APPENDIX I ACCOUNTANTS' REPORT - AASTOCKS.com
167
The following is the text of a report set out on pages 1 to [167], prepared for the purpose of inclusion in this Document, received from the Company’s reporting accountants, Deloitte Touche Tohmatsu, Certified Public Accountants, Hong Kong. ACCOUNTANTS’ REPORT ON HISTORICAL FINANCIAL INFORMATION TO THE DIRECTORS OF CHINA YOURAN DAIRY GROUP LIMITED AND [REDACTED] Introduction We report on the historical financial information of China Youran Dairy Group Limited (the “Company”) and its subsidiaries (together, the “Group”) set out on pages I-[4] to I-[167] which comprises the combined statements of financial position of the Group as at December 31, 2017, 2018 and 2019 and June 30, 2020, and the combined statements of profit or loss and other comprehensive income, the combined statements of changes in equity and the combined statements of cash flows of the Group for each of the three years ended December 31, 2019 and the six months ended June 30, 2020 (the “Track Record Period”) and a summary of significant accounting policies and other explanatory information (together, the “Historical Financial Information”). The Historical Financial Information set out on pages I-[4] to I-[167] forms an integral part of this report, which has been prepared for inclusion in the document of the Company dated [●] (the “Document”) in connection with the [REDACTED] of The Stock Exchange of Hong Kong Limited (the “Stock Exchange”). Directors’ responsibility for the Historical Financial Information The directors of the Company are responsible for the preparation of the Historical Financial Information that gives a true and fair view in accordance with the basis of preparation and presentation set out in Note 2 to the Historical Financial Information, and for such internal control as the directors of the Company determine is necessary to enable the preparation of the Historical Financial Information that is free from material misstatement, whether due to fraud or error. Reporting accountants’ responsibility Our responsibility is to express an opinion on the Historical Financial Information and to report our opinion to you. We conducted our work in accordance with Hong Kong Standard on Investment Circular Reporting Engagements 200 “Accountants’ Reports on Historical Financial Information in Investment Circulars” issued by the Hong Kong Institute of Certified Public Accountants (the “HKICPA”). This standard requires that we comply with ethical standards and plan and perform our work to obtain reasonable assurance about whether the Historical Financial Information is free from material misstatement. APPENDIX I ACCOUNTANTS’ REPORT – I-1 – THIS DOCUMENT IS IN DRAFT FORM, INCOMPLETE AND SUBJECT TO CHANGE AND THAT INFORMATION MUST BE READ IN CONJUNCTION WITH THE SECTION HEADED “WARNING” ON THE COVER OF THIS DOCUMENT.
-
Upload
khangminh22 -
Category
Documents
-
view
3 -
download
0
Transcript of APPENDIX I ACCOUNTANTS' REPORT - AASTOCKS.com
The following is the text of a report set out on pages 1 to [167], prepared for the purposeof inclusion in this Document, received from the Company’s reporting accountants, DeloitteTouche Tohmatsu, Certified Public Accountants, Hong Kong.
ACCOUNTANTS’ REPORT ON HISTORICAL FINANCIAL INFORMATION TO THEDIRECTORS OF CHINA YOURAN DAIRY GROUP LIMITED AND [REDACTED]
Introduction
We report on the historical financial information of China Youran Dairy Group Limited(the “Company”) and its subsidiaries (together, the “Group”) set out on pages I-[4] to I-[167]which comprises the combined statements of financial position of the Group as at December31, 2017, 2018 and 2019 and June 30, 2020, and the combined statements of profit or loss andother comprehensive income, the combined statements of changes in equity and the combinedstatements of cash flows of the Group for each of the three years ended December 31, 2019 andthe six months ended June 30, 2020 (the “Track Record Period”) and a summary of significantaccounting policies and other explanatory information (together, the “Historical FinancialInformation”).
The Historical Financial Information set out on pages I-[4] to I-[167] forms an integralpart of this report, which has been prepared for inclusion in the document of the Companydated [●] (the “Document”) in connection with the [REDACTED] of The Stock Exchange ofHong Kong Limited (the “Stock Exchange”).
Directors’ responsibility for the Historical Financial Information
The directors of the Company are responsible for the preparation of the HistoricalFinancial Information that gives a true and fair view in accordance with the basis of preparationand presentation set out in Note 2 to the Historical Financial Information, and for such internalcontrol as the directors of the Company determine is necessary to enable the preparation of theHistorical Financial Information that is free from material misstatement, whether due to fraudor error.
Reporting accountants’ responsibility
Our responsibility is to express an opinion on the Historical Financial Information and toreport our opinion to you. We conducted our work in accordance with Hong Kong Standard onInvestment Circular Reporting Engagements 200 “Accountants’ Reports on HistoricalFinancial Information in Investment Circulars” issued by the Hong Kong Institute of CertifiedPublic Accountants (the “HKICPA”). This standard requires that we comply with ethicalstandards and plan and perform our work to obtain reasonable assurance about whether theHistorical Financial Information is free from material misstatement.
APPENDIX I ACCOUNTANTS’ REPORT
– I-1 –
THIS DOCUMENT IS IN DRAFT FORM, INCOMPLETE AND SUBJECT TO CHANGE AND THAT INFORMATION MUST BEREAD IN CONJUNCTION WITH THE SECTION HEADED “WARNING” ON THE COVER OF THIS DOCUMENT.
Our work involved performing procedures to obtain evidence about the amounts and
disclosures in the Historical Financial Information. The procedures selected depend on the
reporting accountants’ judgment, including the assessment of risks of material misstatement of
the Historical Financial Information, whether due to fraud or error. In making those risk
assessments, the reporting accountants consider internal control relevant to the entity’s
preparation of the Historical Financial Information that gives a true and fair view in accordance
with the basis of preparation and presentation set out in Note 2 to the Historical Financial
Information in order to design procedures that are appropriate in the circumstances, but not for
the purpose of expressing an opinion on the effectiveness of the entity’s internal control. Our
work also included evaluating the appropriateness of accounting policies used and the
reasonableness of accounting estimates made by the directors of the Company, as well as
evaluating the overall presentation of the Historical Financial Information.
We believe that the evidence we have obtained is sufficient and appropriate to provide a
basis for our opinion.
Opinion
In our opinion the Historical Financial Information gives, for the purposes of the
accountants’ report, a true and fair view of the Group’s financial position as at December 31,
2017, 2018 and 2019 and June 30, 2020, and of the Group’s financial performance and cash
flows for the Track Record Period in accordance with the basis of preparation and presentation
set out in Note 2 to the Historical Financial Information.
Review of stub period comparative financial information
We have reviewed the stub period comparative financial information of the Group which
comprises the combined statement of profit or loss and other comprehensive income, the
combined statement of changes in equity and the combined statement of cash flows of the
Group for the six months ended June 30, 2019 and other explanatory information (the “Stub
Period Comparative Financial Information”).
The directors of the Company are responsible for the preparation and presentation of the
Stub Period Comparative Financial Information in accordance with the basis of preparation and
presentation set out in Note 2 to the Historical Financial Information. Our responsibility is to
express a conclusion on the Stub Period Comparative Financial Information based on our
review. We conducted our review in accordance with Hong Kong Standard on Review
Engagements 2410 “Review of Interim Financial Information Performed by the Independent
Auditor of the Entity” issued by the HKICPA. A review consists of making inquiries, primarily
of persons responsible for financial and accounting matters, and applying analytical and other
review procedures. A review is substantially less in scope than an audit conducted in
accordance with International Standards on Auditing and consequently does not enable us to
obtain assurance that we would become aware of all significant matters that might be identified
in an audit. Accordingly, we do not express an audit opinion.
APPENDIX I ACCOUNTANTS’ REPORT
– I-2 –
THIS DOCUMENT IS IN DRAFT FORM, INCOMPLETE AND SUBJECT TO CHANGE AND THAT INFORMATION MUST BEREAD IN CONJUNCTION WITH THE SECTION HEADED “WARNING” ON THE COVER OF THIS DOCUMENT.
Based on our review, nothing has come to our attention that causes us to believe that the
Stub Period Comparative Financial Information, for the purposes of the accountants’ report, is
not prepared, in all material respects, in accordance with the basis of preparation and
presentation set out in Note 2 to the Historical Financial Information.
Report on matters under the Rules Governing the Listing of Securities on the StockExchange and the Companies (Winding Up and Miscellaneous Provisions) Ordinance
Adjustments
The Historical Financial Information is stated after making such adjustments to the
Underlying Financial Statements as defined on page I-[4] as were considered necessary.
Dividends
We refer to Note 16 to the Historical Financial Information which states that no dividend
was declared or paid by the group entities comprising the Group in respect of the Track Record
Period and contains information about the dividend declared by the Company subsequent to the
Track Record Period.
No historical financial statements for the Company
No financial statements have been prepared for the Company since its date of
incorporation.
[Deloitte Touche Tohmatsu]Certified Public Accountants
Hong Kong
[Date]
APPENDIX I ACCOUNTANTS’ REPORT
– I-3 –
THIS DOCUMENT IS IN DRAFT FORM, INCOMPLETE AND SUBJECT TO CHANGE AND THAT INFORMATION MUST BEREAD IN CONJUNCTION WITH THE SECTION HEADED “WARNING” ON THE COVER OF THIS DOCUMENT.
I. HISTORICAL FINANCIAL INFORMATION OF THE GROUP
PREPARATION OF HISTORICAL FINANCIAL INFORMATION
Set out below is the Historical Financial Information which forms an integral part of this
accountants’ report.
The consolidated financial statements of Yogurt Holding II Limited (“Youran BVI”), a
company incorporated in the British Virgin Islands, for the Track Record Period, on which the
Historical Financial Information is based, have been prepared in accordance with accounting
policies which conform with International Financial Reporting Standards (“IFRSs”) issued by
International Accounting Standards Board (the “IASB”) and were audited by us in accordance
with International Standards on Auditing (the “Underlying Financial Statements”).
The Historical Financial Information is presented in Renminbi (“RMB”) and all values
are rounded to the nearest thousand (RMB’000) except when otherwise indicated.
APPENDIX I ACCOUNTANTS’ REPORT
– I-4 –
THIS DOCUMENT IS IN DRAFT FORM, INCOMPLETE AND SUBJECT TO CHANGE AND THAT INFORMATION MUST BEREAD IN CONJUNCTION WITH THE SECTION HEADED “WARNING” ON THE COVER OF THIS DOCUMENT.
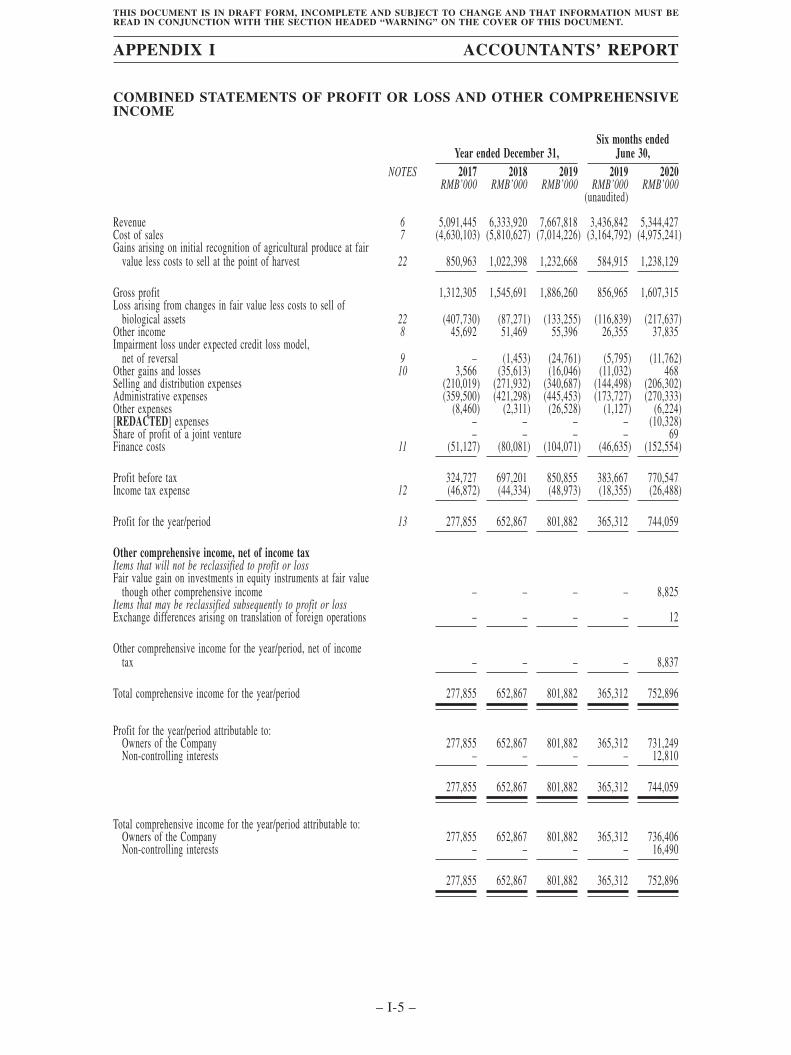
COMBINED STATEMENTS OF PROFIT OR LOSS AND OTHER COMPREHENSIVEINCOME
Year ended December 31,Six months ended
June 30,NOTES 2017 2018 2019 2019 2020
RMB’000 RMB’000 RMB’000 RMB’000 RMB’000(unaudited)
Revenue 6 5,091,445 6,333,920 7,667,818 3,436,842 5,344,427Cost of sales 7 (4,630,103) (5,810,627) (7,014,226) (3,164,792) (4,975,241)Gains arising on initial recognition of agricultural produce at fair
value less costs to sell at the point of harvest 22 850,963 1,022,398 1,232,668 584,915 1,238,129
Gross profit 1,312,305 1,545,691 1,886,260 856,965 1,607,315Loss arising from changes in fair value less costs to sell of
biological assets 22 (407,730) (87,271) (133,255) (116,839) (217,637)Other income 8 45,692 51,469 55,396 26,355 37,835Impairment loss under expected credit loss model,
net of reversal 9 – (1,453) (24,761) (5,795) (11,762)Other gains and losses 10 3,566 (35,613) (16,046) (11,032) 468Selling and distribution expenses (210,019) (271,932) (340,687) (144,498) (206,302)Administrative expenses (359,500) (421,298) (445,453) (173,727) (270,333)Other expenses (8,460) (2,311) (26,528) (1,127) (6,224)[REDACTED] expenses – – – – (10,328)Share of profit of a joint venture – – – – 69Finance costs 11 (51,127) (80,081) (104,071) (46,635) (152,554)
Profit before tax 324,727 697,201 850,855 383,667 770,547Income tax expense 12 (46,872) (44,334) (48,973) (18,355) (26,488)
Profit for the year/period 13 277,855 652,867 801,882 365,312 744,059
Other comprehensive income, net of income taxItems that will not be reclassified to profit or lossFair value gain on investments in equity instruments at fair value
though other comprehensive income – – – – 8,825Items that may be reclassified subsequently to profit or lossExchange differences arising on translation of foreign operations – – – – 12
Other comprehensive income for the year/period, net of incometax – – – – 8,837
Total comprehensive income for the year/period 277,855 652,867 801,882 365,312 752,896
Profit for the year/period attributable to:Owners of the Company 277,855 652,867 801,882 365,312 731,249Non-controlling interests – – – – 12,810
277,855 652,867 801,882 365,312 744,059
Total comprehensive income for the year/period attributable to:Owners of the Company 277,855 652,867 801,882 365,312 736,406Non-controlling interests – – – – 16,490
277,855 652,867 801,882 365,312 752,896
APPENDIX I ACCOUNTANTS’ REPORT
– I-5 –
THIS DOCUMENT IS IN DRAFT FORM, INCOMPLETE AND SUBJECT TO CHANGE AND THAT INFORMATION MUST BEREAD IN CONJUNCTION WITH THE SECTION HEADED “WARNING” ON THE COVER OF THIS DOCUMENT.
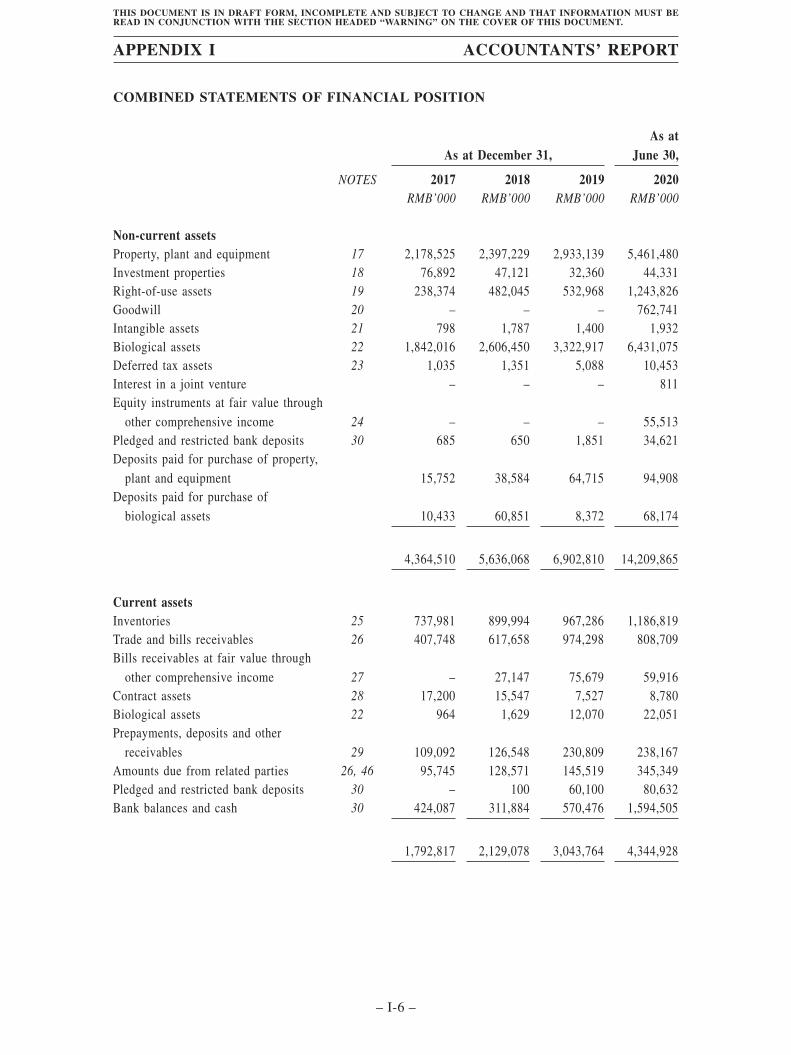
COMBINED STATEMENTS OF FINANCIAL POSITION
As at December 31,As at
June 30,
NOTES 2017 2018 2019 2020RMB’000 RMB’000 RMB’000 RMB’000
Non-current assetsProperty, plant and equipment 17 2,178,525 2,397,229 2,933,139 5,461,480Investment properties 18 76,892 47,121 32,360 44,331Right-of-use assets 19 238,374 482,045 532,968 1,243,826Goodwill 20 – – – 762,741Intangible assets 21 798 1,787 1,400 1,932Biological assets 22 1,842,016 2,606,450 3,322,917 6,431,075Deferred tax assets 23 1,035 1,351 5,088 10,453Interest in a joint venture – – – 811Equity instruments at fair value through
other comprehensive income 24 – – – 55,513Pledged and restricted bank deposits 30 685 650 1,851 34,621Deposits paid for purchase of property,
plant and equipment 15,752 38,584 64,715 94,908Deposits paid for purchase of
biological assets 10,433 60,851 8,372 68,174
4,364,510 5,636,068 6,902,810 14,209,865
Current assetsInventories 25 737,981 899,994 967,286 1,186,819Trade and bills receivables 26 407,748 617,658 974,298 808,709Bills receivables at fair value through
other comprehensive income 27 – 27,147 75,679 59,916Contract assets 28 17,200 15,547 7,527 8,780Biological assets 22 964 1,629 12,070 22,051Prepayments, deposits and other
receivables 29 109,092 126,548 230,809 238,167Amounts due from related parties 26, 46 95,745 128,571 145,519 345,349Pledged and restricted bank deposits 30 – 100 60,100 80,632Bank balances and cash 30 424,087 311,884 570,476 1,594,505
1,792,817 2,129,078 3,043,764 4,344,928
APPENDIX I ACCOUNTANTS’ REPORT
– I-6 –
THIS DOCUMENT IS IN DRAFT FORM, INCOMPLETE AND SUBJECT TO CHANGE AND THAT INFORMATION MUST BEREAD IN CONJUNCTION WITH THE SECTION HEADED “WARNING” ON THE COVER OF THIS DOCUMENT.
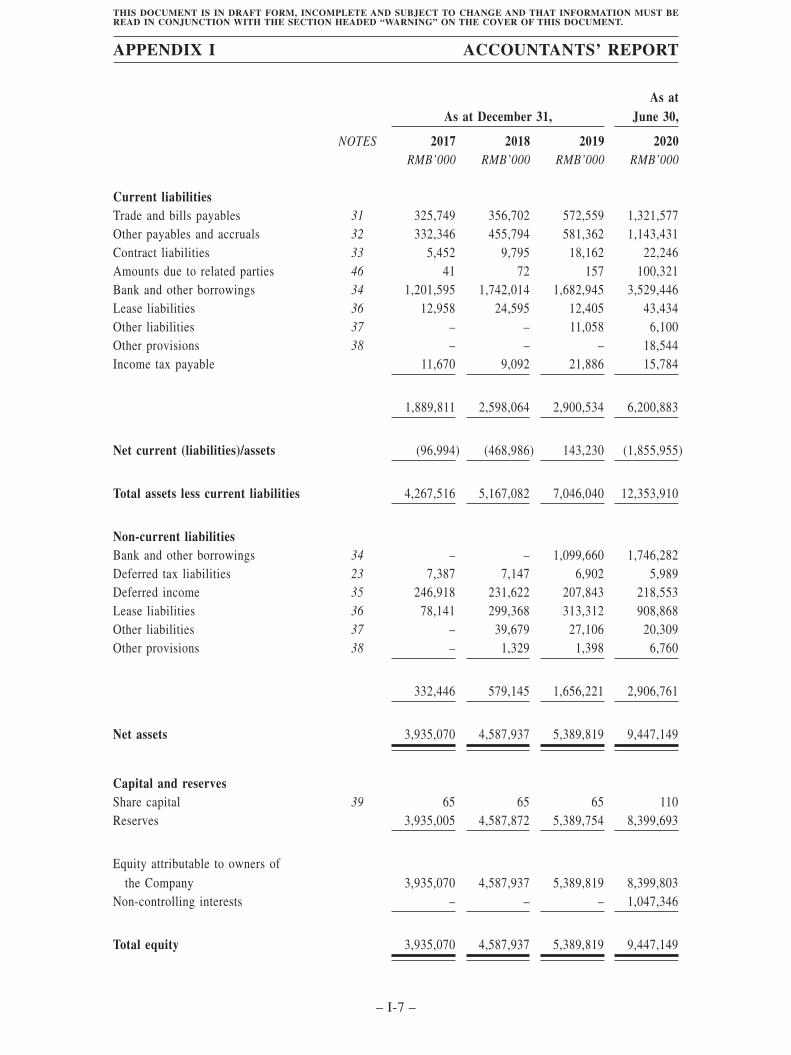
As at December 31,As at
June 30,
NOTES 2017 2018 2019 2020RMB’000 RMB’000 RMB’000 RMB’000
Current liabilitiesTrade and bills payables 31 325,749 356,702 572,559 1,321,577Other payables and accruals 32 332,346 455,794 581,362 1,143,431Contract liabilities 33 5,452 9,795 18,162 22,246Amounts due to related parties 46 41 72 157 100,321Bank and other borrowings 34 1,201,595 1,742,014 1,682,945 3,529,446Lease liabilities 36 12,958 24,595 12,405 43,434Other liabilities 37 – – 11,058 6,100Other provisions 38 – – – 18,544Income tax payable 11,670 9,092 21,886 15,784
1,889,811 2,598,064 2,900,534 6,200,883
Net current (liabilities)/assets (96,994) (468,986) 143,230 (1,855,955)
Total assets less current liabilities 4,267,516 5,167,082 7,046,040 12,353,910
Non-current liabilitiesBank and other borrowings 34 – – 1,099,660 1,746,282Deferred tax liabilities 23 7,387 7,147 6,902 5,989Deferred income 35 246,918 231,622 207,843 218,553Lease liabilities 36 78,141 299,368 313,312 908,868Other liabilities 37 – 39,679 27,106 20,309Other provisions 38 – 1,329 1,398 6,760
332,446 579,145 1,656,221 2,906,761
Net assets 3,935,070 4,587,937 5,389,819 9,447,149
Capital and reservesShare capital 39 65 65 65 110Reserves 3,935,005 4,587,872 5,389,754 8,399,693
Equity attributable to owners ofthe Company 3,935,070 4,587,937 5,389,819 8,399,803
Non-controlling interests – – – 1,047,346
Total equity 3,935,070 4,587,937 5,389,819 9,447,149
APPENDIX I ACCOUNTANTS’ REPORT
– I-7 –
THIS DOCUMENT IS IN DRAFT FORM, INCOMPLETE AND SUBJECT TO CHANGE AND THAT INFORMATION MUST BEREAD IN CONJUNCTION WITH THE SECTION HEADED “WARNING” ON THE COVER OF THIS DOCUMENT.
CO
MB
INE
DS
TA
TE
ME
NT
SO
FC
HA
NG
ES
INE
QU
ITY
Attr
ibut
able
toow
ners
ofth
eCo
mpa
ny
Shar
eca
pita
lO
ther
rese
rve
Capi
tal
rese
rve
Inve
stm
ent
reva
luat
ion
rese
rve
Tran
slatio
nre
serv
eSt
atut
ory
rese
rve
(Acc
umul
ated
loss
es)/
reta
ined
earn
ings
Tota
l
Non-
cont
rolli
ngin
tere
sts
Tota
leq
uity
RMB’
000
RMB’
000
RMB’
000
RMB’
000
RMB’
000
RMB’
000
RMB’
000
RMB’
000
RMB’
000
RMB’
000
(Not
e(i)
)(N
ote
(i))
(Not
e(ii
))
As
atJa
nuar
y1,
2017
–3,
688,
567
––
–3,
791
(35,
143)
3,65
7,21
5–
3,65
7,21
5Pr
ofit
and
tota
lcom
preh
ensiv
ein
com
efo
rthe
year
––
––
––
277,
855
277,
855
–27
7,85
5St
atut
ory
fund
appr
opria
tion
––
––
–9,
632
(9,6
32)
––
–
As
atD
ecem
ber3
1,20
17an
dJa
nuar
y1,
2018
–3,
688,
567
––
–13
,423
233,
080
3,93
5,07
0–
3,93
5,07
0Pr
ofit
and
tota
lcom
preh
ensiv
ein
com
efo
rthe
year
––
––
––
652,
867
652,
867
–65
2,86
7St
atut
ory
fund
appr
opria
tion
––
––
–55
,872
(55,
872)
––
–
As
atD
ecem
ber3
1,20
18an
dJa
nuar
y1,
2019
–3,
688,
567
––
–69
,295
830,
075
4,58
7,93
7–
4,58
7,93
7Pr
ofit
and
tota
lcom
preh
ensiv
ein
com
efo
rthe
year
––
––
––
801,
882
801,
882
–80
1,88
2St
atut
ory
fund
appr
opria
tion
––
––
–42
,502
(42,
502)
––
–
As
atD
ecem
ber3
1,20
19an
dJa
nuar
y1,
2020
–3,
688,
567
––
–11
1,79
71,
589,
455
5,38
9,81
9–
5,38
9,81
9Pr
ofit
and
tota
lcom
preh
ensiv
ein
com
efo
rthe
perio
d–
––
5,15
16
–73
1,24
973
6,40
616
,490
752,
896
Capi
talc
ontri
butio
ns(N
ote
(i))
–2,
278,
500
––
––
–2,
278,
500
–2,
278,
500
Acq
uisit
ion
ofsu
bsid
iarie
s(N
ote
42)
––
––
––
––
1,03
7,93
21,
037,
932
Acq
uisit
ion
ofad
ditio
nali
nter
ests
insu
bsid
iarie
s(N
ote
(iii))
––
(4,9
22)
––
––
(4,9
22)
(7,0
76)
(11,
998)
As
atJu
ne30
,202
0–
5,96
7,06
7(4
,922
)5,
151
611
1,79
72,
320,
704
8,39
9,80
31,
047,
346
9,44
7,14
9
As
atJa
nuar
y1,
2019
–3,
688,
567
––
–69
,295
830,
075
4,58
7,93
7–
4,58
7,93
7Pr
ofit
and
tota
lcom
preh
ensiv
ein
com
efo
rthe
perio
d–
––
––
–36
5,31
236
5,31
2–
365,
312
Stat
utor
yfu
ndap
prop
riatio
n–
––
––
6,02
2(6
,022
)–
––
As
atJu
ne30
,201
9(u
naud
ited)
–3,
688,
567
––
–75
,317
1,18
9,36
54,
953,
249
–4,
953,
249
APPENDIX I ACCOUNTANTS’ REPORT
– I-8 –
THIS DOCUMENT IS IN DRAFT FORM, INCOMPLETE AND SUBJECT TO CHANGE AND THAT INFORMATION MUST BEREAD IN CONJUNCTION WITH THE SECTION HEADED “WARNING” ON THE COVER OF THIS DOCUMENT.
Notes:
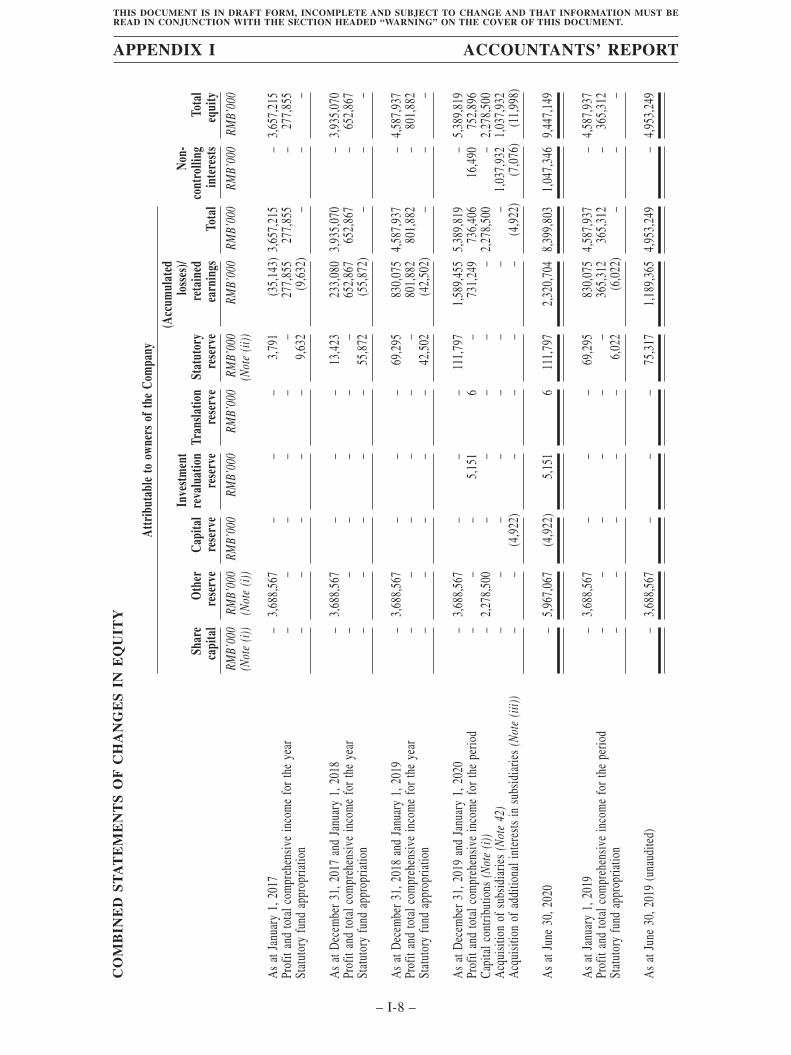
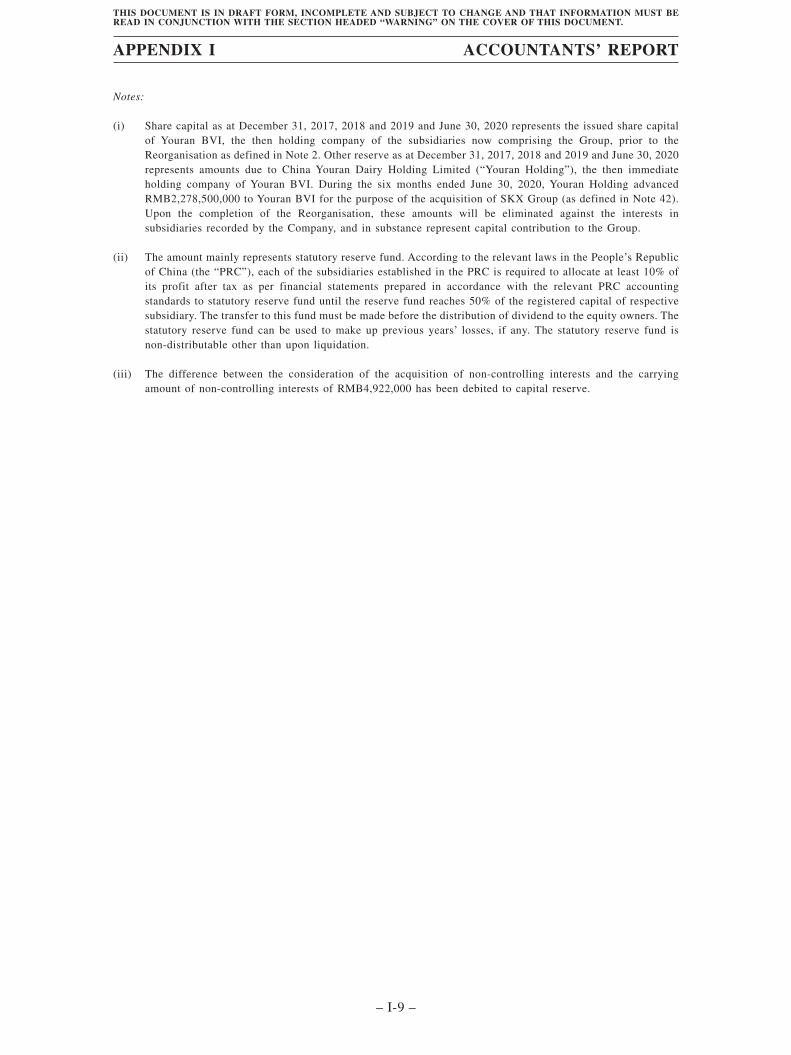
(i) Share capital as at December 31, 2017, 2018 and 2019 and June 30, 2020 represents the issued share capitalof Youran BVI, the then holding company of the subsidiaries now comprising the Group, prior to theReorganisation as defined in Note 2. Other reserve as at December 31, 2017, 2018 and 2019 and June 30, 2020represents amounts due to China Youran Dairy Holding Limited (“Youran Holding”), the then immediateholding company of Youran BVI. During the six months ended June 30, 2020, Youran Holding advancedRMB2,278,500,000 to Youran BVI for the purpose of the acquisition of SKX Group (as defined in Note 42).Upon the completion of the Reorganisation, these amounts will be eliminated against the interests insubsidiaries recorded by the Company, and in substance represent capital contribution to the Group.
(ii) The amount mainly represents statutory reserve fund. According to the relevant laws in the People’s Republicof China (the “PRC”), each of the subsidiaries established in the PRC is required to allocate at least 10% ofits profit after tax as per financial statements prepared in accordance with the relevant PRC accountingstandards to statutory reserve fund until the reserve fund reaches 50% of the registered capital of respectivesubsidiary. The transfer to this fund must be made before the distribution of dividend to the equity owners. Thestatutory reserve fund can be used to make up previous years’ losses, if any. The statutory reserve fund isnon-distributable other than upon liquidation.
(iii) The difference between the consideration of the acquisition of non-controlling interests and the carryingamount of non-controlling interests of RMB4,922,000 has been debited to capital reserve.
APPENDIX I ACCOUNTANTS’ REPORT
– I-9 –
THIS DOCUMENT IS IN DRAFT FORM, INCOMPLETE AND SUBJECT TO CHANGE AND THAT INFORMATION MUST BEREAD IN CONJUNCTION WITH THE SECTION HEADED “WARNING” ON THE COVER OF THIS DOCUMENT.
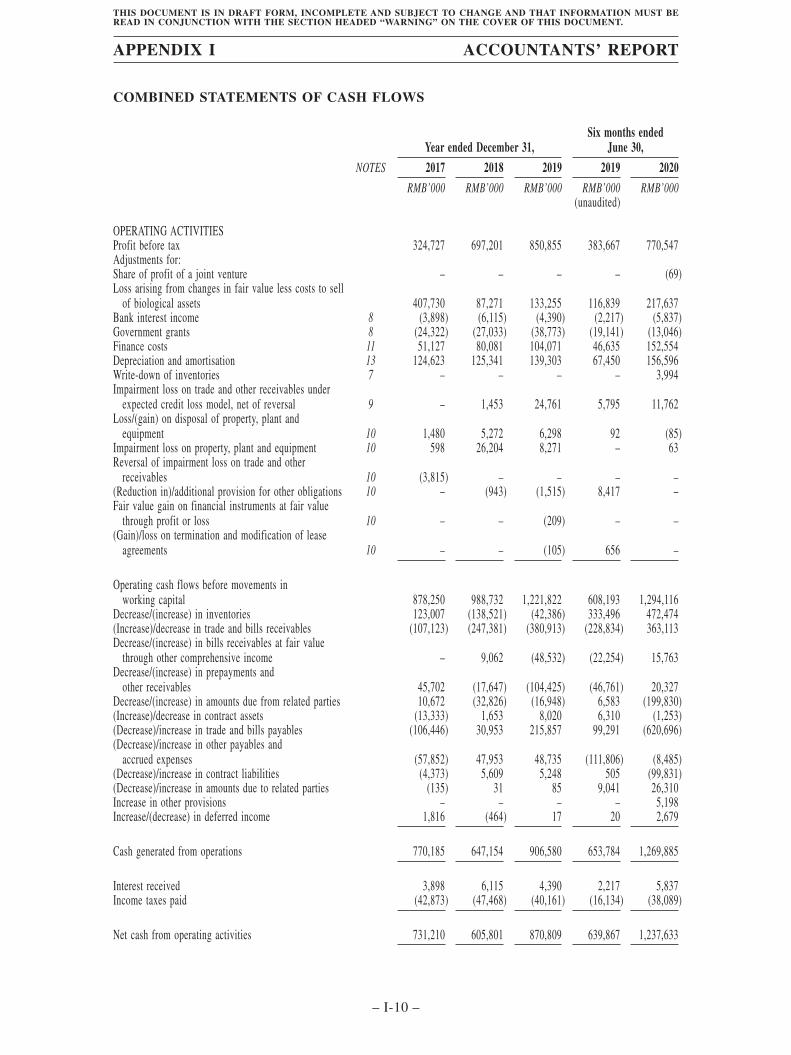
COMBINED STATEMENTS OF CASH FLOWS
Year ended December 31,Six months ended
June 30,
NOTES 2017 2018 2019 2019 2020
RMB’000 RMB’000 RMB’000 RMB’000 RMB’000(unaudited)
OPERATING ACTIVITIESProfit before tax 324,727 697,201 850,855 383,667 770,547Adjustments for:Share of profit of a joint venture – – – – (69)Loss arising from changes in fair value less costs to sell
of biological assets 407,730 87,271 133,255 116,839 217,637Bank interest income 8 (3,898) (6,115) (4,390) (2,217) (5,837)Government grants 8 (24,322) (27,033) (38,773) (19,141) (13,046)Finance costs 11 51,127 80,081 104,071 46,635 152,554Depreciation and amortisation 13 124,623 125,341 139,303 67,450 156,596Write-down of inventories 7 – – – – 3,994Impairment loss on trade and other receivables under
expected credit loss model, net of reversal 9 – 1,453 24,761 5,795 11,762Loss/(gain) on disposal of property, plant and
equipment 10 1,480 5,272 6,298 92 (85)Impairment loss on property, plant and equipment 10 598 26,204 8,271 – 63Reversal of impairment loss on trade and other
receivables 10 (3,815) – – – –(Reduction in)/additional provision for other obligations 10 – (943) (1,515) 8,417 –Fair value gain on financial instruments at fair value
through profit or loss 10 – – (209) – –(Gain)/loss on termination and modification of lease
agreements 10 – – (105) 656 –
Operating cash flows before movements inworking capital 878,250 988,732 1,221,822 608,193 1,294,116
Decrease/(increase) in inventories 123,007 (138,521) (42,386) 333,496 472,474(Increase)/decrease in trade and bills receivables (107,123) (247,381) (380,913) (228,834) 363,113Decrease/(increase) in bills receivables at fair value
through other comprehensive income – 9,062 (48,532) (22,254) 15,763Decrease/(increase) in prepayments and
other receivables 45,702 (17,647) (104,425) (46,761) 20,327Decrease/(increase) in amounts due from related parties 10,672 (32,826) (16,948) 6,583 (199,830)(Increase)/decrease in contract assets (13,333) 1,653 8,020 6,310 (1,253)(Decrease)/increase in trade and bills payables (106,446) 30,953 215,857 99,291 (620,696)(Decrease)/increase in other payables and
accrued expenses (57,852) 47,953 48,735 (111,806) (8,485)(Decrease)/increase in contract liabilities (4,373) 5,609 5,248 505 (99,831)(Decrease)/increase in amounts due to related parties (135) 31 85 9,041 26,310Increase in other provisions – – – – 5,198Increase/(decrease) in deferred income 1,816 (464) 17 20 2,679
Cash generated from operations 770,185 647,154 906,580 653,784 1,269,885
Interest received 3,898 6,115 4,390 2,217 5,837Income taxes paid (42,873) (47,468) (40,161) (16,134) (38,089)
Net cash from operating activities 731,210 605,801 870,809 639,867 1,237,633
APPENDIX I ACCOUNTANTS’ REPORT
– I-10 –
THIS DOCUMENT IS IN DRAFT FORM, INCOMPLETE AND SUBJECT TO CHANGE AND THAT INFORMATION MUST BEREAD IN CONJUNCTION WITH THE SECTION HEADED “WARNING” ON THE COVER OF THIS DOCUMENT.
Year ended December 31,Six months ended
June 30,
NOTES 2017 2018 2019 2019 2020
RMB’000 RMB’000 RMB’000 RMB’000 RMB’000(unaudited)
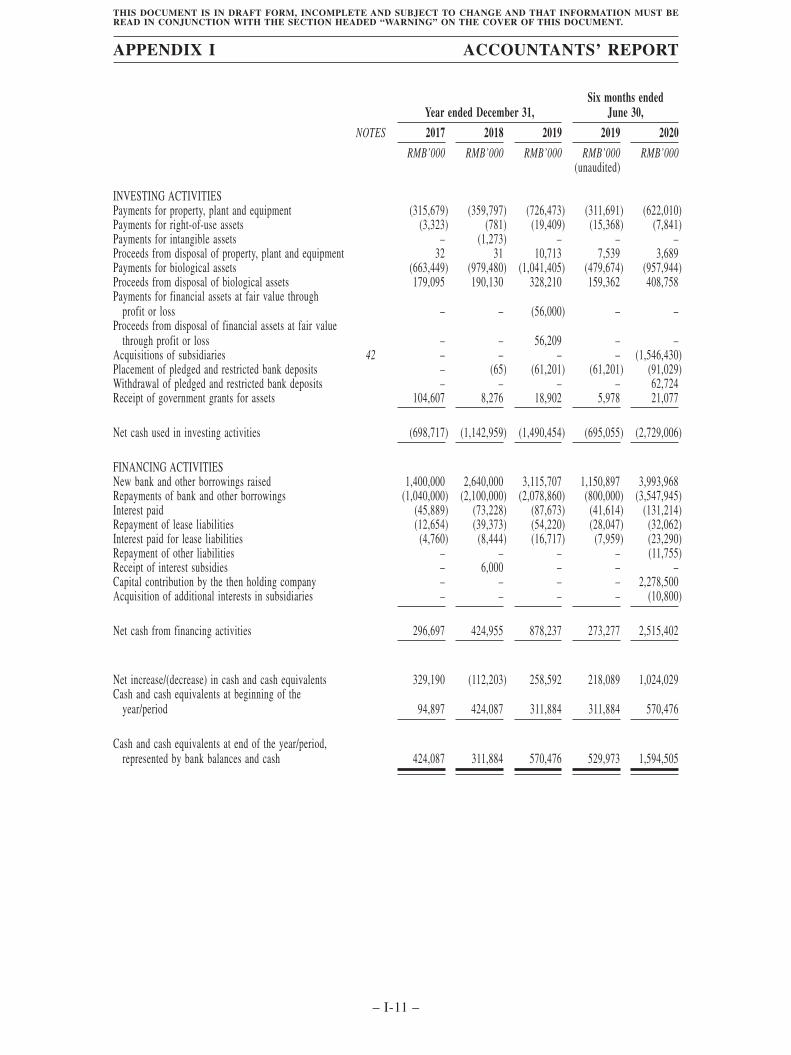
INVESTING ACTIVITIESPayments for property, plant and equipment (315,679) (359,797) (726,473) (311,691) (622,010)Payments for right-of-use assets (3,323) (781) (19,409) (15,368) (7,841)Payments for intangible assets – (1,273) – – –Proceeds from disposal of property, plant and equipment 32 31 10,713 7,539 3,689Payments for biological assets (663,449) (979,480) (1,041,405) (479,674) (957,944)Proceeds from disposal of biological assets 179,095 190,130 328,210 159,362 408,758Payments for financial assets at fair value through
profit or loss – – (56,000) – –Proceeds from disposal of financial assets at fair value
through profit or loss – – 56,209 – –Acquisitions of subsidiaries 42 – – – – (1,546,430)Placement of pledged and restricted bank deposits – (65) (61,201) (61,201) (91,029)Withdrawal of pledged and restricted bank deposits – – – – 62,724Receipt of government grants for assets 104,607 8,276 18,902 5,978 21,077
Net cash used in investing activities (698,717) (1,142,959) (1,490,454) (695,055) (2,729,006)
FINANCING ACTIVITIESNew bank and other borrowings raised 1,400,000 2,640,000 3,115,707 1,150,897 3,993,968Repayments of bank and other borrowings (1,040,000) (2,100,000) (2,078,860) (800,000) (3,547,945)Interest paid (45,889) (73,228) (87,673) (41,614) (131,214)Repayment of lease liabilities (12,654) (39,373) (54,220) (28,047) (32,062)Interest paid for lease liabilities (4,760) (8,444) (16,717) (7,959) (23,290)Repayment of other liabilities – – – – (11,755)Receipt of interest subsidies – 6,000 – – –Capital contribution by the then holding company – – – – 2,278,500Acquisition of additional interests in subsidiaries – – – – (10,800)
Net cash from financing activities 296,697 424,955 878,237 273,277 2,515,402
Net increase/(decrease) in cash and cash equivalents 329,190 (112,203) 258,592 218,089 1,024,029Cash and cash equivalents at beginning of the
year/period 94,897 424,087 311,884 311,884 570,476
Cash and cash equivalents at end of the year/period,represented by bank balances and cash 424,087 311,884 570,476 529,973 1,594,505
APPENDIX I ACCOUNTANTS’ REPORT
– I-11 –
THIS DOCUMENT IS IN DRAFT FORM, INCOMPLETE AND SUBJECT TO CHANGE AND THAT INFORMATION MUST BEREAD IN CONJUNCTION WITH THE SECTION HEADED “WARNING” ON THE COVER OF THIS DOCUMENT.
II. NOTES TO THE HISTORICAL FINANCIAL INFORMATION OF THE GROUP
1. GENERAL
China Youran Dairy Group Limited (the “Company”) was incorporated in the Cayman Islands on August 21,2020 as an exempted company with limited liability under the Companies Law (Cap. 22, Law 3 of 1961 asconsolidated and revised) of the Cayman Islands. The address of the Company’s registered office is at the offices ofOgier Global (Cayman) Limited, 89 Nexus Way, Camana Bay, Grand Cayman KY1-9009, Cayman Islands. Theprincipal place of business of the Company is No. 169, Hexi Road, Saihan District Hohhot, Inner Mongolia, the PRC.
The Company is an investment holding company and has not carried out any business operations since the dateof incorporation save for the corporate reorganisation mentioned below. The Company and its subsidiaries (together,the “Group”) is primarily engaged in the production and sale of raw milk, and the trading, production and sale ofdairy farming products in the PRC.
The functional currency of the Company is RMB, which is the same as the presentation currency of theHistorical Financial Information.
2. GROUP REORGANISATION AND BASIS OF PRESENTATION AND PREPARATION OF THEHISTORICAL FINANCIAL INFORMATION
Throughout the Track Record Period, the Group’s operations were conducted by the existing group of entitiesheld by China Youran Dairy Holding Limited (“Youran Holding”), a company incorporated in the Cayman Islandsand the then holding company of all subsidiaries now comprising the Group.
In preparation for the [REDACTED] of the shares of the Company on the [REDACTED] of The StockExchange of Hong Kong Limited (the “Stock Exchange”), the entities now comprising the Group underwent a groupreorganisation (the “Reorganisation”) which involves major steps as follows:
(a) On August 21, 2020, the Company was incorporated as an exempted company with limited liabilityunder the laws of Cayman Islands with an authorised share capital of US$100,000 divided into10,000,000,000 ordinary shares of US$0.00001 each.
(b) On October 27, 2020, Youran Holding and the Company entered into an instrument of transfer, pursuantto which Youran Holding transferred the entirety of its 100 ordinary shares in Youran BVI to theCompany in consideration for the issuance and allotment of 3,302,000,000 ordinary shares with a parvalue of US$0.00001 by the Company, and the Company became a wholly-owned subsidiary of YouranHolding.
Pursuant to the Reorganisation detailed above, which was completed by interspersing the Company betweenYouran Holding and the Company, the Company has become the holding company of the companies now comprisingthe Group on October 27, 2020.
The Group comprising the Company and its subsidiaries resulting from the Reorganisation is regarded as acontinuing entity, accordingly, the Historical Financial Information has been prepared as if the Company had alwaysbeen the holding company of the Group.
The combined statements of profit or loss and other comprehensive income, combined statements of changesin equity and combined statements of cash flows of the Group for the Track Record Period include the results andcash flows of the companies now comprising the Group as if the current group structure had been in existencethroughout the Track Record Period or since the date of incorporation, where this is a shorter period.
The combined statements of financial position of the Group as at December 31, 2017, 2018 and 2019 and June30, 2020 have been prepared to present the assets and liabilities of the companies now comprising the Group as ifthe current group structure had been in existence at those dates, taking into account the respective dates ofincorporation, where applicable.
APPENDIX I ACCOUNTANTS’ REPORT
– I-12 –
THIS DOCUMENT IS IN DRAFT FORM, INCOMPLETE AND SUBJECT TO CHANGE AND THAT INFORMATION MUST BEREAD IN CONJUNCTION WITH THE SECTION HEADED “WARNING” ON THE COVER OF THIS DOCUMENT.
3. APPLICATION OF INTERNATIONAL FINANCIAL REPORTING STANDARDS
For the purpose of preparing and presenting the Historical Financial Information for the Track Record Period,the Group has consistently applied the accounting policies which conform with the IFRSs, which are effective for theGroup’s accounting period beginning on January 1, 2020 throughout the Track Record Period, including IFRS 15Revenue from Contracts with Customers and IFRS 16 Leases, except that the Group adopted IFRS 9 FinancialInstruments on January 1, 2018 and International Accounting Standard (“IAS”) 39 Financial Instruments:Recognition and Measurement prior to January 1, 2018, and amendments to IFRS 9 Prepayment Features withNegative Compensation on January 1, 2019.
IFRS 9 Financial Instruments
On January 1, 2018, the Group has applied IFRS 9 and the related consequential amendments to other IFRSs.IFRS 9 introduces new requirements for 1) the classification and measurement of financial assets and financialliabilities; 2) expected credit losses (“ECL”) for financial assets and other items (for example, contract assets) thatare subject to the impairment provisions; and 3) general hedge accounting.
The Group has applied IFRS 9 in accordance with the transition provisions set out in IFRS 9, i.e. applied theclassification and measurement requirements (including impairment under ECL model) retrospectively to instrumentsthat have not been derecognised as at January 1, 2018 (date of initial application) and has not applied the requirementto instruments that have already been derecognised as at January 1, 2018. Accordingly, certain financial informationfor the year ended December 31, 2017 may not be comparable as the information was prepared under IAS 39. Keyrequirements of IFRS 9 which are relevant to the Group are:
• all recognised financial assets that are within the scope of IFRS 9 are required to be subsequentlymeasured at amortised cost or fair value. Specifically, debt investments that are held within a businessmodel whose objective is to collect the contractual cash flows, and that have contractual cash flows thatare solely payments of principal and interest on the principal amount outstanding are generally measuredat amortised cost at the end of subsequent accounting periods. All other debt investments and equityinvestments are measured at their fair value at the end of subsequent accounting periods.
• in relation to the impairment of financial assets, IFRS 9 requires an ECL model, as opposed to anincurred credit loss model under IAS 39. The ECL model requires an entity to account for ECL andchanges in those ECLs at each reporting date to reflect changes in credit risk since initial recognition.In other words, it is no longer necessary for a credit event to have occurred before credit losses arerecognised.
Accounting policies resulting from application of IFRS 9 are disclosed in Note 4.
Summary of effects arising from initial application of IFRS 9
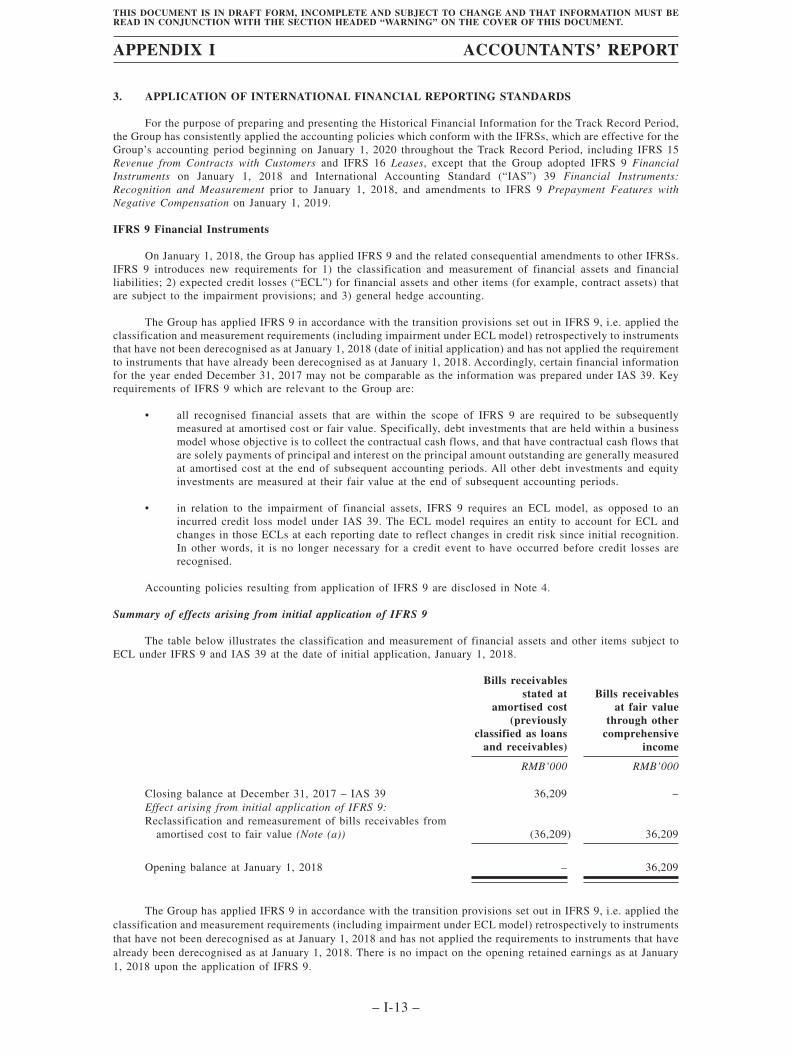
The table below illustrates the classification and measurement of financial assets and other items subject toECL under IFRS 9 and IAS 39 at the date of initial application, January 1, 2018.
Bills receivablesstated at
amortised cost(previously
classified as loansand receivables)
Bills receivablesat fair value
through othercomprehensive
income
RMB’000 RMB’000
Closing balance at December 31, 2017 – IAS 39 36,209 –Effect arising from initial application of IFRS 9:Reclassification and remeasurement of bills receivables from
amortised cost to fair value (Note (a)) (36,209) 36,209
Opening balance at January 1, 2018 – 36,209
The Group has applied IFRS 9 in accordance with the transition provisions set out in IFRS 9, i.e. applied theclassification and measurement requirements (including impairment under ECL model) retrospectively to instrumentsthat have not been derecognised as at January 1, 2018 and has not applied the requirements to instruments that havealready been derecognised as at January 1, 2018. There is no impact on the opening retained earnings as at January1, 2018 upon the application of IFRS 9.
APPENDIX I ACCOUNTANTS’ REPORT
– I-13 –
THIS DOCUMENT IS IN DRAFT FORM, INCOMPLETE AND SUBJECT TO CHANGE AND THAT INFORMATION MUST BEREAD IN CONJUNCTION WITH THE SECTION HEADED “WARNING” ON THE COVER OF THIS DOCUMENT.
Notes:
(a) Bills receivables
As part of the Group’s cash flow management, the Group has the practice of discounting some of thebills received from debtors to financial institutions before the bills are due for payment and derecognisesbills discounted on the basis that the Group has transferred substantially all risks and rewards to therelevant counterparties. Accordingly, the Group’s bills receivables of RMB36,209,000 were consideredas within the hold to collect contractual cash flows and to sell business model, and reclassified to debtinstruments at fair value through other comprehensive income (“FVTOCI”) as at January 1, 2018. Therelated fair value changes are minimal.
(b) Impairment under ECL model
The application of the ECL model of IFRS 9 on January 1, 2018 resulted in earlier provision of creditlosses which are not yet incurred in relation to the Group’s financial assets measured at amortised cost,debt instruments at FVTOCI and other items (for example, contract assets) that subject to theimpairment provisions.
The Group applies the IFRS 9 simplified approach to measure ECL which uses a lifetime ECL for alltrade receivables and contract assets. To measure the ECL, trade receivables and contract assets havebeen grouped based on shared credit risk characteristics and debtors’ aging except for those which hadbeen determined as credit impaired under IAS 39 and those with significant outstanding balances whichhave been assessed individually.
Loss allowances other financial assets at amortised cost which mainly comprise of bank balances,pledged and restricted bank deposits, deposits and other receivables, amounts due from related partiesand bills receivables at fair value through other comprehensive income are measured on 12-month ECLbasis and there had been no significant increase in credit risk since initial recognition, except for certainother receivables which are measured as lifetime ECL basis as those credit risk had increasedsignificantly since initial recognition.
No additional loss allowance is charged against the respective assets as at January 1, 2018 upon theapplication of IFRS 9.
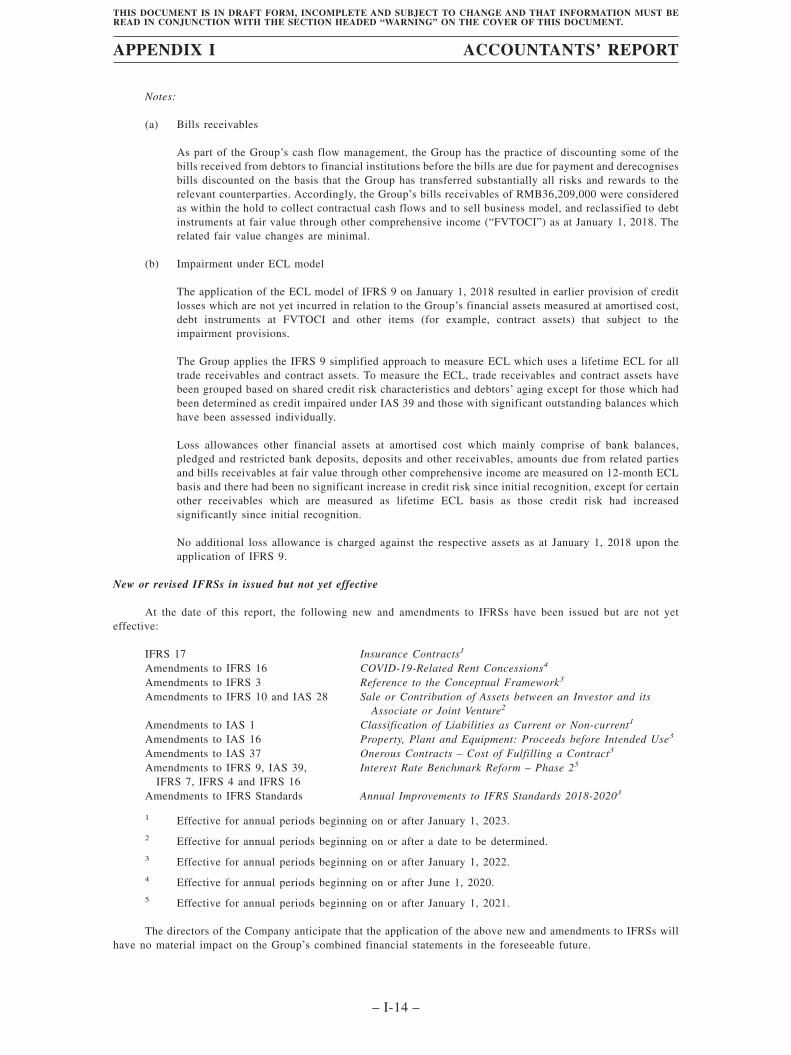
New or revised IFRSs in issued but not yet effective
At the date of this report, the following new and amendments to IFRSs have been issued but are not yeteffective:
IFRS 17 Insurance Contracts1
Amendments to IFRS 16 COVID-19-Related Rent Concessions4
Amendments to IFRS 3 Reference to the Conceptual Framework3
Amendments to IFRS 10 and IAS 28 Sale or Contribution of Assets between an Investor and itsAssociate or Joint Venture2
Amendments to IAS 1 Classification of Liabilities as Current or Non-current1
Amendments to IAS 16 Property, Plant and Equipment: Proceeds before Intended Use3
Amendments to IAS 37 Onerous Contracts – Cost of Fulfilling a Contract3
Amendments to IFRS 9, IAS 39,IFRS 7, IFRS 4 and IFRS 16
Interest Rate Benchmark Reform – Phase 25
Amendments to IFRS Standards Annual Improvements to IFRS Standards 2018-20203
1 Effective for annual periods beginning on or after January 1, 2023.
2 Effective for annual periods beginning on or after a date to be determined.
3 Effective for annual periods beginning on or after January 1, 2022.
4 Effective for annual periods beginning on or after June 1, 2020.
5 Effective for annual periods beginning on or after January 1, 2021.
The directors of the Company anticipate that the application of the above new and amendments to IFRSs willhave no material impact on the Group’s combined financial statements in the foreseeable future.
APPENDIX I ACCOUNTANTS’ REPORT
– I-14 –
THIS DOCUMENT IS IN DRAFT FORM, INCOMPLETE AND SUBJECT TO CHANGE AND THAT INFORMATION MUST BEREAD IN CONJUNCTION WITH THE SECTION HEADED “WARNING” ON THE COVER OF THIS DOCUMENT.
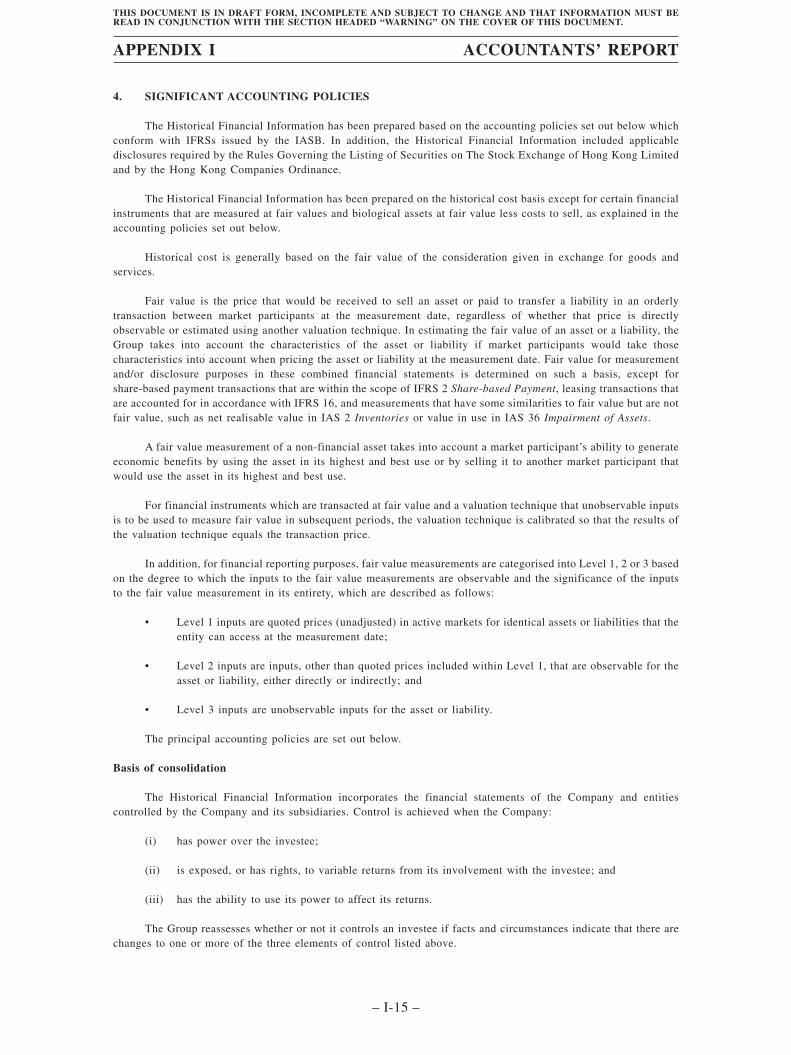
4. SIGNIFICANT ACCOUNTING POLICIES
The Historical Financial Information has been prepared based on the accounting policies set out below whichconform with IFRSs issued by the IASB. In addition, the Historical Financial Information included applicabledisclosures required by the Rules Governing the Listing of Securities on The Stock Exchange of Hong Kong Limitedand by the Hong Kong Companies Ordinance.
The Historical Financial Information has been prepared on the historical cost basis except for certain financialinstruments that are measured at fair values and biological assets at fair value less costs to sell, as explained in theaccounting policies set out below.
Historical cost is generally based on the fair value of the consideration given in exchange for goods andservices.
Fair value is the price that would be received to sell an asset or paid to transfer a liability in an orderlytransaction between market participants at the measurement date, regardless of whether that price is directlyobservable or estimated using another valuation technique. In estimating the fair value of an asset or a liability, theGroup takes into account the characteristics of the asset or liability if market participants would take thosecharacteristics into account when pricing the asset or liability at the measurement date. Fair value for measurementand/or disclosure purposes in these combined financial statements is determined on such a basis, except forshare-based payment transactions that are within the scope of IFRS 2 Share-based Payment, leasing transactions thatare accounted for in accordance with IFRS 16, and measurements that have some similarities to fair value but are notfair value, such as net realisable value in IAS 2 Inventories or value in use in IAS 36 Impairment of Assets.
A fair value measurement of a non-financial asset takes into account a market participant’s ability to generateeconomic benefits by using the asset in its highest and best use or by selling it to another market participant thatwould use the asset in its highest and best use.
For financial instruments which are transacted at fair value and a valuation technique that unobservable inputsis to be used to measure fair value in subsequent periods, the valuation technique is calibrated so that the results ofthe valuation technique equals the transaction price.
In addition, for financial reporting purposes, fair value measurements are categorised into Level 1, 2 or 3 basedon the degree to which the inputs to the fair value measurements are observable and the significance of the inputsto the fair value measurement in its entirety, which are described as follows:
• Level 1 inputs are quoted prices (unadjusted) in active markets for identical assets or liabilities that theentity can access at the measurement date;
• Level 2 inputs are inputs, other than quoted prices included within Level 1, that are observable for theasset or liability, either directly or indirectly; and
• Level 3 inputs are unobservable inputs for the asset or liability.
The principal accounting policies are set out below.
Basis of consolidation
The Historical Financial Information incorporates the financial statements of the Company and entitiescontrolled by the Company and its subsidiaries. Control is achieved when the Company:
(i) has power over the investee;
(ii) is exposed, or has rights, to variable returns from its involvement with the investee; and
(iii) has the ability to use its power to affect its returns.
The Group reassesses whether or not it controls an investee if facts and circumstances indicate that there arechanges to one or more of the three elements of control listed above.
APPENDIX I ACCOUNTANTS’ REPORT
– I-15 –
THIS DOCUMENT IS IN DRAFT FORM, INCOMPLETE AND SUBJECT TO CHANGE AND THAT INFORMATION MUST BEREAD IN CONJUNCTION WITH THE SECTION HEADED “WARNING” ON THE COVER OF THIS DOCUMENT.
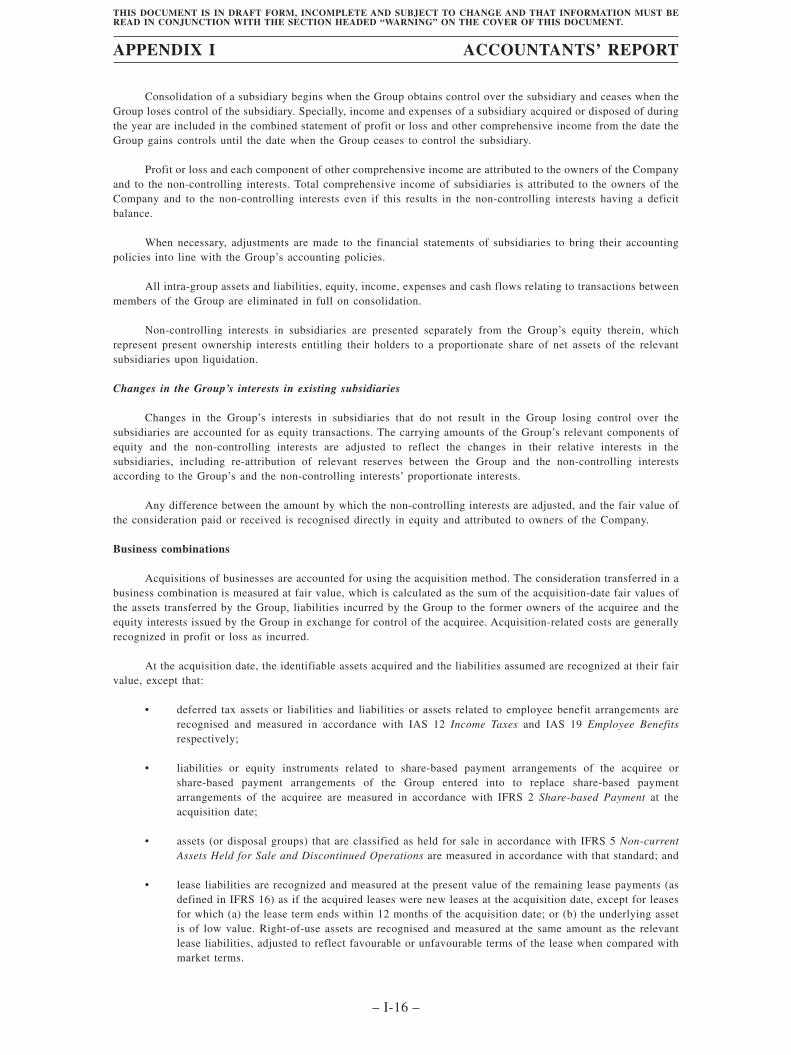
Consolidation of a subsidiary begins when the Group obtains control over the subsidiary and ceases when theGroup loses control of the subsidiary. Specially, income and expenses of a subsidiary acquired or disposed of duringthe year are included in the combined statement of profit or loss and other comprehensive income from the date theGroup gains controls until the date when the Group ceases to control the subsidiary.
Profit or loss and each component of other comprehensive income are attributed to the owners of the Companyand to the non-controlling interests. Total comprehensive income of subsidiaries is attributed to the owners of theCompany and to the non-controlling interests even if this results in the non-controlling interests having a deficitbalance.
When necessary, adjustments are made to the financial statements of subsidiaries to bring their accountingpolicies into line with the Group’s accounting policies.
All intra-group assets and liabilities, equity, income, expenses and cash flows relating to transactions betweenmembers of the Group are eliminated in full on consolidation.
Non-controlling interests in subsidiaries are presented separately from the Group’s equity therein, whichrepresent present ownership interests entitling their holders to a proportionate share of net assets of the relevantsubsidiaries upon liquidation.
Changes in the Group’s interests in existing subsidiaries
Changes in the Group’s interests in subsidiaries that do not result in the Group losing control over thesubsidiaries are accounted for as equity transactions. The carrying amounts of the Group’s relevant components ofequity and the non-controlling interests are adjusted to reflect the changes in their relative interests in thesubsidiaries, including re-attribution of relevant reserves between the Group and the non-controlling interestsaccording to the Group’s and the non-controlling interests’ proportionate interests.
Any difference between the amount by which the non-controlling interests are adjusted, and the fair value ofthe consideration paid or received is recognised directly in equity and attributed to owners of the Company.
Business combinations
Acquisitions of businesses are accounted for using the acquisition method. The consideration transferred in abusiness combination is measured at fair value, which is calculated as the sum of the acquisition-date fair values ofthe assets transferred by the Group, liabilities incurred by the Group to the former owners of the acquiree and theequity interests issued by the Group in exchange for control of the acquiree. Acquisition-related costs are generallyrecognized in profit or loss as incurred.
At the acquisition date, the identifiable assets acquired and the liabilities assumed are recognized at their fairvalue, except that:
• deferred tax assets or liabilities and liabilities or assets related to employee benefit arrangements arerecognised and measured in accordance with IAS 12 Income Taxes and IAS 19 Employee Benefitsrespectively;
• liabilities or equity instruments related to share-based payment arrangements of the acquiree orshare-based payment arrangements of the Group entered into to replace share-based paymentarrangements of the acquiree are measured in accordance with IFRS 2 Share-based Payment at theacquisition date;
• assets (or disposal groups) that are classified as held for sale in accordance with IFRS 5 Non-currentAssets Held for Sale and Discontinued Operations are measured in accordance with that standard; and
• lease liabilities are recognized and measured at the present value of the remaining lease payments (asdefined in IFRS 16) as if the acquired leases were new leases at the acquisition date, except for leasesfor which (a) the lease term ends within 12 months of the acquisition date; or (b) the underlying assetis of low value. Right-of-use assets are recognised and measured at the same amount as the relevantlease liabilities, adjusted to reflect favourable or unfavourable terms of the lease when compared withmarket terms.
APPENDIX I ACCOUNTANTS’ REPORT
– I-16 –
THIS DOCUMENT IS IN DRAFT FORM, INCOMPLETE AND SUBJECT TO CHANGE AND THAT INFORMATION MUST BEREAD IN CONJUNCTION WITH THE SECTION HEADED “WARNING” ON THE COVER OF THIS DOCUMENT.
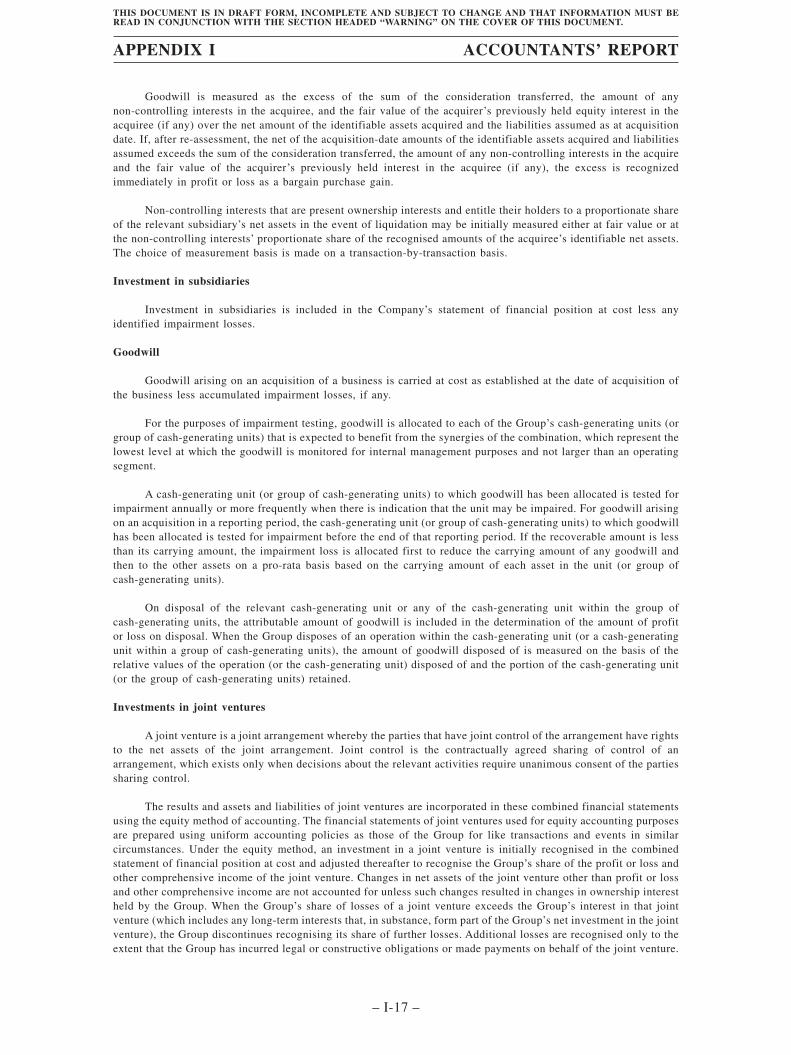
Goodwill is measured as the excess of the sum of the consideration transferred, the amount of anynon-controlling interests in the acquiree, and the fair value of the acquirer’s previously held equity interest in theacquiree (if any) over the net amount of the identifiable assets acquired and the liabilities assumed as at acquisitiondate. If, after re-assessment, the net of the acquisition-date amounts of the identifiable assets acquired and liabilitiesassumed exceeds the sum of the consideration transferred, the amount of any non-controlling interests in the acquireand the fair value of the acquirer’s previously held interest in the acquiree (if any), the excess is recognizedimmediately in profit or loss as a bargain purchase gain.
Non-controlling interests that are present ownership interests and entitle their holders to a proportionate shareof the relevant subsidiary’s net assets in the event of liquidation may be initially measured either at fair value or atthe non-controlling interests’ proportionate share of the recognised amounts of the acquiree’s identifiable net assets.The choice of measurement basis is made on a transaction-by-transaction basis.
Investment in subsidiaries
Investment in subsidiaries is included in the Company’s statement of financial position at cost less anyidentified impairment losses.
Goodwill
Goodwill arising on an acquisition of a business is carried at cost as established at the date of acquisition ofthe business less accumulated impairment losses, if any.
For the purposes of impairment testing, goodwill is allocated to each of the Group’s cash-generating units (orgroup of cash-generating units) that is expected to benefit from the synergies of the combination, which represent thelowest level at which the goodwill is monitored for internal management purposes and not larger than an operatingsegment.
A cash-generating unit (or group of cash-generating units) to which goodwill has been allocated is tested forimpairment annually or more frequently when there is indication that the unit may be impaired. For goodwill arisingon an acquisition in a reporting period, the cash-generating unit (or group of cash-generating units) to which goodwillhas been allocated is tested for impairment before the end of that reporting period. If the recoverable amount is lessthan its carrying amount, the impairment loss is allocated first to reduce the carrying amount of any goodwill andthen to the other assets on a pro-rata basis based on the carrying amount of each asset in the unit (or group ofcash-generating units).
On disposal of the relevant cash-generating unit or any of the cash-generating unit within the group ofcash-generating units, the attributable amount of goodwill is included in the determination of the amount of profitor loss on disposal. When the Group disposes of an operation within the cash-generating unit (or a cash-generatingunit within a group of cash-generating units), the amount of goodwill disposed of is measured on the basis of therelative values of the operation (or the cash-generating unit) disposed of and the portion of the cash-generating unit(or the group of cash-generating units) retained.
Investments in joint ventures
A joint venture is a joint arrangement whereby the parties that have joint control of the arrangement have rightsto the net assets of the joint arrangement. Joint control is the contractually agreed sharing of control of anarrangement, which exists only when decisions about the relevant activities require unanimous consent of the partiessharing control.
The results and assets and liabilities of joint ventures are incorporated in these combined financial statementsusing the equity method of accounting. The financial statements of joint ventures used for equity accounting purposesare prepared using uniform accounting policies as those of the Group for like transactions and events in similarcircumstances. Under the equity method, an investment in a joint venture is initially recognised in the combinedstatement of financial position at cost and adjusted thereafter to recognise the Group’s share of the profit or loss andother comprehensive income of the joint venture. Changes in net assets of the joint venture other than profit or lossand other comprehensive income are not accounted for unless such changes resulted in changes in ownership interestheld by the Group. When the Group’s share of losses of a joint venture exceeds the Group’s interest in that jointventure (which includes any long-term interests that, in substance, form part of the Group’s net investment in the jointventure), the Group discontinues recognising its share of further losses. Additional losses are recognised only to theextent that the Group has incurred legal or constructive obligations or made payments on behalf of the joint venture.
APPENDIX I ACCOUNTANTS’ REPORT
– I-17 –
THIS DOCUMENT IS IN DRAFT FORM, INCOMPLETE AND SUBJECT TO CHANGE AND THAT INFORMATION MUST BEREAD IN CONJUNCTION WITH THE SECTION HEADED “WARNING” ON THE COVER OF THIS DOCUMENT.
An investment in a joint venture is accounted for using the equity method from the date on which the investeebecomes a joint venture. On acquisition of the investment in a joint venture, any excess of the cost of the investmentover the Group’s share of the net fair value of the identifiable assets and liabilities of the investee is recognised asgoodwill, which is included within the carrying amount of the investment. Any excess of the Group’s share of thenet fair value of the identifiable assets and liabilities over the cost of the investment, after reassessment, is recognisedimmediately in profit or loss in the period in which the investment is acquired.
The Group assesses whether there is an objective evidence that the interest in a joint venture may be impaired.When any objective evidence exists, the entire carrying amount of the investment (including goodwill) is tested forimpairment in accordance with IAS 36 as a single asset by comparing its recoverable amount (higher of value in useand fair value less costs of disposal) with its carrying amount. Any impairment loss recognised is not allocated toany asset, including goodwill that forms part of the carrying amount of the investment. Any reversal of thatimpairment loss is recognised in accordance with IAS 36 to the extent that the recoverable amount of the investmentsubsequently increases.
When a group entity transacts with a joint venture of the Group, profits and losses resulting from thetransactions with the joint venture are recognised in the Group’s combined financial statements only to the extent ofinterests in the joint venture that are not related to the Group.
Revenue from contracts with customers
The Group recognises revenue when (or as) a performance obligation is satisfied, i.e. when “control” of thegoods or services underlying the particular performance obligation is transferred to the customer.
A performance obligation represents a good or service (or a bundle of goods or services) that is distinct or aseries of distinct goods or services that are substantially the same.
Control is transferred over time and revenue is recognised over time by reference to the progress towardscomplete satisfaction of the relevant performance obligation if one of the following criteria is met:
• the customer simultaneously receives and consumes the benefits provided by the Group’s performanceas the Group performs;
• the Group’s performance creates and enhances an asset that the customer controls as the Groupperforms; or
• the Group’s performance does not create an asset with an alternative use to the Group and the Grouphas an enforceable right to payment for performance completed to date.
Otherwise, revenue is recognised at a point in time when the customer obtains control of the distinct good orservice.
A contract asset represents the Group’s right to consideration in exchange for goods or services that the Grouphas transferred to a customer that is not yet unconditional. It is assessed for impairment in accordance with IFRS 9.In contrast, a receivable represents the Group’s unconditional right to consideration, i.e. only the passage of time isrequired before payment of that consideration is due.
A contract liability represents the Group’s obligation to transfer goods or services to a customer for which theGroup has received consideration (or an amount of consideration is due) from the customer.
A contract asset and a contract liability relating to the same contract are accounted for and presented on a netbasis.
Contracts with multiple performance obligations (including allocation of transaction price)
For contracts that contain more than one performance obligations, the Group allocates the transaction price toeach performance obligation on a relative stand-alone selling price basis.
The stand-alone selling price of the distinct good or service underlying each performance obligation isdetermined at contract inception. It represents the price at which the Group would sell a promised good or serviceseparately to a customer. If a stand-alone selling price is not directly observable, the Group estimates it usingappropriate techniques such that the transaction price ultimately allocated to any performance obligation reflects theamount of consideration to which the Group expects to be entitled in exchange for transferring the promised goodsor services to the customer.
APPENDIX I ACCOUNTANTS’ REPORT
– I-18 –
THIS DOCUMENT IS IN DRAFT FORM, INCOMPLETE AND SUBJECT TO CHANGE AND THAT INFORMATION MUST BEREAD IN CONJUNCTION WITH THE SECTION HEADED “WARNING” ON THE COVER OF THIS DOCUMENT.
Principal versus agent
When another party is involved in providing goods or services to a customer, the Group determines whetherthe nature of its promise is a performance obligation to provide the specified goods or services itself (i.e. the Groupis a principal) or to arrange for those goods or services to be provided by the other party (i.e. the Group is an agent).
The Group is a principal if it controls the specified good or service before that good or service is transferredto a customer.
The Group is an agent if its performance obligation is to arrange for the provision of the specified good orservice by another party. In this case, the Group does not control the specified good or service provided by anotherparty before that good or service is transferred to the customer. When the Group acts as an agent, it recognisesrevenue in the amount of any fee or commission to which it expects to be entitled in exchange for arranging for thespecified goods or services to be provided by the other party.
Leases
Definition of a lease
A contract is, or contains, a lease if the contract conveys the right to control the use of an identified asset fora period of time in exchange for consideration.
The Group assesses whether a contract is or contains a lease based on the definition under IFRS 16 atinception, modification date or acquisition date. Such contract will not be reassessed unless the terms and conditionsof the contract are subsequently changed.
Sublease
When the Group is an intermediate lessor, it accounts for the head lease and the sublease as two separatecontracts. The sublease is classified as a finance or operating lease by reference to the right-of-use asset arising fromthe head lease, not with reference to the underlying asset.
The Group as a lessee
Short-term leases
The Group applies the short-term lease recognition exemption to leases of motor vehicles, machinery andequipment and buildings that have a lease term of 12 months or less from the commencement date and do not containa purchase option. Lease payments on short-term leases and leases of low-value assets are recognised as expense ona straight-line basis or another systematic basis over the lease term.
Right-of-use assets
The cost of right-of-use assets includes:
• the amount of the initial measurement of the lease liability;
• any lease payments made at or before the commencement date, less any lease incentives received;
• any initial direct costs incurred by the Group; and
• an estimate of costs to be incurred by the Group in dismantling and removing the underlying assets,restoring the site on which it is located or restoring the underlying asset to the condition required by theterms and conditions of the lease.
Right-of-use assets are measured at cost, less any accumulated depreciation and impairment losses, andadjusted for any remeasurement of lease liabilities.
APPENDIX I ACCOUNTANTS’ REPORT
– I-19 –
THIS DOCUMENT IS IN DRAFT FORM, INCOMPLETE AND SUBJECT TO CHANGE AND THAT INFORMATION MUST BEREAD IN CONJUNCTION WITH THE SECTION HEADED “WARNING” ON THE COVER OF THIS DOCUMENT.
Right-of-use assets in which the Group is reasonably certain to obtain ownership of the underlying leasedassets at the end of the lease term is depreciated from commencement date to the end of the useful life. Otherwise,right-of-use assets are depreciated on a straight-line basis over the shorter of its estimated useful life and the leaseterm.
The Group presents right-of-use assets that do not meet the definition of investment property as a separate lineitem on the combined statements of financial position. Right-of-use assets that meet the definition of investmentproperty are presented within “investment properties”.
Refundable rental deposits
Refundable rental deposits paid are accounted under IFRS 9 and initially measured at fair value. Adjustmentsto fair value at initial recognition are considered as additional lease payments and included in the cost of right-of-useassets.
Lease liabilities
At the commencement date of a lease, the Group recognises and measures the lease liability at the present valueof lease payments that are unpaid at that date. In calculating the present value of lease payments, the Group uses theincremental borrowing rate at the lease commencement date if the interest rate implicit in the lease is not readilydeterminable.
The lease payments include:
• fixed payments (including in-substance fixed payments) less any lease incentives receivable;
• amounts expected to be paid under residual value guarantees; and
• payments of penalties for terminating a lease, if the lease term reflects the Group exercising the optionto terminate the lease.
Variable lease payments that reflect changes in market rental rates are initially measured using the marketrental rates as at the commencement date. Variable lease payments that do not depend on an index or a rate are notincluded in the measurement of lease liabilities and right-of-use assets, and are recognised as expense in the periodon which the event or condition that triggers the payment occurs.
After the commencement date, lease liabilities are adjusted by interest accretion and lease payments.
The Group remeasures lease liabilities (and makes a corresponding adjustment to the related right-of-useassets) whenever the lease term has changed or there is a change in the assessment of exercise of a purchase option,in which case the related lease liability is remeasured by discounting the revised lease payments using a reviseddiscount rate at the date of reassessment.
The Group presents lease liabilities as a separate line item on the combined statements of financial position.
Lease payments in relation to lease liability will be allocated into a principal and an interest portion which arepresented as financing cash flows by the Group.
Lease modifications
The Group accounts for a lease modification as a separate lease if:
• the modification increases the scope of the lease by adding the right to use one or more underlyingassets; and
• the consideration for the leases increases by an amount commensurate with the stand-alone price for theincrease in scope and any appropriate adjustments to that stand-alone price to reflect the circumstancesof the particular contract.
APPENDIX I ACCOUNTANTS’ REPORT
– I-20 –
THIS DOCUMENT IS IN DRAFT FORM, INCOMPLETE AND SUBJECT TO CHANGE AND THAT INFORMATION MUST BEREAD IN CONJUNCTION WITH THE SECTION HEADED “WARNING” ON THE COVER OF THIS DOCUMENT.
For a lease modification that is not accounted for as a separate lease, the Group remeasures the lease liabilitybased on the lease term of the modified lease by discounting the revised lease payments using a revised discount rateat the effective date of the modification.
The Group accounts for the remeasurement of lease liabilities by making corresponding adjustments to therelevant right-of-use assets. When the modified contract contains a lease component and one or more additional leaseor non-lease components, the Group allocates the consideration in the modified contract to each lease component onthe basis of the relative stand-alone price of the lease component and the aggregate stand-alone price of the non-leasecomponents.
The Group as a lessor
Classification and measurement of leases
Leases for which the Group is a lessor are classified as finance or operating leases. Whenever the terms of thelease transfer substantially all the risks and rewards incidental to ownership of an underlying asset to the lessee, thecontract is classified as a finance lease. All other leases are classified as operating leases.
Rental income from operating leases is recognised in profit or loss on a straight-line basis over the term of therelevant lease.
Foreign currencies
In preparing the financial statements of individual entities, transactions in currencies other than the entity’sfunctional currency (foreign currencies) are recorded at the rates of exchange prevailing on the dates of thetransactions. At the end of each reporting period, monetary items denominated in foreign currencies are re-translatedat the rates prevailing at that date. Non-monetary items that are measured in terms of historical cost in a foreigncurrency are not retranslated.
Exchange differences arising on the settlement of monetary items, and on the translation of monetary items,are recognised in profit or loss in the period in which they arise.
For the purposes of presenting the combined financial statements, the assets and liabilities of the Group’soperations are translated into the presentation currency of the Group (i.e. RMB) using exchange rates prevailing atthe end of each reporting period. Income and expenses items are translated at the average exchange rates for theperiod. Exchange differences arising, if any, are recognised in other comprehensive income and accumulated inequity under the heading of translation reserve (attributed to non-controlling interests as appropriate).
Borrowing costs
Borrowing costs directly attributed to the acquisition, construction or production of qualifying assets, whichare assets that necessarily take a substantial period of time to get ready for their intended use or sale, are added tothe cost of those assets until such time as the assets are substantially ready for their intended use or sale.
Any specific borrowing that remain outstanding after the related asset is ready for its intended use or sale isincluded in the general borrowing pool for calculation of capitalisation rate on general borrowings. Investmentincome earned on the temporary investment of specific borrowings pending their expenditure on qualifying assets isdeducted from the borrowing cost eligible for capitalisation.
All other borrowing costs are recognised in profit or loss in the period in which they are incurred.
Government grants
Government grants are not recognised until there is reasonable assurance that the Group will comply with theconditions attaching to them and the grants will be received.
Grants relating to biological assets
An unconditional government grant related to a biological asset measured at its fair value less costs to sell isrecognised in profit or loss when, and only when, the government grant becomes receivable.
APPENDIX I ACCOUNTANTS’ REPORT
– I-21 –
THIS DOCUMENT IS IN DRAFT FORM, INCOMPLETE AND SUBJECT TO CHANGE AND THAT INFORMATION MUST BEREAD IN CONJUNCTION WITH THE SECTION HEADED “WARNING” ON THE COVER OF THIS DOCUMENT.
Other grants
Government grants are recognised in profit or loss on a systematic basis over the periods in which the Grouprecognises as expenses the related costs for which the grants are intended to compensate. Specifically, governmentgrants whose primary condition is that the Group should purchase, construct or otherwise acquire non-current assetsare recognised as deferred income in the combined statement of financial position and transferred to profit or losson a systematic and rational basis over the useful lives of the related assets.
Government grants that are receivable as compensation for expenses or losses already incurred or for thepurpose of giving immediate financial support to the Group with no future related costs are recognised in profit orloss in the period in which they become receivable.
Retirement benefit costs
Payments to defined contribution retirement benefit under the state-managed retirement benefit schemes in thePRC are charged as an expense when employees have rendered service entitling them to the contributions.
Short-term employee benefits
Short-term employee benefits are recognised at the undiscounted amount of the benefits expected to be paidas and when employees rendered the services. All short-term employee benefits are recognised as an expense unlessanother IFRS requires or permits the inclusion of the benefit in the cost of an asset.
A liability is recognised for benefits accruing to employees (such as wages and salaries, annual leave and sickleave) after deducting any amount already paid.
Taxation
Income tax expenses represent the sum of the tax currently payable and deferred tax.
The tax currently payable is based on taxable profit for the year. Taxable profit differs from profit/loss beforetax because of income or expense that are taxable or deductible in other years and items that are never taxable ordeductible. The Group’s liability for current tax is calculated using tax rates that have been enacted or substantivelyenacted by the end of the reporting period.
Deferred tax is recognised on temporary differences between the carrying amount of assets and liabilities inthe Historical Financial Information and the corresponding tax bases used in the computation of taxable profit.Deferred tax liabilities are generally recognised for all taxable temporary differences. Deferred tax assets aregenerally recognised for all deductible temporary differences to the extent that it is probable that taxable profits willbe available against which those deductible temporary differences can be utilised. Such deferred tax assets andliabilities are not recognised if the temporary difference arises from the initial recognition (other than in a businesscombination) of assets and liabilities in a transaction that affects neither the taxable profit nor the accounting profit.In addition, deferred tax liabilities are not recognised if the temporary difference arises from the initial recognitionof goodwill.
Deferred tax liabilities are recognised for taxable temporary differences associated with investments insubsidiaries and interests in joint ventures, except where the Group is able to control the reversal of the temporarydifference and it is probable that the temporary difference will not reverse in the foreseeable future. Deferred taxassets arising from deductible temporary differences associated with such investments and interests are onlyrecognised to the extent that it is probable that there will be sufficient taxable profits against which to utilise thebenefits of the temporary differences and they are expected to reverse in the foreseeable future.
The carrying amount of deferred tax assets is reviewed at the end of the reporting period and reduced to theextent that it is no longer probable that sufficient taxable profit will be available to allow all or part of the asset tobe recovered.
Deferred tax liabilities and assets are measured at the tax rates that are expected to apply in the period in whichthe liability is settled or the asset is realised, based on tax rate (and tax laws) that have been enacted or substantivelyenacted by the end of the reporting period.
APPENDIX I ACCOUNTANTS’ REPORT
– I-22 –
THIS DOCUMENT IS IN DRAFT FORM, INCOMPLETE AND SUBJECT TO CHANGE AND THAT INFORMATION MUST BEREAD IN CONJUNCTION WITH THE SECTION HEADED “WARNING” ON THE COVER OF THIS DOCUMENT.
The measurement of deferred tax liabilities and assets reflects the tax consequences that would follow fromthe manner in which the Group expects, at the end of the reporting period, to recover or settle the carrying amountof its assets and liabilities.
For the purposes of measuring deferred tax for leasing transactions in which the Group recognises theright-of-use assets and the related lease liabilities, the Group first determines whether the tax deductions areattributable to the right-of-use assets or the lease liabilities.
For leasing transactions in which the tax deductions are attributable to the lease liabilities, the Group appliesIAS 12 Income Taxes requirements to the leasing transaction as a whole. Temporary differences relating toright-of-use assets and lease liabilities are assessed on a net basis. Excess of depreciation on right-of-use assets overthe lease payments for the principal portion of lease liabilities resulting in net deductible temporary differences.
Deferred tax assets and liabilities are offset when there is a legally enforceable right to set off current tax assetsagainst current tax liabilities and when they relate to income taxes levied to the same taxable entity by the sametaxation authority.
Current and deferred tax is recognised in profit or loss, except when they relate to items that are recognisedin other comprehensive income or directly in equity, in which case, the current and deferred tax are also recognisedin other comprehensive income or directly in equity respectively. Where current tax or deferred tax arises from theinitial accounting for a business combination, the tax effect is included in the accounting for the businesscombination.
Property, plant and equipment
Property, plant and equipment are tangible assets that are held for use in the production or supply of goods orservices, or for administrative purposes (other than properties under construction as described below). Property, plantand equipment are stated in the combined statements of financial position at cost less subsequent accumulateddepreciation and subsequent accumulated impairment losses, if any.
Properties in the course of construction for production, supply or administrative purposes are carried at cost,less any recognised impairment loss. Costs include any costs directly attributable to bringing the asset to the locationand condition necessary for it to be capable of operating in the manner intended by management and, for qualifyingassets, borrowing costs capitalised in accordance with the Group’s accounting policy. Depreciation of these assets,on the same basis as other property assets, commences when the assets are ready for their intended use.
Depreciation is recognised so as to write off the cost of items of property, plant and equipment other thanproperties under construction less their residual values over their estimated useful lives, using the straight-linemethod. The estimated useful lives, residual values and depreciation method are reviewed at the end of the reportingperiod, with the effect of any changes in estimate accounted for on a prospective basis.
An item of property, plant and equipment is derecognised upon disposal or when no future economic benefitsare expected to arise from the continued use of the asset. Any gain or loss arising on the disposal is determined asthe difference between the sales proceeds and the carrying amount of the asset and is recognised in profit or loss.
Investment properties
Investment properties are properties held to earn rentals and/or for capital appreciation (including propertiesunder construction for such purposes). Investment properties also include leased properties which are beingrecognised as right-of-use assets upon application of IFRS 16 and subleased by the Group under operating leases.
Investment properties are initially measured at cost, including any directly attributable expenditure.Subsequent to initial recognition, investment properties are stated at cost less subsequent accumulated depreciationand any accumulated impairment losses. Depreciation is recognised so as to write off the cost of investmentproperties over their estimated useful lives and after taking into account of their estimated residual value, using thestraight-line method.
Construction costs incurred for investment properties under construction are capitalised as part of the carryingamount of the investment properties under construction.
APPENDIX I ACCOUNTANTS’ REPORT
– I-23 –
THIS DOCUMENT IS IN DRAFT FORM, INCOMPLETE AND SUBJECT TO CHANGE AND THAT INFORMATION MUST BEREAD IN CONJUNCTION WITH THE SECTION HEADED “WARNING” ON THE COVER OF THIS DOCUMENT.
An investment property is derecognised upon disposal or when the investment property is permanentlywithdrawn from use and no future economic benefits are expected from its disposal. A leased property which isrecognised as a right-of-use asset is derecognised if the Group as intermediate lessor classifies the sublease as afinance lease. Any gain or loss arising on derecognition of the property (calculated as the difference between the netdisposal proceeds and the carrying amount of the asset) is included in profit or loss in the period in which the propertyis derecognised.
Intangible assets
Intangible assets with finite useful lives that are acquired separately are carried at costs less accumulatedamortisation and any accumulated impairment losses. Amortisation for intangible assets with finite useful lives isrecognised on a straight-line basis over their estimated useful lives. The estimated useful life and amortisationmethod are reviewed at the end of each reporting period, with the effect of any changes in estimate being accountedfor on a prospective basis. Intangible assets with indefinite useful lives that are acquired separately are carried at costless any subsequent accumulated impairment losses.
Expenditure on research activities is recognised as an expense in the period in which it is incurred.
Impairment on property, plant and equipment, investment properties, right-of-use assets and intangible assetsother than goodwill
At the end of the reporting period, the Group reviews the carrying amounts of its property, plant andequipment, investment properties, right-of-use assets, and intangible assets with finite useful lives to determinewhether there is any indication that those assets have suffered an impairment loss. If any such indication exists, therecoverable amount of the relevant asset is estimated in order to determine the extent of the impairment loss (if any).
The recoverable amount of property, plant and equipment, investment properties, right-of-use assets, andintangible assets are estimated individually. When it is not possible to estimate the recoverable amount of an assetindividually, the Group estimates the recoverable amount of the cash-generating unit to which the asset belongs.
In addition, corporate assets are allocated to individual cash generating units when a reasonable and consistentbasis of allocation can be established, or otherwise they are allocated to the smallest group of cash generating unitsfor which a reasonable and consistent allocation basis can be established. The Group assesses whether there isindication that corporate assets may be impaired. If such indication exists, the recoverable amount is determined forthe cash-generating unit or group of cash-generating units to which the corporate asset belongs, and is compared withthe carrying amount of the relevant cash-generating unit or group of cash-generating units.
Recoverable amount is the higher of fair value less costs of disposal and value in use. In assessing value inuse, the estimated future cash flows are discounted to their present value using a pre-tax discount rate that reflectscurrent market assessments of the time value of money and the risks specific to the asset (or a cash-generating unit)for which the estimates of future cash flows have not been adjusted.
If the recoverable amount of an asset (or a cash-generating unit) is estimated to be less than its carryingamount, the carrying amount of the asset (or a cash-generating unit) is reduced to its recoverable amount. Forcorporate assets or portion of corporate assets which cannot be allocated on a reasonable and consistent basis to acash-generating unit, the Group compares the carrying amount of a group of cash-generating units, including thecarrying amounts of the corporate assets or portion of corporate assets allocated to that group of cash-generatingunits, with the recoverable amount of the group of cash-generating units.
In allocating the impairment loss, the impairment loss is allocated first to reduce the carrying amount of anygoodwill (if applicable) and then to the other assets on a pro-rata basis based on the carrying amount of each assetin the unit or the group of cash-generating units. The carrying amount of an asset is not reduced below the highestof its fair value less costs of disposal (if measurable), its value in use (if determinable) and zero. The amount of theimpairment loss that would otherwise have been allocated to the assets is allocated pro rata to the other assets of theunit or the group of cash-generating units. An impairment loss is recognised immediately in profit or loss.
Where an impairment loss subsequently reverses, the carrying amount of the asset (or cash-generating unit ora group of cash-generating units) is increased to the revised estimate of its recoverable amount, but so that theincreased carrying amount does not exceed the carrying amount that would have been determined had no impairmentloss been recognised for the asset (or a cash-generating unit or a group of cash-generating units) in prior years. Areversal of an impairment loss is recognised immediately in profit or loss.
APPENDIX I ACCOUNTANTS’ REPORT
– I-24 –
THIS DOCUMENT IS IN DRAFT FORM, INCOMPLETE AND SUBJECT TO CHANGE AND THAT INFORMATION MUST BEREAD IN CONJUNCTION WITH THE SECTION HEADED “WARNING” ON THE COVER OF THIS DOCUMENT.
Inventories
Inventories are stated at the lower of cost and net realisable value. Costs of inventories are determined on aweighted average method. Net realisable value represents the estimated selling price for inventories less all estimatedcosts of completion and costs necessary to make the sale.
Provisions
Provisions are recognised when the Group has a present obligation (legal or constructive) as a result of a pastevent, it is probable that the Group will be required to settle that obligation, and a reliable estimate can be made ofthe amount of the obligation.
The amount recognised as a provision is the best estimate of the consideration required to settle the presentobligation at the end of the reporting period, taking into account the risks and uncertainties surrounding theobligation. When a provision is measured using the cash flows estimated to settle the present obligation, its carryingamount is the present value of those cash flows (where the effect of the time value of money is material).
Provisions for the costs to restore leased assets to their original condition, as required by the terms andconditions of the lease, are recognised at the date of inception of the lease at the directors’ best estimate of theexpenditure that would be required to restore the assets. Estimates are regularly reviewed and adjusted as appropriatefor new circumstances.
An obligation to incur rehabilitation and environmental costs arises when environmental disturbance is causedby the development or ongoing dairy farming operation. These costs discounted to net present value are provided forand a corresponding amount is capitalised as soon as the obligation to incur such costs arises. These costs are chargedto profit or loss over the life of the operation through the depreciation of the asset and the unwinding of the discounton the provision. The cost estimates are reviewed periodically and are adjusted to reflect known developments whichmay have an impact on the cost estimates or life of operations. The unwinding of the discount is shown as a financecost in profit or loss.
Biological assets
The Group’s biological assets mainly include dairy cows, feeder cattle and breeding stock. Dairy cows,including milkable cows, calves and heifers, and breeding stock are measured on initial recognition and at the endof the reporting period at their fair value less costs to sell, with any resulting gain or loss recognised in profit or lossfor the year in which it arises. Costs to sell are the incremental costs directly attributable to the disposal of an asset,mainly transportation cost and excluding finance costs and income taxes. The fair value of dairy cows and breedingstock is determined based on their present location and condition and is determined independently by a professionalvaluer.
The feeding costs and other related costs including staff costs, depreciation and amortisation charge, utilitycosts and consumables incurred for raising of calves and heifers are capitalised, until such time as the calves andheifers begin to produce milk.
Agricultural produce
Agricultural produce represents raw milk, frozen bovine semen and forage grass, which are recognised at thepoint of harvest at fair value less costs to sell. A gain or loss arising from agricultural produce at the point of harvestmeasuring at fair value less costs to sell is included in profit or loss for the period in which it arises.
Financial instruments
Financial assets and financial liabilities are recognised when a group entity becomes a party to the contractualprovisions of the instrument. All regular way purchases or sales of financial assets are recognised and derecognisedon a trade date basis. Regular way purchases or sales are purchases or sales of financial assets that require deliveryof assets within the time frame established by regulation or convention in the market place.
APPENDIX I ACCOUNTANTS’ REPORT
– I-25 –
THIS DOCUMENT IS IN DRAFT FORM, INCOMPLETE AND SUBJECT TO CHANGE AND THAT INFORMATION MUST BEREAD IN CONJUNCTION WITH THE SECTION HEADED “WARNING” ON THE COVER OF THIS DOCUMENT.
Financial assets and financial liabilities are initially measured at fair value except for trade receivables arisingfrom contracts with customers which are initially measured in accordance with IFRS 15. Transaction costs that aredirectly attributable to the acquisition or issue of financial assets and financial liabilities (other than financial assetsor financial liabilities at fair value through profit or loss (“FVTPL”)) are added to or deducted from the fair valueof the financial assets or financial liabilities, as appropriate, on initial recognition. Transaction costs directlyattributable to the acquisition of financial assets or financial liabilities at FVTPL are recognised immediately in profitor loss.
The effective interest method is a method of calculating the amortised cost of a financial asset or financialliability and of allocating interest income and interest expense over the relevant period. The effective interest rateis the rate that exactly discounts estimated future cash receipts and payments (including all fees and points paid orreceived that form an integral part of the effective interest rate, transaction costs and other premiums or discounts)through the expected life of the financial asset or financial liability, or, where appropriate, a shorter period, to thenet carrying amount on initial recognition.
Financial assets
Classification and subsequent measurement of financial assets (before application of IFRS 9 on January 1, 2018)
Financial assets are classified as loans and receivables. The classification depends on the nature and purposeof the financial assets and is determined at the time of initial recognition. All regular way purchases or sales offinancial assets are recognised and derecognised on a trade date basis. Regular way purchases or sales are purchasesor sales of financial assets that require delivery of assets within the time frame established by regulation orconvention in the marketplace.
Loans and receivables
Loans and receivables are non-derivative financial assets with fixed or determinable payments that are notquoted in an active market. Subsequent to initial recognition, loans and receivables (including trade and billsreceivables, deposits and other receivables, amounts due from related parties, pledged and restricted deposits, andbank balances and cash) are measured at amortised cost using the effective interest method, less any impairment.
Interest income is recognised by applying the effective interest rate, except for short-term receivables wherethe recognition of interest would be immaterial.
Impairment of financial assets (before application of IFRS 9 on January 1, 2018)
Financial assets are assessed for indicators of impairment at the end of each reporting period. Financial assetsare considered to be impaired when there is objective evidence that, as a result of one or more events that occurredafter the initial recognition of the financial asset, the estimated future cash flows of the financial assets have beenaffected.
Objective evidence of impairment could include:
• significant financial difficulty of the issuer or counterparty; or
• breach of contract, such as default or delinquency in interest or principal payments; or
• it becoming probable that the borrower will enter bankruptcy or financial re-organisation.
Objective evidence of impairment for a portfolio of receivables could include the Group’s past experience ofcollecting payments, an increase in the number of delayed payments in the portfolio past the respective credit period,observable changes in national or local economic conditions that correlate with default on receivables.
For financial assets carried at amortised cost, the amount of the impairment loss recognised is the differencebetween the asset’s carrying amount and the present value of the estimated future cash flows discounted at thefinancial asset’s original effective interest rate.
For financial assets carried at cost, the amount of the impairment loss is measured as the difference betweenthe asset’s carrying amount and the present value of the estimated future cash flows discounted at the current marketrate of return for a similar financial asset. Such impairment loss will not be reversed in subsequent periods.
APPENDIX I ACCOUNTANTS’ REPORT
– I-26 –
THIS DOCUMENT IS IN DRAFT FORM, INCOMPLETE AND SUBJECT TO CHANGE AND THAT INFORMATION MUST BEREAD IN CONJUNCTION WITH THE SECTION HEADED “WARNING” ON THE COVER OF THIS DOCUMENT.
The carrying amount of the financial asset is reduced by the impairment loss directly for all financial assetswith the exception of trade receivables, where the carrying amount is reduced through the use of an allowanceaccount. Changes in the carrying amount of the allowance account are recognised in profit or loss. When a tradereceivable is considered uncollectible, it is written off against the allowance account. Subsequent recoveries ofamounts previously written off are credited to profit or loss.
For financial assets measured at amortised cost, if, in a subsequent period, the amount of impairment lossdecreases and the decrease can be related objectively to an event occurring after the impairment was recognised, thepreviously recognised impairment loss is reversed through profit or loss to the extent that the carrying amount of theinvestment at the date the impairment is reversed does not exceed what the amortised cost would have been had theimpairment not been recognised.
Classification and subsequent measurement of financial assets (upon application of IFRS 9 on January 1, 2018 inaccordance with transitions in Note 3)
Financial assets that meet the following conditions are subsequently measured at amortised cost:
• the financial asset is held within a business model whose objective is to collect contractual cash flows;and
• the contractual terms give rise on specified dates to cash flows that are solely payments of principal andinterest on the principal amount outstanding.
Financial assets that meet the following conditions are subsequently measured at FVTOCI:
• the financial asset is held within a business model whose objective is achieved by both selling andcollecting contractual cash flows; and
• the contractual terms give rise on specified dates to cash flows that are solely payments of principal andinterest on the principal amount outstanding.
All other financial assets are subsequently measured at FVTPL.
A financial asset is held for trading if:
• it has been acquired principally for the purpose of selling in the near term; or
• on initial recognition it is a part of a portfolio of identified financial instruments that the Group managestogether and has a recent actual pattern of short-term profit-taking; or
• it is a derivative that is not designated and effective as a hedging instrument.
In addition, the Group may irrevocably designate a financial asset that are required to be measured at theamortised cost or FVTOCI as measured at FVTPL if doing so eliminates or significantly reduces an accountingmismatch.
(i) Amortised cost and interest income
Interest income is recognised using the effective interest method for financial assets measuredsubsequently at amortised cost. Interest income is calculated by applying the effective interest rate to the grosscarrying amount of a financial asset, except for financial assets that have subsequently become credit-impaired(see below). For financial assets that have subsequently become credit-impaired, interest income is recognisedby applying the effective interest rate to the amortised cost of the financial asset from the next reporting period.If the credit risk on the credit-impaired financial instrument improves so that the financial asset is no longercredit-impaired, interest income is recognised by applying the effective interest rate to the gross carryingamount of the financial asset from the beginning of the reporting period following the determination that theasset is no longer credit-impaired.
APPENDIX I ACCOUNTANTS’ REPORT
– I-27 –
THIS DOCUMENT IS IN DRAFT FORM, INCOMPLETE AND SUBJECT TO CHANGE AND THAT INFORMATION MUST BEREAD IN CONJUNCTION WITH THE SECTION HEADED “WARNING” ON THE COVER OF THIS DOCUMENT.
(ii) Debt instruments classified as at FVTOCI
Subsequent changes in the carrying amounts for debt instruments classified as at FVTOCI as a result ofinterest income calculated using the effective interest method are recognised in profit or loss. All other changesin the carrying amount of these debt instruments are recognised in other comprehensive income (“OCI”) andaccumulated under the heading of “Investment revaluation reserve”. Impairment allowances are recognised inprofit or loss with corresponding adjustment to OCI without reducing the carrying amounts of these debtinstruments. The amounts that are recognised in profit or loss are the same as the amounts that would have beenrecognised in profit or loss if these debt instruments had been measured at amortised cost. When these debtinstruments are derecognised, the cumulative gains or losses previously recognised in OCI are reclassified toprofit or loss.
(iii) Equity instruments designated as at FVTOCI
Investments in equity instruments at FVTOCI are subsequently measured at fair value with gains andlosses arising from changes in fair value recognised in OCI and accumulated in the investment revaluationreserve; and are not subject to impairment assessment. The cumulative gain or loss will not be reclassified toprofit or loss on disposal of the equity investments, and will be transferred to retained profits.
Dividends from these investments in equity instruments are recognised in profit or loss when theGroup’s right to receive the dividends is established, unless the dividends clearly represent a recovery of partof the cost of the investment. Dividends are included in the “other income” line item in profit or loss.
(iv) Financial assets at FVTPL
Financial assets that do not meet the criteria for being measured at amortised cost or FVTOCI ordesignated as FVTOCI are measured at FVTPL.
Financial assets at FVTPL are measured at fair value at the end of each reporting period, with any fairvalue gains or losses recognised in profit or loss.
Impairment of financial assets (upon application of IFRS 9 on January 1, 2018 with transitions in accordance withNote 3)
The Group performs impairment assessment under ECL model on financial assets (including trade receivables,deposits, other receivables, amounts due from related parties, pledged and restricted bank deposits, and bankbalances) and other items (including contract assets) which are subject to impairment under IFRS 9. The amount ofECL is updated at each reporting date to reflect changes in credit risk since initial recognition.
Lifetime ECL represents the ECL that will result from all possible default events over the expected life of therelevant instrument. In contrast, 12-month ECL represents the portion of lifetime ECL that is expected to result fromdefault events that are possible within 12 months after the reporting date. Assessment are done based on the Group’shistorical credit loss experience, adjusted for factors that are specific to the debtors, general economic conditions andan assessment of both the current conditions at the reporting date as well as the forecast of future conditions.
The Group always recognises lifetime ECL for trade receivables and contract assets. The ECL on these assetsare assessed individually for debtors with significant balances and/or collectively using a provision matrix withappropriate groupings.
For all other instruments, the Group measures the loss allowance equal to 12-month ECL, unless when therehas been a significant increase in credit risk since initial recognition, the Group recognises lifetime ECL. Theassessment of whether lifetime ECL should be recognised is based on significant increases in the likelihood or riskof a default occurring since initial recognition.
(i) Significant increase in credit risk
In assessing whether the credit risk has increased significantly since initial recognition, the Groupcompares the risk of a default occurring on the financial instruments as at the reporting date with the risk ofa default occurring on the financial instrument as at the date of initial recognition. In making this assessment,the Group considers both quantitative and qualitative information that is reasonable and supportable, includinghistorical experience and forward–looking information that is available without undue cost or effort.
APPENDIX I ACCOUNTANTS’ REPORT
– I-28 –
THIS DOCUMENT IS IN DRAFT FORM, INCOMPLETE AND SUBJECT TO CHANGE AND THAT INFORMATION MUST BEREAD IN CONJUNCTION WITH THE SECTION HEADED “WARNING” ON THE COVER OF THIS DOCUMENT.
In particular, the following information is taken into account when assessing whether credit risk hasincrease significantly:
• an actual or expected significant deterioration in the financial instrument’s external (if available)or internal credit rating;
• significant deterioration in external market indicators of credit risk, e.g. a significant increase inthe credit spread, the credit default swap prices for the debtor;
• existing or forecast adverse changes in business, financial or economic conditions that areexpected to cause a significant decrease in the debtor’s ability to meet its debt obligations;
• an actual or expected significant deterioration in the operating results of the debtor;
• an actual or expected significant adverse change in the regulatory, economic, or technologicalenvironment of the debtor that results in a significant decrease in the debtor’s ability to meet itsdebt obligations.
Irrespective of the outcome of the above assessment, the Group presumes that the credit risk hasincreased significantly since initial recognition when contractual payments are more than 30 days past due,unless the Group has reasonable and supportable information that demonstrates otherwise.
The Group regularly monitors the effectiveness of the criteria used to identify whether there has beena significant increase in credit risk and revises them as appropriate to ensure that the criteria are capable ofidentifying significant increase in credit risk before the amount becomes past due.
(ii) Definition of default
For internal credit risk management, the Group considers an event of default occurs when informationdeveloped internally or obtained from external sources indicates that the debtor is unlikely to pay its creditors,including the Group, in full (without taking into account any collaterals held by the Group).
Irrespective of the above, the Group considers that default has occurred when a financial asset is morethan 90 days past due unless the Group has reasonable and supportable information to demonstrate that a morelagging default criterion is more appropriate.
(iii) Credit-impaired financial assets
A financial asset is credit-impaired when one or more events of default that have a detrimental impacton the estimated future cash flows of that financial asset have occurred. Evidence that a financial asset iscredit-impaired includes observable data about the following events:
(a) significant financial difficulty of the issuer or the borrower;
(b) a breach of contract, such as a default or past due event;
(c) the lender(s) of the borrower, for economic or contractual reasons relating to the borrower’sfinancial difficulty, having granted to the borrower a concession(s) that the lender(s) would nototherwise consider; or
(d) it is becoming probable that the borrower will enter bankruptcy or other financial reorganisation.
(iv) Write-off policy
The Group writes off a financial asset when there is information indicating that the counterparty is insevere financial difficulty and there is no realistic prospect of recovery, for example, when the counterpartyhas been placed under liquidation or has entered into bankruptcy proceedings, or when the trade and otherreceivables are over two years past due, whichever occurs sooner. Financial assets written off may still besubject to enforcement activities under the Group’s recovery procedures, taking into account legal advicewhere appropriate. A write-off constitutes a derecognition event. Any subsequent recoveries are recognised inprofit or loss.
APPENDIX I ACCOUNTANTS’ REPORT
– I-29 –
THIS DOCUMENT IS IN DRAFT FORM, INCOMPLETE AND SUBJECT TO CHANGE AND THAT INFORMATION MUST BEREAD IN CONJUNCTION WITH THE SECTION HEADED “WARNING” ON THE COVER OF THIS DOCUMENT.
(v) Measurement and recognition of ECL
The measurement of ECL is a function of the probability of default, loss given default (i.e. themagnitude of the loss if there is a default) and the exposure at default. The assessment of the probability ofdefault and loss given default is based on historical data adjusted by forward-looking information. Estimationof ECL reflects an unbiased and probability-weighted amount that is determined with the respective risks ofdefault occurring as the weights.
Generally, the ECL is the difference between all contractual cash flows that are due to the Group inaccordance with the contract and the cash flows that the Group expects to receive, discounted at the effectiveinterest rate determined at initial recognition.
The ECL on trade receivables and contract assets, except for those assessed individually for debtors withsignificant balances, is measured on a collective basis and those financial instruments are grouped under aprovision matrix based on shared credit risk characteristics by reference to aging for the debtors.
Interest income is calculated based on the gross carrying amount of the financial asset unless thefinancial asset is credit-impaired, in which case interest income is calculated based on amortised cost of thefinancial assets.
Except for investments in debt instruments that are measured at FVTOCI, the Group recognises animpairment gain or loss in profit or loss for all financial instruments by adjusting their carrying amount, withthe exception of trade receivables, contract assets and other receivables where the corresponding adjustmentis recognised through a loss allowance account. For investments in debt instruments that are measured atFVTOCI, the loss allowance is recognised in OCI and accumulated in the investment revaluation reservewithout reducing the carrying amount of these debt instruments.
Derecognition of financial assets
The Group derecognises a financial asset only when the contractual rights to the cash flows from the assetexpire, or when it transfers the financial asset and substantially all the risks and rewards of ownership of the assetto another entity.
On derecognition of a financial asset measured at amortised cost, the difference between the asset’s carryingamount and the sum of the consideration received and receivable is recognised in profit or loss.
On derecognition of an investment in a debt instrument classified as at FVTOCI upon application of IFRS 9,the cumulative gain or loss previously accumulated in the investment revaluation reserve is reclassified to profit orloss.
On derecognition of an investment in equity instrument which the Group has elected on initial recognition tomeasure at FVTOCI upon application of IFRS 9, the cumulative gain or loss previously accumulated in theinvestment revaluation reserve is not reclassified to profit or loss, but is transferred to retained profits.
Financial liabilities and equity
Classification as debt or equity
Debt and equity instruments are classified as either financial liabilities or as equity in accordance with thesubstance of the contractual arrangements and the definitions of a financial liability and an equity instrument.
An equity instrument is any contract that evidences a residual interest in the assets of the Group after deductingall of its liabilities. Equity instruments issued by the Company are recognised at the proceeds received, net of directissue costs.
Financial liabilities
All financial liabilities are subsequently measured at amortised cost using the effective interest method or atFVTPL.
APPENDIX I ACCOUNTANTS’ REPORT
– I-30 –
THIS DOCUMENT IS IN DRAFT FORM, INCOMPLETE AND SUBJECT TO CHANGE AND THAT INFORMATION MUST BEREAD IN CONJUNCTION WITH THE SECTION HEADED “WARNING” ON THE COVER OF THIS DOCUMENT.
Financial liabilities at FVTPL
Financial liabilities are classified as at FVTPL when the financial liability is (i) contingent consideration ofan acquirer in a business combination to which IFRS 3 applies, (ii) held for trading or (iii) it is designated as atFVTPL.
A financial liability is classified as held for trading if:
• it has been acquired principally for the purpose of repurchasing it in the near term; or
• on initial recognition it is part of a portfolio of identified financial instruments that the Group managestogether and has a recent actual pattern of short-term profit-taking; or
• it is a derivative, except for a derivative that is a financial guarantee contract or a designated andeffective hedging instrument.
A financial liability other than a financial liability held for trading or contingent consideration of an acquirerin a business combination may be designated as at FVTPL upon initial recognition if:
• such designation eliminates or significantly reduces a measurement or recognition inconsistency thatwould otherwise arise; or
• the financial liability forms part of a group of financial assets or financial liabilities or both, which ismanaged and its performance is evaluated on a fair value basis, in accordance with the Group’sdocumented risk management or investment strategy, and information about the grouping is providedinternally on that basis; or
• it forms part of a contract containing one or more embedded derivatives, and IAS 39/IFRS 9 permits theentire combined contract to be designated as at FVTPL.
Financial liabilities at amortised cost
Financial liabilities including trade and bills payables, other payables, bank and other borrowings, amounts dueto related parties and other liabilities at amortised cost, are subsequently measured at amortised cost, using theeffective interest method.
Derecognition of financial liabilities
The Group derecognises financial liabilities when, and only when, the Group’s obligations are discharged,cancelled or have expired. The difference between the carrying amount of the financial liability derecognised and theconsideration paid and payable is recognised in profit or loss.
Derivative financial instruments
Derivatives are initially recognised at fair value at the date when derivative contracts are entered into and aresubsequently remeasured to their fair value at the end of the reporting period. The resulting gain or loss is recognisedin profit or loss.
5. KEY SOURCES OF ESTIMATION UNCERTAINTY
In the application of the Group’s accounting policies, which are described in Note 4, the directors of theCompany are required to make judgements, estimates and assumptions about the carrying amounts of assets andliabilities that are not readily apparent from other sources. The estimates and underlying assumptions are based onhistorical experience and other factors that are considered to be relevant. Actual results may differ from theseestimates.
The estimates and underlying assumptions are reviewed on an on-going basis. Revisions to accountingestimates are recognised in the period in which the estimate is revised if the revision affects only that period, or inthe period of the revision and future periods if the revision affects both current and future periods.
APPENDIX I ACCOUNTANTS’ REPORT
– I-31 –
THIS DOCUMENT IS IN DRAFT FORM, INCOMPLETE AND SUBJECT TO CHANGE AND THAT INFORMATION MUST BEREAD IN CONJUNCTION WITH THE SECTION HEADED “WARNING” ON THE COVER OF THIS DOCUMENT.
Key sources of estimation uncertainty
The following are the key assumptions concerning the future, and other key sources of estimation uncertaintyat the end of the reporting period, that may have a significant risk of causing a material adjustment to the carryingamounts of assets and liabilities within the next financial year.
Fair value measurements of biological assets – milkable cows
The Group’s biological assets are measured at fair value less costs to sell at the end of each reporting period.The Group uses valuation techniques that include inputs that are not based on market observable data to estimate thefair value of biological assets. For milkable cows, the fair value is determined by using the multi-period excessearning method with key inputs including the discount rate, the estimated feed costs per kilogram of raw milk,estimated average daily milk yield at each lactation cycle and the estimated local future market price of raw milk.Any changes in the inputs may affect the fair value of the Group’s biological assets – milkable cows significantly.The carrying amount of the Group’s milkable cows as at December 31, 2017, 2018 and 2019 and June 30, 2020 wasRMB1,192,842,000, RMB1,596,129,000, RMB2,228,130,000 and RMB4,119,619,000, respectively. Further detailsare given in Notes 22 and 45.
Estimated impairment of property, plant and equipment, investment properties, right-of-use assets and intangibleassets other than goodwill
The carrying amount of property, plant and equipment, investment properties, right-of-use assets andintangible assets other than goodwill are reviewed for impairment when events or changes in circumstances indicatethe carrying amount may not be recoverable in accordance with the accounting policies as disclosed in the relevantparts in Note 4. The recoverable amount of these assets are the greater of the fair value less costs of disposal andvalue in use, the calculations of which involve the use of estimates. Any change in these estimates may have amaterial impact on the results of the Group.
As at December 31, 2017, 2018 and 2019 and June 30, 2020, the aggregate carrying amounts of these assetsof the Group are approximately RMB2,494,589,000, RMB2,928,182,000, RMB3,499,867,000 andRMB6,751,569,000, respectively, as disclosed in Notes 17, 18, 19 and 21, respectively.
Provision of ECL for trade receivables (upon application of IFRS 9)
Trade receivables with significant balances and credit-impaired are assessed for ECL individually. In addition,the Group uses provision matrix to calculate ECL for the trade receivables which are individually insignificant. Theprovision rates are based on aging as groupings of various debtors that have similar loss patterns. The provisionmatrix is based on the Group’s historical default rates taking into consideration forward-looking information that isreasonable and supportable available without undue costs or effort. At every reporting date, the historical observeddefault rates are reassessed and changes in the forward-looking information are considered.
The provision of ECL is sensitive to changes in estimates. The information about the ECL and the Group’strade receivables are disclosed in Notes 26 and 44.
6. REVENUE AND SEGMENT INFORMATION
(i) Disaggregation of revenue from contracts with customers
Year ended December 31,Six months ended
June 30,
2017 2018 2019 2019 2020
RMB’000 RMB’000 RMB’000 RMB’000 RMB’000(unaudited)
Types of goodsSales of raw milk 2,237,474 2,610,333 3,063,615 1,453,840 3,192,968Sales of feeds 2,643,555 3,508,771 4,376,520 1,886,469 1,977,149Sales of ruminant farming
products 210,416 214,816 227,683 96,533 146,377Sales of frozen bovine
semen – – – – 27,933
5,091,445 6,333,920 7,667,818 3,436,842 5,344,427
Timing of revenuerecognitionA point in time 5,091,445 6,333,920 7,667,818 3,436,842 5,344,427
APPENDIX I ACCOUNTANTS’ REPORT
– I-32 –
THIS DOCUMENT IS IN DRAFT FORM, INCOMPLETE AND SUBJECT TO CHANGE AND THAT INFORMATION MUST BEREAD IN CONJUNCTION WITH THE SECTION HEADED “WARNING” ON THE COVER OF THIS DOCUMENT.
(ii) Performance obligations for contracts with customers
The Group sells raw milk, feeds, ruminant farming products and frozen bovine semen directly to its customers.Revenue is recognised when control of the goods has transferred, being at the point the customer received the goodsand accepted the quality.
For the sale of raw milk, payments are generally due in two weeks after delivery. The credit term for the saleof feeds, ruminant farming products, and frozen bovine semen is normally one to three months for certain largecustomers and customers having long business relationship with the Group. The Group requests advance paymentsfor certain new customers and such advance payments are recorded as contract liabilities until the control of the goodsis transferred to the customers.
(iii) Transaction price allocated to the remaining performance obligation for contracts with customers
Most of the sale contracts are for periods of one year or less. As permitted by IFRS 15, the transaction priceallocated to these unsatisfied performance obligations is not disclosed.
Information regarding segments is reported below.
Segment information has been identified on the basis of internal management reports, which are regularlyreviewed by senior management, which composed of executive directors of the Company and top management (beingchief operating decision maker (the “CODM”)), in order to allocate resources to operating segments and to assesstheir performance focuses on types of products delivered. Specifically, the Group’s reportable segments under IFRS 8Operating Segment are as follows:
• Raw milk business – raising and breeding dairy cows, and raw milk production
• Comprehensive ruminant farming solutions – trading, production and sales of feeds, dairy farmingruminant farming products, and frozen bovine semen.
Segment revenue and results
The following is an analysis of the Group’s revenue and results by reportable segment:
Raw milkbusiness
Comprehensiveruminant
farmingsolutions
Segmenttotal Eliminations Total
RMB’000 RMB’000 RMB’000 RMB’000 RMB’000
For the year ended December 31, 2017Segment revenueExternal customers 2,237,474 2,853,971 5,091,445 – 5,091,445Inter-segment revenue – 392,661 392,661 (392,661) –
2,237,474 3,246,632 5,484,106 (392,661) 5,091,445
Segment results 599,256 260,388 859,644 859,644
Loss arising from changes infair value less costs to sellof biological assets (407,730)
Unallocated other income andexpenses (80,820)
Unallocated finance costs (46,367)
Profit before tax 324,727
APPENDIX I ACCOUNTANTS’ REPORT
– I-33 –
THIS DOCUMENT IS IN DRAFT FORM, INCOMPLETE AND SUBJECT TO CHANGE AND THAT INFORMATION MUST BEREAD IN CONJUNCTION WITH THE SECTION HEADED “WARNING” ON THE COVER OF THIS DOCUMENT.
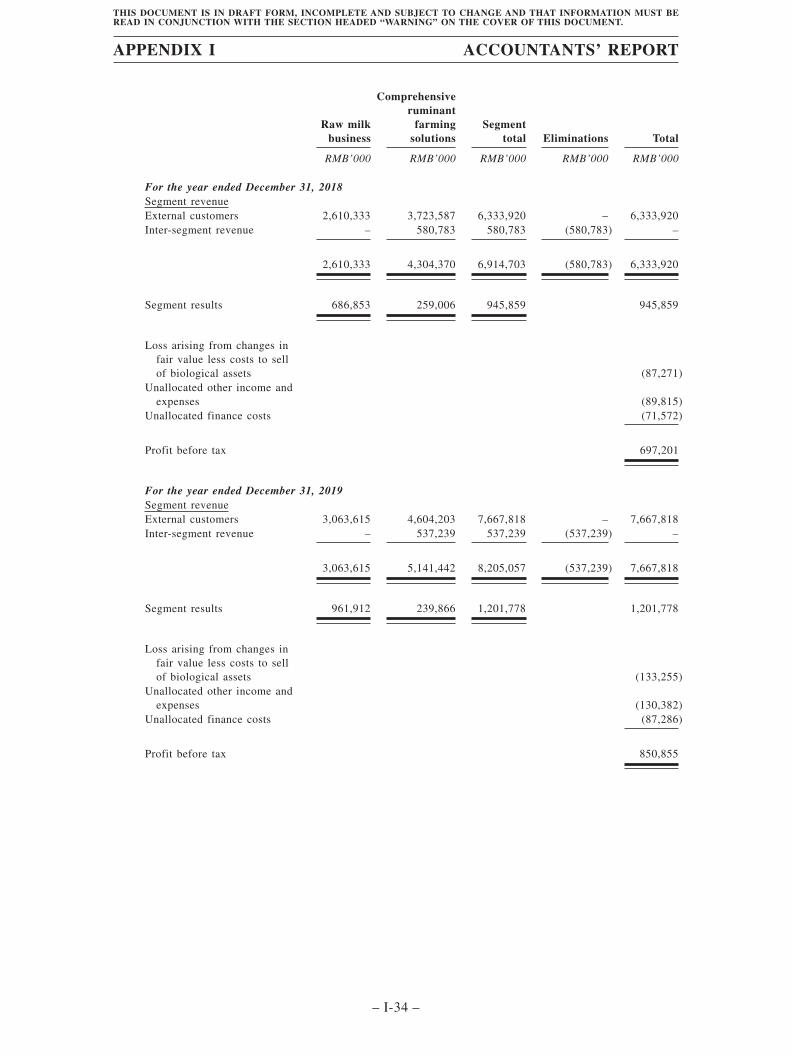
Raw milkbusiness
Comprehensiveruminant
farmingsolutions
Segmenttotal Eliminations Total
RMB’000 RMB’000 RMB’000 RMB’000 RMB’000
For the year ended December 31, 2018Segment revenueExternal customers 2,610,333 3,723,587 6,333,920 – 6,333,920Inter-segment revenue – 580,783 580,783 (580,783) –
2,610,333 4,304,370 6,914,703 (580,783) 6,333,920
Segment results 686,853 259,006 945,859 945,859
Loss arising from changes infair value less costs to sellof biological assets (87,271)
Unallocated other income andexpenses (89,815)
Unallocated finance costs (71,572)
Profit before tax 697,201
For the year ended December 31, 2019Segment revenueExternal customers 3,063,615 4,604,203 7,667,818 – 7,667,818Inter-segment revenue – 537,239 537,239 (537,239) –
3,063,615 5,141,442 8,205,057 (537,239) 7,667,818
Segment results 961,912 239,866 1,201,778 1,201,778
Loss arising from changes infair value less costs to sellof biological assets (133,255)
Unallocated other income andexpenses (130,382)
Unallocated finance costs (87,286)
Profit before tax 850,855
APPENDIX I ACCOUNTANTS’ REPORT
– I-34 –
THIS DOCUMENT IS IN DRAFT FORM, INCOMPLETE AND SUBJECT TO CHANGE AND THAT INFORMATION MUST BEREAD IN CONJUNCTION WITH THE SECTION HEADED “WARNING” ON THE COVER OF THIS DOCUMENT.
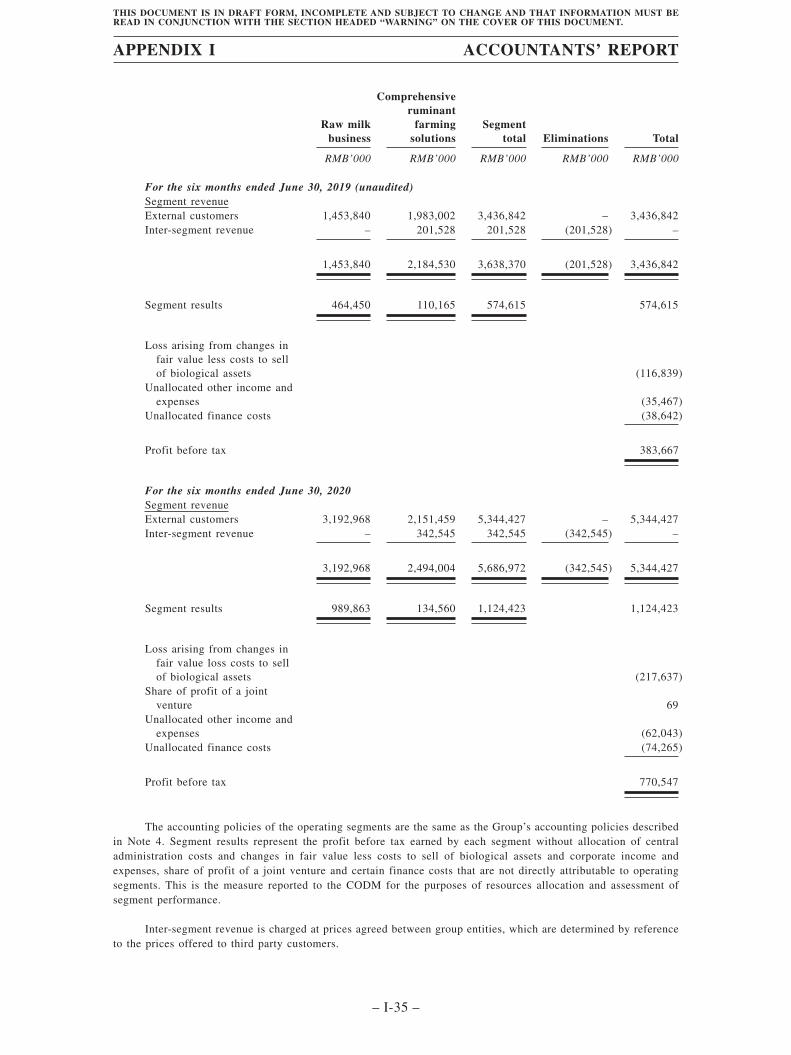
Raw milkbusiness
Comprehensiveruminant
farmingsolutions
Segmenttotal Eliminations Total
RMB’000 RMB’000 RMB’000 RMB’000 RMB’000
For the six months ended June 30, 2019 (unaudited)Segment revenueExternal customers 1,453,840 1,983,002 3,436,842 – 3,436,842Inter-segment revenue – 201,528 201,528 (201,528) –
1,453,840 2,184,530 3,638,370 (201,528) 3,436,842
Segment results 464,450 110,165 574,615 574,615
Loss arising from changes infair value less costs to sellof biological assets (116,839)
Unallocated other income andexpenses (35,467)
Unallocated finance costs (38,642)
Profit before tax 383,667
For the six months ended June 30, 2020Segment revenueExternal customers 3,192,968 2,151,459 5,344,427 – 5,344,427Inter-segment revenue – 342,545 342,545 (342,545) –
3,192,968 2,494,004 5,686,972 (342,545) 5,344,427
Segment results 989,863 134,560 1,124,423 1,124,423
Loss arising from changes infair value loss costs to sellof biological assets (217,637)
Share of profit of a jointventure 69
Unallocated other income andexpenses (62,043)
Unallocated finance costs (74,265)
Profit before tax 770,547
The accounting policies of the operating segments are the same as the Group’s accounting policies describedin Note 4. Segment results represent the profit before tax earned by each segment without allocation of centraladministration costs and changes in fair value less costs to sell of biological assets and corporate income andexpenses, share of profit of a joint venture and certain finance costs that are not directly attributable to operatingsegments. This is the measure reported to the CODM for the purposes of resources allocation and assessment ofsegment performance.
Inter-segment revenue is charged at prices agreed between group entities, which are determined by referenceto the prices offered to third party customers.
APPENDIX I ACCOUNTANTS’ REPORT
– I-35 –
THIS DOCUMENT IS IN DRAFT FORM, INCOMPLETE AND SUBJECT TO CHANGE AND THAT INFORMATION MUST BEREAD IN CONJUNCTION WITH THE SECTION HEADED “WARNING” ON THE COVER OF THIS DOCUMENT.
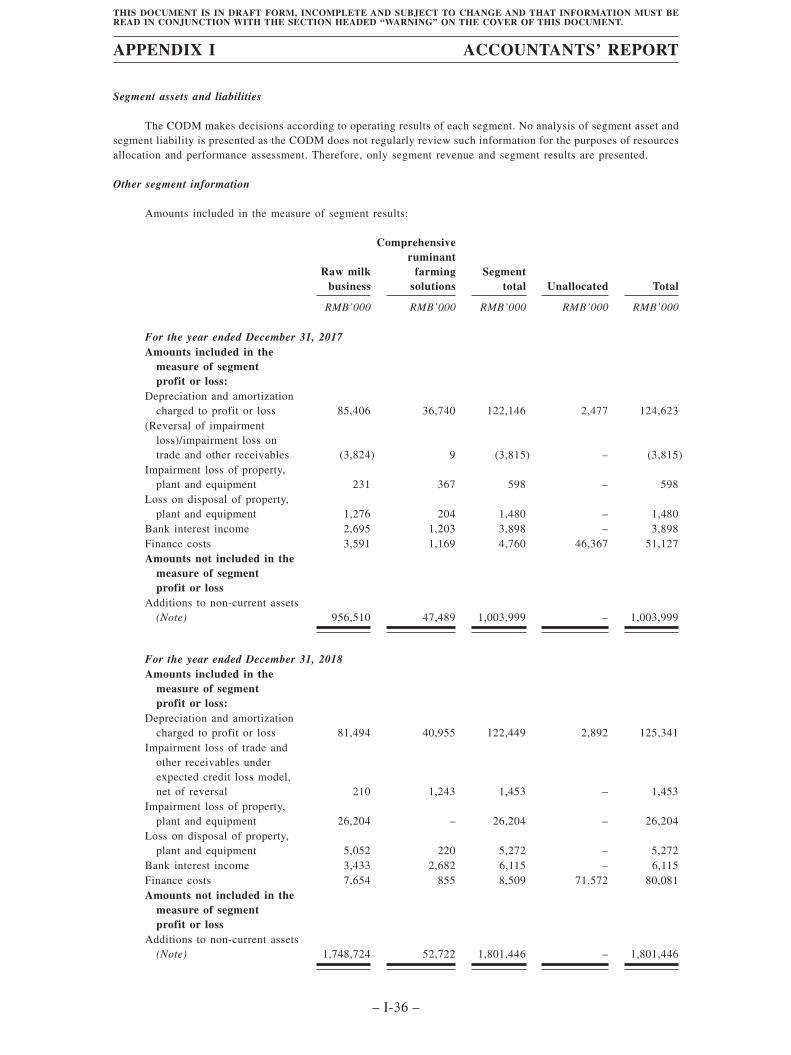
Segment assets and liabilities
The CODM makes decisions according to operating results of each segment. No analysis of segment asset andsegment liability is presented as the CODM does not regularly review such information for the purposes of resourcesallocation and performance assessment. Therefore, only segment revenue and segment results are presented.
Other segment information
Amounts included in the measure of segment results:
Raw milkbusiness
Comprehensiveruminant
farmingsolutions
Segmenttotal Unallocated Total
RMB’000 RMB’000 RMB’000 RMB’000 RMB’000
For the year ended December 31, 2017Amounts included in the
measure of segmentprofit or loss:
Depreciation and amortizationcharged to profit or loss 85,406 36,740 122,146 2,477 124,623
(Reversal of impairmentloss)/impairment loss ontrade and other receivables (3,824) 9 (3,815) – (3,815)
Impairment loss of property,plant and equipment 231 367 598 – 598
Loss on disposal of property,plant and equipment 1,276 204 1,480 – 1,480
Bank interest income 2,695 1,203 3,898 – 3,898Finance costs 3,591 1,169 4,760 46,367 51,127Amounts not included in the
measure of segmentprofit or loss
Additions to non-current assets(Note) 956,510 47,489 1,003,999 – 1,003,999
For the year ended December 31, 2018Amounts included in the
measure of segmentprofit or loss:
Depreciation and amortizationcharged to profit or loss 81,494 40,955 122,449 2,892 125,341
Impairment loss of trade andother receivables underexpected credit loss model,net of reversal 210 1,243 1,453 – 1,453
Impairment loss of property,plant and equipment 26,204 – 26,204 – 26,204
Loss on disposal of property,plant and equipment 5,052 220 5,272 – 5,272
Bank interest income 3,433 2,682 6,115 – 6,115Finance costs 7,654 855 8,509 71,572 80,081Amounts not included in the
measure of segmentprofit or loss
Additions to non-current assets(Note) 1,748,724 52,722 1,801,446 – 1,801,446
APPENDIX I ACCOUNTANTS’ REPORT
– I-36 –
THIS DOCUMENT IS IN DRAFT FORM, INCOMPLETE AND SUBJECT TO CHANGE AND THAT INFORMATION MUST BEREAD IN CONJUNCTION WITH THE SECTION HEADED “WARNING” ON THE COVER OF THIS DOCUMENT.
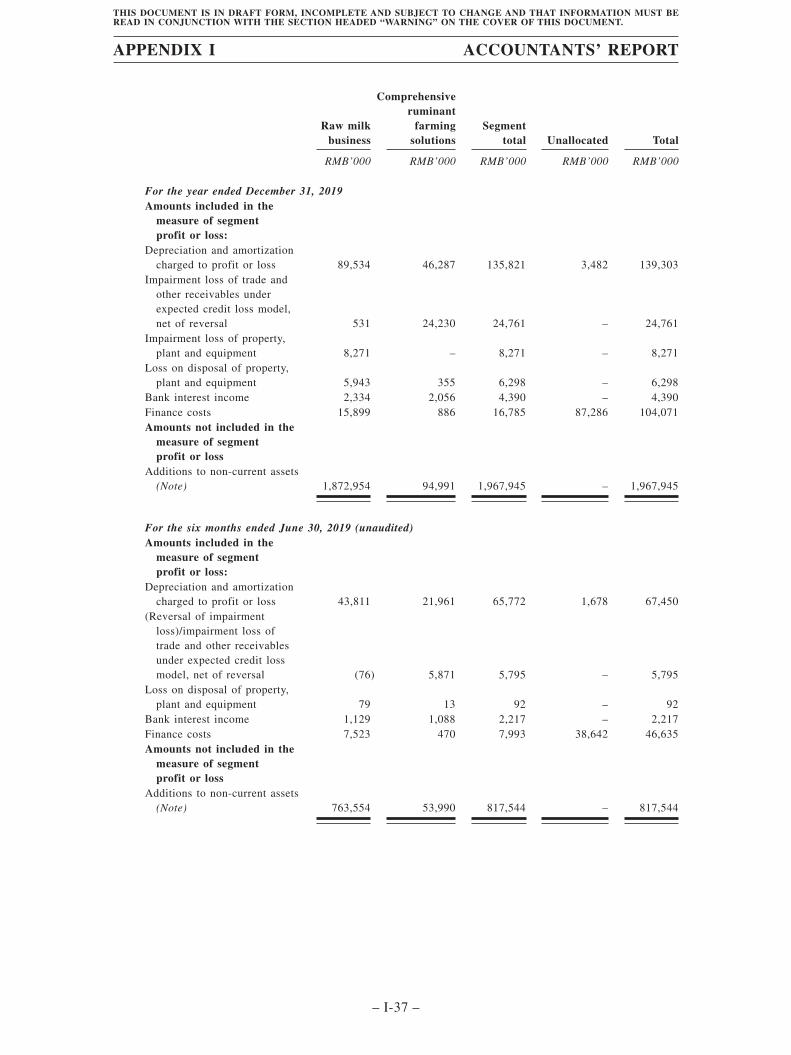
Raw milkbusiness
Comprehensiveruminant
farmingsolutions
Segmenttotal Unallocated Total
RMB’000 RMB’000 RMB’000 RMB’000 RMB’000
For the year ended December 31, 2019Amounts included in the
measure of segmentprofit or loss:
Depreciation and amortizationcharged to profit or loss 89,534 46,287 135,821 3,482 139,303
Impairment loss of trade andother receivables underexpected credit loss model,net of reversal 531 24,230 24,761 – 24,761
Impairment loss of property,plant and equipment 8,271 – 8,271 – 8,271
Loss on disposal of property,plant and equipment 5,943 355 6,298 – 6,298
Bank interest income 2,334 2,056 4,390 – 4,390Finance costs 15,899 886 16,785 87,286 104,071Amounts not included in the
measure of segmentprofit or loss
Additions to non-current assets(Note) 1,872,954 94,991 1,967,945 – 1,967,945
For the six months ended June 30, 2019 (unaudited)Amounts included in the
measure of segmentprofit or loss:
Depreciation and amortizationcharged to profit or loss 43,811 21,961 65,772 1,678 67,450
(Reversal of impairmentloss)/impairment loss oftrade and other receivablesunder expected credit lossmodel, net of reversal (76) 5,871 5,795 – 5,795
Loss on disposal of property,plant and equipment 79 13 92 – 92
Bank interest income 1,129 1,088 2,217 – 2,217Finance costs 7,523 470 7,993 38,642 46,635Amounts not included in the
measure of segmentprofit or loss
Additions to non-current assets(Note) 763,554 53,990 817,544 – 817,544
APPENDIX I ACCOUNTANTS’ REPORT
– I-37 –
THIS DOCUMENT IS IN DRAFT FORM, INCOMPLETE AND SUBJECT TO CHANGE AND THAT INFORMATION MUST BEREAD IN CONJUNCTION WITH THE SECTION HEADED “WARNING” ON THE COVER OF THIS DOCUMENT.
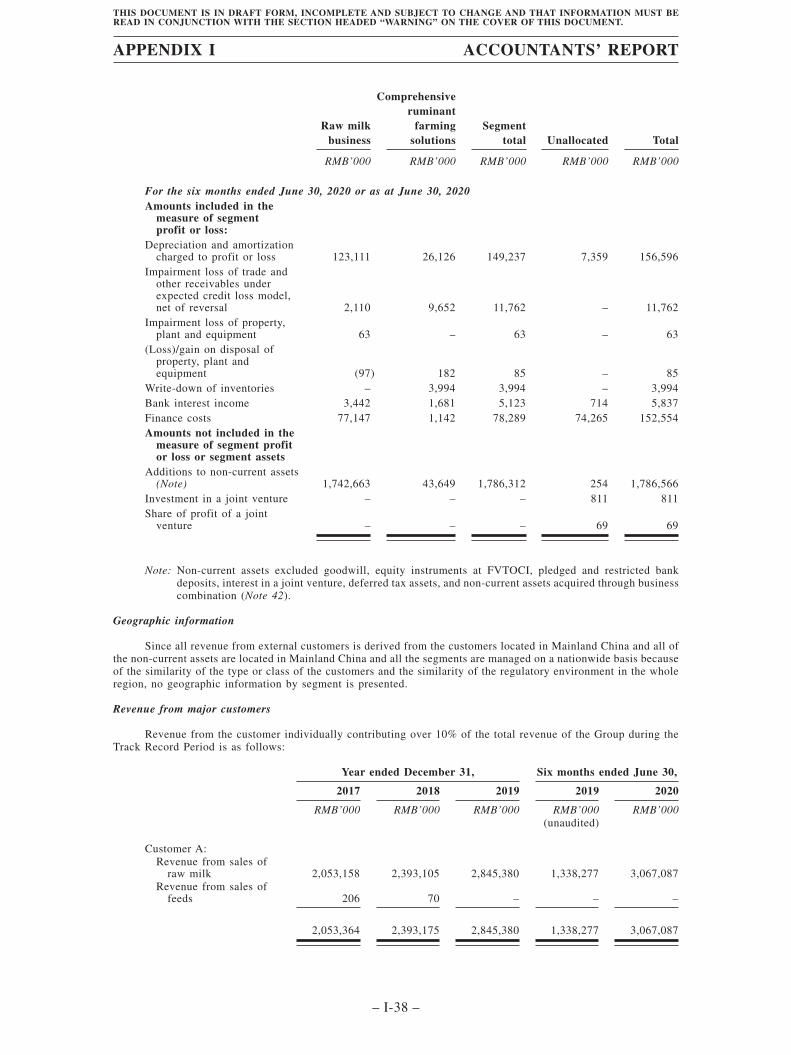
Raw milkbusiness
Comprehensiveruminant
farmingsolutions
Segmenttotal Unallocated Total
RMB’000 RMB’000 RMB’000 RMB’000 RMB’000
For the six months ended June 30, 2020 or as at June 30, 2020Amounts included in the
measure of segmentprofit or loss:
Depreciation and amortizationcharged to profit or loss 123,111 26,126 149,237 7,359 156,596
Impairment loss of trade andother receivables underexpected credit loss model,net of reversal 2,110 9,652 11,762 – 11,762
Impairment loss of property,plant and equipment 63 – 63 – 63
(Loss)/gain on disposal ofproperty, plant andequipment (97) 182 85 – 85
Write-down of inventories – 3,994 3,994 – 3,994Bank interest income 3,442 1,681 5,123 714 5,837Finance costs 77,147 1,142 78,289 74,265 152,554Amounts not included in the
measure of segment profitor loss or segment assets
Additions to non-current assets(Note) 1,742,663 43,649 1,786,312 254 1,786,566
Investment in a joint venture – – – 811 811Share of profit of a joint
venture – – – 69 69
Note: Non-current assets excluded goodwill, equity instruments at FVTOCI, pledged and restricted bankdeposits, interest in a joint venture, deferred tax assets, and non-current assets acquired through businesscombination (Note 42).
Geographic information
Since all revenue from external customers is derived from the customers located in Mainland China and all ofthe non-current assets are located in Mainland China and all the segments are managed on a nationwide basis becauseof the similarity of the type or class of the customers and the similarity of the regulatory environment in the wholeregion, no geographic information by segment is presented.
Revenue from major customers
Revenue from the customer individually contributing over 10% of the total revenue of the Group during theTrack Record Period is as follows:
Year ended December 31, Six months ended June 30,
2017 2018 2019 2019 2020
RMB’000 RMB’000 RMB’000 RMB’000 RMB’000(unaudited)
Customer A:Revenue from sales of
raw milk 2,053,158 2,393,105 2,845,380 1,338,277 3,067,087Revenue from sales of
feeds 206 70 – – –
2,053,364 2,393,175 2,845,380 1,338,277 3,067,087
APPENDIX I ACCOUNTANTS’ REPORT
– I-38 –
THIS DOCUMENT IS IN DRAFT FORM, INCOMPLETE AND SUBJECT TO CHANGE AND THAT INFORMATION MUST BEREAD IN CONJUNCTION WITH THE SECTION HEADED “WARNING” ON THE COVER OF THIS DOCUMENT.
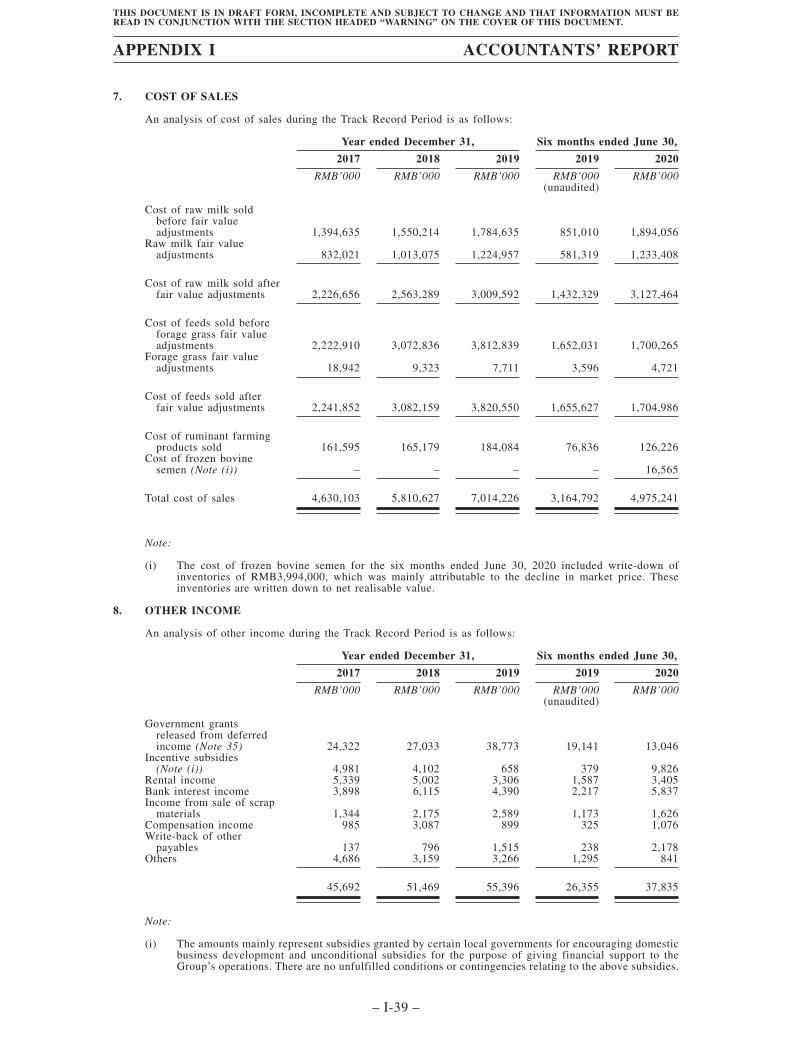
7. COST OF SALES
An analysis of cost of sales during the Track Record Period is as follows:
Year ended December 31, Six months ended June 30,
2017 2018 2019 2019 2020
RMB’000 RMB’000 RMB’000 RMB’000 RMB’000(unaudited)
Cost of raw milk soldbefore fair valueadjustments 1,394,635 1,550,214 1,784,635 851,010 1,894,056
Raw milk fair valueadjustments 832,021 1,013,075 1,224,957 581,319 1,233,408
Cost of raw milk sold afterfair value adjustments 2,226,656 2,563,289 3,009,592 1,432,329 3,127,464
Cost of feeds sold beforeforage grass fair valueadjustments 2,222,910 3,072,836 3,812,839 1,652,031 1,700,265
Forage grass fair valueadjustments 18,942 9,323 7,711 3,596 4,721
Cost of feeds sold afterfair value adjustments 2,241,852 3,082,159 3,820,550 1,655,627 1,704,986
Cost of ruminant farmingproducts sold 161,595 165,179 184,084 76,836 126,226
Cost of frozen bovinesemen (Note (i)) – – – – 16,565
Total cost of sales 4,630,103 5,810,627 7,014,226 3,164,792 4,975,241
Note:
(i) The cost of frozen bovine semen for the six months ended June 30, 2020 included write-down ofinventories of RMB3,994,000, which was mainly attributable to the decline in market price. Theseinventories are written down to net realisable value.
8. OTHER INCOME
An analysis of other income during the Track Record Period is as follows:
Year ended December 31, Six months ended June 30,
2017 2018 2019 2019 2020
RMB’000 RMB’000 RMB’000 RMB’000 RMB’000(unaudited)
Government grantsreleased from deferredincome (Note 35) 24,322 27,033 38,773 19,141 13,046
Incentive subsidies(Note (i)) 4,981 4,102 658 379 9,826
Rental income 5,339 5,002 3,306 1,587 3,405Bank interest income 3,898 6,115 4,390 2,217 5,837Income from sale of scrap
materials 1,344 2,175 2,589 1,173 1,626Compensation income 985 3,087 899 325 1,076Write-back of other
payables 137 796 1,515 238 2,178Others 4,686 3,159 3,266 1,295 841
45,692 51,469 55,396 26,355 37,835
Note:
(i) The amounts mainly represent subsidies granted by certain local governments for encouraging domesticbusiness development and unconditional subsidies for the purpose of giving financial support to theGroup’s operations. There are no unfulfilled conditions or contingencies relating to the above subsidies.
APPENDIX I ACCOUNTANTS’ REPORT
– I-39 –
THIS DOCUMENT IS IN DRAFT FORM, INCOMPLETE AND SUBJECT TO CHANGE AND THAT INFORMATION MUST BEREAD IN CONJUNCTION WITH THE SECTION HEADED “WARNING” ON THE COVER OF THIS DOCUMENT.
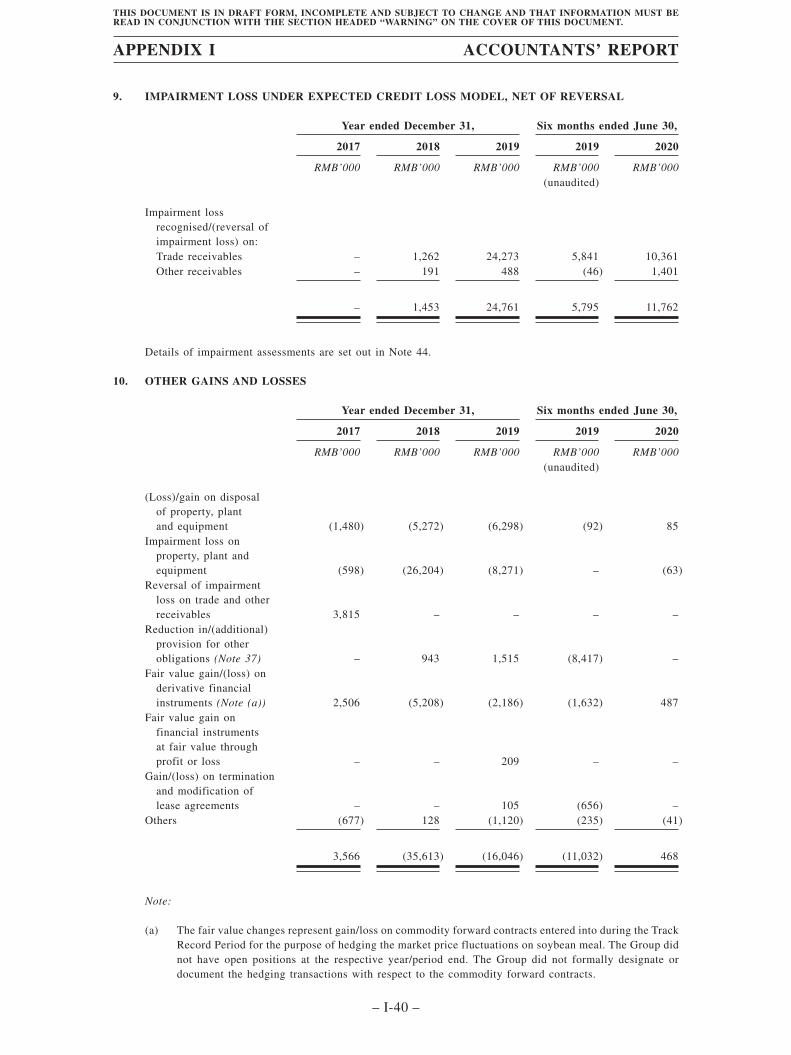
9. IMPAIRMENT LOSS UNDER EXPECTED CREDIT LOSS MODEL, NET OF REVERSAL
Year ended December 31, Six months ended June 30,
2017 2018 2019 2019 2020
RMB’000 RMB’000 RMB’000 RMB’000 RMB’000(unaudited)
Impairment lossrecognised/(reversal ofimpairment loss) on:Trade receivables – 1,262 24,273 5,841 10,361Other receivables – 191 488 (46) 1,401
– 1,453 24,761 5,795 11,762
Details of impairment assessments are set out in Note 44.
10. OTHER GAINS AND LOSSES
Year ended December 31, Six months ended June 30,
2017 2018 2019 2019 2020
RMB’000 RMB’000 RMB’000 RMB’000 RMB’000(unaudited)
(Loss)/gain on disposalof property, plantand equipment (1,480) (5,272) (6,298) (92) 85
Impairment loss onproperty, plant andequipment (598) (26,204) (8,271) – (63)
Reversal of impairmentloss on trade and otherreceivables 3,815 – – – –
Reduction in/(additional)provision for otherobligations (Note 37) – 943 1,515 (8,417) –
Fair value gain/(loss) onderivative financialinstruments (Note (a)) 2,506 (5,208) (2,186) (1,632) 487
Fair value gain onfinancial instrumentsat fair value throughprofit or loss – – 209 – –
Gain/(loss) on terminationand modification oflease agreements – – 105 (656) –
Others (677) 128 (1,120) (235) (41)
3,566 (35,613) (16,046) (11,032) 468
Note:
(a) The fair value changes represent gain/loss on commodity forward contracts entered into during the TrackRecord Period for the purpose of hedging the market price fluctuations on soybean meal. The Group didnot have open positions at the respective year/period end. The Group did not formally designate ordocument the hedging transactions with respect to the commodity forward contracts.
APPENDIX I ACCOUNTANTS’ REPORT
– I-40 –
THIS DOCUMENT IS IN DRAFT FORM, INCOMPLETE AND SUBJECT TO CHANGE AND THAT INFORMATION MUST BEREAD IN CONJUNCTION WITH THE SECTION HEADED “WARNING” ON THE COVER OF THIS DOCUMENT.
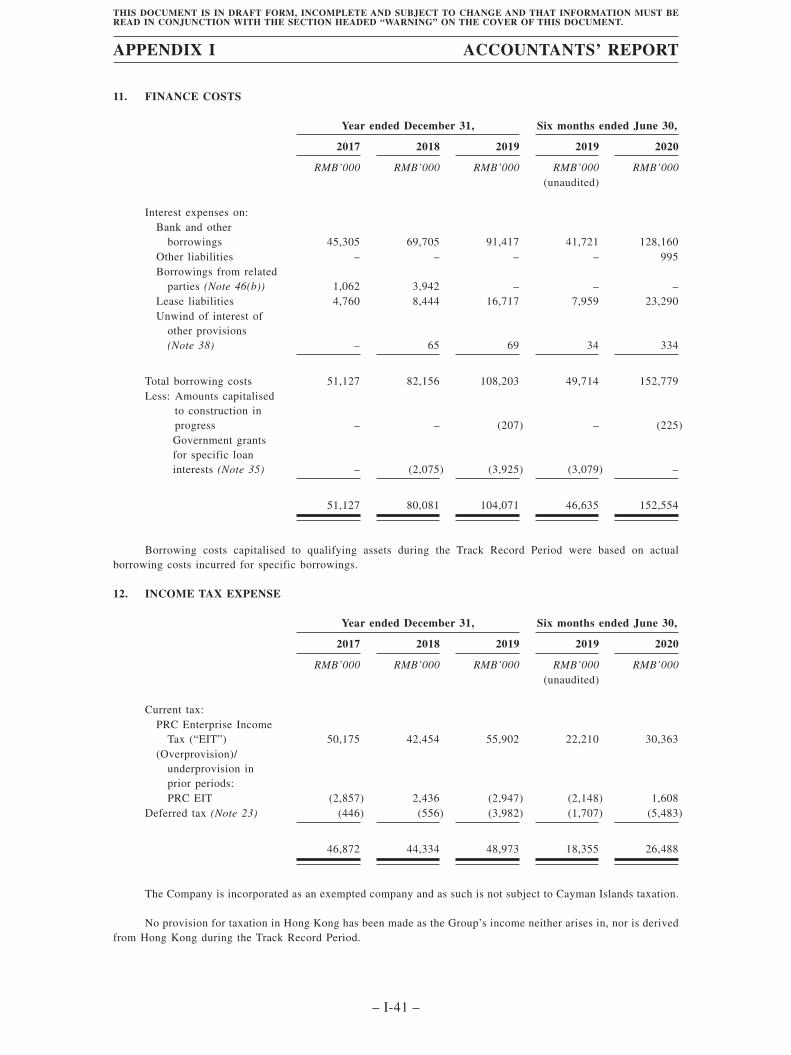
11. FINANCE COSTS
Year ended December 31, Six months ended June 30,
2017 2018 2019 2019 2020
RMB’000 RMB’000 RMB’000 RMB’000 RMB’000(unaudited)
Interest expenses on:Bank and other
borrowings 45,305 69,705 91,417 41,721 128,160Other liabilities – – – – 995Borrowings from related
parties (Note 46(b)) 1,062 3,942 – – –Lease liabilities 4,760 8,444 16,717 7,959 23,290Unwind of interest of
other provisions(Note 38) – 65 69 34 334
Total borrowing costs 51,127 82,156 108,203 49,714 152,779Less: Amounts capitalised
to construction inprogress – – (207) – (225)Government grantsfor specific loaninterests (Note 35) – (2,075) (3,925) (3,079) –
51,127 80,081 104,071 46,635 152,554
Borrowing costs capitalised to qualifying assets during the Track Record Period were based on actualborrowing costs incurred for specific borrowings.
12. INCOME TAX EXPENSE
Year ended December 31, Six months ended June 30,
2017 2018 2019 2019 2020
RMB’000 RMB’000 RMB’000 RMB’000 RMB’000(unaudited)
Current tax:PRC Enterprise Income
Tax (“EIT”) 50,175 42,454 55,902 22,210 30,363(Overprovision)/
underprovision inprior periods:PRC EIT (2,857) 2,436 (2,947) (2,148) 1,608
Deferred tax (Note 23) (446) (556) (3,982) (1,707) (5,483)
46,872 44,334 48,973 18,355 26,488
The Company is incorporated as an exempted company and as such is not subject to Cayman Islands taxation.
No provision for taxation in Hong Kong has been made as the Group’s income neither arises in, nor is derivedfrom Hong Kong during the Track Record Period.
APPENDIX I ACCOUNTANTS’ REPORT
– I-41 –
THIS DOCUMENT IS IN DRAFT FORM, INCOMPLETE AND SUBJECT TO CHANGE AND THAT INFORMATION MUST BEREAD IN CONJUNCTION WITH THE SECTION HEADED “WARNING” ON THE COVER OF THIS DOCUMENT.
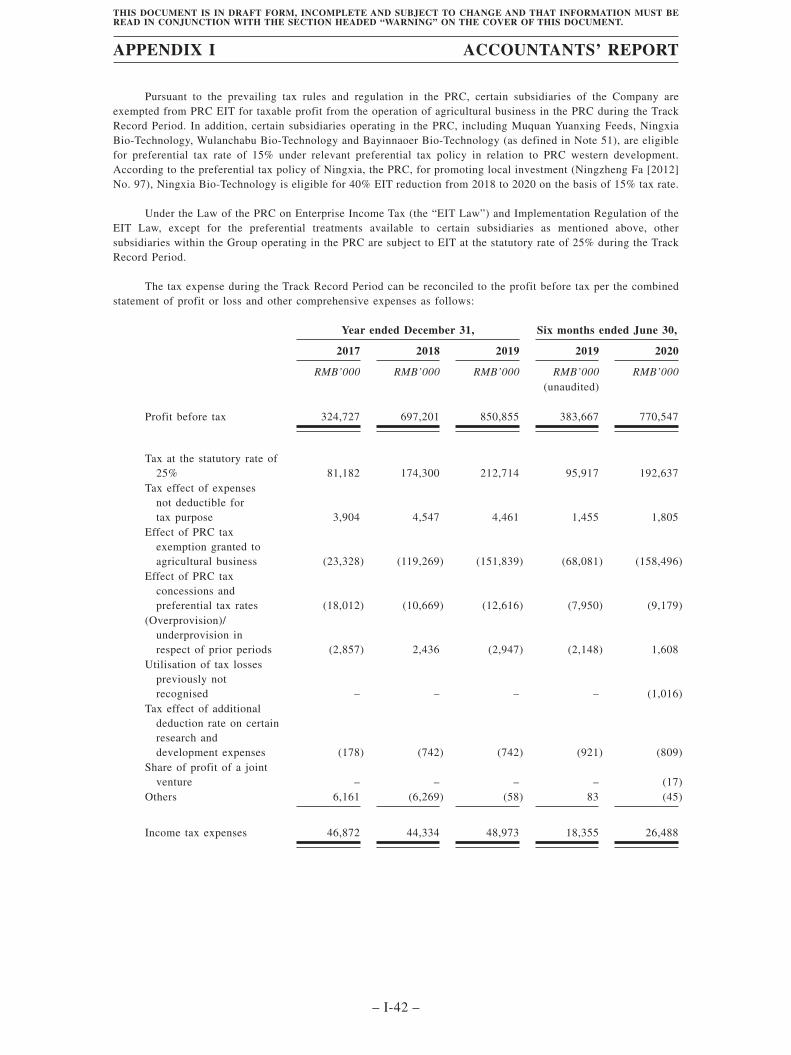
Pursuant to the prevailing tax rules and regulation in the PRC, certain subsidiaries of the Company areexempted from PRC EIT for taxable profit from the operation of agricultural business in the PRC during the TrackRecord Period. In addition, certain subsidiaries operating in the PRC, including Muquan Yuanxing Feeds, NingxiaBio-Technology, Wulanchabu Bio-Technology and Bayinnaoer Bio-Technology (as defined in Note 51), are eligiblefor preferential tax rate of 15% under relevant preferential tax policy in relation to PRC western development.According to the preferential tax policy of Ningxia, the PRC, for promoting local investment (Ningzheng Fa [2012]No. 97), Ningxia Bio-Technology is eligible for 40% EIT reduction from 2018 to 2020 on the basis of 15% tax rate.
Under the Law of the PRC on Enterprise Income Tax (the “EIT Law”) and Implementation Regulation of theEIT Law, except for the preferential treatments available to certain subsidiaries as mentioned above, othersubsidiaries within the Group operating in the PRC are subject to EIT at the statutory rate of 25% during the TrackRecord Period.
The tax expense during the Track Record Period can be reconciled to the profit before tax per the combinedstatement of profit or loss and other comprehensive expenses as follows:
Year ended December 31, Six months ended June 30,
2017 2018 2019 2019 2020
RMB’000 RMB’000 RMB’000 RMB’000 RMB’000(unaudited)
Profit before tax 324,727 697,201 850,855 383,667 770,547
Tax at the statutory rate of25% 81,182 174,300 212,714 95,917 192,637
Tax effect of expensesnot deductible fortax purpose 3,904 4,547 4,461 1,455 1,805
Effect of PRC taxexemption granted toagricultural business (23,328) (119,269) (151,839) (68,081) (158,496)
Effect of PRC taxconcessions andpreferential tax rates (18,012) (10,669) (12,616) (7,950) (9,179)
(Overprovision)/underprovision inrespect of prior periods (2,857) 2,436 (2,947) (2,148) 1,608
Utilisation of tax lossespreviously notrecognised – – – – (1,016)
Tax effect of additionaldeduction rate on certainresearch anddevelopment expenses (178) (742) (742) (921) (809)
Share of profit of a jointventure – – – – (17)
Others 6,161 (6,269) (58) 83 (45)
Income tax expenses 46,872 44,334 48,973 18,355 26,488
APPENDIX I ACCOUNTANTS’ REPORT
– I-42 –
THIS DOCUMENT IS IN DRAFT FORM, INCOMPLETE AND SUBJECT TO CHANGE AND THAT INFORMATION MUST BEREAD IN CONJUNCTION WITH THE SECTION HEADED “WARNING” ON THE COVER OF THIS DOCUMENT.
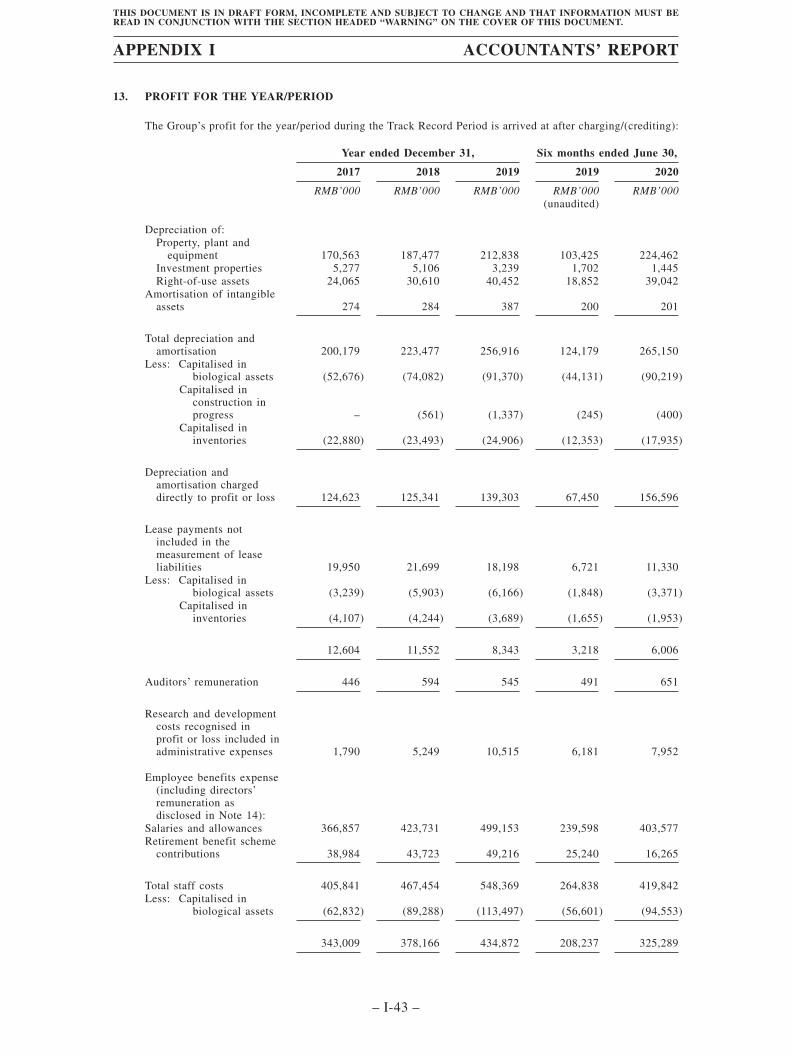
13. PROFIT FOR THE YEAR/PERIOD
The Group’s profit for the year/period during the Track Record Period is arrived at after charging/(crediting):
Year ended December 31, Six months ended June 30,
2017 2018 2019 2019 2020
RMB’000 RMB’000 RMB’000 RMB’000 RMB’000(unaudited)
Depreciation of:Property, plant and
equipment 170,563 187,477 212,838 103,425 224,462Investment properties 5,277 5,106 3,239 1,702 1,445Right-of-use assets 24,065 30,610 40,452 18,852 39,042
Amortisation of intangibleassets 274 284 387 200 201
Total depreciation andamortisation 200,179 223,477 256,916 124,179 265,150
Less: Capitalised inbiological assets (52,676) (74,082) (91,370) (44,131) (90,219)
Capitalised inconstruction inprogress – (561) (1,337) (245) (400)
Capitalised ininventories (22,880) (23,493) (24,906) (12,353) (17,935)
Depreciation andamortisation chargeddirectly to profit or loss 124,623 125,341 139,303 67,450 156,596
Lease payments notincluded in themeasurement of leaseliabilities 19,950 21,699 18,198 6,721 11,330
Less: Capitalised inbiological assets (3,239) (5,903) (6,166) (1,848) (3,371)
Capitalised ininventories (4,107) (4,244) (3,689) (1,655) (1,953)
12,604 11,552 8,343 3,218 6,006
Auditors’ remuneration 446 594 545 491 651
Research and developmentcosts recognised inprofit or loss included inadministrative expenses 1,790 5,249 10,515 6,181 7,952
Employee benefits expense(including directors’remuneration asdisclosed in Note 14):
Salaries and allowances 366,857 423,731 499,153 239,598 403,577Retirement benefit scheme
contributions 38,984 43,723 49,216 25,240 16,265
Total staff costs 405,841 467,454 548,369 264,838 419,842Less: Capitalised in
biological assets (62,832) (89,288) (113,497) (56,601) (94,553)
343,009 378,166 434,872 208,237 325,289
APPENDIX I ACCOUNTANTS’ REPORT
– I-43 –
THIS DOCUMENT IS IN DRAFT FORM, INCOMPLETE AND SUBJECT TO CHANGE AND THAT INFORMATION MUST BEREAD IN CONJUNCTION WITH THE SECTION HEADED “WARNING” ON THE COVER OF THIS DOCUMENT.
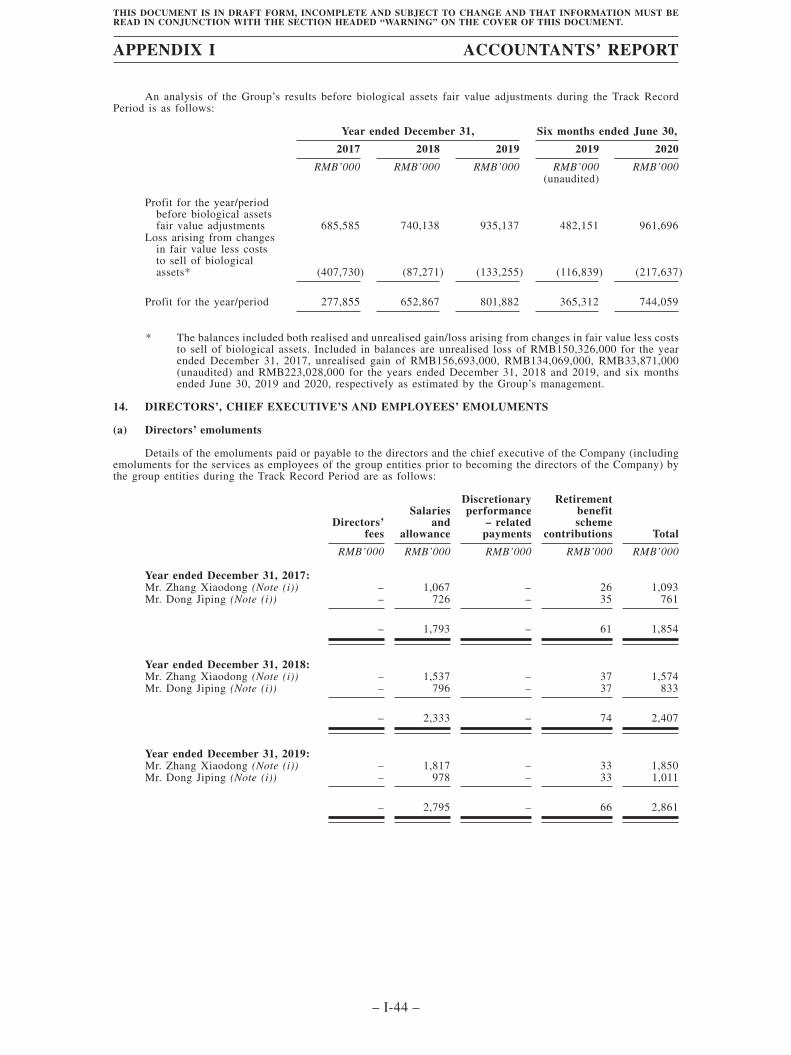
An analysis of the Group’s results before biological assets fair value adjustments during the Track RecordPeriod is as follows:
Year ended December 31, Six months ended June 30,
2017 2018 2019 2019 2020
RMB’000 RMB’000 RMB’000 RMB’000 RMB’000(unaudited)
Profit for the year/periodbefore biological assetsfair value adjustments 685,585 740,138 935,137 482,151 961,696
Loss arising from changesin fair value less coststo sell of biologicalassets* (407,730) (87,271) (133,255) (116,839) (217,637)
Profit for the year/period 277,855 652,867 801,882 365,312 744,059
* The balances included both realised and unrealised gain/loss arising from changes in fair value less coststo sell of biological assets. Included in balances are unrealised loss of RMB150,326,000 for the yearended December 31, 2017, unrealised gain of RMB156,693,000, RMB134,069,000, RMB33,871,000(unaudited) and RMB223,028,000 for the years ended December 31, 2018 and 2019, and six monthsended June 30, 2019 and 2020, respectively as estimated by the Group’s management.
14. DIRECTORS’, CHIEF EXECUTIVE’S AND EMPLOYEES’ EMOLUMENTS
(a) Directors’ emoluments
Details of the emoluments paid or payable to the directors and the chief executive of the Company (includingemoluments for the services as employees of the group entities prior to becoming the directors of the Company) bythe group entities during the Track Record Period are as follows:
Directors’fees
Salariesand
allowance
Discretionaryperformance
– relatedpayments
Retirementbenefitscheme
contributions Total
RMB’000 RMB’000 RMB’000 RMB’000 RMB’000
Year ended December 31, 2017:Mr. Zhang Xiaodong (Note (i)) – 1,067 – 26 1,093Mr. Dong Jiping (Note (i)) – 726 – 35 761
– 1,793 – 61 1,854
Year ended December 31, 2018:Mr. Zhang Xiaodong (Note (i)) – 1,537 – 37 1,574Mr. Dong Jiping (Note (i)) – 796 – 37 833
– 2,333 – 74 2,407
Year ended December 31, 2019:Mr. Zhang Xiaodong (Note (i)) – 1,817 – 33 1,850Mr. Dong Jiping (Note (i)) – 978 – 33 1,011
– 2,795 – 66 2,861
APPENDIX I ACCOUNTANTS’ REPORT
– I-44 –
THIS DOCUMENT IS IN DRAFT FORM, INCOMPLETE AND SUBJECT TO CHANGE AND THAT INFORMATION MUST BEREAD IN CONJUNCTION WITH THE SECTION HEADED “WARNING” ON THE COVER OF THIS DOCUMENT.
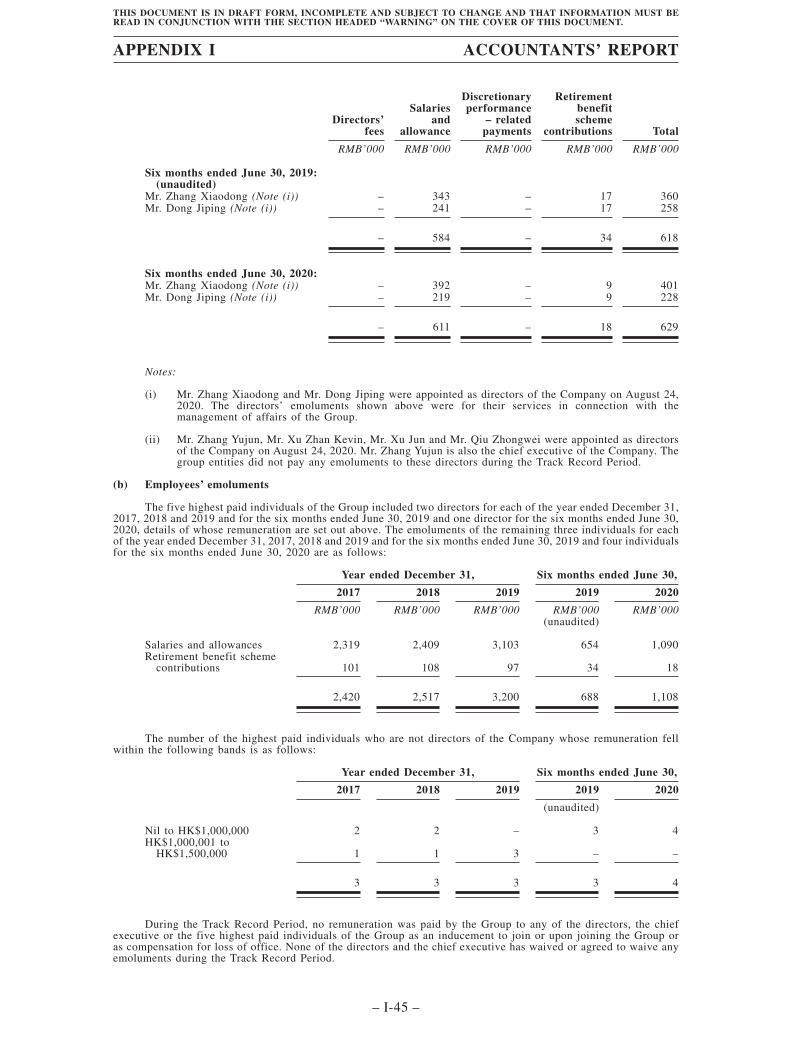
Directors’fees
Salariesand
allowance
Discretionaryperformance
– relatedpayments
Retirementbenefitscheme
contributions Total
RMB’000 RMB’000 RMB’000 RMB’000 RMB’000
Six months ended June 30, 2019:(unaudited)
Mr. Zhang Xiaodong (Note (i)) – 343 – 17 360Mr. Dong Jiping (Note (i)) – 241 – 17 258
– 584 – 34 618
Six months ended June 30, 2020:Mr. Zhang Xiaodong (Note (i)) – 392 – 9 401Mr. Dong Jiping (Note (i)) – 219 – 9 228
– 611 – 18 629
Notes:
(i) Mr. Zhang Xiaodong and Mr. Dong Jiping were appointed as directors of the Company on August 24,2020. The directors’ emoluments shown above were for their services in connection with themanagement of affairs of the Group.
(ii) Mr. Zhang Yujun, Mr. Xu Zhan Kevin, Mr. Xu Jun and Mr. Qiu Zhongwei were appointed as directorsof the Company on August 24, 2020. Mr. Zhang Yujun is also the chief executive of the Company. Thegroup entities did not pay any emoluments to these directors during the Track Record Period.
(b) Employees’ emoluments
The five highest paid individuals of the Group included two directors for each of the year ended December 31,2017, 2018 and 2019 and for the six months ended June 30, 2019 and one director for the six months ended June 30,2020, details of whose remuneration are set out above. The emoluments of the remaining three individuals for eachof the year ended December 31, 2017, 2018 and 2019 and for the six months ended June 30, 2019 and four individualsfor the six months ended June 30, 2020 are as follows:
Year ended December 31, Six months ended June 30,
2017 2018 2019 2019 2020
RMB’000 RMB’000 RMB’000 RMB’000 RMB’000(unaudited)
Salaries and allowances 2,319 2,409 3,103 654 1,090Retirement benefit scheme
contributions 101 108 97 34 18
2,420 2,517 3,200 688 1,108
The number of the highest paid individuals who are not directors of the Company whose remuneration fellwithin the following bands is as follows:
Year ended December 31, Six months ended June 30,
2017 2018 2019 2019 2020
(unaudited)
Nil to HK$1,000,000 2 2 – 3 4HK$1,000,001 to
HK$1,500,000 1 1 3 – –
3 3 3 3 4
During the Track Record Period, no remuneration was paid by the Group to any of the directors, the chiefexecutive or the five highest paid individuals of the Group as an inducement to join or upon joining the Group oras compensation for loss of office. None of the directors and the chief executive has waived or agreed to waive anyemoluments during the Track Record Period.
APPENDIX I ACCOUNTANTS’ REPORT
– I-45 –
THIS DOCUMENT IS IN DRAFT FORM, INCOMPLETE AND SUBJECT TO CHANGE AND THAT INFORMATION MUST BEREAD IN CONJUNCTION WITH THE SECTION HEADED “WARNING” ON THE COVER OF THIS DOCUMENT.
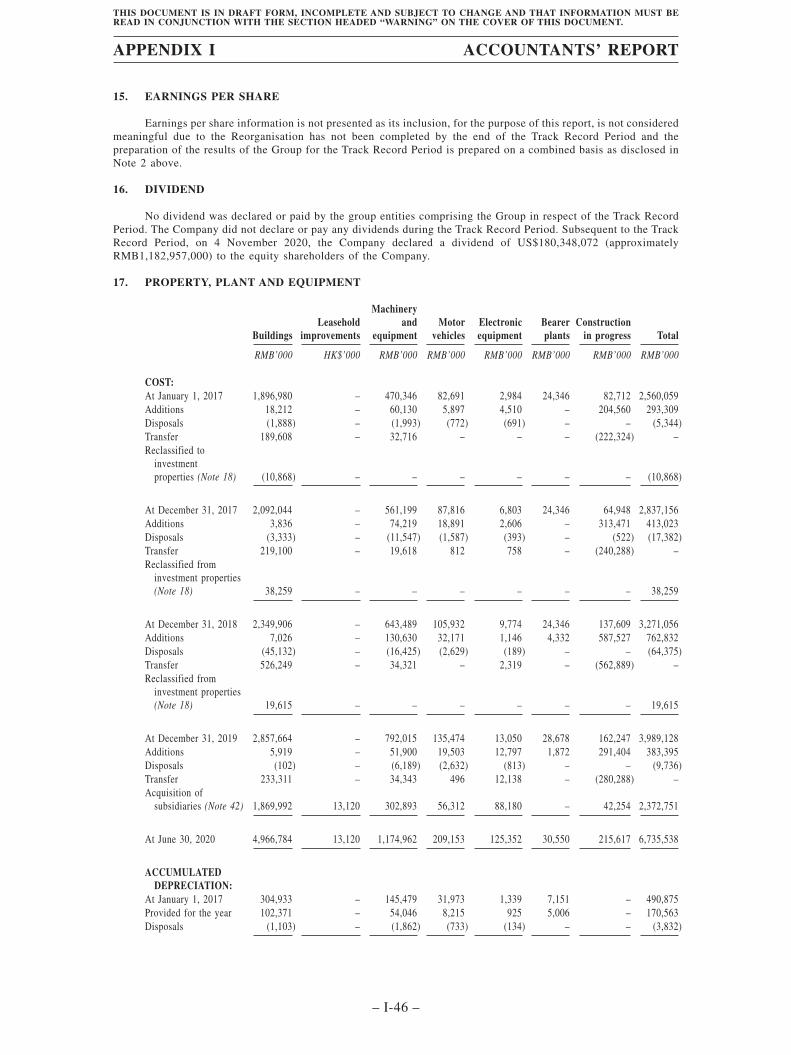
15. EARNINGS PER SHARE
Earnings per share information is not presented as its inclusion, for the purpose of this report, is not consideredmeaningful due to the Reorganisation has not been completed by the end of the Track Record Period and thepreparation of the results of the Group for the Track Record Period is prepared on a combined basis as disclosed inNote 2 above.
16. DIVIDEND
No dividend was declared or paid by the group entities comprising the Group in respect of the Track RecordPeriod. The Company did not declare or pay any dividends during the Track Record Period. Subsequent to the TrackRecord Period, on 4 November 2020, the Company declared a dividend of US$180,348,072 (approximatelyRMB1,182,957,000) to the equity shareholders of the Company.
17. PROPERTY, PLANT AND EQUIPMENT
BuildingsLeasehold
improvements
Machineryand
equipmentMotor
vehiclesElectronicequipment
Bearerplants
Constructionin progress Total
RMB’000 HK$’000 RMB’000 RMB’000 RMB’000 RMB’000 RMB’000 RMB’000
COST:At January 1, 2017 1,896,980 – 470,346 82,691 2,984 24,346 82,712 2,560,059Additions 18,212 – 60,130 5,897 4,510 – 204,560 293,309Disposals (1,888) – (1,993) (772) (691) – – (5,344)Transfer 189,608 – 32,716 – – – (222,324) –Reclassified to
investmentproperties (Note 18) (10,868) – – – – – – (10,868)
At December 31, 2017 2,092,044 – 561,199 87,816 6,803 24,346 64,948 2,837,156Additions 3,836 – 74,219 18,891 2,606 – 313,471 413,023Disposals (3,333) – (11,547) (1,587) (393) – (522) (17,382)Transfer 219,100 – 19,618 812 758 – (240,288) –Reclassified from
investment properties(Note 18) 38,259 – – – – – – 38,259
At December 31, 2018 2,349,906 – 643,489 105,932 9,774 24,346 137,609 3,271,056Additions 7,026 – 130,630 32,171 1,146 4,332 587,527 762,832Disposals (45,132) – (16,425) (2,629) (189) – – (64,375)Transfer 526,249 – 34,321 – 2,319 – (562,889) –Reclassified from
investment properties(Note 18) 19,615 – – – – – – 19,615
At December 31, 2019 2,857,664 – 792,015 135,474 13,050 28,678 162,247 3,989,128Additions 5,919 – 51,900 19,503 12,797 1,872 291,404 383,395Disposals (102) – (6,189) (2,632) (813) – – (9,736)Transfer 233,311 – 34,343 496 12,138 – (280,288) –Acquisition of
subsidiaries (Note 42) 1,869,992 13,120 302,893 56,312 88,180 – 42,254 2,372,751
At June 30, 2020 4,966,784 13,120 1,174,962 209,153 125,352 30,550 215,617 6,735,538
ACCUMULATEDDEPRECIATION:
At January 1, 2017 304,933 – 145,479 31,973 1,339 7,151 – 490,875Provided for the year 102,371 – 54,046 8,215 925 5,006 – 170,563Disposals (1,103) – (1,862) (733) (134) – – (3,832)
APPENDIX I ACCOUNTANTS’ REPORT
– I-46 –
THIS DOCUMENT IS IN DRAFT FORM, INCOMPLETE AND SUBJECT TO CHANGE AND THAT INFORMATION MUST BEREAD IN CONJUNCTION WITH THE SECTION HEADED “WARNING” ON THE COVER OF THIS DOCUMENT.
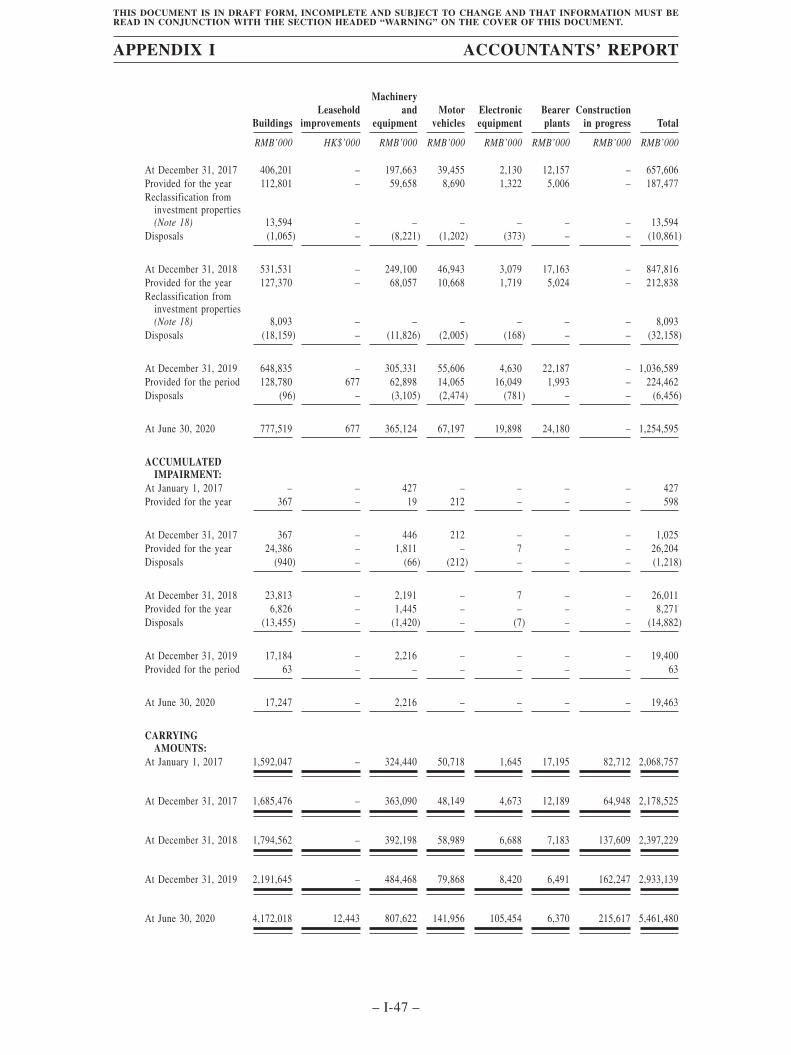
BuildingsLeasehold
improvements
Machineryand
equipmentMotor
vehiclesElectronicequipment
Bearerplants
Constructionin progress Total
RMB’000 HK$’000 RMB’000 RMB’000 RMB’000 RMB’000 RMB’000 RMB’000
At December 31, 2017 406,201 – 197,663 39,455 2,130 12,157 – 657,606Provided for the year 112,801 – 59,658 8,690 1,322 5,006 – 187,477Reclassification from
investment properties(Note 18) 13,594 – – – – – – 13,594
Disposals (1,065) – (8,221) (1,202) (373) – – (10,861)
At December 31, 2018 531,531 – 249,100 46,943 3,079 17,163 – 847,816Provided for the year 127,370 – 68,057 10,668 1,719 5,024 – 212,838Reclassification from
investment properties(Note 18) 8,093 – – – – – – 8,093
Disposals (18,159) – (11,826) (2,005) (168) – – (32,158)
At December 31, 2019 648,835 – 305,331 55,606 4,630 22,187 – 1,036,589Provided for the period 128,780 677 62,898 14,065 16,049 1,993 – 224,462Disposals (96) – (3,105) (2,474) (781) – – (6,456)
At June 30, 2020 777,519 677 365,124 67,197 19,898 24,180 – 1,254,595
ACCUMULATEDIMPAIRMENT:
At January 1, 2017 – – 427 – – – – 427Provided for the year 367 – 19 212 – – – 598
At December 31, 2017 367 – 446 212 – – – 1,025Provided for the year 24,386 – 1,811 – 7 – – 26,204Disposals (940) – (66) (212) – – – (1,218)
At December 31, 2018 23,813 – 2,191 – 7 – – 26,011Provided for the year 6,826 – 1,445 – – – – 8,271Disposals (13,455) – (1,420) – (7) – – (14,882)
At December 31, 2019 17,184 – 2,216 – – – – 19,400Provided for the period 63 – – – – – – 63
At June 30, 2020 17,247 – 2,216 – – – – 19,463
CARRYINGAMOUNTS:
At January 1, 2017 1,592,047 – 324,440 50,718 1,645 17,195 82,712 2,068,757
At December 31, 2017 1,685,476 – 363,090 48,149 4,673 12,189 64,948 2,178,525
At December 31, 2018 1,794,562 – 392,198 58,989 6,688 7,183 137,609 2,397,229
At December 31, 2019 2,191,645 – 484,468 79,868 8,420 6,491 162,247 2,933,139
At June 30, 2020 4,172,018 12,443 807,622 141,956 105,454 6,370 215,617 5,461,480
APPENDIX I ACCOUNTANTS’ REPORT
– I-47 –
THIS DOCUMENT IS IN DRAFT FORM, INCOMPLETE AND SUBJECT TO CHANGE AND THAT INFORMATION MUST BEREAD IN CONJUNCTION WITH THE SECTION HEADED “WARNING” ON THE COVER OF THIS DOCUMENT.
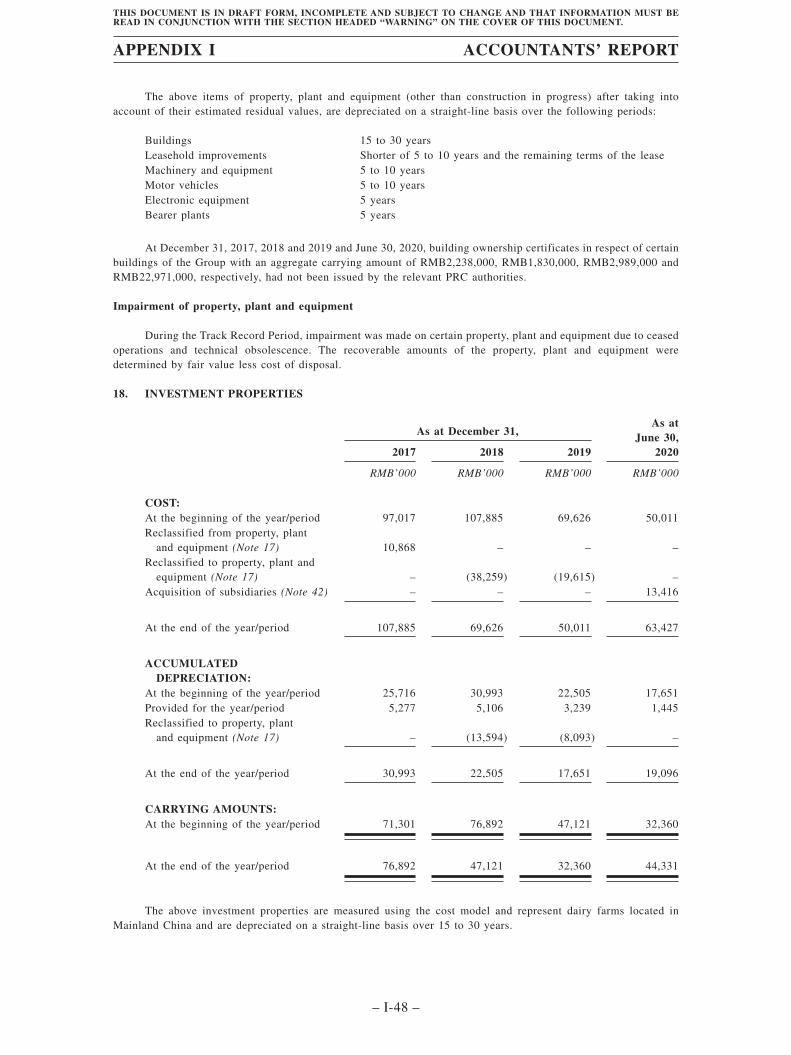
The above items of property, plant and equipment (other than construction in progress) after taking intoaccount of their estimated residual values, are depreciated on a straight-line basis over the following periods:
Buildings 15 to 30 yearsLeasehold improvements Shorter of 5 to 10 years and the remaining terms of the leaseMachinery and equipment 5 to 10 yearsMotor vehicles 5 to 10 yearsElectronic equipment 5 yearsBearer plants 5 years
At December 31, 2017, 2018 and 2019 and June 30, 2020, building ownership certificates in respect of certainbuildings of the Group with an aggregate carrying amount of RMB2,238,000, RMB1,830,000, RMB2,989,000 andRMB22,971,000, respectively, had not been issued by the relevant PRC authorities.
Impairment of property, plant and equipment
During the Track Record Period, impairment was made on certain property, plant and equipment due to ceasedoperations and technical obsolescence. The recoverable amounts of the property, plant and equipment weredetermined by fair value less cost of disposal.
18. INVESTMENT PROPERTIES
As at December 31,As at
June 30,20202017 2018 2019
RMB’000 RMB’000 RMB’000 RMB’000
COST:At the beginning of the year/period 97,017 107,885 69,626 50,011Reclassified from property, plant
and equipment (Note 17) 10,868 – – –Reclassified to property, plant and
equipment (Note 17) – (38,259) (19,615) –Acquisition of subsidiaries (Note 42) – – – 13,416
At the end of the year/period 107,885 69,626 50,011 63,427
ACCUMULATEDDEPRECIATION:
At the beginning of the year/period 25,716 30,993 22,505 17,651Provided for the year/period 5,277 5,106 3,239 1,445Reclassified to property, plant
and equipment (Note 17) – (13,594) (8,093) –
At the end of the year/period 30,993 22,505 17,651 19,096
CARRYING AMOUNTS:At the beginning of the year/period 71,301 76,892 47,121 32,360
At the end of the year/period 76,892 47,121 32,360 44,331
The above investment properties are measured using the cost model and represent dairy farms located inMainland China and are depreciated on a straight-line basis over 15 to 30 years.
APPENDIX I ACCOUNTANTS’ REPORT
– I-48 –
THIS DOCUMENT IS IN DRAFT FORM, INCOMPLETE AND SUBJECT TO CHANGE AND THAT INFORMATION MUST BEREAD IN CONJUNCTION WITH THE SECTION HEADED “WARNING” ON THE COVER OF THIS DOCUMENT.
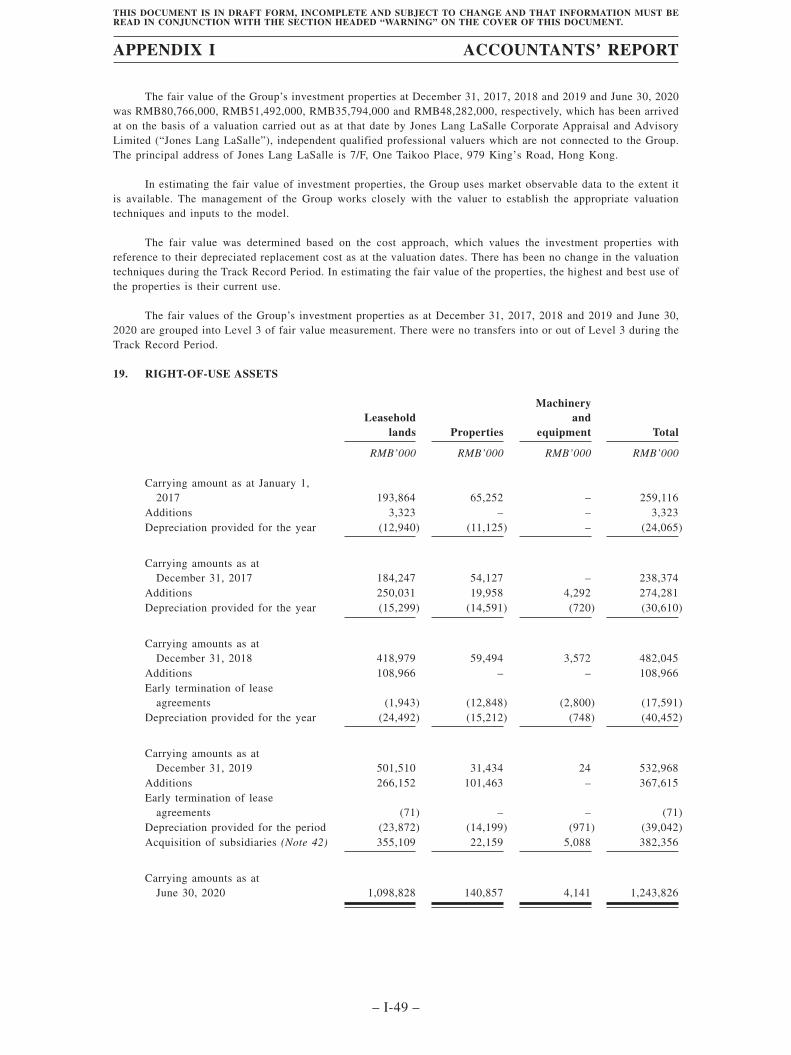
The fair value of the Group’s investment properties at December 31, 2017, 2018 and 2019 and June 30, 2020was RMB80,766,000, RMB51,492,000, RMB35,794,000 and RMB48,282,000, respectively, which has been arrivedat on the basis of a valuation carried out as at that date by Jones Lang LaSalle Corporate Appraisal and AdvisoryLimited (“Jones Lang LaSalle”), independent qualified professional valuers which are not connected to the Group.The principal address of Jones Lang LaSalle is 7/F, One Taikoo Place, 979 King’s Road, Hong Kong.
In estimating the fair value of investment properties, the Group uses market observable data to the extent itis available. The management of the Group works closely with the valuer to establish the appropriate valuationtechniques and inputs to the model.
The fair value was determined based on the cost approach, which values the investment properties withreference to their depreciated replacement cost as at the valuation dates. There has been no change in the valuationtechniques during the Track Record Period. In estimating the fair value of the properties, the highest and best use ofthe properties is their current use.
The fair values of the Group’s investment properties as at December 31, 2017, 2018 and 2019 and June 30,2020 are grouped into Level 3 of fair value measurement. There were no transfers into or out of Level 3 during theTrack Record Period.
19. RIGHT-OF-USE ASSETS
Leaseholdlands Properties
Machineryand
equipment Total
RMB’000 RMB’000 RMB’000 RMB’000
Carrying amount as at January 1,2017 193,864 65,252 – 259,116
Additions 3,323 – – 3,323Depreciation provided for the year (12,940) (11,125) – (24,065)
Carrying amounts as atDecember 31, 2017 184,247 54,127 – 238,374
Additions 250,031 19,958 4,292 274,281Depreciation provided for the year (15,299) (14,591) (720) (30,610)
Carrying amounts as atDecember 31, 2018 418,979 59,494 3,572 482,045
Additions 108,966 – – 108,966Early termination of lease
agreements (1,943) (12,848) (2,800) (17,591)Depreciation provided for the year (24,492) (15,212) (748) (40,452)
Carrying amounts as atDecember 31, 2019 501,510 31,434 24 532,968
Additions 266,152 101,463 – 367,615Early termination of lease
agreements (71) – – (71)Depreciation provided for the period (23,872) (14,199) (971) (39,042)Acquisition of subsidiaries (Note 42) 355,109 22,159 5,088 382,356
Carrying amounts as atJune 30, 2020 1,098,828 140,857 4,141 1,243,826
APPENDIX I ACCOUNTANTS’ REPORT
– I-49 –
THIS DOCUMENT IS IN DRAFT FORM, INCOMPLETE AND SUBJECT TO CHANGE AND THAT INFORMATION MUST BEREAD IN CONJUNCTION WITH THE SECTION HEADED “WARNING” ON THE COVER OF THIS DOCUMENT.
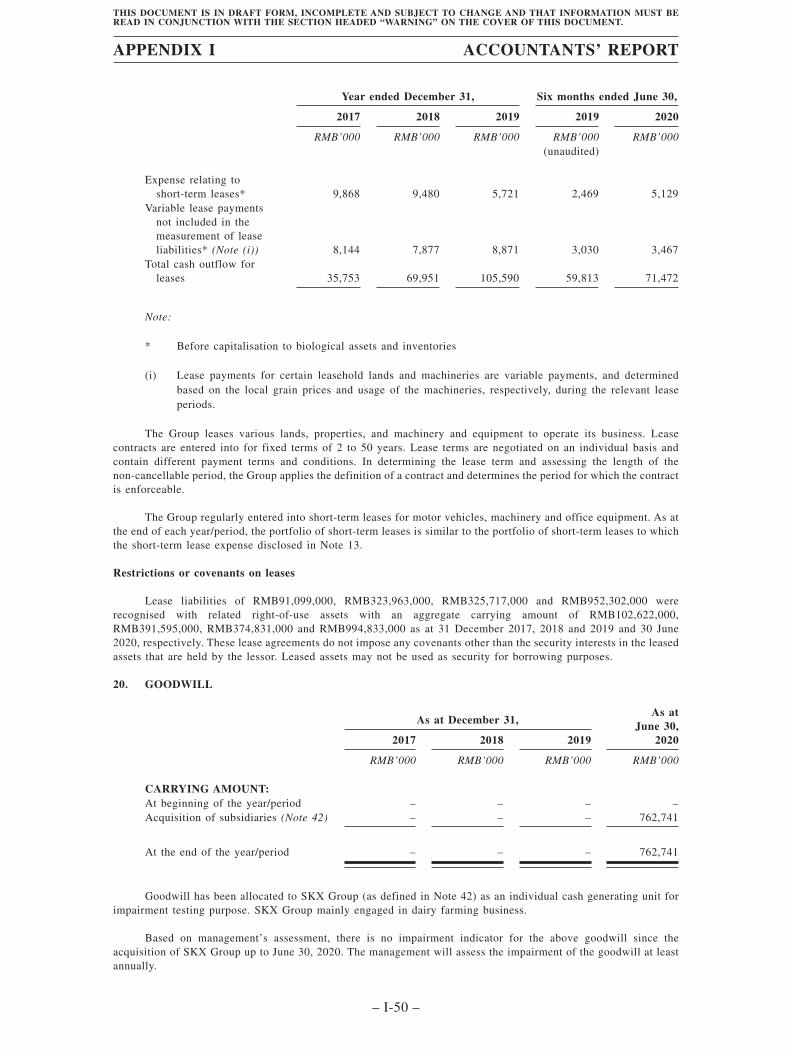
Year ended December 31, Six months ended June 30,
2017 2018 2019 2019 2020
RMB’000 RMB’000 RMB’000 RMB’000 RMB’000(unaudited)
Expense relating toshort-term leases* 9,868 9,480 5,721 2,469 5,129
Variable lease paymentsnot included in themeasurement of leaseliabilities* (Note (i)) 8,144 7,877 8,871 3,030 3,467
Total cash outflow forleases 35,753 69,951 105,590 59,813 71,472
Note:
* Before capitalisation to biological assets and inventories
(i) Lease payments for certain leasehold lands and machineries are variable payments, and determinedbased on the local grain prices and usage of the machineries, respectively, during the relevant leaseperiods.
The Group leases various lands, properties, and machinery and equipment to operate its business. Leasecontracts are entered into for fixed terms of 2 to 50 years. Lease terms are negotiated on an individual basis andcontain different payment terms and conditions. In determining the lease term and assessing the length of thenon-cancellable period, the Group applies the definition of a contract and determines the period for which the contractis enforceable.
The Group regularly entered into short-term leases for motor vehicles, machinery and office equipment. As atthe end of each year/period, the portfolio of short-term leases is similar to the portfolio of short-term leases to whichthe short-term lease expense disclosed in Note 13.
Restrictions or covenants on leases
Lease liabilities of RMB91,099,000, RMB323,963,000, RMB325,717,000 and RMB952,302,000 wererecognised with related right-of-use assets with an aggregate carrying amount of RMB102,622,000,RMB391,595,000, RMB374,831,000 and RMB994,833,000 as at 31 December 2017, 2018 and 2019 and 30 June2020, respectively. These lease agreements do not impose any covenants other than the security interests in the leasedassets that are held by the lessor. Leased assets may not be used as security for borrowing purposes.
20. GOODWILL
As at December 31,As at
June 30,20202017 2018 2019
RMB’000 RMB’000 RMB’000 RMB’000
CARRYING AMOUNT:At beginning of the year/period – – – –Acquisition of subsidiaries (Note 42) – – – 762,741
At the end of the year/period – – – 762,741
Goodwill has been allocated to SKX Group (as defined in Note 42) as an individual cash generating unit forimpairment testing purpose. SKX Group mainly engaged in dairy farming business.
Based on management’s assessment, there is no impairment indicator for the above goodwill since theacquisition of SKX Group up to June 30, 2020. The management will assess the impairment of the goodwill at leastannually.
APPENDIX I ACCOUNTANTS’ REPORT
– I-50 –
THIS DOCUMENT IS IN DRAFT FORM, INCOMPLETE AND SUBJECT TO CHANGE AND THAT INFORMATION MUST BEREAD IN CONJUNCTION WITH THE SECTION HEADED “WARNING” ON THE COVER OF THIS DOCUMENT.
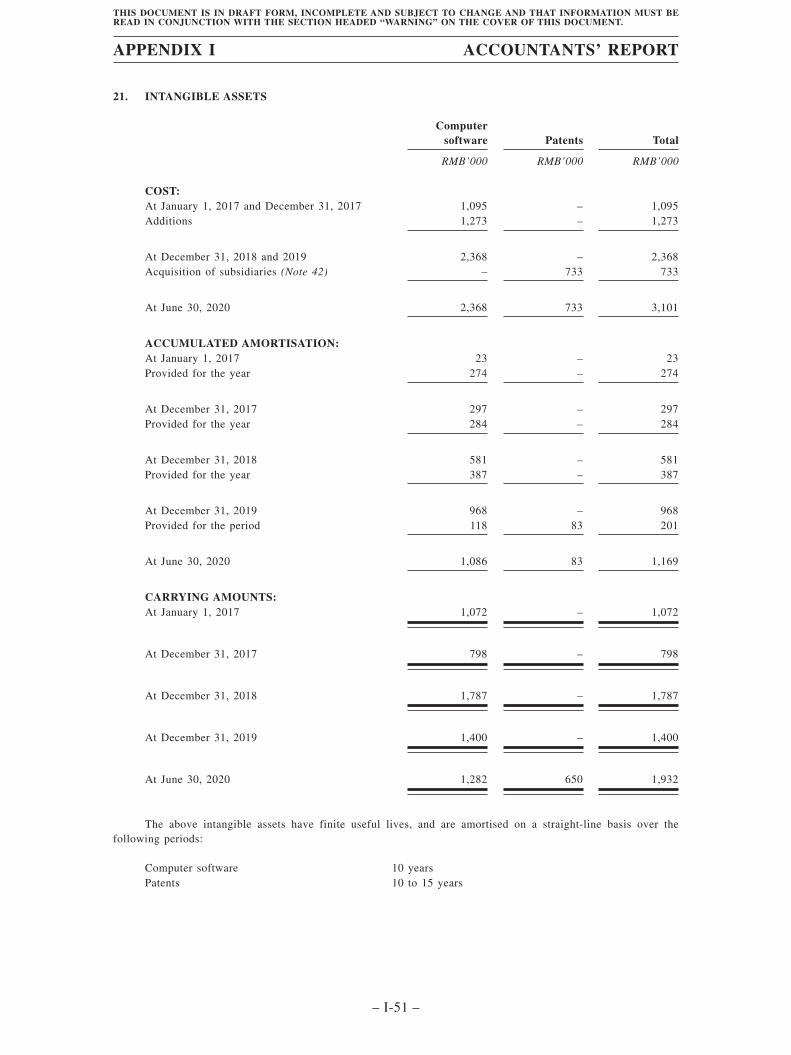
21. INTANGIBLE ASSETS
Computersoftware Patents Total
RMB’000 RMB’000 RMB’000
COST:At January 1, 2017 and December 31, 2017 1,095 – 1,095Additions 1,273 – 1,273
At December 31, 2018 and 2019 2,368 – 2,368Acquisition of subsidiaries (Note 42) – 733 733
At June 30, 2020 2,368 733 3,101
ACCUMULATED AMORTISATION:At January 1, 2017 23 – 23Provided for the year 274 – 274
At December 31, 2017 297 – 297Provided for the year 284 – 284
At December 31, 2018 581 – 581Provided for the year 387 – 387
At December 31, 2019 968 – 968Provided for the period 118 83 201
At June 30, 2020 1,086 83 1,169
CARRYING AMOUNTS:At January 1, 2017 1,072 – 1,072
At December 31, 2017 798 – 798
At December 31, 2018 1,787 – 1,787
At December 31, 2019 1,400 – 1,400
At June 30, 2020 1,282 650 1,932
The above intangible assets have finite useful lives, and are amortised on a straight-line basis over thefollowing periods:
Computer software 10 yearsPatents 10 to 15 years
APPENDIX I ACCOUNTANTS’ REPORT
– I-51 –
THIS DOCUMENT IS IN DRAFT FORM, INCOMPLETE AND SUBJECT TO CHANGE AND THAT INFORMATION MUST BEREAD IN CONJUNCTION WITH THE SECTION HEADED “WARNING” ON THE COVER OF THIS DOCUMENT.
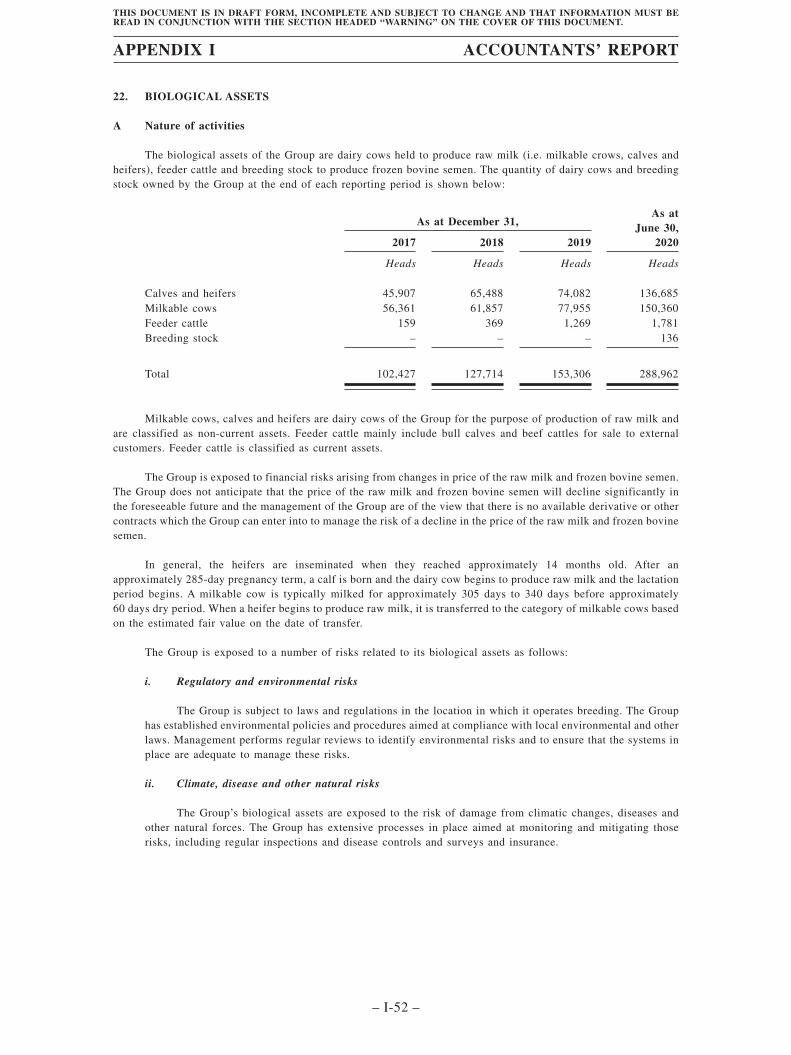
22. BIOLOGICAL ASSETS
A Nature of activities
The biological assets of the Group are dairy cows held to produce raw milk (i.e. milkable crows, calves andheifers), feeder cattle and breeding stock to produce frozen bovine semen. The quantity of dairy cows and breedingstock owned by the Group at the end of each reporting period is shown below:
As at December 31,As at
June 30,20202017 2018 2019
Heads Heads Heads Heads
Calves and heifers 45,907 65,488 74,082 136,685Milkable cows 56,361 61,857 77,955 150,360Feeder cattle 159 369 1,269 1,781Breeding stock – – – 136
Total 102,427 127,714 153,306 288,962
Milkable cows, calves and heifers are dairy cows of the Group for the purpose of production of raw milk andare classified as non-current assets. Feeder cattle mainly include bull calves and beef cattles for sale to externalcustomers. Feeder cattle is classified as current assets.
The Group is exposed to financial risks arising from changes in price of the raw milk and frozen bovine semen.The Group does not anticipate that the price of the raw milk and frozen bovine semen will decline significantly inthe foreseeable future and the management of the Group are of the view that there is no available derivative or othercontracts which the Group can enter into to manage the risk of a decline in the price of the raw milk and frozen bovinesemen.
In general, the heifers are inseminated when they reached approximately 14 months old. After anapproximately 285-day pregnancy term, a calf is born and the dairy cow begins to produce raw milk and the lactationperiod begins. A milkable cow is typically milked for approximately 305 days to 340 days before approximately60 days dry period. When a heifer begins to produce raw milk, it is transferred to the category of milkable cows basedon the estimated fair value on the date of transfer.
The Group is exposed to a number of risks related to its biological assets as follows:
i. Regulatory and environmental risks
The Group is subject to laws and regulations in the location in which it operates breeding. The Grouphas established environmental policies and procedures aimed at compliance with local environmental and otherlaws. Management performs regular reviews to identify environmental risks and to ensure that the systems inplace are adequate to manage these risks.
ii. Climate, disease and other natural risks
The Group’s biological assets are exposed to the risk of damage from climatic changes, diseases andother natural forces. The Group has extensive processes in place aimed at monitoring and mitigating thoserisks, including regular inspections and disease controls and surveys and insurance.
APPENDIX I ACCOUNTANTS’ REPORT
– I-52 –
THIS DOCUMENT IS IN DRAFT FORM, INCOMPLETE AND SUBJECT TO CHANGE AND THAT INFORMATION MUST BEREAD IN CONJUNCTION WITH THE SECTION HEADED “WARNING” ON THE COVER OF THIS DOCUMENT.
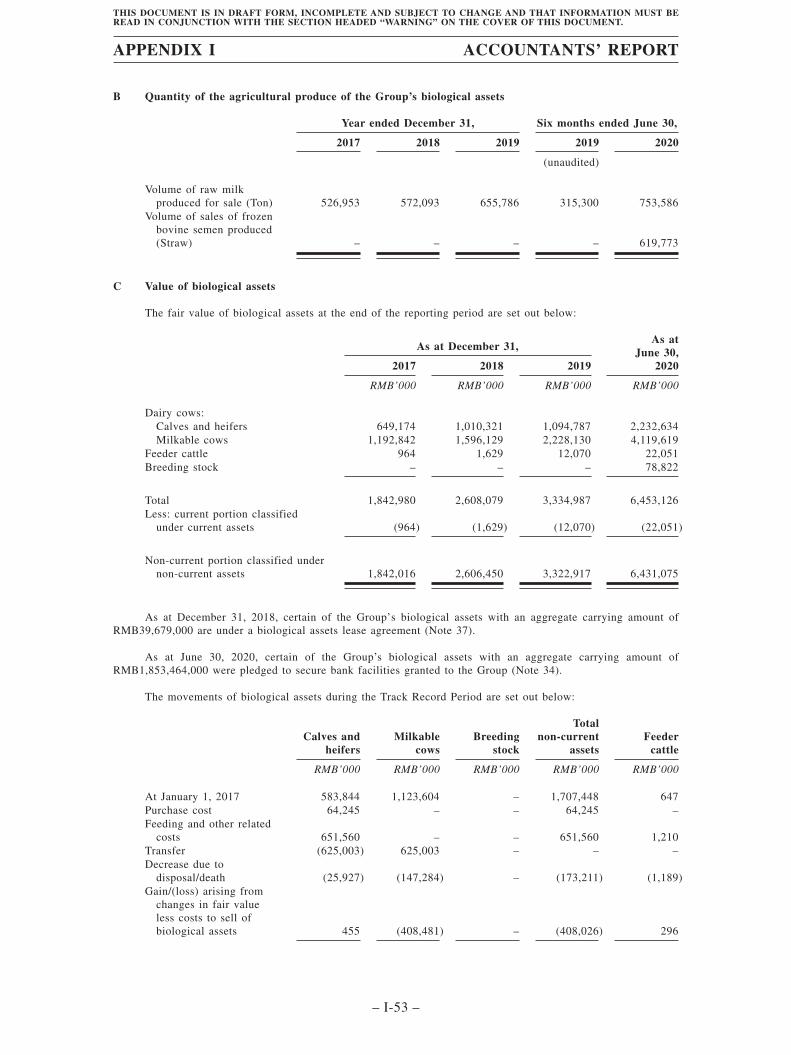
B Quantity of the agricultural produce of the Group’s biological assets
Year ended December 31, Six months ended June 30,
2017 2018 2019 2019 2020
(unaudited)
Volume of raw milkproduced for sale (Ton) 526,953 572,093 655,786 315,300 753,586
Volume of sales of frozenbovine semen produced(Straw) – – – – 619,773
C Value of biological assets
The fair value of biological assets at the end of the reporting period are set out below:
As at December 31,As at
June 30,20202017 2018 2019
RMB’000 RMB’000 RMB’000 RMB’000
Dairy cows:Calves and heifers 649,174 1,010,321 1,094,787 2,232,634Milkable cows 1,192,842 1,596,129 2,228,130 4,119,619
Feeder cattle 964 1,629 12,070 22,051Breeding stock – – – 78,822
Total 1,842,980 2,608,079 3,334,987 6,453,126Less: current portion classified
under current assets (964) (1,629) (12,070) (22,051)
Non-current portion classified undernon-current assets 1,842,016 2,606,450 3,322,917 6,431,075
As at December 31, 2018, certain of the Group’s biological assets with an aggregate carrying amount ofRMB39,679,000 are under a biological assets lease agreement (Note 37).
As at June 30, 2020, certain of the Group’s biological assets with an aggregate carrying amount ofRMB1,853,464,000 were pledged to secure bank facilities granted to the Group (Note 34).
The movements of biological assets during the Track Record Period are set out below:
Calves andheifers
Milkablecows
Breedingstock
Totalnon-current
assetsFeeder
cattle
RMB’000 RMB’000 RMB’000 RMB’000 RMB’000
At January 1, 2017 583,844 1,123,604 – 1,707,448 647Purchase cost 64,245 – – 64,245 –Feeding and other related
costs 651,560 – – 651,560 1,210Transfer (625,003) 625,003 – – –Decrease due to
disposal/death (25,927) (147,284) – (173,211) (1,189)Gain/(loss) arising from
changes in fair valueless costs to sell ofbiological assets 455 (408,481) – (408,026) 296
APPENDIX I ACCOUNTANTS’ REPORT
– I-53 –
THIS DOCUMENT IS IN DRAFT FORM, INCOMPLETE AND SUBJECT TO CHANGE AND THAT INFORMATION MUST BEREAD IN CONJUNCTION WITH THE SECTION HEADED “WARNING” ON THE COVER OF THIS DOCUMENT.
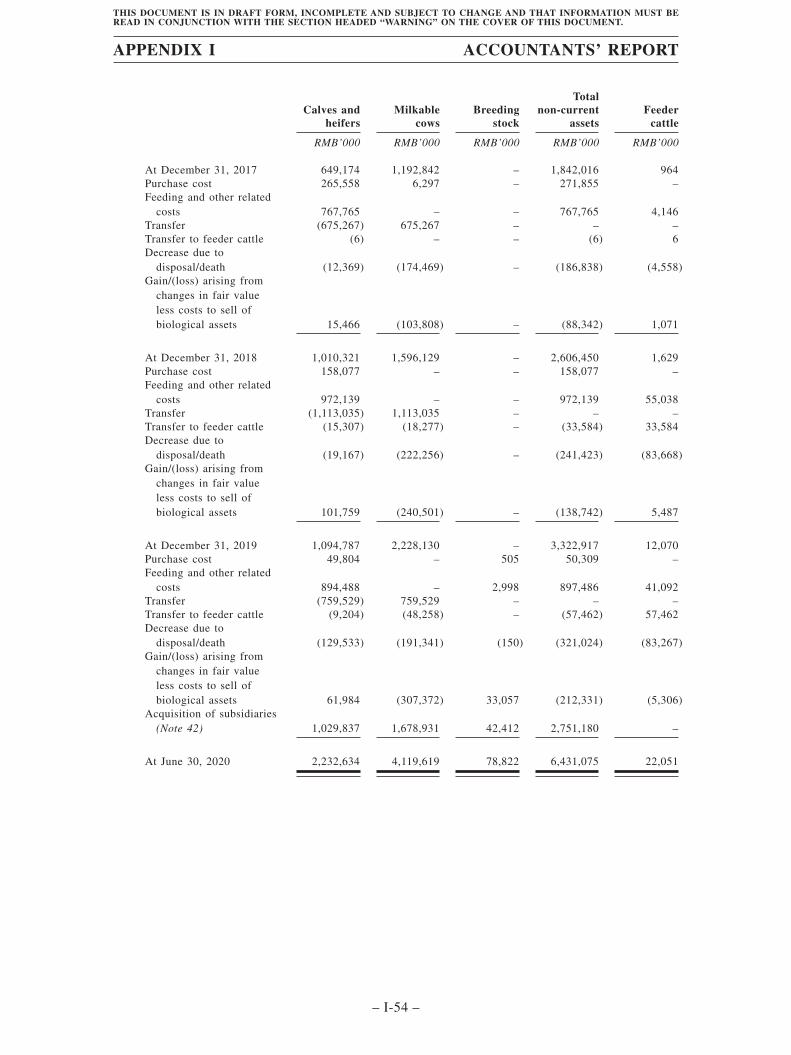
Calves andheifers
Milkablecows
Breedingstock
Totalnon-current
assetsFeeder
cattle
RMB’000 RMB’000 RMB’000 RMB’000 RMB’000
At December 31, 2017 649,174 1,192,842 – 1,842,016 964Purchase cost 265,558 6,297 – 271,855 –Feeding and other related
costs 767,765 – – 767,765 4,146Transfer (675,267) 675,267 – – –Transfer to feeder cattle (6) – – (6) 6Decrease due to
disposal/death (12,369) (174,469) – (186,838) (4,558)Gain/(loss) arising from
changes in fair valueless costs to sell ofbiological assets 15,466 (103,808) – (88,342) 1,071
At December 31, 2018 1,010,321 1,596,129 – 2,606,450 1,629Purchase cost 158,077 – – 158,077 –Feeding and other related
costs 972,139 – – 972,139 55,038Transfer (1,113,035) 1,113,035 – – –Transfer to feeder cattle (15,307) (18,277) – (33,584) 33,584Decrease due to
disposal/death (19,167) (222,256) – (241,423) (83,668)Gain/(loss) arising from
changes in fair valueless costs to sell ofbiological assets 101,759 (240,501) – (138,742) 5,487
At December 31, 2019 1,094,787 2,228,130 – 3,322,917 12,070Purchase cost 49,804 – 505 50,309 –Feeding and other related
costs 894,488 – 2,998 897,486 41,092Transfer (759,529) 759,529 – – –Transfer to feeder cattle (9,204) (48,258) – (57,462) 57,462Decrease due to
disposal/death (129,533) (191,341) (150) (321,024) (83,267)Gain/(loss) arising from
changes in fair valueless costs to sell ofbiological assets 61,984 (307,372) 33,057 (212,331) (5,306)
Acquisition of subsidiaries(Note 42) 1,029,837 1,678,931 42,412 2,751,180 –
At June 30, 2020 2,232,634 4,119,619 78,822 6,431,075 22,051
APPENDIX I ACCOUNTANTS’ REPORT
– I-54 –
THIS DOCUMENT IS IN DRAFT FORM, INCOMPLETE AND SUBJECT TO CHANGE AND THAT INFORMATION MUST BEREAD IN CONJUNCTION WITH THE SECTION HEADED “WARNING” ON THE COVER OF THIS DOCUMENT.
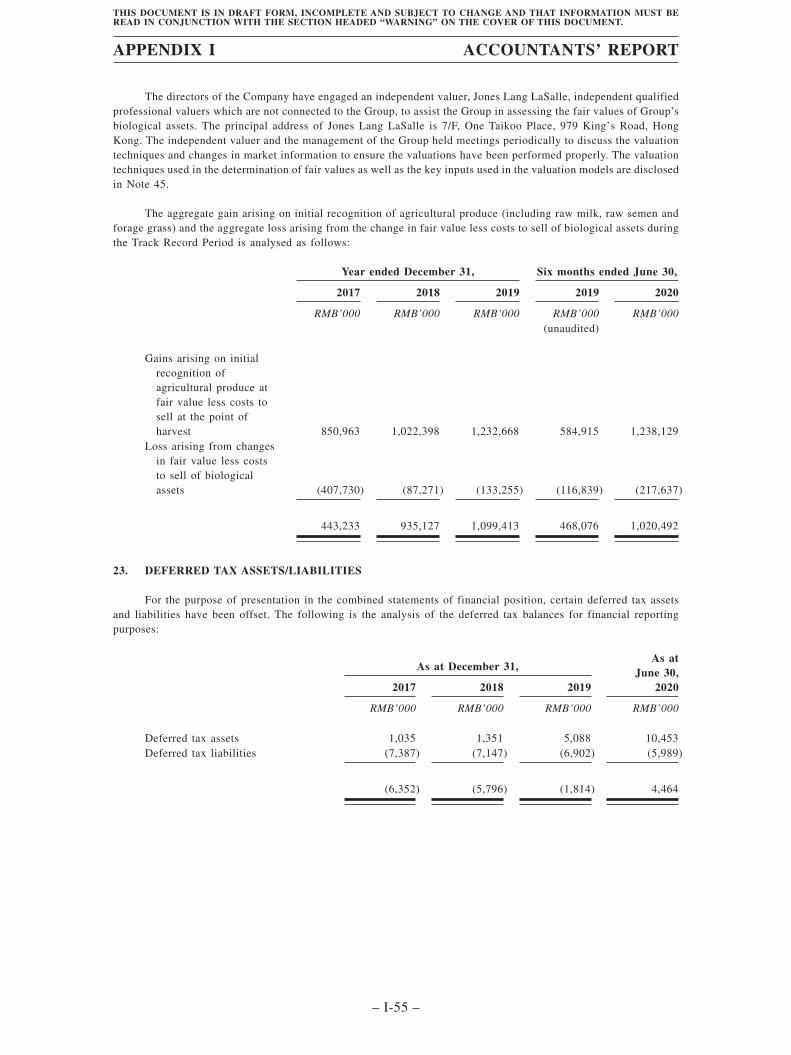
The directors of the Company have engaged an independent valuer, Jones Lang LaSalle, independent qualifiedprofessional valuers which are not connected to the Group, to assist the Group in assessing the fair values of Group’sbiological assets. The principal address of Jones Lang LaSalle is 7/F, One Taikoo Place, 979 King’s Road, HongKong. The independent valuer and the management of the Group held meetings periodically to discuss the valuationtechniques and changes in market information to ensure the valuations have been performed properly. The valuationtechniques used in the determination of fair values as well as the key inputs used in the valuation models are disclosedin Note 45.
The aggregate gain arising on initial recognition of agricultural produce (including raw milk, raw semen andforage grass) and the aggregate loss arising from the change in fair value less costs to sell of biological assets duringthe Track Record Period is analysed as follows:
Year ended December 31, Six months ended June 30,
2017 2018 2019 2019 2020
RMB’000 RMB’000 RMB’000 RMB’000 RMB’000(unaudited)
Gains arising on initialrecognition ofagricultural produce atfair value less costs tosell at the point ofharvest 850,963 1,022,398 1,232,668 584,915 1,238,129
Loss arising from changesin fair value less coststo sell of biologicalassets (407,730) (87,271) (133,255) (116,839) (217,637)
443,233 935,127 1,099,413 468,076 1,020,492
23. DEFERRED TAX ASSETS/LIABILITIES
For the purpose of presentation in the combined statements of financial position, certain deferred tax assetsand liabilities have been offset. The following is the analysis of the deferred tax balances for financial reportingpurposes:
As at December 31,As at
June 30,20202017 2018 2019
RMB’000 RMB’000 RMB’000 RMB’000
Deferred tax assets 1,035 1,351 5,088 10,453Deferred tax liabilities (7,387) (7,147) (6,902) (5,989)
(6,352) (5,796) (1,814) 4,464
APPENDIX I ACCOUNTANTS’ REPORT
– I-55 –
THIS DOCUMENT IS IN DRAFT FORM, INCOMPLETE AND SUBJECT TO CHANGE AND THAT INFORMATION MUST BEREAD IN CONJUNCTION WITH THE SECTION HEADED “WARNING” ON THE COVER OF THIS DOCUMENT.
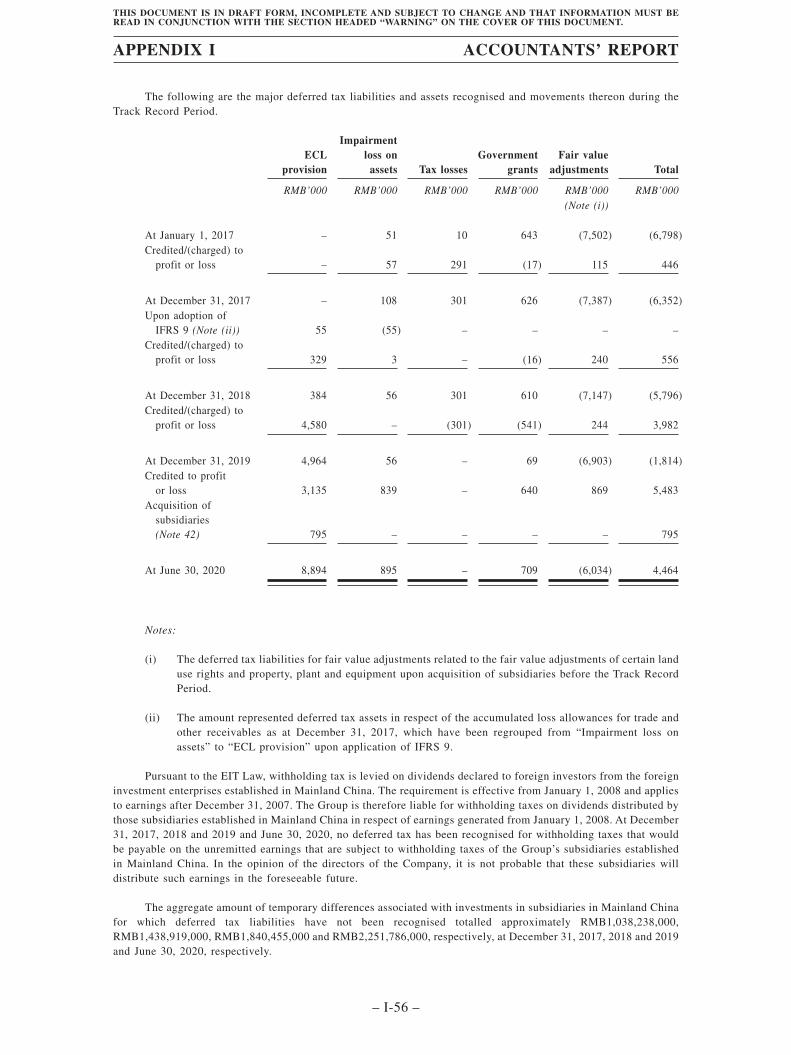
The following are the major deferred tax liabilities and assets recognised and movements thereon during theTrack Record Period.
ECLprovision
Impairmentloss on
assets Tax lossesGovernment
grantsFair value
adjustments Total
RMB’000 RMB’000 RMB’000 RMB’000 RMB’000 RMB’000(Note (i))
At January 1, 2017 – 51 10 643 (7,502) (6,798)Credited/(charged) to
profit or loss – 57 291 (17) 115 446
At December 31, 2017 – 108 301 626 (7,387) (6,352)Upon adoption of
IFRS 9 (Note (ii)) 55 (55) – – – –Credited/(charged) to
profit or loss 329 3 – (16) 240 556
At December 31, 2018 384 56 301 610 (7,147) (5,796)Credited/(charged) to
profit or loss 4,580 – (301) (541) 244 3,982
At December 31, 2019 4,964 56 – 69 (6,903) (1,814)Credited to profit
or loss 3,135 839 – 640 869 5,483Acquisition of
subsidiaries(Note 42) 795 – – – – 795
At June 30, 2020 8,894 895 – 709 (6,034) 4,464
Notes:
(i) The deferred tax liabilities for fair value adjustments related to the fair value adjustments of certain landuse rights and property, plant and equipment upon acquisition of subsidiaries before the Track RecordPeriod.
(ii) The amount represented deferred tax assets in respect of the accumulated loss allowances for trade andother receivables as at December 31, 2017, which have been regrouped from “Impairment loss onassets” to “ECL provision” upon application of IFRS 9.
Pursuant to the EIT Law, withholding tax is levied on dividends declared to foreign investors from the foreigninvestment enterprises established in Mainland China. The requirement is effective from January 1, 2008 and appliesto earnings after December 31, 2007. The Group is therefore liable for withholding taxes on dividends distributed bythose subsidiaries established in Mainland China in respect of earnings generated from January 1, 2008. At December31, 2017, 2018 and 2019 and June 30, 2020, no deferred tax has been recognised for withholding taxes that wouldbe payable on the unremitted earnings that are subject to withholding taxes of the Group’s subsidiaries establishedin Mainland China. In the opinion of the directors of the Company, it is not probable that these subsidiaries willdistribute such earnings in the foreseeable future.
The aggregate amount of temporary differences associated with investments in subsidiaries in Mainland Chinafor which deferred tax liabilities have not been recognised totalled approximately RMB1,038,238,000,RMB1,438,919,000, RMB1,840,455,000 and RMB2,251,786,000, respectively, at December 31, 2017, 2018 and 2019and June 30, 2020, respectively.
APPENDIX I ACCOUNTANTS’ REPORT
– I-56 –
THIS DOCUMENT IS IN DRAFT FORM, INCOMPLETE AND SUBJECT TO CHANGE AND THAT INFORMATION MUST BEREAD IN CONJUNCTION WITH THE SECTION HEADED “WARNING” ON THE COVER OF THIS DOCUMENT.
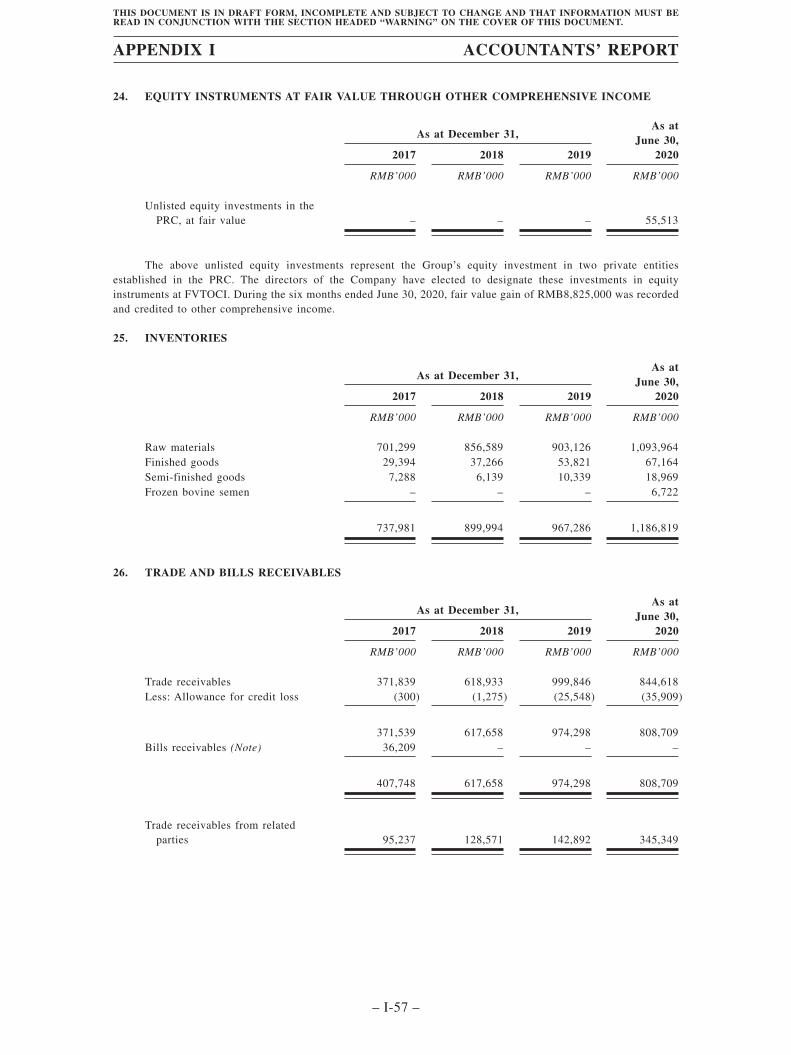
24. EQUITY INSTRUMENTS AT FAIR VALUE THROUGH OTHER COMPREHENSIVE INCOME
As at December 31,As at
June 30,20202017 2018 2019
RMB’000 RMB’000 RMB’000 RMB’000
Unlisted equity investments in thePRC, at fair value – – – 55,513
The above unlisted equity investments represent the Group’s equity investment in two private entitiesestablished in the PRC. The directors of the Company have elected to designate these investments in equityinstruments at FVTOCI. During the six months ended June 30, 2020, fair value gain of RMB8,825,000 was recordedand credited to other comprehensive income.
25. INVENTORIES
As at December 31,As at
June 30,20202017 2018 2019
RMB’000 RMB’000 RMB’000 RMB’000
Raw materials 701,299 856,589 903,126 1,093,964Finished goods 29,394 37,266 53,821 67,164Semi-finished goods 7,288 6,139 10,339 18,969Frozen bovine semen – – – 6,722
737,981 899,994 967,286 1,186,819
26. TRADE AND BILLS RECEIVABLES
As at December 31,As at
June 30,20202017 2018 2019
RMB’000 RMB’000 RMB’000 RMB’000
Trade receivables 371,839 618,933 999,846 844,618Less: Allowance for credit loss (300) (1,275) (25,548) (35,909)
371,539 617,658 974,298 808,709Bills receivables (Note) 36,209 – – –
407,748 617,658 974,298 808,709
Trade receivables from relatedparties 95,237 128,571 142,892 345,349
APPENDIX I ACCOUNTANTS’ REPORT
– I-57 –
THIS DOCUMENT IS IN DRAFT FORM, INCOMPLETE AND SUBJECT TO CHANGE AND THAT INFORMATION MUST BEREAD IN CONJUNCTION WITH THE SECTION HEADED “WARNING” ON THE COVER OF THIS DOCUMENT.
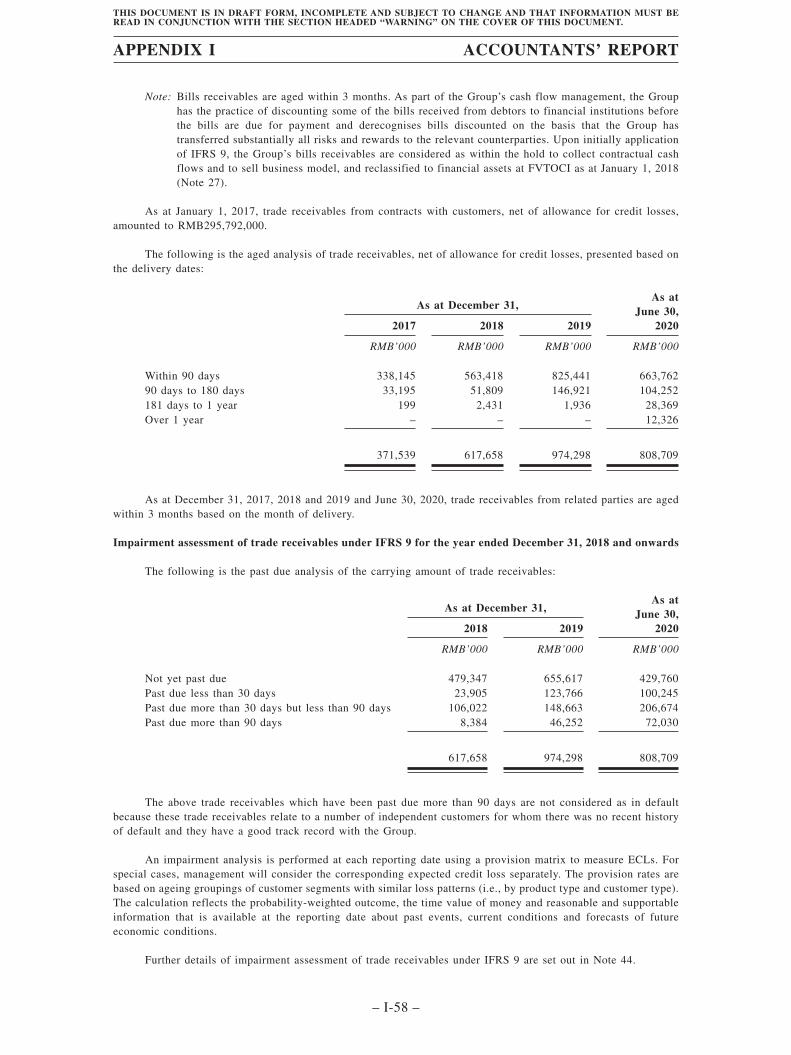
Note: Bills receivables are aged within 3 months. As part of the Group’s cash flow management, the Grouphas the practice of discounting some of the bills received from debtors to financial institutions beforethe bills are due for payment and derecognises bills discounted on the basis that the Group hastransferred substantially all risks and rewards to the relevant counterparties. Upon initially applicationof IFRS 9, the Group’s bills receivables are considered as within the hold to collect contractual cashflows and to sell business model, and reclassified to financial assets at FVTOCI as at January 1, 2018(Note 27).
As at January 1, 2017, trade receivables from contracts with customers, net of allowance for credit losses,amounted to RMB295,792,000.
The following is the aged analysis of trade receivables, net of allowance for credit losses, presented based onthe delivery dates:
As at December 31,As at
June 30,20202017 2018 2019
RMB’000 RMB’000 RMB’000 RMB’000
Within 90 days 338,145 563,418 825,441 663,76290 days to 180 days 33,195 51,809 146,921 104,252181 days to 1 year 199 2,431 1,936 28,369Over 1 year – – – 12,326
371,539 617,658 974,298 808,709
As at December 31, 2017, 2018 and 2019 and June 30, 2020, trade receivables from related parties are agedwithin 3 months based on the month of delivery.
Impairment assessment of trade receivables under IFRS 9 for the year ended December 31, 2018 and onwards
The following is the past due analysis of the carrying amount of trade receivables:
As at December 31,As at
June 30,20202018 2019
RMB’000 RMB’000 RMB’000
Not yet past due 479,347 655,617 429,760Past due less than 30 days 23,905 123,766 100,245Past due more than 30 days but less than 90 days 106,022 148,663 206,674Past due more than 90 days 8,384 46,252 72,030
617,658 974,298 808,709
The above trade receivables which have been past due more than 90 days are not considered as in defaultbecause these trade receivables relate to a number of independent customers for whom there was no recent historyof default and they have a good track record with the Group.
An impairment analysis is performed at each reporting date using a provision matrix to measure ECLs. Forspecial cases, management will consider the corresponding expected credit loss separately. The provision rates arebased on ageing groupings of customer segments with similar loss patterns (i.e., by product type and customer type).The calculation reflects the probability-weighted outcome, the time value of money and reasonable and supportableinformation that is available at the reporting date about past events, current conditions and forecasts of futureeconomic conditions.
Further details of impairment assessment of trade receivables under IFRS 9 are set out in Note 44.
APPENDIX I ACCOUNTANTS’ REPORT
– I-58 –
THIS DOCUMENT IS IN DRAFT FORM, INCOMPLETE AND SUBJECT TO CHANGE AND THAT INFORMATION MUST BEREAD IN CONJUNCTION WITH THE SECTION HEADED “WARNING” ON THE COVER OF THIS DOCUMENT.
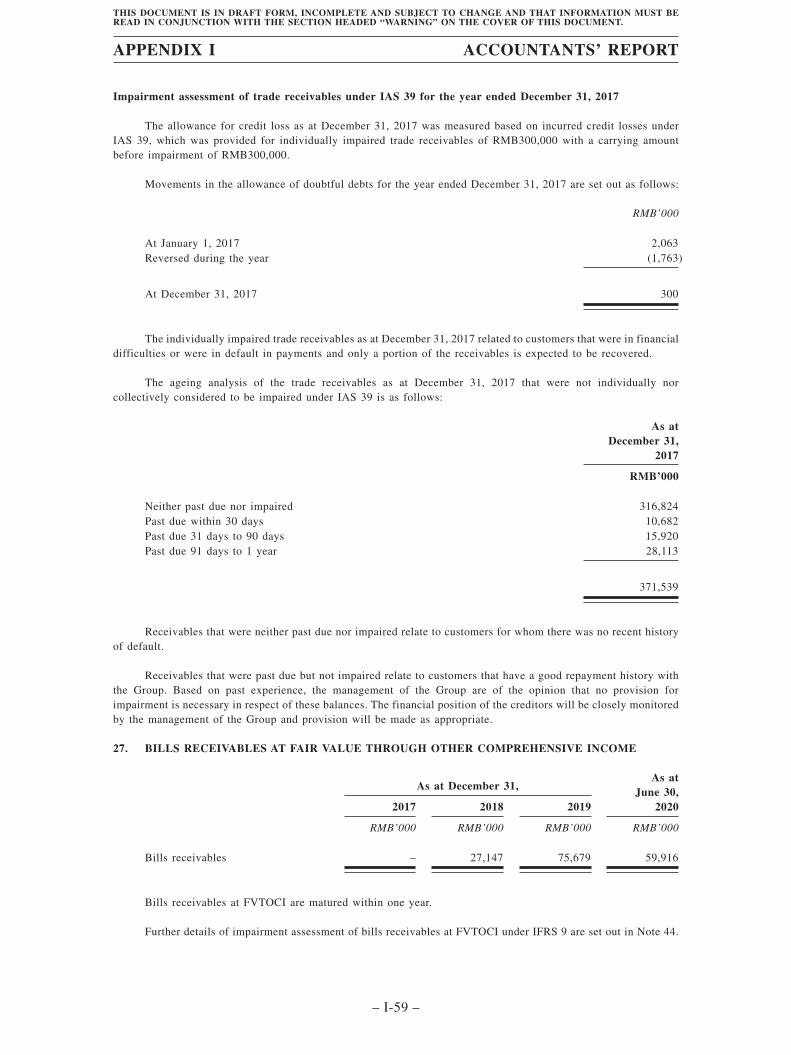
Impairment assessment of trade receivables under IAS 39 for the year ended December 31, 2017
The allowance for credit loss as at December 31, 2017 was measured based on incurred credit losses underIAS 39, which was provided for individually impaired trade receivables of RMB300,000 with a carrying amountbefore impairment of RMB300,000.
Movements in the allowance of doubtful debts for the year ended December 31, 2017 are set out as follows:
RMB’000
At January 1, 2017 2,063Reversed during the year (1,763)
At December 31, 2017 300
The individually impaired trade receivables as at December 31, 2017 related to customers that were in financialdifficulties or were in default in payments and only a portion of the receivables is expected to be recovered.
The ageing analysis of the trade receivables as at December 31, 2017 that were not individually norcollectively considered to be impaired under IAS 39 is as follows:
As atDecember 31,
2017
RMB’000
Neither past due nor impaired 316,824Past due within 30 days 10,682Past due 31 days to 90 days 15,920Past due 91 days to 1 year 28,113
371,539
Receivables that were neither past due nor impaired relate to customers for whom there was no recent historyof default.
Receivables that were past due but not impaired relate to customers that have a good repayment history withthe Group. Based on past experience, the management of the Group are of the opinion that no provision forimpairment is necessary in respect of these balances. The financial position of the creditors will be closely monitoredby the management of the Group and provision will be made as appropriate.
27. BILLS RECEIVABLES AT FAIR VALUE THROUGH OTHER COMPREHENSIVE INCOME
As at December 31,As at
June 30,20202017 2018 2019
RMB’000 RMB’000 RMB’000 RMB’000
Bills receivables – 27,147 75,679 59,916
Bills receivables at FVTOCI are matured within one year.
Further details of impairment assessment of bills receivables at FVTOCI under IFRS 9 are set out in Note 44.
APPENDIX I ACCOUNTANTS’ REPORT
– I-59 –
THIS DOCUMENT IS IN DRAFT FORM, INCOMPLETE AND SUBJECT TO CHANGE AND THAT INFORMATION MUST BEREAD IN CONJUNCTION WITH THE SECTION HEADED “WARNING” ON THE COVER OF THIS DOCUMENT.
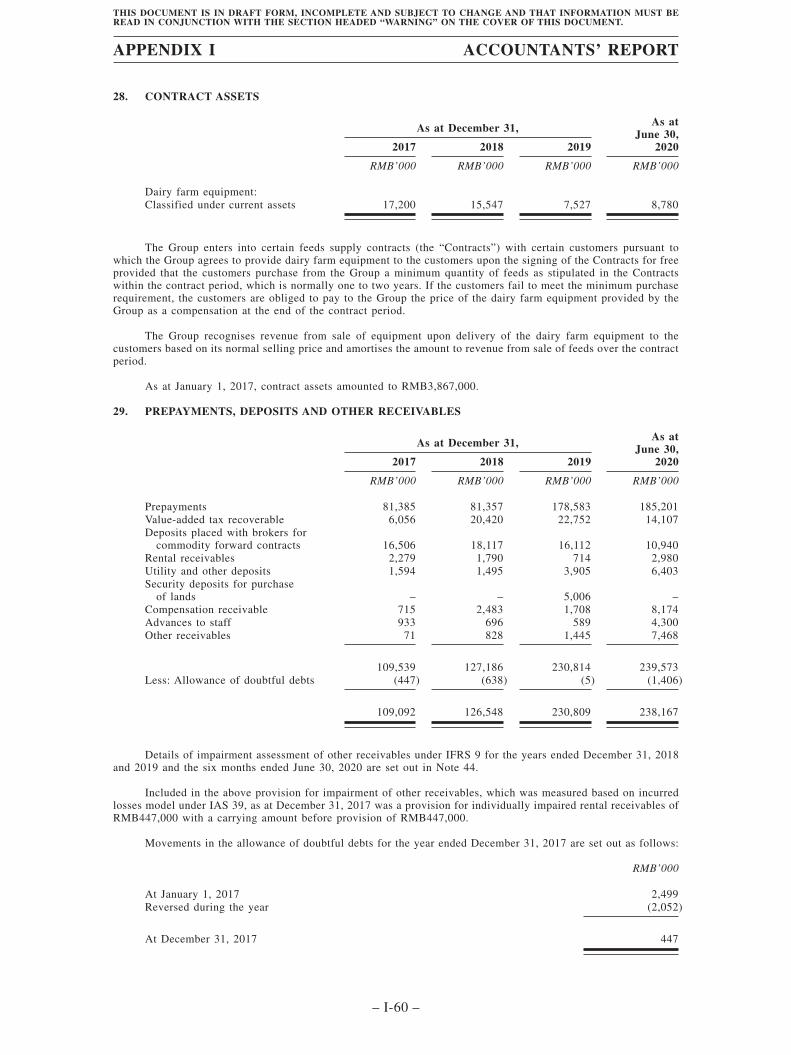
28. CONTRACT ASSETS
As at December 31, As atJune 30,
20202017 2018 2019
RMB’000 RMB’000 RMB’000 RMB’000
Dairy farm equipment:Classified under current assets 17,200 15,547 7,527 8,780
The Group enters into certain feeds supply contracts (the “Contracts”) with certain customers pursuant towhich the Group agrees to provide dairy farm equipment to the customers upon the signing of the Contracts for freeprovided that the customers purchase from the Group a minimum quantity of feeds as stipulated in the Contractswithin the contract period, which is normally one to two years. If the customers fail to meet the minimum purchaserequirement, the customers are obliged to pay to the Group the price of the dairy farm equipment provided by theGroup as a compensation at the end of the contract period.
The Group recognises revenue from sale of equipment upon delivery of the dairy farm equipment to thecustomers based on its normal selling price and amortises the amount to revenue from sale of feeds over the contractperiod.
As at January 1, 2017, contract assets amounted to RMB3,867,000.
29. PREPAYMENTS, DEPOSITS AND OTHER RECEIVABLES
As at December 31, As atJune 30,
20202017 2018 2019
RMB’000 RMB’000 RMB’000 RMB’000
Prepayments 81,385 81,357 178,583 185,201Value-added tax recoverable 6,056 20,420 22,752 14,107Deposits placed with brokers for
commodity forward contracts 16,506 18,117 16,112 10,940Rental receivables 2,279 1,790 714 2,980Utility and other deposits 1,594 1,495 3,905 6,403Security deposits for purchase
of lands – – 5,006 –Compensation receivable 715 2,483 1,708 8,174Advances to staff 933 696 589 4,300Other receivables 71 828 1,445 7,468
109,539 127,186 230,814 239,573Less: Allowance of doubtful debts (447) (638) (5) (1,406)
109,092 126,548 230,809 238,167
Details of impairment assessment of other receivables under IFRS 9 for the years ended December 31, 2018and 2019 and the six months ended June 30, 2020 are set out in Note 44.
Included in the above provision for impairment of other receivables, which was measured based on incurredlosses model under IAS 39, as at December 31, 2017 was a provision for individually impaired rental receivables ofRMB447,000 with a carrying amount before provision of RMB447,000.
Movements in the allowance of doubtful debts for the year ended December 31, 2017 are set out as follows:
RMB’000
At January 1, 2017 2,499Reversed during the year (2,052)
At December 31, 2017 447
APPENDIX I ACCOUNTANTS’ REPORT
– I-60 –
THIS DOCUMENT IS IN DRAFT FORM, INCOMPLETE AND SUBJECT TO CHANGE AND THAT INFORMATION MUST BEREAD IN CONJUNCTION WITH THE SECTION HEADED “WARNING” ON THE COVER OF THIS DOCUMENT.
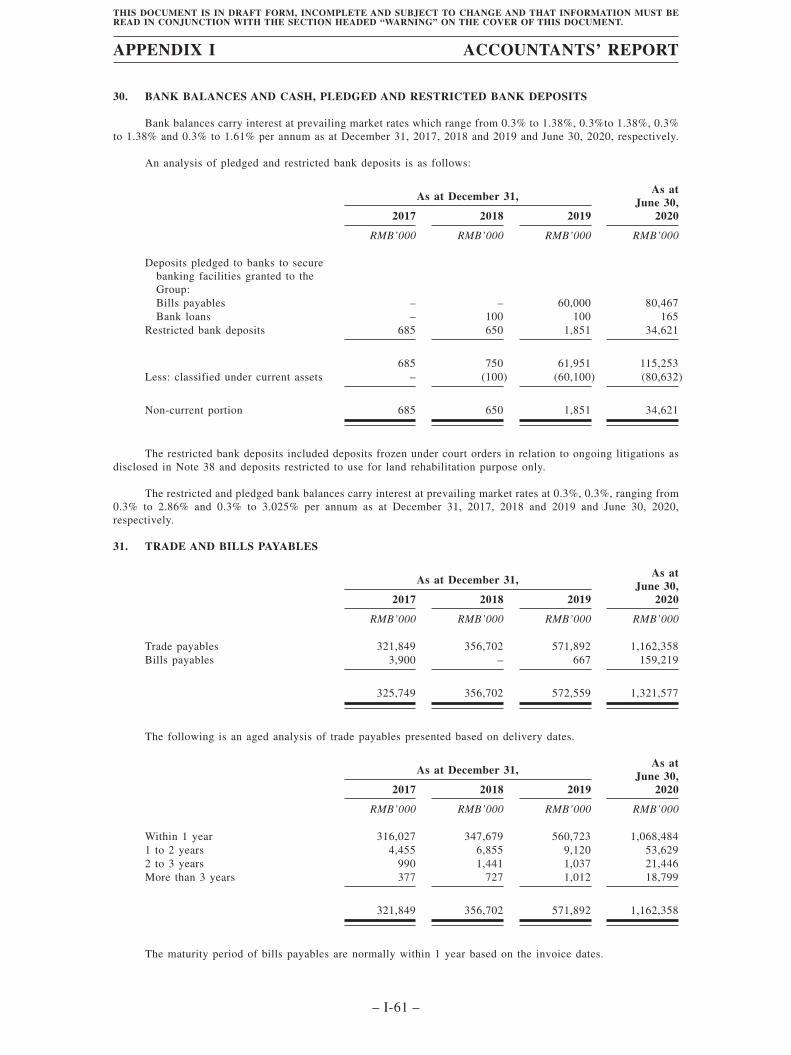
30. BANK BALANCES AND CASH, PLEDGED AND RESTRICTED BANK DEPOSITS
Bank balances carry interest at prevailing market rates which range from 0.3% to 1.38%, 0.3%to 1.38%, 0.3%to 1.38% and 0.3% to 1.61% per annum as at December 31, 2017, 2018 and 2019 and June 30, 2020, respectively.
An analysis of pledged and restricted bank deposits is as follows:
As at December 31,As at
June 30,20202017 2018 2019
RMB’000 RMB’000 RMB’000 RMB’000
Deposits pledged to banks to securebanking facilities granted to theGroup:Bills payables – – 60,000 80,467Bank loans – 100 100 165
Restricted bank deposits 685 650 1,851 34,621
685 750 61,951 115,253Less: classified under current assets – (100) (60,100) (80,632)
Non-current portion 685 650 1,851 34,621
The restricted bank deposits included deposits frozen under court orders in relation to ongoing litigations asdisclosed in Note 38 and deposits restricted to use for land rehabilitation purpose only.
The restricted and pledged bank balances carry interest at prevailing market rates at 0.3%, 0.3%, ranging from0.3% to 2.86% and 0.3% to 3.025% per annum as at December 31, 2017, 2018 and 2019 and June 30, 2020,respectively.
31. TRADE AND BILLS PAYABLES
As at December 31,As at
June 30,20202017 2018 2019
RMB’000 RMB’000 RMB’000 RMB’000
Trade payables 321,849 356,702 571,892 1,162,358Bills payables 3,900 – 667 159,219
325,749 356,702 572,559 1,321,577
The following is an aged analysis of trade payables presented based on delivery dates.
As at December 31,As at
June 30,20202017 2018 2019
RMB’000 RMB’000 RMB’000 RMB’000
Within 1 year 316,027 347,679 560,723 1,068,4841 to 2 years 4,455 6,855 9,120 53,6292 to 3 years 990 1,441 1,037 21,446More than 3 years 377 727 1,012 18,799
321,849 356,702 571,892 1,162,358
The maturity period of bills payables are normally within 1 year based on the invoice dates.
APPENDIX I ACCOUNTANTS’ REPORT
– I-61 –
THIS DOCUMENT IS IN DRAFT FORM, INCOMPLETE AND SUBJECT TO CHANGE AND THAT INFORMATION MUST BEREAD IN CONJUNCTION WITH THE SECTION HEADED “WARNING” ON THE COVER OF THIS DOCUMENT.
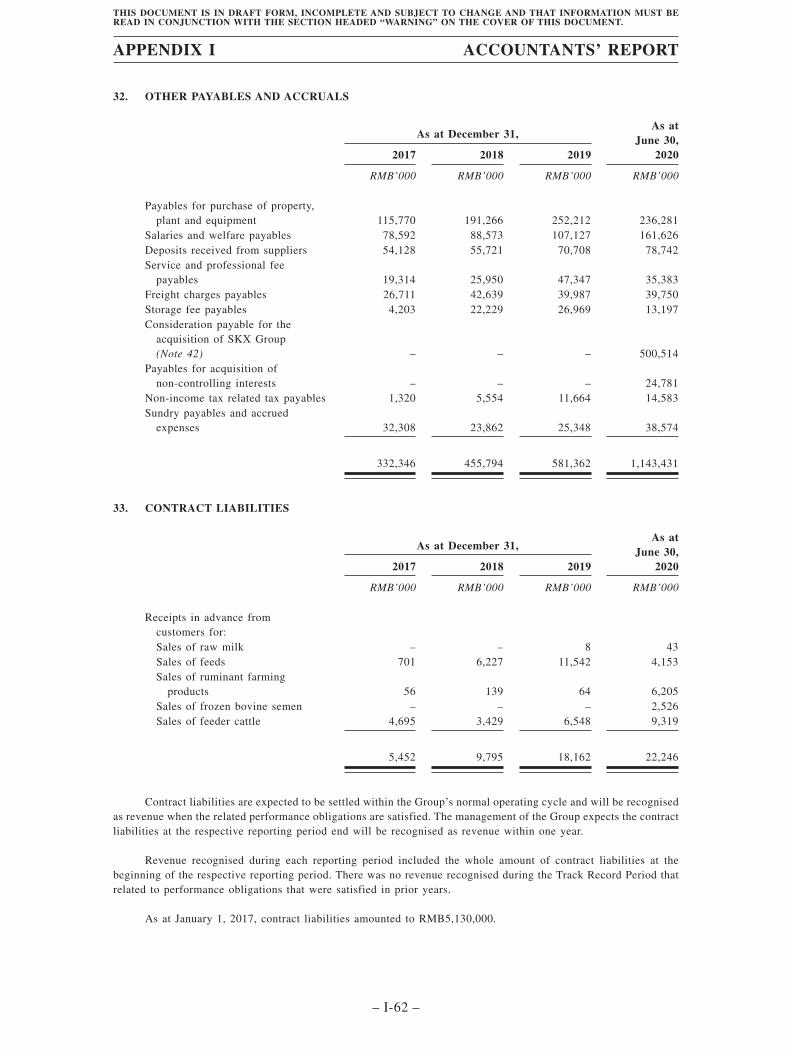
32. OTHER PAYABLES AND ACCRUALS
As at December 31,As at
June 30,20202017 2018 2019
RMB’000 RMB’000 RMB’000 RMB’000
Payables for purchase of property,plant and equipment 115,770 191,266 252,212 236,281
Salaries and welfare payables 78,592 88,573 107,127 161,626Deposits received from suppliers 54,128 55,721 70,708 78,742Service and professional fee
payables 19,314 25,950 47,347 35,383Freight charges payables 26,711 42,639 39,987 39,750Storage fee payables 4,203 22,229 26,969 13,197Consideration payable for the
acquisition of SKX Group(Note 42) – – – 500,514
Payables for acquisition ofnon-controlling interests – – – 24,781
Non-income tax related tax payables 1,320 5,554 11,664 14,583Sundry payables and accrued
expenses 32,308 23,862 25,348 38,574
332,346 455,794 581,362 1,143,431
33. CONTRACT LIABILITIES
As at December 31,As at
June 30,20202017 2018 2019
RMB’000 RMB’000 RMB’000 RMB’000
Receipts in advance fromcustomers for:Sales of raw milk – – 8 43Sales of feeds 701 6,227 11,542 4,153Sales of ruminant farming
products 56 139 64 6,205Sales of frozen bovine semen – – – 2,526Sales of feeder cattle 4,695 3,429 6,548 9,319
5,452 9,795 18,162 22,246
Contract liabilities are expected to be settled within the Group’s normal operating cycle and will be recognisedas revenue when the related performance obligations are satisfied. The management of the Group expects the contractliabilities at the respective reporting period end will be recognised as revenue within one year.
Revenue recognised during each reporting period included the whole amount of contract liabilities at thebeginning of the respective reporting period. There was no revenue recognised during the Track Record Period thatrelated to performance obligations that were satisfied in prior years.
As at January 1, 2017, contract liabilities amounted to RMB5,130,000.
APPENDIX I ACCOUNTANTS’ REPORT
– I-62 –
THIS DOCUMENT IS IN DRAFT FORM, INCOMPLETE AND SUBJECT TO CHANGE AND THAT INFORMATION MUST BEREAD IN CONJUNCTION WITH THE SECTION HEADED “WARNING” ON THE COVER OF THIS DOCUMENT.
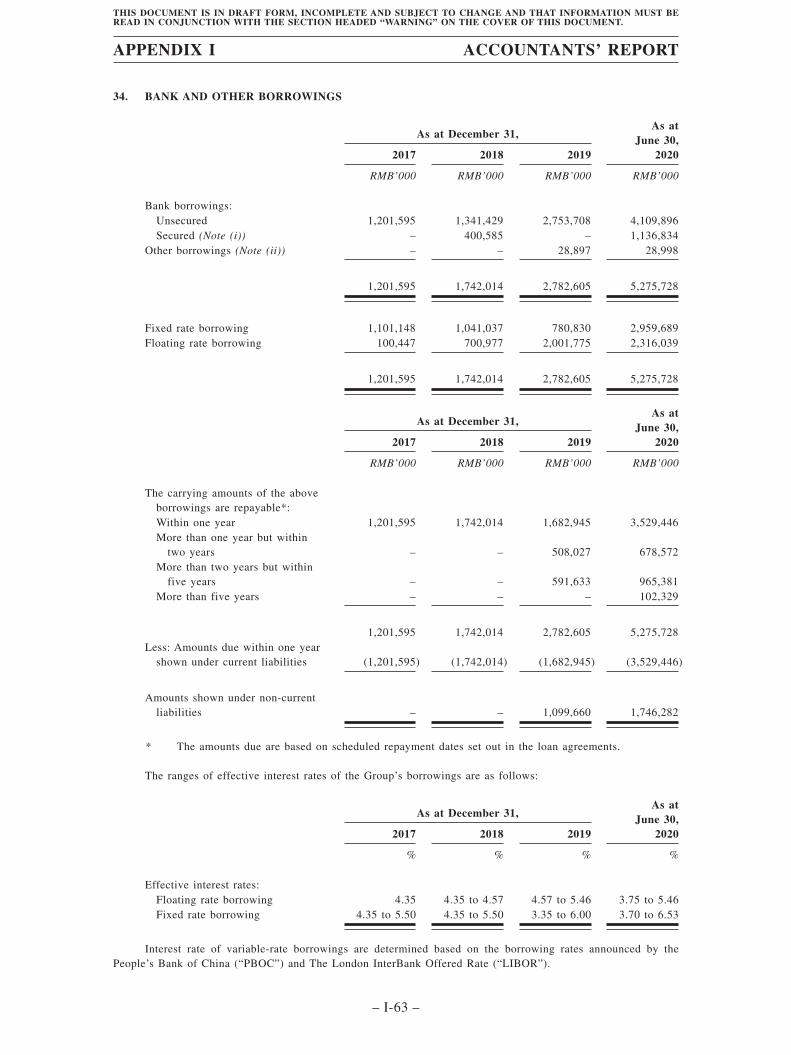
34. BANK AND OTHER BORROWINGS
As at December 31,As at
June 30,20202017 2018 2019
RMB’000 RMB’000 RMB’000 RMB’000
Bank borrowings:Unsecured 1,201,595 1,341,429 2,753,708 4,109,896Secured (Note (i)) – 400,585 – 1,136,834
Other borrowings (Note (ii)) – – 28,897 28,998
1,201,595 1,742,014 2,782,605 5,275,728
Fixed rate borrowing 1,101,148 1,041,037 780,830 2,959,689Floating rate borrowing 100,447 700,977 2,001,775 2,316,039
1,201,595 1,742,014 2,782,605 5,275,728
As at December 31,As at
June 30,20202017 2018 2019
RMB’000 RMB’000 RMB’000 RMB’000
The carrying amounts of the aboveborrowings are repayable*:Within one year 1,201,595 1,742,014 1,682,945 3,529,446More than one year but within
two years – – 508,027 678,572More than two years but within
five years – – 591,633 965,381More than five years – – – 102,329
1,201,595 1,742,014 2,782,605 5,275,728Less: Amounts due within one year
shown under current liabilities (1,201,595) (1,742,014) (1,682,945) (3,529,446)
Amounts shown under non-currentliabilities – – 1,099,660 1,746,282
* The amounts due are based on scheduled repayment dates set out in the loan agreements.
The ranges of effective interest rates of the Group’s borrowings are as follows:
As at December 31,As at
June 30,20202017 2018 2019
% % % %
Effective interest rates:Floating rate borrowing 4.35 4.35 to 4.57 4.57 to 5.46 3.75 to 5.46Fixed rate borrowing 4.35 to 5.50 4.35 to 5.50 3.35 to 6.00 3.70 to 6.53
Interest rate of variable-rate borrowings are determined based on the borrowing rates announced by thePeople’s Bank of China (“PBOC”) and The London InterBank Offered Rate (“LIBOR”).
APPENDIX I ACCOUNTANTS’ REPORT
– I-63 –
THIS DOCUMENT IS IN DRAFT FORM, INCOMPLETE AND SUBJECT TO CHANGE AND THAT INFORMATION MUST BEREAD IN CONJUNCTION WITH THE SECTION HEADED “WARNING” ON THE COVER OF THIS DOCUMENT.
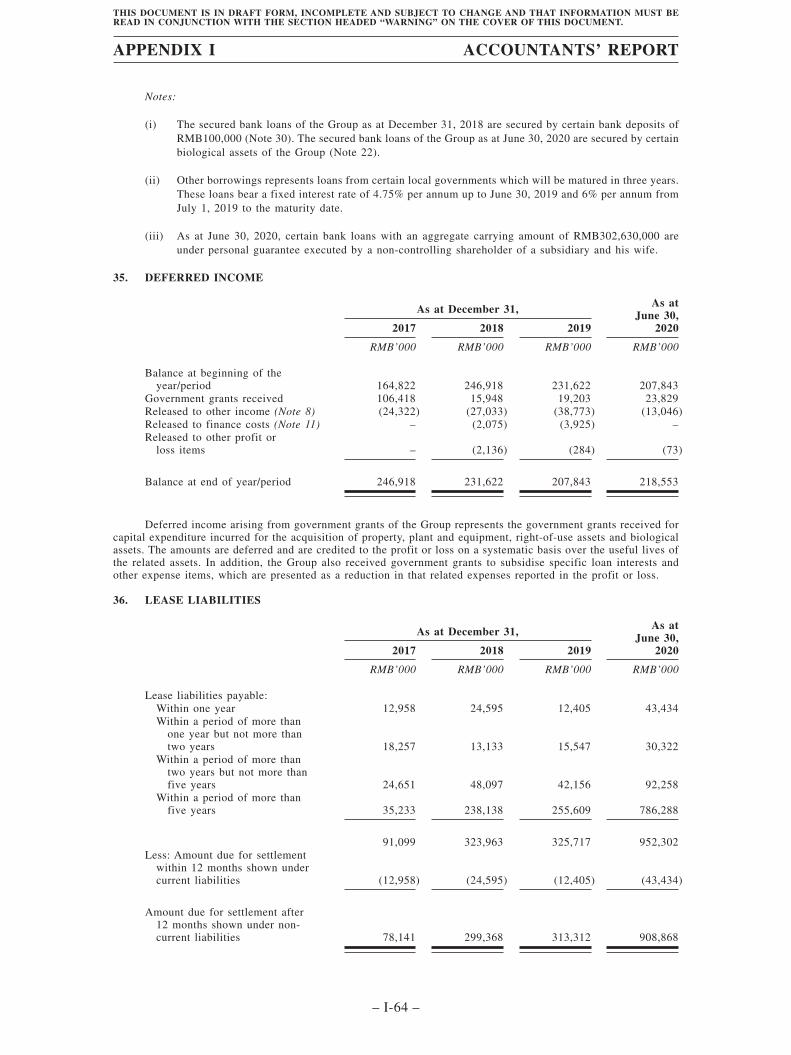
Notes:
(i) The secured bank loans of the Group as at December 31, 2018 are secured by certain bank deposits ofRMB100,000 (Note 30). The secured bank loans of the Group as at June 30, 2020 are secured by certainbiological assets of the Group (Note 22).
(ii) Other borrowings represents loans from certain local governments which will be matured in three years.These loans bear a fixed interest rate of 4.75% per annum up to June 30, 2019 and 6% per annum fromJuly 1, 2019 to the maturity date.
(iii) As at June 30, 2020, certain bank loans with an aggregate carrying amount of RMB302,630,000 areunder personal guarantee executed by a non-controlling shareholder of a subsidiary and his wife.
35. DEFERRED INCOME
As at December 31, As atJune 30,
20202017 2018 2019
RMB’000 RMB’000 RMB’000 RMB’000
Balance at beginning of theyear/period 164,822 246,918 231,622 207,843
Government grants received 106,418 15,948 19,203 23,829Released to other income (Note 8) (24,322) (27,033) (38,773) (13,046)Released to finance costs (Note 11) – (2,075) (3,925) –Released to other profit or
loss items – (2,136) (284) (73)
Balance at end of year/period 246,918 231,622 207,843 218,553
Deferred income arising from government grants of the Group represents the government grants received forcapital expenditure incurred for the acquisition of property, plant and equipment, right-of-use assets and biologicalassets. The amounts are deferred and are credited to the profit or loss on a systematic basis over the useful lives ofthe related assets. In addition, the Group also received government grants to subsidise specific loan interests andother expense items, which are presented as a reduction in that related expenses reported in the profit or loss.
36. LEASE LIABILITIES
As at December 31, As atJune 30,
20202017 2018 2019
RMB’000 RMB’000 RMB’000 RMB’000
Lease liabilities payable:Within one year 12,958 24,595 12,405 43,434Within a period of more than
one year but not more thantwo years 18,257 13,133 15,547 30,322
Within a period of more thantwo years but not more thanfive years 24,651 48,097 42,156 92,258
Within a period of more thanfive years 35,233 238,138 255,609 786,288
91,099 323,963 325,717 952,302Less: Amount due for settlement
within 12 months shown undercurrent liabilities (12,958) (24,595) (12,405) (43,434)
Amount due for settlement after12 months shown under non-current liabilities 78,141 299,368 313,312 908,868
APPENDIX I ACCOUNTANTS’ REPORT
– I-64 –
THIS DOCUMENT IS IN DRAFT FORM, INCOMPLETE AND SUBJECT TO CHANGE AND THAT INFORMATION MUST BEREAD IN CONJUNCTION WITH THE SECTION HEADED “WARNING” ON THE COVER OF THIS DOCUMENT.
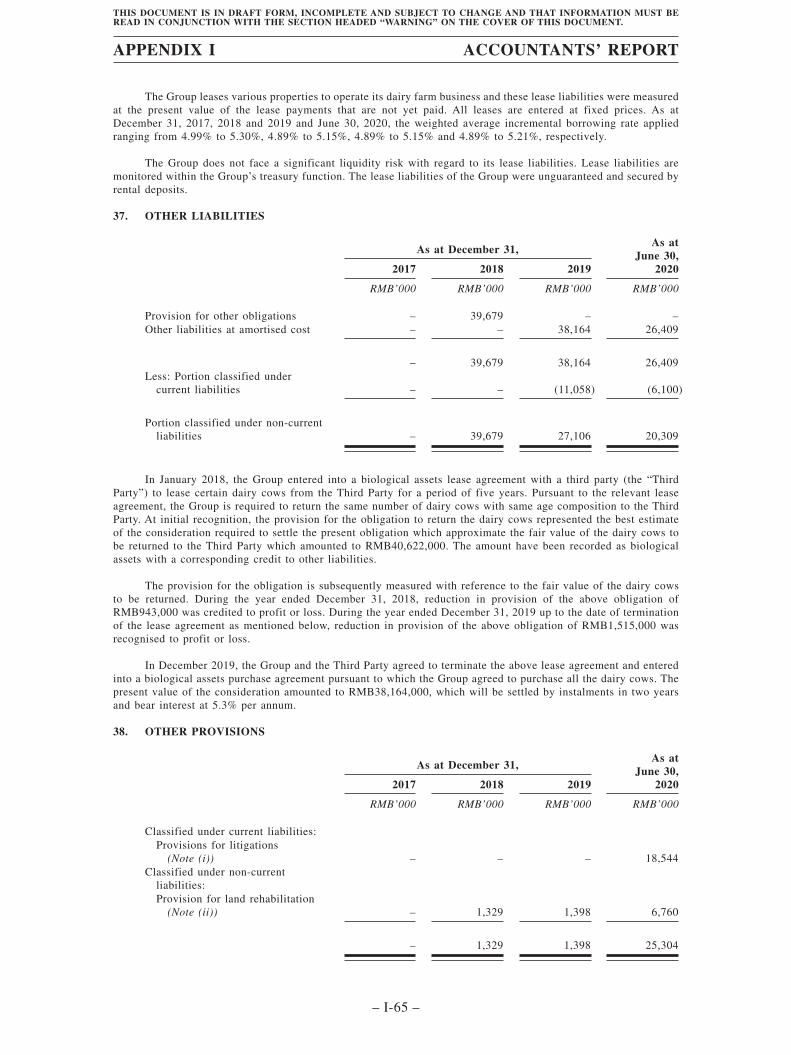
The Group leases various properties to operate its dairy farm business and these lease liabilities were measuredat the present value of the lease payments that are not yet paid. All leases are entered at fixed prices. As atDecember 31, 2017, 2018 and 2019 and June 30, 2020, the weighted average incremental borrowing rate appliedranging from 4.99% to 5.30%, 4.89% to 5.15%, 4.89% to 5.15% and 4.89% to 5.21%, respectively.
The Group does not face a significant liquidity risk with regard to its lease liabilities. Lease liabilities aremonitored within the Group’s treasury function. The lease liabilities of the Group were unguaranteed and secured byrental deposits.
37. OTHER LIABILITIES
As at December 31,As at
June 30,20202017 2018 2019
RMB’000 RMB’000 RMB’000 RMB’000
Provision for other obligations – 39,679 – –Other liabilities at amortised cost – – 38,164 26,409
– 39,679 38,164 26,409Less: Portion classified under
current liabilities – – (11,058) (6,100)
Portion classified under non-currentliabilities – 39,679 27,106 20,309
In January 2018, the Group entered into a biological assets lease agreement with a third party (the “ThirdParty”) to lease certain dairy cows from the Third Party for a period of five years. Pursuant to the relevant leaseagreement, the Group is required to return the same number of dairy cows with same age composition to the ThirdParty. At initial recognition, the provision for the obligation to return the dairy cows represented the best estimateof the consideration required to settle the present obligation which approximate the fair value of the dairy cows tobe returned to the Third Party which amounted to RMB40,622,000. The amount have been recorded as biologicalassets with a corresponding credit to other liabilities.
The provision for the obligation is subsequently measured with reference to the fair value of the dairy cowsto be returned. During the year ended December 31, 2018, reduction in provision of the above obligation ofRMB943,000 was credited to profit or loss. During the year ended December 31, 2019 up to the date of terminationof the lease agreement as mentioned below, reduction in provision of the above obligation of RMB1,515,000 wasrecognised to profit or loss.
In December 2019, the Group and the Third Party agreed to terminate the above lease agreement and enteredinto a biological assets purchase agreement pursuant to which the Group agreed to purchase all the dairy cows. Thepresent value of the consideration amounted to RMB38,164,000, which will be settled by instalments in two yearsand bear interest at 5.3% per annum.
38. OTHER PROVISIONS
As at December 31,As at
June 30,20202017 2018 2019
RMB’000 RMB’000 RMB’000 RMB’000
Classified under current liabilities:Provisions for litigations
(Note (i)) – – – 18,544Classified under non-current
liabilities:Provision for land rehabilitation
(Note (ii)) – 1,329 1,398 6,760
– 1,329 1,398 25,304
APPENDIX I ACCOUNTANTS’ REPORT
– I-65 –
THIS DOCUMENT IS IN DRAFT FORM, INCOMPLETE AND SUBJECT TO CHANGE AND THAT INFORMATION MUST BEREAD IN CONJUNCTION WITH THE SECTION HEADED “WARNING” ON THE COVER OF THIS DOCUMENT.
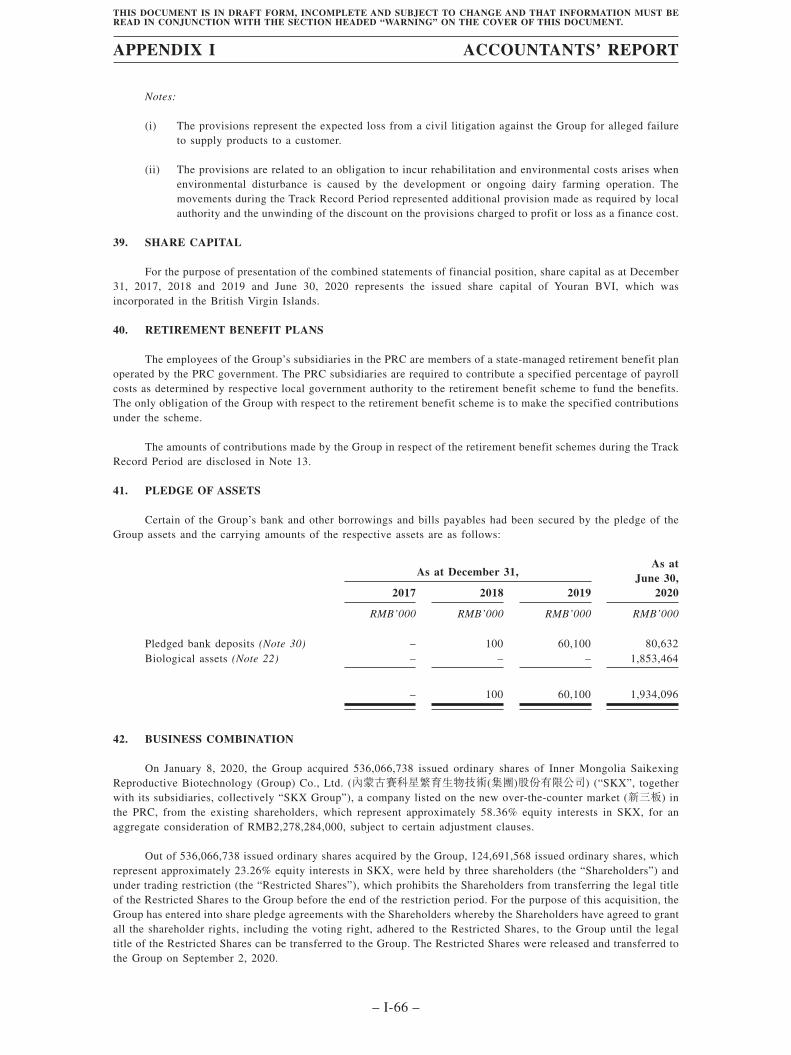
Notes:
(i) The provisions represent the expected loss from a civil litigation against the Group for alleged failureto supply products to a customer.
(ii) The provisions are related to an obligation to incur rehabilitation and environmental costs arises whenenvironmental disturbance is caused by the development or ongoing dairy farming operation. Themovements during the Track Record Period represented additional provision made as required by localauthority and the unwinding of the discount on the provisions charged to profit or loss as a finance cost.
39. SHARE CAPITAL
For the purpose of presentation of the combined statements of financial position, share capital as at December31, 2017, 2018 and 2019 and June 30, 2020 represents the issued share capital of Youran BVI, which wasincorporated in the British Virgin Islands.
40. RETIREMENT BENEFIT PLANS
The employees of the Group’s subsidiaries in the PRC are members of a state-managed retirement benefit planoperated by the PRC government. The PRC subsidiaries are required to contribute a specified percentage of payrollcosts as determined by respective local government authority to the retirement benefit scheme to fund the benefits.The only obligation of the Group with respect to the retirement benefit scheme is to make the specified contributionsunder the scheme.
The amounts of contributions made by the Group in respect of the retirement benefit schemes during the TrackRecord Period are disclosed in Note 13.
41. PLEDGE OF ASSETS
Certain of the Group’s bank and other borrowings and bills payables had been secured by the pledge of theGroup assets and the carrying amounts of the respective assets are as follows:
As at December 31,As at
June 30,20202017 2018 2019
RMB’000 RMB’000 RMB’000 RMB’000
Pledged bank deposits (Note 30) – 100 60,100 80,632Biological assets (Note 22) – – – 1,853,464
– 100 60,100 1,934,096
42. BUSINESS COMBINATION
On January 8, 2020, the Group acquired 536,066,738 issued ordinary shares of Inner Mongolia SaikexingReproductive Biotechnology (Group) Co., Ltd. (內蒙古賽科星繁育生物技術(集團)股份有限公司) (“SKX”, togetherwith its subsidiaries, collectively “SKX Group”), a company listed on the new over-the-counter market (新三板) inthe PRC, from the existing shareholders, which represent approximately 58.36% equity interests in SKX, for anaggregate consideration of RMB2,278,284,000, subject to certain adjustment clauses.
Out of 536,066,738 issued ordinary shares acquired by the Group, 124,691,568 issued ordinary shares, whichrepresent approximately 23.26% equity interests in SKX, were held by three shareholders (the “Shareholders”) andunder trading restriction (the “Restricted Shares”), which prohibits the Shareholders from transferring the legal titleof the Restricted Shares to the Group before the end of the restriction period. For the purpose of this acquisition, theGroup has entered into share pledge agreements with the Shareholders whereby the Shareholders have agreed to grantall the shareholder rights, including the voting right, adhered to the Restricted Shares, to the Group until the legaltitle of the Restricted Shares can be transferred to the Group. The Restricted Shares were released and transferred tothe Group on September 2, 2020.
APPENDIX I ACCOUNTANTS’ REPORT
– I-66 –
THIS DOCUMENT IS IN DRAFT FORM, INCOMPLETE AND SUBJECT TO CHANGE AND THAT INFORMATION MUST BEREAD IN CONJUNCTION WITH THE SECTION HEADED “WARNING” ON THE COVER OF THIS DOCUMENT.
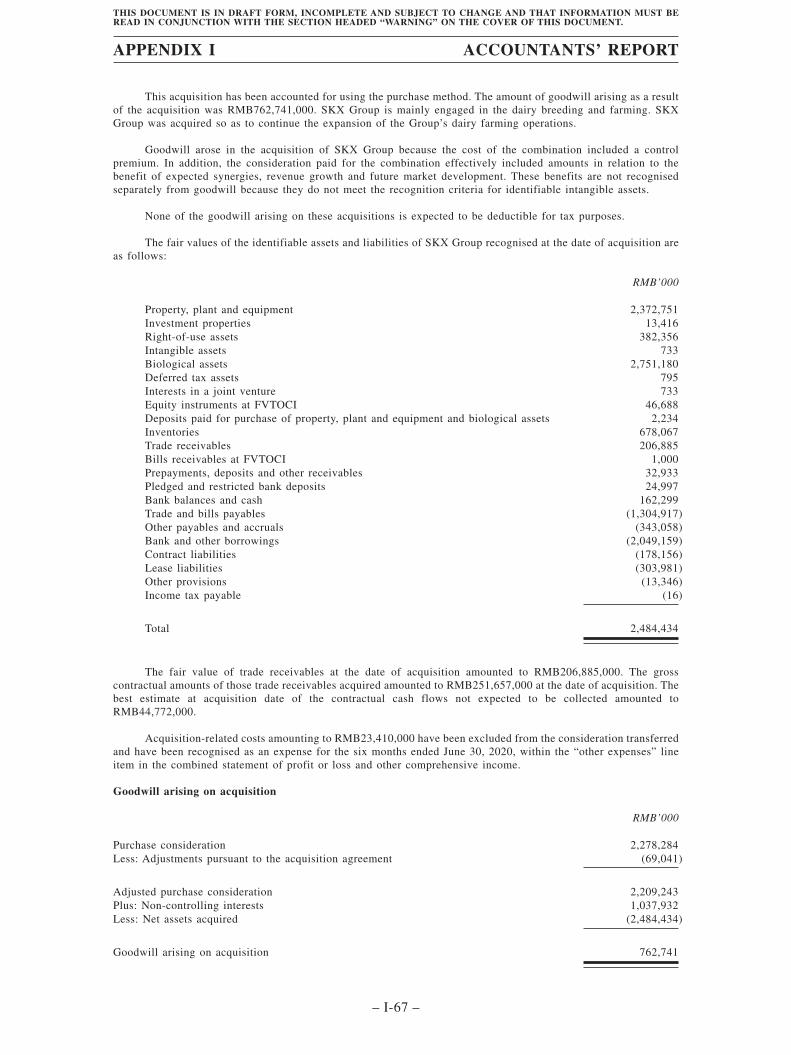
This acquisition has been accounted for using the purchase method. The amount of goodwill arising as a resultof the acquisition was RMB762,741,000. SKX Group is mainly engaged in the dairy breeding and farming. SKXGroup was acquired so as to continue the expansion of the Group’s dairy farming operations.
Goodwill arose in the acquisition of SKX Group because the cost of the combination included a controlpremium. In addition, the consideration paid for the combination effectively included amounts in relation to thebenefit of expected synergies, revenue growth and future market development. These benefits are not recognisedseparately from goodwill because they do not meet the recognition criteria for identifiable intangible assets.
None of the goodwill arising on these acquisitions is expected to be deductible for tax purposes.
The fair values of the identifiable assets and liabilities of SKX Group recognised at the date of acquisition areas follows:
RMB’000
Property, plant and equipment 2,372,751Investment properties 13,416Right-of-use assets 382,356Intangible assets 733Biological assets 2,751,180Deferred tax assets 795Interests in a joint venture 733Equity instruments at FVTOCI 46,688Deposits paid for purchase of property, plant and equipment and biological assets 2,234Inventories 678,067Trade receivables 206,885Bills receivables at FVTOCI 1,000Prepayments, deposits and other receivables 32,933Pledged and restricted bank deposits 24,997Bank balances and cash 162,299Trade and bills payables (1,304,917)Other payables and accruals (343,058)Bank and other borrowings (2,049,159)Contract liabilities (178,156)Lease liabilities (303,981)Other provisions (13,346)Income tax payable (16)
Total 2,484,434
The fair value of trade receivables at the date of acquisition amounted to RMB206,885,000. The grosscontractual amounts of those trade receivables acquired amounted to RMB251,657,000 at the date of acquisition. Thebest estimate at acquisition date of the contractual cash flows not expected to be collected amounted toRMB44,772,000.
Acquisition-related costs amounting to RMB23,410,000 have been excluded from the consideration transferredand have been recognised as an expense for the six months ended June 30, 2020, within the “other expenses” lineitem in the combined statement of profit or loss and other comprehensive income.
Goodwill arising on acquisition
RMB’000
Purchase consideration 2,278,284Less: Adjustments pursuant to the acquisition agreement (69,041)
Adjusted purchase consideration 2,209,243Plus: Non-controlling interests 1,037,932Less: Net assets acquired (2,484,434)
Goodwill arising on acquisition 762,741
APPENDIX I ACCOUNTANTS’ REPORT
– I-67 –
THIS DOCUMENT IS IN DRAFT FORM, INCOMPLETE AND SUBJECT TO CHANGE AND THAT INFORMATION MUST BEREAD IN CONJUNCTION WITH THE SECTION HEADED “WARNING” ON THE COVER OF THIS DOCUMENT.
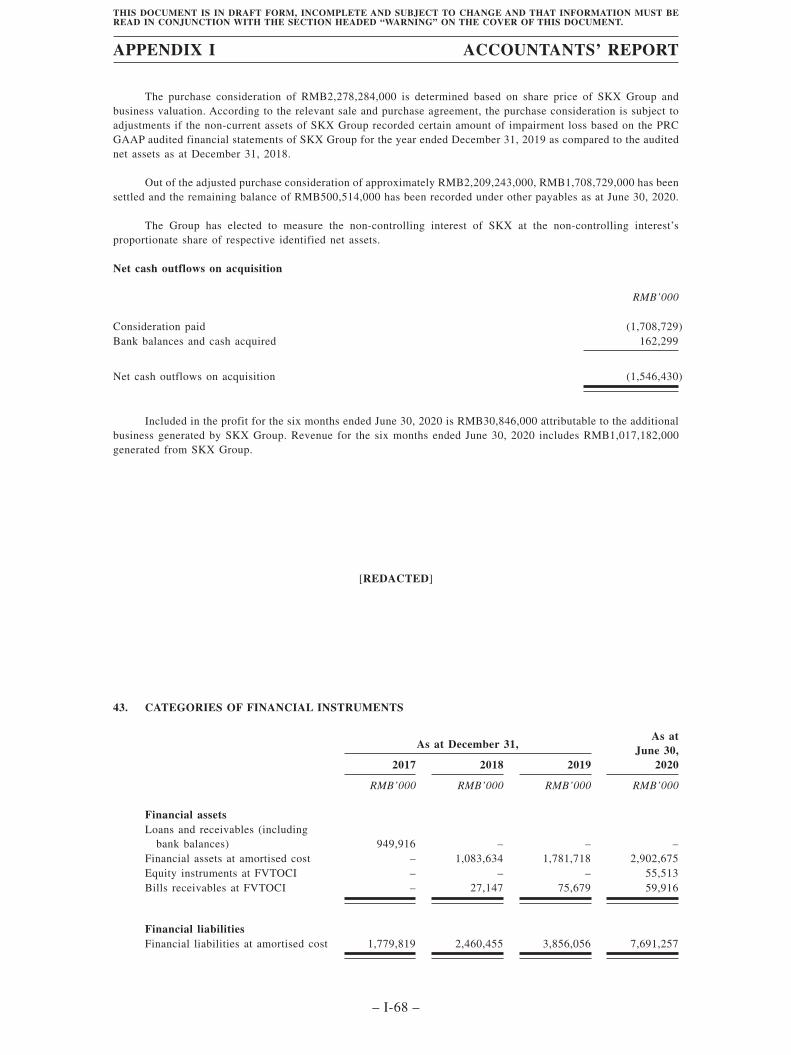
The purchase consideration of RMB2,278,284,000 is determined based on share price of SKX Group andbusiness valuation. According to the relevant sale and purchase agreement, the purchase consideration is subject toadjustments if the non-current assets of SKX Group recorded certain amount of impairment loss based on the PRCGAAP audited financial statements of SKX Group for the year ended December 31, 2019 as compared to the auditednet assets as at December 31, 2018.
Out of the adjusted purchase consideration of approximately RMB2,209,243,000, RMB1,708,729,000 has beensettled and the remaining balance of RMB500,514,000 has been recorded under other payables as at June 30, 2020.
The Group has elected to measure the non-controlling interest of SKX at the non-controlling interest’sproportionate share of respective identified net assets.
Net cash outflows on acquisition
RMB’000
Consideration paid (1,708,729)Bank balances and cash acquired 162,299
Net cash outflows on acquisition (1,546,430)
Included in the profit for the six months ended June 30, 2020 is RMB30,846,000 attributable to the additionalbusiness generated by SKX Group. Revenue for the six months ended June 30, 2020 includes RMB1,017,182,000generated from SKX Group.
[REDACTED]
43. CATEGORIES OF FINANCIAL INSTRUMENTS
As at December 31,As at
June 30,20202017 2018 2019
RMB’000 RMB’000 RMB’000 RMB’000
Financial assetsLoans and receivables (including
bank balances) 949,916 – – –Financial assets at amortised cost – 1,083,634 1,781,718 2,902,675Equity instruments at FVTOCI – – – 55,513Bills receivables at FVTOCI – 27,147 75,679 59,916
Financial liabilitiesFinancial liabilities at amortised cost 1,779,819 2,460,455 3,856,056 7,691,257
APPENDIX I ACCOUNTANTS’ REPORT
– I-68 –
THIS DOCUMENT IS IN DRAFT FORM, INCOMPLETE AND SUBJECT TO CHANGE AND THAT INFORMATION MUST BEREAD IN CONJUNCTION WITH THE SECTION HEADED “WARNING” ON THE COVER OF THIS DOCUMENT.
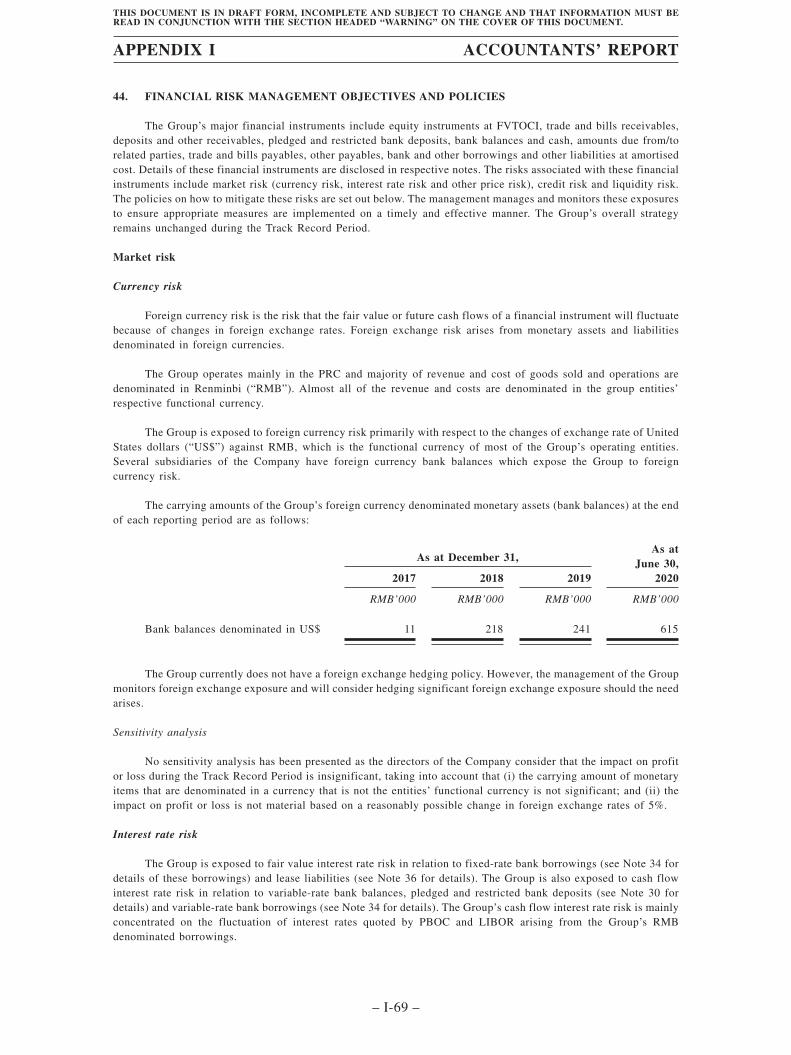
44. FINANCIAL RISK MANAGEMENT OBJECTIVES AND POLICIES
The Group’s major financial instruments include equity instruments at FVTOCI, trade and bills receivables,deposits and other receivables, pledged and restricted bank deposits, bank balances and cash, amounts due from/torelated parties, trade and bills payables, other payables, bank and other borrowings and other liabilities at amortisedcost. Details of these financial instruments are disclosed in respective notes. The risks associated with these financialinstruments include market risk (currency risk, interest rate risk and other price risk), credit risk and liquidity risk.The policies on how to mitigate these risks are set out below. The management manages and monitors these exposuresto ensure appropriate measures are implemented on a timely and effective manner. The Group’s overall strategyremains unchanged during the Track Record Period.
Market risk
Currency risk
Foreign currency risk is the risk that the fair value or future cash flows of a financial instrument will fluctuatebecause of changes in foreign exchange rates. Foreign exchange risk arises from monetary assets and liabilitiesdenominated in foreign currencies.
The Group operates mainly in the PRC and majority of revenue and cost of goods sold and operations aredenominated in Renminbi (“RMB”). Almost all of the revenue and costs are denominated in the group entities’respective functional currency.
The Group is exposed to foreign currency risk primarily with respect to the changes of exchange rate of UnitedStates dollars (“US$”) against RMB, which is the functional currency of most of the Group’s operating entities.Several subsidiaries of the Company have foreign currency bank balances which expose the Group to foreigncurrency risk.
The carrying amounts of the Group’s foreign currency denominated monetary assets (bank balances) at the endof each reporting period are as follows:
As at December 31,As at
June 30,20202017 2018 2019
RMB’000 RMB’000 RMB’000 RMB’000
Bank balances denominated in US$ 11 218 241 615
The Group currently does not have a foreign exchange hedging policy. However, the management of the Groupmonitors foreign exchange exposure and will consider hedging significant foreign exchange exposure should the needarises.
Sensitivity analysis
No sensitivity analysis has been presented as the directors of the Company consider that the impact on profitor loss during the Track Record Period is insignificant, taking into account that (i) the carrying amount of monetaryitems that are denominated in a currency that is not the entities’ functional currency is not significant; and (ii) theimpact on profit or loss is not material based on a reasonably possible change in foreign exchange rates of 5%.
Interest rate risk
The Group is exposed to fair value interest rate risk in relation to fixed-rate bank borrowings (see Note 34 fordetails of these borrowings) and lease liabilities (see Note 36 for details). The Group is also exposed to cash flowinterest rate risk in relation to variable-rate bank balances, pledged and restricted bank deposits (see Note 30 fordetails) and variable-rate bank borrowings (see Note 34 for details). The Group’s cash flow interest rate risk is mainlyconcentrated on the fluctuation of interest rates quoted by PBOC and LIBOR arising from the Group’s RMBdenominated borrowings.
APPENDIX I ACCOUNTANTS’ REPORT
– I-69 –
THIS DOCUMENT IS IN DRAFT FORM, INCOMPLETE AND SUBJECT TO CHANGE AND THAT INFORMATION MUST BEREAD IN CONJUNCTION WITH THE SECTION HEADED “WARNING” ON THE COVER OF THIS DOCUMENT.
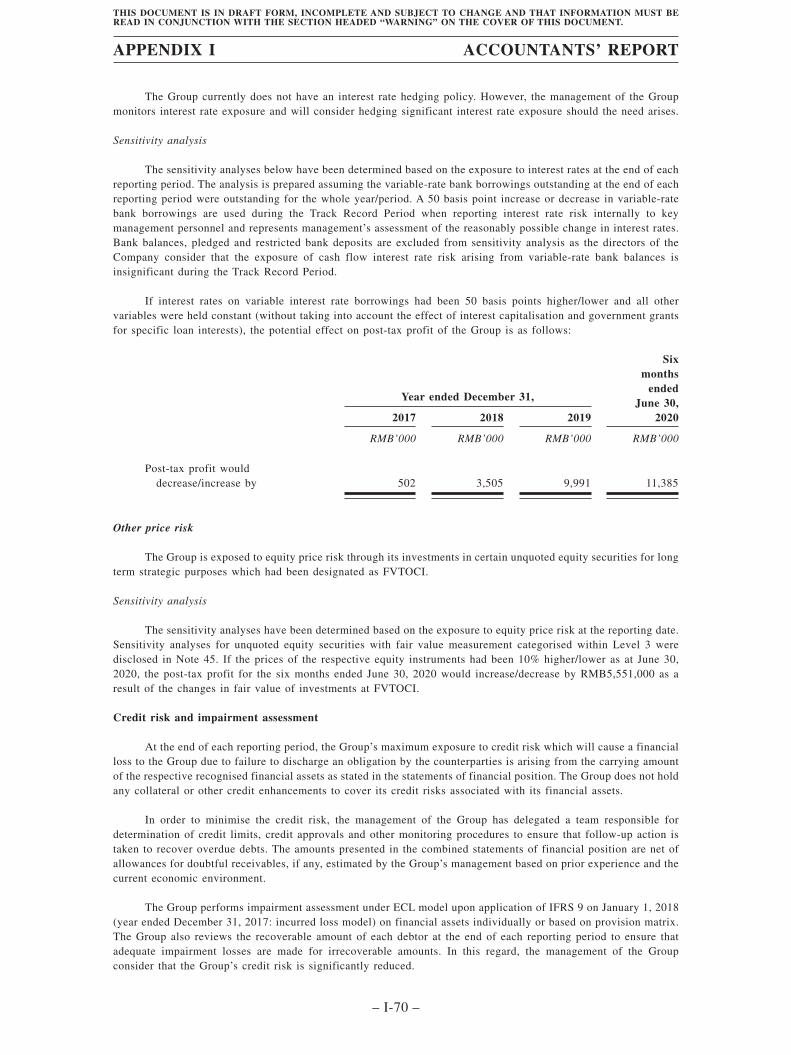
The Group currently does not have an interest rate hedging policy. However, the management of the Groupmonitors interest rate exposure and will consider hedging significant interest rate exposure should the need arises.
Sensitivity analysis
The sensitivity analyses below have been determined based on the exposure to interest rates at the end of eachreporting period. The analysis is prepared assuming the variable-rate bank borrowings outstanding at the end of eachreporting period were outstanding for the whole year/period. A 50 basis point increase or decrease in variable-ratebank borrowings are used during the Track Record Period when reporting interest rate risk internally to keymanagement personnel and represents management’s assessment of the reasonably possible change in interest rates.Bank balances, pledged and restricted bank deposits are excluded from sensitivity analysis as the directors of theCompany consider that the exposure of cash flow interest rate risk arising from variable-rate bank balances isinsignificant during the Track Record Period.
If interest rates on variable interest rate borrowings had been 50 basis points higher/lower and all othervariables were held constant (without taking into account the effect of interest capitalisation and government grantsfor specific loan interests), the potential effect on post-tax profit of the Group is as follows:
Year ended December 31,
Sixmonths
endedJune 30,
20202017 2018 2019
RMB’000 RMB’000 RMB’000 RMB’000
Post-tax profit woulddecrease/increase by 502 3,505 9,991 11,385
Other price risk
The Group is exposed to equity price risk through its investments in certain unquoted equity securities for longterm strategic purposes which had been designated as FVTOCI.
Sensitivity analysis
The sensitivity analyses have been determined based on the exposure to equity price risk at the reporting date.Sensitivity analyses for unquoted equity securities with fair value measurement categorised within Level 3 weredisclosed in Note 45. If the prices of the respective equity instruments had been 10% higher/lower as at June 30,2020, the post-tax profit for the six months ended June 30, 2020 would increase/decrease by RMB5,551,000 as aresult of the changes in fair value of investments at FVTOCI.
Credit risk and impairment assessment
At the end of each reporting period, the Group’s maximum exposure to credit risk which will cause a financialloss to the Group due to failure to discharge an obligation by the counterparties is arising from the carrying amountof the respective recognised financial assets as stated in the statements of financial position. The Group does not holdany collateral or other credit enhancements to cover its credit risks associated with its financial assets.
In order to minimise the credit risk, the management of the Group has delegated a team responsible fordetermination of credit limits, credit approvals and other monitoring procedures to ensure that follow-up action istaken to recover overdue debts. The amounts presented in the combined statements of financial position are net ofallowances for doubtful receivables, if any, estimated by the Group’s management based on prior experience and thecurrent economic environment.
The Group performs impairment assessment under ECL model upon application of IFRS 9 on January 1, 2018(year ended December 31, 2017: incurred loss model) on financial assets individually or based on provision matrix.The Group also reviews the recoverable amount of each debtor at the end of each reporting period to ensure thatadequate impairment losses are made for irrecoverable amounts. In this regard, the management of the Groupconsider that the Group’s credit risk is significantly reduced.
APPENDIX I ACCOUNTANTS’ REPORT
– I-70 –
THIS DOCUMENT IS IN DRAFT FORM, INCOMPLETE AND SUBJECT TO CHANGE AND THAT INFORMATION MUST BEREAD IN CONJUNCTION WITH THE SECTION HEADED “WARNING” ON THE COVER OF THIS DOCUMENT.
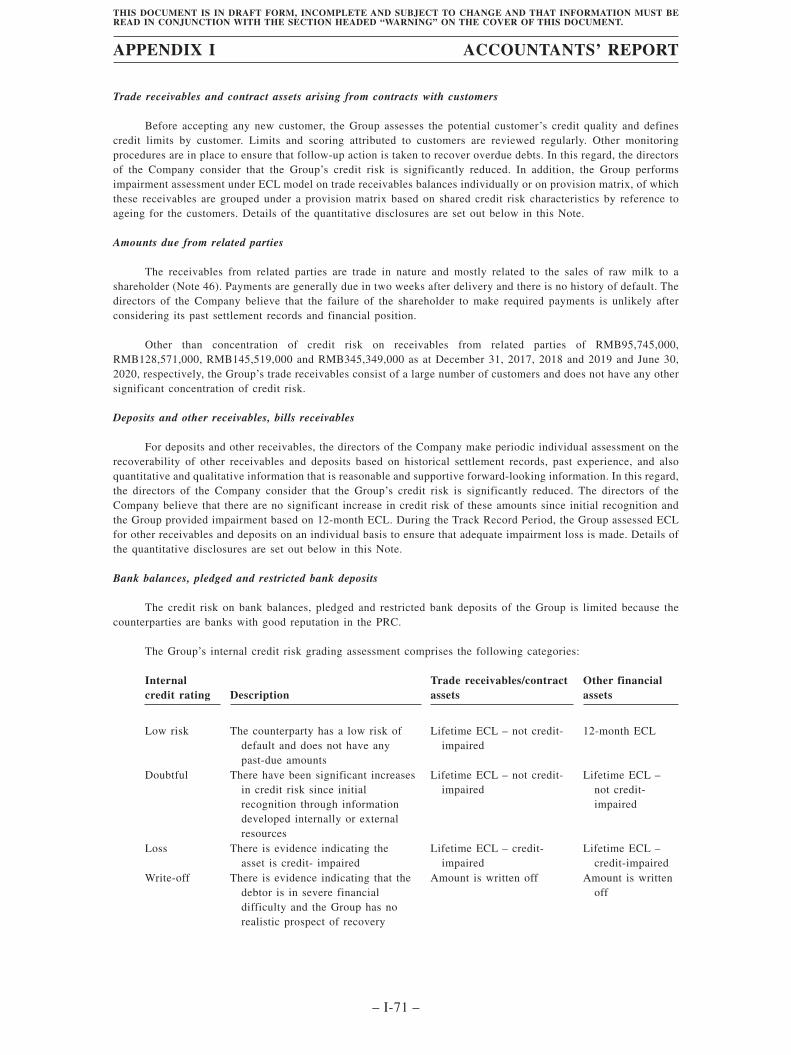
Trade receivables and contract assets arising from contracts with customers
Before accepting any new customer, the Group assesses the potential customer’s credit quality and definescredit limits by customer. Limits and scoring attributed to customers are reviewed regularly. Other monitoringprocedures are in place to ensure that follow-up action is taken to recover overdue debts. In this regard, the directorsof the Company consider that the Group’s credit risk is significantly reduced. In addition, the Group performsimpairment assessment under ECL model on trade receivables balances individually or on provision matrix, of whichthese receivables are grouped under a provision matrix based on shared credit risk characteristics by reference toageing for the customers. Details of the quantitative disclosures are set out below in this Note.
Amounts due from related parties
The receivables from related parties are trade in nature and mostly related to the sales of raw milk to ashareholder (Note 46). Payments are generally due in two weeks after delivery and there is no history of default. Thedirectors of the Company believe that the failure of the shareholder to make required payments is unlikely afterconsidering its past settlement records and financial position.
Other than concentration of credit risk on receivables from related parties of RMB95,745,000,RMB128,571,000, RMB145,519,000 and RMB345,349,000 as at December 31, 2017, 2018 and 2019 and June 30,2020, respectively, the Group’s trade receivables consist of a large number of customers and does not have any othersignificant concentration of credit risk.
Deposits and other receivables, bills receivables
For deposits and other receivables, the directors of the Company make periodic individual assessment on therecoverability of other receivables and deposits based on historical settlement records, past experience, and alsoquantitative and qualitative information that is reasonable and supportive forward-looking information. In this regard,the directors of the Company consider that the Group’s credit risk is significantly reduced. The directors of theCompany believe that there are no significant increase in credit risk of these amounts since initial recognition andthe Group provided impairment based on 12-month ECL. During the Track Record Period, the Group assessed ECLfor other receivables and deposits on an individual basis to ensure that adequate impairment loss is made. Details ofthe quantitative disclosures are set out below in this Note.
Bank balances, pledged and restricted bank deposits
The credit risk on bank balances, pledged and restricted bank deposits of the Group is limited because thecounterparties are banks with good reputation in the PRC.
The Group’s internal credit risk grading assessment comprises the following categories:
Internalcredit rating Description
Trade receivables/contractassets
Other financialassets
Low risk The counterparty has a low risk ofdefault and does not have anypast-due amounts
Lifetime ECL – not credit-impaired
12-month ECL
Doubtful There have been significant increasesin credit risk since initialrecognition through informationdeveloped internally or externalresources
Lifetime ECL – not credit-impaired
Lifetime ECL –not credit-impaired
Loss There is evidence indicating theasset is credit- impaired
Lifetime ECL – credit-impaired
Lifetime ECL –credit-impaired
Write-off There is evidence indicating that thedebtor is in severe financialdifficulty and the Group has norealistic prospect of recovery
Amount is written off Amount is writtenoff
APPENDIX I ACCOUNTANTS’ REPORT
– I-71 –
THIS DOCUMENT IS IN DRAFT FORM, INCOMPLETE AND SUBJECT TO CHANGE AND THAT INFORMATION MUST BEREAD IN CONJUNCTION WITH THE SECTION HEADED “WARNING” ON THE COVER OF THIS DOCUMENT.
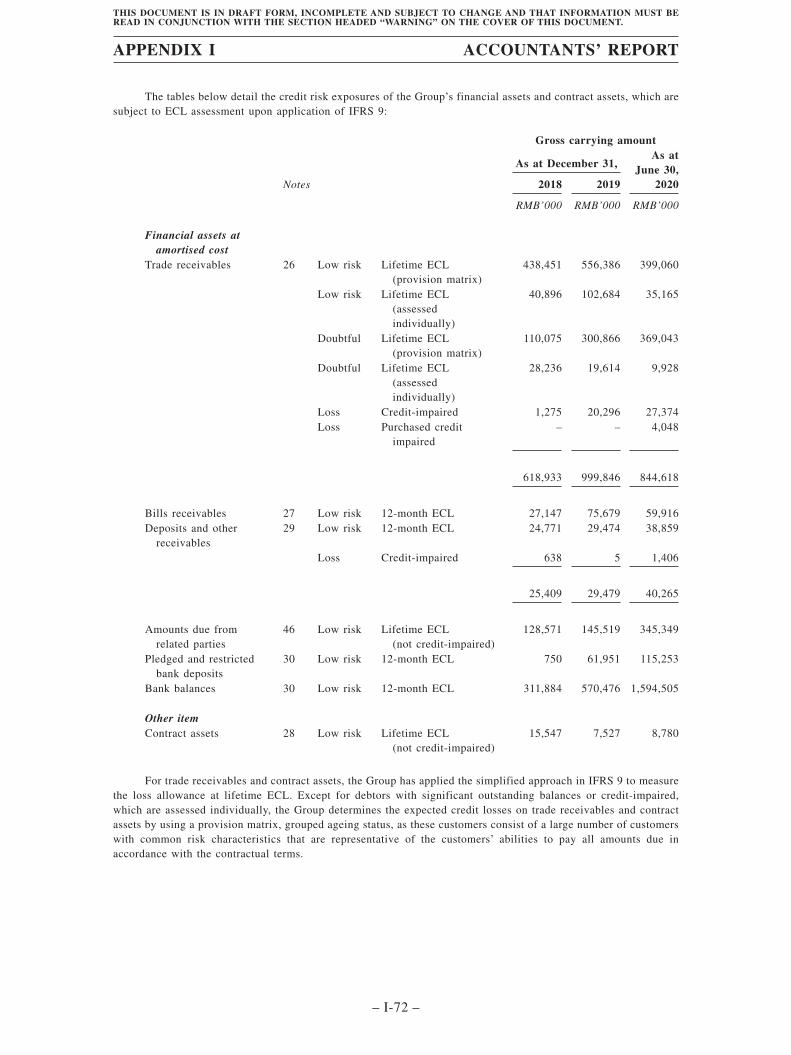
The tables below detail the credit risk exposures of the Group’s financial assets and contract assets, which aresubject to ECL assessment upon application of IFRS 9:
Gross carrying amount
As at December 31,As at
June 30,2020Notes 2018 2019
RMB’000 RMB’000 RMB’000
Financial assets atamortised cost
Trade receivables 26 Low risk Lifetime ECL(provision matrix)
438,451 556,386 399,060
Low risk Lifetime ECL(assessedindividually)
40,896 102,684 35,165
Doubtful Lifetime ECL(provision matrix)
110,075 300,866 369,043
Doubtful Lifetime ECL(assessedindividually)
28,236 19,614 9,928
Loss Credit-impaired 1,275 20,296 27,374Loss Purchased credit
impaired– – 4,048
618,933 999,846 844,618
Bills receivables 27 Low risk 12-month ECL 27,147 75,679 59,916Deposits and other
receivables29 Low risk 12-month ECL 24,771 29,474 38,859
Loss Credit-impaired 638 5 1,406
25,409 29,479 40,265
Amounts due fromrelated parties
46 Low risk Lifetime ECL(not credit-impaired)
128,571 145,519 345,349
Pledged and restrictedbank deposits
30 Low risk 12-month ECL 750 61,951 115,253
Bank balances 30 Low risk 12-month ECL 311,884 570,476 1,594,505
Other itemContract assets 28 Low risk Lifetime ECL
(not credit-impaired)15,547 7,527 8,780
For trade receivables and contract assets, the Group has applied the simplified approach in IFRS 9 to measurethe loss allowance at lifetime ECL. Except for debtors with significant outstanding balances or credit-impaired,which are assessed individually, the Group determines the expected credit losses on trade receivables and contractassets by using a provision matrix, grouped ageing status, as these customers consist of a large number of customerswith common risk characteristics that are representative of the customers’ abilities to pay all amounts due inaccordance with the contractual terms.
APPENDIX I ACCOUNTANTS’ REPORT
– I-72 –
THIS DOCUMENT IS IN DRAFT FORM, INCOMPLETE AND SUBJECT TO CHANGE AND THAT INFORMATION MUST BEREAD IN CONJUNCTION WITH THE SECTION HEADED “WARNING” ON THE COVER OF THIS DOCUMENT.
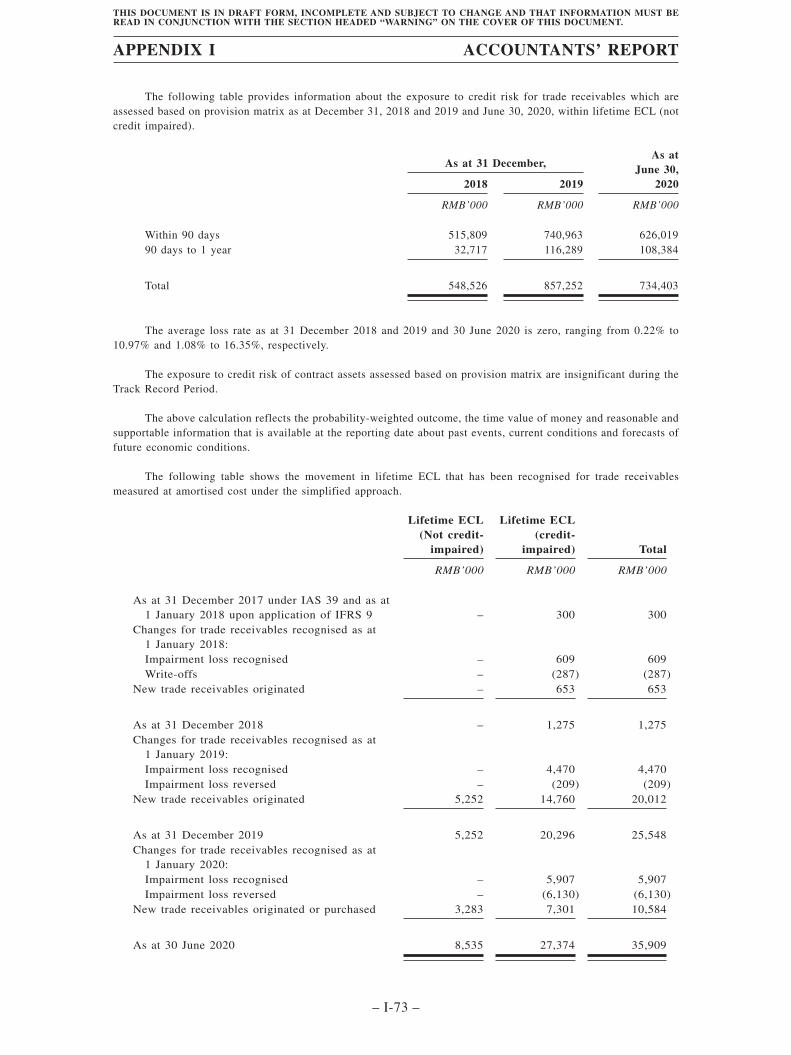
The following table provides information about the exposure to credit risk for trade receivables which areassessed based on provision matrix as at December 31, 2018 and 2019 and June 30, 2020, within lifetime ECL (notcredit impaired).
As at 31 December,As at
June 30,20202018 2019
RMB’000 RMB’000 RMB’000
Within 90 days 515,809 740,963 626,01990 days to 1 year 32,717 116,289 108,384
Total 548,526 857,252 734,403
The average loss rate as at 31 December 2018 and 2019 and 30 June 2020 is zero, ranging from 0.22% to10.97% and 1.08% to 16.35%, respectively.
The exposure to credit risk of contract assets assessed based on provision matrix are insignificant during theTrack Record Period.
The above calculation reflects the probability-weighted outcome, the time value of money and reasonable andsupportable information that is available at the reporting date about past events, current conditions and forecasts offuture economic conditions.
The following table shows the movement in lifetime ECL that has been recognised for trade receivablesmeasured at amortised cost under the simplified approach.
Lifetime ECL(Not credit-
impaired)
Lifetime ECL(credit-
impaired) Total
RMB’000 RMB’000 RMB’000
As at 31 December 2017 under IAS 39 and as at1 January 2018 upon application of IFRS 9 – 300 300
Changes for trade receivables recognised as at1 January 2018:Impairment loss recognised – 609 609Write-offs – (287) (287)
New trade receivables originated – 653 653
As at 31 December 2018 – 1,275 1,275Changes for trade receivables recognised as at
1 January 2019:Impairment loss recognised – 4,470 4,470Impairment loss reversed – (209) (209)
New trade receivables originated 5,252 14,760 20,012
As at 31 December 2019 5,252 20,296 25,548Changes for trade receivables recognised as at
1 January 2020:Impairment loss recognised – 5,907 5,907Impairment loss reversed – (6,130) (6,130)
New trade receivables originated or purchased 3,283 7,301 10,584
As at 30 June 2020 8,535 27,374 35,909
APPENDIX I ACCOUNTANTS’ REPORT
– I-73 –
THIS DOCUMENT IS IN DRAFT FORM, INCOMPLETE AND SUBJECT TO CHANGE AND THAT INFORMATION MUST BEREAD IN CONJUNCTION WITH THE SECTION HEADED “WARNING” ON THE COVER OF THIS DOCUMENT.
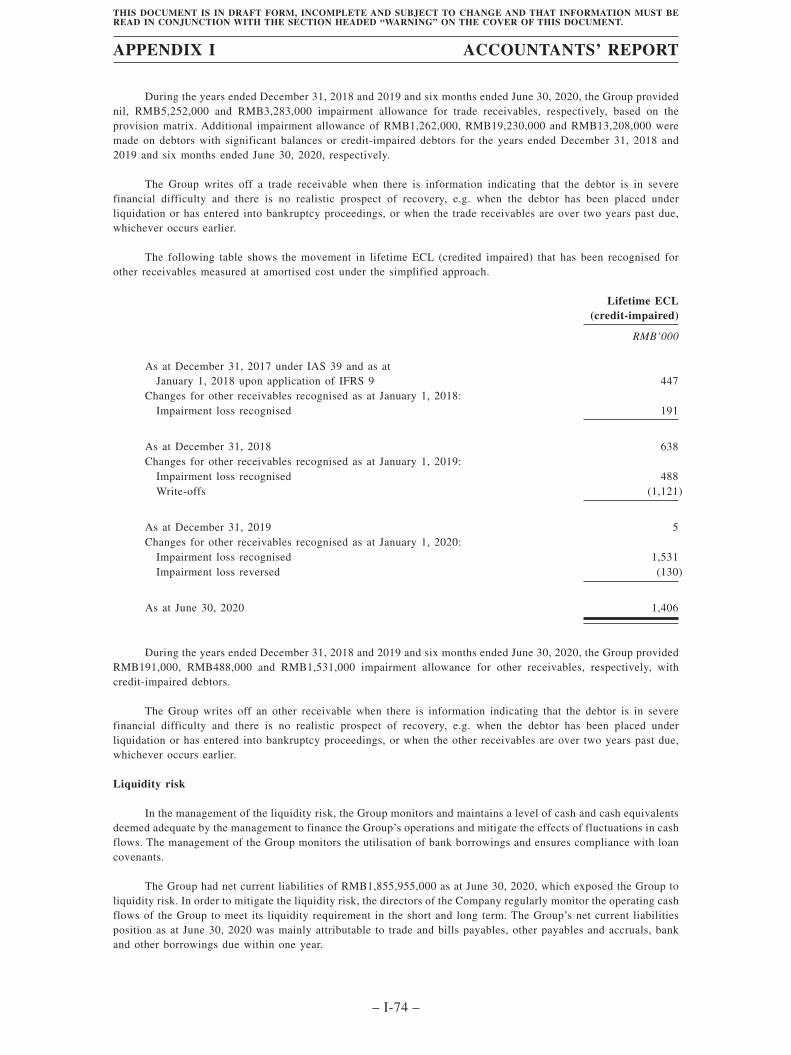
During the years ended December 31, 2018 and 2019 and six months ended June 30, 2020, the Group providednil, RMB5,252,000 and RMB3,283,000 impairment allowance for trade receivables, respectively, based on theprovision matrix. Additional impairment allowance of RMB1,262,000, RMB19,230,000 and RMB13,208,000 weremade on debtors with significant balances or credit-impaired debtors for the years ended December 31, 2018 and2019 and six months ended June 30, 2020, respectively.
The Group writes off a trade receivable when there is information indicating that the debtor is in severefinancial difficulty and there is no realistic prospect of recovery, e.g. when the debtor has been placed underliquidation or has entered into bankruptcy proceedings, or when the trade receivables are over two years past due,whichever occurs earlier.
The following table shows the movement in lifetime ECL (credited impaired) that has been recognised forother receivables measured at amortised cost under the simplified approach.
Lifetime ECL(credit-impaired)
RMB’000
As at December 31, 2017 under IAS 39 and as atJanuary 1, 2018 upon application of IFRS 9 447
Changes for other receivables recognised as at January 1, 2018:Impairment loss recognised 191
As at December 31, 2018 638Changes for other receivables recognised as at January 1, 2019:
Impairment loss recognised 488Write-offs (1,121)
As at December 31, 2019 5Changes for other receivables recognised as at January 1, 2020:
Impairment loss recognised 1,531Impairment loss reversed (130)
As at June 30, 2020 1,406
During the years ended December 31, 2018 and 2019 and six months ended June 30, 2020, the Group providedRMB191,000, RMB488,000 and RMB1,531,000 impairment allowance for other receivables, respectively, withcredit-impaired debtors.
The Group writes off an other receivable when there is information indicating that the debtor is in severefinancial difficulty and there is no realistic prospect of recovery, e.g. when the debtor has been placed underliquidation or has entered into bankruptcy proceedings, or when the other receivables are over two years past due,whichever occurs earlier.
Liquidity risk
In the management of the liquidity risk, the Group monitors and maintains a level of cash and cash equivalentsdeemed adequate by the management to finance the Group’s operations and mitigate the effects of fluctuations in cashflows. The management of the Group monitors the utilisation of bank borrowings and ensures compliance with loancovenants.
The Group had net current liabilities of RMB1,855,955,000 as at June 30, 2020, which exposed the Group toliquidity risk. In order to mitigate the liquidity risk, the directors of the Company regularly monitor the operating cashflows of the Group to meet its liquidity requirement in the short and long term. The Group’s net current liabilitiesposition as at June 30, 2020 was mainly attributable to trade and bills payables, other payables and accruals, bankand other borrowings due within one year.
APPENDIX I ACCOUNTANTS’ REPORT
– I-74 –
THIS DOCUMENT IS IN DRAFT FORM, INCOMPLETE AND SUBJECT TO CHANGE AND THAT INFORMATION MUST BEREAD IN CONJUNCTION WITH THE SECTION HEADED “WARNING” ON THE COVER OF THIS DOCUMENT.
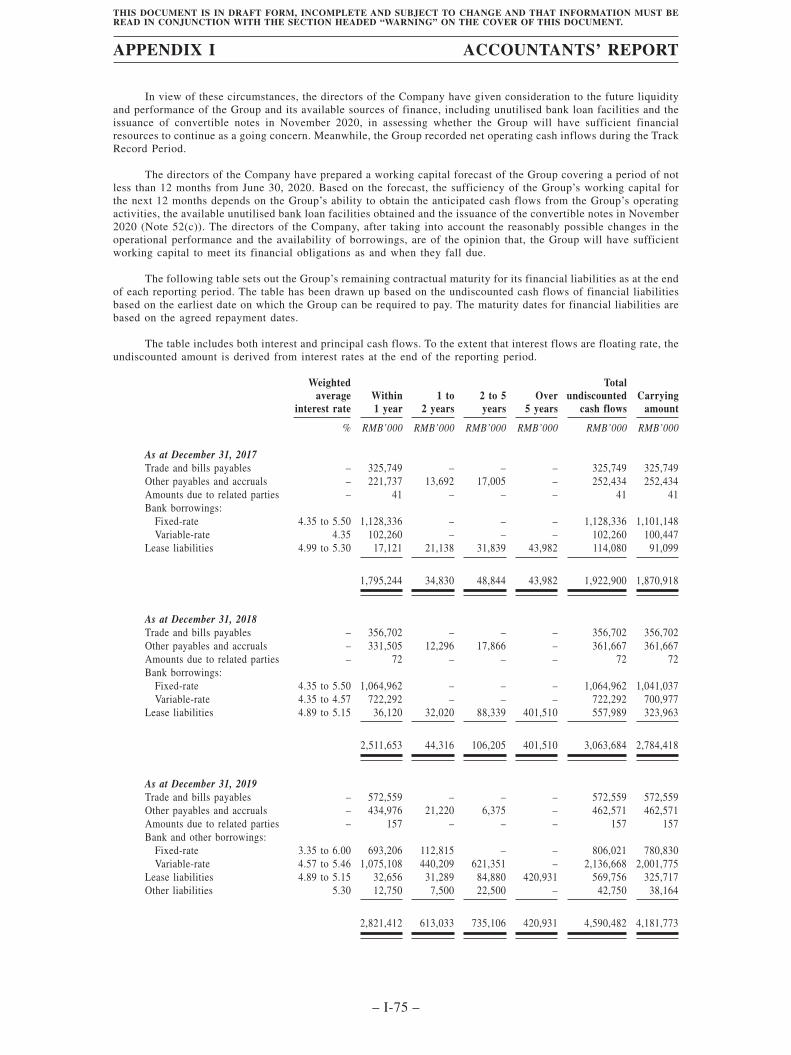
In view of these circumstances, the directors of the Company have given consideration to the future liquidityand performance of the Group and its available sources of finance, including unutilised bank loan facilities and theissuance of convertible notes in November 2020, in assessing whether the Group will have sufficient financialresources to continue as a going concern. Meanwhile, the Group recorded net operating cash inflows during the TrackRecord Period.
The directors of the Company have prepared a working capital forecast of the Group covering a period of notless than 12 months from June 30, 2020. Based on the forecast, the sufficiency of the Group’s working capital forthe next 12 months depends on the Group’s ability to obtain the anticipated cash flows from the Group’s operatingactivities, the available unutilised bank loan facilities obtained and the issuance of the convertible notes in November2020 (Note 52(c)). The directors of the Company, after taking into account the reasonably possible changes in theoperational performance and the availability of borrowings, are of the opinion that, the Group will have sufficientworking capital to meet its financial obligations as and when they fall due.
The following table sets out the Group’s remaining contractual maturity for its financial liabilities as at the endof each reporting period. The table has been drawn up based on the undiscounted cash flows of financial liabilitiesbased on the earliest date on which the Group can be required to pay. The maturity dates for financial liabilities arebased on the agreed repayment dates.
The table includes both interest and principal cash flows. To the extent that interest flows are floating rate, theundiscounted amount is derived from interest rates at the end of the reporting period.
Weightedaverage
interest rateWithin1 year
1 to2 years
2 to 5years
Over5 years
Totalundiscounted
cash flowsCarrying
amount
% RMB’000 RMB’000 RMB’000 RMB’000 RMB’000 RMB’000
As at December 31, 2017Trade and bills payables – 325,749 – – – 325,749 325,749Other payables and accruals – 221,737 13,692 17,005 – 252,434 252,434Amounts due to related parties – 41 – – – 41 41Bank borrowings:
Fixed-rate 4.35 to 5.50 1,128,336 – – – 1,128,336 1,101,148Variable-rate 4.35 102,260 – – – 102,260 100,447
Lease liabilities 4.99 to 5.30 17,121 21,138 31,839 43,982 114,080 91,099
1,795,244 34,830 48,844 43,982 1,922,900 1,870,918
As at December 31, 2018Trade and bills payables – 356,702 – – – 356,702 356,702Other payables and accruals – 331,505 12,296 17,866 – 361,667 361,667Amounts due to related parties – 72 – – – 72 72Bank borrowings:
Fixed-rate 4.35 to 5.50 1,064,962 – – – 1,064,962 1,041,037Variable-rate 4.35 to 4.57 722,292 – – – 722,292 700,977
Lease liabilities 4.89 to 5.15 36,120 32,020 88,339 401,510 557,989 323,963
2,511,653 44,316 106,205 401,510 3,063,684 2,784,418
As at December 31, 2019Trade and bills payables – 572,559 – – – 572,559 572,559Other payables and accruals – 434,976 21,220 6,375 – 462,571 462,571Amounts due to related parties – 157 – – – 157 157Bank and other borrowings:
Fixed-rate 3.35 to 6.00 693,206 112,815 – – 806,021 780,830Variable-rate 4.57 to 5.46 1,075,108 440,209 621,351 – 2,136,668 2,001,775
Lease liabilities 4.89 to 5.15 32,656 31,289 84,880 420,931 569,756 325,717Other liabilities 5.30 12,750 7,500 22,500 – 42,750 38,164
2,821,412 613,033 735,106 420,931 4,590,482 4,181,773
APPENDIX I ACCOUNTANTS’ REPORT
– I-75 –
THIS DOCUMENT IS IN DRAFT FORM, INCOMPLETE AND SUBJECT TO CHANGE AND THAT INFORMATION MUST BEREAD IN CONJUNCTION WITH THE SECTION HEADED “WARNING” ON THE COVER OF THIS DOCUMENT.
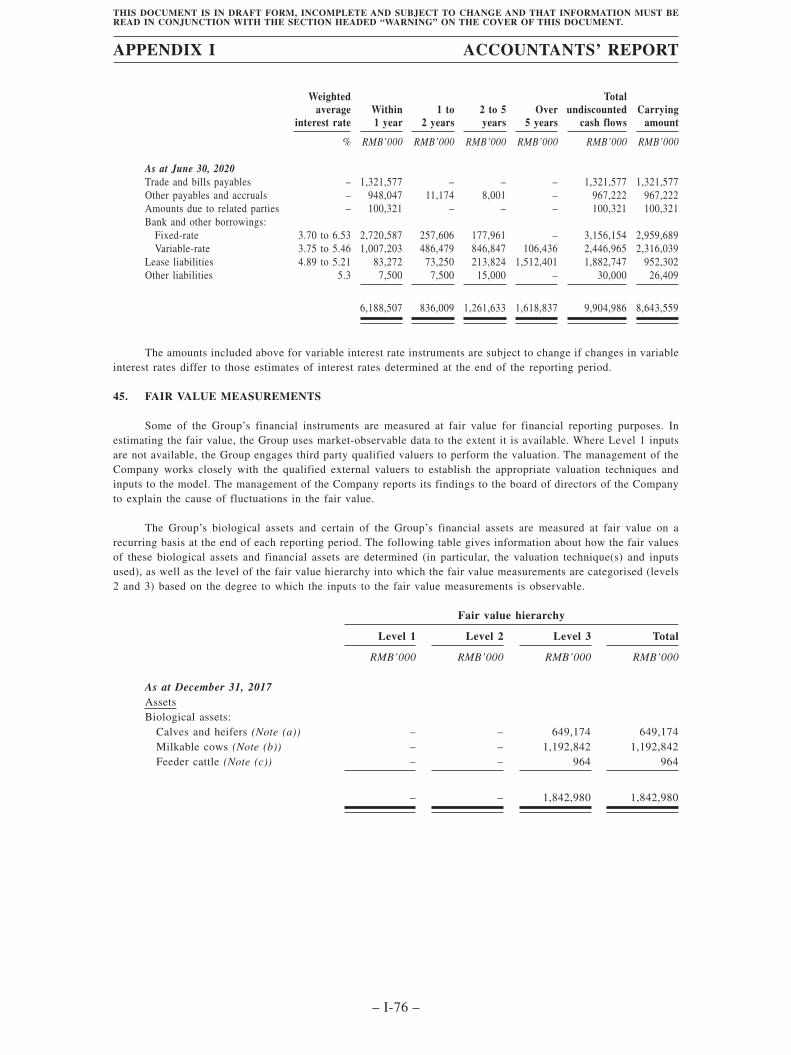
Weightedaverage
interest rateWithin1 year
1 to2 years
2 to 5years
Over5 years
Totalundiscounted
cash flowsCarrying
amount
% RMB’000 RMB’000 RMB’000 RMB’000 RMB’000 RMB’000
As at June 30, 2020Trade and bills payables – 1,321,577 – – – 1,321,577 1,321,577Other payables and accruals – 948,047 11,174 8,001 – 967,222 967,222Amounts due to related parties – 100,321 – – – 100,321 100,321Bank and other borrowings:
Fixed-rate 3.70 to 6.53 2,720,587 257,606 177,961 – 3,156,154 2,959,689Variable-rate 3.75 to 5.46 1,007,203 486,479 846,847 106,436 2,446,965 2,316,039
Lease liabilities 4.89 to 5.21 83,272 73,250 213,824 1,512,401 1,882,747 952,302Other liabilities 5.3 7,500 7,500 15,000 – 30,000 26,409
6,188,507 836,009 1,261,633 1,618,837 9,904,986 8,643,559
The amounts included above for variable interest rate instruments are subject to change if changes in variableinterest rates differ to those estimates of interest rates determined at the end of the reporting period.
45. FAIR VALUE MEASUREMENTS
Some of the Group’s financial instruments are measured at fair value for financial reporting purposes. Inestimating the fair value, the Group uses market-observable data to the extent it is available. Where Level 1 inputsare not available, the Group engages third party qualified valuers to perform the valuation. The management of theCompany works closely with the qualified external valuers to establish the appropriate valuation techniques andinputs to the model. The management of the Company reports its findings to the board of directors of the Companyto explain the cause of fluctuations in the fair value.
The Group’s biological assets and certain of the Group’s financial assets are measured at fair value on arecurring basis at the end of each reporting period. The following table gives information about how the fair valuesof these biological assets and financial assets are determined (in particular, the valuation technique(s) and inputsused), as well as the level of the fair value hierarchy into which the fair value measurements are categorised (levels2 and 3) based on the degree to which the inputs to the fair value measurements is observable.
Fair value hierarchy
Level 1 Level 2 Level 3 Total
RMB’000 RMB’000 RMB’000 RMB’000
As at December 31, 2017AssetsBiological assets:
Calves and heifers (Note (a)) – – 649,174 649,174Milkable cows (Note (b)) – – 1,192,842 1,192,842Feeder cattle (Note (c)) – – 964 964
– – 1,842,980 1,842,980
APPENDIX I ACCOUNTANTS’ REPORT
– I-76 –
THIS DOCUMENT IS IN DRAFT FORM, INCOMPLETE AND SUBJECT TO CHANGE AND THAT INFORMATION MUST BEREAD IN CONJUNCTION WITH THE SECTION HEADED “WARNING” ON THE COVER OF THIS DOCUMENT.
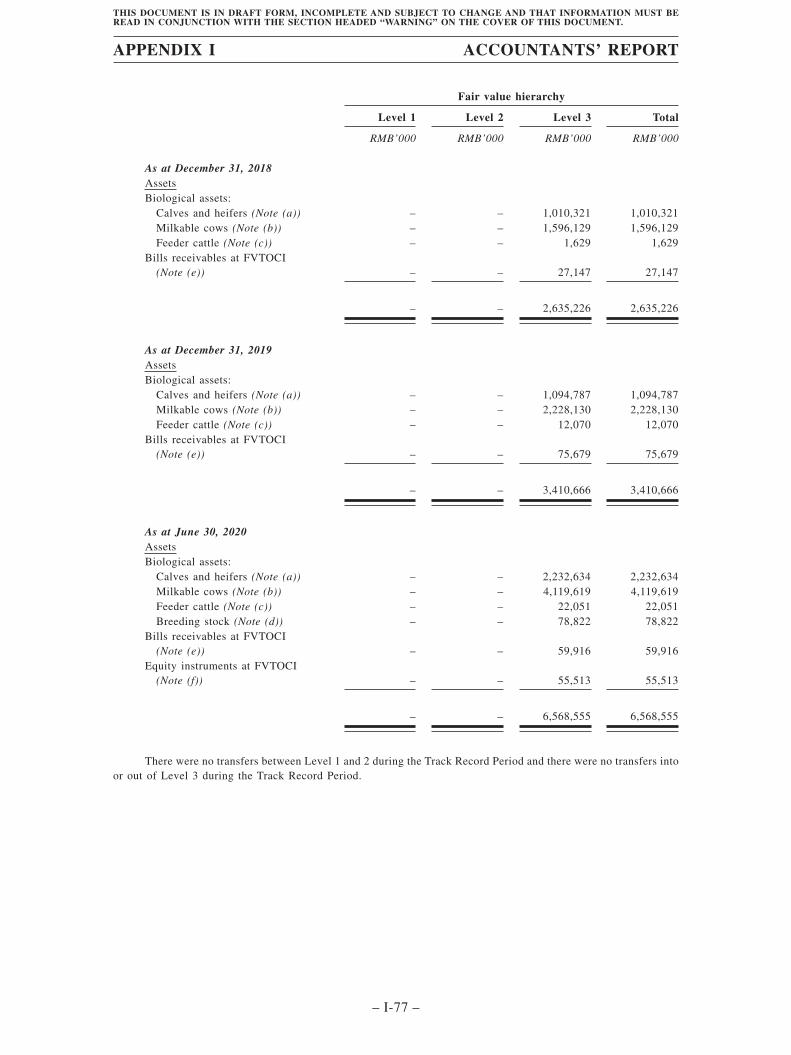
Fair value hierarchy
Level 1 Level 2 Level 3 Total
RMB’000 RMB’000 RMB’000 RMB’000
As at December 31, 2018AssetsBiological assets:
Calves and heifers (Note (a)) – – 1,010,321 1,010,321Milkable cows (Note (b)) – – 1,596,129 1,596,129Feeder cattle (Note (c)) – – 1,629 1,629
Bills receivables at FVTOCI(Note (e)) – – 27,147 27,147
– – 2,635,226 2,635,226
As at December 31, 2019AssetsBiological assets:
Calves and heifers (Note (a)) – – 1,094,787 1,094,787Milkable cows (Note (b)) – – 2,228,130 2,228,130Feeder cattle (Note (c)) – – 12,070 12,070
Bills receivables at FVTOCI(Note (e)) – – 75,679 75,679
– – 3,410,666 3,410,666
As at June 30, 2020AssetsBiological assets:
Calves and heifers (Note (a)) – – 2,232,634 2,232,634Milkable cows (Note (b)) – – 4,119,619 4,119,619Feeder cattle (Note (c)) – – 22,051 22,051Breeding stock (Note (d)) – – 78,822 78,822
Bills receivables at FVTOCI(Note (e)) – – 59,916 59,916
Equity instruments at FVTOCI(Note (f)) – – 55,513 55,513
– – 6,568,555 6,568,555
There were no transfers between Level 1 and 2 during the Track Record Period and there were no transfers intoor out of Level 3 during the Track Record Period.
APPENDIX I ACCOUNTANTS’ REPORT
– I-77 –
THIS DOCUMENT IS IN DRAFT FORM, INCOMPLETE AND SUBJECT TO CHANGE AND THAT INFORMATION MUST BEREAD IN CONJUNCTION WITH THE SECTION HEADED “WARNING” ON THE COVER OF THIS DOCUMENT.
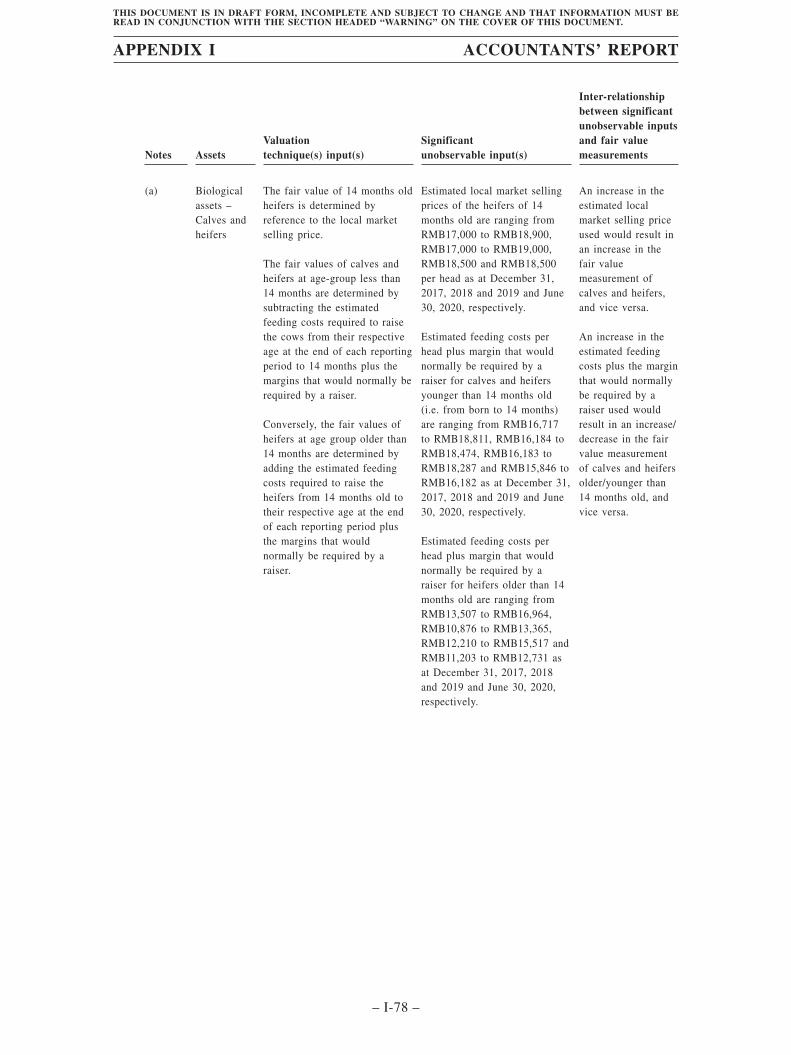
Notes AssetsValuationtechnique(s) input(s)
Significantunobservable input(s)
Inter-relationshipbetween significantunobservable inputsand fair valuemeasurements
(a) Biologicalassets –Calves andheifers
The fair value of 14 months oldheifers is determined byreference to the local marketselling price.
The fair values of calves andheifers at age-group less than14 months are determined bysubtracting the estimatedfeeding costs required to raisethe cows from their respectiveage at the end of each reportingperiod to 14 months plus themargins that would normally berequired by a raiser.
Conversely, the fair values ofheifers at age group older than14 months are determined byadding the estimated feedingcosts required to raise theheifers from 14 months old totheir respective age at the endof each reporting period plusthe margins that wouldnormally be required by araiser.
Estimated local market sellingprices of the heifers of 14months old are ranging fromRMB17,000 to RMB18,900,RMB17,000 to RMB19,000,RMB18,500 and RMB18,500per head as at December 31,2017, 2018 and 2019 and June30, 2020, respectively.
Estimated feeding costs perhead plus margin that wouldnormally be required by araiser for calves and heifersyounger than 14 months old(i.e. from born to 14 months)are ranging from RMB16,717to RMB18,811, RMB16,184 toRMB18,474, RMB16,183 toRMB18,287 and RMB15,846 toRMB16,182 as at December 31,2017, 2018 and 2019 and June30, 2020, respectively.
Estimated feeding costs perhead plus margin that wouldnormally be required by araiser for heifers older than 14months old are ranging fromRMB13,507 to RMB16,964,RMB10,876 to RMB13,365,RMB12,210 to RMB15,517 andRMB11,203 to RMB12,731 asat December 31, 2017, 2018and 2019 and June 30, 2020,respectively.
An increase in theestimated localmarket selling priceused would result inan increase in thefair valuemeasurement ofcalves and heifers,and vice versa.
An increase in theestimated feedingcosts plus the marginthat would normallybe required by araiser used wouldresult in an increase/decrease in the fairvalue measurementof calves and heifersolder/younger than14 months old, andvice versa.
APPENDIX I ACCOUNTANTS’ REPORT
– I-78 –
THIS DOCUMENT IS IN DRAFT FORM, INCOMPLETE AND SUBJECT TO CHANGE AND THAT INFORMATION MUST BEREAD IN CONJUNCTION WITH THE SECTION HEADED “WARNING” ON THE COVER OF THIS DOCUMENT.
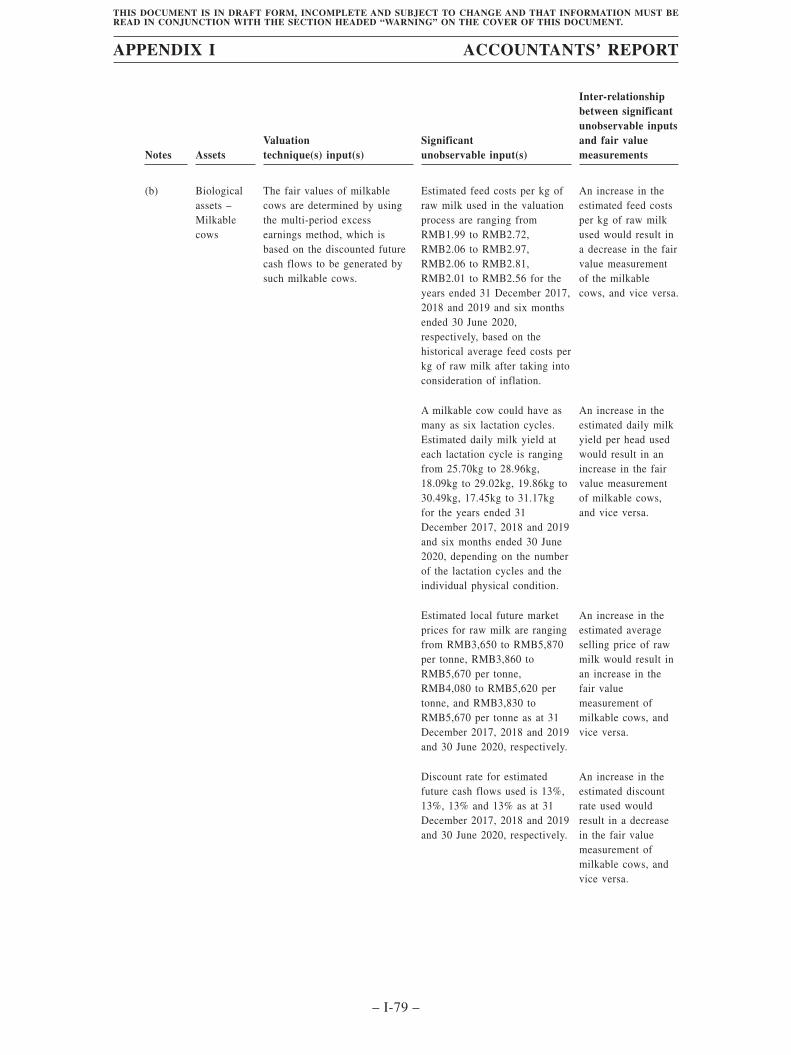
Notes AssetsValuationtechnique(s) input(s)
Significantunobservable input(s)
Inter-relationshipbetween significantunobservable inputsand fair valuemeasurements
(b) Biologicalassets –Milkablecows
The fair values of milkablecows are determined by usingthe multi-period excessearnings method, which isbased on the discounted futurecash flows to be generated bysuch milkable cows.
Estimated feed costs per kg ofraw milk used in the valuationprocess are ranging fromRMB1.99 to RMB2.72,RMB2.06 to RMB2.97,RMB2.06 to RMB2.81,RMB2.01 to RMB2.56 for theyears ended 31 December 2017,2018 and 2019 and six monthsended 30 June 2020,respectively, based on thehistorical average feed costs perkg of raw milk after taking intoconsideration of inflation.
An increase in theestimated feed costsper kg of raw milkused would result ina decrease in the fairvalue measurementof the milkablecows, and vice versa.
A milkable cow could have asmany as six lactation cycles.Estimated daily milk yield ateach lactation cycle is rangingfrom 25.70kg to 28.96kg,18.09kg to 29.02kg, 19.86kg to30.49kg, 17.45kg to 31.17kgfor the years ended 31December 2017, 2018 and 2019and six months ended 30 June2020, depending on the numberof the lactation cycles and theindividual physical condition.
An increase in theestimated daily milkyield per head usedwould result in anincrease in the fairvalue measurementof milkable cows,and vice versa.
Estimated local future marketprices for raw milk are rangingfrom RMB3,650 to RMB5,870per tonne, RMB3,860 toRMB5,670 per tonne,RMB4,080 to RMB5,620 pertonne, and RMB3,830 toRMB5,670 per tonne as at 31December 2017, 2018 and 2019and 30 June 2020, respectively.
An increase in theestimated averageselling price of rawmilk would result inan increase in thefair valuemeasurement ofmilkable cows, andvice versa.
Discount rate for estimatedfuture cash flows used is 13%,13%, 13% and 13% as at 31December 2017, 2018 and 2019and 30 June 2020, respectively.
An increase in theestimated discountrate used wouldresult in a decreasein the fair valuemeasurement ofmilkable cows, andvice versa.
APPENDIX I ACCOUNTANTS’ REPORT
– I-79 –
THIS DOCUMENT IS IN DRAFT FORM, INCOMPLETE AND SUBJECT TO CHANGE AND THAT INFORMATION MUST BEREAD IN CONJUNCTION WITH THE SECTION HEADED “WARNING” ON THE COVER OF THIS DOCUMENT.
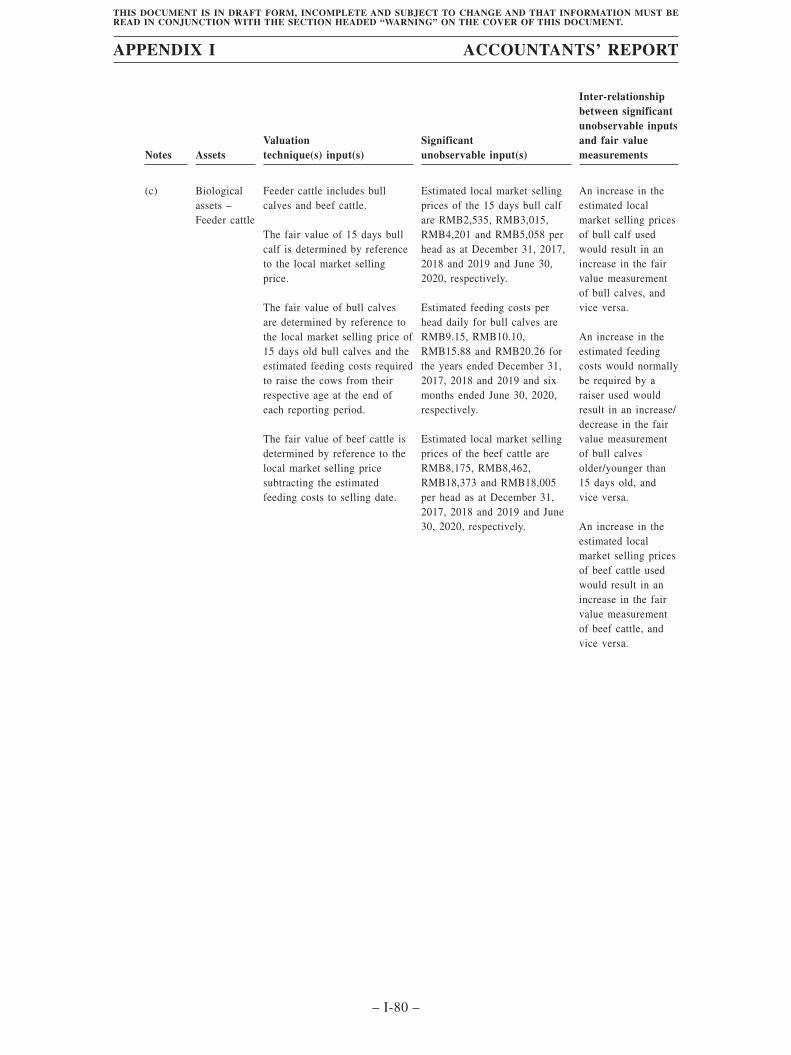
Notes AssetsValuationtechnique(s) input(s)
Significantunobservable input(s)
Inter-relationshipbetween significantunobservable inputsand fair valuemeasurements
(c) Biologicalassets –Feeder cattle
Feeder cattle includes bullcalves and beef cattle.
The fair value of 15 days bullcalf is determined by referenceto the local market sellingprice.
The fair value of bull calvesare determined by reference tothe local market selling price of15 days old bull calves and theestimated feeding costs requiredto raise the cows from theirrespective age at the end ofeach reporting period.
The fair value of beef cattle isdetermined by reference to thelocal market selling pricesubtracting the estimatedfeeding costs to selling date.
Estimated local market sellingprices of the 15 days bull calfare RMB2,535, RMB3,015,RMB4,201 and RMB5,058 perhead as at December 31, 2017,2018 and 2019 and June 30,2020, respectively.
Estimated feeding costs perhead daily for bull calves areRMB9.15, RMB10.10,RMB15.88 and RMB20.26 forthe years ended December 31,2017, 2018 and 2019 and sixmonths ended June 30, 2020,respectively.
Estimated local market sellingprices of the beef cattle areRMB8,175, RMB8,462,RMB18,373 and RMB18,005per head as at December 31,2017, 2018 and 2019 and June30, 2020, respectively.
An increase in theestimated localmarket selling pricesof bull calf usedwould result in anincrease in the fairvalue measurementof bull calves, andvice versa.
An increase in theestimated feedingcosts would normallybe required by araiser used wouldresult in an increase/decrease in the fairvalue measurementof bull calvesolder/younger than15 days old, andvice versa.
An increase in theestimated localmarket selling pricesof beef cattle usedwould result in anincrease in the fairvalue measurementof beef cattle, andvice versa.
APPENDIX I ACCOUNTANTS’ REPORT
– I-80 –
THIS DOCUMENT IS IN DRAFT FORM, INCOMPLETE AND SUBJECT TO CHANGE AND THAT INFORMATION MUST BEREAD IN CONJUNCTION WITH THE SECTION HEADED “WARNING” ON THE COVER OF THIS DOCUMENT.
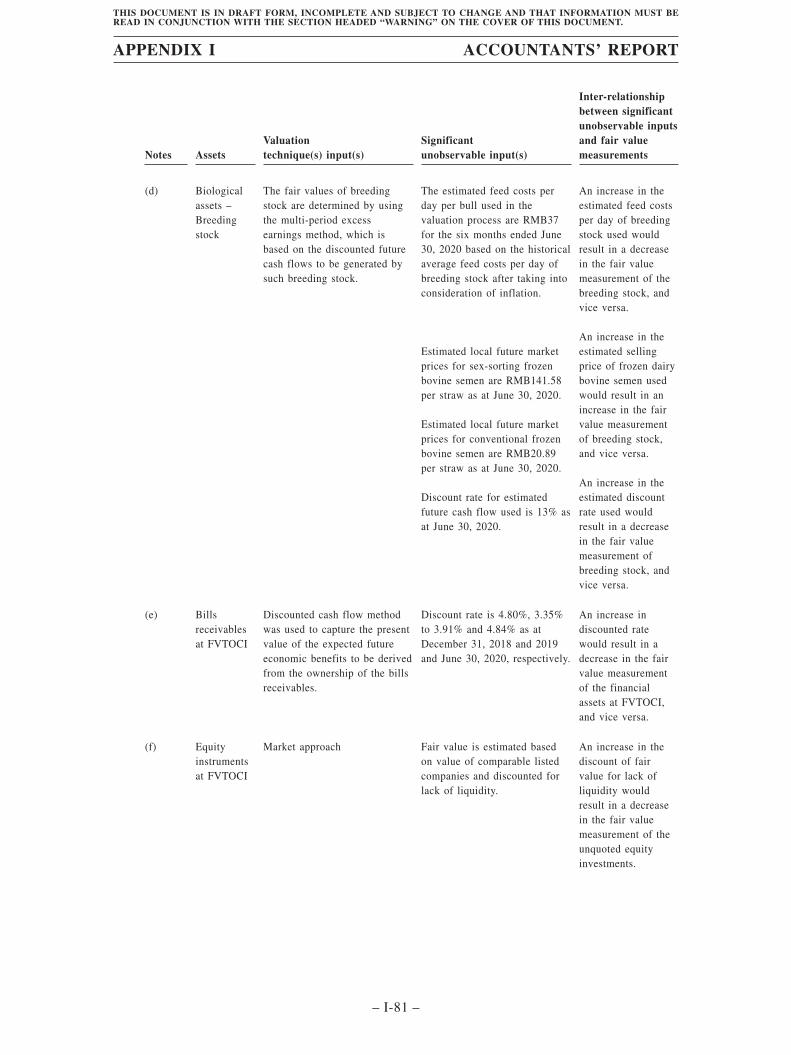
Notes AssetsValuationtechnique(s) input(s)
Significantunobservable input(s)
Inter-relationshipbetween significantunobservable inputsand fair valuemeasurements
(d) Biologicalassets –Breedingstock
The fair values of breedingstock are determined by usingthe multi-period excessearnings method, which isbased on the discounted futurecash flows to be generated bysuch breeding stock.
The estimated feed costs perday per bull used in thevaluation process are RMB37for the six months ended June30, 2020 based on the historicalaverage feed costs per day ofbreeding stock after taking intoconsideration of inflation.
Estimated local future marketprices for sex-sorting frozenbovine semen are RMB141.58per straw as at June 30, 2020.
Estimated local future marketprices for conventional frozenbovine semen are RMB20.89per straw as at June 30, 2020.
Discount rate for estimatedfuture cash flow used is 13% asat June 30, 2020.
An increase in theestimated feed costsper day of breedingstock used wouldresult in a decreasein the fair valuemeasurement of thebreeding stock, andvice versa.
An increase in theestimated sellingprice of frozen dairybovine semen usedwould result in anincrease in the fairvalue measurementof breeding stock,and vice versa.
An increase in theestimated discountrate used wouldresult in a decreasein the fair valuemeasurement ofbreeding stock, andvice versa.
(e) Billsreceivablesat FVTOCI
Discounted cash flow methodwas used to capture the presentvalue of the expected futureeconomic benefits to be derivedfrom the ownership of the billsreceivables.
Discount rate is 4.80%, 3.35%to 3.91% and 4.84% as atDecember 31, 2018 and 2019and June 30, 2020, respectively.
An increase indiscounted ratewould result in adecrease in the fairvalue measurementof the financialassets at FVTOCI,and vice versa.
(f) Equityinstrumentsat FVTOCI
Market approach Fair value is estimated basedon value of comparable listedcompanies and discounted forlack of liquidity.
An increase in thediscount of fairvalue for lack ofliquidity wouldresult in a decreasein the fair valuemeasurement of theunquoted equityinvestments.
APPENDIX I ACCOUNTANTS’ REPORT
– I-81 –
THIS DOCUMENT IS IN DRAFT FORM, INCOMPLETE AND SUBJECT TO CHANGE AND THAT INFORMATION MUST BEREAD IN CONJUNCTION WITH THE SECTION HEADED “WARNING” ON THE COVER OF THIS DOCUMENT.
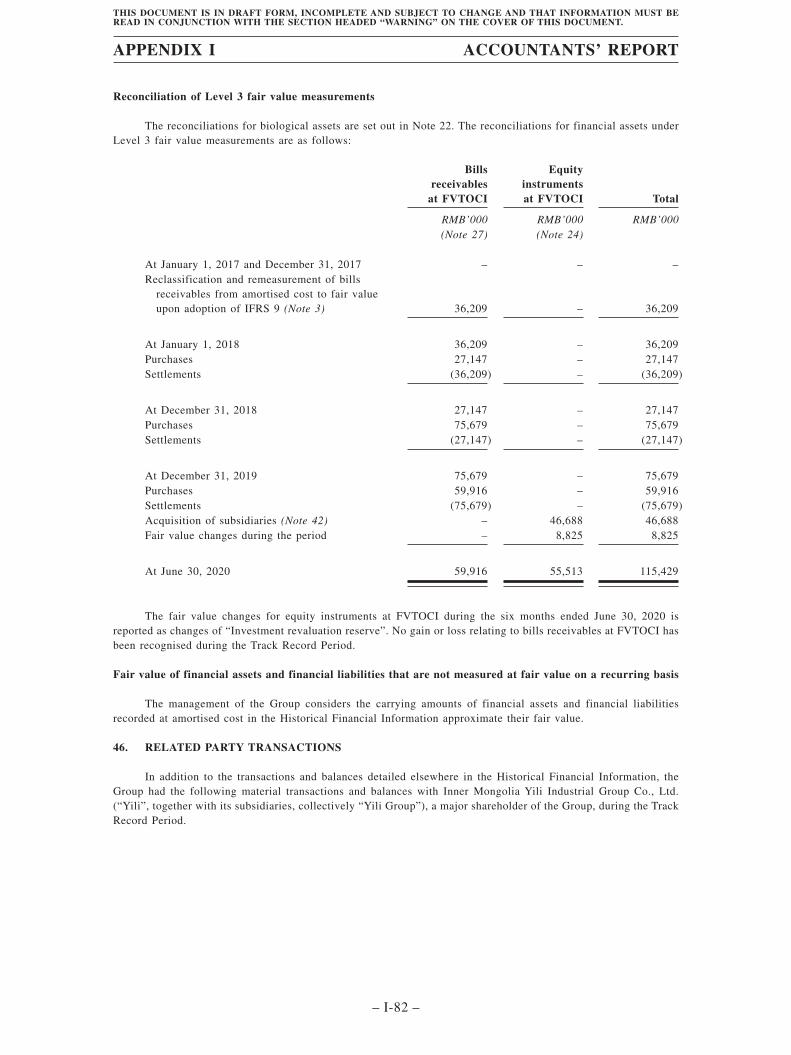
Reconciliation of Level 3 fair value measurements
The reconciliations for biological assets are set out in Note 22. The reconciliations for financial assets underLevel 3 fair value measurements are as follows:
Billsreceivables
at FVTOCI
Equityinstrumentsat FVTOCI Total
RMB’000 RMB’000 RMB’000(Note 27) (Note 24)
At January 1, 2017 and December 31, 2017 – – –Reclassification and remeasurement of bills
receivables from amortised cost to fair valueupon adoption of IFRS 9 (Note 3) 36,209 – 36,209
At January 1, 2018 36,209 – 36,209Purchases 27,147 – 27,147Settlements (36,209) – (36,209)
At December 31, 2018 27,147 – 27,147Purchases 75,679 – 75,679Settlements (27,147) – (27,147)
At December 31, 2019 75,679 – 75,679Purchases 59,916 – 59,916Settlements (75,679) – (75,679)Acquisition of subsidiaries (Note 42) – 46,688 46,688Fair value changes during the period – 8,825 8,825
At June 30, 2020 59,916 55,513 115,429
The fair value changes for equity instruments at FVTOCI during the six months ended June 30, 2020 isreported as changes of “Investment revaluation reserve”. No gain or loss relating to bills receivables at FVTOCI hasbeen recognised during the Track Record Period.
Fair value of financial assets and financial liabilities that are not measured at fair value on a recurring basis
The management of the Group considers the carrying amounts of financial assets and financial liabilitiesrecorded at amortised cost in the Historical Financial Information approximate their fair value.
46. RELATED PARTY TRANSACTIONS
In addition to the transactions and balances detailed elsewhere in the Historical Financial Information, theGroup had the following material transactions and balances with Inner Mongolia Yili Industrial Group Co., Ltd.(“Yili”, together with its subsidiaries, collectively “Yili Group”), a major shareholder of the Group, during the TrackRecord Period.
APPENDIX I ACCOUNTANTS’ REPORT
– I-82 –
THIS DOCUMENT IS IN DRAFT FORM, INCOMPLETE AND SUBJECT TO CHANGE AND THAT INFORMATION MUST BEREAD IN CONJUNCTION WITH THE SECTION HEADED “WARNING” ON THE COVER OF THIS DOCUMENT.
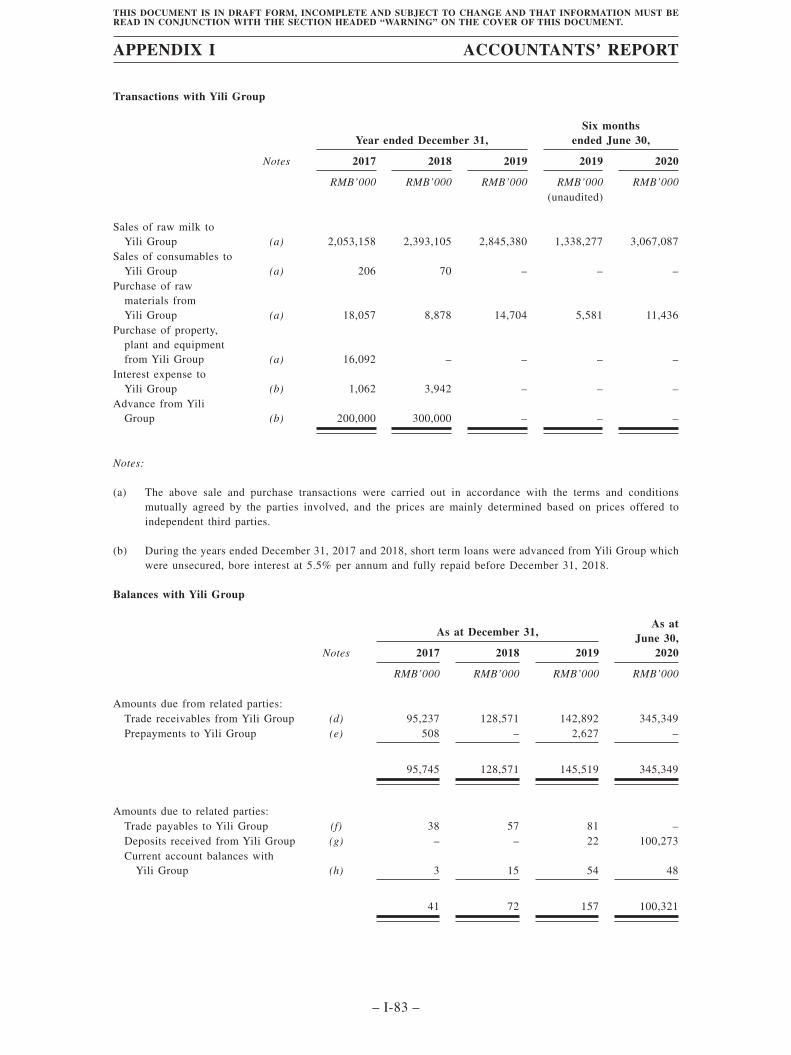
Transactions with Yili Group
Year ended December 31,Six months
ended June 30,
Notes 2017 2018 2019 2019 2020
RMB’000 RMB’000 RMB’000 RMB’000 RMB’000(unaudited)
Sales of raw milk toYili Group (a) 2,053,158 2,393,105 2,845,380 1,338,277 3,067,087
Sales of consumables toYili Group (a) 206 70 – – –
Purchase of rawmaterials fromYili Group (a) 18,057 8,878 14,704 5,581 11,436
Purchase of property,plant and equipmentfrom Yili Group (a) 16,092 – – – –
Interest expense toYili Group (b) 1,062 3,942 – – –
Advance from YiliGroup (b) 200,000 300,000 – – –
Notes:
(a) The above sale and purchase transactions were carried out in accordance with the terms and conditionsmutually agreed by the parties involved, and the prices are mainly determined based on prices offered toindependent third parties.
(b) During the years ended December 31, 2017 and 2018, short term loans were advanced from Yili Group whichwere unsecured, bore interest at 5.5% per annum and fully repaid before December 31, 2018.
Balances with Yili Group
As at December 31,As at
June 30,2020Notes 2017 2018 2019
RMB’000 RMB’000 RMB’000 RMB’000
Amounts due from related parties:Trade receivables from Yili Group (d) 95,237 128,571 142,892 345,349Prepayments to Yili Group (e) 508 – 2,627 –
95,745 128,571 145,519 345,349
Amounts due to related parties:Trade payables to Yili Group (f) 38 57 81 –Deposits received from Yili Group (g) – – 22 100,273Current account balances with
Yili Group (h) 3 15 54 48
41 72 157 100,321
APPENDIX I ACCOUNTANTS’ REPORT
– I-83 –
THIS DOCUMENT IS IN DRAFT FORM, INCOMPLETE AND SUBJECT TO CHANGE AND THAT INFORMATION MUST BEREAD IN CONJUNCTION WITH THE SECTION HEADED “WARNING” ON THE COVER OF THIS DOCUMENT.
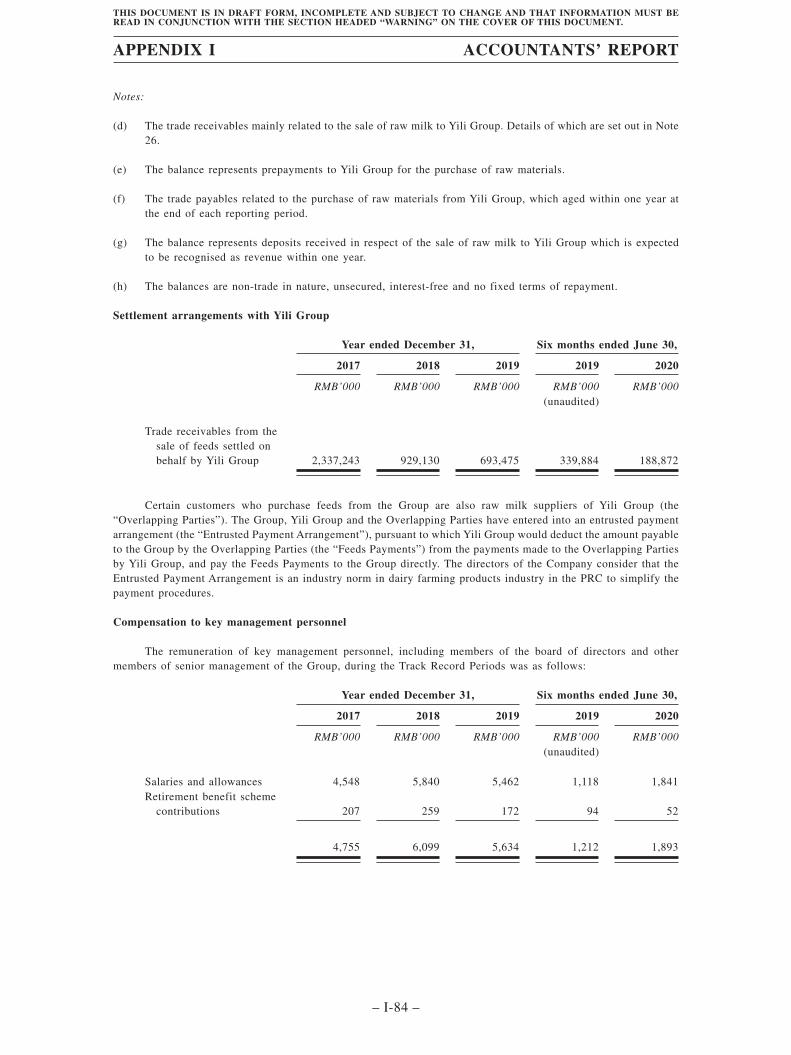
Notes:
(d) The trade receivables mainly related to the sale of raw milk to Yili Group. Details of which are set out in Note26.
(e) The balance represents prepayments to Yili Group for the purchase of raw materials.
(f) The trade payables related to the purchase of raw materials from Yili Group, which aged within one year atthe end of each reporting period.
(g) The balance represents deposits received in respect of the sale of raw milk to Yili Group which is expectedto be recognised as revenue within one year.
(h) The balances are non-trade in nature, unsecured, interest-free and no fixed terms of repayment.
Settlement arrangements with Yili Group
Year ended December 31, Six months ended June 30,
2017 2018 2019 2019 2020
RMB’000 RMB’000 RMB’000 RMB’000 RMB’000(unaudited)
Trade receivables from thesale of feeds settled onbehalf by Yili Group 2,337,243 929,130 693,475 339,884 188,872
Certain customers who purchase feeds from the Group are also raw milk suppliers of Yili Group (the“Overlapping Parties”). The Group, Yili Group and the Overlapping Parties have entered into an entrusted paymentarrangement (the “Entrusted Payment Arrangement”), pursuant to which Yili Group would deduct the amount payableto the Group by the Overlapping Parties (the “Feeds Payments”) from the payments made to the Overlapping Partiesby Yili Group, and pay the Feeds Payments to the Group directly. The directors of the Company consider that theEntrusted Payment Arrangement is an industry norm in dairy farming products industry in the PRC to simplify thepayment procedures.
Compensation to key management personnel
The remuneration of key management personnel, including members of the board of directors and othermembers of senior management of the Group, during the Track Record Periods was as follows:
Year ended December 31, Six months ended June 30,
2017 2018 2019 2019 2020
RMB’000 RMB’000 RMB’000 RMB’000 RMB’000(unaudited)
Salaries and allowances 4,548 5,840 5,462 1,118 1,841Retirement benefit scheme
contributions 207 259 172 94 52
4,755 6,099 5,634 1,212 1,893
APPENDIX I ACCOUNTANTS’ REPORT
– I-84 –
THIS DOCUMENT IS IN DRAFT FORM, INCOMPLETE AND SUBJECT TO CHANGE AND THAT INFORMATION MUST BEREAD IN CONJUNCTION WITH THE SECTION HEADED “WARNING” ON THE COVER OF THIS DOCUMENT.
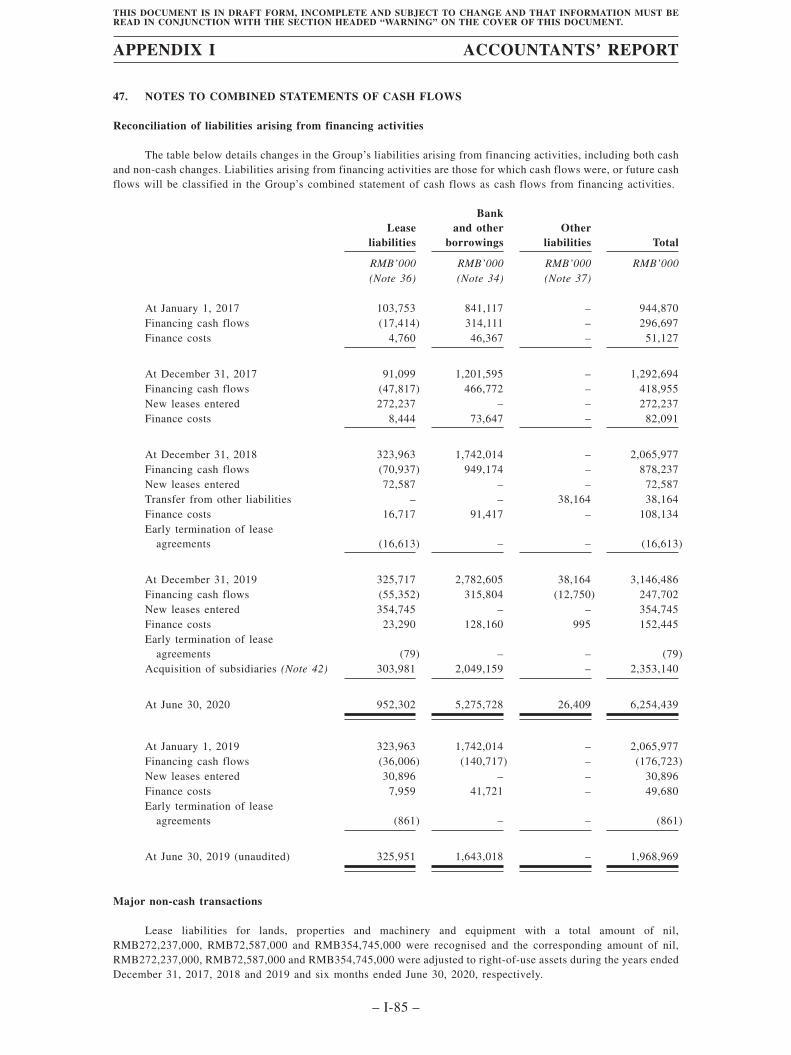
47. NOTES TO COMBINED STATEMENTS OF CASH FLOWS
Reconciliation of liabilities arising from financing activities
The table below details changes in the Group’s liabilities arising from financing activities, including both cashand non-cash changes. Liabilities arising from financing activities are those for which cash flows were, or future cashflows will be classified in the Group’s combined statement of cash flows as cash flows from financing activities.
Leaseliabilities
Bankand other
borrowingsOther
liabilities Total
RMB’000 RMB’000 RMB’000 RMB’000(Note 36) (Note 34) (Note 37)
At January 1, 2017 103,753 841,117 – 944,870Financing cash flows (17,414) 314,111 – 296,697Finance costs 4,760 46,367 – 51,127
At December 31, 2017 91,099 1,201,595 – 1,292,694Financing cash flows (47,817) 466,772 – 418,955New leases entered 272,237 – – 272,237Finance costs 8,444 73,647 – 82,091
At December 31, 2018 323,963 1,742,014 – 2,065,977Financing cash flows (70,937) 949,174 – 878,237New leases entered 72,587 – – 72,587Transfer from other liabilities – – 38,164 38,164Finance costs 16,717 91,417 – 108,134Early termination of lease
agreements (16,613) – – (16,613)
At December 31, 2019 325,717 2,782,605 38,164 3,146,486Financing cash flows (55,352) 315,804 (12,750) 247,702New leases entered 354,745 – – 354,745Finance costs 23,290 128,160 995 152,445Early termination of lease
agreements (79) – – (79)Acquisition of subsidiaries (Note 42) 303,981 2,049,159 – 2,353,140
At June 30, 2020 952,302 5,275,728 26,409 6,254,439
At January 1, 2019 323,963 1,742,014 – 2,065,977Financing cash flows (36,006) (140,717) – (176,723)New leases entered 30,896 – – 30,896Finance costs 7,959 41,721 – 49,680Early termination of lease
agreements (861) – – (861)
At June 30, 2019 (unaudited) 325,951 1,643,018 – 1,968,969
Major non-cash transactions
Lease liabilities for lands, properties and machinery and equipment with a total amount of nil,RMB272,237,000, RMB72,587,000 and RMB354,745,000 were recognised and the corresponding amount of nil,RMB272,237,000, RMB72,587,000 and RMB354,745,000 were adjusted to right-of-use assets during the years endedDecember 31, 2017, 2018 and 2019 and six months ended June 30, 2020, respectively.
APPENDIX I ACCOUNTANTS’ REPORT
– I-85 –
THIS DOCUMENT IS IN DRAFT FORM, INCOMPLETE AND SUBJECT TO CHANGE AND THAT INFORMATION MUST BEREAD IN CONJUNCTION WITH THE SECTION HEADED “WARNING” ON THE COVER OF THIS DOCUMENT.
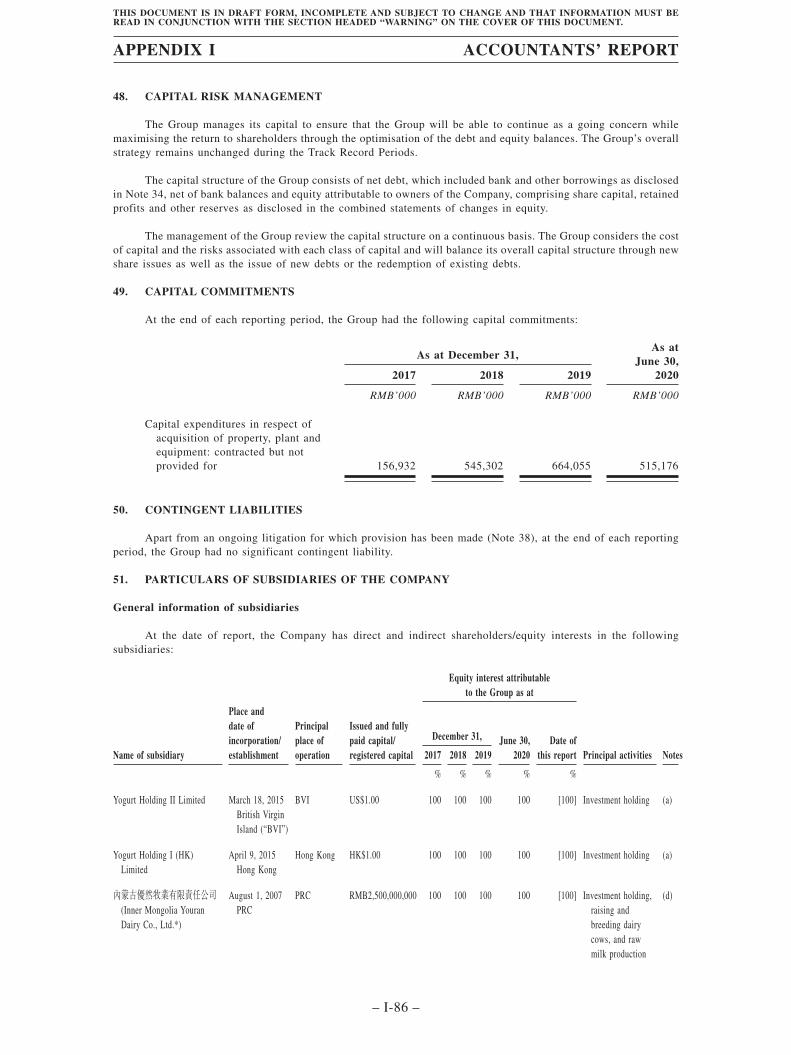
48. CAPITAL RISK MANAGEMENT
The Group manages its capital to ensure that the Group will be able to continue as a going concern whilemaximising the return to shareholders through the optimisation of the debt and equity balances. The Group’s overallstrategy remains unchanged during the Track Record Periods.
The capital structure of the Group consists of net debt, which included bank and other borrowings as disclosedin Note 34, net of bank balances and equity attributable to owners of the Company, comprising share capital, retainedprofits and other reserves as disclosed in the combined statements of changes in equity.
The management of the Group review the capital structure on a continuous basis. The Group considers the costof capital and the risks associated with each class of capital and will balance its overall capital structure through newshare issues as well as the issue of new debts or the redemption of existing debts.
49. CAPITAL COMMITMENTS
At the end of each reporting period, the Group had the following capital commitments:
As at December 31,As at
June 30,20202017 2018 2019
RMB’000 RMB’000 RMB’000 RMB’000
Capital expenditures in respect ofacquisition of property, plant andequipment: contracted but notprovided for 156,932 545,302 664,055 515,176
50. CONTINGENT LIABILITIES
Apart from an ongoing litigation for which provision has been made (Note 38), at the end of each reportingperiod, the Group had no significant contingent liability.
51. PARTICULARS OF SUBSIDIARIES OF THE COMPANY
General information of subsidiaries
At the date of report, the Company has direct and indirect shareholders/equity interests in the followingsubsidiaries:
Equity interest attributableto the Group as at
Name of subsidiary
Place anddate ofincorporation/establishment
Principalplace ofoperation
Issued and fullypaid capital/registered capital
December 31, June 30,2020
Date ofthis report Principal activities Notes2017 2018 2019
% % % % %
Yogurt Holding II Limited March 18, 2015British VirginIsland (“BVI”)
BVI US$1.00 100 100 100 100 [100] Investment holding (a)
Yogurt Holding I (HK)Limited
April 9, 2015Hong Kong
Hong Kong HK$1.00 100 100 100 100 [100] Investment holding (a)
內蒙古優然牧業有限責任公司(Inner Mongolia YouranDairy Co., Ltd.*)
August 1, 2007PRC
PRC RMB2,500,000,000 100 100 100 100 [100] Investment holding,raising andbreeding dairycows, and rawmilk production
(d)
APPENDIX I ACCOUNTANTS’ REPORT
– I-86 –
THIS DOCUMENT IS IN DRAFT FORM, INCOMPLETE AND SUBJECT TO CHANGE AND THAT INFORMATION MUST BEREAD IN CONJUNCTION WITH THE SECTION HEADED “WARNING” ON THE COVER OF THIS DOCUMENT.
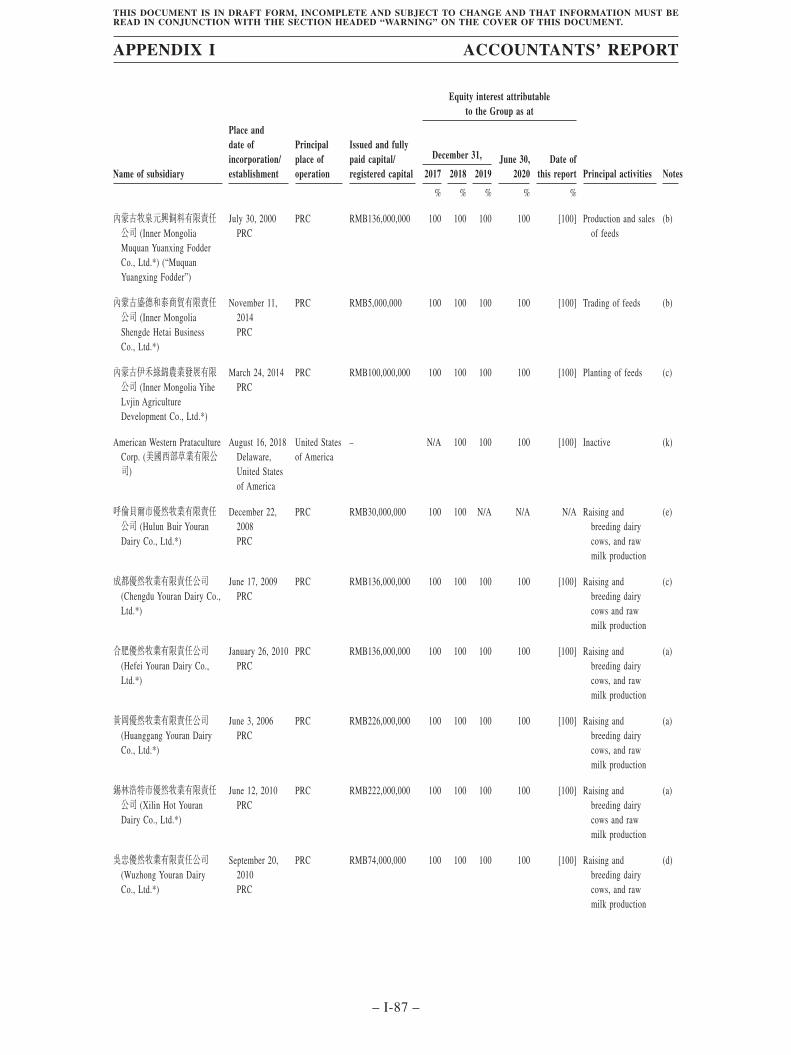
Equity interest attributableto the Group as at
Name of subsidiary
Place anddate ofincorporation/establishment
Principalplace ofoperation
Issued and fullypaid capital/registered capital
December 31, June 30,2020
Date ofthis report Principal activities Notes2017 2018 2019
% % % % %
內蒙古牧泉元興飼料有限責任公司 (Inner MongoliaMuquan Yuanxing FodderCo., Ltd.*) (“MuquanYuangxing Fodder”)
July 30, 2000PRC
PRC RMB136,000,000 100 100 100 100 [100] Production and salesof feeds
(b)
內蒙古盛德和泰商貿有限責任公司 (Inner MongoliaShengde Hetai BusinessCo., Ltd.*)
November 11,2014PRC
PRC RMB5,000,000 100 100 100 100 [100] Trading of feeds (b)
內蒙古伊禾綠錦農業發展有限公司 (Inner Mongolia YiheLvjin AgricultureDevelopment Co., Ltd.*)
March 24, 2014PRC
PRC RMB100,000,000 100 100 100 100 [100] Planting of feeds (c)
American Western PratacultureCorp. (美國西部草業有限公司)
August 16, 2018Delaware,United Statesof America
United Statesof America
– N/A 100 100 100 [100] Inactive (k)
呼倫貝爾市優然牧業有限責任公司 (Hulun Buir YouranDairy Co., Ltd.*)
December 22,2008PRC
PRC RMB30,000,000 100 100 N/A N/A N/A Raising andbreeding dairycows, and rawmilk production
(e)
成都優然牧業有限責任公司(Chengdu Youran Dairy Co.,Ltd.*)
June 17, 2009PRC
PRC RMB136,000,000 100 100 100 100 [100] Raising andbreeding dairycows and rawmilk production
(c)
合肥優然牧業有限責任公司(Hefei Youran Dairy Co.,Ltd.*)
January 26, 2010PRC
PRC RMB136,000,000 100 100 100 100 [100] Raising andbreeding dairycows, and rawmilk production
(a)
黃岡優然牧業有限責任公司(Huanggang Youran DairyCo., Ltd.*)
June 3, 2006PRC
PRC RMB226,000,000 100 100 100 100 [100] Raising andbreeding dairycows, and rawmilk production
(a)
錫林浩特市優然牧業有限責任公司 (Xilin Hot YouranDairy Co., Ltd.*)
June 12, 2010PRC
PRC RMB222,000,000 100 100 100 100 [100] Raising andbreeding dairycows and rawmilk production
(a)
吳忠優然牧業有限責任公司(Wuzhong Youran DairyCo., Ltd.*)
September 20,2010PRC
PRC RMB74,000,000 100 100 100 100 [100] Raising andbreeding dairycows, and rawmilk production
(d)
APPENDIX I ACCOUNTANTS’ REPORT
– I-87 –
THIS DOCUMENT IS IN DRAFT FORM, INCOMPLETE AND SUBJECT TO CHANGE AND THAT INFORMATION MUST BEREAD IN CONJUNCTION WITH THE SECTION HEADED “WARNING” ON THE COVER OF THIS DOCUMENT.
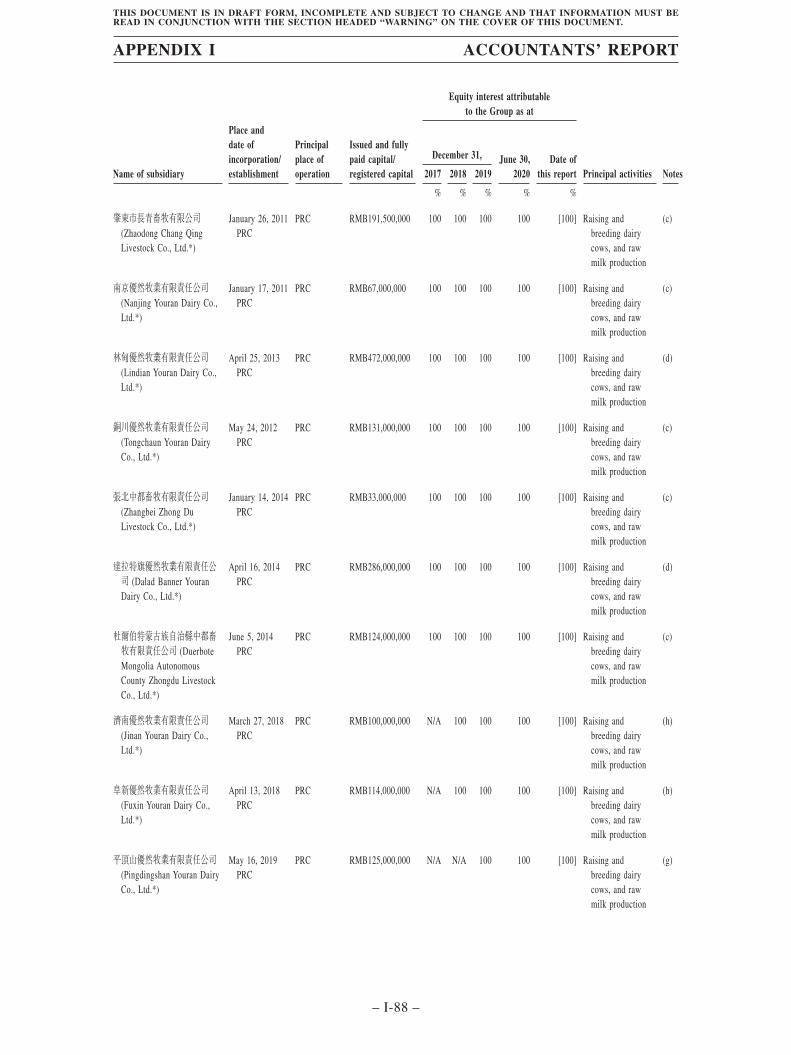
Equity interest attributableto the Group as at
Name of subsidiary
Place anddate ofincorporation/establishment
Principalplace ofoperation
Issued and fullypaid capital/registered capital
December 31, June 30,2020
Date ofthis report Principal activities Notes2017 2018 2019
% % % % %
肇東市長青畜牧有限公司(Zhaodong Chang QingLivestock Co., Ltd.*)
January 26, 2011PRC
PRC RMB191,500,000 100 100 100 100 [100] Raising andbreeding dairycows, and rawmilk production
(c)
南京優然牧業有限責任公司(Nanjing Youran Dairy Co.,Ltd.*)
January 17, 2011PRC
PRC RMB67,000,000 100 100 100 100 [100] Raising andbreeding dairycows, and rawmilk production
(c)
林甸優然牧業有限責任公司(Lindian Youran Dairy Co.,Ltd.*)
April 25, 2013PRC
PRC RMB472,000,000 100 100 100 100 [100] Raising andbreeding dairycows, and rawmilk production
(d)
銅川優然牧業有限責任公司(Tongchaun Youran DairyCo., Ltd.*)
May 24, 2012PRC
PRC RMB131,000,000 100 100 100 100 [100] Raising andbreeding dairycows, and rawmilk production
(c)
張北中都畜牧有限責任公司(Zhangbei Zhong DuLivestock Co., Ltd.*)
January 14, 2014PRC
PRC RMB33,000,000 100 100 100 100 [100] Raising andbreeding dairycows, and rawmilk production
(c)
達拉特旗優然牧業有限責任公司 (Dalad Banner YouranDairy Co., Ltd.*)
April 16, 2014PRC
PRC RMB286,000,000 100 100 100 100 [100] Raising andbreeding dairycows, and rawmilk production
(d)
杜爾伯特蒙古族自治縣中都畜牧有限責任公司 (DuerboteMongolia AutonomousCounty Zhongdu LivestockCo., Ltd.*)
June 5, 2014PRC
PRC RMB124,000,000 100 100 100 100 [100] Raising andbreeding dairycows, and rawmilk production
(c)
濟南優然牧業有限責任公司(Jinan Youran Dairy Co.,Ltd.*)
March 27, 2018PRC
PRC RMB100,000,000 N/A 100 100 100 [100] Raising andbreeding dairycows, and rawmilk production
(h)
阜新優然牧業有限責任公司(Fuxin Youran Dairy Co.,Ltd.*)
April 13, 2018PRC
PRC RMB114,000,000 N/A 100 100 100 [100] Raising andbreeding dairycows, and rawmilk production
(h)
平頂山優然牧業有限責任公司(Pingdingshan Youran DairyCo., Ltd.*)
May 16, 2019PRC
PRC RMB125,000,000 N/A N/A 100 100 [100] Raising andbreeding dairycows, and rawmilk production
(g)
APPENDIX I ACCOUNTANTS’ REPORT
– I-88 –
THIS DOCUMENT IS IN DRAFT FORM, INCOMPLETE AND SUBJECT TO CHANGE AND THAT INFORMATION MUST BEREAD IN CONJUNCTION WITH THE SECTION HEADED “WARNING” ON THE COVER OF THIS DOCUMENT.
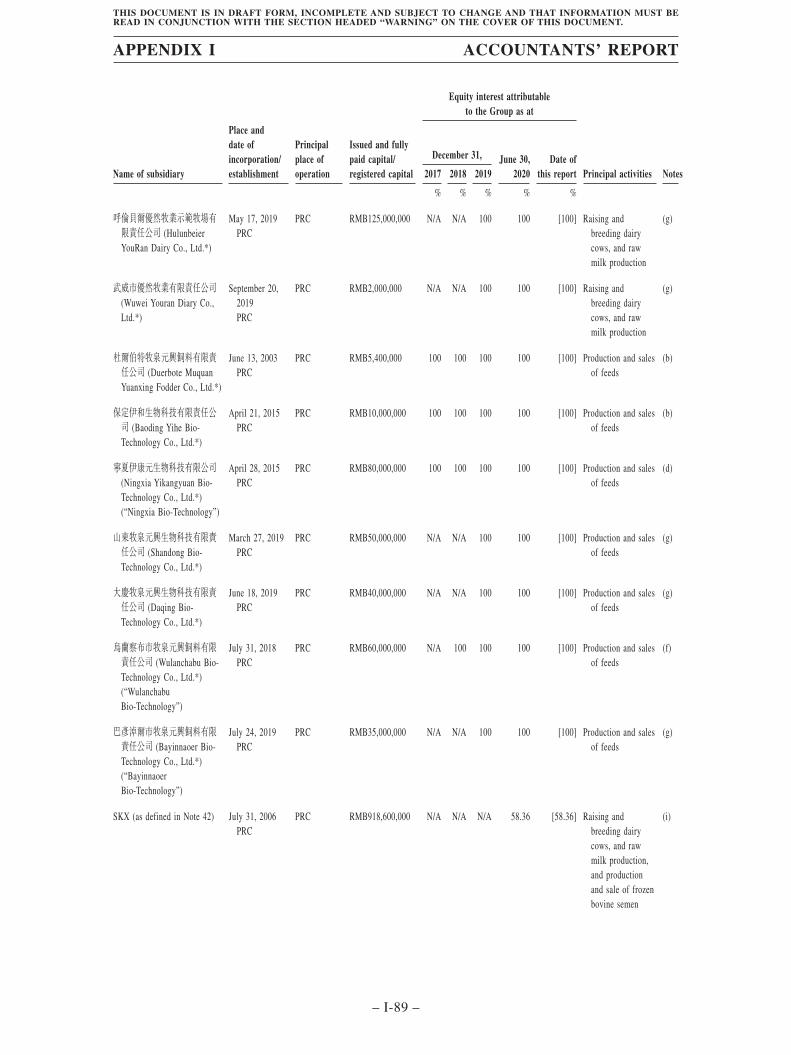
Equity interest attributableto the Group as at
Name of subsidiary
Place anddate ofincorporation/establishment
Principalplace ofoperation
Issued and fullypaid capital/registered capital
December 31, June 30,2020
Date ofthis report Principal activities Notes2017 2018 2019
% % % % %
呼倫貝爾優然牧業示範牧場有限責任公司 (HulunbeierYouRan Dairy Co., Ltd.*)
May 17, 2019PRC
PRC RMB125,000,000 N/A N/A 100 100 [100] Raising andbreeding dairycows, and rawmilk production
(g)
武威市優然牧業有限責任公司(Wuwei Youran Diary Co.,Ltd.*)
September 20,2019PRC
PRC RMB2,000,000 N/A N/A 100 100 [100] Raising andbreeding dairycows, and rawmilk production
(g)
杜爾伯特牧泉元興飼料有限責任公司 (Duerbote MuquanYuanxing Fodder Co., Ltd.*)
June 13, 2003PRC
PRC RMB5,400,000 100 100 100 100 [100] Production and salesof feeds
(b)
保定伊和生物科技有限責任公司 (Baoding Yihe Bio-Technology Co., Ltd.*)
April 21, 2015PRC
PRC RMB10,000,000 100 100 100 100 [100] Production and salesof feeds
(b)
寧夏伊康元生物科技有限公司(Ningxia Yikangyuan Bio-Technology Co., Ltd.*)(“Ningxia Bio-Technology”)
April 28, 2015PRC
PRC RMB80,000,000 100 100 100 100 [100] Production and salesof feeds
(d)
山東牧泉元興生物科技有限責任公司 (Shandong Bio-Technology Co., Ltd.*)
March 27, 2019PRC
PRC RMB50,000,000 N/A N/A 100 100 [100] Production and salesof feeds
(g)
大慶牧泉元興生物科技有限責任公司 (Daqing Bio-Technology Co., Ltd.*)
June 18, 2019PRC
PRC RMB40,000,000 N/A N/A 100 100 [100] Production and salesof feeds
(g)
烏蘭察布市牧泉元興飼料有限責任公司 (Wulanchabu Bio-Technology Co., Ltd.*)(“WulanchabuBio-Technology”)
July 31, 2018PRC
PRC RMB60,000,000 N/A 100 100 100 [100] Production and salesof feeds
(f)
巴彥淖爾市牧泉元興飼料有限責任公司 (Bayinnaoer Bio-Technology Co., Ltd.*)(“BayinnaoerBio-Technology”)
July 24, 2019PRC
PRC RMB35,000,000 N/A N/A 100 100 [100] Production and salesof feeds
(g)
SKX (as defined in Note 42) July 31, 2006PRC
PRC RMB918,600,000 N/A N/A N/A 58.36 [58.36] Raising andbreeding dairycows, and rawmilk production,and productionand sale of frozenbovine semen
(i)
APPENDIX I ACCOUNTANTS’ REPORT
– I-89 –
THIS DOCUMENT IS IN DRAFT FORM, INCOMPLETE AND SUBJECT TO CHANGE AND THAT INFORMATION MUST BEREAD IN CONJUNCTION WITH THE SECTION HEADED “WARNING” ON THE COVER OF THIS DOCUMENT.
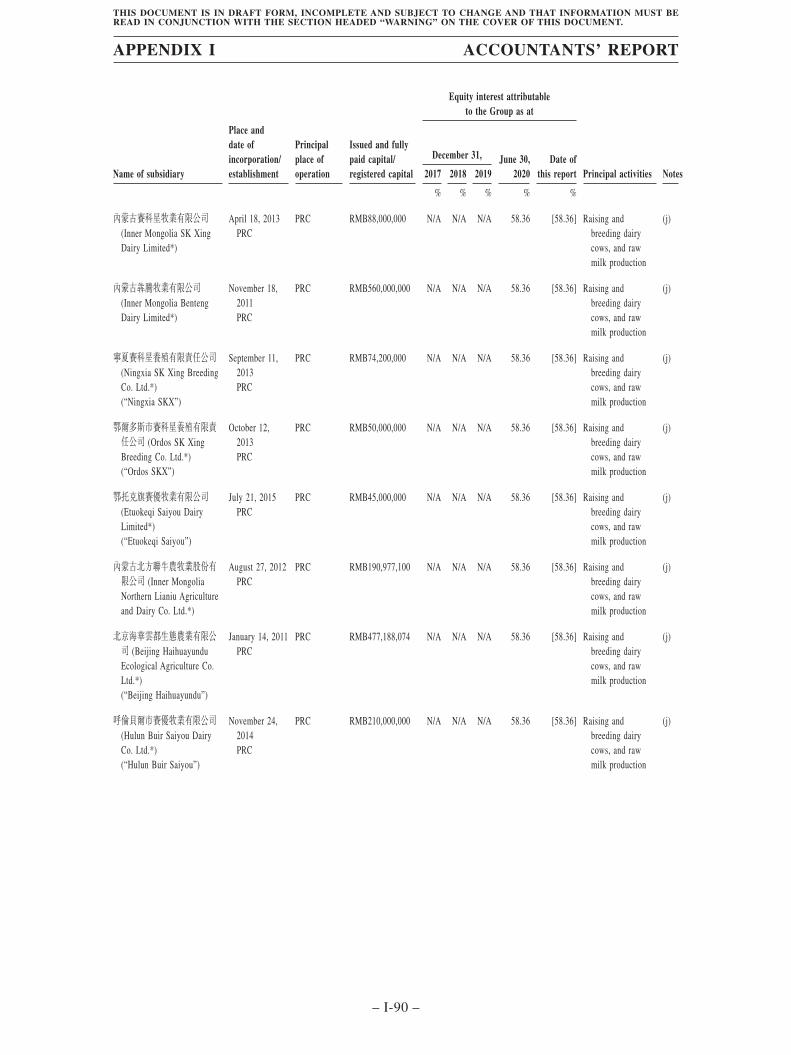
Equity interest attributableto the Group as at
Name of subsidiary
Place anddate ofincorporation/establishment
Principalplace ofoperation
Issued and fullypaid capital/registered capital
December 31, June 30,2020
Date ofthis report Principal activities Notes2017 2018 2019
% % % % %
內蒙古賽科星牧業有限公司(Inner Mongolia SK XingDairy Limited*)
April 18, 2013PRC
PRC RMB88,000,000 N/A N/A N/A 58.36 [58.36] Raising andbreeding dairycows, and rawmilk production
(j)
內蒙古犇騰牧業有限公司(Inner Mongolia BentengDairy Limited*)
November 18,2011PRC
PRC RMB560,000,000 N/A N/A N/A 58.36 [58.36] Raising andbreeding dairycows, and rawmilk production
(j)
寧夏賽科星養殖有限責任公司(Ningxia SK Xing BreedingCo. Ltd.*)(“Ningxia SKX”)
September 11,2013PRC
PRC RMB74,200,000 N/A N/A N/A 58.36 [58.36] Raising andbreeding dairycows, and rawmilk production
(j)
鄂爾多斯市賽科星養殖有限責任公司 (Ordos SK XingBreeding Co. Ltd.*)(“Ordos SKX”)
October 12,2013PRC
PRC RMB50,000,000 N/A N/A N/A 58.36 [58.36] Raising andbreeding dairycows, and rawmilk production
(j)
鄂托克旗賽優牧業有限公司(Etuokeqi Saiyou DairyLimited*)(“Etuokeqi Saiyou”)
July 21, 2015PRC
PRC RMB45,000,000 N/A N/A N/A 58.36 [58.36] Raising andbreeding dairycows, and rawmilk production
(j)
內蒙古北方聯牛農牧業股份有限公司 (Inner MongoliaNorthern Lianiu Agricultureand Dairy Co. Ltd.*)
August 27, 2012PRC
PRC RMB190,977,100 N/A N/A N/A 58.36 [58.36] Raising andbreeding dairycows, and rawmilk production
(j)
北京海華雲都生態農業有限公司 (Beijing HaihuayunduEcological Agriculture Co.Ltd.*)(“Beijing Haihuayundu”)
January 14, 2011PRC
PRC RMB477,188,074 N/A N/A N/A 58.36 [58.36] Raising andbreeding dairycows, and rawmilk production
(j)
呼倫貝爾市賽優牧業有限公司(Hulun Buir Saiyou DairyCo. Ltd.*)(“Hulun Buir Saiyou”)
November 24,2014PRC
PRC RMB210,000,000 N/A N/A N/A 58.36 [58.36] Raising andbreeding dairycows, and rawmilk production
(j)
APPENDIX I ACCOUNTANTS’ REPORT
– I-90 –
THIS DOCUMENT IS IN DRAFT FORM, INCOMPLETE AND SUBJECT TO CHANGE AND THAT INFORMATION MUST BEREAD IN CONJUNCTION WITH THE SECTION HEADED “WARNING” ON THE COVER OF THIS DOCUMENT.
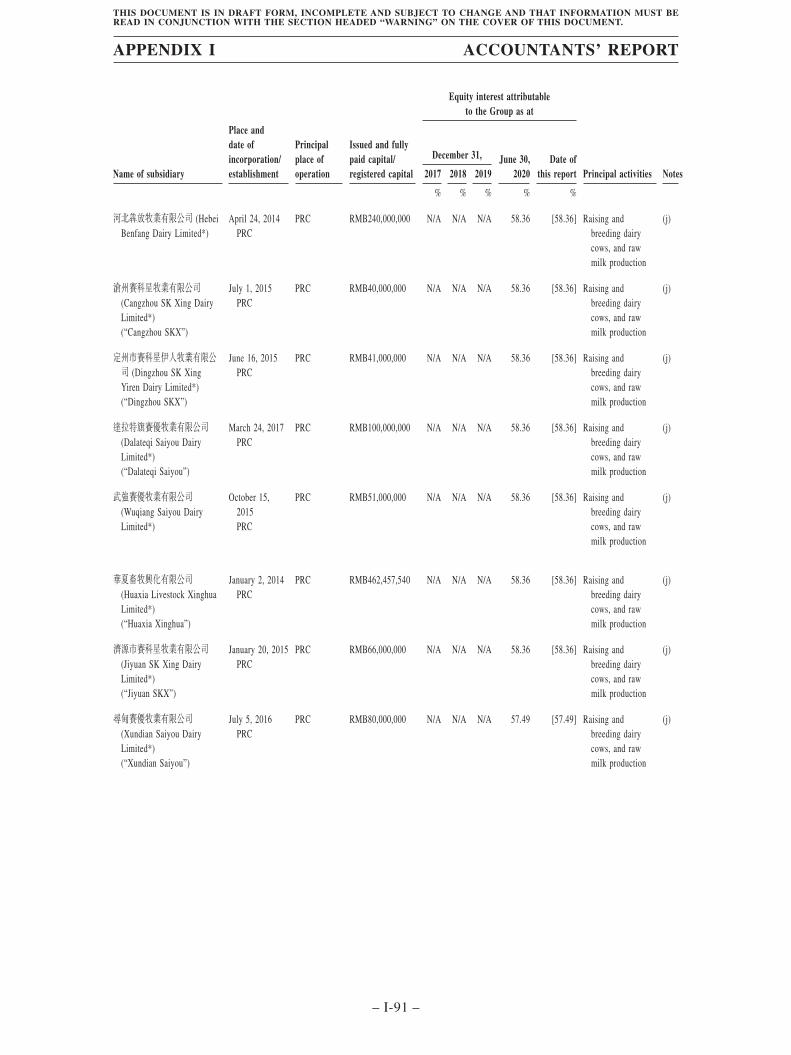
Equity interest attributableto the Group as at
Name of subsidiary
Place anddate ofincorporation/establishment
Principalplace ofoperation
Issued and fullypaid capital/registered capital
December 31, June 30,2020
Date ofthis report Principal activities Notes2017 2018 2019
% % % % %
河北犇放牧業有限公司 (HebeiBenfang Dairy Limited*)
April 24, 2014PRC
PRC RMB240,000,000 N/A N/A N/A 58.36 [58.36] Raising andbreeding dairycows, and rawmilk production
(j)
滄州賽科星牧業有限公司(Cangzhou SK Xing DairyLimited*)(“Cangzhou SKX”)
July 1, 2015PRC
PRC RMB40,000,000 N/A N/A N/A 58.36 [58.36] Raising andbreeding dairycows, and rawmilk production
(j)
定州市賽科星伊人牧業有限公司 (Dingzhou SK XingYiren Dairy Limited*)(“Dingzhou SKX”)
June 16, 2015PRC
PRC RMB41,000,000 N/A N/A N/A 58.36 [58.36] Raising andbreeding dairycows, and rawmilk production
(j)
達拉特旗賽優牧業有限公司(Dalateqi Saiyou DairyLimited*)(“Dalateqi Saiyou”)
March 24, 2017PRC
PRC RMB100,000,000 N/A N/A N/A 58.36 [58.36] Raising andbreeding dairycows, and rawmilk production
(j)
武強賽優牧業有限公司(Wuqiang Saiyou DairyLimited*)
October 15,2015PRC
PRC RMB51,000,000 N/A N/A N/A 58.36 [58.36] Raising andbreeding dairycows, and rawmilk production
(j)
華夏畜牧興化有限公司(Huaxia Livestock XinghuaLimited*)(“Huaxia Xinghua”)
January 2, 2014PRC
PRC RMB462,457,540 N/A N/A N/A 58.36 [58.36] Raising andbreeding dairycows, and rawmilk production
(j)
濟源市賽科星牧業有限公司(Jiyuan SK Xing DairyLimited*)(“Jiyuan SKX”)
January 20, 2015PRC
PRC RMB66,000,000 N/A N/A N/A 58.36 [58.36] Raising andbreeding dairycows, and rawmilk production
(j)
尋甸賽優牧業有限公司(Xundian Saiyou DairyLimited*)(“Xundian Saiyou”)
July 5, 2016PRC
PRC RMB80,000,000 N/A N/A N/A 57.49 [57.49] Raising andbreeding dairycows, and rawmilk production
(j)
APPENDIX I ACCOUNTANTS’ REPORT
– I-91 –
THIS DOCUMENT IS IN DRAFT FORM, INCOMPLETE AND SUBJECT TO CHANGE AND THAT INFORMATION MUST BEREAD IN CONJUNCTION WITH THE SECTION HEADED “WARNING” ON THE COVER OF THIS DOCUMENT.
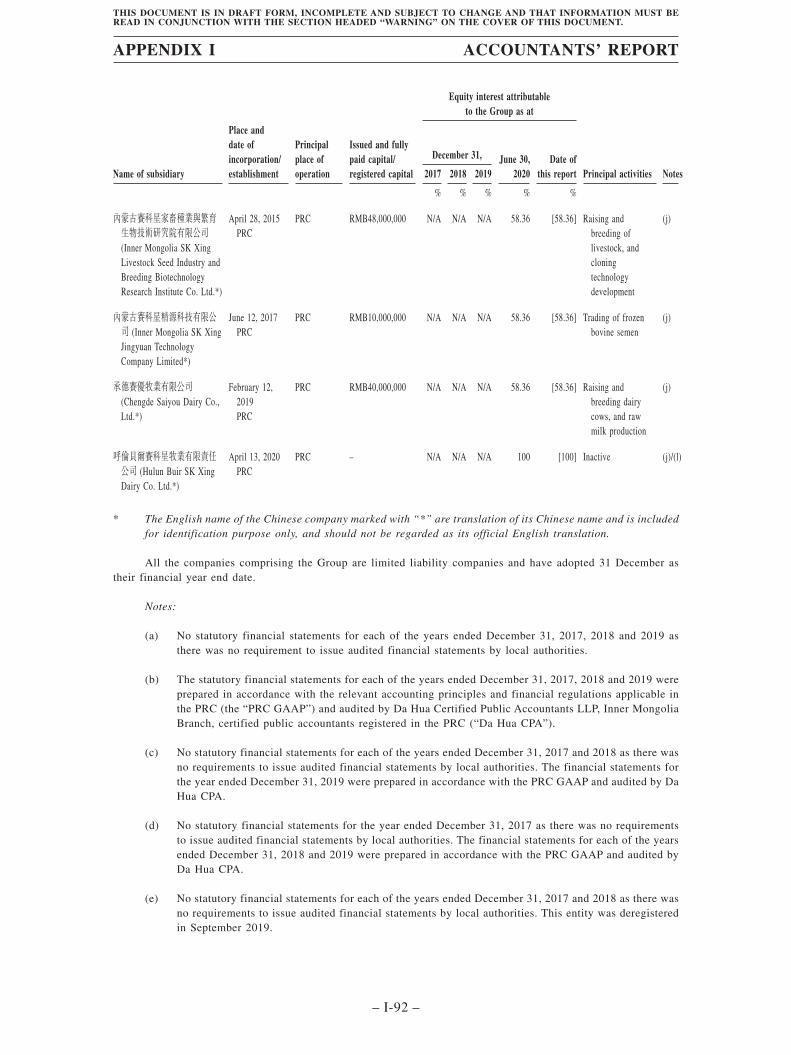
Equity interest attributableto the Group as at
Name of subsidiary
Place anddate ofincorporation/establishment
Principalplace ofoperation
Issued and fullypaid capital/registered capital
December 31, June 30,2020
Date ofthis report Principal activities Notes2017 2018 2019
% % % % %
內蒙古賽科星家畜種業與繁育生物技術研究院有限公司(Inner Mongolia SK XingLivestock Seed Industry andBreeding BiotechnologyResearch Institute Co. Ltd.*)
April 28, 2015PRC
PRC RMB48,000,000 N/A N/A N/A 58.36 [58.36] Raising andbreeding oflivestock, andcloningtechnologydevelopment
(j)
內蒙古賽科星精源科技有限公司 (Inner Mongolia SK XingJingyuan TechnologyCompany Limited*)
June 12, 2017PRC
PRC RMB10,000,000 N/A N/A N/A 58.36 [58.36] Trading of frozenbovine semen
(j)
承德賽優牧業有限公司(Chengde Saiyou Dairy Co.,Ltd.*)
February 12,2019PRC
PRC RMB40,000,000 N/A N/A N/A 58.36 [58.36] Raising andbreeding dairycows, and rawmilk production
(j)
呼倫貝爾賽科星牧業有限責任公司 (Hulun Buir SK XingDairy Co. Ltd.*)
April 13, 2020PRC
PRC – N/A N/A N/A 100 [100] Inactive (j)/(l)
* The English name of the Chinese company marked with “*” are translation of its Chinese name and is includedfor identification purpose only, and should not be regarded as its official English translation.
All the companies comprising the Group are limited liability companies and have adopted 31 December astheir financial year end date.
Notes:
(a) No statutory financial statements for each of the years ended December 31, 2017, 2018 and 2019 asthere was no requirement to issue audited financial statements by local authorities.
(b) The statutory financial statements for each of the years ended December 31, 2017, 2018 and 2019 wereprepared in accordance with the relevant accounting principles and financial regulations applicable inthe PRC (the “PRC GAAP”) and audited by Da Hua Certified Public Accountants LLP, Inner MongoliaBranch, certified public accountants registered in the PRC (“Da Hua CPA”).
(c) No statutory financial statements for each of the years ended December 31, 2017 and 2018 as there wasno requirements to issue audited financial statements by local authorities. The financial statements forthe year ended December 31, 2019 were prepared in accordance with the PRC GAAP and audited by DaHua CPA.
(d) No statutory financial statements for the year ended December 31, 2017 as there was no requirementsto issue audited financial statements by local authorities. The financial statements for each of the yearsended December 31, 2018 and 2019 were prepared in accordance with the PRC GAAP and audited byDa Hua CPA.
(e) No statutory financial statements for each of the years ended December 31, 2017 and 2018 as there wasno requirements to issue audited financial statements by local authorities. This entity was deregisteredin September 2019.
APPENDIX I ACCOUNTANTS’ REPORT
– I-92 –
THIS DOCUMENT IS IN DRAFT FORM, INCOMPLETE AND SUBJECT TO CHANGE AND THAT INFORMATION MUST BEREAD IN CONJUNCTION WITH THE SECTION HEADED “WARNING” ON THE COVER OF THIS DOCUMENT.
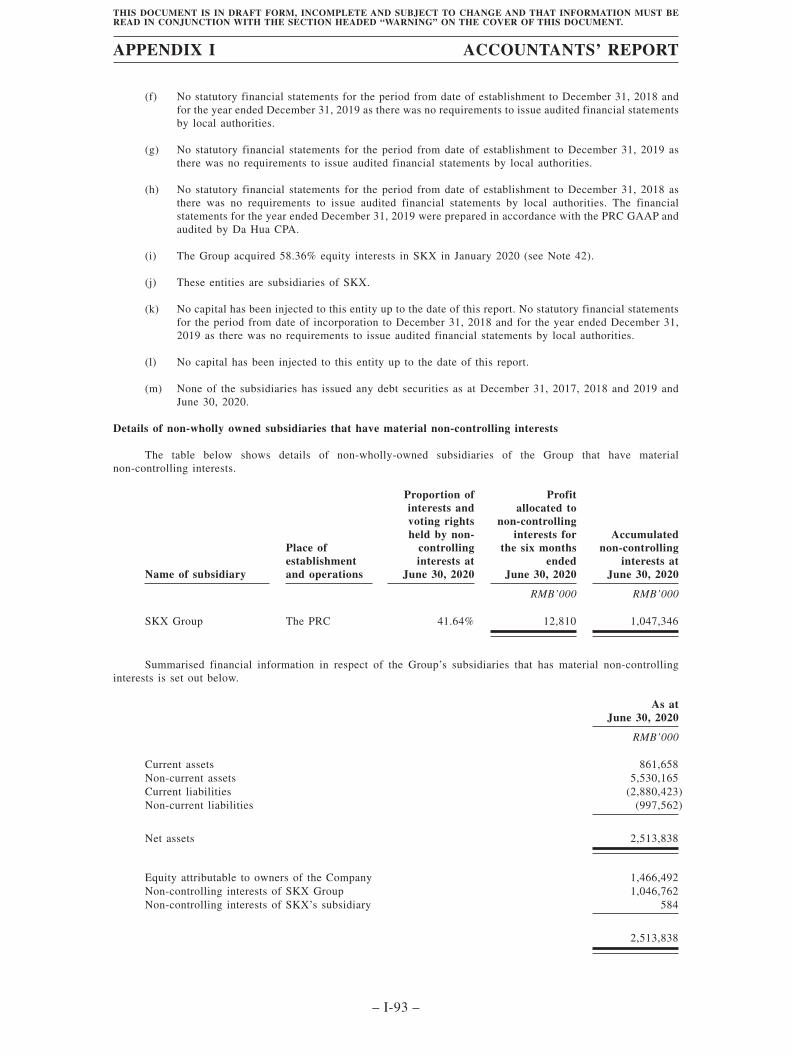
(f) No statutory financial statements for the period from date of establishment to December 31, 2018 andfor the year ended December 31, 2019 as there was no requirements to issue audited financial statementsby local authorities.
(g) No statutory financial statements for the period from date of establishment to December 31, 2019 asthere was no requirements to issue audited financial statements by local authorities.
(h) No statutory financial statements for the period from date of establishment to December 31, 2018 asthere was no requirements to issue audited financial statements by local authorities. The financialstatements for the year ended December 31, 2019 were prepared in accordance with the PRC GAAP andaudited by Da Hua CPA.
(i) The Group acquired 58.36% equity interests in SKX in January 2020 (see Note 42).
(j) These entities are subsidiaries of SKX.
(k) No capital has been injected to this entity up to the date of this report. No statutory financial statementsfor the period from date of incorporation to December 31, 2018 and for the year ended December 31,2019 as there was no requirements to issue audited financial statements by local authorities.
(l) No capital has been injected to this entity up to the date of this report.
(m) None of the subsidiaries has issued any debt securities as at December 31, 2017, 2018 and 2019 andJune 30, 2020.
Details of non-wholly owned subsidiaries that have material non-controlling interests
The table below shows details of non-wholly-owned subsidiaries of the Group that have materialnon-controlling interests.
Name of subsidiary
Place ofestablishmentand operations
Proportion ofinterests andvoting rightsheld by non-
controllinginterests at
June 30, 2020
Profitallocated to
non-controllinginterests for
the six monthsended
June 30, 2020
Accumulatednon-controlling
interests atJune 30, 2020
RMB’000 RMB’000
SKX Group The PRC 41.64% 12,810 1,047,346
Summarised financial information in respect of the Group’s subsidiaries that has material non-controllinginterests is set out below.
As atJune 30, 2020
RMB’000
Current assets 861,658Non-current assets 5,530,165Current liabilities (2,880,423)Non-current liabilities (997,562)
Net assets 2,513,838
Equity attributable to owners of the Company 1,466,492Non-controlling interests of SKX Group 1,046,762Non-controlling interests of SKX’s subsidiary 584
2,513,838
APPENDIX I ACCOUNTANTS’ REPORT
– I-93 –
THIS DOCUMENT IS IN DRAFT FORM, INCOMPLETE AND SUBJECT TO CHANGE AND THAT INFORMATION MUST BEREAD IN CONJUNCTION WITH THE SECTION HEADED “WARNING” ON THE COVER OF THIS DOCUMENT.
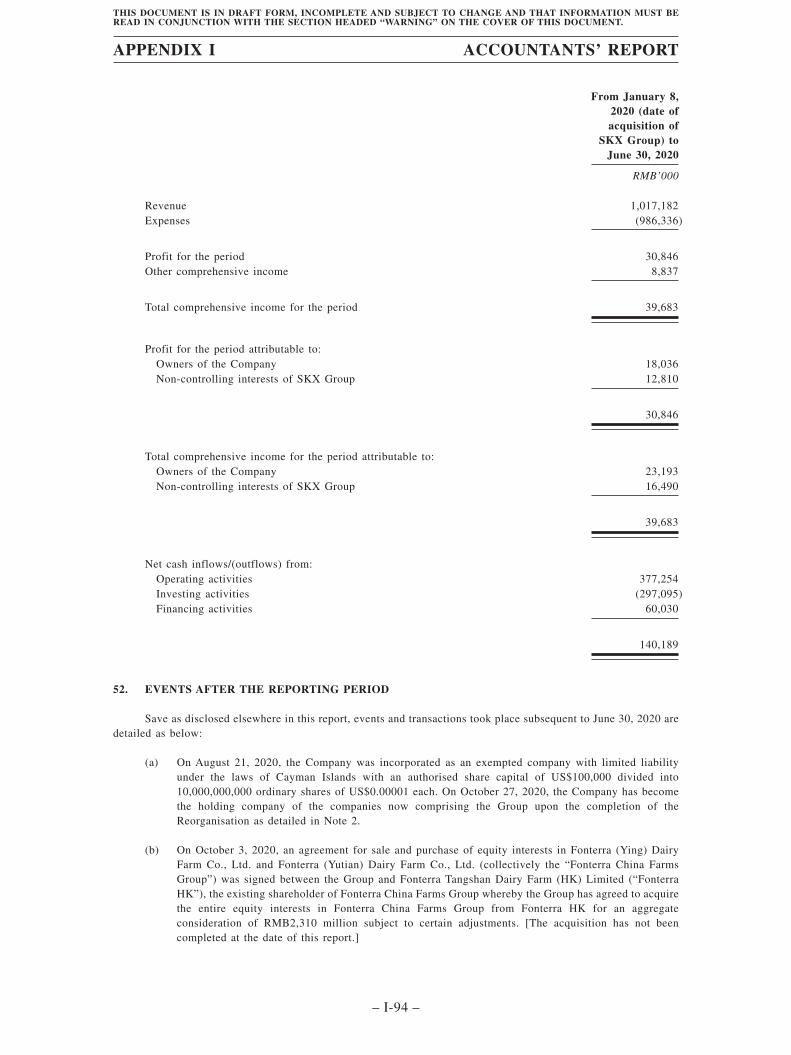
From January 8,2020 (date ofacquisition of
SKX Group) toJune 30, 2020
RMB’000
Revenue 1,017,182Expenses (986,336)
Profit for the period 30,846Other comprehensive income 8,837
Total comprehensive income for the period 39,683
Profit for the period attributable to:Owners of the Company 18,036Non-controlling interests of SKX Group 12,810
30,846
Total comprehensive income for the period attributable to:Owners of the Company 23,193Non-controlling interests of SKX Group 16,490
39,683
Net cash inflows/(outflows) from:Operating activities 377,254Investing activities (297,095)Financing activities 60,030
140,189
52. EVENTS AFTER THE REPORTING PERIOD
Save as disclosed elsewhere in this report, events and transactions took place subsequent to June 30, 2020 aredetailed as below:
(a) On August 21, 2020, the Company was incorporated as an exempted company with limited liabilityunder the laws of Cayman Islands with an authorised share capital of US$100,000 divided into10,000,000,000 ordinary shares of US$0.00001 each. On October 27, 2020, the Company has becomethe holding company of the companies now comprising the Group upon the completion of theReorganisation as detailed in Note 2.
(b) On October 3, 2020, an agreement for sale and purchase of equity interests in Fonterra (Ying) DairyFarm Co., Ltd. and Fonterra (Yutian) Dairy Farm Co., Ltd. (collectively the “Fonterra China FarmsGroup”) was signed between the Group and Fonterra Tangshan Dairy Farm (HK) Limited (“FonterraHK”), the existing shareholder of Fonterra China Farms Group whereby the Group has agreed to acquirethe entire equity interests in Fonterra China Farms Group from Fonterra HK for an aggregateconsideration of RMB2,310 million subject to certain adjustments. [The acquisition has not beencompleted at the date of this report.]
APPENDIX I ACCOUNTANTS’ REPORT
– I-94 –
THIS DOCUMENT IS IN DRAFT FORM, INCOMPLETE AND SUBJECT TO CHANGE AND THAT INFORMATION MUST BEREAD IN CONJUNCTION WITH THE SECTION HEADED “WARNING” ON THE COVER OF THIS DOCUMENT.
(c) In November 2020, convertible notes (the “Notes”) with an aggregate principal amount of US$460million was issued to several [REDACTED] investors (the “[REDACTED] Investors”). The Notes aresubject to cash interest and pay-in-kind interest (the “PIK Interest”) on the outstanding principal amountat the rate of 4% per annum and 6% per annum, respectively. The rate of cash interest is payable on thelast day of each quarter in arrears commencing on December 31, 2020. The PIK Interest shall capitaliseand be added into the then outstanding principal amount, whereupon PIK Interest shall accrue on thethen outstanding principal amount plus any capitalised amount of PIK Interest at the same rate. Accruedand capitalised PIK Interest on any portion of the principal amount that is converted into ordinary sharesof the Company shall be waived upon the completion of such conversion.
The [REDACTED] Investors shall have the right, but not the obligation, to convert the outstandingprincipal amount into such number of ordinary shares of the Company at any time subject to and inaccordance with terms and conditions attached to the Notes.
The Notes will be matured on the third anniversary of the issuance date and, at the sole discretion ofthe [REDACTED] Investors, may be extended to the fifth anniversary of the issuance date. Unless theentire principal amount of the Notes have been redeemed or converted earlier in accordance with theterms thereof, the Company shall redeem the entire outstanding principal amount of the Notes in fulltogether with accrued interest. The [REDACTED] Investors may at any time after the occurrence of anevent of default as stipulated in the Notes instruments require the Company to redeem the outstandingprincipal amount of the Notes or any portion thereof at the redemption price as defined in the Notesinstruments.
(d) On 4 November 2020, the Company declared a dividend of US$180,348,072 (approximatelyRMB1,182,957,000) to the equity shareholders of the Company.
53. SUBSEQUENT FINANCIAL STATEMENTS
No audited financial statements have been prepared by the Company or any of its subsidiaries in respect of anyperiod subsequent to June 30, 2020.
III. PRE–ACQUISITION FINANCIAL INFORMATION
As stated in Note 42 to the Historical Financial Information, on January 8, 2020, the
Group acquired SKX Group.
The pre-acquisition consolidated financial information of SKX for the period from
January 1, 2017 to January 7, 2020 (the “Pre-acquisition Period”) includes the financial
information of SKX Group, for the Pre-acquisition Period and has been prepared in accordance
with the accounting policies set out in Note 4, which conform with IFRSs issued by IASB.
APPENDIX I ACCOUNTANTS’ REPORT
– I-95 –
THIS DOCUMENT IS IN DRAFT FORM, INCOMPLETE AND SUBJECT TO CHANGE AND THAT INFORMATION MUST BEREAD IN CONJUNCTION WITH THE SECTION HEADED “WARNING” ON THE COVER OF THIS DOCUMENT.
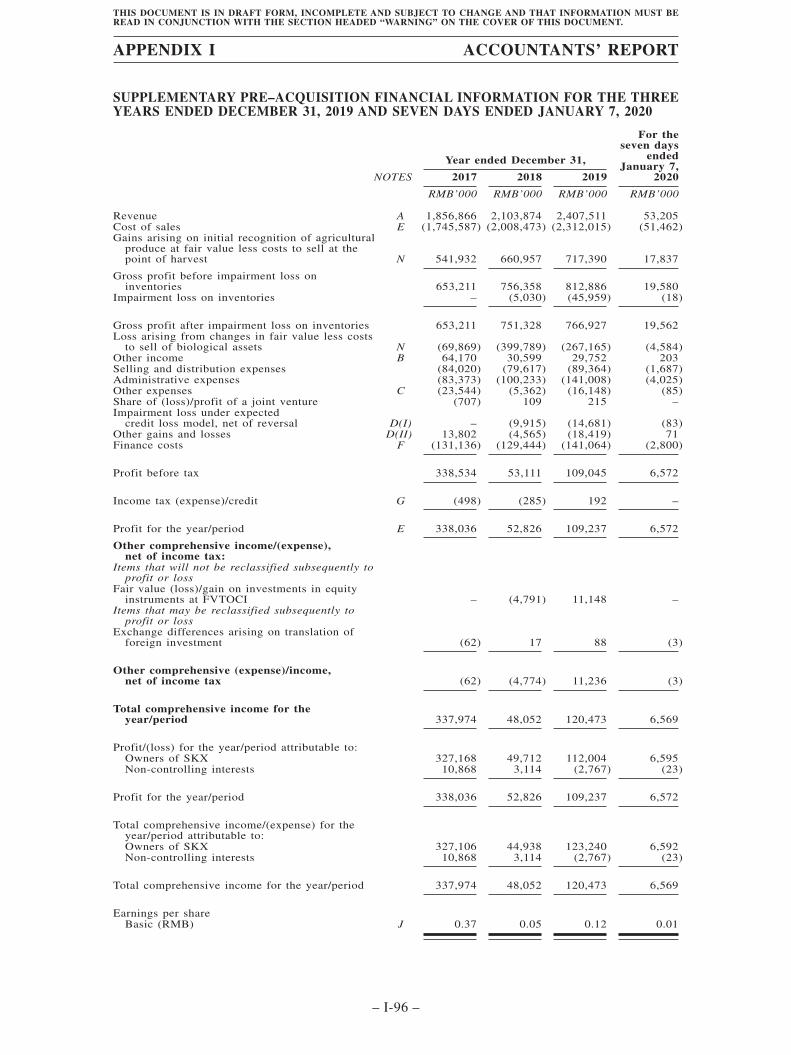
SUPPLEMENTARY PRE–ACQUISITION FINANCIAL INFORMATION FOR THE THREEYEARS ENDED DECEMBER 31, 2019 AND SEVEN DAYS ENDED JANUARY 7, 2020
NOTES
Year ended December 31,
For theseven days
endedJanuary 7,
20202017 2018 2019
RMB’000 RMB’000 RMB’000 RMB’000
Revenue A 1,856,866 2,103,874 2,407,511 53,205Cost of sales E (1,745,587) (2,008,473) (2,312,015) (51,462)Gains arising on initial recognition of agricultural
produce at fair value less costs to sell at thepoint of harvest N 541,932 660,957 717,390 17,837
Gross profit before impairment loss oninventories 653,211 756,358 812,886 19,580
Impairment loss on inventories – (5,030) (45,959) (18)
Gross profit after impairment loss on inventories 653,211 751,328 766,927 19,562Loss arising from changes in fair value less costs
to sell of biological assets N (69,869) (399,789) (267,165) (4,584)Other income B 64,170 30,599 29,752 203Selling and distribution expenses (84,020) (79,617) (89,364) (1,687)Administrative expenses (83,373) (100,233) (141,008) (4,025)Other expenses C (23,544) (5,362) (16,148) (85)Share of (loss)/profit of a joint venture (707) 109 215 –Impairment loss under expected
credit loss model, net of reversal D(I) – (9,915) (14,681) (83)Other gains and losses D(II) 13,802 (4,565) (18,419) 71Finance costs F (131,136) (129,444) (141,064) (2,800)
Profit before tax 338,534 53,111 109,045 6,572
Income tax (expense)/credit G (498) (285) 192 –
Profit for the year/period E 338,036 52,826 109,237 6,572
Other comprehensive income/(expense),net of income tax:
Items that will not be reclassified subsequently toprofit or loss
Fair value (loss)/gain on investments in equityinstruments at FVTOCI – (4,791) 11,148 –
Items that may be reclassified subsequently toprofit or loss
Exchange differences arising on translation offoreign investment (62) 17 88 (3)
Other comprehensive (expense)/income,net of income tax (62) (4,774) 11,236 (3)
Total comprehensive income for theyear/period 337,974 48,052 120,473 6,569
Profit/(loss) for the year/period attributable to:Owners of SKX 327,168 49,712 112,004 6,595Non-controlling interests 10,868 3,114 (2,767) (23)
Profit for the year/period 338,036 52,826 109,237 6,572
Total comprehensive income/(expense) for theyear/period attributable to:Owners of SKX 327,106 44,938 123,240 6,592Non-controlling interests 10,868 3,114 (2,767) (23)
Total comprehensive income for the year/period 337,974 48,052 120,473 6,569
Earnings per shareBasic (RMB) J 0.37 0.05 0.12 0.01
APPENDIX I ACCOUNTANTS’ REPORT
– I-96 –
THIS DOCUMENT IS IN DRAFT FORM, INCOMPLETE AND SUBJECT TO CHANGE AND THAT INFORMATION MUST BEREAD IN CONJUNCTION WITH THE SECTION HEADED “WARNING” ON THE COVER OF THIS DOCUMENT.
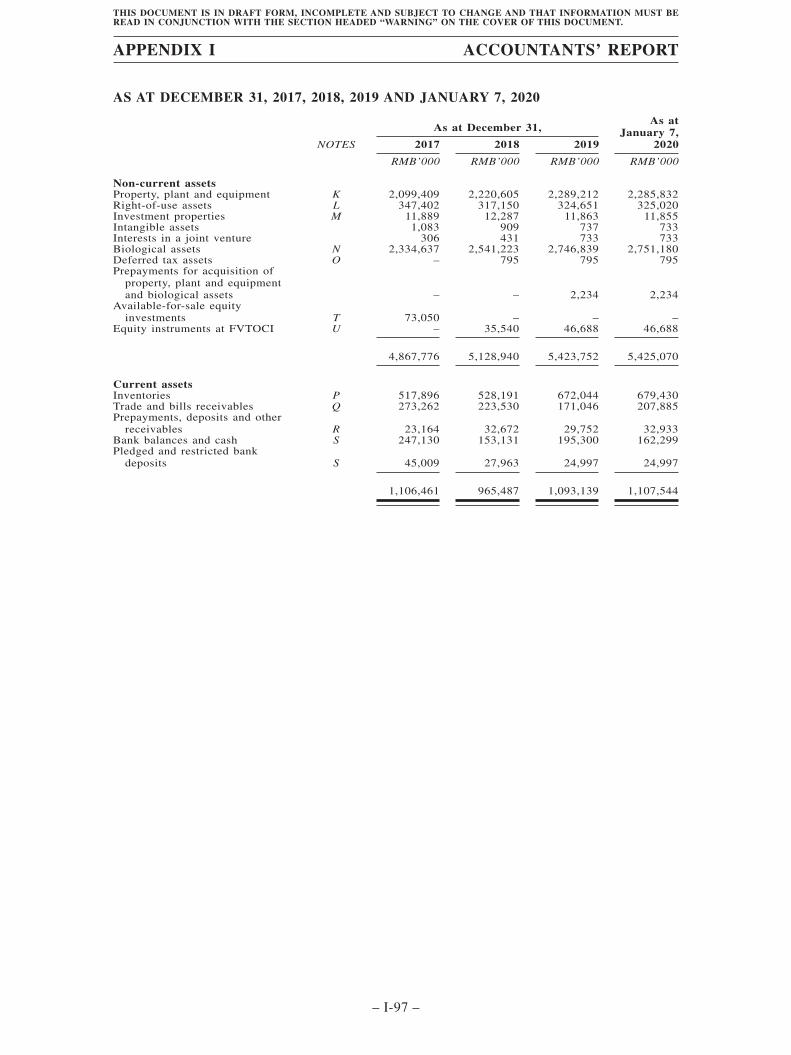
AS AT DECEMBER 31, 2017, 2018, 2019 AND JANUARY 7, 2020
As at December 31,As at
January 7,2020NOTES 2017 2018 2019
RMB’000 RMB’000 RMB’000 RMB’000
Non-current assetsProperty, plant and equipment K 2,099,409 2,220,605 2,289,212 2,285,832Right-of-use assets L 347,402 317,150 324,651 325,020Investment properties M 11,889 12,287 11,863 11,855Intangible assets 1,083 909 737 733Interests in a joint venture 306 431 733 733Biological assets N 2,334,637 2,541,223 2,746,839 2,751,180Deferred tax assets O – 795 795 795Prepayments for acquisition of
property, plant and equipmentand biological assets – – 2,234 2,234
Available-for-sale equityinvestments T 73,050 – – –
Equity instruments at FVTOCI U – 35,540 46,688 46,688
4,867,776 5,128,940 5,423,752 5,425,070
Current assetsInventories P 517,896 528,191 672,044 679,430Trade and bills receivables Q 273,262 223,530 171,046 207,885Prepayments, deposits and other
receivables R 23,164 32,672 29,752 32,933Bank balances and cash S 247,130 153,131 195,300 162,299Pledged and restricted bank
deposits S 45,009 27,963 24,997 24,997
1,106,461 965,487 1,093,139 1,107,544
APPENDIX I ACCOUNTANTS’ REPORT
– I-97 –
THIS DOCUMENT IS IN DRAFT FORM, INCOMPLETE AND SUBJECT TO CHANGE AND THAT INFORMATION MUST BEREAD IN CONJUNCTION WITH THE SECTION HEADED “WARNING” ON THE COVER OF THIS DOCUMENT.
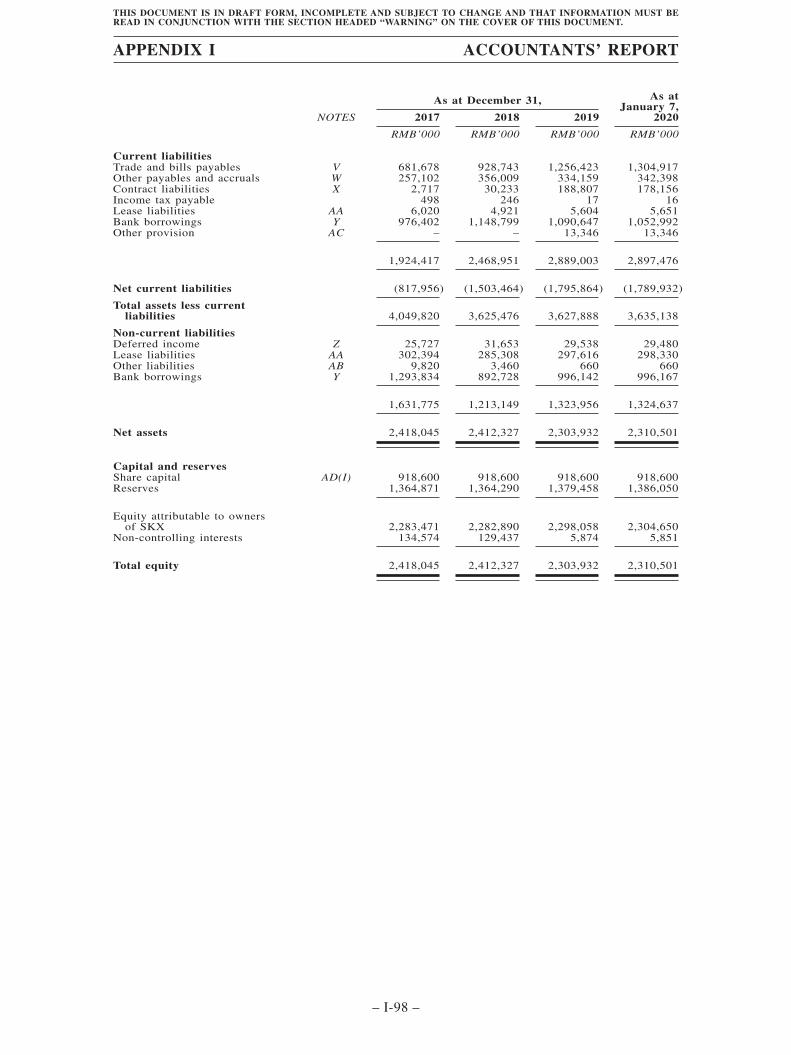
As at December 31, As atJanuary 7,
2020NOTES 2017 2018 2019
RMB’000 RMB’000 RMB’000 RMB’000
Current liabilitiesTrade and bills payables V 681,678 928,743 1,256,423 1,304,917Other payables and accruals W 257,102 356,009 334,159 342,398Contract liabilities X 2,717 30,233 188,807 178,156Income tax payable 498 246 17 16Lease liabilities AA 6,020 4,921 5,604 5,651Bank borrowings Y 976,402 1,148,799 1,090,647 1,052,992Other provision AC – – 13,346 13,346
1,924,417 2,468,951 2,889,003 2,897,476
Net current liabilities (817,956) (1,503,464) (1,795,864) (1,789,932)
Total assets less currentliabilities 4,049,820 3,625,476 3,627,888 3,635,138
Non-current liabilitiesDeferred income Z 25,727 31,653 29,538 29,480Lease liabilities AA 302,394 285,308 297,616 298,330Other liabilities AB 9,820 3,460 660 660Bank borrowings Y 1,293,834 892,728 996,142 996,167
1,631,775 1,213,149 1,323,956 1,324,637
Net assets 2,418,045 2,412,327 2,303,932 2,310,501
Capital and reservesShare capital AD(I) 918,600 918,600 918,600 918,600Reserves 1,364,871 1,364,290 1,379,458 1,386,050
Equity attributable to ownersof SKX 2,283,471 2,282,890 2,298,058 2,304,650
Non-controlling interests 134,574 129,437 5,874 5,851
Total equity 2,418,045 2,412,327 2,303,932 2,310,501
APPENDIX I ACCOUNTANTS’ REPORT
– I-98 –
THIS DOCUMENT IS IN DRAFT FORM, INCOMPLETE AND SUBJECT TO CHANGE AND THAT INFORMATION MUST BEREAD IN CONJUNCTION WITH THE SECTION HEADED “WARNING” ON THE COVER OF THIS DOCUMENT.
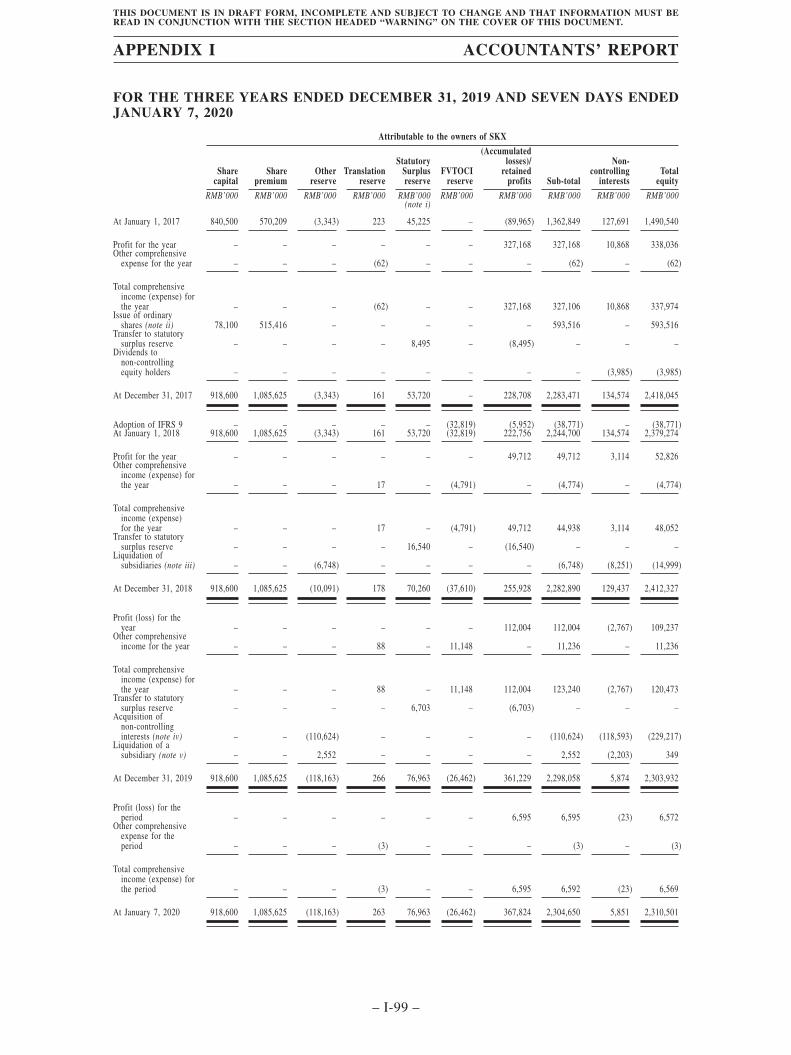
FOR THE THREE YEARS ENDED DECEMBER 31, 2019 AND SEVEN DAYS ENDEDJANUARY 7, 2020
Attributable to the owners of SKX
Sharecapital
Sharepremium
Otherreserve
Translationreserve
StatutorySurplusreserve
FVTOCIreserve
(Accumulatedlosses)/
retainedprofits Sub-total
Non-controlling
interestsTotal
equity
RMB’000 RMB’000 RMB’000 RMB’000 RMB’000 RMB’000 RMB’000 RMB’000 RMB’000 RMB’000(note i)
At January 1, 2017 840,500 570,209 (3,343) 223 45,225 – (89,965) 1,362,849 127,691 1,490,540
Profit for the year – – – – – – 327,168 327,168 10,868 338,036Other comprehensive
expense for the year – – – (62) – – – (62) – (62)
Total comprehensiveincome (expense) forthe year – – – (62) – – 327,168 327,106 10,868 337,974
Issue of ordinaryshares (note ii) 78,100 515,416 – – – – – 593,516 – 593,516
Transfer to statutorysurplus reserve – – – – 8,495 – (8,495) – – –
Dividends tonon-controllingequity holders – – – – – – – – (3,985) (3,985)
At December 31, 2017 918,600 1,085,625 (3,343) 161 53,720 – 228,708 2,283,471 134,574 2,418,045
Adoption of IFRS 9 – – – – – (32,819) (5,952) (38,771) – (38,771)At January 1, 2018 918,600 1,085,625 (3,343) 161 53,720 (32,819) 222,756 2,244,700 134,574 2,379,274
Profit for the year – – – – – – 49,712 49,712 3,114 52,826Other comprehensive
income (expense) forthe year – – – 17 – (4,791) – (4,774) – (4,774)
Total comprehensiveincome (expense)for the year – – – 17 – (4,791) 49,712 44,938 3,114 48,052
Transfer to statutorysurplus reserve – – – – 16,540 – (16,540) – – –
Liquidation ofsubsidiaries (note iii) – – (6,748) – – – – (6,748) (8,251) (14,999)
At December 31, 2018 918,600 1,085,625 (10,091) 178 70,260 (37,610) 255,928 2,282,890 129,437 2,412,327
Profit (loss) for theyear – – – – – – 112,004 112,004 (2,767) 109,237
Other comprehensiveincome for the year – – – 88 – 11,148 – 11,236 – 11,236
Total comprehensiveincome (expense) forthe year – – – 88 – 11,148 112,004 123,240 (2,767) 120,473
Transfer to statutorysurplus reserve – – – – 6,703 – (6,703) – – –
Acquisition ofnon-controllinginterests (note iv) – – (110,624) – – – – (110,624) (118,593) (229,217)
Liquidation of asubsidiary (note v) – – 2,552 – – – – 2,552 (2,203) 349
At December 31, 2019 918,600 1,085,625 (118,163) 266 76,963 (26,462) 361,229 2,298,058 5,874 2,303,932
Profit (loss) for theperiod – – – – – – 6,595 6,595 (23) 6,572
Other comprehensiveexpense for theperiod – – – (3) – – – (3) – (3)
Total comprehensiveincome (expense) forthe period – – – (3) – – 6,595 6,592 (23) 6,569
At January 7, 2020 918,600 1,085,625 (118,163) 263 76,963 (26,462) 367,824 2,304,650 5,851 2,310,501
APPENDIX I ACCOUNTANTS’ REPORT
– I-99 –
THIS DOCUMENT IS IN DRAFT FORM, INCOMPLETE AND SUBJECT TO CHANGE AND THAT INFORMATION MUST BEREAD IN CONJUNCTION WITH THE SECTION HEADED “WARNING” ON THE COVER OF THIS DOCUMENT.
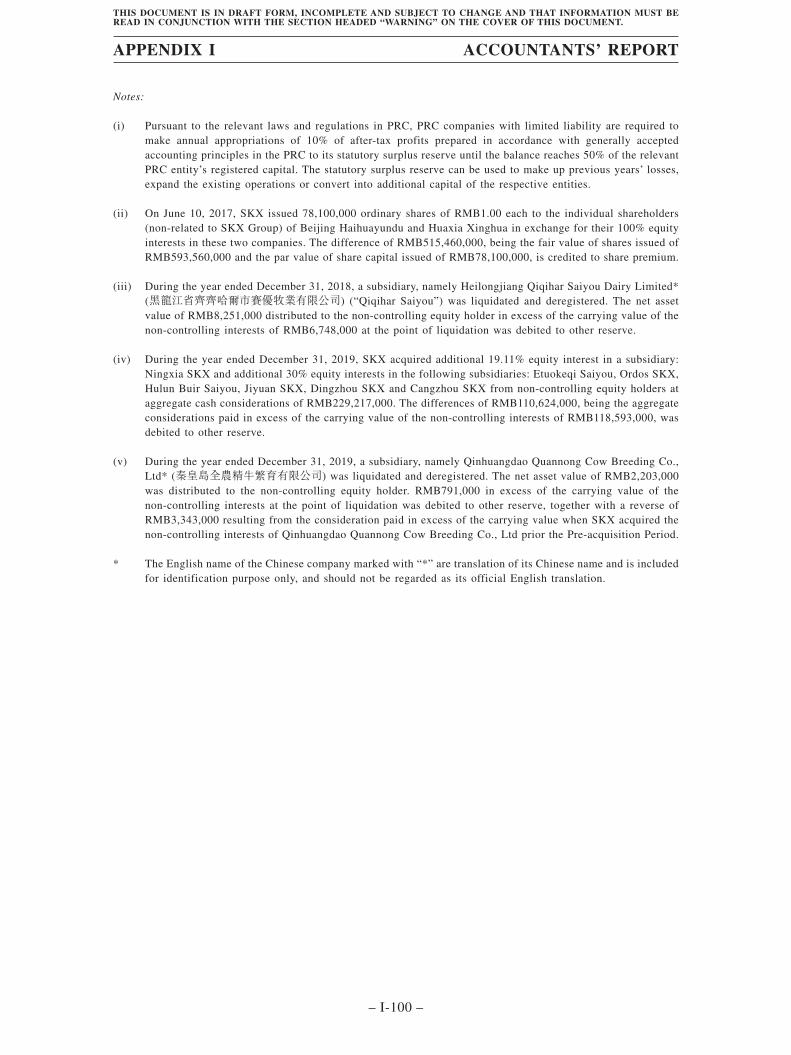
Notes:
(i) Pursuant to the relevant laws and regulations in PRC, PRC companies with limited liability are required tomake annual appropriations of 10% of after-tax profits prepared in accordance with generally acceptedaccounting principles in the PRC to its statutory surplus reserve until the balance reaches 50% of the relevantPRC entity’s registered capital. The statutory surplus reserve can be used to make up previous years’ losses,expand the existing operations or convert into additional capital of the respective entities.
(ii) On June 10, 2017, SKX issued 78,100,000 ordinary shares of RMB1.00 each to the individual shareholders(non-related to SKX Group) of Beijing Haihuayundu and Huaxia Xinghua in exchange for their 100% equityinterests in these two companies. The difference of RMB515,460,000, being the fair value of shares issued ofRMB593,560,000 and the par value of share capital issued of RMB78,100,000, is credited to share premium.
(iii) During the year ended December 31, 2018, a subsidiary, namely Heilongjiang Qiqihar Saiyou Dairy Limited*(黑龍江省齊齊哈爾市賽優牧業有限公司) (“Qiqihar Saiyou”) was liquidated and deregistered. The net assetvalue of RMB8,251,000 distributed to the non-controlling equity holder in excess of the carrying value of thenon-controlling interests of RMB6,748,000 at the point of liquidation was debited to other reserve.
(iv) During the year ended December 31, 2019, SKX acquired additional 19.11% equity interest in a subsidiary:Ningxia SKX and additional 30% equity interests in the following subsidiaries: Etuokeqi Saiyou, Ordos SKX,Hulun Buir Saiyou, Jiyuan SKX, Dingzhou SKX and Cangzhou SKX from non-controlling equity holders ataggregate cash considerations of RMB229,217,000. The differences of RMB110,624,000, being the aggregateconsiderations paid in excess of the carrying value of the non-controlling interests of RMB118,593,000, wasdebited to other reserve.
(v) During the year ended December 31, 2019, a subsidiary, namely Qinhuangdao Quannong Cow Breeding Co.,Ltd* (秦皇島全農精牛繁育有限公司) was liquidated and deregistered. The net asset value of RMB2,203,000was distributed to the non-controlling equity holder. RMB791,000 in excess of the carrying value of thenon-controlling interests at the point of liquidation was debited to other reserve, together with a reverse ofRMB3,343,000 resulting from the consideration paid in excess of the carrying value when SKX acquired thenon-controlling interests of Qinhuangdao Quannong Cow Breeding Co., Ltd prior the Pre-acquisition Period.
* The English name of the Chinese company marked with “*” are translation of its Chinese name and is includedfor identification purpose only, and should not be regarded as its official English translation.
APPENDIX I ACCOUNTANTS’ REPORT
– I-100 –
THIS DOCUMENT IS IN DRAFT FORM, INCOMPLETE AND SUBJECT TO CHANGE AND THAT INFORMATION MUST BEREAD IN CONJUNCTION WITH THE SECTION HEADED “WARNING” ON THE COVER OF THIS DOCUMENT.
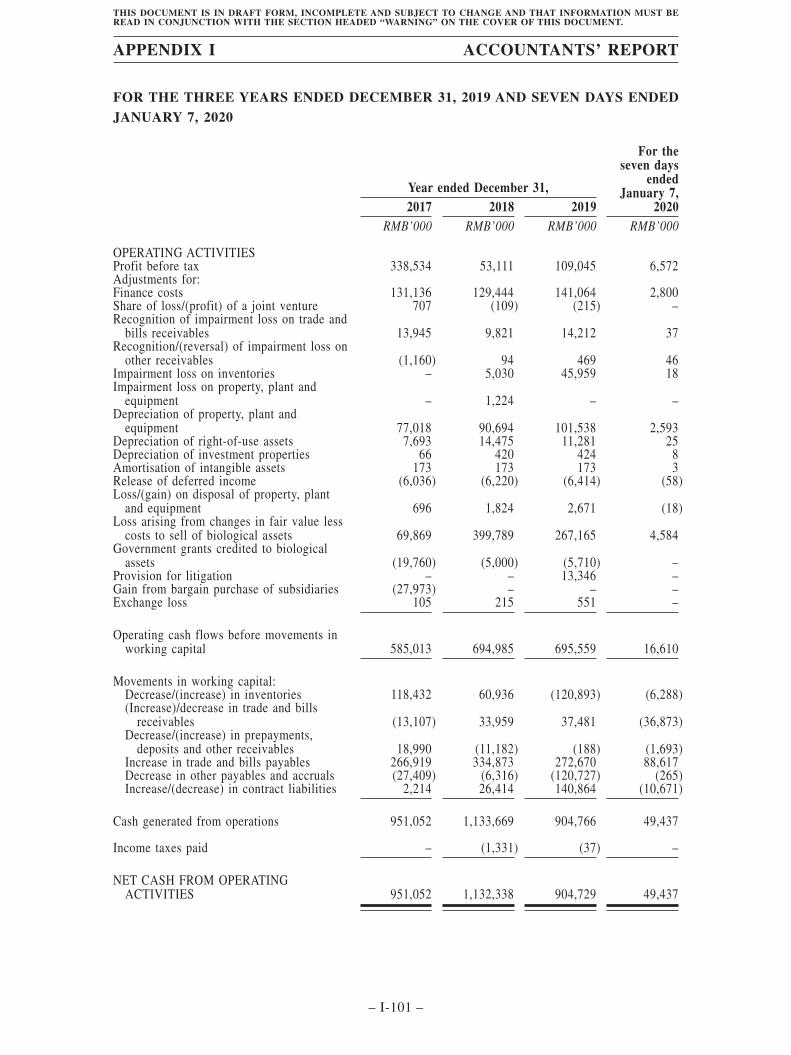
FOR THE THREE YEARS ENDED DECEMBER 31, 2019 AND SEVEN DAYS ENDEDJANUARY 7, 2020
Year ended December 31,
For theseven days
endedJanuary 7,
20202017 2018 2019RMB’000 RMB’000 RMB’000 RMB’000
OPERATING ACTIVITIESProfit before tax 338,534 53,111 109,045 6,572Adjustments for:Finance costs 131,136 129,444 141,064 2,800Share of loss/(profit) of a joint venture 707 (109) (215) –Recognition of impairment loss on trade and
bills receivables 13,945 9,821 14,212 37Recognition/(reversal) of impairment loss on
other receivables (1,160) 94 469 46Impairment loss on inventories – 5,030 45,959 18Impairment loss on property, plant and
equipment – 1,224 – –Depreciation of property, plant and
equipment 77,018 90,694 101,538 2,593Depreciation of right-of-use assets 7,693 14,475 11,281 25Depreciation of investment properties 66 420 424 8Amortisation of intangible assets 173 173 173 3Release of deferred income (6,036) (6,220) (6,414) (58)Loss/(gain) on disposal of property, plant
and equipment 696 1,824 2,671 (18)Loss arising from changes in fair value less
costs to sell of biological assets 69,869 399,789 267,165 4,584Government grants credited to biological
assets (19,760) (5,000) (5,710) –Provision for litigation – – 13,346 –Gain from bargain purchase of subsidiaries (27,973) – – –Exchange loss 105 215 551 –
Operating cash flows before movements inworking capital 585,013 694,985 695,559 16,610
Movements in working capital:Decrease/(increase) in inventories 118,432 60,936 (120,893) (6,288)(Increase)/decrease in trade and bills
receivables (13,107) 33,959 37,481 (36,873)Decrease/(increase) in prepayments,
deposits and other receivables 18,990 (11,182) (188) (1,693)Increase in trade and bills payables 266,919 334,873 272,670 88,617Decrease in other payables and accruals (27,409) (6,316) (120,727) (265)Increase/(decrease) in contract liabilities 2,214 26,414 140,864 (10,671)
Cash generated from operations 951,052 1,133,669 904,766 49,437
Income taxes paid – (1,331) (37) –
NET CASH FROM OPERATINGACTIVITIES 951,052 1,132,338 904,729 49,437
APPENDIX I ACCOUNTANTS’ REPORT
– I-101 –
THIS DOCUMENT IS IN DRAFT FORM, INCOMPLETE AND SUBJECT TO CHANGE AND THAT INFORMATION MUST BEREAD IN CONJUNCTION WITH THE SECTION HEADED “WARNING” ON THE COVER OF THIS DOCUMENT.
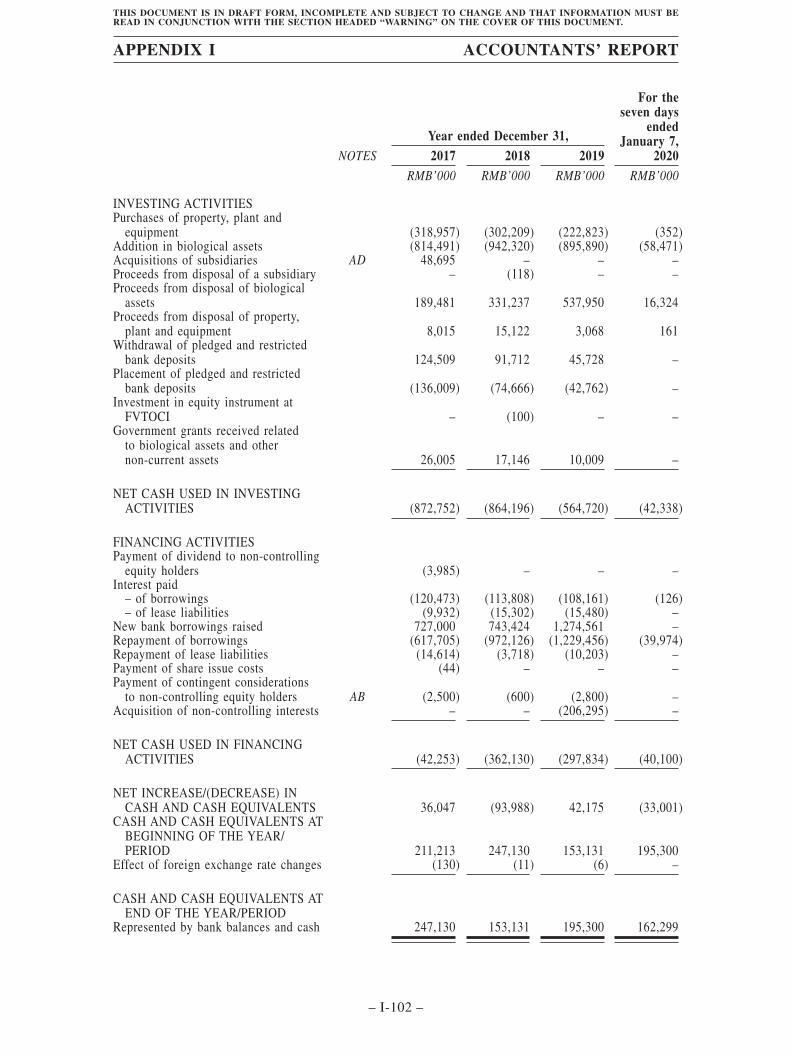
NOTES
Year ended December 31,
For theseven days
endedJanuary 7,
20202017 2018 2019RMB’000 RMB’000 RMB’000 RMB’000
INVESTING ACTIVITIESPurchases of property, plant and
equipment (318,957) (302,209) (222,823) (352)Addition in biological assets (814,491) (942,320) (895,890) (58,471)Acquisitions of subsidiaries AD 48,695 – – –Proceeds from disposal of a subsidiary – (118) – –Proceeds from disposal of biological
assets 189,481 331,237 537,950 16,324Proceeds from disposal of property,
plant and equipment 8,015 15,122 3,068 161Withdrawal of pledged and restricted
bank deposits 124,509 91,712 45,728 –Placement of pledged and restricted
bank deposits (136,009) (74,666) (42,762) –Investment in equity instrument at
FVTOCI – (100) – –Government grants received related
to biological assets and othernon-current assets 26,005 17,146 10,009 –
NET CASH USED IN INVESTINGACTIVITIES (872,752) (864,196) (564,720) (42,338)
FINANCING ACTIVITIESPayment of dividend to non-controlling
equity holders (3,985) – – –Interest paid
– of borrowings (120,473) (113,808) (108,161) (126)– of lease liabilities (9,932) (15,302) (15,480) –
New bank borrowings raised 727,000 743,424 1,274,561 –Repayment of borrowings (617,705) (972,126) (1,229,456) (39,974)Repayment of lease liabilities (14,614) (3,718) (10,203) –Payment of share issue costs (44) – – –Payment of contingent considerations
to non-controlling equity holders AB (2,500) (600) (2,800) –Acquisition of non-controlling interests – – (206,295) –
NET CASH USED IN FINANCINGACTIVITIES (42,253) (362,130) (297,834) (40,100)
NET INCREASE/(DECREASE) INCASH AND CASH EQUIVALENTS 36,047 (93,988) 42,175 (33,001)
CASH AND CASH EQUIVALENTS ATBEGINNING OF THE YEAR/PERIOD 211,213 247,130 153,131 195,300
Effect of foreign exchange rate changes (130) (11) (6) –
CASH AND CASH EQUIVALENTS ATEND OF THE YEAR/PERIOD
Represented by bank balances and cash 247,130 153,131 195,300 162,299
APPENDIX I ACCOUNTANTS’ REPORT
– I-102 –
THIS DOCUMENT IS IN DRAFT FORM, INCOMPLETE AND SUBJECT TO CHANGE AND THAT INFORMATION MUST BEREAD IN CONJUNCTION WITH THE SECTION HEADED “WARNING” ON THE COVER OF THIS DOCUMENT.
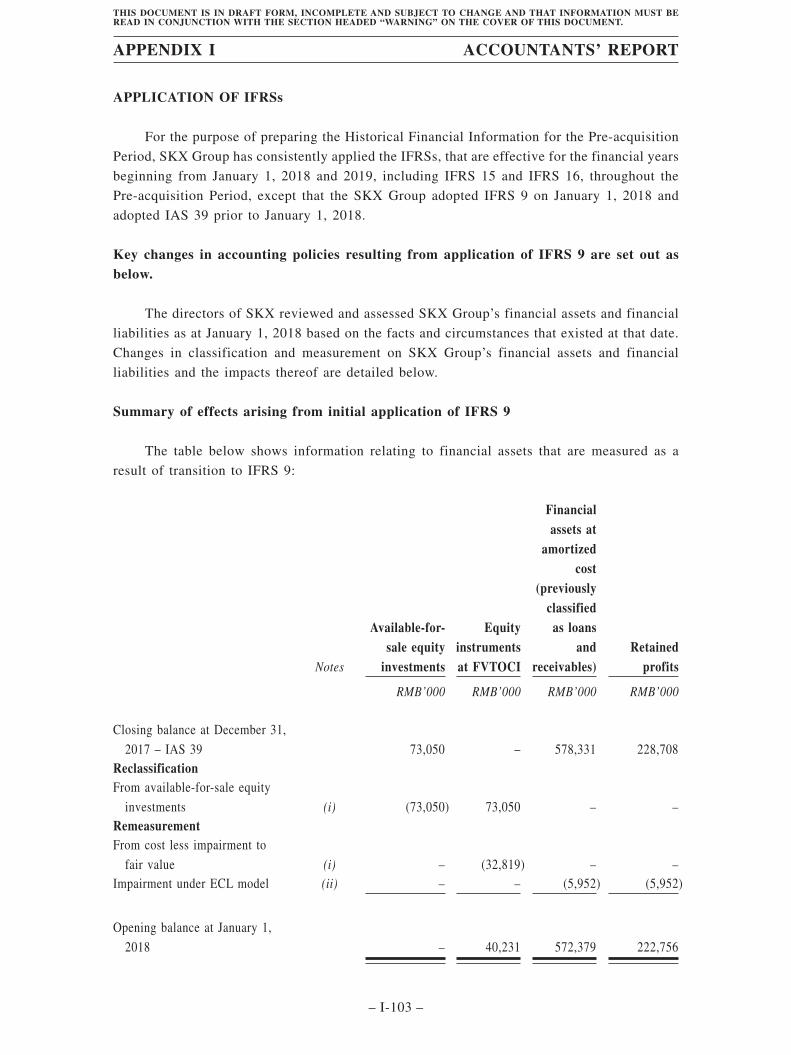
APPLICATION OF IFRSs
For the purpose of preparing the Historical Financial Information for the Pre-acquisition
Period, SKX Group has consistently applied the IFRSs, that are effective for the financial years
beginning from January 1, 2018 and 2019, including IFRS 15 and IFRS 16, throughout the
Pre-acquisition Period, except that the SKX Group adopted IFRS 9 on January 1, 2018 and
adopted IAS 39 prior to January 1, 2018.
Key changes in accounting policies resulting from application of IFRS 9 are set out asbelow.
The directors of SKX reviewed and assessed SKX Group’s financial assets and financial
liabilities as at January 1, 2018 based on the facts and circumstances that existed at that date.
Changes in classification and measurement on SKX Group’s financial assets and financial
liabilities and the impacts thereof are detailed below.
Summary of effects arising from initial application of IFRS 9
The table below shows information relating to financial assets that are measured as a
result of transition to IFRS 9:
Notes
Available-for-sale equity
investments
Equityinstrumentsat FVTOCI
Financialassets at
amortizedcost
(previouslyclassified
as loansand
receivables)Retained
profits
RMB’000 RMB’000 RMB’000 RMB’000
Closing balance at December 31,
2017 – IAS 39 73,050 – 578,331 228,708ReclassificationFrom available-for-sale equity
investments (i) (73,050) 73,050 – –RemeasurementFrom cost less impairment to
fair value (i) – (32,819) – –Impairment under ECL model (ii) – – (5,952) (5,952)
Opening balance at January 1,
2018 – 40,231 572,379 222,756
APPENDIX I ACCOUNTANTS’ REPORT
– I-103 –
THIS DOCUMENT IS IN DRAFT FORM, INCOMPLETE AND SUBJECT TO CHANGE AND THAT INFORMATION MUST BEREAD IN CONJUNCTION WITH THE SECTION HEADED “WARNING” ON THE COVER OF THIS DOCUMENT.
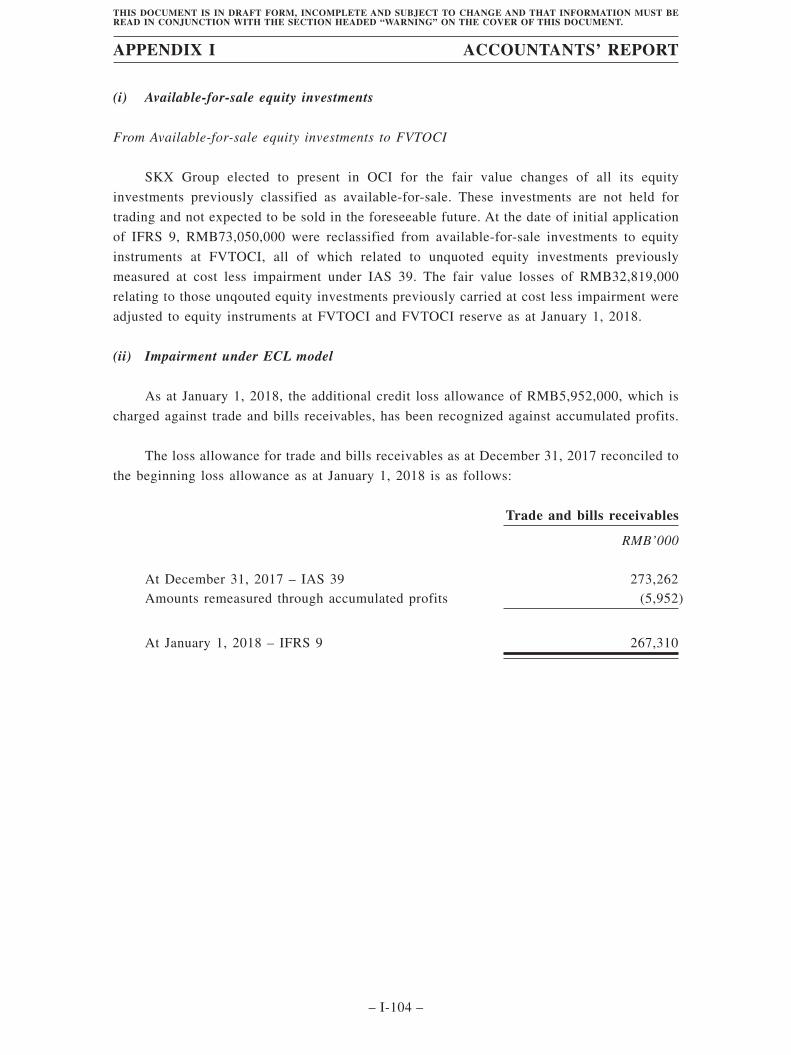
(i) Available-for-sale equity investments
From Available-for-sale equity investments to FVTOCI
SKX Group elected to present in OCI for the fair value changes of all its equity
investments previously classified as available-for-sale. These investments are not held for
trading and not expected to be sold in the foreseeable future. At the date of initial application
of IFRS 9, RMB73,050,000 were reclassified from available-for-sale investments to equity
instruments at FVTOCI, all of which related to unquoted equity investments previously
measured at cost less impairment under IAS 39. The fair value losses of RMB32,819,000
relating to those unqouted equity investments previously carried at cost less impairment were
adjusted to equity instruments at FVTOCI and FVTOCI reserve as at January 1, 2018.
(ii) Impairment under ECL model
As at January 1, 2018, the additional credit loss allowance of RMB5,952,000, which is
charged against trade and bills receivables, has been recognized against accumulated profits.
The loss allowance for trade and bills receivables as at December 31, 2017 reconciled to
the beginning loss allowance as at January 1, 2018 is as follows:
Trade and bills receivables
RMB’000
At December 31, 2017 – IAS 39 273,262Amounts remeasured through accumulated profits (5,952)
At January 1, 2018 – IFRS 9 267,310
APPENDIX I ACCOUNTANTS’ REPORT
– I-104 –
THIS DOCUMENT IS IN DRAFT FORM, INCOMPLETE AND SUBJECT TO CHANGE AND THAT INFORMATION MUST BEREAD IN CONJUNCTION WITH THE SECTION HEADED “WARNING” ON THE COVER OF THIS DOCUMENT.
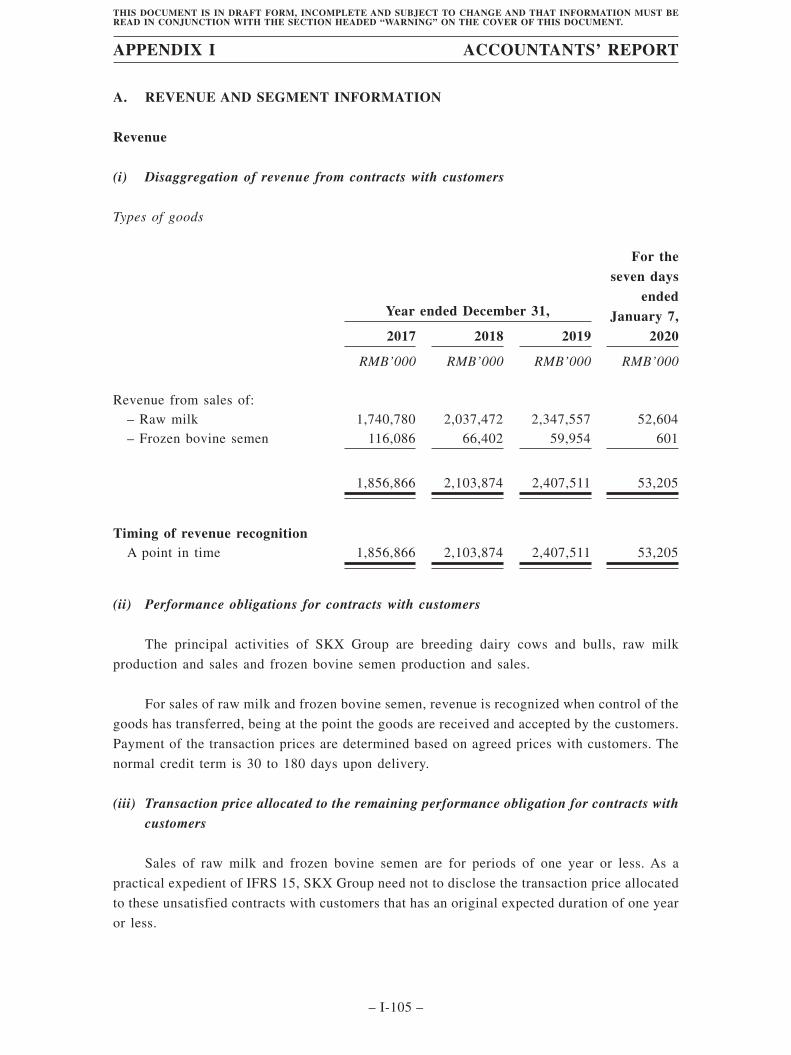
A. REVENUE AND SEGMENT INFORMATION
Revenue
(i) Disaggregation of revenue from contracts with customers
Types of goods
Year ended December 31,
For theseven days
endedJanuary 7,
20202017 2018 2019
RMB’000 RMB’000 RMB’000 RMB’000
Revenue from sales of:– Raw milk 1,740,780 2,037,472 2,347,557 52,604– Frozen bovine semen 116,086 66,402 59,954 601
1,856,866 2,103,874 2,407,511 53,205
Timing of revenue recognitionA point in time 1,856,866 2,103,874 2,407,511 53,205
(ii) Performance obligations for contracts with customers
The principal activities of SKX Group are breeding dairy cows and bulls, raw milk
production and sales and frozen bovine semen production and sales.
For sales of raw milk and frozen bovine semen, revenue is recognized when control of the
goods has transferred, being at the point the goods are received and accepted by the customers.
Payment of the transaction prices are determined based on agreed prices with customers. The
normal credit term is 30 to 180 days upon delivery.
(iii) Transaction price allocated to the remaining performance obligation for contracts with
customers
Sales of raw milk and frozen bovine semen are for periods of one year or less. As a
practical expedient of IFRS 15, SKX Group need not to disclose the transaction price allocated
to these unsatisfied contracts with customers that has an original expected duration of one year
or less.
APPENDIX I ACCOUNTANTS’ REPORT
– I-105 –
THIS DOCUMENT IS IN DRAFT FORM, INCOMPLETE AND SUBJECT TO CHANGE AND THAT INFORMATION MUST BEREAD IN CONJUNCTION WITH THE SECTION HEADED “WARNING” ON THE COVER OF THIS DOCUMENT.
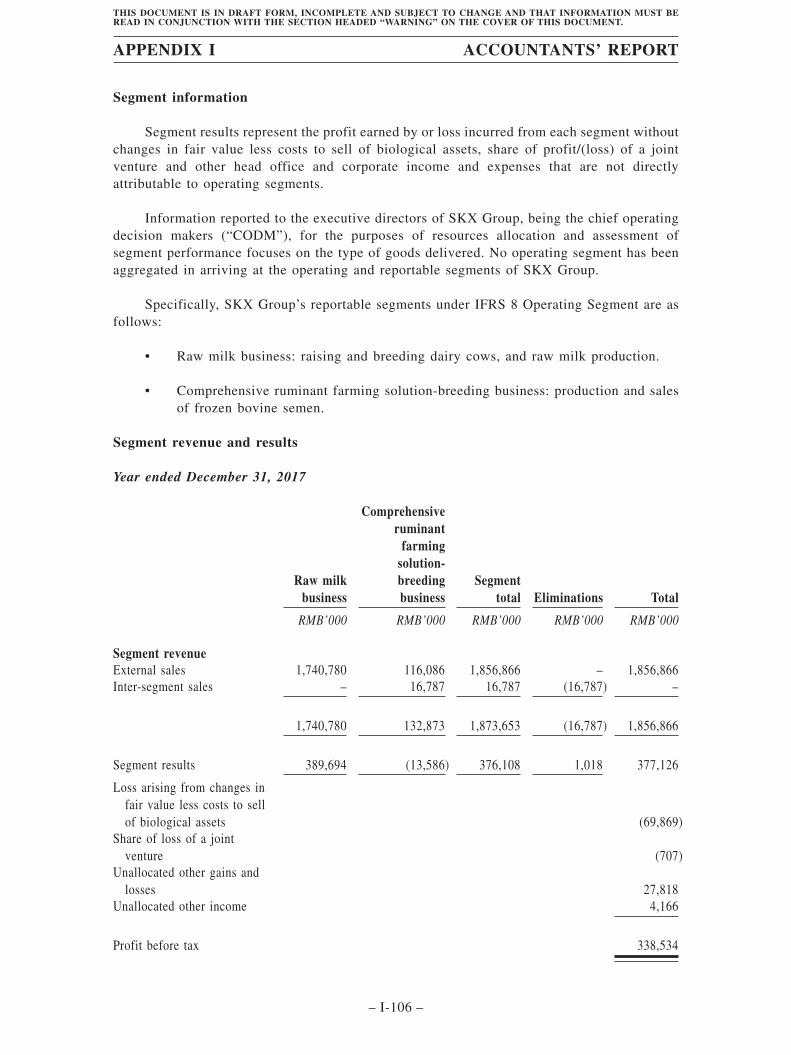
Segment information
Segment results represent the profit earned by or loss incurred from each segment withoutchanges in fair value less costs to sell of biological assets, share of profit/(loss) of a jointventure and other head office and corporate income and expenses that are not directlyattributable to operating segments.
Information reported to the executive directors of SKX Group, being the chief operatingdecision makers (“CODM”), for the purposes of resources allocation and assessment ofsegment performance focuses on the type of goods delivered. No operating segment has beenaggregated in arriving at the operating and reportable segments of SKX Group.
Specifically, SKX Group’s reportable segments under IFRS 8 Operating Segment are asfollows:
• Raw milk business: raising and breeding dairy cows, and raw milk production.
• Comprehensive ruminant farming solution-breeding business: production and salesof frozen bovine semen.
Segment revenue and results
Year ended December 31, 2017
Raw milkbusiness
Comprehensiveruminant
farmingsolution-breedingbusiness
Segmenttotal Eliminations Total
RMB’000 RMB’000 RMB’000 RMB’000 RMB’000
Segment revenueExternal sales 1,740,780 116,086 1,856,866 – 1,856,866Inter-segment sales – 16,787 16,787 (16,787) –
1,740,780 132,873 1,873,653 (16,787) 1,856,866
Segment results 389,694 (13,586) 376,108 1,018 377,126
Loss arising from changes infair value less costs to sellof biological assets (69,869)
Share of loss of a jointventure (707)
Unallocated other gains andlosses 27,818
Unallocated other income 4,166
Profit before tax 338,534
APPENDIX I ACCOUNTANTS’ REPORT
– I-106 –
THIS DOCUMENT IS IN DRAFT FORM, INCOMPLETE AND SUBJECT TO CHANGE AND THAT INFORMATION MUST BEREAD IN CONJUNCTION WITH THE SECTION HEADED “WARNING” ON THE COVER OF THIS DOCUMENT.
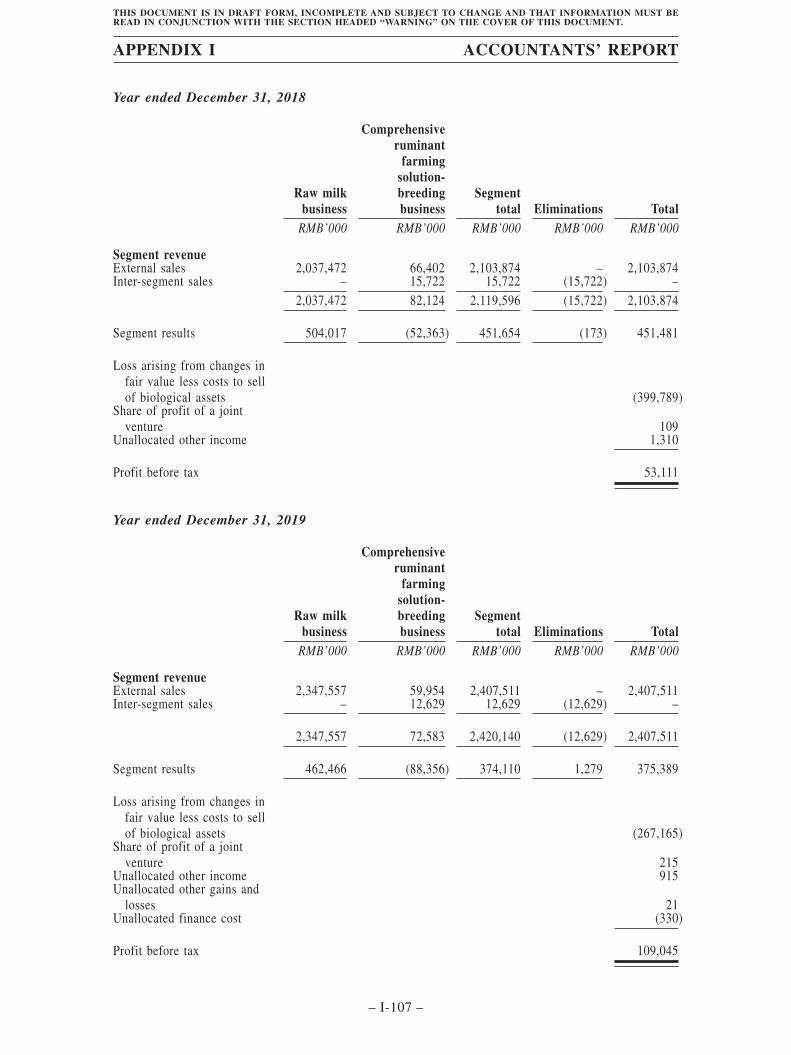
Year ended December 31, 2018
Raw milkbusiness
Comprehensiveruminant
farmingsolution-breedingbusiness
Segmenttotal Eliminations Total
RMB’000 RMB’000 RMB’000 RMB’000 RMB’000
Segment revenueExternal sales 2,037,472 66,402 2,103,874 – 2,103,874Inter-segment sales – 15,722 15,722 (15,722) –
2,037,472 82,124 2,119,596 (15,722) 2,103,874
Segment results 504,017 (52,363) 451,654 (173) 451,481
Loss arising from changes infair value less costs to sellof biological assets (399,789)
Share of profit of a jointventure 109
Unallocated other income 1,310
Profit before tax 53,111
Year ended December 31, 2019
Raw milkbusiness
Comprehensiveruminant
farmingsolution-breedingbusiness
Segmenttotal Eliminations Total
RMB’000 RMB’000 RMB’000 RMB’000 RMB’000
Segment revenueExternal sales 2,347,557 59,954 2,407,511 – 2,407,511Inter-segment sales – 12,629 12,629 (12,629) –
2,347,557 72,583 2,420,140 (12,629) 2,407,511
Segment results 462,466 (88,356) 374,110 1,279 375,389
Loss arising from changes infair value less costs to sellof biological assets (267,165)
Share of profit of a jointventure 215
Unallocated other income 915Unallocated other gains and
losses 21Unallocated finance cost (330)
Profit before tax 109,045
APPENDIX I ACCOUNTANTS’ REPORT
– I-107 –
THIS DOCUMENT IS IN DRAFT FORM, INCOMPLETE AND SUBJECT TO CHANGE AND THAT INFORMATION MUST BEREAD IN CONJUNCTION WITH THE SECTION HEADED “WARNING” ON THE COVER OF THIS DOCUMENT.
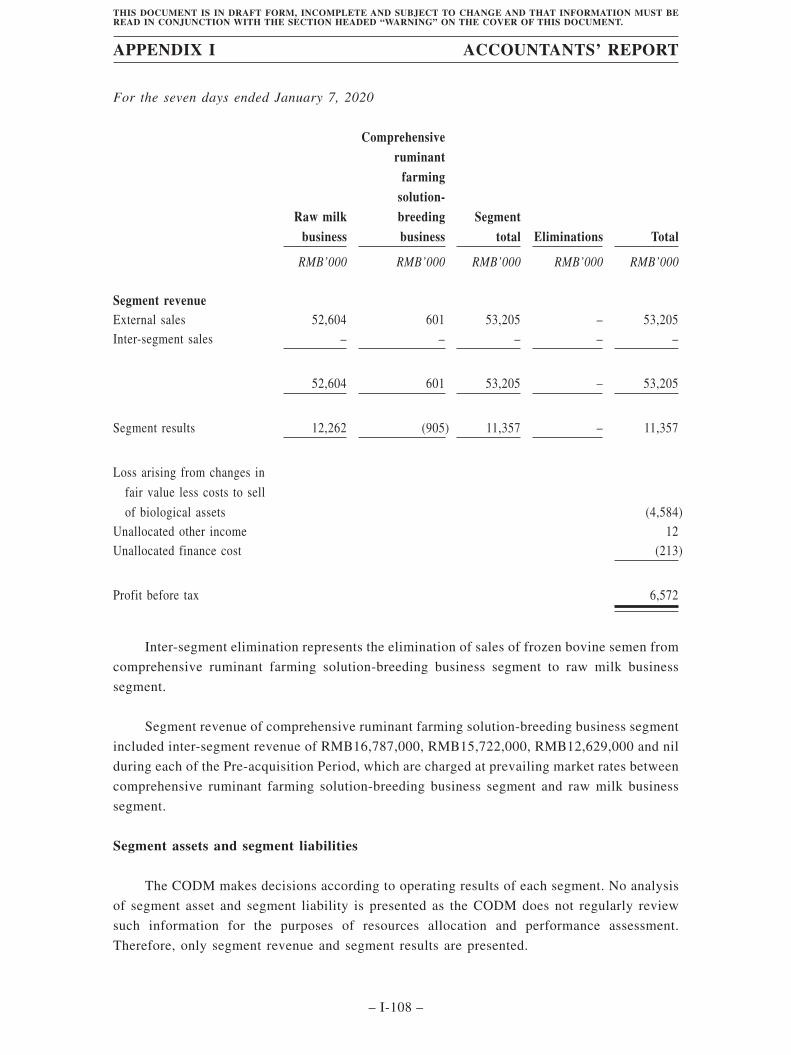
For the seven days ended January 7, 2020
Raw milkbusiness
Comprehensiveruminant
farmingsolution-breedingbusiness
Segmenttotal Eliminations Total
RMB’000 RMB’000 RMB’000 RMB’000 RMB’000
Segment revenueExternal sales 52,604 601 53,205 – 53,205Inter-segment sales – – – – –
52,604 601 53,205 – 53,205
Segment results 12,262 (905) 11,357 – 11,357
Loss arising from changes in
fair value less costs to sell
of biological assets (4,584)Unallocated other income 12Unallocated finance cost (213)
Profit before tax 6,572
Inter-segment elimination represents the elimination of sales of frozen bovine semen from
comprehensive ruminant farming solution-breeding business segment to raw milk business
segment.
Segment revenue of comprehensive ruminant farming solution-breeding business segment
included inter-segment revenue of RMB16,787,000, RMB15,722,000, RMB12,629,000 and nil
during each of the Pre-acquisition Period, which are charged at prevailing market rates between
comprehensive ruminant farming solution-breeding business segment and raw milk business
segment.
Segment assets and segment liabilities
The CODM makes decisions according to operating results of each segment. No analysis
of segment asset and segment liability is presented as the CODM does not regularly review
such information for the purposes of resources allocation and performance assessment.
Therefore, only segment revenue and segment results are presented.
APPENDIX I ACCOUNTANTS’ REPORT
– I-108 –
THIS DOCUMENT IS IN DRAFT FORM, INCOMPLETE AND SUBJECT TO CHANGE AND THAT INFORMATION MUST BEREAD IN CONJUNCTION WITH THE SECTION HEADED “WARNING” ON THE COVER OF THIS DOCUMENT.
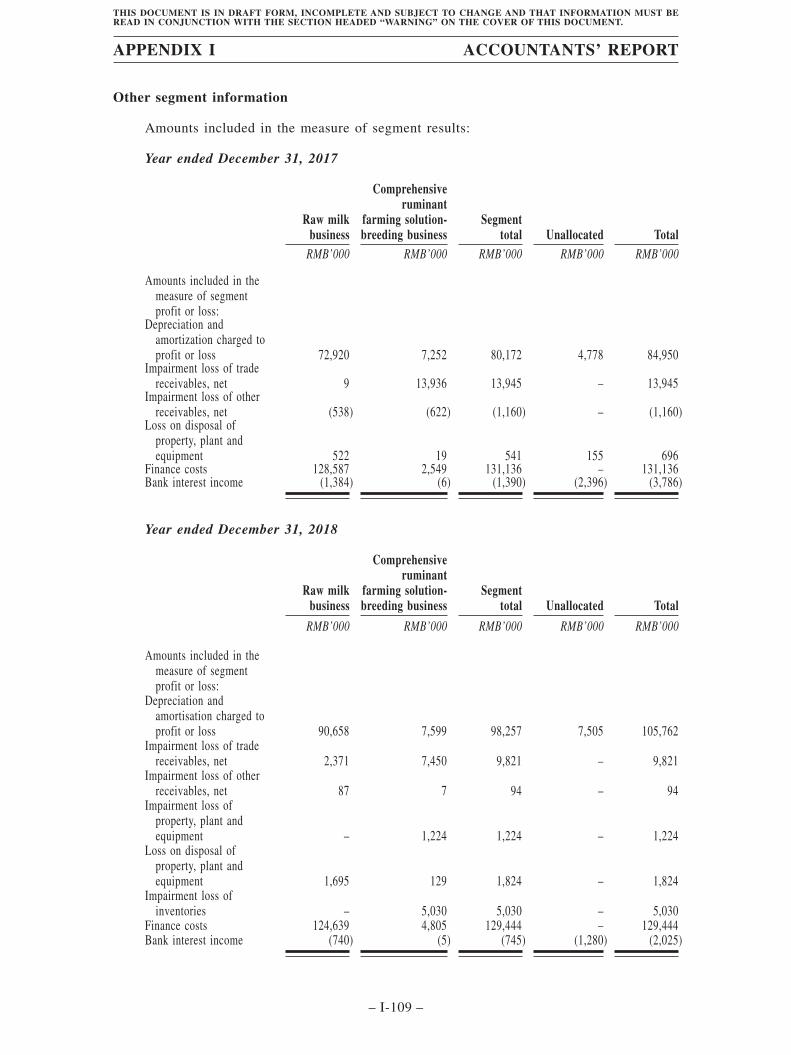
Other segment information
Amounts included in the measure of segment results:
Year ended December 31, 2017
Raw milkbusiness
Comprehensiveruminant
farming solution-breeding business
Segmenttotal Unallocated Total
RMB’000 RMB’000 RMB’000 RMB’000 RMB’000
Amounts included in themeasure of segmentprofit or loss:
Depreciation andamortization charged toprofit or loss 72,920 7,252 80,172 4,778 84,950
Impairment loss of tradereceivables, net 9 13,936 13,945 – 13,945
Impairment loss of otherreceivables, net (538) (622) (1,160) – (1,160)
Loss on disposal ofproperty, plant andequipment 522 19 541 155 696
Finance costs 128,587 2,549 131,136 – 131,136Bank interest income (1,384) (6) (1,390) (2,396) (3,786)
Year ended December 31, 2018
Raw milkbusiness
Comprehensiveruminant
farming solution-breeding business
Segmenttotal Unallocated Total
RMB’000 RMB’000 RMB’000 RMB’000 RMB’000
Amounts included in themeasure of segmentprofit or loss:
Depreciation andamortisation charged toprofit or loss 90,658 7,599 98,257 7,505 105,762
Impairment loss of tradereceivables, net 2,371 7,450 9,821 – 9,821
Impairment loss of otherreceivables, net 87 7 94 – 94
Impairment loss ofproperty, plant andequipment – 1,224 1,224 – 1,224
Loss on disposal ofproperty, plant andequipment 1,695 129 1,824 – 1,824
Impairment loss ofinventories – 5,030 5,030 – 5,030
Finance costs 124,639 4,805 129,444 – 129,444Bank interest income (740) (5) (745) (1,280) (2,025)
APPENDIX I ACCOUNTANTS’ REPORT
– I-109 –
THIS DOCUMENT IS IN DRAFT FORM, INCOMPLETE AND SUBJECT TO CHANGE AND THAT INFORMATION MUST BEREAD IN CONJUNCTION WITH THE SECTION HEADED “WARNING” ON THE COVER OF THIS DOCUMENT.
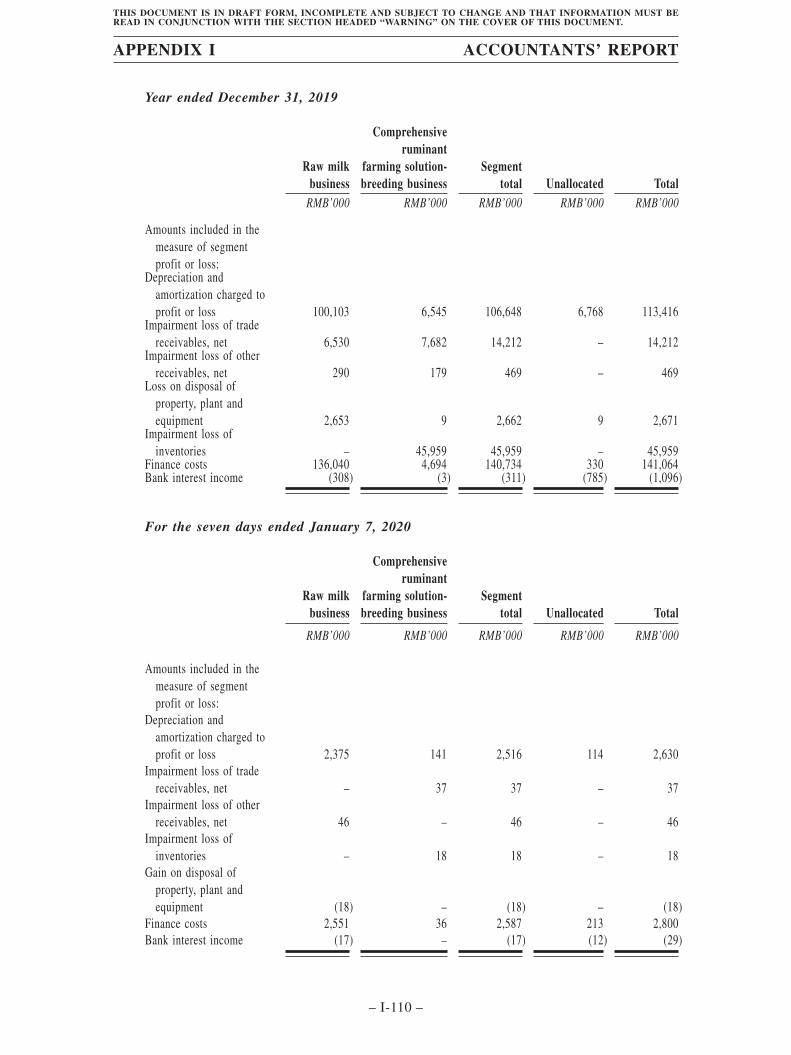
Year ended December 31, 2019
Raw milkbusiness
Comprehensiveruminant
farming solution-breeding business
Segmenttotal Unallocated Total
RMB’000 RMB’000 RMB’000 RMB’000 RMB’000
Amounts included in themeasure of segmentprofit or loss:
Depreciation andamortization charged toprofit or loss 100,103 6,545 106,648 6,768 113,416
Impairment loss of tradereceivables, net 6,530 7,682 14,212 – 14,212
Impairment loss of otherreceivables, net 290 179 469 – 469
Loss on disposal ofproperty, plant andequipment 2,653 9 2,662 9 2,671
Impairment loss ofinventories – 45,959 45,959 – 45,959
Finance costs 136,040 4,694 140,734 330 141,064Bank interest income (308) (3) (311) (785) (1,096)
For the seven days ended January 7, 2020
Raw milkbusiness
Comprehensiveruminant
farming solution-breeding business
Segmenttotal Unallocated Total
RMB’000 RMB’000 RMB’000 RMB’000 RMB’000
Amounts included in themeasure of segmentprofit or loss:
Depreciation andamortization charged toprofit or loss 2,375 141 2,516 114 2,630
Impairment loss of tradereceivables, net – 37 37 – 37
Impairment loss of otherreceivables, net 46 – 46 – 46
Impairment loss ofinventories – 18 18 – 18
Gain on disposal ofproperty, plant andequipment (18) – (18) – (18)
Finance costs 2,551 36 2,587 213 2,800Bank interest income (17) – (17) (12) (29)
APPENDIX I ACCOUNTANTS’ REPORT
– I-110 –
THIS DOCUMENT IS IN DRAFT FORM, INCOMPLETE AND SUBJECT TO CHANGE AND THAT INFORMATION MUST BEREAD IN CONJUNCTION WITH THE SECTION HEADED “WARNING” ON THE COVER OF THIS DOCUMENT.
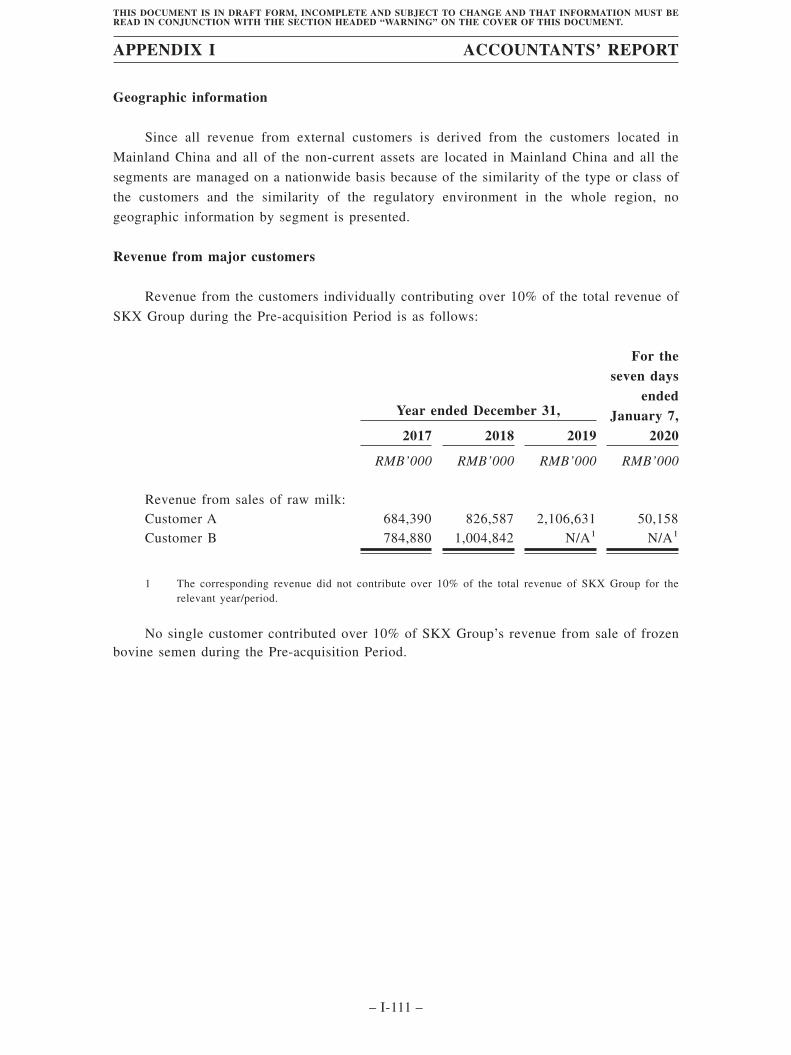
Geographic information
Since all revenue from external customers is derived from the customers located in
Mainland China and all of the non-current assets are located in Mainland China and all the
segments are managed on a nationwide basis because of the similarity of the type or class of
the customers and the similarity of the regulatory environment in the whole region, no
geographic information by segment is presented.
Revenue from major customers
Revenue from the customers individually contributing over 10% of the total revenue of
SKX Group during the Pre-acquisition Period is as follows:
Year ended December 31,
For theseven days
endedJanuary 7,
20202017 2018 2019
RMB’000 RMB’000 RMB’000 RMB’000
Revenue from sales of raw milk:Customer A 684,390 826,587 2,106,631 50,158Customer B 784,880 1,004,842 N/A1 N/A1
1 The corresponding revenue did not contribute over 10% of the total revenue of SKX Group for therelevant year/period.
No single customer contributed over 10% of SKX Group’s revenue from sale of frozenbovine semen during the Pre-acquisition Period.
APPENDIX I ACCOUNTANTS’ REPORT
– I-111 –
THIS DOCUMENT IS IN DRAFT FORM, INCOMPLETE AND SUBJECT TO CHANGE AND THAT INFORMATION MUST BEREAD IN CONJUNCTION WITH THE SECTION HEADED “WARNING” ON THE COVER OF THIS DOCUMENT.
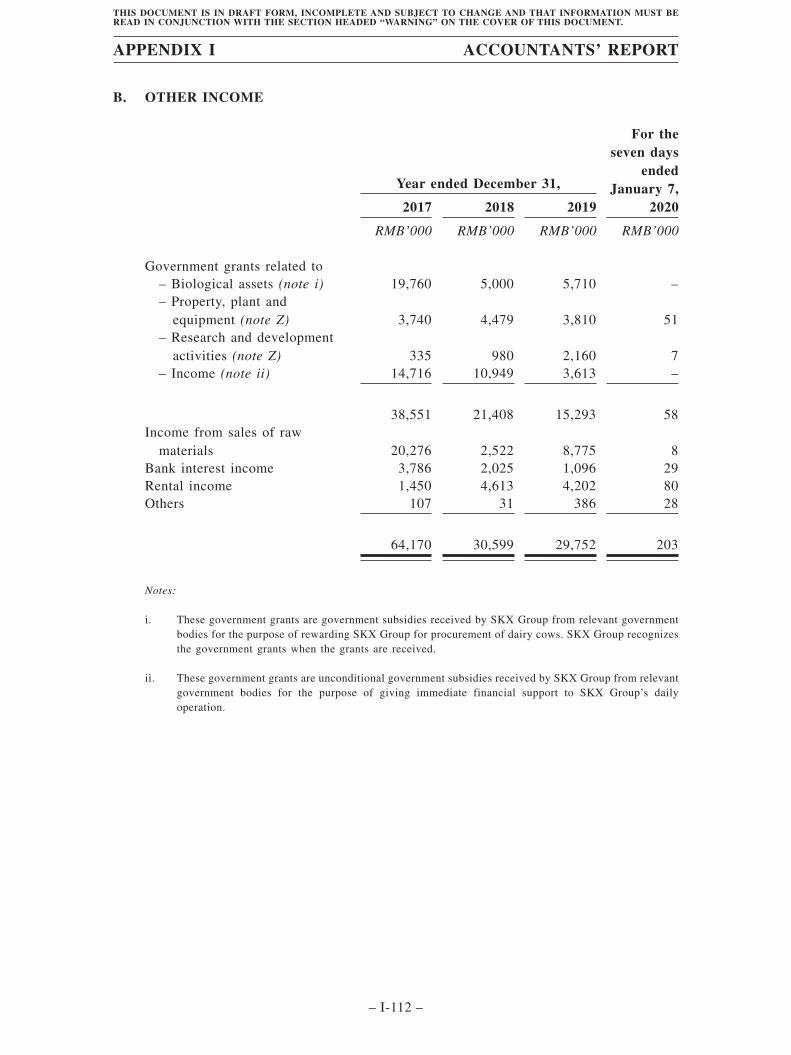
B. OTHER INCOME
Year ended December 31,
For theseven days
endedJanuary 7,
20202017 2018 2019
RMB’000 RMB’000 RMB’000 RMB’000
Government grants related to– Biological assets (note i) 19,760 5,000 5,710 –– Property, plant and
equipment (note Z) 3,740 4,479 3,810 51– Research and development
activities (note Z) 335 980 2,160 7– Income (note ii) 14,716 10,949 3,613 –
38,551 21,408 15,293 58Income from sales of raw
materials 20,276 2,522 8,775 8Bank interest income 3,786 2,025 1,096 29Rental income 1,450 4,613 4,202 80Others 107 31 386 28
64,170 30,599 29,752 203
Notes:
i. These government grants are government subsidies received by SKX Group from relevant governmentbodies for the purpose of rewarding SKX Group for procurement of dairy cows. SKX Group recognizesthe government grants when the grants are received.
ii. These government grants are unconditional government subsidies received by SKX Group from relevantgovernment bodies for the purpose of giving immediate financial support to SKX Group’s dailyoperation.
APPENDIX I ACCOUNTANTS’ REPORT
– I-112 –
THIS DOCUMENT IS IN DRAFT FORM, INCOMPLETE AND SUBJECT TO CHANGE AND THAT INFORMATION MUST BEREAD IN CONJUNCTION WITH THE SECTION HEADED “WARNING” ON THE COVER OF THIS DOCUMENT.
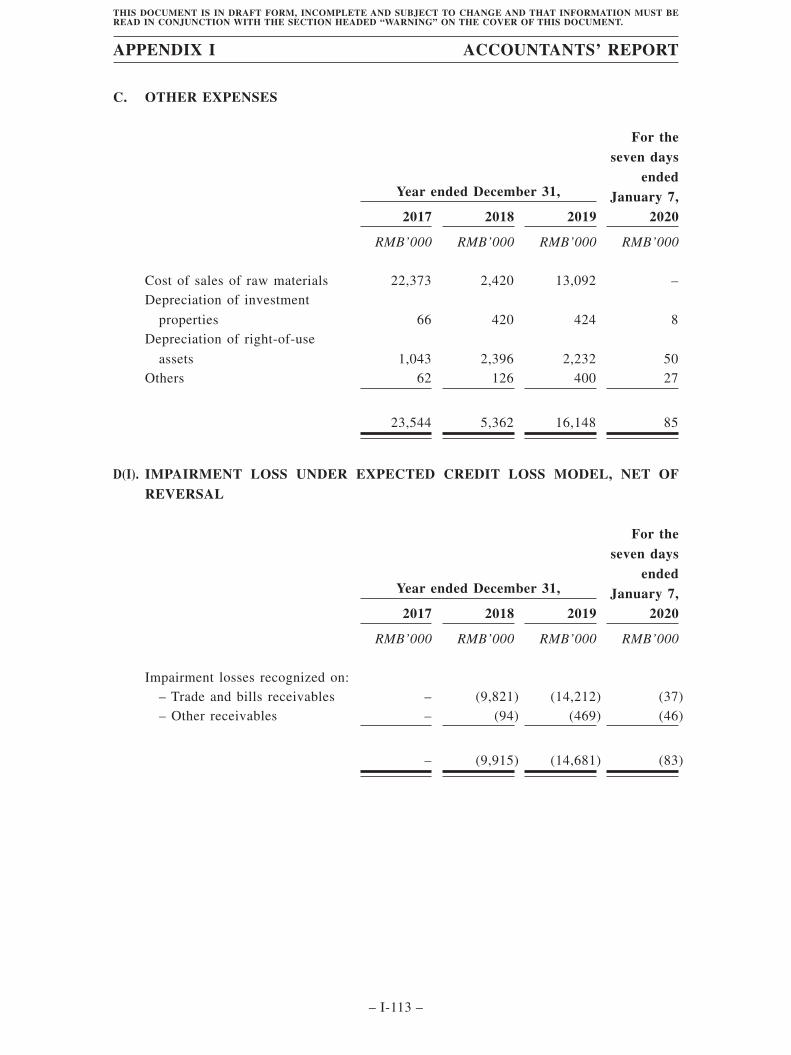
C. OTHER EXPENSES
Year ended December 31,
For theseven days
endedJanuary 7,
20202017 2018 2019
RMB’000 RMB’000 RMB’000 RMB’000
Cost of sales of raw materials 22,373 2,420 13,092 –Depreciation of investment
properties 66 420 424 8Depreciation of right-of-use
assets 1,043 2,396 2,232 50Others 62 126 400 27
23,544 5,362 16,148 85
D(I). IMPAIRMENT LOSS UNDER EXPECTED CREDIT LOSS MODEL, NET OFREVERSAL
Year ended December 31,
For theseven days
endedJanuary 7,
20202017 2018 2019
RMB’000 RMB’000 RMB’000 RMB’000
Impairment losses recognized on:– Trade and bills receivables – (9,821) (14,212) (37)– Other receivables – (94) (469) (46)
– (9,915) (14,681) (83)
APPENDIX I ACCOUNTANTS’ REPORT
– I-113 –
THIS DOCUMENT IS IN DRAFT FORM, INCOMPLETE AND SUBJECT TO CHANGE AND THAT INFORMATION MUST BEREAD IN CONJUNCTION WITH THE SECTION HEADED “WARNING” ON THE COVER OF THIS DOCUMENT.
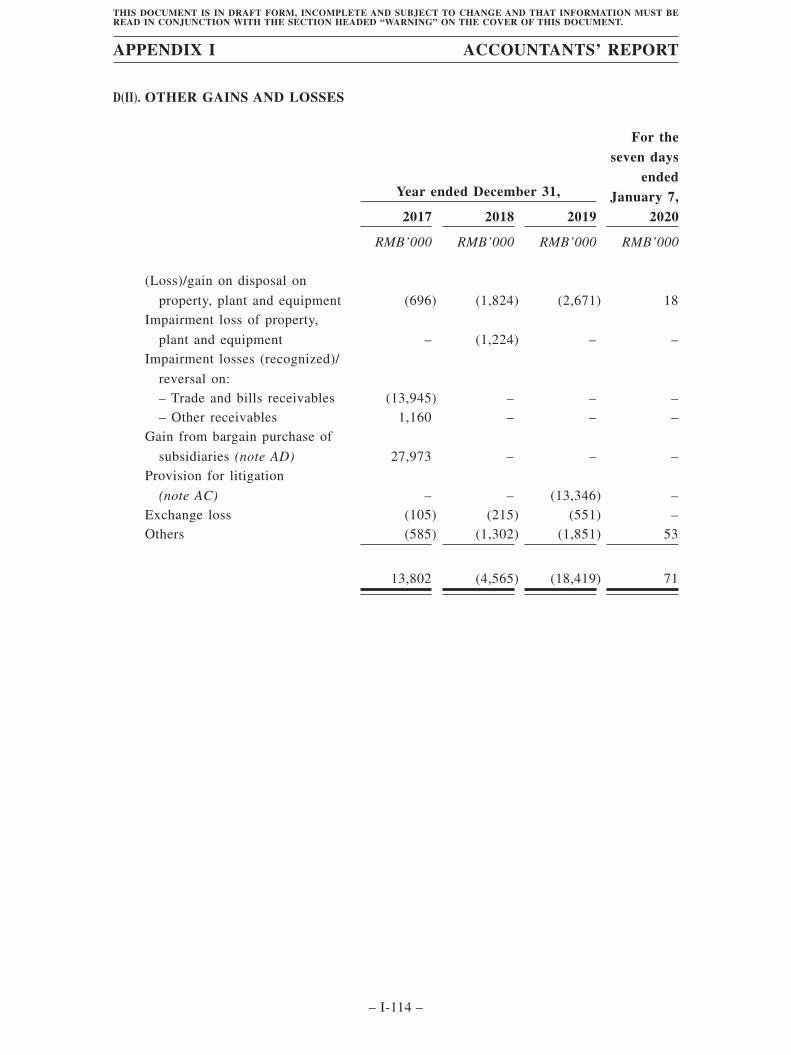
D(II). OTHER GAINS AND LOSSES
Year ended December 31,
For theseven days
endedJanuary 7,
20202017 2018 2019
RMB’000 RMB’000 RMB’000 RMB’000
(Loss)/gain on disposal on
property, plant and equipment (696) (1,824) (2,671) 18Impairment loss of property,
plant and equipment – (1,224) – –Impairment losses (recognized)/
reversal on:– Trade and bills receivables (13,945) – – –– Other receivables 1,160 – – –
Gain from bargain purchase of
subsidiaries (note AD) 27,973 – – –Provision for litigation
(note AC) – – (13,346) –Exchange loss (105) (215) (551) –Others (585) (1,302) (1,851) 53
13,802 (4,565) (18,419) 71
APPENDIX I ACCOUNTANTS’ REPORT
– I-114 –
THIS DOCUMENT IS IN DRAFT FORM, INCOMPLETE AND SUBJECT TO CHANGE AND THAT INFORMATION MUST BEREAD IN CONJUNCTION WITH THE SECTION HEADED “WARNING” ON THE COVER OF THIS DOCUMENT.
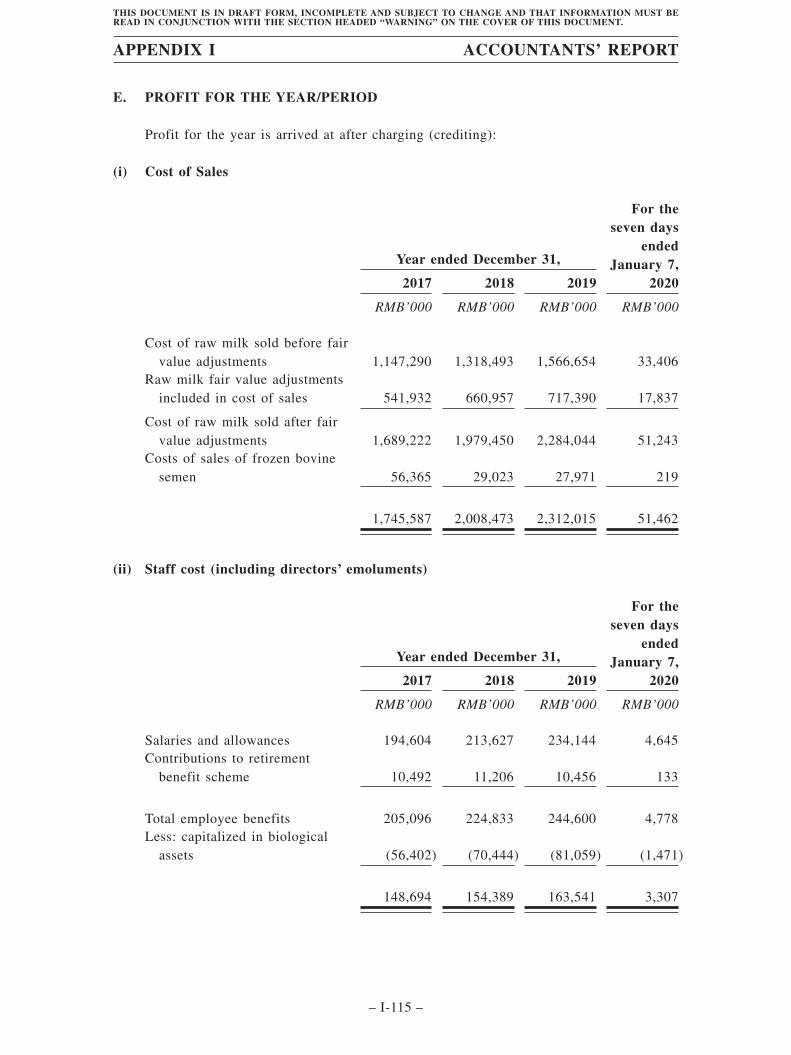
E. PROFIT FOR THE YEAR/PERIOD
Profit for the year is arrived at after charging (crediting):
(i) Cost of Sales
Year ended December 31,
For theseven days
endedJanuary 7,
20202017 2018 2019
RMB’000 RMB’000 RMB’000 RMB’000
Cost of raw milk sold before fairvalue adjustments 1,147,290 1,318,493 1,566,654 33,406
Raw milk fair value adjustmentsincluded in cost of sales 541,932 660,957 717,390 17,837
Cost of raw milk sold after fairvalue adjustments 1,689,222 1,979,450 2,284,044 51,243
Costs of sales of frozen bovinesemen 56,365 29,023 27,971 219
1,745,587 2,008,473 2,312,015 51,462
(ii) Staff cost (including directors’ emoluments)
Year ended December 31,
For theseven days
endedJanuary 7,
20202017 2018 2019
RMB’000 RMB’000 RMB’000 RMB’000
Salaries and allowances 194,604 213,627 234,144 4,645Contributions to retirement
benefit scheme 10,492 11,206 10,456 133
Total employee benefits 205,096 224,833 244,600 4,778Less: capitalized in biological
assets (56,402) (70,444) (81,059) (1,471)
148,694 154,389 163,541 3,307
APPENDIX I ACCOUNTANTS’ REPORT
– I-115 –
THIS DOCUMENT IS IN DRAFT FORM, INCOMPLETE AND SUBJECT TO CHANGE AND THAT INFORMATION MUST BEREAD IN CONJUNCTION WITH THE SECTION HEADED “WARNING” ON THE COVER OF THIS DOCUMENT.
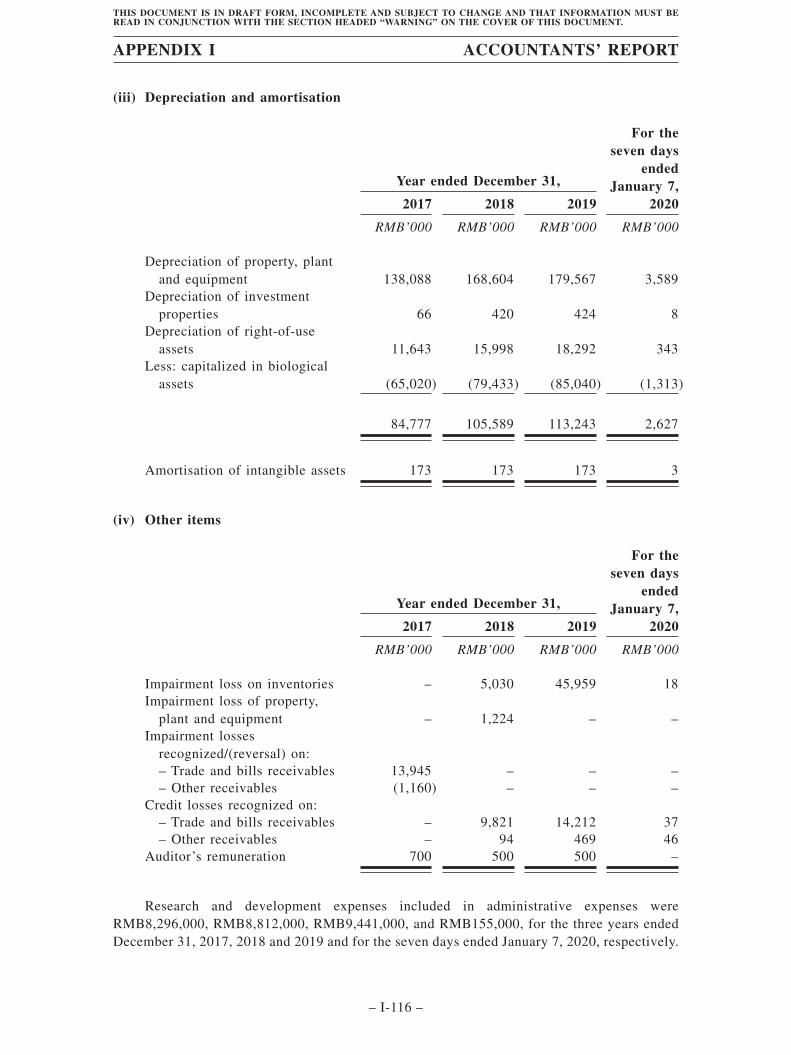
(iii) Depreciation and amortisation
Year ended December 31,
For theseven days
endedJanuary 7,
20202017 2018 2019
RMB’000 RMB’000 RMB’000 RMB’000
Depreciation of property, plantand equipment 138,088 168,604 179,567 3,589
Depreciation of investmentproperties 66 420 424 8
Depreciation of right-of-useassets 11,643 15,998 18,292 343
Less: capitalized in biologicalassets (65,020) (79,433) (85,040) (1,313)
84,777 105,589 113,243 2,627
Amortisation of intangible assets 173 173 173 3
(iv) Other items
Year ended December 31,
For theseven days
endedJanuary 7,
20202017 2018 2019
RMB’000 RMB’000 RMB’000 RMB’000
Impairment loss on inventories – 5,030 45,959 18Impairment loss of property,
plant and equipment – 1,224 – –Impairment losses
recognized/(reversal) on:– Trade and bills receivables 13,945 – – –– Other receivables (1,160) – – –
Credit losses recognized on:– Trade and bills receivables – 9,821 14,212 37– Other receivables – 94 469 46
Auditor’s remuneration 700 500 500 –
Research and development expenses included in administrative expenses wereRMB8,296,000, RMB8,812,000, RMB9,441,000, and RMB155,000, for the three years endedDecember 31, 2017, 2018 and 2019 and for the seven days ended January 7, 2020, respectively.
APPENDIX I ACCOUNTANTS’ REPORT
– I-116 –
THIS DOCUMENT IS IN DRAFT FORM, INCOMPLETE AND SUBJECT TO CHANGE AND THAT INFORMATION MUST BEREAD IN CONJUNCTION WITH THE SECTION HEADED “WARNING” ON THE COVER OF THIS DOCUMENT.
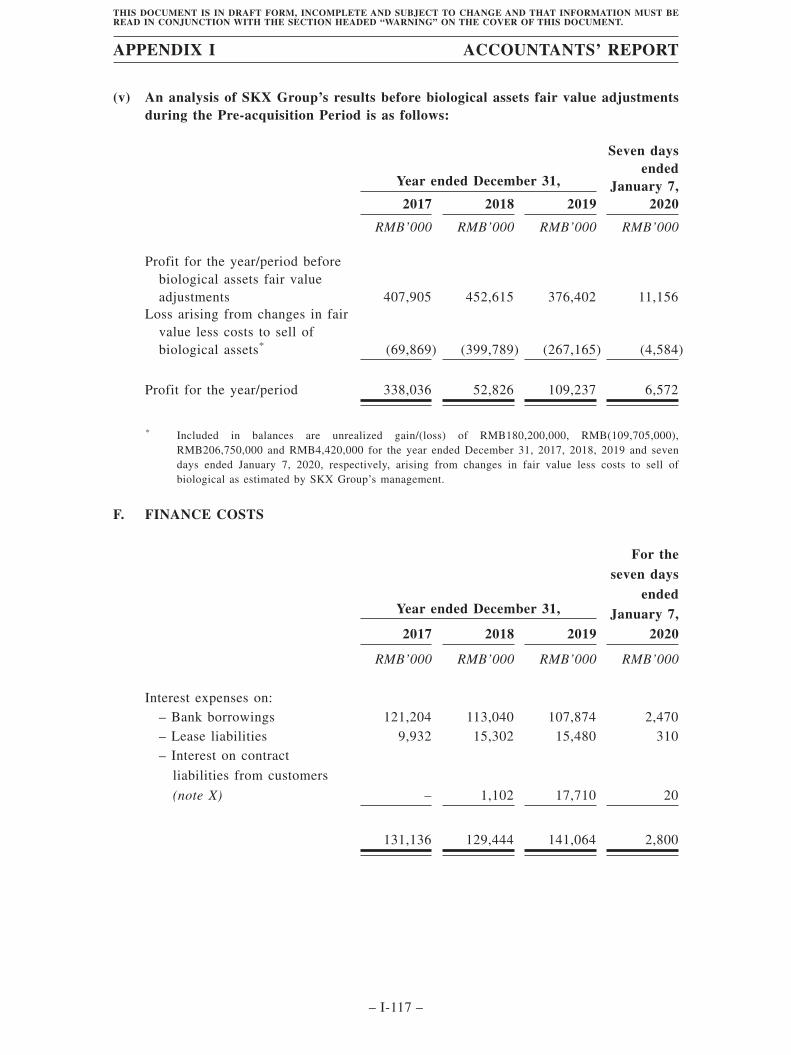
(v) An analysis of SKX Group’s results before biological assets fair value adjustmentsduring the Pre-acquisition Period is as follows:
Year ended December 31,
Seven daysended
January 7,20202017 2018 2019
RMB’000 RMB’000 RMB’000 RMB’000
Profit for the year/period beforebiological assets fair valueadjustments 407,905 452,615 376,402 11,156
Loss arising from changes in fairvalue less costs to sell ofbiological assets* (69,869) (399,789) (267,165) (4,584)
Profit for the year/period 338,036 52,826 109,237 6,572
* Included in balances are unrealized gain/(loss) of RMB180,200,000, RMB(109,705,000),RMB206,750,000 and RMB4,420,000 for the year ended December 31, 2017, 2018, 2019 and sevendays ended January 7, 2020, respectively, arising from changes in fair value less costs to sell ofbiological as estimated by SKX Group’s management.
F. FINANCE COSTS
Year ended December 31,
For theseven days
endedJanuary 7,
20202017 2018 2019
RMB’000 RMB’000 RMB’000 RMB’000
Interest expenses on:– Bank borrowings 121,204 113,040 107,874 2,470– Lease liabilities 9,932 15,302 15,480 310– Interest on contract
liabilities from customers
(note X) – 1,102 17,710 20
131,136 129,444 141,064 2,800
APPENDIX I ACCOUNTANTS’ REPORT
– I-117 –
THIS DOCUMENT IS IN DRAFT FORM, INCOMPLETE AND SUBJECT TO CHANGE AND THAT INFORMATION MUST BEREAD IN CONJUNCTION WITH THE SECTION HEADED “WARNING” ON THE COVER OF THIS DOCUMENT.
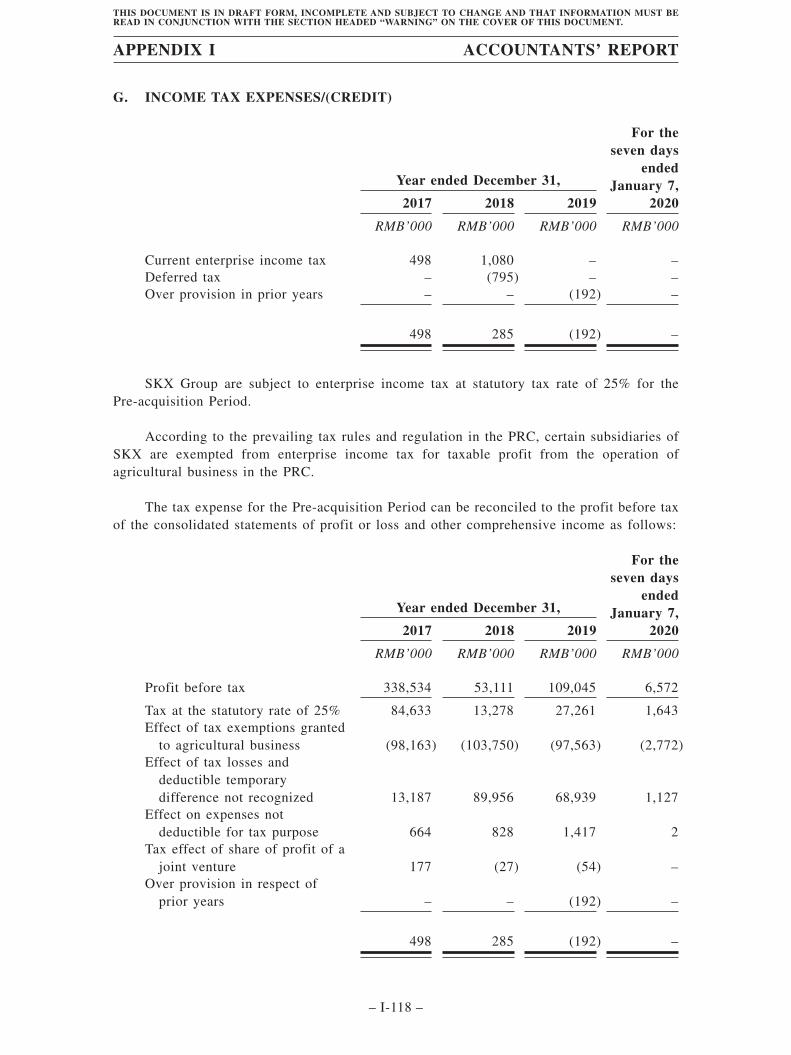
G. INCOME TAX EXPENSES/(CREDIT)
Year ended December 31,
For theseven days
endedJanuary 7,
20202017 2018 2019
RMB’000 RMB’000 RMB’000 RMB’000
Current enterprise income tax 498 1,080 – –Deferred tax – (795) – –Over provision in prior years – – (192) –
498 285 (192) –
SKX Group are subject to enterprise income tax at statutory tax rate of 25% for thePre-acquisition Period.
According to the prevailing tax rules and regulation in the PRC, certain subsidiaries ofSKX are exempted from enterprise income tax for taxable profit from the operation ofagricultural business in the PRC.
The tax expense for the Pre-acquisition Period can be reconciled to the profit before taxof the consolidated statements of profit or loss and other comprehensive income as follows:
Year ended December 31,
For theseven days
endedJanuary 7,
20202017 2018 2019
RMB’000 RMB’000 RMB’000 RMB’000
Profit before tax 338,534 53,111 109,045 6,572
Tax at the statutory rate of 25% 84,633 13,278 27,261 1,643Effect of tax exemptions granted
to agricultural business (98,163) (103,750) (97,563) (2,772)Effect of tax losses and
deductible temporarydifference not recognized 13,187 89,956 68,939 1,127
Effect on expenses notdeductible for tax purpose 664 828 1,417 2
Tax effect of share of profit of ajoint venture 177 (27) (54) –
Over provision in respect ofprior years – – (192) –
498 285 (192) –
APPENDIX I ACCOUNTANTS’ REPORT
– I-118 –
THIS DOCUMENT IS IN DRAFT FORM, INCOMPLETE AND SUBJECT TO CHANGE AND THAT INFORMATION MUST BEREAD IN CONJUNCTION WITH THE SECTION HEADED “WARNING” ON THE COVER OF THIS DOCUMENT.
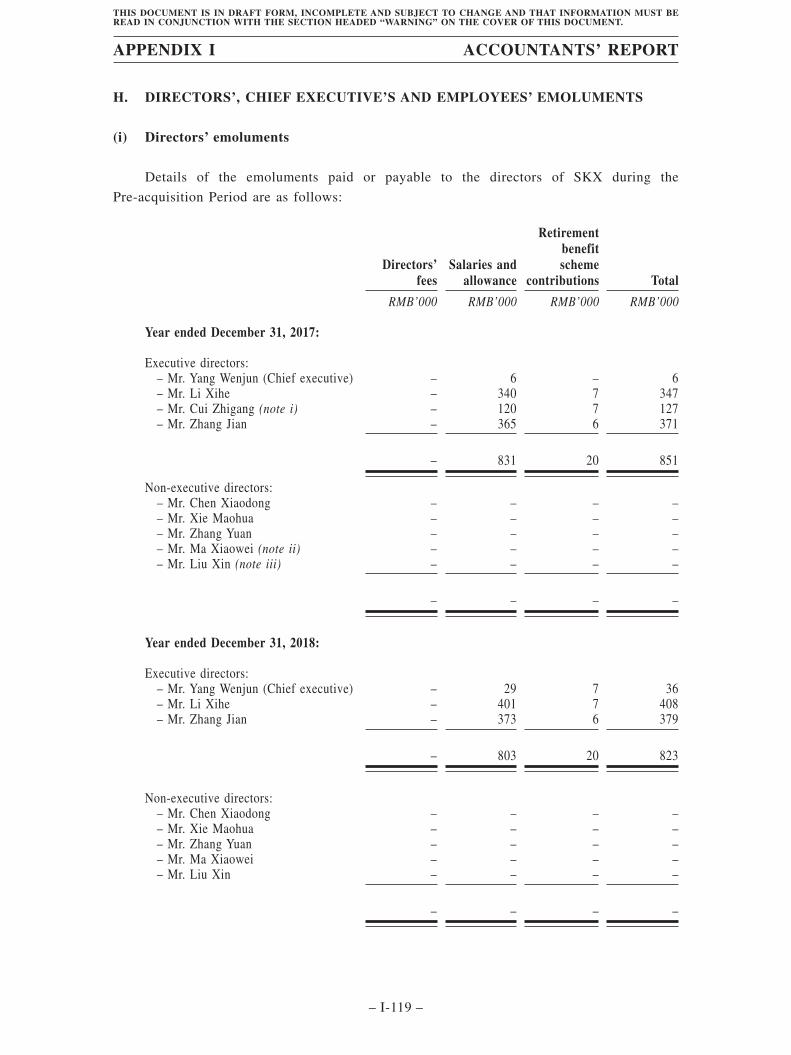
H. DIRECTORS’, CHIEF EXECUTIVE’S AND EMPLOYEES’ EMOLUMENTS
(i) Directors’ emoluments
Details of the emoluments paid or payable to the directors of SKX during the
Pre-acquisition Period are as follows:
Directors’fees
Salaries andallowance
Retirementbenefitscheme
contributions Total
RMB’000 RMB’000 RMB’000 RMB’000
Year ended December 31, 2017:
Executive directors:– Mr. Yang Wenjun (Chief executive) – 6 – 6– Mr. Li Xihe – 340 7 347– Mr. Cui Zhigang (note i) – 120 7 127– Mr. Zhang Jian – 365 6 371
– 831 20 851
Non-executive directors:– Mr. Chen Xiaodong – – – –– Mr. Xie Maohua – – – –– Mr. Zhang Yuan – – – –– Mr. Ma Xiaowei (note ii) – – – –– Mr. Liu Xin (note iii) – – – –
– – – –
Year ended December 31, 2018:
Executive directors:– Mr. Yang Wenjun (Chief executive) – 29 7 36– Mr. Li Xihe – 401 7 408– Mr. Zhang Jian – 373 6 379
– 803 20 823
Non-executive directors:– Mr. Chen Xiaodong – – – –– Mr. Xie Maohua – – – –– Mr. Zhang Yuan – – – –– Mr. Ma Xiaowei – – – –– Mr. Liu Xin – – – –
– – – –
APPENDIX I ACCOUNTANTS’ REPORT
– I-119 –
THIS DOCUMENT IS IN DRAFT FORM, INCOMPLETE AND SUBJECT TO CHANGE AND THAT INFORMATION MUST BEREAD IN CONJUNCTION WITH THE SECTION HEADED “WARNING” ON THE COVER OF THIS DOCUMENT.
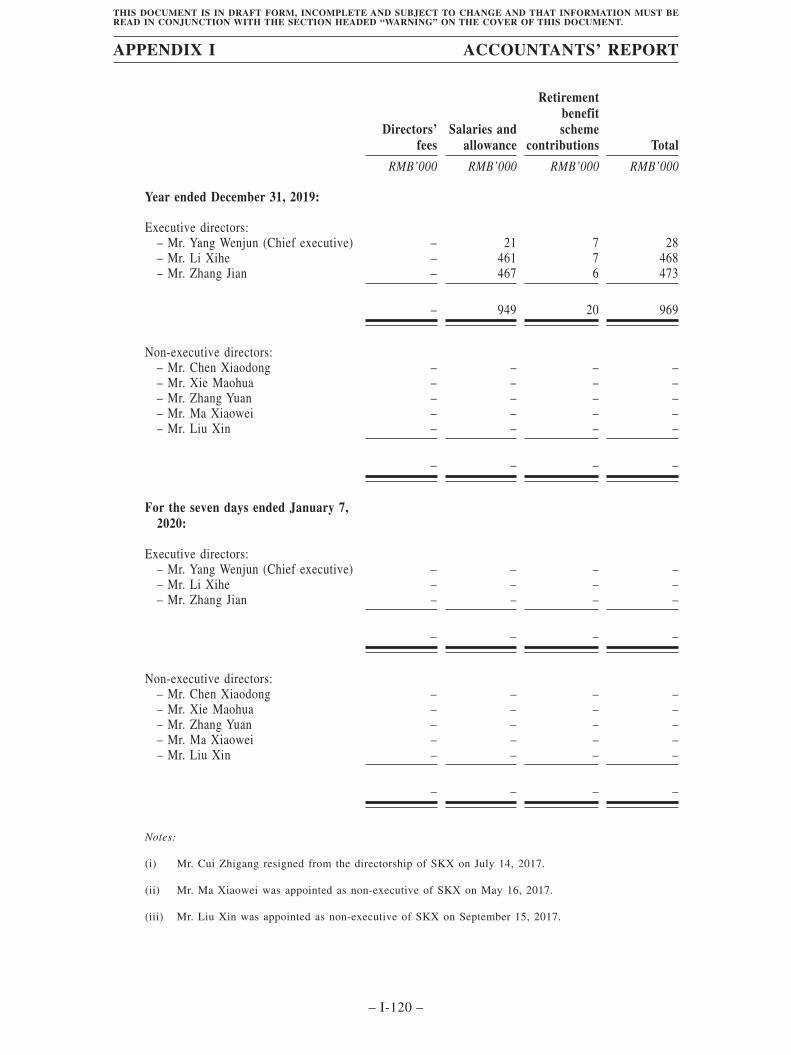
Directors’fees
Salaries andallowance
Retirementbenefitscheme
contributions Total
RMB’000 RMB’000 RMB’000 RMB’000
Year ended December 31, 2019:
Executive directors:– Mr. Yang Wenjun (Chief executive) – 21 7 28– Mr. Li Xihe – 461 7 468– Mr. Zhang Jian – 467 6 473
– 949 20 969
Non-executive directors:– Mr. Chen Xiaodong – – – –– Mr. Xie Maohua – – – –– Mr. Zhang Yuan – – – –– Mr. Ma Xiaowei – – – –– Mr. Liu Xin – – – –
– – – –
For the seven days ended January 7,2020:
Executive directors:– Mr. Yang Wenjun (Chief executive) – – – –– Mr. Li Xihe – – – –– Mr. Zhang Jian – – – –
– – – –
Non-executive directors:– Mr. Chen Xiaodong – – – –– Mr. Xie Maohua – – – –– Mr. Zhang Yuan – – – –– Mr. Ma Xiaowei – – – –– Mr. Liu Xin – – – –
– – – –
Notes:
(i) Mr. Cui Zhigang resigned from the directorship of SKX on July 14, 2017.
(ii) Mr. Ma Xiaowei was appointed as non-executive of SKX on May 16, 2017.
(iii) Mr. Liu Xin was appointed as non-executive of SKX on September 15, 2017.
APPENDIX I ACCOUNTANTS’ REPORT
– I-120 –
THIS DOCUMENT IS IN DRAFT FORM, INCOMPLETE AND SUBJECT TO CHANGE AND THAT INFORMATION MUST BEREAD IN CONJUNCTION WITH THE SECTION HEADED “WARNING” ON THE COVER OF THIS DOCUMENT.
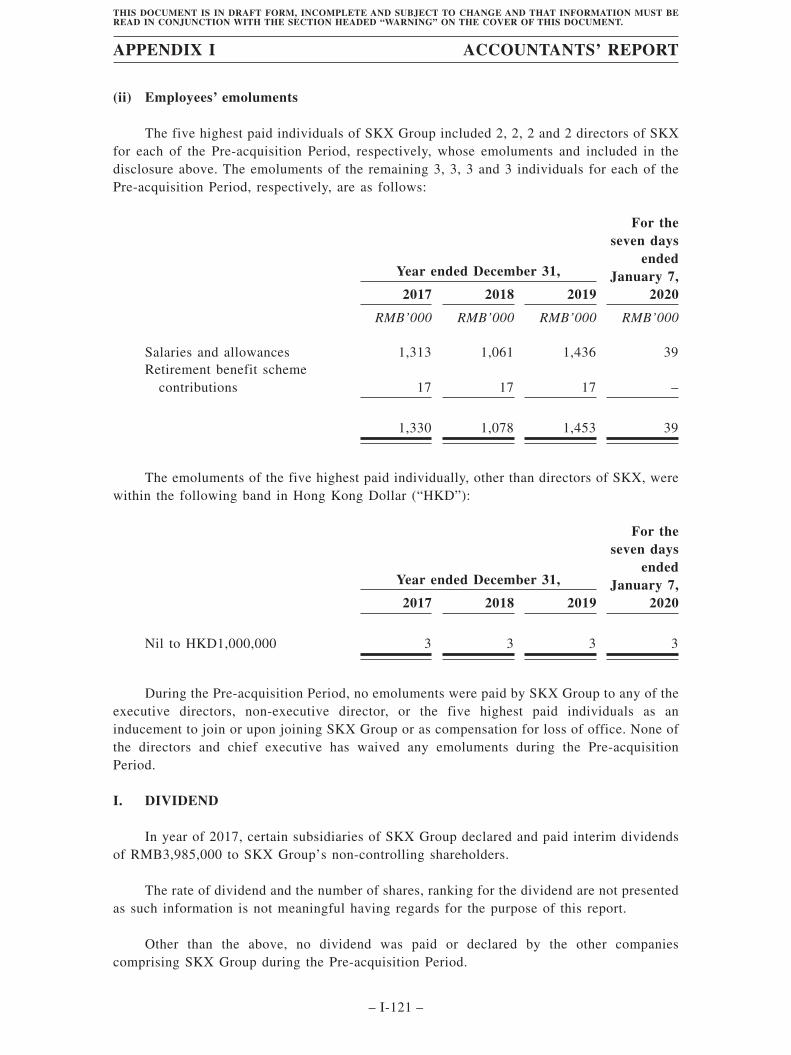
(ii) Employees’ emoluments
The five highest paid individuals of SKX Group included 2, 2, 2 and 2 directors of SKXfor each of the Pre-acquisition Period, respectively, whose emoluments and included in thedisclosure above. The emoluments of the remaining 3, 3, 3 and 3 individuals for each of thePre-acquisition Period, respectively, are as follows:
Year ended December 31,
For theseven days
endedJanuary 7,
20202017 2018 2019
RMB’000 RMB’000 RMB’000 RMB’000
Salaries and allowances 1,313 1,061 1,436 39Retirement benefit scheme
contributions 17 17 17 –
1,330 1,078 1,453 39
The emoluments of the five highest paid individually, other than directors of SKX, werewithin the following band in Hong Kong Dollar (“HKD”):
Year ended December 31,
For theseven days
endedJanuary 7,
20202017 2018 2019
Nil to HKD1,000,000 3 3 3 3
During the Pre-acquisition Period, no emoluments were paid by SKX Group to any of theexecutive directors, non-executive director, or the five highest paid individuals as aninducement to join or upon joining SKX Group or as compensation for loss of office. None ofthe directors and chief executive has waived any emoluments during the Pre-acquisitionPeriod.
I. DIVIDEND
In year of 2017, certain subsidiaries of SKX Group declared and paid interim dividendsof RMB3,985,000 to SKX Group’s non-controlling shareholders.
The rate of dividend and the number of shares, ranking for the dividend are not presentedas such information is not meaningful having regards for the purpose of this report.
Other than the above, no dividend was paid or declared by the other companiescomprising SKX Group during the Pre-acquisition Period.
APPENDIX I ACCOUNTANTS’ REPORT
– I-121 –
THIS DOCUMENT IS IN DRAFT FORM, INCOMPLETE AND SUBJECT TO CHANGE AND THAT INFORMATION MUST BEREAD IN CONJUNCTION WITH THE SECTION HEADED “WARNING” ON THE COVER OF THIS DOCUMENT.
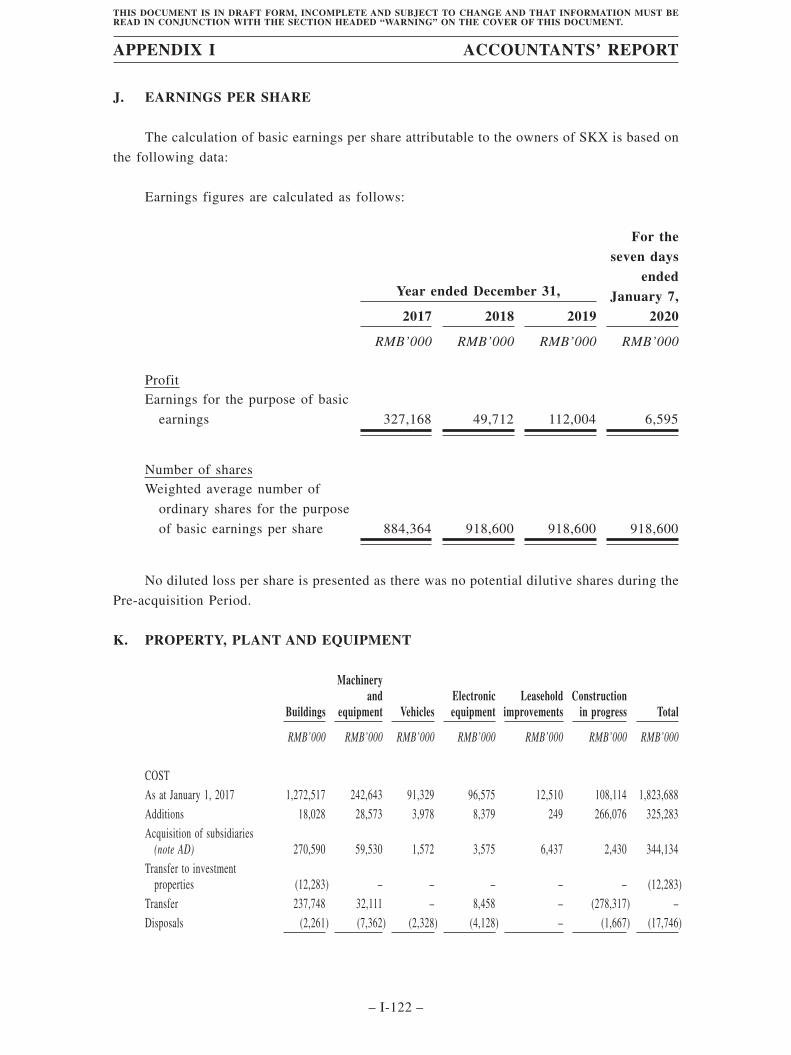
J. EARNINGS PER SHARE
The calculation of basic earnings per share attributable to the owners of SKX is based on
the following data:
Earnings figures are calculated as follows:
Year ended December 31,
For theseven days
endedJanuary 7,
20202017 2018 2019
RMB’000 RMB’000 RMB’000 RMB’000
ProfitEarnings for the purpose of basic
earnings 327,168 49,712 112,004 6,595
Number of sharesWeighted average number of
ordinary shares for the purpose
of basic earnings per share 884,364 918,600 918,600 918,600
No diluted loss per share is presented as there was no potential dilutive shares during the
Pre-acquisition Period.
K. PROPERTY, PLANT AND EQUIPMENT
Buildings
Machineryand
equipment VehiclesElectronicequipment
Leaseholdimprovements
Constructionin progress Total
RMB’000 RMB’000 RMB’000 RMB’000 RMB’000 RMB’000 RMB’000
COSTAs at January 1, 2017 1,272,517 242,643 91,329 96,575 12,510 108,114 1,823,688Additions 18,028 28,573 3,978 8,379 249 266,076 325,283Acquisition of subsidiaries
(note AD) 270,590 59,530 1,572 3,575 6,437 2,430 344,134Transfer to investment
properties (12,283) – – – – – (12,283)Transfer 237,748 32,111 – 8,458 – (278,317) –Disposals (2,261) (7,362) (2,328) (4,128) – (1,667) (17,746)
APPENDIX I ACCOUNTANTS’ REPORT
– I-122 –
THIS DOCUMENT IS IN DRAFT FORM, INCOMPLETE AND SUBJECT TO CHANGE AND THAT INFORMATION MUST BEREAD IN CONJUNCTION WITH THE SECTION HEADED “WARNING” ON THE COVER OF THIS DOCUMENT.
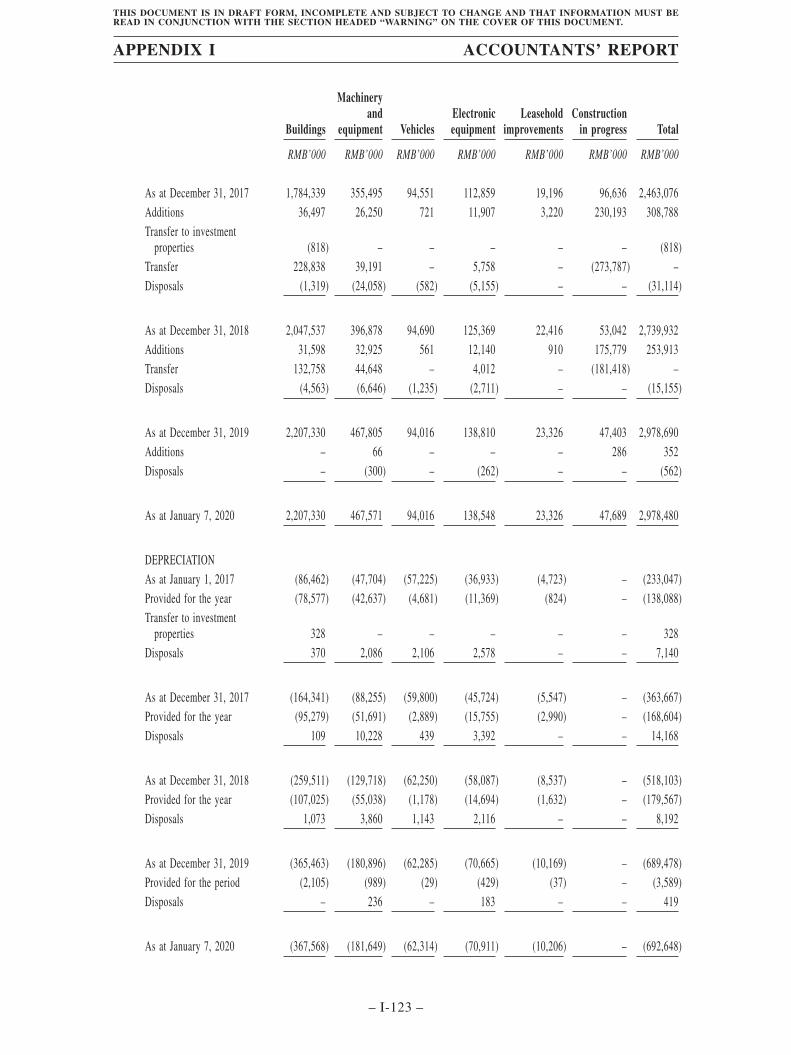
Buildings
Machineryand
equipment VehiclesElectronicequipment
Leaseholdimprovements
Constructionin progress Total
RMB’000 RMB’000 RMB’000 RMB’000 RMB’000 RMB’000 RMB’000
As at December 31, 2017 1,784,339 355,495 94,551 112,859 19,196 96,636 2,463,076Additions 36,497 26,250 721 11,907 3,220 230,193 308,788Transfer to investment
properties (818) – – – – – (818)Transfer 228,838 39,191 – 5,758 – (273,787) –Disposals (1,319) (24,058) (582) (5,155) – – (31,114)
As at December 31, 2018 2,047,537 396,878 94,690 125,369 22,416 53,042 2,739,932Additions 31,598 32,925 561 12,140 910 175,779 253,913Transfer 132,758 44,648 – 4,012 – (181,418) –Disposals (4,563) (6,646) (1,235) (2,711) – – (15,155)
As at December 31, 2019 2,207,330 467,805 94,016 138,810 23,326 47,403 2,978,690Additions – 66 – – – 286 352Disposals – (300) – (262) – – (562)
As at January 7, 2020 2,207,330 467,571 94,016 138,548 23,326 47,689 2,978,480
DEPRECIATIONAs at January 1, 2017 (86,462) (47,704) (57,225) (36,933) (4,723) – (233,047)Provided for the year (78,577) (42,637) (4,681) (11,369) (824) – (138,088)Transfer to investment
properties 328 – – – – – 328Disposals 370 2,086 2,106 2,578 – – 7,140
As at December 31, 2017 (164,341) (88,255) (59,800) (45,724) (5,547) – (363,667)Provided for the year (95,279) (51,691) (2,889) (15,755) (2,990) – (168,604)Disposals 109 10,228 439 3,392 – – 14,168
As at December 31, 2018 (259,511) (129,718) (62,250) (58,087) (8,537) – (518,103)Provided for the year (107,025) (55,038) (1,178) (14,694) (1,632) – (179,567)Disposals 1,073 3,860 1,143 2,116 – – 8,192
As at December 31, 2019 (365,463) (180,896) (62,285) (70,665) (10,169) – (689,478)Provided for the period (2,105) (989) (29) (429) (37) – (3,589)Disposals – 236 – 183 – – 419
As at January 7, 2020 (367,568) (181,649) (62,314) (70,911) (10,206) – (692,648)
APPENDIX I ACCOUNTANTS’ REPORT
– I-123 –
THIS DOCUMENT IS IN DRAFT FORM, INCOMPLETE AND SUBJECT TO CHANGE AND THAT INFORMATION MUST BEREAD IN CONJUNCTION WITH THE SECTION HEADED “WARNING” ON THE COVER OF THIS DOCUMENT.
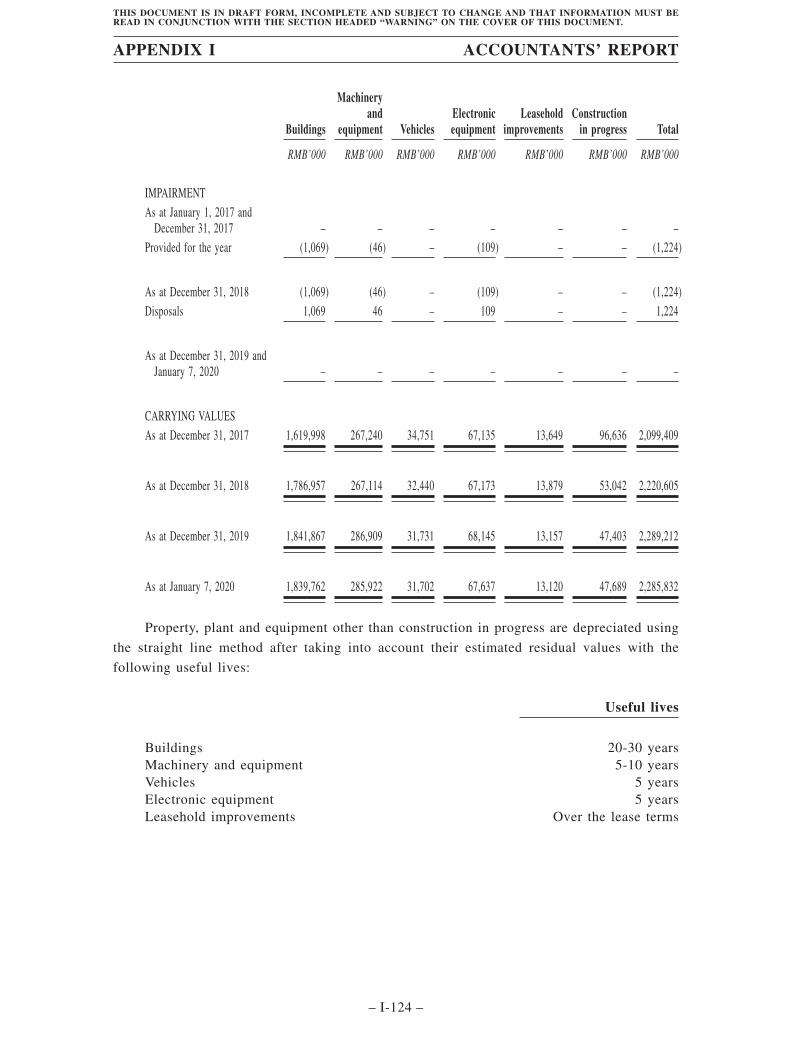
Buildings
Machineryand
equipment VehiclesElectronicequipment
Leaseholdimprovements
Constructionin progress Total
RMB’000 RMB’000 RMB’000 RMB’000 RMB’000 RMB’000 RMB’000
IMPAIRMENTAs at January 1, 2017 and
December 31, 2017 – – – – – – –Provided for the year (1,069) (46) – (109) – – (1,224)
As at December 31, 2018 (1,069) (46) – (109) – – (1,224)Disposals 1,069 46 – 109 – – 1,224
As at December 31, 2019 andJanuary 7, 2020 – – – – – – –
CARRYING VALUESAs at December 31, 2017 1,619,998 267,240 34,751 67,135 13,649 96,636 2,099,409
As at December 31, 2018 1,786,957 267,114 32,440 67,173 13,879 53,042 2,220,605
As at December 31, 2019 1,841,867 286,909 31,731 68,145 13,157 47,403 2,289,212
As at January 7, 2020 1,839,762 285,922 31,702 67,637 13,120 47,689 2,285,832
Property, plant and equipment other than construction in progress are depreciated using
the straight line method after taking into account their estimated residual values with the
following useful lives:
Useful lives
Buildings 20-30 yearsMachinery and equipment 5-10 yearsVehicles 5 yearsElectronic equipment 5 yearsLeasehold improvements Over the lease terms
APPENDIX I ACCOUNTANTS’ REPORT
– I-124 –
THIS DOCUMENT IS IN DRAFT FORM, INCOMPLETE AND SUBJECT TO CHANGE AND THAT INFORMATION MUST BEREAD IN CONJUNCTION WITH THE SECTION HEADED “WARNING” ON THE COVER OF THIS DOCUMENT.
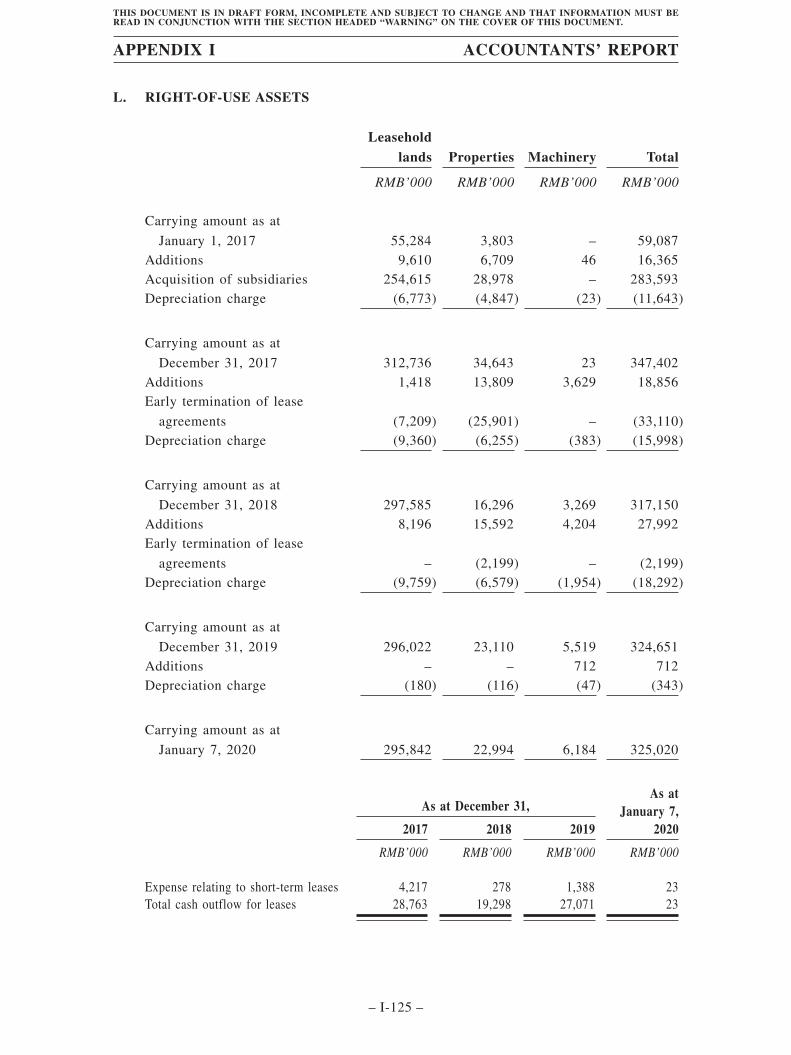
L. RIGHT-OF-USE ASSETS
Leaseholdlands Properties Machinery Total
RMB’000 RMB’000 RMB’000 RMB’000
Carrying amount as at
January 1, 2017 55,284 3,803 – 59,087Additions 9,610 6,709 46 16,365Acquisition of subsidiaries 254,615 28,978 – 283,593Depreciation charge (6,773) (4,847) (23) (11,643)
Carrying amount as at
December 31, 2017 312,736 34,643 23 347,402Additions 1,418 13,809 3,629 18,856Early termination of lease
agreements (7,209) (25,901) – (33,110)Depreciation charge (9,360) (6,255) (383) (15,998)
Carrying amount as at
December 31, 2018 297,585 16,296 3,269 317,150Additions 8,196 15,592 4,204 27,992Early termination of lease
agreements – (2,199) – (2,199)Depreciation charge (9,759) (6,579) (1,954) (18,292)
Carrying amount as at
December 31, 2019 296,022 23,110 5,519 324,651Additions – – 712 712Depreciation charge (180) (116) (47) (343)
Carrying amount as at
January 7, 2020 295,842 22,994 6,184 325,020
As at December 31,As at
January 7,20202017 2018 2019
RMB’000 RMB’000 RMB’000 RMB’000
Expense relating to short-term leases 4,217 278 1,388 23Total cash outflow for leases 28,763 19,298 27,071 23
APPENDIX I ACCOUNTANTS’ REPORT
– I-125 –
THIS DOCUMENT IS IN DRAFT FORM, INCOMPLETE AND SUBJECT TO CHANGE AND THAT INFORMATION MUST BEREAD IN CONJUNCTION WITH THE SECTION HEADED “WARNING” ON THE COVER OF THIS DOCUMENT.
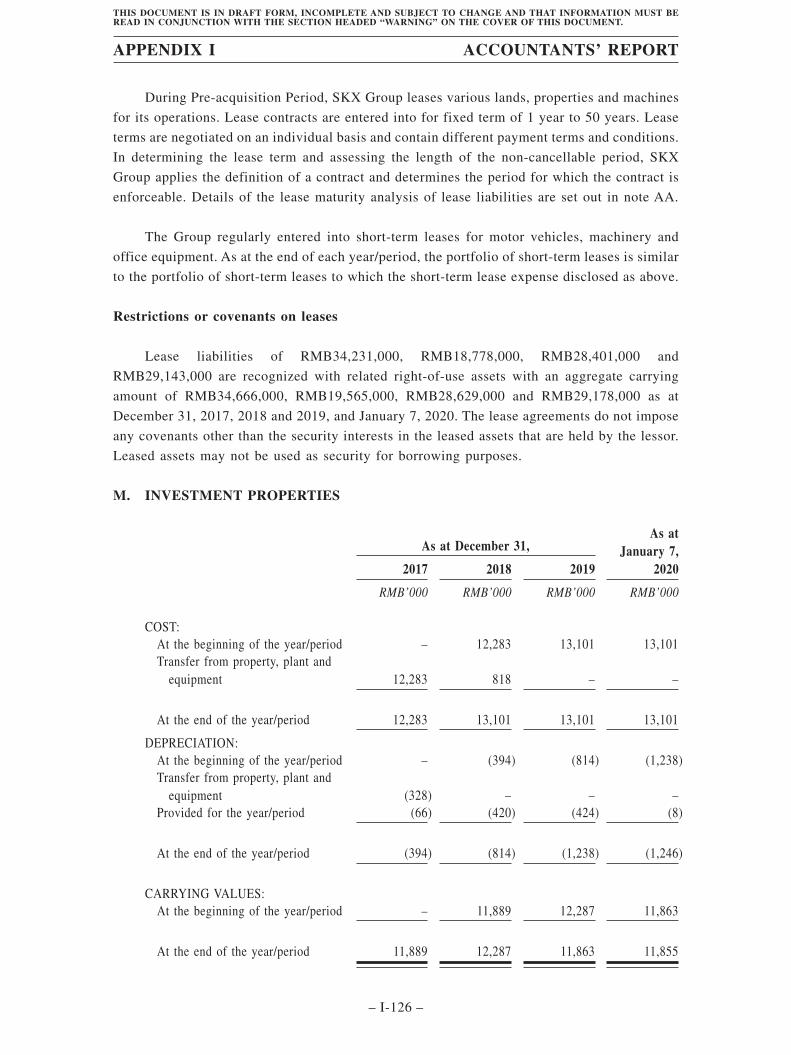
During Pre-acquisition Period, SKX Group leases various lands, properties and machines
for its operations. Lease contracts are entered into for fixed term of 1 year to 50 years. Lease
terms are negotiated on an individual basis and contain different payment terms and conditions.
In determining the lease term and assessing the length of the non-cancellable period, SKX
Group applies the definition of a contract and determines the period for which the contract is
enforceable. Details of the lease maturity analysis of lease liabilities are set out in note AA.
The Group regularly entered into short-term leases for motor vehicles, machinery and
office equipment. As at the end of each year/period, the portfolio of short-term leases is similar
to the portfolio of short-term leases to which the short-term lease expense disclosed as above.
Restrictions or covenants on leases
Lease liabilities of RMB34,231,000, RMB18,778,000, RMB28,401,000 and
RMB29,143,000 are recognized with related right-of-use assets with an aggregate carrying
amount of RMB34,666,000, RMB19,565,000, RMB28,629,000 and RMB29,178,000 as at
December 31, 2017, 2018 and 2019, and January 7, 2020. The lease agreements do not impose
any covenants other than the security interests in the leased assets that are held by the lessor.
Leased assets may not be used as security for borrowing purposes.
M. INVESTMENT PROPERTIES
As at December 31,As at
January 7,20202017 2018 2019
RMB’000 RMB’000 RMB’000 RMB’000
COST:At the beginning of the year/period – 12,283 13,101 13,101Transfer from property, plant and
equipment 12,283 818 – –
At the end of the year/period 12,283 13,101 13,101 13,101
DEPRECIATION:At the beginning of the year/period – (394) (814) (1,238)Transfer from property, plant and
equipment (328) – – –Provided for the year/period (66) (420) (424) (8)
At the end of the year/period (394) (814) (1,238) (1,246)
CARRYING VALUES:At the beginning of the year/period – 11,889 12,287 11,863
At the end of the year/period 11,889 12,287 11,863 11,855
APPENDIX I ACCOUNTANTS’ REPORT
– I-126 –
THIS DOCUMENT IS IN DRAFT FORM, INCOMPLETE AND SUBJECT TO CHANGE AND THAT INFORMATION MUST BEREAD IN CONJUNCTION WITH THE SECTION HEADED “WARNING” ON THE COVER OF THIS DOCUMENT.
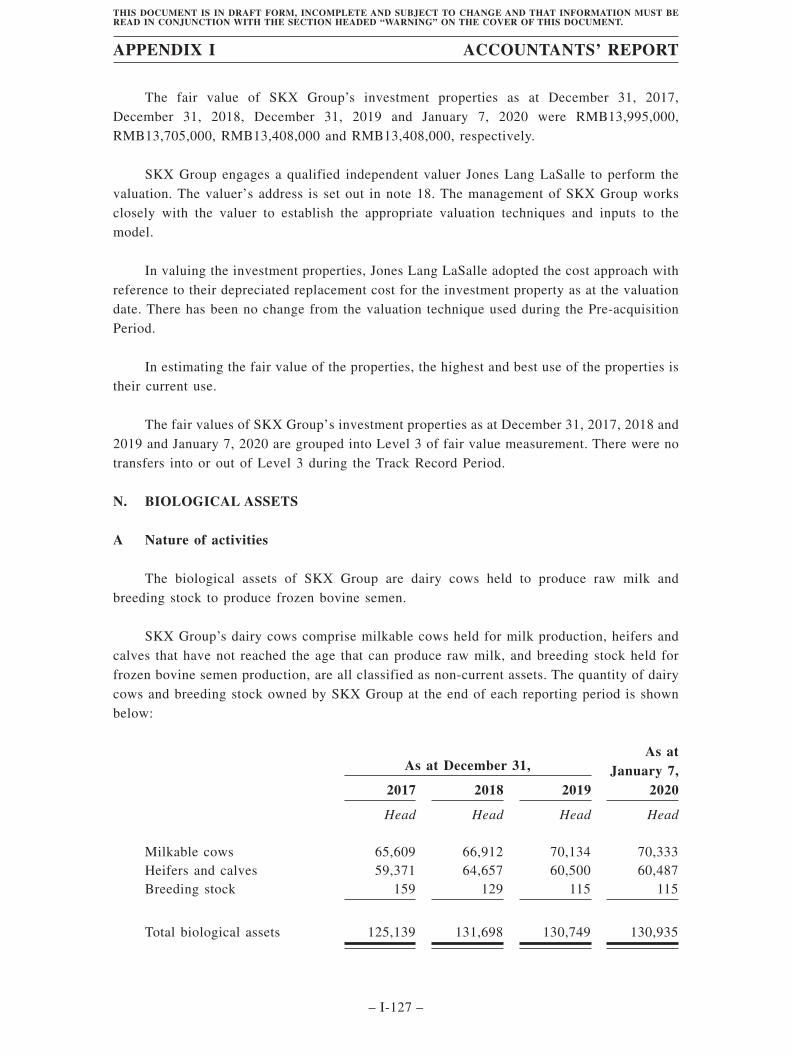
The fair value of SKX Group’s investment properties as at December 31, 2017,December 31, 2018, December 31, 2019 and January 7, 2020 were RMB13,995,000,RMB13,705,000, RMB13,408,000 and RMB13,408,000, respectively.
SKX Group engages a qualified independent valuer Jones Lang LaSalle to perform thevaluation. The valuer’s address is set out in note 18. The management of SKX Group worksclosely with the valuer to establish the appropriate valuation techniques and inputs to themodel.
In valuing the investment properties, Jones Lang LaSalle adopted the cost approach withreference to their depreciated replacement cost for the investment property as at the valuationdate. There has been no change from the valuation technique used during the Pre-acquisitionPeriod.
In estimating the fair value of the properties, the highest and best use of the properties istheir current use.
The fair values of SKX Group’s investment properties as at December 31, 2017, 2018 and2019 and January 7, 2020 are grouped into Level 3 of fair value measurement. There were notransfers into or out of Level 3 during the Track Record Period.
N. BIOLOGICAL ASSETS
A Nature of activities
The biological assets of SKX Group are dairy cows held to produce raw milk andbreeding stock to produce frozen bovine semen.
SKX Group’s dairy cows comprise milkable cows held for milk production, heifers andcalves that have not reached the age that can produce raw milk, and breeding stock held forfrozen bovine semen production, are all classified as non-current assets. The quantity of dairycows and breeding stock owned by SKX Group at the end of each reporting period is shownbelow:
As at December 31,As at
January 7,20202017 2018 2019
Head Head Head Head
Milkable cows 65,609 66,912 70,134 70,333Heifers and calves 59,371 64,657 60,500 60,487Breeding stock 159 129 115 115
Total biological assets 125,139 131,698 130,749 130,935
APPENDIX I ACCOUNTANTS’ REPORT
– I-127 –
THIS DOCUMENT IS IN DRAFT FORM, INCOMPLETE AND SUBJECT TO CHANGE AND THAT INFORMATION MUST BEREAD IN CONJUNCTION WITH THE SECTION HEADED “WARNING” ON THE COVER OF THIS DOCUMENT.
SKX Group is exposed to financial risks arising from changes in prices of raw milk and
sales of frozen bovine semen. SKX Group does not anticipate that the prices of the raw milk
and frozen bovine semen will decline significantly in the foreseeable future and the
management of SKX Group are of the view that there is no available derivative or other
contracts which SKX Group can enter into to manage the risk of a decline in the prices of the
raw milk and frozen bovine semen.
In general, heifers are inseminated when they reached approximately 14 months old. After
an approximately 285-day pregnancy term, a calf is born and the dairy cow begins to produce
raw milk and the lactation period begins. A milkable cow is typically milked for approximately
305 days to 340 days before approximately 60 days dry period. When a heifer begins to
produce raw milk, it is transferred to the category of milkable cows based on the estimated fair
value on the date of transfer.
SKX Group is exposed to a number of operating risks related to its biological assets as
follows:
i. Regulatory and environmental risks
SKX Group is subject to laws and regulations in the location in which it operates.
SKX Group has established environmental policies and procedures aiming at compliance
with local environmental and other laws. Management performs regular reviews to
identify environmental risks and to ensure that the systems in place are adequate to
manage these risks.
ii. Climate, disease and other natural risks
SKX Group’s biological assets are exposed to the risk of damage from climatic
changes, diseases and other natural forces. SKX Group has processed in place aiming at
monitoring and mitigating those risks, including regular inspections and disease controls
and surveys and insurance.
APPENDIX I ACCOUNTANTS’ REPORT
– I-128 –
THIS DOCUMENT IS IN DRAFT FORM, INCOMPLETE AND SUBJECT TO CHANGE AND THAT INFORMATION MUST BEREAD IN CONJUNCTION WITH THE SECTION HEADED “WARNING” ON THE COVER OF THIS DOCUMENT.
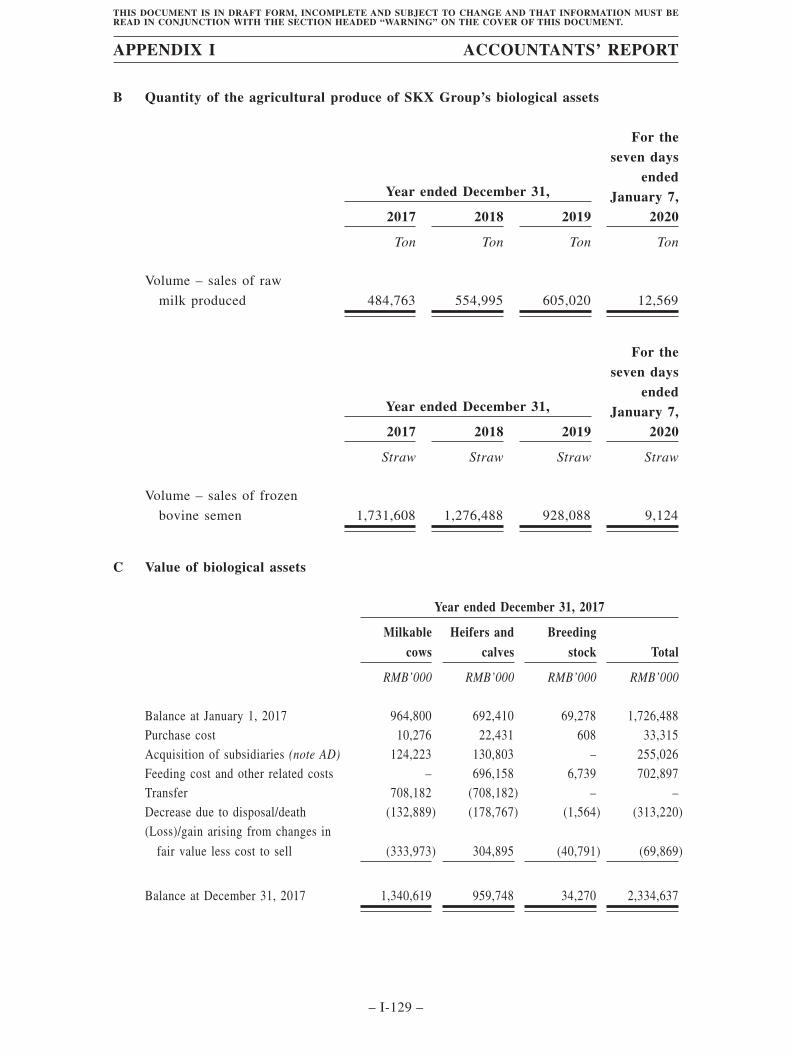
B Quantity of the agricultural produce of SKX Group’s biological assets
Year ended December 31,
For theseven days
endedJanuary 7,
20202017 2018 2019
Ton Ton Ton Ton
Volume – sales of raw
milk produced 484,763 554,995 605,020 12,569
Year ended December 31,
For theseven days
endedJanuary 7,
20202017 2018 2019
Straw Straw Straw Straw
Volume – sales of frozen
bovine semen 1,731,608 1,276,488 928,088 9,124
C Value of biological assets
Year ended December 31, 2017
Milkablecows
Heifers andcalves
Breedingstock Total
RMB’000 RMB’000 RMB’000 RMB’000
Balance at January 1, 2017 964,800 692,410 69,278 1,726,488Purchase cost 10,276 22,431 608 33,315Acquisition of subsidiaries (note AD) 124,223 130,803 – 255,026Feeding cost and other related costs – 696,158 6,739 702,897Transfer 708,182 (708,182) – –Decrease due to disposal/death (132,889) (178,767) (1,564) (313,220)(Loss)/gain arising from changes in
fair value less cost to sell (333,973) 304,895 (40,791) (69,869)
Balance at December 31, 2017 1,340,619 959,748 34,270 2,334,637
APPENDIX I ACCOUNTANTS’ REPORT
– I-129 –
THIS DOCUMENT IS IN DRAFT FORM, INCOMPLETE AND SUBJECT TO CHANGE AND THAT INFORMATION MUST BEREAD IN CONJUNCTION WITH THE SECTION HEADED “WARNING” ON THE COVER OF THIS DOCUMENT.
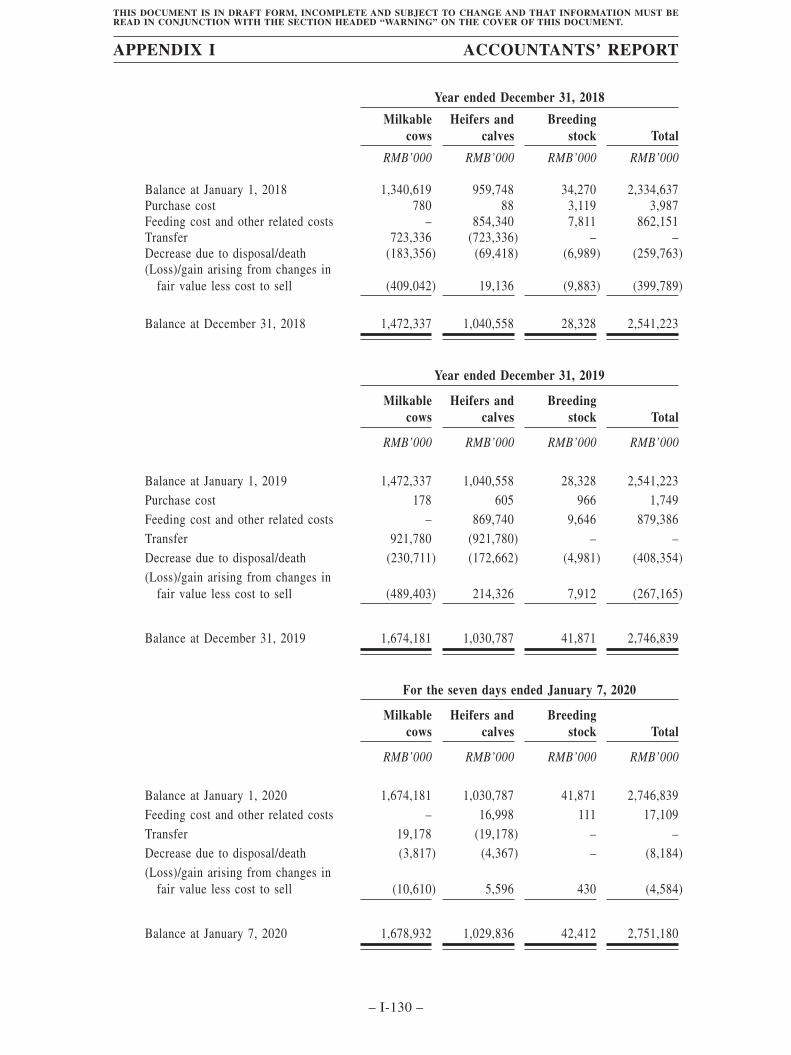
Year ended December 31, 2018
Milkablecows
Heifers andcalves
Breedingstock Total
RMB’000 RMB’000 RMB’000 RMB’000
Balance at January 1, 2018 1,340,619 959,748 34,270 2,334,637Purchase cost 780 88 3,119 3,987Feeding cost and other related costs – 854,340 7,811 862,151Transfer 723,336 (723,336) – –Decrease due to disposal/death (183,356) (69,418) (6,989) (259,763)(Loss)/gain arising from changes in
fair value less cost to sell (409,042) 19,136 (9,883) (399,789)
Balance at December 31, 2018 1,472,337 1,040,558 28,328 2,541,223
Year ended December 31, 2019
Milkablecows
Heifers andcalves
Breedingstock Total
RMB’000 RMB’000 RMB’000 RMB’000
Balance at January 1, 2019 1,472,337 1,040,558 28,328 2,541,223Purchase cost 178 605 966 1,749Feeding cost and other related costs – 869,740 9,646 879,386Transfer 921,780 (921,780) – –Decrease due to disposal/death (230,711) (172,662) (4,981) (408,354)(Loss)/gain arising from changes in
fair value less cost to sell (489,403) 214,326 7,912 (267,165)
Balance at December 31, 2019 1,674,181 1,030,787 41,871 2,746,839
For the seven days ended January 7, 2020
Milkablecows
Heifers andcalves
Breedingstock Total
RMB’000 RMB’000 RMB’000 RMB’000
Balance at January 1, 2020 1,674,181 1,030,787 41,871 2,746,839Feeding cost and other related costs – 16,998 111 17,109Transfer 19,178 (19,178) – –Decrease due to disposal/death (3,817) (4,367) – (8,184)(Loss)/gain arising from changes in
fair value less cost to sell (10,610) 5,596 430 (4,584)
Balance at January 7, 2020 1,678,932 1,029,836 42,412 2,751,180
APPENDIX I ACCOUNTANTS’ REPORT
– I-130 –
THIS DOCUMENT IS IN DRAFT FORM, INCOMPLETE AND SUBJECT TO CHANGE AND THAT INFORMATION MUST BEREAD IN CONJUNCTION WITH THE SECTION HEADED “WARNING” ON THE COVER OF THIS DOCUMENT.
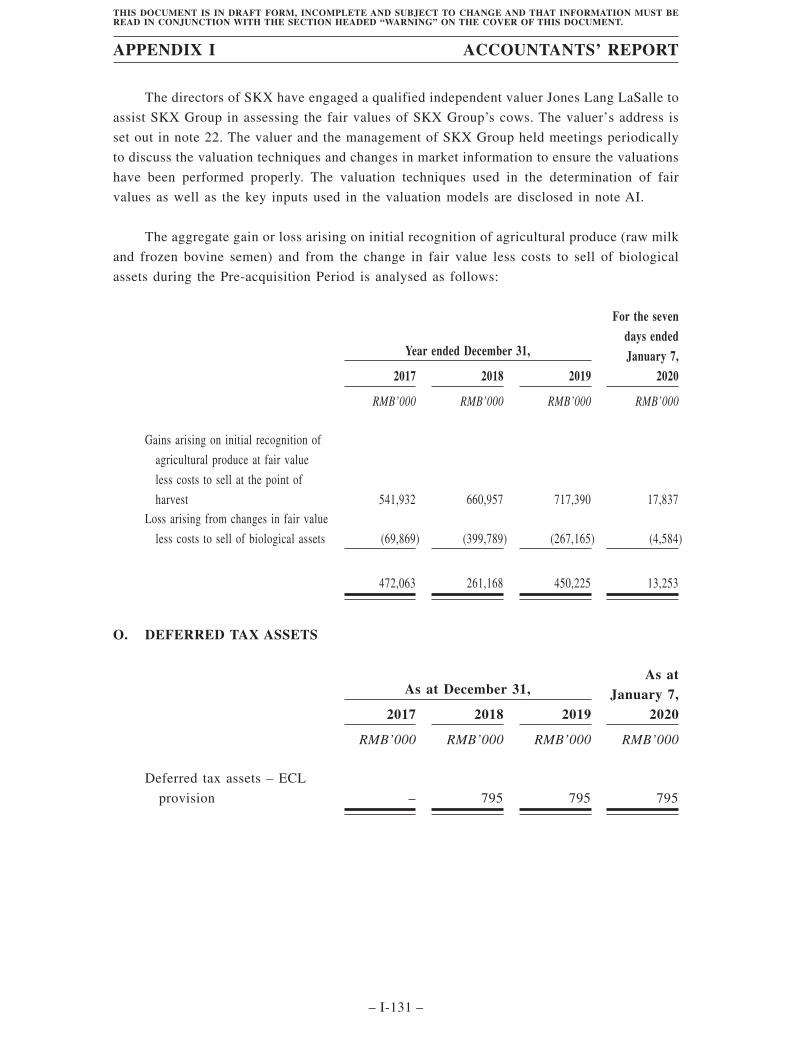
The directors of SKX have engaged a qualified independent valuer Jones Lang LaSalle to
assist SKX Group in assessing the fair values of SKX Group’s cows. The valuer’s address is
set out in note 22. The valuer and the management of SKX Group held meetings periodically
to discuss the valuation techniques and changes in market information to ensure the valuations
have been performed properly. The valuation techniques used in the determination of fair
values as well as the key inputs used in the valuation models are disclosed in note AI.
The aggregate gain or loss arising on initial recognition of agricultural produce (raw milk
and frozen bovine semen) and from the change in fair value less costs to sell of biological
assets during the Pre-acquisition Period is analysed as follows:
Year ended December 31,
For the sevendays endedJanuary 7,
20202017 2018 2019
RMB’000 RMB’000 RMB’000 RMB’000
Gains arising on initial recognition of
agricultural produce at fair value
less costs to sell at the point of
harvest 541,932 660,957 717,390 17,837Loss arising from changes in fair value
less costs to sell of biological assets (69,869) (399,789) (267,165) (4,584)
472,063 261,168 450,225 13,253
O. DEFERRED TAX ASSETS
As at December 31,As at
January 7,20202017 2018 2019
RMB’000 RMB’000 RMB’000 RMB’000
Deferred tax assets – ECL
provision – 795 795 795
APPENDIX I ACCOUNTANTS’ REPORT
– I-131 –
THIS DOCUMENT IS IN DRAFT FORM, INCOMPLETE AND SUBJECT TO CHANGE AND THAT INFORMATION MUST BEREAD IN CONJUNCTION WITH THE SECTION HEADED “WARNING” ON THE COVER OF THIS DOCUMENT.
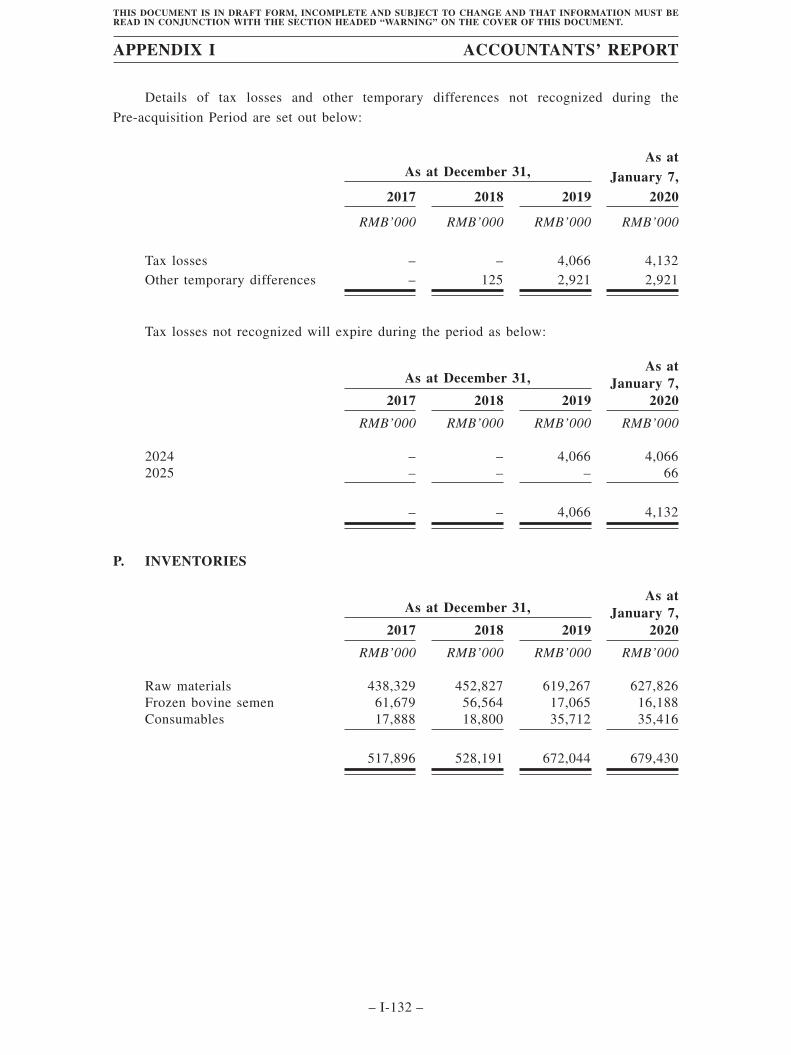
Details of tax losses and other temporary differences not recognized during the
Pre-acquisition Period are set out below:
As at December 31,As at
January 7,20202017 2018 2019
RMB’000 RMB’000 RMB’000 RMB’000
Tax losses – – 4,066 4,132Other temporary differences – 125 2,921 2,921
Tax losses not recognized will expire during the period as below:
As at December 31,As at
January 7,20202017 2018 2019
RMB’000 RMB’000 RMB’000 RMB’000
2024 – – 4,066 4,0662025 – – – 66
– – 4,066 4,132
P. INVENTORIES
As at December 31,As at
January 7,20202017 2018 2019
RMB’000 RMB’000 RMB’000 RMB’000
Raw materials 438,329 452,827 619,267 627,826Frozen bovine semen 61,679 56,564 17,065 16,188Consumables 17,888 18,800 35,712 35,416
517,896 528,191 672,044 679,430
APPENDIX I ACCOUNTANTS’ REPORT
– I-132 –
THIS DOCUMENT IS IN DRAFT FORM, INCOMPLETE AND SUBJECT TO CHANGE AND THAT INFORMATION MUST BEREAD IN CONJUNCTION WITH THE SECTION HEADED “WARNING” ON THE COVER OF THIS DOCUMENT.
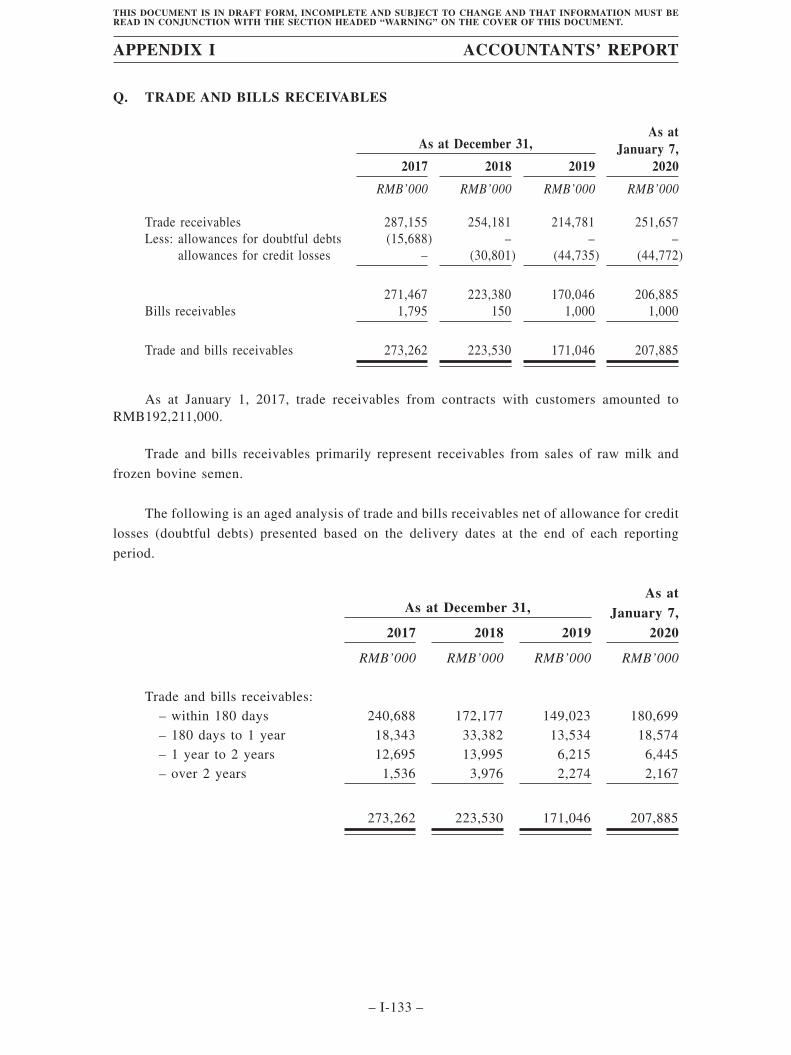
Q. TRADE AND BILLS RECEIVABLES
As at December 31,As at
January 7,20202017 2018 2019
RMB’000 RMB’000 RMB’000 RMB’000
Trade receivables 287,155 254,181 214,781 251,657Less: allowances for doubtful debts (15,688) – – –
allowances for credit losses – (30,801) (44,735) (44,772)
271,467 223,380 170,046 206,885Bills receivables 1,795 150 1,000 1,000
Trade and bills receivables 273,262 223,530 171,046 207,885
As at January 1, 2017, trade receivables from contracts with customers amounted toRMB192,211,000.
Trade and bills receivables primarily represent receivables from sales of raw milk and
frozen bovine semen.
The following is an aged analysis of trade and bills receivables net of allowance for credit
losses (doubtful debts) presented based on the delivery dates at the end of each reporting
period.
As at December 31,As at
January 7,20202017 2018 2019
RMB’000 RMB’000 RMB’000 RMB’000
Trade and bills receivables:– within 180 days 240,688 172,177 149,023 180,699– 180 days to 1 year 18,343 33,382 13,534 18,574– 1 year to 2 years 12,695 13,995 6,215 6,445– over 2 years 1,536 3,976 2,274 2,167
273,262 223,530 171,046 207,885
APPENDIX I ACCOUNTANTS’ REPORT
– I-133 –
THIS DOCUMENT IS IN DRAFT FORM, INCOMPLETE AND SUBJECT TO CHANGE AND THAT INFORMATION MUST BEREAD IN CONJUNCTION WITH THE SECTION HEADED “WARNING” ON THE COVER OF THIS DOCUMENT.
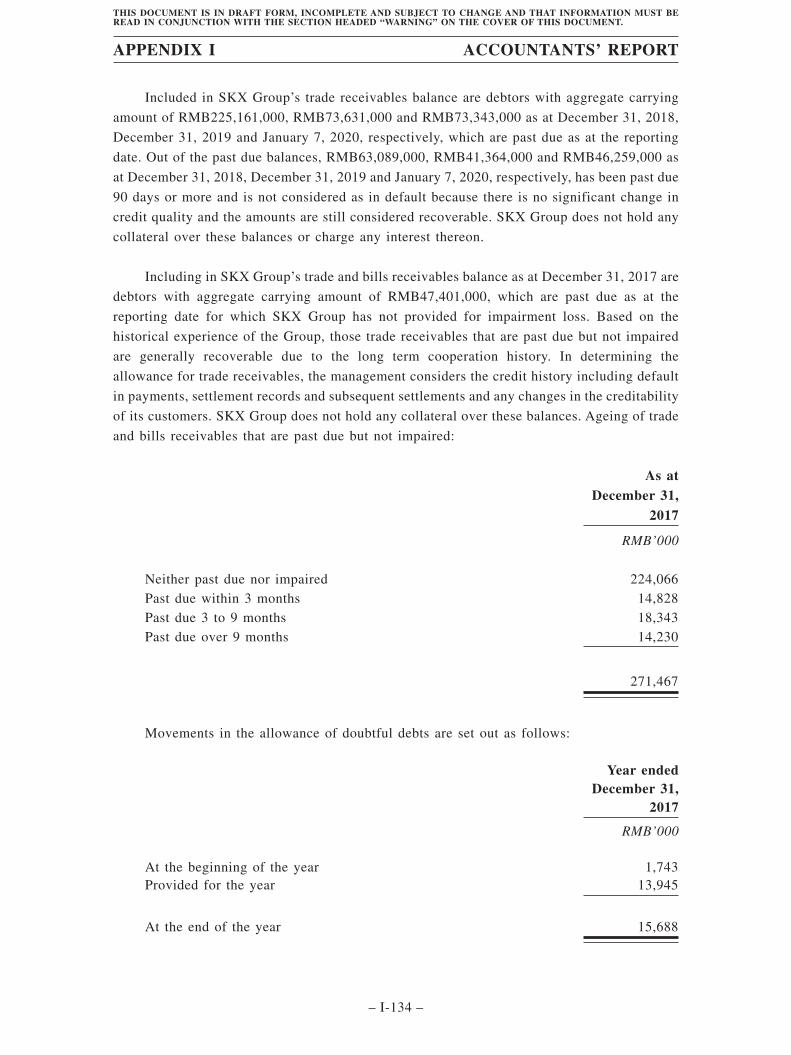
Included in SKX Group’s trade receivables balance are debtors with aggregate carrying
amount of RMB225,161,000, RMB73,631,000 and RMB73,343,000 as at December 31, 2018,
December 31, 2019 and January 7, 2020, respectively, which are past due as at the reporting
date. Out of the past due balances, RMB63,089,000, RMB41,364,000 and RMB46,259,000 as
at December 31, 2018, December 31, 2019 and January 7, 2020, respectively, has been past due
90 days or more and is not considered as in default because there is no significant change in
credit quality and the amounts are still considered recoverable. SKX Group does not hold any
collateral over these balances or charge any interest thereon.
Including in SKX Group’s trade and bills receivables balance as at December 31, 2017 are
debtors with aggregate carrying amount of RMB47,401,000, which are past due as at the
reporting date for which SKX Group has not provided for impairment loss. Based on the
historical experience of the Group, those trade receivables that are past due but not impaired
are generally recoverable due to the long term cooperation history. In determining the
allowance for trade receivables, the management considers the credit history including default
in payments, settlement records and subsequent settlements and any changes in the creditability
of its customers. SKX Group does not hold any collateral over these balances. Ageing of trade
and bills receivables that are past due but not impaired:
As atDecember 31,
2017
RMB’000
Neither past due nor impaired 224,066Past due within 3 months 14,828Past due 3 to 9 months 18,343Past due over 9 months 14,230
271,467
Movements in the allowance of doubtful debts are set out as follows:
Year endedDecember 31,
2017
RMB’000
At the beginning of the year 1,743Provided for the year 13,945
At the end of the year 15,688
APPENDIX I ACCOUNTANTS’ REPORT
– I-134 –
THIS DOCUMENT IS IN DRAFT FORM, INCOMPLETE AND SUBJECT TO CHANGE AND THAT INFORMATION MUST BEREAD IN CONJUNCTION WITH THE SECTION HEADED “WARNING” ON THE COVER OF THIS DOCUMENT.
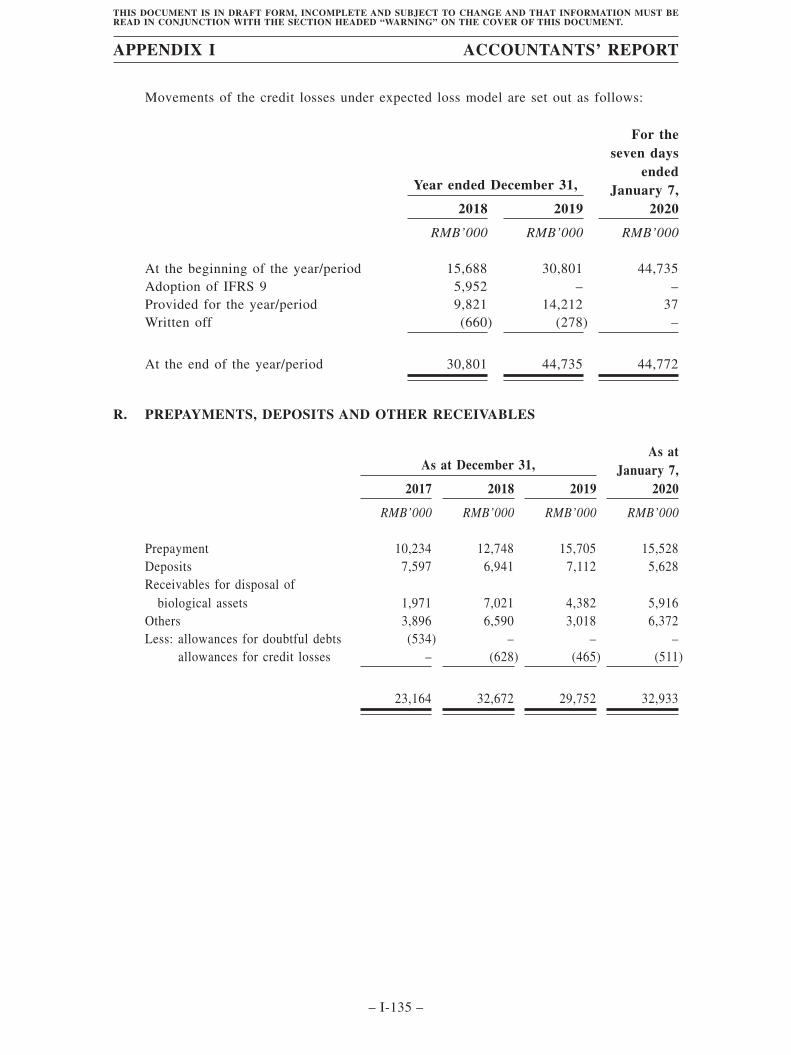
Movements of the credit losses under expected loss model are set out as follows:
Year ended December 31,
For theseven days
endedJanuary 7,
20202018 2019
RMB’000 RMB’000 RMB’000
At the beginning of the year/period 15,688 30,801 44,735Adoption of IFRS 9 5,952 – –Provided for the year/period 9,821 14,212 37Written off (660) (278) –
At the end of the year/period 30,801 44,735 44,772
R. PREPAYMENTS, DEPOSITS AND OTHER RECEIVABLES
As at December 31,As at
January 7,20202017 2018 2019
RMB’000 RMB’000 RMB’000 RMB’000
Prepayment 10,234 12,748 15,705 15,528Deposits 7,597 6,941 7,112 5,628Receivables for disposal of
biological assets 1,971 7,021 4,382 5,916Others 3,896 6,590 3,018 6,372Less: allowances for doubtful debts (534) – – –
allowances for credit losses – (628) (465) (511)
23,164 32,672 29,752 32,933
APPENDIX I ACCOUNTANTS’ REPORT
– I-135 –
THIS DOCUMENT IS IN DRAFT FORM, INCOMPLETE AND SUBJECT TO CHANGE AND THAT INFORMATION MUST BEREAD IN CONJUNCTION WITH THE SECTION HEADED “WARNING” ON THE COVER OF THIS DOCUMENT.
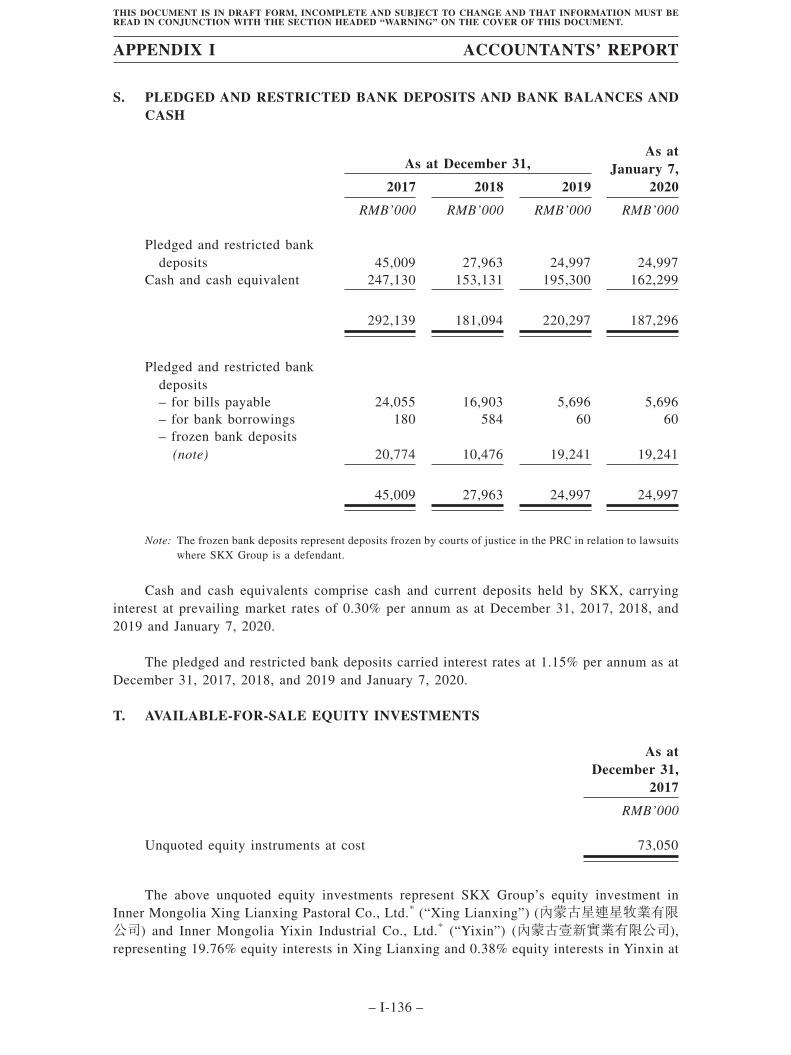
S. PLEDGED AND RESTRICTED BANK DEPOSITS AND BANK BALANCES ANDCASH
As at December 31,As at
January 7,20202017 2018 2019
RMB’000 RMB’000 RMB’000 RMB’000
Pledged and restricted bankdeposits 45,009 27,963 24,997 24,997
Cash and cash equivalent 247,130 153,131 195,300 162,299
292,139 181,094 220,297 187,296
Pledged and restricted bankdeposits– for bills payable 24,055 16,903 5,696 5,696– for bank borrowings 180 584 60 60– frozen bank deposits
(note) 20,774 10,476 19,241 19,241
45,009 27,963 24,997 24,997
Note: The frozen bank deposits represent deposits frozen by courts of justice in the PRC in relation to lawsuitswhere SKX Group is a defendant.
Cash and cash equivalents comprise cash and current deposits held by SKX, carryinginterest at prevailing market rates of 0.30% per annum as at December 31, 2017, 2018, and2019 and January 7, 2020.
The pledged and restricted bank deposits carried interest rates at 1.15% per annum as atDecember 31, 2017, 2018, and 2019 and January 7, 2020.
T. AVAILABLE-FOR-SALE EQUITY INVESTMENTS
As atDecember 31,
2017
RMB’000
Unquoted equity instruments at cost 73,050
The above unquoted equity investments represent SKX Group’s equity investment inInner Mongolia Xing Lianxing Pastoral Co., Ltd.* (“Xing Lianxing”) (內蒙古星連星牧業有限公司) and Inner Mongolia Yixin Industrial Co., Ltd.* (“Yixin”) (內蒙古壹新實業有限公司),representing 19.76% equity interests in Xing Lianxing and 0.38% equity interests in Yinxin at
APPENDIX I ACCOUNTANTS’ REPORT
– I-136 –
THIS DOCUMENT IS IN DRAFT FORM, INCOMPLETE AND SUBJECT TO CHANGE AND THAT INFORMATION MUST BEREAD IN CONJUNCTION WITH THE SECTION HEADED “WARNING” ON THE COVER OF THIS DOCUMENT.
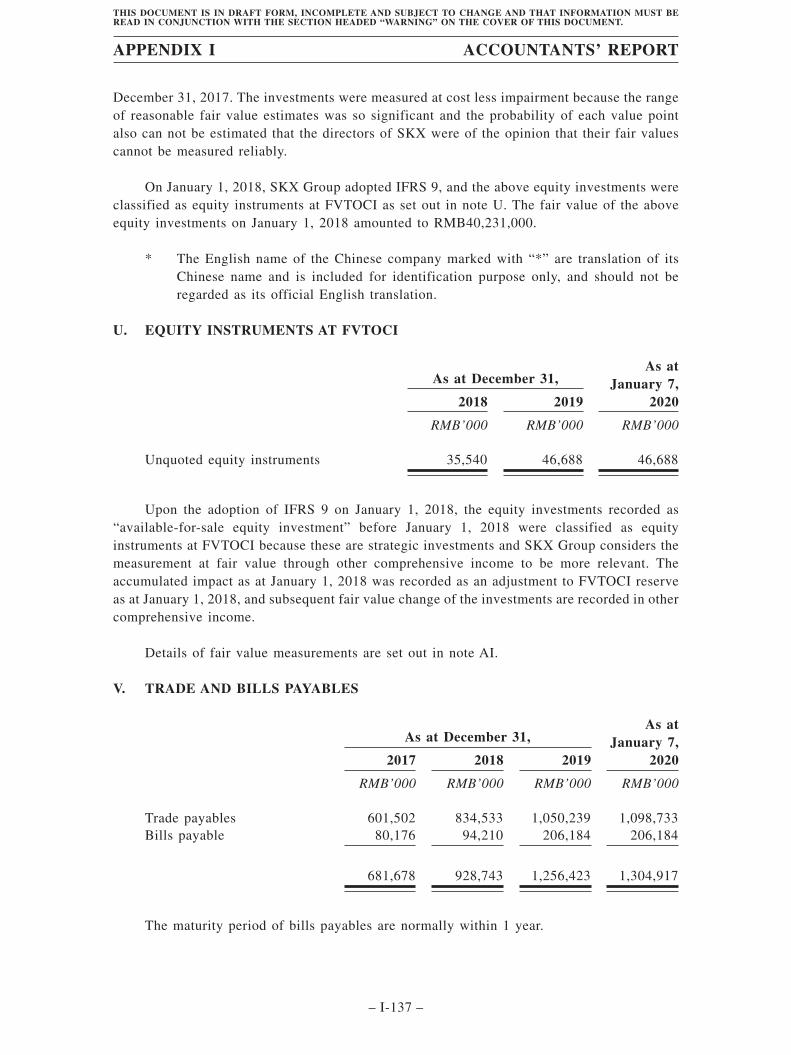
December 31, 2017. The investments were measured at cost less impairment because the rangeof reasonable fair value estimates was so significant and the probability of each value pointalso can not be estimated that the directors of SKX were of the opinion that their fair valuescannot be measured reliably.
On January 1, 2018, SKX Group adopted IFRS 9, and the above equity investments wereclassified as equity instruments at FVTOCI as set out in note U. The fair value of the aboveequity investments on January 1, 2018 amounted to RMB40,231,000.
* The English name of the Chinese company marked with “*” are translation of itsChinese name and is included for identification purpose only, and should not beregarded as its official English translation.
U. EQUITY INSTRUMENTS AT FVTOCI
As at December 31,As at
January 7,20202018 2019
RMB’000 RMB’000 RMB’000
Unquoted equity instruments 35,540 46,688 46,688
Upon the adoption of IFRS 9 on January 1, 2018, the equity investments recorded as“available-for-sale equity investment” before January 1, 2018 were classified as equityinstruments at FVTOCI because these are strategic investments and SKX Group considers themeasurement at fair value through other comprehensive income to be more relevant. Theaccumulated impact as at January 1, 2018 was recorded as an adjustment to FVTOCI reserveas at January 1, 2018, and subsequent fair value change of the investments are recorded in othercomprehensive income.
Details of fair value measurements are set out in note AI.
V. TRADE AND BILLS PAYABLES
As at December 31,As at
January 7,20202017 2018 2019
RMB’000 RMB’000 RMB’000 RMB’000
Trade payables 601,502 834,533 1,050,239 1,098,733Bills payable 80,176 94,210 206,184 206,184
681,678 928,743 1,256,423 1,304,917
The maturity period of bills payables are normally within 1 year.
APPENDIX I ACCOUNTANTS’ REPORT
– I-137 –
THIS DOCUMENT IS IN DRAFT FORM, INCOMPLETE AND SUBJECT TO CHANGE AND THAT INFORMATION MUST BEREAD IN CONJUNCTION WITH THE SECTION HEADED “WARNING” ON THE COVER OF THIS DOCUMENT.
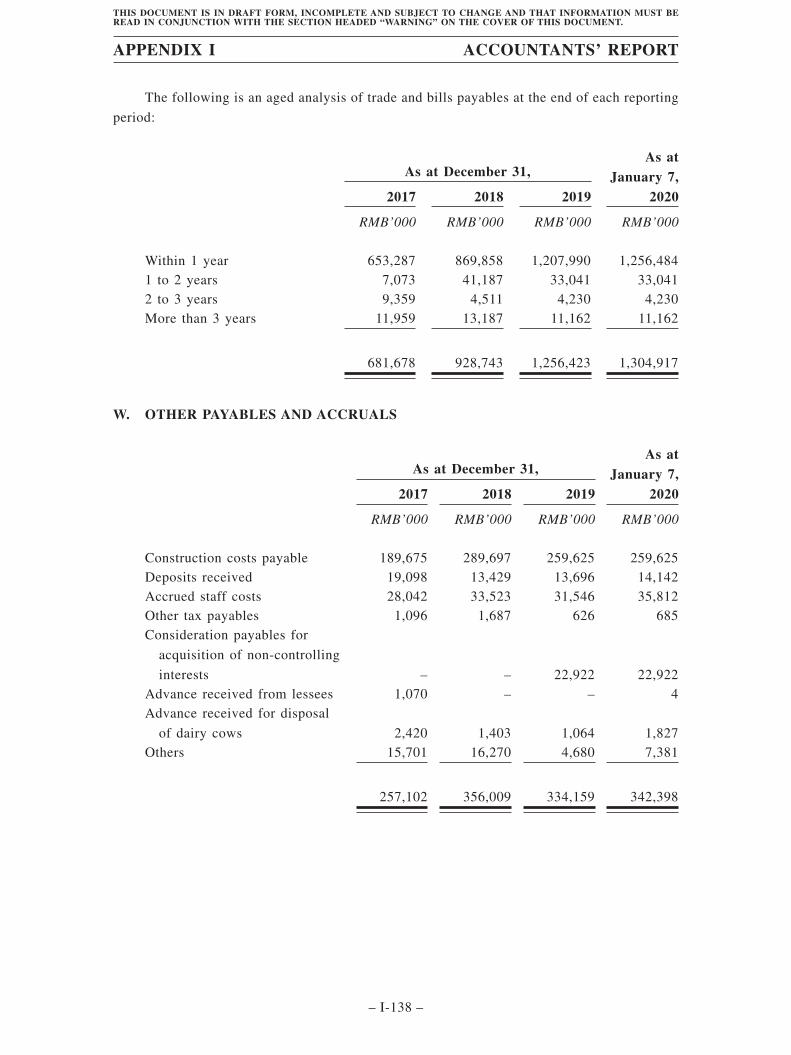
The following is an aged analysis of trade and bills payables at the end of each reporting
period:
As at December 31,As at
January 7,20202017 2018 2019
RMB’000 RMB’000 RMB’000 RMB’000
Within 1 year 653,287 869,858 1,207,990 1,256,4841 to 2 years 7,073 41,187 33,041 33,0412 to 3 years 9,359 4,511 4,230 4,230More than 3 years 11,959 13,187 11,162 11,162
681,678 928,743 1,256,423 1,304,917
W. OTHER PAYABLES AND ACCRUALS
As at December 31,As at
January 7,20202017 2018 2019
RMB’000 RMB’000 RMB’000 RMB’000
Construction costs payable 189,675 289,697 259,625 259,625Deposits received 19,098 13,429 13,696 14,142Accrued staff costs 28,042 33,523 31,546 35,812Other tax payables 1,096 1,687 626 685Consideration payables for
acquisition of non-controlling
interests – – 22,922 22,922Advance received from lessees 1,070 – – 4Advance received for disposal
of dairy cows 2,420 1,403 1,064 1,827Others 15,701 16,270 4,680 7,381
257,102 356,009 334,159 342,398
APPENDIX I ACCOUNTANTS’ REPORT
– I-138 –
THIS DOCUMENT IS IN DRAFT FORM, INCOMPLETE AND SUBJECT TO CHANGE AND THAT INFORMATION MUST BEREAD IN CONJUNCTION WITH THE SECTION HEADED “WARNING” ON THE COVER OF THIS DOCUMENT.
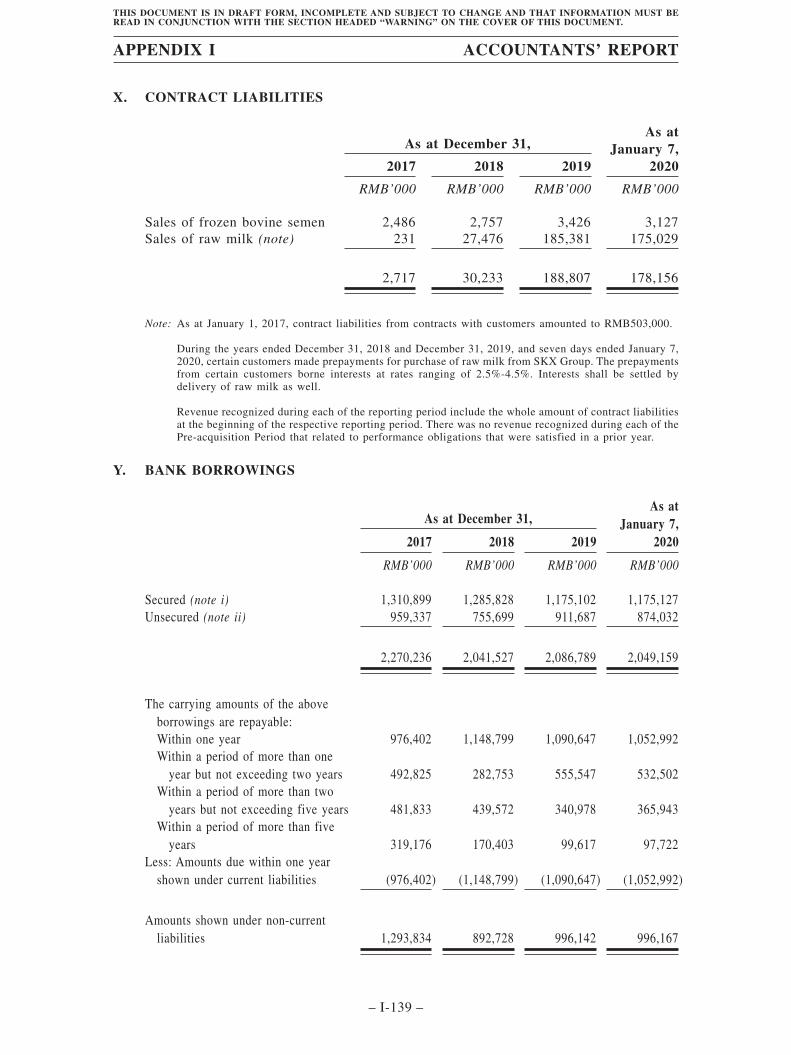
X. CONTRACT LIABILITIES
As at December 31,As at
January 7,20202017 2018 2019
RMB’000 RMB’000 RMB’000 RMB’000
Sales of frozen bovine semen 2,486 2,757 3,426 3,127Sales of raw milk (note) 231 27,476 185,381 175,029
2,717 30,233 188,807 178,156
Note: As at January 1, 2017, contract liabilities from contracts with customers amounted to RMB503,000.
During the years ended December 31, 2018 and December 31, 2019, and seven days ended January 7,2020, certain customers made prepayments for purchase of raw milk from SKX Group. The prepaymentsfrom certain customers borne interests at rates ranging of 2.5%-4.5%. Interests shall be settled bydelivery of raw milk as well.
Revenue recognized during each of the reporting period include the whole amount of contract liabilitiesat the beginning of the respective reporting period. There was no revenue recognized during each of thePre-acquisition Period that related to performance obligations that were satisfied in a prior year.
Y. BANK BORROWINGS
As at December 31,As at
January 7,20202017 2018 2019
RMB’000 RMB’000 RMB’000 RMB’000
Secured (note i) 1,310,899 1,285,828 1,175,102 1,175,127Unsecured (note ii) 959,337 755,699 911,687 874,032
2,270,236 2,041,527 2,086,789 2,049,159
The carrying amounts of the aboveborrowings are repayable:Within one year 976,402 1,148,799 1,090,647 1,052,992Within a period of more than one
year but not exceeding two years 492,825 282,753 555,547 532,502Within a period of more than two
years but not exceeding five years 481,833 439,572 340,978 365,943Within a period of more than five
years 319,176 170,403 99,617 97,722Less: Amounts due within one year
shown under current liabilities (976,402) (1,148,799) (1,090,647) (1,052,992)
Amounts shown under non-currentliabilities 1,293,834 892,728 996,142 996,167
APPENDIX I ACCOUNTANTS’ REPORT
– I-139 –
THIS DOCUMENT IS IN DRAFT FORM, INCOMPLETE AND SUBJECT TO CHANGE AND THAT INFORMATION MUST BEREAD IN CONJUNCTION WITH THE SECTION HEADED “WARNING” ON THE COVER OF THIS DOCUMENT.
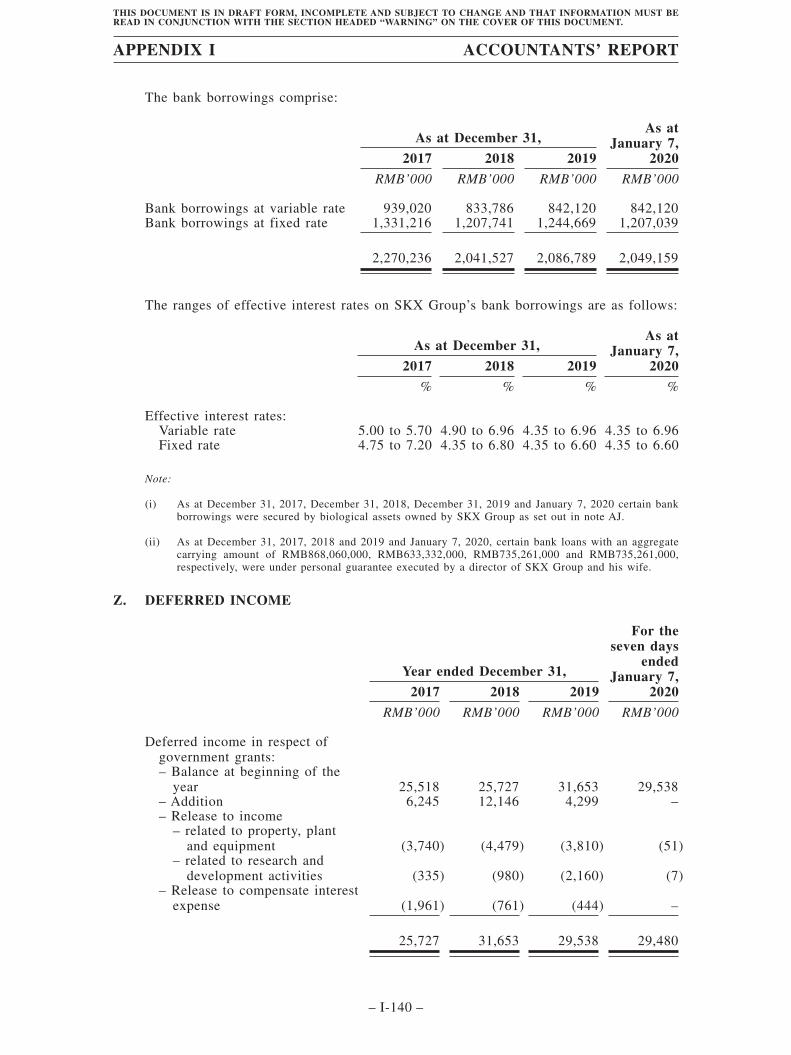
The bank borrowings comprise:
As at December 31,As at
January 7,20202017 2018 2019
RMB’000 RMB’000 RMB’000 RMB’000
Bank borrowings at variable rate 939,020 833,786 842,120 842,120Bank borrowings at fixed rate 1,331,216 1,207,741 1,244,669 1,207,039
2,270,236 2,041,527 2,086,789 2,049,159
The ranges of effective interest rates on SKX Group’s bank borrowings are as follows:
As at December 31,As at
January 7,20202017 2018 2019
% % % %
Effective interest rates:Variable rate 5.00 to 5.70 4.90 to 6.96 4.35 to 6.96 4.35 to 6.96Fixed rate 4.75 to 7.20 4.35 to 6.80 4.35 to 6.60 4.35 to 6.60
Note:
(i) As at December 31, 2017, December 31, 2018, December 31, 2019 and January 7, 2020 certain bankborrowings were secured by biological assets owned by SKX Group as set out in note AJ.
(ii) As at December 31, 2017, 2018 and 2019 and January 7, 2020, certain bank loans with an aggregatecarrying amount of RMB868,060,000, RMB633,332,000, RMB735,261,000 and RMB735,261,000,respectively, were under personal guarantee executed by a director of SKX Group and his wife.
Z. DEFERRED INCOME
Year ended December 31,
For theseven days
endedJanuary 7,
20202017 2018 2019
RMB’000 RMB’000 RMB’000 RMB’000
Deferred income in respect ofgovernment grants:– Balance at beginning of the
year 25,518 25,727 31,653 29,538– Addition 6,245 12,146 4,299 –– Release to income
– related to property, plantand equipment (3,740) (4,479) (3,810) (51)
– related to research anddevelopment activities (335) (980) (2,160) (7)
– Release to compensate interestexpense (1,961) (761) (444) –
25,727 31,653 29,538 29,480
APPENDIX I ACCOUNTANTS’ REPORT
– I-140 –
THIS DOCUMENT IS IN DRAFT FORM, INCOMPLETE AND SUBJECT TO CHANGE AND THAT INFORMATION MUST BEREAD IN CONJUNCTION WITH THE SECTION HEADED “WARNING” ON THE COVER OF THIS DOCUMENT.
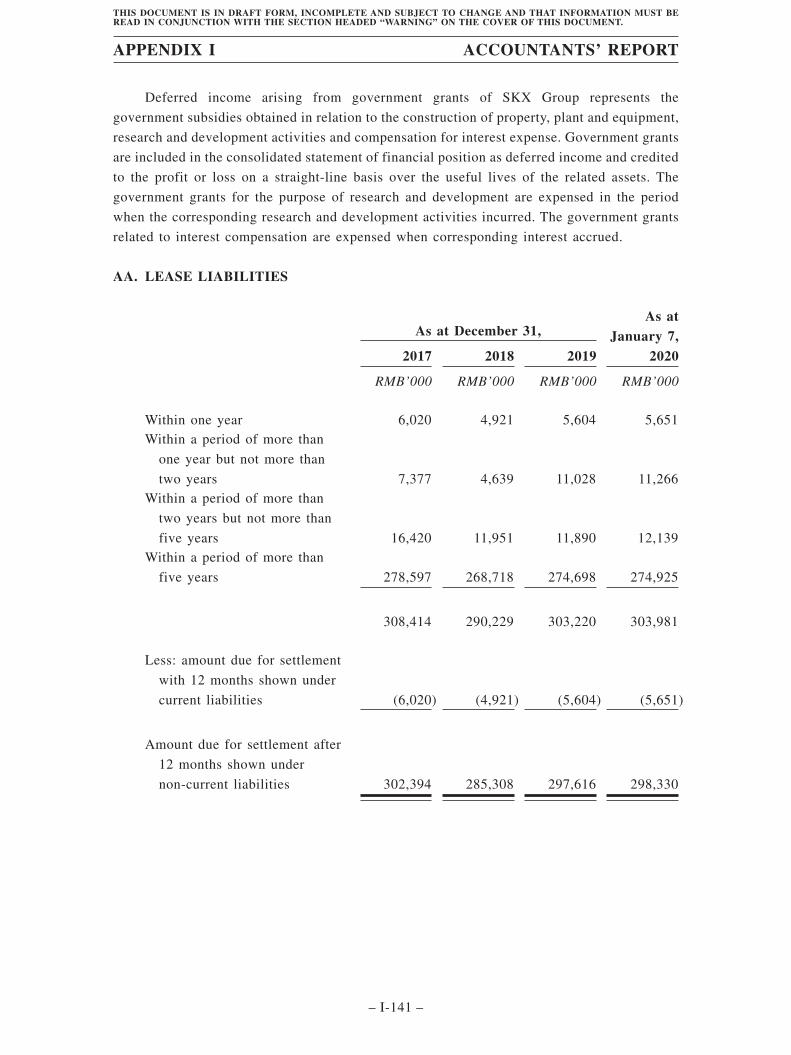
Deferred income arising from government grants of SKX Group represents the
government subsidies obtained in relation to the construction of property, plant and equipment,
research and development activities and compensation for interest expense. Government grants
are included in the consolidated statement of financial position as deferred income and credited
to the profit or loss on a straight-line basis over the useful lives of the related assets. The
government grants for the purpose of research and development are expensed in the period
when the corresponding research and development activities incurred. The government grants
related to interest compensation are expensed when corresponding interest accrued.
AA. LEASE LIABILITIES
As at December 31,As at
January 7,20202017 2018 2019
RMB’000 RMB’000 RMB’000 RMB’000
Within one year 6,020 4,921 5,604 5,651Within a period of more than
one year but not more than
two years 7,377 4,639 11,028 11,266Within a period of more than
two years but not more than
five years 16,420 11,951 11,890 12,139Within a period of more than
five years 278,597 268,718 274,698 274,925
308,414 290,229 303,220 303,981
Less: amount due for settlement
with 12 months shown under
current liabilities (6,020) (4,921) (5,604) (5,651)
Amount due for settlement after
12 months shown under
non-current liabilities 302,394 285,308 297,616 298,330
APPENDIX I ACCOUNTANTS’ REPORT
– I-141 –
THIS DOCUMENT IS IN DRAFT FORM, INCOMPLETE AND SUBJECT TO CHANGE AND THAT INFORMATION MUST BEREAD IN CONJUNCTION WITH THE SECTION HEADED “WARNING” ON THE COVER OF THIS DOCUMENT.
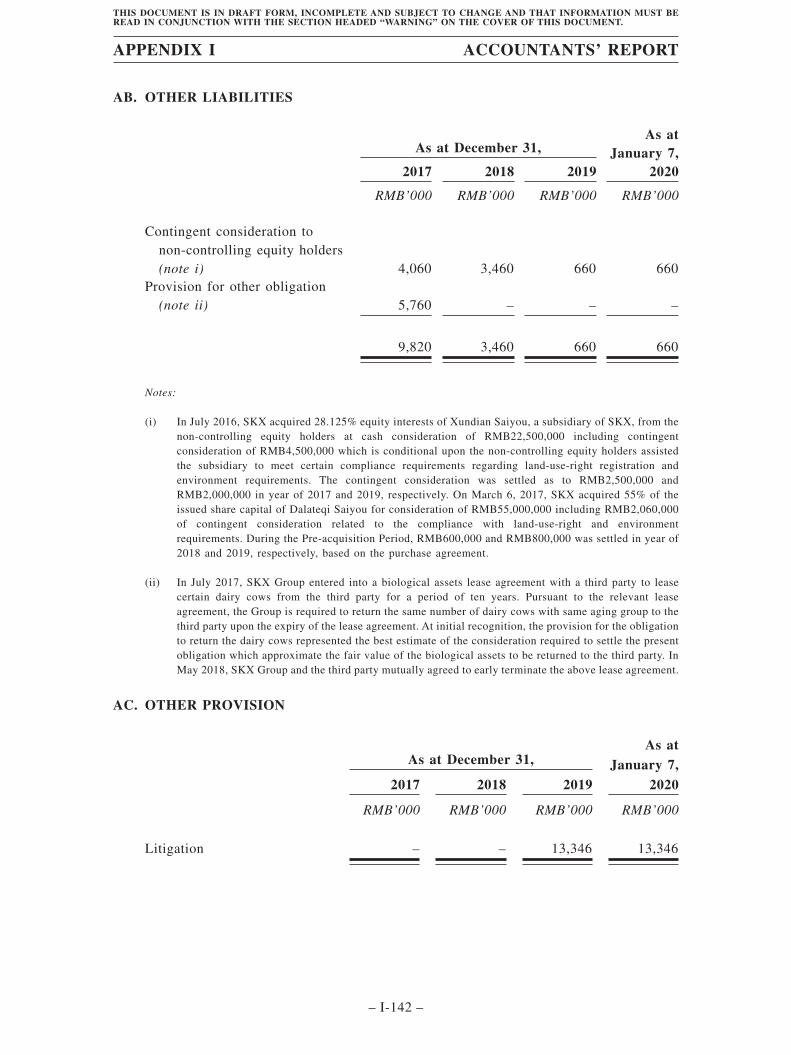
AB. OTHER LIABILITIES
As at December 31,As at
January 7,20202017 2018 2019
RMB’000 RMB’000 RMB’000 RMB’000
Contingent consideration tonon-controlling equity holders(note i) 4,060 3,460 660 660
Provision for other obligation(note ii) 5,760 – – –
9,820 3,460 660 660
Notes:
(i) In July 2016, SKX acquired 28.125% equity interests of Xundian Saiyou, a subsidiary of SKX, from thenon-controlling equity holders at cash consideration of RMB22,500,000 including contingentconsideration of RMB4,500,000 which is conditional upon the non-controlling equity holders assistedthe subsidiary to meet certain compliance requirements regarding land-use-right registration andenvironment requirements. The contingent consideration was settled as to RMB2,500,000 andRMB2,000,000 in year of 2017 and 2019, respectively. On March 6, 2017, SKX acquired 55% of theissued share capital of Dalateqi Saiyou for consideration of RMB55,000,000 including RMB2,060,000of contingent consideration related to the compliance with land-use-right and environmentrequirements. During the Pre-acquisition Period, RMB600,000 and RMB800,000 was settled in year of2018 and 2019, respectively, based on the purchase agreement.
(ii) In July 2017, SKX Group entered into a biological assets lease agreement with a third party to leasecertain dairy cows from the third party for a period of ten years. Pursuant to the relevant leaseagreement, the Group is required to return the same number of dairy cows with same aging group to thethird party upon the expiry of the lease agreement. At initial recognition, the provision for the obligationto return the dairy cows represented the best estimate of the consideration required to settle the presentobligation which approximate the fair value of the biological assets to be returned to the third party. InMay 2018, SKX Group and the third party mutually agreed to early terminate the above lease agreement.
AC. OTHER PROVISION
As at December 31,As at
January 7,20202017 2018 2019
RMB’000 RMB’000 RMB’000 RMB’000
Litigation – – 13,346 13,346
APPENDIX I ACCOUNTANTS’ REPORT
– I-142 –
THIS DOCUMENT IS IN DRAFT FORM, INCOMPLETE AND SUBJECT TO CHANGE AND THAT INFORMATION MUST BEREAD IN CONJUNCTION WITH THE SECTION HEADED “WARNING” ON THE COVER OF THIS DOCUMENT.
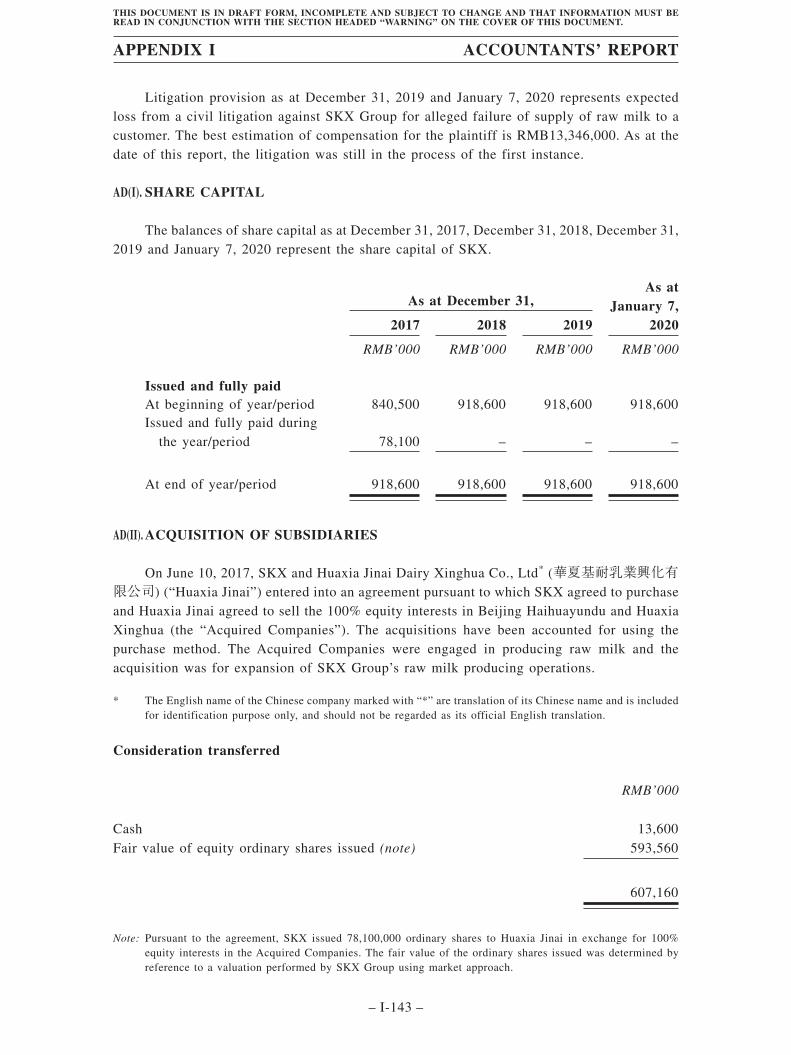
Litigation provision as at December 31, 2019 and January 7, 2020 represents expectedloss from a civil litigation against SKX Group for alleged failure of supply of raw milk to acustomer. The best estimation of compensation for the plaintiff is RMB13,346,000. As at thedate of this report, the litigation was still in the process of the first instance.
AD(I). SHARE CAPITAL
The balances of share capital as at December 31, 2017, December 31, 2018, December 31,2019 and January 7, 2020 represent the share capital of SKX.
As at December 31,As at
January 7,20202017 2018 2019
RMB’000 RMB’000 RMB’000 RMB’000
Issued and fully paidAt beginning of year/period 840,500 918,600 918,600 918,600Issued and fully paid during
the year/period 78,100 – – –
At end of year/period 918,600 918,600 918,600 918,600
AD(II). ACQUISITION OF SUBSIDIARIES
On June 10, 2017, SKX and Huaxia Jinai Dairy Xinghua Co., Ltd* (華夏基耐乳業興化有限公司) (“Huaxia Jinai”) entered into an agreement pursuant to which SKX agreed to purchaseand Huaxia Jinai agreed to sell the 100% equity interests in Beijing Haihuayundu and HuaxiaXinghua (the “Acquired Companies”). The acquisitions have been accounted for using thepurchase method. The Acquired Companies were engaged in producing raw milk and theacquisition was for expansion of SKX Group’s raw milk producing operations.
* The English name of the Chinese company marked with “*” are translation of its Chinese name and is includedfor identification purpose only, and should not be regarded as its official English translation.
Consideration transferred
RMB’000
Cash 13,600Fair value of equity ordinary shares issued (note) 593,560
607,160
Note: Pursuant to the agreement, SKX issued 78,100,000 ordinary shares to Huaxia Jinai in exchange for 100%equity interests in the Acquired Companies. The fair value of the ordinary shares issued was determined byreference to a valuation performed by SKX Group using market approach.
APPENDIX I ACCOUNTANTS’ REPORT
– I-143 –
THIS DOCUMENT IS IN DRAFT FORM, INCOMPLETE AND SUBJECT TO CHANGE AND THAT INFORMATION MUST BEREAD IN CONJUNCTION WITH THE SECTION HEADED “WARNING” ON THE COVER OF THIS DOCUMENT.
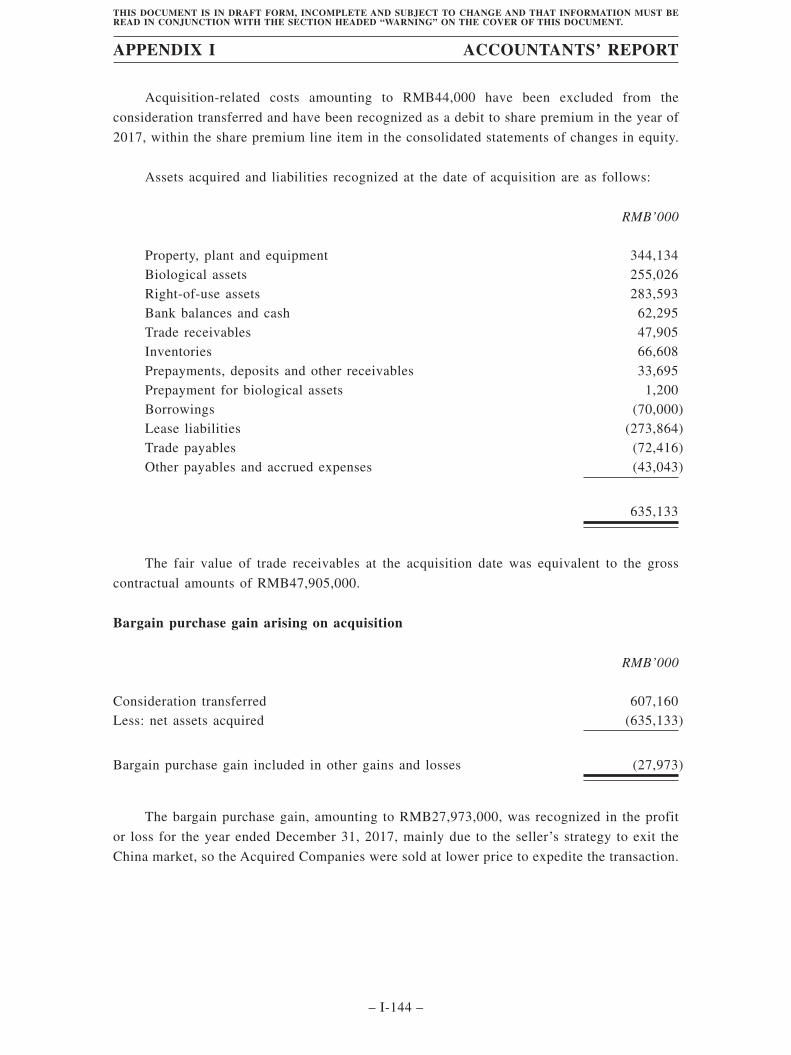
Acquisition-related costs amounting to RMB44,000 have been excluded from the
consideration transferred and have been recognized as a debit to share premium in the year of
2017, within the share premium line item in the consolidated statements of changes in equity.
Assets acquired and liabilities recognized at the date of acquisition are as follows:
RMB’000
Property, plant and equipment 344,134Biological assets 255,026Right-of-use assets 283,593Bank balances and cash 62,295Trade receivables 47,905Inventories 66,608Prepayments, deposits and other receivables 33,695Prepayment for biological assets 1,200Borrowings (70,000)Lease liabilities (273,864)Trade payables (72,416)Other payables and accrued expenses (43,043)
635,133
The fair value of trade receivables at the acquisition date was equivalent to the gross
contractual amounts of RMB47,905,000.
Bargain purchase gain arising on acquisition
RMB’000
Consideration transferred 607,160Less: net assets acquired (635,133)
Bargain purchase gain included in other gains and losses (27,973)
The bargain purchase gain, amounting to RMB27,973,000, was recognized in the profit
or loss for the year ended December 31, 2017, mainly due to the seller’s strategy to exit the
China market, so the Acquired Companies were sold at lower price to expedite the transaction.
APPENDIX I ACCOUNTANTS’ REPORT
– I-144 –
THIS DOCUMENT IS IN DRAFT FORM, INCOMPLETE AND SUBJECT TO CHANGE AND THAT INFORMATION MUST BEREAD IN CONJUNCTION WITH THE SECTION HEADED “WARNING” ON THE COVER OF THIS DOCUMENT.
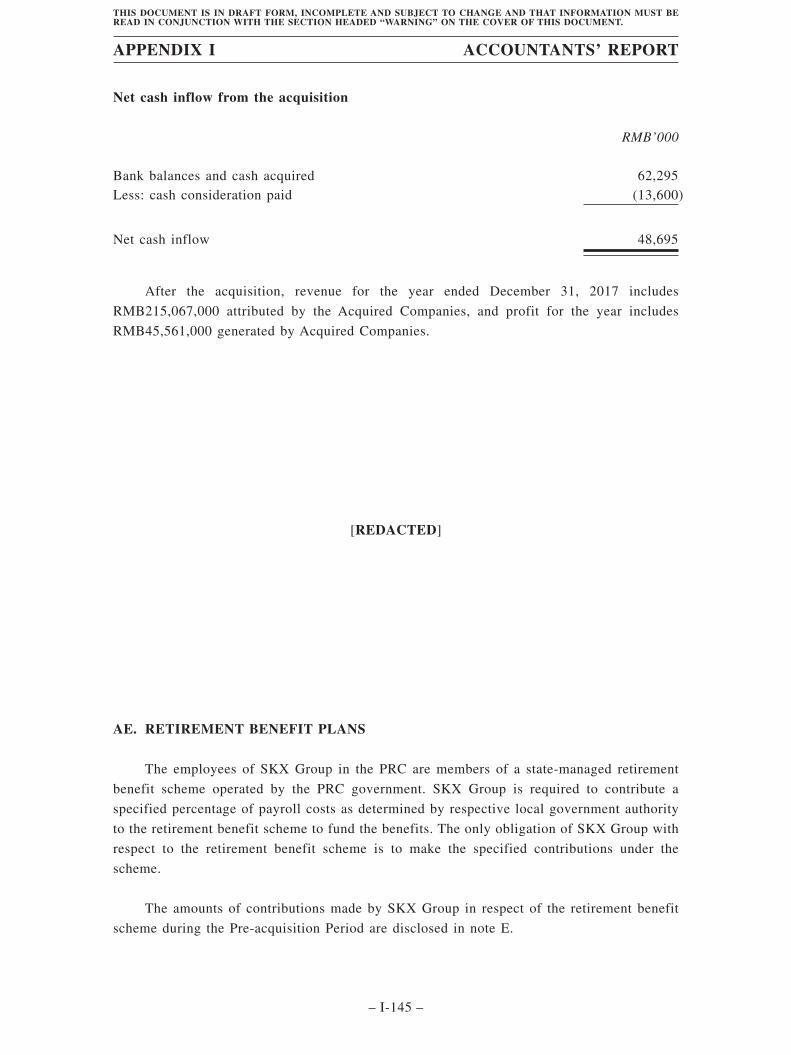
Net cash inflow from the acquisition
RMB’000
Bank balances and cash acquired 62,295Less: cash consideration paid (13,600)
Net cash inflow 48,695
After the acquisition, revenue for the year ended December 31, 2017 includes
RMB215,067,000 attributed by the Acquired Companies, and profit for the year includes
RMB45,561,000 generated by Acquired Companies.
[REDACTED]
AE. RETIREMENT BENEFIT PLANS
The employees of SKX Group in the PRC are members of a state-managed retirement
benefit scheme operated by the PRC government. SKX Group is required to contribute a
specified percentage of payroll costs as determined by respective local government authority
to the retirement benefit scheme to fund the benefits. The only obligation of SKX Group with
respect to the retirement benefit scheme is to make the specified contributions under the
scheme.
The amounts of contributions made by SKX Group in respect of the retirement benefit
scheme during the Pre-acquisition Period are disclosed in note E.
APPENDIX I ACCOUNTANTS’ REPORT
– I-145 –
THIS DOCUMENT IS IN DRAFT FORM, INCOMPLETE AND SUBJECT TO CHANGE AND THAT INFORMATION MUST BEREAD IN CONJUNCTION WITH THE SECTION HEADED “WARNING” ON THE COVER OF THIS DOCUMENT.
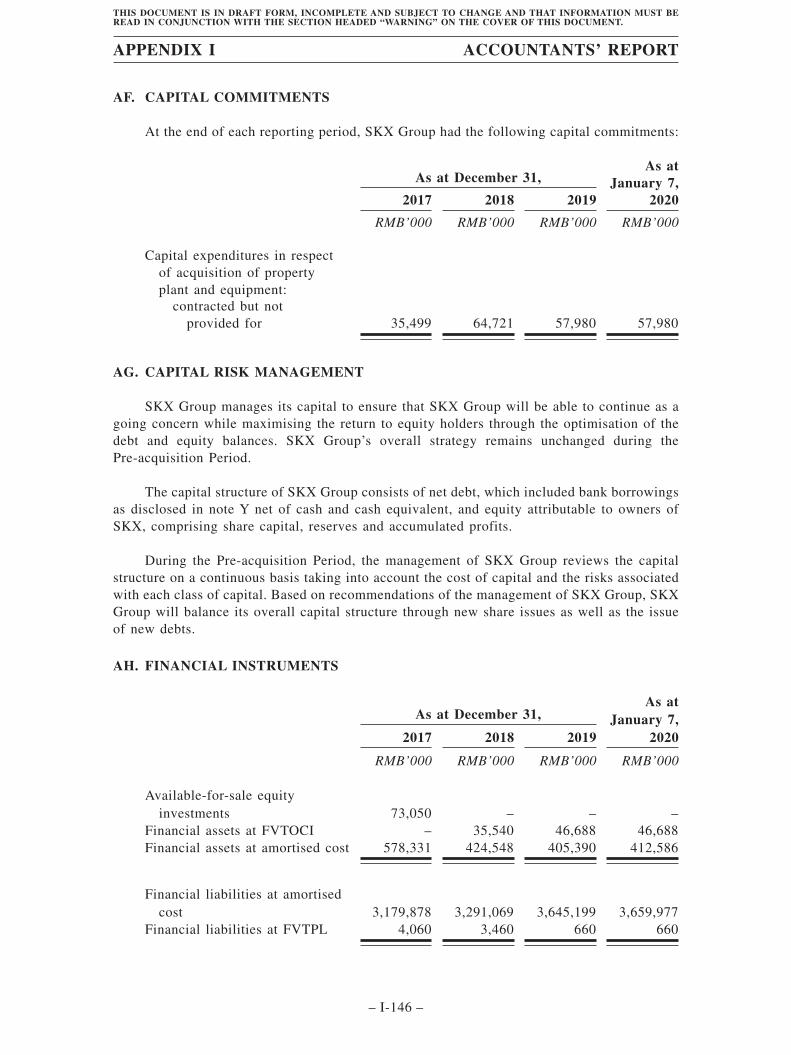
AF. CAPITAL COMMITMENTS
At the end of each reporting period, SKX Group had the following capital commitments:
As at December 31,As at
January 7,20202017 2018 2019
RMB’000 RMB’000 RMB’000 RMB’000
Capital expenditures in respectof acquisition of propertyplant and equipment:
contracted but notprovided for 35,499 64,721 57,980 57,980
AG. CAPITAL RISK MANAGEMENT
SKX Group manages its capital to ensure that SKX Group will be able to continue as agoing concern while maximising the return to equity holders through the optimisation of thedebt and equity balances. SKX Group’s overall strategy remains unchanged during thePre-acquisition Period.
The capital structure of SKX Group consists of net debt, which included bank borrowingsas disclosed in note Y net of cash and cash equivalent, and equity attributable to owners ofSKX, comprising share capital, reserves and accumulated profits.
During the Pre-acquisition Period, the management of SKX Group reviews the capitalstructure on a continuous basis taking into account the cost of capital and the risks associatedwith each class of capital. Based on recommendations of the management of SKX Group, SKXGroup will balance its overall capital structure through new share issues as well as the issueof new debts.
AH. FINANCIAL INSTRUMENTS
As at December 31,As at
January 7,20202017 2018 2019
RMB’000 RMB’000 RMB’000 RMB’000
Available-for-sale equityinvestments 73,050 – – –
Financial assets at FVTOCI – 35,540 46,688 46,688Financial assets at amortised cost 578,331 424,548 405,390 412,586
Financial liabilities at amortisedcost 3,179,878 3,291,069 3,645,199 3,659,977
Financial liabilities at FVTPL 4,060 3,460 660 660
APPENDIX I ACCOUNTANTS’ REPORT
– I-146 –
THIS DOCUMENT IS IN DRAFT FORM, INCOMPLETE AND SUBJECT TO CHANGE AND THAT INFORMATION MUST BEREAD IN CONJUNCTION WITH THE SECTION HEADED “WARNING” ON THE COVER OF THIS DOCUMENT.
Financial risk management objectives and polices
SKX Group’s major financial instruments include bank balances and cash, pledged andrestricted bank deposits, trade and bills receivables, other receivables, available-for-sale equityinvestments, equity investments at FVTOCI, trade and bills payables, other payables, leaseliabilities, contingent consideration to non-controlling equity holders and bank borrowings.Details of these financial instruments are disclosed in the respective notes.
The risks associated with these financial instruments and the policies on how to mitigatethese risks are set out below.
The management of SKX Group manage and monitor these exposures to ensureappropriate measures are implemented on a timely and effective manner. SKX Group’s overallstrategy remains unchanged during the Pre-acquisition Period.
Market risk
(i) Currency risk
As at the end of each reporting period, the SKX Group had no financial assets or financialliabilities in currencies other than RMB. SKX Group is not exposed to any significant currencyrisk.
(ii) Interest rate risk
SKX Group’s fair value interest rate risk relates primarily to its fixed-rate bankborrowings and lease liabilities. SKX Group is also exposed to cash flow interest rate riskthrough the impact of rate changes on interest bearing financial assets and liabilities at variablerates, mainly pledged and restricted bank deposits, bank balances and variable-rates bankborrowings. SKX Group cash flow interest rate risk is mainly concentrated on the fluctuationof Benchmark Deposit Rate of the People’s Bank of China.
Interest rate sensitivity analyses
The sensitivity analysis below has been determined based on the exposure to interest ratesfor pledged and restricted bank deposits, bank balances and borrowings at the end of eachreporting period and assumed that the amount outstanding at the end of each reporting periodwas outstanding for the whole year. A 50 basis point increase or decrease for pledged andrestricted bank deposits, bank balances and bank borrowings are used when reporting interestrate risk internally to key management personnel and represents management’s assessment ofthe reasonably possible change in interest rates.
If interest rates had been 50 basis points higher/lower and all other variables were heldconstant, SKX Group’s post-tax profit for the three years ended December 31, 2019 and sevendays ended January 7, 2020 would decrease/increase by RMB3,304,000, RMB3,356,000,RMB3,058,000 and RMB3,204,000, respectively. This is mainly attributable to SKX Group’sexposure to interest rates on its pledged and restricted bank deposits, bank balances andborrowings with variable rates.
APPENDIX I ACCOUNTANTS’ REPORT
– I-147 –
THIS DOCUMENT IS IN DRAFT FORM, INCOMPLETE AND SUBJECT TO CHANGE AND THAT INFORMATION MUST BEREAD IN CONJUNCTION WITH THE SECTION HEADED “WARNING” ON THE COVER OF THIS DOCUMENT.
(iii) Other price risk
SKX Group is exposed to equity price risk through its investments in unquoted equity
investments measured at FVTOCI. SKX Group invested in certain unquoted equity securities
for investees operating in pastoral industry sector for long term strategic purposes which had
been designated as FVTOCI. The Group has appointed a special team to monitor the price risk
and will consider hedging the risk exposure should the need arise.
Credit risk and impairment assessment
SKX Group’s maximum exposure to credit risk which will cause a financial loss to SKX
Group due to failure to discharge obligations by the counterparties is arising from the carrying
amount of the respective recognized financial assets as stated in the consolidated statements of
financial position.
SKX Group has concentration of credit risk as 14.56%, 15.16%, 17.90% and 19.07% of
the total trade receivables were due from SKX Group’s largest customer as at December 31,
2017, 2018 and 2019 and January 7, 2020, respectively.
The Group also has concentration of credit risk on trade receivables. As at December 31,
2017, December 31, 2018, December 31, 2019 and January 7, 2020, 68.13%, 71.93%, 80.60%
and 74.84% of the total trade receivables were due from SKX Group’s top five customers,
respectively.
Overview of SKX Group’s exposure to credit risk before adoption of IFRS 9 as at January
1, 2018
In order to minimize the credit risk of trade receivables and other receivables, the
management of SKX Group makes periodic collective assessments as well as individual
assessment on the recoverability of trade receivables, other receivables based on historical
settlement records and past experience. SKX Group reviews the recoverable amount of each
individual trade debt at the end of reporting period to ensure that adequate impairment losses
are made for irrecoverable amounts. In this regard, management of SKX Group considers that
SKX Group’s credit risk is significantly reduced.
Other than concentration of credit risk on bills receivables, pledged and restricted bank
deposits, bank balances and cash in which the counterparties are banks with good reputation,
SKX Group has no other significant concentration of credit risk on its receivables, with
exposure spread over a number of counterparties.
APPENDIX I ACCOUNTANTS’ REPORT
– I-148 –
THIS DOCUMENT IS IN DRAFT FORM, INCOMPLETE AND SUBJECT TO CHANGE AND THAT INFORMATION MUST BEREAD IN CONJUNCTION WITH THE SECTION HEADED “WARNING” ON THE COVER OF THIS DOCUMENT.
Overview of SKX Group’s exposure to credit risk after adoption of IFRS 9 as at January 1,
2018
Credit risk refers to the risk that SKX Group’s counterparties default on their contractual
obligations resulting in financial losses to SKX Group. SKX Group’s credit risk exposures are
primarily attributable to trade and bills receivables, other receivables, pledged and restricted
bank deposits, and bank balances and cash. SKX Group does not hold any collateral or other
credit enhancements to cover its credit risks associated with its financial assets.
In order to minimize the credit risk, the management of SKX Group has delegated a team
responsible for determination of credit limits, credit approvals and other monitoring procedures
to ensure that follow-up action is taken to recover overdue debtors. In addition, SKX Group
performs impairment assessment under ECL model in accordance with IFRS 9 on receivable
balances individually or based on provision matrix.
SKX Group has concentration of credit risk on liquid funds which are deposited with
several banks. However, the credit risk on pledged and restricted bank deposits and bank
balances and cash is limited because the majority of the counterparties are banks with good
reputation.
For trade receivables, SKX Group has applied the simplified approach of IFRS 9 to
measure the loss allowance at lifetime ECL. Except for debtors with significant outstanding
balances or credit-impaired, SKX Group determines the ECL on these items by using a
provision matrix by risk portfolio, which is estimated based on the financial quality of the
debtors, historical credit loss experience and the past due status of the debtors, general
economic conditions of the industry in which the debtors operate and assessment of both the
current as well as the forward-looking information that available without undue cost or effort
at the reporting date.
The SKX Group measures the loss allowance of other receivables equal to 12-month ECL,
unless when there has been a significant increase in credit risk since initial recognition, the
Group recognizes lifetime ECL.
SKX Group measures the loss allowance on bank balances and pledged and restricted
bank deposits on 12-month ECL basis as there had been no significant increase in credit risk
since initial recognition. The credit risk is limited because the counterparties are banks with
good credit ratings assigned by international credit rating agencies.
APPENDIX I ACCOUNTANTS’ REPORT
– I-149 –
THIS DOCUMENT IS IN DRAFT FORM, INCOMPLETE AND SUBJECT TO CHANGE AND THAT INFORMATION MUST BEREAD IN CONJUNCTION WITH THE SECTION HEADED “WARNING” ON THE COVER OF THIS DOCUMENT.
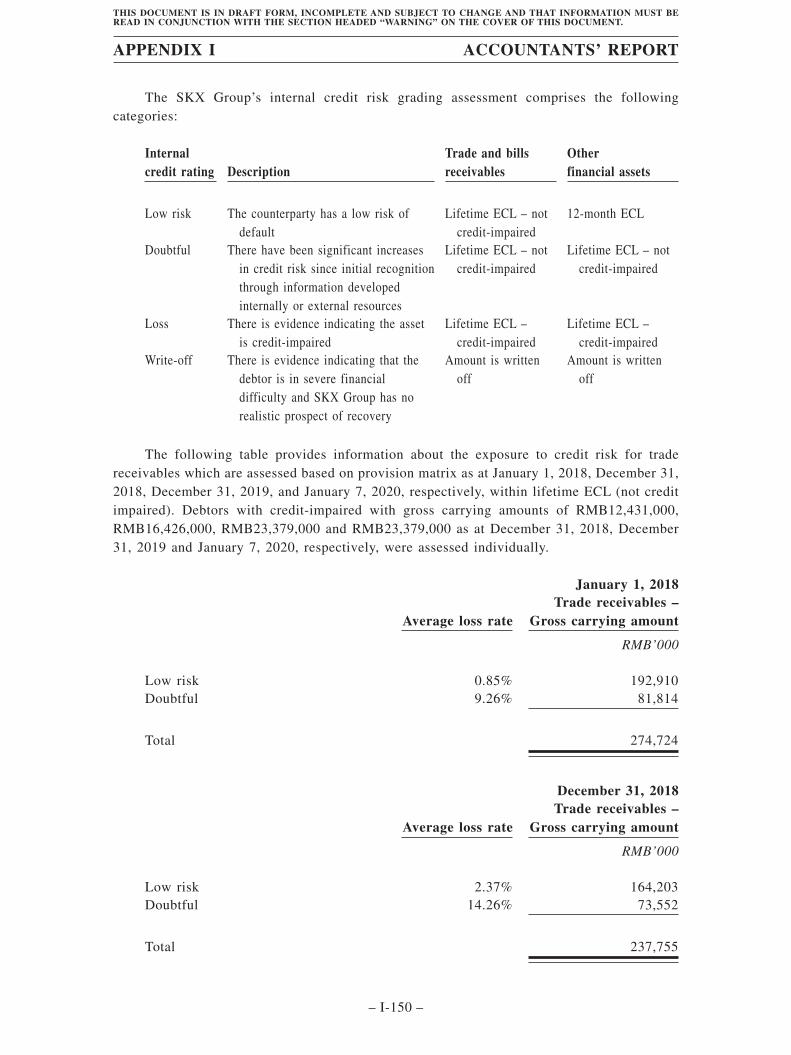
The SKX Group’s internal credit risk grading assessment comprises the followingcategories:
Internalcredit rating Description
Trade and billsreceivables
Otherfinancial assets
Low risk The counterparty has a low risk ofdefault
Lifetime ECL – notcredit-impaired
12-month ECL
Doubtful There have been significant increasesin credit risk since initial recognitionthrough information developedinternally or external resources
Lifetime ECL – notcredit-impaired
Lifetime ECL – notcredit-impaired
Loss There is evidence indicating the assetis credit-impaired
Lifetime ECL –credit-impaired
Lifetime ECL –credit-impaired
Write-off There is evidence indicating that thedebtor is in severe financialdifficulty and SKX Group has norealistic prospect of recovery
Amount is writtenoff
Amount is writtenoff
The following table provides information about the exposure to credit risk for tradereceivables which are assessed based on provision matrix as at January 1, 2018, December 31,2018, December 31, 2019, and January 7, 2020, respectively, within lifetime ECL (not creditimpaired). Debtors with credit-impaired with gross carrying amounts of RMB12,431,000,RMB16,426,000, RMB23,379,000 and RMB23,379,000 as at December 31, 2018, December31, 2019 and January 7, 2020, respectively, were assessed individually.
January 1, 2018
Average loss rateTrade receivables –
Gross carrying amount
RMB’000
Low risk 0.85% 192,910Doubtful 9.26% 81,814
Total 274,724
December 31, 2018
Average loss rateTrade receivables –
Gross carrying amount
RMB’000
Low risk 2.37% 164,203Doubtful 14.26% 73,552
Total 237,755
APPENDIX I ACCOUNTANTS’ REPORT
– I-150 –
THIS DOCUMENT IS IN DRAFT FORM, INCOMPLETE AND SUBJECT TO CHANGE AND THAT INFORMATION MUST BEREAD IN CONJUNCTION WITH THE SECTION HEADED “WARNING” ON THE COVER OF THIS DOCUMENT.
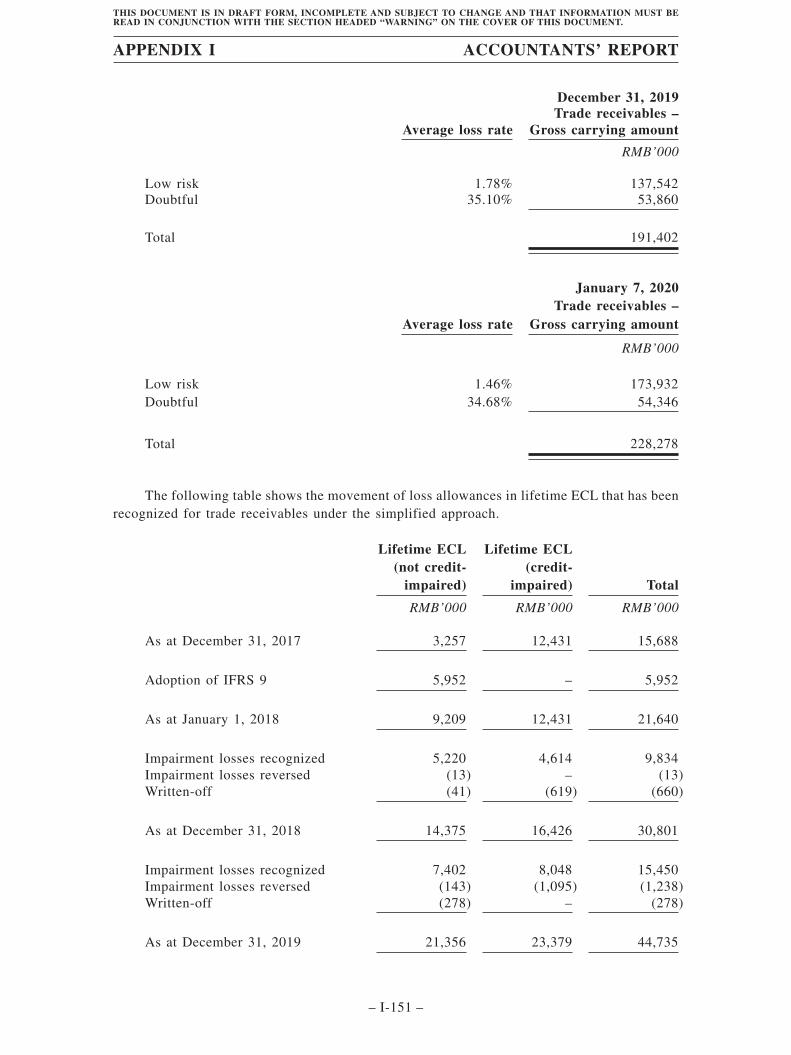
December 31, 2019
Average loss rateTrade receivables –
Gross carrying amount
RMB’000
Low risk 1.78% 137,542Doubtful 35.10% 53,860
Total 191,402
January 7, 2020
Average loss rateTrade receivables –
Gross carrying amount
RMB’000
Low risk 1.46% 173,932Doubtful 34.68% 54,346
Total 228,278
The following table shows the movement of loss allowances in lifetime ECL that has beenrecognized for trade receivables under the simplified approach.
Lifetime ECL(not credit-
impaired)
Lifetime ECL(credit-
impaired) Total
RMB’000 RMB’000 RMB’000
As at December 31, 2017 3,257 12,431 15,688
Adoption of IFRS 9 5,952 – 5,952
As at January 1, 2018 9,209 12,431 21,640
Impairment losses recognized 5,220 4,614 9,834Impairment losses reversed (13) – (13)Written-off (41) (619) (660)
As at December 31, 2018 14,375 16,426 30,801
Impairment losses recognized 7,402 8,048 15,450Impairment losses reversed (143) (1,095) (1,238)Written-off (278) – (278)
As at December 31, 2019 21,356 23,379 44,735
APPENDIX I ACCOUNTANTS’ REPORT
– I-151 –
THIS DOCUMENT IS IN DRAFT FORM, INCOMPLETE AND SUBJECT TO CHANGE AND THAT INFORMATION MUST BEREAD IN CONJUNCTION WITH THE SECTION HEADED “WARNING” ON THE COVER OF THIS DOCUMENT.
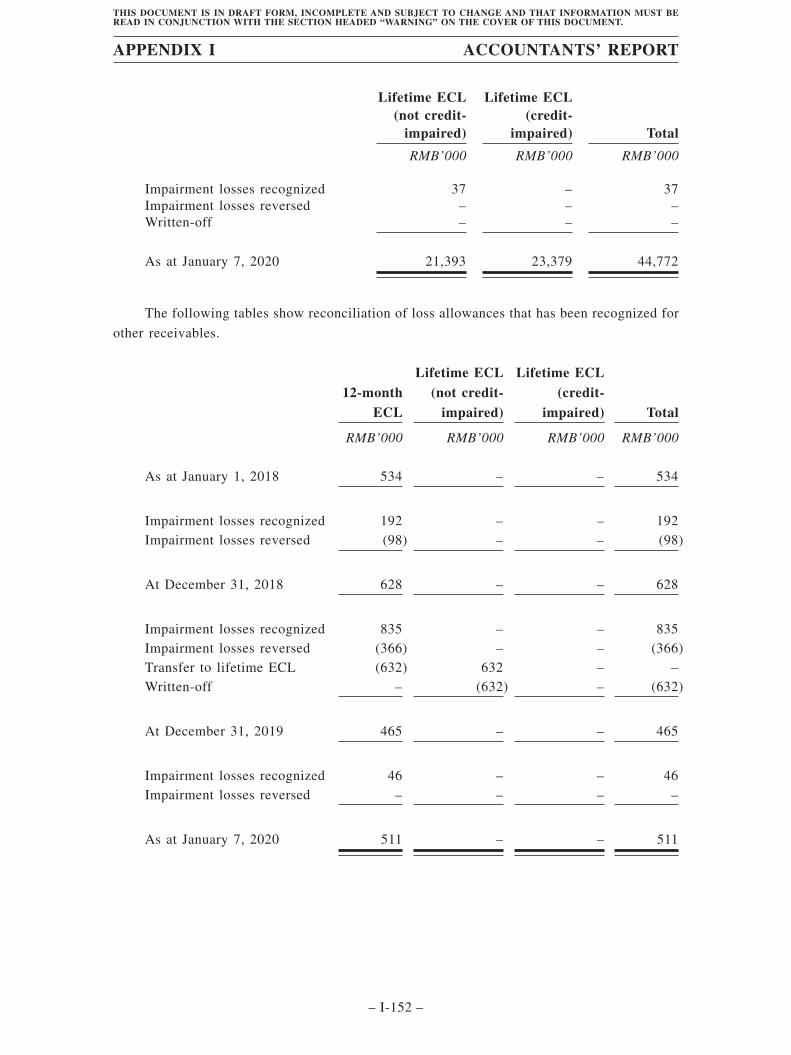
Lifetime ECL(not credit-
impaired)
Lifetime ECL(credit-
impaired) Total
RMB’000 RMB’000 RMB’000
Impairment losses recognized 37 – 37Impairment losses reversed – – –Written-off – – –
As at January 7, 2020 21,393 23,379 44,772
The following tables show reconciliation of loss allowances that has been recognized for
other receivables.
12-monthECL
Lifetime ECL(not credit-
impaired)
Lifetime ECL(credit-
impaired) Total
RMB’000 RMB’000 RMB’000 RMB’000
As at January 1, 2018 534 – – 534
Impairment losses recognized 192 – – 192Impairment losses reversed (98) – – (98)
At December 31, 2018 628 – – 628
Impairment losses recognized 835 – – 835Impairment losses reversed (366) – – (366)Transfer to lifetime ECL (632) 632 – –Written-off – (632) – (632)
At December 31, 2019 465 – – 465
Impairment losses recognized 46 – – 46Impairment losses reversed – – – –
As at January 7, 2020 511 – – 511
APPENDIX I ACCOUNTANTS’ REPORT
– I-152 –
THIS DOCUMENT IS IN DRAFT FORM, INCOMPLETE AND SUBJECT TO CHANGE AND THAT INFORMATION MUST BEREAD IN CONJUNCTION WITH THE SECTION HEADED “WARNING” ON THE COVER OF THIS DOCUMENT.
SKX Group writes off a trade receivable when there is information indicating that the
debtor is in severe financial difficulty and there is no realistic prospect of recovery, e.g. when
the debtor has been placed under liquidation or has entered into bankruptcy proceedings. None
of the trade receivables that have been written-off is subject to enforcement activities.
Liquidity risk
In management of the liquidity risk, SKX Group monitors and maintains levels of cash
and cash equivalents deemed adequate by the management to finance SKX Group’s operations
and mitigate the effects of fluctuations in cash flows. SKX Group relies on bank loans as a
source of liquidity.
SKX Group had net current liabilities of RMB1,789,932,000 as at January 7, 2020, which
exposed the Group to liquidity risk. In order to mitigate the liquidity risk, the directors of SKX
Group regularly monitor the operating cash flows of the Group to meet its liquidity requirement
in the short and long term. SKX Group’s net current liabilities position as at January 7, 2020
was mainly attributable to trade and bills payables and bank borrowings due within one year.
In view of these circumstances, the directors of SKX Group have given consideration to
the future liquidity and performance of SKX Group and its available sources of finance in
assessing whether SKX Group will have sufficient financial resources to continue as a going
concern. Meanwhile, SKX Group recorded positive profit, positive net assets and net operating
cash inflows during the Track Record Period.
The directors of SKX Group, after taking into account the reasonably possible changes in
the operational performance, the availability of retained profits and the expected renewal of the
short-term borrowings, are of the opinion that, SKX Group will have sufficient working capital
to meet its financial obligations as and when they fall due.
The following table details SKX Group’s remaining contractual maturity for its financialliabilities based on the agreed repayment terms. The table has been drawn up based on theundiscounted cash flows of financial liabilities based on the earliest date on which SKX Groupcan be required to pay. The table includes both interest and principal cash flows.
APPENDIX I ACCOUNTANTS’ REPORT
– I-153 –
THIS DOCUMENT IS IN DRAFT FORM, INCOMPLETE AND SUBJECT TO CHANGE AND THAT INFORMATION MUST BEREAD IN CONJUNCTION WITH THE SECTION HEADED “WARNING” ON THE COVER OF THIS DOCUMENT.
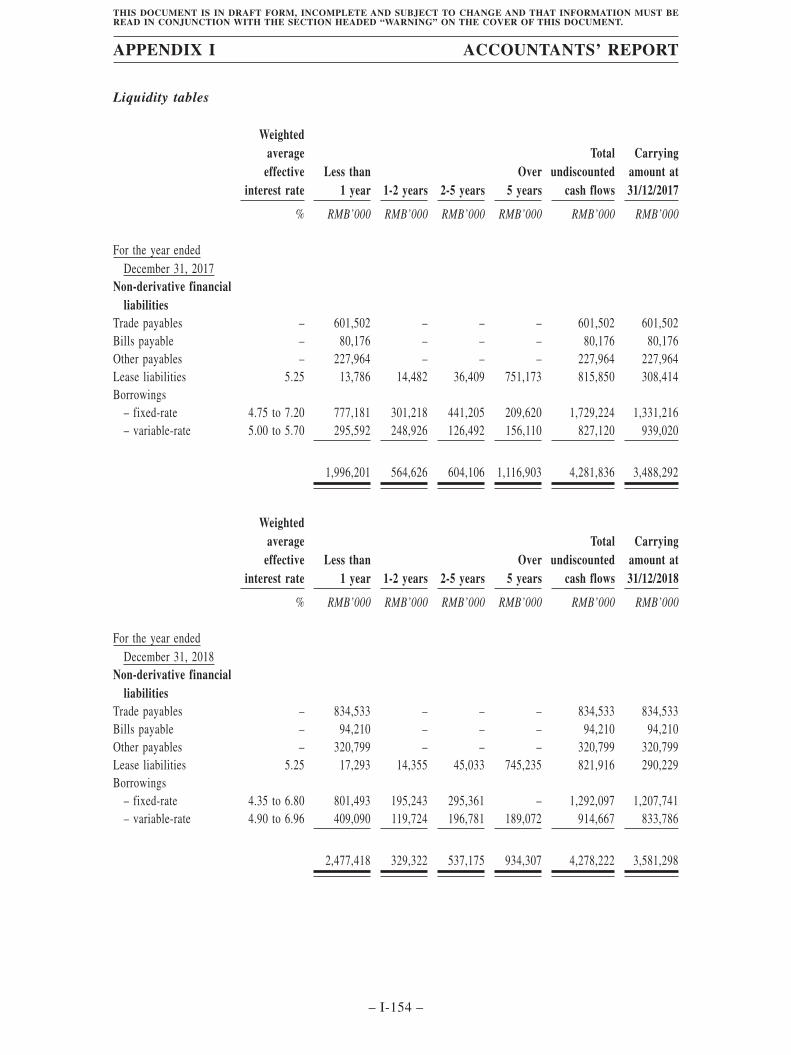
Liquidity tables
Weightedaverage
effectiveinterest rate
Less than1 year 1-2 years 2-5 years
Over5 years
Totalundiscounted
cash flows
Carryingamount at31/12/2017
% RMB’000 RMB’000 RMB’000 RMB’000 RMB’000 RMB’000
For the year endedDecember 31, 2017
Non-derivative financialliabilities
Trade payables – 601,502 – – – 601,502 601,502Bills payable – 80,176 – – – 80,176 80,176Other payables – 227,964 – – – 227,964 227,964Lease liabilities 5.25 13,786 14,482 36,409 751,173 815,850 308,414Borrowings
– fixed-rate 4.75 to 7.20 777,181 301,218 441,205 209,620 1,729,224 1,331,216– variable-rate 5.00 to 5.70 295,592 248,926 126,492 156,110 827,120 939,020
1,996,201 564,626 604,106 1,116,903 4,281,836 3,488,292
Weightedaverage
effectiveinterest rate
Less than1 year 1-2 years 2-5 years
Over5 years
Totalundiscounted
cash flows
Carryingamount at31/12/2018
% RMB’000 RMB’000 RMB’000 RMB’000 RMB’000 RMB’000
For the year endedDecember 31, 2018
Non-derivative financialliabilities
Trade payables – 834,533 – – – 834,533 834,533Bills payable – 94,210 – – – 94,210 94,210Other payables – 320,799 – – – 320,799 320,799Lease liabilities 5.25 17,293 14,355 45,033 745,235 821,916 290,229Borrowings
– fixed-rate 4.35 to 6.80 801,493 195,243 295,361 – 1,292,097 1,207,741– variable-rate 4.90 to 6.96 409,090 119,724 196,781 189,072 914,667 833,786
2,477,418 329,322 537,175 934,307 4,278,222 3,581,298
APPENDIX I ACCOUNTANTS’ REPORT
– I-154 –
THIS DOCUMENT IS IN DRAFT FORM, INCOMPLETE AND SUBJECT TO CHANGE AND THAT INFORMATION MUST BEREAD IN CONJUNCTION WITH THE SECTION HEADED “WARNING” ON THE COVER OF THIS DOCUMENT.
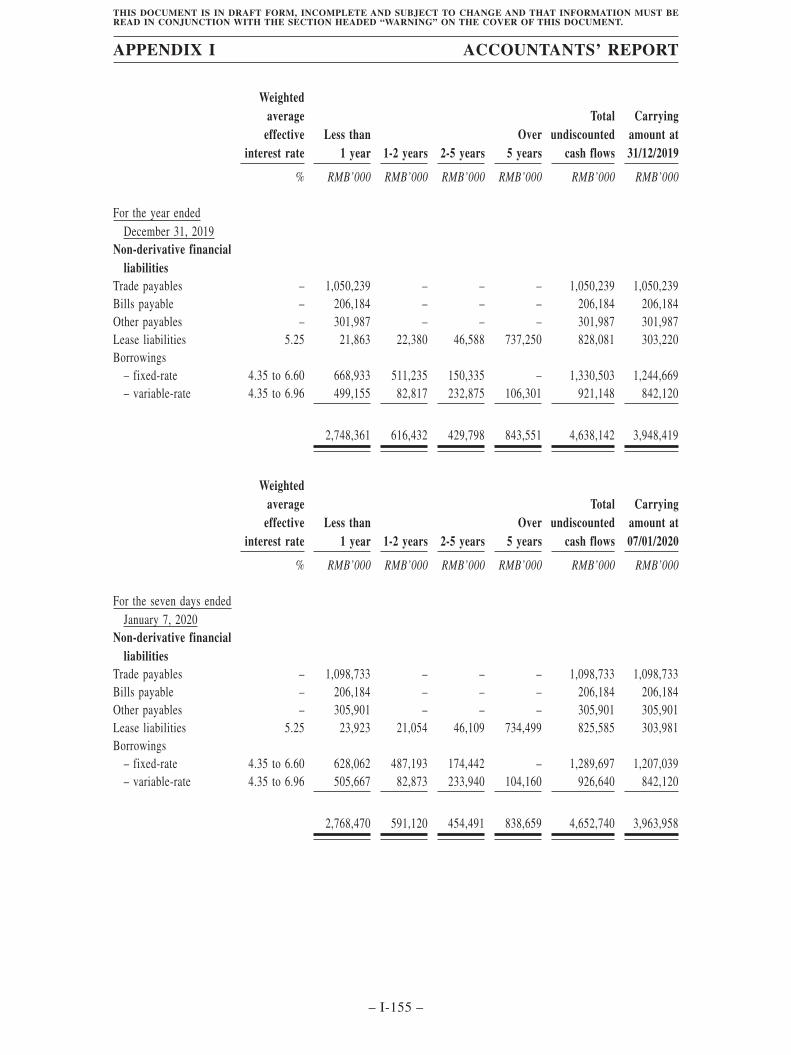
Weightedaverage
effectiveinterest rate
Less than1 year 1-2 years 2-5 years
Over5 years
Totalundiscounted
cash flows
Carryingamount at31/12/2019
% RMB’000 RMB’000 RMB’000 RMB’000 RMB’000 RMB’000
For the year endedDecember 31, 2019
Non-derivative financialliabilities
Trade payables – 1,050,239 – – – 1,050,239 1,050,239Bills payable – 206,184 – – – 206,184 206,184Other payables – 301,987 – – – 301,987 301,987Lease liabilities 5.25 21,863 22,380 46,588 737,250 828,081 303,220Borrowings
– fixed-rate 4.35 to 6.60 668,933 511,235 150,335 – 1,330,503 1,244,669– variable-rate 4.35 to 6.96 499,155 82,817 232,875 106,301 921,148 842,120
2,748,361 616,432 429,798 843,551 4,638,142 3,948,419
Weightedaverage
effectiveinterest rate
Less than1 year 1-2 years 2-5 years
Over5 years
Totalundiscounted
cash flows
Carryingamount at07/01/2020
% RMB’000 RMB’000 RMB’000 RMB’000 RMB’000 RMB’000
For the seven days endedJanuary 7, 2020
Non-derivative financialliabilities
Trade payables – 1,098,733 – – – 1,098,733 1,098,733Bills payable – 206,184 – – – 206,184 206,184Other payables – 305,901 – – – 305,901 305,901Lease liabilities 5.25 23,923 21,054 46,109 734,499 825,585 303,981Borrowings
– fixed-rate 4.35 to 6.60 628,062 487,193 174,442 – 1,289,697 1,207,039– variable-rate 4.35 to 6.96 505,667 82,873 233,940 104,160 926,640 842,120
2,768,470 591,120 454,491 838,659 4,652,740 3,963,958
APPENDIX I ACCOUNTANTS’ REPORT
– I-155 –
THIS DOCUMENT IS IN DRAFT FORM, INCOMPLETE AND SUBJECT TO CHANGE AND THAT INFORMATION MUST BEREAD IN CONJUNCTION WITH THE SECTION HEADED “WARNING” ON THE COVER OF THIS DOCUMENT.
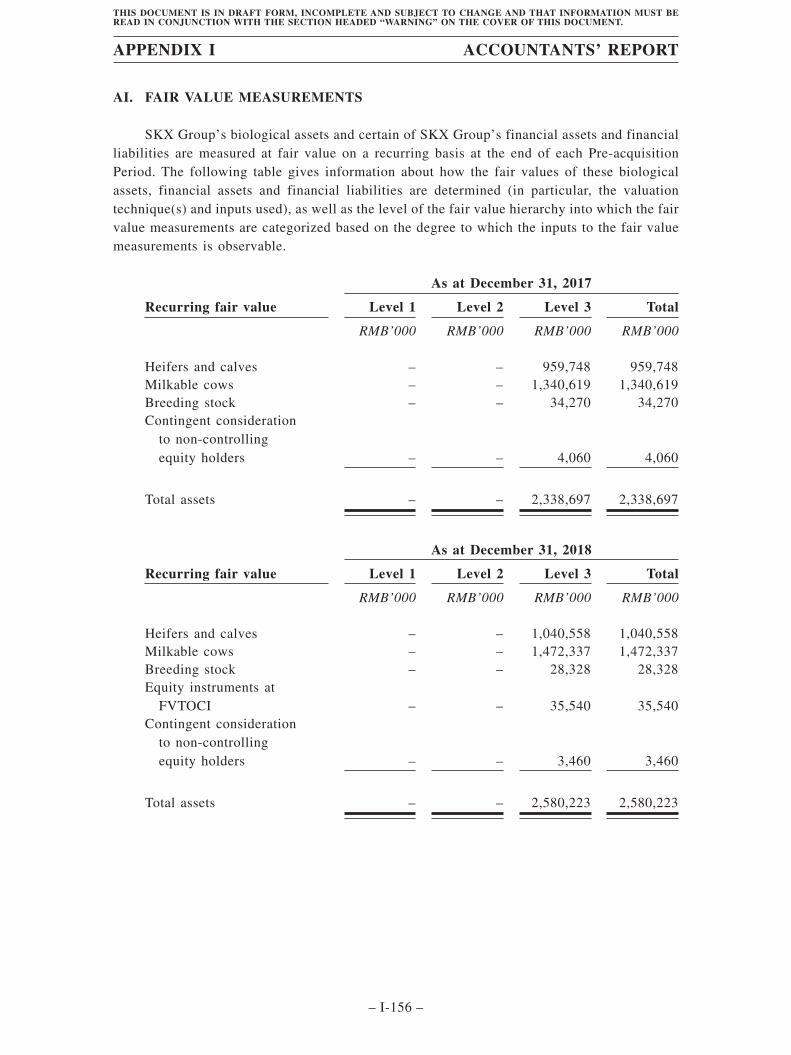
AI. FAIR VALUE MEASUREMENTS
SKX Group’s biological assets and certain of SKX Group’s financial assets and financialliabilities are measured at fair value on a recurring basis at the end of each Pre-acquisitionPeriod. The following table gives information about how the fair values of these biologicalassets, financial assets and financial liabilities are determined (in particular, the valuationtechnique(s) and inputs used), as well as the level of the fair value hierarchy into which the fairvalue measurements are categorized based on the degree to which the inputs to the fair valuemeasurements is observable.
As at December 31, 2017
Recurring fair value Level 1 Level 2 Level 3 Total
RMB’000 RMB’000 RMB’000 RMB’000
Heifers and calves – – 959,748 959,748Milkable cows – – 1,340,619 1,340,619Breeding stock – – 34,270 34,270Contingent consideration
to non-controllingequity holders – – 4,060 4,060
Total assets – – 2,338,697 2,338,697
As at December 31, 2018
Recurring fair value Level 1 Level 2 Level 3 Total
RMB’000 RMB’000 RMB’000 RMB’000
Heifers and calves – – 1,040,558 1,040,558Milkable cows – – 1,472,337 1,472,337Breeding stock – – 28,328 28,328Equity instruments at
FVTOCI – – 35,540 35,540Contingent consideration
to non-controllingequity holders – – 3,460 3,460
Total assets – – 2,580,223 2,580,223
APPENDIX I ACCOUNTANTS’ REPORT
– I-156 –
THIS DOCUMENT IS IN DRAFT FORM, INCOMPLETE AND SUBJECT TO CHANGE AND THAT INFORMATION MUST BEREAD IN CONJUNCTION WITH THE SECTION HEADED “WARNING” ON THE COVER OF THIS DOCUMENT.
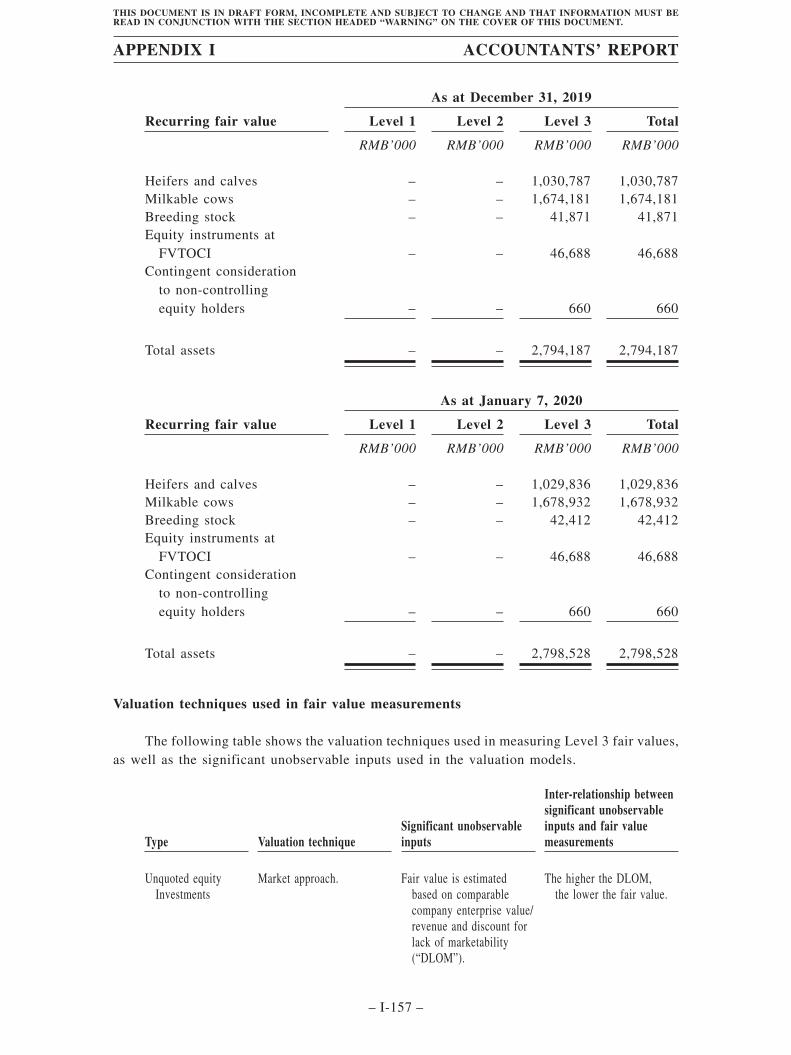
As at December 31, 2019
Recurring fair value Level 1 Level 2 Level 3 Total
RMB’000 RMB’000 RMB’000 RMB’000
Heifers and calves – – 1,030,787 1,030,787Milkable cows – – 1,674,181 1,674,181Breeding stock – – 41,871 41,871Equity instruments at
FVTOCI – – 46,688 46,688Contingent consideration
to non-controllingequity holders – – 660 660
Total assets – – 2,794,187 2,794,187
As at January 7, 2020
Recurring fair value Level 1 Level 2 Level 3 Total
RMB’000 RMB’000 RMB’000 RMB’000
Heifers and calves – – 1,029,836 1,029,836Milkable cows – – 1,678,932 1,678,932Breeding stock – – 42,412 42,412Equity instruments at
FVTOCI – – 46,688 46,688Contingent consideration
to non-controllingequity holders – – 660 660
Total assets – – 2,798,528 2,798,528
Valuation techniques used in fair value measurements
The following table shows the valuation techniques used in measuring Level 3 fair values,as well as the significant unobservable inputs used in the valuation models.
Type Valuation techniqueSignificant unobservableinputs
Inter-relationship betweensignificant unobservableinputs and fair valuemeasurements
Unquoted equityInvestments
Market approach. Fair value is estimatedbased on comparablecompany enterprise value/revenue and discount forlack of marketability(“DLOM”).
The higher the DLOM,the lower the fair value.
APPENDIX I ACCOUNTANTS’ REPORT
– I-157 –
THIS DOCUMENT IS IN DRAFT FORM, INCOMPLETE AND SUBJECT TO CHANGE AND THAT INFORMATION MUST BEREAD IN CONJUNCTION WITH THE SECTION HEADED “WARNING” ON THE COVER OF THIS DOCUMENT.
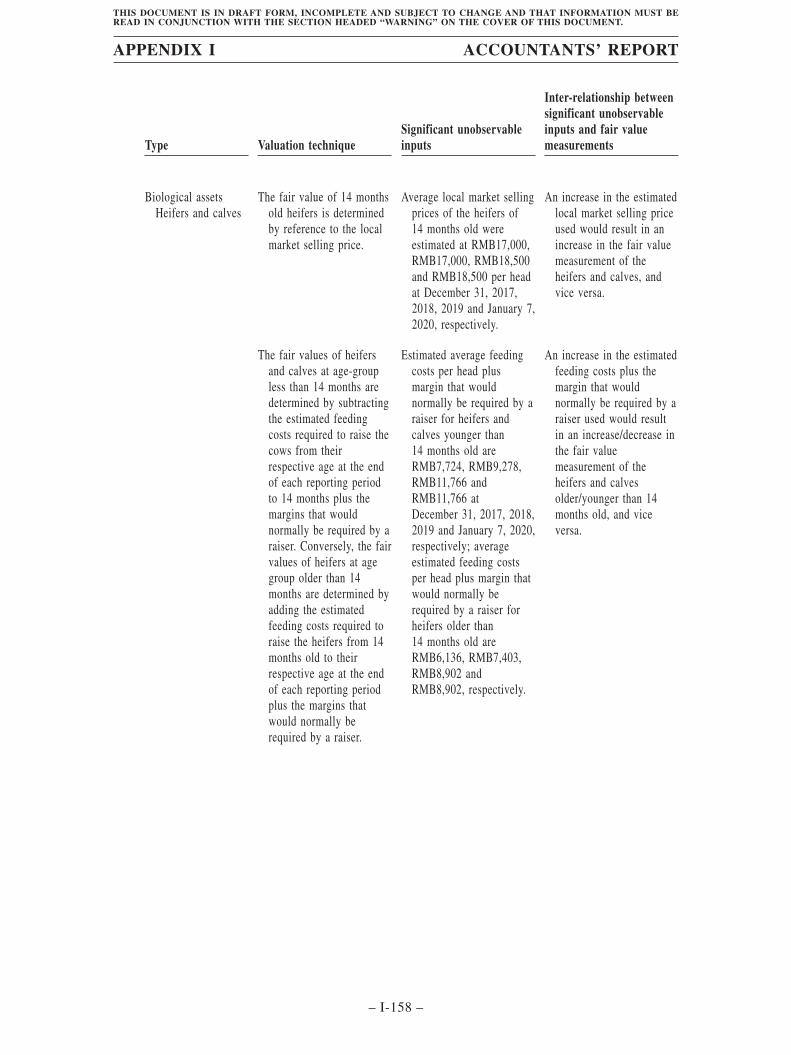
Type Valuation techniqueSignificant unobservableinputs
Inter-relationship betweensignificant unobservableinputs and fair valuemeasurements
Biological assetsHeifers and calves
The fair value of 14 monthsold heifers is determinedby reference to the localmarket selling price.
Average local market sellingprices of the heifers of14 months old wereestimated at RMB17,000,RMB17,000, RMB18,500and RMB18,500 per headat December 31, 2017,2018, 2019 and January 7,2020, respectively.
An increase in the estimatedlocal market selling priceused would result in anincrease in the fair valuemeasurement of theheifers and calves, andvice versa.
The fair values of heifersand calves at age-groupless than 14 months aredetermined by subtractingthe estimated feedingcosts required to raise thecows from theirrespective age at the endof each reporting periodto 14 months plus themargins that wouldnormally be required by araiser. Conversely, the fairvalues of heifers at agegroup older than 14months are determined byadding the estimatedfeeding costs required toraise the heifers from 14months old to theirrespective age at the endof each reporting periodplus the margins thatwould normally berequired by a raiser.
Estimated average feedingcosts per head plusmargin that wouldnormally be required by araiser for heifers andcalves younger than14 months old areRMB7,724, RMB9,278,RMB11,766 andRMB11,766 atDecember 31, 2017, 2018,2019 and January 7, 2020,respectively; averageestimated feeding costsper head plus margin thatwould normally berequired by a raiser forheifers older than14 months old areRMB6,136, RMB7,403,RMB8,902 andRMB8,902, respectively.
An increase in the estimatedfeeding costs plus themargin that wouldnormally be required by araiser used would resultin an increase/decrease inthe fair valuemeasurement of theheifers and calvesolder/younger than 14months old, and viceversa.
APPENDIX I ACCOUNTANTS’ REPORT
– I-158 –
THIS DOCUMENT IS IN DRAFT FORM, INCOMPLETE AND SUBJECT TO CHANGE AND THAT INFORMATION MUST BEREAD IN CONJUNCTION WITH THE SECTION HEADED “WARNING” ON THE COVER OF THIS DOCUMENT.
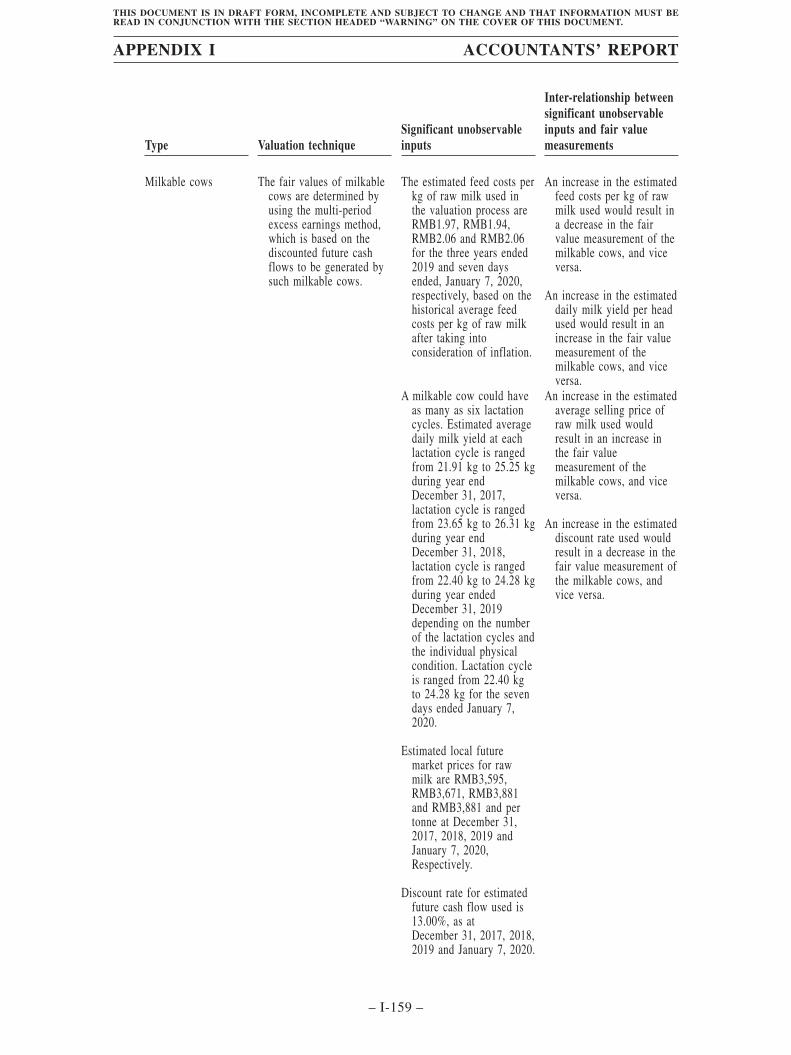
Type Valuation techniqueSignificant unobservableinputs
Inter-relationship betweensignificant unobservableinputs and fair valuemeasurements
Milkable cows The fair values of milkablecows are determined byusing the multi-periodexcess earnings method,which is based on thediscounted future cashflows to be generated bysuch milkable cows.
The estimated feed costs perkg of raw milk used inthe valuation process areRMB1.97, RMB1.94,RMB2.06 and RMB2.06for the three years ended2019 and seven daysended, January 7, 2020,respectively, based on thehistorical average feedcosts per kg of raw milkafter taking intoconsideration of inflation.
An increase in the estimatedfeed costs per kg of rawmilk used would result ina decrease in the fairvalue measurement of themilkable cows, and viceversa.
An increase in the estimateddaily milk yield per headused would result in anincrease in the fair valuemeasurement of themilkable cows, and viceversa.
A milkable cow could haveas many as six lactationcycles. Estimated averagedaily milk yield at eachlactation cycle is rangedfrom 21.91 kg to 25.25 kgduring year endDecember 31, 2017,lactation cycle is rangedfrom 23.65 kg to 26.31 kgduring year endDecember 31, 2018,lactation cycle is rangedfrom 22.40 kg to 24.28 kgduring year endedDecember 31, 2019depending on the numberof the lactation cycles andthe individual physicalcondition. Lactation cycleis ranged from 22.40 kgto 24.28 kg for the sevendays ended January 7,2020.
Estimated local futuremarket prices for rawmilk are RMB3,595,RMB3,671, RMB3,881and RMB3,881 and pertonne at December 31,2017, 2018, 2019 andJanuary 7, 2020,Respectively.
Discount rate for estimatedfuture cash flow used is13.00%, as atDecember 31, 2017, 2018,2019 and January 7, 2020.
An increase in the estimatedaverage selling price ofraw milk used wouldresult in an increase inthe fair valuemeasurement of themilkable cows, and viceversa.
An increase in the estimateddiscount rate used wouldresult in a decrease in thefair value measurement ofthe milkable cows, andvice versa.
APPENDIX I ACCOUNTANTS’ REPORT
– I-159 –
THIS DOCUMENT IS IN DRAFT FORM, INCOMPLETE AND SUBJECT TO CHANGE AND THAT INFORMATION MUST BEREAD IN CONJUNCTION WITH THE SECTION HEADED “WARNING” ON THE COVER OF THIS DOCUMENT.
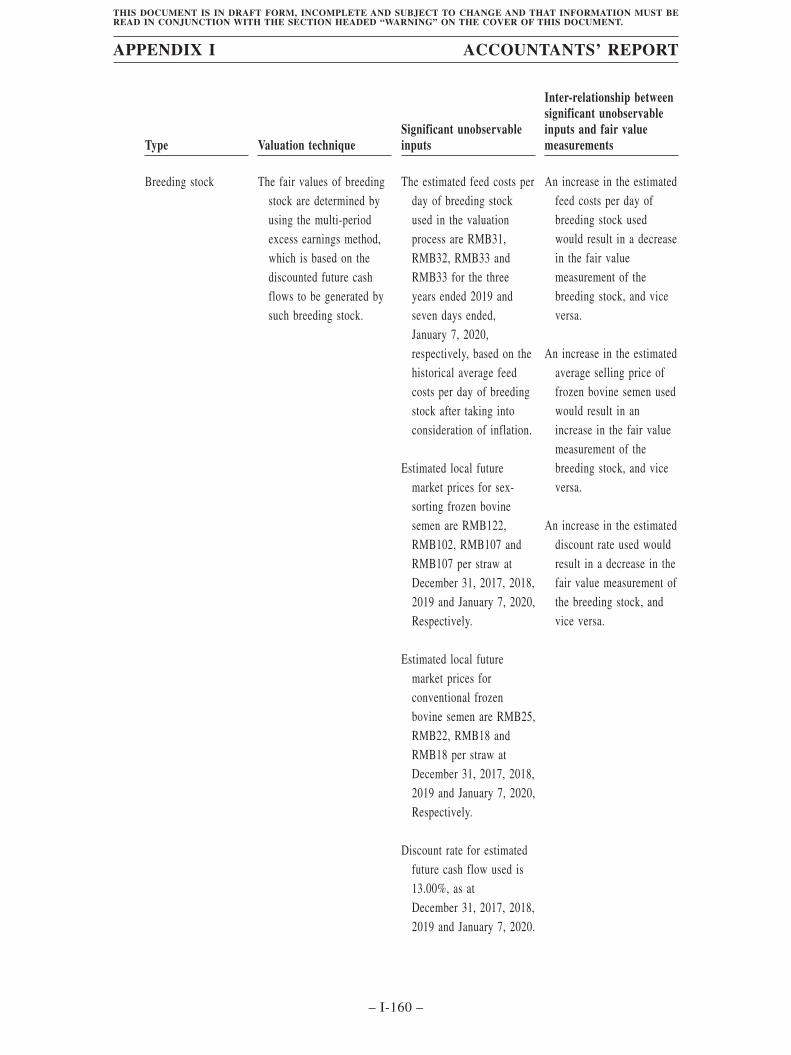
Type Valuation techniqueSignificant unobservableinputs
Inter-relationship betweensignificant unobservableinputs and fair valuemeasurements
Breeding stock The fair values of breedingstock are determined byusing the multi-periodexcess earnings method,which is based on thediscounted future cashflows to be generated bysuch breeding stock.
The estimated feed costs perday of breeding stockused in the valuationprocess are RMB31,RMB32, RMB33 andRMB33 for the threeyears ended 2019 andseven days ended,January 7, 2020,respectively, based on thehistorical average feedcosts per day of breedingstock after taking intoconsideration of inflation.
Estimated local futuremarket prices for sex-sorting frozen bovinesemen are RMB122,RMB102, RMB107 andRMB107 per straw atDecember 31, 2017, 2018,2019 and January 7, 2020,Respectively.
Estimated local futuremarket prices forconventional frozenbovine semen are RMB25,RMB22, RMB18 andRMB18 per straw atDecember 31, 2017, 2018,2019 and January 7, 2020,Respectively.
Discount rate for estimatedfuture cash flow used is13.00%, as atDecember 31, 2017, 2018,2019 and January 7, 2020.
An increase in the estimatedfeed costs per day ofbreeding stock usedwould result in a decreasein the fair valuemeasurement of thebreeding stock, and viceversa.
An increase in the estimatedaverage selling price offrozen bovine semen usedwould result in anincrease in the fair valuemeasurement of thebreeding stock, and viceversa.
An increase in the estimateddiscount rate used wouldresult in a decrease in thefair value measurement ofthe breeding stock, andvice versa.
APPENDIX I ACCOUNTANTS’ REPORT
– I-160 –
THIS DOCUMENT IS IN DRAFT FORM, INCOMPLETE AND SUBJECT TO CHANGE AND THAT INFORMATION MUST BEREAD IN CONJUNCTION WITH THE SECTION HEADED “WARNING” ON THE COVER OF THIS DOCUMENT.
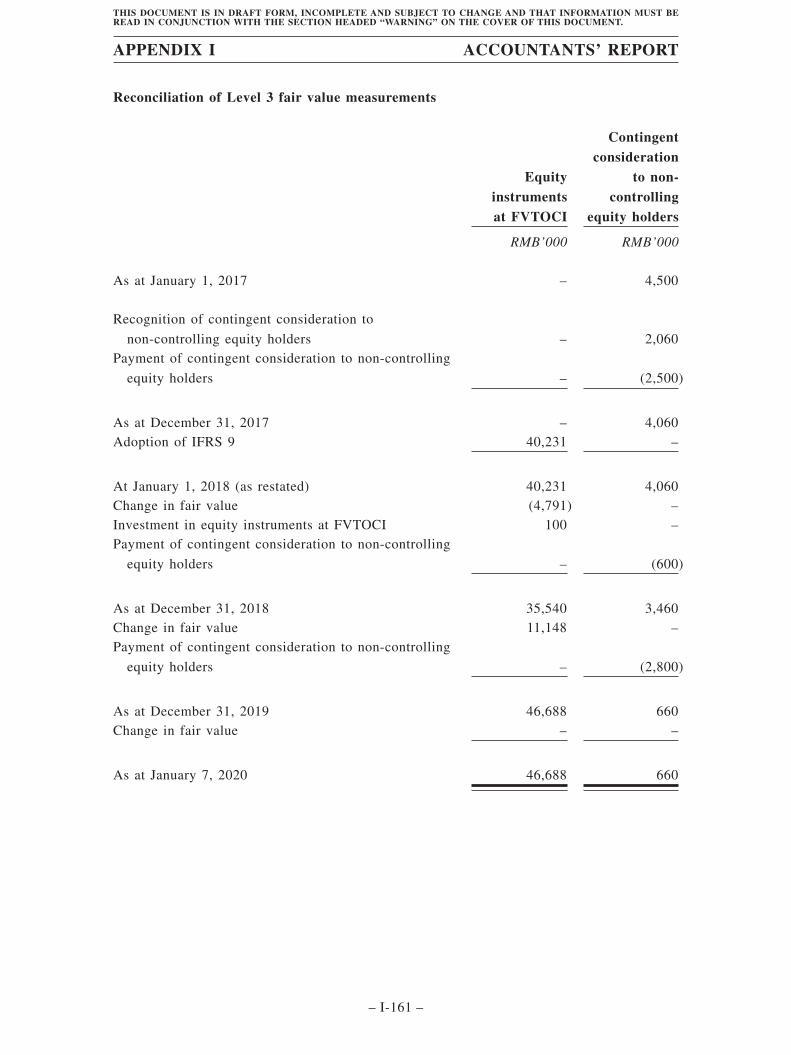
Reconciliation of Level 3 fair value measurements
Equityinstrumentsat FVTOCI
Contingentconsideration
to non-controlling
equity holders
RMB’000 RMB’000
As at January 1, 2017 – 4,500
Recognition of contingent consideration to
non-controlling equity holders – 2,060Payment of contingent consideration to non-controlling
equity holders – (2,500)
As at December 31, 2017 – 4,060Adoption of IFRS 9 40,231 –
At January 1, 2018 (as restated) 40,231 4,060Change in fair value (4,791) –Investment in equity instruments at FVTOCI 100 –Payment of contingent consideration to non-controlling
equity holders – (600)
As at December 31, 2018 35,540 3,460Change in fair value 11,148 –Payment of contingent consideration to non-controlling
equity holders – (2,800)
As at December 31, 2019 46,688 660Change in fair value – –
As at January 7, 2020 46,688 660
APPENDIX I ACCOUNTANTS’ REPORT
– I-161 –
THIS DOCUMENT IS IN DRAFT FORM, INCOMPLETE AND SUBJECT TO CHANGE AND THAT INFORMATION MUST BEREAD IN CONJUNCTION WITH THE SECTION HEADED “WARNING” ON THE COVER OF THIS DOCUMENT.
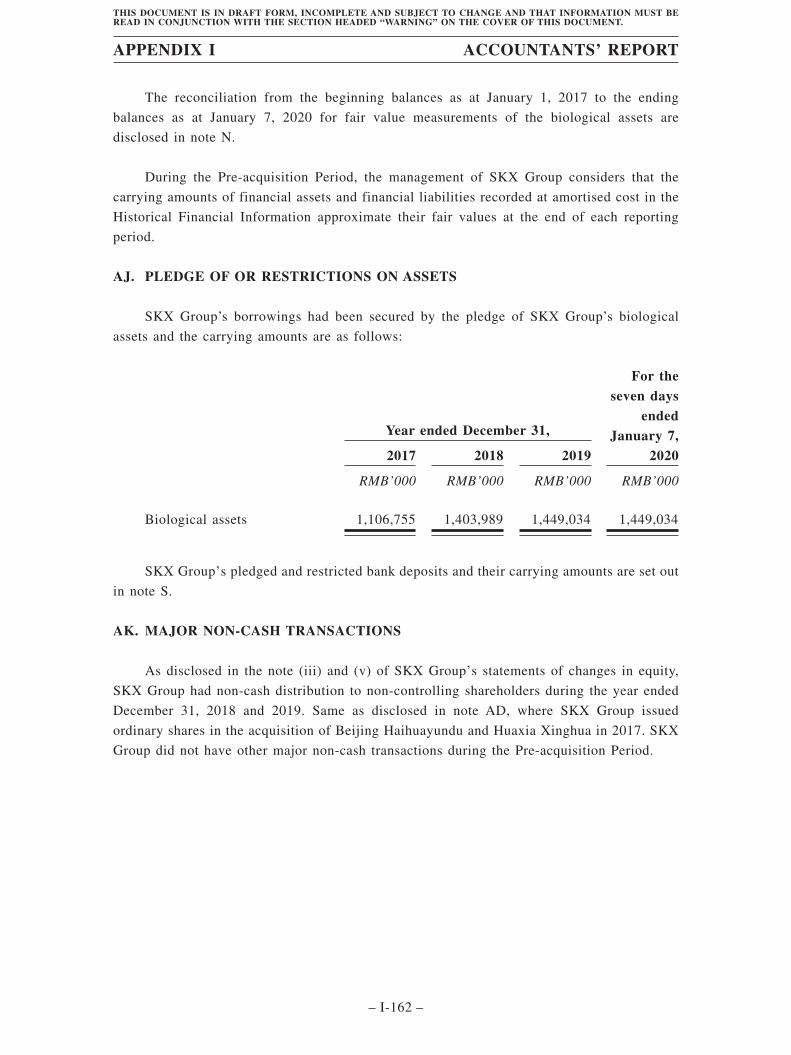
The reconciliation from the beginning balances as at January 1, 2017 to the ending
balances as at January 7, 2020 for fair value measurements of the biological assets are
disclosed in note N.
During the Pre-acquisition Period, the management of SKX Group considers that the
carrying amounts of financial assets and financial liabilities recorded at amortised cost in the
Historical Financial Information approximate their fair values at the end of each reporting
period.
AJ. PLEDGE OF OR RESTRICTIONS ON ASSETS
SKX Group’s borrowings had been secured by the pledge of SKX Group’s biological
assets and the carrying amounts are as follows:
Year ended December 31,
For theseven days
endedJanuary 7,
20202017 2018 2019
RMB’000 RMB’000 RMB’000 RMB’000
Biological assets 1,106,755 1,403,989 1,449,034 1,449,034
SKX Group’s pledged and restricted bank deposits and their carrying amounts are set out
in note S.
AK. MAJOR NON-CASH TRANSACTIONS
As disclosed in the note (iii) and (v) of SKX Group’s statements of changes in equity,
SKX Group had non-cash distribution to non-controlling shareholders during the year ended
December 31, 2018 and 2019. Same as disclosed in note AD, where SKX Group issued
ordinary shares in the acquisition of Beijing Haihuayundu and Huaxia Xinghua in 2017. SKX
Group did not have other major non-cash transactions during the Pre-acquisition Period.
APPENDIX I ACCOUNTANTS’ REPORT
– I-162 –
THIS DOCUMENT IS IN DRAFT FORM, INCOMPLETE AND SUBJECT TO CHANGE AND THAT INFORMATION MUST BEREAD IN CONJUNCTION WITH THE SECTION HEADED “WARNING” ON THE COVER OF THIS DOCUMENT.
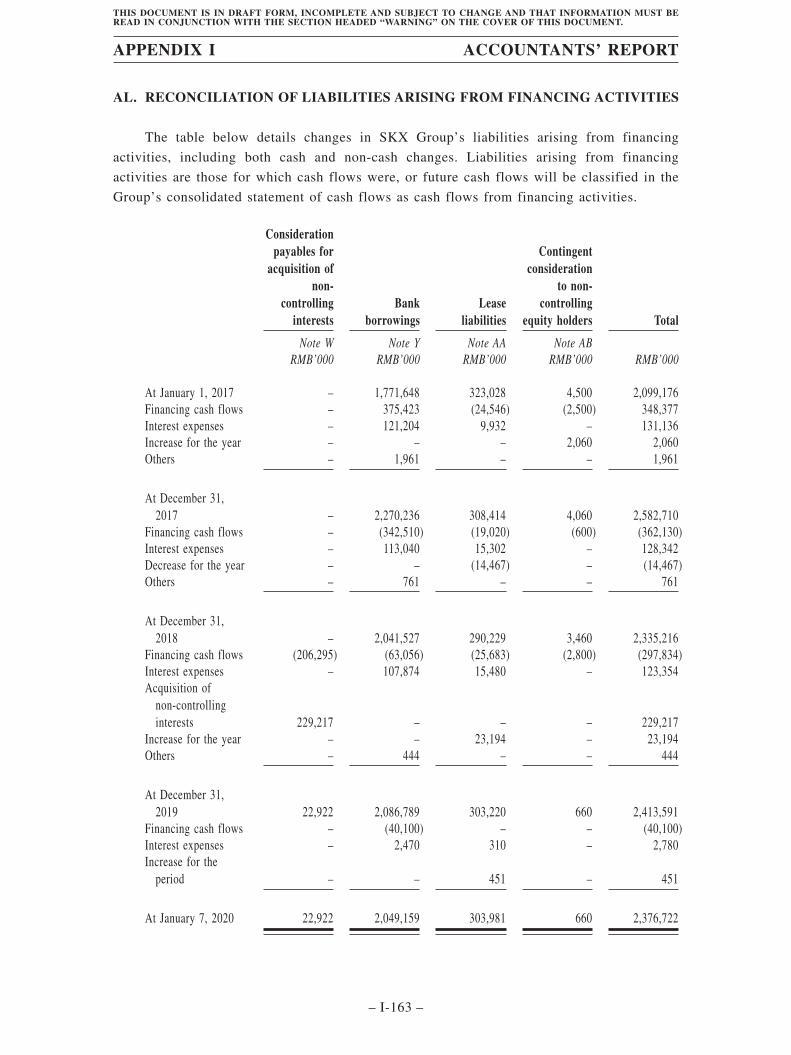
AL. RECONCILIATION OF LIABILITIES ARISING FROM FINANCING ACTIVITIES
The table below details changes in SKX Group’s liabilities arising from financing
activities, including both cash and non-cash changes. Liabilities arising from financing
activities are those for which cash flows were, or future cash flows will be classified in the
Group’s consolidated statement of cash flows as cash flows from financing activities.
Considerationpayables for
acquisition ofnon-
controllinginterests
Bankborrowings
Leaseliabilities
Contingentconsideration
to non-controlling
equity holders Total
Note W Note Y Note AA Note ABRMB’000 RMB’000 RMB’000 RMB’000 RMB’000
At January 1, 2017 – 1,771,648 323,028 4,500 2,099,176Financing cash flows – 375,423 (24,546) (2,500) 348,377Interest expenses – 121,204 9,932 – 131,136Increase for the year – – – 2,060 2,060Others – 1,961 – – 1,961
At December 31,2017 – 2,270,236 308,414 4,060 2,582,710
Financing cash flows – (342,510) (19,020) (600) (362,130)Interest expenses – 113,040 15,302 – 128,342Decrease for the year – – (14,467) – (14,467)Others – 761 – – 761
At December 31,2018 – 2,041,527 290,229 3,460 2,335,216
Financing cash flows (206,295) (63,056) (25,683) (2,800) (297,834)Interest expenses – 107,874 15,480 – 123,354Acquisition of
non-controllinginterests 229,217 – – – 229,217
Increase for the year – – 23,194 – 23,194Others – 444 – – 444
At December 31,2019 22,922 2,086,789 303,220 660 2,413,591
Financing cash flows – (40,100) – – (40,100)Interest expenses – 2,470 310 – 2,780Increase for the
period – – 451 – 451
At January 7, 2020 22,922 2,049,159 303,981 660 2,376,722
APPENDIX I ACCOUNTANTS’ REPORT
– I-163 –
THIS DOCUMENT IS IN DRAFT FORM, INCOMPLETE AND SUBJECT TO CHANGE AND THAT INFORMATION MUST BEREAD IN CONJUNCTION WITH THE SECTION HEADED “WARNING” ON THE COVER OF THIS DOCUMENT.
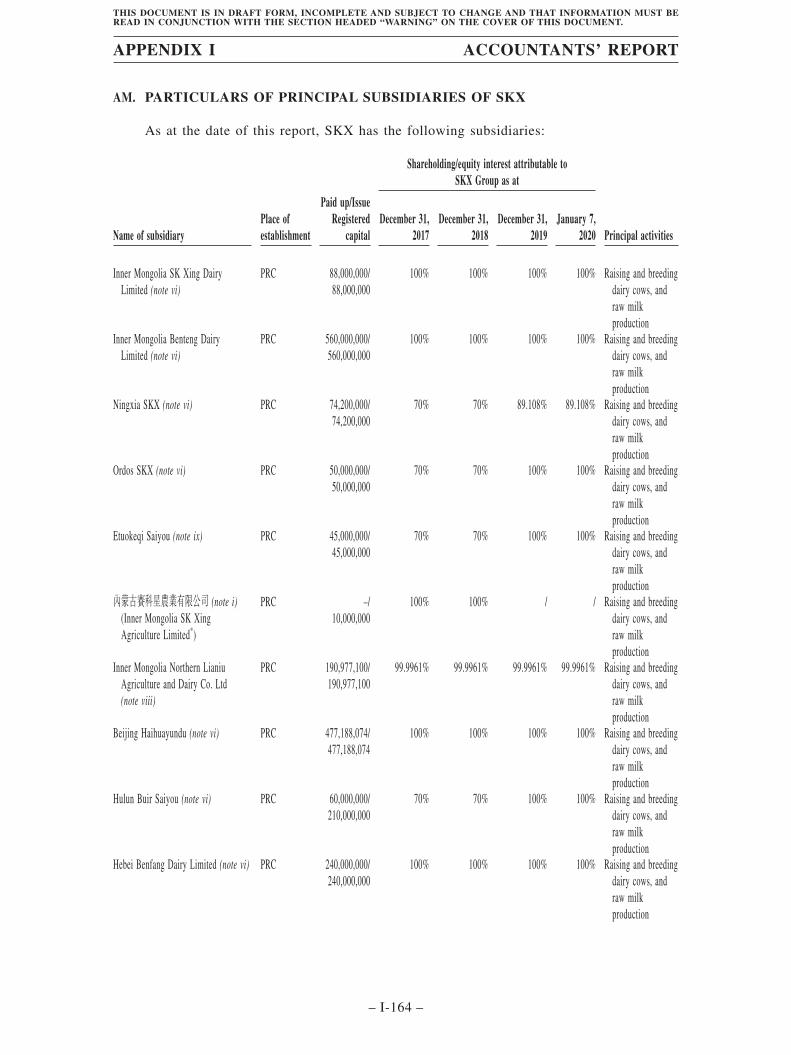
AM. PARTICULARS OF PRINCIPAL SUBSIDIARIES OF SKX
As at the date of this report, SKX has the following subsidiaries:
Shareholding/equity interest attributable toSKX Group as at
Name of subsidiaryPlace ofestablishment
Paid up/IssueRegistered
capitalDecember 31,
2017December 31,
2018December 31,
2019January 7,
2020 Principal activities
Inner Mongolia SK Xing DairyLimited (note vi)
PRC 88,000,000/88,000,000
100% 100% 100% 100% Raising and breedingdairy cows, andraw milkproduction
Inner Mongolia Benteng DairyLimited (note vi)
PRC 560,000,000/560,000,000
100% 100% 100% 100% Raising and breedingdairy cows, andraw milkproduction
Ningxia SKX (note vi) PRC 74,200,000/74,200,000
70% 70% 89.108% 89.108% Raising and breedingdairy cows, andraw milkproduction
Ordos SKX (note vi) PRC 50,000,000/50,000,000
70% 70% 100% 100% Raising and breedingdairy cows, andraw milkproduction
Etuokeqi Saiyou (note ix) PRC 45,000,000/45,000,000
70% 70% 100% 100% Raising and breedingdairy cows, andraw milkproduction
內蒙古賽科星農業有限公司 (note i)(Inner Mongolia SK XingAgriculture Limited*)
PRC –/10,000,000
100% 100% / / Raising and breedingdairy cows, andraw milkproduction
Inner Mongolia Northern LianiuAgriculture and Dairy Co. Ltd(note viii)
PRC 190,977,100/190,977,100
99.9961% 99.9961% 99.9961% 99.9961% Raising and breedingdairy cows, andraw milkproduction
Beijing Haihuayundu (note vi) PRC 477,188,074/477,188,074
100% 100% 100% 100% Raising and breedingdairy cows, andraw milkproduction
Hulun Buir Saiyou (note vi) PRC 60,000,000/210,000,000
70% 70% 100% 100% Raising and breedingdairy cows, andraw milkproduction
Hebei Benfang Dairy Limited (note vi) PRC 240,000,000/240,000,000
100% 100% 100% 100% Raising and breedingdairy cows, andraw milkproduction
APPENDIX I ACCOUNTANTS’ REPORT
– I-164 –
THIS DOCUMENT IS IN DRAFT FORM, INCOMPLETE AND SUBJECT TO CHANGE AND THAT INFORMATION MUST BEREAD IN CONJUNCTION WITH THE SECTION HEADED “WARNING” ON THE COVER OF THIS DOCUMENT.
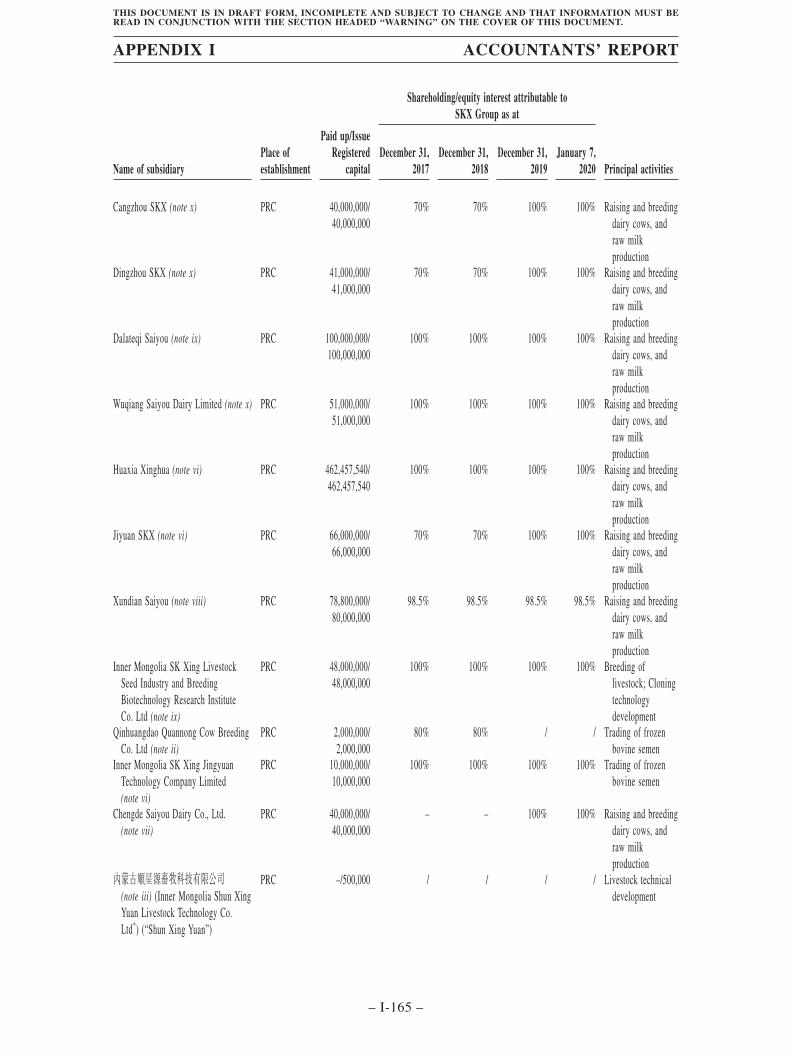
Shareholding/equity interest attributable toSKX Group as at
Name of subsidiaryPlace ofestablishment
Paid up/IssueRegistered
capitalDecember 31,
2017December 31,
2018December 31,
2019January 7,
2020 Principal activities
Cangzhou SKX (note x) PRC 40,000,000/40,000,000
70% 70% 100% 100% Raising and breedingdairy cows, andraw milkproduction
Dingzhou SKX (note x) PRC 41,000,000/41,000,000
70% 70% 100% 100% Raising and breedingdairy cows, andraw milkproduction
Dalateqi Saiyou (note ix) PRC 100,000,000/100,000,000
100% 100% 100% 100% Raising and breedingdairy cows, andraw milkproduction
Wuqiang Saiyou Dairy Limited (note x) PRC 51,000,000/51,000,000
100% 100% 100% 100% Raising and breedingdairy cows, andraw milkproduction
Huaxia Xinghua (note vi) PRC 462,457,540/462,457,540
100% 100% 100% 100% Raising and breedingdairy cows, andraw milkproduction
Jiyuan SKX (note vi) PRC 66,000,000/66,000,000
70% 70% 100% 100% Raising and breedingdairy cows, andraw milkproduction
Xundian Saiyou (note viii) PRC 78,800,000/80,000,000
98.5% 98.5% 98.5% 98.5% Raising and breedingdairy cows, andraw milkproduction
Inner Mongolia SK Xing LivestockSeed Industry and BreedingBiotechnology Research InstituteCo. Ltd (note ix)
PRC 48,000,000/48,000,000
100% 100% 100% 100% Breeding oflivestock; Cloningtechnologydevelopment
Qinhuangdao Quannong Cow BreedingCo. Ltd (note ii)
PRC 2,000,000/2,000,000
80% 80% / / Trading of frozenbovine semen
Inner Mongolia SK Xing JingyuanTechnology Company Limited(note vi)
PRC 10,000,000/10,000,000
100% 100% 100% 100% Trading of frozenbovine semen
Chengde Saiyou Dairy Co., Ltd.(note vii)
PRC 40,000,000/40,000,000
– – 100% 100% Raising and breedingdairy cows, andraw milkproduction
內蒙古順星源畜牧科技有限公司(note iii) (Inner Mongolia Shun XingYuan Livestock Technology Co.Ltd*) (“Shun Xing Yuan”)
PRC –/500,000 / / / / Livestock technicaldevelopment
APPENDIX I ACCOUNTANTS’ REPORT
– I-165 –
THIS DOCUMENT IS IN DRAFT FORM, INCOMPLETE AND SUBJECT TO CHANGE AND THAT INFORMATION MUST BEREAD IN CONJUNCTION WITH THE SECTION HEADED “WARNING” ON THE COVER OF THIS DOCUMENT.
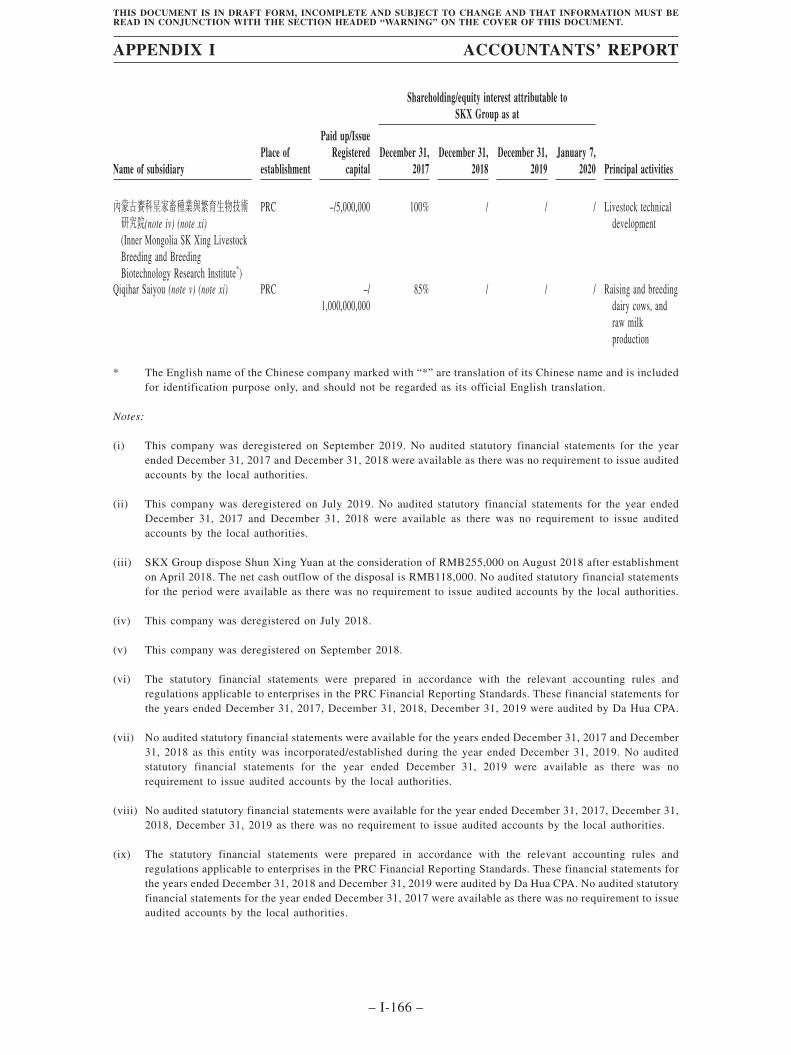
Shareholding/equity interest attributable toSKX Group as at
Name of subsidiaryPlace ofestablishment
Paid up/IssueRegistered
capitalDecember 31,
2017December 31,
2018December 31,
2019January 7,
2020 Principal activities
內蒙古賽科星家畜種業與繁育生物技術研究院(note iv) (note xi)(Inner Mongolia SK Xing LivestockBreeding and BreedingBiotechnology Research Institute*)
PRC –/5,000,000 100% / / / Livestock technicaldevelopment
Qiqihar Saiyou (note v) (note xi) PRC –/1,000,000,000
85% / / / Raising and breedingdairy cows, andraw milkproduction
* The English name of the Chinese company marked with “*” are translation of its Chinese name and is includedfor identification purpose only, and should not be regarded as its official English translation.
Notes:
(i) This company was deregistered on September 2019. No audited statutory financial statements for the yearended December 31, 2017 and December 31, 2018 were available as there was no requirement to issue auditedaccounts by the local authorities.
(ii) This company was deregistered on July 2019. No audited statutory financial statements for the year endedDecember 31, 2017 and December 31, 2018 were available as there was no requirement to issue auditedaccounts by the local authorities.
(iii) SKX Group dispose Shun Xing Yuan at the consideration of RMB255,000 on August 2018 after establishmenton April 2018. The net cash outflow of the disposal is RMB118,000. No audited statutory financial statementsfor the period were available as there was no requirement to issue audited accounts by the local authorities.
(iv) This company was deregistered on July 2018.
(v) This company was deregistered on September 2018.
(vi) The statutory financial statements were prepared in accordance with the relevant accounting rules andregulations applicable to enterprises in the PRC Financial Reporting Standards. These financial statements forthe years ended December 31, 2017, December 31, 2018, December 31, 2019 were audited by Da Hua CPA.
(vii) No audited statutory financial statements were available for the years ended December 31, 2017 and December31, 2018 as this entity was incorporated/established during the year ended December 31, 2019. No auditedstatutory financial statements for the year ended December 31, 2019 were available as there was norequirement to issue audited accounts by the local authorities.
(viii) No audited statutory financial statements were available for the year ended December 31, 2017, December 31,2018, December 31, 2019 as there was no requirement to issue audited accounts by the local authorities.
(ix) The statutory financial statements were prepared in accordance with the relevant accounting rules andregulations applicable to enterprises in the PRC Financial Reporting Standards. These financial statements forthe years ended December 31, 2018 and December 31, 2019 were audited by Da Hua CPA. No audited statutoryfinancial statements for the year ended December 31, 2017 were available as there was no requirement to issueaudited accounts by the local authorities.
APPENDIX I ACCOUNTANTS’ REPORT
– I-166 –
THIS DOCUMENT IS IN DRAFT FORM, INCOMPLETE AND SUBJECT TO CHANGE AND THAT INFORMATION MUST BEREAD IN CONJUNCTION WITH THE SECTION HEADED “WARNING” ON THE COVER OF THIS DOCUMENT.
(x) The statutory financial statements were prepared in accordance with the relevant accounting rules andregulations applicable to enterprises in the PRC Financial Reporting Standards. These financial statements forthe years ended December 31, 2019 were audited by Da Hua CPA. No audited statutory financial statementsfor the year ended December 31, 2017 and December 31, 2018 were available as there was no requirement toissue audited accounts by the local authorities.
(xi) No audited statutory financial statements for the year ended December 31, 2017 were available as there wasno requirement to issue audited accounts by the local authorities.
None of the subsidiaries had issued any debt securities during the Pre-acquisition Period.
APPENDIX I ACCOUNTANTS’ REPORT
– I-167 –
THIS DOCUMENT IS IN DRAFT FORM, INCOMPLETE AND SUBJECT TO CHANGE AND THAT INFORMATION MUST BEREAD IN CONJUNCTION WITH THE SECTION HEADED “WARNING” ON THE COVER OF THIS DOCUMENT.