Appendix E Social Survey Methodology And Findings - E-KAS
105
Appendix E Social Survey Methodology And Findings
-
Upload
khangminh22 -
Category
Documents
-
view
2 -
download
0
Transcript of Appendix E Social Survey Methodology And Findings - E-KAS
Appendix E Social Survey Methodology And Findings
Projek Mass Rapid Transit Laluan 2: Sg Buloh – Serdang – Putrajaya Detailed Environmental Impact Assessment
APPENDIX E : SOCIAL SURVEY METHODOLOGY AND FINDINGS
ERE Consulting Group E-1 Issue1.0/April 2015
1.0 INTRODUCTION
This appendix documents the methodology and the findings of the public perception
survey and the various stakeholder engagement sessions carried out over the
course of the DEIA.
1.1 APPROACH AND METHODOLOGY
Multiple approaches were used to collect data for analysis. It combines a variety of
tools that range from use of secondary data for socioeconomic profiling to the use
of primary data collection using a perception survey and face-to-face encounters
such as focus group discussions (FGDs), case interviews, and public dialogues.
1.1.1 Secondary Data from Population and Housing Census 2010
A 400-metre corridor is identified from each side of the entire alignment. It serves
as a broad impact zone based on the planning principle that an acceptable walking
distance from a transit point is approximately 400 metres.
Secondary data was sourced from the Department of Statistics [DOS] (GIS unit) to
obtain the socio-economic profile in the impact zone from the Population and
Housing Census 2010. The information was extracted from the Census
enumeration blocks. To facilitate data extraction from the enumeration blocks, the
impact zone was subdivided into four major corridors as follows:
1. Northern segment - from Damansara Damai to Jalan Ipoh;
2. Underground segment - from Jalan Ipoh to TRX and Bandar Malaysia
3. Southern elevated segment 1 – Bandar Malaysia to UPM
4. Southern elevated segment 2 - from UPM to Putrajaya
The corridors were also used as basis for the delineation of the initial zones for the
perception survey.
1.1.2 Perception Survey The perception survey used a questionnaire, implemented through interviews by
enumerators. The survey questionnaire is shown in Appendix E1. The findings
were analysed through SPSS.
Projek Mass Rapid Transit Laluan 2: Sg Buloh – Serdang – Putrajaya Detailed Environmental Impact Assessment
APPENDIX E : SOCIAL SURVEY METHODOLOGY AND FINDINGS
ERE Consulting Group E-2 Issue1.0/April 2015
The methodology of the perception survey is described below:
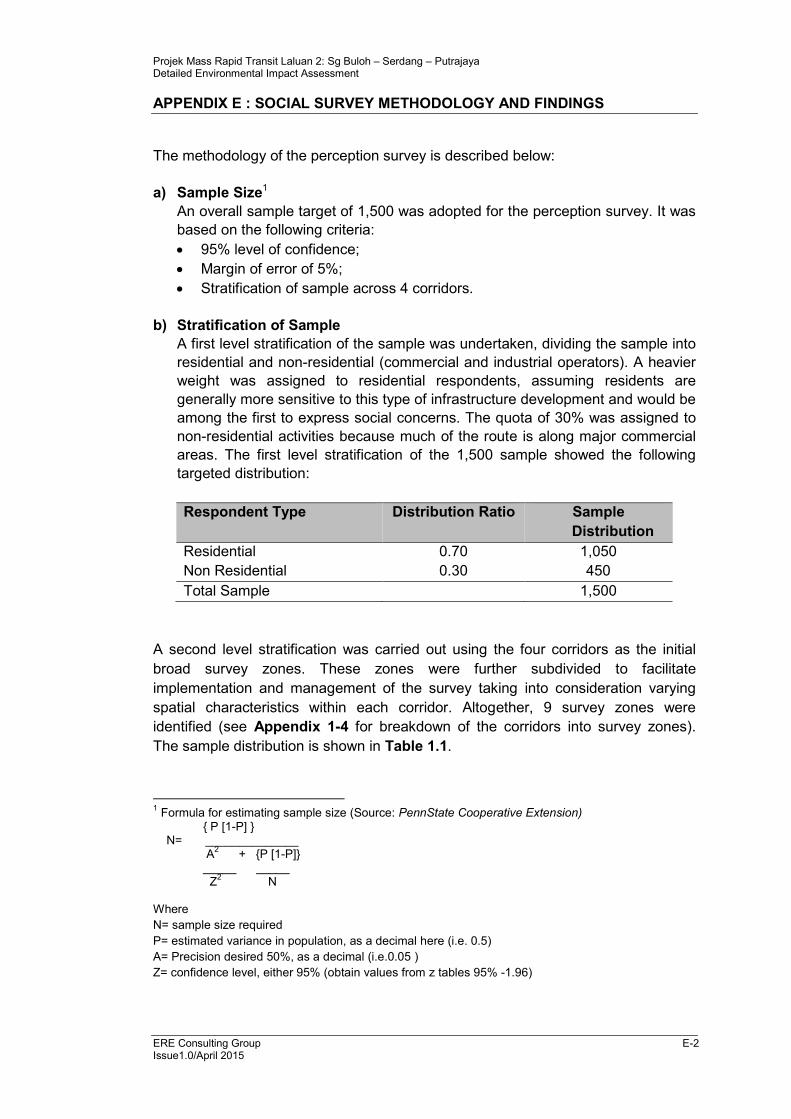
a) Sample Size1
An overall sample target of 1,500 was adopted for the perception survey. It was
based on the following criteria:
• 95% level of confidence;
• Margin of error of 5%;
• Stratification of sample across 4 corridors.
b) Stratification of Sample
A first level stratification of the sample was undertaken, dividing the sample into
residential and non-residential (commercial and industrial operators). A heavier
weight was assigned to residential respondents, assuming residents are
generally more sensitive to this type of infrastructure development and would be
among the first to express social concerns. The quota of 30% was assigned to
non-residential activities because much of the route is along major commercial
areas. The first level stratification of the 1,500 sample showed the following
targeted distribution:
Respondent Type Distribution Ratio Sample
Distribution
Residential 0.70 1,050
Non Residential 0.30 450
Total Sample 1,500
A second level stratification was carried out using the four corridors as the initial
broad survey zones. These zones were further subdivided to facilitate
implementation and management of the survey taking into consideration varying
spatial characteristics within each corridor. Altogether, 9 survey zones were
identified (see Appendix 1-4 for breakdown of the corridors into survey zones).
The sample distribution is shown in Table 1.1.
1 Formula for estimating sample size (Source: PennState Cooperative Extension) { P [1-P] } N= ______________ A
2 + {P [1-P]}
_____ _____ Z
2 N
Where
N= sample size required
P= estimated variance in population, as a decimal here (i.e. 0.5)
A= Precision desired 50%, as a decimal (i.e.0.05 )
Z= confidence level, either 95% (obtain values from z tables 95% -1.96)
Projek Mass Rapid Transit Laluan 2: Sg Buloh – Serdang – Putrajaya Detailed Environmental Impact Assessment
APPENDIX E : SOCIAL SURVEY METHODOLOGY AND FINDINGS
ERE Consulting Group E-3 Issue1.0/April 2015
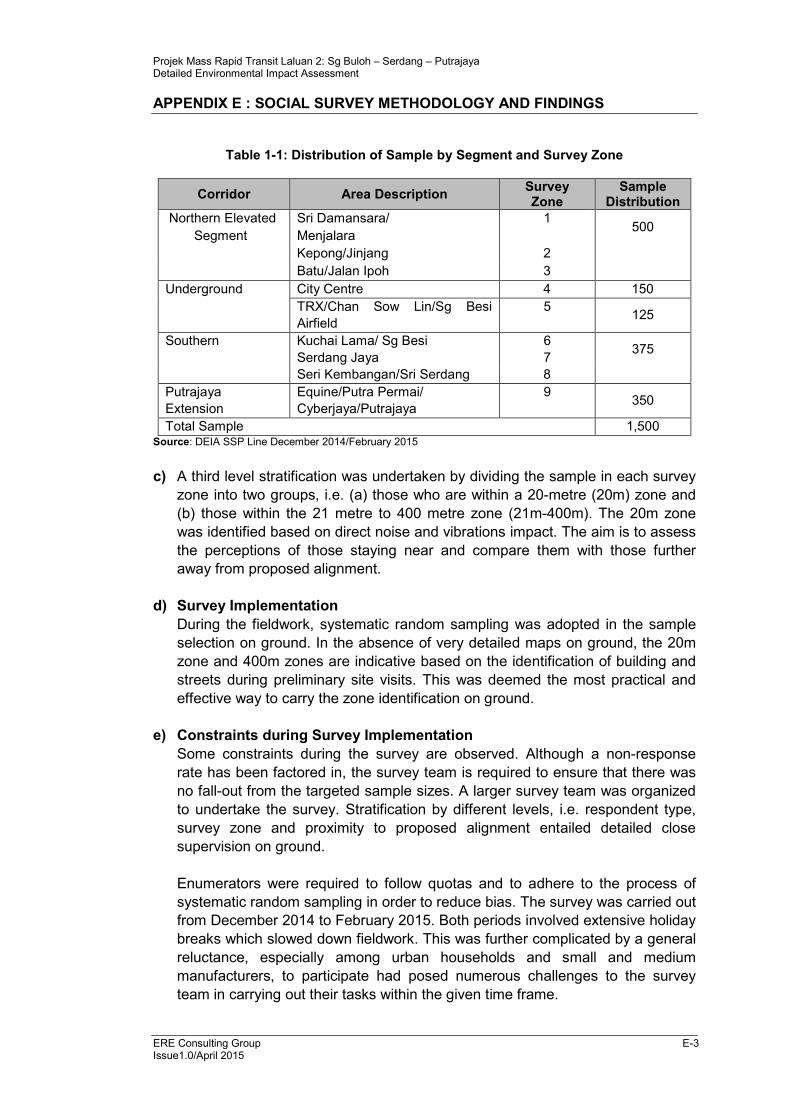
Table 1-1: Distribution of Sample by Segment and Survey Zone
Corridor Area Description Survey Zone
Sample Distribution
Northern Elevated
Segment
Sri Damansara/
Menjalara
1 500
Kepong/Jinjang 2
Batu/Jalan Ipoh 3
Underground City Centre 4 150
TRX/Chan Sow Lin/Sg Besi
Airfield
5 125
Southern Kuchai Lama/ Sg Besi
Serdang Jaya
6
7 375
Seri Kembangan/Sri Serdang 8
Putrajaya
Extension
Equine/Putra Permai/
Cyberjaya/Putrajaya
9 350
Total Sample 1,500 Source: DEIA SSP Line December 2014/February 2015
c) A third level stratification was undertaken by dividing the sample in each survey
zone into two groups, i.e. (a) those who are within a 20-metre (20m) zone and
(b) those within the 21 metre to 400 metre zone (21m-400m). The 20m zone
was identified based on direct noise and vibrations impact. The aim is to assess
the perceptions of those staying near and compare them with those further
away from proposed alignment.
d) Survey Implementation
During the fieldwork, systematic random sampling was adopted in the sample
selection on ground. In the absence of very detailed maps on ground, the 20m
zone and 400m zones are indicative based on the identification of building and
streets during preliminary site visits. This was deemed the most practical and
effective way to carry the zone identification on ground.
e) Constraints during Survey Implementation
Some constraints during the survey are observed. Although a non-response
rate has been factored in, the survey team is required to ensure that there was
no fall-out from the targeted sample sizes. A larger survey team was organized
to undertake the survey. Stratification by different levels, i.e. respondent type,
survey zone and proximity to proposed alignment entailed detailed close
supervision on ground.
Enumerators were required to follow quotas and to adhere to the process of
systematic random sampling in order to reduce bias. The survey was carried out
from December 2014 to February 2015. Both periods involved extensive holiday
breaks which slowed down fieldwork. This was further complicated by a general
reluctance, especially among urban households and small and medium
manufacturers, to participate had posed numerous challenges to the survey
team in carrying out their tasks within the given time frame.
Projek Mass Rapid Transit Laluan 2: Sg Buloh – Serdang – Putrajaya Detailed Environmental Impact Assessment
APPENDIX E : SOCIAL SURVEY METHODOLOGY AND FINDINGS
ERE Consulting Group E-4 Issue1.0/April 2015
1.1.3 Stakeholders’ Engagements
In order to give more depth to the perception survey findings, stakeholders’
engagements were carried out using various methods, combining focus Group
Discussions (FGDs), case interviews and public dialogues. The approach was to
target selected groups and institutions, especially those which are located close to
the proposed SSP Line and who could be significantly impacted by the project.
The general approach adopted in all these engagements included the use of
presentation slides to explain the purpose and intent of these engagements, to
show to participants the SSP Line alignment together with relevant information on
the proposed development. Participants were given time to discuss and to share
their views on the proposed project.
Case interviews were used mostly for institutions where face-to-face engagements
would be more meaningful, allowing them opportunities to discuss the potential
impacts on them. Focus groups were determined based on their locations and their
shared characteristics, e.g. residents or commercial operators. Where such groups
could be merged into larger groups, public dialogue sessions were held.
The initial target number for stakeholders’ engagement set out under the Terms of
Reference was 20 but during fieldwork, the number of engagements was raised to
33 after detailed site assessments on social impacts. While some groups have to
be combined taking into considerations; others have to be further segregated due to
their social characteristics. Some of such examples are given below:
a) The proposed FGD for Sri Damansara Commercial Group were subdivided into
2 groups due to their different socio-economic characteristics;
b) The FGD earmarked for occupants of Ampang Park was merged with those
from Jalan Binjai due to insufficient quorum from Ampang Park;
c) Two interviews with Hospital Kuala Lumpur (HKL) were carried out; the initial
one with the technical personnel of HKL and another with the Director of the
Hospital who requested for a briefing.
d) Kg Malaysia group was separated from the Kuchai Lama residential group into
a different discussion group.
e) The landowners of commercial lots at Serdang Raya requested for a separate
discussion. An interview with them was conducted.
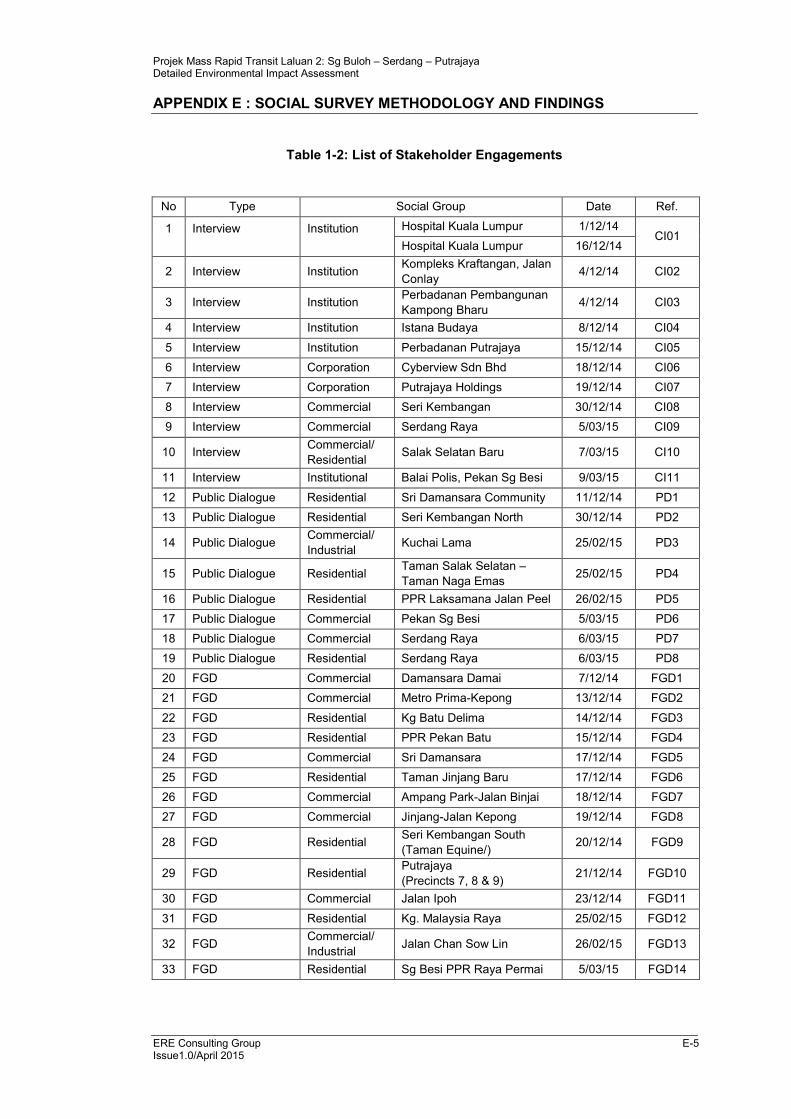
Table 1-2 lists the stakeholders’ engagements into various target groups, giving the
dates and time of interactions.Detailed findings from the interviews, FGDs and
public dialogues are given in Appendix E3.
Projek Mass Rapid Transit Laluan 2: Sg Buloh – Serdang – Putrajaya Detailed Environmental Impact Assessment
APPENDIX E : SOCIAL SURVEY METHODOLOGY AND FINDINGS
ERE Consulting Group E-5 Issue1.0/April 2015
Table 1-2: List of Stakeholder Engagements
No Type Social Group Date Ref.
1
Interview
Institution
Hospital Kuala Lumpur 1/12/14 CI01
Hospital Kuala Lumpur 16/12/14
2 Interview Institution Kompleks Kraftangan, Jalan
Conlay 4/12/14 CI02
3 Interview Institution Perbadanan Pembangunan
Kampong Bharu 4/12/14 CI03
4 Interview Institution Istana Budaya 8/12/14 CI04
5 Interview Institution Perbadanan Putrajaya 15/12/14 CI05
6 Interview Corporation Cyberview Sdn Bhd 18/12/14 CI06
7 Interview Corporation Putrajaya Holdings 19/12/14 CI07
8 Interview Commercial Seri Kembangan 30/12/14 CI08
9 Interview Commercial Serdang Raya 5/03/15 CI09
10 Interview Commercial/
Residential Salak Selatan Baru 7/03/15 CI10
11 Interview Institutional Balai Polis, Pekan Sg Besi 9/03/15 CI11
12 Public Dialogue Residential Sri Damansara Community 11/12/14 PD1
13 Public Dialogue Residential Seri Kembangan North 30/12/14 PD2
14 Public Dialogue Commercial/
Industrial Kuchai Lama 25/02/15 PD3
15 Public Dialogue Residential Taman Salak Selatan –
Taman Naga Emas 25/02/15 PD4
16 Public Dialogue Residential PPR Laksamana Jalan Peel 26/02/15 PD5
17 Public Dialogue Commercial Pekan Sg Besi 5/03/15 PD6
18 Public Dialogue Commercial Serdang Raya 6/03/15 PD7
19 Public Dialogue Residential Serdang Raya 6/03/15 PD8
20 FGD Commercial Damansara Damai 7/12/14 FGD1
21 FGD Commercial Metro Prima-Kepong 13/12/14 FGD2
22 FGD Residential Kg Batu Delima 14/12/14 FGD3
23 FGD Residential PPR Pekan Batu 15/12/14 FGD4
24 FGD Commercial Sri Damansara 17/12/14 FGD5
25 FGD Residential Taman Jinjang Baru 17/12/14 FGD6
26 FGD Commercial Ampang Park-Jalan Binjai 18/12/14 FGD7
27 FGD Commercial Jinjang-Jalan Kepong 19/12/14 FGD8
28 FGD Residential Seri Kembangan South
(Taman Equine/) 20/12/14 FGD9
29 FGD Residential Putrajaya
(Precincts 7, 8 & 9) 21/12/14 FGD10
30 FGD Commercial Jalan Ipoh 23/12/14 FGD11
31 FGD Residential Kg. Malaysia Raya 25/02/15 FGD12
32 FGD Commercial/
Industrial Jalan Chan Sow Lin 26/02/15 FGD13
33 FGD Residential Sg Besi PPR Raya Permai 5/03/15 FGD14
Projek Mass Rapid Transit Laluan 2: Sg Buloh – Serdang – Putrajaya Detailed Environmental Impact Assessment
APPENDIX E : SOCIAL SURVEY METHODOLOGY AND FINDINGS
ERE Consulting Group E-6 Issue1.0/April 2015
1.2 SOCIAL PROFILE
1.2.1 Regional Context
The proposed SSP Line is among the measures identified to tackle the challenge of
inadequate public transport in the Greater Kuala Lumpur. According to the
Population and Housing Census 2010, population in the Greater Kuala Lumpur
(GKL) touched 6.3 million in 2010. The ETP targeted GKL population to 10 million
by 2020, with an immigrant population component of 2.5 million. With rapid
population growth, it believes that GKL contributions to Gross National Income
(GNI) would rise by 2.5 times from RM258 billion in 2010 to RM650 billion in 2020.
This implies that 40% of GNI would be generated from GKL. To achieve this, the
GKL NKEA identifies various measures to be undertaken.
Among them, is the implementation of a comprehensive MRT system to improve
public transportation which is said to be currently fragmented, often unreliable and
where roads are almost always congested.
The SSP Line would complement the SBK Line which is presently under
construction. Its proposed route covers six municipalities under GKL. Spatially, it
stretches from the northern tip of GKL and serves the eastern part of Kuala Lumpur
before cutting through Kuala Lumpur city centre towards the south of Kuala Lumpur
into the south-western part of GKL which is under the jurisdiction of Majlis
Perbandaran Subang Jaya. It then enters the municipality of Sepang tolink to
Cyberjaya city centre before terminating at Putrajaya Sentral, which is underthe
jurisdiction of Perbadanan Putrajaya. Along the way, it would integrate with other
public transportation systems like the monorail, KTM Komuter and LRT as well as
with SBK Line, enhancing connectivity, a factor critical for urban growth and for
improving the labour productivity of the urban population through enhanced
connectivity, faster travel time and savings in costs and travel time.
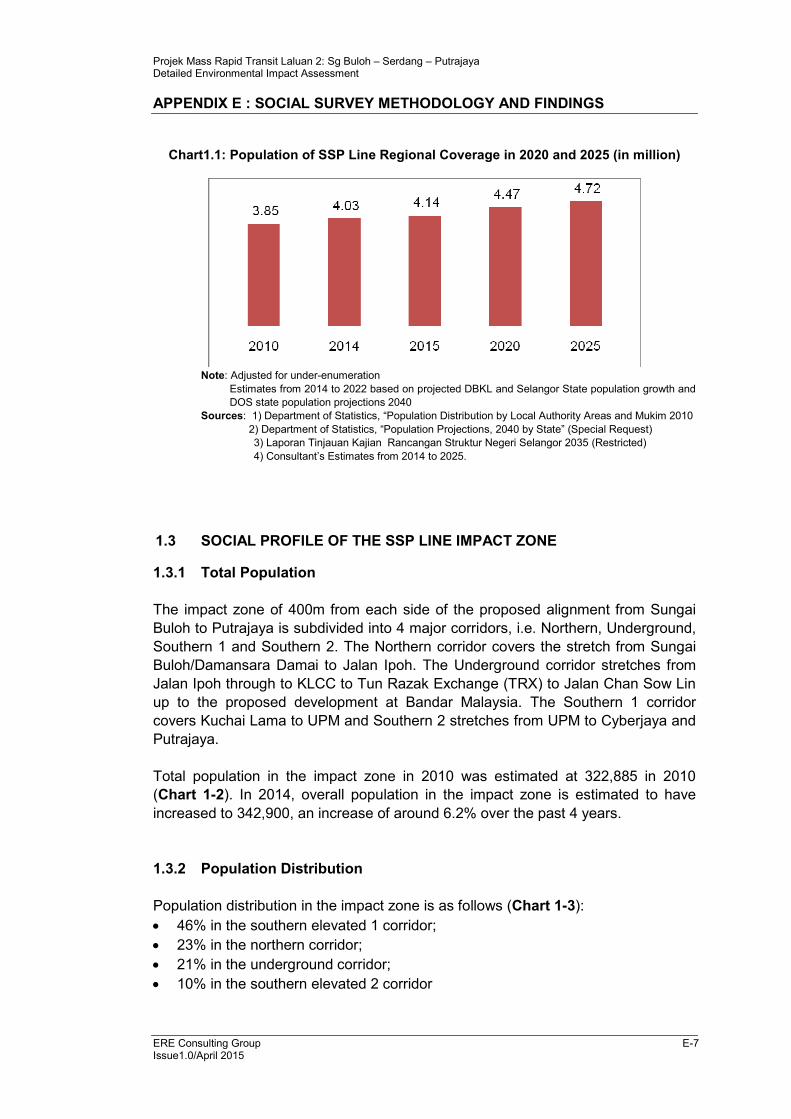
In 2010, total population of the 6 municipalities that serve as the regional corridor
for SSP Line was estimated at 3.9 million (Chart 1-1). By 2015, the regional
corridor population is estimated to rise to 4.1 million. By 2020, it would increase to
4.47 million or slightly less than half of GKL’s 10 million target. In 2025, the regional
corridor population is expected to increase to 4.7million (The estimates consider
state population projections undertaken by DOS (2040) and the target population
for Selangor under the recent structural plan study of Selangor).
Projek Mass Rapid Transit Laluan 2: Sg Buloh – Serdang – Putrajaya Detailed Environmental Impact Assessment
APPENDIX E : SOCIAL SURVEY METHODOLOGY AND FINDINGS
ERE Consulting Group E-7 Issue1.0/April 2015
Chart1.1: Population of SSP Line Regional Coverage in 2020 and 2025 (in million)
Note: Adjusted for under-enumeration
Estimates from 2014 to 2022 based on projected DBKL and Selangor State population growth and
DOS state population projections 2040
Sources: 1) Department of Statistics, “Population Distribution by Local Authority Areas and Mukim 2010
2) Department of Statistics, “Population Projections, 2040 by State” (Special Request)
3) Laporan Tinjauan Kajian Rancangan Struktur Negeri Selangor 2035 (Restricted)
4) Consultant’s Estimates from 2014 to 2025.
1.3 SOCIAL PROFILE OF THE SSP LINE IMPACT ZONE
1.3.1 Total Population
The impact zone of 400m from each side of the proposed alignment from Sungai
Buloh to Putrajaya is subdivided into 4 major corridors, i.e. Northern, Underground,
Southern 1 and Southern 2. The Northern corridor covers the stretch from Sungai
Buloh/Damansara Damai to Jalan Ipoh. The Underground corridor stretches from
Jalan Ipoh through to KLCC to Tun Razak Exchange (TRX) to Jalan Chan Sow Lin
up to the proposed development at Bandar Malaysia. The Southern 1 corridor
covers Kuchai Lama to UPM and Southern 2 stretches from UPM to Cyberjaya and
Putrajaya.
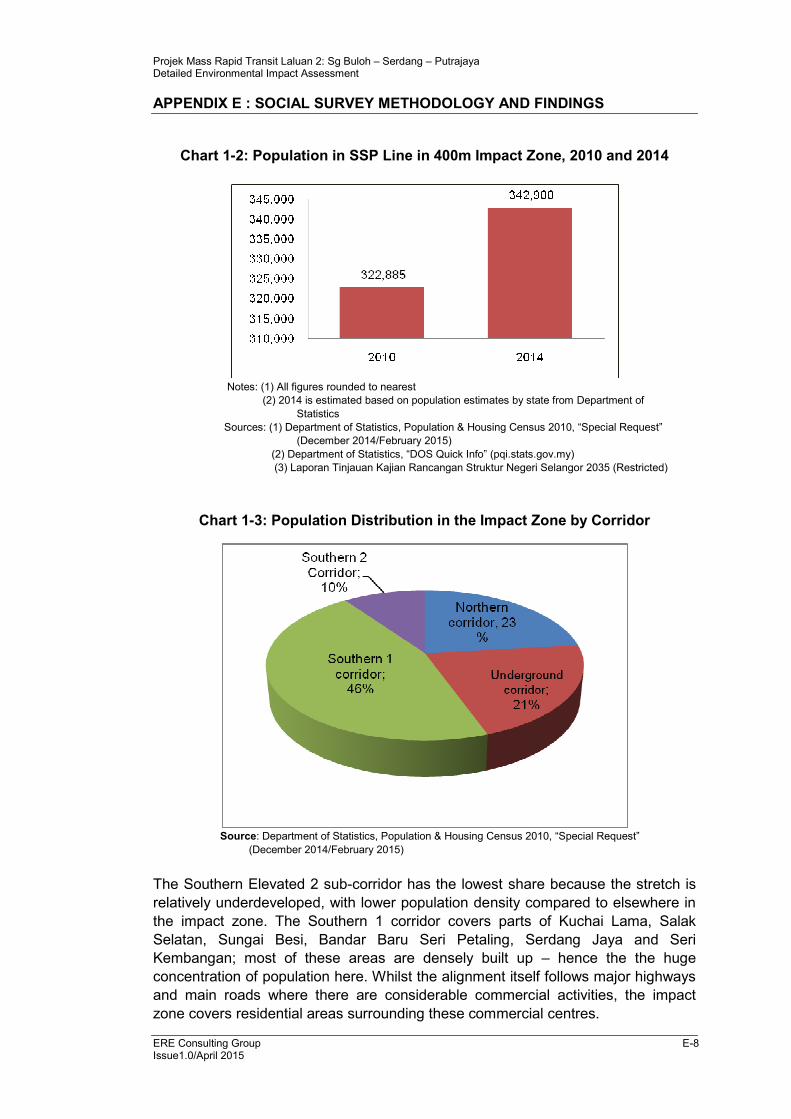
Total population in the impact zone in 2010 was estimated at 322,885 in 2010
(Chart 1-2). In 2014, overall population in the impact zone is estimated to have
increased to 342,900, an increase of around 6.2% over the past 4 years.
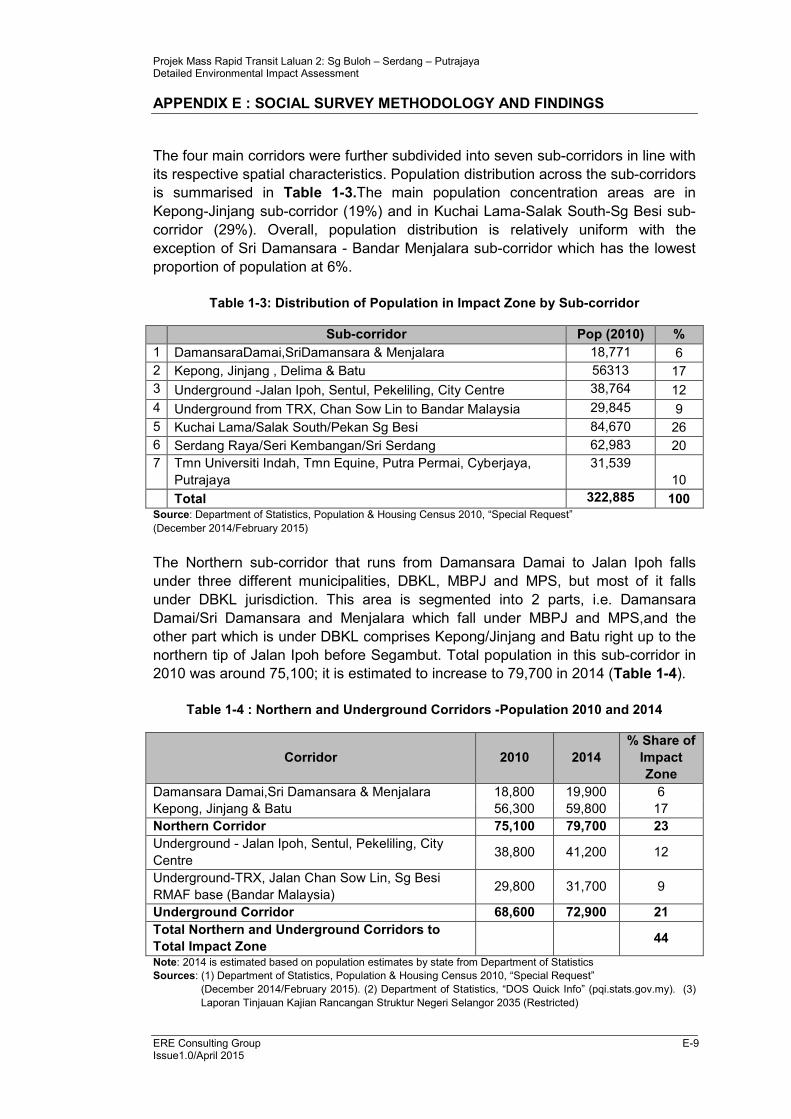
1.3.2 Population Distribution
Population distribution in the impact zone is as follows (Chart 1-3):
• 46% in the southern elevated 1 corridor;
• 23% in the northern corridor;
• 21% in the underground corridor;
• 10% in the southern elevated 2 corridor
Projek Mass Rapid Transit Laluan 2: Sg Buloh – Serdang – Putrajaya Detailed Environmental Impact Assessment
APPENDIX E : SOCIAL SURVEY METHODOLOGY AND FINDINGS
ERE Consulting Group E-8 Issue1.0/April 2015
Chart 1-2: Population in SSP Line in 400m Impact Zone, 2010 and 2014
Notes: (1) All figures rounded to nearest
(2) 2014 is estimated based on population estimates by state from Department of
Statistics
Sources: (1) Department of Statistics, Population & Housing Census 2010, “Special Request”
(December 2014/February 2015)
(2) Department of Statistics, “DOS Quick Info” (pqi.stats.gov.my)
(3) Laporan Tinjauan Kajian Rancangan Struktur Negeri Selangor 2035 (Restricted)
Chart 1-3: Population Distribution in the Impact Zone by Corridor
Source: Department of Statistics, Population & Housing Census 2010, “Special Request”
(December 2014/February 2015)
The Southern Elevated 2 sub-corridor has the lowest share because the stretch is
relatively underdeveloped, with lower population density compared to elsewhere in
the impact zone. The Southern 1 corridor covers parts of Kuchai Lama, Salak
Selatan, Sungai Besi, Bandar Baru Seri Petaling, Serdang Jaya and Seri
Kembangan; most of these areas are densely built up – hence the the huge
concentration of population here. Whilst the alignment itself follows major highways
and main roads where there are considerable commercial activities, the impact
zone covers residential areas surrounding these commercial centres.
Projek Mass Rapid Transit Laluan 2: Sg Buloh – Serdang – Putrajaya Detailed Environmental Impact Assessment
APPENDIX E : SOCIAL SURVEY METHODOLOGY AND FINDINGS
ERE Consulting Group E-9 Issue1.0/April 2015
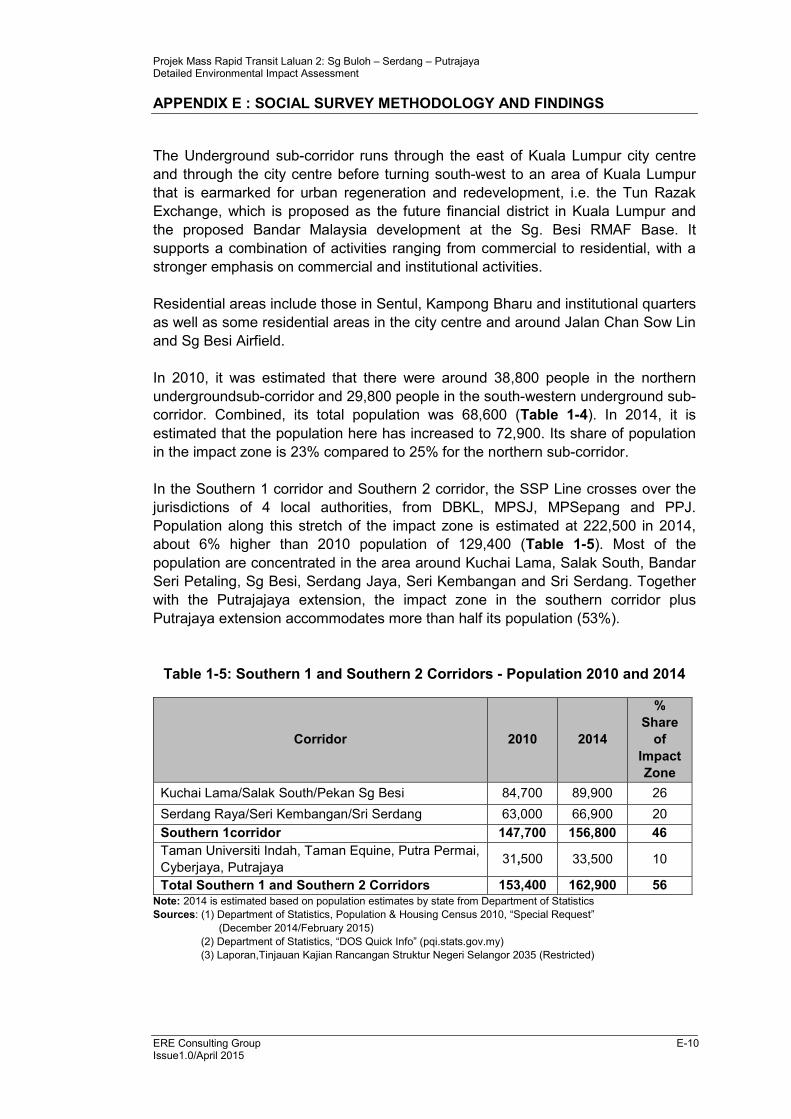
The four main corridors were further subdivided into seven sub-corridors in line with
its respective spatial characteristics. Population distribution across the sub-corridors
is summarised in Table 1-3.The main population concentration areas are in
Kepong-Jinjang sub-corridor (19%) and in Kuchai Lama-Salak South-Sg Besi sub-
corridor (29%). Overall, population distribution is relatively uniform with the
exception of Sri Damansara - Bandar Menjalara sub-corridor which has the lowest
proportion of population at 6%.
Table 1-3: Distribution of Population in Impact Zone by Sub-corridor
Sub-corridor Pop (2010) %
1 DamansaraDamai,SriDamansara & Menjalara 18,771 6
2 Kepong, Jinjang , Delima & Batu 56313 17
3 Underground -Jalan Ipoh, Sentul, Pekeliling, City Centre 38,764 12
4 Underground from TRX, Chan Sow Lin to Bandar Malaysia 29,845 9
5 Kuchai Lama/Salak South/Pekan Sg Besi 84,670 26
6 Serdang Raya/Seri Kembangan/Sri Serdang 62,983 20
7 Tmn Universiti Indah, Tmn Equine, Putra Permai, Cyberjaya,
Putrajaya
31,539
10
Total 322,885 100 Source: Department of Statistics, Population & Housing Census 2010, “Special Request”
(December 2014/February 2015)
The Northern sub-corridor that runs from Damansara Damai to Jalan Ipoh falls
under three different municipalities, DBKL, MBPJ and MPS, but most of it falls
under DBKL jurisdiction. This area is segmented into 2 parts, i.e. Damansara
Damai/Sri Damansara and Menjalara which fall under MBPJ and MPS,and the
other part which is under DBKL comprises Kepong/Jinjang and Batu right up to the
northern tip of Jalan Ipoh before Segambut. Total population in this sub-corridor in
2010 was around 75,100; it is estimated to increase to 79,700 in 2014 (Table 1-4).
Table 1-4 : Northern and Underground Corridors -Population 2010 and 2014
Corridor 2010 2014
% Share of
Impact
Zone
Damansara Damai,Sri Damansara & Menjalara 18,800 19,900 6
Kepong, Jinjang & Batu 56,300 59,800 17
Northern Corridor 75,100 79,700 23
Underground - Jalan Ipoh, Sentul, Pekeliling, City
Centre 38,800 41,200 12
Underground-TRX, Jalan Chan Sow Lin, Sg Besi
RMAF base (Bandar Malaysia) 29,800 31,700 9
Underground Corridor 68,600 72,900 21
Total Northern and Underground Corridors to
Total Impact Zone 44
Note: 2014 is estimated based on population estimates by state from Department of Statistics
Sources: (1) Department of Statistics, Population & Housing Census 2010, “Special Request”
(December 2014/February 2015). (2) Department of Statistics, “DOS Quick Info” (pqi.stats.gov.my). (3)
Laporan Tinjauan Kajian Rancangan Struktur Negeri Selangor 2035 (Restricted)
Projek Mass Rapid Transit Laluan 2: Sg Buloh – Serdang – Putrajaya Detailed Environmental Impact Assessment
APPENDIX E : SOCIAL SURVEY METHODOLOGY AND FINDINGS
ERE Consulting Group E-10 Issue1.0/April 2015
The Underground sub-corridor runs through the east of Kuala Lumpur city centre
and through the city centre before turning south-west to an area of Kuala Lumpur
that is earmarked for urban regeneration and redevelopment, i.e. the Tun Razak
Exchange, which is proposed as the future financial district in Kuala Lumpur and
the proposed Bandar Malaysia development at the Sg. Besi RMAF Base. It
supports a combination of activities ranging from commercial to residential, with a
stronger emphasis on commercial and institutional activities.
Residential areas include those in Sentul, Kampong Bharu and institutional quarters
as well as some residential areas in the city centre and around Jalan Chan Sow Lin
and Sg Besi Airfield.
In 2010, it was estimated that there were around 38,800 people in the northern
undergroundsub-corridor and 29,800 people in the south-western underground sub-
corridor. Combined, its total population was 68,600 (Table 1-4). In 2014, it is
estimated that the population here has increased to 72,900. Its share of population
in the impact zone is 23% compared to 25% for the northern sub-corridor.
In the Southern 1 corridor and Southern 2 corridor, the SSP Line crosses over the
jurisdictions of 4 local authorities, from DBKL, MPSJ, MPSepang and PPJ.
Population along this stretch of the impact zone is estimated at 222,500 in 2014,
about 6% higher than 2010 population of 129,400 (Table 1-5). Most of the
population are concentrated in the area around Kuchai Lama, Salak South, Bandar
Seri Petaling, Sg Besi, Serdang Jaya, Seri Kembangan and Sri Serdang. Together
with the Putrajajaya extension, the impact zone in the southern corridor plus
Putrajaya extension accommodates more than half its population (53%).
Table 1-5: Southern 1 and Southern 2 Corridors - Population 2010 and 2014
Corridor 2010 2014
%
Share
of
Impact
Zone
Kuchai Lama/Salak South/Pekan Sg Besi 84,700 89,900 26
Serdang Raya/Seri Kembangan/Sri Serdang 63,000 66,900 20
Southern 1corridor 147,700 156,800 46
Taman Universiti Indah, Taman Equine, Putra Permai,
Cyberjaya, Putrajaya 31,500 33,500 10
Total Southern 1 and Southern 2 Corridors 153,400 162,900 56
Note: 2014 is estimated based on population estimates by state from Department of Statistics
Sources: (1) Department of Statistics, Population & Housing Census 2010, “Special Request”
(December 2014/February 2015)
(2) Department of Statistics, “DOS Quick Info” (pqi.stats.gov.my)
(3) Laporan,Tinjauan Kajian Rancangan Struktur Negeri Selangor 2035 (Restricted)
Projek Mass Rapid Transit Laluan 2: Sg Buloh – Serdang – Putrajaya Detailed Environmental Impact Assessment
APPENDIX E : SOCIAL SURVEY METHODOLOGY AND FINDINGS
ERE Consulting Group E-11 Issue1.0/April 2015
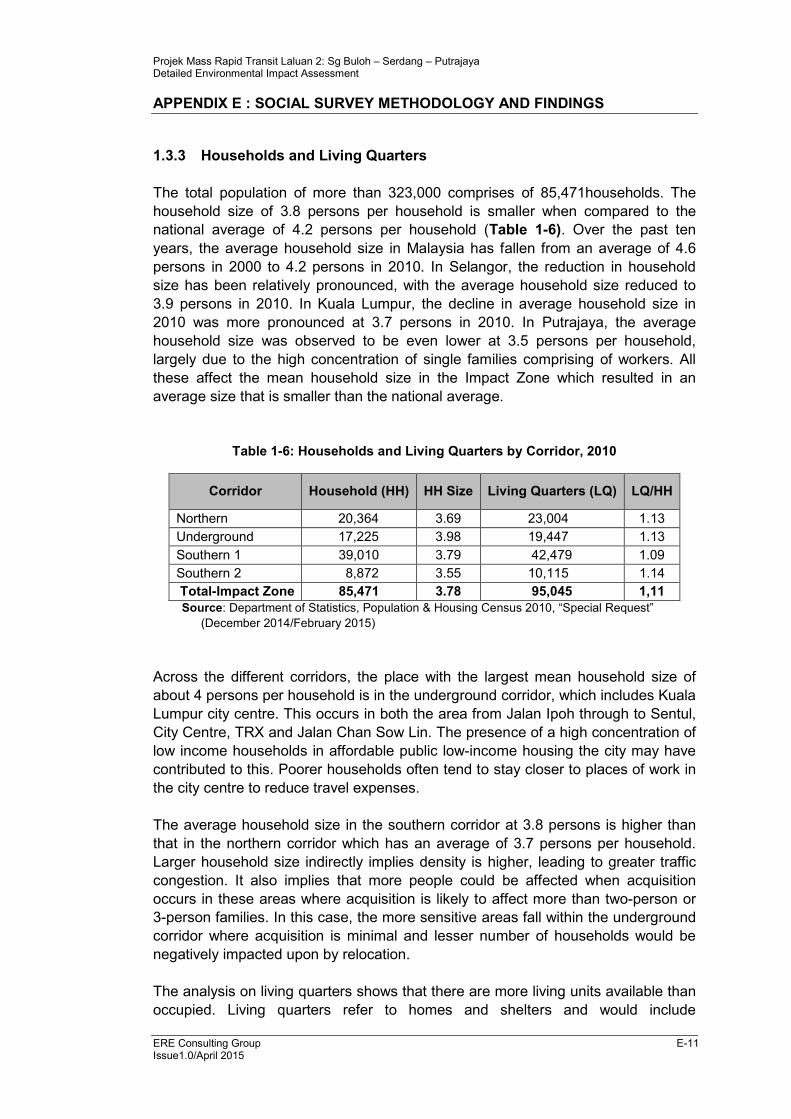
1.3.3 Households and Living Quarters
The total population of more than 323,000 comprises of 85,471households. The
household size of 3.8 persons per household is smaller when compared to the
national average of 4.2 persons per household (Table 1-6). Over the past ten
years, the average household size in Malaysia has fallen from an average of 4.6
persons in 2000 to 4.2 persons in 2010. In Selangor, the reduction in household
size has been relatively pronounced, with the average household size reduced to
3.9 persons in 2010. In Kuala Lumpur, the decline in average household size in
2010 was more pronounced at 3.7 persons in 2010. In Putrajaya, the average
household size was observed to be even lower at 3.5 persons per household,
largely due to the high concentration of single families comprising of workers. All
these affect the mean household size in the Impact Zone which resulted in an
average size that is smaller than the national average.
Table 1-6: Households and Living Quarters by Corridor, 2010
Corridor Household (HH) HH Size Living Quarters (LQ) LQ/HH
Northern 20,364 3.69 23,004 1.13
Underground 17,225 3.98 19,447 1.13
Southern 1 39,010 3.79 42,479 1.09
Southern 2 8,872 3.55 10,115 1.14
Total-Impact Zone 85,471 3.78 95,045 1,11
Source: Department of Statistics, Population & Housing Census 2010, “Special Request”
(December 2014/February 2015)
Across the different corridors, the place with the largest mean household size of
about 4 persons per household is in the underground corridor, which includes Kuala
Lumpur city centre. This occurs in both the area from Jalan Ipoh through to Sentul,
City Centre, TRX and Jalan Chan Sow Lin. The presence of a high concentration of
low income households in affordable public low-income housing the city may have
contributed to this. Poorer households often tend to stay closer to places of work in
the city centre to reduce travel expenses.
The average household size in the southern corridor at 3.8 persons is higher than
that in the northern corridor which has an average of 3.7 persons per household.
Larger household size indirectly implies density is higher, leading to greater traffic
congestion. It also implies that more people could be affected when acquisition
occurs in these areas where acquisition is likely to affect more than two-person or
3-person families. In this case, the more sensitive areas fall within the underground
corridor where acquisition is minimal and lesser number of households would be
negatively impacted upon by relocation.
The analysis on living quarters shows that there are more living units available than
occupied. Living quarters refer to homes and shelters and would include
Projek Mass Rapid Transit Laluan 2: Sg Buloh – Serdang – Putrajaya Detailed Environmental Impact Assessment
APPENDIX E : SOCIAL SURVEY METHODOLOGY AND FINDINGS
ERE Consulting Group E-12 Issue1.0/April 2015
institutional housing. On the average, the ratio is 1.11 living quarters to one
household (Table 1-6). A surplus of 11% is estimated, suggesting the presence of
vacant premises. The incidence of vacancy is higher in the northern corridor and in
the Putrajaya extension compared to elsewhere in the impact zone.
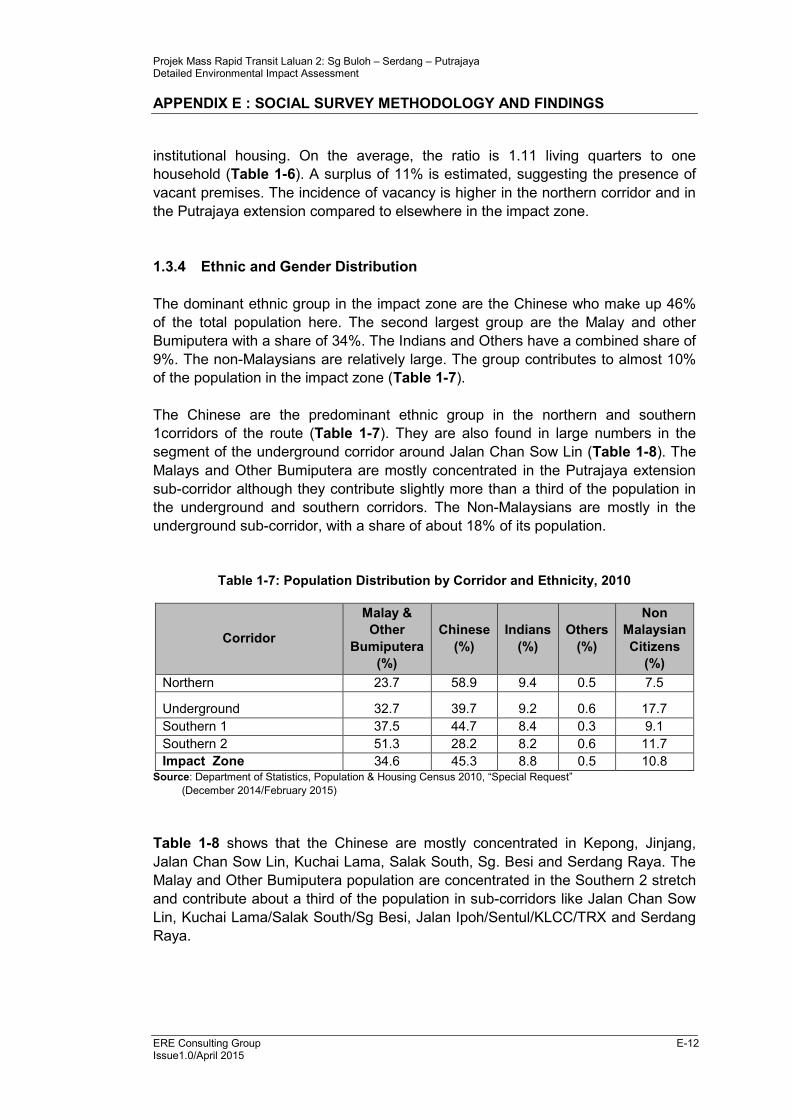
1.3.4 Ethnic and Gender Distribution
The dominant ethnic group in the impact zone are the Chinese who make up 46%
of the total population here. The second largest group are the Malay and other
Bumiputera with a share of 34%. The Indians and Others have a combined share of
9%. The non-Malaysians are relatively large. The group contributes to almost 10%
of the population in the impact zone (Table 1-7).
The Chinese are the predominant ethnic group in the northern and southern
1corridors of the route (Table 1-7). They are also found in large numbers in the
segment of the underground corridor around Jalan Chan Sow Lin (Table 1-8). The
Malays and Other Bumiputera are mostly concentrated in the Putrajaya extension
sub-corridor although they contribute slightly more than a third of the population in
the underground and southern corridors. The Non-Malaysians are mostly in the
underground sub-corridor, with a share of about 18% of its population.
Table 1-7: Population Distribution by Corridor and Ethnicity, 2010
Corridor
Malay &
Other
Bumiputera
(%)
Chinese
(%)
Indians
(%)
Others
(%)
Non
Malaysian
Citizens
(%)
Northern 23.7 58.9 9.4 0.5 7.5
Underground 32.7 39.7 9.2 0.6 17.7
Southern 1 37.5 44.7 8.4 0.3 9.1
Southern 2 51.3 28.2 8.2 0.6 11.7
Impact Zone 34.6 45.3 8.8 0.5 10.8 Source: Department of Statistics, Population & Housing Census 2010, “Special Request”
(December 2014/February 2015)
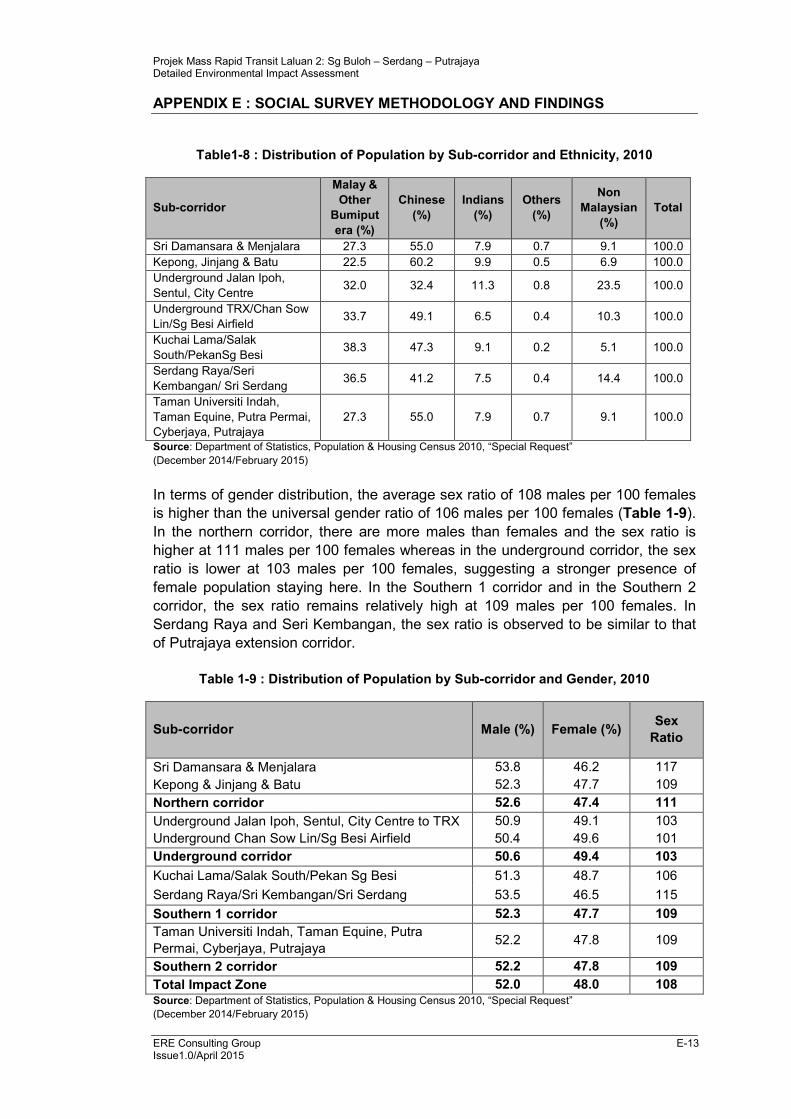
Table 1-8 shows that the Chinese are mostly concentrated in Kepong, Jinjang,
Jalan Chan Sow Lin, Kuchai Lama, Salak South, Sg. Besi and Serdang Raya. The
Malay and Other Bumiputera population are concentrated in the Southern 2 stretch
and contribute about a third of the population in sub-corridors like Jalan Chan Sow
Lin, Kuchai Lama/Salak South/Sg Besi, Jalan Ipoh/Sentul/KLCC/TRX and Serdang
Raya.
Projek Mass Rapid Transit Laluan 2: Sg Buloh – Serdang – Putrajaya Detailed Environmental Impact Assessment
APPENDIX E : SOCIAL SURVEY METHODOLOGY AND FINDINGS
ERE Consulting Group E-13 Issue1.0/April 2015
Table1-8 : Distribution of Population by Sub-corridor and Ethnicity, 2010
Sub-corridor
Malay &
Other
Bumiput
era (%)
Chinese
(%)
Indians
(%)
Others
(%)
Non
Malaysian
(%)
Total
Sri Damansara & Menjalara 27.3 55.0 7.9 0.7 9.1 100.0
Kepong, Jinjang & Batu 22.5 60.2 9.9 0.5 6.9 100.0
Underground Jalan Ipoh,
Sentul, City Centre 32.0 32.4 11.3 0.8 23.5 100.0
Underground TRX/Chan Sow
Lin/Sg Besi Airfield 33.7 49.1 6.5 0.4 10.3 100.0
Kuchai Lama/Salak
South/PekanSg Besi 38.3 47.3 9.1 0.2 5.1 100.0
Serdang Raya/Seri
Kembangan/ Sri Serdang 36.5 41.2 7.5 0.4 14.4 100.0
Taman Universiti Indah,
Taman Equine, Putra Permai,
Cyberjaya, Putrajaya
27.3 55.0 7.9 0.7 9.1 100.0
Source: Department of Statistics, Population & Housing Census 2010, “Special Request”
(December 2014/February 2015)
In terms of gender distribution, the average sex ratio of 108 males per 100 females
is higher than the universal gender ratio of 106 males per 100 females (Table 1-9).
In the northern corridor, there are more males than females and the sex ratio is
higher at 111 males per 100 females whereas in the underground corridor, the sex
ratio is lower at 103 males per 100 females, suggesting a stronger presence of
female population staying here. In the Southern 1 corridor and in the Southern 2
corridor, the sex ratio remains relatively high at 109 males per 100 females. In
Serdang Raya and Seri Kembangan, the sex ratio is observed to be similar to that
of Putrajaya extension corridor.
Table 1-9 : Distribution of Population by Sub-corridor and Gender, 2010
Sub-corridor Male (%) Female (%) Sex
Ratio
Sri Damansara & Menjalara 53.8 46.2 117
Kepong & Jinjang & Batu 52.3 47.7 109
Northern corridor 52.6 47.4 111
Underground Jalan Ipoh, Sentul, City Centre to TRX 50.9 49.1 103
Underground Chan Sow Lin/Sg Besi Airfield 50.4 49.6 101
Underground corridor 50.6 49.4 103
Kuchai Lama/Salak South/Pekan Sg Besi 51.3 48.7 106
Serdang Raya/Sri Kembangan/Sri Serdang 53.5 46.5 115
Southern 1 corridor 52.3 47.7 109
Taman Universiti Indah, Taman Equine, Putra
Permai, Cyberjaya, Putrajaya 52.2 47.8 109
Southern 2 corridor 52.2 47.8 109
Total Impact Zone 52.0 48.0 108 Source: Department of Statistics, Population & Housing Census 2010, “Special Request”
(December 2014/February 2015)
Projek Mass Rapid Transit Laluan 2: Sg Buloh – Serdang – Putrajaya Detailed Environmental Impact Assessment
APPENDIX E : SOCIAL SURVEY METHODOLOGY AND FINDINGS
ERE Consulting Group E-14 Issue1.0/April 2015
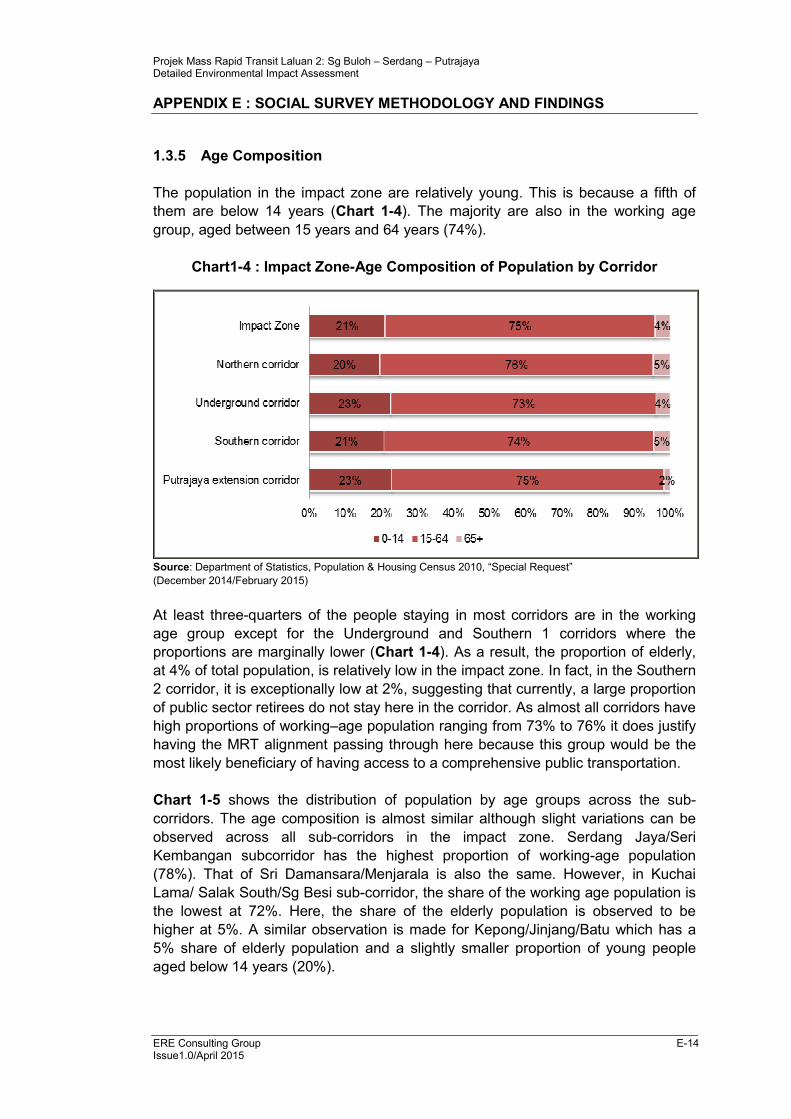
1.3.5 Age Composition
The population in the impact zone are relatively young. This is because a fifth of
them are below 14 years (Chart 1-4). The majority are also in the working age
group, aged between 15 years and 64 years (74%).
Chart1-4 : Impact Zone-Age Composition of Population by Corridor
Source: Department of Statistics, Population & Housing Census 2010, “Special Request”
(December 2014/February 2015)
At least three-quarters of the people staying in most corridors are in the working
age group except for the Underground and Southern 1 corridors where the
proportions are marginally lower (Chart 1-4). As a result, the proportion of elderly,
at 4% of total population, is relatively low in the impact zone. In fact, in the Southern
2 corridor, it is exceptionally low at 2%, suggesting that currently, a large proportion
of public sector retirees do not stay here in the corridor. As almost all corridors have
high proportions of working–age population ranging from 73% to 76% it does justify
having the MRT alignment passing through here because this group would be the
most likely beneficiary of having access to a comprehensive public transportation.
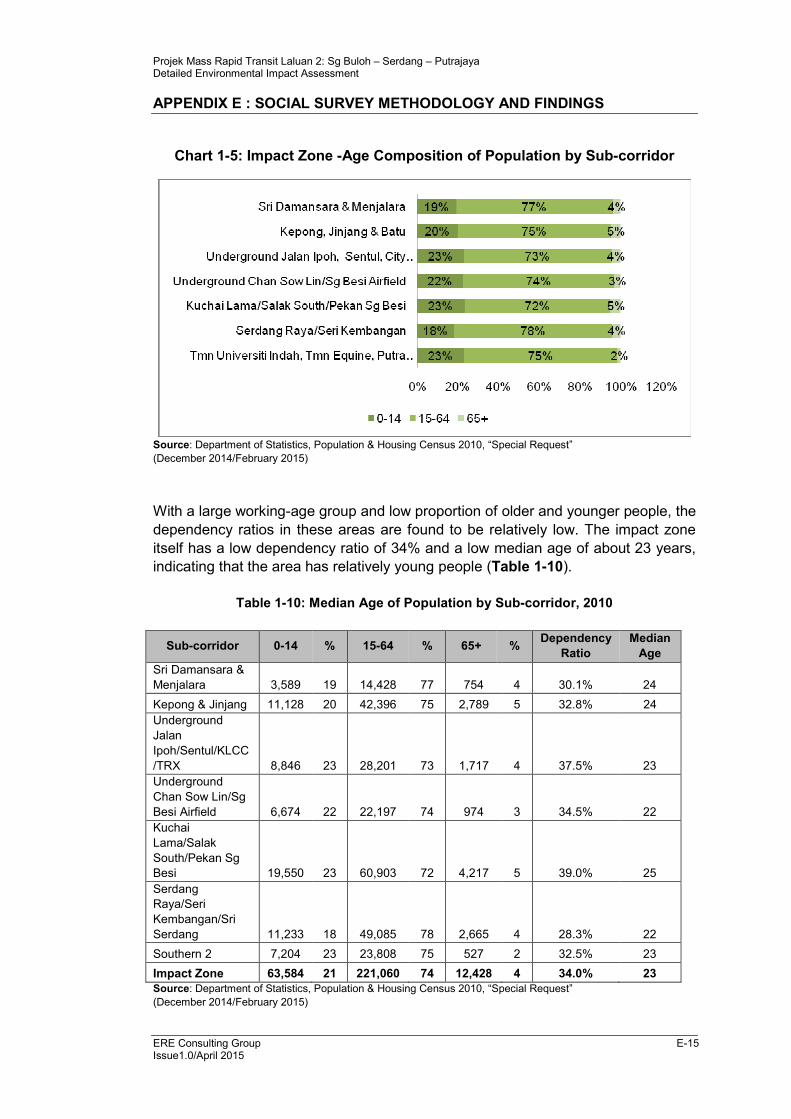
Chart 1-5 shows the distribution of population by age groups across the sub-
corridors. The age composition is almost similar although slight variations can be
observed across all sub-corridors in the impact zone. Serdang Jaya/Seri
Kembangan subcorridor has the highest proportion of working-age population
(78%). That of Sri Damansara/Menjarala is also the same. However, in Kuchai
Lama/ Salak South/Sg Besi sub-corridor, the share of the working age population is
the lowest at 72%. Here, the share of the elderly population is observed to be
higher at 5%. A similar observation is made for Kepong/Jinjang/Batu which has a
5% share of elderly population and a slightly smaller proportion of young people
aged below 14 years (20%).
Projek Mass Rapid Transit Laluan 2: Sg Buloh – Serdang – Putrajaya Detailed Environmental Impact Assessment
APPENDIX E : SOCIAL SURVEY METHODOLOGY AND FINDINGS
ERE Consulting Group E-15 Issue1.0/April 2015
Chart 1-5: Impact Zone -Age Composition of Population by Sub-corridor
Source: Department of Statistics, Population & Housing Census 2010, “Special Request”
(December 2014/February 2015)
With a large working-age group and low proportion of older and younger people, the
dependency ratios in these areas are found to be relatively low. The impact zone
itself has a low dependency ratio of 34% and a low median age of about 23 years,
indicating that the area has relatively young people (Table 1-10).
Table 1-10: Median Age of Population by Sub-corridor, 2010
Sub-corridor 0-14 % 15-64 % 65+ % Dependency
Ratio
Median
Age
Sri Damansara &
Menjalara 3,589 19 14,428 77 754 4 30.1% 24
Kepong & Jinjang 11,128 20 42,396 75 2,789 5 32.8% 24
Underground
Jalan
Ipoh/Sentul/KLCC
/TRX 8,846 23 28,201 73 1,717 4 37.5% 23
Underground
Chan Sow Lin/Sg
Besi Airfield 6,674 22 22,197 74 974 3 34.5% 22
Kuchai
Lama/Salak
South/Pekan Sg
Besi 19,550 23 60,903 72 4,217 5 39.0% 25
Serdang
Raya/Seri
Kembangan/Sri
Serdang 11,233 18 49,085 78 2,665 4 28.3% 22
Southern 2 7,204 23 23,808 75 527 2 32.5% 23
Impact Zone 63,584 21 221,060 74 12,428 4 34.0% 23
Source: Department of Statistics, Population & Housing Census 2010, “Special Request”
(December 2014/February 2015)
Projek Mass Rapid Transit Laluan 2: Sg Buloh – Serdang – Putrajaya Detailed Environmental Impact Assessment
APPENDIX E : SOCIAL SURVEY METHODOLOGY AND FINDINGS
ERE Consulting Group E-16 Issue1.0/April 2015
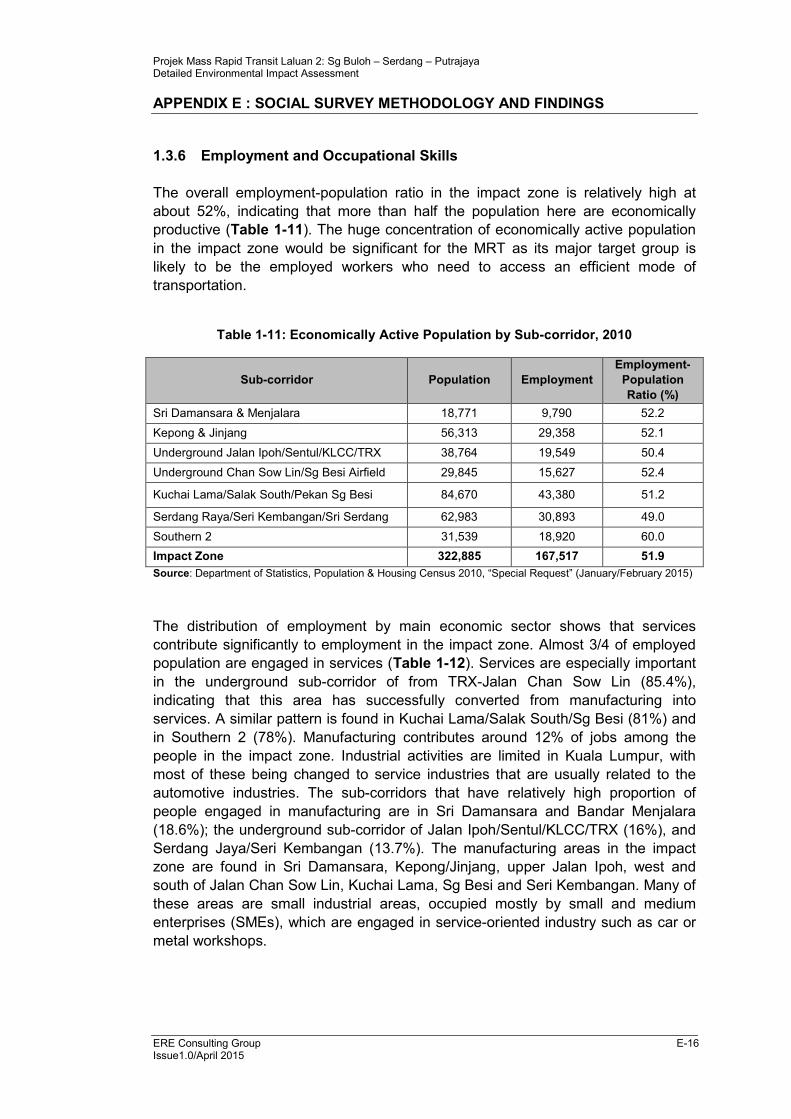
1.3.6 Employment and Occupational Skills
The overall employment-population ratio in the impact zone is relatively high at
about 52%, indicating that more than half the population here are economically
productive (Table 1-11). The huge concentration of economically active population
in the impact zone would be significant for the MRT as its major target group is
likely to be the employed workers who need to access an efficient mode of
transportation.
Table 1-11: Economically Active Population by Sub-corridor, 2010
Sub-corridor Population Employment
Employment-
Population
Ratio (%)
Sri Damansara & Menjalara 18,771 9,790 52.2
Kepong & Jinjang 56,313 29,358 52.1
Underground Jalan Ipoh/Sentul/KLCC/TRX 38,764 19,549 50.4
Underground Chan Sow Lin/Sg Besi Airfield 29,845 15,627 52.4
Kuchai Lama/Salak South/Pekan Sg Besi 84,670 43,380 51.2
Serdang Raya/Seri Kembangan/Sri Serdang 62,983 30,893 49.0
Southern 2 31,539 18,920 60.0
Impact Zone 322,885 167,517 51.9
Source: Department of Statistics, Population & Housing Census 2010, “Special Request” (January/February 2015)
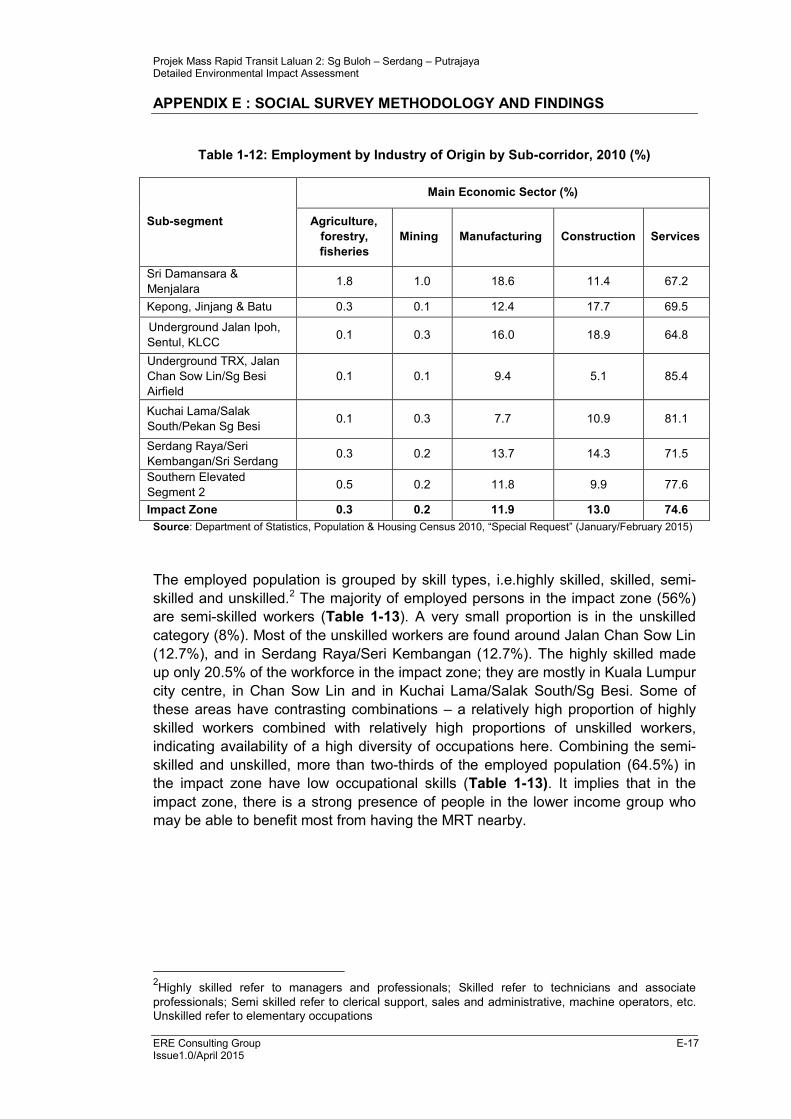
The distribution of employment by main economic sector shows that services
contribute significantly to employment in the impact zone. Almost 3/4 of employed
population are engaged in services (Table 1-12). Services are especially important
in the underground sub-corridor of from TRX-Jalan Chan Sow Lin (85.4%),
indicating that this area has successfully converted from manufacturing into
services. A similar pattern is found in Kuchai Lama/Salak South/Sg Besi (81%) and
in Southern 2 (78%). Manufacturing contributes around 12% of jobs among the
people in the impact zone. Industrial activities are limited in Kuala Lumpur, with
most of these being changed to service industries that are usually related to the
automotive industries. The sub-corridors that have relatively high proportion of
people engaged in manufacturing are in Sri Damansara and Bandar Menjalara
(18.6%); the underground sub-corridor of Jalan Ipoh/Sentul/KLCC/TRX (16%), and
Serdang Jaya/Seri Kembangan (13.7%). The manufacturing areas in the impact
zone are found in Sri Damansara, Kepong/Jinjang, upper Jalan Ipoh, west and
south of Jalan Chan Sow Lin, Kuchai Lama, Sg Besi and Seri Kembangan. Many of
these areas are small industrial areas, occupied mostly by small and medium
enterprises (SMEs), which are engaged in service-oriented industry such as car or
metal workshops.
Projek Mass Rapid Transit Laluan 2: Sg Buloh – Serdang – Putrajaya Detailed Environmental Impact Assessment
APPENDIX E : SOCIAL SURVEY METHODOLOGY AND FINDINGS
ERE Consulting Group E-17 Issue1.0/April 2015
Table 1-12: Employment by Industry of Origin by Sub-corridor, 2010 (%)
Sub-segment
Main Economic Sector (%)
Agriculture,
forestry,
fisheries
Mining Manufacturing Construction Services
Sri Damansara &
Menjalara 1.8 1.0 18.6 11.4 67.2
Kepong, Jinjang & Batu 0.3 0.1 12.4 17.7 69.5
Underground Jalan Ipoh,
Sentul, KLCC 0.1 0.3 16.0 18.9 64.8
Underground TRX, Jalan
Chan Sow Lin/Sg Besi
Airfield
0.1 0.1 9.4 5.1 85.4
Kuchai Lama/Salak
South/Pekan Sg Besi 0.1 0.3 7.7 10.9 81.1
Serdang Raya/Seri
Kembangan/Sri Serdang 0.3 0.2 13.7 14.3 71.5
Southern Elevated
Segment 2 0.5 0.2 11.8 9.9 77.6
Impact Zone 0.3 0.2 11.9 13.0 74.6
Source: Department of Statistics, Population & Housing Census 2010, “Special Request” (January/February 2015)
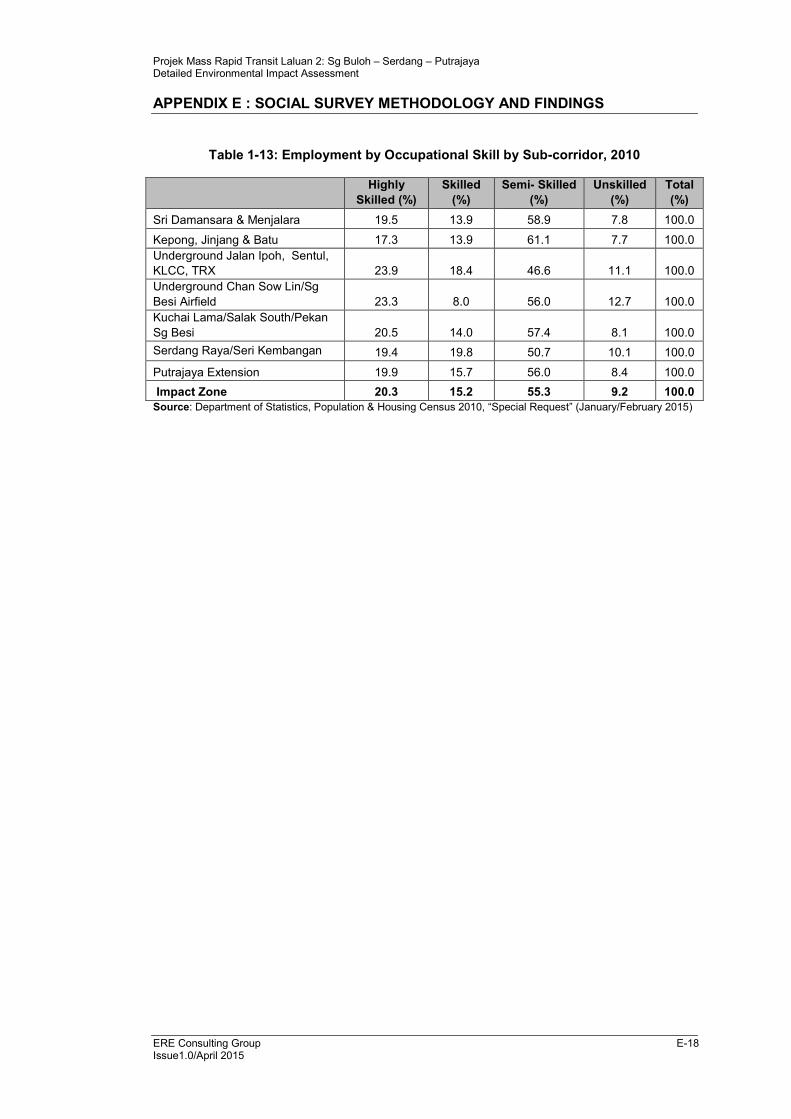
The employed population is grouped by skill types, i.e.highly skilled, skilled, semi-
skilled and unskilled.2 The majority of employed persons in the impact zone (56%)
are semi-skilled workers (Table 1-13). A very small proportion is in the unskilled
category (8%). Most of the unskilled workers are found around Jalan Chan Sow Lin
(12.7%), and in Serdang Raya/Seri Kembangan (12.7%). The highly skilled made
up only 20.5% of the workforce in the impact zone; they are mostly in Kuala Lumpur
city centre, in Chan Sow Lin and in Kuchai Lama/Salak South/Sg Besi. Some of
these areas have contrasting combinations – a relatively high proportion of highly
skilled workers combined with relatively high proportions of unskilled workers,
indicating availability of a high diversity of occupations here. Combining the semi-
skilled and unskilled, more than two-thirds of the employed population (64.5%) in
the impact zone have low occupational skills (Table 1-13). It implies that in the
impact zone, there is a strong presence of people in the lower income group who
may be able to benefit most from having the MRT nearby.
2Highly skilled refer to managers and professionals; Skilled refer to technicians and associate
professionals; Semi skilled refer to clerical support, sales and administrative, machine operators, etc. Unskilled refer to elementary occupations
Projek Mass Rapid Transit Laluan 2: Sg Buloh – Serdang – Putrajaya Detailed Environmental Impact Assessment
APPENDIX E : SOCIAL SURVEY METHODOLOGY AND FINDINGS
ERE Consulting Group E-18 Issue1.0/April 2015
Table 1-13: Employment by Occupational Skill by Sub-corridor, 2010
Highly
Skilled (%)
Skilled
(%)
Semi- Skilled
(%)
Unskilled
(%)
Total
(%)
Sri Damansara & Menjalara 19.5 13.9 58.9 7.8 100.0
Kepong, Jinjang & Batu 17.3 13.9 61.1 7.7 100.0
Underground Jalan Ipoh, Sentul,
KLCC, TRX 23.9 18.4 46.6 11.1 100.0
Underground Chan Sow Lin/Sg
Besi Airfield 23.3 8.0 56.0 12.7 100.0
Kuchai Lama/Salak South/Pekan
Sg Besi 20.5 14.0 57.4 8.1 100.0
Serdang Raya/Seri Kembangan 19.4 19.8 50.7 10.1 100.0
Putrajaya Extension 19.9 15.7 56.0 8.4 100.0
Impact Zone 20.3 15.2 55.3 9.2 100.0
Source: Department of Statistics, Population & Housing Census 2010, “Special Request” (January/February 2015)
Projek Mass Rapid Transit Laluan 2: Sg Buloh – Serdang – Putrajaya Detailed Environmental Impact Assessment
APPENDIX E : SOCIAL SURVEY METHODOLOGY AND FINDINGS
ERE Consulting Group E-19 Issue1.0/April 2015
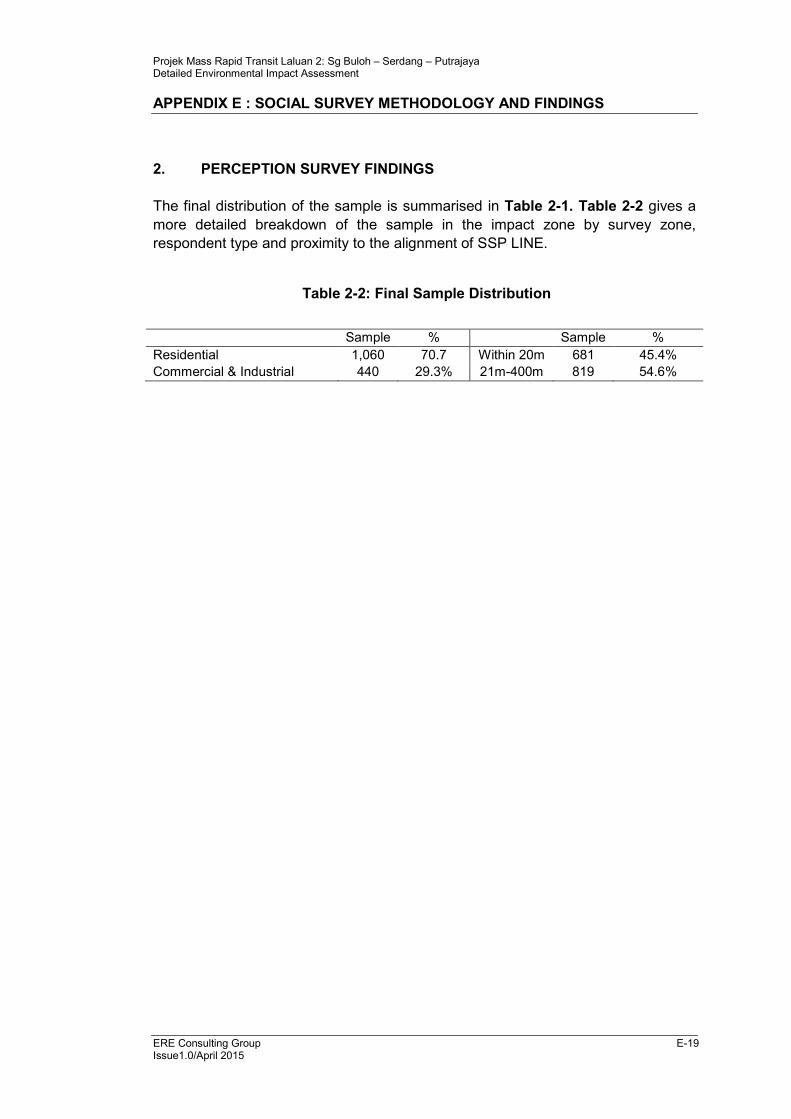
2. PERCEPTION SURVEY FINDINGS
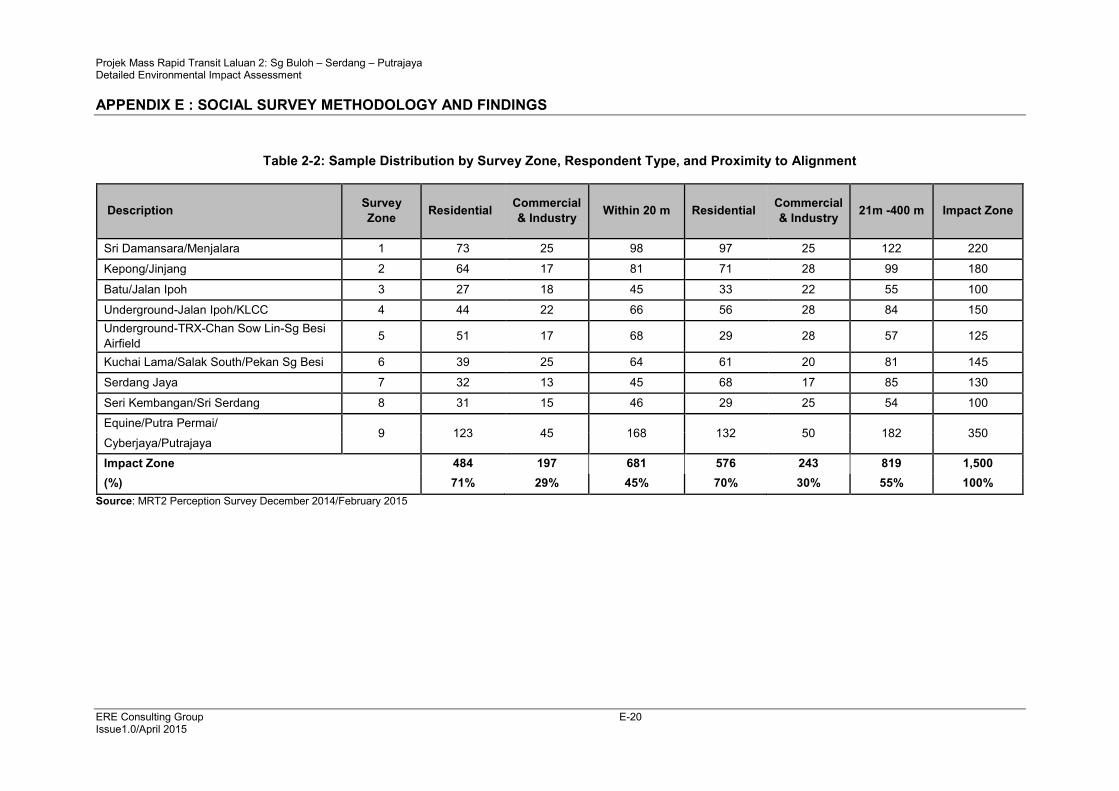
The final distribution of the sample is summarised in Table 2-1. Table 2-2 gives a
more detailed breakdown of the sample in the impact zone by survey zone,
respondent type and proximity to the alignment of SSP LINE.
Table 2-2: Final Sample Distribution
Sample % Sample %
Residential 1,060 70.7 Within 20m 681 45.4%
Commercial & Industrial 440 29.3% 21m-400m 819 54.6%
Projek Mass Rapid Transit Laluan 2: Sg Buloh – Serdang – Putrajaya Detailed Environmental Impact Assessment
APPENDIX E : SOCIAL SURVEY METHODOLOGY AND FINDINGS
ERE Consulting Group E-20 Issue1.0/April 2015
Table 2-2: Sample Distribution by Survey Zone, Respondent Type, and Proximity to Alignment
Description Survey
Zone Residential
Commercial
& Industry Within 20 m Residential
Commercial
& Industry 21m -400 m Impact Zone
Sri Damansara/Menjalara 1 73 25 98 97 25 122 220
Kepong/Jinjang 2 64 17 81 71 28 99 180
Batu/Jalan Ipoh 3 27 18 45 33 22 55 100
Underground-Jalan Ipoh/KLCC 4 44 22 66 56 28 84 150
Underground-TRX-Chan Sow Lin-Sg Besi
Airfield 5 51 17 68 29 28 57 125
Kuchai Lama/Salak South/Pekan Sg Besi 6 39 25 64 61 20 81 145
Serdang Jaya 7 32 13 45 68 17 85 130
Seri Kembangan/Sri Serdang 8 31 15 46 29 25 54 100
Equine/Putra Permai/ 9 123 45 168 132 50 182 350
Cyberjaya/Putrajaya
Impact Zone 484 197 681 576 243 819 1,500
(%) 71% 29% 45% 70% 30% 55% 100%
Source: MRT2 Perception Survey December 2014/February 2015
Projek Mass Rapid Transit Laluan 2: Sg Buloh – Serdang – Putrajaya Detailed Environmental Impact Assessment
APPENDIX E : SOCIAL SURVEY METHODOLOGY AND FINDINGS
ERE Consulting Group E-21 Issue1.0/April 2015
2.1 SURVEY RESPONDENTS’ PROFILE
2.1.1 Ethnic Profile
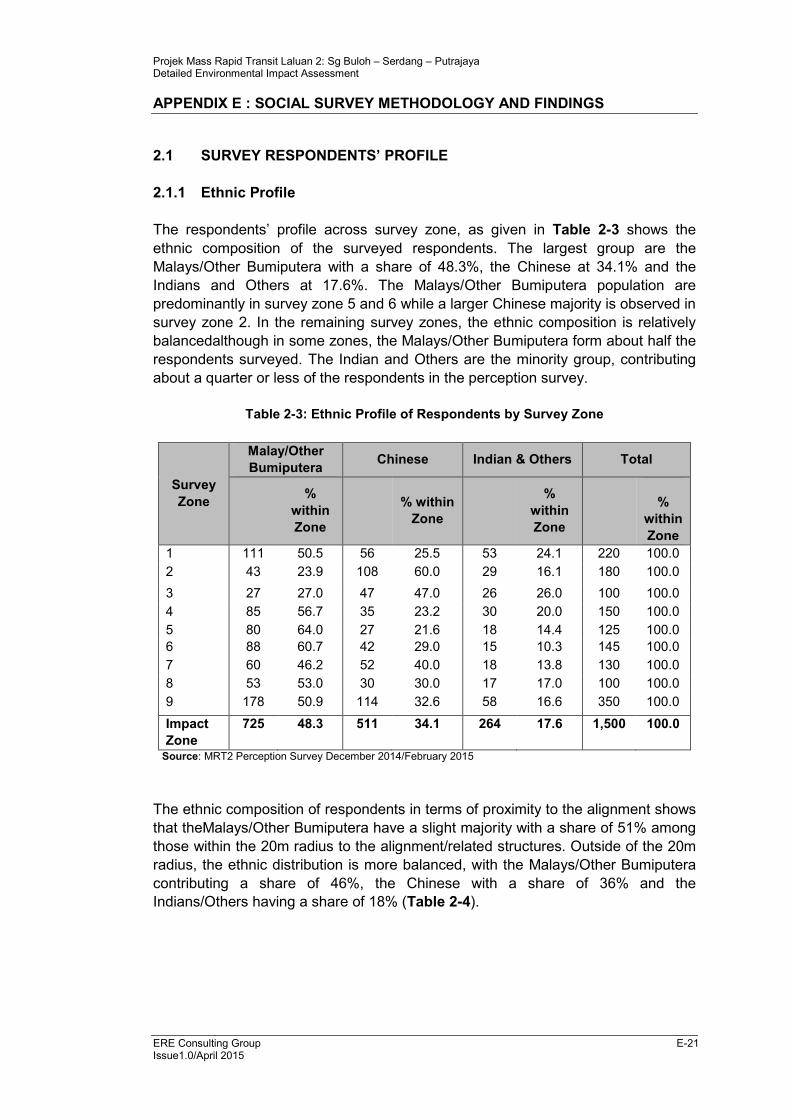
The respondents’ profile across survey zone, as given in Table 2-3 shows the
ethnic composition of the surveyed respondents. The largest group are the
Malays/Other Bumiputera with a share of 48.3%, the Chinese at 34.1% and the
Indians and Others at 17.6%. The Malays/Other Bumiputera population are
predominantly in survey zone 5 and 6 while a larger Chinese majority is observed in
survey zone 2. In the remaining survey zones, the ethnic composition is relatively
balancedalthough in some zones, the Malays/Other Bumiputera form about half the
respondents surveyed. The Indian and Others are the minority group, contributing
about a quarter or less of the respondents in the perception survey.
Table 2-3: Ethnic Profile of Respondents by Survey Zone
Survey
Zone
Malay/Other
Bumiputera Chinese Indian & Others Total
%
within
Zone
% within
Zone
%
within
Zone
%
within
Zone
1 111 50.5 56 25.5 53 24.1 220 100.0
2 43 23.9 108 60.0 29 16.1 180 100.0
3 27 27.0 47 47.0 26 26.0 100 100.0
4 85 56.7 35 23.2 30 20.0 150 100.0
5 80 64.0 27 21.6 18 14.4 125 100.0
6 88 60.7 42 29.0 15 10.3 145 100.0
7 60 46.2 52 40.0 18 13.8 130 100.0
8 53 53.0 30 30.0 17 17.0 100 100.0
9 178 50.9 114 32.6 58 16.6 350 100.0
Impact
Zone
725 48.3 511 34.1 264 17.6 1,500 100.0
Source: MRT2 Perception Survey December 2014/February 2015
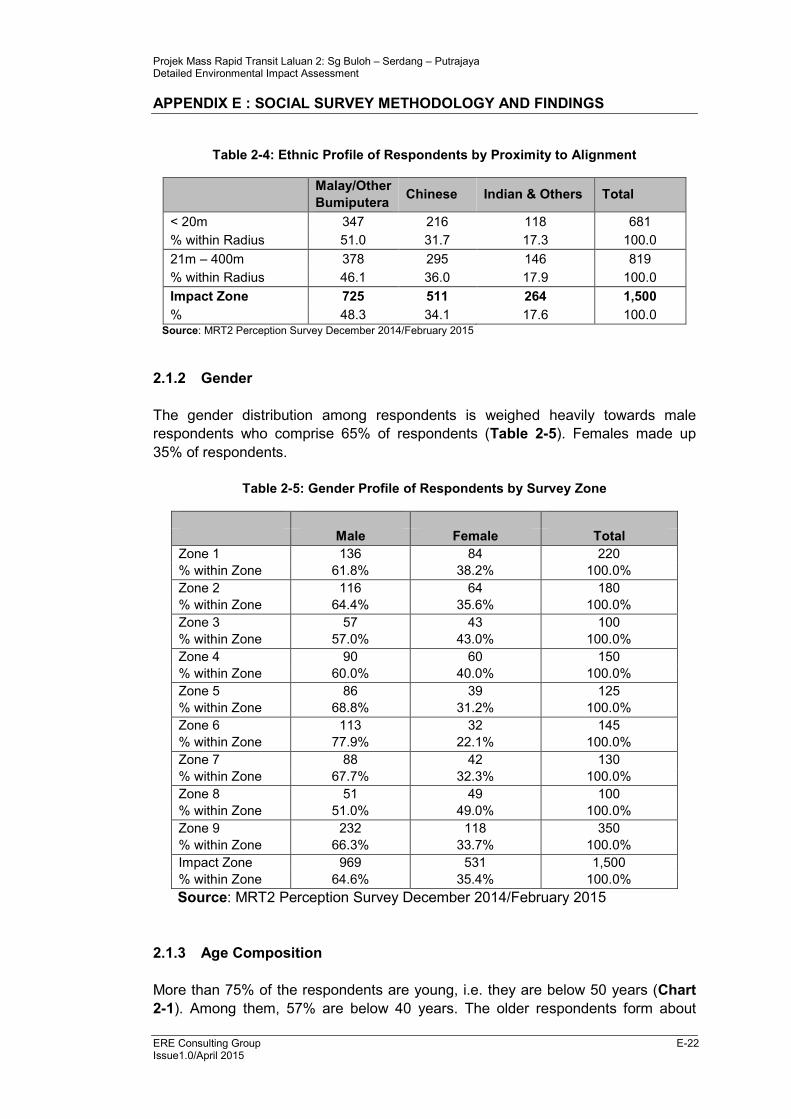
The ethnic composition of respondents in terms of proximity to the alignment shows
that theMalays/Other Bumiputera have a slight majority with a share of 51% among
those within the 20m radius to the alignment/related structures. Outside of the 20m
radius, the ethnic distribution is more balanced, with the Malays/Other Bumiputera
contributing a share of 46%, the Chinese with a share of 36% and the
Indians/Others having a share of 18% (Table 2-4).
Projek Mass Rapid Transit Laluan 2: Sg Buloh – Serdang – Putrajaya Detailed Environmental Impact Assessment
APPENDIX E : SOCIAL SURVEY METHODOLOGY AND FINDINGS
ERE Consulting Group E-22 Issue1.0/April 2015
Table 2-4: Ethnic Profile of Respondents by Proximity to Alignment
Malay/Other
Bumiputera Chinese Indian & Others Total
< 20m 347 216 118 681
% within Radius 51.0 31.7 17.3 100.0
21m – 400m 378 295 146 819
% within Radius 46.1 36.0 17.9 100.0
Impact Zone 725 511 264 1,500
% 48.3 34.1 17.6 100.0 Source: MRT2 Perception Survey December 2014/February 2015
2.1.2 Gender
The gender distribution among respondents is weighed heavily towards male
respondents who comprise 65% of respondents (Table 2-5). Females made up
35% of respondents.
Table 2-5: Gender Profile of Respondents by Survey Zone
Male Female Total
Zone 1 136 84 220
% within Zone 61.8% 38.2% 100.0%
Zone 2 116 64 180
% within Zone 64.4% 35.6% 100.0%
Zone 3 57 43 100
% within Zone 57.0% 43.0% 100.0%
Zone 4 90 60 150
% within Zone 60.0% 40.0% 100.0%
Zone 5 86 39 125
% within Zone 68.8% 31.2% 100.0%
Zone 6 113 32 145
% within Zone 77.9% 22.1% 100.0%
Zone 7 88 42 130
% within Zone 67.7% 32.3% 100.0%
Zone 8 51 49 100
% within Zone 51.0% 49.0% 100.0%
Zone 9 232 118 350
% within Zone 66.3% 33.7% 100.0%
Impact Zone 969 531 1,500
% within Zone 64.6% 35.4% 100.0%
Source: MRT2 Perception Survey December 2014/February 2015
2.1.3 Age Composition
More than 75% of the respondents are young, i.e. they are below 50 years (Chart
2-1). Among them, 57% are below 40 years. The older respondents form about
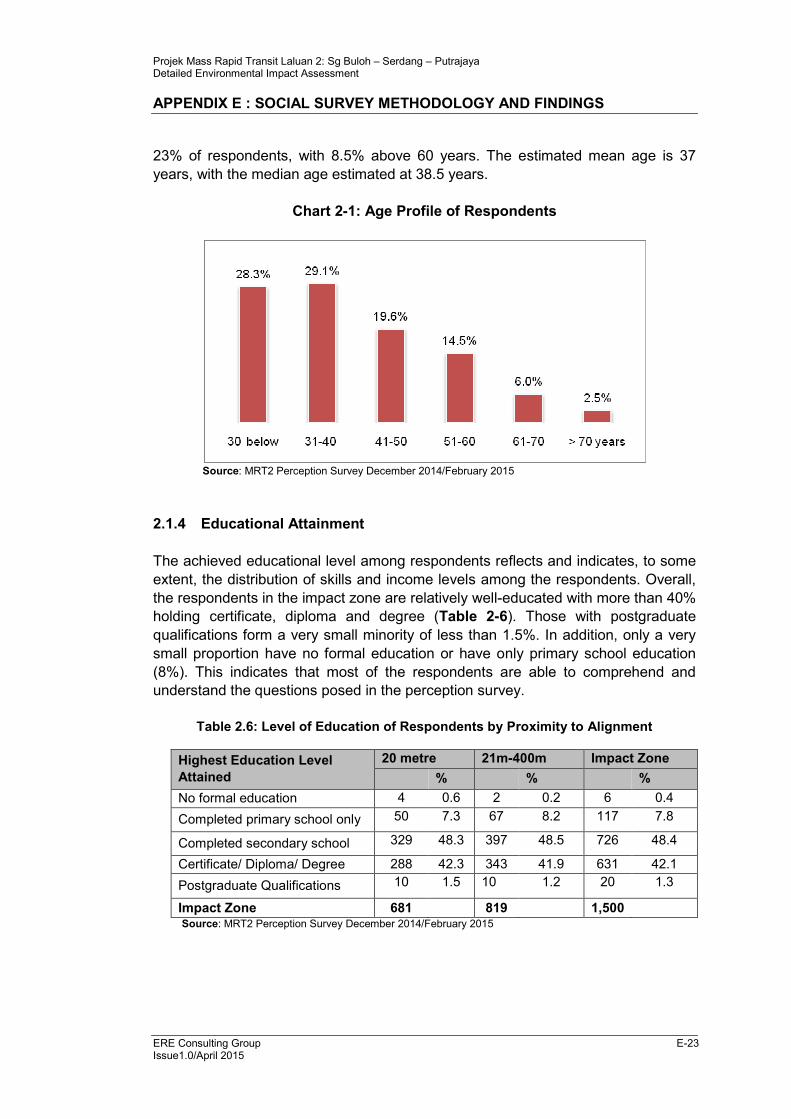
Projek Mass Rapid Transit Laluan 2: Sg Buloh – Serdang – Putrajaya Detailed Environmental Impact Assessment
APPENDIX E : SOCIAL SURVEY METHODOLOGY AND FINDINGS
ERE Consulting Group E-23 Issue1.0/April 2015
23% of respondents, with 8.5% above 60 years. The estimated mean age is 37
years, with the median age estimated at 38.5 years.
Chart 2-1: Age Profile of Respondents
Source: MRT2 Perception Survey December 2014/February 2015
2.1.4 Educational Attainment
The achieved educational level among respondents reflects and indicates, to some
extent, the distribution of skills and income levels among the respondents. Overall,
the respondents in the impact zone are relatively well-educated with more than 40%
holding certificate, diploma and degree (Table 2-6). Those with postgraduate
qualifications form a very small minority of less than 1.5%. In addition, only a very
small proportion have no formal education or have only primary school education
(8%). This indicates that most of the respondents are able to comprehend and
understand the questions posed in the perception survey.
Table 2.6: Level of Education of Respondents by Proximity to Alignment
Highest Education Level
Attained
20 metre 21m-400m Impact Zone
% % %
No formal education 4 0.6 2 0.2 6 0.4
Completed primary school only 50 7.3 67 8.2 117 7.8
Completed secondary school 329 48.3 397 48.5 726 48.4
Certificate/ Diploma/ Degree 288 42.3 343 41.9 631 42.1
Postgraduate Qualifications 10 1.5 10 1.2 20 1.3
Impact Zone 681
819
1,500
Source: MRT2 Perception Survey December 2014/February 2015
Projek Mass Rapid Transit Laluan 2: Sg Buloh – Serdang – Putrajaya Detailed Environmental Impact Assessment
APPENDIX E : SOCIAL SURVEY METHODOLOGY AND FINDINGS
ERE Consulting Group E-24 Issue1.0/April 2015
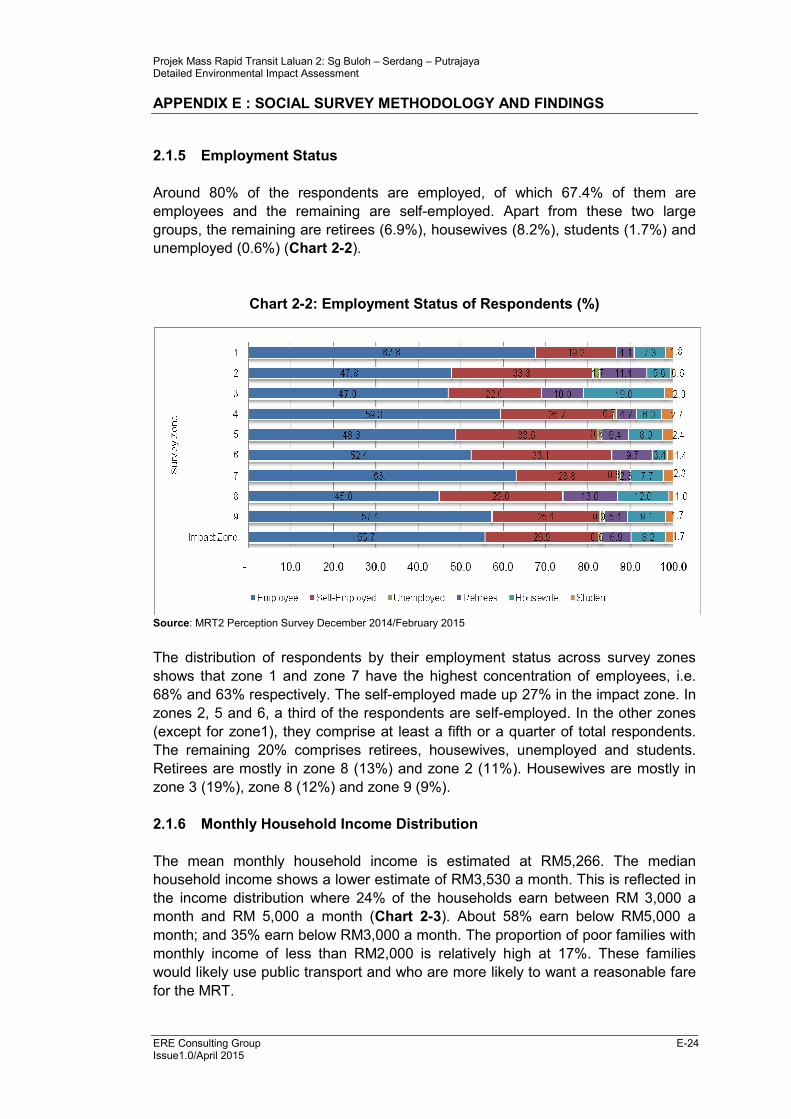
2.1.5 Employment Status
Around 80% of the respondents are employed, of which 67.4% of them are
employees and the remaining are self-employed. Apart from these two large
groups, the remaining are retirees (6.9%), housewives (8.2%), students (1.7%) and
unemployed (0.6%) (Chart 2-2).
Chart 2-2: Employment Status of Respondents (%)
Source: MRT2 Perception Survey December 2014/February 2015
The distribution of respondents by their employment status across survey zones
shows that zone 1 and zone 7 have the highest concentration of employees, i.e.
68% and 63% respectively. The self-employed made up 27% in the impact zone. In
zones 2, 5 and 6, a third of the respondents are self-employed. In the other zones
(except for zone1), they comprise at least a fifth or a quarter of total respondents.
The remaining 20% comprises retirees, housewives, unemployed and students.
Retirees are mostly in zone 8 (13%) and zone 2 (11%). Housewives are mostly in
zone 3 (19%), zone 8 (12%) and zone 9 (9%).
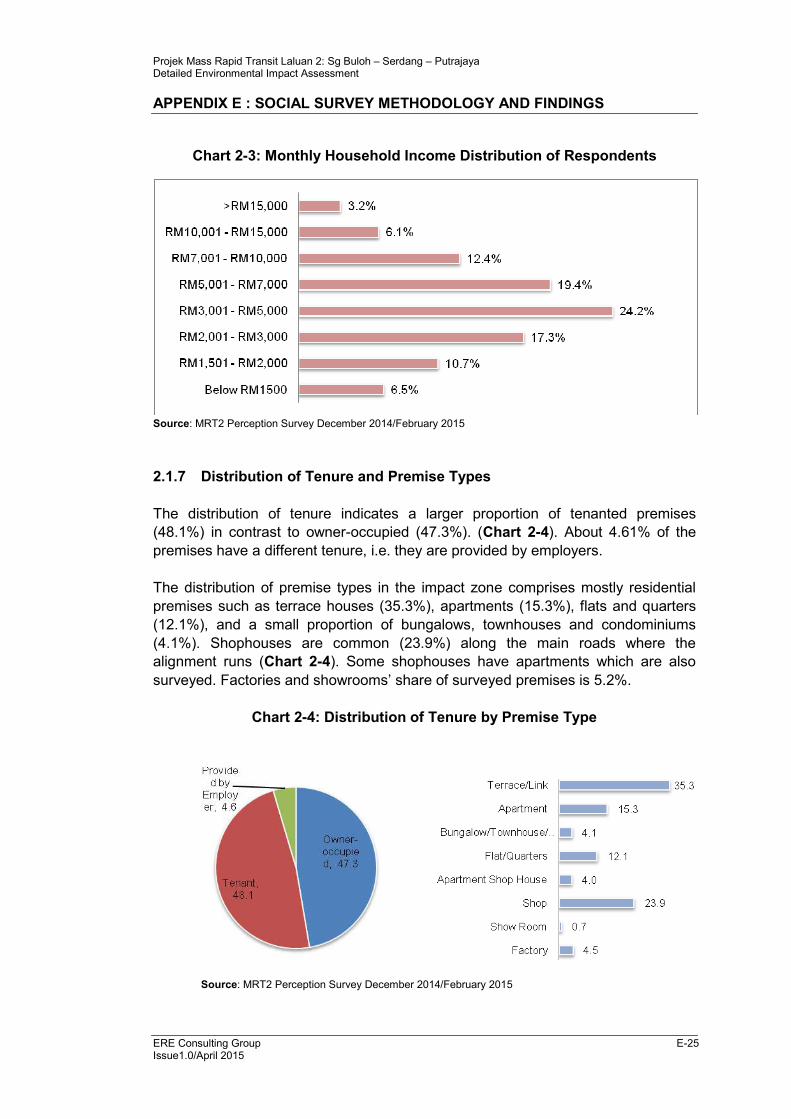
2.1.6 Monthly Household Income Distribution
The mean monthly household income is estimated at RM5,266. The median
household income shows a lower estimate of RM3,530 a month. This is reflected in
the income distribution where 24% of the households earn between RM 3,000 a
month and RM 5,000 a month (Chart 2-3). About 58% earn below RM5,000 a
month; and 35% earn below RM3,000 a month. The proportion of poor families with
monthly income of less than RM2,000 is relatively high at 17%. These families
would likely use public transport and who are more likely to want a reasonable fare
for the MRT.
Projek Mass Rapid Transit Laluan 2: Sg Buloh – Serdang – Putrajaya Detailed Environmental Impact Assessment
APPENDIX E : SOCIAL SURVEY METHODOLOGY AND FINDINGS
ERE Consulting Group E-25 Issue1.0/April 2015
Chart 2-3: Monthly Household Income Distribution of Respondents
Source: MRT2 Perception Survey December 2014/February 2015
2.1.7 Distribution of Tenure and Premise Types
The distribution of tenure indicates a larger proportion of tenanted premises
(48.1%) in contrast to owner-occupied (47.3%). (Chart 2-4). About 4.61% of the
premises have a different tenure, i.e. they are provided by employers.
The distribution of premise types in the impact zone comprises mostly residential
premises such as terrace houses (35.3%), apartments (15.3%), flats and quarters
(12.1%), and a small proportion of bungalows, townhouses and condominiums
(4.1%). Shophouses are common (23.9%) along the main roads where the
alignment runs (Chart 2-4). Some shophouses have apartments which are also
surveyed. Factories and showrooms’ share of surveyed premises is 5.2%.
Chart 2-4: Distribution of Tenure by Premise Type
Source: MRT2 Perception Survey December 2014/February 2015
Projek Mass Rapid Transit Laluan 2: Sg Buloh – Serdang – Putrajaya Detailed Environmental Impact Assessment
APPENDIX E : SOCIAL SURVEY METHODOLOGY AND FINDINGS
ERE Consulting Group E-26 Issue1.0/April 2015
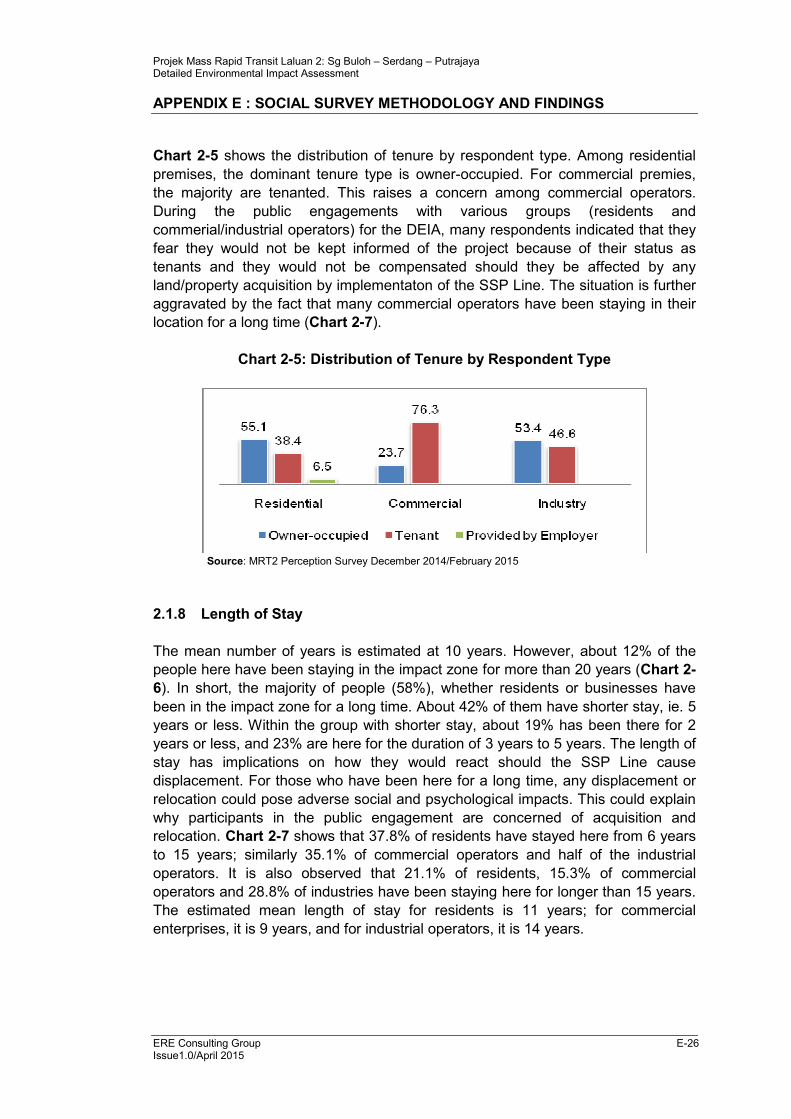
Chart 2-5 shows the distribution of tenure by respondent type. Among residential
premises, the dominant tenure type is owner-occupied. For commercial premies,
the majority are tenanted. This raises a concern among commercial operators.
During the public engagements with various groups (residents and
commerial/industrial operators) for the DEIA, many respondents indicated that they
fear they would not be kept informed of the project because of their status as
tenants and they would not be compensated should they be affected by any
land/property acquisition by implementaton of the SSP Line. The situation is further
aggravated by the fact that many commercial operators have been staying in their
location for a long time (Chart 2-7).
Chart 2-5: Distribution of Tenure by Respondent Type
Source: MRT2 Perception Survey December 2014/February 2015
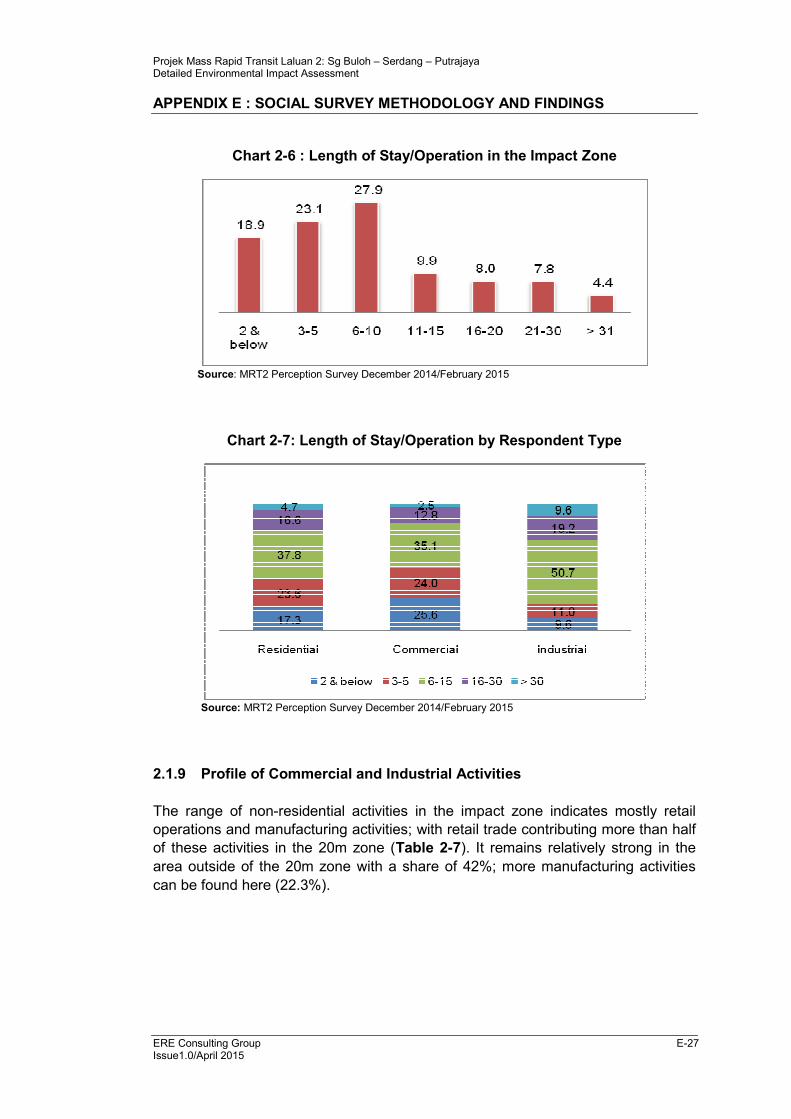
2.1.8 Length of Stay
The mean number of years is estimated at 10 years. However, about 12% of the
people here have been staying in the impact zone for more than 20 years (Chart 2-
6). In short, the majority of people (58%), whether residents or businesses have
been in the impact zone for a long time. About 42% of them have shorter stay, ie. 5
years or less. Within the group with shorter stay, about 19% has been there for 2
years or less, and 23% are here for the duration of 3 years to 5 years. The length of
stay has implications on how they would react should the SSP Line cause
displacement. For those who have been here for a long time, any displacement or
relocation could pose adverse social and psychological impacts. This could explain
why participants in the public engagement are concerned of acquisition and
relocation. Chart 2-7 shows that 37.8% of residents have stayed here from 6 years
to 15 years; similarly 35.1% of commercial operators and half of the industrial
operators. It is also observed that 21.1% of residents, 15.3% of commercial
operators and 28.8% of industries have been staying here for longer than 15 years.
The estimated mean length of stay for residents is 11 years; for commercial
enterprises, it is 9 years, and for industrial operators, it is 14 years.
Projek Mass Rapid Transit Laluan 2: Sg Buloh – Serdang – Putrajaya Detailed Environmental Impact Assessment
APPENDIX E : SOCIAL SURVEY METHODOLOGY AND FINDINGS
ERE Consulting Group E-27 Issue1.0/April 2015
Chart 2-6 : Length of Stay/Operation in the Impact Zone
Source: MRT2 Perception Survey December 2014/February 2015
Chart 2-7: Length of Stay/Operation by Respondent Type
Source: MRT2 Perception Survey December 2014/February 2015
2.1.9 Profile of Commercial and Industrial Activities
The range of non-residential activities in the impact zone indicates mostly retail
operations and manufacturing activities; with retail trade contributing more than half
of these activities in the 20m zone (Table 2-7). It remains relatively strong in the
area outside of the 20m zone with a share of 42%; more manufacturing activities
can be found here (22.3%).
Projek Mass Rapid Transit Laluan 2: Sg Buloh – Serdang – Putrajaya Detailed Environmental Impact Assessment
APPENDIX E : SOCIAL SURVEY METHODOLOGY AND FINDINGS
ERE Consulting Group E-28 Issue1.0/April 2015
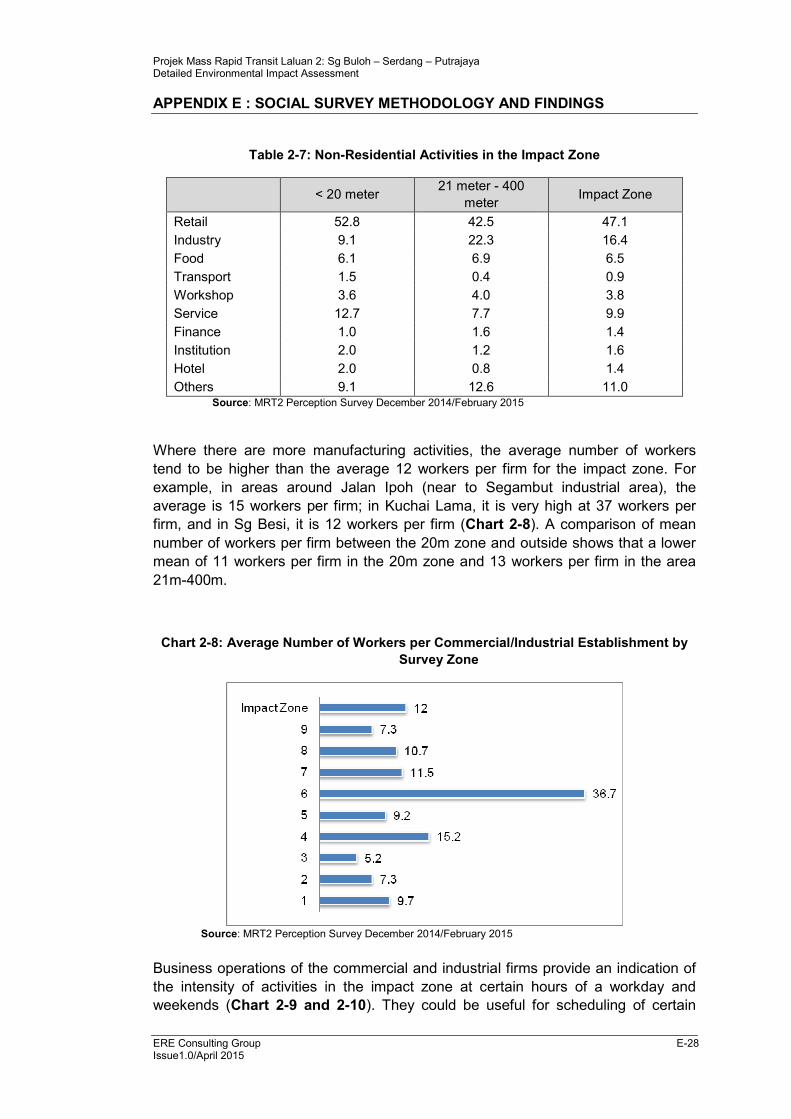
Table 2-7: Non-Residential Activities in the Impact Zone
< 20 meter
21 meter - 400
meter Impact Zone
Retail 52.8 42.5 47.1
Industry 9.1 22.3 16.4
Food 6.1 6.9 6.5
Transport 1.5 0.4 0.9
Workshop 3.6 4.0 3.8
Service 12.7 7.7 9.9
Finance 1.0 1.6 1.4
Institution 2.0 1.2 1.6
Hotel 2.0 0.8 1.4
Others 9.1 12.6 11.0 Source: MRT2 Perception Survey December 2014/February 2015
Where there are more manufacturing activities, the average number of workers
tend to be higher than the average 12 workers per firm for the impact zone. For
example, in areas around Jalan Ipoh (near to Segambut industrial area), the
average is 15 workers per firm; in Kuchai Lama, it is very high at 37 workers per
firm, and in Sg Besi, it is 12 workers per firm (Chart 2-8). A comparison of mean
number of workers per firm between the 20m zone and outside shows that a lower
mean of 11 workers per firm in the 20m zone and 13 workers per firm in the area
21m-400m.
Chart 2-8: Average Number of Workers per Commercial/Industrial Establishment by
Survey Zone
Source: MRT2 Perception Survey December 2014/February 2015
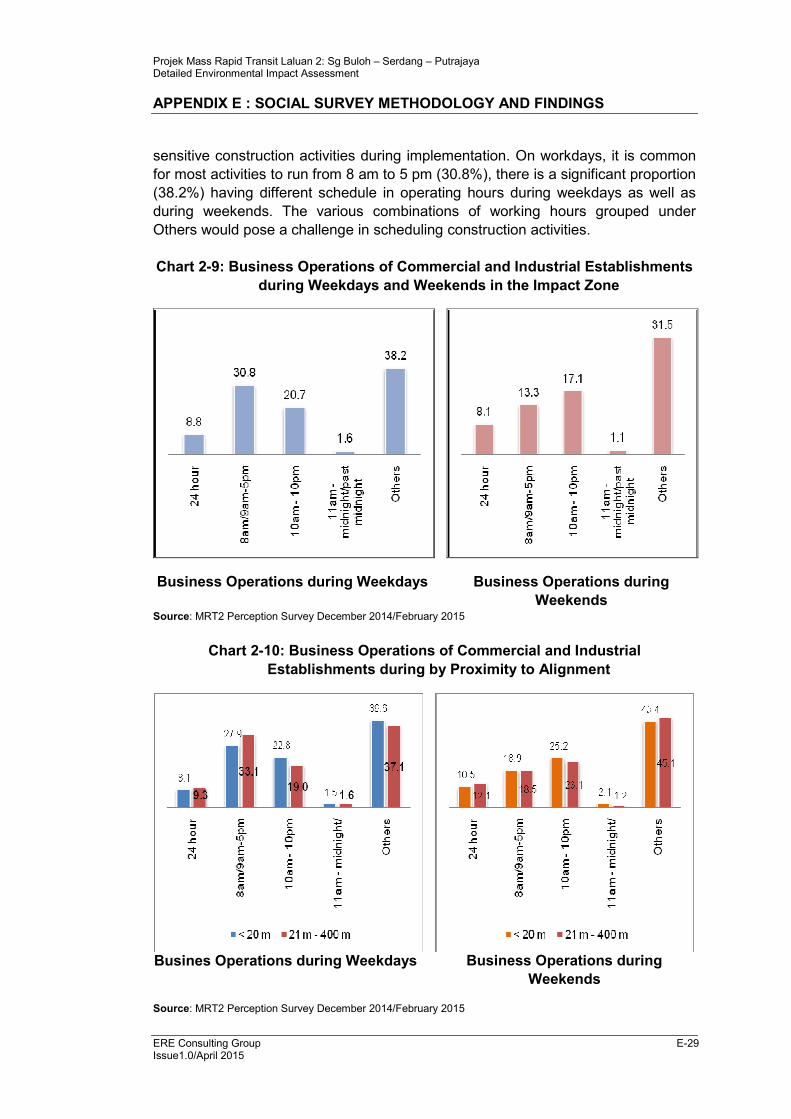
Business operations of the commercial and industrial firms provide an indication of
the intensity of activities in the impact zone at certain hours of a workday and
weekends (Chart 2-9 and 2-10). They could be useful for scheduling of certain
Projek Mass Rapid Transit Laluan 2: Sg Buloh – Serdang – Putrajaya Detailed Environmental Impact Assessment
APPENDIX E : SOCIAL SURVEY METHODOLOGY AND FINDINGS
ERE Consulting Group E-29 Issue1.0/April 2015
sensitive construction activities during implementation. On workdays, it is common
for most activities to run from 8 am to 5 pm (30.8%), there is a significant proportion
(38.2%) having different schedule in operating hours during weekdays as well as
during weekends. The various combinations of working hours grouped under
Others would pose a challenge in scheduling construction activities.
Chart 2-9: Business Operations of Commercial and Industrial Establishments
during Weekdays and Weekends in the Impact Zone
Business Operations during Weekdays
Business Operations during
Weekends Source: MRT2 Perception Survey December 2014/February 2015
Chart 2-10: Business Operations of Commercial and Industrial
Establishments during by Proximity to Alignment
Busines Operations during Weekdays Business Operations during
Weekends
Source: MRT2 Perception Survey December 2014/February 2015
Projek Mass Rapid Transit Laluan 2: Sg Buloh – Serdang – Putrajaya Detailed Environmental Impact Assessment
APPENDIX E : SOCIAL SURVEY METHODOLOGY AND FINDINGS
ERE Consulting Group E-30 Issue1.0/April 2015
2.1.10 Mode of Transport to Major Destinations and Travel Time
The observations on mode of transport provide a background on how people
staying in the impact zone travel, the mode of transport they frequently use and
their use of public transport. The latter is important for this study as it indicates the
extent to which people have turned to public transport in their daily commute.
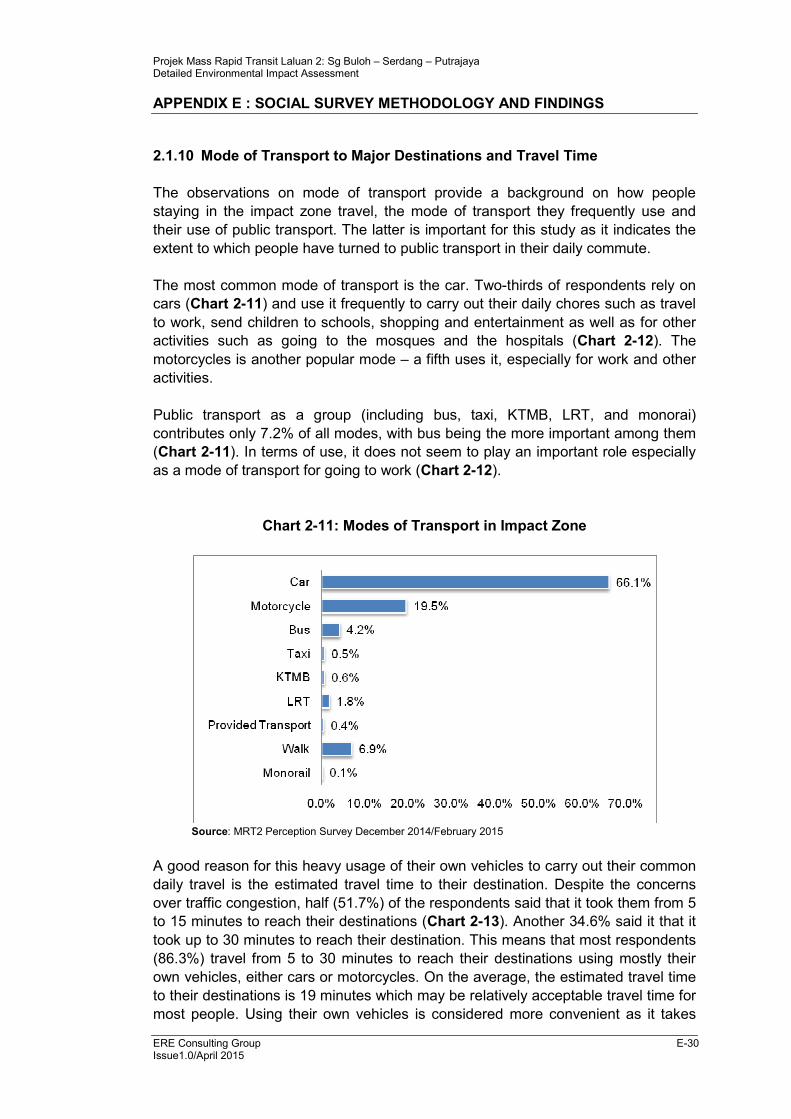
The most common mode of transport is the car. Two-thirds of respondents rely on
cars (Chart 2-11) and use it frequently to carry out their daily chores such as travel
to work, send children to schools, shopping and entertainment as well as for other
activities such as going to the mosques and the hospitals (Chart 2-12). The
motorcycles is another popular mode – a fifth uses it, especially for work and other
activities.
Public transport as a group (including bus, taxi, KTMB, LRT, and monorai)
contributes only 7.2% of all modes, with bus being the more important among them
(Chart 2-11). In terms of use, it does not seem to play an important role especially
as a mode of transport for going to work (Chart 2-12).
Chart 2-11: Modes of Transport in Impact Zone
Source: MRT2 Perception Survey December 2014/February 2015
A good reason for this heavy usage of their own vehicles to carry out their common
daily travel is the estimated travel time to their destination. Despite the concerns
over traffic congestion, half (51.7%) of the respondents said that it took them from 5
to 15 minutes to reach their destinations (Chart 2-13). Another 34.6% said it that it
took up to 30 minutes to reach their destination. This means that most respondents
(86.3%) travel from 5 to 30 minutes to reach their destinations using mostly their
own vehicles, either cars or motorcycles. On the average, the estimated travel time
to their destinations is 19 minutes which may be relatively acceptable travel time for
most people. Using their own vehicles is considered more convenient as it takes

Projek Mass Rapid Transit Laluan 2: Sg Buloh – Serdang – Putrajaya Detailed Environmental Impact Assessment
APPENDIX E : SOCIAL SURVEY METHODOLOGY AND FINDINGS
ERE Consulting Group E-31 Issue1.0/April 2015
them directly to doorsteps of their destinations and back home, without having to
wait for a transport to arrive. Only about 13% took longer, up to 45 minutes/an hour
to reach their destinations. Less than 1% travel more than an hour to reach their
destinations.
Chart 2-12: Purpose of Travel in Impact Zone
Source: MRT2 Perception Survey December 2014/February 2015
Chart 2-13: Travel Time
Source: MRT2 Perception Survey December 2014/February 2015
2.1.11 Usage of Public Transport
Respondents in the impact zone were asked to indicate their use of public transport
in order to gauge the level of use at this point in time. The findings show that the
majority do not use public transport as a norm. Across all modes of public transport,
the use is occassional.
Projek Mass Rapid Transit Laluan 2: Sg Buloh – Serdang – Putrajaya Detailed Environmental Impact Assessment
APPENDIX E : SOCIAL SURVEY METHODOLOGY AND FINDINGS
ERE Consulting Group E-32 Issue1.0/April 2015
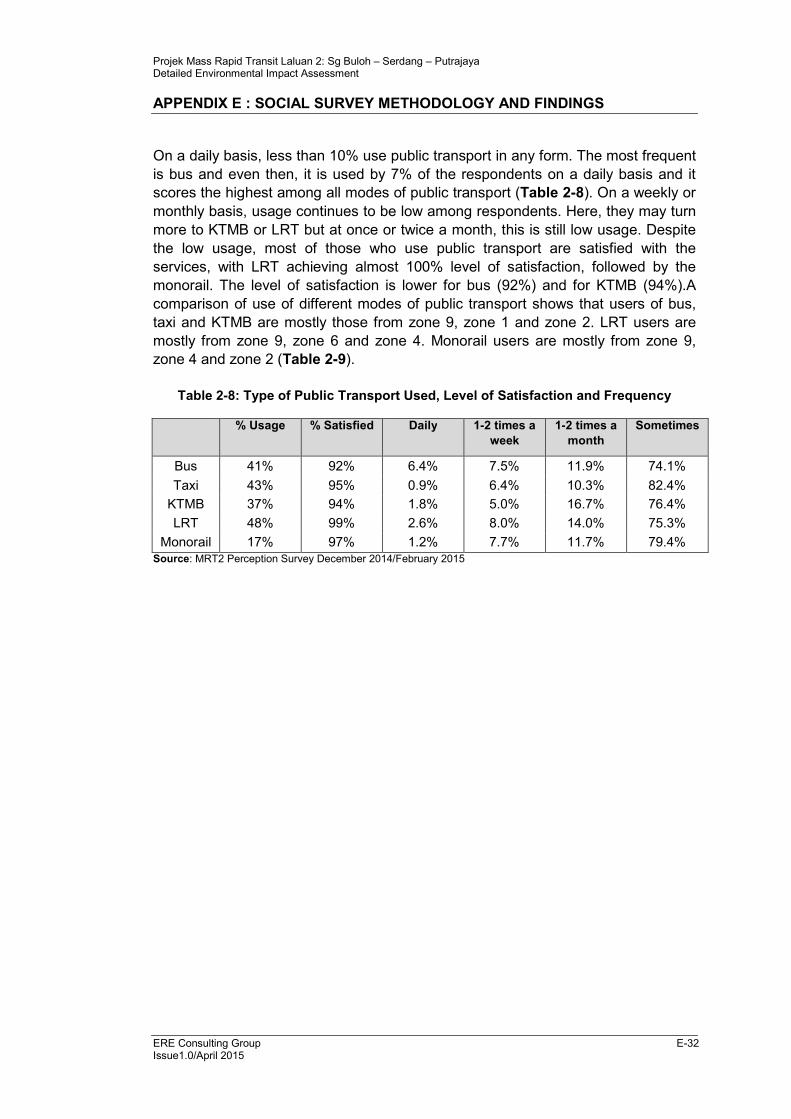
On a daily basis, less than 10% use public transport in any form. The most frequent
is bus and even then, it is used by 7% of the respondents on a daily basis and it
scores the highest among all modes of public transport (Table 2-8). On a weekly or
monthly basis, usage continues to be low among respondents. Here, they may turn
more to KTMB or LRT but at once or twice a month, this is still low usage. Despite
the low usage, most of those who use public transport are satisfied with the
services, with LRT achieving almost 100% level of satisfaction, followed by the
monorail. The level of satisfaction is lower for bus (92%) and for KTMB (94%).A
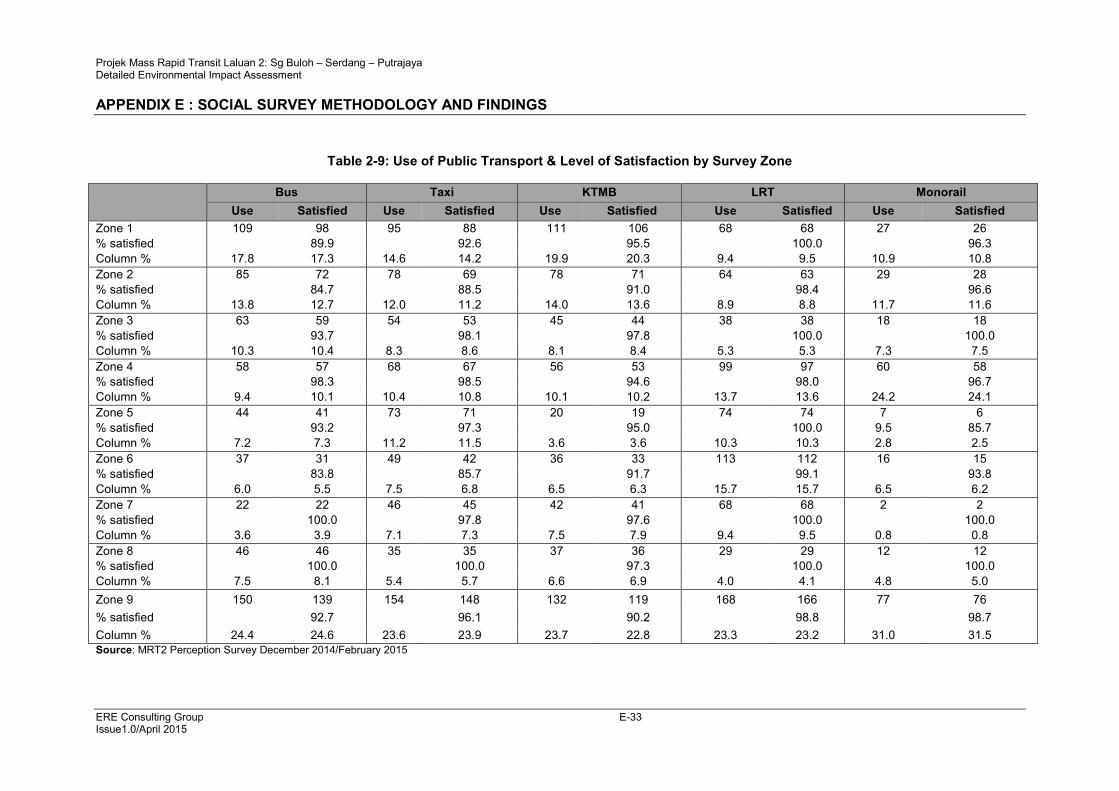
comparison of use of different modes of public transport shows that users of bus,
taxi and KTMB are mostly those from zone 9, zone 1 and zone 2. LRT users are
mostly from zone 9, zone 6 and zone 4. Monorail users are mostly from zone 9,
zone 4 and zone 2 (Table 2-9).
Table 2-8: Type of Public Transport Used, Level of Satisfaction and Frequency
% Usage % Satisfied Daily 1-2 times a
week
1-2 times a
month
Sometimes
Bus 41% 92% 6.4% 7.5% 11.9% 74.1%
Taxi 43% 95% 0.9% 6.4% 10.3% 82.4%
KTMB 37% 94% 1.8% 5.0% 16.7% 76.4%
LRT 48% 99% 2.6% 8.0% 14.0% 75.3%
Monorail 17% 97% 1.2% 7.7% 11.7% 79.4%
Source: MRT2 Perception Survey December 2014/February 2015
Projek Mass Rapid Transit Laluan 2: Sg Buloh – Serdang – Putrajaya Detailed Environmental Impact Assessment
APPENDIX E : SOCIAL SURVEY METHODOLOGY AND FINDINGS
ERE Consulting Group E-33 Issue1.0/April 2015
Table 2-9: Use of Public Transport & Level of Satisfaction by Survey Zone
Bus Taxi KTMB LRT Monorail
Use Satisfied Use Satisfied Use Satisfied Use Satisfied Use Satisfied
Zone 1 109 98 95 88 111 106 68 68 27 26
% satisfied 89.9 92.6 95.5 100.0 96.3
Column % 17.8 17.3 14.6 14.2 19.9 20.3 9.4 9.5 10.9 10.8
Zone 2 85 72 78 69 78 71 64 63 29 28
% satisfied 84.7 88.5 91.0 98.4 96.6
Column % 13.8 12.7 12.0 11.2 14.0 13.6 8.9 8.8 11.7 11.6
Zone 3 63 59 54 53 45 44 38 38 18 18
% satisfied 93.7 98.1 97.8 100.0 100.0
Column % 10.3 10.4 8.3 8.6 8.1 8.4 5.3 5.3 7.3 7.5
Zone 4 58 57 68 67 56 53 99 97 60 58
% satisfied 98.3 98.5 94.6 98.0 96.7
Column % 9.4 10.1 10.4 10.8 10.1 10.2 13.7 13.6 24.2 24.1
Zone 5 44 41 73 71 20 19 74 74 7 6
% satisfied 93.2 97.3 95.0 100.0 9.5 85.7
Column % 7.2 7.3 11.2 11.5 3.6 3.6 10.3 10.3 2.8 2.5
Zone 6 37 31 49 42 36 33 113 112 16 15
% satisfied 83.8 85.7 91.7 99.1 93.8
Column % 6.0 5.5 7.5 6.8 6.5 6.3 15.7 15.7 6.5 6.2
Zone 7 22 22 46 45 42 41 68 68 2 2
% satisfied 100.0 97.8 97.6 100.0 100.0
Column % 3.6 3.9 7.1 7.3 7.5 7.9 9.4 9.5 0.8 0.8
Zone 8 46 46 35 35 37 36 29 29 12 12
% satisfied 100.0 100.0 97.3 100.0 100.0
Column % 7.5 8.1 5.4 5.7 6.6 6.9 4.0 4.1 4.8 5.0
Zone 9 150 139 154 148 132 119 168 166 77 76
% satisfied 92.7 96.1 90.2 98.8 98.7
Column % 24.4 24.6 23.6 23.9 23.7 22.8 23.3 23.2 31.0 31.5
Source: MRT2 Perception Survey December 2014/February 2015
Projek Mass Rapid Transit Laluan 2: Sg Buloh – Serdang – Putrajaya Detailed Environmental Impact Assessment
APPENDIX E : SOCIAL SURVEY METHODOLOGY AND FINDINGS
ERE Consulting Group E-34 Issue1.0/April 2015
2.2 SATISFACTION WITH NEIGHBOURHOOD AND ITS ENVIRONMENT
2.2.1 Satisfaction with Overall Neighbourhood
The respondents’ satisfaction with their neighbourhood affects how they would
react to the presence of the proposed SSP Line, especially if it is to traverse
through their residential and commercial areas. Their satisfaction level is checked
against seven (7) neighbourhood parameters, i.e. (1) overall neighbourhood, (2)
location, (3) access to public transportation, (4) access to major roads or highways,
(5) safety and security of their neighbourhoods, (6) cleanliness of their
neighbourhoods, and (7) community cohesiveness.
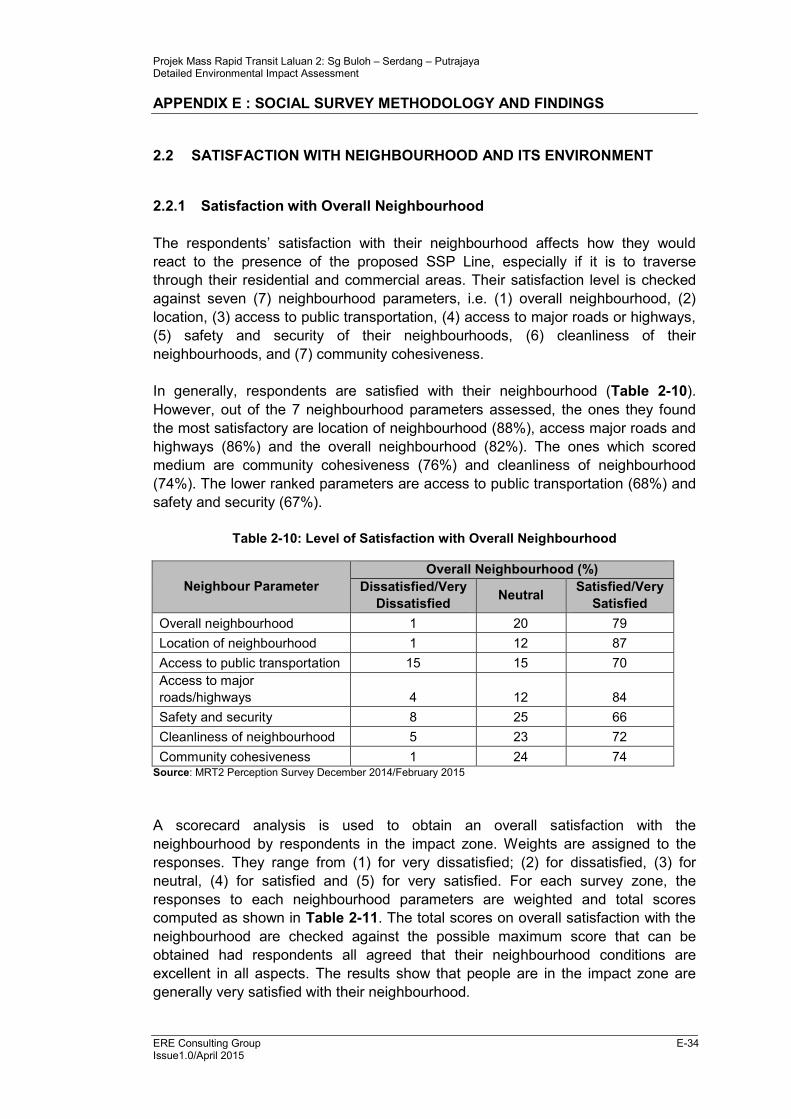
In generally, respondents are satisfied with their neighbourhood (Table 2-10).
However, out of the 7 neighbourhood parameters assessed, the ones they found
the most satisfactory are location of neighbourhood (88%), access major roads and
highways (86%) and the overall neighbourhood (82%). The ones which scored
medium are community cohesiveness (76%) and cleanliness of neighbourhood
(74%). The lower ranked parameters are access to public transportation (68%) and
safety and security (67%).
Table 2-10: Level of Satisfaction with Overall Neighbourhood
Neighbour Parameter
Overall Neighbourhood (%)
Dissatisfied/Very
Dissatisfied Neutral
Satisfied/Very
Satisfied
Overall neighbourhood 1 20 79
Location of neighbourhood 1 12 87
Access to public transportation 15 15 70
Access to major
roads/highways 4 12 84
Safety and security 8 25 66
Cleanliness of neighbourhood 5 23 72
Community cohesiveness 1 24 74 Source: MRT2 Perception Survey December 2014/February 2015
A scorecard analysis is used to obtain an overall satisfaction with the
neighbourhood by respondents in the impact zone. Weights are assigned to the
responses. They range from (1) for very dissatisfied; (2) for dissatisfied, (3) for
neutral, (4) for satisfied and (5) for very satisfied. For each survey zone, the
responses to each neighbourhood parameters are weighted and total scores
computed as shown in Table 2-11. The total scores on overall satisfaction with the
neighbourhood are checked against the possible maximum score that can be
obtained had respondents all agreed that their neighbourhood conditions are
excellent in all aspects. The results show that people are in the impact zone are
generally very satisfied with their neighbourhood.
Projek Mass Rapid Transit Laluan 2: Sg Buloh – Serdang – Putrajaya Detailed Environmental Impact Assessment
APPENDIX E : SOCIAL SURVEY METHODOLOGY AND FINDINGS
ERE Consulting Group E-35 Issue1.0/April 2015
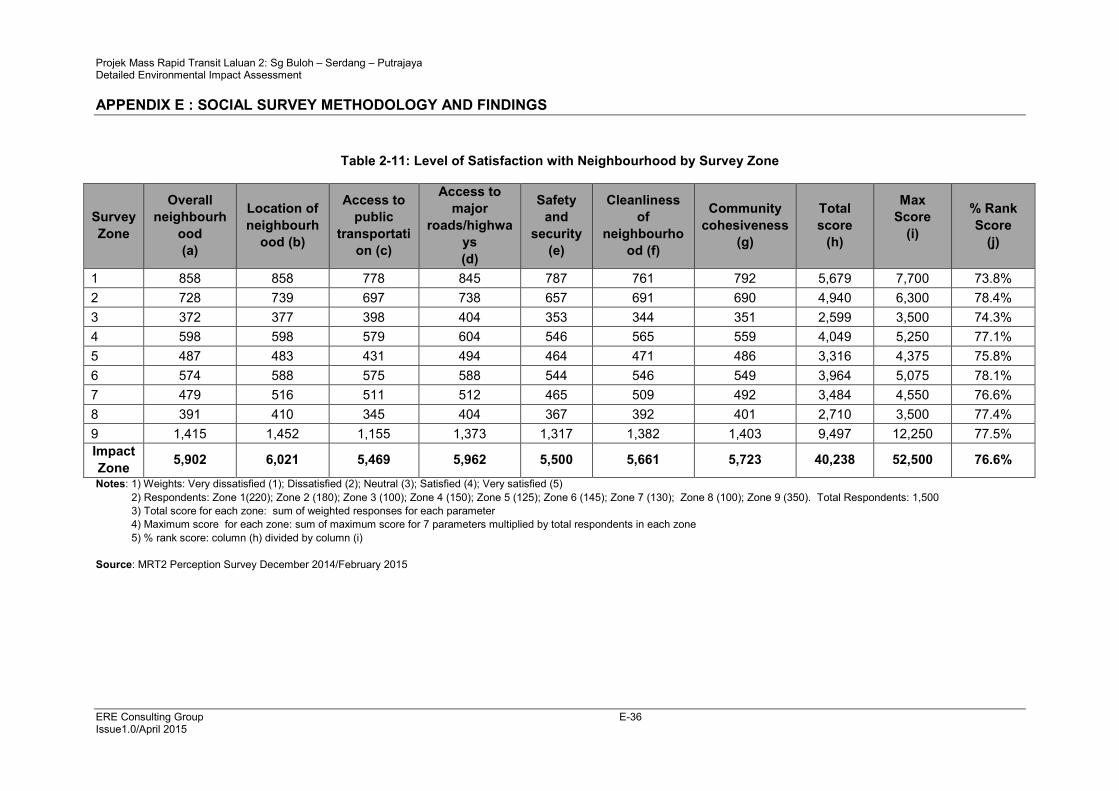
The average score is above 75% (76.6%); in most areas, the scores are relatively
high. The lowest is in zone 1 which is the Sri Damansara/Menjalara area with a
score of 73.8% that indicates dissatisfaction with cleanliness and poor access to
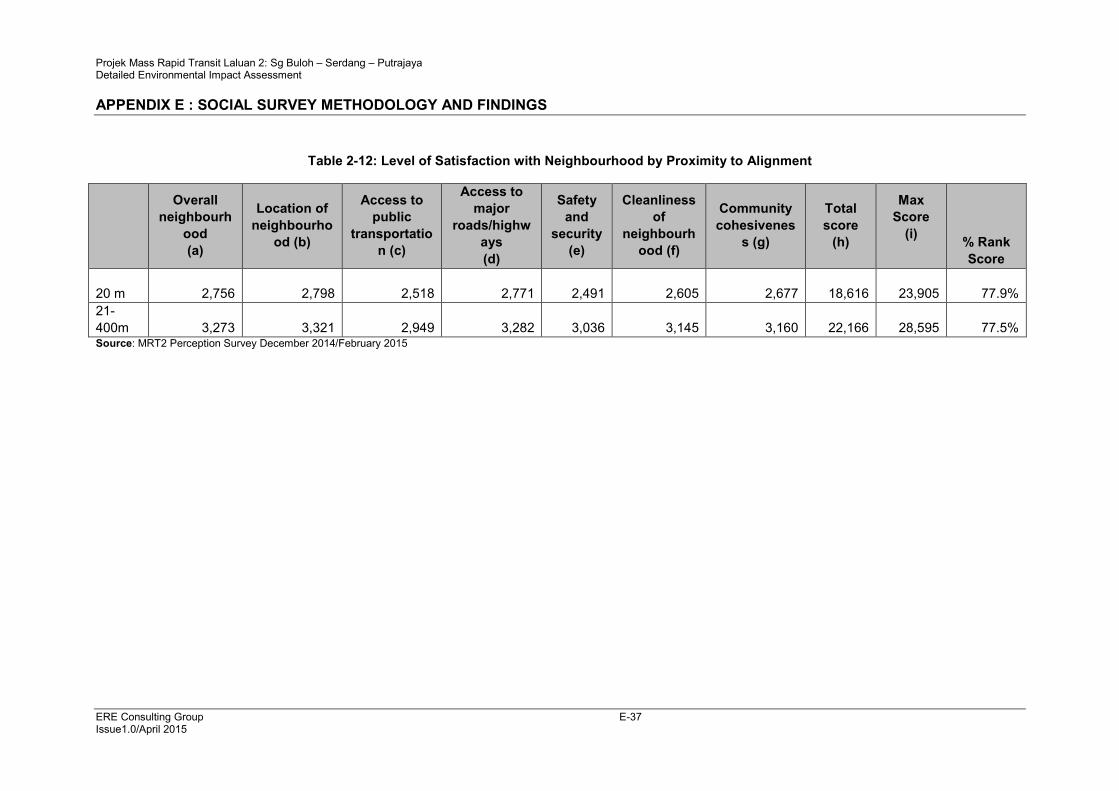
public transportation (Table 2-11). A comparison of rank scores in terms of
proximity to the alignment show that overall satisfaction with neighbourhood
remains relatively high at around 78% regardless of whether people stay near or far
from the alignment (Table 2-12).
Projek Mass Rapid Transit Laluan 2: Sg Buloh – Serdang – Putrajaya Detailed Environmental Impact Assessment
APPENDIX E : SOCIAL SURVEY METHODOLOGY AND FINDINGS
ERE Consulting Group E-36 Issue1.0/April 2015
Table 2-11: Level of Satisfaction with Neighbourhood by Survey Zone
Survey
Zone
Overall
neighbourh
ood
(a)
Location of
neighbourh
ood (b)
Access to
public
transportati
on (c)
Access to
major
roads/highwa
ys
(d)
Safety
and
security
(e)
Cleanliness
of
neighbourho
od (f)
Community
cohesiveness
(g)
Total
score
(h)
Max
Score
(i)
% Rank
Score
(j)
1 858 858 778 845 787 761 792 5,679 7,700 73.8%
2 728 739 697 738 657 691 690 4,940 6,300 78.4%
3 372 377 398 404 353 344 351 2,599 3,500 74.3%
4 598 598 579 604 546 565 559 4,049 5,250 77.1%
5 487 483 431 494 464 471 486 3,316 4,375 75.8%
6 574 588 575 588 544 546 549 3,964 5,075 78.1%
7 479 516 511 512 465 509 492 3,484 4,550 76.6%
8 391 410 345 404 367 392 401 2,710 3,500 77.4%
9 1,415 1,452 1,155 1,373 1,317 1,382 1,403 9,497 12,250 77.5%
Impact
Zone 5,902 6,021 5,469 5,962 5,500 5,661 5,723 40,238 52,500 76.6%
Notes: 1) Weights: Very dissatisfied (1); Dissatisfied (2); Neutral (3); Satisfied (4); Very satisfied (5)
2) Respondents: Zone 1(220); Zone 2 (180); Zone 3 (100); Zone 4 (150); Zone 5 (125); Zone 6 (145); Zone 7 (130); Zone 8 (100); Zone 9 (350). Total Respondents: 1,500
3) Total score for each zone: sum of weighted responses for each parameter
4) Maximum score for each zone: sum of maximum score for 7 parameters multiplied by total respondents in each zone
5) % rank score: column (h) divided by column (i)
Source: MRT2 Perception Survey December 2014/February 2015
Projek Mass Rapid Transit Laluan 2: Sg Buloh – Serdang – Putrajaya Detailed Environmental Impact Assessment
APPENDIX E : SOCIAL SURVEY METHODOLOGY AND FINDINGS
ERE Consulting Group E-37 Issue1.0/April 2015
Table 2-12: Level of Satisfaction with Neighbourhood by Proximity to Alignment
Overall
neighbourh
ood
(a)
Location of
neighbourho
od (b)
Access to
public
transportatio
n (c)
Access to
major
roads/highw
ays
(d)
Safety
and
security
(e)
Cleanliness
of
neighbourh
ood (f)
Community
cohesivenes
s (g)
Total
score
(h)
Max
Score
(i)
% Rank
Score
20 m 2,756 2,798 2,518 2,771
2,491 2,605 2,677
18,616
23,905 77.9%
21-
400m 3,273 3,321 2,949 3,282
3,036 3,145 3,160
22,166
28,595 77.5% Source: MRT2 Perception Survey December 2014/February 2015
Projek Mass Rapid Transit Laluan 2: Sg Buloh – Serdang – Putrajaya Detailed Environmental Impact Assessment
APPENDIX E : SOCIAL SURVEY METHODOLOGY AND FINDINGS
ERE Consulting Group E-38 Issue1.0/April 2015
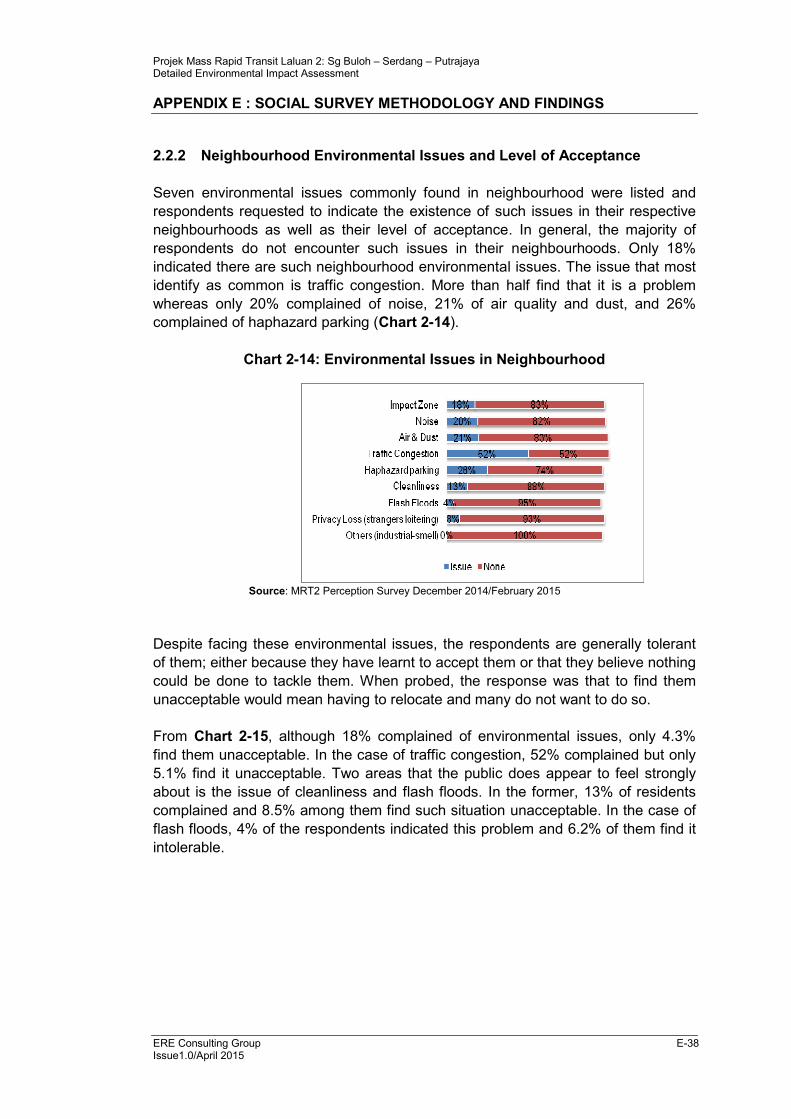
2.2.2 Neighbourhood Environmental Issues and Level of Acceptance
Seven environmental issues commonly found in neighbourhood were listed and
respondents requested to indicate the existence of such issues in their respective
neighbourhoods as well as their level of acceptance. In general, the majority of
respondents do not encounter such issues in their neighbourhoods. Only 18%
indicated there are such neighbourhood environmental issues. The issue that most
identify as common is traffic congestion. More than half find that it is a problem
whereas only 20% complained of noise, 21% of air quality and dust, and 26%
complained of haphazard parking (Chart 2-14).
Chart 2-14: Environmental Issues in Neighbourhood
Source: MRT2 Perception Survey December 2014/February 2015
Despite facing these environmental issues, the respondents are generally tolerant
of them; either because they have learnt to accept them or that they believe nothing
could be done to tackle them. When probed, the response was that to find them
unacceptable would mean having to relocate and many do not want to do so.
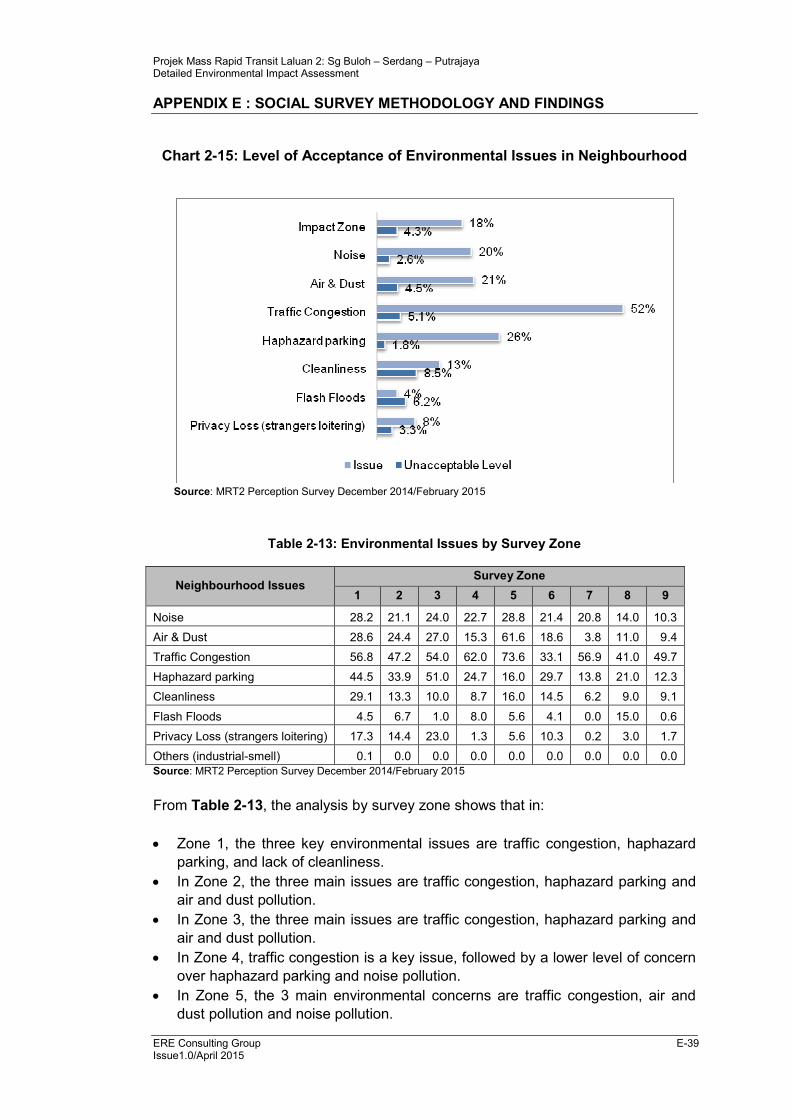
From Chart 2-15, although 18% complained of environmental issues, only 4.3%
find them unacceptable. In the case of traffic congestion, 52% complained but only
5.1% find it unacceptable. Two areas that the public does appear to feel strongly
about is the issue of cleanliness and flash floods. In the former, 13% of residents
complained and 8.5% among them find such situation unacceptable. In the case of
flash floods, 4% of the respondents indicated this problem and 6.2% of them find it
intolerable.
Projek Mass Rapid Transit Laluan 2: Sg Buloh – Serdang – Putrajaya Detailed Environmental Impact Assessment
APPENDIX E : SOCIAL SURVEY METHODOLOGY AND FINDINGS
ERE Consulting Group E-39 Issue1.0/April 2015
Chart 2-15: Level of Acceptance of Environmental Issues in Neighbourhood
Source: MRT2 Perception Survey December 2014/February 2015
Table 2-13: Environmental Issues by Survey Zone
Neighbourhood Issues Survey Zone
1 2 3 4 5 6 7 8 9
Noise 28.2 21.1 24.0 22.7 28.8 21.4 20.8 14.0 10.3
Air & Dust 28.6 24.4 27.0 15.3 61.6 18.6 3.8 11.0 9.4
Traffic Congestion 56.8 47.2 54.0 62.0 73.6 33.1 56.9 41.0 49.7
Haphazard parking 44.5 33.9 51.0 24.7 16.0 29.7 13.8 21.0 12.3
Cleanliness 29.1 13.3 10.0 8.7 16.0 14.5 6.2 9.0 9.1
Flash Floods 4.5 6.7 1.0 8.0 5.6 4.1 0.0 15.0 0.6
Privacy Loss (strangers loitering) 17.3 14.4 23.0 1.3 5.6 10.3 0.2 3.0 1.7
Others (industrial-smell) 0.1 0.0 0.0 0.0 0.0 0.0 0.0 0.0 0.0
Source: MRT2 Perception Survey December 2014/February 2015
From Table 2-13, the analysis by survey zone shows that in:
• Zone 1, the three key environmental issues are traffic congestion, haphazard
parking, and lack of cleanliness.
• In Zone 2, the three main issues are traffic congestion, haphazard parking and
air and dust pollution.
• In Zone 3, the three main issues are traffic congestion, haphazard parking and
air and dust pollution.
• In Zone 4, traffic congestion is a key issue, followed by a lower level of concern
over haphazard parking and noise pollution.
• In Zone 5, the 3 main environmental concerns are traffic congestion, air and
dust pollution and noise pollution.
Projek Mass Rapid Transit Laluan 2: Sg Buloh – Serdang – Putrajaya Detailed Environmental Impact Assessment
APPENDIX E : SOCIAL SURVEY METHODOLOGY AND FINDINGS
ERE Consulting Group E-40 Issue1.0/April 2015
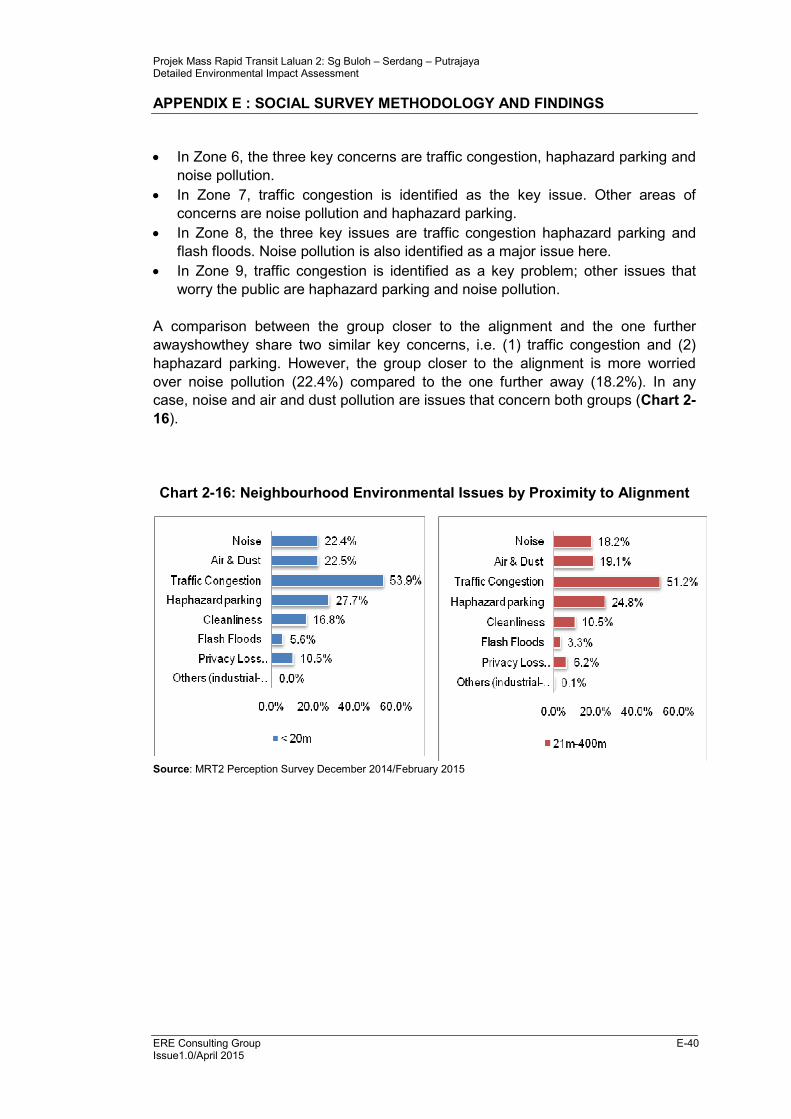
• In Zone 6, the three key concerns are traffic congestion, haphazard parking and
noise pollution.
• In Zone 7, traffic congestion is identified as the key issue. Other areas of
concerns are noise pollution and haphazard parking.
• In Zone 8, the three key issues are traffic congestion haphazard parking and
flash floods. Noise pollution is also identified as a major issue here.
• In Zone 9, traffic congestion is identified as a key problem; other issues that
worry the public are haphazard parking and noise pollution.
A comparison between the group closer to the alignment and the one further
awayshowthey share two similar key concerns, i.e. (1) traffic congestion and (2)
haphazard parking. However, the group closer to the alignment is more worried
over noise pollution (22.4%) compared to the one further away (18.2%). In any
case, noise and air and dust pollution are issues that concern both groups (Chart 2-
16).
Chart 2-16: Neighbourhood Environmental Issues by Proximity to Alignment
Source: MRT2 Perception Survey December 2014/February 2015
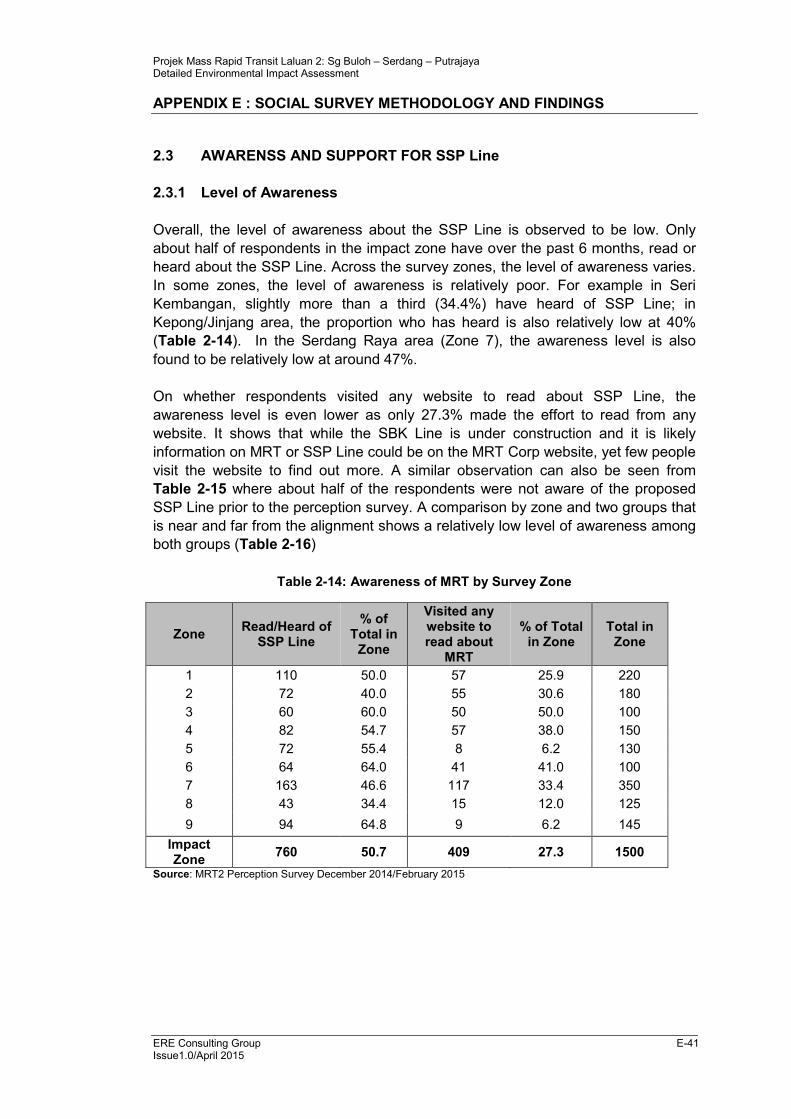
Projek Mass Rapid Transit Laluan 2: Sg Buloh – Serdang – Putrajaya Detailed Environmental Impact Assessment
APPENDIX E : SOCIAL SURVEY METHODOLOGY AND FINDINGS
ERE Consulting Group E-41 Issue1.0/April 2015
2.3 AWARENSS AND SUPPORT FOR SSP Line
2.3.1 Level of Awareness
Overall, the level of awareness about the SSP Line is observed to be low. Only
about half of respondents in the impact zone have over the past 6 months, read or
heard about the SSP Line. Across the survey zones, the level of awareness varies.
In some zones, the level of awareness is relatively poor. For example in Seri
Kembangan, slightly more than a third (34.4%) have heard of SSP Line; in
Kepong/Jinjang area, the proportion who has heard is also relatively low at 40%
(Table 2-14). In the Serdang Raya area (Zone 7), the awareness level is also
found to be relatively low at around 47%.
On whether respondents visited any website to read about SSP Line, the
awareness level is even lower as only 27.3% made the effort to read from any
website. It shows that while the SBK Line is under construction and it is likely
information on MRT or SSP Line could be on the MRT Corp website, yet few people
visit the website to find out more. A similar observation can also be seen from
Table 2-15 where about half of the respondents were not aware of the proposed
SSP Line prior to the perception survey. A comparison by zone and two groups that
is near and far from the alignment shows a relatively low level of awareness among
both groups (Table 2-16)
Table 2-14: Awareness of MRT by Survey Zone
Zone Read/Heard of
SSP Line
% of Total in Zone
Visited any website to read about
MRT
% of Total in Zone
Total in Zone
1 110 50.0 57 25.9 220
2 72 40.0 55 30.6 180
3 60 60.0 50 50.0 100
4 82 54.7 57 38.0 150
5 72 55.4 8 6.2 130
6 64 64.0 41 41.0 100
7 163 46.6 117 33.4 350
8 43 34.4 15 12.0 125
9 94 64.8 9 6.2 145
Impact Zone
760 50.7 409 27.3 1500
Source: MRT2 Perception Survey December 2014/February 2015
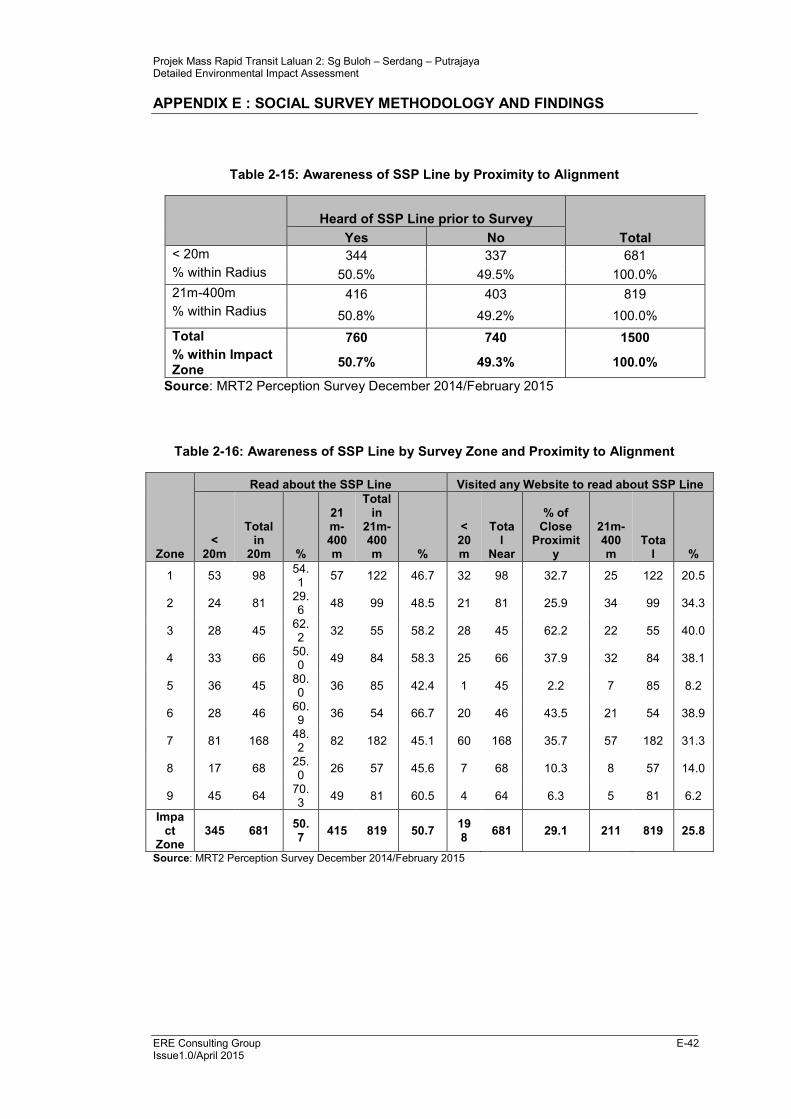
Projek Mass Rapid Transit Laluan 2: Sg Buloh – Serdang – Putrajaya Detailed Environmental Impact Assessment
APPENDIX E : SOCIAL SURVEY METHODOLOGY AND FINDINGS
ERE Consulting Group E-42 Issue1.0/April 2015
Table 2-15: Awareness of SSP Line by Proximity to Alignment
Heard of SSP Line prior to Survey
Total Yes No
< 20m 344 337 681
% within Radius 50.5% 49.5% 100.0%
21m-400m 416 403 819
% within Radius 50.8% 49.2% 100.0%
Total 760 740 1500
% within Impact Zone
50.7% 49.3% 100.0%
Source: MRT2 Perception Survey December 2014/February 2015
Table 2-16: Awareness of SSP Line by Survey Zone and Proximity to Alignment
Zone
Read about the SSP Line Visited any Website to read about SSP Line
< 20m
Total in
20m %
21m-400m
Total in
21m-400m %
< 20m
Total
Near
% of Close
Proximity
21m-400m
Total %
1 53 98 54.1
57 122 46.7 32 98 32.7 25 122 20.5
2 24 81 29.6
48 99 48.5 21 81 25.9 34 99 34.3
3 28 45 62.2
32 55 58.2 28 45 62.2 22 55 40.0
4 33 66 50.0
49 84 58.3 25 66 37.9 32 84 38.1
5 36 45 80.0
36 85 42.4 1 45 2.2 7 85 8.2
6 28 46 60.9
36 54 66.7 20 46 43.5 21 54 38.9
7 81 168 48.2
82 182 45.1 60 168 35.7 57 182 31.3
8 17 68 25.0
26 57 45.6 7 68 10.3 8 57 14.0
9 45 64 70.3
49 81 60.5 4 64 6.3 5 81 6.2
Impact
Zone 345 681
50.7
415 819 50.7 198
681 29.1 211 819 25.8
Source: MRT2 Perception Survey December 2014/February 2015
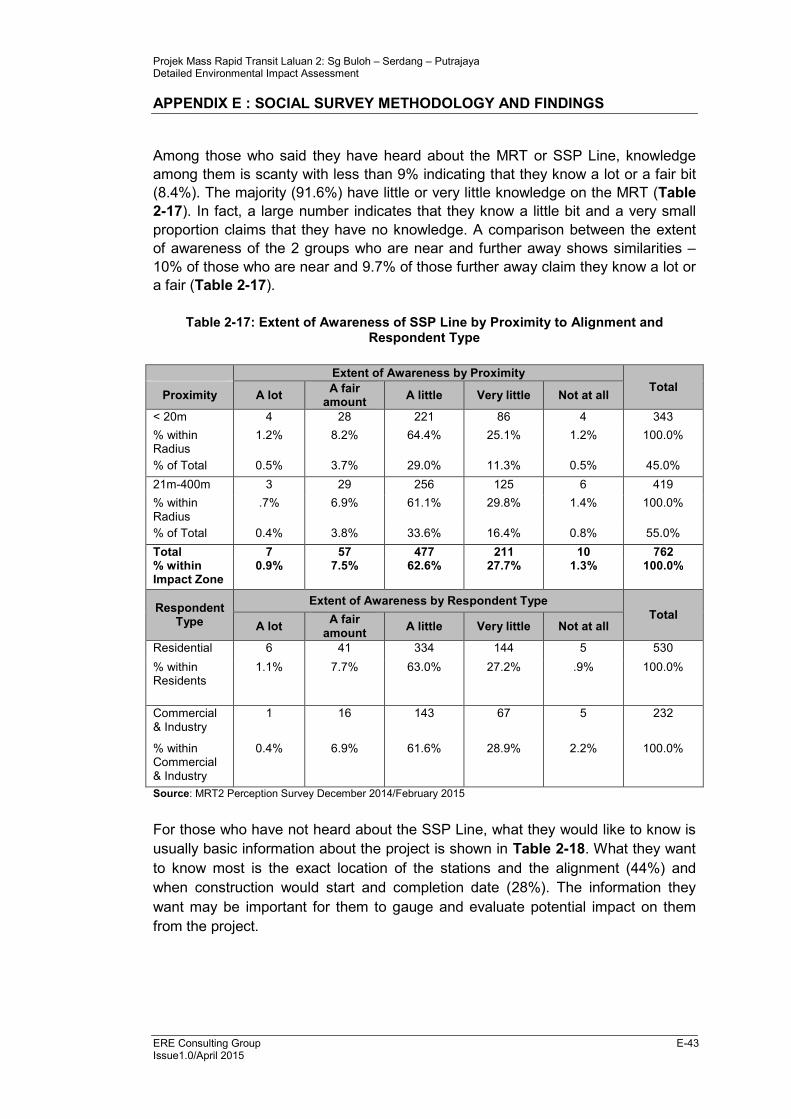
Projek Mass Rapid Transit Laluan 2: Sg Buloh – Serdang – Putrajaya Detailed Environmental Impact Assessment
APPENDIX E : SOCIAL SURVEY METHODOLOGY AND FINDINGS
ERE Consulting Group E-43 Issue1.0/April 2015
Among those who said they have heard about the MRT or SSP Line, knowledge
among them is scanty with less than 9% indicating that they know a lot or a fair bit
(8.4%). The majority (91.6%) have little or very little knowledge on the MRT (Table
2-17). In fact, a large number indicates that they know a little bit and a very small
proportion claims that they have no knowledge. A comparison between the extent
of awareness of the 2 groups who are near and further away shows similarities –
10% of those who are near and 9.7% of those further away claim they know a lot or
a fair (Table 2-17).
Table 2-17: Extent of Awareness of SSP Line by Proximity to Alignment and Respondent Type
Extent of Awareness by Proximity
Total Proximity A lot
A fair amount
A little Very little Not at all
< 20m 4 28 221 86 4 343
% within Radius
1.2% 8.2% 64.4% 25.1% 1.2% 100.0%
% of Total 0.5% 3.7% 29.0% 11.3% 0.5% 45.0%
21m-400m 3 29 256 125 6 419
% within Radius
.7% 6.9% 61.1% 29.8% 1.4% 100.0%
% of Total 0.4% 3.8% 33.6% 16.4% 0.8% 55.0%
Total 7 57 477 211 10 762 % within Impact Zone
0.9% 7.5% 62.6% 27.7% 1.3% 100.0%
Respondent Type
Extent of Awareness by Respondent Type
Total A lot
A fair amount
A little Very little Not at all
Residential 6 41 334 144 5 530
% within Residents
1.1% 7.7% 63.0% 27.2% .9% 100.0%
Commercial & Industry
1 16 143 67 5 232
% within Commercial & Industry
0.4% 6.9% 61.6% 28.9% 2.2% 100.0%
Source: MRT2 Perception Survey December 2014/February 2015
For those who have not heard about the SSP Line, what they would like to know is
usually basic information about the project is shown in Table 2-18. What they want
to know most is the exact location of the stations and the alignment (44%) and
when construction would start and completion date (28%). The information they
want may be important for them to gauge and evaluate potential impact on them
from the project.
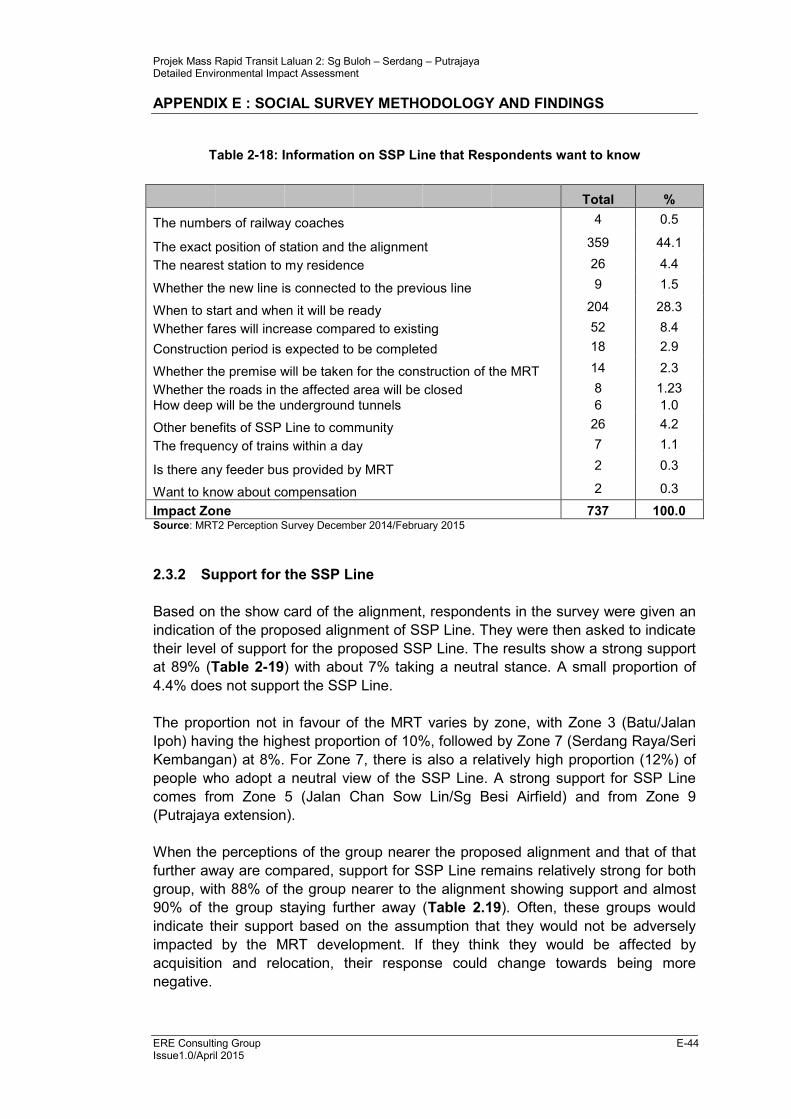
Projek Mass Rapid Transit Laluan 2: Sg Buloh – Serdang – Putrajaya Detailed Environmental Impact Assessment
APPENDIX E : SOCIAL SURVEY METHODOLOGY AND FINDINGS
ERE Consulting Group E-44 Issue1.0/April 2015
Table 2-18: Information on SSP Line that Respondents want to know
Total %
The numbers of railway coaches 4 0.5
The exact position of station and the alignment 359 44.1
The nearest station to my residence 26 4.4
Whether the new line is connected to the previous line 9 1.5
When to start and when it will be ready 204 28.3
Whether fares will increase compared to existing 52 8.4
Construction period is expected to be completed 18 2.9
Whether the premise will be taken for the construction of the MRT 14 2.3
Whether the roads in the affected area will be closed 8 1.23
How deep will be the underground tunnels 6 1.0
Other benefits of SSP Line to community 26 4.2
The frequency of trains within a day 7 1.1
Is there any feeder bus provided by MRT 2 0.3
Want to know about compensation 2 0.3
Impact Zone 737 100.0 Source: MRT2 Perception Survey December 2014/February 2015
2.3.2 Support for the SSP Line
Based on the show card of the alignment, respondents in the survey were given an
indication of the proposed alignment of SSP Line. They were then asked to indicate
their level of support for the proposed SSP Line. The results show a strong support
at 89% (Table 2-19) with about 7% taking a neutral stance. A small proportion of
4.4% does not support the SSP Line.
The proportion not in favour of the MRT varies by zone, with Zone 3 (Batu/Jalan
Ipoh) having the highest proportion of 10%, followed by Zone 7 (Serdang Raya/Seri
Kembangan) at 8%. For Zone 7, there is also a relatively high proportion (12%) of
people who adopt a neutral view of the SSP Line. A strong support for SSP Line
comes from Zone 5 (Jalan Chan Sow Lin/Sg Besi Airfield) and from Zone 9
(Putrajaya extension).
When the perceptions of the group nearer the proposed alignment and that of that
further away are compared, support for SSP Line remains relatively strong for both
group, with 88% of the group nearer to the alignment showing support and almost
90% of the group staying further away (Table 2.19). Often, these groups would
indicate their support based on the assumption that they would not be adversely
impacted by the MRT development. If they think they would be affected by
acquisition and relocation, their response could change towards being more
negative.
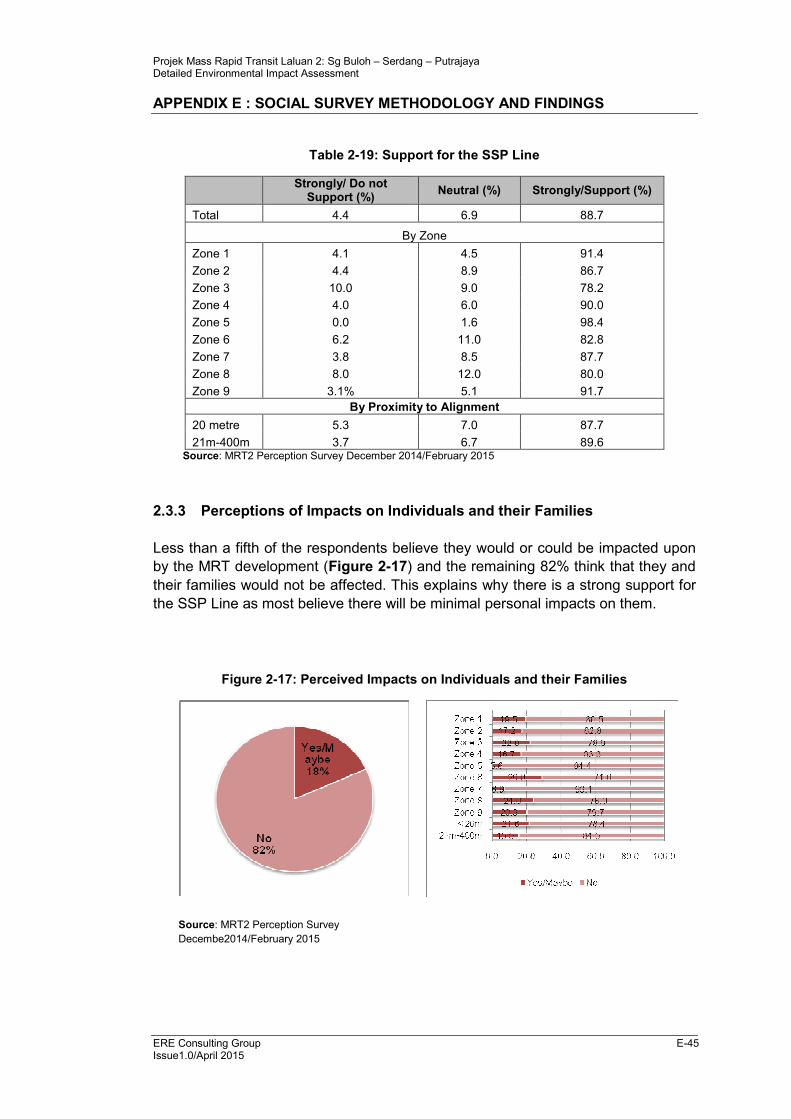
Projek Mass Rapid Transit Laluan 2: Sg Buloh – Serdang – Putrajaya Detailed Environmental Impact Assessment
APPENDIX E : SOCIAL SURVEY METHODOLOGY AND FINDINGS
ERE Consulting Group E-45 Issue1.0/April 2015
Table 2-19: Support for the SSP Line
Strongly/ Do not
Support (%) Neutral (%) Strongly/Support (%)
Total 4.4 6.9 88.7
By Zone
Zone 1 4.1 4.5 91.4
Zone 2 4.4 8.9 86.7
Zone 3 10.0 9.0 78.2
Zone 4 4.0 6.0 90.0
Zone 5 0.0 1.6 98.4
Zone 6 6.2 11.0 82.8
Zone 7 3.8 8.5 87.7
Zone 8 8.0 12.0 80.0
Zone 9 3.1% 5.1 91.7
By Proximity to Alignment
20 metre 5.3 7.0 87.7
21m-400m 3.7 6.7 89.6 Source: MRT2 Perception Survey December 2014/February 2015
2.3.3 Perceptions of Impacts on Individuals and their Families
Less than a fifth of the respondents believe they would or could be impacted upon
by the MRT development (Figure 2-17) and the remaining 82% think that they and
their families would not be affected. This explains why there is a strong support for
the SSP Line as most believe there will be minimal personal impacts on them.
Figure 2-17: Perceived Impacts on Individuals and their Families
Source: MRT2 Perception Survey
Decembe2014/February 2015
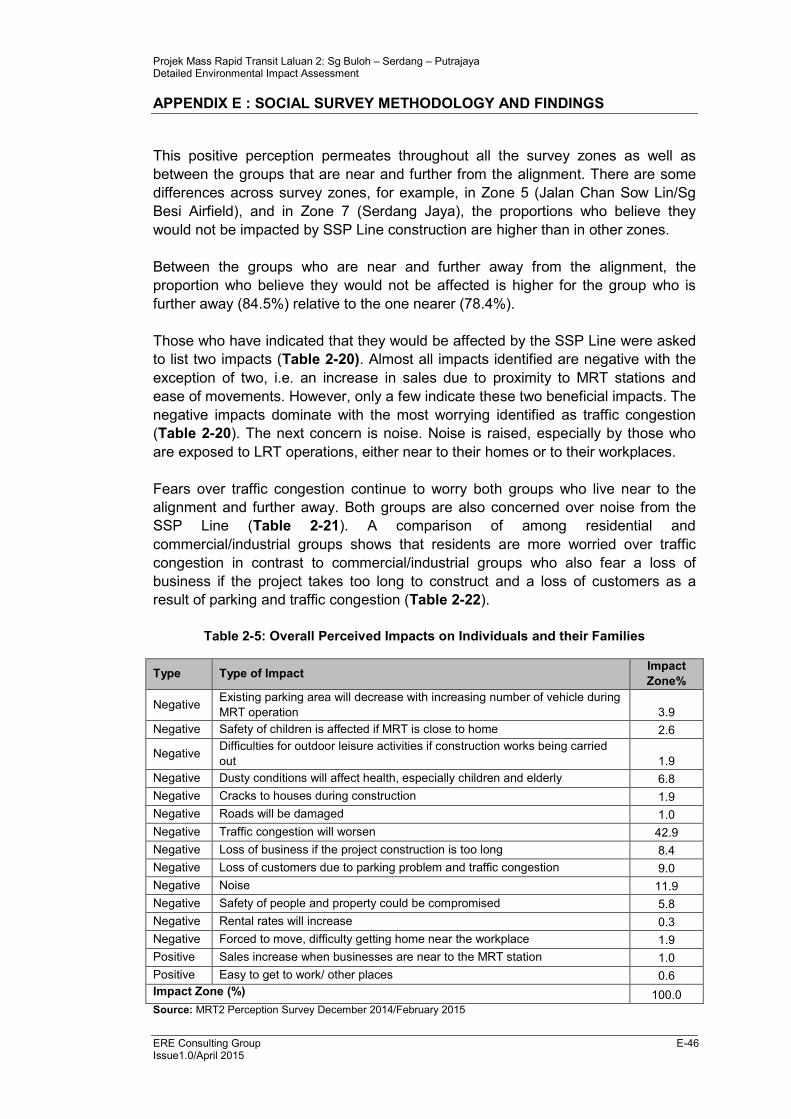
Projek Mass Rapid Transit Laluan 2: Sg Buloh – Serdang – Putrajaya Detailed Environmental Impact Assessment
APPENDIX E : SOCIAL SURVEY METHODOLOGY AND FINDINGS
ERE Consulting Group E-46 Issue1.0/April 2015
This positive perception permeates throughout all the survey zones as well as
between the groups that are near and further from the alignment. There are some
differences across survey zones, for example, in Zone 5 (Jalan Chan Sow Lin/Sg
Besi Airfield), and in Zone 7 (Serdang Jaya), the proportions who believe they
would not be impacted by SSP Line construction are higher than in other zones.
Between the groups who are near and further away from the alignment, the
proportion who believe they would not be affected is higher for the group who is
further away (84.5%) relative to the one nearer (78.4%).
Those who have indicated that they would be affected by the SSP Line were asked
to list two impacts (Table 2-20). Almost all impacts identified are negative with the
exception of two, i.e. an increase in sales due to proximity to MRT stations and
ease of movements. However, only a few indicate these two beneficial impacts. The
negative impacts dominate with the most worrying identified as traffic congestion
(Table 2-20). The next concern is noise. Noise is raised, especially by those who
are exposed to LRT operations, either near to their homes or to their workplaces.
Fears over traffic congestion continue to worry both groups who live near to the
alignment and further away. Both groups are also concerned over noise from the
SSP Line (Table 2-21). A comparison of among residential and
commercial/industrial groups shows that residents are more worried over traffic
congestion in contrast to commercial/industrial groups who also fear a loss of
business if the project takes too long to construct and a loss of customers as a
result of parking and traffic congestion (Table 2-22).
Table 2-5: Overall Perceived Impacts on Individuals and their Families
Type Type of Impact Impact
Zone%
Negative Existing parking area will decrease with increasing number of vehicle during
MRT operation 3.9
Negative Safety of children is affected if MRT is close to home 2.6
Negative Difficulties for outdoor leisure activities if construction works being carried
out 1.9
Negative Dusty conditions will affect health, especially children and elderly 6.8
Negative Cracks to houses during construction 1.9
Negative Roads will be damaged 1.0
Negative Traffic congestion will worsen 42.9
Negative Loss of business if the project construction is too long 8.4
Negative Loss of customers due to parking problem and traffic congestion 9.0
Negative Noise 11.9
Negative Safety of people and property could be compromised 5.8
Negative Rental rates will increase 0.3
Negative Forced to move, difficulty getting home near the workplace 1.9
Positive Sales increase when businesses are near to the MRT station 1.0
Positive Easy to get to work/ other places 0.6
Impact Zone (%) 100.0 Source: MRT2 Perception Survey December 2014/February 2015
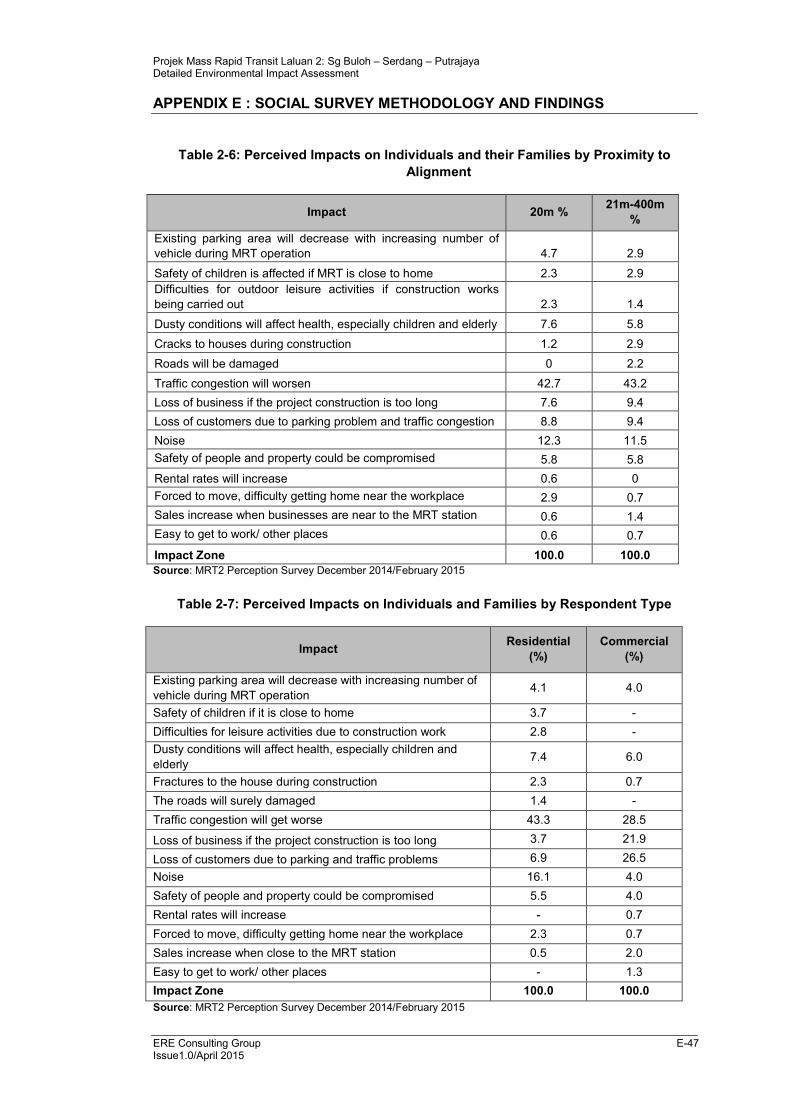
Projek Mass Rapid Transit Laluan 2: Sg Buloh – Serdang – Putrajaya Detailed Environmental Impact Assessment
APPENDIX E : SOCIAL SURVEY METHODOLOGY AND FINDINGS
ERE Consulting Group E-47 Issue1.0/April 2015
Table 2-6: Perceived Impacts on Individuals and their Families by Proximity to
Alignment
Impact 20m % 21m-400m
%
Existing parking area will decrease with increasing number of
vehicle during MRT operation 4.7 2.9
Safety of children is affected if MRT is close to home 2.3 2.9
Difficulties for outdoor leisure activities if construction works
being carried out 2.3 1.4
Dusty conditions will affect health, especially children and elderly 7.6 5.8
Cracks to houses during construction 1.2 2.9
Roads will be damaged 0 2.2
Traffic congestion will worsen 42.7 43.2
Loss of business if the project construction is too long 7.6 9.4
Loss of customers due to parking problem and traffic congestion 8.8 9.4
Noise 12.3 11.5
Safety of people and property could be compromised 5.8 5.8
Rental rates will increase 0.6 0
Forced to move, difficulty getting home near the workplace 2.9 0.7
Sales increase when businesses are near to the MRT station 0.6 1.4
Easy to get to work/ other places 0.6 0.7
Impact Zone 100.0 100.0
Source: MRT2 Perception Survey December 2014/February 2015
Table 2-7: Perceived Impacts on Individuals and Families by Respondent Type
Impact Residential
(%)
Commercial
(%)
Existing parking area will decrease with increasing number of
vehicle during MRT operation 4.1 4.0
Safety of children if it is close to home 3.7 -
Difficulties for leisure activities due to construction work 2.8 -
Dusty conditions will affect health, especially children and
elderly 7.4 6.0
Fractures to the house during construction 2.3 0.7
The roads will surely damaged 1.4 -
Traffic congestion will get worse 43.3 28.5
Loss of business if the project construction is too long 3.7 21.9
Loss of customers due to parking and traffic problems 6.9 26.5
Noise 16.1 4.0
Safety of people and property could be compromised 5.5 4.0
Rental rates will increase - 0.7
Forced to move, difficulty getting home near the workplace 2.3 0.7
Sales increase when close to the MRT station 0.5 2.0
Easy to get to work/ other places - 1.3
Impact Zone 100.0 100.0
Source: MRT2 Perception Survey December 2014/February 2015
Projek Mass Rapid Transit Laluan 2: Sg Buloh – Serdang – Putrajaya Detailed Environmental Impact Assessment
APPENDIX E : SOCIAL SURVEY METHODOLOGY AND FINDINGS
ERE Consulting Group E-48 Issue1.0/April 2015
2.4 PERCEIVED POSITIVE AND NEGATIVE IMPACTS FROM MRT
2.4.1 Perceived Positive Impacts
Nine benefits were identified and respondents were asked to rank them in order of
importance to them. The first four are commonly known. They include savings in
travel expenses; savings in travel time; quick and convenient mode of transport;
and reduction in traffic congestion. The rankings of respondents are weighted, with
higher weights assigned to the higher rankings. The results are given in Table 2-23.
The mean benefit scores are estimated.
Based on the estimated mean benefit scores, the four main benefits are also those
that are commonly associated with an efficient public transport. According to
respondents, the key benefits are (1) reduced travel time (7.2); (2) quick and
convenient mode of transport; (3) savings in travel expenses (7.1); and reduction in
traffic congestion (6.6). Other benefits associated with improvement in air quality
and accidents’ risks do not score highly, with mean scores falling within the range of
4.2 and 4.4. Two economic benefits often associated with public infrastructure
development such as an LRT or an MRT being a growth catalyst and enhancing
property values do not stand out as important among respondents in the impact
zone. Their mean scores fall below the overall mean of 5.0.
Although the 4 key benefits are similarly identified for all survey zones, there are
variations in rankings across survey zones where in some zones such as zones 1,
2, 3, 4, 7 and 8, more people identify savings in travel expenses as an important
benefit, in zones 9, 10 and 11, they are not as important as savings in travel time
and reduction in traffic congestion (Table 2-24). When the perceptions on benefits
of the two groups near and further away from the alignment are compared, their
mean benefit scores are similar with both groups emphasizing the benefit of
reduced travel time and quick easy transport mode as more important than other
benefits (Table 2-25).
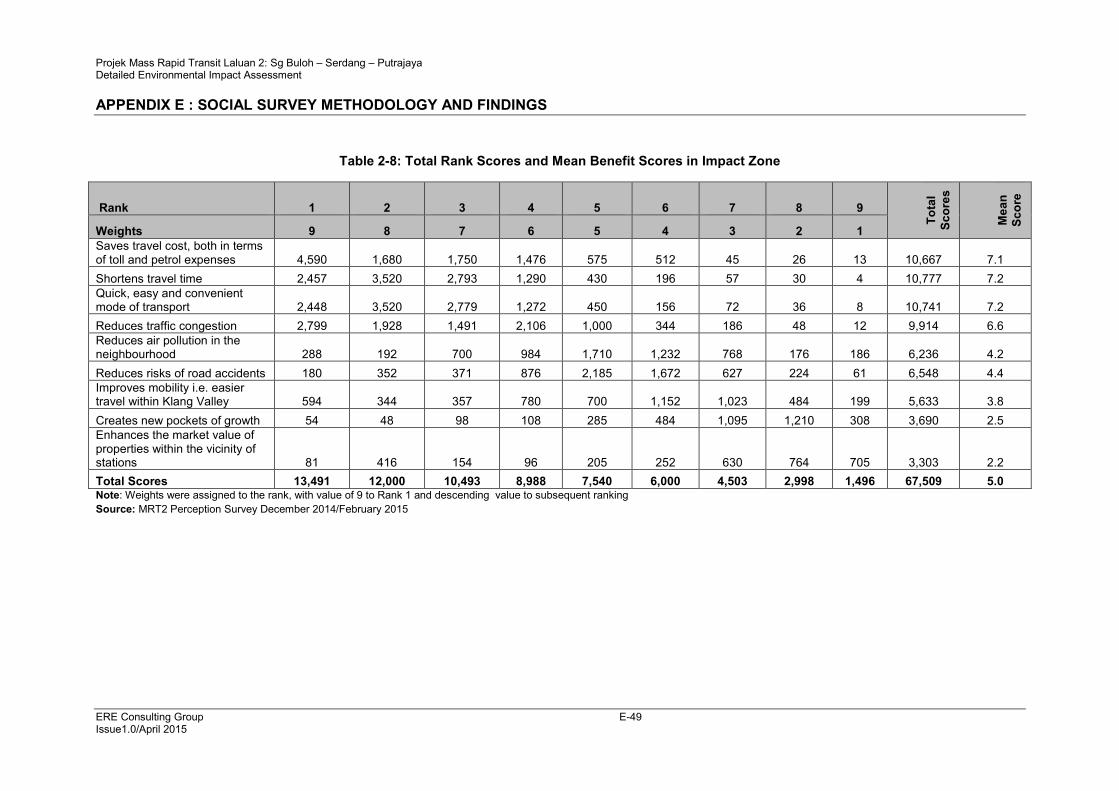
Projek Mass Rapid Transit Laluan 2: Sg Buloh – Serdang – Putrajaya Detailed Environmental Impact Assessment
APPENDIX E : SOCIAL SURVEY METHODOLOGY AND FINDINGS
ERE Consulting Group E-49 Issue1.0/April 2015
Table 2-8: Total Rank Scores and Mean Benefit Scores in Impact Zone
Rank 1 2 3 4 5 6 7 8 9
Tota
l
Score
s
Mean
Score
Weights 9 8 7 6 5 4 3 2 1
Saves travel cost, both in terms of toll and petrol expenses 4,590 1,680 1,750 1,476 575 512 45 26 13 10,667 7.1
Shortens travel time 2,457 3,520 2,793 1,290 430 196 57 30 4 10,777 7.2
Quick, easy and convenient mode of transport 2,448 3,520 2,779 1,272 450 156 72 36 8 10,741 7.2
Reduces traffic congestion 2,799 1,928 1,491 2,106 1,000 344 186 48 12 9,914 6.6
Reduces air pollution in the neighbourhood 288 192 700 984 1,710 1,232 768 176 186 6,236 4.2
Reduces risks of road accidents 180 352 371 876 2,185 1,672 627 224 61 6,548 4.4
Improves mobility i.e. easier travel within Klang Valley 594 344 357 780 700 1,152 1,023 484 199 5,633 3.8
Creates new pockets of growth 54 48 98 108 285 484 1,095 1,210 308 3,690 2.5
Enhances the market value of properties within the vicinity of stations 81 416 154 96 205 252 630 764 705 3,303 2.2
Total Scores 13,491 12,000 10,493 8,988 7,540 6,000 4,503 2,998 1,496 67,509 5.0 Note: Weights were assigned to the rank, with value of 9 to Rank 1 and descending value to subsequent ranking
Source: MRT2 Perception Survey December 2014/February 2015
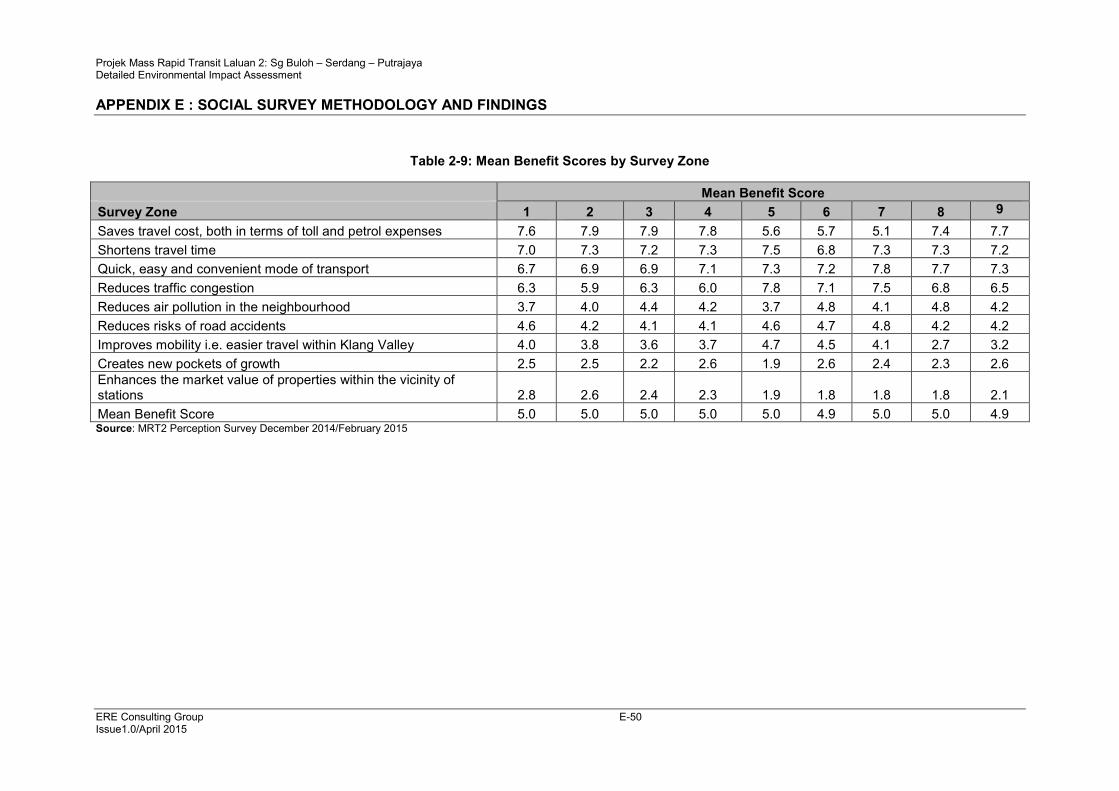
Projek Mass Rapid Transit Laluan 2: Sg Buloh – Serdang – Putrajaya Detailed Environmental Impact Assessment
APPENDIX E : SOCIAL SURVEY METHODOLOGY AND FINDINGS
ERE Consulting Group E-50 Issue1.0/April 2015
Table 2-9: Mean Benefit Scores by Survey Zone
Mean Benefit Score
Survey Zone 1 2 3 4 5 6 7 8 9
Saves travel cost, both in terms of toll and petrol expenses 7.6 7.9 7.9 7.8 5.6 5.7 5.1 7.4 7.7
Shortens travel time 7.0 7.3 7.2 7.3 7.5 6.8 7.3 7.3 7.2
Quick, easy and convenient mode of transport 6.7 6.9 6.9 7.1 7.3 7.2 7.8 7.7 7.3
Reduces traffic congestion 6.3 5.9 6.3 6.0 7.8 7.1 7.5 6.8 6.5
Reduces air pollution in the neighbourhood 3.7 4.0 4.4 4.2 3.7 4.8 4.1 4.8 4.2
Reduces risks of road accidents 4.6 4.2 4.1 4.1 4.6 4.7 4.8 4.2 4.2
Improves mobility i.e. easier travel within Klang Valley 4.0 3.8 3.6 3.7 4.7 4.5 4.1 2.7 3.2
Creates new pockets of growth 2.5 2.5 2.2 2.6 1.9 2.6 2.4 2.3 2.6
Enhances the market value of properties within the vicinity of stations 2.8 2.6 2.4 2.3 1.9 1.8 1.8 1.8 2.1
Mean Benefit Score 5.0 5.0 5.0 5.0 5.0 4.9 5.0 5.0 4.9 Source: MRT2 Perception Survey December 2014/February 2015
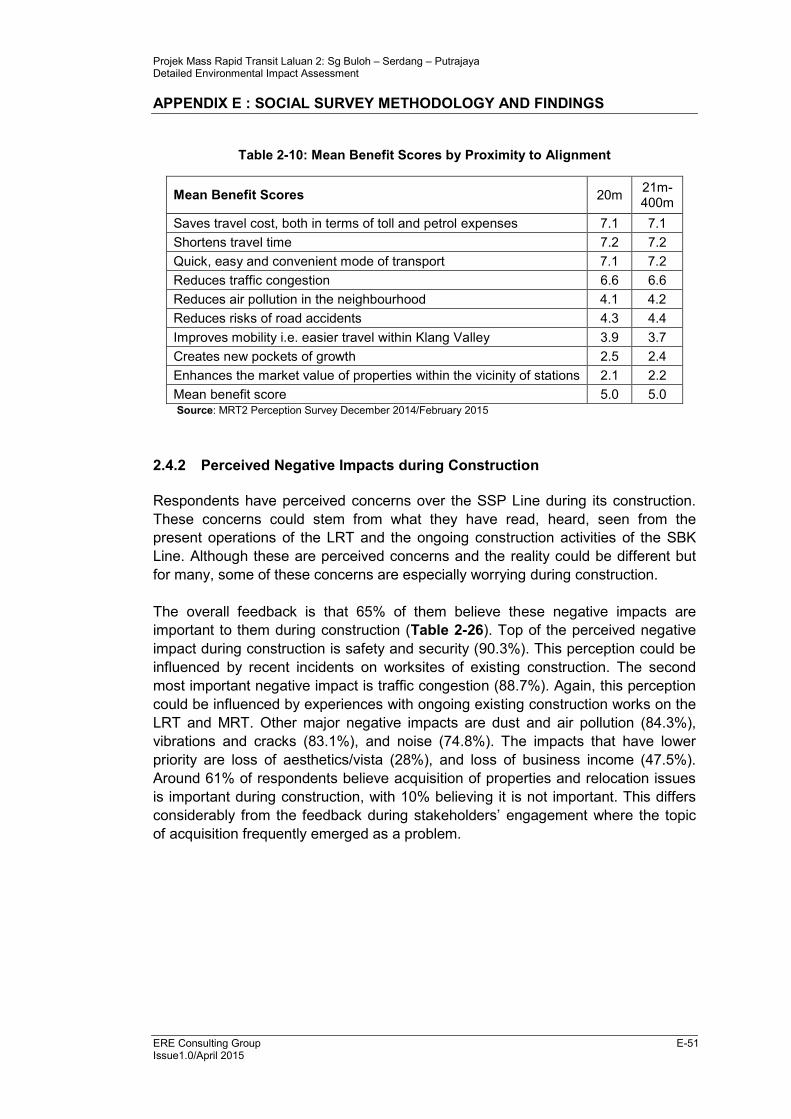
Projek Mass Rapid Transit Laluan 2: Sg Buloh – Serdang – Putrajaya Detailed Environmental Impact Assessment
APPENDIX E : SOCIAL SURVEY METHODOLOGY AND FINDINGS
ERE Consulting Group E-51 Issue1.0/April 2015
Table 2-10: Mean Benefit Scores by Proximity to Alignment
Mean Benefit Scores 20m 21m-400m
Saves travel cost, both in terms of toll and petrol expenses 7.1 7.1
Shortens travel time 7.2 7.2
Quick, easy and convenient mode of transport 7.1 7.2
Reduces traffic congestion 6.6 6.6
Reduces air pollution in the neighbourhood 4.1 4.2
Reduces risks of road accidents 4.3 4.4
Improves mobility i.e. easier travel within Klang Valley 3.9 3.7
Creates new pockets of growth 2.5 2.4
Enhances the market value of properties within the vicinity of stations 2.1 2.2
Mean benefit score 5.0 5.0 Source: MRT2 Perception Survey December 2014/February 2015
2.4.2 Perceived Negative Impacts during Construction
Respondents have perceived concerns over the SSP Line during its construction.
These concerns could stem from what they have read, heard, seen from the
present operations of the LRT and the ongoing construction activities of the SBK
Line. Although these are perceived concerns and the reality could be different but
for many, some of these concerns are especially worrying during construction.
The overall feedback is that 65% of them believe these negative impacts are
important to them during construction (Table 2-26). Top of the perceived negative
impact during construction is safety and security (90.3%). This perception could be
influenced by recent incidents on worksites of existing construction. The second
most important negative impact is traffic congestion (88.7%). Again, this perception
could be influenced by experiences with ongoing existing construction works on the
LRT and MRT. Other major negative impacts are dust and air pollution (84.3%),
vibrations and cracks (83.1%), and noise (74.8%). The impacts that have lower
priority are loss of aesthetics/vista (28%), and loss of business income (47.5%).
Around 61% of respondents believe acquisition of properties and relocation issues
is important during construction, with 10% believing it is not important. This differs
considerably from the feedback during stakeholders’ engagement where the topic
of acquisition frequently emerged as a problem.
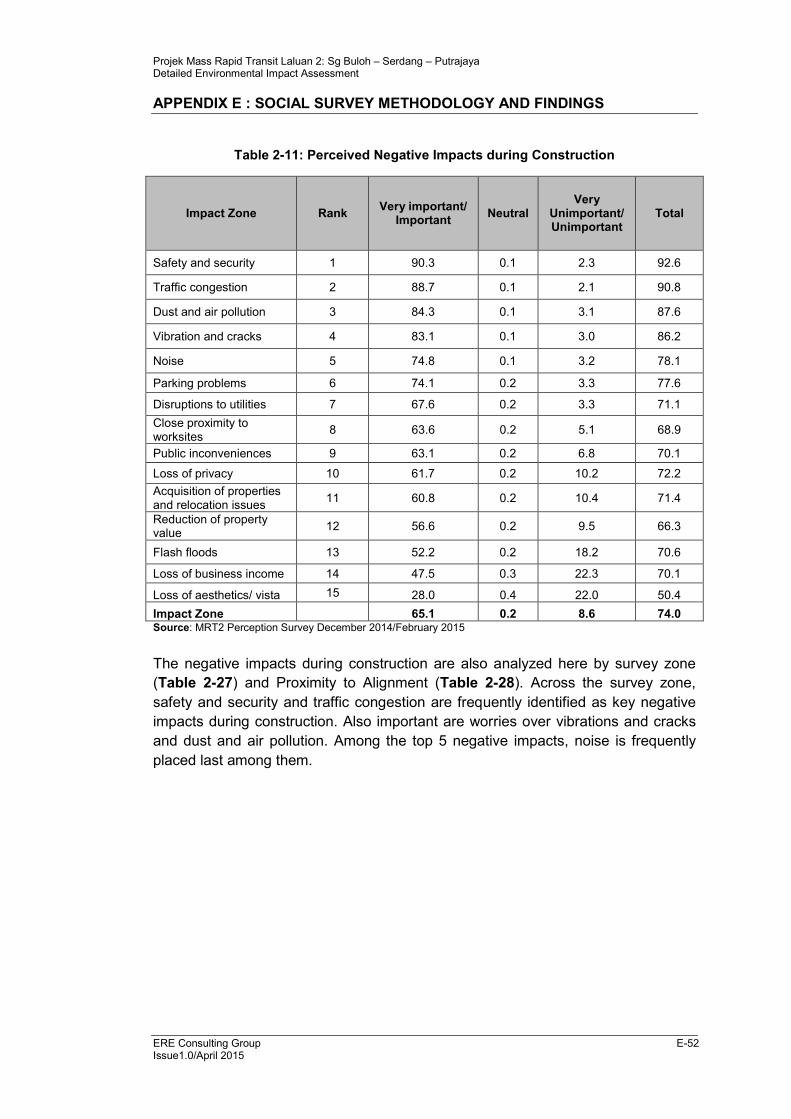
Projek Mass Rapid Transit Laluan 2: Sg Buloh – Serdang – Putrajaya Detailed Environmental Impact Assessment
APPENDIX E : SOCIAL SURVEY METHODOLOGY AND FINDINGS
ERE Consulting Group E-52 Issue1.0/April 2015
Table 2-11: Perceived Negative Impacts during Construction
Impact Zone Rank Very important/
Important Neutral
Very Unimportant/ Unimportant
Total
Safety and security 1 90.3 0.1 2.3 92.6
Traffic congestion 2 88.7 0.1 2.1 90.8
Dust and air pollution 3 84.3 0.1 3.1 87.6
Vibration and cracks 4 83.1 0.1 3.0 86.2
Noise 5 74.8 0.1 3.2 78.1
Parking problems 6 74.1 0.2 3.3 77.6
Disruptions to utilities 7 67.6 0.2 3.3 71.1
Close proximity to worksites
8 63.6 0.2 5.1 68.9
Public inconveniences 9 63.1 0.2 6.8 70.1
Loss of privacy 10 61.7 0.2 10.2 72.2
Acquisition of properties and relocation issues
11 60.8 0.2 10.4 71.4
Reduction of property value
12 56.6 0.2 9.5 66.3
Flash floods 13 52.2 0.2 18.2 70.6
Loss of business income 14 47.5 0.3 22.3 70.1
Loss of aesthetics/ vista 15 28.0 0.4 22.0 50.4
Impact Zone 65.1 0.2 8.6 74.0 Source: MRT2 Perception Survey December 2014/February 2015
The negative impacts during construction are also analyzed here by survey zone
(Table 2-27) and Proximity to Alignment (Table 2-28). Across the survey zone,
safety and security and traffic congestion are frequently identified as key negative
impacts during construction. Also important are worries over vibrations and cracks
and dust and air pollution. Among the top 5 negative impacts, noise is frequently
placed last among them.
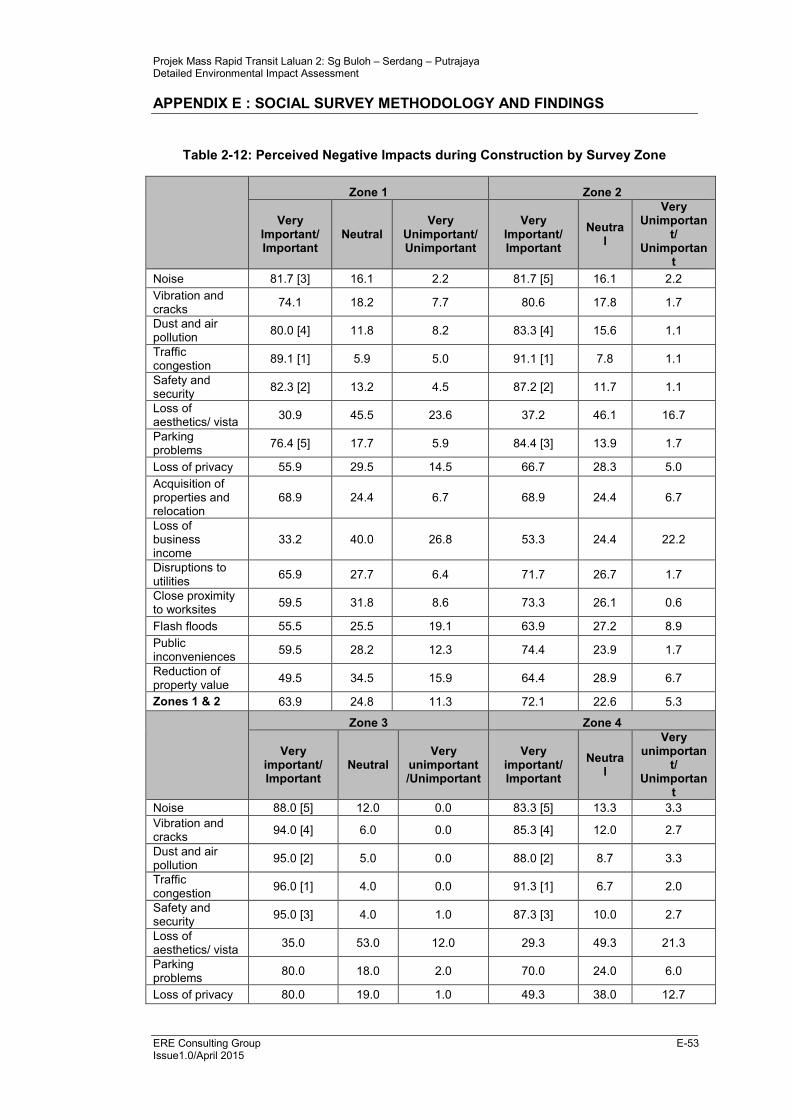
Projek Mass Rapid Transit Laluan 2: Sg Buloh – Serdang – Putrajaya Detailed Environmental Impact Assessment
APPENDIX E : SOCIAL SURVEY METHODOLOGY AND FINDINGS
ERE Consulting Group E-53 Issue1.0/April 2015
Table 2-12: Perceived Negative Impacts during Construction by Survey Zone
Zone 1 Zone 2
Very Important/ Important
Neutral Very
Unimportant/ Unimportant
Very Important/ Important
Neutral
Very Unimportan
t/ Unimportan
t
Noise 81.7 [3] 16.1 2.2 81.7 [5] 16.1 2.2
Vibration and cracks
74.1 18.2 7.7 80.6 17.8 1.7
Dust and air pollution
80.0 [4] 11.8 8.2 83.3 [4] 15.6 1.1
Traffic congestion
89.1 [1] 5.9 5.0 91.1 [1] 7.8 1.1
Safety and security
82.3 [2] 13.2 4.5 87.2 [2] 11.7 1.1
Loss of aesthetics/ vista
30.9 45.5 23.6 37.2 46.1 16.7
Parking problems
76.4 [5] 17.7 5.9 84.4 [3] 13.9 1.7
Loss of privacy 55.9 29.5 14.5 66.7 28.3 5.0
Acquisition of properties and relocation
68.9 24.4 6.7 68.9 24.4 6.7
Loss of business income
33.2 40.0 26.8 53.3 24.4 22.2
Disruptions to utilities
65.9 27.7 6.4 71.7 26.7 1.7
Close proximity to worksites
59.5 31.8 8.6 73.3 26.1 0.6
Flash floods 55.5 25.5 19.1 63.9 27.2 8.9
Public inconveniences
59.5 28.2 12.3 74.4 23.9 1.7
Reduction of property value
49.5 34.5 15.9 64.4 28.9 6.7
Zones 1 & 2 63.9 24.8 11.3 72.1 22.6 5.3
Zone 3 Zone 4
Very important/ Important
Neutral Very
unimportant /Unimportant
Very important/ Important
Neutral
Very unimportan
t/ Unimportan
t
Noise 88.0 [5] 12.0 0.0 83.3 [5] 13.3 3.3
Vibration and cracks
94.0 [4] 6.0 0.0 85.3 [4] 12.0 2.7
Dust and air pollution
95.0 [2] 5.0 0.0 88.0 [2] 8.7 3.3
Traffic congestion
96.0 [1] 4.0 0.0 91.3 [1] 6.7 2.0
Safety and security
95.0 [3] 4.0 1.0 87.3 [3] 10.0 2.7
Loss of aesthetics/ vista
35.0 53.0 12.0 29.3 49.3 21.3
Parking problems
80.0 18.0 2.0 70.0 24.0 6.0
Loss of privacy 80.0 19.0 1.0 49.3 38.0 12.7
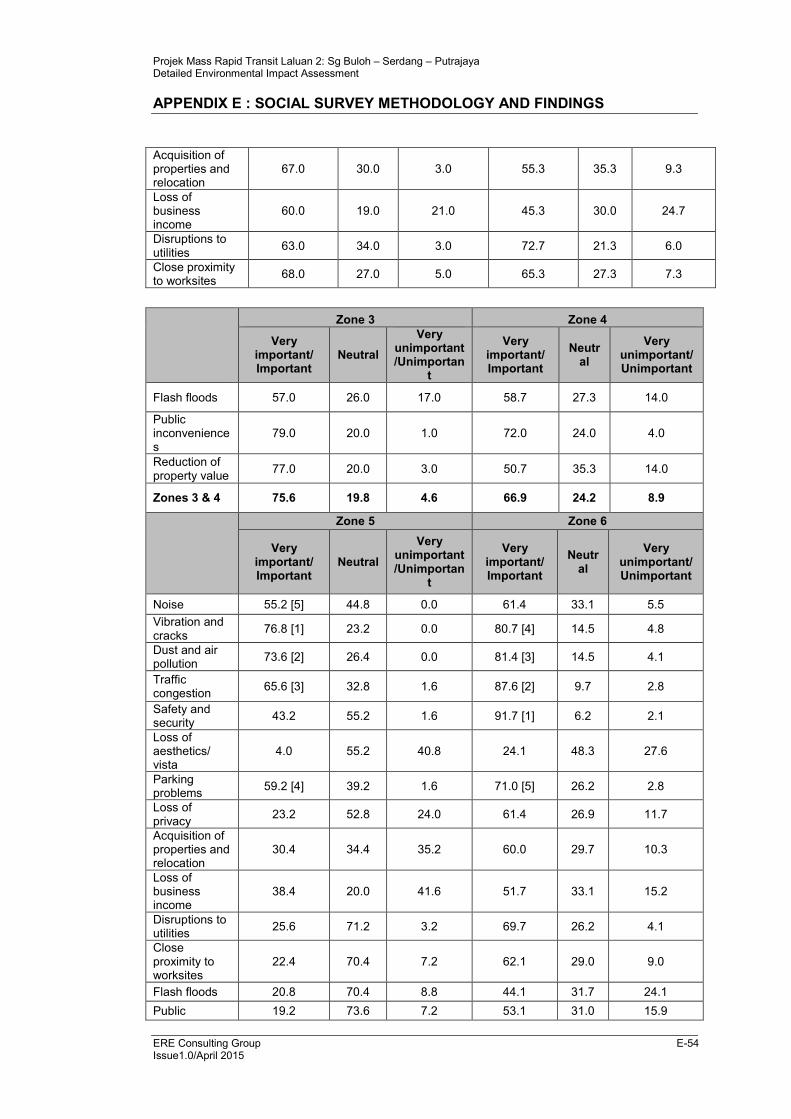
Projek Mass Rapid Transit Laluan 2: Sg Buloh – Serdang – Putrajaya Detailed Environmental Impact Assessment
APPENDIX E : SOCIAL SURVEY METHODOLOGY AND FINDINGS
ERE Consulting Group E-54 Issue1.0/April 2015
Acquisition of properties and relocation
67.0 30.0 3.0 55.3 35.3 9.3
Loss of business income
60.0 19.0 21.0 45.3 30.0 24.7
Disruptions to utilities
63.0 34.0 3.0 72.7 21.3 6.0
Close proximity to worksites
68.0 27.0 5.0 65.3 27.3 7.3
Zone 3 Zone 4
Very important/ Important
Neutral
Very unimportant /Unimportan
t
Very important/ Important
Neutral
Very unimportant/ Unimportant
Flash floods 57.0 26.0 17.0 58.7 27.3 14.0
Public inconveniences
79.0 20.0 1.0 72.0 24.0 4.0
Reduction of property value
77.0 20.0 3.0 50.7 35.3 14.0
Zones 3 & 4 75.6 19.8 4.6 66.9 24.2 8.9
Zone 5 Zone 6
Very important/ Important
Neutral
Very unimportant/Unimportan
t
Very important/ Important
Neutral
Very unimportant/ Unimportant
Noise 55.2 [5] 44.8 0.0 61.4 33.1 5.5
Vibration and cracks
76.8 [1] 23.2 0.0 80.7 [4] 14.5 4.8
Dust and air pollution
73.6 [2] 26.4 0.0 81.4 [3] 14.5 4.1
Traffic congestion
65.6 [3] 32.8 1.6 87.6 [2] 9.7 2.8
Safety and security
43.2 55.2 1.6 91.7 [1] 6.2 2.1
Loss of aesthetics/ vista
4.0 55.2 40.8 24.1 48.3 27.6
Parking problems
59.2 [4] 39.2 1.6 71.0 [5] 26.2 2.8
Loss of privacy
23.2 52.8 24.0 61.4 26.9 11.7
Acquisition of properties and relocation
30.4 34.4 35.2 60.0 29.7 10.3
Loss of business income
38.4 20.0 41.6 51.7 33.1 15.2
Disruptions to utilities
25.6 71.2 3.2 69.7 26.2 4.1
Close proximity to worksites
22.4 70.4 7.2 62.1 29.0 9.0
Flash floods 20.8 70.4 8.8 44.1 31.7 24.1
Public 19.2 73.6 7.2 53.1 31.0 15.9
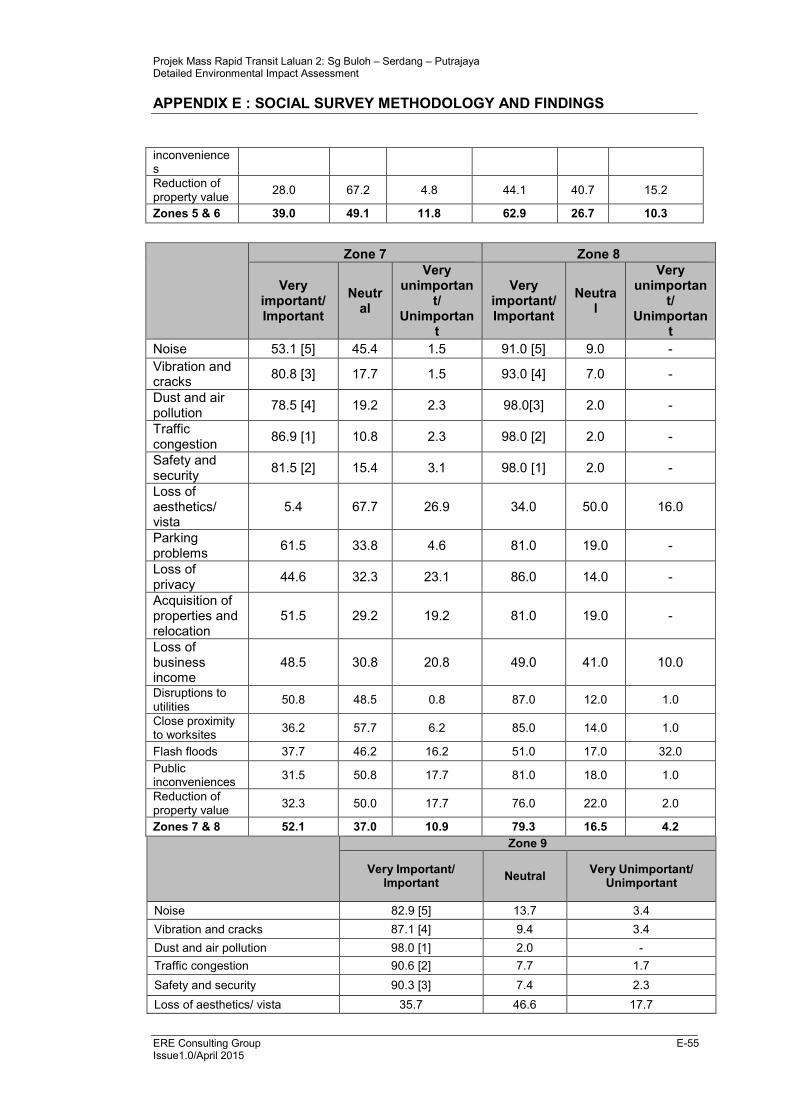
Projek Mass Rapid Transit Laluan 2: Sg Buloh – Serdang – Putrajaya Detailed Environmental Impact Assessment
APPENDIX E : SOCIAL SURVEY METHODOLOGY AND FINDINGS
ERE Consulting Group E-55 Issue1.0/April 2015
inconveniences
Reduction of property value
28.0 67.2 4.8 44.1 40.7 15.2
Zones 5 & 6 39.0 49.1 11.8 62.9 26.7 10.3
Zone 7 Zone 8
Very important/ Important
Neutral
Very unimportan
t/ Unimportan
t
Very important/ Important
Neutral
Very unimportan
t/ Unimportan
t
Noise 53.1 [5] 45.4 1.5 91.0 [5] 9.0 -
Vibration and cracks
80.8 [3] 17.7 1.5 93.0 [4] 7.0 -
Dust and air pollution
78.5 [4] 19.2 2.3 98.0[3] 2.0 -
Traffic congestion
86.9 [1] 10.8 2.3 98.0 [2] 2.0 -
Safety and security
81.5 [2] 15.4 3.1 98.0 [1] 2.0 -
Loss of aesthetics/ vista
5.4 67.7 26.9 34.0 50.0 16.0
Parking problems
61.5 33.8 4.6 81.0 19.0 -
Loss of privacy
44.6 32.3 23.1 86.0 14.0 -
Acquisition of properties and relocation
51.5 29.2 19.2 81.0 19.0 -
Loss of business income
48.5 30.8 20.8 49.0 41.0 10.0
Disruptions to utilities
50.8 48.5 0.8 87.0 12.0 1.0
Close proximity to worksites
36.2 57.7 6.2 85.0 14.0 1.0
Flash floods 37.7 46.2 16.2 51.0 17.0 32.0
Public inconveniences
31.5 50.8 17.7 81.0 18.0 1.0
Reduction of property value
32.3 50.0 17.7 76.0 22.0 2.0
Zones 7 & 8 52.1 37.0 10.9 79.3 16.5 4.2
Zone 9
Very Important/ Important
Neutral Very Unimportant/
Unimportant
Noise 82.9 [5] 13.7 3.4
Vibration and cracks 87.1 [4] 9.4 3.4
Dust and air pollution 98.0 [1] 2.0 -
Traffic congestion 90.6 [2] 7.7 1.7
Safety and security 90.3 [3] 7.4 2.3
Loss of aesthetics/ vista 35.7 46.6 17.7
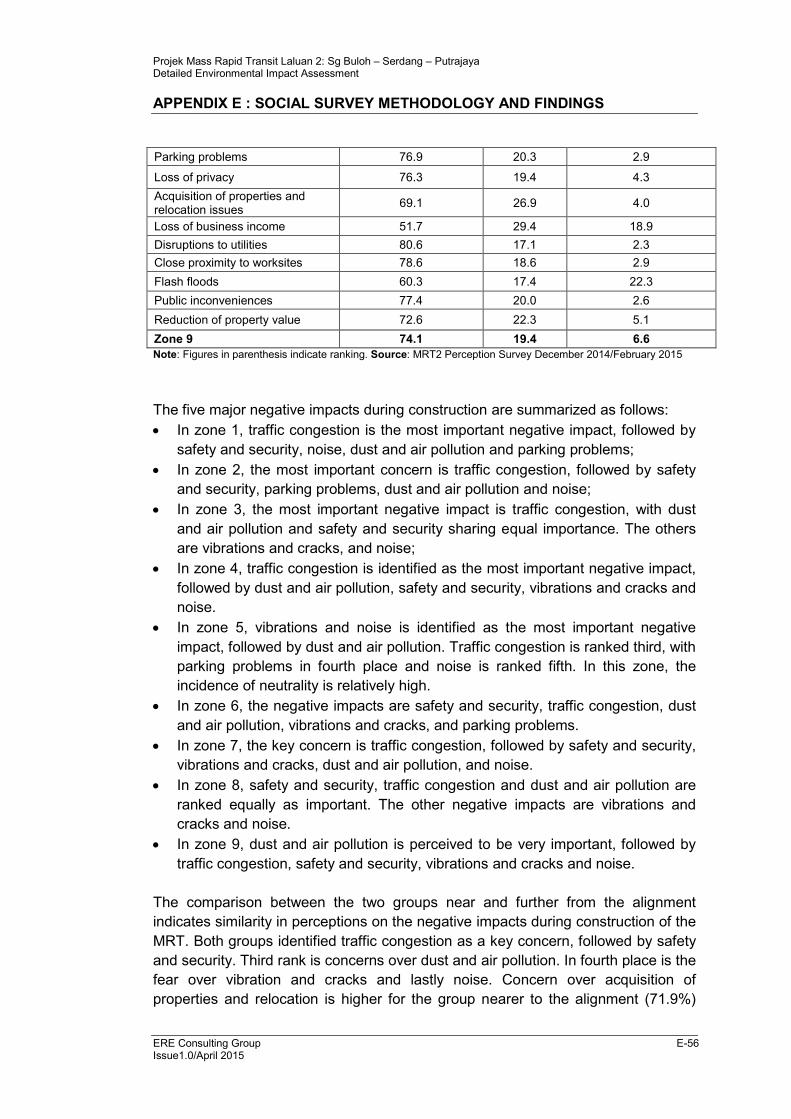
Projek Mass Rapid Transit Laluan 2: Sg Buloh – Serdang – Putrajaya Detailed Environmental Impact Assessment
APPENDIX E : SOCIAL SURVEY METHODOLOGY AND FINDINGS
ERE Consulting Group E-56 Issue1.0/April 2015
Parking problems 76.9 20.3 2.9
Loss of privacy 76.3 19.4 4.3
Acquisition of properties and relocation issues
69.1 26.9 4.0
Loss of business income 51.7 29.4 18.9
Disruptions to utilities 80.6 17.1 2.3
Close proximity to worksites 78.6 18.6 2.9
Flash floods 60.3 17.4 22.3
Public inconveniences 77.4 20.0 2.6
Reduction of property value 72.6 22.3 5.1
Zone 9 74.1 19.4 6.6
Note: Figures in parenthesis indicate ranking. Source: MRT2 Perception Survey December 2014/February 2015
The five major negative impacts during construction are summarized as follows:
• In zone 1, traffic congestion is the most important negative impact, followed by
safety and security, noise, dust and air pollution and parking problems;
• In zone 2, the most important concern is traffic congestion, followed by safety
and security, parking problems, dust and air pollution and noise;
• In zone 3, the most important negative impact is traffic congestion, with dust
and air pollution and safety and security sharing equal importance. The others
are vibrations and cracks, and noise;
• In zone 4, traffic congestion is identified as the most important negative impact,
followed by dust and air pollution, safety and security, vibrations and cracks and
noise.
• In zone 5, vibrations and noise is identified as the most important negative
impact, followed by dust and air pollution. Traffic congestion is ranked third, with
parking problems in fourth place and noise is ranked fifth. In this zone, the
incidence of neutrality is relatively high.
• In zone 6, the negative impacts are safety and security, traffic congestion, dust
and air pollution, vibrations and cracks, and parking problems.
• In zone 7, the key concern is traffic congestion, followed by safety and security,
vibrations and cracks, dust and air pollution, and noise.
• In zone 8, safety and security, traffic congestion and dust and air pollution are
ranked equally as important. The other negative impacts are vibrations and
cracks and noise.
• In zone 9, dust and air pollution is perceived to be very important, followed by
traffic congestion, safety and security, vibrations and cracks and noise.
The comparison between the two groups near and further from the alignment
indicates similarity in perceptions on the negative impacts during construction of the
MRT. Both groups identified traffic congestion as a key concern, followed by safety
and security. Third rank is concerns over dust and air pollution. In fourth place is the
fear over vibration and cracks and lastly noise. Concern over acquisition of
properties and relocation is higher for the group nearer to the alignment (71.9%)
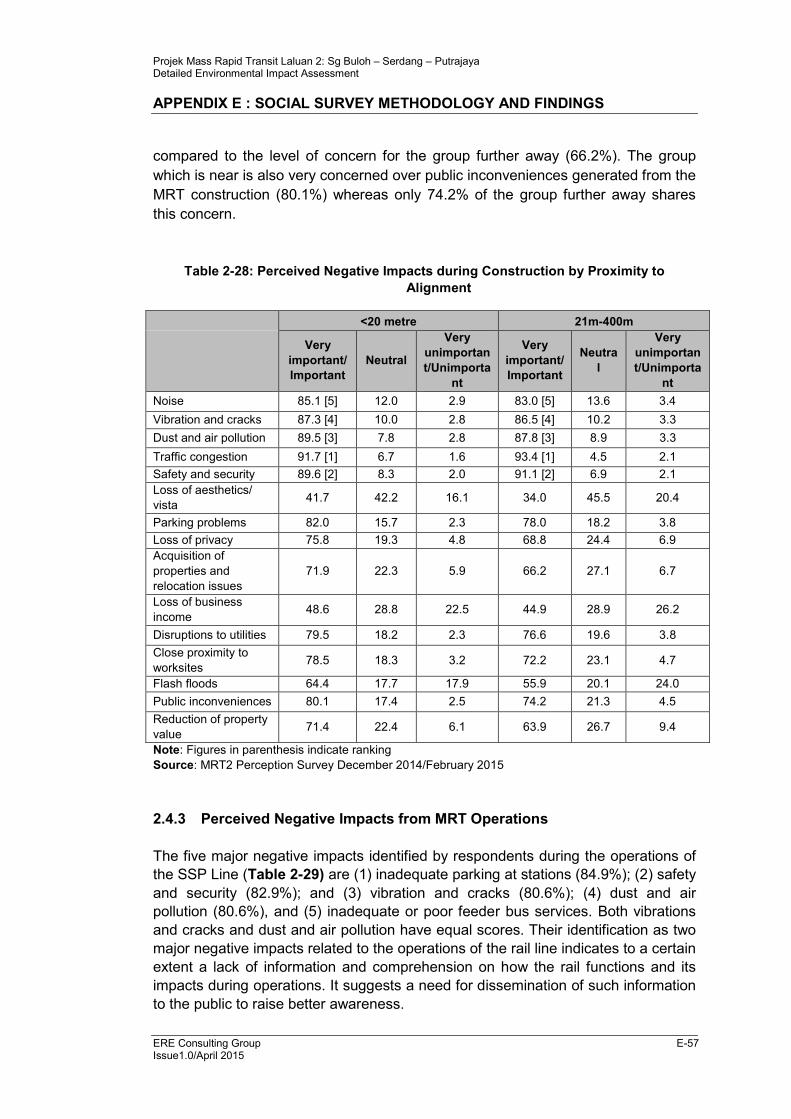
Projek Mass Rapid Transit Laluan 2: Sg Buloh – Serdang – Putrajaya Detailed Environmental Impact Assessment
APPENDIX E : SOCIAL SURVEY METHODOLOGY AND FINDINGS
ERE Consulting Group E-57 Issue1.0/April 2015
compared to the level of concern for the group further away (66.2%). The group
which is near is also very concerned over public inconveniences generated from the
MRT construction (80.1%) whereas only 74.2% of the group further away shares
this concern.
Table 2-28: Perceived Negative Impacts during Construction by Proximity to
Alignment
<20 metre 21m-400m
Very
important/
Important
Neutral
Very
unimportan
t/Unimporta
nt
Very
important/
Important
Neutra
l
Very
unimportan
t/Unimporta
nt
Noise 85.1 [5] 12.0 2.9 83.0 [5] 13.6 3.4
Vibration and cracks 87.3 [4] 10.0 2.8 86.5 [4] 10.2 3.3
Dust and air pollution 89.5 [3] 7.8 2.8 87.8 [3] 8.9 3.3
Traffic congestion 91.7 [1] 6.7 1.6 93.4 [1] 4.5 2.1
Safety and security 89.6 [2] 8.3 2.0 91.1 [2] 6.9 2.1
Loss of aesthetics/
vista 41.7 42.2 16.1 34.0 45.5 20.4
Parking problems 82.0 15.7 2.3 78.0 18.2 3.8
Loss of privacy 75.8 19.3 4.8 68.8 24.4 6.9
Acquisition of
properties and
relocation issues
71.9 22.3 5.9 66.2 27.1 6.7
Loss of business
income 48.6 28.8 22.5 44.9 28.9 26.2
Disruptions to utilities 79.5 18.2 2.3 76.6 19.6 3.8
Close proximity to
worksites 78.5 18.3 3.2 72.2 23.1 4.7
Flash floods 64.4 17.7 17.9 55.9 20.1 24.0
Public inconveniences 80.1 17.4 2.5 74.2 21.3 4.5
Reduction of property
value 71.4 22.4 6.1 63.9 26.7 9.4
Note: Figures in parenthesis indicate ranking
Source: MRT2 Perception Survey December 2014/February 2015
2.4.3 Perceived Negative Impacts from MRT Operations
The five major negative impacts identified by respondents during the operations of
the SSP Line (Table 2-29) are (1) inadequate parking at stations (84.9%); (2) safety
and security (82.9%); and (3) vibration and cracks (80.6%); (4) dust and air
pollution (80.6%), and (5) inadequate or poor feeder bus services. Both vibrations
and cracks and dust and air pollution have equal scores. Their identification as two
major negative impacts related to the operations of the rail line indicates to a certain
extent a lack of information and comprehension on how the rail functions and its
impacts during operations. It suggests a need for dissemination of such information
to the public to raise better awareness.
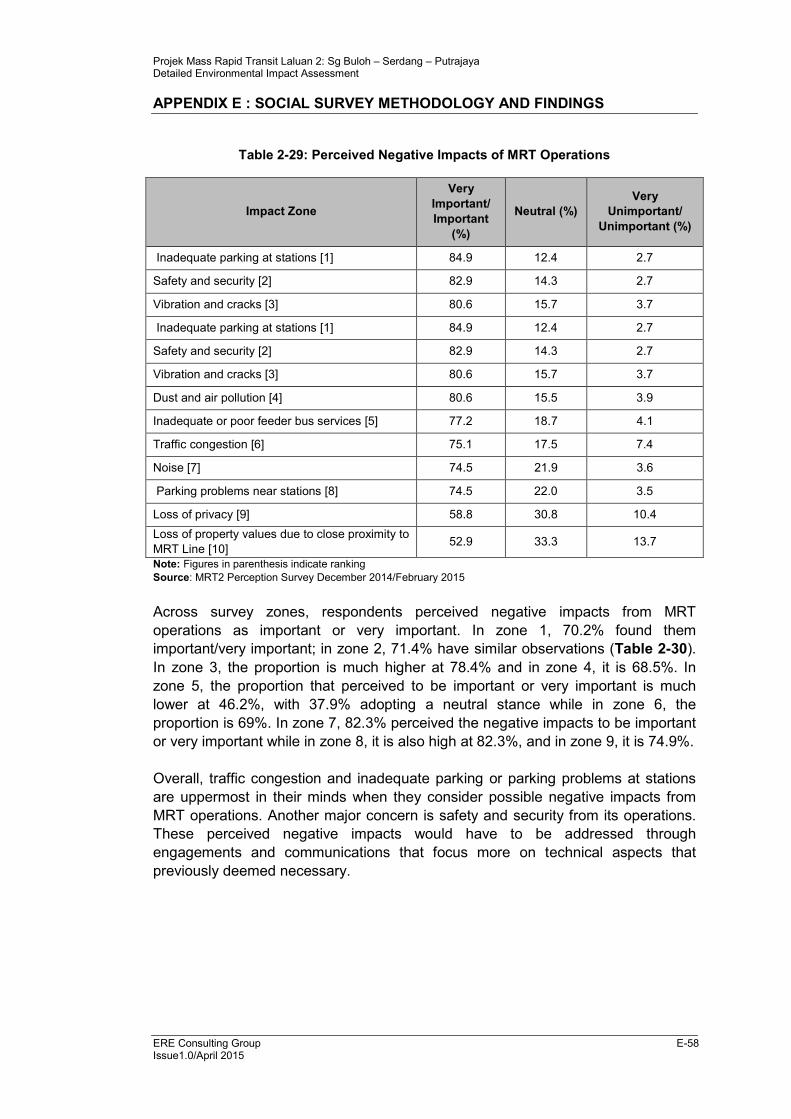
Projek Mass Rapid Transit Laluan 2: Sg Buloh – Serdang – Putrajaya Detailed Environmental Impact Assessment
APPENDIX E : SOCIAL SURVEY METHODOLOGY AND FINDINGS
ERE Consulting Group E-58 Issue1.0/April 2015
Table 2-29: Perceived Negative Impacts of MRT Operations
Impact Zone
Very
Important/
Important
(%)
Neutral (%)
Very
Unimportant/
Unimportant (%)
Inadequate parking at stations [1] 84.9 12.4 2.7
Safety and security [2] 82.9 14.3 2.7
Vibration and cracks [3] 80.6 15.7 3.7
Inadequate parking at stations [1] 84.9 12.4 2.7
Safety and security [2] 82.9 14.3 2.7
Vibration and cracks [3] 80.6 15.7 3.7
Dust and air pollution [4] 80.6 15.5 3.9
Inadequate or poor feeder bus services [5] 77.2 18.7 4.1
Traffic congestion [6] 75.1 17.5 7.4
Noise [7] 74.5 21.9 3.6
Parking problems near stations [8] 74.5 22.0 3.5
Loss of privacy [9] 58.8 30.8 10.4
Loss of property values due to close proximity to
MRT Line [10] 52.9 33.3 13.7
Note: Figures in parenthesis indicate ranking
Source: MRT2 Perception Survey December 2014/February 2015
Across survey zones, respondents perceived negative impacts from MRT
operations as important or very important. In zone 1, 70.2% found them
important/very important; in zone 2, 71.4% have similar observations (Table 2-30).
In zone 3, the proportion is much higher at 78.4% and in zone 4, it is 68.5%. In
zone 5, the proportion that perceived to be important or very important is much
lower at 46.2%, with 37.9% adopting a neutral stance while in zone 6, the
proportion is 69%. In zone 7, 82.3% perceived the negative impacts to be important
or very important while in zone 8, it is also high at 82.3%, and in zone 9, it is 74.9%.
Overall, traffic congestion and inadequate parking or parking problems at stations
are uppermost in their minds when they consider possible negative impacts from
MRT operations. Another major concern is safety and security from its operations.
These perceived negative impacts would have to be addressed through
engagements and communications that focus more on technical aspects that
previously deemed necessary.
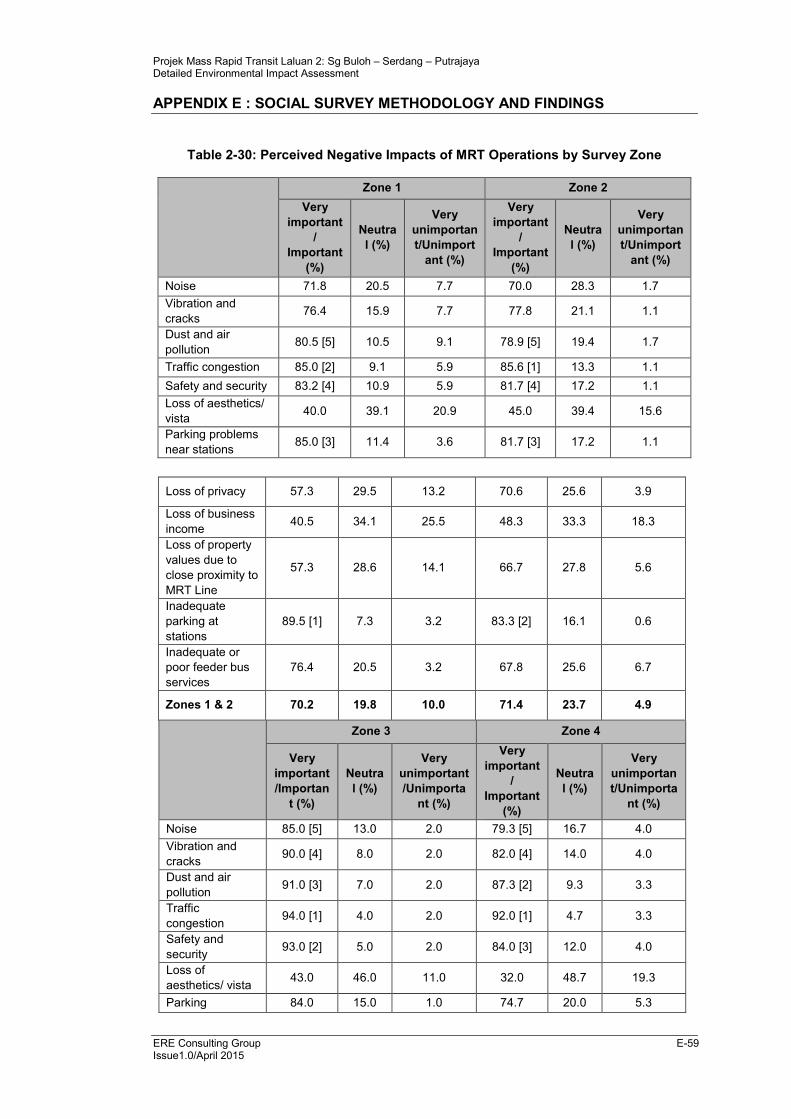
Projek Mass Rapid Transit Laluan 2: Sg Buloh – Serdang – Putrajaya Detailed Environmental Impact Assessment
APPENDIX E : SOCIAL SURVEY METHODOLOGY AND FINDINGS
ERE Consulting Group E-59 Issue1.0/April 2015
Table 2-30: Perceived Negative Impacts of MRT Operations by Survey Zone
Zone 1 Zone 2
Very
important
/
Important
(%)
Neutra
l (%)
Very
unimportan
t/Unimport
ant (%)
Very
important
/
Important
(%)
Neutra
l (%)
Very
unimportan
t/Unimport
ant (%)
Noise 71.8 20.5 7.7 70.0 28.3 1.7
Vibration and
cracks 76.4 15.9 7.7 77.8 21.1 1.1
Dust and air
pollution 80.5 [5] 10.5 9.1 78.9 [5] 19.4 1.7
Traffic congestion 85.0 [2] 9.1 5.9 85.6 [1] 13.3 1.1
Safety and security 83.2 [4] 10.9 5.9 81.7 [4] 17.2 1.1
Loss of aesthetics/
vista 40.0 39.1 20.9 45.0 39.4 15.6
Parking problems
near stations 85.0 [3] 11.4 3.6 81.7 [3] 17.2 1.1
Loss of privacy 57.3 29.5 13.2 70.6 25.6 3.9
Loss of business
income 40.5 34.1 25.5 48.3 33.3 18.3
Loss of property
values due to
close proximity to
MRT Line
57.3 28.6 14.1 66.7 27.8 5.6
Inadequate
parking at
stations
89.5 [1] 7.3 3.2 83.3 [2] 16.1 0.6
Inadequate or
poor feeder bus
services
76.4 20.5 3.2 67.8 25.6 6.7
Zones 1 & 2 70.2 19.8 10.0 71.4 23.7 4.9
Zone 3 Zone 4
Very
important
/Importan
t (%)
Neutra
l (%)
Very
unimportant
/Unimporta
nt (%)
Very
important
/
Important
(%)
Neutra
l (%)
Very
unimportan
t/Unimporta
nt (%)
Noise 85.0 [5] 13.0 2.0 79.3 [5] 16.7 4.0
Vibration and
cracks 90.0 [4] 8.0 2.0 82.0 [4] 14.0 4.0
Dust and air
pollution 91.0 [3] 7.0 2.0 87.3 [2] 9.3 3.3
Traffic
congestion 94.0 [1] 4.0 2.0 92.0 [1] 4.7 3.3
Safety and
security 93.0 [2] 5.0 2.0 84.0 [3] 12.0 4.0
Loss of
aesthetics/ vista 43.0 46.0 11.0 32.0 48.7 19.3
Parking 84.0 15.0 1.0 74.7 20.0 5.3
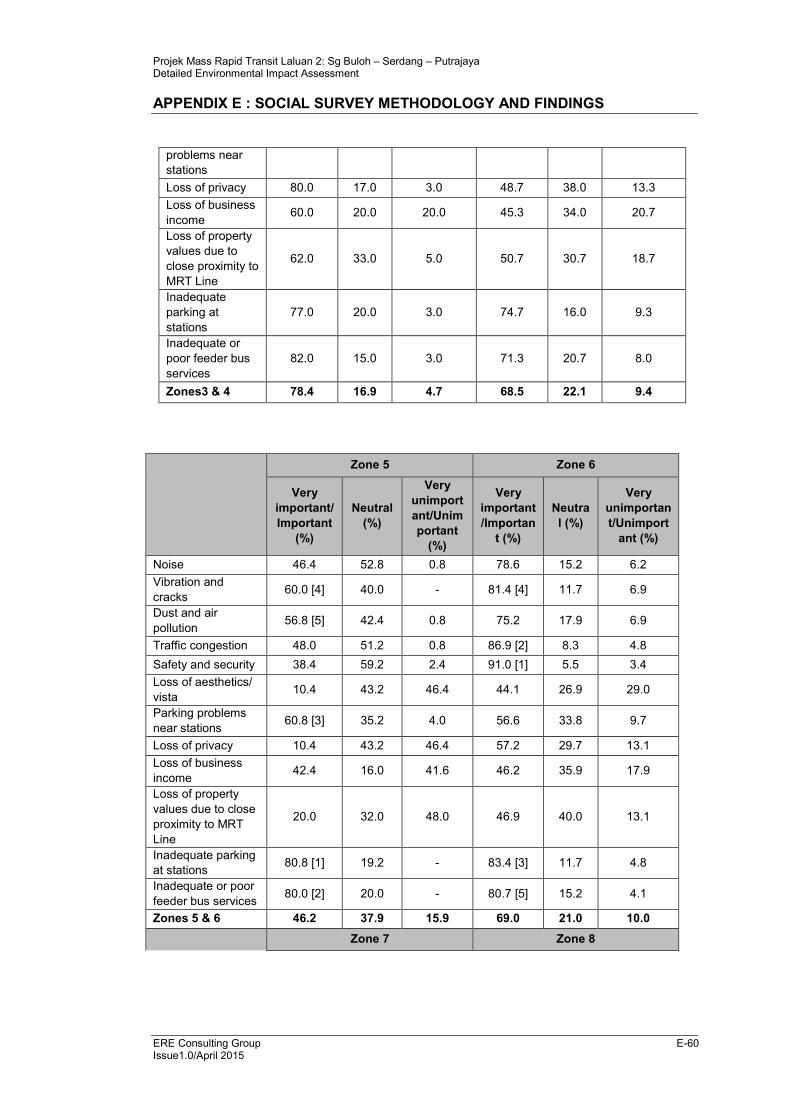
Projek Mass Rapid Transit Laluan 2: Sg Buloh – Serdang – Putrajaya Detailed Environmental Impact Assessment
APPENDIX E : SOCIAL SURVEY METHODOLOGY AND FINDINGS
ERE Consulting Group E-60 Issue1.0/April 2015
problems near
stations
Loss of privacy 80.0 17.0 3.0 48.7 38.0 13.3
Loss of business
income 60.0 20.0 20.0 45.3 34.0 20.7
Loss of property
values due to
close proximity to
MRT Line
62.0 33.0 5.0 50.7 30.7 18.7
Inadequate
parking at
stations
77.0 20.0 3.0 74.7 16.0 9.3
Inadequate or
poor feeder bus
services
82.0 15.0 3.0 71.3 20.7 8.0
Zones3 & 4 78.4 16.9 4.7 68.5 22.1 9.4
Zone 5 Zone 6
Very
important/
Important
(%)
Neutral
(%)
Very
unimport
ant/Unim
portant
(%)
Very
important
/Importan
t (%)
Neutra
l (%)
Very
unimportan
t/Unimport
ant (%)
Noise 46.4 52.8 0.8 78.6 15.2 6.2
Vibration and
cracks 60.0 [4] 40.0 - 81.4 [4] 11.7 6.9
Dust and air
pollution 56.8 [5] 42.4 0.8 75.2 17.9 6.9
Traffic congestion 48.0 51.2 0.8 86.9 [2] 8.3 4.8
Safety and security 38.4 59.2 2.4 91.0 [1] 5.5 3.4
Loss of aesthetics/
vista 10.4 43.2 46.4 44.1 26.9 29.0
Parking problems
near stations 60.8 [3] 35.2 4.0 56.6 33.8 9.7
Loss of privacy 10.4 43.2 46.4 57.2 29.7 13.1
Loss of business
income 42.4 16.0 41.6 46.2 35.9 17.9
Loss of property
values due to close
proximity to MRT
Line
20.0 32.0 48.0 46.9 40.0 13.1
Inadequate parking
at stations 80.8 [1] 19.2 - 83.4 [3] 11.7 4.8
Inadequate or poor
feeder bus services 80.0 [2] 20.0 - 80.7 [5] 15.2 4.1
Zones 5 & 6 46.2 37.9 15.9 69.0 21.0 10.0
Zone 7 Zone 8
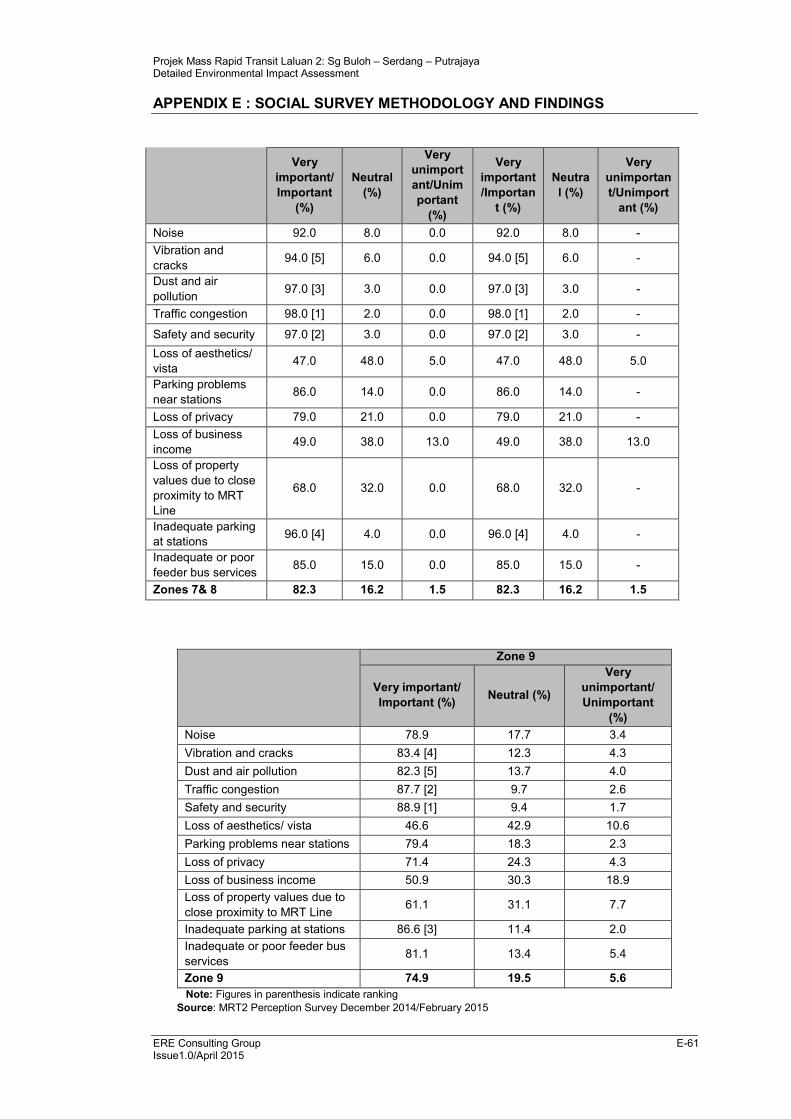
Projek Mass Rapid Transit Laluan 2: Sg Buloh – Serdang – Putrajaya Detailed Environmental Impact Assessment
APPENDIX E : SOCIAL SURVEY METHODOLOGY AND FINDINGS
ERE Consulting Group E-61 Issue1.0/April 2015
Very
important/
Important
(%)
Neutral
(%)
Very
unimport
ant/Unim
portant
(%)
Very
important
/Importan
t (%)
Neutra
l (%)
Very
unimportan
t/Unimport
ant (%)
Noise 92.0 8.0 0.0 92.0 8.0 -
Vibration and
cracks 94.0 [5] 6.0 0.0 94.0 [5] 6.0 -
Dust and air
pollution 97.0 [3] 3.0 0.0 97.0 [3] 3.0 -
Traffic congestion 98.0 [1] 2.0 0.0 98.0 [1] 2.0 -
Safety and security 97.0 [2] 3.0 0.0 97.0 [2] 3.0 -
Loss of aesthetics/
vista 47.0 48.0 5.0 47.0 48.0 5.0
Parking problems
near stations 86.0 14.0 0.0 86.0 14.0 -
Loss of privacy 79.0 21.0 0.0 79.0 21.0 -
Loss of business
income 49.0 38.0 13.0 49.0 38.0 13.0
Loss of property
values due to close
proximity to MRT
Line
68.0 32.0 0.0 68.0 32.0 -
Inadequate parking
at stations 96.0 [4] 4.0 0.0 96.0 [4] 4.0 -
Inadequate or poor
feeder bus services 85.0 15.0 0.0 85.0 15.0 -
Zones 7& 8 82.3 16.2 1.5 82.3 16.2 1.5
Zone 9
Very important/
Important (%) Neutral (%)
Very
unimportant/
Unimportant
(%)
Noise 78.9 17.7 3.4
Vibration and cracks 83.4 [4] 12.3 4.3
Dust and air pollution 82.3 [5] 13.7 4.0
Traffic congestion 87.7 [2] 9.7 2.6
Safety and security 88.9 [1] 9.4 1.7
Loss of aesthetics/ vista 46.6 42.9 10.6
Parking problems near stations 79.4 18.3 2.3
Loss of privacy 71.4 24.3 4.3
Loss of business income 50.9 30.3 18.9
Loss of property values due to
close proximity to MRT Line 61.1 31.1 7.7
Inadequate parking at stations 86.6 [3] 11.4 2.0
Inadequate or poor feeder bus
services 81.1 13.4 5.4
Zone 9 74.9 19.5 5.6
Note: Figures in parenthesis indicate ranking
Source: MRT2 Perception Survey December 2014/February 2015
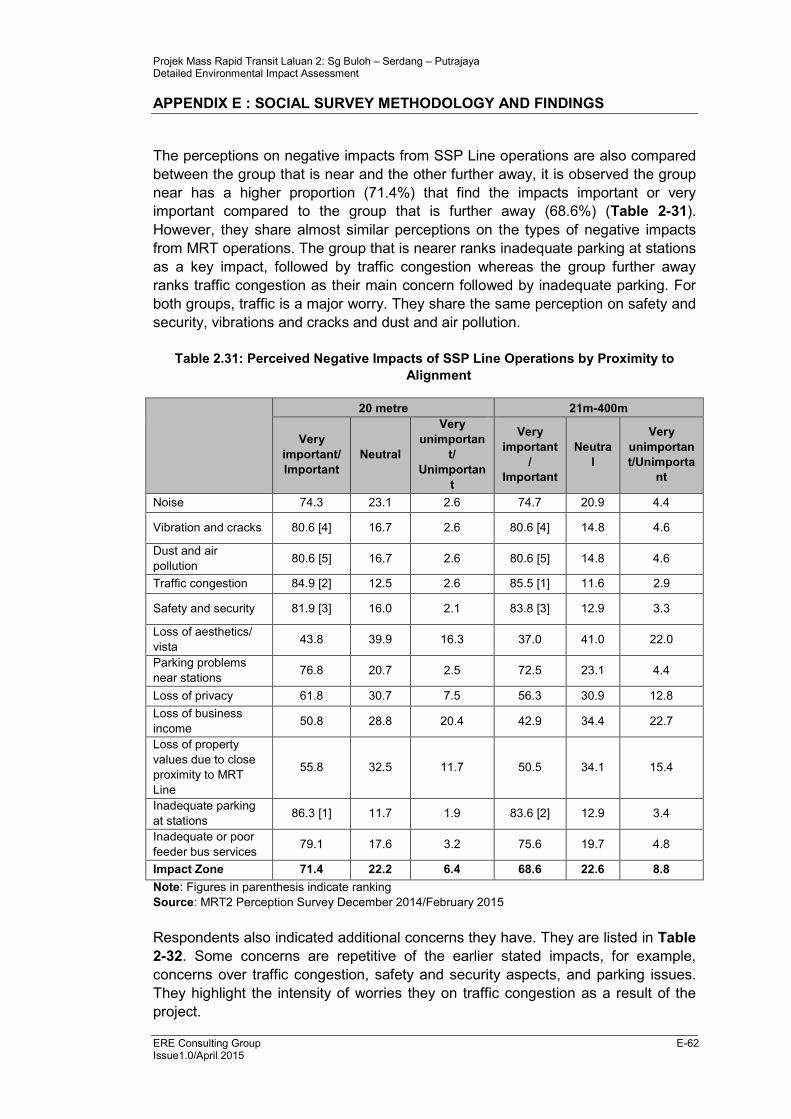
Projek Mass Rapid Transit Laluan 2: Sg Buloh – Serdang – Putrajaya Detailed Environmental Impact Assessment
APPENDIX E : SOCIAL SURVEY METHODOLOGY AND FINDINGS
ERE Consulting Group E-62 Issue1.0/April 2015
The perceptions on negative impacts from SSP Line operations are also compared
between the group that is near and the other further away, it is observed the group
near has a higher proportion (71.4%) that find the impacts important or very
important compared to the group that is further away (68.6%) (Table 2-31).
However, they share almost similar perceptions on the types of negative impacts
from MRT operations. The group that is nearer ranks inadequate parking at stations
as a key impact, followed by traffic congestion whereas the group further away
ranks traffic congestion as their main concern followed by inadequate parking. For
both groups, traffic is a major worry. They share the same perception on safety and
security, vibrations and cracks and dust and air pollution.
Table 2.31: Perceived Negative Impacts of SSP Line Operations by Proximity to
Alignment
20 metre 21m-400m
Very
important/
Important
Neutral
Very
unimportan
t/
Unimportan
t
Very
important
/
Important
Neutra
l
Very
unimportan
t/Unimporta
nt
Noise 74.3 23.1 2.6 74.7 20.9 4.4
Vibration and cracks 80.6 [4] 16.7 2.6 80.6 [4] 14.8 4.6
Dust and air
pollution 80.6 [5] 16.7 2.6 80.6 [5] 14.8 4.6
Traffic congestion 84.9 [2] 12.5 2.6 85.5 [1] 11.6 2.9
Safety and security 81.9 [3] 16.0 2.1 83.8 [3] 12.9 3.3
Loss of aesthetics/
vista 43.8 39.9 16.3 37.0 41.0 22.0
Parking problems
near stations 76.8 20.7 2.5 72.5 23.1 4.4
Loss of privacy 61.8 30.7 7.5 56.3 30.9 12.8
Loss of business
income 50.8 28.8 20.4 42.9 34.4 22.7
Loss of property
values due to close
proximity to MRT
Line
55.8 32.5 11.7 50.5 34.1 15.4
Inadequate parking
at stations 86.3 [1] 11.7 1.9 83.6 [2] 12.9 3.4
Inadequate or poor
feeder bus services 79.1 17.6 3.2 75.6 19.7 4.8
Impact Zone 71.4 22.2 6.4 68.6 22.6 8.8
Note: Figures in parenthesis indicate ranking
Source: MRT2 Perception Survey December 2014/February 2015
Respondents also indicated additional concerns they have. They are listed in Table
2-32. Some concerns are repetitive of the earlier stated impacts, for example,
concerns over traffic congestion, safety and security aspects, and parking issues.
They highlight the intensity of worries they on traffic congestion as a result of the
project.
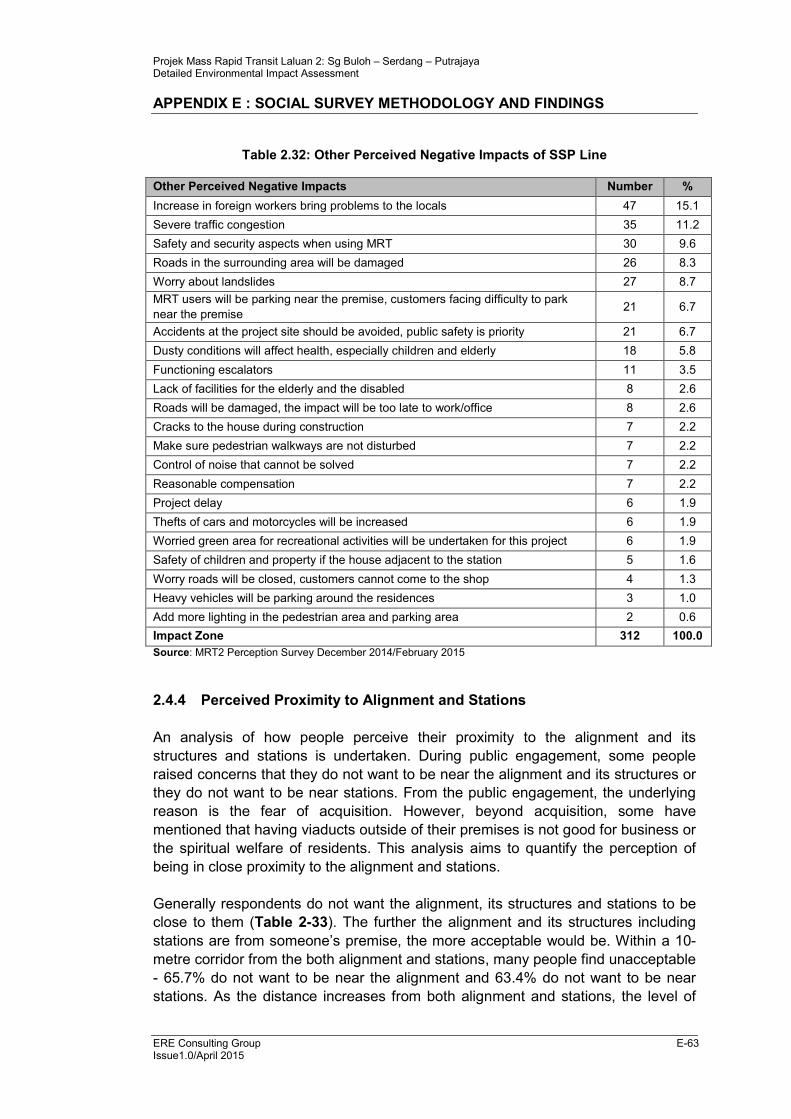
Projek Mass Rapid Transit Laluan 2: Sg Buloh – Serdang – Putrajaya Detailed Environmental Impact Assessment
APPENDIX E : SOCIAL SURVEY METHODOLOGY AND FINDINGS
ERE Consulting Group E-63 Issue1.0/April 2015
Table 2.32: Other Perceived Negative Impacts of SSP Line
Other Perceived Negative Impacts Number %
Increase in foreign workers bring problems to the locals 47 15.1
Severe traffic congestion 35 11.2
Safety and security aspects when using MRT 30 9.6
Roads in the surrounding area will be damaged 26 8.3
Worry about landslides 27 8.7
MRT users will be parking near the premise, customers facing difficulty to park
near the premise 21 6.7
Accidents at the project site should be avoided, public safety is priority 21 6.7
Dusty conditions will affect health, especially children and elderly 18 5.8
Functioning escalators 11 3.5
Lack of facilities for the elderly and the disabled 8 2.6
Roads will be damaged, the impact will be too late to work/office 8 2.6
Cracks to the house during construction 7 2.2
Make sure pedestrian walkways are not disturbed 7 2.2
Control of noise that cannot be solved 7 2.2
Reasonable compensation 7 2.2
Project delay 6 1.9
Thefts of cars and motorcycles will be increased 6 1.9
Worried green area for recreational activities will be undertaken for this project 6 1.9
Safety of children and property if the house adjacent to the station 5 1.6
Worry roads will be closed, customers cannot come to the shop 4 1.3
Heavy vehicles will be parking around the residences 3 1.0
Add more lighting in the pedestrian area and parking area 2 0.6
Impact Zone 312 100.0
Source: MRT2 Perception Survey December 2014/February 2015
2.4.4 Perceived Proximity to Alignment and Stations
An analysis of how people perceive their proximity to the alignment and its
structures and stations is undertaken. During public engagement, some people
raised concerns that they do not want to be near the alignment and its structures or
they do not want to be near stations. From the public engagement, the underlying
reason is the fear of acquisition. However, beyond acquisition, some have
mentioned that having viaducts outside of their premises is not good for business or
the spiritual welfare of residents. This analysis aims to quantify the perception of
being in close proximity to the alignment and stations.
Generally respondents do not want the alignment, its structures and stations to be
close to them (Table 2-33). The further the alignment and its structures including
stations are from someone’s premise, the more acceptable would be. Within a 10-
metre corridor from the both alignment and stations, many people find unacceptable
- 65.7% do not want to be near the alignment and 63.4% do not want to be near
stations. As the distance increases from both alignment and stations, the level of
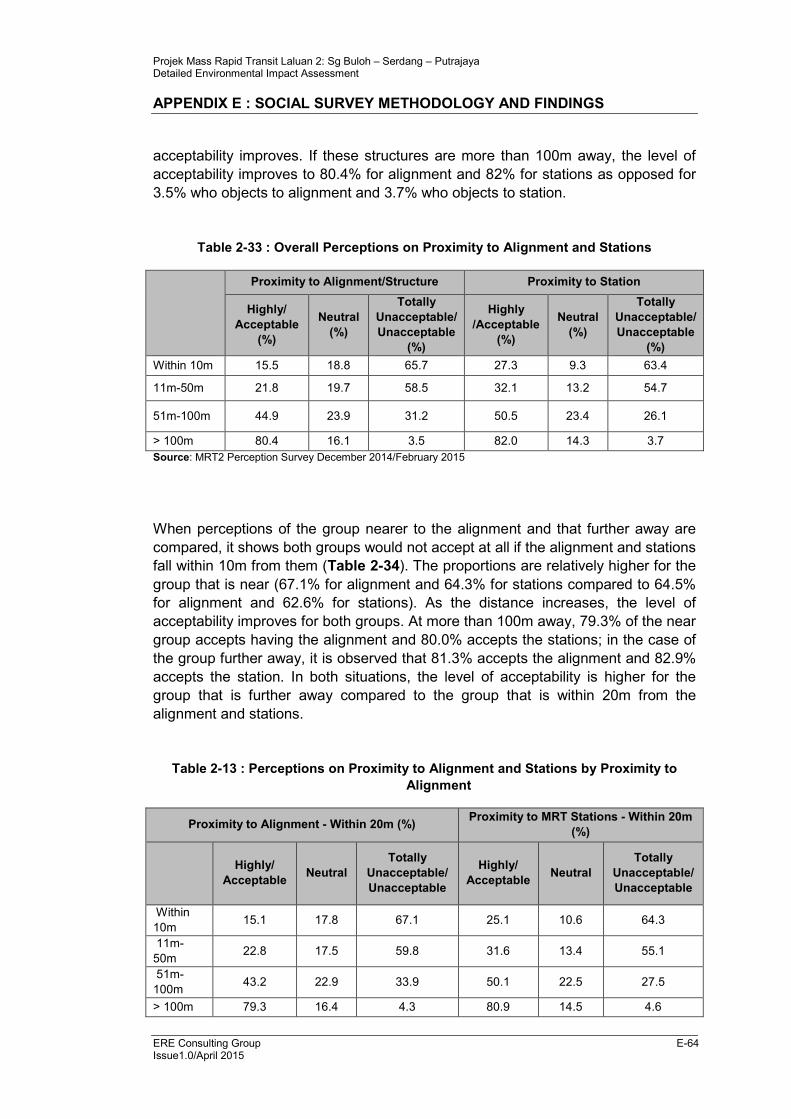
Projek Mass Rapid Transit Laluan 2: Sg Buloh – Serdang – Putrajaya Detailed Environmental Impact Assessment
APPENDIX E : SOCIAL SURVEY METHODOLOGY AND FINDINGS
ERE Consulting Group E-64 Issue1.0/April 2015
acceptability improves. If these structures are more than 100m away, the level of
acceptability improves to 80.4% for alignment and 82% for stations as opposed for
3.5% who objects to alignment and 3.7% who objects to station.
Table 2-33 : Overall Perceptions on Proximity to Alignment and Stations
Proximity to Alignment/Structure Proximity to Station
Highly/
Acceptable
(%)
Neutral
(%)
Totally
Unacceptable/
Unacceptable
(%)
Highly
/Acceptable
(%)
Neutral
(%)
Totally
Unacceptable/
Unacceptable
(%)
Within 10m 15.5 18.8 65.7 27.3 9.3 63.4
11m-50m 21.8 19.7 58.5 32.1 13.2 54.7
51m-100m 44.9 23.9 31.2 50.5 23.4 26.1
> 100m 80.4 16.1 3.5 82.0 14.3 3.7
Source: MRT2 Perception Survey December 2014/February 2015
When perceptions of the group nearer to the alignment and that further away are
compared, it shows both groups would not accept at all if the alignment and stations
fall within 10m from them (Table 2-34). The proportions are relatively higher for the
group that is near (67.1% for alignment and 64.3% for stations compared to 64.5%
for alignment and 62.6% for stations). As the distance increases, the level of
acceptability improves for both groups. At more than 100m away, 79.3% of the near
group accepts having the alignment and 80.0% accepts the stations; in the case of
the group further away, it is observed that 81.3% accepts the alignment and 82.9%
accepts the station. In both situations, the level of acceptability is higher for the
group that is further away compared to the group that is within 20m from the
alignment and stations.
Table 2-13 : Perceptions on Proximity to Alignment and Stations by Proximity to
Alignment
Proximity to Alignment - Within 20m (%) Proximity to MRT Stations - Within 20m
(%)
Highly/
Acceptable Neutral
Totally
Unacceptable/
Unacceptable
Highly/
Acceptable Neutral
Totally
Unacceptable/
Unacceptable
Within
10m 15.1 17.8 67.1 25.1 10.6 64.3
11m-
50m 22.8 17.5 59.8 31.6 13.4 55.1
51m-
100m 43.2 22.9 33.9 50.1 22.5 27.5
> 100m 79.3 16.4 4.3 80.9 14.5 4.6
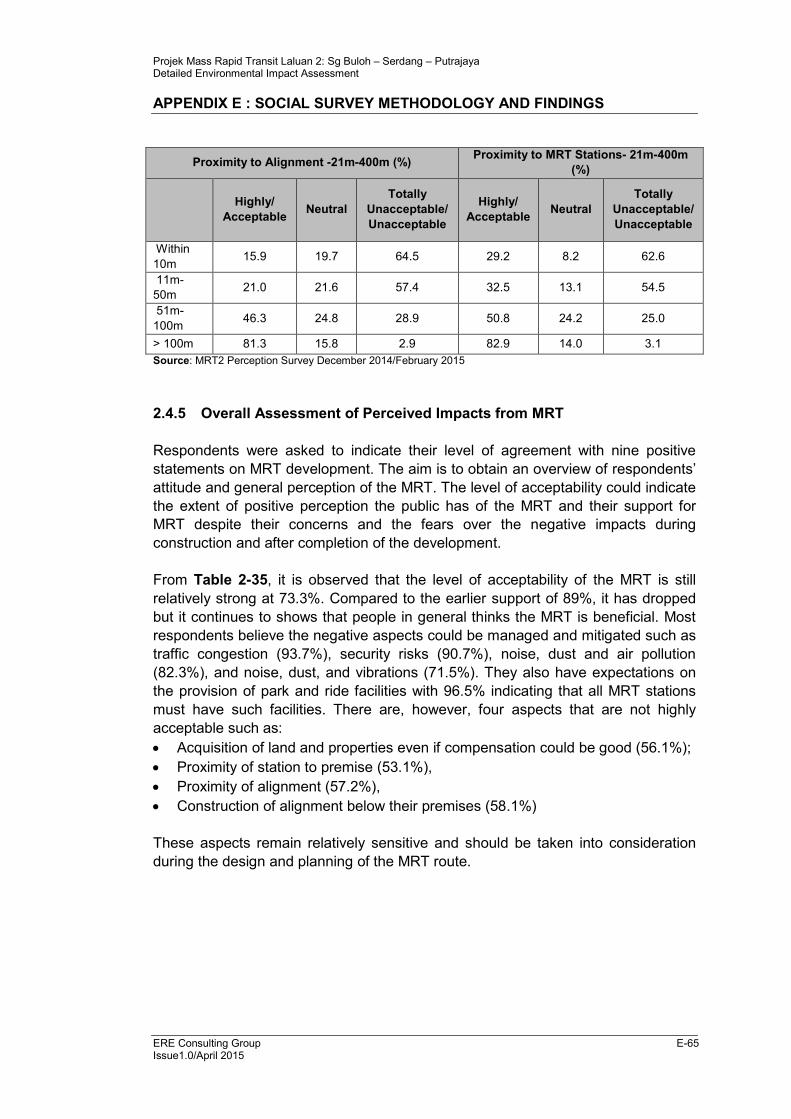
Projek Mass Rapid Transit Laluan 2: Sg Buloh – Serdang – Putrajaya Detailed Environmental Impact Assessment
APPENDIX E : SOCIAL SURVEY METHODOLOGY AND FINDINGS
ERE Consulting Group E-65 Issue1.0/April 2015
Proximity to Alignment -21m-400m (%) Proximity to MRT Stations- 21m-400m
(%)
Highly/
Acceptable Neutral
Totally
Unacceptable/
Unacceptable
Highly/
Acceptable Neutral
Totally
Unacceptable/
Unacceptable
Within
10m 15.9 19.7 64.5 29.2 8.2 62.6
11m-
50m 21.0 21.6 57.4 32.5 13.1 54.5
51m-
100m 46.3 24.8 28.9 50.8 24.2 25.0
> 100m 81.3 15.8 2.9 82.9 14.0 3.1
Source: MRT2 Perception Survey December 2014/February 2015
2.4.5 Overall Assessment of Perceived Impacts from MRT
Respondents were asked to indicate their level of agreement with nine positive
statements on MRT development. The aim is to obtain an overview of respondents’
attitude and general perception of the MRT. The level of acceptability could indicate
the extent of positive perception the public has of the MRT and their support for
MRT despite their concerns and the fears over the negative impacts during
construction and after completion of the development.
From Table 2-35, it is observed that the level of acceptability of the MRT is still
relatively strong at 73.3%. Compared to the earlier support of 89%, it has dropped
but it continues to shows that people in general thinks the MRT is beneficial. Most
respondents believe the negative aspects could be managed and mitigated such as
traffic congestion (93.7%), security risks (90.7%), noise, dust and air pollution
(82.3%), and noise, dust, and vibrations (71.5%). They also have expectations on
the provision of park and ride facilities with 96.5% indicating that all MRT stations
must have such facilities. There are, however, four aspects that are not highly
acceptable such as:
• Acquisition of land and properties even if compensation could be good (56.1%);
• Proximity of station to premise (53.1%),
• Proximity of alignment (57.2%),
• Construction of alignment below their premises (58.1%)
These aspects remain relatively sensitive and should be taken into consideration
during the design and planning of the MRT route.
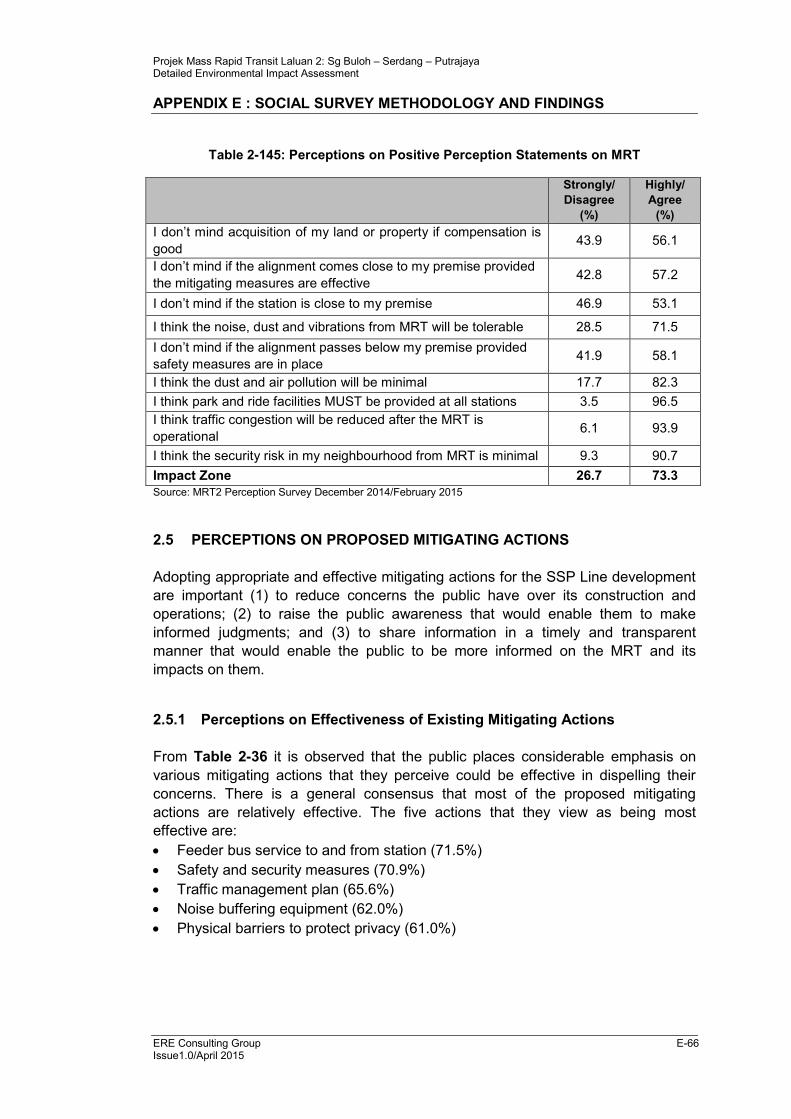
Projek Mass Rapid Transit Laluan 2: Sg Buloh – Serdang – Putrajaya Detailed Environmental Impact Assessment
APPENDIX E : SOCIAL SURVEY METHODOLOGY AND FINDINGS
ERE Consulting Group E-66 Issue1.0/April 2015
Table 2-145: Perceptions on Positive Perception Statements on MRT
Strongly/
Disagree
(%)
Highly/
Agree
(%)
I don’t mind acquisition of my land or property if compensation is
good 43.9 56.1
I don’t mind if the alignment comes close to my premise provided
the mitigating measures are effective 42.8 57.2
I don’t mind if the station is close to my premise 46.9 53.1
I think the noise, dust and vibrations from MRT will be tolerable 28.5 71.5
I don’t mind if the alignment passes below my premise provided
safety measures are in place 41.9 58.1
I think the dust and air pollution will be minimal 17.7 82.3
I think park and ride facilities MUST be provided at all stations 3.5 96.5
I think traffic congestion will be reduced after the MRT is
operational 6.1 93.9
I think the security risk in my neighbourhood from MRT is minimal 9.3 90.7
Impact Zone 26.7 73.3
Source: MRT2 Perception Survey December 2014/February 2015
2.5 PERCEPTIONS ON PROPOSED MITIGATING ACTIONS
Adopting appropriate and effective mitigating actions for the SSP Line development
are important (1) to reduce concerns the public have over its construction and
operations; (2) to raise the public awareness that would enable them to make
informed judgments; and (3) to share information in a timely and transparent
manner that would enable the public to be more informed on the MRT and its
impacts on them.
2.5.1 Perceptions on Effectiveness of Existing Mitigating Actions
From Table 2-36 it is observed that the public places considerable emphasis on
various mitigating actions that they perceive could be effective in dispelling their
concerns. There is a general consensus that most of the proposed mitigating
actions are relatively effective. The five actions that they view as being most
effective are:
• Feeder bus service to and from station (71.5%)
• Safety and security measures (70.9%)
• Traffic management plan (65.6%)
• Noise buffering equipment (62.0%)
• Physical barriers to protect privacy (61.0%)
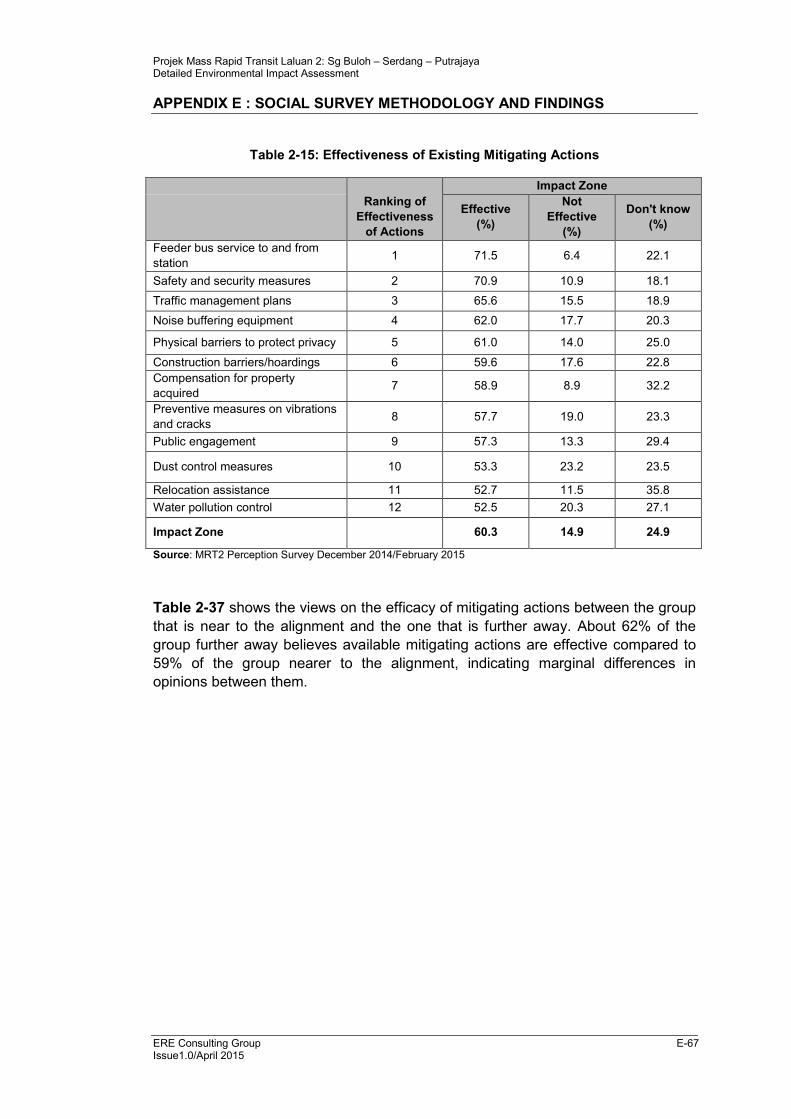
Projek Mass Rapid Transit Laluan 2: Sg Buloh – Serdang – Putrajaya Detailed Environmental Impact Assessment
APPENDIX E : SOCIAL SURVEY METHODOLOGY AND FINDINGS
ERE Consulting Group E-67 Issue1.0/April 2015
Table 2-15: Effectiveness of Existing Mitigating Actions
Ranking of
Effectiveness
of Actions
Impact Zone
Effective
(%)
Not
Effective
(%)
Don't know
(%)
Feeder bus service to and from
station 1 71.5 6.4 22.1
Safety and security measures 2 70.9 10.9 18.1
Traffic management plans 3 65.6 15.5 18.9
Noise buffering equipment 4 62.0 17.7 20.3
Physical barriers to protect privacy 5 61.0 14.0 25.0
Construction barriers/hoardings 6 59.6 17.6 22.8
Compensation for property
acquired 7 58.9 8.9 32.2
Preventive measures on vibrations
and cracks 8 57.7 19.0 23.3
Public engagement 9 57.3 13.3 29.4
Dust control measures 10 53.3 23.2 23.5
Relocation assistance 11 52.7 11.5 35.8
Water pollution control 12 52.5 20.3 27.1
Impact Zone
60.3 14.9 24.9
Source: MRT2 Perception Survey December 2014/February 2015
Table 2-37 shows the views on the efficacy of mitigating actions between the group
that is near to the alignment and the one that is further away. About 62% of the
group further away believes available mitigating actions are effective compared to
59% of the group nearer to the alignment, indicating marginal differences in
opinions between them.
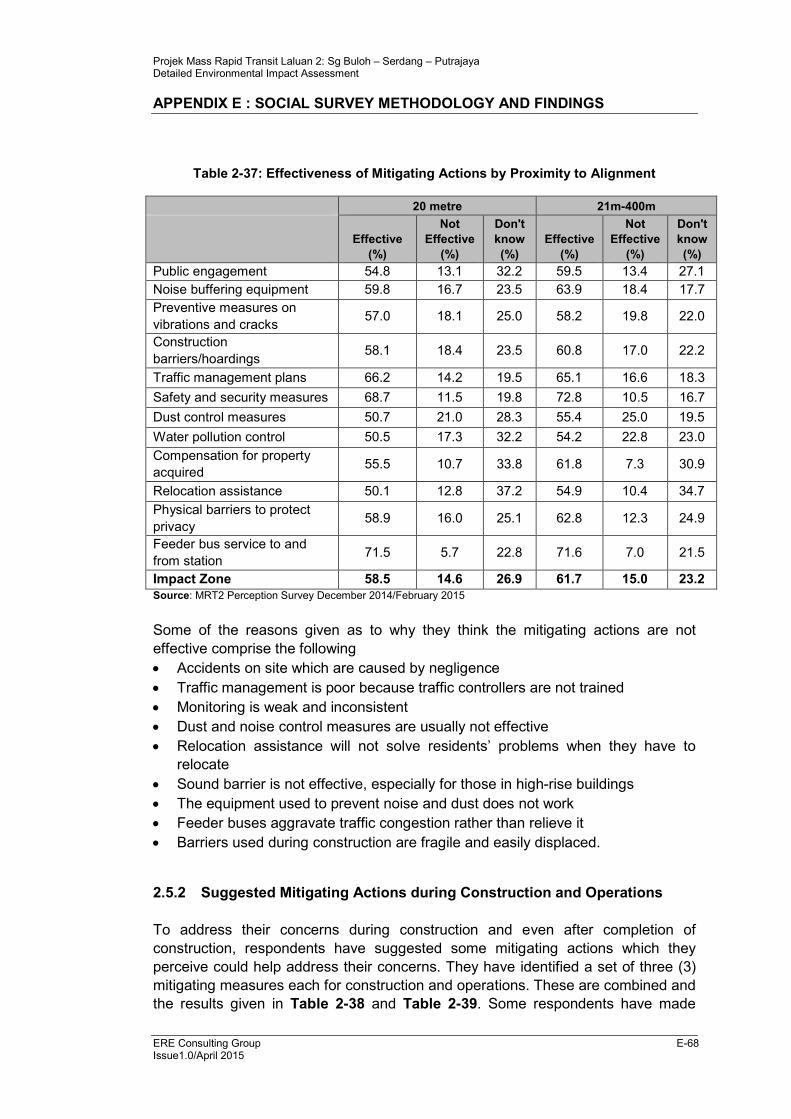
Projek Mass Rapid Transit Laluan 2: Sg Buloh – Serdang – Putrajaya Detailed Environmental Impact Assessment
APPENDIX E : SOCIAL SURVEY METHODOLOGY AND FINDINGS
ERE Consulting Group E-68 Issue1.0/April 2015
Table 2-37: Effectiveness of Mitigating Actions by Proximity to Alignment
20 metre 21m-400m
Effective
(%)
Not
Effective
(%)
Don't
know
(%)
Effective
(%)
Not
Effective
(%)
Don't
know
(%)
Public engagement 54.8 13.1 32.2 59.5 13.4 27.1
Noise buffering equipment 59.8 16.7 23.5 63.9 18.4 17.7
Preventive measures on
vibrations and cracks 57.0 18.1 25.0 58.2 19.8 22.0
Construction
barriers/hoardings 58.1 18.4 23.5 60.8 17.0 22.2
Traffic management plans 66.2 14.2 19.5 65.1 16.6 18.3
Safety and security measures 68.7 11.5 19.8 72.8 10.5 16.7
Dust control measures 50.7 21.0 28.3 55.4 25.0 19.5
Water pollution control 50.5 17.3 32.2 54.2 22.8 23.0
Compensation for property
acquired 55.5 10.7 33.8 61.8 7.3 30.9
Relocation assistance 50.1 12.8 37.2 54.9 10.4 34.7
Physical barriers to protect
privacy 58.9 16.0 25.1 62.8 12.3 24.9
Feeder bus service to and
from station 71.5 5.7 22.8 71.6 7.0 21.5
Impact Zone 58.5 14.6 26.9 61.7 15.0 23.2
Source: MRT2 Perception Survey December 2014/February 2015
Some of the reasons given as to why they think the mitigating actions are not
effective comprise the following
• Accidents on site which are caused by negligence
• Traffic management is poor because traffic controllers are not trained
• Monitoring is weak and inconsistent
• Dust and noise control measures are usually not effective
• Relocation assistance will not solve residents’ problems when they have to
relocate
• Sound barrier is not effective, especially for those in high-rise buildings
• The equipment used to prevent noise and dust does not work
• Feeder buses aggravate traffic congestion rather than relieve it
• Barriers used during construction are fragile and easily displaced.
2.5.2 Suggested Mitigating Actions during Construction and Operations
To address their concerns during construction and even after completion of
construction, respondents have suggested some mitigating actions which they
perceive could help address their concerns. They have identified a set of three (3)
mitigating measures each for construction and operations. These are combined and
the results given in Table 2-38 and Table 2-39. Some respondents have made
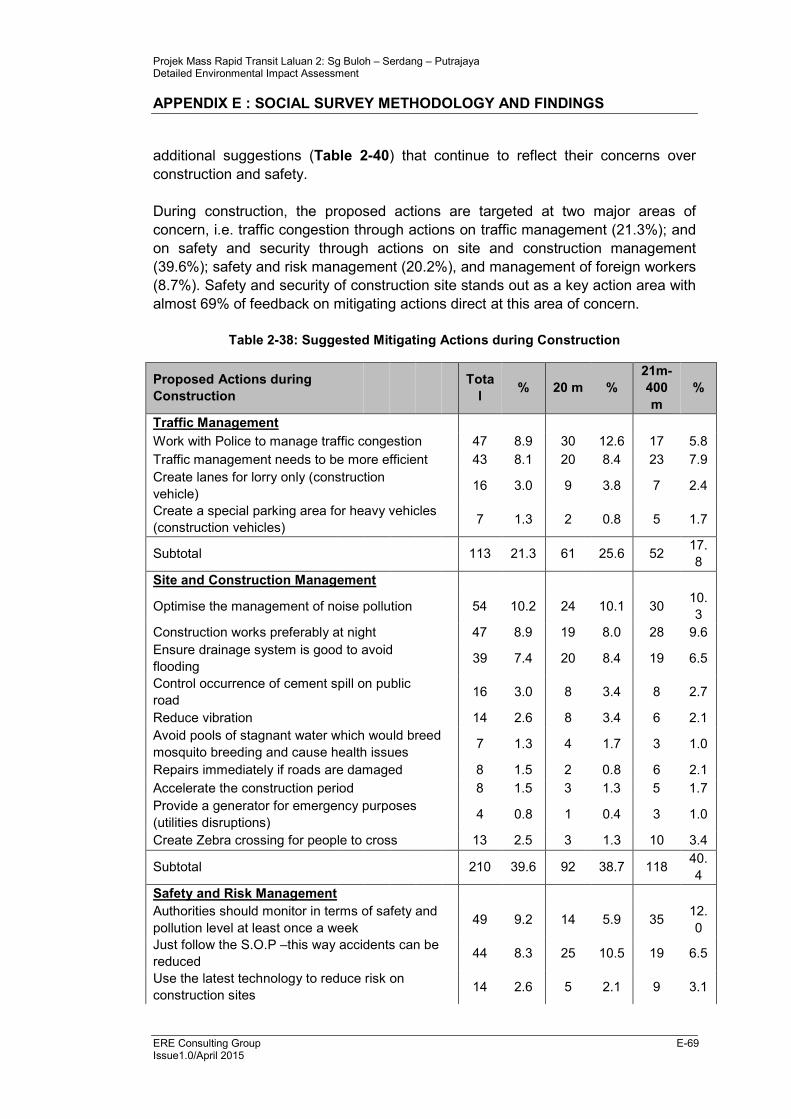
Projek Mass Rapid Transit Laluan 2: Sg Buloh – Serdang – Putrajaya Detailed Environmental Impact Assessment
APPENDIX E : SOCIAL SURVEY METHODOLOGY AND FINDINGS
ERE Consulting Group E-69 Issue1.0/April 2015
additional suggestions (Table 2-40) that continue to reflect their concerns over
construction and safety.
During construction, the proposed actions are targeted at two major areas of
concern, i.e. traffic congestion through actions on traffic management (21.3%); and
on safety and security through actions on site and construction management
(39.6%); safety and risk management (20.2%), and management of foreign workers
(8.7%). Safety and security of construction site stands out as a key action area with
almost 69% of feedback on mitigating actions direct at this area of concern.
Table 2-38: Suggested Mitigating Actions during Construction
Proposed Actions during
Construction
Tota
l % 20 m %
21m-
400
m
%
Traffic Management
Work with Police to manage traffic congestion
47 8.9 30 12.6 17 5.8
Traffic management needs to be more efficient
43 8.1 20 8.4 23 7.9
Create lanes for lorry only (construction
vehicle) 16 3.0 9 3.8 7 2.4
Create a special parking area for heavy vehicles
(construction vehicles) 7 1.3 2 0.8 5 1.7
Subtotal
113 21.3 61 25.6 52 17.
8
Site and Construction Management
Optimise the management of noise pollution 54 10.2 24 10.1 30 10.
3
Construction works preferably at night 47 8.9 19 8.0 28 9.6
Ensure drainage system is good to avoid
flooding 39 7.4 20 8.4 19 6.5
Control occurrence of cement spill on public
road 16 3.0 8 3.4 8 2.7
Reduce vibration
14 2.6 8 3.4 6 2.1
Avoid pools of stagnant water which would breed
mosquito breeding and cause health issues 7 1.3 4 1.7 3 1.0
Repairs immediately if roads are damaged 8 1.5 2 0.8 6 2.1
Accelerate the construction period 8 1.5 3 1.3 5 1.7
Provide a generator for emergency purposes
(utilities disruptions) 4 0.8 1 0.4 3 1.0
Create Zebra crossing for people to cross 13 2.5 3 1.3 10 3.4
Subtotal
210 39.6 92 38.7 118 40.
4
Safety and Risk Management
Authorities should monitor in terms of safety and
pollution level at least once a week 49 9.2 14 5.9 35
12.
0
Just follow the S.O.P –this way accidents can be
reduced 44 8.3 25 10.5 19 6.5
Use the latest technology to reduce risk on
construction sites 14 2.6 5 2.1 9 3.1
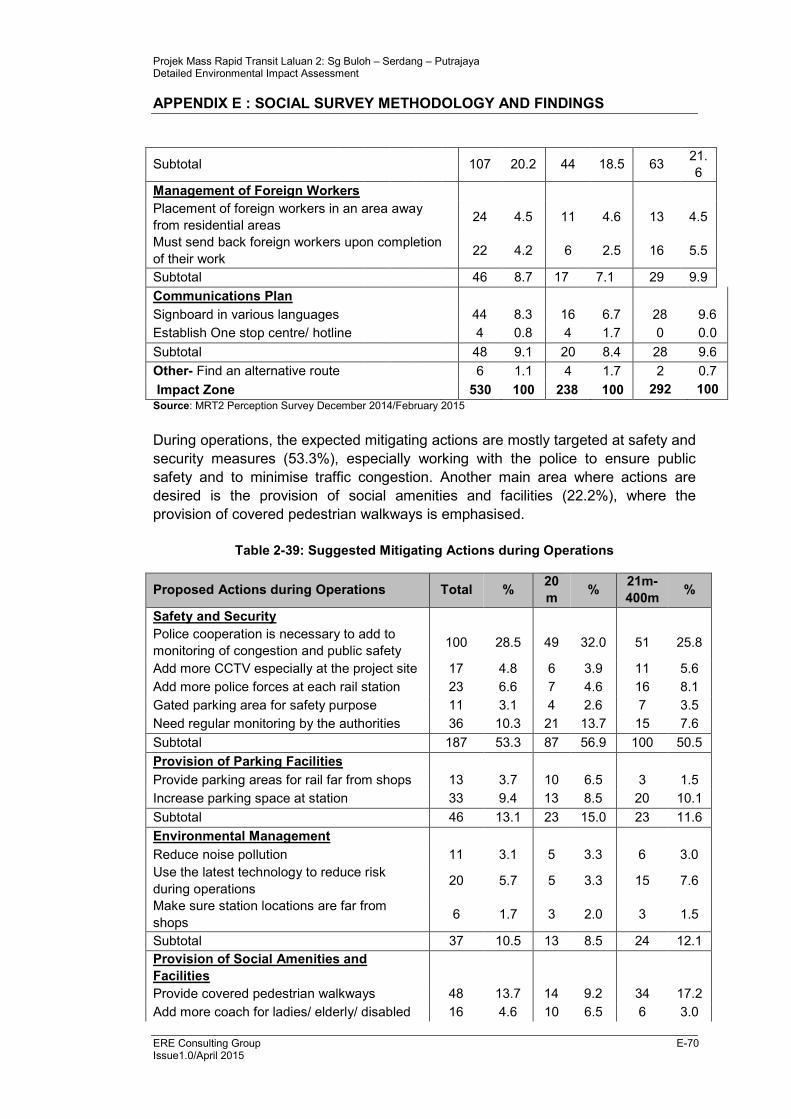
Projek Mass Rapid Transit Laluan 2: Sg Buloh – Serdang – Putrajaya Detailed Environmental Impact Assessment
APPENDIX E : SOCIAL SURVEY METHODOLOGY AND FINDINGS
ERE Consulting Group E-70 Issue1.0/April 2015
Subtotal
107 20.2 44 18.5 63 21.
6
Management of Foreign Workers
Placement of foreign workers in an area away
from residential areas 24 4.5 11 4.6 13 4.5
Must send back foreign workers upon completion
of their work 22 4.2 6 2.5 16 5.5
Subtotal 46 8.7 17 7.1 29 9.9
Communications Plan
Signboard in various languages 44 8.3 16 6.7 28 9.6
Establish One stop centre/ hotline 4 0.8 4 1.7 0 0.0
Subtotal 48 9.1 20 8.4 28 9.6
Other- Find an alternative route 6 1.1 4 1.7 2 0.7
Impact Zone 530 100 238 100 292 100
Source: MRT2 Perception Survey December 2014/February 2015
During operations, the expected mitigating actions are mostly targeted at safety and
security measures (53.3%), especially working with the police to ensure public
safety and to minimise traffic congestion. Another main area where actions are
desired is the provision of social amenities and facilities (22.2%), where the
provision of covered pedestrian walkways is emphasised.
Table 2-39: Suggested Mitigating Actions during Operations
Proposed Actions during Operations Total % 20
m %
21m-
400m %
Safety and Security
Police cooperation is necessary to add to
monitoring of congestion and public safety 100 28.5 49 32.0 51 25.8
Add more CCTV especially at the project site 17 4.8 6 3.9 11 5.6
Add more police forces at each rail station 23 6.6 7 4.6 16 8.1
Gated parking area for safety purpose 11 3.1 4 2.6 7 3.5
Need regular monitoring by the authorities 36 10.3 21 13.7 15 7.6
Subtotal 187 53.3 87 56.9 100 50.5
Provision of Parking Facilities
Provide parking areas for rail far from shops 13 3.7 10 6.5 3 1.5
Increase parking space at station 33 9.4 13 8.5 20 10.1
Subtotal 46 13.1 23 15.0 23 11.6
Environmental Management
Reduce noise pollution 11 3.1 5 3.3 6 3.0
Use the latest technology to reduce risk
during operations 20 5.7 5 3.3 15 7.6
Make sure station locations are far from
shops 6 1.7 3 2.0 3 1.5
Subtotal 37 10.5 13 8.5 24 12.1
Provision of Social Amenities and
Facilities
Provide covered pedestrian walkways 48 13.7 14 9.2 34 17.2
Add more coach for ladies/ elderly/ disabled 16 4.6 10 6.5 6 3.0
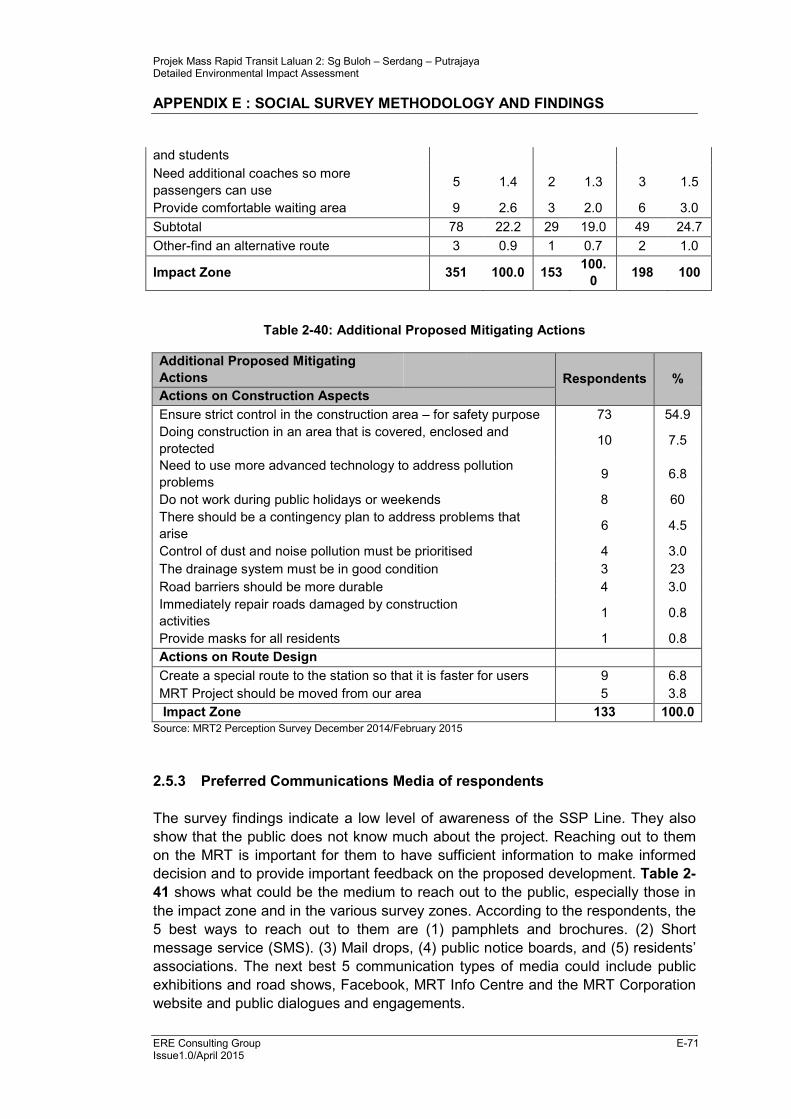
Projek Mass Rapid Transit Laluan 2: Sg Buloh – Serdang – Putrajaya Detailed Environmental Impact Assessment
APPENDIX E : SOCIAL SURVEY METHODOLOGY AND FINDINGS
ERE Consulting Group E-71 Issue1.0/April 2015
and students
Need additional coaches so more
passengers can use 5 1.4 2 1.3 3 1.5
Provide comfortable waiting area 9 2.6 3 2.0 6 3.0
Subtotal 78 22.2 29 19.0 49 24.7
Other-find an alternative route 3 0.9 1 0.7 2 1.0
Impact Zone 351 100.0 153 100.
0 198 100
Table 2-40: Additional Proposed Mitigating Actions
Additional Proposed Mitigating
Actions
Respondents %
Actions on Construction Aspects
Ensure strict control in the construction area – for safety purpose 73 54.9
Doing construction in an area that is covered, enclosed and
protected 10 7.5
Need to use more advanced technology to address pollution
problems 9 6.8
Do not work during public holidays or weekends 8 60
There should be a contingency plan to address problems that
arise 6 4.5
Control of dust and noise pollution must be prioritised 4 3.0
The drainage system must be in good condition 3 23
Road barriers should be more durable 4 3.0
Immediately repair roads damaged by construction
activities 1 0.8
Provide masks for all residents 1 0.8
Actions on Route Design
Create a special route to the station so that it is faster for users 9 6.8
MRT Project should be moved from our area 5 3.8
Impact Zone 133 100.0
Source: MRT2 Perception Survey December 2014/February 2015
2.5.3 Preferred Communications Media of respondents
The survey findings indicate a low level of awareness of the SSP Line. They also
show that the public does not know much about the project. Reaching out to them
on the MRT is important for them to have sufficient information to make informed
decision and to provide important feedback on the proposed development. Table 2-
41 shows what could be the medium to reach out to the public, especially those in
the impact zone and in the various survey zones. According to the respondents, the
5 best ways to reach out to them are (1) pamphlets and brochures. (2) Short
message service (SMS). (3) Mail drops, (4) public notice boards, and (5) residents’
associations. The next best 5 communication types of media could include public
exhibitions and road shows, Facebook, MRT Info Centre and the MRT Corporation
website and public dialogues and engagements.
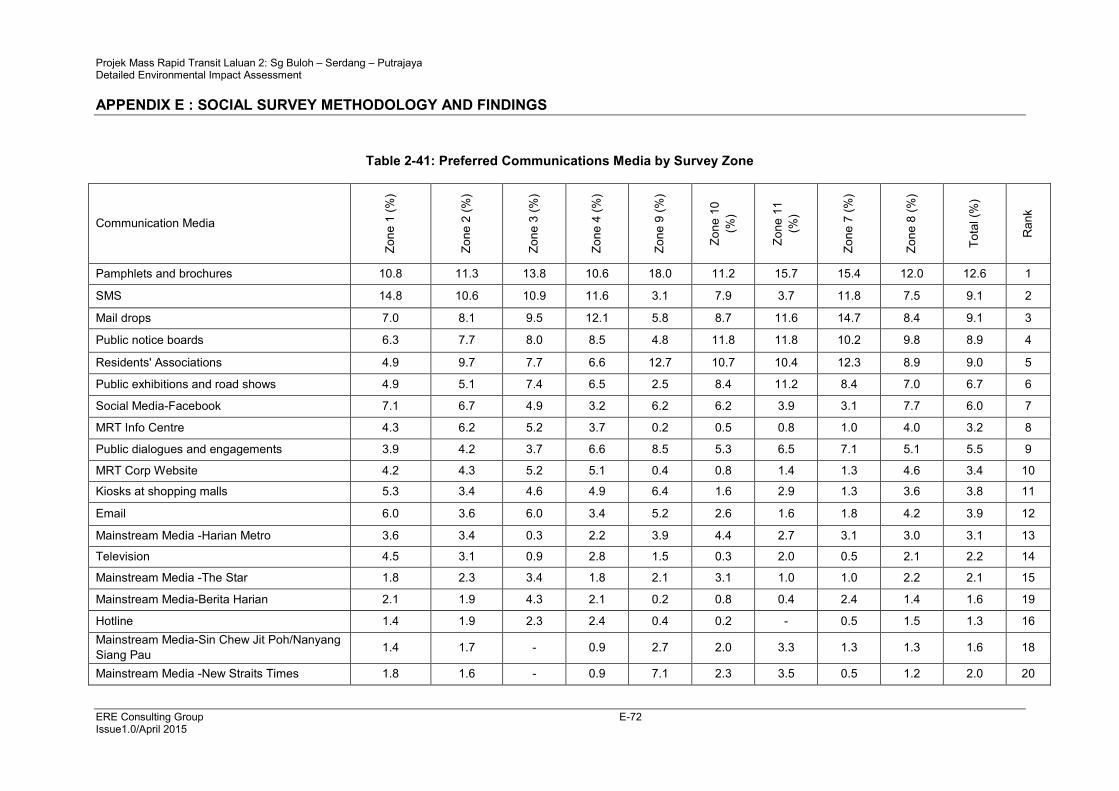
Projek Mass Rapid Transit Laluan 2: Sg Buloh – Serdang – Putrajaya Detailed Environmental Impact Assessment
APPENDIX E : SOCIAL SURVEY METHODOLOGY AND FINDINGS
ERE Consulting Group E-72 Issue1.0/April 2015
Table 2-41: Preferred Communications Media by Survey Zone
Communication Media
Zone 1 (%)
Zone 2 (%)
Zone 3 (%)
Zone 4 (%)
Zone 9 (%)
Zone 10
(%)
Zone 11
(%)
Zone 7 (%)
Zone 8 (%)
Total (%)
Rank
Pamphlets and brochures 10.8 11.3 13.8 10.6 18.0 11.2 15.7 15.4 12.0 12.6 1
SMS 14.8 10.6 10.9 11.6 3.1 7.9 3.7 11.8 7.5 9.1 2
Mail drops 7.0 8.1 9.5 12.1 5.8 8.7 11.6 14.7 8.4 9.1 3
Public notice boards 6.3 7.7 8.0 8.5 4.8 11.8 11.8 10.2 9.8 8.9 4
Residents' Associations 4.9 9.7 7.7 6.6 12.7 10.7 10.4 12.3 8.9 9.0 5
Public exhibitions and road shows 4.9 5.1 7.4 6.5 2.5 8.4 11.2 8.4 7.0 6.7 6
Social Media-Facebook 7.1 6.7 4.9 3.2 6.2 6.2 3.9 3.1 7.7 6.0 7
MRT Info Centre 4.3 6.2 5.2 3.7 0.2 0.5 0.8 1.0 4.0 3.2 8
Public dialogues and engagements 3.9 4.2 3.7 6.6 8.5 5.3 6.5 7.1 5.1 5.5 9
MRT Corp Website 4.2 4.3 5.2 5.1 0.4 0.8 1.4 1.3 4.6 3.4 10
Kiosks at shopping malls 5.3 3.4 4.6 4.9 6.4 1.6 2.9 1.3 3.6 3.8 11
Email 6.0 3.6 6.0 3.4 5.2 2.6 1.6 1.8 4.2 3.9 12
Mainstream Media -Harian Metro 3.6 3.4 0.3 2.2 3.9 4.4 2.7 3.1 3.0 3.1 13
Television 4.5 3.1 0.9 2.8 1.5 0.3 2.0 0.5 2.1 2.2 14
Mainstream Media -The Star 1.8 2.3 3.4 1.8 2.1 3.1 1.0 1.0 2.2 2.1 15
Mainstream Media-Berita Harian 2.1 1.9 4.3 2.1 0.2 0.8 0.4 2.4 1.4 1.6 19
Hotline 1.4 1.9 2.3 2.4 0.4 0.2 - 0.5 1.5 1.3 16
Mainstream Media-Sin Chew Jit Poh/Nanyang
Siang Pau 1.4 1.7 - 0.9 2.7 2.0 3.3 1.3 1.3 1.6 18
Mainstream Media -New Straits Times 1.8 1.6 - 0.9 7.1 2.3 3.5 0.5 1.2 2.0 20
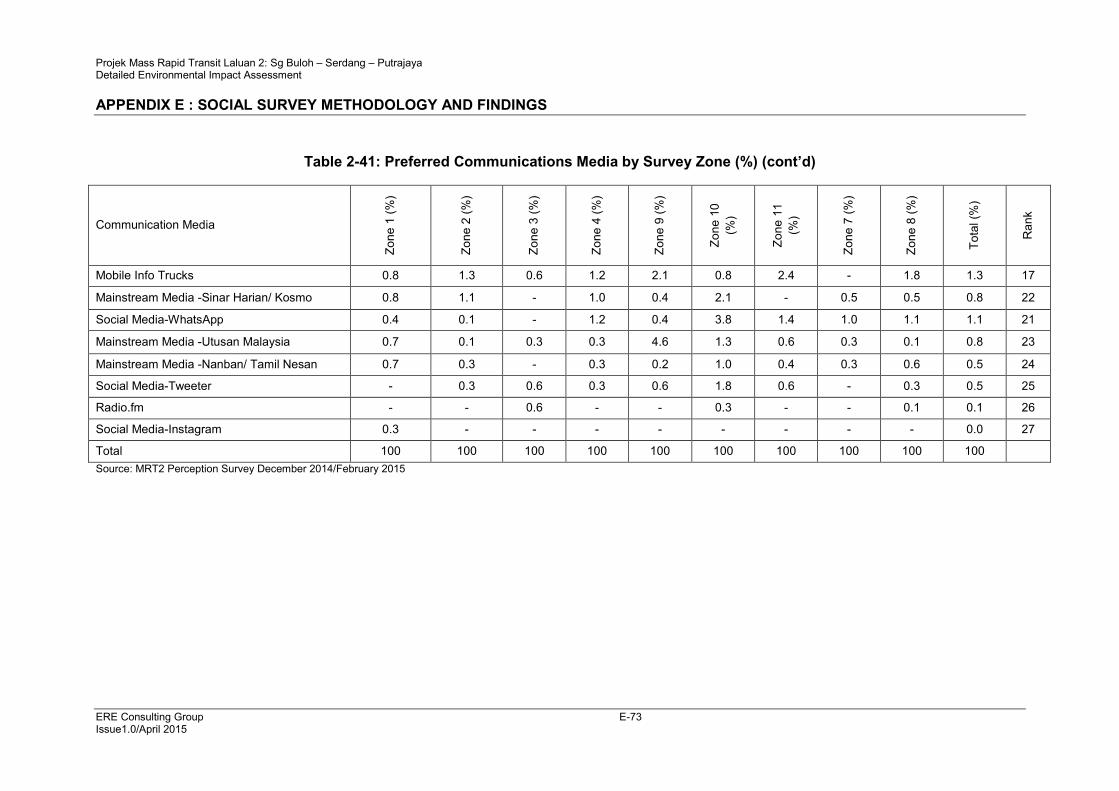
Projek Mass Rapid Transit Laluan 2: Sg Buloh – Serdang – Putrajaya Detailed Environmental Impact Assessment
APPENDIX E : SOCIAL SURVEY METHODOLOGY AND FINDINGS
ERE Consulting Group E-73 Issue1.0/April 2015
Table 2-41: Preferred Communications Media by Survey Zone (%) (cont’d)
Communication Media
Zone 1 (%)
Zone 2 (%)
Zone 3 (%)
Zone 4 (%)
Zone 9 (%)
Zone 10
(%)
Zone 11
(%)
Zone 7 (%)
Zone 8 (%)
Total (%)
Rank
Mobile Info Trucks 0.8 1.3 0.6 1.2 2.1 0.8 2.4 - 1.8 1.3 17
Mainstream Media -Sinar Harian/ Kosmo 0.8 1.1 - 1.0 0.4 2.1 - 0.5 0.5 0.8 22
Social Media-WhatsApp 0.4 0.1 - 1.2 0.4 3.8 1.4 1.0 1.1 1.1 21
Mainstream Media -Utusan Malaysia 0.7 0.1 0.3 0.3 4.6 1.3 0.6 0.3 0.1 0.8 23
Mainstream Media -Nanban/ Tamil Nesan 0.7 0.3 - 0.3 0.2 1.0 0.4 0.3 0.6 0.5 24
Social Media-Tweeter - 0.3 0.6 0.3 0.6 1.8 0.6 - 0.3 0.5 25
Radio.fm - - 0.6 - - 0.3 - - 0.1 0.1 26
Social Media-Instagram 0.3 - - - - - - - - 0.0 27
Total 100 100 100 100 100 100 100 100 100 100
Source: MRT2 Perception Survey December 2014/February 2015
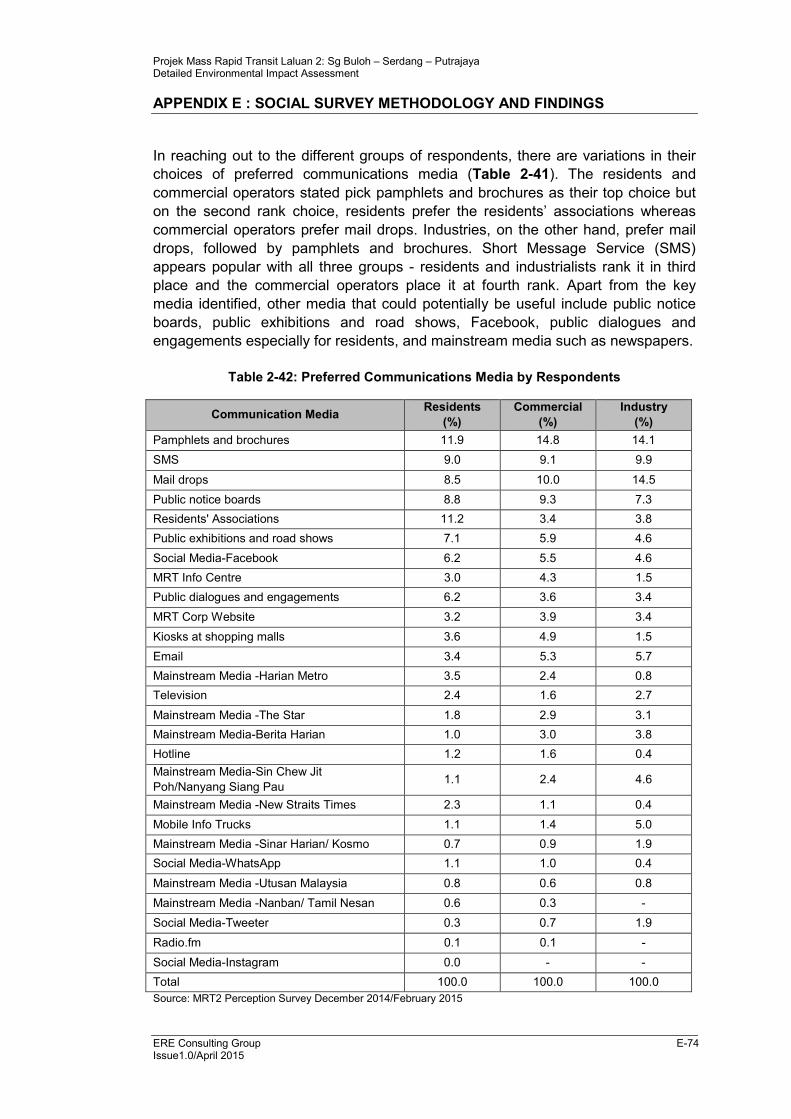
Projek Mass Rapid Transit Laluan 2: Sg Buloh – Serdang – Putrajaya Detailed Environmental Impact Assessment
APPENDIX E : SOCIAL SURVEY METHODOLOGY AND FINDINGS
ERE Consulting Group E-74 Issue1.0/April 2015
In reaching out to the different groups of respondents, there are variations in their
choices of preferred communications media (Table 2-41). The residents and
commercial operators stated pick pamphlets and brochures as their top choice but
on the second rank choice, residents prefer the residents’ associations whereas
commercial operators prefer mail drops. Industries, on the other hand, prefer mail
drops, followed by pamphlets and brochures. Short Message Service (SMS)
appears popular with all three groups - residents and industrialists rank it in third
place and the commercial operators place it at fourth rank. Apart from the key
media identified, other media that could potentially be useful include public notice
boards, public exhibitions and road shows, Facebook, public dialogues and
engagements especially for residents, and mainstream media such as newspapers.
Table 2-42: Preferred Communications Media by Respondents
Communication Media Residents
(%)
Commercial
(%)
Industry
(%)
Pamphlets and brochures 11.9 14.8 14.1
SMS 9.0 9.1 9.9
Mail drops 8.5 10.0 14.5
Public notice boards 8.8 9.3 7.3
Residents' Associations 11.2 3.4 3.8
Public exhibitions and road shows 7.1 5.9 4.6
Social Media-Facebook 6.2 5.5 4.6
MRT Info Centre 3.0 4.3 1.5
Public dialogues and engagements 6.2 3.6 3.4
MRT Corp Website 3.2 3.9 3.4
Kiosks at shopping malls 3.6 4.9 1.5
Email 3.4 5.3 5.7
Mainstream Media -Harian Metro 3.5 2.4 0.8
Television 2.4 1.6 2.7
Mainstream Media -The Star 1.8 2.9 3.1
Mainstream Media-Berita Harian 1.0 3.0 3.8
Hotline 1.2 1.6 0.4
Mainstream Media-Sin Chew Jit
Poh/Nanyang Siang Pau 1.1 2.4 4.6
Mainstream Media -New Straits Times 2.3 1.1 0.4
Mobile Info Trucks 1.1 1.4 5.0
Mainstream Media -Sinar Harian/ Kosmo 0.7 0.9 1.9
Social Media-WhatsApp 1.1 1.0 0.4
Mainstream Media -Utusan Malaysia 0.8 0.6 0.8
Mainstream Media -Nanban/ Tamil Nesan 0.6 0.3 -
Social Media-Tweeter 0.3 0.7 1.9
Radio.fm 0.1 0.1 -
Social Media-Instagram 0.0 - -
Total 100.0 100.0 100.0
Source: MRT2 Perception Survey December 2014/February 2015
Projek Mass Rapid Transit Laluan 2: Sg Buloh – Serdang – Putrajaya Detailed Environmental Impact Assessment
APPENDIX E : SOCIAL SURVEY METHODOLOGY AND FINDINGS
ERE Consulting Group E-75 Issue1.0/April 2015
2.6 SUMMARY OF PERCEPTION SURVEY FINDINGS
1. The perception survey covered residential, commercial and industrial groups
within the 400 impact zone from each side of the proposed SSP Line
alignment. The survey also covered those who supposedly stay near to the
proposed alignment (within 20m corridor) and outside of it. There are 9 survey
zones to cover the entire 52km length of the SSP Line. The zones stretch from
Damansara Damai into Sri Damansara and Kepong/Jinjang to Jalan Ipoh and
Jalan Tun Razak, Jalan Raja Muda Abdul Aziz to KLCC West, Jalan Binjai and
to the proposed Tun Razak Exchange before it enters the industrial area of
Jalan Chan Sow Lin and the proposed Bandar Malaysia and crossing the East
West Link into Kuchai Lama, Sg Besi, Serdang Raya, Seri Kembangan, UPM,
Taman Equine, Taman Putra Permai into Cyberjaya and eventually ends in
Putrajaya Sentral. A total of 1,500 respondents were interviewed.
2. The average age of those interviewed is 37 years with a median age of 39
years. Most are educated; the majority have completed secondary education
and hold certificates or diplomas or degrees. Around 80% are employed; of
which two thirds are employees and the balance are self-employed. The mean
monthly household income is estimated at RM5,300 but the median is found to
be lower at RM3,500. It is observed that about 17% of the respondents have
household income of RM2,000 or less a month. This group is also expected to
turn to public transport if it is affordable and efficient compared to using their
own motor vehicles. For this group, a main competitor would be motorcycles.
At this point in time, cars and motorcycles are the most popular mode of
transport and are used mainly in people’s daily travels such as to work, to fetch
their children around, and to shop. The use of public transport, comprising bus,
taxi, KTMB, LRT and monorail makes up about 7% of their use and even then,
public transport is often used occasionally rather than on a regular, daily basis.
Those who use public transport are generally satisfied, especially with the LRT
and monorail and to some extent, KTMB but for now, they appear to rely more
on their automobiles and motorcycles to move around.
3. The distribution between tenanted and owner-occupied premises is relatively
equal, with a slightly higher proportion of tenanted premises. Among residential
premises, more than half are owner-occupied but among commercial premises,
more than three-quarters are tenanted. This poses an issue among commercial
operators who, during public engagements, are worried that they would not be
involved in any negotiations over acquisition of land should the alignment
affects them directly. It explains also that many of them object to any possible
acquisition. Another dimension that lends weight to their concerns is that most
of them have been staying or operating in their premises for a considerable
length of time. On the average, they have been where they are for 10 years.
Twelve percent have been staying there for 20 years and there are some who
have been in their premises for more than 30 years. Although the survey
findings did not show considerable worries over acquisition, during
stakeholders’ engagements fears over such a possibility are quite obvious.
Projek Mass Rapid Transit Laluan 2: Sg Buloh – Serdang – Putrajaya Detailed Environmental Impact Assessment
APPENDIX E : SOCIAL SURVEY METHODOLOGY AND FINDINGS
ERE Consulting Group E-76 Issue1.0/April 2015
Such fears are also fuelled by a lack of knowledge, information and
understanding on how the Land Acquisition Act works and impacts on them
during such a development. Some participants at the stakeholders
engagements raise questions on (1) how their propriety rights could be
protected in the face of the Land Acquisition Act (2) whether at the stage of the
Railway Scheme, it would be too late to object, (3) how does the compensation
arrangement works if they are affected, and (4) what are the tenants’ rights in
the entire process of acquisition and relocation. These gaps in their knowledge
and information generate fears and misconceptions on this aspect of social
impact, i.e. land/property acquisition and the immediate response for some is to
object to the SSP Line coming into their areas
4. Respondents were asked to assess their level of satisfaction with their
neighbourhood. The aim is to find out if there is any underlying reason that
could prompt them to accept the development of the MRT within their
neighbourhood or in close proximity to them and relocation, should it happen.
The overall feedback is the majority are satisfied with their neighbourhoods.
They were asked to check against seven parameters that are believed to be
important for a neighbourhood to be considered good. The seven are (1)
overall neighbourhood, (2) location, (3) access to public transportation, (4)
access to major roads or highways, (5) safety and security of their
neighbourhoods, (6) cleanliness of their neighbourhoods, and (7) community
cohesiveness. Most people are satisfied with the location of neighbourhood
(88%), access major roads and highways (86%) and their overall
neighbourhoods (82%). Aspects that they ranked as medium include
community cohesiveness (76%) and cleanliness of neighbourhood (74%).
Those that scored low are access to public transportation (68%) and safety and
security (67%). The overall satisfaction score is relatively good at about 77%.
5. Overall, the level of awareness on the MRT is observed to be low. Only
about half of respondents in the impact zone have over the past 6 months read
or heard about the MRT. Across the survey zones, the level of awareness
varies. In some zones, the level of awareness is relatively poor, e.g. in Seri
Kembangan, slightly more than a third have read or heard of the MRT. In
Kepong/Jinjang, the proportion is observed at 40% -still relatively low. When
asked whether they have visited any website to read about MRT or MRT2, the
response is poor with 27.3% acknowledging that they did. Among those who
indicated that they have heard and are aware, two-thirds said that they know a
little about the MRT. There are gaps in information and awareness and this
could affect their attitude and responses to the project and how it could impact
them. This knowledge is also reflected at stakeholders’ engagement where the
key interest is to find out the whether the alignment affects them directly and if
it does not, the level of interest is reduced.
6. Despite gaps in knowledge, when shown the show card depicting the broad
alignment, the majority of respondents (89%) support having an MRT. A small
proportion of 4.4% did not. Those who did not probably worried about any
Projek Mass Rapid Transit Laluan 2: Sg Buloh – Serdang – Putrajaya Detailed Environmental Impact Assessment
APPENDIX E : SOCIAL SURVEY METHODOLOGY AND FINDINGS
ERE Consulting Group E-77 Issue1.0/April 2015
direct impacts on them. When a comparison is made between the group that is
near and that further away, support for the SSP Line remains strong; with 88%
of the former and 90% of the latter saying they would support the proposed
development. It is possible that most people believe that they and their families
would not be directly and adversely affected by having the SSP Line. This is
apparent when less than a fifth of the respondents think that they could be
affected by the project. This positive perception permeates all through the
survey zones and between the groups that are near and far, thus, explaining
why they would support the MRT development. Among those who perceive
they could be impacted upon, the main fears are over traffic congestion and
noise.
7. Positive impacts are based on perceptions. Nine benefits commonly identified
with mass public transportation are put forward to the respondents to rank in
order of importance. The more generic benefits that are usually associated with
public transport include (a) savings in travel expenses; (b) savings in travel
time; (c) quick and convenient mode of transport; and (d) reduction in traffic
congestion. These four are easily agreed by the respondents. They are
identified in order of importance as follows (1) Reduction in travel time, (2)
quick and convenient mode of transport; (3) savings in travel expenses; and (4)
reduction in traffic congestion.
8. Perceived negative impacts usually occur during construction although the
public do have some concerns over operations of the rail transport. The
negative impacts during construction and operations are listed and
respondents asked to rank them in terms of importance to them. On the whole,
65% believe the negative impacts are important to them during construction.
Top of the perceived negative impact during construction is safety and security
(90.3%). This perception could be influenced by recent incidents on worksites
of existing construction. The second most important negative impact is traffic
congestion (88.7%). Again, this perception could be influenced by experiences
with ongoing existing construction works on the LRT and MRT. Others in terms
of their importance are dust and air pollution (84.3%), vibrations and cracks
(83.1%), and noise (74.8%). The last three impacts are usually associated with
the environment and they are accorded lower significance compared to safety
and security and traffic congestion. It is also interesting to note that people are
less concerned over the aesthetics or damage to the vista as a result of an
overhead MRT construction, and loss of business income. The last could be
due to an overwhelming presence of residents in the sample. This may not be
true when discussing with commercial operators during stakeholders
engagements. Quite a number of commercial operators, when met, do express
concerns that their business could be adversely impacted during construction.
Projek Mass Rapid Transit Laluan 2: Sg Buloh – Serdang – Putrajaya Detailed Environmental Impact Assessment
APPENDIX E : SOCIAL SURVEY METHODOLOGY AND FINDINGS
ERE Consulting Group E-78 Issue1.0/April 2015
9. Perceptions on impacts during operations of the MRT2 are also explored. The
five major impacts identified as important to respondents during MRT operations
are (1) inadequate parking at stations (84.9%); (2) safety and security (82.9%);
and (3) vibration and cracks (80.6%); (4) dust and air pollution (80.6%), and (5)
inadequate or poor feeder bus services. Both vibrations and cracks and dust
and air pollution have equal scores. The two most important perceived negative
impacts are linked to MRT operations which reflect gaps in respondents’
knowledge on vital information such as availability of car parking and safety and
security features of the rail transport. The lack of information can cause undue
psychological fears over the rail operations when it should not. The identification
of over traffic congestion as a key negative impact is an irony because the MRT
is address traffic congestion when it is ready and operational and yet people
perceive that it would cause traffic congestion.
10. Perceptions of respondents on proximity to the MRT alignment and stations
were explored to gauge their acceptability to having the MRT in close proximity.
The overall response is a rejection of the alignment or stations being close to
them. Up to 50m distance, the level of rejection occurs among two-thirds of
respondents. As the distance increases, the level of acceptability improves. At
more than 100m away, 80% of respondents find it acceptable. During
stakeholders’ engagement, reasons for objecting to proximity include possible
acquisition, viaducts affecting their premises and hence, their luck, haphazard
parking near stations, lack of customer parking and traffic congestion around
stations.
11. The earlier analyses have looked at overall support for MRT combined with
perceived positive and negative impacts without yielding an overall
acceptability of MRT among the respondents. In an attempt to obtain an overall
gauge, respondents were asked to indicate their acceptance of a set of positive
statements on the MRT. The implications of these statements are to that many
of the issues related to the MRT can eventually be resolved through proper
mitigating actions. The result shows that a high level of acceptance to these
statements (73.3%) against 26.7% who disagreed/strong disagreed,
suggesting that despite perceived concerns and worries, there is a relatively
strong support for the MRT. For an infrastructure of this nature, it is usual for
the DEIA study to recommend an environmental management plan and traffic
management plan to address the concerns of the public. The general
consensus among respondents is most of the proposed mitigating actions are
relatively effective, especially those that cover (1) provision of feeder bus
service to and from station (71.5%(; (2) safety and security measures (70.9%);
(3) traffic management plan (65.6%); (4) noise buffering equipment (62.0%);
and (5) physical barriers to protect privacy (61.0%). These responses show a
high level of trust among the public that such actions would work even though
at this point in time, there is no example of an operational MRT for them to
base their opinions. However, despite this positive feedback, it must be
reminded that on the average, around 30% -40% of respondents have a
different view. There could be reasons. For example, during some
Projek Mass Rapid Transit Laluan 2: Sg Buloh – Serdang – Putrajaya Detailed Environmental Impact Assessment
APPENDIX E : SOCIAL SURVEY METHODOLOGY AND FINDINGS
ERE Consulting Group E-79 Issue1.0/April 2015
stakeholders’ engagement, there is negative feedback on noise and vibrations.
Participants from PPR Raya Permai and Pangsapuri Permai, including the
police personnel from Sg Besi Station indicated that the nearby LRT station
and its operations are noisy and disturbing to some of them. Some from PPR
Laksamana Peel indicated that the construction activities on the SBK Line near
to them are noisy and caused discomfort to some residents.
12. The respondents have suggested some mitigating actions to be taken during
construction and operations. The proposed actions appear to address directly
their concerns. The proposed actions during construction are directed at (1)
traffic management where they believe that it should be done jointly with the
police (an action that the police at Sg Besi station has also recommended) as
well as the management of movements and parking of construction vehicles;
(2) site and construction management, much of which are aimed at
management of noise, vibrations, damages to roads, utilities, maintenance of
drainage and cleanliness of site, languages of signboards, and safety
measures. During operations, the expected mitigating actions are mostly
targeted at safety and security measures (53.3%), especially working with the
police to ensure public safety and to minimise traffic congestion. Another main
area where actions are desired is the provision of social amenities and facilities
(22.2%), where the provision of covered pedestrian walkways is emphasised.
13. In earlier observations, information and knowledge gaps are identified and
have to be addressed. The respondents are asked to indicate how best to
reach out to them. This is important for SSP Line when it moves into
operational stage and wants to provide information to the public. The general
feedback is people rely most on the distribution of pamphlets and leaflets, short
message service (SMS), mail drops, public notice boards, and residents’
associations. Although there are similarities in choices of communication
modes, there are also variations across types of respondents. Residents and
commercial operators pick pamphlets and brochures as their top choice but on
their second rank choice, residents prefer the residents’ associations whereas
commercial operators prefer mail drops Industries, on the other hand, prefer
mail drops, followed by pamphlets and brochures. In selecting their top choice,
all groups seem to prefer a less personal touch in communicating with them.
Short Message Service (SMS) appears popular with all three groups.
Projek Mass Rapid Transit Laluan 2: Sg Buloh – Serdang – Putrajaya Detailed Environmental Impact Assessment
APPENDIX E : SOCIAL SURVEY METHODOLOGY AND FINDINGS
ERE Consulting Group E-80 Issue1.0/April 2015
3. FEEDBACK FROM STAKEHOLDERS’ ENGAGEMENT
Stakeholders’ engagement is undertaken to complement the findings from the
perception survey. They are framed to allow further probing of perceptions,
especially from groups who are close to the proposed alignment and stations.
These groups may enjoy benefits from their proximity to the SSP Line; they may
also experience reservations and worries over such proximity, and if so, what
actions could be taken to mitigate the adverse impacts, and if possible, to reduce
their concerns, enabling them to move on with their lives when the SSP Line is
being implemented. This section identifies the various stakeholders along the
alignment for engagement and discusses the issues raised from such feedback.
3.1 STAKEHOLDER GROUPS IN THE SSP LINE CORRIDOR
The proposed SSP Line stretches over 52km. It is a long alignment, passing
through many town centres and residential areas along the fringes of Kuala Lumpur
and in the city centre itself. In order to identify stakeholders for engagement, the
communities along the SSP Line route are divided into two main social groups, i.e.
residential and business/commercial groups. The latter includes business
operators, institutions and industrialists. Each group may share similar views on
impacts; they also would have differing views, especially on impacts affecting them
directly. A further stratification is then taken by subdividing the SSP Line corridor
into zones, similar to the zones of the perception survey. This enabled and
expedited the targeting of the various residential and business groups for
engagement. There are nine zones as summarized in Table 3-1. Stakeholders
were identified and approached in various ways through the local authorities,
residents associations, KRT or JKP, survey respondents, and site visits. In many
instances, personal invitations were extended to invite shopkeepers and
commercial operators along the route, especially those near to the alignment to join
these engagements.
Table 3-1: List of Stakeholder Engagements and Types of Engagement
No Stakeholder Social Group Type of En
Zone 1
1 Damansara Damai Commercial FGD
2 Sri Damansara – Menjalara Commercial FGD
3 Sri Damansara Community Residential Public Dialogue
Zone 2
4 Metro Prima-Kepong Commercial FGD
5 Taman Jinjang Baru Residential FGD
6 Jinjang-Jalan Kepong Commercial FGD
7 Kg Batu Delima Residential FGD
Zone 3
8 Pekan Batu PPR/Taman Rainbow/Taman
Bamboo
Residential FGD
9 Jalan Ipoh Commercial FGD
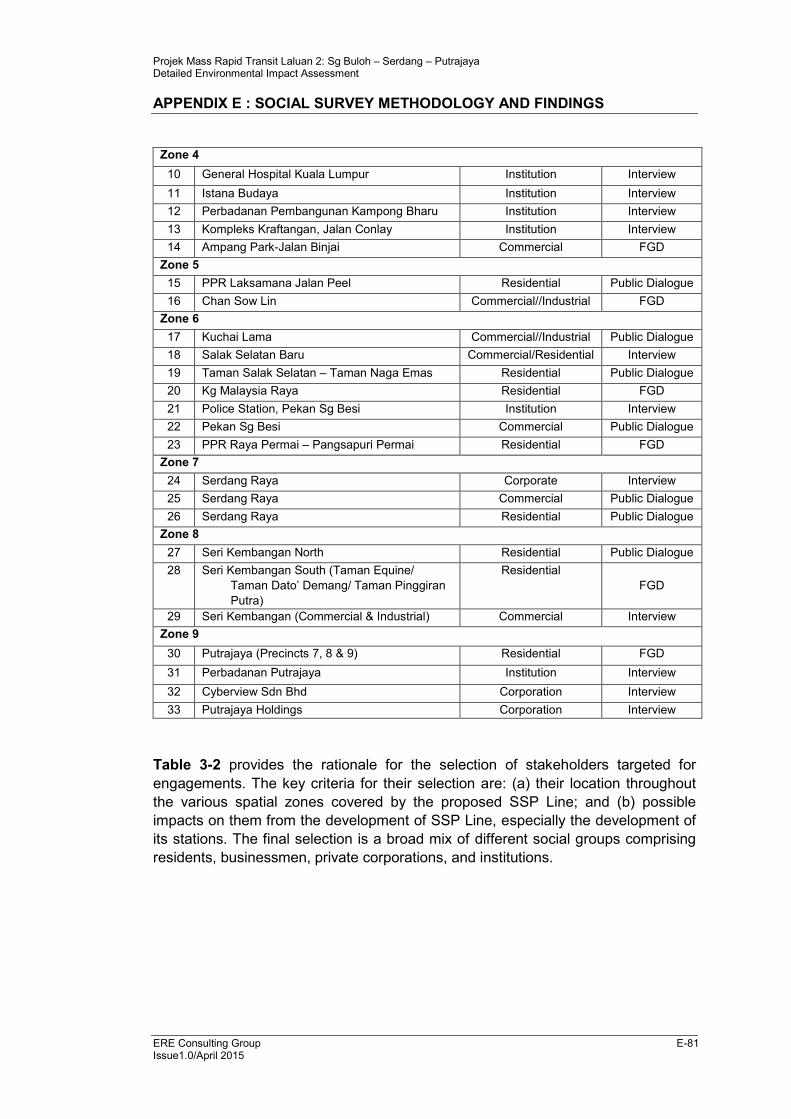
Projek Mass Rapid Transit Laluan 2: Sg Buloh – Serdang – Putrajaya Detailed Environmental Impact Assessment
APPENDIX E : SOCIAL SURVEY METHODOLOGY AND FINDINGS
ERE Consulting Group E-81 Issue1.0/April 2015
Zone 4
10 General Hospital Kuala Lumpur Institution Interview
11 Istana Budaya Institution Interview
12 Perbadanan Pembangunan Kampong Bharu Institution Interview
13 Kompleks Kraftangan, Jalan Conlay Institution Interview
14 Ampang Park-Jalan Binjai Commercial FGD
Zone 5
15 PPR Laksamana Jalan Peel Residential Public Dialogue
16 Chan Sow Lin Commercial//Industrial FGD
Zone 6
17 Kuchai Lama Commercial//Industrial Public Dialogue
18 Salak Selatan Baru Commercial/Residential Interview
19 Taman Salak Selatan – Taman Naga Emas Residential Public Dialogue
20 Kg Malaysia Raya Residential FGD
21 Police Station, Pekan Sg Besi Institution Interview
22 Pekan Sg Besi Commercial Public Dialogue
23 PPR Raya Permai – Pangsapuri Permai Residential FGD
Zone 7
24 Serdang Raya Corporate Interview
25 Serdang Raya Commercial Public Dialogue
26 Serdang Raya Residential Public Dialogue
Zone 8
27 Seri Kembangan North Residential Public Dialogue
28 Seri Kembangan South (Taman Equine/
Taman Dato’ Demang/ Taman Pinggiran
Putra)
Residential
FGD
29 Seri Kembangan (Commercial & Industrial) Commercial Interview
Zone 9
30 Putrajaya (Precincts 7, 8 & 9) Residential FGD
31 Perbadanan Putrajaya Institution Interview
32 Cyberview Sdn Bhd Corporation Interview
33 Putrajaya Holdings Corporation Interview
Table 3-2 provides the rationale for the selection of stakeholders targeted for
engagements. The key criteria for their selection are: (a) their location throughout
the various spatial zones covered by the proposed SSP Line; and (b) possible
impacts on them from the development of SSP Line, especially the development of
its stations. The final selection is a broad mix of different social groups comprising
residents, businessmen, private corporations, and institutions.
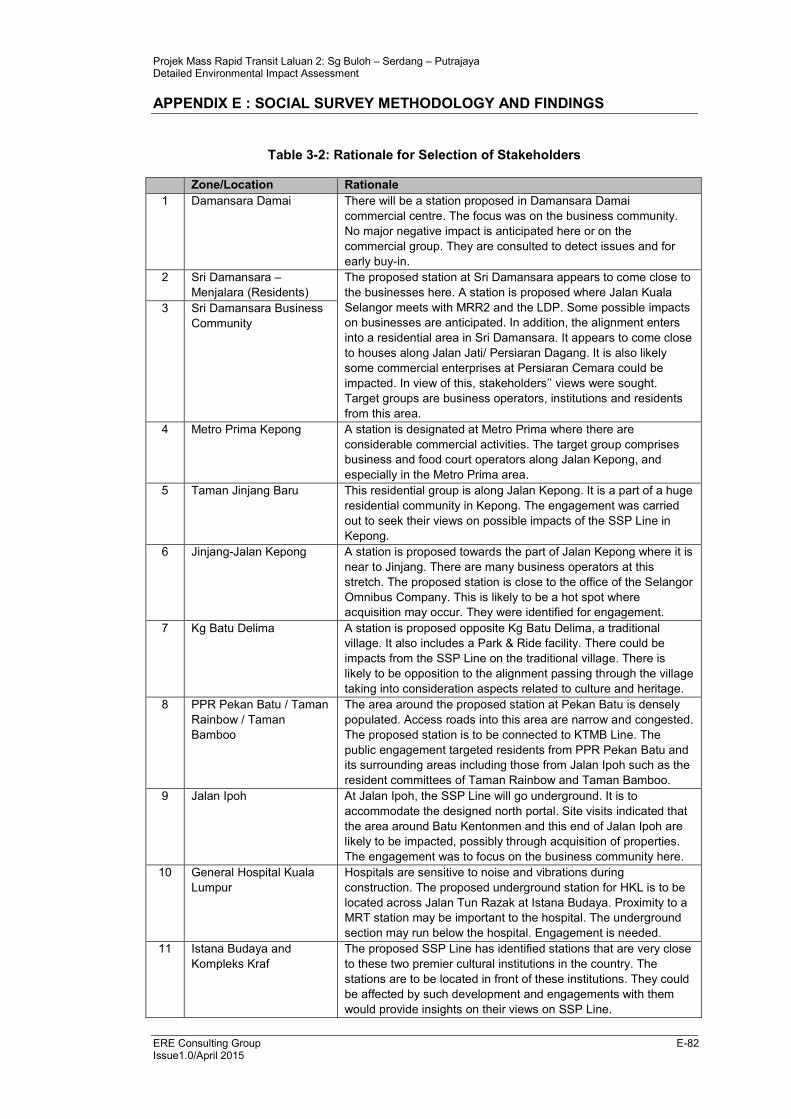
Projek Mass Rapid Transit Laluan 2: Sg Buloh – Serdang – Putrajaya Detailed Environmental Impact Assessment
APPENDIX E : SOCIAL SURVEY METHODOLOGY AND FINDINGS
ERE Consulting Group E-82 Issue1.0/April 2015
Table 3-2: Rationale for Selection of Stakeholders
Zone/Location Rationale
1 Damansara Damai There will be a station proposed in Damansara Damai
commercial centre. The focus was on the business community.
No major negative impact is anticipated here or on the
commercial group. They are consulted to detect issues and for
early buy-in.
2 Sri Damansara –
Menjalara (Residents)
The proposed station at Sri Damansara appears to come close to
the businesses here. A station is proposed where Jalan Kuala
Selangor meets with MRR2 and the LDP. Some possible impacts
on businesses are anticipated. In addition, the alignment enters
into a residential area in Sri Damansara. It appears to come close
to houses along Jalan Jati/ Persiaran Dagang. It is also likely
some commercial enterprises at Persiaran Cemara could be
impacted. In view of this, stakeholders’’ views were sought.
Target groups are business operators, institutions and residents
from this area.
3 Sri Damansara Business
Community
4 Metro Prima Kepong A station is designated at Metro Prima where there are
considerable commercial activities. The target group comprises
business and food court operators along Jalan Kepong, and
especially in the Metro Prima area.
5 Taman Jinjang Baru This residential group is along Jalan Kepong. It is a part of a huge
residential community in Kepong. The engagement was carried
out to seek their views on possible impacts of the SSP Line in
Kepong.
6 Jinjang-Jalan Kepong A station is proposed towards the part of Jalan Kepong where it is
near to Jinjang. There are many business operators at this
stretch. The proposed station is close to the office of the Selangor
Omnibus Company. This is likely to be a hot spot where
acquisition may occur. They were identified for engagement.
7 Kg Batu Delima A station is proposed opposite Kg Batu Delima, a traditional
village. It also includes a Park & Ride facility. There could be
impacts from the SSP Line on the traditional village. There is
likely to be opposition to the alignment passing through the village
taking into consideration aspects related to culture and heritage.
8 PPR Pekan Batu / Taman
Rainbow / Taman
Bamboo
The area around the proposed station at Pekan Batu is densely
populated. Access roads into this area are narrow and congested.
The proposed station is to be connected to KTMB Line. The
public engagement targeted residents from PPR Pekan Batu and
its surrounding areas including those from Jalan Ipoh such as the
resident committees of Taman Rainbow and Taman Bamboo.
9 Jalan Ipoh At Jalan Ipoh, the SSP Line will go underground. It is to
accommodate the designed north portal. Site visits indicated that
the area around Batu Kentonmen and this end of Jalan Ipoh are
likely to be impacted, possibly through acquisition of properties.
The engagement was to focus on the business community here.
10 General Hospital Kuala
Lumpur
Hospitals are sensitive to noise and vibrations during
construction. The proposed underground station for HKL is to be
located across Jalan Tun Razak at Istana Budaya. Proximity to a
MRT station may be important to the hospital. The underground
section may run below the hospital. Engagement is needed.
11 Istana Budaya and
Kompleks Kraf
The proposed SSP Line has identified stations that are very close
to these two premier cultural institutions in the country. The
stations are to be located in front of these institutions. They could
be affected by such development and engagements with them
would provide insights on their views on SSP Line.
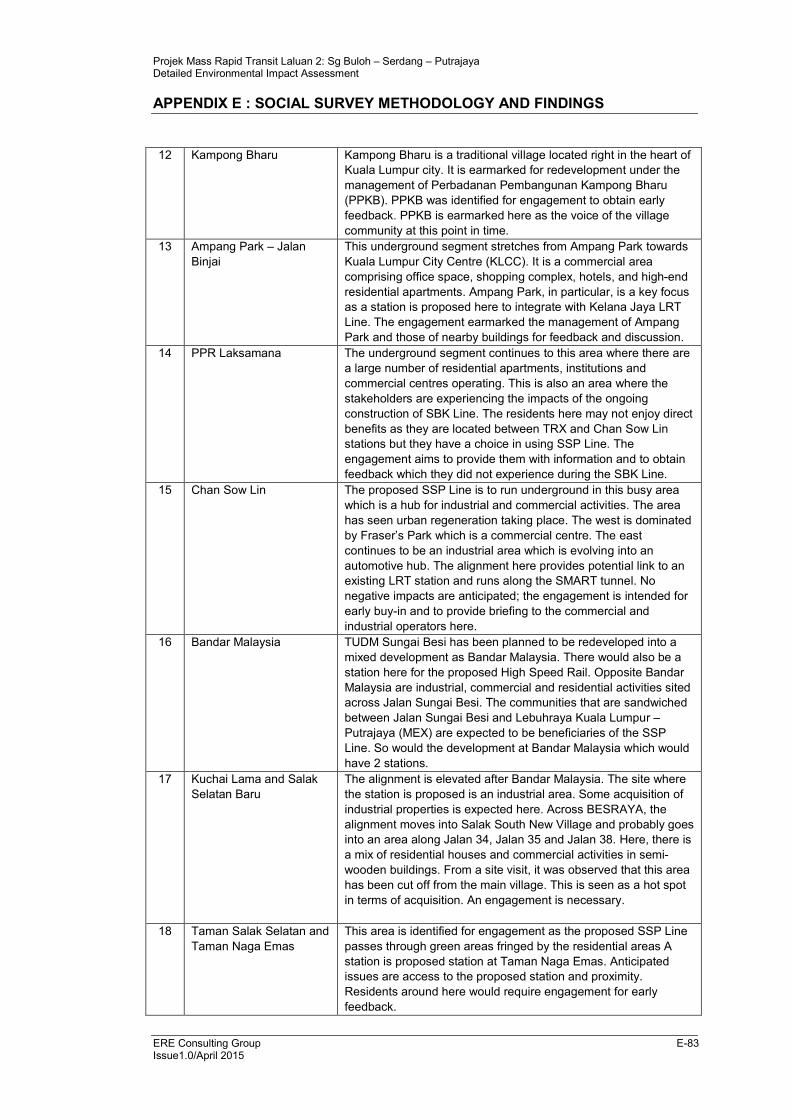
Projek Mass Rapid Transit Laluan 2: Sg Buloh – Serdang – Putrajaya Detailed Environmental Impact Assessment
APPENDIX E : SOCIAL SURVEY METHODOLOGY AND FINDINGS
ERE Consulting Group E-83 Issue1.0/April 2015
12 Kampong Bharu Kampong Bharu is a traditional village located right in the heart of
Kuala Lumpur city. It is earmarked for redevelopment under the
management of Perbadanan Pembangunan Kampong Bharu
(PPKB). PPKB was identified for engagement to obtain early
feedback. PPKB is earmarked here as the voice of the village
community at this point in time.
13 Ampang Park – Jalan
Binjai
This underground segment stretches from Ampang Park towards
Kuala Lumpur City Centre (KLCC). It is a commercial area
comprising office space, shopping complex, hotels, and high-end
residential apartments. Ampang Park, in particular, is a key focus
as a station is proposed here to integrate with Kelana Jaya LRT
Line. The engagement earmarked the management of Ampang
Park and those of nearby buildings for feedback and discussion.
14 PPR Laksamana The underground segment continues to this area where there are
a large number of residential apartments, institutions and
commercial centres operating. This is also an area where the
stakeholders are experiencing the impacts of the ongoing
construction of SBK Line. The residents here may not enjoy direct
benefits as they are located between TRX and Chan Sow Lin
stations but they have a choice in using SSP Line. The
engagement aims to provide them with information and to obtain
feedback which they did not experience during the SBK Line.
15 Chan Sow Lin The proposed SSP Line is to run underground in this busy area
which is a hub for industrial and commercial activities. The area
has seen urban regeneration taking place. The west is dominated
by Fraser’s Park which is a commercial centre. The east
continues to be an industrial area which is evolving into an
automotive hub. The alignment here provides potential link to an
existing LRT station and runs along the SMART tunnel. No
negative impacts are anticipated; the engagement is intended for
early buy-in and to provide briefing to the commercial and
industrial operators here.
16 Bandar Malaysia TUDM Sungai Besi has been planned to be redeveloped into a
mixed development as Bandar Malaysia. There would also be a
station here for the proposed High Speed Rail. Opposite Bandar
Malaysia are industrial, commercial and residential activities sited
across Jalan Sungai Besi. The communities that are sandwiched
between Jalan Sungai Besi and Lebuhraya Kuala Lumpur –
Putrajaya (MEX) are expected to be beneficiaries of the SSP
Line. So would the development at Bandar Malaysia which would
have 2 stations.
17 Kuchai Lama and Salak
Selatan Baru
The alignment is elevated after Bandar Malaysia. The site where
the station is proposed is an industrial area. Some acquisition of
industrial properties is expected here. Across BESRAYA, the
alignment moves into Salak South New Village and probably goes
into an area along Jalan 34, Jalan 35 and Jalan 38. Here, there is
a mix of residential houses and commercial activities in semi-
wooden buildings. From a site visit, it was observed that this area
has been cut off from the main village. This is seen as a hot spot
in terms of acquisition. An engagement is necessary.
18 Taman Salak Selatan and
Taman Naga Emas
This area is identified for engagement as the proposed SSP Line
passes through green areas fringed by the residential areas A
station is proposed station at Taman Naga Emas. Anticipated
issues are access to the proposed station and proximity.
Residents around here would require engagement for early
feedback.
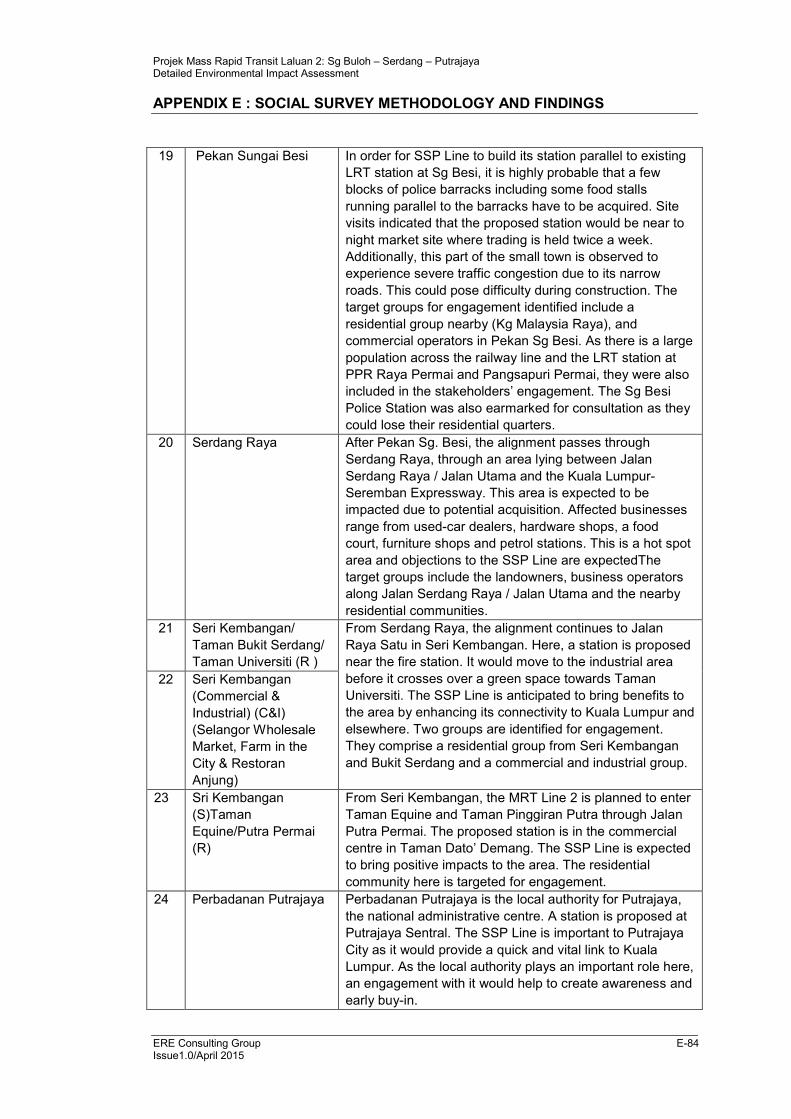
Projek Mass Rapid Transit Laluan 2: Sg Buloh – Serdang – Putrajaya Detailed Environmental Impact Assessment
APPENDIX E : SOCIAL SURVEY METHODOLOGY AND FINDINGS
ERE Consulting Group E-84 Issue1.0/April 2015
19 Pekan Sungai Besi In order for SSP Line to build its station parallel to existing
LRT station at Sg Besi, it is highly probable that a few
blocks of police barracks including some food stalls
running parallel to the barracks have to be acquired. Site
visits indicated that the proposed station would be near to
night market site where trading is held twice a week.
Additionally, this part of the small town is observed to
experience severe traffic congestion due to its narrow
roads. This could pose difficulty during construction. The
target groups for engagement identified include a
residential group nearby (Kg Malaysia Raya), and
commercial operators in Pekan Sg Besi. As there is a large
population across the railway line and the LRT station at
PPR Raya Permai and Pangsapuri Permai, they were also
included in the stakeholders’ engagement. The Sg Besi
Police Station was also earmarked for consultation as they
could lose their residential quarters.
20 Serdang Raya After Pekan Sg. Besi, the alignment passes through
Serdang Raya, through an area lying between Jalan
Serdang Raya / Jalan Utama and the Kuala Lumpur-
Seremban Expressway. This area is expected to be
impacted due to potential acquisition. Affected businesses
range from used-car dealers, hardware shops, a food
court, furniture shops and petrol stations. This is a hot spot
area and objections to the SSP Line are expectedThe
target groups include the landowners, business operators
along Jalan Serdang Raya / Jalan Utama and the nearby
residential communities.
21 Seri Kembangan/
Taman Bukit Serdang/
Taman Universiti (R )
From Serdang Raya, the alignment continues to Jalan
Raya Satu in Seri Kembangan. Here, a station is proposed
near the fire station. It would move to the industrial area
before it crosses over a green space towards Taman
Universiti. The SSP Line is anticipated to bring benefits to
the area by enhancing its connectivity to Kuala Lumpur and
elsewhere. Two groups are identified for engagement.
They comprise a residential group from Seri Kembangan
and Bukit Serdang and a commercial and industrial group.
22 Seri Kembangan
(Commercial &
Industrial) (C&I)
(Selangor Wholesale
Market, Farm in the
City & Restoran
Anjung)
23 Sri Kembangan
(S)Taman
Equine/Putra Permai
(R)
From Seri Kembangan, the MRT Line 2 is planned to enter
Taman Equine and Taman Pinggiran Putra through Jalan
Putra Permai. The proposed station is in the commercial
centre in Taman Dato’ Demang. The SSP Line is expected
to bring positive impacts to the area. The residential
community here is targeted for engagement.
24 Perbadanan Putrajaya Perbadanan Putrajaya is the local authority for Putrajaya,
the national administrative centre. A station is proposed at
Putrajaya Sentral. The SSP Line is important to Putrajaya
City as it would provide a quick and vital link to Kuala
Lumpur. As the local authority plays an important role here,
an engagement with it would help to create awareness and
early buy-in.
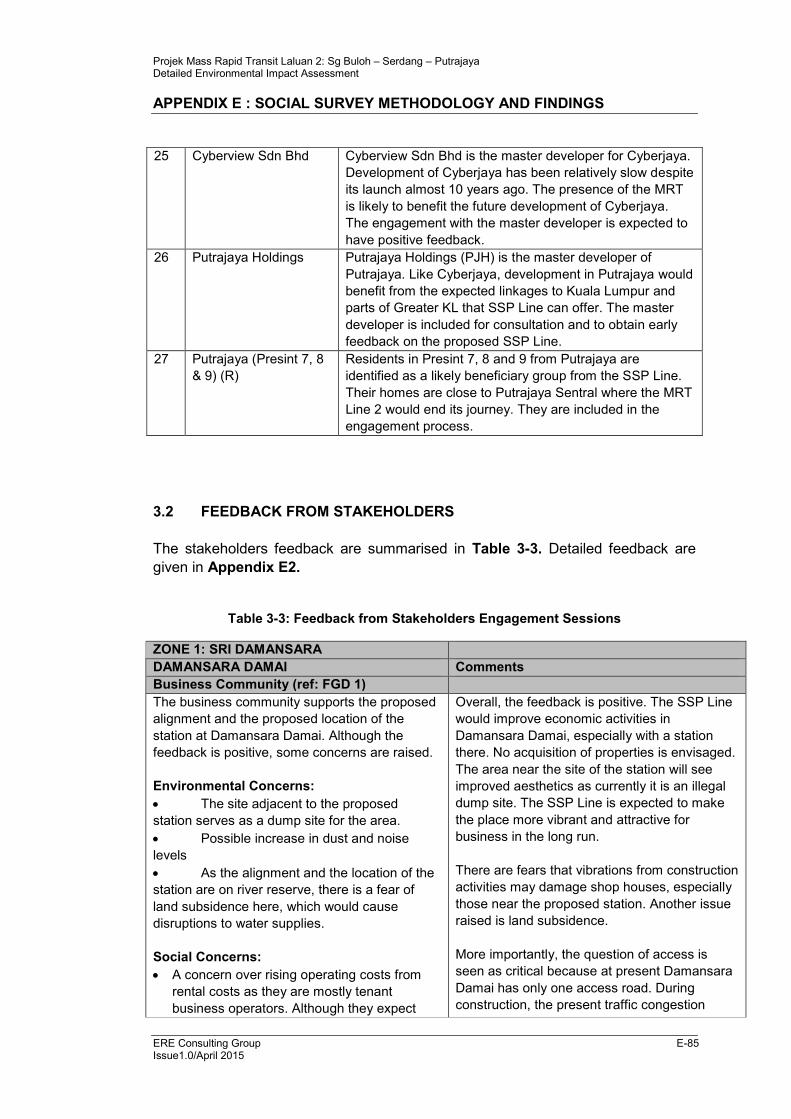
Projek Mass Rapid Transit Laluan 2: Sg Buloh – Serdang – Putrajaya Detailed Environmental Impact Assessment
APPENDIX E : SOCIAL SURVEY METHODOLOGY AND FINDINGS
ERE Consulting Group E-85 Issue1.0/April 2015
25 Cyberview Sdn Bhd Cyberview Sdn Bhd is the master developer for Cyberjaya.
Development of Cyberjaya has been relatively slow despite
its launch almost 10 years ago. The presence of the MRT
is likely to benefit the future development of Cyberjaya.
The engagement with the master developer is expected to
have positive feedback.
26 Putrajaya Holdings Putrajaya Holdings (PJH) is the master developer of
Putrajaya. Like Cyberjaya, development in Putrajaya would
benefit from the expected linkages to Kuala Lumpur and
parts of Greater KL that SSP Line can offer. The master
developer is included for consultation and to obtain early
feedback on the proposed SSP Line.
27 Putrajaya (Presint 7, 8
& 9) (R)
Residents in Presint 7, 8 and 9 from Putrajaya are
identified as a likely beneficiary group from the SSP Line.
Their homes are close to Putrajaya Sentral where the MRT
Line 2 would end its journey. They are included in the
engagement process.
3.2 FEEDBACK FROM STAKEHOLDERS
The stakeholders feedback are summarised in Table 3-3. Detailed feedback are
given in Appendix E2.
Table 3-3: Feedback from Stakeholders Engagement Sessions
ZONE 1: SRI DAMANSARA
DAMANSARA DAMAI Comments
Business Community (ref: FGD 1)
The business community supports the proposed
alignment and the proposed location of the
station at Damansara Damai. Although the
feedback is positive, some concerns are raised.
Environmental Concerns:
• The site adjacent to the proposed
station serves as a dump site for the area.
• Possible increase in dust and noise
levels
• As the alignment and the location of the
station are on river reserve, there is a fear of
land subsidence here, which would cause
disruptions to water supplies.
Social Concerns:
• A concern over rising operating costs from
rental costs as they are mostly tenant
business operators. Although they expect
Overall, the feedback is positive. The SSP Line
would improve economic activities in
Damansara Damai, especially with a station
there. No acquisition of properties is envisaged.
The area near the site of the station will see
improved aesthetics as currently it is an illegal
dump site. The SSP Line is expected to make
the place more vibrant and attractive for
business in the long run.
There are fears that vibrations from construction
activities may damage shop houses, especially
those near the proposed station. Another issue
raised is land subsidence.
More importantly, the question of access is
seen as critical because at present Damansara
Damai has only one access road. During
construction, the present traffic congestion
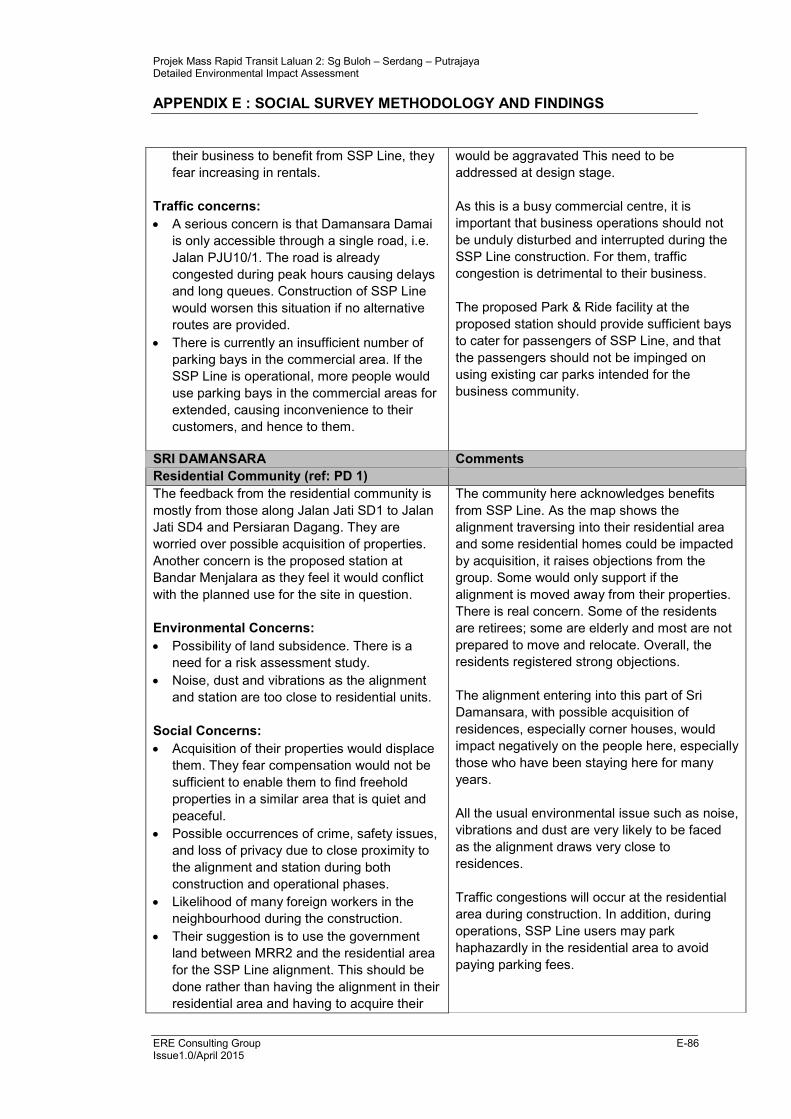
Projek Mass Rapid Transit Laluan 2: Sg Buloh – Serdang – Putrajaya Detailed Environmental Impact Assessment
APPENDIX E : SOCIAL SURVEY METHODOLOGY AND FINDINGS
ERE Consulting Group E-86 Issue1.0/April 2015
their business to benefit from SSP Line, they
fear increasing in rentals.
Traffic concerns:
• A serious concern is that Damansara Damai
is only accessible through a single road, i.e.
Jalan PJU10/1. The road is already
congested during peak hours causing delays
and long queues. Construction of SSP Line
would worsen this situation if no alternative
routes are provided.
• There is currently an insufficient number of
parking bays in the commercial area. If the
SSP Line is operational, more people would
use parking bays in the commercial areas for
extended, causing inconvenience to their
customers, and hence to them.
would be aggravated This need to be
addressed at design stage.
As this is a busy commercial centre, it is
important that business operations should not
be unduly disturbed and interrupted during the
SSP Line construction. For them, traffic
congestion is detrimental to their business.
The proposed Park & Ride facility at the
proposed station should provide sufficient bays
to cater for passengers of SSP Line, and that
the passengers should not be impinged on
using existing car parks intended for the
business community.
SRI DAMANSARA Comments
Residential Community (ref: PD 1)
The feedback from the residential community is
mostly from those along Jalan Jati SD1 to Jalan
Jati SD4 and Persiaran Dagang. They are
worried over possible acquisition of properties.
Another concern is the proposed station at
Bandar Menjalara as they feel it would conflict
with the planned use for the site in question.
Environmental Concerns:
• Possibility of land subsidence. There is a
need for a risk assessment study.
• Noise, dust and vibrations as the alignment
and station are too close to residential units.
Social Concerns:
• Acquisition of their properties would displace
them. They fear compensation would not be
sufficient to enable them to find freehold
properties in a similar area that is quiet and
peaceful.
• Possible occurrences of crime, safety issues,
and loss of privacy due to close proximity to
the alignment and station during both
construction and operational phases.
• Likelihood of many foreign workers in the
neighbourhood during the construction.
• Their suggestion is to use the government
land between MRR2 and the residential area
for the SSP Line alignment. This should be
done rather than having the alignment in their
residential area and having to acquire their
The community here acknowledges benefits
from SSP Line. As the map shows the
alignment traversing into their residential area
and some residential homes could be impacted
by acquisition, it raises objections from the
group. Some would only support if the
alignment is moved away from their properties.
There is real concern. Some of the residents
are retirees; some are elderly and most are not
prepared to move and relocate. Overall, the
residents registered strong objections.
The alignment entering into this part of Sri
Damansara, with possible acquisition of
residences, especially corner houses, would
impact negatively on the people here, especially
those who have been staying here for many
years.
All the usual environmental issue such as noise,
vibrations and dust are very likely to be faced
as the alignment draws very close to
residences.
Traffic congestions will occur at the residential
area during construction. In addition, during
operations, SSP Line users may park
haphazardly in the residential area to avoid
paying parking fees.
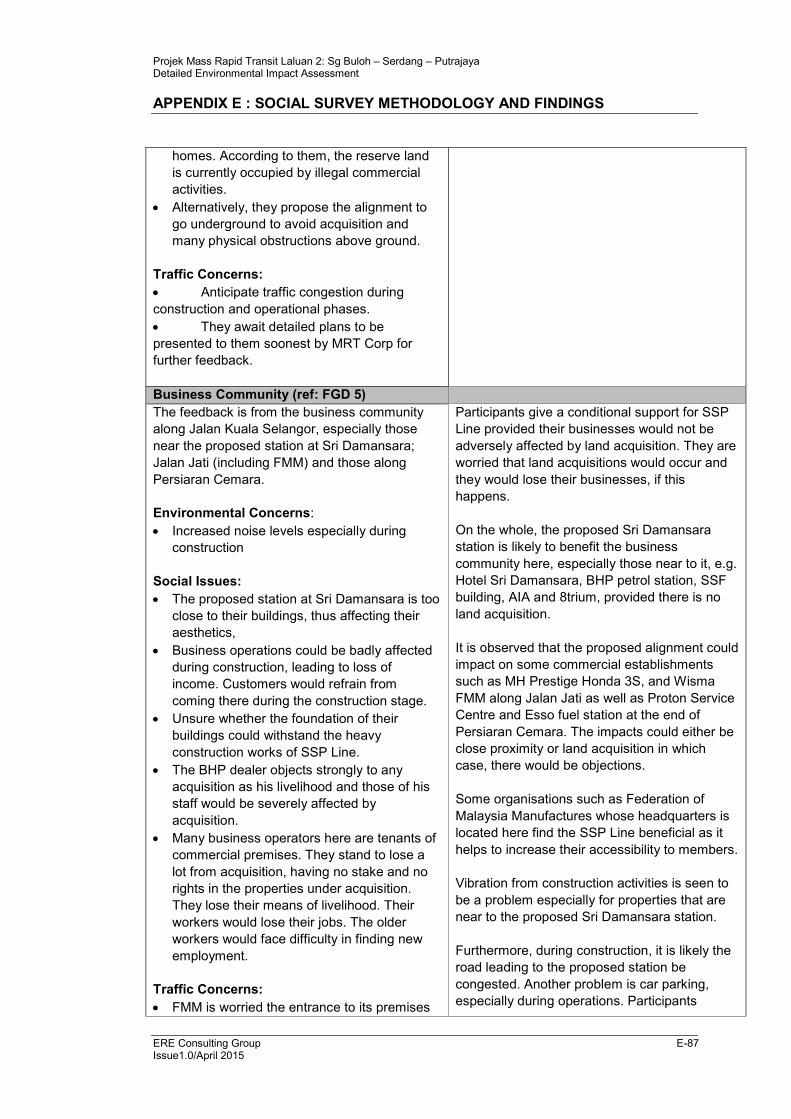
Projek Mass Rapid Transit Laluan 2: Sg Buloh – Serdang – Putrajaya Detailed Environmental Impact Assessment
APPENDIX E : SOCIAL SURVEY METHODOLOGY AND FINDINGS
ERE Consulting Group E-87 Issue1.0/April 2015
homes. According to them, the reserve land
is currently occupied by illegal commercial
activities.
• Alternatively, they propose the alignment to
go underground to avoid acquisition and
many physical obstructions above ground.
Traffic Concerns:
• Anticipate traffic congestion during
construction and operational phases.
• They await detailed plans to be
presented to them soonest by MRT Corp for
further feedback.
Business Community (ref: FGD 5)
The feedback is from the business community
along Jalan Kuala Selangor, especially those
near the proposed station at Sri Damansara;
Jalan Jati (including FMM) and those along
Persiaran Cemara.
Environmental Concerns:
• Increased noise levels especially during
construction
Social Issues:
• The proposed station at Sri Damansara is too
close to their buildings, thus affecting their
aesthetics,
• Business operations could be badly affected
during construction, leading to loss of
income. Customers would refrain from
coming there during the construction stage.
• Unsure whether the foundation of their
buildings could withstand the heavy
construction works of SSP Line.
• The BHP dealer objects strongly to any
acquisition as his livelihood and those of his
staff would be severely affected by
acquisition.
• Many business operators here are tenants of
commercial premises. They stand to lose a
lot from acquisition, having no stake and no
rights in the properties under acquisition.
They lose their means of livelihood. Their
workers would lose their jobs. The older
workers would face difficulty in finding new
employment.
Traffic Concerns:
• FMM is worried the entrance to its premises
Participants give a conditional support for SSP
Line provided their businesses would not be
adversely affected by land acquisition. They are
worried that land acquisitions would occur and
they would lose their businesses, if this
happens.
On the whole, the proposed Sri Damansara
station is likely to benefit the business
community here, especially those near to it, e.g.
Hotel Sri Damansara, BHP petrol station, SSF
building, AIA and 8trium, provided there is no
land acquisition.
It is observed that the proposed alignment could
impact on some commercial establishments
such as MH Prestige Honda 3S, and Wisma
FMM along Jalan Jati as well as Proton Service
Centre and Esso fuel station at the end of
Persiaran Cemara. The impacts could either be
close proximity or land acquisition in which
case, there would be objections.
Some organisations such as Federation of
Malaysia Manufactures whose headquarters is
located here find the SSP Line beneficial as it
helps to increase their accessibility to members.
Vibration from construction activities is seen to
be a problem especially for properties that are
near to the proposed Sri Damansara station.
Furthermore, during construction, it is likely the
road leading to the proposed station be
congested. Another problem is car parking,
especially during operations. Participants
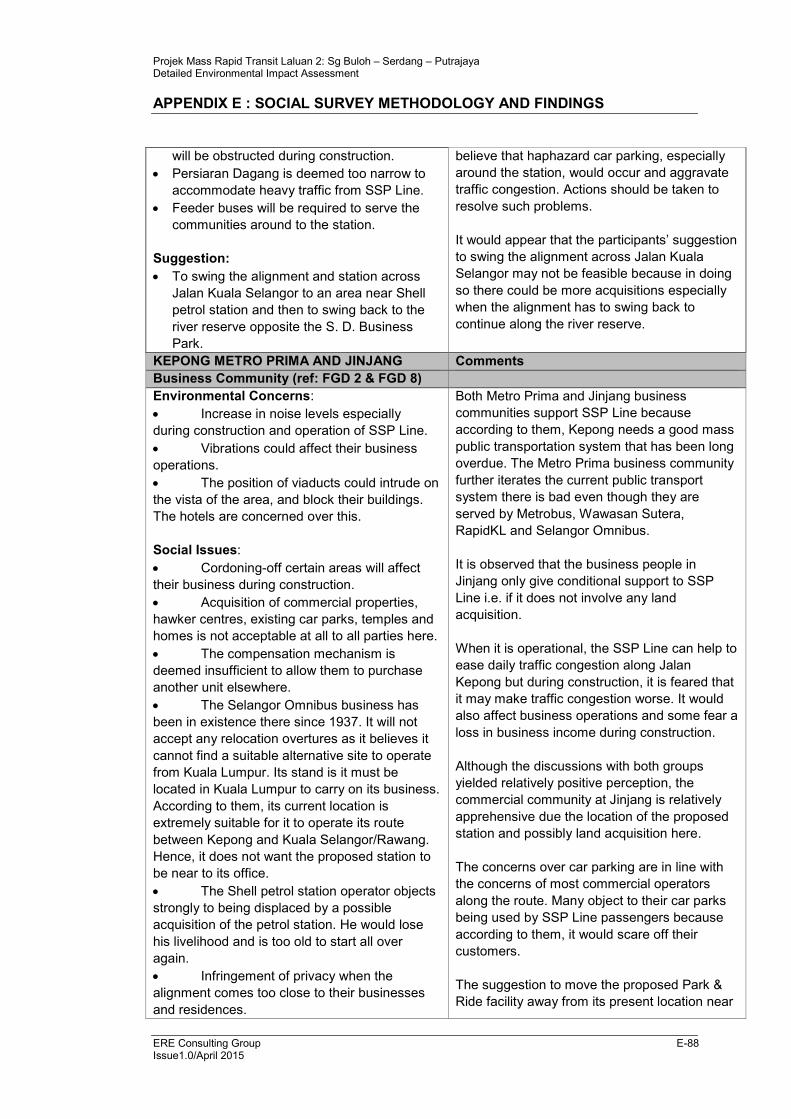
Projek Mass Rapid Transit Laluan 2: Sg Buloh – Serdang – Putrajaya Detailed Environmental Impact Assessment
APPENDIX E : SOCIAL SURVEY METHODOLOGY AND FINDINGS
ERE Consulting Group E-88 Issue1.0/April 2015
will be obstructed during construction.
• Persiaran Dagang is deemed too narrow to
accommodate heavy traffic from SSP Line.
• Feeder buses will be required to serve the
communities around to the station.
Suggestion:
• To swing the alignment and station across
Jalan Kuala Selangor to an area near Shell
petrol station and then to swing back to the
river reserve opposite the S. D. Business
Park.
believe that haphazard car parking, especially
around the station, would occur and aggravate
traffic congestion. Actions should be taken to
resolve such problems.
It would appear that the participants’ suggestion
to swing the alignment across Jalan Kuala
Selangor may not be feasible because in doing
so there could be more acquisitions especially
when the alignment has to swing back to
continue along the river reserve.
KEPONG METRO PRIMA AND JINJANG Comments
Business Community (ref: FGD 2 & FGD 8)
Environmental Concerns:
• Increase in noise levels especially
during construction and operation of SSP Line.
• Vibrations could affect their business
operations.
• The position of viaducts could intrude on
the vista of the area, and block their buildings.
The hotels are concerned over this.
Social Issues:
• Cordoning-off certain areas will affect
their business during construction.
• Acquisition of commercial properties,
hawker centres, existing car parks, temples and
homes is not acceptable at all to all parties here.
• The compensation mechanism is
deemed insufficient to allow them to purchase
another unit elsewhere.
• The Selangor Omnibus business has
been in existence there since 1937. It will not
accept any relocation overtures as it believes it
cannot find a suitable alternative site to operate
from Kuala Lumpur. Its stand is it must be
located in Kuala Lumpur to carry on its business.
According to them, its current location is
extremely suitable for it to operate its route
between Kepong and Kuala Selangor/Rawang.
Hence, it does not want the proposed station to
be near to its office.
• The Shell petrol station operator objects
strongly to being displaced by a possible
acquisition of the petrol station. He would lose
his livelihood and is too old to start all over
again.
• Infringement of privacy when the
alignment comes too close to their businesses
and residences.
Both Metro Prima and Jinjang business
communities support SSP Line because
according to them, Kepong needs a good mass
public transportation system that has been long
overdue. The Metro Prima business community
further iterates the current public transport
system there is bad even though they are
served by Metrobus, Wawasan Sutera,
RapidKL and Selangor Omnibus.
It is observed that the business people in
Jinjang only give conditional support to SSP
Line i.e. if it does not involve any land
acquisition.
When it is operational, the SSP Line can help to
ease daily traffic congestion along Jalan
Kepong but during construction, it is feared that
it may make traffic congestion worse. It would
also affect business operations and some fear a
loss in business income during construction.
Although the discussions with both groups
yielded relatively positive perception, the
commercial community at Jinjang is relatively
apprehensive due the location of the proposed
station and possibly land acquisition here.
The concerns over car parking are in line with
the concerns of most commercial operators
along the route. Many object to their car parks
being used by SSP Line passengers because
according to them, it would scare off their
customers.
The suggestion to move the proposed Park &
Ride facility away from its present location near
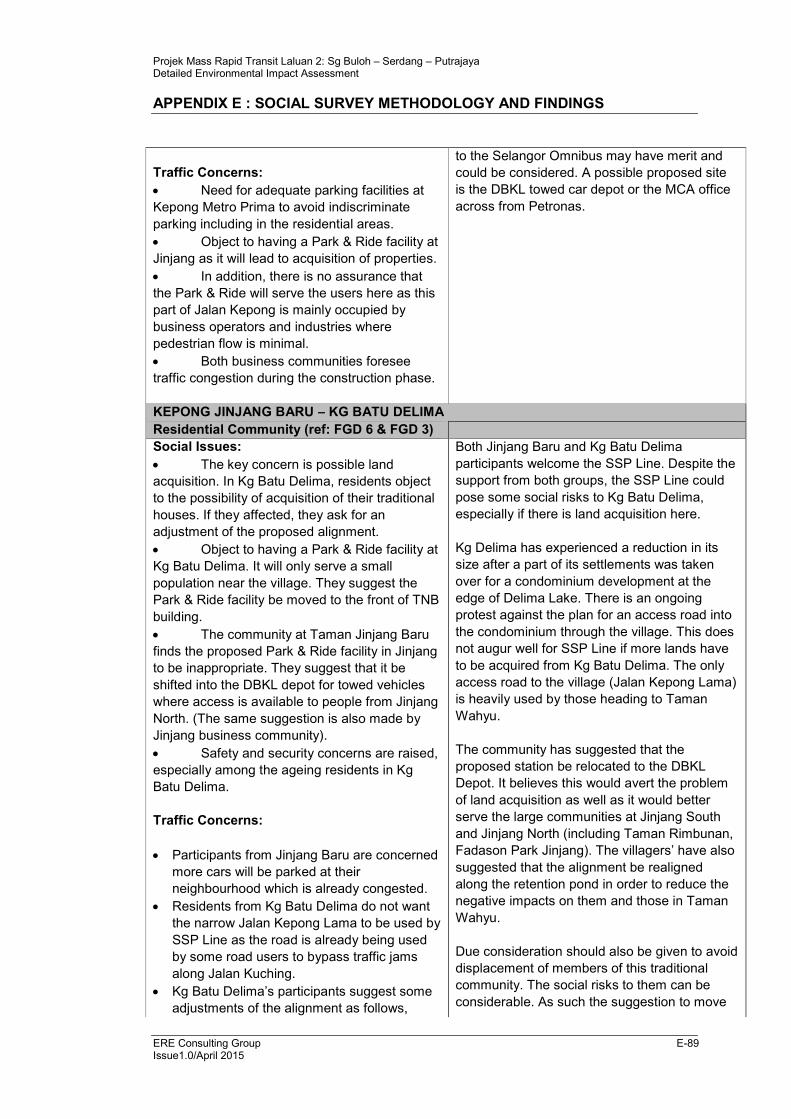
Projek Mass Rapid Transit Laluan 2: Sg Buloh – Serdang – Putrajaya Detailed Environmental Impact Assessment
APPENDIX E : SOCIAL SURVEY METHODOLOGY AND FINDINGS
ERE Consulting Group E-89 Issue1.0/April 2015
Traffic Concerns:
• Need for adequate parking facilities at
Kepong Metro Prima to avoid indiscriminate
parking including in the residential areas.
• Object to having a Park & Ride facility at
Jinjang as it will lead to acquisition of properties.
• In addition, there is no assurance that
the Park & Ride will serve the users here as this
part of Jalan Kepong is mainly occupied by
business operators and industries where
pedestrian flow is minimal.
• Both business communities foresee
traffic congestion during the construction phase.
to the Selangor Omnibus may have merit and
could be considered. A possible proposed site
is the DBKL towed car depot or the MCA office
across from Petronas.
KEPONG JINJANG BARU – KG BATU DELIMA
Residential Community (ref: FGD 6 & FGD 3)
Social Issues:
• The key concern is possible land
acquisition. In Kg Batu Delima, residents object
to the possibility of acquisition of their traditional
houses. If they affected, they ask for an
adjustment of the proposed alignment.
• Object to having a Park & Ride facility at
Kg Batu Delima. It will only serve a small
population near the village. They suggest the
Park & Ride facility be moved to the front of TNB
building.
• The community at Taman Jinjang Baru
finds the proposed Park & Ride facility in Jinjang
to be inappropriate. They suggest that it be
shifted into the DBKL depot for towed vehicles
where access is available to people from Jinjang
North. (The same suggestion is also made by
Jinjang business community).
• Safety and security concerns are raised,
especially among the ageing residents in Kg
Batu Delima.
Traffic Concerns:
• Participants from Jinjang Baru are concerned
more cars will be parked at their
neighbourhood which is already congested.
• Residents from Kg Batu Delima do not want
the narrow Jalan Kepong Lama to be used by
SSP Line as the road is already being used
by some road users to bypass traffic jams
along Jalan Kuching.
• Kg Batu Delima’s participants suggest some
adjustments of the alignment as follows,
Both Jinjang Baru and Kg Batu Delima
participants welcome the SSP Line. Despite the
support from both groups, the SSP Line could
pose some social risks to Kg Batu Delima,
especially if there is land acquisition here.
Kg Delima has experienced a reduction in its
size after a part of its settlements was taken
over for a condominium development at the
edge of Delima Lake. There is an ongoing
protest against the plan for an access road into
the condominium through the village. This does
not augur well for SSP Line if more lands have
to be acquired from Kg Batu Delima. The only
access road to the village (Jalan Kepong Lama)
is heavily used by those heading to Taman
Wahyu.
The community has suggested that the
proposed station be relocated to the DBKL
Depot. It believes this would avert the problem
of land acquisition as well as it would better
serve the large communities at Jinjang South
and Jinjang North (including Taman Rimbunan,
Fadason Park Jinjang). The villagers’ have also
suggested that the alignment be realigned
along the retention pond in order to reduce the
negative impacts on them and those in Taman
Wahyu.
Due consideration should also be given to avoid
displacement of members of this traditional
community. The social risks to them can be
considerable. As such the suggestion to move
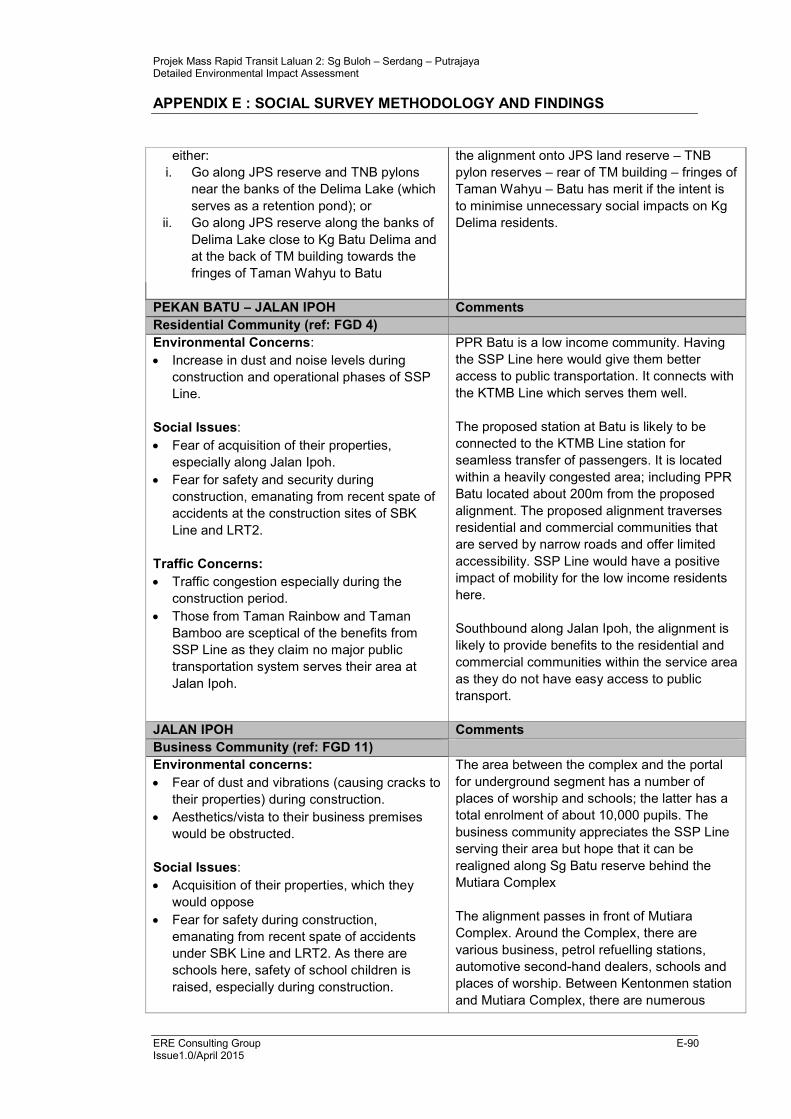
Projek Mass Rapid Transit Laluan 2: Sg Buloh – Serdang – Putrajaya Detailed Environmental Impact Assessment
APPENDIX E : SOCIAL SURVEY METHODOLOGY AND FINDINGS
ERE Consulting Group E-90 Issue1.0/April 2015
either:
i. Go along JPS reserve and TNB pylons
near the banks of the Delima Lake (which
serves as a retention pond); or
ii. Go along JPS reserve along the banks of
Delima Lake close to Kg Batu Delima and
at the back of TM building towards the
fringes of Taman Wahyu to Batu
the alignment onto JPS land reserve – TNB
pylon reserves – rear of TM building – fringes of
Taman Wahyu – Batu has merit if the intent is
to minimise unnecessary social impacts on Kg
Delima residents.
PEKAN BATU – JALAN IPOH Comments
Residential Community (ref: FGD 4)
Environmental Concerns:
• Increase in dust and noise levels during
construction and operational phases of SSP
Line.
Social Issues:
• Fear of acquisition of their properties,
especially along Jalan Ipoh.
• Fear for safety and security during
construction, emanating from recent spate of
accidents at the construction sites of SBK
Line and LRT2.
Traffic Concerns:
• Traffic congestion especially during the
construction period.
• Those from Taman Rainbow and Taman
Bamboo are sceptical of the benefits from
SSP Line as they claim no major public
transportation system serves their area at
Jalan Ipoh.
PPR Batu is a low income community. Having
the SSP Line here would give them better
access to public transportation. It connects with
the KTMB Line which serves them well.
The proposed station at Batu is likely to be
connected to the KTMB Line station for
seamless transfer of passengers. It is located
within a heavily congested area; including PPR
Batu located about 200m from the proposed
alignment. The proposed alignment traverses
residential and commercial communities that
are served by narrow roads and offer limited
accessibility. SSP Line would have a positive
impact of mobility for the low income residents
here.
Southbound along Jalan Ipoh, the alignment is
likely to provide benefits to the residential and
commercial communities within the service area
as they do not have easy access to public
transport.
JALAN IPOH Comments
Business Community (ref: FGD 11)
Environmental concerns:
• Fear of dust and vibrations (causing cracks to
their properties) during construction.
• Aesthetics/vista to their business premises
would be obstructed.
Social Issues:
• Acquisition of their properties, which they
would oppose
• Fear for safety during construction,
emanating from recent spate of accidents
under SBK Line and LRT2. As there are
schools here, safety of school children is
raised, especially during construction.
The area between the complex and the portal
for underground segment has a number of
places of worship and schools; the latter has a
total enrolment of about 10,000 pupils. The
business community appreciates the SSP Line
serving their area but hope that it can be
realigned along Sg Batu reserve behind the
Mutiara Complex
The alignment passes in front of Mutiara
Complex. Around the Complex, there are
various business, petrol refuelling stations,
automotive second-hand dealers, schools and
places of worship. Between Kentonmen station
and Mutiara Complex, there are numerous
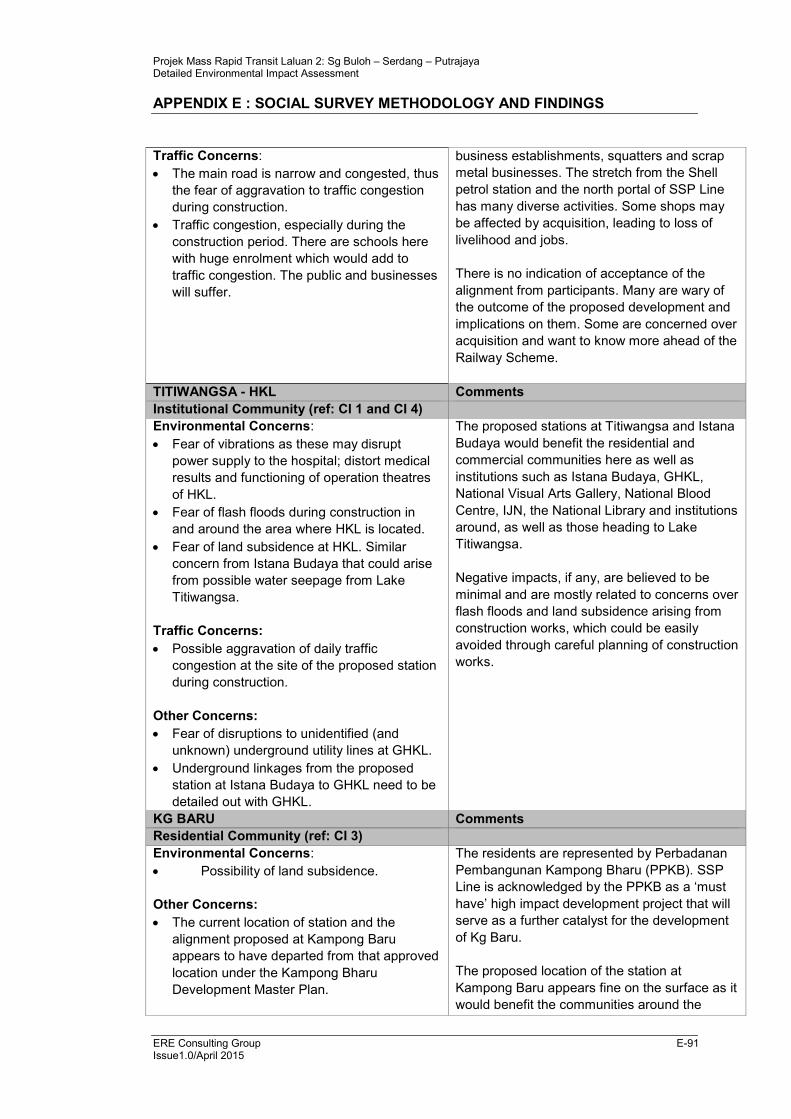
Projek Mass Rapid Transit Laluan 2: Sg Buloh – Serdang – Putrajaya Detailed Environmental Impact Assessment
APPENDIX E : SOCIAL SURVEY METHODOLOGY AND FINDINGS
ERE Consulting Group E-91 Issue1.0/April 2015
Traffic Concerns:
• The main road is narrow and congested, thus
the fear of aggravation to traffic congestion
during construction.
• Traffic congestion, especially during the
construction period. There are schools here
with huge enrolment which would add to
traffic congestion. The public and businesses
will suffer.
business establishments, squatters and scrap
metal businesses. The stretch from the Shell
petrol station and the north portal of SSP Line
has many diverse activities. Some shops may
be affected by acquisition, leading to loss of
livelihood and jobs.
There is no indication of acceptance of the
alignment from participants. Many are wary of
the outcome of the proposed development and
implications on them. Some are concerned over
acquisition and want to know more ahead of the
Railway Scheme.
TITIWANGSA - HKL Comments
Institutional Community (ref: CI 1 and CI 4)
Environmental Concerns:
• Fear of vibrations as these may disrupt
power supply to the hospital; distort medical
results and functioning of operation theatres
of HKL.
• Fear of flash floods during construction in
and around the area where HKL is located.
• Fear of land subsidence at HKL. Similar
concern from Istana Budaya that could arise
from possible water seepage from Lake
Titiwangsa.
Traffic Concerns:
• Possible aggravation of daily traffic
congestion at the site of the proposed station
during construction.
Other Concerns:
• Fear of disruptions to unidentified (and
unknown) underground utility lines at GHKL.
• Underground linkages from the proposed
station at Istana Budaya to GHKL need to be
detailed out with GHKL.
The proposed stations at Titiwangsa and Istana
Budaya would benefit the residential and
commercial communities here as well as
institutions such as Istana Budaya, GHKL,
National Visual Arts Gallery, National Blood
Centre, IJN, the National Library and institutions
around, as well as those heading to Lake
Titiwangsa.
Negative impacts, if any, are believed to be
minimal and are mostly related to concerns over
flash floods and land subsidence arising from
construction works, which could be easily
avoided through careful planning of construction
works.
KG BARU Comments
Residential Community (ref: CI 3)
Environmental Concerns:
• Possibility of land subsidence.
Other Concerns:
• The current location of station and the
alignment proposed at Kampong Baru
appears to have departed from that approved
location under the Kampong Bharu
Development Master Plan.
The residents are represented by Perbadanan
Pembangunan Kampong Bharu (PPKB). SSP
Line is acknowledged by the PPKB as a ‘must
have’ high impact development project that will
serve as a further catalyst for the development
of Kg Baru.
The proposed location of the station at
Kampong Baru appears fine on the surface as it
would benefit the communities around the
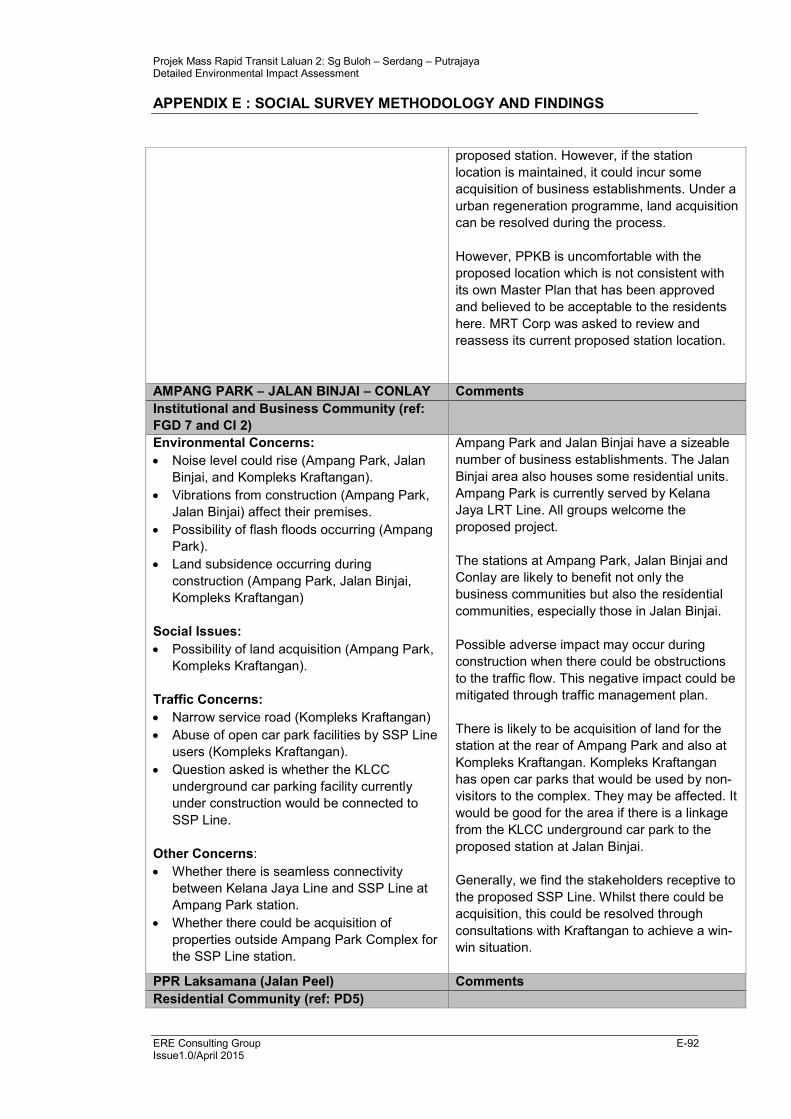
Projek Mass Rapid Transit Laluan 2: Sg Buloh – Serdang – Putrajaya Detailed Environmental Impact Assessment
APPENDIX E : SOCIAL SURVEY METHODOLOGY AND FINDINGS
ERE Consulting Group E-92 Issue1.0/April 2015
proposed station. However, if the station
location is maintained, it could incur some
acquisition of business establishments. Under a
urban regeneration programme, land acquisition
can be resolved during the process.
However, PPKB is uncomfortable with the
proposed location which is not consistent with
its own Master Plan that has been approved
and believed to be acceptable to the residents
here. MRT Corp was asked to review and
reassess its current proposed station location.
AMPANG PARK – JALAN BINJAI – CONLAY Comments
Institutional and Business Community (ref:
FGD 7 and CI 2)
Environmental Concerns:
• Noise level could rise (Ampang Park, Jalan
Binjai, and Kompleks Kraftangan).
• Vibrations from construction (Ampang Park,
Jalan Binjai) affect their premises.
• Possibility of flash floods occurring (Ampang
Park).
• Land subsidence occurring during
construction (Ampang Park, Jalan Binjai,
Kompleks Kraftangan)
Social Issues:
• Possibility of land acquisition (Ampang Park,
Kompleks Kraftangan).
Traffic Concerns:
• Narrow service road (Kompleks Kraftangan)
• Abuse of open car park facilities by SSP Line
users (Kompleks Kraftangan).
• Question asked is whether the KLCC
underground car parking facility currently
under construction would be connected to
SSP Line.
Other Concerns:
• Whether there is seamless connectivity
between Kelana Jaya Line and SSP Line at
Ampang Park station.
• Whether there could be acquisition of
properties outside Ampang Park Complex for
the SSP Line station.
Ampang Park and Jalan Binjai have a sizeable
number of business establishments. The Jalan
Binjai area also houses some residential units.
Ampang Park is currently served by Kelana
Jaya LRT Line. All groups welcome the
proposed project.
The stations at Ampang Park, Jalan Binjai and
Conlay are likely to benefit not only the
business communities but also the residential
communities, especially those in Jalan Binjai.
Possible adverse impact may occur during
construction when there could be obstructions
to the traffic flow. This negative impact could be
mitigated through traffic management plan.
There is likely to be acquisition of land for the
station at the rear of Ampang Park and also at
Kompleks Kraftangan. Kompleks Kraftangan
has open car parks that would be used by non-
visitors to the complex. They may be affected. It
would be good for the area if there is a linkage
from the KLCC underground car park to the
proposed station at Jalan Binjai.
Generally, we find the stakeholders receptive to
the proposed SSP Line. Whilst there could be
acquisition, this could be resolved through
consultations with Kraftangan to achieve a win-
win situation.
PPR Laksamana (Jalan Peel) Comments
Residential Community (ref: PD5)
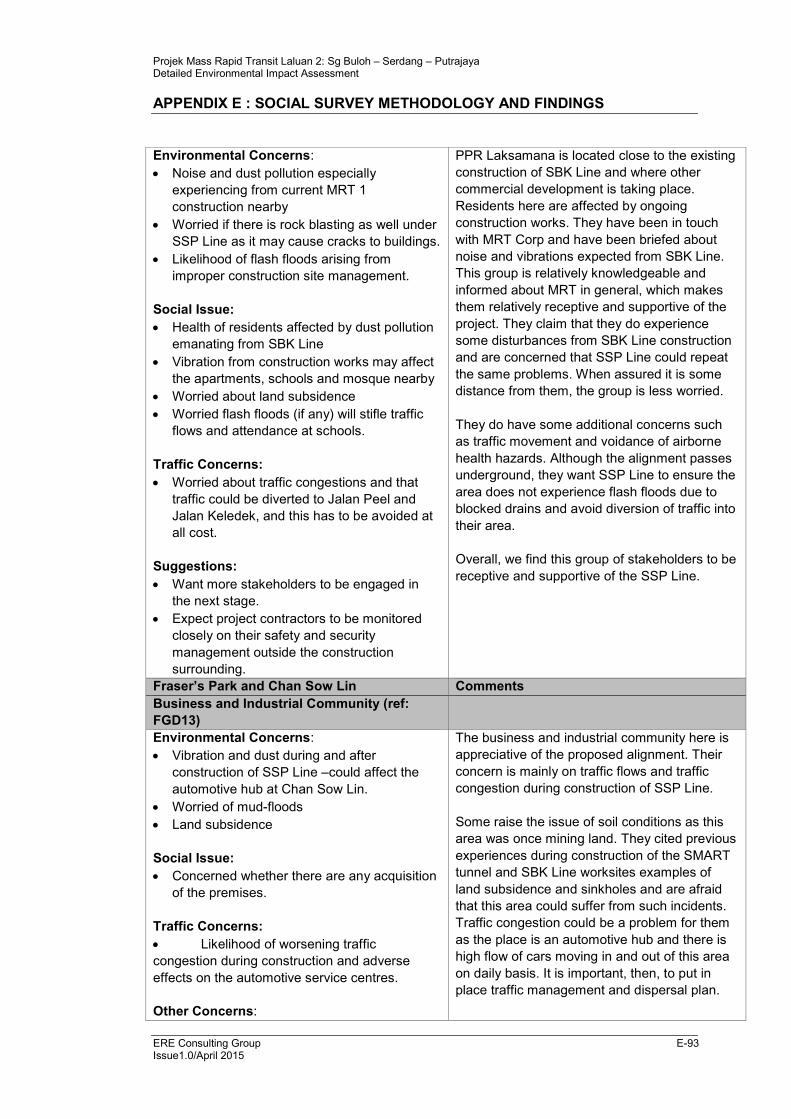
Projek Mass Rapid Transit Laluan 2: Sg Buloh – Serdang – Putrajaya Detailed Environmental Impact Assessment
APPENDIX E : SOCIAL SURVEY METHODOLOGY AND FINDINGS
ERE Consulting Group E-93 Issue1.0/April 2015
Environmental Concerns:
• Noise and dust pollution especially
experiencing from current MRT 1
construction nearby
• Worried if there is rock blasting as well under
SSP Line as it may cause cracks to buildings.
• Likelihood of flash floods arising from
improper construction site management.
Social Issue:
• Health of residents affected by dust pollution
emanating from SBK Line
• Vibration from construction works may affect
the apartments, schools and mosque nearby
• Worried about land subsidence
• Worried flash floods (if any) will stifle traffic
flows and attendance at schools.
Traffic Concerns:
• Worried about traffic congestions and that
traffic could be diverted to Jalan Peel and
Jalan Keledek, and this has to be avoided at
all cost.
Suggestions:
• Want more stakeholders to be engaged in
the next stage.
• Expect project contractors to be monitored
closely on their safety and security
management outside the construction
surrounding.
PPR Laksamana is located close to the existing
construction of SBK Line and where other
commercial development is taking place.
Residents here are affected by ongoing
construction works. They have been in touch
with MRT Corp and have been briefed about
noise and vibrations expected from SBK Line.
This group is relatively knowledgeable and
informed about MRT in general, which makes
them relatively receptive and supportive of the
project. They claim that they do experience
some disturbances from SBK Line construction
and are concerned that SSP Line could repeat
the same problems. When assured it is some
distance from them, the group is less worried.
They do have some additional concerns such
as traffic movement and voidance of airborne
health hazards. Although the alignment passes
underground, they want SSP Line to ensure the
area does not experience flash floods due to
blocked drains and avoid diversion of traffic into
their area.
Overall, we find this group of stakeholders to be
receptive and supportive of the SSP Line.
Fraser’s Park and Chan Sow Lin Comments
Business and Industrial Community (ref:
FGD13)
Environmental Concerns:
• Vibration and dust during and after
construction of SSP Line –could affect the
automotive hub at Chan Sow Lin.
• Worried of mud-floods
• Land subsidence
Social Issue:
• Concerned whether there are any acquisition
of the premises.
Traffic Concerns:
• Likelihood of worsening traffic
congestion during construction and adverse
effects on the automotive service centres.
Other Concerns:
The business and industrial community here is
appreciative of the proposed alignment. Their
concern is mainly on traffic flows and traffic
congestion during construction of SSP Line.
Some raise the issue of soil conditions as this
area was once mining land. They cited previous
experiences during construction of the SMART
tunnel and SBK Line worksites examples of
land subsidence and sinkholes and are afraid
that this area could suffer from such incidents.
Traffic congestion could be a problem for them
as the place is an automotive hub and there is
high flow of cars moving in and out of this area
on daily basis. It is important, then, to put in
place traffic management and dispersal plan.
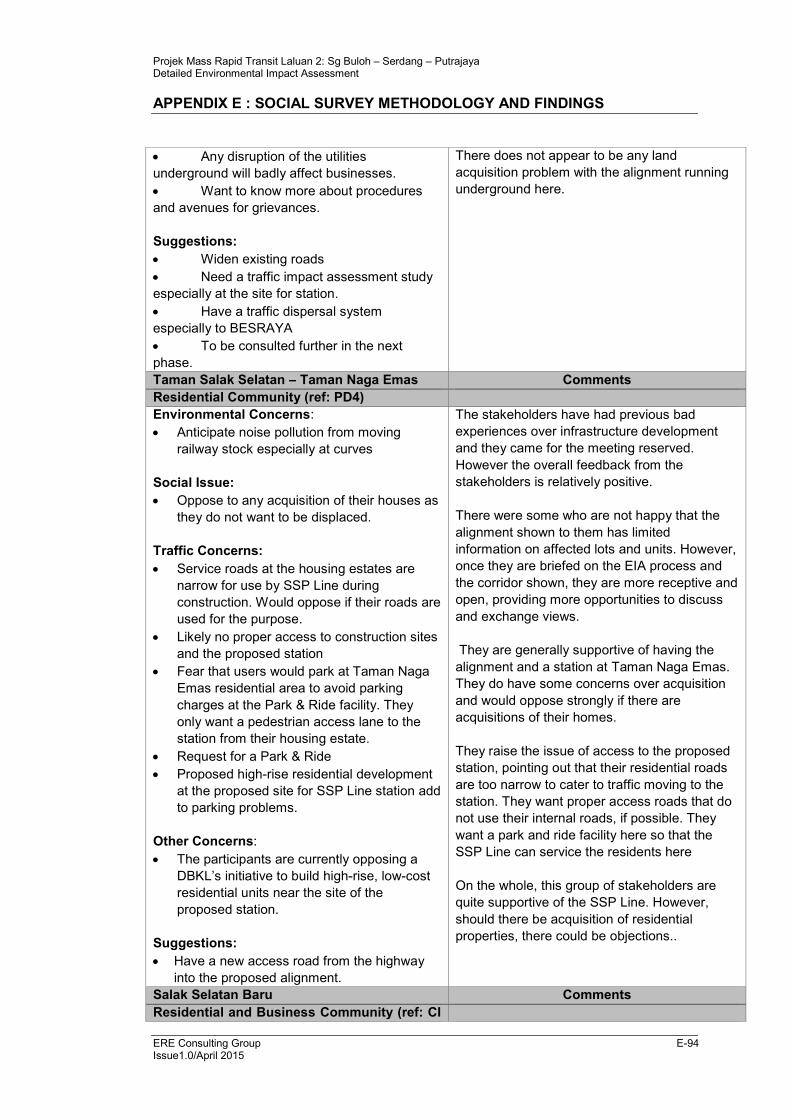
Projek Mass Rapid Transit Laluan 2: Sg Buloh – Serdang – Putrajaya Detailed Environmental Impact Assessment
APPENDIX E : SOCIAL SURVEY METHODOLOGY AND FINDINGS
ERE Consulting Group E-94 Issue1.0/April 2015
• Any disruption of the utilities
underground will badly affect businesses.
• Want to know more about procedures
and avenues for grievances.
Suggestions:
• Widen existing roads
• Need a traffic impact assessment study
especially at the site for station.
• Have a traffic dispersal system
especially to BESRAYA
• To be consulted further in the next
phase.
There does not appear to be any land
acquisition problem with the alignment running
underground here.
Taman Salak Selatan – Taman Naga Emas Comments
Residential Community (ref: PD4)
Environmental Concerns:
• Anticipate noise pollution from moving
railway stock especially at curves
Social Issue:
• Oppose to any acquisition of their houses as
they do not want to be displaced.
Traffic Concerns:
• Service roads at the housing estates are
narrow for use by SSP Line during
construction. Would oppose if their roads are
used for the purpose.
• Likely no proper access to construction sites
and the proposed station
• Fear that users would park at Taman Naga
Emas residential area to avoid parking
charges at the Park & Ride facility. They
only want a pedestrian access lane to the
station from their housing estate.
• Request for a Park & Ride
• Proposed high-rise residential development
at the proposed site for SSP Line station add
to parking problems.
Other Concerns:
• The participants are currently opposing a
DBKL’s initiative to build high-rise, low-cost
residential units near the site of the
proposed station.
Suggestions:
• Have a new access road from the highway
into the proposed alignment.
The stakeholders have had previous bad
experiences over infrastructure development
and they came for the meeting reserved.
However the overall feedback from the
stakeholders is relatively positive.
There were some who are not happy that the
alignment shown to them has limited
information on affected lots and units. However,
once they are briefed on the EIA process and
the corridor shown, they are more receptive and
open, providing more opportunities to discuss
and exchange views.
They are generally supportive of having the
alignment and a station at Taman Naga Emas.
They do have some concerns over acquisition
and would oppose strongly if there are
acquisitions of their homes.
They raise the issue of access to the proposed
station, pointing out that their residential roads
are too narrow to cater to traffic moving to the
station. They want proper access roads that do
not use their internal roads, if possible. They
want a park and ride facility here so that the
SSP Line can service the residents here
On the whole, this group of stakeholders are
quite supportive of the SSP Line. However,
should there be acquisition of residential
properties, there could be objections..
Salak Selatan Baru Comments
Residential and Business Community (ref: CI
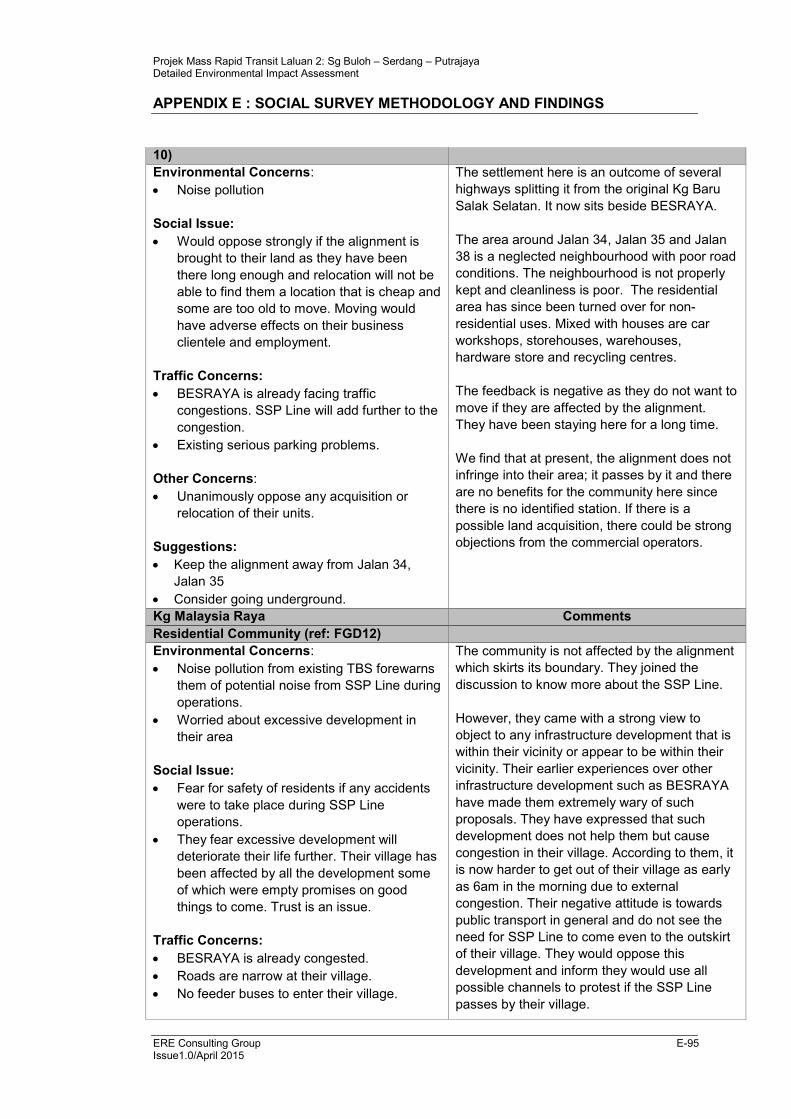
Projek Mass Rapid Transit Laluan 2: Sg Buloh – Serdang – Putrajaya Detailed Environmental Impact Assessment
APPENDIX E : SOCIAL SURVEY METHODOLOGY AND FINDINGS
ERE Consulting Group E-95 Issue1.0/April 2015
10)
Environmental Concerns:
• Noise pollution
Social Issue:
• Would oppose strongly if the alignment is
brought to their land as they have been
there long enough and relocation will not be
able to find them a location that is cheap and
some are too old to move. Moving would
have adverse effects on their business
clientele and employment.
Traffic Concerns:
• BESRAYA is already facing traffic
congestions. SSP Line will add further to the
congestion.
• Existing serious parking problems.
Other Concerns:
• Unanimously oppose any acquisition or
relocation of their units.
Suggestions:
• Keep the alignment away from Jalan 34,
Jalan 35
• Consider going underground.
The settlement here is an outcome of several
highways splitting it from the original Kg Baru
Salak Selatan. It now sits beside BESRAYA.
The area around Jalan 34, Jalan 35 and Jalan
38 is a neglected neighbourhood with poor road
conditions. The neighbourhood is not properly
kept and cleanliness is poor. The residential
area has since been turned over for non-
residential uses. Mixed with houses are car
workshops, storehouses, warehouses,
hardware store and recycling centres.
The feedback is negative as they do not want to
move if they are affected by the alignment.
They have been staying here for a long time.
We find that at present, the alignment does not
infringe into their area; it passes by it and there
are no benefits for the community here since
there is no identified station. If there is a
possible land acquisition, there could be strong
objections from the commercial operators.
Kg Malaysia Raya Comments
Residential Community (ref: FGD12)
Environmental Concerns:
• Noise pollution from existing TBS forewarns
them of potential noise from SSP Line during
operations.
• Worried about excessive development in
their area
Social Issue:
• Fear for safety of residents if any accidents
were to take place during SSP Line
operations.
• They fear excessive development will
deteriorate their life further. Their village has
been affected by all the development some
of which were empty promises on good
things to come. Trust is an issue.
Traffic Concerns:
• BESRAYA is already congested.
• Roads are narrow at their village.
• No feeder buses to enter their village.
The community is not affected by the alignment
which skirts its boundary. They joined the
discussion to know more about the SSP Line.
However, they came with a strong view to
object to any infrastructure development that is
within their vicinity or appear to be within their
vicinity. Their earlier experiences over other
infrastructure development such as BESRAYA
have made them extremely wary of such
proposals. They have expressed that such
development does not help them but cause
congestion in their village. According to them, it
is now harder to get out of their village as early
as 6am in the morning due to external
congestion. Their negative attitude is towards
public transport in general and do not see the
need for SSP Line to come even to the outskirt
of their village. They would oppose this
development and inform they would use all
possible channels to protest if the SSP Line
passes by their village.
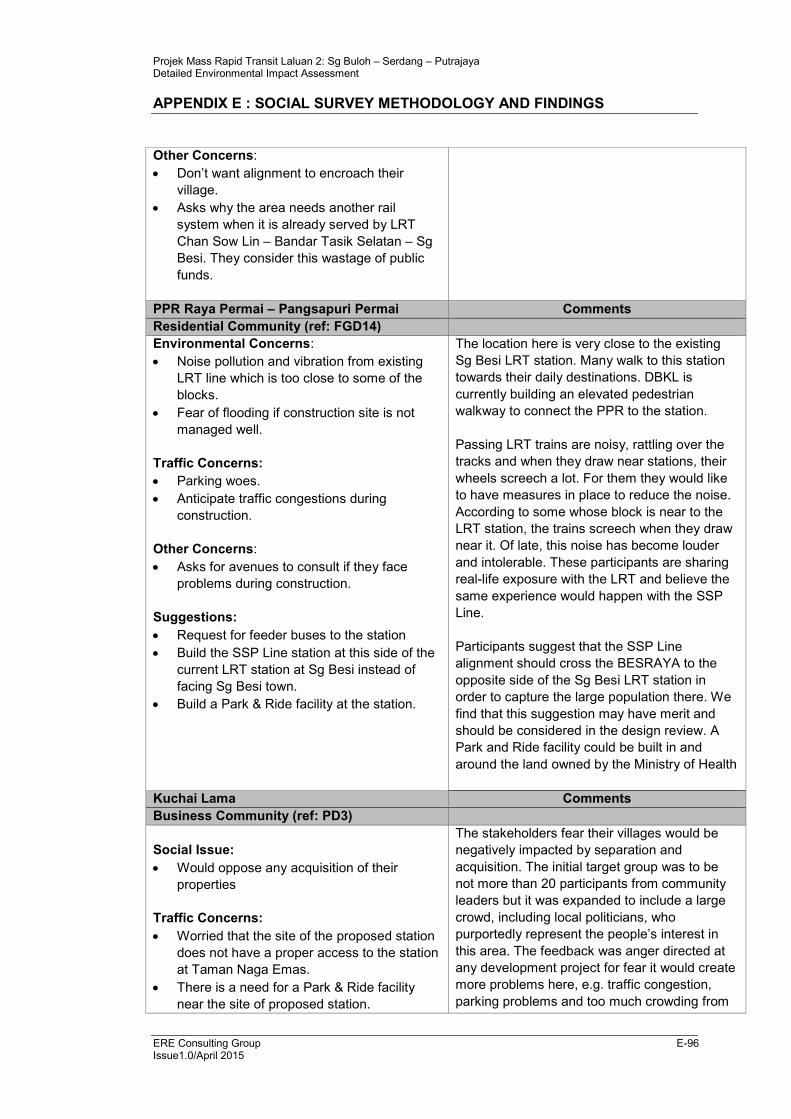
Projek Mass Rapid Transit Laluan 2: Sg Buloh – Serdang – Putrajaya Detailed Environmental Impact Assessment
APPENDIX E : SOCIAL SURVEY METHODOLOGY AND FINDINGS
ERE Consulting Group E-96 Issue1.0/April 2015
Other Concerns:
• Don’t want alignment to encroach their
village.
• Asks why the area needs another rail
system when it is already served by LRT
Chan Sow Lin – Bandar Tasik Selatan – Sg
Besi. They consider this wastage of public
funds.
PPR Raya Permai – Pangsapuri Permai Comments
Residential Community (ref: FGD14)
Environmental Concerns:
• Noise pollution and vibration from existing
LRT line which is too close to some of the
blocks.
• Fear of flooding if construction site is not
managed well.
Traffic Concerns:
• Parking woes.
• Anticipate traffic congestions during
construction.
Other Concerns:
• Asks for avenues to consult if they face
problems during construction.
Suggestions:
• Request for feeder buses to the station
• Build the SSP Line station at this side of the
current LRT station at Sg Besi instead of
facing Sg Besi town.
• Build a Park & Ride facility at the station.
The location here is very close to the existing
Sg Besi LRT station. Many walk to this station
towards their daily destinations. DBKL is
currently building an elevated pedestrian
walkway to connect the PPR to the station.
Passing LRT trains are noisy, rattling over the
tracks and when they draw near stations, their
wheels screech a lot. For them they would like
to have measures in place to reduce the noise.
According to some whose block is near to the
LRT station, the trains screech when they draw
near it. Of late, this noise has become louder
and intolerable. These participants are sharing
real-life exposure with the LRT and believe the
same experience would happen with the SSP
Line.
Participants suggest that the SSP Line
alignment should cross the BESRAYA to the
opposite side of the Sg Besi LRT station in
order to capture the large population there. We
find that this suggestion may have merit and
should be considered in the design review. A
Park and Ride facility could be built in and
around the land owned by the Ministry of Health
Kuchai Lama Comments
Business Community (ref: PD3)
Social Issue:
• Would oppose any acquisition of their
properties
Traffic Concerns:
• Worried that the site of the proposed station
does not have a proper access to the station
at Taman Naga Emas.
• There is a need for a Park & Ride facility
near the site of proposed station.
The stakeholders fear their villages would be
negatively impacted by separation and
acquisition. The initial target group was to be
not more than 20 participants from community
leaders but it was expanded to include a large
crowd, including local politicians, who
purportedly represent the people’s interest in
this area. The feedback was anger directed at
any development project for fear it would create
more problems here, e.g. traffic congestion,
parking problems and too much crowding from
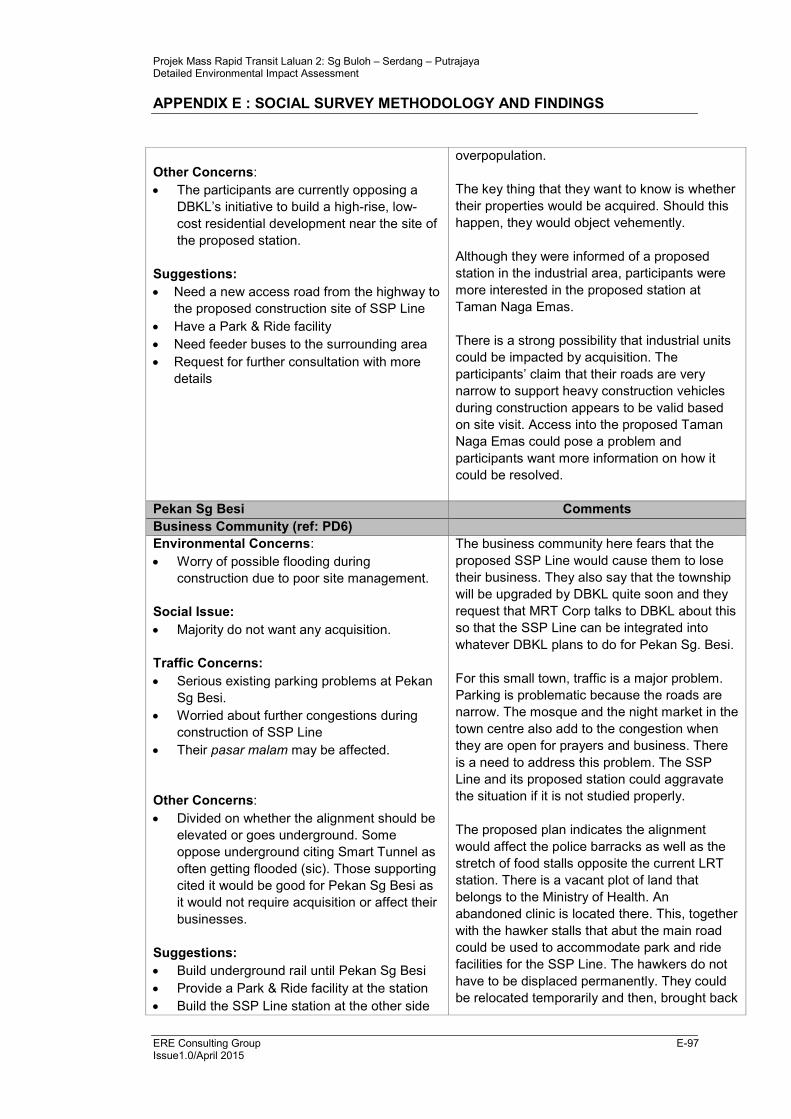
Projek Mass Rapid Transit Laluan 2: Sg Buloh – Serdang – Putrajaya Detailed Environmental Impact Assessment
APPENDIX E : SOCIAL SURVEY METHODOLOGY AND FINDINGS
ERE Consulting Group E-97 Issue1.0/April 2015
Other Concerns:
• The participants are currently opposing a
DBKL’s initiative to build a high-rise, low-
cost residential development near the site of
the proposed station.
Suggestions:
• Need a new access road from the highway to
the proposed construction site of SSP Line
• Have a Park & Ride facility
• Need feeder buses to the surrounding area
• Request for further consultation with more
details
overpopulation.
The key thing that they want to know is whether
their properties would be acquired. Should this
happen, they would object vehemently.
Although they were informed of a proposed
station in the industrial area, participants were
more interested in the proposed station at
Taman Naga Emas.
There is a strong possibility that industrial units
could be impacted by acquisition. The
participants’ claim that their roads are very
narrow to support heavy construction vehicles
during construction appears to be valid based
on site visit. Access into the proposed Taman
Naga Emas could pose a problem and
participants want more information on how it
could be resolved.
Pekan Sg Besi Comments
Business Community (ref: PD6)
Environmental Concerns:
• Worry of possible flooding during
construction due to poor site management.
Social Issue:
• Majority do not want any acquisition.
Traffic Concerns:
• Serious existing parking problems at Pekan
Sg Besi.
• Worried about further congestions during
construction of SSP Line
• Their pasar malam may be affected.
Other Concerns:
• Divided on whether the alignment should be
elevated or goes underground. Some
oppose underground citing Smart Tunnel as
often getting flooded (sic). Those supporting
cited it would be good for Pekan Sg Besi as
it would not require acquisition or affect their
businesses.
Suggestions:
• Build underground rail until Pekan Sg Besi
• Provide a Park & Ride facility at the station
• Build the SSP Line station at the other side
The business community here fears that the
proposed SSP Line would cause them to lose
their business. They also say that the township
will be upgraded by DBKL quite soon and they
request that MRT Corp talks to DBKL about this
so that the SSP Line can be integrated into
whatever DBKL plans to do for Pekan Sg. Besi.
For this small town, traffic is a major problem.
Parking is problematic because the roads are
narrow. The mosque and the night market in the
town centre also add to the congestion when
they are open for prayers and business. There
is a need to address this problem. The SSP
Line and its proposed station could aggravate
the situation if it is not studied properly.
The proposed plan indicates the alignment
would affect the police barracks as well as the
stretch of food stalls opposite the current LRT
station. There is a vacant plot of land that
belongs to the Ministry of Health. An
abandoned clinic is located there. This, together
with the hawker stalls that abut the main road
could be used to accommodate park and ride
facilities for the SSP Line. The hawkers do not
have to be displaced permanently. They could
be relocated temporarily and then, brought back
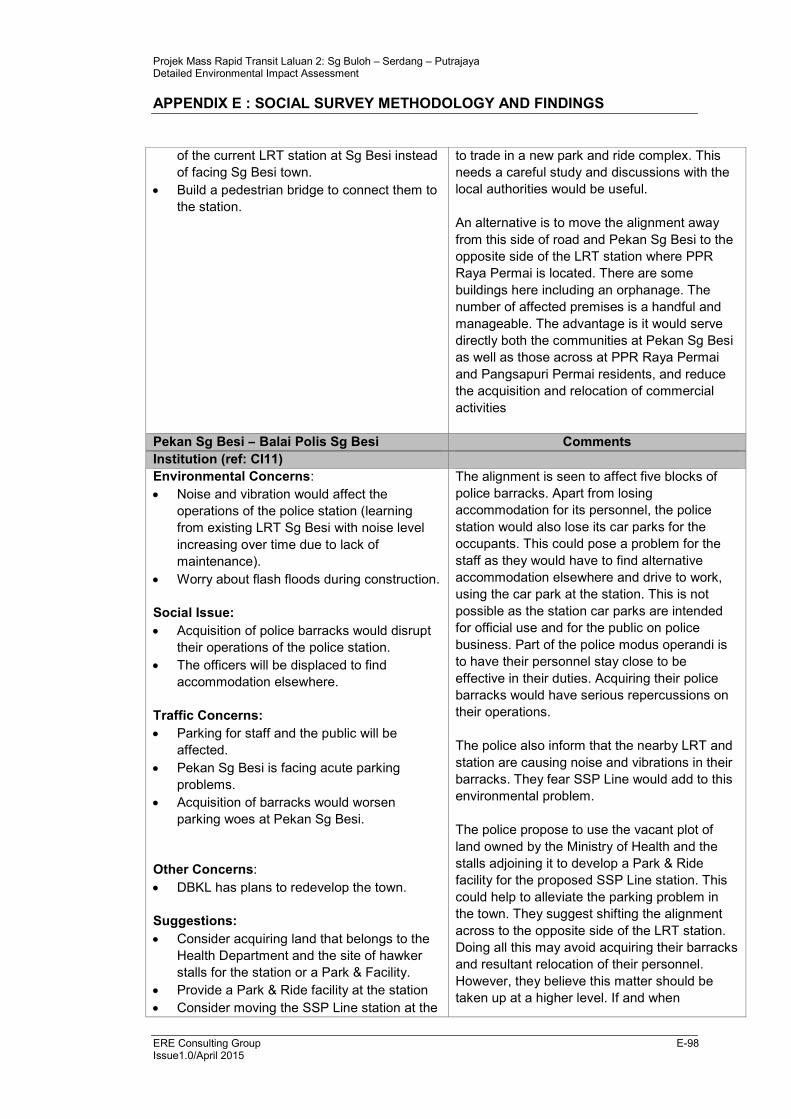
Projek Mass Rapid Transit Laluan 2: Sg Buloh – Serdang – Putrajaya Detailed Environmental Impact Assessment
APPENDIX E : SOCIAL SURVEY METHODOLOGY AND FINDINGS
ERE Consulting Group E-98 Issue1.0/April 2015
of the current LRT station at Sg Besi instead
of facing Sg Besi town.
• Build a pedestrian bridge to connect them to
the station.
to trade in a new park and ride complex. This
needs a careful study and discussions with the
local authorities would be useful.
An alternative is to move the alignment away
from this side of road and Pekan Sg Besi to the
opposite side of the LRT station where PPR
Raya Permai is located. There are some
buildings here including an orphanage. The
number of affected premises is a handful and
manageable. The advantage is it would serve
directly both the communities at Pekan Sg Besi
as well as those across at PPR Raya Permai
and Pangsapuri Permai residents, and reduce
the acquisition and relocation of commercial
activities
Pekan Sg Besi – Balai Polis Sg Besi Comments
Institution (ref: CI11)
Environmental Concerns:
• Noise and vibration would affect the
operations of the police station (learning
from existing LRT Sg Besi with noise level
increasing over time due to lack of
maintenance).
• Worry about flash floods during construction.
Social Issue:
• Acquisition of police barracks would disrupt
their operations of the police station.
• The officers will be displaced to find
accommodation elsewhere.
Traffic Concerns:
• Parking for staff and the public will be
affected.
• Pekan Sg Besi is facing acute parking
problems.
• Acquisition of barracks would worsen
parking woes at Pekan Sg Besi.
Other Concerns:
• DBKL has plans to redevelop the town.
Suggestions:
• Consider acquiring land that belongs to the
Health Department and the site of hawker
stalls for the station or a Park & Facility.
• Provide a Park & Ride facility at the station
• Consider moving the SSP Line station at the
The alignment is seen to affect five blocks of
police barracks. Apart from losing
accommodation for its personnel, the police
station would also lose its car parks for the
occupants. This could pose a problem for the
staff as they would have to find alternative
accommodation elsewhere and drive to work,
using the car park at the station. This is not
possible as the station car parks are intended
for official use and for the public on police
business. Part of the police modus operandi is
to have their personnel stay close to be
effective in their duties. Acquiring their police
barracks would have serious repercussions on
their operations.
The police also inform that the nearby LRT and
station are causing noise and vibrations in their
barracks. They fear SSP Line would add to this
environmental problem.
The police propose to use the vacant plot of
land owned by the Ministry of Health and the
stalls adjoining it to develop a Park & Ride
facility for the proposed SSP Line station. This
could help to alleviate the parking problem in
the town. They suggest shifting the alignment
across to the opposite side of the LRT station.
Doing all this may avoid acquiring their barracks
and resultant relocation of their personnel.
However, they believe this matter should be
taken up at a higher level. If and when
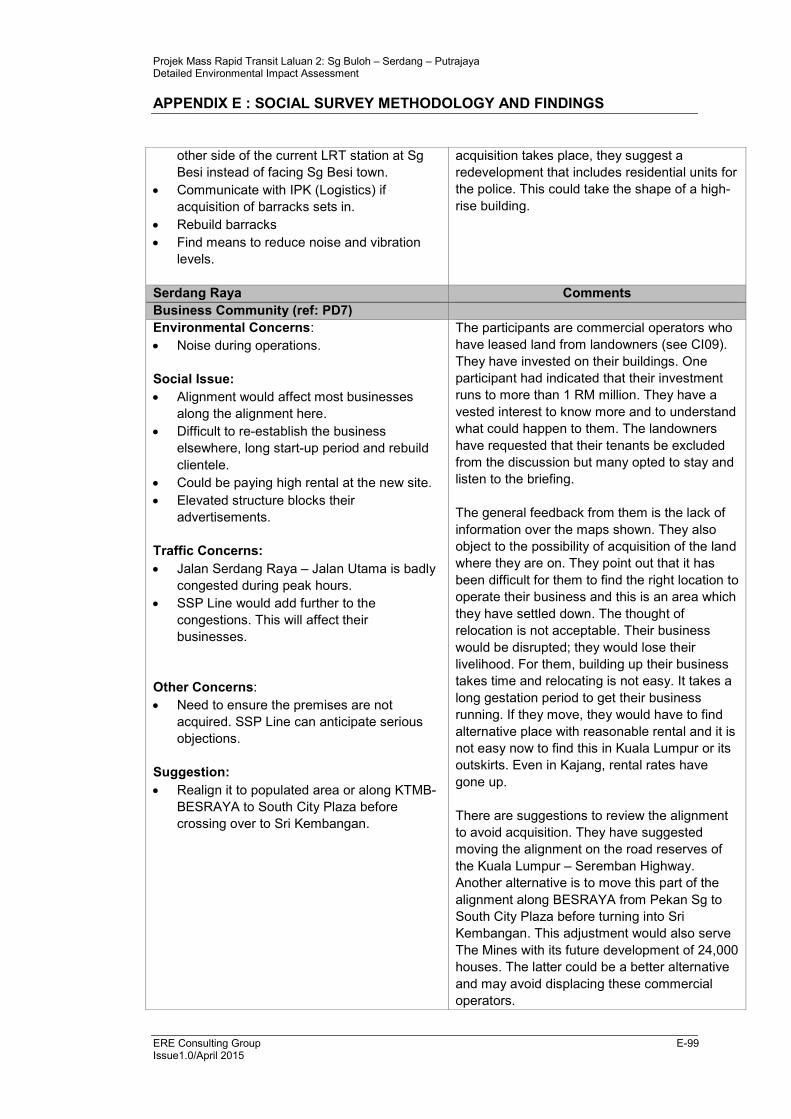
Projek Mass Rapid Transit Laluan 2: Sg Buloh – Serdang – Putrajaya Detailed Environmental Impact Assessment
APPENDIX E : SOCIAL SURVEY METHODOLOGY AND FINDINGS
ERE Consulting Group E-99 Issue1.0/April 2015
other side of the current LRT station at Sg
Besi instead of facing Sg Besi town.
• Communicate with IPK (Logistics) if
acquisition of barracks sets in.
• Rebuild barracks
• Find means to reduce noise and vibration
levels.
acquisition takes place, they suggest a
redevelopment that includes residential units for
the police. This could take the shape of a high-
rise building.
Serdang Raya Comments
Business Community (ref: PD7)
Environmental Concerns:
• Noise during operations.
Social Issue:
• Alignment would affect most businesses
along the alignment here.
• Difficult to re-establish the business
elsewhere, long start-up period and rebuild
clientele.
• Could be paying high rental at the new site.
• Elevated structure blocks their
advertisements.
Traffic Concerns:
• Jalan Serdang Raya – Jalan Utama is badly
congested during peak hours.
• SSP Line would add further to the
congestions. This will affect their
businesses.
Other Concerns:
• Need to ensure the premises are not
acquired. SSP Line can anticipate serious
objections.
Suggestion:
• Realign it to populated area or along KTMB-
BESRAYA to South City Plaza before
crossing over to Sri Kembangan.
The participants are commercial operators who
have leased land from landowners (see CI09).
They have invested on their buildings. One
participant had indicated that their investment
runs to more than 1 RM million. They have a
vested interest to know more and to understand
what could happen to them. The landowners
have requested that their tenants be excluded
from the discussion but many opted to stay and
listen to the briefing.
The general feedback from them is the lack of
information over the maps shown. They also
object to the possibility of acquisition of the land
where they are on. They point out that it has
been difficult for them to find the right location to
operate their business and this is an area which
they have settled down. The thought of
relocation is not acceptable. Their business
would be disrupted; they would lose their
livelihood. For them, building up their business
takes time and relocating is not easy. It takes a
long gestation period to get their business
running. If they move, they would have to find
alternative place with reasonable rental and it is
not easy now to find this in Kuala Lumpur or its
outskirts. Even in Kajang, rental rates have
gone up.
There are suggestions to review the alignment
to avoid acquisition. They have suggested
moving the alignment on the road reserves of
the Kuala Lumpur – Seremban Highway.
Another alternative is to move this part of the
alignment along BESRAYA from Pekan Sg to
South City Plaza before turning into Sri
Kembangan. This adjustment would also serve
The Mines with its future development of 24,000
houses. The latter could be a better alternative
and may avoid displacing these commercial
operators.
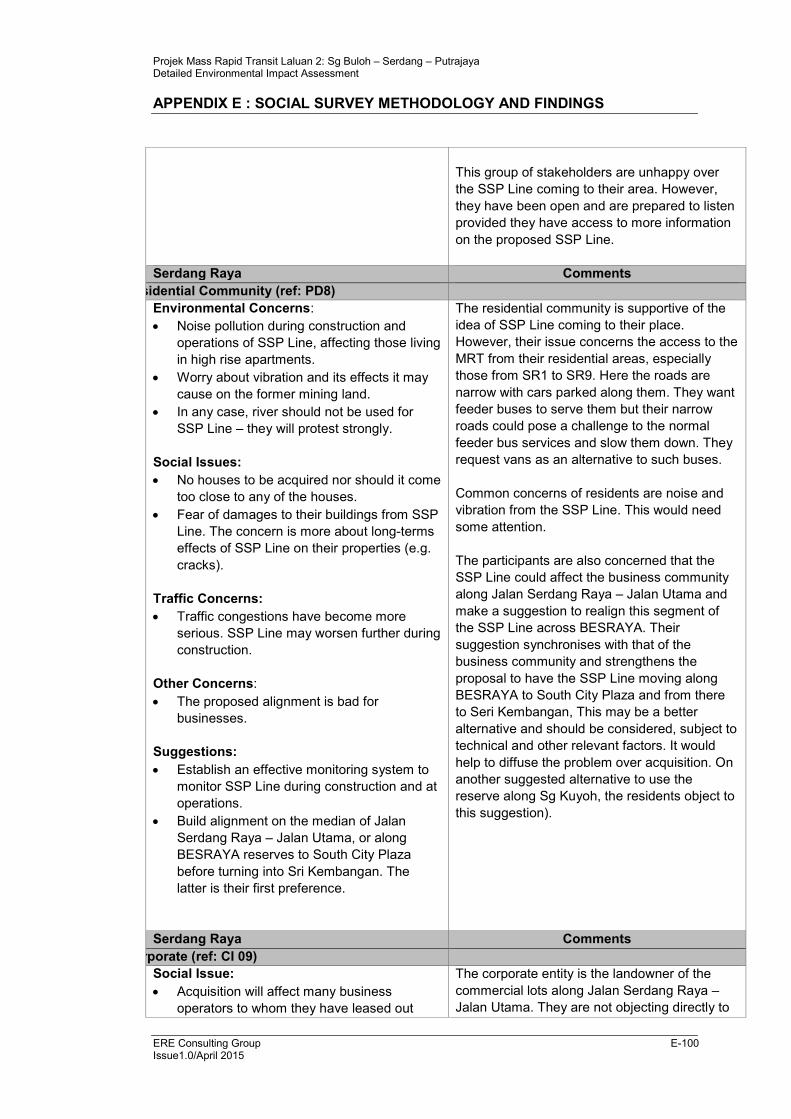
Projek Mass Rapid Transit Laluan 2: Sg Buloh – Serdang – Putrajaya Detailed Environmental Impact Assessment
APPENDIX E : SOCIAL SURVEY METHODOLOGY AND FINDINGS
ERE Consulting Group E-100 Issue1.0/April 2015
This group of stakeholders are unhappy over
the SSP Line coming to their area. However,
they have been open and are prepared to listen
provided they have access to more information
on the proposed SSP Line.
Serdang Raya Comments
Residential Community (ref: PD8)
Environmental Concerns:
• Noise pollution during construction and
operations of SSP Line, affecting those living
in high rise apartments.
• Worry about vibration and its effects it may
cause on the former mining land.
• In any case, river should not be used for
SSP Line – they will protest strongly.
Social Issues:
• No houses to be acquired nor should it come
too close to any of the houses.
• Fear of damages to their buildings from SSP
Line. The concern is more about long-terms
effects of SSP Line on their properties (e.g.
cracks).
Traffic Concerns:
• Traffic congestions have become more
serious. SSP Line may worsen further during
construction.
Other Concerns:
• The proposed alignment is bad for
businesses.
Suggestions:
• Establish an effective monitoring system to
monitor SSP Line during construction and at
operations.
• Build alignment on the median of Jalan
Serdang Raya – Jalan Utama, or along
BESRAYA reserves to South City Plaza
before turning into Sri Kembangan. The
latter is their first preference.
The residential community is supportive of the
idea of SSP Line coming to their place.
However, their issue concerns the access to the
MRT from their residential areas, especially
those from SR1 to SR9. Here the roads are
narrow with cars parked along them. They want
feeder buses to serve them but their narrow
roads could pose a challenge to the normal
feeder bus services and slow them down. They
request vans as an alternative to such buses.
Common concerns of residents are noise and
vibration from the SSP Line. This would need
some attention.
The participants are also concerned that the
SSP Line could affect the business community
along Jalan Serdang Raya – Jalan Utama and
make a suggestion to realign this segment of
the SSP Line across BESRAYA. Their
suggestion synchronises with that of the
business community and strengthens the
proposal to have the SSP Line moving along
BESRAYA to South City Plaza and from there
to Seri Kembangan, This may be a better
alternative and should be considered, subject to
technical and other relevant factors. It would
help to diffuse the problem over acquisition. On
another suggested alternative to use the
reserve along Sg Kuyoh, the residents object to
this suggestion).
Serdang Raya Comments
Corporate (ref: CI 09)
Social Issue:
• Acquisition will affect many business
operators to whom they have leased out
The corporate entity is the landowner of the
commercial lots along Jalan Serdang Raya –
Jalan Utama. They are not objecting directly to
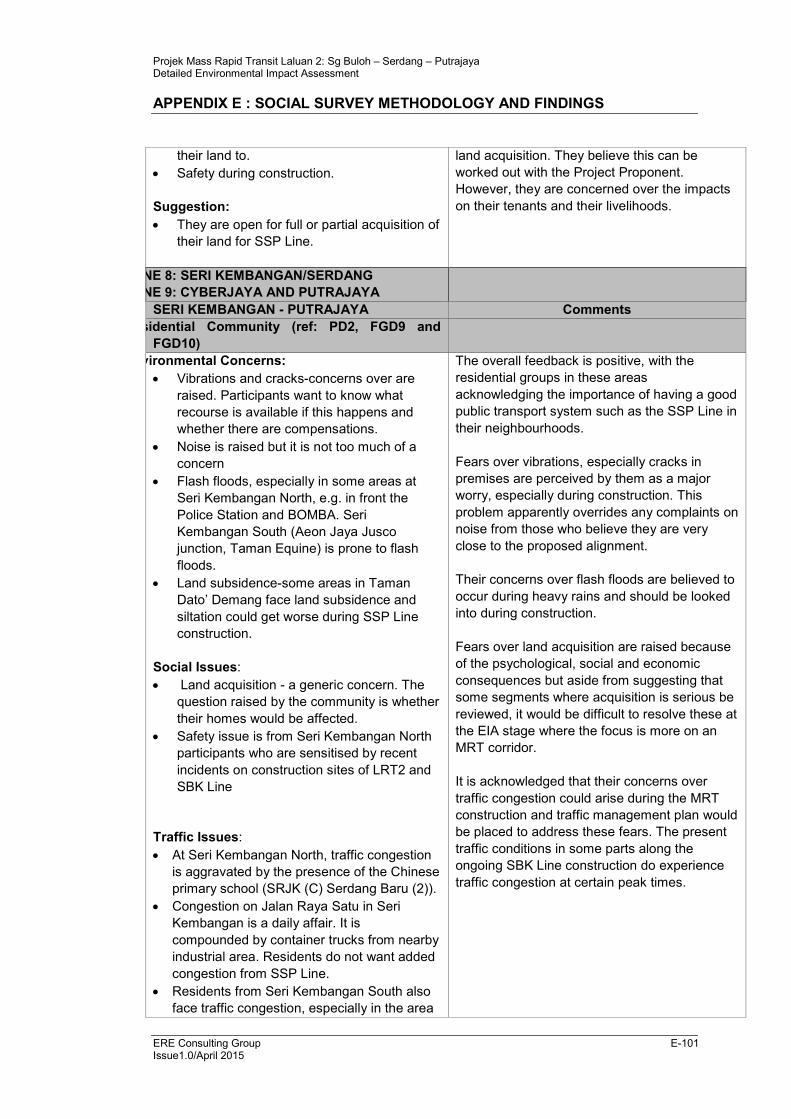
Projek Mass Rapid Transit Laluan 2: Sg Buloh – Serdang – Putrajaya Detailed Environmental Impact Assessment
APPENDIX E : SOCIAL SURVEY METHODOLOGY AND FINDINGS
ERE Consulting Group E-101 Issue1.0/April 2015
their land to.
• Safety during construction.
Suggestion:
• They are open for full or partial acquisition of
their land for SSP Line.
land acquisition. They believe this can be
worked out with the Project Proponent.
However, they are concerned over the impacts
on their tenants and their livelihoods.
ZONE 8: SERI KEMBANGAN/SERDANG
ZONE 9: CYBERJAYA AND PUTRAJAYA
SERI KEMBANGAN - PUTRAJAYA Comments
Residential Community (ref: PD2, FGD9 and
FGD10)
Environmental Concerns:
• Vibrations and cracks-concerns over are
raised. Participants want to know what
recourse is available if this happens and
whether there are compensations.
• Noise is raised but it is not too much of a
concern
• Flash floods, especially in some areas at
Seri Kembangan North, e.g. in front the
Police Station and BOMBA. Seri
Kembangan South (Aeon Jaya Jusco
junction, Taman Equine) is prone to flash
floods.
• Land subsidence-some areas in Taman
Dato’ Demang face land subsidence and
siltation could get worse during SSP Line
construction.
Social Issues:
• Land acquisition - a generic concern. The
question raised by the community is whether
their homes would be affected.
• Safety issue is from Seri Kembangan North
participants who are sensitised by recent
incidents on construction sites of LRT2 and
SBK Line
Traffic Issues:
• At Seri Kembangan North, traffic congestion
is aggravated by the presence of the Chinese
primary school (SRJK (C) Serdang Baru (2)).
• Congestion on Jalan Raya Satu in Seri
Kembangan is a daily affair. It is
compounded by container trucks from nearby
industrial area. Residents do not want added
congestion from SSP Line.
• Residents from Seri Kembangan South also
face traffic congestion, especially in the area
The overall feedback is positive, with the
residential groups in these areas
acknowledging the importance of having a good
public transport system such as the SSP Line in
their neighbourhoods.
Fears over vibrations, especially cracks in
premises are perceived by them as a major
worry, especially during construction. This
problem apparently overrides any complaints on
noise from those who believe they are very
close to the proposed alignment.
Their concerns over flash floods are believed to
occur during heavy rains and should be looked
into during construction.
Fears over land acquisition are raised because
of the psychological, social and economic
consequences but aside from suggesting that
some segments where acquisition is serious be
reviewed, it would be difficult to resolve these at
the EIA stage where the focus is more on an
MRT corridor.
It is acknowledged that their concerns over
traffic congestion could arise during the MRT
construction and traffic management plan would
be placed to address these fears. The present
traffic conditions in some parts along the
ongoing SBK Line construction do experience
traffic congestion at certain peak times.
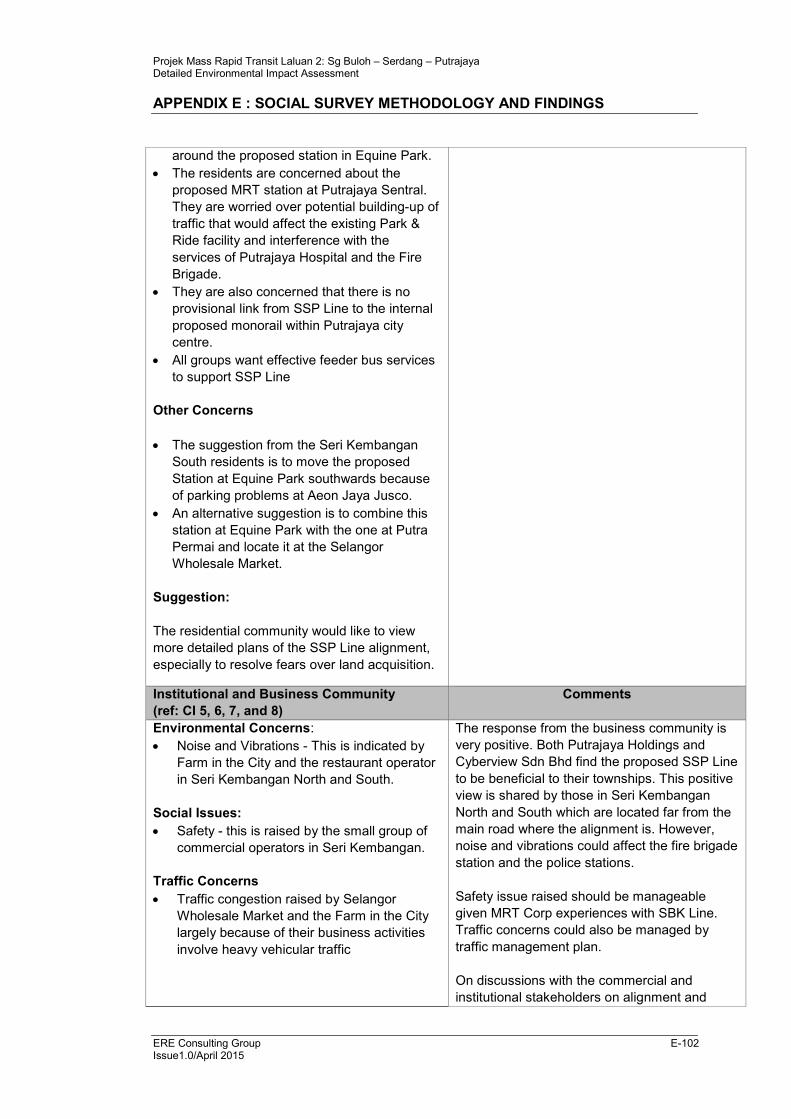
Projek Mass Rapid Transit Laluan 2: Sg Buloh – Serdang – Putrajaya Detailed Environmental Impact Assessment
APPENDIX E : SOCIAL SURVEY METHODOLOGY AND FINDINGS
ERE Consulting Group E-102 Issue1.0/April 2015
around the proposed station in Equine Park.
• The residents are concerned about the
proposed MRT station at Putrajaya Sentral.
They are worried over potential building-up of
traffic that would affect the existing Park &
Ride facility and interference with the
services of Putrajaya Hospital and the Fire
Brigade.
• They are also concerned that there is no
provisional link from SSP Line to the internal
proposed monorail within Putrajaya city
centre.
• All groups want effective feeder bus services
to support SSP Line
Other Concerns
• The suggestion from the Seri Kembangan
South residents is to move the proposed
Station at Equine Park southwards because
of parking problems at Aeon Jaya Jusco.
• An alternative suggestion is to combine this
station at Equine Park with the one at Putra
Permai and locate it at the Selangor
Wholesale Market.
Suggestion:
The residential community would like to view
more detailed plans of the SSP Line alignment,
especially to resolve fears over land acquisition.
Institutional and Business Community
(ref: CI 5, 6, 7, and 8)
Comments
Environmental Concerns:
• Noise and Vibrations - This is indicated by
Farm in the City and the restaurant operator
in Seri Kembangan North and South.
Social Issues:
• Safety - this is raised by the small group of
commercial operators in Seri Kembangan.
Traffic Concerns
• Traffic congestion raised by Selangor
Wholesale Market and the Farm in the City
largely because of their business activities
involve heavy vehicular traffic
The response from the business community is
very positive. Both Putrajaya Holdings and
Cyberview Sdn Bhd find the proposed SSP Line
to be beneficial to their townships. This positive
view is shared by those in Seri Kembangan
North and South which are located far from the
main road where the alignment is. However,
noise and vibrations could affect the fire brigade
station and the police stations.
Safety issue raised should be manageable
given MRT Corp experiences with SBK Line.
Traffic concerns could also be managed by
traffic management plan.
On discussions with the commercial and
institutional stakeholders on alignment and
Projek Mass Rapid Transit Laluan 2: Sg Buloh – Serdang – Putrajaya Detailed Environmental Impact Assessment
APPENDIX E : SOCIAL SURVEY METHODOLOGY AND FINDINGS
ERE Consulting Group E-103 Issue1.0/April 2015
stations, there is a need for further discussions
between them and the Project Proponent once
the project moves ahead into design stage.
** All groups requested for more engagement sessions/ dialogues.
Projek Mass Rapid Transit Laluan 2: Sg Buloh – Serdang – Putrajaya Detailed Environmental Impact Assessment
APPENDIX E : SOCIAL SURVEY METHODOLOGY AND FINDINGS
ERE Consulting Group E-104 Issue1.0/April 2015
This page has been intentionally left blank.