Apoplasmic assimilates and grain growth of contrasting rice cultivars differing in grain dry mass...
17
ORIGINAL PAPER Apoplasmic assimilates and grain growth of contrasting rice cultivars differing in grain dry mass and size Sandhya Rani Kuanar • Rashmi Panigrahi • Ekamber Kariali • Pravat Kumar Mohapatra Received: 17 July 2009 / Accepted: 12 February 2010 / Published online: 2 March 2010 Ó Springer Science+Business Media B.V. 2010 Abstract Apical dominance in assimilate filling impacts grain growth in basal spikelets of rice panicle. In this study, organic materials of the pericarp, apoplasmic space and endosperm of the apical and basal caryopses, and photo- synthesis of the flag leaf were measured during early part of grain development in three types of rice cultivars with similar phenology, but difference in grain weight and size in the dry and wet seasons of 2006 and 2007, respectively. Photosynthetic activity of the flag leaf was consistently low in small-seeded cultivars. Rates of grain filling and cell division of endosperm and concentration of assimilates, starch, proteins and chlorophylls of the caryopsis were lower, but spikelet ethylene production and peroxidase activity were higher in a small-seeded cultivar compared to a big-seeded cultivar. Similar disparities in grain filling and other attributes were noticed for the inferior basal spikelets of the panicle compared to the superior apical spikelets, except the assimilate concentration of the pericarp and endosperm. Temporal fluctuation in assimilate concentra- tion of the organs were similar between the cultivars. Concentration of apoplasmic assimilates mostly exhibited negative correlation with that of pericarp and endosperm. Compared to the apical spikelets, correlation was more negative for the basal spikelets. Conversely, correlation was positive between the concentration of apoplasmic assimilates and endosperm cell number and grain weight of the cultivars. Ethylene released from the spikelets at anthesis affected growth and cell division rates of endosperm and enhanced protein and chlorophyll degra- dation and peroxidase activity of the caryopsis. It was concluded that variation in spikelet ethylene production may be responsible for differences in size or weight of grains among rice cultivars and spikelets at different locations of the panicle. The concentration of apoplasmic assimilates could be an indicator for grain filling capacity, and ethylene regulated the concentration by affecting pericarp activity for assimilate unloading. Keywords Rice Assimilates Spikelets Ethylene Apoplasmic space Introduction Seed number and weight are important biological and agronomical features, which give a measure of repro- ductive success/grain yield of a plant in an environment. Theoretically, grain yield is a function of average seed weight summed over the total number of seeds. In rice, grain weight is considered a stable varietal character (Yoshida 1972). But, strong apical dominance results in considerable variation of single rice grains within a pan- icle; the poorly or partially filled basal grains become investment loss on account of poor quality and low market value (Venkateswarlu et al. 1986a, b; Mohapatra et al. 1993). The ultimate size or weight of the mature grain in rice is a function of the rate and duration of grain growth; both these components vary because of differ- ences in spatial and temporal location within the panicle (Xu and Vergara 1986) and genotype (Yoshida 1981). Inferior grains receive low priority in partitioning of assimilates within the panicle and such discrimination limits endosperm growth and grain size (Sikder and Das S. R. Kuanar R. Panigrahi E. Kariali P. K. Mohapatra (&) School of Life Science, Sambalpur University, Jyoti Vihar, Sambalpur 768019, India e-mail: [email protected] 123 Plant Growth Regul (2010) 61:135–151 DOI 10.1007/s10725-010-9459-8
-
Upload
independent -
Category
Documents
-
view
1 -
download
0
Transcript of Apoplasmic assimilates and grain growth of contrasting rice cultivars differing in grain dry mass...
ORIGINAL PAPER
Apoplasmic assimilates and grain growth of contrasting ricecultivars differing in grain dry mass and size
Sandhya Rani Kuanar • Rashmi Panigrahi •
Ekamber Kariali • Pravat Kumar Mohapatra
Received: 17 July 2009 / Accepted: 12 February 2010 / Published online: 2 March 2010
� Springer Science+Business Media B.V. 2010
Abstract Apical dominance in assimilate filling impacts
grain growth in basal spikelets of rice panicle. In this study,
organic materials of the pericarp, apoplasmic space and
endosperm of the apical and basal caryopses, and photo-
synthesis of the flag leaf were measured during early part
of grain development in three types of rice cultivars with
similar phenology, but difference in grain weight and size
in the dry and wet seasons of 2006 and 2007, respectively.
Photosynthetic activity of the flag leaf was consistently low
in small-seeded cultivars. Rates of grain filling and cell
division of endosperm and concentration of assimilates,
starch, proteins and chlorophylls of the caryopsis were
lower, but spikelet ethylene production and peroxidase
activity were higher in a small-seeded cultivar compared to
a big-seeded cultivar. Similar disparities in grain filling and
other attributes were noticed for the inferior basal spikelets
of the panicle compared to the superior apical spikelets,
except the assimilate concentration of the pericarp and
endosperm. Temporal fluctuation in assimilate concentra-
tion of the organs were similar between the cultivars.
Concentration of apoplasmic assimilates mostly exhibited
negative correlation with that of pericarp and endosperm.
Compared to the apical spikelets, correlation was more
negative for the basal spikelets. Conversely, correlation
was positive between the concentration of apoplasmic
assimilates and endosperm cell number and grain weight
of the cultivars. Ethylene released from the spikelets
at anthesis affected growth and cell division rates of
endosperm and enhanced protein and chlorophyll degra-
dation and peroxidase activity of the caryopsis. It was
concluded that variation in spikelet ethylene production
may be responsible for differences in size or weight of
grains among rice cultivars and spikelets at different
locations of the panicle. The concentration of apoplasmic
assimilates could be an indicator for grain filling capacity,
and ethylene regulated the concentration by affecting
pericarp activity for assimilate unloading.
Keywords Rice � Assimilates � Spikelets � Ethylene �Apoplasmic space
Introduction
Seed number and weight are important biological and
agronomical features, which give a measure of repro-
ductive success/grain yield of a plant in an environment.
Theoretically, grain yield is a function of average seed
weight summed over the total number of seeds. In rice,
grain weight is considered a stable varietal character
(Yoshida 1972). But, strong apical dominance results in
considerable variation of single rice grains within a pan-
icle; the poorly or partially filled basal grains become
investment loss on account of poor quality and low
market value (Venkateswarlu et al. 1986a, b; Mohapatra
et al. 1993). The ultimate size or weight of the mature
grain in rice is a function of the rate and duration of grain
growth; both these components vary because of differ-
ences in spatial and temporal location within the panicle
(Xu and Vergara 1986) and genotype (Yoshida 1981).
Inferior grains receive low priority in partitioning of
assimilates within the panicle and such discrimination
limits endosperm growth and grain size (Sikder and Das
S. R. Kuanar � R. Panigrahi � E. Kariali � P. K. Mohapatra (&)
School of Life Science, Sambalpur University, Jyoti Vihar,
Sambalpur 768019, India
e-mail: [email protected]
123
Plant Growth Regul (2010) 61:135–151
DOI 10.1007/s10725-010-9459-8
Gupta 1976; Mohapatra et al. 1993; Peng et al. 1994).
During seed filling, assimilates are mostly supplied as
soluble sugars to the developing seeds (Thorne 1985).
They are symplastically transported from the phloem
terminal of the seed coat to the maternal tissue prior to
their entry into the free space of embryonic apoplast and
ultimate storage in the endosperm (Oparka and Gates
1981a, b; Partick and Offler 1995; Olsen et al. 1999). It is
believed that transfer of solutes through this pathway
occurs by an osmotically driven pressure gradient between
the source leaf and the developing seed (Taiz and Zeiger
2002). In developing rice seeds, sucrose is the major
phloem solute and its supply is dependent on the mem-
brane bound sucrose efflux and influx carriers (Lim et al.
2006). Therefore, unloading from the maternal tissue of
the seed coat and concentration of sugars in the embry-
onic free space (apoplasmic space) confers an important
attribute for grain filling. The solutes of the apoplasmic
solution are involved in the regulation of turgor motivated
sugar unloading from the seed coat as well as uptake of
solutes by the sink tissue (Partick and Offler 1995; Lim
et al. 2006). Thus, slackening of grain filling in an inferior
grain may be consequential to the poor physiological
activity of seed coat (Ishimaru et al. 2003) as well as low
concentration of solutes in the embryonic fluid (Partick
and Offler 1995; Weber et al. 1997). The apoplasmic
solutions of developing seeds of cereals or legumes, have
been obtained by empty ovule technique or perfusion
methods so long (Thorne 1985; Wang and Fisher 1994;
Partick and Offler 1995). These techniques could not be
tested on developing rice kernels, because smallness of the
endosperm cavity existing between nucellar projection and
aleurone layer (Hoshikawa 1984; Matsuo and Hoshikawa
1993) precluded scope for surgical manipulations. In the
present experiment, we measured the carbohydrate con-
centration of the pericarp (caryopsis coat—De Datta
1981) as well as apoplasmic space fluid surrounding the
embryo and endosperm in three categories of indica rice
seeds differing in weight and size during the period of
development by using an equilibration procedure through
matching the apoplasmic concentration of sugars with that
of known concentration of the material in the external
solution. This technique is similar to that used by Gifford
and Thorne (1985). In the process, we intended to deter-
mine the genetic as well as positional variability in con-
centration of solutes in apoplasmic fluids on seed yield
between different rice cultivars in relation to partitioning
of assimilates between the source and sink organs. In our
previous work, ethylene was identified as an inhibitor for
the process of dry matter partitioning (Mohapatra et al.
2000, 2009; Mohapatra and Mohapatra 2005). In the
present endeavour, we have tried to elaborate this concept
further.
Materials and methods
Plant material and culture
Three indica rice (Oryza sativa L.) cultivars, differing in
grain size and weight, Jogesh (large), Udayagiri (medium)
and Sidhanta (small), were grown in pots (330 9
330 9 260 mm) placed in the farmyard of the School of
Life Science, Sambalpur University, India during the dry
season of 2006. The cultivars belonged to early duration
group with similar maturity duration. The soil of the pots
was a sandy clay loam. The soil contained sand 67. 4%, silt
9.3% and clay 23.3%. The initial N, P and K composition
was 10.00, 10.04 and 87.12 kg ha-1, respectively and pH
was 6.5. The pots were arranged in three replicates, each
replicate containing 18 pots and identical numbers of pots
selected at random in each replicate were used for culti-
vation of the three cultivars. Four seedlings were trans-
planted to each pot 30 days after growth in a nursery bed.
Plants were grown at a density of 36 plants/m2. Commer-
cial N, P and K were applied at a ratio of 82.8: 17.46:
33.6 kg ha-1 (1 ha = 10,000 kg soil) in split doses. Half
of each fertiliser was applied to the plants at the time of
transplantation and one quarter each at tillering and
anthesis. The water level in the pots was 5 ± 2 cm at the
surface of soil. The plants were free from any physico-
chemical or biological stresses. A similar experiment was
conducted during the wet season of 2007. Three cultivars
differing in grain size and weight, such as, Ramachandi
(large), Mahanadi (medium) and Ganjeikali (small) were
used in the experiment. The cultivars belonged to the late
duration group with similar maturity duration. The mete-
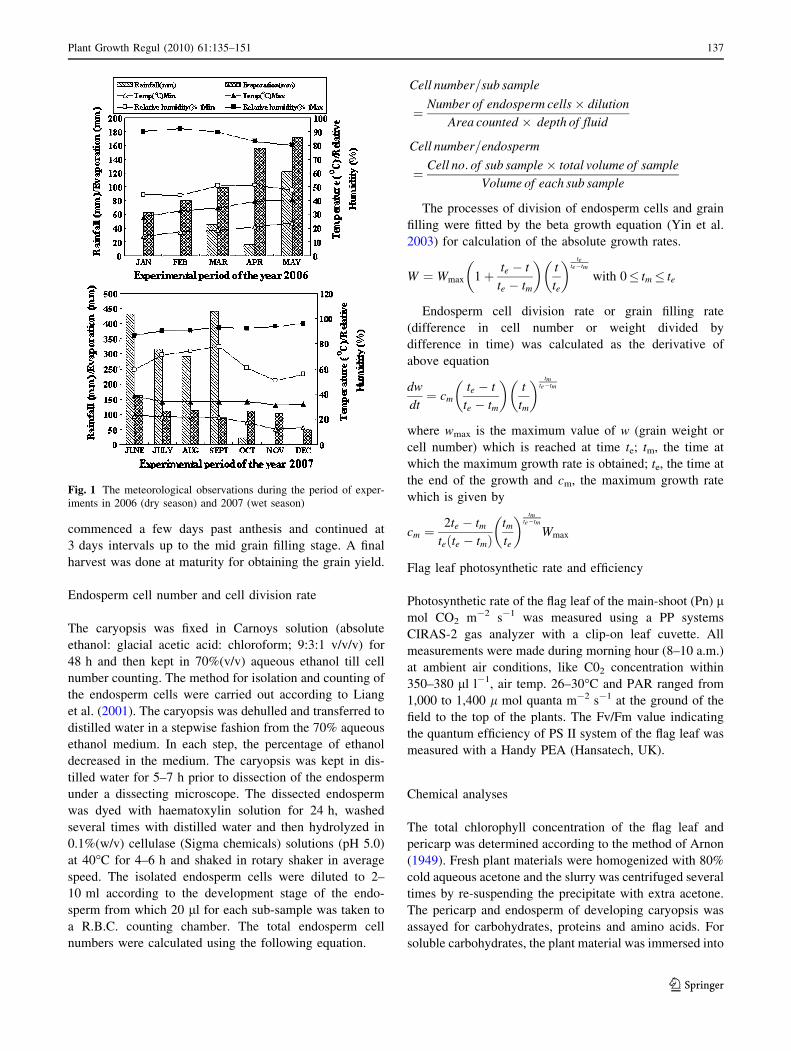
orological observations during the period of plantation are
given in Fig. 1.
Harvesting
For each cultivar, at least 30 plants were screened for
uniform development by leaf count and height measure-
ment. On each occasion of sampling, three plants were
uprooted carefully from each cultivar and brought to the
laboratory in moist condition inside a thermo-cool box
within 2 min for biochemical studies of the developing
caryopses of spikelets from different parts of the panicle.
The spikelets of the two uppermost primary branches of the
panicle, which reached anthesis on the first day, were
separated from the plant. These spikelets were called the
‘apical’ spikelets. Anthesis was delayed for 5 days in many
spikelets of the basal primary branches; these were the
‘basal’ spikelets. The external appendages of the spikelet
like lemma and palea were removed to isolate the cary-
opsis. The caryopsis was dissected carefully to obtain the
pericarp (caryopsis coat) and endosperm. The sampling
136 Plant Growth Regul (2010) 61:135–151
123
commenced a few days past anthesis and continued at
3 days intervals up to the mid grain filling stage. A final
harvest was done at maturity for obtaining the grain yield.
Endosperm cell number and cell division rate
The caryopsis was fixed in Carnoys solution (absolute
ethanol: glacial acetic acid: chloroform; 9:3:1 v/v/v) for
48 h and then kept in 70%(v/v) aqueous ethanol till cell
number counting. The method for isolation and counting of
the endosperm cells were carried out according to Liang
et al. (2001). The caryopsis was dehulled and transferred to
distilled water in a stepwise fashion from the 70% aqueous
ethanol medium. In each step, the percentage of ethanol
decreased in the medium. The caryopsis was kept in dis-
tilled water for 5–7 h prior to dissection of the endosperm
under a dissecting microscope. The dissected endosperm
was dyed with haematoxylin solution for 24 h, washed
several times with distilled water and then hydrolyzed in
0.1%(w/v) cellulase (Sigma chemicals) solutions (pH 5.0)
at 40�C for 4–6 h and shaked in rotary shaker in average
speed. The isolated endosperm cells were diluted to 2–
10 ml according to the development stage of the endo-
sperm from which 20 ll for each sub-sample was taken to
a R.B.C. counting chamber. The total endosperm cell
numbers were calculated using the following equation.
Cell number=sub sample
¼ Number of endosperm cells� dilution
Area counted � depth of fluid
Cell number=endosperm
¼ Cell no: of sub sample� total volume of sample
Volume of each sub sample
The processes of division of endosperm cells and grain
filling were fitted by the beta growth equation (Yin et al.
2003) for calculation of the absolute growth rates.
W ¼ Wmax 1þ te � t
te � tm
� �t
te
� � tete�tm
with 0� tm� te
Endosperm cell division rate or grain filling rate
(difference in cell number or weight divided by
difference in time) was calculated as the derivative of
above equation
dw
dt¼ cm
te � t
te � tm
� �t
tm
� � tmte�tm
where wmax is the maximum value of w (grain weight or
cell number) which is reached at time te; tm, the time at
which the maximum growth rate is obtained; te, the time at
the end of the growth and cm, the maximum growth rate
which is given by
cm ¼2te � tm
te te � tmð Þtm
te
� � tmte�tm
Wmax
Flag leaf photosynthetic rate and efficiency
Photosynthetic rate of the flag leaf of the main-shoot (Pn) lmol CO2 m-2 s-1 was measured using a PP systems
CIRAS-2 gas analyzer with a clip-on leaf cuvette. All
measurements were made during morning hour (8–10 a.m.)
at ambient air conditions, like C02 concentration within
350–380 ll l-1, air temp. 26–30�C and PAR ranged from
1,000 to 1,400 l mol quanta m-2 s-1 at the ground of the
field to the top of the plants. The Fv/Fm value indicating
the quantum efficiency of PS II system of the flag leaf was
measured with a Handy PEA (Hansatech, UK).
Chemical analyses
The total chlorophyll concentration of the flag leaf and
pericarp was determined according to the method of Arnon
(1949). Fresh plant materials were homogenized with 80%
cold aqueous acetone and the slurry was centrifuged several
times by re-suspending the precipitate with extra acetone.
The pericarp and endosperm of developing caryopsis was
assayed for carbohydrates, proteins and amino acids. For
soluble carbohydrates, the plant material was immersed into
Fig. 1 The meteorological observations during the period of exper-
iments in 2006 (dry season) and 2007 (wet season)
Plant Growth Regul (2010) 61:135–151 137
123
3 ml of boiling 80% aqueous methanol for 5 min. The
extract was removed to a 10 ml volumetric flask. The res-
idue was boiled for a second time with 50% aqueous
methanol and both the extracts were pooled. The volume of
the extract was made up to the mark with distilled water.
Aliquot of the extract was used for estimation of soluble
carbohydrates (Buysee and Merck 1993). The free amino
acids were estimated according to the method of Yemm and
Cocking (1955). The residue after methanolic extraction
was digested with 3% HCl and used for estimation of starch
(Buysee and Merck 1993). For total protein estimation,
fresh plant material was homogenized and centrifuged
with10% TCA. The precipitate was dissolved in 1 N NaOH
for the estimation of proteins (Lowry et al. 1951).
Ethylene estimation was carried out after collecting the
spikelets from the panicle and sealing them airtight inside
a 5 ml vial (Naik and Mohapatra 2000). The vial was
incubated in darkness for 2 h at room temperature. Head-
space gas (1 ml) was drawn into an airtight syringe and
injected into gas chromatograph (Hewlett-Packard Com-
pany model 6890, Palo Alto, USA). The micro-capillary
column was 30 m long and internal diameter was
0.53 mm. It was packed with cross-linked methylesilox-
ane. N2 was the carrier gas; H2 and O2 were used for the
flame ionization detector. The detector and injector tem-
peratures were 150 and 100�C, respectively.
For estimation of soluble carbohydrates in the apoplasmic
space, the pericarp was removed very carefully from each
caryopsis with forceps, and the pericarp as well as the
enclosed endosperm/embryo combines were dipped in
0.2 ml solutions of different milli-molar sucrose concen-
trations ranging from 0.5 to 5.0 mM in small tubes for 5 s.
The solution in the tube was mixed properly by shaking.
Then 0.1 ml of the solution was taken from each test tube for
estimation of soluble carbohydrates (Buysee and Merck
1993). Another set of sucrose solutions like the previous one
was prepared without the addition of the seed components,
which served as a control. Percentage change in absorbance
was calculated; taking the percentage change in absorbance
verses sucrose concentration (mM), a graph was plotted. The
isotonic concentration found out from the graph was taken as
the concentration of sugars in the apoplasmic space fluid.
The short duration of the wash was intended only to capture
the apoplasmic sugars adhering to the outer layer of the
endosperm/embryo and inner layer of the pericarp; and
exclude possibility of facilitated diffusion of solutes (Wang
and Fisher 1995) into and from the dipped structures.
Peroxidase enzyme activity was measured in fresh plant
material homogenized with 0.1 M sodium phosphate buffer
(pH 7.0) and centrifuged at 4�C for 10 min at 7000 9 g.The
supernatant was collected and buffer was added to reach the
mark in a 5 ml volumetric flask. Aliquots of the stock
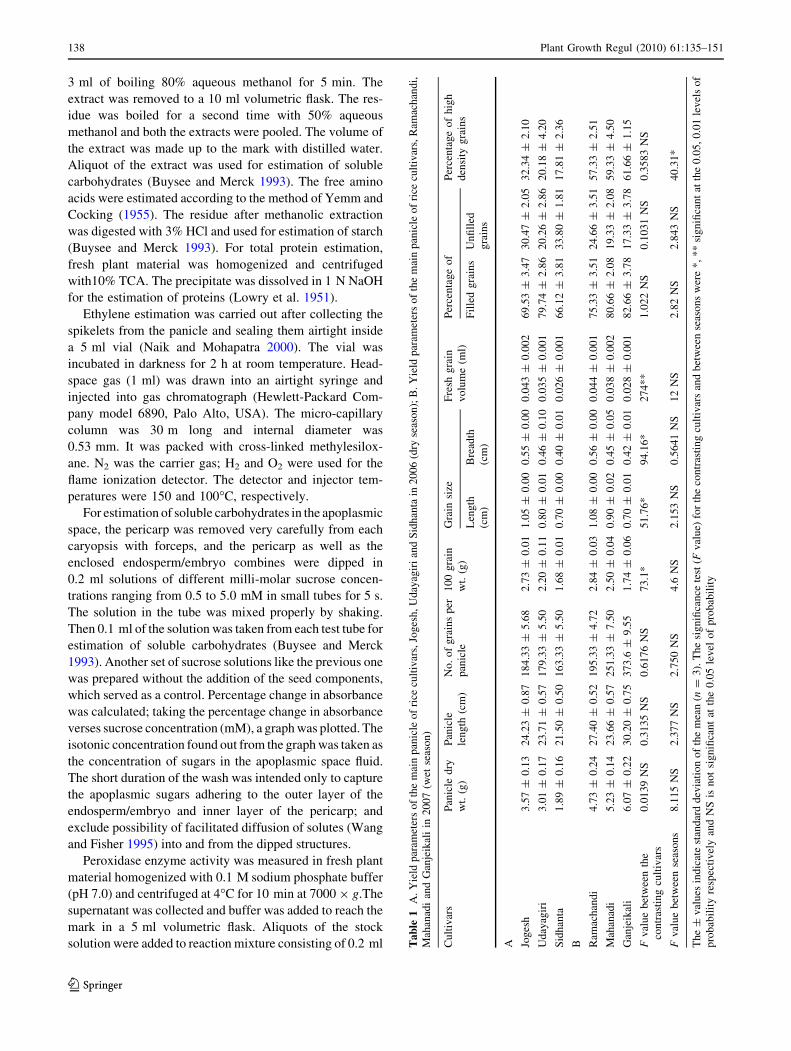
solution were added to reaction mixture consisting of 0.2 ml Ta
ble
1A
.Y
ield
par
amet
ers
of
the
mai
np
anic
leo
fri
cecu
ltiv
ars,
Jog
esh
,U
day
agir
ian
dS
idh
anta
in2
00
6(d
ryse
aso
n);
B.
Yie
ldp
aram
eter
so
fth
em
ain
pan
icle
of
rice
cult
ivar
s,R
amac
han
di,
Mah
anad
ian
dG
anje
ikal
iin
20
07
(wet
seas
on
)
Cu
ltiv
ars
Pan
icle
dry
wt.
(g)
Pan
icle
len
gth
(cm
)
No
.o
fg
rain
sp
er
pan
icle
10
0g
rain
wt.
(g)
Gra
insi
zeF
resh
gra
in
vo
lum
e(m
l)
Per
cen
tag
eo
fP
erce
nta
ge
of
hig
h
den
sity
gra
ins
Len
gth
(cm
)
Bre
adth
(cm
)
Fil
led
gra
ins
Un
fill
ed
gra
ins
A Jog
esh
3.5
7±
0.1
32
4.2
3±
0.8
71
84
.33
±5
.68
2.7
3±
0.0
11
.05
±0
.00
0.5
5±
0.0
00
.04
3±
0.0
02
69
.53
±3
.47
30
.47
±2
.05
32
.34
±2
.10
Ud
ayag
iri
3.0
1±
0.1
72
3.7
1±
0.5
71
79
.33
±5
.50
2.2
0±
0.1
10
.80
±0
.01
0.4
6±
0.1
00
.03
5±
0.0
01
79
.74
±2
.86
20
.26
±2
.86
20
.18
±4
.20
Sid
han
ta1
.89
±0
.16
21
.50
±0
.50
16
3.3
3±
5.5
01
.68
±0
.01
0.7
0±
0.0
00
.40
±0
.01
0.0
26
±0
.00
16
6.1
2±
3.8
13
3.8
0±
1.8
11
7.8
1±
2.3
6
B Ram
ach
and
i4
.73
±0
.24
27
.40
±0
.52
19
5.3
3±
4.7
22
.84
±0
.03
1.0
8±
0.0
00
.56
±0
.00
0.0
44
±0
.00
17
5.3
3±
3.5
12
4.6
6±
3.5
15
7.3
3±
2.5
1
Mah
anad
i5
.23
±0
.14
23
.66
±0
.57
25
1.3
3±
7.5
02
.50
±0
.04
0.9
0±
0.0
20
.45
±0
.05
0.0
38
±0
.00
28
0.6
6±
2.0
81
9.3
3±
2.0
85
9.3
3±
4.5
0
Gan
jeik
ali
6.0
7±
0.2
23
0.2
0±
0.7
53
73
.6±
9.5
51
.74
±0
.06
0.7
0±
0.0
10
.42
±0
.01
0.0
28
±0
.00
18
2.6
6±
3.7
81
7.3
3±
3.7
86
1.6
6±
1.1
5
Fv
alu
eb
etw
een
the
con
tras
tin
gcu
ltiv
ars
0.0
13
9N
S0
.31
35
NS
0.6
17
6N
S7
3.1
*5
1.7
6*
94
.16
*2
74
**
1.0
22
NS
0.1
03
1N
S0
.35
83
NS
Fv
alu
eb
etw
een
seas
on
s8
.11
5N
S2
.37
7N
S2
.75
0N
S4
.6N
S2
.15
3N
S0
.56
41
NS
12
NS
2.8
2N
S2
.84
3N
S4
0.3
1*
Th
e±
val
ues
ind
icat
est
and
ard
dev
iati
on
of
the
mea
n(n
=3
).T
he
sig
nifi
can
cete
st(F
val
ue)
for
the
con
tras
tin
gcu
ltiv
ars
and
bet
wee
nse
aso
ns
wer
e*
,*
*si
gn
ifica
nt
atth
e0
.05
,0
.01
lev
els
of
pro
bab
ilit
yre
spec
tiv
ely
and
NS
isn
ot
sig
nifi
can
tat
the
0.0
5le
vel
of
pro
bab
ilit
y
138 Plant Growth Regul (2010) 61:135–151
123

Fig. 2 Grain dry matter growth
and change in cell number of
endosperm in different cultivars
of rice during the period of grain
filling in the dry season of 2006.
Vertical bars indicate ±
standard deviation of the mean
(n = 3)
Fig. 3 Temporal changes in the
dry weight and volume of the
developing endosperm of rice
cultivars during the period of
grain filling in the dry season of
2006. Difference in dry weight
between the cultivars was
significant at P B 0.01 level
(df = 2, 8). The difference
between apical and basal
spikelets of the cultivars was
significant at P B 0.05 level
(df = 4) on most of the
sampling occasions. Symbols:
Triangle Sidhanta, RectangleUdayagiri, Rhombus Jogesh,
Closed Apical, Open Basal
Plant Growth Regul (2010) 61:135–151 139
123
sodium phosphate buffer, 1 ml 0.01 M pyrogallol and 1 ml
0.01 M H2O2. The reaction was terminated by addition of
1 ml 5% H2SO4 after an incubation period of 5 min at 25�C.
Measuring O.D. at 430 nm determined the concentration of
purpurogallin formed. Enzyme activity was calculated as
change in O.D. per g fresh weight per minutes according to
the method of Chance and Machly (1955).
Results
Morphological features of the panicle on main shoot
The three types of cultivars used in the experiment differed
significantly in grain weight, size and volume in both the
dry and wet seasons, although the differences in grain
number, dry weight, high density grain number and per-
centage of filled grain of the panicle were not always sig-
nificant (Table 1). Compared to Jogesh, grain size, volume
and weight were nearly 20 and 30–40% lower in Udayagiri
and Sidhanta cultivars, respectively, in the dry season.
Almost the same trend was noticed in the grains of the
other cultivars in the wet season. Grain weight, volume and
size of Mahanadi and Ganjeikali were nearly 10–20 and
25–39% smaller, respectively, in comparison to that of
Ramachandi. In the dry season, grain quality differed
between the cultivars; Jogesh possessed 32% of high-
density grains compared to Udayagiri and Sidhanta having
20 and 17% of such grains respectively, in the panicle. The
percentage of high density grains was high in the wet
season, although varietal difference was not significant.
Grain dry mass and endosperm cell number
In the dry season, average dry mass of grains increased
temporally during the period of grain filling in all the
cultivars; the apical grains accumulated larger weight
compared to the basal grains (Fig. 2). Increase of dry mass
continued in the apical grains up to day 22 after anthesis
and stopped thereafter until maturity. Conversely, the basal
grains accumulated dry mass slowly up to the time of
maturity. The variation in endosperm volume and weight
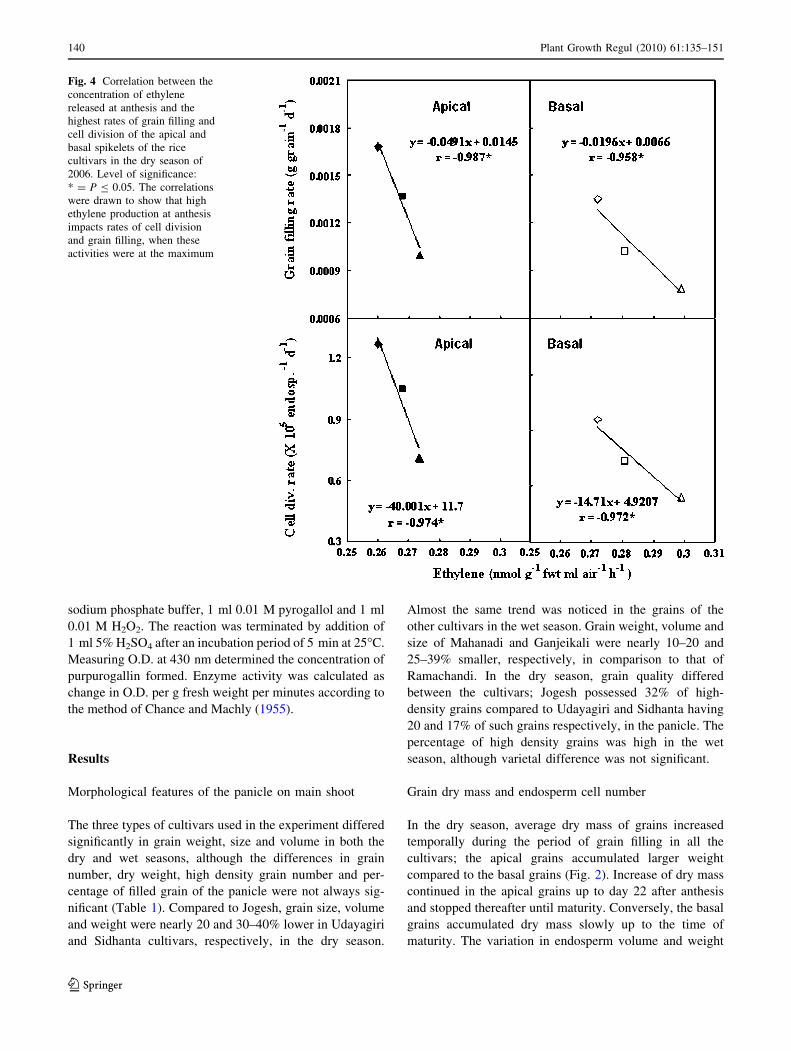
Fig. 4 Correlation between the
concentration of ethylene
released at anthesis and the
highest rates of grain filling and
cell division of the apical and
basal spikelets of the rice
cultivars in the dry season of
2006. Level of significance:
* = P B 0.05. The correlations
were drawn to show that high
ethylene production at anthesis
impacts rates of cell division
and grain filling, when these
activities were at the maximum
140 Plant Growth Regul (2010) 61:135–151
123
(Fig. 3) matched the variation in weights of grains among
different cultivars. The endosperm cell number also dif-
fered according to the location of spikelets on the panicle
axis and the variation of cultivars; the larger seeds pos-
sessed more weight and cell number (Fig. 2). In the apical
spikelet, endosperm cell number increased rapidly with
passage of time during the first 10 days after anthesis and
the rate declined thereafter; there was no increase in cell
number during the last 6 days of observation. In contrast,
cell number continued to increase with passage of time in
the basal endosperm until day 19 after anthesis, although
the change in cell number during the last 6 days was much
slower compared to the first 6 days of observation. Endo-
sperm volume and weight were larger in the apical spikelet
compared to the basal spikelet on day 7 after anthesis
(Fig. 3). The difference was maintained on subsequent
days of sampling although the rate of growth did not differ
much between the apical and basal spikelets. During the
period of observation, weight of the endosperm increased
more than two times in both the spikelets, although growth
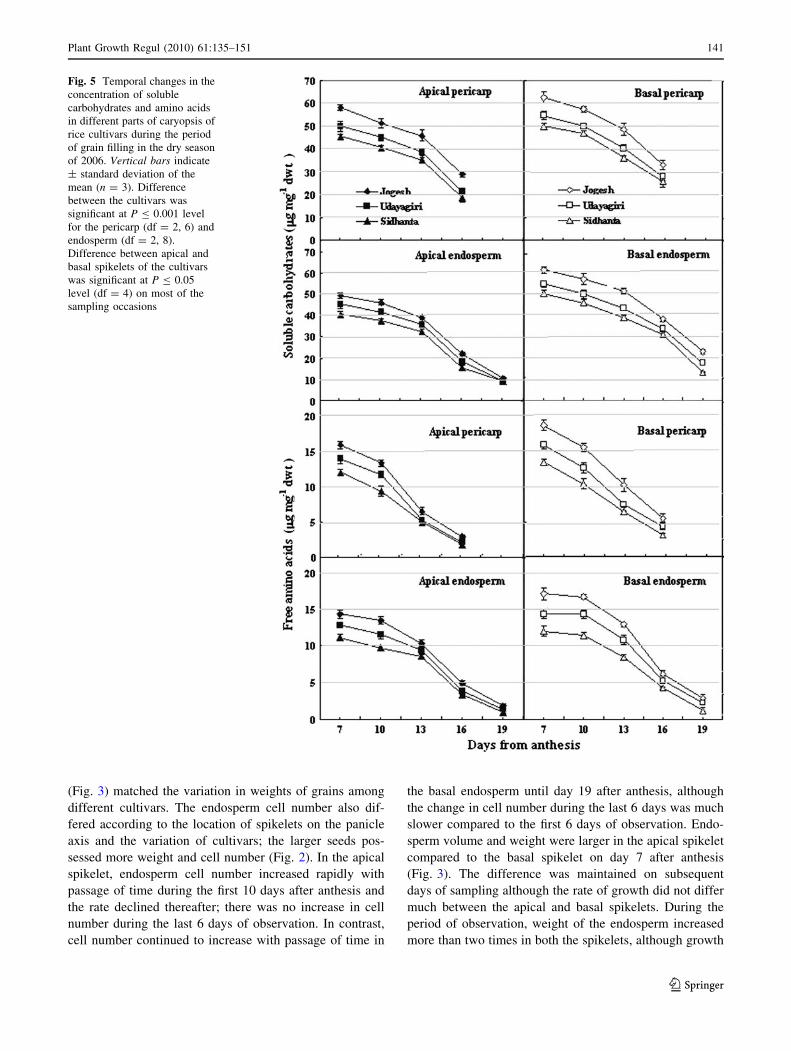
Fig. 5 Temporal changes in the
concentration of soluble
carbohydrates and amino acids
in different parts of caryopsis of
rice cultivars during the period
of grain filling in the dry season
of 2006. Vertical bars indicate
± standard deviation of the
mean (n = 3). Difference
between the cultivars was
significant at P B 0.001 level
for the pericarp (df = 2, 6) and
endosperm (df = 2, 8).
Difference between apical and
basal spikelets of the cultivars
was significant at P B 0.05
level (df = 4) on most of the
sampling occasions
Plant Growth Regul (2010) 61:135–151 141
123

in volume did not increase as high. Compared to cell
number or dry matter accumulation, growth in endosperm
volume was not as prominent; it increased marginally
during the period of observation. The pattern of dry matter
accumulation and cell number of the three contrasting
cultivars in the wet season was similar to that of dry sea-
son. Correlations between ethylene released from spikelets
at anthesis with rates of grain filling and cell division of the
endosperm of apical and basal spikelets at early post
anthesis stage, were negative and significant (P B 0.05) in
the dry season of 2006 (Fig. 4).
Assimilates and starch concentrations of the pericarp
and endosperm
The concentrations of soluble carbohydrates of the pericarp
and endosperm decreased with the passage of time in all
three cultivars during the period of observation between
days 7 and 19 after anthesis in the dry season (Fig. 5). The
concentration was high in Jogesh and low in Sidhanta, and
it remained intermediate between the two for Udayagiri. A
trend similar to this was observed for the temporal fluctu-
ation of amino acid concentration of the pericarp and
endosperm of the cultivars used. The concentration of both
soluble carbohydrates and amino acids of the cultivars
were higher in the basal spikelet compared to apical
spikelet on most of the sampling occasions. The basal
spikelets retained high assimilate concentration for a longer
time compared to the apical spikelets. In contrast to
assimilates, the concentration of starch increased tempo-
rally in all three cultivars (Fig. 6). The rate of increase was
fastest in Jogesh and slowest in Sidhanta. Starch concen-
tration increased faster in the apical spikelets in compari-
son to the basal spikelet. Temporal and spatial variation in
the concentration of assimilates and starch between the
three different types of cultivars grown in the wet season
was similar to that of the dry season.
Protein and chlorophyll concentration of the pericarp
and endosperm
The total protein and chlorophyll concentration of the
pericarp and endosperm of the apical and basal caryopses
increased mostly between days 7 and 13 after anthesis and
declined thereafter in all cultivars (Fig. 7). On all sampling
occasions, the big-seeded cultivars contained a higher
Fig. 6 Temporal changes in the
concentration of starch in
different parts of caryopsis of
rice cultivars during the period
of grain filling in the dry season
of 2006. Vertical bars indicate
± standard deviation of the
mean (n = 3). Difference
between the cultivars was
significant at P B 0.001 level
for the pericarp (df = 2, 6) and
endosperm (df = 2, 8).
Difference between apical and
basal spikelets of the cultivars
was significant at P B 0.01
level (df = 4) on most of the
sampling occasions
142 Plant Growth Regul (2010) 61:135–151
123
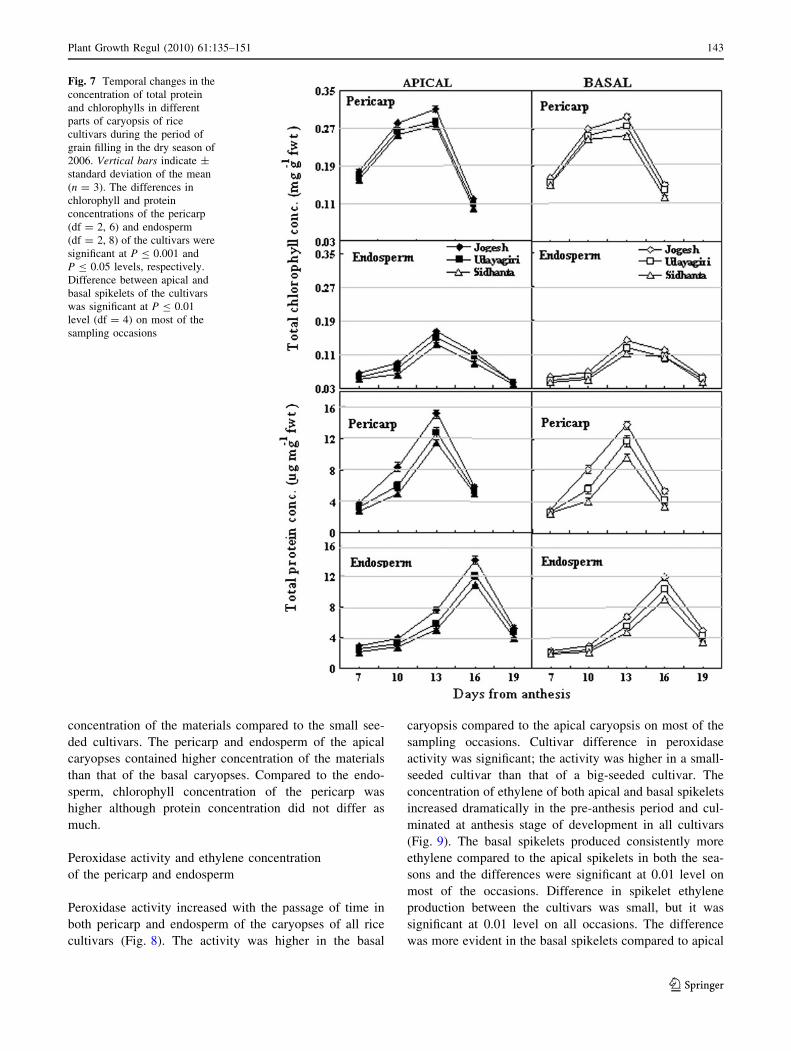
concentration of the materials compared to the small see-
ded cultivars. The pericarp and endosperm of the apical
caryopses contained higher concentration of the materials
than that of the basal caryopses. Compared to the endo-
sperm, chlorophyll concentration of the pericarp was
higher although protein concentration did not differ as
much.
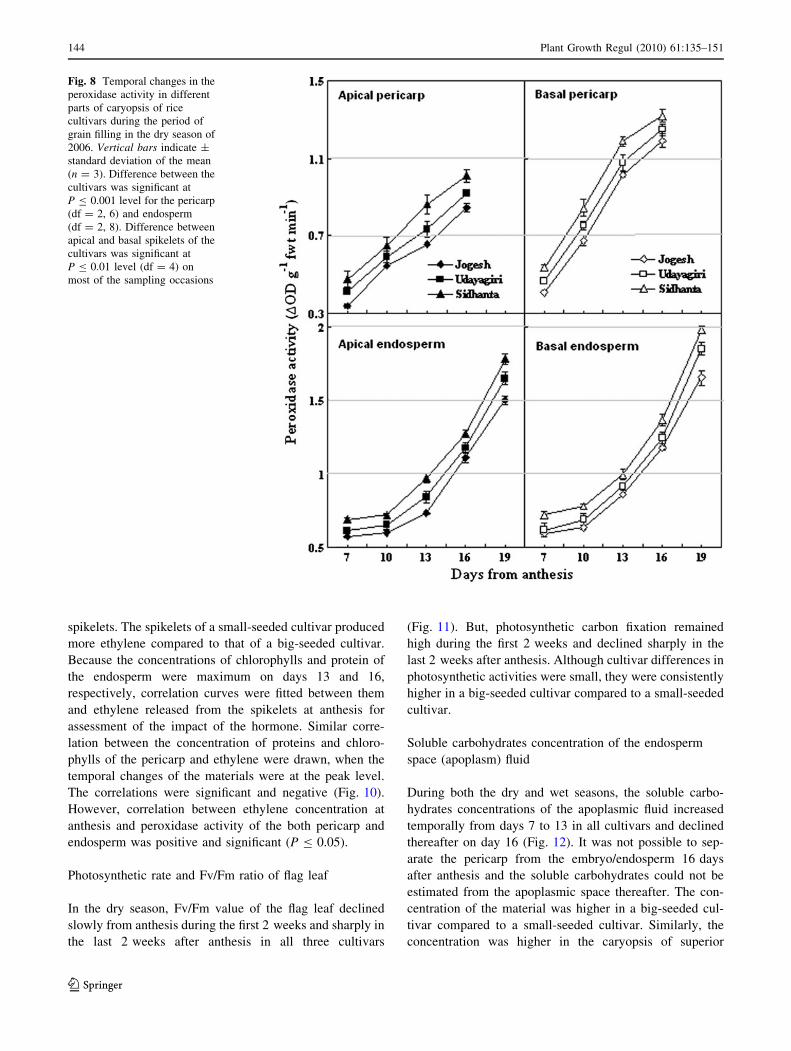
Peroxidase activity and ethylene concentration
of the pericarp and endosperm
Peroxidase activity increased with the passage of time in
both pericarp and endosperm of the caryopses of all rice
cultivars (Fig. 8). The activity was higher in the basal
caryopsis compared to the apical caryopsis on most of the
sampling occasions. Cultivar difference in peroxidase
activity was significant; the activity was higher in a small-
seeded cultivar than that of a big-seeded cultivar. The
concentration of ethylene of both apical and basal spikelets
increased dramatically in the pre-anthesis period and cul-
minated at anthesis stage of development in all cultivars
(Fig. 9). The basal spikelets produced consistently more
ethylene compared to the apical spikelets in both the sea-
sons and the differences were significant at 0.01 level on
most of the occasions. Difference in spikelet ethylene
production between the cultivars was small, but it was
significant at 0.01 level on all occasions. The difference
was more evident in the basal spikelets compared to apical
Fig. 7 Temporal changes in the
concentration of total protein
and chlorophylls in different
parts of caryopsis of rice
cultivars during the period of
grain filling in the dry season of
2006. Vertical bars indicate ±
standard deviation of the mean
(n = 3). The differences in
chlorophyll and protein
concentrations of the pericarp
(df = 2, 6) and endosperm
(df = 2, 8) of the cultivars were
significant at P B 0.001 and
P B 0.05 levels, respectively.
Difference between apical and
basal spikelets of the cultivars
was significant at P B 0.01
level (df = 4) on most of the
sampling occasions
Plant Growth Regul (2010) 61:135–151 143
123
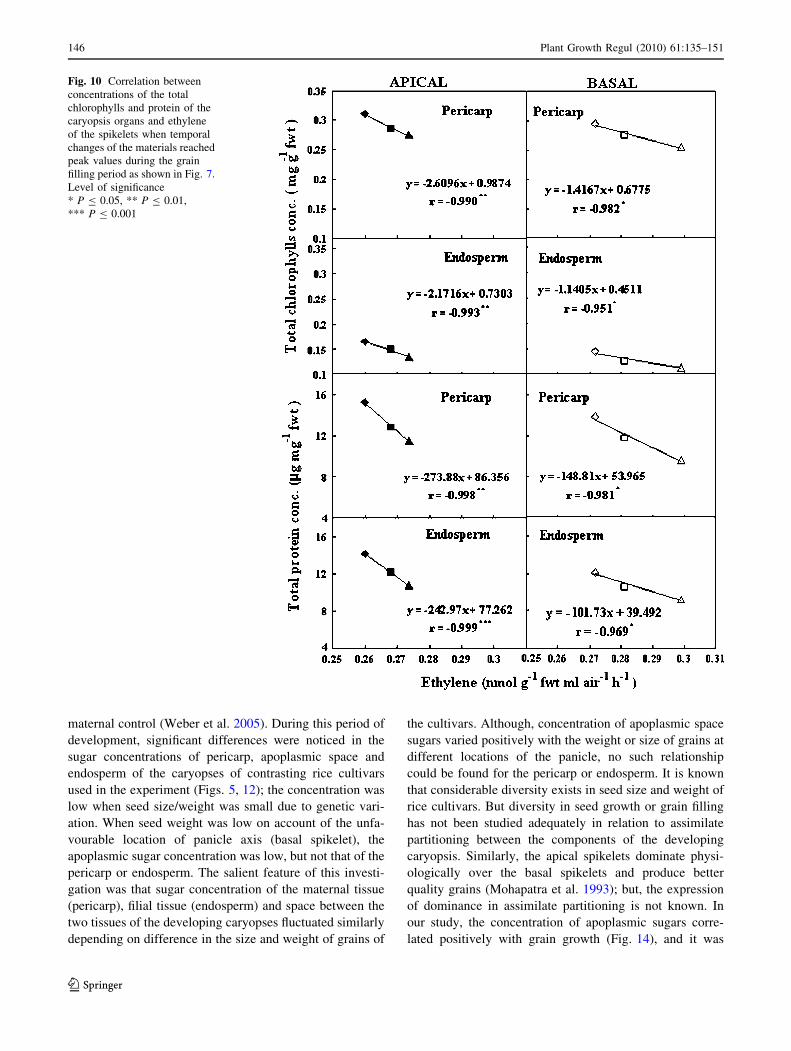
spikelets. The spikelets of a small-seeded cultivar produced
more ethylene compared to that of a big-seeded cultivar.
Because the concentrations of chlorophylls and protein of
the endosperm were maximum on days 13 and 16,
respectively, correlation curves were fitted between them
and ethylene released from the spikelets at anthesis for
assessment of the impact of the hormone. Similar corre-
lation between the concentration of proteins and chloro-
phylls of the pericarp and ethylene were drawn, when the
temporal changes of the materials were at the peak level.
The correlations were significant and negative (Fig. 10).
However, correlation between ethylene concentration at
anthesis and peroxidase activity of the both pericarp and
endosperm was positive and significant (P B 0.05).
Photosynthetic rate and Fv/Fm ratio of flag leaf
In the dry season, Fv/Fm value of the flag leaf declined
slowly from anthesis during the first 2 weeks and sharply in
the last 2 weeks after anthesis in all three cultivars
(Fig. 11). But, photosynthetic carbon fixation remained
high during the first 2 weeks and declined sharply in the
last 2 weeks after anthesis. Although cultivar differences in
photosynthetic activities were small, they were consistently
higher in a big-seeded cultivar compared to a small-seeded
cultivar.
Soluble carbohydrates concentration of the endosperm
space (apoplasm) fluid
During both the dry and wet seasons, the soluble carbo-
hydrates concentrations of the apoplasmic fluid increased
temporally from days 7 to 13 in all cultivars and declined
thereafter on day 16 (Fig. 12). It was not possible to sep-
arate the pericarp from the embryo/endosperm 16 days
after anthesis and the soluble carbohydrates could not be
estimated from the apoplasmic space thereafter. The con-
centration of the material was higher in a big-seeded cul-
tivar compared to a small-seeded cultivar. Similarly, the
concentration was higher in the caryopsis of superior
Fig. 8 Temporal changes in the
peroxidase activity in different
parts of caryopsis of rice
cultivars during the period of
grain filling in the dry season of
2006. Vertical bars indicate ±
standard deviation of the mean
(n = 3). Difference between the
cultivars was significant at
P B 0.001 level for the pericarp
(df = 2, 6) and endosperm
(df = 2, 8). Difference between
apical and basal spikelets of the
cultivars was significant at
P B 0.01 level (df = 4) on
most of the sampling occasions
144 Plant Growth Regul (2010) 61:135–151
123

spikelets compared to that of the inferior spikelets of dif-
ferent rice cultivars.
Correlation of apoplasmic soluble carbohydrates
with grain weight, cell number of endosperm
and soluble assimilates and starch concentration
of endosperm and pericarp
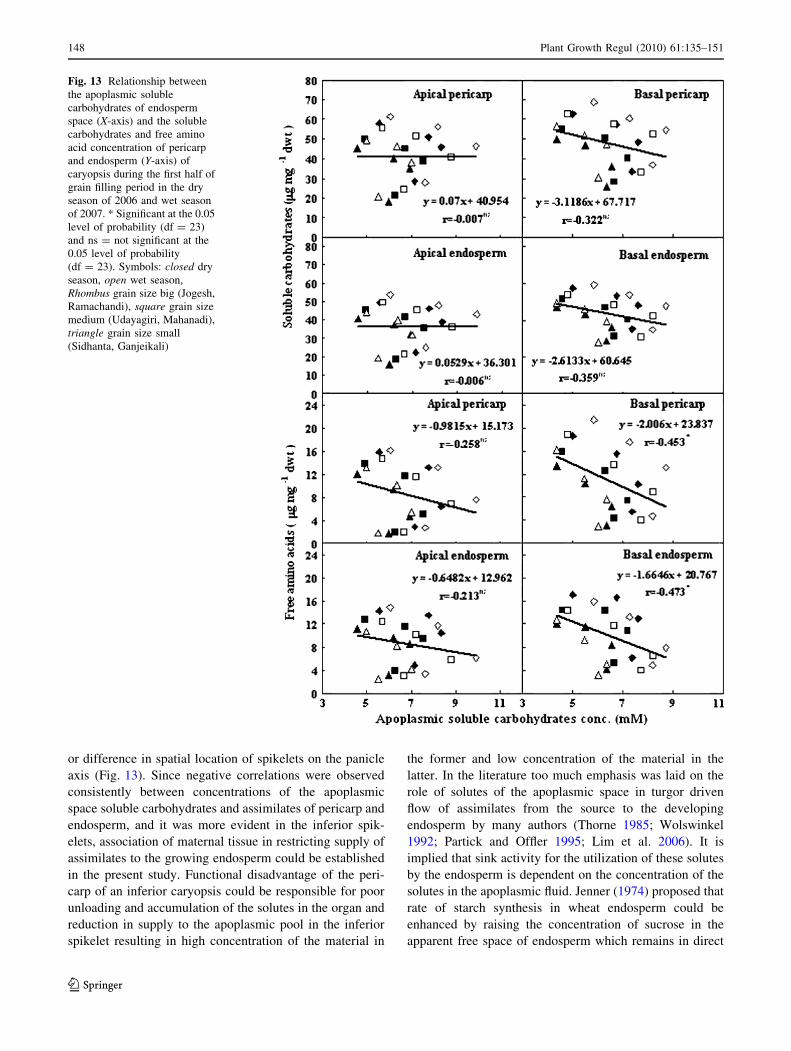
The soluble carbohydrates concentration of apoplasmic
space fluid correlated negatively with that of the soluble
carbohydrates and amino acids of pericarp and endosperm
of the caryopsis on apical and basal spikelets, when con-
centration of the materials was studied during the first half
of grain filling period in the three different types of rice
cultivars in both dry and wet seasons (Fig. 13). The neg-
ative correlation was more evident in the basal spikelets of
the cultivars than that of the apical spikelets. However, the
concentration of embryonic space soluble carbohydrates
exhibited significant positive correlation with the starch
concentration of caryopsis components, grain weight and
endosperm cell number of the rice cultivars (Fig. 14).
Discussion
Seed development in a plant is genetically programmed.
The whole process of development is prone to the control
of metabolites, which are provided to the filial tissue by the
maternal organs. It is proposed that the early phase of
embryo growth is maternally controlled, but a switchover
to filial control is necessary for growth during maturation
phase (Weber et al. 2005). Sugar and phytohormone
response pathways navigate responses at the level of
transcription and protein phosphorylation for change over
in the control system (Gibson 2004). In our study, seed
development was followed in rice cultivars belonging to
identical duration groups both in the wet and dry seasons.
The grains of the cultivars differed in size and weight.
Besides, weight, size and volume of grains of the cultivars
also varied with difference in positions on the panicle from
early embryonic stage to the maturation phase (Table 1;
Figs. 2, 3). However, the impact of metabolites and hor-
mone on development were only studied during the
embryonic phase, when seed development was fully under
Fig. 9 Concentrations of
ethylene in apical and basal
spikelets of the rice cultivars
during the period of grain
development in dry season of
2006 and wet season of 2007.
Vertical bars indicate ±
standard deviation of the mean
(n = 3). Cultivar difference in
ethylene concentration of the
spikelets was significant at
P B 0.01 level (df = 10). The
difference in ethylene
concentration of the apical and
basal spikelets of the cultivars
was significant at P B 0.01
level on most of the sampling
occasions
Plant Growth Regul (2010) 61:135–151 145
123
maternal control (Weber et al. 2005). During this period of
development, significant differences were noticed in the
sugar concentrations of pericarp, apoplasmic space and
endosperm of the caryopses of contrasting rice cultivars
used in the experiment (Figs. 5, 12); the concentration was
low when seed size/weight was small due to genetic vari-
ation. When seed weight was low on account of the unfa-
vourable location of panicle axis (basal spikelet), the
apoplasmic sugar concentration was low, but not that of the
pericarp or endosperm. The salient feature of this investi-
gation was that sugar concentration of the maternal tissue
(pericarp), filial tissue (endosperm) and space between the
two tissues of the developing caryopses fluctuated similarly
depending on difference in the size and weight of grains of
the cultivars. Although, concentration of apoplasmic space
sugars varied positively with the weight or size of grains at
different locations of the panicle, no such relationship
could be found for the pericarp or endosperm. It is known
that considerable diversity exists in seed size and weight of
rice cultivars. But diversity in seed growth or grain filling
has not been studied adequately in relation to assimilate
partitioning between the components of the developing
caryopsis. Similarly, the apical spikelets dominate physi-
ologically over the basal spikelets and produce better
quality grains (Mohapatra et al. 1993); but, the expression
of dominance in assimilate partitioning is not known. In
our study, the concentration of apoplasmic sugars corre-
lated positively with grain growth (Fig. 14), and it was
Fig. 10 Correlation between
concentrations of the total
chlorophylls and protein of the
caryopsis organs and ethylene
of the spikelets when temporal
changes of the materials reached
peak values during the grain
filling period as shown in Fig. 7.
Level of significance
* P B 0.05, ** P B 0.01,
*** P B 0.001
146 Plant Growth Regul (2010) 61:135–151
123

proved that irrespective of either the genetic or spatial
variation, final seed weight is dependent on assimilates
provided to it by the maternal tissue during the early part of
endosperm development. The developing endosperm
remains confined within the embryonic space (apoplasmic
space; Oparka and Gates 1981a, b; Thorne 1985; Weber
et al. 2005) and does not have any alternate source of
supply for assimilates. Endosperm cell number increases
rapidly during this period and positional disadvantage on
panicle axis restricting cell multiplication limits seed filling
and weight in an inferior caryopsis (Patel and Mohapatra
1996). The low sink efficiency of such caryopses might
have resulted in accumulation of the unused assimilates in
the pericarp and endosperm (Fig. 5). Additionally, the
premature termination of growth might have paved entry of
water into the hull space at the cost of carbon assimilates,
decreasing grain quality at maturity (Mohapatra et al.
1993). Similarly, low sink efficiency owing to poor endo-
sperm cell division rate in small-seeded cultivars (Fig. 2)
could be responsible for the restricted starch synthesis
(Fig. 6). In the present study, both photosynthetic rate and
efficiency of the flag leaf differed significantly between the
cultivars; they were consistently higher in the heavy-see-
ded cultivars compared to the relatively small-seeded cul-
tivars (Fig. 11). High source activity might have sustained
greater concentration of assimilates in different parts of the
caryopses of the former compared to the latter. Hence,
contribution of source activity as a factor for larger grain
size or weight could be significant as well.
A holistic approach was lacking in the literature for
studying the role of pericarp, apoplasmic space solutes and
endosperm in the seed filling of rice hitherto, and our work
proposed a new insight by revealing their contributions to
the process in consortium. The assimilate concentration of
pericarp, apoplasmic space and endosperm of the caryopses
was higher in a heavy-weight seed compared to a low-
weight seed; but, there was no significant correlation
between the concentration of the materials of one organ
with that of the other irrespective of either genetic variation
Fig. 11 Temporal changes in
the Fv/Fm value of the PS II
system and photosynthetic rate
of the flag leaf during the period
of grain filling of rice cultivars
in the dry season of 2006. The
observations taken for the
cultivars differed significantly at
P B 0.001 level (df = 2, 8)
Fig. 12 Temporal changes in concentration of apoplasmic soluble
carbohydrates in the endosperm space of caryposis of rice cultivars
during the period of grain filling in the dry season of 2006 and wet
season of 2007. aa similar letters indicate no significant difference
between apical and basal spikelet, ab dissimilar letters indicate
significant difference between apical and basal spikelet, pqr letters
indicate significant difference between apical spiklets and xyz letters
indicate significant difference between basal spikelets of three
contrasting rice cultivars
Plant Growth Regul (2010) 61:135–151 147
123
or difference in spatial location of spikelets on the panicle
axis (Fig. 13). Since negative correlations were observed
consistently between concentrations of the apoplasmic
space soluble carbohydrates and assimilates of pericarp and
endosperm, and it was more evident in the inferior spik-
elets, association of maternal tissue in restricting supply of
assimilates to the growing endosperm could be established
in the present study. Functional disadvantage of the peri-
carp of an inferior caryopsis could be responsible for poor
unloading and accumulation of the solutes in the organ and
reduction in supply to the apoplasmic pool in the inferior
spikelet resulting in high concentration of the material in
the former and low concentration of the material in the
latter. In the literature too much emphasis was laid on the
role of solutes of the apoplasmic space in turgor driven
flow of assimilates from the source to the developing
endosperm by many authors (Thorne 1985; Wolswinkel
1992; Partick and Offler 1995; Lim et al. 2006). It is
implied that sink activity for the utilization of these solutes
by the endosperm is dependent on the concentration of the
solutes in the apoplasmic fluid. Jenner (1974) proposed that
rate of starch synthesis in wheat endosperm could be
enhanced by raising the concentration of sucrose in the
apparent free space of endosperm which remains in direct
Fig. 13 Relationship between
the apoplasmic soluble
carbohydrates of endosperm
space (X-axis) and the soluble
carbohydrates and free amino
acid concentration of pericarp
and endosperm (Y-axis) of
caryopsis during the first half of
grain filling period in the dry
season of 2006 and wet season
of 2007. * Significant at the 0.05
level of probability (df = 23)
and ns = not significant at the
0.05 level of probability
(df = 23). Symbols: closed dry
season, open wet season,
Rhombus grain size big (Jogesh,
Ramachandi), square grain size
medium (Udayagiri, Mahanadi),
triangle grain size small
(Sidhanta, Ganjeikali)
148 Plant Growth Regul (2010) 61:135–151
123
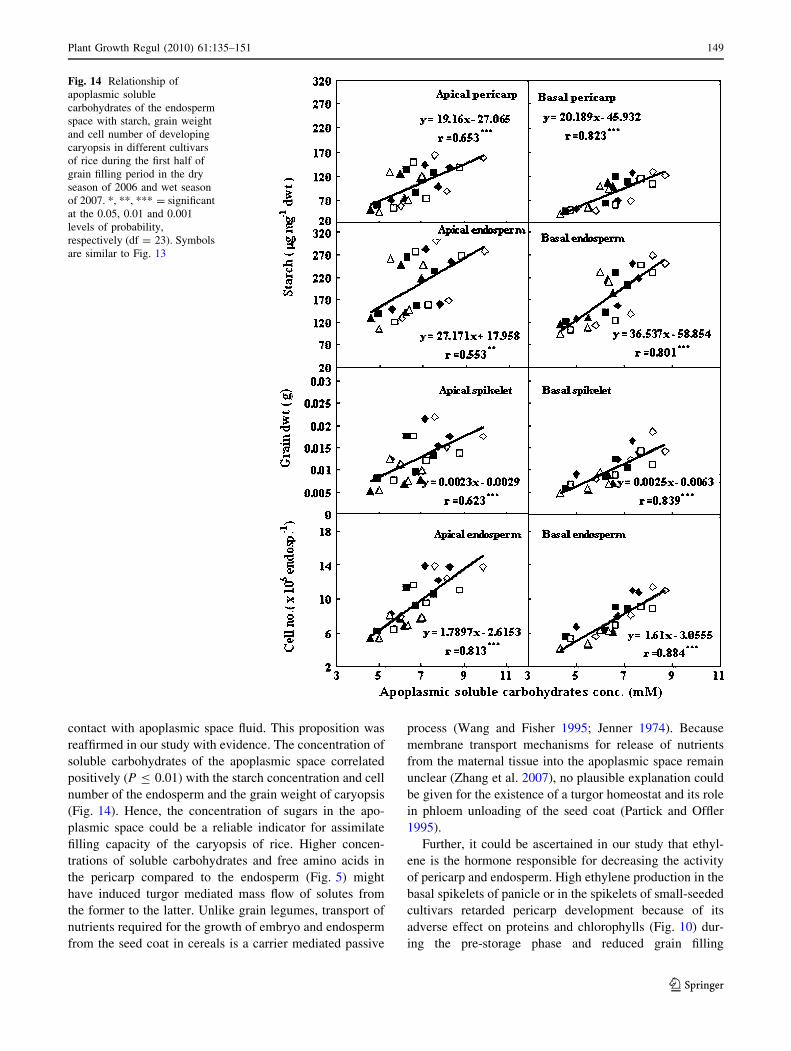
contact with apoplasmic space fluid. This proposition was
reaffirmed in our study with evidence. The concentration of
soluble carbohydrates of the apoplasmic space correlated
positively (P B 0.01) with the starch concentration and cell
number of the endosperm and the grain weight of caryopsis
(Fig. 14). Hence, the concentration of sugars in the apo-
plasmic space could be a reliable indicator for assimilate
filling capacity of the caryopsis of rice. Higher concen-
trations of soluble carbohydrates and free amino acids in
the pericarp compared to the endosperm (Fig. 5) might
have induced turgor mediated mass flow of solutes from
the former to the latter. Unlike grain legumes, transport of
nutrients required for the growth of embryo and endosperm
from the seed coat in cereals is a carrier mediated passive
process (Wang and Fisher 1995; Jenner 1974). Because
membrane transport mechanisms for release of nutrients
from the maternal tissue into the apoplasmic space remain
unclear (Zhang et al. 2007), no plausible explanation could
be given for the existence of a turgor homeostat and its role
in phloem unloading of the seed coat (Partick and Offler
1995).
Further, it could be ascertained in our study that ethyl-
ene is the hormone responsible for decreasing the activity
of pericarp and endosperm. High ethylene production in the
basal spikelets of panicle or in the spikelets of small-seeded
cultivars retarded pericarp development because of its
adverse effect on proteins and chlorophylls (Fig. 10) dur-
ing the pre-storage phase and reduced grain filling
Fig. 14 Relationship of
apoplasmic soluble
carbohydrates of the endosperm
space with starch, grain weight
and cell number of developing
caryopsis in different cultivars
of rice during the first half of
grain filling period in the dry
season of 2006 and wet season
of 2007. *, **, *** = significant
at the 0.05, 0.01 and 0.001
levels of probability,
respectively (df = 23). Symbols
are similar to Fig. 13
Plant Growth Regul (2010) 61:135–151 149
123

(Mohapatra and Mohapatra 2006). The concentration of
ethylene produced by the spikelets at anthesis correlated
positively (P B 0.05) with peroxidase activity and nega-
tively with photosynthetic pigments, and protein concen-
trations of the pericarp and endosperm (Fig. 10), and grain
filling rate and endosperm cell division rate (Fig. 4) of the
spikelets in our study. It is possible that, ethylene-induced
senescence of the pericarp and endosperm might be
responsible for depleted supply and the resultant low
concentration of assimilates in the apoplasmic space
(Fig. 12) and reduced sink activity (Fig. 2) of the caryopsis
of the basal spikelets or spikelets of small-seeded cultivars.
It is known that grain filling at the base of panicle decreases
because these spikelets produce more ethylene compared to
the apical spikelets (Mohapatra and Mohapatra 2005; Yang
et al. 2006) and the high concentration of ethylene impacts
activities of starch synthesizing enzymes (Mohapatra et al.
2009) resulting in restricted sink activity of the endosperm
for sugar consumption. In our study, unused assimilates
might have accumulated in the pericarp and endosperm of
the inferior basal spikelets because of poor sink activity of
the organs (Fig. 5). Hence unlike apoplasmic pool sugars,
the concentration of assimilate in these organs could not be
an indicator for sink strength of the rice grain. This infer-
ence is similar to the observation made on wheat grain
(Singh and Jenner 1982). In our study, the concentration of
soluble carbohydrates increased in the apoplasmic space
during the embryonic phase of grain development
(Fig. 12), when cell number increased rapidly in the
endosperm (Fig. 2). The soluble carbohydrates were rap-
idly converted to starch in the endosperm (Fig. 6), as long
as carrier mediated transport of sugars in the pericarp was
not affected by any external stimulus. Strong apical dom-
inance in the panicle grain filling (Xu and Vergara 1986;
Peng et al. 1994) resulted in faster grain filling of the
caryopses of apical spikelets, whereas ethylene induced
senescence of the organs (Fig. 10) limited sink activity
(Fig. 4) of the basal spikelets. Therefore, ethylene pro-
duction should be minimized for the sake of fast-syn-
chronized filling and higher yield potential of rice.
Ethylene has been identified as a promoter of senescence,
but its role as a signal determining progression of bud
development has been undermined so long (Dun et al.
2006). We need to know how this hormone cues hetero-
geneity of spikelet development in a strongly apical dom-
inant cultivar and its suppression increases proportion of
high density grains in agronomic fit cultivars. In our study,
genetic difference in seed size influenced concentration of
soluble carbohydrates of the apoplasmic space during seed
filling (Fig. 12); pericarp of a large-sized seed might have
unloaded more sugar into the apoplast than a small-sized
seed. It is also possible that high ethylene production of
spikelets in small-seeded cultivars might have affected
pericarp activity and impacted assimilate unloading into
the apoplasmic space to the detriment of grain filling.
Acknowledgments The authors thank University Grants Commis-
sion, New Delhi for support under DRS project and Council of Sci-
entific and Industrial Research, New Delhi for support under the
Emeritus Scientist project.
References
Arnon DI (1949) Copper enzymes in isolated chloroplasts. Polyphe-
nol oxidase in Beta vulgaris. Plant Physiol 29:1–15
Buysee J, Merck R (1993) An improved colorimetric method to
quantify sugar content of plant tissue. J Exp Bot 44:1627–1629
Chance B, Machly AC (1955) Assay of catalase and peroxidase.
Methods Enzymol 2:746–775
De Datta SK (1981) Principles and practices of rice production.
Wiley, New York
Dun EA, Ferguson BJ, Beveridge CA (2006) Apical dominance and
shoot branching. Divergent opinions or divergent mechanisms?
Plant Physiol 142:812–819
Gibson SI (2004) Sugar and phytohormone response pathway:
navigating a signal network. J Exp Bot 55:253–264
Gifford RM, Thorne JH (1985) Sucrose concentration at the
apoplastic interface between seed coat and cotyledons of
developing soybean seeds. Plant Physiol 77:863–868
Hoshikawa K (1984) Development of endosperm tissue with special
reference to the translocation of reserve substances in cereals.
Jpn J Crop Sci 53:153–162
Ishimaru T, Matsuda T, Ohsugi R, Yamagishi T (2003) Morpholog-
ical development of rice caryopses located at the different
positions in a panicle from early to middle stage of grain filling.
Funct Plant Biol 30:1139–1149
Jenner CF (1974) Factors in the grain regulating the accumulation of
starch. In: Bieleski RL, Ferguson AR, Cresswell MM (eds)
Mechanisms of regulation of plant growth. Bulletin 12, The
Royal Society of New Zealand, Wellington, pp 901–908
Liang J, Zhang J, Cao X (2001) Grain sink strength may be related to
poor grain filling of indica-japonica rice (Oryza sativa) hybrids.
Physiol Plant 112:470–477
Lim JD, Cho JI, Park YI, Hahn TR, Choi SB, Jeon JS (2006) Sucrose
transport from source to sink seeds in rice. Physiol Plant
126:572–584
Lowry OH, Rosebrough NJ, Farr AL, Randall RI (1951) Protein
measurement with Folin-phenol reagent. J Biol Chem 193:265–
275
Matsuo T, Hoshikawa K (1993) Science of the rice plant, vol 1.
Morphology, Japanese Ministry of Agriculture, Forestry and
Fisheries, Tokyo
Mohapatra PK, Mohapatra R (2005) Sink source relationship and
yield potential of rice: the effect of ethylene on grain filling of
late flowering spikelets. In: Toriyama K, Heong KL, Hardy B
(eds) Rice is life: scientific perspectives for the 21st century.
International Rice Research Institute, Philippines, pp 120–123
Mohapatra R, Mohapatra PK (2006) Ethylene control of seed coat
development in low and high sterile semidwarf indica rice
cultivars. Plant Growth Regul 50:47–55
Mohapatra PK, Patel R, Sahu SK (1993) Time of flowering affects
grain quality and spikelet partitioning within the rice panicle.
Aust J Plant Physiol 20:231–241
Mohapatra PK, Naik PK, Patel R (2000) Ethylene inhibitors improve
dry matter partitioning and development of late flowering
spikelets on rice panicle. Aust J Plant Physiol 27:311–323
150 Plant Growth Regul (2010) 61:135–151
123
Mohapatra PK, Sarkar RK, Kuanar SR (2009) Starch synthesizing
enzymes and sink strength of grains of contrasting rice cultivars.
Plant Sci 176:256–263
Naik PK, Mohapatra PK (2000) Ethylene inhibitors enhanced sucrose
synthase activity and promoted grain filling of basal rice kernels.
Aust J Plant Physiol 27:997–1008
Olsen QA, Linnstead C, Nichols SE (1999) Developmental biology of
the cereal endosperm. Trends Plant Sci 4:253–257
Oparka KJ, Gates P (1981a) Transport of assimilates in the
developing caryopsis of rice (Oryza sativa).Ultra-structure of
the pericarp vascular bundle and its connections with aleurone
layer. Planta 151:561–573
Opraka KJ, Gates P (1981b) Transport of assimilates in the
developing caryopsis of rice (Oryza sativa).The pathway of
water and assimilated carbon. Planta 152:388–396
Partick JW, Offler CE (1995) Post sieve element transport of sucrose
in developing seeds. Aust J Plant Physiol 22:681–702
Patel R, Mohapatra PK (1996) Assimilate partitioning within floret
components of contrasting rice spikelets producing qualitatively
different types of grains. Aust J Plant Physiol 23:85–92
Peng S, Khush GS, Cassman KG (1994) Evolution of the new plant
ideotype for increased yield potential. In: Cassman KG (ed)
Breaking the yield barrier. Proceedings of a workshop on rice
yield potential in favourable environments. International Rice
Research Institute, Philippines, pp 5–20
Sikder HP, Das Gupta DK (1976) Physiology of grain filling in rice
IV. Role of panicle morphology. Indian Agric 20:143–151
Singh BK, Jenner CF (1982) Association between concentrations of
organic nutrients in the grain, endosperm cell number and grain
dry weight within ear of wheat. Aust J Plant Physiol 9:83–95
Taiz L, Zeiger E (2002) Plant physiology, 3rd edn. Sianuer Associates
Inc. Publishers, Sunderland, USA
Thorne JH (1985) Phloem unloading of C and N assimilates in
developing seeds. Ann Rev Plant Physiol 36:317–343
Venkateswarlu B, Vergara BS, Parao FT, Visperas RM (1986a)
Enhancing grain yield potential by increasing number of high
density grains. Philipp J Crop Sci 11:145–152
Venkateswarlu B, Parao FT, Visperas RM, Vergara BS (1986b)
Screening quality grains of rice with a seed blower. Sabrao J
18:19–24
Wang N, Fisher DB (1994) Monitoring phloem unloading and post-
phloem transport by micro-perfusion of attached wheat grains.
Plant Physiol 104:7–17
Wang N, Fisher DB (1995) Sucrose release into the endosperm cavity
of wheat grains apparently occurs by facilitated diffusion across
nucellar membranes. Plant Physiol 109:579–585
Weber H, Borisjuk L, Wobus U (1997) Sugar import and metabolism
during seed development. Trends Plant Sci 2:169–174
Weber H, Borisjuk L, Wobus U (2005) Molecular physiology of
legume seed development. Ann Rev Plant Biol 56:253–279
Wolswinkel P (1992) Transport of nutrients into developing seeds: a
review of physiological mechanisms. Seed Sci Res 2:59–73
Xu X, Vergara BS (1986) Morphological changes in rice panicle
development. A review of literature. IRRI research paper series
no. 117. International Rice Research Institute, Los Banos,
Philippines
Yang J, Zhang J, Wang Z, Liu K, Wang P (2006) Post anthesis
development of inferior and superior spikelets in rice in relation
to abscisic acid and ethylene. J Exp Bot 57:149–160
Yemm EW, Cocking EC (1955) The determination of amino acids
with ninhydrin. Analyst 80:209–212
Yin X, Goudriaan J, Lantinga EA, Vos J, Spiertz HJ (2003) A flexible
sigmoid function of determinate growth. Ann Bot 91:361–371
Yoshida S (1972) Physiological aspects of grain yield. Ann Rev Plant
Physiol 23:437–464
Yoshida S (1981) Fundamentals of rice crop science. International
Rice Research Institute, Los Banos, Philippines
Zhang W-H, Zhaou Y, Dibley KE, Tyerman SD, Furbank RT, Patrick
JW (2007) Nutrient loading of developing seeds. Funct Plant
Biol 34:314–333
Plant Growth Regul (2010) 61:135–151 151
123