Antisaccade performance in biological relatives of schizophrenia patients: a meta-analysis
13
Antisaccade performance in biological relatives of schizophrenia patients: a meta-analysis Deborah L. Levy a, * , Gillian O’Driscoll b , Steven Matthysse a , Samantha R. Cook c , Philip S. Holzman a , Nancy R. Mendell d a Psychology Research Laboratory, McLean Hospital, 115 Mill Street, Belmont, MA 02478, USA b Department of Psychology and Douglas Hospital Research Center, McGill University, Montreal, Quebec, Canada c Department of Statistics, Harvard University, Cambridge, MA 02138, USA d Department of Applied Mathematics and Statistics, State University of New York at Stony Brook, Stony Brook, NY 11794, USA Received 4 September 2003; accepted 12 November 2003 Available online 22 January 2004 Abstract Poor performance on the antisaccade (AS) task has been interpreted as a potential indicator of genetic liability that may enhance the power of linkage studies of a multidimensional phenotype for schizophrenia. Every study has replicated the finding of significantly worse performance in schizophrenia patients regardless of which specific antisaccade paradigm was employed. In some studies involving a standard version of the antisaccade task, relatives of schizophrenia patients made an increased number of errors, but in other studies that used this same paradigm, relatives of schizophrenia patients did not differ from controls. In this paper, we report the results of a meta-analysis on studies that used the standard antisaccade paradigm. The meta-analysis shows that those studies that reported large effect sizes and statistically significant differences between relatives of schizophrenia patients and controls used inclusion/exclusion criteria that were not symmetrical between the two groups, whereas those studies that reported small and nonsignificant differences between relatives of schizophrenia patients and controls used symmetrical inclusion/exclusion criteria. Specifically, studies that applied stricter psychopathology exclusion criteria to controls than to relatives of schizophrenia patients had larger effect sizes than studies that applied comparable exclusion criteria to both groups, suggesting that antisaccade performance is compromised by psychopathology in general rather than by schizophrenia per se. Since symmetrical inclusion/exclusion criteria between relatives of schizophrenia patients and controls are essential for a genetic analysis, and those studies that did apply symmetrical criteria had small effect sizes, the available data suggest that poor antisaccade performance is unlikely to be useful in identifying clinically unaffected carriers of genes for schizophrenia. D 2003 Elsevier B.V. All rights reserved. Keywords: Schizophrenia; Antisaccade performance; Meta-analysis 1. Introduction The risk for schizophrenia in first-degree biological relatives of schizophrenics (RSP) is only about 6.5% (Kendler et al., 1993), possibly too low to have 0920-9964/$ - see front matter D 2003 Elsevier B.V. All rights reserved. doi:10.1016/j.schres.2003.11.006 * Corresponding author. Tel.: +1-617-855-2854; fax: +1-617- 855-2778. E-mail address: [email protected] (D.L. Levy). www.elsevier.com/locate/schres Schizophrenia Research 71 (2004) 113– 125
-
Upload
independent -
Category
Documents
-
view
0 -
download
0
Transcript of Antisaccade performance in biological relatives of schizophrenia patients: a meta-analysis

www.elsevier.com/locate/schres
Schizophrenia Research 71 (2004) 113–125
Antisaccade performance in biological relatives of
schizophrenia patients: a meta-analysis
Deborah L. Levya,*, Gillian O’Driscollb, Steven Matthyssea, Samantha R. Cookc,Philip S. Holzmana, Nancy R. Mendelld
aPsychology Research Laboratory, McLean Hospital, 115 Mill Street, Belmont, MA 02478, USAbDepartment of Psychology and Douglas Hospital Research Center, McGill University, Montreal, Quebec, Canada
cDepartment of Statistics, Harvard University, Cambridge, MA 02138, USAdDepartment of Applied Mathematics and Statistics, State University of New York at Stony Brook, Stony Brook, NY 11794, USA
Received 4 September 2003; accepted 12 November 2003
Available online 22 January 2004
Abstract
Poor performance on the antisaccade (AS) task has been interpreted as a potential indicator of genetic liability that may
enhance the power of linkage studies of a multidimensional phenotype for schizophrenia. Every study has replicated the finding
of significantly worse performance in schizophrenia patients regardless of which specific antisaccade paradigm was employed.
In some studies involving a standard version of the antisaccade task, relatives of schizophrenia patients made an increased
number of errors, but in other studies that used this same paradigm, relatives of schizophrenia patients did not differ from
controls. In this paper, we report the results of a meta-analysis on studies that used the standard antisaccade paradigm. The
meta-analysis shows that those studies that reported large effect sizes and statistically significant differences between relatives
of schizophrenia patients and controls used inclusion/exclusion criteria that were not symmetrical between the two groups,
whereas those studies that reported small and nonsignificant differences between relatives of schizophrenia patients and controls
used symmetrical inclusion/exclusion criteria. Specifically, studies that applied stricter psychopathology exclusion criteria to
controls than to relatives of schizophrenia patients had larger effect sizes than studies that applied comparable exclusion criteria
to both groups, suggesting that antisaccade performance is compromised by psychopathology in general rather than by
schizophrenia per se. Since symmetrical inclusion/exclusion criteria between relatives of schizophrenia patients and controls are
essential for a genetic analysis, and those studies that did apply symmetrical criteria had small effect sizes, the available data
suggest that poor antisaccade performance is unlikely to be useful in identifying clinically unaffected carriers of genes for
schizophrenia.
D 2003 Elsevier B.V. All rights reserved.
Keywords: Schizophrenia; Antisaccade performance; Meta-analysis
0920-9964/$ - see front matter D 2003 Elsevier B.V. All rights reserved.
doi:10.1016/j.schres.2003.11.006
* Corresponding author. Tel.: +1-617-855-2854; fax: +1-617-
855-2778.
E-mail address: [email protected] (D.L. Levy).
1. Introduction
The risk for schizophrenia in first-degree biological
relatives of schizophrenics (RSP) is only about 6.5%
(Kendler et al., 1993), possibly too low to have
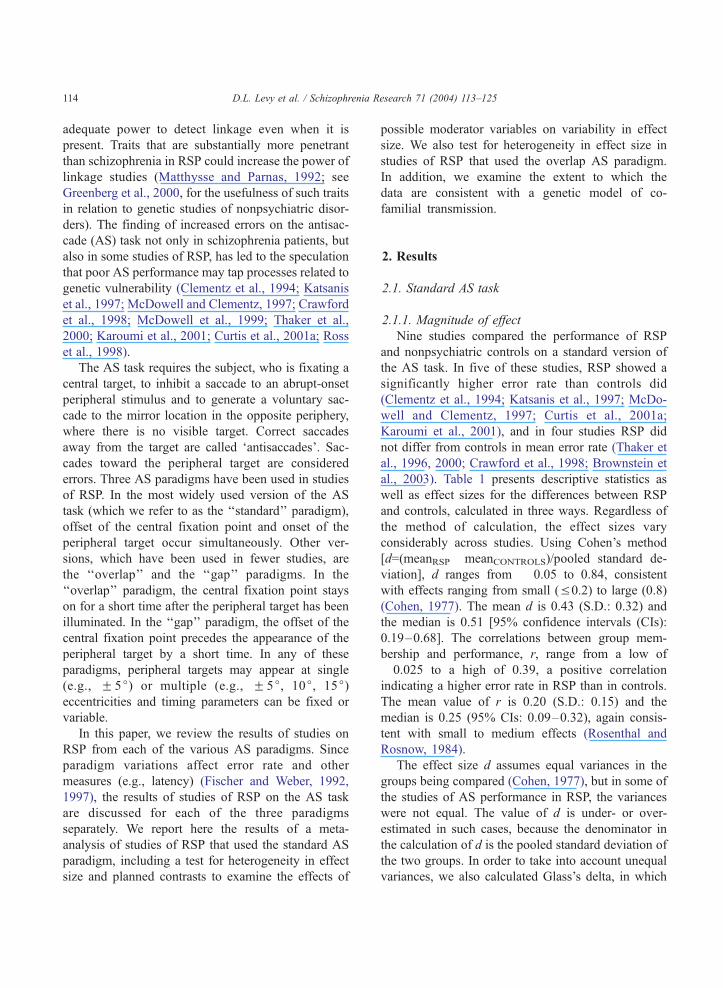
D.L. Levy et al. / Schizophrenia Research 71 (2004) 113–125114
adequate power to detect linkage even when it is
present. Traits that are substantially more penetrant
than schizophrenia in RSP could increase the power of
linkage studies (Matthysse and Parnas, 1992; see
Greenberg et al., 2000, for the usefulness of such traits
in relation to genetic studies of nonpsychiatric disor-
ders). The finding of increased errors on the antisac-
cade (AS) task not only in schizophrenia patients, but
also in some studies of RSP, has led to the speculation
that poor AS performance may tap processes related to
genetic vulnerability (Clementz et al., 1994; Katsanis
et al., 1997; McDowell and Clementz, 1997; Crawford
et al., 1998; McDowell et al., 1999; Thaker et al.,
2000; Karoumi et al., 2001; Curtis et al., 2001a; Ross
et al., 1998).
The AS task requires the subject, who is fixating a
central target, to inhibit a saccade to an abrupt-onset
peripheral stimulus and to generate a voluntary sac-
cade to the mirror location in the opposite periphery,
where there is no visible target. Correct saccades
away from the target are called ‘antisaccades’. Sac-
cades toward the peripheral target are considered
errors. Three AS paradigms have been used in studies
of RSP. In the most widely used version of the AS
task (which we refer to as the ‘‘standard’’ paradigm),
offset of the central fixation point and onset of the
peripheral target occur simultaneously. Other ver-
sions, which have been used in fewer studies, are
the ‘‘overlap’’ and the ‘‘gap’’ paradigms. In the
‘‘overlap’’ paradigm, the central fixation point stays
on for a short time after the peripheral target has been
illuminated. In the ‘‘gap’’ paradigm, the offset of the
central fixation point precedes the appearance of the
peripheral target by a short time. In any of these
paradigms, peripheral targets may appear at single
(e.g., F 5j) or multiple (e.g., F 5j, 10j, 15j)eccentricities and timing parameters can be fixed or
variable.
In this paper, we review the results of studies on
RSP from each of the various AS paradigms. Since
paradigm variations affect error rate and other
measures (e.g., latency) (Fischer and Weber, 1992,
1997), the results of studies of RSP on the AS task
are discussed for each of the three paradigms
separately. We report here the results of a meta-
analysis of studies of RSP that used the standard AS
paradigm, including a test for heterogeneity in effect
size and planned contrasts to examine the effects of
possible moderator variables on variability in effect
size. We also test for heterogeneity in effect size in
studies of RSP that used the overlap AS paradigm.
In addition, we examine the extent to which the
data are consistent with a genetic model of co-
familial transmission.
2. Results
2.1. Standard AS task
2.1.1. Magnitude of effect
Nine studies compared the performance of RSP
and nonpsychiatric controls on a standard version of
the AS task. In five of these studies, RSP showed a
significantly higher error rate than controls did
(Clementz et al., 1994; Katsanis et al., 1997; McDo-
well and Clementz, 1997; Curtis et al., 2001a;
Karoumi et al., 2001), and in four studies RSP did
not differ from controls in mean error rate (Thaker et
al., 1996, 2000; Crawford et al., 1998; Brownstein et
al., 2003). Table 1 presents descriptive statistics as
well as effect sizes for the differences between RSP
and controls, calculated in three ways. Regardless of
the method of calculation, the effect sizes vary
considerably across studies. Using Cohen’s method
[d=(meanRSP�meanCONTROLS)/pooled standard de-
viation], d ranges from � 0.05 to 0.84, consistent
with effects ranging from small (V 0.2) to large (0.8)
(Cohen, 1977). The mean d is 0.43 (S.D.: 0.32) and
the median is 0.51 [95% confidence intervals (CIs):
0.19–0.68]. The correlations between group mem-
bership and performance, r, range from a low of
� 0.025 to a high of 0.39, a positive correlation
indicating a higher error rate in RSP than in controls.
The mean value of r is 0.20 (S.D.: 0.15) and the
median is 0.25 (95% CIs: 0.09–0.32), again consis-
tent with small to medium effects (Rosenthal and
Rosnow, 1984).
The effect size d assumes equal variances in the
groups being compared (Cohen, 1977), but in some of
the studies of AS performance in RSP, the variances
were not equal. The value of d is under- or over-
estimated in such cases, because the denominator in
the calculation of d is the pooled standard deviation of
the two groups. In order to take into account unequal
variances, we also calculated Glass’s delta, in which

Table 1
Antisaccade studies (standard paradigm) of first-degree relatives of schizophrenia patients ordered by effect size (Cohen’s d)
Study First-degree relatives of
schizophrenia patients
Nonpsychiatric controls Effect size
N % Error Scorea N % Error Scorea Cohen’s d r Glass’ delta
Brownstein et al.
(2003)
98 23.2 (18.5) 24 24.2 (19.1) � 0.05 � 0.025 � 0.05
Thaker et al.
(1996)b26 26.7 (10.8) 68 24.3 (19.2) 0.14 0.07 0.13
Thaker et al.
(2000)b55 28.96 (23.2) 62 24.98 (18.7) 0.19 0.095 0.21
Crawford et al.
(1998)
50 33.0 (29.0) 38 27.0 (23.0) 0.23 0.114 0.26
Clementz et al.
(1994)
32 32.1 (23.2) 33 22.0 (15.9) 0.51 0.25 0.63
McDowell and
Clementz
(1997)
60 17.0 (21.0) 32 7.0 (16.0) 0.51 0.25 0.625
Curtis et al.
(2001a)
116 38.2 (22.3) 109 24.6 (17.0) 0.68 0.32 0.80
Karoumi et al.
(2001)
21 36.6 (24.1) 21 20.4 (13.6) 0.83 0.38 1.20
Katsanis et al.
(1997)
55 45.0c (26.2d) 38 25.0c (19.5d) 0.84 0.39 1.00
Mean (standard deviation).a Error rate was age-adjusted in some studies but not in others.b Regardless of the method of calculation, all of the effect sizes in the Thaker et al. (1996, 2000) studies become smaller when the controls
are restricted to community subjects without schizophrenia spectrum personality (SSP) traits. Thus, including all community subjects in the
control group in the effect sizes shown above did not mask a larger difference between RSP and controls.c Median; for estimating effect size, the median was considered equivalent to the mean.d Estimated based on interquartile range as follows: (3/4)(Q3�Q1), where Q3 and Q1 were the upper and lower ends of the interquartile
range, respectively.
D.L. Levy et al. / Schizophrenia Research 71 (2004) 113–125 115
the denominator is the standard deviation of the
control group (Glass, 1976; see Rosenthal, 1984).
As Table 1 shows, Glass’s delta tends to be larger
than d, especially in those studies in which RSP and
controls differed in variance. The mean Glass’ delta is
0.53 (S.D.: 0.42) and the median is 0.625 (95% CIs:
0.21–0.86).
One-sample t-tests on the values of Cohen’s d, r,
and Glass’ delta for the various studies indicated that
that each of the means differed significantly from 0
(Ps < 0.005). Although this result would seem to rule
out the possibility of no difference in AS performance
between RSP and controls, such an interpretation is
clouded not only because there is significant hetero-
geneity among the studies, but also because the
heterogeneity is traceable to a specific methodological
feature of the studies (see next two sections below).
Therefore, the mean effect sizes are not interpretable
as a population indicator, because the values differ
significantly among the studies depending on the
methods used and the overall mean of the group of
studies will depend on the number of studies using
each method.
2.1.2. Heterogeneity analysis
We evaluated whether the effect sizes could be
considered consistent with each other, or were con-
tradictory, by performing an analysis for heterogeneity
in effect size (Rosenthal and Rosnow, 1984). The
results showed evidence of significant heterogeneity
(X2 = 19.68, = 8, 0.01 <P < 0.02), indicating that the
effect sizes among the various studies are not consis-
tent with a single mean and thus were drawn from
more than one distribution. Having found significant

1 Although the overlap condition increased effect size relative
to the standard condition in one study (McDowell and Clementz,
1997) and reduced it in another (Curtis et al., 2001b), the results of
the two studies may, nevertheless, be consistent with each other. The
single eccentricity (F 10j) target used by Curtis et al. (2001b) is
comparable to the ‘‘near’’ target (F 8j) used by McDowell et al.
(1999). The results of both the McDowell et al. (1999) and Curtis et
al. (2001b) studies indicate that ‘‘near’’ overlap targets do not seem
to optimize differences between RSP and controls. Thus, the overlap
condition may not have produced a larger effect than the standard
condition in the Curtis et al. (2001b) study because a ‘‘far’’
peripheral target may be required to detect it, and that study used
only a ‘‘near’’ peripheral target. Averaging across near and far
targets in the McDowell and Clementz (1997) study may have
obscured the difference in effect size between the near and far
overlap targets that became apparent when the eccentricities were
evaluated separately in their 1999 study. This interpretation is
consistent with the finding that an overlap paradigm that used only a
‘‘near’’ target normalized errors in schizophrenia patients (Levy et
al., 1998).
D.L. Levy et al. / Schizophrenia R116
heterogeneity, we tried to identify possible sources of
this heterogeneity.
2.1.3. Sources of heterogeneity
Based on the published literature, we identified
several possible sources of heterogeneity: (1) wheth-
er symmetrical or asymmetrical diagnostic exclusion
criteria were applied to controls and RSP; (2)
whether relatively few or many AS trials were
administered (V 24 vs. >25, respectively); and (3)
whether the peripheral target appeared at one or
multiple eccentricities (1 vs. >1 eccentricity). Stud-
ies were classified as applying symmetrical diagnos-
tic exclusion criteria if the same exclusion criteria
were applied to both groups, and as applying
asymmetrical exclusion criteria if the exclusion
criteria differed for the two groups. The specific
details of the classifications are described in footnote
b of Table 2, but an example of the kinds of
asymmetry that we observed in the studies being
reviewed here would be excluding individuals with
a history of a nonpsychotic mood disorder from the
control group but not excluding them from the RSP
group.
To determine whether any of these variables was
related to variability in the magnitude of the observed
effect sizes, we performed three planned linear con-
trasts. In all of the contrasts, the sum of the weights
for each contrast was 0 and the effect size used was d
(Rosenthal and Rubin, 1982). For each contrast the
nine studies could be divided into two groups of
approximately equal size (i.e., 4 vs. 5). Table 2
presents the weights assigned to each study for each
planned contrast. Each contrast yielded a standard
score, Z, which corresponds to a p-value indicating
whether a particular methodological variable accounts
for significant variability in the magnitude of the
observed effect sizes.
Studies that applied more restrictive diagnostic
exclusion criteria to controls than to RSP had a
significantly larger mean effect size than studies that
applied comparable exclusion criteria to both groups
(Z = 3.60; P= 0.00034). Specific features of the AS
procedure did not account for variability in effect size
across studies: neither the contrast for number of trials
(Z =� 0.16; P= 0.88) nor the contrast for number of
eccentricities (Z =� 0.76, P= 0.44) was statistically
significant.
2.2. Overlap AS task
Two groups of investigators compared RSP and
controls on the overlap AS task (McDowell and Clem-
entz, 1997;McDowell et al., 1999; Curtis et al., 2001b).
Because data were also available from subsets of some
of these samples on the standard AS paradigm, the
effect sizes for the two paradigms can be compared as
well. Table 3 presents descriptive statistics and effect
sizes for those studies that used the overlap paradigm.
In the McDowell and Clementz (1997) study, RSP
made significantly more errors than controls in both
AS paradigms. The effect size, Glass’ delta, was larger
for the overlap paradigm than for the standard para-
digm (0.73 vs. 0.625, respectively), although Cohen’s d
(0.39 vs. 0.51, respectively) and r (0.19 vs. 0.25,
respectively) were actually smaller. In the Curtis et al.
(2001b) study, RSP made significantly more errors
than controls on the standard AS task, but not on the
overlap AS task. All effect sizes for the overlap
paradigm were smaller than those for the standard
paradigm (Glass’ delta: 0.29 vs. 0.50, respectively; d:
0.23 vs. 0.52, respectively; r: 0.11 vs. 0.25, respective-
ly). In the McDowell et al. (1999) study, only the
overlap paradigm was used, so the relative sensitivity
of the overlap vs. standard paradigms cannot be
addressed. That study evaluated the effect of target
eccentricity and found that the effect sizes for ‘‘far’’
overlap targets were much larger than those for ‘‘near’’
overlap targets in each of three samples of RSP.1
esearch 71 (2004) 113–125

Table 2
Relevant statistical values and contrast weights for planned contrast calculations: standard antisaccade paradigm ordered as in Table 1a
Study df t Contrast weights
Symmetric vs. asymmetric
diagnostic exclusion criteriabNumber of
eccentricitiescNumber
of trialsd
Brownstein et al. (2003) 120 � 0.27 � 1.0 � 1.25 � 1.0
Thaker et al. (1996) 92 0.67 � 1.0 1.0 1.25
Thaker et al. (2000) 115 1.02 � 1.0 1.0 1.25
Crawford et al. (1998) 86 1.07 � 1.0 1.0 � 1.0
Clementz et al. (1994) 63 2.02 0.80 � 1.25 � 1.0
McDowell and Clementz (1997) 90 2.42 0.80 1.0 1.25
Curtis et al. (2001a) 223 5.08 0.80 � 1.25 � 1.0
Karoumi et al. (2001) 40 2.62 0.80 1.0 1.25
Katsanis et al. (1997) 91 4.01 0.80 � 1.25 � 1.0
a Based on the information in published articles, supplemented by additional information from the authors when available.b Symmetric diagnostic exclusion criteria applied to RSP and controls (� 1.0) vs. asymmetric inclusion criteria applied to RSP and controls
(0.80). Specifics are as follows: symmetric criteria: Thaker et al. (1996): both groups: no personal Axis I disorder other than one episode of past
major depression (none within the preceding 2 years), for which no hospitalization, tricyclic antidepressant or electroshock treatment was
received; no substance abuse within 2 years; both controls and RSP included two subgroups: subjects who met subthreshold criteria (less one
criterion) for schizotypal, schizoid, or paranoid personality disorder, and subjects who did not meet subthreshold criteria for these disorders;
normal controls (NC): no family history of major psychosis. Crawford et al. (1998): both groups: no substance abuse or heavy alcohol use
within 1 year; RSP: recurrent major depressive disorder (N = 5), bulimia (N = 1), schizotypal personality disorder (SPD) (N = 3); NC: no
personal or family history of psychotic illness. Thaker et al. (2000): both groups: no personal Axis I disorder; both controls and RSP included
subjects who met subthreshold criteria for schizophrenia-related personality disorders as in Thaker et al. (1996); NC: no family history of
psychosis. Brownstein et al. (2003): both groups: no psychotic disorder, no schizotypal, schizoid or paranoid personality disorder, no current or
past substance abuse or dependence within 1 year; RSP: nonpsychotic affective disorders (N = 26), anxiety disorders (N = 6), substance use
disorders (N = 18), adjustment disorder (N = 1); NC: no family history of psychosis; nonpsychotic affective disorders (N= 9), anxiety disorders
(N = 3), substance use disorders (N = 4). Asymmetric criteria: Clementz et al. (1994): RSP: schizophrenia (N= 1), SPD (N= 3), past major
depressive disorder (N= 7); NC: no major affective disorder, psychotic disorder, or current psychoactive substance use disorder; no
schizophrenia-related personality disorder; no T score >70 on MMPI-2 scales L, F, 2, 6, 7, 8; no family history of psychotic disorder, suicide or
psychiatric hospitalization. McDowell and Clementz (1997): RSP: schizophrenia (N = 1); morbid risk rate for schizophrenia: 2.3%; ‘‘Relatives
were given SCID diagnoses’’, but no other diagnostic information about specific disorders in RSP was included; NC: no Axis I disorder, no T
score >70 on MMPI-2 scales L, F, 2, 6, 7, 8; no family history of psychotic disorder, suicide or psychiatric hospitalization. Katsanis et al. (1997):
RSP: schizophrenia (N = 4), past or current major depressive disorder without psychotic features (N = 5), past bipolar disorder without psychotic
features (N = 1), past bipolar disorder with psychotic features (N = 1), psychotic disorder not otherwise specified (N = 1); past substance abuse or
dependence (N = 5), current substance dependence and past major depressive disorder without psychotic features (N = 1); NC: no personal or
family history of major affective, psychotic or substance use disorder. Curtis et al. (2001a): RSP: past but not current psychotic disorder
(schizophrenia, bipolar disorder, delusional disorder) (N = 8); nonpsychotic Axis I disorders (depression, substance dependence) (N = 36); NC:
no mood disorder, psychotic symptoms, lifetime substance dependence, or current substance abuse; no personal or first-degree family history of
treatment for any psychiatric disorder. Karoumi et al. (2001): both groups: no Axis I disorder; no SPD; NC: no first-degree family history of
Axis I disorder.c Eccentricity: one (� 1.25) vs. >1 (1.0). Each study had the following number of eccentricities: 1 (Clementz et al., 1994; Katsanis et al.,
1997; Curtis et al., 2001a; Brownstein et al., 2003); 2 (McDowell and Clementz, 1997; Crawford et al., 1998); 3 (Thaker et al., 1996, 2000;
Karoumi et al., 2001).d Number of trials: V 24 (� 1.0) vs. >25 (1.25). Each study had the following number of trials: 14 (Brownstein et al., 2003); 20 (Clementz et
al., 1994; Katsanis et al., 1997; Curtis et al., 2001a); 24 (Crawford et al., 1998); 40 (McDowell and Clementz, 1997); 60 (Thaker et al., 1996;
2000; Karoumi et al., 2001).
D.L. Levy et al. / Schizophrenia Research 71 (2004) 113–125 117
As Table 3 indicates, there is substantial variabil-
ity in the effect sizes found in studies that used the
overlap AS paradigm. The effect sizes for the Salt
Lake City and Palau samples are much larger than
the effect sizes for the San Diego sample (McDowell
et al., 1999). The effect sizes for the single peripheral
target (F 10j) used by Curtis et al. (2001b) are
substantially smaller than the effect sizes for the
‘‘near’’ (F 8j) peripheral target used by McDowell
et al. (1999). We evaluated whether there was

Table 3
Antisaccade studies (overlap paradigm) of relatives of schizophrenia patients ordered chronologically
Study First-degree relatives of
schizophrenia patients
Nonpsychiatric controls Effect size
N % Error score
(near/far)
N % Error score
(near/far)
Cohen’s d
(near/far)
r
(near/far)
Glass’ delta
(near/far)
McDowell and
Clementz (1997)a60 10.0 (24.0)b 32 2.0 (11.0)b 0.39 0.19 0.73
McDowell et al.
(1999)a
San Diego 60 31.0 (25.0)/19.0 (23.0) 94 22.0 (18.0)/8.0 (8.0) 0.43/0.70 0.21/0.33 0.50/1.375
Salt Lake City 29 48.0 (29.0)/38.0 (28.0) 94 22.0 (18.0)/8.0 (8.0) 1.23/1.97 0.52/0.70 1.44/3.75
Palau 41 47.0 (22.0)/36.0 (24.0) 94 22.0 (18.0)/8.0 (8.0) 1.30/1.90 0.54/0.70 1.39/3.5
Curtis et al.
(2001b)c42 12.3 (11.6) 38 9.9 (8.4) 0.23/NA 0.11/NA 0.29/NA
Mean (standard deviation).a Peripheral targets at F 8j (near), F 16j (far); San Diego RSP is the same group as in the 1997 study; error rate is not age-adjusted.b Age-adjusted error rates averaged across F 8j (near) and F 16j (far) targets.c Peripheral target at F 10j; error rate is not age-adjusted.
2 McDowell et al. (1999) have speculated that the much larger
effect sizes in the Palau and Salt Lake City samples than in the San
Diego sample may reflect differences in genetic loading for
schizophrenia. They reasoned that all of the Palau and Salt Lake
City families had multiple cases of schizophrenia, whereas all but
one of the San Diego families had only one schizophrenic member.
This explanation may account for variability in results based on the
‘‘overlap-far’’ AS paradigm, but it does not convincingly account
for variability in results based on the standard or ‘‘overlap-near’’ AS
paradigms. Using the standard AS paradigm to compare RSP from
multiplex families with controls, Crawford et al. (1998) obtained a
small effect size. Using the ‘‘overlap-near’’ AS paradigm to
compare RSP primarily from simplex families with controls, Curtis
et al. (2001b) obtained a much smaller effect size than McDowell et
al. (1999) obtained for the San Diego families. Since submitting this
manuscript, we have become aware of another study that compared
the performance of RSP and controls on the standard AS task. The
full study is currently unpublished, but the results have been
presented as an abstract (MacCabe et al., 2002). The results showed
that neither ‘‘obligate carrier’’ RSP, other relatives from multiplex
families, nor relatives from families with only one schizophrenic
member made significantly more errors than controls did. The effect
sizes (Glass’ delta) ranged from � 0.41 to 0.14. As in the Crawford
et al. (1998) study, symmetrical exclusion criteria were applied to
RSP and controls.
D.L. Levy et al. / Schizophrenia Research 71 (2004) 113–125118
evidence of significant heterogeneity in these effect
sizes using an extension of the Hedges and Olkin
(1985) Q statistic. The Q statistic was developed to
provide a test for heterogeneity when effect sizes are
correlated because multiple variables or outcomes are
measured on each subject. Cook (submitted for
publication) has extended this method to estimate
the correlation between effect sizes due to the non-
independence of the control group in the McDowell
et al. (1999) study (three groups of RSP were
compared with one control group), and used an
estimate of this correlation in the Q statistic. The
results of the heterogeneity analysis for the three
samples in McDowell et al. (1999) were significant
for both ‘‘near’’ (X2(2) = 22.95, P < 0.0001) and ‘‘far’’
targets (X2(2) = 134.53, P < 0.00000001), indicating
that the RSP-control differences in the three compar-
isons for each target eccentricity were unlikely to be
drawn from the same distribution. The analysis of the
effect sizes for the ‘‘near’’ targets in four samples of
RSP and controls (i.e., three from the McDowell et
al., 1999 study and one from the Curtis et al., 2001b
study) also showed significant heterogeneity
(X2(3) = 27.25, P < 0.00005). We did not try to eval-
uate possible sources of effect size heterogeneity in
studies that used the overlap paradigm, because of
the small number of independent studies and control
groups. Both studies used similarly asymmetric ex-
clusion criteria, indicating that some other factor
must be the source of the heterogeneity in effect
size.2
2.3. Gap AS task
One study (Ross et al., 1998) used the gap version
of the AS task to compare the performance of RSP

D.L. Levy et al. / Schizophrenia Research 71 (2004) 113–125 119
and controls. They divided eight ‘‘parental dyads’’
into two groups, one composed of the parent in each
pair with a family history of schizophrenia (‘‘most
likely gene carriers’’) and the other composed of the
parent with no such family history (‘‘least likely gene
carriers’’). The performance of each group was com-
pared with that of controls. They found that the group
of ‘‘most likely gene carrier’’ parents (but not the
group of ‘‘least likely gene carrier’’ parents) made
significantly more errors than controls did (Glass’
delta: 0.75; d: 0.81; r: 0.37).
3. Discussion
Our results indicate that the effect sizes for com-
parisons of RSP and controls on the standard version
of the AS task were significantly heterogeneous. The
mean effect size is therefore not interpretable as a
population indicator. Variability in effect size was
accounted for by subject selection criteria but not
by aspects of the experimental procedures. Signifi-
cantly larger effect sizes were found in studies that
applied less stringent exclusion criteria to RSP than to
controls than in studies that applied comparable
exclusion criteria to RSP and controls. Significant
heterogeneity in effect size was also found for the
overlap version of the AS task, but the specific
sources of this heterogeneity could not be identified
based on the existing literature. These findings, their
implications for sample composition, and considera-
tions relevant to a genetic model of AS performance
are discussed below.
3.1. Asymmetric diagnostic exclusion criteria in
controls and RSP
Of the five studies that employed asymmetric
diagnostic exclusion criteria (Clementz et al., 1994;
McDowell and Clementz, 1997; Katsanis et al., 1997;
Curtis et al., 2001a; Karoumi et al., 2001), four
allowed psychiatric disorders in RSP but excluded
those same disorders in the controls (Clementz et al.,
1994; McDowell and Clementz, 1997; Katsanis et al.,
1997; Curtis et al., 2001a). The fifth study (Karoumi
et al., 2001) was asymmetric because although diag-
nostic exclusion criteria were symmetric with respect
to personal psychopathology, they were asymmetric
with respect to familial psychopathology (an asym-
metry that was also present in two studies that applied
asymmetric personal psychopathology criteria). The
effect sizes in these five studies were significantly
larger than the effect sizes in the four studies that
applied symmetrical exclusion criteria to both groups
(Thaker et al., 1996, 2000; Crawford et al., 1998;
Brownstein et al., 2003). Below we discuss each of
these features of asymmetry.
With respect to personal psychopathology, two
kinds of asymmetry were present. The first involved
excluding individuals with nonpsychotic Axis I dis-
orders from the control group but not from the RSP
group. In the Clementz et al. (1994) study, 7/32 RSP
met criteria for past major depression, but controls
with a major affective disorder were excluded. In
addition, in the same study, three subjects who met
diagnostic criteria for schizotypal personality disorder
were included in the RSP group, but this condition
was an exclusion criterion for controls. Similarly, in
the Katsanis et al. (1997) and Curtis et al. (2001a)
studies, 12/55 and 36/116 RSP, respectively, met
diagnostic criteria for nonpsychotic mood and sub-
stance use disorders, which were exclusion criteria for
controls. In the McDowell and Clementz (1997) study,
controls with any Axis I disorder were excluded, but
RSP with an Axis I disorder were not (see footnote b
of Table 2). In the Karoumi et al. (2001) study, Axis I
disorders were excluded from both RSP and controls,
but controls were also excluded if there was a family
history of any Axis I disorder, a topic that is discussed
below.
The same four studies that were asymmetric with
respect to nonpsychotic Axis I disorders also includ-
ed individuals with psychotic disorders in the RSP
group (Clementz et al., 1994; McDowell and Clem-
entz, 1997; Katsanis et al., 1997; Curtis et al.,
2001a). Therefore, the magnitude of the contribution
of each type of asymmetry to the effect size cannot
be determined. There are strong a priori reasons,
however, to expect that the presence of psychotic
individuals in the RSP group will inflate the mean
and variance of that group. The magnitude of these
effects will, of course, depend on the proportion of
RSP with psychotic disorders. The empirical litera-
ture clearly shows that the AS performance of
individuals with psychotic conditions would be
expected to increase the mean and variance of error
D.L. Levy et al. / Schizophrenia Research 71 (2004) 113–125120
rate in the RSP group as a whole, because psychotic
conditions, even in remission, are associated with an
increased probability of poor performance. Every AS
study of schizophrenia patients has reported signifi-
cantly worse performance in these patients compared
with controls (Fukushima et al., 1988, 1990a,b,
1994; Thaker et al., 1989; Rosse et al., 1993;
Clementz et al., 1994; Matsue et al., 1994; Crawford
et al., 1995a, 1998; Sereno and Holzman, 1995;
Allen et al., 1996; Tien et al., 1996; Katsanis et
al., 1997; McDowell and Clementz, 1997; Hutton et
al., 1998; Karoumi et al., 1998, 2001; Levy et al.,
1998; Maruff et al., 1998; Ross et al., 1998; McDo-
well et al., 1999; Muller et al., 1999; Brenner et al.,
2001; Curtis et al., 2001a; Gooding and Tallent,
2001; Manoach et al., 2002). Moreover, schizophre-
nia patients in full remission perform as poorly as
acutely psychotic schizophrenia patients (Curtis et
al., 2001a). The mean error rate of the eight RSP
with a history (but no current evidence) of psychosis
was found to be ‘‘more similar’’ to the mean error
rates of both acutely psychotic and remitted schizo-
phrenia patients than to that of RSP with no Axis I
pathology (Curtis et al., 2001a). In the Clementz et
al. (1994) study, the relative with the highest error
rate (more than 2 S.D. above the mean of RSP) was
one of four RSP with a ‘‘schizophrenia-spectrum
disorder’’. In the McDowell and Clementz (1997)
study, the one relative with a diagnosis of schizo-
phrenia had an error rate (on the overlap AS task)
that was outside the range of the controls (perfor-
mance of this individual on the standard AS task was
not described). Similarly, both psychotic (Katsanis et
al., 1997; Curtis et al., 2001a) and remitted bipolar
patients (McDowell and Clementz, 1997; Gooding
and Tallent, 2001) have been reported to have
significantly elevated error rates compared with con-
trols [in other studies bipolar patients did not per-
form more poorly than controls (Fukushima et al.,
1990a; Clementz et al., 1994; Crawford et al.,
1995a)].
With respect to family history of psychopatholo-
gy, stricter exclusion criteria were applied to con-
trols than to RSP in three of the studies with the
largest effect sizes. In addition to the personal
psychopathology screening criteria described above,
controls were also excluded if family members had:
(1) received treatment for a major affective disorder
or for substance abuse (Katsanis et al., 1997), (2)
received any psychiatric treatment (Curtis et al.,
2001a), or (3) any Axis I disorder (Karoumi et al.,
2001). Thus, controls differed from RSP not only
because they were not first-degree relatives of a
schizophrenia patient, but also because they were
not relatives of individuals with many other psychi-
atric disorders. As a result, the control groups
remained more selective with respect to family
history of psychiatric illness even when RSP with-
out Axis I disorders were compared with controls
(Katsanis et al., 1997; Curtis et al., 2001a; Karoumi
et al., 2001).
The four studies with the smallest effect sizes
used the same personal and family history criteria to
exclude both RSP and controls, with the exception
that controls, unlike RSP, also had no family history
of psychosis (Thaker et al., 1996, 2000; Crawford et
al., 1998; Brownstein et al., 2003). In all four
studies, psychotic individuals were excluded from
both groups. In one study, neither group included
individuals with Axis I disorders (Thaker et al.,
2000) and in another both groups were largely free
of Axis I disorders [Thaker et al. (1996) allowed in
both groups a single episode of untreated major
depression if it occurred more than 2 years earlier].
One study allowed nonpsychotic Axis I disorders in
both groups and excluded individuals with schizo-
phrenia-related personality disorders from both
(Brownstein et al., 2003). One study allowed non-
psychotic disorders in both groups (Crawford et al.,
1998).
Our results indicate that applying more selective
diagnostic exclusion criteria to RSP than to controls
is a major condition for obtaining medium to large
effect sizes in studies of RSP on the standard AS
task. A conservative interpretation of this finding is
that the larger effect sizes were not related to
schizophrenia per se, but to the over-representation
of psychiatric illnesses in RSP and the under-repre-
sentation of the same disorders in the controls and in
the relatives of the controls. This interpretation is
consistent with reports that poor performance on the
AS task is found not only in psychiatric conditions
thought to be related to schizophrenia, such as
psychometric and clinical schizotypy (Holzman et
al., 1995; O’Driscoll et al., 1998; Gooding, 1999;
Larrison et al., 2000; Brenner et al., 2001), but also

D.L. Levy et al. / Schizophrenia Research 71 (2004) 113–125 121
in a range of other psychiatric disorders. Findings
vary for each of these diagnostic groups (for the sake
of completeness we cite both positive and negative
studies), but there is at least some support for
increased error rate in patients with bipolar disorder
(Sereno and Holzman, 1995; Crawford et al.,
1995a,b; Katsanis et al., 1997; McDowell and Clem-
entz, 1997; Curtis et al., 2001a; Gooding and Tallent,
2001), major depressive disorder (Katsanis et al.,
1997; Sweeney et al., 1998; Curtis et al., 2001a),
obsessive-compulsive disorder (Tien et al., 1992;
McDowell and Clementz, 1997; Rosenberg et al.,
1997; Maruff et al., 1999), and attention deficit
hyperactivity disorder (Rothlind et al., 1991; Aman
et al., 1998; Munoz et al., 1999, 2003). The presence
of increased AS errors in a range of psychopatho-
logical conditions suggests that studies of AS perfor-
mance may be less relevant for understanding
schizophrenia per se than for understanding processes
that are common to a broad range of psychiatric
disorders.
3.2. Issues of sample composition
It is clear that subject selection factors affect the
magnitude of the performance difference between
RSP and controls, an outcome that has more general
methodological implications. The optimal inclusion/
exclusion criteria in any study, including the degree
of symmetry and stringency of the exclusion criteria,
depend on the goal of the study. For example, if one
seeks to determine whether a particular process is
associated with schizophrenia, it is inefficient to
compare schizophrenia subjects with a control group
that includes individuals with that disorder. Asym-
metric exclusion criteria are thus appropriate in this
case. If, however, one studies the same process in
RSP in order to determine whether a particular
behavior is useful as an auxiliary trait in linkage
studies (i.e., a pleiotropic gene effect or an endophe-
notype), one must be able to distinguish a diathesis
(the trait either causes the disease or is a pointer to an
underlying causal process) from an epiphenomenon
(a secondary effect caused by the disease) (Mat-
thysse, 1993). Symmetrical exclusion criteria, in
which both RSP and controls are purified of clinical
conditions that could produce the trait as an epiphe-
nomenon (Chapman and Chapman, 1973; Holzman
and Matthysse, 1990; Lenzenweger, 1998), are es-
sential for making this distinction. In this case,
symmetric exclusion criteria are appropriate. Purify-
ing one group of potentially confounding conditions
but not the other makes it likely that the groups will
perform differently, but such a difference would not
provide strong evidence that the trait is heritable,
because it could be a secondary effect of the asym-
metry in sample composition.
3.3. Differences in AS task administration
The aspects of task administration that we exam-
ined did not contribute significantly to effect size
heterogeneity. Specifically, neither number of target
eccentricities nor number of trials was related to the
magnitude of effect size. We had hypothesized that the
number of trials used to assess AS performance might
be related to the magnitude of RSP-control differ-
ences. For example, studies that used a larger number
of trials might be expected to yield more stable
estimates of performance ability than studies that used
fewer trials. However, studies that administered rela-
tively few trials (range: 14–24) (Clementz et al.,
1994; Katsanis et al., 1997; Crawford et al., 1998;
Curtis et al., 2001a; Brownstein et al., 2003) did not
differ in effect size from those that administered a
larger number of trials (range: 40–60) (Thaker et al.,
1996, 2000; McDowell and Clementz, 1997; Karoumi
et al., 2001). Indeed, medium to large effect sizes
were obtained in studies that used as few as 20 trials
(Clementz et al., 1994; Katsanis et al., 1997; Curtis et
al., 2001a), and small effect sizes were obtained in
studies that used as many as 60 trials (Thaker et al.,
1996, 2000). The nonsignificant effect of number of
trials is consistent with the finding of stable perfor-
mance across up to six blocks of 20 trials per block in
schizophrenia, bipolar disorder, and obsessive-com-
pulsive disorder patients as well as in nonpsychiatric
controls (McDowell and Clementz, 1997).
We had also hypothesized that task difficulty might
increase with number of eccentricities, which might
be associated with larger effect sizes. However, num-
ber of eccentricities was not a significant source of
variability in effect size. Medium to large effect sizes
were obtained in studies that used only one eccentric-
ity (Clementz et al., 1994; Katsanis et al., 1997; Curtis
et al., 2001a) and small effect sizes were obtained in

D.L. Levy et al. / Schizophrenia Research 71 (2004) 113–125122
studies that used multiple eccentricities (Thaker et al.,
1996, 2000).
We do not rule out the possibility that variables
relevant to test administration do play a role in effect
size heterogeneity. For example, we were unable to
assess the influence of variables that were not consis-
tently reported but which could have had an effect,
such as inter-trial interval, whether subjects were given
feedback on performance during the experimental
trials, and number of practice trials.
3.4. Confidence limits
It is interesting to note that if the underlying
sources of heterogeneity had been unknown, an
analysis based on the confidence limits alone would
have revealed that a systematic difference between
RSP and controls, if there is one, must be small, but a
large effect could be ruled out. That result would not
represent the underlying reality accurately, because
the heterogeneity analysis shows that there is not a
consistent small effect.3 Rather, we have a collection
of studies, some of which show large effects and some
of which show small effects, with the magnitude of
3 Using a normal theory approximation, the upper 95%
confidence limit for the difference between the mean error scores
of RSP and relatives of nonpsychiatric controls in the Brownstein et
al. (2003) study is 6.31, indicating that a mean difference between
the groups smaller than 6.31 cannot be ruled out, even though the
observed mean difference was � 1.0. The upper 95% confidence
limits for the three other studies whose effect sizes were small
(Thaker et al., 1996, 2000; Crawford et al., 1998) are 7.64, 10.50,
and 15.22, respectively, showing substantial overlap with the
differences in means reported in the studies with medium– large
effect sizes. These findings indicate that the studies reporting small
effect sizes do not rule out a small effect, or an effect in a small
proportion of RSP, but they do rule out a consistent large group
effect. When applying this procedure in the converse way, the lower
confidence limits of the studies with medium– large effect sizes
were 1.82, 3.48, 5.97, and 9.25, respectively (Clementz et al., 1994;
McDowell and Clementz, 1997; Karoumi et al., 2001; Curtis et al.,
2001a), barely overlapping the upper confidence intervals of the
studies with small effect sizes [the Katsanis et al. (1997) study was
excluded, because it presented medians and interquartile ranges,
rather than means and standard deviations]. Therefore, using this
method, the confidence intervals for the two groups of studies have
sufficient overlap that it is not possible to rule out a consistent small
effect underlying all of the findings, but a consistent large effect can
be ruled out. The meta-analysis, however, does rule out a consistent
small effect.
the effects varying as a function of the subject
selection criteria used.
3.5. Expectations from a genetic model
As indicated earlier, the finding of increased errors
on the AS task in schizophrenia patients and RSP has
led to the speculation that AS performance may tap
processes related to genetic vulnerability. According
to a genetic model that involves co-familial transmis-
sion, RSP would be expected to have both a higher
mean error rate and a larger variance than controls. As
we showed above, however, the magnitude of the
observed mean difference between RSP and controls
varies as a function of subject selection criteria. From
the data presented in published studies, it is possible
to test whether RSP had a significantly larger variance
than controls. The variance ratios for the eight inde-
pendent studies that provided means and standard
deviations of RSP and controls are shown in Table
4. Under the null hypothesis the variance ratio is 1 and
is distributed as F. A test of whether the variances of
RSP were larger than those of controls was not
statistically significant (F values were converted to
Table 4
Variance ratiosa in antisaccade studies (standard paradigm) of first-
degree relatives of schizophrenia patients (ordered from smallest to
largest)
Study Variance ratiob P-value ln(variance
ratio)c
Thaker et al.
(1996)
F = 0.32,
df= 25,67
>0.995 � 1.14
Brownstein et al.
(2003)
F = 0.90,
df= 97,23
>0.50 � 0.10
Karoumi et al.
(2001)
F = 1.40,
df= 20,20
0.10 <P< 0.25 0.33
Thaker et al.
(2000)
F = 1.54,
df= 54,61
0.05 <P< 0.10 0.43
Crawford et al.
(1998)
F = 1.59,
df= 49,37
0.05 <P< 0.10 0.46
McDowell and
Clementz
(1997)
F = 1.72,
df= 59,31
0.05 <P< 0.10 0.54
Curtis et al.
(2001a)
F = 1.72,
df= 115,108
0.01 <P< 0.025 0.54
Clementz et al.
(1994)
F = 2.13,
df= 31,32
0.025 <P< 0.05 0.76
a s2RSP/s2NORMALS (one-sided to the right).
b Mean: 1.4; standard deviation: 0.56; median: 1.6.c Median: 0.445.

D.L. Levy et al. / Schizophrenia Research 71 (2004) 113–125 123
the natural log of F so that studies with F’s above and
below 1.0 would be equally weighted: Wilcoxon
Signed Rank Test; S = 9.0, P= 0.11, one sided).
From the meta-analysis, we conclude that the use of
a purified control group yields large and statistically
significant RSP-control effects, whereas applying ex-
clusion criteria of comparable stringency in the two
groups yields small and statistically nonsignificant
effects. On the basis of the studies in the literature,
therefore, we conclude that performance on the stan-
dard AS task does not appear to be a pleiotropic effect
of a schizophrenia gene. For the purpose of detecting
the presence of a pleiotropic effect of a schizophrenia
gene, applying criteria of comparable stringency in the
RSP and control groups is the proper strategy. Using
asymmetrical inclusion/exclusion criteria is bound to
create an upward bias in the direction of magnifying
group differences (Smith and Iacono, 1986; Tsuang et
al., 1988; Schwartz and Link, 1989; Kendler, 1990),
and may tend falsely to suggest an effect related to
schizophrenia gene. In an ideal genetic study, two
groups are compared that differ only in the probability
that members of the groups have a gene relevant to
schizophrenia and not in the presence of unrelated
psychopathology. Although perfect symmetry of in-
clusion/exclusion criteria typically cannot be achieved
(i.e., in the absence of definitive diagnostic informa-
tion, a family history of psychosis will usually exclude
a control but not an RSP), reasonable symmetry can be
achieved. The significant within-family correlation in
performance, both in RSP (Crawford et al., 1998;
Curtis et al., 2001a; Brownstein et al., 2003) and in
twins who were not ascertained for being RSP
(Malone and Iacono, 2002), suggests that genetic
effects may contribute to variability in AS perfor-
mance, but in order to show convincingly that this
trait is related to a schizophrenia genotype, RSP must
be shown to perform worse than controls in samples
ascertained on the basis of comparable diagnostic
exclusion criteria.
Acknowledgements
This study was supported in part by NIMH grants
MH49487, MH31340, MH01021, MH31154, by a
grant from The Roy Hunt Foundation, by an operating
grant from the Canadian Institute of Health Research,
and by a Harvard University Graduate School of Arts
and Sciences Merit Fellowship. The authors thank
Donald Rubin for his helpful comments. We also
thank Drs. Thierry d’Amato, Monica Calkins, Brett
Clementz, Jennifer McDowell, and Gunvant Thaker
for clarifying methodological questions. The method
developed by Cook to handle correlated effect sizes is
available on request.
References
Allen, J.S., Lambert, A.J., Attah Johnson, F.Y., Schmidt, K., Nero,
K.L., 1996. Antisaccadic eye movements and attentional asym-
metry in schizophrenia in three Pacific populations. Acta Psy-
chiatr. Scand. 94, 258–265.
Aman, C.J., Roberts, R.J., Pennington, B.F., 1998. A neuropsycho-
logical examination of the underlying deficit in attention deficit
hyperactivity disorder: frontal lobe versus right parietal lobe
theories. Dev. Psychol. 34, 956–969.
Brenner, C.A., McDowell, J.E., Cadenhead, K.S., Clementz, B.A.,
2001. Saccadic inhibition among schizotypal personality disor-
der subjects. Psychophysiology 38, 399–403.
Brownstein, J., Krastoshevsky, O., McCollum, C., Kundamal, S.,
Matthysse, S., Holzman, P.S., Mendell, N.R., Levy, D.L., 2003.
Antisaccade performance is abnormal in schizophrenia patients
but not in their biological relatives. Schizophr. Res. 63, 13–15.
Chapman, L.J., Chapman, J.P., 1973. Problems in the measurement
of cognitive deficit. Psychol. Bull. 79, 380–385.
Clementz, B.A., McDowell, J.E., Zisook, S., 1994. Saccadic system
functioning among schizophrenia patients and their first-degree
relatives. J. Abnorm. Psychology 103, 277–287.
Cohen, J., 1977. Statistical Power Analysis for the Behavioral Sci-
ences. Academic Press, New York.
Cook, S., 2004. A note on testing for heterogeneity among corre-
lated effect sizes (submitted for publication).
Crawford, T.J., Haegar, B., Kennard, C., Reveley, M.A., Henderson,
L., 1995a. Saccadic abnormalities in psychotic patients: I. Neu-
roleptic-free psychotic patients. Psychol. Med. 25, 461–471.
Crawford, T.J., Haegar, B., Kennard, C., Reveley, M.A., Hender-
son, L., 1995b. Saccadic abnormalities in psychotic patients: II.
The role of neuroleptic treatment. Psychol. Med. 25, 473–483.
Crawford, T.J., Sharma, T., Puri, B.K., Murray, R.M., Lewis, S.W.,
1998. Saccadic eye movements in families multiply affected
with schizophrenia: the Maudsley family study. Am. J. Psychi-
atry 155, 1703–1710.
Curtis, C.E., Calkins, M.E., Grove, W.M., Feil, K.J., Iacono, W.G.,
2001a. Saccadic disinhibition in patients with acute and remitted
schizophrenia and their first-degree biological relatives. Am. J.
Psychiatry 158, 100–106.
Curtis, C.E., Calkins, M.E., Iacono, W.G., 2001b. Saccadic disin-
hibition in patients and their first-degree biological relatives.
Exp. Brain Res. 137, 228–236.
Fischer, B., Weber, H., 1992. Characteristics of ‘‘anti’’ saccades in
man. Exp. Brain Res. 89, 415–424.
Fischer, B., Weber, H., 1997. Effects of stimulus conditions on
D.L. Levy et al. / Schizophrenia Research 71 (2004) 113–125124
the performance of antisaccades in man. Exp. Brain Res. 116,
191–200.
Fukushima, J., Fukushima, K., Chiba, T., Tanaka, S., Yamashita, I.,
Kato, M., 1988. Disturbances of voluntary control of saccadic
eye movements in schizophrenic patients. Biol. Psychiatry 23,
670–677.
Fukushima, J., Morita, N., Fukushima, K., Chiba, T., Tanaka, S.,
Yamashita, I., 1990a. Voluntary control of saccadic eye move-
ments in patients with schizophrenic and affective disorders.
J. Psychiatr. Res. 24, 9–24.
Fukushima, J., Fukushima, K., Morita, N., Yamashita, I., 1990b.
Further analysis of the control of voluntary saccadic eye move-
ments in schizophrenic patients. Biol. Psychiatry 28, 943–958.
Fukushima, J., Fukushima, K., Miyasaka, K., Yamashita, I., 1994.
Voluntary control of saccadic eye movement in patients with
frontal cortical lesions and parkinsonian patients in comparison
with that in schizophrenics. Biol. Psychiatry 36, 21–30.
Glass, G.V., 1976. Primary, secondary, and meta-analysis of re-
search. Educ. Res. 5, 3–8.
Gooding, D.C., 1999. Antisaccade task performance in question-
naire-identified schizotypes. Schizophr. Res. 35, 157–166.
Gooding, D.C., Tallent, K.A., 2001. The association between anti-
saccade task and working memory task performance in schizo-
phrenia and bipolar disorder. J. of Nerv. Ment. Dis. 189, 8–16.
Greenberg, D.A., Durner, M., Keddache, M., Shinnar, S., Resor,
S.R., Moshe, S.L., Rosenbaum, D., Cohen, J., Harden, C., Kang,
H., Wallace, S., Luciano, D., Ballaban-Gil, K., Tomasini, L.,
Zhou, G., Klotz, I., Dicker, E., 2000. Reproducibility and com-
plications in gene searches: linkage on chromosome 6, hetero-
geneity, association, and maternal inheritance in juvenile myo-
clonic epilepsy. Am. J. Hum. Genet. 66, 508–516.
Hedges, L.V., Olkin, I., 1985. Statistical Methods for Meta-Analy-
sis. Academic Press, Orlando, FL.
Holzman, P.S., Matthysse, S., 1990. The genetics of schizophrenia:
a review. Psychol. Sci. 1, 279–286.
Holzman, P.S., Coleman, M., Lenzenweger, M.F., Levy, D.L., Mat-
thysse, S., O’Driscoll, G., Park, S., 1995. Working memory
deficits, antisaccades, and thought disorder in relation to percep-
tual aberration. In: Raine, A., Lencz, T., Mednick, S. (Eds.),
Schizotypal Personality. Cambridge Univ. Press, New York,
pp. 353–381.
Hutton, S.B., Crawford, T.J., Puri, B.K., Duncan, L.J., Chapman,
M., Kennard, C., Barnes, T.R.E., Joyce, E.M., 1998. Smooth
pursuit and saccadic abnormalities in first-episode schizophrenia.
Psychol. Med. 28, 685–692.
Karoumi, B., Ventre-Dominey, J., Vighetto, A., Dalery, J., d’Amato,
T., 1998. Saccadic eye movements in schizophrenic patients.
Psychiatry Res. 77, 9–19.
Karoumi, R., Saoud, M., d’Amato, T., Rosenfeld, F., Denise, P.,
Gutknecht, C., Gaveau, V., Beaulieu, F., Dalery, J., Rochet, T.,
2001. Poor performance in smooth pursuit and antisaccadic eye-
movement tasks in healthy siblings of patients with schizophre-
nia. Psychiatry Res. 101, 209–219.
Katsanis, J., Kortenkamp, S., Iacono, W.G., Grove, W.M., 1997.
Antisaccade performance in patients with schizophrenia and
affective disorder. J. Abnorm. Psychology 106, 468–472.
Kendler, K.S., 1990. The super-normal control group in psychiatric
genetics: possible artifactual evidence for coaggregation. Psy-
chiatr. Genet. 1, 45–53.
Kendler, K.S., McGuire, M., Gruenberg, A., O’Hare, A., Spellman,
M., Walsh, D., 1993. The Roscommon family study: I. Methods,
diagnosis of probands, and risk of schizophrenia in relatives.
Arch. Gen. Psychiatry 50, 527–540.
Larrison, A.L., Ferrante, C.F., Briand, K.A., Sereno, A.B., 2000.
Schizotypal traits, attention and eye movements. Prog. Neuro-
psychopharmacol. Biol. Psychiatry 24, 357–372.
Lenzenweger, M.F., 1998. Schizotypy and schizotypic psychopa-
thology: mapping an alternative expression of schizophrenia
liability. In: Lenzenweger, M.F., Dworkin, R. (Eds.), Origins
and Development of Schizophrenia: Advances in Experimental
Psychopathology. American Psychological Association Press,
Washington, DC, pp. 93–121.
Levy, D.L., Mendell, N.R., LaVancher, C., Brownstein, J., Shor-
rock, K., Krastoshevsky, O., Teraspulsky, L., Lo, Y., Bloom, R.,
Matthysse, S., Holzman, P.S., 1998. Disinhibition in antisaccade
performance in schizophrenia. In: Lenzenweger, M.F., Dworkin,
R. (Eds.), Origins and Development of Schizophrenia: Advan-
ces in Experimental Psychopathology. American Psychological
Association Press, Washington, DC, pp. 185–210.
MacCabe, J.H., Simon, H., Murray, J.M., 2002. Is antisaccade per-
formance a marker of genetic liability in schizophrenia. Schiz-
ophr. Res. 53, 78–79.
Malone, S.M., Iacono, W.G., 2002. Error rate on the antisaccade
task: heritability and developmental change in performance
among preadolescent and late-adolescent female twin youth.
Psychophysiology 39, 664–673.
Manoach, D.S., Lindgren, K.A., Cherkasova, M.V., Goff, D.C.,
Halpern, E.F., Intriligator, J., Barton, J.J.S., 2002. Schizophrenic
subjects show deficient inhibition but intact task switching on
saccadic tasks. Biol. Psychiatry 51, 816–826.
Maruff, P., Danckert, J., Pantelis, C., Currie, J., 1998. Saccadic and
attentional abnormalities in patients with schizophrenia. Psy-
chol. Med. 28, 1091–1100.
Maruff, P., Purcell, R., Tyler, P., Pantelis, C., Currie, J., 1999.
Abnormalities of internally generated saccades in obsessive-
compulsive disorder. Psychol. Med. 29, 1377–1385.
Matsue, Y., Saito, H., Osakabe, K., Awata, S., Ueno, T., Matsuoka,
H., Chiba, H., Fuse, Y., Sato, M., 1994. Smooth pursuit eye
movements and voluntary control of saccades in the antisac-
cades task in schizophrenic patients. Jap. J. Psychiatry Neurol.
48, 13–22.
Matthysse, S., 1993. Genetics and the problem of causality in ab-
normal psychology. In: Sutker, P.B., Adams, H.E. (Eds.), Com-
prehensive Handbook of Psychopathology. Plenum, New York,
NY, pp. 47–56.
Matthysse, S., Parnas, J., 1992. Extending the phenotype of schizo-
phrenia: implications for linkage analysis. J. Psychiatr. Res. 26,
329–344.
McDowell, J.E., Clementz, B.A., 1997. The effect of fixation
condition manipulations on antisaccade performance in schizo-
phrenia: studies of diagnostic specificity. Exp. Brain Res. 115,
333–344.
McDowell, J.E., Myles-Worsley, M., Coon, H., Byerley, W., Clem-
entz, B.A., 1999. Measuring liability for schizophrenia using

D.L. Levy et al. / Schizophrenia Research 71 (2004) 113–125 125
optimized antisaccade stimulus parameters. Psychophysiology
36, 138–141.
Muller, N., Riedel, M., Eggert, T., Straube, A., 1999. Internally and
externally guided voluntary saccades in unmedicated and medi-
cated schizophrenics: II. Saccadic latency, gain, and fixation sup-
pression errors. Eur. Arch. Psychiatry Clin. Neurosci. 249, 7–14.
Munoz, D.P., Hampton, K.A., Moore, K.D., Goldring, J.E., 1999.
Control of purposive saccadic eye movements and visual fixa-
tion in children with attention-deficit hyperactivity disorder. In:
Becker, W., Deubel, H., Mergner, T. (Eds.), Current Oculomotor
Research: Physiological and Psychological Aspects. Plenum,
New York, pp. 415–423.
Munoz, D.P., Armstrong, I.T., Hampton, K.A., Moore, K.D., 2003.
Altered control of visual fixation and saccadic eye movements
in attention-deficit hyperactivity disorder. J. Neurophysiol. 90,
503–514.
O’Driscoll, G.A., Lenzenweger, M.F., Holzman, P.S., 1998. Anti-
saccades and smooth pursuit eye movements and schizotypy.
Arch. Gen. Psychiatry 55, 837–843.
Rosenberg, D.R., Averbach, D.H., O’Hearn, K.M., Seymour, A.B.,
Birmaher, B., Sweeney, J.A., 1997. Oculomotor response inhi-
bition abnormalities in pediatric obsessive-compulsive disorder.
Arch. Gen. Psychiatry 54, 831–838.
Rosenthal, R., 1984. Meta-analytic Procedures for Social Research.
Sage Publications, Beverly Hills, CA.
Rosenthal, R., Rosnow, R.L., 1984. Essentials of Behavioral
Research: Methods and Data Analysis. McGraw-Hill, New
York, NY.
Rosenthal, R., Rubin, D.B., 1982. Comparing effect sizes of inde-
pendent studies. Psychol. Bull. 92, 500–504.
Ross, R.G., Harris, J.G., Olincy, A., Radant, A., Adler, L.E., Freed-
man, R., 1998. Familial transmission of two independent saccad-
ic abnormalities in schizophrenia. Schizophr. Res. 30, 59–70.
Rosse, R.B., Schwartz, B.L., Kim, S.Y., Deutsch, S.I., 1993. Cor-
relation between antisaccade and Wisconsin card sorting test
performance in schizophrenia. Am. J. Psychiatry 150, 333–335.
Rothlind, J.C., Posner, M.I., Schaughency, E.A., 1991. Lateralized
control of eye movements in attention deficit hyperactivity dis-
order. J. Cogn. Neurosci. 3, 377–381.
Schwartz, S., Link, B.G., 1989. The ‘well control’ artefact in case/
control studies of specific psychiatric disorders. Psychol. Med.
19, 737–742.
Sereno, A.B., Holzman, P.S., 1995. Antisaccades and smooth pur-
suit eye movements in schizophrenia. Biol. Psychiatry 37,
394–401.
Smith, G.N., Iacono, W.G., 1986. Lateral ventricular size in schizo-
phrenia and choice of control group. Lancet 1, 1450.
Sweeney, J.A., Strojwas, M.H., Mann, J.J., Thase, M.E., 1998.
Prefrontal and cerebellar abnormalities in major depression:
evidence from oculomotor studies. Biol. Psychiatry 43,
584–594.
Thaker, G.K., Nguyen, J.A., Tamminga, C.A., 1989. Increased
saccadic distractibility in tardive dyskinesia: functional evi-
dence for subcortical GABA dysfunction. Biol. Psychiatry 25,
49–59.
Thaker, G.K., Cassady, S.L., Adami, H.M., Moran, M., Ross, D.E.,
1996. Eye movements in spectrum personality disorders: com-
parison of community subjects and relatives of schizophrenic
patients. Am. J. Psychiatry 153, 362–368.
Thaker, G.K., Ross, D.E., Cassady, S.L., Adami, H.M., Medoff,
D.R., Sherr, J., 2000. Saccadic eye movement abnormalities in
relatives of patients with schizophrenia. Schizophr. Res. 45,
235–244.
Tien, A.Y., Pearlson, G.D., Machlin, S.R., Bylsma, F.W., Hoehn-
Sarie, R., 1992. Oculomotor performance in obsessive-compul-
sive disorder. Am. J. Psychiatry 149, 641–646.
Tien, A.Y., Ross, D.E., Pearlson, G., Strauss, M.E., 1996. Eye
movements and psychopathology in schizophrenia and bipolar
disorder. J. of Nerv. Ment. Dis. 184, 331–338.
Tsuang, M.T., Fleming, J.A., Kendler, K.S., Gruenberg, A.S., 1988.
Selection of controls for family studies. Biases and implications.
Arch. Gen. Psychiatry 45, 1006–1008.