Answer Keys - CSOMIO
16
Answer Keys 45 Answer Keys Lesson 1: Go with the Flow! Inquiry question: How do computers help us predict changes in systems? Duck Drifters Watch the video https://www.youtube.com/watch?v=eLMSMs6AYYc and answer these questions. 1. How many ducks were in the container lost at sea? 29,000 2. What made the ducks move? The ducks were carried across the ocean by surface currents. 3. Where would you go today if you wanted to find one of the ducks? Today, you can find them all over the world. They have made their way into the North Atlantic and are found in Scotland. 4. What factors are important in determining where a duck will wash ashore? The speed and direction of ocean currents are most important in determining where a duck will wash ashore. 5. What is the value of collecting data about the ducks’ locations? Collecting data about the ducks’ location helps us to understand where the gyres are in the ocean, how the Great Pacific Garbage Patch formed, and where to focus on ocean clean-up. 6. Show what the ducks revealed about ocean currents by adding arrows to this map: https://commons.wikimedia.org/wiki/File:ColoredBlankMap-World-162E.svg Computer-based mathematical models Scientific models are representations of the natural world. Models can be physical - a larger or smaller copy of an object. Models can be conceptual - representing a phenomenon with an illustration or system of organization. Models can also be mathematical - applying mathematical formulas and data to show events and make predictions about outcomes. These mathematical models often employ computers to make calculations and show results.
-
Upload
khangminh22 -
Category
Documents
-
view
1 -
download
0
Transcript of Answer Keys - CSOMIO

Answer Keys 45
Answer Keys
Lesson 1: Go with the Flow!
Inquiry question: How do computers help us predict changes in systems? Duck Drifters Watch the video https://www.youtube.com/watch?v=eLMSMs6AYYc and answer these questions. 1. How many ducks were in the container lost at sea?
29,000
2. What made the ducks move?
The ducks were carried across the ocean by surface currents.
3. Where would you go today if you wanted to find one of the ducks?
Today, you can find them all over the world. They have made their way into the North Atlantic and are found in Scotland.
4. What factors are important in determining where a duck will wash ashore?
The speed and direction of ocean currents are most important in determining where a duck will wash ashore.
5. What is the value of collecting data about the ducks’ locations?
Collecting data about the ducks’ location helps us to understand where the gyres are in the ocean, how the Great Pacific Garbage Patch formed, and where to focus on ocean clean-up.
6. Show what the ducks revealed about ocean currents by adding arrows to this map:
https://commons.wikimedia.org/wiki/File:ColoredBlankMap-World-162E.svg
Computer-based mathematical models
Scientific models are representations of the natural world. Models can be physical - a larger or smaller copy of an object. Models can be conceptual - representing a phenomenon with an illustration or system of organization. Models can also be mathematical - applying mathematical formulas and data to show events and make predictions about outcomes. These mathematical models often employ computers to make calculations and show results.

46 Modeling the Gulf: A Curriculum for Middle School Science
7. Give an example of a physical model
Examples may include: dioramas, solar system mobile, architectural models/mockups, model airplanes or trains, anatomical skeletons or organs, etc.
8. Give an example of a conceptual model
Examples may include: flow-charts, diagrams and illustrations, verbal or written explanations, etc.
9. Give an example of a mathematical model
Examples may include: Newton’s laws, population growth models, gas laws, computer simulations, weather predicting model, etc.
In order to represent what happens to rubber ducks, or other materials in the ocean, we will use a computer-based mathematical model. Start by running a model of rubber ducks dropped in the ocean.
StarLogo Nova
Run the Model Floating Ducks Ver1 on StarLogo Nova (SLNova.org).
10. What things are shown in this model?
In this model, the ocean with currents, the speed and direction of those currents, and the movement of the ducks is included.
11. How does this model show a system (a group of related parts that make up a whole)?
The speed and direction of the currents interact to move the ducks around. This shows how the ducks interact with the ocean as a system.
12. Does this model show what really happens in the ocean system? Tell your evidence.
This does not show what really happens in the ocean system. The currents don’t make gyres and there are no land masses for the ducks to wash onto. There isn’t wind to direct the currents or any other weather that might affect how and where the ducks go.
13. What other things could you add to make a better model to show the fate of ducks dropped into the ocean?
I would add the shape of the ocean, where the continents are, how deep the water is, and actual currents that show things like the gyres and Great Pacific Garbage Patch.
Members of the ocean system: the actual things in the ocean system (living and non-living)
Variables: environmental conditions that can vary and influence the system (such as currents and water temperature)
Water Seafloor Rocks Fish Plankton Whales
Currents Salinity Wind (speed and directions) Weather conditions Depth Water temperature Waves
One way to refine this model would be to add code that takes into account wind direction and speed. Test out Model Floating Ducks Flow Ver1. Does this do a better job of modeling the ducks? Examine the code. What is different about how this is programmed?
This code is programmed so that instead of the ducks spreading out randomly, the person running the model chooses the direction and speed of the currents. It is more realistic, since the currents do flow in one direction, but they still don’t move in circles.

Answer Keys 47
Lesson 2: Oil Remediation
Inquiry question: What happens to oil in the ocean?
With a partner, talk about some properties of oil (cooking oil, motor oil, gasoline, etc.). How do these properties affect how oil acts in the environment and how it impacts ecosystems? Be prepared to share at least one idea with the class.
Match the descriptions below with the processes named in the diagram from NOAA’s Office of Response and Restoration.
Source NOAA: https://response.restoration.noaa.gov/oil-and-chemical-spills/oil-spills/weathering-processes-affecting-spills
1. Absorption – The process by which one substance is attracted to and adheres to the surface of another substance without actually penetrating its internal structure (includes sedimentation).
2. Biodegradation – The degradation of substances resulting from their use as food energy sources by certain microorganisms including bacteria, fungi, and yeasts.
3. Dispersion – The distribution of spilled oil into the upper layers of the water column by natural wave action or application of chemical dispersants.
4. Dissolution – The act or process of dissolving one substance in another.
5. Emulsification – The process whereby one liquid is dispersed into another liquid in the form of small droplets.
6. Evaporation – The process whereby any substance is converted from a liquid state to become part of the surrounding atmosphere in the form of a vapor.
7. Photo oxidation – Sunlight-promoted chemical reaction of oxygen in the air and oil.
List the ways oil might be “removed” from an ecosystem. What are some advantages and disadvantages to each method? Oil skimmers can confine the oil to one area so that it can be removed more easily, but they don’t work very well under rough conditions or if the oil has already spread out over a wide area.

48 Modeling the Gulf: A Curriculum for Middle School Science
Oil absorbers soak up the oil and are good at removing it from the water, but they can be expensive, and also required workers to gather them and take them out of the water. They work best in small spills or to gather the last of a large spill, so they’re best when used with other methods. Burning off the oil can be very effective at removing a thick layer on the surface of the water. This doesn’t work very well if a lot of the oil has already evaporated or sunk. It also increases air pollution in the area and can harm wildlife or workers. Dispersants are good for oil that has already spread out and is in a thinner layer, and they break up the oil so that it is more likely to evaporate or be broken down. Dispersants can be toxic, though, and don’t work at all temperatures. Bioremediation uses microbes to break down the oil. These microbes already exists in the ocean so they are not harmful, but too many of them can use up all the oxygen in the water and kill fish. It’s also difficult to get enough of them to clean up a very large oil spill. Read the passage “Oil Spill Removal and Cleanup”. Are any of your ideas being used in real-life oil spills? Answers may vary.
Applying what you learned Login to StarLogo Nova (use the StarLogo Nova guide if you need help). Open Model Oil Ver1 in StarLogo Nova. 8. How well does this model show what happens during an ocean oil spill? This model shows the oil dispersing into the ocean, but it does not include any of the ways in which oil gets broken down and leaves the ocean, like dispersion, dissolution, biodegradation, evaporation, emulsification, etc
9. What could we add to this model to make it more accurate? We can add any of those natural processes, or some of the human removal efforts, or microbes that eat oil. We can also add real currents to see which way the oil moves.
10. How could we add the unused blocks on the right-hand side of the coding workspace to model how microbes act on oil in the ocean? Those coding blocks can be used to create the features in question 9.

Answer Keys 49
Lesson 3: Visualizing Ocean Currents
Inquiry question: What causes oceanic currents?
These activities will help you understand the phenomena that drive ocean currents. Rheoscopic fluids will be used. The prefix rheo- means flow and the root -scopic means see. The fluids we will use will help us see the movement of water.
Each group needs to follow your teacher’s instructions for obtaining: safety goggles, 1 smooth-walled bottle of rheoscopic fluid, several straws, a stirring rod or metal utensil, one ice cube, dishes of saltwater and freshwater, a shallow dish with room temperature water.
First pass the bottle of rheoscopic fluid to all of your lab partners to examine. Discuss with your partners what you observe. For the remainder of these procedures, try to make sure you keep the fluid as still as possible as you begin each activity.
Procedure 1 - Warm water bath
Leave the rheoscopic fluid bottle on the table for 1 minute to allow the movement of particles to slow. Carefully place the bottle containing room temperature rheoscopic fluid into a larger dish of very warm water. Observe the flow of the fluid in the bottle (use a flashlight, if available).
Procedure 2 - Blowing across surface
Once you and your lab partners have recorded observations for procedure 1, pour rheoscopic fluid into a shallow tray. The fluid should not fill more than half of the tray. Use a drinking straw (do not share a straw with your partners) to very gently blow a full breath of air parallel to the fluid surface. Describe what you observe in the data table. Repeat blowing and observing using a slightly stronger and then a stronger force. Observe how blowing affects movement of water in the dish.
Procedure 3 - Salt and freshwater mixing
Put the red ice cubes in both containers and watch where the melt water goes. This melt water represents the cold/salty dense water in the poles. The top layer of fresh water is the surrounding surface waters and the bottom salty layer represents the deep dense layers in the ocean.
Procedure Treatment Which process are we modeling?
Observations
1. In a warm water bath Initially placed in water Convection Initially, water moved in all directions.
After 2 minutes Convection After 2 minutes, water starts to rise from the bottom to the top, then sink again. It creates a loop.
2. Blowing across surface Gentle blowing Low wind speed, breezes The water slowly moved in the same direction as the wind blows, but does not make waves.
Medium blowing Medium wind speed The water moves more quickly and there are ripples on the water.
Strong blowing High winds, storms, hurricanes
The water moves faster, the ripples start to make waves and it splashes on the sides of the tray.
3. Salt and freshwater mixing As colors start to flow Thermohaline circulation The ice cubes float on top of the water.
After 3 minutes Thermohaline circulation As the ice cubes melt, the red water sinks to the bottom.
Procedure 5 - Coriolis effect Watch this video https://www.youtube.com/watch?v=6L5UD240mCQ and discuss. How does Coriolis effect influence the movement of water in the ocean?

50 Modeling the Gulf: A Curriculum for Middle School Science
Without the Coriolis effect, water would just go north and south. As the earth rotates, water in the Northern hemisphere curves to the right as it goes toward the pole. Water in the southern hemisphere curves to the left as it moves from the equator to the pole. Wrapping it up Now read about ocean currents and watch this video from NOAA https://oceanservice.noaa.gov/podcast/apr14/mw123-currents.html.
1. What is an eddy? An eddy is a circular current of water. 2. What is the Loop Current? The Loop Current moves water from the Yucatan peninsula in Mexico, up
to the US Gulf Coast and between Florida and Cuba out to the Atlantic Ocean. 3. Name three factors that put the motion in the ocean. Water temperature and salinity, and wind.
View the live current map at https://earth.nullschool.net/#current/ocean/surface/currents/orthographic and zoom into the Gulf of Mexico. 5. What was happening in the Gulf of Mexico? How is it connected to the rest of the Atlantic Ocean? Answers may vary 6. How do you think understanding currents can help us when oil spills happen? The currents might carry oil from the Gulf of Mexico out to the Atlantic Ocean. If this happens, the damage will be over a much bigger area. By understanding the currents, scientists can try to prevent this and keep the oil spill confined.
Lesson 4: The Gulf of Mexico Ecosystem
Inquiry question: How is the Gulf of Mexico a system?
For this activity, you will use information from Gulf of Mexico Ecosystem: A Coastal and Marine Atlas (Ocean Conservancy publication) https://oceanconservancy.org/wp-content/uploads/2017/05/gulf-atlas.pdf. This document used a variety of scientific sources to compile data about many parts of the Gulf of Mexico ecosystem.
Take a look at the cover of the Atlas and notice who made it and when. It was produced after the Deepwater Horizon oil disaster to be a resource for people interested in restoring the Gulf of Mexico.
Before diving into your task, take a look at the project area map in the Atlas.
1. Write down 5 things you observe:
Answers may vary.
2. Approximately how far does one centimeter on this map represent?
About 50 kilometers
3. What kinds of data do you think will be shown in the Atlas?
Answers may vary.
4. Watch the following video https://www.fisheries.noaa.gov/southeast/ecosystems/gulf-mexico-regional-ecosystem.
Define Gulf of Mexico Ecosystem:
The Gulf of Mexico ecosystem stretches from the southern coast of the US in the north to Mexico in the south and west, and Cuba in the east. It is a marine ecosystem and includes nonliving factors such as water, temperature, depth, salinity, wind, and weather. It also includes living organisms such as plankton, fish, whales, dolphins, turtles, crabs, and shrimp.
Your teacher will pass out some maps for you to share with nearby students. Examine each map and be ready to share something you notice.
Your task:
Now that you are familiar with the area, you will be working in a team to conduct an analysis of the ecosystem. Your group is a research team from universities around the Gulf of Mexico coast. The team includes a physical oceanographer, marine biologist, resource manager, and communications coordinator. Groups like this are interdisciplinary. By having a team with expertise in many areas, your group can get the big picture about what is happening in a system. Your teacher will assign your team and role.

Answer Keys 51
Physical oceanographers are experts in the physical properties and changes in the ocean. They may study currents, salinity, dissolved oxygen and carbon dioxide, or other chemicals.
Marine biologists study the living things in the ocean. This can include the very largest fish or the tiniest bacterium and everything in between.
Resource managers have the job of assessing the abundance of all the types of resources in the ocean and advising lawmakers and other agencies. They plan for the long-term sustainability of ocean resources.
Communications coordinators help scientists share information with the public in a way that they can understand. Communications coordinators help us understand why scientific research is relevant to our lives.
The team has received correspondence from a citizen. It’s your job to investigate by using data from the Atlas. Your team should use the maps and accompanying text related to different parts of the ecosystem. Once your team has made a conclusion, you will prepare a response to the citizen. This will be presented to the class as a poster or single slide using the format below.
The presentation is the reply to original correspondence. Presenters must include: A summary of the problem A claim (state whether the team thinks there may be an issue of concern or not) and what should be
done about it, Evidence (actual scientific data that supports this claim), and Reasoning (a scientific explanation of the principles that justify using this data to make the claim). Teams should also answer any other questions posed in the correspondence. Answers to these
might be found in the text description that precedes each map in the Atlas.
The Problem Group members and Roles
Our Claim
Evidence Reasoning
Answers will vary depending on which maps and prompts are used. Please see the rubric on the following page for grading guide.

4 3 2 1 0 Claim – a conclusion that answers the original question
Scientifically accurate Completely answers the
question
Scientifically accurate Nearly completely answers
the question
Partially scientifically accurate
Partially answers the question
Is not scientifically accurate overall
Does not adequately answer the question
No claim
Evidence – scientific data that supports the claim
The data are scientifically appropriate to support the claim.
At least 2 maps are used to produce detailed data
Proper units are used in data
The data are scientifically appropriate to support the claim
Data comes from a single map or lacks detail
Evidence may be repetitive
The data relate to the claim, but are not entirely scientifically appropriate
Data is include but is insufficient and/or not attributed to a map
There is some evidence provided, but it is not logically linked to the claim or scientifically appropriate
No evidence provided
Reasoning – a justification that links the claim and evidence
Reasoning clearly links evidence to claim
Shows why the data count as evidence by using appropriate scientific principles
There are at least two examples of relating a data point to the claim
Reasoning adequately links claim to evidence
Includes related scientific principles, but only passably clarifies why this data count as evidence
There is at least one example of relating a data point to the claim
Reasoning does not adequately link claim to evidence, or clarify why data count as evidence
Includes non-related scientific principles, and shows little depth of content understanding
Reasoning is clearly insufficient and relates only tangentially to question and claim at hand
Scientific understanding is very limited
Does not provide reasoning
Language and Vocabulary
Response expresses ideas in complete sentences with specific examples using vocabulary from the reading
Response expresses ideas in complete sentences, but examples are generic and/or lack scientific terms
Response inconsistently and sometimes inappropriately expresses ideas or scientific descriptions and vocabulary
Scientific language and vocabulary are not precise or appropriate
Not under- standable
Rubric adapted from National Science Teachers Association (NSTA)

Answer Keys 53
Lesson 5: Pair Programming to Refine an Ocean Model
Inquiry question: How do scientists refine computer-based mathematical models?
The final phase of the unit is to use what you’ve learned to make a more refined oil spill model. Work with a partner for this activity.
1. Use the StarLogo Nova Student Guide to create a login on the website. Email addresses are not required. Your programming team will share the login.
2. Load the Model Floating Ducks Ver1 model.
3. Play around with changing the code to make this model do different things. Troubleshoot as you run into problems. If you get too lost, you can always re-load the original model.
Which features did you change in the model and what was the result?
Answers may vary.
4. Open our current oil spill model - Model Oil Dispersal with Current Ver2.
5. Run the model and describe what happens.
Answers may vary.
6. Now it’s time to include some new information in this model. Choose from one of these options to refine the model. If you are successful, see if you can use two or three of these options.
a. There are oil-consuming microbes present in the area. These microbes must eat 5 units of oil in order to have enough energy to reproduce. To represent this in the model, there is a 20% chance of reproduction after each encounter with an oil particle.
The change percentage is used here because in this software, a counter variable cannot be attached to a collision event.
The following screenshots show an example of how this can be set up. Note that there are several pages that can be toggled between, displayed at the top.
First, the interface needs to be created. “Run model” and “setup” are there as default options.
In order to later introduce the microbes to the simulation, a third button needs to be added. To add a new button, click “Edit Interface” (the text on the button will then change to “Lock Interface”. Click on “Create Widget” and scroll down to “Push button”, which will appear in the interface. Students can name this whatever they feel is appropriate for their model. This example uses “save ocean”.

54 Modeling the Gulf: A Curriculum for Middle School Science
This sends the data to the output graph.
This dictates what happens as soon as the simulation starts. When setup is pressed, it spawns 1000 oil units and sets the clock to zero.
This creates one microbe.
This is the code that instructs the microbe to consume the oil and reproduce
This instructs the microbes how to move based on ocean currents

Answer Keys 55
To run the model, click “run model” and ensure that the off/on button is green. Next, click “setup” to add oil to the simulation. It’s recommended to let the model run for 5-10 seconds to observe the movement and behavior of oil particles before clicking “save ocean”, which introduces oil-eating microbes.
b. Different types of oil evaporate at different rates. Jet fuel evaporates at a rate of .002 percent per time
unit. Diesel evaporates at a rate of .001 percent per time unit. Crude oil evaporates at a rate of .0005 percent per time unit.
In real life, there comes a point where oil stops evaporating and either sinks or goes into the food chain. Due to limitations of the modeling software, this is difficult to include in the model. The following screenshots show an example of how an oil evaporation model can be set up. Note that there are several pages that can be toggled between, shown at the top.
This instructs oil particles how to move based on ocean currents.

56 Modeling the Gulf: A Curriculum for Middle School Science
This dictates what happens as soon as the simulation starts. When setup is pressed, it spawns 1000 particles of oil and sets the clock to zero.
This describes the movement and evaporation rate for the diesel particles.
This sends the data to the output graph.

Answer Keys 57
To run the model, click “run model” and ensure that the off/on button is green. Next, click “setup” which will add the oil particles to the model which will then start to evaporate.
This describes the movement and evaporation rate for the jet fuel particles.
This describes the movement and evaporation rate for the crude oil particles.

58 Modeling the Gulf: A Curriculum for Middle School Science
c. Oil-consuming microbes will reproduce rapidly in the presence of oil, but as oil runs out, the microbes
die off. This die-off starts to happen after 100 time units and there is a .005 percent chance of dying per time unit after 100. Once they die, microbes will sink to the bottom.
The counter for time units begins when the first microbe is created, as that starts the process of using up the oil as a food source.
This sends the data to the two output graphs.
This spawns one microbe when save ocean is clicked.
This dictates what happens as soon as the simulation starts. When setup is pressed, it spawns 1000 microbes and sets the clock to zero.
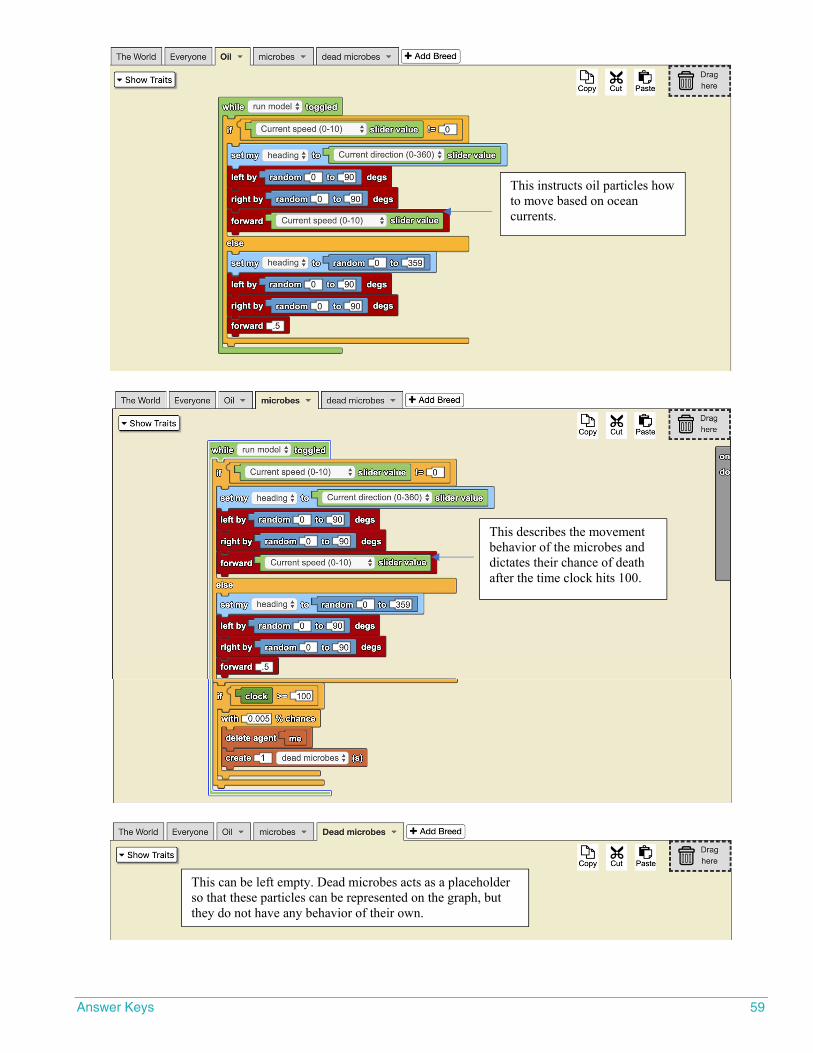
Answer Keys 59
This instructs oil particles how to move based on ocean currents.
This describes the movement behavior of the microbes and dictates their chance of death after the time clock hits 100.
This can be left empty. Dead microbes acts as a placeholder so that these particles can be represented on the graph, but they do not have any behavior of their own.

60 Modeling the Gulf: A Curriculum for Middle School Science
Now that you and your partner have developed a computer-based mathematical model for the fate of oil, share your work.
StarLogo Nova will give you the option of creating a graph from your data.
Conclusion questions:
1. Which options did you choose for your final model?
Answers may vary.
2. What was the most challenging part of programming?
Answers may vary.
3. Could you use this model to predict what would happen in the Gulf of Mexico?
This model can be used to predict what would happen in the Gulf of Mexico, because it includes many ways for the oil to leave the system. However, it is still incomplete.
4. What other features of the system could be included in this model to make it a more realistic representation of the Gulf of Mexico?
Examples may include: human oil removal efforts, wind and waves, rough weather, movement in the Loop Current, ocean bathymetry and interaction with landmasses/shorelines, continued leaking of oil, reactions with chemical dispersants, etc.