ansi s12.2 noise.pdf - William J. Hughes Technical Center
50
ANSI/ASA S12.2-2008 (Revision of ANSI S12.2-1995) AMERICAN NATIONAL STANDARD Criteria for Evaluating Room Noise Accredited Standards Committee S12, Noise Standards Secretariat Acoustical Society of America 35 Pinelawn Road, Suite 114 E Melville, NY 11747-3177 ANSI/ASA S12.2-2008 Copyright Acoustical Society of America Provided by IHS under license with ASA Sold to:FAA WJH TECH CNTR (TDX DA), 01868452 Not for Resale,2011/7/18 16:30:11 GMT No reproduction or networking permitted without license from IHS --```,,`,,,,,`,`,`,,`,,-`-`,,`,,`,`,,`---
-
Upload
khangminh22 -
Category
Documents
-
view
0 -
download
0
Transcript of ansi s12.2 noise.pdf - William J. Hughes Technical Center

ANSI/ASA S12.2-2008
(Revision of ANSI S12.2-1995)
AMERICAN NATIONAL STANDARD Criteria for Evaluating Room Noise
Accredited Standards Committee S12, Noise
Standards Secretariat Acoustical Society of America 35 Pinelawn Road, Suite 114 E Melville, NY 11747-3177
AN
SI/A
SA S
12.2
-200
8
Copyright Acoustical Society of America Provided by IHS under license with ASA Sold to:FAA WJH TECH CNTR (TDX DA), 01868452
Not for Resale,2011/7/18 16:30:11 GMTNo reproduction or networking permitted without license from IHS
--```,,`,,,,,`,`,`,,`,,-`-`,,`,,`,`,,`---

The American National Standards Institute, Inc. (ANSI) is the national coordinator of voluntary standards development and the clearinghouse in the U.S.A. for information on national and international standards.
The Acoustical Society of America (ASA) is an organization of scientists and engineers formed in 1929 to increase and diffuse the knowledge of acoustics and to promote its practical applications.
Copyright Acoustical Society of America Provided by IHS under license with ASA Sold to:FAA WJH TECH CNTR (TDX DA), 01868452
Not for Resale,2011/7/18 16:30:11 GMTNo reproduction or networking permitted without license from IHS
--```,,`,,,,,`,`,`,,`,,-`-`,,`,,`,`,,`---

ANSI/ASA S12.2-2008 (Revision of ANSI S12.2-1995)
AMERICAN NATIONAL STANDARD
Criteria for Evaluating Room Noise
Secretariat:
Acoustical Society of America
Approved July 3, 2008 by:
American National Standards Institute, Inc.
Abstract
This Standard provides three primary methods for evaluating room noise: a survey method that employs the A-weighted sound level; an engineering method that employs expanded noise criteria (NC) curves; and a method for evaluating low-frequency fluctuating noise using room noise criterion (RNC) curves.
Copyright Acoustical Society of America Provided by IHS under license with ASA Sold to:FAA WJH TECH CNTR (TDX DA), 01868452
Not for Resale,2011/7/18 16:30:11 GMTNo reproduction or networking permitted without license from IHS
--```,,`,,,,,`,`,`,,`,,-`-`,,`,,`,`,,`---

AMERICAN NATIONAL STANDARDS ON ACOUSTICS
The Acoustical Society of America (ASA) provides the Secretariat for Accredited Standards Committees S1 on Acoustics, S2 on Mechanical Vibration and Shock, S3 on Bioacoustics, S3/SC 1 on Animal Bioacoustics, and S12 on Noise. These committees have wide representation from the technical community (manufacturers, consumers, trade associations, organizations with a general interest, and government representatives). The standards are published by the Acoustical Society of America through the American Institute of Physics as American National Standards after approval by their respective Standards Committees and the American National Standards Institute (ANSI).
These standards are developed and published as a public service to provide standards useful to the public, industry, and consumers, and to Federal, State, and local governments.
Each of the Accredited Standards Committees (operating in accordance with procedures approved by ANSI) is responsible for developing, voting upon, and maintaining or revising its own Standards. The ASA Standards Secretariat administers Committee organization and activity and provides liaison between the Accredited Standards Committees and ANSI. After the Standards have been produced and adopted by the Accredited Standards Committees, and approved as American National Standards by ANSI, the ASA Standards Secretariat arranges for their publication and distribution.
An American National Standard implies a consensus of those substantially concerned with its scope and provisions. Consensus is established when, in the judgment of the ANSI Board of Standards Review, substantial agreement has been reached by directly and materially affected interests. Substantial agreement means much more than a simple majority, but not necessarily unanimity. Consensus requires that all views and objections be considered and that a concerted effort be made towards their resolution.
The use of an American National Standard is completely voluntary. Their existence does not in any respect preclude anyone, whether he or she has approved the Standards or not, from manufacturing, marketing, purchasing, or using products, processes, or procedures not conforming to the Standards.
NOTICE: This American National Standard may be revised or withdrawn at any time. The procedures of the American National Standards Institute require that action be taken periodically to reaffirm, revise, or withdraw this Standard.
Acoustical Society of America ASA Secretariat 35 Pinelawn Road, Suite 114E Melville, New York 11747-3177 Telephone: 1 (631) 390-0215 Fax: 1 (631) 390-0217 E-mail: [email protected]
©2008 by Acoustical Society of America. This standard may not be reproduced in whole or in part in any form for sale, promotion, or any commercial purpose, or any purpose not falling within the provisions of the U.S. Copyright Act of 1976, without prior written permission of the publisher. For permission, address a request to the Standards Secretariat of the Acoustical Society of America.
Copyright Acoustical Society of America Provided by IHS under license with ASA Sold to:FAA WJH TECH CNTR (TDX DA), 01868452
Not for Resale,2011/7/18 16:30:11 GMTNo reproduction or networking permitted without license from IHS
--```,,`,,,,,`,`,`,,`,,-`-`,,`,,`,`,,`---

i
Contents
1 Scope ............................................................................................................................................... 1
2 Normative references ....................................................................................................................... 2
3 Terms, definitions, abbreviations, and symbols ............................................................................... 2
4 Significance and use of this Standard and deviations from the previous ANSI S12.2-1995 ........... 4
5 Criteria .............................................................................................................................................. 6 5.1 A-weighted criteria .................................................................................................................... 6 5.2 NC (noise criteria) curves ......................................................................................................... 6 5.3 RNC (room noise criterion) .....................................................................................................10
6 Acoustically induced vibrations and rattles .................................................................................... 17
Annex A (informative) Example evaluations using RNC ..................................................................... 18 A.1 Evaluation of room noise using the RNC curves .................................................................... 18 A.2 Example 1 — Excessive turbulence (large standard deviation) and minimal surging............ 18 A.3 Example 2 — Strong surging and strong turbulence .............................................................. 21
Annex B (informative) A discussion of the criteria............................................................................... 24 B.1 Discussion of RC, NC, and NCB criteria curves ..................................................................... 24 B.2 Discussion of RNC criteria curves .......................................................................................... 25
Annex C (informative) Recommended noise level criteria for various occupied activity areas........... 26 C.1 Recommended A-weighted criteria......................................................................................... 26 C.2 Recommended NC and RNC criteria...................................................................................... 27
Annex D (informative) RC Mark II........................................................................................................ 30 D.1 Introduction ............................................................................................................................. 30 D.2 Room criterion curves ............................................................................................................. 30 D.3 Spectrum classification ........................................................................................................... 30 D.4 Method for calculating an RC value ........................................................................................ 33 D.5 Quality assessment index (QAI) ............................................................................................. 33 D.6 Recommended criteria............................................................................................................ 33
Annex E (informative) Criteria for recording studios and other low-noise situations........................... 35 E.1 Criteria..................................................................................................................................... 35 E.2 Recording studio "audibility" threshold curves........................................................................ 35
Bibliography........................................................................................................................................... 37
Tables
Table 1 — Octave-band sound levels to the nearest decibel for noise criteria curves [15, p. 893] ........ 7
Copyright Acoustical Society of America Provided by IHS under license with ASA Sold to:FAA WJH TECH CNTR (TDX DA), 01868452
Not for Resale,2011/7/18 16:30:11 GMTNo reproduction or networking permitted without license from IHS
--```,,`,,,,,`,`,`,,`,,-`-`,,`,,`,`,,`---

ii
Table 2 — Measured sound pressure deviations from an NC (SIL) curve that may lead to serious complaints ........................................................................................................................................ 9
Table 3 — Screening criteria to determine the presence of large random fluctuations ........................ 11
Table 4 — Octave-band sound pressure levels to the nearest decibel for room noise criteria curves [10] ................................................................................................................................................. 11
Table 5 — Coefficients to calculate an RNC value from a given octave-band level, or an octave-band level from a given RNC value — see Eqs. (1) and (2) ................................................................... 13
Table 6 — Measured sound pressure levels for perceptible vibration and rattles in lightweight wall and ceiling structures ............................................................................................................................ 17
Table A.1 — This table shows the first 5 samples for Example 1......................................................... 19
Table A.2 — This table contains the summary data for Example 1 ...................................................... 19
Table A.3 — These data represent artificially generated Gaussian noise. This table shows the first 20 samples for Example 2. The sample period is 100 ms and the octave-band levels are fast-time weighted. The OASPL has been calculated as the energy sum of the 10 indicated octave-band levels. The “3-band sum” is the energy sum of the 16, 31.5, and 63-Hz octave-band levels after 14 dB have been subtracted from the 16-Hz octave-band levels and 14 dB have been added to the 63-Hz octave-band levels. Surging has been implemented as a sine wave with a 2-s period and a 15-dB peak-to-peak amplitude. ............................................................................................ 21
Table A.4 — This table contains the summary data for Example 2. The LEQ is the energy average for all time samples represented by the indicated column. The 3-band sum correction of 11.3 dB is added to the 31.5-Hz octave band LEQ and the 1.6-dB correction at 125 Hz is added to the LEQ in this octave band. Therefore, the reported adjusted 31.5-Hz octave-band level is 73.1 (the LEQ of 61.8 in the 31.5-Hz octave band plus the adjustment of 11.3 dB). The reported level in the 125-Hz octave band is just the 125-Hz LEQ plus 1.6. .......................................................................... 22
Table C.1 — A-weighted (unoccupied) sound level criteria for rooms of various uses [15, p. 890] ..... 26
Table C.2 — NC and RNC (unoccupied) criteria values for rooms of various uses [15, p. 891] .......... 27
Table D.1 — Mark II room criteria (RC) curves..................................................................................... 31
Table D.2 — RC criteria for various activity areas excluding the noise due to human occupancy. The (N) stands for a neutral spectrum as defined in Clause D.3.1. ...................................................... 34
Table E.1 — Recording studio "audibility" threshold for one-third octave bands — see [8] ................. 36
Figures
Figure 1 — Noise criteria (NC) curves – The example shows an NC-51 (125 Hz) spectrum................. 8
Figure 2 — Room noise criteria (RNC) curves...................................................................................... 12
Figure A.1 — The spectrum of Example 1 plotted on the RNC curves. In this example sound exhibits no surging, but it does include large turbulence. The standard deviation of the sound level in the 3-band sum combined 16, 31.5 and 63-Hz octave bands is 3.2 dB. Using the tangent method, the
Copyright Acoustical Society of America Provided by IHS under license with ASA Sold to:FAA WJH TECH CNTR (TDX DA), 01868452
Not for Resale,2011/7/18 16:30:11 GMTNo reproduction or networking permitted without license from IHS
--```,,`,,,,,`,`,`,,`,,-`-`,,`,,`,`,,`---

iii
highest RNC curve is contacted by the 31.5-Hz octave band and has a value of RNC-40. So this spectrum is reported as an RNC-40 (31.5 Hz). The correction factor of 3.6 dB that is added to the measured LEQ in the 31-Hz octave band changes this spectrum from an RNC-31 (8 kHz) to an RNC-40 (31.5 Hz)........................................................................................................................... 20
Figure A.2 — The spectrum of Example 2 plotted on the RNC curves. In this example sound exhibits 15-dB peak-to-peak sinusoidal surging and large turbulence. The standard deviation of the sound level in the 3-band sum combined 16, 31.5 and 63-Hz octave bands is 3.1 dB. Using the tangent method, the highest RNC curve is contacted by the 31.5-Hz octave band and has a value of RNC-44. So this spectrum is reported as an RNC-44 (31.5 Hz). The correction factor of 11.3 dB that is added to the measured LEQ in the 31.5-Hz octave band changes this spectrum from an RNC-25 (250 Hz) to an RNC-44 (31.5 Hz)..................................................................................... 23
Figure D.1 — Mark II room criteria curves ............................................................................................ 32
Copyright Acoustical Society of America Provided by IHS under license with ASA Sold to:FAA WJH TECH CNTR (TDX DA), 01868452
Not for Resale,2011/7/18 16:30:11 GMTNo reproduction or networking permitted without license from IHS
--```,,`,,,,,`,`,`,,`,,-`-`,,`,,`,`,,`---

iv
Foreword
[This Foreword is for information only and is not a part of the American National Standard ANSI/ASA S12.2-2008 American National Standard Criteria for Evaluating Room Noise.]
This standard comprises a part of a group of definitions, standards, and specifications for use in noise. It was developed and approved by Accredited Standards Committee S12, Noise, under its approved operating procedures. Those procedures have been accredited by the American National Standards Institute (ANSI). The Scope of Accredited Standards Committee S12 is as follows:
Standards, specifications, and terminology in the field of acoustical noise pertaining to methods of measurement, evaluation, and control; including biological safety, tolerance, and comfort, and physical acoustics as related to environmental and occupational noise.
This standard is a revision of ANSI S12.2-1995, which has been technically revised. The NCB has been replaced by NC curves that have been extended down to 16 Hz, which makes them nearly the same as the NCB curves. The RC procedures of the 1995 edition now also are presented briefly in an informative Annex. This new Standard provides three primary methods for evaluating room noise: a survey method that employs the A-weighted sound level; an engineering method that employs expanded noise criteria (NC) curves; and a method for evaluating low-frequency fluctuating noise using room noise criterion (RNC) curves.
This standard is not comparable to any existing ISO Standard.
At the time this Standard was submitted to Accredited Standards Committee S12, Noise, for approval, the membership was as follows:
R.D. Hellweg, Chair W.J. Murphy, Vice-Chair
S.B. Blaeser, Secretary Acoustical Society of America....................................................................................................B.M. Brooks Aearo Company.............................................................................................................................E.H. Berger Air-Conditioning and Refrigeration Institute .....................................................................................R. Seel ................................................................................................................................................... D. Brown (Alt.) Alcoa, Inc. ................................................................................................................................ W.D. Gallagher American Industrial Hygiene Association..................................................................................... D. Driscoll ...............................................................................................................................................S.N. Hacker (Alt.) American Society of Heating, Refrigeration and Air-Cond........................................................ R.J. Peppin ............................................................................................................................................ E. Rosenberg (Alt.) American Speech-Language -Hearing Association .................................................................... L.A. Wilber ............................................................................................................................................. V. Gladstone (Alt.) Bruel & Kjaer Instruments, Inc.................................................................................................. M. Alexander ......................................................................................................................................................J. Chou (Alt.)
Copyright Acoustical Society of America Provided by IHS under license with ASA Sold to:FAA WJH TECH CNTR (TDX DA), 01868452
Not for Resale,2011/7/18 16:30:11 GMTNo reproduction or networking permitted without license from IHS
--```,,`,,,,,`,`,`,,`,,-`-`,,`,,`,`,,`---

v
Caterpillar, Inc. .................................................................................................................................K.G. Meitl .................................................................................................................................................... D. Roley (Alt.) Compressed Air and Gas Institute..........................................................................................J.H. Addington ...........................................................................................................................................D.R. Bookshar (Alt.) Council for Accreditation in Occupational Hearing Conservation.............................................. J. Banach ............................................................................................................................................... E.H. Berger (Alt.) Emerson Electric – Copeland Corporation .................................................................................. A.T. Herfat General Motors ..................................................................................................................................D. Moore Howard Leight Industries .....................................................................................................................B. Witt ...................................................................................................................................................V. Larson (Alt.) Information Technology Industry Council ................................................................................R.D. Hellweg .............................................................................................................................................J. Rosenberg (Alt.) Institute of Noise Control Engineering ........................................................................................ B. Tinianov ................................................................................................................................................... M. Lucas (Alt.) International Safety Equipment Association ................................................................................. J. Birkner .............................................................................................................................................. J.C. Bradley (Alt.) James, Anderson & Associates .............................................................................................R.R. Anderson ............................................................................................................................................... R.R. James (Alt.) John Deere.......................................................................................................................................... K. Cone National Council of Acoustical Consultants ................................................................................ J. Erdreich ...............................................................................................................................................G.E. Winzer (Alt.) National Hearing Conservation Association.................................................................................K. Michael National Institute for Occupational Safety and Health............................................................. W.J. Murphy ..........................................................................................................................................M. Stephenson (Alt.) Noise Control Engineering, Inc. ................................................................................................ M. Bahtiarian ..................................................................................................................................................R. Fischer (Alt.) North American Insulation Manufacturers Association...........................................................R.D. Godfrey PCB Group .............................................................................................................................................K. Cox .............................................................................................................................................. L. Harbaugh (Alt.) Plantronics, Inc................................................................................................................................. K.A. Woo Power Tool Institute, Inc. .......................................................................................................... W.D. Spencer .................................................................................................................................................. M. Hickok (Alt.) Quest Technologies, Inc. ..................................................................................................................M. Wurm ............................................................................................................................................P. Battenberg (Alt.) Rubber Manufacturers Association ...............................................................................................S. Butcher ...................................................................................................................................................A. Hartke (Alt.) SAE .................................................................................................................................................C. Michaels Schomer and Associates, Inc................................................................................................... P.D. Schomer
Copyright Acoustical Society of America Provided by IHS under license with ASA Sold to:FAA WJH TECH CNTR (TDX DA), 01868452
Not for Resale,2011/7/18 16:30:11 GMTNo reproduction or networking permitted without license from IHS
--```,,`,,,,,`,`,`,,`,,-`-`,,`,,`,`,,`---

vi
U.S. Air Force (USAF) .................................................................................................................. R. McKinley U.S. Army Aeromedical Research Lab ..........................................................................................W. Ahroon ..................................................................................................................................................... N. Alem (Alt.) U.S. Army Center for Health Promotion and Preventive Medicine ......................................... W.A. Russell ..........................................................................................................................................W.D. Whiteford (Alt.) U.S. Army Research Laboratory, Human Research and Engineering Directorate ..........................J. Kalb ..............................................................................................................................................M.S. Binseel (Alt.) U.S. Army Construction Engineering Research Laboratories ...................................................... M. White ..................................................................................................................................................... L. Pater (Alt.) U.S. Department of Transportation.............................................................................................. A. Konheim U.S. Naval Surface Warfare Center Carderock .............................................................................M. Craun ................................................................................................................................................. J. Niemiec (Alt.) Individual Experts of Accredited Standards Committee S12, Noise, were:
P.K. Baade L.S. Finegold J.P. Seiler L.L. Beranek W.J. Galloway L.C. Sutherland E.H. Berger R.D. Hellweg W.R. Thornton S.H.P. Bly R.K. Hillquist G.C. Tocci B.M. Brooks W.W. Lang H.E. von Gierke A.J. Campanella R.J. Peppin L.A. Wilber K.M. Eldred J. Pope G.E. Winzer P.D. Schomer G.S.K. Wong
Working Group S12/WG 18, Criteria for Room Noise, which assisted Accredited Standards Committee S12, Noise, in the development of this standard, had the following membership:
R.J. Peppin, Chair
L.L. Beranek R.K. Herbert J. Van Houten W.E. Blazier P.D. Schomer G.E. Winzer R.D. Hellweg G.C. Tocci
Suggestions for improvements of this standard will be welcomed. They should be sent to Accredited Standards Committee S12, Noise, in care of the Standards Secretariat of the Acoustical Society of America, 35 Pinelawn Road, Suite 114E, Melville, New York 11747-3177. Telephone: 631-390-0215; FAX: 631-390-0217; E-mail: [email protected].
Copyright Acoustical Society of America Provided by IHS under license with ASA Sold to:FAA WJH TECH CNTR (TDX DA), 01868452
Not for Resale,2011/7/18 16:30:11 GMTNo reproduction or networking permitted without license from IHS
--```,,`,,,,,`,`,`,,`,,-`-`,,`,,`,`,,`---

AMERICAN NATIONAL STANDARD ANSI/ASA S12.2-2008
©2008 Acoustical Society of America – All rights reserved 1
American National Standard
Criteria for Evaluating Room Noise
1 Scope
This Standard provides three primary methods for evaluating room noise: a survey method, an engineering method, and a method for evaluating low-frequency fluctuating noise. Two methods for evaluating room noise—RC (room criterion) and NCB (balanced noise criterion) curves—were the basis of the previous ANSI S12.2-1995 standard, and RC is included briefly for informational purposes in Annex D. All of the methods assume that the measured noise is free of tones. (ANSI S1.13-2005 Annex A gives an accurate method for assessing the presence of prominent discrete tones using narrow band analysis.)
The three primary methods are:
1. The survey method that employs the A-weighted sound level;
2. The engineering method that employs noise criteria (NC) curves; and
3. The method for evaluating low-frequency fluctuating noise using room noise criteria (RNC) curves.
This Standard also contains one ancillary set of criteria curves for evaluating acoustically induced vibrations or rattles.
Requirements are given in the body of the Standard for determining whether a:
1. Measured or estimated A-weighted sound level satisfies a specified noise criterion.
2. Set of octave-band sound pressure levels satisfies a specified noise criterion (NC) curve.
3. Time-series of octave-band sound pressure levels satisfies a specified room noise criterion (RNC) curve.
4. Table of octave-band sound pressure levels that, when modulated by fluctuations at low frequencies, may cause perceptible vibrations or rattles in lightweight constructions.
Annex A presents examples of the use of RNC for evaluating measured or estimated sound level spectra in rooms.
Annex B presents a discussion of RC, NC, NCB, and RNC curves.
Annex C contains recommended noise level specifications for various occupied activity areas.
Annex D contains the procedures for use of the room criteria (RC) curves.
Annex E contains criteria for recording studios and other low-noise situations.
Copyright Acoustical Society of America Provided by IHS under license with ASA Sold to:FAA WJH TECH CNTR (TDX DA), 01868452
Not for Resale,2011/7/18 16:30:11 GMTNo reproduction or networking permitted without license from IHS
--```,,`,,,,,`,`,`,,`,,-`-`,,`,,`,`,,`---

ANSI/ASA S12.2-2008
©2008 Acoustical Society of America – All rights reserved 2
No guidance is given for the selection of equipment or the methods for measuring noise levels to be evaluated by the curves.
2 Normative references
The following referenced documents are indispensable for the application of this standard. For dated references, only the edition cited applies. For undated references, the latest edition of the referenced document (including any amendments) applies.
ANSI S1.1-1994 (R 2004) American National Standard Acoustical Terminology.
ANSI S1.4-1983 (R 2006) American National Standard Specification for Sound Level Meters.
ANSI S1.4A-1985 (R 2006) Amendments to ANSI S1.4-1983.
ANSI S1.6-1984 (R 2006) American National Standard Preferred Frequencies, Frequency Levels, and Band Numbers for Acoustical Measurements.
ANSI S1.13-2005 American National Standard Measurement of Sound Pressure Levels in Air.
ANSI S12.65-2006 American National Standards Rating Noise with Respect to Speech Interference.
3 Terms, definitions, abbreviations, and symbols
For the purposes of this standard, the terms and definitions given in ANSI S1.1-1994 and the following apply:
3.1 mid-frequency average (LMF) the average of the octave-band sound pressure levels in Band Nos. 27 (500 Hz), 30 (1000 Hz), and 33 (2000 Hz):
LMF = (⅓)(L27+L30+L33),
where L27, L30, and L33 are the octave-band sound pressure levels in Band Nos. 27, 30, and 33, respectively. Unit: decibel (dB); abbreviation: LMF; symbol: LMF.
3.2 speech-interference level (SIL) the average of the octave-band sound pressure levels in Band Nos. 27 (500 Hz), 30 (1000 Hz), 33 (2000 Hz), and 36 (4000 Hz):
SIL = (¼)(L27+L30+L33+L36),
where L27, L30, L33, and L36 are the octave-band sound pressure levels in Band Nos. 27, 30, 33, and 36, respectively.
NOTE This definition is consistent with the American National Standard definition in ANSI S12.65-2006.
Copyright Acoustical Society of America Provided by IHS under license with ASA Sold to:FAA WJH TECH CNTR (TDX DA), 01868452
Not for Resale,2011/7/18 16:30:11 GMTNo reproduction or networking permitted without license from IHS
--```,,`,,,,,`,`,`,,`,,-`-`,,`,,`,`,,`---

ANSI/ASA S12.2-2008
©2008 Acoustical Society of America – All rights reserved 3
3.3 rumble noise with excessive levels in the octave bands at and below Band No. 27 (500 Hz)
3.4 rattle audible noise due to excessive motion of wall or ceiling systems and furnishings attached to them
3.5 hiss noise with excessive levels in the octave bands at and above Band No. 30 (1000 Hz)
3.6 equivalent (continuous) sound level (LEQ) ten times the logarithm to the base ten of the ratio of time-mean-square instantaneous A-weighted sound pressure, during a stated time interval T, to the square of the standard reference sound pressure. Unit: decibel (dB); abbreviation: LEQ; symbol: LeqT.
NOTE 1 A frequency weighting other than the standard A-weighting may be employed if specified explicitly. The frequency weighting that is essentially constant between limits specified by a manufacturer is called flat.
NOTE 2 In symbols, equivalent (continuous) sound level in decibels is:
2A
eq 200
( )d110 logT
T p t tL
T p
⎧ ⎫⎛ ⎞⎪ ⎪= ⎨ ⎬⎜ ⎟⎝ ⎠⎪ ⎪⎩ ⎭
∫
where 2Ap is the squared instantaneous A-weighted sound pressure signal, a function of elapsed time t; in air at
standard temperature and pressure, reference sound pressure p0 = 20 μPa; T is a stated time interval.
NOTE 3 In principle, the sound pressure signal is not exponentially time-weighted, neither before nor after squaring.
3.7 Surge a sizeable or clearly perceptible fluctuation in low-frequency sound and mostly produced by airflow in building ventilation systems
3.8 Abbreviations and symbols For the purposes of this standard, the following abbreviations and symbols apply:
NC Noise criteria
RNC Room noise criteria
NCB Balanced noise criteria
N Neutral noise spectrum designator
H Hiss, a hissy noise spectrum designator
R Rumble, a “rumbly” noise spectrum designator
Copyright Acoustical Society of America Provided by IHS under license with ASA Sold to:FAA WJH TECH CNTR (TDX DA), 01868452
Not for Resale,2011/7/18 16:30:11 GMTNo reproduction or networking permitted without license from IHS
--```,,`,,,,,`,`,`,,`,,-`-`,,`,,`,`,,`---

ANSI/ASA S12.2-2008
©2008 Acoustical Society of America – All rights reserved 4
RV Perceptible vibration
QAI Quality assessment indicator
SIL Speech interference level
OASPL Overall sound pressure level
LEQ Equivalent (sound pressure) level
RC Room criteria
LMF Mid-frequency average
L10 Sound level exceeded 10 percent of the time
LL Loudness level
LMAX Maximum sound level
HVAC Heating, ventilating, and air-conditioning
The following are the symbols for the main quantities calculated by Eqs. (1), (3), and (6). Eq. (2), also a main equation, is for calculating RNC values. Eqs. (4), (5), (7), and (8) are for calculating intermediate quantities.
Lob Octave-band level given by Eq. (1)
KLFC Low-frequency correction given by Eq. (3)
K125C 125 Hz octave-band correction given by Eq. (6)
4 Significance and use of this Standard and deviations from the previous ANSI S12.2-1995
4.1 This standard is based on the best data available at the time of writing and may be subject to change. It is assumed that the methods described are appropriate for evaluating environments similar to those where data were collected during the development of those methods. See Annex B and references for a further discussion of the development of those methods.
4.2 Either A-weighted sound level or noise criteria (NC) may be specified in order to help control the level and spectrum of sound in dwelling units, offices, auditoria, hospital rooms, and other spaces intended for human occupancy. When HVAC system sound contains sizeable fluctuations, often referred to as surge, use the RNC criteria method in lieu of either the A-weighting or NC criteria methods. For guidance in choosing whether to use A-weighted sound level, NC, or RNC, see Clause 4.8.
4.3 NC or RNC curves may be used to evaluate the suitability of a set of octave-band sound pressure levels that characterize the noise in a space when a criterion has not been provided. Alternatively, the A-weighted sound level may be used to characterize the noise in a space instead. For guidance in choosing whether to use A-weighted sound level, NC, or RNC, see Clause 4.8.
Copyright Acoustical Society of America Provided by IHS under license with ASA Sold to:FAA WJH TECH CNTR (TDX DA), 01868452
Not for Resale,2011/7/18 16:30:11 GMTNo reproduction or networking permitted without license from IHS
--```,,`,,,,,`,`,`,,`,,-`-`,,`,,`,`,,`---

ANSI/ASA S12.2-2008
©2008 Acoustical Society of America – All rights reserved 5
4.4 The previous edition of this standard (ANSI S12.2-1995) specified the use of RC and NCB criteria curves. The NCB curves have been replaced by the NC curves extended down to the 16-Hz octave band. The implementation of RC curves is briefly described for information in Annex D.
4.5 The new RNC curves provide a procedure that reduces essentially to the NC curves of this standard when systems are well designed and acoustically well behaved. However, if strong turbulence or fluctuating low-frequency sound is present, the RNC curves essentially revert to rumble criterion determined using the RC method of the previous standard. Unlike NCB or RC, the RNC curves use a tangency method to derive the RNC value. Also, both the NCB and RC methods include an appended rating that describes the general spectral characteristic of sound. The terms used to characterize sound are: "neutral," “hissy,” or “rumbly.” However, there are inconsistent results when the RC and NCB rumble and hiss criteria are employed to evaluate the spectral balance of the same measured spectra [14]. For this reason, the RNC method does not include such spectral descriptions since, at this time, there is no consensus on how they should be characterized.
4.6 All methods assume that the measured noise is free of tones. ANSI S1.13-2005 Annex A gives an accurate method for assessing the presence of prominent discrete tones using narrow band analysis.
4.7 Perceptible vibration and rattle:
4.7.1 Moderately perceptible vibration and rattle is likely in lightweight wall and ceiling structures when the measured noise levels exceed the lower values indicated in Clause 6.
4.7.2 Clearly perceptible vibration and rattle is likely in lightweight wall and ceiling structures when the measured noise levels exceed the higher values indicated in Clause 6.
4.8 The A-weighted level can be used as a screening tool. It is used most commonly with environmental noise; e.g., the indoor (residential) sound level (LEQ) at night should be less than 30 dB. It can also be used to set required room noise levels in other situations, but, because it lacks spectral information, it may be inappropriate. A-weighted levels are readily measured with the simplest existing sound level meters.
NC curves are the commonly used method for evaluating octave-band noise spectra. Their use is limited to situations where high levels at low frequencies are not accompanied by appreciable fluctuations or surging. The data needed for NC curve evaluations are readily measured with existing modern sound level meters that contain octave-band filters.
RNC curves should be used in critical applications, or whenever the measured levels at low frequencies are high enough and are accompanied by suspected large fluctuations or surging. While the raw data needed for RNC curve evaluation are readily obtained with hand-held octave-band spectrum analyzers, a spreadsheet calculation is often required to complete the RNC evaluation.
Copyright Acoustical Society of America Provided by IHS under license with ASA Sold to:FAA WJH TECH CNTR (TDX DA), 01868452
Not for Resale,2011/7/18 16:30:11 GMTNo reproduction or networking permitted without license from IHS
--```,,`,,,,,`,`,`,,`,,-`-`,,`,,`,`,,`---

ANSI/ASA S12.2-2008
©2008 Acoustical Society of America – All rights reserved 6
5 Criteria
5.1 A-weighted criteria
5.1.1 Use of criteria
The A-weighted criteria apply to the measured A-weighted sound pressure level at a point (or average of points) in the space under test. The measured level (or average level) is compared with the criteria developed for specific spaces on the basis of space use. For guidance on appropriate criteria for building spaces by use, refer to Annex C, Table C.1. The measurements shall be of the maximum A-weighted sound level, slow response using a meter that, at a minimum, meets the Type 2 sound level meter specifications of ANSI S1.4 and S1.4A.
5.1.2 Measurements
Sound measurements for rating room noise under this standard shall be made at locations that are near the average normal standing or seated height of human ears in the space: 5’-6” for standing and 4’-0” for seated adults––3’-6” standing and 2’-6” for seated children. The microphone shall be no closer than 2’-0” from any sound reflecting surface or 4’-0” from the intersection of two intersecting reflecting surfaces, or 8’-0” from the intersection of three intersecting reflecting surfaces.
5.2 NC (noise criteria) curves
5.2.1 Introduction
The NC curves, given in Table 1 and Figure 1, are the most widely used means for evaluating background sound in buildings and for specification of desired levels in advance of construction. The NC curves were first published in 1957, revised in 1960, and extended in 2004 [2],[3]. The designating number for any NC curve is, approximately, its Speech Interference Level (SIL): the average of the levels in the 250, 500, 1000, and 2000-Hz octave bands (see ANSI S12.65-2006).
The underlying study that produced the NC curves found that occupants of rooms, when asked about the noise around them, were most often concerned about their ability to understand speech. A measure of the effects of noise on speech intelligibility is the Speech Interference Level (SIL). For any particular space, an SIL suitable for adequate speech intelligibility in that space can be chosen (see Table C.2 in Appendix C for values determined from field experience). In addition, in the underlying study, it was found that if the calculated loudness level in phons of any particular measured noise spectrum exceeded its SIL in dB by more than 23 units, room occupants complained about the annoyance of the noise. Thus, each NC curve is shaped so that the loudness level for that noise spectrum is about 23 units above its speech interference level.
5.2.2 Rating a noise level spectrum using this standard
To rate a measured or calculated octave-band noise level spectrum, first determine the speech interference level (SIL) for that spectrum. Use that SIL value to choose an NC curve with the same value applicable to that spectrum, i.e., NC-(SIL). If the measured spectrum in any octave band does not exceed any of the octave bands of that NC-(SIL) curve, the spectrum is designated NC-(SIL). If one or more octave-band levels exceed the NC(SIL) curve, the NC rating for that spectrum must be determined using the tangency method. As an example in Figure 1, a typical room sound level spectrum is plotted on the NC curves. The SIL is 44. Four of the octave-band levels exceed NC-44; hence, the spectrum must be rated by the tangency method.
Copyright Acoustical Society of America Provided by IHS under license with ASA Sold to:FAA WJH TECH CNTR (TDX DA), 01868452
Not for Resale,2011/7/18 16:30:11 GMTNo reproduction or networking permitted without license from IHS
--```,,`,,,,,`,`,`,,`,,-`-`,,`,,`,`,,`---

ANSI/ASA S12.2-2008
©2008 Acoustical Society of America – All rights reserved 7
NOTE The average of the levels in the four SIL bands for each NC curve in Figure 1 is between 0.25 and 1 dB higher than the designating number shown for the curve. The reason is that a shift in the frequency limits for the octave bands was standardized some years after the NC curves were developed. However, the decibel values for the points and the designating numbers on the present curves are exactly the same as originally presented.
Table 1 — Octave-band sound levels to the nearest decibel for noise criteria curves [15, p. 893]
Octave-band-center frequency in Hz
16 31.5 63 125 250 500 1000 2000 4000 8000
NC-70 90 90 84 79 75 72 71 70 68 68
NC-65 90 88 80 75 71 68 65 64 63 62
NC-60 90 85 77 71 66 63 60 59 58 57
NC-55 89 82 74 67 62 58 56 54 53 52
NC-50 87 79 71 64 58 54 51 49 48 47
NC-45 85 76 67 60 54 49 46 44 43 42
NC-40 84 74 64 56 50 44 41 39 38 37
NC-35 82 71 60 52 45 40 36 34 33 32
NC-30 81 68 57 48 41 35 32 29 28 27
NC-25 80 65 54 44 37 31 27 24 22 22
NC-20 79 63 50 40 33 26 22 20 17 16
NC-15 78 61 47 36 28 22 18 14 12 11
5.2.3 NC tangency method
The tangency method is the simplest and most commonly used method for rating octave-band noise level spectra in rooms using NC curves. With it, the NC rating of a spectrum is designated as the value of the highest NC curve “touched” by the measured octave-band spectrum. The band in which this “touching” occurs is always noted along with the NC designation. For example, the rating for the illustrative noise level spectrum in Figure 1 by the tangency method is NC-51 (125 Hz). This rating is obviously considerably higher than the NC-44 of the previous paragraph, i.e., the SIL-based NC rating.
Copyright Acoustical Society of America Provided by IHS under license with ASA Sold to:FAA WJH TECH CNTR (TDX DA), 01868452
Not for Resale,2011/7/18 16:30:11 GMTNo reproduction or networking permitted without license from IHS
--```,,`,,,,,`,`,`,,`,,-`-`,,`,,`,`,,`---

ANSI/ASA S12.2-2008
©2008 Acoustical Society of America – All rights reserved 8
NC-70
NC-65
NC-60
NC-55
NC-50
NC-45
NC-40
NC-35
NC-30
NC-25
NC-20
NC-15
0
10
20
30
40
50
60
70
80
90
16 31.5 63 125 250 500 1000 2000 4000 8000 1600
octave-band center frequency (Hz)
soun
d pr
essu
re le
vel (
dB re
: 20 μP
a)
Figure 1 — Noise criteria (NC) curves – The example shows an NC-51 (125 Hz) spectrum
5.2.4 Spectrum imbalance determination
Based on an analysis of measured noise spectra determined in offices, lecture halls, and meeting rooms where low-frequency noise has been severe enough to require remedial measures in the HVAC
Copyright Acoustical Society of America Provided by IHS under license with ASA Sold to:FAA WJH TECH CNTR (TDX DA), 01868452
Not for Resale,2011/7/18 16:30:11 GMTNo reproduction or networking permitted without license from IHS
--```,,`,,,,,`,`,`,,`,,-`-`,,`,,`,`,,`---

ANSI/ASA S12.2-2008
©2008 Acoustical Society of America – All rights reserved 9
system, the following procedure for estimating the severity of excessive noise levels in the octave bands below 500 Hz is presented:
(1) Calculate the speech interference level, SIL, for the measured spectrum.
(2) Select the NC criterion curve with the same number as the SIL.
(3) Plot the measured spectra and NC criterion curve on the same graph and determine the differences between the two curves in the octave bands below 500 Hz.
(4) Using Table 2, estimate the likelihood that the excess low-frequency levels will annoy occupants of the space. For example, if the difference in the levels in any one of the bands below 500 Hz is greater than 9 dB, the occupants are likely to register complaints strong enough to require remedial action.
Table 2 — Measured sound pressure deviations from an NC (SIL) curve that may lead to serious complaints
Octave-band frequencies, Hz 31.5 63 125 250
Possible serious dissatisfaction * 6-9 dB 6-9 dB 6-9 dB
Likely serious dissatisfaction * >9 dB >9 dB >9 dB
*Insufficient data available to quantify. For all the measured curves investigated where the room occupants complained seriously, the levels in one or more of the 63 to 250 Hz bands were 6 or more dB above the NC (SIL) curve. In some of those same cases, the levels in the 31.5 Hz band were sufficiently high to indicate the possibility of clearly perceptible vibrations and rattles.
5.2.5 Measurements
If the desire is to characterize the sound at a specific position in the space in question, then the sound measurement should be made at that position measuring LEQ using an integrating-averaging meter. (Modern integrating-averaging sound level meters [SLMs] measure the true integral of the sound pressure squared. If an old SLM with LEQ function is used, then the meter shall be set to the fast meter function.) If the sound in the entire space is to be characterized, then an integrating-averaging meter shall be used to scan the room. The microphone shall be swept slowly around the entire space during a period of time that is more than 20 seconds long.
Sound measurements for rating room noise under this standard shall be made at locations that are near the average normal standing or seated height of human ears in the space: 5’-6” for standing and 4’-0” for seated adults––3’-6” standing and 2’-6” for seated children. The microphone shall be no closer than 2’-0” from any sound reflecting surface or 4’-0” from the intersection of two intersecting reflecting surfaces, or 8’-0” from the intersection of three intersecting reflecting surfaces.
NOTE At the very lowest frequencies (e.g., 16 Hz), the wavelength is so long that pressure doubling may occur well beyond the standoff distances given above. To the extent that people are situated in regions of pressure doubling, pressure-doubled measurements are to be desired. However, if people are situated towards the center of a large space, then a scan of the room may yield a result that is biased high. Also, the lower the frequency, the narrower the bandwidth, and hence, the greater the temporal fluctuation that results from a given noise stimulus. Thus, the user should be alert to time-varying measurement results that, potentially, are biased high.
Copyright Acoustical Society of America Provided by IHS under license with ASA Sold to:FAA WJH TECH CNTR (TDX DA), 01868452
Not for Resale,2011/7/18 16:30:11 GMTNo reproduction or networking permitted without license from IHS
--```,,`,,,,,`,`,`,,`,,-`-`,,`,,`,`,,`---

ANSI/ASA S12.2-2008
©2008 Acoustical Society of America – All rights reserved 10
5.2.6 NC criteria
For guidance on appropriate criteria for building spaces by use, refer to Annex C, Table C.2.
5.2.7 Sample specification using NC curves (and reference to RNC curves when indicated)
In writing a specification for acceptable ambient noise, the first step is to select an NC curve that is appropriate for the space under consideration. Suggested values are given in Table C.2. For accuracy the range of octaves in which the noise is to be measured should be specified. As a sample specification, assume a private office and a chosen NC-35 curve. The specification for that office might be:
The noise measured in the completed space must lie at or below the NC-35 curve in the octave bands from 63 to 4000 Hz. If the measured noise level spectrum exceeds the NC-35 curve in any octave band, use the tangency method to determine the corresponding NC curve. Reduce the noise levels in the octave bands that lie between these two curves to levels of the NC-35 curve.
A spectrum is defined as imbalanced if the A-weighted sound pressure level minus the C-weighted sound pressure level exceeds 13 dB. Make needed changes to the ventilation system to cause the noise spectrum to be balanced.
Use the screening test outlined in Clause 5.3.2 to detect surging or large random fluctuations. If the noise in the space fails this test, use the RNC method of Clauses 5.3.3 to 5.3.7 to determine the amount that the surging or random noise fluctuations must be reduced. Incorporate changes to reduce surging or random noise fluctuations to acceptable limits as defined in Clauses 5.3.3 to 5.3.7.
Re-evaluate the noise spectrum to show conformance to the NC curve limit, to show that the spectrum is balanced, and to show that surging and random fluctuations conform to the limits of Clauses 5.3.3 to 5.3.7.
5.3 RNC (room noise criterion)
5.3.1 General Introduction
The RNC method should be used to determine noise ratings when the noise from HVAC systems at low frequencies is loud and is suspected of containing sizeable fluctuations or surging. For example, HVAC fans must be selected to avoid unstable operation or hunting along a fan curve. System ductwork must be designed to avoid triggering turbulence in ducts with large airflow volumes. To listeners, even modest fluctuation in low-frequency sound can be very apparent and disturbing, and it should be addressed both in the air distribution system design and in the project specification. Large random low-frequency fluctuations and/or surging cannot be determined by a conventional sound level meter with the slow meter speed and “A” frequency weighted response in place, partly because surging primarily affects the levels in the low-frequency bands and partly because surging may be averaged-out if the slow speed is used. For measurements, the screening criteria of 5.3.3 shall be used to determine the presence or absence of large random low-frequency fluctuations or surging.
5.3.2 Screening for surging or large random fluctuations
The sound field shall be screened for surging and for large random fluctuations. If no surging or large random fluctuations are observed, then the NC method of Clause 5.2 may be used to evaluate the
Copyright Acoustical Society of America Provided by IHS under license with ASA Sold to:FAA WJH TECH CNTR (TDX DA), 01868452
Not for Resale,2011/7/18 16:30:11 GMTNo reproduction or networking permitted without license from IHS
--```,,`,,,,,`,`,`,,`,,-`-`,,`,,`,`,,`---

ANSI/ASA S12.2-2008
©2008 Acoustical Society of America – All rights reserved 11
room noise. If, however, large random fluctuations and/or surging are observed, then the RNC method of Clause 5.3 should be used to evaluate the room noise.
5.3.2.1 Surging
Surging shall be screened aurally and/or visually on a sound level meter by observing the levels in the 16, 31.5, and 63-Hz octave bands. For this screening, the sound level meter shall be set for fast response and "flat" or C-weighting.
5.3.2.2 Large random fluctuations
One shall observe the differences between the maximum level (LMAX) and the LEQ or the level exceeded 10 percent of the time (L10) and the LEQ in the 16, 31.5, 63 and 125-Hz octave bands using a meter set to fast. If any of the differences (in decibels) exceed the values in Table 3, the presence of large random fluctuations is indicated.
Table 3 — Screening criteria to determine the presence of large random fluctuations
Band Combined 16, 31.5, and 63 Hz
125 Hz
LMAX minus LEQ 7 6
L10 minus LEQ 3.5 3
5.3.3 The RNC curves
The RNC curves are given in Figure 2 and tabulated in Table 4.
Table 4 — Octave-band sound pressure levels to the nearest decibel for room noise criteria curves [10]
Octave-band center frequency, Hz RNC- curve 16 31.5 63 125 250 500 1000 2000 4000 8000
RNC-70 101 96 91 86 81 76 72 68 64 60 RNC-65 96 91 86 81 76 71 67 63 59 55 RNC-60 91 86 81 76 71 66 62 58 54 50 RNC-55 86 81 76 71 66 61 57 53 49 45 RNC-50 81 76 71 66 61 56 52 48 44 40 RNC-45 79 74 68 62 56 51 47 43 39 35 RNC-40 78 71 64 58 51 46 42 38 34 30 RNC-35 76 69 61 54 46 41 37 33 29 25 RNC-30 74 66 58 49 41 36 32 28 24 20 RNC-25 73 64 54 45 36 31 27 23 19 15 RNC-20 71 61 51 41 31 26 22 18 14 10 RNC-15 69 59 48 37 26 21 17 13 9 5 RNC-10 68 56 44 33 21 16 12 8 4 0
Copyright Acoustical Society of America Provided by IHS under license with ASA Sold to:FAA WJH TECH CNTR (TDX DA), 01868452
Not for Resale,2011/7/18 16:30:11 GMTNo reproduction or networking permitted without license from IHS
--```,,`,,,,,`,`,`,,`,,-`-`,,`,,`,`,,`---

ANSI/ASA S12.2-2008
©2008 Acoustical Society of America – All rights reserved 12
RNC-70
RNC-65
RNC-60
RNC-55
RNC-50
RNC-45
RNC-40
RNC-35
RNC-30
RNC-25
RNC-20
RNC-15
RNC-100
10
20
30
40
50
60
70
80
90
16 31.5 63 125 250 500 1000 2000 4000 8000 16000octave-band center frequency (Hz)
soun
d pr
essu
re le
vel (
dB re
: 20 μP
a)
Figure 2 — Room noise criteria (RNC) curves
Each RNC-X curve, e.g., RNC-40, RNC-50, can be derived from Eq. (1) or Eq. (2),
Lob = (RNC-X / K2ob) + K1ob (1)
where, RNC-X is the number attached to a particular curve, Lob is the y-axis level for the particular octave band, and the constants K2ob and K1ob are taken from Table 5 for the particular octave bands.
Copyright Acoustical Society of America Provided by IHS under license with ASA Sold to:FAA WJH TECH CNTR (TDX DA), 01868452
Not for Resale,2011/7/18 16:30:11 GMTNo reproduction or networking permitted without license from IHS
--```,,`,,,,,`,`,`,,`,,-`-`,,`,,`,`,,`---
ANSI/ASA S12.2-2008
©2008 Acoustical Society of America – All rights reserved 13
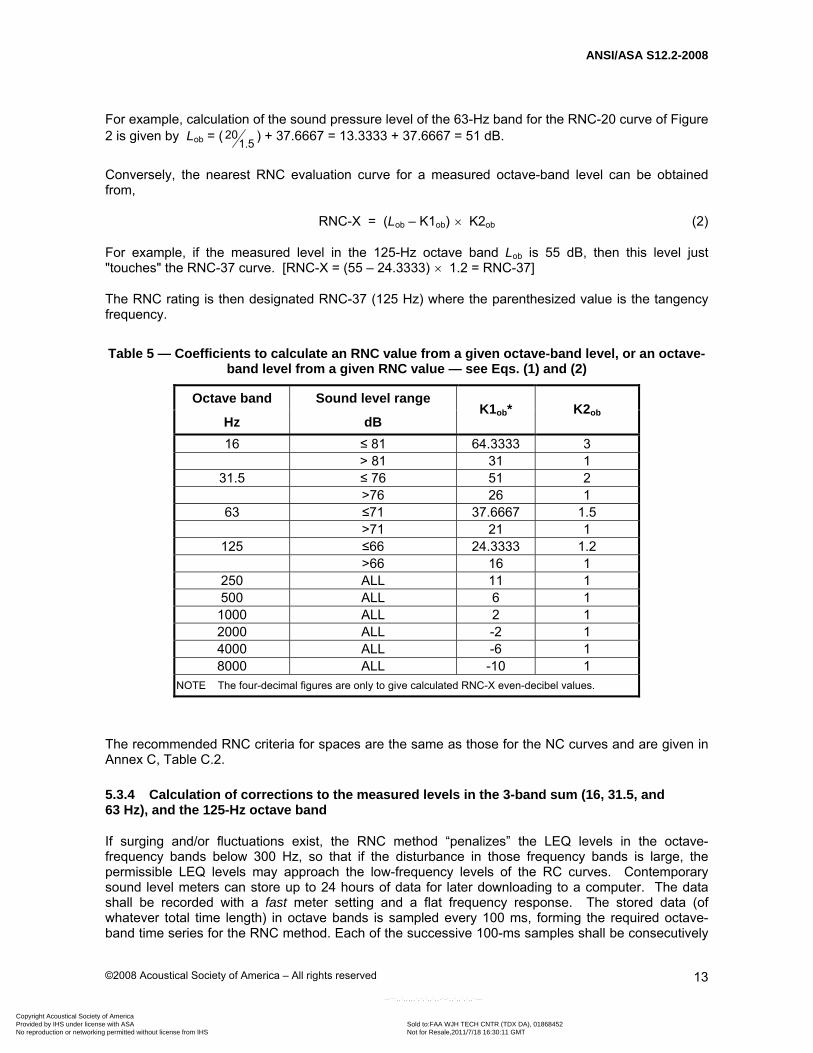
For example, calculation of the sound pressure level of the 63-Hz band for the RNC-20 curve of Figure 2 is given by Lob = ( .
201 5 ) + 37.6667 = 13.3333 + 37.6667 = 51 dB.
Conversely, the nearest RNC evaluation curve for a measured octave-band level can be obtained from,
RNC-X = (Lob – K1ob) × K2ob (2)
For example, if the measured level in the 125-Hz octave band Lob is 55 dB, then this level just "touches" the RNC-37 curve. [RNC-X = (55 – 24.3333) × 1.2 = RNC-37]
The RNC rating is then designated RNC-37 (125 Hz) where the parenthesized value is the tangency frequency.
Table 5 — Coefficients to calculate an RNC value from a given octave-band level, or an octave-band level from a given RNC value — see Eqs. (1) and (2)
Octave band Sound level range
Hz dB K1ob* K2ob
16 ≤ 81 64.3333 3 > 81 31 1
31.5 ≤ 76 51 2 >76 26 1
63 ≤71 37.6667 1.5 >71 21 1
125 ≤66 24.3333 1.2 >66 16 1
250 ALL 11 1 500 ALL 6 1 1000 ALL 2 1 2000 ALL -2 1 4000 ALL -6 1 8000 ALL -10 1
NOTE The four-decimal figures are only to give calculated RNC-X even-decibel values.
The recommended RNC criteria for spaces are the same as those for the NC curves and are given in Annex C, Table C.2.
5.3.4 Calculation of corrections to the measured levels in the 3-band sum (16, 31.5, and 63 Hz), and the 125-Hz octave band
If surging and/or fluctuations exist, the RNC method “penalizes” the LEQ levels in the octave-frequency bands below 300 Hz, so that if the disturbance in those frequency bands is large, the permissible LEQ levels may approach the low-frequency levels of the RC curves. Contemporary sound level meters can store up to 24 hours of data for later downloading to a computer. The data shall be recorded with a fast meter setting and a flat frequency response. The stored data (of whatever total time length) in octave bands is sampled every 100 ms, forming the required octave-band time series for the RNC method. Each of the successive 100-ms samples shall be consecutively
Copyright Acoustical Society of America Provided by IHS under license with ASA Sold to:FAA WJH TECH CNTR (TDX DA), 01868452
Not for Resale,2011/7/18 16:30:11 GMTNo reproduction or networking permitted without license from IHS
--```,,`,,,,,`,`,`,,`,,-`-`,,`,,`,`,,`---

ANSI/ASA S12.2-2008
©2008 Acoustical Society of America – All rights reserved 14
numbered. At a minimum, the total number of samples shall be between 150 and 1000 depending on the suspected magnitude of the surging. For the total time period, the maximum level (LMAX), the level exceeded 10 percent of the time (L10), and the level exceeded 50 percent of the time (L50) should be available or calculated from the time series of data.
NOTE In the clauses that follow, an arbitrary sample from the time series is designated the ith sample.
5.3.5 Psychoacoustic background
The RNC method uses the theories from psychoacoustics to provide a more precise method to evaluate whether the low-frequency noise (frequently from the HVAC) is intrusive. Three major points follow from the psychoacoustics of hearing:
5.3.5.1 The ear only integrates significant variations in the level of a sound provided they occur within a short time period, i.e., if the variations occur within a time period that is less than about 125 ms. That is to say, any fluctuations in HVAC noise that occur within a time interval of about 100 ms are perceived as though the noise were continuous (with the same energy) in that period without fluctuations. For this reason, the RNC method uses 100 ms samples to evaluate room noise.
5.3.5.2 In the frequency region below 125 Hz, the critical bands are about 100 Hz wide. Hence, the RNC method combines the 16, 31.5 and 63-Hz octave-band levels into one surrogate band centered at 31.5 Hz, in order that it can be treated in the same way as the higher frequency bands.
5.3.5.3 For a given change in sound pressure level, the apparent change in the loudness sensation varies with frequency, especially at frequencies below about 200 Hz. For the three octave bands, 16, 31.5 and 63 Hz, a change of approximately 5 decibels in level creates a doubling in the subjective loudness of a sound. For the 125-Hz band, a change of about 8 decibels causes a doubling of loudness. For octave bands with mid-frequencies of 250 Hz and above, a change of 10 decibels is necessary to create a doubling in loudness. Thus, variations in level of the successive 100 ms intervals for the four lowest frequency bands must be treated differently from variations in level of the 100-ms intervals for the higher frequency bands. The RNC procedure "integrates" the sound according to the characteristics of human hearing rather than using simple energy integration.
5.3.5.4 Corrections to the 16, 31.5, and 63-Hz octave-band data
5.3.5.4.1 The 3-band sum
Because the loudness of a sound at a given level is considerably less at 16 Hz than at 31.5 Hz, and, in turn, the loudness at 31.5 Hz is considerably less than that at 63 Hz, in the RNC method the three octave bands with mid-frequencies at 16, 31.5 and 63 are combined and replaced by a “3-band-sum” at 31.5 Hz. All of the measured 100-ms samples for the 16-Hz octave band shall be reduced by 14 dB, and the samples for the 63-Hz octave band shall be increased by 14 dB. These adjusted levels for the 16 and 63-Hz bands are combined with the measured levels in the 31.5-Hz band on an energy basis and the new level (in dB) is called “3-band-sum.” The ith element is symbolized as LLFi. If data are not available for the 16-Hz band, the “3-band-sum” may be determined from just the 31.5 and 63-Hz bands. This shall be noted in any report.
5.3.5.4.2 Intermediate calculations
The equivalent level for the entire set of 3-band levels, symbolized as LLF,eq, shall be calculated by summing the energies of the 3-band samples, dividing by the number of samples, and taking 10 log of
Copyright Acoustical Society of America Provided by IHS under license with ASA Sold to:FAA WJH TECH CNTR (TDX DA), 01868452
Not for Resale,2011/7/18 16:30:11 GMTNo reproduction or networking permitted without license from IHS
--```,,`,,,,,`,`,`,,`,,-`-`,,`,,`,`,,`---

ANSI/ASA S12.2-2008
©2008 Acoustical Society of America – All rights reserved 15
the result. Also, the mean level, symbolized by LLFm, of the set of “3-band-sum” samples shall be calculated.
5.3.5.4.3 Calculating the correction to the measured 31.5-Hz octave-band level
A correction, symbolized by KLFC, shall be added to the measured LEQ at 31.5 Hz.
NOTE 1 This correction is not added to the 3-band-sum LEQ of 5.3.5.4.1.
NOTE 2 Per Clause 5.3.5.3, this correction takes into consideration both the LLFi values and the fact that a change of only 5 dB is needed for a doubling of loudness at 31.5 Hz.
The correction at 31.5 Hz shall be calculated by:
KLFC = KLFα – (LLF,eq – LLFm) (3)
where,
KLFα = 10 log[(1/N) α
=∑ 10
110
N L j /
j] (4)
and where, at 31.5 Hz,
Lαj = 2(LLFj – LLFm). (5)
The quantity KLFC shall be added to the measured equivalent level LEQ (long-time energy average) in the 31.5-Hz octave band, and this sum is plotted on Figure 2. In this case, no numbers shall be plotted for the 16 and 63-Hz bands.
NOTE When there is no strong surging, the following may be used to calculate KLFα:
KLFα = 0.115(2)2 σLF2 = 0.46 σLF
2 (4a)
where σLF is the standard deviation to the 3-band sum data.
5.3.5.5 Corrections to the 125-Hz octave-band data
5.3.5.5.1 Intermediate calculations
The equivalent level for the entire set of 125-Hz octave-band levels, symbolized as L125,eq, shall be calculated by summing the energies of the 125-Hz octave-band samples, dividing by the number of samples, and taking 10 log of the result. Also, the mean level, symbolized by L125m, of the set of 125-Hz octave-band samples shall be calculated.
5.3.5.5.2 Calculating the correction to the measured 125-Hz octave-band level
A correction, symbolized by K125C, shall be added to the measured LEQ at 125 Hz.
Copyright Acoustical Society of America Provided by IHS under license with ASA Sold to:FAA WJH TECH CNTR (TDX DA), 01868452
Not for Resale,2011/7/18 16:30:11 GMTNo reproduction or networking permitted without license from IHS
--```,,`,,,,,`,`,`,,`,,-`-`,,`,,`,`,,`---

ANSI/ASA S12.2-2008
©2008 Acoustical Society of America – All rights reserved 16
The correction at 125 Hz shall be calculated by:
K125C = K125α – (L125,eq – L125m) (6)
where,
K125α = 10 log[(1/N) α
=∑ 10
110
N L j /
j] (7)
and where, at 125 Hz,
Lαj = 1.25(L125j – L125m). (8)
NOTE 1 Per Clause 5.3.5.3, this correction takes into consideration the fact that a change of only 8 dB is needed for a doubling of loudness at 125 Hz.
NOTE 2 When there is no strong surging, the following may be used to calculate K125α:
K125α = 0.115(1.25)2 (σ125)2 = 0.180 (σ125)2 (7a)
where σ125 is the standard deviation to the 125-Hz octave-band data.
The quantity K125C, shall be added to the measured equivalent level LEQ (long time energy average) in the 125-Hz octave band and is plotted on Figure 2.
NOTE The constants 2 and 1.25 in equations 5 and 8, respectively (and also 4a and 7a, respectively), are determined by considering the doubling of loudness at low frequencies. Let δ be the number of decibels at a given frequency and moderately low sound levels that elicit the sensation of a doubling of loudness. Then the general coefficient to Eqs. (5) and (8) is 10/δ. In the 31.5-Hz band, δ = 5 and the coefficient in Eq. (5) is 10/5 = 2. In the 125-Hz band, δ = 8 and the coefficient in Eq. (8) is 10/8 = 1.25.
5.3.6 Measurements
If the desire is to characterize the sound at a specific position in the space in question, then the sound measurement should be made at that position measuring LEQ using an integrating-averaging meter. (Modern integrating-averaging sound level meters [SLMs] measure the true integral of the sound pressure squared. If an old SLM with LEQ function is used, then the meter shall be set to the fast meter function.) If the sound in the entire space is to be characterized, then an integrating-averaging meter shall be used to scan the room. The microphone shall be swept slowly around the entire space during a period of time that is more than 20 seconds long.
Sound measurements for rating room noise under this standard shall be made at locations that are near the average normal standing or seated height of human ears in the space: 5’-6” for standing and 4’-0” for seated adults––3’-6” standing and 2-’6” for seated children. The microphone shall be no closer than 2’-0” from any sound reflecting surface or 4’-0” from the intersection of two intersecting reflecting surfaces, or 8’-0” from the intersection of three intersecting reflecting surfaces.
NOTE At the very lowest frequencies (e.g., 16 Hz), the wavelength is so long that pressure doubling may occur well beyond the standoff distances given above. To the extent that people are situated in regions of pressure doubling, pressure-doubled measurements are to be desired. However, if people are situated towards the center of a large space, then a scan of the room may yield a result that is biased high. Also, the lower the
Copyright Acoustical Society of America Provided by IHS under license with ASA Sold to:FAA WJH TECH CNTR (TDX DA), 01868452
Not for Resale,2011/7/18 16:30:11 GMTNo reproduction or networking permitted without license from IHS
--```,,`,,,,,`,`,`,,`,,-`-`,,`,,`,`,,`---

ANSI/ASA S12.2-2008
©2008 Acoustical Society of America – All rights reserved 17
frequency, the narrower the bandwidth, and hence, the greater the temporal fluctuation that results from a given noise stimulus. Thus, the user should be alert to time-varying measurement results that, potentially, are biased high.
6 Acoustically induced vibrations and rattles
Limiting levels at low frequencies are listed in Table 6 for assessing (a) the probability of clearly perceptible acoustically induced vibration and rattles in lightweight wall and ceiling constructions, and (b) the probability of moderately perceptible acoustically induced vibration in similar constructions.
Table 6 — Measured sound pressure levels for perceptible vibration and rattles in lightweight wall and ceiling structures
Octave-band center frequency (Hz) (band number)
16 (12)
31.5 (15)
63 (18)
Clearly perceptible vibration and rattles likely 75 75 80
Moderately perceptible vibration and rattle likely 65 65 70
NOTE Values are sound pressure levels in decibels 20 μPa. (See [12].)
Copyright Acoustical Society of America Provided by IHS under license with ASA Sold to:FAA WJH TECH CNTR (TDX DA), 01868452
Not for Resale,2011/7/18 16:30:11 GMTNo reproduction or networking permitted without license from IHS
--```,,`,,,,,`,`,`,,`,,-`-`,,`,,`,`,,`---

ANSI/ASA S12.2-2008
©2008 Acoustical Society of America – All rights reserved 18
Annex A (informative)
Example evaluations using RNC
A.1 Evaluation of room noise using the RNC curves
The measured or adjusted LEQ levels, as appropriate, in all the bands are plotted on the graph of Figure 2, and by the tangency method, the RNC rating for the noise is obtained.
A.2 Example 1 — Excessive turbulence (large standard deviation) and minimal surging
This example is based on an artificial set of random data having a Gaussian distribution with a standard deviation of 3.2 dB in the 3-band sum combined 16-31.5-63 Hz band. During Step 1 of the evaluation procedure, no surging was detected. During 10 seconds of measurement, the maximum level in the 31.5-Hz octave band was 76.0 dB while the LEQ in this octave band was 67.0 dB. Since the difference between Lmax and LEQ is 9.0 dB, which is greater than the screening value of 7 dB, a detailed evaluation using Clauses 5.3.5.4 and 5.3.5.5 is required.
Table A.1 shows 5 consecutive examples of “measured” octave-band levels. The “3-band sum” contains the energy-sum for the 16, 31.5, and 63-Hz octave-band levels. In computing this sum, 14 dB are subtracted from the 16-Hz octave-band levels and 14 dB are added to the 63-Hz octave-band levels.
Table A.2 contains summary information for the 1000 artificially generated Gaussian noise samples used in this example. It includes the mean levels and the standard deviation of these levels, and the equivalent level. Max 1000 is the maximum level found throughout the entire 1000 samples, and Max 100 is the maximum level found throughout the first 100 samples of the entire 1000 samples.
Using Eq. (4a) the calculated correction to the 31.5-Hz octave-band equivalent level is 3.6 dB. This correction of 3.6 dB is calculated using the standard deviation equal to 3.2 dB (the 3-band standard deviation) and δ equal to 5. No calculation need be made for the 125-Hz octave band since the standard deviation for this band’s data is less than 1.5 dB [11]. However, the calculated correction to the 125-Hz octave-band level is 0.05 dB. For this latter calculation δ is equal to 8. The adjusted 31.5-Hz octave-band level is the “measured” equivalent level of 67.0 dB plus the correction of 3.6 dB for an adjusted total of 70.6 dB. In this example, no adjustment is added to the 125-Hz octave-band level since the adjustment is negligible.
The adjusted 31.5-Hz octave-band level and the “measured” octave-band levels from 125 Hz through 8000 Hz are plotted in Figure A.1 over the RNC curves. Using the tangent method, the highest RNC curve (RNC-40) is contacted by the 31.5-Hz octave band at 70.6 dB. Therefore, this spectrum is reported as an RNC-40 (31.5 Hz). Note that the strong turbulence changes the reported RNC value for this spectrum from and uncorrected RNC-31 (8 kHz) to a corrected RNC-40 (31.5 Hz).
Copyright Acoustical Society of America Provided by IHS under license with ASA Sold to:FAA WJH TECH CNTR (TDX DA), 01868452
Not for Resale,2011/7/18 16:30:11 GMTNo reproduction or networking permitted without license from IHS
--```,,`,,,,,`,`,`,,`,,-`-`,,`,,`,`,,`---

ANSI/ASA S12.2-2008
©2008 Acoustical Society of America – All rights reserved 19
Table A.1 — This table shows the first 5 samples for Example 1
3-band sum 16 31.5 63 125 250 500 1 K 2 K 4 K 8 K
71.9 72.2 70.8 50.3 46.6 38.9 37.9 30.0 26.0 24.9 21.4
64.9 69.0 60.4 48.3 47.4 38.9 36.7 31.6 27.6 22.8 20.4
70.5 74.7 66.4 53.5 49.7 42.3 35.4 30.7 27.1 25.1 21.1
70.2 75.4 66.8 52.3 49.0 39.1 34.3 30.7 27.8 25.3 21.8
74.5 76.0 72.6 55.3 47.2 39.1 34.6 33.0 26.4 22.6 22.0
Table A.2 — This table contains the summary data for Example 1
3-band sum 16 31.5 63 125 250 500 1 K 2 K 4 K 8 K
Mean level 68.9 72.1 65.2 51.1 48.0 40.0 36.0 31.0 27.0 24.0 21.0
Standard deviation 3.2 5.1 4.0 2.8 1.2 0.9 1.0 1.0 1.0 1.0 1.0
LEQ 70.1 75.0 67.0 52.0 48.2 40.1 36.1 31.1 27.1 24.1 21.2
LEQ minus mean level 1.2 3.0 1.8 0.9 0.2 0.1 0.1 0.1 0.1 0.1 0.2
Corrections to LEQ:
Eq. (3) and Eq. (6)
-- 3.6 -- 0.05 0 0 0 0 0 0
Final spectrum
(Figure A.1) -- 70.6 -- 48.2 40.1 36.1 31.1 27.1 24.1 21.2
Max 1000 79.5 86.5 78.1 58.8 51.7 43.1 39.1 33.9 29.6 27.0 23.8
Max 100 77.4 86.5 76.0 57.5 51.5 43.1 39.0 33.2 29.0 26.7 23.6
Copyright Acoustical Society of America Provided by IHS under license with ASA Sold to:FAA WJH TECH CNTR (TDX DA), 01868452
Not for Resale,2011/7/18 16:30:11 GMTNo reproduction or networking permitted without license from IHS
--```,,`,,,,,`,`,`,,`,,-`-`,,`,,`,`,,`---

ANSI/ASA S12.2-2008
©2008 Acoustical Society of America – All rights reserved 20
RNC-70
RNC-65
RNC-60
RNC-55
RNC-50
RNC-45
RNC-40
RNC-35
RNC-30
RNC-25
RNC-20
RNC-15
RNC-100
10
20
30
40
50
60
70
80
90
16 31.5 63 125 250 500 1000 2000 4000 8000 16000octave-band center frequency (Hz)
soun
d pr
essu
re le
vel (
dB re
: 20 μP
a)
Figure A.1 — The spectrum of Example 1 plotted on the RNC curves. In this example sound exhibits no surging, but it does include large turbulence. The standard deviation of the sound
level in the 3-band sum combined 16, 31.5 and 63-Hz octave bands is 3.2 dB. Using the tangent method, the highest RNC curve is contacted by the 31.5-Hz octave band and has a value of
RNC-40. So this spectrum is reported as an RNC-40 (31.5 Hz). The correction factor of 3.6 dB that is added to the measured LEQ in the 31-Hz octave band changes this spectrum from an
RNC-31 (8 kHz) to an RNC-40 (31.5 Hz).
Copyright Acoustical Society of America Provided by IHS under license with ASA Sold to:FAA WJH TECH CNTR (TDX DA), 01868452
Not for Resale,2011/7/18 16:30:11 GMTNo reproduction or networking permitted without license from IHS
--```,,`,,,,,`,`,`,,`,,-`-`,,`,,`,`,,`---

ANSI/ASA S12.2-2008
©2008 Acoustical Society of America – All rights reserved 21
A.3 Example 2 — Strong surging and strong turbulence
This example is based on an artificial set of random data having a Gaussian distribution with a standard deviation of about 3 dB in the 3-band sum combined 16-31.5-63 Hz band and a superimposed sinusoidal variation with a peak-to-peak amplitude of 15 dB to the sinusoidal function and with a 2-second period. Table A.3 shows 20 consecutive examples of “measured” octave-band levels. During Step 1 of the evaluation procedure, surging is detected. Therefore, a detailed evaluation using general methods of 5.3.5.4 and 5.3.5.5 is required. The “3-band sum” column contains the energy-sum for the 16, 31.5, and 63-Hz octave-band levels. As above, in computing this sum, 14 dB are subtracted from 16-Hz octave-band levels and 14 dB are added to 63-Hz octave-band levels.
Table A.4 contains summary information for the 1000 artificially generated Gaussian noise samples with added sinusoidal surging. It includes the mean levels, the equivalent level, and the difference between the equivalent and mean levels. The (rounded) difference between the 3-band equivalent level and the 3-band mean level is 4.2 dB. Eq. (3) yields an 11.3-dB value as the correction to be added to the 31.5-Hz octave-band equivalent level. The adjusted 31.5-Hz octave-band level is the equivalent level of 61.8 dB plus the correction of 11.3 dB for an adjusted total of 73.1 dB. In the 125-Hz octave band, the calculated result including correction is 44.8 dB, and this is the level to be reported. It represents a 1.6-dB correction (according to Eq. [6]) to the measured LEQ in the 125-Hz octave band.
The adjusted “31.5-Hz” band level and the adjusted 125-Hz octave-band level along with the measured octave-band levels at 250 through 8000 Hz are plotted in Figure A.2 over the RNC curves from Figure 2. Because of the 15-dB peak-to-peak surging and the large random component, the corrected spectrum yields a large RNC. The tangent value for this example occurs at 31.5 Hz and indicates that this spectrum corresponds to an RNC-44 (31.5 Hz). Note that the correction changes what would have been an RNC-25 (250 Hz) to an RNC-44 (31.5 Hz) because of the strong surging and turbulence.
Table A.3 — These data represent artificially generated Gaussian noise. This table shows the first 20 samples for Example 2. The sample period is 100 ms and the octave-band levels are fast-time weighted. The OASPL has been calculated as the energy sum of the 10 indicated octave-band levels. The “3-band sum” is the energy sum of the 16, 31.5, and 63-Hz octave-band levels after 14 dB have been subtracted from the 16-Hz octave-band levels and 14 dB have been added to the 63-Hz octave-band levels. Surging has been implemented as a sine
wave with a 2-s period and a 15-dB peak-to-peak amplitude.
3-band sum 16 31.5 63 125 250 500 1 K 2 K 4 K 8 K
1 59.5 69.6 54.8 39.6 42.3 31.8 28.2 21.1 19.4 12.9 9.3
2 60.4 70.1 50.4 43.7 41.5 34.8 30.5 23.1 20.3 15.6 11.1
3 63.7 59.2 60.7 46.5 42.8 37.3 31.6 25.6 23.4 17.7 14.2
4 64.4 59.7 52.8 50.0 50.3 37.8 33.8 28.5 25.5 19.5 16.8
5 61.9 67.3 55.7 45.8 46.4 41.0 36.7 29.2 25.2 22.3 17.4
6 61.2 65.3 53.2 45.9 45.7 40.4 35.9 29.5 25.2 21.3 17.1
7 65.1 61.8 63.0 46.8 47.8 41.4 35.9 27.6 25.2 18.7 16.1
Copyright Acoustical Society of America Provided by IHS under license with ASA Sold to:FAA WJH TECH CNTR (TDX DA), 01868452
Not for Resale,2011/7/18 16:30:11 GMTNo reproduction or networking permitted without license from IHS
--```,,`,,,,,`,`,`,,`,,-`-`,,`,,`,`,,`---

ANSI/ASA S12.2-2008
©2008 Acoustical Society of America – All rights reserved 22
3-band sum 16 31.5 63 125 250 500 1 K 2 K 4 K 8 K
8 66.6 65.2 65.2 46.6 44.3 39.5 34.1 26.7 23.9 19.1 14.3
9 62.6 68.8 59.4 44.0 46.4 36.7 32.0 26.2 22.3 18.2 14.5
10 67.2 64.8 66.5 44.2 42.7 34.2 30.0 24.0 19.2 15.3 12.4
11 63.6 75.5 52.3 44.6 39.0 32.3 26.8 22.7 19.2 12.7 8.7
12 55.6 53.4 52.4 38.7 34.4 30.3 26.0 18.3 16.9 12.5 8.0
13 56.1 68.0 47.4 36.2 34.3 29.0 21.4 19.6 14.1 8.8 6.6
14 53.3 55.8 45.8 38.1 36.4 26.5 21.7 16.0 12.0 9.1 2.8
15 53.1 41.3 52.0 32.4 33.8 26.7 21.7 14.2 10.7 7.4 3.4
16 54.6 57.2 49.2 38.6 34.2 25.3 20.7 13.7 10.5 5.7 2.0
17 56.4 48.8 46.9 41.9 32.5 24.8 22.2 16.1 10.0 5.7 2.5
18 53.8 63.5 49.8 33.4 35.1 28.7 21.6 16.7 13.5 8.9 4.8
19 56.3 63.8 53.8 35.3 35.8 28.5 24.7 17.7 14.1 8.3 4.0
20 54.4 60.1 42.7 39.3 38.9 29.0 26.7 19.8 13.5 11.6 7.6
Table A.4 — This table contains the summary data for Example 2. The LEQ is the energy average for all time samples represented by the indicated column. The 3-band sum correction
of 11.3 dB is added to the 31.5-Hz octave band LEQ and the 1.6-dB correction at 125 Hz is added to the LEQ in this octave band. Therefore, the reported adjusted 31.5-Hz octave-band level is 73.1 (the LEQ of 61.8 in the 31.5-Hz octave band plus the adjustment of 11.3 dB). The
reported level in the 125-Hz octave band is just the 125-Hz LEQ plus 1.6.
3-band sum 16 31.5 63 125 250 500 1 K 2 K 4 K 8 K
Mean level 60.2 62.0 54.9 42.1 39.9 32.9 28.0 22.0 18.0 14.0 10.1
LEQ 64.5 68.6 61.8 46.0 43.2 35.9 30.9 24.9 20.9 17.0 12.9
Corrections to LEQ: Eq. (3) and Eq. (6) -- 11.3 -- 1.6 0 0 0 0 0 0
Final spectrum (Figure A.2) -- 73.1 -- 44.8 35.9 30.9 24.9 20.9 17.0 12.9
Copyright Acoustical Society of America Provided by IHS under license with ASA Sold to:FAA WJH TECH CNTR (TDX DA), 01868452
Not for Resale,2011/7/18 16:30:11 GMTNo reproduction or networking permitted without license from IHS
--```,,`,,,,,`,`,`,,`,,-`-`,,`,,`,`,,`---

ANSI/ASA S12.2-2008
©2008 Acoustical Society of America – All rights reserved 23
RNC-70
RNC-65
RNC-60
RNC-55
RNC-50
RNC-45
RNC-40
RNC-35
RNC-30
RNC-25
RNC-20
RNC-15
RNC-100
10
20
30
40
50
60
70
80
90
16 31.5 63 125 250 500 1000 2000 4000 8000 16000octave-band center frequency (Hz)
soun
d pr
essu
re le
vel (
dB re
: 20 μP
a)
Figure A.2 — The spectrum of Example 2 plotted on the RNC curves. In this example sound exhibits 15-dB peak-to-peak sinusoidal surging and large turbulence. The standard deviation
of the sound level in the 3-band sum combined 16, 31.5 and 63-Hz octave bands is 3.1 dB. Using the tangent method, the highest RNC curve is contacted by the 31.5-Hz octave band and
has a value of RNC-44. So this spectrum is reported as an RNC-44 (31.5 Hz). The correction factor of 11.3 dB that is added to the measured LEQ in the 31.5-Hz octave band changes this
spectrum from an RNC-25 (250 Hz) to an RNC-44 (31.5 Hz).
Copyright Acoustical Society of America Provided by IHS under license with ASA Sold to:FAA WJH TECH CNTR (TDX DA), 01868452
Not for Resale,2011/7/18 16:30:11 GMTNo reproduction or networking permitted without license from IHS
--```,,`,,,,,`,`,`,,`,,-`-`,,`,,`,`,,`---

ANSI/ASA S12.2-2008
©2008 Acoustical Society of America – All rights reserved 24
Annex B (informative)
A discussion of the criteria
B.1 Discussion of RC, NC, and NCB criteria curves
The previous version of ANSI S12.2-1995, American National Standard Criteria for Evaluating Room Noise, presented two sets of room noise criteria curves: one termed NCB and the other RC. The NCB criterion curves were derived from the characteristics of hearing to be consistent with equal loudness curves and to be consistent with subjective responses. The RC criterion curves are parallel lines with a –5 dB per octave slope that goes through the stated RC value in the 1000-Hz octave band and, because of lower designated levels in the low-frequency bands, are designed to protect against the effects of slowly fluctuating low-frequency noise.
The RC curves were derived from an experimental study of the noise in 68 offices where the heating, ventilating, and air-conditioning (HVAC) systems were the source of noise and where there were no complaints by the occupants about the HVAC noise [6]. This meant that speech communication was satisfactory in each type of office measured, and there were no complaints of rumble (excessive noise in low-frequency bands) or hiss (excessive noise in high-frequency bands). The levels in these offices were all rated acceptable and the range represented was 40 to 50 dB, measured using A-weighting, which corresponds to a mid-frequency average level LMF of 32.5 to 42.5 dB. The occupants were subjected to no other significant sources of noise, either from outdoors, e.g., traffic, or from themselves or from equipment inside or outside the rooms. (Annex C presents more information on RC.)
The original NC curves (from which the NCB curves are extensions) were based on measurements made in offices at a university, an aluminum manufacturing company, an electronic equipment company, and a U.S. Air Force repair base. The most extensive data were taken in the USAF facility where a wide range of noise levels in rooms where speech communication was necessary was available. The NC curves were published in 1956 [1]. The complete NC study was published in 1957 [2]. The speech interference levels calculated from the measured levels in the rooms investigated ranged from 25 to 75 dB.
Those studies revealed that freedom from interference with speech communication (face-to-face and telephonic) appropriate to that type of space was the most important requirement by the occupants. Thus, the first requirement in rating seriousness of a noise was whether the SIL was appropriate for the space under consideration.
Those studies also revealed that even when the SIL was satisfactory for a particular type of space, complaints were found whenever the loudness level in phons, LL [1], of the overall spectrum was in excess of about 23 units above the SIL. Thus, the NC curves were constructed by assuming that the shape of the criterion curves should approximate that of the equal loudness level contours; i.e., the levels should rise monotonically at low frequencies and decrease to some extent at high frequencies. The NC curves were extended to SIL levels of 15 to 20 dB later by successful application throughout the world to hundreds of concert halls and rooms for music reproduction [5].
The NCB curves [4] were derived assuming that (a) the LL minus 23 of the original NC curves had to hold approximately, and (b) the shape of each curve was actually determined by the loudness in sones of each critical band in the noise associated with that curve was equal. The rating number on the NCB curves (and now the NC curves) is equal to the American National Standard speech
Copyright Acoustical Society of America Provided by IHS under license with ASA Sold to:FAA WJH TECH CNTR (TDX DA), 01868452
Not for Resale,2011/7/18 16:30:11 GMTNo reproduction or networking permitted without license from IHS
--```,,`,,,,,`,`,`,,`,,-`-`,,`,,`,`,,`---

ANSI/ASA S12.2-2008
©2008 Acoustical Society of America – All rights reserved 25
interference level, SIL, which is 1 to 2 dB lower than LMF depending on the spectrum shape. The finding that the NCB curves so obtained are nearly identical to the NC curves of the same rating number produced the logic necessary to extend them downward in frequency to the bands with mid-frequencies of 31.5 and 16 Hz. By the same logic, the NC curves herein have been extended down to 16 Hz. Also, the original octave-band limiting frequencies for the NC curves were replaced by the currently standard octave-band center frequencies with different limiting frequencies. The NCB curves of ANSI S12.2-1995 have not come into general use. Instead, it has been found that the NC curves of this standard are in widespread use and that their users prefer to continue with them.
These two sets of room criteria curves, RC and NC (NCB), are based on data and theory, and each is correct for a specific set of situations. They depart most markedly from one another at low frequencies and low sound levels. The RC curves, when arbitrarily applied, “penalize” a well-designed HVAC system such as the type that is usually found in concert halls or similar spaces. Although in such spaces there is no need to consider (non-existent) fluctuations and surging, the RC criterion could require 10 dB or more of unnecessary and highly expensive noise quieting at low frequencies. On the other hand, the NC curves set criteria levels that are based on “well-behaved” HVAC systems—systems where turbulence generation is minimized and fan surging does not exist. As such, these criteria do not automatically protect the user from acoustically poor systems.
B.2 Discussion of RNC criteria curves
The new RNC curves provide a procedure to be used when strong turbulence or sound surging is present at low frequencies. Unlike RC and NCB curves, the RNC curves use a tangency method to derive the RNC value. Also, both the NCB and RC methods include a rating that is supposed to describe the spectral makeup of the sound with terms such as "neutral," “hissy,” or “rumbly.” However, there are inconsistent results when the RC and NCB rumble and hiss criteria are employed to evaluate the spectral balance of the same measured spectra [14]. For this reason, the RNC and NC methods of this standard do not include such spectral descriptions since, at this time, there is no consensus on how they should be included. However, both descriptors are appended by the tangency frequency, e.g., RNC-35 (31.5 Hz).
Copyright Acoustical Society of America Provided by IHS under license with ASA Sold to:FAA WJH TECH CNTR (TDX DA), 01868452
Not for Resale,2011/7/18 16:30:11 GMTNo reproduction or networking permitted without license from IHS
--```,,`,,,,,`,`,`,,`,,-`-`,,`,,`,`,,`---

ANSI/ASA S12.2-2008
©2008 Acoustical Society of America – All rights reserved 26
Annex C (informative)
Recommended noise level criteria for various occupied activity areas
C.1 Recommended A-weighted criteria
A-weighted sound levels suitable for typical room types may be determined from Table C.1.
Table C.1 — A-weighted (unoccupied) sound level criteria for rooms of various uses [15, p. 890]
Occupancy A-weighted sound level
Small auditoriums (≤500 seats) 35-39
Large auditoriums, large drama theaters, and large churches (for very good speech articulation) (>500 seats)
30-35
TV and broadcast studios (close microphone pickup only) 16-35
Legitimate theaters 30-35
Private residences: Bedrooms 35-39 Apartments 39-48 Family rooms and living rooms 39-48
Schools: Lecture and classrooms core learning space with enclosed volume
<566 cu m(≤ 20,000 cu ft) 35
core learning space with enclosed volume >566 cu m(> 20,000 cu ft)
40
Open-plan classrooms 35
Hotels/motels: Individual rooms or suites 39-44 Meeting/banquet rooms 35-44 Service support areas 48-57
Office buildings: Offices executive 35-44 small, private 44-48 large, with conference tables 39-44 Conference rooms large 35-39 small 39-44 Open-plan areas 44-48
Copyright Acoustical Society of America Provided by IHS under license with ASA Sold to:FAA WJH TECH CNTR (TDX DA), 01868452
Not for Resale,2011/7/18 16:30:11 GMTNo reproduction or networking permitted without license from IHS
--```,,`,,,,,`,`,`,,`,,-`-`,,`,,`,`,,`---

ANSI/ASA S12.2-2008
©2008 Acoustical Society of America – All rights reserved 27
Occupancy A-weighted sound level
Business machines, computers 48-53 Public circulation 48-57
Hospitals and clinics Private rooms 35-39 Wards 39-44 Operating rooms 35-44 Laboratories 44-53 Corridors 44-53 Public areas 48-52
Movie theaters 39-48
Churches, small 39-44
Courtrooms 39-44
Libraries 44-48
Restaurants 48-52
Light maintenance shop, industrial plant control rooms, kitchens, and laundries
52-62
Shops and garages 57-67
C.2 Recommended NC and RNC criteria
NC and RNC values suitable for typical room types may be determined from Table C.2.
Table C.2 — NC and RNC (unoccupied) criteria values for rooms of various uses [15, p. 891]
Occupancy Recommended NC and RNC
criteria curve
Recording studios See Annex E
Concert halls, opera houses, and recital halls (listening to faint musical sounds)
15-18
Small auditoriums (≤500 seats) 25-30
Large auditoriums, large drama theaters, and large churches (for very good speech articulation) (>500 seats)
20-25
TV and broadcast studios (close microphone pickup only) 15-25
Legitimate theaters 20-25
Copyright Acoustical Society of America Provided by IHS under license with ASA Sold to:FAA WJH TECH CNTR (TDX DA), 01868452
Not for Resale,2011/7/18 16:30:11 GMTNo reproduction or networking permitted without license from IHS
--```,,`,,,,,`,`,`,,`,,-`-`,,`,,`,`,,`---

ANSI/ASA S12.2-2008
©2008 Acoustical Society of America – All rights reserved 28
Occupancy Recommended NC and RNC
criteria curve
Private residences: Bedrooms 25-30 Apartments 30-40 Family rooms and living rooms 30-40
Schools: Lecture and classrooms core learning space with enclosed volume
<566 cu m(≤ 20,000 cu ft) 25-30
core learning space with enclosed volume >566 cu m(> 20,000 cu ft)
30-35
Open-plan classrooms 25-30
Hotels/motels: Individual rooms or suites 30-35 Meeting/banquet rooms 25-35 Service support areas 40-50
Office buildings: Offices executive 25-35 small, private 35-40 large, with conference tables 30-35 Conference rooms large 25-30 small 30-35 Open-plan areas 35-40 Business machines, computers 40-45 Public circulation 40-50
Hospitals and clinics Private rooms 25-30 Operating rooms 25-35 Laboratories 35-45 Corridors 35-45 Public areas 40-45
Movie theaters 30-40
Churches, small 30-35
Courtrooms 30-35
Libraries 35-40
Restaurants 40-45
Light maintenance shop, industrial plant control rooms, 45-55
Copyright Acoustical Society of America Provided by IHS under license with ASA Sold to:FAA WJH TECH CNTR (TDX DA), 01868452
Not for Resale,2011/7/18 16:30:11 GMTNo reproduction or networking permitted without license from IHS
--```,,`,,,,,`,`,`,,`,,-`-`,,`,,`,`,,`---

ANSI/ASA S12.2-2008
©2008 Acoustical Society of America – All rights reserved 29
Occupancy Recommended NC and RNC
criteria curve
kitchens, and laundries
Shops and garages 50-60
In lightweight ceilings, ductwork, lighting fixtures, doors and windows that are exposed to the levels that exceed those given in Table 6 for “moderately perceptible rattle,” noise-induced vibrations and rattles can be expected, with moderate probability.
In lightweight ceilings, ductwork, lighting fixtures, doors and windows that are exposed to levels that exceed those given in Table 6 for “clearly perceptible rattle,” noise-induced vibrations and rattles can be expected, with high probability.
Copyright Acoustical Society of America Provided by IHS under license with ASA Sold to:FAA WJH TECH CNTR (TDX DA), 01868452
Not for Resale,2011/7/18 16:30:11 GMTNo reproduction or networking permitted without license from IHS
--```,,`,,,,,`,`,`,,`,,-`-`,,`,,`,`,,`---

ANSI/ASA S12.2-2008
©2008 Acoustical Society of America – All rights reserved 30
Annex D (informative) RC Mark II
D.1 Introduction
The RC curves were derived from an experimental study of the noise in 68 offices where the heating, ventilating, and air-conditioning (HVAC) systems were the source of noise and where there were no complaints by the occupants about the HVAC noise [6]. This meant that speech communication was satisfactory in each type of office measured, and there were no complaints of rumble (excessive noise in low-frequency bands) or hiss (excessive noise in high-frequency bands). The levels in these offices were all rated acceptable and the range represented was 40 to 50 dB, measured using A-weighting, which corresponds to a mid-frequency average level LMF of 32.5 to 42.5 dB. Apparently, the occupants were subjected to no other significant sources of noise, either from outdoors, e.g., traffic, or from themselves or from equipment inside or outside the rooms.
The RC criterion curves given in Table D.1 and shown in Figure D.1 were derived for use in the design of heating, ventilating, and air-conditioning (HVAC) systems in office buildings, dwelling units, and the like [6], [7], where the desired mid-frequency levels LMF are in the range of 25 to 50 dB. It is assumed that there are no sources of noise other than that of the HVAC system. The cited study did not include noise environments considered marginal or unacceptable by the occupants, and thus the levels are representative of well-designed and properly installed HVAC systems for contemporary building structures. Each RC criterion curve bears a rating number equal to the mid-frequency average level LMF which also equals the value at 1000 Hz.
D.2 Room criterion curves
The Mark II Room Criterion (RC) curves shown in Figure D.1 are defined for the octave bands from Band No. 12 (16 Hz) through Band No. 39 (8000 Hz) by a set of curves with a constant slope of -5 dB/octave except that curve values in Band No. 12 (16 Hz) are equal to those in Band No. 15 (31.5 Hz) [7]. Each curve is designated by its value at 1000 Hz (Band No. 30). The values of the RC curves are tabulated by octave-band mid-frequency and band number in Table D.1. The RC curves and their use to rate sound level spectra, together with the Quality Assessment Index (QAI) comprise the RC Mark II method.
D.3 Spectrum classification
D.3.1 Neutral spectrum (N)
A neutral spectrum is such that the levels in Band No. 27 (500 Hz) and below do not exceed the RC curve corresponding to a sound level spectrum by more than 5 dB; and the spectrum levels in Band No. 30 (1000 Hz) and higher do not exceed the corresponding RC curve by more than 3 dB.
Only a neutral (N) spectrum should be normally acceptable as a specification.
Copyright Acoustical Society of America Provided by IHS under license with ASA Sold to:FAA WJH TECH CNTR (TDX DA), 01868452
Not for Resale,2011/7/18 16:30:11 GMTNo reproduction or networking permitted without license from IHS
--```,,`,,,,,`,`,`,,`,,-`-`,,`,,`,`,,`---

ANSI/ASA S12.2-2008
©2008 Acoustical Society of America – All rights reserved 31
Table D.1 — Mark II room criteria (RC) curves
Octave-band center frequency in Hz 16 31.5 63 125 250 500 1000 2000 4000 8000 A-Wt.
RC-25 55 55 45 40 35 30 25 20 15 10 32 RC-26 55 55 46 41 36 31 26 21 16 11 33 RC-27 55 55 47 42 37 32 27 22 17 12 34 RC-28 55 55 48 43 38 33 28 23 18 13 35 RC-29 55 55 49 44 39 34 29 24 19 14 36 RC-30 55 55 50 45 40 35 30 25 20 15 37 RC-31 56 56 51 46 41 36 31 26 21 16 38 RC-32 57 57 52 47 42 37 32 27 22 17 39 RC-33 58 58 53 48 43 38 33 28 23 18 40 RC-34 59 59 54 49 44 39 34 29 24 19 41 RC-35 60 60 55 50 45 40 35 30 25 20 42 RC-36 61 61 56 51 46 41 36 31 26 21 43 RC-37 62 62 57 52 47 42 37 32 27 22 44 RC-38 63 63 58 53 48 43 38 33 28 23 45 RC-39 64 64 59 54 49 44 39 34 29 24 46 RC-40 65 65 60 55 50 45 40 35 30 25 47 RC-41 66 66 61 56 51 46 41 36 31 26 48 RC-42 67 67 62 57 52 47 42 37 32 27 49 RC-43 68 68 63 58 53 48 43 38 33 28 50 RC-44 69 69 64 59 54 49 44 39 34 29 51 RC-45 70 70 65 60 55 50 45 40 35 30 52 RC-46 71 71 66 61 56 51 46 41 36 31 53 RC-47 72 72 67 62 57 52 47 42 37 32 54 RC-48 73 73 68 63 58 53 48 43 38 33 55 RC-49 74 74 69 64 59 54 49 44 39 34 56 RC-50 75 75 70 65 60 55 50 45 40 35 57
Copyright Acoustical Society of America Provided by IHS under license with ASA Sold to:FAA WJH TECH CNTR (TDX DA), 01868452
Not for Resale,2011/7/18 16:30:11 GMTNo reproduction or networking permitted without license from IHS
--```,,`,,,,,`,`,`,,`,,-`-`,,`,,`,`,,`---

ANSI/ASA S12.2-2008
©2008 Acoustical Society of America – All rights reserved 32
RC-50
RC-45
RC-40
RC-35
RC-30
RC-25
0
10
20
30
40
50
60
70
80
90
16 31.5 63 125 250 500 1000 2000 4000 8000 16000octave-band center frequency (Hz)
soun
d pr
essu
re le
vel (
dB re
: 20 μP
a)
Figure D.1 — Mark II room criteria curves
Region A
Region B
Clearly perceptible vibration and rattle likely Moderately perceptible vibration and rattle likely
Copyright Acoustical Society of America Provided by IHS under license with ASA Sold to:FAA WJH TECH CNTR (TDX DA), 01868452
Not for Resale,2011/7/18 16:30:11 GMTNo reproduction or networking permitted without license from IHS
--```,,`,,,,,`,`,`,,`,,-`-`,,`,,`,`,,`---

ANSI/ASA S12.2-2008
©2008 Acoustical Society of America – All rights reserved 33
D.3.2 Spectrum with rumble (R)
The level in one or more of the octave bands at and below Band No. 27 (500 Hz) exceeds the RC curve corresponding to a spectrum by more than 5 dB. The rumble (R) classification should be used only in the diagnosis of noisy environments.
D.3.3 Spectrum with hiss (H)
The level in one or more of the octave bands at and above Band No. 30 (1000 Hz) exceeds the RC curve corresponding to a spectrum by more than 3 dB. The hiss (H) classification should be used only in the diagnosis of noisy environments.
D.3.4 Acoustically induced perceptible vibration and rattle (RV)
The level in one or more of the octave bands from Band No. 12 (16 Hz) through Band No. 18 (63 Hz) exceed the criterion for moderately noticeable rattle (see Table 6). The vibration and rattle (RV) classification should be used only in the diagnosis of a noisy environment.
D.3.5 Spectrum label
A room criterion rating is designated in the form RC-NN(A) where NN is an integer from 25 through 50 designating the reference RC curve and A is one of the letters N, R, or H or the combination of letters RV.
D.4 Method for calculating an RC value
A set of octave-band sound pressure levels that includes at least the bands from Band No. 15 (31.5 Hz) through Band No. 36 (4000 Hz) may be used to evaluate room noise using this standard as follows:
Mid-frequency average (LMF). Calculate the mid-frequency average (LMF) of the sound level spectrum. The numerical part of the RC designation is the calculated LMF, rounded to the nearest decibel. Use the calculated LMF to determine whether the environment in question is adequate for speech communication in a room of the type under consideration.
Spectral tag. The tag following the RC designation should be developed as indicated in D.3.
D.5 Quality assessment index (QAI)
The RC Mark II method uses two quantities for computing qualitative (rumble, hiss) characteristics of sound. These are the “energy-average spectral deviation factors” and the “quality assessment index.” The reader is referred to the original references for further details on the RC method [6], [7].
D.6 Recommended criteria
Recommended criteria for use with the RC curves are given in Table D.2.
Copyright Acoustical Society of America Provided by IHS under license with ASA Sold to:FAA WJH TECH CNTR (TDX DA), 01868452
Not for Resale,2011/7/18 16:30:11 GMTNo reproduction or networking permitted without license from IHS
--```,,`,,,,,`,`,`,,`,,-`-`,,`,,`,`,,`---

ANSI/ASA S12.2-2008
©2008 Acoustical Society of America – All rights reserved 34
Table D.2 — RC criteria for various activity areas excluding the noise due to human occupancy. The (N) stands for a neutral spectrum as defined in Clause D.3.1.
Occupancy RC curve
Private residences 25-30(N)
Apartments 30-35 (N)
Hotels/motels: Individual rooms or suites 25-35 (N) Meeting/banquet rooms 25-35 (N) Halls, corridors, lobbies 25-35 (N) Service/support areas 35-45 (N)
Offices: Executive 25-35 (N) Conference rooms 25-35 (N) Private 25-35 (N) Open-plan areas 30-40 (N) Public circulations 40-45 (N)
Hospitals and clinics: Private rooms 25-35 (N) Wards 30-40 (N) Operating rooms (The indicated range partly reflects the current reality of sound produced by medical equipment, and current air curtain and other ventilation design concepts to control infection. Ideally, sound level criteria should be 5 dB lower than the range specified.)
30-40 (N)
Laboratories 35-45 (N) Corridors 35-45 (N) Public areas 40-50 (N)
Churches 25-35 (N)
Schools: Lecture and classrooms 25-30 (N) Large lecture rooms 35-40 (N)
Libraries 30-40 (N)
Courtrooms (unamplified) 25-35 (N)
Copyright Acoustical Society of America Provided by IHS under license with ASA Sold to:FAA WJH TECH CNTR (TDX DA), 01868452
Not for Resale,2011/7/18 16:30:11 GMTNo reproduction or networking permitted without license from IHS
--```,,`,,,,,`,`,`,,`,,-`-`,,`,,`,`,,`---

ANSI/ASA S12.2-2008
©2008 Acoustical Society of America – All rights reserved 35
Annex E (informative)
Criteria for recording studios and other low-noise situations
E.1 Criteria
The criteria curves in Annex C may not be appropriate for the specification of background noise in contemporary recording studios and other low-noise situations. The appropriate background sound level for a studio requires consideration of recording dynamic range, the type of material being recorded, the demands the market places on the type of material recorded, and budgetary constraints. Listening to recorded music is different from acceptable speech or music intelligibility in live venues because it can be played back in very quiet rooms at high volumes.
The one-third octave-band sound pressure levels that include the bands from Band No. 14 (25 Hz) through Band No. 42 (16 kHz) as given in Table E.1 may, under certain circumstances, be appropriate to evaluate the suitability of a recording environment to produce recordings without audible background noise. This method is based on the critical band concept and direct application of the best data regarding the threshold of hearing.
E.2 Recording studio "audibility" threshold curves
The one-third octave band recording studio "audibility" threshold curve is defined from Band No. 14 (25 Hz) through Band No. 42 (16 kHz) in Table E.1. (See [8].)
These one-third-octave-band threshold levels were derived from the American National Standard threshold curve for pure tones but modified to take account of the assumed continuous noise and diffuse sound field at the listening positions [8]. However, as noted in 5.3, it is erroneous to simply measure LEQ at low frequencies and assume that if the LEQ is below the threshold of hearing, then the sound is inaudible. First, if a signal slowly surges, it may be audible even though the LEQ is below the threshold of audibility. This is especially true at low frequencies such as 31.5 Hz, because the characteristics of human hearing are such that approximately a 5-decibel change in sound pressure level corresponds to a doubling in perceived loudness. Second, because of this low-frequency hearing characteristic, a random low-frequency band of noise with a large standard deviation (after fast-time weighting) will be audible even though the LEQ is below the threshold of hearing. Thus, the threshold of audibility is for bands of noise such that the standard deviations are small.
Copyright Acoustical Society of America Provided by IHS under license with ASA Sold to:FAA WJH TECH CNTR (TDX DA), 01868452
Not for Resale,2011/7/18 16:30:11 GMTNo reproduction or networking permitted without license from IHS
--```,,`,,,,,`,`,`,,`,,-`-`,,`,,`,`,,`---

ANSI/ASA S12.2-2008
©2008 Acoustical Society of America – All rights reserved 36
Table E.1 — Recording studio "audibility" threshold for one-third octave bands — see [8]
Band No. Frequency (Hz) Threshold decibels re 20 micro Pa
14 25 55 15 31.5 46 16 40 41 17 50 35 18 63 30 19 80 25 20 100 21 21 125 18 22 160 14 23 200 11 24 250 8 25 315 6 26 400 5 27 500 4 28 630 2 29 800 1 30 1000 0 31 1250 1 32 1600 -2 33 2000 -2 34 2500 -3 35 3150 -4 36 4000 -4 37 5000 -4 38 6300 -4 39 8000 -4 40 10000 -4 41 12500 -4 42 16000 -4
Copyright Acoustical Society of America Provided by IHS under license with ASA Sold to:FAA WJH TECH CNTR (TDX DA), 01868452
Not for Resale,2011/7/18 16:30:11 GMTNo reproduction or networking permitted without license from IHS
--```,,`,,,,,`,`,`,,`,,-`-`,,`,,`,`,,`---

ANSI/ASA S12.2-2008
©2008 Acoustical Society of America – All rights reserved 37
Bibliography
[1] Beranek, L.L., “Criteria for office quieting based on questionnaire rating studies.” J. Acoust. Soc. Amer. 28, 833-852 (1956).
[2] Beranek, L.L., “Revised criteria for noise in buildings.” Noise Control 3, 19-27 (1957).
[3] Beranek, L.L., Noise Reduction, McGraw-Hill Book Co., p. 519 (1960).
[4] Beranek, L.L., "Balanced noise criterion (NCB) curves." J. Acoust. Soc. Am. 86(2), 650-664 (1989).
[5] Beranek, L.L., “Applications of NCB and RC noise criterion curves for specification for and evaluation of noise in buildings.” Noise Control Eng. J., 45, 209-216 (1997).
[6] Blazier, W.E., "Revised noise criteria for application in the acoustical design and rating of HVAC systems." Noise Control Eng. J. 16(2), 64-73 (1981).
[7] Blazier, W.E., "RC Mark II: A refined procedure for rating the noise of heating, ventilating, and air-conditioning (HVAC) systems in buildings." Noise Control Eng. J. 45(6), 243-250 (1997).
[8] Cohen, E.A, and Fielder, L.D., "Determining noise criteria for recording environments." J. Audio Eng. Soc. 40, 384-402 (1992).
[9] ISO 226:2003, Acoustics – Normal equal-loudness-level contours.
[10] Schomer, P.D., and Bradley, J.S., “A test of proposed revisions to room noise criteria curves.” Noise Control Eng. J., 48(4), 124-129 (July/August 2000).
[11] Schomer, P.D., “Proposed revisions to room noise criteria.” Noise Control Eng. J., 48(3), 85-96 (May/June 2000).
[12] Sound and vibration control, Chap. 47, 2003 ASHRAE Handbook, Heating, Ventilating, and Air-Conditioning Applications (2003).
[13] Stevens, S.S., "Perceived level of noise by Mark VII and Decibels E." J. Acoust. Soc. Am. 51, 575-599 (1972).
[14] Tocci, G.C., “Room Noise Criteria—The State-Of-The-Art In The Year 2000.” Noise/News International, 8(3), 106-119 (2000).
[15] Ver, I.L. and Beranek, L.L., Noise and Vibration Control Engineering, John Wiley and Sons, Inc., 2006.
Copyright Acoustical Society of America Provided by IHS under license with ASA Sold to:FAA WJH TECH CNTR (TDX DA), 01868452
Not for Resale,2011/7/18 16:30:11 GMTNo reproduction or networking permitted without license from IHS
--```,,`,,,,,`,`,`,,`,,-`-`,,`,,`,`,,`---

Copyright Acoustical Society of America Provided by IHS under license with ASA Sold to:FAA WJH TECH CNTR (TDX DA), 01868452
Not for Resale,2011/7/18 16:30:11 GMTNo reproduction or networking permitted without license from IHS
--```,,`,,,,,`,`,`,,`,,-`-`,,`,,`,`,,`---

MEMBERS OF THE ASA COMMITTEE ON STANDARDS (ASACOS)
P.D. Schomer, Chair and ASA Standards Director Schomer and Associates 2117 Robert Drive Champaign, IL 61821 Tel: +1 217 359 6602 Fax: +1 217 359 3303 Email: [email protected] R.D. Hellweg, Jr., Vice Chair Hellweg Acoustics 13 Pine Tree Road Wellesley, MA 02482 Tel: +1 781 431 9176 Email: [email protected] S.B. Blaeser, Standards Manager Standards Secretariat Acoustical Society of America 35 Pinelawn Rd., Suite 114E Melville, NY 11747 Tel: +1 631 390 0215 Fax: +1 631 390 0217 Email: [email protected]
Representation S1, Acoustics P. Battenberg, Chair, S1
R.J. Peppin, Vice Chair, S1
A.H. Marsh, ASA Representative, S1
P.D. Schomer, ASA Alternate Representative, S1 Representation S2, Mechanical Vibration and Shock A.T. Herfat, Chair, S2
R.L. Eshleman, Vice Chair, S2
S.I. Hayek, ASA Representative, S2
B.E. Douglas, ASA Alternate Representative, S2 Representation S3, Bioacoustics C.A. Champlin, Chair, S3 ASA Representative, S3
D.A. Preves, Vice Chair, S3
M.D. Burkhard, ASA Alternate Representative, S3
Representation S3/SC1, Animal Bioacoustics D.K. Delaney, Chair, S3/SC1
W.W.L. Au, Vice Chair, S3/SC1 ASA Representative, S3 Representation S12, Noise R.D. Hellweg, Chair, S12
ASA Representative, S12
W.J. Murphy, Vice Chair, S12
D. Lubman, ASA Alternate Representative, S12
ASA Technical Committee Representation A.P. Lyons, Acoustical
Oceanography
A.E. Bowles, Animal Bioacoustics
A. Campanella, Architectural Acoustics
P.J. Kaczkowski, Biomedical Ultrasound/Bioresponse to Vibration
M.D. Burkhard, Engineering Acoustics
D. Deutsch, Musical Acoustics
R.J. Peppin, Noise
R. Raspet, Physical Acoustics
B.W. Edwards, Psychological and Physiological Acoustics
C.F. Gaumond, Signal Processing in Acoustics
S. Narayanan, Speech Communication
S.I. Hayek, Structural Acoustics and Vibration
R. Drake, Underwater Acoustics
Ex Officio Members of ASACOS V.W. Sparrow, Chair, ASA Technical Council D. Feit, ASA Treasurer T.F.W. Embleton, Past Chair ASACOS C.E. Schmid, ASA Executive Director U. S. Technical Advisory Group (TAG) Chairs for International Technical Committees P.D. Schomer, Chair, U. S. TAG, ISO/TC 43 V. Nedzelnitsky, Chair, U. S. TAG, IEC/TC 29 D.J. Evans, Chair, U. S. TAG, ISO/TC 108
Copyright Acoustical Society of America Provided by IHS under license with ASA Sold to:FAA WJH TECH CNTR (TDX DA), 01868452
Not for Resale,2011/7/18 16:30:11 GMTNo reproduction or networking permitted without license from IHS
--```,,`,,,,,`,`,`,,`,,-`-`,,`,,`,`,,`---

ANSI/ASA S12.2-2008 (Revision of ANSI S12.2-1995)
Copyright Acoustical Society of America Provided by IHS under license with ASA Sold to:FAA WJH TECH CNTR (TDX DA), 01868452
Not for Resale,2011/7/18 16:30:11 GMTNo reproduction or networking permitted without license from IHS
--```,,`,,,,,`,`,`,,`,,-`-`,,`,,`,`,,`---