
Anomalous melting behavior under extreme conditions: Hard matter turning ``soft
14
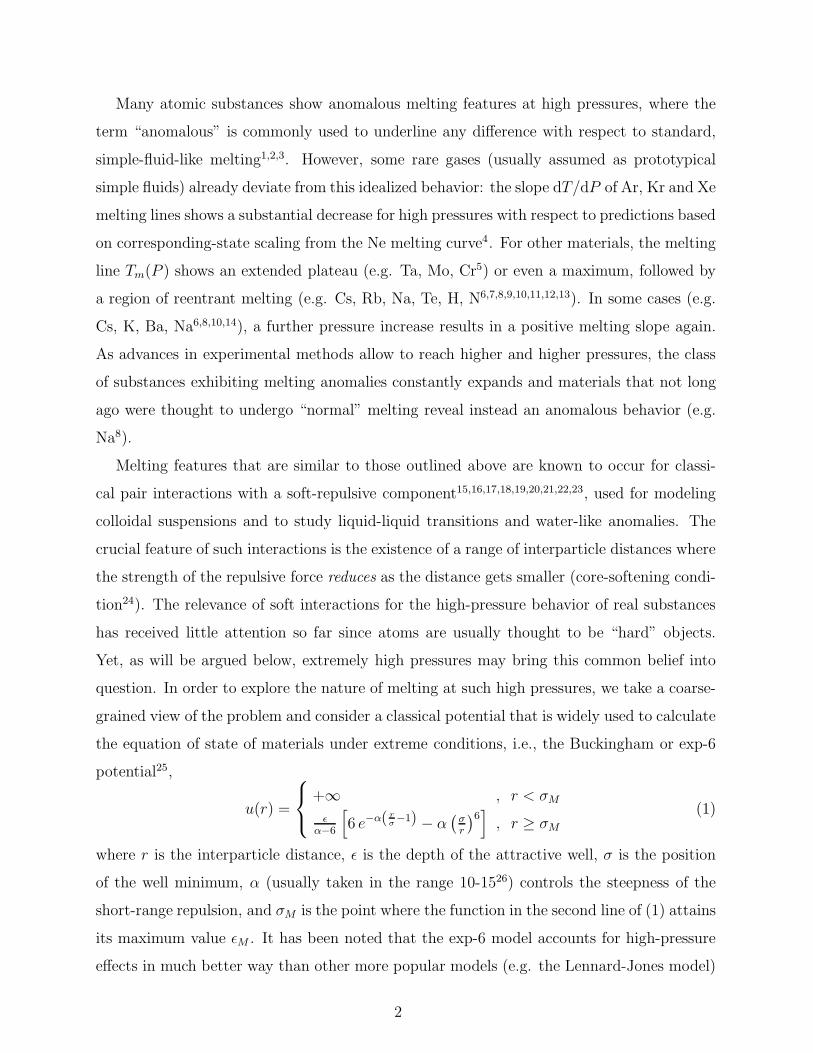
arXiv:0812.4957v1 [cond-mat.soft] 29 Dec 2008 Anomalous melting behavior under extreme conditions: hard matter turning “soft” Gianpietro Malescio 1 † , Franz Saija 2‡ , and Santi Prestipino 1* 1 Universit` a degli Studi di Messina, Dipartimento di Fisica, Contrada Papardo, 98166 Messina, Italy 2 CNR-Istituto per i Processi Chimico-Fisici, Contrada Papardo, 98158 Messina, Italy Abstract We show that a system of particles interacting through the exp-6 pair potential, commonly used to describe effective interatomic forces under high compression, exhibits anomalous melting features such as reentrant melting and a rich solid polymorphism, including a stable BC8 crystal. We relate this behavior to the crossover, with increasing pressure, between two different regimes of local order that are associated with the two repulsive length scales of the potential. Our results provide a unifying picture for the high-pressure melting anomalies observed in many elements and point out that, under extreme conditions, atomic systems may reveal surprising similarities with soft matter. 1
Transcript of Anomalous melting behavior under extreme conditions: Hard matter turning ``soft

arX
iv:0
812.
4957
v1 [
cond
-mat
.sof
t] 2
9 D
ec 2
008
Anomalous melting behavior under extreme conditions:
hard matter turning “soft”
Gianpietro Malescio1†, Franz Saija2‡, and Santi Prestipino1*
1 Universita degli Studi di Messina, Dipartimento di Fisica,
Contrada Papardo, 98166 Messina, Italy
2 CNR-Istituto per i Processi Chimico-Fisici,
Contrada Papardo, 98158 Messina, Italy
Abstract
We show that a system of particles interacting through the exp-6 pair potential, commonly
used to describe effective interatomic forces under high compression, exhibits anomalous melting
features such as reentrant melting and a rich solid polymorphism, including a stable BC8 crystal.
We relate this behavior to the crossover, with increasing pressure, between two different regimes
of local order that are associated with the two repulsive length scales of the potential. Our results
provide a unifying picture for the high-pressure melting anomalies observed in many elements and
point out that, under extreme conditions, atomic systems may reveal surprising similarities with
soft matter.
1
Many atomic substances show anomalous melting features at high pressures, where the
term “anomalous” is commonly used to underline any difference with respect to standard,
simple-fluid-like melting1,2,3. However, some rare gases (usually assumed as prototypical
simple fluids) already deviate from this idealized behavior: the slope dT/dP of Ar, Kr and Xe
melting lines shows a substantial decrease for high pressures with respect to predictions based
on corresponding-state scaling from the Ne melting curve4. For other materials, the melting
line Tm(P ) shows an extended plateau (e.g. Ta, Mo, Cr5) or even a maximum, followed by
a region of reentrant melting (e.g. Cs, Rb, Na, Te, H, N6,7,8,9,10,11,12,13). In some cases (e.g.
Cs, K, Ba, Na6,8,10,14), a further pressure increase results in a positive melting slope again.
As advances in experimental methods allow to reach higher and higher pressures, the class
of substances exhibiting melting anomalies constantly expands and materials that not long
ago were thought to undergo “normal” melting reveal instead an anomalous behavior (e.g.
Na8).
Melting features that are similar to those outlined above are known to occur for classi-
cal pair interactions with a soft-repulsive component15,16,17,18,19,20,21,22,23, used for modeling
colloidal suspensions and to study liquid-liquid transitions and water-like anomalies. The
crucial feature of such interactions is the existence of a range of interparticle distances where
the strength of the repulsive force reduces as the distance gets smaller (core-softening condi-
tion24). The relevance of soft interactions for the high-pressure behavior of real substances
has received little attention so far since atoms are usually thought to be “hard” objects.
Yet, as will be argued below, extremely high pressures may bring this common belief into
question. In order to explore the nature of melting at such high pressures, we take a coarse-
grained view of the problem and consider a classical potential that is widely used to calculate
the equation of state of materials under extreme conditions, i.e., the Buckingham or exp-6
potential25,
u(r) =
+∞ , r < σM
ǫ
α−6
[6 e−α( r
σ−1) − α
(σ
r
)6]
, r ≥ σM
(1)
where r is the interparticle distance, ǫ is the depth of the attractive well, σ is the position
of the well minimum, α (usually taken in the range 10-1526) controls the steepness of the
short-range repulsion, and σM is the point where the function in the second line of (1) attains
its maximum value ǫM . It has been noted that the exp-6 model accounts for high-pressure
effects in much better way than other more popular models (e.g. the Lennard-Jones model)
2
owing to its less steep repulsion27. However, the ability of the exp-6 interaction to satisfy the
core-softening condition (see Fig. 1) has not been pointed out so far and its phase behavior
was investigated only in a restricted range of pressures and temperatures where no melting
anomaly occurs27,28,29.
Using standard simulation methods (NPT Metropolis Monte Carlo in conjunction with
Widom and Frenkel-Ladd free-energy methods30), we computed the exp-6 phase diagram for
a given α (choosing initially α = 11) over a wide range of pressures P and temperatures T
(expressed throughout the text in units of ǫ/σ3 and ǫ/kB, respectively). Our samples con-
tained a number N of particles of the order of 1000 (finite-size corrections are negligible).
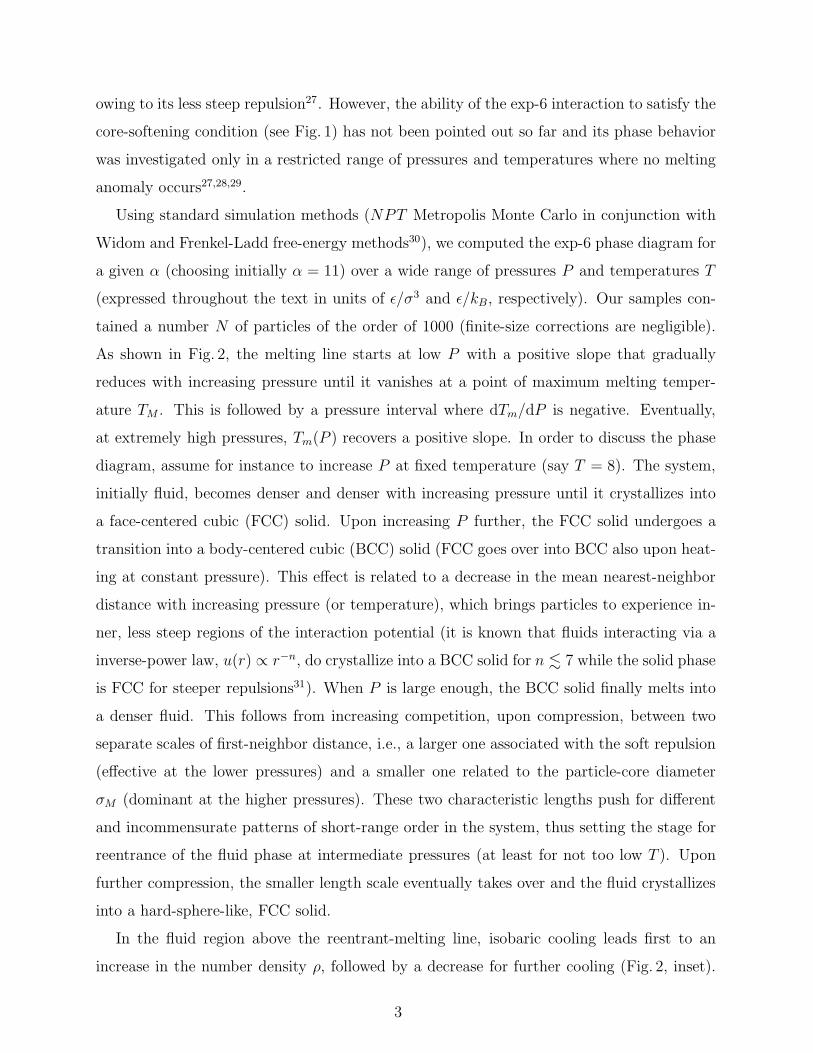
As shown in Fig. 2, the melting line starts at low P with a positive slope that gradually
reduces with increasing pressure until it vanishes at a point of maximum melting temper-
ature TM . This is followed by a pressure interval where dTm/dP is negative. Eventually,
at extremely high pressures, Tm(P ) recovers a positive slope. In order to discuss the phase
diagram, assume for instance to increase P at fixed temperature (say T = 8). The system,
initially fluid, becomes denser and denser with increasing pressure until it crystallizes into
a face-centered cubic (FCC) solid. Upon increasing P further, the FCC solid undergoes a
transition into a body-centered cubic (BCC) solid (FCC goes over into BCC also upon heat-
ing at constant pressure). This effect is related to a decrease in the mean nearest-neighbor
distance with increasing pressure (or temperature), which brings particles to experience in-
ner, less steep regions of the interaction potential (it is known that fluids interacting via a
inverse-power law, u(r) ∝ r−n, do crystallize into a BCC solid for n . 7 while the solid phase
is FCC for steeper repulsions31). When P is large enough, the BCC solid finally melts into
a denser fluid. This follows from increasing competition, upon compression, between two
separate scales of first-neighbor distance, i.e., a larger one associated with the soft repulsion
(effective at the lower pressures) and a smaller one related to the particle-core diameter
σM (dominant at the higher pressures). These two characteristic lengths push for different
and incommensurate patterns of short-range order in the system, thus setting the stage for
reentrance of the fluid phase at intermediate pressures (at least for not too low T ). Upon
further compression, the smaller length scale eventually takes over and the fluid crystallizes
into a hard-sphere-like, FCC solid.
In the fluid region above the reentrant-melting line, isobaric cooling leads first to an
increase in the number density ρ, followed by a decrease for further cooling (Fig. 2, inset).
3

The locus of points where ρ attains its maximum encloses a region of “density anomaly”
(see Fig. 2). This has been observed under ordinary pressure in a number of systems, among
which water is the most important32. Our findings raise the possibility that a density
anomaly may as well occur at much higher pressures in those substances that are character-
ized by reentrant melting.
The above results are confirmed and further corroborated by an analysis of the system
structure in terms of the radial distribution function g(r) and of the structure factor S(k).
We computed g(r) at a temperature T close to TM and in the pressure range where reentrant
melting occurs. Upon compression, the first peak of g(r) (at r ≃ σM) moves upward while
the second and third peaks go down, signalling that more and more particles can overcome
the soft-repulsive shoulder (Fig. 3, top panel). This behavior is mirrored in the pressure
dependence of S(k) whose main peak first builds up and then goes down (Fig. 3, inset of
top panel). This is different from simple fluids, where all g(r) and S(k) peaks get higher as
P grows at constant T . We also computed g(r) at a somewhat lower temperature (T = 10)
and for intermediate pressures. Here, g(r) is highly structured for r < σ while it shows
an ideal-gas behavior for larger distances (Fig. 3, bottom panel). This suggests that, in the
fluid region being considered, particles are grouped in clusters whose linear extent is of the
order of σ, with inter-cluster spacing large enough that no significant radial correlations
exist between particles in different clusters.
We did not attempt a full analysis of solid polymorphism in the exp-6 system at low
temperature, but to a large extent this can be anticipated by the T = 0 calculation of the
chemical potential (i.e., enthalpy) for a number of relevant crystal structures (see Fig. 4).
Optimized structures were computed for the following lattices: FCC, BCC, hexagonal closed
packed, simple cubic (SC), simple hexagonal (SH), body-centered tetragonal, plus a few
non-Bravais lattices (diamond, BC8, cI16, hR1, and ST12) that occur, either as stable or
near-optimal phases, for Li, Na, and Si under high compression33,34,35,36. We found that the
sequence of stable phases for increasing pressures is
FCC5500−→ BCC
12500−→ SH
19500−→ BC8
31500−→ SH
42500−→ SC
53500−→ SH
72500−→ FCC , (2)
where the numbers above the arrows indicate the transition pressures (to within a precision
of 500). The three separate SH regions correspond to distinct ranges of the ratio c/a between
transverse and in-plane lattice parameters, that is 0.69–0.73, 1.33–1.23, and 1, respectively.
4

In turn, the number of neighbors in close contact with a given particle is 2, 6, and 8.
Moreover, at exactly P = 20000, the stable BC8 crystal can also be viewed as a cI16
crystal with an internal positional parameter of 0.125. The occurrence of BC8 and cI16
solids (same Pearson symbol37) in light alkali metals has been associated with complex
modifications of the electronic density of states33,34,38. Remarkably, our findings show that
low-symmetry non-Bravais lattices can be stabilized also for a simple spherically-symmetric
classical interaction. The existence of two competing repulsive length scales appears to be
an essential ingredient for this surprising result, which discloses the possibility that suitably-
tailored colloids (i.e., micrometer-sized particles) may exist as “exotic” solids at standard
conditions.
We finally analysed how the phase diagram of the exp-6 model changes with the repulsion
steepness by performing calculations for other values of α in the range 10-13. We found that
the typical pressure and temperature (P , T ) where anomalous features occur do approxi-
mately scale as ǫM(α)/σM(α)3 and ǫM (α), respectively. This amounts to about a tenfold
(P ) and a fivefold (T ) increase per unit α variation. In addition to this major effect, we
found that the maximum of Tm(P ) becomes more and more pronounced with increasing α.
As illustrated above, the melting behavior of the exp-6 system is related to the gradual
switching off, under sufficiently high pressure, of the soft-repulsive length scale in favor of
the hard one, which leads to a series of transitions to more and more compact structures.
This offers a clue to understand the anomalous melting features of many materials under
extreme conditions. As is well known, pressure may trigger a reorganization of the atomic
structure, leading to charge transfer to more localized orbitals (see e.g. the 6s-5d transition
in Cs6). A similar phenomenon is pressure-driven 5p-5d hybridization in Xe39. More often, a
pressure-induced symmetry-breaking transition is the large-scale manifestation of a collective
response of conduction electrons: upon compression, pseudo-ions will eventually adjust to
a new and more compact crystal lattice provided this also ensures an optimum electronic-
energy content. Both atomic and structural transitions take place at definite pressures in
the solid while in the fluid such changes occur over a broader pressure range. The transition
of an element to a more compact solid is usually reflected in a sudden increase of the Tm(P )
slope. This is generally preceded by a part of the melting line having negative, vanishing,
or very small positive slope. Aside from the specific mechanism at work, such behaviors can
be interpreted, in the effective-potential approach, as effects of the weakening of repulsive
5

forces that is associated with the crossover from a larger to a smaller repulsive length scale.
This affects, to a greater or lesser extent, any substance and will induce its structure, at
sufficiently high pressure, to settle down on a more compact and stiff arrangement. In some
systems, this process may occur repeatedly as pressure increases, which provides a rationale
for the behavior hypothesized for K14 and observed in Sr10.
The melting behavior that was for long considered as general, i.e., a regularly increasing
and concave Tm(P ) (typical of e.g. hard-sphere and inverse-power potentials), is actually
unrealistic at extreme pressures since it is associated with an essentially rigid-like response to
compression. On the contrary, anomalous melting can be expected to be the norm among the
elements. However, the pressures and temperatures where structural softening occurs can
vary considerably from one substance to the other, as suggested by the sensitive dependence
on the repulsion steepness of the location of exp-6 anomalies. In particular, atoms with more
electrons should be more susceptible, at least within the same chemical family, to pressure-
induced modifications in the condensed phases. This is consistent, for example, with the
known properties of alkali metals6,7,8,9,11,14 and with the behavior of rare gases, where the
flattening observed in the melting line at high pressures is more marked and occurs at a
smaller pressure for the heavier gases4,39.
† E-mail: [email protected]
‡ E-mail: [email protected] (corresponding author)
* E-mail: [email protected]
1 P. F. McMillan, Nature Materials 1, 19 (2002).
2 D. A. Young, Phase diagrams of the elements (University of California, Berkeley, 1991).
3 S. K. Saxena, G. Shen, and P. Lazor, Science 264, 405 (1994).
4 R. Boehler et al., Phys. Rev. Lett. 86, 5731 (2001).
5 D. Errandonea et al., Phys. Rev. B 63, 132104 (2001).
6 A. Jayaraman, R. C. Newton, and J. M. McDonough, Phys. Rev. 159, 527 (1967).
7 F. P. Bundy, Phys. Rev. 115, 274 (1959).
8 E. Gregoryanz et al., Phys. Rev. Lett. 94, 185502 (2005).
9 J-Y. Raty, E. Schwegler, and S. A. Bonev, Nature 449, 448 (2007).
6

10 D. Errandonea, R. Boehler, and M. Ross, Phys. Rev. B 65, 012108 (2001).
11 E. Rapoport, J. Chem. Phys. 48, 1433 (1968).
12 S. A. Bonev et al., Nature 431, 669 (2004).
13 G. D. Mukherjee and R. Boehler, Phys. Rev. Lett. 99, 225701 (2007).
14 C.-S. Zha and R. Boehler, Phys. Rev. B 31, 3199 (1985).
15 C. P. Royall et al., J. Chem. Phys. 124, 244706 (2006).
16 F. H. Stillinger, J. Chem. Phys. 65, 3968 (1976).
17 C. N. Likos, Phys. Rep. 348, 267 (2001).
18 S. Prestipino, F. Saija, and P. V. Giaquinta, Phys. Rev. E 71, 050102(R) (2005).
19 G. Malescio, J. Phys.: Condensed Matter 19, 073101 (2007).
20 G. Malescio and G. Pellicane, Nature Materials 2, 97 (2003).
21 P. C. Hemmer and G. Stell, Phys. Rev. Lett. 24, 1284 (1970).
22 D. A. Young and B. J. Alder, Phys. Rev. Lett. 38, 1213 (1977).
23 E. A. Jagla, Phys. Rev. E 63, 061501 (2001).
24 P. G. Debenedetti, V. S. Raghavan, and S. S. Borick, J. Phys. Chem. 95, 4540 (1991).
25 R. A. Buckingham, Proc. R. Soc. London, Ser. A 168, 264 (1938).
26 L. E. Fried, W. M. Howard, and P. C. Souers, Exp-6: a new equation of state library for high
pressure thermochemistry, 12th International Detonation Symposium, August 11-16, 2002 (San
Diego, USA).
27 M. Ross and A. K. McMahan, Phys. Rev. B 21, 1658 (1980).
28 A. B. Belonoshko et al., J. Chem. Phys. 117, 7733 (2002).
29 F. Saija and S. Prestipino, Phys. Rev. B 72, 024113 (2005).
30 D. Frenkel and B. Smit, Understanding molecular simulation (Academic, New York, 2001).
31 R. Agrawal and D. A. Kofke, Phys. Rev. Lett. 74, 122 (1995).
32 P. G. Debenedetti, Metastable liquids: concepts and principles (Princeton University Press,
Princeton, 1996).
33 J. B. Neaton and N. W. Ashcroft, Nature 400, 117 (1999).
34 M. Hanfland et al., Nature 408, 174 (2000).
35 M. I. McMahon et al., Proc. Natl. Acad. Sci. U.S.A. 104, 17297 (2007).
36 I. Tamblyn, J-Y. Raty, and S. A. Bonev, Phys. Rev. Lett. 101, 075703 (2008).
37 W. B. Pearson, A Handbook of Lattice Spacings and Structures of Metals and Alloys (Pergamon,
7

Oxford, 1967).
38 R. M. Martin, Nature 400, 117 (1999).
39 M. Ross, R. Boehler, and P. Soderlind, Phys. Rev. Lett. 95, 257801 (2005).
8

FIGURE CAPTIONS
Fig. 1 : The exp-6 potential u(r) for α = 11 (solid line, left vertical axis) and the cor-
responding force f(r) = −du/dr (dashed line, right vertical axis). The force has a
maximum strength in the region of the soft-repulsive core. Hence, a new “soft” length
scale emerges in the system in addition to the hard-core diameter σM . With increasing
α, σM decreases while ǫM gets larger. For instance, when α grows from 11 to 13, σM
varies from about 0.374σ to 0.245σ whereas ǫM varies from about 370ǫ to 7104ǫ.
Fig. 2 : High P -high T phase diagram of the exp-6 model for α = 11. Pressure P and
temperature T are in units of ǫ/σ3 and ǫ/kB, respectively. Coexistence curves are
represented as solid lines. Open circles mark coexistence points as estimated through
exact free-energy calculations (errors are smaller than the symbols size). The full
circle is the outcome of a total-energy calculation. The boundary between the fluid
phase and the FCC crystal at extremely high pressures corresponds to the lower sta-
bility threshold of the solid. In the intermediate-pressure region (from about 15000 to
70000), additional phases at low temperature are likely present (a BC8 solid, various
instances of SH solids, and a SC solid, see text), whose precise boundaries, however,
were not computed. The locus of density maxima, (∂ρ/∂T )P = 0, in the fluid phase
is represented as a dotted line. All lines in the figure are guides to the eye. Inset:
reduced number density ρσ3 as a function of temperature for P = 10000.
Fig. 3 : Spatial correlations in the exp-6 system for α = 11. Top panel: radial distribution
function g(r) for T = 17; P = 9000 (solid line), 12000 (dashed line), 15000 (dotted
line), and 18000 (dash-dotted line). Inset: height of the first peak of the structure
factor S(k) as a function of pressure at T = 17. Bottom panel: g(r) for T = 10;
P = 15000 (dotted line), 20000 (dash-dotted line), 40000 (dashed line), 60000 (solid
line).
Fig. 4 : (Color online) T = 0 chemical potential µ, plotted as a function of pressure P ,
for a number of crystal arrangements, choosing the FCC lattice (blue solid line) as a
reference (both µ and P are in reduced units; the chemical potentials of structures
that are never stable are not shown): BCC (triangles and red solid line), simple cubic
(SC, boxes and black solid line), simple hexagonal (SH, dots and light blue solid line),
9

BC8 (magenta dotted line), and cI16 (green dashed line). The optimized cI16 crystal
is actually a BCC crystal up to the pressure where the BC8 solid prevails over BCC.
From there onwards, the cI16 line runs over the BC8 line, departing from it only for
P > 20000.
10

FIG. 1:
11
FIG. 2:
12

0.3 0.6 0.9 1.2 1.50
2
4
6
g(r)
r/
0 5000 10000 15000 20000
2.0
2.4
2.8
1st P
eak
Max
. of
S(k
)
P
0
1
2
3
g(r)
FIG. 3:
13

FIG. 4:
14