Annual report Annual report - Lifestyle International Holdings ...
Upload
khangminh22Category
view
2download
0
1SOLVANG ASA - ANNUAL REPORT 2015
ANNUAL REPORT2015
INDUSTRY LEADING PROVIDER OF LPG AND PETROCHEMICAL TONNAGE.

SOLVANG ASA - ANNUAL REPORT 2015 2
The main reasons for the very tight shipping market is the new LPG export volumes coming out of USA, a product of the rapidly increasing shale gas and shale oil production in the period up to 2015. In addition, price differences on LPG between regions have made extra arbitrage available, resulting in more long-haul LPG voyages from west to east. The market peaked in July 2015, reaching a spot market at time charter equivalent of USD 4.2 million per month, and has since then been on a downward spiral, with a year-end level of about USD 1.8 million. This represents a huge drop from the peak, but still a historically strong level. The drop came as a result of closed arbitrage between west and east, as well as a record level of new-builds entering the market. A total of 35 new vessels were delivered during 2015, representing more than 20% of the existing fleet at the start of the year. With this record high growth and still achieving an all-time high market, just shows how much the LPG export volume has increased from 2013 levels.
With this record high LPG market, Solvang also increased earnings even further from 2014, and can now confirm that 2015 is the new record year for the group. This came both as a result of the strong VLGC and LGC market, but also further boosted by our three LGC new-builds entering the market on strong time charters.
The flipside of having a period of high expectations and then followed by two years of very strong VLGC market, is of course a strong interest for existing and new players to increase their market exposure. The result has been well over 50% order book, where 35 ships were delivered in 2015, 44 are scheduled for delivery in 2016 and another 27 in 2017. Needless to say this will have an effect on the VLGC market, and with the sustained low oil price and signs of falling production in USA, we feel confident we’ll see a market correction in 2016 and 2017, at least a normalization to more historic levels.
In the midst of exciting and challenging times, I am very proud of what we have achieved. We have a stable operation and technical management, with little or no turnover onshore, and our organization is capable of handling any technical issue without using external expertise. As a matter of fact, our in-house expertise is often requested by the shipping industry players in Norway to give advice and join development projects.
The very tight shipping market and a large new-build fleet in order, put a lot of pressure on retaining our sailing crew as well as office staff. So far, we have been able to keep a high retention rate, and we continue to focus on keeping it high through developing and empowering all our personnel.
From the CEO
One year ago, at the start of 2015 we were celebrating the conclusion of our best year ever for the bigger LPG vessels, and were speculating about the possibility that 2015 could be even better. Our conjectures
were correct, and 2015 turned out to be an even stronger year, despite a record number of new-builds delivered.

3SOLVANG ASA - ANNUAL REPORT 2015
Throughout 2015, we delivered outstanding performance on all key success factors; HSE, Quality, CSR and Financial.
• We have zero LTI or serious personnel incidents and now stand with only 4 LTI in the past 8 years. Smaller potential incidents happen every day though, so we will never let our guard down on safety.
• We have record low number of seafarers becoming unfit for duty after medical check.
• Our environmental footprint is improved with 6 vessels now running a full scale exhaust cleaning system.
• Our Quality statistics / vetting results are among the best in our segment.
• We continue to support a SOS Children´s Village in the Philippines, as well as other local welfare causes. We are a supporter and member of MACN (Marine Anti-Corruption Network) and comply with the good corporate practices in the maritime industry as described in the network´s operating charter.
• All-time high financial results, with improved contracts from a strong market, but also from reduced opex levels, while maintaining the highest possible quality in operations.
In 2015, we took delivery of three new LGC vessels from Hyundai Heavy Industries in South Korea. These vessels are designed and purpose-built for a certain niche of the gas segment, and represent yet another great step forward in terms of fuel efficiency and emission control. All three vessels perform according to expectations, including a smooth new-build delivery process and timely start-up of contracts.
With the expected change in the market condition, the Solvang group has initiated some key structural changes, by consolidating ship-owning companies, refinancing and generally enabling us to exploit opportunities arising over the next couple of years. Solvang ASA has a strong position, both in the market place and financially. We believe that the future looks bright, and we continue to focus on excellence in operating our ships and in high quality service-delivery to our customers.
Edvin Endresen CEO

SOLVANG ASA - ANNUAL REPORT 2015 4
Definitions
Ammonia / NH3 Used as raw material for fertilizer production.
Cbm Cubic meter. The most common capacity nomination for gas vessels.
CoA Contract of Affrightment. A CoA is an agreement between ship owner and customer for the transportation of a min-max volume of cargo at a given rate per ton, normally for one or several years.
Dry docking Normally related to a vessels periodic maintenance according to class requirements. The intervals are normally 5 years for newer vessels.
FFJV Fully Fledge Joint Venture.
Freight rate The rate paid by customer to owners for the transportation service provided. Calculated either per ton basis or per days basis.
HSEQ Health, safety, environment and quality.
IFRS International Financial Reporting Standards. All Norwegian companies quoted at the Oslo Stock Exchange are required to follow this accounting standard.
IGC International Gas Carriers AS. Marketing company for Solvang’s vessels.
KPI Key Performance Indicators. Key figures.
LGC Large Gas Carrier. LPG vessels between 50.000 cbm and 70.000 cbm. Normal size for newer vessels is 60.000.
LIBOR London Interbank Offered Rate.
LPG Liquefied Petroleum Gas.
LTI Lost Time Incident Ratio measuring the level of injuries in a company or an operation.
Panamax VLGC Very Large Gas Carrier with a beam of 32,2 meter enabling the vessels to trade through the Panama canal.
Petrochemical Gases Gases used as input/feedstock in petrochemical industry.
Semiref/Ethylene vessel A gas carrier capable of transporting cargoes both under high pressure and with full refrigeration.
Spot rate The rate obtained when chartering out a vessel for a single voyage.
TC Time Charter. A contract between ship owner and customer for anything between 2 months and several years. All voyage cost such as bunkers, canal and harbour fees are payable by the customer. Operating Cost is for the owner’s account.
VLGC Very Large Gas Carrier. LPG carriers with over 75,000 cbm load capacity The normal size for modern vessels is 82,000 cbm. As opposed to Panamax VLGC, these vessels cannot sail through the Panama Canal.

5SOLVANG ASA - ANNUAL REPORT 2015
Key FiguresKey figures, joint venture accounting, reference made to note 3 in the group accounts
Number of ships v/s cargo capacity (CMB)
Investments (Mill USD)
0
2
4
6
8
10
12
14
16
18
20
22
0
97
194
291
388
485
583
680
777
874
971
1,068
2010 2011 2012 2013 2014 2015
Num
berofvessels
Carg
oc
apacity(CM
B)
Numberofvessels Cargocapacity(CMB)
200
160
120
80
40
0
20
00
-20
02
20
03
-20
05
20
06
-20
08
20
09
-20
12
20
13
-20
15
8,6
35
,7
21
1
0 86
0
20
40
60
80
100
120
140
160
180
0.0
0.2
0.4
0.7
0.9
1.1
1.3
1.6
1.8
2.0
2010 2011 2012 2013 2014 2015
Res
ult
Div
iden
dp
ers
ha
re
Result Dividendpershare
10
8
6
4
2
0
0-
5y
ea
rs
5-
10
ye
ars
10
-1
5y
ea
rs
>1
5y
ea
rs
5 11
3 2
Result development (Mill NOK) before tax. Dividend in NOK.
Fleet age

SOLVANG ASA - ANNUAL REPORT 2015 6
2015 2014 2013 2012 2011
Operating revenues mill. NOK 480,9 324,2 249,1 263,2 202,4
Op. exp. excl. depreciation mill. NOK 199,4 161,3 146,9 138,7 108,5
Depreciation mill. NOK 86,6 47,6 49,9 47,7 41,6
Operating profit/loss mill. NOK 194,9 115,3 52,3 76,8 52,3
Net financial items mill. NOK -23,4 -7,0 11,5 -12,6 -38,2
Profit/loss before tax mill. NOK 171,6 108,4 63,8 64,1 14,2
Net profit/loss for the year mill. NOK 168,9 102,8 65,7 55,5 -22,5
Net Cash flow mill. NOK 38,4 33,9 -3,9 5,4 36,1
Total capital joint venture accounting mill. NOK 2 638,3 1 790,2 1 550,0 1 290,1 1 378,8
Equity mill. NOK 1 164,8 849,8 626,1 533,0 498,7
Equity % 44,15 % 47,47 % 40,40 % 41,31 % 36,17 %
KEY FIGURES PER SHARE
Nominal value per share 5,00 5,00 5,00 5,00 5,00
Price 31.12 (market price - tax assessment) 31,90 22,50 20,25 19,20 18,40
Yield per share 7,02 4,44 2,62 2,63 0,58
Earnings per share 6,91 4,21 2,69 2,28 -0,93
Cash flow per share 1,57 1,39 -0,16 0,22 1,48
Dividend per share 2,00 1,00 0,50 0,50 0,00
Price-Earnings Ratio per 31.12 4,55 5,07 7,74 7,29 31,53
PRICE DEVELOPMENT
Nominal value per share 5,00 5,00 5,00 5,00 5,00
Highest quoted price 34,00 26,00 24,00 20,90 25,00
Lowest quoted price 21,00 20,20 16,00 14,10 18,10
Weighted average no. of shares 24 450 653 24 403 578 24 372 413 24 332 859 24 332 859
Formulas used for calculating key figures
Equity %: Book equity
Total capital joint venture accounting
Yield per share Profit/loss before tax
Average no. of shares
Earnings per share: Profit/loss for the year
Average no. of shares
Price-Earnings Ratio: Price at 31.12
Profit/loss before tax per share
Financial

7SOLVANG ASA - ANNUAL REPORT 2015
VLGC2015 was yet another action-packed year for the VLGCs, with the highest average earnings of all time, the second highest average rates of all time, volatility and high ordering activity. This year as in the last two years, increased US export capacity was the driver for both freight rates and ordering activity.
The Baltic LPG Index (BLPG) bottomed out at USD 60 per metric ton (pmt) in the start of January, which equals about USD 1.5 million per month on time charter equivalent (TCE), before it went on an increasing trend, supported by increased US export volumes, west-east arbitrage movement, and high Indian spot demand combined with congestions in Indian ports. The BLPG stabilized at around USD 100 pmt at the middle of February (USD 2.8 million TCE) before it declined to around USD 80 pmt towards the end of March (USD 2.3 million TCE). Then, supported by the seasonal summer market, the BLPG increased again towards the peak of USD 137 pmt in mid-July (USD 4.2 million TCE). For the reminder of the year, freight rates were on a downward slope, with the BLPG being assessed at USD 63 pmt (USD 1.86 million TCE) at the last day of the year. Average BLPG for 2015 ended at USD 91.843 pmt, which is the second highest average value since the all-time high of USD 92.491 pmt in 2014. Measured by earnings though (excl. waiting time), the average BLPG TCE was at all-time high for 2015 at USD 2.68 million per month, supported by low bunker costs as well as strong freight rates.
A record number of 35 VLGCs were delivered in 2015, while no vessels were scrapped. The orderbook expanded by 29 new vessels, with 24 of them being placed in second half of the year, in front of new regulation, which makes vessels more expensive and with smaller cargo capacity. 8 of these orders were Panamax VLGCs able to transit the existing Panama Canal lane.
Going forward, the fundamentals will soften on the back of delivery of the large orderbook. How much fundamentals and rates will soften is dependent on the crude oil price development, as this drives US LPG production, Asian LPG demand as well as the LPG location arbitrages.
Market Analysis
VLGC TCE Rates
0
500
1,000
1,500
2,000
2,500
3,000
3,500
4,000
4,500
5,000
jan
.10
jan
.11
jan
.12
jan
.13
jan
.14
jan
.15
82,000-East(BLPGTCE) 82,000-West
Existingfleet60
55
50
45
40
35
30
25
20
15
10
5
0
30
+y
rs
25
-29
yrs
20
-24
yrs
15
-19
yrs
10
-14
yrs
5-9
yrs
0-4
yrs
7 13
21
17
23
62
59
Orderbook
40
35
30
25
20
15
10
5
0
2016 2017 2018 2019
44
27
4 3
Existing fleet
VLGC TCE age
Orderbook

SOLVANG ASA - ANNUAL REPORT 2015 8
LGC
The LGC segment performed very well in 2015 as freight rates boomed together with the strong VLGC market. The LPG market was the demand driver this year as last year, with LPG arbitrage conditions making larger LPG tonnage high in demand. At the end of 2015, only five LGCs were trading ammonia. Most vessels were committed on time charter or own program.
No vessels were scrapped, but for the first time since 2009 the fleet received new vessels, with three LGCs being delivered to Solvang, taking the fleet to 23 vessels. Latsco entered the LGC market, adding two orders to the orderbook, which at the end of 2015 contained two vessels.
Going forward, the softening fundamentals of the VLGC and midsize market will give negative spillover effects and the future demand from the LPG market is fairly dependent on the crude oil price.
LGC Rates
LGC Age
200
400
600
800
1,000
1,200
1,400
1,600
1,800
2,000
jan
.10
jan
.11
jan
.12
jan
.13
jan
.14
jan
.15
57,000TCE 59/60,000TCE
Existingfleet10
9
8
7
6
5
4
3
2
1
0
30
+y
rs
25
-29
yrs
20
-24
yrs
15
-19
yrs
10
-14
yrs
5-9
yrs
0-4
yrs
0 2 2 0 10
6 3
Orderbook10
9
8
7
6
5
4
3
2
1
0
2016
2
Existing fleet
Orderbook

9SOLVANG ASA - ANNUAL REPORT 2015
Ethylene/semi-ref
Rates were relatively stable through the year, with the established premium for larger tonnage continuing around last years’ levels.
In 2014 as in 2013, Iranian ethylene export remained very limited, even with the limited sanction relief, which allowed Iran to export petrochemicals. The negotiations towards a final deal were extended to an end June 2015 deadline. In April 2015, an agreement for a framework for a final deal was negotiated, which gives optimism for an eventually increase in the Iranian export numbers. However, the final deal is still not signed and the Iranian oil and gas as well as petrochemical sector is suffering after years of underinvestment and sanctions, so the effect on the ethylene and semi-ref market will take time to materialize.
Middle East Gulf ethylene exports were at low numbers, around the 2013 level of 800,000 tons. The main reason for low exports was low Iran and Saudi volumes. The year started on a slow note, with very little export from Saudi Arabia and Iran in the first half of the year. In the second half of the year, Saudi export picked up and UAE export increased from already healthy numbers due to a new steam cracker in Abu Dhabi.
Open west-east arbitrage window for ethylene paved the way for unusual long haul volumes from Europe and South America to Asia. In the opposite direction, the east-west arbitrage window for propylene and especially C4s gave long haul employment for the fleet.
High trans-Atlantic LPG activity during the year gave employment, especially for larger vessels and contributed to keeping rates at decent levels. We expect LPG trade to be an increasing part of the handysize trade, with added volumes from the US and Ust Luga.
During 2014 13 vessels were delivered, and 9 were scrapped. The orderbook expanded rapidly in 2014 with 20 vessels in the in the 21-22.000 cbm range, and in addition, 16 larger ethylene vessels (up to 6x87,000 cbm) were ordered for dedicated ethane trade. The trend in the orderbook is clearly a move towards larger sizes, with ordering of larger tonnage and scrapping of smaller tonnage.
Ethylene/semi-ref rates
400
500
600
700
800
900
1,000
1,100
1,200
jan
.10
jan
.11
jan
.12
jan
.13
jan
.14
jan
.15
8,000ETHTCE 12,000ETHTCE 15,000SRTCE
20-22,000SRTCE
Ethylene/semi-ref age
Existingfleet
30
25
20
15
10
5
0
30
+y
rs
25
-29
yrs
20
-24
yrs
15
-19
yrs
10
-14
yrs
5-9
yrs
0-4
yrs
4 6 6 14
5 27
32
Orderbook22
20
18
16
14
12
10
8
6
4
2
0
2016 2017 2018
11
22
3
Existing fleet
Orderbook

SOLVANG ASA - ANNUAL REPORT 2015 10
Annual Report 2015Profit developement 2010-2015 (mill. NOK Profit before taxes) and Dividend per share
0
20
40
60
80
100
120
140
160
180
0.0
0.2
0.4
0.7
0.9
1.1
1.3
1.6
1.8
2.0
2010 2011 2012 2013 2014 2015
Res
ult
Div
iden
dp
ers
ha
re
Result Dividendpershare
YearResult (Mill NOK, before tax)
Dividend per share
2010 -0,68 0,00
2011 14,2 0,00
2012 64,1 0,50
2013 63,8 0,50
2014 108,4 1,00
2015 171,6 2,00
1. INTRODUCTION
The 2015 results were the best ever for Solvang and surpassed the peak year of 2014 by a wide margin. The high earnings from shipping activities came from a very tight LPG market driven by high export growth from the United States. The market remained at a high level throughout the year, despite significant fleet renewal. In addition to the good market, Solvang took delivery of three LGC (Large Gas Carrier) and one MGC (Mid-size Gas Carrier), which further improved the results from 2014 level.
The Group recorded a profit before tax of NOK 171.6 million against NOK 108.4 million in 2014. Positive cash flow was NOK 38.4 million compared to NOK 33.9 million in 2014. Tax expense was NOK 2.7 million, and the Group had a profit after tax of NOK 168.9 million against NOK 102.8 million in 2014.
The board of directors propose a dividend for 2015 of NOK 2.00 per share.

11SOLVANG ASA - ANNUAL REPORT 2015
2. OPERATIONS
The group’s activities are divided in two main segments; Ship-management and Ship-ownership through participation in ship owning companies. The latter segment can be divided into three sub-segments for the transportation of Liquefied Petroleum Gas (LPG), ammonia (NH3) and petrochemical gases: • 12,000 cbm – 17,000 cbm ships (Semi-refrigerated /
Ethylene)• 38,000 - 60,000 cbm fully refrigerated LPG ships (LGC/
MGC)• 75,000 – 84,000 cbm fully refrigerated LPG ships (VLGC)
The company’s headquarters are located in Stavanger, Norway, where the operation of all the ships are managed from the company’s fully integrated shipping organisation.
The chartering is handled by International Gas Carriers (IGC) in Oslo. IGC is a 100% owned subsidiary of Solvang ASA. In addition, the company has a crewing office in Manila, Philippines.
The company operates and has ownership in 21 ships by year end. Furthermore, Solvang has ownership in two 78,700 cbm Panamax VLGC ship, for delivery in 2017.
3. MARKET
3.1 Semi-refrigerated / ethylene carriersThis sub segment includes semi-refrigerated and ethylene carriers from 8,000 cbm and up. The group had six ships in this sub segment where one is on a long term TC, while the other five has been operating in the spot marked, on short term TC and on consecutive voyage contracts.
The “Clipper Harald” is on a time charter (TC) until July 2019, and the charterer has an option to extend the contract for an additional eighteen months. This contract was extended by 5 years in 2013, commencing in July 2014, based on “Clipper Harald” retrofitting exhaust gas cleaning equipment (Scrubber) during the fall of 2014, enabling the vessel to comply with new emission regulations from January 2015.
3.2 LGC/MGCThis sub segment is defined as fully refrigerated LPG ships from 59,000 – 60,000 cbm. The fleet consist of 9 LGC ships, where 3 were delivered in second and third quarter 2015. In addition one MGC of 38,000 cbm delivered in fourth quarter 2015 is also included in this sub segment. All ships operate on TC with varying length.
The LGC newbuilds represent a new type of LGC, with a shorter hull to avoid waiting time in certain areas, and there is considerable amount of development done in order to create the most energy efficient vessels possible. Changes including hull shape, propulsion technology, antifouling technology and cargo systems. Furthermore, the newbuilds are the first LGC LPG carriers in the world with fully integrated exhaust gas cleaning system for both the main and auxiliary engines. This means that the ships comply with all existing environmental standards in Emission Control Areas (ECA) from 2015, and the new expected global standards in 2020.
The average earnings on TC basis showed a continuous positive trend with improvements from 2014, where earnings for 2015
were about 20% higher compared to 2014. The significant increase comes from better contracts for existing ships, as well as very good contracts for the newbuilds delivered in 2015. The LGC segment has benefited from the strong LPG market, and from favourable changes in trade patterns for Ammonia.
3.3 VLGCThis sub segment is defined as fully refrigerated LPG ships of 75,000 – 84,000 cbm. Solvang has a total of 5 ships in this sub segment with further two newbuilds in order. The group has two Panamax VLGC ships of 75,000 cbm, one VLGC of 82.000 cbm, and two VLGC ships of 84.000 cbm.
The Panamax VLGC’s are purpose built for transporting LPG from the Atlantic Ocean and Gulf of Mexico to the west coast of Central America. As a result of these features, the Panamax VLGC’s have achieved better TC earnings than the VLGC fleet in general. The “Clipper Victory” is on TC to August 2016, while the “Clipper Sirius” is on TC to January 2017.
The 82,000 cbm VLGC “Clipper Sun” is on a TC until October 2016. “Clipper Quito” a 84,000 cbm vessel, is on TC to December 2016, and the “Clipper Posh”, a 84,000 cbm vessel, is on TC to December 2018.
4. PROFIT (Figures in parentheses refer to 2014)
Operating income increased significantly from NOK 80 million to NOK 84 million, with a full year of LGC newbuilds from date of delivery.
The group’s result after tax was NOK 168.9 million (NOK 102.8 million). Earnings per share were NOK 6.91 (NOK 4.21). The result for the parent company was NOK 0.6 million (NOK 9.1 million).
4.1 Financial items The group reported net financial items of NOK -1.0 million (NOK 6.9 million). The corresponding figure for the parent company was a result of NOK -0.9 million (NOK 9.7 million).
4.2 Liquidity and financial strength At year-end, the group had liquidity consisting of cash totalling NOK 130.6 million (NOK 92.1 million). The corresponding figure for the parent company was NOK 12.1 million (NOK 18.8 million). Total current assets at year-end was NOK 159.3 million (NOK 123.2 million), while current liabilities totalled NOK 194.8 million (NOK 58.8 million). Long-term liabilities and obligations totalled NOK 17.9 million (NOK 30.5 million). For the parent company, total current assets at year-end amounted to NOK 23.1 million (NOK 35.6 million), while short-term liabilities totalled NOK 110 million (NOK 107.9 million). The parent company’s long-term liabilities and obligations totalled NOK 7.3 million (NOK 18.4 million). The group’s share of current assets and liabilities in ship owning companies totalled NOK 163.1 million and NOK 1,260.8 million respectively.
Net cash flow from operating activities was NOK 95.3 million, compared to an operating profit of NOK 172.5 million. The main difference comes from the reversal of earnings from shipping companies using the equity method, partially offset by changes in working capital.

SOLVANG ASA - ANNUAL REPORT 2015 12
The group’s book equity totalled NOK 1,164.8 million (NOK 849.8 million) at the year-end.
4.3 Taxes The group is from 2013 part of the tonnage-tax regime through its subsidiary Clipper Shipping AS. Other companies within the group are taxed ordinary.
All the company’s current interests in ships except for two, are owned under the tonnage-tax regime.
4.4 Financial riskThe group’s interests in ships that are owned through participation in general partnerships with shared liability, are primarily USD-based. Most of the revenues and the majority of expenses are in USD. Furthermore, the market value of the ships, and thus the greatest share of the assets, is priced in USD. The same applies to the financing of the ships. This entails that the real foreign currency exposure is limited in financial terms.
The group’s entire fleet is financed by long-term financing at favourable terms compared with what can be achieved in the market today. The group has not entered into any contracts concerning financial derivatives or other financial instruments where there is any particular counterparty risk.
Most of the group’s liabilities consist of a share of the mortgage debt for ships that are owned through general partnerships. This is denominated in USD and priced at a floating LIBOR interest rate. In addition, mortgage debt in certain general partnerships is hedged through fixed interest rate contracts. The group has a satisfactory debt-equity ratio, and this, together with active management of the interest rate exposure, ensures that the risk associated with any change in interest rate levels is acceptable.
The group’s fleet is employed in a mix of long & short TC contracts as well as in the spot market. This is a result of a conscious strategy aimed at ensuring earnings and cash flow, while at the same time benefiting from upturns in the market. The development of the world economy makes future market prospects uncertain.
The group has 12 ships on TC contracts in excess of one year. The charterers are oil majors and major operators within the Ammonia market. Credit risk is considered to be limited. The company sees the settlement risk for the business carried out in the spot market as satisfactory.
4.5 GeneralThe year-end accounts are based on the assumption of a going concern. In the opinion of the Board of Directors, the accounts provide a true picture of the results for the year and the company’s position at the year-end.
The group’s interests in ships are owned through participation in general partnerships, with shared liability. In Note 3 of the accounts, the income statement and balance sheet have been compiled according to the proportionate consolidation method in order to provide more detailed accounting information on the operations.
All of the group’s interests in ships are significant and they are recognised in accordance with IFRS based on the equity method of accounting.
5. ORGANISATION, HEALTH SAFETY AND THE ENVIRONMENT
5.1 OrganisationBoth at sea and onshore, the company’s primary focus is to ensure continuity on the personnel side. The company strives to establish an interesting and attractive workplace that attracts competent employees, where appraisals and employee surveys are key measures. We believe that we have succeeded in this context and that we have a stable and highly –qualified workforce.
Of the company’s office staff, 40% are women and 60% are men. Women and men have equal opportunities to qualify for all types of jobs and positions, and they have equal opportunities for promotion. Working conditions are deemed to be good. Salaries reflect the individual’s qualifications, regardless of gender.
Solvang is an international company with employees from a number of countries and cultures in addition to Norway. This recruitment policy is important for the future development of the company. The company wants to attract competent employees, regardless of religion, gender, race or sexual orientation.
The company engages in research and development work to optimise the ships’ operations and to reduce emissions.
5.2 HealthThe group has 40 onshore employees and around 600 sailing personnel. Working conditions on shore and on the ships are considered to be good. Sick leave on board the ships was 0.45%. The group had no incidents that resulted in sick leave or lost time in 2015, and have only had 4 incidents causing lost time over the last 8 years. The target is always zero accidents, and the very low injury frequency can be attributes to a conscious attention on this area across the entire group.
Sick leave among the onshore employees was 1.58% in 2015. There were no incidents resulting in personal injury at the office in 2015.
5.3 Board of DirectorsThe Board of Directors consists of two women and three men. There is a healthy and positive working relationship between the management and Board of Directors.
5.4 Compensation policyBy offering a complete range of jobs, salaries and other benefits, Solvang aims to be an attractive employer for skilled individuals in all relevant disciplines.
All of Solvang’s employees, including the Managing Director, are employed at a fixed salary with no fixed bonus or option elements. Salaries are adjusted once a year. The Managing Director’s salary is evaluated correspondingly by the Board once a year. The company has a pension scheme that covers around 66% of the employees’ salary with full entitlement based on 30 years of service and a retirement age of 67 for employees who started with the company before 31 December 2010. Persons who were employed after this date are offered a

13SOLVANG ASA - ANNUAL REPORT 2015
defined contribution scheme. In addition, the company has an ordinary insurance scheme covering disability, accidents and death.
The Board is remunerated by fixed directors’ fees that are determined annually by the General Meeting. Board members have no bonus or options agreements with the company.
5.5 External environmentThe transport of LPG and petrochemical gases by sea entails little risk of emissions or leakage into the sea. Loading and unloading operations are conducted in closed systems, and strict quality and safety requirements reduce the risk of emissions to a minimum.
All transport at sea entails emissions to the air from the combustion of oil by the ships’ main and auxiliary engines. Our policy in this area is thus to reduce such emissions as much as practically possible. The group focuses primarily on reducing the consumption of bunkers and lubricants, and has through active measures been able to continue the positive trend achieved in recent years. The modern ships today use up to 40% less fuel compared to ships of same size 20 years ago.
Measurements are carried out regularly using a number of systems. Fuel consumption measured against the distance travelled is one of the most important key figures. Wherever possible, we optimise our speed, in other words the speed that gives the lowest emissions and consumption given the contractual obligations we have towards our customers. These systematic analyses have generated excellent results in only a short timeframe. Our modern fleet is also significantly more environmentally friendly than older ships.
In 2010, the company was certified and approved in accordance with the ISO 14001 environmental standards, and will continue in its work to comply with the standard in future.
5.6 SafetyThe company has strict quality and safety requirements, both on board the ships and within the onshore organisation. This is reflected in very good statistics for Loss Time Incident (LTI) injuries, with zero incidents in 2015 and only four incidents in the entire period from 2008-2015, with around 3.5 million working hours per year. This is further demonstrated in our good insurance statistics. In order to ensure that this positive development continues, the company invests significant resources in programmes for the continuous improvement of quality and safety on board and on land. We conduct regular and systematic inspections of our ships as part of this work. The same applies to several of our customers, which includes several major oil companies. There were a total of 254 inspections on our 21 ships in 2015. Of these inspections, 125 were conducted by Solvang, while our customers, port authorities and classification companies conducted a total of 129 inspections.
The company uses the “Best Management Practice” in waters as appropriate according to the situation.
5.7 Corporate Social Responsibility The group’s main contribution to society is to conduct long-term, sustainable and value-added business for our shareholders, employees, customers, suppliers and other relations. Our goal is to ensure that our business practices
and investments are sustainable and contribute to long-term economic, environmental and social development. The group’s material sustainability areas are within Environment, Finance, Human Resources and Community, including ethics and anti-corruption
The Group recognizes its environmental responsibility and strive to maintain a high standard in order to reduce the environmental impact of its operations. The company has focused on reducing fuel consumption, which is the main source of the shipping sector’s emissions of CO2, NOx and SOx. Continuous measurements of all consumption are being done, as well as implementing measures and setting clear targets for improvement. The Group also has two VLGCs which were the first in the world of its kind with full exhaust cleaning system, have done a complete retrofit of one of the ethylene carriers with the same exhaust gas cleaning equipment, and all the three newbuilds delivered in 2015 had full scale exhaust gas cleaning installed.
With regards to Finances, the company strives for good corporate governance with necessary internal controls, risk management, and solidity.
It is the company’s policy to integrate attention to human and labour rights in its existing business. In practice, a large part of human and labour rights are covered by the company’s health and safety work. The company values its employees as its most important resource, and always aim to continuously provide and promote high quality of working conditions, both on land and on board ships.
The company believes that corruption hinders well-functioning business processes and suppresses economic development. The group focuses on transparency in its business practices, and compete in a fair and ethical manner. The Board of Solvang ASA has approved a Code of Conduct, a set of ethical guidelines that define the company’s ethical standards. The Group is furthermore a full member of MACN (Marine Anti-Corruption Network), a network of companies doing knowledge sharing and working actively to reduce corruption in the most exposed areas.
6. CORPORATE GOVERNANCE
Solvang attaches importance to good corporate governance. There is a good relationship between the owners, Board and management, and all three parties have a desire and a stated goal to comply with any significant requirements stipulated by the Corporate Governance Code.
6.1 GeneralSolvang shall conduct operations that are commercially sound and beneficial to the owners, employees, customers and suppliers. The operations shall be conducted in accordance with clear ethical guidelines and with a focus on the impact on the environment and society as a whole.
6.2 OperationsThe operations are described in the company’s articles of association as being shipping, shipowning operations and real estate. The company is currently concentrating entirely on shipowning operations and shipping.

SOLVANG ASA - ANNUAL REPORT 2015 14
6.3 Company capital and dividendsShipping is a cyclical industry that requires the company to be adequately capitalised with regard to equity and liquidity. This is reflected in the company’s balance sheet structure. The company aims to have a stable and predictable dividend policy. This means that the dividends shall reflect the profit for the year, but dividends have also been paid during years with less earnings. In recent years dividends have been based on striking a balance between these two considerations. It is proposed a dividend of NOK 2.00 per share for 2015. The dividend consists of base dividends of NOK 1 per share and an addition of NOK 1 per share due to very good financial results for 2015.
6.4 Equal treatment of shareholders and transactions with related partiesThe Company has only one class of share, with the same voting right for all shares. Transactions with related parties take place in accordance with the guidelines set by the code. The group’s main broker for sale and purchase is Inge Steensland AS. There are also parallel investments with companies controlled by the Steensland family. All transactions are carried out on market terms.
The Board of Directors has been granted a power of attorney by the General Meeting to increase the share capital by a maximum of 4 million shares. This power of attorney is valid for 12 months and has not yet been utilised.
The board has also been granted a power of attorney to approve the distribution of dividends on the basis of the financial statements for 2014. The power of attorney is valid until the Annual General Meeting in 2016, and has not been used.
6.5 Free negotiabilityThe shares are freely negotiable, and Board approval is not required for the acquisition of shares.
6.6 General MeetingThe General Meeting is called and held in accordance with the company’s articles of association. The Auditor and Chairman of the Board attend the General Meeting. Ample time shall be allowed for holding the General Meeting and for discussion.
6.7 Nominating CommitteeMore than 65% of the share capital is represented by the company’s Board of Directors. It is therefore not deemed necessary to establish a separate nominating committee.
6.8 Board of Directors, composition and independenceThe Board plays an important role as a link and as a control function between the shareholders and the company’s management. The board members are elected for a term of one year at a time. The General Meeting also elects the Chairman of the Board. The Board also acts as the audit committee.
Some of the board members have shares in the company. These are shares that have been acquired at market price. The Board is remunerated through a fixed directors’ fee.
The Board’s composition reflects the ownership structure and the need for a broad range of expertise in shipping, finance, and HSE.
6.9 Work of the BoardThe work of the Board and its meeting schedule is established once a year for the next 12-month period. The meetings include regular reporting and discussion in all relevant areas, including safety, quality, technical operations and finance. At least once a year, the company’s Auditor participates in a board meeting at which feedback is given on the company’s internal control, among other things.
6.10 Risk management and internal controlAn important element in the company’s risk management and internal control is an open and systematic dialogue between the Board and the management. A detailed review of the company’s financial and operational position is carried out by the Board before presenting any quarterly report.
In general, there is a good dialogue between the Board and the management. No changes to the business plan or significant investments are made without prior discussion and approval by the Board.
6.11 Remuneration of the BoardThe principles for remuneration of the Board and the management have remained unchanged for a long period of time. None of the Board’s members have any additional duties for the company. The Board has not been allocated options in the company.
6.12 Remuneration of executive managementThe company’s senior executives are employed on a fixed salary. No options or fixed bonuses are linked to salary agreements. Details of the remuneration of the Board and senior executives are given in Note 10 to the consolidated accounts and Note 8 to the annual accounts for Solvang ASA. For several years, the company has had a programme for the sale of shares to employees, most recently at the start of 2016. Each employee has had an opportunity to purchase shares worth up to a maximum of NOK 30,000 at a 20% discount.
6.13 Information and communicationThe company attaches great importance to ensuring that all shareholders and the market in general receive accurate and detailed information simultaneously and at the right time. The reports are published and distributed relatively soon after the end of each quarter and year. The company will only publish the annual report and quarterly reports on the Internet.
6.14 Corporate takeoversAs mentioned in Section 6.5, the company’s shares are freely negotiable. In the event of a bid for the company, the Board will strive to provide the company’s shareholders with accurate and timely information, as well as adequate time to evaluate the bid. If the situation so requires, the Board will seek an independent valuation to assess the value of the bid submitted.
6.15 AuditorEach year, the Auditor presents a plan for the auditing work and reports the results of the audit that has been conducted. The Board summons the Auditor to board meetings at which significant accounting matters are to be discussed. This normally occurs once or twice a year. Information on the Auditor’s remuneration, broken down by auditing and other work, is

15SOLVANG ASA - ANNUAL REPORT 2015
presented in the company’s annual report and submitted to the General Meeting for approval.
One meeting is held each year between the Auditor and the Board without the presence of the management.
7. FUTURE OUTLOOK
After a slow start of 2015 for the ethylene fleet, several contracts were secured in the second half, which extends over the main part of 2016. Expectations are that we continue the cooperation we have achieved with important ethylene operators, and that earnings will be on an acceptable level throughout the year.
For the fully refrigerated ships (VLGC and LGC), the 2015 market was at a historical high level, and even exceeded the record year 2014. The rates fell gradually throughout the second half of 2015 and have continued dropping in the first quarter of 2016. The decrease comes from closed arbitrage between USA and Asia, and a very high number of newbuilds delivered. There are now several signs that the VLGC market will be significantly weaker in 2016, more at a historical level than 2014 and 2015. For Solvang most of the year 2016 is covered by existing contracts, resulting in limited effects from the drop in the VLGC market.
The Group had at year-end contract coverage of 94% for 2016 for the fleet, with only three LGC coming available in June - August 2016 and one VLGC in fourth quarter.
8. ALLOCATION OF THE PARENT COMPANY’S PROFIT
Solvang ASA posted a result of KNOK 582.
The Board of Directors proposes the following allocation:Suggested dividend: KNOK -48,988 From other equity: KNOK 48,406
At the year-end, the parent company’s equity amounted to KNOK 503 168 (KNOK 542 732).
9. SUBSEQUENT EVENTS
Solvang has decided to merge their fully owned subsidiary, International Gas Carriers (IGC), into Solvang ASA as of 01.01.2016. Solvang ASA has also agreed to sell 37,5% of its ownership share in Partrederiet Clipper Sirius DA. New ownership share in the company will be 18,75%. The sale will generate a profit of approximately USD 2.9 million in the accounts for second quarter 2016. Moreover, it is exercised a purchase option for the vessel Clipper Harald with effect in July 2016. There are no other subsequent events of material concern.
10. CONCLUSION
The Board of Directors and the management would like to thank all the employees, both at sea and on shore, for their fine efforts during a busy period, where the Group delivers strong results in terms of safety, quality and financial. We would also like to thank our customers and suppliers for their good support and cooperation in 2015 and look forward to the same good cooperation in 2016.
Stavanger, 22nd April 2016

SOLVANG ASA - GROUP 2015 16
GROUP ACCOUNTS 2015

17SOLVANG ASA - GROUP 2015
Amounts in NOK 1 000 Note 2015 2014
Management fee 12 83 994 79 965
Total operating income 83 994 79 965
Salaries and other personnel expenses 10,11 61 009 55 847Depreciation 15 1 036 990Other operating expenses 15 965 15 110Total operating expenses 78 010 71 947
Ship owning companies equity method 3,4,5 166 564 95 880Loss sale of share in ship owning company 3,4,5 0 -2 434
Operating result 172 548 101 463
Financial income and cost Other affiliated companies equity method 6 -688 108Other financial income 7 9 049 21 846Other financial expenses 8,12 -9 350 -15 044
Net financial items -989 6 911
Ordinary result before tax 171 559 108 374
Tax on ordinary result 9 2 706 5 581
Net profit / (loss) for the year 168 853 102 793
Earnings per share (whole NOK) 14 6,91 4,21Diluted earnings per share (whole NOK) 14 6,85 4,17
STATEMENT OF COMPREHENSIVE INCOME
Earnings of the period 168 853 102 793 Items that will not be reclassified to profit or loss Remeasurements pension liability 11 618 -13 685Tax effects of remeasurements pension liability -3 137 3 695 Items that may be reclassified to profit or loss Translation differences ship owning companies etc. 5,6,15 161 145 142 381Tax effects of translation differences ship owning companies
Comprehensive income to the shareholders of Solvang ASA 338 479 235 184
Profit & Loss | Solvang Group

SOLVANG ASA - GROUP 2015 18
Continued on next page
Amounts in NOK 1 000 Note 31.12.15 31.12.14ASSETS
Fixed Assets
Intangible fixed assets Deferred tax asset 9 3 111 7 913Total intangible fixed assets 3 111 7 913
Tangible fixed assets Share of Newbuild contract 20 37 549 0Office equipment, furniture etc. 15 3 666 2 319Total tangible fixed assets 41 215 2 319
Financial fixed assets Investments ship owning companies equity method 3,4,5 1 173 492 804 593Investments in affiliated companies 6 314 1 019Other shares 20 20Total financial fixed assets 1 173 826 805 631 Total fixed assets 1 218 153 815 863
Current Assets
Receivables Other short term receivables 12,13,16 28 767 31 086Total receivables 28 767 31 086
Cash and bank deposits 13 130 573 92 134 Total current assets 159 340 123 220
TOTAL ASSETS 1 377 492 939 083
Balance Sheet | Solvang Group

19SOLVANG ASA - GROUP 2015
Amounts in NOK 1 000 Note 31.12.15 31.12.14
Balance Sheet | Solvang Group
EQUITY AND LIABILITIES
Equity
Paid-in capital Share capital 18 123 264 123 264Treasury shares 19 -1 011 -1 246Total paid-in capital 122 253 122 018
Retained earnings Other equity, unrecognized 288 658 119 032Retained earnings 753 936 608 719Total retained earnings 1 042 593 727 751 Total equity 18 1 164 847 849 769 Liabilities
Provisions Pension liabilities 11 17 883 30 473Total provisions 17 883 30 473
Long term liabilities Other long term liabilities 12,17 0 0Total long term liabilities 0 0
Current liabilities Liabilities to financial institution 17 45 842 0Tax payable 9 1 292 2 980Public duties paytable 9 363 10 054Other short term liabilities 12 138 265 45 807Total current liabilities 194 762 58 841 Total liabilities 212 645 89 314
TOTAL EQUITY AND LIABILITIES 1 377 492 939 083
Stavanger, 22nd April 2016

SOLVANG ASA - GROUP 2015 20
Share capitalTreasury
sharesOther
reservesRetained earnings Total equity
123 264 -1 402 -13 360 517 608 626 110
102 793 102 793 -9 990 -9 990
142 381 142 381132 391 102 793 235 184
-12 202 -12 202 156 521 677
156 132 391 91 112 223 658
123 264 -1 246 119 032 608 719 849 769
Share capitalTreasury
sharesOther
reservesRetained earnings Total equity
123 264 -1 246 119 032 608 719 849 769
168 853 168 853 8 481 8 481
161 145 161 145169 626 168 853 338 479
-24 451 -24 451 235 815 1 050
235 169 626 145 217 315 078
123 264 -1 011 288 658 753 936 1 164 847
Equity as of 31.12.2014
Equity as of 31.12.2014
Profit/(loss) of the yearRemeasurements pension liabilities
2015
Equity as of 31.12.2015
Translation differences ship owning companies etc.Total comprehensive income
Paid dividendBuy back / Sale treasury shares
Total changes in equity for the year
Amounts in NOK 1 000
Equity as of 31.12.2013
Profit/(loss) of the yearRemeasurements pension liabilitiesTranslation differences ship owning companies etc.Total comprehensive income
2014
Changes in Equity | Group
Paid dividendBuy back / Sale treasury shares
Total changes in equity for the year

21SOLVANG ASA - GROUP 2015
Amounts in NOK 1 000 Note 2015 2014CASH FLOW FROM OPERATING ACTIVITIES Profit / (loss) before tax 171 559 108 374Tax paid for the period -2 729 39Tap/gevinst ved salg av anleggsmidler -144 0Depreciation and amortisation 15 1 036 990Difference between expensed pension and paid in/out -973 745Result in affiliated ship owning companies 3,4,5 -166 564 -93 445Result in affiliated companies 6 688 -108Changes in other current balance sheet items 92 600 6 663Earnings shipping co-operation partners 0 883Financial income 7 -8 623 -21 517Financial expenses 8 8 459 14 621Net cash flow from operating activities 95 310 17 245 CASH FLOW FROM INVESTING ACTIVITIES Proceeds from sale / purchase of tangible fixed assets 15 -2 240 -507Payments newbuilding contracts 20 -37 549 0Payments purchase of securities 0 16 223Dividend received 7 0 408Net changes Investment affiliated companies 6 17 -203Payments from ship owning companies 5 39 789 58 289Payments from sale / purchase of share in ship owning companies 5 -26 000 15 835Payments to ship owning companies 5 -55 645 -67 883Net cash flow from investing activities -81 628 22 161 CASH FLOW FROM FINANCING ACTIVITIES Changes in overdraft facility 17 45 842 -87Purchase / sale of treasury shares 18 1 050 677Dividend payment 18 -24 451 -12 202Net cash flow from financing activities 22 441 -11 613 Effect of exchange rate changes on cash and cash equivalents 2 316 6 096 Net change in cash and cash equivalents 38 439 33 889 Cash and cash equivalents 01.01 92 134 58 245 Cash and cash equivalents 31.12 130 573 92 134
Cash Flow Statement | Group

SOLVANG ASA - GROUP 2015 22
NOTE 1 - CORPORATE INFORMATION AND SIGNIFICANT ACCOUNTING POLICIES
CORPORATE INFORMATIONSolvang ASA is a public limited company incorporated and domiciled in Norway whose shares are publicly traded on Oslo Børs. The company was incorporated in 1936, and the address of the registered office is: Solvang ASA, Næringslivets Hus, Haakon VII’s gate 8, 4005 Stavanger, Norway.
Solvang ASA and its subsidiaries’ (“Solvang” or “the Company”) business is fully concentrated on shipping and ship owning activities through investments in shipping partnerships. The investments in shipping partnerships are accounted for using the equity method.
As of 31.12, Solvang’s fleet consists of 21 ships that carry liquid petrochemical gases, liquefied petroleum gases and ammonia.
BASIS OF PRESENTATION The consolidated financial statements have been prepared on a historical cost basis, except for ownership in ship owning companies which are valued according to equity method of accounting.
The consolidated financial statements are presented in Norwegian kroner (NOK).
Statement of ComplianceThe consolidated financial statements have been prepared in accordance with International Financial Reporting Standards adopted by the EU-adopted and appurtenant interpretations and additional country-specific disclosure requirements according to the Norwegian Accounting Act and stock exchange rules, in effect as of 31st of December 2015.
The proposed consolidated financial statement was approved by the board of directors and the managing director on the date which appears on the dated and signed balance sheet.
The consolidated financial statement will be handled by the annual general meeting on 12 May 2016 for final approval. Until final approval, the board is authorised to amend the consolidated financial statement.
Basis of consolidationThe consolidated financial statements of Solvang ASA comprise the financial statements of Solvang ASA and its subsidiaries. As of 31 December 2015, Solvang ASA has three fully-owned subsidiaries: Clipper Shipping AS, Solvang Maritime AS, and International Gas Carriers AS.
Consistent accounting policies are applied throughout the group.
All intercompany balances, transactions, income and expenses together with unrealized profits and losses resulting from intercompany transactions that are recognized in assets, have been eliminated.
Functional CurrencyThe functional currency of an entity is the currency of the primary economic environment in which the entity operates. Normally, that is the currency of the environment in which an entity primarily generates and expends cash. The Company has Norwegian kroner as the reporting currency at group level. Both Solvang ASA and its fully-owned subsidiaries Clipper Shipping AS and Solvang Maritime AS have Norwegian kroner as their functional currency. However, International Gas Carriers ASA and investments in ship owning companies accounted for using the equity method, have US dollar (USD) as the functional currency. Exchange differences arising on translation of the ship owning companies from USD to NOK is recognized as a separate item through other comprehensive income, net of any deferred tax.
ParentcompanySolvangASA
100%Subsidiary:ClipperShippingAS
Affiliatedshipowningcompanies
100%Subsidiary:SolvangMaritimeAS
100%Subsidiary:InternationalGasCarriers
AS
Affiliatedcompanies:SolvangPhilippinesInc

23SOLVANG ASA - GROUP 2015
SIGNIFICANT ACCOUNTING JUDGMENTS AND ESTIMATESEstimation uncertaintyThe preparation of consolidated financial statements in conformity with IFRS requires management to make estimates and assumptions that affect the reported amounts of assets and liabilities and the disclosure of contingent assets and liabilities at the date of the financial statements and the reported revenues and expenses during the reporting periods. The most significant estimates and assumptions relate to fixed asset impairment tests and pension liabilities. We evaluate these estimates on an ongoing basis, utilizing past experience, consultations with experts and other methods we consider reasonable in the particular circumstances. Nevertheless, actual results may differ significantly from our estimates.
The key assumptions concerning the future and other key sources of estimating uncertainty at the balance sheet date and which have a significant risk of material adjustment to the carrying amounts of assets and liabilities within the next financial year are discussed below:
Impairment of tangible fixed assetThe company invests in ships through shipping partnerships. For ships held in entities accounted for using the equity method, the Company assesses at each reporting date whether there is an indication that an asset that is held in entities accounted for using the equity method may be impaired. If any such indication exists, the Company makes an estimate of the asset’s recoverable amount, which is the higher of fair value less costs to sell or value in use.
All tangible fixed assets are evaluated for impairment when events or changes in circumstances indicate that the carrying value may not be recoverable. This requires an estimation of the asset’s value, which, if available, is based on market appraisals or value in use.
The value in use is determined on the basis of the total estimated discounted future cash flows, excluding taxes. In determining impairment of fixed assets, management must make judgments and estimates to determine the cash flows generated by those assets. Discount rates must also be estimated. Assumptions used in these estimates are consistent with internal forecasts. To support management’s estimates, market outlook and considerations provided by the joint/venture chartering companies have been used.
If the carrying amount of an asset exceeds its recoverable amount, the asset is considered impaired and is written down to its recoverable amount. The impairment is reflected through the Company’s share of income/(loss) from ship owning companies in the profit and loss account.
The Company considers whether there is a basis for reversing previous asset impairment write-downs, using the same evaluation criteria as for impairment. If the review suggests that there is a basis for reversal, the carrying amount is reversed to the estimated fair value, limited to the carrying amount the asset would have had if no impairment had been recognized.
PensionsThe present value of the pension obligations depends on a number of factors that are determined on an actuarial basis
using a number of assumptions. The assumptions used in determining the net cost (income) for pensions include the discount rate. Any changes in these assumptions will impact the carrying amount of pension obligations. The group determines the appropriate discount rate at the end of each year. This is the interest rate that should be used to determine the present value of estimated future cash outflows expected to be required to settle the pension obligations. In determining the appropriate discount rate, the group considers the interest rates of high-quality corporate bonds that are denominated in the currency in which the benefits will be paid and that have terms to maturity approximating the terms of the related pension obligation. Other key assumptions for pension obligations are based in part on current market conditions. Additional information is disclosed in note 11.
SIGNIFICANT ACCOUNTING POLICIESRevenue and expense recognition The Company’s revenues are mainly derived from ship management. These revenues are fixed per year according to contracts and recognized monthly throughout the year. Operating expenses are expensed when incurred.
Income in shipping partnerships booked using the equity method, are either income from joint ventures or income from time charters. Freight income and demurrage are recognized according to monthly joint venture settlements and monthly time charters. Direct voyage expenses are matched to income when relevant. Essentially, all direct voyage expenses for the joint ventures and time charter are recognized on the accounts of the charterers.
Foreign currency transactionsTransactions in foreign currencies are recorded using the exchange rate at the transaction date. Balances denominated in foreign currencies are translated using the exchange rates at the balance sheet date. Foreign currency gains and losses are recorded as financial items when incurred.
Investments in shipping partnerships – equity methodThe equity method is used for investments in limited partnerships and shipping partnerships in which the Company has significant influence. The Company’s share of profits and losses are adjusted to include amortization of excess value on ships if the original cost of the owner interest is higher than the acquired share of booked equity.
Tangible fixed assetsTangible fixed assets are stated at cost, less accumulated depreciation and impairment write-downs. Depreciation is straight-line over the estimated useful life of the asset. When assets are sold or retired, their costs and related accumulated depreciation are removed from the balance sheet and any gain or loss is included in net income. Estimates of useful life, residual value and method of depreciation are reviewed at each financial year end and adjusted if appropriate. Any changes are accounted for prospectively as a change in accounting estimate.

SOLVANG ASA - GROUP 2015 24
Tangible fixed assets in shipping partnershipsIn the shipping partnerships booked using the equity method, the ships are booked at cost less accumulated depreciation and impairment write-downs. Cost includes the expense of adding/replacing part of a ship, machinery or equipment when that expense is incurred if the recognition criteria are met. The carrying amount of those parts that are replaced is derecognized.
Depreciation of ships is computed using the straight line method over estimated useful life. The depreciable amount is determined after deducting the residual value of the asset. The cost of ships has been categorized separately by its main components, and useful life has been determined for each component. The average useful life for gas ships is 30 years.
A part of the original cost of ships is allocated to periodical maintenance. Periodical maintenance for ships is recognized in the balance sheet and expensed over the period up to the next periodical maintenance. Current maintenance is expensed as incurred.
When assets are sold or retired, their costs and related accumulated depreciation are removed from the balance sheet and any gain or loss is included in net income.
Estimates of useful life, residual values and methods of depreciation are reviewed at each financial year end and adjusted if appropriate. Any changes are accounted for prospectively as a change in accounting estimate. The estimated useful life of the ships could change, resulting in different depreciation amounts in the future.
Financial assetsFinancial assets are recognized on the contract date, when the group becomes party to the contractual provisions of the instrument. Initially, all financial assets which are not recognized at fair value through profit or loss are recognized in the balance sheet at fair value including transaction costs. Financial assets which are recognized at fair value through profit or loss are recognized at the time of acquisition at fair value and the transactions costs are recognized.
The group derecognizes a financial asset when the contractual right to the cash flow from the asset expires or when the group transfers the contractual right to a transaction where substantially all the risks and rewards of ownership of the financial asset are transferred. All rights and obligations that are created or retained in this type of transfer are recognized separately as assets or liabilities.
As a rule, the group classifies financial assets in one of the following categories: financial assets at fair value through profit or loss; loans and receivables; and financial assets available for sale.
Financial assets at fair value through profit or lossA financial asset is classified at fair value through profit or loss if on initial recognition it is designated as such or is classified as held for trading. Financial assets are designated at fair value through profit or loss if management and acquisition and sales decisions are based on the instrument’s fair value in accordance with the group’s documented risk management or investment strategy. On initial recognition, attributable
transaction costs are recognized in profit or loss when incurred. Instruments are measured at fair value, and changes in value are recognized in profit or loss.
Loans and receivables Loans and receivables are financial assets with fixed or determinable payments that are not quoted in an active market. Loans and receivables are initially recognized at fair value plus directly attributable transaction costs. After initial recognition, loans and receivables are measured at amortized cost using the effective interest method, less any impairment loss.
Held for saleFinancial assets held for sale is non-derivative financial assets which we choose to classify in this category, or which do not belong to any other category. They are classified as assets as long as the investment does not fall due within twelve months or the management has as intention to sell the investment within twelve months from the balance sheet date.
OffsettingFinancial assets and obligations are presented net if the group has a legally enforceable right to set off the amounts and intends either to settle on a net basis or to realize the asset and settle the liability simultaneously.
Financial liabilitiesFinancial liabilities are recognized on the contract date, when the group becomes party to the contractual provisions of the instrument. On initial recognition, non-derivative financial liabilities are recognized at fair value plus directly attributable transaction costs. After initial recognition, liabilities are measured at amortized costs using the effective interest method.
Share capitalOrdinary shares are classified as equity. Costs that are directly attributable to the issuance of ordinary shares and share options are recognized as a reduction of equity (share premium reserves) net after any tax.
When shares which is recognized as equity is reacquired, the consideration, including directly attributable costs, is recognized as a reduction in equity, net after tax. The shares that are acquired are classified as treasury shares, and are presented separately. The shares’ face value is separated, and deducted from the share capital. When treasury shares are sold, the amount received is recognized as an increase in equity and divided between share capital and other equity. Gain or loss as a consequence of the transaction is transferred to/ from retained earnings.
Impairment of financial assets At the balance sheet date (reporting date), financial assets that are not measured at fair value with value changes recognized in profit or loss are measured to determine whether there is objective evidence of impairment. A financial asset is assessed to be exposed to impairment if objective evidence exists that one or more events have had a negative effect on the estimated future cash flow for the asset. Objective evidence that financial assets have been subjected to impairment may be: failure of the debtor to make payments; changes in outstanding claims at terms which the group would otherwise not have accepted; indications that a debtor or issuer will

25SOLVANG ASA - GROUP 2015
become bankrupt or the lack of an active market for securities. For equity instruments classified as available for sale, there will be objective evidence of impairment due to a significant or prolonged decline in the fair value below its cost.
Basic and diluted earnings per shareBasic earnings per share are computed by dividing profit for the year by the weighted average number of common shares outstanding during the period. On a diluted basis, both profit for the year and shares outstanding are adjusted to assume exercise of all potential shares which have been outstanding in the period. For diluted earnings per share, the Company must also consider the potential outstanding shares of its equity method investees. Neither the Company nor its equity method investees has any potentially outstanding shares. The difference between basic earnings per share and diluted earnings per share is a consequence of treasury shares.
PensionsThe company has both a defined benefit pension plan and a contribution based pension plan whereas the benefit pension plan was closed for new employees per 01.01.2011. All employees starting from 2011 will be included in the contribution based pension plan.
Defined benefit pension planThe Company has a defined benefit pension plan for employees, managed and funded through a Norwegian life insurance company, and non-funded pension obligations for two pensioners, which are not covered by the general pension plan. The present value of benefit obligations is calculated based on actuarial methods, and compared with the value of pension assets. The net amount of the present value of benefit obligations and pension assets, adjusted for unrecognized changes in estimates, is included under long-term liabilities or non-current assets. Net pension costs (benefits earned during the period including interest on the projected benefit obligation, less estimated return on pension assets and amortization of accumulated changes in estimates) are included in salaries and other personnel expenses.
Gains and losses resulting from the remeasurements of the pension liability based on experience variances and changes in actuarial assumptions are recognized in equity through other comprehensive income in the period they occur..
Contribution based pension planFor contribution based pension plans, the company pays contributions to a public or private managed pension plan. The company has no further payment obligations after the contribution have been paid. Contributions are recognized as personnel expenses in line with the obligation to pay contributions accrue.
TaxesIncome tax expense consists of taxes payable and the net change in deferred taxes arising as a result of temporary differences.
Current tax for the current and prior periods is measured at the amount expected to be paid to the tax authorities for present and earlier years. The tax rates and tax laws used to compute the amount are those that are enacted by the balance sheet date.
Change deferred taxes reflect the future tax effects resulting from the activities for the period. Deferred taxes in the balance sheet are calculated on the basis of temporary differences between financial and taxable values, with consideration for taxable losses carried forward. The carrying amount of deferred tax assets is reviewed at each balance sheet date and reduced to the extent that is not probable that sufficient taxable profit will be available to allow all or part of the deferred tax assets to be utilized. Unrecognized deferred tax assets are reassessed at each balance sheet date and are recognized to the extent that it has become probable that future taxable profit will allow the deferred tax asset to be recovered. Deferred tax assets and liabilities are measured at the tax rates that are expected to apply to the year when the asset is realized or the liability is settled, based on tax rates (and tax laws) that have been enacted or substantively enacted at the balance sheet date.
ProvisionsProvisions are recognized when the Company has a present obligation (legal or constructive) as a result of a past event and where it is probable that an outflow of resources embodying economic benefits will be required to settle the obligation and a reliable estimate can be made of the amount of the obligation.
DividendsDividends proposed by the Board of Directors are not recorded as liability in the financial statements until they have been approved by the shareholders at the annual general meeting.
Related partiesParties are related if one party has the ability, directly or indirectly, to control the other party or exercise significant influence over the other party in making financial and operating decisions. Parties are also related if they are subject to common control or common significant influence. The Company believes that all transactions between related parties are based on the principle of arm’s length (estimated market value).
Business areas/segmentsShip management and ship ownership are the business areas for Solvang. Ship ownership is further divided based on type and size of ship. Solvang has ownership interests in gas ships. These ships are divided into three types based on size, semi-ref ships from 12,000 – 17,000 cbm, MGC/LGC ships from 38,000 - 60,000 cbm and VLGC ships above 75,000 cbm. Accounting information based on business area and ship types are given in note 3 to the accounts.
Cash flow statement / Cash and cash equivalentsThe Company uses the indirect method for calculating cash flow statements. Cash flows generated by investment and financing activities is shown gross, while for operations a reconciliation is shown between profit for the year and cash flows from operating activities. Cash and cash equivalents include cash and bank deposits.

SOLVANG ASA - GROUP 2015 26
NEW IFRS AND IFRIC INTERPRETATIONS There are no new or changed IFRSs or IFRIC interpretations that are effective for the 2015 financial statements, which is considered to have or expected to have a material impact on the Group.
New standards and interpretations which have not come into force There are a number of new standards and interpretations that have been adopted but not yet made effective for the year ending 31 December 2015. For example
IFRS 9 - Financial Instruments will replace IAS 39IFRS 15 – Revenue from contracts with customersIFRS 16 - Leasing
The Group has not used early adoption of any new or amended IFRSs and IFRIC interpretations, and based on the information known to Solvang ASA at the reporting date (when the financial statements are prepared) it has been determined that these will most likely not have a material effect on the consolidated accounts for Solvang ASA in 2015.
When it comes to changes in accounting rules for financial instruments, IFRS 9 was adopted in late 2009. Implementation of IFRS 9 is postponed indefinitely. It is not yet approved for use by the EU and Solvang ASA will consider adopting this standard early when it has been approved for use. If this becomes relevant, Solvang will demonstrate the possible consequences.

27SOLVANG ASA - GROUP 2015
Credit risk
Liquidity risk
Market risk
Asset management
Bank deposits 12 179 -12 179
12 321-12 321
The group is exposed to credit risk, liquidity risk and market risk by use of financial instruments.
Credit risk is risk for financial loss if a counterpart to a financial instrument does not manage to fulfil its obligations under the contract. There are attached credit risk to the group's receivables. Receivables are mainly towards affiliated ship owning companies included using the equity method of accounting. As manager for these companies, we have a good view of their financial standing, and the credit risk is considered minimal.
Liquidity risk is the risk for the group not being able to fulfil its financial obligations as they fall due. Shipping is a cyclical business, and the group has therefore chosen to be well capitalized, and have a significant cash position. As of 31.12.2015 the liquidity reserves amount to 9.5 % of the total balance sheet, while current liabilities together with liability to pay equity to affiliated companies amount to 18.4 % of the balance sheet. The liquidity risk is considered acceptable.
Market risk is risk for changes in market prices, such as exchange rates on currency, interest rates and share prices, influence on income or value of financial instruments. There is attached financial market risk to bank deposits (exchange rate) and loans (exchange rate and interest rates). In addition the group is exposed to market risk related to mortgage loans in the ship owning companies included using the equity method of accounting (interest rates). The groups activities are mainly USD based, and deposits are to a large extent held in USD to reduce exchange rate risk. The group is mainly exposed to interest rate risk through mortgage loan in the ship owning companies. These loans are priced at floating LIBOR rate + margin. Interest rate exposure is actively handled, and parts of the loans are secured by fixed interest rate contracts to reduce interest rate risk. Due to a conservative strategy regarding financial instruments, and active handling of market risk, we are of the opinion that the groups market risk is satisfactory seen in relation to the balance sheet.
The board's goal is to keep a sufficient capital base, to maintain confidence from investors, creditors and the market in general, and to develop the business activity. The Board considers any investments in financial instruments continuously. The Group currently has no investments in financial instruments with the exception of treasury shares. Capital return is monitored by the board. The group trade in its own shares on a limited basis. The purpose is to offer its employees shares in the company at a discounted rate. There has not been made any changes in how asset management is approached during the year. None of the group's companies is subordinated external capital requirements.
Change in exchange rates
Effect on profit or loss
Value change
10 % reduction of exchange rates10 % increase of exchange rates
Effect of change of interest rates for bank deposits is evaluated insignificant, and there is not made a sensitivity analysis.
Mortgage loans on ships in companies included using the equity method of accounting
100 basis points increase of interest rates100 basis points reduction of interest rates
SENSITIVITY ANALYSIS
Change of interest rates
NOTE 2 - FINANCIAL MARKET RISK

SOLVANG ASA - GROUP 2015 28
2015 2014396 896 246 684
0 -2 43483 994 79 965
480 890 324 214
122 430 90 33161 009 55 84715 965 15 11085 525 56 317
0 -9 7301 036 990
285 965 208 865
194 925 115 349
-688 1089 049 21 846
-22 377 -13 886-9 350 -15 044
-23 366 -6 975
171 559 108 374
-2 706 -5 581168 853 102 793
Financial incomeShare of financial expenses shipsFinancial expensesNet financial items
Ordinary result before tax
Tax on ordinary result
NOTE 3 - AREAS OF OPERATION
OPERATING INCOME/EXPENSES
Write-down ships / reversal previous write-down
Total operating income
Share of operating expenses shipsSalaries and other personnel expensesOther operating expensesDepreciation ships including periodic maintenance
PROFIT AND LOSS ACCOUNT PROPORTIONATE CONSOLIDATION
Share of revenue on t/c-basis shipsProfit on sale of ships / interests in ship owning companiesManagement fee
Net profit or loss for the year
FINANCIAL ITEMS
DepreciationTotal operating expenses
Operating result
Other affiliated companies equity method
Solvangs management reports and control are reported according to the proportionate consolidation method. In the companys view this gives the best information regarding total risk related to the groups operation. The main reason for using this principle is that the majority of the ship owning companies are organized as pro rata unlimited partnerships where each partners has an unlimited, pro rata liability for the ship owning companys commitments. In the notes to the accounts the profit and loss account as well as the balance sheet are presented according to the proportionate consolidation method. Further, main figures for areas of operation for our ship owning activity are presented with a split on market segments by ship size and ship management activities.
Continued on next page

29SOLVANG ASA - GROUP 2015
NOTE 3 - AREAS OF OPERATION
31.12.15 31.12.14
3 111 7 9132 211 936 1 397 544
59 313 50 03737 549 119 1843 666 2 319
2 315 575 1 576 996
314 1 01920 20
2 315 909 1 578 034
163 082 88 92528 767 31 086
191 849 120 011
130 573 92 134
322 422 212 145
2 638 331 1 790 179
123 264 123 264
-1 011 -1 246
288 658 119 032753 936 608 719
1 164 847 849 769
1 205 034 821 66817 883 30 473
1 222 917 852 141
45 842 01 292 2 9809 363 10 054
55 805 29 429138 265 45 807250 567 88 269
2 638 331 1 790 179
Total
Share of periodic maintenance shipsShare of new build contractsOffice equipment, furniture etc
Fixed AssetsDeferred tax assetShare of ships
BALANCE SHEET PROPORTIONATE CONSOLIDATION ASSETS
Current AssetsReceivablesShare of current assets ship owning companiesOther short term receivables
Financial fixed assetsInvestments in affiliated companiesOther shares
Total receivables
Bank deposits
EQUITY AND LIABILITIESEquityPaid-in capitalShare capital (24 652 837 shares a NOK 5)Treasury shares
Retained earningsOther equity, unrecognizedRetained earningsTotal equity
Long term liabilities
Share of long term liabilities ship owning companiesPension liabilitiesTotal long term liabilities Current liabilities
TOTAL EQUITY AND LIABILITIES
Liabilities to financial institutionTax payablePublic duties payableShare of current liabilities of ship owning companiesOther short term liabilitiesTotal current liabilities
Total fixed assets
Bank deposits Total current assets TOTAL ASSETS
Continued on next page

SOLVANG ASA - GROUP 2015 30
NOTE 3 - AREAS OF OPERATION
2015 2014 2015 2014 2015 2014
83 994 79 965 83 994 79 965
72 305 80 922 72 305 80 922165 110 76 736 165 110 76 736159 481 89 026 159 481 89 026
-122 430 -90 331 -76 974 -70 957 -199 404 -161 288-85 525 -46 587 -1 036 -990 -86 562 -47 577188 941 109 766 5 983 8 018 194 925 117 783
-2 434 -688 108 -688 -2 326
-22 377 -13 886 -301 6 803 -22 678 -7 084166 564 93 445 4 995 14 929 171 559 108 374
3 111 7 913 3 111 7 913
478 719 422 048 478 719 422 0481 096 927 433 754 1 096 927 433 754
636 290 541 741 636 290 541 74137 549 119 184 37 549 119 184
2 249 485 1 516 728 2 249 485 1 516 728
18 224 21 006 18 224 21 00629 711 16 107 29 711 16 10711 378 12 924 11 378 12 92459 313 50 037 59 313 50 037
26 686 35 307 26 686 35 30759 760 29 317 59 760 29 31776 636 24 300 76 636 24 300
163 082 88 925 163 082 88 925
3 980 3 337 3 980 3 337159 360 123 240 159 360 123 240
2 471 880 1 655 689 166 451 134 490 2 638 331 1 790 179
235 464 224 032 235 464 224 032647 943 261 889 647 943 261 889321 627 335 746 321 627 335 746
1 205 034 821 668 1 205 034 821 668
9 965 9 346 9 965 9 34637 796 5 034 37 796 5 0348 031 15 038 8 031 15 038
55 792 29 419 55 792 29 419
166 804 89 314 166 804 89 31445 842 45 842
1 260 826 851 086 212 645 89 314 1 473 471 940 400
336 940 77 780 336 940 77 78037 549 37 549
2 240 507 2 240 507
SHIP OWNERSHIP SHIP MANAGEMENT TOTAL Operating incomeShare of profit ship owning companies Semi ref ships LGC ships VLGC shipsOperating expensesDepreciation Operating profit/loss Shares in affiliated companiesFinancial itemsProfit/loss before tax Deferred tax assets Interest in ship owning companies equity method Semi ref ships LGC ships VLGC ships New buildTotal Share periodic maintenance ships Semi ref ships LGC ships VLGC shipsTotal Share of current assets ships Semi ref ships LGC ships VLGC shipsTotal Other investmentsAssetsTotal assets
Total
Share long term debt ships Semi ref ships LGC ships VLGC shipsTotal
None Interest bearing debtInterest-bearing debtTotal debts
Office equipment, furniture etc
Share current liability ships Semi-ref skip LGC skip VLGC skip
AREAS OF OPERATION AND SEGMENTS
Net investments in fixed assets in the periodInterest in ship owning companies equity method LGC ships VLGC ship

31SOLVANG ASA - GROUP 2015
Ow
ner-
ship
%
Frei
ght
earn
ings
on T
/C b
ase
Ope
ratin
gex
pens
esD
epre
ciat
ion
Writ
e-of
f /
reve
rsal
Net
fina
ncia
l ite
ms
Net
pro
fitSh
are
vess
elSh
are
accr
.dr
y-do
ckin
gSh
are
curr
ent
asse
ts
Shar
e lo
ng
term
liabi
litie
s
Shar
e cu
rren
tlia
bilit
ies
Shar
e un
calle
dca
pita
l as
of
31.1
2.20
15
Net
boo
k va
lue
bala
nce
shee
t at
31.
12.2
015
20,0
0 %
-31
-15
0-2
-18
00
50
05
20,0
0 %
8 69
95
364
2 69
50
3667
632
178
2 19
63
957
067
10
37 6
6020
,00
%6
483
4 90
11
607
0-5
2-7
70
8 99
21
906
05
224
05
674
22,0
0 %
62 9
7718
131
13 1
080
-2 6
0829
131
260
091
7 22
214
523
134
141
1 46
60
146
229
23,0
0 %
45 4
7412
736
9 24
70
-1 9
2921
562
194
931
6 58
715
523
112
428
1 13
90
103
474
25,0
0 %
25 8
8613
447
9 48
40
-1 2
821
673
207
427
2 07
18
589
100
138
2 15
90
115
790
15,0
0 %
12 9
263
835
3 59
20
-579
4 92
184
214
1 61
24
215
38 1
011
669
050
271
30,0
0 %
31 2
6914
846
10 8
310
-1 7
113
881
239
114
4 96
612
229
135
326
1 91
00
119
072
30,0
0 %
55 2
829
081
7 30
80
-1 3
0737
587
171
815
2 64
958
062
95 7
721
980
013
4 77
420
,00
%17
809
5 11
34
639
0-3
030
5 02
713
6 55
21
832
5 10
583
852
1 70
10
57 9
3616
,83
%61
726
9 05
38
201
0-1
995
42 4
7721
3 44
23
973
6 09
882
006
2 11
759
232
139
389
20,0
0 %
24 6
645
645
5 39
00
-1 0
2012
609
114
481
2 92
47
371
59 9
972
233
062
546
25,0
0 %
40 9
3917
976
8 64
70
-5 9
398
377
456
124
10 2
3920
139
299
923
20 6
350
165
945
30,0
0 %
2 79
42
318
777
0-9
60-1
261
101
568
4 05
05
360
63 3
5012
888
034
740
39
6 89
612
2 43
085
525
0-2
2 37
716
6 56
42
211
936
59 3
1316
3 08
21
205
034
55 7
9259
232
1 17
3 49
2
246
684
90 3
3156
317
-9 7
30-1
3 88
695
880
1 51
6 72
850
037
88 9
2582
1 66
829
418
45 4
7180
4 59
3
NO
TE
4 -
SHIP
PIN
G A
CTIV
ITY
SH
AR
E IN
SH
IP O
WN
ING
CO
MPA
NIE
S U
ND
ER
TH
E E
QU
ITY
ME
THO
D O
F A
CC
OU
NTI
NG
, SH
AR
E O
F P
&L
AN
D B
ALA
NC
E S
HE
ET
ITE
MS
Whe
re th
e co
mpa
ny h
as in
vest
ed in
pro
rata
unl
imite
d pa
rtner
ship
s (P
artre
deri
DA
), th
e co
mpa
ny h
as a
pro
rata
liab
ility
for t
he s
hip
owni
ng c
ompa
ny's
com
mitm
ents
. The
ow
ners
hip
in th
e sh
ip o
wni
ng c
ompa
nies
hav
e be
en te
sted
for i
mpa
irmen
t by
com
parin
g th
e ca
rryi
ng v
alue
s ag
ains
t val
uatio
ns o
btai
ned
from
bro
kers
. The
re a
re in
dica
tions
of i
mpa
irmen
t for
sev
eral
of t
he v
esse
ls. E
stim
ated
val
ue o
f use
are
cal
cula
ted
for t
he v
esse
ls
that
hav
a an
indi
catio
n of
impa
irmen
t. Th
e re
cove
rabl
e am
ount
is fi
xed
at e
stim
ated
val
ue o
f use
of e
ach
ship
. Est
imat
ed v
alue
of u
se is
cal
cula
ted
as a
net
pre
sent
val
ue b
ased
on
the
rest
of l
ife a
nd ri
sk. T
he n
et p
rese
nt
valu
e is
cal
cula
ted
base
d on
eac
h ve
ssel
's re
mai
ning
eco
nom
ic li
fe, a
nd th
e fir
st y
ear's
cas
h-flo
w b
ased
on
appr
oved
bud
gets
.
Mor
tgag
e de
bt in
shi
p ow
ning
com
pani
es a
re n
omin
ated
in U
SD
and
pric
ed b
y LI
BO
R +
mar
gin.
For
par
ts o
f the
deb
t int
eres
t rat
e S
WA
PS
has
bee
n en
tere
d fo
r mat
uriti
es u
p to
5 y
ears
.
Com
pany
PR
Clip
per S
kage
n D
AP
R C
lippe
r Vik
ing
DA
PR
Clip
per H
aral
d D
AP
R C
lippe
r Sta
r DA
PR
Clip
per S
ky D
AP
R C
lippe
r Heb
e D
AP
R C
lippe
r Mar
s D
AP
R C
lippe
r Her
mes
DA
PR
Clip
per S
irius
DA
PR
Clip
per P
osh
DA
Vict
ory
DIS
PR
Clip
per S
un II
DA
PR
Clip
per J
upite
r DA
Tota
l 201
4
Tota
l 201
3 P
R C
lippe
r Odi
n D
A

SOLVANG ASA - GROUP 2015 32
Ow
ner-
ship
in %
Bal
ance
01
.01.
2014
Shar
e pr
ofit
of th
e ye
ar
Inve
stm
ents
/ re
paym
ents
/ sa
le
Tran
slat
ion
diffe
renc
esB
alan
ce
31.1
2.20
14B
alan
ce
01.0
1.20
15Sh
are
prof
it of
the
year
Dis
posa
l /
sold
Inve
stm
ents
/ re
paym
ents
/ sa
le
Tran
slat
ion
diffe
renc
esB
alan
ce
31.1
2.20
15
20,0
0 %
10 3
5577
3-1
0 27
388
41
739
1 73
9-1
8-1
760
455
20,0
0 %
29 4
522
562
-2 5
516
363
35 8
2635
826
676
-4 9
186
076
37 6
6120
,00
%2
746
-1 3
902
551
882
4 78
94
789
-77
962
5 67
422
,00
%74
374
11 7
02-7
262
16 4
7495
288
95 2
8829
131
9 50
0-7
271
19 5
8114
6 22
923
,00
%45
363
7 93
511
032
64 3
3064
330
21 5
629
700
-6 0
2013
902
103
474
25,0
0 %
83 0
049
109
-9 4
3517
809
100
487
100
487
1 67
3-3
853
17 4
7011
5 77
715
,00
%37
384
12 0
896
689
37 8
9337
893
4 92
17
457
50 2
7130
,00
%84
747
10 6
44-1
1 80
718
548
102
133
102
133
3 88
1-4
624
17 6
8311
9 07
230
,00
%42
045
16 0
16-7
181
10 1
1460
994
60 9
9437
587
21 0
5615
138
134
774
20,0
0 %
32 8
103
556
7 90
144
267
44 2
675
027
8 64
157
936
16,8
3 %
45 2
6814
590
12 4
2772
285
72 2
8542
477
6 80
017
827
139
389
20,0
0 %
31 1
3510
818
8 68
350
636
50 6
3612
609
-9 9
709
271
62 5
4625
,00
%49
177
-2 5
2465
139
22 1
3513
3 92
713
3 92
78
377
23 6
4116
5 94
530
,00
%-1
261
34 5
891
412
34 7
40
56
7 86
095
880
19 1
8013
9 94
280
4 59
380
4 59
316
6 56
426
000
17 2
2815
9 10
71
173
492
Reg
iste
red
offic
e fo
r shi
ps o
pera
ted
by S
olva
ng A
SA
, are
in S
tava
nger
. The
righ
t to
vote
is a
ccor
ding
to p
ro ra
ta, o
wne
rshi
p sh
are.
Som
e of
the
com
pani
es w
hich
is in
clud
ed u
nder
the
equi
ty m
etho
d of
acc
ount
ing
has
loan
agr
eem
ents
with
fina
ncia
l ins
titut
ions
whi
ch re
stric
ts d
istri
butio
n to
the
owne
rs. T
his
can
be re
quire
men
t fo
r min
imum
cas
h ho
ldin
gs, w
orki
ng c
apita
l, or
writ
ten
appr
oval
from
the
lend
er b
efor
e di
strib
utio
n to
ow
ners
.
NO
TE
5 -
SHIP
PIN
G A
CTIV
ITY
SH
AR
E IN
SH
IP O
WN
ING
CO
MPA
NIE
S U
ND
ER
TH
E E
QU
ITY
ME
THO
D O
F A
CC
OU
NTI
NG
20
1520
14 C
ompa
ny
PR
Clip
per S
kage
n D
AP
R C
lippe
r Vik
ing
DA
PR
Clip
per H
aral
d D
AP
R C
lippe
r Sta
r DA
PR
Clip
per S
ky D
AP
R C
lippe
r Heb
e D
A
PR
Clip
per J
upite
r DA
Tota
l
PR
Clip
per M
ars
DA
PR
Clip
per H
erm
es D
AP
R C
lippe
r Siri
us D
AP
R C
lippe
r Pos
h D
AVi
ctor
y D
ISP
R C
lippe
r Sun
II D
A
PR
Clip
per O
din
DA
Dis
posa
l
25 %
102
102
247
81-3
622
314
50 %
292
292
772
-772
0
394
394
1 01
981
-36
-772
2231
4
We
have
not
rece
ived
fina
l aud
ited
acco
unts
from
the
com
pani
es, a
nd re
sults
pre
sent
ed in
this
not
e is
by
defin
ition
est
imat
es.
Ow
ners hip
Tran
slat
ion
His
toric
al
cost
Boo
k eq
uity
at
acqu
isiti
onD
ivid
end
Sol
vang
Phi
lippi
nes
Inc.
is lo
cate
d in
Man
ila, P
hilip
pine
s.
Votin
g rig
hts
are
acco
rdin
g to
pro
rata
ow
ners
hip
shar
e.
Sha
re p
rofit
of
the
year
Com
pany
Eve
rgas
Sol
vang
Eth
ylen
e A
STo
tal
Eve
rgas
Sol
vang
Eth
ylen
e A
S is
loca
ted
in C
open
hage
n, D
enm
ark.
Sol
vang
sol
d th
eir s
hare
s in
con
nect
ion
to th
e te
rmin
atio
n of
poo
l coo
pera
tion.
Thi
s ge
nera
ted
an a
ccou
ntin
g lo
ss o
f K
NO
K 7
69.
Inco
min
g ba
lanc
e 01
.01.
2015
Sol
vang
Phi
llipi
nes
Inc
Out
goin
g ba
lanc
e 31
.12.
2015
NO
TE
6 -
OTH
ER A
FFIL
IATED
CO
MPA
NIE
S
SH
AR
E IN
AFF
ILIA
TED
CO
MPA
NIE
S IN
CLU
DE
D U
ND
ER
TH
E E
QU
ITY
ME
THO
D O
F A
CC
OU
NTI
NG

33SOLVANG ASA - GROUP 2015
2015 2014
352 3298 623 18 6978 976 19 026
0 2 4120 4080 2 820
73 09 049 21 846
FINANCIAL ASSETS HELD AT FAIR VALUE THROUGH PROFIT OR LOSSGain on sale of sharesDividend Norwegian shares
Other financial incomeTotal
NOTE 7 - FINANCIAL INCOME RECEIVABLESInterest incomeCurrency gainTotal receivables
Total held at fair value through profit and loss
2015 2014
279 2048 459 14 6218 738 14 825
611 219
9 350 15 044
NOTE 8 - FINANCIAL EXPENSES LOANSInterest and banking expensesCurrency lossTotal loans
Other financial expensesTotal

SOLVANG ASA - GROUP 2015 34
TAX EXPENSES FOR THE YEAR 2015 2014Payable tax 1 059 2 782Tonnage tax 234 198Gross changes in deferred tax / deferred tax assets 4 553 -878Herof changes booked through other comprehensive income -3 137 3 695Effect of changed tax rate 249 0Translation differences -251 0Tax previous years 0 -216Total tax on income for the year 2 706 5 581
SPECIFICATION OF TEMPORARY DIFFERENCES: 31.12.15 31.12.14
267 -178-17 883 -30 473
5 171 3 931-15 003 -17 589
Total basis for deferred tax -27 448 -44 310
ANALYSIS OF RECOGNISED DEFERRED TAX IN RESPECT OF EACH TYPE OF TEMPORARY DIFFERENCES AND UNUSED TAX LOSSES
31.12.15 31.12.14 2015 2014
67 -48 115 -47-4 471 -8 228 3 757 -3 8961 293 1 061 231 1 061
-3 751 -4 749 998 -954-6 862 -11 964 5 102 -3 836
-3 751 -4 051 300 -2 958-3 111 -7 913 4 802 -878
1 665 2 8173 137 -3 695
Total 4 802 -878
2015 % 2014 %46 321 27 % 29 261 27 %
0 0 % -130 0 %10 0 % -750 -1 %
-44 718 -26 % -26 593 -25 %234 0 % 198 0 %
Translation differences 611 0 % 637 1 %249 0 % 0 0 %
0 0 % 2 958 3 %2 706 2 % 5 581 5 %Tax cost according to Profit & Loss account
Long term temporary differencesTangible fixed assetPension liabilitiesInvestment ship owning companies
Tax loss carry-forward
Change deferred tax recognized through profit and loss accountOther changes deferred tax (recognized through OCI and equity)
Adjustment previous year27% effect of permanent differences related to shares27% effect of other permanent differencesWithholding tax
Effect of changed tax rateEffect of deferred tax asset not recognised
NOTE 9 - TAX
Reconciliation tax expenses for the year
There is no tax payable for 2015 under the tonnage tax regime, except for the tonnage tax itself.
Investment ship owning companiesTax loss carry-forwardTotal deferred tax / tax asset (25%/27%)
The Group's subsidiary, Clipper Shipping AS enters into the tonnage tax scheme in 2013, and is therefore only assigned tax on financial records in accordance with the tonnage tax regulations. Clipper Shipping AS is the owner of the investments in ship owning companies which result will then also be taxed under the tonnage tax regime.
Changes in deferred tax recognized through other comprehensive income consist of tax effect related to remeasurements of pension liabilities.
Changes
It is not recognized deferred tax assets related to finance deficits within the tonnage tax regime.
Deferred tax asset not recognised (27%)Total recognised deferred tax (25%/27%)
Temporary differencesTangible fixed assetPension liabilities
27% of ordinary income/loss before tax

35SOLVANG ASA - GROUP 2015
2015 201441 547 40 6507 024 6 6425 039 5 3597 399 3 197
61 009 55 847
40 40
2015 2014
2 387 2 227196 196282 260133 102
2 000 1 798145 141249 207152 116
5 543 5 047
2 2
650 400
6 193 5 447
2015 2014
511 6157 8
14 24532 647
Pension costOther remuneration
Salary
Total personnel expenses
Bonuses
Employers taxPension costOther benefits
Salary
REMUNERATION (IN NOK 1000)
Pension cost
Director Marine Operations
Total remuneration to key management personnel and Board of Directors
NOTE 10 - PAYROLL EXPENSES
Remuneration to auditor consist of the following
Managing Director
Total remuneration to key management personnel
Number of individuals included in key management personnel
Number of employees
PERSONNEL EXPENSES
All employees were paid bonuses in 2015. The total bonus payment for 2015 was 3 714 972,-.
Other non-audit services
The Managing Director has an agreement of one year pay after termination of employment, and an additional contribution based pension of 15% of salary above 12G.
The company's senior executives are employed on a fixed salary. There are no related share-based payments or fixed bonuses to the salary agreements. It is also not granted loans or guarantees from the Company to any of its employees.The amounts stated are exclusive of social security contributions.
SalaryBonuses
Other remuneration
Board of Directors
Total
Remuneration
Auditor
Audit mandatory by lawTax advisory services

SOLVANG ASA - GROUP 2015 36
2015 20142,70 % 2,30 %2,50 % 2,75 %0,00 % 0,00 %2,25 % 2,50 %2,70 % 2,30 %
14,10 % 14,10 %KU KU
K2013 K2013
2015 2014 2015 2014
282 1 349 3 423 2 991192 264 261 216
47 6567 227 519 452
542 1 840 4 250 3 725
4,00 % 5,00 %
2015 2014 2015 2014
8 952 6 777 41 271 27 179-161 675 -5 357 10 164282 1 349 3 423 2 991192 264 945 1 084
-807 -113 -392 -148
8 459 8 952 39 889 41 271
2015 2014 2015 2014
23 515 19 585 4 965 -859 684 868 4 245 4 422 -342 -353 -392 -148
32 674 23 515
Non-funded plans Funded plans
Fair value of plan assets at January 1RemeasurementsActual return on plan assetsCompany contributions
NOTE 11 - PENSION COST AND PENSION LIABILITIES
Non-funded plans Funded plans
Non-funded plans Funded plans
Funded plans
Discount rateExpected salary increases
The group has a general pension plans in a life insurance company. The plan entitles its members to defined future benefits. These benefits are mainly dependent on number of years of employment, salary at the end of ordinary employment and the size of the benefits from the National Insurance Scheme. Full retirement pension will amount to approximately 66% of the basis for pension (limited to 12G), and the plan also includes entitlement to disability and children's pensions. Retirement age is 67 years. The company has the right to alter the pension plan. The benefits accruing under the scheme are funded. The pension plan has 28 members. The defined benefit pension plan for Solvang ASA has been closed for new employees. New employees are members of a defined-contribution pension plan.
This pension plan together with the defined contribution pension plan meets the requirement in the Act on Mandatory company pension.Non-funded plansThe group also has non-funded pension obligations for 2 pensioners, and for the Managing Directors of IGC and Solvang, which are not covered by the general pension plan. The pension obligations for the Managing Director include early retirement pension and pension for salary exceeding 12 G.
Pension liabilities and pension costs are calculated by a third party independent actuary, and are valued according to Revised IAS 19. Changes in pension liabilities due to actuarial assumptions and differences between actual and expected return on plan a assets are recognized in other comprehensive income. The following Assumptions were used:
Assumptions
Rate of pension increasesIncrease of National Insurance Basic amount (G)Expected return on plan assetsSocial Security TaxDisability tariffMortality tariff
Net periodic pension cost:
Current service costNet interest expense /(income)Administrative expensesSocial Security Tax
Net pension cost
Actual return on plan assets
Present value of benefit obligation
Present value of benefit obligation at January 1RemeasurementsPresent value of the service costNet interest cost on benefit obligationPensions paid during the year
Present value of benefit obligation at December 31
Fair value of plan assets
Administrative expensesPensions paid during the year
Fair value of plan assets at December 31
Continued on next page

37SOLVANG ASA - GROUP 2015
NOTE 11 - PENSION COST AND PENSION LIABILITIES
2015 2014 2015 2014
-8 459 -8 952 -39 889 -41 27132 674 23 515
-8 459 -8 952 -7 215 -17 756
-1 193 -1 262 -1 017 -2 504
-9 651 -10 214 -8 232 -20 259 2015 2014
-17 883 -30 473
2015 20149,10 % 10,80 %
39,90 % 62,00 %34,40 % 10,00 %13,80 % 15,00 %2,80 % 2,20 %
100,00 % 100,00 %
Increase in assumption
Decrease in assumption
0,50 % Decrease 9.4 % Increase 10.8 %0,50 % Increase 4.5 % Decrease 4.9 %
0,50 % Decrease 1.1 % Increase 0.3 %0,50 % Increase 2 % Decrease 0 %
Pension liability from subsidiary, Solvang Maritime ASSolvang Maritime´s pension liabilities are charged to the shipping companies and therefore represents no cost to the Group. A receivable towards the shipping companies matching the pension liability is therefore recognized in the balance sheet making the net pension liability zero out. Pension obligations from Solvang Maritime is thus not included in the figures above.
The sensitivity of the gross defined benefit obligation to changes in the weighted principal assumptions is:
Impact on defined benefit obligation
Change in assumption
The above sensitivity analyses are based on a change in an assumption while holding all other assumptions constant. In practice, this is unlikely to occur, and changes in some of the assumptions may be correlated.
Expected payments related to the pension plans in 2015The Group's estimate contribution to the funded pension plan for the fiscal year 2016 is NOK 4 323 537.The Company's estimated payments for non-funded pension plans are NOK 709 950 for the fiscal year 2016.
The value adjusted return on plan assets (secured pension plan) was estimated at 4% per 31.12.2015, and for 2014 the value adjusted return was 5%.
Composition of plan assets on major investment categories
Properties and real estateOtherTotal
Non-funded plans Funded plans
Total net pension liability non-funded and funded plans recognised at Dec. 31
Status of pension plans reconciled to the balance sheet
The defined benefit pension plan for Solvang ASA has been closed for new employees. New employees are members of a defined-contribution pension plan. Per 31.12.2015 this plan had 15 members. Paid contributions in 2015 was NOK 731 841.
Defined-contribution pension plan
Present value of pension obligationsFair value of plan assets
Funded status of plans at December 31.
Social Security Tax
Net pension obligations as at December 31
Shares and other equity instrumentsBondsMoney market and similar
The company's pension funds are managed by an independent life insurance company that invests the funds of the plan according to Norwegian law. The major categories of plan assets as a percentage of the fair value of plan assets are as follows:
Sensitivity
Discount rateSalary growth rateChanges in pension from the Norwegian National InsurancePension growth rate

SOLVANG ASA - GROUP 2015 38
2015 2014 31.12.15 31.12.14
79 395 72 371 188 71
16 495 24 634 0 0 -114 608 -31 891 0 0
79 583 72 442 -98 113 -7 257
Liabilities related parties are priced at 3 months LIBOR + margin of 2% for foreign exchange loans, and 3 months NIBOR + margin 2% for NOK loans.
Interest expenses other related parties
Receivables ship owning companiesReceivables other related partiesLiabilities ship owning companiesLiabilities other related parties
Total
The shipping companies where Solvang has an ownership share of more than 15% and companies where the Steensland family have control are regarded as related parties. All transactions with related parties, are at arm's length and market terms. In connection with Solvang's position as manager for the shipping partnerships, there are ongoing transactions between Solvang and the individual shipping partnerships. Solvang receives a yearly fee as managers. The size of the fee is regulated by the management agreement, and is approved each year by the annual general meeting of the shipping partnerships. Solvang's regular broker for sale and purchase is Inge Steensland AS. Parallel investments with companies controlled by the Steensland family, are also made.
Profit & Loss Account Balance Sheet
Management fee and technical fee (income)Interest income ship owning companies
NOTE 12 - RELATED PARTIES
2015 20145 376 5 441
473 4736 729 7 430
2015 20148 778 18 817
121 795 73 317130 573 92 134
The group has the following restricted bank deposits
NOTE 13 - BANK DEPOSIT
Restricted bank deposit payroll withholding taxRestricted bank deposit rent guarantee (*)Restricted bank deposit pension liability (*)
(*) As of 2015, the items are classified together with other receivables in the balance sheet.
USDTotal
The groups bank deposits at 31.12 are divided on different currencies as follows:
NOK
2015 2014
Profit / loss for the year (numerator) 168 853 102 793Average number of shares outstanding (denominator) 24 451 24 404Total number of shares issued 24 653 24 653Earnings per share (NOK) 6,91 4,21Diluted earnings per share (NOK) 6,85 4,17
NOTE 14 - EARNINGS PER SHARE

39SOLVANG ASA - GROUP 2015
Car
Softw
are
and
offic
e eq
uipm
ent
Furn
iture
and
fix
ture
sN
on d
epre
ciab
le
asse
ts20
1520
14
1 28
82
830
3 12
624
07
483
6 80
723
729
266
234
1 29
61
329
2 62
544
3-1
525
-1 5
251
296
4 15
93
155
240
8 84
97
483
969
1 42
02
776
5 16
54
006
249
651
136
1 03
699
0-1
224
-1 2
2420
15
206
169
194
2 07
12
918
5 18
35
165
1 10
22
088
237
240
3 66
62
319
5 ye
ars
3-4
year
s6
year
s-
3 - 6
yea
rsLi
near
Line
arLi
near
Line
arLi
near
20 %
25 -
30%
15 %
0 %
15 -
30%
Acc
umul
ated
ord
inar
y de
prec
iatio
n 01
.01
Dep
reci
atio
n du
ring
the
year
Tran
slat
ion
diffe
renc
esA
ccum
ulat
ed d
epre
ciat
ion
and
writ
e-of
f 31.
12
NO
TE
15 -
TA
NGIB
LE F
IXED
ASS
ETS
Acq
uisi
tion
cost
s 01
.01
Tran
slat
ion
diffe
renc
esA
dditi
ons
durin
g th
e ye
ar
Boo
k va
lue
as o
f 31.
12
Use
ful l
ifeD
epre
ciat
ion
plan
Dep
reci
atio
n pe
rcen
tage
Dis
posa
ls d
urin
g th
e ye
ar
Acc
umul
ated
dep
reci
atio
n so
ld/d
ispo
sed
asse
ts
Acq
uisi
tion
cost
s 31
.12

SOLVANG ASA - GROUP 2015 40
2015 201445 842 0
552 104 68 016
2015 20141 232 053 824 454
2015 2014
3 297 3 2172 906 6 053
0 06 203 9 271
Security overdraft facility (Book value Clipping Shipping AS)
Solvang ASA has in 2015 signed two shipbuilding contracts with Hyundai Heavy Industries with a total value of MUSD 153.4. The first installment (10%) was paid upon signing the contract.The contracts have always been intended for Partrederiet Clipper Sirius DA and will by the end of April 2016 be finally transferred to the company in the form of a Novation agreement. See note 20 for further details.
NOTE 17 - LIABILITIES
Security
As security for this the company has furnished the shares of Clipper Shipping AS as collateral.
Solvang ASA has a credit facility of NOK 60 million. The facility provides the ability to draw in both USD and NOK, unless the equivalent of the total drawdown does not exceed NOK 60 million.
LeasingThe group has operating lease commitments for office space that expires at 31.12.2016 and 31.12.2019
År 1
Drawn amount overdraft facility
Security overdraft facility (Book value Solvang Shipping AS) In addition the group has parts of mortgage debt through participation in shipping partnerships. As security for this mortgage debt, the lender has a mortgage on ships belonging to the respective companies.
Newbuild contract
År 2-5
The groups share of mortgage debt
There is options under the agreements to extend the leases with 5 years from 31.12.2016 and 31.12.2019 at market terms.
At 31.12 The Company had the following minimum non-cancellable leasing commitments:
The company recognized lease expenses of KNOK 3 763 for 2015 and KNOK 3 478 for 2014.
År 6-10Sum
2015 201416 495 24 6347 202 01 432 4 7933 638 1 659
28 767 31 086
(ref note 13 - Bank deposit)
Recivables consist mainly of trade debtors, prepaid voyage costs and receivables from shipping partnerships. None of the receivables is falling due more than one year after the end of the fiscal year. None of the receivables of significant amount is due on the balance sheet date.
Receivables at 31.12 can be divided as follows:
All the groups trade debtors at 31.12 are nominated in USD and are less than 30 days old.Receivables from shipping partnerhips are nominated in both NOK and USD.
NOTE 16 - RECEIVABLES
(ref note 12 - Related parties)
Total receivables
Receivables from shipping partnershipsDeposit and guaranteesAccrualsOther receivables

41SOLVANG ASA - GROUP 2015
NOTE 19 - TREASURY SHARES
As of 31.12.2015 Solvang ASA had shareholdings of 202 184 treasury shares, booked at KNOK 377.The purpose for buy back of own shares is to offer its employees shares in the company at a discounted price.
# of shares Ownership # of shares Ownership
5 460 932 22,15 % 5 460 932 22,15 %5 405 157 21,93 % 5 405 157 21,93 %3 589 014 14,56 % 3 589 014 14,56 %1 182 000 4,79 % 1 000 000 4,06 %
981 201 3,98 % 981 201 3,98 %860 893 3,49 % 0 0,00 %821 363 3,33 % 821 363 3,33 %655 902 2,66 % 655 902 2,66 %
0 0,00 % 500 000 2,03 %445 870 1,81 % 482 381 1,96 %500 000 2,03 % 500 000 2,03 %400 000 1,62 % 404 000 1,64 %149 510 0,61 % 354 510 1,44 %202 184 0,82 % 249 259 1,01 %
0 0,00 % 0 0,00 %3 998 811 16,22 % 4 249 118 17,24 %
24 652 837 100,00 % 24 652 837 100,00 %
981 2012 7815 746
The company's main shareholders as of 31.12.2015
31.12.15 31.12.14
The board of directors and managing director own or control shares in the company as of 31.12.2015 as follows:
The Board of Directors has proposed a dividend of NOK 2,- per share for 2015. The dividend consist of base dividends of NOK 1 per share and an addition of NOK 1 per share due to very good financial results for 2015. There was paid a dividend of NOK 1,- per share for 2014. The company has no other dividend limitations than those imposed by Norwegian law.
NOTE 18 - EQUITY
Name of owner
Clipper ASStraen ASAudley ASMertoun Capital ASMichael Steensland Brun
MP Pensjon PKSkagenkaien Eiendom
SEB Prime Solutions Skandinaviska
Olger Invest AS
Myhre Leif HaraldJaco Invest AS
Kontrari ASInge Steenslands Stiftelse
Wenche RettedalEdvin Endresen (CEO)
Proposed dividend
Solvang ASASøgne Shipping ASØvrige < 1%Totalt
Michael Steensland Brun

SOLVANG ASA - GROUP 2015 42
NOTE 20 - SHARE OF NEWBUILD CONTRACT
In 2015 Solvang ASA signed two shipbuilding contracts with Hyundai Heavy Industries with a total value of MUSD 153.4. The contracts covers two Panamax newbuildings with delivery in 2017. The contracts have always been intended for Partrederiet Clipper Sirius DA, but due to limited time in connection with the signing of contracts, they were temporarily placed in Solvang ASA. When the final bank financing is agreed upon, they will be transferred to the shipowning company, Partrederiet Clipper Sirius DA, owned by Clipper Shipping AS (subsidiary of Solvang ASA). The newbuilding contracts will be finally transferred to the company in the form of a Novation agreement by the end of April 2016. During autumn 2015 there was also a call of capital in PR Clipper Sirius DA to cover the first installment to the shipyard.
The contracts are to be regarded as jointly owned asset between Solvang (30%) and other co-partners via Audley Shipholding AS (70%). In connection with the payment of the first installment to the shipyard, Solvang received a transfer from Audley Shipholding AS of KUSD 10,738 and paid a total of KUSD 15,340 to the shipyard. Carrying deposit of newbuilding contract is thus netted with KUSD 4,602 (KNOK 37,549) and represents Solvang's share of the deposit.
NOTE 21 - SUBSEQUENT EVENTS
Solvang ASA has agreed to sell 37,5% of its ownership share in Partrederiet Clipper Sirius DA. New ownership share in the company will be 18,75%. The sale will generate a profit of approximately USD 2.9 million in the accounts for second quarter 2016. Moreover, it is exercised a purchase option for the vessel Clipper Harald with effect in July 2016.
There are no other subsequent events of a material concern.
Solvang has deceided to merge their fully owned subsidiary, International Gas Carriers (IGC), into Solvang ASA as of 01.01.2016.

43SOLVANG ASA - PARENT COMPANY 2015
PARENT COMPANY 2015

SOLVANG ASA - PARENT COMPANY 2015 44
Amounts in NOK 1 000 Note 2015 2014
Management fee 10 57 126 54 808Total Operating income 57 126 54 808
Salaries and other personnel expenses 8,10 41 808 40 422Depreciation 13 742 765Other operating expenses 8 12 371 11 806Total operating expenses 54 921 52 994
Operating result 2 205 1 815
Recieved group contributions 2 400 2 533Ship-owning companies equity method 2 -320 -2 060Other affiliated companies equity method 3 81 108Other financial income 4,10 5 715 19 369Other financial expenses 5,10 -8 748 -10 219Net financial items -871 9 731
Ordinary result before tax 1 334 11 546
Tax on ordinary result 6 752 2 398Net profit or loss for the year 582 9 148
Net profit or loss for the year is distributed as follows Dividend -48 988 -24 451
48 406 15 303Total distributed -582 -9 148
Profit & Loss Account | Solvang ASA
To/from other equity

45SOLVANG ASA - PARENT COMPANY 2015
Continued on next page:
Amounts in NOK 1 000 Note 31.12.15 31.12.14ASSETS
Fixed Assets
Intangible fixed assets Deferred tax asset 6 1 636 5 045Total intangible fixed assets 1 636 5 045
Tangible fixed assets Share of newbuild contract 20 37 549 0Office equipment, furniture etc 13 2 434 1 848Total tangible fixed assets 39 983 1 848
Financial fixed assets Investments in subsidiaries 7,15 554 196 622 212Investments ship-owning companies equity method 2 1 262 3 236Investments in affiliated companies 3 314 1 019Total financial fixed assets 555 772 626 467 Total fixed assets 597 391 633 359
Current Assets
Receivables Short term receivables group companies 10,14 2 822 6 132Other short term receivables 10,14 8 200 10 642Total receivables 11 022 16 774
Cash and bank deposits 11 12 069 18 837 Total current assets 23 091 35 612
TOTAL ASSETS 620 482 668 971
Balance Sheet | Solvang ASA

SOLVANG ASA - PARENT COMPANY 2015 46
Amounts in NOK 1 000 Note 31.12.15 31.12.14
Balance Sheet | Solvang ASAEQUITY AND LIABILITIES
Equity
Paid-in capital Share capital 17 123 264 123 264Treasury shares 18 -1 011 -1 246Total paid-in capital 122 253 122 018
Retained earnings Other equity 380 915 420 714Total retained earnings 380 915 420 714 Total equity 17 503 168 542 732 Liabilities
Provisions Pension liabilities 9 7 294 18 355Total provisions 7 294 18 355
Current liabilities Liabilities to financial institution 15 45 842 0Trade creditors 2 340 3 823Current liabilities Group companies 10 3 127 70 862Tax payable 6 209 0Public duties payable 5 274 4 973Dividend 17 48 988 24 451Other short term liabilities 10 4 243 3 775Total current liabilities 110 020 107 884 Total liabilities 117 314 126 239
TOTAL EQUITY AND LIABILITIES 620 482 668 971
Stavanger, 22nd April 2016

47SOLVANG ASA - PARENT COMPANY 2015
Amounts in NOK 1 000 2015 2014CASH FLOW FROM OPERATING ACTIVITIES Profit / (loss) before tax 1 334 11 546Taxes paid 0 0Depreciation and amortisation 742 765Return on investments in equity shares 0 -2 820Difference between expensed pension and paid in/out -450 241Result in other affiliated companies 688 -108Result in affiliated ship owning companies 320 2 060Changes in inventories, trade receivables and trade payables -1 484 784Changes in other current balance sheet items 3 233 2 357Net cash flow from operating activities 4 384 14 826 CASH FLOW FROM INVESTING ACTIVITIES Proceeds from sale / purchase of tangible fixed assets -38 878 -285Proceeds from sale / purchase of securities 0 16 223Dividend received 0 408Proceeds from subsidiary (Liquidation) 4 698 0Investment affiliated companies 39 29Proceeds from ship owning companies 1 748 0Purchase share of ship owning companies -94 0Payments to ship owning companies 0 -2 551Net cash flow from investing activities -32 486 13 824 CASH FLOW FROM FINANCING ACTIVITIES Changes in overdraft facility 45 842 -87Purchase / sale of treasury shares 1 050 676500Change in outstanding accounts group companies -1 108 -6 246Dividends paid -24 451 -12 202Net cash flow from financing activities 21 333 -17 859 Net change in cash and cash equivalents -6 768 10 790 Cash and cash equivalents 01.01 18 837 8 047 Cash and cash equivalents 31.12 12 069 18 837
Cash Flow Statement | Solvang ASA

SOLVANG ASA - PARENT COMPANY 2015 48
NOTE 1 ACCOUNTING PRINCIPLES
The annual accounts consist of the profit and loss account, balance sheet, cash flow statement and notes to the accounts, and have been presented in compliance with the Norwegian Companies Act, the Norwegian Accounting Act and Norwegian generally accepted accounting principles in effect as of 31st of December 2015.
The annual accounts have been prepared based on the fundamental accounting principles and the classification of assets and liabilities are according to the Norwegian Accounting Act. The application of the accounting principles and the presentation of transactions and other issues attach importance to economic realities, not only legal form. Contingent losses, which are likely to happen and are quantifiable, will be expensed.
General principlesAssets that are meant for long-term ownership or use are classified as fixed assets. Other assets are classified as current assets. Receivables are classified as current assets if they are to be re-paid within one year after payment. The same criteria apply for liabilities.
The annual accounts have been prepared based on the fundamental accounting principles historical cost, comparability, going concern, congruence and prudence. Transactions are recorded at their value at the time of the transaction. Income is recognised at the time of delivery of goods or service sold and matches costs expensed in the same period as the income to which they relate is recognized.
Valuation of fixed assets is entered in the accounts at original cost. If the fair value of a fixed asset is lower than book value, and the decline in value is not temporary, the fixed asset will be written down to fair value. Fixed assets with a limited expected useful life is depreciated according to plan.
Current assets are valued at the lower of acquisition cost and fair value. Short-term liability is booked nominally at the point of establishment.
According to the accounting principles there are some exceptions from the general principles. These exceptions are commented below.
Fixed assetsFixed assets are entered in the accounts at original cost, with deductions for accumulated depreciation and write-down. If the fair value of a fixed asset is lower than book value, and the decline in value is not temporary, the fixed asset will be written down to fair value. Depreciation is calculated and distributed linearly over the estimated useful life. Maintenance of fixed assets is continuously booked to operating cost. Major replacement and improvements witch significantly improve the fixed assets useful life, are added to the purchase price of the assets.
Investment in subsidiariesBy subsidiaries means investments where the company directly or indirectly owns more than 50% of the voting shares, where the investment have a long-term and strategic dimension, and investments where the company have a controlling interest. Investments in subsidiaries are accounted for using the purchase method. Cost price increases when means are contributed by a capital increase, or when group contribution is received by the subsidiary. Received dividends are normally booked as income. Dividends which exceeds retained earnings after the initial investment, is booked as reduction of historical acquisition cost. Year-end allocation related to dividend from subsidiaries is entered as financial income the same fiscal year.
Investment in affiliated companiesBy affiliated companies means investments where the company directly or indirectly owns 20-50% of the voting shares, where the investment have a long-term and strategic dimension, and investments where the company can exercise a considerable influence. Investments in affiliated companies are accounted for using the equity method.
Solvang’s share of the profit in an affiliated company is based on profit after tax in the affiliated company less any depreciation on excess value due to the acquisition cost of the owner interest being higher than the acquired share of book equity. In the profit and loss account, the share of the profit in affiliated companies is presented as financial items. In the balance sheet, owner interests in affiliated companies are presented together with fixed assets.
For affiliated participant taxed companies are Solvang’s share of the profit based on the pre-tax profit in the affiliated company. Tax on profit share is recognized through the general tax cost of the Group.
ReceivablesReceivables are valuated at face value after deduction of accrual for anticipated loss. Accruals for anticipated loss are made on basis of assessment of the individual outstanding claims.
Foreign currencyTransactions in foreign currencies are recorded at transaction date.
All cash and bank balances in foreign currency are accounted for at the exchange rate at year-end.
Financial expensesWhen a new debt financing is established any up-front fees and other cost related to the financing are expensed at the date of drawdown of the loan.

49SOLVANG ASA - PARENT COMPANY 2015
Pension liability and pension costThe Company has both defined benefit and contribution based pension plans, which the defined benefit pension plan was closed by 01.01.2011 so that all new employees starting from 2011 will be included in the contribution based pension plan.
Defined benefit pension planNet pension cost includes the period calculated pension benefits, including expected salary increases, estimated interest expenses, less the expected return on plan assets and any effects of changes in estimates and plans. The surplus is capitalized to the extent it can be applied to future pension obligations. The company applies Revised IAS 19 Employee Benefits as a basis for accounting for pension.
Gains and losses arising from recalculation of the obligation due to experience variances and changes in actuarial assumptions are recorded against equity and deferred tax in the period when they occur.
Contribution based pension planFor defined contribution plans the company pays contributions to publicly or privately administered pension insurance plans. The company has no further payment obligations once the contributions have been paid. Contributions are recognized as compensation expense in line with the obligation to pay contributions accrue.
Treasury sharesOwn shares are posted at face value on a separate line of the balance sheet under equity. The difference between the face value of the share and the original cost is deducted from other equity.
TaxesTaxes in the Profit and Loss statement contain both payable tax of the year and changes in deferred tax / deferred tax asset.
Deferred tax /deferred tax assets are calculated on basis of temporary differences between accounting standards and tax legislation by the end of the fiscal year. The calculation is based on nominal tax rate. Tax-augmenting and tax-reducing temporary differences that can be reversed in the same period are balanced in the accounts. Deferred tax assets arise if there are net tax-reducing temporary differences which can be justified by the assumption of future profits. This year tax on ordinary result consist of net changes in deferred tax and deferred tax assets together with payable tax of the year and adjusted for any differences in provision previous years.
Cash flow statementThe Cash Flow statement is prepared in accordance with the indirect method. Cash flow generated by investing and financing activities is shown gross, while for operations reconciliation is shown between book profit and cash flow from operating activities. Investments in securities are not included under cash equivalents. Cash and cash-equivalents include petty cash and bank payments.
NOTE 1 ACCOUNTING PRINCIPLES (cont)

SOLVANG ASA - PARENT COMPANY 2015 50
Dis
posa
ls
25
%10
210
224
781
-36
2231
450
%29
229
277
20
-772
00
39
439
41
019
81-3
6-7
7222
314
NO
TE
3 -
AFF
ILIA
TED
CO
MPA
NIE
S A
FFIL
IATE
D C
OM
PAN
IES
INC
LUD
ED
UN
DE
R T
HE
EQ
UIT
Y M
ETH
OD
OF
AC
CO
UN
TIN
G
Ow
ner-
ship
Shar
e of
net
pr
ofit
The
votin
g rig
hts
are
acco
rdin
g to
pro
rata
ow
ners
hip
shar
e.
Equi
ty a
t ac
quis
ition
Com
pany
Eve
rgas
Sol
vang
Eth
ylen
e A
STo
tal
Eve
rgas
Sol
vang
Eth
ylen
e A
S is
loca
ted
in C
open
hage
n, D
enm
ark.
Due
to te
rmin
atio
n of
the
pool
col
labo
ratio
n, S
olva
ng h
as e
xite
d fro
m th
e co
mpa
ny w
hich
gen
erat
ed a
loss
of
KN
OK
769
.
We
have
not
rece
ived
fina
l or a
udite
d ac
coun
ts fr
om th
e af
filia
ted
com
pani
es, h
ence
the
amou
nts
pres
ente
d in
this
not
e is
est
imat
e on
ly.
Tran
slat
ion
diffe
renc
es
Clo
sing
ba
lanc
e 31
.12.
2015
Sol
vang
Phi
llipi
nes
Inc
Div
iden
d re
ceiv
edA
cqui
sitio
n co
st
Ope
ning
ba
lanc
e 01
.01.
2015
Sol
vang
Phi
llipi
nes
Inc
is lo
cate
d in
Man
ila, P
hilli
pine
s.
20
%6
188
3 23
6-3
512
885
20 %
9431
94-1
748
-1 6
23
6
282
3 23
6-3
2094
-1 7
481
262
Clo
sing
ba
lanc
e 31
.12.
2015
Reg
iste
red
offic
e of
shi
p ow
ning
com
pani
es in
clud
ed a
fter t
he e
quity
met
hod
of a
ccou
ntin
g is
in S
tava
nger
.
Th
e vo
ting
right
s ar
e ac
cord
ing
to p
ro ra
ta o
wne
rshi
p sh
are.
Com
pany
PR
Clip
per H
aral
d D
A
Tota
l
PR
Clip
per S
kage
n D
A
The
reas
on fo
r neg
ativ
e ba
lanc
e re
late
d to
ow
ners
hip
in P
R C
lippe
r Ska
gen
DA
is d
ue to
a d
effe
red
tax
liabi
lity
that
was
adj
uste
d fo
r whe
n pu
rcha
sing
the
shar
e.
NO
TE
2 -
SHIP
PIN
G A
CTIV
ITY
SH
AR
E IN
VE
SS
ELS
INC
LUD
ED
UN
DE
R T
HE
EQ
UIT
Y M
ETH
OD
OF
AC
CO
UN
TIN
G
Ow
ner-
ship
Acq
uisi
tion
cost
Ope
ning
ba
lanc
e 01
.01.
2015
Shar
e of
ne
t pro
fitA
dditi
ons/
di
spos
als
Inco
min
g pa
ymen
ts/
repa
ymen
ts
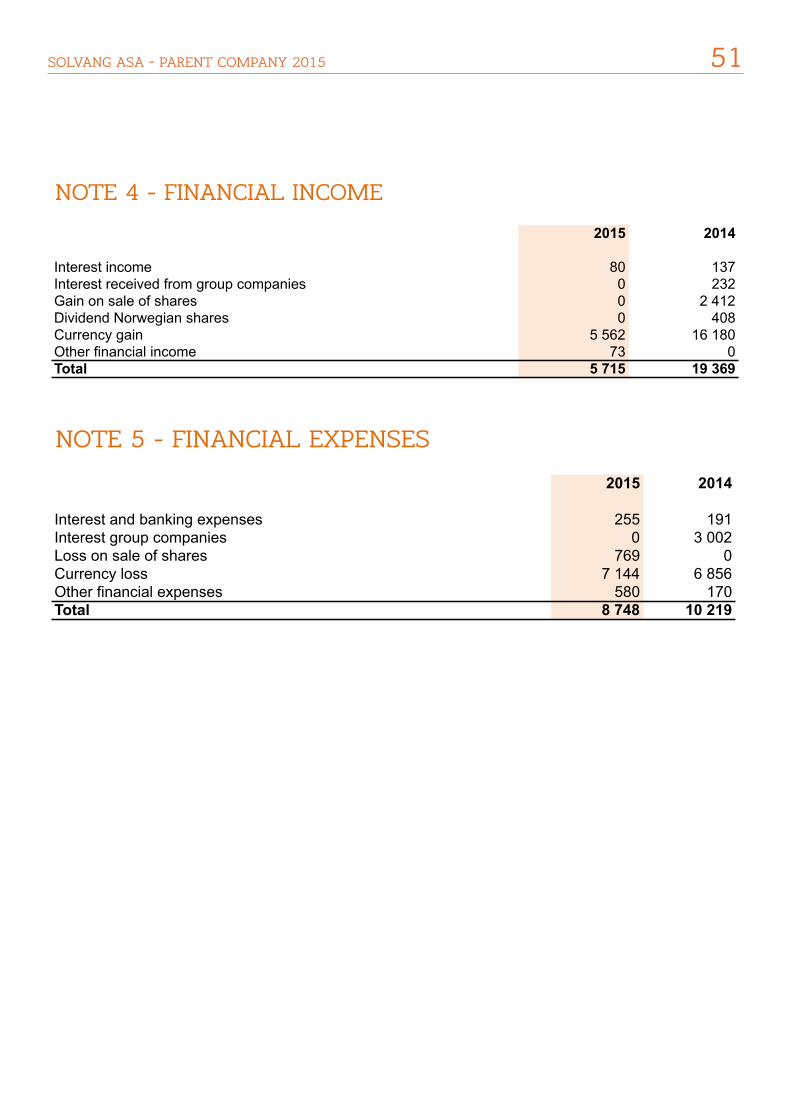
51SOLVANG ASA - PARENT COMPANY 2015
2015 2014
Interest income 80 137Interest received from group companies 0 232Gain on sale of shares 0 2 412Dividend Norwegian shares 0 408Currency gain 5 562 16 180Other financial income 73 0Total 5 715 19 369
NOTE 4 - FINANCIAL INCOME
2015 2014
Interest and banking expenses 255 191Interest group companies 0 3 002Loss on sale of shares 769 0Currency loss 7 144 6 856Other financial expenses 580 170Total 8 748 10 219
NOTE 5 - FINANCIAL EXPENSES

SOLVANG ASA - PARENT COMPANY 2015 52
2015 2014
1 334 11 546 805 -2 779 176 210 1 692 -2 365 -81 -108 -567 358 -2 587 -6 862 772 0
27 % 209 0 209 0 3 278 -357 -2 865 2 755 131 0 752 2 398 -3 -121 -7 294 -18 355 754 2 378 0 -2 587 -6 543 -18 684 25/27% -1 636 -5 045 360 3 117 -22 -29 217 -750 66 60 131 0 752 2 398
Effect of change in tax rateTax cost according to Profit & Loss account
27% of ordinary income/loss before taxChanges related to equity method27% effect of permanent differences related to shares27% effect of other permanent differences
Total
Deferred tax / deferred tax assets
Reconciliation tax expenses for the year
Tangible fixed assetPension liabilitiesInvestment ship owning companiesTax loss carry-forward
Effect Change in tax rate Total tax on income for the year
Specification of temporary differences:Long term temporary differences
Tax Payable
Tax expenses for the yearTax PayableGross changes in deferred tax / deferred tax assetsDeferred tax of remeasurement pensions recognized in equity
Permanent differences ship owning companiesDifferences related to equity methodChanges in temporary differencesApplied loss carried forwardNet taxable income/loss
NOTE 6 - TAX
Ordinary income/loss before taxPermanent differences related to sharesPermanent differences

53SOLVANG ASA - PARENT COMPANY 2015
Clipper Shipping AS 100 % 559 316 900 100 5 593 169 559 316 900 552 103 671Solvang Maritime AS 100 % 100 000 1 000 100 100 000 106 000International Gas Carriers AS 100 % 1 000 000 100 10 000 1 000 000 1 986 533Total Subsidiaries 554 196 204
Clipper Shipping AS and Solvang Maritime AS are located in Stavanger.International Gas Carriers AS is located in Oslo.
Solvang Shipping AS was finally deleted in Brønnøysund January 2015. The liquidtation was therfore not recognized in the accounts until 2015. There was no gain/loss in relation to the liquidation.
NOTE 7 - SHARES IN SUBSIDIARIES
Company nameOwnership/
voting rights Share capitalNominal
valueNumber of
shares ownedTotal nominal
valueValue on
balance sheet
2015 2014
30 305 29 5175 104 4 8803 364 3 6773 034 2 348
41 808 40 422
34 34
Director's fees Salary Bonuses Pension costsOther
remunerationTotal
remuneration
2 387 035 195 833 282 019 132 587 2 997 4742 000 095 145 422 248 674 151 622 2 545 813
150 000 0 0 0 0 150 000125 000 0 0 0 0 125 000125 000 0 0 0 0 125 000125 000 0 0 0 0 125 000125 000 0 0 0 0 125 000650 000 4 387 130 341 255 530 693 284 209 6 193 287
AUDITORThe fee to the auditors for 2015 amounts to NOK 278 601, whereof NOK 271 951 relates to audit required by law and NOK 6 650 for tax advisory. The amounts are reported exclusive of VAT.
Michael Steensland Brun, Chairman BOARD OF DIRECTORS
Alf Andersen, Board memberWenche Rettedal, Board memberEllen Solstad, Board memberHans Petter Aas, Board member
Number of employees
Managing Director has an agreement of one year pay after termination of employment, and an additional contribution based pension of 15% of salary above 12G. The company's senior executives are employed on a fixed salary. No share-based payments or fixed bonuses are related to the salary agreements. The Company has not granted loans or guarantees to any of its employees.All employees got paid a bonus in 2015 equal to one months salary. Total bonus of 2015 amounted to NOK 2 195 387,-.
MANAGERSEdvin Endresen, CEOTor Øyvind Ask, Dir. Marine Operations
Total remuneration
Remuneration (in NOK) 2015
Other benefitsTotal personnel expenses
NOTE 8 - PAYROLL EXPENSES Personnel expensesSalaryEmployers taxPension cost

SOLVANG ASA - PARENT COMPANY 2015 54
2015 2014Discount rate 2,70 % 2,30 %Expected salary increases 2,50 % 2,75 %Rate of pension increases 0,00 % 0,00 %Increase of National Insurance Basic amount (G) 2,25 % 2,50 %Expected return on plan assets 2,70 % 2,30 %Social Security Tax 14,10 % 14,10 %
Net periodic pension cost: 2015 2014 2015 2014 Benefits earned during the year 191 175 309 2 151 2 183Interest cost 13 20 218 212Administrative expenses 0 0 39 40Social Security Tax 29 28 334 338Net periodic pension cost 234 223 2 742 2 773
Actual return on plan assets 4,00 % 5,00 %
2015 2014
Net actuarial gains/losses 01.01 -11 660 -4 210Current year actuarial gains/losses 10 612 -10 205Tax -2 865 2 755
Net actuarial gains/losses 31.12 -3 913 -11 660
Funded plansThe company is obligated to have a pension plan according to the Act on Mandatory company pension, and has a pension plan which follows the requirement as set in the Act on Mandatory company pension.
The company has a general pension plan in a life insurance company. The plan entitles its members to defined future benefits. These benefits are mainly dependent on number of years of employment, salary at the end of ordinary employment and the size of the benefits from the National Insurance Scheme. Full retirement pension will amount to approximately 66% of the basis for pension (limited to 12G), and the plan also includes entitlement to disability and children's pensions. Retirement age is 67 years. The company has the right to alter the pension plan. The benefits accruing under the scheme are funded. The pension plan has 22 members (2014: 22 members).
Non-funded plansThe company also has non-funded pension obligations for 2 pensioners and an additional defined contribution plan for CEO, which are not covered by the general pension plan.
AssumptionsPension liabilities and pension costs are calculated by a third party independent actuary, and has been evaluated according to revised IAS 19. Actuarial gains and losses arising from experience adjustments and changes in actuarial assumptions are charged or credited through Equity. The following assumptions were used:
Overview of actuarial gains and losses recognized directly through other equity:
NOTE 9 - PENSION COST AND PENSION LIABILITIES
Non-funded plans Funded plans
Continues on next page

55SOLVANG ASA - PARENT COMPANY 2015
Status of pension plans reconciled to the balance sheet
2015 2014 2015 2014 Present value of pension obligations -909 -804 -31 689 -33 759Fair value of plan assets 0 0 26 206 18 476Funded status of plans at December 31. -909 -804 -5 483 -15 282 Social Security Tax -128 -113 -773 -2 155 Net pension liability recognised at December 31. -1 037 -917 -6 256 -17 437
2015 2014Total net pension liability non-funded and funded plans as of 31.12 -7 294 -18 355
2015 2014Shares and other equity instruments 9,10 % 10,80 %Bonds 39,90 % 62,00 %Money market and similar 34,40 % 10,00 %Properties and real estate 13,80 % 15,00 %Other 2,80 % 2,20 %Total 100,00 % 100,00 %
Defined-contribution pension plan
Composition of plan assets on major investment categories. The company's pension funds are managed by an independent life insurance company that invests the funds of the plan according to Norwegian law.
The major categories of plan assets as a percentage of the fair value of plan assets are as follows:
The defined benefit pension plan for Solvang ASA has been closed for new employees. New employees are members of a defined-contribution pension plan. Per 31.12.2015 this plan had 15 members. Paid contributions in 2015 was NOK 731 841.
Non-funded plans Funded plans
2015 2014 31.12.15 31.12.14Management fee (income) 57 126 54 808 Net interest subsidiaries -2 770 Interest expenses other related parties 18 0 Receivables group companies 2 822 6 132Liabilities group companies -3 127 -70 862Net receivables ship owning companies 505 0Net receivables other related parties 0 0Liabilities other related parties 0 0Total 57 145 52 038 200 -64 730
NOTE 10 - RELATED PARTIES
Profit & Loss Account Balance Sheet
The shipping companies where Solvang has an ownership share of more than 15% and companies where the Steensland family have control are regarded as related parties. All transactions with related parties, are at arm's length and market terms. In connection with Solvang's position as manager for the shipping partnerships, there are ongoing transactions between Solvang and the individual shipping partnerships. Solvang receives a yearly fee as managers. The size of the fee is regulated by the management agreement, and is approved each year by the annual general meeting of the shipping partnerships. Solvang's regular broker for sale and purchase is Inge Steensland AS. Parallel investments with companies controlled by the Steensland family, are also made.
In 2015 Solvang ASA purchased the share in PR Clipper Skagen DA from Clipper Shipping AS for KNOK 94.

SOLVANG ASA - PARENT COMPANY 2015 56
NOTE 11 - RESTRICTED BANK DEPOSIT
In connection with payment of payroll withholding tax, the company has a restricted bank deposit of NOK 3 169 360,-
NOTE 14 - RECEIVABLES
Debtors consist mainly of receivables from shipping partnerships. None of the receivables is falling due more than one year after the end of the fiscal year.
2015 2014
581 613 9 147 78824 450 653 24 403 57824 652 837 24 652 837
0,02 0,370,02 0,37
NOTE 12 - EARNINGS PER SHARE
Profit / loss for the year (numerator)Average number of shares outstanding (denominator)Total number of shares issuedEarnings per share (NOK)Diluted earnings per share (NOK)
Software and office
equipmentFurniture
and fixtures
Non depreciable
assets 2015 20142 830 2 968 240 6 038 5 7531 329 0 0 1 329 285
0 0 0 0 04 159 2 968 240 7 367 6 038
1 420 2 771 0 4 190 3 425
651 91 0 742 7650 0 0 0 0
2 071 2 862 0 4 932 4 1902 088 107 240 2 434 1 848
3-4 years 6 years - 3 - 6 years
Linear Linear Linear Linear25 - 30% 15 % 0 % 15 - 30%
Depreciation planDepreciation percentage
Accumulated depreciation sold/disposed assetsAccumulated depreciation and write-off 31.12Book value as of 31.12
Useful life
Disposals during the yearAcquisition costs 31.12 Accumulated ordinary depreciation 01.01Depreciation during the year
NOTE 13 - TANGIBLE FIXED ASSETS
Acquisition costs 01.01Additions during the year

57SOLVANG ASA - PARENT COMPANY 2015
NOTE 15 - LIABILITIES
Newbuild contract
Solvang ASA has a credit facility of NOK 60 million. The facility provides the ability to draw in both USD and NOK, unless the equivalent of the total drawdown does not exceed NOK 60 million. As of 31.12.2015 there was drawn USD 4,6 million and NOK 5,1 million on the revolving credit facility corresponding to NOK 45,8 million. As security for this the company has furnished the shares of Clipper Shipping AS as collateral. Book value of the shares in Clipper Shipping AS is NOK 552 million as of 31.12.2015.
Solvang ASA has otherwise given a guarantee for the share of debt that its subsidiary Clipper Shipping AS is committed to through its ownership in shipowning companies. This is limited to ownership of the individual shipping partnerships. Share of the debt as of 31.12. amounts to MNOK 1 232.
Solvang ASA has in 2015 signed two shipbuilding contracts with Hyundai Heavy Industries with a total value of MUSD 153.4. The first installment (10%) was paid upon signing the contract.The contracts have always been intended for Partrederiet Clipper Sirius DA and will by the end of April 2016 be finally transferred to the company in the form of a Novation agreement. See note 20 for further details.
NOTE 16 - AREAS OF OPERATION
Since practically all of the company's ship ownership was sold to the subsidiary Clipper Shipping AS in December 2007, the company is left with one area of operation, ship management.

SOLVANG ASA - PARENT COMPANY 2015 58
Share capitalTreasury
shares Other Equity Total equity
123 264 -1 246 420 714 542 732
582 58222 22
7 746 7 74623 23
-48 988 -48 988235 815 1 050
123 264 -1 011 380 915 503 168
Shareholders
# of shares Ownership5 460 932 22,15 %5 405 157 21,93 %3 589 014 14,56 %1 182 000 4,79 %
981 201 3,98 %860 893 3,49 %821 363 3,33 %655 902 2,66 %500 000 2,03 %445 870 1,81 %400 000 1,62 %202 184 0,82 %
4 148 321 16,83 %24 652 837 100,00 %
981 2012 7815 746
Proposed dividend
Allocated dividend is based on the number of shares outstanding on the grant date.
The board of directors and CEO own or control shares in the company as of 31.12.2015 as follows:Michael Steensland Brun (Chairman)Wenche RettedalEdvin Endresen (CEO)
The Board of Directors has proposed a dividend of NOK 2.00 per share for 2015. The dividend consist of base dividends of NOK 1 per share and an addition of NOK 1 per share due to very good financial results for 2015. A dividend of NOK 1.00 per share was paid for 2014.
Totalt
Inge Steenslands StiftelseKontrari ASMyhre Leif HaraldSolvang ASA
Audley ASMertoun Capital ASMichael Steensland Brun
MP Pensjon PKSkagenkaien Eiendom
Others < 1%
SEB Prime Solutions Skandinaviska
The share capital of Solvang ASA consist of 24 652 837 ordinary shares, each with a par value of NOK 5,-.All shares have equal rights.
Name of ownerClipper AS
The company's main shareholders as of 31.12.2015
Straen AS
Remeasurement pension liability (net after tax)
Proposed dividendTreasury shares
Difference between proposed and paid dividend
Equity as of 31.12.2015
The company has no other dividend limitations than those imposed by Norwegian law.
NOTE 17 - EQUITY
Solvang ASA
Equity as of 31.12.2014
Profit / loss of the yearTranslation differences (note 3)

59SOLVANG ASA - PARENT COMPANY 2015
NOTE 18 - TREASURY SHARES
As of 31.12.2015 Solvang ASA had shareholdings of 202 184 treasury sahares, booked at NOK 376 533.The purpose for buy back of own shares is to offer its employees shares in the company at a discounted price.
NOTE 19 - FINANCIAL MARKET RISK
The operations of the company's investments in ship owning companies accounted for according to the equity method are mainly USD based. Most of the revenues are in USD. The majority of the income is in USD. Furthermore, the market value of the ships, and thus most of the assets, are priced in USD. Most of the debts are also in USD. This leads to foreign exchange exposure being limited.
Most of the company's debt is share of the debt in the ship owning companies accounted for according to the equity method. This is denominated in USD and is priced by floating LIBOR interest. All loans are at floating interest rates. The company has an acceptable equity ratio. This together with an active handling of interest rate exposure, leads to the risk of any changes in the interest rate level being limited for the company.
Investment in ship owning companiesCURRENCY RISK AND INTEREST RISK
The company's operations expose the company for currency risk and interest risk, whilst the company only have a very limited exposure to credit risk and market risk.
NOTE 20 - SHARE NEWBUILD CONTRACT
In 2015 Solvang ASA signed two shipbuilding contracts with Hyundai Heavy Industries with a total value of MUSD 153.4. The contracts covers two Panamax newbuildings with delivery in 2017. The contracts have always been intended for Partrederiet Clipper Sirius DA, but due to limited time in connection with the signing of contracts, they were temporarily placed in Solvang ASA. When the final bank financing is agreed upon, they will be transferred to the shipowning company, Partrederiet Clipper Sirius DA, owned by Clipper Shipping AS (subsidiary of Solvang ASA). The newbuilding contracts will be finally transferred to the company in the form of a Novation agreement by the end of April 2016. During autumn 2015 there was also a call of capital in PR Clipper Sirius DA to cover the first installment to the shipyard.
The contracts are to be regarded as jointly owned asset between Solvang (30%) and other co-partners via Audley Shipholding AS (70%). In connection with the payment of the first installment to the shipyard, Solvang received a transfer from Audley Shipholding AS of KUSD 10,738 and paid a total of KUSD 15,340 to the shipyard. Carrying deposit of newbuilding contract is thus netted with KUSD 4,602 (KNOK 37,549) and represents Solvang's share of the deposit.

SOLVANG ASA - ANNUAL REPORT 2015 60
STATEMENT OF COMPLIANCEBOARD AND GENERAL MANAGER’S STATEMENT OF COMPLIANCEWe confirm that the annual accounts for the period 1 January 2015 to 31 December 2015 are, to the best of our knowledge, presented in compliance with current applicable accounting standards, and that the information contained in the accounts give a true and fair view of the company’s and the groups’ assets, liabilities, financial position and results as a whole. We also confirm that the information in the annual report gives a true summary of the developments, profits and losses and position of the company and the group together with a description of the most central risk factors and uncertainties with which the company is faced.
Stavanger, 22nd April 2016
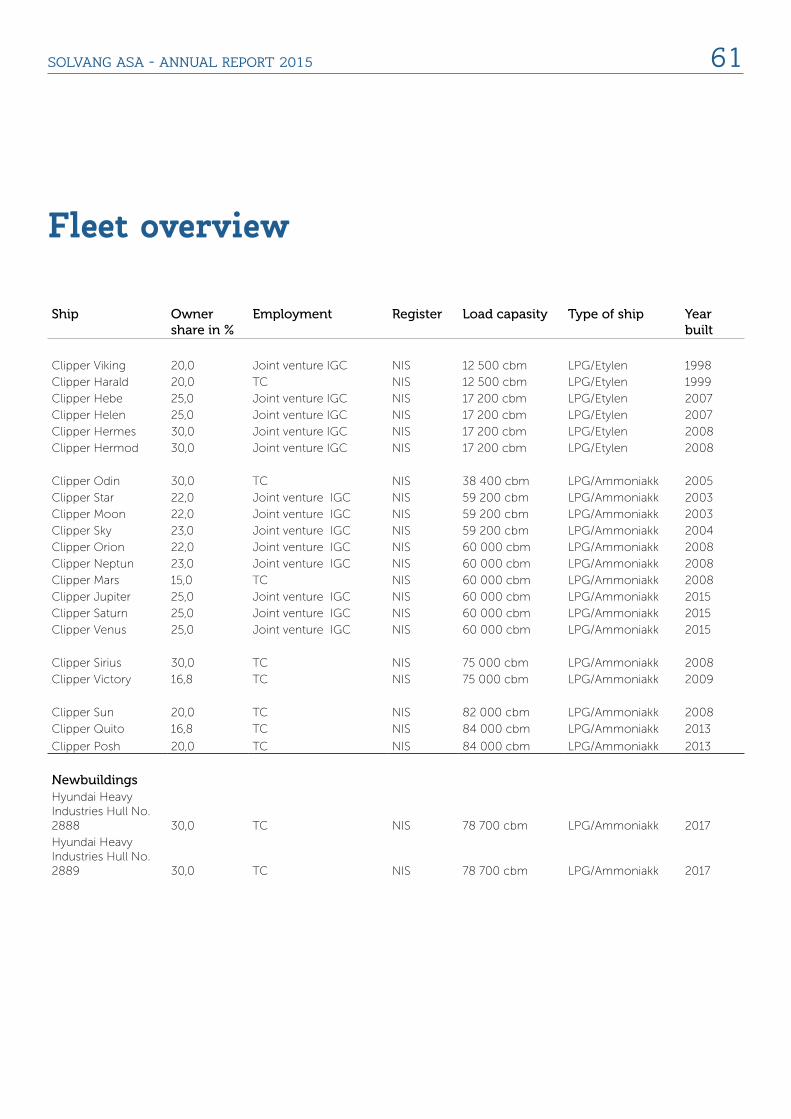
61SOLVANG ASA - ANNUAL REPORT 2015
Fleet overview
Ship Owner share in %
Employment Register Load capasity Type of ship Year built
Clipper Viking 20,0 Joint venture IGC NIS 12 500 cbm LPG/Etylen 1998
Clipper Harald 20,0 TC NIS 12 500 cbm LPG/Etylen 1999
Clipper Hebe 25,0 Joint venture IGC NIS 17 200 cbm LPG/Etylen 2007
Clipper Helen 25,0 Joint venture IGC NIS 17 200 cbm LPG/Etylen 2007
Clipper Hermes 30,0 Joint venture IGC NIS 17 200 cbm LPG/Etylen 2008
Clipper Hermod 30,0 Joint venture IGC NIS 17 200 cbm LPG/Etylen 2008
Clipper Odin 30,0 TC NIS 38 400 cbm LPG/Ammoniakk 2005
Clipper Star 22,0 Joint venture IGC NIS 59 200 cbm LPG/Ammoniakk 2003
Clipper Moon 22,0 Joint venture IGC NIS 59 200 cbm LPG/Ammoniakk 2003
Clipper Sky 23,0 Joint venture IGC NIS 59 200 cbm LPG/Ammoniakk 2004
Clipper Orion 22,0 Joint venture IGC NIS 60 000 cbm LPG/Ammoniakk 2008
Clipper Neptun 23,0 Joint venture IGC NIS 60 000 cbm LPG/Ammoniakk 2008
Clipper Mars 15,0 TC NIS 60 000 cbm LPG/Ammoniakk 2008
Clipper Jupiter 25,0 Joint venture IGC NIS 60 000 cbm LPG/Ammoniakk 2015
Clipper Saturn 25,0 Joint venture IGC NIS 60 000 cbm LPG/Ammoniakk 2015
Clipper Venus 25,0 Joint venture IGC NIS 60 000 cbm LPG/Ammoniakk 2015
Clipper Sirius 30,0 TC NIS 75 000 cbm LPG/Ammoniakk 2008
Clipper Victory 16,8 TC NIS 75 000 cbm LPG/Ammoniakk 2009
Clipper Sun 20,0 TC NIS 82 000 cbm LPG/Ammoniakk 2008
Clipper Quito 16,8 TC NIS 84 000 cbm LPG/Ammoniakk 2013
Clipper Posh 20,0 TC NIS 84 000 cbm LPG/Ammoniakk 2013
NewbuildingsHyundai Heavy Industries Hull No. 2888 30,0 TC NIS 78 700 cbm LPG/Ammoniakk 2017
Hyundai Heavy Industries Hull No. 2889 30,0 TC NIS 78 700 cbm LPG/Ammoniakk 2017

SOLVANG ASA - ANNUAL REPORT 2015 62
PricewaterhouseCoopers AS, Kanalsletta 8, Postboks 8017, NO-4068 StavangerT: 02316, org. no.: 987 009 713 MVA, www.pwc.noStatsautoriserte revisorer, medlemmer av Den norske Revisorforening og autorisert regnskapsførerselskap
To the Annual Shareholders' Meeting of Solvang ASA
Independent auditor’s report
Report on the Financial Statements
We have audited the accompanying financial statements of Solvang ASA, which comprise the financialstatements of the parent company and the financial statements of the group. The financial statementsof the parent company comprise the balance sheet as at 31 December 2015, and the income statementand cash flow statement, for the year then ended, and a summary of significant accounting policies andother explanatory information. The financial statements of the group comprise the balance sheet at 31December 2015, income statement, changes in equity and cash flow for the year then ended, and asummary of significant accounting policies and other explanatory information.
The Board of Directors and the Managing Director’s Responsibility for the Financial Statements
The Board of Directors and the Managing Director are responsible for the preparation and fairpresentation of the financial statements of the parent company in accordance with NorwegianAccounting Act and accounting standards and practices generally accepted in Norway, and for thepreparation and fair presentation of the financial statements of the group in accordance withInternational Financial Reporting Standards as adopted by EU and for such internal control as theBoard of Directors and the Managing Director determine is necessary to enable the preparation offinancial statements that are free from material misstatement, whether due to fraud or error.
Auditor’s Responsibility
Our responsibility is to express an opinion on these financial statements based on our audit. Weconducted our audit in accordance with laws, regulations, and auditing standards and practicesgenerally accepted in Norway, including International Standards on Auditing. Those standards requirethat we comply with ethical requirements and plan and perform the audit to obtain reasonableassurance about whether the financial statements are free from material misstatement.
An audit involves performing procedures to obtain audit evidence about the amounts and disclosuresin the financial statements. The procedures selected depend on the auditor’s judgment, including theassessment of the risks of material misstatement of the financial statements, whether due to fraud orerror. In making those risk assessments, the auditor considers internal control relevant to the entity’spreparation and fair presentation of the financial statements in order to design audit procedures thatare appropriate in the circumstances, but not for the purpose of expressing an opinion on theeffectiveness of the entity’s internal control. An audit also includes evaluating the appropriateness ofaccounting policies used and the reasonableness of accounting estimates made by management, aswell as evaluating the overall presentation of the financial statements.
We believe that the audit evidence we have obtained is sufficient and appropriate to provide a basis forour audit opinion.

63SOLVANG ASA - ANNUAL REPORT 2015
Independent auditor's report - 2015 - Solvang ASA, page 2
(2)
Opinion on the financial statements of the parent company
In our opinion, the financial statements of the parent company are prepared in accordance with thelaw and regulations and present fairly, in all material respects, the financial position for Solvang ASAas at 31 December 2015, and its financial performance and its cash flows for the year then ended inaccordance with the Norwegian Accounting Act and accounting standards and practices generallyaccepted in Norway.
Opinion on the financial statements of the group
In our opinion, the financial statements of the group are prepared in accordance with the law andregulations and present fairly, in all material respects, the financial position of the group Solvang ASAas at 31 December 2015, and its financial performance and its cash flows for the year then ended inaccordance with International Financial Reporting Standards as adopted by EU.
Report on Other Legal and Regulatory Requirements
Opinion on the Board of Directors' report and the statements on Corporate Governance andCorporate Social Responsibility
Based on our audit of the financial statements as described above, it is our opinion that theinformation presented in the Board of Directors report and in the statements on CorporateGovernance and Corporate Social Responsibility concerning the financial statements, the goingconcern assumption and the proposal for the allocation of the profit is consistent with the financialstatements and complies with the law and regulations.
Opinion on Registration and Documentation
Based on our audit of the financial statements as described above, and control procedures we haveconsidered necessary in accordance with the International Standard on Assurance Engagements ISAE3000 “Assurance Engagements Other than Audits or Reviews of Historical Financial Information”, it isour opinion that management has fulfilled its duty to produce a proper and clearly set out registrationand documentation of the company’s accounting information in accordance with the law andbookkeeping standards and practices generally accepted in Norway.
Stavanger, 22 April 2016PricewaterhouseCoopers AS
Henrik Zetlitz NesslerState Authorised Public Accountant (Norway)
Note: This translation from Norwegian has been prepared for information purposes only.

SOLVANG ASA - ANNUAL REPORT 2015 64
NORWAY PHILIPPINES
Næringslivets husHaakon VII’s gt 8PO Boks 90, N-4001 Stavanger
Tel: +47 51 84 84 00Fax: +47 51 84 84 11
TSM House, 4. floor1751 Dian St., Palanan
Makati City, Manila 1235
Tel:. +63 233 81 731Fax: +63 233 81 732
E-mail: [email protected]
Copyright © 2022 FDOKUMEN