annual report - For personal use only
92
ANNUAL REPORT 2019 THE LEADER IN MINERAL DRILLING INNOVATION For personal use only
-
Upload
khangminh22 -
Category
Documents
-
view
4 -
download
0
Transcript of annual report - For personal use only

ANNUAL REPORT 2019
THE LEADER IN MINERAL DRILLING INNOVATION
For
per
sona
l use
onl
y

CORPORATE DIRECTORY
ASX Code: SWK (fully paid shares)Listed on the Australian Securities Exchange
ABN: 20 112 917 905
DirectorsAndrew Simpson - Non-Executive Chairman
Kent Swick - Managing Director
David Nixon - Non-Executive Director
Phillip Lockyer - Non-Executive Director
Ian McCubbing - Non-Executive Director
Stuart Carmichael - Non-Executive Director
Company SecretaryFrank Campagna
Registered and Operations Office64 Great Eastern Highway South Guildford, Western Australia
Telephone: +61 8 9277 8800 Facsimile: +61 8 9277 8844 Email: [email protected] Website: www.swickmining.com
Postal AddressPO Box 74 Guildford, Western Australia, 6935
AuditorErnst & Young11 Mounts Bay Rd Perth, Western Australia, 6000
SolicitorsSteinepreis Paganin Lawyers and ConsultantsLevel 4, The Read Buildings 16 Milligan Street Perth, Western Australia
Share RegistrySecurity Transfer Australia Pty Ltd770 Canning Highway Applecross, Western Australia
Telephone: +61 8 9315 2333 Facsimile: +61 8 9315 2233
BankersNational Australia Bank Ltd
For
per
sona
l use
onl
y

1ANNUAL REPORT 2019 SWICK MINING SERVICES
CONTENTS
Chairman’s Letter 4
Managing Director’s Report on Operations 7
Directors’ Report 15
Auditor’s Independence Declaration 28
Consolidated Statement of Profit or Loss and Other Comprehensive Income
30
Consolidated Statement of Financial Position 31
Consolidated Statement of Changes in Equity 32
Consolidated Statement of Cash Flows 33
Notes to the Consolidated Financial Statements 34
Directors’ Declaration 79
Independent Auditor’s Report 80
ASX Additional Information 86For
per
sona
l use
onl
y

2 SWICK MINING SERVICES ANNUAL REPORT 2019
■ Successfully executed strategy to shift rigs to better performing contracts
■ Revenue up 4.5% and EBITDA up 47.3% on prior year
■ Strong operating cash flows enabling resumption of dividend payments
2019 MILESTONES
For
per
sona
l use
onl
y

3ANNUAL REPORT 2019 SWICK MINING SERVICES
OUR LOCATIONS
Underground Diamond Drilling
Surface Reverse Circulation Drilling
Swick Head Office
Orexplore
EBITDA ($M)Revenue ($M)
63
8
68
8 8
60
7
65
8
65
4
71
7
67
10
75
15
69
11
1H15 2H15 1H16 2H16 1H17 2H17 2H18 2H191H191H18
65
Consolidated - Half Yearly Revenue and EBITDA (excluding significant items)1 July 2015 to 30 June 2019
For
per
sona
l use
onl
y

4 SWICK MINING SERVICES ANNUAL REPORT 2019
CHAIRMAN’S LETTER
Dear Shareholders,
On behalf of the Board of Directors of Swick Mining Services Ltd (“Swick” or the “Company”), I am pleased to present the Company’s 2019 Annual Report.
The 2019 financial year (FY2019) marks a return to bottom-line profitability for Swick, brought about by successful implementation of the Company’s clear strategy of shifting drill rigs onto better performing contracts or new projects. In addition, both operating and non-operating costs have been reduced. This combined approach has ensured that each contract is profitable on a standalone basis.
This strong financial performance, supported by our solid balance sheet, has enabled the Board to declare a fully franked final dividend of 0.6 cents per share, our first dividend since 2016.
Swick met its revenue and earnings guidance for the Drilling Business. FY2019 Drilling Business revenue was $142.9 million, up 4 per cent on FY2018, and EBITDA was $28.2 million, up 49 per cent on FY2018. The strong earnings growth demonstrates the success of our strategy of targeting improved rates and strong cost management across the business, building on the platform that was set in FY2018. Pleasingly, the earnings growth was achieved despite the demobilisation of rigs and transition to new sites during the period under this strategy, including the planned cessation of short-term rates at two contracts at the end of March 2019 that impacted the second half FY2019 result. With our contracts at reset rates and new work awarded, the Drilling Business is well placed for growth in FY2020.
Since Swick’s Mineral Technology Business was launched in May 2018, it has continued to progress its key milestones to commercialisation. A total of 18 customers have now had core scanned at the Orexplore facility in Bassendean, many on pilot trials initially, with a high success rate in obtaining repeat business. The scanning machine has offered geologists and metallurgists a unique perspective by looking inside the core, providing real-time, non-destructive assay and tomography results.
The Orexplore product offering has also evolved during the year to make the technology more attractive to our clients, including the addition of software that enables identification of gold grains inside the drill core, providing a coarse gold grade estimation. This success provides confidence in our ability to build on this early momentum in FY2020.
An Australian-based General Manager has recently been appointed to Orexplore, with the specific objective of advancing sales in this region and moving the company to a self-funding position.
ResultsAt a Group level, Swick delivered an improved financial result for the year, recording an NPAT of $1.0 million in FY2019, a turnaround from the $1.0 million NPAT loss in FY2018. Swick recorded $144 million in revenue and other income and EBITDA of $25.5 million, up 47 per cent on FY2018. The earnings growth was driven by EBITDA margin improvement, with Swick achieving an 18 per cent EBITDA margin in FY2019, up from 13 per cent in FY2018. Looking at the two different business units, the Drilling Business reported an EBITDA of $28.2 million (2018: $19.1 million), while the Mineral Technology Business reported an EBITDA loss of $3.3 million (2018: $1.9 million EBITDA loss), as we continued to invest in growing this segment.
Free cashflow of $0.8 million (2018: $2.1 million) reflected large capital expenditure in the fourth quarter FY2019 required to prepare for rigs being mobilised through the first half of FY2020.
SafetySafety continues to be an integral part of the Swick brand and underpins everything we do. Our Total Recordable Injury Frequency Rate (TRIFR) of 14.3 at year end is a 9% reduction over a five-year period, despite a slight increase at the end of FY2018. Complementing the overall TRIFR reduction was a reduction in the severity of injuries, with only one Loss Time Injury (LTI) during the year, compared to three in FY2018.
The Company continues to partner with external organisations to leverage their expertise to assist Swick with our safety management program, in order to minimise harm to our employees.
Research & DevelopmentTo best position Swick to capture the increasing demand for deeper underground drilling, the Company created a new division called DeepEX in FY2019. This division will have the most powerful rigs available in the underground market. Rig development is being finalised for release in FY2020.
Swick continues to develop rig enhancements for its existing fleet, with a number of manual handling solutions completed in FY2019 and a rollout across the entire fleet commencing in FY2020. Swick retains a dedicated research and development resource for our enhancement projects, with external experts engaged to partner in the next step-change improvements being developed.
The Mineral Technology Business will continue to focus on product and software development to enhance the GeoCore X10 core scanning machine and the Insight software. Our Orexplore developers are advancing a prototype spectrometer that will
For
per
sona
l use
onl
y
5ANNUAL REPORT 2019 SWICK MINING SERVICES
increase the accuracy of the assays to below 0.5ppm (parts per million) with a target of 0.1ppm. This work is ongoing concurrently with refining the existing products functionality, as identified by the wide range of commercial scanning being undertaken.
Strategic Focus Swick’s strategy is centred on growing and developing our two businesses – the Drilling Business, which is the driver of our earnings and a key source of growth, and the Mineral Technology Business, which has the potential to disrupt the multi-billion dollar a year minerals analysis industry. By building on the momentum gained in these two businesses, we believe Swick will generate sustainable returns for our shareholders.
For the Underground Diamond drilling division, following the successful execution of contract renegotiations, the focus now moves to executing on our projects and targeting 70 rigs in work at target margins by the end of FY2020. During the first half of FY2020 rigs in work is expected to increase to 65, an increase of 16 rigs compared to the end of June 2019. We are aiming for this 70-rig target through opportunities to increase scope at existing contracts and selective tendering in our operating regions where the clients and margins meet our corporate objectives. In addition, we will also continue to develop the DeepEX division and work with new and existing clients to roll out the new DeepEX rigs when they are available.
The achievement of 70 rigs in work will be undertaken in a measured way so that the focus on cost management, including both capital and operating costs, can be maintained at acceptable levels so that profits, and therefore cash flow, can be maximised.
The Reverse Circulation (RC) – or above ground – component of the Drilling Business has experienced variable utilisation. Swick has entered into a contract with a major mining company and will also look to take advantage of opportunities for short and medium-term drilling programs as these are identified.
The Orexplore Mineral Technology division is a standalone business, with its own dedicated resources and set of strategic initiatives that are being pursued. Since Orexplore’s launch in May 2018, the Mineral Technology business has been focused on reaching full commercialisation. The next stage in this process is development of a full function, mine site based scanning solution, a project that is well advanced. This project will work alongside the existing Perth-based scanning solution for smaller clients, with learnings assisting the ongoing product development. We also continue to develop products, such as the prototype precious metal spectrometer, to deliver the range of mineral analysis options sought after by mining clients.
The FutureSwick enters FY2020 in a strong operational position on the back of a successful FY2019 result and delivery of our strategy to improve margins. We have also secured work that will drive strong rig activity increases in the first half of FY2020 in the core Underground Diamond drilling division.
Over the first half of FY2020, our key focus will be the successful and safe execution of work at our secured projects, whilst ensuring that ongoing improvements in efficiencies are embedded across the business. As outlined in our strategy, a priority will also be the capture of further opportunities to increase rig utilisation where the clients and margins meet our requirements. In parallel with our focus on our core Underground Diamond drilling business, we will continue to progress the development and rollout of Swick’s DeepEX division.
The further commercialisation of the Mineral Technology Business provides an additional growth path for Swick. Successful completion of the planned site-based trial will provide a significant boost in market confidence in the technology, which will enhance the reputation of this disruptive technology in the marketplace. Successful completion of the trial is also expected to result in revenue generation, thereby reducing the cash drain currently associated with the investment in this service and getting it to a break-even position. The Company is confident in the opportunity for this technology, whilst continuing to focus on its profitable Drilling Business.
The dedicated safety and research and development teams will continue developing improved performance and targeting reduced harm to our employees as they partner with external parties to create the next generation of operational improvements. It is these safety and performance improvements which will allow the Company to maintain its market leading position in the industry.
The return to profitability provides Swick with the opportunity to improve returns to shareholders. The dividend proposed for the FY2019 year is first in a plan to return to paying regular half yearly dividends going forward.
On behalf of the Board, I would like to thank the Managing Director, Kent Swick, and the Chief Financial Officer, Jitu Bhudia, and the wider management team for developing and implementing the strategies that have positioned the Company to take advantage of a more buoyant market. I would also like to recognise the broader Swick team – a committed group of people passionate about living the values of an industry leading company.
I would also like to thank Swick’s clients, partners and suppliers for the continued support towards our business and their shared vision of further improving safety and productivity.
We look forward to further developing our market-leading position, continuing to generate returns for our shareholders and delivering our innovations across the industry.
Yours faithfully,
Andrew SimpsonChairman
For
per
sona
l use
onl
y

6 SWICK MINING SERVICES ANNUAL REPORT 2019
“During the year, the Company successfully implemented the Drilling Business strategy of re-pricing below target margin contracts and exiting where necessary and deploying rigs to new contracts with appropriate returns.”
For
per
sona
l use
onl
y

7ANNUAL REPORT 2019 SWICK MINING SERVICES
MANAGING DIRECTOR’S REPORT ON OPERATIONS
2019 Financial Year OverviewThe 2019 financial year was a successful year on many levels for Swick, not the least of which was a return to bottom line profitability with a statutory NPAT of $1.0 million. The Group’s FY2019 EBIT of $4.6 million, a 929 per cent improvement on FY2018, reflected the strong contribution from Swick’s Drilling Business (EBIT of $9.2 million). Group revenue was $144.4 million, up 4.5 per cent.
This profit improvement was driven by our strategy to shift drill rigs onto better performing contracts or new projects whilst also reducing operating and overhead costs across the business. The successful execution of this strategy saw revenue per shift increase by 9 per cent in the core Underground Diamond (UD) drilling division. At the same time, a continued focus on cost management saw UD costs per shift reduce by 1 per cent despite the impact of rig demobilisation and transitioning to new sites during the second half.
The Swick UD drilling division has expanded its market share overseas and added new products. For example, Swick has grown its market position in North America, securing two long-term multi-rig contracts, with 12 rigs in work at the end of FY2019 increasing to approximately 20 rigs in the first half of FY2020. In Europe, Swick’s Portugal operation has expanded into Spain. Meanwhile, Swick’s DeepEX operation has successfully commenced, completing programs at two different sites. To service these new contracts and expected increase in rigs in work, Swick has manufactured four new UD mobile rigs, purchased two DeepEX skid rigs, and has three mobile DeepEX rigs under construction.
All of this additional work has been completed without adding any significant costs to the streamlined management structure that was implemented in FY2018.
Swick’s Mineral Technology Business continued the commercial development of its Orexplore Technology, having now scanned core for 18 different clients either as an early pilot or on a commercial basis. In June, three new specification machines were completed ready for delivery to Australia in preparation for the first mine based pilot project, which is targeted to commence in the second quarter of FY2020. The brand awareness campaign also ramped up with a presence at various industry events all across the world.
As a result of the improved financial result, Swick has declared a final FY2019 dividend of 0.6 cents per share, fully franked. This will be Swick’s first dividend since 2016.
I would like to thank the Board of Directors for their guidance and support over the past twelve months, as well as the Executive and Management Teams, whose hard work and focus on implementing the Company’s strategic targets made the year so successful. The efforts of the team to reposition Swick with improved margins and a strong pipeline of work has the Company poised to maximise returns from the current market of strong demand for drilling services.
“The improved profitability is the result of successful implementation of the company’s strategy to target contract rates improvement which saw the revenue per shift increase by 9% in the core Underground Diamond (UD) drilling division.”
For
per
sona
l use
onl
y

8 SWICK MINING SERVICES ANNUAL REPORT 2019
MANAGING DIRECTOR’S REPORT ON OPERATIONS
Operating results and review of operations for the yearReview of result
2019 FINANCIAL RESULTS (UNAUDITED NON-IFRS) 2019 2018 Change
$000 $000 %
Profit & Loss
Revenue and other income 144,448 138,178 4.5%
EBITDA (Drilling business) 28,205 19,085 47.8%
EBITDA (Mineral technology) (3,300) (1,887) (74.9%)
EBITDA (Total) 25,514 17,318 47.3%
EBIT (Drilling business) 9,213 2,373 288.2%
EBIT (Mineral technology) (5,262) (2,050) (156.7%)
EBIT (Total) 4,560 443 929.3%
NPAT (Total) 1,038 (975) 206.5%
Cash Flow
Net cash from operating activities 23,589 16,155 46.0%
Net cash used in investing activities (22,813) (14,023) 62.7%
Free cash flow 776 2,132 (63.6%)
Operating cash flow before interest and taxes 25,142 17,249 45.8%
At Balance Date
Cash 11,553 11,461 0.8%
Debt 29,644 29,220 1.5%
Net Debt 18,091 17,759 1.9%
Ratios
EBITDA margin (Drilling Business) (%) 19.7% 13.9%
EBITDA margin 17.7% 12.5%
EBIT margin (Drilling Business) (%) 6.4% 1.7%
EBIT margin 3.2% 0.3%
Basic EPS (reported) – cents per share 0.45 (0.42)
EBITDA cash conversion (%) 98.5% 99.6%
Gearing (Net debt/equity) (%) 21.4% 21.3%
For
per
sona
l use
onl
y

9ANNUAL REPORT 2019 SWICK MINING SERVICES
MANAGING DIRECTOR’S REPORT ON OPERATIONS
During the year, the Company successfully implemented the Drilling Business strategy of re-pricing below target margin contracts. This involved exiting projects where necessary and deploying rigs to new contracts with appropriate returns. The benefits of this strategy can be shown in the graph below with the Drilling Business yielding an EBIT of $9.2 million at a margin of 6.4 per cent in FY2019, a significant improvement from prior years.
Drilling Business EBIT ($M) and Margin
The graph below shows the history of revenue and cost per shift for the UD division, and how the Company has been able to adapt to different market conditions so that it is well positioned to take advantage of the continued improvement in the current drilling services market. The graph shows how the strategy of working with clients through the tough years up to FY2015 enabled Swick to maintain a critical level of rigs in work. This provided the platform for recovery which led to the significantly improved result in FY2019. An important part of the return to profitability has been maintaining good cost controls, with costs per shift being below the FY2016 year.
UD Revenue and Site Costs per shift ($)
0.8
0%
(2.3)
2%
1%
0.0
(2%)
2.4
9.2
FY15* FY16* FY17 FY18 FY19
* before significant items
6%
For
per
sona
l use
onl
y

10 SWICK MINING SERVICES ANNUAL REPORT 2019
MANAGING DIRECTOR’S REPORT ON OPERATIONS
The improved earnings also supported growth in the Group’s net assets in FY2019, increasing by $1.4 million to $84.7 million at 30 June 2019. Working capital investment (trade receivables plus inventories plus prepayments less trade payables) decreased by $0.1 million as preparations for rigs returning to work in FY2020 counteracted reductions from lower activity. Net borrowings (net debt) increased by only $0.3 million, an impressive result considering Swick invested $9.6 million in growth capital across the Drilling and Mineral Technology businesses.
Preparations for additional rigs going to site in FY2020 has seen significant capital spent in the final quarter of FY2019, with approximately 40 per cent of the annual capital spend being incurred in the last three months of the year. The strong result for the year meant Swick was able to undertake this growth capital spend from operating cashflow and still remain with a positive free cash flow for the year.
Safety and TrainingDuring the FY2019 financial year Swick had one Lost Time Injury (LTI) and 15 Restricted Work Day injuries (RDI) and Medical Treatment Injuries (MTI), which was a reduction from the 17 total injuries in FY2018 which included three LTIs. It is encouraging that there were only four reportable incidents in the second half of the year as rig numbers were reducing, a time often associated with increased injury risk as employees start focussing on their future. The high prevalence of finger pinch injuries and sprains/strains is a constant reminder of the highly manual work in difficult conditions that characterises our daily operations. To tackle the pinch issue, Swick successfully completed a trial of gloves that contain customised back of finger protection without overly restricting the ability of employees to complete their daily tasks. These will be rolled out across sites as supplies become available.
Swick is committed to improvement in all facets of the business and is continually exploring scientific research and development for possibilities to increase performance, reduce fatigue, improve ergonomics, accelerate injured workers recovery and reduce injury risk factors. Swick is currently conducting a surface electromyography (sEMG) project to explore the neuromuscular system relationship between muscle activation, movement and force. To complete this study, Swick has invested in two Athos suits and is working closely with a physiotherapy expert to understand how different repetitive tasks activate various parts of the body. With this technology Swick will continue to engineer out injury risk factors and where it can, look to improve procedures and training to minimise harm.
Safety Performance (TRIFR)
During the year, Swick had an increased focus in the area of mental health by educating all field-based Supervisors and Health Safety and Environment officers in Mental First Aid, giving them valuable training in how to identify and assist someone with mental health issues. We have already seen benefits in minimising harm on site with supervisors able to ask the right questions by recognising the early warning signs taught as part of this training. We are also addressing learning and literacy challenges by simplifying the safe work procedures and training packages.
JUN-15 JUN-16 JUN-18 JUN-19JUN-17
13.9
9.1
11.1
14.9 14.3
For
per
sona
l use
onl
y

11ANNUAL REPORT 2019 SWICK MINING SERVICES
MANAGING DIRECTOR’S REPORT ON OPERATIONS
Production and RevenueOverall the number of rigs in work declined over the year, from 55 (including 2 RC rigs) at the end of FY2018 to a low of 45 rigs (including 2 RC rigs) in May 2019, before rebounding to 51 rigs (including 2 RC rigs) at 30 June 2019.
The reduction in metres drilled was due to the general reduction in rigs in work due to exiting underperforming contracts as well as an increase in rigs operating under a fixed shift rate pricing mechanism for sites with difficult drilling conditions and clients requesting deeper drilling.
The growth in earnings despite the reduction in metres drilled demonstrates Swick’s success in moving to higher margin contracts, particularly given rig utilisation is set to increase in the first half of FY2020 as more rigs are deployed at secured projects.
Metres Drilled by Quarter
The split of Drilling Business revenue by commodity is shown below. The increase in revenue from gold is predominantly driven by the increase in volumes at Barrick Gold in Nevada increasing to 8 rigs in the second half of FY2019, while copper increased with additional rigs sent to BHP’s Olympic Dam. Conversely, Copper/Nickel reduced with Independence Group reducing their drilling requirements at their Nova mine.
Drilling Buisness Revenue by Commodity
FY15 FY16 FY18 FY19
Diamond
Others
Tin
Copper/Nickel
Lea/Zinc/Silver
Manganese
Copper/Zinc
Copper/Gold
Copper
Nickel
Gold
FY17
40% 44%52%
66%61%
0
50
100
150
200
250
300
350
1Q15 2Q15 3Q15 4Q15 1Q16 2Q16 3Q16 4Q16 1Q17 2Q17 3Q17 4Q17 1Q18 2Q18 3Q18 4Q18 1Q19 2Q19 3Q19 4Q19
Met
res
Drill
ed ('
000)
Underground Diamond Reverse Circulation
For
per
sona
l use
onl
y

12 SWICK MINING SERVICES ANNUAL REPORT 2019
MANAGING DIRECTOR’S REPORT ON OPERATIONS
Underground Diamond (UD) DrillingThe 2019 financial year ended with UD drilling 1,036,182 metres for the year, an 8.9 per cent reduction from the prior year. Metres drilled in Swick’s APAC operations reduced 11.9 per cent to 926,998 metres while international operations increased 29.7 per cent to 109,184 metres.
The focus on improved pricing supported a revenue increase to $137.7 million, up 5.2 per cent on FY2018. This improvement was despite fewer rigs being in work over the year, with a number of rigs demobilising and transitioning to new sites during FY2019 as we delivered on our strategy to improve return on assets in work. Revenue per shift increased 9 per cent, offsetting the steady decline in rigs in work. The international business carried its momentum from the end of FY2018 into the year, representing 19.8 per cent of revenue for FY2019 (FY2018: 13.3 per cent). This ratio is expected to continue to increase as Swick’s Pogo contract in Alaska, USA ramps-up in early FY2020.
UD (inc. DeepEX) Fleet Size at Year-end & FTE Utilisation
The utilisation graph shows the impact of work that was not renewed as Swick focussed on achieving appropriate contract returns. During the second half of the year, rigs were demobilised from Fosterville (7 rigs), Granites (6 rigs), and Mount Charlotte (2 rigs), while the first four rigs were mobilised to Pogo in Alaska, USA. The four rigs sent to Pogo were new rigs, further reducing fleet utilisation with the additional capacity.
DeepEXSwick has formed a dedicated underground deep exploration and infrastructure drilling division given the increased requirement for drilling in difficult ground and deeper holes. This division will provide the industry with the most powerful high torque, high speed underground drill rigs available on the market. The rigs are capable of drilling B, N, HQ & P size holes at depths of over 2000 metres with six times more torque available compared to any rigs currently available in Australia. Swick has matched these rigs with highly skilled dedicated drilling crews to make DeepEX the new force in the deep underground exploration market.
Prototype DeepEX rigs began drilling in FY2019 under the UD division, with the final specification rigs currently being built and set for release during the first half of FY2020.
Reverse Circulation (RC) DrillingThe FY2019 financial year saw the RC division report revenue of $4.9 million, which was a decrease of 17 per cent from the prior year. This revenue reduction was mainly due to the sporadic nature of work won. With additional opportunities starting to present, the opportunity was taken to start preparing all rigs for a return to work. At year end, one rig was operating under a long-term contract, with a second preparing to re-start drilling with an existing customer on a longer term deal.
*FTE - Full Time Equivalent
69 68 68 6976
75%
66%72%
76%73%
FY15 FY16 FY17 FY18 FY19
For
per
sona
l use
onl
y

13ANNUAL REPORT 2019 SWICK MINING SERVICES
MANAGING DIRECTOR’S REPORT ON OPERATIONS
Mineral TechnologyThe Mineral Technology Business continued its progression towards full commercialisation.
The Australian-based team has been focused on building brand awareness. In the year, the team worked with a wide range of clients from various mines to undertake scans and worked with mine geologists and mining teams on maximising the benefits of the mineralisation and tomography data provided by the GeoCore X10 core scanning machine.
During the year, the Mineral Technology business designed and manufactured a site specification mobile facility in preparation for a site-based trial targeted to commence in the second quarter of FY2020. The container is designed to house up to three GeoCore X10 machines and provides a working space for one operator. This will be able to provide the opportunity for real time direct access to core scan data for the client. The GeoCore X10 machines have been built in Sweden and were delivered to Australia in July 2019.
Product and software development for the Mineral Technology business is maintained by its Swedish research and development base, which is also where the machines are manufactured. The product developers are working closely with the Australian operation to continuously improve and refine the product based on scan results and customer feedback.
During the year a significant new feature was added to the software for the GeoCore X10 which allows the identification of gold grains inside the drill core, providing the data required for a gold grade estimation. By identifying coarse gold within the core, clients can identify areas of the drill hole that are mineralised that may have been overlooked in the past due to the potential sampling error that occurs when using conventional assay methods.
Outlook for the 2020 Financial YearThe first half of FY2020 will see a net increase of 16 UD rigs deployed across one new and six existing sites across all three areas of Swick’s operation – APAC, North America and Europe. The immediate focus will be delivering on this new work for our clients by getting all rigs to work efficiently and ensuring new employees are trained correctly and managed to minimise risk of safety incidents. We are also focused on the continued delivery of our existing projects safely and efficiently.
The development of the DeepEX rigs will provide a complementary product to the existing UD fleet, giving Swick the flexibility to assist clients in a wider range of drilling requirements as the mining industry requirements for deeper and more difficult drilling continue to increase.
For the Mineral Technology Business, the targeted commencement of onsite scanning is a significant milestone towards the planned business model. A successful trial is expected to lead to the first onsite commercial agreement, with opportunities for continued expansion of in-field scanning to complement the growing requirement for Perth based scanning.
The Company expects to show continued improvement in financial results in the 2020 financial year and beyond. The successful repositioning of rigs into more profitable contracts has provided a solid base for the additional rigs now being deployed. Although Swick is in a growth phase, we continue to drive a strong approach to cost management to make sure the benefits of the improved market conditions are maximised for shareholders. Complementing this is expected revenue generation from the Mineral Technology business as it builds on its early success. These factors combined provide Swick with confidence that revenue, profit, and margins are expected to improve in FY2020.
Yours faithfully,
Kent SwickManaging DirectorF
or p
erso
nal u
se o
nly

14 SWICK MINING SERVICES ANNUAL REPORT 2019
“The Group also carries out research and development activities in mineral analysis technologies”
For
per
sona
l use
onl
y

15ANNUAL REPORT 2019 SWICK MINING SERVICES
DIRECTORS’ REPORT
Your Directors present their report, together with the financial statements of Swick Mining Services Ltd (the “Parent” or the “Company”) and its controlled entities (collectively referred to as “Swick Mining Services Group” or the “Group”) for the financial year ended 30 June 2019. The names and particulars of the directors of the company during or since the end of the financial year are:
Information on directorsAndrew Simpson Non-executive chairman
Qualifications Grad Dip (Bus), MAICD
Experience Mr Simpson is a senior marketing executive with extensive global marketing experience in the resource and mining industry, including more than 30 years of international marketing and distribution of minerals and metals. He is currently the Managing Director of Resource & Technology Marketing Services Pty Ltd, a company providing specialist marketing and business assessment advisory services to the mineral resources and technology industries, both in Australia and internationally. Mr Simpson graduated from Curtin University holding a Graduate Diploma in Business and Administration (majoring in Marketing and Finance). He has also completed the Advanced Management Program at the University of Western Australia and is a Member of the Australian Institute of Company Directors. Mr Simpson was appointed as a Director of the Company on 24 October 2006.
Interest in shares at the date of this report
605,000 Fully Paid Ordinary Shares
Special responsibilities Mr Simpson is a member of the Board’s Remuneration and Nomination Committee (Committee Chairman).
Directorships held in other listed entities during the three years prior to the current year
Symbol Mining Ltd non-executive chairman – 19 December 2017 to presentVital Metals Ltd non-executive director – 23 February 2005 to 16 November 2018India Resources Ltd non-executive director – 21 August 2006 to 7 October 2016
Kent Swick Managing director
Qualifications B.Eng (Mech)
Experience Mr Swick is a Mechanical Engineer with over 25 years experience in civil construction, mining maintenance and surface and underground mineral drilling. He was previously employed by Atlas Copco Australia as a Maintenance Engineer managing underground maintenance, where he developed a strong understanding of underground mining methods and equipment. Mr Swick was the driving technical force behind the design of the Company’s innovative underground diamond drill rig and award winning surface reverse circulation drill rig. He graduated from the University of Western Australia holding a Bachelor of Engineering (majoring in Mechanical Engineering) and has completed the Owner/President Management program at Harvard Business School. Mr Swick was appointed as a Director of the Company on 24 October 2006.
Interest in shares at the date of this report
33,322,182 Fully Paid Ordinary Shares6,452,114 Unlisted Share Options
Special responsibilities Nil
Directorships held in other listed entities during the three years prior to the current year
Nil
For
per
sona
l use
onl
y

DIRECTORS’ REPORT
16 SWICK MINING SERVICES ANNUAL REPORT 2019
David Nixon Non-executive director
Qualifications B.Sc. Eng (Mech), MAICD
Experience Mr Nixon is a Mechanical Engineer with over 40 years experience in the mining and construction industries in Southern Africa, Australia, New Zealand, Canada and Indonesia. He was a founding executive of Signet Engineering in 1990 and a director until its acquisition by Fluor Australia in 1996. Mr Nixon is a past non-executive chairman of Atlas Iron and past non-executive director of Brockman Resources and Moly Mines. Mr Nixon graduated from the University of Natal (South Africa) holding a Bachelor of Science (Mechanical Engineering) and is a member of the Australian Institute of Company Directors. Mr Nixon was appointed as a Director of the Company on 1 January 2007.
Interest in shares at the date of this report
300,000 Fully Paid Ordinary Shares
Special responsibilities Mr Nixon is a member of the Board’s Audit and Corporate Governance Committee and the Remuneration and Nomination Committee.
Directorships held in other listed entities during the three years prior to the current year
Nil
Phillip Lockyer Non-executive director
Qualifications Dip Met, Assoc Min Eng, M.Min Econs
Experience Mr Lockyer is a Mining Engineer and Metallurgist who has over 50 years experience in the mineral industry, with a focus on gold and nickel in both underground and open pit operations. He was employed by WMC Resources for 20 years and as General Manager for Western Australia was responsible for WMC’s nickel division and gold operations. Mr Lockyer also held the position of Director Operations for Dominion Mining Ltd and Resolute Ltd. He holds a Diploma of Metallurgy from the Ballarat School of Mines, an Associateship of Mining Engineering from the Western Australian School of Mines and a Masters of Minerals Economics from Curtin University. Mr Lockyer was appointed as a Director of the Company on 11 February 2008.
Interest in shares at the date of this report
400,000 Fully Paid Ordinary Shares
Special responsibilities Mr Lockyer is a member of the Board’s Audit and Corporate Governance Committee and the Remuneration and Nomination Committee.
Directorships held in other listed entities during the three years prior to the current year
GR Engineering Services Ltd non-executive director – 7 October 2016 to present (non-executive chairman – 16 October 2016 to present)RTG Mining Inc. non-executive director – 26 March 2013 to presentWestern Desert Resources Ltd non-executive director – 1 June 2010 to 15 September 2018
Ian McCubbing Non-executive director
Qualifications B.Com (Hons), MBA (Ex), CA, GAICD
Experience Mr McCubbing is a Chartered Accountant with more than 30 years experience, principally in the areas of accounting, corporate finance and mergers and acquisition. He spent more than 15 years working with ASX200 and other listed companies in senior finance roles, including positions as Finance Director and Chief Financial Officer in mining and industrial companies. Mr McCubbing was appointed as a Director of the Company on 1 August 2010.
Interest in shares at the date of this report
350,000 Fully Paid Ordinary Shares
Special responsibilities Mr McCubbing is a member of the Board’s Audit and Corporate Governance Committee (Committee Chairman).
Directorships held in other listed entities during the three years prior to the current year
Sun Resources NL non-executive chairman – 25 October 2016 to presentRimfire Pacific Ltd non-executive chairman – 25 July 2016 to presentSymbol Mining Ltd non executive director – 19 December 2017 to 28 February 2019Avenira Ltd non-executive director - 20 December 2012 to 31 January 2019Kasbah Resources Ltd non-executive director - 1 March 2011 to 19 December 2016
For
per
sona
l use
onl
y

DIRECTORS’ REPORT
17ANNUAL REPORT 2019 SWICK MINING SERVICES
Stuart Carmichael Non-executive director
Qualifications B.Com, CA
Experience Mr Carmichael is a Chartered Accountant with over 20 years experience in the provision of corporate advisory services both within Australia and internationally. Mr Carmichael is a principal and director of Ventnor Capital Pty Ltd and Ventnor Securities Pty Ltd which specialises in the provision of corporate and financial advice to small cap ASX listed companies including capital raisings, initial public offerings, corporate restructures and mergers and acquisitions. Mr Carmichael was appointed as a Director of the Company on 1 August 2019.
Interest in shares at the date of this report
Nil
Special responsibilities Nil
Directorships held in other listed entities during the three years prior to the current year
ClearVue Technologies Limited non-executive director - 19 January 2018 to presentSchrole Group Limited non-executive chairman - 10 August 2017 to presentSerpentine Technologies Limited non-executive chairman - 30 June 2017 to presentDe.mem Limited non-executive director - 21 November 2016 to present
Company Secretary
Mr Frank Campagna held the position of company secretary at the end of the financial year:
Qualifications B.Bus (Acc), CPA
Experience Company Secretary of Swick Mining Services Ltd since June 2014. Mr Campagna is a Certified Practicing Accountant with over 25 years’ experience as Company Secretary, Chief Financial Officer and Commercial Manager for listed resources and industrial companies. He presently operates a corporate consultancy practice which provides corporate secretarial and advisory services to both listed and unlisted companies.
Board committeesAt the date of this report, the committees and their current membership are as follows:
Audit and Corporate Governance Committee - Ian McCubbing (non-executive director and committee chairman), David Nixon (non-executive director) and Phillip Lockyer (non-executive director).
Remuneration and Nomination Committee - Andrew Simpson (non-executive chairman and committee chairman), David Nixon (non-executive director) and Phillip Lockyer (non-executive director).
Meetings of directorsDuring the financial year, 18 meetings of directors (including committees of directors) were held. Attendances by each director during the year were as follows:
Directors’ meetings Audit and Corporate Governance Remuneration and Nomination
Number eligible to attend
Number attended
Number eligible to attend
Number attended
Number eligible to attend
Number attended
Andrew Simpson 13 12 - - 2 2
Kent Swick 13 13 - - - -
David Nixon 13 12 3 3 2 2
Phillip Lockyer 13 13 3 3 2 2
Ian McCubbing 13 13 3 3 - -
For
per
sona
l use
onl
y

DIRECTORS’ REPORT
18 SWICK MINING SERVICES ANNUAL REPORT 2019
Principal activities and significant changes in nature of activitiesThe principal activity of the Group during the 2019 financial year was the provision of mineral drilling services to the mining industry in the Asia Pacific and other international regions, primarily in the areas of underground diamond drilling and surface reverse circulation drilling. The Group also carries out research and development activities in mineral analysis technologies, with early stage commercial activities. There were no significant changes in the nature of the principal activities during the year.
Operating results and review of operations for the yearReview of operationsRefer to commentary in the Managing Director’s Report on Operations.
Significant changes in state of affairsThere have been no significant changes in the state of affairs of the Company and/or Group during the financial year.
Dividends paid or recommendedFinal ordinary dividend of 0.6 cents per share approved on 22 August 2019 by the Directors to be paid on 18 October 2019 out of retained profits at 30 June 2019 $1,388,705
Events after the reporting periodThe directors are not aware of any significant events since the end of the reporting period.
Future developments and operational outlookFuture developments and prospects for operations of the consolidated entity in future financial years and the expected results of those operations have been included generally within the financial reports and the Managing Director’s Report on Operations.
Environmental regulationIn the course of its drilling activities, the Group is required to adhere to environmental regulations imposed on it by various regulatory authorities, particularly those regulations relating to ground disturbance and the protection of rare and endangered flora and fauna. From time to time, compliance with these environmental regulations is audited by client personnel, where deemed necessary.
The Group has not received any notification from any regulatory authority or client of any breaches of environmental regulations and to the best of its knowledge has complied with all material environmental requirements up to the date of this report.
Indemnifying officersDuring the financial year, the Company paid a premium of $68,671 (2018: $62,000) to insure all the directors and officers against liabilities for any costs and expenses incurred by them in defending legal proceedings arising from their conduct while acting in the capacity of directors and officers of the Company, other than conduct which might be a wilful breach of duty in relation to the Company.
Indemnification of auditorsTo the extent permitted by law, the Company has agreed to indemnify its auditors, Ernst & Young Australia, as part of the terms of its audit engagement agreement against claims by third parties arising from the audit (for an unspecified amount). No payment has been made to indemnify Ernst & Young during or since the financial year.
OptionsAt the date of this report, the unissued ordinary shares of Swick Mining Services Limited under Options are as follows:
Grant date Vesting date Expiry date Exercise price Number under options
11 November 2016 30 June 2019 30 June 2020 $0.37 6,452,114
6,452,114
Option holders do not have any rights to participate in any issues of shares or other interests in the Company or any other entity.
For
per
sona
l use
onl
y

DIRECTORS’ REPORT
19ANNUAL REPORT 2019 SWICK MINING SERVICES
Performance rightsAt the date of this report, the unvested Performance Rights of Swick Mining Services Limited are as follows:
Grant date Vesting date Expiry date Number under rights
2 June 20171 30 June 2022 31 December 2022 784,314
1 July 2018 30 June 2020 30 June 2020 474,547
1,258,861
Note 1: Performance rights issued on 2 June 2017 are to employees of Orexplore AB. The above number of performance rights are based on a valuation of the Orexplore business at grant date. Final number issued will be based on a valuation of the Orexplore business at the time of vesting and may differ from the above value.
Performance right holders do not have any rights to participate in any issues of shares or other interests in the Company or any other entity.
For details of performance rights issued to directors and executives as remuneration, refer to the Remuneration Report.
During the year ended 30 June 2019, the following ordinary shares of Swick Mining Services Limited were purchased on market by the employee share trust for vesting of performance rights granted under the Company’s Performance Rights Plan:
ExecutiveNumber of shares
purchased during 2019 Vesting condition Grant date Vesting date
Jitu Bhudia 477,075 Service condition 25 November 2016 30 June 2018
477,075
Proceedings on behalf of CompanyNo person has applied for leave of Court to bring proceedings on behalf of the Company or intervene in any proceedings to which the Company is a party for the purpose of taking responsibility on behalf of the Company for all or any part of those proceedings. The Company was not a party to any such proceedings during the year.
Non-audit services provided by AuditorDetails of amounts paid or payable to the auditor for non-audit services provided during the year are outlined in Note 6.7 to the financial statements.
The Board, in accordance with advice from the Audit and Corporate Governance Committee, is satisfied that the provision of non-audit services, when provided, is compatible with the general standard of independence for auditors imposed by the Corporations Act 2001. The directors use the principles set out below to judge whether the external auditor’s independence is compromised:
+ All non-audit services are reviewed and approved by the audit committee prior to commencement to ensure they do not adversely affect the integrity and objectivity of the auditor; and
+ The nature of the services provided does not compromise the general principles relating to auditor independence in accordance with APES 110: Code of Ethics for Professional Accountants set by the Accounting Professional and Ethical Standards Board.
Auditor’s Independence DeclarationThe lead auditor’s Independence Declaration for the year ended 30 June 2019 has been received.
ASIC Corporations Instrument 2016/191The company is of the kind referred to in ASIC Corporations (Rounding in Financials/Directors’ Reports) Instrument 2016/191, dated 24 March 2016, and in accordance with that Corporations Instrument amounts in the Directors’ Report and the financial statements are rounded off to the nearest thousand dollars, unless otherwise indicated.
For
per
sona
l use
onl
y

DIRECTORS’ REPORT
20 SWICK MINING SERVICES ANNUAL REPORT 2019
Remuneration Report (Audited)Remuneration policyThe remuneration policy of the Group is designed to align the interests of directors and management with the interests of shareholders and the Company’s objectives by providing a fixed remuneration component and, where appropriate, offering specific short-term (cash bonuses) and long-term (equity schemes) incentives linked to performance. The Board considers that the remuneration policy is appropriate and effective in its ability to attract, retain and motivate suitably qualified and experienced directors and management to direct and manage the Group’s business and corporate activities, as well as to create goal congruence with the Company’s shareholders.
Specifically, the remuneration policy has been put in place with the following aims in mind:
+ remuneration practices and systems should support the Company’s wider objectives and strategies;
+ remuneration of directors and management should be aligned to the long-term interests of shareholders within an appropriate control framework;
+ remuneration of directors and management should reflect their duties and responsibilities;
+ remuneration of directors and management should be comparative and competitive, thereby allowing the Company to attract, retain and motivate suitably qualified and experienced people; and
+ there should be a clear relationship between performance and remuneration.
Relationship between remuneration policy and Company performanceThe remuneration policy has been tailored to increase goal congruence between shareholders, directors and executives. Two methods have been applied to achieve this aim, the first being a performance-based bonus based on key performance indicators (KPI’s), and the second being the issue of performance rights and share options to Key Management Personnel to encourage the alignment of personal and shareholder interests, as well as a longer-term retention strategy. The Company believes this policy will be effective in increasing shareholder wealth over time.
The following table shows the gross revenue, profits and dividends for the last five years for the Company, as well as the share price at the end of the respective financial year. Analysis of the figures show the impact of the tough operating environment that was felt in financial years 2015 and 2016. 2017 and beyond reflect an increase in activity and market sentiment for the industry, with the return to profitability in 2019 the result of improved margins. The spend in the Mineral Technology division is continuing to limit share price growth. The Board is of the opinion that the tough macro-economic market conditions that impacted results in 2015, 2016 and 2017, were well managed by the Company and that management have positioned the Company well to capitalise on the improved market conditions and hence are satisfied with the current positioning of the remuneration policy. The information below has not been updated for the impact of the new accounting standards.
2019 2018 2017 2016 2015
$000 $000 $000 $000 $000
Revenue and other income 144,448 138,178 130,010 124,885 131,981
Net profit/(loss) before tax 3,096 (888) (4,633) (2,243) (24,549)
Net profit/(loss) after tax 1,038 (975) (4,559) (2,806) (17,533)
Share price at start of year $0.22 $0.24 $0.14 $0.13 $0.26
Share price at end of year $0.24 $0.22 $0.24 $0.14 $0.13
Basic earnings/(loss) per share 0.45 cps (0.42 cps) (2.01 cps) (1.24 cps) (8.09 cps)
Dividends declared 0.6 cps - - 0.4 cps 0.2 cps
For
per
sona
l use
onl
y

DIRECTORS’ REPORT
21ANNUAL REPORT 2019 SWICK MINING SERVICES
Remuneration and Nomination CommitteeThe Board has established a Remuneration and Nomination Committee to assist the Board in fulfilling its responsibilities in relation to developing and assessing the Group’s remuneration policies to ensure that remuneration is sufficient and reasonable and that its relationship to performance is clear. The primary objectives of the Remuneration and Nomination Committee is to develop remuneration policies for the Group that are appropriate to the organisation with respect to its size, peers and market conditions, and to recommend remuneration packages and incentive schemes for directors and management, and remuneration packages for non-executive directors, that motivate and reward performance, attract and retain quality people, and align interests with those of shareholders.
Remuneration structure - non-executive directorsObjectiveThe Board seeks to set remuneration for non-executive directors at a level which provides the Company with the ability to attract and retain suitably qualified and experienced directors, whilst incurring a cost which is acceptable to shareholders. Non-executive directors should be adequately remunerated for their time and effort and the risks inherently involved with holding such a position.
StructureRemuneration levels for non-executive directors are reviewed at least annually by the Remuneration and Nomination Committee. The maximum aggregate fee pool for non-executive directors is $500,000, as approved at the Annual General Meeting in November 2012. The Remuneration and Nomination Committee provides recommendations for the remuneration of non-executive directors, including the Chairman, and the Board is then responsible for ratifying the recommendations, if appropriate. As at the date of this report, remuneration for non-executive directors was set at $66,950 per annum plus superannuation, with remuneration for the non-executive chairman set at $100,425 per annum plus superannuation.
The Remuneration and Nomination Committee has also set an additional amount payable to the chairman of the Audit and Corporate Governance Committee of $10,300 per annum plus superannuation.
Remuneration structure - executive directors & managementObjectiveThe remuneration for executive directors and management is designed to promote superior performance and long-term commitment to the Company. The Board aims to reward executive directors and management with a level and mix of remuneration commensurate with their position and responsibilities within the Group.
The Company’s remuneration policy for executive directors and management reflects its commitment to align remuneration with shareholders’ interests and to retain appropriately qualified executive talent for the benefit of the Group.
The principles of the policy are:
+ to provide rewards that reflect the competitive market in which the Company operates;
+ individual reward should be linked to performance criteria; and
+ executives should be rewarded for both financial and non-financial performance.
StructureRemuneration for executive directors and management may comprise fixed and variable remuneration components. Remuneration is reviewed at least annually by the Remuneration and Nomination Committee. The Remuneration and Nomination Committee provides recommendations for the remuneration of executive directors and management and the Board is then responsible for ratifying the recommendations, if appropriate. Remuneration packages for executive directors and management currently comprise a base salary and superannuation (fixed components) and may also include cash bonuses and securities (variable, performance based components).
For
per
sona
l use
onl
y

DIRECTORS’ REPORT
22 SWICK MINING SERVICES ANNUAL REPORT 2019
In determining individual remuneration packages, the Remuneration and Nomination Committee reviews the individual’s annual performance, specific roles and responsibilities, and remuneration relative to their position within the Group and with positions in comparable companies through the use of market data and surveys. Where appropriate, a package may be adjusted to reflect the role, responsibilities and importance of that position and to keep pace with market trends and ensure continued remuneration competitiveness. In conducting a comparative analysis, the Group’s expected performance for the year is considered in the context of the Group’s capacity to fund remuneration budgets. From time to time, a review of the total remuneration package by an independent remuneration consultant may be undertaken to provide an independent reference point.
Fixed remunerationThe components of the fixed remuneration of executive directors and management are determined individually and may include:
+ cash remuneration;
+ superannuation;
+ accommodation and travel benefits;
+ motor vehicle; and
+ other benefits.
Variable remunerationThe components of the variable remuneration of executive directors and management are determined individually and may include:
+ Short term incentives (non-salary cash-based incentives) – executive directors and management are eligible to participate in a cash bonus if so determined by the Remuneration and Nomination Committee and the Board: and
+ Long term incentives – executive directors and management are eligible to receive share options and performance rights if so determined by the Remuneration and Nomination Committee and the Board.
Director and senior management detailsThe following table provides employment details of persons who were Directors or Key Management Personnel (KMP) of the Group during the financial year:
Directors
Andrew Simpson Non-executive chairman
Kent Swick Managing director
David Nixon Non-executive director
Phillip Lockyer Non-executive director
Ian McCubbing Non-executive director
Executives
Jitu Bhudia Chief Financial Officer
For
per
sona
l use
onl
y

DIRECTORS’ REPORT
23ANNUAL REPORT 2019 SWICK MINING SERVICES
Employment contractsAs at the date of this report, the Group had entered into employment contracts with the following executive directors and management personnel:
Kent Swick - Managing Director + The service arrangement commenced on 1 July 2006 and continues until terminated.
+ If the service agreement is terminated without cause by the Company, Mr Swick may (subject to shareholder approval that may be required at the time of termination) be paid one month’s remuneration for each full year, or pro rata for each part year, of service to the Group from 1 July 2006, in addition to three months’ notice of termination, or payment in lieu thereof.
+ If the service agreement is terminated as a result of a change in control, Mr Swick will not be entitled to receive any payments additional to notice and statutory leave entitlements, pursuant to the ASX Listing Rules.
There are no other contracts to which a director is a party or under which a director is entitled to a benefit other than as disclosed in the Directors’ Report.
Executive service contractsRemuneration and terms of employment for Executives are formalised in employment contracts.
Jitu Bhudia - Chief Financial Officer + Appointed on 8 April 2015.
+ Contract is ongoing and has no fixed term.
+ The Contract can be terminated by either party with 8 weeks’ notice or payment in lieu.
All contracts contain redundancy/severance benefits in accordance with the applicable legislation.
Performance rights planThe Company has adopted a Performance Rights Plan (PRP). The objective of the PRP is to provide the Company with a remuneration mechanism through the granting of rights for securities in the capital of the Company to motivate and retain employees.
Details of performance rights issued during the year can be found under the Performance rights heading in the Remuneration details for year ended 30 June 2019.
Share options planThe Company has adopted a Share Options Plan (SOP) that provides the Company with a remuneration mechanism for executive directors through the granting of “premium priced” options for securities in the capital of the Company to motivate and retain executive directors.
No share options were issued during the year ended 30 June 2019.
For
per
sona
l use
onl
y
DIRECTORS’ REPORT
24 SWICK MINING SERVICES ANNUAL REPORT 2019
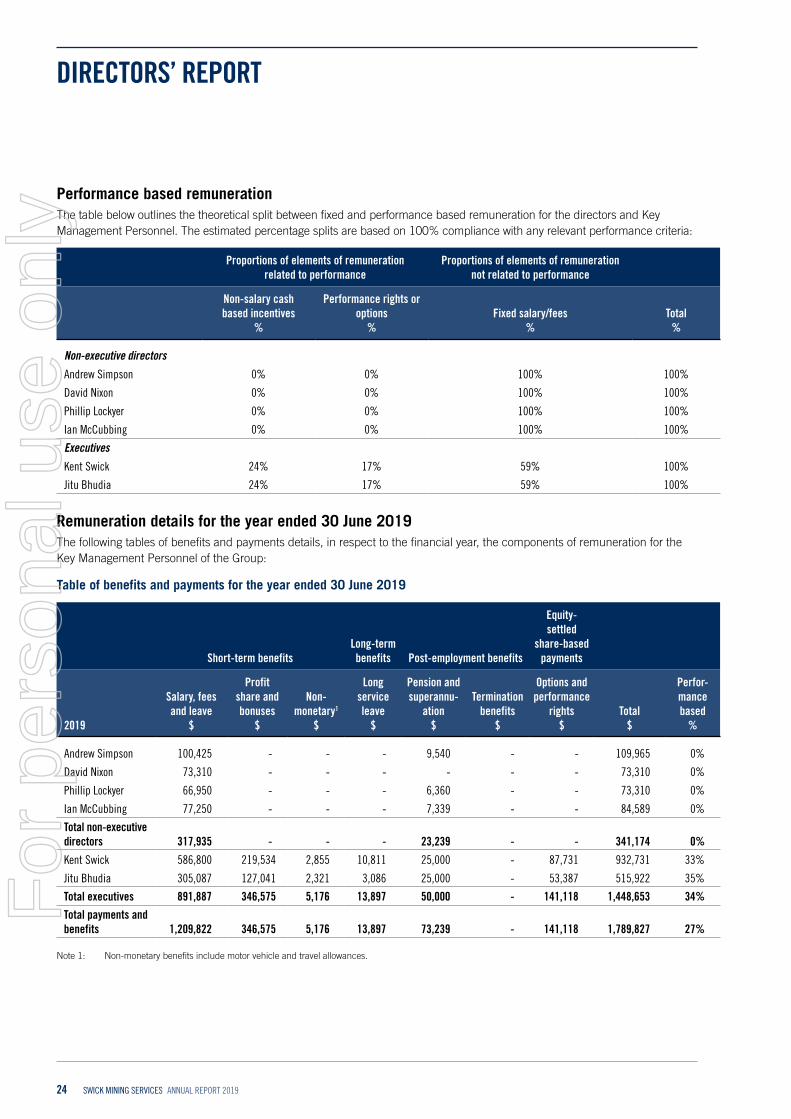
Performance based remunerationThe table below outlines the theoretical split between fixed and performance based remuneration for the directors and Key Management Personnel. The estimated percentage splits are based on 100% compliance with any relevant performance criteria:
Proportions of elements of remuneration related to performance
Proportions of elements of remuneration not related to performance
Non-salary cash based incentives
%
Performance rights or options
%Fixed salary/fees
%Total
%
Non-executive directors
Andrew Simpson 0% 0% 100% 100%
David Nixon 0% 0% 100% 100%
Phillip Lockyer 0% 0% 100% 100%
Ian McCubbing 0% 0% 100% 100%
Executives
Kent Swick 24% 17% 59% 100%
Jitu Bhudia 24% 17% 59% 100%
Remuneration details for the year ended 30 June 2019The following tables of benefits and payments details, in respect to the financial year, the components of remuneration for the Key Management Personnel of the Group:
Table of benefits and payments for the year ended 30 June 2019
Short-term benefitsLong-term benefits Post-employment benefits
Equity-settled
share-based payments
2019
Salary, fees and leave
$
Profit share and bonuses
$
Non-monetary1
$
Long service leave
$
Pension and superannu-
ation$
Termination benefits
$
Options and performance
rights$
Total$
Perfor-mance based
%
Andrew Simpson 100,425 - - - 9,540 - - 109,965 0%
David Nixon 73,310 - - - - - - 73,310 0%
Phillip Lockyer 66,950 - - - 6,360 - - 73,310 0%
Ian McCubbing 77,250 - - - 7,339 - - 84,589 0%
Total non-executive directors 317,935 - - - 23,239 - - 341,174 0%
Kent Swick 586,800 219,534 2,855 10,811 25,000 - 87,731 932,731 33%
Jitu Bhudia 305,087 127,041 2,321 3,086 25,000 - 53,387 515,922 35%
Total executives 891,887 346,575 5,176 13,897 50,000 - 141,118 1,448,653 34%
Total payments and benefits 1,209,822 346,575 5,176 13,897 73,239 - 141,118 1,789,827 27%
Note 1: Non-monetary benefits include motor vehicle and travel allowances.
For
per
sona
l use
onl
y

DIRECTORS’ REPORT
25ANNUAL REPORT 2019 SWICK MINING SERVICES
Table of benefits and payments for the year ended 30 June 2018
Short-term benefitsLong-term benefits Post-employment benefits
Equity-settled
share-based payments
2018
Salary, fees and leave
$
Profit share and bonuses
$
Non-monetary1
$
Long service leave
$
Pension and superannu-
ation$
Termination benefits
$
Options and perfor-mance rights
$Total
$
Perfor-mance based
%
Andrew Simpson 100,425 - - - 9,540 - - 109,965 0%
David Nixon 73,310 - - - - - - 73,310 0%
Phillip Lockyer 66,950 - - - 6,360 - - 73,310 0%
Ian McCubbing 77,250 - - - 7,339 - - 84,589 0%
Total non-executive directors 317,935 - - - 23,239 - - 341,174 0%
Kent Swick 586,800 - 1,754 10,722 25,000 - 87,731 712,007 12%
Vahid Haydari2 366,331 - 235 - 25,000 271,550 145,447 808,563 18%
Jitu Bhudia 325,761 - 3,372 1,441 25,000 - 86,732 442,306 20%
Tony Tamlin3 158,172 - 5,497 - 10,220 - (34,133) 139,756 -
Will Gove4 151,298 - 14,892 - 8,453 63,260 (10,097) 227,806 -
Total executives 1,588,362 - 25,750 12,163 93,673 334,810 275,680 2,330,438 12%
Total payments and benefits 1,906,297 - 25,750 12,163 116,912 334,810 275,680 2,671,612 10%
Note 1: Non-monetary benefits include motor vehicle and travel allowances.
Note 2: Resigned 16 October 2017.
Note 3: Resigned 22 December 2017.
Note 4: Resigned 3 November 2017.
BonusesA new Short Term Incentive (STI) plan for executives and senior managers was introduced for 2019. The STI is payable based on performance against key corporate and individual performance indicators (KPIs) set at the beginning of the financial year. Details are as follows:
What are the performance criteria:
+ Improved safety performance measured as a reduction in the Total Recordable Injury Frequency Rate (12%)
+ Drilling Business profitability against budget (48%)
+ A set of personal performance metrics designed to improve overall profitability as specifically related to each managers area of responsibility. Personal targets are designed to align the individual managers performance with the company goals.
The Managing Director and Chief Financial Officer have an opportunity to earn up to 40% of their respective fixed remuneration as bonus if all stretch targets are achieved. For managers who are participants in the plan, this figure is between 10% and 30%.
For each KPI there are defined “Threshold”, “Target” and “Stretch” measures which are capable of objective assessment. Payment for individual KPIs is set out in the following table:
For
per
sona
l use
onl
y

DIRECTORS’ REPORT
26 SWICK MINING SERVICES ANNUAL REPORT 2019
Company KPIs (% of maximum)
Individual KPIs (% of maximum)
Below Threshold Nil Nil
Threshold performance 50% 75%
Target 75% 90%
Stretch 100% 100%
During the year cash bonuses totalling $575,408 (2018: $nil) are expected to be paid under the 2019 short term incentive program based on the financial performance of the Company. Payment for these bonuses will be made in September 2019.
Options and performance rightsDuring the year the following share-based payment arrangements were in existence:
Series Grant date Expiry date Grant date fair value Exercise price Vesting date
Issued 11 November 2016 11 November 2016 Note 1 $0.04 $0.37 Note 1
Issued 1 July 2018 1 July 2018 Note 2 $0.225 - Note 2
The terms and conditions relating to Options and Performance Rights in operation during the year for KMP are as follows:
Grant dateVesting conditions
Vested/paid during year
Forfeited during year
Remaining as unvested Vesting date
Executive
Kent Swick 11 November 2016 Note 1 100% - - Note 1
Jitu Bhudia 1 July 2018 Note 2 - - 100% Note 2
Note 1: The options with Swick Mining Services Limited vest 100% on 30 June 2019 and expire on 30 June 2020.
Note 2: The performance rights with Swick Mining Services Limited vest 100% on 30 June 2020.
For all long-term incentive plans, the performance condition is that the employee is still employed by the Company on vesting date. The performance rights do not have entitlement to dividends and are not entitled to vote at a meeting of the Company.
Rights issued from 2018 were issued as units in the employee share trust and entitle the holder to one ordinary share in Swick Mining Services Limited upon vesting.
The following share-based payment compensation to KMP relate to the current financial year:
Grant date
Number granted during
the year
Number forfeited during
the yearNumber vested
during year
Number exercised
during the year
Value on grant date
$
Value on date of exercise
$
Executive
Kent Swick 11 November 2016 - - (6,452,114) - - -
Jitu Bhudia 1 July 2018 474,547 - - - 106,773 -
474,547 - (6,452,114) - 106,773 -For
per
sona
l use
onl
y
DIRECTORS’ REPORT
27ANNUAL REPORT 2019 SWICK MINING SERVICES
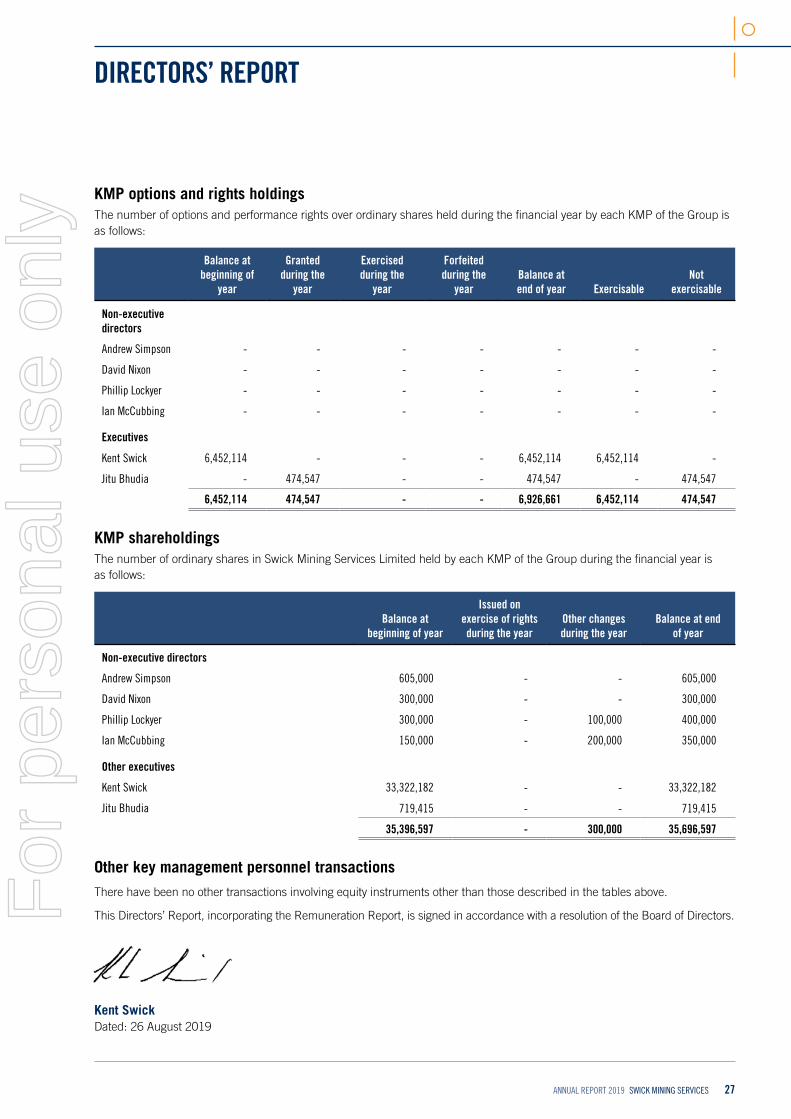
KMP options and rights holdings The number of options and performance rights over ordinary shares held during the financial year by each KMP of the Group is as follows:
Balance at beginning of
year
Granted during the
year
Exercised during the
year
Forfeited during the
yearBalance at end of year Exercisable
Not exercisable
Non-executive directors
Andrew Simpson - - - - - - -
David Nixon - - - - - - -
Phillip Lockyer - - - - - - -
Ian McCubbing - - - - - - -
Executives
Kent Swick 6,452,114 - - - 6,452,114 6,452,114 -
Jitu Bhudia - 474,547 - - 474,547 - 474,547
6,452,114 474,547 - - 6,926,661 6,452,114 474,547
KMP shareholdingsThe number of ordinary shares in Swick Mining Services Limited held by each KMP of the Group during the financial year is as follows:
Balance at beginning of year
Issued on exercise of rights during the year
Other changes during the year
Balance at end of year
Non-executive directors
Andrew Simpson 605,000 - - 605,000
David Nixon 300,000 - - 300,000
Phillip Lockyer 300,000 - 100,000 400,000
Ian McCubbing 150,000 - 200,000 350,000
Other executives
Kent Swick 33,322,182 - - 33,322,182
Jitu Bhudia 719,415 - - 719,415
35,396,597 - 300,000 35,696,597
Other key management personnel transactionsThere have been no other transactions involving equity instruments other than those described in the tables above.
This Directors’ Report, incorporating the Remuneration Report, is signed in accordance with a resolution of the Board of Directors.
Kent SwickDated: 26 August 2019
For
per
sona
l use
onl
y
28 SWICK MINING SERVICES ANNUAL REPORT 2019
AUDITOR’S INDEPENDENCE DECLARATION
A member firm of Ernst & Young Global Limited GB:JG:SWICK:029 Liability limited by a scheme approved under Professional Standards Legislation
Ernst & Young 11 Mounts Bay Road Perth WA 6000 Australia GPO Box M939 Perth WA 6843
Tel: +61 8 9429 2222 Fax: +61 8 9429 2436 ey.com/au
Auditor’s independence declaration to the Directors of Swick Mining Services Limited
As lead auditor for the audit of Swick Mining Services Limited for the financial year ended 30 June 2019, I declare to the best of my knowledge and belief, there have been:
a) no contraventions of the auditor independence requirements of the Corporations Act 2001 in relation to the audit; and
b) no contraventions of any applicable code of professional conduct in relation to the audit.
This declaration is in respect of Swick Mining Services Limited and the entities it controlled during the financial year.
Ernst & Young Gavin Buckingham Partner 26 August 2019
For
per
sona
l use
onl
y

29ANNUAL REPORT 2019 SWICK MINING SERVICES
FINANCIAL STATEMENTS
Consolidated Statement of Profit or Loss and Other Comprehensive Income
30
Consolidated Statement of Financial Position 31
Consolidated Statement of Changes in Equity 32
Consolidated Statement of Cash Flows 33
Notes to the Consolidated Financial Statements 34
Directors’ Declaration 79
Independent Auditor’s Report 80
ASX Additional Information 86
For
per
sona
l use
onl
y

30 SWICK MINING SERVICES ANNUAL REPORT 2019
CONSOLIDATED GROUP
Note 2019 $000
2018 $000
Revenue 2.2 142,606 136,771
Other income 2.2 1,842 1,407
Raw materials and consumables used (26,106) (29,026)
Employee benefits expense (74,008) (73,463)
Depreciation and amortisation expense 3.4, 3.5 (20,954) (16,875)
Finance costs (1,464) (1,331)
Other expenses 2.3 (18,820) (18,371)
Profit/(loss) before income tax 3,096 (888)
Income tax expense 2.4 (2,058) (87)
Net profit/(loss) after tax 1,038 (975)
Profit/(loss) for the year attributable to:
Owners of the Company 1,038 (975)
1,038 (975)
Other comprehensive income:
Items that may be reclassified subsequently to profit or loss:
Exchange differences on translating foreign controlled entities 272 289
Items that can not be reclassified subsequently to profit or loss:
Net fair value gain on FVOCI equity investments - 175
Other comprehensive income for the year, net of tax 272 464
Total comprehensive income/(loss) for the year 1,310 (511)
Comprehensive profit/(loss) for the year attributable to:
Owners of the Company 1,310 (511)
1,310 (511)
Earnings per share
Basic earnings/(loss) per share (cents) 2.6 0.45 (0.42)
Diluted earnings/(loss) per share (cents) 2.6 0.43 (0.42)
The consolidated statement of profit or loss and other comprehensive income should be read in conjunction with the accompanying notes.
CONSOLIDATED STATEMENT OF PROFIT OR LOSS AND OTHER COMPREHENSIVE INCOME FOR THE YEAR ENDED 30 JUNE 2019
For
per
sona
l use
onl
y

31ANNUAL REPORT 2019 SWICK MINING SERVICES
CONSOLIDATED STATEMENT OF FINANCIAL POSITIONAS AT 30 JUNE 2019
CONSOLIDATED GROUP
Note 2019 $000
2018 $000
Assets
Current assets
Cash 3.1 11,257 10,914
Restricted cash 3.1 296 547
Trade and other receivables 3.2 17,866 16,003
Inventories 3.3 14,259 13,840
Prepayments 1,474 1,396
Current tax asset 127 -
Total current assets 45,279 42,700
Non-current assets
Property, plant and equipment 3.4 81,590 77,414
Intangible assets 3.5 12,196 12,674
Financial asset classified as FVOCI 3.6 1,630 1,630
Deferred tax assets 3.7 249 186
Total non-current assets 95,665 91,904
Total assets 140,944 134,604
Liabilities
Current liabilities
Trade and other payables 17,890 15,413
Current tax liability 156 36
Deferred revenue 3.8 296 547
Borrowings 3.9 2,902 577
Provisions 3.10 5,633 5,243
Total current liabilities 26,877 21,816
Non-current liabilities
Borrowings 3.9 26,742 28,643
Provisions 3.10 495 729
Deferred tax liabilities 3.7 2,147 108
Total non-current liabilities 29,384 29,480
Total liabilities 56,261 51,296
Net assets 84,683 83,308
Equity
Issued capital 4.1 79,446 79,446
Reserved shares 4.2 (777) (667)
Reserves 4.3 3,174 2,727
Retained earnings 2,840 1,802
Total equity 84,683 83,308
The consolidated statement of financial position should be read in conjunction with the accompanying notes.
For
per
sona
l use
onl
y

32 SWICK MINING SERVICES ANNUAL REPORT 2019
Note Issued capital
Reserved shares Reserves
Retained earnings Total
$000 $000 $000 $000 $000
Consolidated Group
Balance at 1 July 2017 79,446 (453) 1,960 2,777 83,730
Comprehensive income
Loss for the year - - - (975) (975)
Other comprehensive gain for the year - - 464 - 464
Total comprehensive loss for the year - - 464 (975) (511)
Transactions with owners, in their capacity as owners, and other transfers
Reserved shares purchased 4.2 - (214) - - (214)
Share-based payments 4.3 - - 303 - 303
Total transactions with owners and other transfers - (214) 303 - 89
Balance at 30 June 2018 79,446 (667) 2,727 1,802 83,308
Comprehensive income
Profit for the year - - - 1,038 1,038
Other comprehensive gain for the year - - 272 - 272
Total comprehensive income for the year - - 272 1,038 1,310
Transactions with owners, in their capacity as owners, and other transfers
Reserved shares purchased 4.2 - (110) - - (110)
Share-based payments 4.3 - - 175 - 175
Total transactions with owners and other transfers - (110) 175 - 65
Balance at 30 June 2019 79,446 (777) 3,174 2,840 84,683
The consolidated statement of changes in equity should be read in conjunction with the accompanying notes.
CONSOLIDATED STATEMENT OF CHANGES IN EQUITYFOR THE YEAR ENDED 30 JUNE 2019
For
per
sona
l use
onl
y
33ANNUAL REPORT 2019 SWICK MINING SERVICES
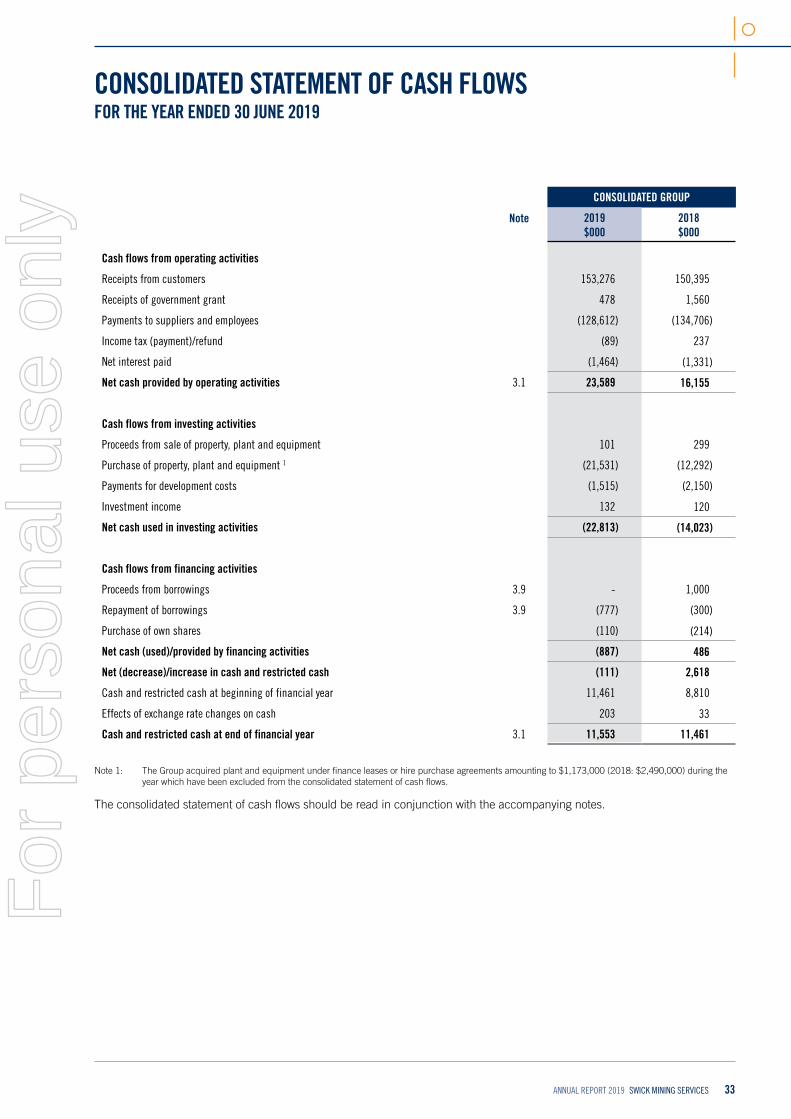
CONSOLIDATED STATEMENT OF CASH FLOWSFOR THE YEAR ENDED 30 JUNE 2019
CONSOLIDATED GROUP
Note 2019 $000
2018 $000
Cash flows from operating activities
Receipts from customers 153,276 150,395
Receipts of government grant 478 1,560
Payments to suppliers and employees (128,612) (134,706)
Income tax (payment)/refund (89) 237
Net interest paid (1,464) (1,331)
Net cash provided by operating activities 3.1 23,589 16,155
Cash flows from investing activities
Proceeds from sale of property, plant and equipment 101 299
Purchase of property, plant and equipment 1 (21,531) (12,292)
Payments for development costs (1,515) (2,150)
Investment income 132 120
Net cash used in investing activities (22,813) (14,023)
Cash flows from financing activities
Proceeds from borrowings 3.9 - 1,000
Repayment of borrowings 3.9 (777) (300)
Purchase of own shares (110) (214)
Net cash (used)/provided by financing activities (887) 486
Net (decrease)/increase in cash and restricted cash (111) 2,618
Cash and restricted cash at beginning of financial year 11,461 8,810
Effects of exchange rate changes on cash 203 33
Cash and restricted cash at end of financial year 3.1 11,553 11,461
Note 1: The Group acquired plant and equipment under finance leases or hire purchase agreements amounting to $1,173,000 (2018: $2,490,000) during the year which have been excluded from the consolidated statement of cash flows.
The consolidated statement of cash flows should be read in conjunction with the accompanying notes.
For
per
sona
l use
onl
y

34 SWICK MINING SERVICES ANNUAL REPORT 2019
NOTES TO THE CONSOLIDATED FINANCIAL STATEMENTSFOR THE YEAR ENDED 30 JUNE 2019
1. General Notes1.1 General Information
Swick Mining Services Ltd (the “Parent” or the “Company”) (ASX: SWK) is a public company listed on the Australian Securities Exchange (“ASX”) and is incorporated in Australia. Swick Mining Services Ltd and its subsidiaries (collectively referred to as “Swick Mining Services Group” or the “Group”) operate extensively throughout Australia and internationally.
The address for its registered office and principal place of business is as follows: 64 Great Eastern Highway South Guildford, Western Australia 6055, Australia Tel: +61 8 9277 8800
The financial report of the Company and its controlled entities for the year ended 30 June 2019 was authorised for issue on 26 August 2019 by the directors of the Company.
The principal activity of the Group during the 2019 financial year was the provision of mineral drilling services to the mining industry in the Asia Pacific and other international regions, primarily in the areas of underground diamond drilling and surface reverse circulation drilling. The Group also carries out research and development activities in mineral analysis technologies, with early stage commercial activities. There were no significant changes in the nature of the principal activities during the year.
1.2 Basis of PreparationThese financial statements are general purpose financial statements which have been prepared in accordance with the Corporations Act 2001, Australian Accounting Standards and Interpretations, and comply with other requirements of the law. Compliance with Australian Accounting Standards ensures that the financial statements and notes of the Group comply with International Financial Reporting Standards (‘IFRS’).
The financial statements comprise the consolidated financial statements of the Group. The Company is a for-profit entity.
The consolidated financial statements have been prepared on the basis of historical cost, except for certain financial instruments that are measured at fair values, as explained in the accounting policies below. Historical cost is generally based on the fair values of the consideration given in exchange for assets. All amounts are presented in Australian dollars, unless otherwise noted.
The company is a company of the kind referred to in ASIC Corporations (Rounding in Financials/Directors’ Report) Instrument 2016/191, dated 24 March 2016, and in accordance with that Corporations Instrument amounts in the financial report are rounded off to the nearest thousand dollars, unless otherwise indicated.
When required by Accounting Standards, comparative figures have been adjusted to conform to changes in presentation for the current financial year.
1.3 Functional currencyEach entity in the Group determines its own functional currency based on the currency of the primary economic environment in which the entity operates. For the purpose of the consolidated financial statements, the results and financial position of each entity are translated into Australian dollars, which is the functional currency of the Parent entity, and the presentation currency for the consolidated financial statements.
Transactions in currencies other than the entity’s functional currency (foreign currencies) are recorded at the rates of exchange prevailing on the dates of the transactions. At each reporting date, monetary items denominated in foreign currencies are retranslated at the rates prevailing at the reporting date. Non-monetary items that are measured in terms of historical cost in a foreign currency are not re-translated.
Exchange differences on monetary items are recognised in profit or loss in the period in which they arise except for:
+ exchange differences on foreign currency borrowings relating to assets under construction for future productive use, which are included in the cost of those assets when they are regarded as an adjustment to interest costs on those foreign currency borrowings;
+ exchange differences on transactions entered into in order to hedge certain foreign currency risks; and
For
per
sona
l use
onl
y

35ANNUAL REPORT 2019 SWICK MINING SERVICES
NOTES TO THE CONSOLIDATED FINANCIAL STATEMENTSFOR THE YEAR ENDED 30 JUNE 2019
+ exchange differences on monetary items receivable from or payable to a foreign operation for which settlement is neither planned nor likely to occur (therefore forming part of the net investment in the foreign operation), which are recognised initially in other comprehensive income.
For the purpose of presenting consolidated financial statements, the assets and liabilities of the Group’s foreign operations are translated into Australian dollars using exchange rates prevailing at the end of the reporting period. Income and expense items are translated at the monthly rate for Orexplore AB and at the exchange rates at the dates of the transactions for other entities in the group. Exchange differences arising, if any, are recognised in other comprehensive income and accumulated in equity. On disposal of a foreign operation, the component of other comprehensive income relating to that particular foreign operation is reclassified to profit or loss.
1.4 Principles of consolidationThe consolidated financial statements incorporate the financial statements of Swick Mining Services Limited and entities controlled by the Company and its subsidiaries. Control is achieved when the Company:
+ has power over the investee;
+ is exposed, or has rights, to variable returns from its involvement with the investee; and
+ has the ability to use its power to affect its returns.
The Company reassesses whether or not it controls an investee if facts and circumstances indicate that there are changes to one or more of the three elements of control listed above. There is a general presumption that the Company has control when they have majority voting rights. When the Company has less than a majority of the voting rights of an investee, it has power over the investee when the voting rights are sufficient to give it the practical ability to direct the relevant activities of the investee unilaterally. The Company considers all relevant facts and circumstances in assessing whether or not the Company’s voting rights in an investee are sufficient to give it power, including:
+ the size of the Company’s holding of voting rights relative to the size and dispersion of holdings of the other vote holders;
+ potential voting rights held by the Company, other vote holders or other parties;
+ rights arising from other contractual arrangements; and
+ any additional facts and circumstances that indicate that the Company has, or does not have, the current ability to direct the relevant activities at the time that decisions need to be made, including voting patterns at previous shareholders’ meetings.
Consolidation of a subsidiary begins when the Company obtains control over the subsidiary and ceases when the Company loses control of the subsidiary. Specifically, assets, liabilities, income and expenses of a subsidiary acquired or disposed of during the year are included in the consolidated statement of financial position and the consolidated statement of profit or loss and other comprehensive income from the date the Company gains control until the date when the Company ceases to control the subsidiary.
When necessary, adjustments are made to the financial statements of subsidiaries to bring their accounting policies into line with the Group’s accounting policies.
All intragroup assets and liabilities, equity, income, expenses and cash flows relating to transactions between members of the Group are eliminated in full on consolidation.
A change in the ownership interest in a subsidiary, without a loss of control, is accounted for as an equity transaction.
1.5 Other accounting policiesSignificant and other accounting policies that summarise the measurement basis used and are relevant in understanding of the financial statements are provided throughout the notes to the financial statements to which it relates.
Trade and other payablesTrade and other payables are carried at amortised cost. They represent unsecured liabilities for goods and services procured by the Group prior to the financial period end that remain unpaid and occur when the Group becomes obligated to make future payments. The amounts are unsecured and are usually paid within 30-60 days of recognition.
For
per
sona
l use
onl
y

36 SWICK MINING SERVICES ANNUAL REPORT 2019
NOTES TO THE CONSOLIDATED FINANCIAL STATEMENTSFOR THE YEAR ENDED 30 JUNE 2019
1.6 Changes to accounting standards and interpretationsNew and revised accounting standards and interpretations adoptedThe consolidated entity has adopted all new standards and amended standards issued by the Australian Accounting Standards Board (‘AASB’) with a date of initial application of 1 July 2018, including:
+ AASB 9 ‘Financial Instruments’, and relevant amending standards
+ AASB 2016-5 ‘Classification and Measurement of Share-based Payment Transactions’
+ AASB 15 ‘Revenue from Contracts with Customers’, and relevant amending standards
+ AASB Interpretation 22 ‘Foreign Currency Transactions and Advance Consideration’
Except for AASB 9 ‘Financial Instruments’ and AASB 15 ‘Revenue from Contracts with Customers’, the application of the new standards and these amendments did not have any material impact on the amounts recognised in the financial statements nor resulted in any additional disclosures upon adoption.
AASB 9 ‘Financial Instruments’The Group applies, for the first time, AASB 9 ‘Financial Instruments’.
AASB 9 ‘Financial Instruments’ replaces AASB 139 ‘Financial Instruments: Recognition and Measurement’ bringing together all three aspects of the accounting for financial instruments: classification and measurement; impairment; and hedge accounting.
AASB 9 sets out requirements for recognising and measuring financial assets, financial liabilities and some contracts to buy or sell non-financial items. The Group has adopted AASB 9 retrospectively, with initial application date of 1 July 2018, in accordance with the standard; changes in accounting policies resulting from the adoption of AASB 9 did not have a material impact on the Company’s consolidated financial statements and comparatives were not restated.
AASB 9 largely retains the existing requirements of AASB 139 for the classification and measurement of financial liabilities, however, it eliminates the previous AASB 139 categories for financial assets held to maturity, receivables and available for sale. Under AASB 9, on initial recognition a financial asset is classified as measured at:
a. Amortised cost;
b. Fair Value through Other Comprehensive Income (FVOCI) – debt investment;
c. FVOCI – equity investment; or
d. Fair Value through Profit or Loss (FVTPL)
The classification of financial assets under AASB 9 is generally based on the business model in which a financial asset is managed and its contractual cash flow characteristics. A financial asset (unless it is a trade receivable without a significant financing component that is initially measured at the transaction price) is initially measured at fair value plus, for an item not at FVTPL, transaction costs that are directly attributable to its acquisition. For financial assets measured at amortised cost, these assets are subsequently measured at amortised cost using the effective interest method. The amortised cost is reduced by impairment losses. Interest income, foreign exchange gains and losses and impairment are recognised in profit or loss. Any gain or loss on derecognition is recognised in profit or loss.
As of 30 June 2019 and 30 June 2018, the Group’s financial instruments consist of cash and cash equivalents, restricted cash, trade and other receivables, investments, trade and other payables and borrowings. The change in classification has not resulted in any re-measurement adjustment at 1 July 2018. The result of the assessment is as follows:F
or p
erso
nal u
se o
nly

37ANNUAL REPORT 2019 SWICK MINING SERVICES
NOTES TO THE CONSOLIDATED FINANCIAL STATEMENTSFOR THE YEAR ENDED 30 JUNE 2019
Class of financial instrument presented in the statement of financial position
Original measurement category under AASB 139
New measurement category under AASB 9
Carrying value as at 30 June 2018 $000
Carrying value as at 1 July 2018 $000
Cash and cash equivalents Loans and receivables Financial assets at amortised cost
10,914 10,914
Restricted cash Loans and receivables Financial assets at amortised cost
547 547
Trade and other receivables Loans and receivables Financial assets at amortised cost
16,003 16,003
Financial asset classified as FVOCI
Available for sale financial assets
FVOCI equity investments 1,630 1,630
Trade and other payables Financial Liability at amortised cost
Financial liability at amortised cost
15,413 15,413
Borrowings Financial Liability at amortised cost
Financial liability at amortised cost
29,220 29,220
The cash and cash equivalents, restricted cash, trade and other receivables, trade and other payables and borrowings approximate their fair value.
Qualifying investments in equity instruments are irrevocably designated as FVOCI. Fair value movements continue to be recognised in equity through other comprehensive income and are not eligible for recycling through profit or loss upon realisation of the asset.
Impairment of financial assetsIn relation to the financial assets carried at amortised cost, AASB 9 requires an expected credit loss (“ECL”) model to be applied as opposed to an incurred credit loss model under AASB 139. The expected credit loss model requires the Group to account for ECL and changes in those expected credit losses at each reporting date to reflect changes in credit risk since initial recognition of the financial asset. In particular, AASB 9 requires the Group to measure the loss allowance at an amount equal to lifetime expected credit loss if the credit risk on the instrument has increased significantly since initial recognition. On the other hand, if the credit risk on the financial instrument has not increased significantly since initial recognition, the Group is required to measure the loss allowance for that financial instrument at an amount equal to the ECL within the next 12 months.
As at 1 July 2018, the directors of the Company reviewed and assessed the Group’s existing financial assets for impairment using reasonable and supportable information. For trade and other receivables, the Group has applied the standard’s simplified approach and has calculated ECLs based on lifetime expected credit losses. The Group has established a provision matrix that is based on the Group’s historical credit loss experience, adjusted for forward-looking factors specific to the debtors and the economic environment. Based on this simplified approach, the lifetime ECL model has an immaterial impact on the Group.
Cash balances, other than immaterial petty cash balances, are being held with reputable financial institutions with sound credit ratings, which reduces credit risk and the expected credit loss to be insignificant.
For
per
sona
l use
onl
y

38 SWICK MINING SERVICES ANNUAL REPORT 2019
NOTES TO THE CONSOLIDATED FINANCIAL STATEMENTSFOR THE YEAR ENDED 30 JUNE 2019
AASB 15 ‘Revenue from Contracts with Customers’The Group applies, for the first time, AASB 15 ‘Revenue from Contracts with Customers’ (“AASB 15”).
AASB 15 supersedes AASB 118 ‘Revenue’ and related Interpretations and it applies to all revenue arising from contracts with customers, unless those contracts are in the scope of other standards. The new standard establishes a five-step model to account for revenue arising from contracts with customers. Under AASB 15, revenue is recognised at an amount that reflects the consideration to which an entity expects to be entitled in exchange for transferring goods or services to a customer.
The standard requires entities to exercise judgement, taking into consideration all of the relevant facts and circumstances when applying each step of the model to contracts with their customers. The standard also specifies the accounting for the incremental costs of obtaining a contract and the costs directly related to fulfilling a contract.
The Group adopted the cumulative effect method to implement the new standard and has therefore been applied only to contracts that remain in force at 1 July 2018. The effect of adopting AASB 15 on the Group’s accounting policy for revenue is discussed below, however there is no impact on the consolidated financial statements of the Group.
The Group is in the business of providing mineral drilling services and mineral analysis services to the mining industry.
The effect of adopting AASB 15 is set out below.
Drilling segmentsCustomer contracts typically comprise two performance obligations because the promises to provide drilling and grouting services are capable of being distinct and are separately identifiable. The transaction price for each service, based on standalone selling prices for each hour, shift, metre or unit is set out in the customer contract. Where the Group has a right to consideration from a customer, in an amount that corresponds directly with the value to the customer of the Group’s performance completed to date, the Group recognises revenue in the amount the Group has the right to invoice.
Billing is done for periods no longer than one month and customers are given up to 60 days to settle.
Mineral Technology segmentThe Mineral Technology segment of the Group generates revenue from providing mineral analysis services to the mining industry. Revenue is earned by metre of core scanned.
New standards and interpretations issued but not yet effectiveCertain new accounting standards and interpretations have been published that are not mandatory for 30 June 2019 reporting periods and have not been early adopted by the Group. The standards and interpretations that were issued but not yet effective are set out below. The Group is in the process of considering the impact of the new standards. Unless stated otherwise below, the potential effects of the following standards and interpretations have not yet been fully determined
For
per
sona
l use
onl
y

39ANNUAL REPORT 2019 SWICK MINING SERVICES
NOTES TO THE CONSOLIDATED FINANCIAL STATEMENTSFOR THE YEAR ENDED 30 JUNE 2019
Reference SummaryApplication date of
standardApplication date for
Group
AASB 16 Leases The key features of AASB 16 are as follows:
Lessee accounting
+ Lessees are required to recognise assets and liabilities for all leases with a term of more than 12 months, unless the underlying asset is of low value.
+ A lessee measures right-of-use assets similarly to other non-financial assets and lease liabilities similarly to other financial liabilities.
+ Assets and liabilities arising from a lease are initially measured on a present value basis. The measurement includes non-cancellable lease payments (including inflation-linked payments), and also includes payments to be made in optional periods if the lessee is reasonably certain to exercise an option to extend the lease, or not to exercise an option to terminate the lease.
+ AASB 16 contains disclosure requirements for lessees.
1 January 2019 1 July 2019
The Group plans to adopt AASB 16 using the modified retrospective approach, which means it will apply the standard from 1 July 2019, the cumulative impact of adoption will be recognised as at 1 July 2019 and comparatives will not be restated. The Group will elect to use the exemptions proposed by the standard on lease contracts for which the lease terms ends within 12 months as of the date of initial application, and lease contracts for which the underlying asset is of low-value.
Estimated impact on the statement of financial position as at 1 July 2019:
$ million
Assets
Property, plant and equipment (right-of-use) 14
Liabilities
Lease liabilities 14
Net impact on equity -
Work completed by the Group to date indicates the new lease standard is expected to have a material effect on the Group’s financial statements as it will significantly increase the Group’s recognised assets and liabilities (as described above). This is due to the change in the accounting for expenses of leases that were classified as operating leases under AASB 117. In addition, the classification between cash flow from operating activities and cash flow from financing activities will also change. Many commonly used financial ratios and performance metrics for the Group, using existing definitions, will also be impacted including net debt, gearing, EBITDA, unit costs and operating cash flows.
The Group’s existing operating leases will be the main source of leases under the new standard. Information on the Group’s operating lease commitments under AASB 117 Leases (undiscounted) is disclosed in Note 6.1(b) Operating lease commitments.
For
per
sona
l use
onl
y

40 SWICK MINING SERVICES ANNUAL REPORT 2019
NOTES TO THE CONSOLIDATED FINANCIAL STATEMENTSFOR THE YEAR ENDED 30 JUNE 2019
Reference SummaryApplication date of
standardApplication date for
Group
AASB 2017-6 Amendments to Australian Accounting Standards – Prepayment Features with Negative Compensation
This Standard amends AASB 9 Financial Instruments to permit entities to measure at amortised cost or fair value through other comprehensive income particular financial assets that would otherwise have contractual cash flows that are solely payments of principal and interest but do not meet that condition only as a result of a prepayment feature. This is subject to meeting other conditions, such as the nature of the business model relevant to the financial asset. Otherwise, the financial assets would be measured at fair value through profit or loss.
The Standard also clarifies in the Basis for Conclusion that, under AASB 9, gains and losses arising on modifications of financial liabilities that do not result in derecognition should be recognised in profit or loss.
1 January 2019 1 July 2019
AASB 2018-1 Annual Improvements to IFRS Standards 2015-2017 Cycle
The amendments clarify certain requirements in:
+ AASB 3 Business Combinations and AASB 11 Joint Arrangements – previously held interest in a joint operation
+ AASB 112 Income Taxes – income tax consequences of payments on financial instruments classified as equity
+ AASB 123 Borrowing Costs – borrowing costs eligible for capitalisation
1 January 2019 1 July 2019
AASB Interpretation 23, and relevant amending standards Uncertainty over Income Tax Treatments
The Interpretation clarifies the application of the recognition and measurement criteria in AASB 112 Income Taxes when there is uncertainty over income tax treatments. The Interpretation specifically addresses the following:
+ Whether an entity considers uncertain tax treatments separately
+ The assumptions an entity makes about the examination of tax treatments by taxation authorities
+ How an entity determines taxable profit (tax loss), tax bases, unused tax losses unused tax credits and tax rates
+ How an entity considers changes in facts and circumstances
1 January 2019 1 July 2019
For
per
sona
l use
onl
y

41ANNUAL REPORT 2019 SWICK MINING SERVICES
NOTES TO THE CONSOLIDATED FINANCIAL STATEMENTSFOR THE YEAR ENDED 30 JUNE 2019
Reference SummaryApplication date of
standardApplication date for
Group
Conceptual Framework AASB 2019-1 Conceptual Framework for Financial Reporting Amendments to Australian Accounting Standards – Reference to the Conceptual Framework
The revised Conceptual Framework includes some new concepts, provides updated definitions and recognition criteria for assets and liabilities and clarifies some important concepts. It is arranged in eight chapters, as follows:
+ Chapter 1 – The objective of financial reporting + Chapter 2 – Qualitative characteristics of useful financial
information + Chapter 3 – Financial statements and the reporting entity + Chapter 4 – The elements of financial statements + Chapter 5 – Recognition and derecognition + Chapter 6 – Measurement + Chapter 7 – Presentation and disclosure + Chapter 8 – Concepts of capital and capital maintenance
AASB 2019-1 has also been issued, which sets out the amendments to Australian Accounting Standards, Interpretations and other pronouncements in order to update references to the revised Conceptual Framework. The changes to the Conceptual Framework may affect the application of accounting standards in situations where no standard applies to a particular transaction or event. In addition, relief has been provided in applying AASB 3 and developing accounting policies for regulatory account balances using AASB 108, such that entities must continue to apply the definitions of an asset and a liability (and supporting concepts) in the Framework for the Preparation and Presentation of Financial Statements (July 2004), and not the definitions in the revised Conceptual Framework.
1 January 2020 1 July 2020
AASB 2018-7 Amendments to Australian Accounting Standards – Definition of Material
This Standard amends AASB 101 Presentation of Financial Statements and AAS 108 Accounting Policies, Changes in Accounting Estimates and Errors to align the definition of ‘material’ across the standards and to clarify certain aspects of the definition. The amendments clarify that materiality will depend on the nature or magnitude of information. An entity will need to assess whether the information, either individually or in combination with other information, is material in the context of the financial statements. A misstatement of information is material if it could reasonably be expected to influence decisions made by the primary users.
1 January 2020 1 July 2020
For
per
sona
l use
onl
y

42 SWICK MINING SERVICES ANNUAL REPORT 2019
NOTES TO THE CONSOLIDATED FINANCIAL STATEMENTSFOR THE YEAR ENDED 30 JUNE 2019
1.7 Critical accounting estimates and judgementsIn the application of the Group’s accounting policies, management is required to make judgments, estimates and assumptions about carrying values of assets and liabilities that are not readily apparent from other sources. The directors evaluate estimates and judgments incorporated into the financial statements based on historical knowledge and best available current information. Estimates assume a reasonable expectation of future events and are based on current trends and economic data, obtained both externally and within the Group. Actual results may differ from these estimates.
The estimates and underlying assumptions are reviewed on an ongoing basis. Revisions to accounting estimates are recognised in the period in which the estimate is revised if the revision affects only that period or in the period of the revision and future periods if the revision affects both current and future periods. Significant judgments, estimates and assumptions made by management in the preparation of these financial statements are outlined below:
+ Net realisable value of inventories (Note 3.3)
+ Impairment of assets (Note 3.4)
+ Useful lives of property, plant & equipment (Note 3.4)
+ Recoverability of internally generated intangible assets (Note 3.5)
+ Recoverability of recognised tax losses (Note 3.7)
2. Financial performance2.1 Operating segments
General informationIdentification of reportable segmentsFor management purposes, the Group is organised into business units based on type of activities and regions. The Group’s chief operating decision maker for the purpose of resource allocation and assessment of performance of segments is specifically focused on three reportable segments, as follows:
+ Drilling Services in Asia Pacific, which provides mineral drilling services to mining industry in the Asia Pacific region.
+ Drilling Services International, which provides mineral drilling services to mining industry in the International region.
+ Mineral Technology, which carries out research and development activities and provides mineral analysis services.
Unless stated otherwise, all amounts reported to the Board of Directors, being the chief operating decision makers with respect to operating segments, are determined in accordance with accounting policies that are consistent to those adopted in the annual financial statements of the Group.
Transfer prices between operating segments are on an arm’s length basis in a manner similar to transactions with third parties.
For
per
sona
l use
onl
y

43ANNUAL REPORT 2019 SWICK MINING SERVICES
NOTES TO THE CONSOLIDATED FINANCIAL STATEMENTSFOR THE YEAR ENDED 30 JUNE 2019
The Group’s revenue from continuing operations and information about its assets and liabilities by reportable segments are detailed below:
Year ended 30 June 2019 $000
Drilling services –
Asia Pacific
Drilling services –
InternationalMineral
Technology Other Elimination Total
Revenue 114,303 28,272 31 - - 142,606
Other income 368 7 618 853 (4) 1,842
Inter-segment revenue 2,613 - - - (2,613) -
Total revenue and other income 117,284 28,279 649 853 (2,617) 144,448
EBITDA 22,472 5,733 (3,300) 609 - 25,514
Depreciation and amortisation (15,555) (3,437) (1,962) - - (20,954)
Segment result - EBIT 6,917 2,296 (5,262) 609 - 4,560
Finance costs (1,464)
Profit before tax 3,096
Total assets 112,664 36,358 11,256 2,359 (21,693) 140,944
Total liabilities (49,856) (26,896) (1,126) (76) 21,693 (56,261)
Total net assets 62,808 9,462 10,130 2,283 - 84,683
Additions to property, plant and equipment 18,765 2,753 1,186 - - 22,704
Additions to intangible assets 845 - 670 - - 1,515
Total additions to non-current assets 19,610 2,753 1,856 - - 24,219
Year ended 30 June 2018 $000
Drilling services –
Asia Pacific
Drilling services –
InternationalMineral
Technology Other Elimination Total
Revenue 118,579 18,189 3 - - 136,771
Other income 180 188 919 120 - 1,407
Inter-segment revenue 1,125 - - - (1,125) -
Total revenue and other income 119,884 18,377 922 120 (1,125) 138,178
EBITDA 16,816 2,269 (1,887) 120 - 17,318
Depreciation and amortisation (14,966) (1,746) (163) - - (16,875)
Segment result - EBIT 1,850 523 (2,050) 120 - 443
Finance costs (1,331)
Loss before tax (888)
Total assets 115,351 20,522 11,152 1,630 (14,051) 134,604
Total liabilities (48,314) (15,740) (1,293) - 14,051 (51,296)
Total net assets 67,037 4,782 9,859 1,630 - 83,308
Additions to property, plant and equipment 12,872 2,465 477 - - 15,814
Additions to intangible assets 389 - 1,761 - - 2,150
Total additions to non-current assets 13,261 2,465 2,238 - - 17,964
For
per
sona
l use
onl
y
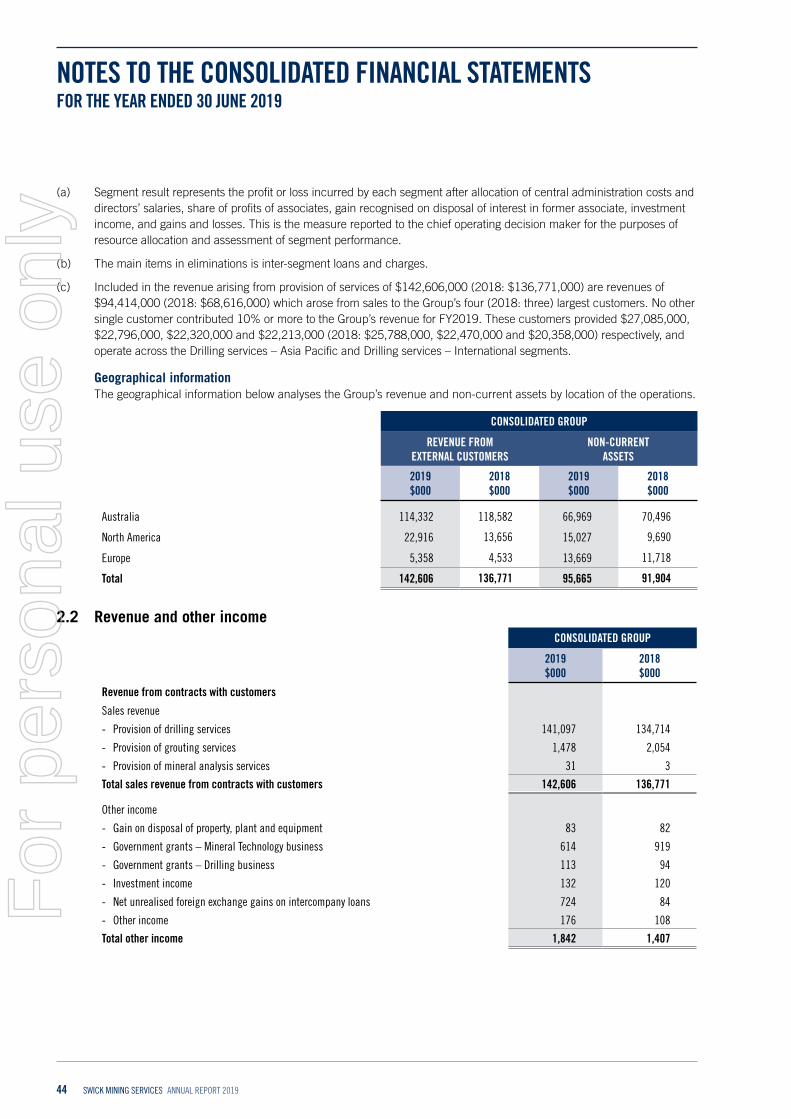
44 SWICK MINING SERVICES ANNUAL REPORT 2019
NOTES TO THE CONSOLIDATED FINANCIAL STATEMENTSFOR THE YEAR ENDED 30 JUNE 2019
(a) Segment result represents the profit or loss incurred by each segment after allocation of central administration costs and directors’ salaries, share of profits of associates, gain recognised on disposal of interest in former associate, investment income, and gains and losses. This is the measure reported to the chief operating decision maker for the purposes of resource allocation and assessment of segment performance.
(b) The main items in eliminations is inter-segment loans and charges.
(c) Included in the revenue arising from provision of services of $142,606,000 (2018: $136,771,000) are revenues of $94,414,000 (2018: $68,616,000) which arose from sales to the Group’s four (2018: three) largest customers. No other single customer contributed 10% or more to the Group’s revenue for FY2019. These customers provided $27,085,000, $22,796,000, $22,320,000 and $22,213,000 (2018: $25,788,000, $22,470,000 and $20,358,000) respectively, and operate across the Drilling services – Asia Pacific and Drilling services – International segments.
Geographical informationThe geographical information below analyses the Group’s revenue and non-current assets by location of the operations.
CONSOLIDATED GROUP
REVENUE FROM EXTERNAL CUSTOMERS
NON-CURRENT ASSETS
2019 $000
2018 $000
2019 $000
2018 $000
Australia 114,332 118,582 66,969 70,496
North America 22,916 13,656 15,027 9,690
Europe 5,358 4,533 13,669 11,718
Total 142,606 136,771 95,665 91,904
2.2 Revenue and other incomeCONSOLIDATED GROUP
2019 $000
2018 $000
Revenue from contracts with customers
Sales revenue
- Provision of drilling services 141,097 134,714
- Provision of grouting services 1,478 2,054
- Provision of mineral analysis services 31 3
Total sales revenue from contracts with customers 142,606 136,771
Other income
- Gain on disposal of property, plant and equipment 83 82
- Government grants – Mineral Technology business 614 919
- Government grants – Drilling business 113 94
- Investment income 132 120
- Net unrealised foreign exchange gains on intercompany loans 724 84
- Other income 176 108
Total other income 1,842 1,407
For
per
sona
l use
onl
y
45ANNUAL REPORT 2019 SWICK MINING SERVICES
NOTES TO THE CONSOLIDATED FINANCIAL STATEMENTSFOR THE YEAR ENDED 30 JUNE 2019
Revenue from provision of services
Pre 1 July 2018Revenue from the provision of services is measured at the fair value of the consideration received or receivable, net of goods and services tax or other sales taxes. Revenue is recognised as the service has been delivered to the client and the recovery of the consideration is probable.
Post 1 July 2018Revenue is recognised upon the satisfaction of performance obligations, which occurs when control of the service transfers to the customer when services are rendered.
Services Nature, timing of satisfaction of performance obligations and significant payment terms
Drilling and related services
The Group recognises revenue when drilling services, whether chargeable by metre or by shift, are provided. It is billed on periods no longer than one month.
Grouting The Group recognises revenue when grouting services are provided. It is billed on periods no longer than one month.
Mineral analysis The Group recognises revenue when mineral analysis services, chargeable by metre, are provided. It is billed on periods no longer than one month.
Drilling segmentsCustomer contracts typically comprise two performance obligations because the promises to provide drilling and grouting services are capable of being distinct and are separately identifiable. The transaction price for each service, based on standalone selling prices for each hour, shift, metre or unit is set out in the customer contract. Where the Group has a right to consideration from a customer, in an amount that corresponds directly with the value to the customer of the Group’s performance completed to date, the Group recognises revenue in the amount the Group has the right to invoice.
Mineral Technology segmentThe Mineral Technology segment of the Group generates revenue from providing mineral analysis services to the mining industry. Revenue is earned by metre of core scanned.
Grants and contributionsGrants and contributions are benefits received in respect of specific qualifying expenditure in respect of qualifying activities. The grant is recognised only when there is reasonable assurance that the entity will comply with any conditions attached to the grant and the grant will be received. The grant is recognised as deferred revenue and are released to the Income Statement over the period necessary to match them with the related cost, for which they are intended to compensate, on a systematic basis.
Investment incomeInvestment income is recognised as it accrues.
For
per
sona
l use
onl
y

46 SWICK MINING SERVICES ANNUAL REPORT 2019
NOTES TO THE CONSOLIDATED FINANCIAL STATEMENTSFOR THE YEAR ENDED 30 JUNE 2019
Disaggregation of revenueIn the following table, revenue is disaggregated by primary geographical market, major services and timing of revenue recognition. The table also includes a reconciliation of the disaggregated revenue with the Group’s strategic divisions, which are its reportable segments (see note 2.1).
For the year ended 30 June 2019 $’000
Drilling Services – Asia Pacific
Drilling Services – International
Mineral Technology Total
Primary geographical markets based on location of customersAustralia 114,303 - 29 114,332
North America - 22,916 - 22,916
Europe - 5,356 2 5,358
Total revenue 114,303 28,272 31 142,606
Major services
Underground diamond drilling 109,447 28,272 - 137,719
Reverse circulation drilling 4,856 - - 4,856Mineral analysis - - 31 31
Total revenue 114,303 28,272 31 142,606
Timing of revenue recognition
Services transferred over time 114,303 28,272 31 142,606
For the year ended 30 June 2018 $’000
Drilling Services – Asia Pacific
Drilling Services – International
Mineral Technology Total
Primary geographical markets based on location of customersAustralia 118,579 - 3 118,582
North America - 13,656 - 13,656
Europe - 4,533 - 4,533
Total revenue 118,579 18,189 3 136,771
Major services
Underground diamond drilling 112,747 18,189 - 130,936
Reverse circulation drilling 5,832 - - 5,832Mineral analysis - - 3 3
Total revenue 118,579 18,189 3 136,771
Timing of revenue recognition
Services transferred over time 118,579 18,189 3 136,771
Comparatives have been presented on a consistent basis with the current period but have not been restated or remeasured for the impact of AASB 15 adoption.F
or p
erso
nal u
se o
nly

47ANNUAL REPORT 2019 SWICK MINING SERVICES
NOTES TO THE CONSOLIDATED FINANCIAL STATEMENTSFOR THE YEAR ENDED 30 JUNE 2019
2.3 Other expensesCONSOLIDATED GROUP
2019 $000
2018 $000
Other expensesAccommodation and travel 4,845 5,380Repairs and maintenance 6,615 5,738Administration costs 2,957 3,292Insurance 2,044 1,721Recruitment and training 562 574Rental expense on operating leases 1,797 1,666Total other expenses 18,820 18,371
Operating leasesOperating lease payments are recognised as an expense on a straight-line basis over the lease term.
2.4 Income tax expenseCONSOLIDATED GROUP
2019 $000
2018 $000
(a) Income tax recognised in profit or loss:Current taxCurrent year tax expense (63) 249Prior year over/(under) provision - (4)
(63) 245
Deferred taxRelating to origination and reversal of temporary differences (2,052) (218)Prior year over/(under) provision 57 (114)
(1,995) (332)
Net income tax expense reported in profit or loss (2,058) (87)
(b) The expense for the year can be reconciled to accounting profit as follows:Accounting profit/(loss) before income tax 3,096 (888)
Prima facie tax benefit on loss from ordinary activities before income tax at 30% (929) 266- Non-deductible expenses (154) (35)- Share-based payments expense (11) (10)- Effect of foreign tax rate 6 (10)- Carry forward losses not recognised (1,027) (180)- Prior year over/(under) provision 57 (118)
Income tax expense attributable to entity (2,058) (87)
(i) The tax rate used for the reconciliations above is the corporate tax rate of 30% (2018: 30%) payable by Australian corporate entities on taxable profits under Australian tax law.
(i) The increase in the weighted average effective consolidated tax rate for 2019 of 67% (2018: 9.8%) is a result of non-recognition (2018: recognition) of overseas losses.
For
per
sona
l use
onl
y

48 SWICK MINING SERVICES ANNUAL REPORT 2019
NOTES TO THE CONSOLIDATED FINANCIAL STATEMENTSFOR THE YEAR ENDED 30 JUNE 2019
Current taxThe tax currently payable is based on taxable profit for the year. Taxable profit differs from profit before tax as reported in the consolidated statement of profit or loss and other comprehensive income because of items of income or expense that are taxable or deductible in other years and items that are never taxable or deductible. The Group’s current tax is calculated using tax rates that have been enacted or substantively enacted by the end of the reporting period.
See note 3.7 for deferred tax balances.
Tax consolidationThe Company and its wholly-owned Australian resident entities have formed a tax-consolidated Group with effect from 1 July 2009 and are therefore taxed as a single entity from that date. The head entity within the tax-consolidated Group is Swick Mining Services Limited. Tax expense/income, deferred tax liabilities and deferred tax assets arising from temporary differences of the members of the tax-consolidated Group are recognised in the separate financial statements of the members of the tax-consolidated Group using the ‘separate taxpayer within Group’ approach by reference to the carrying amounts in the separate financial statements of each entity and the tax values applying under tax consolidation. Current tax liabilities and assets and deferred tax assets arising from unused tax losses and relevant tax credits of the members of the tax-consolidated Group are recognised by the Company (as head entity in the tax-consolidated Group). Due to the existence of a tax funding arrangement between the entities in the tax-consolidated Group, amounts are recognised as payable to or receivable by the Company and each member of the Group in relation to the tax contribution amounts paid or payable between the parent entity and the other members of the tax-consolidated Group in accordance with the arrangement.
Goods and services tax (GST)Revenues, expenses and assets are recognised net of the amount of GST, except where the amount of GST incurred is not recoverable from the relevant tax authority. In these circumstances the GST is recognised as part of the cost of acquisition of the asset or as part of an item of the expense.
Receivables and payables in the statement of financial position are shown inclusive of GST. The net amount of GST recoverable from, or payable to, the relevant tax authority is included as a current asset or liability in the statement of financial position.
2.5 Dividends
CONSOLIDATED GROUP
Cents per Share
2019 $000
2018 $000
Distributions paid/payable2019 final fully franked ordinary dividend franked at the tax rate of 30% 0.6 1,389 -
Total dividends 1,389 -
(a) Franking account balance:Closing balance 1,319 1,332Subsequent to year end, the franking account would be reduced by the proposed dividend as follows: (595) -Adjusted franking account balance 724 1,332
Provision is made for the amount of any dividend declared, being appropriately authorised and no longer at the discretion of the entity, on or before the end of the reporting period but not distributed at the end of the reporting period.
For
per
sona
l use
onl
y

49ANNUAL REPORT 2019 SWICK MINING SERVICES
NOTES TO THE CONSOLIDATED FINANCIAL STATEMENTSFOR THE YEAR ENDED 30 JUNE 2019
2.6 Earnings per shareThe earnings and weighted average number of ordinary shares used in the calculation of basic earnings per share are as follows:
CONSOLIDATED GROUP
2019 $000
2018 $000
Earnings used to calculate basic earnings per shareProfit/(loss) after income tax expense attributable to owners of the Company 1,038 (975)Profit/(loss) used to determine diluted earnings per share 1,038 (975)
CONSOLIDATED GROUP
2019 No.
2018 No.
Weighted average number of ordinary shares outstanding during the year 231,450,825 231,450,825
Adjustments for:- Shares held by Employee Share Trust (919,433) (442,358)
Weighted average number of ordinary shares outstanding during the year used in calculating basic earnings per share 230,531,392 231,008,467
Adjustments for:
- Shares held by Employee Share Trust 919,433 442,358
- Employee Share Options Scheme (i) 6,452,114 -
- Performance rights (i) 1,258,861 -
Weighted average number of ordinary shares outstanding during the year used in calculating dilutive earnings per share 239,161,800 231,450,825
Basic earnings/(loss) per share (cents) 0.45 (0.42)
Diluted earnings/(loss) per share (cents) 0.43 (0.42)
(i) The impact of performance rights and options in 2019 has been factored into the calculation of the diluted earnings per share while in 2018 it has not been as the Group was in a loss position. The number of options and performance rights not included in diluted earnings per share calculation for 2018 was 6,452,114 and 784,314 respectively.
Basic earnings per shareBasic earnings per share is calculated as net profit attributable to members of the parent, adjusted to exclude any costs of servicing equity (other than dividends) and preference share dividends, divided by the weighted average number of ordinary shares, adjusted for any bonus element.
Diluted earnings per shareDiluted earnings per share are calculated as net profit attributable to members of the parent, adjusted for:
+ costs of servicing equity (other than dividends) and preference share dividends; + the after-tax effect of dividends and interest associated with dilutive potential ordinary shares that have been recognised as an expense; and
+ other non-discretionary changes in revenue or expenses during the period that would result from the dilution of potential ordinary shares; divided by the weighted average number of ordinary shares and dilutive potential ordinary shares, adjusted for any bonus element.
The dilutive effect, if any, of outstanding options and performance rights is reflected as additional share dilution in the computation of diluted earnings per share.
For
per
sona
l use
onl
y

50 SWICK MINING SERVICES ANNUAL REPORT 2019
NOTES TO THE CONSOLIDATED FINANCIAL STATEMENTSFOR THE YEAR ENDED 30 JUNE 2019
3. Assets and Liabilities3.1 Cash and restricted cash
CONSOLIDATED GROUP
2019 $000
2018 $000
Cash at bank and in hand 11,257 10,914
Restricted cash 296 547
11,553 11,461
The cash balance primarily consists of cash and on-call bank deposits.
The restricted cash relates to government grant received for a certain project within the Mineral Technology division.
CONSOLIDATED GROUP
2019 $000
2018 $000
With credit ratings (Moody’s):
- A2 27 -
- Aa2 7,042 1,606
- Aa3 3,774 9,066
- B2 273 787
- Ba3 436 -
Without external credit ratings 1 2
11,553 11,461
For
per
sona
l use
onl
y

51ANNUAL REPORT 2019 SWICK MINING SERVICES
NOTES TO THE CONSOLIDATED FINANCIAL STATEMENTSFOR THE YEAR ENDED 30 JUNE 2019
CONSOLIDATED GROUP
2019 $000
2018 $000
Reconciliation of cash flow from operations with profit/(loss) after income tax
Profit/(loss) after income tax 1,038 (975)
Non-cash flows in profit and loss
Depreciation and amortisation 20,954 16,875
Net foreign exchange gains (724) (44)
Net gain on disposal of property, plant and equipment (83) (82)
Share options/performance rights expensed 175 303
Government grant recognised through deferred revenue (574) -
Change in assets and liabilities, net of the effects of purchase and disposal of subsidiaries:
(Increase)/decrease in trade and other receivables (1,863) 723
(Increase)/decrease in inventories (419) 1,292
(Increase)/decrease in prepayments (78) 664
Increase in current tax asset (127) -
Increase/(decrease) in trade payables 2,713 (4,026)
Increase in current tax liabilities 120 4
(Increase)/decrease in deferred tax assets (63) 212
Increase in deferred tax liabilities 2,039 108
Increase in deferred revenue 325 547
Increase in provisions 156 554
Cash flow from operations 23,589 16,155
Cash flows are included in the statement of cash flows on a gross basis and the GST component of cash flows arising from investing and financing activities, which is recoverable from, or payable to, the taxation authority is classified as part of operating cash flows.
For
per
sona
l use
onl
y

52 SWICK MINING SERVICES ANNUAL REPORT 2019
NOTES TO THE CONSOLIDATED FINANCIAL STATEMENTSFOR THE YEAR ENDED 30 JUNE 2019
3.2 Trade and other receivablesCONSOLIDATED GROUP
2019 $000
2018 $000
CURRENT
Trade receivables 17,383 15,410
Other receivables 483 593
Total current trade and other receivables 17,866 16,003
Pre 1 July 2018Trade receivables are carried at amortised cost less an allowance for impairment. The Group reviews the collectability of trade receivables on an ongoing basis and makes an objective judgement concerning amounts considered not collectible. The amount of the loss is recognised in the statement of profit or loss within operating expenses and classified as doubtful debts. Any subsequent recovery of amounts previously written off, are recorded as other income in the statement of profit or loss.
Post 1 July 2018Trade and other receivables are classified as financial assets at initial recognition, and subsequently measured at amortised cost determined under AASB 9. See note 1.6 for the accounting policy for financial assets.
Fair values and credit riskDue to the short-term nature of these receivables their carrying value is assumed to approximate their fair values.
As at 30 June, the ageing analysis of trade and other receivables is as follows:
CONSOLIDATED GROUP
2019 $000
2018 $000
Current 17,866 16,003
Past due 0 to 30 days - -
Past due 31+ days - -
17,866 16,003
Trade debtors are non-interest bearing and generally on 30-60 day terms.
Amounts are considered as ‘past due’ when the debt has not been settled with the terms and conditions agreed between the Group and the customer or counter party to the transaction. Receivables that are past due are assessed for impairment by ascertaining solvency of the debtors and are provided for where there are specific circumstances indicating that the debt may not be fully repaid to the Group.
The balances of receivables that remain within initial trade terms (as detailed in the table) are considered to be of high credit quality.
Based on review at the date of reporting, expected credit loss rate is 0% (2018: 0%) and no impairment allowance is required as at 30 June 2019 (2018: nil).F
or p
erso
nal u
se o
nly
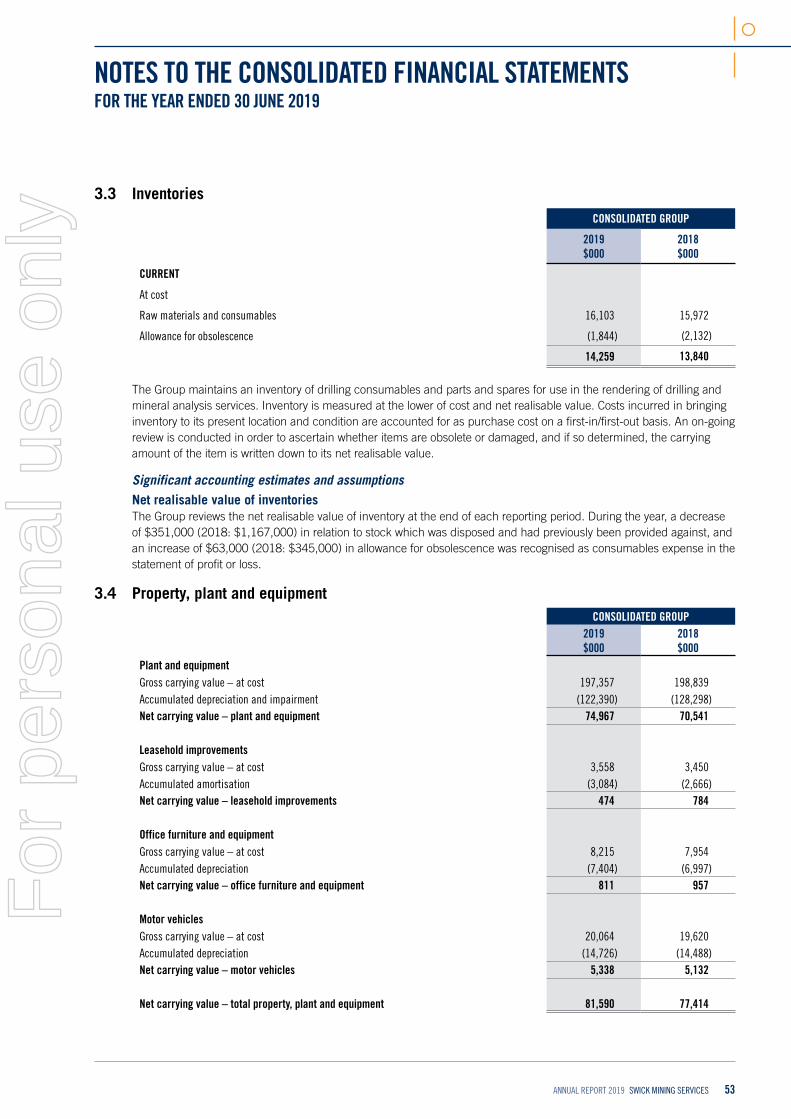
53ANNUAL REPORT 2019 SWICK MINING SERVICES
NOTES TO THE CONSOLIDATED FINANCIAL STATEMENTSFOR THE YEAR ENDED 30 JUNE 2019
3.3 InventoriesCONSOLIDATED GROUP
2019 $000
2018 $000
CURRENT
At cost
Raw materials and consumables 16,103 15,972
Allowance for obsolescence (1,844) (2,132)
14,259 13,840
The Group maintains an inventory of drilling consumables and parts and spares for use in the rendering of drilling and mineral analysis services. Inventory is measured at the lower of cost and net realisable value. Costs incurred in bringing inventory to its present location and condition are accounted for as purchase cost on a first-in/first-out basis. An on-going review is conducted in order to ascertain whether items are obsolete or damaged, and if so determined, the carrying amount of the item is written down to its net realisable value.
Significant accounting estimates and assumptionsNet realisable value of inventoriesThe Group reviews the net realisable value of inventory at the end of each reporting period. During the year, a decrease of $351,000 (2018: $1,167,000) in relation to stock which was disposed and had previously been provided against, and an increase of $63,000 (2018: $345,000) in allowance for obsolescence was recognised as consumables expense in the statement of profit or loss.
3.4 Property, plant and equipmentCONSOLIDATED GROUP
2019 $000
2018 $000
Plant and equipmentGross carrying value – at cost 197,357 198,839Accumulated depreciation and impairment (122,390) (128,298)Net carrying value – plant and equipment 74,967 70,541
Leasehold improvementsGross carrying value – at cost 3,558 3,450Accumulated amortisation (3,084) (2,666)Net carrying value – leasehold improvements 474 784
Office furniture and equipmentGross carrying value – at cost 8,215 7,954Accumulated depreciation (7,404) (6,997)Net carrying value – office furniture and equipment 811 957
Motor vehicles Gross carrying value – at cost 20,064 19,620Accumulated depreciation (14,726) (14,488)Net carrying value – motor vehicles 5,338 5,132
Net carrying value – total property, plant and equipment 81,590 77,414
For
per
sona
l use
onl
y

54 SWICK MINING SERVICES ANNUAL REPORT 2019
NOTES TO THE CONSOLIDATED FINANCIAL STATEMENTSFOR THE YEAR ENDED 30 JUNE 2019
Plant and equipment
$000
Leasehold improvements
$000
Office furniture and
equipment $000
Motor vehicles
$000Total $000
Consolidated group
Balance at 1 July 2017 71,222 901 1,489 4,138 77,750
Additions (i) 12,833 190 313 2,478 15,814
Disposals (60) - - (157) (217)
Exchange rate revaluation 398 3 1 39 441
Depreciation expense (13,852) (310) (846) (1,366) (16,374)
Balance at 30 June 2018 70,541 784 957 5,132 77,414
Additions (i) 20,147 110 514 1,933 22,704
Disposals (1) - - (17) (18)
Exchange rate revaluation 303 1 2 48 354
Depreciation expense (16,023) (421) (662) (1,758) (18,864)
Balance at 30 June 2019 74,967 474 811 5,338 81,590
(i) Additions include $nil (2018: $1,032,000) of development costs capitalised to plant and equipment (note 3.5).
Items of plant and equipment are measured at cost less accumulated depreciation and impairment. Cost includes acquisition, being the fair value of the consideration provided, plus incidental costs directly attributable to the acquisition.
Subsequent costs directly related to an item of plant and equipment, which enhances the functionality of the asset, are recognised in the carrying amount of that item of property, plant and equipment only when it is probable that the future economic benefits embodied within the item will flow to the consolidated entity and the cost of the item can be measured reliably. All other costs, including repairs and maintenance, are recognised in the statement of profit or loss and other comprehensive income as an expense.
An asset’s carrying amount is written down immediately to its recoverable amount if the asset’s carrying amount is greater than its estimated recoverable amount.
Gains and losses on disposals are determined by comparing proceeds with the carrying amount. These gains and losses are included in the profit and loss. When revalued assets are sold, amounts included in the revaluation surplus relating to that asset are transferred to retained earnings.
DepreciationDepreciation is recognised in profit and loss on a straight-line or usage basis over the estimated useful life of each part of an item of property, plant and equipment. The depreciation method reflects the pattern in which the future economic benefit is expected to be consumed for each asset giving consideration to the estimated working life of each asset. The estimated working life and idle time for each asset is assessed annually. Those items of property, plant and equipment undertaking construction are not depreciated.
The following are the estimated useful lives for each class of property, plant and equipment:
Class of fixed asset Useful life
Plant and equipment 1.5 - 20 years
Leasehold improvements 2 - 15 years
Office furniture & equipment 5 - 10 years
Motor vehicles 3 - 10 years
For
per
sona
l use
onl
y
55ANNUAL REPORT 2019 SWICK MINING SERVICES
NOTES TO THE CONSOLIDATED FINANCIAL STATEMENTSFOR THE YEAR ENDED 30 JUNE 2019
Significant accounting estimates and assumptionsUseful lives and residual values
The Group reviews the estimated useful lives of property, plant and equipment at the end of each reporting period. No changes to useful lives have been made for the financial year ending 30 June 2019.
Impairment of non-financial assetsAt the end of each reporting period, the Group reviews the carrying amounts of its non-financial assets to determine whether there is any indication that those assets have suffered an impairment loss. If any such indication exists, the recoverable amount of the asset is estimated in order to determine the extent of the impairment loss (if any). Where it is not possible to estimate the recoverable amount of an individual asset, the Group estimates the recoverable amount of the cash generating unit to which the asset belongs. Where a reasonable and consistent basis of allocation can be identified, corporate assets are also allocated to individual cash generating units, or otherwise they are allocated to the smallest group of cash generating units for which a reasonable and consistent allocation basis can be identified.
The carrying value of intangible assets not yet available for use are tested for impairment annually or more frequently when an indication of impairment arises during the reporting period.
Recoverable amount is the higher of fair value less costs of disposal and value-in-use. In assessing value-in-use, the estimated future cash flows are discounted to their present value using a pre-tax discount rate that reflects current market assessments of the time value of money and the risks specific to the asset for which the estimates of future cash flows have not been adjusted.
If the recoverable amount of the cash generating unit (or group of cash generating units) is less than the carrying amount of the cash generating unit (or groups of cash generating units), the impairment loss is allocated to the assets of the cash generating units pro-rata on the basis of the carrying amount of each asset in the cash generating unit (or groups of cash generating units).
Where an impairment loss subsequently reverses, the carrying amount of the asset (cash generating unit) is increased to the revised estimate of its recoverable amount, but only to the extent that the increased carrying amount does not exceed the carrying amount that would have been determined had no impairment loss been recognised for the asset (cash generating unit) in prior years. A reversal of an impairment loss is recognised immediately in profit or loss.
In assessing any potential impairment of assets, management have identified three separate functional divisions as being the cash generating units (CGUs) within the Group:
+ Underground Diamond (UD) drilling;
+ Reverse Circulation (RC) drilling; and
+ Mineral Technology.
For impairment purposes, intangible assets have been allocated to either the Underground Diamond drilling or the Mineral Technology CGUs.
According to AASB 136 Impairment of Assets, impairment testing is required when there is an indication of possible impairment. The Group has considered all indications of possible impairment including the relationship between its market capitalisation and the carrying value of its net assets, and has determined this to be one of the main impairment indicators noted for year ended 30 June 2019 and 30 June 2018.
Significant accounting estimates and assumptionsFair value less costs of disposal
Determining whether the assets of the Group are impaired under this method requires an estimation of the market value of each asset individually and adjusting this value by expected costs required to dispose of the asset. Where the calculated value is less than the book value, an impairment loss may arise. In supporting the fair value less costs of disposal, the directors have engaged an independent valuer to estimate the value of the appropriate assets.
For
per
sona
l use
onl
y

56 SWICK MINING SERVICES ANNUAL REPORT 2019
NOTES TO THE CONSOLIDATED FINANCIAL STATEMENTSFOR THE YEAR ENDED 30 JUNE 2019
Impairment assumptionsUnderground Diamond (UD) drilling
The impairment assessment of the UD CGU has been performed by engaging an independent third party to complete the valuation. Valuation has been determined by capitalization of future maintainable earnings methodology, with historically achieved EBITDA (earnings before interest, tax, depreciation and amortisation expenses) used to estimate future earnings and the earnings multiple derived from trading multiples of listed companies with comparable operations to the UD CGU. A cost of disposal was then applied to the value.
Key assumptions used in the valuation were annual revenue of $150 million to $155 million (2018: $119 million to $145 million), future maintainable earnings (EBITDA) margin of 20% (2018: 16% to 18%), earnings multiple (on a control basis) of 4.0 times to 4.5 times (2018: 4.0 times to 5.5 times) and a cost of disposal of 2% (2018: 2%).
Based on the independent valuation, no impairment expense has been recognised in the UD CGU (2018: nil).
Reverse Circulation (RC) drilling
The impairment assessment of the RC CGU has been performed using the fair value less cost of disposal method for each piece of equipment in the CGU and was undertaken by an independent third party. The valuation was completed by comparing the available assets against recent sales of similar assets, then applying a 4% sales commission.
Based on the independent valuation, no impairment expense has been recognised in the RC CGU (2018: nil).
Mineral Technology
The impairment assessment for the Mineral Technology CGU has been performed using the fair value less cost of disposal method and was undertaken by an independent third party. The valuation was carried out by undertaking an evidence-based review of the risk profile and earnings potential of the CGU from the last observable arms length transaction which occurred on 1 June 2017.
Based on the review, which identified a higher earnings potential on achievement of key milestones, an improved moderate risk profile following the successful launch of the GeoCore X10 machine and technology and execution of commercial agreements with customers, no impairment has been recognised for the Mineral Technology CGU (2018: nil).
3.5 Intangible assets
CONSOLIDATED GROUP
2019 $000
2018 $000
Development costs
Drilling Services: amortising
Gross carrying value – at cost 9,552 9,294
Accumulated amortisation (5,784) (5,302)
Net carrying value – drilling services: amortising 3,768 3,992
Drilling Services: non-amortising 1,172 585
Mineral Technology: amortising
Gross carrying value – at cost 7,539 7,417
Accumulated amortisation (1,698) (82)
Net carrying value – mineral technology: amortising 5,841 7,335
Mineral Technology: non-amortising 1,415 762
Total intangible assets 12,196 12,674
For
per
sona
l use
onl
y
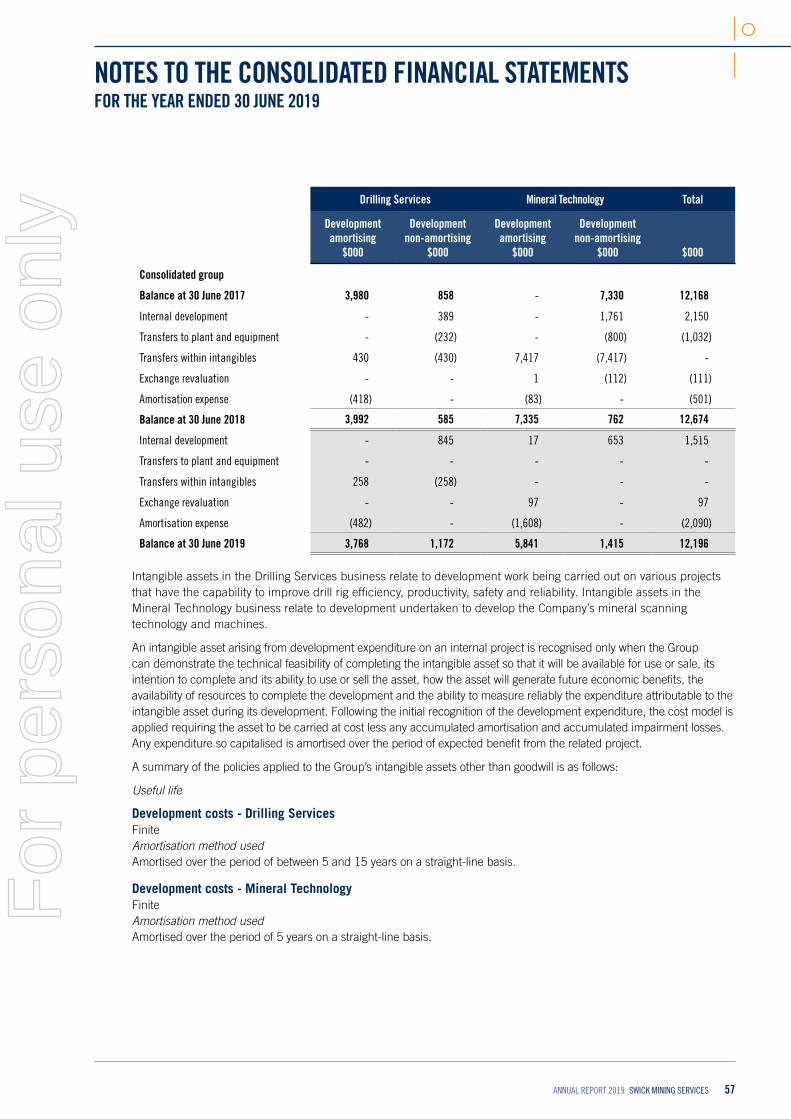
57ANNUAL REPORT 2019 SWICK MINING SERVICES
NOTES TO THE CONSOLIDATED FINANCIAL STATEMENTSFOR THE YEAR ENDED 30 JUNE 2019
Drilling Services Mineral Technology Total
Development amortising
$000
Development non-amortising
$000
Development amortising
$000
Development non-amortising
$000
$000
Consolidated group
Balance at 30 June 2017 3,980 858 - 7,330 12,168
Internal development - 389 - 1,761 2,150
Transfers to plant and equipment - (232) - (800) (1,032)
Transfers within intangibles 430 (430) 7,417 (7,417) -
Exchange revaluation - - 1 (112) (111)
Amortisation expense (418) - (83) - (501)
Balance at 30 June 2018 3,992 585 7,335 762 12,674
Internal development - 845 17 653 1,515
Transfers to plant and equipment - - - - -
Transfers within intangibles 258 (258) - - -
Exchange revaluation - - 97 - 97
Amortisation expense (482) - (1,608) - (2,090)
Balance at 30 June 2019 3,768 1,172 5,841 1,415 12,196
Intangible assets in the Drilling Services business relate to development work being carried out on various projects that have the capability to improve drill rig efficiency, productivity, safety and reliability. Intangible assets in the Mineral Technology business relate to development undertaken to develop the Company’s mineral scanning technology and machines.
An intangible asset arising from development expenditure on an internal project is recognised only when the Group can demonstrate the technical feasibility of completing the intangible asset so that it will be available for use or sale, its intention to complete and its ability to use or sell the asset, how the asset will generate future economic benefits, the availability of resources to complete the development and the ability to measure reliably the expenditure attributable to the intangible asset during its development. Following the initial recognition of the development expenditure, the cost model is applied requiring the asset to be carried at cost less any accumulated amortisation and accumulated impairment losses. Any expenditure so capitalised is amortised over the period of expected benefit from the related project.
A summary of the policies applied to the Group’s intangible assets other than goodwill is as follows:
Useful life
Development costs - Drilling Services Finite Amortisation method used Amortised over the period of between 5 and 15 years on a straight-line basis.
Development costs - Mineral TechnologyFinite Amortisation method used Amortised over the period of 5 years on a straight-line basis.
For
per
sona
l use
onl
y

58 SWICK MINING SERVICES ANNUAL REPORT 2019
NOTES TO THE CONSOLIDATED FINANCIAL STATEMENTSFOR THE YEAR ENDED 30 JUNE 2019
Significant accounting estimates and assumptionsThe carrying value of an intangible asset arising from development expenditure is tested for impairment annually when the asset is not yet available for use or more frequently when an indication of impairment arises during the reporting period. The amortisation method is reviewed at each financial year-end.
Recoverability of internally generated intangible assets
Drilling ServicesDuring the year, the directors considered the recoverability of the Group’s capitalised development costs included in the consolidated statement of financial position at 30 June 2019 of $4,940,000 (2018: $4,577,000).
Development projects continue to progress in accordance with the Group’s project management plans. During the year the company moved into the commercial phase of the project. An independent valuation has been undertaken which concluded that company can expect to recover the carrying value of the assets in full.
Mineral TechnologyDuring the year, the directors considered the recoverability of the Group’s capitalised development costs included in the consolidated statement of financial position at 30 June 2019 of $7,256,000 (2018: $8,097,000).
Development projects continue to progress in accordance with the Group’s project management plans. During the year the company continued to progress the commercial phase of the project. An independent valuation has been undertaken which concluded that company can expect to recover the carrying value of the assets in full.
Impairment of intangible assetsDrilling ServicesThe value of the amortising development intangibles in the UD drilling CGU are included as appropriate under impairment testing for property, plant and equipment. Other intangibles are still in development and each item is tested for expected completion and expected recoverable value.
Management has conducted a review of the current development projects (amortising and non-amortising) which have been capitalised to determine the expected future cash flows to be generated from future use under impairment testing for property, plant and equipment. The modelling undertaken showed the book value of these assets will be recovered through future use and therefore no impairment is required (2018: nil).
Mineral TechnologyThe value of the amortising development intangibles in the Mineral Technology CGU are included as appropriate under impairment testing for property, plant and equipment. Other intangibles are still in development and each item is tested for expected completion and expected recoverable value.
Management has conducted a review of the current development projects (amortising and non-amortising) which have been capitalised to determine the expected future cash flows to be generated from future use under impairment testing for property, plant and equipment. The review undertaken showed the book value of these assets will be recovered through future use and therefore no impairment is required (2018: nil).
3.6 Financial asset classified as FVOCICONSOLIDATED GROUP
2019 $000
2018 $000
Financial asset classified as FVOCI
Units in unlisted property trust 1,630 1,630For
per
sona
l use
onl
y

59ANNUAL REPORT 2019 SWICK MINING SERVICES
NOTES TO THE CONSOLIDATED FINANCIAL STATEMENTSFOR THE YEAR ENDED 30 JUNE 2019
Pre 1 July 2018The Group has an investment in an unlisted unit trust that is not traded in an active market but is classified as a Fair Value through Other Comprehensive Income (FVOCI) financial asset and stated at fair value (because the directors consider that fair value can be reliably measured). Gains and losses arising from changes in fair value are recognised in other comprehensive income and accumulated in the fair value reserve. Where the investment is disposed of or is determined to be impaired, the cumulative gain or loss previously accumulated in the fair value reserve is reclassified to profit or loss.
Dividends on AFS equity instruments are recognised in profit or loss when the Group’s right to receive the dividends is established.
Post 1 July 2018The Group has an investment in an unlisted unit trust that is not traded in an active market but is classified as a Fair Value through Other Comprehensive Income (FVOCI) equity investments. Fair value movements continue to be recognised in equity through other comprehensive income and are not eligible for recycling through profit or loss upon realisation of the asset.
Dividends on Fair Value through Other Comprehensive Income (FVOCI) equity investments are recognised in profit or loss when the Group’s right to receive the dividends is established.
Fair valueFair value is the price at which an orderly transaction to sell the asset or to transfer the liability would take place between market participants at the measurement date under current market conditions. The fair values of financial assets and financial liabilities are determined as follows:
+ the fair values of financial assets and financial liabilities with standard terms and conditions and traded on active liquid markets are determined with reference to quoted market prices; and
+ the fair values of other financial assets and financial liabilities (excluding derivative instruments) are determined in accordance with generally accepted pricing models based on discounted cash flow analysis.
For financial reporting purposes, fair value measurements are categorised into Level 1, 2 or 3 based on the degree to which the inputs to the fair value measurements are observable and the significance of the inputs to the fair value measurement in its entirety, which are described as follows:
+ Level 1 inputs are quoted prices (unadjusted) in active markets for identical assets or liabilities that the entity can access at the measurement date;
+ Level 2 inputs are inputs, other than quoted prices included within Level 1, that are observable for the asset or liability, either directly or indirectly; and
+ Level 3 inputs are unobservable inputs for the asset or liability.
Description of significant unobservable inputs to valuationThe significant unobservable inputs used in the fair value measurements categorised within Level 3 of the fair value hierarchy, together with a qualitative sensitivity analysis as at 30 June 2019 and 2018 are as shown below:
Financial asset
Fair value as at
Valuation technique
Significant unobservable input(s)
Sensitivity of the input to fair value
30/06/19$000
30/06/18$000
Investment in unlisted property trust (i)(ii)
1,630 1,630 Comparable Sales Method
Sales of sites within similar areas taking into account the location, size and condition of improvements to determine a rate per square metre of $425 - $450 (2018: $425 - $450).
A $25 per square metre increase in price would increase the value by $124,000 (2018: $124,000), and vice versa.
(i) A gain of $nil (2018: $250,000 resulting from the revaluation of the underlying property in the unit trust) is recognised in other comprehensive income and accumulated in the fair value reserve.
(ii) Investment income of $132,000 (2018: $120,000) received during the financial year from the investment in the unlisted property trust has been included in other income.
For
per
sona
l use
onl
y

60 SWICK MINING SERVICES ANNUAL REPORT 2019
NOTES TO THE CONSOLIDATED FINANCIAL STATEMENTSFOR THE YEAR ENDED 30 JUNE 2019
3.7 Net deferred tax assets
CONSOLIDATED GROUP
CONSOLIDATED STATEMENT OF FINANCIAL POSITION
CONSOLIDATED GROUP
CONSOLIDATED STATEMENT OF PROFIT OR LOSS AND OTHER COMPREHENSIVE INCOME
Deferred tax assets and liabilities are attributable to the following:
2019$000
2018 $000
2019$000
2018$000
Recognised deferred tax assets
Provisions and accrued expenses 2,642 2,457 185 (267)
Tax deductibility for capital raising 65 69 (4) 64
Research and development credit 2,469 1,906 563 201
Tax losses 986 2,228 (1,242) 1,022
Deferred tax assets 6,162 6,660
Set off of deferred tax liability (5,913) (6,474)
Net deferred tax assets 249 186
Recognised deferred tax liabilities
Consumables (1,661) (1,700) 39 267
Prepayments (75) - (75) -
Property, plant and equipment (6,073) (4,642) (1,431) (1,607)
Tax on fair value reserve (251) (240) (11) (75)
Deferred tax liabilities (8,060) (6,582)
Set off to deferred tax asset 5,913 6,474
Net deferred tax liabilities (2,147) (108) (1,976) (395)
Movements:
Opening balance 1 July 78 473
Credit to the income statement (1,990) (332)
Credit to equity - (75)
Exchange rate revaluation 14 12
Closing balance at 30 June (1,898) 78
As at 30 June 2019 the Company had $4,457,000 (2018: $2,755,000) in unrecognised tax losses. These tax losses arose from three separate tax jurisdictions and can be carried forward for a maximum period of 5 years, 20 years or indefinitely from the year of the loss.
Deferred taxDeferred tax is recognised on temporary differences between the carrying amounts of assets and liabilities in the financial statements and the corresponding tax bases used in the computation of taxable profit. Deferred tax liabilities are generally recognised for all taxable temporary differences. Deferred tax assets are generally recognised for all deductible temporary differences to the extent that it is probable that taxable profits will be available against which those deductible temporary differences can be utilised. Deferred tax assets and liabilities are not recognised if the temporary difference arises from goodwill or from the initial recognition (other than in a business combination) of other assets and liabilities in a transaction that affects neither the taxable profit nor the accounting profit.F
or p
erso
nal u
se o
nly

61ANNUAL REPORT 2019 SWICK MINING SERVICES
NOTES TO THE CONSOLIDATED FINANCIAL STATEMENTSFOR THE YEAR ENDED 30 JUNE 2019
Deferred tax liabilities are recognised for taxable temporary differences associated with investments in subsidiaries and associates except where the Group is able to control the reversal of the temporary difference and it is probable that the temporary difference will not reverse in the foreseeable future. Deferred tax assets arising from deductible temporary differences associated with such investments and interests are only recognised to the extent that it is probable that there will be sufficient taxable profits against which to utilise the benefits of the temporary differences and they are expected to reverse in the foreseeable future.
The carrying amount of deferred tax assets is reviewed at the end of each reporting period and reduced to the extent that it is no longer probable that sufficient taxable profits will be available to allow all or part of the asset to be recovered.
Deferred tax assets and liabilities are offset when there is a legally enforceable right to set off current tax assets against current tax liabilities and when they relate to income taxes levied by the same taxation authority and the Group intends to settle its current tax assets and liabilities on a net basis.
Current & deferred tax for the periodCurrent and deferred tax are recognised as an expense or income in profit or loss, except when they relate to items that are recognised outside profit or loss (whether in other comprehensive income or directly in equity), in which case the tax is also recognised outside profit or loss, or where it arises from the initial accounting for a business combination. In the case of a business combination, the tax effect is included in the accounting for the business combination.
Significant accounting estimates and assumptionsRecoverability of tax losses The Group is subject to income taxes in Australia and foreign jurisdictions, significant estimates are required in determining the recoverability of deferred tax assets in these locations. The assumptions regarding future realisation, and therefore the recognition of deferred tax assets, may change due to future operating performance and other factors.
The directors have considered the recoverability of international tax losses as included in net deferred tax asset balances at 30 June 2019 of $0.2 million (2018: $0.2 million). Tax losses have been recognised where they are available to be recovered over a period of not more than 10 years and it is probable that the Company will generate future profits to use the tax losses.
3.8 Deferred revenueCONSOLIDATED GROUP
2019 $000
2018 $000
Balance at 1 July 547 -
Government grant received during the year 325 1,396
Government grant released to the statement of profit or loss (574) (869)
Foreign exchange movement (2) 20
Balance at 30 June 296 547
Current 296 547
Non-current - -
296 547
Government grants have been received for specific projects within the Mineral Technology business.For
per
sona
l use
onl
y
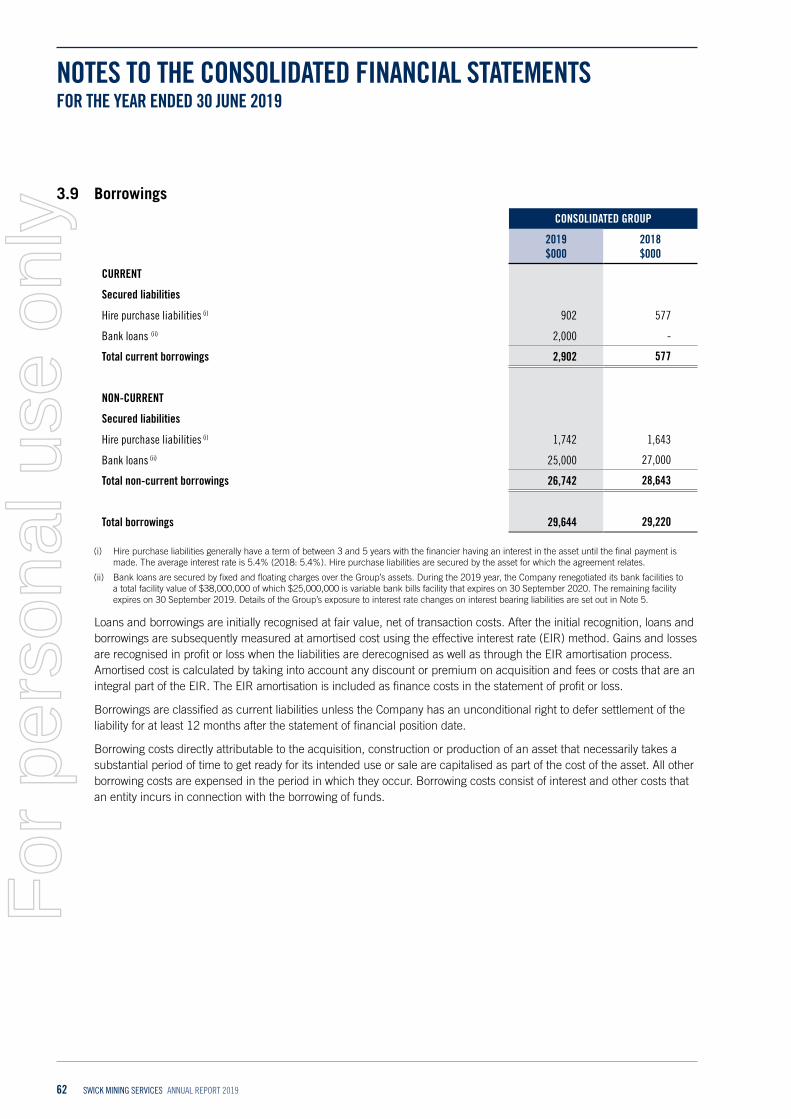
62 SWICK MINING SERVICES ANNUAL REPORT 2019
NOTES TO THE CONSOLIDATED FINANCIAL STATEMENTSFOR THE YEAR ENDED 30 JUNE 2019
3.9 BorrowingsCONSOLIDATED GROUP
2019 $000
2018 $000
CURRENT
Secured liabilities
Hire purchase liabilities (i) 902 577
Bank loans (ii) 2,000 -
Total current borrowings 2,902 577
NON-CURRENT
Secured liabilities
Hire purchase liabilities (i) 1,742 1,643
Bank loans (ii) 25,000 27,000
Total non-current borrowings 26,742 28,643
Total borrowings 29,644 29,220
(i) Hire purchase liabilities generally have a term of between 3 and 5 years with the financier having an interest in the asset until the final payment is made. The average interest rate is 5.4% (2018: 5.4%). Hire purchase liabilities are secured by the asset for which the agreement relates.
(ii) Bank loans are secured by fixed and floating charges over the Group’s assets. During the 2019 year, the Company renegotiated its bank facilities to a total facility value of $38,000,000 of which $25,000,000 is variable bank bills facility that expires on 30 September 2020. The remaining facility expires on 30 September 2019. Details of the Group’s exposure to interest rate changes on interest bearing liabilities are set out in Note 5.
Loans and borrowings are initially recognised at fair value, net of transaction costs. After the initial recognition, loans and borrowings are subsequently measured at amortised cost using the effective interest rate (EIR) method. Gains and losses are recognised in profit or loss when the liabilities are derecognised as well as through the EIR amortisation process. Amortised cost is calculated by taking into account any discount or premium on acquisition and fees or costs that are an integral part of the EIR. The EIR amortisation is included as finance costs in the statement of profit or loss.
Borrowings are classified as current liabilities unless the Company has an unconditional right to defer settlement of the liability for at least 12 months after the statement of financial position date.
Borrowing costs directly attributable to the acquisition, construction or production of an asset that necessarily takes a substantial period of time to get ready for its intended use or sale are capitalised as part of the cost of the asset. All other borrowing costs are expensed in the period in which they occur. Borrowing costs consist of interest and other costs that an entity incurs in connection with the borrowing of funds.
For
per
sona
l use
onl
y

63ANNUAL REPORT 2019 SWICK MINING SERVICES
NOTES TO THE CONSOLIDATED FINANCIAL STATEMENTSFOR THE YEAR ENDED 30 JUNE 2019
Changes in liabilities arising from financing activities
Non-cash changes
Consolidated group 2018 Cash flows New leases
Foreign exchange movement Other 2019
$000 $000 $000 $000 $000 $000
Current hire purchase liabilities 577 (777) 1,173 28 (99) 902Current bank loans - - - - 2,000 2,000
Non-current hire purchase liabilities 1,643 - - - 99 1,742
Non-current bank loans 27,000 - - - (2,000) 25,000
Total liabilities from financing activities 29,220 (777) 1,173 28 - 29,644
Non-cash changes
Consolidated group 2017 Cash flows New leases
Foreign exchange movement Other 2018
$000 $000 $000 $000 $000 $000
Current hire purchase liabilities - (300) 847 30 - 577Current bank loans 3,000 - - - (3,000) -
Non-current hire purchase liabilities - - 1,643 - - 1,643
Non-current bank loans 23,000 1,000 - - 3,000 27,000
Total liabilities from financing activities 26,000 700 2,490 30 - 29,220
Available borrowing facilities
Bank loan Revolving credit Multi-option facility TotalConsolidated group 2019 2018 2019 2018 2019 2018 2019 2018
$000 $000 $000 $000 $000 $000 $000 $000
Available facilities 35,000 29,500 2,644 2,819 3,000 500 40,644 32,819Used at balance date (27,000) (27,000) (2,644) (2,220) (469) (469) (30,113) (29,689)
Unused at balance date 8,000 2,500 - 599 2,531 31 10,531 3,130
Nature of bank loan Bank loans are secured by fixed and floating charges over the Group’s assets.
Nature of revolving credit The revolving credit relates to equipment hire purchase and leasing facilities.
Nature of Multi-option facility Multi-option facility consists of bank guarantee facility, documentary letter of credit and standby letter of credit. Bank guarantees on issue relate to rental lease commitments.
Banking covenants The Company complied with and continues to comply with all banking covenants specified in the finance agreement with its financier.
Fair valuesDue to the variable interest rate for the majority of these borrowings their carrying value is assumed to approximate their fair values.
For
per
sona
l use
onl
y
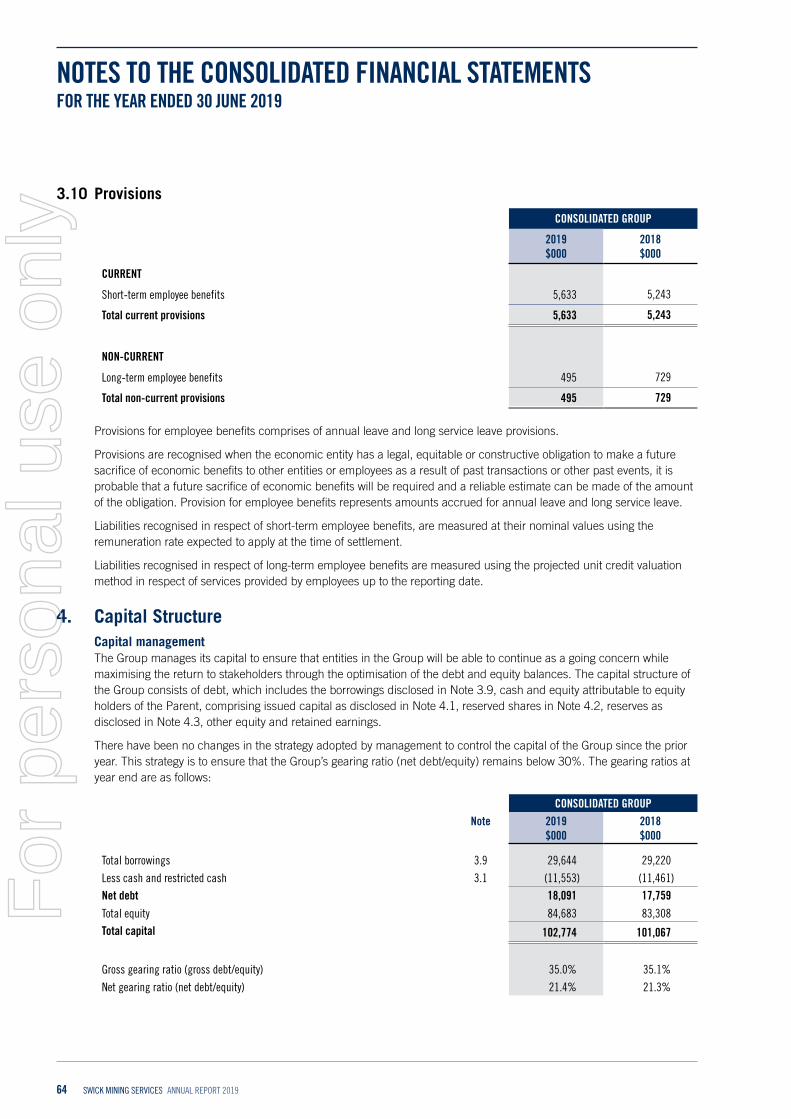
64 SWICK MINING SERVICES ANNUAL REPORT 2019
NOTES TO THE CONSOLIDATED FINANCIAL STATEMENTSFOR THE YEAR ENDED 30 JUNE 2019
3.10 ProvisionsCONSOLIDATED GROUP
2019 $000
2018 $000
CURRENT
Short-term employee benefits 5,633 5,243
Total current provisions 5,633 5,243
NON-CURRENT
Long-term employee benefits 495 729
Total non-current provisions 495 729
Provisions for employee benefits comprises of annual leave and long service leave provisions.
Provisions are recognised when the economic entity has a legal, equitable or constructive obligation to make a future sacrifice of economic benefits to other entities or employees as a result of past transactions or other past events, it is probable that a future sacrifice of economic benefits will be required and a reliable estimate can be made of the amount of the obligation. Provision for employee benefits represents amounts accrued for annual leave and long service leave.
Liabilities recognised in respect of short-term employee benefits, are measured at their nominal values using the remuneration rate expected to apply at the time of settlement.
Liabilities recognised in respect of long-term employee benefits are measured using the projected unit credit valuation method in respect of services provided by employees up to the reporting date.
4. Capital StructureCapital managementThe Group manages its capital to ensure that entities in the Group will be able to continue as a going concern while maximising the return to stakeholders through the optimisation of the debt and equity balances. The capital structure of the Group consists of debt, which includes the borrowings disclosed in Note 3.9, cash and equity attributable to equity holders of the Parent, comprising issued capital as disclosed in Note 4.1, reserved shares in Note 4.2, reserves as disclosed in Note 4.3, other equity and retained earnings.
There have been no changes in the strategy adopted by management to control the capital of the Group since the prior year. This strategy is to ensure that the Group’s gearing ratio (net debt/equity) remains below 30%. The gearing ratios at year end are as follows:
CONSOLIDATED GROUPNote 2019
$0002018 $000
Total borrowings 3.9 29,644 29,220
Less cash and restricted cash 3.1 (11,553) (11,461)Net debt 18,091 17,759Total equity 84,683 83,308Total capital 102,774 101,067
Gross gearing ratio (gross debt/equity) 35.0% 35.1%
Net gearing ratio (net debt/equity) 21.4% 21.3%
For
per
sona
l use
onl
y

65ANNUAL REPORT 2019 SWICK MINING SERVICES
NOTES TO THE CONSOLIDATED FINANCIAL STATEMENTSFOR THE YEAR ENDED 30 JUNE 2019
4.1 Issued capitalCONSOLIDATED GROUP
Movement in ordinary shares on issue No. $000
Balance at 1 July 2017 231,450,825 79,446
Balance at 30 June 2018 231,450,825 79,446
Balance at 30 June 2019 231,450,825 79,446
Fully paid ordinary shares carry one vote per share and carry the right to dividends. The Company does not have a limited amount of authorised capital and issued shares do not have a par value.
Where the Group issues new equity instruments, any consideration received, net of any directly attributable incremental transaction costs and the related income tax effects, is included in equity attributable to the owners of the Company.
Where any group company purchases the Company’s equity instruments, for example as the result of a share buy-back or a share-based payment plan, the consideration paid, including any directly attributable incremental costs (net of income taxes) is deducted from equity attributable to the owners of the Company as treasury shares until the shares are cancelled or reissued.
Where such ordinary shares are subsequently reissued, any consideration received, net of any directly attributable incremental transaction costs and the related income tax effects, is included in equity attributable to the owners of the Company.
4.2 Reserved SharesCONSOLIDATED GROUP
Movement in reserved shares No. $000
Balance at 30 June 2017 - (453)
Shares bought back during the year 800,064 (214)
Shares allocated to exercised performance rights (800,046) -
Balance at 30 June 2018 18 (667)
Shares bought back during the year 477,075 (110)
Shares allocated to exercised performance rights (477,075) -
Balance at 30 June 2019 18 (777)
Reserve for own sharesThe reserve for the Company’s own shares comprises the cost (net of tax) of the Company’s shares held by the trustee of the consolidated entity’s equity compensation plans which were purchased on-market in anticipation of vesting of share-based payment awards under the equity compensation plans. During the year 477,075 shares (2018: 800,064) were purchased by the employee share trust for a total cost of $110,000 (2018: $214,000) at an average price of $0.231 (2018: $0.267) per share. As at 30 June 2019, there are 18 (2018: 18) unallocated Swick shares held in trust.F
or p
erso
nal u
se o
nly

66 SWICK MINING SERVICES ANNUAL REPORT 2019
NOTES TO THE CONSOLIDATED FINANCIAL STATEMENTSFOR THE YEAR ENDED 30 JUNE 2019
4.3 Reserves
Foreign currency
translation reserve
$000
Fair value reserve
$000
Share-based payments reserve
$000
Transactions with Non
Controlling Interest reserve
$000Total$000
Consolidated Group
Balance at 1 July 2017 465 266 2,234 (1,005) 1,960
Other comprehensive income for the year 289 175 - - 464
Share-based payments - - 303 - 303
Balance at 30 June 2018 754 441 2,537 (1,005) 2,727
Other comprehensive income for the year 272 - - - 272
Share-based payments - - 175 - 175
Balance at 30 June 2019 1,026 441 2,712 (1,005) 3,174
Foreign currency translation reserveThe foreign currency translation reserve records exchange differences arising on translation of foreign controlled subsidiaries.
Fair value reservePre 1 July 2018The fair value reserve represents the cumulative gains and losses arising on the revaluation of a Fair Value through Other Comprehensive Income (FVOCI) financial asset that have been recognised in other comprehensive income, net of amounts reclassified to profit or loss when those assets have been disposed of or are determined to be impaired.
Post 1 July 2018The fair value reserve represents the cumulative gains and losses arising on the revaluation of a Fair Value through Other Comprehensive Income (FVOCI) equity investments. Fair value movements continue to be recognised in equity through other comprehensive income and are not eligible for recycling through profit or loss upon realisation of the asset.
Share-based payments reserveThe share-based payments reserve records items recognised as expenses on valuation of employee share options or issue of performance rights. Details of share-based payments can be found in the Remuneration Report and below.
Transactions with non-controlling interest (NCI) reserveThis reserve is used to record the differences between the amount of the adjustment to non-controlling interests and any consideration paid as a result of transactions with non-controlling interests that do not result in a loss of control.
For
per
sona
l use
onl
y

67ANNUAL REPORT 2019 SWICK MINING SERVICES
NOTES TO THE CONSOLIDATED FINANCIAL STATEMENTSFOR THE YEAR ENDED 30 JUNE 2019
Share-based payments Share optionsEach share option converts into one ordinary share of Swick Mining Services Limited on exercise. No amounts are paid or payable by the recipient on receipt of the option. The options carry neither rights to dividends nor voting rights. Options may be exercised at any time from the date of vesting to the date of expiry.
The weighted average fair value of the share options granted during the financial year is $nil (2018: $nil). Options are priced using a binomial option pricing model. Where relevant, the expected life used in the model has been adjusted based on management’s best estimate for the effects of non-transferability, exercise restrictions (including the probability of meeting market conditions attached to the option), and behavioural considerations. Expected volatility is based on the historical share price volatility over the past 3 years. To allow for the effects of early exercise, it was assumed that executives and senior employees would exercise the options immediately after the vesting date.
A summary of the movements of all Company options on issue is as follows:
CONSOLIDATED GROUP
2019 2018
No. Weighted average exercise price
No. Weighted average exercise price
Balance at the beginning of the year 6,452,114 $0.37 6,452,114 $0.37
Granted - - - -
Balance at year end 6,452,114 $0.37 6,452,114 $0.37
Exercisable at year end 6,452,114 $0.37 - -
Performance rights planThe Company has established the Swick Mining Services Limited Performance Rights Plan. The rights were granted at no cost to the executives and will convert into ordinary shares on completion of specified periods of service. Performance rights granted are issued as units in the employee share trust.
A summary of the movements of all Company performance rights on issue is as follows:
CONSOLIDATED GROUP
2019 No.
2018 No.
Balance at the beginning of the year - 1,939,893
Granted 474,547 -
Vested and exercised - (1,277,121)
Forfeited - (662,772)
Expired - -
Balance at year end 474,547 -
Exercisable at year end - -
Performance rights vested on meeting the continuing service vesting condition. Further information relating to the Group’s Performance Rights, including details of issued, exercised, and lapsed Performance Rights is set out in the Directors Remuneration Report.
For
per
sona
l use
onl
y

68 SWICK MINING SERVICES ANNUAL REPORT 2019
NOTES TO THE CONSOLIDATED FINANCIAL STATEMENTSFOR THE YEAR ENDED 30 JUNE 2019
Mineral Technology warrantsThe unlisted warrants were offered under Orexplore shadow equity plan with nil issue price and nil exercise price and an ultimate expiry date of 31 December 2022.
A summary of the movements of all Company warrants on issue is as follows:
CONSOLIDATED GROUP
2019 No.
2018 No.
Balance at the beginning of the year 784,314 627,451
Granted - 156,863
Vested and exercised - -
Forfeited - -
Expired - -
Balance at year end 784,314 784,314
Exercisable at year end - -
Each warrant is exercisable based on certain milestones being achieved regarding the commercialisation of Orexplore. Figures shown above represent the number of Swick shares that would have been exercised at grant date.
Share based paymentsThe Group provides benefits to employees of the Group in the form of share-based payment transactions, whereby employees render services in exchange for shares or rights over shares (‘equity-settled transactions’). The cost of these equity-settled transactions with employees is measured by reference to the fair value at the date at which they are granted.
In valuing equity-settled transactions, the company uses the price of the shares of the Company. The cost of equity-settled transactions is recognised, together with a corresponding increase in equity, over the period in which the performance conditions are fulfilled, ending on the date on which the relevant employees become fully entitled to the award (‘vesting date’). The cumulative expense recognised for equity-settled transactions at each reporting date until vesting date reflects:
(i) the extent to which the vesting period has expired; and
(ii) the number of awards that, in the opinion of the directors of the Group, will ultimately vest. This opinion is formed based on the best available information at reporting date. No adjustment is made for the likelihood of market performance conditions being met as the effect of these conditions is included in the determination of fair value at grant date. No expense is recognised for awards that do not ultimately vest, except for awards where vesting is conditional upon a market condition.
Where the terms of an equity-settled award are modified, as a minimum an expense is recognised as if the terms had not been modified. In addition, an expense is recognised for any increase in the value of the transaction as a result of the modification, as measured at the date of modification. Where an equity-settled award is cancelled, it is treated as if it had vested on the date of cancellation, and any expense not yet recognised for the award is recognised immediately. However, if a new award is substituted for the cancelled award, and designated as a replacement award on the date that it is granted, the cancelled and new awards are treated as if they were a modification of the original award, as described in the previous paragraph.F
or p
erso
nal u
se o
nly

69ANNUAL REPORT 2019 SWICK MINING SERVICES
NOTES TO THE CONSOLIDATED FINANCIAL STATEMENTSFOR THE YEAR ENDED 30 JUNE 2019
MD LTI plan
Under the MD LTI plan, awards are made to Managing Director, which are delivered in the form of options over shares which vest over a period of three years subject to continuous employment with the Group. The fair value of share options granted is estimated at the date of grant using a Black-Scholes simulation model, taking into account the terms and conditions upon which the share options were granted.
The exercise price of the share options equal to 143% of the 20 days volume weighted average share price of a share up to and including the date of the 2016 annual general meeting.
Executive LTI plan
Under the Executive LTI plan, awards are made to executives and other key talent who have an impact on the Group’s performance. LTI awards are delivered in the form of performance rights, which vest two years from the start of the year in which they are granted and the employee continues to be employed by the Group at the vesting date. The fair value of the performance rights is measured at the grant date of the performance rights and amortised over the vesting period.
The following table list the inputs to the models used for the plans for the year ended 2017 and 2019. There were no issues in 2018.
MD LTI plan Executive LTI plan Executive LTI plan
Options Performance rights Performance rights
Weighted average fair value ($) 0.0358 0.2587 0.22
Share price ($) 0.265 0.265 0.220
Grant date 11/11/2016 25/11/2016 01/07/2018
Vesting date 30/06/2019 30/06/2018 30/06/2020
Expiry date 30/06/2020 30/06/2018 30/06/2020
Share price volatility 32.90% 33.29% 35.79%
Interest rate 1.93% 1.755% 1.89%
Dividend yield 1.33% 1.51% 0.0%
Model used Black-Scholes Black-Scholes Black-Scholes
Mineral Technology warrants
Following the purchase of non-controlling interest shares in Orexplore AB (Orexplore) in June 2017, employees of the company were offered warrants entitling them to Swick shares based on changes in the value of Orexplore over a period of up to five years. On 12 February 2018, 24 unlisted warrants (estimated to be 784,314 shares to be received at the end of vesting period) were issued to 8 Orexplore employees with nil issue price and nil exercise price and an ultimate expiry date of 31 December 2022. The valuation has been made using a Monte Carlo simulation approach where monthly time series for the share development has been simulated assuming a Brownian Motion development of the underlying share. Each warrant is exercisable based on certain milestones being achieved regarding the commercialisation of Orexplore and will entitle the holder to a number of Swick shares in accordance with a formula relating to the externally determined equity value of the Orexplore business unit, at the time of each milestone date in the future (i.e. the Valuation Date), multiplied by a relevant percentage (being 12.5% in aggregate for all of the Orexplore employees granted warrants), divided by the volume weighted average price of Swick shares for the 20 trading days prior to the relevant Valuation Date.F
or p
erso
nal u
se o
nly

70 SWICK MINING SERVICES ANNUAL REPORT 2019
NOTES TO THE CONSOLIDATED FINANCIAL STATEMENTSFOR THE YEAR ENDED 30 JUNE 2019
5. Financial Risk ManagementFinancial risk management objectivesThe Group’s corporate finance function provides services to the business, coordinates access to domestic and financial markets, and monitors and manages the financial risks relating to the operations of the Group through internal risk reports which analyse exposures by degree and magnitude of risks. These risks include market risk (including currency risk, fair value interest rate risk and price risk), credit risk, liquidity risk and cash flow interest rate risk. The Group seeks to minimise the effects of these risks, where deemed appropriate.
Specific financial risk exposures and managementThe main risks the Group is exposed to through its financial instruments are credit risk, liquidity risk and market risk consisting of interest rate risk, foreign currency risk and other price risk (commodity and equity price risk). There have been no substantive changes in the types of risks the Group is exposed to, how these risks arise, or the Board’s objectives, policies and processes for managing or measuring the risks from the previous period.
(a) Credit riskCredit risk refers to the risk that a counter party will default on its contractual obligations resulting in financial loss to the Group. The Group has adopted a policy of only dealing with credit worthy counterparties as a means of mitigating the risk of financial loss from defaults.
Trade receivables consist of a large number of customers, spread across diverse industries and geographical areas. Ongoing credit evaluation is performed on the financial condition of accounts receivable.
As disclosed in Note 2.1, the Group has four customers which individually contribute more than 10% of the revenue. Other than these four customers the Group does not have any significant credit risk exposure to any single counterparty or any Group of counterparties having similar characteristics. The credit risk on liquid funds is limited because the counterparties are banks with high credit ratings assigned by international credit-rating agencies.
The carrying amount of financial assets recorded in the financial statements, net of any allowances for losses, represents the Group’s maximum exposure to credit risk.
Swick monitors all receivables and placements with financial institutions on a monthly basis to determine whether credit risk has increased significantly. An amount is deemed to be in default when payment is not received by the due date, as per the credit period stated in the contract, or when the credit rating of the financial institution deteriorates significantly. When assessing expected credit losses, receivables and cash balances are reviewed on a customer or financial institution basis. Based on the expected credit risk assessment, there has been no expected credit loss and therefore no impairment provided for.
(b) Liquidity riskUltimate responsibility for liquidity risk management rests with management and the Board of Directors, who have built an appropriate liquidity risk management framework for the management of the Group’s short, medium and long-term funding and liquidity management requirements.
The Group manages liquidity risk by maintaining adequate reserves, banking facilities and reserve borrowing facilities by continuously monitoring forecast and actual cash flows and matching the maturity profiles of financial assets and liabilities. Included in Note 3.9 is a listing of undrawn facilities that the Group has at its disposal to further reduce liquidity risk.
For
per
sona
l use
onl
y

71ANNUAL REPORT 2019 SWICK MINING SERVICES
NOTES TO THE CONSOLIDATED FINANCIAL STATEMENTSFOR THE YEAR ENDED 30 JUNE 2019
The following table sets out the maturity analysis for financial liabilities based on contractual cash flows:
WITHIN 1 YEAR 1 TO 5 YEARS OVER 5 YEARS TOTAL
Consolidated Group 2019 $000
2018 $000
2019 $000
2018 $000
2019 $000
2018 $000
2019 $000
2018 $000
Financial liabilities:
Trade and other payables 17,890 15,413 - - - - 17,890 15,413
Bank and other loans including payable interest 3,107 1,235 25,266 27,727 - - 28,373 28,962
Hire purchase liabilities including future finance charges 1,018 680 1,841 1,768 - - 2,859 2,448
Total 22,015 17,328 27,107 29,495 - - 49,122 46,823
(c) Market riskThe Group’s activities expose it primarily to the financial risks of changes in interest rates. The Group has entered into fixed and floating rate funding agreements with one financial institution to manage its exposure to interest rate risk. The Groups foreign currency exchange rate risk is outlined in note 5(e). The Group does not hedge foreign currency exchange risk.
(d) Interest rate riskThe Parent and the Group are exposed to interest rate risk as entities within the Group borrow funds at fixed and variable interest rates. The interest rate risk is managed using a mix of fixed and floating rate debt. At 30 June 2019 8.9% (2018: 8.5%) of the Group debt is fixed.
At the end of the reporting period, the details of fixed rate borrowings and the respective interest rates are as follows:
CONSOLIDATED GROUP
Effective average fixed interest rate payable Notional principal
2019 %
2018 %
2019 $000
2018 $000
Fixed rate instruments
Less than 1 year 5.42 5.42 902 577
1 to 2 years 5.42 5.42 925 602
3 to 5 years 5.42 5.42 817 1,041
2,644 2,220
The net effective variable interest rate borrowings expose the Group to interest rate risk which will impact future cash flows and interest charges and is indicated by the following floating interest rate financial liabilities:
CONSOLIDATED GROUP
Effective average variable interest rate payable
Notional principal
2019 %
2018 %
2019 $000
2018 $000
Floating rate instruments
Bank loans 3.22 3.24 27,000 27,000
For
per
sona
l use
onl
y

72 SWICK MINING SERVICES ANNUAL REPORT 2019
NOTES TO THE CONSOLIDATED FINANCIAL STATEMENTSFOR THE YEAR ENDED 30 JUNE 2019
A one percentage point increase/decrease in interest rates would result in a net profit after tax decrease/increase of approximately $189,000 (2018: $189,000).
The Group cash and restricted cash balance at 30 June 2019 was $11,553,000 (2018: $11,461,000). These funds do not attract interest (2018: 0% per annum).
(e) Foreign exchange riskThe Group is exposed to currency fluctuations through its subsidiary operations carried on in USA, Canada and Europe.
The table below details the Group’s net financial assets/liabilities that have exposure to foreign currency.
CONSOLIDATED GROUP
2019 $000
2018 $000
Canadian dollar (2,950) (11,473)
US dollar (16,983) (4,063)
Euro (9,900) (8,041)
Total (29,833) (23,577)
The following table details the Group’s sensitivity to a 10% increase in the Australian dollar against the relevant foreign currencies. 10% is the sensitivity rate used when reporting foreign currency risk internally to Key Management Personnel and represents management’s assessment of the reasonably possible change in foreign exchange rates in a single year. The sensitivity analysis includes loans to foreign operations within the Group where the denomination of the loan is in a currency other than the functional currency of the lender or the borrower. A positive number below indicates an increase in equity.
CONSOLIDATED GROUP
Post tax profit higher/(lower)
2019 $000
2018 $000
Australian Dollar increases 10%Canadian dollar (201) (887)US dollar (1,220) (226)Euro (711) (578)
Australian Dollar decreases 10%Canadian dollar 246 1,084US dollar 1,491 325Euro 869 706
(f) Equity price riskThe Group’s unlisted equity securities are susceptible to market price risk arising from uncertainties about future values of the investment securities. At the reporting date, the exposure to unlisted equity securities at fair value was $1,630,000. Sensitivity analysis of this investment has been provided in Note 3.6.F
or p
erso
nal u
se o
nly

73ANNUAL REPORT 2019 SWICK MINING SERVICES
NOTES TO THE CONSOLIDATED FINANCIAL STATEMENTSFOR THE YEAR ENDED 30 JUNE 2019
6. Other Notes6.1 Leasing and other commitments
CONSOLIDATED GROUP
Note 2019 $000
2018 $000
(a) Hire purchase commitments
Payable – minimum lease payments
Not later than 12 months 1,018 680
Between 12 months and 5 years 1,841 1,768
Later than 5 years - -
Minimum lease payments 2,859 2,448
Less future finance charges (215) (228)
Present value of minimum lease payments 2,644 2,220
Comprising:
Current liability 3.9 902 577
Non-current liability 3.9 1,742 1,643
Total financial liability 2,644 2,220
(b) Operating lease commitments
Payments recognised as an expense 2.3 1,797 1,666
Non-cancellable operating leases contracted for but not recognised in the financial statements
Payable minimum lease payments
Not later than 12 months 1,940 1,851
Between 12 months and 5 years 6,923 6,744
Later than 5 years 7,269 8,401
16,132 16,996
Leases are classified as finance leases whenever the terms of the lease transfer substantially all the risks and rewards of ownership to the lessee. All other leases are classified as operating leases. Operating leases relate to leases of business premises with terms of between 1 to 15 years. All operating lease contracts contain clauses for yearly rental review in line with the Consumer Price Index (CPI) or a yearly fixed 3% increase. The Group does not have an option to purchase the leased premises at the expiry of the lease period.
In the event that lease incentives are received to enter into operating leases, such incentives are recognised as a liability. The aggregate benefit of incentives is recognised as a reduction of rental expense on a straight-line basis, except where another systematic basis is more representative of the time pattern in which economic benefits from the leased asset are consumed.F
or p
erso
nal u
se o
nly

74 SWICK MINING SERVICES ANNUAL REPORT 2019
NOTES TO THE CONSOLIDATED FINANCIAL STATEMENTSFOR THE YEAR ENDED 30 JUNE 2019
6.2 Contingent liabilities
CONSOLIDATED GROUP
2019 $000
2018 $000
Bank guarantees 469 469
6.3 Parent informationThe following information has been extracted from the books and records of the parent and has been prepared in accordance with Australian Accounting Standards.
PARENT
2019 $000
2018 $000
Statement of financial position
Assets
Current assets 655 41
Non-current assets 65,701 66,159
Total assets 66,356 66,200
Liabilities
Current liabilities 295 787
Non-current liabilities 605 -
Total liabilities 900 787
Equity
Issued capital 92,995 92,995
Accumulated losses (30,251) (30,119)
Reserves 2,712 2,537
Total equity 65,456 65,413
Statement of comprehensive loss
Total loss (132) (45)
Total comprehensive loss (132) (45)
Guarantees entered into by the parent entity in relation to the debts of its subsidiaries
Guarantee provided under the deed of cross guarantee 49,856 48,314
On 28 June 2016, Swick Mining Services Limited entered into a deed of cross guarantee with a number of its subsidiaries listed in Note 6.4.
There are no commitments or contingent liabilities in the Parent Entity at 30 June 2019 (2018: nil).
The Company and its wholly-owned Australian resident entities have formed a tax-consolidated Group with effect from 1 July 2009 and are therefore taxed as a single entity from that date. The head entity within the tax-consolidated Group is Swick Mining Services Limited.
Subsequent to initial recognition, investments in subsidiaries are measured at cost in the Company financial statements.
For
per
sona
l use
onl
y
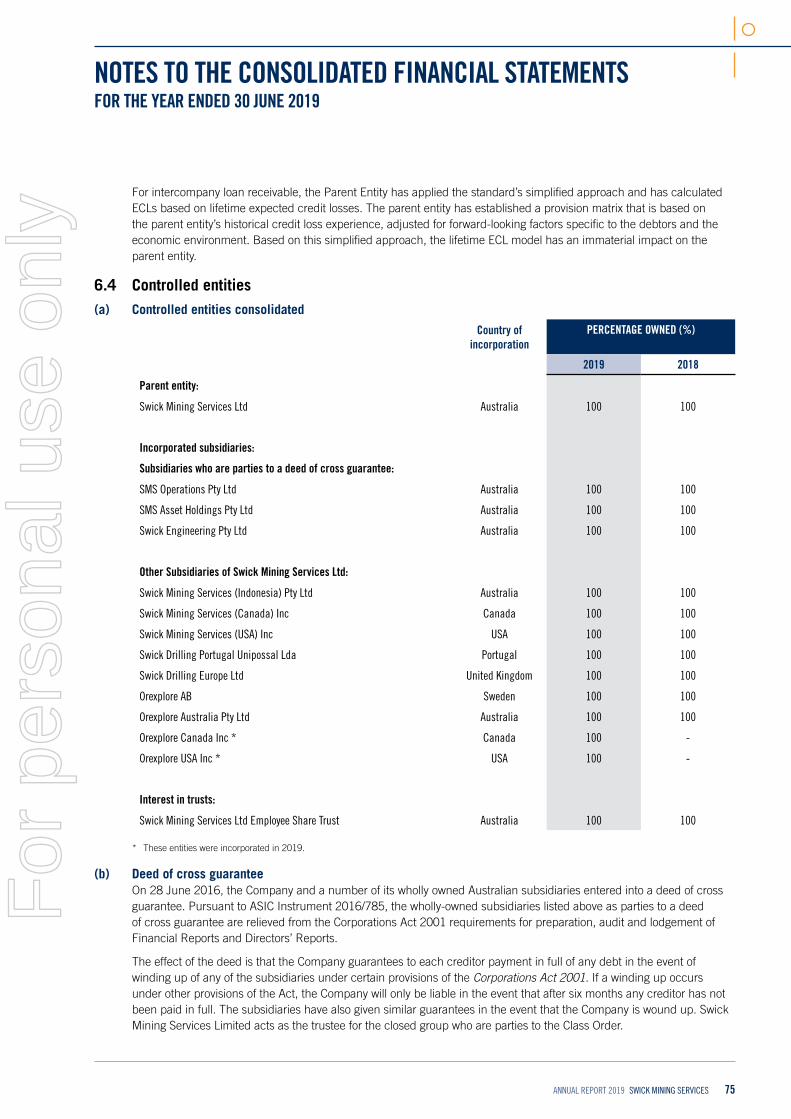
75ANNUAL REPORT 2019 SWICK MINING SERVICES
NOTES TO THE CONSOLIDATED FINANCIAL STATEMENTSFOR THE YEAR ENDED 30 JUNE 2019
For intercompany loan receivable, the Parent Entity has applied the standard’s simplified approach and has calculated ECLs based on lifetime expected credit losses. The parent entity has established a provision matrix that is based on the parent entity’s historical credit loss experience, adjusted for forward-looking factors specific to the debtors and the economic environment. Based on this simplified approach, the lifetime ECL model has an immaterial impact on the parent entity.
6.4 Controlled entities(a) Controlled entities consolidated
Country of incorporation
PERCENTAGE OWNED (%)
2019 2018
Parent entity:
Swick Mining Services Ltd Australia 100 100
Incorporated subsidiaries:
Subsidiaries who are parties to a deed of cross guarantee:
SMS Operations Pty Ltd Australia 100 100
SMS Asset Holdings Pty Ltd Australia 100 100
Swick Engineering Pty Ltd Australia 100 100
Other Subsidiaries of Swick Mining Services Ltd:
Swick Mining Services (Indonesia) Pty Ltd Australia 100 100
Swick Mining Services (Canada) Inc Canada 100 100
Swick Mining Services (USA) Inc USA 100 100
Swick Drilling Portugal Unipossal Lda Portugal 100 100
Swick Drilling Europe Ltd United Kingdom 100 100
Orexplore AB Sweden 100 100
Orexplore Australia Pty Ltd Australia 100 100
Orexplore Canada Inc * Canada 100 -
Orexplore USA Inc * USA 100 -
Interest in trusts:
Swick Mining Services Ltd Employee Share Trust Australia 100 100
* These entities were incorporated in 2019.
(b) Deed of cross guaranteeOn 28 June 2016, the Company and a number of its wholly owned Australian subsidiaries entered into a deed of cross guarantee. Pursuant to ASIC Instrument 2016/785, the wholly-owned subsidiaries listed above as parties to a deed of cross guarantee are relieved from the Corporations Act 2001 requirements for preparation, audit and lodgement of Financial Reports and Directors’ Reports.
The effect of the deed is that the Company guarantees to each creditor payment in full of any debt in the event of winding up of any of the subsidiaries under certain provisions of the Corporations Act 2001. If a winding up occurs under other provisions of the Act, the Company will only be liable in the event that after six months any creditor has not been paid in full. The subsidiaries have also given similar guarantees in the event that the Company is wound up. Swick Mining Services Limited acts as the trustee for the closed group who are parties to the Class Order.
For
per
sona
l use
onl
y

76 SWICK MINING SERVICES ANNUAL REPORT 2019
NOTES TO THE CONSOLIDATED FINANCIAL STATEMENTSFOR THE YEAR ENDED 30 JUNE 2019
The Consolidated Statement of Profit or Loss and Other Comprehensive Income and Consolidated Statement of Financial Position of the Company and controlled entities party to the deed of cross guarantee are:
Statement of Profit or Loss and Other Comprehensive Income 2019 $000
2018 $000
Continuing operations
Revenue 114,320 118,582
Other income 3,159 1,380
Raw materials and consumables used (21,034) (22,832)
Employee benefits expense (59,674) (64,317)
Depreciation and amortisation expense (15,485) (15,036)
Impairment of intercompany receivables (5,722) -
Finance costs (1,437) (1,313)
Other expenses (12,791) (16,667)
Loss before income tax 1,336 (203)
Income tax expense (1,903) (87)
Net loss from continuing operations after tax (567) (290)
Other comprehensive income:
Items that may be reclassified subsequently to profit or loss:
Net fair value gain on available-for-sale financial assets - 175
Other comprehensive income for the year, net of tax - 175
Total comprehensive loss for the year (567) (115)
Summary of movements in retained earnings 2019 $000
2018 $000
Retained earnings at the beginning of the year 198 488
Loss for the year (567) (290)
Dividends recognised for the year - -
Retained earnings at the end of the year (369) 198
For
per
sona
l use
onl
y

77ANNUAL REPORT 2019 SWICK MINING SERVICES
NOTES TO THE CONSOLIDATED FINANCIAL STATEMENTSFOR THE YEAR ENDED 30 JUNE 2019
Statement of Financial Position 2019 $000
2018 $000
Assets
Current assets
Cash 3,659 8,978
Trade and other receivables 7,057 12,365
Inventories 11,000 11,761
Prepayments 1,280 1,267
Current tax assets - 1
Total current assets 22,996 34,372
Non-current assets
Intercompany receivables 25,858 13,423
Property, plant and equipment 59,902 64,291
Intangible assets 4,939 4,576
Financial asset classified as FVOCI 1,630 1,630
Investment in subsidiaries 16,915 12,722
Net deferred tax assets - -
Total non-current assets 109,244 96,642
Total assets 132,240 131,014
Liabilities
Current liabilities
Trade and other payables 13,241 14,150
Current tax liabilities 311 -
Borrowings 2,781 468
Provisions 5,272 4,677
Total current liabilities 21,605 19,295
Non-current liabilities
Borrowings 26,378 28,183
Provisions 495 728
Net deferred tax liabilities 1,454 108
Total non-current liabilities 28,327 29,019
Total liabilities 49,932 48,314
Net assets 82,308 82,700
Equity
Issued capital 79,490 79,490
Reserves 3,187 3,012
Retained earnings (369) 198
Total equity 82,308 82,700
For
per
sona
l use
onl
y

78 SWICK MINING SERVICES ANNUAL REPORT 2019
NOTES TO THE CONSOLIDATED FINANCIAL STATEMENTSFOR THE YEAR ENDED 30 JUNE 2019
6.5 Related party transactionsUltimate parentThe ultimate parent entity that exercises control over the Group is Swick Mining Services Limited, which is incorporated in Australia.
There were no related party transactions other than those related to Key Management Personnel.
For details of disclosures relating to Key Management Personnel, refer to Note 6.6 and the Remuneration Report.
6.6 Key management personnel compensationRefer to the Remuneration Report contained in the Director’s Report for details of the remuneration paid or payable to each member of the Group’s key management personnel (KMP) for the year ended 30 June 2019.
The total remuneration paid to KMP of the Company and the Group during the year is as follows:
CONSOLIDATED GROUP
2019 $
2018 $
Short-term employee benefits 1,561,573 1,932,047
Long-term employee benefits 13,897 12,163
Post-employment benefits 73,239 451,722
Share-based payments 141,118 275,680
Total KMP compensation 1,789,827 2,671,612
Post-employment benefits consist of superannuation payment made to KMPs.
6.7 Auditor’s remunerationCONSOLIDATED GROUP
2019 $
2018 $
Remuneration of the auditor for:
- Audit and review of the financial report 98,800 95,000
- Tax and related matters 34,500 43,160
- Other services - 36,125
133,300 174,285
The auditor of Swick Mining Services Limited is Ernst & Young.
6.8 Events after the reporting periodThe directors are not aware of any significant events since the end of the reporting period.
For
per
sona
l use
onl
y

79ANNUAL REPORT 2019 SWICK MINING SERVICES
DIRECTORS’ DECLARATION
In accordance with a resolution of the directors of Swick Mining Services Limited, I state that:
1. In the opinion of the directors:
(a) the financial statements and notes of Swick Mining Services Limited for the financial year ended 30 June 2019 are in accordance with the Corporations Act 2001, including:
(i) giving a true and fair view of the consolidated entity’s financial position as at 30 June 2019 and of its performance for the year ended on that date; and
(ii) complying with Accounting Standards and the Corporations Regulations 2001;
(b) the financial statements and notes also comply with International Financial Reporting Standards as disclosed in Note 1.2; and
(c) there are reasonable grounds to believe that the Company will be able to pay its debts as and when they become due and payable.
2. This declaration has been made after receiving the declarations required to be made to the directors by the chief executive officer and chief financial officer in accordance with section 295A of the Corporations Act 2001 for the financial year ended 30 June 2019.
On behalf of the Directors
Kent SwickManaging Director
Dated this 26th day of August 2019
For
per
sona
l use
onl
y

80 SWICK MINING SERVICES ANNUAL REPORT 2019
INDEPENDENT AUDITOR’S REPORT
A member firm of Ernst & Young Global Limited GB:JG:SWICK:028 Liability limited by a scheme approved under Professional Standards Legislation
Ernst & Young 11 Mounts Bay Road Perth WA 6000 Australia GPO Box M939 Perth WA 6843
Tel: +61 8 9429 2222 Fax: +61 8 9429 2436 ey.com/au
Independent Auditor's Report to the Members of Swick Mining Services Limited
Report on the Audit of the Financial Report
Opinion
We have audited the financial report of Swick Mining Services Limited (the Company) and its subsidiaries (collectively the Group), which comprises the consolidated statement of financial position as at 30 June 2019, the consolidated statement of profit or loss and other comprehensive income, consolidated statement of changes in equity and consolidated statement of cash flows for the year then ended, notes to the financial statements, including a summary of significant accounting policies, and the Directors' declaration.
In our opinion, the accompanying financial report of the Group is in accordance with the Corporations Act 2001, including:
a) giving a true and fair view of the consolidated financial position of the Group as at 30 June 2019 and of its consolidated financial performance for the year ended on that date; and
b) complying with Australian Accounting Standards and the Corporations Regulations 2001.
Basis for Opinion
We conducted our audit in accordance with Australian Auditing Standards. Our responsibilities under those standards are further described in the Auditor’s Responsibilities for the Audit of the Financial Report section of our report. We are independent of the Group in accordance with the auditor independence requirements of the Corporations Act 2001 and the ethical requirements of the Accounting Professional and Ethical Standards Board’s APES 110 Code of Ethics for Professional Accountants (the Code) that are relevant to our audit of the financial report in Australia. We have also fulfilled our other ethical responsibilities in accordance with the Code.
We believe that the audit evidence we have obtained is sufficient and appropriate to provide a basis for our opinion.
Key Audit Matters
Key audit matters are those matters that, in our professional judgment, were of most significance in our audit of the financial report of the current year. These matters were addressed in the context of our audit of the financial report as a whole, and in forming our opinion thereon, but we do not provide a separate opinion on these matters. For each matter below, our description of how our audit addressed the matter is provided in that context. F
or p
erso
nal u
se o
nly

81ANNUAL REPORT 2019 SWICK MINING SERVICES
INDEPENDENT AUDITOR’S REPORT
A member firm of Ernst & Young Global Limited Liability limited by a scheme approved under Professional Standards Legislation
We have fulfilled the responsibilities described in the Auditor’s Responsibilities for the Audit of the Financial Report section of our report, including in relation to these matters. Accordingly, our audit included the performance of procedures designed to respond to our assessment of the risks of material misstatement of the financial report. The results of our audit procedures, including the procedures performed to address the matters below, provide the basis for our audit opinion on the accompanying financial report.
Impairment assessment of property, plant and equipment and drilling rig development costs
Why significant How our audit addressed the key audit matter
As at 30 June 2019 the Group had non-current assets totaling $84,485,000 comprising property, plant and equipment, and drilling rig development intangible assets (refer to Notes 3.4 and 3.5 to the financial report).
At the end of each reporting period, the Directors exercise judgment in determining whether there are any indicators of impairment present. If any such indication exists, the entity estimates the recoverable amount of the relevant asset.
Impairment indicators were identified by the Group and impairment tests were performed for all of the Group’s Cash Generating Units (CGUs) at 30 June 2019. No impairment was recognised by the Group as a result of this assessment. Refer to Notes 3.4 and 3.5 to the financial report for further details relating to the Group’s impairment assessment.
We focused on this matter because of the significant judgment and estimates involved in the determination of the recoverable amount of the Underground Diamond Drilling and Reverse Circulation Drilling CGUs.
Our audit procedures included the following:
► Examined the third-party valuation reports obtained by the Group to assess whether the valuations supported the carrying values of the assets
► Assessed the qualifications, competence and objectivity of the external valuation experts
► With the involvement of our valuation specialists we evaluated the appropriateness of the inputs, assumptions and methodologies used by the external valuation experts
► Performed sensitivity analyses to ascertain the extent to which changes in assumptions could lead to alternative conclusions
► Assessed the adequacy of the disclosure in Notes 3.4 and 3.5 of the financial report.
For
per
sona
l use
onl
y

82 SWICK MINING SERVICES ANNUAL REPORT 2019
INDEPENDENT AUDITOR’S REPORT
A member firm of Ernst & Young Global Limited Liability limited by a scheme approved under Professional Standards Legislation
Recognition and recoverability of the Orexplore mineral analysis and measurement technology intangible assets
Why significant How our audit addressed the key audit matter
As disclosed in Note 3.5, the Group has capitalised development costs of $7,256,000 as at 30 June 2019 relating to the development of the Orexplore mineral analysis technology intangible asset.
The analysis of the recognition and recoverability of internally developed intangible assets was significant to our audit because it is judgmental and is based on assumptions and estimates that are affected by expected future performance and market conditions. The costs of development are capitalised as intangible assets where the investment they represent has demonstrable value and the technical and commercial feasibility is probable. The Group exercises judgment in determining which costs meet the Australian Accounting Standards’ criteria for capitalisation and when considering the recoverability of these assets.
The Group performed an impairment assessment on the capitalised costs relating to the Group’s Orexplore technology and concluded based on this assessment that no impairment was required at 30 June 2019. Refer to notes 3.4 and 3.5 to the financial report for further details.
We assessed the eligibility and allocation of the development costs for capitalisation as an intangible asset by selecting a sample of expenditure and determining whether it was capitalised in accordance with Australian Accounting Standards.
We assessed the appropriateness of the impairment assessment and methodology for the Orexplore mineral analysis technology intangible asset determined by the Group. In doing so:
► We examined the third-party valuation report obtained by the Group to assess whether the valuation supported the carrying value of the asset
► With the involvement of our valuation specialists we evaluated the appropriateness of the assumptions and methodologies used by the Group's external valuation experts to test the impairment of the Orexplore technology asset and outlook on market technology
► We assessed the qualifications, competence and objectivity of the external valuation experts which included considering their experience
► We reviewed the Board of Directors minutes, Orexplore Managing Director's reports and Orexplore strategic plan in order to understand the future plans for the asset and whether there was any potential contradictory information within these reports
► We assessed the adequacy of the related disclosures in Notes 3.4 and 3.5 of the financial report.
Information Other than the Financial Report and Auditor’s Report Thereon
The Directors are responsible for the other information. The other information comprises the information included in the Company’s 2019 Annual Report but does not include the financial report and our auditor’s report thereon.
Our opinion on the financial report does not cover the other information and accordingly we do not express any form of assurance conclusion thereon, with the exception of the Remuneration Report and our related assurance opinion.
For
per
sona
l use
onl
y
83ANNUAL REPORT 2019 SWICK MINING SERVICES
INDEPENDENT AUDITOR’S REPORT
A member firm of Ernst & Young Global Limited Liability limited by a scheme approved under Professional Standards Legislation
In connection with our audit of the financial report, our responsibility is to read the other information and, in doing so, consider whether the other information is materially inconsistent with the financial report or our knowledge obtained in the audit or otherwise appears to be materially misstated.
If, based on the work we have performed, we conclude that there is a material misstatement of this other information, we are required to report that fact. We have nothing to report in this regard.
Responsibilities of the Directors for the Financial Report
The Directors of the Company are responsible for the preparation of the financial report that gives a true and fair view in accordance with Australian Accounting Standards and the Corporations Act 2001 and for such internal control as the Directors determine is necessary to enable the preparation of the financial report that gives a true and fair view and is free from material misstatement, whether due to fraud or error.
In preparing the financial report, the Directors are responsible for assessing the Group’s ability to continue as a going concern, disclosing, as applicable, matters relating to going concern and using the going concern basis of accounting unless the Directors either intend to liquidate the Group or to cease operations, or have no realistic alternative but to do so.
Auditor's Responsibilities for the Audit of the Financial Report
Our objectives are to obtain reasonable assurance about whether the financial report as a whole is free from material misstatement, whether due to fraud or error, and to issue an auditor’s report that includes our opinion. Reasonable assurance is a high level of assurance but is not a guarantee that an audit conducted in accordance with the Australian Auditing Standards will always detect a material misstatement when it exists. Misstatements can arise from fraud or error and are considered material if, individually or in the aggregate, they could reasonably be expected to influence the economic decisions of users taken on the basis of this financial report.
As part of an audit in accordance with the Australian Auditing Standards, we exercise professional judgment and maintain professional scepticism throughout the audit. We also:
► Identify and assess the risks of material misstatement of the financial report, whether due to fraud or error, design and perform audit procedures responsive to those risks, and obtain audit evidence that is sufficient and appropriate to provide a basis for our opinion. The risk of not detecting a material misstatement resulting from fraud is higher than for one resulting from error, as fraud may involve collusion, forgery, intentional omissions, misrepresentations, or the override of internal control
► Obtain an understanding of internal control relevant to the audit in order to design audit procedures that are appropriate in the circumstances, but not for the purpose of expressing an opinion on the effectiveness of the Group’s internal control
► Evaluate the appropriateness of accounting policies used and the reasonableness of accounting estimates and related disclosures made by the Directors
For
per
sona
l use
onl
y

84 SWICK MINING SERVICES ANNUAL REPORT 2019
INDEPENDENT AUDITOR’S REPORT
A member firm of Ernst & Young Global Limited Liability limited by a scheme approved under Professional Standards Legislation
► Conclude on the appropriateness of the Directors’ use of the going concern basis of accounting and, based on the audit evidence obtained, whether a material uncertainty exists related to events or conditions that may cast significant doubt on the Group’s ability to continue as a going concern. If we conclude that a material uncertainty exists, we are required to draw attention in our auditor’s report to the related disclosures in the financial report or, if such disclosures are inadequate, to modify our opinion. Our conclusions are based on the audit evidence obtained up to the date of our auditor’s report. However, future events or conditions may cause the Group to cease to continue as a going concern
► Evaluate the overall presentation, structure and content of the financial report, including the disclosures, and whether the financial report represents the underlying transactions and events in a manner that achieves fair presentation
► Obtain sufficient appropriate audit evidence regarding the financial information of the entities or business activities within the Group to express an opinion on the financial report. We are responsible for the direction, supervision and performance of the Group audit. We remain solely responsible for our audit opinion.
We communicate with the Directors regarding, among other matters, the planned scope and timing of the audit and significant audit findings, including any significant deficiencies in internal control that we identify during our audit.
We also provide the Directors with a statement that we have complied with relevant ethical requirements regarding independence, and to communicate with them all relationships and other matters that may reasonably be thought to bear on our independence, and where applicable, related safeguards.
From the matters communicated to the Directors, we determine those matters that were of most significance in the audit of the financial report of the current year and are therefore the key audit matters. We describe these matters in our auditor’s report unless law or regulation precludes public disclosure about the matter or when, in extremely rare circumstances, we determine that a matter should not be communicated in our report because the adverse consequences of doing so would reasonably be expected to outweigh the public interest benefits of such communication.
Report on the Audit of the Remuneration Report
Opinion on the Remuneration Report
We have audited the Remuneration Report included in the Directors’ report for the year ended 30 June 2019.
In our opinion, the Remuneration Report of Swick Mining Services Limited for the year ended 30 June 2019, complies with section 300A of the Corporations Act 2001.
For
per
sona
l use
onl
y

85ANNUAL REPORT 2019 SWICK MINING SERVICES
INDEPENDENT AUDITOR’S REPORT
A member firm of Ernst & Young Global Limited Liability limited by a scheme approved under Professional Standards Legislation
Responsibilities
The Directors of the Company are responsible for the preparation and presentation of the Remuneration Report in accordance with section 300A of the Corporations Act 2001. Our responsibility is to express an opinion on the Remuneration Report, based on our audit conducted in accordance with Australian Auditing Standards.
Ernst & Young
Gavin Buckingham Partner Perth 26 August 2019
For
per
sona
l use
onl
y

86 SWICK MINING SERVICES ANNUAL REPORT 2019
ASX ADDITIONAL INFORMATION
The additional information set out below is current as at 19 August 2019 and is provided in accordance with the ASX Listing Rules.
1. Substantial shareholdersThe following shareholders have lodged a notice of substantial shareholding in the Company.
SHAREHOLDER NUMBER OF SHARES %
Kent Jason Swick 33,117,498 14.31
IOOF Holdings Limited 34,463,116 14.89
Circle 5 Management Pty Ltd (formerly Hercules International Pty Ltd) 29,053,502 12.55
Vanshap Capital LLC 21,739,586 9.39
2. Distribution schedule of equity security holdersNUMBER OF HOLDERS
Fully paid shares Unlisted options Unlisted warrants
1 – 1,000 326 - 8
1,001 – 5,000 486 - -
5,001 – 10,000 246 - -
10,001 – 100,000 540 - -
100,001 and over 121 1 -
Total number of holders 1,719 1 8
3. Holders of unmarketable parcelsThere are 463 shareholders holding less than a marketable parcel of ordinary shares (based on a market price of $0.255 per share).
4. Classes of shares and voting rightsAt meetings of members or classes of members, each member entitled to vote may vote in person or by proxy or attorney or representative. On a show of hands every holder of ordinary shares present at a meeting in person or by proxy is entitled to one vote, and on a poll, every person present in person or by proxy has one vote for each ordinary share held.
5. Register of securitiesThe register of securities is kept at the office of the Company’s share registry, Security Transfer Australia Pty Ltd at 770 Canning Highway, Applecross, Western Australia.
6. Stock Exchange listingThe Company’s securities are quoted on the Australian Securities Exchange (Trading code: SWK).
7. On-market buy-backNo on-market buy-back is currently being undertaken by the Company.
For
per
sona
l use
onl
y

87ANNUAL REPORT 2019 SWICK MINING SERVICES
ASX ADDITIONAL INFORMATION
8. Corporate governance statementThe Company’s 2019 corporate governance statement can be viewed at https://swickmining.com/our-company/corporate-governance/.
9. Twenty largest holders of fully paid sharesSHAREHOLDER SHARES %
1. Circle 5 Management Pty Ltd 27,712,257 11.97
2. HSBC Custody Nominees (Australia) Limited <GSCO ECA> 21,739,586 9.39
3. National Nominees Limited 19,906,486 8.60
4. JP Morgan Nominees Australia Pty Ltd 15,613,741 6.75
5. Kent Jason Swick 13,182,410 5.70
6. Tanya Michelle Swick 13,182,410 5.70
7. BNP Paribas Noms (NZ) Limited <DRP> 11,498,963 4.97
8. HSBC Custody Nominees (Australia) Limited 10,813,746 4.67
9. Rosanne Thelma Swick 10,216,861 4.41
10. BNP Paribas Noms Pty Ltd <DRP> 9,859,967 4.26
11. BNP Paribas Nominees Pty Ltd <IB AU Noms Retail Client DRP> 6,037,600 2.61
12. Kent Swick & Tanya Swick 5,748,698 2.48
13. BNP Paribas Nominees Pty Ltd <Agency Lending DRP A/C> 4,622,955 2.00
14. Citicorp Nominees Pty Ltd 3,171,229 1.37
15. Jared Lawrence & Kathryn Zaccaria 1,879,478 0.81
16. Gary Lillicrap, Damian Lillicrap & Imelda Lillicrap 1,498,000 0.65
17. Australian Executor Trustees Limited 1,280,000 0.55
18. Carl Holt & Lorraine Holt 1,259,430 0.54
19. K & T Swick Pty Ltd 1,208,664 0.52
20. Peter Scarf & Ida Scarf 1,000,000 0.43
181,432,481 78.38
10. Unquoted securitiesThe following classes of unquoted securities are on issue:
SecurityNumber on issue
Holders of greater than 20% of each class of security
Name of holder Number %
Options over fully paid shares exercisable:
- at 37 cents each on or before 30.06.20 6,452,114 K & T Swick Pty Ltd 6,452,114 100.00
Warrants over fully paid shares:
- maturity date of 31.12.22 24
For
per
sona
l use
onl
y

For
per
sona
l use
onl
y

For
per
sona
l use
onl
y

SWICK MINING SERVICES LTD(ABN 20 112 917 905)
64 Great Eastern Highway
South Guildford, Western Australia 6055
T +61 8 9277 8800F +61 8 9277 8844E [email protected]
swickmining.com
For
per
sona
l use
onl
y