ANNuAL - REPORT - For personal use only
88
ANNUAL REPORT ACN: 057 140 922 …a period marked by our transition from iron ore developer to iron ore producer… in parallel with significant gains in our maiden thermal coal initiatives… For personal use only
-
Upload
khangminh22 -
Category
Documents
-
view
2 -
download
0
Transcript of ANNuAL - REPORT - For personal use only

ANNuAL REPORT
ACN: 057 140 922
…a period marked by our transition from iron
ore developer to iron ore producer…
in parallel with signifi cant gains in our
maiden thermal coal initiatives…
For
per
sona
l use
onl
y
The Indian operations are focussed around the Company’s newly constructed Kurnool Phase 1 (dry) and pending Phase 2 (wet) iron ore processing plants, supported by NSL’s two foundation hematite iron ore mines near Kurnool; these being Kuja and Mangal. A third Indian iron ore project, the 290 acre AP14 Karimnagar magnetite iron ore mining lease application, is located 200 kilometres from the Andhra Pradesh capital, Hyderabad.
It is anticipated that the commissioning of these fi rst two projects, and particularly the processing plants, will also lead to signifi cant new opportunities, either through direct ownership, joint venture, or mining and selling rights, including third party processing.
NSL also owns and has under application four thermal coal projects – EPC’s 2198, 2336, 2337 and 2338, each generally south of Longreach in southwest Queensland, and all of which are currently going through various permitting and granting processes. All four tenements are located adjacent to other prospective thermal coal resources, attracting signifi cant regional export infrastructure and investment momentum.
WHO WE ARE AND WHAT WE DO
Perth-based NSL Consolidated Limited (NSL or Company) is a publicly-listed bulk commodities explorer, developer and producer focussed on strategic iron ore opportunities in India and thermal coal projects in southwest Queensland. Its goal is to evolve the unique but synergistic commercial opportunities resulting from natural Australian-Indian partnerships and alliances to bring both of these bulk commodities to global markets.
The Company emerged in 2012 as a maiden iron ore producer in the southeastern Indian state of Andhra Pradesh, the only foreign iron ore company to date to own and operate in India’s massive domestic and international iron ore market, the 4th largest in the world. This generated NSL’s fi rst revenues.
NSL CONSOLIDATED LTD ANNuAL REPORT 2012
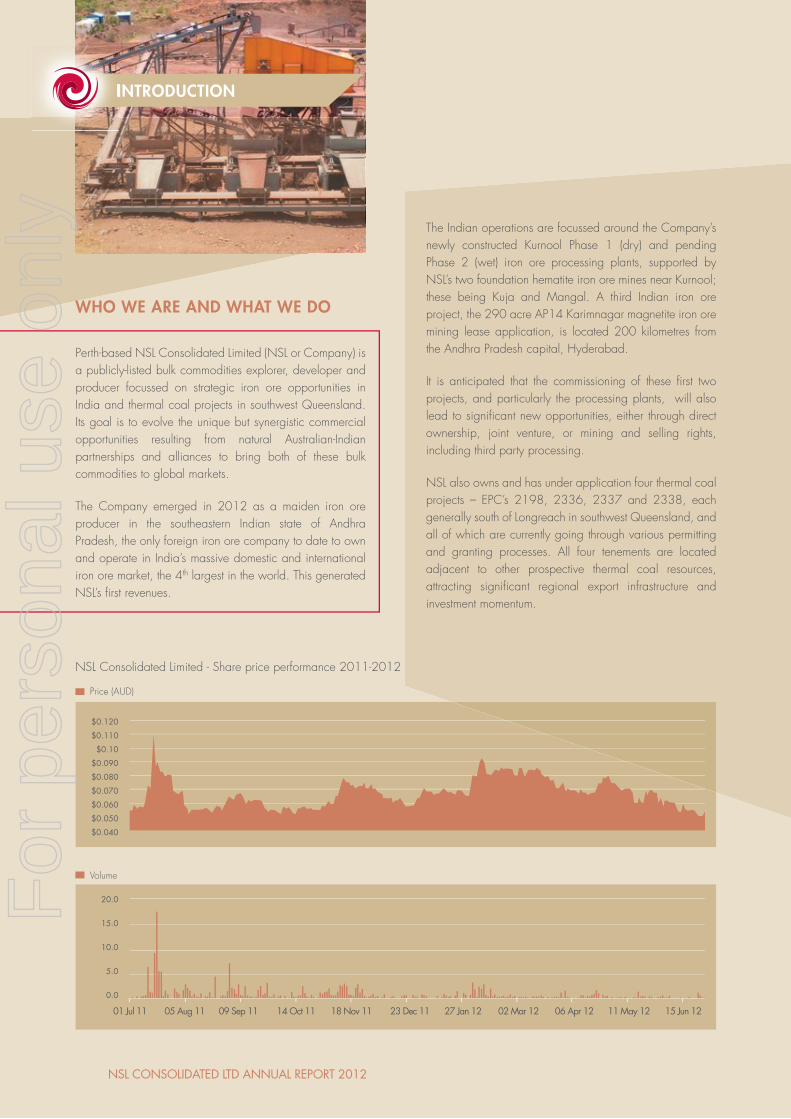
$0.120
$0.110
$0.10
$0.090
$0.080
$0.070
$0.060
$0.050
$0.040
Price (AUD)
Volume
20.0
15.0
10.0
5.0
0.0
01 Jul 11 05 Aug 11 09 Sep 11 14 Oct 11 18 Nov 11 23 Dec 11 27 Jan 12 02 Mar 12 06 Apr 12 11 May 12 15 Jun 12
INTRODUCTIONINTRODUCTION
NSL Consolidated Limited - Share price performance 2011-2012
For
per
sona
l use
onl
y
INTRODUCTIONINTRODUCTION
Magnetite can be combined with bentonite (a clay) and heat to produce high quality pellets preferred by steelmakers for use in their blast furnaces as they are more effi cient and reduce costs and pollution. Magnetite pellets attract a higher price over hematite ores. Magnetite is the main product of the world’s largest producer of iron ore and steel, China. With hematite grades dropping, more and more magnetite is being used in blends. Magnetite processing is decades old, well understood and low risk.
What is thermal coal?
Thermal coal, also known as steaming coal, is generally used to generate power used in either public electricity grids or directly by industry consuming electrical power (such as chemical industries, paper manufacturers, cement works and brickworks). For use in power generation, the coal is ground to a powder and fi red into a boiler to produce steam to drive turbines that produce electricity.
It is different to coking coal which is metallurgical coal used as a reducing agent in a blast furnace to temper iron ore into steel products. Since 2000, global coal consumption has grown faster than any other fuel. The fi ve largest coal users - China, USA, India, Russia and Japan - account for around 77% of total global coal use. The biggest market for coal is Asia, which currently accounts for over 65% of global coal consumption. Many countries do not have natural energy resources suffi cient to cover their energy needs, and therefore need to import energy to help meet their requirements. India, Japan, Chinese Taipei and Korea import signifi cant quantities of steam coal for electricity generation and coking coal for steel production. (Source: World Coal Association)
OUR COMMODITIES
What is hematite iron ore?
Hematite (Fe2O3) is a non magnetic style of iron ore oxide mineral and in pure form contains 69.9% iron ore. It has been the dominant iron ore mined in Australia since the early 1960s. High grade hematite ores are referred to as Direct Shipping Ore (DSO) because they are mined and benefi ciated using a relatively simple crushing and screening process before being exported for use in steel making. Australia’s hematite DSO averages 56% to 62% iron ore content, without treatment. Hematite ores tend however to have higher levels of impurities such as phosphorous, sulphur and aluminium. Hematite DSO ores are exploited on all continents except Antarctica, with the largest intensity in South America, Australia and Asia. Most large hematite iron ore deposits are sourced from altered banded iron ore formations. DSO deposits are typically rarer than the magnetite-bearing strata but are considerably cheaper to mine and process as they require less benefi ciation due to the higher iron ore content.
What is magnetite iron ore?
Magnetite (Fe3O4) is a magnetic mineral ore that can be crushed and passed over a magnet and the magnetite extracted leaving a clean high grade product. It occurs as four general types: 1) Banded iron ore formation (BIFs) or BIF/gneiss 2) Taconite 3) Skarn and 4) Siltstone. Magnetite ore in the ground is of lower grade than commercially exploited hematite ores but after processing, a product with much higher iron ore grades and much lower costly impurities is produced.
NSL CONSOLIDATED LTD ANNuAL REPORT 2012
For
per
sona
l use
onl
y

HIGHLIGHTSHIGHLIGHTS
HIGHLIGHTS FOR 2011-2012:
Indian iron ore
• Gained all necessary mining and environmental approvals for the commencement of operations
• Successful construction of Indian iron ore processing plant at Kurnool
• Successful commissioning of Kurnool’s Phase 1 dry plant circuit
• Generated maiden Phase 1 iron ore production and revenue
• Ensured maiden transition from developer to iron ore producer
Queensland thermal coal
• Substantial progress in permitting and approvals process for all four close proximity tenements
• Ministerial approval pending at balance date on fi rst grant – EPC 2198
• Current process on track for fi nal grants for all four by end 2H 2012
• Tenements host estimated total exploration target of 6.6 – 18.7 billion tonnes
• Maiden Inferred resource proven up during 2011-2012 in non-related contiguous tenement
NSL CONSOLIDATED LTD ANNuAL REPORT 2012
For
per
sona
l use
onl
y

NSL CONSOLIDATED LTD ANNuAL REPORT 2012
CONTENTS
Corporate Directory 1
Chairman’s Letter 2
Managing Director’s Report 3
Directors’ Report 9
Auditor’s Independence Declaration 23
Corporate Governance Statement 24
Consolidated Statement of Comprehensive Income 30
Consolidated Statement of Financial Position 31
Consolidated Statement of Cash Flows 32
Consolidated Statement of Changes in Equity 33
Notes to the Financial Statements 36
CONTENTSCONTENTS
For
per
sona
l use
onl
y

CORPORATE DIRECTORY CORPORATE DIRECTORY
1
DIRECTORSJ Muir ACA
Chairman / Non-Executive Director
C F Goode MBA
Managing Director / CEO
P C Wall LLB, B.Comm, M.App.Fin
Non-Executive Director
P I Richards B.Comm
Non-Executive Director
COMPANY SECRETARY S P Henbury
REGISTERED OFFICEc/- FJH Solutions
21 Teddington Road
Burswood WA 6100
Telephone: (08) 9486 2333
Facsimile: (08) 9355 4580
CORPORATE OFFICE Level 1, 30 Ord Street
West Perth WA 6005
Telephone: (08) 9322 5562
Facsimile: (08) 9322 5563
WEB SITE ADDRESSwww.nslconsolidated.com
SHARE REGISTRY Security Transfer Registrars
770 Canning Highway
Applecross WA 6153
Telephone: (08) 9315 2333
Facsimile: (08) 9315 2233
AUDITORS BDO Audit (WA) P/L
38 Station Street
Subiaco WA 6008
SOLICITORS TO THE COMPANY Steinepreis Paganin Lawyers and Consultants
Level 4, The Read Buildings
16 Milligan Street
Perth WA 6000
STOCK EXCHANGE LISTING NSL Consolidated Limited’s shares are listed on the Australian Securities Exchange and Frankfurt Stock Exchange
Australian Stock Exchange Code: NSL
Frankfurt Stock Exchange Code: 2NC
NSL CONSOLIDATED LTD ANNuAL REPORT 2012
For
per
sona
l use
onl
y

CHAIRMAN’S LETTERCHAIRMAN’S LETTER
Dear Fellow Shareholders,
The continuing global economic uncertainty and its effect on commodity prices and capital markets make it very diffi cult to forecast the future in any detail. This is refl ected in a tough year for the junior end of the resources market, with many participants entering 2012-2013 focussed on survival measures and protection of cash reserves.
Your company is subject to these pressures as much as any other company at this stage of its development. Where we differ from our peers is our geographical positioning which puts us right in the middle of a growing market and a low cost environment, and importantly, at the threshold of generating positive cash fl ows.
India’s appetite for iron ore is driven by its need to upgrade infrastructure over the next 10-20 years and that requires steel (and also energy). The iron ore mining industry, with the exception of mines associated with steel mills is fragmented and security of supply will be a major factor in our success. While our operations are close to many Indian steel mills which will enable us to supply directly into the domestic market, importantly we are also within easy reach of East Coast ports for the short shipping distance to China.
While global seaborne iron ore prices have been drifting down, Indian domestic iron ore prices continue to strongly rise, highlighting the existing domestic supply and demand imbalance associated with iron ore. The result of this imbalance highlights the unique opportunity your company has as the only foreign company to own and operate iron ore mines in India.
The Indian mining environment is very different to that in Australia but the hard won experience we have gained over the last three years shows in where we are today.
Our major achievements this year are the commissioning of our dry benefi ciation plant and our fi rst sales. The building and commissioning of the plant was completed on schedule with zero harm to our employees and contractors. We are also working with the local communities to ensure that we have a social license to operate. The longer we operate in India the more we understand how to work within a different business environment and the better we become in getting things done.
Your Directors were also pleased to note continued investment and thermal coal resource estimations during the year in Queensland’s prolifi c thermal coal province in the State’s southwest, where our four thermal coal tenements are undergoing approvals processes. Subject to approvals, it is our objective to commence our maiden thermal coal exploration campaign with substantive on-ground survey, exploration and drilling to be programmed and scheduled.
This again should deliver to the equities markets an assurance that NSL’s plan to deliver production and development milestones are on track.
We thank you sincerely for your loyalty as shareholders during the past challenging 12 months. Finally the board sincerely thanks the hard work of our Australian and Indian staff in building up the business for the future.
Jock MuirChairman
2NSL CONSOLIDATED LTD ANNuAL REPORT 2012
For
per
sona
l use
onl
y

MANAGING DIRECTOR’S REPORTMANAGING DIRECTOR’S REPORT
3 NSL CONSOLIDATED LTD ANNuAL REPORT 2012
Why Indian iron ore?
With signifi cant investment to be made in upgrading India’s infrastructure in the next 10 years (estimated to be US$1.7 trillion) India’s Government is taking various steps to further encourage private and foreign investments. NSL is positioned to be part of that growth plan – a plan which has to service strong domestic consumption, higher workforce numbers, and emerging middle classes. India’s wealthiest consumers (those earning US$1m or more in PPP terms) will increase by 40 million in the next 10 years! Every sector within India’s consumer market is booming, making India far less vulnerable to external shocks and pressures than other emerging markets.
It may be the world’s 4th largest steel producer and is the 3rd
largest iron ore exporter, but India’s iron ore market, though large, is fragmented, with many small-scale operations. Its iron ore sector boasts about 80 companies operating over 250 mines to produce approximately160Mtpa.
As a participant in the local market, India’s economic growth and stability therefore favours NSL’s long-term presence in India and provides high leverage to attractive iron ore prices, both domestic and export, while it can also leverage its cash fl ow and asset base in line with India’s economic growth.
No junior resources developer should, however, focus all of their resources into a single market or commodity. Encouraged by our Indian alliances, NSL moved into Queensland’s bulk commodities market, focussing on thermal coal opportunities, a commodity that is well understood by domestic and international consumers, joint venture partners, fi nanciers and the equities market.
Our entry has been at low cost but with strong upside. While the early period has serviced the requirements of applications and approvals necessary before exploration can commence, nonetheless all four tenements are expected to be licensed by year’s end. This will facilitate the commencement of substantive on-ground survey, exploration and drilling campaigns to be planned and scheduled in the near future. We see the projects as having company maker potential.
THE REASONS BEHIND OUR BUSINESS STRATEGY…
Why India?
India’s GDP is currently US$1.3 trillion, making it the 8th largest economy in the world. However, in Purchasing Power Parity (PPP) terms, which recognises India’s low cost base, the GDP notionally rises to three times this amount (US$3.8 trillion) which places it on a similar size to Japan. By 2013, it is expected to become the third largest economy in the world (after the USA and China) in PPP terms.
India’s economy grew by 8.4% per annum (in 2010-11). High GDP growth rate is expected to be maintained over the next 10 years. India’s GDP will grow fi ve times in the next 20 years, and GDP per capita will almost quadruple. The country is also one of the youngest countries in the world, with an average age of 25 and likely to get younger. India’s working-age population will increase by 240 million over the next 20 years. With a population of 1.2 billion, a strong work ethic, high levels of education, democracy, English language skills and an entrepreneurial culture, demand for energy commodities will continue to grow. This is supported by its national savings rate of 37% of GDP, a rate which fuels most of its investment requirements. Not surprisingly, only 20% of India’s total public debt is sourced from foreign borrowings.
No junior resources developer should, however, focus all of their resources into a single market or commodity. Encouraged by our Indian alliances, NSL moved into Queensland’s bulk commodities market, focussing on thermal coal opportunities, a commodity that is well understood by domestic and international consumers, joint venture partners, fi nanciers and the equities market.
Our entry has been at low cost but with strong upside. While the early period has serviced the requirements of applications and approvals necessary before exploration can commence, nonetheless all four tenements are expected to be licensed by year’s end. This will facilitate the commencement of substantive on-ground survey, exploration and drilling campaigns to be planned and scheduled in the near future. We see the projects as having company maker potential.
For
per
sona
l use
onl
y

MANAGING DIRECTOR’S REPORTMANAGING DIRECTOR’S REPORT
4NSL CONSOLIDATED LTD ANNuAL REPORT 2012
Our Qld coal for India?
In addition NSL’s strategy includes the option to examine and where possible develop opportunities to supply our Australian thermal coal, if proven up as mineable resource, into the expanding Indian market. This opportunity is no better demonstrated than in October last year when most of India’s 86 coal-based power projects were operating with less than a week’s coal supply – in a country that has the 5th largest generation capacity in the world – 83GW (Aug 2010) rising to an expected ~ 240 GW over the next four years. Its acute power defi cit of ~15% was no better demonstrated than in the massive blackout that struck most of the country’s north in July this year.
Its thermal power sector is facing a 15% shortage (50-60 Mt) of domestically supplied coal, yet owing to its rapid economic growth creating increasing energy needs, thermal coal requirement growth in India is likely to outstrip domestic thermal coal supply growth. Domestic coal defi cit for thermal power plants is expected to touch 30% and 32% in FY 2012 and FY 2017 respectively. As coal assumes an even greater role in India’s energy supply, the projected coal shortage is likely to lead to increased coal imports in the future – the gateway targeted by NSL for our Queensland projects
Indian Iron Ore
This year has delivered a number of milestones, culminating in the commissioning in June of Phase 1 of the Company’s wholly-owned Kurnool iron ore dry separation plant in Andhra Pradesh, southeast India.
That has set the stage for a build-up during the new fi nancial year to Kurnool’s anticipated 200,000 tonnes per annum rate while NSL installs the Phase 2 wet benefi ciation plant to add an anticipated additional 200,000 tpa capacity (for 400,000 tpa total).
Increased buyer interest generated by plant completion and start-up bodes well for fi rst sales from the Phase 2 output in the opening half of calendar 2013.
The achievements were driven by the Company’s Australian and Indian based operational and management teams.
NSL’s Mangal hematite mine, just fi ve kilometres from the stockyard servicing the Kurnool dry plant, is now fully operational with a permanent fl eet of excavators and trucks on site. These fl eet levels will be increased as Kurnool moves towards nameplate production capacity.
The nearby Kuja hematite mine, immediately adjacent to NSL’s stockyard facilities is on track to commence mine start up during the September 2012 quarter, with an initial fl eet of excavators and trucks servicing deliveries into Kurnool.
Major construction and commissioning gains were made during the year at the Kurnool operations, including start-up on the weighbridge, developing the site’s laboratory and commissioning the Phase 1 dry separation plant. This plant is capable of delivering iron ore grades of 54-58% Fe in 5-20mm sized material.
For
per
sona
l use
onl
y
5 NSL CONSOLIDATED LTD ANNuAL REPORT 2012
MANAGING DIRECTOR’S REPORT
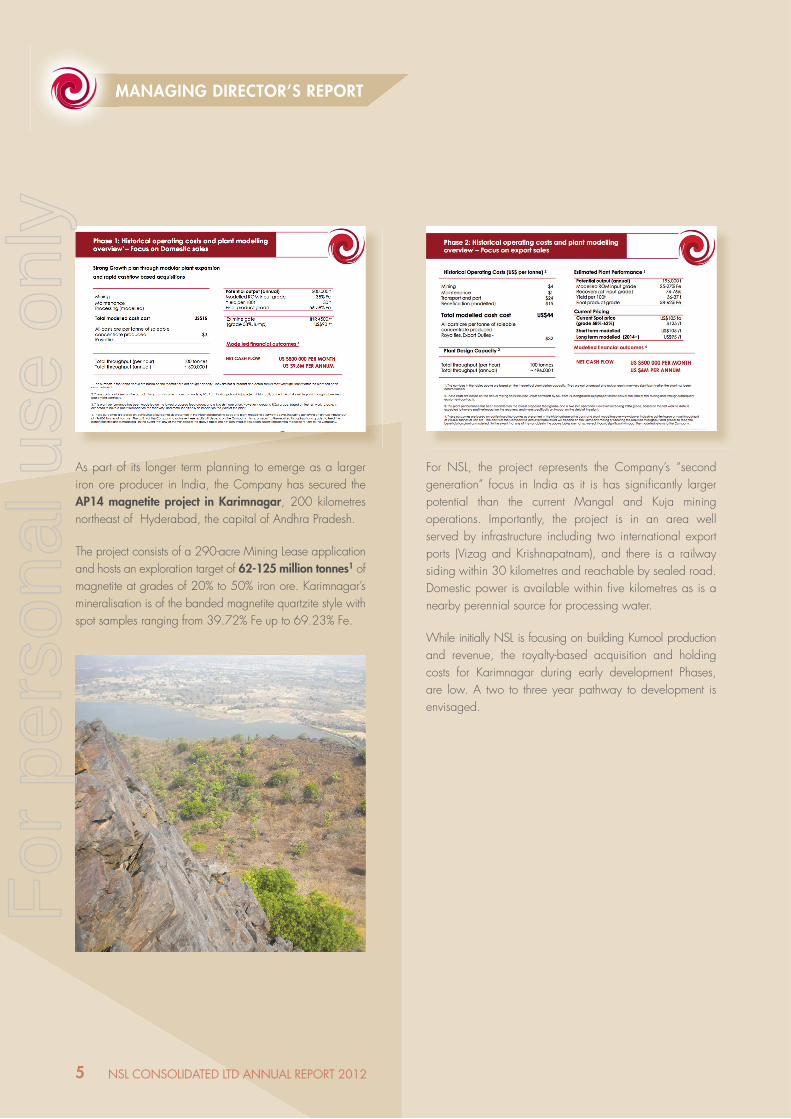
As part of its longer term planning to emerge as a larger iron ore producer in India, the Company has secured the AP14 magnetite project in Karimnagar, 200 kilometres northeast of Hyderabad, the capital of Andhra Pradesh.
The project consists of a 290-acre Mining Lease application and hosts an exploration target of 62-125 million tonnes1 of magnetite at grades of 20% to 50% iron ore. Karimnagar’s mineralisation is of the banded magnetite quartzite style with spot samples ranging from 39.72% Fe up to 69.23% Fe.
For NSL, the project represents the Company’s “second generation” focus in India as it is has signifi cantly larger potential than the current Mangal and Kuja mining operations. Importantly, the project is in an area well served by infrastructure including two international export ports (Vizag and Krishnapatnam), and there is a railway siding within 30 kilometres and reachable by sealed road. Domestic power is available within fi ve kilometres as is a nearby perennial source for processing water.
While initially NSL is focusing on building Kurnool production and revenue, the royalty-based acquisition and holding costs for Karimnagar during early development Phases, are low. A two to three year pathway to development is envisaged.
MANAGING DIRECTOR’S REPORT
For
per
sona
l use
onl
y

6NSL CONSOLIDATED LTD ANNuAL REPORT 2012
The Company’s development timeline then for our Indian iron ore operations is as follows:
NSL IRON ORE - STRONG GROWTH PIPELINE
Ramp up production from Kuja, Mangal and Phase 1 plant Cash fl ows commenced
Phase 2 construction,commissioning
Close proximity opportunities withtimely access to material Strong expanded cashfl ows
DSO and low grade benefi ciation projects
Target run rate of 1.5million tonnes per annumStrict criteria
One to two year timehorizon to production
Finalise Mining Leaseapproval
Two to three year timehorizon to production
Initial review - scopeproject Establish JORC resource
Kurnool Expansion - leveraged existing asset base - 2nd half 2012 to 2013
Target acquisitions - 2012 to 2014
Continue AP14 development
Unlock further value throughbenefi ciation
Pelletisation offers attractivemargins
Government incentives to valueadd - no export duty
Move up the value chain
Queenslandthermal
coal evaluation continues
MANAGING DIRECTOR’S REPORTMANAGING DIRECTOR’S REPORT
Queenslandthermal
coal evaluation continues
Existing production from Kurnool (via Mangal / Kuja)
For
per
sona
l use
onl
y
7 NSL CONSOLIDATED LTD ANNuAL REPORT 2012
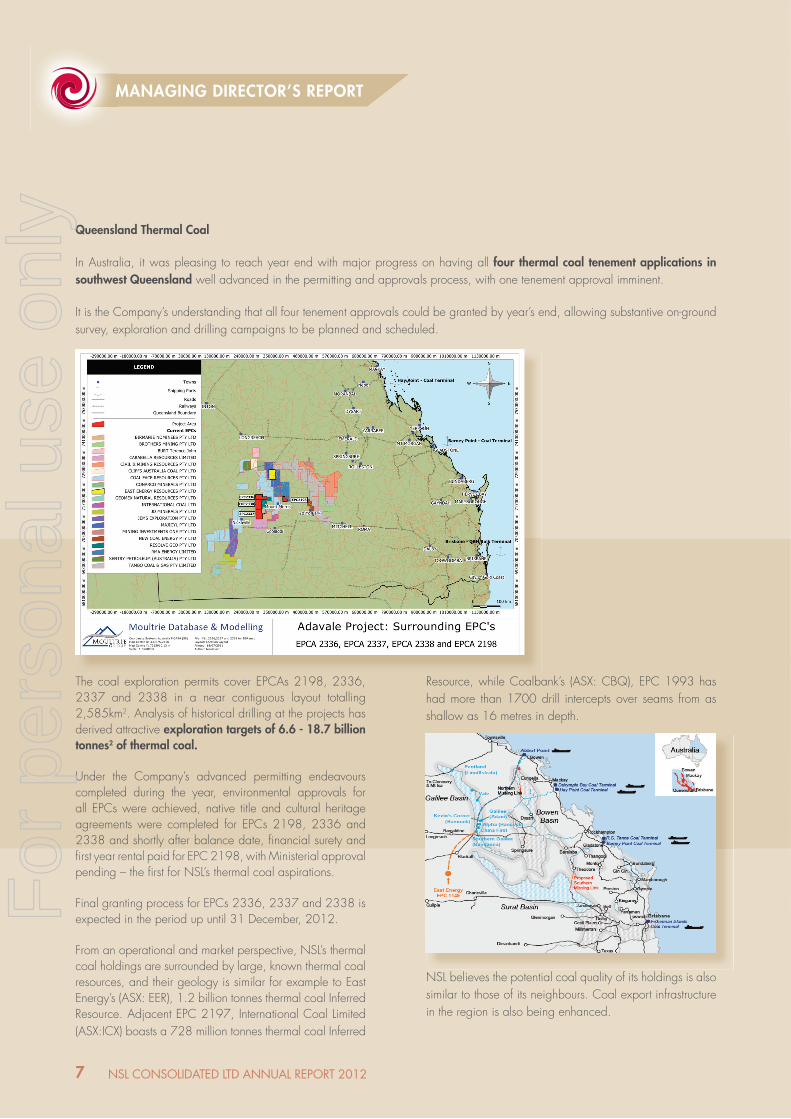
The coal exploration permits cover EPCAs 2198, 2336, 2337 and 2338 in a near contiguous layout totalling 2,585km2. Analysis of historical drilling at the projects has derived attractive exploration targets of 6.6 - 18.7 billion tonnes2 of thermal coal.
Under the Company’s advanced permitting endeavours completed during the year, environmental approvals for all EPCs were achieved, native title and cultural heritage agreements were completed for EPCs 2198, 2336 and 2338 and shortly after balance date, fi nancial surety and fi rst year rental paid for EPC 2198, with Ministerial approval pending – the fi rst for NSL’s thermal coal aspirations.
Final granting process for EPCs 2336, 2337 and 2338 is expected in the period up until 31 December, 2012.
From an operational and market perspective, NSL’s thermal coal holdings are surrounded by large, known thermal coal resources, and their geology is similar for example to East Energy’s (ASX: EER), 1.2 billion tonnes thermal coal Inferred Resource. Adjacent EPC 2197, International Coal Limited (ASX:ICX) boasts a 728 million tonnes thermal coal Inferred
Resource, while Coalbank’s (ASX: CBQ), EPC 1993 has had more than 1700 drill intercepts over seams from as shallow as 16 metres in depth.
NSL believes the potential coal quality of its holdings is also similar to those of its neighbours. Coal export infrastructure in the region is also being enhanced.
MANAGING DIRECTOR’S REPORTMANAGING DIRECTOR’S REPORT
Queensland Thermal Coal
In Australia, it was pleasing to reach year end with major progress on having all four thermal coal tenement applications in southwest Queensland well advanced in the permitting and approvals process, with one tenement approval imminent.
It is the Company’s understanding that all four tenement approvals could be granted by year’s end, allowing substantive on-ground survey, exploration and drilling campaigns to be planned and scheduled.
For
per
sona
l use
onl
y
8NSL CONSOLIDATED LTD ANNuAL REPORT 2012
MANAGING DIRECTOR’S REPORTMANAGING DIRECTOR’S REPORT
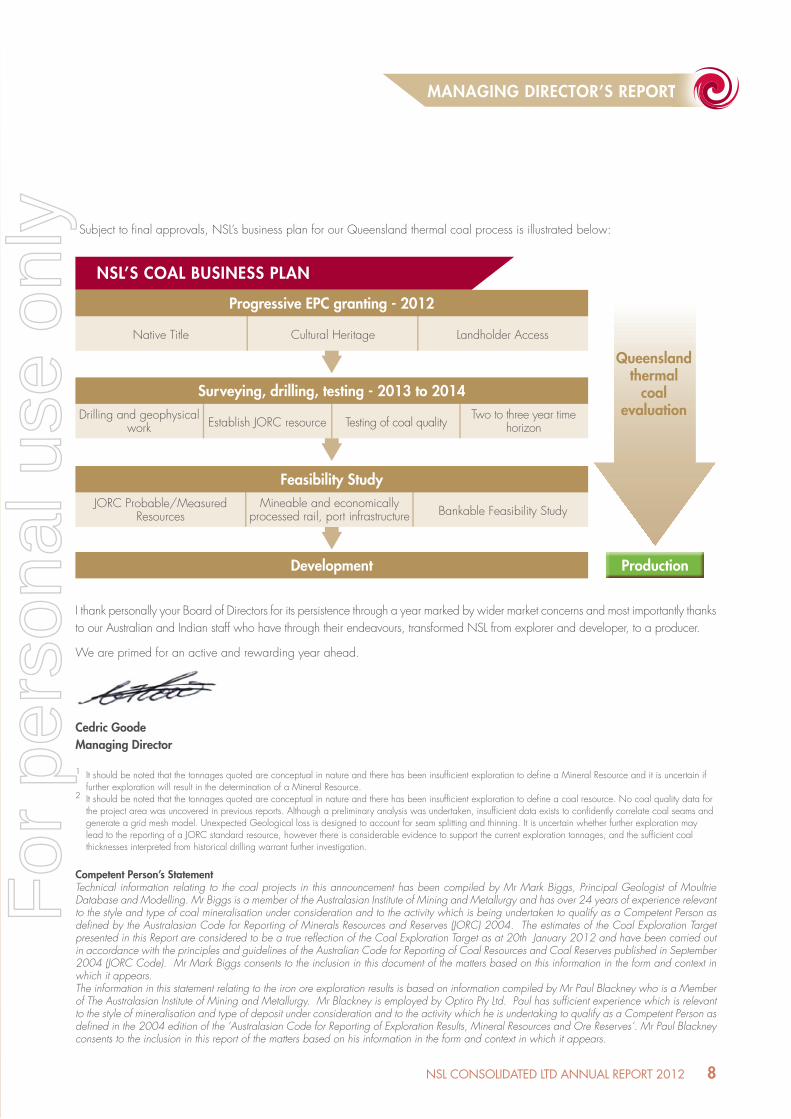
Subject to fi nal approvals, NSL’s business plan for our Queensland thermal coal process is illustrated below:
NSL’S COAL BUSINESS PLAN
Landholder Access
Progressive EPC granting - 2012
JORC Probable/MeasuredResources
Mineable and economicallyprocessed rail, port infrastructure Bankable Feasibility Study
Feasibility Study
Queenslandthermal
coal evaluation
Native Title Cultural Heritage
Drilling and geophysical work Testing of coal qualityEstablish JORC resource
Two to three year timehorizon
Surveying, drilling, testing - 2013 to 2014
Development Production
I thank personally your Board of Directors for its persistence through a year marked by wider market concerns and most importantly thanks to our Australian and Indian staff who have through their endeavours, transformed NSL from explorer and developer, to a producer.
We are primed for an active and rewarding year ahead.
Cedric GoodeManaging Director
1 It should be noted that the tonnages quoted are conceptual in nature and there has been insuffi cient exploration to defi ne a Mineral Resource and it is uncertain if further exploration will result in the determination of a Mineral Resource.2 It should be noted that the tonnages quoted are conceptual in nature and there has been insuffi cient exploration to defi ne a coal resource. No coal quality data for the project area was uncovered in previous reports. Although a preliminary analysis was undertaken, insuffi cient data exists to confi dently correlate coal seams and generate a grid mesh model. Unexpected Geological loss is designed to account for seam splitting and thinning. It is uncertain whether further exploration may lead to the reporting of a JORC standard resource, however there is considerable evidence to support the current exploration tonnages, and the suffi cient coal thicknesses interpreted from historical drilling warrant further investigation.
Competent Person’s StatementTechnical information relating to the coal projects in this announcement has been compiled by Mr Mark Biggs, Principal Geologist of Moultrie Database and Modelling. Mr Biggs is a member of the Australasian Institute of Mining and Metallurgy and has over 24 years of experience relevant to the style and type of coal mineralisation under consideration and to the activity which is being undertaken to qualify as a Competent Person as defi ned by the Australasian Code for Reporting of Minerals Resources and Reserves (JORC) 2004. The estimates of the Coal Exploration Target presented in this Report are considered to be a true refl ection of the Coal Exploration Target as at 20th January 2012 and have been carried out in accordance with the principles and guidelines of the Australian Code for Reporting of Coal Resources and Coal Reserves published in September 2004 (JORC Code). Mr Mark Biggs consents to the inclusion in this document of the matters based on this information in the form and context in which it appears. The information in this statement relating to the iron ore exploration results is based on information compiled by Mr Paul Blackney who is a Member of The Australasian Institute of Mining and Metallurgy. Mr Blackney is employed by Optiro Pty Ltd. Paul has suffi cient experience which is relevant to the style of mineralisation and type of deposit under consideration and to the activity which he is undertaking to qualify as a Competent Person as defi ned in the 2004 edition of the ‘Australasian Code for Reporting of Exploration Results, Mineral Resources and Ore Reserves’. Mr Paul Blackney consents to the inclusion in this report of the matters based on his information in the form and context in which it appears.
For
per
sona
l use
onl
y
9 NSL CONSOLIDATED LTD ANNuAL REPORT 2012
The Directors of NSL Consolidated Limited (the Company or NSL) present their report on the consolidated entity (referred to hereafter as the Group), consisting of NSL Consolidated Limited and the entities it controlled at the end of, and during, the fi nancial year ended 30 June 2012.
DIRECTORS
The following persons were Directors of NSL Consolidated Limited during the whole of the fi nancial year and up to the date of this report, unless otherwise stated:
Jock Muir Chairman/Non-Executive
Cedric Goode Managing Director/CEO
Peter Wall Non-Executive Director
Peter Richards Non-Executive Director
PRINCIPAL ACTIVITIESThe principal activity of the Group during the fi nancial year was review, assessment, exploration, development and strategic investment in Indian iron ore and Queensland Coal projects.
DIVIDENDSThe Directors do not recommend the payment of a dividend and no amounts have been paid or declared by way of dividend since the start of the fi nancial year.
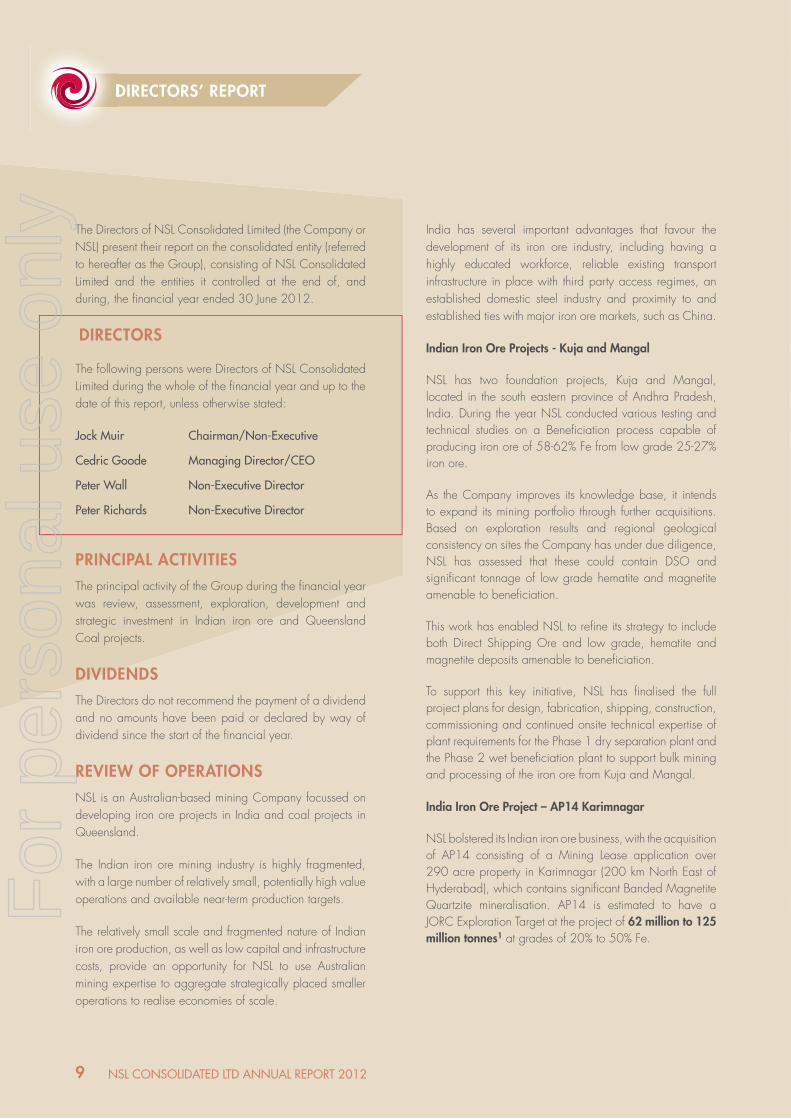
REVIEW OF OPERATIONSNSL is an Australian-based mining Company focussed on developing iron ore projects in India and coal projects in Queensland.
The Indian iron ore mining industry is highly fragmented, with a large number of relatively small, potentially high value operations and available near-term production targets.
The relatively small scale and fragmented nature of Indian iron ore production, as well as low capital and infrastructure costs, provide an opportunity for NSL to use Australian mining expertise to aggregate strategically placed smaller operations to realise economies of scale.
India has several important advantages that favour the development of its iron ore industry, including having a highly educated workforce, reliable existing transport infrastructure in place with third party access regimes, an established domestic steel industry and proximity to and established ties with major iron ore markets, such as China.
Indian Iron Ore Projects - Kuja and Mangal
NSL has two foundation projects, Kuja and Mangal, located in the south eastern province of Andhra Pradesh, India. During the year NSL conducted various testing and technical studies on a Benefi ciation process capable of producing iron ore of 58-62% Fe from low grade 25-27% iron ore.
As the Company improves its knowledge base, it intends to expand its mining portfolio through further acquisitions. Based on exploration results and regional geological consistency on sites the Company has under due diligence, NSL has assessed that these could contain DSO and signifi cant tonnage of low grade hematite and magnetite amenable to benefi ciation.
This work has enabled NSL to refi ne its strategy to include both Direct Shipping Ore and low grade, hematite and magnetite deposits amenable to benefi ciation.
To support this key initiative, NSL has fi nalised the full project plans for design, fabrication, shipping, construction, commissioning and continued onsite technical expertise of plant requirements for the Phase 1 dry separation plant and the Phase 2 wet benefi ciation plant to support bulk mining and processing of the iron ore from Kuja and Mangal.
India Iron Ore Project – AP14 Karimnagar
NSL bolstered its Indian iron ore business, with the acquisition of AP14 consisting of a Mining Lease application over 290 acre property in Karimnagar (200 km North East of Hyderabad), which contains signifi cant Banded Magnetite Quartzite mineralisation. AP14 is estimated to have a JORC Exploration Target at the project of 62 million to 125 million tonnes1 at grades of 20% to 50% Fe.
DIRECTORS’ REPORTDIRECTORS’ REPORT
For
per
sona
l use
onl
y
In addition to the unsecured Convertible Note, the Company has also entered into a Marketing Agreement with Resources First Pte Ltd to market the Company’s iron ore and procure sales contracts in a manner and at a price consistent with industry standards. This can include Resources First Pte Ltd directly purchasing the iron ore. NSL retain the ultimate and fi nal say to whom, and for what price the iron ore is sold.
The non-exclusive Marketing Agreement is for a three year period (shortened to two years from the date of early conversion of all Notes).
NSL will pay a 2.5% commission for any sales secured to or by Resources First Pte Ltd from Kurnool. The agreement does not apply to any other iron production projects which may be developed by NSL in India.
The agreement caps Resources First Pte Ltd commissioned sales to 300,000 tpa – or about three quarters of Kurnool’s current anticipated total output of 400,000 tpa.
Queensland thermal coal project EPC 2198 granted
As announced on 13 August 2012, the fi rst of the Companys four thermal coal tenements, EPC 2198 has now been formally granted.
10NSL CONSOLIDATED LTD ANNuAL REPORT 2012
DIRECTORS’ REPORTDIRECTORS’ REPORT
Queensland Coal Assets
In conjunction with our Indian iron ore strategy and following enquiries from our Indian and Chinese contacts,
the Company has expanded its commodity portfolio and added value in Queensland with the acquisition of thermal coal exploration permits (EPC Applications) 2198, 2336, 2337 and 2338.
NSL has an Exploration Target of 6.6-18.7 billion tonnes2 of thermal coal across of 4 EPC Applications.
A detailed discussion and analysis of NSL’s operations will be set out in the annual report.
SIGNIFICANT CHANGES IN STATE OF AFFAIRSDuring the fi nancial year the nature of the business changed from an exploration phase to a development phase.
MATTERS SUBSEQUENT TO THE END OF THE FINANCIAL YEARConvertible Note and Marketing Agreement
As announced on 8 August 2012, the Company has entered into a low cost three-year unsecured US$2.5 million Convertible Note with Resources First Pte Ltd at an interest rate of 6%pa.
Interest payments will be yearly on an arrears basis, with the Notes convertible in two tranches at a 10% discount to the 20 VWAP (Volume Weighted Average Price) of Ordinary Shares on issue. The tranche conversion dates are any time after 12 months and 24 months respectively from date of issue, with the conversion price set at a discount to the 20 day VWAP prior to the time of conversion.
NSL can elect to buy some or all of the Notes at its election at any time during the three year term without penalties.
Any shares issued from converted Notes will be voluntarily escrowed for a period of three months post conversion.
The Notes in no way prohibit the Company from undertaking any equity capital raising activities.
NSL CONSOLIDATED LTD ANNuAL REPORT 2012 10
For
per
sona
l use
onl
y
11 NSL CONSOLIDATED LTD ANNuAL REPORT 2012
INFORMATION ON DIRECTORS
The Directors of the Company at any time during or since the end of the fi nancial year are set out below, together with details of qualifi cations, experience and responsibilities.
DIRECTORS’ REPORTDIRECTORS’ REPORT
LIKELY DEVELOPMENT AND EXPECTED RESULTS OF OPERATIONS
Further information as to likely developments in the operations of the Group and the expected results of those operations in subsequent fi nancial years have not been included in this report because the Directors believe it would be likely to result in unreasonable prejudice to the Group.
ENVIRONMENTAL REGULATION
The Group’s current Australian operations are subject to environmental regulation under the laws of the Commonwealth and or State of Queensland.
The Indian entity, NSL Mining Resources India Pvt Ltd, is subject to environmental regulations / legislation in respect of its mines in Andhra Pradesh.
The Directors have considered compliance with the National Greenhouse and Energy Reporting Act 2007 which requires entities to report annual greenhouse gas emissions and energy use. For the period 1 July 2011 to 30 June 2012 the directors have assessed that there are no current reporting requirements, but may be required to do so in the future.
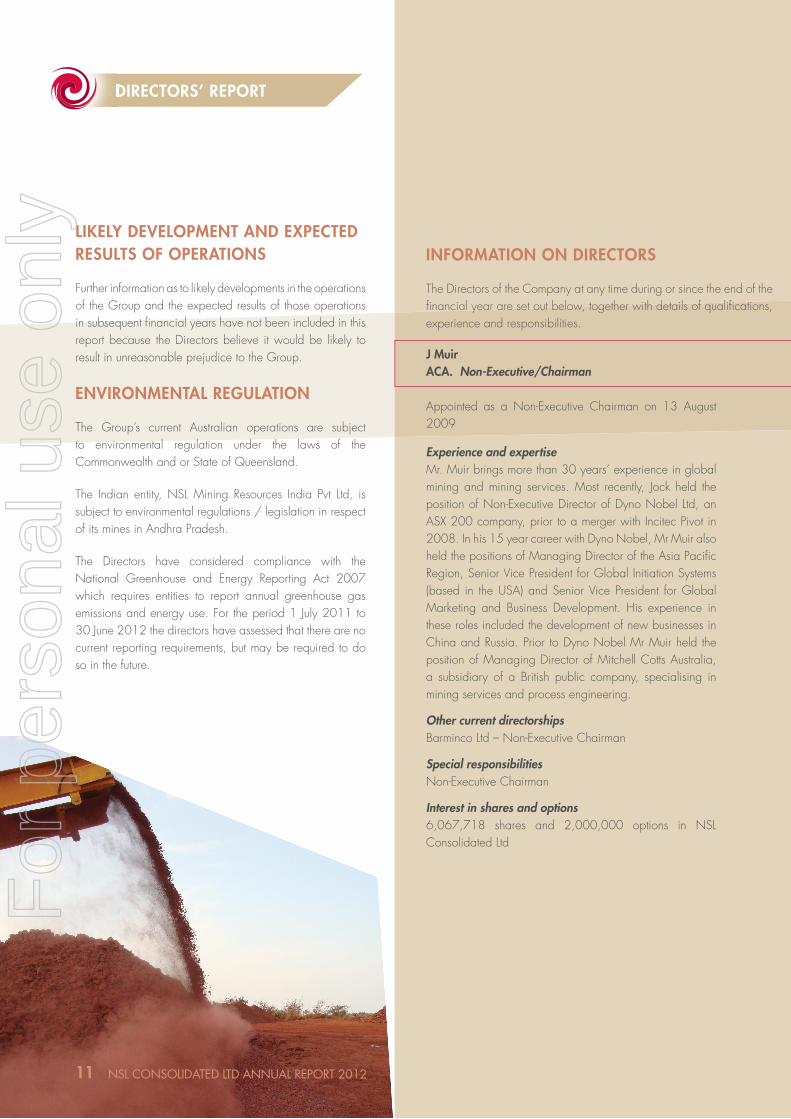
J Muir ACA. Non-Executive/Chairman
Appointed as a Non-Executive Chairman on 13 August 2009
Experience and expertiseMr. Muir brings more than 30 years’ experience in global mining and mining services. Most recently, Jock held the position of Non-Executive Director of Dyno Nobel Ltd, an ASX 200 company, prior to a merger with Incitec Pivot in 2008. In his 15 year career with Dyno Nobel, Mr Muir also held the positions of Managing Director of the Asia Pacifi c Region, Senior Vice President for Global Initiation Systems (based in the USA) and Senior Vice President for Global Marketing and Business Development. His experience in these roles included the development of new businesses in China and Russia. Prior to Dyno Nobel Mr Muir held the position of Managing Director of Mitchell Cotts Australia, a subsidiary of a British public company, specialising in mining services and process engineering.
Other current directorshipsBarminco Ltd – Non-Executive Chairman
Special responsibilitiesNon-Executive Chairman
Interest in shares and options6,067,718 shares and 2,000,000 options in NSL Consolidated Ltd
For
per
sona
l use
onl
y

C F Goode MBA. Managing Director/Chief Executive Offi cer
Appointed as a Managing Director / CEO on 1 December 2008
Experience and expertiseMr Goode brings more than 20 years of mining industry experience. With industry experience focussed in the Iron Ore, Coal and Gold sectors Mr Goode has held a variety of technical, commercial, operational and strategic roles both domestically and internationally with mining and mining services companies. Mr Goode has a proven track record in global strategic planning, global new business acquisitions, merger integration, joint venture establishment and profi t and loss responsibility.
Other current directorshipsNone
Former directorship in last 3 yearsNone
Special responsibilitiesManaging Director
Interest in shares and options22,409,090 shares and 8,000,000 options in NSL Consolidated Ltd
Interest in shares and options22,409,090 shares and 8,000,000 options in NSL
12NSL CONSOLIDATED LTD ANNuAL REPORT 2012
DIRECTORS’ REPORTDIRECTORS’ REPORT
P C Wall LLB, B.Comm, M.App.Fin. Non-Executive Director
Appointed as a Non-Executive Director on 11 April 2007
Experience and expertiseFollowing graduation from UWA, Mr Wall commenced employment at a large Perth based law fi rm and later joined Steinepreis Paganin in January 2000. (Appointed as a Partner in July 2005). He has a wide range of experience in all forms of corporate and commercial law with specifi c expertise in equity capital markets, mergers and acquisitions and resources law.
Other current directorshipsPTO Consolidated Ltd – March 2012 to presentDiscovery Resources Ltd – June 2012 to presentPartner of Steinepreis Paganin
Special responsibilitiesNon-Executive Director
Interest in shares and options12,229,531 shares and 2,000,000 options in NSL Consolidated Ltd
For
per
sona
l use
onl
y
13 NSL CONSOLIDATED LTD ANNuAL REPORT 2012
DIRECTORS’ REPORTDIRECTORS’ REPORT
INFORMATION ON DIRECTORS (CONTINUED)
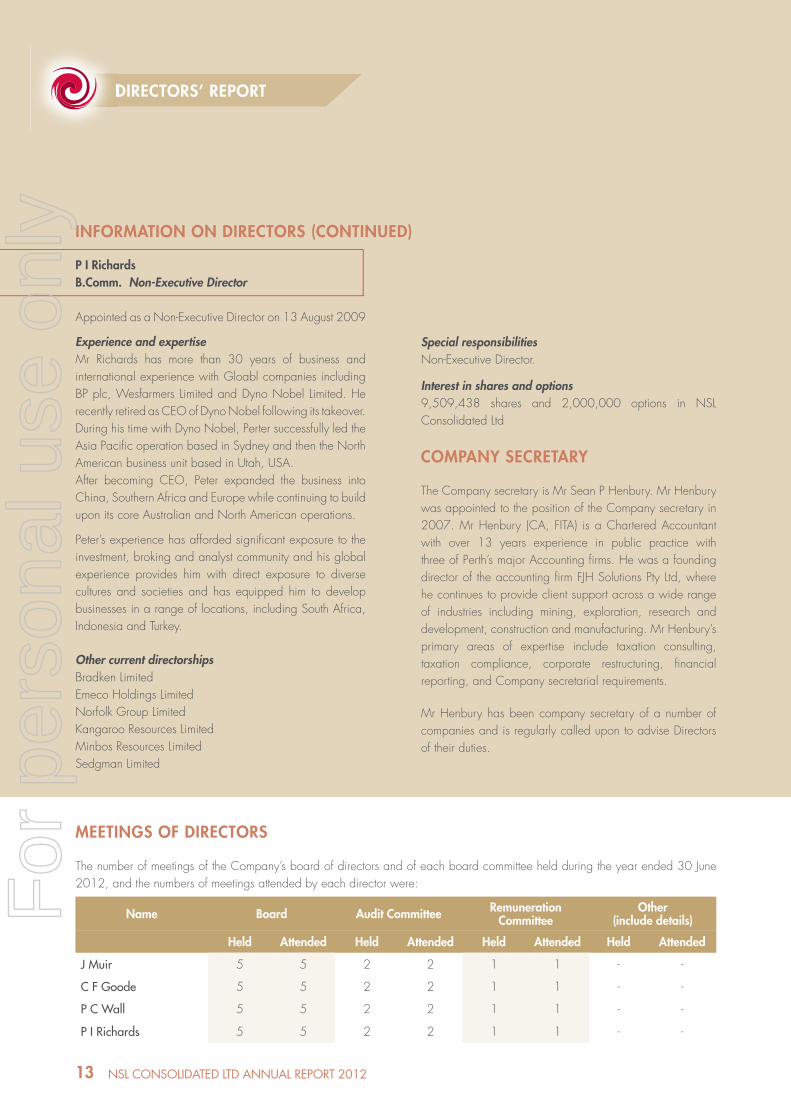
MEETINGS OF DIRECTORS
The number of meetings of the Company’s board of directors and of each board committee held during the year ended 30 June 2012, and the numbers of meetings attended by each director were:
Name Board Audit Committee RemunerationCommittee
Other(include details)
Held Attended Held Attended Held Attended Held Attended
J Muir 5 5 2 2 1 1 - -
C F Goode 5 5 2 2 1 1 - -
P C Wall 5 5 2 2 1 1 - -
P I Richards 5 5 2 2 1 1 - -
P I Richards B.Comm. Non-Executive Director
Appointed as a Non-Executive Director on 13 August 2009
Experience and expertiseMr Richards has more than 30 years of business and international experience with Gloabl companies including BP plc, Wesfarmers Limited and Dyno Nobel Limited. He recently retired as CEO of Dyno Nobel following its takeover. During his time with Dyno Nobel, Perter successfully led the Asia Pacifi c operation based in Sydney and then the North American business unit based in Utah, USA. After becoming CEO, Peter expanded the business into China, Southern Africa and Europe while continuing to build upon its core Australian and North American operations.
Peter’s experience has afforded signifi cant exposure to the investment, broking and analyst community and his global experience provides him with direct exposure to diverse cultures and societies and has equipped him to develop businesses in a range of locations, including South Africa, Indonesia and Turkey.
Other current directorshipsBradken LimitedEmeco Holdings Limited Norfolk Group LimitedKangaroo Resources LimitedMinbos Resources LimitedSedgman Limited
Special responsibilitiesNon-Executive Director.
Interest in shares and options9,509,438 shares and 2,000,000 options in NSL Consolidated Ltd
COMPANY SECRETARY
The Company secretary is Mr Sean P Henbury. Mr Henbury was appointed to the position of the Company secretary in 2007. Mr Henbury (CA, FITA) is a Chartered Accountant with over 13 years experience in public practice with three of Perth’s major Accounting fi rms. He was a founding director of the accounting fi rm FJH Solutions Pty Ltd, where he continues to provide client support across a wide range of industries including mining, exploration, research and development, construction and manufacturing. Mr Henbury’s primary areas of expertise include taxation consulting, taxation compliance, corporate restructuring, fi nancial reporting, and Company secretarial requirements.
Mr Henbury has been company secretary of a number of companies and is regularly called upon to advise Directors of their duties.
For
per
sona
l use
onl
y

MEETINGS OF DIRECTORS (CONTINUED)
The audit committee and remuneration committee functions are performed by the full board. Please refer the Corporate Governance Statement section under the heading Principle 2: Structure the Board to add value.
REMUNERATION REPORT – AUDITED
This remuneration report sets out remuneration information for the Company’s non-executive directors, executive director and other key management personnel.
Directors and executives disclosed in this report
14NSL CONSOLIDATED LTD ANNuAL REPORT 2012
DIRECTORS’ REPORTDIRECTORS’ REPORT
Role of the remuneration committeeThe remuneration committee is a committee of the board. It is primary responsible for making recommendation to the board on: – non-executive director fees– executive remuneration (directors and other executives), and– the over-arching executive remuneration framework and incentive plan policies.
Their objective is to ensure that remuneration policies and structures are fair and competitive and aligned with long-term interests of the Company.
The Corporate Governance Statement provides further information on the role of this committee.
Name Position
Non-executive and executive directors – see page 11 to 13 above
Other key management personnel of the Group.
J S M Tambyrajah Chief Financial Offi cer (resigned 30 March 2012)
S M Freeman Chief Operating Offi cer
T K S Lee Financial Controller (commenced 16 March 2012)
For
per
sona
l use
onl
y
15 NSL CONSOLIDATED LTD ANNuAL REPORT 2012
REMUNERATION REPORT – AUDITED (CONTINUED)
Principles used to determine the nature and amount of remuneration
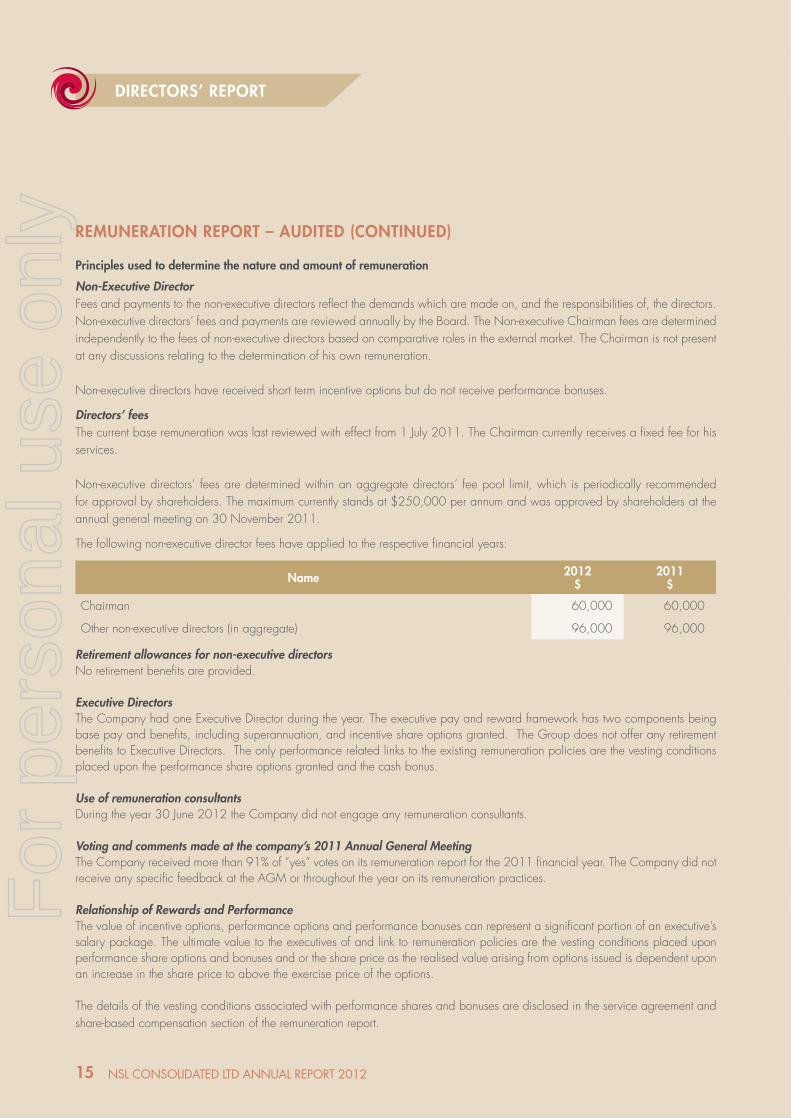
Non-Executive DirectorFees and payments to the non-executive directors refl ect the demands which are made on, and the responsibilities of, the directors. Non-executive directors’ fees and payments are reviewed annually by the Board. The Non-executive Chairman fees are determined independently to the fees of non-executive directors based on comparative roles in the external market. The Chairman is not present at any discussions relating to the determination of his own remuneration.
Non-executive directors have received short term incentive options but do not receive performance bonuses.
Directors’ feesThe current base remuneration was last reviewed with effect from 1 July 2011. The Chairman currently receives a fi xed fee for his services.
Non-executive directors’ fees are determined within an aggregate directors’ fee pool limit, which is periodically recommended for approval by shareholders. The maximum currently stands at $250,000 per annum and was approved by shareholders at the annual general meeting on 30 November 2011.
The following non-executive director fees have applied to the respective fi nancial years:
Name 2012$
2011$
Chairman 60,000 60,000
Other non-executive directors (in aggregate) 96,000 96,000
Retirement allowances for non-executive directorsNo retirement benefi ts are provided.
Executive DirectorsThe Company had one Executive Director during the year. The executive pay and reward framework has two components being base pay and benefi ts, including superannuation, and incentive share options granted. The Group does not offer any retirement benefi ts to Executive Directors. The only performance related links to the existing remuneration policies are the vesting conditions placed upon the performance share options granted and the cash bonus.
Use of remuneration consultantsDuring the year 30 June 2012 the Company did not engage any remuneration consultants.
Voting and comments made at the company’s 2011 Annual General MeetingThe Company received more than 91% of “yes” votes on its remuneration report for the 2011 fi nancial year. The Company did not receive any specifi c feedback at the AGM or throughout the year on its remuneration practices.
Relationship of Rewards and PerformanceThe value of incentive options, performance options and performance bonuses can represent a signifi cant portion of an executive’s salary package. The ultimate value to the executives of and link to remuneration policies are the vesting conditions placed upon performance share options and bonuses and or the share price as the realised value arising from options issued is dependent upon an increase in the share price to above the exercise price of the options.
The details of the vesting conditions associated with performance shares and bonuses are disclosed in the service agreement and share-based compensation section of the remuneration report.
DIRECTORS’ REPORT
For
per
sona
l use
onl
y

2012
Short-term employee benefi tsPost-
employment benefi ts
Long-termbenefi ts
Share-based
payments
Proportion of remuneration
that is performance
based
% of Value of remune-ration that consists of optionsCash salary
and feesCash bonus
Non-monetary benefi ts
Super-annuation
Long service leave
Termination benefi ts
Options Total
$ $ $ $ $ $ $ $ % %
Non-Executive Directors
J Muir 60,000 - - - - - - 60,000 - -
P C Wall 48,000 - - - - - - 48,000 - -
P I Richards 48,000 - - - - - - 48,000 - -
Executive Director
C F Goode 350,000 - 9,077 42,000 - - - 401,077 - -
Other key management personnel
J S M Tambyrajah* 169,902 - - 20,388 - - - 190,290 - -
S M Freeman 250,000 - 6,796 30,000 - - - 286,796 - -
T K S Lee** 52,159 - - 4,694 - - - 56,853 - -
Specifi ed executive
S P Henbury - - - - - - - - - -
Total key management personnel compensation
978,061 - 15,873 97,082 - - - 1,091,016 - -
Details of Remuneration Details of the remuneration of the directors and the key management personnel of the Group (as defi ned in AASB 124 Related Party Disclosures) are set out in the following tables.
Key management personnel of the Group and other executives of the Company and the Group
16NSL CONSOLIDATED LTD ANNuAL REPORT 2012
DIRECTORS’ REPORTDIRECTORS’ REPORT
REMUNERATION REPORT – AUDITED (CONTINUED)
Company performance, shareholder wealth and Director and Executive remunerationAs the Company is not yet generating earnings nor paying dividends, the share price is the key measure of shareholder value. The table below shows the performance in share price over the year and previous 3 years.
Year 30 June 2009$
30 June 2010$
30 June 2011$
30 June 2012$
Closing Share price 0.01 0.062 0.055 0.054
% Change - 520% -11% -1.8%
The issuing of share options under Director and Employee share option plans helps align the Boards personal interests to that of the shareholders.
* Resigned 30 March 2012 as Chief Financial Offi cer ** Commenced 16 March 2012 as Financial Controll
For
per
sona
l use
onl
y
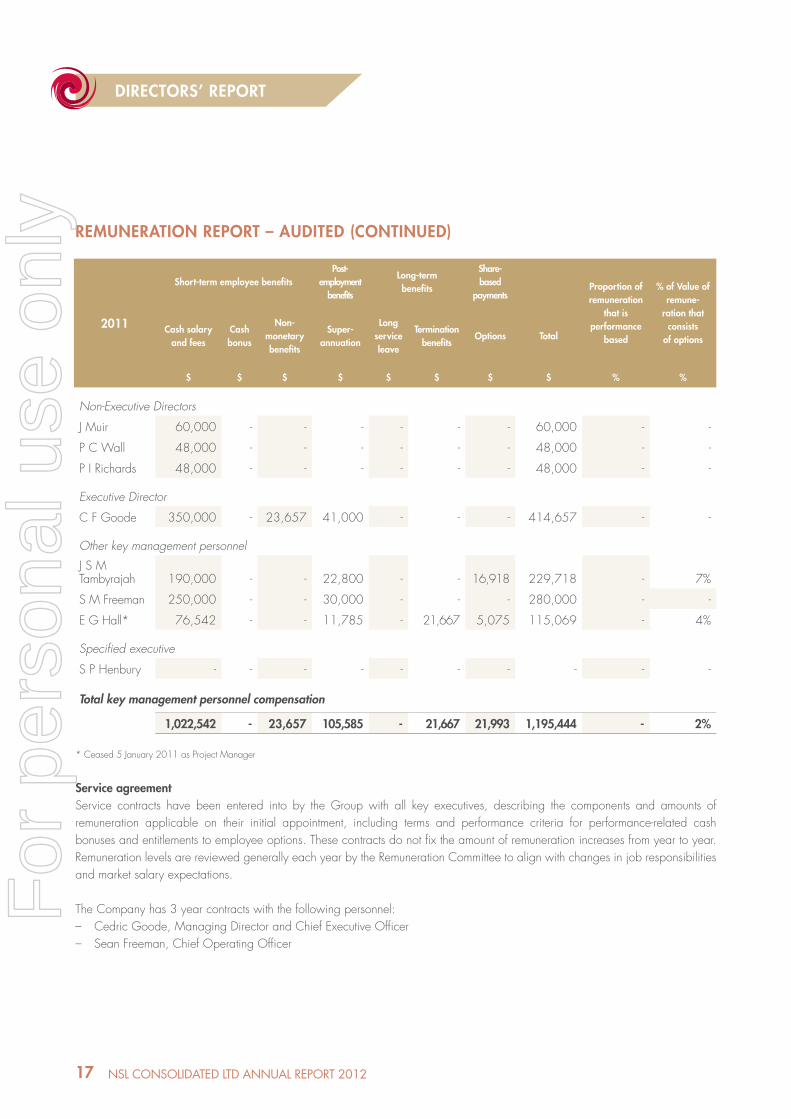
2011
Short-term employee benefi tsPost-
employment benefits
Long-termbenefi ts
Share-based
paymentsProportion of remuneration
that is performance
based
% of Value of remune-
ration that consists
of optionsCash salary
and feesCash bonus
Non-monetary benefi ts
Super-annuation
Long service leave
Termination benefi ts
Options Total
$ $ $ $ $ $ $ $ % %
Non-Executive Directors
J Muir 60,000 - - - - - - 60,000 - -
P C Wall 48,000 - - - - - - 48,000 - -
P I Richards 48,000 - - - - - - 48,000 - -
Executive Director
C F Goode 350,000 - 23,657 41,000 - - - 414,657 - -
Other key management personnel
J S M Tambyrajah 190,000 - - 22,800 - - 16,918 229,718 - 7%
S M Freeman 250,000 - - 30,000 - - - 280,000 - -
E G Hall* 76,542 - - 11,785 - 21,667 5,075 115,069 - 4%
Specifi ed executive
S P Henbury - - - - - - - - - -
Total key management personnel compensation
1,022,542 - 23,657 105,585 - 21,667 21,993 1,195,444 - 2%
60
REMUNERATION REPORT – AUDITED (CONTINUED)
Service agreementService contracts have been entered into by the Group with all key executives, describing the components and amounts of remuneration applicable on their initial appointment, including terms and performance criteria for performance-related cash bonuses and entitlements to employee options. These contracts do not fi x the amount of remuneration increases from year to year. Remuneration levels are reviewed generally each year by the Remuneration Committee to align with changes in job responsibilities and market salary expectations.
The Company has 3 year contracts with the following personnel:– Cedric Goode, Managing Director and Chief Executive Offi cer– Sean Freeman, Chief Operating Offi cer
* Ceased 5 January 2011 as Project Manager
17 NSL CONSOLIDATED LTD ANNuAL REPORT 2012
DIRECTORS’ REPORT
For
per
sona
l use
onl
y

REMUNERATION REPORT – AUDITED (CONTINUED)
Service agreement (continued)These contracts are renewable on expiry. A summary of the terms and conditions of the service agreements is as follows:
– Cedric Goode – 3 years commencing on 1st September 2009.
Annual salary is $350,000. Other benefi ts include a Company provided car, 12% superannuation contribution by the employer, short term incentive options, long term performance options and performance based bonus.
The performance bonus will be awarded on milestones, subject to production and profi tability conditions which are; (a) 0.25 years Salary on achievement of 20kt ore shipped from acquired mine(s); (b) 0.5 years Salary on achievement of 250kt ore shipped from acquired mine(s; (c) 0.75 years Salary on achievement of 500kt ore shipped from acquired mine(s); (d) 1.5 years Salary on achievement of 1Mt ore shipped from acquired mine(s); and (e) 2 years Salary on achievement of 2Mt ore shipped from acquired mine(s).
Performance based bonuses (c), (d) and (e) above: (f) will be paid in the year following achievement after the audited fi nancial report for the prior year is available; and (g) are subject to the net profi t before tax and fi nancing costs (NPBTFC) per tonne of ore mined and sold: - US$12 per tonne NPBTFC = pay performance bonuses in full; and - US$6 per tonne NPBTFC = 50% of performance bonus to be paid.
The performance bonus will be paid pro-rata between US$6 per tonne and US$12 per tonne, with no additional bonus being payable if NPBTFC is greater than US$12.
Termination benefi ts The Company may at its sole discretion terminate the employment with reasons according to clause 14.1 of the service agreement, or without reason by giving 6 months written notice and making a payment of 12 months salary after the expiry of the 6 months written notice period. If the Company elects to pay the equivalent of the 6 months salary and dispense with the notice period, the total payment inclusive of the 12 months notice period will be equivalent of 18 months salary.
– Sean Freeman – 3 years commencing on 1st July 2009.
Annual salary is $250,000. Other benefi ts include 12% superannuation contribution by the employer, short term incentive options, long term performance options and performance based bonus.
The performance bonus will be awarded on milestones, subject to production and profi tability conditions which are; (a) 0.25 years Salary on achievement of 20kt ore shipped from acquired mine(s); (b) 0.25 years Salary on achievement of 250kt ore shipped from acquired mine(s; (c) 0.5 years Salary on achievement of 500kt ore shipped from acquired mine(s); (d) 0.5 years Salary on achievement of 1Mt ore shipped from acquired mine(s); and (e) 1 years Salary on achievement of 2Mt ore shipped from acquired mine(s).
18NSL CONSOLIDATED LTD ANNuAL REPORT 2012
DIRECTORS’ REPORTDIRECTORS’ REPORT
For
per
sona
l use
onl
y
REMUNERATION REPORT – AUDITED (CONTINUED)
Service agreement (continued) Performance based bonuses (c), (d) and (e) above: (f) will be paid in the year following achievement after the audited financial report for the prior year is available; and (g) are subject to the net profit before tax and financing costs (NPBTFC) per tonne of ore mined and sold: - US$12 per tonne NPBTFC = pay performance bonuses in full; and - US$6 per tonne NPBTFC = 50% of performance bonus to be paid.
The performance bonus will be paid pro-rata between US$6 per tonne and US$12 per tonne, with no additional bonus being payable if NPBTFC is greater than US$12.
Termination benefits The Company may at its sole discretion terminate the employment with reasons according to clause 14.1 of the service agreement or without reason by giving three months written notice and making a payment of six month’s salary after the expiry of the written three months notice. If the Company elects to pay the equivalent of three month’s salary and dispense with the notice period, the total payment inclusive of six months notice period will be the equivalent of nine month’s salary.
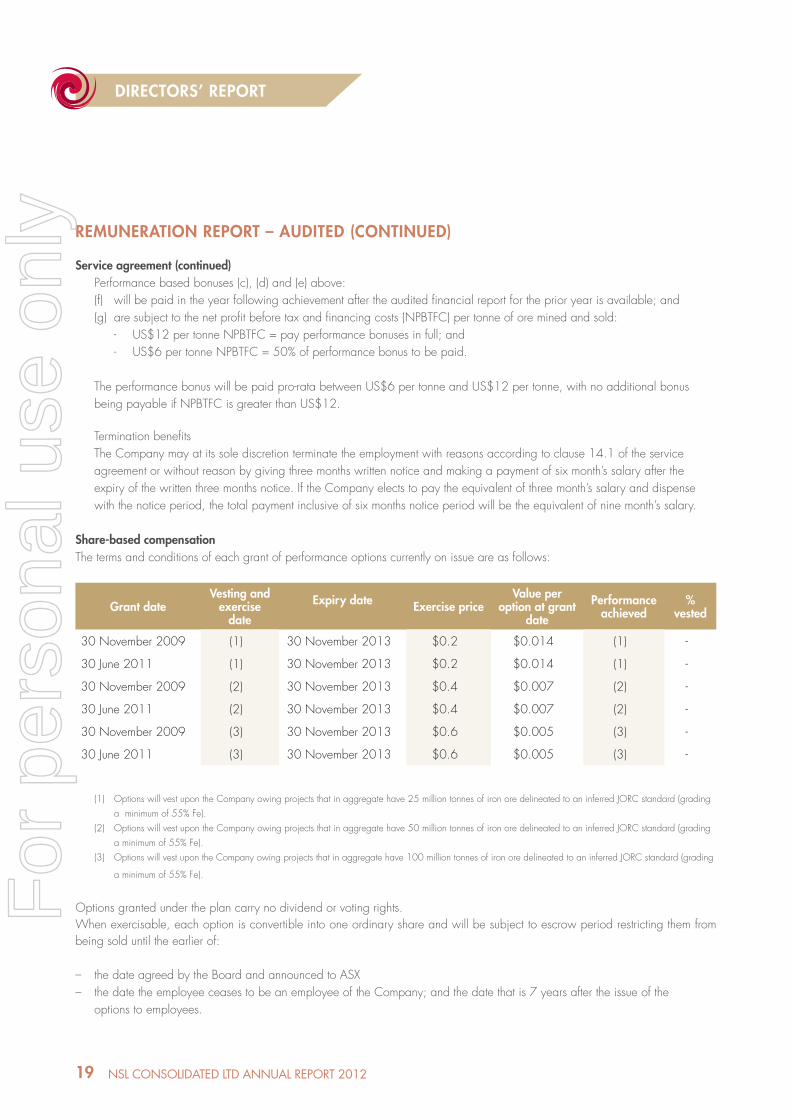
Share-based compensationThe terms and conditions of each grant of performance options currently on issue are as follows:
(1) Options will vest upon the Company owing projects that in aggregate have 25 million tonnes of iron ore delineated to an inferred JORC standard (grading a minimum of 55% Fe). (2) Options will vest upon the Company owing projects that in aggregate have 50 million tonnes of iron ore delineated to an inferred JORC standard (grading a minimum of 55% Fe). (3) Options will vest upon the Company owing projects that in aggregate have 100 million tonnes of iron ore delineated to an inferred JORC standard (grading
a minimum of 55% Fe).
Options granted under the plan carry no dividend or voting rights.When exercisable, each option is convertible into one ordinary share and will be subject to escrow period restricting them from being sold until the earlier of:
– the date agreed by the Board and announced to ASX– the date the employee ceases to be an employee of the Company; and the date that is 7 years after the issue of the options to employees.
Grant dateVesting and
exercise date
Expiry date Exercise priceValue per
option at grant date
Performance achieved
% vested
30 November 2009 (1) 30 November 2013 $0.2 $0.014 (1) -
30 June 2011 (1) 30 November 2013 $0.2 $0.014 (1) -
30 November 2009 (2) 30 November 2013 $0.4 $0.007 (2) -
30 June 2011 (2) 30 November 2013 $0.4 $0.007 (2) -
30 November 2009 (3) 30 November 2013 $0.6 $0.005 (3) -
30 June 2011 (3) 30 November 2013 $0.6 $0.005 (3) -
19 NSL CONSOLIDATED LTD ANNuAL REPORT 2012
DIRECTORS’ REPORT
For
per
sona
l use
onl
y
REMUNERATION REPORT – AUDITED (CONTINUED)
Share-based compensation (continued)The assessed fair value at grant date of options granted to the individuals is allocated equally over the period from grant date to vesting date, and the amount is included in the remuneration tables above. Fair values at grant date are independently determined using a Black-Scholes option pricing model that takes into account the exercise price, the term of the option, the impact of dilution, the share price at grant date and expected price volatility of the underlying share, the expected dividend yield and the risk-free interest rate for the term of the option.
Shares provided on exercise of remuneration optionsThere was no option exercised during the year.
Employee share schemeNone of the directors of the Company, other key management personnel of the Group or the Group Company Secretary is eligible to participate in the Company’s employee share scheme.
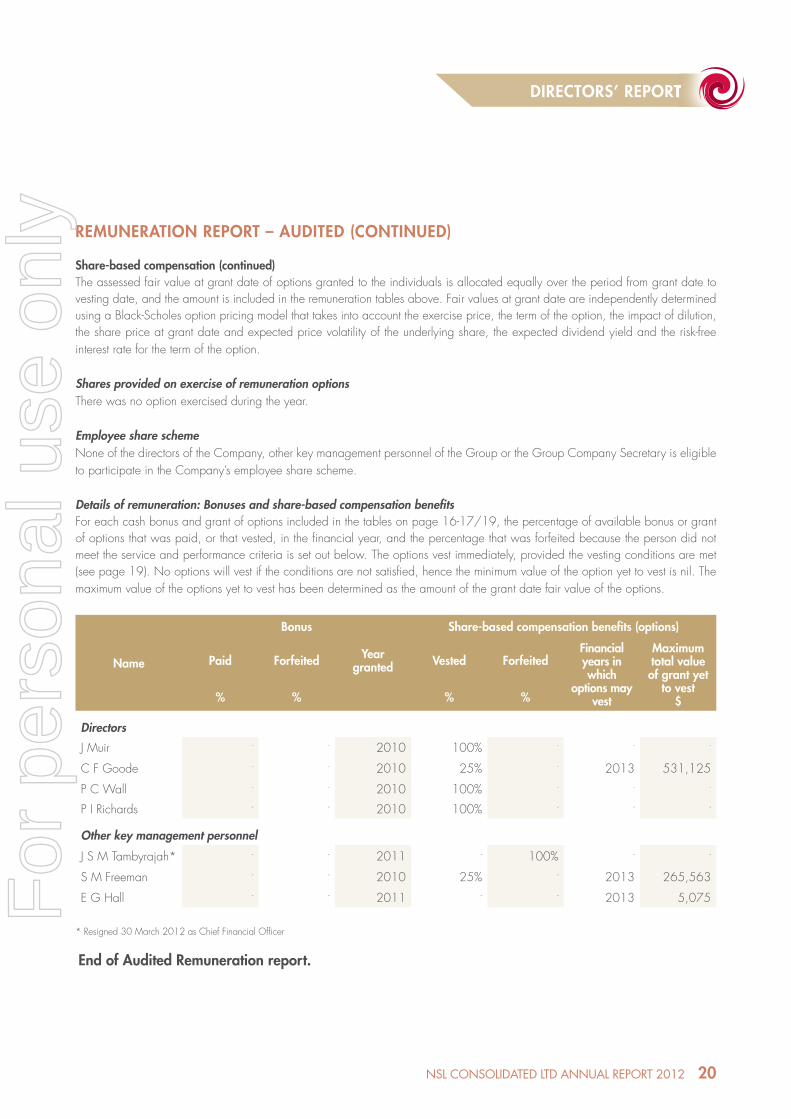
Details of remuneration: Bonuses and share-based compensation benefi tsFor each cash bonus and grant of options included in the tables on page 16-17/19, the percentage of available bonus or grant of options that was paid, or that vested, in the fi nancial year, and the percentage that was forfeited because the person did not meet the service and performance criteria is set out below. The options vest immediately, provided the vesting conditions are met (see page 19). No options will vest if the conditions are not satisfi ed, hence the minimum value of the option yet to vest is nil. The maximum value of the options yet to vest has been determined as the amount of the grant date fair value of the options.
Name
Bonus Share-based compensation benefi ts (options)
Paid Forfeited Year granted Vested Forfeited
Financial years in which
options may vest
Maximum total value of grant yet
to vest$% % % %
Directors
J Muir - - 2010 100% - - -
C F Goode - - 2010 25% - 2013 531,125
P C Wall - - 2010 100% - - -
P I Richards - - 2010 100% - - -
Other key management personnel
J S M Tambyrajah* - - 2011 - 100% - -
S M Freeman - - 2010 25% - 2013 265,563
E G Hall - - 2011 - - 2013 5,07560
End of Audited Remuneration report.
20NSL CONSOLIDATED LTD ANNuAL REPORT 2012
DIRECTORS’ REPORTDIRECTORS’ REPORT
* Resigned 30 March 2012 as Chief Financial Offi cer
For
per
sona
l use
onl
y
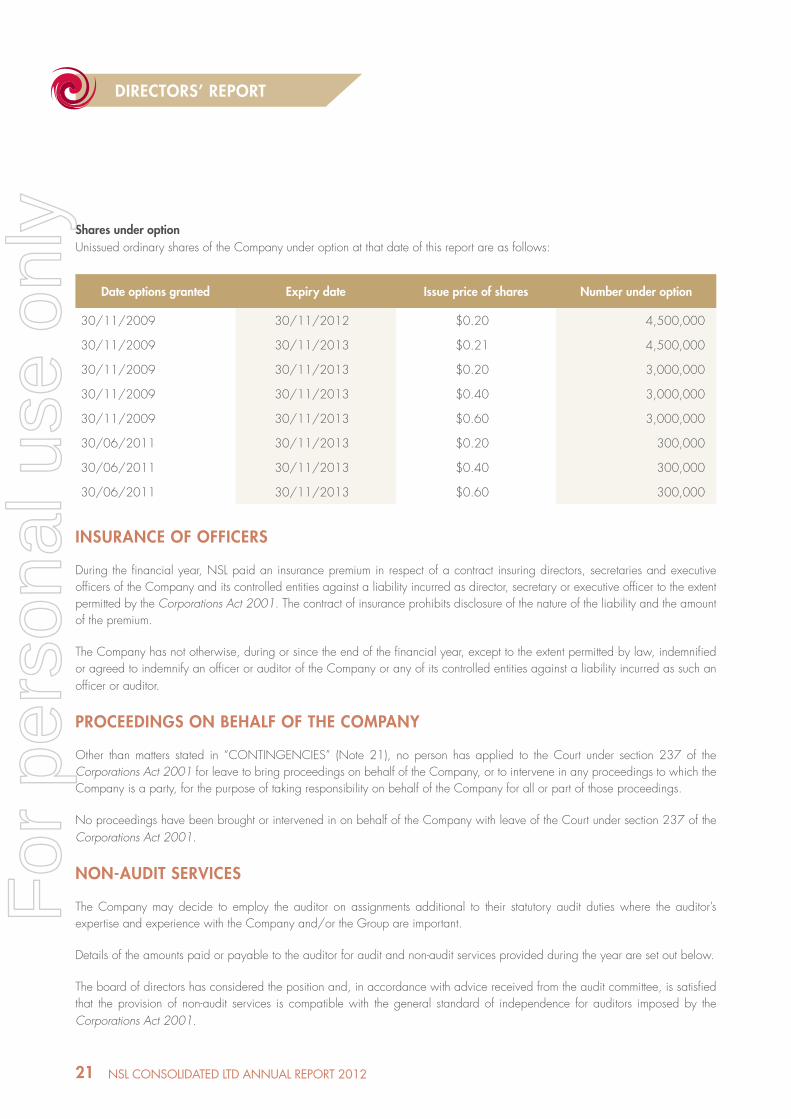
Shares under optionUnissued ordinary shares of the Company under option at that date of this report are as follows:
Date options granted Expiry date Issue price of shares Number under option
30/11/2009 30/11/2012 $0.20 4,500,000
30/11/2009 30/11/2013 $0.21 4,500,000
30/11/2009 30/11/2013 $0.20 3,000,000
30/11/2009 30/11/2013 $0.40 3,000,000
30/11/2009 30/11/2013 $0.60 3,000,000
30/06/2011 30/11/2013 $0.20 300,000
30/06/2011 30/11/2013 $0.40 300,000
30/06/2011 30/11/2013 $0.60 300,000
INSURANCE OF OFFICERS
During the financial year, NSL paid an insurance premium in respect of a contract insuring directors, secretaries and executive officers of the Company and its controlled entities against a liability incurred as director, secretary or executive officer to the extent permitted by the Corporations Act 2001. The contract of insurance prohibits disclosure of the nature of the liability and the amount of the premium.
The Company has not otherwise, during or since the end of the financial year, except to the extent permitted by law, indemnified or agreed to indemnify an officer or auditor of the Company or any of its controlled entities against a liability incurred as such an officer or auditor.
PROCEEDINGS ON BEHALF OF THE COMPANY
Other than matters stated in “CONTINGENCIES” (Note 21), no person has applied to the Court under section 237 of the Corporations Act 2001 for leave to bring proceedings on behalf of the Company, or to intervene in any proceedings to which the Company is a party, for the purpose of taking responsibility on behalf of the Company for all or part of those proceedings.
No proceedings have been brought or intervened in on behalf of the Company with leave of the Court under section 237 of the Corporations Act 2001.
NON-AUDIT SERVICES
The Company may decide to employ the auditor on assignments additional to their statutory audit duties where the auditor’s expertise and experience with the Company and/or the Group are important.
Details of the amounts paid or payable to the auditor for audit and non-audit services provided during the year are set out below.
The board of directors has considered the position and, in accordance with advice received from the audit committee, is satisfied that the provision of non-audit services is compatible with the general standard of independence for auditors imposed by the Corporations Act 2001.
DIRECTORS’ REPORT
21 NSL CONSOLIDATED LTD ANNuAL REPORT 2012
For
per
sona
l use
onl
y
DIRECTORS’ REPORTDIRECTORS’ REPORT
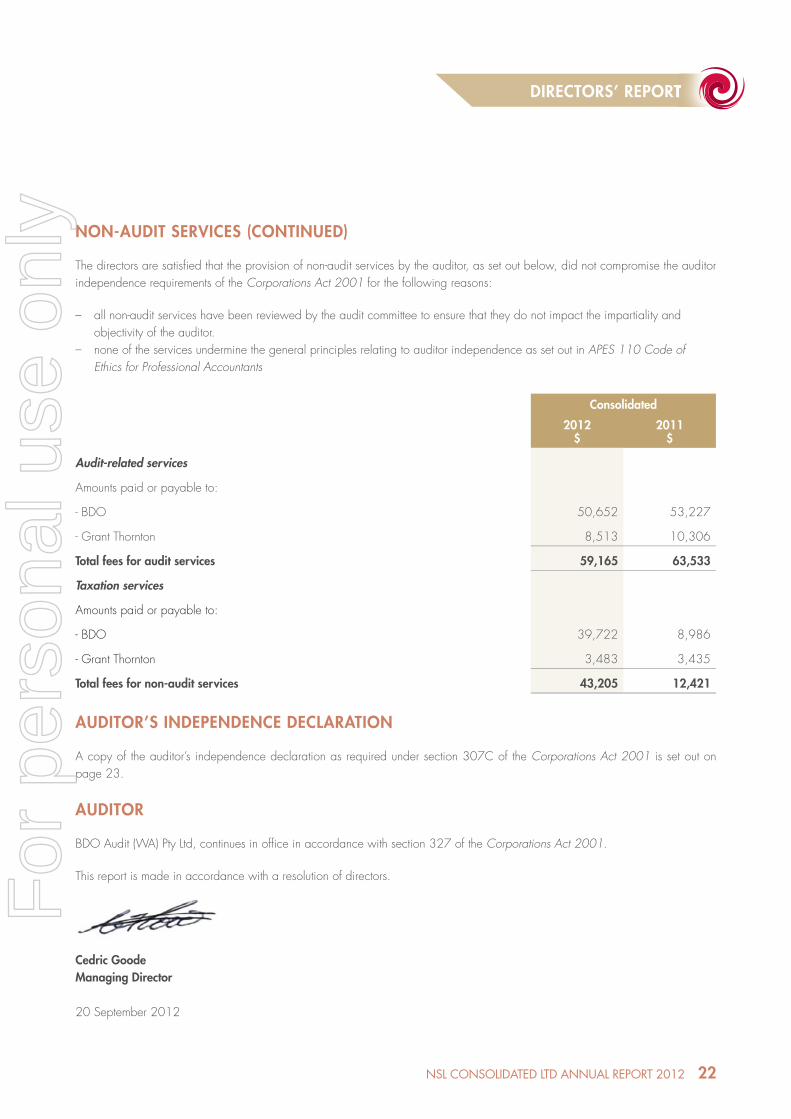
NON-AUDIT SERVICES (CONTINUED)
The directors are satisfi ed that the provision of non-audit services by the auditor, as set out below, did not compromise the auditor independence requirements of the Corporations Act 2001 for the following reasons:
– all non-audit services have been reviewed by the audit committee to ensure that they do not impact the impartiality and objectivity of the auditor.– none of the services undermine the general principles relating to auditor independence as set out in APES 110 Code of Ethics for Professional Accountants
Consolidated
2012$
2011$
Audit-related services
Amounts paid or payable to:
- BDO 50,652 53,227
- Grant Thornton 8,513 10,306
Total fees for audit services 59,165 63,533
Taxation services
Amounts paid or payable to:
- BDO 39,722 8,986
- Grant Thornton 3,483 3,435
Total fees for non-audit services 43,205 12,421
AUDITOR’S INDEPENDENCE DECLARATION
A copy of the auditor’s independence declaration as required under section 307C of the Corporations Act 2001 is set out on page 23.
AUDITOR
BDO Audit (WA) Pty Ltd, continues in offi ce in accordance with section 327 of the Corporations Act 2001.
This report is made in accordance with a resolution of directors.
Cedric GoodeManaging Director
20 September 2012
22NSL CONSOLIDATED LTD ANNuAL REPORT 2012
For
per
sona
l use
onl
y
AUDITOR’S INDEPENDANCE DECLARATION
23 NSL CONSOLIDATED LTD ANNuAL REPORT 2012
23
Tel: +8 6382 4600 Fax: +8 6382 4601 www.bdo.com.au
38 Station Street Subiaco, WA 6008 PO Box 700 West Perth WA 6872 Australia
BDO Audit (WA) Pty Ltd ABN 79 112 284 787 is a member of a national association of independent entities which are all members of BDO (Australia) Ltd ABN 77 050 110 275, an Australian company limited by guarantee. BDO Audit (WA) Pty Ltd and BDO (Australia) Ltd are members of BDO International Ltd, a UK company limited by guarantee, and form part of the international BDO network of independent member firms. Liability limited by a scheme approved under Professional Standards Legislation (other than for the acts or omissions of financial services licensees) in each State or Territory other than Tasmania.
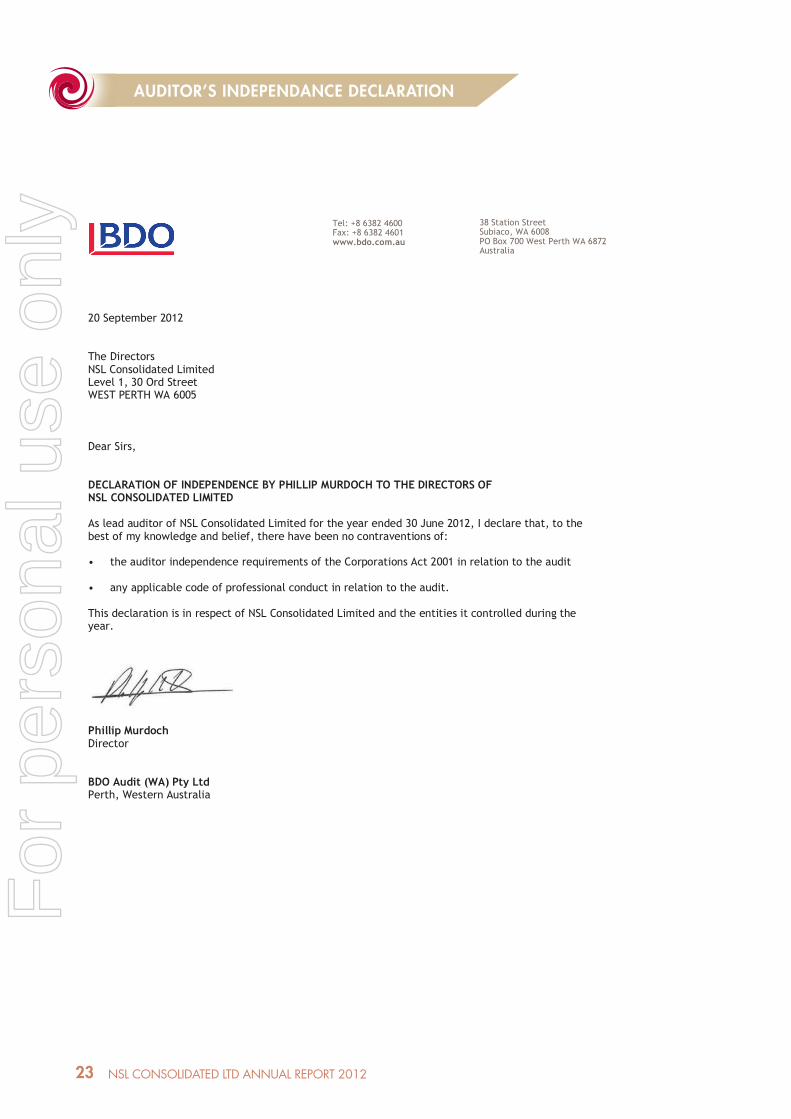
20 September 2012 The Directors NSL Consolidated Limited Level 1, 30 Ord Street WEST PERTH WA 6005 Dear Sirs, DECLARATION OF INDEPENDENCE BY PHILLIP MURDOCH TO THE DIRECTORS OF NSL CONSOLIDATED LIMITED As lead auditor of NSL Consolidated Limited for the year ended 30 June 2012, I declare that, to the best of my knowledge and belief, there have been no contraventions of: • the auditor independence requirements of the Corporations Act 2001 in relation to the audit
• any applicable code of professional conduct in relation to the audit. This declaration is in respect of NSL Consolidated Limited and the entities it controlled during the year.
Phillip Murdoch Director BDO Audit (WA) Pty Ltd Perth, Western Australia
For
per
sona
l use
onl
y
CORPORATE GOVERNANCE STATEMENT
Corporate governance is the system by which companies are directed and managed. It infl uences how the objectives of the Company are set and achieved, how risk is monitored and assessed, and how performance is optimised. Good corporate governance structures encourage companies to create value through entrepreneurism, innovation, development and exploration and provide accountability and control systems commensurate with risks involved.
Good corporate governance will evolve with the changing circumstances of a Company and must be tailored to meet these circumstances. NSL is a junior mining and exploration Company.
The Company’s Board and management are committed to a high standard of corporate governance practices, ensuring that the Company complies with the Corporations Act 2001, Australian Securities Exchange (ASX) Listing Rules, Company Constitution and other applicable laws and regulations.
However, at this stage of the Company’s corporate development, implementation of the ASX Corporate Governance Principles and Recommendations, whilst wholeheartedly supported, is not practical in every instance given the modest size and simplicity of the business. The principles and recommendations and details of the current and evolving governance practices are identifi ed in the following pages.
Principle 1: Lay solid foundations for management and oversight
The Board has the responsibility of protecting the rights and interests of shareholders and enhancement of long-term shareholder value. To fulfi ll this role, the Board is responsible for:
– Appointment of the Chief Executive Offi cer and other senior executives and the determination of their terms and conditions including remuneration and termination;– Driving the strategic direction of the Company, ensuring appropriate resources are available to meet objectives and monitoring management’s performance;– Reviewing and ratifying systems of risk management and internal compliance and control, codes of conduct and legal compliance;– Approving and monitoring the progress of major capital expenditure, capital management and signifi cant acquisitions and divestitures;– Approving and monitoring the budget and the adequacy and integrity of fi nancial and other reporting;– Approving the annual, half yearly and quarterly accounts;– Approving signifi cant changes to the organisational structure;– Approving the issue of any shares, options, equity instruments or other securities in the Company;– Ensuring a high standard of corporate governance practice and regulatory compliance and promoting ethical and responsible decision making;– Recommending to shareholders the appointment of the external auditor as and when their appointment or re-appointment is required to be approved by them; and– Meeting with the external auditor, at their request, without management being present.
24NSL CONSOLIDATED LTD ANNuAL REPORT 2012
CORPORATE GOVERNANCE STATEMENTCORPORATE GOVERNANCE STATEMENT
For
per
sona
l use
onl
y
CORPORATE GOVERNANCE STATEMENT (CONTINUED)
Principle 2: Structure the Board to add value
The Board is currently made up of four directors, two (Jock Muir and Peter Richards) of whom are considered independent. The Board considers a director to be independent where he or she is not a member of management and is free of any business or other relationship that could materially interfere with, or could reasonably be perceived to materially interfere with, the director’s ability to act in the best interests of the Company. This is not compliant with the ASX Corporate Governance Councils recommendations that the majority of Directors should be independent non-executives and the Chairman should be independent. The Board considers the current composition to be both satisfactory and realistic under the present circumstances.
Under the Company’s Constitution and the Australian Stock Exchange Listing Rules, all directors are subject to shareholder re-election every three years.
The full Board currently hold a number of scheduled meetings each year, plus strategy meetings and any extraordinary meetings at such other times as may be necessary to address signifi cant matters as they arise.
Standing Board meeting agenda items include the Managing Director’s report, fi nancial reports, strategic matters, governance and compliance.
Board members possess complementary business disciplines and experience aligned with the Company objectives. The experience and qualifi cations of directors are noted in the Directors’ Report.
Where any director has a personal interest in a matter, the director is not permitted to be present during discussions or to vote on the matter. The enforcement of this requirement ensures that the interest of shareholders, as a whole, are pursued and not jeopardised by a lack of a majority of independent directors.
The Company has developed Board committee charters for both the Audit Committee and Remuneration Committee, however due to the size of the Company the Board has not established committees to review compensation arrangements of senior executives or to manage Board succession. The full board approves all management remuneration including the allocation of options and involves itself in the nomination, selection and retirement of directors.
The Company will give consideration at an appropriate juncture in the Company’s development, for the creation of a Nomination and Remuneration Committee. The current size of the full Board permits it to act as this committee and to regularly review membership. The Board will give consideration to appointment of specialist and independent directors when the activities and scale of operation of the Company warrant such appointments.
The Board reviews the performance of Board members regularly on an on-going basis. The reviews are conducted by the Chairman and involve an exchange of views with all the members of the Board. In particular, the Board assesses the appropriate mix of skills, experience and expertise required by the Board and assesses the extent to which the required skills and experience are represented on the Board.
The Board intends to formally introduce a formal process of self assessment of its collective performance, the performance of individual directors and of Board committees.
CORPORATE GOVERNANCE STATEMENTCORPORATE GOVERNANCE STATEMENT
25 NSL CONSOLIDATED LTD ANNuAL REPORT 2012
For
per
sona
l use
onl
y
CORPORATE GOVERNANCE STATEMENT (CONTINUED)
Principle 3: Promote ethical and responsible decision making
The Company actively promotes ethical and responsible decision-making. The Company has established a formal code of conduct that addresses practices necessary to maintain confi dence in the Company’s integrity. The code takes into account the Board’s legal obligations and the reasonable expectations of its stakeholders. In addition, it is a condition of each employee’s employment contract that they uphold minimum standards of generally accepted ethical conduct.
Dealing in Company sharesThe Board has formally instituted a Company requirement that limits the purchase or disposal of shares by directors, offi cers and employees to the period of four weeks from the:a) date of the Company’s Annual General Meeting;b) release of the quarterly results announcement to the Australia Stock Exchange (ASX);c) release of the half yearly results announcement to the ASX;d) release of the preliminary fi nal results announcement to the ASX; ore) release of a disclosure document offering securities in the Company.
NSL has a policy agreed to by the Board members, other Company offi cers and employees that any proposed trade in the Company’s securities is to be fi rstly advised to the Chairman. Once the Chairman has given approval, the relevant person may execute the trade. Such policy clearly mitigates the risk of breaching the insider trading provisions and gives the Chairman control to restrict trading if the Chairman may be privy to sensitive information before the other Company offi cers and personnel are, or the Chairman has knowledge that certain sensitive information (eg. exploration results) are due for receipt within a short term timeframe.
Directors, offi cers and employees with any non-public sensitive information are prohibited from purchasing or disposing of Company shares, in accordance with the Corporations Act 2001.
Directors must advise the Company of any transactions conducted by them in the shares of the Company, in accordance with the Corporations Act 2001 and ASX Listing Rules.
The Board has approved and published in the public domain the Guidelines for Buying and Selling Securities which details the points listed above.
Diversity PolicyThe Company recognises the benefi ts arising from employee and board diversity, including a broader pool of high quality employees, improving employee retention, accessing different perspectives and ideas and benefi ting from all available talent.
The Diversity policy provides a framework for the Company to achieve: a) diverse and skilled workforce, leading to continuous improvement in service delivery and achievement of corporate goals;b) workplace culture characterised by inclusive practices and behaviours for the benefi t of all staff;c) improved employment and career development opportunities for women; d) a work environment that values and utilises the contributions of employees with diverse backgrounds, experiences and perspectives through improved awareness of the benefi ts of workforce diversity and successful management of diversity; and e) awareness in all staff of their rights and responsibilities with regards to fairness, equity and respect for all aspects of diversity.
There are currently no women in executive roles in the organisation.
CORPORATE GOVERNANCE STATEMENTCORPORATE GOVERNANCE STATEMENT
26NSL CONSOLIDATED LTD ANNuAL REPORT 2012
For
per
sona
l use
onl
y
CORPORATE GOVERNANCE STATEMENT (CONTINUED)
Principle 4: Safeguard integrity in fi nancial reporting
The Board has previously established an audit committee whose responsibility it was to monitor and review the effectiveness of the Company’s controls in the areas of operational and balance sheet risk, legal and regulatory compliance and fi nancial reporting.
The Company presently does not have a separately constituted audit committee as it is not presently of a size, or its affairs of such complexity, to warrant such a committee. All matters capable of delegation to such a committee are presently dealt with by the full Board. The Board is responsible for the establishment and maintenance of a framework of internal control and appropriate ethical standards for the management of the Company. A charter has been formulated and is on the Company’s website.
The responsibilities include:– reviewing and approving statutory fi nancial reports and all other fi nancial information distributed externally;– monitoring the effective operation of the risk management and compliance framework;– reviewing the effectiveness of the Company’s internal control environment including compliance with applicable laws and regulations;– the nomination of the external auditors and the review of the adequacy of the existing external audit arrangements; and– considering whether non-audit services provided by the external auditor are consistent with maintaining the external auditor’s independence.
The external auditor, BDO, has engagement terms refreshed annually and has indicated its independence to the Board. BDO were appointed as auditors in 2008.
Principle 5 and 6: Make timely and balanced disclosures and respect the rights of shareholders
The Board adopts communications strategies and practices to promote communication with shareholders, in language capable of interpretation, and to encourage effective participation at General Meetings. The external auditor will attend the meeting to respond to specifi c questions from shareholders relating to the conduct of the audit and the preparation and content of the auditor’s report.
The Company Secretary has been nominated as the person responsible for communications with the Australian Securities Exchange (ASX). This role includes responsibility for ensuring compliance with the continuous disclosure requirements in the ASX Listing Rules and overseeing and co-coordinating information disclosure to the ASX, analysts, brokers, shareholders, the media and the public.
The Board aims to ensure that shareholders are informed of all major developments affecting the Company’s state of affairs, in accordance with Corporations Act 2001 and ASX Listing Rules.
The Board encourages full participation of shareholders at General Meetings to ensure a high level of accountability and identifi cation with the Company’s strategy and goals. Important issues are presented to shareholders as single resolutions.
Shareholders are requested to vote on the appointment of Directors, the granting of options and shares to directors and changes to the Constitution. Copies of the Constitution are available to any shareholder upon request.
Material information is lodged immediately with the ASX and on acknowledgement, disseminated by posting to the website.
27 NSL CONSOLIDATED LTD ANNuAL REPORT 2012
CORPORATE GOVERNANCE STATEMENTCORPORATE GOVERNANCE STATEMENT
For
per
sona
l use
onl
y
CORPORATE GOVERNANCE STATEMENT (CONTINUED)
Principle 5 and 6: Make timely and balanced disclosures and respect the rights of shareholders (continued)
Timely and balanced disclosure The Board supports the Australasian Investor Relations Association “Best Practice Guidelines for Communication between Listed Entities and the Investment Community”. The Board endorses a culture in favour of continuous disclosure and recognises the benefi ts of consistency to be achieved through a dedicated authorised spokesperson.
Material information is lodged immediately with the ASX and on acknowledgement disseminated by posting to the website. A strict protocol is practiced for all investors/analyst/media meetings, roup briefi ngs and conference calls.
Principle 7: Recognise and manage risk
The Company has identifi ed material business risks associated with its day-to-day operations and the possible impacts on the Company as a consequence. The Company aims to review its’ risk management policies on a quarterly basis to mitigate material risks identifi ed from eventuating and to ensure a sound internal control system is in place. The Managing Director is required to report to the Board if any material business risks that signifi cantly impact on the business have arisen since the last Board meeting and if an effective internal control policy is in place and has been followed (as applicable). The Board declares that it has received assurance from the CEO and CFO that a sound and effective risk management and internal control had been adhered to during the fi nancial year ended 30 June 2012.
As part of the Company’s internal risk management policies, the CEO and CFO have recently completed a review identifying risk areas and internal controls required to mitigate such risk. The report relating thereto has been circulated to the Board concluding that an effective internal control system is in place. Such review will occur on an ongoing basis.
In summary, the Company’s internal risk management policies are designed to ensure strategic, operational, legal, reputational and fi nancial risks are identifi ed, assessed, effectively and effi ciently managed and monitored to enable achievement of the Company’s business objectives.
Considerable importance is placed on maintaining a strong control environment. There is an organisation structure with clearly drawn lines of accountability and delegation of authority. The Board actively promotes a culture of quality and integrity.
Principle 8: Remunerate fairly and responsibly
Due to the size of the Group the Board has not established committees to review compensation arrangements of senior executives or to manage Board succession. The full board approves all management remuneration including the allocation of options and involves itself in the nomination, selection and retirement of directors.
The Board is kept advised on remuneration and incentive policies and practices generally and makes specifi c recommendations in relation to compensation arrangements for executive and non-executive directors and in respect of all equity based remuneration plans.
The remuneration policy states that executive directors may participate in share option schemes with the prior approval of shareholders. Other executives may also participate in employee share option schemes, with any option issues normally being made in accordance with thresholds set in plans approved by shareholders. The Board however, considers it appropriate to retain the fl exibility to issue options to executives outside of approved employee option plans in appropriate circumstances. The Company has not distinguished the structure of the non-executive directors’ remuneration from that of executive director due to its size.
28NSL CONSOLIDATED LTD ANNuAL REPORT 2012
CORPORATE GOVERNANCE STATEMENTCORPORATE GOVERNANCE STATEMENT
For
per
sona
l use
onl
y
CORPORATE GOVERNANCE STATEMENT (CONTINUED)
Principle 8: Remunerate fairly and responsibly (continued)
The Board also assumes responsibility for overseeing management succession planning, including the implementation of appropriate executive development programs and ensuring adequate arrangements are in place, so that appropriate candidates are recruited for later promotion to senior positions.
Access to professional adviceIssues of substance are considered by the Board with external advice from its professional advisers as required. The Board’s individual members can seek independent professional advice at the Company’s expense in carrying out their duties.
SUMMARY
NSL Consolidated Limited has adopted or is in the process of adopting the following policies and charters:
Board Charter, Corporate Code of Conduct, Guidelines for Buying and Selling Securities, Audit Committee Charter, Continuous Disclosure Policy, Shareholder Communication Policy, Remuneration Committee Charter and Diversity Policy.
The Company has departed from the ASX Corporate Governance recommendations with respect to the Directors being considered independent for reasons stated. The Company’s full board of Directors performs the functions of the Audit Committee and the Nomination and Remuneration Committee. Other corporate practices continue to evolve.
29 NSL CONSOLIDATED LTD ANNuAL REPORT 2012
CORPORATE GOVERNANCE STATEMENTCORPORATE GOVERNANCE STATEMENT
For
per
sona
l use
onl
y
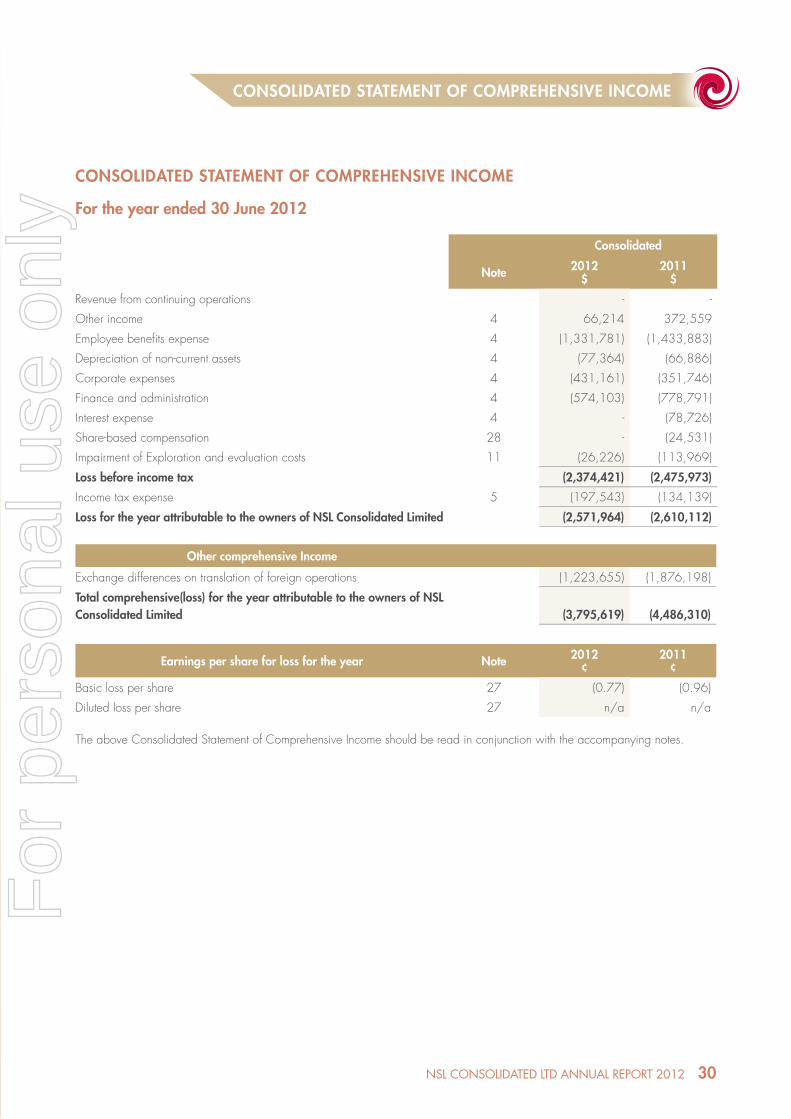
CONSOLIDATED STATEMENT OF COMPREHENSIVE INCOME
CONSOLIDATED STATEMENT OF COMPREHENSIVE INCOME
For the year ended 30 June 2012
Consolidated
Note 2012$
2011$
Revenue from continuing operations - -
Other income 4 66,214 372,559
Employee benefi ts expense 4 (1,331,781) (1,433,883)
Depreciation of non-current assets 4 (77,364) (66,886)
Corporate expenses 4 (431,161) (351,746)
Finance and administration 4 (574,103) (778,791)
Interest expense 4 - (78,726)
Share-based compensation 28 - (24,531)
Impairment of Exploration and evaluation costs 11 (26,226) (113,969)
Loss before income tax (2,374,421) (2,475,973)
Income tax expense 5 (197,543) (134,139)
Loss for the year attributable to the owners of NSL Consolidated Limited (2,571,964) (2,610,112)
Other comprehensive Income
Exchange differences on translation of foreign operations (1,223,655) (1,876,198)
Total comprehensive(loss) for the year attributable to the owners of NSL Consolidated Limited (3,795,619) (4,486,310)
Earnings per share for loss for the year Note 2012¢
2011¢
Basic loss per share 27 (0.77) (0.96)
Diluted loss per share 27 n/a n/a
The above Consolidated Statement of Comprehensive Income should be read in conjunction with the accompanying notes.
30NSL CONSOLIDATED LTD ANNuAL REPORT 2012
For
per
sona
l use
onl
y
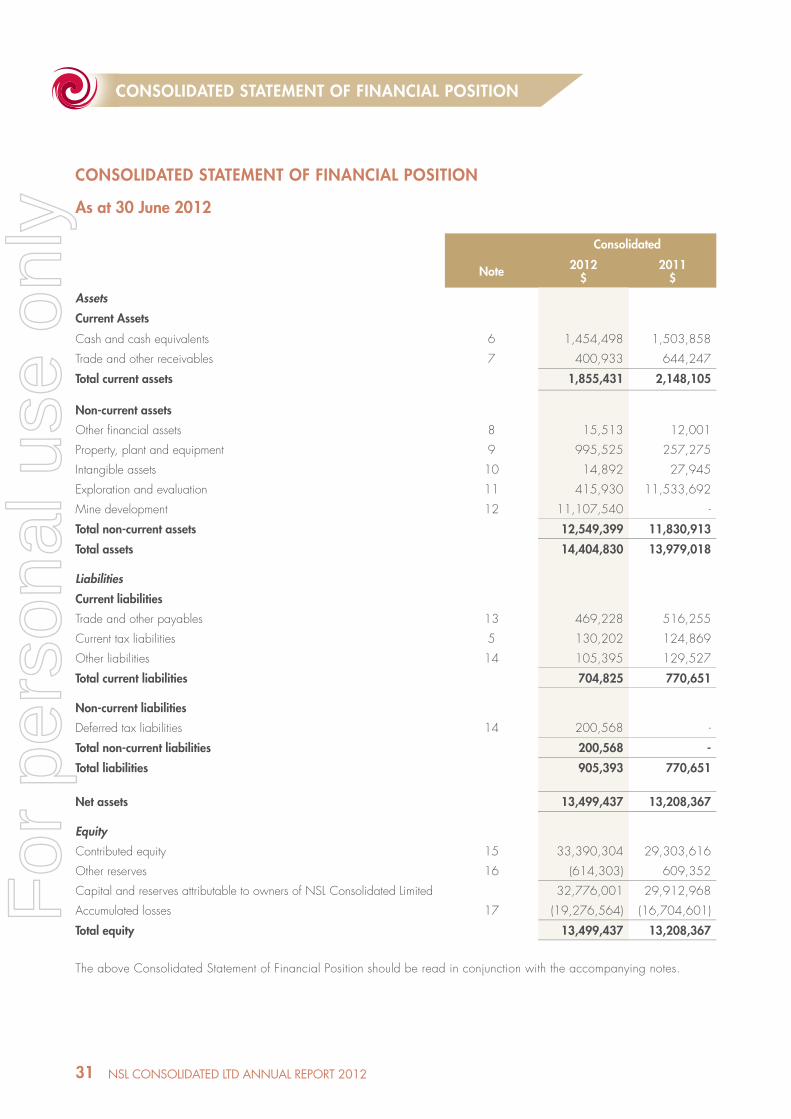
CONSOLIDATED STATEMENT OF FINANCIAL POSITION
As at 30 June 2012
Consolidated
Note 2012$
2011$
Assets
Current Assets
Cash and cash equivalents 6 1,454,498 1,503,858
Trade and other receivables 7 400,933 644,247
Total current assets 1,855,431 2,148,105
Non-current assets
Other fi nancial assets 8 15,513 12,001
Property, plant and equipment 9 995,525 257,275
Intangible assets 10 14,892 27,945
Exploration and evaluation 11 415,930 11,533,692
Mine development 12 11,107,540 -
Total non-current assets 12,549,399 11,830,913
Total assets 14,404,830 13,979,018
Liabilities
Current liabilities
Trade and other payables 13 469,228 516,255
Current tax liabilities 5 130,202 124,869
Other liabilities 14 105,395 129,527
Total current liabilities 704,825 770,651
Non-current liabilities
Deferred tax liabilities 14 200,568 -
Total non-current liabilities 200,568 -
Total liabilities 905,393 770,651
Net assets 13,499,437 13,208,367
Equity
Contributed equity 15 33,390,304 29,303,616
Other reserves 16 (614,303) 609,352
Capital and reserves attributable to owners of NSL Consolidated Limited 32,776,001 29,912,968
Accumulated losses 17 (19,276,564) (16,704,601)
Total equity 13,499,437 13,208,367
The above Consolidated Statement of Financial Position should be read in conjunction with the accompanying notes.
31 NSL CONSOLIDATED LTD ANNuAL REPORT 2012
CONSOLIDATED STATEMENT OF FINANCIAL POSITIONCONSOLIDATED STATEMENT OF FINANCIAL POSITION
For
per
sona
l use
onl
y
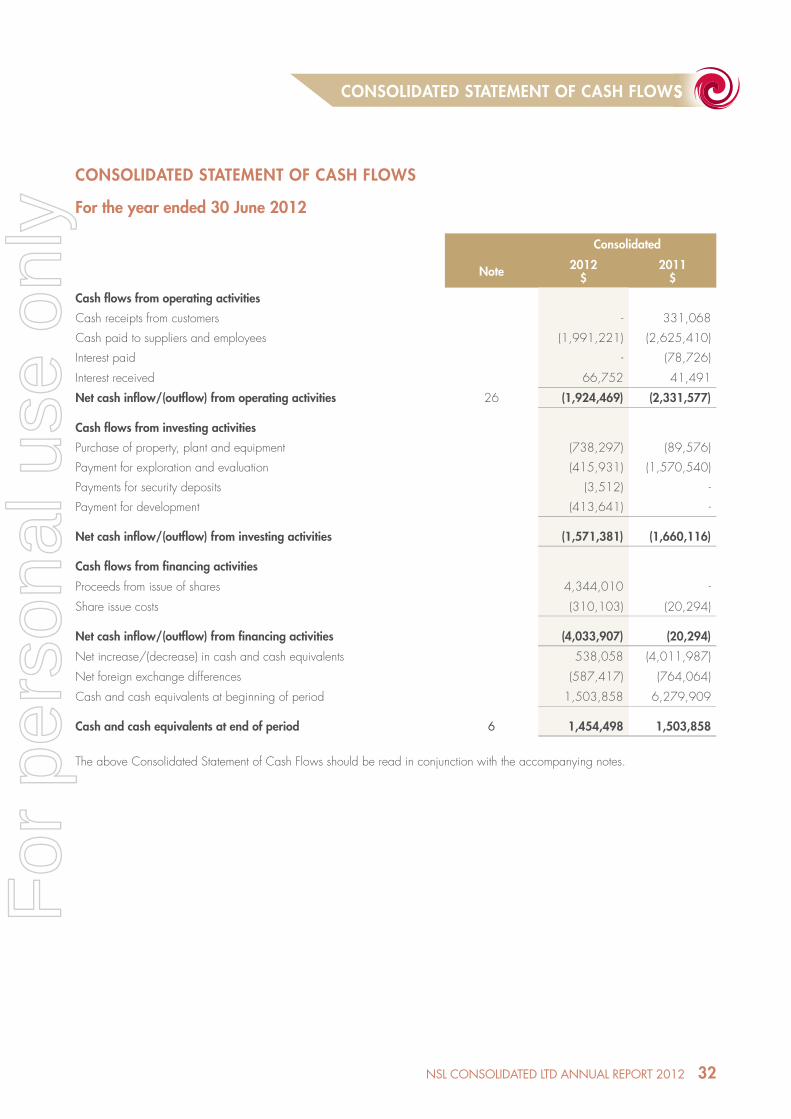
CONSOLIDATED STATEMENT OF CASH FLOWS
For the year ended 30 June 2012
Consolidated
Note 2012$
2011$
Cash fl ows from operating activities
Cash receipts from customers - 331,068
Cash paid to suppliers and employees (1,991,221) (2,625,410)
Interest paid - (78,726)
Interest received 66,752 41,491
Net cash infl ow/(outfl ow) from operating activities 26 (1,924,469) (2,331,577) Cash fl ows from investing activities
Purchase of property, plant and equipment (738,297) (89,576)
Payment for exploration and evaluation (415,931) (1,570,540)
Payments for security deposits (3,512) -
Payment for development (413,641) - Net cash infl ow/(outfl ow) from investing activities (1,571,381) (1,660,116) Cash fl ows from fi nancing activities
Proceeds from issue of shares 4,344,010 -
Share issue costs (310,103) (20,294) Net cash infl ow/(outfl ow) from fi nancing activities (4,033,907) (20,294)
Net increase/(decrease) in cash and cash equivalents 538,058 (4,011,987)
Net foreign exchange differences (587,417) (764,064)
Cash and cash equivalents at beginning of period 1,503,858 6,279,909 Cash and cash equivalents at end of period 6 1,454,498 1,503,858
The above Consolidated Statement of Cash Flows should be read in conjunction with the accompanying notes.
32NSL CONSOLIDATED LTD ANNuAL REPORT 2012
CONSOLIDATED STATEMENT OF CASH FLOWSCONSOLIDATED STATEMENT OF CASH FLOWS
For
per
sona
l use
onl
y
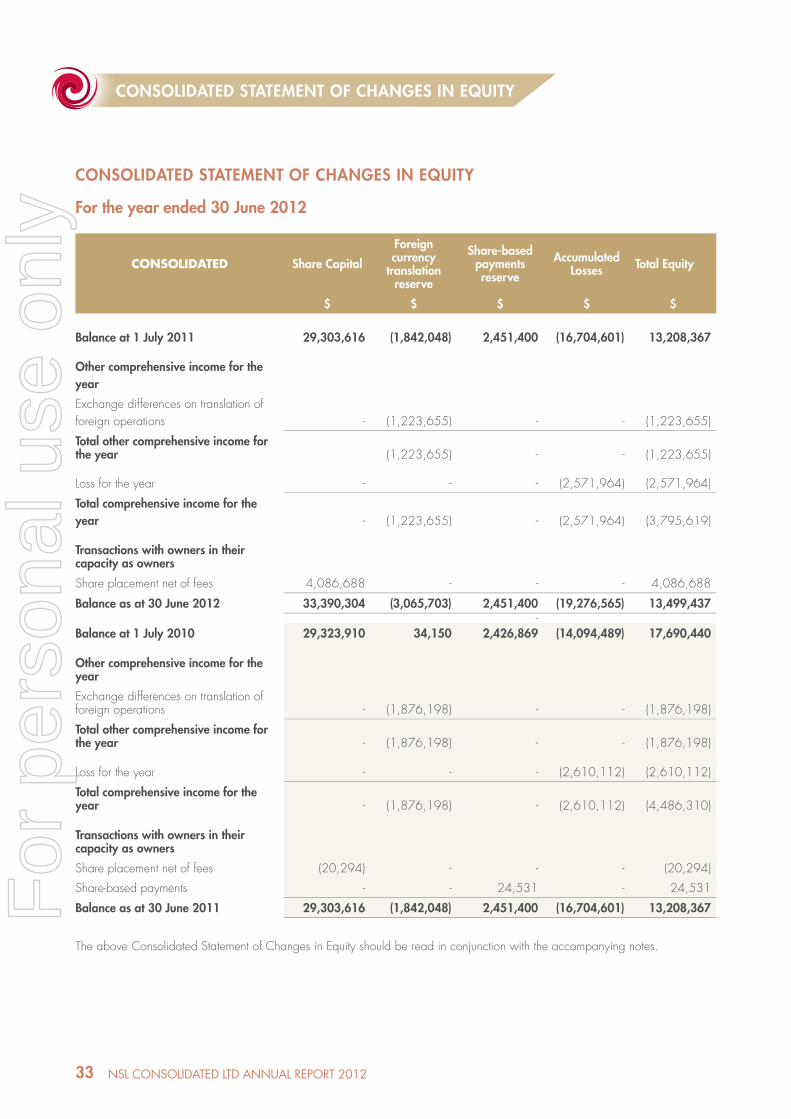
CONSOLIDATED STATEMENT OF CHANGES IN EQUITY
For the year ended 30 June 2012
CONSOLIDATED Share Capital
Foreign currency
translation reserve
Share-based payments reserve
Accumulated Losses Total Equity
$ $ $ $ $
Balance at 1 July 2011 29,303,616 (1,842,048) 2,451,400 (16,704,601) 13,208,367
Other comprehensive income for the year
Exchange differences on translation of foreign operations - (1,223,655) - - (1,223,655)
Total other comprehensive income for the year (1,223,655) - - (1,223,655)
Loss for the year - - - (2,571,964) (2,571,964)
Total comprehensive income for the year - (1,223,655) - (2,571,964) (3,795,619)
Transactions with owners in their capacity as owners
Share placement net of fees 4,086,688 - - - 4,086,688
Balance as at 30 June 2012 33,390,304 (3,065,703) 2,451,400 (19,276,565) 13,499,437-
Balance at 1 July 2010 29,323,910 34,150 2,426,869 (14,094,489) 17,690,440
Other comprehensive income for the year
Exchange differences on translation of foreign operations - (1,876,198) - - (1,876,198)
Total other comprehensive income for the year - (1,876,198) - - (1,876,198)
Loss for the year - - - (2,610,112) (2,610,112)
Total comprehensive income for the year - (1,876,198) - (2,610,112) (4,486,310)
Transactions with owners in their capacity as owners
Share placement net of fees (20,294) - - - (20,294)
Share-based payments - - 24,531 - 24,531
Balance as at 30 June 2011 29,303,616 (1,842,048) 2,451,400 (16,704,601) 13,208,367
The above Consolidated Statement of Changes in Equity should be read in conjunction with the accompanying notes.
33 NSL CONSOLIDATED LTD ANNuAL REPORT 2012
CONSOLIDATED STATEMENT OF CHANGES IN EQUITYCONSOLIDATED STATEMENT OF CHANGES IN EQUITY
For
per
sona
l use
onl
y

3434NSL CONSOLIDATED LTD ANNuAL REPORT 2012
For
per
sona
l use
onl
y
35 NSL CONSOLIDATED LTD ANNuAL REPORT 2012
For
per
sona
l use
onl
y
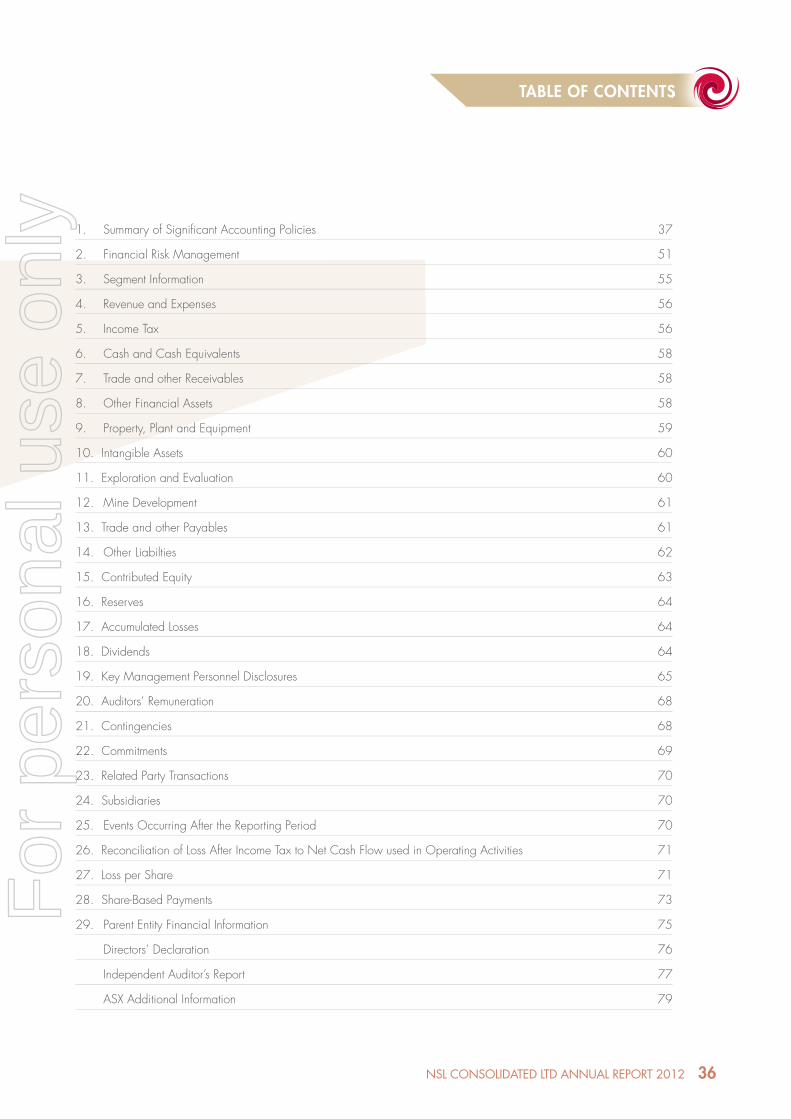
36NSL CONSOLIDATED LTD ANNuAL REPORT 2012
TABLE OF CONTENTSTABLE OF CONTENTS
1. Summary of Signifi cant Accounting Policies 37
2. Financial Risk Management 51
3. Segment Information 55
4. Revenue and Expenses 56
5. Income Tax 56
6. Cash and Cash Equivalents 58
7. Trade and other Receivables 58
8. Other Financial Assets 58
9. Property, Plant and Equipment 59
10. Intangible Assets 60
11. Exploration and Evaluation 60
12. Mine Development 61
13. Trade and other Payables 61
14. Other Liabilties 62
15. Contributed Equity 63
16. Reserves 64
17. Accumulated Losses 64
18. Dividends 64
19. Key Management Personnel Disclosures 65
20. Auditors’ Remuneration 68
21. Contingencies 68
22. Commitments 69
23. Related Party Transactions 70
24. Subsidiaries 70
25. Events Occurring After the Reporting Period 70
26. Reconciliation of Loss After Income Tax to Net Cash Flow used in Operating Activities 71
27. Loss per Share 71
28. Share-Based Payments 73
29. Parent Entity Financial Information 75
Directors’ Declaration 76
Independent Auditor’s Report 77
ASX Additional Information 79
For
per
sona
l use
onl
y
37 NSL CONSOLIDATED LTD ANNuAL REPORT 2012
NOTES TO THE FINANCIAL STATEMENTSNOTES TO THE FINANCIAL STATEMENTS
NOTES TO THE FINANCIAL STATEMENTS For the year ended 30 June 2012
1. SUMMARY OF SIGNIFICANT ACCOUNTING POLICIESThe principal accounting policies adopted in the preparation of these consolidated fi nancial statements are set out below. These policies have been consistently applied to all the years presented, unless otherwise stated. The fi nancial statements are for the consolidated entity consisting of NSL Consolidated Limited and its subsidiaries.
a) Basis of PreparationThese fi nancial statements are general purpose fi nancial statements which has been prepared in accordance with Australian Accounting Standards, other authoritative pronouncements of the Australian Accounting Standards Board, Urgent Issues Group Interpretations and the Corporations Act 2001.
i) Compliance with IFRS The consolidated fi nancial statements of NSL Consolidated Limited also comply with International Financial Reporting Standards (IFRS) as issued by the International Accounting Standards Board (IASB).
ii) Historical cost convention The fi nancial report has also been prepared on a historical cost basis.
iii) Critical accounting estimatesThe preparation of fi nancial statements requires the use of certain critical accounting estimates. It also requires management to exercise its judgement in the process of applying the Group’s accounting policies. The areas involving a higher degree of judgement or complexity, or areas where assumptions and estimates are signifi cant to the fi nancial statements, are disclosed in note (1)(v).
b) Basis of consolidation i) Subsidiaries
The consolidated fi nancial statements incorporate the assets and liabilities of all subsidiaries of NSL Consolidated Limited (“Company” or “parent entity”) as at 30 June 2012 and the results of all subsidiaries for the year then ended. NSL Consolidated Limited and its subsidiaries together are referred to in this fi nancial report as the Group or the consolidated entity.
Subsidiaries are all entities over which the Group has the power to govern the fi nancial and operating policies, generally accompanying a shareholding more than one-half of the voting rights. The existence and effect of potential voting rights that are currently exercisable or convertible are considered when accessing whether the Group controls another entity.
Subsidiaries are fully consolidated from the date on which control is transferred to the Group. They are de-consolidated from the date that control ceases.
Intercompany transactions, balances and unrealised gains on transactions between the Group companies are eliminated. Unrealised losses are also eliminated unless the transaction provides evidence of the impairment of the asset transferred. Accounting policies of subsidiaries have been changed where necessary to ensure consistency with the policy adopted by the Group.
Non-controlling interests in the results and equity of subsidiaries are shown separately in the consolidated statement of comprehensive income and statement of fi nancial position respectively.
For
per
sona
l use
onl
y
38NSL CONSOLIDATED LTD ANNuAL REPORT 2012
1. SUMMARY OF SIGNIFICANT ACCOUNTING POLICIES (CONTINUED)
c) Segment reportingOperating segments are reported in a manner consistent with the internal reporting provided to the chief operating decision maker. The chief operating decision maker, who is responsible for allocating resources and assessing performance of the operating segments, has been identifi ed as the Managing Director and the Board of Directors of NSL.
d) Foreign currency translation i) Functional and presentation currency
Items included in the fi nancial statements of each of the Group’s entities are measured using the currency of the primary economic environment in which the entity operates (‘the functional currency’). The consolidated fi nancial statements are presented in AUD, which is NSL’s functional and presentation currency.
ii) Transactions and balancesForeign currency transactions are translated into the functional currency using the exchange rates prevailing at the dates of the transactions. Foreign exchange gains and losses resulting from the settlement of such transactions and from the translation at year end exchange rates of monetary assets and liabilities denominated in foreign currencies are recognised in profi t or loss, except when they are deferred in equity as qualifying cash fl ow hedges and qualifying net investment hedges or are attributable to part of the net investment in a foreign operation.
Foreign exchange gains and losses that relate to borrowings are presented in the income statement, within fi nance costs. All other foreign exchange gains and losses are presented in the income statement on a net basis within other income or other expenses.
Non-monetary items that are measured at fair value in a foreign currency are translated using the exchange rates at the date when the fair value was determined. Translation differences on assets and liabilities carried at fair value are reported as part of the fair value gain or loss.
iii) Group companiesThe results and fi nancial position of foreign operations (none of which has the currency of a hyperinfl ationary economy) that have a functional currency different from the presentation currency are translated into the presentation currency as follows:– assets and liabilities for each statement of fi nancial position presented are translated at the closing rate at the date of the statement of fi nancial position.– Income and expenses for each income statement and statement of comprehensive income are translated at average exchange rates (unless this is not a reasonable approximation of the cumulative effect of the rates prevailing on the transactions dates, in which case income and expenses are translated at the dates of the transactions), and– all resulting exchange differences are recognised in other comprehensive income.
On consolidation, exchange differences arising from the translation of any net investment in foreign entities, and of borrowings and other fi nancial instruments designated as hedges of such investments, are recognised in other comprehensive income. When a foreign operation is sold or any borrowings forming part of the net investment are repaid, a proportionate share of such exchange difference is reclassifi ed to profi t or loss, as part of the gain or loss on sale where applicable.
NOTES TO THE FINANCIAL STATEMENTSNOTES TO THE FINANCIAL STATEMENTS
For
per
sona
l use
onl
y
39 NSL CONSOLIDATED LTD ANNuAL REPORT 2012
1. SUMMARY OF SIGNIFICANT ACCOUNTING POLICIES (CONTINUED)
e) Revenue RecognitionRevenue is measured at the fair value of the consideration received or receivable.The Group recognises revenue when the amount of revenue can be reliably measured, it is probable that future economic benefi ts will fl ow to the entity and specifi c criteria have been met as described below.
i) Interest incomeInterest income is recognised using the effective interest method. When a receivable is impaired, the Group reduces the carrying amount to its recoverable amount, being the estimated future cash fl ow discounted at the original effective interest rate of the instrument, and continues unwinding the discount as interest income.
f) Income TaxThe income tax expense or revenue for the period is the tax payable on the current period’s taxable income based on the applicable income tax rate for each jurisdiction adjusted by changes in deferred tax assets and liabilities attributable to temporary differences and to unused tax losses.
The current income tax charge is calculated on the basis of the tax laws enacted or substantively enacted at the end of the reporting period in the countries where the Company’s subsidiaries and associates operate and generate taxable income. Management periodically evaluates positions taken in tax returns with respect to situations in which applicable tax regulation is subject to interpretation. It establishes provisions where appropriate on the basis of amounts expected to be paid to the tax authorities.
Deferred income tax is provided in full, using the liability method, on temporary differences arising between tax bases of assets and liabilities and their carrying amounts in the consolidated fi nancial statements. However, deferred tax liabilities are not recognised if they arise from the initial recognition of goodwill. Deferred income tax is also not accounted for if it arises from initial recognition of an asset or liability in a transaction other than a business combination that at the time of the transaction affects neither accounting, nor taxable profi t or loss. Deferred income tax is determined using tax rates (and laws) that have been enacted or substantially enacted by the end of the reporting period and are expected to apply when the related deferred income tax asset is realised or the deferred income tax liability is settled.
Deferred tax assets are recognised for deductible temporary differences and unused tax losses only if it is probable that future taxable amounts will be available to utilise those temporary differences and losses.
Deferred tax assets and liabilities are not recognised for temporary differences between the carrying amount and tax bases of investments in foreign operations where the Company is able to control; the timing of the reversal of the temporary differences and it is probable that the differences will not reverse in the foreseeable future.
Deferred tax assets and liabilities are offset when there is a legally enforceable right to offset current tax assets and liabilities and when the deferred tax balances relate to the same taxation authority.
Current tax assets and liabilities are offset where the entity has a legally enforceable right to offset and intends either to settle on a net basis, or to realise the asset and settle the liability simultaneously.
Current and deferred tax is recognised in profi t or loss, except to the extent that it relates to items recognised in other comprehensive income or directly in equity. In this case, the tax is also recognised in other comprehensive income or directly in equity, respectively.
NOTES TO THE FINANCIAL STATEMENTSNOTES TO THE FINANCIAL STATEMENTS
For
per
sona
l use
onl
y

40NSL CONSOLIDATED LTD ANNuAL REPORT 2012
1. SUMMARY OF SIGNIFICANT ACCOUNTING POLICIES (CONTINUED)
g) LeasesLease of property, plant and equipment where the Group, as lessee, has substantially all the risks and rewards of ownership are classifi ed as fi nance leases. Finance leases are capitalised at the lease’s inception at fair value of the leased property or, if lower, the present value of the minimum lease payments. The corresponding rental obligations, net of fi nance charges, are included in other short-term and long-term payables. Each lease payment is allocated between the liability and the fi nance cost. The fi nance cost is charged to profi t or loss over the lease period so as to produce a constant periodic rate of interest on the remaining balance for the liability of each period. The property, plant and equipment acquired under fi nance lease is depreciated over the asset’s useful life or over the shorter of the asset’s useful life and the lease term if there is no reasonable certainty that the Group will obtain ownership at the end of the lease term.
Leases in which a signifi cant portion of the risks and rewards of ownership are not transferred to the Group as lessee are classifi ed as operating leases. Payments made under operating leases (net of any incentives received from the lessor) are charged to profi t or loss on a straight-line basis over the period of the lease.
h) Impairment of assets Goodwill and intangible assets that have an indefi nite useful life are not subject to amortisation and are tested annually for impairment, or more frequently if events or changes in circumstances indicate that they might be impaired. Other assets are tested for impairment whenever events or changes in circumstances indicate that the carrying amount may not be recoverable. An impairment loss is recognised for the amount by which the asset’s carrying amount exceeds its recoverable amount. The recoverable amount is the higher of an asset’s fair value less costs to sell and value in use. For the purpose of assessing impairment, assets are grouped at the lowest levels for which there are separately identifi able cash infl ows which are largely independent of cash infl ows from other assets or groups of assets (cash-generating units). Non-fi nancial assets other than goodwill that suffered an impairment are reviewed for possible reversal of the impairment at the end of each reporting period.
i) Cash and cash equivalentsFor the purpose of presentation in the statement of cash fl ows, cash and cash equivalents includes cash on hand, deposits held at call with fi nancial institutions, other short-term, highly liquid investments with original maturities of three months or less that are readily convertible to known amounts of cash and which are subject to an insignifi cant risk of changes in value, and bank overdrafts.
Bank overdrafts are shown within borrowings in current liabilities in the statement of fi nancial position.
j) Trade receivablesTrade receivables are recognised initially at fair value and subsequently measured at amortised cost using the effective interest method, less provision for impairment. Trade receivables are generally due for settlement between 30 and 90 days. They are presented as current assets unless collection is not expected for more than 12 months after the reporting date.
Collectability of trade receivables is reviewed on an ongoing basis. Debts which are known to be uncollectible are written off by reducing the carrying amount directly. An allowance account (provision for impairment of trade receivables) is used when there is objective evidence that the Group will not be able to collect all amounts due according to the original terms of the receivables. Signifi cant fi nancial diffi culties of the debtor, probability that the debtor will enter bankruptcy or fi nancial reorganisation, and default or delinquency in payments (more than 30 days overdue) are considered indicators that trade receivable is impaired. The amount of the impairment allowance is the difference between the asset’s carrying amount and the present value of estimated future cash fl ows, discounted at the original effective interest rate. Cash fl ows relating to short-term receivables are not discounted if the effect of discounting is immaterial.
NOTES TO THE FINANCIAL STATEMENTSNOTES TO THE FINANCIAL STATEMENTS
For
per
sona
l use
onl
y
41 NSL CONSOLIDATED LTD ANNuAL REPORT 2012
1. SUMMARY OF SIGNIFICANT ACCOUNTING POLICIES (CONTINUED)
j) Trade receivables (continued)The amount of the impairment loss is recognised in profi t or loss within other expenses. When a trade receivable for which an impairment allowance had been recognised becomes uncollectible in a subsequent period, it is written off against the allowance account. Subsequent recoveries of amounts previously written off are credited against other expenses in profi t or loss.
k) Financial assetsClassifi cationThe Group classifi es all of its fi nancial assets as loans and receivables. Management determines the classifi cation of its investments at initial recognition.
i) Loans and receivablesLoans and receivables are non-derivative fi nancial assets with fi xed or determinable payments that are not quoted in an active market. They are included in current assets, except for those with maturities greater than 12 months after the reporting date which are classifi ed as non-current assets. Loans and receivables are included in trade and other receivables (note 7) in the statement of fi nancial position.
ii) Subsequent measurementLoans and receivables are carried at amortised cost using the effective interest method.
The translation differences related to changes in the amortised cost are recognised in profi t or loss, and other changes in carrying amount are recognised in equity.
Details on how the fair value of fi nancial instruments is determined are disclosed in the fi nancial risk management note at note 2.
ImpairmentThe Group assesses at each statement of fi nancial position whether there is objective evidence that a fi nancial asset or group of fi nancial assets is impaired. A fi nancial asset or a group of fi nancial assets is impaired and impairment losses are incurred only if there is objective evidence of impairment as a result of one or more events that occurred after the initial recognition of the asset (a “loss event”) and that loss event (or events) has an impact on the estimated future cash fl ows of the fi nancial asset or group of fi nancial assets that can be reliable estimated.For loan and receivables, the amount of loss is measured as the difference between the asset’s carrying amount and the present value of estimated future cash fl ows (excluding future credit losses that have not been incurred) discounted at the fi nancial asset’s original effective interest rate. The carrying amount of the asset is reduced and the amount of the loss is recognised in the consolidated income statement.
If, in a subsequent period, the amount of the impairment loss decreases and the decrease can be related objectively to an event occurring after the impairment was recognised, the reversal of the previously recognised impairment loss is recognised in the consolidated income statement.
l) Property, Plant and EquipmentAll other property, plant and equipment is stated at historical cost less depreciation. Historical cost includes expenditure that is directly attributable to the acquisition of the items.
Subsequent costs are included in the asset’s carrying amount or recognised as a separate asset, as appropriate, only when it is probable that future economic benefi ts associated with the item will fl ow to the Group and the cost of the item can be measured reliably. The carrying amount of any component accounted for as a separate asset is derecognised when replaced. All other repairs and maintenance are charged to profi t and loss during the reporting period in which they are incurred.
NOTES TO THE FINANCIAL STATEMENTSNOTES TO THE FINANCIAL STATEMENTS
For
per
sona
l use
onl
y
42NSL CONSOLIDATED LTD ANNuAL REPORT 2012
1. SUMMARY OF SIGNIFICANT ACCOUNTING POLICIES (CONTINUED)
l) Property, Plant and Equipment (continued)Increase in the carrying amount arising on revaluation of land is recognised, net of tax, in other comprehensive income and accumulated in reserves in equity. To the extent that the increase in reserves a decrease previously recognised in profi t or loss, the increase is fi rst recognised in profi t or loss. Decreases that reserve previous increases of the same asset are fi rst recognised in other comprehensive income to the extent of the remaining surplus attributable to the asset; all other decreases are charged to profi t or loss.
Land is not depreciated. Depreciation on other assets is calculated using the diminishing-balance method to allocate their cost:– Plant and equipment 13% - 25%– Furniture and fi xtures 18% – Computer equipment 18.75% - 40%– Buildings 20%
The assets’ residual values and useful lives are reviewed, and adjusted if appropriate, at the end of each reporting period.
An asset’s carrying amount is written down immediately to its recoverable amount if the asset’s carrying amount is greater than its estimated recoverable amount.
Gains and losses on disposals are determined by comparing proceeds with carrying amount. These are included in profi t or loss. When revalued assets are sold, it is Group policy to transfer any amounts included in other reserves in respect of those assets to retained earnings.
m) Intangible assets i) Computer software
Costs incurred in acquiring software that will contribute to the future period fi nancial benefi ts through revenue generation and/or cost reduction are capitalised to software and systems. Amortisation is calculated using diminishing-balance method. Depreciation rate is 40%.
n) Exploration and evaluation assetExploration and evaluation costs are accumulated in respect of each separate ‘area of interest’ or geographical segment. Costs are either expensed as incurred or capitalised as an exploration and evaluation asset provided exploration titles are current and at least one of the following conditions are satisfi ed: – the expenditure is expected to be recouped through successful development and exploitation of the area of interest; or– activities in the area of interest have not, at the reporting date, reached a stage which permits a reasonable assessment of the existence or otherwise of economically recoverable reserves and active and signifi cant operations in, or in relation to, the area of interest are continuing.
Exploration and evaluation assets are assessed for impairment if (i) suffi cient data exists to determine technical feasibility and commercial viability, and (ii) facts and circumstances suggest that the carrying amounts exceeds the recoverable amount. For the purposes of impairment testing, exploration and evaluation assets are allocated to cash-generating units to which the exploration activity relates. Impairment losses are recognised in the income statement.
NOTES TO THE FINANCIAL STATEMENTSNOTES TO THE FINANCIAL STATEMENTS
For
per
sona
l use
onl
y
43 NSL CONSOLIDATED LTD ANNuAL REPORT 2012
1. SUMMARY OF SIGNIFICANT ACCOUNTING POLICIES (CONTINUED)
o) Development Expenditure Once a mining project has been established as commercially viable and technically feasible, expenditure other than that on land, buildings and plant and equipment is capitalised under development expenditure. Development expenditure costs include past capitalised exploration and evaluation costs, pre-production development costs, development excavation, development studies and other subsurface expenditure pertaining to that area of interest. Costs related to surface plant and equipment and any associated land and buildings are accounted for as property, plant and equipment.
Development costs are accumulated in respect of each separate area of interest. Costs associated with commissioning new assets in the period before they are capable of operating in the manner intended by management, are capitalised. Development costs incurred after the commencement of production are capitalised to the extent they are expected to give rise to a future economic benefi t.
When an area of interest is abandoned or the Directors decide that it is not commercial or technically feasible, any accumulated cost in respect of that area is written off in the fi nancial period the decision is made. Each area of interest is reviewed at the end of each accounting period and accumulated cost written off to the profi t or loss to the extent that they will not be recoverable in the future.
Amortisation of carried forward exploration and development costs is charged on a unit of production basis over the life of economically recoverable reserves once production commences.
Development assets are assessed for impairment if facts and circumstances suggest that the carrying amount exceeds the recoverable amount. For the purposes of impairment testing, development assets are allocated to cash-generating units to which the development activity relates. The cash generating unit shall not be larger than the area of interest.
p) Trade and other payablesTrade and other payables represent liabilities for goods and services provided to the Group prior to the year end and which are unpaid. These amounts are unsecured and have 7-30 day payment terms. Trade and other payables are presented as current liabilities unless payment is not due within 12 months from the reporting date. They are recognised initially at their fair value and subsequently measured at amortised cost using the effective interest method.
q) ProvisionsProvision for legal claims, and make good obligations are recognised when the Group has a present legal or constructive obligation as a result of past events, and it is probable that an outfl ow of resources will be required to settle the obligation and the amount has been reliably estimated. Provisions are not recognised for future operating losses.
Where there are a number of similar obligations, the likelihood that an outfl ow will be required in settlement is determined by considering the class of obligations as a whole. A provision is recognised even if the likelihood of an outfl ow with respect to any one item included in the same class of obligations may be small.
Provisions are measured at the present value of management’s best estimate of the expenditure required to settle the present obligation at the end of the reporting period. The discount rate used to determine the present value is a pre-tax that refl ects current market assessments of the time value of money and the risks specifi c to the liability. The increase in the provision due to the passage of time is recognised as interest expense.
NOTES TO THE FINANCIAL STATEMENTSNOTES TO THE FINANCIAL STATEMENTS
For
per
sona
l use
onl
y
44NSL CONSOLIDATED LTD ANNuAL REPORT 2012
1. SUMMARY OF SIGNIFICANT ACCOUNTING POLICIES (CONTINUED)
r) Employee benefi ts i) Short-term obligations
Liabilities for wages and salaries, including non-monetary benefi ts, annual leave and accumulating sick leave expected to be settled within 12 months after the end of the period in which the employees render the related service are recognised in respect of employees’ services up to the end of the reporting period and are measured at the amounts expected to be paid when the liabilities are settled.
The liability for annual leave is recognised in the provision for employee benefi ts. All other short-term employee obligations are presented as payables.
ii) Other long-term employee benefi t obligationsLiability for long service leave and annual leave which is not expected to be settled within 12 months after the end of the period in which the employees render the related service is recognised in the provision for employee benefi ts and measured at the present value of expected future payments to be made in respect of services provided by employees up to the end of the reporting period using the projected unit credit method. Consideration is given to expected future salary and wage levels, experience of employee departures and periods of service. Expected future payments are discounted using market yields at the end of the reporting period on national government bonds with terms to maturity and currency that match, as closely as possible, the estimated future cash outfl ows.
iii) Share-based paymentsShare-based compensation benefi ts are provided to employees via the Company Employee Option Plan. Information relating to the scheme is set out in Note 28 .
The fair value of options granted under the Company Employee Option Plan is recognised as an employee benefi ts expense with a corresponding increase in equity. The total amount to be expensed is determined by reference to the fair value of the options granted, which includes any market performance conditions and the impact of any non-vesting conditions but excludes the impact of any service and non-market performance vesting conditions.
Non-market vesting conditions are included in assumptions about the number of options that are expected to vest. The total expense is recognised over the vesting period, which is the period over which all of the specifi ed vesting conditions are to be satisfi ed. At the end of each period, the entity revises its estimates of the number of options that are expected to vest based on the non-marketing vesting conditions. It recognises the impact of the revision to original estimates, if any, in profi t or loss, with a corresponding adjustment to equity.
The Employee Option Plan is administered by the Company Employee Share Trust. When the options are exercised, the trust transfers the appropriate amount of shares to the employee. The proceeds received net of any directly attributable transaction costs are credited directly to equity.
iv) Profi t-Sharing and Bonus PlansThe Group recognises a liability and an expense for bonuses and profi t-sharing based on a formula that takes into consideration the profi t attributable to the Company’s shareholders after certain adjustments. The Group recognises a provision where contractually obliged or where there is past practise that has created a constructive obligation.
v) Termination benefi tsTermination benefi ts are payable when employment is terminated before the normal retirement date, or when an employee accepts voluntary redundancy in exchange for those benefi ts. The Group recognises termination benefi ts when it is demonstrably committed to either terminating the employment of current employees according to a detailed formal plan without possibility of withdrawal or to providing termination benefi ts as a result of an offer made to encourage voluntary redundancy. Benefi ts falling due more than 12 months after the end of the reporting period are discounted to present value.
NOTES TO THE FINANCIAL STATEMENTSNOTES TO THE FINANCIAL STATEMENTS
For
per
sona
l use
onl
y
45 NSL CONSOLIDATED LTD ANNuAL REPORT 2012
1. SUMMARY OF SIGNIFICANT ACCOUNTING POLICIES (CONTINUED)
s) Contributed EquityOrdinary shares are classifi ed as equity. Incremental costs directly attributable to the issue of new shares or options are shown in equity as a deduction, net of tax, from the equity proceeds.
Costs directly attributable to the issue of new shares or options associated with the acquisition of a business are included as part of the purchase consideration.
t) Earnings per Sharei) Basic earnings per share
Basic earnings per share is calculated by dividing:– the profi t attributable to owners of NSL Consolidated Limited, excluding any costs of servicing equity other than ordinary shares– by the weighted average number of ordinary shares outstanding during the fi nancial year, adjusted for bonus elements in ordinary shares issued during the year.
ii) Diluted earnings per shareDiluted earnings per share adjusts the fi gures used in the determination of basic earnings per share to take into account:– the after income tax effect of interest and other fi nancing costs associated with dilutive potential ordinary shares– the weighted average number of additional ordinary shares that would have been outstanding assuming the conversion of all dilutive potential ordinary shares.
u) Goods and Services TaxRevenues, expenses and assets are recognised net of the amount of associated goods and services tax (GST), unless the GST incurred is not recoverable from the taxation authority. In this case, it is recognised as part of the cost of acquisition of the asset or as part of the expense.Receivables and payables are stated inclusive of the amount of GST receivable or payable. The net amount of GST recoverable from, or payable to, the taxation authority is included with other receivables or payables in the statement of fi nancial position.
Cash fl ows are presented on a gross basis. The GST component of cash fl ows arising from investing or fi nancing activities which are recoverable from, or payable to the taxation authority, are presented as operating cash fl ows.
v) Critical accounting estimates and judgements In the process of applying the accounting policies, management has made certain judgements or estimations which have an effect on the amounts recognised in the fi nancial statements.
The carrying amounts of certain assets and liabilities are often determined based on estimates and assumptions of future events. The key estimates and assumptions that have a signifi cant risk causing a material adjustment to the carrying amounts of certain assets and liabilities within the next annual reporting period are:
NOTES TO THE FINANCIAL STATEMENTSNOTES TO THE FINANCIAL STATEMENTS
For
per
sona
l use
onl
y
46NSL CONSOLIDATED LTD ANNuAL REPORT 2012
1. SUMMARY OF SIGNIFICANT ACCOUNTING POLICIES (CONTINUED)
v) Critical accounting estimates and judgements (continued)i) Share-based payment transactions
The grant date fair value of share-based payment awards granted to employees is recognised as an employee expense with a corresponding increase in equity, over the period that the employees unconditionally become entitled to the awards. The amount recognised as an expense is adjusted to refl ect the number of awards for which the related service and non-market vesting conditions are expected to be met, such that, the amount ultimately recognised as an expense is based on the number of awards that do not meet the related service and non-market performance conditions at the vesting date.
The Company follows the guidelines of AASB 2 ‘Share-based payments’ and takes into account all non-vesting conditions and estimates the probability and expected timing of achieving these performance conditions. Accordingly, the expense recognised over the vesting period may vary based upon information available and estimates made at each reporting period, until the expiry of the vesting period.
The performance conditions relating to the Class A, B and C performance options issued are expected to be met within terms and the total value of these options of $nil (2011: $24,531) has been expensed to the profi t and loss in the prior period.
ii) Capitalisation of exploration and evaluation expenditureThe Group has capitalised signifi cant exploration and evaluation expenditure on the basis either that this is expected to be recouped through future successful development (or alternatively sale) of the Areas of Interest concerned or on the basis that it is not yet possible to assess whether it will be recouped.
iii) Impairment of capitalised exploration and evaluation expenditureThe future recoverability of capitalised exploration and evaluation expenditure is dependent on a number of factors, including whether the Group decides to exploit the related lease itself, or, if not, whether it successfully recovers the related exploration and evaluation asset through sale. Factors that could impact the future recoverability include the level of reserves and resources, future technological changes, costs of drilling and production, production rates, future legal changes (including changes to environmental restoration obligations) and changes to commodity prices.
As at 30 June 2012, the carrying value of exploration expenditure for the Group is $415,931 (2011: $11,533,692).
iv) Capitalisation of development expenditure.The Group has capitalised signifi cant development expenditure on the basis that a mining project has been established as commercially viable and technically feasible
v) Impairment of capitalised development expenditure.The future recoverability of capitalised development expenditure is dependent on a number of factors, including whether or not the development costs are expected to give rise to a future economic benefi t. Development assets are assessed for impairment if facts and circumstances suggest that the carrying amount exceeds the recoverable amount. For the purposes of impairment testing, development assets are allocated to cash-generating units to which the development activity relates. The cash generating unit shall not be larger than the area of interest.
Factors that could impact the future recoverability include the level of reserves and resources, future technological changes, costs of drilling and production, production rates, future legal changes (including changes to environmental restoration obligations), changes to foreign exchange prices and changes to commodity prices.
As at 30 June 2012, the carrying value of development expenditure for the Group is $11,107,540 (2011: $nil).
NOTES TO THE FINANCIAL STATEMENTSNOTES TO THE FINANCIAL STATEMENTS
For
per
sona
l use
onl
y
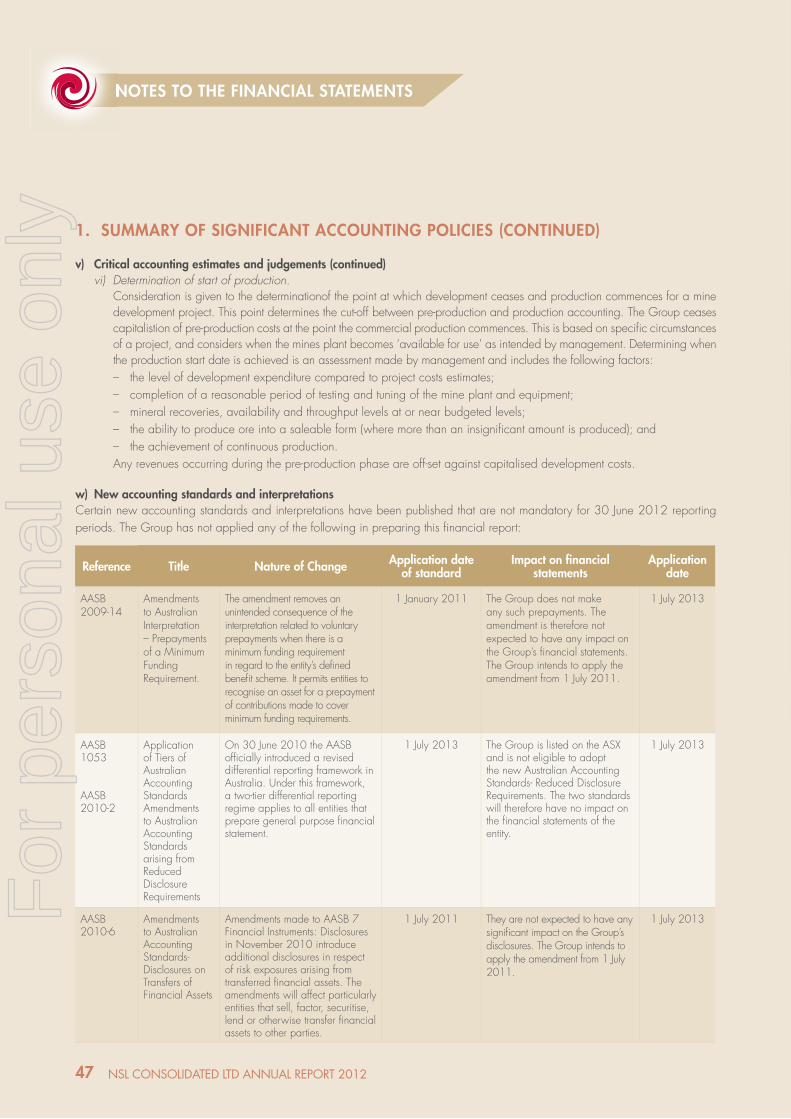
Reference Title Nature of Change Application date of standard
Impact on fi nancial statements
Application date
AASB2009-14
Amendments to Australian Interpretation – Prepayments of a Minimum Funding Requirement.
The amendment removes an unintended consequence of the interpretation related to voluntary prepayments when there is a minimum funding requirement in regard to the entity’s defi ned benefi t scheme. It permits entities to recognise an asset for a prepayment of contributions made to cover minimum funding requirements.
1 January 2011 The Group does not make any such prepayments. The amendment is therefore not expected to have any impact on the Group’s fi nancial statements. The Group intends to apply the amendment from 1 July 2011.
1 July 2013
AASB1053
AASB2010-2
Application of Tiers of Australian Accounting Standards Amendments to Australian Accounting Standards arising from Reduced Disclosure Requirements
On 30 June 2010 the AASB offi cially introduced a revised differential reporting framework in Australia. Under this framework, a two-tier differential reporting regime applies to all entities that prepare general purpose fi nancial statement.
1 July 2013 The Group is listed on the ASX and is not eligible to adopt the new Australian Accounting Standards- Reduced Disclosure Requirements. The two standards will therefore have no impact on the fi nancial statements of the entity.
1 July 2013
AASB 2010-6
Amendments to Australian Accounting Standards- Disclosures on Transfers of Financial Assets
Amendments made to AASB 7 Financial Instruments: Disclosures in November 2010 introduce additional disclosures in respect of risk exposures arising from transferred fi nancial assets. The amendments will affect particularly entities that sell, factor, securitise, lend or otherwise transfer fi nancial assets to other parties.
1 July 2011 They are not expected to have any signifi cant impact on the Group’s disclosures. The Group intends to apply the amendment from 1 July 2011.
1 July 2013
47 NSL CONSOLIDATED LTD ANNuAL REPORT 2012
1. SUMMARY OF SIGNIFICANT ACCOUNTING POLICIES (CONTINUED)
v) Critical accounting estimates and judgements (continued)vi) Determination of start of production.
Consideration is given to the determinationof the point at which development ceases and production commences for a mine development project. This point determines the cut-off between pre-production and production accounting. The Group ceases capitalistion of pre-production costs at the point the commercial production commences. This is based on specifi c circumstances of a project, and considers when the mines plant becomes ‘available for use’ as intended by management. Determining when the production start date is achieved is an assessment made by management and includes the following factors:– the level of development expenditure compared to project costs estimates;– completion of a reasonable period of testing and tuning of the mine plant and equipment;– mineral recoveries, availability and throughput levels at or near budgeted levels;– the ability to produce ore into a saleable form (where more than an insignifi cant amount is produced); and– the achievement of continuous production.Any revenues occurring during the pre-production phase are off-set against capitalised development costs.
w) New accounting standards and interpretations Certain new accounting standards and interpretations have been published that are not mandatory for 30 June 2012 reporting periods. The Group has not applied any of the following in preparing this fi nancial report:
NOTES TO THE FINANCIAL STATEMENTSNOTES TO THE FINANCIAL STATEMENTS
For
per
sona
l use
onl
y
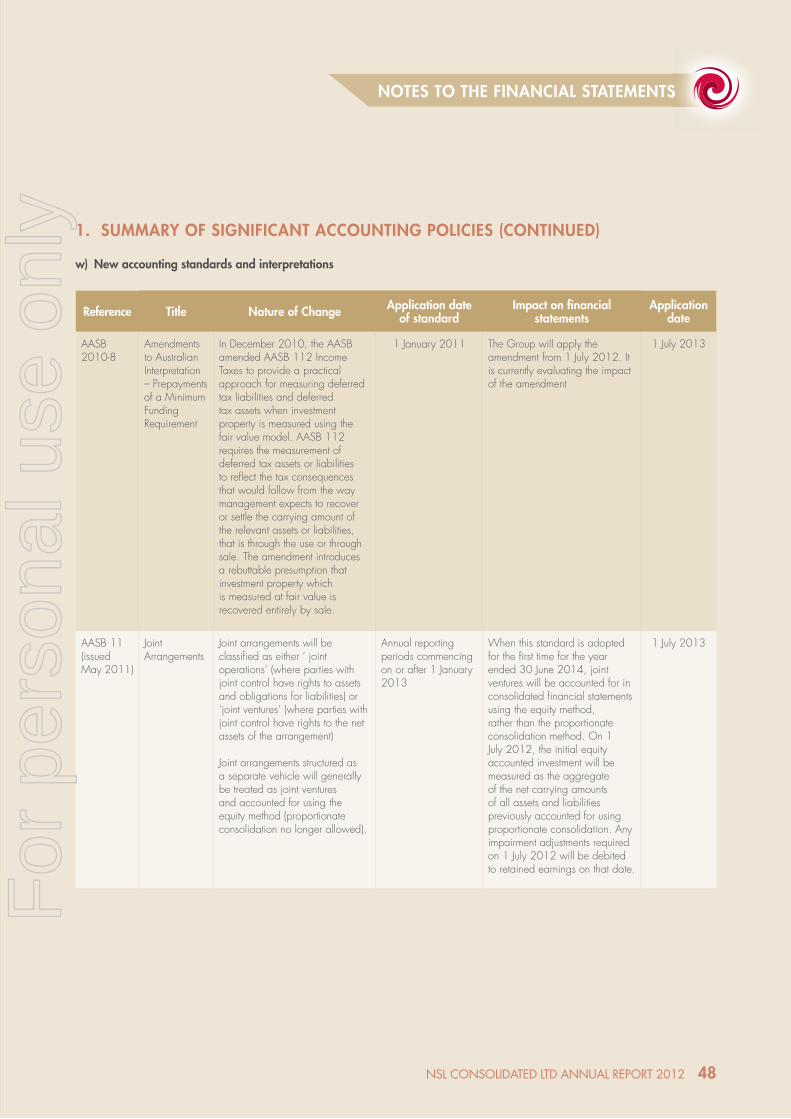
48NSL CONSOLIDATED LTD ANNuAL REPORT 2012
1. SUMMARY OF SIGNIFICANT ACCOUNTING POLICIES (CONTINUED)
w) New accounting standards and interpretations
Reference Title Nature of Change Application date of standard
Impact on fi nancial statements
Application date
AASB2010-8
Amendments to Australian Interpretation – Prepayments of a Minimum Funding Requirement
In December 2010, the AASB amended AASB 112 Income Taxes to provide a practical approach for measuring deferred tax liabilities and deferred tax assets when investment property is measured using the fair value model. AASB 112 requires the measurement of deferred tax assets or liabilities to refl ect the tax consequences that would follow from the way management expects to recover or settle the carrying amount of the relevant assets or liabilities, that is through the use or through sale. The amendment introduces a rebuttable presumption that investment property which is measured at fair value is recovered entirely by sale.
1 January 2011 The Group will apply the amendment from 1 July 2012. It is currently evaluating the impact of the amendment
1 July 2013
AASB 11 (issued May 2011)
Joint Arrangements
Joint arrangements will be classifi ed as either ‘ joint operations’ (where parties with joint control have rights to assets and obligations for liabilities) or ‘joint ventures’ (where parties with joint control have rights to the net assets of the arrangement)
Joint arrangements structured as a separate vehicle will generally be treated as joint ventures and accounted for using the equity method (proportionate consolidation no longer allowed).
Annual reporting periods commencing on or after 1 January 2013
When this standard is adopted for the fi rst time for the year ended 30 June 2014, joint ventures will be accounted for in consolidated fi nancial statements using the equity method, rather than the proportionate consolidation method. On 1 July 2012, the initial equity accounted investment will be measured as the aggregate of the net carrying amounts of all assets and liabilities previously accounted for using proportionate consolidation. Any impairment adjustments required on 1 July 2012 will be debited to retained earnings on that date.
1 July 2013
NOTES TO THE FINANCIAL STATEMENTSNOTES TO THE FINANCIAL STATEMENTS
For
per
sona
l use
onl
y
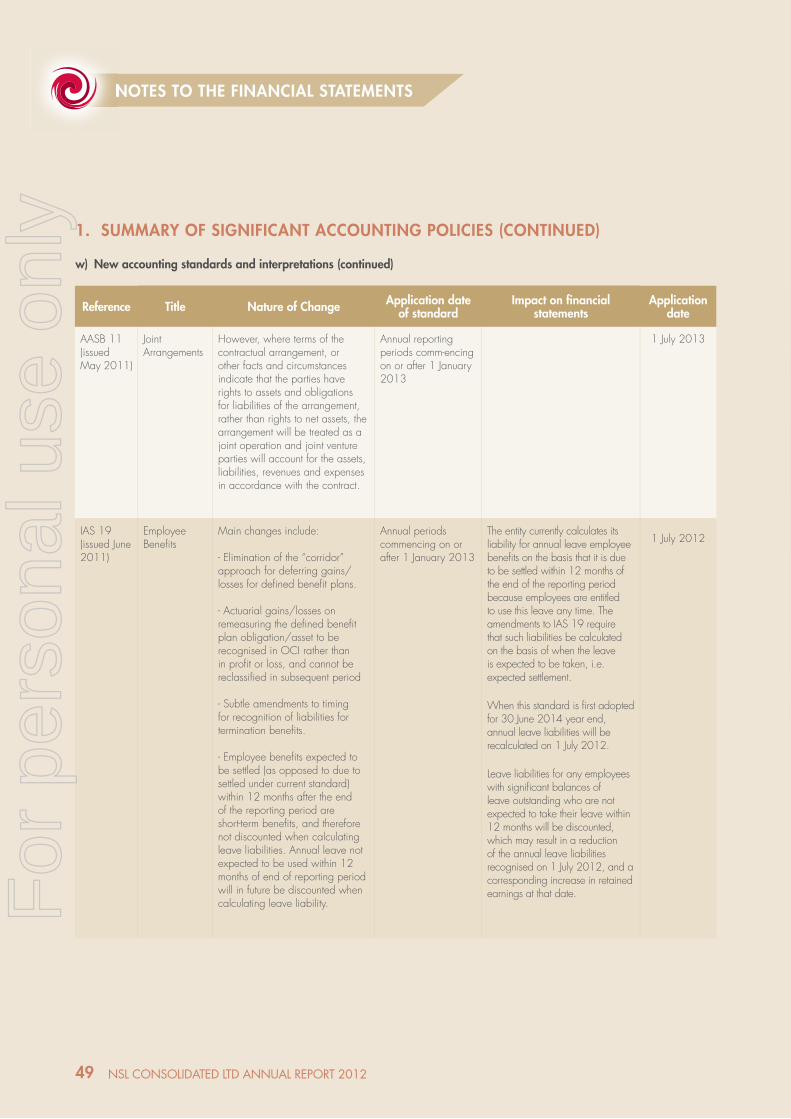
49 NSL CONSOLIDATED LTD ANNuAL REPORT 2012
1. SUMMARY OF SIGNIFICANT ACCOUNTING POLICIES (CONTINUED)
w) New accounting standards and interpretations (continued)
Reference Title Nature of Change Application date of standard
Impact on fi nancial statements
Application date
AASB 11 (issued May 2011)
Joint Arrangements
However, where terms of the contractual arrangement, or other facts and circumstances indicate that the parties have rights to assets and obligations for liabilities of the arrangement, rather than rights to net assets, the arrangement will be treated as a joint operation and joint venture parties will account for the assets, liabilities, revenues and expenses in accordance with the contract.
Annual reporting periods comm-encing on or after 1 January 2013
1 July 2013
IAS 19 (issued June 2011)
Employee Benefi ts
Main changes include:
- Elimination of the “corridor” approach for deferring gains/losses for defi ned benefi t plans.
- Actuarial gains/losses on remeasuring the defi ned benefi t plan obligation/asset to be recognised in OCI rather than in profi t or loss, and cannot be reclassifi ed in subsequent period
- Subtle amendments to timing for recognition of liabilities for termination benefi ts.
- Employee benefi ts expected to be settled (as opposed to due to settled under current standard) within 12 months after the end of the reporting period are short-term benefi ts, and therefore not discounted when calculating leave liabilities. Annual leave not expected to be used within 12 months of end of reporting period will in future be discounted when calculating leave liability.
Annual periods commencing on or after 1 January 2013
The entity currently calculates its liability for annual leave employee benefi ts on the basis that it is due to be settled within 12 months of the end of the reporting period because employees are entitled to use this leave any time. The amendments to IAS 19 require that such liabilities be calculated on the basis of when the leave is expected to be taken, i.e. expected settlement.
When this standard is fi rst adopted for 30 June 2014 year end, annual leave liabilities will be recalculated on 1 July 2012.
Leave liabilities for any employees with signifi cant balances of leave outstanding who are not expected to take their leave within 12 months will be discounted, which may result in a reduction of the annual leave liabilities recognised on 1 July 2012, and a corresponding increase in retained earnings at that date.
1 July 2012
NOTES TO THE FINANCIAL STATEMENTSNOTES TO THE FINANCIAL STATEMENTS
For
per
sona
l use
onl
y
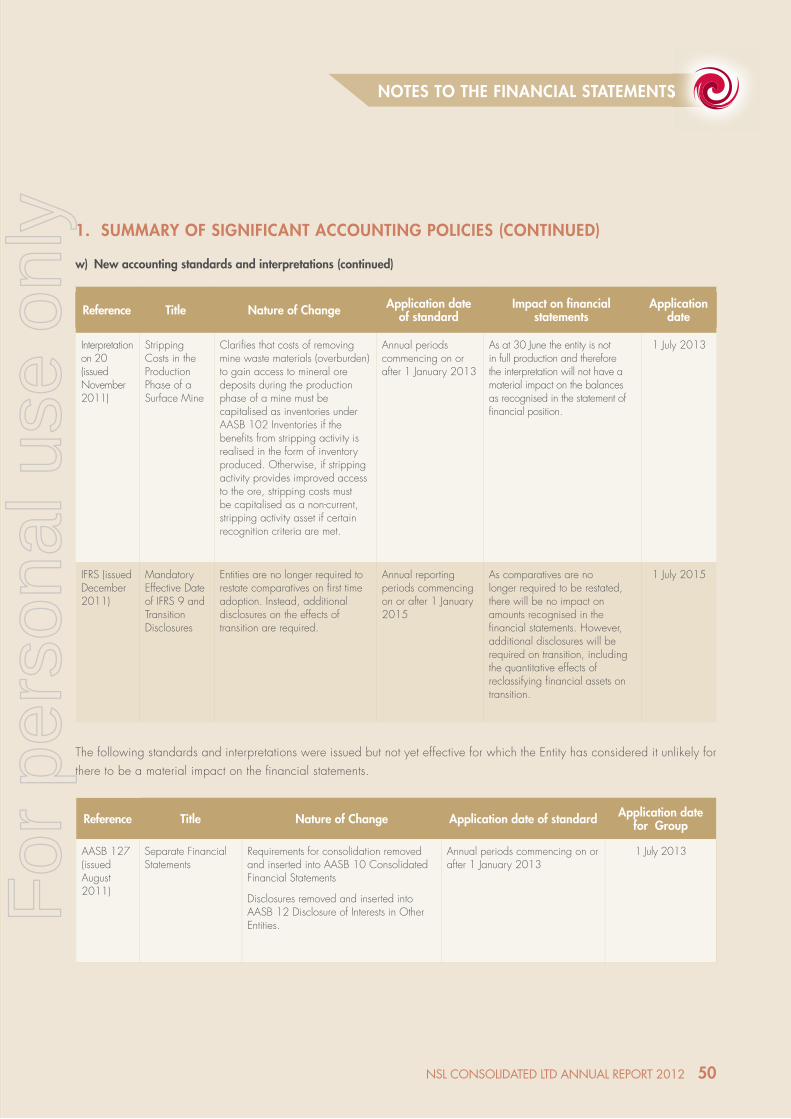
50NSL CONSOLIDATED LTD ANNuAL REPORT 2012
1. SUMMARY OF SIGNIFICANT ACCOUNTING POLICIES (CONTINUED)
w) New accounting standards and interpretations (continued)
Reference Title Nature of Change Application date of standard
Impact on fi nancial statements
Application date
Interpretation on 20 (issued November 2011)
Stripping Costs in the Production Phase of a Surface Mine
Clarifi es that costs of removing mine waste materials (overburden) to gain access to mineral ore deposits during the production phase of a mine must be capitalised as inventories under AASB 102 Inventories if the benefi ts from stripping activity is realised in the form of inventory produced. Otherwise, if stripping activity provides improved access to the ore, stripping costs must be capitalised as a non-current, stripping activity asset if certain recognition criteria are met.
Annual periods commencing on or after 1 January 2013
As at 30 June the entity is not in full production and therefore the interpretation will not have a material impact on the balances as recognised in the statement of fi nancial position.
1 July 2013
IFRS (issued December 2011)
Mandatory Effective Date of IFRS 9 and Transition Disclosures
Entities are no longer required to restate comparatives on fi rst time adoption. Instead, additional disclosures on the effects of transition are required.
Annual reporting periods commencing on or after 1 January 2015
As comparatives are no longer required to be restated, there will be no impact on amounts recognised in the fi nancial statements. However, additional disclosures will be required on transition, including the quantitative effects of reclassifying fi nancial assets on transition.
1 July 2015
The following standards and interpretations were issued but not yet effective for which the Entity has considered it unlikely for there to be a material impact on the fi nancial statements.
Reference Title Nature of Change Application date of standard Application date for Group
AASB 127 (issued August 2011)
Separate Financial Statements
Requirements for consolidation removed and inserted into AASB 10 Consolidated Financial Statements
Disclosures removed and inserted into AASB 12 Disclosure of Interests in Other Entities.
Annual periods commencing on or after 1 January 2013
1 July 2013
NOTES TO THE FINANCIAL STATEMENTSNOTES TO THE FINANCIAL STATEMENTS
For
per
sona
l use
onl
y
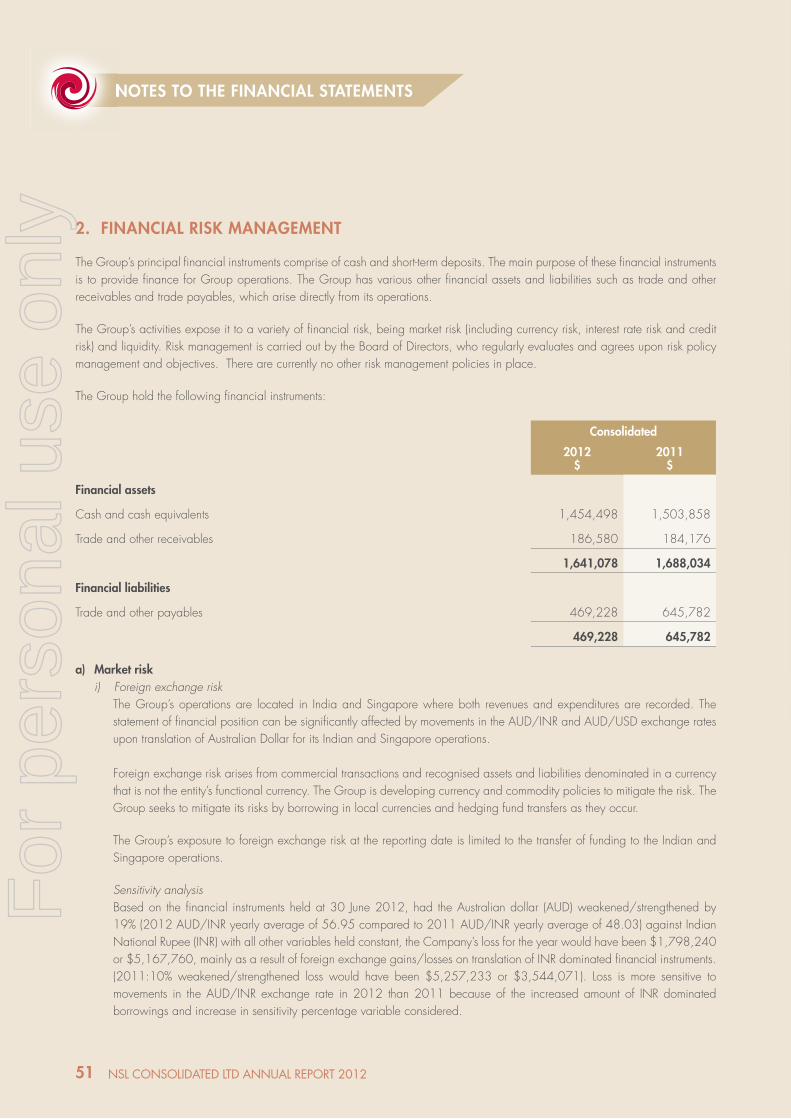
51 NSL CONSOLIDATED LTD ANNuAL REPORT 2012
2. FINANCIAL RISK MANAGEMENT
The Group’s principal fi nancial instruments comprise of cash and short-term deposits. The main purpose of these fi nancial instruments is to provide fi nance for Group operations. The Group has various other fi nancial assets and liabilities such as trade and other receivables and trade payables, which arise directly from its operations.
The Group’s activities expose it to a variety of fi nancial risk, being market risk (including currency risk, interest rate risk and credit risk) and liquidity. Risk management is carried out by the Board of Directors, who regularly evaluates and agrees upon risk policy management and objectives. There are currently no other risk management policies in place.
The Group hold the following fi nancial instruments:
Consolidated
2012$
2011$
Financial assets
Cash and cash equivalents 1,454,498 1,503,858
Trade and other receivables 186,580 184,176
1,641,078 1,688,034
Financial liabilities
Trade and other payables 469,228 645,782
469,228 645,782
a) Market riski) Foreign exchange risk
The Group’s operations are located in India and Singapore where both revenues and expenditures are recorded. The statement of fi nancial position can be signifi cantly affected by movements in the AUD/INR and AUD/USD exchange rates upon translation of Australian Dollar for its Indian and Singapore operations.
Foreign exchange risk arises from commercial transactions and recognised assets and liabilities denominated in a currency that is not the entity’s functional currency. The Group is developing currency and commodity policies to mitigate the risk. The Group seeks to mitigate its risks by borrowing in local currencies and hedging fund transfers as they occur.
The Group’s exposure to foreign exchange risk at the reporting date is limited to the transfer of funding to the Indian and Singapore operations.
Sensitivity analysisBased on the fi nancial instruments held at 30 June 2012, had the Australian dollar (AUD) weakened/strengthened by 19% (2012 AUD/INR yearly average of 56.95 compared to 2011 AUD/INR yearly average of 48.03) against Indian National Rupee (INR) with all other variables held constant, the Company’s loss for the year would have been $1,798,240 or $5,167,760, mainly as a result of foreign exchange gains/losses on translation of INR dominated fi nancial instruments. (2011:10% weakened/strengthened loss would have been $5,257,233 or $3,544,071). Loss is more sensitive to movements in the AUD/INR exchange rate in 2012 than 2011 because of the increased amount of INR dominated borrowings and increase in sensitivity percentage variable considered.
NOTES TO THE FINANCIAL STATEMENTSNOTES TO THE FINANCIAL STATEMENTS
For
per
sona
l use
onl
y

52NSL CONSOLIDATED LTD ANNuAL REPORT 2012
2. FINANCIAL RISK MANAGEMENT (CONTINUED)
a) Market risk (continued)ii) Cash fl ow and interest rate risk
The Group’s only interest rate risk arises from cash and cash equivalents held. Term deposits and current accounts held with variable interest rates expose the Group to cash fl ow interest rate risk. The Group does not consider this to be material to the Group and have therefore not undertaken any further analysis of risk exposure.
The following sets out the Group’s exposure to interest rate risk, including the effective weighted average interest rate by maturity periods:
Consolidated
2012$
2011$
Floating interest rate
Cash and cash equivalents 1,454,498 1,503,858
Weighted average interest rate 3.05% 6.8%
b) Credit riskThe Group does not have any signifi cant concentrations of credit risk. Credit risk is managed by the Board and arises from cash and cash equivalents as well as credit exposure including outstanding receivables and committed transactions.All cash balances held at banks are held at internationally recognised institutions. The majority of receivables are immaterial to the Group. Given this the credit quality of fi nancial assets that are neither past due or impaired can be assessed by reference to historical information about default rates.
The maximum exposure to credit risk at reporting date is the carrying amount of the fi nancial assets as summarised at the start of Note 2.
Financial assets that are neither past due and not impaired are as follows:
Consolidated
2012$
2011$
Cash and cash equivalents – ‘AA’ S&P rating 1,454,498 1,503,858
Trade and other receivables 400,933 644,247
NOTES TO THE FINANCIAL STATEMENTSNOTES TO THE FINANCIAL STATEMENTS
For
per
sona
l use
onl
y

53 NSL CONSOLIDATED LTD ANNuAL REPORT 2012
2. FINANCIAL RISK MANAGEMENT (CONTINUED)
c) Liquidity riskPrudent liquidity risk management implies maintaining suffi cient cash balances and access to equity funding. The Directors monitor the cash-burn rate of the Group on an on-going basis against forecast and the maturity profi les of fi nancial assets and liabilities to manage its liquidity risk.
As at reporting date the Group had suffi cient cash reserves to meet its requirements.
The fi nancial liabilities of the Group at reporting date were trade payables incurred in the normal course of the business. These were non interest bearing and were due within the normal 7-60 days terms of creditor payments. No borrowings existed at year end.
Maturities of fi nancial liabilitiesThe table below analyses the Group’s fi nancial liabilities into relevant maturity groupings based on the remaining period at the reporting date to the contractual maturity date. The amounts disclosed in the table are the contractual undiscounted cash fl ows.
Group – At 30 June 2012 Less than 6 months
6-12months 1-2 years 2-5 years Over 5
years
Total contractual cash fl ows
Carrying amount (assets)/liabilities
$ $ $ $ $ $ $
Non-derivatives
Non-interest bearing 574,623 - - - - 574,623 574,623
Total non-derivatives 574,623 - - - - 574,623 574,623
Group – At 30 June 2012 Less than 6 months
6-12months 1-2 years 2-5 years Over 5
years
Total contractual cash fl ows
Carrying amount (assets)/liabilities
$ $ $ $ $ $ $
Non-derivatives
Non-interest bearing 645,782 - - - - 645,782 645,782
Total non-derivatives 645,782 - - - - 645,782 645,782
NOTES TO THE FINANCIAL STATEMENTSNOTES TO THE FINANCIAL STATEMENTS
For
per
sona
l use
onl
y

54NSL CONSOLIDATED LTD ANNuAL REPORT 2012
2. FINANCIAL RISK MANAGEMENT (CONTINUED)
d) Fair value estimationThe fair value of fi nancial assets and liabilities must be estimated for recognition and measurement for disclosure purposes. The carrying value less impairment provision of trade receivables and payables are assumed to approximate their fair values due to their short term nature.
The Group’s principle fi nancial instruments consist of cash and deposits with banks, accounts receivable and trade payables. The main purpose of these non-derivative fi nancial instruments is to fi nance the entity’s operations.
NOTES TO THE FINANCIAL STATEMENTSNOTES TO THE FINANCIAL STATEMENTS
For
per
sona
l use
onl
y

55 NSL CONSOLIDATED LTD ANNuAL REPORT 2012
3. SEGMENT INFORMATION
Description of the segmentManagement has determined the operating segments based on the reports reviewed by the strategic steering committee that are used to make strategic decisions.
For management purposes, the Group is organised into two main operating segments, which involves mining and exploration for iron ore in India and exploration for thermal coal in Queensland. Discrete fi nancial information is reported to the Board (Chief Operating Decision Makers) as two segments. Accordingly, all signifi cant operating decisions are based upon analysis of the Group as two segments.
Segment information Segment information provided to the Board of Directors for the year is as follows:
Iron Ore Coal Consolidated Iron Ore
2012$
2012$
Total 2011$
Revenue from external sources 7,121 45 66,752 -
Reportable segment loss (509,769) (2,695) (2,571,964) (465,697)
Depreciation (40,447) - (77,364) (29,602)
Reportable segment assets 12,507,119 434,217 14,404,830 12,325,178
Additions to non-current assets 831,432 - 831,432 114,236
Reconciliation of reportable segment profi t or loss
Reportable segment loss (509,769) (2,695) (512,463) (465,697)
Unallocated:
Corporate expenses - - (2,059,501) (2,144,415)
Loss before tax (509,769) (2,695) (2,571,964) (2,610,112)
Reportable segment assets are reconciled to total assets as follows:
Segment assets 12,507,119 434,217 14,404,830 12,325,178
Unallocated:
Cash and cash equivalents 98,298 16,168 1,454,498 1,265,406
Corporate assets - - 12,950,332 388,434
Total assets as per the statement of fi nancial position 12,507,119 434,217 14,404,830 13,979,018
Reportable segment liabilities are reconciled to total liabilities as follows:
Segment liabilities – external 217,627 17,718 469,228 154,841
Segment liabilities – intra-group 79,635 419,194 - 16,691
Unallocated:
Corporate liabilities - - 235,597 599,119
Total liabilities as per the statement of fi nancial position 297,262 436,912 905,393 770,651
NOTES TO THE FINANCIAL STATEMENTSNOTES TO THE FINANCIAL STATEMENTS
For
per
sona
l use
onl
y
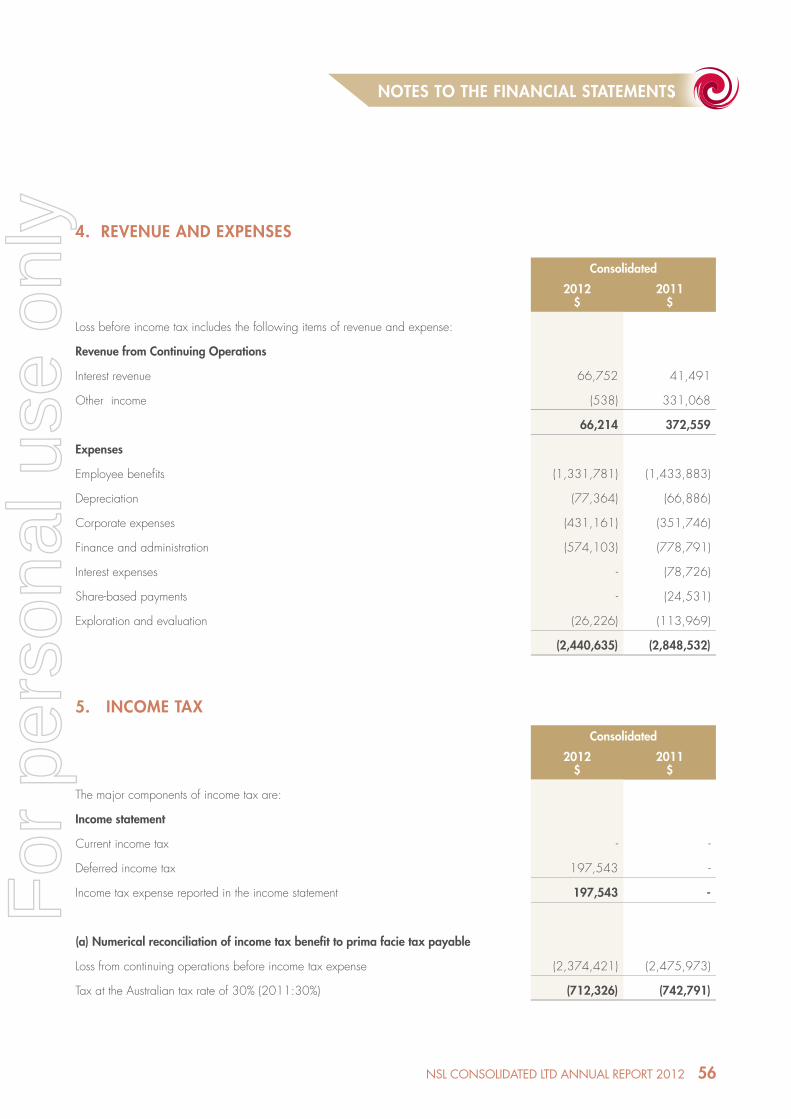
56NSL CONSOLIDATED LTD ANNuAL REPORT 2012
4. REVENUE AND EXPENSES
Consolidated
2012$
2011$
Loss before income tax includes the following items of revenue and expense:
Revenue from Continuing Operations
Interest revenue 66,752 41,491
Other income (538) 331,068
66,214 372,559
Expenses
Employee benefi ts (1,331,781) (1,433,883)
Depreciation (77,364) (66,886)
Corporate expenses (431,161) (351,746)
Finance and administration (574,103) (778,791)
Interest expenses - (78,726)
Share-based payments - (24,531)
Exploration and evaluation (26,226) (113,969)
(2,440,635) (2,848,532)
5. INCOME TAX
Consolidated
2012$
2011$
The major components of income tax are:
Income statement
Current income tax - -
Deferred income tax 197,543 -
Income tax expense reported in the income statement 197,543 -
(a) Numerical reconciliation of income tax benefi t to prima facie tax payable
Loss from continuing operations before income tax expense (2,374,421) (2,475,973)
Tax at the Australian tax rate of 30% (2011:30%) (712,326) (742,791)
NOTES TO THE FINANCIAL STATEMENTSNOTES TO THE FINANCIAL STATEMENTS
For
per
sona
l use
onl
y
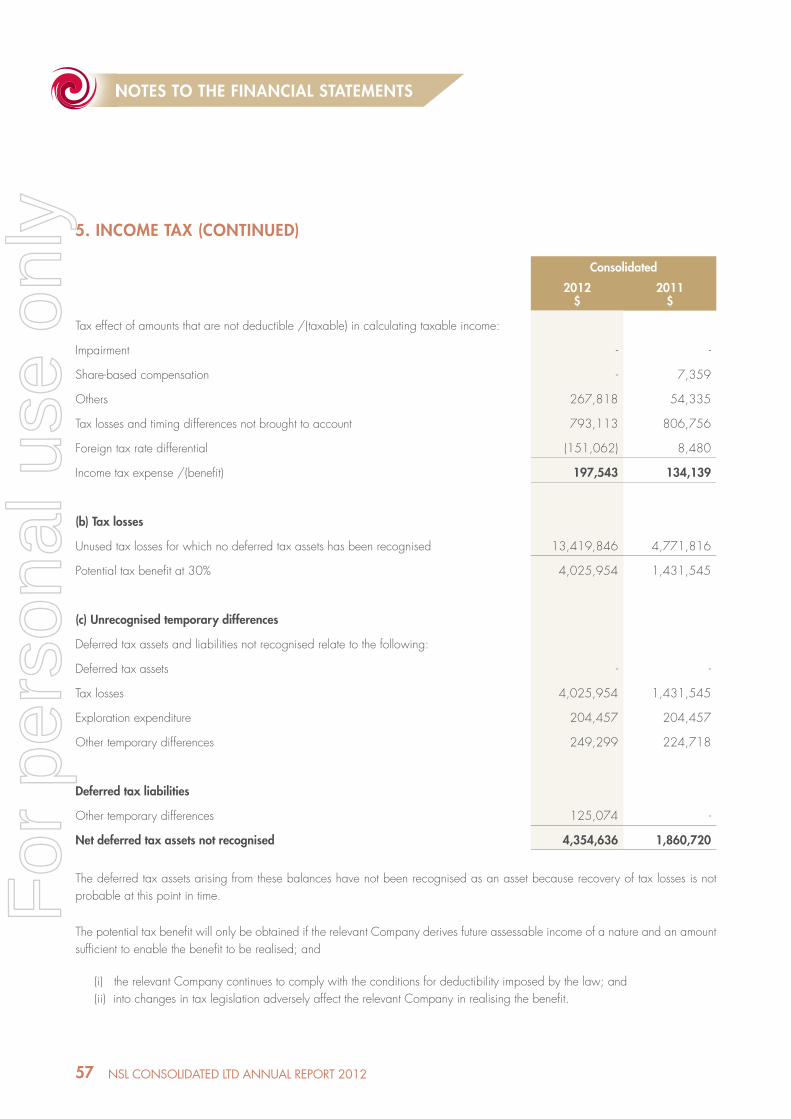
57 NSL CONSOLIDATED LTD ANNuAL REPORT 2012
5. INCOME TAX (CONTINUED)
Consolidated
2012$
2011$
Tax effect of amounts that are not deductible /(taxable) in calculating taxable income:
Impairment - -
Share-based compensation - 7,359
Others 267,818 54,335
Tax losses and timing differences not brought to account 793,113 806,756
Foreign tax rate differential (151,062) 8,480
Income tax expense /(benefi t) 197,543 134,139
(b) Tax losses
Unused tax losses for which no deferred tax assets has been recognised 13,419,846 4,771,816
Potential tax benefi t at 30% 4,025,954 1,431,545
(c) Unrecognised temporary differences
Deferred tax assets and liabilities not recognised relate to the following:
Deferred tax assets - -
Tax losses 4,025,954 1,431,545
Exploration expenditure 204,457 204,457
Other temporary differences 249,299 224,718
Deferred tax liabilities
Other temporary differences 125,074 -
Net deferred tax assets not recognised 4,354,636 1,860,720
The deferred tax assets arising from these balances have not been recognised as an asset because recovery of tax losses is not probable at this point in time.
The potential tax benefi t will only be obtained if the relevant Company derives future assessable income of a nature and an amount suffi cient to enable the benefi t to be realised; and
(i) the relevant Company continues to comply with the conditions for deductibility imposed by the law; and(ii) into changes in tax legislation adversely affect the relevant Company in realising the benefi t.
NOTES TO THE FINANCIAL STATEMENTSNOTES TO THE FINANCIAL STATEMENTS
For
per
sona
l use
onl
y

58NSL CONSOLIDATED LTD ANNuAL REPORT 2012
6. CASH AND CASH EQUIVALENTS
Consolidated
2012$
2011$
Cash at bank and in hand 1,454,498 1,503,858
The Groups exposure to interest rate risk is disclosed in Note 2. The maximum exposure to credit risk at the end of the reporting period is the carrying value amount of cash and cash equivalents above.
7. TRADE AND OTHER RECEIVABLES
Consolidated
2012$
2011$
Current
Security Deposits 160,426 109,152
Prepayments (1) 214,353 460,071
Other receivables (2) 26,154 575,024
Impairment write down - (500,000)
400,933 644,247
Ageing of trade receivables past due not impaired
As at 30 June 2012 and 30 June 2011 there were no trade receivables.
(1) Prepayments relate to advances made to suppliers based on service and construction contracts/agreements in place.
(2) Other receivablesThese transactions generally arise from transactions outside the usual operating activities of the entity. The balance represents the receivables relating to good and services tax.
8. OTHER FINANCIAL ASSETS
Consolidated
2012$
2011$
Non-current 15,513 12,001
Others 15,513 12,001
NOTES TO THE FINANCIAL STATEMENTSNOTES TO THE FINANCIAL STATEMENTS
For
per
sona
l use
onl
y
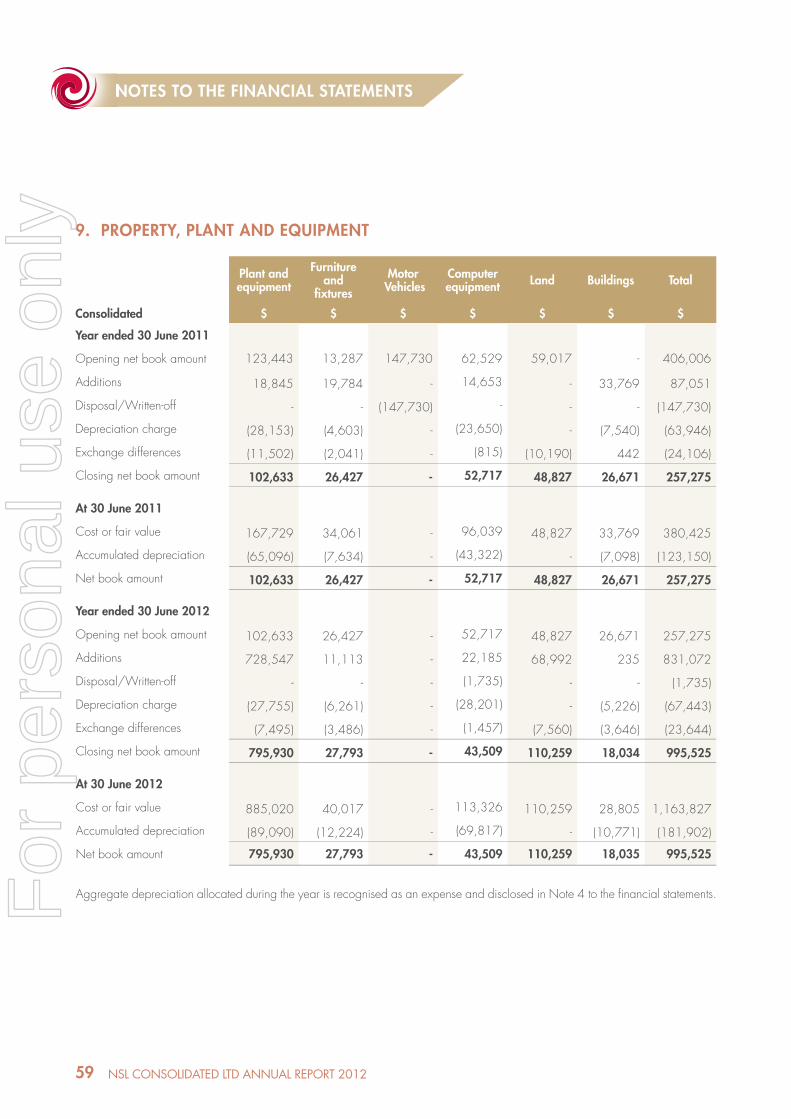
59 NSL CONSOLIDATED LTD ANNuAL REPORT 2012
9. PROPERTY, PLANT AND EQUIPMENT
Plant and equipment
Furnitureand
fi xtures
Motor Vehicles
Computer equipment Land Buildings Total
Consolidated $ $ $ $ $ $ $
Year ended 30 June 2011
Opening net book amount 123,443 13,287 147,730 62,529 59,017 - 406,006
Additions 18,845 19,784 - 14,653 - 33,769 87,051
Disposal/Written-off - - (147,730) - - - (147,730)
Depreciation charge (28,153) (4,603) - (23,650) - (7,540) (63,946)
Exchange differences (11,502) (2,041) - (815) (10,190) 442 (24,106)
Closing net book amount 102,633 26,427 - 52,717 48,827 26,671 257,275
At 30 June 2011
Cost or fair value 167,729 34,061 - 96,039 48,827 33,769 380,425
Accumulated depreciation (65,096) (7,634) - (43,322) - (7,098) (123,150)
Net book amount 102,633 26,427 - 52,717 48,827 26,671 257,275
Year ended 30 June 2012
Opening net book amount 102,633 26,427 - 52,717 48,827 26,671 257,275
Additions 728,547 11,113 - 22,185 68,992 235 831,072
Disposal/Written-off - - - (1,735) - - (1,735)
Depreciation charge (27,755) (6,261) - (28,201) - (5,226) (67,443)
Exchange differences (7,495) (3,486) - (1,457) (7,560) (3,646) (23,644)
Closing net book amount 795,930 27,793 - 43,509 110,259 18,034 995,525
At 30 June 2012
Cost or fair value 885,020 40,017 - 113,326 110,259 28,805 1,163,827
Accumulated depreciation (89,090) (12,224) - (69,817) - (10,771) (181,902)
Net book amount 795,930 27,793 - 43,509 110,259 18,035 995,525
Aggregate depreciation allocated during the year is recognised as an expense and disclosed in Note 4 to the fi nancial statements.
NOTES TO THE FINANCIAL STATEMENTSNOTES TO THE FINANCIAL STATEMENTS
For
per
sona
l use
onl
y
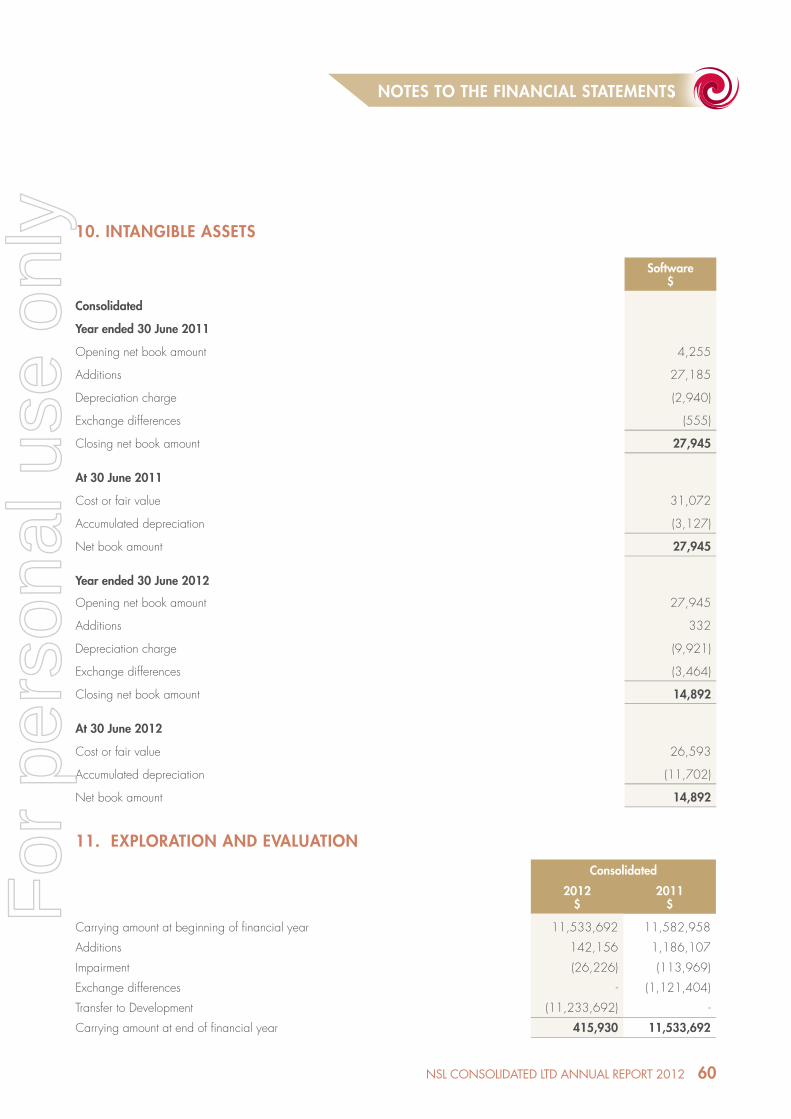
60NSL CONSOLIDATED LTD ANNuAL REPORT 2012
10. INTANGIBLE ASSETS
Software$
Consolidated
Year ended 30 June 2011
Opening net book amount 4,255
Additions 27,185
Depreciation charge (2,940)
Exchange differences (555)
Closing net book amount 27,945
At 30 June 2011
Cost or fair value 31,072
Accumulated depreciation (3,127)
Net book amount 27,945
Year ended 30 June 2012
Opening net book amount 27,945
Additions 332
Depreciation charge (9,921)
Exchange differences (3,464)
Closing net book amount 14,892
At 30 June 2012
Cost or fair value 26,593
Accumulated depreciation (11,702)
Net book amount 14,892
11. EXPLORATION AND EVALUATION
Consolidated
2012$
2011$
Carrying amount at beginning of fi nancial year 11,533,692 11,582,958
Additions 142,156 1,186,107
Impairment (26,226) (113,969)
Exchange differences - (1,121,404)
Transfer to Development (11,233,692) -
Carrying amount at end of fi nancial year 415,930 11,533,692
NOTES TO THE FINANCIAL STATEMENTSNOTES TO THE FINANCIAL STATEMENTS
For
per
sona
l use
onl
y
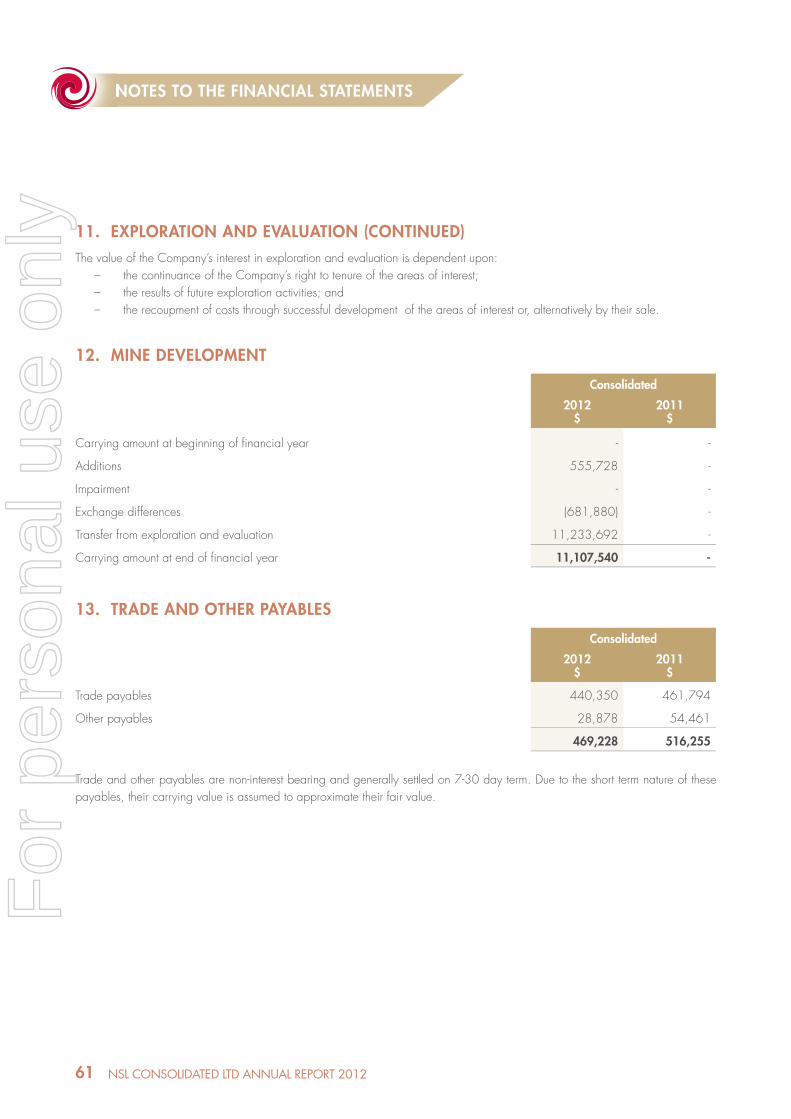
61 NSL CONSOLIDATED LTD ANNuAL REPORT 2012
11. EXPLORATION AND EVALUATION (CONTINUED)The value of the Company’s interest in exploration and evaluation is dependent upon:
– the continuance of the Company’s right to tenure of the areas of interest;– the results of future exploration activities; and– the recoupment of costs through successful development of the areas of interest or, alternatively by their sale.
12. MINE DEVELOPMENT
Consolidated
2012$
2011$
Carrying amount at beginning of fi nancial year - -
Additions 555,728 -
Impairment - -
Exchange differences (681,880) -
Transfer from exploration and evaluation 11,233,692 -
Carrying amount at end of fi nancial year 11,107,540 -
13. TRADE AND OTHER PAYABLES
Consolidated
2012$
2011$
Trade payables 440,350 461,794
Other payables 28,878 54,461
469,228 516,255
Trade and other payables are non-interest bearing and generally settled on 7-30 day term. Due to the short term nature of these payables, their carrying value is assumed to approximate their fair value.
NOTES TO THE FINANCIAL STATEMENTSNOTES TO THE FINANCIAL STATEMENTS
For
per
sona
l use
onl
y
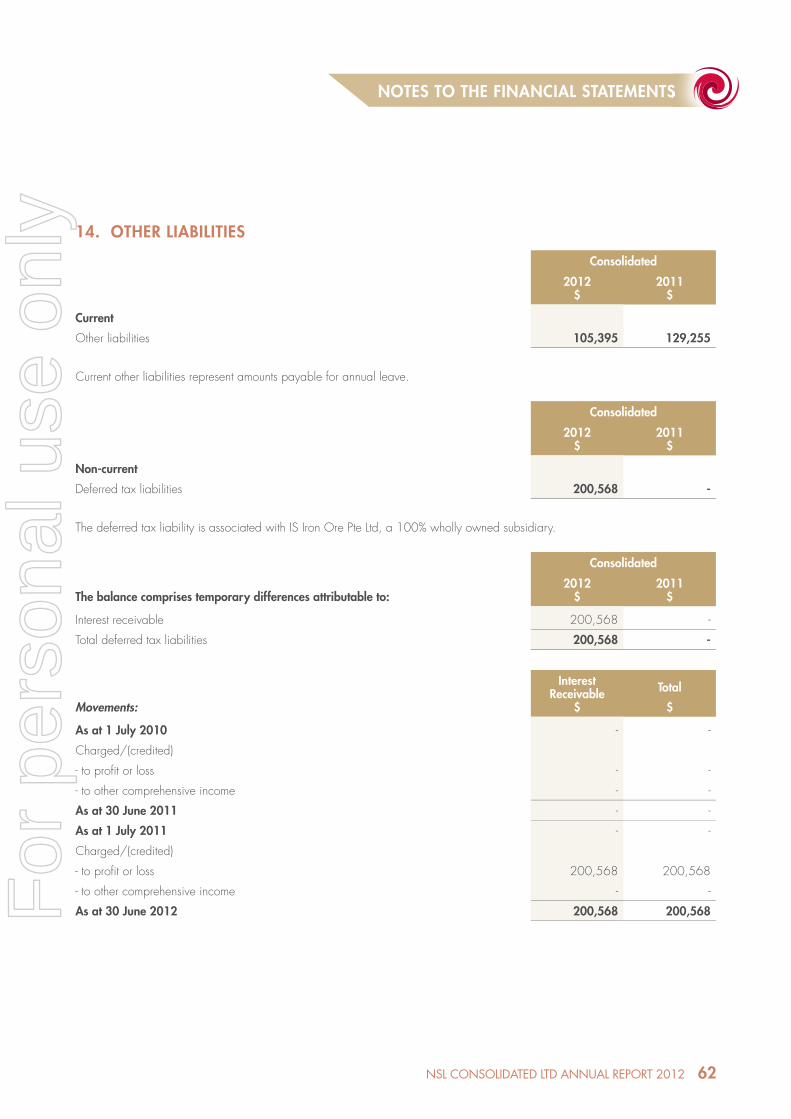
62NSL CONSOLIDATED LTD ANNuAL REPORT 2012
14. OTHER LIABILITIES
Consolidated
2012$
2011$
Current
Other liabilities 105,395 129,255
Current other liabilities represent amounts payable for annual leave.
Consolidated
2012$
2011$
Non-current
Deferred tax liabilities 200,568 -
The deferred tax liability is associated with IS Iron Ore Pte Ltd, a 100% wholly owned subsidiary.
The balance comprises temporary differences attributable to:
Consolidated
2012$
2011$
Interest receivable 200,568 -
Total deferred tax liabilities 200,568 -
Movements:
InterestReceivable
$
Total
$
As at 1 July 2010 - -
Charged/(credited)
- to profi t or loss - -
- to other comprehensive income - -
As at 30 June 2011 - -
As at 1 July 2011 - -
Charged/(credited)
- to profi t or loss 200,568 200,568
- to other comprehensive income - -
As at 30 June 2012 200,568 200,568
NOTES TO THE FINANCIAL STATEMENTSNOTES TO THE FINANCIAL STATEMENTS
For
per
sona
l use
onl
y
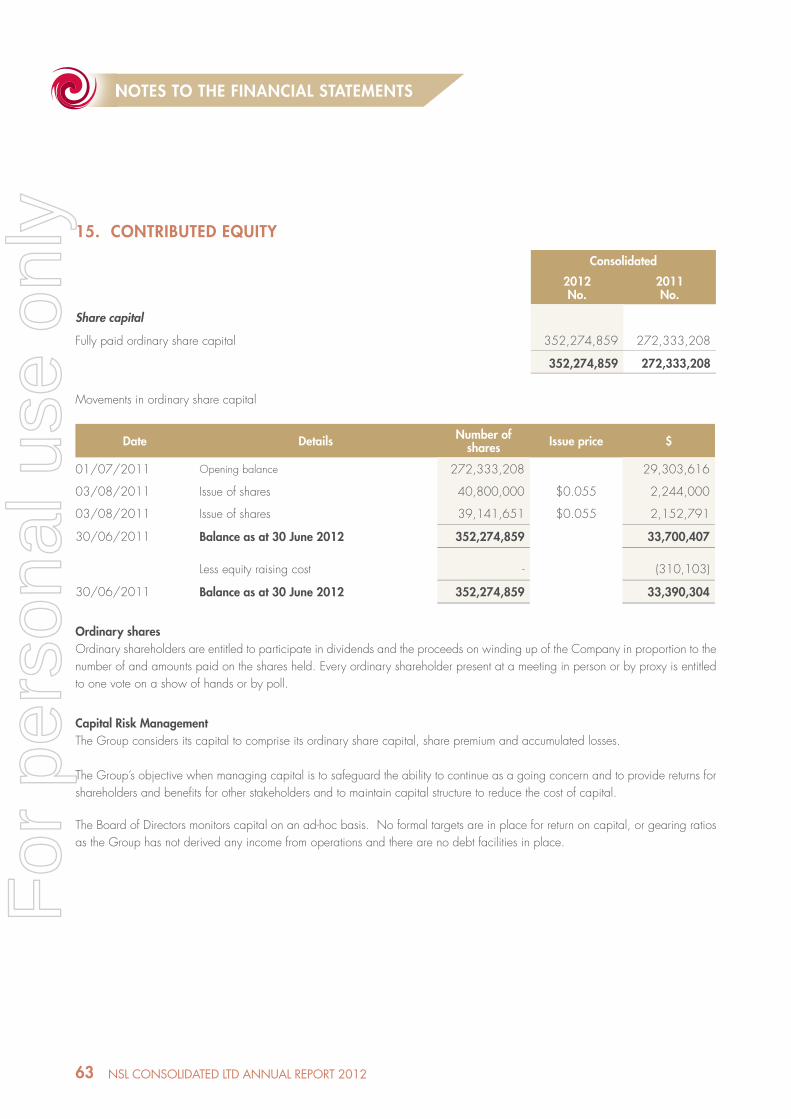
63 NSL CONSOLIDATED LTD ANNuAL REPORT 2012
15. CONTRIBUTED EQUITY
Consolidated
2012No.
2011No.
Share capital
Fully paid ordinary share capital 352,274,859 272,333,208
352,274,859 272,333,208
Movements in ordinary share capital
Date Details Number of shares Issue price $
01/07/2011 Opening balance 272,333,208 29,303,616
03/08/2011 Issue of shares 40,800,000 $0.055 2,244,000
03/08/2011 Issue of shares 39,141,651 $0.055 2,152,791
30/06/2011 Balance as at 30 June 2012 352,274,859 33,700,407
Less equity raising cost - (310,103)
30/06/2011 Balance as at 30 June 2012 352,274,859 33,390,304
Ordinary shares Ordinary shareholders are entitled to participate in dividends and the proceeds on winding up of the Company in proportion to the number of and amounts paid on the shares held. Every ordinary shareholder present at a meeting in person or by proxy is entitled to one vote on a show of hands or by poll.
Capital Risk ManagementThe Group considers its capital to comprise its ordinary share capital, share premium and accumulated losses.
The Group’s objective when managing capital is to safeguard the ability to continue as a going concern and to provide returns for shareholders and benefi ts for other stakeholders and to maintain capital structure to reduce the cost of capital.
The Board of Directors monitors capital on an ad-hoc basis. No formal targets are in place for return on capital, or gearing ratios as the Group has not derived any income from operations and there are no debt facilities in place.
NOTES TO THE FINANCIAL STATEMENTSNOTES TO THE FINANCIAL STATEMENTS
For
per
sona
l use
onl
y
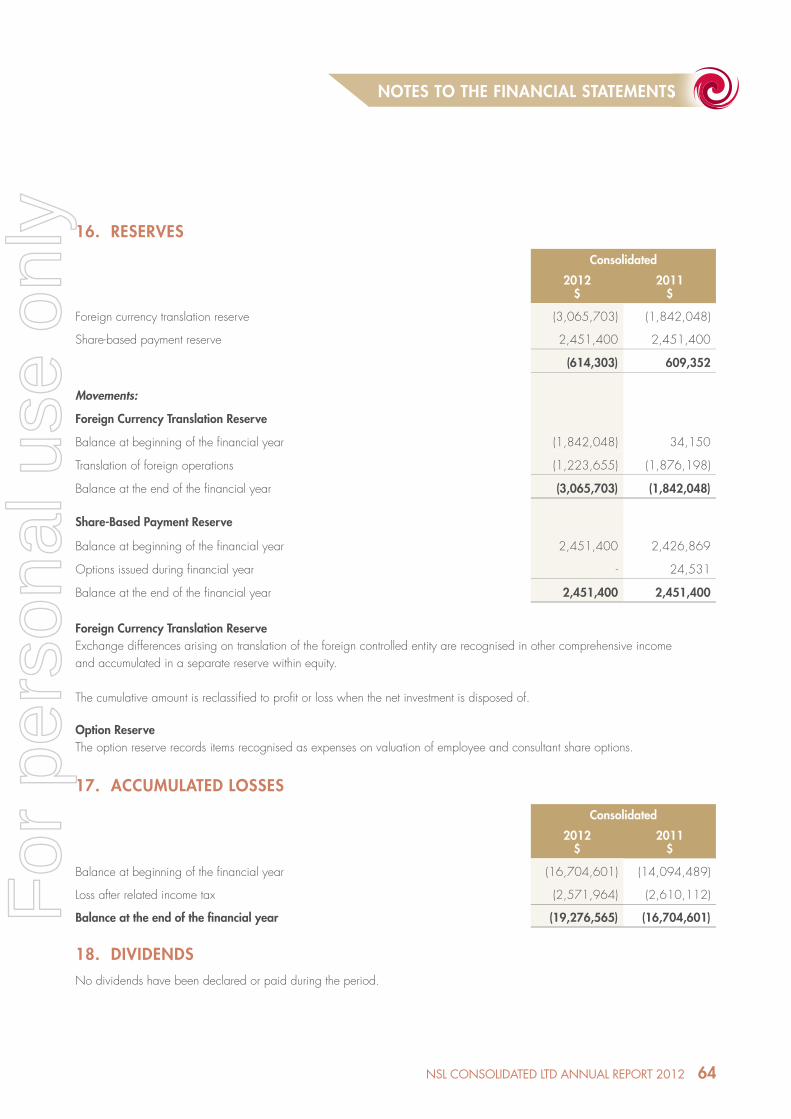
64NSL CONSOLIDATED LTD ANNuAL REPORT 2012
16. RESERVES
Consolidated
2012$
2011$
Foreign currency translation reserve (3,065,703) (1,842,048)
Share-based payment reserve 2,451,400 2,451,400
(614,303) 609,352
Movements:
Foreign Currency Translation Reserve
Balance at beginning of the fi nancial year (1,842,048) 34,150
Translation of foreign operations (1,223,655) (1,876,198)
Balance at the end of the fi nancial year (3,065,703) (1,842,048)
Share-Based Payment Reserve
Balance at beginning of the fi nancial year 2,451,400 2,426,869
Options issued during fi nancial year - 24,531
Balance at the end of the fi nancial year 2,451,400 2,451,400
Foreign Currency Translation ReserveExchange differences arising on translation of the foreign controlled entity are recognised in other comprehensive income and accumulated in a separate reserve within equity.
The cumulative amount is reclassifi ed to profi t or loss when the net investment is disposed of.
Option ReserveThe option reserve records items recognised as expenses on valuation of employee and consultant share options.
17. ACCUMULATED LOSSES
Consolidated
2012$
2011$
Balance at beginning of the fi nancial year (16,704,601) (14,094,489)
Loss after related income tax (2,571,964) (2,610,112)
Balance at the end of the fi nancial year (19,276,565) (16,704,601)
18. DIVIDENDSNo dividends have been declared or paid during the period.
NOTES TO THE FINANCIAL STATEMENTSNOTES TO THE FINANCIAL STATEMENTS
For
per
sona
l use
onl
y

65 NSL CONSOLIDATED LTD ANNuAL REPORT 2012
19. KEY MANAGEMENT PERSONNEL DISCLOSURES
(a) Key management personnel compensation
Consolidated
2012$
2011$
Short-term employee benefi ts 993,934 1,046,199
Post-employment benefi ts 97,082 105,585
Long-term employee benefi ts - 21,667
Share-based payments - 21,993
1,091,016 1,195,444
Further information regarding the identity of key management personnel and their compensation can be found in the “Remuneration Report – Audited contained in the Directors’ Report which forms part of this Annual Financial Report.
(b) Equity Instrument disclosures relating to key management personnelDetails of option holdings and rights held directly, indirectly or benefi cially by key management personnel and their related parties are as follows:
2012
Name
Balance at the start of the year
Granted as
CompensationExercised Other
Changes
Balance at the end of the year
Vested and exercisable Unvested
Non-Executive Directors
J Muir 2,000,000 - - - 2,000,000 2,000,000 -
P C Wall 2,000,000 - - - 2,000,000 2,000,000 -
P I Richards 2,000,000 - - - 2,000,000 2,000,000 -
Executive Director
C F Goode 8,000,000 - - - 8,000,000 2,000,000 6,000,000
Other key management personnel
S M Freeman 4,000,000 - - - 4,000,000 1,000,000 3,000,000
J S M Tambyrajah* 2,000,000 - - (2,000,000) - - -
E G Hall** 600,000 - - - 600,000 - 600,000
T Lee*** - - - - - - -
Total 20,600,000 - - (2,000,000) 18,600,000 9,000,000 9,600,000
* resigned 30 March 2012 as Chief Financial Offi cer ** ceased 5 January 2011 as Project Manager*** commenced 16 March 2012 as Financial Controller
NOTES TO THE FINANCIAL STATEMENTSNOTES TO THE FINANCIAL STATEMENTS
For
per
sona
l use
onl
y
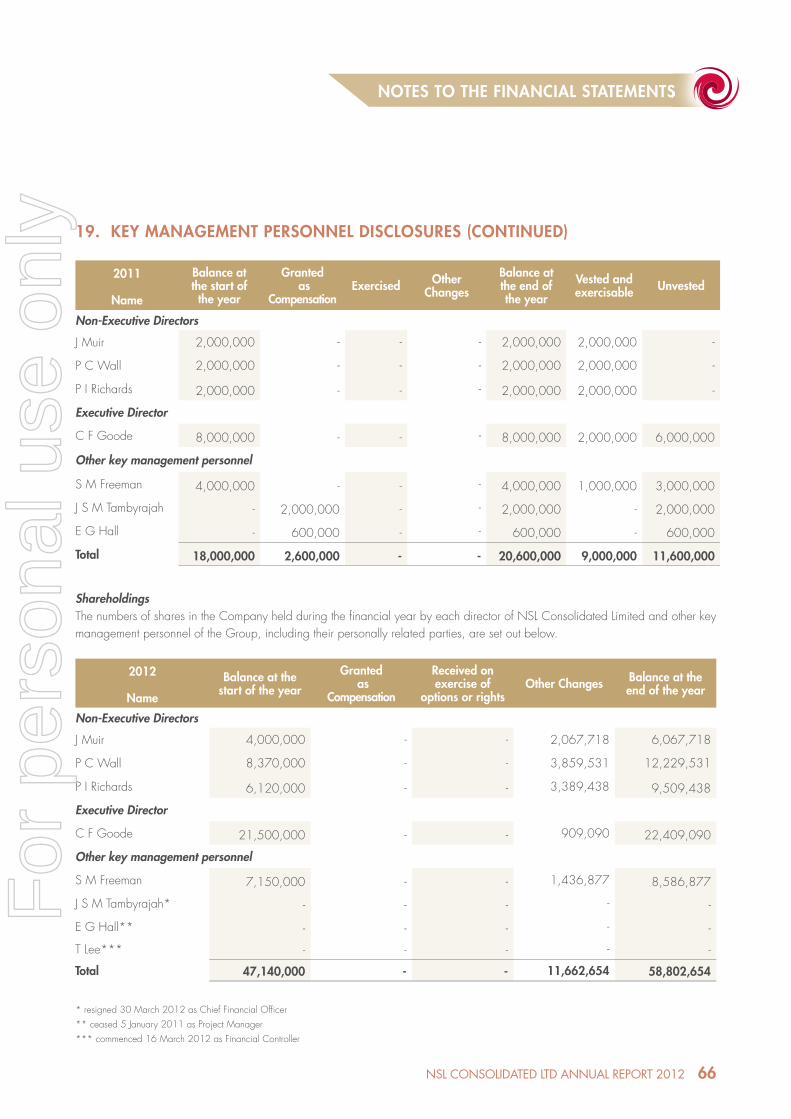
66NSL CONSOLIDATED LTD ANNuAL REPORT 2012
19. KEY MANAGEMENT PERSONNEL DISCLOSURES (CONTINUED)
2011
Name
Balance at the start of the year
Granted as
CompensationExercised Other
Changes
Balance at the end of the year
Vested and exercisable Unvested
Non-Executive Directors
J Muir 2,000,000 - - - 2,000,000 2,000,000 -
P C Wall 2,000,000 - - - 2,000,000 2,000,000 -
P I Richards 2,000,000 - - - 2,000,000 2,000,000 -
Executive Director
C F Goode 8,000,000 - - - 8,000,000 2,000,000 6,000,000
Other key management personnel
S M Freeman 4,000,000 - - - 4,000,000 1,000,000 3,000,000
J S M Tambyrajah - 2,000,000 - - 2,000,000 - 2,000,000
E G Hall - 600,000 - - 600,000 - 600,000
Total 18,000,000 2,600,000 - - 20,600,000 9,000,000 11,600,000
ShareholdingsThe numbers of shares in the Company held during the fi nancial year by each director of NSL Consolidated Limited and other key management personnel of the Group, including their personally related parties, are set out below.
2012
Name
Balance at the start of the year
Granted as
Compensation
Received on exercise of
options or rightsOther Changes Balance at the
end of the year
Non-Executive Directors
J Muir 4,000,000 - - 2,067,718 6,067,718
P C Wall 8,370,000 - - 3,859,531 12,229,531
P I Richards 6,120,000 - - 3,389,438 9,509,438
Executive Director
C F Goode 21,500,000 - - 909,090 22,409,090
Other key management personnel
S M Freeman 7,150,000 - - 1,436,877 8,586,877
J S M Tambyrajah* - - - - -
E G Hall** - - - - -
T Lee*** - - - - -
Total 47,140,000 - - 11,662,654 58,802,654
* resigned 30 March 2012 as Chief Financial Offi cer** ceased 5 January 2011 as Project Manager*** commenced 16 March 2012 as Financial Controller
NOTES TO THE FINANCIAL STATEMENTSNOTES TO THE FINANCIAL STATEMENTS
For
per
sona
l use
onl
y
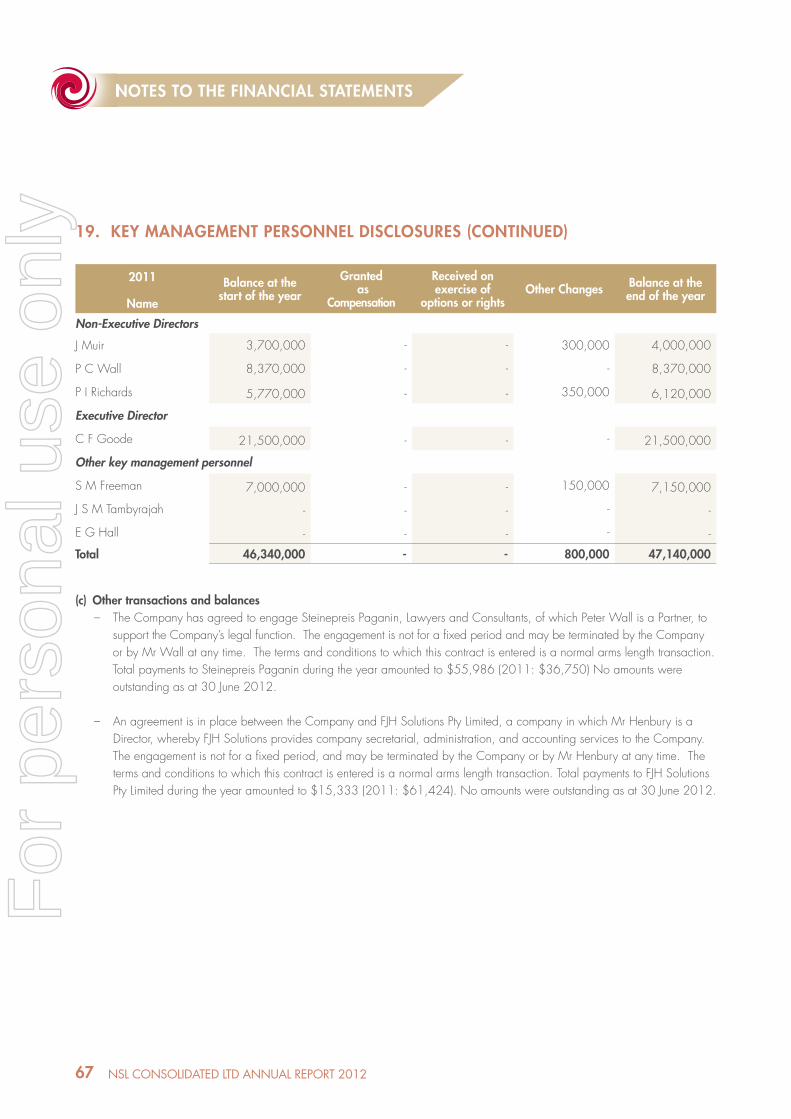
67 NSL CONSOLIDATED LTD ANNuAL REPORT 2012
19. KEY MANAGEMENT PERSONNEL DISCLOSURES (CONTINUED)
2011
Name
Balance at the start of the year
Granted as
Compensation
Received on exercise of
options or rightsOther Changes Balance at the
end of the year
Non-Executive Directors
J Muir 3,700,000 - - 300,000 4,000,000
P C Wall 8,370,000 - - - 8,370,000
P I Richards 5,770,000 - - 350,000 6,120,000
Executive Director
C F Goode 21,500,000 - - - 21,500,000
Other key management personnel
S M Freeman 7,000,000 - - 150,000 7,150,000
J S M Tambyrajah - - - - -
E G Hall - - - - -
Total 46,340,000 - - 800,000 47,140,000
(c) Other transactions and balances– The Company has agreed to engage Steinepreis Paganin, Lawyers and Consultants, of which Peter Wall is a Partner, to support the Company’s legal function. The engagement is not for a fi xed period and may be terminated by the Company or by Mr Wall at any time. The terms and conditions to which this contract is entered is a normal arms length transaction. Total payments to Steinepreis Paganin during the year amounted to $55,986 (2011: $36,750) No amounts were outstanding as at 30 June 2012.
– An agreement is in place between the Company and FJH Solutions Pty Limited, a company in which Mr Henbury is a Director, whereby FJH Solutions provides company secretarial, administration, and accounting services to the Company. The engagement is not for a fi xed period, and may be terminated by the Company or by Mr Henbury at any time. The terms and conditions to which this contract is entered is a normal arms length transaction. Total payments to FJH Solutions Pty Limited during the year amounted to $15,333 (2011: $61,424). No amounts were outstanding as at 30 June 2012.
NOTES TO THE FINANCIAL STATEMENTSNOTES TO THE FINANCIAL STATEMENTS
For
per
sona
l use
onl
y

68NSL CONSOLIDATED LTD ANNuAL REPORT 2012
20. AUDITORS’ REMUNERATION
Consolidated
2012$
2011$
Amounts paid/payable for audit for review of the fi nancial statements for the entity or any entity in the Group
- BDO 50,562 53,227
- Grant Thornton 8,513 10,306
Taxation services
- BDO 39,722 8,986
- Grant Thornton 3,483 3,435
Total auditor’s remuneration 102,280 75,954
21. CONTINGENCIES
Litigation between NSL Consolidated Ltd and Kingsway Resources Pte LtdOn 16 July 2008, NSL Consolidated Ltd signed an agreement with Kingsway Resources Pte Ltd to lend $500,000. The loan related to a transaction for the purchase of the Iron Ore Hill project in India, which was terminated on 16 February 2009. This loan was secured by a personal guarantee. Repayment has not been forthcoming to date, as a result, NSL is pursuing legal action to recover the outstanding amount.
On 28 July 2011, the District Court of Western Australia in Civil has concluded that the guarantor (Mr Sean Spence) is responsible to pay NSL $500,000 plus interest at a rate of 14% per annum calculated with daily rests from 31 July 2008. The Company has been endeavouring to enforce the judgement against Mr Spence, however, since reporting on this fi rst in the year ended 30 June 2011, Mr Spence has fi led for bankruptcy and therefore the Company does not expect to recoup this amount. This amount has been fully provided for in the prior year.
Litigation between NSL Mining Resources India (Pvt) Ltd (NSL MRI) and Mega Logistics and SolutionsSince reporting on this fi rst in the year 30 June 2011, NSL MRI is continuing the process of a counterclaim, through Arbitration for approximately $250,000 for unrecovered advances to Mega Logistics and Solutions, a related Company of Mega Mining and Solutions.
Litigation between NSL Mining Resources India (Pvt) Ltd (NSL MRI) and Mega Mining and SolutionsNSL MRI was recently involved in litigation brought by Mega Mining and Solutions in the High Court of India. The total quantum of the claim was approximately $500,000 for disputed invoices of approximately $125,000. The litigation was recently dismissed in the High Court of India on jurisdictional grounds, however it is unknown if Mega Mining and Solutions will seek to bring the litigation again in different court. Although the Board considers the claim brought by Mega Mining and Solutions to be frivolous, it does note that there is a risk that NSL MRI will again in the future face legal action from Mega Mining and Solutions in India and there are uncertainties in relation to the outcome of any claim due to the Indian legal jurisdiction. Since reporting on this fi rst in the year end 30 June 2011, no further action on this matter has been received. Invoices as they were originally received have been processed in the system, however, they remain unpaid.
NOTES TO THE FINANCIAL STATEMENTSNOTES TO THE FINANCIAL STATEMENTS
For
per
sona
l use
onl
y
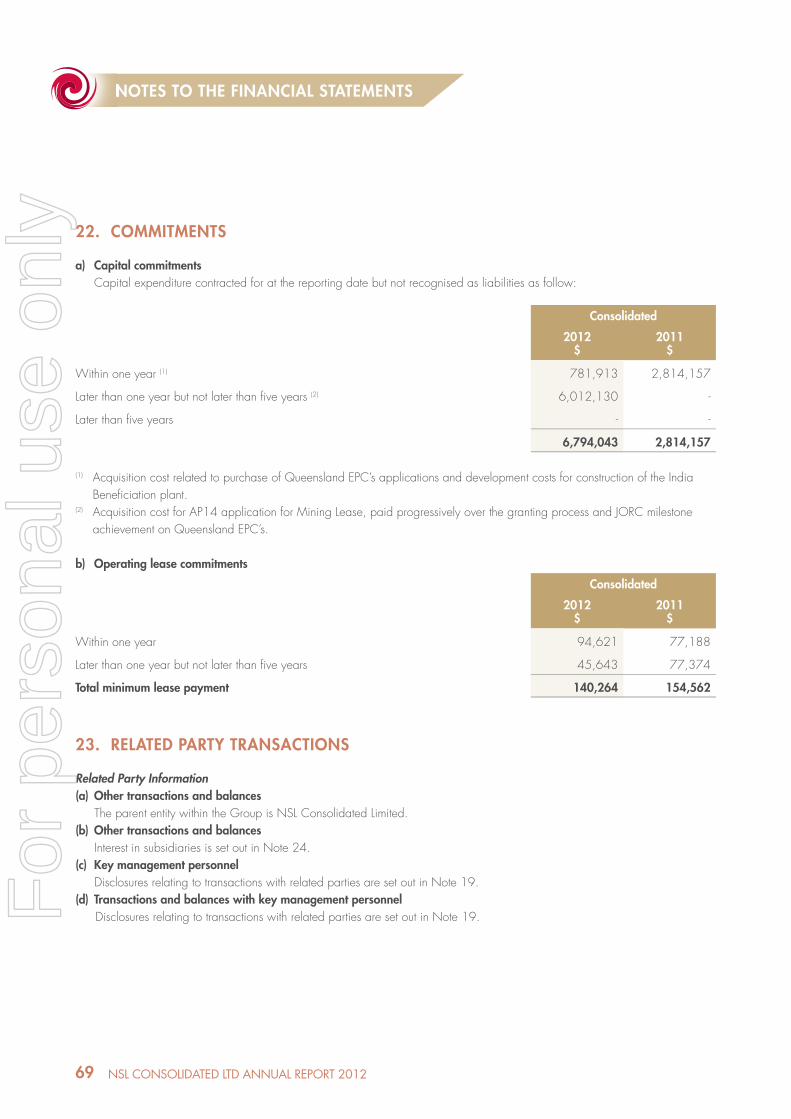
69 NSL CONSOLIDATED LTD ANNuAL REPORT 2012
22. COMMITMENTS
a) Capital commitments Capital expenditure contracted for at the reporting date but not recognised as liabilities as follow:
Consolidated
2012$
2011$
Within one year (1) 781,913 2,814,157
Later than one year but not later than fi ve years (2) 6,012,130 -
Later than fi ve years - -
6,794,043 2,814,157
(1) Acquisition cost related to purchase of Queensland EPC’s applications and development costs for construction of the India Benefi ciation plant.(2) Acquisition cost for AP14 application for Mining Lease, paid progressively over the granting process and JORC milestone achievement on Queensland EPC’s.
b) Operating lease commitments
Consolidated
2012$
2011$
Within one year 94,621 77,188
Later than one year but not later than fi ve years 45,643 77,374
Total minimum lease payment 140,264 154,562
23. RELATED PARTY TRANSACTIONS
Related Party Information (a) Other transactions and balances
The parent entity within the Group is NSL Consolidated Limited.(b) Other transactions and balances
Interest in subsidiaries is set out in Note 24.(c) Key management personnel
Disclosures relating to transactions with related parties are set out in Note 19.(d) Transactions and balances with key management personnel Disclosures relating to transactions with related parties are set out in Note 19.
NOTES TO THE FINANCIAL STATEMENTSNOTES TO THE FINANCIAL STATEMENTS
For
per
sona
l use
onl
y
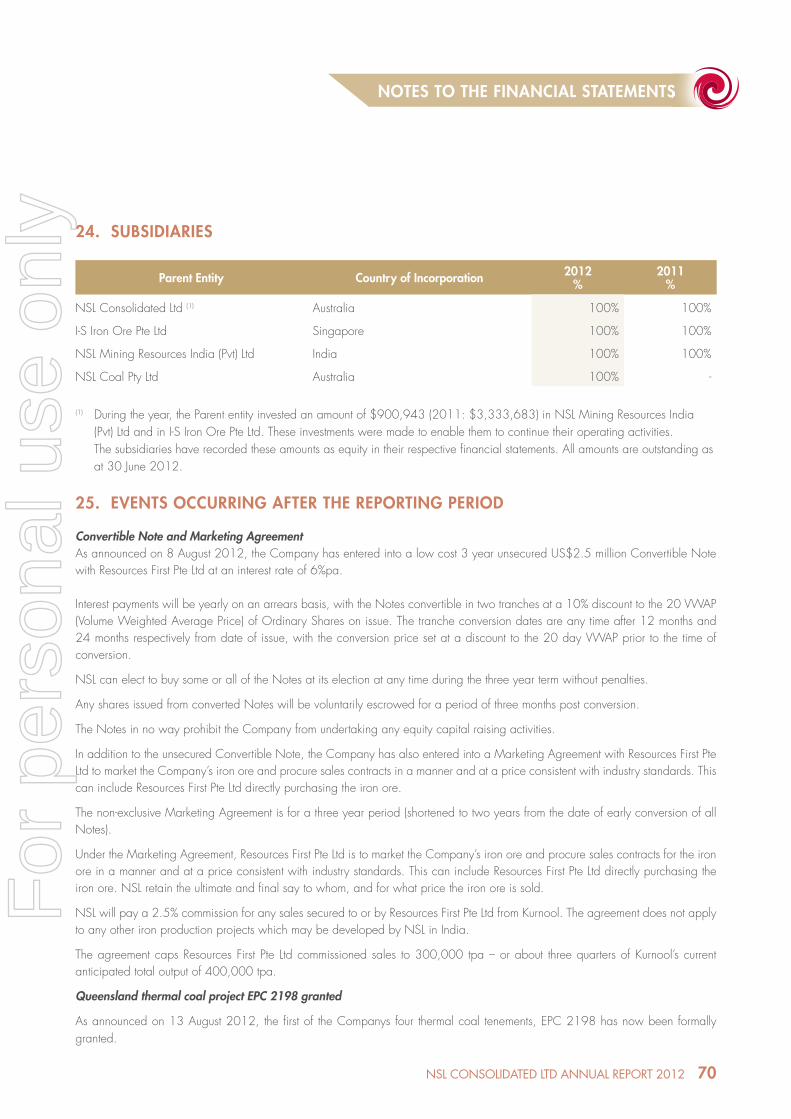
70NSL CONSOLIDATED LTD ANNuAL REPORT 2012
25. EVENTS OCCURRING AFTER THE REPORTING PERIOD
Convertible Note and Marketing AgreementAs announced on 8 August 2012, the Company has entered into a low cost 3 year unsecured US$2.5 million Convertible Note with Resources First Pte Ltd at an interest rate of 6%pa.
Interest payments will be yearly on an arrears basis, with the Notes convertible in two tranches at a 10% discount to the 20 VWAP (Volume Weighted Average Price) of Ordinary Shares on issue. The tranche conversion dates are any time after 12 months and 24 months respectively from date of issue, with the conversion price set at a discount to the 20 day VWAP prior to the time of conversion.
NSL can elect to buy some or all of the Notes at its election at any time during the three year term without penalties.
Any shares issued from converted Notes will be voluntarily escrowed for a period of three months post conversion.
The Notes in no way prohibit the Company from undertaking any equity capital raising activities.
In addition to the unsecured Convertible Note, the Company has also entered into a Marketing Agreement with Resources First Pte Ltd to market the Company’s iron ore and procure sales contracts in a manner and at a price consistent with industry standards. This can include Resources First Pte Ltd directly purchasing the iron ore.
The non-exclusive Marketing Agreement is for a three year period (shortened to two years from the date of early conversion of all Notes).
Under the Marketing Agreement, Resources First Pte Ltd is to market the Company’s iron ore and procure sales contracts for the iron ore in a manner and at a price consistent with industry standards. This can include Resources First Pte Ltd directly purchasing the iron ore. NSL retain the ultimate and fi nal say to whom, and for what price the iron ore is sold.
NSL will pay a 2.5% commission for any sales secured to or by Resources First Pte Ltd from Kurnool. The agreement does not apply to any other iron production projects which may be developed by NSL in India.
The agreement caps Resources First Pte Ltd commissioned sales to 300,000 tpa – or about three quarters of Kurnool’s current anticipated total output of 400,000 tpa.
Queensland thermal coal project EPC 2198 granted
As announced on 13 August 2012, the fi rst of the Companys four thermal coal tenements, EPC 2198 has now been formally granted.
24. SUBSIDIARIES
Parent Entity Country of Incorporation 2012%
2011%
NSL Consolidated Ltd (1) Australia 100% 100%
I-S Iron Ore Pte Ltd Singapore 100% 100%
NSL Mining Resources India (Pvt) Ltd India 100% 100%
NSL Coal Pty Ltd Australia 100% -
(1) During the year, the Parent entity invested an amount of $900,943 (2011: $3,333,683) in NSL Mining Resources India (Pvt) Ltd and in I-S Iron Ore Pte Ltd. These investments were made to enable them to continue their operating activities. The subsidiaries have recorded these amounts as equity in their respective fi nancial statements. All amounts are outstanding as at 30 June 2012.
NOTES TO THE FINANCIAL STATEMENTSNOTES TO THE FINANCIAL STATEMENTS
For
per
sona
l use
onl
y

71 NSL CONSOLIDATED LTD ANNuAL REPORT 2012
26. RECONCILIATION OF LOSS AFTER INCOME TAX TO NET CASH FLOW USED IN OPERATING ACTIVITIES
Reconciliation of loss after income tax to net cash fl ow from operating activities
Consolidated
2012$
2011$
Operating loss after tax (2,571,964) (2,610,112)
Adjustment for:
Depreciation and amortisation 77,364 66,886
Gain on disposal of fi xed assets 538 (1,358)
Exploration and evaluation 26,226 113,969
Non-cash share-based payments expense - 24,531
Non-cash income tax expense 197,543 -
Changes in assets / liabilities
- (increase)/decrease in trade and other receivables (2,404) 368,068
- (increase)/decrease in prepayments 245,718 (113,644)
- increase/(decrease) in provision for income taxes payable 5,333 134,139
- increase/(decrease) in provision for deferred tax liability 200,568 -
- increase/(decrease) in trade and other payables (103,391) (314,056)
Net cash fl ow used in operating activities (1,924,469) (2,331,577)
27. LOSS PER SHAREBasic and diluted earnings per share
Consolidated
2012¢
2011¢
Basic loss per share (0.77) (0.96)
Diluted loss per share n/a n/a
Diluted loss per share not disclosed as it does not increase loss per share.
Loss attributable to the ordinary equity holders of the Company used in calculating basic and diluted earnings per share
Consolidated
2012$
2011$
Loss attributable to the ordinary equity holders of the Company used in calculating basicand diluted earnings per share. (2,571,964) (2,610,112)
NOTES TO THE FINANCIAL STATEMENTSNOTES TO THE FINANCIAL STATEMENTS
For
per
sona
l use
onl
y

72NSL CONSOLIDATED LTD ANNuAL REPORT 2012
27. LOSS PER SHARE (CONTINUED)
Weighted average number of shares used as the denominator
Consolidated
2012No.
2011No.
Weighted average number of ordinary shares used as the denominator in calculating basic earnings per share 335,848,492 201,859,840
Adjustments for calculation of diluted earnings per share:
- options (anti dilutive) 18,900,000 23,900,000
Weighted average number of ordinary shares used as the denominator in calculating diluted earnings per share 335,848,492 272,333,208
Options outstanding as at 30 June 2012 have not been included in the calculation of diluted earnings per share because they are anti-dilutive for the year ended 30 June 2012. These options could potentially dilute basic earnings per share in the future.
NOTES TO THE FINANCIAL STATEMENTSNOTES TO THE FINANCIAL STATEMENTS
For
per
sona
l use
onl
y

28. SHARE-BASED PAYMENTS
The Company in its annual general meeting held on 30 November 2009, approved a Directors’ share scheme which allowed the allotment and issue up to a maximum of 3,000,000 Shares (subject to adjustment by any share consolidation or split) per year to each of the directors during the three-year period commencing from the date of this Annual General Meeting. The actual number of Shares to be acquired by the Participants under the Scheme will be determined by the Participants’ election to convert all or a portion of directors’ fees owed by the Company into Shares divided by the issue price of Shares. The issue price of the Shares shall be calculated on the basis of the weighted average trading price of Shares on ASX during the fi ve trading days immediately preceding the last day of each calendar month of service provided to the Company by the Participant. The issue of Shares under the Scheme will be in full and fi nal satisfaction of the Company’s obligation to pay that portion of directors’ fees that are subject to the Participant’s election to convert. During the year, no shares were issued under the scheme.
Grantdate
Expirydate
Exerciseprice
$
Balance at start of the
yearNumber
Granted during the
yearNumber
Exercised during the
yearNumber
Forfeited / lapsed
during the year
Number
Vested and Exercisable at end of
yearNumber
2012
30/11/2009 30/11/2012 $0.200 4,500,000 - - - 4,500,000
30/11/2009 30/11/2013 $0.210 4,500,000 - - - 4,500,000
30/11/2009 30/11/2013 $0.200 3,000,000 - - - -
30/11/2009 30/11/2013 $0.400 3,000,000 - - - -
30/11/2009 30/11/2013 $0.600 3,000,000 - - - -
30/11/2009 30/11/2011 $0.200 1,000,000 - - (1,000,000) -
30/11/2009 30/11/2011 $0.300 1,000,000 - - (1,000,000) -
30/11/2009 30/11/2011 $0.400 1,000,000 - - (1,000,000) -
30/06/2011 30/11/2013 $0.200 966,666 - - (666,666) -
30/06/2011 30/11/2013 $0.400 966,666 - - (666,666) -
30/06/2011 30/11/2013 $0.600 966,668 - - (666,668) -
Total 23,900,000 - - (5,000,000) 9,000,000
Weighted average exercise price $0.314 $0.34 $0.205
73 NSL CONSOLIDATED LTD ANNuAL REPORT 2012
NOTES TO THE FINANCIAL STATEMENTSNOTES TO THE FINANCIAL STATEMENTS
For
per
sona
l use
onl
y
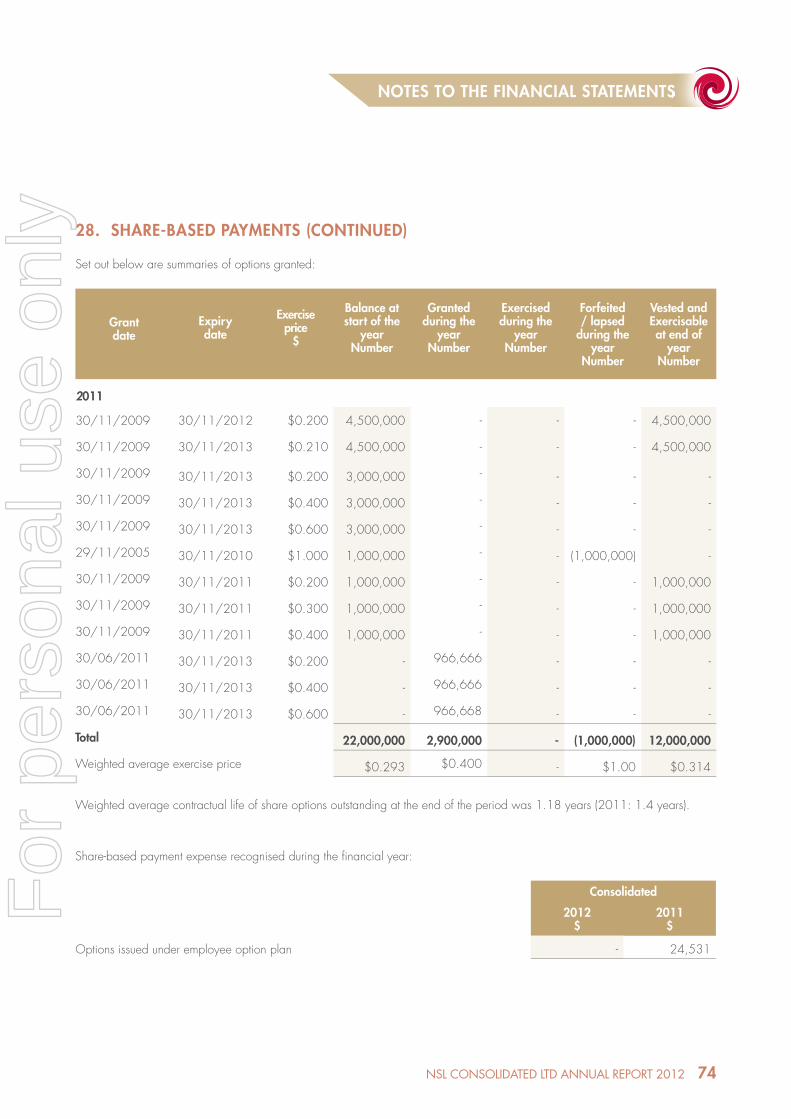
28. SHARE-BASED PAYMENTS (CONTINUED)
Set out below are summaries of options granted:
Grantdate
Expirydate
Exerciseprice
$
Balance at start of the
yearNumber
Granted during the
yearNumber
Exercised during the
yearNumber
Forfeited / lapsed
during the year
Number
Vested and Exercisable at end of
yearNumber
2011
30/11/2009 30/11/2012 $0.200 4,500,000 - - - 4,500,000
30/11/2009 30/11/2013 $0.210 4,500,000 - - - 4,500,000
30/11/2009 30/11/2013 $0.200 3,000,000 - - - -
30/11/2009 30/11/2013 $0.400 3,000,000 - - - -
30/11/2009 30/11/2013 $0.600 3,000,000 - - - -
29/11/2005 30/11/2010 $1.000 1,000,000 - - (1,000,000) -
30/11/2009 30/11/2011 $0.200 1,000,000 - - - 1,000,000
30/11/2009 30/11/2011 $0.300 1,000,000 - - - 1,000,000
30/11/2009 30/11/2011 $0.400 1,000,000 - - - 1,000,000
30/06/2011 30/11/2013 $0.200 - 966,666 - - -
30/06/2011 30/11/2013 $0.400 - 966,666 - - -
30/06/2011 30/11/2013 $0.600 - 966,668 - - -
Total 22,000,000 2,900,000 - (1,000,000) 12,000,000
Weighted average exercise price $0.293 $0.400 - $1.00 $0.314
Weighted average contractual life of share options outstanding at the end of the period was 1.18 years (2011: 1.4 years).
Share-based payment expense recognised during the fi nancial year:
Consolidated
2012$
2011$
Options issued under employee option plan - 24,531
74NSL CONSOLIDATED LTD ANNuAL REPORT 2012
NOTES TO THE FINANCIAL STATEMENTSNOTES TO THE FINANCIAL STATEMENTS
For
per
sona
l use
onl
y
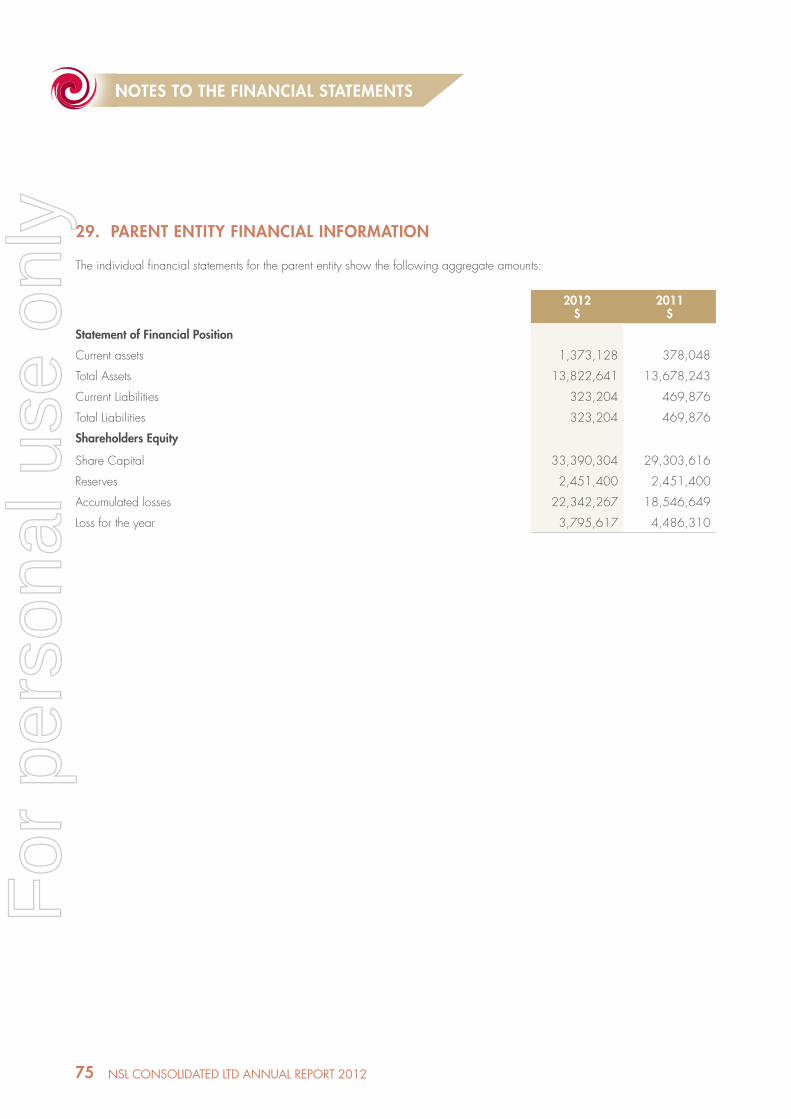
75 NSL CONSOLIDATED LTD ANNuAL REPORT 2012
29. PARENT ENTITY FINANCIAL INFORMATION
The individual fi nancial statements for the parent entity show the following aggregate amounts:
2012$
2011$
Statement of Financial Position
Current assets 1,373,128 378,048
Total Assets 13,822,641 13,678,243
Current Liabilities 323,204 469,876
Total Liabilities 323,204 469,876
Shareholders Equity
Share Capital 33,390,304 29,303,616
Reserves 2,451,400 2,451,400
Accumulated losses 22,342,267 18,546,649
Loss for the year 3,795,617 4,486,310
NOTES TO THE FINANCIAL STATEMENTSNOTES TO THE FINANCIAL STATEMENTS
For
per
sona
l use
onl
y
DIRECTORS’ DECLARATION
In the directors’ opinion:
a) The fi nancial statements and notes set out on page 30 to 75 are in accordance with the Corporations Act 2001, including:
i) complying with Accounting Standards, the Corporations Regulations 2001 and other mandatory professional reporting equirements; and
ii) giving a true and fair view of the Company’s and consolidated entity’s fi nancial position as at 30 June 2012 and of their performance for the fi nancial year ended on that date;
b) There are reasonable grounds to believe that the Company will be able to pay its debts as and when they become due and payable.
c) The Company has included in the notes to the fi nancial statements an explicit and unreserved statement of compliance with the International Financial Reporting Standards.
The directors have been given the declarations required by Section 295A of the Corporations Act 2001 from the Chief Executive Offi cer and Chief Financial Offi cer for the fi nancial year ended 30 June 2012.
Signed in accordance with a resolution of the Directors made pursuant to section 295(5) of the Corporations Act 2001.
On behalf of the Directors
Cedric GoodeManaging DirectorNSL Consolidated Limited
20 September 2012
76NSL CONSOLIDATED LTD ANNuAL REPORT 2012
DIRECTORS’ DECLARATIONDIRECTORS’ DECLARATION
For
per
sona
l use
onl
y
77 NSL CONSOLIDATED LTD ANNuAL REPORT 2012
INDEPENDENT AUDITOR’S REPORTINDEPENDENT AUDITOR’S REPORT
77
Tel: +8 6382 4600 Fax: +8 6382 4601 www.bdo.com.au
38 Station Street Subiaco, WA 6008 PO Box 700 West Perth WA 6872 Australia
BDO Audit (WA) Pty Ltd ABN 79 112 284 787 is a member of a national association of independent entities which are all members of BDO (Australia) Ltd ABN 77 050 110 275, an Australian company limited by guarantee. BDO Audit (WA) Pty Ltd and BDO (Australia) Ltd are members of BDO International Ltd, a UK company limited by guarantee, and form part of the international BDO network of independent member firms. Liability limited by a scheme approved under Professional Standards Legislation (other than for the acts or omissions of financial services licensees) in each State or Territory other than Tasmania.
INDEPENDENT AUDITOR’S REPORT TO THE MEMBERS OF NSL CONSOLIDATED LIMITED
Report on the Financial Report We have audited the accompanying financial report of NSL Consolidated Limited, which comprises the consolidated statement of financial position as at 30 June 2012, the consolidated statement of comprehensive income, the consolidated statement of changes in equity and the consolidated statement of cash flows for the year then ended, notes comprising a summary of significant accounting policies and other explanatory information, and the directors’ declaration of the consolidated entity comprising the company and the entities it controlled at the year’s end or from time to time during the financial year. Directors’ Responsibility for the Financial Report The directors of the company are responsible for the preparation of the financial report that gives a true and fair view in accordance with Australian Accounting Standards and the Corporations Act 2001 and for such internal control as the directors determine is necessary to enable the preparation of the financial report that is free from material misstatement, whether due to fraud or error. In Note 1(a), the directors also state, in accordance with Accounting Standard AASB 101 Presentation of Financial Statements, that the financial statements comply with International Financial Reporting Standards. Auditor’s Responsibility Our responsibility is to express an opinion on the financial report based on our audit. We conducted our audit in accordance with Australian Auditing Standards. Those standards require that we comply with relevant ethical requirements relating to audit engagements and plan and perform the audit to obtain reasonable assurance about whether the financial report is free from material misstatement. An audit involves performing procedures to obtain audit evidence about the amounts and disclosures in the financial report. The procedures selected depend on the auditor’s judgement, including the assessment of the risks of material misstatement of the financial report, whether due to fraud or error. In making those risk assessments, the auditor considers internal control relevant to the entity’s preparation of the financial report that gives a true and fair view in order to design audit procedures that are appropriate in the circumstances, but not for the purpose of expressing an opinion on the effectiveness of the entity’s internal control. An audit also includes evaluating the appropriateness of accounting policies used and the reasonableness of accounting estimates made by the directors, as well as evaluating the overall presentation of the financial report. We believe that the audit evidence we have obtained is sufficient and appropriate to provide a basis for our audit opinion. Independence In conducting our audit, we have complied with the independence requirements of the Corporations Act 2001. We confirm that the independence declaration required by the Corporations Act 2001, which has been given to the directors of NSL Consolidated Limited, would be in the same terms if given to the directors as at the time of this auditor’s report.
For
per
sona
l use
onl
y
78NSL CONSOLIDATED LTD ANNuAL REPORT 2012
DIRECTORS REPORTINDEPENDENT AUDITOR’S REPORTINDEPENDENT AUDITOR’S REPORT
78
Opinion In our opinion: (a) The financial report of NSL Consolidated Limited is in accordance with the Corporations Act
2001, including: (i) giving a true and fair view of the consolidated entity’s financial position as at 30 June
2012 and of its performance for the year ended on that date; and (ii) complying with Australian Accounting Standards and the Corporations Regulations 2001;
and (b) The financial report also complies with International Financial Reporting Standards as disclosed
in Note 1(a). Report on the Remuneration Report We have audited the Remuneration Report included in the directors’ report for the year ended 30 June 2012. The directors of the company are responsible for the preparation and presentation of the Remuneration Report in accordance with section 300A of the Corporations Act 2001. Our responsibility is to express an opinion on the Remuneration Report, based on our audit conducted in accordance with Australian Auditing Standards. Auditor’s Opinion In our opinion, the Remuneration Report of NSL Consolidated Limited for the year ended 30 June 2012, complies with section 300A of the Corporations Act 2001. BDO Audit (WA) Pty Ltd
Phillip Murdoch
Director
Perth, Western Australia Dated this 20th day of September 2012
For
per
sona
l use
onl
y
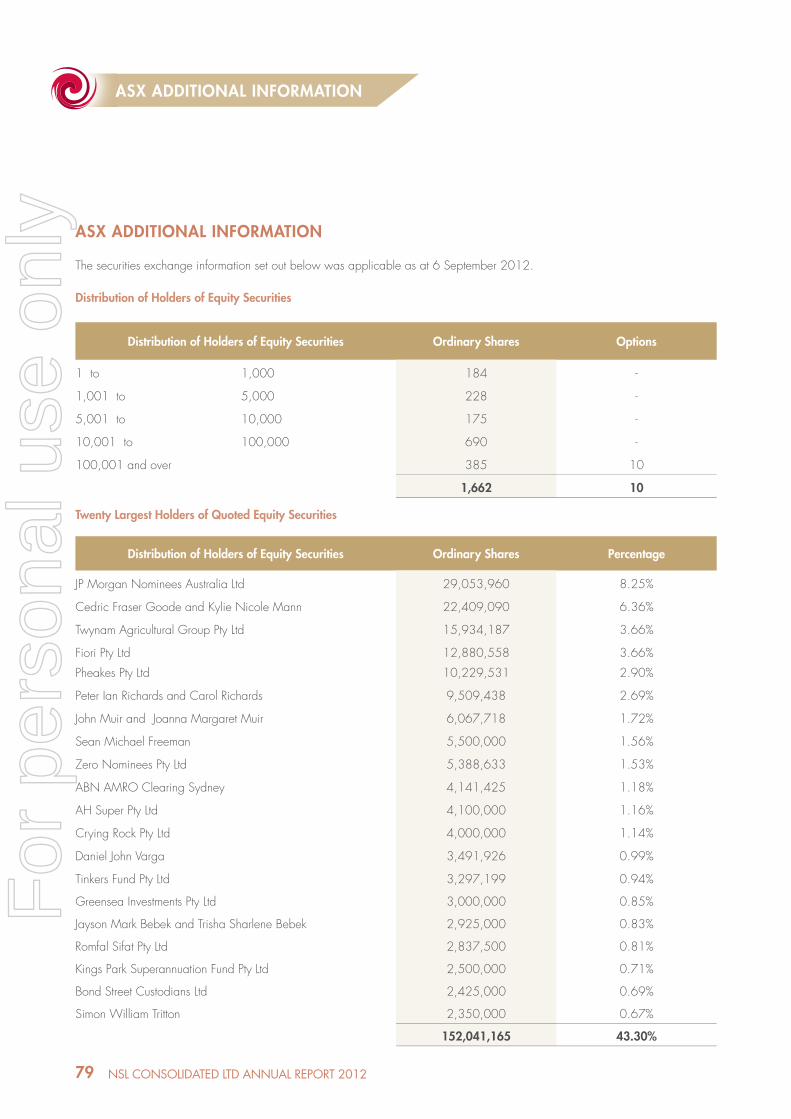
79 NSL CONSOLIDATED LTD ANNuAL REPORT 2012
ASX ADDITIONAL INFORMATIONASX ADDITIONAL INFORMATION
ASX ADDITIONAL INFORMATION
The securities exchange information set out below was applicable as at 6 September 2012.
Distribution of Holders of Equity Securities
Distribution of Holders of Equity Securities Ordinary Shares Options
1 to 1,000 184 -
1,001 to 5,000 228 -
5,001 to 10,000 175 -
10,001 to 100,000 690 -
100,001 and over 385 10
1,662 10
Twenty Largest Holders of Quoted Equity Securities
Distribution of Holders of Equity Securities Ordinary Shares Percentage
JP Morgan Nominees Australia Ltd 29,053,960 8.25%
Cedric Fraser Goode and Kylie Nicole Mann 22,409,090 6.36%
Twynam Agricultural Group Pty Ltd 15,934,187 3.66%
Fiori Pty Ltd 12,880,558 3.66%
Pheakes Pty Ltd 10,229,531 2.90%
Peter Ian Richards and Carol Richards 9,509,438 2.69%
John Muir and Joanna Margaret Muir 6,067,718 1.72%
Sean Michael Freeman 5,500,000 1.56%
Zero Nominees Pty Ltd 5,388,633 1.53%
ABN AMRO Clearing Sydney 4,141,425 1.18%
AH Super Pty Ltd 4,100,000 1.16%
Crying Rock Pty Ltd 4,000,000 1.14%
Daniel John Varga 3,491,926 0.99%
Tinkers Fund Pty Ltd 3,297,199 0.94%
Greensea Investments Pty Ltd 3,000,000 0.85%
Jayson Mark Bebek and Trisha Sharlene Bebek 2,925,000 0.83%
Romfal Sifat Pty Ltd 2,837,500 0.81%
Kings Park Superannuation Fund Pty Ltd 2,500,000 0.71%
Bond Street Custodians Ltd 2,425,000 0.69%
Simon William Tritton 2,350,000 0.67%
152,041,165 43.30%
For
per
sona
l use
onl
y
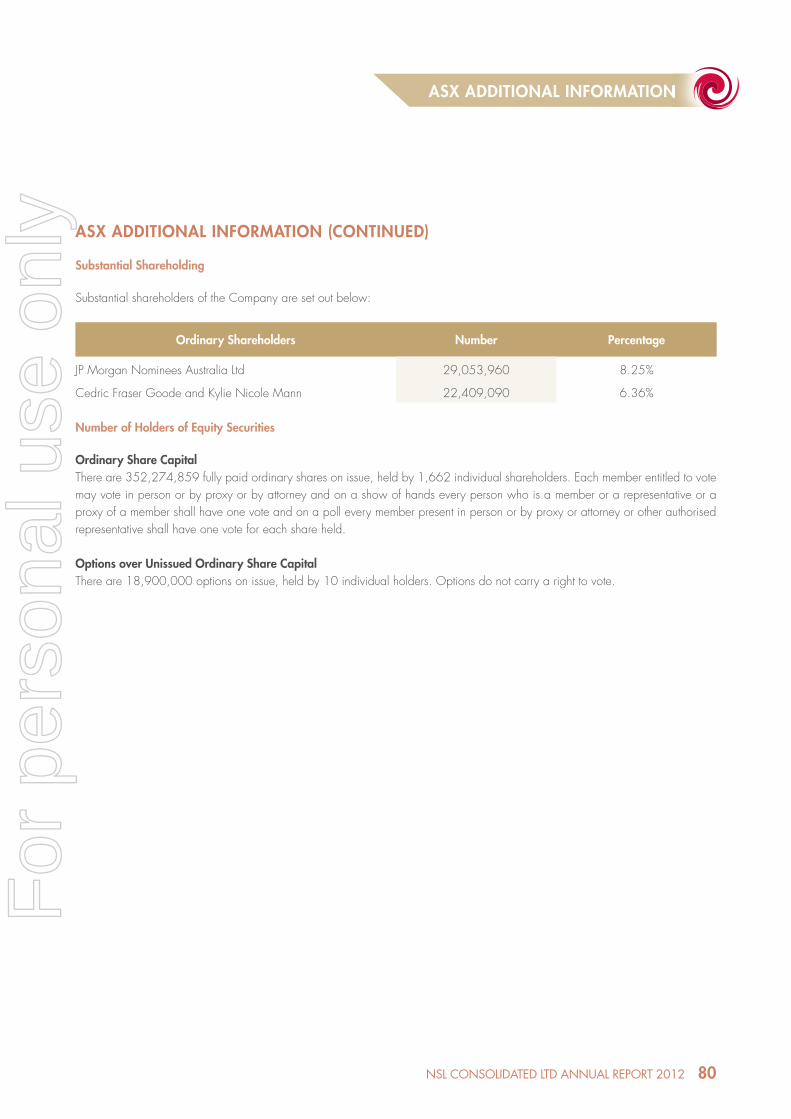
ASX ADDITIONAL INFORMATION (CONTINUED)
Substantial Shareholding
Substantial shareholders of the Company are set out below:
Ordinary Shareholders Number Percentage
JP Morgan Nominees Australia Ltd 29,053,960 8.25%
Cedric Fraser Goode and Kylie Nicole Mann 22,409,090 6.36%
Number of Holders of Equity Securities
Ordinary Share CapitalThere are 352,274,859 fully paid ordinary shares on issue, held by 1,662 individual shareholders. Each member entitled to vote may vote in person or by proxy or by attorney and on a show of hands every person who is a member or a representative or a proxy of a member shall have one vote and on a poll every member present in person or by proxy or attorney or other authorised representative shall have one vote for each share held.
Options over Unissued Ordinary Share CapitalThere are 18,900,000 options on issue, held by 10 individual holders. Options do not carry a right to vote.
80NSL CONSOLIDATED LTD ANNuAL REPORT 2012
DIRECTORS REPORTASX ADDITIONAL INFORMATIONASX ADDITIONAL INFORMATION
For
per
sona
l use
onl
y

81 NSL CONSOLIDATED LTD ANNuAL REPORT 201281 NSL CONSOLIDATED LTD ANNuAL REPORT 2012
For
per
sona
l use
onl
y

82NSL CONSOLIDATED LTD ANNuAL REPORT 2012 82NSL CONSOLIDATED LTD ANNuAL REPORT 2012
For
per
sona
l use
onl
y
Corporate Directory
DirectorsJock Muir ACAChairman / Non-Executive DirectorCedric Goode MBAManaging Director / CEOPeter Wall LLB, B.Comm, M.App.FinNon-Executive DirectorPeter Richards B.CommNon-Executive Director
Sean HenburyCompany Secretary
Registered Offi cec/- FJH Solutions21 Teddington RoadBurswood WA 6100Telephone: (08) 9486 2333Facsimile: (08) 9355 4580
Corporate Offi ceLevel 1, 30 Ord StreetWest Perth WA 6005Telephone: (08) 9322 5562Facsimile: (08) 9322 5563
Website Addresswww.nslconsolidated.com
Share RegistrySecurity Transfer Registrars770 Canning HighwayApplecross WA 6153Telephone: (08) 9315 2333Facsimile: (08) 9315 2233
AuditorBDO Audit (WA) P/L38 Station StreetSubiaco WA 6008
SolicitorsSteinepreis Paganin Lawyers and ConsultantsLevel 4, The Read Buildings16 Milligan StreetPerth WA 6000
Stock Exchange ListingNSL Consolidated Limited’s shares are listed on the AustralianSecurities Exchange and Frankfurt Stock Exchange
Australian Stock Exchange Code: NSL
Frankfurt Stock Exchange Code: 2NC
For
per
sona
l use
onl
y