


ANNUAL REPORT - Elektro Celje
238
ANNUAL REPORT of the company Elektro Celje and the Elektro Celje group DISTRIBUTION RELATIONSHIP
-
Upload
khangminh22 -
Category
Documents
-
view
0 -
download
0
Transcript of ANNUAL REPORT - Elektro Celje
ANNUAL REPORTof the company Elektro Celje and the Elektro Celje group
DISTRIBUTION
RELATIONSHIP

ANNUAL REPORTof the company Elektro Celje and the Elektro Celje group
DISTRIBUTION
RELATIONSHIP
4 Elektro Celje ANNUAL REPORT 2016
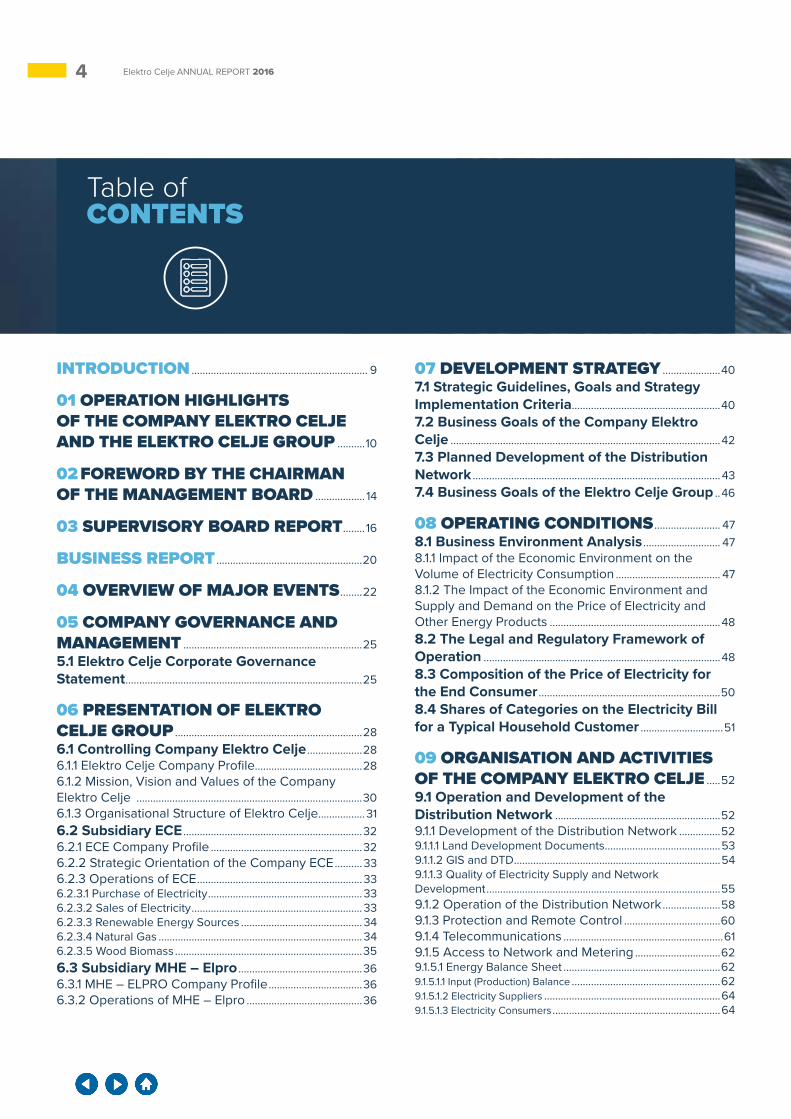
Table ofCONTENTS
INTRODUCTION ................................................................ 9
01 OPERATION HIGHLIGHTS OF THE COMPANY ELEKTRO CELJE AND THE ELEKTRO CELJE GROUP ..........10
02 FOREWORD BY THE CHAIRMAN OF THE MANAGEMENT BOARD .................. 14
03 SUPERVISORY BOARD REPORT ........16
BUSINESS REPORT .....................................................20
04 OVERVIEW OF MAJOR EVENTS ........22
05 COMPANY GOVERNANCE AND MANAGEMENT .................................................................255.1 Elektro Celje Corporate Governance Statement ......................................................................................25
06 PRESENTATION OF ELEKTRO CELJE GROUP ....................................................................286.1 Controlling Company Elektro Celje ....................286.1.1 Elektro Celje Company Profile.......................................286.1.2 Mission, Vision and Values of the Company Elektro Celje ..................................................................................306.1.3 Organisational Structure of Elektro Celje.................316.2 Subsidiary ECE .................................................................326.2.1 ECE Company Profile .......................................................326.2.2 Strategic Orientation of the Company ECE .......... 336.2.3 Operations of ECE ............................................................ 336.2.3.1 Purchase of Electricity ........................................................ 336.2.3.2 Sales of Electricity .............................................................. 336.2.3.3 Renewable Energy Sources ............................................ 346.2.3.4 Natural Gas .......................................................................... 346.2.3.5 Wood Biomass ....................................................................356.3 Subsidiary MHE – Elpro .............................................366.3.1 MHE – ELPRO Company Profile ..................................366.3.2 Operations of MHE – Elpro ..........................................36
07 DEVELOPMENT STRATEGY .....................407.1 Strategic Guidelines, Goals and Strategy Implementation Criteria......................................................407.2 Business Goals of the Company Elektro Celje ..................................................................................................427.3 Planned Development of the Distribution Network .......................................................................................... 437.4 Business Goals of the Elektro Celje Group ..46
08 OPERATING CONDITIONS ........................ 478.1 Business Environment Analysis ............................ 478.1.1 Impact of the Economic Environment on the Volume of Electricity Consumption ...................................... 478.1.2 The Impact of the Economic Environment and Supply and Demand on the Price of Electricity and Other Energy Products ..............................................................488.2 The Legal and Regulatory Framework of Operation ......................................................................................488.3 Composition of the Price of Electricity for the End Consumer ..................................................................508.4 Shares of Categories on the Electricity Bill for a Typical Household Customer ..............................51
09 ORGANISATION AND ACTIVITIES OF THE COMPANY ELEKTRO CELJE .....529.1 Operation and Development of the Distribution Network ............................................................529.1.1 Development of the Distribution Network ...............529.1.1.1 Land Development Documents ..........................................539.1.1.2 GIS and DTD ...........................................................................549.1.1.3 Quality of Electricity Supply and Network Development .....................................................................................559.1.2 Operation of the Distribution Network .....................589.1.3 Protection and Remote Control ...................................609.1.4 Telecommunications ..........................................................619.1.5 Access to Network and Metering ...............................629.1.5.1 Energy Balance Sheet .........................................................629.1.5.1.1 Input (Production) Balance ......................................................629.1.5.1.2 Electricity Suppliers ................................................................649.1.5.1.3 Electricity Consumers .............................................................64
5Elektro Celje ANNUAL REPORT 2016
9.1.5.2 Metering Equipment ...........................................................659.1.6 Network Charge Calculation .........................................659.2 Maintenance and Engineering .............................659.2.1 Maintenance .........................................................................669.2.2 Engineering ......................................................................... 679.2.2.1 Design ....................................................................................689.2.2.2 Investments .........................................................................699.2.3 Marketing Services of the Company Elektro Celje .................................................................................... 73
10 OPERATION AND PERFORMANCE ANALYSIS ................................................................................. 7610.1 Operation and Performance Analysis of the Company Elektro Celje ........................................ 7610.1.1 Profit or Loss ....................................................................... 7610.1.2 Assets and Liabilities ...................................................... 7910.1.3 Cash Flow Statement ......................................................8010.1.4 Performance Indicators of the Company Elektro Celje ....................................................................................8010.2 Operation and performance Analysis of the Elektro Celje Group ................................................8610.2.1 Profit or Loss .......................................................................8610.2.2 Assets and Liabilities .....................................................8910.2.3 Cash Flow Statement ....................................................9010.2.4 Performance Indicators of the Elektro Celje Group .................................................................................................90
11 ORGANISATIONAL DEVELOPMENT ....
9611.1 Management Systems ................................................9611.2 Risk Management at the Company Elektro Celje ................................................................................9911.2.1 Overview of Basic Risks at the Company Elektro Celje ....................................................................................9911.2.1.1 Groups of Strategic Risks ...................................................9911.2.1.2 Groups of Operational Risks .......................................... 10011.2.1.3 Financial risks ...................................................................... 10111.2.2 Risk Management and Types of Risks in the Elektro Celje Group ................................................................... 10211.3 Internal Audit .................................................................. 102
11.4 Corporate Integrity and the Code of Ethics .............................................................................................. 103
12 SUSTAINABLE DEVELOPMENT ......... 10612.1 Research and Development Investment and Other Investments ...................................................... 10612.2 Societal and Social Aspects ............................... 10812.2.1 Responsibility towards Employees ......................... 10812.2.1.1 Number and Structure of Employees........................... 10812.2.1.2 Employee Education and Training ................................ 11012.2.1.3 Concern for Employee Development ............................11112.2.2 Responsibility towards Investors and the Financial Public ............................................................................. 11212.2.3 Responsibility towards Customers ......................... 11212.2.4 Social Responsibility ......................................................11312.3 Environmental Aspect ..............................................114
FINANCIAL REPORT ................................................. 116
13 INDEPENDENT AUDITOR'S REPORTS ................................................................................. 118
14 FINANCIAL STATEMENTS OF ELEKTRO CELJE ............................................................. 12214.1 Balance sheet ................................................................. 12214.2 Income statement ...................................................... 12414.3 Statement of comprehensive income ......... 12514.4 Statement of cash flows ........................................ 12614.5 Statement of changes in equity .......................127
15 EXPLANATORY NOTES TO THE FINANCIAL STATEMENTS ................................. 12915.1 Bases for the Preparation of the Financial Statements .......................................................... 12915.2 Transition to SAS 2016 .............................................13115.3 Significant Accounting Policies .........................13115.4 Disclosure of Items in the Balance Sheet .13815.4.1 Long-term Intangible Assets and Long-term Accrued Revenue and Deferred Expenses .................... 139

6 Elektro Celje ANNUAL REPORT 2016
Table ofCONTENTS
15.4.2 Tangible Fixed Assets ................................................. 14015.4.3 Long-term Financial Investments ........................... 14215.4.4 Deferred Tax Assets ......................................................14315.4.5 Inventories .........................................................................14415.4.6 Receivables .......................................................................14415.4.6.1 Long-term Trade Receivables ....................................... 14515.4.6.2 Short-term Trade Receivables ..................................... 14615.4.7 Cash and Cash Equivalents .......................................14715.4.8 Accrued Revenue and Deferred Expenses .......14715.4.9 Equity ...................................................................................14715.4.10 Provisions and Long-term Accrued Expenses and Deferred Revenue ..............................................................14815.4.11 Long-term Financial and Operating Liabilities . 15015.4.12 Deferred Tax Liabilities .............................................. 15015.4.13 Short-term Financial and Operating Liabilities .......................................................................................... 15115.4.14 Short-term Accrued Expenses and Deferred Revenue .......................................................................................... 15215.4.15 Contingent Liabilities ................................................. 15215.4.16 Potential Receivables and Other Off-balance Sheet Items ................................................................................... 15215.5 Significant Events After the Balance Sheet Date .................................................................................. 15315.6 Disclosure of Items in the Income Statement .................................................................................... 15315.6.1 Net Sales Revenue ........................................................ 15315.6.2 Capitalised Own Services ......................................... 15415.6.3 Other Operating Revenue......................................... 15415.6.4 Costs of Goods, Materials and Services............. 15415.6.5 Labour Costs ................................................................... 15515.6.6 Write-downs and Write-offs ...................................... 15615.6.7 Other Operating Expenses ........................................15715.6.8 Financial Income from Shareholdings ..................15715.6.9 Financial Income from Granted Loans ................ 15815.6.10 Financial Income from Trade Receivables ....... 15815.6.11 Financial Expenses from Impairment and Write-downs of Financial Investments .............................. 15815.6.12 Financial Expenses from Financial Liabilities . 15815.6.13 Financial Expenses from Operating Liabilities 15815.6.14 Other Income ................................................................. 15815.6.15 Other Expenses ............................................................ 159
15.6.16 Profit or Loss .................................................................. 15915.6.17 Statement of Comprehensive Income ............... 15915.6.18 Income Tax ...................................................................... 15915.7 Disclosure of Items in the Statement of Cash Flows ................................................................................. 15915.7.1 Inflows from Operating Activities ............................. 15915.7.2 Outflows from Operating Activities ........................ 16015.7.3 Inflows from Investing Activities .............................. 16015.7.4 Outflows from Investing Activities .......................... 16015.7.5 Inflows from Financing Activities ............................ 16015.7.6 Outflows from Financing Activities ........................ 16015.8 Disclosure of Items in the Statement of Changes in Equity ................................................................. 16015.9 Financial Risk Management ................................ 16115.9.1 Credit Risk ........................................................................... 16115.9.2 Market Risk ...................................................................... 16215.9.3 Liquidity Risk ................................................................... 16315.9.4 Equity Risk ........................................................................ 16415.10 Transactions with Associated Parties ....... 16515.10.1 Transactions with Companies within the Corporate Group ......................................................................... 16515.10.2 Data on Groups of Persons ..................................... 16515.11 Disclosures Pursuant to the Energy Act ... 16815.11.1 Balance Sheet Broken Down by Activities ......... 16815.11.2 Income Statement Broken Down by Activities .17415.11.3 Statement of Cash Flows Broken Down by Activities........................................................................................... 177
16 CONSOLIDATED FINANCIAL STATEMENTS OF ELEKTRO CELJE GROUP ...................................................................................... 18216.1 Consolidated statement of financial position ......................................................................................... 18216.2 Consolidated income statement ......................18316.3 Consolidated comprehensive income statement .....................................................................................18316.4 Consolidated statement of cash flows ........18416.5 Consolidated statement of changes in equity .............................................................................................. 185

7Elektro Celje ANNUAL REPORT 2016
17 EXPLANATORY NOTES TO THE CONSOLIDATED FINANCIAL STATEMENTS .........................................................................18717.1 Reporting Company .....................................................18717.2 Bases for the Preparation of Consolidated Financial Statements ..........................18717.3 Transition to IFRC ....................................................... 18917.4 Significant Accounting Policies ........................ 18917.5 Determination of Fair Value ................................ 19917.6 Composition of the Elektro Celje Group ...20017.7 Intangible Assets ........................................................20017.8 Tangible Fixed Assets .............................................. 20117.9 Investment Property ................................................ 20317.10 Financial Investments ........................................... 20317.11 Deferred Tax Assets and Liabilities .............. 20417.11.1 Deferred Tax Assets ...................................................... 20417.11.2 Deferred Tax Liabilities............................................... 20517.12 Inventory ......................................................................... 20617.13 Trade Receivables .................................................... 20617.13.1 Long-term Trade Receivables .................................. 20617.13.2 Short-term Trade Receivables from Customers and Other Trade Receivables ...................... 20717.13.3 Income Tax Receivables ........................................... 20817.14 Cash and Cash Equivalents ............................. 20817.15 Equity and Reserves ............................................. 20917.16 Provisions ........................................................................ 21117.17 Long-term Deferred Revenue ........................... 21217.18 Loans Received and Other Financial Liabilities ...................................................................................... 21317.19 Long-term Operating Liabilities ...................... 21417.20 Short-term Operating and Other Liabilities ...................................................................................... 21417.21 Income Tax Liabilities ............................................ 21417.22 Contingent Liabilities ......................................... 21517.23 Contingent Assets and Other Off-balance-sheet Records ............................................. 21617.24 Determination of Fair Value ............................. 216
17.25 Important Events Following the Date of the Group’s Statement of Financial Position......21717.26 Net Sales Revenue ...................................................21717.27 Capitalised Own Products ..................................21717.28 Other Operating Revenue ................................. 21817.29 Costs of Materials and Services.................... 21817.30 Labour Costs ............................................................... 21917.31 Amortisation and Depreciation ..................... 22017.32 Operating Expenses from Revaluation ... 22017.33 Other Operating Expenses ............................... 22117.34 Financial income and financial expenses ...................................................................................... 22117.35 Income Tax ................................................................... 22217.36 Earnings per Share ................................................ 22217.37 Disclosure of Items in the Consolidated Statement of Cash Flows ................................................ 22317.37.1 Inflows from Operating Activities .......................... 22317.37.2 Outflows from Operating Activities .................... 22317.37.3 Inflows from Investing Activities ........................... 22317.37.4 Outflows from Investing Activities ....................... 22317.37.5 Inflows from Financing Activities ......................... 22317.37.6 Outflows from Financing Activities ..................... 22317.38 Financial Risk Management ............................ 22417.38.1 Credit Risk ....................................................................... 22417.38.2 Market Risk.................................................................... 22617.38.3 Liquidity Risk................................................................. 22617.38.4 Capital Risk.....................................................................22717.39 Transactions with Associated Parties ...... 22817.39.1 Transactions with Owners ........................................ 22817.39.2 Transaction of Parent Company with Group Subsidiaries .................................................................................. 22817.39.3 Data on Groups of Natural Persons ................... 22917.40 Auditor Costs ............................................................. 232
18 STATEMENT OF THE MANAGEMENT BOARD .......................................233
LIST OF ABBREVIATIONS .................................234

8 Elektro Celje ANNUAL REPORT 2016
RELATIONSHIP
INTEGRITYWe respect the rules of the game. As power transmission specialists, we act in accordance with legislation, internal rules, standards and the Code of Ethics. Impartiality and independence from personal interests guide us in our operations.
Elektro Celje ANNUAL REPORT 201610
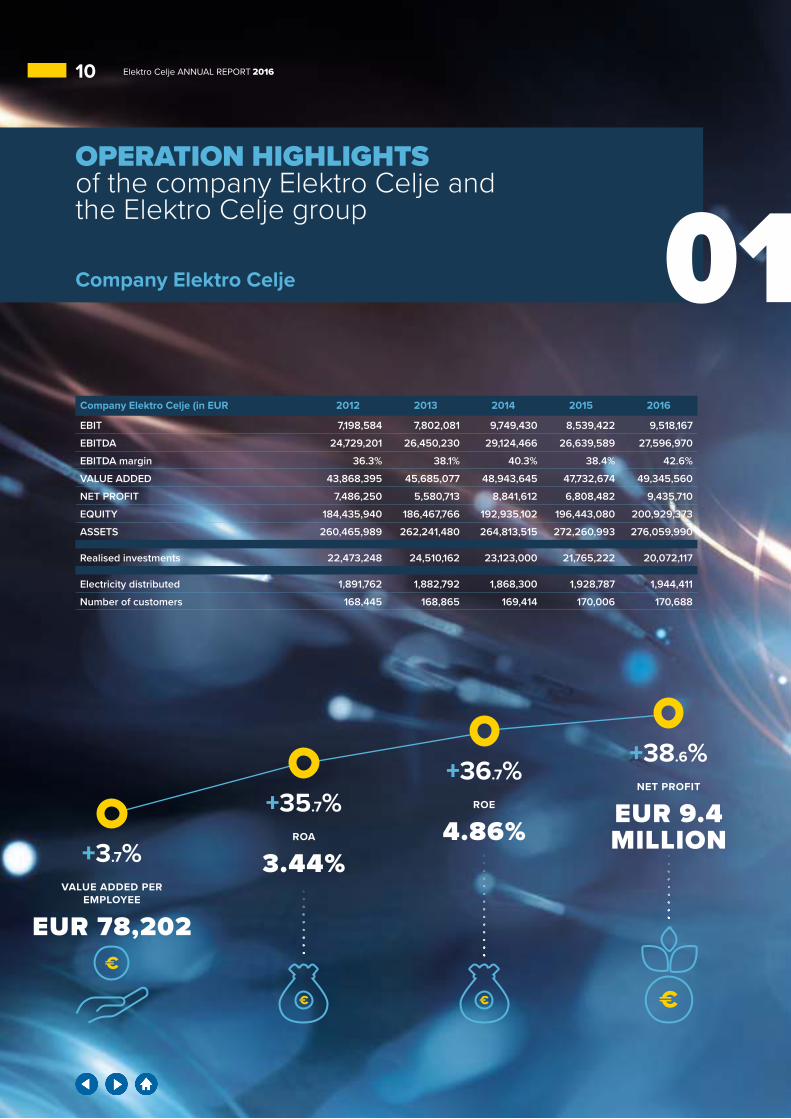
OPERATION HIGHLIGHTS of the company Elektro Celje and the Elektro Celje group
Company Elektro Celje (in EUR 2012 2013 2014 2015 2016
EBIT 7,198,584 7,802,081 9,749,430 8,539,422 9,518,167
EBITDA 24,729,201 26,450,230 29,124,466 26,639,589 27,596,970
EBITDA margin 36.3% 38.1% 40.3% 38.4% 42.6%
VALUE ADDED 43,868,395 45,685,077 48,943,645 47,732,674 49,345,560
NET PROFIT 7,486,250 5,580,713 8,841,612 6,808,482 9,435,710
EQUITY 184,435,940 186,467,766 192,935,102 196,443,080 200,929,373
ASSETS 260,465,989 262,241,480 264,813,515 272,260,993 276,059,990
Realised investments 22,473,248 24,510,162 23,123,000 21,765,222 20,072,117
Electricity distributed 1,891,762 1,882,792 1,868,300 1,928,787 1,944,411
Number of customers 168,445 168,865 169,414 170,006 170,688
ROE
4.86%ROA
3.44%
NET PROFIT
EUR 9.4 MILLION
VALUE ADDED PER EMPLOYEE
EUR 78,202
+35.7%
+38.6%
+3.7%
+36.7%
Company Elektro Celje
Elektro Celje ANNUAL REPORT 2016 1101 OPERATION HIGHLIGHTS OF THE COMPANY ELEKTRO CELJE AND THE ELEKTRO CELJE GROUP
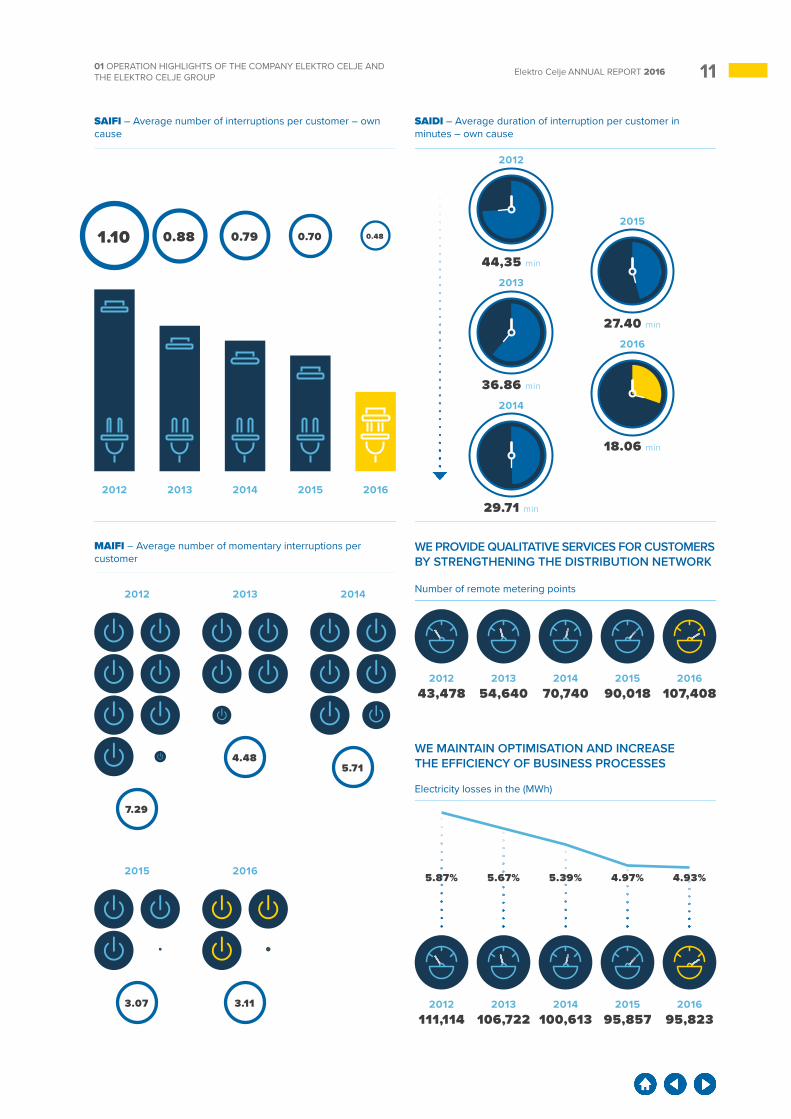
SAIFI ― Average number of interruptions per customer – own cause
Number of remote metering points
Electricity losses in the (MWh)
MAIFI − Average number of momentary interruptions per customer
SAIDI ― Average duration of interruption per customer in minutes – own cause
WE PROVIDE QUALITATIVE SERVICES FOR CUSTOMERS BY STRENGTHENING THE DISTRIBUTION NETWORK
WE MAINTAIN OPTIMISATION AND INCREASE THE EFFICIENCY OF BUSINESS PROCESSES
20132012 2014 2015 2016
1.10 0.480.88 0.79 0.70
2012 2013
201243,478
2012111,114
201354,640
2013106,722
201470,740
2014100,613
201590,018
201595,857
2016107,408
201695,823
2014
7.29
4.485.71
3.07 3.11
5.87% 5.67% 5.39% 4.97% 4.93%2015 2016
27.40 min
2015
18.06 min
2016
44,35 min
2012
36.86 min
2013
29.71 min
2014
Elektro Celje ANNUAL REPORT 201612
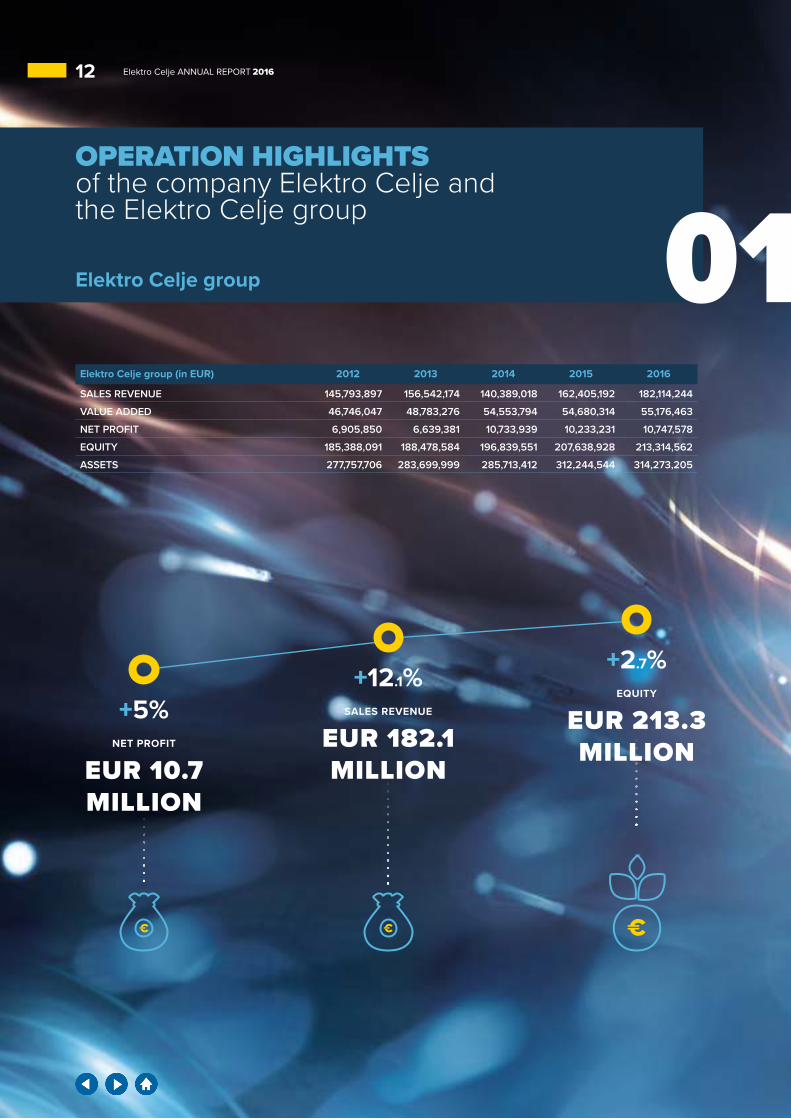
OPERATION HIGHLIGHTS of the company Elektro Celje and the Elektro Celje group
Elektro Celje group (in EUR) 2012 2013 2014 2015 2016
SALES REVENUE 145,793,897 156,542,174 140,389,018 162,405,192 182,114,244
VALUE ADDED 46,746,047 48,783,276 54,553,794 54,680,314 55,176,463
NET PROFIT 6,905,850 6,639,381 10,733,939 10,233,231 10,747,578
EQUITY 185,388,091 188,478,584 196,839,551 207,638,928 213,314,562
ASSETS 277,757,706 283,699,999 285,713,412 312,244,544 314,273,205
SALES REVENUE
EUR 182.1MILLION
NET PROFIT
EUR 10.7 MILLION
EQUITY
EUR 213.3MILLION
+5%
+2.7%+12.1%
Elektro Celje ANNUAL REPORT 201612
Elektro Celje group
Elektro Celje ANNUAL REPORT 2016 1301 OPERATION HIGHLIGHTS OF THE COMPANY ELEKTRO CELJE AND THE ELEKTRO CELJE GROUP
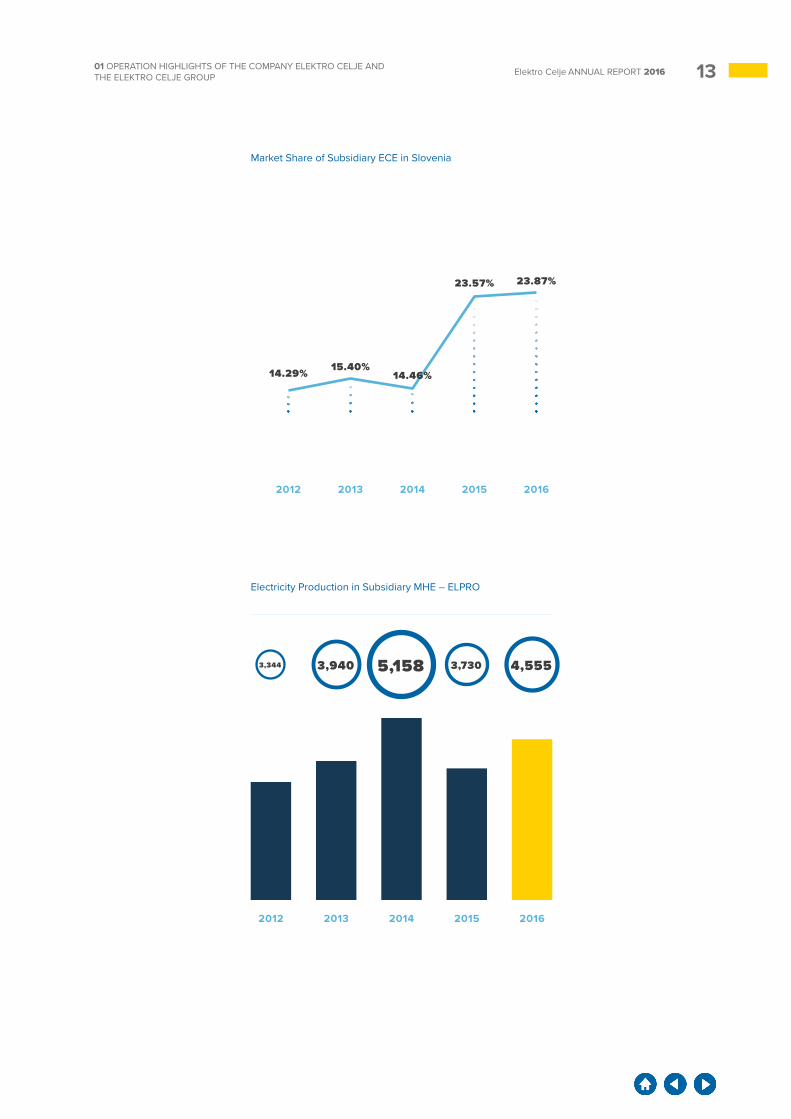
Market Share of Subsidiary ECE in Slovenia
2012 2013 2014 2015 2016
14.29% 15.40%14.46%
23.57% 23.87%
Electricity Production in Subsidiary MHE – ELPRO
20132012 2014 2015 2016
5,1583,344 4,5553,940 3,730
14 Elektro Celje ANNUAL REPORT 2016
Our operation was successful
The Elektro Celje Public Limited Com-pany followed the key goals of SHH, the company for managing capital assets, in managing the investments of power distribution companies in 2016. All operations were executed successfully in accordance with the confirmed operational plan and, at the same time, we generated an an-nual profit before tax in the amount of EUR 9.3 million. We realised in-vestments in the amount of EUR 20.1 million and distributed electricity to 170,688 household and business cus-tomers. We have supplied a total of 1,944 GWh of electricity to the distri-bution network users, with the net-work charge charged to the company SODO amounting to EUR 86.6 mil-lion, which is 9.2% more than planned (EUR 79.2 million). The share of loss-es per unit of electricity distributed in 2016 stood at 4.93%, which is less than planned (5.3%) and less than the losses recognised as per the regula-tive framework of the Energy Agency (5.7%). The value of services provided to customers amounted to EUR 1.5 million (with EUR 0.8 being planned).
We are building a robust networkWe put the recently erected DTS 110/20 kV Žalec into operation. The investment amounting to over EUR 5 million is of great importance for further economic development of the Savinja Region. The operation of the new DTS 110/20 kV Žalec also enables a faster and simpler transi-tion of the town of Celje to a higher voltage level. During this period, we executed the first phase of cabling the existing OPL 2x20 kV Nazarje – Ljubno, and OPL 20 kV Vuhred, built several 20/0.4 kV transformer substa-tions and restored a large portion of the LV distribution network. We are actively conducting a project of sit-ing OPL 2x110 kV DTS Trebnje – DTS 110/20 kV Mokronog – DTS 110/20 kV Sevnica. In 2016, the Government of the Republic of Slovenia issued a Decision on the most favourable OPL route. Because of that, we continued with the procedures to finish the NSP. Siting of the OPL 2x110 kV Ravne – Mežica installation was stopped be-cause the Prevalje Municipality failed to confirm the recommended Munici-pal Detailed Spatial Plan (MDSP) in
2016. That is why we will begin with the activities of siting the OPL 2x110 kV in question according to the Na-tional Spatial Plan (NSP) in 2017.
In 2016, we continued with the pro-cess of replacing the existing electric-ity meters with more modern ones, enabling remote data transfer via various communication channels. At the end of 2016, we managed to in-crease the number of metering points included in the advanced metering system to 107,408, which represents 63% of all metering points in the Elektro Celje, d.d. distribution area. In 2017, we will include at least an-other 13,000 metering points in the advanced metering system. This will enable us to increase the number of included metering points by 10%.
We have been active in digital trans-formation and, consequently, the change in the business operation model for several years. Renewable energy resources, e-mobility, distri-bution network automation and the use of modern metering devices with consumers result in data collection,
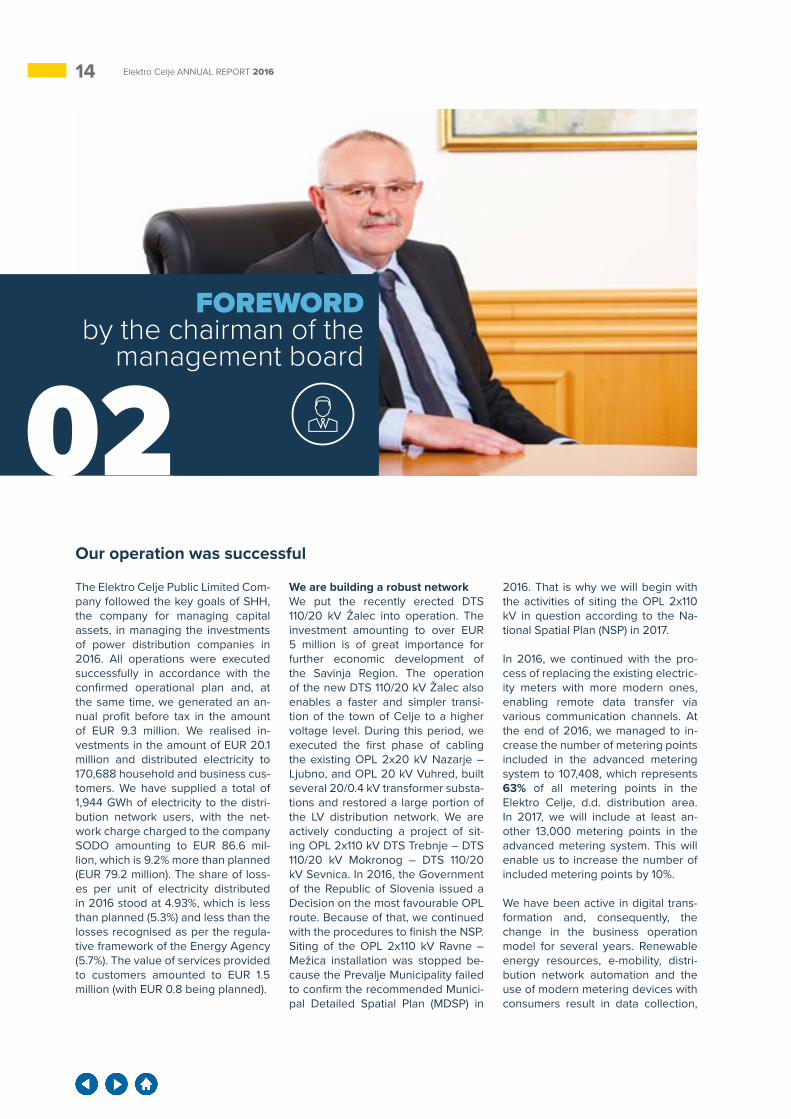
FOREWORD by the chairman of the
management board
1502 FOREWORD BY THE CHAIRMAN OF THE MANAGEMENT BOARD Elektro Celje ANNUAL REPORT 2016
processing and exchange processes, based on which we perform techno-logical optimisation of the functioning of the network and increase its effi-ciency reflecting also in its economi-cal functioning. Here, it is important to realise that the data obtained can also be used as marketable goods and a new business opportunity for our company and, at the same time, for the distribution network users. Structured data enable them to man-age their consumption in a manner that they find suitable and sensible.
Since our company is aware of the complexity of digitalisation and changes that are already taking place in the company, we have launched a project for information system re-newal by implementing two new modern programmes (Microsoft Dy-namics AX – AXEC project and EAM IBM Maximo – MaxEC project), which will enable the company to manage the electricity infrastructure and the rapidly changing business processes. The first project refers to setting up a comprehensive information system to support our operations, whereas for the second project, we are planning and establishing a Resource Manage-ment System throughout its entire life cycle.
We are strengthening cooperation in international projectsThe company takes part in two inter-national projects, the Slovenian and Japanese NEDO project, in the scope of which advanced functionalities en-abling better coordination between stakeholders in the electricity system and more effective system operation will be established, and the European project Flex4Grid, focusing on devel-oping an open technological system for data management and provision of services enabling management of the flexibility of distribution network users during both in consumption, as well as generation, of electricity.
Strategic guidelinesThe company Elektro Celje adopted a strategic business plan for the period 2015 to 2018 and, consequently, stra-tegic guidelines, goals, activities and duties. They are structured in a man-ner that enables the use of a system for managing strategy implementa-tion with a balanced indicator system. In cooperation with the Supervisory Board, we determine maximum risks that the company shall take into ac-count while attempting to reach its goals. The purpose of Risk Manage-ment is to recognise preferential risks (compliance with the legislation, safe-ty of people, service quality, project management etc.), handle them and adopt measures for managing them within acceptable limits.
We strive for excellenceThe company Elektro Celje accepted a decision and commitment to act in accordance with the principles of excellence years ago. By introduc-ing quality management standards, developing standards and complying with regulations regarding occupa-tional safety, concern for the health of employees and the environmental protection, and by adopting meas-ures of a family-friendly enterprise, we have created a foundation for striving for, and proving the excel-lence of our organisation as defined in the excellence model EFQM. In 2016, we conducted a third self-ap-praisal in accordance with the EFQM model. Based on the results, we ap-plied for the competition for the Busi-ness Excellence Prize of the Republic of Slovenia (PRSPO), managed by the Ministry of Economic Development and Technology. The main purpose of this was to evaluate our self-appraisal and to allow external appraisers to evaluate our organisation so that we would receive numerous oppor-tunities to improve our activities and strengthen those we are good at. The number of points that we achieved
has confirmed our expectations based on the results from the internal appraisal, and we were placed among the PRSPO finalists. Additionally, we received an award for being included on the shortlist and the EFQM Recog-nised for Excellence Certificate.
Chairman of the Management BoardBoris Kupec, MSc

16 03Elektro Celje ANNUAL REPORT 2016
03 SUPERVISORY BOARD REPORT
I. INTRODUCTION
In 2016, The Supervisory Board su-pervised the operations of the com-pany Elektro Celje d.d. and the Ele-ktro Celje Group in accordance with relevant legislation, the company’s Articles of Association, the Rules of Procedure of the Supervisory Board, the Code of Corporate Governance of State-Owned Enterprises, recom-mendations of the Capital Assets Management Agency of the Republic of Slovenia, and other principles of good practice of corporate govern-ance. The SB read reports on the company’s operations and other key company activities regularly, adopted adequate resolutions and monitored their implementation.
II. GENERAL INFORMATION
In 2016, the Supervisory Board of the company Elektro Celje, d.d. consisted of six members, four of whom were shareholder representatives:- Mirjan Trampuž, BSc Electrical Engi-
neering, MSM and MSc Energetics, Chairman,
- Dejan Božič, BA Economics, MBA, Deputy Chairman (until 19 June 2016),
- Mitja Vatovec, BA Economics, mem-ber (until 12 September 2016) and Deputy Chairman of the Supervisory Board (since 13 September 2016),
- Tatjana Habjan, BA Economics, member,
- Miha Kerin, MSc, member (since 1 September 2016)
and two employee representatives:- Tomislav Pajić, BSc in Energy Tech-
nology , - Boris Počivavšek, Electronics Engi-
neer and energetics expert.
In 2016, the composition of the Super-visory Board changed due to the ex-piration of the mandate of one of the Supervisory Board members. In the period between 19 June 2016 and 31 August 2016, the Supervisory Board was comprised of five members.
The Supervisory Board had fifteen regular meetings and four meetings by correspondence in 2016. More meetings were needed so that a new Chairman could be selected; the Su-pervisory Board did not appoint a spe-cial Staff Committee for this purpose.
The Supervisory Board appointed the Supervisory Board Audit Committee consisting of:- Tatjana Habjan, BA Economics,
Chairwoman,- Dejan Božič, BA Economics, MBA,
member (until 19 June 2016),- Mirjan Trampuž, BSc Electrical Engi-
neering, MSM and MSc Energetics, member,
- Darinka Virant, BA Economics, inde-pendent external expert in account-ing and finance, member of the Au-dit Committee
The Supervisory Board Audit Com-mittee consisted of three members since 19 June 2016, at first due to the expiration of the mandate of an SB member, who was also an Audit Committee member, and from 1 Sep-tember 2016, due to the amendment of the company’s Articles of Associa-tion laying down the structure of the Audit Committee comprised of three members. Other appointed members of the Audit Committee continued with their duties after the Supervisory Board had adopted the Resolution.
The Supervisory Board Audit Com-mittee had seven regular meetings and no meetings by correspondence.
The expenses for the operation of the Supervisory Board and the Au-dit Committee, which consist of payments for their duties, meeting fees, and training and business trip expenses, are in accordance with the Resolutions of the Shareholders Assembly and disclosed in Chapter 15.10.2 of the Annual Report of the company for 2016. A Contract was signed with the third-party independ-ent expert taking part in the Audit Committee, which is subject to the
criteria and recommendations by the Capital Assets Management Agency of the Republic of Slovenia.
III. SUPERVISION OF OPERATIONS AND MANAGEMENT OF THE COM-PANY
As part of its fundamental function of responsible supervision of company management, the Supervisory Board monitored the implementation of the set goals and the efficiency of com-pany operations. The SB paid close attention to developmental orienta-tions, risk management and improve-ments of the company. Its proactive-ness and recommendations raised the company to a higher level of cor-porate governance.
The reports and data prepared by the Management Board enabled the Su-pervisory Board to conduct efficient supervision and reach informed and competent decisions. The Manage-ment Board observed and acted, ex-cept in certain legal matters, on the recommendations, instructions and resolutions adopted by the Super-visory Board, and prepared reports on their implementation regularly. In compliance with the company Arti-cles of Association, the Supervisory Board granted approvals to individual company transactions. At its meet-ings, the Supervisory Board adopted the following decisions regarding individual tasks and areas of opera-tions:
Appointment of the Chairman of the Management Board• The Supervisory Board carried out
the selection procedure, the ap-pointment and the definition of rights and duties of the new Chair-man of the Management Board. While doing that, it acknowledged the recommendations from the Code of Corporate Governance of State-Owned Enterprises, prac-tical instructions for supervisory boards on management staffing, and the specificity of the company
1703 SUPERVISORY BOARD REPORT Elektro Celje ANNUAL REPORT 2016
or sector. It acknowledged the ex-clusion and evaluation criteria, the required profile of competences, the psychological evaluation re-sults and the integrity of the work programme and candidates’ vision during the selection process. Both the external and the internal candi-dates that had applied were treat-ed in the same manner throughout the selection procedure.
• Pursuant to the Companies Act (ZGD-1), the Supervisory Board made sure that the total remunera-tion paid out to the Management Board is in proportion to the Man-agement Board’s tasks and the fi-nancial position of the company, as well as in compliance with the Act Governing the Remuneration of Managers of Companies with Majority Ownership held by the Re-public of Slovenia or Self-Govern-ing Local Communities.
Strategic planning and business ex-cellence• The SB monitored the realisation of
strategic goals set out in the Strate-gic Business Plan of the company for the period 2015-2018, and not-ed the preparation activities for a new Strategic Business Plan.
• After putting the company on the path to business excellence, it not-ed the self-appraisal report follow-ing the EFQM excellence model in 2016 and supported the company when it applied for an evaluation to receive a Business Excellence Prize of the Republic of Slovenia.
Operations supervision• The Supervisory Board (SB) was
presented with Quarterly Reports on the operations and performance of the company Elektro Celje, d.d., and the companies ECE d.o.o. and MHE ELPRO d.o.o. within the Elek-tro Celje Group, examined reports on the collection of outstanding receivables and liabilities and on legal matters, while monitoring the company performance indicators carefully;
• The SB read the Quarterly Reports on Risk Management in the compa-ny Elektro Celje, d.d. and drew at-tention to possible risks in specific business areas, and suggested that the risk assessment methodology be modernised.
• From the Management Board of the company EC, the SB received and examined the report of the company ECE d.o.o. on the realisa-tion of synergies from the merger of the companies ECE and EGP, as well as the reports of the Share-holders Assemblies of the compa-ny ECE d.o.o.
• The SB approved the Business Plan of the company Elektro Celje, d.d., and Elektro Celje Group for 2017, complete with the starting points for 2018 and 2019.
• The SB monitored the company’s project to buy back its Treasury Shares.
Company organisation• The SB confirmed the establish-
ment of a new staff duty for or-ganisational development and other recommended organisa-tional changes in the company to strengthen business processes. These changes were introduced on 1 May 2016, and again on 1 Janu-ary 2017.
• The SB examined individual busi-ness processes in greater detail, especially processes of orders, purchases, conclusion of contracts and staffing, and recommended which improvements could be made, pointing out potential risks.
• The SB monitored activities to dis-cover possibilities for merging sub-sidiaries with strategic partners.
Digitalization• The SB examined the Contract with
Informatika d.d. on Information Ser-vices and recommended several adjustments.
• The SB gave consent to a Contract with Informatika d.d. for the intro-duction of a system for managing and maintaining resources, and monitored the renewal project.
• The SB gave consent to the Con-tract on Enterprise Resource Plan-ning (ERP) Microsoft Dynamics AX system and monitored the renewal project.
Contracts• The SB consented to the execution
of important transactions in accord-ance with the company’s Articles of Association.
• The SB reviewed individual Con-tracts, especially Contracts for loans, insurance, information sup-port and purchase of key equip-ment, and demanded additional ex-planations, which it also received.
• With the help of the transaction re-garding the contract overview of information service maintenance from the Internal Audit Department, it introduced changes in the quality of the contracts concluded and in-ternal regulations for that area.
Internal Audit• The SB confirmed the Operations
Plan for the Internal Audit Depart-ment for 2016, the multi-annual Operating Plan of the Internal Audit Department, and the update of the fundamental document of Internal Audit Department activities with new Standards, and confirmed the Annual Report on the Internal Audit Department activities for 2015.
Shareholders Assembly• The SB approved the Annual Re-
port of the company Elektro Celje, d.d. for 2015, and the Consolidated Annual Report of the Elektro Celje Group, and adopted the report on the Annual Report audit.
• The SB approved the Audit Report on the operations of the companies in 2015.
• The SB proposed to the company’s Shareholders Assembly that they appoint the auditing firm BDO Re-vizija, d.o.o., as the authorised Au-ditor for the fiscal year 2016, and concluded a Contract with the same.
18 03Elektro Celje ANNUAL REPORT 2016
• The SB proposed to the compa-ny’s Shareholders Assembly that they adopt the Decision on grant-ing a discharge from liability to the company Management Board and Supervisory Board for 2015, and approved the proposal of the Man-agement Board for the allocation of distributable profits.
Corporate governance• The SB adopted the Management
Policy, which represents a frame-work of company management and in which the Supervisory and Man-agement Boards, in accordance with legal and statutory provisions, under-take to disclose how they intend to oversee and manage the company.
• The SB adopted the dividend pol-icy of the company and the man-agement revenue policy.
• The SB adopted a profile of compe-tences for members of the compa-ny’s Supervisory Board with regard to the optimum size and structure of the SB, and recommended that the Shareholders Assembly ap-point a Supervisory Board mem-ber as a member’s mandate had expired, and amend the Articles of Association of the company.
• The SB renewed the rules of pro-cedure regarding the work of the Supervisory Board and the Audit Committee.
• The SB was presented with the updated Code of Ethics and the reports of the Corporate Integrity Compliance Officer
IV. SUPERVISORY BOARD AUDIT COMMITTEE
Prior to the Supervisory Board meet-ings, the Audit Committee reviewed business reports for the reporting pe-riod and provided its opinion thereon to the Supervisory Board and rec-ommendations for the Management Board. It worked in close cooperation with the Internal Audit Department. At its meetings, the Committee dis-cussed the areas of financial report-ing, the internal control system and risk management systems regularly. It studied the individual reports by the Internal Audit Department and reports on the status of outstanding receivables and liabilities, while ex-amining in detail the individual key processes or operations.
In addition, the Committee con-ducted two separate interviews with the internal and independent auditors, without the Management Board being present. It participated in the selection process for Financial Statement auditors and held several interviews with them. The Committee also reviewed the unaudited and au-dited Annual Reports of the company of Elektro Celje, d.d., and the Consoli-dated Annual Report of the Elektro Celje Group, providing its opinion for the Supervisory Board.
The Audit Committee reported on its operations to the Supervisory Board, providing the perspective and rec-ommendations to the points under evaluation. All members of the Su-pervisory Board receive Minutes from the meetings of the Audit Commit-tee, which ensures the transparency of the Committee’s operation and greater efficiency of the Supervisory Board. The Audit Committee’s self-appraisal concerning its work in 2016 was performed in February 2017. The results have shown that the commit-tee performs its tasks well; however, activities will be implemented in ar-eas with opportunities for improve-ment.
V. SUPERVISORY BOARD COMPO-SITION AND SELF-APPRAISALThe members of the Supervisory Board representing the sharehold-ers were appointed via a structured nomination accreditation procedure by the former Capital Assets Manage-ment Agency (AUKN) and the Slo-vene Compensation Company (SOD) referred to as SDH, d.d. in 2016, and subsequently elected and, thus, con-firmed by the Shareholders Assem-bly; the employee representatives were elected by the Works Council.
All Supervisory Board members meet, in addition to the statutory criteria, the requirements of the Corporate Governance Code for state-owned assets of the Republic of Slovenia. The members of the board have rel-evant education, expertise, work ex-perience, skills, and they are not in any potential conflict of interest with the company. They provide expert knowledge from different fields, as well as complementary knowledge and skills. The two employee repre-
sentatives also support the functions of the Supervisory Board with their long-years` experience and specific knowledge of power distribution and the conditions in the company.
The members of the Supervisory Board supervise the work of the company Management Board in a re-sponsible and professional manner, which also reflects their personal in-volvement. The members are allowed to carry out their functions indepen-dently and objectively, but must ac-knowledge the interest of the com-pany and the principles of corporate governance and good practice. They are committed to personal integrity and business ethics. All members of the Supervisory Board have signed the Statements of Independence and Absence of Conflict of Interest, pub-lished on the company website.
In 2016, the Shareholders Assembly acknowledged the recommendations of the Supervisory Board and adopt-ed a Resolution to disburse funds for this purpose. Members of the Super-visory Board take part in training and education in specific fields that are relevant to the function of supervis-ing the company’s operations on their own initiative. Members of the Supervisory Board take part regularly in educational meetings organised by SSH, while also monitoring changes in the legislation, following current events that are important for the com-pany’s operations, or taking part in them.
The Supervisory Board continued what it had been practising in the past few years and conducted a self-as-sessment, or an assessment of work efficiency to improve the efficiency, communication and quality of work conducted by the Supervisory Board and Audit Committee and improve commercial practices. The Slovenian Directors’ Association methodology was applied. The joint assessment was higher than the assessment from the previous year. The Supervisory Board examined each area that had not achieved the planned assess-ment individually, and adopted ap-propriate measures.
1903 SUPERVISORY BOARD REPORT Elektro Celje ANNUAL REPORT 2016
VI. SUPERVISION OF COMPANY AND GROUP OPERATIONS AFTER THE END OF THE FISCAL YEAR
After the end of the fiscal year 2016, the Supervisory Board devoted spe-cial attention to staffing, alteration of business processes, Risk Manage-ment, corporate integrity and Internal Audit Department activities, examina-tion of the Annual Management Plan of SDH d.d., examination of the state when the company acquired its own shares, examination of the company’s Annual Report for 2016, the review of the recommendation to alter the Stra-tegic Business Plan and supplement the Business Plan of the subsidiary MHE ELPRO d.o.o., and to monitoring of the final phase of auditing the Fi-nancial Statements for 2016.
V. AUDIT AND APPROVAL OF THE ANNUAL REPORT
The Supervisory Board reviewed the audited 2016 Annual Report of the company Elektro Celje, d.d., and the Elektro Celje Group for 2016 at its 5th regular session held on 25 May 2017.
The Audit of the Annual Report was carried out by the authorised audit company, BDO Revizija, d.o.o. The company’s subsidiary ECE, d.o.o. was audited as well. The audit company gave a favourable opinion on the An-nual Report of Elektro Celje d.d. on 28 April 2017, as well as on the Con-solidated Annual Report of the Elek-tro Celje Group for 2016.
In accordance with good practice, the Audit Committee examined the Annu-al Report for 2016, including the Audit Report and letter to the Management, and gave recommendations on sup-plementation, views and opinions, which were acknowledged by the Su-pervisory Board. It conducted these examinations prior to the meeting of the Supervisory Board and with due attention and in accordance with good practice.
The Supervisory Board discovered that the Annual Report of the Elek-tro Celje Group for 2016, which was prepared by the Management Board and reviewed by an Auditor, was drafted in a clear and transparent manner, and is in accordance with the provisions of ZGD-1, the Slovenian Accounting Standards that apply to the company, and the International Standards that apply to the Elektro Celje Group. The Supervisory Board believes that the Annual Report of the company and the Elektro Celje Group is a credible reflection of the compa-nies’ operations in the past financial year, and presents a true and fair view of the financial state of Elektro Celje, d.d., and the Elektro Celje Group on 31 December, 2016, of its Profit or Loss and Cash Flows in 2016.
Therefore, based on its own audit of the Annual Reports, the review of the Audit Report issued by the certified auditor for 2016, and the report by the Supervisory Board Audit Commit-tee on the audit of the Annual Report of the company Elektro Celje, d.d., for 2016 and of the Consolidated Annual
Report of Elektro Celje Group:• The Supervisory Board of the com-
pany Elektro Celje, d.d., approves, without any comments, the An-nual Report of the company Elektro Celje, d.d. for 2016 and the Consoli-dated Annual Report of the Elektro Celje Group for 2016.
• The Supervisory Board of the com-pany Elektro Celje, d.d., gives a positive opinion on the Audit Re-port on the companies’ operations in 2016, as it finds that the Report was compiled in conformity with the relevant law and prepared on the basis of a careful and compre-hensive review of the operations and performance and the Annual Reports of Group companies.
• The Supervisory Board of the com-pany Elektro Celje, d.d., proposes to the Shareholders Assembly to adopt the Decision to grant dis-charge from liability to the compa-ny Management Board and Super-visory Board for the year 2016, for it judges that the company opera-tions were carried out in conformity with the set goals and the Business Plan for 2016.
• The Supervisory Board hereby adopts the Supervisory Board Au-dit Committee Report on the audit of the Annual Report of the compa-ny Elektro Celje and of the Consoli-dated Annual Report of the Elektro Celje Group for 2016.
Celje, 25 May 2017
Chairman of the Supervisory BoardMirjan Trampuž, MSM and MSc Ener-getics

21Elektro Celje ANNUAL REPORT 2016
RELATIONSHIP
ENTREPRENEURSHIPWe continuously strengthen self-initiative and entrepreneurial spirit. We strive to create a productive work environment, enabling personal and professional development of all employees. We encourage creativity and identification of opportunities for improvement.
22 04Elektro Celje ANNUAL REPORT 2016
04 OVERVIEW OF MAJOR EVENTS
January
March
April
• On 1 January 2016, the organisa-tional units Rogaška Slatina and Šmarje pri Jelšah control units were abolished with a new organi-sational unit − the Mestinje control unit formed in their place. The or-ganisational unit Selce Warehouse was also abolished.
• On 20 January 2016, a control audit of the occupational health and safe-ty management system performed by external examiners of the test-ing, inspection and certification firm Bureau Veritas Certification
showed that our company honours the commitments made when we introduced the occupational health and safety management system.
• On 21 January 2016, the Govern-ment of the Republic of Slove-nia appointed two inter-sectoral groups in the field of energy in-dustry to find synergy effects in investing in construction of smart grids and broadband infrastructure. The task of the working group for the regulation of the DNSO’s PU service is to perform activities nec-
essary for the implementation of engagements from the response report and to create a plan of ac-tivities necessary for achieving the objectives of acquiring 100% state ownership stakes in the five EDCs and to divest or break-up subsidiar-ies for the sale and trading of elec-tricity from their parent distribution companies, which own a significant part of the distribution network in the Republic of Slovenia, or other-wise to reorganise the distribution groups into holding companies.
• At its 5th regular session held on 21 March 2016, the Supervisory Board of the company adopted the decision to appoint a new Chairman of the Management Board. The position of Chairman
of the Management Board of the company Elektro Celje for the sub-sequent four-year term. extending from 1 May 2016 to 30 April 2020 was given to Boris Kupec, BSEE, MSc.
• The company Elektro Celje agreed to submit the application for the EFQM Business Excellence model in accordance with the decision of the Supervisory Board.
• A scheduled general strike with re-quirements which were submitted to the Government of the Republic of Slovenia pursuant to the provi-sions of the Strike Act took place in the company in the period from 4 to 18 April 2016 in accordance with the decision of the committee of the Trade Union of Energy Sector Workers of Slovenia.
• At the second strategic confer-ence of Slovene Electricity Distri-bution, which was held on 5 April, EDCs presented the state of devel-
opment of smart grids in Slovenia, highlighting legislative barriers and emphasising numerous advantag-es and challenges of smart grids for end users.
• At the Energetika (Energy Indus-try) Fair, which took place from 12 to 15 April, the company Elektro Celje together with its partnership companies ECE d.o.o. and Gore-njske elektrarne, d.o.o. presented themselves, together with the European Development Project Flex4Grid. The project is aimed
at developing a smart grid of the future which will enable users to adapt the consumption or produc-tion of electricity to the needs of other stakeholders of the distribu-tion network.
• The company began the pro-cess of the third self-appraisal, conducted on the basis of the EFQM model in April. In addition to appraising and acknowledging achievements, the motivation for participation was above all bench-marking with top organisations.
2304 OVERVIEW OF MAJOR EVENTS Elektro Celje ANNUAL REPORT 2016
August
June
May
• On August 31 2016, at the 21st regular Shareholders Assembly of Elektro Celje, d.d., the sharehold-ers were informed of the company’s operations in 2015 and presented with the reports of the Manage-ment and Supervisory Boards. The shareholders adopted the decision on the use of distributable profit in the amount of EUR 3,235,246.43, that is: EUR 3,234,527.22 to be used for dividend pay-outs in the gross amount of EUR 0.1337 per share, with the remainder of the distributable profit amounting to EUR 719.21 EUR to remain unal-
located. The audit company BDO revizija was appointed as the certi-fied auditor for the fiscal year 2016. The shareholders appointed Miha Kerina, MSc as a new Supervisory Board member, effective as of 1 September 2016 and approved the proposal of payments to the Super-visory Board members. The share-holders approved the amendment and supplementation of the com-pany’s Articles of Association pur-suant to the proposed text of the Articles of Association of the pro-poser, the company SDH, d.d., and adopted a decision authorising the
Management Board to acquire and dispose of the company’s treasury shares.
• Self-appraisal based on the EFQM model was concluded and a re-sponse to a call for tenders for the PRSPO Business Excellence pre-pared.
• A contract for purchasing me-ters and related equipment was signed in August between the supplier of the equipment and four EDCs, with a schedule plan for sup-plying the meters by the end of 2016 prepared.
• In June 2016, the company Elektro Celje, d.d. decided to implement two major infor-mation projects, which will be launched by the end of 2017: - establishment of a compre-hensive information system to support operations (ERP – En-
terprise Resource Planning) − the Microsoft Dynamics AX system, with the company Informatika d.d. being the contractor and the company Adacta d.o.o. being the subcontractor will be established. - establishment of the asset man-agement system (EAM – Enter-
prise Asset Management). The IBM Maximo system will be established with the company Informatika d.d. being the contractor and the com-panies Troia d.o.o. and IBM d.o.o. being subcontractors.
• Replacement of the e-mail pro-vider and Lync cooperation tool began. The existing e-mail boxes
and Lync accounts hosted on the infrastructure of the company In-formatika d.d. were migrated to the
cloud of the company Microsoft Of-fice365.
24 04Elektro Celje ANNUAL REPORT 2016
October
• External audits of management systems (quality and environmental management systems) were conducted in October.
November
• On 11 November 2016 the company Elektro Celje, d.d. began implementing the programme of purchasing treasury shares outside the organised market based on the decision adopted at the Shareholder’s Assembly.
Events after the End of the Accounting Period
• Changes to the Organisation of the Company Elektro Celje
Certain organisational changes were implemented on 1 January 2017 after consultation with social partners and with the consent of the company’s Supervisory Board. In a period of in-creasing speed of change, the com-pany has to also make adjustments to certain processes and find a way to respond to these changes. If we wish to be successful, we have to find ca-pacities to enable us to operate more effectively. These capacities are also reflected in the organisational struc-ture itself.
• Calculating Network Charges on 2 January 2017
The 2nd of January is a holiday pur-suant to the Act Amending the Pub-lic Holidays and Work-off Days in the Republic of Slovenia Act (Official Gazette of the Republic of Slovenia, No. 83 dated 23 December 2016). In accordance with the guidelines re-ceived from the EAgen, we have noti-fied our customers that the change of daily periods in calculating network charges would be arranged remotely for meter points included in the ad-vanced metering system by 2 January 2017 and that the timely adaptation of metering devices will be possible. At meter points where the change of
daily periods in charging for the net-work charge requires a visit to the meter point in the field, the change will be implemented by the end of 2017 as adaptation in the short time available is not possible. At these meter points, the network charge will be, in accordance with the opinion of the EAgen, calculated identically on 2 January 2017 as on working days.
• Amendment no. 5 to the Agree-ment on the Lease of Electric-ity Distribution Infrastructure and Provision of Services for the Dis-tribution Network System Opera-tor for the regulatory period 2016-2018 was signed in February.
September
• The document referred to as the Rules of Management of the com-pany Elektro Celje, d.d. effective as of 1 September 2016 was es-tablished for managing processes related to the adopted standards.
• The newly constructed DS 110/20 kV Žalec distribution substation was opened in September. The in-vestment worth slightly more than EUR 5 million is of vital importance for further economic development of the Savinjska region. The facil-ity currently supplies the entire Arnovski gozd business zone, the Juteks complex and the company Novem Car Interior with electric-ity. New underground cables to
the town of Žalec and supply lines towards Celje were constructed. The new Žalec distribution substa-tion enables, among other things, a quicker and simpler transition of the town of Celje to a higher volt-age level.
• Internal audits of quality, environ-mental, and occupational health and safety management systems were conducted in September. A review of system functioning was performed by the Management System Council, all documents were reviewed and the process of updating the documents started.
• The first assessment of the EU project Flex4Grid, which is usu-
ally performed for such projects at the mid-term of the duration of the project, was held in mid-Septem-ber. The company Elektro Celje, d.d. successfully presented a work package entitled “Implementa-tion and Validation of Project Pilot Testing” and exceeded the expec-tations of the European Commis-sion with certain results. Thus, the company began the second part of the project and consequently, while the second part of financing of the project from the EU Financial Framework Horizon 2020 will also be approved.
2505 COMPANY GOVERNANCE AND MANAGEMENT Elektro Celje ANNUAL REPORT 2016
05 COMPANY GOVERNANCE AND MANAGEMENT
The corporate governance bodies at Elektro Celje are: the Management Board, the Supervisory Board and the Shareholders Assembly.
The Management Board is com-posed of a single member appointed by the company’s Supervisory Board for a four-year mandate. In 2016, the company Elektro Celje was managed by the Management Board, repre-sented by the Chairman of the Man-agement Board Rade Knežević, BSEE during the period from 1 January 2016 until his retirement on 30 April 2016. Boris Kupec, MSc was given the position as new Chairman of the Management Board for a four-year mandate from 1 May 2016 to 30 April 2020 by the Supervisory Board of the company Elektro Celje at its 5th ses-sion, held on 21 March 2016.
The Supervisory Board is composed of six members, two of whom are employee representatives. The mem-bers of the Supervisory Board are ap-pointed for four-year terms and are eligible for re-election. The members of the Supervisory Board represent-ing capital are appointed to the board by the Shareholders Assembly with a simple majority of the sharehold-ers present. The two board members representing employees are appoint-ed by the company’s Works Council.
In 2016, the company’s Supervisory Board was composed of:
Representatives of shareholders:Mirjan Trampuž, MSM and MSc Ener-getics, MBA – Chairman of the Super-visory Board
Dejan Božič, MBA – Deputy Chair-man (until 19 June 2016)Mitja Vatovec, BA in Economics – member of the Supervisory Board (from 1 January 2016 to 12 Sep-tember 2016) and Deputy Chairman (from 13 September 2016)Tatjana Habjan, BA in Economics – member of the Supervisory BoardMiha Kerin, MSc – member of the Su-pervisory Board (from 1 September 2016)
Representatives of employees:Tomislav Pajić, BSc in energy tech-nology – member of the Supervisory BoardBoris Počivavšek – member of the Supervisory Board
5.1 Elektro Celje Corporate Governance StatementThe Management and Supervisory Boards of the company Elektro Celje, d.d. declare that the management of the company in 2016 was carried out in accordance with the laws and regu-lations, the Articles of Association of the joint-stock company Elektro Celje as well as the recommendations and expectations of Slovenski državni holding d.d. - Slovene Sovereign Hold-ing (February 2016, published on its website www.sdh.si).
In its work and operations, Elektro Celje voluntarily observes and applies the Corporate Governance Code for Companies with Capital Assets of the State (March 2016, published on the website of Slovene Sovereign Holding (SSH); www.sdh.si).
The Corporate Government Statement is an integral part of the 2016 Annual Report and is accessible on the com-pany’s website www.elektro-celje.si.
The Management Board represents the company and manages the com-
pany’s business independently and on its own responsibility. In doing so, it makes decisions in line with the strategic goals of the company and to the benefit of the shareholders. The system of governance and manage-ment steers the company and enables supervision over the company and its controlled undertakings. It defines the distribution of rights and respon-sibilities among the managing bodies, determines the rules and procedures to follow in deciding on corporate is-sues, provides a framework for set-ting, achieving and supervising the achievement of business goals, and establishes the values, principles and standards of fair and responsible de-cision-making and behaviour in all as-pects of the company’s business. The applicable regulations important for the operation of the company as well as the company’s Articles of Associa-tion are published on the company’s website (www.elektro-celje.si).
The governance and management sys-tem is a means for achieving the com-
pany’s long-term strategic goals and the manner in which the Management Board and the Supervisory Board of the company Elektro Celje, d.d., carry out their responsibility towards share-holders and other stakeholders of the company. The vision and objective of Elektro Celje and its subsidiaries is the implementation of modern principles of governance and management and represents the fullest conformity with advanced business practices in Slove-nia and abroad.
Explanations Relating to the Code of Corporate Governance of State-Owned Enterprises and Recommen-dations and Expectations of the Slo-venian Sovereign Holding.
In 2016, the company’s operation did not deviate from the principles, pro-cedures and criteria prescribed by the above code or from recommen-dations and expectations of the com-pany SSH. The company declares that it may depart from the latter when the provisions of the said code or recom-
26 05Elektro Celje ANNUAL REPORT 2016
mendations and expectations are al-ready governed differently by the law or the company’s Articles of Associa-tion, when non-mandatory actions are not prescribed in the company acts, or when practices are not established as legal obligations.
The company’s operations deviated from the following principles, proce-dures and criteria:- Public Obligations and Duties –
Section 5.1.2:The company Elektro Celje, d. d. has no public obligations and duties.
- Non-Economic Goals – Section 5.1.3:The company Elektro Celje, d. d. has no non-economic goals.
- Supervisory Board – The selection procedure of candidates for the Su-pervisory Board and proposal-mak-ing for the Assembly – section 6.8.1, Section 6.8.2:
In 2016, the Supervisory Board did not set up a Nomination Committee for the selection procedure of candi-dates for the Supervisory Board and, consequently, accepted no new ex-ternal members. In accordance with Section 6.8.7, the Supervisory Board functioned as a Nomination Commit-tee and followed the proposals from Sections 6.8.3 to 6.8.5.
- Management Board, or Manage-ment – Remuneration paid out to the Management Board members – Sec-tion 7.3:
The Supervisory Board determines the remuneration paid out to the Man-agement Board members pursuant to the Act Governing the Remuneration of Managers of Companies with Ma-jority Ownership held by the Republic of Slovenia or Self-Governing Local Communities (Official Gazette RS, nos. 21/10 and 8/11).
It is this company’s opinion that the members of the Supervisory Board are professional, responsible and inde-pendent in performing their duties and act in accordance with the provisions of the said Code as well as recommenda-tions and expectations of SHH.
The company also declares that in 2016, the Management Board of the controlling company has actively fol-lowed and directly supervised the op-
eration of the controlled undertakings ECE, d. o. o., and MHE – ELPRO, d. o. o., in accordance with strategic guide-lines, with the purpose of achieving the set business objectives. In the governance and management of its subsidiaries, the company has im-posed uniform corporate governance standards as apply for the controlling company in the Elektro Celje Group.
Elektro Celje will continue to observe the recommendations of SSH in the future, fine-tuning and improving its management system accordingly. In the case of any departure from the present statement on the Code’s ob-servance, the company will see to its timely publication.
Clarifications in accordance with the Companies ActPursuant to the provision of Paragraph 5 of Article 70 of the Companies Act (ZGD-1), which establishes the mini-mum required contents of the cor-porate governance statement, the company Elektro Celje sets forth the following clarifications:
1. Description of the principal char-acteristics of internal control and risk management systems in the company in connection with the fi-nancial reporting procedure.Internal controls represent guidelines and procedures that the company Elektro Celje conducts at all levels to manage risks, including those re-lated to financial reporting. The pur-pose of this process is to ensure the efficiency and success of operations, and the reliability of financial report-ing in accordance with applicable laws and other external and internal regulations. Accounting controls are based on authenticity verification, the division of responsibilities, transaction execution control, up-to-date record keeping, and checking if the balance in accounting records corresponds to the actual situation.
The company has established a system of internal controls and Risk Manage-ment related to financial reporting. In this system, controls are integrated into business processes and systems, more precisely, they are connected with fi-nancial reporting procedures, and de-fined in the accounting rules and regu-lations, the provisions of the financial
regulation, the provisions of stock veri-fication and precise guidelines within the scope of ISO documents. The controls include, among other things, double control and confirmation of ac-curacy, completeness and authenticity of transactions, which must be proven with invoices and other accounting documents, verification of accounting situations (e.g. by checking if the fig-ures correspond with those of buyers and suppliers, checking if the balance in books corresponds with the actual balance) and the limitation of authority and responsibility (e.g. separate book-ing and payment of invoices, obligatory additional confirmation of payments).
Accounting controls are related close-ly to controls in the field of Information Support which, among other things, guarantee limitations and monitoring of data and application access (access rights are granted selectively) as well as completeness (systemic control) and accuracy of data collection and processing.
The adequacy of internal controls is checked by an authorised audit compa-ny annually. In addition to that, the com-pany also established an Internal Audit reviewing the adequacy and efficiency of the established internal controls and their reliability when several risks are being managed simultaneously.
2. Significant direct and indirect ownership of the company’s securi-ties in terms of achieving a qualified holding, as determined by the act governing acquisitions.All company shares are ordinary reg-istered no-par value shares giving their holders the right to manage the company, and entitlement to a divi-dend and to the payment of remaining assets in the event of liquidation. All shares are of the same class and is-sued in un-certificated form. All shares are freely transferable.
The owner of a qualified holding as determined by the Takeovers Act of the company Elektro Celje, d.d., is as of 31 December 2016, the Republic of Slovenia, with a 79.50% ownership stake; that is 19,232,978 shares.
The company Elektro Celje has no share schemes for employees.
2705 COMPANY GOVERNANCE AND MANAGEMENT Elektro Celje ANNUAL REPORT 2016
3. Clarifications on each holder of securities with special controlling rights.Individual shareholders of the com-pany Elektro Celje, d.d. have no spe-cial controlling rights arising from their holding shares of the company. There are no special agreements that could result in a restriction on the transfer of shares or delegation of voting rights.
4. Clarifications concerning all re-strictions of voting rights.The shareholders of Elektro Celje, d.d. have no restrictions in exercising their voting rights.
5. The company’s rules on the ap-pointment and replacement of mem-bers of management or supervisory bodies and amendments to the Arti-cles of Association.Company regulations do not govern separately the appointment or re-placement of members of manage-ment or supervisory bodies or amend-ments to the Articles of Association. In such cases, the company refers en-tirely to the current legislation.
6. Authorisation to the management, particularly authorisations to issue or purchase treasury shares.In 2016, the company Elektro Celje, d.d. obtained an authorisation to re-deem treasury shares based on the decision of the Shareholder’s Assem-bly dated 31 August 2016 and adopted the Regulation on the treasury shares fund. Based on the authorisation of the general meeting valid for the period from 1 September 2016 to 31 March 2018, the company’s Manage-ment Board is authorised to acquire up to 2,419,242 shares in total, repre-senting 10% of the company’s share capital. The authorisation enabled the company’s Management Board to ac-quire up to 790,068 treasury shares in 2016, up to 781,443 treasury shares in 2017 and in 2018, treasury shares up to the amount of difference between 2,419,242 shares and acquired treas-ury shares in 2016 and 2017. Follow-ing the authorisation of the general
meeting, the company may purchase treasury shares in the period from 1 September 2016 to 31 March 2018 at a price not lower than EUR 2.38 and not higher than EUR 3.43 per share.
Based on the authorisation and deci-sion of the general meeting, the com-pany acquires shares for the purposes defined in paragraph one Article 247 of ZGD-1 due to increased value of the company’s assets and for other purpos-es. Following the authorisation of the general meeting and the conducted public call for shareholders to redeem treasury shares, the company acquired 227,661 treasury shares in 2016.
7. Activities of the company’s general meeting and its key responsibilities.In 2016, the Shareholders Assembly met once. The powers of the Share-holders Assembly and the sharehold-ers’ rights are specified by law and shall be exercised in the manner as provided in the company’s Articles of Association, assembly rules of proce-dure and by the Chair of the Assembly.
8. Data on the structure and opera-tion of the management and super-visory bodies and their commissions.A comprehensive presentation of the management and supervisory bodies and their commissions is given in the Annual Report 2016.
9. System of Operations Compliance and Corporate IntegrityA system of corporate integrity with elements containing elements defined by the Slovenian Guidelines of Corpo-rate Integrity was established and used in the company in 2016. Corporate in-tegrity and the related risks are inte-grated in the company’s existing risk management system. Risks related to corporate integrity are included in the Risk Register, where they are identi-fied, assessed and managed through proposed measures. Through a corpo-rate integrity officer, a mechanism for regular and comprehensive identifica-tion of corporate integrity risks, their assessment and a systematic and in-
dependent control of risk management efficiency was established.
The company’s corporate integrity is one of our strategic goals and as such, integrated into the strategic orienta-tion of the Elektro Celje Group. In this way, we wish to facilitate the attain-ment of set goals, promote proactive management, enhance the identifica-tion of opportunities and threats, act in compliance with the applicable regula-tions and standards, and increase op-erational efficiency and performance.
In 2016, we renewed the Code of Eth-ics defining the basic principles and rules followed by our personnel, pro-viding an additional basis for ensuring compliance of operations with posi-tive legislation and codes and a legal framework for ensuring data protection and integrity and prevention of discrim-ination of all forms in the workplace. The renewed Code of Ethics was dis-tributed to all employees in printed edi-tion and is published on the company’s intranet as well as its website for the purpose of informing the internal and external publics about its content. All employees have signed the statement on acquaintance with and observation of the provisions of the Code of Ethics. The company adopted additional or-ganisational and technical measures, enabling anonymous notification of any irregularities or violations of compli-ance of operations in the company by means of an additional communication channel. Any procedures of disclosure of conflicts of interest, self-elimination and adoptions of decisions on elimi-nation are also recorded through the corporate integrity officer appointed by the Management Board.
Pursuant to Article 60a of the Compa-nies Act, the Management Board and the Supervisory Board of the company Elektro Celje, d.d., jointly ensure that the Annual Report of the Company Elektro Celje and Elektro Celje Group for the year 2016 is compiled and published in compliance with the Companies Act and Slovenian Accounting Standards.
Chairman of the Management Board Chairman of the Supervisory BoardBoris Kupec, MSc Mirjan Trampuž, MSM and MSc Energetics
28 06Elektro Celje ANNUAL REPORT 2016
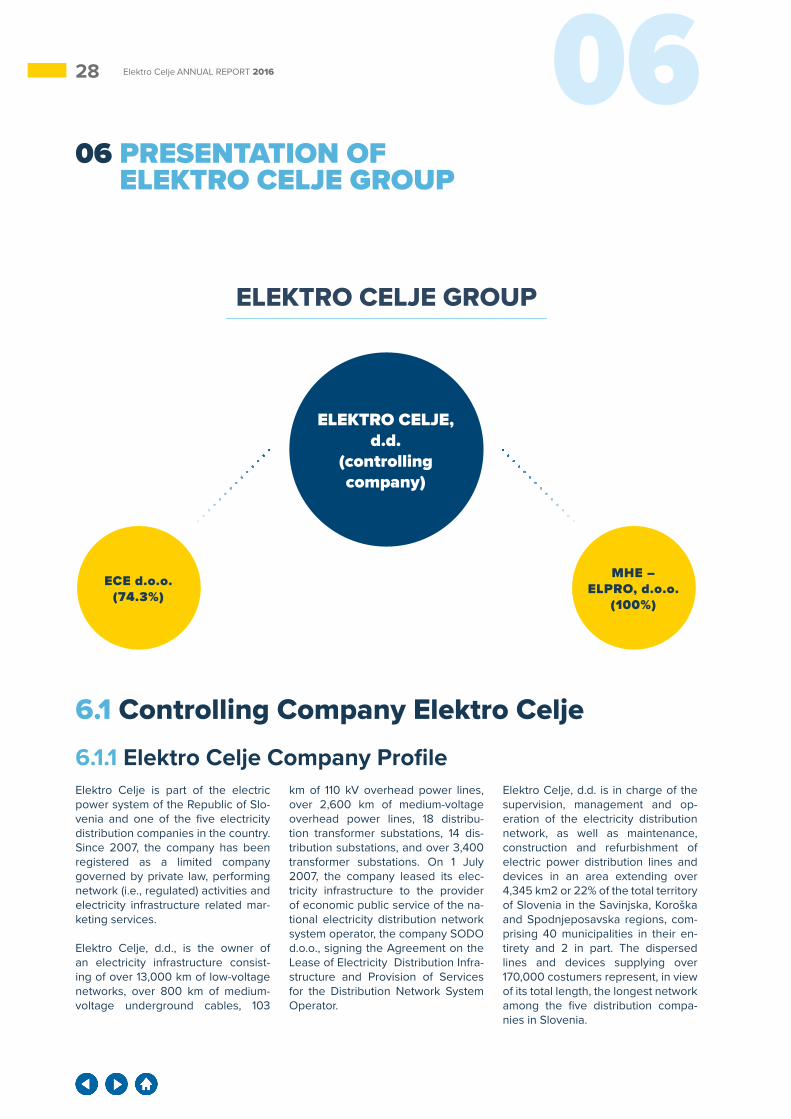
06 PRESENTATION OF ELEKTRO CELJE GROUP
ELEKTRO CELJE GROUP
ELEKTRO CELJE, d.d.
(controlling company)
ECE d.o.o. (74.3%)
6.1 Controlling Company Elektro Celje6.1.1 Elektro Celje Company ProfileElektro Celje is part of the electric power system of the Republic of Slo-venia and one of the five electricity distribution companies in the country. Since 2007, the company has been registered as a limited company governed by private law, performing network (i.e., regulated) activities and electricity infrastructure related mar-keting services.
Elektro Celje, d.d., is the owner of an electricity infrastructure consist-ing of over 13,000 km of low-voltage networks, over 800 km of medium-voltage underground cables, 103
km of 110 kV overhead power lines, over 2,600 km of medium-voltage overhead power lines, 18 distribu-tion transformer substations, 14 dis-tribution substations, and over 3,400 transformer substations. On 1 July 2007, the company leased its elec-tricity infrastructure to the provider of economic public service of the na-tional electricity distribution network system operator, the company SODO d.o.o., signing the Agreement on the Lease of Electricity Distribution Infra-structure and Provision of Services for the Distribution Network System Operator.
Elektro Celje, d.d. is in charge of the supervision, management and op-eration of the electricity distribution network, as well as maintenance, construction and refurbishment of electric power distribution lines and devices in an area extending over 4,345 km2 or 22% of the total territory of Slovenia in the Savinjska, Koroška and Spodnjeposavska regions, com-prising 40 municipalities in their en-tirety and 2 in part. The dispersed lines and devices supplying over 170,000 costumers represent, in view of its total length, the longest network among the five distribution compa-nies in Slovenia.
MHE ―ELPRO, d.o.o.
(100%)
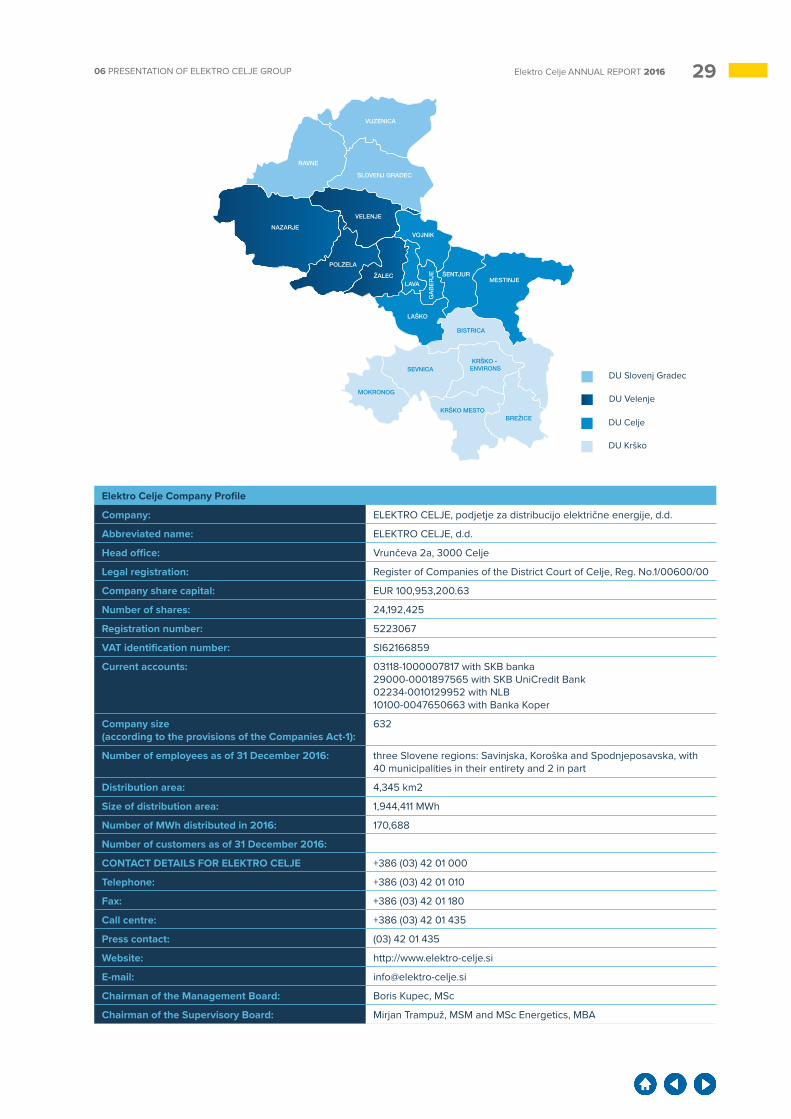
2906 PRESENTATION OF ELEKTRO CELJE GROUP Elektro Celje ANNUAL REPORT 2016
DU Slovenj Gradec
DU Velenje
DU Celje
DU Krško
Elektro Celje Company Profile
Company: ELEKTRO CELJE, podjetje za distribucijo električne energije, d.d.
Abbreviated name: ELEKTRO CELJE, d.d.
Head office: Vrunčeva 2a, 3000 Celje
Legal registration: Register of Companies of the District Court of Celje, Reg. No.1/00600/00
Company share capital: EUR 100,953,200.63
Number of shares: 24,192,425
Registration number: 5223067
VAT identification number: SI62166859
Current accounts: 03118-1000007817 with SKB banka29000-0001897565 with SKB UniCredit Bank02234-0010129952 with NLB10100-0047650663 with Banka Koper
Company size (according to the provisions of the Companies Act-1):
632
Number of employees as of 31 December 2016: three Slovene regions: Savinjska, Koroška and Spodnjeposavska, with 40 municipalities in their entirety and 2 in part
Distribution area: 4,345 km2
Size of distribution area: 1,944,411 MWh
Number of MWh distributed in 2016: 170,688
Number of customers as of 31 December 2016:
CONTACT DETAILS FOR ELEKTRO CELJE +386 (03) 42 01 000
Telephone: +386 (03) 42 01 010
Fax: +386 (03) 42 01 180
Call centre: +386 (03) 42 01 435
Press contact: (03) 42 01 435
Website: http://www.elektro-celje.si
E-mail: [email protected]
Chairman of the Management Board: Boris Kupec, MSc
Chairman of the Supervisory Board: Mirjan Trampuž, MSM and MSc Energetics, MBA
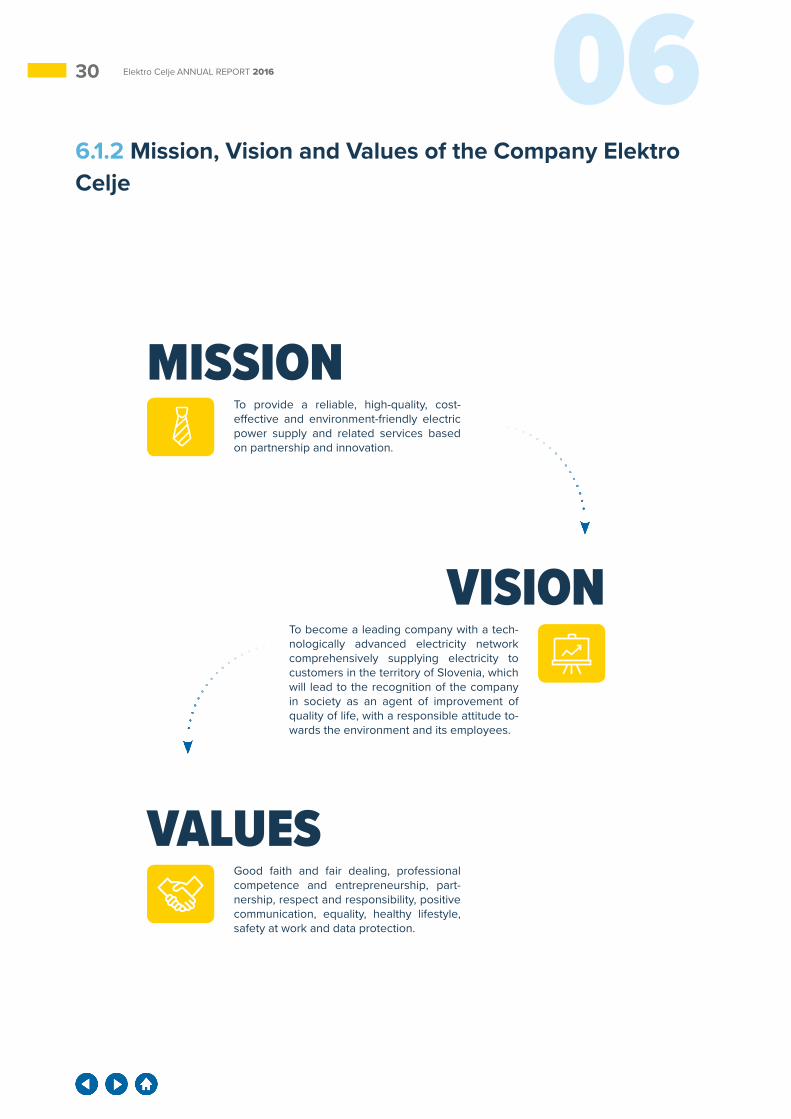
30 06Elektro Celje ANNUAL REPORT 2016
6.1.2 Mission, Vision and Values of the Company Elektro Celje
MISSIONTo provide a reliable, high-quality, cost-effective and environment-friendly electric power supply and related services based on partnership and innovation.
VALUESGood faith and fair dealing, professional competence and entrepreneurship, part-nership, respect and responsibility, positive communication, equality, healthy lifestyle, safety at work and data protection.
VISIONTo become a leading company with a tech-nologically advanced electricity network comprehensively supplying electricity to customers in the territory of Slovenia, which will lead to the recognition of the company in society as an agent of improvement of quality of life, with a responsible attitude to-wards the environment and its employees.
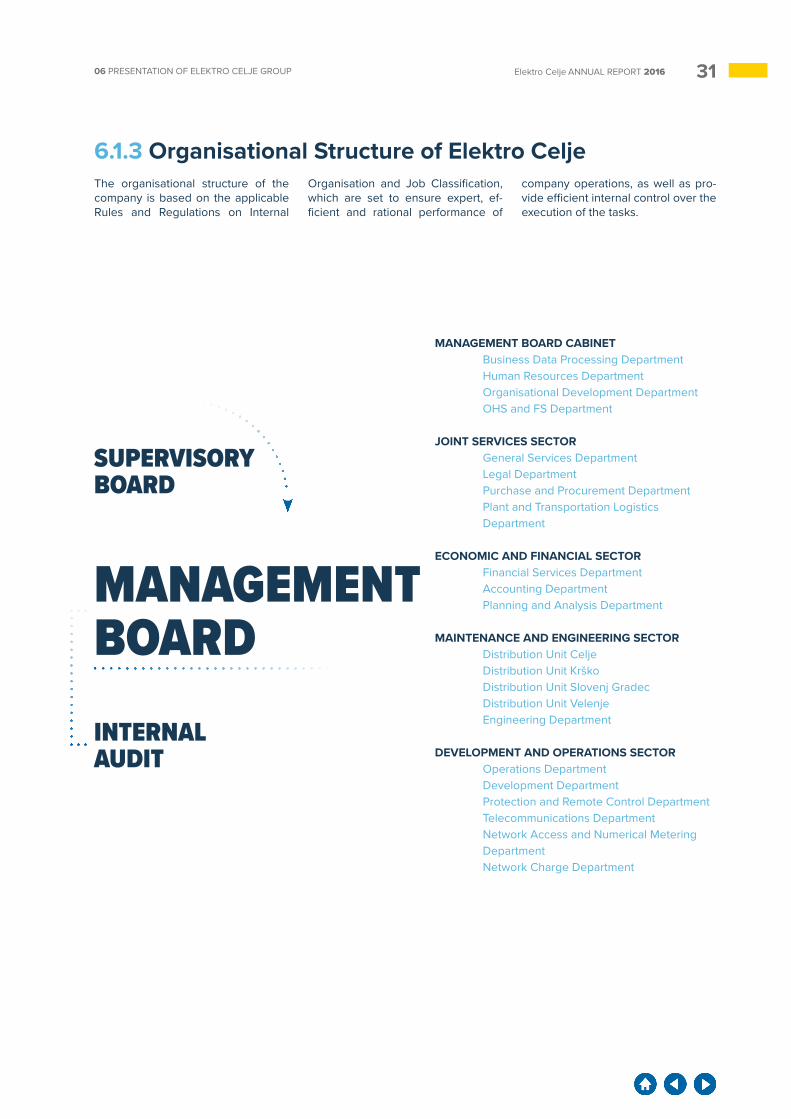
3106 PRESENTATION OF ELEKTRO CELJE GROUP Elektro Celje ANNUAL REPORT 2016
6.1.3 Organisational Structure of Elektro CeljeThe organisational structure of the company is based on the applicable Rules and Regulations on Internal
Organisation and Job Classification, which are set to ensure expert, ef-ficient and rational performance of
company operations, as well as pro-vide efficient internal control over the execution of the tasks.
MANAGEMENT BOARD CABINET Business Data Processing Department Human Resources Department Organisational Development Department OHS and FS Department
JOINT SERVICES SECTOR General Services Department Legal Department Purchase and Procurement Department Plant and Transportation Logistics
Department
ECONOMIC AND FINANCIAL SECTOR Financial Services Department Accounting Department Planning and Analysis Department
MAINTENANCE AND ENGINEERING SECTOR Distribution Unit Celje Distribution Unit Krško Distribution Unit Slovenj Gradec Distribution Unit Velenje Engineering Department
DEVELOPMENT AND OPERATIONS SECTOR Operations Department Development Department Protection and Remote Control Department Telecommunications Department Network Access and Numerical Metering
Department Network Charge Department
SUPERVISORY BOARD
INTERNAL AUDIT
MANAGEMENT BOARD
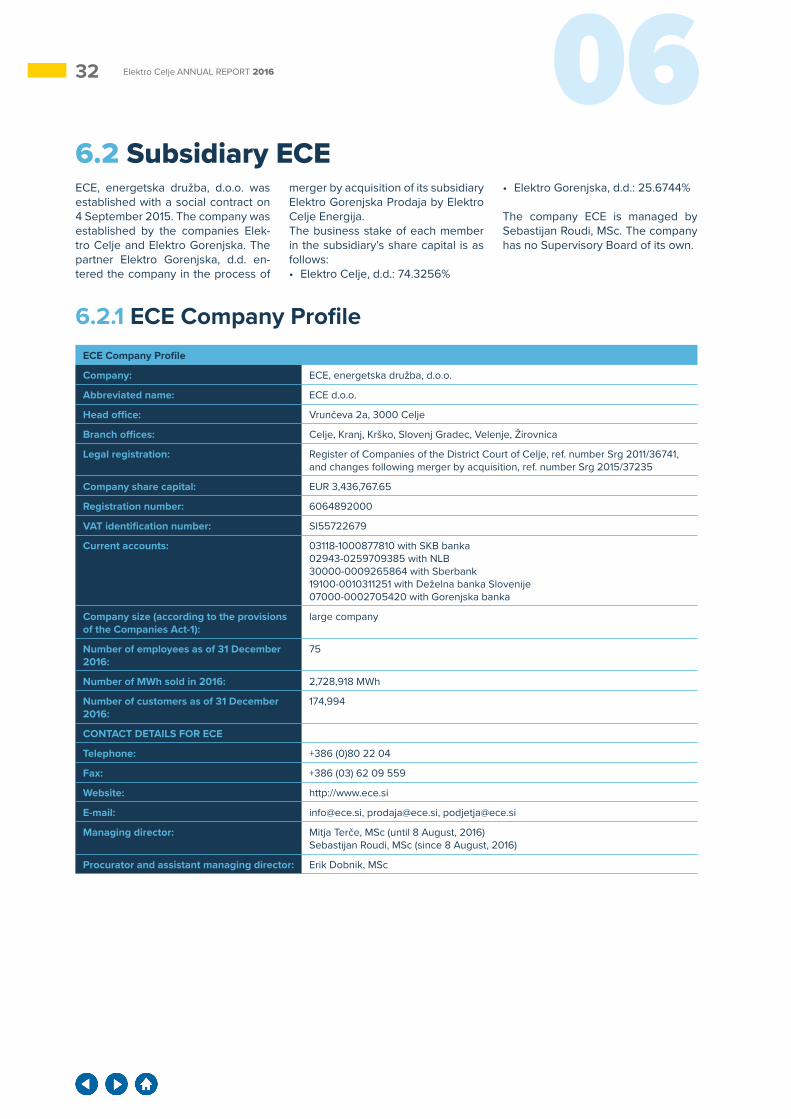
32 06Elektro Celje ANNUAL REPORT 2016
6.2 Subsidiary ECEECE, energetska družba, d.o.o. was established with a social contract on 4 September 2015. The company was established by the companies Elek-tro Celje and Elektro Gorenjska. The partner Elektro Gorenjska, d.d. en-tered the company in the process of
merger by acquisition of its subsidiary Elektro Gorenjska Prodaja by Elektro Celje Energija.The business stake of each member in the subsidiary’s share capital is as follows:• Elektro Celje, d.d.: 74.3256%
• Elektro Gorenjska, d.d.: 25.6744%
The company ECE is managed by Sebastijan Roudi, MSc. The company has no Supervisory Board of its own.
6.2.1 ECE Company ProfileECE Company Profile
Company: ECE, energetska družba, d.o.o.
Abbreviated name: ECE d.o.o.
Head office: Vrunčeva 2a, 3000 Celje
Branch offices: Celje, Kranj, Krško, Slovenj Gradec, Velenje, Žirovnica
Legal registration: Register of Companies of the District Court of Celje, ref. number Srg 2011/36741, and changes following merger by acquisition, ref. number Srg 2015/37235
Company share capital: EUR 3,436,767.65
Registration number: 6064892000
VAT identification number: SI55722679
Current accounts: 03118-1000877810 with SKB banka02943-0259709385 with NLB30000-0009265864 with Sberbank19100-0010311251 with Deželna banka Slovenije07000-0002705420 with Gorenjska banka
Company size (according to the provisions of the Companies Act-1):
large company
Number of employees as of 31 December 2016:
75
Number of MWh sold in 2016: 2,728,918 MWh
Number of customers as of 31 December 2016:
174,994
CONTACT DETAILS FOR ECE
Telephone: +386 (0)80 22 04
Fax: +386 (03) 62 09 559
Website: http://www.ece.si
E-mail: [email protected], [email protected], [email protected]
Managing director: Mitja Terče, MSc (until 8 August, 2016) Sebastijan Roudi, MSc (since 8 August, 2016)
Procurator and assistant managing director: Erik Dobnik, MSc
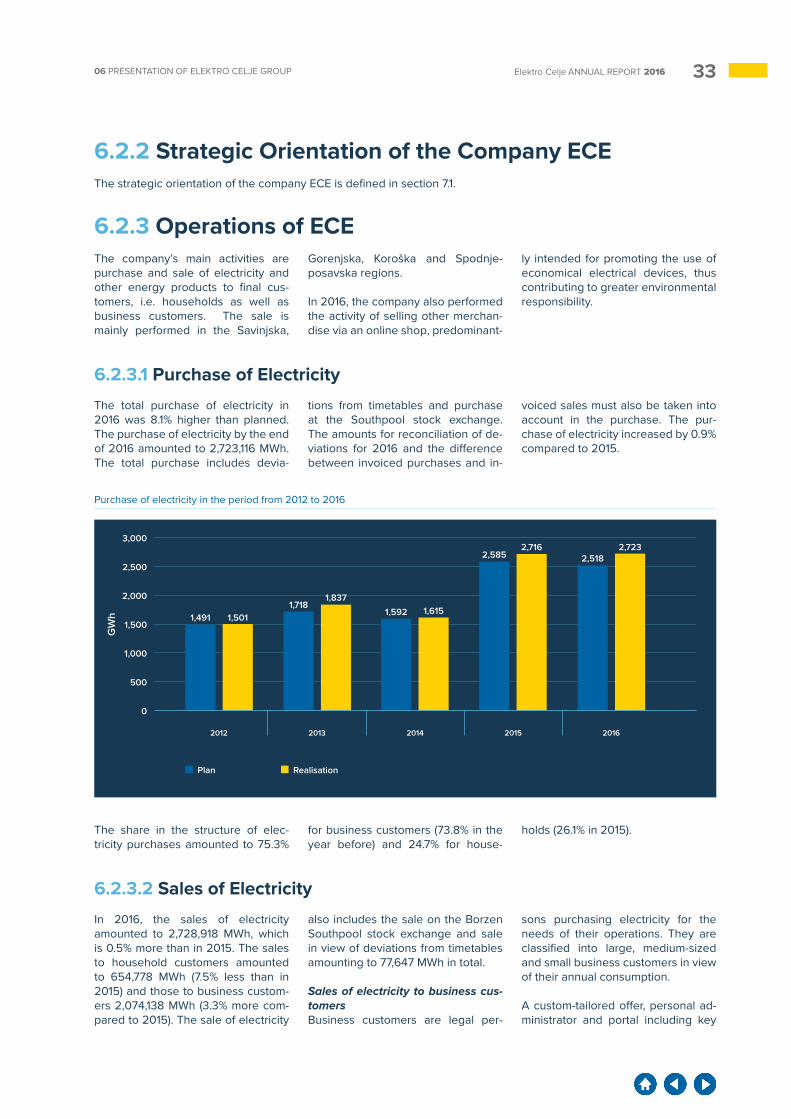
3306 PRESENTATION OF ELEKTRO CELJE GROUP Elektro Celje ANNUAL REPORT 2016
6.2.2 Strategic Orientation of the Company ECEThe strategic orientation of the company ECE is defined in section 7.1.
6.2.3 Operations of ECEThe company’s main activities are purchase and sale of electricity and other energy products to final cus-tomers, i.e. households as well as business customers. The sale is mainly performed in the Savinjska,
Gorenjska, Koroška and Spodnje-posavska regions.
In 2016, the company also performed the activity of selling other merchan-dise via an online shop, predominant-
ly intended for promoting the use of economical electrical devices, thus contributing to greater environmental responsibility.
6.2.3.1 Purchase of ElectricityThe total purchase of electricity in 2016 was 8.1% higher than planned. The purchase of electricity by the end of 2016 amounted to 2,723,116 MWh. The total purchase includes devia-
tions from timetables and purchase at the Southpool stock exchange. The amounts for reconciliation of de-viations for 2016 and the difference between invoiced purchases and in-
voiced sales must also be taken into account in the purchase. The pur-chase of electricity increased by 0.9% compared to 2015.
500
0
3,000
2,500
2,000
1,500
1,000
GW
h
2012 2013 2014 2015 2016
1,491
Plan Realisation
1,7181,501
1,8371,592 1,615
2,5852,716
2,5182,723
Purchase of electricity in the period from 2012 to 2016
The share in the structure of elec-tricity purchases amounted to 75.3%
for business customers (73.8% in the year before) and 24.7% for house-
holds (26.1% in 2015).
6.2.3.2 Sales of ElectricityIn 2016, the sales of electricity amounted to 2,728,918 MWh, which is 0.5% more than in 2015. The sales to household customers amounted to 654,778 MWh (7.5% less than in 2015) and those to business custom-ers 2,074,138 MWh (3.3% more com-pared to 2015). The sale of electricity
also includes the sale on the Borzen Southpool stock exchange and sale in view of deviations from timetables amounting to 77,647 MWh in total.
Sales of electricity to business cus-tomersBusiness customers are legal per-
sons purchasing electricity for the needs of their operations. They are classified into large, medium-sized and small business customers in view of their annual consumption.
A custom-tailored offer, personal ad-ministrator and portal including key
34 06Elektro Celje ANNUAL REPORT 2016
information are available for large business customers. Some custom-ers decided to switch to another sup-plier due to fierce competition, never-theless, we managed to attract more new customers and slightly increase sales in this segment.
Medium-sized and small business customers were addressed at the mass level, with a standardised offer, which will be supplemented with an individual approach in future. Fewer customers than in the past respond-ed to the standard written offer, de-spite more favourable supply condi-tions compared to the existing ones. Those who did not respond were contacted individually, which turned out to be a good decision as we man-aged to conclude new contracts with most customers. We achieve positive price differences in these two groups, which are thus also interesting for the competition. Therefore, the number
of agents offering electricity to small business customers for various sup-pliers increased.
In 2016, the number of metering points (23,627) and business consumption customers (13,423) decreased. This is mainly due to the expired tender of the Slovene municipalities group. We had a concluded umbrella agreement with them valid until the end of 2015, but were not selected in the new ten-der. In spite of the smaller number of metering points, we managed to increase sold quantities by attracting new customers with larger electricity consumption at a smaller number of metering points.
Sales of electricity to household customersIn 2016, we continued with the of-fer “A cell phone for EUR 1” for new customers at stands in large shop-ping centres and through agents in
the field. Around 10,000 customers accepted the special offer. Towards the end of 2016, with the desire of avoiding a downward trend in the number of customers, we organised the campaign “Electricity at more fa-vourable prices 17”, through which we concluded around 3,000 contracts (mostly with existing customers) until 31 December 2016.
We have maintained external con-tractual field agents with the estab-lished offer of electricity “Special offer package 18” offering a price guarantee which is valid until the end of 2018. Up to 800 contracts are con-cluded monthly with new customers via agent sale services, thus compen-sating for the loss of customers due to the activities of other suppliers. In 2016, there were 161,571 household customers.
6.2.3.3 Renewable Energy SourcesIn 2016, we supplied electricity en-tirely generated by renewable en-ergy sources to all household and small business customers. We also supplied all business customers con-cluding a contract with us based on a public tender with such electricity.
Our commitment is confirmed by re-deeming guarantees of origin prov-ing the origin of the electricity sold.
Thus, at the beginning of 2016, we informed customers about the re-deemed guarantees of origin related to their consumption in 2015.
In the future, we would also like to offer electricity generated from re-newable energy sources to large business customers. Currently, the interest of these customers for such energy is low as they cannot obtain
state financial benefits for the con-sumption of such energy. Conse-quently, customers are not willing to pay more for such energy. However, we have detected increased interest in the energy referred to with custom-ers trading with large international companies. The latter require from them that they meet certain environ-mental standards, including energy from renewable sources.
6.2.3.4 Natural GasThe natural gas market is despite common legislation, significantly less developed compared to the electric-ity market. Due to their small size, dis-tribution system operators do not see the need for improvement to make the market more open and transpar-ent and the state does not force them
to act differently despite leverage. The main deficiency of the market is the lack of a single entry point which would enable suppliers to communi-cate with operators in a uniform way.
The greatest success in conclud-ing contracts is achieved with small
business and household customers where our offer is among the most fa-vourable ones in the market.
In 2016, 7,272,032 Sm³ of natural gas was sold to business customers and 1,206,654 Sm³ to households, for a combined total of 8,478,686 Sm³.
* The company ECE introduced the sale of natural gas in December 2013.
Volume and values of natural gas sales * 2013 2014 2015 2016
Volume (Sm³) 52,851 3,911,434 7,858,529 8,478,686
Value (in EUR) 22,376 1,337,119 2,770,986 2,150,443
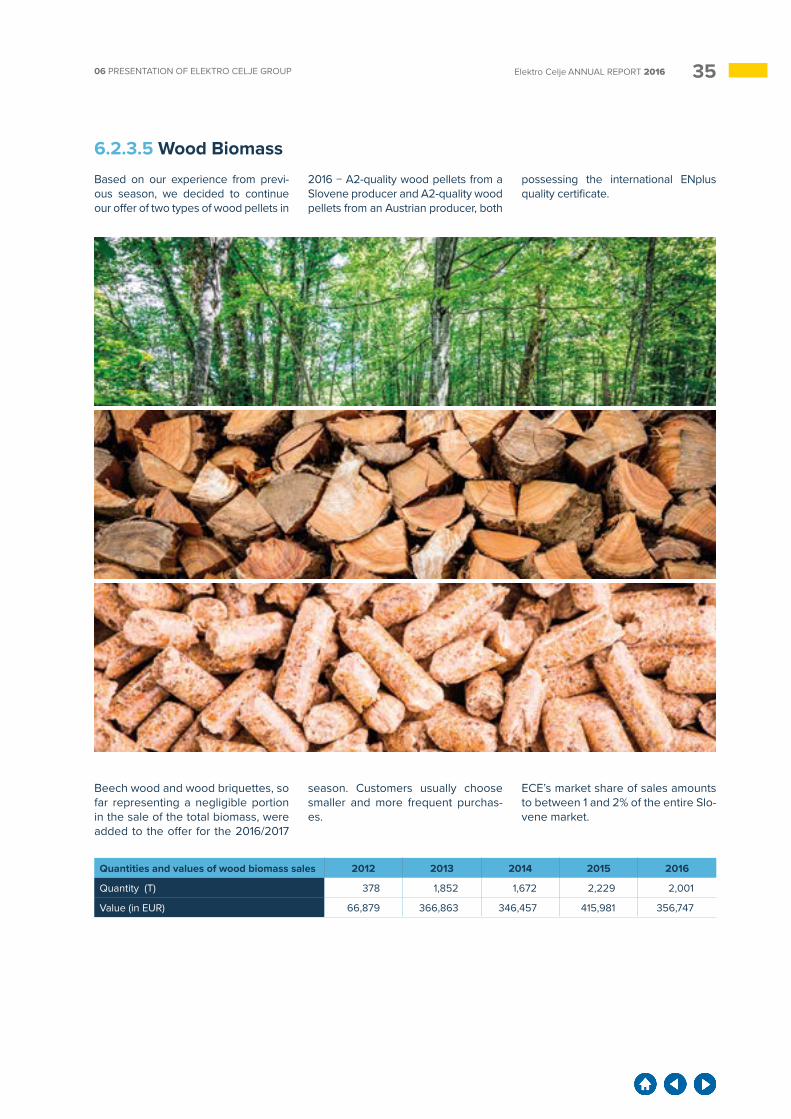
3506 PRESENTATION OF ELEKTRO CELJE GROUP Elektro Celje ANNUAL REPORT 2016
6.2.3.5 Wood BiomassBased on our experience from previ-ous season, we decided to continue our offer of two types of wood pellets in
2016 − A2-quality wood pellets from a Slovene producer and A2-quality wood pellets from an Austrian producer, both
possessing the international ENplus quality certificate.
Beech wood and wood briquettes, so far representing a negligible portion in the sale of the total biomass, were added to the offer for the 2016/2017
season. Customers usually choose smaller and more frequent purchas-es.
ECE’s market share of sales amounts to between 1 and 2% of the entire Slo-vene market.
Quantities and values of wood biomass sales 2012 2013 2014 2015 2016
Quantity (T) 378 1,852 1,672 2,229 2,001
Value (in EUR) 66,879 366,863 346,457 415,981 356,747
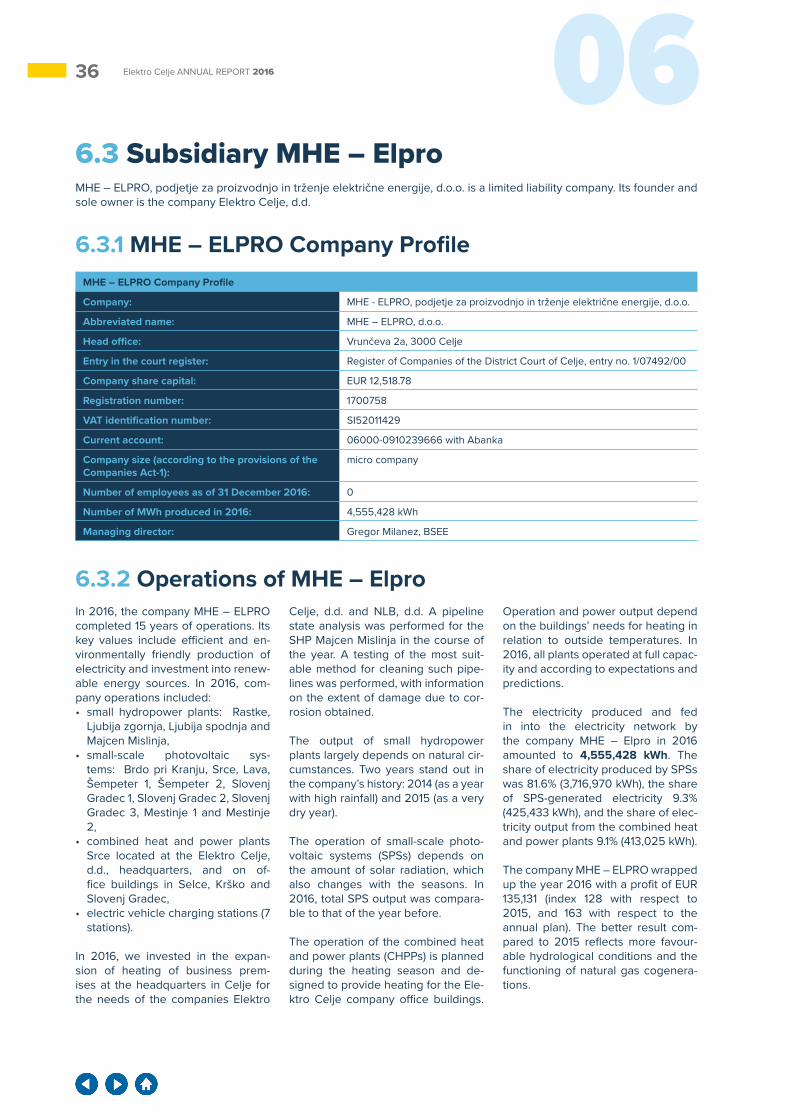
36 06Elektro Celje ANNUAL REPORT 2016
6.3 Subsidiary MHE – ElproMHE – ELPRO, podjetje za proizvodnjo in trženje električne energije, d.o.o. is a limited liability company. Its founder and sole owner is the company Elektro Celje, d.d.
6.3.1 MHE – ELPRO Company ProfileMHE – ELPRO Company Profile
Company: MHE - ELPRO, podjetje za proizvodnjo in trženje električne energije, d.o.o.
Abbreviated name: MHE – ELPRO, d.o.o.
Head office: Vrunčeva 2a, 3000 Celje
Entry in the court register: Register of Companies of the District Court of Celje, entry no. 1/07492/00
Company share capital: EUR 12,518.78
Registration number: 1700758
VAT identification number: SI52011429
Current account: 06000-0910239666 with Abanka
Company size (according to the provisions of the Companies Act-1):
micro company
Number of employees as of 31 December 2016: 0
Number of MWh produced in 2016: 4,555,428 kWh
Managing director: Gregor Milanez, BSEE
6.3.2 Operations of MHE – ElproIn 2016, the company MHE – ELPRO completed 15 years of operations. Its key values include efficient and en-vironmentally friendly production of electricity and investment into renew-able energy sources. In 2016, com-pany operations included:• small hydropower plants: Rastke,
Ljubija zgornja, Ljubija spodnja and Majcen Mislinja,
• small-scale photovoltaic sys-tems: Brdo pri Kranju, Srce, Lava, Šempeter 1, Šempeter 2, Slovenj Gradec 1, Slovenj Gradec 2, Slovenj Gradec 3, Mestinje 1 and Mestinje 2,
• combined heat and power plants Srce located at the Elektro Celje, d.d., headquarters, and on of-fice buildings in Selce, Krško and Slovenj Gradec,
• electric vehicle charging stations (7 stations).
In 2016, we invested in the expan-sion of heating of business prem-ises at the headquarters in Celje for the needs of the companies Elektro
Celje, d.d. and NLB, d.d. A pipeline state analysis was performed for the SHP Majcen Mislinja in the course of the year. A testing of the most suit-able method for cleaning such pipe-lines was performed, with information on the extent of damage due to cor-rosion obtained.
The output of small hydropower plants largely depends on natural cir-cumstances. Two years stand out in the company’s history: 2014 (as a year with high rainfall) and 2015 (as a very dry year).
The operation of small-scale photo-voltaic systems (SPSs) depends on the amount of solar radiation, which also changes with the seasons. In 2016, total SPS output was compara-ble to that of the year before.
The operation of the combined heat and power plants (CHPPs) is planned during the heating season and de-signed to provide heating for the Ele-ktro Celje company office buildings.
Operation and power output depend on the buildings’ needs for heating in relation to outside temperatures. In 2016, all plants operated at full capac-ity and according to expectations and predictions.
The electricity produced and fed in into the electricity network by the company MHE – Elpro in 2016 amounted to 4,555,428 kWh. The share of electricity produced by SPSs was 81.6% (3,716,970 kWh), the share of SPS-generated electricity 9.3% (425,433 kWh), and the share of elec-tricity output from the combined heat and power plants 9.1% (413,025 kWh).
The company MHE – ELPRO wrapped up the year 2016 with a profit of EUR 135,131 (index 128 with respect to 2015, and 163 with respect to the annual plan). The better result com-pared to 2015 reflects more favour-able hydrological conditions and the functioning of natural gas cogenera-tions.
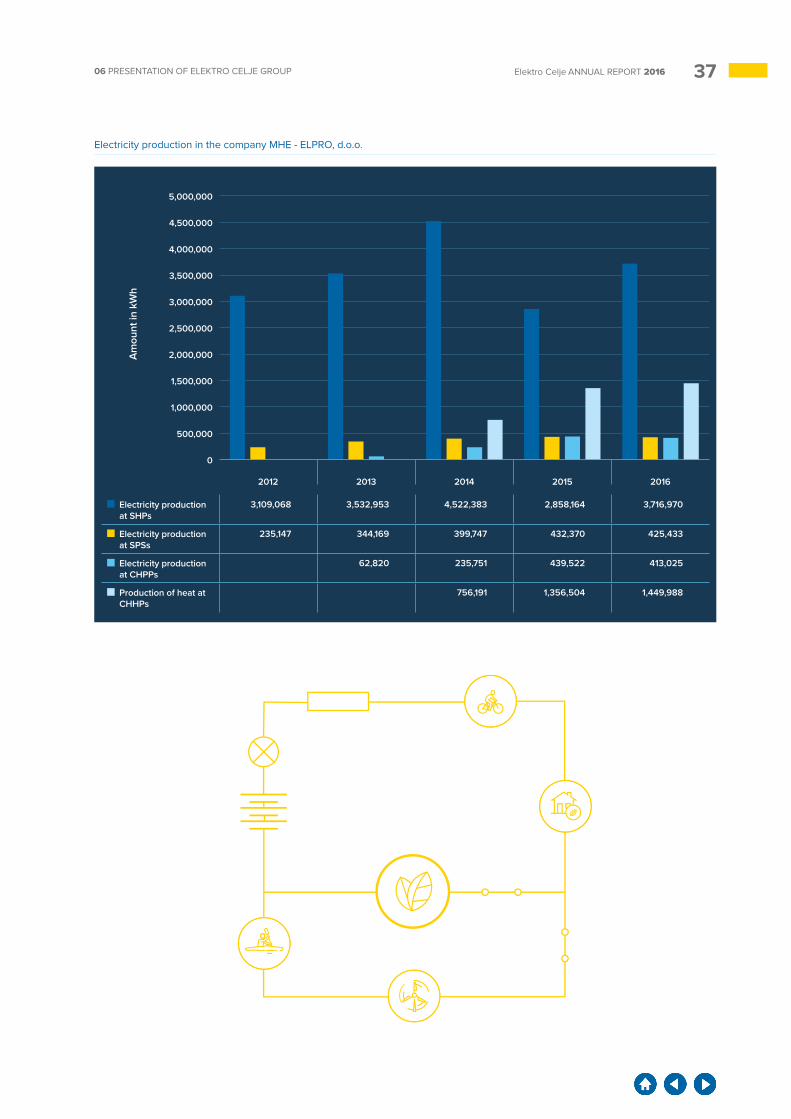
3706 PRESENTATION OF ELEKTRO CELJE GROUP Elektro Celje ANNUAL REPORT 2016
0
5,000,000
4,500,000
3,500,000
2,500,000
1,500,000
4,000,000
3,000,000
2,000,000
1,000,000
500,000
Am
ount
in k
Wh
2012 2013 2014 2015 2016
Electricity production in the company MHE - ELPRO, d.o.o.
Electricity production at SHPs
3,109,068 3,532,953 4,522,383 2,858,164 3,716,970
Electricity production at SPSs
235,147 344,169 399,747 432,370 425,433
Electricity production at CHPPs
62,820 235,751 439,522 413,025
Production of heat at CHHPs
756,191 1,356,504 1,449,988

38 Elektro Celje ANNUAL REPORT 2016
RELATIONSHIP
TRUSTTrust represents the basis of our work. Through open and honest communication with our customers, business partners, shareholders and other stakeholders, we strengthen good relations and lay foundations for the future.
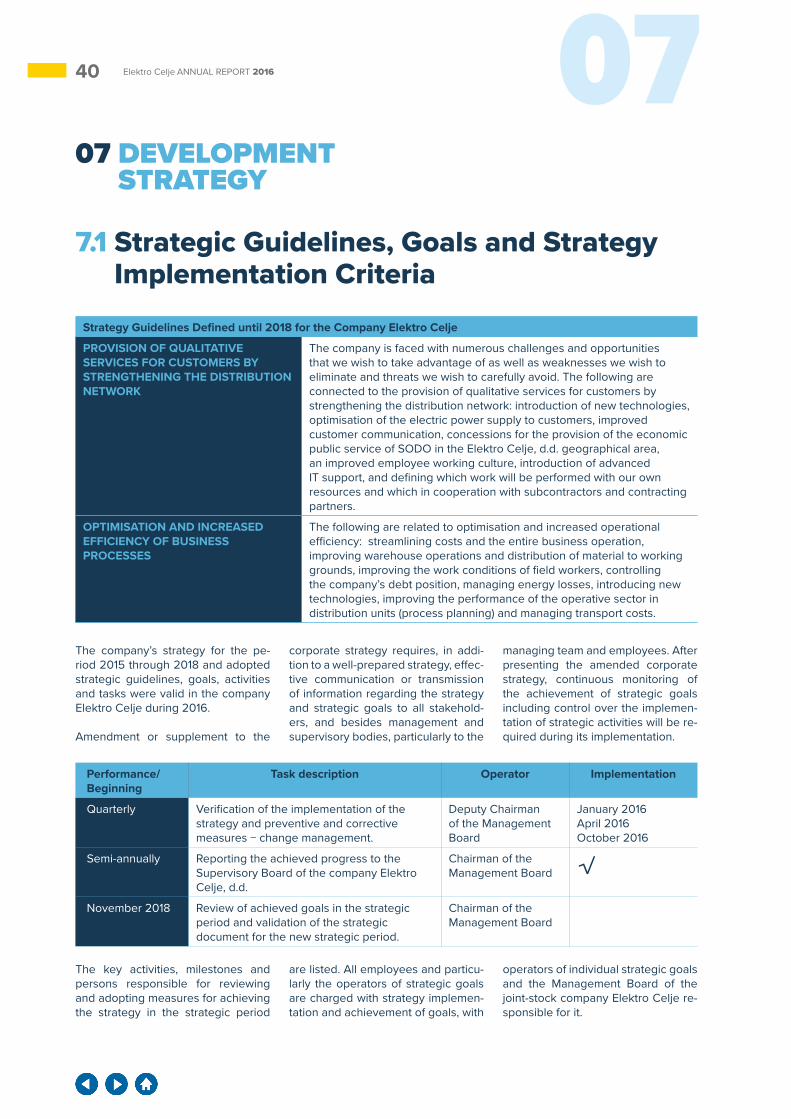
40 07Elektro Celje ANNUAL REPORT 2016
07 DEVELOPMENT STRATEGY
7.1 Strategic Guidelines, Goals and Strategy Implementation Criteria
The company’s strategy for the pe-riod 2015 through 2018 and adopted strategic guidelines, goals, activities and tasks were valid in the company Elektro Celje during 2016.
Amendment or supplement to the
corporate strategy requires, in addi-tion to a well-prepared strategy, effec-tive communication or transmission of information regarding the strategy and strategic goals to all stakehold-ers, and besides management and supervisory bodies, particularly to the
managing team and employees. After presenting the amended corporate strategy, continuous monitoring of the achievement of strategic goals including control over the implemen-tation of strategic activities will be re-quired during its implementation.
Strategy Guidelines Defined until 2018 for the Company Elektro Celje
PROVISION OF QUALITATIVE SERVICES FOR CUSTOMERS BY STRENGTHENING THE DISTRIBUTION NETWORK
The company is faced with numerous challenges and opportunities that we wish to take advantage of as well as weaknesses we wish to eliminate and threats we wish to carefully avoid. The following are connected to the provision of qualitative services for customers by strengthening the distribution network: introduction of new technologies, optimisation of the electric power supply to customers, improved customer communication, concessions for the provision of the economic public service of SODO in the Elektro Celje, d.d. geographical area, an improved employee working culture, introduction of advanced IT support, and defining which work will be performed with our own resources and which in cooperation with subcontractors and contracting partners.
OPTIMISATION AND INCREASED EFFICIENCY OF BUSINESS PROCESSES
The following are related to optimisation and increased operational efficiency: streamlining costs and the entire business operation, improving warehouse operations and distribution of material to working grounds, improving the work conditions of field workers, controlling the company’s debt position, managing energy losses, introducing new technologies, improving the performance of the operative sector in distribution units (process planning) and managing transport costs.
Performance/Beginning
Task description Operator Implementation
Quarterly Verification of the implementation of the strategy and preventive and corrective measures − change management.
Deputy Chairman of the Management Board
January 2016April 2016October 2016
Semi-annually Reporting the achieved progress to the Supervisory Board of the company Elektro Celje, d.d.
Chairman of the Management Board √
November 2018 Review of achieved goals in the strategic period and validation of the strategic document for the new strategic period.
Chairman of the Management Board
The key activities, milestones and persons responsible for reviewing and adopting measures for achieving the strategy in the strategic period
are listed. All employees and particu-larly the operators of strategic goals are charged with strategy implemen-tation and achievement of goals, with
operators of individual strategic goals and the Management Board of the joint-stock company Elektro Celje re-sponsible for it.

4107 DEVELOPMENT STRATEGY Elektro Celje ANNUAL REPORT 2016
Strategy Guidelines Defined until 2019 for the Company ECE
• Become the leading provider of energy products in terms of quality and diversity of services.• Introduce the sale of new products and services for purchasers of energy products and also to become the national
provider of energy products for households and companies.• Develop an excellently organised and high-quality IT-based company which will lead by example in its sector and
attract highly qualified, motivated and development-oriented personnel.• Continue strategic connections with companies from the electric power sector in order to become bigger, better
and more stable, which is of great importance for those purchasing energy products.• Improve provision of information and advisory services to large business customers, thus establishing long-term
partnerships which will not depend merely on the sales price.
Strategic goals, activities and tasks are structured in such a way to enable a system of supervision over strategy imple-mentation by means of a system of balanced indicators.
Strategy Guidelines Defined until 2018 for the Company Elektro Celje
PERSPECTIVE STRATEGIC GOALS STRATEGY IMPLEMENTATION CRITERIA
Learning and Growth Perspective
Introduction of a comprehensive system of personnel development.Development of an excellent organisational structure.Introduction of a comprehensive asset management system.Efficient implementation and control over the performance of works.Renovation/redevelopment of the distribution network.Business optimisation through a new ERP system.
Regular maintenance plan realisation (Target for 2018: 100%).Average value of organisational climate (Target for 2018: >3.3)Number of hours of training and education per employee (Target for 2018: >15)Sick leave usage (Target for 2018: <4.8%).
Internal Business Process Perspective
Management of electricity losses.Management of distributed energy resources and e-mobility.
Share of distributed electricity loss (Target for 2018: <5.4%).
Customer and Market Perspective
Reliability and safety of network operation. SAIDI cumulative (Target for 2018: <35). SAIFI cumulative (Target for 2018: <0.8).
Financial Perspective Distribution cost-effectiveness.Effective management of finances.Guaranteed return on equity (ROE).
Return on equity - ROE (Target for 2018: >2%).OPEX (operating expenditure) per standardised network length (Target for 2018: <€ 73,000/km.Net debt/EBITDA (Target for 2018: <2.5). Added value per employee (Target for 2018: >70,000).
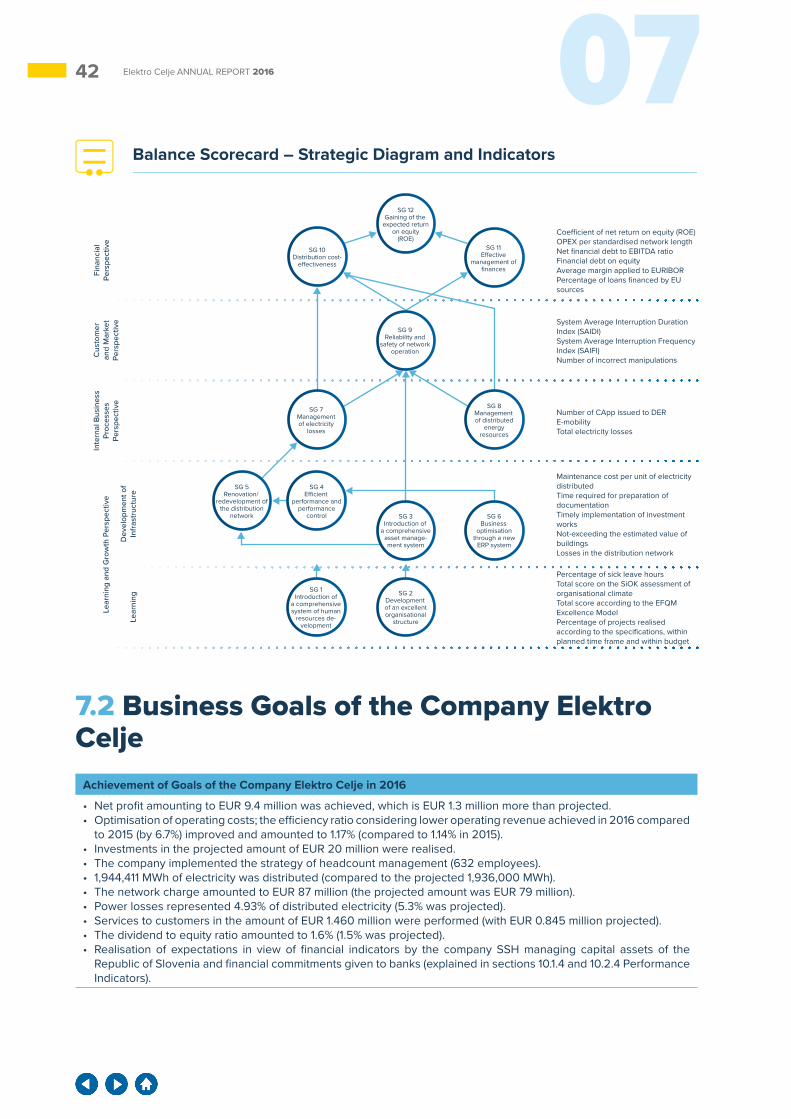
42 07Elektro Celje ANNUAL REPORT 2016
SG 11Effective
management of finances
SG 12Gaining of the
expected return on equity
(ROE)
Lear
ning
D
evel
opm
ent o
fIn
fras
truc
ture
Inte
rnal
Bus
ines
sPr
oces
ses
Pers
pect
ive
Cus
tom
eran
d M
arke
tPe
rspe
ctiv
e
Fina
ncia
lPe
rspe
ctiv
eLe
arni
ng a
nd G
row
th P
ersp
ectiv
e
System Average Interruption DurationIndex (SAIDI)System Average Interruption FrequencyIndex (SAIFI)Number of incorrect manipulations
Coefficient of net return on equity (ROE)OPEX per standardised network lengthNet financial debt to EBITDA ratioFinancial debt on equityAverage margin applied to EURIBORPercentage of loans financed by EUsources
Number of CApp issued to DERE-mobilityTotal electricity losses
Maintenance cost per unit of electricitydistributedTime required for preparation ofdocumentationTimely implementation of investment worksNot-exceeding the estimated value ofbuildingsLosses in the distribution network
Percentage of sick leave hoursTotal score on the SiOK assessment oforganisational climateTotal score according to the EFQMExcellence ModelPercentage of projects realisedaccording to the specifications, withinplanned time frame and within budget
SG 1Introduction of
a comprehensive system of human
resources de-velopment
SG 2Development of an excellent organisational
structure
SG 4Efficient
performance and performance
control SG 6Business
optimisation through a new
ERP system
SG 5Renovation/
redevelopment of the distribution
network SG 3Introduction of
a comprehensive asset manage-ment system
SG 7Managementof electricity
losses
SG 10Distribution cost-
effectiveness
SG 9Reliability and
safety of network operation
SG 8Management of distributed
energy resources
Balance Scorecard – Strategic Diagram and Indicators
7.2 Business Goals of the Company Elektro Celje
Achievement of Goals of the Company Elektro Celje in 2016
• Net profit amounting to EUR 9.4 million was achieved, which is EUR 1.3 million more than projected.• Optimisation of operating costs; the efficiency ratio considering lower operating revenue achieved in 2016 compared
to 2015 (by 6.7%) improved and amounted to 1.17% (compared to 1.14% in 2015).• Investments in the projected amount of EUR 20 million were realised.• The company implemented the strategy of headcount management (632 employees).• 1,944,411 MWh of electricity was distributed (compared to the projected 1,936,000 MWh).• The network charge amounted to EUR 87 million (the projected amount was EUR 79 million).• Power losses represented 4.93% of distributed electricity (5.3% was projected).• Services to customers in the amount of EUR 1.460 million were performed (with EUR 0.845 million projected).• The dividend to equity ratio amounted to 1.6% (1.5% was projected).• Realisation of expectations in view of financial indicators by the company SSH managing capital assets of the
Republic of Slovenia and financial commitments given to banks (explained in sections 10.1.4 and 10.2.4 Performance Indicators).
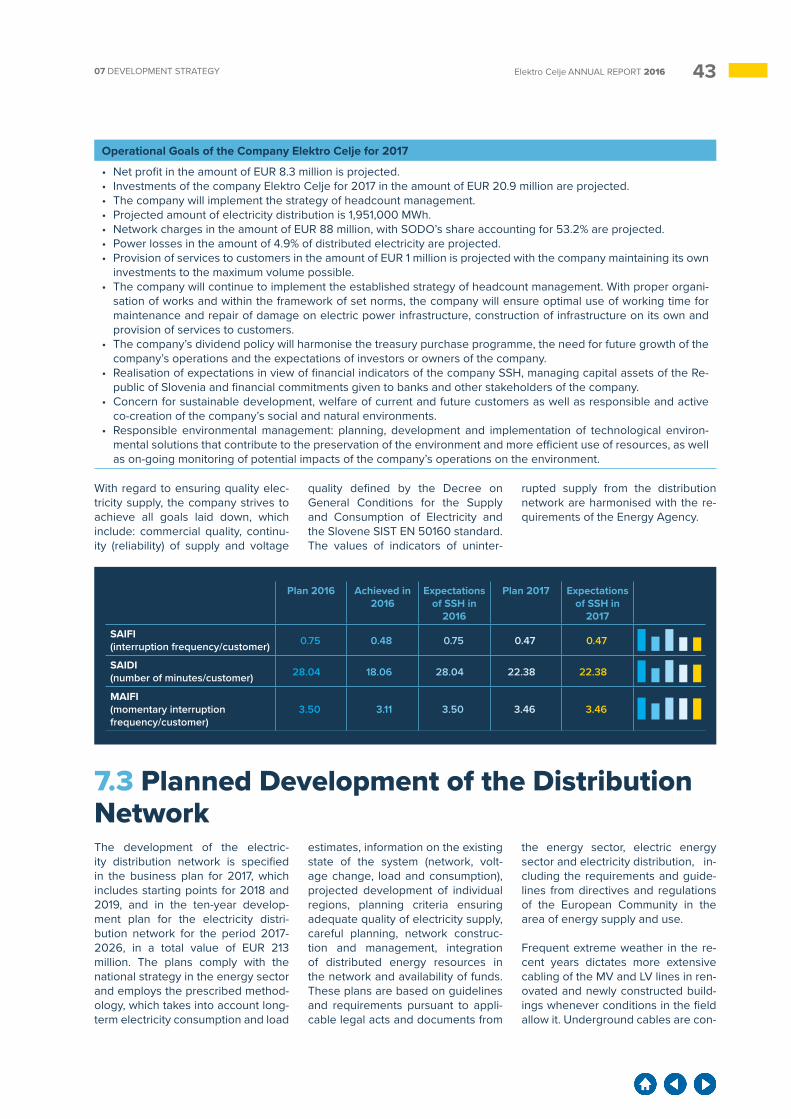
4307 DEVELOPMENT STRATEGY Elektro Celje ANNUAL REPORT 2016
Operational Goals of the Company Elektro Celje for 2017
• Net profit in the amount of EUR 8.3 million is projected.• Investments of the company Elektro Celje for 2017 in the amount of EUR 20.9 million are projected.• The company will implement the strategy of headcount management. • Projected amount of electricity distribution is 1,951,000 MWh.• Network charges in the amount of EUR 88 million, with SODO’s share accounting for 53.2% are projected.• Power losses in the amount of 4.9% of distributed electricity are projected.• Provision of services to customers in the amount of EUR 1 million is projected with the company maintaining its own
investments to the maximum volume possible.• The company will continue to implement the established strategy of headcount management. With proper organi-
sation of works and within the framework of set norms, the company will ensure optimal use of working time for maintenance and repair of damage on electric power infrastructure, construction of infrastructure on its own and provision of services to customers.
• The company’s dividend policy will harmonise the treasury purchase programme, the need for future growth of the company’s operations and the expectations of investors or owners of the company.
• Realisation of expectations in view of financial indicators of the company SSH, managing capital assets of the Re-public of Slovenia and financial commitments given to banks and other stakeholders of the company.
• Concern for sustainable development, welfare of current and future customers as well as responsible and active co-creation of the company’s social and natural environments.
• Responsible environmental management: planning, development and implementation of technological environ-mental solutions that contribute to the preservation of the environment and more efficient use of resources, as well as on-going monitoring of potential impacts of the company’s operations on the environment.
With regard to ensuring quality elec-tricity supply, the company strives to achieve all goals laid down, which include: commercial quality, continu-ity (reliability) of supply and voltage
quality defined by the Decree on General Conditions for the Supply and Consumption of Electricity and the Slovene SIST EN 50160 standard. The values of indicators of uninter-
rupted supply from the distribution network are harmonised with the re-quirements of the Energy Agency.
Plan 2016 Achieved in 2016
Expectations of SSH in
2016
Plan 2017 Expectations of SSH in
2017
SAIFI (interruption frequency/customer) 0.75 0.48 0.75 0.47 0.47
SAIDI (number of minutes/customer) 28.04 18.06 28.04 22.38 22.38
MAIFI (momentary interruption frequency/customer)
3.50 3.11 3.50 3.46 3.46
7.3 Planned Development of the Distribution NetworkThe development of the electric-ity distribution network is specified in the business plan for 2017, which includes starting points for 2018 and 2019, and in the ten-year develop-ment plan for the electricity distri-bution network for the period 2017-2026, in a total value of EUR 213 million. The plans comply with the national strategy in the energy sector and employs the prescribed method-ology, which takes into account long-term electricity consumption and load
estimates, information on the existing state of the system (network, volt-age change, load and consumption), projected development of individual regions, planning criteria ensuring adequate quality of electricity supply, careful planning, network construc-tion and management, integration of distributed energy resources in the network and availability of funds. These plans are based on guidelines and requirements pursuant to appli-cable legal acts and documents from
the energy sector, electric energy sector and electricity distribution, in-cluding the requirements and guide-lines from directives and regulations of the European Community in the area of energy supply and use.
Frequent extreme weather in the re-cent years dictates more extensive cabling of the MV and LV lines in ren-ovated and newly constructed build-ings whenever conditions in the field allow it. Underground cables are con-
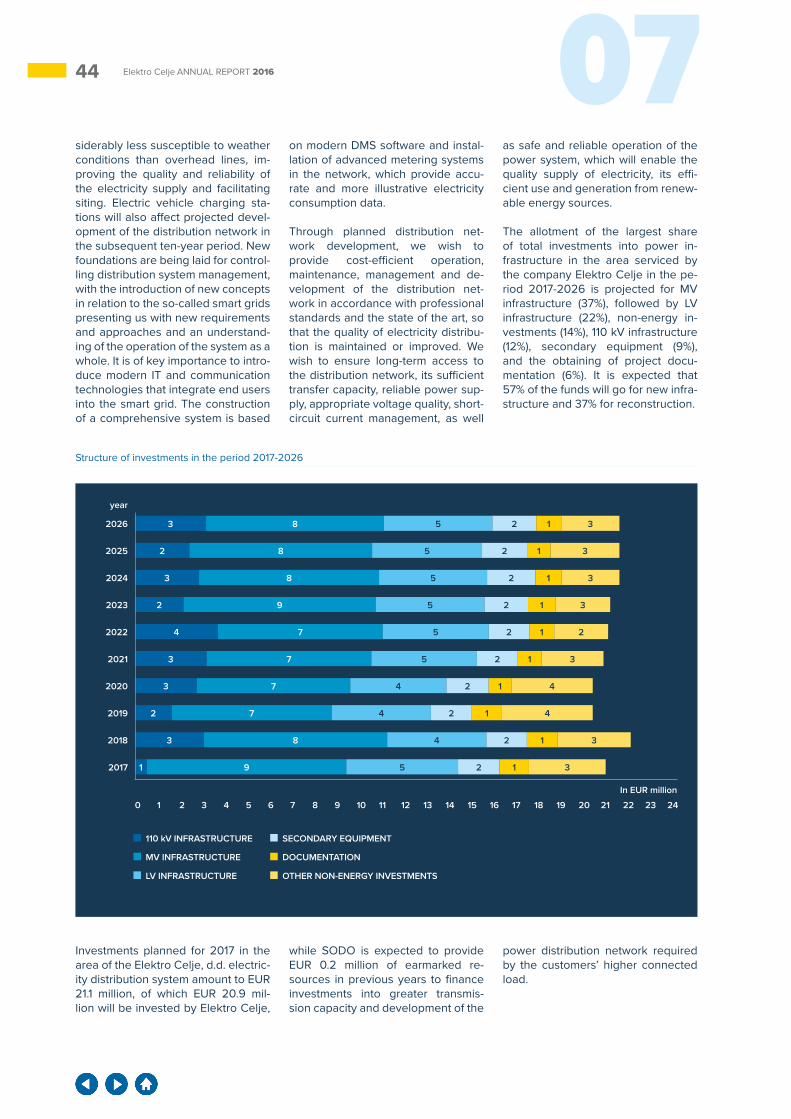
44 07Elektro Celje ANNUAL REPORT 2016
siderably less susceptible to weather conditions than overhead lines, im-proving the quality and reliability of the electricity supply and facilitating siting. Electric vehicle charging sta-tions will also affect projected devel-opment of the distribution network in the subsequent ten-year period. New foundations are being laid for control-ling distribution system management, with the introduction of new concepts in relation to the so-called smart grids presenting us with new requirements and approaches and an understand-ing of the operation of the system as a whole. It is of key importance to intro-duce modern IT and communication technologies that integrate end users into the smart grid. The construction of a comprehensive system is based
on modern DMS software and instal-lation of advanced metering systems in the network, which provide accu-rate and more illustrative electricity consumption data.
Through planned distribution net-work development, we wish to provide cost-efficient operation, maintenance, management and de-velopment of the distribution net-work in accordance with professional standards and the state of the art, so that the quality of electricity distribu-tion is maintained or improved. We wish to ensure long-term access to the distribution network, its sufficient transfer capacity, reliable power sup-ply, appropriate voltage quality, short-circuit current management, as well
as safe and reliable operation of the power system, which will enable the quality supply of electricity, its effi-cient use and generation from renew-able energy sources.
The allotment of the largest share of total investments into power in-frastructure in the area serviced by the company Elektro Celje in the pe-riod 2017-2026 is projected for MV infrastructure (37%), followed by LV infrastructure (22%), non-energy in-vestments (14%), 110 kV infrastructure (12%), secondary equipment (9%), and the obtaining of project docu-mentation (6%). It is expected that 57% of the funds will go for new infra-structure and 37% for reconstruction.
2017
0 1 2 3 4 5 6 7 8 9 10 11 12 13 14 15 16 17 18 19 20 21 22 23 24
2018
2019
2020
2021
2022
2023
2024
2025
2026
year
In EUR million
1
3
2
3
3
4
2
3
2
3
9
8
7
7
7
7
9
8
8
8
5
4
4
4
5
5
5
5
5
5
2
2
2
2
2
2
2
2
2
2
1
1
1
1
1
1
1
1
1
1
3
3
4
4
3
2
3
3
3
3
110 kV INFRASTRUCTURE
MV INFRASTRUCTURE
LV INFRASTRUCTURE
SECONDARY EQUIPMENT
DOCUMENTATION
OTHER NON-ENERGY INVESTMENTS
Investments planned for 2017 in the area of the Elektro Celje, d.d. electric-ity distribution system amount to EUR 21.1 million, of which EUR 20.9 mil-lion will be invested by Elektro Celje,
while SODO is expected to provide EUR 0.2 million of earmarked re-sources in previous years to finance investments into greater transmis-sion capacity and development of the
power distribution network required by the customers’ higher connected load.
Structure of investments in the period 2017-2026
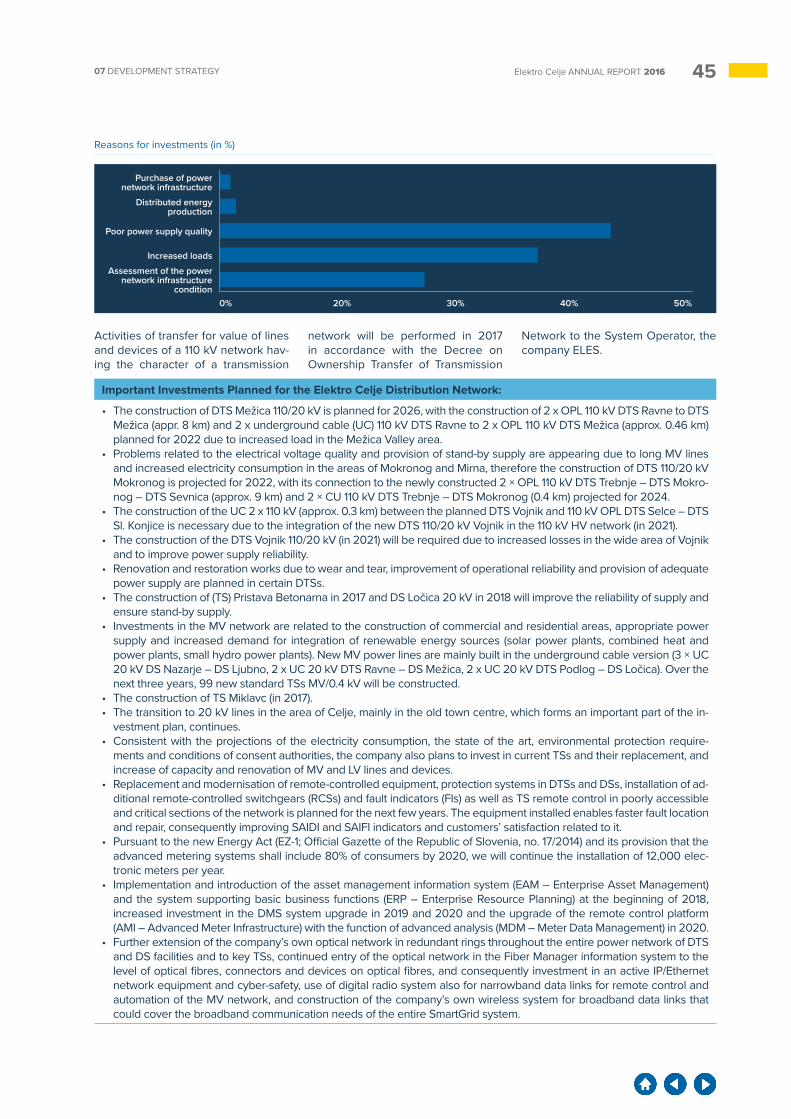
4507 DEVELOPMENT STRATEGY Elektro Celje ANNUAL REPORT 2016
Assessment of the power network infrastructure
condition
Increased loads
Poor power supply quality
Distributed energy production
Purchase of power network infrastructure
0% 20% 30% 40% 50%
Activities of transfer for value of lines and devices of a 110 kV network hav-ing the character of a transmission
network will be performed in 2017 in accordance with the Decree on Ownership Transfer of Transmission
Network to the System Operator, the company ELES.
Important Investments Planned for the Elektro Celje Distribution Network:
• The construction of DTS Mežica 110/20 kV is planned for 2026, with the construction of 2 x OPL 110 kV DTS Ravne to DTS Mežica (appr. 8 km) and 2 x underground cable (UC) 110 kV DTS Ravne to 2 x OPL 110 kV DTS Mežica (approx. 0.46 km) planned for 2022 due to increased load in the Mežica Valley area.
• Problems related to the electrical voltage quality and provision of stand-by supply are appearing due to long MV lines and increased electricity consumption in the areas of Mokronog and Mirna, therefore the construction of DTS 110/20 kV Mokronog is projected for 2022, with its connection to the newly constructed 2 × OPL 110 kV DTS Trebnje – DTS Mokro-nog – DTS Sevnica (approx. 9 km) and 2 × CU 110 kV DTS Trebnje – DTS Mokronog (0.4 km) projected for 2024.
• The construction of the UC 2 x 110 kV (approx. 0.3 km) between the planned DTS Vojnik and 110 kV OPL DTS Selce – DTS Sl. Konjice is necessary due to the integration of the new DTS 110/20 kV Vojnik in the 110 kV HV network (in 2021).
• The construction of the DTS Vojnik 110/20 kV (in 2021) will be required due to increased losses in the wide area of Vojnik and to improve power supply reliability.
• Renovation and restoration works due to wear and tear, improvement of operational reliability and provision of adequate power supply are planned in certain DTSs.
• The construction of (TS) Pristava Betonarna in 2017 and DS Ločica 20 kV in 2018 will improve the reliability of supply and ensure stand-by supply.
• Investments in the MV network are related to the construction of commercial and residential areas, appropriate power supply and increased demand for integration of renewable energy sources (solar power plants, combined heat and power plants, small hydro power plants). New MV power lines are mainly built in the underground cable version (3 × UC 20 kV DS Nazarje – DS Ljubno, 2 x UC 20 kV DTS Ravne – DS Mežica, 2 x UC 20 kV DTS Podlog – DS Ločica). Over the next three years, 99 new standard TSs MV/0.4 kV will be constructed.
• The construction of TS Miklavc (in 2017).• The transition to 20 kV lines in the area of Celje, mainly in the old town centre, which forms an important part of the in-
vestment plan, continues.• Consistent with the projections of the electricity consumption, the state of the art, environmental protection require-
ments and conditions of consent authorities, the company also plans to invest in current TSs and their replacement, and increase of capacity and renovation of MV and LV lines and devices.
• Replacement and modernisation of remote-controlled equipment, protection systems in DTSs and DSs, installation of ad-ditional remote-controlled switchgears (RCSs) and fault indicators (FIs) as well as TS remote control in poorly accessible and critical sections of the network is planned for the next few years. The equipment installed enables faster fault location and repair, consequently improving SAIDI and SAIFI indicators and customers’ satisfaction related to it.
• Pursuant to the new Energy Act (EZ-1; Official Gazette of the Republic of Slovenia, no. 17/2014) and its provision that the advanced metering systems shall include 80% of consumers by 2020, we will continue the installation of 12,000 elec-tronic meters per year.
• Implementation and introduction of the asset management information system (EAM – Enterprise Asset Management) and the system supporting basic business functions (ERP – Enterprise Resource Planning) at the beginning of 2018, increased investment in the DMS system upgrade in 2019 and 2020 and the upgrade of the remote control platform (AMI – Advanced Meter Infrastructure) with the function of advanced analysis (MDM – Meter Data Management) in 2020.
• Further extension of the company’s own optical network in redundant rings throughout the entire power network of DTS and DS facilities and to key TSs, continued entry of the optical network in the Fiber Manager information system to the level of optical fibres, connectors and devices on optical fibres, and consequently investment in an active IP/Ethernet network equipment and cyber-safety, use of digital radio system also for narrowband data links for remote control and automation of the MV network, and construction of the company’s own wireless system for broadband data links that could cover the broadband communication needs of the entire SmartGrid system.
Reasons for investments (in %)
46 07Elektro Celje ANNUAL REPORT 2016
7.4 Business Goals of the Elektro Celje GroupAchievement of the Goals of the Elektro Celje Group in 2016
• Net profit of the Group amounted to EUR 10.7 million, with EUR 10 million of the amount comprising majority share-holders’ profit (the planned net profit amounted to EUR 10.7 million, with EUR 10 million comprising majority share-holders’ profit).
• Higher values of financial indicators concerning the Group’s financial position compared to the commitments given to the banks were achieved: financial debt/EBITDA must be below 2.5 (achieved value 1.5) and financial debt/equity must be below 0.3 (achieved value 0.2).
• The Group managed to cover current liabilities with current assets (the current ratio amounted to 1.12).• 2,728,918 MWh of electricity was sold (compared to the projected amount of 2,517,823 MWh).• Production of electricity generated by the Group’s own SHPs, SPSs and CHPPs in the amount of 4,555,428 kWh,
and 1,449,988 kWh of heat energy was achieved (projected electricity generation amounted to 3,935,054 kWh and 1,180,000 kWh of heat energy).
• A series of measures to retain household and small business customers purchasing electricity in the subsidiary ECE was implemented.
• Expansion of the sales offer for energy products in the subsidiary (beech wood, wood briquettes).• In 2016, the Group’s activities were aimed at the development of modern IT support for all operating processes in
the Group’s companies, as well as for communication with consumers, customers, suppliers and other business partners.
Operational Goals of the Elektro Celje Group for 2017
• Planned net profit of the Group amounts to EUR 10.2 million, with EUR 9.7 million of the amount comprising majority shareholders’ profit.
• The financial indicators concerning the Group’s financial position (i.e. financial debt/EBITDA and net financial debt/equity) will comply with commitments made to the banks.
• The Group plans to cover current liabilities with current assets.• Sale of electricity in the amount of 2,615,683 MWh is planned, 1,985,682 MWh of which is projected to be sold to
business customers and 630,001 MWh to household customers. • A series of measures to retain household and small business customers purchasing electricity will be implemented.• The sale of natural gas and biomass compared to the previous year will be increased.• Sale of electricity generated by the Group’s own SHPs, SPSs and CHPPs in the amount of 3,737,005 kWh and
1,356,000 kWh of heat energy. • Renovation of SHP Majcen in 2017 and SHP Rastke in the period from 2017 to 2019.• Establishment of modern IT support for operating processes as well as for communication with consumers, custom-
ers, suppliers and other business partners. • Enhancement of social responsibility, sustainable development, reputation and visibility of the Elektro Celje Group.• Comprehensive development of employees, their personal growth and creation of a good work climate.• Exploitation of new business opportunities in the area of environment-friendly energy.• Enhancement of the reputation and visibility of the Elektro Celje Group.
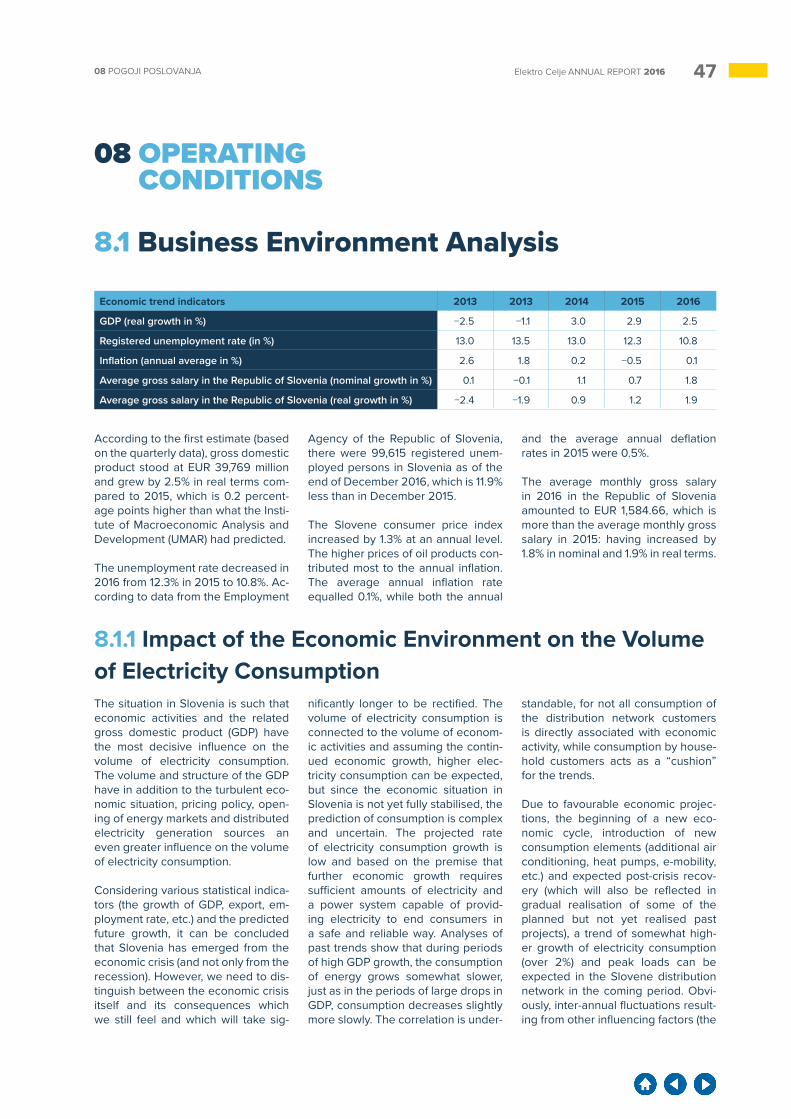
4708 POGOJI POSLOVANJA Elektro Celje ANNUAL REPORT 2016
08 OPERATING CONDITIONS
8.1 Business Environment Analysis
Economic trend indicators 2013 2013 2014 2015 2016
GDP (real growth in %) −2.5 −1.1 3.0 2.9 2.5
Registered unemployment rate (in %) 13.0 13.5 13.0 12.3 10.8
Inflation (annual average in %) 2.6 1.8 0.2 −0.5 0.1
Average gross salary in the Republic of Slovenia (nominal growth in %) 0.1 −0.1 1.1 0.7 1.8
Average gross salary in the Republic of Slovenia (real growth in %) −2.4 −1.9 0.9 1.2 1.9
According to the first estimate (based on the quarterly data), gross domestic product stood at EUR 39,769 million and grew by 2.5% in real terms com-pared to 2015, which is 0.2 percent-age points higher than what the Insti-tute of Macroeconomic Analysis and Development (UMAR) had predicted.
The unemployment rate decreased in 2016 from 12.3% in 2015 to 10.8%. Ac-cording to data from the Employment
Agency of the Republic of Slovenia, there were 99,615 registered unem-ployed persons in Slovenia as of the end of December 2016, which is 11.9% less than in December 2015.
The Slovene consumer price index increased by 1.3% at an annual level. The higher prices of oil products con-tributed most to the annual inflation. The average annual inflation rate equalled 0.1%, while both the annual
and the average annual deflation rates in 2015 were 0.5%.
The average monthly gross salary in 2016 in the Republic of Slovenia amounted to EUR 1,584.66, which is more than the average monthly gross salary in 2015: having increased by 1.8% in nominal and 1.9% in real terms.
8.1.1 Impact of the Economic Environment on the Volume of Electricity ConsumptionThe situation in Slovenia is such that economic activities and the related gross domestic product (GDP) have the most decisive influence on the volume of electricity consumption. The volume and structure of the GDP have in addition to the turbulent eco-nomic situation, pricing policy, open-ing of energy markets and distributed electricity generation sources an even greater influence on the volume of electricity consumption.
Considering various statistical indica-tors (the growth of GDP, export, em-ployment rate, etc.) and the predicted future growth, it can be concluded that Slovenia has emerged from the economic crisis (and not only from the recession). However, we need to dis-tinguish between the economic crisis itself and its consequences which we still feel and which will take sig-
nificantly longer to be rectified. The volume of electricity consumption is connected to the volume of econom-ic activities and assuming the contin-ued economic growth, higher elec-tricity consumption can be expected, but since the economic situation in Slovenia is not yet fully stabilised, the prediction of consumption is complex and uncertain. The projected rate of electricity consumption growth is low and based on the premise that further economic growth requires sufficient amounts of electricity and a power system capable of provid-ing electricity to end consumers in a safe and reliable way. Analyses of past trends show that during periods of high GDP growth, the consumption of energy grows somewhat slower, just as in the periods of large drops in GDP, consumption decreases slightly more slowly. The correlation is under-
standable, for not all consumption of the distribution network customers is directly associated with economic activity, while consumption by house-hold customers acts as a “cushion” for the trends.
Due to favourable economic projec-tions, the beginning of a new eco-nomic cycle, introduction of new consumption elements (additional air conditioning, heat pumps, e-mobility, etc.) and expected post-crisis recov-ery (which will also be reflected in gradual realisation of some of the planned but not yet realised past projects), a trend of somewhat high-er growth of electricity consumption (over 2%) and peak loads can be expected in the Slovene distribution network in the coming period. Obvi-ously, inter-annual fluctuations result-ing from other influencing factors (the
48 08Elektro Celje ANNUAL REPORT 2016
influence of weather and outdoor temperatures) are still possible and expected. Future growth in consump-tion will also be affected by increased consumption in transport (electric vehicles, increased consumption in railways).
The current situation does not justify
the halt of the development cycle of investments. First, because the elec-tric power system of the Republic of Slovenia has to be prepared for consumption regrowth and second, because electricity infrastructure in-vestments, due to their complex sit-ing and execution, require long-term planning. The systems that will be
ready for such regrowth will provide a long-term competitive advantage to their economies. Due to their exten-sive multiplicative effect, investments in the power infrastructure have to be considered as opportunities for mitigating the effects of the crisis and faster further development.
8.1.2 The Impact of the Economic Environment and Supply and Demand on the Price of Electricity and Other Energy ProductsCompared to other forms of goods, electricity is characterised by several specifics: it has no adequate sub-stitute, cannot be stored, and is not freely transferable between coun-tries, for it is limited by the physical capacity of the network.
The economic crisis and attempts at economic recovery in recent years still exert a powerful influence on the price of electricity. The trends of the latter in 2016 on European stock exchanges moved in accordance with weather conditions, the avail-able amount of electricity generated from renewable sources, and the prices of other energy products. The reason for the electricity price fluc-tuation also lie in the expectations of economic recovery and the situ-ation in financial and other markets. In 2016, the price of electricity was also affected by prices of other en-ergy products (largely oil, which lost some of its value at the beginning of the year that grew again by the end of the year due to geopolitical deci-sions regarding production limitation
and expectations of other markets, and natural gas). The electricity price is also affected by the prices of trans-mission capacities (these were fairly high in 2016, as they are dependant on prices on the Hungarian electric-ity market) and largely also by other events on the European electricity and global energy products markets (political decisions on the possible additional phasing out of nuclear energy in France and consequently, increased demand for conventional energy sources, agreements on bal-ancing the production of and demand for oil aimed at price stabilisation, Brexit, etc.).
Finally, the price of electricity is also related to renewable energy sources, which represent a growing category in the structure of electricity genera-tion sources. An increasing number of countries wish to reduce their en-ergy dependency on conventional sources in this way and increase the share of renewable sources in their production structure in accordance with European directives, which is
creating growing uncertainty regard-ing the network itself as well as pric-es on the market. Due to their strong correlation with weather conditions, renewable energy sources influence the relationship between rates for individual hours of the day. Recently we have witnessed large differenc-es between day and night rates of electricity; the day rate, at peak load times, when there was a shortage of production sources, was very high, while the night rate was quite low. In 2016, the difference between night and day rates had been decreasing, mostly due to RES, which produce more electricity during the day and thus contribute to the increased sup-ply of electricity on the market.
The purchase of natural gas is en-tirely covered by imports, mostly from Russia. The problems arising in the natural gas market are related to the non-standardised service of system operators with regard to data neces-sary for the management of purchas-es and uninterrupted supply to end customers.
8.2 The Legal and Regulatory Framework of OperationThe role of distribution in the elec-tric power system of the Republic of Slovenia is defined in the National Energy Programme (NEP). Following the adoption of the Energy Act (EZ-1), the current NEP will be replaced by Slovenia’s Energy Concept, in which the targets of reliable, sustainable and competitive electricity supply for
the subsequent 20-year period and 40-year framework period will be set, based on the projections of econom-ic, environmental and social develop-ment of our country, and international commitments made.
The development of an electricity distribution network and provision of
long-term, stable electricity supply is defined in the Plan for the Develop-ment of the Electricity Distribution Network in the Republic of Slovenia for the 10-year period from 2015 to 2024, produced by the company SODO, concessionaire for the per-formance of the PU service of the distribution network system operator
4908 POGOJI POSLOVANJA Elektro Celje ANNUAL REPORT 2016
(DNSO) in the territory of the Repub-lic of Slovenia based on the Plans for the Development of the Electricity Distribution Network for the 10-year period from 2015 to 2024 prepared by individual electricity distribution companies of Slovenia.
In its operation in 2016, the Elektro Celje Group complied with all core legislative and regulatory bases.
MAJOR EU DIRECTIVES RELATED TO ENERGY:
• Directive 2009/72/EC of the Euro-pean Parliament and the Council of 13 July 2009 Concerning Com-mon Rules for the National Electric-ity market and Repealing Directive 2003/54/EC (OJ L 211 of 14 August 2009, pp. 55–93).
• Directive 2005/89/EC of the Euro-pean Parliament and of the Coun-cil of 18 January 2006 Concerning Measures to Safeguard Security of Electricity Supply and Infrastructure Investment (OJ L 33 of 4 February 2006, p. 22).
ACTS RELATED TO ENERGY:• Energy Act (EZ-1) (Official Gazette
of the Republic of Slovenia, nos. 17/2014), 81/2015);
• Companies Act (ZGD-1), Official Ga-zette of the Republic of Slovenia, no. 65/09 – official consolidated text, 33/11, 91/11, 32/12, 57/12, 44/13 – decision CC and no. 82/13.
EXECUTIVE REGULATIONS RELAT-ED TO ELECTRICITY:>> Regulations related to electricity distribution• Legal Act on the Criteria and Rules
for Providing Emergency Supply of Electricity, Official Gazette of the Republic of Slovenia, no. 48/16;
• Decree on Measures and Proce-dures for the Introduction and In-teroperability of Advanced Electric Power Metering Systems, Official Gazette of the Republic of Slove-nia, no. 79/15;
• Legal Act on the Methodology De-termining the Regulatory Frame-work and Network Charge for the Electricity Distribution System, Of-ficial Gazette of the Republic of Slovenia, nos. 66/15, 105/15, 61/16, (unofficial consolidated text of the Legal Act);
• Legal Act on the Rules for Monitor-ing the Quality of Electricity Supply, Official Gazette of the Republic of Slovenia, no. 59/15;
• Decree on the Awarding of a Concession and on the Method of Provision of a Service of Gen-eral Economic Interest – Electric-ity Transmission System Operator, Official Gazette of the Republic of Slovenia, no. 46/15;
• Legal Act on the Identification of Entities in the Data Exchange among Participants in the Electric-ity and Natural Gas Markets, Offi-cial Gazette of the Republic of Slo-venia, nos. 39/15, 36/16, (unofficial consolidated text of the legal Act);
• Legal Act on the Method for the Submission of Data and Docu-ments by Providers of Energy Sec-tor Activities, Official Gazette of the Republic of Slovenia, no. 98/14;
• Legal Act on the Methodology for the Preparation and Evaluation of an Investment Plan of the Electric-ity Distribution System Operator, Official Gazette of the Republic of Slovenia, no. 97/14;
• Rules on the System Operation of Electricity Distribution Network, Of-ficial Gazette of the Republic of Slo-venia, nos. 41/11, 17/14 - EZ-1;
• Decree on the Concession of an Electricity DSO Service of General Economic Interest, Official Gazette of the Republic of Slovenia, nos. 39/07, 17/14 - EZ-1;
• Decree on the Method of Provi-sion of an Electricity DSO Service of General Economic Interest and a Service of General Economic In-terest of Electricity Supply to Tariff, Official Gazette of the Republic of Slovenia, nos. 117/04, 23/07, 17/14 - EZ-1;
• General Conditions for Connection to the Distribution Electric System, Official Gazette of the Republic of Slovenia, nos. 126/07, 37/11 - deci-sion CC, no. 17/14 - EZ-1;
• Decree on Maintenance Works for the Public Benefit in the Energy Sector, Official Gazette of the Re-public of Slovenia, nos. 125/04, 71/09, 22/10 - EZ-D, 17/14 - EZ-1.
>> Market activities• Rules on the Operation of the Elec-
tricity Market, Official Gazette of the Republic of Slovenia, no. 105/15;
• Decree on the Award of a Conces-
sion and on the Method of Provi-sion of a Service of General Eco-nomic Interest – Electricity Market Operator, Official Gazette of the Republic of Slovenia, no. 39/15;
• Act on the Determination of the Shares of Individual Electricity Pro-duction Sources and on the Meth-od of their Presentation, Official Ga-zette of the Republic of Slovenia, no. 22/16;
• Rules on the Balancing of the Elec-tricity Market, Official Gazette of the Republic of Slovenia, no. 97/14;
• Act Concerning the Method of Electronic Data Reporting for Valid Regular Tariffs Comparison of Elec-tricity and Natural Gas Suppliers for Household and Small Business Customers, Official Gazette of the Republic of Slovenia, no. 69/14;
• Decision Laying Down Prices for the Electricity Supply to Household Consumers and Prices for Cover-ing the Supplier’s Costs Associated with the Electricity Supply, Official Gazette of the Republic of Slove-nia, no. 27/07.
OTHER LEGISLATION• Construction Act (ZGO-1), Official
Gazette of the Republic of Slove-nia, 102/04 – official consolidated text, nos. 14/05 – corr., 92/05 - ZJC-B, 93/05 - ZVMS, 111/05 - decision CC, 120/06 (CC decision), 126/07, 108/09, 61/10 - ZRud-1, 20/11 - deci-sion CC, 57/12, 101/13 - ZDavNepr, and 110/13;
• Spatial Planning Act (ZPNačrt), Of-ficial Gazette of the Republic of Slovenia, nos. 33/07, 70/08 - ZVO-1B, 108/09, 80/10 - ZUPUDPP, 43/11 - ZKZ-C, 57/12, 57/12 - ZUPUDPP-A, (109/12), and 76/14 - decision CC;
• Spatial Management Act (ZUreP-1), Official Gazette of the Republic of Slovenia, nos. 110/02, 8/03 – corr., 58/03 - ZZK-1, 33/07 - ZPNačrt, 108/09 - ZGO-1C, 80/10 – ZU-PUDPP;
• Environmental Protection Act (ZVO-1), Official Gazette of the Republic of Slovenia, 39/06 - official consoli-dated text, 49/06 - ZMetD, 66/06 - decision CC, 33/07 - ZPNačrt, 57/08 - ZFO-1A, 70/08, 108/09, 108/09 - ZPNačrt-A, 48/12, 57/12, and 92/13;
• Public Information Access Act (ZDI-JZ), Official Gazette of the Repub-lic of Slovenia, nos. 51/06 - official
50 08Elektro Celje ANNUAL REPORT 2016
consolidated text, 117/06 - ZDavP-2, 23/14, and 50/14;
• General Administrative Procedure Act (ZUP), Official Gazette of the Republic of Slovenia, nos. 24/06 - official consolidated text, 105/06 - ZUS-1, 126/07, 65/08, 8/10, and 82/13;
• Administrative Dispute Act (ZUS-1), Official Gazette of the Republic of Slovenia, nos. 105/06, 107/09 - de-cision CC, 62/10, 98/11 - decision CC, and 109/12;
• Public Procurement Act (ZJN-2), Official Gazette of the Republic of Slovenia, nos. 12/13 - official con-solidated text, and 19/14; until 31 March 2016;
• Public Procurement Act (ZJN-3), Official Gazette of the Republic of Slovenia, no. 91/2015;
• Act Regulating Public Procurement in the Water, Energy, Transport and Postal Services Sectors (ZJNVET-PS), Official Gazette of the Republic of Slovenia, nos. 72/11 - official con-solidated text, 43/12 - decision CC, 90/12, and 19/14; - until 31 March 2016;
• Legal Protection in Public Procure-ment Procedures Act (ZPVPJN),
Official Gazette of the Republic of Slovenia, nos. 43/11, 60/11 - ZTP-D, and 63/13;
• Physical Assets of the State and Local Government Act (ZSPDSLS), Official Gazette of the Republic of Slovenia, nos. 86/10, 75/12, 47/13 - ZDU- 1G, and 50/14;
• Public Finance Act (ZJF), Official Gazette of the Republic of Slove-nia, nos. 11/11 - official consolidated text, 14/13 - corr., and 101/13;
• Siting of Spatial Arrangements of National Importance Act (ZU-PUDPP), Official Gazette of the Republic of Slovenia, nos. 80/10, 106/10 - corr., and 57/12;
• Excise Duty Act (ZTro-1), Official Ga-zette of the Republic of Slovenia, nos. 84/1998, 52/1999, 57/1999, 2/2001, 33/2001, 99/2001, 5/2002, 126/2003, 7/2004 - corr., 42/2004, 114/2006 - ZUE, 122/2006, 25/2009, 41/2009, 19/2010, 56/2010, 61/2010, 85/2010, 48/2012, 109/2012, 32/2014, 47/2016 - ZTro-1, valid until 31 July 2016;
• Excise Duty Act (ZTro), Official Ga-zette of the Republic of Slovenia, no. 47/2016;
• Value Added Tax Act (ZDDV-1), Of-ficial Gazette of the Republic of Slovenia, nos. 117/2006, 52/2007, 33/2009, 85/2009, 85/2010, 18/2011, 78/2011, 38/2012, 40/2012 - ZUJF, 83/2012, 14/2013, 46/2013 - ZIPRS1314-A, 101/2013 - ZIPRS1415, 86/2014, 90/2015;
• Code of Obligations (OZ), Official Gazette of the Republic of Slovenia, nos. 83/2001, 32/2004, 28/2006 - dec. CC, 40/2007, 64/2016 - deci-sion CC;
• Law of Property Code (SPZ), Official Gazette of the Republic of Slove-nia, nos. 87/2002, 91/2013;
• Rules on Conditions and Restric-tions Regarding the Construction and Use of Installations and the Performance of Activities in the Electricity Network Safety Zone, Of-ficial Gazette of the Republic of Slo-venia, nos. 101/10, and 17/14 - EZ-1;
• Resolution on the National Energy Programme, Official Gazette of the Republic of Slovenia, no. 57/04 (Re-Nep);
• Strategy for Development of the Power distribution System in the Republic of Slovenia between 2013 and 2022.
8.3 Composition of the Price of Electricity for the End ConsumerThe final price of supplied electricity for a customer who is billed for the network charge and the electricity consumed, charged by the electricity supplier is composed of the following categories:>> price of electricity formed in the
free market;>> network charge (determined by
EAgen):
>> transmission network charge and>> distribution network charge;>> contributions (determined by the
Government of the Republic of Slovenia):
>> contribution for provision of sup-port to high-efficiency combined heat and power generation and for energy generation from re-newable energy sources (RES and CHP);
>> contribution for efficient energy use (EE),
>> contribution for the activity of mar-ket operator;
>> excise duties on electricity (deter-mined by the Government of the Republic of Slovenia) and
>> VAT (determined by the Govern-ment of the Republic of Slovenia).
Source: Energy Agency
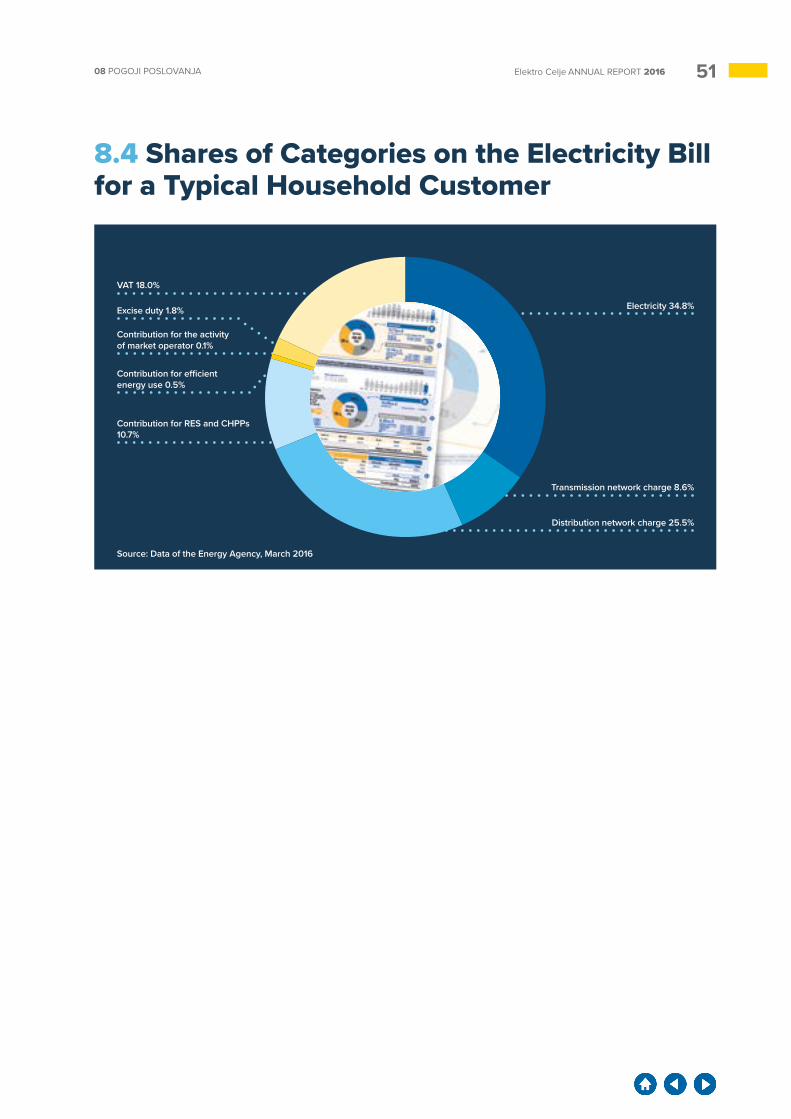
5108 POGOJI POSLOVANJA Elektro Celje ANNUAL REPORT 2016
Electricity 34.8%
VAT 18.0%
Excise duty 1.8%
Contribution for the activity of market operator 0.1%
Contribution for efficient energy use 0.5%
Contribution for RES and CHPPs 10.7%
Source: Data of the Energy Agency, March 2016
Transmission network charge 8.6%
Distribution network charge 25.5%
8.4 Shares of Categories on the Electricity Bill for a Typical Household Customer
52 09Elektro Celje ANNUAL REPORT 2016
09 ORGANISATION AND ACTIVITIES OF THE COMPANY ELEKTRO CELJE
9.1 Operation and Development of the Distribution NetworkThe Operations and Development sector performs the following tasks:>> distribution of electricity,>> management, control and opera-
tion of the distribution network,>> provision of network development,>> compliance with systemic opera-
tional instructions,>> management of electricity trans-
mission via the distribution net-work and exchange with other networks,
>> provision of optimum restoration of system operations following any faults,
>> coordinated operation of the dis-tribution network with connected networks,
>> provision of systemic protection of the distribution network,
>> conducting operational measure-ments in the distribution network,
>> conducting measurements and analyses in the field of quality of electricity supply,
>> development of operational statis-tics.
In 2016, the Operations and Devel-opment sector continued upgrading the DMS/OMS V2 software tool by concentrating on actively reducing losses of electricity in the network. Together with our external partners, we are successfully participating in the European project Flex4Grid.
Focussing on a reliable provision of electricity to our customers, in 2016 the company Elektro Celje continued the activities of the project “parallel operation of the MV network.” The electrical codes allow normal power-line loads that cause up to a 7.5% voltage drop, but in extraordinary operating conditions, the maximum permitted voltage drop can be high-er. Temporal and financial limitations regarding the siting of facilities can result in an extraordinary operating
condition, reducing to ordinary oper-ating conditions. The disadvantages of such an operating condition are mainly greater electricity losses and a negative impact on the continuity of supply parameters. The company Elektro Celje set itself the goal of uti-lising the existing infrastructure op-timally even in such circumstances. In order to achieve this goal, project documentation, background docu-ments and technical specifications were prepared for the planned equip-ment.
In 2016, we implemented this project into the real environment. We per-formed parallel operation of power supply lines for DTS Mokronog from DTS Sevnica, and began actively monitoring the first experiences of such an operation. It should be noted that this is the first project of its kind in Slovenia.
9.1.1 Development of the Distribution NetworkThe Development Department is-sues land development documents and agreements on connection to the
distribution network, while also be-ing responsible for the processing of geographic data for the Geographic
Information System (GIS), the quality of electricity supply, and network de-
velopment plans.
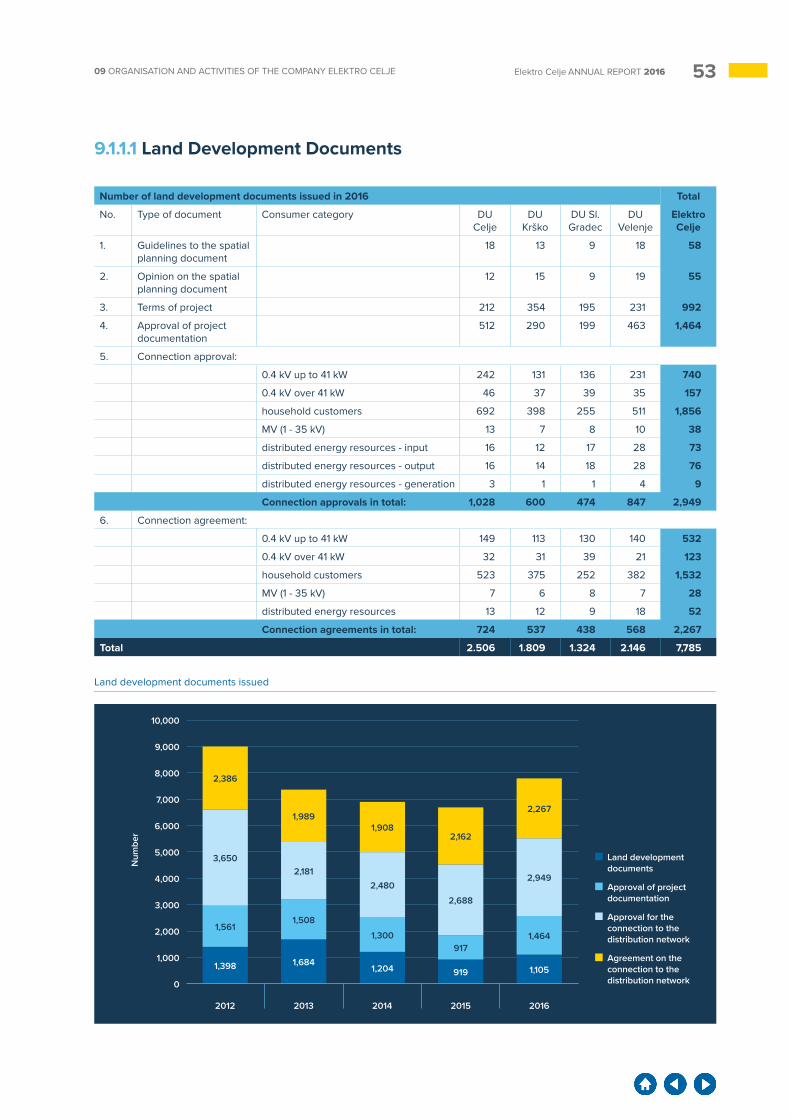
5309 ORGANISATION AND ACTIVITIES OF THE COMPANY ELEKTRO CELJE Elektro Celje ANNUAL REPORT 2016
9.1.1.1 Land Development Documents
Number of land development documents issued in 2016 Total
No. Type of document Consumer category DU Celje
DU Krško
DU Sl. Gradec
DU Velenje
Elektro Celje
1. Guidelines to the spatial planning document
18 13 9 18 58
2. Opinion on the spatial planning document
12 15 9 19 55
3. Terms of project 212 354 195 231 992
4. Approval of project documentation
512 290 199 463 1,464
5. Connection approval:
0.4 kV up to 41 kW 242 131 136 231 740
0.4 kV over 41 kW 46 37 39 35 157
household customers 692 398 255 511 1,856
MV (1 - 35 kV) 13 7 8 10 38
distributed energy resources - input 16 12 17 28 73
distributed energy resources - output 16 14 18 28 76
distributed energy resources - generation 3 1 1 4 9
Connection approvals in total: 1,028 600 474 847 2,949
6. Connection agreement:
0.4 kV up to 41 kW 149 113 130 140 532
0.4 kV over 41 kW 32 31 39 21 123
household customers 523 375 252 382 1,532
MV (1 - 35 kV) 7 6 8 7 28
distributed energy resources 13 12 9 18 52
Connection agreements in total: 724 537 438 568 2,267
Total 2.506 1.809 1.324 2.146 7,785
0
10,000
Num
ber
9,000
7,000
5,000
3,000
8,000
6,000
4,000
2,000
1,000
2012 2013 2014 2015 2016
1,398 1,6841,204 919 1,105
1,5611,508
1,300917
1,464
3,6502,181
2,480
2,688
2,949
Land development documents issued
2,386
1,9891,908
2,162
2,267
Land development documents
Approval of project documentation
Approval for the connection to the distribution network
Agreement on the connection to the distribution network
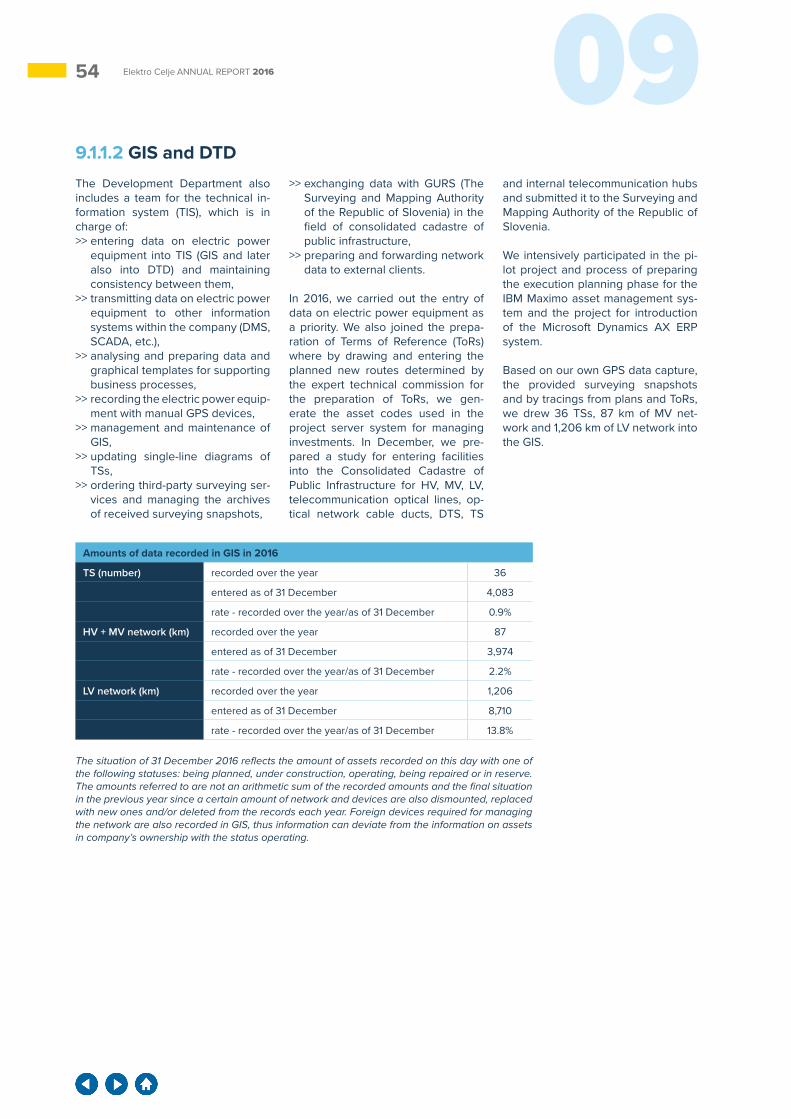
54 09Elektro Celje ANNUAL REPORT 2016
9.1.1.2 GIS and DTDThe Development Department also includes a team for the technical in-formation system (TIS), which is in charge of: >> entering data on electric power
equipment into TIS (GIS and later also into DTD) and maintaining consistency between them,
>> transmitting data on electric power equipment to other information systems within the company (DMS, SCADA, etc.),
>> analysing and preparing data and graphical templates for supporting business processes,
>> recording the electric power equip-ment with manual GPS devices,
>> management and maintenance of GIS,
>> updating single-line diagrams of TSs,
>> ordering third-party surveying ser-vices and managing the archives of received surveying snapshots,
>> exchanging data with GURS (The Surveying and Mapping Authority of the Republic of Slovenia) in the field of consolidated cadastre of public infrastructure,
>> preparing and forwarding network data to external clients.
In 2016, we carried out the entry of data on electric power equipment as a priority. We also joined the prepa-ration of Terms of Reference (ToRs) where by drawing and entering the planned new routes determined by the expert technical commission for the preparation of ToRs, we gen-erate the asset codes used in the project server system for managing investments. In December, we pre-pared a study for entering facilities into the Consolidated Cadastre of Public Infrastructure for HV, MV, LV, telecommunication optical lines, op-tical network cable ducts, DTS, TS
and internal telecommunication hubs and submitted it to the Surveying and Mapping Authority of the Republic of Slovenia.
We intensively participated in the pi-lot project and process of preparing the execution planning phase for the IBM Maximo asset management sys-tem and the project for introduction of the Microsoft Dynamics AX ERP system.
Based on our own GPS data capture, the provided surveying snapshots and by tracings from plans and ToRs, we drew 36 TSs, 87 km of MV net-work and 1,206 km of LV network into the GIS.
The situation of 31 December 2016 reflects the amount of assets recorded on this day with one of the following statuses: being planned, under construction, operating, being repaired or in reserve. The amounts referred to are not an arithmetic sum of the recorded amounts and the final situation in the previous year since a certain amount of network and devices are also dismounted, replaced with new ones and/or deleted from the records each year. Foreign devices required for managing the network are also recorded in GIS, thus information can deviate from the information on assets in company’s ownership with the status operating.
Amounts of data recorded in GIS in 2016
TS (number) recorded over the year 36
entered as of 31 December 4,083
rate - recorded over the year/as of 31 December 0.9%
HV + MV network (km) recorded over the year 87
entered as of 31 December 3,974
rate - recorded over the year/as of 31 December 2.2%
LV network (km) recorded over the year 1,206
entered as of 31 December 8,710
rate - recorded over the year/as of 31 December 13.8%
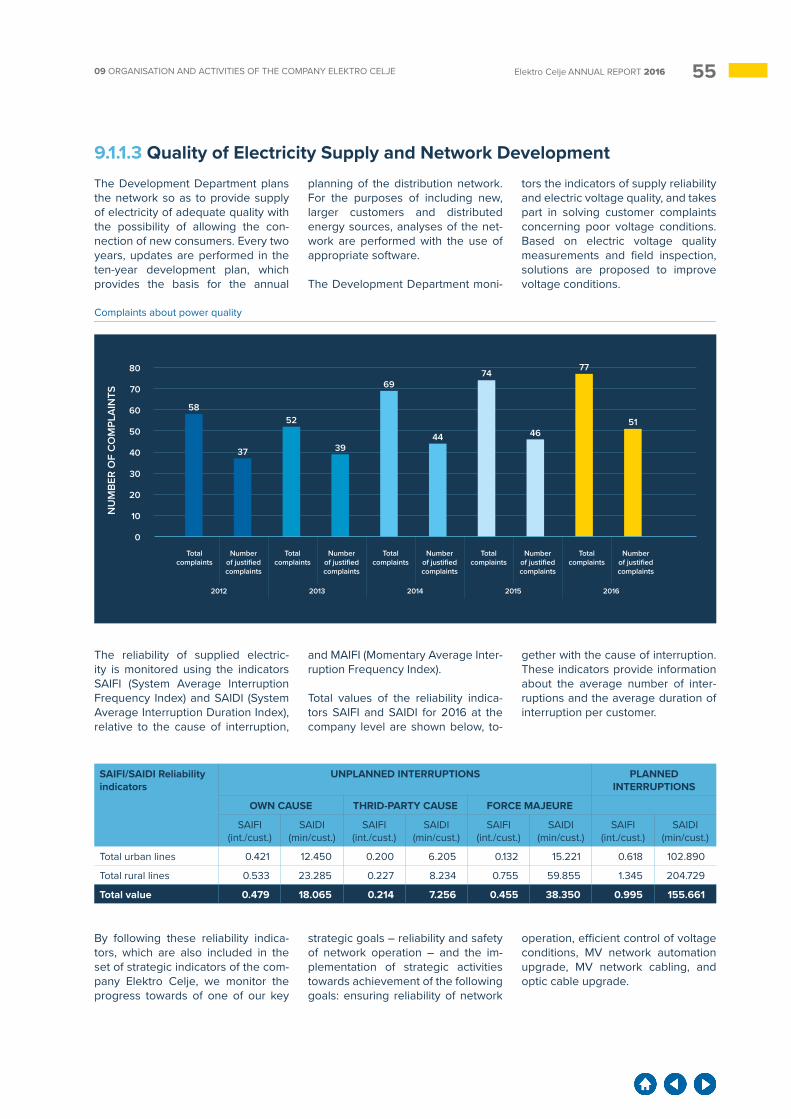
5509 ORGANISATION AND ACTIVITIES OF THE COMPANY ELEKTRO CELJE Elektro Celje ANNUAL REPORT 2016
9.1.1.3 Quality of Electricity Supply and Network DevelopmentThe Development Department plans the network so as to provide supply of electricity of adequate quality with the possibility of allowing the con-nection of new consumers. Every two years, updates are performed in the ten-year development plan, which provides the basis for the annual
planning of the distribution network. For the purposes of including new, larger customers and distributed energy sources, analyses of the net-work are performed with the use of appropriate software.
The Development Department moni-
tors the indicators of supply reliability and electric voltage quality, and takes part in solving customer complaints concerning poor voltage conditions. Based on electric voltage quality measurements and field inspection, solutions are proposed to improve voltage conditions.
40
20
60
10
0
50
30
70
80
NU
MB
ER O
F C
OM
PLA
INTS
2012 2013 2014 2015 2016
Total complaints
Number of justified complaints
Total complaints
Number of justified complaints
Total complaints
Number of justified complaints
Total complaints
Number of justified complaints
Total complaints
Number of justified complaints
58
37
52
6974
77
3944 46
51
Complaints about power quality
The reliability of supplied electric-ity is monitored using the indicators SAIFI (System Average Interruption Frequency Index) and SAIDI (System Average Interruption Duration Index), relative to the cause of interruption,
and MAIFI (Momentary Average Inter-ruption Frequency Index).
Total values of the reliability indica-tors SAIFI and SAIDI for 2016 at the company level are shown below, to-
gether with the cause of interruption. These indicators provide information about the average number of inter-ruptions and the average duration of interruption per customer.
SAIFI/SAIDI Reliability indicators
UNPLANNED INTERRUPTIONS PLANNED INTERRUPTIONS
OWN CAUSE THRID-PARTY CAUSE FORCE MAJEURE
SAIFI(int./cust.)
SAIDI (min/cust.)
SAIFI(int./cust.)
SAIDI (min/cust.)
SAIFI(int./cust.)
SAIDI (min/cust.)
SAIFI(int./cust.)
SAIDI (min/cust.)
Total urban lines 0.421 12.450 0.200 6.205 0.132 15.221 0.618 102.890
Total rural lines 0.533 23.285 0.227 8.234 0.755 59.855 1.345 204.729
Total value 0.479 18.065 0.214 7.256 0.455 38.350 0.995 155.661
By following these reliability indica-tors, which are also included in the set of strategic indicators of the com-pany Elektro Celje, we monitor the progress towards of one of our key
strategic goals – reliability and safety of network operation – and the im-plementation of strategic activities towards achievement of the following goals: ensuring reliability of network
operation, efficient control of voltage conditions, MV network automation upgrade, MV network cabling, and optic cable upgrade.
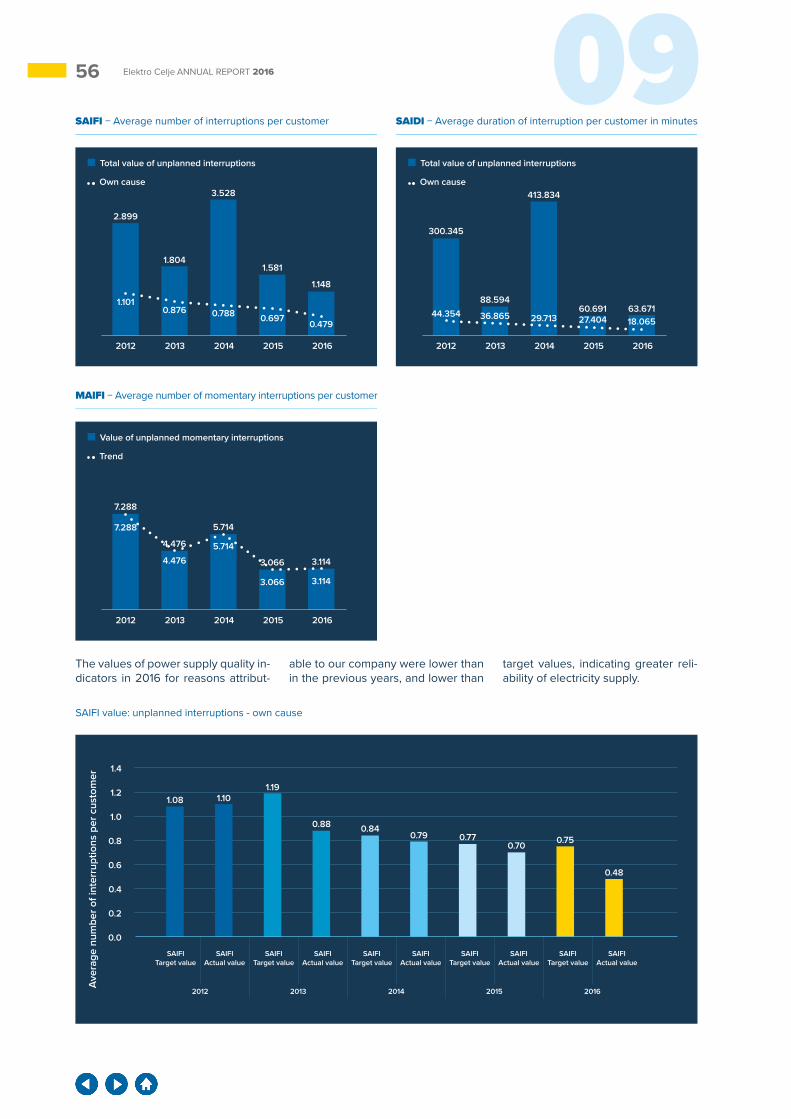
56 09Elektro Celje ANNUAL REPORT 2016
0.8
0.4
1.2
0.2
0.0
1.0
0.6
1.4
Ave
rage
num
ber o
f int
erru
ptio
ns p
er c
usto
mer
2012 2013 2014 2015 2016
SAIFITarget value
SAIFIActual value
SAIFITarget value
SAIFIActual value
SAIFITarget value
SAIFIActual value
SAIFITarget value
SAIFIActual value
SAIFITarget value
SAIFIActual value
1.101.19
0.840.77 0.75
0.880.79
0.70
0.48
SAIFI value: unplanned interruptions - own cause
The values of power supply quality in-dicators in 2016 for reasons attribut-
able to our company were lower than in the previous years, and lower than
target values, indicating greater reli-ability of electricity supply.
SAIFI − Average number of interruptions per customer
MAIFI − Average number of momentary interruptions per customer
SAIDI − Average duration of interruption per customer in minutes
2012 2013 2014 2015 2016
2012 2013 2014 2015 2016
2012 2013 2014 2015 2016
2.899
7.288
7.288
300.345
1.10144.354
1.804
4.476
4.476
88.5940.876
36.865
3.528
5.714
5.714
413.834
0.788 29.713
1.581
3.066
3.066
60.6910.697 27.404
1.148
3.114
3.114
63.671
0.479 18.065
Total value of unplanned interruptions
Own cause
Value of unplanned momentary interruptions
Trend
Total value of unplanned interruptions
Own cause
1.08
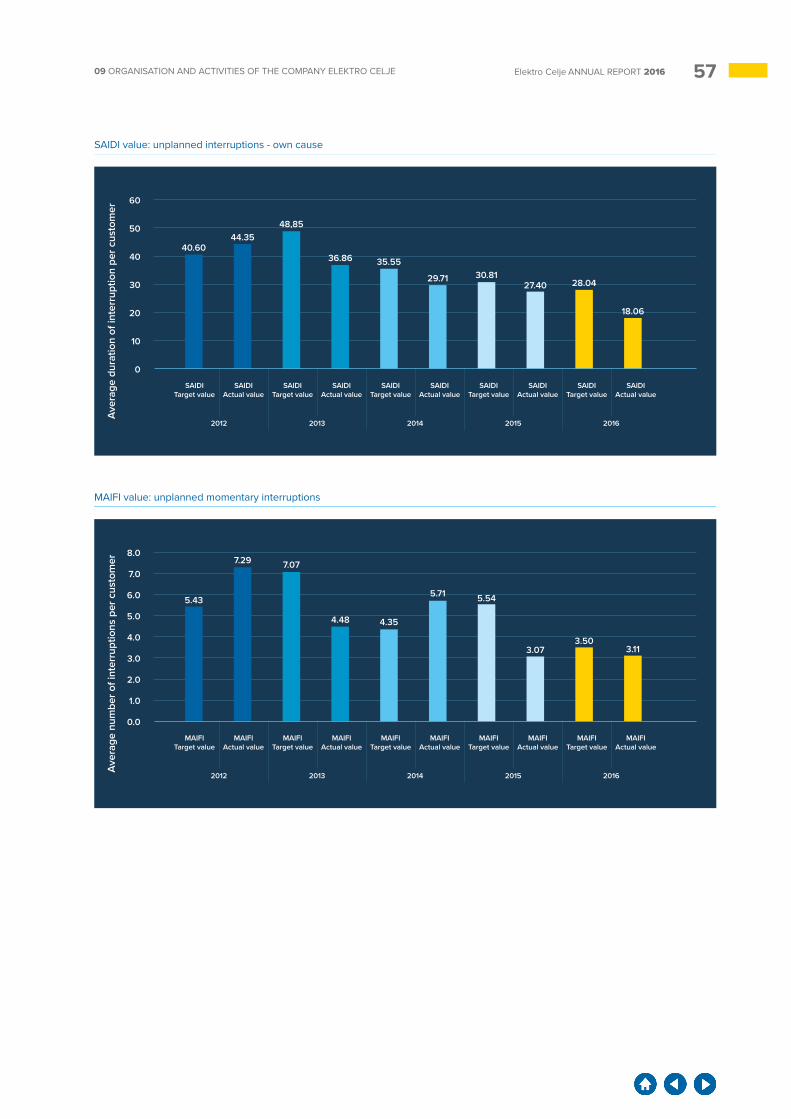
5709 ORGANISATION AND ACTIVITIES OF THE COMPANY ELEKTRO CELJE Elektro Celje ANNUAL REPORT 2016
40
4.0
20
2.0
10
1.0
0
0.0
50
5.0
30
3.0
60
8.0
7.0
6.0
Ave
rage
dur
atio
n of
inte
rrup
tion
per c
usto
mer
Ave
rage
num
ber o
f int
erru
ptio
ns p
er c
usto
mer
2012 2013 2014 2015 2016
2012 2013 2014 2015 2016
SAIDITarget value
SAIDIActual value
SAIDITarget value
SAIDIActual value
SAIDITarget value
SAIDIActual value
SAIDITarget value
SAIDIActual value
SAIDITarget value
SAIDIActual value
MAIFITarget value
MAIFIActual value
MAIFITarget value
MAIFIActual value
MAIFITarget value
MAIFIActual value
MAIFITarget value
MAIFIActual value
MAIFITarget value
MAIFIActual value
44.3548,85
7.07
35.55
4.35
30.81
5.54
28.04
3.50
36.86
4.48
29.71
5.71
27.40
3.07
18.06
3.11
SAIDI value: unplanned interruptions - own cause
MAIFI value: unplanned momentary interruptions
40.60
5.43
7.29
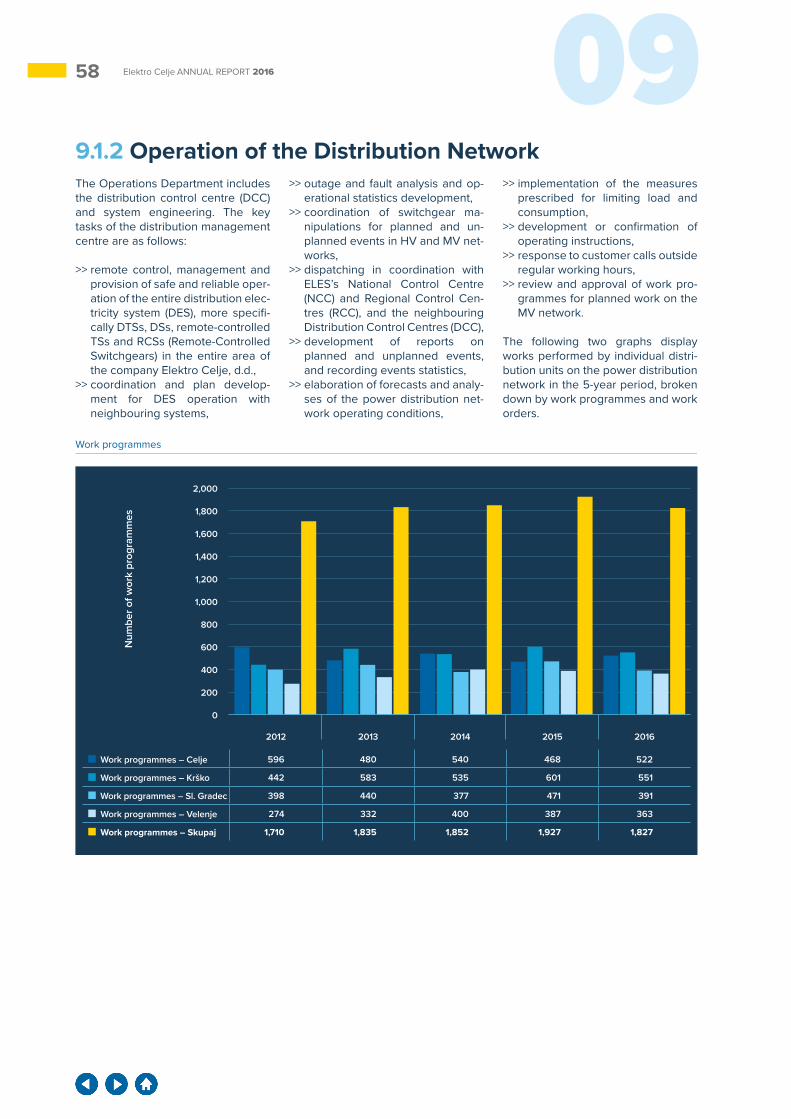
58 09Elektro Celje ANNUAL REPORT 2016
9.1.2 Operation of the Distribution NetworkThe Operations Department includes the distribution control centre (DCC) and system engineering. The key tasks of the distribution management centre are as follows:
>> remote control, management and provision of safe and reliable oper-ation of the entire distribution elec-tricity system (DES), more specifi-cally DTSs, DSs, remote-controlled TSs and RCSs (Remote-Controlled Switchgears) in the entire area of the company Elektro Celje, d.d.,
>> coordination and plan develop-ment for DES operation with neighbouring systems,
>> outage and fault analysis and op-erational statistics development,
>> coordination of switchgear ma-nipulations for planned and un-planned events in HV and MV net-works,
>> dispatching in coordination with ELES’s National Control Centre (NCC) and Regional Control Cen-tres (RCC), and the neighbouring Distribution Control Centres (DCC),
>> development of reports on planned and unplanned events, and recording events statistics,
>> elaboration of forecasts and analy-ses of the power distribution net-work operating conditions,
>> implementation of the measures prescribed for limiting load and consumption,
>> development or confirmation of operating instructions,
>> response to customer calls outside regular working hours,
>> review and approval of work pro-grammes for planned work on the MV network.
The following two graphs display works performed by individual distri-bution units on the power distribution network in the 5-year period, broken down by work programmes and work orders.
0
2,000
1,800
1,400
1,000
600
1,600
1,200
800
400
200
Num
ber o
f wor
k pr
ogra
mm
es
2012 2013 2014 2015 2016
Work programmes
Work programmes – Celje 596 480 540 468 522
Work programmes – Krško 442 583 535 601 551
Work programmes – Sl. Gradec 398 440 377 471 391
Work programmes – Velenje 274 332 400 387 363
Work programmes – Skupaj 1,710 1,835 1,852 1,927 1,827
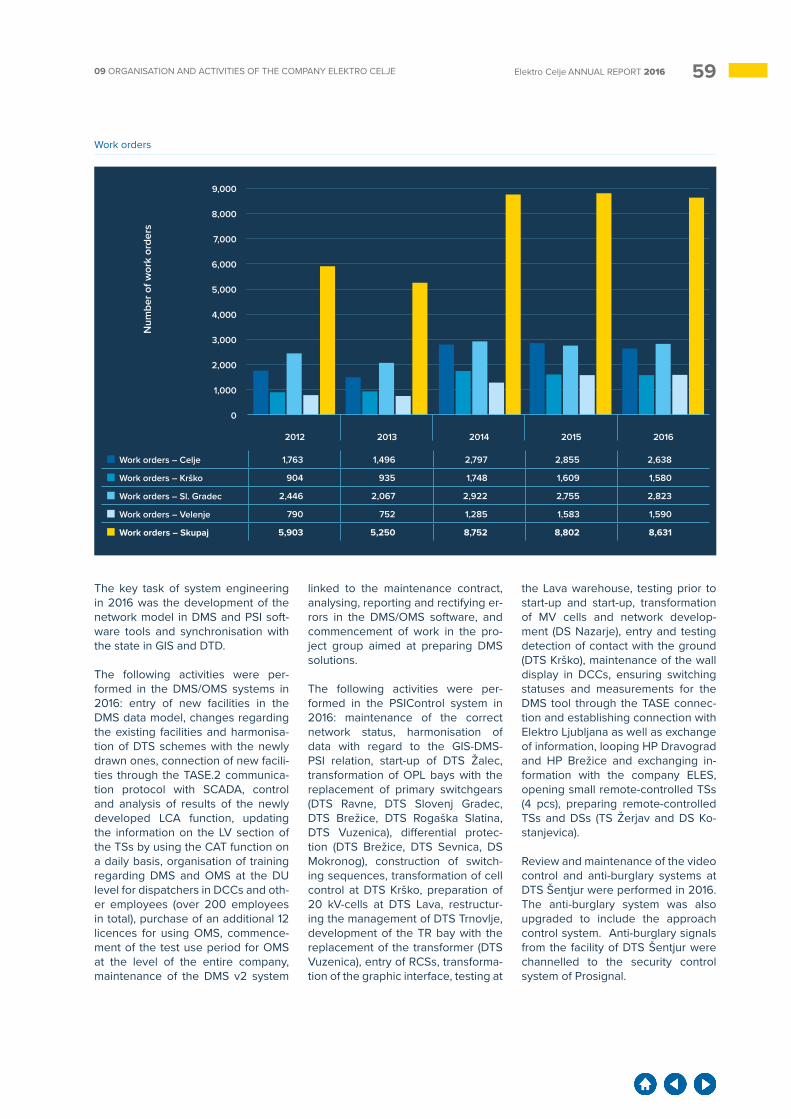
5909 ORGANISATION AND ACTIVITIES OF THE COMPANY ELEKTRO CELJE Elektro Celje ANNUAL REPORT 2016
0
9,000
7,000
5,000
3,000
8,000
6,000
4,000
2,000
1,000
Num
ber o
f wor
k or
ders
2012 2013 2014 2015 2016
Work orders
Work orders – Celje 1,763 1,496 2,797 2,855 2,638
Work orders – Krško 904 935 1,748 1,609 1,580
Work orders – Sl. Gradec 2,446 2,067 2,922 2,755 2,823
Work orders – Velenje 790 752 1,285 1,583 1,590
Work orders – Skupaj 5,903 5,250 8,752 8,802 8,631
The key task of system engineering in 2016 was the development of the network model in DMS and PSI soft-ware tools and synchronisation with the state in GIS and DTD.
The following activities were per-formed in the DMS/OMS systems in 2016: entry of new facilities in the DMS data model, changes regarding the existing facilities and harmonisa-tion of DTS schemes with the newly drawn ones, connection of new facili-ties through the TASE.2 communica-tion protocol with SCADA, control and analysis of results of the newly developed LCA function, updating the information on the LV section of the TSs by using the CAT function on a daily basis, organisation of training regarding DMS and OMS at the DU level for dispatchers in DCCs and oth-er employees (over 200 employees in total), purchase of an additional 12 licences for using OMS, commence-ment of the test use period for OMS at the level of the entire company, maintenance of the DMS v2 system
linked to the maintenance contract, analysing, reporting and rectifying er-rors in the DMS/OMS software, and commencement of work in the pro-ject group aimed at preparing DMS solutions.
The following activities were per-formed in the PSIControl system in 2016: maintenance of the correct network status, harmonisation of data with regard to the GIS-DMS-PSI relation, start-up of DTS Žalec, transformation of OPL bays with the replacement of primary switchgears (DTS Ravne, DTS Slovenj Gradec, DTS Brežice, DTS Rogaška Slatina, DTS Vuzenica), differential protec-tion (DTS Brežice, DTS Sevnica, DS Mokronog), construction of switch-ing sequences, transformation of cell control at DTS Krško, preparation of 20 kV-cells at DTS Lava, restructur-ing the management of DTS Trnovlje, development of the TR bay with the replacement of the transformer (DTS Vuzenica), entry of RCSs, transforma-tion of the graphic interface, testing at
the Lava warehouse, testing prior to start-up and start-up, transformation of MV cells and network develop-ment (DS Nazarje), entry and testing detection of contact with the ground (DTS Krško), maintenance of the wall display in DCCs, ensuring switching statuses and measurements for the DMS tool through the TASE connec-tion and establishing connection with Elektro Ljubljana as well as exchange of information, looping HP Dravograd and HP Brežice and exchanging in-formation with the company ELES, opening small remote-controlled TSs (4 pcs), preparing remote-controlled TSs and DSs (TS Žerjav and DS Ko-stanjevica).
Review and maintenance of the video control and anti-burglary systems at DTS Šentjur were performed in 2016. The anti-burglary system was also upgraded to include the approach control system. Anti-burglary signals from the facility of DTS Šentjur were channelled to the security control system of Prosignal.
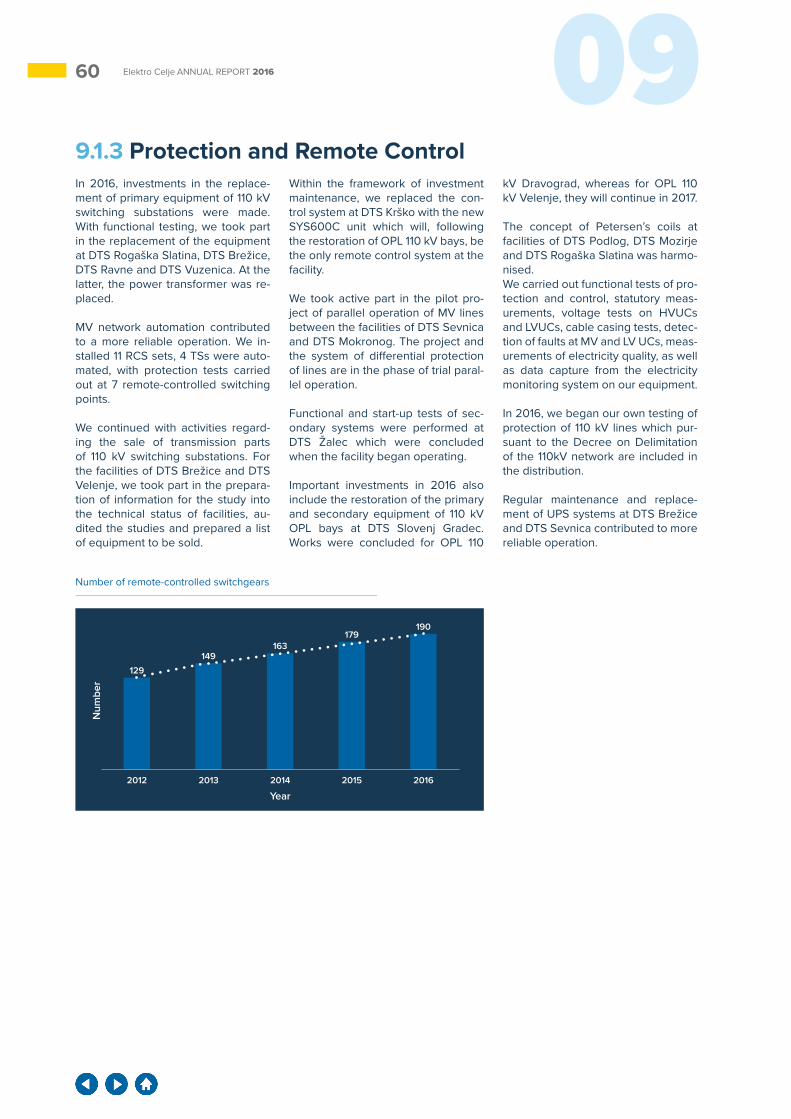
60 09Elektro Celje ANNUAL REPORT 2016
9.1.3 Protection and Remote ControlIn 2016, investments in the replace-ment of primary equipment of 110 kV switching substations were made. With functional testing, we took part in the replacement of the equipment at DTS Rogaška Slatina, DTS Brežice, DTS Ravne and DTS Vuzenica. At the latter, the power transformer was re-placed.
MV network automation contributed to a more reliable operation. We in-stalled 11 RCS sets, 4 TSs were auto-mated, with protection tests carried out at 7 remote-controlled switching points.
We continued with activities regard-ing the sale of transmission parts of 110 kV switching substations. For the facilities of DTS Brežice and DTS Velenje, we took part in the prepara-tion of information for the study into the technical status of facilities, au-dited the studies and prepared a list of equipment to be sold.
Within the framework of investment maintenance, we replaced the con-trol system at DTS Krško with the new SYS600C unit which will, following the restoration of OPL 110 kV bays, be the only remote control system at the facility.
We took active part in the pilot pro-ject of parallel operation of MV lines between the facilities of DTS Sevnica and DTS Mokronog. The project and the system of differential protection of lines are in the phase of trial paral-lel operation.
Functional and start-up tests of sec-ondary systems were performed at DTS Žalec which were concluded when the facility began operating.
Important investments in 2016 also include the restoration of the primary and secondary equipment of 110 kV OPL bays at DTS Slovenj Gradec. Works were concluded for OPL 110
kV Dravograd, whereas for OPL 110 kV Velenje, they will continue in 2017.
The concept of Petersen’s coils at facilities of DTS Podlog, DTS Mozirje and DTS Rogaška Slatina was harmo-nised.We carried out functional tests of pro-tection and control, statutory meas-urements, voltage tests on HVUCs and LVUCs, cable casing tests, detec-tion of faults at MV and LV UCs, meas-urements of electricity quality, as well as data capture from the electricity monitoring system on our equipment.
In 2016, we began our own testing of protection of 110 kV lines which pur-suant to the Decree on Delimitation of the 110kV network are included in the distribution.
Regular maintenance and replace-ment of UPS systems at DTS Brežice and DTS Sevnica contributed to more reliable operation.
Number of remote-controlled switchgears
2012 2013 2014 2015 2016
190179
163149
129
Num
ber
Year
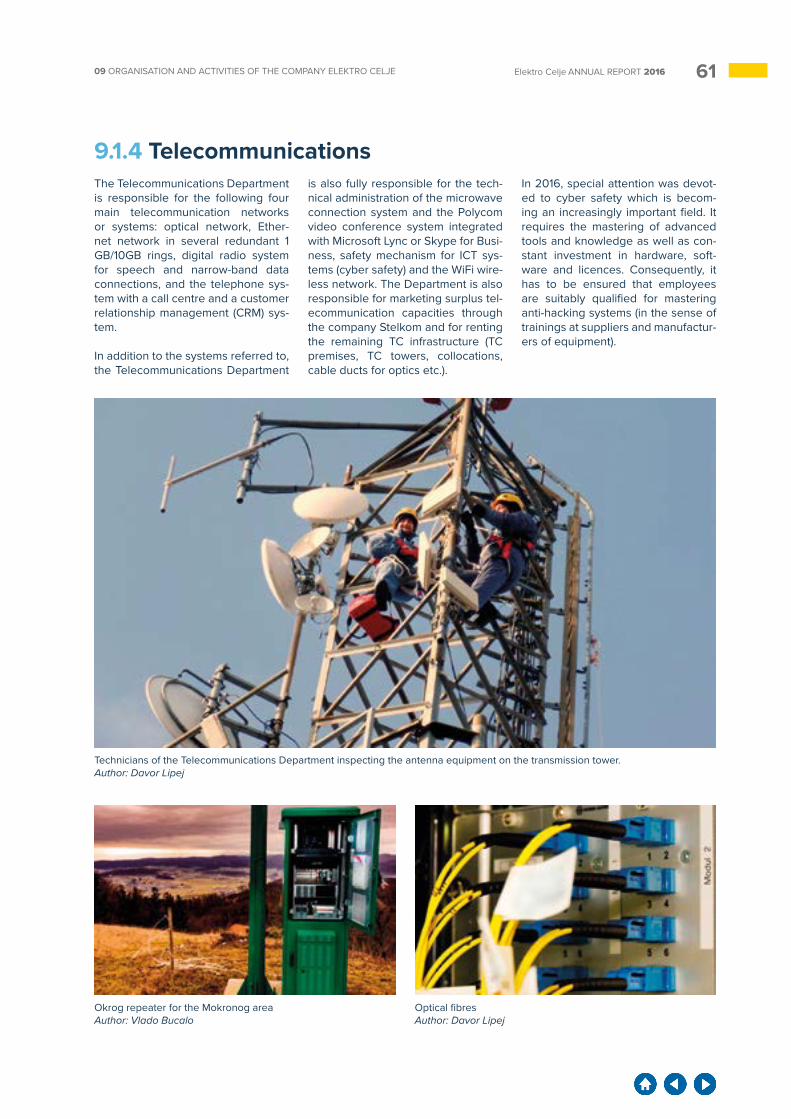
6109 ORGANISATION AND ACTIVITIES OF THE COMPANY ELEKTRO CELJE Elektro Celje ANNUAL REPORT 2016
9.1.4 TelecommunicationsThe Telecommunications Department is responsible for the following four main telecommunication networks or systems: optical network, Ether-net network in several redundant 1 GB/10GB rings, digital radio system for speech and narrow-band data connections, and the telephone sys-tem with a call centre and a customer relationship management (CRM) sys-tem.
In addition to the systems referred to, the Telecommunications Department
is also fully responsible for the tech-nical administration of the microwave connection system and the Polycom video conference system integrated with Microsoft Lync or Skype for Busi-ness, safety mechanism for ICT sys-tems (cyber safety) and the WiFi wire-less network. The Department is also responsible for marketing surplus tel-ecommunication capacities through the company Stelkom and for renting the remaining TC infrastructure (TC premises, TC towers, collocations, cable ducts for optics etc.).
In 2016, special attention was devot-ed to cyber safety which is becom-ing an increasingly important field. It requires the mastering of advanced tools and knowledge as well as con-stant investment in hardware, soft-ware and licences. Consequently, it has to be ensured that employees are suitably qualified for mastering anti-hacking systems (in the sense of trainings at suppliers and manufactur-ers of equipment).
Technicians of the Telecommunications Department inspecting the antenna equipment on the transmission tower.Author: Davor Lipej
Okrog repeater for the Mokronog areaAuthor: Vlado Bucalo
Optical fibresAuthor: Davor Lipej
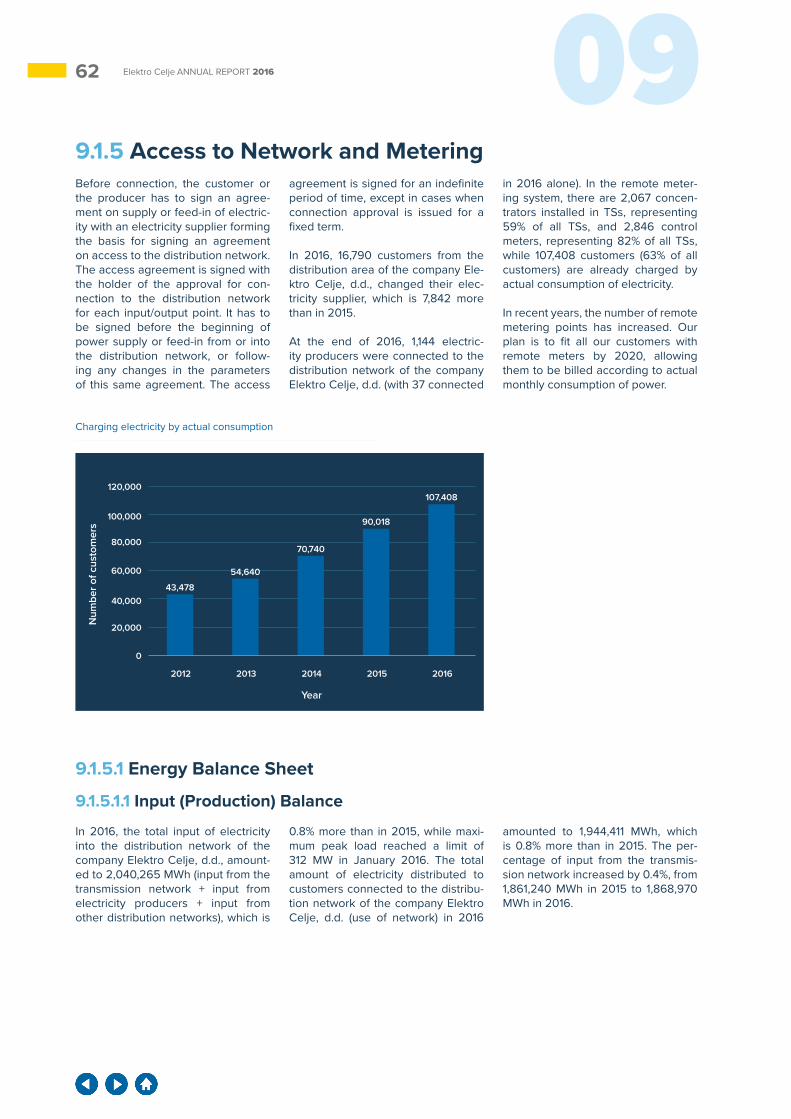
62 09Elektro Celje ANNUAL REPORT 2016
9.1.5 Access to Network and MeteringBefore connection, the customer or the producer has to sign an agree-ment on supply or feed-in of electric-ity with an electricity supplier forming the basis for signing an agreement on access to the distribution network. The access agreement is signed with the holder of the approval for con-nection to the distribution network for each input/output point. It has to be signed before the beginning of power supply or feed-in from or into the distribution network, or follow-ing any changes in the parameters of this same agreement. The access
agreement is signed for an indefinite period of time, except in cases when connection approval is issued for a fixed term.
In 2016, 16,790 customers from the distribution area of the company Ele-ktro Celje, d.d., changed their elec-tricity supplier, which is 7,842 more than in 2015.
At the end of 2016, 1,144 electric-ity producers were connected to the distribution network of the company Elektro Celje, d.d. (with 37 connected
in 2016 alone). In the remote meter-ing system, there are 2,067 concen-trators installed in TSs, representing 59% of all TSs, and 2,846 control meters, representing 82% of all TSs, while 107,408 customers (63% of all customers) are already charged by actual consumption of electricity.
In recent years, the number of remote metering points has increased. Our plan is to fit all our customers with remote meters by 2020, allowing them to be billed according to actual monthly consumption of power.
Charging electricity by actual consumption
20,000
40,000
60,000
80,000
100,000
120,000
0
Num
ber o
f cus
tom
ers
Year
2012 2013 2014 2015 2016
43,478
54,640
70,740
90,018
107,408
9.1.5.1 Energy Balance Sheet
9.1.5.1.1 Input (Production) Balance
In 2016, the total input of electricity into the distribution network of the company Elektro Celje, d.d., amount-ed to 2,040,265 MWh (input from the transmission network + input from electricity producers + input from other distribution networks), which is
0.8% more than in 2015, while maxi-mum peak load reached a limit of 312 MW in January 2016. The total amount of electricity distributed to customers connected to the distribu-tion network of the company Elektro Celje, d.d. (use of network) in 2016
amounted to 1,944,411 MWh, which is 0.8% more than in 2015. The per-centage of input from the transmis-sion network increased by 0.4%, from 1,861,240 MWh in 2015 to 1,868,970 MWh in 2016.

6309 ORGANISATION AND ACTIVITIES OF THE COMPANY ELEKTRO CELJE Elektro Celje ANNUAL REPORT 2016
Input and output (generation and consumption) balance
2012in MWh
Sharein %
2013in MWh
Sharein %
2014in MWh
Sharein %
2015in MWh
Sharein %
2016in MWh
Sharein %
Transmission network 1,883,051 94.00 1,850,964 93.03 1,809,644 91.89 1,861,240 91.93 1,868,970 91.61
Power producers 119,174 5.95 131,261 6.60 143,781 7.30 143,688 7.10 152,298 7.46
Unregulated supply 947 0.05 7,288 0.37 16,005 0.81 19,719 0.97 19,032 0.93
Total input into the distribution network
2,003,172 100 1,989,513 100 1,969,430 100 2,024,647 100 2,040,300 100
Total supply (output) of electricity
1,891,762 / 1,882,792 / 1,868,300 / 1,928,787 / 1,944,411 /
Unregulated supply 296 / 0,449 / 518 / 3,770 / 66,322 /
Losses 111,114 5.87 106,722 5.67 100,613 5.39 95,857 4.97 95,823 4.93
Electricity losses in the distribution network decreased from 4.97% in 2015 to 4.93% in 2016, calculated in compliance with the Act Determining the Methodology for the Calculation of Network Charge. The consider-able decrease of losses from previ-ous years is a result of measurement of commercial losses, which include losses due to metering errors, inac-curacy of metering devices, unregis-
tered consumption, unjustified con-sumption, and other unforeseeable events in the operation of the power distribution system. The reason for lower losses of electric energy in 2016 is particularly more frequent controls of metering points and a higher share of remote metering points. The meas-ures to reduce commercial and tech-nical losses include the implementa-tion of AMI systems. In fact, remote
metering systems simplify our work, while allowing us to perform it more accurately.
Compared to the previous year, the production of electricity in SHPs in-creased by 16% in 2016, while the power production in SPSs decreased by 1.3%.
0
50,000
30,000
60,000
40,000
20,000
10,000
Am
ount
in k
Wh
MHE [MWh] MFE [MWh]
Annual electricity generation at SHPs and SPSs
2012 28,272 42,111
2013 34,189 49,699
2014 42,959 50,434
2015 27,611 54,242
2016 32,073 53,298
In comparison to the previous year, the number of newly connected small power plants increased. The reason lies in the adoption of the Decree on Self-supply of Electricity from the Re-
newable Energy Sources (OG of the Republic of Slovenia, no. 97/15) es-tablishing measures to promote the consumption of electricity generated from renewable sources by means of
self-supply devices. In 2016, 36 new solar power stations and 1 gas-fired power plant were connected. Total number of power plants in view of en-ergy source is shown below.
Energy source
Sun Water Biomass Gas Wind Total
829 3 7 75 2 916
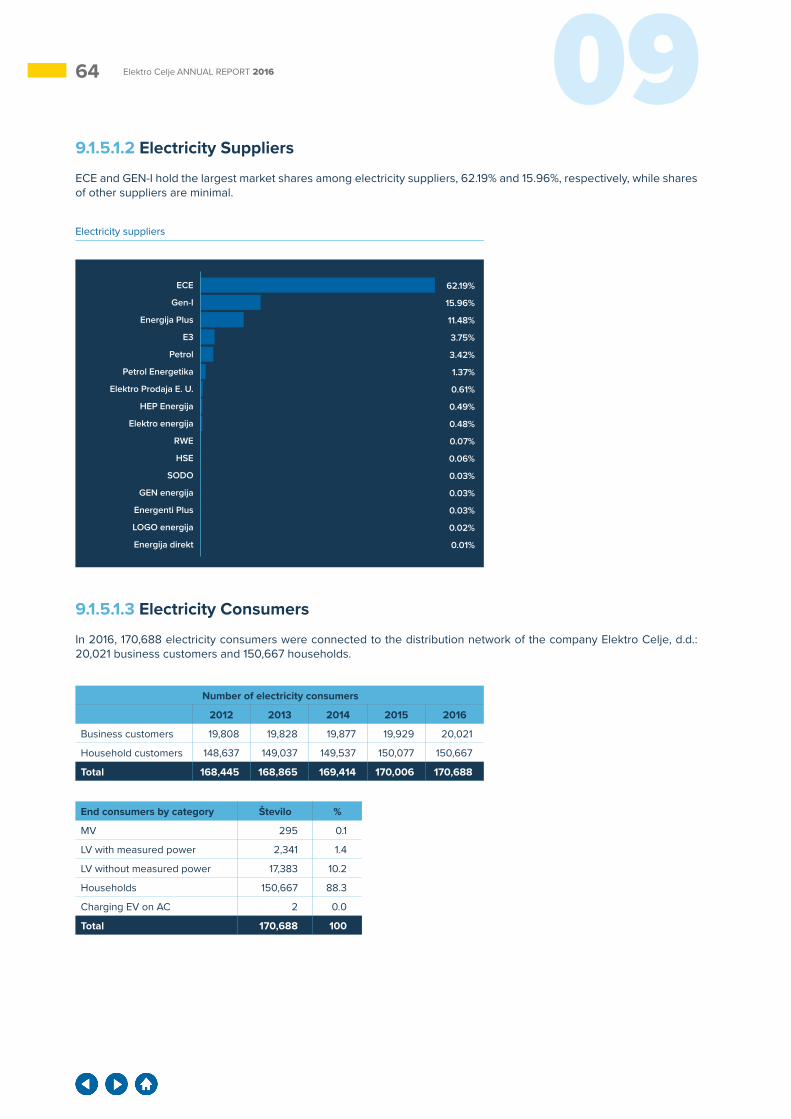
64 09Elektro Celje ANNUAL REPORT 2016
Electricity suppliers
9.1.5.1.2 Electricity Suppliers
ECE and GEN-I hold the largest market shares among electricity suppliers, 62.19% and 15.96%, respectively, while shares of other suppliers are minimal.
ECE
Gen-I
Energija Plus
E3
Petrol
Petrol Energetika
Elektro Prodaja E. U.
HEP Energija
Elektro energija
RWE
HSE
SODO
GEN energija
Energenti Plus
LOGO energija
Energija direkt
62.19%
15.96%
11.48%
3.75%
3.42%
1.37%
0.61%
0.49%
0.48%
0.07%
0.06%
0.03%
0.03%
0.03%
0.02%
0.01%
9.1.5.1.3 Electricity Consumers
In 2016, 170,688 electricity consumers were connected to the distribution network of the company Elektro Celje, d.d.: 20,021 business customers and 150,667 households.
Number of electricity consumers
2012 2013 2014 2015 2016
Business customers 19,808 19,828 19,877 19,929 20,021
Household customers 148,637 149,037 149,537 150,077 150,667
Total 168,445 168,865 169,414 170,006 170,688
End consumers by category Število %
MV 295 0.1
LV with measured power 2,341 1.4
LV without measured power 17,383 10.2
Households 150,667 88.3
Charging EV on AC 2 0.0
Total 170,688 100
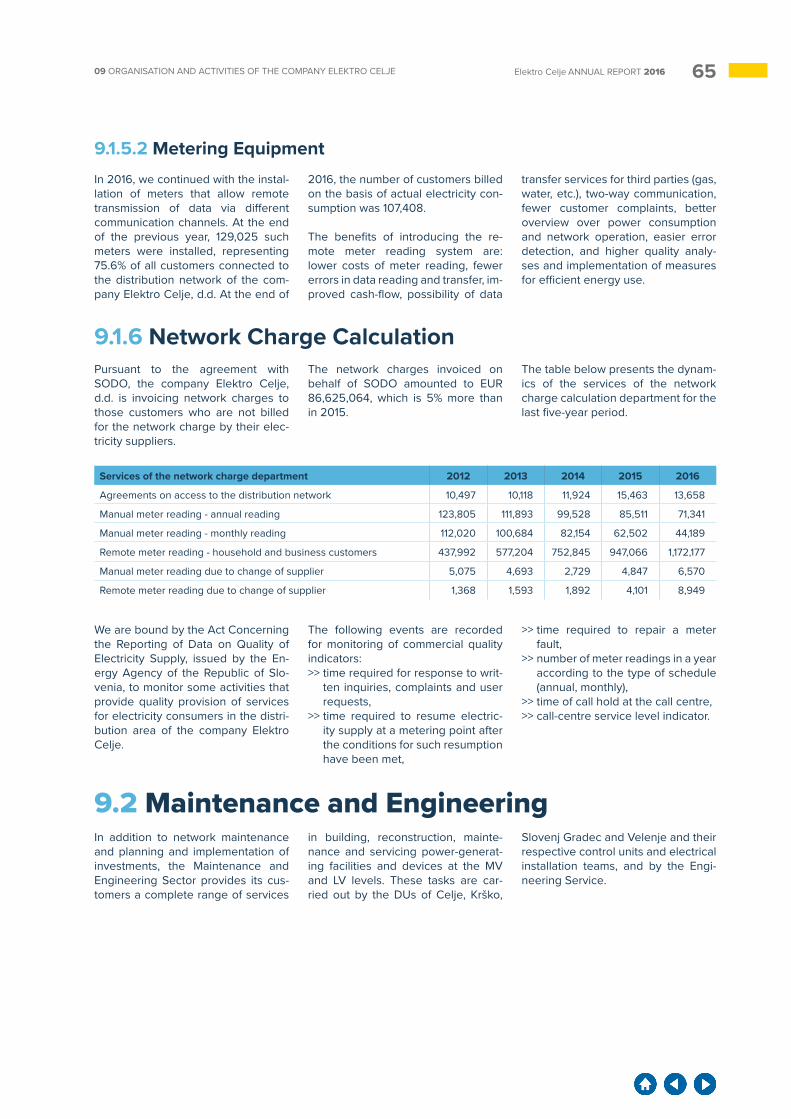
6509 ORGANISATION AND ACTIVITIES OF THE COMPANY ELEKTRO CELJE Elektro Celje ANNUAL REPORT 2016
9.1.5.2 Metering EquipmentIn 2016, we continued with the instal-lation of meters that allow remote transmission of data via different communication channels. At the end of the previous year, 129,025 such meters were installed, representing 75.6% of all customers connected to the distribution network of the com-pany Elektro Celje, d.d. At the end of
2016, the number of customers billed on the basis of actual electricity con-sumption was 107,408.
The benefits of introducing the re-mote meter reading system are: lower costs of meter reading, fewer errors in data reading and transfer, im-proved cash-flow, possibility of data
transfer services for third parties (gas, water, etc.), two-way communication, fewer customer complaints, better overview over power consumption and network operation, easier error detection, and higher quality analy-ses and implementation of measures for efficient energy use.
9.1.6 Network Charge CalculationPursuant to the agreement with SODO, the company Elektro Celje, d.d. is invoicing network charges to those customers who are not billed for the network charge by their elec-tricity suppliers.
The network charges invoiced on behalf of SODO amounted to EUR 86,625,064, which is 5% more than in 2015.
The table below presents the dynam-ics of the services of the network charge calculation department for the last five-year period.
Services of the network charge department 2012 2013 2014 2015 2016
Agreements on access to the distribution network 10,497 10,118 11,924 15,463 13,658
Manual meter reading - annual reading 123,805 111,893 99,528 85,511 71,341
Manual meter reading - monthly reading 112,020 100,684 82,154 62,502 44,189
Remote meter reading - household and business customers 437,992 577,204 752,845 947,066 1,172,177
Manual meter reading due to change of supplier 5,075 4,693 2,729 4,847 6,570
Remote meter reading due to change of supplier 1,368 1,593 1,892 4,101 8,949
We are bound by the Act Concerning the Reporting of Data on Quality of Electricity Supply, issued by the En-ergy Agency of the Republic of Slo-venia, to monitor some activities that provide quality provision of services for electricity consumers in the distri-bution area of the company Elektro Celje.
The following events are recorded for monitoring of commercial quality indicators:>> time required for response to writ-
ten inquiries, complaints and user requests,
>> time required to resume electric-ity supply at a metering point after the conditions for such resumption have been met,
>> time required to repair a meter fault,
>> number of meter readings in a year according to the type of schedule (annual, monthly),
>> time of call hold at the call centre,>> call-centre service level indicator.
9.2 Maintenance and EngineeringIn addition to network maintenance and planning and implementation of investments, the Maintenance and Engineering Sector provides its cus-tomers a complete range of services
in building, reconstruction, mainte-nance and servicing power-generat-ing facilities and devices at the MV and LV levels. These tasks are car-ried out by the DUs of Celje, Krško,
Slovenj Gradec and Velenje and their respective control units and electrical installation teams, and by the Engi-neering Service.
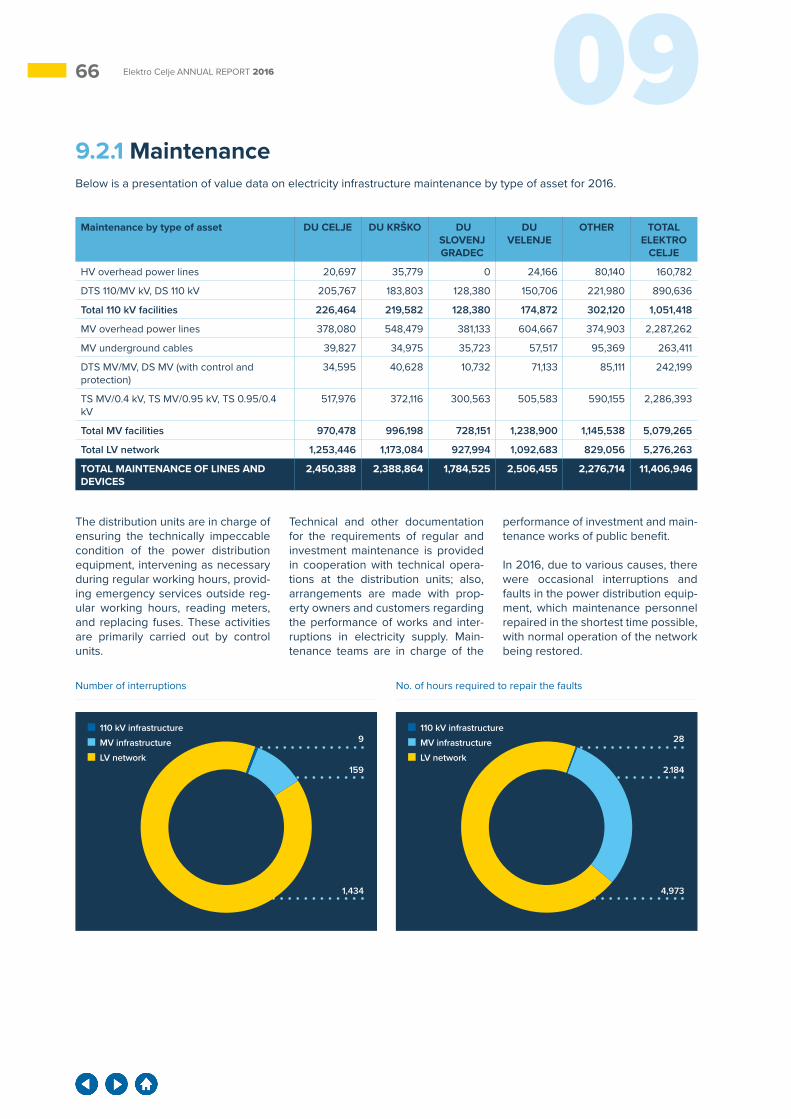
66 09Elektro Celje ANNUAL REPORT 2016
Maintenance by type of asset DU CELJE DU KRŠKO DU SLOVENJ GRADEC
DU VELENJE
OTHER TOTAL ELEKTRO
CELJE
HV overhead power lines 20,697 35,779 0 24,166 80,140 160,782
DTS 110/MV kV, DS 110 kV 205,767 183,803 128,380 150,706 221,980 890,636
Total 110 kV facilities 226,464 219,582 128,380 174,872 302,120 1,051,418
MV overhead power lines 378,080 548,479 381,133 604,667 374,903 2,287,262
MV underground cables 39,827 34,975 35,723 57,517 95,369 263,411
DTS MV/MV, DS MV (with control and protection)
34,595 40,628 10,732 71,133 85,111 242,199
TS MV/0.4 kV, TS MV/0.95 kV, TS 0.95/0.4 kV
517,976 372,116 300,563 505,583 590,155 2,286,393
Total MV facilities 970,478 996,198 728,151 1,238,900 1,145,538 5,079,265
Total LV network 1,253,446 1,173,084 927,994 1,092,683 829,056 5,276,263
TOTAL MAINTENANCE OF LINES AND DEVICES
2,450,388 2,388,864 1,784,525 2,506,455 2,276,714 11,406,946
The distribution units are in charge of ensuring the technically impeccable condition of the power distribution equipment, intervening as necessary during regular working hours, provid-ing emergency services outside reg-ular working hours, reading meters, and replacing fuses. These activities are primarily carried out by control units.
Technical and other documentation for the requirements of regular and investment maintenance is provided in cooperation with technical opera-tions at the distribution units; also, arrangements are made with prop-erty owners and customers regarding the performance of works and inter-ruptions in electricity supply. Main-tenance teams are in charge of the
performance of investment and main-tenance works of public benefit.
In 2016, due to various causes, there were occasional interruptions and faults in the power distribution equip-ment, which maintenance personnel repaired in the shortest time possible, with normal operation of the network being restored.
Number of interruptions No. of hours required to repair the faults
110 kV infrastructure
MV infrastructure
LV network
110 kV infrastructure
MV infrastructure
LV network
1,434 4,973
159 2.184
9 28
9.2.1 MaintenanceBelow is a presentation of value data on electricity infrastructure maintenance by type of asset for 2016.
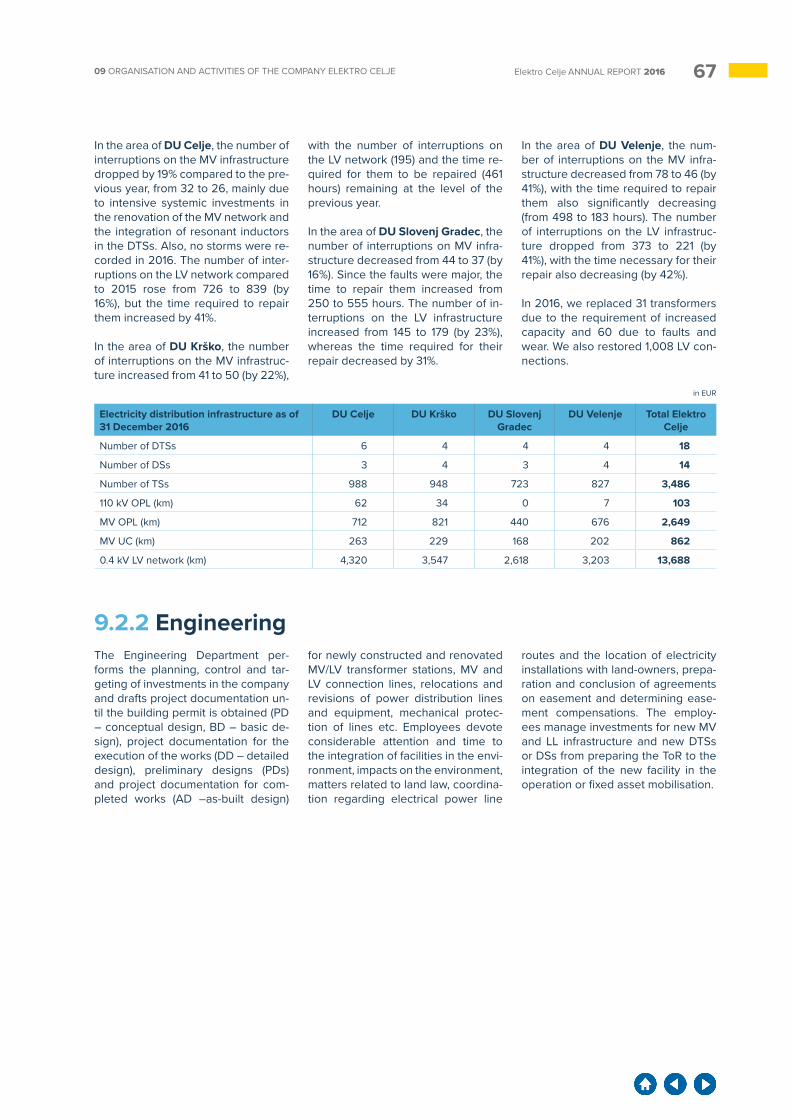
6709 ORGANISATION AND ACTIVITIES OF THE COMPANY ELEKTRO CELJE Elektro Celje ANNUAL REPORT 2016
In the area of DU Celje, the number of interruptions on the MV infrastructure dropped by 19% compared to the pre-vious year, from 32 to 26, mainly due to intensive systemic investments in the renovation of the MV network and the integration of resonant inductors in the DTSs. Also, no storms were re-corded in 2016. The number of inter-ruptions on the LV network compared to 2015 rose from 726 to 839 (by 16%), but the time required to repair them increased by 41%.
In the area of DU Krško, the number of interruptions on the MV infrastruc-ture increased from 41 to 50 (by 22%),
with the number of interruptions on the LV network (195) and the time re-quired for them to be repaired (461 hours) remaining at the level of the previous year.
In the area of DU Slovenj Gradec, the number of interruptions on MV infra-structure decreased from 44 to 37 (by 16%). Since the faults were major, the time to repair them increased from 250 to 555 hours. The number of in-terruptions on the LV infrastructure increased from 145 to 179 (by 23%), whereas the time required for their repair decreased by 31%.
In the area of DU Velenje, the num-ber of interruptions on the MV infra-structure decreased from 78 to 46 (by 41%), with the time required to repair them also significantly decreasing (from 498 to 183 hours). The number of interruptions on the LV infrastruc-ture dropped from 373 to 221 (by 41%), with the time necessary for their repair also decreasing (by 42%).
In 2016, we replaced 31 transformers due to the requirement of increased capacity and 60 due to faults and wear. We also restored 1,008 LV con-nections.
in EUR
Electricity distribution infrastructure as of 31 December 2016
DU Celje DU Krško DU Slovenj Gradec
DU Velenje Total Elektro Celje
Number of DTSs 6 4 4 4 18
Number of DSs 3 4 3 4 14
Number of TSs 988 948 723 827 3,486
110 kV OPL (km) 62 34 0 7 103
MV OPL (km) 712 821 440 676 2,649
MV UC (km) 263 229 168 202 862
0.4 kV LV network (km) 4,320 3,547 2,618 3,203 13,688
9.2.2 EngineeringThe Engineering Department per-forms the planning, control and tar-geting of investments in the company and drafts project documentation un-til the building permit is obtained (PD – conceptual design, BD – basic de-sign), project documentation for the execution of the works (DD – detailed design), preliminary designs (PDs) and project documentation for com-pleted works (AD –as-built design)
for newly constructed and renovated MV/LV transformer stations, MV and LV connection lines, relocations and revisions of power distribution lines and equipment, mechanical protec-tion of lines etc. Employees devote considerable attention and time to the integration of facilities in the envi-ronment, impacts on the environment, matters related to land law, coordina-tion regarding electrical power line
routes and the location of electricity installations with land-owners, prepa-ration and conclusion of agreements on easement and determining ease-ment compensations. The employ-ees manage investments for new MV and LL infrastructure and new DTSs or DSs from preparing the ToR to the integration of the new facility in the operation or fixed asset mobilisation.

68 09Elektro Celje ANNUAL REPORT 2016
140180
100
120
140
160
80
60
40
20
0
100
60
20
120
80
40
0
Num
ber o
f pro
ject
s
Number of projects completed by year
2012 2013 2014 2015 2016
PD
AD
BD, DD
TOTAL
Linear (TOTAL)
In 2016, a total of 159 designs were prepared, of which 75 were BDs and/or DDs, 75 ADs, and 9 PDs. Of all
designs prepared, a total of 32 were developed for third-party customers, of which 16 were BDs and (or) DDs, 7
ADs and 9 PDs.
5
127
159149
129
159
9 5 1 940 62 59 54 7582 88 85 74 75
9,000,000 120,000,000
100,000,000
80,000,000
60,000,000
40,000,000
20,000,000
0
7,000,000
5,000,000
3,000,000
8,000,000
6,000,000
4,000,000
2,000,000
Valu
e
Plan and realisation of completed projects according to estimated value of investment
2012 2013 2014 2015 2016
7,793
,481
7,67
6,01
5
7,56
5,14
3
6,15
3,56
6
8,04
6,14
4
7,21
7,82
2
8,36
2,16
9
7,720
,003
8,08
8,37
6
8,38
1,616
Planned value
Realised value
Cumulative value
9.2.2.1 DesignThe total investment value of completed BD and DD project documentation in 2016 amounted to EUR 8,381,616.
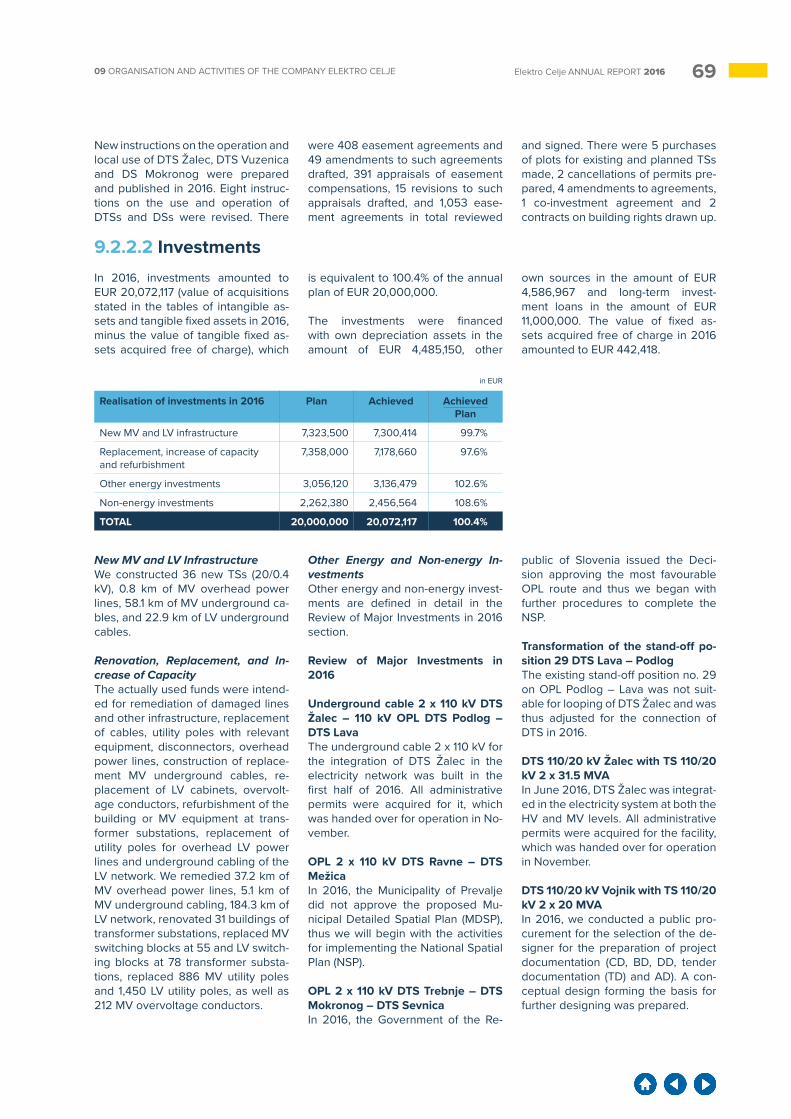
6909 ORGANISATION AND ACTIVITIES OF THE COMPANY ELEKTRO CELJE Elektro Celje ANNUAL REPORT 2016
New instructions on the operation and local use of DTS Žalec, DTS Vuzenica and DS Mokronog were prepared and published in 2016. Eight instruc-tions on the use and operation of DTSs and DSs were revised. There
were 408 easement agreements and 49 amendments to such agreements drafted, 391 appraisals of easement compensations, 15 revisions to such appraisals drafted, and 1,053 ease-ment agreements in total reviewed
and signed. There were 5 purchases of plots for existing and planned TSs made, 2 cancellations of permits pre-pared, 4 amendments to agreements, 1 co-investment agreement and 2 contracts on building rights drawn up.
9.2.2.2 InvestmentsIn 2016, investments amounted to EUR 20,072,117 (value of acquisitions stated in the tables of intangible as-sets and tangible fixed assets in 2016, minus the value of tangible fixed as-sets acquired free of charge), which
is equivalent to 100.4% of the annual plan of EUR 20,000,000.
The investments were financed with own depreciation assets in the amount of EUR 4,485,150, other
own sources in the amount of EUR 4,586,967 and long-term invest-ment loans in the amount of EUR 11,000,000. The value of fixed as-sets acquired free of charge in 2016 amounted to EUR 442,418.
Realisation of investments in 2016 Plan Achieved AchievedPlan
New MV and LV infrastructure 7,323,500 7,300,414 99.7%
Replacement, increase of capacity and refurbishment
7,358,000 7,178,660 97.6%
Other energy investments 3,056,120 3,136,479 102.6%
Non-energy investments 2,262,380 2,456,564 108.6%
TOTAL 20,000,000 20,072,117 100.4%
in EUR
New MV and LV InfrastructureWe constructed 36 new TSs (20/0.4 kV), 0.8 km of MV overhead power lines, 58.1 km of MV underground ca-bles, and 22.9 km of LV underground cables.
Renovation, Replacement, and In-crease of CapacityThe actually used funds were intend-ed for remediation of damaged lines and other infrastructure, replacement of cables, utility poles with relevant equipment, disconnectors, overhead power lines, construction of replace-ment MV underground cables, re-placement of LV cabinets, overvolt-age conductors, refurbishment of the building or MV equipment at trans-former substations, replacement of utility poles for overhead LV power lines and underground cabling of the LV network. We remedied 37.2 km of MV overhead power lines, 5.1 km of MV underground cabling, 184.3 km of LV network, renovated 31 buildings of transformer substations, replaced MV switching blocks at 55 and LV switch-ing blocks at 78 transformer substa-tions, replaced 886 MV utility poles and 1,450 LV utility poles, as well as 212 MV overvoltage conductors.
Other Energy and Non-energy In-vestmentsOther energy and non-energy invest-ments are defined in detail in the Review of Major Investments in 2016 section.
Review of Major Investments in 2016
Underground cable 2 x 110 kV DTS Žalec – 110 kV OPL DTS Podlog – DTS LavaThe underground cable 2 x 110 kV for the integration of DTS Žalec in the electricity network was built in the first half of 2016. All administrative permits were acquired for it, which was handed over for operation in No-vember.
OPL 2 x 110 kV DTS Ravne – DTS MežicaIn 2016, the Municipality of Prevalje did not approve the proposed Mu-nicipal Detailed Spatial Plan (MDSP), thus we will begin with the activities for implementing the National Spatial Plan (NSP).
OPL 2 x 110 kV DTS Trebnje – DTS Mokronog – DTS Sevnica In 2016, the Government of the Re-
public of Slovenia issued the Deci-sion approving the most favourable OPL route and thus we began with further procedures to complete the NSP.
Transformation of the stand-off po-sition 29 DTS Lava – PodlogThe existing stand-off position no. 29 on OPL Podlog – Lava was not suit-able for looping of DTS Žalec and was thus adjusted for the connection of DTS in 2016.
DTS 110/20 kV Žalec with TS 110/20 kV 2 x 31.5 MVAIn June 2016, DTS Žalec was integrat-ed in the electricity system at both the HV and MV levels. All administrative permits were acquired for the facility, which was handed over for operation in November.
DTS 110/20 kV Vojnik with TS 110/20 kV 2 x 20 MVAIn 2016, we conducted a public pro-curement for the selection of the de-signer for the preparation of project documentation (CD, BD, DD, tender documentation (TD) and AD). A con-ceptual design forming the basis for further designing was prepared.
70 09Elektro Celje ANNUAL REPORT 2016
DTS 110/20 kV LavaA separator and oil-collector signal-ling devices were installed with 20 kV cells activated.
DTS 110/20 kV SelceThe Petersen’s coil was upgraded.
DTS 110/20 kV MozirjeA separator and oil-collector signal-ling devices were installed.
DTS 110/20/10 kV TrnovljeA separator and oil-collector signal-ling devices were installed and a staircase canopy mounted.
DTS 110/20 kV MozirjeA separator and oil-collector signal-ling devices were installed.
DTS 110/20 kV VuzenicaWe replaced the power transformer with 31.5 MVA funded by the com-pany SODO in the amount of EUR 540,000. The company Elektro Celje, d.d. replaced the primary equipment for the TS bay, painted the façade and renovated the façade base. Win-dows in toilet facilities and the lobby were replaced.
DTS 110/20 kV Rogaška SlatinaWe replaced the primary equipment for the TS bay, upgraded the Peters-en’s coil system, and replaced the windows in the control room, toilet facilities and the AKU room.
DTS 110/20 kV ŠentjurWe restored 20 kV cells and replaced the windows in the control room, toi-let facilities and the AKU room.
DTS 110/20 kV Slovenj GradecWe replaced the primary and second-ary equipment for the OPL bay and installed a separator and oil-collector signalling devices.
DTS 110/20 kV RavneWe replaced the primary and sec-ondary equipment for the OPL bay, installed a separator and oil-collector signalling devices, upgraded the Pe-tersen’s coil system and rehabilitated the floor at the 20 kV switchyard.
DTS 110/20 kV KrškoA separator and oil-collector signal-ling devices were installed.
DTS 110/20 kV BrežiceThe primary equipment of TS I and TS II was replaced.
DTS 110/20 kV PodlogThe Petersen’s coil system was up-graded with the foundations of TS and concrete cable ducts restored.
DTS 110/20 kV SevnicaThe secondary equipment was re-placed.
DS LjubnoThe DD and AD documentation was prepared with the primary and sec-ondary equipment replaced.
DS LočicaThe Term of Reference for secondary equipment was prepared.
DS Pristava betonarnaWe began with the preparation of project documentation for the inte-gration of MV lines in the direction towards DS Pristava and ordered equipment for DS Pristava.
DS MokronogWe implemented the project of paral-lel operation of MV lines between the facilities of DTS Sevnica and DS (DTS) Mokronog.
Metering DevicesRegular and extraordinary substitu-tion activities included the replace-ment of 14,269 meters, while 1,000 meters were replaced for the require-ments of statistical sampling.
Telecommunication NetworkAs regards cyber-safety, we in-creased the number of licences in 2016 to increase the number of moni-tored sessions in the SIEM Juniper Secure Analytics system.
As regards the Ethernet network, we purchased Extreme Networks Ether-net switches for upgrading Ethernet hubs in business facilities and Sie-mens/RuggedCom Ethernet switches for upgrading hubs in several energy facilities. The hubs are new or the capacity of connection points of the existing hubs was increased.
Communication hubs were renovated or upgraded with new universal wir-
ing in the business premises Vuzeni-ca and Mestinje.
We purchased the equipment for the new digital radio repeater for the Mislinja area including the cabinet for outdoor installation with supply system. The repeater is under con-struction and will be connected to the radio centre through the microwave link to the hub Mala Kopa which is al-ready connected to the centre.
As regards the phone system, we up-graded the software of all phone sys-tem elements: on three NEC phone exchanges, and on the NEC Business ConneCT phone exchange server and the NEC MA4000 control system server including the NEC Expense Management system for tariffing and monitoring phone calls.As regards the optical network, we concluded an agreement for the pro-vision of services for external con-tractors and purchased 5,000 m of underground optical cable, fibre optic closures and modules for implement-ing current projects related to con-struction of the optical network. The following projects were realised: con-struction of the underground optical cable TS Stari trg - Nama Slovenj Gra-dec (from ADSS to the underground optical cable - UOC) for the purpose of OPL cabling, construction of the opti-cal route in the UOC/ADSS combina-tion from DTS Brežice in the direction towards Bizeljsko, implementation of the optical connection between the Business Facility SG (ECE) and TS Bolnica v Slovenj Gradcu (mostly by using the associated optical fibres in the optical cable of Stelkom to the base station of Si.mobil near TS Bolnica), with some short optical con-nections also implemented for the purposes of marketing optical fibres through the company Stelkom.
MV Network AutomationIn 2016, we continued with the instal-lation of remote-controlled switching points (RCSs). We installed 11 sets, au-tomated TS Potok, TS Zg. Vižinga, TS Control Unit Šmarje and TS Bencinski servis Šentrupert and tested protec-tion at 7 remote-controlled switch-gears. The pilot project of parallel operation between the facilities of DTS Sevnica and DTS Mokronog was
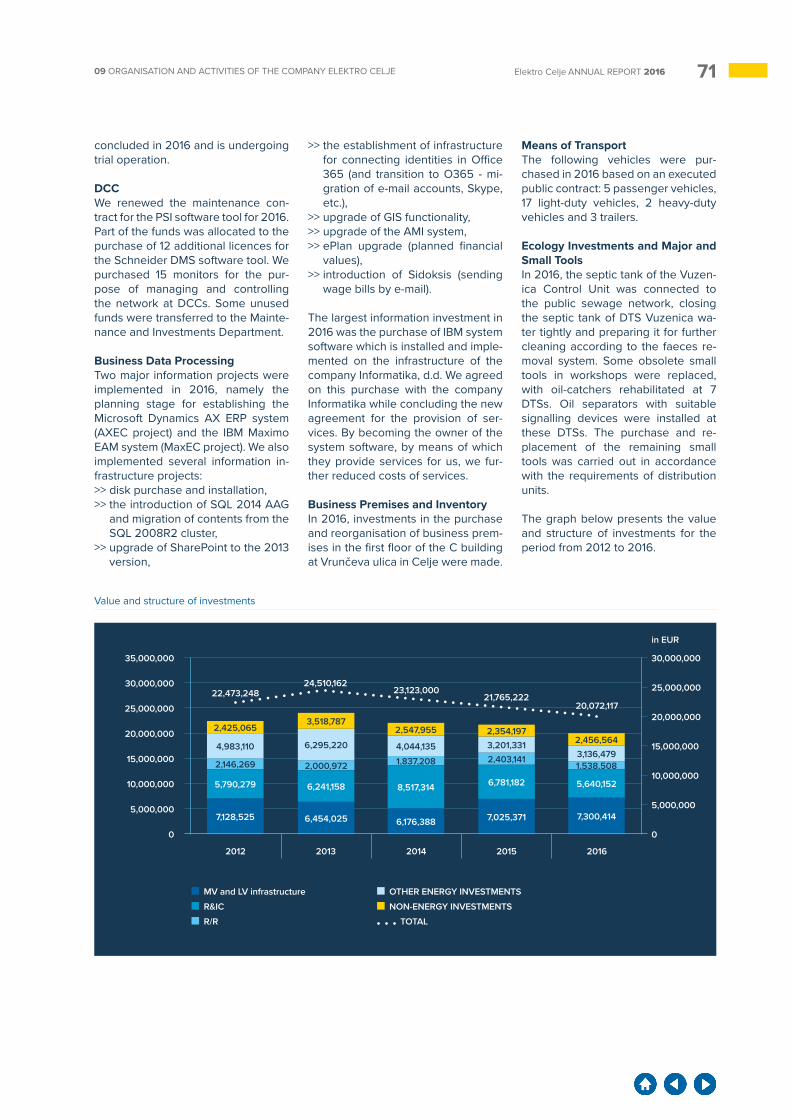
7109 ORGANISATION AND ACTIVITIES OF THE COMPANY ELEKTRO CELJE Elektro Celje ANNUAL REPORT 2016
concluded in 2016 and is undergoing trial operation.
DCCWe renewed the maintenance con-tract for the PSI software tool for 2016. Part of the funds was allocated to the purchase of 12 additional licences for the Schneider DMS software tool. We purchased 15 monitors for the pur-pose of managing and controlling the network at DCCs. Some unused funds were transferred to the Mainte-nance and Investments Department.
Business Data ProcessingTwo major information projects were implemented in 2016, namely the planning stage for establishing the Microsoft Dynamics AX ERP system (AXEC project) and the IBM Maximo EAM system (MaxEC project). We also implemented several information in-frastructure projects:>> disk purchase and installation,>> the introduction of SQL 2014 AAG
and migration of contents from the SQL 2008R2 cluster,
>> upgrade of SharePoint to the 2013 version,
>> the establishment of infrastructure for connecting identities in Office 365 (and transition to O365 - mi-gration of e-mail accounts, Skype, etc.),
>> upgrade of GIS functionality,>> upgrade of the AMI system,>> ePlan upgrade (planned financial
values),>> introduction of Sidoksis (sending
wage bills by e-mail).
The largest information investment in 2016 was the purchase of IBM system software which is installed and imple-mented on the infrastructure of the company Informatika, d.d. We agreed on this purchase with the company Informatika while concluding the new agreement for the provision of ser-vices. By becoming the owner of the system software, by means of which they provide services for us, we fur-ther reduced costs of services.
Business Premises and InventoryIn 2016, investments in the purchase and reorganisation of business prem-ises in the first floor of the C building at Vrunčeva ulica in Celje were made.
Means of TransportThe following vehicles were pur-chased in 2016 based on an executed public contract: 5 passenger vehicles, 17 light-duty vehicles, 2 heavy-duty vehicles and 3 trailers.
Ecology Investments and Major and Small ToolsIn 2016, the septic tank of the Vuzen-ica Control Unit was connected to the public sewage network, closing the septic tank of DTS Vuzenica wa-ter tightly and preparing it for further cleaning according to the faeces re-moval system. Some obsolete small tools in workshops were replaced, with oil-catchers rehabilitated at 7 DTSs. Oil separators with suitable signalling devices were installed at these DTSs. The purchase and re-placement of the remaining small tools was carried out in accordance with the requirements of distribution units.
The graph below presents the value and structure of investments for the period from 2012 to 2016.
35,000,000
0
25,000,000
25,000,000
15,000,00015,000,000
5,000,000 5,000,000
30,000,000
30,000,000
in EUR
20,000,000
20,000,000
10,000,00010,000,000
0
Value and structure of investments
2012 2013 2014 2015 2016
MV and LV infrastructure
R&IC
R/R
OTHER ENERGY INVESTMENTS
NON-ENERGY INVESTMENTS
TOTAL
22,473,24824,510,162
23,123,00021,765,222
20,072,117
7,128,525 6,454,025 6,176,388 7,025,371 7,300,414
2,146,269 2,000,972 1,837,208 2,403,1411,538,508
5,790,279 6,241,158 8,517,314 6,781,182 5,640,152
4,983,110 6,295,220 4,044,135 3,201,3313,136,479
2,425,0653,518,787
2,547,955 2,354,1972,456,564
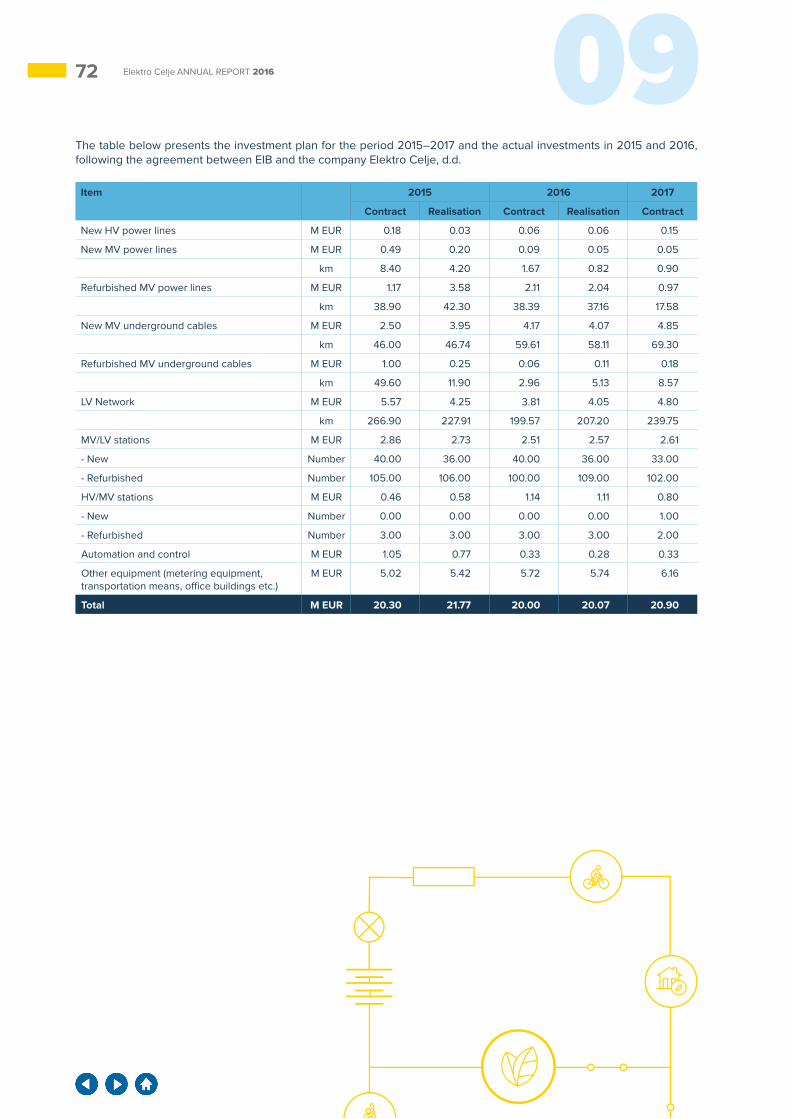
72 09Elektro Celje ANNUAL REPORT 2016
The table below presents the investment plan for the period 2015–2017 and the actual investments in 2015 and 2016, following the agreement between EIB and the company Elektro Celje, d.d.
Item 2015 2016 2017
Contract Realisation Contract Realisation Contract
New HV power lines M EUR 0.18 0.03 0.06 0.06 0.15
New MV power lines M EUR 0.49 0.20 0.09 0.05 0.05
km 8.40 4.20 1.67 0.82 0.90
Refurbished MV power lines M EUR 1.17 3.58 2.11 2.04 0.97
km 38.90 42.30 38.39 37.16 17.58
New MV underground cables M EUR 2.50 3.95 4.17 4.07 4.85
km 46.00 46.74 59.61 58.11 69.30
Refurbished MV underground cables M EUR 1.00 0.25 0.06 0.11 0.18
km 49.60 11.90 2.96 5.13 8.57
LV Network M EUR 5.57 4.25 3.81 4.05 4.80
km 266.90 227.91 199.57 207.20 239.75
MV/LV stations M EUR 2.86 2.73 2.51 2.57 2.61
- New Number 40.00 36.00 40.00 36.00 33.00
- Refurbished Number 105.00 106.00 100.00 109.00 102.00
HV/MV stations M EUR 0.46 0.58 1.14 1.11 0.80
- New Number 0.00 0.00 0.00 0.00 1.00
- Refurbished Number 3.00 3.00 3.00 3.00 2.00
Automation and control M EUR 1.05 0.77 0.33 0.28 0.33
Other equipment (metering equipment, transportation means, office buildings etc.)
M EUR 5.02 5.42 5.72 5.74 6.16
Total M EUR 20.30 21.77 20.00 20.07 20.90
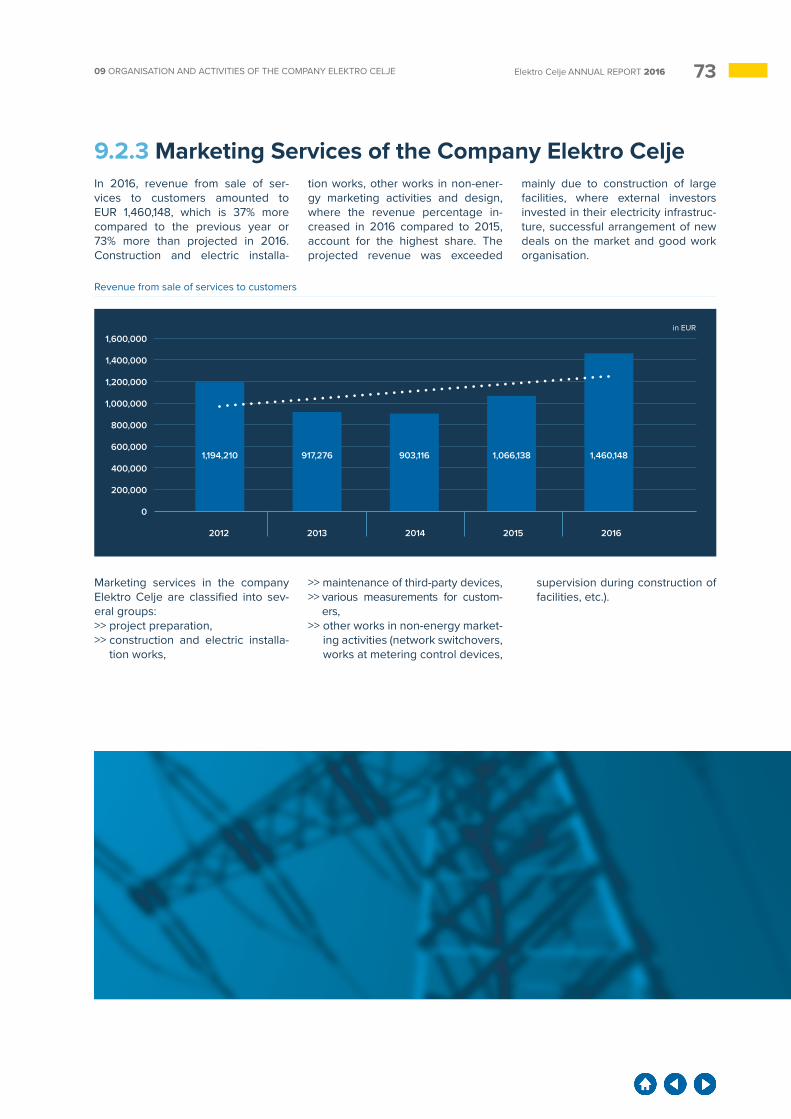
7309 ORGANISATION AND ACTIVITIES OF THE COMPANY ELEKTRO CELJE Elektro Celje ANNUAL REPORT 2016
9.2.3 Marketing Services of the Company Elektro CeljeIn 2016, revenue from sale of ser-vices to customers amounted to EUR 1,460,148, which is 37% more compared to the previous year or 73% more than projected in 2016. Construction and electric installa-
tion works, other works in non-ener-gy marketing activities and design, where the revenue percentage in-creased in 2016 compared to 2015, account for the highest share. The projected revenue was exceeded
mainly due to construction of large facilities, where external investors invested in their electricity infrastruc-ture, successful arrangement of new deals on the market and good work organisation.
Marketing services in the company Elektro Celje are classified into sev-eral groups:>> project preparation,>> construction and electric installa-
tion works,
>> maintenance of third-party devices,>> various measurements for custom-
ers,>> other works in non-energy market-
ing activities (network switchovers, works at metering control devices,
supervision during construction of facilities, etc.).
200,000
400,000
600,000
800,000
1,000,000
1,200,000
1,400,000
1,600,000
0
2012 2013 2014 2015 2016
Revenue from sale of services to customers
1,194,210 917,276 903,116 1,066,138 1,460,148
in EUR
75Elektro Celje ANNUAL REPORT 2016
RELATIONSHIP
RESPONSIBILITYWe recognize our responsibility to the natural environment. We are strategically and continuously faced with the challenges of electricity supply in the future, so the development of the distribution network is planned carefully, in the long term and in cooperation with all stakeholders.
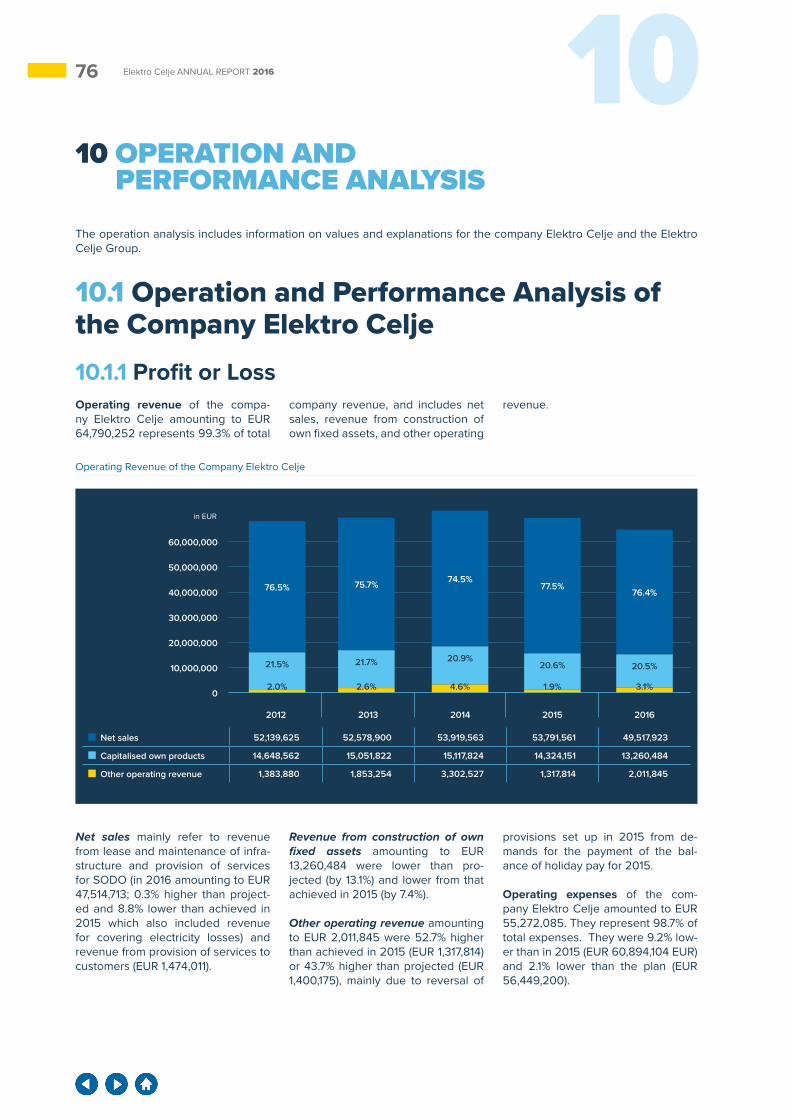
76 10Elektro Celje ANNUAL REPORT 2016
10 OPERATION AND PERFORMANCE ANALYSIS
The operation analysis includes information on values and explanations for the company Elektro Celje and the Elektro Celje Group.
10.1 Operation and Performance Analysis of the Company Elektro Celje10.1.1 Profit or Loss Operating revenue of the compa-ny Elektro Celje amounting to EUR 64,790,252 represents 99.3% of total
company revenue, and includes net sales, revenue from construction of own fixed assets, and other operating
revenue.
0
50,000,000
30,000,000
60,000,000
40,000,000
20,000,000
10,000,000
2012 2013 2014 2015 2016
Operating Revenue of the Company Elektro Celje
Net sales 52,139,625 52,578,900 53,919,563 53,791,561 49,517,923
Capitalised own products 14,648,562 15,051,822 15,117,824 14,324,151 13,260,484
Other operating revenue 1,383,880 1,853,254 3,302,527 1,317,814 2,011,845
76.5% 75.7% 74.5%77.5%
76.4%
21.5% 21.7% 20.9%20.6% 20.5%
in EUR
2.0% 2.6% 4.6% 1.9% 3.1%
Net sales mainly refer to revenue from lease and maintenance of infra-structure and provision of services for SODO (in 2016 amounting to EUR 47,514,713; 0.3% higher than project-ed and 8.8% lower than achieved in 2015 which also included revenue for covering electricity losses) and revenue from provision of services to customers (EUR 1,474,011).
Revenue from construction of own fixed assets amounting to EUR 13,260,484 were lower than pro-jected (by 13.1%) and lower from that achieved in 2015 (by 7.4%).
Other operating revenue amounting to EUR 2,011,845 were 52.7% higher than achieved in 2015 (EUR 1,317,814) or 43.7% higher than projected (EUR 1,400,175), mainly due to reversal of
provisions set up in 2015 from de-mands for the payment of the bal-ance of holiday pay for 2015.
Operating expenses of the com-pany Elektro Celje amounted to EUR 55,272,085. They represent 98.7% of total expenses. They were 9.2% low-er than in 2015 (EUR 60,894,104 EUR) and 2.1% lower than the plan (EUR 56,449,200).
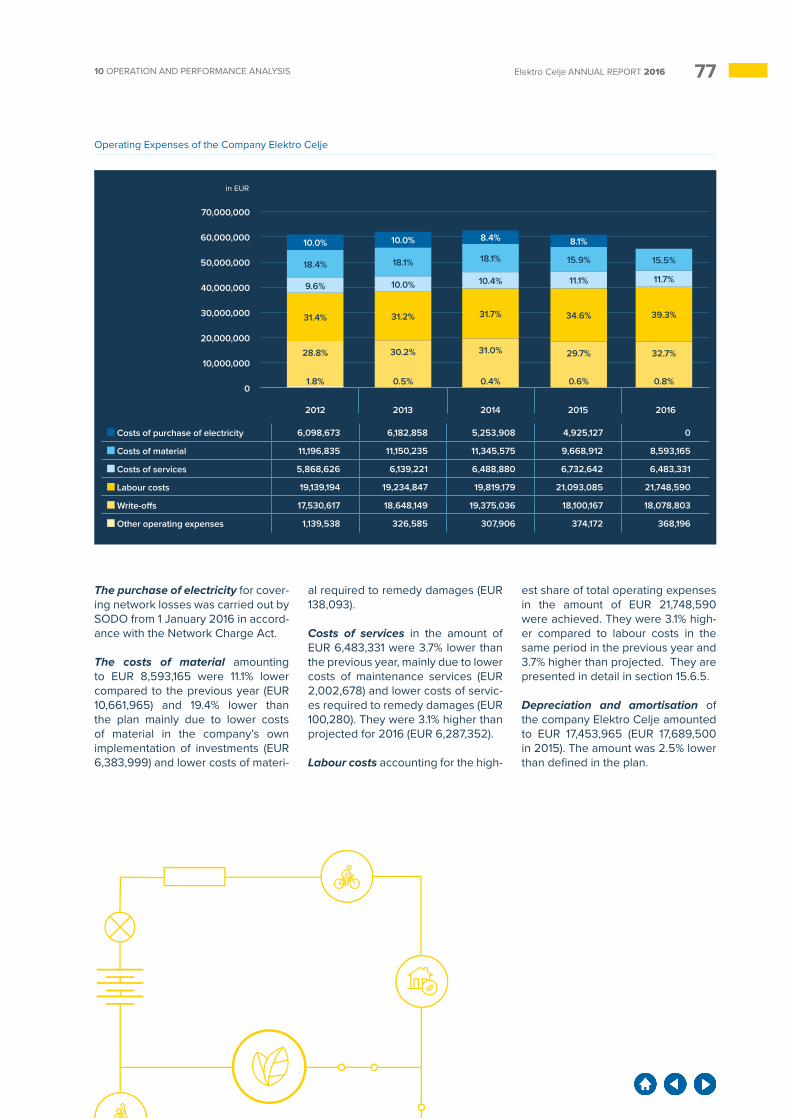
7710 OPERATION AND PERFORMANCE ANALYSIS Elektro Celje ANNUAL REPORT 2016
0
50,000,000
30,000,000
60,000,000
70,000,000
40,000,000
20,000,000
10,000,000
2012 2013 2014 2015 2016
Operating Expenses of the Company Elektro Celje
Costs of purchase of electricity 6,098,673 6,182,858 5,253,908 4,925,127 0
Costs of material 11,196,835 11,150,235 11,345,575 9,668,912 8,593,165
Costs of services 5,868,626 6,139,221 6,488,880 6,732,642 6,483,331
Labour costs 19,139,194 19,234,847 19,819,179 21,093,085 21,748,590
Write-offs 17,530,617 18,648,149 19,375,036 18,100,167 18,078,803
Other operating expenses 1,139,538 326,585 307,906 374,172 368,196
in EUR
31.4% 31.2% 31.7% 34.6% 39.3%
9.6% 10.0% 10.4% 11.1% 11.7%
18.4% 18.1% 18.1% 15.9% 15.5%
10.0% 10.0% 8.4% 8.1%
28.8% 30.2% 31.0% 29.7% 32.7%
1.8% 0.5% 0.4% 0.6% 0.8%
The purchase of electricity for cover-ing network losses was carried out by SODO from 1 January 2016 in accord-ance with the Network Charge Act.
The costs of material amounting to EUR 8,593,165 were 11.1% lower compared to the previous year (EUR 10,661,965) and 19.4% lower than the plan mainly due to lower costs of material in the company’s own implementation of investments (EUR 6,383,999) and lower costs of materi-
al required to remedy damages (EUR 138,093).
Costs of services in the amount of EUR 6,483,331 were 3.7% lower than the previous year, mainly due to lower costs of maintenance services (EUR 2,002,678) and lower costs of servic-es required to remedy damages (EUR 100,280). They were 3.1% higher than projected for 2016 (EUR 6,287,352).
Labour costs accounting for the high-
est share of total operating expenses in the amount of EUR 21,748,590 were achieved. They were 3.1% high-er compared to labour costs in the same period in the previous year and 3.7% higher than projected. They are presented in detail in section 15.6.5.
Depreciation and amortisation of the company Elektro Celje amounted to EUR 17,453,965 (EUR 17,689,500 in 2015). The amount was 2.5% lower than defined in the plan.
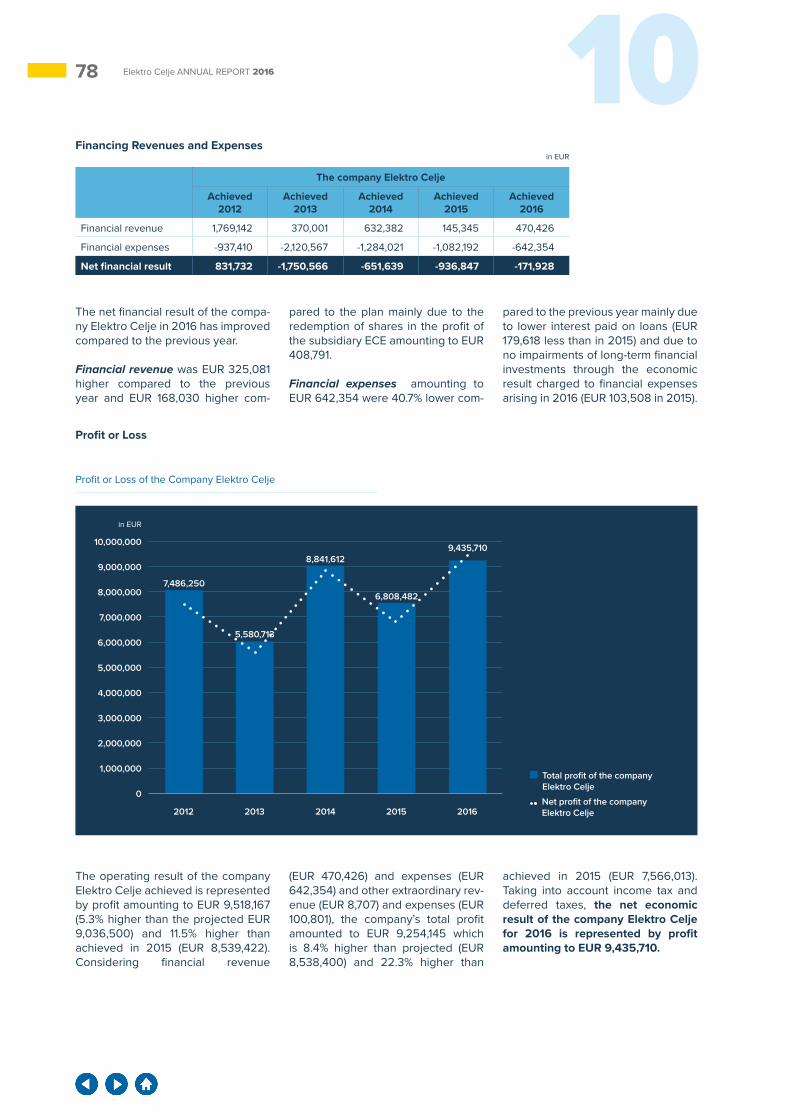
78 10Elektro Celje ANNUAL REPORT 2016
Financing Revenues and Expenses
The company Elektro Celje
Achieved 2012
Achieved 2013
Achieved 2014
Achieved 2015
Achieved 2016
Financial revenue 1,769,142 370,001 632,382 145,345 470,426
Financial expenses -937,410 -2,120,567 -1,284,021 -1,082,192 -642,354
Net financial result 831,732 -1,750,566 -651,639 -936,847 -171,928
The net financial result of the compa-ny Elektro Celje in 2016 has improved compared to the previous year.
Financial revenue was EUR 325,081 higher compared to the previous year and EUR 168,030 higher com-
pared to the plan mainly due to the redemption of shares in the profit of the subsidiary ECE amounting to EUR 408,791.
Financial expenses amounting to EUR 642,354 were 40.7% lower com-
pared to the previous year mainly due to lower interest paid on loans (EUR 179,618 less than in 2015) and due to no impairments of long-term financial investments through the economic result charged to financial expenses arising in 2016 (EUR 103,508 in 2015).
Profit or Loss
Profit or Loss of the Company Elektro Celje
1,000,000
2,000,000
3,000,000
4,000,000
5,000,000
6,000,000
7,000,000
8,000,000
9,000,000
10,000,000
0
2012 2013 2014 2015 2016
in EUR
in EUR
Total profit of the company Elektro Celje
Net profit of the company Elektro Celje
7,486,250
5,580,713
8,841,612
6,808,482
9,435,710
The operating result of the company Elektro Celje achieved is represented by profit amounting to EUR 9,518,167 (5.3% higher than the projected EUR 9,036,500) and 11.5% higher than achieved in 2015 (EUR 8,539,422). Considering financial revenue
(EUR 470,426) and expenses (EUR 642,354) and other extraordinary rev-enue (EUR 8,707) and expenses (EUR 100,801), the company’s total profit amounted to EUR 9,254,145 which is 8.4% higher than projected (EUR 8,538,400) and 22.3% higher than
achieved in 2015 (EUR 7,566,013). Taking into account income tax and deferred taxes, the net economic result of the company Elektro Celje for 2016 is represented by profit amounting to EUR 9,435,710.

7910 OPERATION AND PERFORMANCE ANALYSIS Elektro Celje ANNUAL REPORT 2016
in EUR
in EUR
10.1.2 Assets and Liabilities
ASSETS The company Elektro Celje
31 Dec 2016 Share (in %)
31 Dec 2015 Share (in %)
Index2016/2015
Non-current assets 261,663,678 94.8% 259,214,761 95.2% 101
Intangible assets and long-term accrued revenue and deferred expenses
1,544,031 0.6% 1,115,166 0.4% 138
Tangible fixed assets 246,036,537 89.1% 243,946,137 89.6% 101
Long-term financial investments 7,579,228 2.7% 7,580,116 2.8% 100
Long-term trade receivables 4,733,721 1.7% 5,934,882 2.2% 80
Deferred tax receivables 1,770,161 0.6% 638,460 0.2% 277
Current assets 11,579,999 4.2% 12,306,938 4.5% 94
Inventory 1,161,017 0.4% 1,380,529 0.5% 84
Short-term trade receivables 10,238,293 3.7% 10,902,286 4.0% 94
Cash and cash equivalents 180,689 0.1% 24,123 0.0% 749
Short-term accrued revenue and deferred expenses
2,816,313 1.0% 739,294 0.3% 381
Total assets 276,059,990 100.0% 272,260,993 100.0% 101
The value of the assets of the com-pany increased by 1.4% compared to the previous year and amounted to EUR 276,059,990 at the end of 2016. Tangible fixed assets accounting for 89.1% of the balance-sheet total in-creased by 0.9%. Investments in 2016
reached EUR 20,072,117 accounting for 100.4% of projected investments. They are presented in detail in sec-tion 9.2.2.2.
The value of inventory as of the bal-ance sheet date was 15.9% lower
compared to the previous year, with the index of average inventory com-mitment standing at 91 and average purchase price 1.5% lower compared to the previous year.
Equity and liabilities The company Elektro Celje
31 Dec 2016 Share (in %)
31 Dec 2015 Share (in %)
Index2016/2015
Equity and liabilities 200,929,373 72.8% 196,443,080 72.2% 102
Provisions and long-term accrued expenses and deferred revenue
19,132,507 6.9% 19,644,210 7.2% 97
Non-current financial liabilities 34,146,052 12.4% 33,550,207 12.3% 102
Current financial liabilities 21,156,172 7.7% 21,825,063 8.0% 97
Short-term accrued expenses and deferred revenue
695,886 0.3% 798,433 0.3% 87
Total equity and liabilities 276,059,990 100.0% 272,260,993 100.0% 101
The company’s equity as at 31 De-cember 2016 amounted to EUR 200,929,373 accounting for 72.8% of liabilities. It increased by 2.3% compared to 2015. It is divided into 24,192,425 non-par value shares Of these, 19,232,978 shares (79.50%) are held by the Republic of Slovenia, 370,238 shares (1.53%) by the pen-sion fund management company Ka-pitalska družba and Modra zavaroval-nica insurance company, 3,592,264
shares (14.85%) held by other legal persons, 769,284 shares (3.18%) by natural persons and 227,661 shares (0.94%) by the company Elektro Celje. The carrying value per share as of 31 December 2016 amounted to EUR 8.31.
Non-current financial liabilities of the company refer to non-current portions of investment loans pro-vided by banks amounting to EUR
43,958,475 as of 31 December 2016. Current financial and operating liabili-ties mainly refer to current portions of non-current loans provided by banks amounting to EUR 11,182,132, short-term trade payables from op-erations for third-party accounts (EUR 3,940,329), trade payables (EUR 2,713,544) and short-term trade paya-bles to employees (EUR 2,137,316).
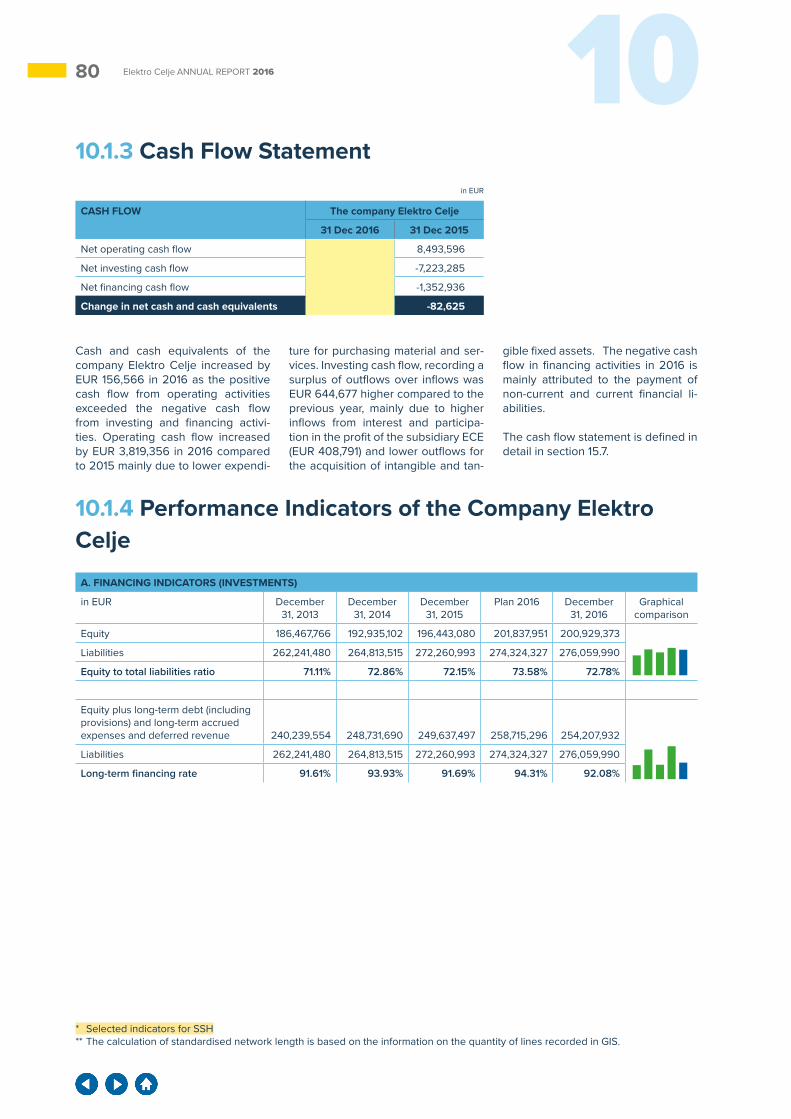
80 10Elektro Celje ANNUAL REPORT 2016
10.1.3 Cash Flow Statement
CASH FLOW The company Elektro Celje
31 Dec 2016 31 Dec 2015
Net operating cash flow 12,312,952 8,493,596
Net investing cash flow -6,578,608 -7,223,285
Net financing cash flow -5,577,778 -1,352,936
Change in net cash and cash equivalents 156,566 -82,625
A. FINANCING INDICATORS (INVESTMENTS)
in EUR December 31, 2013
December 31, 2014
December 31, 2015
Plan 2016 December 31, 2016
Graphical comparison
Equity 186,467,766 192,935,102 196,443,080 201,837,951 200,929,373
Liabilities 262,241,480 264,813,515 272,260,993 274,324,327 276,059,990
Equity to total liabilities ratio 71.11% 72.86% 72.15% 73.58% 72.78%
Equity plus long-term debt (including provisions) and long-term accrued expenses and deferred revenue 240,239,554 248,731,690 249,637,497 258,715,296 254,207,932
Liabilities 262,241,480 264,813,515 272,260,993 274,324,327 276,059,990
Long-term financing rate 91.61% 93.93% 91.69% 94.31% 92.08%
in EUR
Cash and cash equivalents of the company Elektro Celje increased by EUR 156,566 in 2016 as the positive cash flow from operating activities exceeded the negative cash flow from investing and financing activi-ties. Operating cash flow increased by EUR 3,819,356 in 2016 compared to 2015 mainly due to lower expendi-
ture for purchasing material and ser-vices. Investing cash flow, recording a surplus of outflows over inflows was EUR 644,677 higher compared to the previous year, mainly due to higher inflows from interest and participa-tion in the profit of the subsidiary ECE (EUR 408,791) and lower outflows for the acquisition of intangible and tan-
gible fixed assets. The negative cash flow in financing activities in 2016 is mainly attributed to the payment of non-current and current financial li-abilities.
The cash flow statement is defined in detail in section 15.7.
10.1.4 Performance Indicators of the Company Elektro Celje
* Selected indicators for SSH** The calculation of standardised network length is based on the information on the quantity of lines recorded in GIS.
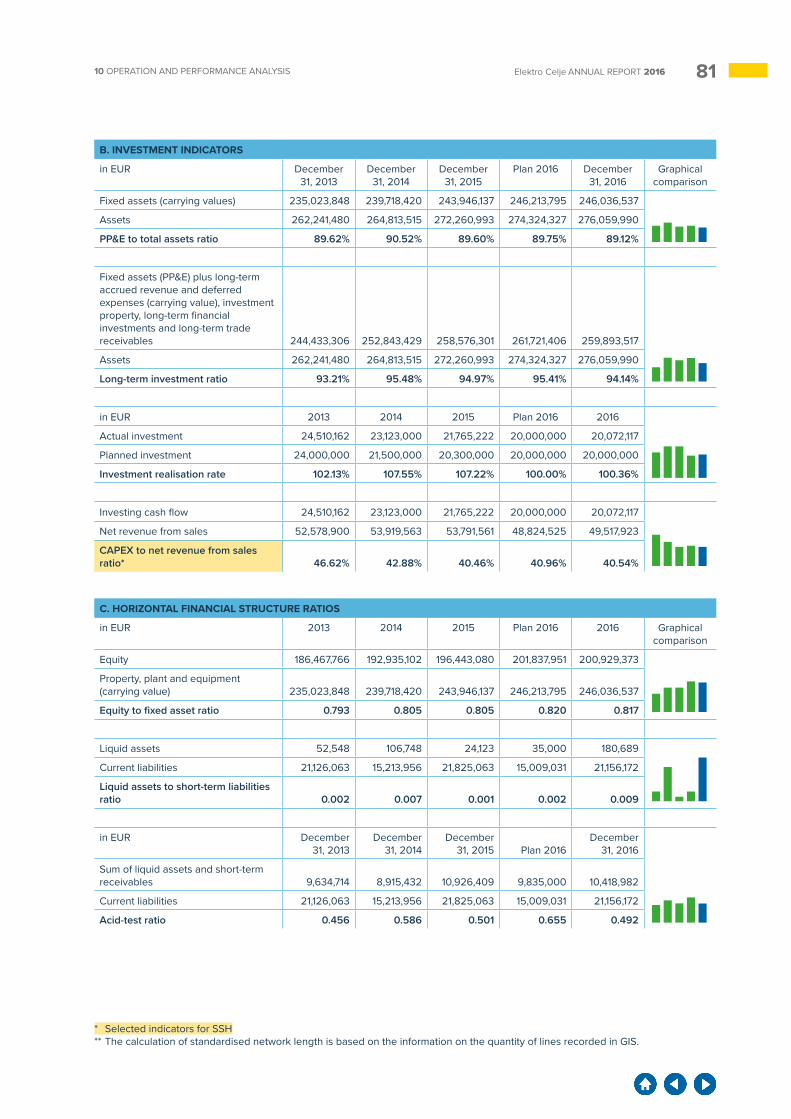
8110 OPERATION AND PERFORMANCE ANALYSIS Elektro Celje ANNUAL REPORT 2016
B. INVESTMENT INDICATORS
in EUR December 31, 2013
December 31, 2014
December 31, 2015
Plan 2016 December 31, 2016
Graphical comparison
Fixed assets (carrying values) 235,023,848 239,718,420 243,946,137 246,213,795 246,036,537
Assets 262,241,480 264,813,515 272,260,993 274,324,327 276,059,990
PP&E to total assets ratio 89.62% 90.52% 89.60% 89.75% 89.12%
Fixed assets (PP&E) plus long-term accrued revenue and deferred expenses (carrying value), investment property, long-term financial investments and long-term trade receivables 244,433,306 252,843,429 258,576,301 261,721,406 259,893,517
Assets 262,241,480 264,813,515 272,260,993 274,324,327 276,059,990
Long-term investment ratio 93.21% 95.48% 94.97% 95.41% 94.14%
in EUR 2013 2014 2015 Plan 2016 2016
Actual investment 24,510,162 23,123,000 21,765,222 20,000,000 20,072,117
Planned investment 24,000,000 21,500,000 20,300,000 20,000,000 20,000,000
Investment realisation rate 102.13% 107.55% 107.22% 100.00% 100.36%
Investing cash flow 24,510,162 23,123,000 21,765,222 20,000,000 20,072,117
Net revenue from sales 52,578,900 53,919,563 53,791,561 48,824,525 49,517,923
CAPEX to net revenue from sales ratio* 46.62% 42.88% 40.46% 40.96% 40.54%
C. HORIZONTAL FINANCIAL STRUCTURE RATIOS
in EUR 2013 2014 2015 Plan 2016 2016 Graphical comparison
Equity 186,467,766 192,935,102 196,443,080 201,837,951 200,929,373
Property, plant and equipment (carrying value) 235,023,848 239,718,420 243,946,137 246,213,795 246,036,537
Equity to fixed asset ratio 0.793 0.805 0.805 0.820 0.817
Liquid assets 52,548 106,748 24,123 35,000 180,689
Current liabilities 21,126,063 15,213,956 21,825,063 15,009,031 21,156,172
Liquid assets to short-term liabilities ratio 0.002 0.007 0.001 0.002 0.009
in EUR December 31, 2013
December 31, 2014
December 31, 2015 Plan 2016
December 31, 2016
Sum of liquid assets and short-term receivables 9,634,714 8,915,432 10,926,409 9,835,000 10,418,982
Current liabilities 21,126,063 15,213,956 21,825,063 15,009,031 21,156,172
Acid-test ratio 0.456 0.586 0.501 0.655 0.492
* Selected indicators for SSH** The calculation of standardised network length is based on the information on the quantity of lines recorded in GIS.

82 10Elektro Celje ANNUAL REPORT 2016
D. ECONOMIC INDICATOR
in EUR 2013 2014 2015 Plan 2016 2016 Graphical comparison
Operating revenue 69.483.976 72.339.914 69.433.526 65.485.700 64.790.252
Operating expenses 61.681.895 62.590.484 60.894.104 56.449.200 55.272.085
Operating efficiency ratio 1.126 1.156 1.140 1.160 1.172
E. PROFITABILITY INDICATORS
in EUR 2013 2014 2015 Plan 2016 2016 Graphical comparison
EBITDA 26,450,230 29,124,466 26,639,589 27,210,322 27,596,970
Gross operating profit 69,483,976 72,339,914 69,433,526 65,485,700 64,790,252
EBITDA margin* 38.07% 40.26% 38.37% 41.55% 42.59%
EBIT 7,802,081 9,749,430 8,539,422 9,036,500 9,518,167
Gross operating profit 69,483,976 72,339,914 69,433,526 65,485,700 64,790,252
EBIT margin 11.23% 13.48% 12.30% 13.80% 14.69%
Net profit 5,580,713 8,841,612 6,808,482 8,129,800 9,435,710
Average equity (excl. net income from the current year) 182,661,497 185,280,628 191,284,850 191,558,254 193,968,372
Net return on equity (ROE) 3.06% 4.77% 3.56% 4.24% 4.86%
Net profit 5,580,713 8,841,612 6,808,482 8,129,800 9,435,710
Average assets 261,353,735 263,527,498 268,537,254 270,551,727 274,160,492
Return on assets (ROA)* 2.14% 3.36% 2.54% 3.00% 3.44%
in EUR December 31, 2013
December 31, 2014
December 31, 2015 Plan 2016
December 31, 2016
Sum of dividends for the fiscal year 3,556,286 2,419,242 3,145,015 2,898,127 3,234,527
Average share capital 100,953,201 100,953,201 100,953,201 100,953,201 100,953,201
Dividend to share capital ratio 0.035 0.024 0.031 0.029 0.032
Dividend paid out in the year 3,556,286 2,419,242 3,145,015 2,898,127 3,234,527
Average equity 185,451,853 189,701,434 194,689,091 195,623,154 198,686,227
Dividend to equity ratio 1.92% 1.28% 1.62% 1.48% 1.63%
F. LABOUR PRODUCTIVITY INDICATOR
in EUR 2013 2014 2015 Plan 2016 2016 Graphical comparison
Gross value added 45,685,077 48,943,645 47,732,674 48,185,822 49,345,560
Number of employees per hours worked 623 635 633 632 631
Gross value added per employee* 73,331 77,077 75,407 76,243 78,202
* Selected indicators for SSH** The calculation of standardised network length is based on the information on the quantity of lines recorded in GIS.
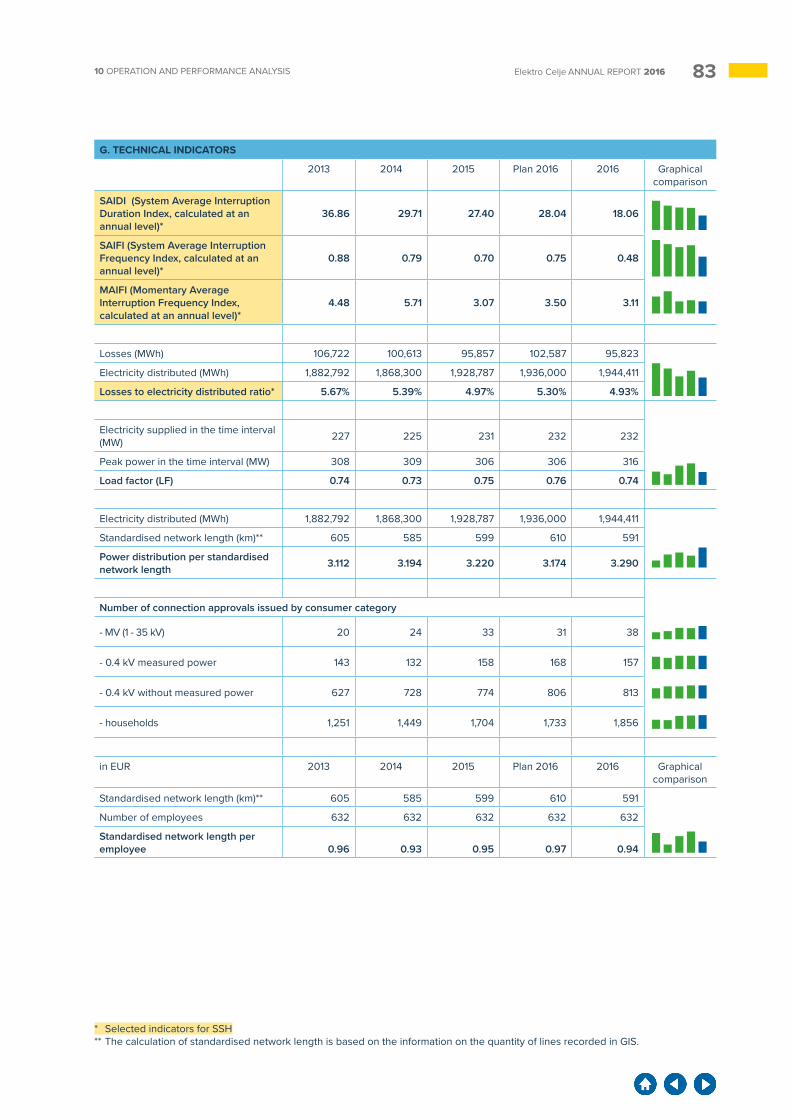
8310 OPERATION AND PERFORMANCE ANALYSIS Elektro Celje ANNUAL REPORT 2016
G. TECHNICAL INDICATORS
2013 2014 2015 Plan 2016 2016 Graphical comparison
SAIDI (System Average Interruption Duration Index, calculated at an annual level)*
36.86 29.71 27.40 28.04 18.06
SAIFI (System Average Interruption Frequency Index, calculated at an annual level)*
0.88 0.79 0.70 0.75 0.48
MAIFI (Momentary Average Interruption Frequency Index, calculated at an annual level)*
4.48 5.71 3.07 3.50 3.11
Losses (MWh) 106,722 100,613 95,857 102,587 95,823
Electricity distributed (MWh) 1,882,792 1,868,300 1,928,787 1,936,000 1,944,411
Losses to electricity distributed ratio* 5.67% 5.39% 4.97% 5.30% 4.93%
Electricity supplied in the time interval (MW) 227 225 231 232 232
Peak power in the time interval (MW) 308 309 306 306 316
Load factor (LF) 0.74 0.73 0.75 0.76 0.74
Electricity distributed (MWh) 1,882,792 1,868,300 1,928,787 1,936,000 1,944,411
Standardised network length (km)** 605 585 599 610 591
Power distribution per standardised network length 3.112 3.194 3.220 3.174 3.290
Number of connection approvals issued by consumer category
- MV (1 - 35 kV) 20 24 33 31 38
- 0.4 kV measured power 143 132 158 168 157
- 0.4 kV without measured power 627 728 774 806 813
- households 1,251 1,449 1,704 1,733 1,856
in EUR 2013 2014 2015 Plan 2016 2016 Graphical comparison
Standardised network length (km)** 605 585 599 610 591
Number of employees 632 632 632 632 632
Standardised network length per employee 0.96 0.93 0.95 0.97 0.94
* Selected indicators for SSH** The calculation of standardised network length is based on the information on the quantity of lines recorded in GIS.
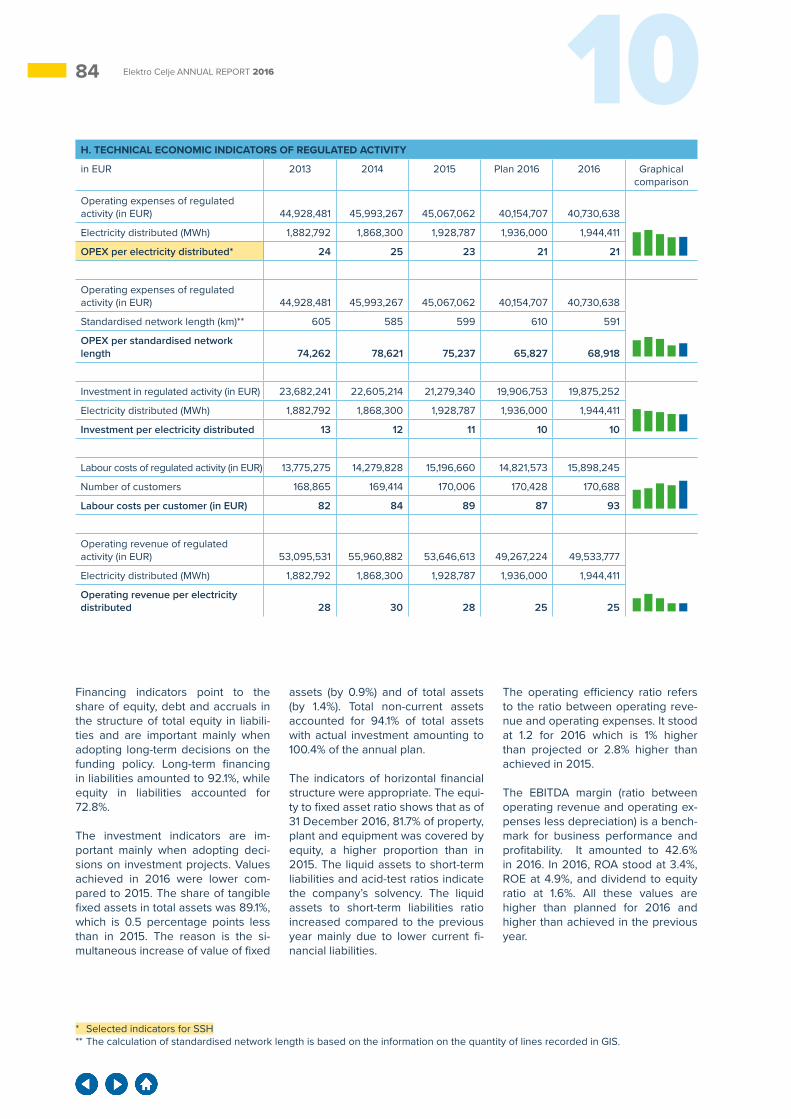
84 10Elektro Celje ANNUAL REPORT 2016
* Selected indicators for SSH** The calculation of standardised network length is based on the information on the quantity of lines recorded in GIS.
H. TECHNICAL ECONOMIC INDICATORS OF REGULATED ACTIVITY
in EUR 2013 2014 2015 Plan 2016 2016 Graphical comparison
Operating expenses of regulated activity (in EUR) 44,928,481 45,993,267 45,067,062 40,154,707 40,730,638
Electricity distributed (MWh) 1,882,792 1,868,300 1,928,787 1,936,000 1,944,411
OPEX per electricity distributed* 24 25 23 21 21
Operating expenses of regulated activity (in EUR) 44,928,481 45,993,267 45,067,062 40,154,707 40,730,638
Standardised network length (km)** 605 585 599 610 591
OPEX per standardised network length 74,262 78,621 75,237 65,827 68,918
Investment in regulated activity (in EUR) 23,682,241 22,605,214 21,279,340 19,906,753 19,875,252
Electricity distributed (MWh) 1,882,792 1,868,300 1,928,787 1,936,000 1,944,411
Investment per electricity distributed 13 12 11 10 10
Labour costs of regulated activity (in EUR) 13,775,275 14,279,828 15,196,660 14,821,573 15,898,245
Number of customers 168,865 169,414 170,006 170,428 170,688
Labour costs per customer (in EUR) 82 84 89 87 93
Operating revenue of regulated activity (in EUR) 53,095,531 55,960,882 53,646,613 49,267,224 49,533,777
Electricity distributed (MWh) 1,882,792 1,868,300 1,928,787 1,936,000 1,944,411
Operating revenue per electricity distributed 28 30 28 25 25
Financing indicators point to the share of equity, debt and accruals in the structure of total equity in liabili-ties and are important mainly when adopting long-term decisions on the funding policy. Long-term financing in liabilities amounted to 92.1%, while equity in liabilities accounted for 72.8%.
The investment indicators are im-portant mainly when adopting deci-sions on investment projects. Values achieved in 2016 were lower com-pared to 2015. The share of tangible fixed assets in total assets was 89.1%, which is 0.5 percentage points less than in 2015. The reason is the si-multaneous increase of value of fixed
assets (by 0.9%) and of total assets (by 1.4%). Total non-current assets accounted for 94.1% of total assets with actual investment amounting to 100.4% of the annual plan.
The indicators of horizontal financial structure were appropriate. The equi-ty to fixed asset ratio shows that as of 31 December 2016, 81.7% of property, plant and equipment was covered by equity, a higher proportion than in 2015. The liquid assets to short-term liabilities and acid-test ratios indicate the company’s solvency. The liquid assets to short-term liabilities ratio increased compared to the previous year mainly due to lower current fi-nancial liabilities.
The operating efficiency ratio refers to the ratio between operating reve-nue and operating expenses. It stood at 1.2 for 2016 which is 1% higher than projected or 2.8% higher than achieved in 2015.
The EBITDA margin (ratio between operating revenue and operating ex-penses less depreciation) is a bench-mark for business performance and profitability. It amounted to 42.6% in 2016. In 2016, ROA stood at 3.4%, ROE at 4.9%, and dividend to equity ratio at 1.6%. All these values are higher than planned for 2016 and higher than achieved in the previous year.
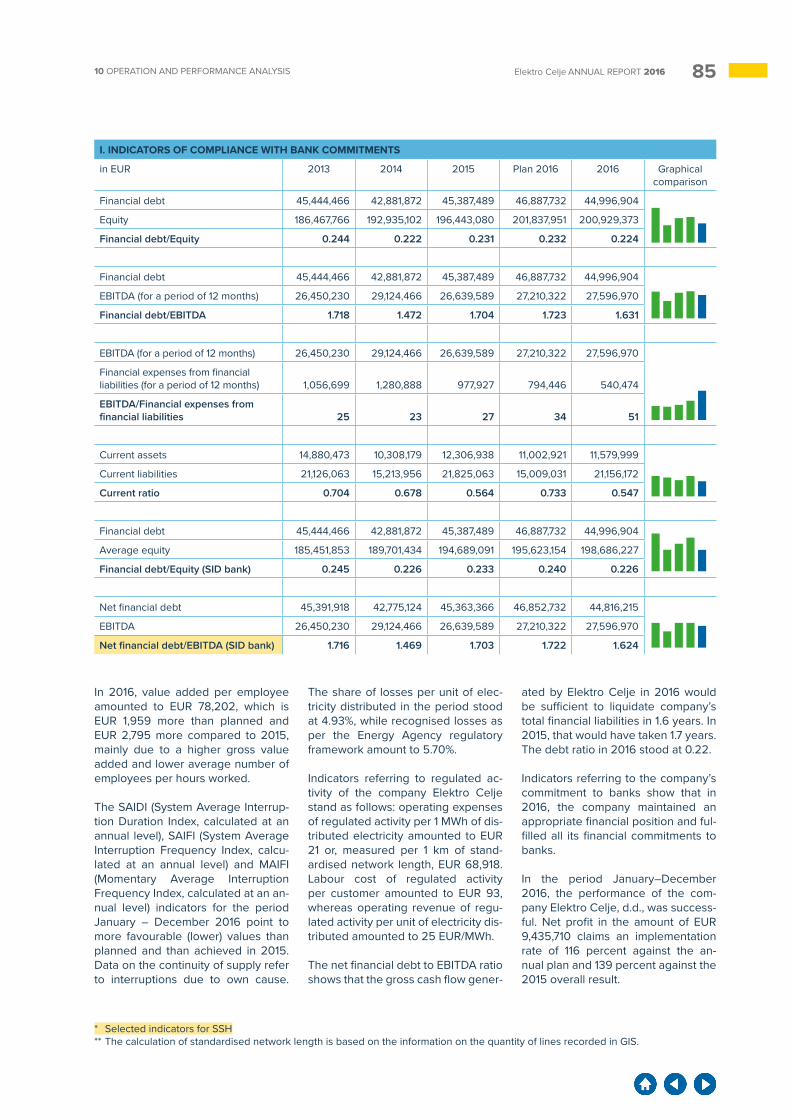
8510 OPERATION AND PERFORMANCE ANALYSIS Elektro Celje ANNUAL REPORT 2016
* Selected indicators for SSH** The calculation of standardised network length is based on the information on the quantity of lines recorded in GIS.
I. INDICATORS OF COMPLIANCE WITH BANK COMMITMENTS
in EUR 2013 2014 2015 Plan 2016 2016 Graphical comparison
Financial debt 45,444,466 42,881,872 45,387,489 46,887,732 44,996,904
Equity 186,467,766 192,935,102 196,443,080 201,837,951 200,929,373
Financial debt/Equity 0.244 0.222 0.231 0.232 0.224
Financial debt 45,444,466 42,881,872 45,387,489 46,887,732 44,996,904
EBITDA (for a period of 12 months) 26,450,230 29,124,466 26,639,589 27,210,322 27,596,970
Financial debt/EBITDA 1.718 1.472 1.704 1.723 1.631
EBITDA (for a period of 12 months) 26,450,230 29,124,466 26,639,589 27,210,322 27,596,970
Financial expenses from financial liabilities (for a period of 12 months) 1,056,699 1,280,888 977,927 794,446 540,474
EBITDA/Financial expenses from financial liabilities 25 23 27 34 51
Current assets 14,880,473 10,308,179 12,306,938 11,002,921 11,579,999
Current liabilities 21,126,063 15,213,956 21,825,063 15,009,031 21,156,172
Current ratio 0.704 0.678 0.564 0.733 0.547
Financial debt 45,444,466 42,881,872 45,387,489 46,887,732 44,996,904
Average equity 185,451,853 189,701,434 194,689,091 195,623,154 198,686,227
Financial debt/Equity (SID bank) 0.245 0.226 0.233 0.240 0.226
Net financial debt 45,391,918 42,775,124 45,363,366 46,852,732 44,816,215
EBITDA 26,450,230 29,124,466 26,639,589 27,210,322 27,596,970
Net financial debt/EBITDA (SID bank) 1.716 1.469 1.703 1.722 1.624
In 2016, value added per employee amounted to EUR 78,202, which is EUR 1,959 more than planned and EUR 2,795 more compared to 2015, mainly due to a higher gross value added and lower average number of employees per hours worked.
The SAIDI (System Average Interrup-tion Duration Index, calculated at an annual level), SAIFI (System Average Interruption Frequency Index, calcu-lated at an annual level) and MAIFI (Momentary Average Interruption Frequency Index, calculated at an an-nual level) indicators for the period January – December 2016 point to more favourable (lower) values than planned and than achieved in 2015. Data on the continuity of supply refer to interruptions due to own cause.
The share of losses per unit of elec-tricity distributed in the period stood at 4.93%, while recognised losses as per the Energy Agency regulatory framework amount to 5.70%.
Indicators referring to regulated ac-tivity of the company Elektro Celje stand as follows: operating expenses of regulated activity per 1 MWh of dis-tributed electricity amounted to EUR 21 or, measured per 1 km of stand-ardised network length, EUR 68,918. Labour cost of regulated activity per customer amounted to EUR 93, whereas operating revenue of regu-lated activity per unit of electricity dis-tributed amounted to 25 EUR/MWh.
The net financial debt to EBITDA ratio shows that the gross cash flow gener-
ated by Elektro Celje in 2016 would be sufficient to liquidate company’s total financial liabilities in 1.6 years. In 2015, that would have taken 1.7 years. The debt ratio in 2016 stood at 0.22.
Indicators referring to the company’s commitment to banks show that in 2016, the company maintained an appropriate financial position and ful-filled all its financial commitments to banks.
In the period January–December 2016, the performance of the com-pany Elektro Celje, d.d., was success-ful. Net profit in the amount of EUR 9,435,710 claims an implementation rate of 116 percent against the an-nual plan and 139 percent against the 2015 overall result.
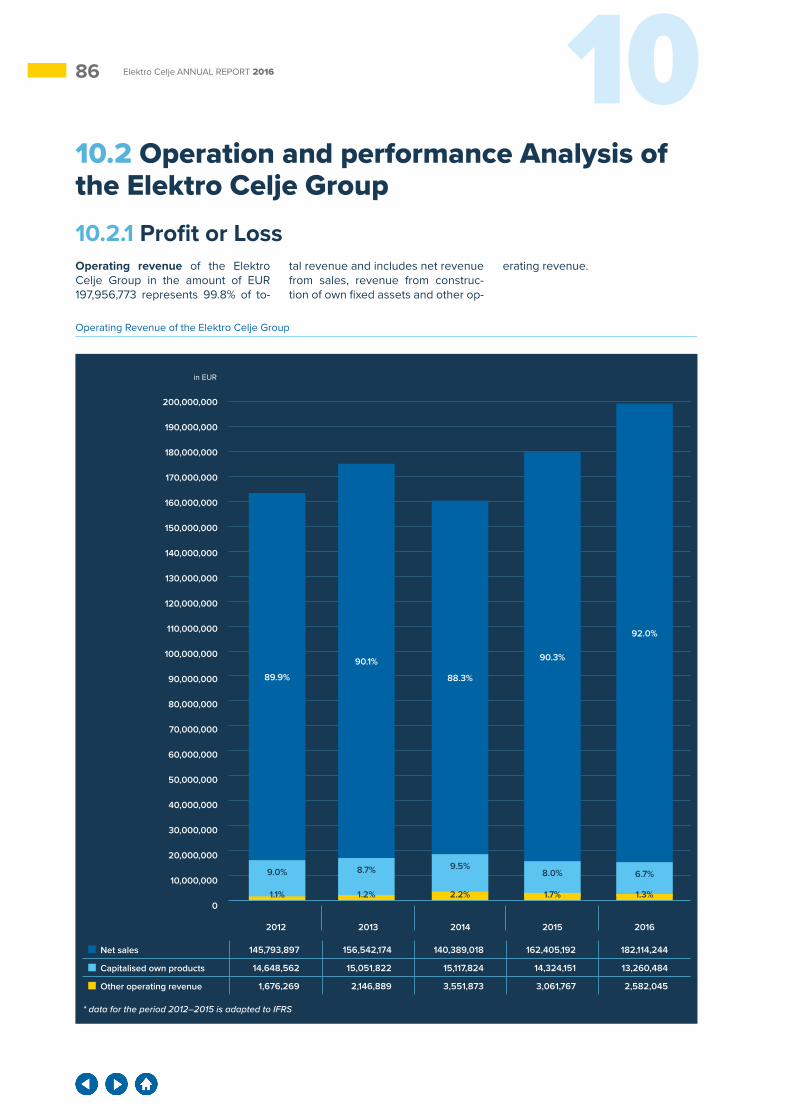
86 10Elektro Celje ANNUAL REPORT 2016
10.2 Operation and performance Analysis of the Elektro Celje Group10.2.1 Profit or LossOperating revenue of the Elektro Celje Group in the amount of EUR 197,956,773 represents 99.8% of to-
tal revenue and includes net revenue from sales, revenue from construc-tion of own fixed assets and other op-
erating revenue.
0
50,000,000
30,000,000
60,000,000
70,000,000
80,000,000
90,000,000
100,000,000
110,000,000
120,000,000
130,000,000
140,000,000
150,000,000
160,000,000
170,000,000
180,000,000
190,000,000
200,000,000
40,000,000
20,000,000
10,000,000
2012 2013 2014 2015 2016
Operating Revenue of the Elektro Celje Group
Net sales 145,793,897 156,542,174 140,389,018 162,405,192 182,114,244
Capitalised own products 14,648,562 15,051,822 15,117,824 14,324,151 13,260,484
Other operating revenue 1,676,269 2,146,889 3,551,873 3,061,767 2,582,045
89.9%
90.1%
88.3%
90.3%
92.0%
9.0% 8.7% 9.5%8.0% 6.7%
in EUR
1.1% 1.2% 2.2% 1.7% 1.3%
* data for the period 2012–2015 is adapted to IFRS
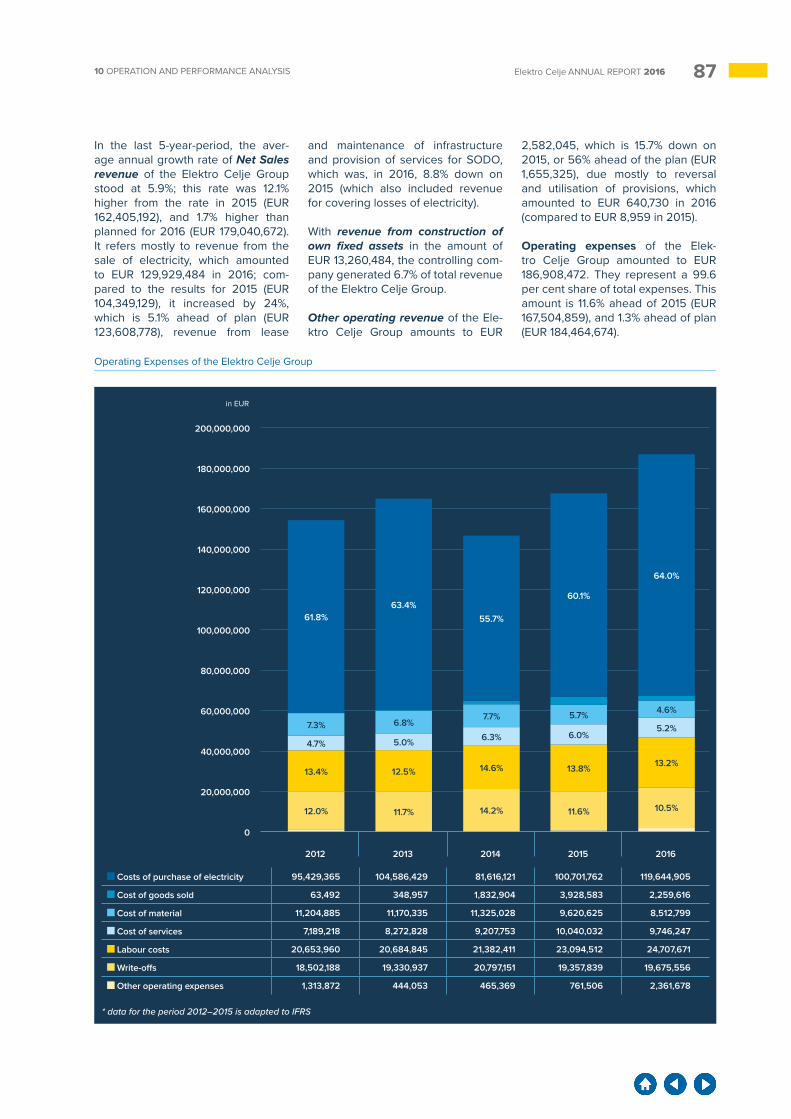
8710 OPERATION AND PERFORMANCE ANALYSIS Elektro Celje ANNUAL REPORT 2016
In the last 5-year-period, the aver-age annual growth rate of Net Sales revenue of the Elektro Celje Group stood at 5.9%; this rate was 12.1% higher from the rate in 2015 (EUR 162,405,192), and 1.7% higher than planned for 2016 (EUR 179,040,672). It refers mostly to revenue from the sale of electricity, which amounted to EUR 129,929,484 in 2016; com-pared to the results for 2015 (EUR 104,349,129), it increased by 24%, which is 5.1% ahead of plan (EUR 123,608,778), revenue from lease
and maintenance of infrastructure and provision of services for SODO, which was, in 2016, 8.8% down on 2015 (which also included revenue for covering losses of electricity).
With revenue from construction of own fixed assets in the amount of EUR 13,260,484, the controlling com-pany generated 6.7% of total revenue of the Elektro Celje Group.
Other operating revenue of the Ele-ktro Celje Group amounts to EUR
2,582,045, which is 15.7% down on 2015, or 56% ahead of the plan (EUR 1,655,325), due mostly to reversal and utilisation of provisions, which amounted to EUR 640,730 in 2016 (compared to EUR 8,959 in 2015).
Operating expenses of the Elek-tro Celje Group amounted to EUR 186,908,472. They represent a 99.6 per cent share of total expenses. This amount is 11.6% ahead of 2015 (EUR 167,504,859), and 1.3% ahead of plan (EUR 184,464,674).
* data for the period 2012–2015 is adapted to IFRS
0
180,000,000
120,000,000
200,000,000
160,000,000
80,000,000
20,000,000
40,000,000
60,000,000
100,000,000
140,000,000
2012 2013 2014 2015 2016
Operating Expenses of the Elektro Celje Group
Costs of purchase of electricity 95,429,365 104,586,429 81,616,121 100,701,762 119,644,905
Cost of goods sold 63,492 348,957 1,832,904 3,928,583 2,259,616
Cost of material 11,204,885 11,170,335 11,325,028 9,620,625 8,512,799
Cost of services 7,189,218 8,272,828 9,207,753 10,040,032 9,746,247
Labour costs 20,653,960 20,684,845 21,382,411 23,094,512 24,707,671
Write-offs 18,502,188 19,330,937 20,797,151 19,357,839 19,675,556
Other operating expenses 1,313,872 444,053 465,369 761,506 2,361,678
in EUR
13.4% 12.5% 14.6% 13.8% 13.2%
4.7% 5.0% 6.3% 6.0%5.2%7.3% 6.8%
7.7% 5.7% 4.6%
61.8%63.4%
55.7%
60.1%
64.0%
12.0% 11.7% 14.2% 11.6% 10.5%
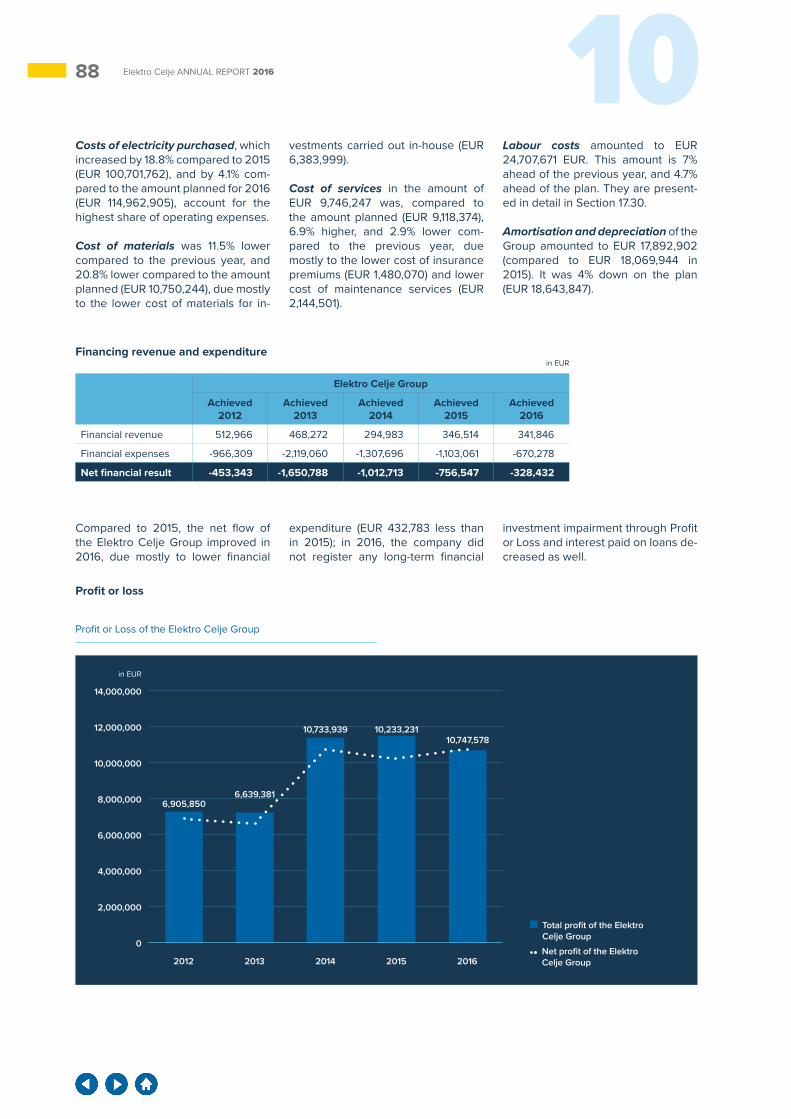
88 10Elektro Celje ANNUAL REPORT 2016
Costs of electricity purchased, which increased by 18.8% compared to 2015 (EUR 100,701,762), and by 4.1% com-pared to the amount planned for 2016 (EUR 114,962,905), account for the highest share of operating expenses.
Cost of materials was 11.5% lower compared to the previous year, and 20.8% lower compared to the amount planned (EUR 10,750,244), due mostly to the lower cost of materials for in-
vestments carried out in-house (EUR 6,383,999).
Cost of services in the amount of EUR 9,746,247 was, compared to the amount planned (EUR 9,118,374), 6.9% higher, and 2.9% lower com-pared to the previous year, due mostly to the lower cost of insurance premiums (EUR 1,480,070) and lower cost of maintenance services (EUR 2,144,501).
Labour costs amounted to EUR 24,707,671 EUR. This amount is 7% ahead of the previous year, and 4.7% ahead of the plan. They are present-ed in detail in Section 17.30.
Amortisation and depreciation of the Group amounted to EUR 17,892,902 (compared to EUR 18,069,944 in 2015). It was 4% down on the plan (EUR 18,643,847).
Financing revenue and expenditure
Elektro Celje Group
Achieved 2012
Achieved 2013
Achieved 2014
Achieved 2015
Achieved 2016
Financial revenue 512,966 468,272 294,983 346,514 341,846
Financial expenses -966,309 -2,119,060 -1,307,696 -1,103,061 -670,278
Net financial result -453,343 -1,650,788 -1,012,713 -756,547 -328,432
in EUR
Compared to 2015, the net flow of the Elektro Celje Group improved in 2016, due mostly to lower financial
expenditure (EUR 432,783 less than in 2015); in 2016, the company did not register any long-term financial
investment impairment through Profit or Loss and interest paid on loans de-creased as well.
Profit or loss
Profit or Loss of the Elektro Celje Group
2,000,000
4,000,000
6,000,000
8,000,000
10,000,000
12,000,000
14,000,000
0
2012 2013 2014 2015 2016
in EUR
Total profit of the Elektro Celje Group
Net profit of the Elektro Celje Group
6,905,8506,639,381
10,733,939 10,233,23110,747,578
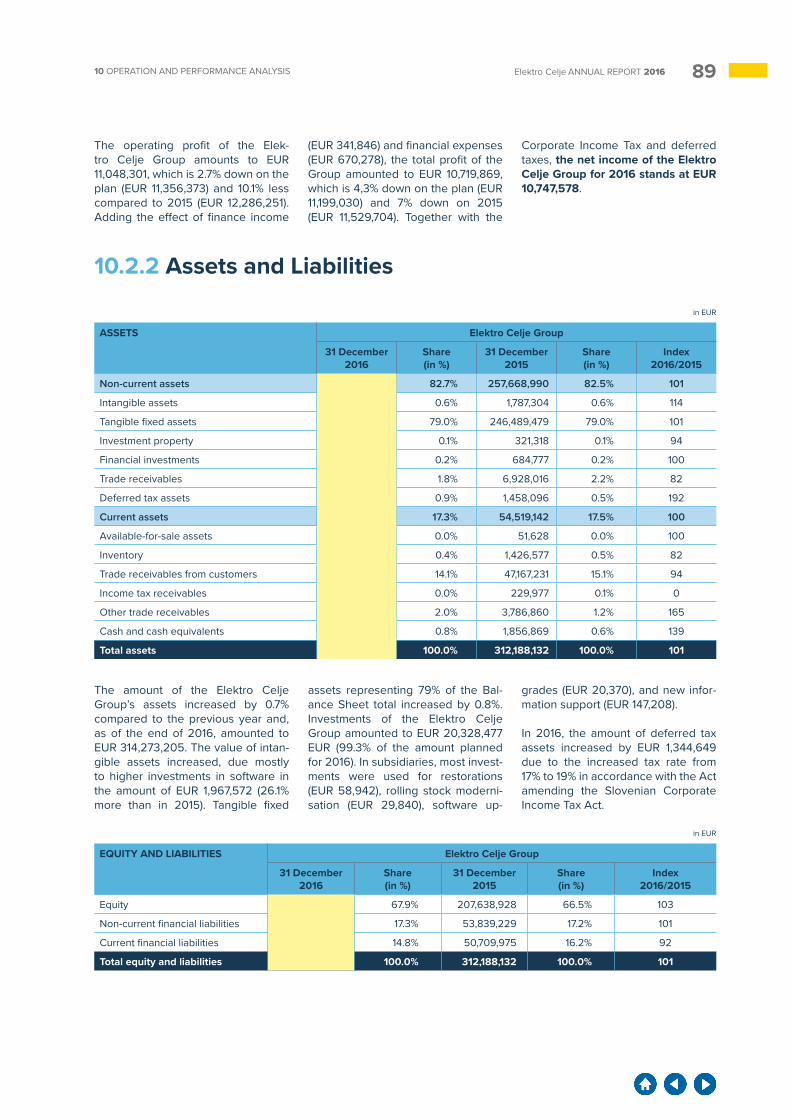
8910 OPERATION AND PERFORMANCE ANALYSIS Elektro Celje ANNUAL REPORT 2016
The operating profit of the Elek-tro Celje Group amounts to EUR 11,048,301, which is 2.7% down on the plan (EUR 11,356,373) and 10.1% less compared to 2015 (EUR 12,286,251). Adding the effect of finance income
(EUR 341,846) and financial expenses (EUR 670,278), the total profit of the Group amounted to EUR 10,719,869, which is 4,3% down on the plan (EUR 11,199,030) and 7% down on 2015 (EUR 11,529,704). Together with the
Corporate Income Tax and deferred taxes, the net income of the Elektro Celje Group for 2016 stands at EUR 10,747,578.
10.2.2 Assets and Liabilities
in EUR
ASSETS Elektro Celje Group
31 December 2016
Share(in %)
31 December 2015
Share(in %)
Index2016/2015
Non-current assets 259,939,760 82.7% 257,668,990 82.5% 101
Intangible assets 2,035,257 0.6% 1,787,304 0.6% 114
Tangible fixed assets 248,417,284 79.0% 246,489,479 79.0% 101
Investment property 302,975 0.1% 321,318 0.1% 94
Financial investments 682,824 0.2% 684,777 0.2% 100
Trade receivables 5,698,675 1.8% 6,928,016 2.2% 82
Deferred tax assets 2,802,745 0.9% 1,458,096 0.5% 192
Current assets 54,333,445 17.3% 54,519,142 17.5% 100
Available-for-sale assets 51,628 0.0% 51,628 0.0% 100
Inventory 1,169,107 0.4% 1,426,577 0.5% 82
Trade receivables from customers 44,291,888 14.1% 47,167,231 15.1% 94
Income tax receivables 0 0.0% 229,977 0.1% 0
Other trade receivables 6,239,815 2.0% 3,786,860 1.2% 165
Cash and cash equivalents 2,581,007 0.8% 1,856,869 0.6% 139
Total assets 314,273,205 100.0% 312,188,132 100.0% 101
The amount of the Elektro Celje Group’s assets increased by 0.7% compared to the previous year and, as of the end of 2016, amounted to EUR 314,273,205. The value of intan-gible assets increased, due mostly to higher investments in software in the amount of EUR 1,967,572 (26.1% more than in 2015). Tangible fixed
assets representing 79% of the Bal-ance Sheet total increased by 0.8%. Investments of the Elektro Celje Group amounted to EUR 20,328,477 EUR (99.3% of the amount planned for 2016). In subsidiaries, most invest-ments were used for restorations (EUR 58,942), rolling stock moderni-sation (EUR 29,840), software up-
grades (EUR 20,370), and new infor-mation support (EUR 147,208).
In 2016, the amount of deferred tax assets increased by EUR 1,344,649 due to the increased tax rate from 17% to 19% in accordance with the Act amending the Slovenian Corporate Income Tax Act.
in EUR
EQUITY AND LIABILITIES Elektro Celje Group
31 December 2016
Share(in %)
31 December 2015
Share(in %)
Index 2016/2015
Equity 213,314,562 67.9% 207,638,928 66.5% 103
Non-current financial liabilities 54,370,651 17.3% 53,839,229 17.2% 101
Current financial liabilities 46,587,992 14.8% 50,709,975 16.2% 92
Total equity and liabilities 314,273,205 100.0% 312,188,132 100.0% 101
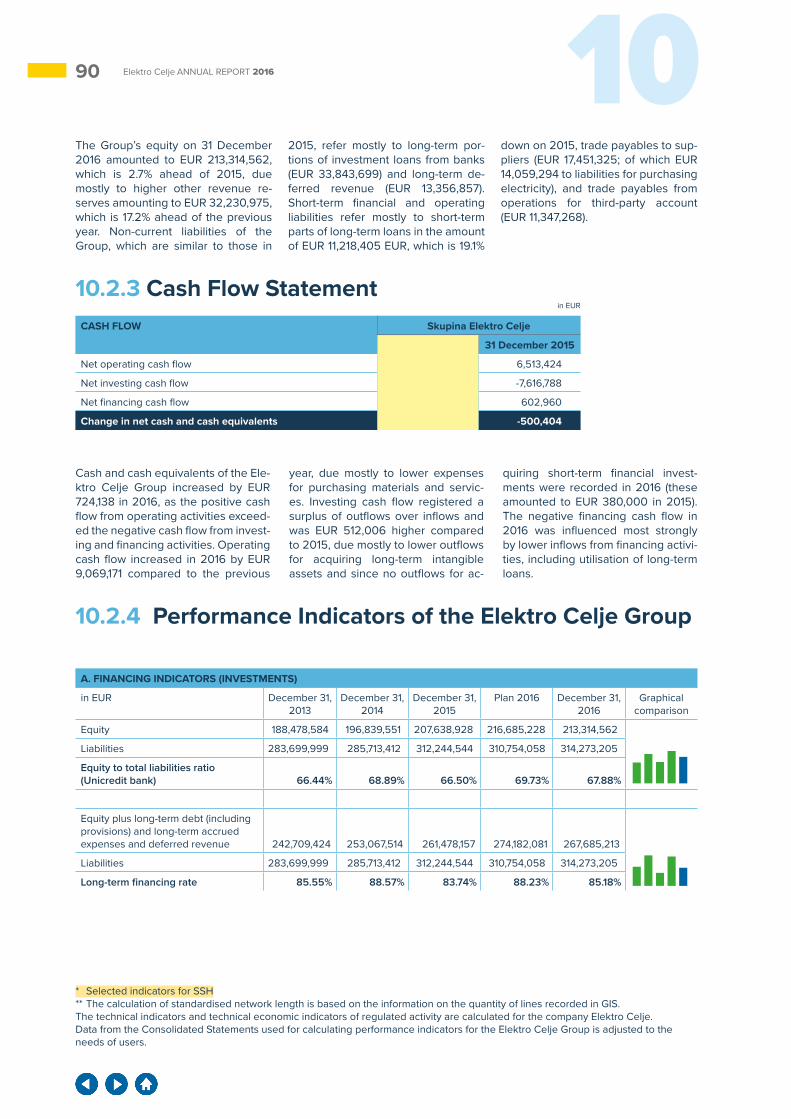
90 10Elektro Celje ANNUAL REPORT 2016
The Group’s equity on 31 December 2016 amounted to EUR 213,314,562, which is 2.7% ahead of 2015, due mostly to higher other revenue re-serves amounting to EUR 32,230,975, which is 17.2% ahead of the previous year. Non-current liabilities of the Group, which are similar to those in
2015, refer mostly to long-term por-tions of investment loans from banks (EUR 33,843,699) and long-term de-ferred revenue (EUR 13,356,857). Short-term financial and operating liabilities refer mostly to short-term parts of long-term loans in the amount of EUR 11,218,405 EUR, which is 19.1%
down on 2015, trade payables to sup-pliers (EUR 17,451,325; of which EUR 14,059,294 to liabilities for purchasing electricity), and trade payables from operations for third-party account (EUR 11,347,268).
10.2.3 Cash Flow StatementCASH FLOW Skupina Elektro Celje
31 December 2016 31 December 2015
Net operating cash flow 15,582,595 6,513,424
Net investing cash flow -7,104,782 -7,616,788
Net financing cash flow -7,753,675 602,960
Change in net cash and cash equivalents 724,138 -500,404
in EUR
Cash and cash equivalents of the Ele-ktro Celje Group increased by EUR 724,138 in 2016, as the positive cash flow from operating activities exceed-ed the negative cash flow from invest-ing and financing activities. Operating cash flow increased in 2016 by EUR 9,069,171 compared to the previous
year, due mostly to lower expenses for purchasing materials and servic-es. Investing cash flow registered a surplus of outflows over inflows and was EUR 512,006 higher compared to 2015, due mostly to lower outflows for acquiring long-term intangible assets and since no outflows for ac-
quiring short-term financial invest-ments were recorded in 2016 (these amounted to EUR 380,000 in 2015). The negative financing cash flow in 2016 was influenced most strongly by lower inflows from financing activi-ties, including utilisation of long-term loans.
10.2.4 Performance Indicators of the Elektro Celje Group
A. FINANCING INDICATORS (INVESTMENTS)
in EUR December 31, 2013
December 31, 2014
December 31, 2015
Plan 2016 December 31, 2016
Graphical comparison
Equity 188,478,584 196,839,551 207,638,928 216,685,228 213,314,562
Liabilities 283,699,999 285,713,412 312,244,544 310,754,058 314,273,205
Equity to total liabilities ratio (Unicredit bank) 66.44% 68.89% 66.50% 69.73% 67.88%
Equity plus long-term debt (including provisions) and long-term accrued expenses and deferred revenue 242,709,424 253,067,514 261,478,157 274,182,081 267,685,213
Liabilities 283,699,999 285,713,412 312,244,544 310,754,058 314,273,205
Long-term financing rate 85.55% 88.57% 83.74% 88.23% 85.18%
* Selected indicators for SSH** The calculation of standardised network length is based on the information on the quantity of lines recorded in GIS.The technical indicators and technical economic indicators of regulated activity are calculated for the company Elektro Celje.Data from the Consolidated Statements used for calculating performance indicators for the Elektro Celje Group is adjusted to the needs of users.
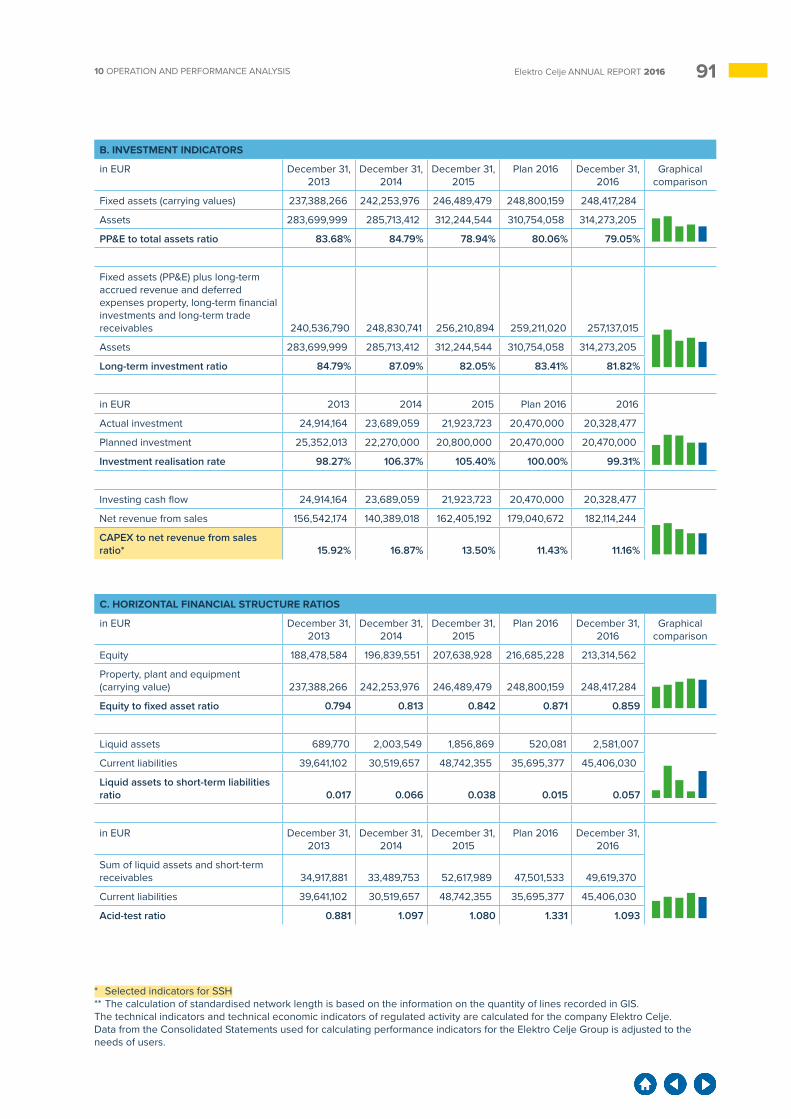
9110 OPERATION AND PERFORMANCE ANALYSIS Elektro Celje ANNUAL REPORT 2016
B. INVESTMENT INDICATORS
in EUR December 31, 2013
December 31, 2014
December 31, 2015
Plan 2016 December 31, 2016
Graphical comparison
Fixed assets (carrying values) 237,388,266 242,253,976 246,489,479 248,800,159 248,417,284
Assets 283,699,999 285,713,412 312,244,544 310,754,058 314,273,205
PP&E to total assets ratio 83.68% 84.79% 78.94% 80.06% 79.05%
Fixed assets (PP&E) plus long-term accrued revenue and deferred expenses property, long-term financial investments and long-term trade receivables 240,536,790 248,830,741 256,210,894 259,211,020 257,137,015
Assets 283,699,999 285,713,412 312,244,544 310,754,058 314,273,205
Long-term investment ratio 84.79% 87.09% 82.05% 83.41% 81.82%
in EUR 2013 2014 2015 Plan 2016 2016
Actual investment 24,914,164 23,689,059 21,923,723 20,470,000 20,328,477
Planned investment 25,352,013 22,270,000 20,800,000 20,470,000 20,470,000
Investment realisation rate 98.27% 106.37% 105.40% 100.00% 99.31%
Investing cash flow 24,914,164 23,689,059 21,923,723 20,470,000 20,328,477
Net revenue from sales 156,542,174 140,389,018 162,405,192 179,040,672 182,114,244
CAPEX to net revenue from sales ratio* 15.92% 16.87% 13.50% 11.43% 11.16%
C. HORIZONTAL FINANCIAL STRUCTURE RATIOS
in EUR December 31, 2013
December 31, 2014
December 31, 2015
Plan 2016 December 31, 2016
Graphical comparison
Equity 188,478,584 196,839,551 207,638,928 216,685,228 213,314,562
Property, plant and equipment (carrying value) 237,388,266 242,253,976 246,489,479 248,800,159 248,417,284
Equity to fixed asset ratio 0.794 0.813 0.842 0.871 0.859
Liquid assets 689,770 2,003,549 1,856,869 520,081 2,581,007
Current liabilities 39,641,102 30,519,657 48,742,355 35,695,377 45,406,030
Liquid assets to short-term liabilities ratio 0.017 0.066 0.038 0.015 0.057
in EUR December 31, 2013
December 31, 2014
December 31, 2015
Plan 2016 December 31, 2016
Sum of liquid assets and short-term receivables 34,917,881 33,489,753 52,617,989 47,501,533 49,619,370
Current liabilities 39,641,102 30,519,657 48,742,355 35,695,377 45,406,030
Acid-test ratio 0.881 1.097 1.080 1.331 1.093
* Selected indicators for SSH** The calculation of standardised network length is based on the information on the quantity of lines recorded in GIS.The technical indicators and technical economic indicators of regulated activity are calculated for the company Elektro Celje.Data from the Consolidated Statements used for calculating performance indicators for the Elektro Celje Group is adjusted to the needs of users.
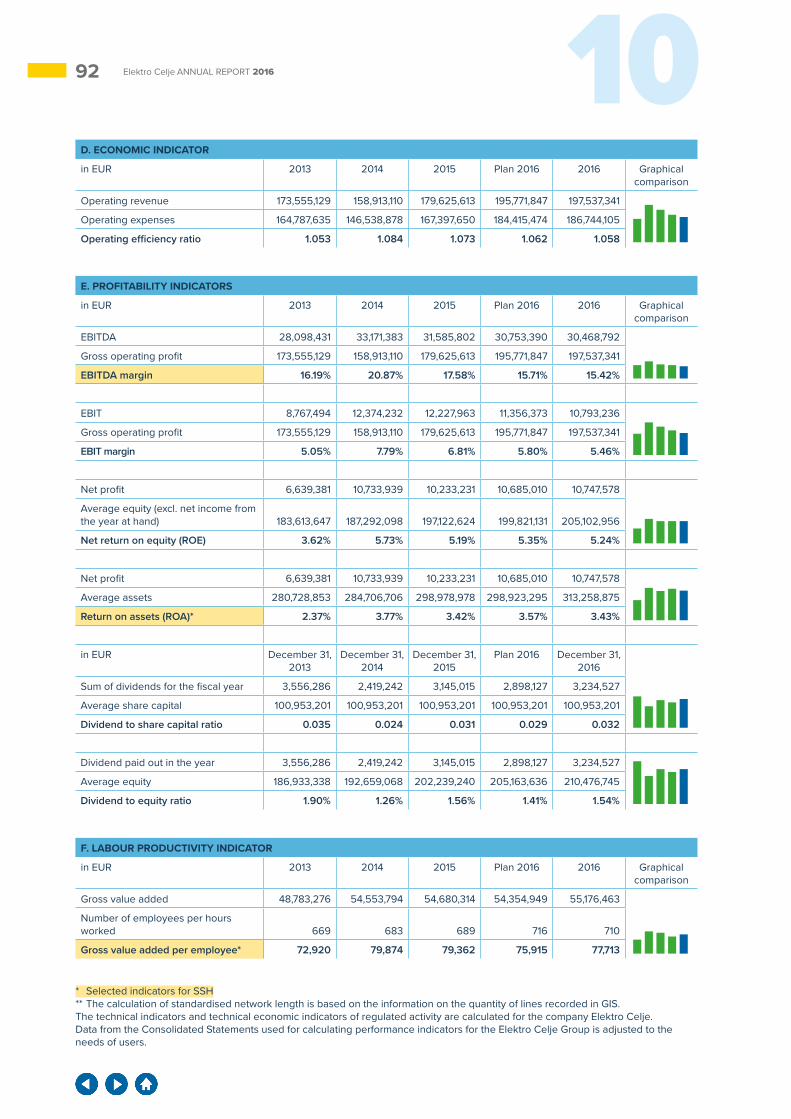
92 10Elektro Celje ANNUAL REPORT 2016
D. ECONOMIC INDICATOR
in EUR 2013 2014 2015 Plan 2016 2016 Graphical comparison
Operating revenue 173,555,129 158,913,110 179,625,613 195,771,847 197,537,341
Operating expenses 164,787,635 146,538,878 167,397,650 184,415,474 186,744,105
Operating efficiency ratio 1.053 1.084 1.073 1.062 1.058
E. PROFITABILITY INDICATORS
in EUR 2013 2014 2015 Plan 2016 2016 Graphical comparison
EBITDA 28,098,431 33,171,383 31,585,802 30,753,390 30,468,792
Gross operating profit 173,555,129 158,913,110 179,625,613 195,771,847 197,537,341
EBITDA margin 16.19% 20.87% 17.58% 15.71% 15.42%
EBIT 8,767,494 12,374,232 12,227,963 11,356,373 10,793,236
Gross operating profit 173,555,129 158,913,110 179,625,613 195,771,847 197,537,341
EBIT margin 5.05% 7.79% 6.81% 5.80% 5.46%
Net profit 6,639,381 10,733,939 10,233,231 10,685,010 10,747,578
Average equity (excl. net income from the year at hand) 183,613,647 187,292,098 197,122,624 199,821,131 205,102,956
Net return on equity (ROE) 3.62% 5.73% 5.19% 5.35% 5.24%
Net profit 6,639,381 10,733,939 10,233,231 10,685,010 10,747,578
Average assets 280,728,853 284,706,706 298,978,978 298,923,295 313,258,875
Return on assets (ROA)* 2.37% 3.77% 3.42% 3.57% 3.43%
in EUR December 31, 2013
December 31, 2014
December 31, 2015
Plan 2016 December 31, 2016
Sum of dividends for the fiscal year 3,556,286 2,419,242 3,145,015 2,898,127 3,234,527
Average share capital 100,953,201 100,953,201 100,953,201 100,953,201 100,953,201
Dividend to share capital ratio 0.035 0.024 0.031 0.029 0.032
Dividend paid out in the year 3,556,286 2,419,242 3,145,015 2,898,127 3,234,527
Average equity 186,933,338 192,659,068 202,239,240 205,163,636 210,476,745
Dividend to equity ratio 1.90% 1.26% 1.56% 1.41% 1.54%
F. LABOUR PRODUCTIVITY INDICATOR
in EUR 2013 2014 2015 Plan 2016 2016 Graphical comparison
Gross value added 48,783,276 54,553,794 54,680,314 54,354,949 55,176,463
Number of employees per hours worked 669 683 689 716 710
Gross value added per employee* 72,920 79,874 79,362 75,915 77,713
* Selected indicators for SSH** The calculation of standardised network length is based on the information on the quantity of lines recorded in GIS.The technical indicators and technical economic indicators of regulated activity are calculated for the company Elektro Celje.Data from the Consolidated Statements used for calculating performance indicators for the Elektro Celje Group is adjusted to the needs of users.
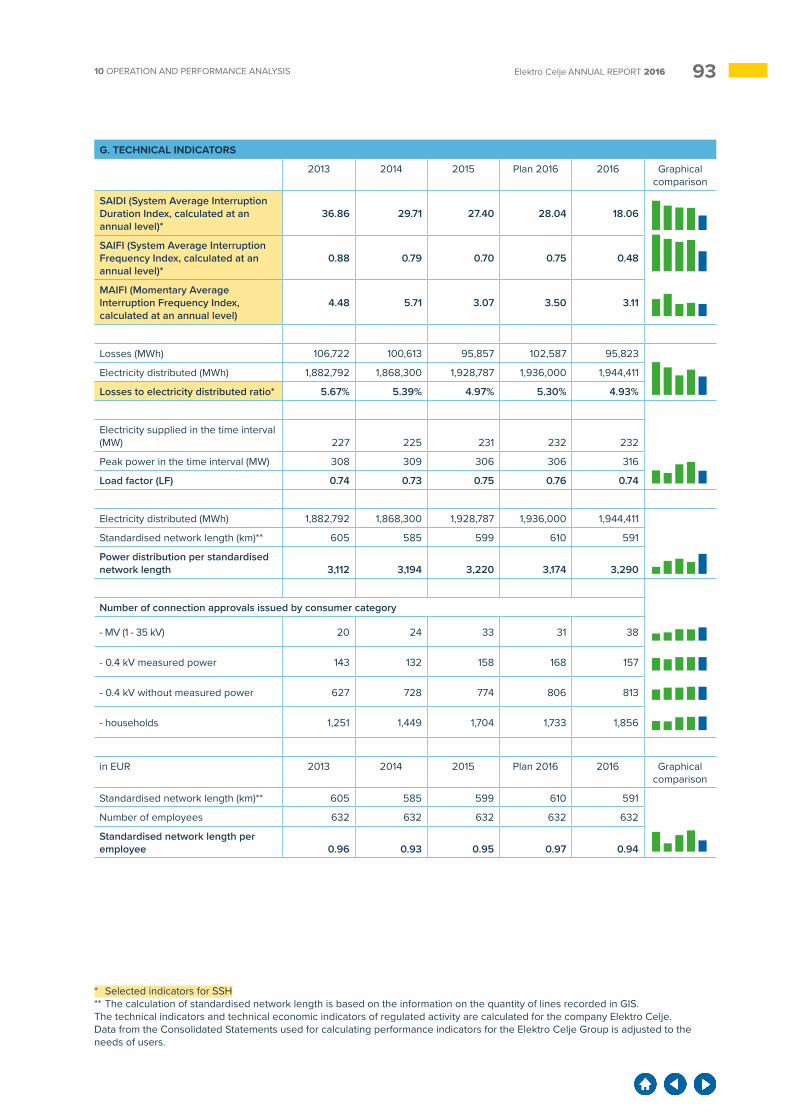
9310 OPERATION AND PERFORMANCE ANALYSIS Elektro Celje ANNUAL REPORT 2016
G. TECHNICAL INDICATORS
2013 2014 2015 Plan 2016 2016 Graphical comparison
SAIDI (System Average Interruption Duration Index, calculated at an annual level)*
36.86 29.71 27.40 28.04 18.06
SAIFI (System Average Interruption Frequency Index, calculated at an annual level)*
0.88 0.79 0.70 0.75 0.48
MAIFI (Momentary Average Interruption Frequency Index, calculated at an annual level)
4.48 5.71 3.07 3.50 3.11
Losses (MWh) 106,722 100,613 95,857 102,587 95,823
Electricity distributed (MWh) 1,882,792 1,868,300 1,928,787 1,936,000 1,944,411
Losses to electricity distributed ratio* 5.67% 5.39% 4.97% 5.30% 4.93%
Electricity supplied in the time interval (MW) 227 225 231 232 232
Peak power in the time interval (MW) 308 309 306 306 316
Load factor (LF) 0.74 0.73 0.75 0.76 0.74
Electricity distributed (MWh) 1,882,792 1,868,300 1,928,787 1,936,000 1,944,411
Standardised network length (km)** 605 585 599 610 591
Power distribution per standardised network length 3,112 3,194 3,220 3,174 3,290
Number of connection approvals issued by consumer category
- MV (1 - 35 kV) 20 24 33 31 38
- 0.4 kV measured power 143 132 158 168 157
- 0.4 kV without measured power 627 728 774 806 813
- households 1,251 1,449 1,704 1,733 1,856
in EUR 2013 2014 2015 Plan 2016 2016 Graphical comparison
Standardised network length (km)** 605 585 599 610 591
Number of employees 632 632 632 632 632
Standardised network length per employee 0.96 0.93 0.95 0.97 0.94
* Selected indicators for SSH** The calculation of standardised network length is based on the information on the quantity of lines recorded in GIS.The technical indicators and technical economic indicators of regulated activity are calculated for the company Elektro Celje.Data from the Consolidated Statements used for calculating performance indicators for the Elektro Celje Group is adjusted to the needs of users.
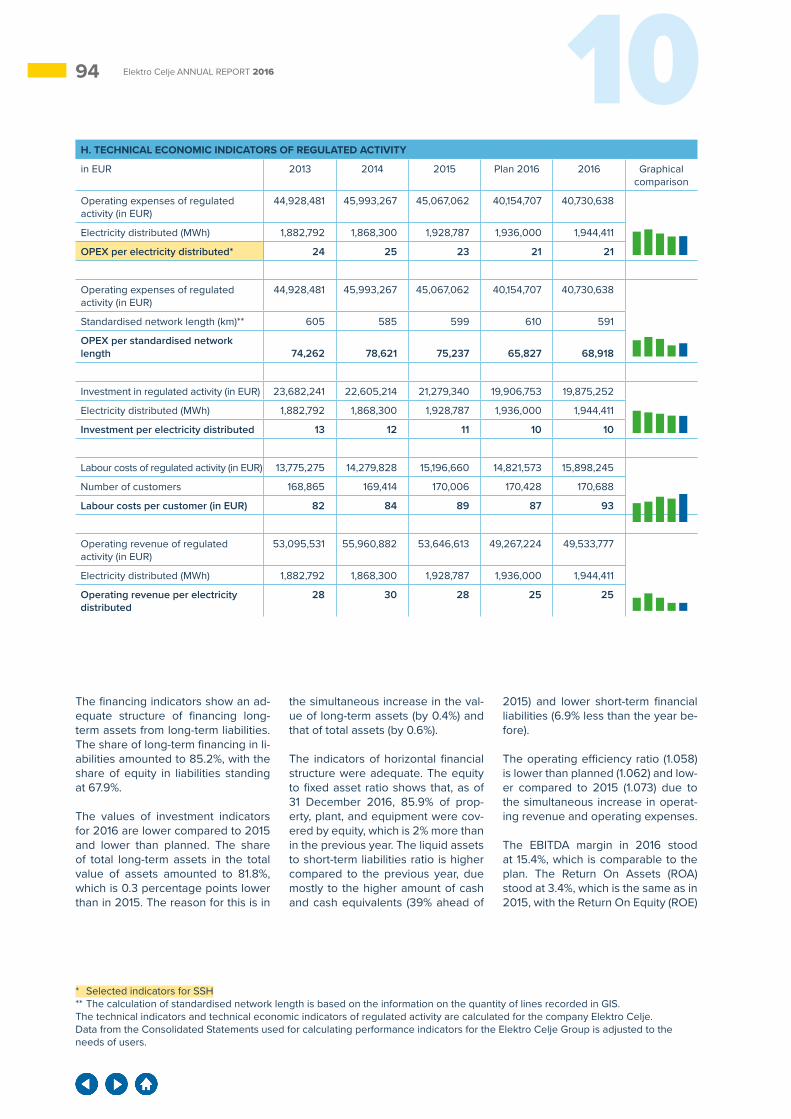
94 10Elektro Celje ANNUAL REPORT 2016
H. TECHNICAL ECONOMIC INDICATORS OF REGULATED ACTIVITY
in EUR 2013 2014 2015 Plan 2016 2016 Graphical comparison
Operating expenses of regulated activity (in EUR)
44,928,481 45,993,267 45,067,062 40,154,707 40,730,638
Electricity distributed (MWh) 1,882,792 1,868,300 1,928,787 1,936,000 1,944,411
OPEX per electricity distributed* 24 25 23 21 21
Operating expenses of regulated activity (in EUR)
44,928,481 45,993,267 45,067,062 40,154,707 40,730,638
Standardised network length (km)** 605 585 599 610 591
OPEX per standardised network length 74,262 78,621 75,237 65,827 68,918
Investment in regulated activity (in EUR) 23,682,241 22,605,214 21,279,340 19,906,753 19,875,252
Electricity distributed (MWh) 1,882,792 1,868,300 1,928,787 1,936,000 1,944,411
Investment per electricity distributed 13 12 11 10 10
Labour costs of regulated activity (in EUR) 13,775,275 14,279,828 15,196,660 14,821,573 15,898,245
Number of customers 168,865 169,414 170,006 170,428 170,688
Labour costs per customer (in EUR) 82 84 89 87 93
Operating revenue of regulated activity (in EUR)
53,095,531 55,960,882 53,646,613 49,267,224 49,533,777
Electricity distributed (MWh) 1,882,792 1,868,300 1,928,787 1,936,000 1,944,411
Operating revenue per electricity distributed
28 30 28 25 25
The financing indicators show an ad-equate structure of financing long-term assets from long-term liabilities. The share of long-term financing in li-abilities amounted to 85.2%, with the share of equity in liabilities standing at 67.9%.
The values of investment indicators for 2016 are lower compared to 2015 and lower than planned. The share of total long-term assets in the total value of assets amounted to 81.8%, which is 0.3 percentage points lower than in 2015. The reason for this is in
the simultaneous increase in the val-ue of long-term assets (by 0.4%) and that of total assets (by 0.6%).
The indicators of horizontal financial structure were adequate. The equity to fixed asset ratio shows that, as of 31 December 2016, 85.9% of prop-erty, plant, and equipment were cov-ered by equity, which is 2% more than in the previous year. The liquid assets to short-term liabilities ratio is higher compared to the previous year, due mostly to the higher amount of cash and cash equivalents (39% ahead of
2015) and lower short-term financial liabilities (6.9% less than the year be-fore).
The operating efficiency ratio (1.058) is lower than planned (1.062) and low-er compared to 2015 (1.073) due to the simultaneous increase in operat-ing revenue and operating expenses.
The EBITDA margin in 2016 stood at 15.4%, which is comparable to the plan. The Return On Assets (ROA) stood at 3.4%, which is the same as in 2015, with the Return On Equity (ROE)
* Selected indicators for SSH** The calculation of standardised network length is based on the information on the quantity of lines recorded in GIS.The technical indicators and technical economic indicators of regulated activity are calculated for the company Elektro Celje.Data from the Consolidated Statements used for calculating performance indicators for the Elektro Celje Group is adjusted to the needs of users.
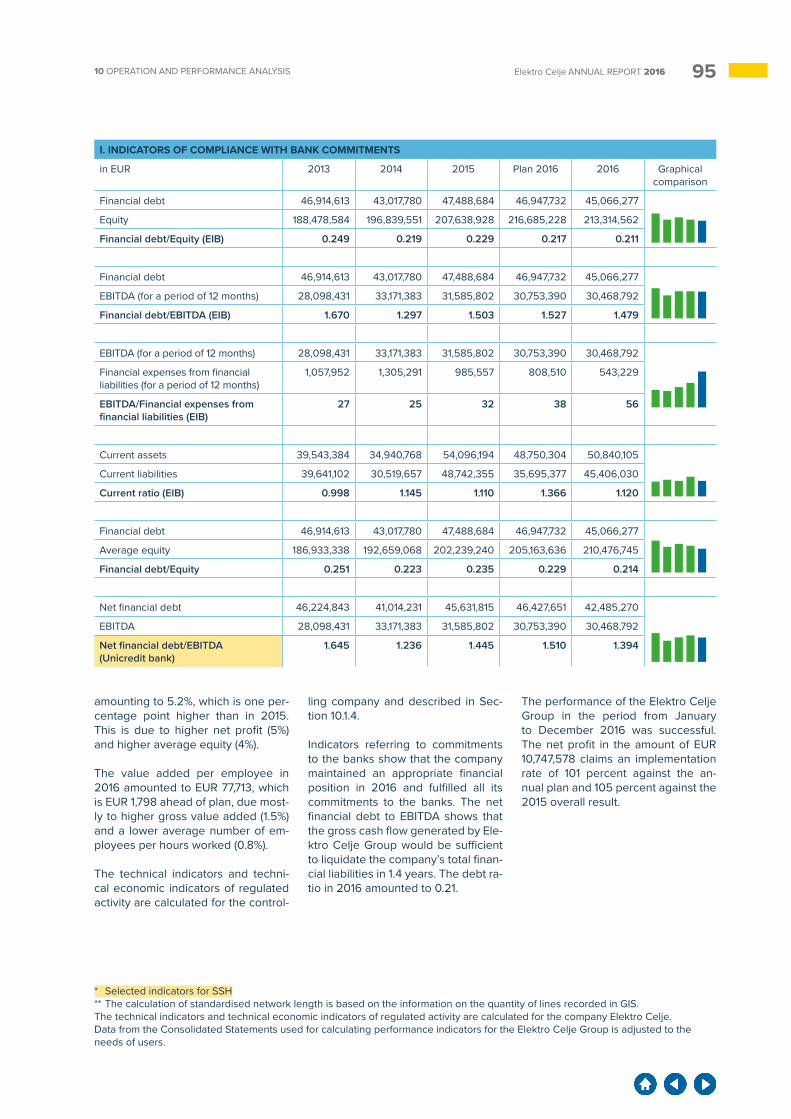
9510 OPERATION AND PERFORMANCE ANALYSIS Elektro Celje ANNUAL REPORT 2016
I. INDICATORS OF COMPLIANCE WITH BANK COMMITMENTS
in EUR 2013 2014 2015 Plan 2016 2016 Graphical comparison
Financial debt 46,914,613 43,017,780 47,488,684 46,947,732 45,066,277
Equity 188,478,584 196,839,551 207,638,928 216,685,228 213,314,562
Financial debt/Equity (EIB) 0.249 0.219 0.229 0.217 0.211
Financial debt 46,914,613 43,017,780 47,488,684 46,947,732 45,066,277
EBITDA (for a period of 12 months) 28,098,431 33,171,383 31,585,802 30,753,390 30,468,792
Financial debt/EBITDA (EIB) 1.670 1.297 1.503 1.527 1.479
EBITDA (for a period of 12 months) 28,098,431 33,171,383 31,585,802 30,753,390 30,468,792
Financial expenses from financial liabilities (for a period of 12 months)
1,057,952 1,305,291 985,557 808,510 543,229
EBITDA/Financial expenses from financial liabilities (EIB)
27 25 32 38 56
Current assets 39,543,384 34,940,768 54,096,194 48,750,304 50,840,105
Current liabilities 39,641,102 30,519,657 48,742,355 35,695,377 45,406,030
Current ratio (EIB) 0.998 1.145 1.110 1.366 1.120
Financial debt 46,914,613 43,017,780 47,488,684 46,947,732 45,066,277
Average equity 186,933,338 192,659,068 202,239,240 205,163,636 210,476,745
Financial debt/Equity 0.251 0.223 0.235 0.229 0.214
Net financial debt 46,224,843 41,014,231 45,631,815 46,427,651 42,485,270
EBITDA 28,098,431 33,171,383 31,585,802 30,753,390 30,468,792
Net financial debt/EBITDA (Unicredit bank)
1.645 1.236 1.445 1.510 1.394
amounting to 5.2%, which is one per-centage point higher than in 2015. This is due to higher net profit (5%) and higher average equity (4%).
The value added per employee in 2016 amounted to EUR 77,713, which is EUR 1,798 ahead of plan, due most-ly to higher gross value added (1.5%) and a lower average number of em-ployees per hours worked (0.8%).
The technical indicators and techni-cal economic indicators of regulated activity are calculated for the control-
ling company and described in Sec-tion 10.1.4.
Indicators referring to commitments to the banks show that the company maintained an appropriate financial position in 2016 and fulfilled all its commitments to the banks. The net financial debt to EBITDA shows that the gross cash flow generated by Ele-ktro Celje Group would be sufficient to liquidate the company’s total finan-cial liabilities in 1.4 years. The debt ra-tio in 2016 amounted to 0.21.
The performance of the Elektro Celje Group in the period from January to December 2016 was successful. The net profit in the amount of EUR 10,747,578 claims an implementation rate of 101 percent against the an-nual plan and 105 percent against the 2015 overall result.
* Selected indicators for SSH** The calculation of standardised network length is based on the information on the quantity of lines recorded in GIS.The technical indicators and technical economic indicators of regulated activity are calculated for the company Elektro Celje.Data from the Consolidated Statements used for calculating performance indicators for the Elektro Celje Group is adjusted to the needs of users.
96 11Elektro Celje ANNUAL REPORT 2016
11 ORGANISATIONAL DEVELOPMENT
11.1 Management SystemsQuality Management System – QMS and Environmental Management System – EMSThe management system at Elektro Celje, d.d. functions in accordance with the ISO 9001:2008 Standard and is a system standard for company management. The management, Oc-cupational Health and Safety and en-vironmental management processes are certified in accordance with OH-SAS 18001:2007 and ISO 14001:2004, but they are not formally integrated into a uniform management sys-tem, even though, in practice, they function as a system with the same procedures for documentation man-agement, preventive and corrective measures, management reviews and other measures and activities that enable the execution of measures for improvement of operations. All documentation related to the certi-fied Management and Environmental Management Systems is published on the company website and avail-able to all employees. In 2013, the company conducted a self-appraisal following the business excellence model. The results and suggested measures were presented to the management. Certain suggested measures were initiated and some improvements were introduced into everyday activities.
The ISO 9001 Management System was introduced into our management systems in 2003. In 2012, the certifi-
cation was performed after issuing the 2008 Standard. The umbrella document defining the management system, the processes and proce-dures, is referred to as »Poslovnik vodenja« (Rules of Management) of the company Elektro Celje, d.d.. The main tools used in company man-agement are internal audits, exter-nal audits and management reviews. Internal audits are governed by an organisation regulation that also di-rects the execution of internal audits for a system for the protection of em-ployees’ health and the environment. With regular implementation of inter-nal audits, the following is provided:>> Determination of the efficiency of
achieving the goals pursued,>> Creation of conditions that ensure
constant improvement,>> Maintaining the level of quality that
is necessary for the certification and maintaining the certificate.
With the management review as the most important activity, we deter-mine the efficiency and suitability of the management system. As a rule, a comprehensive management re-view is conducted annually in the second quarter of the financial year; alternately, partial management re-views can be carried out constantly, depending on the nature of business events and the needs of manag-ing and coordinating business pro-cesses. Preventive and corrective measures are also important tools.
Their implementation depends on the management review. Examiners from BVQI review the functioning of the management system every year.
The company has an established system of managing Occupational Health and Safety, which is a part of the management system and is used for the development and execution of the Occupational Health and Safety Policy and for managing recognised occupational Health and Safety risks.The management system is com-prised of a series of interconnected elements that are used for setting up a policy and goals, and for achieving these goals. The management sys-tem includes an organisational struc-ture, planning, responsibilities, work techniques, procedures, processes and sources.The Environmental Management System is in accordance with the re-quirements of the ISO 14001:2004 Standard and includes all the activi-ties, processes and locations in the company.
The management system functions in accordance with identified processes and includes a succession of these processes and their interactions. We control, measure and analyse these processes, as well as execute meas-ures that are necessary for reaching our goals. Additionally, we improve the processes constantly.
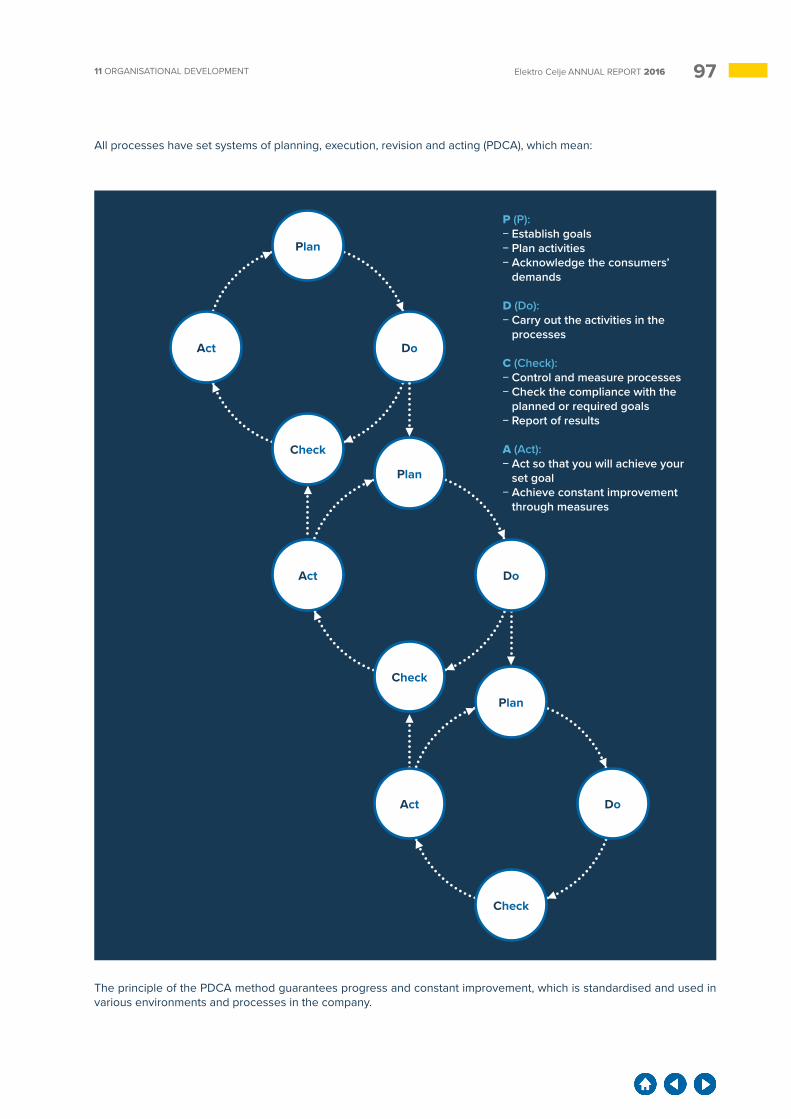
9711 ORGANISATIONAL DEVELOPMENT Elektro Celje ANNUAL REPORT 2016
All processes have set systems of planning, execution, revision and acting (PDCA), which mean:
Plan
Act
Check
Do
Plan
Act
Check
Do
Plan
Act
Check
Do
P (P):− Establish goals− Plan activities− Acknowledge the consumers’
demands
D (Do):− Carry out the activities in the
processes
C (Check):− Control and measure processes− Check the compliance with the
planned or required goals− Report of results
A (Act):− Act so that you will achieve your
set goal− Achieve constant improvement
through measures
The principle of the PDCA method guarantees progress and constant improvement, which is standardised and used in various environments and processes in the company.
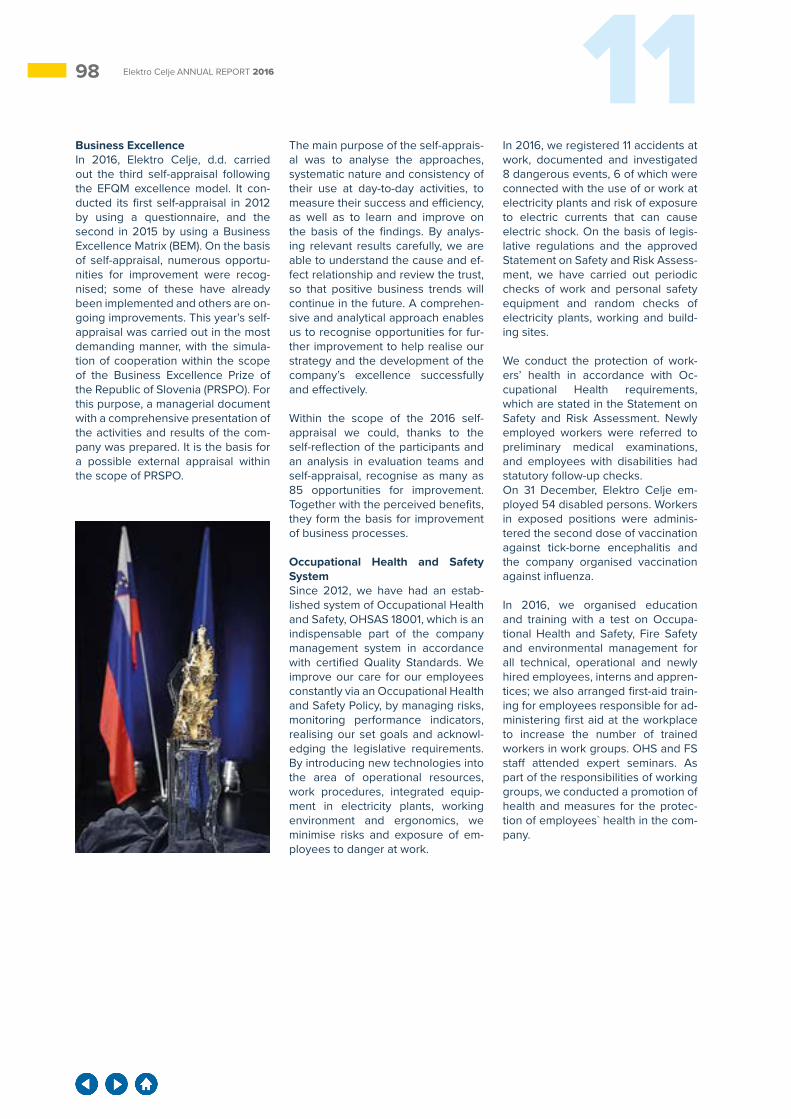
98 11Elektro Celje ANNUAL REPORT 2016
Business ExcellenceIn 2016, Elektro Celje, d.d. carried out the third self-appraisal following the EFQM excellence model. It con-ducted its first self-appraisal in 2012 by using a questionnaire, and the second in 2015 by using a Business Excellence Matrix (BEM). On the basis of self-appraisal, numerous opportu-nities for improvement were recog-nised; some of these have already been implemented and others are on-going improvements. This year’s self-appraisal was carried out in the most demanding manner, with the simula-tion of cooperation within the scope of the Business Excellence Prize of the Republic of Slovenia (PRSPO). For this purpose, a managerial document with a comprehensive presentation of the activities and results of the com-pany was prepared. It is the basis for a possible external appraisal within the scope of PRSPO.
The main purpose of the self-apprais-al was to analyse the approaches, systematic nature and consistency of their use at day-to-day activities, to measure their success and efficiency, as well as to learn and improve on the basis of the findings. By analys-ing relevant results carefully, we are able to understand the cause and ef-fect relationship and review the trust, so that positive business trends will continue in the future. A comprehen-sive and analytical approach enables us to recognise opportunities for fur-ther improvement to help realise our strategy and the development of the company’s excellence successfully and effectively.
Within the scope of the 2016 self-appraisal we could, thanks to the self-reflection of the participants and an analysis in evaluation teams and self-appraisal, recognise as many as 85 opportunities for improvement. Together with the perceived benefits, they form the basis for improvement of business processes.
Occupational Health and Safety SystemSince 2012, we have had an estab-lished system of Occupational Health and Safety, OHSAS 18001, which is an indispensable part of the company management system in accordance with certified Quality Standards. We improve our care for our employees constantly via an Occupational Health and Safety Policy, by managing risks, monitoring performance indicators, realising our set goals and acknowl-edging the legislative requirements. By introducing new technologies into the area of operational resources, work procedures, integrated equip-ment in electricity plants, working environment and ergonomics, we minimise risks and exposure of em-ployees to danger at work.
In 2016, we registered 11 accidents at work, documented and investigated 8 dangerous events, 6 of which were connected with the use of or work at electricity plants and risk of exposure to electric currents that can cause electric shock. On the basis of legis-lative regulations and the approved Statement on Safety and Risk Assess-ment, we have carried out periodic checks of work and personal safety equipment and random checks of electricity plants, working and build-ing sites.
We conduct the protection of work-ers’ health in accordance with Oc-cupational Health requirements, which are stated in the Statement on Safety and Risk Assessment. Newly employed workers were referred to preliminary medical examinations, and employees with disabilities had statutory follow-up checks.On 31 December, Elektro Celje em-ployed 54 disabled persons. Workers in exposed positions were adminis-tered the second dose of vaccination against tick-borne encephalitis and the company organised vaccination against influenza.
In 2016, we organised education and training with a test on Occupa-tional Health and Safety, Fire Safety and environmental management for all technical, operational and newly hired employees, interns and appren-tices; we also arranged first-aid train-ing for employees responsible for ad-ministering first aid at the workplace to increase the number of trained workers in work groups. OHS and FS staff attended expert seminars. As part of the responsibilities of working groups, we conducted a promotion of health and measures for the protec-tion of employees` health in the com-pany.
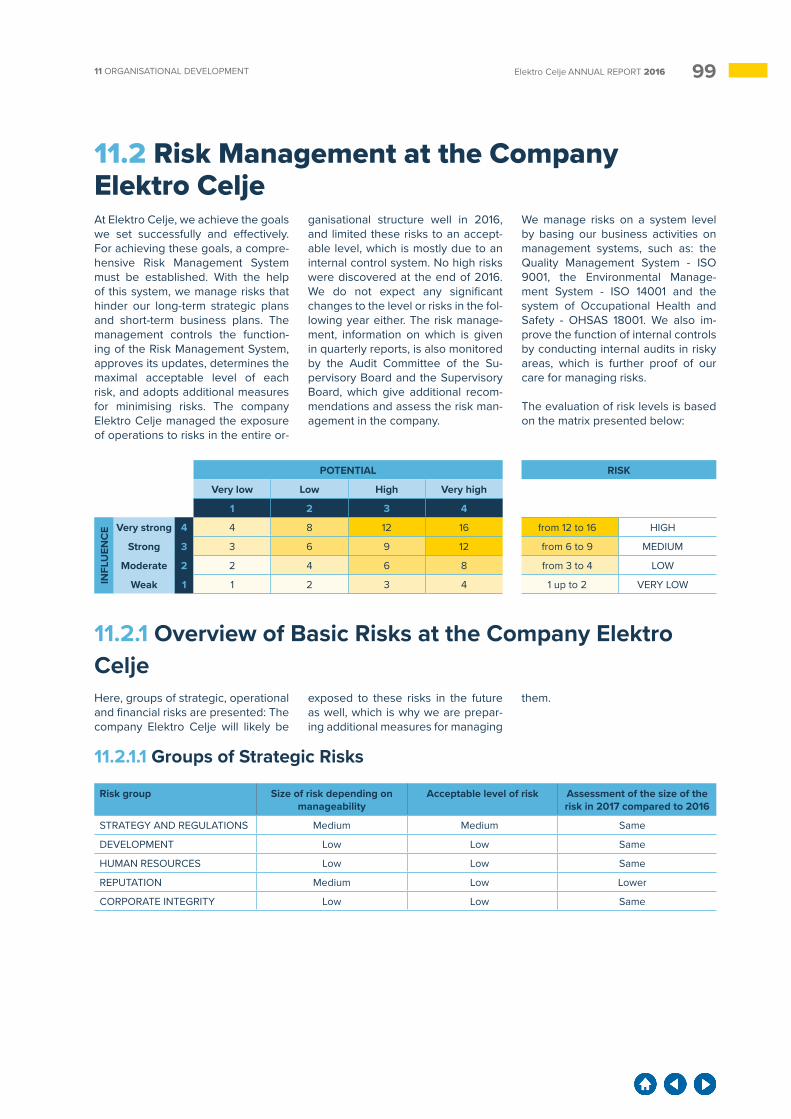
9911 ORGANISATIONAL DEVELOPMENT Elektro Celje ANNUAL REPORT 2016
11.2 Risk Management at the Company Elektro CeljeAt Elektro Celje, we achieve the goals we set successfully and effectively. For achieving these goals, a compre-hensive Risk Management System must be established. With the help of this system, we manage risks that hinder our long-term strategic plans and short-term business plans. The management controls the function-ing of the Risk Management System, approves its updates, determines the maximal acceptable level of each risk, and adopts additional measures for minimising risks. The company Elektro Celje managed the exposure of operations to risks in the entire or-
ganisational structure well in 2016, and limited these risks to an accept-able level, which is mostly due to an internal control system. No high risks were discovered at the end of 2016. We do not expect any significant changes to the level or risks in the fol-lowing year either. The risk manage-ment, information on which is given in quarterly reports, is also monitored by the Audit Committee of the Su-pervisory Board and the Supervisory Board, which give additional recom-mendations and assess the risk man-agement in the company.
We manage risks on a system level by basing our business activities on management systems, such as: the Quality Management System - ISO 9001, the Environmental Manage-ment System - ISO 14001 and the system of Occupational Health and Safety - OHSAS 18001. We also im-prove the function of internal controls by conducting internal audits in risky areas, which is further proof of our care for managing risks.
The evaluation of risk levels is based on the matrix presented below:
POTENTIAL RISK
Very low Low High Very high
1 2 3 4
INFL
UEN
CE Very strong 4 4 8 12 16 from 12 to 16 HIGH
Strong 3 3 6 9 12 from 6 to 9 MEDIUM
Moderate 2 2 4 6 8 from 3 to 4 LOW
Weak 1 1 2 3 4 1 up to 2 VERY LOW
11.2.1 Overview of Basic Risks at the Company Elektro CeljeHere, groups of strategic, operational and financial risks are presented: The company Elektro Celje will likely be
exposed to these risks in the future as well, which is why we are prepar-ing additional measures for managing
them.
11.2.1.1 Groups of Strategic Risks
Risk group Size of risk depending on manageability
Acceptable level of risk Assessment of the size of the risk in 2017 compared to 2016
STRATEGY AND REGULATIONS Medium Medium Same
DEVELOPMENT Low Low Same
HUMAN RESOURCES Low Low Same
REPUTATION Medium Low Lower
CORPORATE INTEGRITY Low Low Same
100 11Elektro Celje ANNUAL REPORT 2016
Strategic risks can have a significant impact on the goals of our company and its business success, which is why the company manages them in one of the three risk groups.
Strategy and regulationsDue to the regulated activities of Elektro Celje, d.d., its business is af-fected significantly by external fac-tors, which can affect the business strategy and plans. For this reason, the company must adapt to them. It cannot manage the risks fully but, in-stead, accepts them. These are:>> SSH, as the representative of the
majority shareholder,>> SODO, as the holder of the con-
cession (an amendment to the agreement on the lease and main-tenance of electricity distribution infrastructure was not yet signed at the end of 2016),
>> The Energy Agency, which de-termines the price for using the network on the basis of the Act on the Methodology for Charging the Network Charge and Crite-ria for Determining Eligible Costs of Electricity System Operators. In accordance with this Act, the company can acquire incentives, which depend on achieving costs that are lower from eligible costs and the level of supply quality achieved.
Legal changes in the energy sector and other fields also impact the com-
pany Elektro Celje greatly. The com-pany adapted adequately to all regu-latory changes and, consequently, managed all risks connected with the strategy of the company Elektro Celje, d.d.. The company is implementing its strategy by following its set strategic guidelines, achieving strategic goals, goals stated in the yearly Business Plan, and process goals.
Development riskThe company participates in numer-ous development projects. The two most important projects that should be noted are Flex4grid, a pilot project dealing with the critical peak tariff, and the NEDO, which is conducted by Slovenia and Japan. The above-men-tioned projects are aimed at search-ing for solutions to lower peak loads and the imbalance between the con-sumption and distributed energy pro-duction, and they test more advanced technologies for the distribution and management of electricity, thus im-proving the agility of the company Elektro Celje. The above-mentioned national and international research and development investments are proof of the successful introduction of new technologies and develop-ment risk management.
Human resources riskThis risk is connected with the selec-tion of employees, the evaluation of their competences, their motivation, knowledge transfer, and the replace-
ment of key employees. The compa-ny Elektro Celje is reducing the risk successfully by conducting yearly plans of employees, creating a Cata-logue of Descriptions of the Desired Approaches, Methods and Conduct at Work, identifying prospective hu-man resources, measuring the work environment of the organisation, up-dating the Code of Ethics, preparing a Corporate Integrity Plan, performing a SiOK analysis and yearly discussions on the development of the company.
Risk to reputationReputation is both a threat and an op-portunity. By conducting relevant im-plemented reviews of the existing risks, we also minimise the risk to our reputa-tion, which creates new opportunities for introducing new improvements.
Corporate integrity riskIn 2016, the Code of Ethics was re-newed, with the creation of a com-munication plan of the Code of Ethics and corporate integrity. Corporate in-tegrity risks were first included into the Risk Register in 2015. The established system of corporate integrity ensures that these values will be respected in day-to-day business and in relations within the company Elektro Celje. The employees received an opportunity to report detected irregularities in com-pany business activities to a repre-sentative for corporate integrity. There were no reports of non-compliance or other irregularities in 2016.
11.2.1.2 Groups of Operational Risks
Risk group Size of risk depending on manageability
Acceptable level of risk Assessment of the size of the risk in 2017 compared to 2016
EMPLOYEE BEHAVIOUR Low Low Same
SYSTEMS OPERATION Low Low Same
EXTERNAL EVENTS Low Low Same
Employee behaviour and execution of internal procedures:Such risk arises from behaviour, which is the employees’ responsibility, and can either affect the fulfilment of an-nual business goals positively or negatively. The company Elektro Celje manages this risk successfully with a system of planning, managing and monitoring work, a system of internal controls, through employee training,
proper organisation, fulfilment of ISO requirements (ISO 9001, ISO 14001) and achievement of process goals.
In 2016, the company began execut-ing investments into ERP (Microsoft Dynamics AX) and EAM (IBM Maxi-mo). At the beginning stage, an inad-equate analysis and dissatisfaction of employees with the solutions could present a risk. That is why a project for
the implementation of new technolo-gies has been launched (the project is managed by the contractor), which includes the management and a large number of employees. On the basis of numerous workshops, an external contractor, with the help of compe-tent employees, prepared an ERP im-plementation plan by the end of year 2016 (the so called “blueprint”), as the company planned. The execution of
10111 ORGANISATIONAL DEVELOPMENT Elektro Celje ANNUAL REPORT 2016
the investment will be controlled by an appointed project council in the fu-ture. The Maximo project is currently at the preparation stage.
At the company Elektro Celje, we take great care in managing Occupational Health and Safety, as well as Fire Safety risks. Since 2012, the company has been certified according to the OHSAS 18001 Standard. We minimise risks through internal and external audits, controlling dangerous events and accidents at work, regular checks of work equipment and operational resources, working environment re-search, preventive medical examina-tions of employees, and regular em-ployee training. In 2016, an internal audit was conducted given the defined risk level in the area. The execution of internal controls of the effectiveness of the Occupational Health and Safety Office is, thus, improving further and is being perfected in accordance with recommendations.
The risks of environmental impacts that arise when electricity plants and equipment are being built, oper-ated and serviced are also important. We manage this risk with audits, by
checking and assessing environmen-tal aspects and meeting the require-ments of ISO 14001.
Systems operationThe systems operation risk refers to electricity and information systems. Distribution network fallouts cause interruptions of electricity supply to consumers and, consequently, a re-duction in the quality of electricity, which can lead to liability for pay-ment of compensation on the basis of contracts between Elektro Celje and its consumers. The company Elektro Celje monitors the continuity of sup-ply and commercial quality indicators and acts accordingly whenever nec-essary. The indicators for the year of 2016 were very good.
In the previous year, the highest risk in the field of systems operation was the risk of malfunction of the information systems provided by the company In-formatika d.d., which was facing the danger of illiquidity and insolvency. The company Elektro Celje could re-main without any information support for its basic functions and for manag-ing the public utility service. In the last quarter of 2016, the risk was reduced
somewhat, although the company Ele-ktro Celje continues to monitor the sit-uation. In 2016, we launched activities to insure the continuity of business, which is why we will set and conduct an adequate system architecture for a back-up data centre.
External eventsThe risk of weather impact on the electricity system is one of the ex-ternal events that have been recog-nised as a significant risk. Such risk has, considering the amount of con-sequences, increased, as the Energy Agency covers much less expenses since the new Network Charge Act has been passed, which is only 10% of the cost of damages remaining after the insurance companies cover the damage. We minimise the risk of damage caused by meteorological disasters through cabling and other measures, and have passed part of the liability on to insurance compa-nies on the basis of insurance con-tracts. In view of the risk recognised, an internal audit in the field of Col-lateral has been carried out. A col-lateral review (for a longer period of time) has been conducted and future guidelines have been set.
11.2.1.3 Financial risks
Risk group Size of risk depending on manageability
Acceptable level of risk Assessment of the size of the risk in 2017 compared to 2016
CREDIT RISK Medium Low Same
MARKET RISK Low Low Same
LIQUIDITY RISK Low Low Same
EQUITY RISK Low Low Same
The credit risk is the risk of non-payment of debtors’ contractual ob-ligations as a consequence of insol-vency. Receivable management and recovery of receivables from debtors are conducted in accordance with the provisions of Article 76 of the Slove-nian Energy Act (EZ – 1), Article 42 of the Regulation on the General Condi-tions of the Supply and Distribution of Electricity (SPDOEE) and internal company regulations. Short-term re-ceivables are only partially insured with debt collection instruments, as trade receivables for network charg-es cannot be insured because this is not foreseen by the SPDOEE. We
manage the risk with measures that are prescribed in recovery processes.The credit risk is presented in more detail in section 15.9.1.
The market risk is associated with an increase in financing costs due to varying interest rates, most notably the EURIBOR reference interest rate. The company does not deal with cur-rency risks due to the limited area of its activities.The market risk is presented in more detail in section 15.9.2.
The liquidity risk is a risk of inconsist-ent liquidity, or the maturity of assets
and liabilities of the company, which could cause insolvency. The basic frameworks of the financial policy are determined in a three-year operating plan, defining the extent of revenue and expenditure of each activity, the assets and resources, the size of investments, sources of financing the investments, and other business guidelines. A prospective Cash Flow statement is also a part of the operat-ing plan.The liquidity risk is presented in more detail in section 15.9.3.
The risk related to equity adequacy arises if a company does not pos-
102 11Elektro Celje ANNUAL REPORT 2016
sess an adequate amount of long-term sources of financing in regard to the size and type of business that it conducts, and the risks to which it is exposed during its conduct. The management monitors and verifies the company’s achievement of eq-
uity adequacy regularly. The owners, who decide on sharing or distributing the profit, also have a great influence on the equity risk. The opinion of the majority shareholder is of particular importance (acquisition of Treasury shares) because he or she indirectly
defines the regulatory environment and can affect the company’s finan-cial results and fulfilment of financial commitments greatly.The equity risk is presented in more detail in section 15.9.4.
11.2.2 Risk Management and Types of Risks in the Elektro Celje GroupThe risks in the Elektro Celje Group are divided into: strategic, operation-al and financial risks.
Strategic risks in the Group are pos-sible events with an (un)favourable impact on achieving medium-term or long-term operational goals of companies in the Group. We manage them successfully by setting, moni-toring and analysing strategic and an-nual business plans. They are related to the company’s reputation and
managed by checking the consum-ers’, shareholders’, employees’ and suppliers’ satisfaction and the satis-faction of the general public, and by acting depending on the results.
Operational risks are possible events that could have an (un)favourable im-pact on achieving the annual opera-tional goals of the Group companies and present a risk of losses (benefits) due to internal processes. We identi-fied the risk of performing the process-
es of managing the subsidiaries on the Group level. We manage this risk by preparing backup documents for the management of subsidiaries and choosing an appropriate structure of staff and management in subsidiaries.
Financial risks are related to possible events that have an (un)favourable impact on reaching the strategic and annual goals of financing the compa-nies. We identified credit and market risks on the Group level.
11.3 Internal AuditThe aim of an internal audit is to strengthen and protect the value of the company by providing objective guarantees based on risk assessment, consulting and gaining deeper under-standing of the company’s operation.
Internal audits are aimed at achieving better management, better risk man-agement and greater success and efficiency of operations within the framework of the adopted strategic and annual operating plans.
The bases for the operation of an internal audit are defined in the fun-damental Charter of the Activity of Internal Audits, which was amended in 2016 and defines the purpose, ju-risdiction, responsibilities and duties of internal audits in Elektro Celje, d.d., and is in accordance with the compul-sory components of the International Professional Practices Framework.
The company has established an inter-nal audit which, in view of administra-tion, acts in the authority of the Chair-man of the Management Board, and, as regards its function, to the Supervi-sory Board Audit Committee (SB AC),
or the Supervisory Board (SB). The Management Board, and the SB AC or the SB, are actively working to carry out the planned internal audit activities and include outsourcing for perform-ing internal audit activities when faced with larger unforeseen risks or in case of lengthy absence of risks. The Man-ager of the Internal Audit ensures that the planned internal audit activities are carried out adequately, provided that no greater unforeseen risks have been identified or there has been no lengthy absence of risks.
The Internal Audit carries out its du-ties on the basis of a multi-annual and annual operations plan of internal audit activities, and submits it to the company’s Management and Super-visory Boards for adoption and to the SB AC for review.
In accordance with the operations plan of the Internal Audit for 2016, the internal audit reviews were con-ducted in the area of storage and stock monitoring, occupational and fire safety, metering and control de-vices, electricity network and device operation and maintenance, moni-
toring contract implementation and company property insurance.
The Internal Audit reviewed and as-sessed the adequacy and efficiency of internal controls within the scope of individual internal audit transac-tions and tasks and declared that the control system in the company Elek-tro Celje is established adequately. The controls, authorisations and re-sponsibilities are mostly defined in the ISO 9001 Quality Management System, the ISO 14001 Environmental Management System and the OHSAS 18001 Occupational Health and Safe-ty Management System. The com-pany manages risks successfully in order to achieve important business goals, but there is room for improving the internal control system in the re-vised units or processes. For this rea-son, recommendations were given, categorised by level of risk, and their implementation is controlled regular-ly. Control of the implementation of the recommendations is carried out in accordance with the annual plan. The concrete effects of this imple-mentation can be seen in better risk and company management (better
10311 ORGANISATIONAL DEVELOPMENT Elektro Celje ANNUAL REPORT 2016
management of stocks, property in-surance, etc.).
Within the framework of the internal audit operations, attention was drawn to the possibility of fraud and the mal-function of Information Technology. A system of preventive internal controls for preventing larger frauds in areas that were reviewed by the Internal Au-dit has been established and is func-tioning successfully. During the review of the Information and Communication Technology area, the Internal Audit
assessed that the internal controls of traceability, security of information and data processing are adequate.
In 2016, quarterly reports were pre-pared on the function of internal audit activities. They were reviewed by the SB AC and the SB, as defined in the Companies Act (ZGD-1).
The Management Board ensures adequate conditions for quality and independent work of the Internal Au-dit. The Manager of the Internal Audit
took part in meetings of the SB AC regularly, and of the SB if necessary, and monitored the company’s op-erations. The necessary knowledge and skills were provided for carrying out each task in the Internal Audit. The training programmes that were planned for 2016 were realised.
A programme for improving the quality of internal audit operations ensures that operations are carried out in accord-ance with the expectations of the Man-agement Board, the SB AC or the SB.
11.4 Corporate Integrity and the Code of EthicsAt the company Elektro Celje, a sys-tem of corporate integrity has been established with elements defined by the Slovenian Guidelines of Cor-porate Integrity. These rely mostly on the OECD Guidelines on good internal control practice, ethics and compliance, the OECD corporate governance principles, the standards of socially responsible operations of the Ministry of Economy (ICC Rules on Combating Corruption, ICC Guide-lines on Whistleblowing, anti-corrup-tion clause, etc.), the IAIS Recommen-dations, and other relevant practices.
Ethical rules, which we as employees must follow in certain circumstances, are laid down in the Elektro Celje Group Code of Ethics. The Code, which is made available publicly on the company’s website, is a guide of fundamental regulations, standards of conduct and decision-making that must be followed by all Group com-panies. We use it in everyday activi-ties and its set out values and princi-ples help us in situations when we are uncertain about how we should act.
Corporate integrity is acknowledged and defined as one of the strategic goals and included into the strategic guidelines of the Elektro Celje Group. In this manner, we wish to increase the likelihood of achieving our goals, en-courage proactive management, im-prove the ability to recognise oppor-tunities and risks, to act in accordance with relevant legislative provisions and standards, and to improve the op-erational efficiency and success.
Corporate integrity and risks related to it are included into the already func-tioning Risk Management System. Risks related to corporate integrity are included in the Risk Register, where they are identified, assessed and man-aged through suggested measures.
With the help of a Corporate Integrity Compliance Officer, a mechanism has been established for regular and com-
prehensive identification of corpo-rate integrity risks, their assessment, and a systematic and independent control to ensure the efficiency of measures for managing such risks. The Management Board provided an additional communication chan-nel that enables anonymous reports of potential irregularities or violations of the compliance with the company’s operations. On the company website, anyone can access the tab “Compli-ance of Operations—Corporate In-tegrity”, which enables him or her to create an anonymous mailbox at the end of the application form with the
help of an external administrator. As correspondence, the reporter can ei-ther send personal data or create an anonymous mailbox, through which he or she can communicate with the Compliance Officer. This way, the re-porter remains anonymous and no one can come in contact with him or her. The reporter also has the oppor-tunity to report and view the mailbox he or she created, where he or she can check whether the Compliance Officer sent additional questions to clear the matter and monitor the pro-gress of settling the case. In this man-ner, we widen the communication channels further to ensure that the Codes of Ethics and Corporate Integ-rity are adhered to.
With the support of competent servic-es, the Compliance Officer for Corpo-rate Integrity prepared a Training and Communication Programme in the field of Corporate Integrity. Its basic purpose is to familiarise all employ-ees with the Code of Ethics through the Annual Training Programme, so that they will know the basic ethi-cal values of the company and the Group, which enables the company to form clear expectations from the employees, heads and Managers, and that each value in the Code of Ethics is presented systematically and, in view of its content, to employ-ees depending on concrete cases. In-dividual workshops and materials are set up accordingly. With these meth-ods, we strive to encourage fair and ethical conduct on all levels—in rela-tion to our environment, employees and, most of all, ourselves.

104 Elektro Celje ANNUAL REPORT 2016
RELATIONSHIP
PARTNERSHIPWe believe that success is the result of joint work and common objectives, which allow us to continuously advance along the path of our planned strategy. Therefore, we develop long-term partnerships, prioritising professionalism, reliability and honesty.
106 12Elektro Celje ANNUAL REPORT 2016
12 SUSTAINABLE DEVELOPMENT
At Elektro Celje, d.d., we practice sus-tainable development, which is based on economic and social development and on environment protection. We strive to do business in a sustainable manner by wasting as little space as possible when erecting new energy installations and using natural and degradable materials whenever we can. An important factor within the scope of electricity distribution is the generation of electricity from distrib-uted resources—i.e. from small hydro power plants, solar power plants and co-generation of heat and electricity. Over 450 diffuse power plants are connected to the distribution network managed by Elektro Celje, d.d. Elek-tro Celje, d.d. also produces electric-
ity in 5 small hydro power plants and 3 solar power plants.
At the Elektro Celje company, the environment policy regulates the en-vironment protection, and the entire company is dedicated to observing the environmental legislation, regula-tions, agreements and Standards. By adopting an environment policy, we have committed ourselves to observ-ing the environmental management policy and bringing it to the attention of all working on behalf of the com-pany. We have committed ourselves to constant improvement of the envi-ronmental aspects of business, with emphasis on preventive conduct and introduction of environmentally
friendly technologies, economical use of energy and materials, as well as thorough verification of the use of dangerous materials in the company, which we will eliminate gradually. We offer environmentally friendly energy generated from renewable sources to our consumers. Our activities in the area of preservation of the envi-ronment for future generations are available publicly and we acknowl-edge the opinions of our consumers, locals and communities, because we share their concern for efficient and rational environmental management. The company has a certified system of environmental management in ac-cordance with the ISO 14001:2004 Standard.
12.1 Research and Development Investment and Other InvestmentsResearch and Development Invest-ments
Flex4Grid European Development ProjectFlex4Grid is a European research project that is conducted within the scope of the Horizon 2020 pro-gramme. The project was launched on 1 January 2015 and combines eight project partners from Slovenia, Finland, Slovakia and Germany com-prised of various knowledge institu-tions, or research institutes, electricity distributors, and industrial partners. The project, which will cost nearly EUR 3.2 million and will be financed almost entirely by the European Com-mission, will last 36 months, and is being coordinated by VTT, a Finnish research institute.
The project focuses on the devel-opment of an open technological system for data management and the provision of services enabling the management of flexibility of dis-tribution network users for both the consumption and generation of elec-tricity. User flexibility means that the
user is able to adapt the con-sumption or generation to the needs of other participants of the system, for which the user could be rewarded. Power dis-tribution companies will be able to use this flexibility to lower peak loads and the imbalance between the consumption and distributed energy generation, while other, or new, partici-pants, will be able to offer their new services in the electricity market based on the data and open interfaces of the Flex4Grid technological system.
Three main pilots will also be erected in the second half of the year 2017 within the project; two in Germa-ny and one in the Elektro Celje, d.d. distribution area, which will incorpo-rate up to 2,000 household electricity consumers.
In the pilots, the response and use of the system shall be measured on three levels:
1) At each consumer,
2) On the transformer substation level,3) On the level of all participants in the project.
Responses of participants in both pilots will also be collected via ques-tionnaires. After the end of the pro-ject, a summary of selected results of pilots shall be made available pub-licly.
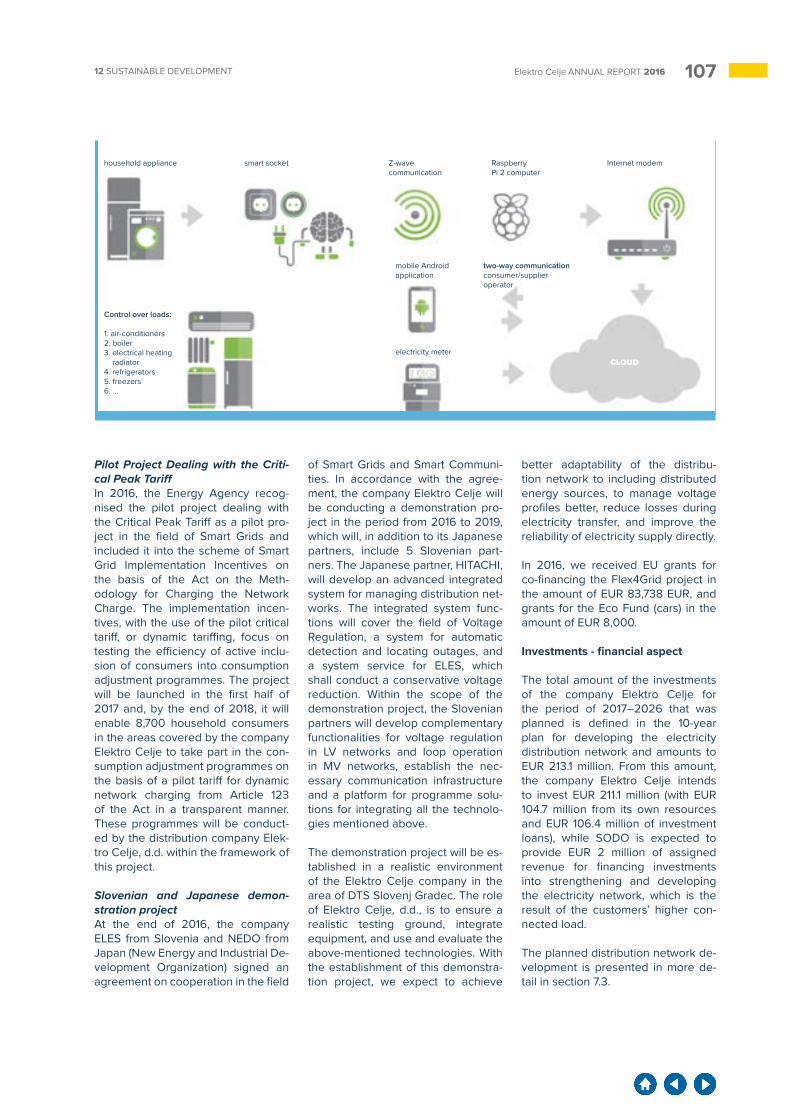
10712 SUSTAINABLE DEVELOPMENT Elektro Celje ANNUAL REPORT 2016
household appliance smart socket Z-wave communication
mobile Android application
electricity meter
two-way communicationconsumer/supplieroperator
Control over loads:
1. air-conditioners2. boiler3. electrical heating
radiator4. refrigerators5. freezers6. ...
CLOUD
Raspberry Pi 2 computer
Internet modem
Pilot Project Dealing with the Criti-cal Peak TariffIn 2016, the Energy Agency recog-nised the pilot project dealing with the Critical Peak Tariff as a pilot pro-ject in the field of Smart Grids and included it into the scheme of Smart Grid Implementation Incentives on the basis of the Act on the Meth-odology for Charging the Network Charge. The implementation incen-tives, with the use of the pilot critical tariff, or dynamic tariffing, focus on testing the efficiency of active inclu-sion of consumers into consumption adjustment programmes. The project will be launched in the first half of 2017 and, by the end of 2018, it will enable 8,700 household consumers in the areas covered by the company Elektro Celje to take part in the con-sumption adjustment programmes on the basis of a pilot tariff for dynamic network charging from Article 123 of the Act in a transparent manner. These programmes will be conduct-ed by the distribution company Elek-tro Celje, d.d. within the framework of this project.
Slovenian and Japanese demon-stration projectAt the end of 2016, the company ELES from Slovenia and NEDO from Japan (New Energy and Industrial De-velopment Organization) signed an agreement on cooperation in the field
of Smart Grids and Smart Communi-ties. In accordance with the agree-ment, the company Elektro Celje will be conducting a demonstration pro-ject in the period from 2016 to 2019, which will, in addition to its Japanese partners, include 5 Slovenian part-ners. The Japanese partner, HITACHI, will develop an advanced integrated system for managing distribution net-works. The integrated system func-tions will cover the field of Voltage Regulation, a system for automatic detection and locating outages, and a system service for ELES, which shall conduct a conservative voltage reduction. Within the scope of the demonstration project, the Slovenian partners will develop complementary functionalities for voltage regulation in LV networks and loop operation in MV networks, establish the nec-essary communication infrastructure and a platform for programme solu-tions for integrating all the technolo-gies mentioned above.
The demonstration project will be es-tablished in a realistic environment of the Elektro Celje company in the area of DTS Slovenj Gradec. The role of Elektro Celje, d.d., is to ensure a realistic testing ground, integrate equipment, and use and evaluate the above-mentioned technologies. With the establishment of this demonstra-tion project, we expect to achieve
better adaptability of the distribu-tion network to including distributed energy sources, to manage voltage profiles better, reduce losses during electricity transfer, and improve the reliability of electricity supply directly.
In 2016, we received EU grants for co-financing the Flex4Grid project in the amount of EUR 83,738 EUR, and grants for the Eco Fund (cars) in the amount of EUR 8,000.
Investments - financial aspect
The total amount of the investments of the company Elektro Celje for the period of 2017–2026 that was planned is defined in the 10-year plan for developing the electricity distribution network and amounts to EUR 213.1 million. From this amount, the company Elektro Celje intends to invest EUR 211.1 million (with EUR 104.7 million from its own resources and EUR 106.4 million of investment loans), while SODO is expected to provide EUR 2 million of assigned revenue for financing investments into strengthening and developing the electricity network, which is the result of the customers’ higher con-nected load.
The planned distribution network de-velopment is presented in more de-tail in section 7.3.
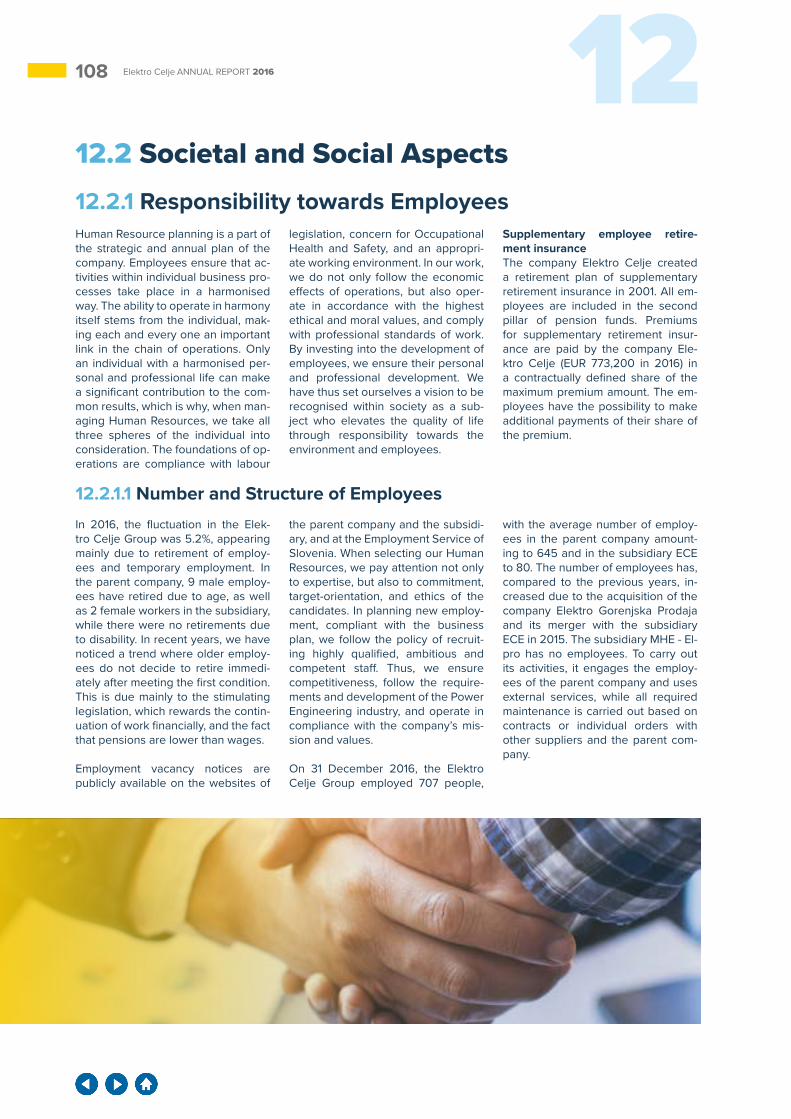
108 12Elektro Celje ANNUAL REPORT 2016
12.2 Societal and Social Aspects12.2.1 Responsibility towards EmployeesHuman Resource planning is a part of the strategic and annual plan of the company. Employees ensure that ac-tivities within individual business pro-cesses take place in a harmonised way. The ability to operate in harmony itself stems from the individual, mak-ing each and every one an important link in the chain of operations. Only an individual with a harmonised per-sonal and professional life can make a significant contribution to the com-mon results, which is why, when man-aging Human Resources, we take all three spheres of the individual into consideration. The foundations of op-erations are compliance with labour
legislation, concern for Occupational Health and Safety, and an appropri-ate working environment. In our work, we do not only follow the economic effects of operations, but also oper-ate in accordance with the highest ethical and moral values, and comply with professional standards of work. By investing into the development of employees, we ensure their personal and professional development. We have thus set ourselves a vision to be recognised within society as a sub-ject who elevates the quality of life through responsibility towards the environment and employees.
Supplementary employee retire-ment insurance The company Elektro Celje created a retirement plan of supplementary retirement insurance in 2001. All em-ployees are included in the second pillar of pension funds. Premiums for supplementary retirement insur-ance are paid by the company Ele-ktro Celje (EUR 773,200 in 2016) in a contractually defined share of the maximum premium amount. The em-ployees have the possibility to make additional payments of their share of the premium.
12.2.1.1 Number and Structure of EmployeesIn 2016, the fluctuation in the Elek-tro Celje Group was 5.2%, appearing mainly due to retirement of employ-ees and temporary employment. In the parent company, 9 male employ-ees have retired due to age, as well as 2 female workers in the subsidiary, while there were no retirements due to disability. In recent years, we have noticed a trend where older employ-ees do not decide to retire immedi-ately after meeting the first condition. This is due mainly to the stimulating legislation, which rewards the contin-uation of work financially, and the fact that pensions are lower than wages.
Employment vacancy notices are publicly available on the websites of
the parent company and the subsidi-ary, and at the Employment Service of Slovenia. When selecting our Human Resources, we pay attention not only to expertise, but also to commitment, target-orientation, and ethics of the candidates. In planning new employ-ment, compliant with the business plan, we follow the policy of recruit-ing highly qualified, ambitious and competent staff. Thus, we ensure competitiveness, follow the require-ments and development of the Power Engineering industry, and operate in compliance with the company’s mis-sion and values.
On 31 December 2016, the Elektro Celje Group employed 707 people,
with the average number of employ-ees in the parent company amount-ing to 645 and in the subsidiary ECE to 80. The number of employees has, compared to the previous years, in-creased due to the acquisition of the company Elektro Gorenjska Prodaja and its merger with the subsidiary ECE in 2015. The subsidiary MHE - El-pro has no employees. To carry out its activities, it engages the employ-ees of the parent company and uses external services, while all required maintenance is carried out based on contracts or individual orders with other suppliers and the parent com-pany.
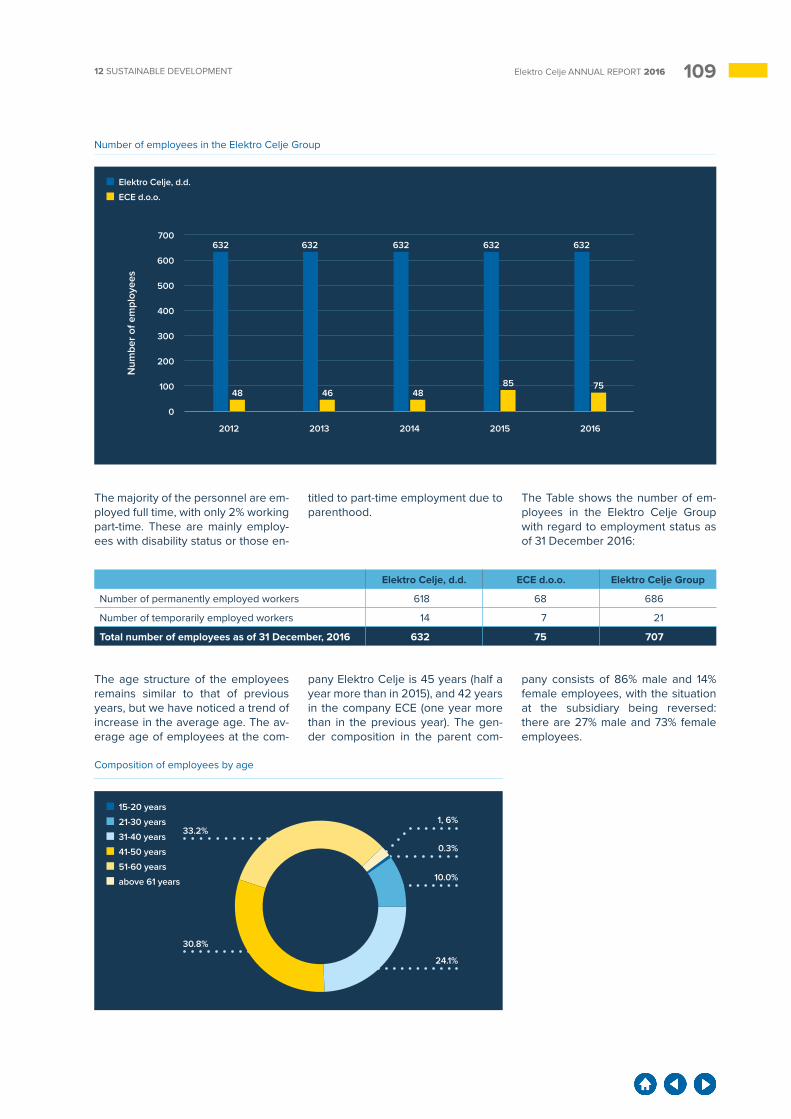
10912 SUSTAINABLE DEVELOPMENT Elektro Celje ANNUAL REPORT 2016
700
500
300
100
600
400
200
0
Num
ber o
f em
ploy
ees
Number of employees in the Elektro Celje Group
2012 2013 2014 2015 2016
Elektro Celje, d.d.
ECE d.o.o.
632 632 632 632 632
48 46 4885 75
The majority of the personnel are em-ployed full time, with only 2% working part-time. These are mainly employ-ees with disability status or those en-
titled to part-time employment due to parenthood.
The Table shows the number of em-ployees in the Elektro Celje Group with regard to employment status as of 31 December 2016:
Elektro Celje, d.d. ECE d.o.o. Elektro Celje Group
Number of permanently employed workers 618 68 686
Number of temporarily employed workers 14 7 21
Total number of employees as of 31 December, 2016 632 75 707
The age structure of the employees remains similar to that of previous years, but we have noticed a trend of increase in the average age. The av-erage age of employees at the com-
pany Elektro Celje is 45 years (half a year more than in 2015), and 42 years in the company ECE (one year more than in the previous year). The gen-der composition in the parent com-
pany consists of 86% male and 14% female employees, with the situation at the subsidiary being reversed: there are 27% male and 73% female employees.
Composition of employees by age
15-20 years
21-30 years
31-40 years
41-50 years
51-60 years
above 61 years
24.1%
10.0%
0.3%
33.2%1, 6%
30.8%
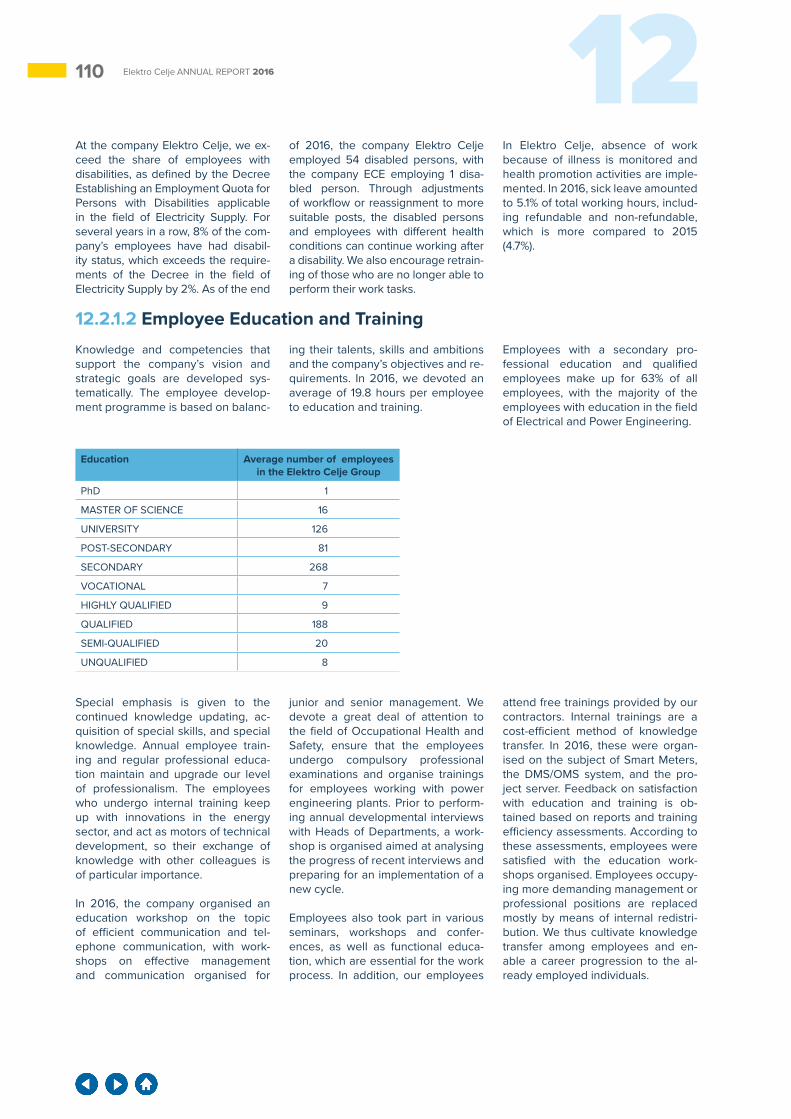
110 12Elektro Celje ANNUAL REPORT 2016
At the company Elektro Celje, we ex-ceed the share of employees with disabilities, as defined by the Decree Establishing an Employment Quota for Persons with Disabilities applicable in the field of Electricity Supply. For several years in a row, 8% of the com-pany’s employees have had disabil-ity status, which exceeds the require-ments of the Decree in the field of Electricity Supply by 2%. As of the end
of 2016, the company Elektro Celje employed 54 disabled persons, with the company ECE employing 1 disa-bled person. Through adjustments of workflow or reassignment to more suitable posts, the disabled persons and employees with different health conditions can continue working after a disability. We also encourage retrain-ing of those who are no longer able to perform their work tasks.
In Elektro Celje, absence of work because of illness is monitored and health promotion activities are imple-mented. In 2016, sick leave amounted to 5.1% of total working hours, includ-ing refundable and non-refundable, which is more compared to 2015 (4.7%).
12.2.1.2 Employee Education and TrainingKnowledge and competencies that support the company’s vision and strategic goals are developed sys-tematically. The employee develop-ment programme is based on balanc-
ing their talents, skills and ambitions and the company’s objectives and re-quirements. In 2016, we devoted an average of 19.8 hours per employee to education and training.
Employees with a secondary pro-fessional education and qualified employees make up for 63% of all employees, with the majority of the employees with education in the field of Electrical and Power Engineering.
Education Average number of employees in the Elektro Celje Group
PhD 1
MASTER OF SCIENCE 16
UNIVERSITY 126
POST-SECONDARY 81
SECONDARY 268
VOCATIONAL 7
HIGHLY QUALIFIED 9
QUALIFIED 188
SEMI-QUALIFIED 20
UNQUALIFIED 8
Special emphasis is given to the continued knowledge updating, ac-quisition of special skills, and special knowledge. Annual employee train-ing and regular professional educa-tion maintain and upgrade our level of professionalism. The employees who undergo internal training keep up with innovations in the energy sector, and act as motors of technical development, so their exchange of knowledge with other colleagues is of particular importance.
In 2016, the company organised an education workshop on the topic of efficient communication and tel-ephone communication, with work-shops on effective management and communication organised for
junior and senior management. We devote a great deal of attention to the field of Occupational Health and Safety, ensure that the employees undergo compulsory professional examinations and organise trainings for employees working with power engineering plants. Prior to perform-ing annual developmental interviews with Heads of Departments, a work-shop is organised aimed at analysing the progress of recent interviews and preparing for an implementation of a new cycle.
Employees also took part in various seminars, workshops and confer-ences, as well as functional educa-tion, which are essential for the work process. In addition, our employees
attend free trainings provided by our contractors. Internal trainings are a cost-efficient method of knowledge transfer. In 2016, these were organ-ised on the subject of Smart Meters, the DMS/OMS system, and the pro-ject server. Feedback on satisfaction with education and training is ob-tained based on reports and training efficiency assessments. According to these assessments, employees were satisfied with the education work-shops organised. Employees occupy-ing more demanding management or professional positions are replaced mostly by means of internal redistri-bution. We thus cultivate knowledge transfer among employees and en-able a career progression to the al-ready employed individuals.
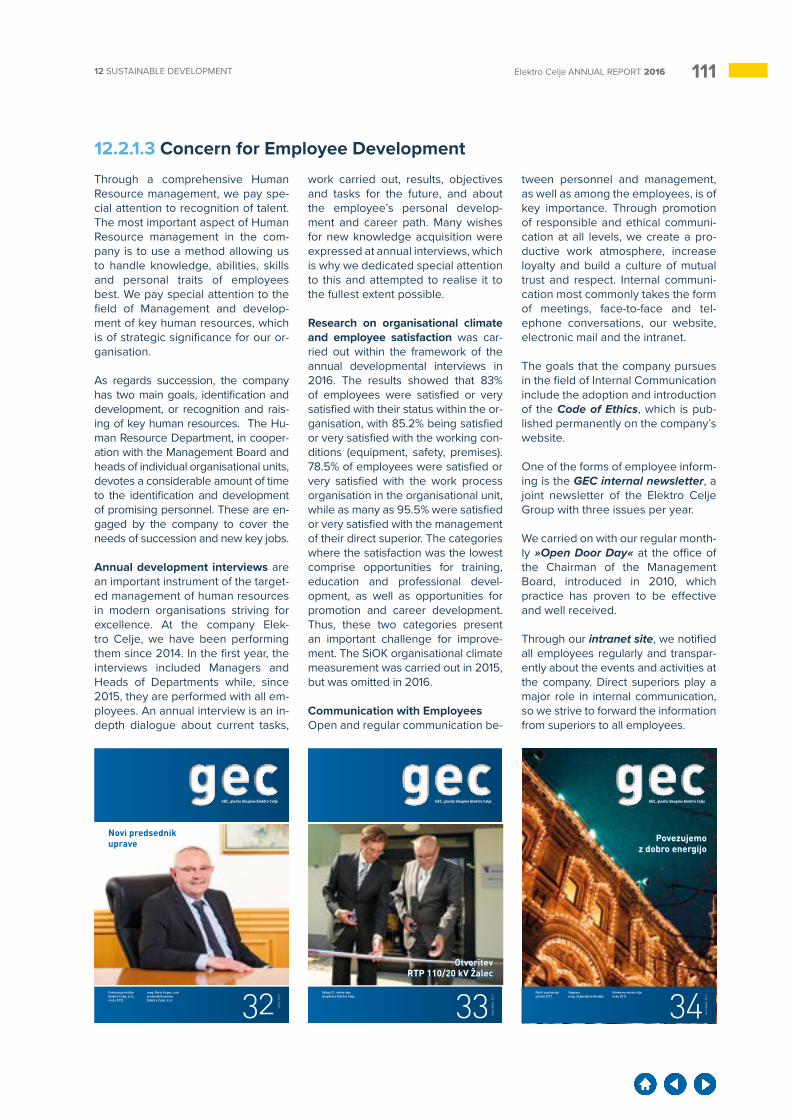
11112 SUSTAINABLE DEVELOPMENT Elektro Celje ANNUAL REPORT 2016
12.2.1.3 Concern for Employee DevelopmentThrough a comprehensive Human Resource management, we pay spe-cial attention to recognition of talent. The most important aspect of Human Resource management in the com-pany is to use a method allowing us to handle knowledge, abilities, skills and personal traits of employees best. We pay special attention to the field of Management and develop-ment of key human resources, which is of strategic significance for our or-ganisation.
As regards succession, the company has two main goals, identification and development, or recognition and rais-ing of key human resources. The Hu-man Resource Department, in cooper-ation with the Management Board and heads of individual organisational units, devotes a considerable amount of time to the identification and development of promising personnel. These are en-gaged by the company to cover the needs of succession and new key jobs.
Annual development interviews are an important instrument of the target-ed management of human resources in modern organisations striving for excellence. At the company Elek-tro Celje, we have been performing them since 2014. In the first year, the interviews included Managers and Heads of Departments while, since 2015, they are performed with all em-ployees. An annual interview is an in-depth dialogue about current tasks,
work carried out, results, objectives and tasks for the future, and about the employee’s personal develop-ment and career path. Many wishes for new knowledge acquisition were expressed at annual interviews, which is why we dedicated special attention to this and attempted to realise it to the fullest extent possible.
Research on organisational climate and employee satisfaction was car-ried out within the framework of the annual developmental interviews in 2016. The results showed that 83% of employees were satisfied or very satisfied with their status within the or-ganisation, with 85.2% being satisfied or very satisfied with the working con-ditions (equipment, safety, premises). 78.5% of employees were satisfied or very satisfied with the work process organisation in the organisational unit, while as many as 95.5% were satisfied or very satisfied with the management of their direct superior. The categories where the satisfaction was the lowest comprise opportunities for training, education and professional devel-opment, as well as opportunities for promotion and career development. Thus, these two categories present an important challenge for improve-ment. The SiOK organisational climate measurement was carried out in 2015, but was omitted in 2016.
Communication with EmployeesOpen and regular communication be-
tween personnel and management, as well as among the employees, is of key importance. Through promotion of responsible and ethical communi-cation at all levels, we create a pro-ductive work atmosphere, increase loyalty and build a culture of mutual trust and respect. Internal communi-cation most commonly takes the form of meetings, face-to-face and tel-ephone conversations, our website, electronic mail and the intranet.
The goals that the company pursues in the field of Internal Communication include the adoption and introduction of the Code of Ethics, which is pub-lished permanently on the company’s website.
One of the forms of employee inform-ing is the GEC internal newsletter, a joint newsletter of the Elektro Celje Group with three issues per year.
We carried on with our regular month-ly »Open Door Day« at the office of the Chairman of the Management Board, introduced in 2010, which practice has proven to be effective and well received.
Through our intranet site, we notified all employees regularly and transpar-ently about the events and activities at the company. Direct superiors play a major role in internal communication, so we strive to forward the information from superiors to all employees.
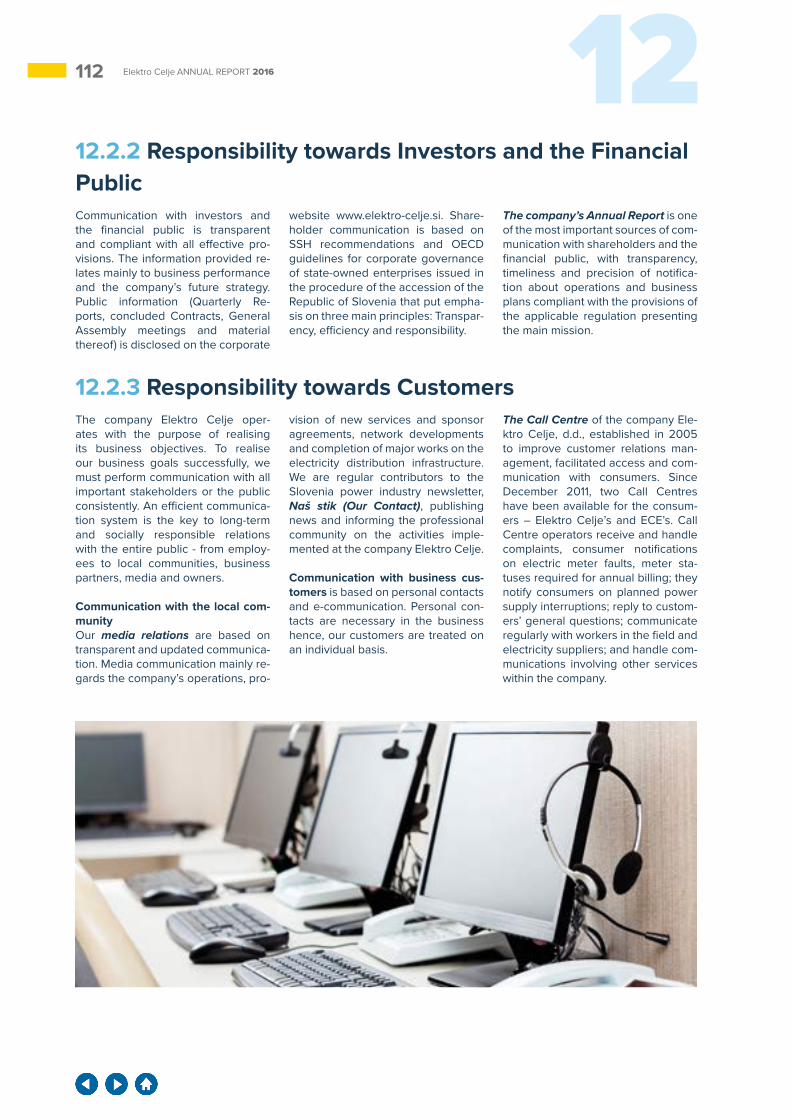
112 12Elektro Celje ANNUAL REPORT 2016
12.2.2 Responsibility towards Investors and the Financial PublicCommunication with investors and the financial public is transparent and compliant with all effective pro-visions. The information provided re-lates mainly to business performance and the company’s future strategy. Public information (Quarterly Re-ports, concluded Contracts, General Assembly meetings and material thereof) is disclosed on the corporate
website www.elektro-celje.si. Share-holder communication is based on SSH recommendations and OECD guidelines for corporate governance of state-owned enterprises issued in the procedure of the accession of the Republic of Slovenia that put empha-sis on three main principles: Transpar-ency, efficiency and responsibility.
The company’s Annual Report is one of the most important sources of com-munication with shareholders and the financial public, with transparency, timeliness and precision of notifica-tion about operations and business plans compliant with the provisions of the applicable regulation presenting the main mission.
12.2.3 Responsibility towards CustomersThe company Elektro Celje oper-ates with the purpose of realising its business objectives. To realise our business goals successfully, we must perform communication with all important stakeholders or the public consistently. An efficient communica-tion system is the key to long-term and socially responsible relations with the entire public - from employ-ees to local communities, business partners, media and owners.
Communication with the local com-munityOur media relations are based on transparent and updated communica-tion. Media communication mainly re-gards the company’s operations, pro-
vision of new services and sponsor agreements, network developments and completion of major works on the electricity distribution infrastructure. We are regular contributors to the Slovenia power industry newsletter, Naš stik (Our Contact), publishing news and informing the professional community on the activities imple-mented at the company Elektro Celje.
Communication with business cus-tomers is based on personal contacts and e-communication. Personal con-tacts are necessary in the business hence, our customers are treated on an individual basis.
The Call Centre of the company Ele-ktro Celje, d.d., established in 2005 to improve customer relations man-agement, facilitated access and com-munication with consumers. Since December 2011, two Call Centres have been available for the consum-ers – Elektro Celje’s and ECE’s. Call Centre operators receive and handle complaints, consumer notifications on electric meter faults, meter sta-tuses required for annual billing; they notify consumers on planned power supply interruptions; reply to custom-ers’ general questions; communicate regularly with workers in the field and electricity suppliers; and handle com-munications involving other services within the company.
11312 SUSTAINABLE DEVELOPMENT Elektro Celje ANNUAL REPORT 2016
The website of the company Elek-tro Celje is informative, user-friendly and facilitates access to information of interest. The website contains all information required by SSH and the Public Information Act. Transparency of operations is compliant with good practices of corporate governance and the governance codes adopted.
Notification of customers on planned power supply interruptions is neces-sary and essential for performing all necessary work on electricity instal-lations safely and as soon as possi-ble. The works are planned carefully, meaning that we can inform our cus-tomers about planned power sup-ply interruptions at least 48 hours in advance. Notifications on planned power supply interruptions are pub-lished on the company website, radio stations and local televisions.
Communication with influential pub-lic on the content related to the regu-lations and legislation, and the man-agement of relationships with various institutions, is regular and open. It includes governmental institutions
of the Government of the Republic of Slovenia as the majority shareholder of the company, line ministries and other important institutions: AE, SSH and others.
12.2.4 Social ResponsibilityEvery company is interdependent on its local environment - it takes from the environment and returns to it. The objective of the company Elektro Celje is to maintain a good relation-ship with the community enabling long-term survival.
Quality Standards at the company Elektro Celje (ISO 9001:2008, ISO 14001:2004, OHSAS 18001:2007)At Elektro Celje, we strive towards quality and transparent operations, as the fundamental mission of the com-pany is a reliable and quality electric-ity supply to consumers and the pro-vision of related services.
Family Friendly EnterpriseFor many years, the company has been encouraging the values of mu-tual respect and meeting ethical and legal standards. Since 2011, special attention has been devoted to har-monisation of professional and pri-vate lives. We adopted measures to facilitate harmonisation of profession-al and private lives, but it is thereby important that these measures are maintained and a part of our every day work and mindset.
The acquisition of the full “Fam-ily Friendly Enterprise” certificate in 2015 presents, for our company, a reward for the work performed so far, as well as a commitment to keep
following these principles and rein-force them. As a socially responsible company, we are aware that employ-ees are the most important part of an organisation and that their opinions, points of view, suggestions, and also problems, are important. With com-mon efforts to implement an employ-ee-friendly organisational policy, we ensure conditions to facilitate harmo-nisation of family and business obli-gations.
Our Sports Society promotes physi-cal activities among the employees. Employees and retired workers are offered the company’s holiday fa-cilities, where they can spend quality free time.
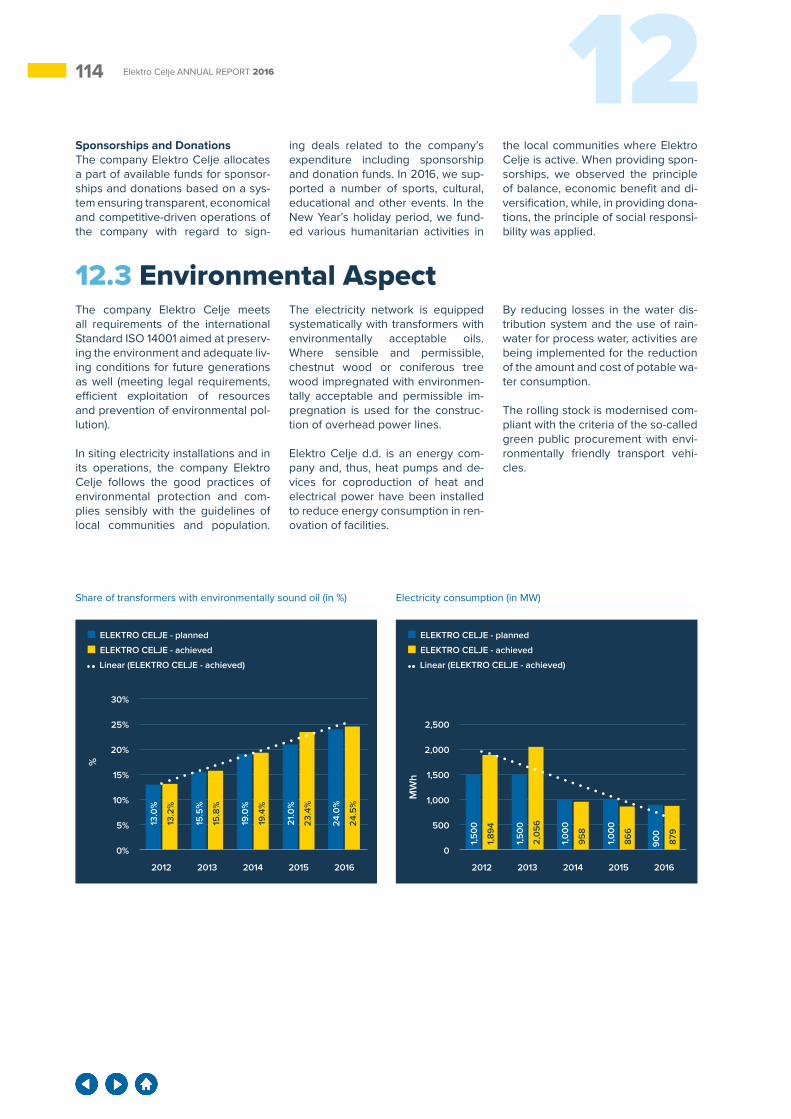
114 12Elektro Celje ANNUAL REPORT 2016
Sponsorships and DonationsThe company Elektro Celje allocates a part of available funds for sponsor-ships and donations based on a sys-tem ensuring transparent, economical and competitive-driven operations of the company with regard to sign-
ing deals related to the company’s expenditure including sponsorship and donation funds. In 2016, we sup-ported a number of sports, cultural, educational and other events. In the New Year’s holiday period, we fund-ed various humanitarian activities in
the local communities where Elektro Celje is active. When providing spon-sorships, we observed the principle of balance, economic benefit and di-versification, while, in providing dona-tions, the principle of social responsi-bility was applied.
12.3 Environmental AspectThe company Elektro Celje meets all requirements of the international Standard ISO 14001 aimed at preserv-ing the environment and adequate liv-ing conditions for future generations as well (meeting legal requirements, efficient exploitation of resources and prevention of environmental pol-lution).
In siting electricity installations and in its operations, the company Elektro Celje follows the good practices of environmental protection and com-plies sensibly with the guidelines of local communities and population.
The electricity network is equipped systematically with transformers with environmentally acceptable oils. Where sensible and permissible, chestnut wood or coniferous tree wood impregnated with environmen-tally acceptable and permissible im-pregnation is used for the construc-tion of overhead power lines.
Elektro Celje d.d. is an energy com-pany and, thus, heat pumps and de-vices for coproduction of heat and electrical power have been installed to reduce energy consumption in ren-ovation of facilities.
By reducing losses in the water dis-tribution system and the use of rain-water for process water, activities are being implemented for the reduction of the amount and cost of potable wa-ter consumption.
The rolling stock is modernised com-pliant with the criteria of the so-called green public procurement with envi-ronmentally friendly transport vehi-cles.
25%
15%
5%
30%
20%
10%
0%
%
Share of transformers with environmentally sound oil (in %)
2012 2013 2014 2015 2016
13.0
%
13.2
%
15.5
%
15.8
%
19.0
%
19.4
%
21.0
%
23.4
%
24.0
%
24.5
%
ELEKTRO CELJE - planned
ELEKTRO CELJE - achieved
Linear (ELEKTRO CELJE - achieved)
2,500
1,500
500
2,000
1,000
0
MW
h
Electricity consumption (in MW)
2012 2013 2014 2015 2016
1,5
00
1,8
94
1,5
00
2,0
56
1,0
00
958
1,0
00
866
900
879
ELEKTRO CELJE - planned
ELEKTRO CELJE - achieved
Linear (ELEKTRO CELJE - achieved)
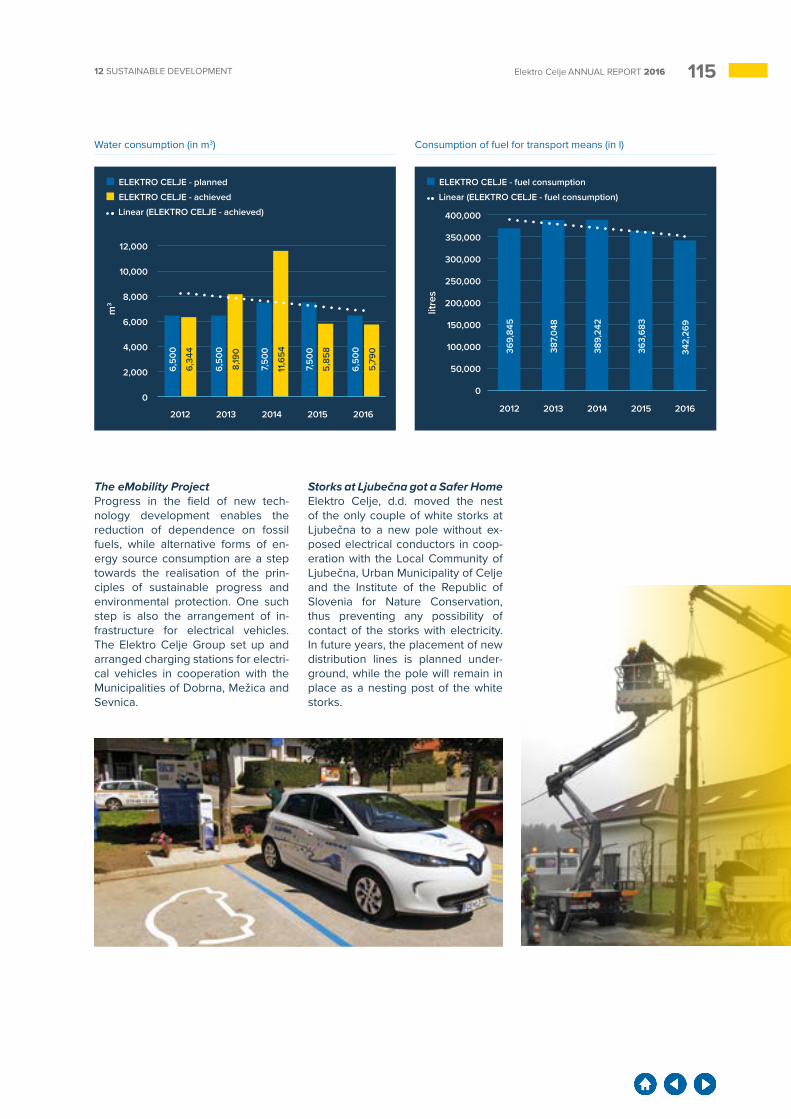
11512 SUSTAINABLE DEVELOPMENT Elektro Celje ANNUAL REPORT 2016
The eMobility ProjectProgress in the field of new tech-nology development enables the reduction of dependence on fossil fuels, while alternative forms of en-ergy source consumption are a step towards the realisation of the prin-ciples of sustainable progress and environmental protection. One such step is also the arrangement of in-frastructure for electrical vehicles. The Elektro Celje Group set up and arranged charging stations for electri-cal vehicles in cooperation with the Municipalities of Dobrna, Mežica and Sevnica.
Storks at Ljubečna got a Safer Home Elektro Celje, d.d. moved the nest of the only couple of white storks at Ljubečna to a new pole without ex-posed electrical conductors in coop-eration with the Local Community of Ljubečna, Urban Municipality of Celje and the Institute of the Republic of Slovenia for Nature Conservation, thus preventing any possibility of contact of the storks with electricity. In future years, the placement of new distribution lines is planned under-ground, while the pole will remain in place as a nesting post of the white storks.
Consumption of fuel for transport means (in l)
50,000
100,000
150,000
200,000
250,000
300,000
350,000
400,000
0
litre
s
2012 2013 2014 2015 2016
ELEKTRO CELJE - fuel consumption
Linear (ELEKTRO CELJE - fuel consumption)
369
,845
387
,048
389
,242
363
,683
342,
269
10,000
6,000
2,000
12,000
8,000
4,000
0
m3
Water consumption (in m3)
2012 2013 2014 2015 2016
6,5
00
6,3
44
6,5
00
8,19
0
7,5
00
11,6
54
7,5
00
5,8
58
6,5
00
5,7
90
ELEKTRO CELJE - planned
ELEKTRO CELJE - achieved
Linear (ELEKTRO CELJE - achieved)

117Elektro Celje ANNUAL REPORT 2016
RELATIONSHIP
EXPERTISEExpertise is the point of departure for our mission − the supply of electricity to customers. Through continuous transfers and upgrades of knowledge and experience, we raise society's potential as a whole.
118 13Elektro Celje ANNUAL REPORT 2016
13 INDEPENDENT AUDITOR'S REPORTS
11913 INDEPENDENT AUDITOR’S REPORTS Elektro Celje ANNUAL REPORT 2016
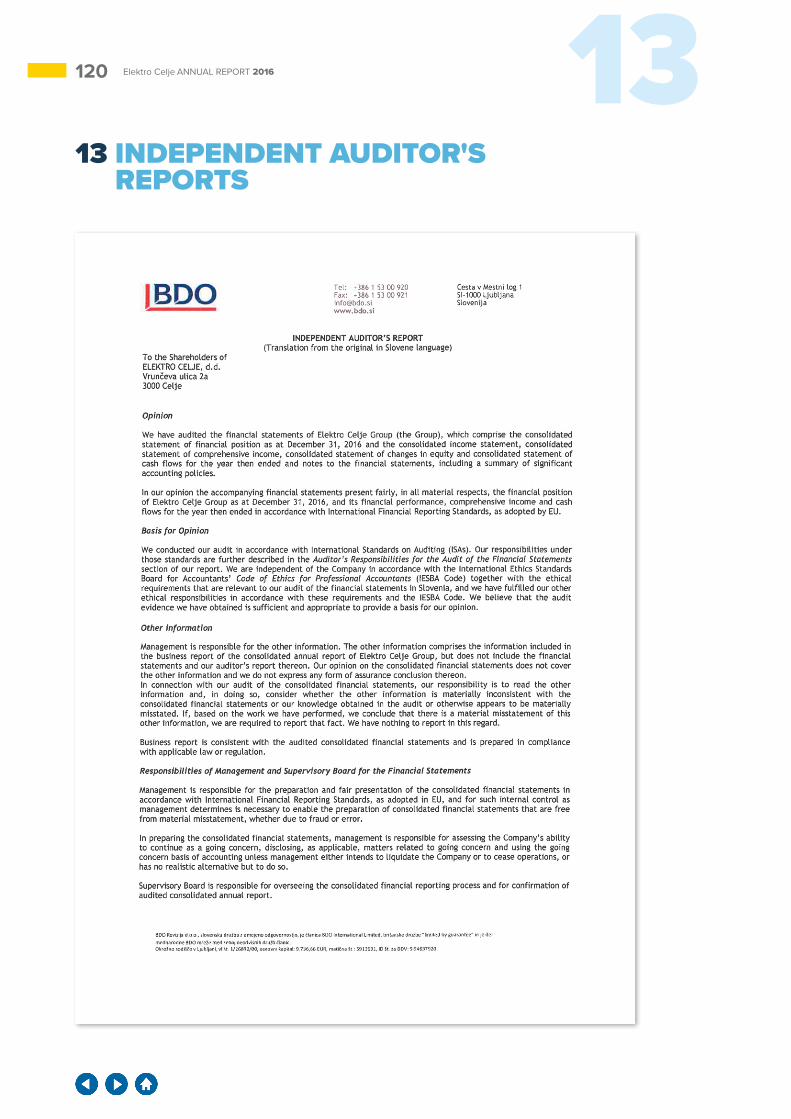
120 13Elektro Celje ANNUAL REPORT 2016
13 INDEPENDENT AUDITOR'S REPORTS
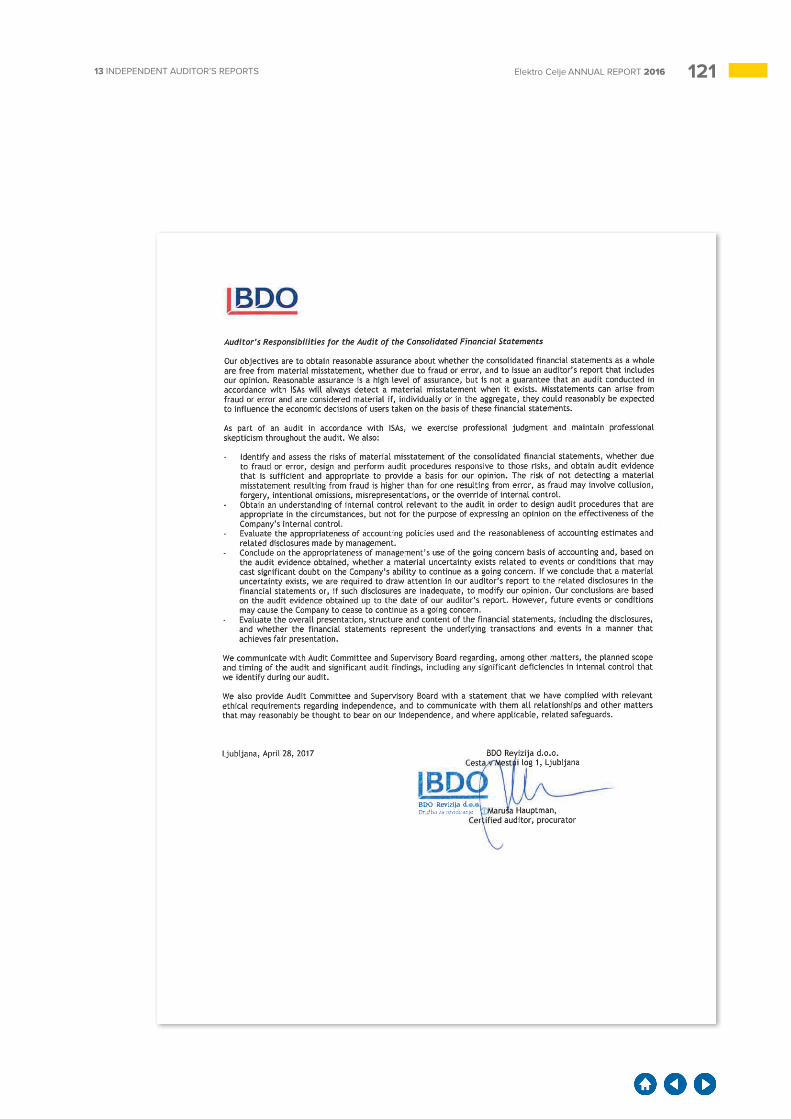
12113 INDEPENDENT AUDITOR’S REPORTS Elektro Celje ANNUAL REPORT 2016
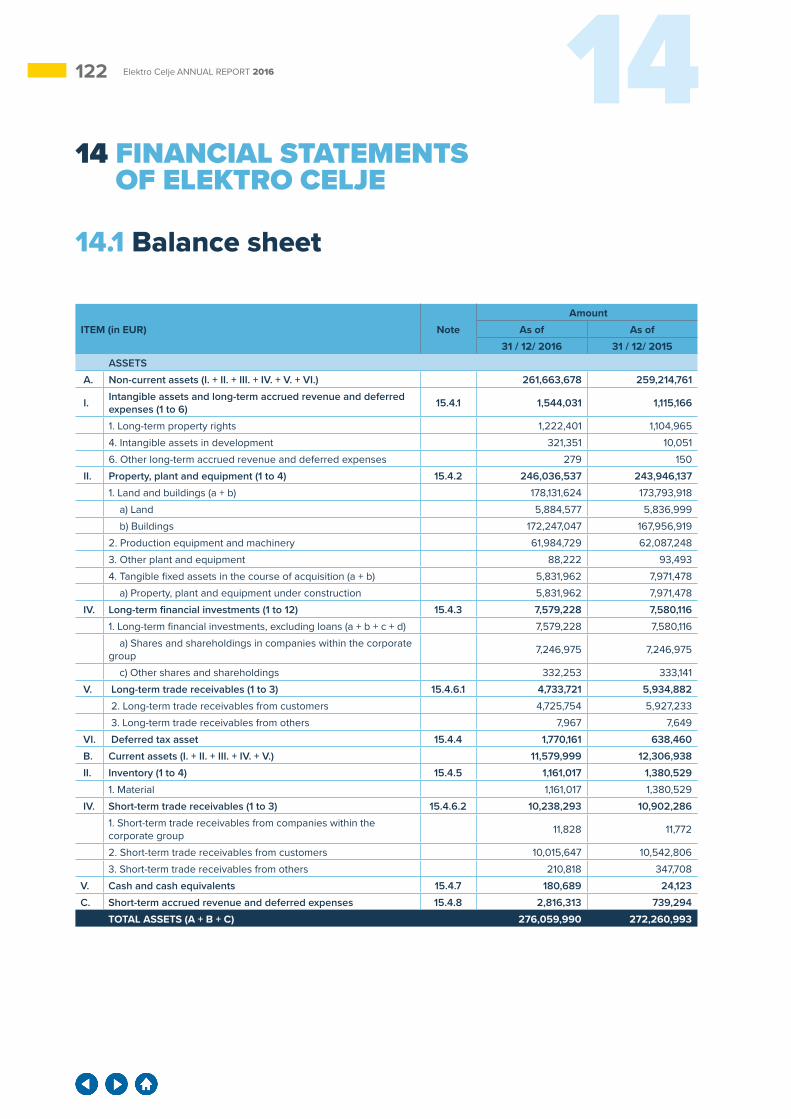
122 14Elektro Celje ANNUAL REPORT 2016
14 FINANCIAL STATEMENTS OF ELEKTRO CELJE
14.1 Balance sheet
ITEM (in EUR) Note Amount
As of As of31 / 12/ 2016 31 / 12/ 2015
ASSETS
A. Non-current assets (I. + II. + III. + IV. + V. + VI.) 261,663,678 259,214,761
I. Intangible assets and long-term accrued revenue and deferred expenses (1 to 6) 15.4.1 1,544,031 1,115,166
1. Long-term property rights 1,222,401 1,104,965
4. Intangible assets in development 321,351 10,051
6. Other long-term accrued revenue and deferred expenses 279 150
II. Property, plant and equipment (1 to 4) 15.4.2 246,036,537 243,946,137
1. Land and buildings (a + b) 178,131,624 173,793,918
a) Land 5,884,577 5,836,999
b) Buildings 172,247,047 167,956,919
2. Production equipment and machinery 61,984,729 62,087,248
3. Other plant and equipment 88,222 93,493
4. Tangible fixed assets in the course of acquisition (a + b) 5,831,962 7,971,478
a) Property, plant and equipment under construction 5,831,962 7,971,478
IV. Long-term financial investments (1 to 12) 15.4.3 7,579,228 7,580,116
1. Long-term financial investments, excluding loans (a + b + c + d) 7,579,228 7,580,116
a) Shares and shareholdings in companies within the corporate group 7,246,975 7,246,975
c) Other shares and shareholdings 332,253 333,141
V. Long-term trade receivables (1 to 3) 15.4.6.1 4,733,721 5,934,882
2. Long-term trade receivables from customers 4,725,754 5,927,233
3. Long-term trade receivables from others 7,967 7,649
VI. Deferred tax asset 15.4.4 1,770,161 638,460
B. Current assets (I. + II. + III. + IV. + V.) 11,579,999 12,306,938
II. Inventory (1 to 4) 15.4.5 1,161,017 1,380,529
1. Material 1,161,017 1,380,529
IV. Short-term trade receivables (1 to 3) 15.4.6.2 10,238,293 10,902,286
1. Short-term trade receivables from companies within the corporate group 11,828 11,772
2. Short-term trade receivables from customers 10,015,647 10,542,806
3. Short-term trade receivables from others 210,818 347,708
V. Cash and cash equivalents 15.4.7 180,689 24,123
C. Short-term accrued revenue and deferred expenses 15.4.8 2,816,313 739,294
TOTAL ASSETS (A + B + C) 276,059,990 272,260,993
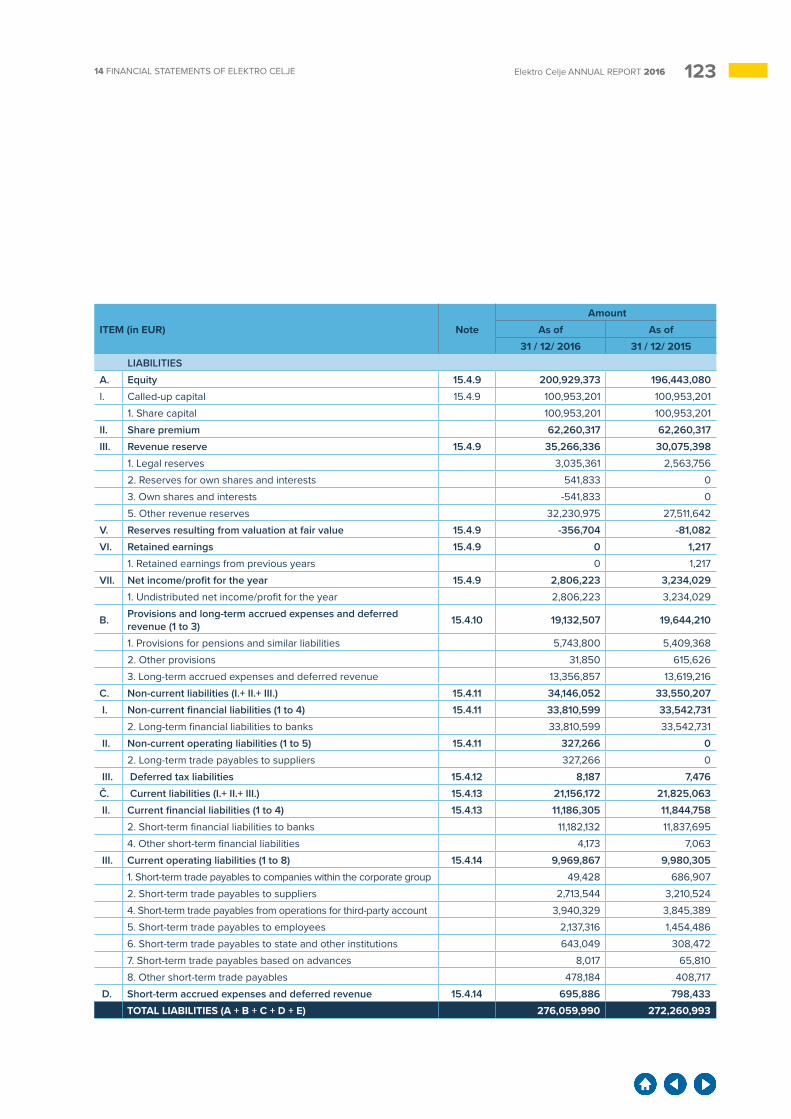
12314 FINANCIAL STATEMENTS OF ELEKTRO CELJE Elektro Celje ANNUAL REPORT 2016
ITEM (in EUR) Note Amount
As of As of31 / 12/ 2016 31 / 12/ 2015
LIABILITIES
A. Equity 15.4.9 200,929,373 196,443,080
I. Called-up capital 15.4.9 100,953,201 100,953,201
1. Share capital 100,953,201 100,953,201
II. Share premium 62,260,317 62,260,317
III. Revenue reserve 15.4.9 35,266,336 30,075,398
1. Legal reserves 3,035,361 2,563,756
2. Reserves for own shares and interests 541,833 0
3. Own shares and interests -541,833 0
5. Other revenue reserves 32,230,975 27,511,642
V. Reserves resulting from valuation at fair value 15.4.9 -356,704 -81,082
VI. Retained earnings 15.4.9 0 1,217
1. Retained earnings from previous years 0 1,217
VII. Net income/profit for the year 15.4.9 2,806,223 3,234,029
1. Undistributed net income/profit for the year 2,806,223 3,234,029
B. Provisions and long-term accrued expenses and deferred revenue (1 to 3) 15.4.10 19,132,507 19,644,210
1. Provisions for pensions and similar liabilities 5,743,800 5,409,368
2. Other provisions 31,850 615,626
3. Long-term accrued expenses and deferred revenue 13,356,857 13,619,216
C. Non-current liabilities (I.+ II.+ III.) 15.4.11 34,146,052 33,550,207
I. Non-current financial liabilities (1 to 4) 15.4.11 33,810,599 33,542,731
2. Long-term financial liabilities to banks 33,810,599 33,542,731
II. Non-current operating liabilities (1 to 5) 15.4.11 327,266 0
2. Long-term trade payables to suppliers 327,266 0
III. Deferred tax liabilities 15.4.12 8,187 7,476
Č. Current liabilities (I.+ II.+ III.) 15.4.13 21,156,172 21,825,063
II. Current financial liabilities (1 to 4) 15.4.13 11,186,305 11,844,758
2. Short-term financial liabilities to banks 11,182,132 11,837,695
4. Other short-term financial liabilities 4,173 7,063
III. Current operating liabilities (1 to 8) 15.4.14 9,969,867 9,980,305
1. Short-term trade payables to companies within the corporate group 49,428 686,907
2. Short-term trade payables to suppliers 2,713,544 3,210,524
4. Short-term trade payables from operations for third-party account 3,940,329 3,845,389
5. Short-term trade payables to employees 2,137,316 1,454,486
6. Short-term trade payables to state and other institutions 643,049 308,472
7. Short-term trade payables based on advances 8,017 65,810
8. Other short-term trade payables 478,184 408,717
D. Short-term accrued expenses and deferred revenue 15.4.14 695,886 798,433
TOTAL LIABILITIES (A + B + C + D + E) 276,059,990 272,260,993
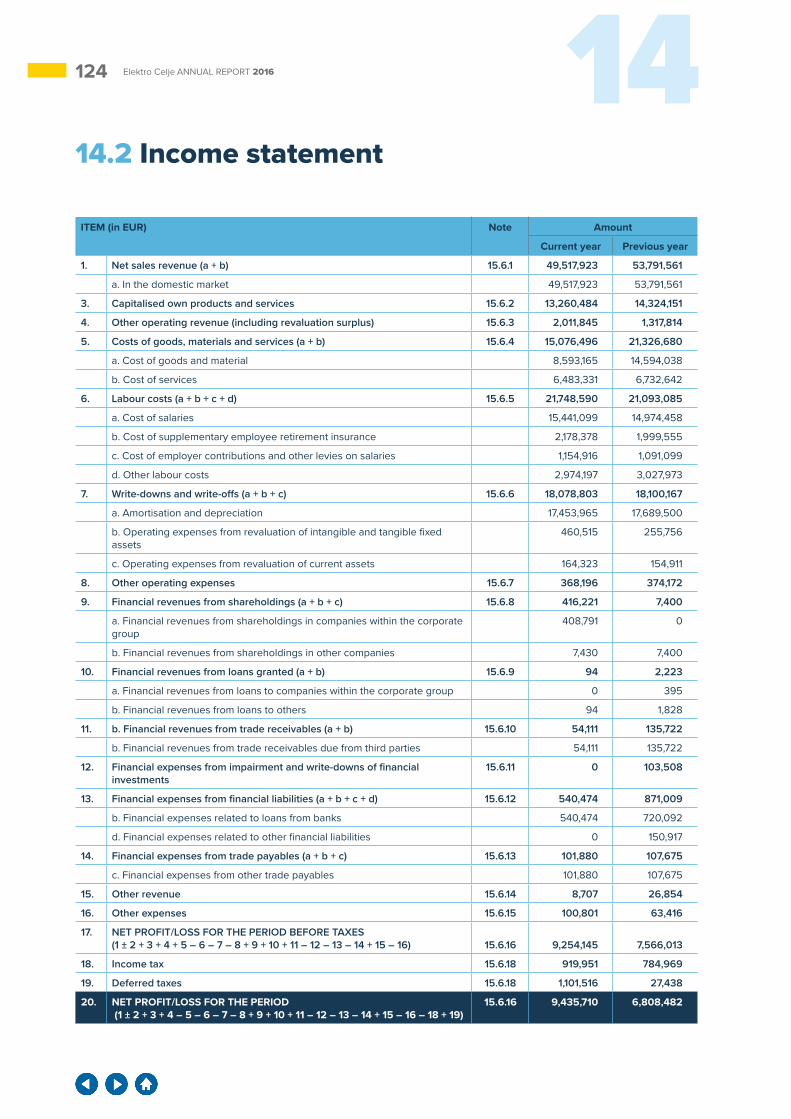
124 14Elektro Celje ANNUAL REPORT 2016
14.2 Income statement
ITEM (in EUR) Note Amount
Current year Previous year
1. Net sales revenue (a + b) 15.6.1 49,517,923 53,791,561
a. In the domestic market 49,517,923 53,791,561
3. Capitalised own products and services 15.6.2 13,260,484 14,324,151
4. Other operating revenue (including revaluation surplus) 15.6.3 2,011,845 1,317,814
5. Costs of goods, materials and services (a + b) 15.6.4 15,076,496 21,326,680
a. Cost of goods and material 8,593,165 14,594,038
b. Cost of services 6,483,331 6,732,642
6. Labour costs (a + b + c + d) 15.6.5 21,748,590 21,093,085
a. Cost of salaries 15,441,099 14,974,458
b. Cost of supplementary employee retirement insurance 2,178,378 1,999,555
c. Cost of employer contributions and other levies on salaries 1,154,916 1,091,099
d. Other labour costs 2,974,197 3,027,973
7. Write-downs and write-offs (a + b + c) 15.6.6 18,078,803 18,100,167
a. Amortisation and depreciation 17,453,965 17,689,500
b. Operating expenses from revaluation of intangible and tangible fixed assets
460,515 255,756
c. Operating expenses from revaluation of current assets 164,323 154,911
8. Other operating expenses 15.6.7 368,196 374,172
9. Financial revenues from shareholdings (a + b + c) 15.6.8 416,221 7,400
a. Financial revenues from shareholdings in companies within the corporate group
408,791 0
b. Financial revenues from shareholdings in other companies 7,430 7,400
10. Financial revenues from loans granted (a + b) 15.6.9 94 2,223
a. Financial revenues from loans to companies within the corporate group 0 395
b. Financial revenues from loans to others 94 1,828
11. b. Financial revenues from trade receivables (a + b) 15.6.10 54,111 135,722
b. Financial revenues from trade receivables due from third parties 54,111 135,722
12. Financial expenses from impairment and write-downs of financial investments
15.6.11 0 103,508
13. Financial expenses from financial liabilities (a + b + c + d) 15.6.12 540,474 871,009
b. Financial expenses related to loans from banks 540,474 720,092
d. Financial expenses related to other financial liabilities 0 150,917
14. Financial expenses from trade payables (a + b + c) 15.6.13 101,880 107,675
c. Financial expenses from other trade payables 101,880 107,675
15. Other revenue 15.6.14 8,707 26,854
16. Other expenses 15.6.15 100,801 63,416
17. NET PROFIT/LOSS FOR THE PERIOD BEFORE TAXES (1 ± 2 + 3 + 4 + 5 – 6 – 7 – 8 + 9 + 10 + 11 – 12 – 13 – 14 + 15 – 16) 15.6.16 9,254,145 7,566,013
18. Income tax 15.6.18 919,951 784,969
19. Deferred taxes 15.6.18 1,101,516 27,438
20. NET PROFIT/LOSS FOR THE PERIOD (1 ± 2 + 3 + 4 – 5 – 6 – 7 – 8 + 9 + 10 + 11 – 12 – 13 – 14 + 15 – 16 – 18 + 19)
15.6.16 9,435,710 6,808,482
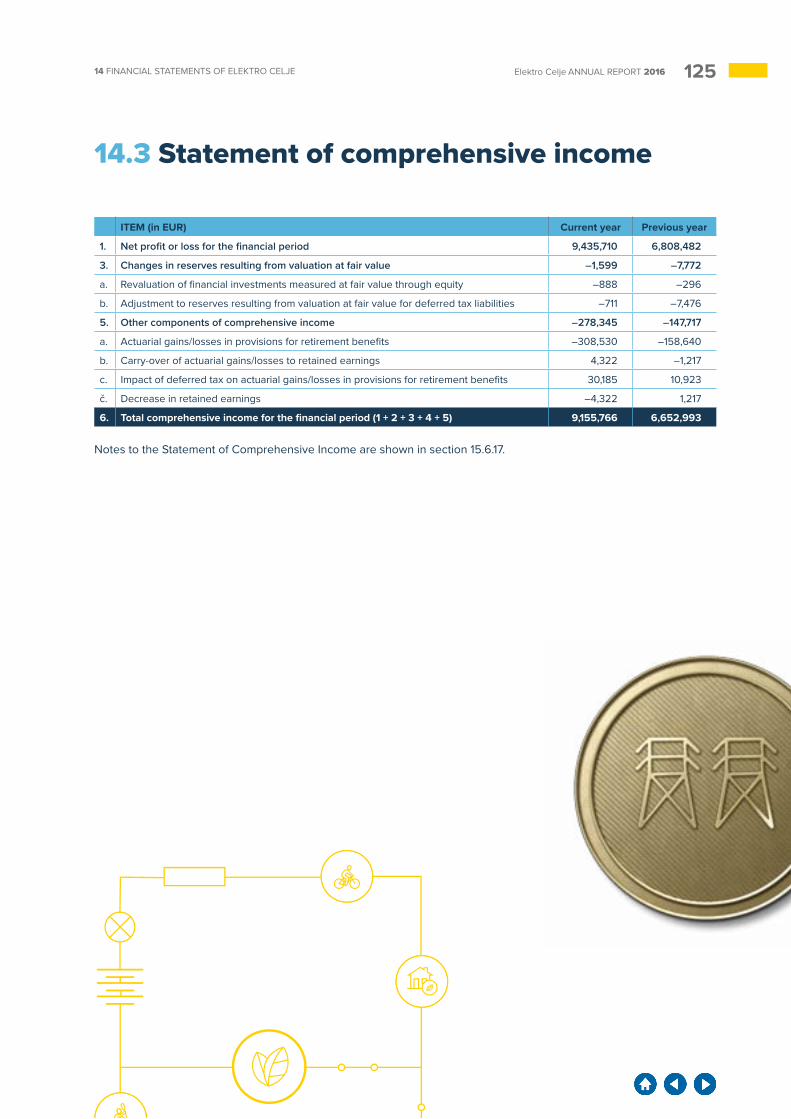
12514 FINANCIAL STATEMENTS OF ELEKTRO CELJE Elektro Celje ANNUAL REPORT 2016
14.3 Statement of comprehensive income
ITEM (in EUR) Current year Previous year
1. Net profit or loss for the financial period 9,435,710 6,808,482
3. Changes in reserves resulting from valuation at fair value –1,599 –7,772
a. Revaluation of financial investments measured at fair value through equity –888 –296
b. Adjustment to reserves resulting from valuation at fair value for deferred tax liabilities –711 –7,476
5. Other components of comprehensive income –278,345 –147,717
a. Actuarial gains/losses in provisions for retirement benefits –308,530 –158,640
b. Carry-over of actuarial gains/losses to retained earnings 4,322 –1,217
c. Impact of deferred tax on actuarial gains/losses in provisions for retirement benefits 30,185 10,923
č. Decrease in retained earnings –4,322 1,217
6. Total comprehensive income for the financial period (1 + 2 + 3 + 4 + 5) 9,155,766 6,652,993
Notes to the Statement of Comprehensive Income are shown in section 15.6.17.
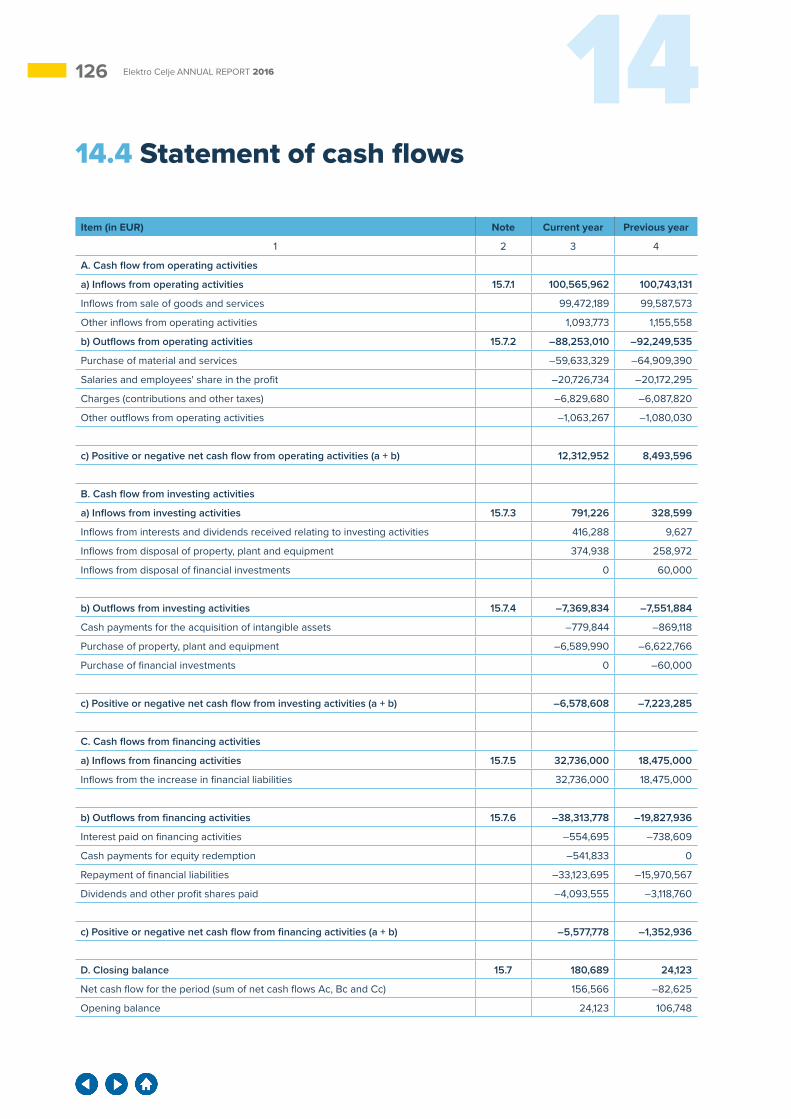
126 14Elektro Celje ANNUAL REPORT 2016
14.4 Statement of cash flows
Item (in EUR) Note Current year Previous year
1 2 3 4
A. Cash flow from operating activities
a) Inflows from operating activities 15.7.1 100,565,962 100,743,131
Inflows from sale of goods and services 99,472,189 99,587,573
Other inflows from operating activities 1,093,773 1,155,558
b) Outflows from operating activities 15.7.2 –88,253,010 –92,249,535
Purchase of material and services –59,633,329 –64,909,390
Salaries and employees' share in the profit –20,726,734 –20,172,295
Charges (contributions and other taxes) –6,829,680 –6,087,820
Other outflows from operating activities –1,063,267 –1,080,030
c) Positive or negative net cash flow from operating activities (a + b) 12,312,952 8,493,596
B. Cash flow from investing activities
a) Inflows from investing activities 15.7.3 791,226 328,599
Inflows from interests and dividends received relating to investing activities 416,288 9,627
Inflows from disposal of property, plant and equipment 374,938 258,972
Inflows from disposal of financial investments 0 60,000
b) Outflows from investing activities 15.7.4 –7,369,834 –7,551,884
Cash payments for the acquisition of intangible assets –779,844 –869,118
Purchase of property, plant and equipment –6,589,990 –6,622,766
Purchase of financial investments 0 –60,000
c) Positive or negative net cash flow from investing activities (a + b) –6,578,608 –7,223,285
C. Cash flows from financing activities
a) Inflows from financing activities 15.7.5 32,736,000 18,475,000
Inflows from the increase in financial liabilities 32,736,000 18,475,000
b) Outflows from financing activities 15.7.6 –38,313,778 –19,827,936
Interest paid on financing activities –554,695 –738,609
Cash payments for equity redemption –541,833 0
Repayment of financial liabilities –33,123,695 –15,970,567
Dividends and other profit shares paid –4,093,555 –3,118,760
c) Positive or negative net cash flow from financing activities (a + b) –5,577,778 –1,352,936
D. Closing balance 15.7 180,689 24,123
Net cash flow for the period (sum of net cash flows Ac, Bc and Cc) 156,566 –82,625
Opening balance 24,123 106,748
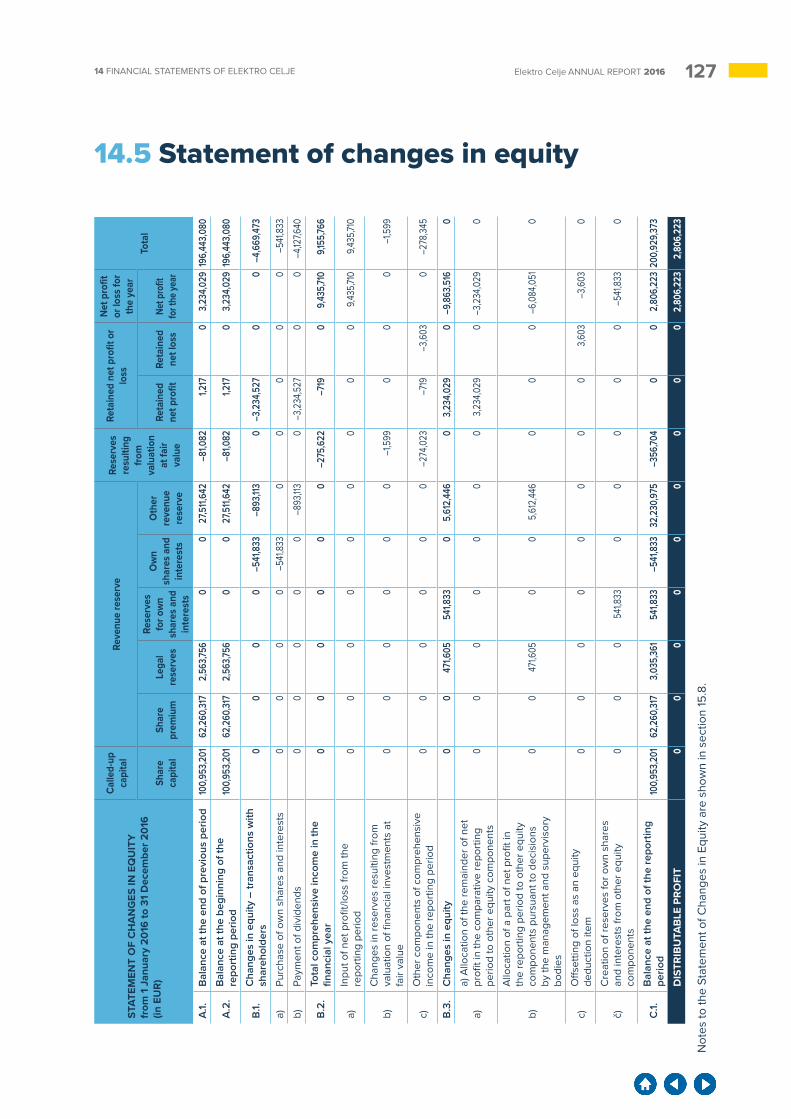
12714 FINANCIAL STATEMENTS OF ELEKTRO CELJE Elektro Celje ANNUAL REPORT 2016
14.5 Statement of changes in equityST
ATEM
ENT
OF
CH
AN
GES
IN E
QU
ITY
fr
om 1
Jan
uary
201
6 to
31
Dec
embe
r 201
6 (in
EU
R)
Calle
d-up
ca
pita
lRe
venu
e re
serv
e Re
serv
es
resu
lting
fro
m
valu
atio
n at
fair
valu
e
Reta
ined
net
pro
fit o
r lo
ss
Net
pro
fit
or lo
ss fo
r th
e ye
arTo
tal
Shar
e ca
pita
lSh
are
prem
ium
Lega
l re
serv
es
Rese
rves
fo
r ow
n sh
ares
and
in
tere
sts
Ow
n sh
ares
and
in
tere
sts
Oth
er
reve
nue
rese
rve
Reta
ined
ne
t pro
fitRe
tain
ed
net l
oss
Net p
rofit
fo
r the
year
A.1.
Bal
ance
at t
he e
nd o
f pre
viou
s pe
riod
100,
953,
201
62,2
60,3
172,
563,7
560
027
,511,
642
–81,0
821,2
170
3,23
4,02
919
6,44
3,08
0
A.2
.B
alan
ce a
t the
beg
inni
ng o
f the
re
port
ing
perio
d10
0,95
3,20
162
,260
,317
2,56
3,756
00
27,5
11,64
2–8
1,082
1,217
03,
234,
029
196,
443,
080
B.1.
Cha
nges
in e
quity
– tr
ansa
ctio
ns w
ith
shar
ehol
ders
00
00
–541
,833
–893
,113
0–3
,234
,527
00
–4,6
69,4
73
a)Pu
rcha
se o
f ow
n sh
ares
and
inte
rest
s0
00
0–5
41,8
330
00
00
–541
,833
b)Pa
ymen
t of d
ivid
ends
00
00
0–8
93,11
30
–3,2
34,5
270
0–4
,127,6
40
B.2
.To
tal c
ompr
ehen
sive
inco
me
in th
e fin
anci
al y
ear
00
00
00
–275
,622
–719
09,
435,7
109,1
55,76
6
a)In
put o
f net
pro
fit/lo
ss fr
om th
e re
port
ing
perio
d0
00
00
00
00
9,43
5,710
9,43
5,710
b)C
hang
es in
rese
rves
resu
lting
from
va
luat
ion
of fi
nanc
ial i
nves
tmen
ts a
t fa
ir va
lue
00
00
00
–1,5
990
00
–1,5
99
c)O
ther
com
pone
nts
of c
ompr
ehen
sive
in
com
e in
the
repo
rtin
g pe
riod
00
00
00
–274
,023
–719
–3,6
030
–278
,345
B.3
.C
hang
es in
equ
ity0
047
1,605
541,8
330
5,61
2,44
60
3,23
4,02
90
–9,8
63,5
160
a)a)
Allo
catio
n of
the
rem
aind
er o
f net
pr
ofit i
n th
e co
mpa
rativ
e re
port
ing
perio
d to
oth
er e
quity
com
pone
nts
00
00
00
03,
234,
029
0–3
,234
,029
0
b)
Allo
catio
n of
a p
art o
f net
pro
fit in
th
e re
port
ing
perio
d to
oth
er e
quity
co
mpo
nent
s pu
rsua
nt to
dec
isio
ns
by th
e m
anag
emen
t and
sup
ervi
sory
bo
dies
00
471,6
050
05,
612,
446
00
0–6
,084
,051
0
c)O
ffset
ting
of lo
ss a
s an
equ
ity
dedu
ctio
n ite
m0
00
00
00
03,
603
–3,6
030
č)C
reat
ion
of re
serv
es fo
r ow
n sh
ares
an
d in
tere
sts
from
oth
er e
quity
co
mpo
nent
s0
00
541,8
330
00
00
–541
,833
0
C.1.
Bal
ance
at t
he e
nd o
f the
repo
rtin
g pe
riod
100,
953,
201
62,2
60,3
173,
035,
361
541,8
33–5
41,8
3332
,230
,975
–356
,704
00
2,80
6,22
320
0,92
9,37
3
DIS
TRIB
UTA
BLE
PR
OFI
T0
00
00
00
00
2,80
6,22
32,
806,
223
Not
es to
the
Stat
emen
t of C
hang
es in
Equ
ity a
re s
how
n in
sec
tion
15.8
.
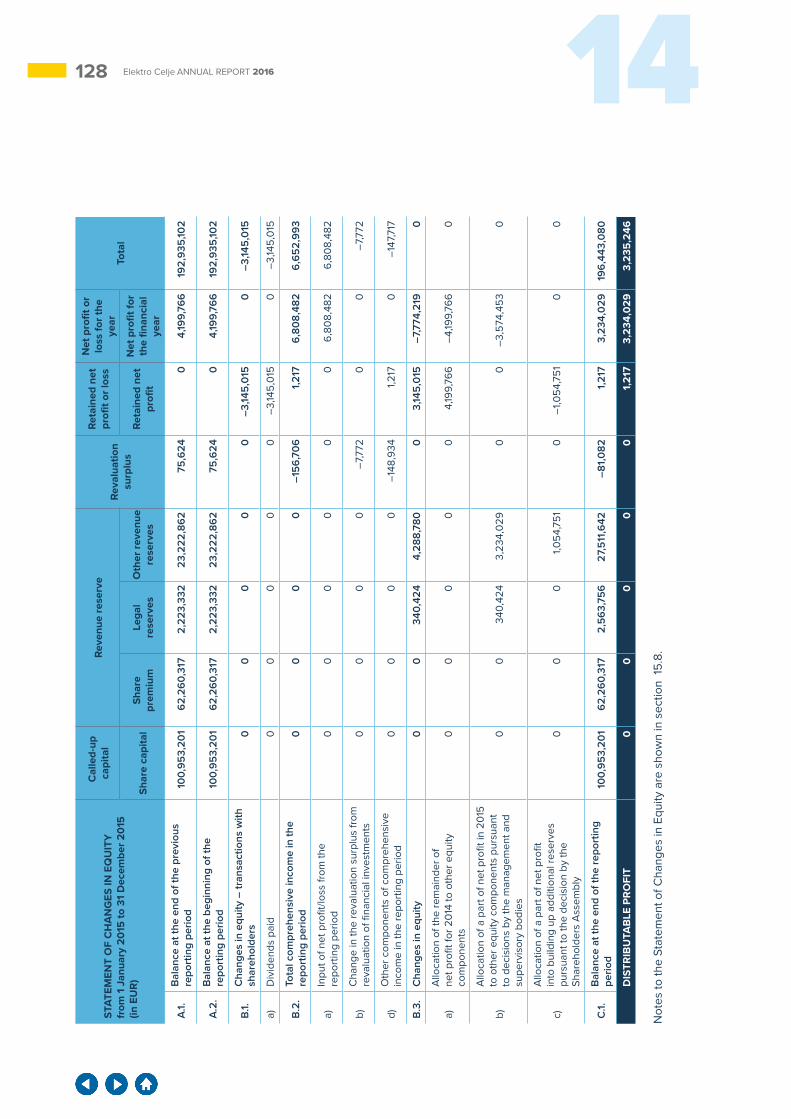
128 14Elektro Celje ANNUAL REPORT 2016
STAT
EMEN
T O
F C
HA
NG
ES IN
EQ
UIT
Y
from
1 J
anua
ry 2
015
to 3
1 D
ecem
ber 2
015
(in E
UR
)
C
alle
d-up
ca
pita
lRe
venu
e re
serv
e Re
valu
atio
n su
rplu
s
Reta
ined
net
pr
ofit o
r los
s
Net
pro
fit o
r lo
ss fo
r the
ye
arTo
tal
Shar
e ca
pita
lSh
are
prem
ium
Lega
l re
serv
esO
ther
reve
nue
rese
rves
Reta
ined
net
pr
ofit
Net
pro
fit fo
r th
e fin
anci
al
year
A.1.
Bal
ance
at t
he e
nd o
f the
pre
viou
s re
port
ing
perio
d10
0,95
3,20
162
,260
,317
2,22
3,33
223
,222
,862
75,6
240
4,19
9,76
619
2,93
5,10
2
A.2
.B
alan
ce a
t the
beg
inni
ng o
f the
re
port
ing
perio
d10
0,95
3,20
162
,260
,317
2,22
3,33
223
,222
,862
75,6
240
4,19
9,76
619
2,93
5,10
2
B.1.
Cha
nges
in e
quity
– tr
ansa
ctio
ns w
ith
shar
ehol
ders
00
00
0–3
,145,
015
0–3
,145,
015
a)D
ivid
ends
pai
d0
00
00
–3,14
5,01
50
–3,14
5,01
5
B.2
.To
tal c
ompr
ehen
sive
inco
me
in th
e re
port
ing
perio
d0
00
0–1
56,7
061,
217
6,80
8,48
26,
652,
993
a)In
put o
f net
pro
fit/lo
ss fr
om th
e re
port
ing
perio
d0
00
00
06,
808,
482
6,80
8,48
2
b)C
hang
e in
the
reva
luat
ion
surp
lus
from
re
valu
atio
n of
fina
ncia
l inv
estm
ents
00
00
–7,7
720
0–7
,772
d)O
ther
com
pone
nts
of c
ompr
ehen
sive
in
com
e in
the
repo
rtin
g pe
riod
00
00
–148
,934
1,217
0–1
47,7
17
B.3
.C
hang
es in
equ
ity0
034
0,42
44,
288,
780
03,
145,
015
–7,7
74,2
190
a)A
lloca
tion
of th
e re
mai
nder
of
net p
rofit
for 2
014
to o
ther
equ
ity
com
pone
nts
00
00
04,
199,
766
–4,19
9,76
60
b)
Allo
catio
n of
a p
art o
f net
pro
fit in
201
5 to
oth
er e
quity
com
pone
nts
purs
uant
to
dec
isio
ns b
y th
e m
anag
emen
t and
su
perv
isor
y bo
dies
00
340,
424
3,23
4,02
90
0–3
,574
,453
0
c)
Allo
catio
n of
a p
art o
f net
pro
fit
into
bui
ldin
g up
add
ition
al re
serv
es
purs
uant
to th
e de
cisi
on b
y th
e Sh
areh
olde
rs A
ssem
bly
00
01,0
54,7
510
–1,0
54,7
510
0
C.1.
Bal
ance
at t
he e
nd o
f the
repo
rtin
g pe
riod
100,
953,
201
62,2
60,3
172,
563,
756
27,5
11,6
42–8
1,08
21,
217
3,23
4,02
919
6,44
3,08
0
DIS
TRIB
UTA
BLE
PR
OFI
T0
00
00
1,21
73,
234,
029
3,23
5,24
6
Not
es to
the
Stat
emen
t of C
hang
es in
Equ
ity a
re s
how
n in
sec
tion
15.8
.
12915 EXPLANATORY NOTES TO THE FINANCIAL STATEMENTS Elektro Celje ANNUAL REPORT 2016
15 EXPLANATORY NOTES TO THE FINANCIAL STATEMENTS
The Elektro Celje Group consists of the parent company Elektro Celje d.d. (hereinafter: Company) and its sub-sidiary ECE, d.o.o. and MHE − ELPRO d.o.o., all with their registered seat at Vrunčeva 2a in Celje, Slovenia.
The financial statements of the Com-pany have been prepared for the
financial year which coincides with the calendar year from 1 January to 31 December 2016. In accordance with Article 56 of the Companies Act (ZGD-1), a company based in Slovenia which is the parent company of one or more companies must prepare a consolidated annual report.
The key task of the Company is that through the planning of the net-work, its development, construction, management, operation and main-tenance in the distribution zone of Elektro Celje, it ensures the long-term performance of the network, as well reliable, safe and efficient electricity supply to customers.
15.1 Bases for the Preparation of the Financial Statementsa) Declaration of conformityThe Company’s financial statements have been prepared in accordance with Slovenian Accounting Standards 2016 (hereinafter: SAS 2016) with the corresponding relevant positions and interpretations as adopted by the Professional Council of Slovenian In-stitute of Auditors, the provisions of the Companies Act (hereinafter: ZGD-1), rules on accounting, the Energy Act (EZ-1) and other regulations gov-erning the accounting, financial and tax fields. The Management Board of the Company approved the financial statements on 31 March 2017.
b) Reporting by business and geo-graphical segmentsThe Company performs services of general economic interest of distribu-tion network system operator pursu-ant to the contract with SODO d.o.o., energy market activities and non-energy market activities, which are considered business segments. The Company does not have geographi-cal segments.
In accordance with Article 109 of EZ-1, the Company ensures separate accounting for monitoring activities pursuant to the contract on the lease of electricity distribution infrastruc-ture and provision of services for the distribution network system op-erator and for the marketing activity; these two activities are also consid-ered business segments according to SAS 2016. The balance sheet, in-
come statement, statement of cash flows and criteria and standards for allocating direct and indirect costs, expenses, revenues, and assets and liabilities for individual activities are presented in section 15.11.
c) Basis of measurementThe financial statements reflect a true and fair presentation of the Compa-ny’s financial position, its economic outturn and cash flows. In preparing financial statements, the Company observes the fundamental account-ing assumptions of accruals and the going concern basis. In doing so the qualitative characteristics of financial statements are taken into account: clarity, relevance, reliability and com-parability. The selection and applica-tion of accounting policies are based on prudence, substance over form and materiality.
The financial statements have been prepared on a historical cost basis, except for financial assets, which are quoted at active market prices and whose value can be reliably meas-ured and are therefore measured and accounted for at fair value.
d) Functional and presentation cur-rencyThe financial statements are present-ed in euros (EUR), which is the func-tional currency of the Company. All financial data presented in euros are shown as rounded-off figures.
e) Use of estimates and assumptions and significant uncertainty in opera-tions
Use of estimates and assumptions in the preparation of the financial state-mentsThe preparation of the financial state-ments in accordance with SAS 2016 requires the use of estimates and assumptions that affect the residual value of reported assets and liabilities on the reporting date and the amount of revenue, costs and expenses dur-ing the reporting period. Estimates and assumptions are based on man-agement’s best knowledge of current and future events and activities, and are regularly reviewed, with adjust-ments recognized in the period of the change, valid for all future periods which the changes affect. Informa-tion regarding significant estimated uncertainty and critical assessments are described in the following notes:- Note 15.4.1 and Accounting Policy
15.3 (b) - Determining the useful lives of intangible and tangible fixed assets,
- Note 15.4.4 and Accounting Policy 15.3 (d) - Deferred taxes,
- Note 15.4.10 and Accounting Policy 15.3 (i) - Long-term accruals and deferred income, measurement of provisions for severance pay and jubilee awards and lawsuits,
- Note 15.4.3 and Accounting Policy 15.3 (c) - Valuation of investments,
- Note 15.4.6 and Accounting Policy 15.3 (f) - Impairment of receivables.
130 15Elektro Celje ANNUAL REPORT 2016
Regulatory framework for the peri-od 2016 - 2018 and operations with SODOThe Energy Agency, pursuant to Arti-cle 116 of the Energy Act (EZ-1) has the authority to determine the methodol-ogy for calculating network charges and eligible costs of providers of SODO activities. On 7 August 2015 the Council of the Energy Agency adopted the Legal act on the meth-odology determining the regulatory framework and network charge for the electricity distribution system (Official Gazette of RS, no. 66/2015, hereinafter: Network Charge Act) which defines the methodology for determining the regulatory frame-work and calculation of the network charge. On 15 December 2015 the Energy Agency with Decision no. 211-58/2015-122/452 defined the regula-tory framework for the period 2016-2018. In determining eligible costs of operation and maintenance, the En-ergy Agency took into account Article 13 of the Network Charge Act, which states that all elements of the regula-tory framework for individual regions of the distribution system are based on data from the electricity operator and distribution companies if the dis-tribution operator is not the owner of all or a significant part of the distribu-tion system and if distribution compa-nies perform the tasks of the distri-bution operator. Eligible costs of the distribution network system operator (i.e. SODO) no longer intervene in the part of eligible costs determined by the distribution companies, as was prescribed in previous years. Con-trolled eligible costs of operation and maintenance (hereinafter: CCOM) are determined based on historical data, the average realized eligible costs in the period 2011-2013. Significant changes which also affect the amount of revenue in the new regulatory pe-riod are the changed conditions of recognition of the cost of insurance premiums as they are no longer rec-ognized in the actual amount incurred in the year they originate, but are now included in CCOM. With the insurance contract concluded in 2015 for a pe-
riod of three years, the cost of premi-ums are significantly higher than they were in previous years, mainly due to large loss events involving ice and snow damage in 2013 and 2014. The Energy Agency also defined that only 10% of the cost of loss events could be recognized as eligible expenses, at the same time lowering the regulat-ed return on assets before tax for the new electricity infrastructure (EI) from 7.8% to 7.14%. The Network Charges Act also fails to provide financial in-centives for pilot projects, with the cost of pilot projects completely ex-empted from CCOM; assuring the reliability and quality of the electricity supply and its efficient use however, requires investment in research and development (smart grid, advanced metering infrastructure, effective in-formation - communications technol-ogy support).
Purchase of electricity for losses of electricity in the distribution network in the distribution area of Elektro Celje is being performed by SODO from 1 January 2016 onwards, in accord-ance with the Network Charges Act. As a result, the Company no longer has revenues and expenses under this heading, with the contractual clause between the Company and SODO d.o.o. regulating stimulation and penalization under the heading of managing quantities of electricity losses in the network valid. Revenue under this heading for the year 2016 amounted to EUR 666,990.
From 2007 onwards the company SODO d.o.o. has been operating as the exclusive holder of the conces-sion for the implementation of the service of general economic interest of the electricity distribution network system operator in the territory of the Republic of Slovenia. The Company, which owns the electricity distribution infrastructure, concluded the Agree-ment on the Lease of Electricity Dis-tribution Infrastructure and Provision of Services with SODO on 21 Febru-ary 2012, and in accordance with the terms of the Agreement, the contract-
ing parties conclude annexes, defin-ing the amount of the lease fee and scope of services implemented in the distribution network for each regula-tory year. Mutual relationships for the regulatory period 2016-2018 are reg-ulated by Annex no. 5, signed at the beginning of 2017.
In March 2017, the Company received a preliminary calculation of the regu-latory fee for 2016 from SODO, which was carried out on the basis of data from the unaudited financial state-ments of the Company. From the off-set it is seen that the already charged contractual value of services and lease in 2016 was EUR 2,730,926 less than the value determined on the basis of the preliminary account. The Company in the calculated amount of the deficit in March issued an invoice with payment due in April 2017 and in the amount of established differ-ence, recognised additional revenue to SODO for 2016. The final calcula-tion for the regulatory year 2016 will be based on audited figures from both contracting parties and the deci-sion that will be issued by the Energy Agency.
The deficit from preliminary accounts for 2014 and 2015, due to the network charge deficits in both years, have not been paid in full; part of the deficit for 2014 (amounting to EUR 3,860,759) will be paid in the regulatory period 2016-2018, namely a third of the amount each year, while the deficit for 2015 (EUR 3,426,391) is expected to be fully integrated into the regula-tory period 2019-2021, if the Energy Agency charges for it in the tariff items for the network charge, which will then be charged to customers. The Company had not yet received the final accounts for the years 2014 and 2015 by the conclusion of the fi-nancial year 2016.
f) Amendments in accounting poli-ciesThe Company did not amend its ac-counting policies in 2016.
13115 EXPLANATORY NOTES TO THE FINANCIAL STATEMENTS Elektro Celje ANNUAL REPORT 2016
15.2 Transition to SAS 2016The Company has been using SAS 2016 from 1 January 2016 onwards. No significant effects due to the transition from SAS 2006 to SAS 2016 were observed, but the Com-pany pursuant to individual standards which specify the aforementioned, reclassified certain items of assets and liabilities as at 1 January 2016 and also took this into account in the comparative period on 31 December 2015. The Company also does not ap-ply accounting policies that were pre-viously permitted by SAS 2006 and which do not comply with individual
accounting standards of SAS 2016.In accordance with SAS 2.39, rights to immovable property and other similar rights which on the basis of this stand-ard are recognized and measured in accounting records as intangible assets, are reclassified as land and buildings in the Balance Sheet as at 1 January 2016. The acquisition cost of real rights to immovable property on 31 December 2016 amounted to EUR 44,175 (EUR 42,410 on 31 December 2015), with revaluation adjustment amounting to EUR 1,655 (EUR 1215 on 31 December 2015).
The revaluation surplus, which on 31 December 2015 amounted to EUR -81,082 was according to the state as at 1 January 2016 reallocated to reserves originating from valuation at fair value related to an increase or de-crease in the carrying value of finan-cial investments, creation of actuarial gains and losses identified in creation of provisions for retirement and de-ferred tax actuarial losses. Reserves arising from revaluation at fair value as at 31 December 2016 amounted to EUR -356,704.
15.3 Significant Accounting PoliciesSAS 2016 is directly applied for the presentation and valuation of items in the financial statements, with items for which SAS 2016 offers a choice between different methods for valu-ation defined by accounting policies disclosed by individual item in the annual report. Pursuant to SAS 2016 the Company discloses all significant items, with the importance of individ-ual items defined in the accounting rules.
a) Intangible non-current assets and long-term accrued revenue and de-ferred expensesAn intangible asset is a non-mone-tary asset, as a rule without physical form and appears as an intangible non-current asset. The Company discloses long-term property rights (investment in software and material rights to use apartments), such assets under preparation and accrued rev-
enues and deferred expenses (long-term deferred expenses) among the long-term intangible assets of the Company. Investments into real rights on immovable property are disclosed in the item land and buildings in the balance sheet according to SAS 2.39.
Recognition and elimination of rec-ognition of intangible assetsAn intangible asset is recognized when it is probable that future eco-nomic benefits associated with it will flow to the Company and its cost can be measured reliably. An intangible asset is derecognised upon disposal or when no more economic benefits are expected from its use and subse-quent disposal.
Initial accounting measurement and measurement after recognitionAn intangible asset is valued at cost upon initial recognition, which also
includes import and non-refundable purchase duties, after deducting dis-counts and any directly attributable costs of preparing the asset for its intended use. Acquisition costs are subsequently reduced by the amount of accumulated depreciation.
Depreciation and useful lifeAll intangible assets are depreciable assets with finite useful lives. The straight-line depreciation method is used, with the depreciation basis equal to the acquisition value of in-tangible assets. Amortization of intan-gible assets begins on the first day of the following month after the asset becomes available for use. Deprecia-tion calculated for each accounting period is recognized as a cost or op-erating expense for the period. Intan-gible assets are not revalued since they represent less than 1% of total assets.
Significant groups of depreciable assets Estimated useful life in years
Depreciation rate in %
Minimum Maximum
Computer software 3 33.33 33.33
Real rights in immovable property 100 1.00 1.00
Right to use facilities 30 3.33 3.33
Long-term accrued revenue and de-ferred costs include amounts of de-ferred costs and expenses relating to a period longer than one year and not yet charged to the income statement.
b) Tangible fixed assetsA tangible fixed asset is an asset owned or financially leased or oth-erwise controlled by the Company which is used for the implementation of services, leasing or administra-
tive purposes and is expected to be used for this purpose during more than one accounting period. Groups of tangible fixed assets are immove-able property (land, buildings), equip-ment and other tangible fixed assets
132 15Elektro Celje ANNUAL REPORT 2016
as well as investments in the acqui-sition of such assets and receivables for advances in this respect. Some types of small tools with useful lives longer than one year (hand tools and devices) are also considered tangible fixed assets.
Recognition, initial measurement and derecognition of tangible fixed assetsA tangible fixed asset is recognized when it is probable that future eco-nomic benefits associated with it will flow to the Company and its cost can be measured reliably. A tangible fixed asset is valued at cost upon initial rec-ognition. This consists of the acquisi-tion cost, import and non-refundable purchase duties and expenses which are directly attributable to the activi-ties necessary to prepare the asset for its intended use. The acquisition cost also comprises the costs of loans related to the acquisition of new tangi-ble fixed assets for those fixed assets, for which the period from the date of the provision of services of the first invoice for construction-assembly services or equipment up to commis-sioning of the fixed asset for use is longer than one year, namely for the period from the payment deadline of the individual invoice until the date of commissioning of the fixed asset for use. If the acquisition cost of a fixed asset is significant, the cost is distrib-uted to its parts. If these parts have different useful lives and/or usage patterns, important in relation to the total cost of the tangible fixed asset, each part is treated separately.
Land is valued at acquisition cost, which includes costs of real estate turnover taxes and land registry fee.
The acquisition cost of buildings comprises expenditures to cover the purchase, construction or upgrading of facilities, project and other docu-mentation on the basis of which the acquisition was made, construction or upgrades for land development for the necessary permits for the manu-facture of connections and other costs that can be directly attributable to preparing them for use. Expendi-tures for the acquisition of land on which buildings are situated and ex-penditures for the acquisition of land intended for access to buildings or for
other needs regarding their use are not included in the acquisition cost.
The acquisition cost of equipment comprises expenditures to cover the purchase, manufacture or elabora-tion of equipment, costs of delivery, installation and other expenses aris-ing during purchase, manufacture or elaboration.
The acquisition cost of tangible fixed assets constructed or produced in the Company consists of costs origi-nating from their construction or manufacture and indirect costs of construction or manufacture that can be attributed to the asset. It does not comprise costs not related to their construction or manufacture, and costs which the market does not rec-ognize. The acquisition cost of such fixed assets cannot be greater than that of identical or similar fixed assets in the market. Investments carried out in the Company are divided into reconstruction, which covers major repairs of fixed assets due to wear, substitution and capacity increases, which include investment for replace-ment and increasing of capacity of existing fixed assets and new invest-ments, which cover investments in the acquisition of new fixed assets.
Here, the fixed assets acquired free of charge are valued at cost, and if this is not known, at fair value as determined in the free acquisition agreement.
Recognition of a tangible fixed asset is derecognised upon its disposal or when no future economic benefits are expected from its use or disposal. Gains and losses upon disposal or elimination, which is determined by comparing sales revenue to the car-rying value, are included in the in-come statement by the Company.
Measurement after recognition and subsequent costsIn evaluating tangible fixed assets, the Company uses the cost model and carries them at cost, less accu-mulated depreciation and accumu-lated impairment losses.
Subsequent costs incurred for repairs and maintenance related to tangi-ble fixed assets are recognized as
maintenance costs when they are in-curred in the process of restoring and maintaining future economic benefits based on the initial estimated level of the asset’s efficiency. Estimated costs of regular inspections or repairs of tangible fixed assets are treated as parts of tangible fixed assets.
RevaluationThe Company revalues tangible fixed assets due to impairment as a rule, immediately once their carry-ing amount exceeds the recoverable amount. The recoverable amount is the fair value less costs of sale or value in use, whichever is greater. A significant change in the operat-ing situation is one for which the as-sumptions used in assessing value in use and fair value reduced by costs of sale, changes by more than 5% in one year. A review of impairments is decided based on a significant asset with the longest useful life; the Com-pany defines a significant asset as an asset whose acquisition cost is more than 0.5% of the total cost of tangible fixed assets. A decrease in value of a depreciable asset due to impairment is treated as an operating expense from revaluation, as is the residual value of an asset that no longer pos-sesses any usefulness; if this asset is sold and the net realizable value is greater than the carrying amount, the difference is treated as a revenue from revaluation.
The value of land, buildings and dis-tribution equipment is assessed by certified appraisers. The Company as a rule does not revalue other equip-ment as they represent less than 5% of total fixed assets.
Depreciation and useful lifeA tangible fixed asset begins to be depreciated on the first day of the following month after the asset be-comes available for use. The Compa-ny uses the straight-line depreciation method. Depreciation rates are set according to the expected useful lives which depend on expected physical wear, technical and economic aging and expected legal or other restric-tions regarding their the use, taking into account the one that is the short-est. The useful life of fixed assets is determined by the Joint Commission of electricity distribution companies
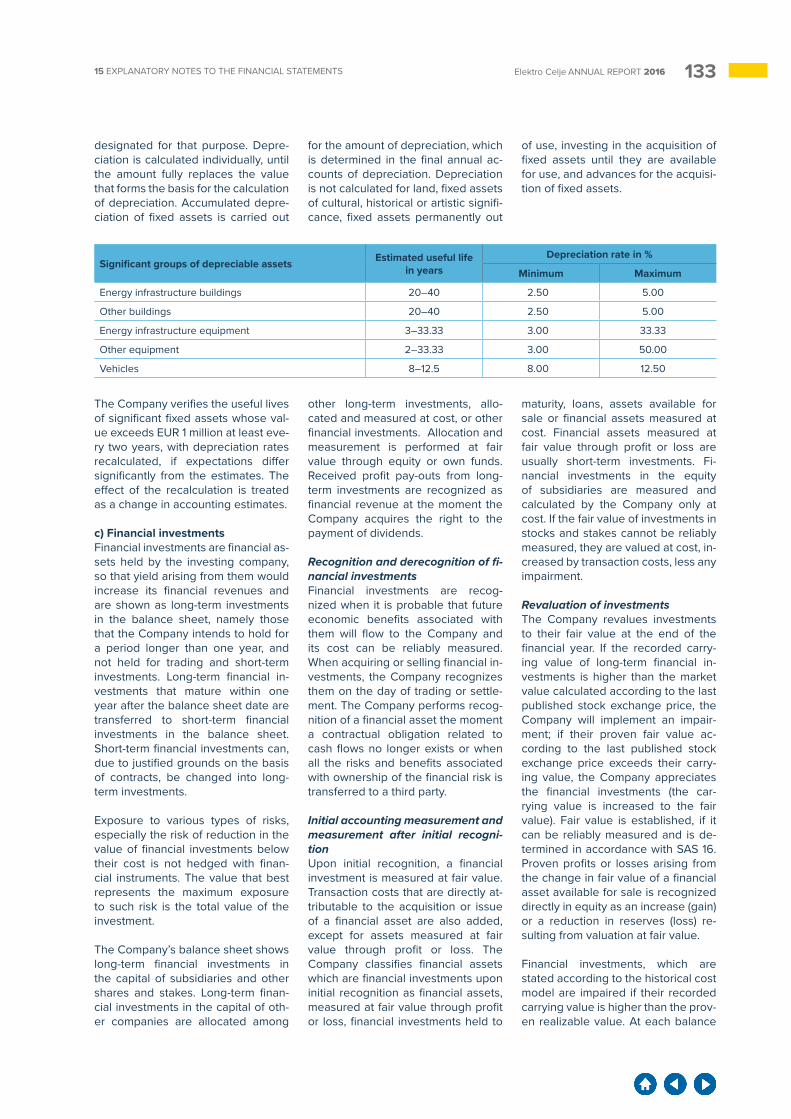
13315 EXPLANATORY NOTES TO THE FINANCIAL STATEMENTS Elektro Celje ANNUAL REPORT 2016
Significant groups of depreciable assets Estimated useful life in years
Depreciation rate in %
Minimum Maximum
Energy infrastructure buildings 20–40 2.50 5.00
Other buildings 20–40 2.50 5.00
Energy infrastructure equipment 3–33.33 3.00 33.33
Other equipment 2–33.33 3.00 50.00
Vehicles 8–12.5 8.00 12.50
The Company verifies the useful lives of significant fixed assets whose val-ue exceeds EUR 1 million at least eve-ry two years, with depreciation rates recalculated, if expectations differ significantly from the estimates. The effect of the recalculation is treated as a change in accounting estimates.
c) Financial investmentsFinancial investments are financial as-sets held by the investing company, so that yield arising from them would increase its financial revenues and are shown as long-term investments in the balance sheet, namely those that the Company intends to hold for a period longer than one year, and not held for trading and short-term investments. Long-term financial in-vestments that mature within one year after the balance sheet date are transferred to short-term financial investments in the balance sheet. Short-term financial investments can, due to justified grounds on the basis of contracts, be changed into long-term investments.
Exposure to various types of risks, especially the risk of reduction in the value of financial investments below their cost is not hedged with finan-cial instruments. The value that best represents the maximum exposure to such risk is the total value of the investment.
The Company’s balance sheet shows long-term financial investments in the capital of subsidiaries and other shares and stakes. Long-term finan-cial investments in the capital of oth-er companies are allocated among
other long-term investments, allo-cated and measured at cost, or other financial investments. Allocation and measurement is performed at fair value through equity or own funds. Received profit pay-outs from long-term investments are recognized as financial revenue at the moment the Company acquires the right to the payment of dividends.
Recognition and derecognition of fi-nancial investmentsFinancial investments are recog-nized when it is probable that future economic benefits associated with them will flow to the Company and its cost can be reliably measured. When acquiring or selling financial in-vestments, the Company recognizes them on the day of trading or settle-ment. The Company performs recog-nition of a financial asset the moment a contractual obligation related to cash flows no longer exists or when all the risks and benefits associated with ownership of the financial risk is transferred to a third party.
Initial accounting measurement and measurement after initial recogni-tionUpon initial recognition, a financial investment is measured at fair value. Transaction costs that are directly at-tributable to the acquisition or issue of a financial asset are also added, except for assets measured at fair value through profit or loss. The Company classifies financial assets which are financial investments upon initial recognition as financial assets, measured at fair value through profit or loss, financial investments held to
maturity, loans, assets available for sale or financial assets measured at cost. Financial assets measured at fair value through profit or loss are usually short-term investments. Fi-nancial investments in the equity of subsidiaries are measured and calculated by the Company only at cost. If the fair value of investments in stocks and stakes cannot be reliably measured, they are valued at cost, in-creased by transaction costs, less any impairment.
Revaluation of investmentsThe Company revalues investments to their fair value at the end of the financial year. If the recorded carry-ing value of long-term financial in-vestments is higher than the market value calculated according to the last published stock exchange price, the Company will implement an impair-ment; if their proven fair value ac-cording to the last published stock exchange price exceeds their carry-ing value, the Company appreciates the financial investments (the car-rying value is increased to the fair value). Fair value is established, if it can be reliably measured and is de-termined in accordance with SAS 16. Proven profits or losses arising from the change in fair value of a financial asset available for sale is recognized directly in equity as an increase (gain) or a reduction in reserves (loss) re-sulting from valuation at fair value.
Financial investments, which are stated according to the historical cost model are impaired if their recorded carrying value is higher than the prov-en realizable value. At each balance
designated for that purpose. Depre-ciation is calculated individually, until the amount fully replaces the value that forms the basis for the calculation of depreciation. Accumulated depre-ciation of fixed assets is carried out
for the amount of depreciation, which is determined in the final annual ac-counts of depreciation. Depreciation is not calculated for land, fixed assets of cultural, historical or artistic signifi-cance, fixed assets permanently out
of use, investing in the acquisition of fixed assets until they are available for use, and advances for the acquisi-tion of fixed assets.
134 15Elektro Celje ANNUAL REPORT 2016
sheet date, it should be assessed whether objective evidence of im-pairment of the financial investment exists. A financial investment/group of financial investments is impaired (long-term) causing losses if there is objective evidence of impairment as a result of an event/events after the initial recognition of the investment. The Company carries out a test to assess the impairment of financial investments in equity instruments which are not measured at fair value, if the carrying amount of the invest-ments at the balance sheet date is more than 20% greater than the pro-portional part of the carrying amount of the total capital of the company in which it has an investment and also, if the Company’s future business plans indicate permanent impairment of these investments. The amount of loss is measured as the difference between the carrying amount of the financial investments on the balance sheet date and the present value of expected future cash flows of these investments, discounted at the cur-rent market rate of return (recover-able value), which applies to similar fi-nancial assets, and recognised in the income statement as a revaluation financial expense. Such impairment losses may not be reversed.
d) Deferred tax assets and liabilitiesDeferred tax assets and liabilities are the result of calculating current and future tax consequences (future re-payment/settlement of the carrying value of assets/liabilities recognized in the balance sheet of the Company and transactions and other business events in the period in question, rec-ognized in the financial statements of the Company.
Deferred tax assets are the amounts of income taxes recoverable in fu-ture periods and recognized by the Company at the end of the reporting period, if it is likely to have future tax-able profits which could be burdened by deductible temporary differences. Deferred tax assets reduce tax ex-pense, thereby contributing to an improved operating result, or directly increasing capital.
The Company accounts for deferred taxes by using the liability method on the balance sheet, taking into
account temporary differences be-tween the book and tax values of individual assets and liabilities which arise from each respective state of accounting items and not from dif-ferences between the previous and current states. Deferred taxes are measured at tax rates that are ex-pected to be applied in the financial year when the deferred tax assets are realized or deferred liabilities set-tled, and are based on tax rates and tax regulations valid until the balance sheet date.
Whenever the carrying amount of de-ferred tax changes due to changes in tax rates or tax regulations, a re-assessment of the recoverability of deferred tax assets or changes in the expected manner of recovery of the assets, the resulting deferred tax is recognized in profit or loss, except to the extent that it relates to items previously recognized outside profit or loss.
e) InventoriesInventories comprise a part of current assets in tangible form, which will be used to create products or provide services. The Company shows mate-rial and small tools with a useful life of up to one year which have the char-acteristics of inventory among stocks of materials, but may also include those with useful lives exceeding one year, if their individual acquisi-tion value does not exceed EUR 500. The Company also includes protec-tive equipment and tools under small tools. The Company monitors stocks of materials by individual material and warehouse in its analytical records.
Recognition and elimination of rec-ognition of inventories Stocks of materials in the accounting records and the balance sheet are recognized if it is probable that future economic benefits associated with them exist and their value or cost can be reliably measured. Recognition of inventories is eliminated when the material has been consumed, sold, or otherwise ceases to exist, as con-firmed by relevant documents.
Initial measurement and valuation of inventories after recognitionA unit of stock of materials is valued at cost, which comprises the acquisition
cost, reduced by discounts, import and other non-refundable acquisition duties and direct acquisition costs. Consumption of stocks of materials is valued according to the moving aver-age price method.
Revaluation of inventoriesInventories are revalued due to im-pairment if their book value exceeds their net realizable value. Write-downs of damaged and obsolete in-ventories are performed by the Com-pany regularly throughout the year and during inventory-taking.
f) ReceivablesReceivables are property rights and other rights based on legal relation-ships to demand that a particular person pay a debt or in the case of advance payments to demand the supply of goods or performance of a service and depending on their ma-turities, are allocated to short-term re-ceivables due within one year, while the other are long-term. Long-term receivables that have matured and are not yet settled, and those which will fall due for payment within one year after the balance sheet date are recognized as short-term receiva-bles. Receivables that arise in the Company are mainly trade receiva-bles, receivables due from suppliers for advance payments, from employ-ees, from the state, etc.
Recognition and elimination of re-ceivablesReceivables in the accounting re-cords and balance sheet are recog-nised if it is probable that future eco-nomic benefits associated with them exist and their historical cost can be reliably measured. Derecognition is implemented if they no longer fall under binding contractual rights be-cause they either expired or were as-signed.
Initial accounting measurement and measurement upon recognitionUpon initial recognition, receiva-bles of all types are recognized in the amounts that arise from relevant documents (invoices, contracts), as-suming that they will be paid. Receiv-ables from legal and natural persons abroad are converted into domestic currency on the day of occurrence using the current reference exchange
13515 EXPLANATORY NOTES TO THE FINANCIAL STATEMENTS Elektro Celje ANNUAL REPORT 2016
rate of the European Central Bank. Later receivables can be increased or decreased (subsequent discounts, complaints), thereby affecting the relevant business and financial rev-enues.
Revaluation of receivablesThey mainly appear as a revaluation of receivables due to their impair-ment or reversal of impairment, i.e. reduction or subsequent increase in their value to their liquid value. In the balance sheet receivables are car-ried at amortized cost, which means that they are reduced by the amount of the value adjustment for doubtful and disputed receivables. In accord-ance with SAS, the Company carries out a revaluation adjustment in the total amount for receivables in bank-ruptcy proceedings, for receivables which are the subject of litigation, and for receivables whose due date has exceeded 90 days on the balance sheet date. For receivables in com-pulsory settlement proceedings, the Company carries out a revaluation adjustment depending on the deci-sions of compulsory settlements or in the amount of 80% if compulsory set-tlement has not yet been confirmed. Revaluation adjustments are reduced by payments and write-offs of receiv-ables on the basis of supporting doc-uments: court decision, decision on compulsory settlement, decision on bankruptcy proceedings and other relevant documents.
Long-term receivables relating to trade receivables, which are under-going compulsory settlement are remunerated in accordance with the decisions on compulsory settle-ments. The decisions usually denote the scope, dynamics of repayment and interest rate at which receivables are remunerated (if at all). Long-term trade receivables from the company SODO are remunerated in accord-ance with Article 84 and section 5.3 of the Network Charges Act (Official Gazette of RS, no. 81, dated 29 Oc-tober 2012).
Receivables of significant value which are not remunerated are shown at discounted values in the balance sheet, taking into account the interest rate, which is equal to the average in-terest rate of long-term loans.
g) Cash and cash equivalentsCash and cash equivalents of the Company include scriptural money (i.e. money in the transactions ac-counts listed in section 6.1.1.) and de-posits at commercial banks. They are shown in the amounts arising from relevant documents, after verification of such nature. Cash also includes cash equivalents, investments that can be quickly converted to known amounts of cash in the near future and where the risk of changes in val-ue is insignificant (overnight deposits with banks).
h) EquityTotal equity is the liability to own-ers of the company, which is due for payment when the company goes out of business. It is defined in the amounts invested by the owners and the amounts generated during opera-tion that belong to the owners. Equity is reduced by loss from operations, repurchase of treasury shares and dividend payments. Total equity is the company’s liability to owners of the company, which is due for payment when the company goes out of busi-ness. It consists of called-up capital, capital reserves, revenue reserves, revaluation reserves, reserves result-ing from valuation at fair value, re-tained net earnings from previous pe-riods, and temporarily undistributed net profit for the business year.
Called-up capital of the Company is share capital divided into 24,192,425 ordinary freely transferable shares. Ordinary shares give their holders the right to participate in the management of the Company, entitlement to a part of the profits (dividends) and the right to participate in an appropriate share of assets remaining after the liquida-tion or bankruptcy of the Company. There are no agreements between shareholders which could result in a limitation of transfer of securities and voting rights. The Company also has no restrictions on voting rights, except for treasury shares which do not have voting rights, nor provide dividends. All shares are of the same class and have been fully paid up. The shares are issued in dematerialized form and held at KDD - Centralna klirinško de-potna družba, d. d. (Central Securities Clearing Corporation) in accordance with regulations. The Company has
no employee shareholder scheme and during the financial year, did not conditionally increase share capital, with treasury shares formed from net profit in the amount of EUR 541,833 in accordance with the Articles of As-sociation of the Company.
The Company’s capital reserves con-sist of amounts of reversals of the general capital revaluation adjust-ment and are formed in accordance with the transitional provisions (item 15 of the introduction to SAS 2006) to be used in accordance with Article 64 of the Companies Act (ZGD – 1). Profit reserves include legal reserves, re-serves for treasury shares, acquired treasury shares and other profit re-serves. Profit reserves are formed in the amount and under the conditions laid down in Article 64 of the Compa-nies Act and Articles of Association of the Company from net profit amounts for the business year and retained profit
Other profit reserves may be used for any purpose, except in the case of the fifth paragraph of Article 64 of the Companies Act or if the Company’s Articles of Association provide oth-erwise Capital and statutory reserves may pursuant to the Companies Act be used to cover net loss for the year if it cannot be covered from retained profit or other profit reserves and for coverage of retained loss, if it cannot be covered by net profit for the year or from other profit reserves. If the to-tal amount of these reserves is higher than the statutory prescribed percent of share capital (10%), they can also be used to increase share capital from the Company’s assets and to cover net and retained loss for the business year if profit reserves are not used for the distribution of profit to shareholders.
The Company also formed reserves arising from revaluation at fair value, based on actuarial gains or losses from severance pay upon retirement and amounts of proven gains or loss-es from changes in fair value of finan-cial assets available for sale.
i) Provisions and long-term accrued expenses and deferred revenue The purpose of these provisions is to collect amounts in the form of ac-
136 15Elektro Celje ANNUAL REPORT 2016
crued costs or expenses which will in the future be used to cover costs or expenses incurred at that time. Deferred revenue, which will cover estimated expenses in a period ex-ceeding one year, fall under long-term accrued expenses and deferred revenue.
Recognition and elimination of the recognition of provisionsProvisions are recognized if due to a past event a current obligation exists (probability must be greater than 50%), which is expected to be settled in a period which cannot be determined with certainty, and if the amount of the obligation can be measured reliably. Derecognition is carried out when the item for which the provisions were made has al-ready been used or there is no longer a need for it.
Initial accounting measurement of provisionsThe amount recognized as a provi-sion is the best estimate of the expen-ditures (includes risks and uncertain-ties) required for settlement of usually long-term commitments existing on the balance sheet date and is equal to the value of the expenditures ex-pected to be required to settle the obligation. If the effect of the time val-ue of money is material, the expected expenditures must be appropriately discounted to their present value.
Provisions for payment of retire-ment benefits and long-service awardsThe Company pursuant to legisla-tion and the collective agreement is obliged to pay long-service awards to employees, severance upon their retirement and allowance in the case of the death of employees, for which provisions were created for the long-term benefit of future payments discounted at the balance sheet date. The actuarial calculation was prepared using the projected unit credit method based on the multiple decrement model and takes into ac-count current service costs, interest costs, payment of benefits and ac-tuarial gains/losses that result from changes in actuarial assumptions and adjustments based on experi-ence. In accordance with SAS 10.35 on the balance cut-off date, the Com-
pany determines and in the income statement recognizes revenues or expenses connected to the adjust-ment of provisions for retirement ben-efits (long-service costs and interest), while actuarial gains and losses aris-ing from liabilities for retirement ben-efits are recognized in equity within reserves resulting from valuation at fair value.
The Company similarly in accordance with SAS 10.36 on the cut-off balance date determines, and in the income statement recognises, revenue and expenses connected to the adjust-ment of provisions for long-service payments and allowance payments in the case of death of an employee (long-service costs, interest, actuarial gains/losses).
Provisions for lawsuitsThe Company discloses provisions for lawsuits in which it is the defend-ant. Every year the eligibility of provi-sions formed is assessed in relation to the state of disputes and the likeli-hood of a favourable or unfavourable resolution. The amount of provisions is determined by the known amount of compensation claims or according to the anticipated amount, if the claim amount is not yet known.
Long-term accrued expenses and deferred revenue The Company recognizes long-term accrued expenses and deferred rev-enue for fixed assets acquired free of charge classified in categories ac-cording to the rate of depreciation of the acquired assets. They are in-tended to cover depreciation costs of depreciable assets and are used by reallocating them to operating revenues. Acquisition of fixed assets free of charge relates mainly to the connections of customers which the Company assumed as tangible fixed assets with a commitment to main-tain and restore them, in accordance with regulations (Official Gazette of RS, no. 126/07, General conditions for connection to the distribution electric system).
The Company also recognizes long-term accrued expenses and deferred revenue for the calculation of aver-age costs of connection pursuant to the Decision on determining the net-
work charge for use of the electricity networks of the Energy Agency of the Republic of Slovenia for electric-ity for the period up to 30 June 2007 and relate to the dedicated payment of connections to the network or in-crease in coupling strength (financing investments in network expansion). Their purpose is to cover deprecia-tion of assets and they are used by reallocating them to operating rev-enue at the prevailing rate of fixed as-sets of the energy infrastructure, i.e. at a rate of 3%.
Revaluation and measuring chang-es in provisions and long-term ac-crued expenses and deferred rev-enue Provisions and long-term accrued ex-penses and deferred revenue are not revalued. At the end of the account-ing period, they are adjusted due to changed estimates so that their value is equal to the current value of the ex-penditure expected to be required to settle the obligation.
j) LiabilitiesLiabilities are recognized obligations associated with the financing of own assets, which must be repaid or set-tled, in particular in cash. The Com-pany discloses financial and operat-ing liabilities, and depending on the maturity of the payment as long-term or short-term. Short-term liabilities mature into payment within a period shorter than one year.
Recognition and elimination of li-abilitiesLiabilities are recognized if it is likely that their settlement will reduce fac-tors allowing for economic benefits and if the amount of their settlement can be reliably measured. Derecogni-tion is performed when the obligation specified in a contract or other legal instrument is discharged, cancelled or expires.
Initial accounting measurement of liabilitiesUpon initial recognition, liabilities are valued at the amounts arising from relevant documents on their origin, which for financial liabilities is evidence of received loans, or obliga-tions for the payment of interest, divi-dends or payment of a business debt, for operating liabilities receipt of a
13715 EXPLANATORY NOTES TO THE FINANCIAL STATEMENTS Elektro Celje ANNUAL REPORT 2016
product or service, performed work or accrued cost, expense or a share in profit or loss.
Measurement after initial recognitionLiabilities are measured at amortized cost. Before compiling the financial statements, the Company estimates the fair value of short-term liabilities based on contracts at least once a year, and if the carrying values are lower than the established fair values, a mandatory increase in the value of the Company’s short-term liabilities is implemented. Liabilities increase by the amount of accrued interest and decrease by the amount of repaid amounts or other form of settlement. The carrying value of long-term liabili-ties equals their historical cost de-creased by repayment of the principal and transfers under short-term debts. When purchasing on credit and if the contractual deadline for payment is exceeded, that part of the liability re-lating to interest is treated as finan-cial expense. Subsequent reduction by the amount for which agreements with creditors exist (subsequent dis-counts, returns of sold material, rec-ognized complaints, etc.), reduce the relevant costs or operating or finan-cial expenses. Short-term debts de-nominated in foreign currencies are translated into local currency at the reference exchange rate of the Euro-pean Central Bank by the Company on the balance sheet date.
Revaluation of liabilitiesThe Company does not carry out im-pairment of short-term liabilities or disclose it.
k) Short-term accruals and deferralsShort-term deferred costs and ac-crued revenue include short-term deferred costs (expenses), which are expected to be realized in the coming year and whose appearance is prob-able and whose size can be reliably estimated and which do not yet affect profit or loss, accrued revenue if they are justified in the income statement, for which the Company has not yet received payment and which could not be invoiced, and VAT on advanc-es received and overpayments of network charges.
Short-term deferred costs and ac-crued revenue include accrued costs
or expenses arising on the basis of equal burdening of profit or loss with expected costs, which have not yet arisen, and deferred revenue and VAT from granted advances.
Recognition and elimination of short-term accruals and deferralsShort-term accruals and deferrals are recognized when it is probable that during the period for which they were created, such revenues and costs or expenses are actually incurred. Derecognition is performed when all incurred options have expired or ac-cruals and deferrals are no longer needed. They are only used for the items for which they were originally recognized. The reality of the items in short-term accrued revenue and deferred costs must be justified on the balance sheet date, while items in accrued expenses and deferred rev-enue should not hide the reserves.
Revaluation of short-term accruals and deferrals Accruals and deferrals are not reval-ued and at the end of the accounting period, their reality and eligibility of their formation is verified.
l) Income taxIncome tax for the business year comprises current and deferred tax. Current tax is the tax paid by the Company from its taxable profit for the year, using tax rates in force on the reporting date, and taking into ac-count any adjustment to tax liabilities in respect of previous business years.
m) RevenueRevenue is broken down into oper-ating revenue, financial income and other revenue. Operating revenue and financial income are regular rev-enue.
Operating revenue comprise net sales revenues, capitalized own products and services and other op-erating revenue associated with busi-ness effects.
Net sales revenue include revenue of SODO from the lease of electricity infrastructure and the provision of re-lated services, and revenue from the provision of services to customers in the market, including rental of prem-
ises, the Company’s vacation facili-ties, etc. Amounts that have been in-voiced to the account of SODO d.o.o. are not shown under revenue, but among operating liabilities towards SODO d.o.o. VAT and excise duty are not counted as sales revenue, but as withdrawal liabilities.
Capitalised own services are servic-es rendered for the Company’s own needs and capitalised among tan-gible fixed assets or intangible non-current assets.
Other operating revenue comprises revenue from the reversal of provi-sions (mainly for fixed assets acquired free of charge), revenue associated with business effects (received com-pensation, subsidies, grants, etc.), and operating revenue from revalua-tion, arising from the disposal of fixed assets as surpluses of their sales val-ue over their carrying amounts, sale of dismantled material, write-offs of li-abilities and the elimination of revalu-ation adjustments.
Financial income arises in connec-tion to financial investments (mainly income from dividend payments and participation in profits of subsidiar-ies), receivables (mainly interest on late payments of the network charge and services), interest received from deposits, cash in accounts and grant-ed loans, positive exchange rate dif-ferences and revaluation financial revenues. Revenue from interest is recognised on the date of its occur-rence using the effective interest rate, income from dividends on the date when the shareholder’s right to receive payment is exercised, and late charges on overdue payments of the network charge and services rendered at settlement when there is no doubt with respect to their amount and maturity date.
Other revenue comprises unusual items which are not expected to oc-cur regularly or frequently (recovered receivables written off in previous years, received reimbursement of le-gal costs and damages, etc.).
Recognition of revenueRevenue is recognized if increases in economic benefits during the ac-counting period are associated with
138 15Elektro Celje ANNUAL REPORT 2016
increases in assets or decreases in liabilities, and if those increases can be measured reliably. Recognition cri-teria are usually applied separately to each transaction. Net sales revenue is recognized upon the sale of prod-ucts or services if it is reasonable to expect that sales will lead to receipts if they are not realised at the time of occurrence. Recognition of revenue from services rendered is performed using the method of work completion rate on the balance sheet date.
Initial accounting measurement of revenueRevenue is measured at the selling prices stated in invoices and other documents, reduced by any returns and rebates approved upon sale or subsequently for early payment.
n) Costs and expensesCosts and expenses are classified as operating, financial and other ex-penses. Operating and financial ex-penses are regular expenses.
Operating costs and expenses in-clude costs of goods, materials and services, labour costs, write-downs and other operating expenses. Financial expenses are expenses from the Company’s financing (bor-rowing costs, exchange rate differ-ences, etc.) and expenses from in-vesting activities (e.g. impairment and write-downs from investments) and are divided into the part associated with the creation of operating reve-nue, and the part associated with the creation of financial income.
Other expenses include unusual items and other expenses reducing profit. (fines, compensation and an-nuities, etc.).
Recognition of expensesCosts and expenses are recognized if decreases in economic benefits during the accounting period are as-
sociated with decreases in assets or increases in liabilities and if these decreases can be reliably measured. Operating expenses from revaluation are recognized when the adequate revaluation is performed. Financial expenses are recognized at settle-ment irrespective of the payments associated with them. Borrowing costs are recognized in the income statement using the effective interest method, except for those costs that are capitalized and attributable to tangible fixed assets in the course of construction or development.
Initial accounting measurement of expensesConsumption of stocks of materials is valued using the moving average price method. Labour costs include salaries and other labour costs cal-culated in gross amounts, as well as contributions paid from these bases which are not a constituent part of the gross amounts. The Company com-plied with the provisions of general and industry collective agreements and individual employment contracts with regard to payment of salaries. Write-offs include depreciation and operating expenses from revaluation. Depreciation was calculated based on the depreciation rates laid down by the so-called single commission of the five distribution companies with respect to the useful life of fixed assets. Operating expenses from re-valuation arise in connection to long-term intangible and tangible fixed assets and fixed assets due to their revaluation to a lower value, and in relation to the sale or other disposal and derecognition of fixed assets.
o) Statement of comprehensive in-comeThe statement of comprehensive in-come is a financial statement which gives a true and fair view of all com-ponents of the income statement for the periods for which it is prepared, and includes those items of income
and expense that are not recognized in profit or loss, but have an impact on the size of total equity.
The Company uses Version I of the profit or loss statement in accordance with SAS 21.8. Total comprehensive income with items from 19 to 24 of SAS 21.8 and items from 25 to 29 of SAS 21.10 is given in an additional statement.
p) Statement of cash flowsThe statement of cash flows faith-fully and fairly presents the changes in inflows and outflows in operating, investing and financing activities and explains the changes in the balance of cash flows for the financial year.
Cash and cash equivalents in the statement of cash flows include cash in current accounts, cash items in the process of collection, and deposits redeemable at notice. The statement of cash flows is compiled using the di-rect method (Version I) in accordance with SAS 22.6.
Proceeds from sales include value added tax and excise duties; cash flow items in investing and financing activities are reported in non-offset amounts. The data for the items of the statement of cash flows are de-rived from analytical records, current account summaries, and offsets.
q) Statement of changes in equityThe statement of changes in equity faithfully and fairly presents changes in all equity components in the bal-ance sheet for the financial year in ac-cordance with SAS 23.4 and SAS 23.5 in the form of a table of changes in all equity components. Total Company equity consists of share capital as entered into the court registry, capi-tal reserves, profit reserves, reserves arising from valuation at fair value, net profit or loss brought forward and net income for the fiscal year.
15.4 Disclosure of Items in the Balance SheetThe balance sheet is a fundamental financial statement which shows the fair balance of assets and liabilities as at 31 December 2016. It is compiled
in a sequential order as defined in SAS 20.4 and the Companies Act. Balance sheet items are recorded at their carrying values as the difference
between total value and revaluation adjustment. The principle of individu-al valuation of assets and liabilities is observed.
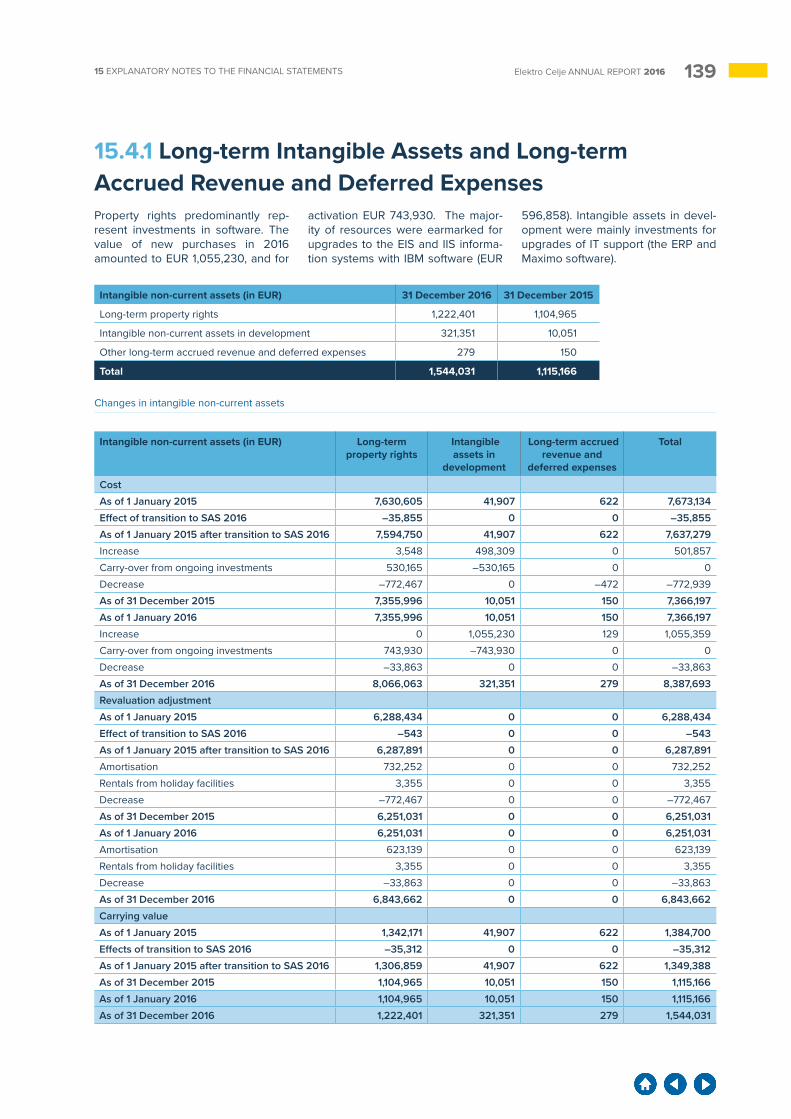
13915 EXPLANATORY NOTES TO THE FINANCIAL STATEMENTS Elektro Celje ANNUAL REPORT 2016
Intangible non-current assets (in EUR) 31 December 2016 31 December 2015
Long-term property rights 1,222,401 1,104,965
Intangible non-current assets in development 321,351 10,051
Other long-term accrued revenue and deferred expenses 279 150
Total 1,544,031 1,115,166
Changes in intangible non-current assets
Intangible non-current assets (in EUR) Long-term property rights
Intangible assets in
development
Long-term accrued revenue and
deferred expenses
Total
Cost
As of 1 January 2015 7,630,605 41,907 622 7,673,134
Effect of transition to SAS 2016 –35,855 0 0 –35,855
As of 1 January 2015 after transition to SAS 2016 7,594,750 41,907 622 7,637,279
Increase 3,548 498,309 0 501,857
Carry-over from ongoing investments 530,165 –530,165 0 0
Decrease –772,467 0 –472 –772,939
As of 31 December 2015 7,355,996 10,051 150 7,366,197
As of 1 January 2016 7,355,996 10,051 150 7,366,197
Increase 0 1,055,230 129 1,055,359
Carry-over from ongoing investments 743,930 –743,930 0 0
Decrease –33,863 0 0 –33,863
As of 31 December 2016 8,066,063 321,351 279 8,387,693
Revaluation adjustment
As of 1 January 2015 6,288,434 0 0 6,288,434
Effect of transition to SAS 2016 –543 0 0 –543
As of 1 January 2015 after transition to SAS 2016 6,287,891 0 0 6,287,891
Amortisation 732,252 0 0 732,252
Rentals from holiday facilities 3,355 0 0 3,355
Decrease –772,467 0 0 –772,467
As of 31 December 2015 6,251,031 0 0 6,251,031
As of 1 January 2016 6,251,031 0 0 6,251,031
Amortisation 623,139 0 0 623,139
Rentals from holiday facilities 3,355 0 0 3,355
Decrease –33,863 0 0 –33,863
As of 31 December 2016 6,843,662 0 0 6,843,662
Carrying value
As of 1 January 2015 1,342,171 41,907 622 1,384,700
Effects of transition to SAS 2016 –35,312 0 0 –35,312
As of 1 January 2015 after transition to SAS 2016 1,306,859 41,907 622 1,349,388
As of 31 December 2015 1,104,965 10,051 150 1,115,166
As of 1 January 2016 1,104,965 10,051 150 1,115,166
As of 31 December 2016 1,222,401 321,351 279 1,544,031
15.4.1 Long-term Intangible Assets and Long-term Accrued Revenue and Deferred ExpensesProperty rights predominantly rep-resent investments in software. The value of new purchases in 2016 amounted to EUR 1,055,230, and for
activation EUR 743,930. The major-ity of resources were earmarked for upgrades to the EIS and IIS informa-tion systems with IBM software (EUR
596,858). Intangible assets in devel-opment were mainly investments for upgrades of IT support (the ERP and Maximo software).
140 15Elektro Celje ANNUAL REPORT 2016
The carrying value of property rights, which pursuant to SAS 2.39 are man-aged as intangible assets in the ac-counting records and shown in the item land and buildings in the bal-ance sheet, amounted to EUR 44,175 as at 31 December 2016 (EUR 42,410
on 31 December 2015), while the re-valuation adjustment of those rights amounted to EUR 1,655 (EUR 1,215 on 31 December 2015).
Trade payables for the acquisition of intangible assets amounted to EUR
543,690 on 31 December 2016. The Company did not have any intangi-ble assets related to limited property rights or pledged as security for the repayment of debts as at 31 Decem-ber 2016.
15.4.2 Tangible Fixed AssetsThe carrying value of tangible fixed assets as at 31 December 2016 in the amount of EUR 246,036,537 represented 89.1% of balance sheet total of the Company.
Property, Plant and Equipment (in EUR) 31 December 2016 31 December 2015
Land 5,884,577 5,836,999
Buildings 172,247,047 167,956,919
Equipment 62,072,951 62,180,741
Property, plant and equipment in the course of acquisition 5,831,962 7,971,478
Total 246,036,537 243,946,137
Significant activation in 2016 related to the construction of the underground cable for 20 Kv TS Bukovšek Cerjak (EUR 180,844 EUR), underground ca-ble for 20 kV DTS Žalec - Novo Celje (EUR 192,422), underground cable for 20 kV DTS Žalec - Varioform (EUR 200,470), underground cable for 20 kV TS Solčava – TS Solčava hunting lodge (EUR 204,965), underground cable for 20 kV TS Brstovnica item 36 - TS Gračnica (EUR 209,843), un-derground cables for 2 x 20 kV DTS Vuzenica – DS Radlje (EUR 442,838), underground cable for 20 kV TS Armeško - TS Lokve (EUR 229,52), underground cable for OPL 2 x 20 kV Nazarje - Ljubno to TS Rečica trg (EUR 231,386) and reconstruction of the 20 kV overhead power line for DTS Šentjur - DS Podplat (EUR 233,114), and replacement of the equipment for the supply and trans-former bay (EUR 205,380) in the 110 kV switchyard of DTS Vuzenica. Bor-rowing costs which in 2016 were at-tributed to the newly activated engi-neering structures amounted to EUR 9,888 (EUR 7,257 in 2015), with EUR 800 (EUR 862 in 2015) attributed to new equipment.
The rate of depreciation of buildings
amounted to 69.6% and equipment 61.7%. Disposal and elimination of tan-gible fixed assets arose due to new investments, investment in recon-struction and renovation or technical, economic or physical obsolescence of fixed assets. Significant individual disposal (elimination) of the electric-ity infrastructure relate to fixed as-sets, which no longer had current values, therefore acquisition costs and accumulated depreciation were reduced by the same amount: 35 kV OPL DTS Selce - Bukovžlak – Podplat (EUR 536,480), 35 kV OPL DTS Selce – Štore north (EUR 225,206), 35 kV OPL DTS Selce – Štore south (EUR 224,248), 20 kV OPL DTS Mozirje - Letuš Topovlje (EUR 120,358), etc.
Electricity infrastructure is defined in the Decree on the energy infra-structure (Official Gazette of RS, no. 22/16) and also includes a portion of land in addition to buildings and equipment. The carrying value of long-term intangible and tangible fixed assets based on the Contract on leasing of the electricity distri-bution infrastructure and provision of services for the system operator and associated annexes leased to SODO d.o.o. on 31 December 2016
amounted to EUR 218,905,578 (EUR 214,469,851 in 2015) with that of other assets amounting to EUR 21,306,367 (EUR 21,568,221 in 2015); out of this amount, intangible fixed assets amounted to EUR 1,205,256 and tan-gible fixed assets EUR 239,006,68. The calculated value of revenue from leases to SODO for the financial year 2016 in the preliminary reconciliation of the regulatory year 2016 amounted to EUR 25,588,834 (EUR 26,238,701 in 2015).
The cost of the construction and man-ufacture of tangible fixed assets for the Company’s own account in 2016 amounted to EUR 13,260,484 (EUR 14,324,151 in 2015), purchases of prop-erty, plant and equipment from sup-pliers EUR 5,758,418 (EUR 7,441,071 in 2015), and acquisitions free of charge EUR 442,418 (EUR 380,390 in 2015). The Company disclosed liabilities in the amount of EUR 942,594 for the acquisition of tangible fixed assets on 31 December 2016.
The Company did not have any tan-gible fixed assets acquired through financial leasing or any tangible fixed assets pledged as security for liabili-ties as at 31 December 2016.
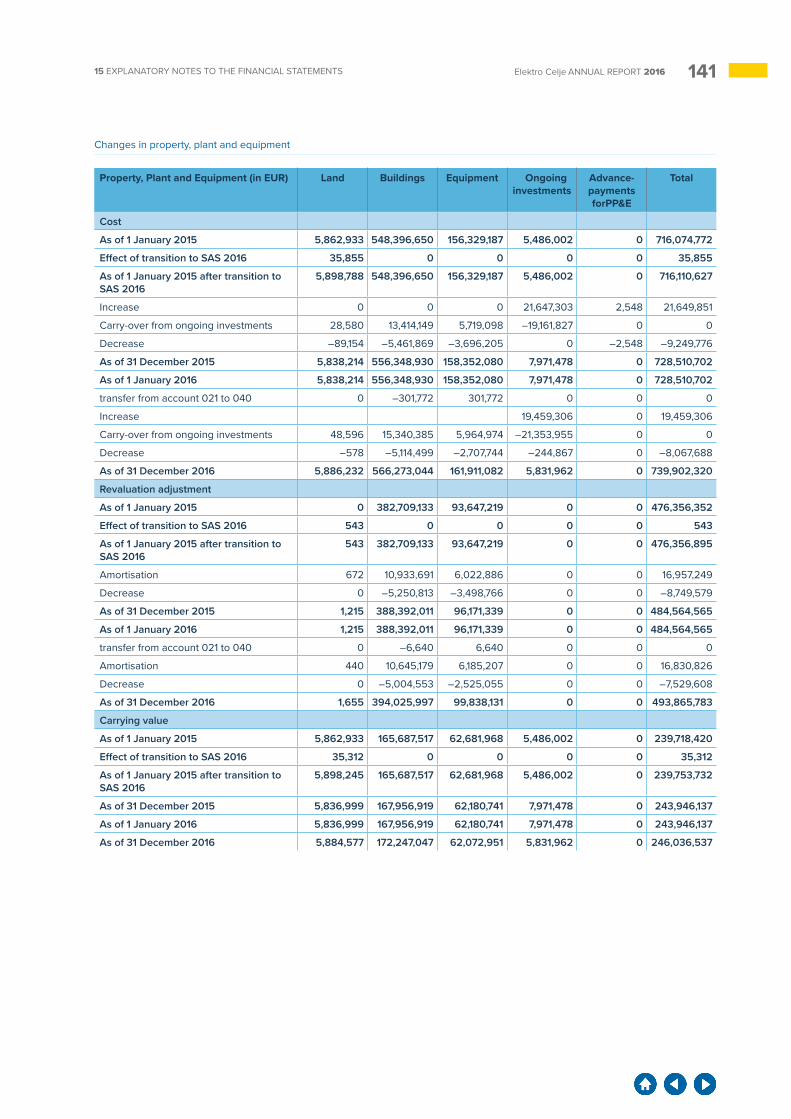
14115 EXPLANATORY NOTES TO THE FINANCIAL STATEMENTS Elektro Celje ANNUAL REPORT 2016
Changes in property, plant and equipment
Property, Plant and Equipment (in EUR) Land Buildings Equipment Ongoing investments
Advance-payments forPP&E
Total
Cost
As of 1 January 2015 5,862,933 548,396,650 156,329,187 5,486,002 0 716,074,772
Effect of transition to SAS 2016 35,855 0 0 0 0 35,855
As of 1 January 2015 after transition to SAS 2016
5,898,788 548,396,650 156,329,187 5,486,002 0 716,110,627
Increase 0 0 0 21,647,303 2,548 21,649,851
Carry-over from ongoing investments 28,580 13,414,149 5,719,098 –19,161,827 0 0
Decrease –89,154 –5,461,869 –3,696,205 0 –2,548 –9,249,776
As of 31 December 2015 5,838,214 556,348,930 158,352,080 7,971,478 0 728,510,702
As of 1 January 2016 5,838,214 556,348,930 158,352,080 7,971,478 0 728,510,702
transfer from account 021 to 040 0 –301,772 301,772 0 0 0
Increase 19,459,306 0 19,459,306
Carry-over from ongoing investments 48,596 15,340,385 5,964,974 –21,353,955 0 0
Decrease –578 –5,114,499 –2,707,744 –244,867 0 –8,067,688
As of 31 December 2016 5,886,232 566,273,044 161,911,082 5,831,962 0 739,902,320
Revaluation adjustment
As of 1 January 2015 0 382,709,133 93,647,219 0 0 476,356,352
Effect of transition to SAS 2016 543 0 0 0 0 543
As of 1 January 2015 after transition to SAS 2016
543 382,709,133 93,647,219 0 0 476,356,895
Amortisation 672 10,933,691 6,022,886 0 0 16,957,249
Decrease 0 –5,250,813 –3,498,766 0 0 –8,749,579
As of 31 December 2015 1,215 388,392,011 96,171,339 0 0 484,564,565
As of 1 January 2016 1,215 388,392,011 96,171,339 0 0 484,564,565
transfer from account 021 to 040 0 –6,640 6,640 0 0 0
Amortisation 440 10,645,179 6,185,207 0 0 16,830,826
Decrease 0 –5,004,553 –2,525,055 0 0 –7,529,608
As of 31 December 2016 1,655 394,025,997 99,838,131 0 0 493,865,783
Carrying value
As of 1 January 2015 5,862,933 165,687,517 62,681,968 5,486,002 0 239,718,420
Effect of transition to SAS 2016 35,312 0 0 0 0 35,312
As of 1 January 2015 after transition to SAS 2016
5,898,245 165,687,517 62,681,968 5,486,002 0 239,753,732
As of 31 December 2015 5,836,999 167,956,919 62,180,741 7,971,478 0 243,946,137
As of 1 January 2016 5,836,999 167,956,919 62,180,741 7,971,478 0 243,946,137
As of 31 December 2016 5,884,577 172,247,047 62,072,951 5,831,962 0 246,036,537
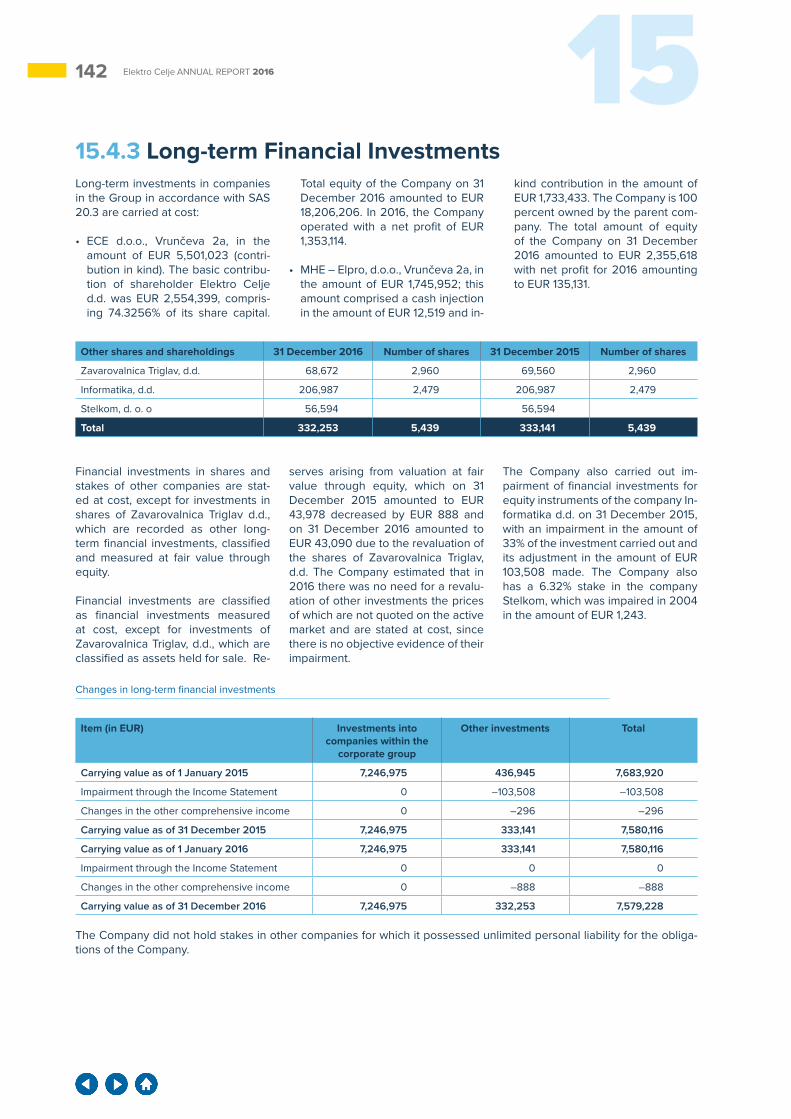
142 15Elektro Celje ANNUAL REPORT 2016
15.4.3 Long-term Financial InvestmentsLong-term investments in companies in the Group in accordance with SAS 20.3 are carried at cost:
• ECE d.o.o., Vrunčeva 2a, in the amount of EUR 5,501,023 (contri-bution in kind). The basic contribu-tion of shareholder Elektro Celje d.d. was EUR 2,554,399, compris-ing 74.3256% of its share capital.
Total equity of the Company on 31 December 2016 amounted to EUR 18,206,206. In 2016, the Company operated with a net profit of EUR 1,353,114.
• MHE – Elpro, d.o.o., Vrunčeva 2a, in the amount of EUR 1,745,952; this amount comprised a cash injection in the amount of EUR 12,519 and in-
kind contribution in the amount of EUR 1,733,433. The Company is 100 percent owned by the parent com-pany. The total amount of equity of the Company on 31 December 2016 amounted to EUR 2,355,618 with net profit for 2016 amounting to EUR 135,131.
Changes in long-term financial investments
Item (in EUR) Investments into companies within the
corporate group
Other investments Total
Carrying value as of 1 January 2015 7,246,975 436,945 7,683,920
Impairment through the Income Statement 0 –103,508 –103,508
Changes in the other comprehensive income 0 –296 –296
Carrying value as of 31 December 2015 7,246,975 333,141 7,580,116
Carrying value as of 1 January 2016 7,246,975 333,141 7,580,116
Impairment through the Income Statement 0 0 0
Changes in the other comprehensive income 0 –888 –888
Carrying value as of 31 December 2016 7,246,975 332,253 7,579,228
The Company did not hold stakes in other companies for which it possessed unlimited personal liability for the obliga-tions of the Company.
Other shares and shareholdings 31 December 2016 Number of shares 31 December 2015 Number of shares
Zavarovalnica Triglav, d.d. 68,672 2,960 69,560 2,960
Informatika, d.d. 206,987 2,479 206,987 2,479
Stelkom, d. o. o 56,594 56,594
Total 332,253 5,439 333,141 5,439
Financial investments in shares and stakes of other companies are stat-ed at cost, except for investments in shares of Zavarovalnica Triglav d.d., which are recorded as other long-term financial investments, classified and measured at fair value through equity.
Financial investments are classified as financial investments measured at cost, except for investments of Zavarovalnica Triglav, d.d., which are classified as assets held for sale. Re-
serves arising from valuation at fair value through equity, which on 31 December 2015 amounted to EUR 43,978 decreased by EUR 888 and on 31 December 2016 amounted to EUR 43,090 due to the revaluation of the shares of Zavarovalnica Triglav, d.d. The Company estimated that in 2016 there was no need for a revalu-ation of other investments the prices of which are not quoted on the active market and are stated at cost, since there is no objective evidence of their impairment.
The Company also carried out im-pairment of financial investments for equity instruments of the company In-formatika d.d. on 31 December 2015, with an impairment in the amount of 33% of the investment carried out and its adjustment in the amount of EUR 103,508 made. The Company also has a 6.32% stake in the company Stelkom, which was impaired in 2004 in the amount of EUR 1,243.

14315 EXPLANATORY NOTES TO THE FINANCIAL STATEMENTS Elektro Celje ANNUAL REPORT 2016
Changes in the Deferred Tax Asset
Deferred Tax Assets (in EUR) 31 December 2016 31 December 2015
Short-term receivables 177,336 167,030
Long-term receivables 14,561 6,322
Provisions for long-term benefits 535,854 447,511
Financial assets measured at cost 19,667 17,597
Long-term accrued expenses and deferred revenue for fixed assets acquired free of charge 1,022,743 0
Total 1,770,161 638,460
15.4.4 Deferred Tax AssetsThe tax rate of 19% was used for the calculation of deferred tax assets in 2016, with the same rate expected to be used in the coming years (17% in 2015).
Item (in EUR) Short-term receivables
Long-term receivables
Provisions for long-term
benefits
Financial investments
Long-term accrued
expenses and deferred revenue for fixed assets
acquired free of charge
Total
As of 1 January 2015 164,831 3,990 431,278 0 0 600,099
Recognised in the Income Statement 2,199 2,332 5,310 17,597 0 27,438
Recognised in the Comprehensive IncomeStatement
0 0 10,923 0 0 10,923
Reversed in the Income Statement 0 0 0 0 0 0
As of 31 December 2015 167,030 6,322 447,511 17,597 0 638,460
As of 1 January 2016 167,030 6,322 447,511 17,597 0 638,460
Recognised in the Income Statement 10,306 8,239 58,158 2,070 1,022,743 1,101,516
Recognised in the Comprehensive IncomeStatement
0 0 30,185 0 0 30,185
Reversed in the Income Statement 0 0 0 0 0 0
As of 31 December 2016 177,336 14,561 535,854 19,667 1,022,743 1,770,161
As at 31 December 2016, the Company had no other significant temporary tax differences and tax credits, which could constitute an additional source for the formation of deferred tax assets.
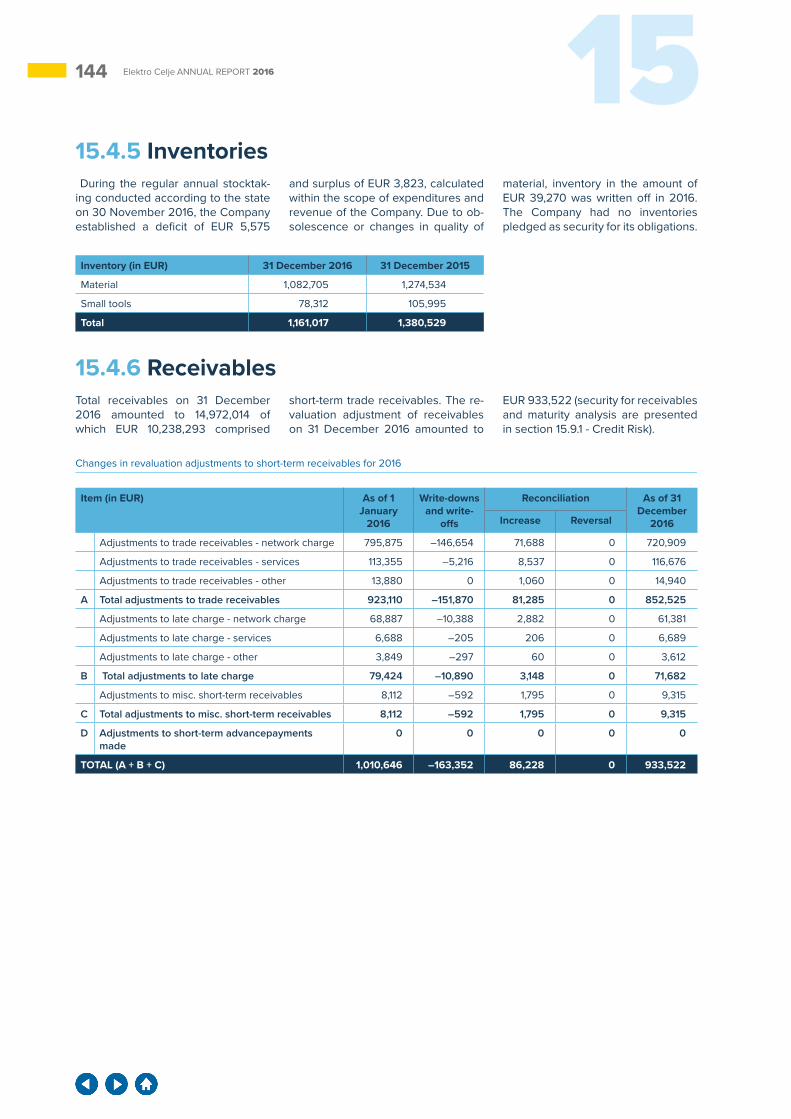
144 15Elektro Celje ANNUAL REPORT 2016
15.4.5 Inventories During the regular annual stocktak-ing conducted according to the state on 30 November 2016, the Company established a deficit of EUR 5,575
and surplus of EUR 3,823, calculated within the scope of expenditures and revenue of the Company. Due to ob-solescence or changes in quality of
material, inventory in the amount of EUR 39,270 was written off in 2016. The Company had no inventories pledged as security for its obligations.
Changes in revaluation adjustments to short-term receivables for 2016
Item (in EUR) As of 1 January
2016
Write-downs and write-
offs
Reconciliation As of 31 December
2016Increase Reversal
Adjustments to trade receivables - network charge 795,875 –146,654 71,688 0 720,909
Adjustments to trade receivables - services 113,355 –5,216 8,537 0 116,676
Adjustments to trade receivables - other 13,880 0 1,060 0 14,940
A Total adjustments to trade receivables 923,110 –151,870 81,285 0 852,525
Adjustments to late charge - network charge 68,887 –10,388 2,882 0 61,381
Adjustments to late charge - services 6,688 –205 206 0 6,689
Adjustments to late charge - other 3,849 –297 60 0 3,612
B Total adjustments to late charge 79,424 –10,890 3,148 0 71,682
Adjustments to misc. short-term receivables 8,112 –592 1,795 0 9,315
C Total adjustments to misc. short-term receivables 8,112 –592 1,795 0 9,315
D Adjustments to short-term advancepayments made
0 0 0 0 0
TOTAL (A + B + C) 1,010,646 –163,352 86,228 0 933,522
15.4.6 ReceivablesTotal receivables on 31 December 2016 amounted to 14,972,014 of which EUR 10,238,293 comprised
short-term trade receivables. The re-valuation adjustment of receivables on 31 December 2016 amounted to
EUR 933,522 (security for receivables and maturity analysis are presented in section 15.9.1 - Credit Risk).
Inventory (in EUR) 31 December 2016 31 December 2015
Material 1,082,705 1,274,534
Small tools 78,312 105,995
Total 1,161,017 1,380,529
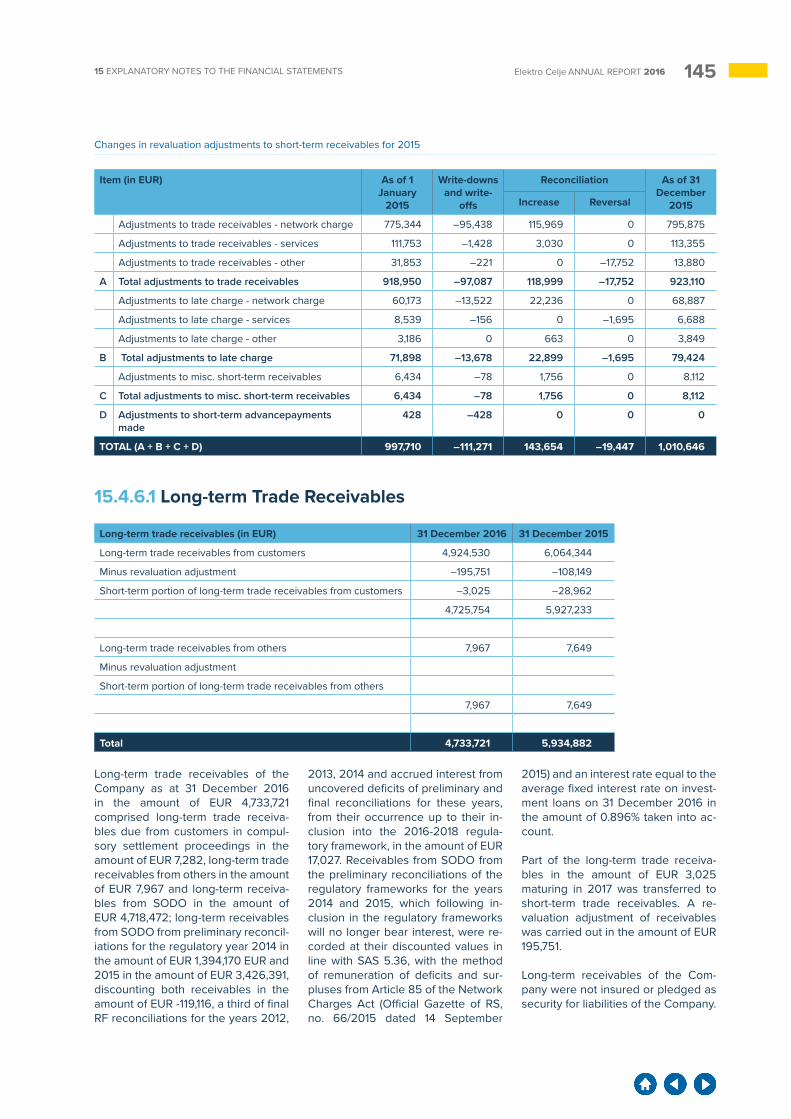
14515 EXPLANATORY NOTES TO THE FINANCIAL STATEMENTS Elektro Celje ANNUAL REPORT 2016
Changes in revaluation adjustments to short-term receivables for 2015
Item (in EUR) As of 1 January
2015
Write-downs and write-
offs
Reconciliation As of 31 December
2015Increase Reversal
Adjustments to trade receivables - network charge 775,344 –95,438 115,969 0 795,875
Adjustments to trade receivables - services 111,753 –1,428 3,030 0 113,355
Adjustments to trade receivables - other 31,853 –221 0 –17,752 13,880
A Total adjustments to trade receivables 918,950 –97,087 118,999 –17,752 923,110
Adjustments to late charge - network charge 60,173 –13,522 22,236 0 68,887
Adjustments to late charge - services 8,539 –156 0 –1,695 6,688
Adjustments to late charge - other 3,186 0 663 0 3,849
B Total adjustments to late charge 71,898 –13,678 22,899 –1,695 79,424
Adjustments to misc. short-term receivables 6,434 –78 1,756 0 8,112
C Total adjustments to misc. short-term receivables 6,434 –78 1,756 0 8,112
D Adjustments to short-term advancepayments made
428 –428 0 0 0
TOTAL (A + B + C + D) 997,710 –111,271 143,654 –19,447 1,010,646
15.4.6.1 Long-term Trade Receivables
Long-term trade receivables (in EUR) 31 December 2016 31 December 2015
Long-term trade receivables from customers 4,924,530 6,064,344
Minus revaluation adjustment –195,751 –108,149
Short-term portion of long-term trade receivables from customers –3,025 –28,962
4,725,754 5,927,233
Long-term trade receivables from others 7,967 7,649
Minus revaluation adjustment
Short-term portion of long-term trade receivables from others
7,967 7,649
Total 4,733,721 5,934,882
Long-term trade receivables of the Company as at 31 December 2016 in the amount of EUR 4,733,721 comprised long-term trade receiva-bles due from customers in compul-sory settlement proceedings in the amount of EUR 7,282, long-term trade receivables from others in the amount of EUR 7,967 and long-term receiva-bles from SODO in the amount of EUR 4,718,472; long-term receivables from SODO from preliminary reconcil-iations for the regulatory year 2014 in the amount of EUR 1,394,170 EUR and 2015 in the amount of EUR 3,426,391, discounting both receivables in the amount of EUR -119,116, a third of final RF reconciliations for the years 2012,
2013, 2014 and accrued interest from uncovered deficits of preliminary and final reconciliations for these years, from their occurrence up to their in-clusion into the 2016-2018 regula-tory framework, in the amount of EUR 17,027. Receivables from SODO from the preliminary reconciliations of the regulatory frameworks for the years 2014 and 2015, which following in-clusion in the regulatory frameworks will no longer bear interest, were re-corded at their discounted values in line with SAS 5.36, with the method of remuneration of deficits and sur-pluses from Article 85 of the Network Charges Act (Official Gazette of RS, no. 66/2015 dated 14 September
2015) and an interest rate equal to the average fixed interest rate on invest-ment loans on 31 December 2016 in the amount of 0.896% taken into ac-count.
Part of the long-term trade receiva-bles in the amount of EUR 3,025 maturing in 2017 was transferred to short-term trade receivables. A re-valuation adjustment of receivables was carried out in the amount of EUR 195,751.
Long-term receivables of the Com-pany were not insured or pledged as security for liabilities of the Company.
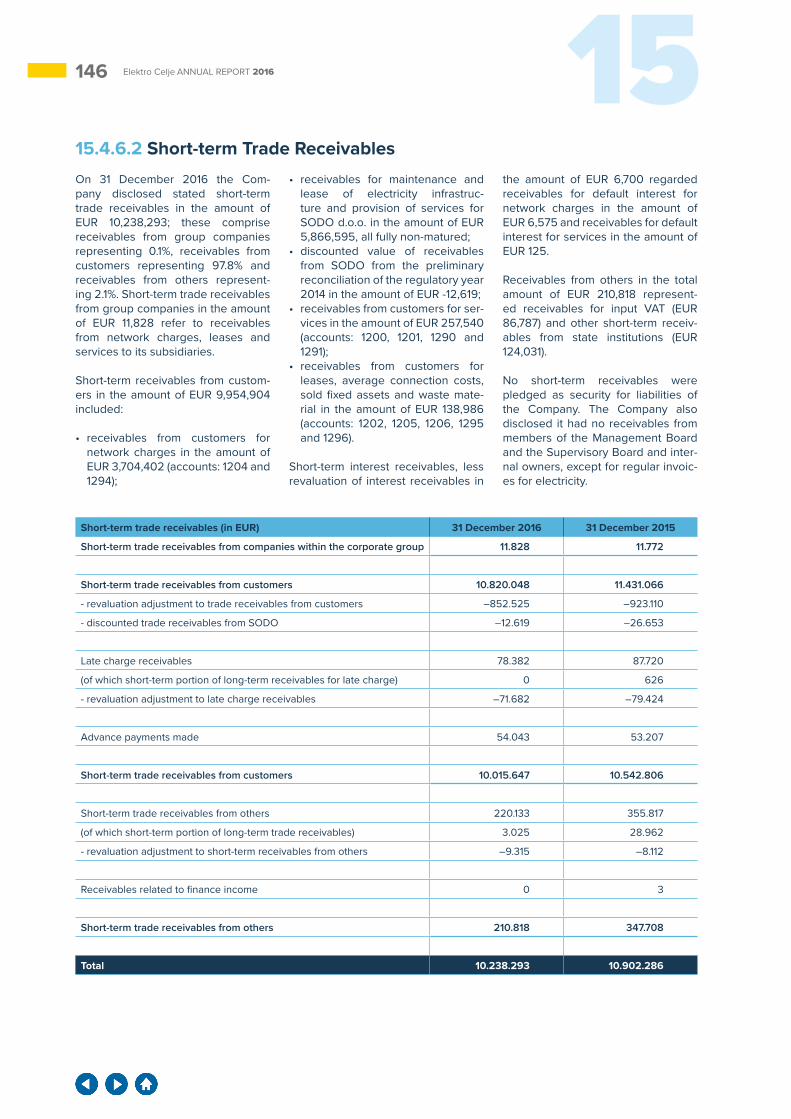
146 15Elektro Celje ANNUAL REPORT 2016
Short-term trade receivables (in EUR) 31 December 2016 31 December 2015
Short-term trade receivables from companies within the corporate group 11.828 11.772
Short-term trade receivables from customers 10.820.048 11.431.066
- revaluation adjustment to trade receivables from customers –852.525 –923.110
- discounted trade receivables from SODO –12.619 –26.653
Late charge receivables 78.382 87.720
(of which short-term portion of long-term receivables for late charge) 0 626
- revaluation adjustment to late charge receivables –71.682 –79.424
Advance payments made 54.043 53.207
Short-term trade receivables from customers 10.015.647 10.542.806
Short-term trade receivables from others 220.133 355.817
(of which short-term portion of long-term trade receivables) 3.025 28.962
- revaluation adjustment to short-term receivables from others –9.315 –8.112
Receivables related to finance income 0 3
Short-term trade receivables from others 210.818 347.708
Total 10.238.293 10.902.286
15.4.6.2 Short-term Trade ReceivablesOn 31 December 2016 the Com-pany disclosed stated short-term trade receivables in the amount of EUR 10,238,293; these comprise receivables from group companies representing 0.1%, receivables from customers representing 97.8% and receivables from others represent-ing 2.1%. Short-term trade receivables from group companies in the amount of EUR 11,828 refer to receivables from network charges, leases and services to its subsidiaries.
Short-term receivables from custom-ers in the amount of EUR 9,954,904 included:
• receivables from customers for network charges in the amount of EUR 3,704,402 (accounts: 1204 and 1294);
• receivables for maintenance and lease of electricity infrastruc-ture and provision of services for SODO d.o.o. in the amount of EUR 5,866,595, all fully non-matured;
• discounted value of receivables from SODO from the preliminary reconciliation of the regulatory year 2014 in the amount of EUR -12,619;
• receivables from customers for ser-vices in the amount of EUR 257,540 (accounts: 1200, 1201, 1290 and 1291);
• receivables from customers for leases, average connection costs, sold fixed assets and waste mate-rial in the amount of EUR 138,986 (accounts: 1202, 1205, 1206, 1295 and 1296).
Short-term interest receivables, less revaluation of interest receivables in
the amount of EUR 6,700 regarded receivables for default interest for network charges in the amount of EUR 6,575 and receivables for default interest for services in the amount of EUR 125.
Receivables from others in the total amount of EUR 210,818 represent-ed receivables for input VAT (EUR 86,787) and other short-term receiv-ables from state institutions (EUR 124,031).
No short-term receivables were pledged as security for liabilities of the Company. The Company also disclosed it had no receivables from members of the Management Board and the Supervisory Board and inter-nal owners, except for regular invoic-es for electricity.
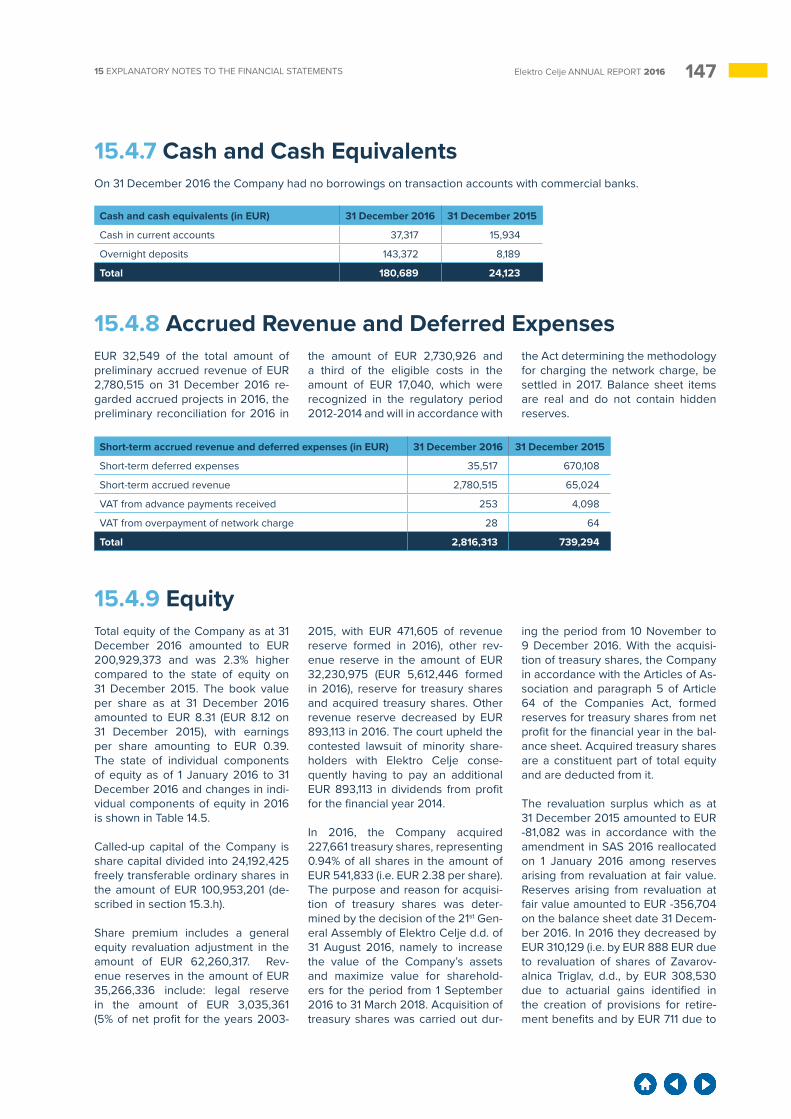
14715 EXPLANATORY NOTES TO THE FINANCIAL STATEMENTS Elektro Celje ANNUAL REPORT 2016
Cash and cash equivalents (in EUR) 31 December 2016 31 December 2015
Cash in current accounts 37,317 15,934
Overnight deposits 143,372 8,189
Total 180,689 24,123
Short-term accrued revenue and deferred expenses (in EUR) 31 December 2016 31 December 2015
Short-term deferred expenses 35,517 670,108
Short-term accrued revenue 2,780,515 65,024
VAT from advance payments received 253 4,098
VAT from overpayment of network charge 28 64
Total 2,816,313 739,294
15.4.7 Cash and Cash EquivalentsOn 31 December 2016 the Company had no borrowings on transaction accounts with commercial banks.
15.4.8 Accrued Revenue and Deferred ExpensesEUR 32,549 of the total amount of preliminary accrued revenue of EUR 2,780,515 on 31 December 2016 re-garded accrued projects in 2016, the preliminary reconciliation for 2016 in
the amount of EUR 2,730,926 and a third of the eligible costs in the amount of EUR 17,040, which were recognized in the regulatory period 2012-2014 and will in accordance with
the Act determining the methodology for charging the network charge, be settled in 2017. Balance sheet items are real and do not contain hidden reserves.
15.4.9 EquityTotal equity of the Company as at 31 December 2016 amounted to EUR 200,929,373 and was 2.3% higher compared to the state of equity on 31 December 2015. The book value per share as at 31 December 2016 amounted to EUR 8.31 (EUR 8.12 on 31 December 2015), with earnings per share amounting to EUR 0.39. The state of individual components of equity as of 1 January 2016 to 31 December 2016 and changes in indi-vidual components of equity in 2016 is shown in Table 14.5.
Called-up capital of the Company is share capital divided into 24,192,425 freely transferable ordinary shares in the amount of EUR 100,953,201 (de-scribed in section 15.3.h).
Share premium includes a general equity revaluation adjustment in the amount of EUR 62,260,317. Rev-enue reserves in the amount of EUR 35,266,336 include: legal reserve in the amount of EUR 3,035,361 (5% of net profit for the years 2003-
2015, with EUR 471,605 of revenue reserve formed in 2016), other rev-enue reserve in the amount of EUR 32,230,975 (EUR 5,612,446 formed in 2016), reserve for treasury shares and acquired treasury shares. Other revenue reserve decreased by EUR 893,113 in 2016. The court upheld the contested lawsuit of minority share-holders with Elektro Celje conse-quently having to pay an additional EUR 893,113 in dividends from profit for the financial year 2014.
In 2016, the Company acquired 227,661 treasury shares, representing 0.94% of all shares in the amount of EUR 541,833 (i.e. EUR 2.38 per share). The purpose and reason for acquisi-tion of treasury shares was deter-mined by the decision of the 21st Gen-eral Assembly of Elektro Celje d.d. of 31 August 2016, namely to increase the value of the Company’s assets and maximize value for sharehold-ers for the period from 1 September 2016 to 31 March 2018. Acquisition of treasury shares was carried out dur-
ing the period from 10 November to 9 December 2016. With the acquisi-tion of treasury shares, the Company in accordance with the Articles of As-sociation and paragraph 5 of Article 64 of the Companies Act, formed reserves for treasury shares from net profit for the financial year in the bal-ance sheet. Acquired treasury shares are a constituent part of total equity and are deducted from it.
The revaluation surplus which as at 31 December 2015 amounted to EUR -81,082 was in accordance with the amendment in SAS 2016 reallocated on 1 January 2016 among reserves arising from revaluation at fair value. Reserves arising from revaluation at fair value amounted to EUR -356,704 on the balance sheet date 31 Decem-ber 2016. In 2016 they decreased by EUR 310,129 (i.e. by EUR 888 EUR due to revaluation of shares of Zavarov-alnica Triglav, d.d., by EUR 308,530 due to actuarial gains identified in the creation of provisions for retire-ment benefits and by EUR 711 due to
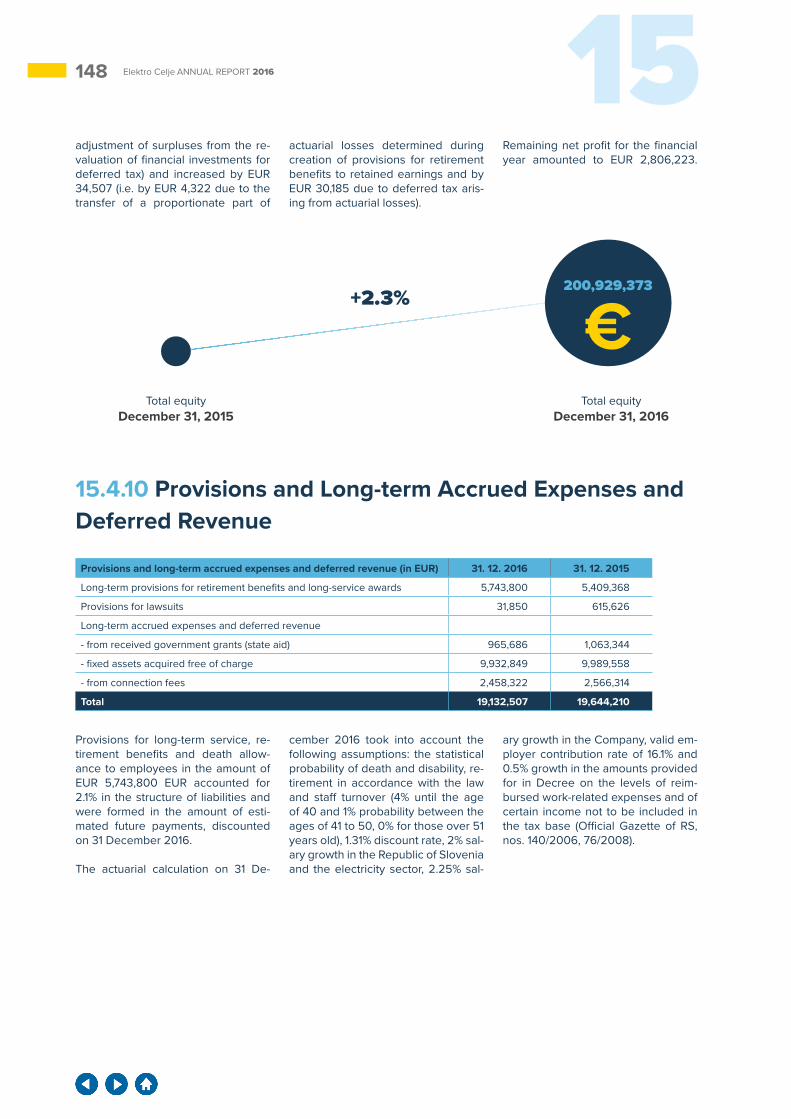
148 15Elektro Celje ANNUAL REPORT 2016
adjustment of surpluses from the re-valuation of financial investments for deferred tax) and increased by EUR 34,507 (i.e. by EUR 4,322 due to the transfer of a proportionate part of
actuarial losses determined during creation of provisions for retirement benefits to retained earnings and by EUR 30,185 due to deferred tax aris-ing from actuarial losses).
Remaining net profit for the financial year amounted to EUR 2,806,223.
Provisions and long-term accrued expenses and deferred revenue (in EUR) 31. 12. 2016 31. 12. 2015
Long-term provisions for retirement benefits and long-service awards 5,743,800 5,409,368
Provisions for lawsuits 31,850 615,626
Long-term accrued expenses and deferred revenue
- from received government grants (state aid) 965,686 1,063,344
- fixed assets acquired free of charge 9,932,849 9,989,558
- from connection fees 2,458,322 2,566,314
Total 19,132,507 19,644,210
15.4.10 Provisions and Long-term Accrued Expenses and Deferred Revenue
200,929,373
Total equity December 31, 2016
Total equity December 31, 2015
+2.3%
Provisions for long-term service, re-tirement benefits and death allow-ance to employees in the amount of EUR 5,743,800 EUR accounted for 2.1% in the structure of liabilities and were formed in the amount of esti-mated future payments, discounted on 31 December 2016.
The actuarial calculation on 31 De-
cember 2016 took into account the following assumptions: the statistical probability of death and disability, re-tirement in accordance with the law and staff turnover (4% until the age of 40 and 1% probability between the ages of 41 to 50, 0% for those over 51 years old), 1.31% discount rate, 2% sal-ary growth in the Republic of Slovenia and the electricity sector, 2.25% sal-
ary growth in the Company, valid em-ployer contribution rate of 16.1% and 0.5% growth in the amounts provided for in Decree on the levels of reim-bursed work-related expenses and of certain income not to be included in the tax base (Official Gazette of RS, nos. 140/2006, 76/2008).

14915 EXPLANATORY NOTES TO THE FINANCIAL STATEMENTS Elektro Celje ANNUAL REPORT 2016
Liabilities related to long-term employment benefits
Changes in provisions and long-term accrued expenses and deferred revenue
Item (in EUR) Long-service awards Retirement benefits Death allowance Total
As of 1 January 2015 1,697,369 3,275,939 166,780 5,140,088
Current service costs 116,811 162,803 11,422 291,036
Interest expense 32,668 70,846 3,403 106,917
Payments of benefits –245,445 –127,218 –15,518 –388,181
Actuarial surplus 84,261 158,640 16,607 259,508
As of 31 December 2015 1,685,664 3,541,010 182,694 5,409,368
As of 1 January 2016 1,685,664 3,541,010 182,694 5,409,368
Current service costs 114,085 184,919 8,868 307,872
Interest expense 29,068 68,438 3,654 101,160
Payments of benefits –232,261 –119,099 0 –351,360
Actuarial surplus 22,053 308,529 –53,822 276,760
As of 31 December 2016 1,618,609 3,983,797 141,394 5,743,800
Item (in EUR) Provisions for long-term benefits
Other provisions Long-term accrued expenses and deferred
revenue
Total
As of 1 January 2015 5,140,088 40,000 13,947,157 19,127,245
Utilisation –388,182 –31,050 0 –419,232
Recognition 657,462 615,626 474,595 1,747,683
Reversal 0 –8,950 –802,536 –811,486
As of 31 December 2015 5,409,368 615,626 13,619,216 19,644,210
As of 1 January 2016 5,409,368 615,626 13,619,216 19,644,210
Utilisation –351,360 0 0 –351,360
Recognition 730,746 12,000 450,418 1,193,164
Reversal –44,954 –595,776 –712,777 –1,353,507
As of 31 December 2016 5,743,800 31,850 13,356,857 19,132,507
The expected present value of liabili-ties also includes actuarial gains/loss-es due to changes in financial and demographic assumptions and ad-justments for experience. During the year EUR 351,360 of provisions were used based on actual costs incurred for long-term employee benefits, EUR 730,746 of additional provisions were formed and a reversal of provisions in the amount of EUR 44,954 carried out.Long-term accrued expenses and de-ferred revenue regarding fixed assets acquired free of charge were formed
in the amount of EUR 442,418. EUR 607,120 in long-term deferrals and ac-cruals were reversed for fixed assets acquired free of charge and average connection fees, EUR 8,298 for the use of assigned contributions un-der the Vocational Rehabilitation and Employment of Disabled Persons Act and EUR 97,359 8298 for use of gov-ernment subsidies for the purchase of fixed assets.
Other provisions as at 31 December 2016 include provisions for lawsuits in the amount of EUR 19,850 formed in
2015 (action for damages due to the disconnection of the neutral line) and additional provisions created in 2016 in the amount of EUR 12,000 (action for damages due to TS ownership). Provisions formed in 2015 due to a lawsuit for payment of balance of the 2015 holiday pay up to the amount 2015 prescribed in Article 128 of the Collective Agreement for Slovenian Electricity Industry amounting to EUR 595,776 were eliminated in 2016 due to the withdrawal of the lawsuit.
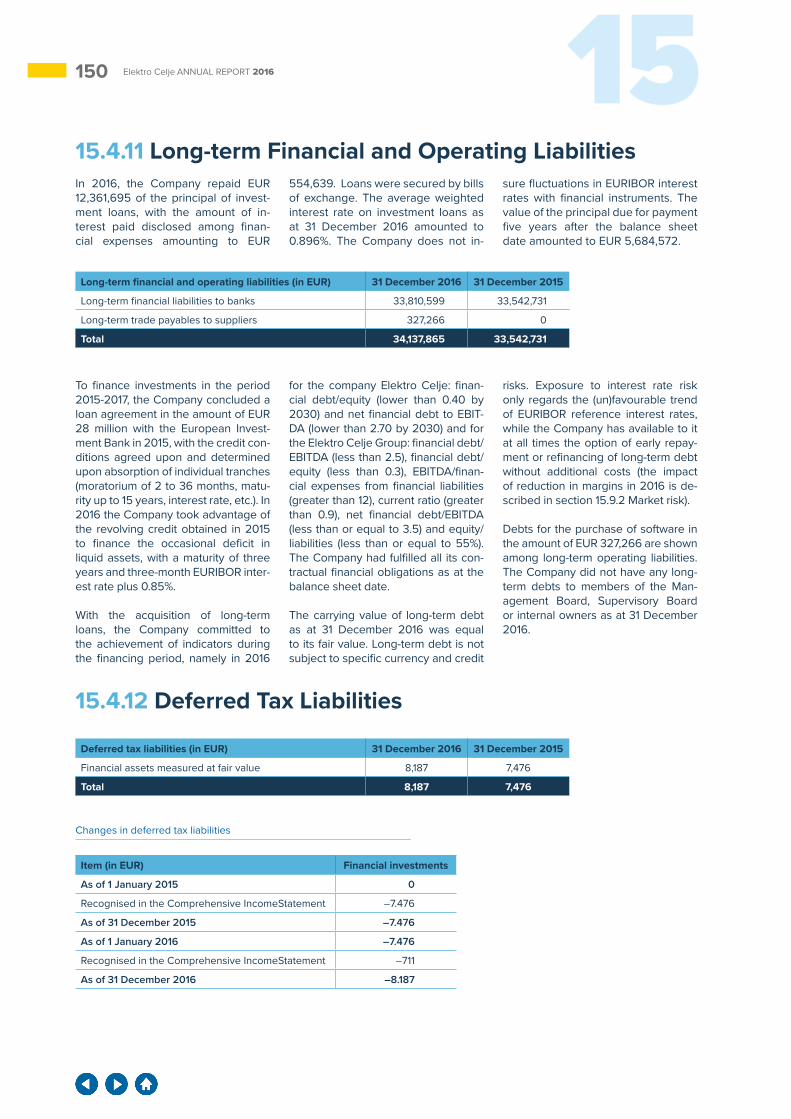
150 15Elektro Celje ANNUAL REPORT 2016
Deferred tax liabilities (in EUR) 31 December 2016 31 December 2015
Financial assets measured at fair value 8,187 7,476
Total 8,187 7,476
Changes in deferred tax liabilities
Item (in EUR) Financial investments
As of 1 January 2015 0
Recognised in the Comprehensive IncomeStatement –7.476
As of 31 December 2015 –7.476
As of 1 January 2016 –7.476
Recognised in the Comprehensive IncomeStatement –711
As of 31 December 2016 –8.187
15.4.11 Long-term Financial and Operating LiabilitiesIn 2016, the Company repaid EUR 12,361,695 of the principal of invest-ment loans, with the amount of in-terest paid disclosed among finan-cial expenses amounting to EUR
554,639. Loans were secured by bills of exchange. The average weighted interest rate on investment loans as at 31 December 2016 amounted to 0.896%. The Company does not in-
sure fluctuations in EURIBOR interest rates with financial instruments. The value of the principal due for payment five years after the balance sheet date amounted to EUR 5,684,572.
Long-term financial and operating liabilities (in EUR) 31 December 2016 31 December 2015
Long-term financial liabilities to banks 33,810,599 33,542,731
Long-term trade payables to suppliers 327,266 0
Total 34,137,865 33,542,731
To finance investments in the period 2015-2017, the Company concluded a loan agreement in the amount of EUR 28 million with the European Invest-ment Bank in 2015, with the credit con-ditions agreed upon and determined upon absorption of individual tranches (moratorium of 2 to 36 months, matu-rity up to 15 years, interest rate, etc.). In 2016 the Company took advantage of the revolving credit obtained in 2015 to finance the occasional deficit in liquid assets, with a maturity of three years and three-month EURIBOR inter-est rate plus 0.85%.
With the acquisition of long-term loans, the Company committed to the achievement of indicators during the financing period, namely in 2016
for the company Elektro Celje: finan-cial debt/equity (lower than 0.40 by 2030) and net financial debt to EBIT-DA (lower than 2.70 by 2030) and for the Elektro Celje Group: financial debt/EBITDA (less than 2.5), financial debt/equity (less than 0.3), EBITDA/finan-cial expenses from financial liabilities (greater than 12), current ratio (greater than 0.9), net financial debt/EBITDA (less than or equal to 3.5) and equity/liabilities (less than or equal to 55%). The Company had fulfilled all its con-tractual financial obligations as at the balance sheet date.
The carrying value of long-term debt as at 31 December 2016 was equal to its fair value. Long-term debt is not subject to specific currency and credit
risks. Exposure to interest rate risk only regards the (un)favourable trend of EURIBOR reference interest rates, while the Company has available to it at all times the option of early repay-ment or refinancing of long-term debt without additional costs (the impact of reduction in margins in 2016 is de-scribed in section 15.9.2 Market risk).
Debts for the purchase of software in the amount of EUR 327,266 are shown among long-term operating liabilities. The Company did not have any long-term debts to members of the Man-agement Board, Supervisory Board or internal owners as at 31 December 2016.
15.4.12 Deferred Tax Liabilities
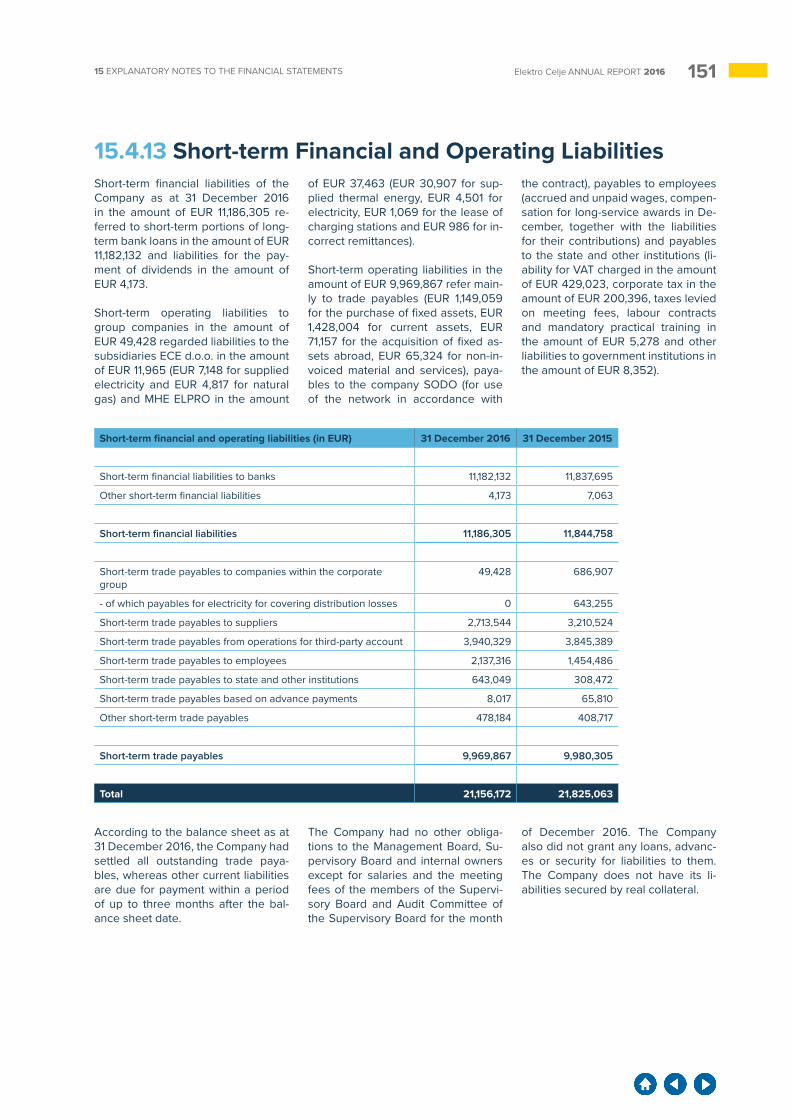
15115 EXPLANATORY NOTES TO THE FINANCIAL STATEMENTS Elektro Celje ANNUAL REPORT 2016
15.4.13 Short-term Financial and Operating LiabilitiesShort-term financial liabilities of the Company as at 31 December 2016 in the amount of EUR 11,186,305 re-ferred to short-term portions of long-term bank loans in the amount of EUR 11,182,132 and liabilities for the pay-ment of dividends in the amount of EUR 4,173.
Short-term operating liabilities to group companies in the amount of EUR 49,428 regarded liabilities to the subsidiaries ECE d.o.o. in the amount of EUR 11,965 (EUR 7,148 for supplied electricity and EUR 4,817 for natural gas) and MHE ELPRO in the amount
of EUR 37,463 (EUR 30,907 for sup-plied thermal energy, EUR 4,501 for electricity, EUR 1,069 for the lease of charging stations and EUR 986 for in-correct remittances).
Short-term operating liabilities in the amount of EUR 9,969,867 refer main-ly to trade payables (EUR 1,149,059 for the purchase of fixed assets, EUR 1,428,004 for current assets, EUR 71,157 for the acquisition of fixed as-sets abroad, EUR 65,324 for non-in-voiced material and services), paya-bles to the company SODO (for use of the network in accordance with
the contract), payables to employees (accrued and unpaid wages, compen-sation for long-service awards in De-cember, together with the liabilities for their contributions) and payables to the state and other institutions (li-ability for VAT charged in the amount of EUR 429,023, corporate tax in the amount of EUR 200,396, taxes levied on meeting fees, labour contracts and mandatory practical training in the amount of EUR 5,278 and other liabilities to government institutions in the amount of EUR 8,352).
According to the balance sheet as at 31 December 2016, the Company had settled all outstanding trade paya-bles, whereas other current liabilities are due for payment within a period of up to three months after the bal-ance sheet date.
The Company had no other obliga-tions to the Management Board, Su-pervisory Board and internal owners except for salaries and the meeting fees of the members of the Supervi-sory Board and Audit Committee of the Supervisory Board for the month
of December 2016. The Company also did not grant any loans, advanc-es or security for liabilities to them. The Company does not have its li-abilities secured by real collateral.
Short-term financial and operating liabilities (in EUR) 31 December 2016 31 December 2015
Short-term financial liabilities to banks 11,182,132 11,837,695
Other short-term financial liabilities 4,173 7,063
Short-term financial liabilities 11,186,305 11,844,758
Short-term trade payables to companies within the corporate group
49,428 686,907
- of which payables for electricity for covering distribution losses 0 643,255
Short-term trade payables to suppliers 2,713,544 3,210,524
Short-term trade payables from operations for third-party account 3,940,329 3,845,389
Short-term trade payables to employees 2,137,316 1,454,486
Short-term trade payables to state and other institutions 643,049 308,472
Short-term trade payables based on advance payments 8,017 65,810
Other short-term trade payables 478,184 408,717
Short-term trade payables 9,969,867 9,980,305
Total 21,156,172 21,825,063
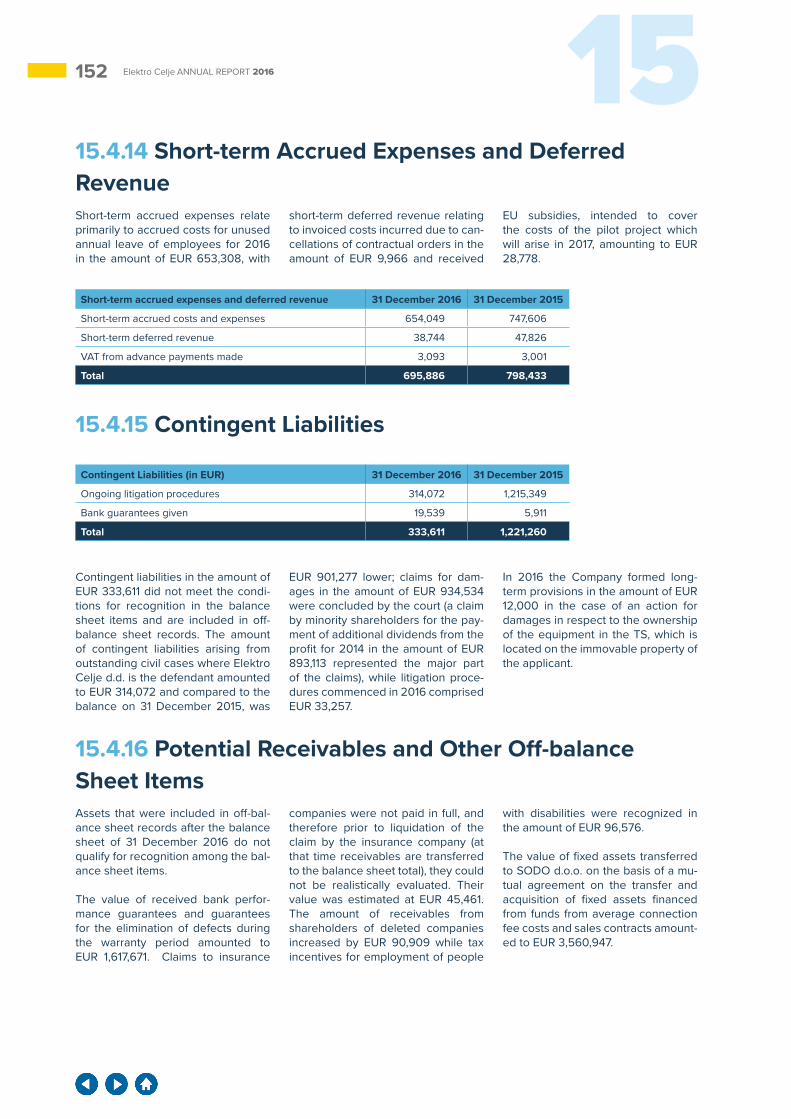
152 15Elektro Celje ANNUAL REPORT 2016
Contingent Liabilities (in EUR) 31 December 2016 31 December 2015
Ongoing litigation procedures 314,072 1,215,349
Bank guarantees given 19,539 5,911
Total 333,611 1,221,260
15.4.15 Contingent Liabilities
Contingent liabilities in the amount of EUR 333,611 did not meet the condi-tions for recognition in the balance sheet items and are included in off-balance sheet records. The amount of contingent liabilities arising from outstanding civil cases where Elektro Celje d.d. is the defendant amounted to EUR 314,072 and compared to the balance on 31 December 2015, was
EUR 901,277 lower; claims for dam-ages in the amount of EUR 934,534 were concluded by the court (a claim by minority shareholders for the pay-ment of additional dividends from the profit for 2014 in the amount of EUR 893,113 represented the major part of the claims), while litigation proce-dures commenced in 2016 comprised EUR 33,257.
In 2016 the Company formed long-term provisions in the amount of EUR 12,000 in the case of an action for damages in respect to the ownership of the equipment in the TS, which is located on the immovable property of the applicant.
15.4.16 Potential Receivables and Other Off-balance Sheet ItemsAssets that were included in off-bal-ance sheet records after the balance sheet of 31 December 2016 do not qualify for recognition among the bal-ance sheet items.
The value of received bank perfor-mance guarantees and guarantees for the elimination of defects during the warranty period amounted to EUR 1,617,671. Claims to insurance
companies were not paid in full, and therefore prior to liquidation of the claim by the insurance company (at that time receivables are transferred to the balance sheet total), they could not be realistically evaluated. Their value was estimated at EUR 45,461. The amount of receivables from shareholders of deleted companies increased by EUR 90,909 while tax incentives for employment of people
with disabilities were recognized in the amount of EUR 96,576.
The value of fixed assets transferred to SODO d.o.o. on the basis of a mu-tual agreement on the transfer and acquisition of fixed assets financed from funds from average connection fee costs and sales contracts amount-ed to EUR 3,560,947.
15.4.14 Short-term Accrued Expenses and Deferred RevenueShort-term accrued expenses relate primarily to accrued costs for unused annual leave of employees for 2016 in the amount of EUR 653,308, with
short-term deferred revenue relating to invoiced costs incurred due to can-cellations of contractual orders in the amount of EUR 9,966 and received
EU subsidies, intended to cover the costs of the pilot project which will arise in 2017, amounting to EUR 28,778.
Short-term accrued expenses and deferred revenue 31 December 2016 31 December 2015
Short-term accrued costs and expenses 654,049 747,606
Short-term deferred revenue 38,744 47,826
VAT from advance payments made 3,093 3,001
Total 695,886 798,433
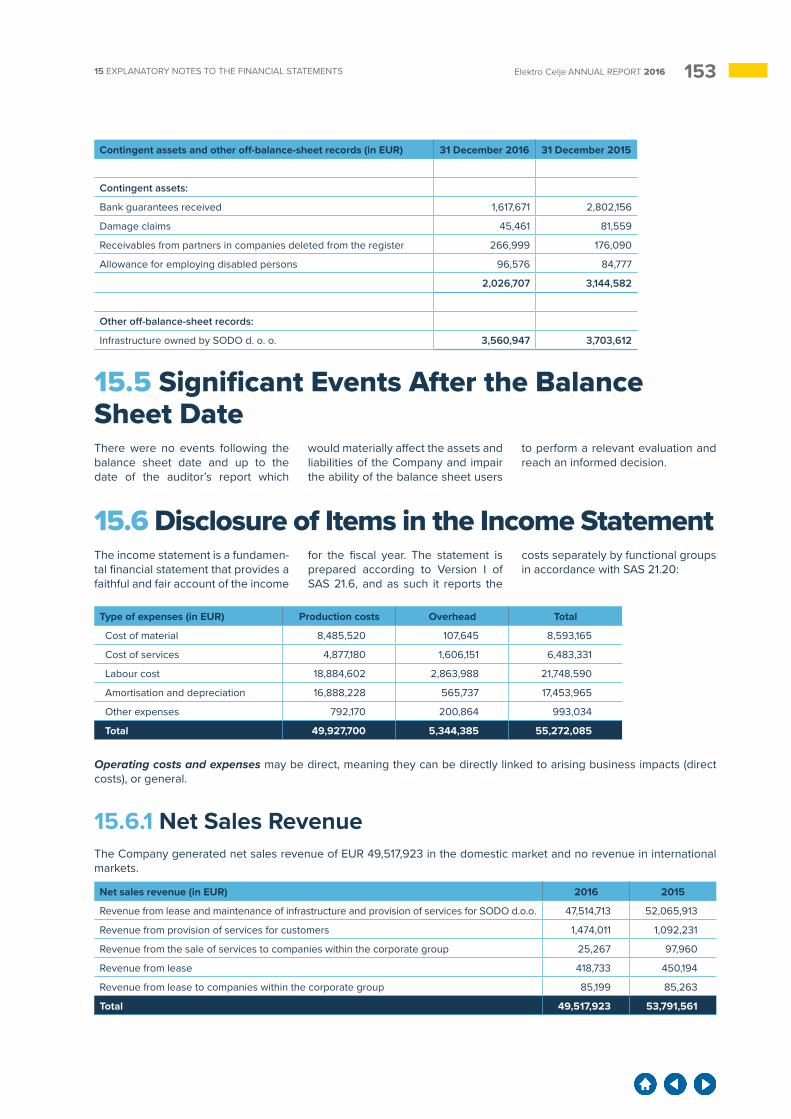
15315 EXPLANATORY NOTES TO THE FINANCIAL STATEMENTS Elektro Celje ANNUAL REPORT 2016
Contingent assets and other off-balance-sheet records (in EUR) 31 December 2016 31 December 2015
Contingent assets:
Bank guarantees received 1,617,671 2,802,156
Damage claims 45,461 81,559
Receivables from partners in companies deleted from the register 266,999 176,090
Allowance for employing disabled persons 96,576 84,777
2,026,707 3,144,582
Other off-balance-sheet records:
Infrastructure owned by SODO d. o. o. 3,560,947 3,703,612
15.5 Significant Events After the Balance Sheet DateThere were no events following the balance sheet date and up to the date of the auditor’s report which
would materially affect the assets and liabilities of the Company and impair the ability of the balance sheet users
to perform a relevant evaluation and reach an informed decision.
15.6 Disclosure of Items in the Income StatementThe income statement is a fundamen-tal financial statement that provides a faithful and fair account of the income
for the fiscal year. The statement is prepared according to Version I of SAS 21.6, and as such it reports the
costs separately by functional groups in accordance with SAS 21.20:
Type of expenses (in EUR) Production costs Overhead Total
Cost of material 8,485,520 107,645 8,593,165
Cost of services 4,877,180 1,606,151 6,483,331
Labour cost 18,884,602 2,863,988 21,748,590
Amortisation and depreciation 16,888,228 565,737 17,453,965
Other expenses 792,170 200,864 993,034
Total 49,927,700 5,344,385 55,272,085
Operating costs and expenses may be direct, meaning they can be directly linked to arising business impacts (direct costs), or general.
15.6.1 Net Sales RevenueThe Company generated net sales revenue of EUR 49,517,923 in the domestic market and no revenue in international markets.
Net sales revenue (in EUR) 2016 2015
Revenue from lease and maintenance of infrastructure and provision of services for SODO d.o.o. 47,514,713 52,065,913
Revenue from provision of services for customers 1,474,011 1,092,231
Revenue from the sale of services to companies within the corporate group 25,267 97,960
Revenue from lease 418,733 450,194
Revenue from lease to companies within the corporate group 85,199 85,263
Total 49,517,923 53,791,561
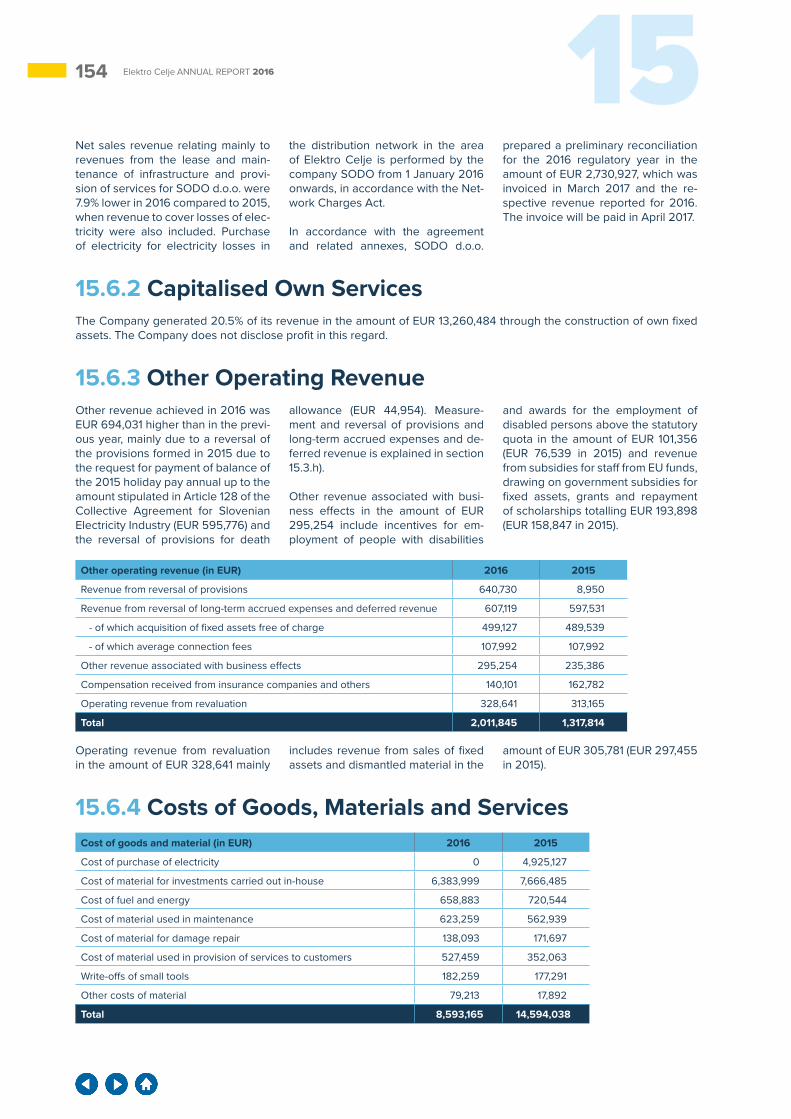
154 15Elektro Celje ANNUAL REPORT 2016
Operating revenue from revaluation in the amount of EUR 328,641 mainly
includes revenue from sales of fixed assets and dismantled material in the
amount of EUR 305,781 (EUR 297,455 in 2015).
15.6.4 Costs of Goods, Materials and Services
Other operating revenue (in EUR) 2016 2015
Revenue from reversal of provisions 640,730 8,950
Revenue from reversal of long-term accrued expenses and deferred revenue 607,119 597,531
- of which acquisition of fixed assets free of charge 499,127 489,539
- of which average connection fees 107,992 107,992
Other revenue associated with business effects 295,254 235,386
Compensation received from insurance companies and others 140,101 162,782
Operating revenue from revaluation 328,641 313,165
Total 2,011,845 1,317,814
Cost of goods and material (in EUR) 2016 2015
Cost of purchase of electricity 0 4,925,127
Cost of material for investments carried out in-house 6,383,999 7,666,485
Cost of fuel and energy 658,883 720,544
Cost of material used in maintenance 623,259 562,939
Cost of material for damage repair 138,093 171,697
Cost of material used in provision of services to customers 527,459 352,063
Write-offs of small tools 182,259 177,291
Other costs of material 79,213 17,892
Total 8,593,165 14,594,038
Net sales revenue relating mainly to revenues from the lease and main-tenance of infrastructure and provi-sion of services for SODO d.o.o. were 7.9% lower in 2016 compared to 2015, when revenue to cover losses of elec-tricity were also included. Purchase of electricity for electricity losses in
the distribution network in the area of Elektro Celje is performed by the company SODO from 1 January 2016 onwards, in accordance with the Net-work Charges Act.
In accordance with the agreement and related annexes, SODO d.o.o.
prepared a preliminary reconciliation for the 2016 regulatory year in the amount of EUR 2,730,927, which was invoiced in March 2017 and the re-spective revenue reported for 2016. The invoice will be paid in April 2017.
15.6.2 Capitalised Own ServicesThe Company generated 20.5% of its revenue in the amount of EUR 13,260,484 through the construction of own fixed assets. The Company does not disclose profit in this regard.
15.6.3 Other Operating RevenueOther revenue achieved in 2016 was EUR 694,031 higher than in the previ-ous year, mainly due to a reversal of the provisions formed in 2015 due to the request for payment of balance of the 2015 holiday pay annual up to the amount stipulated in Article 128 of the Collective Agreement for Slovenian Electricity Industry (EUR 595,776) and the reversal of provisions for death
allowance (EUR 44,954). Measure-ment and reversal of provisions and long-term accrued expenses and de-ferred revenue is explained in section 15.3.h).
Other revenue associated with busi-ness effects in the amount of EUR 295,254 include incentives for em-ployment of people with disabilities
and awards for the employment of disabled persons above the statutory quota in the amount of EUR 101,356 (EUR 76,539 in 2015) and revenue from subsidies for staff from EU funds, drawing on government subsidies for fixed assets, grants and repayment of scholarships totalling EUR 193,898 (EUR 158,847 in 2015).
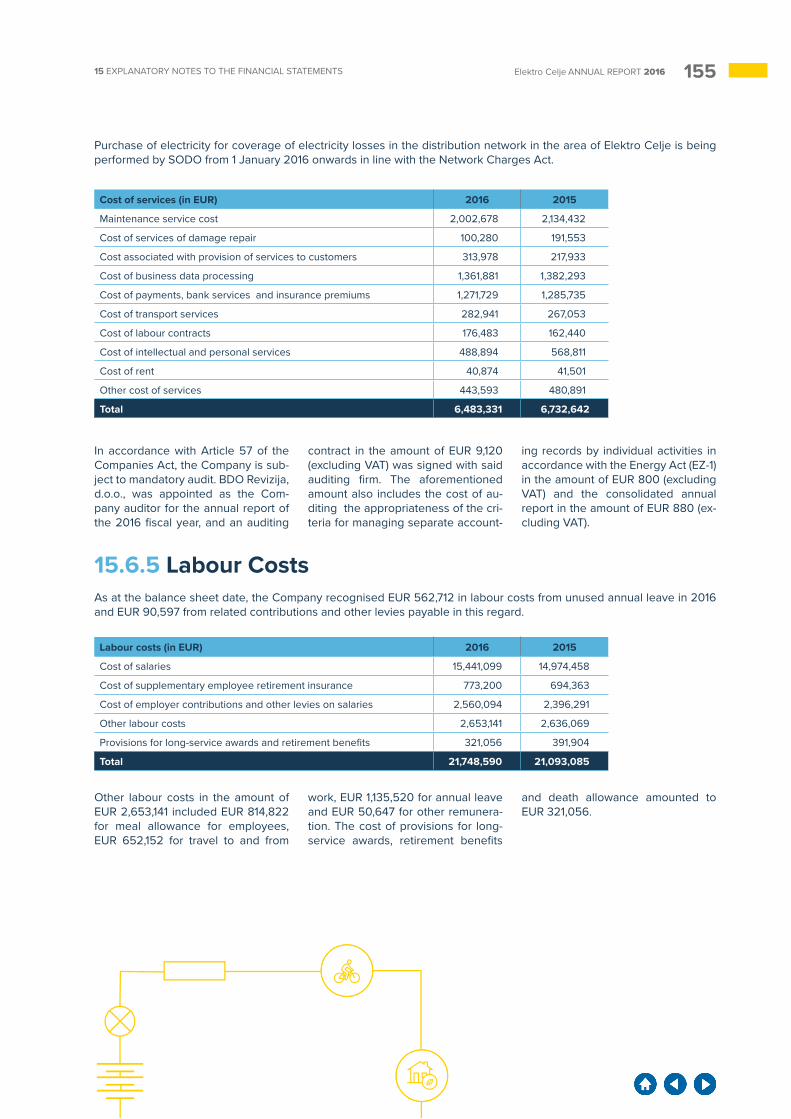
15515 EXPLANATORY NOTES TO THE FINANCIAL STATEMENTS Elektro Celje ANNUAL REPORT 2016
Purchase of electricity for coverage of electricity losses in the distribution network in the area of Elektro Celje is being performed by SODO from 1 January 2016 onwards in line with the Network Charges Act.
In accordance with Article 57 of the Companies Act, the Company is sub-ject to mandatory audit. BDO Revizija, d.o.o., was appointed as the Com-pany auditor for the annual report of the 2016 fiscal year, and an auditing
contract in the amount of EUR 9,120 (excluding VAT) was signed with said auditing firm. The aforementioned amount also includes the cost of au-diting the appropriateness of the cri-teria for managing separate account-
ing records by individual activities in accordance with the Energy Act (EZ-1) in the amount of EUR 800 (excluding VAT) and the consolidated annual report in the amount of EUR 880 (ex-cluding VAT).
15.6.5 Labour CostsAs at the balance sheet date, the Company recognised EUR 562,712 in labour costs from unused annual leave in 2016 and EUR 90,597 from related contributions and other levies payable in this regard.
Cost of services (in EUR) 2016 2015
Maintenance service cost 2,002,678 2,134,432
Cost of services of damage repair 100,280 191,553
Cost associated with provision of services to customers 313,978 217,933
Cost of business data processing 1,361,881 1,382,293
Cost of payments, bank services and insurance premiums 1,271,729 1,285,735
Cost of transport services 282,941 267,053
Cost of labour contracts 176,483 162,440
Cost of intellectual and personal services 488,894 568,811
Cost of rent 40,874 41,501
Other cost of services 443,593 480,891
Total 6,483,331 6,732,642
Other labour costs in the amount of EUR 2,653,141 included EUR 814,822 for meal allowance for employees, EUR 652,152 for travel to and from
work, EUR 1,135,520 for annual leave and EUR 50,647 for other remunera-tion. The cost of provisions for long-service awards, retirement benefits
and death allowance amounted to EUR 321,056.
Labour costs (in EUR) 2016 2015
Cost of salaries 15,441,099 14,974,458
Cost of supplementary employee retirement insurance 773,200 694,363
Cost of employer contributions and other levies on salaries 2,560,094 2,396,291
Other labour costs 2,653,141 2,636,069
Provisions for long-service awards and retirement benefits 321,056 391,904
Total 21,748,590 21,093,085
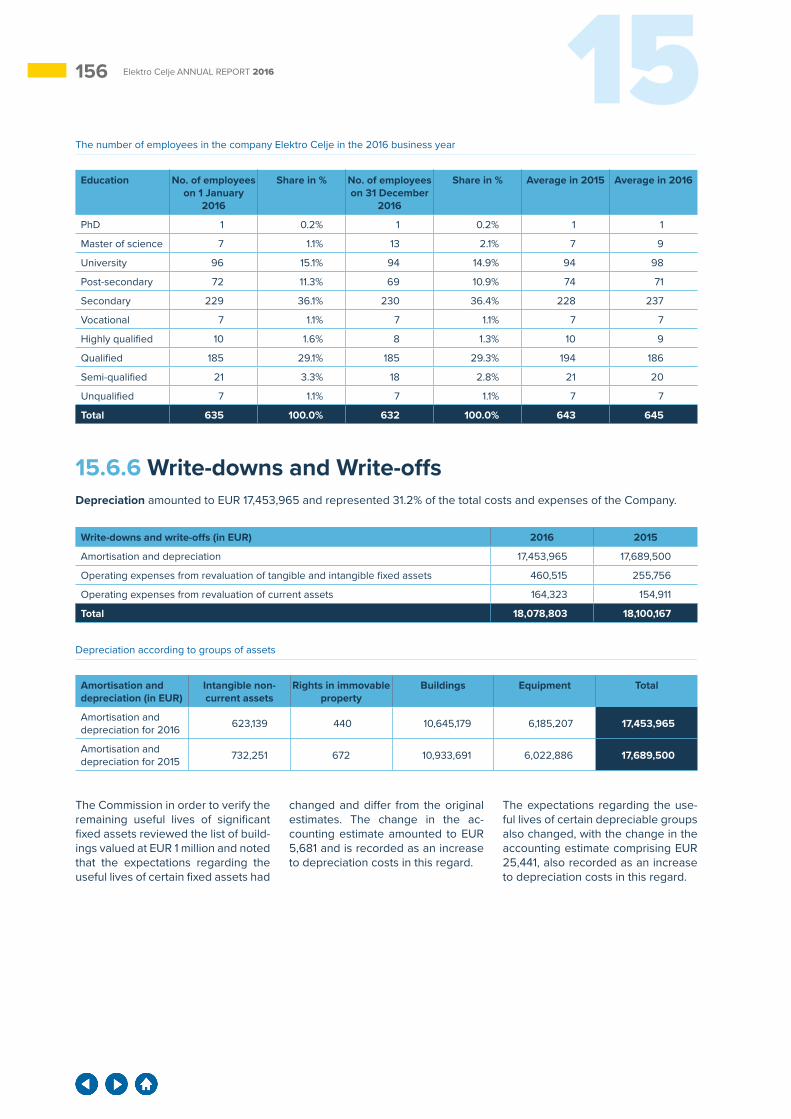
156 15Elektro Celje ANNUAL REPORT 2016
15.6.6 Write-downs and Write-offsDepreciation amounted to EUR 17,453,965 and represented 31.2% of the total costs and expenses of the Company.
The Commission in order to verify the remaining useful lives of significant fixed assets reviewed the list of build-ings valued at EUR 1 million and noted that the expectations regarding the useful lives of certain fixed assets had
changed and differ from the original estimates. The change in the ac-counting estimate amounted to EUR 5,681 and is recorded as an increase to depreciation costs in this regard.
The expectations regarding the use-ful lives of certain depreciable groups also changed, with the change in the accounting estimate comprising EUR 25,441, also recorded as an increase to depreciation costs in this regard.
The number of employees in the company Elektro Celje in the 2016 business year
Depreciation according to groups of assets
Education No. of employees on 1 January
2016
Share in % No. of employees on 31 December
2016
Share in % Average in 2015 Average in 2016
PhD 1 0.2% 1 0.2% 1 1
Master of science 7 1.1% 13 2.1% 7 9
University 96 15.1% 94 14.9% 94 98
Post-secondary 72 11.3% 69 10.9% 74 71
Secondary 229 36.1% 230 36.4% 228 237
Vocational 7 1.1% 7 1.1% 7 7
Highly qualified 10 1.6% 8 1.3% 10 9
Qualified 185 29.1% 185 29.3% 194 186
Semi-qualified 21 3.3% 18 2.8% 21 20
Unqualified 7 1.1% 7 1.1% 7 7
Total 635 100.0% 632 100.0% 643 645
Amortisation and depreciation (in EUR)
Intangible non-current assets
Rights in immovable property
Buildings Equipment Total
Amortisation and depreciation for 2016 623,139 440 10,645,179 6,185,207 17,453,965
Amortisation and depreciation for 2015 732,251 672 10,933,691 6,022,886 17,689,500
Write-downs and write-offs (in EUR) 2016 2015
Amortisation and depreciation 17,453,965 17,689,500
Operating expenses from revaluation of tangible and intangible fixed assets 460,515 255,756
Operating expenses from revaluation of current assets 164,323 154,911
Total 18,078,803 18,100,167
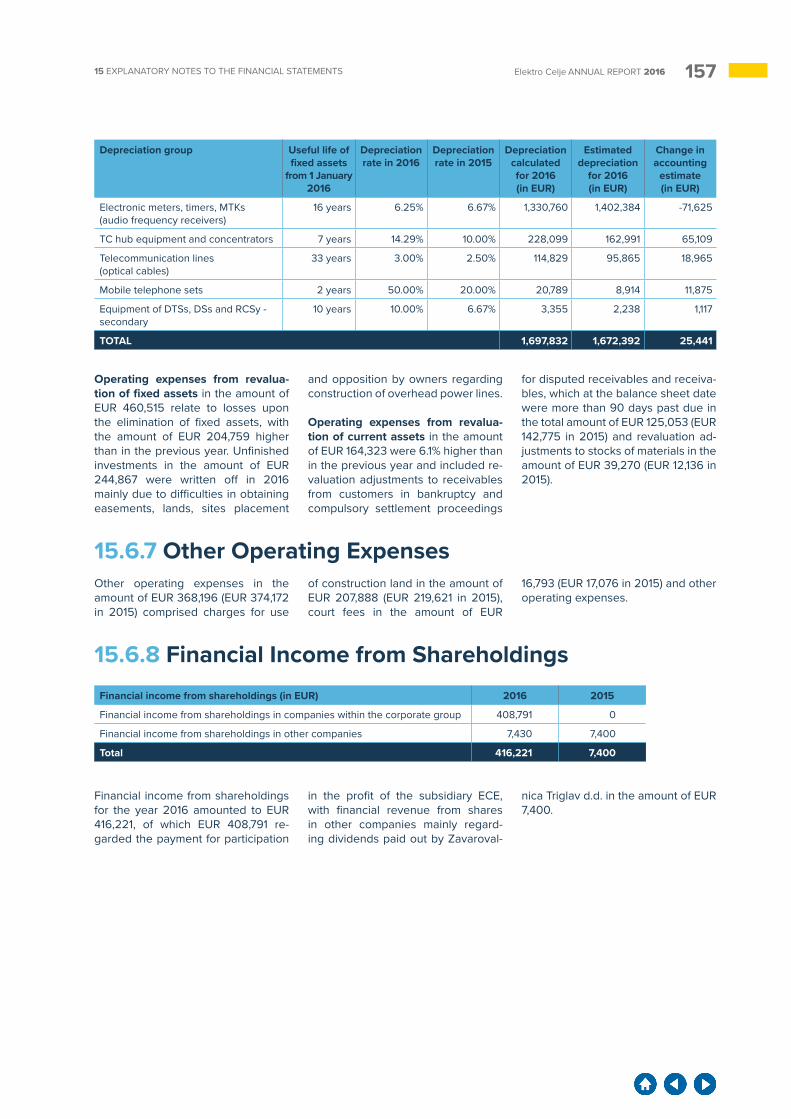
15715 EXPLANATORY NOTES TO THE FINANCIAL STATEMENTS Elektro Celje ANNUAL REPORT 2016
Operating expenses from revalua-tion of fixed assets in the amount of EUR 460,515 relate to losses upon the elimination of fixed assets, with the amount of EUR 204,759 higher than in the previous year. Unfinished investments in the amount of EUR 244,867 were written off in 2016 mainly due to difficulties in obtaining easements, lands, sites placement
and opposition by owners regarding construction of overhead power lines.
Operating expenses from revalua-tion of current assets in the amount of EUR 164,323 were 6.1% higher than in the previous year and included re-valuation adjustments to receivables from customers in bankruptcy and compulsory settlement proceedings
for disputed receivables and receiva-bles, which at the balance sheet date were more than 90 days past due in the total amount of EUR 125,053 (EUR 142,775 in 2015) and revaluation ad-justments to stocks of materials in the amount of EUR 39,270 (EUR 12,136 in 2015).
15.6.7 Other Operating ExpensesOther operating expenses in the amount of EUR 368,196 (EUR 374,172 in 2015) comprised charges for use
of construction land in the amount of EUR 207,888 (EUR 219,621 in 2015), court fees in the amount of EUR
16,793 (EUR 17,076 in 2015) and other operating expenses.
15.6.8 Financial Income from Shareholdings
Depreciation group Useful life of fixed assets
from 1 January 2016
Depreciation rate in 2016
Depreciation rate in 2015
Depreciation calculated for 2016 (in EUR)
Estimated depreciation
for 2016 (in EUR)
Change in accounting
estimate (in EUR)
Electronic meters, timers, MTKs (audio frequency receivers)
16 years 6.25% 6.67% 1,330,760 1,402,384 -71,625
TC hub equipment and concentrators 7 years 14.29% 10.00% 228,099 162,991 65,109
Telecommunication lines (optical cables)
33 years 3.00% 2.50% 114,829 95,865 18,965
Mobile telephone sets 2 years 50.00% 20.00% 20,789 8,914 11,875
Equipment of DTSs, DSs and RCSy - secondary
10 years 10.00% 6.67% 3,355 2,238 1,117
TOTAL 1,697,832 1,672,392 25,441
Financial income from shareholdings (in EUR) 2016 2015
Financial income from shareholdings in companies within the corporate group 408,791 0
Financial income from shareholdings in other companies 7,430 7,400
Total 416,221 7,400
Financial income from shareholdings for the year 2016 amounted to EUR 416,221, of which EUR 408,791 re-garded the payment for participation
in the profit of the subsidiary ECE, with financial revenue from shares in other companies mainly regard-ing dividends paid out by Zavaroval-
nica Triglav d.d. in the amount of EUR 7,400.
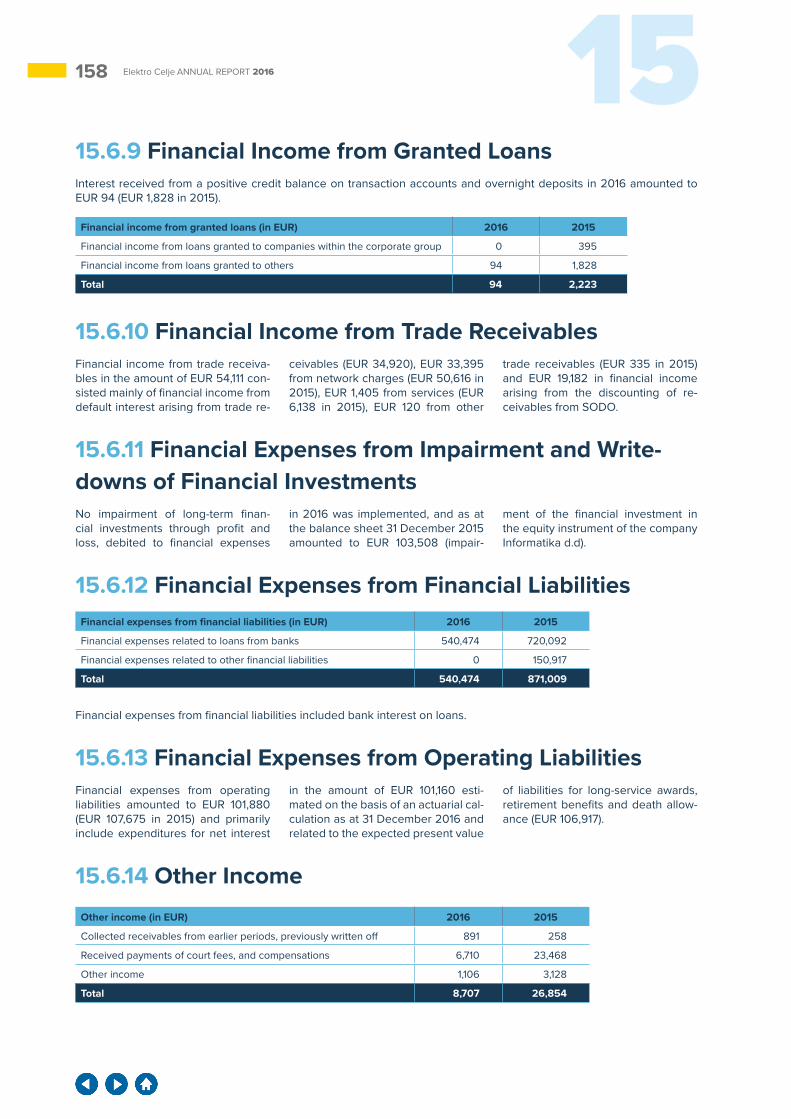
158 15Elektro Celje ANNUAL REPORT 2016
15.6.10 Financial Income from Trade ReceivablesFinancial income from trade receiva-bles in the amount of EUR 54,111 con-sisted mainly of financial income from default interest arising from trade re-
ceivables (EUR 34,920), EUR 33,395 from network charges (EUR 50,616 in 2015), EUR 1,405 from services (EUR 6,138 in 2015), EUR 120 from other
trade receivables (EUR 335 in 2015) and EUR 19,182 in financial income arising from the discounting of re-ceivables from SODO.
15.6.11 Financial Expenses from Impairment and Write-downs of Financial InvestmentsNo impairment of long-term finan-cial investments through profit and loss, debited to financial expenses
in 2016 was implemented, and as at the balance sheet 31 December 2015 amounted to EUR 103,508 (impair-
ment of the financial investment in the equity instrument of the company Informatika d.d).
15.6.12 Financial Expenses from Financial Liabilities
Financial expenses from financial liabilities included bank interest on loans.
15.6.13 Financial Expenses from Operating LiabilitiesFinancial expenses from operating liabilities amounted to EUR 101,880 (EUR 107,675 in 2015) and primarily include expenditures for net interest
in the amount of EUR 101,160 esti-mated on the basis of an actuarial cal-culation as at 31 December 2016 and related to the expected present value
of liabilities for long-service awards, retirement benefits and death allow-ance (EUR 106,917).
15.6.14 Other Income
Financial expenses from financial liabilities (in EUR) 2016 2015
Financial expenses related to loans from banks 540,474 720,092
Financial expenses related to other financial liabilities 0 150,917
Total 540,474 871,009
Other income (in EUR) 2016 2015
Collected receivables from earlier periods, previously written off 891 258
Received payments of court fees, and compensations 6,710 23,468
Other income 1,106 3,128
Total 8,707 26,854
15.6.9 Financial Income from Granted LoansInterest received from a positive credit balance on transaction accounts and overnight deposits in 2016 amounted to EUR 94 (EUR 1,828 in 2015).
Financial income from granted loans (in EUR) 2016 2015
Financial income from loans granted to companies within the corporate group 0 395
Financial income from loans granted to others 94 1,828
Total 94 2,223
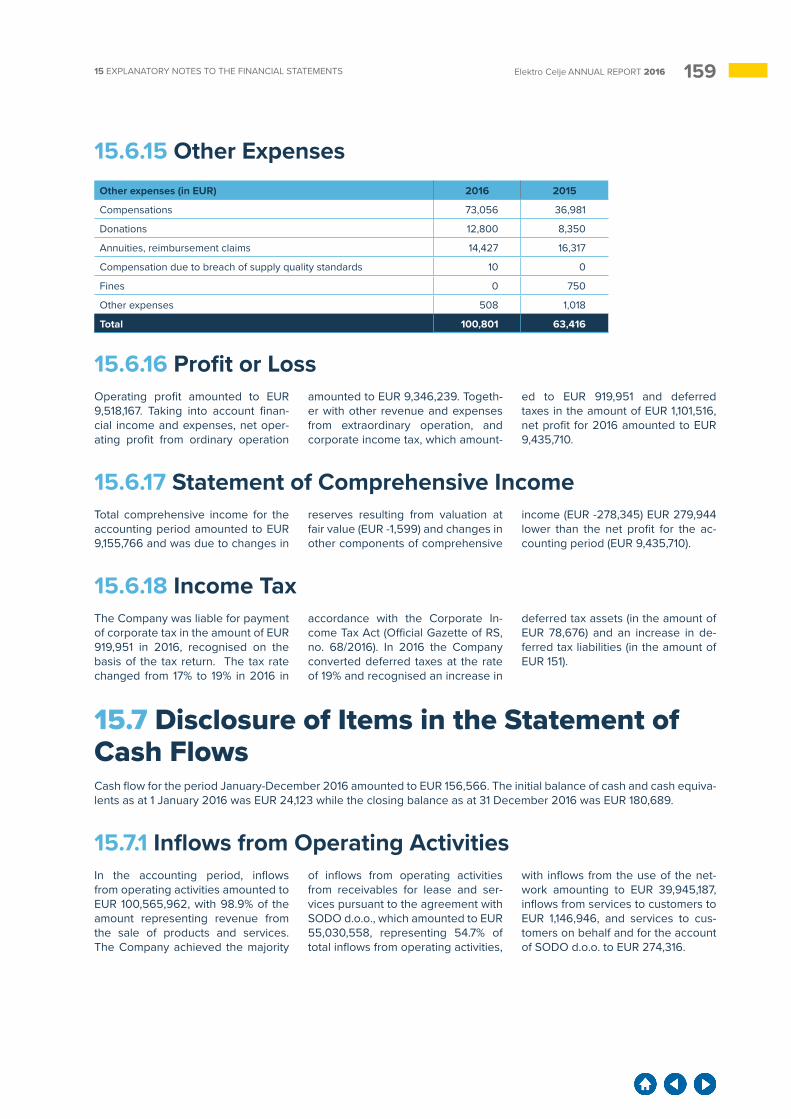
15915 EXPLANATORY NOTES TO THE FINANCIAL STATEMENTS Elektro Celje ANNUAL REPORT 2016
15.6.15 Other Expenses
15.6.16 Profit or LossOperating profit amounted to EUR 9,518,167. Taking into account finan-cial income and expenses, net oper-ating profit from ordinary operation
amounted to EUR 9,346,239. Togeth-er with other revenue and expenses from extraordinary operation, and corporate income tax, which amount-
ed to EUR 919,951 and deferred taxes in the amount of EUR 1,101,516, net profit for 2016 amounted to EUR 9,435,710.
15.6.17 Statement of Comprehensive IncomeTotal comprehensive income for the accounting period amounted to EUR 9,155,766 and was due to changes in
reserves resulting from valuation at fair value (EUR -1,599) and changes in other components of comprehensive
income (EUR -278,345) EUR 279,944 lower than the net profit for the ac-counting period (EUR 9,435,710).
15.6.18 Income TaxThe Company was liable for payment of corporate tax in the amount of EUR 919,951 in 2016, recognised on the basis of the tax return. The tax rate changed from 17% to 19% in 2016 in
accordance with the Corporate In-come Tax Act (Official Gazette of RS, no. 68/2016). In 2016 the Company converted deferred taxes at the rate of 19% and recognised an increase in
deferred tax assets (in the amount of EUR 78,676) and an increase in de-ferred tax liabilities (in the amount of EUR 151).
15.7 Disclosure of Items in the Statement of Cash FlowsCash flow for the period January-December 2016 amounted to EUR 156,566. The initial balance of cash and cash equiva-lents as at 1 January 2016 was EUR 24,123 while the closing balance as at 31 December 2016 was EUR 180,689.
15.7.1 Inflows from Operating ActivitiesIn the accounting period, inflows from operating activities amounted to EUR 100,565,962, with 98.9% of the amount representing revenue from the sale of products and services. The Company achieved the majority
of inflows from operating activities from receivables for lease and ser-vices pursuant to the agreement with SODO d.o.o., which amounted to EUR 55,030,558, representing 54.7% of total inflows from operating activities,
with inflows from the use of the net-work amounting to EUR 39,945,187, inflows from services to customers to EUR 1,146,946, and services to cus-tomers on behalf and for the account of SODO d.o.o. to EUR 274,316.
Other expenses (in EUR) 2016 2015
Compensations 73,056 36,981
Donations 12,800 8,350
Annuities, reimbursement claims 14,427 16,317
Compensation due to breach of supply quality standards 10 0
Fines 0 750
Other expenses 508 1,018
Total 100,801 63,416
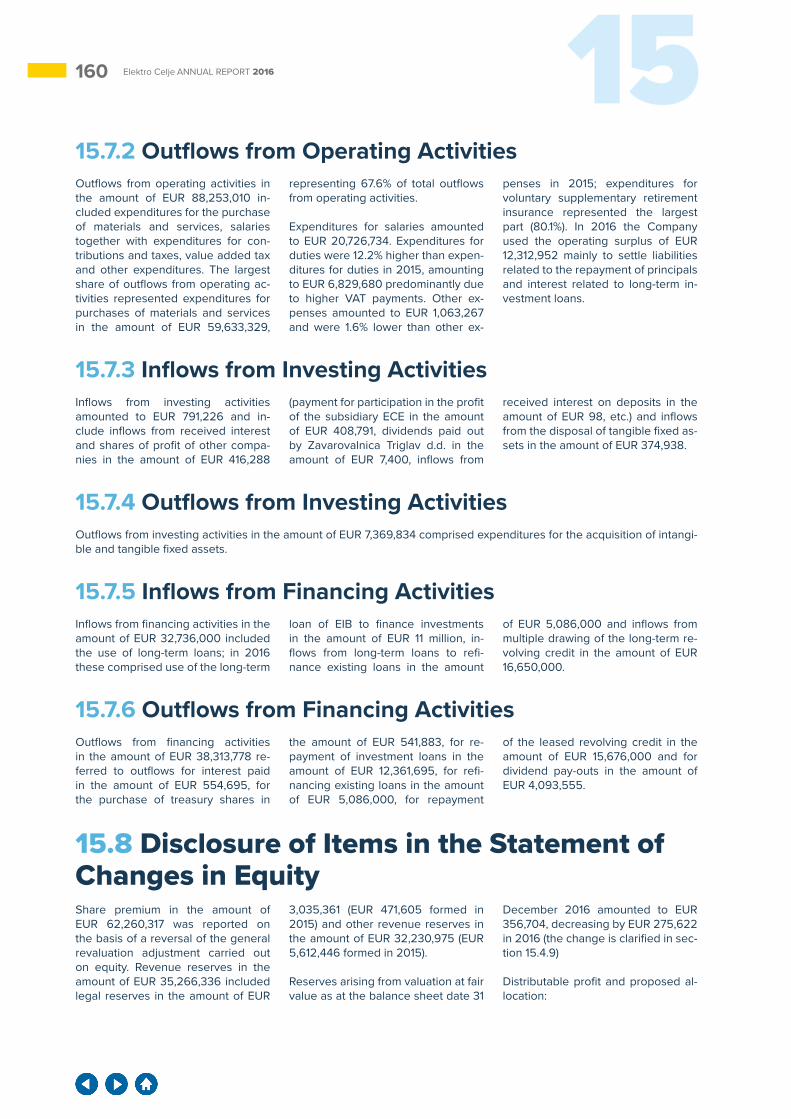
160 15Elektro Celje ANNUAL REPORT 2016
15.7.2 Outflows from Operating ActivitiesOutflows from operating activities in the amount of EUR 88,253,010 in-cluded expenditures for the purchase of materials and services, salaries together with expenditures for con-tributions and taxes, value added tax and other expenditures. The largest share of outflows from operating ac-tivities represented expenditures for purchases of materials and services in the amount of EUR 59,633,329,
representing 67.6% of total outflows from operating activities.
Expenditures for salaries amounted to EUR 20,726,734. Expenditures for duties were 12.2% higher than expen-ditures for duties in 2015, amounting to EUR 6,829,680 predominantly due to higher VAT payments. Other ex-penses amounted to EUR 1,063,267 and were 1.6% lower than other ex-
penses in 2015; expenditures for voluntary supplementary retirement insurance represented the largest part (80.1%). In 2016 the Company used the operating surplus of EUR 12,312,952 mainly to settle liabilities related to the repayment of principals and interest related to long-term in-vestment loans.
15.7.3 Inflows from Investing ActivitiesInflows from investing activities amounted to EUR 791,226 and in-clude inflows from received interest and shares of profit of other compa-nies in the amount of EUR 416,288
(payment for participation in the profit of the subsidiary ECE in the amount of EUR 408,791, dividends paid out by Zavarovalnica Triglav d.d. in the amount of EUR 7,400, inflows from
received interest on deposits in the amount of EUR 98, etc.) and inflows from the disposal of tangible fixed as-sets in the amount of EUR 374,938.
15.7.4 Outflows from Investing ActivitiesOutflows from investing activities in the amount of EUR 7,369,834 comprised expenditures for the acquisition of intangi-ble and tangible fixed assets.
15.7.5 Inflows from Financing ActivitiesInflows from financing activities in the amount of EUR 32,736,000 included the use of long-term loans; in 2016 these comprised use of the long-term
loan of EIB to finance investments in the amount of EUR 11 million, in-flows from long-term loans to refi-nance existing loans in the amount
of EUR 5,086,000 and inflows from multiple drawing of the long-term re-volving credit in the amount of EUR 16,650,000.
15.7.6 Outflows from Financing ActivitiesOutflows from financing activities in the amount of EUR 38,313,778 re-ferred to outflows for interest paid in the amount of EUR 554,695, for the purchase of treasury shares in
the amount of EUR 541,883, for re-payment of investment loans in the amount of EUR 12,361,695, for refi-nancing existing loans in the amount of EUR 5,086,000, for repayment
of the leased revolving credit in the amount of EUR 15,676,000 and for dividend pay-outs in the amount of EUR 4,093,555.
15.8 Disclosure of Items in the Statement of Changes in EquityShare premium in the amount of EUR 62,260,317 was reported on the basis of a reversal of the general revaluation adjustment carried out on equity. Revenue reserves in the amount of EUR 35,266,336 included legal reserves in the amount of EUR
3,035,361 (EUR 471,605 formed in 2015) and other revenue reserves in the amount of EUR 32,230,975 (EUR 5,612,446 formed in 2015).
Reserves arising from valuation at fair value as at the balance sheet date 31
December 2016 amounted to EUR 356,704, decreasing by EUR 275,622 in 2016 (the change is clarified in sec-tion 15.4.9)
Distributable profit and proposed al-location:
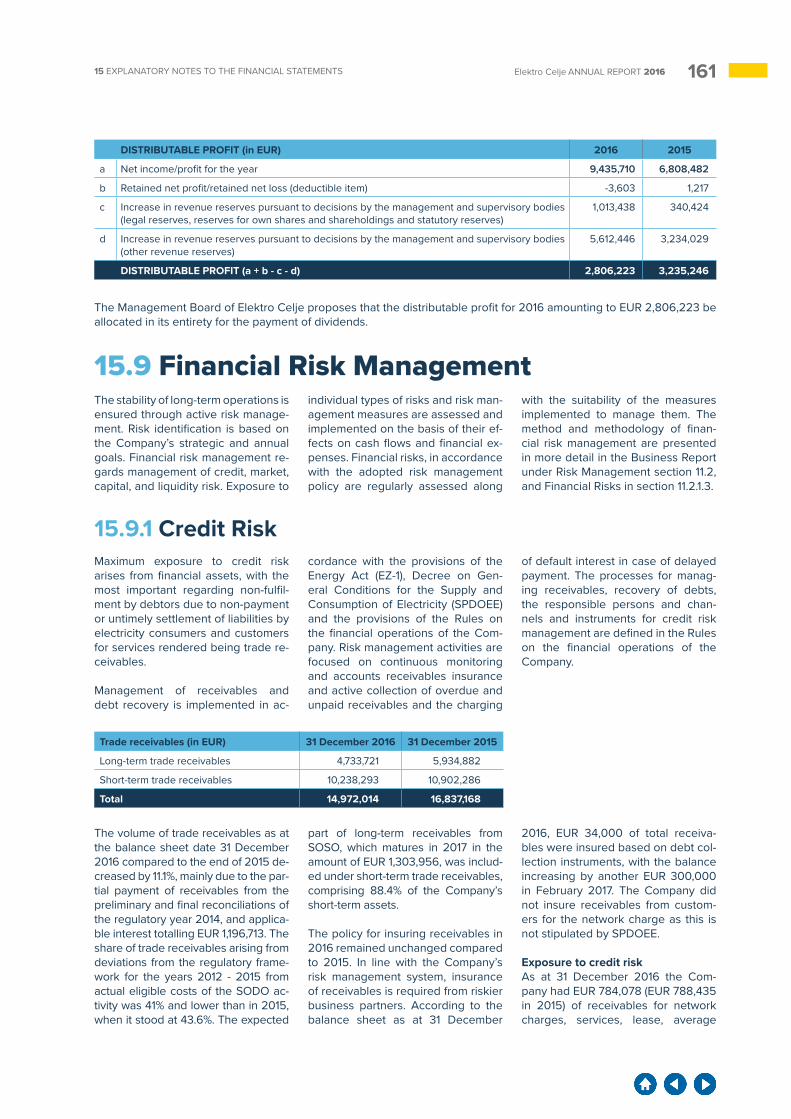
16115 EXPLANATORY NOTES TO THE FINANCIAL STATEMENTS Elektro Celje ANNUAL REPORT 2016
DISTRIBUTABLE PROFIT (in EUR) 2016 2015
a Net income/profit for the year 9,435,710 6,808,482
b Retained net profit/retained net loss (deductible item) -3,603 1,217
c Increase in revenue reserves pursuant to decisions by the management and supervisory bodies (legal reserves, reserves for own shares and shareholdings and statutory reserves)
1,013,438 340,424
d Increase in revenue reserves pursuant to decisions by the management and supervisory bodies (other revenue reserves)
5,612,446 3,234,029
DISTRIBUTABLE PROFIT (a + b - c - d) 2,806,223 3,235,246
The Management Board of Elektro Celje proposes that the distributable profit for 2016 amounting to EUR 2,806,223 be allocated in its entirety for the payment of dividends.
15.9 Financial Risk ManagementThe stability of long-term operations is ensured through active risk manage-ment. Risk identification is based on the Company’s strategic and annual goals. Financial risk management re-gards management of credit, market, capital, and liquidity risk. Exposure to
individual types of risks and risk man-agement measures are assessed and implemented on the basis of their ef-fects on cash flows and financial ex-penses. Financial risks, in accordance with the adopted risk management policy are regularly assessed along
with the suitability of the measures implemented to manage them. The method and methodology of finan-cial risk management are presented in more detail in the Business Report under Risk Management section 11.2, and Financial Risks in section 11.2.1.3.
15.9.1 Credit RiskMaximum exposure to credit risk arises from financial assets, with the most important regarding non-fulfil-ment by debtors due to non-payment or untimely settlement of liabilities by electricity consumers and customers for services rendered being trade re-ceivables.
Management of receivables and debt recovery is implemented in ac-
cordance with the provisions of the Energy Act (EZ-1), Decree on Gen-eral Conditions for the Supply and Consumption of Electricity (SPDOEE) and the provisions of the Rules on the financial operations of the Com-pany. Risk management activities are focused on continuous monitoring and accounts receivables insurance and active collection of overdue and unpaid receivables and the charging
of default interest in case of delayed payment. The processes for manag-ing receivables, recovery of debts, the responsible persons and chan-nels and instruments for credit risk management are defined in the Rules on the financial operations of the Company.
The volume of trade receivables as at the balance sheet date 31 December 2016 compared to the end of 2015 de-creased by 11.1%, mainly due to the par-tial payment of receivables from the preliminary and final reconciliations of the regulatory year 2014, and applica-ble interest totalling EUR 1,196,713. The share of trade receivables arising from deviations from the regulatory frame-work for the years 2012 - 2015 from actual eligible costs of the SODO ac-tivity was 41% and lower than in 2015, when it stood at 43.6%. The expected
part of long-term receivables from SOSO, which matures in 2017 in the amount of EUR 1,303,956, was includ-ed under short-term trade receivables, comprising 88.4% of the Company’s short-term assets.
The policy for insuring receivables in 2016 remained unchanged compared to 2015. In line with the Company’s risk management system, insurance of receivables is required from riskier business partners. According to the balance sheet as at 31 December
2016, EUR 34,000 of total receiva-bles were insured based on debt col-lection instruments, with the balance increasing by another EUR 300,000 in February 2017. The Company did not insure receivables from custom-ers for the network charge as this is not stipulated by SPDOEE.
Exposure to credit riskAs at 31 December 2016 the Com-pany had EUR 784,078 (EUR 788,435 in 2015) of receivables for network charges, services, lease, average
Trade receivables (in EUR) 31 December 2016 31 December 2015
Long-term trade receivables 4,733,721 5,934,882
Short-term trade receivables 10,238,293 10,902,286
Total 14,972,014 16,837,168
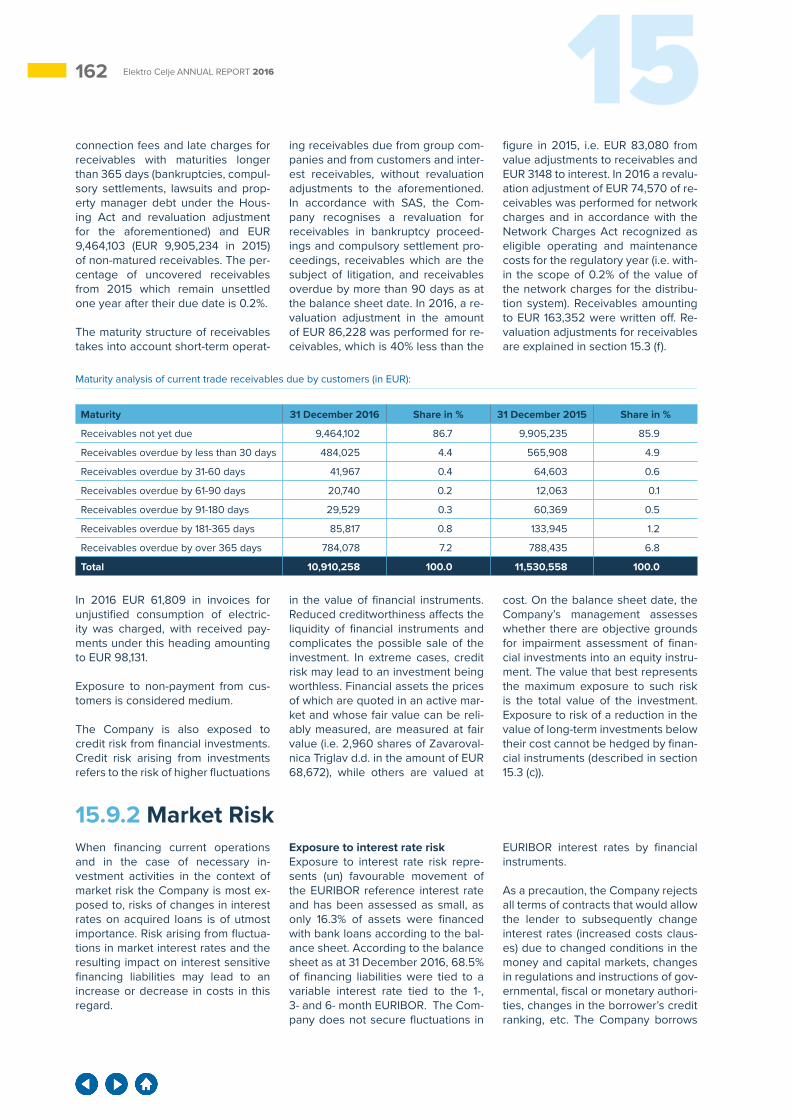
162 15Elektro Celje ANNUAL REPORT 2016
connection fees and late charges for receivables with maturities longer than 365 days (bankruptcies, compul-sory settlements, lawsuits and prop-erty manager debt under the Hous-ing Act and revaluation adjustment for the aforementioned) and EUR 9,464,103 (EUR 9,905,234 in 2015) of non-matured receivables. The per-centage of uncovered receivables from 2015 which remain unsettled one year after their due date is 0.2%.
The maturity structure of receivables takes into account short-term operat-
ing receivables due from group com-panies and from customers and inter-est receivables, without revaluation adjustments to the aforementioned. In accordance with SAS, the Com-pany recognises a revaluation for receivables in bankruptcy proceed-ings and compulsory settlement pro-ceedings, receivables which are the subject of litigation, and receivables overdue by more than 90 days as at the balance sheet date. In 2016, a re-valuation adjustment in the amount of EUR 86,228 was performed for re-ceivables, which is 40% less than the
figure in 2015, i.e. EUR 83,080 from value adjustments to receivables and EUR 3148 to interest. In 2016 a revalu-ation adjustment of EUR 74,570 of re-ceivables was performed for network charges and in accordance with the Network Charges Act recognized as eligible operating and maintenance costs for the regulatory year (i.e. with-in the scope of 0.2% of the value of the network charges for the distribu-tion system). Receivables amounting to EUR 163,352 were written off. Re-valuation adjustments for receivables are explained in section 15.3 (f).
Maturity analysis of current trade receivables due by customers (in EUR):
Maturity 31 December 2016 Share in % 31 December 2015 Share in %
Receivables not yet due 9,464,102 86.7 9,905,235 85.9
Receivables overdue by less than 30 days 484,025 4.4 565,908 4.9
Receivables overdue by 31-60 days 41,967 0.4 64,603 0.6
Receivables overdue by 61-90 days 20,740 0.2 12,063 0.1
Receivables overdue by 91-180 days 29,529 0.3 60,369 0.5
Receivables overdue by 181-365 days 85,817 0.8 133,945 1.2
Receivables overdue by over 365 days 784,078 7.2 788,435 6.8
Total 10,910,258 100.0 11,530,558 100.0
In 2016 EUR 61,809 in invoices for unjustified consumption of electric-ity was charged, with received pay-ments under this heading amounting to EUR 98,131.
Exposure to non-payment from cus-tomers is considered medium.
The Company is also exposed to credit risk from financial investments. Credit risk arising from investments refers to the risk of higher fluctuations
in the value of financial instruments. Reduced creditworthiness affects the liquidity of financial instruments and complicates the possible sale of the investment. In extreme cases, credit risk may lead to an investment being worthless. Financial assets the prices of which are quoted in an active mar-ket and whose fair value can be reli-ably measured, are measured at fair value (i.e. 2,960 shares of Zavaroval-nica Triglav d.d. in the amount of EUR 68,672), while others are valued at
cost. On the balance sheet date, the Company’s management assesses whether there are objective grounds for impairment assessment of finan-cial investments into an equity instru-ment. The value that best represents the maximum exposure to such risk is the total value of the investment. Exposure to risk of a reduction in the value of long-term investments below their cost cannot be hedged by finan-cial instruments (described in section 15.3 (c)).
15.9.2 Market RiskWhen financing current operations and in the case of necessary in-vestment activities in the context of market risk the Company is most ex-posed to, risks of changes in interest rates on acquired loans is of utmost importance. Risk arising from fluctua-tions in market interest rates and the resulting impact on interest sensitive financing liabilities may lead to an increase or decrease in costs in this regard.
Exposure to interest rate riskExposure to interest rate risk repre-sents (un) favourable movement of the EURIBOR reference interest rate and has been assessed as small, as only 16.3% of assets were financed with bank loans according to the bal-ance sheet. According to the balance sheet as at 31 December 2016, 68.5% of financing liabilities were tied to a variable interest rate tied to the 1-, 3- and 6- month EURIBOR. The Com-pany does not secure fluctuations in
EURIBOR interest rates by financial instruments.
As a precaution, the Company rejects all terms of contracts that would allow the lender to subsequently change interest rates (increased costs claus-es) due to changed conditions in the money and capital markets, changes in regulations and instructions of gov-ernmental, fiscal or monetary authori-ties, changes in the borrower’s credit ranking, etc. The Company borrows
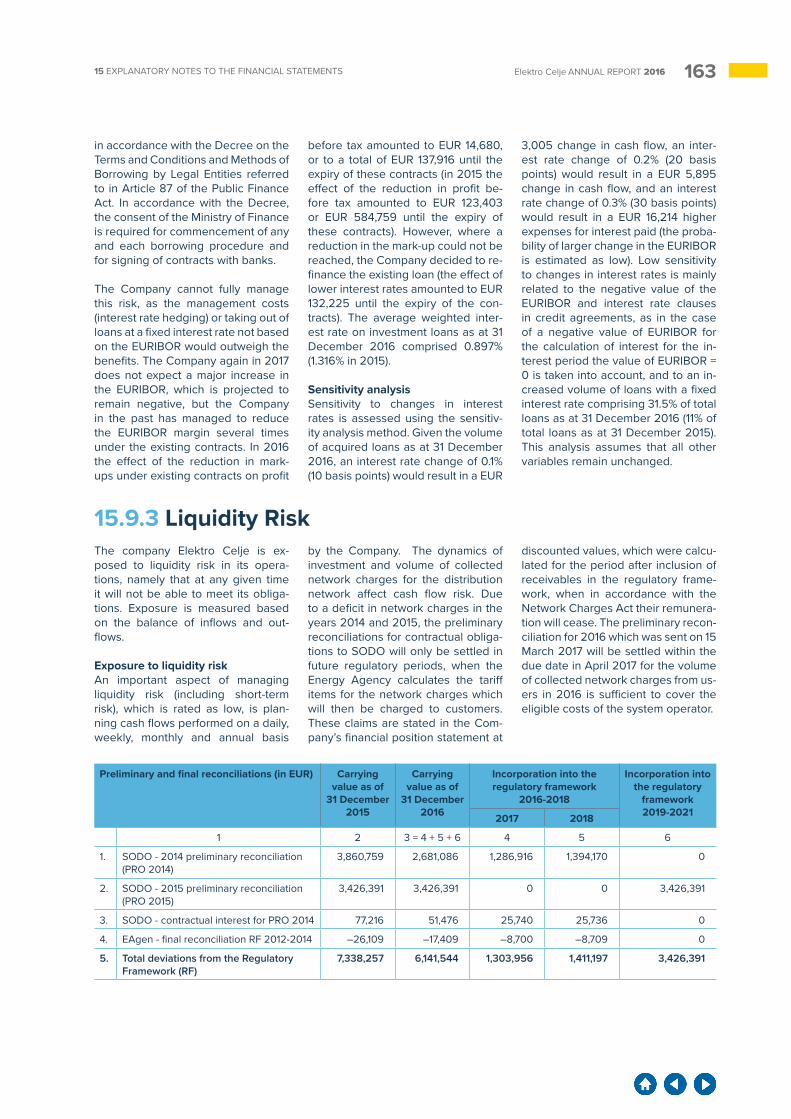
16315 EXPLANATORY NOTES TO THE FINANCIAL STATEMENTS Elektro Celje ANNUAL REPORT 2016
in accordance with the Decree on the Terms and Conditions and Methods of Borrowing by Legal Entities referred to in Article 87 of the Public Finance Act. In accordance with the Decree, the consent of the Ministry of Finance is required for commencement of any and each borrowing procedure and for signing of contracts with banks.
The Company cannot fully manage this risk, as the management costs (interest rate hedging) or taking out of loans at a fixed interest rate not based on the EURIBOR would outweigh the benefits. The Company again in 2017 does not expect a major increase in the EURIBOR, which is projected to remain negative, but the Company in the past has managed to reduce the EURIBOR margin several times under the existing contracts. In 2016 the effect of the reduction in mark-ups under existing contracts on profit
before tax amounted to EUR 14,680, or to a total of EUR 137,916 until the expiry of these contracts (in 2015 the effect of the reduction in profit be-fore tax amounted to EUR 123,403 or EUR 584,759 until the expiry of these contracts). However, where a reduction in the mark-up could not be reached, the Company decided to re-finance the existing loan (the effect of lower interest rates amounted to EUR 132,225 until the expiry of the con-tracts). The average weighted inter-est rate on investment loans as at 31 December 2016 comprised 0.897% (1.316% in 2015).
Sensitivity analysisSensitivity to changes in interest rates is assessed using the sensitiv-ity analysis method. Given the volume of acquired loans as at 31 December 2016, an interest rate change of 0.1% (10 basis points) would result in a EUR
3,005 change in cash flow, an inter-est rate change of 0.2% (20 basis points) would result in a EUR 5,895 change in cash flow, and an interest rate change of 0.3% (30 basis points) would result in a EUR 16,214 higher expenses for interest paid (the proba-bility of larger change in the EURIBOR is estimated as low). Low sensitivity to changes in interest rates is mainly related to the negative value of the EURIBOR and interest rate clauses in credit agreements, as in the case of a negative value of EURIBOR for the calculation of interest for the in-terest period the value of EURIBOR = 0 is taken into account, and to an in-creased volume of loans with a fixed interest rate comprising 31.5% of total loans as at 31 December 2016 (11% of total loans as at 31 December 2015). This analysis assumes that all other variables remain unchanged.
15.9.3 Liquidity RiskThe company Elektro Celje is ex-posed to liquidity risk in its opera-tions, namely that at any given time it will not be able to meet its obliga-tions. Exposure is measured based on the balance of inflows and out-flows.
Exposure to liquidity riskAn important aspect of managing liquidity risk (including short-term risk), which is rated as low, is plan-ning cash flows performed on a daily, weekly, monthly and annual basis
by the Company. The dynamics of investment and volume of collected network charges for the distribution network affect cash flow risk. Due to a deficit in network charges in the years 2014 and 2015, the preliminary reconciliations for contractual obliga-tions to SODO will only be settled in future regulatory periods, when the Energy Agency calculates the tariff items for the network charges which will then be charged to customers. These claims are stated in the Com-pany’s financial position statement at
discounted values, which were calcu-lated for the period after inclusion of receivables in the regulatory frame-work, when in accordance with the Network Charges Act their remunera-tion will cease. The preliminary recon-ciliation for 2016 which was sent on 15 March 2017 will be settled within the due date in April 2017 for the volume of collected network charges from us-ers in 2016 is sufficient to cover the eligible costs of the system operator.
Preliminary and final reconciliations (in EUR) Carrying value as of
31 December 2015
Carrying value as of
31 December 2016
Incorporation into the regulatory framework
2016-2018
Incorporation into the regulatory
framework 2019-20212017 2018
1 2 3 = 4 + 5 + 6 4 5 6
1. SODO - 2014 preliminary reconciliation (PRO 2014)
3,860,759 2,681,086 1,286,916 1,394,170 0
2. SODO - 2015 preliminary reconciliation (PRO 2015)
3,426,391 3,426,391 0 0 3,426,391
3. SODO - contractual interest for PRO 2014 77,216 51,476 25,740 25,736 0
4. EAgen - final reconciliation RF 2012-2014 –26,109 –17,409 –8,700 –8,709 0
5. Total deviations from the Regulatory Framework (RF)
7,338,257 6,141,544 1,303,956 1,411,197 3,426,391
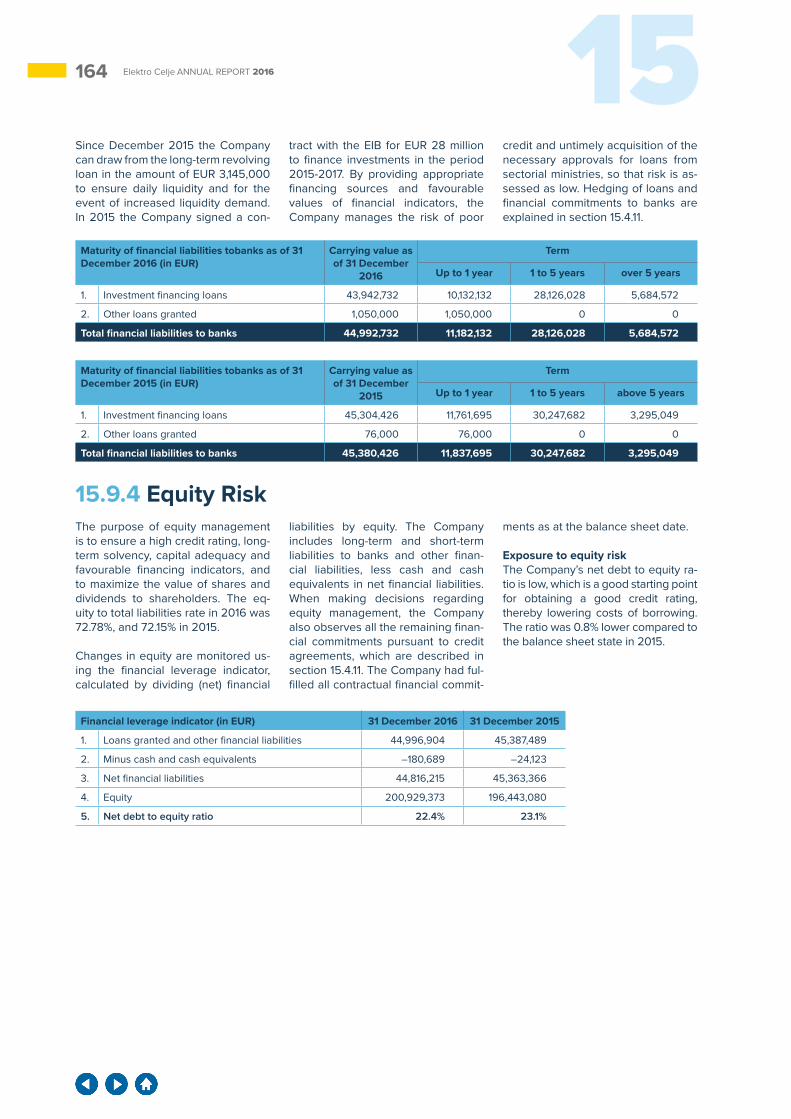
164 15Elektro Celje ANNUAL REPORT 2016
Since December 2015 the Company can draw from the long-term revolving loan in the amount of EUR 3,145,000 to ensure daily liquidity and for the event of increased liquidity demand. In 2015 the Company signed a con-
tract with the EIB for EUR 28 million to finance investments in the period 2015-2017. By providing appropriate financing sources and favourable values of financial indicators, the Company manages the risk of poor
credit and untimely acquisition of the necessary approvals for loans from sectorial ministries, so that risk is as-sessed as low. Hedging of loans and financial commitments to banks are explained in section 15.4.11.
15.9.4 Equity RiskThe purpose of equity management is to ensure a high credit rating, long-term solvency, capital adequacy and favourable financing indicators, and to maximize the value of shares and dividends to shareholders. The eq-uity to total liabilities rate in 2016 was 72.78%, and 72.15% in 2015.
Changes in equity are monitored us-ing the financial leverage indicator, calculated by dividing (net) financial
liabilities by equity. The Company includes long-term and short-term liabilities to banks and other finan-cial liabilities, less cash and cash equivalents in net financial liabilities.When making decisions regarding equity management, the Company also observes all the remaining finan-cial commitments pursuant to credit agreements, which are described in section 15.4.11. The Company had ful-filled all contractual financial commit-
ments as at the balance sheet date.
Exposure to equity riskThe Company’s net debt to equity ra-tio is low, which is a good starting point for obtaining a good credit rating, thereby lowering costs of borrowing. The ratio was 0.8% lower compared to the balance sheet state in 2015.
Financial leverage indicator (in EUR) 31 December 2016 31 December 2015
1. Loans granted and other financial liabilities 44,996,904 45,387,489
2. Minus cash and cash equivalents –180,689 –24,123
3. Net financial liabilities 44,816,215 45,363,366
4. Equity 200,929,373 196,443,080
5. Net debt to equity ratio 22.4% 23.1%
Maturity of financial liabilities tobanks as of 31 December 2016 (in EUR)
Carrying value as of 31 December
2016
Term
Up to 1 year 1 to 5 years over 5 years
1. Investment financing loans 43,942,732 10,132,132 28,126,028 5,684,572
2. Other loans granted 1,050,000 1,050,000 0 0
Total financial liabilities to banks 44,992,732 11,182,132 28,126,028 5,684,572
Maturity of financial liabilities tobanks as of 31 December 2015 (in EUR)
Carrying value as of 31 December
2015
Term
Up to 1 year 1 to 5 years above 5 years
1. Investment financing loans 45,304,426 11,761,695 30,247,682 3,295,049
2. Other loans granted 76,000 76,000 0 0
Total financial liabilities to banks 45,380,426 11,837,695 30,247,682 3,295,049
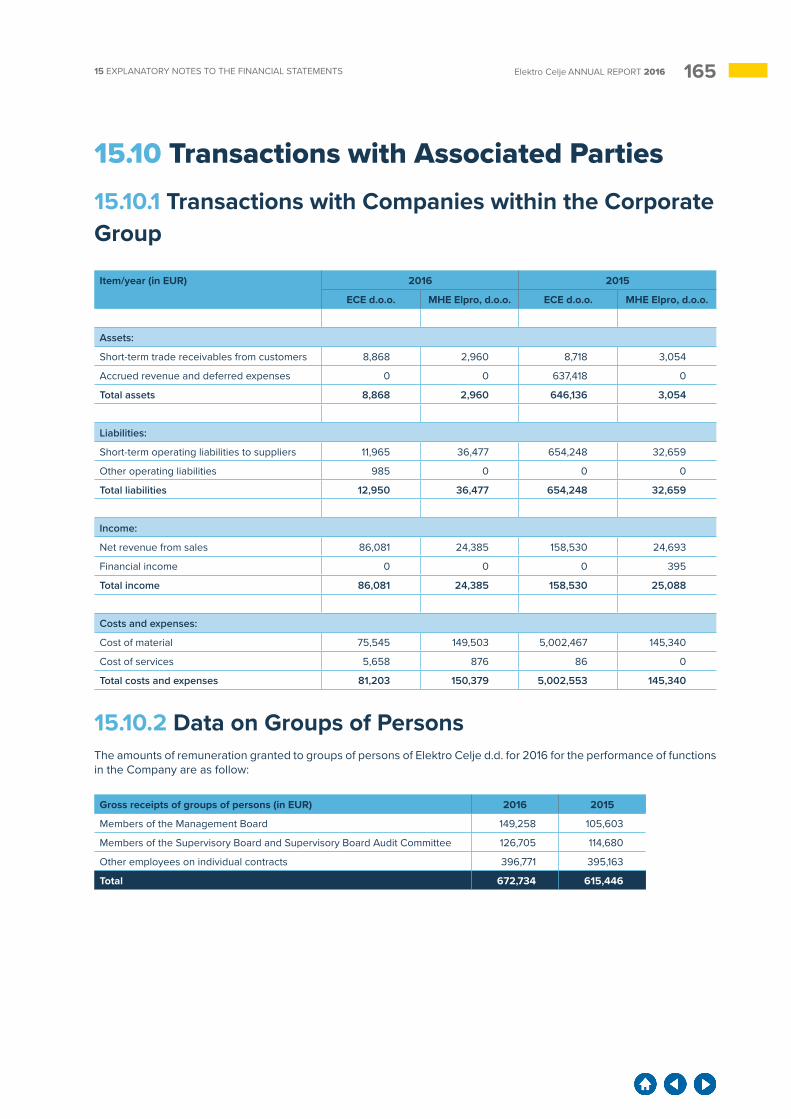
16515 EXPLANATORY NOTES TO THE FINANCIAL STATEMENTS Elektro Celje ANNUAL REPORT 2016
15.10 Transactions with Associated Parties15.10.1 Transactions with Companies within the Corporate Group
Item/year (in EUR) 2016 2015
ECE d.o.o. MHE Elpro, d.o.o. ECE d.o.o. MHE Elpro, d.o.o.
Assets:
Short-term trade receivables from customers 8,868 2,960 8,718 3,054
Accrued revenue and deferred expenses 0 0 637,418 0
Total assets 8,868 2,960 646,136 3,054
Liabilities:
Short-term operating liabilities to suppliers 11,965 36,477 654,248 32,659
Other operating liabilities 985 0 0 0
Total liabilities 12,950 36,477 654,248 32,659
Income:
Net revenue from sales 86,081 24,385 158,530 24,693
Financial income 0 0 0 395
Total income 86,081 24,385 158,530 25,088
Costs and expenses:
Cost of material 75,545 149,503 5,002,467 145,340
Cost of services 5,658 876 86 0
Total costs and expenses 81,203 150,379 5,002,553 145,340
15.10.2 Data on Groups of PersonsThe amounts of remuneration granted to groups of persons of Elektro Celje d.d. for 2016 for the performance of functions in the Company are as follow:
Gross receipts of groups of persons (in EUR) 2016 2015
Members of the Management Board 149,258 105,603
Members of the Supervisory Board and Supervisory Board Audit Committee 126,705 114,680
Other employees on individual contracts 396,771 395,163
Total 672,734 615,446
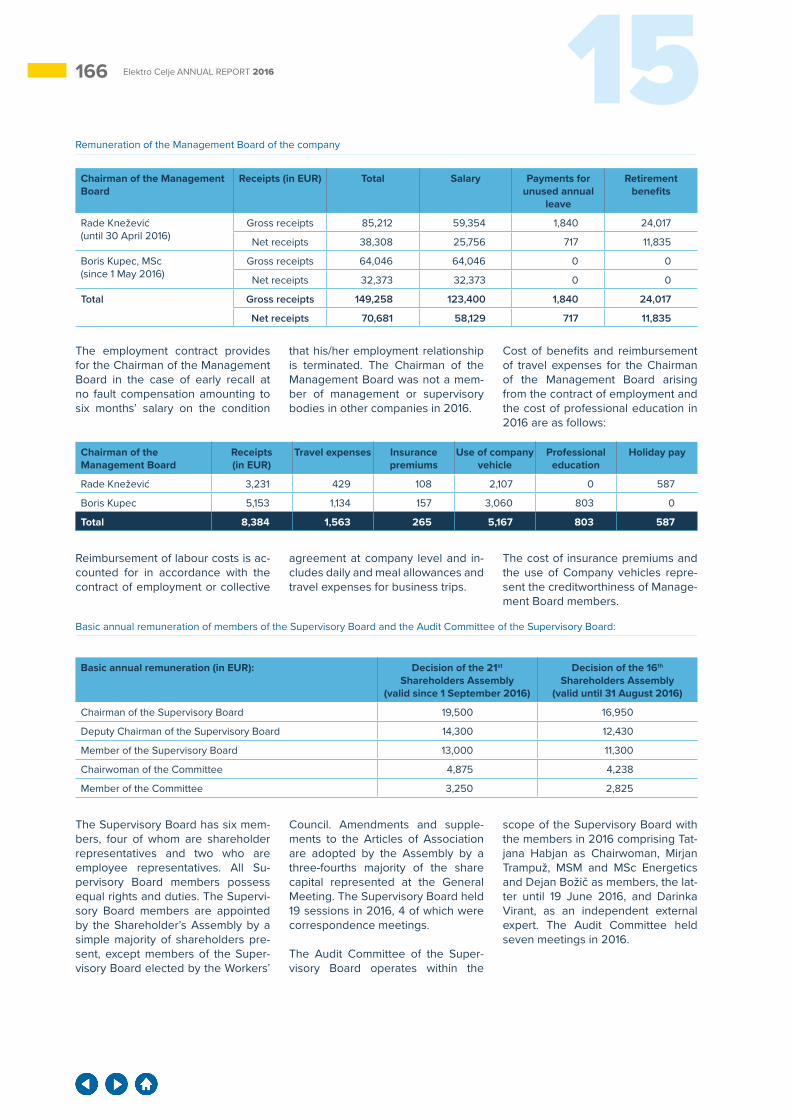
166 15Elektro Celje ANNUAL REPORT 2016
Remuneration of the Management Board of the company
Basic annual remuneration of members of the Supervisory Board and the Audit Committee of the Supervisory Board:
Reimbursement of labour costs is ac-counted for in accordance with the contract of employment or collective
agreement at company level and in-cludes daily and meal allowances and travel expenses for business trips.
The cost of insurance premiums and the use of Company vehicles repre-sent the creditworthiness of Manage-ment Board members.
Chairman of the Management Board
Receipts (in EUR) Total Salary Payments for unused annual
leave
Retirement benefits
Rade Knežević (until 30 April 2016)
Gross receipts 85,212 59,354 1,840 24,017
Net receipts 38,308 25,756 717 11,835
Boris Kupec, MSc (since 1 May 2016)
Gross receipts 64,046 64,046 0 0
Net receipts 32,373 32,373 0 0
Total Gross receipts 149,258 123,400 1,840 24,017
Net receipts 70,681 58,129 717 11,835
Chairman of the Management Board
Receipts (in EUR)
Travel expenses Insurance premiums
Use of company vehicle
Professional education
Holiday pay
Rade Knežević 3,231 429 108 2,107 0 587
Boris Kupec 5,153 1,134 157 3,060 803 0
Total 8,384 1,563 265 5,167 803 587
Basic annual remuneration (in EUR): Decision of the 21st Shareholders Assembly
(valid since 1 September 2016)
Decision of the 16th Shareholders Assembly
(valid until 31 August 2016)
Chairman of the Supervisory Board 19,500 16,950
Deputy Chairman of the Supervisory Board 14,300 12,430
Member of the Supervisory Board 13,000 11,300
Chairwoman of the Committee 4,875 4,238
Member of the Committee 3,250 2,825
The Supervisory Board has six mem-bers, four of whom are shareholder representatives and two who are employee representatives. All Su-pervisory Board members possess equal rights and duties. The Supervi-sory Board members are appointed by the Shareholder’s Assembly by a simple majority of shareholders pre-sent, except members of the Super-visory Board elected by the Workers’
Council. Amendments and supple-ments to the Articles of Association are adopted by the Assembly by a three-fourths majority of the share capital represented at the General Meeting. The Supervisory Board held 19 sessions in 2016, 4 of which were correspondence meetings.
The Audit Committee of the Super-visory Board operates within the
scope of the Supervisory Board with the members in 2016 comprising Tat-jana Habjan as Chairwoman, Mirjan Trampuž, MSM and MSc Energetics and Dejan Božič as members, the lat-ter until 19 June 2016, and Darinka Virant, as an independent external expert. The Audit Committee held seven meetings in 2016.
The employment contract provides for the Chairman of the Management Board in the case of early recall at no fault compensation amounting to six months’ salary on the condition
that his/her employment relationship is terminated. The Chairman of the Management Board was not a mem-ber of management or supervisory bodies in other companies in 2016.
Cost of benefits and reimbursement of travel expenses for the Chairman of the Management Board arising from the contract of employment and the cost of professional education in 2016 are as follows:
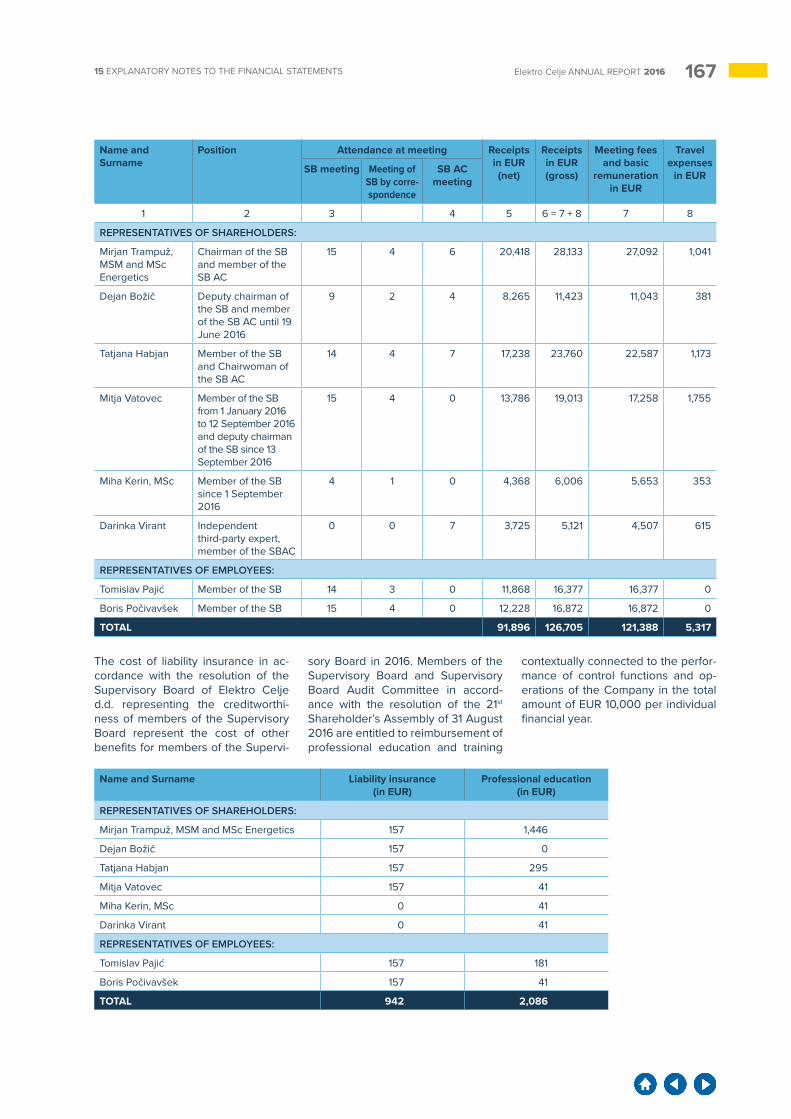
16715 EXPLANATORY NOTES TO THE FINANCIAL STATEMENTS Elektro Celje ANNUAL REPORT 2016
The cost of liability insurance in ac-cordance with the resolution of the Supervisory Board of Elektro Celje d.d. representing the creditworthi-ness of members of the Supervisory Board represent the cost of other benefits for members of the Supervi-
sory Board in 2016. Members of the Supervisory Board and Supervisory Board Audit Committee in accord-ance with the resolution of the 21st Shareholder’s Assembly of 31 August 2016 are entitled to reimbursement of professional education and training
contextually connected to the perfor-mance of control functions and op-erations of the Company in the total amount of EUR 10,000 per individual financial year.
Name and Surname
Position Attendance at meeting Receipts in EUR (net)
Receipts in EUR (gross)
Meeting fees and basic
remuneration in EUR
Travel expenses
in EURSB meeting Meeting of SB by corre-spondence
SB AC meeting
1 2 3 4 5 6 = 7 + 8 7 8
REPRESENTATIVES OF SHAREHOLDERS:
Mirjan Trampuž, MSM and MSc Energetics
Chairman of the SB and member of the SB AC
15 4 6 20,418 28,133 27,092 1,041
Dejan Božič Deputy chairman of the SB and member of the SB AC until 19 June 2016
9 2 4 8,265 11,423 11,043 381
Tatjana Habjan Member of the SB and Chairwoman of the SB AC
14 4 7 17,238 23,760 22,587 1,173
Mitja Vatovec Member of the SB from 1 January 2016 to 12 September 2016 and deputy chairman of the SB since 13 September 2016
15 4 0 13,786 19,013 17,258 1,755
Miha Kerin, MSc Member of the SB since 1 September 2016
4 1 0 4,368 6,006 5,653 353
Darinka Virant Independent third-party expert, member of the SBAC
0 0 7 3,725 5,121 4,507 615
REPRESENTATIVES OF EMPLOYEES:
Tomislav Pajić Member of the SB 14 3 0 11,868 16,377 16,377 0
Boris Počivavšek Member of the SB 15 4 0 12,228 16,872 16,872 0
TOTAL 91,896 126,705 121,388 5,317
Name and Surname Liability insurance (in EUR)
Professional education (in EUR)
REPRESENTATIVES OF SHAREHOLDERS:
Mirjan Trampuž, MSM and MSc Energetics 157 1,446
Dejan Božič 157 0
Tatjana Habjan 157 295
Mitja Vatovec 157 41
Miha Kerin, MSc 0 41
Darinka Virant 0 41
REPRESENTATIVES OF EMPLOYEES:
Tomislav Pajić 157 181
Boris Počivavšek 157 41
TOTAL 942 2,086
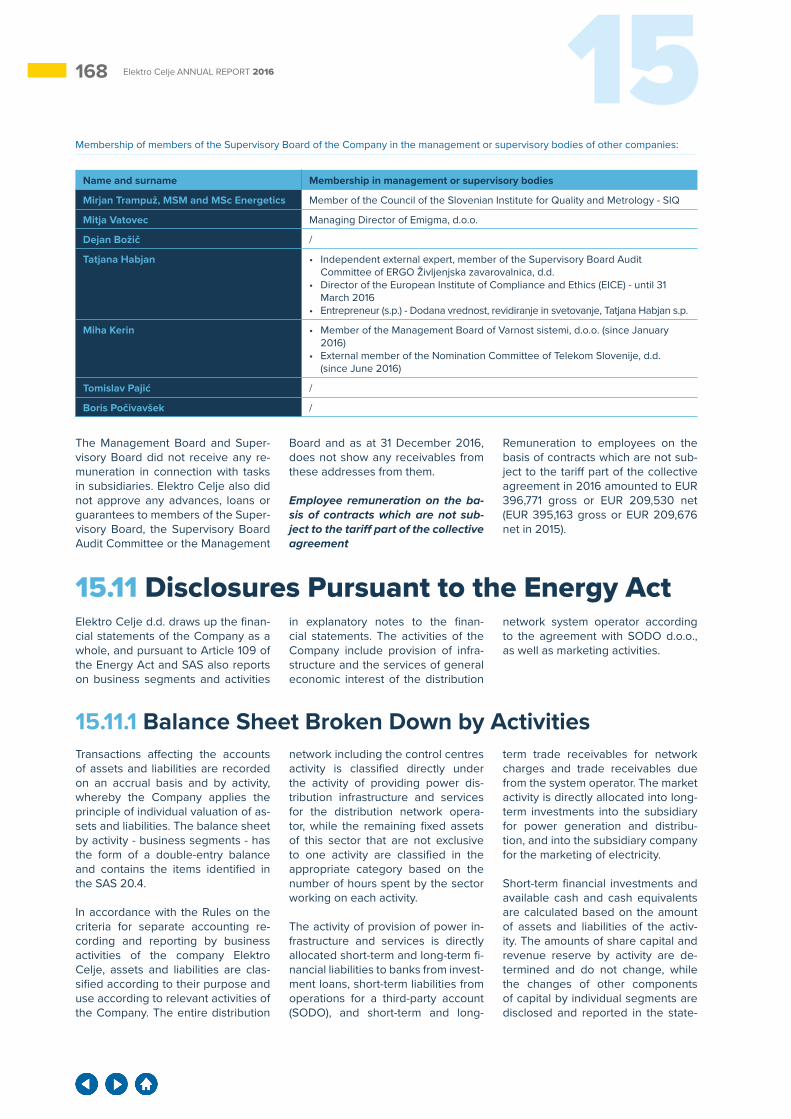
168 15Elektro Celje ANNUAL REPORT 2016
Membership of members of the Supervisory Board of the Company in the management or supervisory bodies of other companies:
Name and surname Membership in management or supervisory bodies
Mirjan Trampuž, MSM and MSc Energetics Member of the Council of the Slovenian Institute for Quality and Metrology - SIQ
Mitja Vatovec Managing Director of Emigma, d.o.o.
Dejan Božič /
Tatjana Habjan • Independent external expert, member of the Supervisory Board Audit Committee of ERGO Življenjska zavarovalnica, d.d.
• Director of the European Institute of Compliance and Ethics (EICE) - until 31 March 2016
• Entrepreneur (s.p.) - Dodana vrednost, revidiranje in svetovanje, Tatjana Habjan s.p.
Miha Kerin • Member of the Management Board of Varnost sistemi, d.o.o. (since January 2016)
• External member of the Nomination Committee of Telekom Slovenije, d.d. (since June 2016)
Tomislav Pajić /
Boris Počivavšek /
The Management Board and Super-visory Board did not receive any re-muneration in connection with tasks in subsidiaries. Elektro Celje also did not approve any advances, loans or guarantees to members of the Super-visory Board, the Supervisory Board Audit Committee or the Management
Board and as at 31 December 2016, does not show any receivables from these addresses from them.
Employee remuneration on the ba-sis of contracts which are not sub-ject to the tariff part of the collective agreement
Remuneration to employees on the basis of contracts which are not sub-ject to the tariff part of the collective agreement in 2016 amounted to EUR 396,771 gross or EUR 209,530 net (EUR 395,163 gross or EUR 209,676 net in 2015).
15.11 Disclosures Pursuant to the Energy ActElektro Celje d.d. draws up the finan-cial statements of the Company as a whole, and pursuant to Article 109 of the Energy Act and SAS also reports on business segments and activities
in explanatory notes to the finan-cial statements. The activities of the Company include provision of infra-structure and the services of general economic interest of the distribution
network system operator according to the agreement with SODO d.o.o., as well as marketing activities.
15.11.1 Balance Sheet Broken Down by ActivitiesTransactions affecting the accounts of assets and liabilities are recorded on an accrual basis and by activity, whereby the Company applies the principle of individual valuation of as-sets and liabilities. The balance sheet by activity - business segments - has the form of a double-entry balance and contains the items identified in the SAS 20.4.
In accordance with the Rules on the criteria for separate accounting re-cording and reporting by business activities of the company Elektro Celje, assets and liabilities are clas-sified according to their purpose and use according to relevant activities of the Company. The entire distribution
network including the control centres activity is classified directly under the activity of providing power dis-tribution infrastructure and services for the distribution network opera-tor, while the remaining fixed assets of this sector that are not exclusive to one activity are classified in the appropriate category based on the number of hours spent by the sector working on each activity.
The activity of provision of power in-frastructure and services is directly allocated short-term and long-term fi-nancial liabilities to banks from invest-ment loans, short-term liabilities from operations for a third-party account (SODO), and short-term and long-
term trade receivables for network charges and trade receivables due from the system operator. The market activity is directly allocated into long-term investments into the subsidiary for power generation and distribu-tion, and into the subsidiary company for the marketing of electricity.
Short-term financial investments and available cash and cash equivalents are calculated based on the amount of assets and liabilities of the activ-ity. The amounts of share capital and revenue reserve by activity are de-termined and do not change, while the changes of other components of capital by individual segments are disclosed and reported in the state-
16915 EXPLANATORY NOTES TO THE FINANCIAL STATEMENTS Elektro Celje ANNUAL REPORT 2016
ments of changes in equity, broken down by activity. The remaining as-sets and liabilities of the sector that are not exclusive to one activity are
classified into the appropriate cat-egory based on the number of hours spent by the sector working on each activity.
With regard to assets and liabilities of shared functions, classification by activity follows these criteria:
Account Criterion
007, 06, 07, 08, 25, 262, 263, 2655, 2663, 270, 277, 282, 285, 2851 do 2859, 320, 321, 966, 989 1
003, 004, 008, 010, 015, 020, 021, 027, 035, 040, 041, 045, 047, 048, 050, 051, 055, 058, 089, 130, 131, 968 2
120, 129, 1321, 133, 150, 151, 155, 159, 160, 161, 164, 165, 169, 190, 191, 192, 195, 260, 290, 291, 295 3
30, 31, 1320 4
2201, 230, 2212, 224, 2656/8 and 2660/1, 2, 4, 5 5
100, 101, 102, 109, 110, 111, 112, 180, 183, 189, 900, 919, 920, 923, 930, 931, 932, 963 Calculation
• Criterion 1 − Share of hours worked for a particular activity in the ac-counting period is used to allocate long-term financial investments not assigned to a particular activity, long-term loans granted, long-term trade receivables, liabilities related to salaries, short-term liabilities to state and other institutions, other short-term trade payables, small tools inventory, long-term trade payables and retained contribu-tions for employment of persons with disabilities over the mandatory quota. These assets and liabilities are related by content and amount to the number of hours worked or the number of employees (sale of apartments with payment in instal-ments, small tools inventory pur-chases, employees’ salaries).
• Criterion 2 − Share of fixed assets current value is used in classify-ing fixed assets used within shared functions that serve both activities. Fixed assets are allocated to the appropriated category based on the share of fixed assets pertaining to each activity in the maintenance and investment sector.
• Criterion 3 – Share of total rev-enue in the accounting period, excluding revenue from shared functions is used in classifying short-term receivables, payables for VAT, and short-term accruals and deferrals that are not assigned to a particular activity. The balance of these assets and liabilities de-pends on the scope of invoicing and the related total revenue.
• Criterion 4 – Share of material used in the accounting period by individual activity (excluding the cost of electricity purchased to cover the losses) – is used in clas-sifying the inventory of material. Increased consumption of material requires larger purchases, and con-sequently a larger inventory.
• Criterion 5 − Share of cost of mate-rial and services by individual ac-tivity (excluding the cost of electric-ity purchased to cover the losses) – is used in classifying trade paya-bles to suppliers of fixed and cur-rent assets. Since these payables are based on the invoices for ma-terial and services received, which are recorded upon occurrence at the level of shared functions, they are classified based on a combined criteria of used material and servic-es by the activity from which these payables reasonably derive.
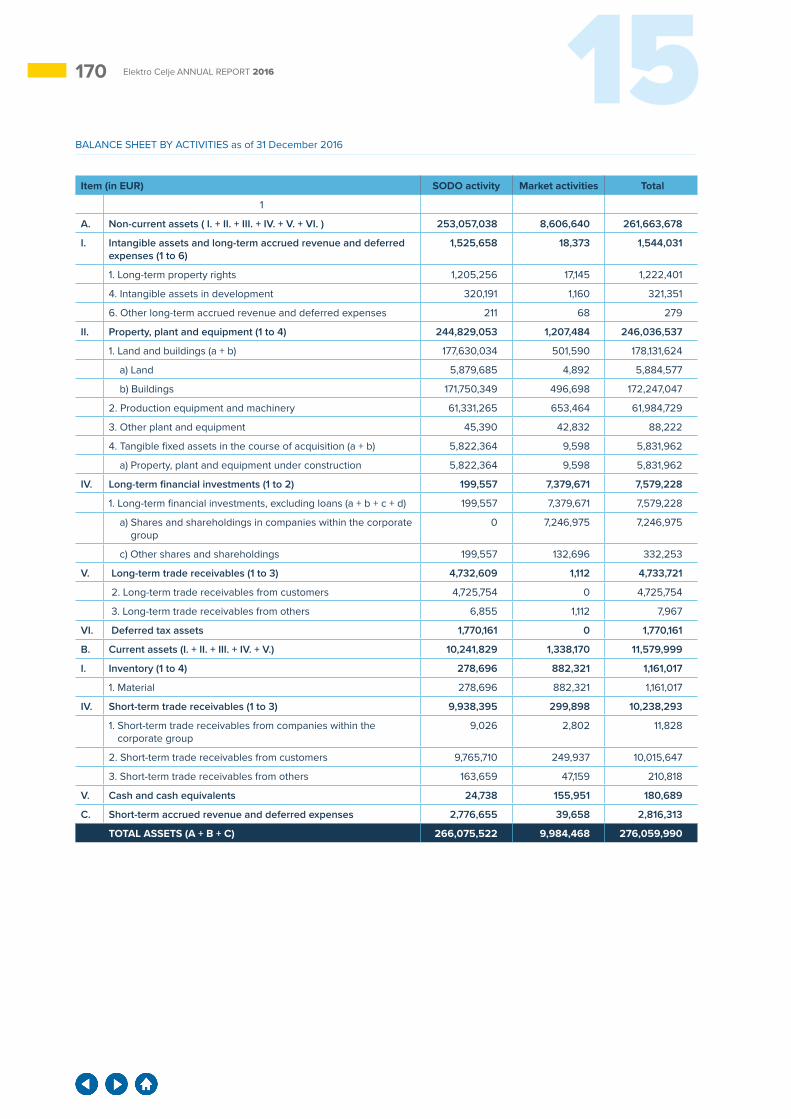
170 15Elektro Celje ANNUAL REPORT 2016
BALANCE SHEET BY ACTIVITIES as of 31 December 2016
Item (in EUR) SODO activity Market activities Total
1
A. Non-current assets ( I. + II. + III. + IV. + V. + VI. ) 253,057,038 8,606,640 261,663,678
I. Intangible assets and long-term accrued revenue and deferred expenses (1 to 6)
1,525,658 18,373 1,544,031
1. Long-term property rights 1,205,256 17,145 1,222,401
4. Intangible assets in development 320,191 1,160 321,351
6. Other long-term accrued revenue and deferred expenses 211 68 279
II. Property, plant and equipment (1 to 4) 244,829,053 1,207,484 246,036,537
1. Land and buildings (a + b) 177,630,034 501,590 178,131,624
a) Land 5,879,685 4,892 5,884,577
b) Buildings 171,750,349 496,698 172,247,047
2. Production equipment and machinery 61,331,265 653,464 61,984,729
3. Other plant and equipment 45,390 42,832 88,222
4. Tangible fixed assets in the course of acquisition (a + b) 5,822,364 9,598 5,831,962
a) Property, plant and equipment under construction 5,822,364 9,598 5,831,962
IV. Long-term financial investments (1 to 2) 199,557 7,379,671 7,579,228
1. Long-term financial investments, excluding loans (a + b + c + d) 199,557 7,379,671 7,579,228
a) Shares and shareholdings in companies within the corporate group
0 7,246,975 7,246,975
c) Other shares and shareholdings 199,557 132,696 332,253
V. Long-term trade receivables (1 to 3) 4,732,609 1,112 4,733,721
2. Long-term trade receivables from customers 4,725,754 0 4,725,754
3. Long-term trade receivables from others 6,855 1,112 7,967
VI. Deferred tax assets 1,770,161 0 1,770,161
B. Current assets (I. + II. + III. + IV. + V.) 10,241,829 1,338,170 11,579,999
I. Inventory (1 to 4) 278,696 882,321 1,161,017
1. Material 278,696 882,321 1,161,017
IV. Short-term trade receivables (1 to 3) 9,938,395 299,898 10,238,293
1. Short-term trade receivables from companies within the corporate group
9,026 2,802 11,828
2. Short-term trade receivables from customers 9,765,710 249,937 10,015,647
3. Short-term trade receivables from others 163,659 47,159 210,818
V. Cash and cash equivalents 24,738 155,951 180,689
C. Short-term accrued revenue and deferred expenses 2,776,655 39,658 2,816,313
TOTAL ASSETS (A + B + C) 266,075,522 9,984,468 276,059,990
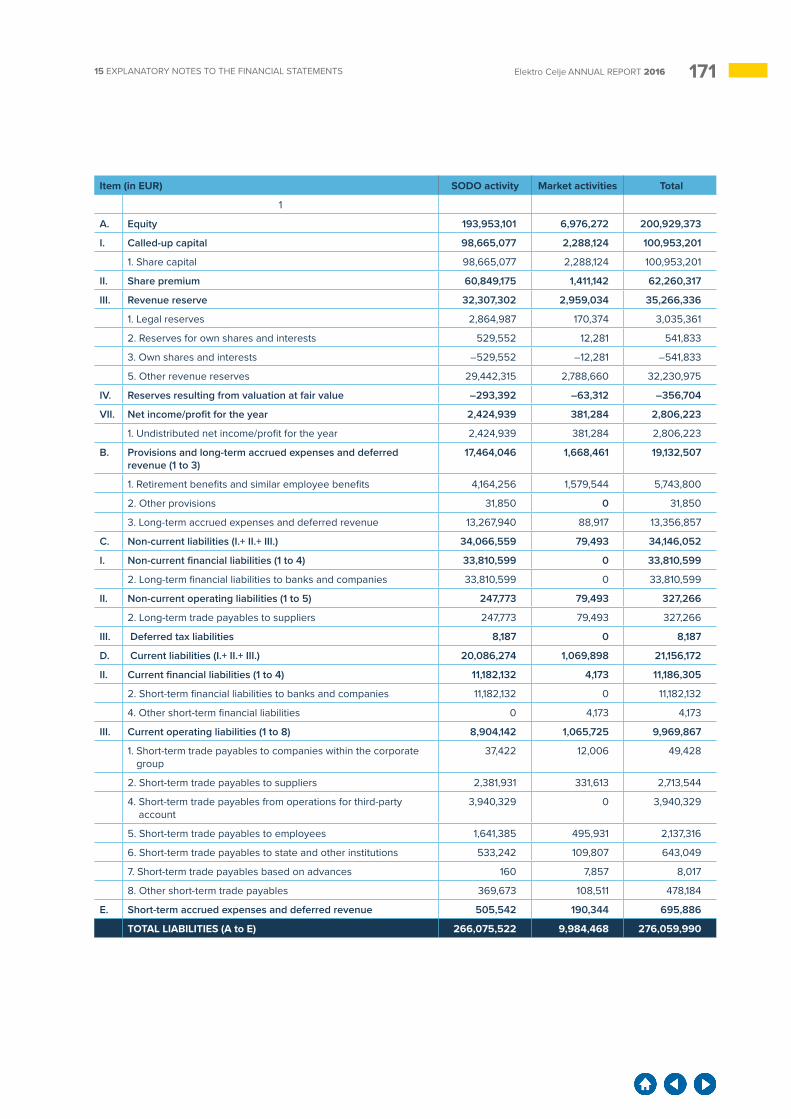
17115 EXPLANATORY NOTES TO THE FINANCIAL STATEMENTS Elektro Celje ANNUAL REPORT 2016
Item (in EUR) SODO activity Market activities Total
1
A. Equity 193,953,101 6,976,272 200,929,373
I. Called-up capital 98,665,077 2,288,124 100,953,201
1. Share capital 98,665,077 2,288,124 100,953,201
II. Share premium 60,849,175 1,411,142 62,260,317
III. Revenue reserve 32,307,302 2,959,034 35,266,336
1. Legal reserves 2,864,987 170,374 3,035,361
2. Reserves for own shares and interests 529,552 12,281 541,833
3. Own shares and interests –529,552 –12,281 –541,833
5. Other revenue reserves 29,442,315 2,788,660 32,230,975
IV. Reserves resulting from valuation at fair value –293,392 –63,312 –356,704
VII. Net income/profit for the year 2,424,939 381,284 2,806,223
1. Undistributed net income/profit for the year 2,424,939 381,284 2,806,223
B. Provisions and long-term accrued expenses and deferred revenue (1 to 3)
17,464,046 1,668,461 19,132,507
1. Retirement benefits and similar employee benefits 4,164,256 1,579,544 5,743,800
2. Other provisions 31,850 0 31,850
3. Long-term accrued expenses and deferred revenue 13,267,940 88,917 13,356,857
C. Non-current liabilities (I.+ II.+ III.) 34,066,559 79,493 34,146,052
I. Non-current financial liabilities (1 to 4) 33,810,599 0 33,810,599
2. Long-term financial liabilities to banks and companies 33,810,599 0 33,810,599
II. Non-current operating liabilities (1 to 5) 247,773 79,493 327,266
2. Long-term trade payables to suppliers 247,773 79,493 327,266
III. Deferred tax liabilities 8,187 0 8,187
D. Current liabilities (I.+ II.+ III.) 20,086,274 1,069,898 21,156,172
II. Current financial liabilities (1 to 4) 11,182,132 4,173 11,186,305
2. Short-term financial liabilities to banks and companies 11,182,132 0 11,182,132
4. Other short-term financial liabilities 0 4,173 4,173
III. Current operating liabilities (1 to 8) 8,904,142 1,065,725 9,969,867
1. Short-term trade payables to companies within the corporate group
37,422 12,006 49,428
2. Short-term trade payables to suppliers 2,381,931 331,613 2,713,544
4. Short-term trade payables from operations for third-party account
3,940,329 0 3,940,329
5. Short-term trade payables to employees 1,641,385 495,931 2,137,316
6. Short-term trade payables to state and other institutions 533,242 109,807 643,049
7. Short-term trade payables based on advances 160 7,857 8,017
8. Other short-term trade payables 369,673 108,511 478,184
E. Short-term accrued expenses and deferred revenue 505,542 190,344 695,886
TOTAL LIABILITIES (A to E) 266,075,522 9,984,468 276,059,990
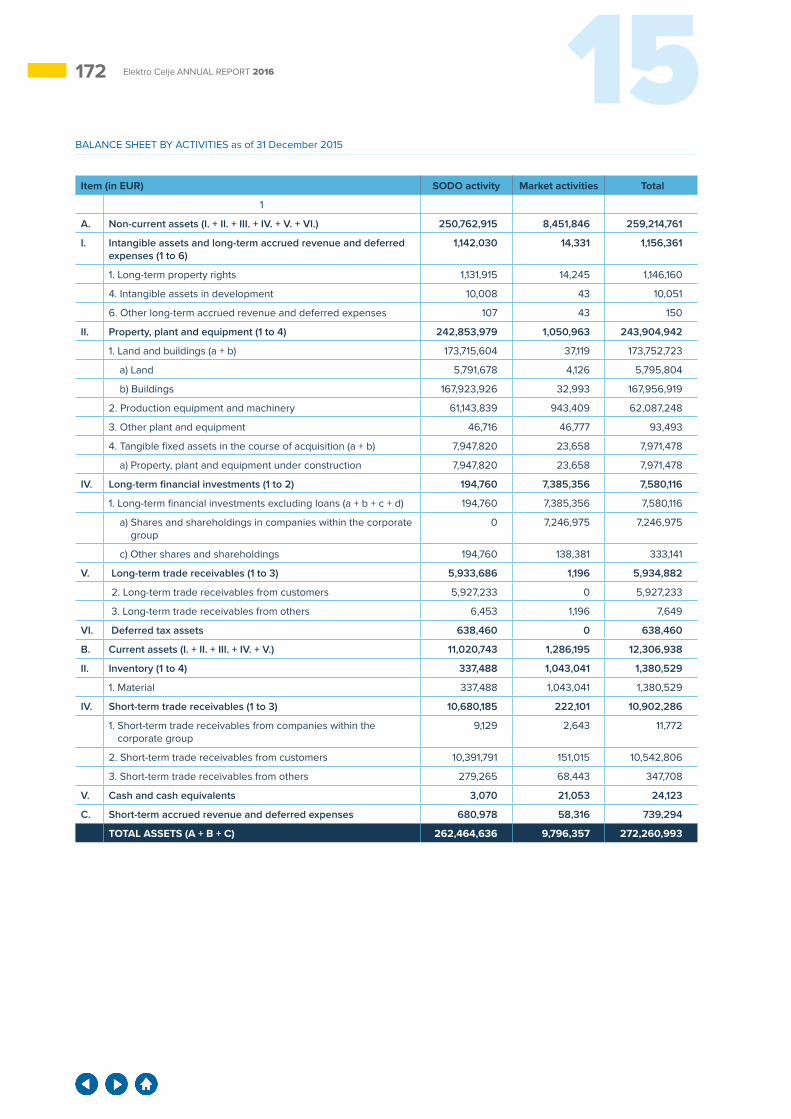
172 15Elektro Celje ANNUAL REPORT 2016
BALANCE SHEET BY ACTIVITIES as of 31 December 2015
Item (in EUR) SODO activity Market activities Total
1
A. Non-current assets (I. + II. + III. + IV. + V. + VI.) 250,762,915 8,451,846 259,214,761
I. Intangible assets and long-term accrued revenue and deferred expenses (1 to 6)
1,142,030 14,331 1,156,361
1. Long-term property rights 1,131,915 14,245 1,146,160
4. Intangible assets in development 10,008 43 10,051
6. Other long-term accrued revenue and deferred expenses 107 43 150
II. Property, plant and equipment (1 to 4) 242,853,979 1,050,963 243,904,942
1. Land and buildings (a + b) 173,715,604 37,119 173,752,723
a) Land 5,791,678 4,126 5,795,804
b) Buildings 167,923,926 32,993 167,956,919
2. Production equipment and machinery 61,143,839 943,409 62,087,248
3. Other plant and equipment 46,716 46,777 93,493
4. Tangible fixed assets in the course of acquisition (a + b) 7,947,820 23,658 7,971,478
a) Property, plant and equipment under construction 7,947,820 23,658 7,971,478
IV. Long-term financial investments (1 to 2) 194,760 7,385,356 7,580,116
1. Long-term financial investments excluding loans (a + b + c + d) 194,760 7,385,356 7,580,116
a) Shares and shareholdings in companies within the corporate group
0 7,246,975 7,246,975
c) Other shares and shareholdings 194,760 138,381 333,141
V. Long-term trade receivables (1 to 3) 5,933,686 1,196 5,934,882
2. Long-term trade receivables from customers 5,927,233 0 5,927,233
3. Long-term trade receivables from others 6,453 1,196 7,649
VI. Deferred tax assets 638,460 0 638,460
B. Current assets (I. + II. + III. + IV. + V.) 11,020,743 1,286,195 12,306,938
II. Inventory (1 to 4) 337,488 1,043,041 1,380,529
1. Material 337,488 1,043,041 1,380,529
IV. Short-term trade receivables (1 to 3) 10,680,185 222,101 10,902,286
1. Short-term trade receivables from companies within the corporate group
9,129 2,643 11,772
2. Short-term trade receivables from customers 10,391,791 151,015 10,542,806
3. Short-term trade receivables from others 279,265 68,443 347,708
V. Cash and cash equivalents 3,070 21,053 24,123
C. Short-term accrued revenue and deferred expenses 680,978 58,316 739,294
TOTAL ASSETS (A + B + C) 262,464,636 9,796,357 272,260,993
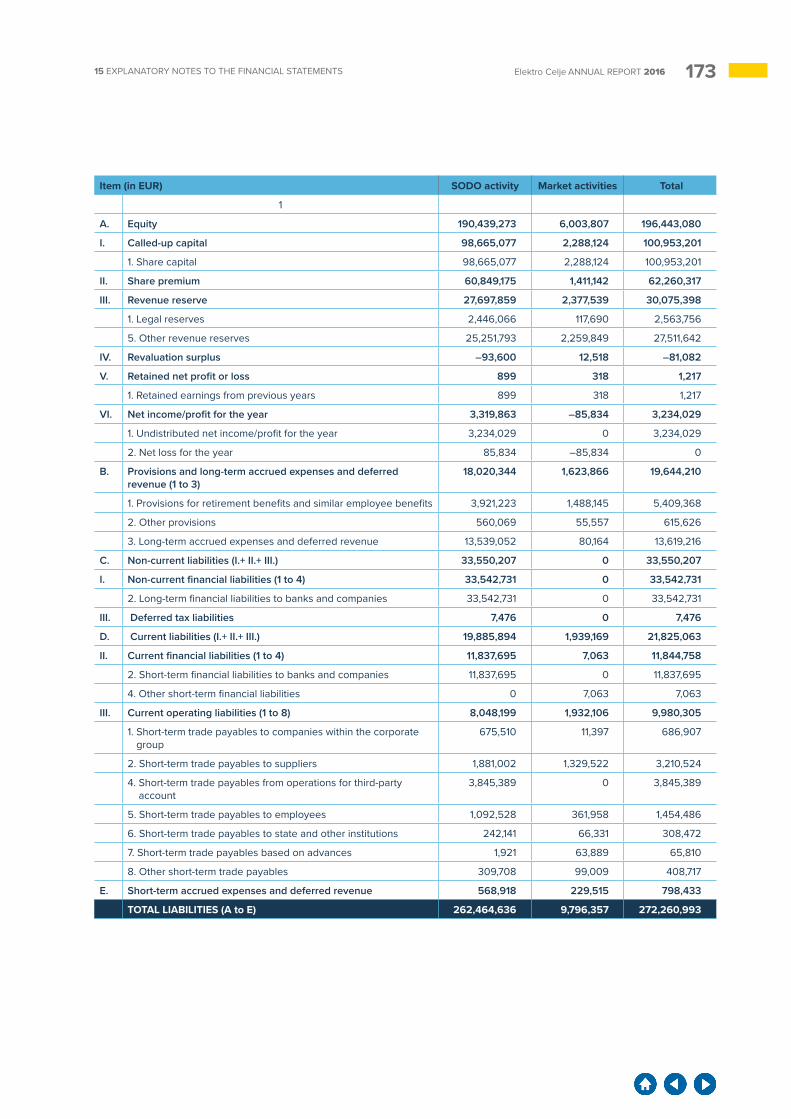
17315 EXPLANATORY NOTES TO THE FINANCIAL STATEMENTS Elektro Celje ANNUAL REPORT 2016
Item (in EUR) SODO activity Market activities Total
1
A. Equity 190,439,273 6,003,807 196,443,080
I. Called-up capital 98,665,077 2,288,124 100,953,201
1. Share capital 98,665,077 2,288,124 100,953,201
II. Share premium 60,849,175 1,411,142 62,260,317
III. Revenue reserve 27,697,859 2,377,539 30,075,398
1. Legal reserves 2,446,066 117,690 2,563,756
5. Other revenue reserves 25,251,793 2,259,849 27,511,642
IV. Revaluation surplus –93,600 12,518 –81,082
V. Retained net profit or loss 899 318 1,217
1. Retained earnings from previous years 899 318 1,217
VI. Net income/profit for the year 3,319,863 –85,834 3,234,029
1. Undistributed net income/profit for the year 3,234,029 0 3,234,029
2. Net loss for the year 85,834 –85,834 0
B. Provisions and long-term accrued expenses and deferred revenue (1 to 3)
18,020,344 1,623,866 19,644,210
1. Provisions for retirement benefits and similar employee benefits 3,921,223 1,488,145 5,409,368
2. Other provisions 560,069 55,557 615,626
3. Long-term accrued expenses and deferred revenue 13,539,052 80,164 13,619,216
C. Non-current liabilities (I.+ II.+ III.) 33,550,207 0 33,550,207
I. Non-current financial liabilities (1 to 4) 33,542,731 0 33,542,731
2. Long-term financial liabilities to banks and companies 33,542,731 0 33,542,731
III. Deferred tax liabilities 7,476 0 7,476
D. Current liabilities (I.+ II.+ III.) 19,885,894 1,939,169 21,825,063
II. Current financial liabilities (1 to 4) 11,837,695 7,063 11,844,758
2. Short-term financial liabilities to banks and companies 11,837,695 0 11,837,695
4. Other short-term financial liabilities 0 7,063 7,063
III. Current operating liabilities (1 to 8) 8,048,199 1,932,106 9,980,305
1. Short-term trade payables to companies within the corporate group
675,510 11,397 686,907
2. Short-term trade payables to suppliers 1,881,002 1,329,522 3,210,524
4. Short-term trade payables from operations for third-party account
3,845,389 0 3,845,389
5. Short-term trade payables to employees 1,092,528 361,958 1,454,486
6. Short-term trade payables to state and other institutions 242,141 66,331 308,472
7. Short-term trade payables based on advances 1,921 63,889 65,810
8. Other short-term trade payables 309,708 99,009 408,717
E. Short-term accrued expenses and deferred revenue 568,918 229,515 798,433
TOTAL LIABILITIES (A to E) 262,464,636 9,796,357 272,260,993
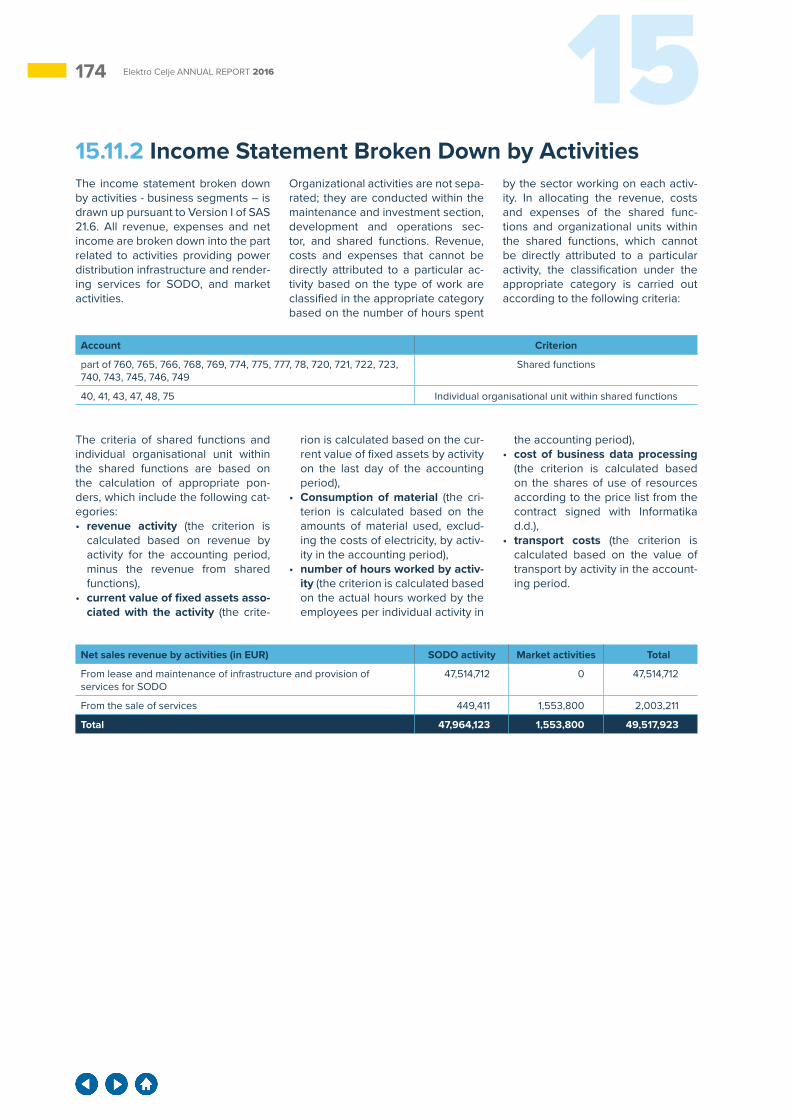
174 15Elektro Celje ANNUAL REPORT 2016
15.11.2 Income Statement Broken Down by ActivitiesThe income statement broken down by activities - business segments – is drawn up pursuant to Version I of SAS 21.6. All revenue, expenses and net income are broken down into the part related to activities providing power distribution infrastructure and render-ing services for SODO, and market activities.
Organizational activities are not sepa-rated; they are conducted within the maintenance and investment section, development and operations sec-tor, and shared functions. Revenue, costs and expenses that cannot be directly attributed to a particular ac-tivity based on the type of work are classified in the appropriate category based on the number of hours spent
by the sector working on each activ-ity. In allocating the revenue, costs and expenses of the shared func-tions and organizational units within the shared functions, which cannot be directly attributed to a particular activity, the classification under the appropriate category is carried out according to the following criteria:
The criteria of shared functions and individual organisational unit within the shared functions are based on the calculation of appropriate pon-ders, which include the following cat-egories:• revenue activity (the criterion is
calculated based on revenue by activity for the accounting period, minus the revenue from shared functions),
• current value of fixed assets asso-ciated with the activity (the crite-
rion is calculated based on the cur-rent value of fixed assets by activity on the last day of the accounting period),
• Consumption of material (the cri-terion is calculated based on the amounts of material used, exclud-ing the costs of electricity, by activ-ity in the accounting period),
• number of hours worked by activ-ity (the criterion is calculated based on the actual hours worked by the employees per individual activity in
the accounting period),• cost of business data processing
(the criterion is calculated based on the shares of use of resources according to the price list from the contract signed with Informatika d.d.),
• transport costs (the criterion is calculated based on the value of transport by activity in the account-ing period.
Account Criterion
part of 760, 765, 766, 768, 769, 774, 775, 777, 78, 720, 721, 722, 723, 740, 743, 745, 746, 749
Shared functions
40, 41, 43, 47, 48, 75 Individual organisational unit within shared functions
Net sales revenue by activities (in EUR) SODO activity Market activities Total
From lease and maintenance of infrastructure and provision of services for SODO
47,514,712 0 47,514,712
From the sale of services 449,411 1,553,800 2,003,211
Total 47,964,123 1,553,800 49,517,923
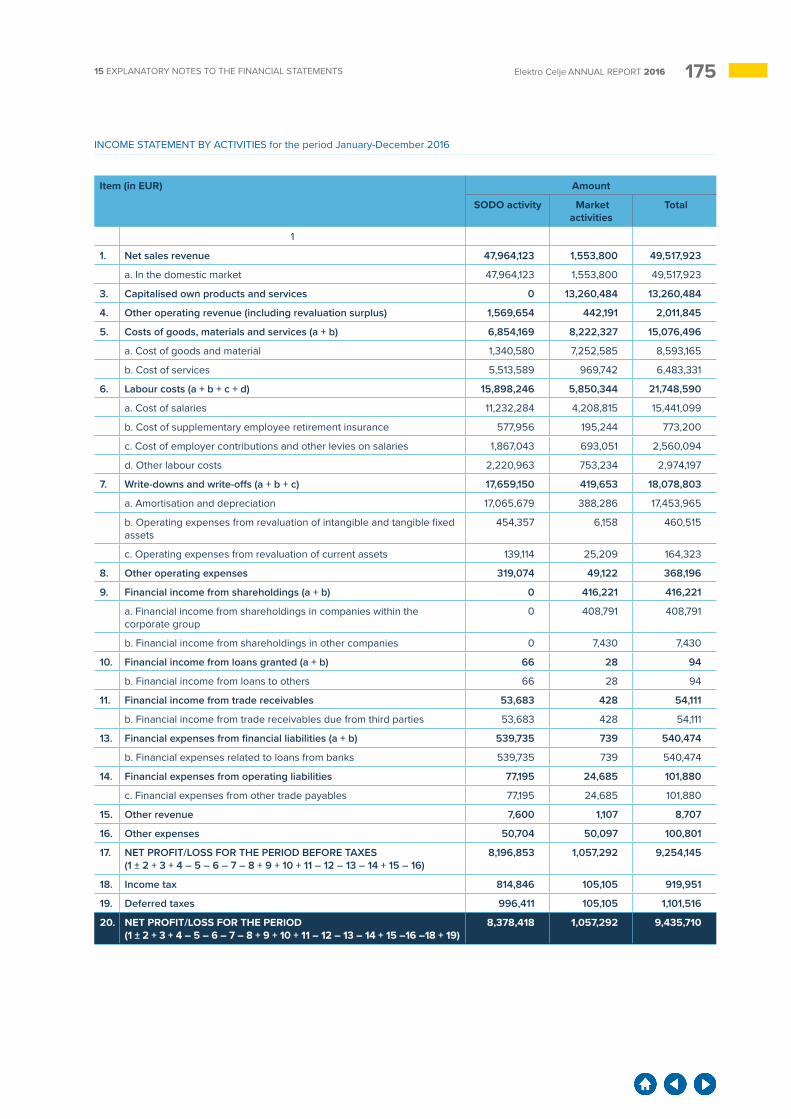
17515 EXPLANATORY NOTES TO THE FINANCIAL STATEMENTS Elektro Celje ANNUAL REPORT 2016
INCOME STATEMENT BY ACTIVITIES for the period January-December 2016
Item (in EUR) Amount
SODO activity Market activities
Total
1
1. Net sales revenue 47,964,123 1,553,800 49,517,923
a. In the domestic market 47,964,123 1,553,800 49,517,923
3. Capitalised own products and services 0 13,260,484 13,260,484
4. Other operating revenue (including revaluation surplus) 1,569,654 442,191 2,011,845
5. Costs of goods, materials and services (a + b) 6,854,169 8,222,327 15,076,496
a. Cost of goods and material 1,340,580 7,252,585 8,593,165
b. Cost of services 5,513,589 969,742 6,483,331
6. Labour costs (a + b + c + d) 15,898,246 5,850,344 21,748,590
a. Cost of salaries 11,232,284 4,208,815 15,441,099
b. Cost of supplementary employee retirement insurance 577,956 195,244 773,200
c. Cost of employer contributions and other levies on salaries 1,867,043 693,051 2,560,094
d. Other labour costs 2,220,963 753,234 2,974,197
7. Write-downs and write-offs (a + b + c) 17,659,150 419,653 18,078,803
a. Amortisation and depreciation 17,065,679 388,286 17,453,965
b. Operating expenses from revaluation of intangible and tangible fixed assets
454,357 6,158 460,515
c. Operating expenses from revaluation of current assets 139,114 25,209 164,323
8. Other operating expenses 319,074 49,122 368,196
9. Financial income from shareholdings (a + b) 0 416,221 416,221
a. Financial income from shareholdings in companies within the corporate group
0 408,791 408,791
b. Financial income from shareholdings in other companies 0 7,430 7,430
10. Financial income from loans granted (a + b) 66 28 94
b. Financial income from loans to others 66 28 94
11. Financial income from trade receivables 53,683 428 54,111
b. Financial income from trade receivables due from third parties 53,683 428 54,111
13. Financial expenses from financial liabilities (a + b) 539,735 739 540,474
b. Financial expenses related to loans from banks 539,735 739 540,474
14. Financial expenses from operating liabilities 77,195 24,685 101,880
c. Financial expenses from other trade payables 77,195 24,685 101,880
15. Other revenue 7,600 1,107 8,707
16. Other expenses 50,704 50,097 100,801
17. NET PROFIT/LOSS FOR THE PERIOD BEFORE TAXES (1 ± 2 + 3 + 4 – 5 – 6 – 7 – 8 + 9 + 10 + 11 – 12 – 13 – 14 + 15 – 16)
8,196,853 1,057,292 9,254,145
18. Income tax 814,846 105,105 919,951
19. Deferred taxes 996,411 105,105 1,101,516
20. NET PROFIT/LOSS FOR THE PERIOD (1 ± 2 + 3 + 4 – 5 – 6 – 7 – 8 + 9 + 10 + 11 – 12 – 13 – 14 + 15 –16 –18 + 19)
8,378,418 1,057,292 9,435,710
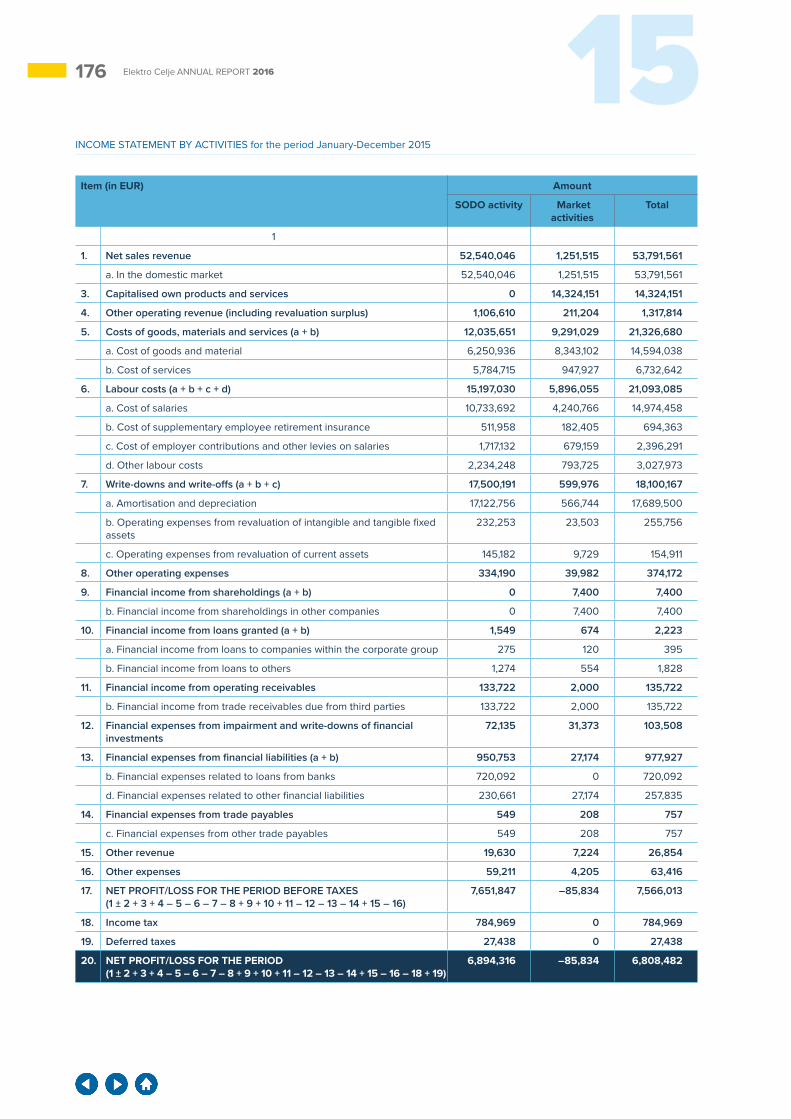
176 15Elektro Celje ANNUAL REPORT 2016
INCOME STATEMENT BY ACTIVITIES for the period January-December 2015
Item (in EUR) Amount
SODO activity Market activities
Total
1
1. Net sales revenue 52,540,046 1,251,515 53,791,561
a. In the domestic market 52,540,046 1,251,515 53,791,561
3. Capitalised own products and services 0 14,324,151 14,324,151
4. Other operating revenue (including revaluation surplus) 1,106,610 211,204 1,317,814
5. Costs of goods, materials and services (a + b) 12,035,651 9,291,029 21,326,680
a. Cost of goods and material 6,250,936 8,343,102 14,594,038
b. Cost of services 5,784,715 947,927 6,732,642
6. Labour costs (a + b + c + d) 15,197,030 5,896,055 21,093,085
a. Cost of salaries 10,733,692 4,240,766 14,974,458
b. Cost of supplementary employee retirement insurance 511,958 182,405 694,363
c. Cost of employer contributions and other levies on salaries 1,717,132 679,159 2,396,291
d. Other labour costs 2,234,248 793,725 3,027,973
7. Write-downs and write-offs (a + b + c) 17,500,191 599,976 18,100,167
a. Amortisation and depreciation 17,122,756 566,744 17,689,500
b. Operating expenses from revaluation of intangible and tangible fixed assets
232,253 23,503 255,756
c. Operating expenses from revaluation of current assets 145,182 9,729 154,911
8. Other operating expenses 334,190 39,982 374,172
9. Financial income from shareholdings (a + b) 0 7,400 7,400
b. Financial income from shareholdings in other companies 0 7,400 7,400
10. Financial income from loans granted (a + b) 1,549 674 2,223
a. Financial income from loans to companies within the corporate group 275 120 395
b. Financial income from loans to others 1,274 554 1,828
11. Financial income from operating receivables 133,722 2,000 135,722
b. Financial income from trade receivables due from third parties 133,722 2,000 135,722
12. Financial expenses from impairment and write-downs of financial investments
72,135 31,373 103,508
13. Financial expenses from financial liabilities (a + b) 950,753 27,174 977,927
b. Financial expenses related to loans from banks 720,092 0 720,092
d. Financial expenses related to other financial liabilities 230,661 27,174 257,835
14. Financial expenses from trade payables 549 208 757
c. Financial expenses from other trade payables 549 208 757
15. Other revenue 19,630 7,224 26,854
16. Other expenses 59,211 4,205 63,416
17. NET PROFIT/LOSS FOR THE PERIOD BEFORE TAXES (1 ± 2 + 3 + 4 – 5 – 6 – 7 – 8 + 9 + 10 + 11 – 12 – 13 – 14 + 15 – 16)
7,651,847 –85,834 7,566,013
18. Income tax 784,969 0 784,969
19. Deferred taxes 27,438 0 27,438
20. NET PROFIT/LOSS FOR THE PERIOD (1 ± 2 + 3 + 4 – 5 – 6 – 7 – 8 + 9 + 10 + 11 – 12 – 13 – 14 + 15 – 16 – 18 + 19)
6,894,316 –85,834 6,808,482
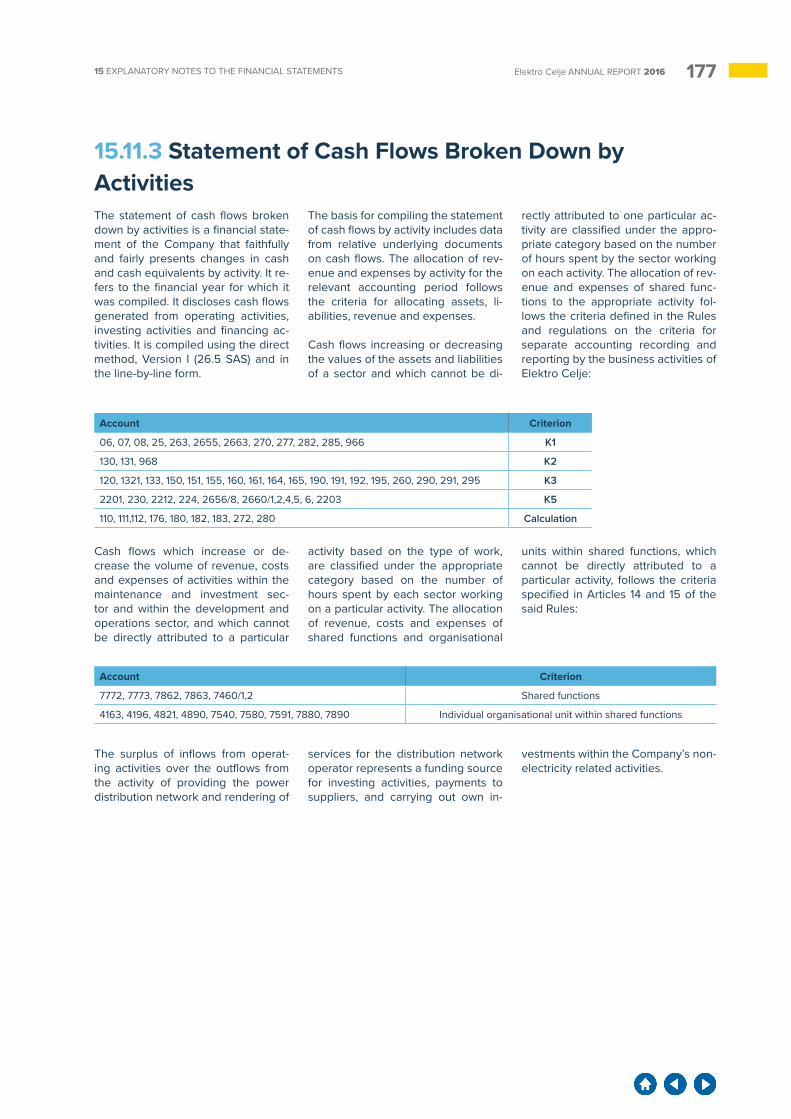
17715 EXPLANATORY NOTES TO THE FINANCIAL STATEMENTS Elektro Celje ANNUAL REPORT 2016
15.11.3 Statement of Cash Flows Broken Down by ActivitiesThe statement of cash flows broken down by activities is a financial state-ment of the Company that faithfully and fairly presents changes in cash and cash equivalents by activity. It re-fers to the financial year for which it was compiled. It discloses cash flows generated from operating activities, investing activities and financing ac-tivities. It is compiled using the direct method, Version I (26.5 SAS) and in the line-by-line form.
The basis for compiling the statement of cash flows by activity includes data from relative underlying documents on cash flows. The allocation of rev-enue and expenses by activity for the relevant accounting period follows the criteria for allocating assets, li-abilities, revenue and expenses.
Cash flows increasing or decreasing the values of the assets and liabilities of a sector and which cannot be di-
rectly attributed to one particular ac-tivity are classified under the appro-priate category based on the number of hours spent by the sector working on each activity. The allocation of rev-enue and expenses of shared func-tions to the appropriate activity fol-lows the criteria defined in the Rules and regulations on the criteria for separate accounting recording and reporting by the business activities of Elektro Celje:
Account Criterion
06, 07, 08, 25, 263, 2655, 2663, 270, 277, 282, 285, 966 K1
130, 131, 968 K2
120, 1321, 133, 150, 151, 155, 160, 161, 164, 165, 190, 191, 192, 195, 260, 290, 291, 295 K3
2201, 230, 2212, 224, 2656/8, 2660/1,2,4,5, 6, 2203 K5
110, 111,112, 176, 180, 182, 183, 272, 280 Calculation
Account Criterion
7772, 7773, 7862, 7863, 7460/1,2 Shared functions
4163, 4196, 4821, 4890, 7540, 7580, 7591, 7880, 7890 Individual organisational unit within shared functions
Cash flows which increase or de-crease the volume of revenue, costs and expenses of activities within the maintenance and investment sec-tor and within the development and operations sector, and which cannot be directly attributed to a particular
activity based on the type of work, are classified under the appropriate category based on the number of hours spent by each sector working on a particular activity. The allocation of revenue, costs and expenses of shared functions and organisational
units within shared functions, which cannot be directly attributed to a particular activity, follows the criteria specified in Articles 14 and 15 of the said Rules:
The surplus of inflows from operat-ing activities over the outflows from the activity of providing the power distribution network and rendering of
services for the distribution network operator represents a funding source for investing activities, payments to suppliers, and carrying out own in-
vestments within the Company’s non-electricity related activities.
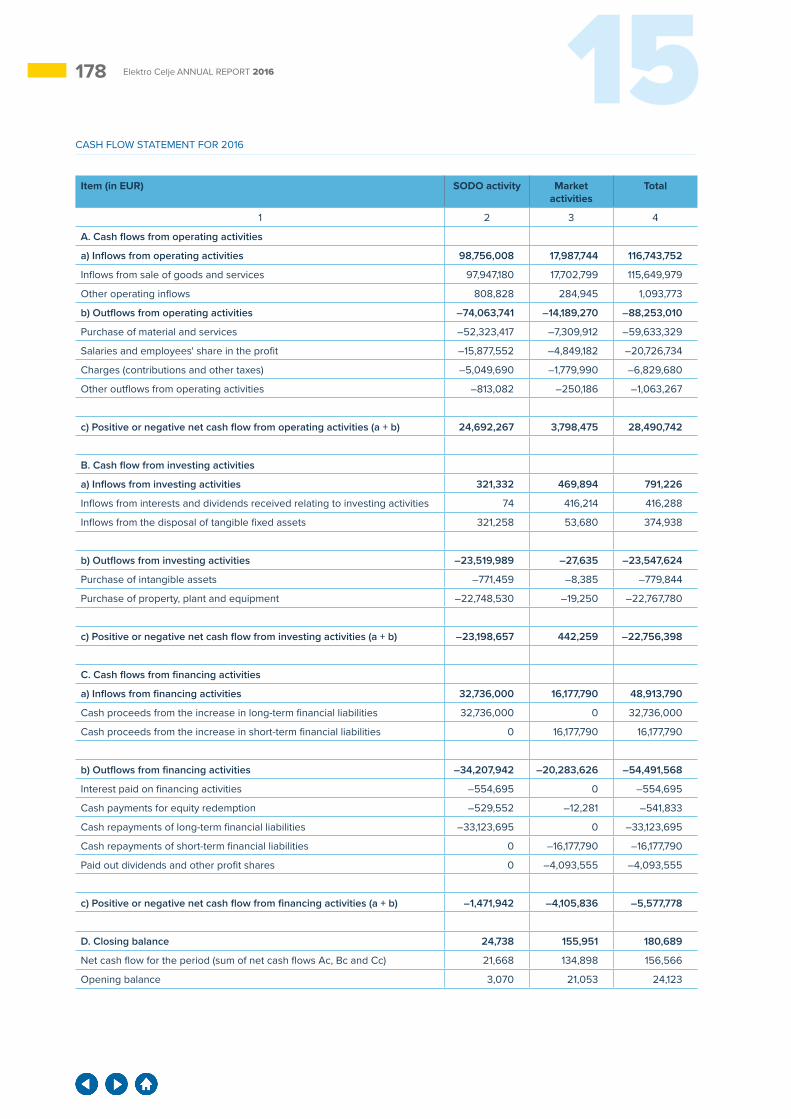
178 15Elektro Celje ANNUAL REPORT 2016
CASH FLOW STATEMENT FOR 2016
Item (in EUR) SODO activity Market activities
Total
1 2 3 4
A. Cash flows from operating activities
a) Inflows from operating activities 98,756,008 17,987,744 116,743,752
Inflows from sale of goods and services 97,947,180 17,702,799 115,649,979
Other operating inflows 808,828 284,945 1,093,773
b) Outflows from operating activities –74,063,741 –14,189,270 –88,253,010
Purchase of material and services –52,323,417 –7,309,912 –59,633,329
Salaries and employees' share in the profit –15,877,552 –4,849,182 –20,726,734
Charges (contributions and other taxes) –5,049,690 –1,779,990 –6,829,680
Other outflows from operating activities –813,082 –250,186 –1,063,267
c) Positive or negative net cash flow from operating activities (a + b) 24,692,267 3,798,475 28,490,742
B. Cash flow from investing activities
a) Inflows from investing activities 321,332 469,894 791,226
Inflows from interests and dividends received relating to investing activities 74 416,214 416,288
Inflows from the disposal of tangible fixed assets 321,258 53,680 374,938
b) Outflows from investing activities –23,519,989 –27,635 –23,547,624
Purchase of intangible assets –771,459 –8,385 –779,844
Purchase of property, plant and equipment –22,748,530 –19,250 –22,767,780
c) Positive or negative net cash flow from investing activities (a + b) –23,198,657 442,259 –22,756,398
C. Cash flows from financing activities
a) Inflows from financing activities 32,736,000 16,177,790 48,913,790
Cash proceeds from the increase in long-term financial liabilities 32,736,000 0 32,736,000
Cash proceeds from the increase in short-term financial liabilities 0 16,177,790 16,177,790
b) Outflows from financing activities –34,207,942 –20,283,626 –54,491,568
Interest paid on financing activities –554,695 0 –554,695
Cash payments for equity redemption –529,552 –12,281 –541,833
Cash repayments of long-term financial liabilities –33,123,695 0 –33,123,695
Cash repayments of short-term financial liabilities 0 –16,177,790 –16,177,790
Paid out dividends and other profit shares 0 –4,093,555 –4,093,555
c) Positive or negative net cash flow from financing activities (a + b) –1,471,942 –4,105,836 –5,577,778
D. Closing balance 24,738 155,951 180,689
Net cash flow for the period (sum of net cash flows Ac, Bc and Cc) 21,668 134,898 156,566
Opening balance 3,070 21,053 24,123
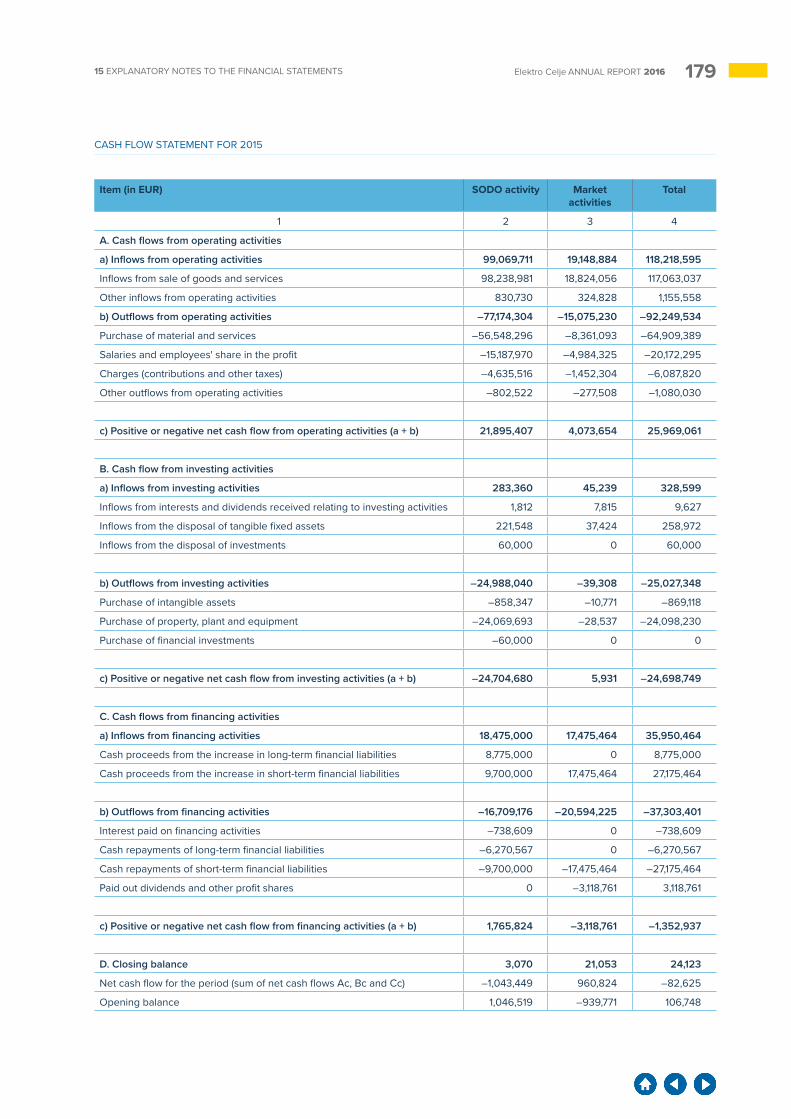
17915 EXPLANATORY NOTES TO THE FINANCIAL STATEMENTS Elektro Celje ANNUAL REPORT 2016
CASH FLOW STATEMENT FOR 2015
Item (in EUR) SODO activity Market activities
Total
1 2 3 4
A. Cash flows from operating activities
a) Inflows from operating activities 99,069,711 19,148,884 118,218,595
Inflows from sale of goods and services 98,238,981 18,824,056 117,063,037
Other inflows from operating activities 830,730 324,828 1,155,558
b) Outflows from operating activities –77,174,304 –15,075,230 –92,249,534
Purchase of material and services –56,548,296 –8,361,093 –64,909,389
Salaries and employees' share in the profit –15,187,970 –4,984,325 –20,172,295
Charges (contributions and other taxes) –4,635,516 –1,452,304 –6,087,820
Other outflows from operating activities –802,522 –277,508 –1,080,030
c) Positive or negative net cash flow from operating activities (a + b) 21,895,407 4,073,654 25,969,061
B. Cash flow from investing activities
a) Inflows from investing activities 283,360 45,239 328,599
Inflows from interests and dividends received relating to investing activities 1,812 7,815 9,627
Inflows from the disposal of tangible fixed assets 221,548 37,424 258,972
Inflows from the disposal of investments 60,000 0 60,000
b) Outflows from investing activities –24,988,040 –39,308 –25,027,348
Purchase of intangible assets –858,347 –10,771 –869,118
Purchase of property, plant and equipment –24,069,693 –28,537 –24,098,230
Purchase of financial investments –60,000 0 0
c) Positive or negative net cash flow from investing activities (a + b) –24,704,680 5,931 –24,698,749
C. Cash flows from financing activities
a) Inflows from financing activities 18,475,000 17,475,464 35,950,464
Cash proceeds from the increase in long-term financial liabilities 8,775,000 0 8,775,000
Cash proceeds from the increase in short-term financial liabilities 9,700,000 17,475,464 27,175,464
b) Outflows from financing activities –16,709,176 –20,594,225 –37,303,401
Interest paid on financing activities –738,609 0 –738,609
Cash repayments of long-term financial liabilities –6,270,567 0 –6,270,567
Cash repayments of short-term financial liabilities –9,700,000 –17,475,464 –27,175,464
Paid out dividends and other profit shares 0 –3,118,761 3,118,761
c) Positive or negative net cash flow from financing activities (a + b) 1,765,824 –3,118,761 –1,352,937
D. Closing balance 3,070 21,053 24,123
Net cash flow for the period (sum of net cash flows Ac, Bc and Cc) –1,043,449 960,824 –82,625
Opening balance 1,046,519 –939,771 106,748

180 Elektro Celje ANNUAL REPORT 2016
RELATIONSHIP
RESPECT We strive for good mutual relations. Based on respect, we establish continuous, timely and transparent communication, which contributes to a good working atmosphere and mutual trust.

182 16Elektro Celje ANNUAL REPORT 2016
16 CONSOLIDATED FINANCIAL STATEMENTS OF ELEKTRO CELJE GROUP
16.1 Consolidated statement of financial position
Item (in EUR) Note Amount
As of 31 december 2016
As of 31 december 2015
As of 1 January 2015
ASSETSA Non-current assets (1 + 2 + 3 + 4 + 5 + 6) 259,991,388 257,668,990 249,934,0241. Intangible assets 17.7 2,035,257 1,787,304 1,670,2602. Property, plant and equipment 17.8 248,417,284 246,489,479 242,253,976
a. Land 5,908,405 5,862,153 5,928,244b. Buildings 173,224,451 168,972,879 166,746,043c. Production equipment, machinery and other equipment 63,446,733 63,682,969 64,093,687d. Property, plant and equipment under construction 5,837,695 7,971,478 5,486,002
3. Investment property 17.9 302,975 321,318 298,7734. Financial investments 17.10 734,452 684,777 436,9445. Trade receivables 17.13.1 5,698,675 6,928,016 4,170,7886. Deferred tax assets 17.11.1 2,802,745 1,458,096 1,103,283B Current assets (1 + 2 + 3 + 4 + 5 + 6) 54,281,817 54,519,142 35,779,3881. Available-for-sale assets 0 51,628 02. Inventory 17.12 1,169,107 1,426,577 1,451,0153. Trade receivables from customers 17.13.2 43,991,990 47,167,231 29,407,8214. Income tax receivables 17.13.3 0 229,977 05. Other trade receivables 17.13.2 6,539,713 3,786,860 2,917,0036. Cash and cash equivalents 17.14 2,581,007 1,856,869 2,003,549TOTAL ASSETS (A + B) 314,273,205 312,188,132 285,713,412LIABILITIESA Equity (1 + 2 + 3 + 4 + 5) 17.15 213,314,562 207,638,928 196,839,5511. Share capital 100,953,201 100,953,201 100,953,2012. Share premium 62,260,317 62,260,317 62,260,3173. Revenue reserve 35,267,588 30,076,650 25,447,446
a. Legal reserves 3,036,613 2,565,008 2,224,584b. Reserves for own shares and interests 541,833 0 0c. Own shares and interests -541,833 0 0d. Other revenue reserves 32,230,975 27,511,642 23,222,862
4. Fair value reserves -302,184 -40,448 76,9275. Net income/profit 10,401,635 9,925,865 8,101,660
a. Retained net income/profit from previous years 6,690,619 3,903,111 2,009,567b. Net income/profit for the year 3,711,016 6,022,754 6,092,093
Equity share of non-controlling interests 4,734,005 4,463,343 0Equity share of controlling interests 208,580,557 203,175,585 196,839,551B Non-current liabilities (1 + 2 + 3 + 4 + 5) 54,370,651 53,839,229 56,227,9631. Provisions 17.16 6,818,075 6,587,091 5,510,5282. Long-term deferred revenue 17.17 13,356,857 13,619,216 13,947,1573. Financial liabilities 17.18 33,843,699 33,609,060 36,770,2784. Operating liabilities 17.19 334,925 7,659 05. Deferred tax liabilities 17.11.2 17,095 16,203 0C Current liabilities (1 + 2 + 3 + 4 + 5) 46,587,992 50,709,975 32,645,8981. Financial liabilities 17.18 11,222,578 13,879,624 6,247,5022. Trade payables 17.20 17,451,325 18,974,262 12,321,9123. Trade payables from operations for third-party account 17.20 11,347,268 11,455,151 7,896,0434. Other trade payables 17.20 6,329,106 6,400,938 5,396,9785. Income tax liabilities 17.21 237,715 0 783,463TOTAL LIABILITIES (A + B + C) 314,273,205 312,188,132 285,713,412
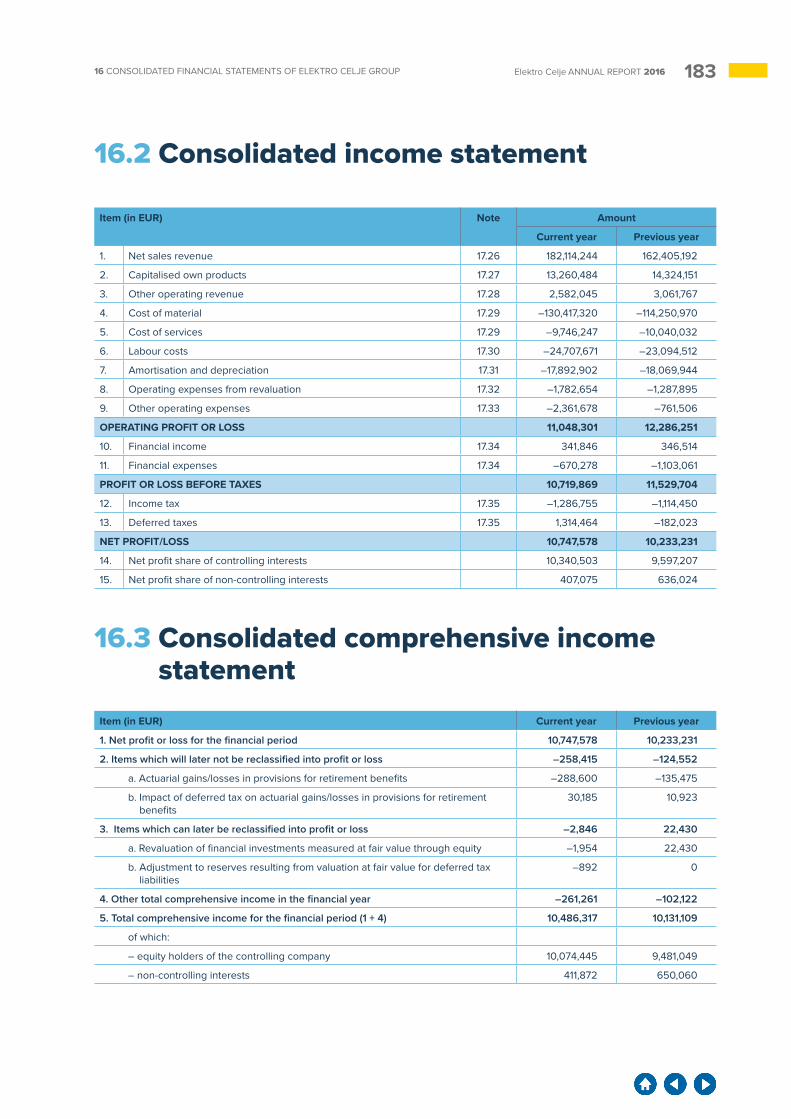
18316 CONSOLIDATED FINANCIAL STATEMENTS OF ELEKTRO CELJE GROUP Elektro Celje ANNUAL REPORT 2016
16.2 Consolidated income statement
16.3 Consolidated comprehensive income statement
Item (in EUR) Note Amount
Current year Previous year
1. Net sales revenue 17.26 182,114,244 162,405,192
2. Capitalised own products 17.27 13,260,484 14,324,151
3. Other operating revenue 17.28 2,582,045 3,061,767
4. Cost of material 17.29 –130,417,320 –114,250,970
5. Cost of services 17.29 –9,746,247 –10,040,032
6. Labour costs 17.30 –24,707,671 –23,094,512
7. Amortisation and depreciation 17.31 –17,892,902 –18,069,944
8. Operating expenses from revaluation 17.32 –1,782,654 –1,287,895
9. Other operating expenses 17.33 –2,361,678 –761,506
OPERATING PROFIT OR LOSS 11,048,301 12,286,251
10. Financial income 17.34 341,846 346,514
11. Financial expenses 17.34 –670,278 –1,103,061
PROFIT OR LOSS BEFORE TAXES 10,719,869 11,529,704
12. Income tax 17.35 –1,286,755 –1,114,450
13. Deferred taxes 17.35 1,314,464 –182,023
NET PROFIT/LOSS 10,747,578 10,233,231
14. Net profit share of controlling interests 10,340,503 9,597,207
15. Net profit share of non-controlling interests 407,075 636,024
Item (in EUR) Current year Previous year
1. Net profit or loss for the financial period 10,747,578 10,233,231
2. Items which will later not be reclassified into profit or loss –258,415 –124,552
a. Actuarial gains/losses in provisions for retirement benefits –288,600 –135,475
b. Impact of deferred tax on actuarial gains/losses in provisions for retirement benefits
30,185 10,923
3. Items which can later be reclassified into profit or loss –2,846 22,430
a. Revaluation of financial investments measured at fair value through equity –1,954 22,430
b. Adjustment to reserves resulting from valuation at fair value for deferred tax liabilities
–892 0
4. Other total comprehensive income in the financial year –261,261 –102,122
5. Total comprehensive income for the financial period (1 + 4) 10,486,317 10,131,109
of which:
– equity holders of the controlling company 10,074,445 9,481,049
– non-controlling interests 411,872 650,060
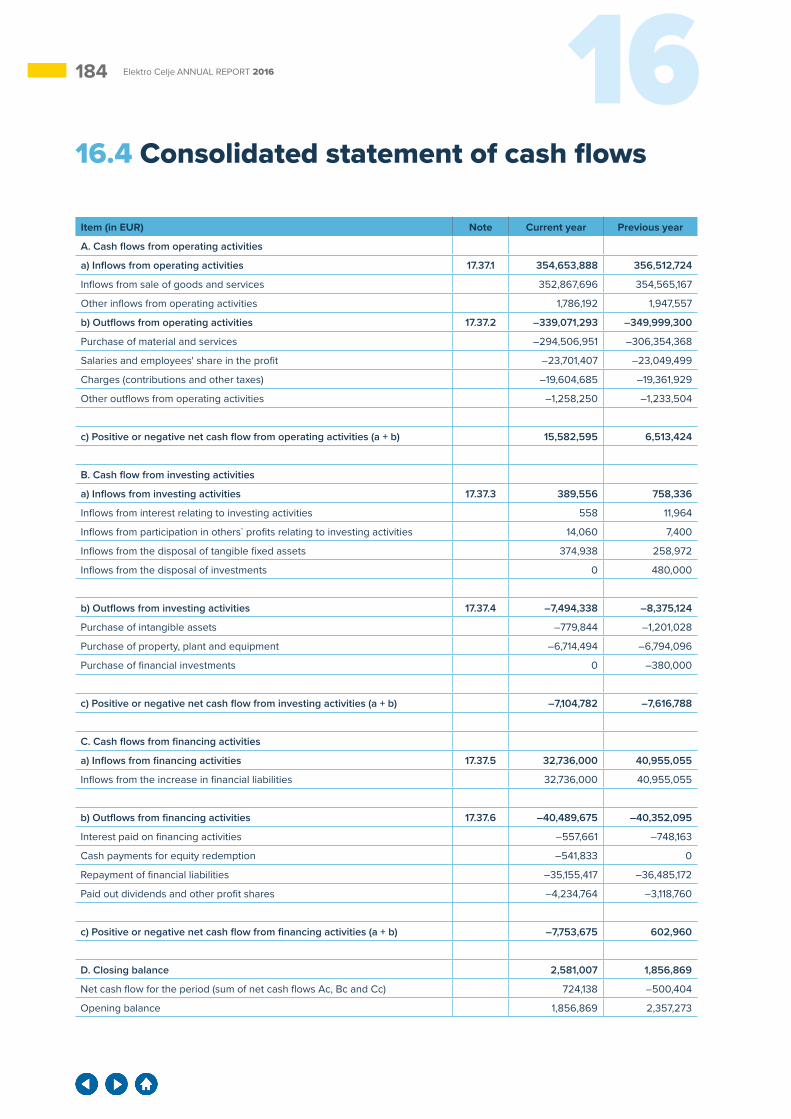
184 16Elektro Celje ANNUAL REPORT 2016
16.4 Consolidated statement of cash flows
Item (in EUR) Note Current year Previous year
A. Cash flows from operating activities
a) Inflows from operating activities 17.37.1 354,653,888 356,512,724
Inflows from sale of goods and services 352,867,696 354,565,167
Other inflows from operating activities 1,786,192 1,947,557
b) Outflows from operating activities 17.37.2 –339,071,293 –349,999,300
Purchase of material and services –294,506,951 –306,354,368
Salaries and employees' share in the profit –23,701,407 –23,049,499
Charges (contributions and other taxes) –19,604,685 –19,361,929
Other outflows from operating activities –1,258,250 –1,233,504
c) Positive or negative net cash flow from operating activities (a + b) 15,582,595 6,513,424
B. Cash flow from investing activities
a) Inflows from investing activities 17.37.3 389,556 758,336
Inflows from interest relating to investing activities 558 11,964
Inflows from participation in others` profits relating to investing activities 14,060 7,400
Inflows from the disposal of tangible fixed assets 374,938 258,972
Inflows from the disposal of investments 0 480,000
b) Outflows from investing activities 17.37.4 –7,494,338 –8,375,124
Purchase of intangible assets –779,844 –1,201,028
Purchase of property, plant and equipment –6,714,494 –6,794,096
Purchase of financial investments 0 –380,000
c) Positive or negative net cash flow from investing activities (a + b) –7,104,782 –7,616,788
C. Cash flows from financing activities
a) Inflows from financing activities 17.37.5 32,736,000 40,955,055
Inflows from the increase in financial liabilities 32,736,000 40,955,055
b) Outflows from financing activities 17.37.6 –40,489,675 –40,352,095
Interest paid on financing activities –557,661 –748,163
Cash payments for equity redemption –541,833 0
Repayment of financial liabilities –35,155,417 –36,485,172
Paid out dividends and other profit shares –4,234,764 –3,118,760
c) Positive or negative net cash flow from financing activities (a + b) –7,753,675 602,960
D. Closing balance 2,581,007 1,856,869
Net cash flow for the period (sum of net cash flows Ac, Bc and Cc) 724,138 –500,404
Opening balance 1,856,869 2,357,273
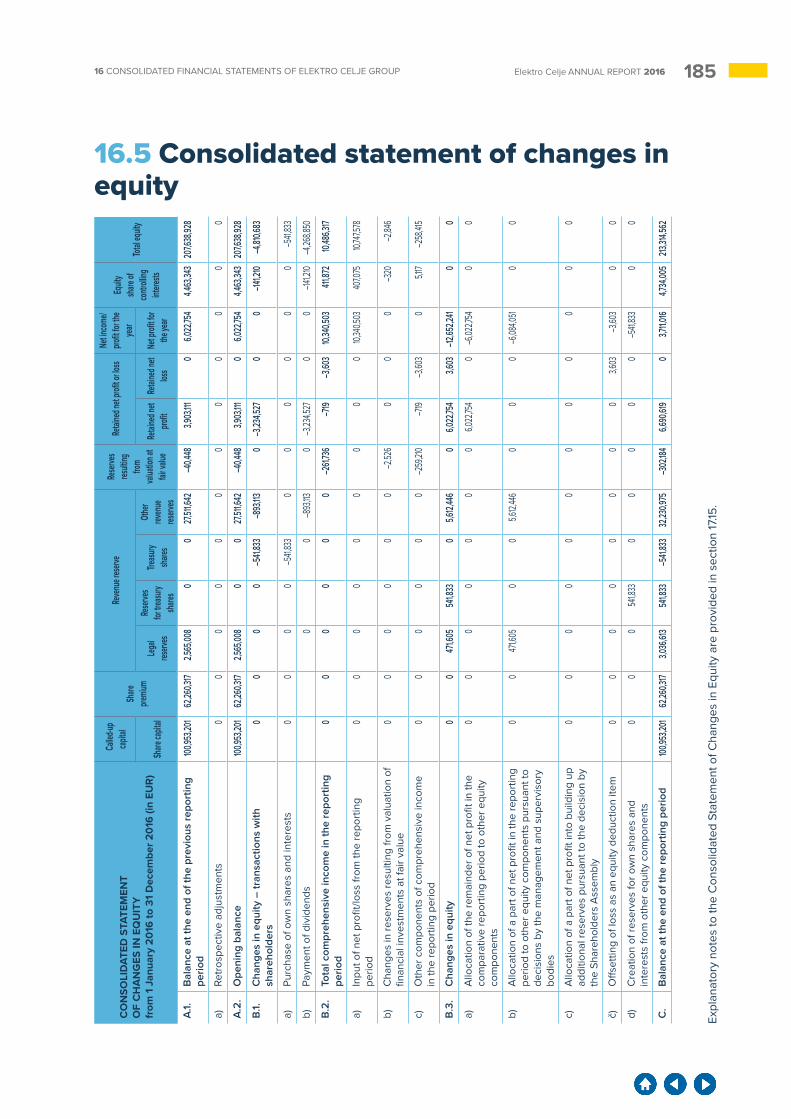
18516 CONSOLIDATED FINANCIAL STATEMENTS OF ELEKTRO CELJE GROUP Elektro Celje ANNUAL REPORT 2016
16.5 Consolidated statement of changes in equity
Expl
anat
ory
note
s to
the
Con
solid
ated
Sta
tem
ent o
f Cha
nges
in E
quity
are
pro
vide
d in
sec
tion
17.15
.
CO
NSO
LID
ATED
STA
TEM
ENT
OF
CH
AN
GES
IN E
QU
ITY
fr
om 1
Jan
uary
201
6 to
31
Dec
embe
r 201
6 (in
EU
R)
Calle
d-up
capita
lSh
are
premi
um
Reve
nue r
eserve
Re
serve
s res
ulting
fro
m va
luatio
n at
fair v
alue
Retai
ned n
et pro
fit or
loss
Net in
come
/pro
fit for
the
year
Equit
y sh
are of
co
ntroll
ing
intere
sts
Total
equit
y
Share
capit
alLe
gal
reserv
es
Reser
ves
for tre
asury
share
s
Treasu
ry sh
ares
Othe
r rev
enue
res
erves
Retai
ned n
et pro
fitRe
taine
d net
loss
Net p
rofit fo
r the
year
A.1.
Bal
ance
at t
he e
nd o
f the
pre
viou
s re
port
ing
perio
d100
,953,2
0162
,260,3
172,5
65,00
80
027
,511,6
42–4
0,448
3,903
,1110
6,022
,754
4,463
,343
207,6
38,92
8
a)Re
tros
pect
ive
adju
stm
ents
00
00
00
00
00
00
A.2
.O
peni
ng b
alan
ce100
,953,2
0162
,260,3
172,5
65,00
80
027
,511,6
42–4
0,448
3,903
,1110
6,022
,754
4,463
,343
207,6
38,92
8
B.1.
Cha
nges
in e
quity
– tr
ansa
ctio
ns w
ith
shar
ehol
ders
00
00
–541,
833
–893
,1130
–3,23
4,527
00
–141,2
10–4
,810,6
83
a)Pu
rcha
se o
f ow
n sh
ares
and
inte
rest
s0
00
0–5
41,83
30
00
00
0–5
41,83
3
b)Pa
ymen
t of d
ivid
ends
00
–893
,1130
–3,23
4,527
00
–141,2
10–4
,268,8
50
B.2
.To
tal c
ompr
ehen
sive
inco
me
in th
e re
port
ing
perio
d0
00
00
0–2
61,73
6–7
19–3
,603
10,34
0,503
411,87
210,
486,3
17
a)In
put o
f net
pro
fit/lo
ss fr
om th
e re
port
ing
perio
d0
00
00
00
00
10,34
0,503
407,0
7510,
747,5
78
b)C
hang
es in
rese
rves
resu
lting
from
val
uatio
n of
fin
anci
al in
vest
men
ts a
t fai
r val
ue0
00
00
0–2
,526
00
0–3
20–2
,846
c)O
ther
com
pone
nts
of c
ompr
ehen
sive
inco
me
in th
e re
port
ing
perio
d0
00
00
0–2
59,21
0–7
19–3
,603
05,1
17–2
58,41
5
B.3
.C
hang
es in
equ
ity0
047
1,605
541,8
330
5,612,
446
06,0
22,75
43,6
03–12
,652,2
410
0
a)A
lloca
tion
of th
e re
mai
nder
of n
et p
rofit
in th
e co
mpa
rativ
e re
port
ing
perio
d to
oth
er e
quity
co
mpo
nent
s
00
00
00
06,0
22,75
40
–6,02
2,754
00
b)A
lloca
tion
of a
par
t of n
et p
rofit
in th
e re
port
ing
perio
d to
oth
er e
quity
com
pone
nts
purs
uant
to
deci
sion
s by
the
man
agem
ent a
nd s
uper
viso
ry
bodi
es
00
471,6
050
05,6
12,44
60
00
–6,08
4,051
00
c)A
lloca
tion
of a
par
t of n
et p
rofit
into
bui
ldin
g up
ad
ditio
nal r
eser
ves
purs
uant
to th
e de
cisi
on b
y th
e Sh
areh
olde
rs A
ssem
bly
00
00
00
00
00
00
č)O
ffset
ting
of lo
ss a
s an
equ
ity d
educ
tion
item
00
00
00
00
3,603
–3,60
30
0
d)C
reat
ion
of re
serv
es fo
r ow
n sh
ares
and
in
tere
sts
from
oth
er e
quity
com
pone
nts
00
054
1,833
00
00
0–5
41,83
30
0
C.
Bal
ance
at t
he e
nd o
f the
repo
rtin
g pe
riod
100,95
3,201
62,26
0,317
3,036
,613
541,8
33–5
41,83
332
,230,9
75–3
02,18
46,6
90,61
90
3,711,
0164,7
34,00
5213
,314,5
62

186 16Elektro Celje ANNUAL REPORT 2016
Expl
anat
ory
note
s to
the
Con
solid
ated
Sta
tem
ent o
f Cha
nges
in E
quity
are
pro
vide
d in
sec
tion
17.15
.
CO
NSO
LID
ATED
STA
TEM
ENT
OF
CH
AN
GES
IN E
QU
ITY
fr
om 1
Jan
uary
201
5 to
31
Dec
embe
r 201
5 (in
EU
R)
Calle
d-up
ca
pita
lSh
are
pre-
miu
m
Reve
nue
rese
rve
Reva
luat
ion
surp
lus
Reta
ined
ne
t pro
fit o
r lo
ss
Net i
ncom
e/pr
ofit f
or th
e ye
arTo
tal e
quity
of
ow
ners
of
the
cont
rolli
ng
com
pany
Equi
ty sh
are
of n
on-
cont
rolli
ng
inte
rest
s
Tota
lSh
are
capi
tal
Lega
l re
serv
es
Oth
er
reve
nue
rese
rves
Reta
ined
ne
t pro
fitNe
t pro
fit
for t
he y
ear
A.1.
Bal
ance
at t
he e
nd o
f the
pre
viou
s re
port
ing
perio
d10
0,95
3,20
162
,260
,317
2,22
4,58
423
,222
,862
76,9
272,
009,
567
6,09
2,09
319
6,83
9,55
10
196,
839,
551
A.2
.B
alan
ce a
t the
beg
inni
ng o
f the
re
port
ing
perio
d10
0,95
3,20
162
,260
,317
2,22
4,58
423
,222
,862
76,9
272,
009,
567
6,09
2,09
319
6,83
9,55
10
196,
839,
551
B.1.
Cha
nges
in e
quity
– tr
ansa
ctio
ns w
ith
shar
ehol
ders
00
00
0–3
,145,
015
0–3
,145,
015
3,81
3,28
366
8,26
8
a)Pa
ymen
t of d
ivid
ends
00
00
0–3
,145,
015
0–3
,145,
015
0–3
,145,
015
b)Eff
ects
of t
he m
erge
r by
acqu
isiti
on0
00
00
00
03,
813,
283
3,81
3,28
3
B.2
.To
tal c
ompr
ehen
sive
inco
me
in th
e re
port
ing
perio
d0
00
0–1
16,15
80
9,59
7,207
9,48
1,049
650,
060
10,13
1,109
a)In
put o
f net
pro
fit/lo
ss fr
om th
e re
port
ing
perio
d0
00
00
09,
597,2
079,
597,2
0763
6,02
410
,233
,231
b)C
hang
e in
the
reva
luat
ion
surp
lus
from
re
valu
atio
n of
fina
ncia
l inv
estm
ents
00
00
22,4
300
022
,430
10,4
3332
,863
c)A
djus
tmen
t of t
he re
valu
atio
n su
rplu
s -
actu
aria
l gai
ns0
00
0–1
38,5
880
0–1
38,5
883,
603
–134
,985
B.3
.C
hang
es in
equ
ity0
034
0,42
44,
288,
780
–1,2
175,
038,
559
–9,6
66,5
460
00
a)A
lloca
tion
of th
e re
mai
nder
of
net p
rofit
for 2
014
to o
ther
equ
ity
com
pone
nts
00
00
06,
092,
093
-6,0
92,0
930
00
b)A
lloca
tion
of a
par
t of n
et p
rofit
in 2
015
to o
ther
equ
ity c
ompo
nent
s pu
rsua
nt
to d
ecis
ions
by
the
man
agem
ent a
nd
supe
rvis
ory
bodi
es
00
340,
424
3,23
4,02
90
0-3
,574
,453
00
0
c)A
lloca
tion
of a
par
t of n
et p
rofit
in
to b
uild
ing
up a
dditi
onal
rese
rves
pu
rsua
nt to
the
deci
sion
by
the
Shar
ehol
ders
Ass
embl
y
00
01,0
54,75
10
-1,05
4,751
00
00
č)O
ther
cha
nges
in e
quity
00
00
-1,21
71,2
170
00
0
C.
Bal
ance
at t
he e
nd o
f the
repo
rtin
g pe
riod
100,
953,
201
62,2
60,3
172,
565,
008
27,5
11,6
42-4
0,44
83,
903,1
116,
022,
754
203,1
75,5
854,
463,
343
207,6
38,9
28
18717 POJASNILA H KONSOLIDIRANIM RAČUNOVODSKIM IZKAZOM Elektro Celje ANNUAL REPORT 2016
17 EXPLANATORY NOTES TO THE CONSOLIDATED FINANCIAL STATEMENTS
17.1 Reporting CompanyThe Elektro Celje Group, (hereinafter Group), consists of the parent compa-ny Elektro Celje d.d. (hereinafter: Par-ent Company), as well as its subsidi-aries ECE, energetska družba, d.o.o., podjetje za prodajo električne ener-gije in drugih energentov, svetovanje in storitve (hereinafter: the company ECE), and MHE – ELPRO, družba za
proizvodnjo in trženje električne en-ergije, d.o.o (hereinafter: the com-pany MHE - ELPRO). The Group com-panies were founded and operate in Slovenia, with their registered Head Office at Vrunčeva 2a in Celje.
The key tasks of the Group are to de-liver a reliable, safe and efficient elec-
tricity supply to its customers in the area of Elektro Celje, as well as the purchase and sale of electricity and other energy products to end cus-tomers, electricity and heat genera-tion, and Investments in renewable energy sources.
17.2 Bases for the Preparation of Consolidated Financial Statementsa) Declaration of ConformityThe Consolidated Financial State-ments of the Elektro Celje Group have been prepared in compliance with International Financial Report-ing Standards (hereinafter IFRS) as adopted by the European Union, and Explanations, adopted by the Interna-tional Financial Reporting Interpreta-tions Committee (IFRIC) as well as the European Union, and in accordance with the provisions of the Compa-nies Act (ZGD-1). The Group does not disclose information for which it may reasonably estimate that such disclo-sure could cause significant damage.
At the Balance Sheet date there are no differences in the Group’s ac-counting policies between the IFRS used and those adopted by the Euro-pean Union in terms of the process of confirming standards adopted by the European Union.
The Consolidated Financial State-ments were confirmed by the Man-agement Board on 21 April 2017.
b) Basis of measurementThe Consolidated Financial State-ments present an understandable and appropriate account of the finan-cial position, financial performance and cash flows of the Group. They are prepared by observing the as-sumptions of accruals and the going concern basis, with the information presented ensuring reliability, and are complete in terms of significance and costs. The fiscal year is the calendar year from 1 January to 31 December 2016.
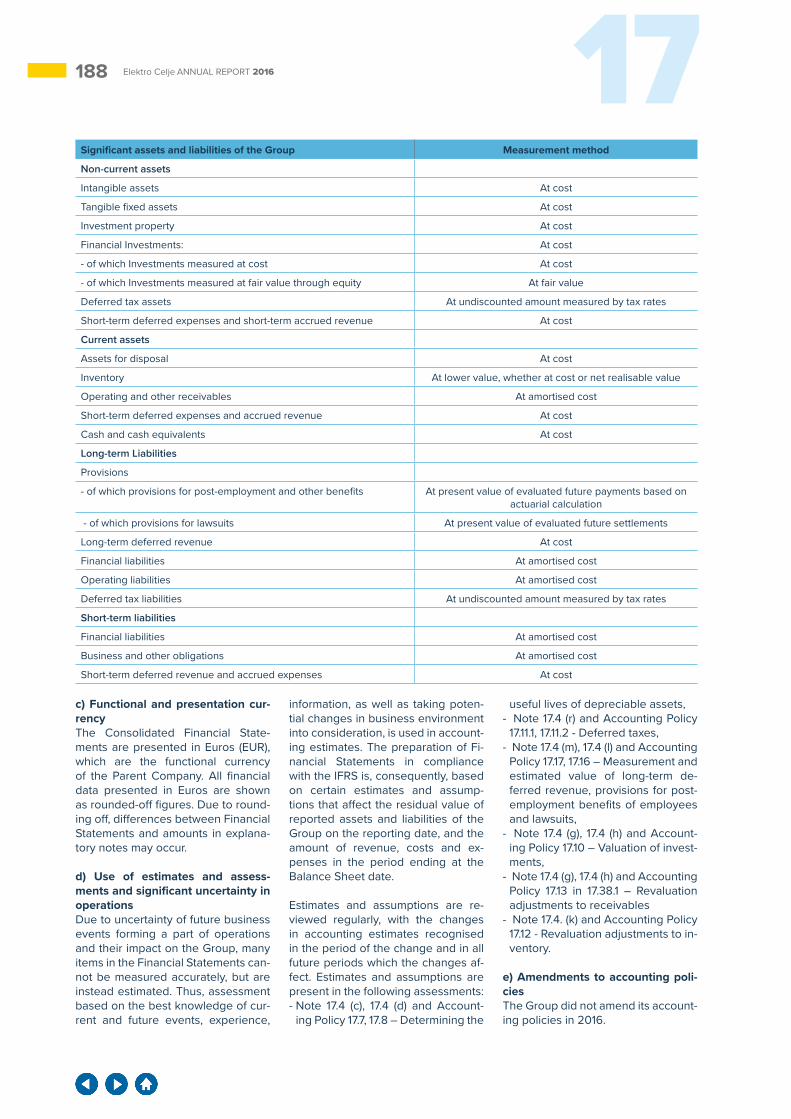
188 17Elektro Celje ANNUAL REPORT 2016
c) Functional and presentation cur-rencyThe Consolidated Financial State-ments are presented in Euros (EUR), which are the functional currency of the Parent Company. All financial data presented in Euros are shown as rounded-off figures. Due to round-ing off, differences between Financial Statements and amounts in explana-tory notes may occur.
d) Use of estimates and assess-ments and significant uncertainty in operationsDue to uncertainty of future business events forming a part of operations and their impact on the Group, many items in the Financial Statements can-not be measured accurately, but are instead estimated. Thus, assessment based on the best knowledge of cur-rent and future events, experience,
information, as well as taking poten-tial changes in business environment into consideration, is used in account-ing estimates. The preparation of Fi-nancial Statements in compliance with the IFRS is, consequently, based on certain estimates and assump-tions that affect the residual value of reported assets and liabilities of the Group on the reporting date, and the amount of revenue, costs and ex-penses in the period ending at the Balance Sheet date.
Estimates and assumptions are re-viewed regularly, with the changes in accounting estimates recognised in the period of the change and in all future periods which the changes af-fect. Estimates and assumptions are present in the following assessments: - Note 17.4 (c), 17.4 (d) and Account-
ing Policy 17.7, 17.8 – Determining the
useful lives of depreciable assets,- Note 17.4 (r) and Accounting Policy
17.11.1, 17.11.2 - Deferred taxes, - Note 17.4 (m), 17.4 (l) and Accounting
Policy 17.17, 17.16 – Measurement and estimated value of long-term de-ferred revenue, provisions for post-employment benefits of employees and lawsuits,
- Note 17.4 (g), 17.4 (h) and Account-ing Policy 17.10 – Valuation of invest-ments,
- Note 17.4 (g), 17.4 (h) and Accounting Policy 17.13 in 17.38.1 – Revaluation adjustments to receivables
- Note 17.4. (k) and Accounting Policy 17.12 - Revaluation adjustments to in-ventory.
e) Amendments to accounting poli-ciesThe Group did not amend its account-ing policies in 2016.
Significant assets and liabilities of the Group Measurement method
Non-current assets
Intangible assets At cost
Tangible fixed assets At cost
Investment property At cost
Financial Investments: At cost
- of which Investments measured at cost At cost
- of which Investments measured at fair value through equity At fair value
Deferred tax assets At undiscounted amount measured by tax rates
Short-term deferred expenses and short-term accrued revenue At cost
Current assets
Assets for disposal At cost
Inventory At lower value, whether at cost or net realisable value
Operating and other receivables At amortised cost
Short-term deferred expenses and accrued revenue At cost
Cash and cash equivalents At cost
Long-term Liabilities
Provisions
- of which provisions for post-employment and other benefits At present value of evaluated future payments based on actuarial calculation
- of which provisions for lawsuits At present value of evaluated future settlements
Long-term deferred revenue At cost
Financial liabilities At amortised cost
Operating liabilities At amortised cost
Deferred tax liabilities At undiscounted amount measured by tax rates
Short-term liabilities
Financial liabilities At amortised cost
Business and other obligations At amortised cost
Short-term deferred revenue and accrued expenses At cost
18917 POJASNILA H KONSOLIDIRANIM RAČUNOVODSKIM IZKAZOM Elektro Celje ANNUAL REPORT 2016
17.3 Transition to IFRCThe Group’s Consolidated Financial Statements for the financial year 2015 ending on 31 December, 2015, were prepared in accordance with the Slo-venian Accounting Standards 2006 (hereinafter: SAS 2006). The Finan-cial Statements for the financial year ending on 31 December 2016, are drawn up in accordance with the re-quirements of the IFRS as adopted by the EU, and notes adopted by the In-ternational Financial Reporting Inter-pretations Committee (IFRIC), as well as by the European Union. The tran-sition took place on 1 January 2015. The accounting policies applied by the Group in preparing the Financial Statements, taking into account the SAS 2006, are also in line with the requirements of the IFRS as adopted by the EU and, therefore, there were no differences due to the transition to IFRS.
Due to the reporting requirements in the transition to the IFRS, the Finan-
cial Statements include figures for the reporting period that ended on 31 December 2016, for the comparative period, which ended on 31 December 2015, and at the date of transition to the IFRS, i.e. on 1 January 2015. These are the first Annual Financial Statements prepared in accordance with the IFRS.
In the opening Balance Sheet under the IFRS, individual items of state-ments which the Group used to pre-pare in accordance with SAS, are classified in accordance with the re-quirements of the IFRS. The transi-tion from SAS to IFRS did not affect the financial position, financial perfor-mance, equity and cash flows of the Group, and the following reclassifica-tions were carried out:- Income tax receivables and liabili-
ties are reported separately from other short-term operating receiva-bles and liabilities;
- Accrued revenue and deferred ex-
penses were reclassified to other short-term operating receivables;
- Deferred revenue and accrued ex-penses were reclassified to other short-term operating liabilities;
- Other income and other expenses were reclassified to other operating and other income, as well as to oth-er operating and other expenditure.
Since the Group used a different scheme of fundamental Financial Statements in the past, a review of the reclassifications is neither possi-ble nor sensible.
The Group did not use exceptions permitted by IFRS 1 for the first use of IFRS in relation to the retrospective application.
Accounting estimates, used by situ-ation as of 1 January 2015, and 31 December 2015, comply with the estimates made on these two dates, pursuant to SAS.
17.4 Significant Accounting PoliciesThe Financial Statements of Group companies are prepared for the same reporting period as the Financial Statements of the Parent Company, using the same accounting policies. The Elektro Celje Group uses the same accounting policies for all pe-riods presented in the Consolidated Financial Statements.
At the Balance Sheet date, 31 Decem-ber 2016, there were no differences in the accounting policies of the Group between the IFRS and IFRS adopted by the European Union.
a) The newly adopted Standards and Explanatory Notes which came into effect on 1 January, 2016In the current accounting period, the following amendments to existing Standards and interpretations issued by the International Financial Report-ing Interpretations Committee (IFRIC), as well as adopted by the EU, are in force:
- Amendments to IFRS 11 - Joint Ar-
rangements: Accounting for the pur-chase of shares
- Amendments to IAS 16 and IAS 38 – Explanation regarding acceptable methods of depreciation calculation
- Amendments to IAS 16 and IAS 41 - Agriculture: Bearer Plants
- The amendments to Standards and interpretations adopted in the pe-riod 2012-2014
- Amendments to IAS 27 - Equity method in separate Financial State-ments
- Amendments to IAS 1 - Presentation of Financial Statements: Disclosures Initiative
The adoption of these amendments to the existing Standards and inter-pretations has not led to significant changes in the Financial Statements of the Group.
b) Newly adopted Standards and Explanations, which have not yet entered into forceThe new Standards and interpreta-tions listed below are not yet in force
and, during the preparation of the Annual Financial Statements on the 31 December 2016, these were not taken into account:
IFRS 9 Financial Instruments (2014) Effective for annual accounting pe-riods, beginning on 1 January 2018; applied retroactively, unless there are exceptional circumstances. Conver-sion of earlier periods is not neces-sary and is permitted as long as the information is available and without the use of findings. Earlier applica-tion is permitted. This Standard re-places IAS 39 Financial Instruments: Recognition and Measurement, with the exception that IAS 39 remains in place in the event of hedging the fair value of the portfolio of financial as-sets or financial liabilities against the risk of changes in interest rates; com-panies have the option to choose be-tween the use of hedge accounting in accordance with IFRS 9 or existing hedge accounting under IAS 39 in all cases of accounting.
190 17Elektro Celje ANNUAL REPORT 2016
Although the foundations of allow-able measurement of financial assets - amortised cost, Fair Value through Other Comprehensive Income (FVO-CI) and Fair Value through Profit or Loss (FVPL) - are similar to IAS 39, the criteria for determining the appropri-ate measurement vary significantly. A financial asset is measured at amor-tised cost when the following condi-tions are met: - Assets are managed within a busi-
ness model aimed at collecting con-tractual cash flows and
- Contractual provisions include the exact dates of the cash flows that are solely payments of principal and interest on the unpaid principal.
Further, a group may present subse-quent changes in Fair Value (includ-ing positive and negative exchange rate differences) of an equity instru-ment not intended for trading, ir-revocably in the context of other comprehensive income. These sub-sequent changes can, in no case, no longer be reclassified to profit or loss. Debt instruments measured at Fair Value through other comprehensive income, interest income, expected credit losses, as well as positive and negative exchange differences, are recognised in profit or loss in the same manner as assets measured at amortised cost. Other profit or loss is recognised in other comprehensive income and is, once derecognised, reclassified to profit or loss.
The model of impairment calculation, in accordance with IFRS 9, replaces the model of incurred losses, as it is known by IAS 39, which also includes a model of expected credit losses; the latter means that the impairment may be recognised before the loss has even been incurred. IFRS 9 con-tains a new general model of hedge accounting which accommodates such accounting better to risk man-agement. Different types of hedg-ing relationships - Fair Value, Cash Flow and net investments in foreign companies - remain unchanged, but further assessment is needed. The Standard contains new requirements, which need to be met (continuation and cessation of hedge accounting), and allows additional types of expo-sures to be treated as hedged items. Additional extensive disclosures are
required regarding risk management and hedging activities.
The Group anticipates that IFRS 9 will not affect the Financial Statements significantly. Classification and meas-urement of financial instruments of the company will not change signifi-cantly due to compliance with IFRS 9.
IFRS 15 Revenue from contracts with customers Effective for annual accounting pe-riods beginning on 1 January 2018. Earlier application is permitted. The Standard has not yet been approved by the EU, but the latter confirmed IFRS 15 Revenue from Contracts with foreigners, including the effective date of IFRS 15. The new Standard provides a framework that replaces the existing instructions for revenue recognition under IFRS. The Group uses a five-step model to determine exactly when to recognise revenue and to what amount. The new model clarifies that revenue is recognised at the time, or when the Group transfers the control over goods and services to the client, namely, in the amount to which the Group expects to be eli-gible. With regard to the criteria met, revenue is recognised: - Over time, and in a way that shows
the operations of the company, or - At the moment when the control
over the goods and services is transferred to the customer
IFRS 15 also establishes principles that bind the Group to ensure qual-ity and extensive disclosures which provide useful information to users of the Financial Statements regard-ing the type, amount, time aspect and uncertainty of revenue and cash flows arising from Contracts with cus-tomers. Although the initial estimate of the potential impact of IFRS 15 on the Group’s Financial Statements is not yet fully completed, the manage-ment assumes that the Standard, on the date of first use, will not have a significant impact on those Financial Statements.
The Group does not foresee that the timing and measurement of its income under IFRS 15 will change significantly due to the nature of its operations and the types of income.
Amendments to IAS 40 Investment Property Effective for annual accounting peri-ods beginning on 1 January 2018, or later, and used for the future. Amend-ments strengthen the principle, set out in IAS 40 Investment Property, concerning the transfer into the in-vestment property or from it, so that they now provide that such a transfer is made only if there is a change in the use of the property. In accordance with changes, the transfer is made only and exclusively when there is a real change in use - i.e. the asset starts or ceases to meet the definition of an investment property, and there is evidence of the change of use. A change in the intent of management alone is not a reason for transfer.
The Group anticipates that changes, on the date of the first use, will not affect the Financial Statements sig-nificantly.
IFRS 16 LeasesEffective for annual accounting peri-ods beginning on 1 January 2019, or later. Earlier application is allowed if a group also uses IFRS 15. The amendment is not yet approved by the EU. IFRS 16 supersedes IAS 17 Leases and the related explanations. The Standard eliminates the existing model of dual accounting for leases and, instead demands that the group presents most of the leases in the statement of financial position with a single model, without distinguish-ing between business and financial leasing. According to IFRS 16, the Contract of Lease is considered to be a Contract which grants the right to use certain assets in return for pay-ment for a specified time period. A new model for such agreements pro-vides that the tenant shall recognise the right to use the assets and liabili-ties from the Lease. The right to use the asset is depreciated, with interest credited to the liabilities. This leads to concentrated sample of cost for a majority of Leases, even if the tenant pays fixed annual rents.
The new Standard for tenants intro-duces a number of limited excep-tions, including: - Leases for a period of 12 months or
less, with no purchase option, and - Leases where the asset has a low
19117 POJASNILA H KONSOLIDIRANIM RAČUNOVODSKIM IZKAZOM Elektro Celje ANNUAL REPORT 2016
value (cheap/affordable low-rent/small-ticket leases).
With the introduction of the new Ac-counting Standard, the Lease calcula-tion for the lessor will not be changed significantly, and the distinction be-tween the business and financial leasing remains in force for them.
The Group is still examining the im-pact of the new Standard on its Finan-cial Statements.
Amendment to IFRS 2: Classifica-tion and measurement of share-based payments Effective for annual accounting peri-ods beginning on 1 January 2018. It is used retroactively. Earlier application is permitted. The amendment has not yet been approved by the EU.
The amendment defines share-based payments more precisely in the fol-lowing areas: - The effects of compulsory and op-
tional conditions regarding the measurement of share-based pay-ments that are settled in cash;
- Share-based payments with a set-tlement option in case of the obliga-tions of tax withheld at the source, and
- Changes in conditions of share-based payments relating to the classification of payments settled in cash into payments settled with equity.
The Group anticipates that the new Standard, at the date of first use, will not affect the Financial Statements significantly.
Amendments to IAS 7 Effective for annual accounting peri-ods beginning on 1 January 2017. It is used retroactively. Earlier application is permitted. The amendment is not yet approved by the EU. The amend-ment requires additional disclosures that will help users to evaluate the changes in financial liabilities, includ-ing changes in cash flows and non-monetary changes (e.g. the impact of positive and negative exchange rate differences, changes in the acquisi-tion or loss of control over subsidiar-ies, changes in Fair Value).
The Group anticipates that the new
Standard, at the date of first use, will not affect the Financial Statements significantly.
IFRIC 22 Transactions in foreign cur-rencies and advancesEffective for annual accounting peri-ods beginning on 1 January 2018, or later. The Interpretation clarifies how to determine the date of the transac-tion for the purpose of determining the exchange rate to be applied upon initial recognition of the related asset, expense or income (or a part thereof) on derecognition of non-monetary assets or non-monetary liabilities in relation to given or received advanc-es in a foreign currency. In this case, the transaction date is the date on which the company first recognises a non-cash asset or a non-monetary lia-bility in relation to a given or received advance.
The Group anticipates that the ex-planation on the day of its first use will not have a significant impact on its Financial Statements as, at initial recognition of non-monetary assets or liabilities in connection with the given or received advances, it uses an exchange rate that is in effect on the date of the transaction.
Supplement to IAS 12: Recognition of deferred tax receivables in con-nection with unrealised losses Effective for annual accounting peri-ods beginning on 1 January 2017. It is used retroactively. Earlier application is permitted. The amendment has not yet been approved by the EU. The amendment specifies more clearly how and when, in certain cases, de-ferred tax liabilities should be cal-culated, and how to determine the amount of future taxable income for the purpose of assessing the recogni-tion of deferred tax liabilities.
The Group anticipates that the new Standard, at the date of first use, will not affect the financial statements significantly.
Amendments to IFRS 10 and IAS 28 Sale or investment of assets be-tween investors and its affiliated companies or joint ventures Day of entry into force has not yet been fixed by the IASB; early appli-cation is permitted. The amendment
clarifies that, in the transactions with affiliated companies or joint ventures, the amount of recognised gains or losses depends on whether the sold or invested asset is part of a trans-action wherein the total gain or loss is recognised when the transaction concluded between the investor and its affiliated companies or joint ven-tures includes the transfer of asset or assets representing the company (irrespective of whether the asset is located in a subsidiary or not), while the partial gain or loss is recognised when the transaction concluded be-tween the investor and its affiliated companies or joint ventures includes the asset, which does not represent the company, irrespective of whether such an asset is located in a subsidi-ary.
The Group anticipates that the new Standard, at the date of first use, will not affect the Financial Statements significantly.
a) Basis of consolidationBasis of consolidation and transac-tions eliminated from consolidationThe Consolidated Financial State-ments have been prepared on the basis of the separate Financial State-ments of the Parent Company and its subsidiaries as at 31 December 2016. The Financial Statements of the Group are combined into the Consoli-dated Financial Statements based on the full consolidation method, by add-ing related items of assets, liabilities, equity, income and expenses, taking into account the consolidation adjust-ments.
In preparing the Consolidated Finan-cial Statements, financial investments of the Parent Company into the equi-ty of the subsidiaries and associated shares of the parent company in the equity of subsidiaries have been elim-inated, as well as all balances, profits and losses or income and expenses arising from intra-group transactions.
Subsidiary companiesSubsidiaries are entities controlled by the parent company. Control ex-ists when the parent company has the ability to affect the financial and business decisions of a company in the group to obtain benefits from its activities. In assessing the influence,
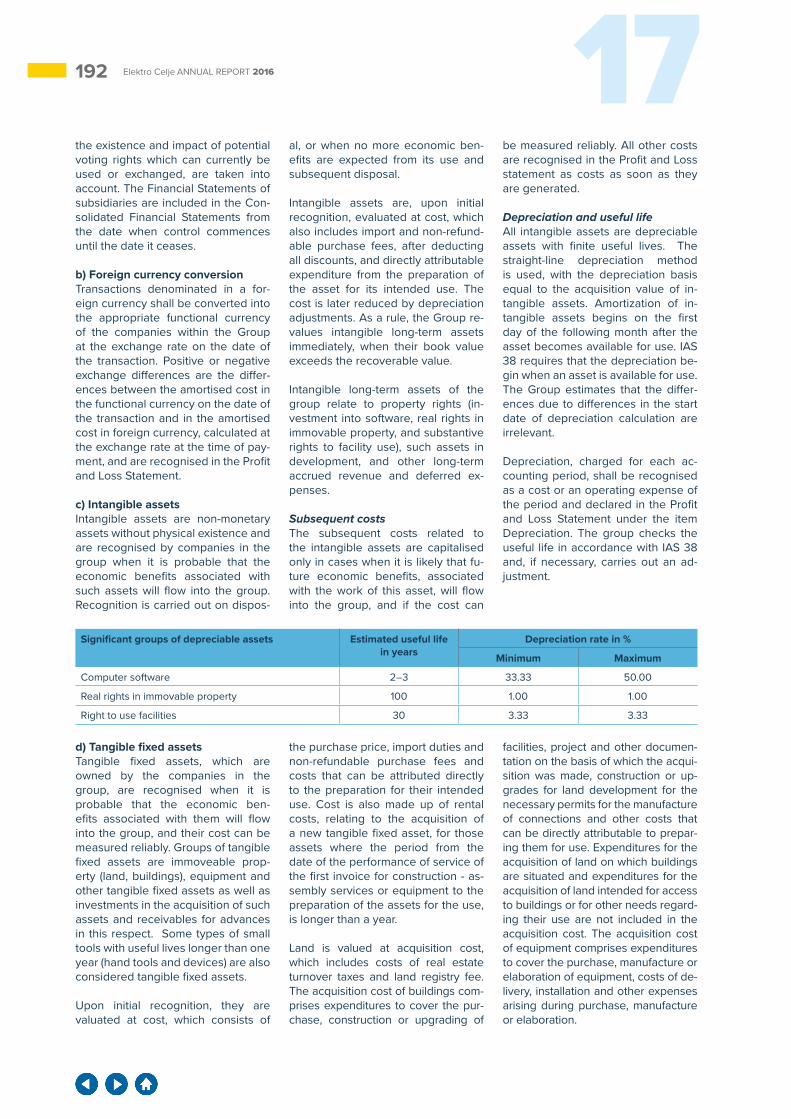
192 17Elektro Celje ANNUAL REPORT 2016
the existence and impact of potential voting rights which can currently be used or exchanged, are taken into account. The Financial Statements of subsidiaries are included in the Con-solidated Financial Statements from the date when control commences until the date it ceases.
b) Foreign currency conversion Transactions denominated in a for-eign currency shall be converted into the appropriate functional currency of the companies within the Group at the exchange rate on the date of the transaction. Positive or negative exchange differences are the differ-ences between the amortised cost in the functional currency on the date of the transaction and in the amortised cost in foreign currency, calculated at the exchange rate at the time of pay-ment, and are recognised in the Profit and Loss Statement.
c) Intangible assets Intangible assets are non-monetary assets without physical existence and are recognised by companies in the group when it is probable that the economic benefits associated with such assets will flow into the group. Recognition is carried out on dispos-
al, or when no more economic ben-efits are expected from its use and subsequent disposal.
Intangible assets are, upon initial recognition, evaluated at cost, which also includes import and non-refund-able purchase fees, after deducting all discounts, and directly attributable expenditure from the preparation of the asset for its intended use. The cost is later reduced by depreciation adjustments. As a rule, the Group re-values intangible long-term assets immediately, when their book value exceeds the recoverable value.
Intangible long-term assets of the group relate to property rights (in-vestment into software, real rights in immovable property, and substantive rights to facility use), such assets in development, and other long-term accrued revenue and deferred ex-penses.
Subsequent costsThe subsequent costs related to the intangible assets are capitalised only in cases when it is likely that fu-ture economic benefits, associated with the work of this asset, will flow into the group, and if the cost can
be measured reliably. All other costs are recognised in the Profit and Loss statement as costs as soon as they are generated.
Depreciation and useful lifeAll intangible assets are depreciable assets with finite useful lives. The straight-line depreciation method is used, with the depreciation basis equal to the acquisition value of in-tangible assets. Amortization of in-tangible assets begins on the first day of the following month after the asset becomes available for use. IAS 38 requires that the depreciation be-gin when an asset is available for use. The Group estimates that the differ-ences due to differences in the start date of depreciation calculation are irrelevant.
Depreciation, charged for each ac-counting period, shall be recognised as a cost or an operating expense of the period and declared in the Profit and Loss Statement under the item Depreciation. The group checks the useful life in accordance with IAS 38 and, if necessary, carries out an ad-justment.
d) Tangible fixed assets Tangible fixed assets, which are owned by the companies in the group, are recognised when it is probable that the economic ben-efits associated with them will flow into the group, and their cost can be measured reliably. Groups of tangible fixed assets are immoveable prop-erty (land, buildings), equipment and other tangible fixed assets as well as investments in the acquisition of such assets and receivables for advances in this respect. Some types of small tools with useful lives longer than one year (hand tools and devices) are also considered tangible fixed assets.
Upon initial recognition, they are valuated at cost, which consists of
the purchase price, import duties and non-refundable purchase fees and costs that can be attributed directly to the preparation for their intended use. Cost is also made up of rental costs, relating to the acquisition of a new tangible fixed asset, for those assets where the period from the date of the performance of service of the first invoice for construction - as-sembly services or equipment to the preparation of the assets for the use, is longer than a year.
Land is valued at acquisition cost, which includes costs of real estate turnover taxes and land registry fee. The acquisition cost of buildings com-prises expenditures to cover the pur-chase, construction or upgrading of
facilities, project and other documen-tation on the basis of which the acqui-sition was made, construction or up-grades for land development for the necessary permits for the manufacture of connections and other costs that can be directly attributable to prepar-ing them for use. Expenditures for the acquisition of land on which buildings are situated and expenditures for the acquisition of land intended for access to buildings or for other needs regard-ing their use are not included in the acquisition cost. The acquisition cost of equipment comprises expenditures to cover the purchase, manufacture or elaboration of equipment, costs of de-livery, installation and other expenses arising during purchase, manufacture or elaboration.
Significant groups of depreciable assets Estimated useful life in years
Depreciation rate in %
Minimum Maximum
Computer software 2–3 33.33 50.00
Real rights in immovable property 100 1.00 1.00
Right to use facilities 30 3.33 3.33
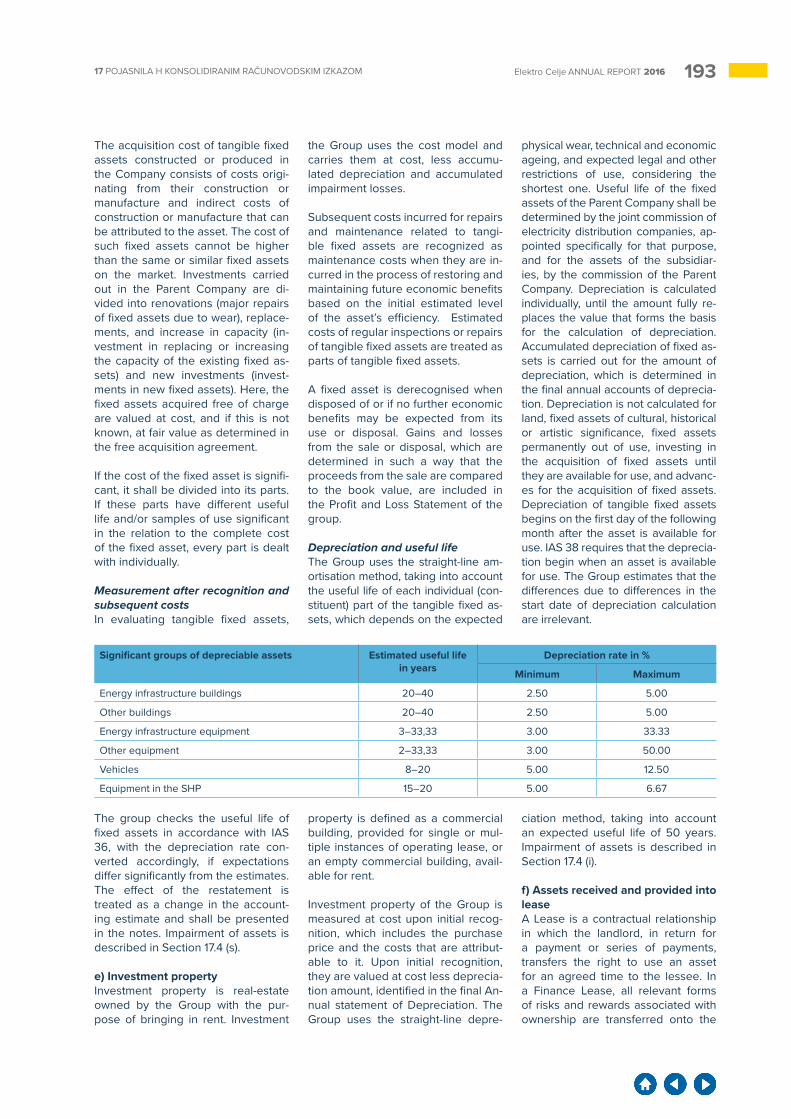
19317 POJASNILA H KONSOLIDIRANIM RAČUNOVODSKIM IZKAZOM Elektro Celje ANNUAL REPORT 2016
The acquisition cost of tangible fixed assets constructed or produced in the Company consists of costs origi-nating from their construction or manufacture and indirect costs of construction or manufacture that can be attributed to the asset. The cost of such fixed assets cannot be higher than the same or similar fixed assets on the market. Investments carried out in the Parent Company are di-vided into renovations (major repairs of fixed assets due to wear), replace-ments, and increase in capacity (in-vestment in replacing or increasing the capacity of the existing fixed as-sets) and new investments (invest-ments in new fixed assets). Here, the fixed assets acquired free of charge are valued at cost, and if this is not known, at fair value as determined in the free acquisition agreement.
If the cost of the fixed asset is signifi-cant, it shall be divided into its parts. If these parts have different useful life and/or samples of use significant in the relation to the complete cost of the fixed asset, every part is dealt with individually.
Measurement after recognition and subsequent costsIn evaluating tangible fixed assets,
the Group uses the cost model and carries them at cost, less accumu-lated depreciation and accumulated impairment losses.
Subsequent costs incurred for repairs and maintenance related to tangi-ble fixed assets are recognized as maintenance costs when they are in-curred in the process of restoring and maintaining future economic benefits based on the initial estimated level of the asset’s efficiency. Estimated costs of regular inspections or repairs of tangible fixed assets are treated as parts of tangible fixed assets.
A fixed asset is derecognised when disposed of or if no further economic benefits may be expected from its use or disposal. Gains and losses from the sale or disposal, which are determined in such a way that the proceeds from the sale are compared to the book value, are included in the Profit and Loss Statement of the group.
Depreciation and useful lifeThe Group uses the straight-line am-ortisation method, taking into account the useful life of each individual (con-stituent) part of the tangible fixed as-sets, which depends on the expected
physical wear, technical and economic ageing, and expected legal and other restrictions of use, considering the shortest one. Useful life of the fixed assets of the Parent Company shall be determined by the joint commission of electricity distribution companies, ap-pointed specifically for that purpose, and for the assets of the subsidiar-ies, by the commission of the Parent Company. Depreciation is calculated individually, until the amount fully re-places the value that forms the basis for the calculation of depreciation. Accumulated depreciation of fixed as-sets is carried out for the amount of depreciation, which is determined in the final annual accounts of deprecia-tion. Depreciation is not calculated for land, fixed assets of cultural, historical or artistic significance, fixed assets permanently out of use, investing in the acquisition of fixed assets until they are available for use, and advanc-es for the acquisition of fixed assets. Depreciation of tangible fixed assets begins on the first day of the following month after the asset is available for use. IAS 38 requires that the deprecia-tion begin when an asset is available for use. The Group estimates that the differences due to differences in the start date of depreciation calculation are irrelevant.
The group checks the useful life of fixed assets in accordance with IAS 36, with the depreciation rate con-verted accordingly, if expectations differ significantly from the estimates. The effect of the restatement is treated as a change in the account-ing estimate and shall be presented in the notes. Impairment of assets is described in Section 17.4 (s).
e) Investment property Investment property is real-estate owned by the Group with the pur-pose of bringing in rent. Investment
property is defined as a commercial building, provided for single or mul-tiple instances of operating lease, or an empty commercial building, avail-able for rent.
Investment property of the Group is measured at cost upon initial recog-nition, which includes the purchase price and the costs that are attribut-able to it. Upon initial recognition, they are valued at cost less deprecia-tion amount, identified in the final An-nual statement of Depreciation. The Group uses the straight-line depre-
ciation method, taking into account an expected useful life of 50 years. Impairment of assets is described in Section 17.4 (i).
f) Assets received and provided into lease A Lease is a contractual relationship in which the landlord, in return for a payment or series of payments, transfers the right to use an asset for an agreed time to the lessee. In a Finance Lease, all relevant forms of risks and rewards associated with ownership are transferred onto the
Significant groups of depreciable assets Estimated useful life in years
Depreciation rate in %
Minimum Maximum
Energy infrastructure buildings 20–40 2.50 5.00
Other buildings 20–40 2.50 5.00
Energy infrastructure equipment 3–33,33 3.00 33.33
Other equipment 2–33,33 3.00 50.00
Vehicles 8–20 5.00 12.50
Equipment in the SHP 15–20 5.00 6.67
194 17Elektro Celje ANNUAL REPORT 2016
lessee, with all other Leases treated as Operating Leases. In accordance with the criteria defined in the Ac-counting Standards, the Group as-sesses whether there is a Business or a Finance Lease.
The Group recognises Lease costs (excluding the cost of services such as insurance, maintenance etc.) on a straight-line basis in the Profit or Loss Statement under the item of Service Expenses.
Assets provided by the Group into an Operating lease, are demonstrated among its tangible assets; rental in-come is recognised on a straight-line basis in the Profit or Loss Statement under the Operating Revenue item in the rental period.
g) Financial instruments Financial instruments relate to invest-ments into equity, operating and oth-er receivables, cash and cash equiva-lents, loans received and given, as well as operating and other liabilities. Upon initial recognition, the Group classifies them as Financial Assets or Financial Liabilities measured at Fair Value through Profit or Loss, loans given and receivables, available-for-sale financial assets and financial li-abilities measured at amortised cost. The classification depends on the purpose for which the instrument has been obtained.
Financial assets Financial Assets of the Group include cash and cash equivalents, receiva-bles, loans given, and investments. The Group initially recognises loans and receivables, while cash and its equivalents are recognised on the day of their creation, with other Fi-nancial Assets recognised initially on the day of trading or settlement. Financial Assets are derecognised by the Group when it no longer has any contractual obligations in respect to the cash flows from a particular asset, or when all the risks and rewards of ownership of the Financial Assets are transferred to a third party.
Available-for-sale financial assets are, upon initial recognition, meas-ured at Fair Value plus transaction costs arising directly out of the pur-chase or issue of the Financial Asset.
Investments in the shares and share-holdings of companies that are clas-sified as Available-for-sale Financial Assets and that are listed on the Stock Exchange, are displayed by the Group at Fair Value. The Fair Value is measured according to the closing Stock Exchange price. Gains or losses from the revaluation are shown directly in Equity (i.e. in the reserve for Fair Value), in an amount that has already been reduced by de-ferred taxes, and are recognised in the Statement of other comprehen-sive income. Reversal of investment also means reversal of loss or profit, previously recognised in the Fair Value reserve and recognises it in the Profit or Loss Statement. The Fair Value of investments which are not dealt in on a Stock Exchange cannot be determined reliably, therefore it is recognised at cost. The Group, at the end of the year, on the Balance Sheet date, evaluates these investments to determine whether there is objective evidence for their impairment.
Exposure to various types of risks, especially the risk of reduction in the value of financial investments below their cost is not hedged with finan-cial instruments. The value that best represents the maximum exposure to such risk is the total value of the investment.
Loans given and receivables are, de-pending on their maturity, classified as Current Financial Assets (maturity of up to 12 months after the date of the Statement of Financial Position) or long-term Financial Assets (maturity over 12 months after the date of the Statement of Financial Position). The Group recognises them initially at their historical cost, plus direct trans-action costs. Upon initial recognition, receivables and loans are measured at amortised cost using the method of the applicable interest rate reduced due to impairment or increased as a result of their reversal. The exception are long-term trade receivables from customers undergoing compulsory settlement procedures bearing inter-est pursuant to the decisions on com-pulsory settlements, operating re-ceivables from the company SODO, bearing interest in accordance with Article 84 Item 5.3 of the Network Charge Act (Official Gazette of the
Republic of Slovenia, no. 81, of 29 Oc-tober, 2012), and non-interest-bearing receivables of significant amount rec-ognised at the discounted amount, taking into account the interest rate equal to the average interest rate of all long-term credits.
Cash and cash equivalents include cash on current accounts and de-posits at commercial banks (invest-ments which, in the near future, can be converted quickly to an amount of cash, known in advance, and which are subject to an insignificant risk of changes in value). They are recog-nised in the amounts derived from the relevant documents after verifi-cation that they have such a nature. Current account overdrafts at banks, which can be settled on call and are an integral part of the Group’s cash, are included among the components of cash and cash equivalents in the Statement of Cash Flows.
Financial liabilitiesAmong financial liabilities, the Group also shows recognised received loans, recognised when the Group becomes a Contractual Party related to a particular instrument. The group derecognises such items when the obligations specified in the Contract or other legal act are met, annulled, revoked or expired.
Financial liabilities are recognised initially with the amounts from the relevant documents on their crea-tion, plus costs directly attributable to the transaction. Received loans are measured at amortised cost. At least once a year, prior to drawing up Financial Statements, the Group esti-mates the Fair Value of short-term lia-bilities based on Contracts, and, if the book value is lower than the estab-lished Fair Values, it increases their value. Received loans are increased by accrued interest and reduced by the liquidated amounts or any po-tential other settlements. Depending on the maturity, Financial Liabilities are classified as short-term (maturity of up to 12 months after the date of the Statement of Financial Position), or long-term (maturity over 12 months after the date of the Statement of Fi-nancial Position).
The Group has, on the Balance Sheet
19517 POJASNILA H KONSOLIDIRANIM RAČUNOVODSKIM IZKAZOM Elektro Celje ANNUAL REPORT 2016
date, 31 December 2016, concluded Contracts for the purchase of electric-ity for the years 2017 and 2018, which are in its possession for the purpose of receiving or providing non-finan-cial assets in accordance with the expected purchase, sale or use. The group does not deal with them as derivatives, but took the view that they are normal Contracts of Sale and Purchase (depending on the purpose of the purchase of electricity, man-agement of the operations related to electricity, whether there is a physical delivery etc.) and they therefore do not fall within the scope of the IAS 39 Standard.Among other Financial Liabilities, the Group also shows the liabilities relat-ing to the distribution of income (divi-dends). Dividends are recognised as a liability in the period and at the level approved by the Assembly.
h) Impairment of financial assetsA Financial Asset is deemed to be im-paired if there is objective evidence which shows that, due to one or multi-ple events, a reduction in the expect-ed future cash flows from this asset has occurred, and can be measured reliably.
Objective evidence of an impairment of Financial Assets can be as follows: Receivables which are the subject of litigation, receivables more than 90 days past maturity on the Bal-ance Sheet date, indications that the debtor will initiate compulsory settle-ment or bankruptcy, disappearance of an active market for this kind of in-strument etc. The Group also checks whether the market for an individual financial investment works, or wheth-er sufficient transactions have been concluded to reflect its Fair Value. In the case of investments that are not quoted in an active market, such checks are performed also if there are objective reasons for tests as-sessing impairment of such invest-ments, if any of the investments is los-ing value significantly or permanently, or if there is objective evidence that indicates permanent impairment of investments (e.g. future business plans).
Impairment of available-for-sale fi-nancial assets The Group revalues investments to
their Fair Value at the end of the fi-nancial year. If the recorded book value of a long-term investment is higher than the market value calcu-lated according to the last published Stock Exchange price, impairment is carried out. Proven losses from changes in Fair Value of a Financial Asset Available for sale is recognised directly in equity as a reduction in re-serves (loss) resulting from Fair-Value based evaluation. Financial invest-ments which are not listed on an ac-tive market are impaired to the extent that their reported book value is high-er than the proven realisable value. On Balance Sheet date, the Group assesses whether there is objective evidence of the impairment of a finan-cial investment. When testing invest-ments in shares or shareholdings for the purpose of assessment whether impairment was present or not, sig-nificant or prolonged decline in value of these investments below their ac-quisition cost for a period longer than 12 months should also be considered. The Group companies carry out a test to assess the impairment of the in-vestment in an equity instrument not measured at Fair Value if the book value of such investments on the cut-off Balance Sheet date is more than 20% above the proportional part of the book value of the total equity of the company, and if future plans of the company’s operation indicate perma-nent impairment of investments. If the book value of total equity is not (yet) published or otherwise publicly avail-able, other, less reliable evidence of the book value of the total equity can also be used on the Balance Sheet date (assessment).
The amount of loss is measured as the difference between the book value of the investments on Balance Sheet date and the present value of expected future cash flows of the in-vestment, discounted at the current market rate of return (recoverable val-ue), which applies to similar Financial Assets, and recognised in the Income Statement as a Financial Expense. Such impairment losses may not be reversed.
Expenses due to impairment of Avail-able-for-sale Financial Assets are recognised in a way where any cu-mulative loss, previously recognised
in other comprehensive income of the period, and presented in the Fair Value Reserve, is transferred to the Profit or Loss Statement. Any subse-quent increase in the Fair Value of an impaired equity security that is avail-able for sale is recognised in other comprehensive income of the period, or in the Fair Value Reserve.
Impairment of receivables The Group assesses evidence of an impairment of receivables and car-ries out a revaluation adjustment for total receivables in bankruptcy proceedings, for receivables which are the subject of litigation, and for receivables more than 90 days past maturity on the Balance Sheet date. For receivables in compulsory set-tlement procedures, a revaluation adjustment is carried out in accord-ance with the Decisions on such set-tlements, or in the amount of 80% if the compulsory settlement has not yet been confirmed. Adjustments are reduced by payments and write-offs of receivables based on supporting documents: A Compulsory Settle-ment Decision, Bankruptcy Proceed-ings Decision and other documents.
Losses due to adjustments or impair-ment of receivables are recognised in Profit or Loss Statements among Expenses. When, due to later events, the amount of impairment loss is de-creased, the decrease in impairment loss is reversed through Profit and Loss.
i) Impairment of non-financial assets The Group verifies the book value of significant Non-financial Assets in order to determine whether there are indications of impairment. If such indi-cations exist, the recoverable amount of the asset is estimated. The recov-erable amount is Fair Value less costs of sale, or value in use, whichever is higher. As a rule, the Group revalues Non-financial Assets immediately, when their book value exceeds the recoverable value due to impairment. Impairment is shown in the Profit and Loss Statement.
A substantial change in circumstanc-es of operations as regards Tangi-ble Fixed Assets are such that, the assumptions used in estimating the value in use and Fair Value less costs
196 17Elektro Celje ANNUAL REPORT 2016
of sale, change by more than 5% in a single year. A review of impairments is decided based on a significant as-set with the longest useful life; the Group defines a significant asset as an asset whose acquisition cost is more than 0.5% of the total cost of Tangible Fixed Assets. A decrease in value of depreciable assets due to impairment is treated as an Operating Expense.
The value of land, buildings, distri-bution equipment and investment property is assessed by certified ap-praisers. Based on the Fair Value of investment property resulting from the official assessment of GURS, the Group identifies potential impairment indications.
j) EquityEquity is the liability to owners of Group companies, which is due for payment when the company goes out of business. It is defined in the amounts invested by the owners and the amounts generated during opera-tion that belong to the owners. Equity is reduced by loss from operations and payment of dividends. Total eq-uity consists of share capital, share premium, revenue reserves, retained net profit and Fair Value Reserves.
Called-up or share capitalCalled-up Capital of the Group re-fers to the share capital of the Parent Company, divided into 24,192,425 ordinary freely transferable shares. Called-up Capital is defined as the share capital in the Parent Company registered in court and paid by its owners. Ordinary shares provide holders with the right to participate in the management of the Parent Com-pany, to a share of profit and a pro-portional share of the assets remain-ing after liquidation or bankruptcy of the Parent Company. Dividends on ordinary shares are recognised as a liability in the period in which they were approved at the Assembly.
Share premiumShare premium of the Group consist of amounts of reversals of the gener-al capital revaluation adjustment and are formed in accordance with the purpose of use pursuant to Article 64 of the Companies Act (ZGD-1).
Profit reserves Profit reserves include statutory re-serves, reserves for treasury shares, acquired treasury shares, and other profit reserves. Profit reserves are formed in the amount and under the conditions laid down in Article 64 of the Companies Act (ZGD-1) and the Articles of Association of the Parent Company, from net profit amounts of the financial year and retained profit.
Other profit reserves may be used for any purpose, except in the case of the fifth paragraph of Article 64 of the Companies Act or if the Company’s Articles of Association provide oth-erwise Capital and statutory reserves may pursuant to the Companies Act be used to cover net loss for the year if it cannot be covered from retained profit or other profit reserves and for coverage of retained loss, if it can-not be covered by net profit for the year or from other profit reserves. If the total amount of these reserves is higher than the statutory prescribed percent of share capital (10%), they can also be used to increase share capital from the Parent Company’s assets and to cover net and retained loss for the business year if profit re-serves are not used for the distribu-tion of profit to shareholders.
- Statutory reserves Statutory reserves are the amounts
which are retained from profits from previous years purposefully, in par-ticular for the settlement of poten-tial future losses.
- Reserves for treasury shares If the companies in the Group buy
back their Treasury Shares, in the statement of Financial Position, in accordance with the Articles of As-sociation and paragraph 5 Article 64 of the Companies Act (ZGD-1) the reserves for Treasury Shares are formed from the net profit of the business year. Acquired Treas-ury Shares (i.e. equal to the amount paid, including costs relating to the purchase) are an integral part of to-tal equity and are deducted from it. Reserves for Treasury Shares may be released only if Treasury Shares have been alienated or withdrawn.
- Other profit reserves Other profit reserves are formed
from the profits in the amount and under the conditions defined by the
law and the Articles of Association of Group companies.
Reserves for fair valueReserves for Fair Value contain the effects of the valuation of the Avail-able-for-sale Financial Assets at Fair Value, as well as actuarial gains and losses related to the provisions for post-employment and other long-term employee benefits.
k) InventoryThe Group’s inventory includes the material, small tools with useful lives of up to a year, which has the charac-teristics of inventory, but also with the useful life of more than one year if its individual cost does not exceed EUR 500, and merchandise. Small tools of the Group include protective equip-ment and tools.
An inventory unit is recognised at cost consisting of the purchase price, less any discount obtained, import and other non-refundable purchase fees (excise duties) as well as the direct costs of acquisition (transport costs, the costs of loading, unloading, handling and transport insurance cost etc.). Inventory of material is valued at cost or net realisable value, specifi-cally, the lesser of the two. Inventory of merchandise is held by retail prices including VAT, and are recorded at cost or net realisable value, the lesser of the two, in the Statement of Finan-cial Position. Consumption of inven-tory of material is valued according to the moving average price method, with merchandise valued at the most recent average cost.
Inventory of materials and merchan-dise is revalued due to the impair-ment if their book value exceeds the net realisable value. Write-offs of damaged and obsolete inventories are carried out regularly during the year and during inventory-taking by the Group.
l) ProvisionsProvisions are recognised when the Group has a present obligation as a result of a past event (legal or indi-rect), the amount of which can be es-timated reliably, and it is likely that, in the settlement of the commitment, an outflow of the factors providing eco-nomic benefits will be necessary. The
19717 POJASNILA H KONSOLIDIRANIM RAČUNOVODSKIM IZKAZOM Elektro Celje ANNUAL REPORT 2016
amount recognized as a provision is the best estimate of the expenditures (includes risks and uncertainties) required for settlement of usually long-term commitments existing on the date of the statement of financial position and is equal to the value of the expenditures expected to be re-quired to settle the obligation. If the effect of the time value of money is material, the expected expenditures must be appropriately discounted to their present value. Provisions are not revalued. At the end of the account-ing period, they are adjusted in such a way that their value is equal to the present value of the expenditure ex-pected to be required to settle the obligation.
Provisions for post-employment and other long-term benefits of employ-eesLong-term provisions of the Group are formed for long-service awards to employees, severance upon their re-tirement and allowance in the case of the death of employees in the amount of estimated future payments for sev-erance and long-service awards dis-counted at the end of the reporting period. The calculation is made for each employee in a way which takes the costs of the severance pay on re-tirement and the cost of all expected long-service awards to retirement into account. A calculation using the Pro-jected Unit Credit method based on the multiple decrement model, which takes into account the cost of the cur-rent service, interest expense, pay-ment of earnings, and actuarial gains/losses incurred as a result of changes in actuarial assumptions adjustments based on experience, is prepared by the authorised Actuary. Payments of severance upon retirement and payments of long-service awards re-duce the provisions formed. In the Profit and Loss Statement, the Group recognises revenue or expenses in connection with the adjustment of provisions for retirement severance (service costs, interest expenses), while actuarial gains and losses in respect of retirement severance com-mitments are recognised in equity in the context of the reserves for Fair Value. The revenue and expenditure in connection with the adjustment of the provision for long-service awards and allowance payments in the case
of death of an employee (service costs, interest costs, actuarial gains/losses) are recognised in the Profit and Loss Statement.
Other liabilities arising from post-em-ployment benefits of employees do not exist.
Lawsuit provisionsThe Group discloses lawsuit provi-sions in which the companies act as the defendant. Every year, the eligibil-ity of provisions formed is assessed in relation to the state of disputes and the likelihood of a favourable or unfavourable resolution. The amount of the provisions is determined by the known amount of compensation claims or according to the anticipated amount if the claim amount is not yet known.
m) Long-term deferred revenue Long-term deferred revenue for Fixed Assets acquired free of chargeThe Group recognises long-term deferred revenue for Fixed Assets acquired free of charge, classified in categories according to the rate of depreciation of the acquired assets. Deferred revenue is reallocated to revenue in proportion to the depre-ciation rate of those depreciable as-sets. Acquisition of fixed assets free of charge relates mainly to the con-nections of customers which the Company assumed as tangible fixed assets with a commitment to main-tain and restore them, in accordance with regulations (Official Gazette of RS, no. 126/07, General conditions for connection to the distribution electric system).
Long-term deferred revenue for av-erage connection costs chargedThe Group recognises long-term de-ferred revenue also for average con-nection costs charged pursuant to the Decision on determining the net-work charge for use of the electricity networks of the Energy Agency of the Republic of Slovenia, for the pe-riod up to 30 June, 2007, relate to the dedicated payment of connections to the network or increase in coupling strength (financing investments in network expansion). Deferred Rev-enue is reallocated to Operating Rev-enue in proportion to the deprecia-tion rate of those depreciable assets
equal to the prevailing level of Fixed Assets of electricity infrastructure, i.e. 3%.
Long-term deferred revenue for gov-ernment supportGovernment grants, received to cover expenses, are recognised as income over the periods in which the expenses in question which should be replaced by these supports are produced.
n) Operating and other LiabilitiesThe Group discloses financial and operating liabilities depending on the maturity of the payment, as long-term or short-term. Short-term liabilities mature into payment within a pe-riod shorter than one year. Liabilities, upon initial recognition, are shown at cost, whereas after recognition, they are measured at amortised cost. Im-pairment of short-term liabilities is not identified or disclosed by the Group. Short-term liabilities denominated in foreign currencies at the Balance Sheet date are converted into na-tional currency according to the ref-erence rate of the European Central Bank.
o) Short-term accrued and deferred revenue and expensesShort-term deferred costs (Expenses) are those expected to be realised in the following year, and the formation of which is likely, with the size being estimated reliably, and which do not yet affect the profit or loss, while ac-crued revenue includes revenue, for which payment has not been received and was not possible to charge yet.
Accrued costs (Expenses) are formed on the basis of the steady burden of Profit and Loss with expected costs (Expenses) which have not yet ap-peared. Short-term deferred revenue is generated in the case of not yet carried out, but already charged or even paid service, but that does not create normal liabilities to customers, which would be considered as ad-vances obtained.
p) RevenueNet revenue from sales includes revenue from the sale of electricity, charged rent and maintenance of the infrastructure, and the provision of services for SODO, revenue from the
198 17Elektro Celje ANNUAL REPORT 2016
sale of other energy products (sale of wood pellets, natural gas), and other net income from services rendered (revenue from services rendered to customers, rent). They are measured on the basis of sales prices stated in the invoices and other documents, reduced by refunds and rebates granted at the time of sale, or later as a result of the earlier payments, ex-cluding Value Added Tax.
Net proceeds from the sale are rec-ognised at the time of the sale of goods or services, if it is reasonably expected that the sale will lead to income, if these are not yet realised when they are created. Revenue from services rendered is recognised based on the stage of completion of the transaction at the reporting date.
Sales of services to SODOThe Parent Company, as the owner of the electricity distribution infra-structure, signed the Agreement on the Lease of Electricity Distribution Infrastructure and Provision of Ser-vices for the Distribution Network System Operator SODO d.o.o., which is the exclusive holder of the conces-sion for performing the compulsory public service of Distribution System Operator in the Republic of Slove-nia. Pursuant to the provisions of said Agreement, the parties sign an amendment to the Agreement each year for the current year, which de-fines the amount of Lease payments and the volume of services to be ren-dered by the Parent Company Elek-tro Celje, d.d. for SODO d.o.o. in the power distribution area of Elektro Celje. The Energy Agency, which is, on the basis of Article 116 of the Ener-gy Act (EZ-1), competent for determin-ing a methodology for charging the network charge and the eligible costs of DNSO operators, defined, with De-cision No. 211-58/2015-122/452 the regulatory framework for the period 2016-2018. The Parent Company’s revenue from leasing the electric-ity distribution infrastructure and the provision of services for SODO is rec-ognised on a monthly basis of issued advance invoices, while the basis for the recognition of total and actual revenue from the lease of electricity infrastructure and services rendered during the period is preliminary rec-onciliation submitted by the company
SODO on the basis of unaudited data from the Financial Statements to the Parent Company by 15 March after the end of the accounting year.
Sale of servicesRevenue from sales of services is recognised in the accounting period in which they are carried out if it is reasonably expected that the sale will lead to income, if said income is not yet realised upon creation. In the case of long-term projects, the Group recognises revenue from services rendered by using the method of completion level of works at the Bal-ance Sheet date of the Group com-pany.
Capitalised own servicesCapitalised own services are servic-es rendered for the Company’s own needs and capitalised among tan-gible fixed assets or intangible non-current assets. The Group recognises revenue in the amount of expenses, required for the construction or pro-duction of an asset which, however, shall not exceed the cost of similar assets that the Group may buy on the market.
Proceeds from the sale of electricity and energy productsOperating income is recognised at the time of the sale of electricity and energy products if it is reasonably expected that the sale will lead to benefits, if they are not implemented upon the sale itself. Electricity billing is carried out in three ways, namely:- According to actual consumption
on a monthly basis for the calendar month – larger customers are pro-vided with partial invoices for elec-tricity consumed during a month, which are taken into account in the final monthly invoice (representing a 3-percent share of annual turnover of electricity);
- According to actual consumption on a monthly basis, where the invoices are issued from the 1st up to 8th busi-ness day of each month for the pre-ceding calendar month, the amount of consumption is taken monthly (64% of the annual turnover of elec-tricity);
- Annual invoicing, when informative calculations are issued during the year based on average daily con-sumption of the previous account-
ing period, while, once annually, meters are recorded and an invoice is created - household customers (33% share of the annual turnover of electricity). A network charge is also included in these invoices.
VAT and excise duty, and the network charge on shared invoices shall not be considered as income from sale, but rather as withdrawal liabilities.
Other operating revenueThis includes revenue from reversal of provisions (mostly for fixed assets acquired free of charge), the revenue related to business effects (received compensation, subsidies, grants etc.), operating revenue achieved from the sale of Fixed Assets and uninstalled material, the revenue from write-off liabilities and the reversal of adjust-ments to receivables, and unusual items, for which it is not expected that they will occur regularly or frequently (recovered written off receivables from previous years, received reim-bursement of court costs and dam-ages,…)
q) Financial revenue and expendi-tureFinancial Revenue includes revenue from dividend payments, proceeds from disposals of financial assets, in-terest received from deposits, assets of the accounts and loans granted, exchange gains, income, and inter-est on late payment of electricity, net-work charges and services. Interest income is recognised as it accrues, using the effective interest rate, in-come from dividends on the date when the shareholder’s right to re-ceive payment is enforced, whereas interest on late payment of electric-ity, network charges and service are recognised when charged, if there is no doubt about their size and date of maturity.
Financial Expenses comprise costs of borrowing (if these are not capi-talised), expenses due to impairment and write-off of investments, interest from operating liabilities and nega-tive exchange rate differences. They are recognised in the Profit and Loss Statement, if a decrease in economic benefits during the accounting period is associated with the reduction of assets or increase in debt, and if this
19917 POJASNILA H KONSOLIDIRANIM RAČUNOVODSKIM IZKAZOM Elektro Celje ANNUAL REPORT 2016
reduction can be measured reliably. Financial expenses are recognized at settlement irrespective of the pay-ments associated with them. Bor-rowing costs are recognized by the Group in the income statement using the effective interest method, except for those costs that are capitalized and attributable to tangible fixed as-sets in the course of construction or development.
r) Income taxIncome Taxes from the business year include current and deferred tax.
Income Tax is shown in the Profit and Loss Statement, except for the part that is associated with the items dis-closed directly in the Comprehensive Income.
Current tax is charged from the tax-able profit of the Group for the finan-cial year according to the tax rates applicable at the reporting date, and any adjustments to tax liabilities in
relation to the previous fiscal years. Taxable profit differs from the net profit reported in the Profit and Loss Statement, because it excludes items of income or expense that are taxable or deductible in other years, as well as items that are never taxable or de-ductible.
Deferred tax is reported using the method of the liabilities under the Statement of Financial Position, tak-ing into account the temporary dif-ferences arising between the tax val-ues of assets and liabilities and their book values in the separate Financial Statements of Group companies. The amount of the deferred tax is based on the expected mode of reimburse-ment or settlement of the book value of assets and liabilities, using tax rates (and laws), which are expected to be used when the deferred tax as-set is realised or the deferred tax li-ability will be cleared.
A deferred tax asset is recognised in
the amount of probable future tax-able profits available, against which the deferred assets can be used in the future. Deferred tax assets are re-duced by the amount for which it is no longer likely that tax relief, associated with an asset, can be claimed.
s) Earnings per shareThe Group discloses the basic profit-ability of shares, which is calculated by dividing the profit accruing to the holders of the controlling interest in net profit by the weighted average number of ordinary shares for the fi-nancial year; the Group’s own shares are thereby excluded.
t) Cash flow statementThe Cash Flow Statement of the Group is prepared according to the direct method and shows truly and fairly income and expenses from op-erating, investing and financing activi-ties explaining changes in the move-ment of cash.
17.5 Determination of Fair ValueAccording to the accounting policies of the Group, it is necessary, in certain cases, to determine the Fair Value of financial and non-financial assets and liabilities. Fair Value is the amount for which an asset could be sold or a liability exchanged, between knowl-edgeable, willing parties in an arm’s length transaction. The Fair Value of the Group, for the purpose of meas-urement or reporting, is set by the methods below:
Tangible fixed assetsThe Fair Value of land, buildings, dis-tribution equipment, and investment property is estimated by authorised Assessors of property and equipment values.
Investment propertyIn determining the Fair Value of the investment property owned by the Group, it adheres to the Fair Value
stemming from the official evaluation of GURS.
Investments available for saleThe Fair Value of financial assets avail-able for sale that are listed on a Stock Exchange is determined on the basis of the final stock on the reporting date.
Financial investments which are not listed on an active market and the Fair Value of which cannot be esti-mated reliably, are assessed by the Group on Balance Sheet date to de-cide whether there is impartial evi-dence of their impairment. It identifies whether significant or longer-term reduction of value of these financial investments is present, dropping be-low their cost in a period exceeding 12 months, and a test is carried out to evaluate the impairment of a financial investment into an equity instrument (if the book value of such a financial
investment, on cut-off Balance Sheet date, exceeds the proportionate part of book value of the total equity of the company by 20%, if the future busi-ness plans indicate a lasting impair-ment of the investment etc.).
Operating and other receivablesShort-term Operating Receivables, due to being short-term, are not dis-counted, but the impairment of the Fair Value is taken into consideration. All receivables are subject to inter-est, except SODO receivables, in re-spect of the outstanding preliminary reconciliations, which are only sub-ject to interest until their inclusion in the regulatory framework. These are receivables of significant value, thus they are shown in the Balance Sheet at their discounted value, whereby the interest rate, equal to the average interest rate of all long-term loans, is taken into consideration.
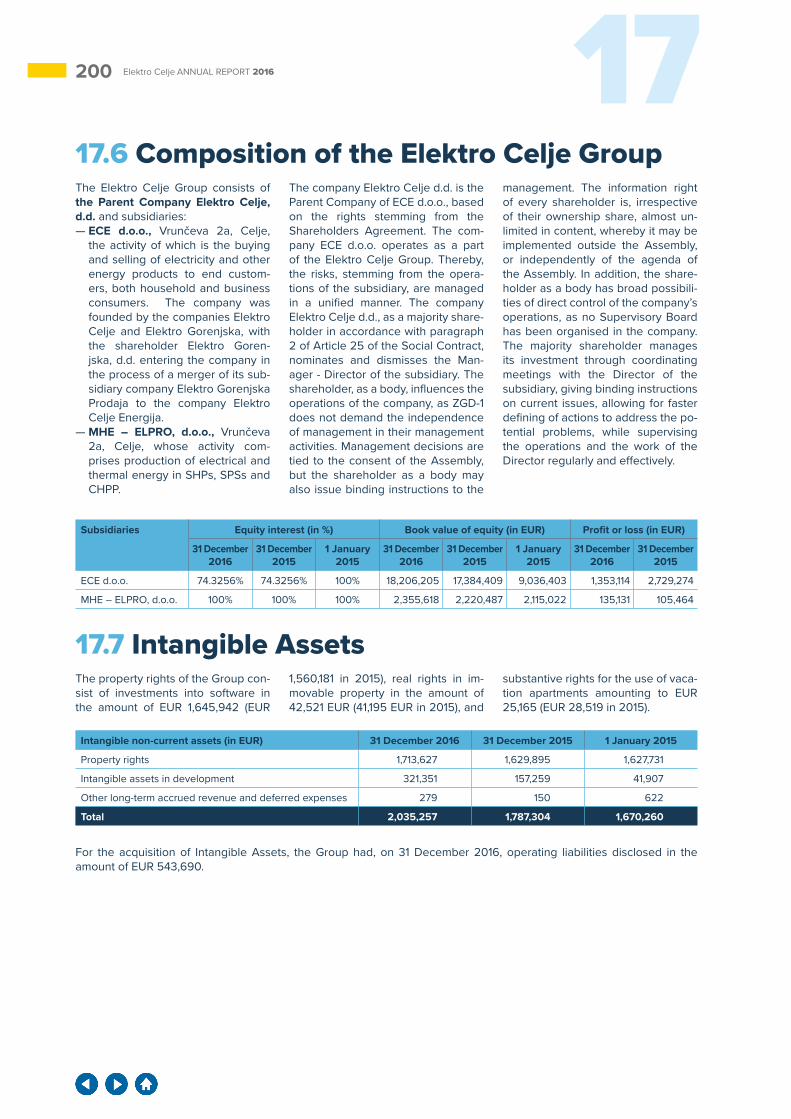
200 17Elektro Celje ANNUAL REPORT 2016
17.6 Composition of the Elektro Celje GroupThe Elektro Celje Group consists of the Parent Company Elektro Celje, d.d. and subsidiaries:— ECE d.o.o., Vrunčeva 2a, Celje,
the activity of which is the buying and selling of electricity and other energy products to end custom-ers, both household and business consumers. The company was founded by the companies Elektro Celje and Elektro Gorenjska, with the shareholder Elektro Goren-jska, d.d. entering the company in the process of a merger of its sub-sidiary company Elektro Gorenjska Prodaja to the company Elektro Celje Energija.
— MHE – ELPRO, d.o.o., Vrunčeva 2a, Celje, whose activity com-prises production of electrical and thermal energy in SHPs, SPSs and CHPP.
The company Elektro Celje d.d. is the Parent Company of ECE d.o.o., based on the rights stemming from the Shareholders Agreement. The com-pany ECE d.o.o. operates as a part of the Elektro Celje Group. Thereby, the risks, stemming from the opera-tions of the subsidiary, are managed in a unified manner. The company Elektro Celje d.d., as a majority share-holder in accordance with paragraph 2 of Article 25 of the Social Contract, nominates and dismisses the Man-ager - Director of the subsidiary. The shareholder, as a body, influences the operations of the company, as ZGD-1 does not demand the independence of management in their management activities. Management decisions are tied to the consent of the Assembly, but the shareholder as a body may also issue binding instructions to the
management. The information right of every shareholder is, irrespective of their ownership share, almost un-limited in content, whereby it may be implemented outside the Assembly, or independently of the agenda of the Assembly. In addition, the share-holder as a body has broad possibili-ties of direct control of the company’s operations, as no Supervisory Board has been organised in the company. The majority shareholder manages its investment through coordinating meetings with the Director of the subsidiary, giving binding instructions on current issues, allowing for faster defining of actions to address the po-tential problems, while supervising the operations and the work of the Director regularly and effectively.
17.7 Intangible AssetsThe property rights of the Group con-sist of investments into software in the amount of EUR 1,645,942 (EUR
1,560,181 in 2015), real rights in im-movable property in the amount of 42,521 EUR (41,195 EUR in 2015), and
substantive rights for the use of vaca-tion apartments amounting to EUR 25,165 (EUR 28,519 in 2015).
For the acquisition of Intangible Assets, the Group had, on 31 December 2016, operating liabilities disclosed in the amount of EUR 543,690.
Intangible non-current assets (in EUR) 31 December 2016 31 December 2015 1 January 2015
Property rights 1,713,627 1,629,895 1,627,731
Intangible assets in development 321,351 157,259 41,907
Other long-term accrued revenue and deferred expenses 279 150 622
Total 2,035,257 1,787,304 1,670,260
Subsidiaries Equity interest (in %) Book value of equity (in EUR) Profit or loss (in EUR)
31 December 2016
31 December 2015
1 January 2015
31 December 2016
31 December 2015
1 January 2015
31 December 2016
31 December 2015
ECE d.o.o. 74.3256% 74.3256% 100% 18,206,205 17,384,409 9,036,403 1,353,114 2,729,274
MHE – ELPRO, d.o.o. 100% 100% 100% 2,355,618 2,220,487 2,115,022 135,131 105,464
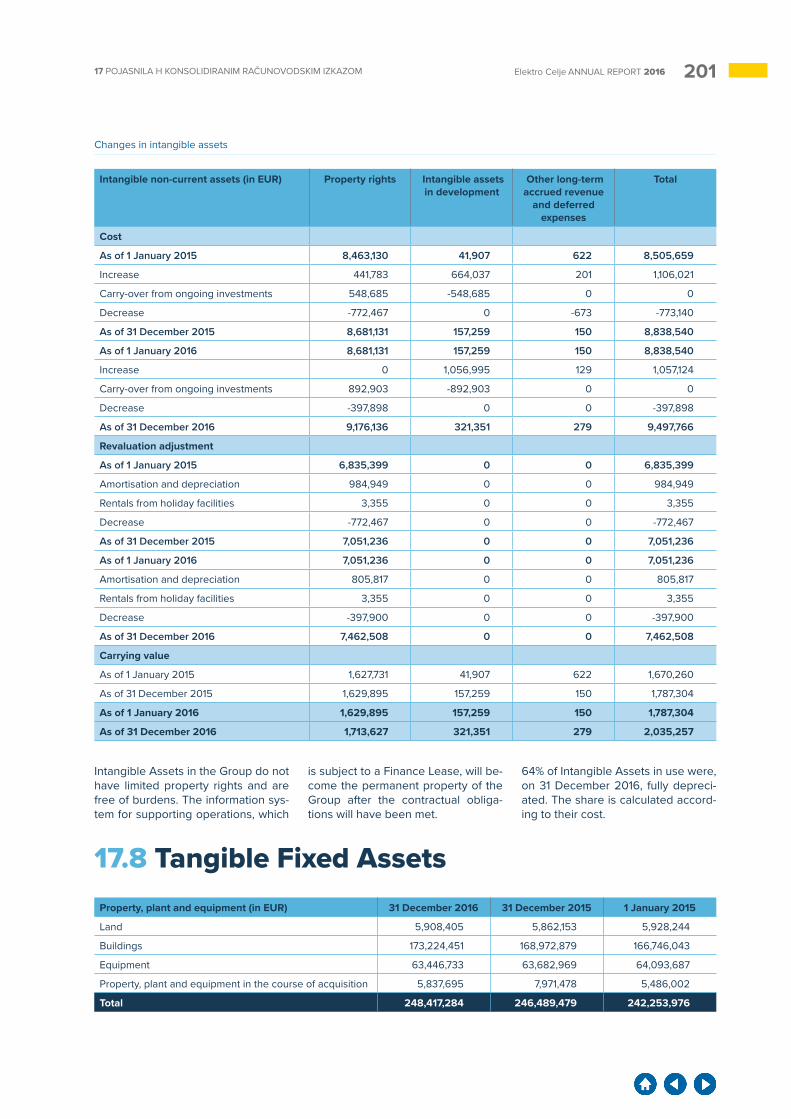
20117 POJASNILA H KONSOLIDIRANIM RAČUNOVODSKIM IZKAZOM Elektro Celje ANNUAL REPORT 2016
Changes in intangible assets
Intangible non-current assets (in EUR) Property rights Intangible assets in development
Other long-term accrued revenue
and deferred expenses
Total
Cost
As of 1 January 2015 8,463,130 41,907 622 8,505,659
Increase 441,783 664,037 201 1,106,021
Carry-over from ongoing investments 548,685 -548,685 0 0
Decrease -772,467 0 -673 -773,140
As of 31 December 2015 8,681,131 157,259 150 8,838,540
As of 1 January 2016 8,681,131 157,259 150 8,838,540
Increase 0 1,056,995 129 1,057,124
Carry-over from ongoing investments 892,903 -892,903 0 0
Decrease -397,898 0 0 -397,898
As of 31 December 2016 9,176,136 321,351 279 9,497,766
Revaluation adjustment
As of 1 January 2015 6,835,399 0 0 6,835,399
Amortisation and depreciation 984,949 0 0 984,949
Rentals from holiday facilities 3,355 0 0 3,355
Decrease -772,467 0 0 -772,467
As of 31 December 2015 7,051,236 0 0 7,051,236
As of 1 January 2016 7,051,236 0 0 7,051,236
Amortisation and depreciation 805,817 0 0 805,817
Rentals from holiday facilities 3,355 0 0 3,355
Decrease -397,900 0 0 -397,900
As of 31 December 2016 7,462,508 0 0 7,462,508
Carrying value
As of 1 January 2015 1,627,731 41,907 622 1,670,260
As of 31 December 2015 1,629,895 157,259 150 1,787,304
As of 1 January 2016 1,629,895 157,259 150 1,787,304
As of 31 December 2016 1,713,627 321,351 279 2,035,257
Intangible Assets in the Group do not have limited property rights and are free of burdens. The information sys-tem for supporting operations, which
is subject to a Finance Lease, will be-come the permanent property of the Group after the contractual obliga-tions will have been met.
64% of Intangible Assets in use were, on 31 December 2016, fully depreci-ated. The share is calculated accord-ing to their cost.
17.8 Tangible Fixed AssetsProperty, plant and equipment (in EUR) 31 December 2016 31 December 2015 1 January 2015
Land 5,908,405 5,862,153 5,928,244
Buildings 173,224,451 168,972,879 166,746,043
Equipment 63,446,733 63,682,969 64,093,687
Property, plant and equipment in the course of acquisition 5,837,695 7,971,478 5,486,002
Total 248,417,284 246,489,479 242,253,976
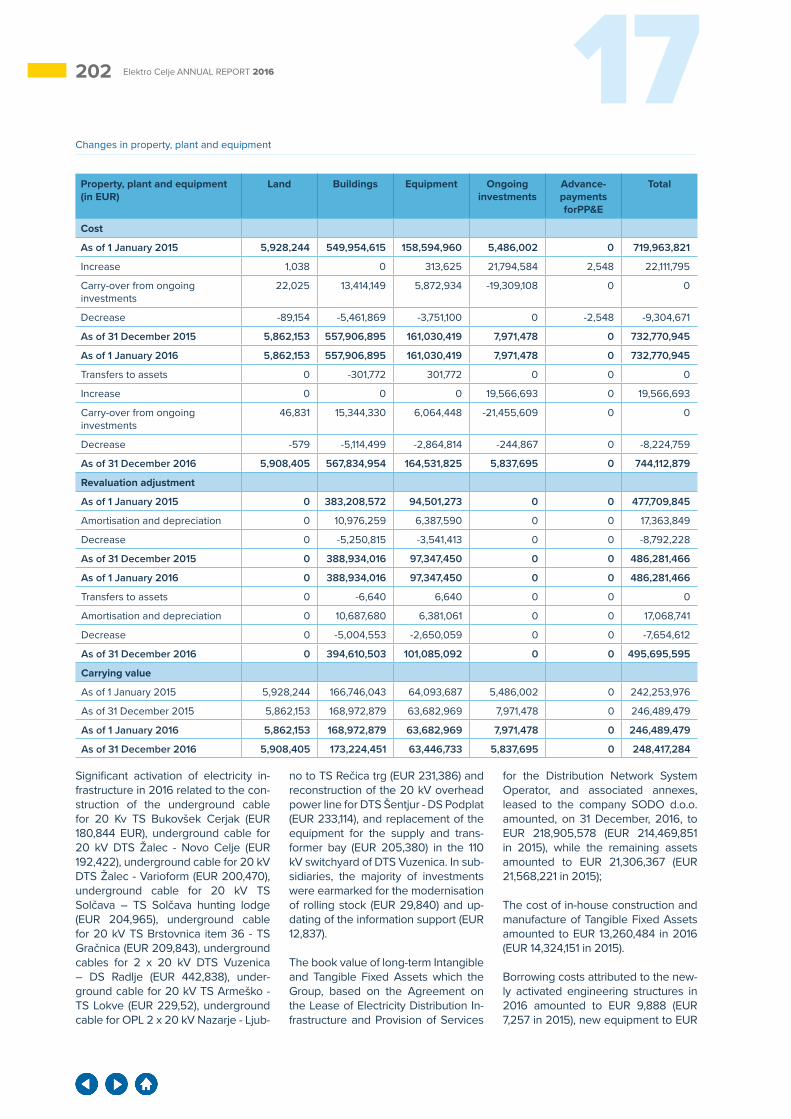
202 17Elektro Celje ANNUAL REPORT 2016
Significant activation of electricity in-frastructure in 2016 related to the con-struction of the underground cable for 20 Kv TS Bukovšek Cerjak (EUR 180,844 EUR), underground cable for 20 kV DTS Žalec - Novo Celje (EUR 192,422), underground cable for 20 kV DTS Žalec - Varioform (EUR 200,470), underground cable for 20 kV TS Solčava – TS Solčava hunting lodge (EUR 204,965), underground cable for 20 kV TS Brstovnica item 36 - TS Gračnica (EUR 209,843), underground cables for 2 x 20 kV DTS Vuzenica – DS Radlje (EUR 442,838), under-ground cable for 20 kV TS Armeško - TS Lokve (EUR 229,52), underground cable for OPL 2 x 20 kV Nazarje - Ljub-
no to TS Rečica trg (EUR 231,386) and reconstruction of the 20 kV overhead power line for DTS Šentjur - DS Podplat (EUR 233,114), and replacement of the equipment for the supply and trans-former bay (EUR 205,380) in the 110 kV switchyard of DTS Vuzenica. In sub-sidiaries, the majority of investments were earmarked for the modernisation of rolling stock (EUR 29,840) and up-dating of the information support (EUR 12,837).
The book value of long-term Intangible and Tangible Fixed Assets which the Group, based on the Agreement on the Lease of Electricity Distribution In-frastructure and Provision of Services
for the Distribution Network System Operator, and associated annexes, leased to the company SODO d.o.o. amounted, on 31 December, 2016, to EUR 218,905,578 (EUR 214,469,851 in 2015), while the remaining assets amounted to EUR 21,306,367 (EUR 21,568,221 in 2015);
The cost of in-house construction and manufacture of Tangible Fixed Assets amounted to EUR 13,260,484 in 2016 (EUR 14,324,151 in 2015).
Borrowing costs attributed to the new-ly activated engineering structures in 2016 amounted to EUR 9,888 (EUR 7,257 in 2015), new equipment to EUR
Changes in property, plant and equipment
Property, plant and equipment (in EUR)
Land Buildings Equipment Ongoing investments
Advance-payments forPP&E
Total
Cost
As of 1 January 2015 5,928,244 549,954,615 158,594,960 5,486,002 0 719,963,821
Increase 1,038 0 313,625 21,794,584 2,548 22,111,795
Carry-over from ongoing investments
22,025 13,414,149 5,872,934 -19,309,108 0 0
Decrease -89,154 -5,461,869 -3,751,100 0 -2,548 -9,304,671
As of 31 December 2015 5,862,153 557,906,895 161,030,419 7,971,478 0 732,770,945
As of 1 January 2016 5,862,153 557,906,895 161,030,419 7,971,478 0 732,770,945
Transfers to assets 0 -301,772 301,772 0 0 0
Increase 0 0 0 19,566,693 0 19,566,693
Carry-over from ongoing investments
46,831 15,344,330 6,064,448 -21,455,609 0 0
Decrease -579 -5,114,499 -2,864,814 -244,867 0 -8,224,759
As of 31 December 2016 5,908,405 567,834,954 164,531,825 5,837,695 0 744,112,879
Revaluation adjustment
As of 1 January 2015 0 383,208,572 94,501,273 0 0 477,709,845
Amortisation and depreciation 0 10,976,259 6,387,590 0 0 17,363,849
Decrease 0 -5,250,815 -3,541,413 0 0 -8,792,228
As of 31 December 2015 0 388,934,016 97,347,450 0 0 486,281,466
As of 1 January 2016 0 388,934,016 97,347,450 0 0 486,281,466
Transfers to assets 0 -6,640 6,640 0 0 0
Amortisation and depreciation 0 10,687,680 6,381,061 0 0 17,068,741
Decrease 0 -5,004,553 -2,650,059 0 0 -7,654,612
As of 31 December 2016 0 394,610,503 101,085,092 0 0 495,695,595
Carrying value
As of 1 January 2015 5,928,244 166,746,043 64,093,687 5,486,002 0 242,253,976
As of 31 December 2015 5,862,153 168,972,879 63,682,969 7,971,478 0 246,489,479
As of 1 January 2016 5,862,153 168,972,879 63,682,969 7,971,478 0 246,489,479
As of 31 December 2016 5,908,405 173,224,451 63,446,733 5,837,695 0 248,417,284

20317 POJASNILA H KONSOLIDIRANIM RAČUNOVODSKIM IZKAZOM Elektro Celje ANNUAL REPORT 2016
Changes in investment property (in EUR) Amount
Cost
As of 1 January 2015 917,182
Increase 40,889
As of 31 December 2015 958,071
As of 1 January 2016 958,071
As of 31 December 2016 958,071
Revaluation adjustment
As of 1 January 2015 618,409
Amortisation and depreciation 18,344
As of 31 December 2015 636,753
As of 1 January 2016 636,753
Amortisation and depreciation 18,343
As of 31 December 2016 655,096
Carrying value
As of 1 January 2015 298,773
As of 31 December 2015 321,318
As of 1 January 2016 321,318
As of 31 December 2016 302,975
Financial investments (in EUR)
31 december 2016
Number of shares
31 december 2015
Number of shares
1 january 2015
Number of shares
Gorenjska banka, d.d. 288,766 2,350 288,766 2,350 0 0
Zavarovalnica Triglav, d.d. 130,477 5,624 132,430 5,624 69,855 2,960
Informatika, d.d. 206,987 2,479 206,987 2,479 310,495 2,479
Stelkom, d. o. o 108,222 0 108,222 0 56,594 0
Total 734,452 10,453 736,405 10,453 436,944 5,439
800 (EUR 862 in 2015), and they are shown according to the weighted in-terest rate for investment credits dur-ing the period for which interest is cal-culated.
For the acquisition of Tangible Fixed Assets the Group disclosed on 31 De-cember 2016, liabilities amounting to EUR 942,594.
The Group, according to the situation as of 31 December 2016, did not dis-close any tangible assets with limited right to property, nor were any of them pledged as security for liabilities.
All tangible assets owned by the Group were, on 31 December 2016, in use, of which 28% of all the buildings and
equipment were fully depreciated on 31 December 2016. The share is calcu-lated in relation to the cost of buildings and equipment. For Fixed Assets that have been damaged (partially or fully), the Group received EUR 113,289 in damages from insurance companies.
17.9 Investment Property
Investment Property relates to a com-mercial building leased to individuals or other companies by the Group. According to official evaluations of GURS, the market value of the prop-erty amounts to EUR 489,909 which,
according to our estimates, is a good approximation of the Fair Value, while the Group itself did not obtain an evaluation of investment property from an authorised Assessor of prop-erty. Proceeds from rent amounted
to EUR 7,296 in 2016 (EUR 6,410 in 2015), with the related costs amount-ing to EUR 7,383 (EUR 7,080 in 2015), and relating to the current mainte-nance of the property.
17.10 Financial Investments
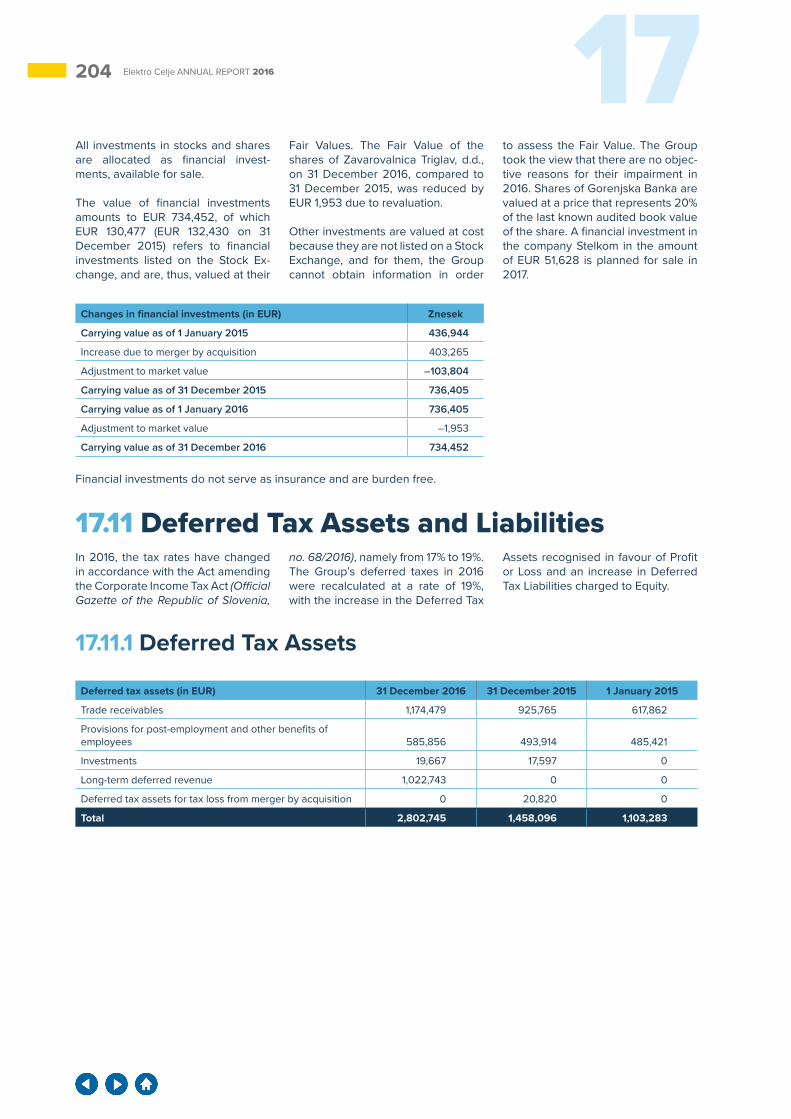
204 17Elektro Celje ANNUAL REPORT 2016
Financial investments do not serve as insurance and are burden free.
17.11 Deferred Tax Assets and LiabilitiesIn 2016, the tax rates have changed in accordance with the Act amending the Corporate Income Tax Act (Official Gazette of the Republic of Slovenia,
no. 68/2016), namely from 17% to 19%. The Group’s deferred taxes in 2016 were recalculated at a rate of 19%, with the increase in the Deferred Tax
Assets recognised in favour of Profit or Loss and an increase in Deferred Tax Liabilities charged to Equity.
17.11.1 Deferred Tax Assets
All investments in stocks and shares are allocated as financial invest-ments, available for sale.
The value of financial investments amounts to EUR 734,452, of which EUR 130,477 (EUR 132,430 on 31 December 2015) refers to financial investments listed on the Stock Ex-change, and are, thus, valued at their
Fair Values. The Fair Value of the shares of Zavarovalnica Triglav, d.d., on 31 December 2016, compared to 31 December 2015, was reduced by EUR 1,953 due to revaluation.
Other investments are valued at cost because they are not listed on a Stock Exchange, and for them, the Group cannot obtain information in order
to assess the Fair Value. The Group took the view that there are no objec-tive reasons for their impairment in 2016. Shares of Gorenjska Banka are valued at a price that represents 20% of the last known audited book value of the share. A financial investment in the company Stelkom in the amount of EUR 51,628 is planned for sale in 2017.
Deferred tax assets (in EUR) 31 December 2016 31 December 2015 1 January 2015
Trade receivables 1,174,479 925,765 617,862
Provisions for post-employment and other benefits of employees 585,856 493,914 485,421
Investments 19,667 17,597 0
Long-term deferred revenue 1,022,743 0 0
Deferred tax assets for tax loss from merger by acquisition 0 20,820 0
Total 2,802,745 1,458,096 1,103,283
Changes in financial investments (in EUR) Znesek
Carrying value as of 1 January 2015 436,944
Increase due to merger by acquisition 403,265
Adjustment to market value –103,804
Carrying value as of 31 December 2015 736,405
Carrying value as of 1 January 2016 736,405
Adjustment to market value –1,953
Carrying value as of 31 December 2016 734,452
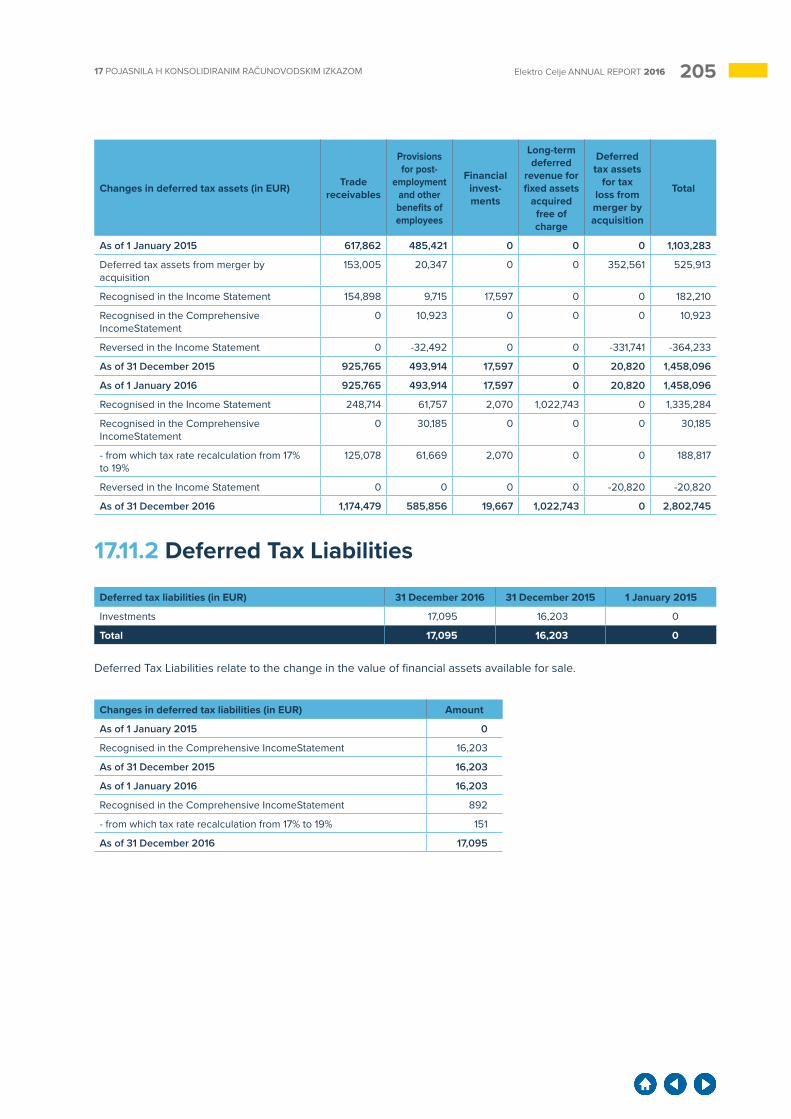
20517 POJASNILA H KONSOLIDIRANIM RAČUNOVODSKIM IZKAZOM Elektro Celje ANNUAL REPORT 2016
17.11.2 Deferred Tax Liabilities
Deferred tax liabilities (in EUR) 31 December 2016 31 December 2015 1 January 2015
Investments 17,095 16,203 0
Total 17,095 16,203 0
Changes in deferred tax assets (in EUR) Trade receivables
Provisions for post-
employment and other benefits of employees
Financial invest-ments
Long-term deferred
revenue for fixed assets
acquired free of charge
Deferred tax assets
for tax loss from merger by acquisition
Total
As of 1 January 2015 617,862 485,421 0 0 0 1,103,283
Deferred tax assets from merger by acquisition
153,005 20,347 0 0 352,561 525,913
Recognised in the Income Statement 154,898 9,715 17,597 0 0 182,210
Recognised in the Comprehensive IncomeStatement
0 10,923 0 0 0 10,923
Reversed in the Income Statement 0 -32,492 0 0 -331,741 -364,233
As of 31 December 2015 925,765 493,914 17,597 0 20,820 1,458,096
As of 1 January 2016 925,765 493,914 17,597 0 20,820 1,458,096
Recognised in the Income Statement 248,714 61,757 2,070 1,022,743 0 1,335,284
Recognised in the Comprehensive IncomeStatement
0 30,185 0 0 0 30,185
- from which tax rate recalculation from 17% to 19%
125,078 61,669 2,070 0 0 188,817
Reversed in the Income Statement 0 0 0 0 -20,820 -20,820
As of 31 December 2016 1,174,479 585,856 19,667 1,022,743 0 2,802,745
Changes in deferred tax liabilities (in EUR) Amount
As of 1 January 2015 0
Recognised in the Comprehensive IncomeStatement 16,203
As of 31 December 2015 16,203
As of 1 January 2016 16,203
Recognised in the Comprehensive IncomeStatement 892
- from which tax rate recalculation from 17% to 19% 151
As of 31 December 2016 17,095
Deferred Tax Liabilities relate to the change in the value of financial assets available for sale.
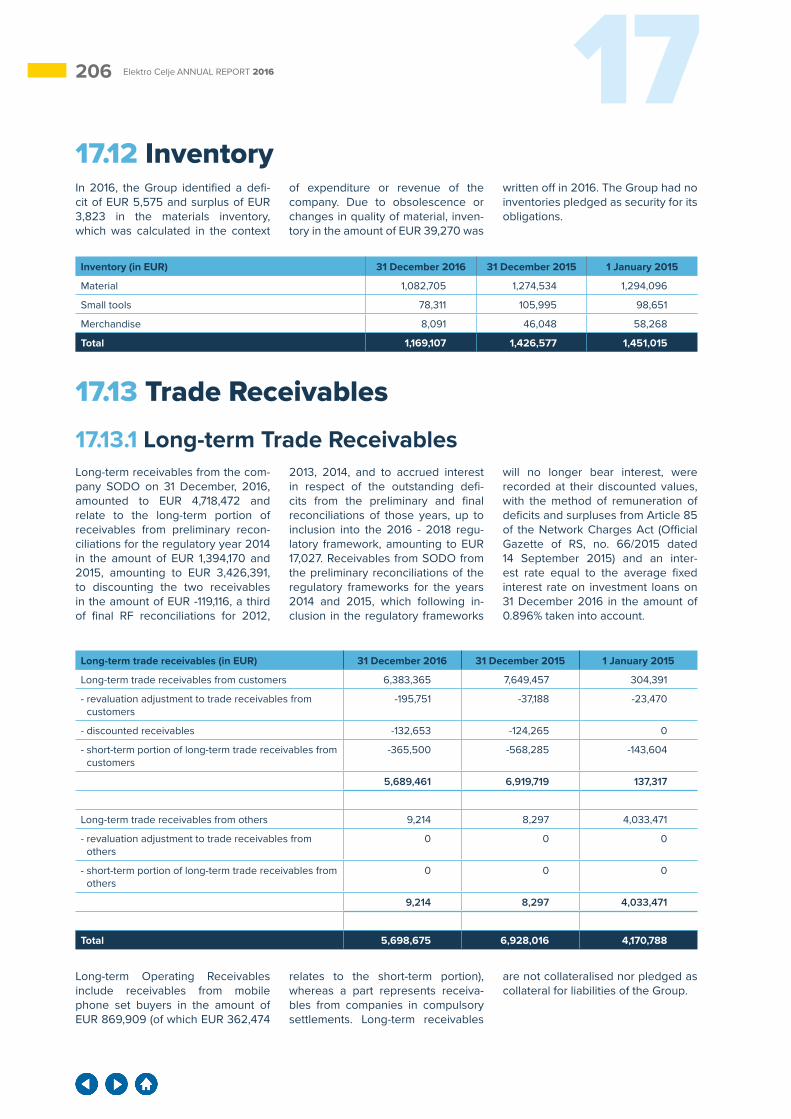
206 17Elektro Celje ANNUAL REPORT 2016
17.12 InventoryIn 2016, the Group identified a defi-cit of EUR 5,575 and surplus of EUR 3,823 in the materials inventory, which was calculated in the context
of expenditure or revenue of the company. Due to obsolescence or changes in quality of material, inven-tory in the amount of EUR 39,270 was
written off in 2016. The Group had no inventories pledged as security for its obligations.
Long-term trade receivables (in EUR) 31 December 2016 31 December 2015 1 January 2015
Long-term trade receivables from customers 6,383,365 7,649,457 304,391
- revaluation adjustment to trade receivables from customers
-195,751 -37,188 -23,470
- discounted receivables -132,653 -124,265 0
- short-term portion of long-term trade receivables from customers
-365,500 -568,285 -143,604
5,689,461 6,919,719 137,317
Long-term trade receivables from others 9,214 8,297 4,033,471
- revaluation adjustment to trade receivables from others
0 0 0
- short-term portion of long-term trade receivables from others
0 0 0
9,214 8,297 4,033,471
Total 5,698,675 6,928,016 4,170,788
17.13 Trade Receivables17.13.1 Long-term Trade ReceivablesLong-term receivables from the com-pany SODO on 31 December, 2016, amounted to EUR 4,718,472 and relate to the long-term portion of receivables from preliminary recon-ciliations for the regulatory year 2014 in the amount of EUR 1,394,170 and 2015, amounting to EUR 3,426,391, to discounting the two receivables in the amount of EUR -119,116, a third of final RF reconciliations for 2012,
2013, 2014, and to accrued interest in respect of the outstanding defi-cits from the preliminary and final reconciliations of those years, up to inclusion into the 2016 - 2018 regu-latory framework, amounting to EUR 17,027. Receivables from SODO from the preliminary reconciliations of the regulatory frameworks for the years 2014 and 2015, which following in-clusion in the regulatory frameworks
will no longer bear interest, were recorded at their discounted values, with the method of remuneration of deficits and surpluses from Article 85 of the Network Charges Act (Official Gazette of RS, no. 66/2015 dated 14 September 2015) and an inter-est rate equal to the average fixed interest rate on investment loans on 31 December 2016 in the amount of 0.896% taken into account.
Inventory (in EUR) 31 December 2016 31 December 2015 1 January 2015
Material 1,082,705 1,274,534 1,294,096
Small tools 78,311 105,995 98,651
Merchandise 8,091 46,048 58,268
Total 1,169,107 1,426,577 1,451,015
Long-term Operating Receivables include receivables from mobile phone set buyers in the amount of EUR 869,909 (of which EUR 362,474
relates to the short-term portion), whereas a part represents receiva-bles from companies in compulsory settlements. Long-term receivables
are not collateralised nor pledged as collateral for liabilities of the Group.
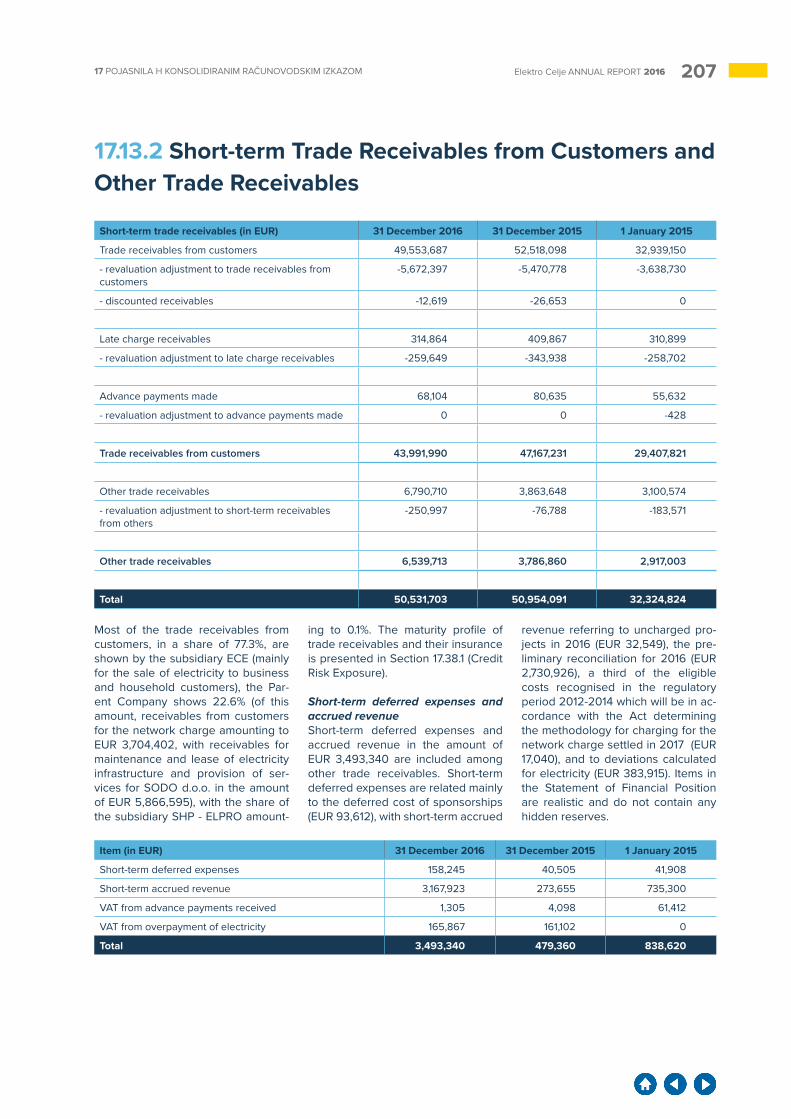
20717 POJASNILA H KONSOLIDIRANIM RAČUNOVODSKIM IZKAZOM Elektro Celje ANNUAL REPORT 2016
17.13.2 Short-term Trade Receivables from Customers and Other Trade Receivables
Most of the trade receivables from customers, in a share of 77.3%, are shown by the subsidiary ECE (mainly for the sale of electricity to business and household customers), the Par-ent Company shows 22.6% (of this amount, receivables from customers for the network charge amounting to EUR 3,704,402, with receivables for maintenance and lease of electricity infrastructure and provision of ser-vices for SODO d.o.o. in the amount of EUR 5,866,595), with the share of the subsidiary SHP - ELPRO amount-
ing to 0.1%. The maturity profile of trade receivables and their insurance is presented in Section 17.38.1 (Credit Risk Exposure).
Short-term deferred expenses and accrued revenueShort-term deferred expenses and accrued revenue in the amount of EUR 3,493,340 are included among other trade receivables. Short-term deferred expenses are related mainly to the deferred cost of sponsorships (EUR 93,612), with short-term accrued
revenue referring to uncharged pro-jects in 2016 (EUR 32,549), the pre-liminary reconciliation for 2016 (EUR 2,730,926), a third of the eligible costs recognised in the regulatory period 2012-2014 which will be in ac-cordance with the Act determining the methodology for charging for the network charge settled in 2017 (EUR 17,040), and to deviations calculated for electricity (EUR 383,915). Items in the Statement of Financial Position are realistic and do not contain any hidden reserves.
Short-term trade receivables (in EUR) 31 December 2016 31 December 2015 1 January 2015
Trade receivables from customers 49,553,687 52,518,098 32,939,150
- revaluation adjustment to trade receivables from customers
-5,672,397 -5,470,778 -3,638,730
- discounted receivables -12,619 -26,653 0
Late charge receivables 314,864 409,867 310,899
- revaluation adjustment to late charge receivables -259,649 -343,938 -258,702
Advance payments made 68,104 80,635 55,632
- revaluation adjustment to advance payments made 0 0 -428
Trade receivables from customers 43,991,990 47,167,231 29,407,821
Other trade receivables 6,790,710 3,863,648 3,100,574
- revaluation adjustment to short-term receivables from others
-250,997 -76,788 -183,571
Other trade receivables 6,539,713 3,786,860 2,917,003
Total 50,531,703 50,954,091 32,324,824
Item (in EUR) 31 December 2016 31 December 2015 1 January 2015
Short-term deferred expenses 158,245 40,505 41,908
Short-term accrued revenue 3,167,923 273,655 735,300
VAT from advance payments received 1,305 4,098 61,412
VAT from overpayment of electricity 165,867 161,102 0
Total 3,493,340 479,360 838,620
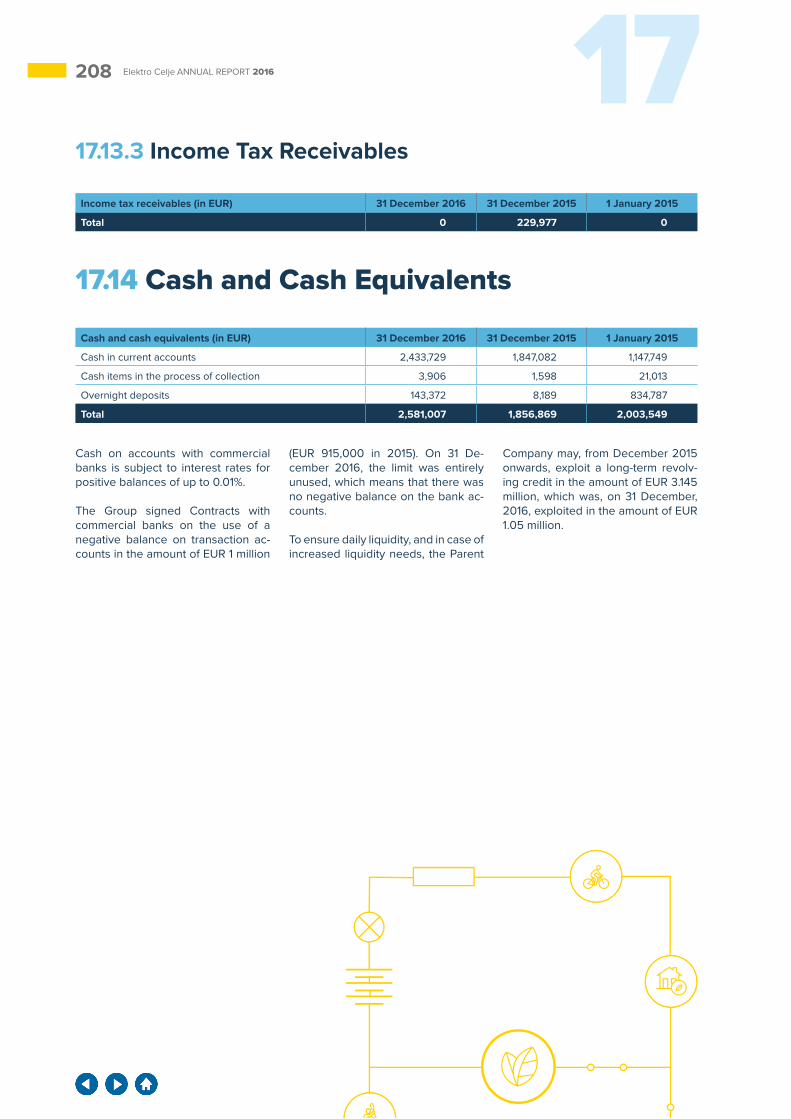
208 17Elektro Celje ANNUAL REPORT 2016
17.13.3 Income Tax Receivables
17.14 Cash and Cash Equivalents
Cash on accounts with commercial banks is subject to interest rates for positive balances of up to 0.01%.
The Group signed Contracts with commercial banks on the use of a negative balance on transaction ac-counts in the amount of EUR 1 million
(EUR 915,000 in 2015). On 31 De-cember 2016, the limit was entirely unused, which means that there was no negative balance on the bank ac-counts.
To ensure daily liquidity, and in case of increased liquidity needs, the Parent
Company may, from December 2015 onwards, exploit a long-term revolv-ing credit in the amount of EUR 3.145 million, which was, on 31 December, 2016, exploited in the amount of EUR 1.05 million.
Income tax receivables (in EUR) 31 December 2016 31 December 2015 1 January 2015
Total 0 229,977 0
Cash and cash equivalents (in EUR) 31 December 2016 31 December 2015 1 January 2015
Cash in current accounts 2,433,729 1,847,082 1,147,749
Cash items in the process of collection 3,906 1,598 21,013
Overnight deposits 143,372 8,189 834,787
Total 2,581,007 1,856,869 2,003,549
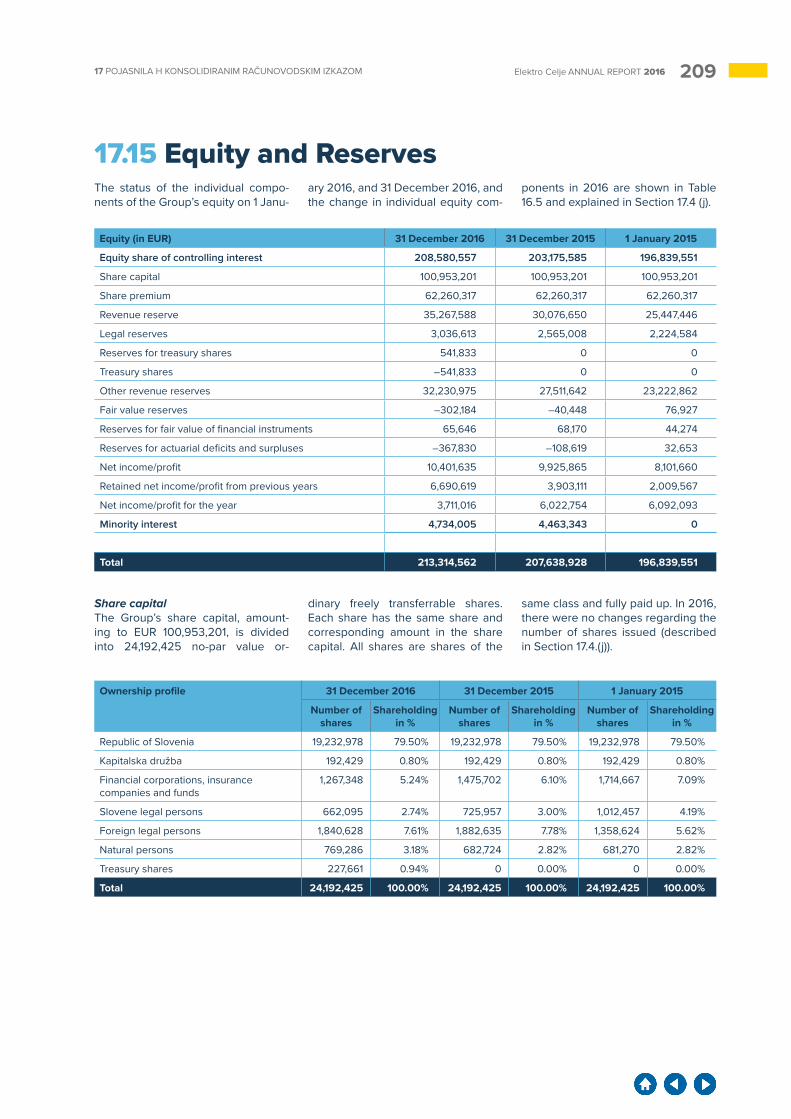
20917 POJASNILA H KONSOLIDIRANIM RAČUNOVODSKIM IZKAZOM Elektro Celje ANNUAL REPORT 2016
17.15 Equity and Reserves The status of the individual compo-nents of the Group’s equity on 1 Janu-
ary 2016, and 31 December 2016, and the change in individual equity com-
ponents in 2016 are shown in Table 16.5 and explained in Section 17.4 (j).
Share capitalThe Group’s share capital, amount-ing to EUR 100,953,201, is divided into 24,192,425 no-par value or-
dinary freely transferrable shares. Each share has the same share and corresponding amount in the share capital. All shares are shares of the
same class and fully paid up. In 2016, there were no changes regarding the number of shares issued (described in Section 17.4.(j)).
Equity (in EUR) 31 December 2016 31 December 2015 1 January 2015
Equity share of controlling interest 208,580,557 203,175,585 196,839,551
Share capital 100,953,201 100,953,201 100,953,201
Share premium 62,260,317 62,260,317 62,260,317
Revenue reserve 35,267,588 30,076,650 25,447,446
Legal reserves 3,036,613 2,565,008 2,224,584
Reserves for treasury shares 541,833 0 0
Treasury shares –541,833 0 0
Other revenue reserves 32,230,975 27,511,642 23,222,862
Fair value reserves –302,184 –40,448 76,927
Reserves for fair value of financial instruments 65,646 68,170 44,274
Reserves for actuarial deficits and surpluses –367,830 –108,619 32,653
Net income/profit 10,401,635 9,925,865 8,101,660
Retained net income/profit from previous years 6,690,619 3,903,111 2,009,567
Net income/profit for the year 3,711,016 6,022,754 6,092,093
Minority interest 4,734,005 4,463,343 0
Total 213,314,562 207,638,928 196,839,551
Ownership profile 31 December 2016 31 December 2015 1 January 2015
Number of shares
Shareholding in %
Number of shares
Shareholding in %
Number of shares
Shareholding in %
Republic of Slovenia 19,232,978 79.50% 19,232,978 79.50% 19,232,978 79.50%
Kapitalska družba 192,429 0.80% 192,429 0.80% 192,429 0.80%
Financial corporations, insurance companies and funds
1,267,348 5.24% 1,475,702 6.10% 1,714,667 7.09%
Slovene legal persons 662,095 2.74% 725,957 3.00% 1,012,457 4.19%
Foreign legal persons 1,840,628 7.61% 1,882,635 7.78% 1,358,624 5.62%
Natural persons 769,286 3.18% 682,724 2.82% 681,270 2.82%
Treasury shares 227,661 0.94% 0 0.00% 0 0.00%
Total 24,192,425 100.00% 24,192,425 100.00% 24,192,425 100.00%
210 17Elektro Celje ANNUAL REPORT 2016
Treasury sharesShareholders of the Parent Company authorised the management, at the 21st Shareholders Assembly, in order to maximise the value for sharehold-ers and to increase the value of the company’s assets, to acquire Treas-ury Shares in the company, in accord-ance with the Article of Association of the Parent Company and Article 247 of the Companies Act (ZGD-1). The overall share of Treasury Shares acquired may not exceed 10% of the share capital of the Parent Company, i.e. 2,419,242 shares, and the pur-chase price must not be lower than EUR 2.38 and higher than EUR 3.43 per share. In 2016, the Parent Com-pany could acquire up to 790,068 Treasury Shares, whereas, in 2017, up to 781,443, and in 2018, up to 847,731 shares can be purchased. On 31 December 2016, the Parent Com-pany had 227,661 Treasury Shares acquired in the period from 10 No-vember 2016, to 9 December 2016, at a price of EUR 2.38, which amounts to a total of EUR 541,833. In 2015, the Group did not hold its Treasury Shares.
The Parent Company may, in accord-ance with the Article of Association, with the prior consent of the Super-visory Board, withdraw Treasury Shares acquired pursuant to this au-thorisation without any further deci-sion on reduction of share capital or exchange them for shares or stakes in other companies or offer them for sale to a potential strategic investor.
ReservesThe Group’s Reserves are comprised of share premium, profit reserves and reserves for Fair Value. Profit re-serves include statutory reserves, re-serves for Treasury Shares, acquired Treasury Shares, and other profit re-serves. Creation, purpose of creation,
and utilisation of individual reserves is described in Section 17.4(j).
Share premium of the Group in-clude a general equity revaluation adjustment in the amount of EUR 62,260,317, which was, upon transi-tion to IFRS, included in the share premium. Share premium is not dis-tributable and can be used under the terms and for the purposes provided by law.
Statutory reserves are formed from the Net Profit of the financial year and, on 31 December 2016, amounted to EUR 3,036,613, EUR 471,605 more than on 31 December 2015. They can be used under the terms and for the purposes provided by law.
Reserves for treasury shares are formed from the Net Profit for the fi-nancial year 2016 in the amount of purchase of Treasury Shares, and, on 31 December 2016, amounted to EUR 541,833.
Other profit reserves, as at 31 De-cember 2016, amounted to EUR 32,230,975, which is EUR 4,719,333 more than on 31 December 2015, and were formed out of profit in the amount and under the conditions laid down by law and the Articles of As-sociations of the companies in the Group.
Fair value reserves for financial in-struments in 2016, in comparison with the previous year, decreased by EUR 2,526 and, on 31 December 2016, amounted to EUR 65,646. The change is due to the decrease in the Fair Value of financial assets available for sale by EUR 1,680 and a reduction in deferred tax effect in connection with the change in value of these in-vestments by EUR 846.
Reserves for actuarial deficits and surpluses on 31 December, 2016, amounted to EUR -367,830, and in-clude a change of the present value of post-employment benefits in the amount of EUR -259,210, of which reduction, as a result of converted post-employment benefits, amounts to EUR -289,395, and the increase of the impact of deferred taxes due to the restatement of post-employment benefits amounts to EUR 30,185.
Retained net profit or loss and divi-dend per shareRetained Net Profit or Loss in the amount of EUR 10,401,635 includes retained profit of previous years (EUR 6,690,619) and Net Profit of the cur-rent year (EUR 3,711,016).
On 31 August, 2016, shareholders of the Parent Company adopted a Deci-sion on the allocation of distributable profit in the amount of EUR 3,235,246; EUR 3,234,527 was intended for the payment of the dividends, which was EUR 0.1337 per share (in 2014 dividends were paid for 2014 in the amount of EUR 3,145,015, which was EUR 0.13 per share), while EUR 719 remained non-distributed. The pro-posed payment of dividends for 2016 amounts to EUR 2,806,223, repre-senting EUR 0.116 per share.
Equity share of non-controlling in-terestEquity share of non-controlling inter-est pertains to the company Elektro Gorenjska, which entered the compa-ny ECE as a partner in the process of merger with acquisition of its subsidi-ary Elektro Gorenjska Prodaja as the company acquired by the company Elektro Celje Energija on 1 October 2015.
Minority shareholder's interest
Non-controlling interest in % Minority shareholder's equity (in EUR)
Minority shareholder's net profit (in EUR)
31 December
2016
31 December
2015
1 January 2015
31 December
2016
31 December
2015
1 January 2015
31 December
2016
31 December
2015
1 January 2015
Elektro Gorenjska, d.d., a minority shareholder of the subsidiary ECE d.o.o. 25.6744% 25.6744% 0% 4,734,005 4,463,343 0 407,075 636,024 0

21117 POJASNILA H KONSOLIDIRANIM RAČUNOVODSKIM IZKAZOM Elektro Celje ANNUAL REPORT 2016
17.16 Provisions
Provisions for post-employment and other long-term employee benefitsThe actuarial calculation on 31 De-cember 2016 took into account the following assumptions: the statistical probability of death and disability, re-tirement in accordance with the law and staff turnover (4% until the age of 40 and 1% probability between the
ages of 41 to 50, 0% for those over 51 years old), 1.31% discount rate, 2% sal-ary growth in the Republic of Slovenia and the electricity sector, 2.25% sal-ary growth in the Company, valid em-ployer contribution rate of 16.1% and 0.5% growth in the amounts provided for in Decree on the levels of reim-bursed work-related expenses and of
certain income not to be included in the tax base (Official Gazette of RS, nos. 140/2006, 76/2008).
Benefit payments amounted to EUR 398,022, additional recognition to EUR 463,570, and the actuarial sur-plus of the Group to EUR 245,463.
Lawsuit provisionsOther provisions on 31 December, 2016, include provision for lawsuits in the amount of EUR 19,850, formed in 2015 (action for damages due to the disconnection of a neutral line) and further created reservations in 2016:
In respect of an action for damages by a private individual due to the ownership of the TS in the amount of EUR 12,000 and passive actions amounting to EUR 503,749. Provi-sions formed in 2015 due to a law-suit for payment of balance of the
2015 holiday pay up to the amount 2015 prescribed in Article 128 of the Collective Agreement for Slovenian Electricity Industry amounting to EUR 595,776 were eliminated in 2016 due to the withdrawal of the lawsuit.
Provisions (in EUR) 31 December 2016 31 December 2015 1 January 2015
Liabilities related to post-employment benefits of employees
6,282,476 5,971,465 5,470,528
Provisions for lawsuits 535,599 615,626 40,000
Total 6,818,075 6,587,091 5,510,528
Liabilities related to long-term employment benefits (in EUR)
Long-service awards
Retirement benefits
Death allowance
Total
As of 1 January 2015 1,804,750 3,490,557 175,221 5,470,528
Liabilities related to long-term benefits of employees of the company acquired
91,252 150,104 0 241,356
Current service costs 134,665 184,979 19,160 338,804
Interest expense 36,837 78,473 3,593 118,903
Payments of benefits -258,774 -152,956 -15,518 -427,248
Actuarial surplus/deficit 66,798 145,906 16,418 229,122
As of 31 December 2015 1,875,528 3,897,063 198,874 5,971,465
As of 1 January 2016 1,875,528 3,897,063 198,874 5,971,465
Current service costs 131,032 211,014 10,055 352,101
Interest expense 32,282 75,209 3,978 111,469
Payments of benefits -261,420 -136,602 0 -398,022
Actuarial surplus/deficit 16,040 288,599 -59,176 245,463
As of 31 December 2016 1,793,462 4,335,283 153,731 6,282,476
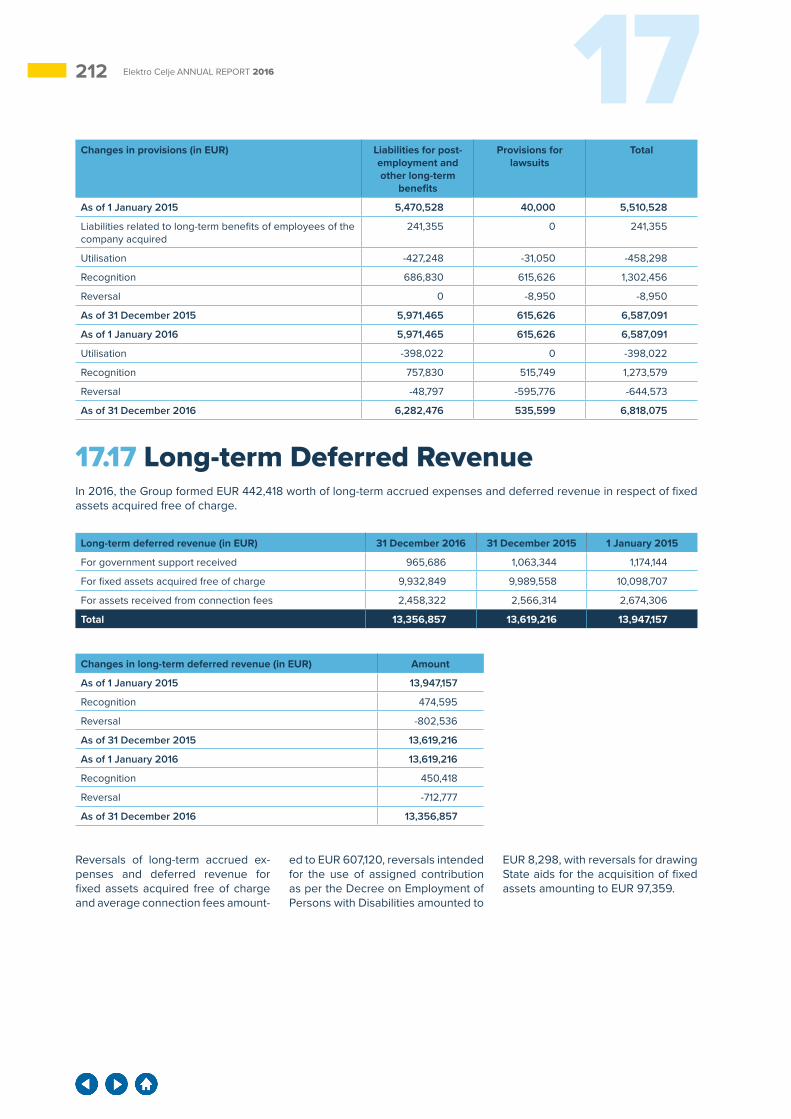
212 17Elektro Celje ANNUAL REPORT 2016
17.17 Long-term Deferred RevenueIn 2016, the Group formed EUR 442,418 worth of long-term accrued expenses and deferred revenue in respect of fixed assets acquired free of charge.
Changes in provisions (in EUR) Liabilities for post-employment and other long-term
benefits
Provisions for lawsuits
Total
As of 1 January 2015 5,470,528 40,000 5,510,528
Liabilities related to long-term benefits of employees of the company acquired
241,355 0 241,355
Utilisation -427,248 -31,050 -458,298
Recognition 686,830 615,626 1,302,456
Reversal 0 -8,950 -8,950
As of 31 December 2015 5,971,465 615,626 6,587,091
As of 1 January 2016 5,971,465 615,626 6,587,091
Utilisation -398,022 0 -398,022
Recognition 757,830 515,749 1,273,579
Reversal -48,797 -595,776 -644,573
As of 31 December 2016 6,282,476 535,599 6,818,075
Long-term deferred revenue (in EUR) 31 December 2016 31 December 2015 1 January 2015
For government support received 965,686 1,063,344 1,174,144
For fixed assets acquired free of charge 9,932,849 9,989,558 10,098,707
For assets received from connection fees 2,458,322 2,566,314 2,674,306
Total 13,356,857 13,619,216 13,947,157
Changes in long-term deferred revenue (in EUR) Amount
As of 1 January 2015 13,947,157
Recognition 474,595
Reversal -802,536
As of 31 December 2015 13,619,216
As of 1 January 2016 13,619,216
Recognition 450,418
Reversal -712,777
As of 31 December 2016 13,356,857
Reversals of long-term accrued ex-penses and deferred revenue for fixed assets acquired free of charge and average connection fees amount-
ed to EUR 607,120, reversals intended for the use of assigned contribution as per the Decree on Employment of Persons with Disabilities amounted to
EUR 8,298, with reversals for drawing State aids for the acquisition of fixed assets amounting to EUR 97,359.
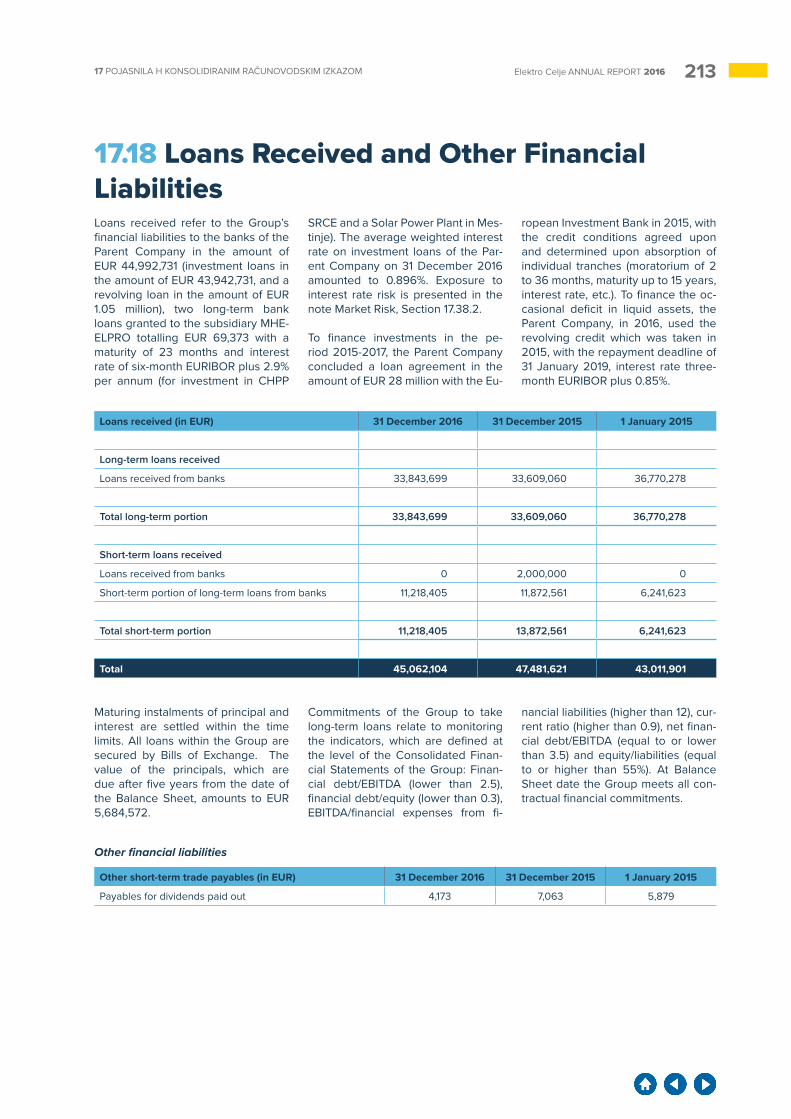
21317 POJASNILA H KONSOLIDIRANIM RAČUNOVODSKIM IZKAZOM Elektro Celje ANNUAL REPORT 2016
17.18 Loans Received and Other Financial LiabilitiesLoans received refer to the Group’s financial liabilities to the banks of the Parent Company in the amount of EUR 44,992,731 (investment loans in the amount of EUR 43,942,731, and a revolving loan in the amount of EUR 1.05 million), two long-term bank loans granted to the subsidiary MHE-ELPRO totalling EUR 69,373 with a maturity of 23 months and interest rate of six-month EURIBOR plus 2.9% per annum (for investment in CHPP
SRCE and a Solar Power Plant in Mes-tinje). The average weighted interest rate on investment loans of the Par-ent Company on 31 December 2016 amounted to 0.896%. Exposure to interest rate risk is presented in the note Market Risk, Section 17.38.2.
To finance investments in the pe-riod 2015-2017, the Parent Company concluded a loan agreement in the amount of EUR 28 million with the Eu-
ropean Investment Bank in 2015, with the credit conditions agreed upon and determined upon absorption of individual tranches (moratorium of 2 to 36 months, maturity up to 15 years, interest rate, etc.). To finance the oc-casional deficit in liquid assets, the Parent Company, in 2016, used the revolving credit which was taken in 2015, with the repayment deadline of 31 January 2019, interest rate three-month EURIBOR plus 0.85%.
Maturing instalments of principal and interest are settled within the time limits. All loans within the Group are secured by Bills of Exchange. The value of the principals, which are due after five years from the date of the Balance Sheet, amounts to EUR 5,684,572.
Commitments of the Group to take long-term loans relate to monitoring the indicators, which are defined at the level of the Consolidated Finan-cial Statements of the Group: Finan-cial debt/EBITDA (lower than 2.5), financial debt/equity (lower than 0.3), EBITDA/financial expenses from fi-
nancial liabilities (higher than 12), cur-rent ratio (higher than 0.9), net finan-cial debt/EBITDA (equal to or lower than 3.5) and equity/liabilities (equal to or higher than 55%). At Balance Sheet date the Group meets all con-tractual financial commitments.
Other financial liabilities
Other short-term trade payables (in EUR) 31 December 2016 31 December 2015 1 January 2015
Payables for dividends paid out 4,173 7,063 5,879
Loans received (in EUR) 31 December 2016 31 December 2015 1 January 2015
Long-term loans received
Loans received from banks 33,843,699 33,609,060 36,770,278
Total long-term portion 33,843,699 33,609,060 36,770,278
Short-term loans received
Loans received from banks 0 2,000,000 0
Short-term portion of long-term loans from banks 11,218,405 11,872,561 6,241,623
Total short-term portion 11,218,405 13,872,561 6,241,623
Total 45,062,104 47,481,621 43,011,901
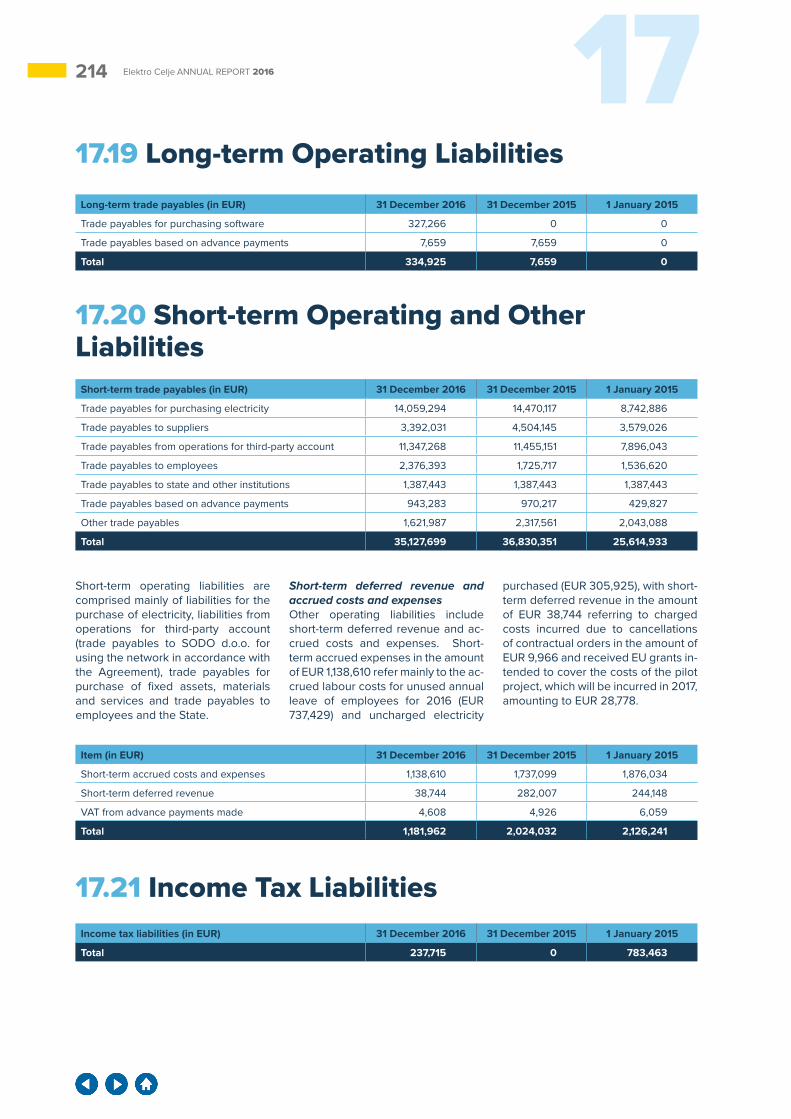
214 17Elektro Celje ANNUAL REPORT 2016
17.19 Long-term Operating Liabilities
17.20 Short-term Operating and Other Liabilities
Short-term operating liabilities are comprised mainly of liabilities for the purchase of electricity, liabilities from operations for third-party account (trade payables to SODO d.o.o. for using the network in accordance with the Agreement), trade payables for purchase of fixed assets, materials and services and trade payables to employees and the State.
Short-term deferred revenue and accrued costs and expensesOther operating liabilities include short-term deferred revenue and ac-crued costs and expenses. Short-term accrued expenses in the amount of EUR 1,138,610 refer mainly to the ac-crued labour costs for unused annual leave of employees for 2016 (EUR 737,429) and uncharged electricity
purchased (EUR 305,925), with short-term deferred revenue in the amount of EUR 38,744 referring to charged costs incurred due to cancellations of contractual orders in the amount of EUR 9,966 and received EU grants in-tended to cover the costs of the pilot project, which will be incurred in 2017, amounting to EUR 28,778.
Long-term trade payables (in EUR) 31 December 2016 31 December 2015 1 January 2015
Trade payables for purchasing software 327,266 0 0
Trade payables based on advance payments 7,659 7,659 0
Total 334,925 7,659 0
Short-term trade payables (in EUR) 31 December 2016 31 December 2015 1 January 2015
Trade payables for purchasing electricity 14,059,294 14,470,117 8,742,886
Trade payables to suppliers 3,392,031 4,504,145 3,579,026
Trade payables from operations for third-party account 11,347,268 11,455,151 7,896,043
Trade payables to employees 2,376,393 1,725,717 1,536,620
Trade payables to state and other institutions 1,387,443 1,387,443 1,387,443
Trade payables based on advance payments 943,283 970,217 429,827
Other trade payables 1,621,987 2,317,561 2,043,088
Total 35,127,699 36,830,351 25,614,933
Item (in EUR) 31 December 2016 31 December 2015 1 January 2015
Short-term accrued costs and expenses 1,138,610 1,737,099 1,876,034
Short-term deferred revenue 38,744 282,007 244,148
VAT from advance payments made 4,608 4,926 6,059
Total 1,181,962 2,024,032 2,126,241
Income tax liabilities (in EUR) 31 December 2016 31 December 2015 1 January 2015
Total 237,715 0 783,463
17.21 Income Tax Liabilities
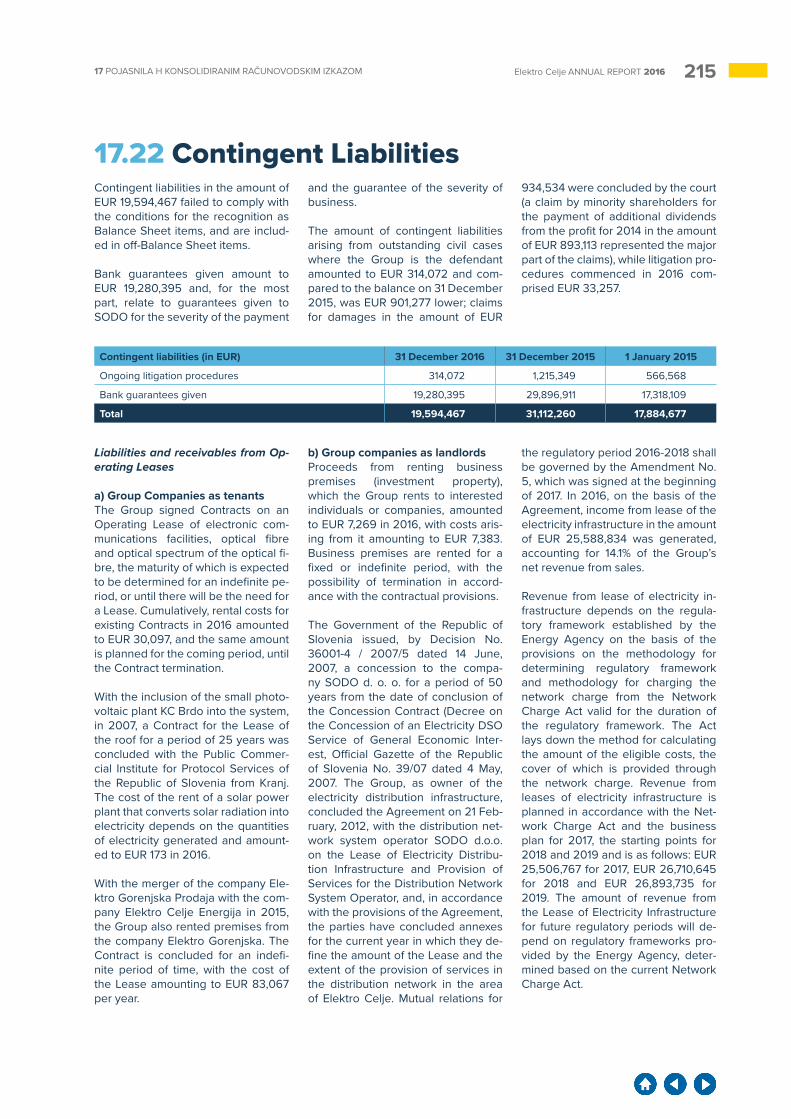
21517 POJASNILA H KONSOLIDIRANIM RAČUNOVODSKIM IZKAZOM Elektro Celje ANNUAL REPORT 2016
17.22 Contingent Liabilities Contingent liabilities in the amount of EUR 19,594,467 failed to comply with the conditions for the recognition as Balance Sheet items, and are includ-ed in off-Balance Sheet items.
Bank guarantees given amount to EUR 19,280,395 and, for the most part, relate to guarantees given to SODO for the severity of the payment
and the guarantee of the severity of business.
The amount of contingent liabilities arising from outstanding civil cases where the Group is the defendant amounted to EUR 314,072 and com-pared to the balance on 31 December 2015, was EUR 901,277 lower; claims for damages in the amount of EUR
934,534 were concluded by the court (a claim by minority shareholders for the payment of additional dividends from the profit for 2014 in the amount of EUR 893,113 represented the major part of the claims), while litigation pro-cedures commenced in 2016 com-prised EUR 33,257.
Liabilities and receivables from Op-erating Leases
a) Group Companies as tenantsThe Group signed Contracts on an Operating Lease of electronic com-munications facilities, optical fibre and optical spectrum of the optical fi-bre, the maturity of which is expected to be determined for an indefinite pe-riod, or until there will be the need for a Lease. Cumulatively, rental costs for existing Contracts in 2016 amounted to EUR 30,097, and the same amount is planned for the coming period, until the Contract termination.
With the inclusion of the small photo-voltaic plant KC Brdo into the system, in 2007, a Contract for the Lease of the roof for a period of 25 years was concluded with the Public Commer-cial Institute for Protocol Services of the Republic of Slovenia from Kranj. The cost of the rent of a solar power plant that converts solar radiation into electricity depends on the quantities of electricity generated and amount-ed to EUR 173 in 2016.
With the merger of the company Ele-ktro Gorenjska Prodaja with the com-pany Elektro Celje Energija in 2015, the Group also rented premises from the company Elektro Gorenjska. The Contract is concluded for an indefi-nite period of time, with the cost of the Lease amounting to EUR 83,067 per year.
b) Group companies as landlordsProceeds from renting business premises (investment property), which the Group rents to interested individuals or companies, amounted to EUR 7,269 in 2016, with costs aris-ing from it amounting to EUR 7,383. Business premises are rented for a fixed or indefinite period, with the possibility of termination in accord-ance with the contractual provisions.
The Government of the Republic of Slovenia issued, by Decision No. 36001-4 / 2007/5 dated 14 June, 2007, a concession to the compa-ny SODO d. o. o. for a period of 50 years from the date of conclusion of the Concession Contract (Decree on the Concession of an Electricity DSO Service of General Economic Inter-est, Official Gazette of the Republic of Slovenia No. 39/07 dated 4 May, 2007. The Group, as owner of the electricity distribution infrastructure, concluded the Agreement on 21 Feb-ruary, 2012, with the distribution net-work system operator SODO d.o.o. on the Lease of Electricity Distribu-tion Infrastructure and Provision of Services for the Distribution Network System Operator, and, in accordance with the provisions of the Agreement, the parties have concluded annexes for the current year in which they de-fine the amount of the Lease and the extent of the provision of services in the distribution network in the area of Elektro Celje. Mutual relations for
the regulatory period 2016-2018 shall be governed by the Amendment No. 5, which was signed at the beginning of 2017. In 2016, on the basis of the Agreement, income from lease of the electricity infrastructure in the amount of EUR 25,588,834 was generated, accounting for 14.1% of the Group’s net revenue from sales.
Revenue from lease of electricity in-frastructure depends on the regula-tory framework established by the Energy Agency on the basis of the provisions on the methodology for determining regulatory framework and methodology for charging the network charge from the Network Charge Act valid for the duration of the regulatory framework. The Act lays down the method for calculating the amount of the eligible costs, the cover of which is provided through the network charge. Revenue from leases of electricity infrastructure is planned in accordance with the Net-work Charge Act and the business plan for 2017, the starting points for 2018 and 2019 and is as follows: EUR 25,506,767 for 2017, EUR 26,710,645 for 2018 and EUR 26,893,735 for 2019. The amount of revenue from the Lease of Electricity Infrastructure for future regulatory periods will de-pend on regulatory frameworks pro-vided by the Energy Agency, deter-mined based on the current Network Charge Act.
Contingent liabilities (in EUR) 31 December 2016 31 December 2015 1 January 2015
Ongoing litigation procedures 314,072 1,215,349 566,568
Bank guarantees given 19,280,395 29,896,911 17,318,109
Total 19,594,467 31,112,260 17,884,677
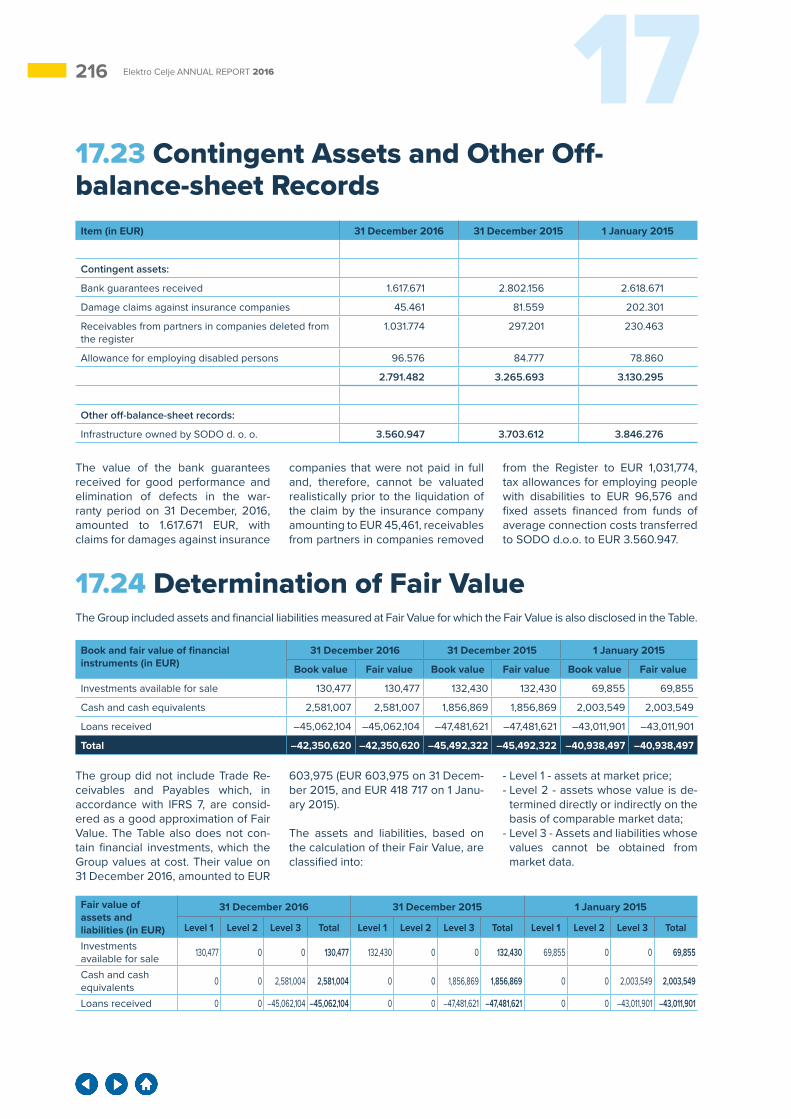
216 17Elektro Celje ANNUAL REPORT 2016
17.23 Contingent Assets and Other Off-balance-sheet Records
The value of the bank guarantees received for good performance and elimination of defects in the war-ranty period on 31 December, 2016, amounted to 1.617.671 EUR, with claims for damages against insurance
companies that were not paid in full and, therefore, cannot be valuated realistically prior to the liquidation of the claim by the insurance company amounting to EUR 45,461, receivables from partners in companies removed
from the Register to EUR 1,031,774, tax allowances for employing people with disabilities to EUR 96,576 and fixed assets financed from funds of average connection costs transferred to SODO d.o.o. to EUR 3.560.947.
17.24 Determination of Fair ValueThe Group included assets and financial liabilities measured at Fair Value for which the Fair Value is also disclosed in the Table.
The group did not include Trade Re-ceivables and Payables which, in accordance with IFRS 7, are consid-ered as a good approximation of Fair Value. The Table also does not con-tain financial investments, which the Group values at cost. Their value on 31 December 2016, amounted to EUR
603,975 (EUR 603,975 on 31 Decem-ber 2015, and EUR 418 717 on 1 Janu-ary 2015).
The assets and liabilities, based on the calculation of their Fair Value, are classified into:
- Level 1 - assets at market price;- Level 2 - assets whose value is de-
termined directly or indirectly on the basis of comparable market data;
- Level 3 - Assets and liabilities whose values cannot be obtained from market data.
Item (in EUR) 31 December 2016 31 December 2015 1 January 2015
Contingent assets:
Bank guarantees received 1.617.671 2.802.156 2.618.671
Damage claims against insurance companies 45.461 81.559 202.301
Receivables from partners in companies deleted from the register
1.031.774 297.201 230.463
Allowance for employing disabled persons 96.576 84.777 78.860
2.791.482 3.265.693 3.130.295
Other off-balance-sheet records:
Infrastructure owned by SODO d. o. o. 3.560.947 3.703.612 3.846.276
Book and fair value of financial instruments (in EUR)
31 December 2016 31 December 2015 1 January 2015
Book value Fair value Book value Fair value Book value Fair value
Investments available for sale 130,477 130,477 132,430 132,430 69,855 69,855
Cash and cash equivalents 2,581,007 2,581,007 1,856,869 1,856,869 2,003,549 2,003,549
Loans received –45,062,104 –45,062,104 –47,481,621 –47,481,621 –43,011,901 –43,011,901
Total –42,350,620 –42,350,620 –45,492,322 –45,492,322 –40,938,497 –40,938,497
Fair value of assets and liabilities (in EUR)
31 December 2016 31 December 2015 1 January 2015
Level 1 Level 2 Level 3 Total Level 1 Level 2 Level 3 Total Level 1 Level 2 Level 3 Total
Investments available for sale 130,477 0 0 130,477 132,430 0 0 132,430 69,855 0 0 69,855
Cash and cash equivalents 0 0 2,581,004 2,581,004 0 0 1,856,869 1,856,869 0 0 2,003,549 2,003,549
Loans received 0 0 –45,062,104 –45,062,104 0 0 –47,481,621 –47,481,621 0 0 –43,011,901 –43,011,901
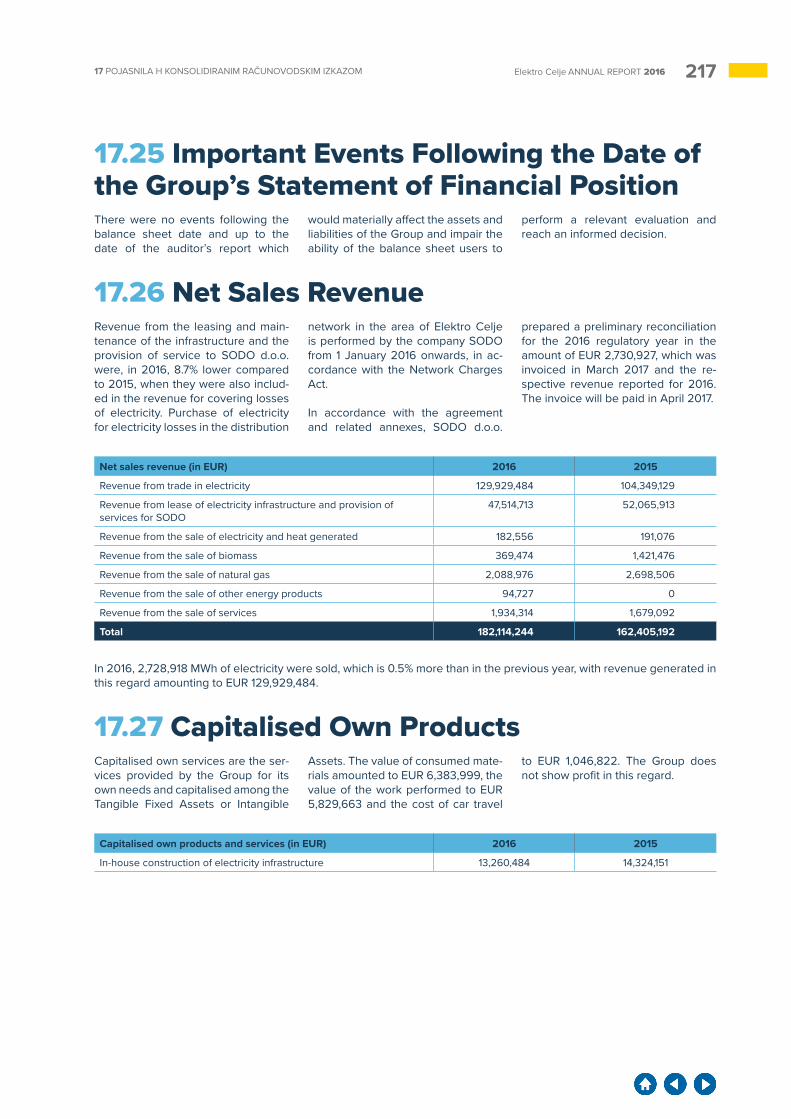
21717 POJASNILA H KONSOLIDIRANIM RAČUNOVODSKIM IZKAZOM Elektro Celje ANNUAL REPORT 2016
17.25 Important Events Following the Date of the Group’s Statement of Financial PositionThere were no events following the balance sheet date and up to the date of the auditor’s report which
would materially affect the assets and liabilities of the Group and impair the ability of the balance sheet users to
perform a relevant evaluation and reach an informed decision.
17.26 Net Sales RevenueRevenue from the leasing and main-tenance of the infrastructure and the provision of service to SODO d.o.o. were, in 2016, 8.7% lower compared to 2015, when they were also includ-ed in the revenue for covering losses of electricity. Purchase of electricity for electricity losses in the distribution
network in the area of Elektro Celje is performed by the company SODO from 1 January 2016 onwards, in ac-cordance with the Network Charges Act.
In accordance with the agreement and related annexes, SODO d.o.o.
prepared a preliminary reconciliation for the 2016 regulatory year in the amount of EUR 2,730,927, which was invoiced in March 2017 and the re-spective revenue reported for 2016. The invoice will be paid in April 2017.
In 2016, 2,728,918 MWh of electricity were sold, which is 0.5% more than in the previous year, with revenue generated in this regard amounting to EUR 129,929,484.
17.27 Capitalised Own ProductsCapitalised own services are the ser-vices provided by the Group for its own needs and capitalised among the Tangible Fixed Assets or Intangible
Assets. The value of consumed mate-rials amounted to EUR 6,383,999, the value of the work performed to EUR 5,829,663 and the cost of car travel
to EUR 1,046,822. The Group does not show profit in this regard.
Net sales revenue (in EUR) 2016 2015
Revenue from trade in electricity 129,929,484 104,349,129
Revenue from lease of electricity infrastructure and provision of services for SODO
47,514,713 52,065,913
Revenue from the sale of electricity and heat generated 182,556 191,076
Revenue from the sale of biomass 369,474 1,421,476
Revenue from the sale of natural gas 2,088,976 2,698,506
Revenue from the sale of other energy products 94,727 0
Revenue from the sale of services 1,934,314 1,679,092
Total 182,114,244 162,405,192
Capitalised own products and services (in EUR) 2016 2015
In-house construction of electricity infrastructure 13,260,484 14,324,151
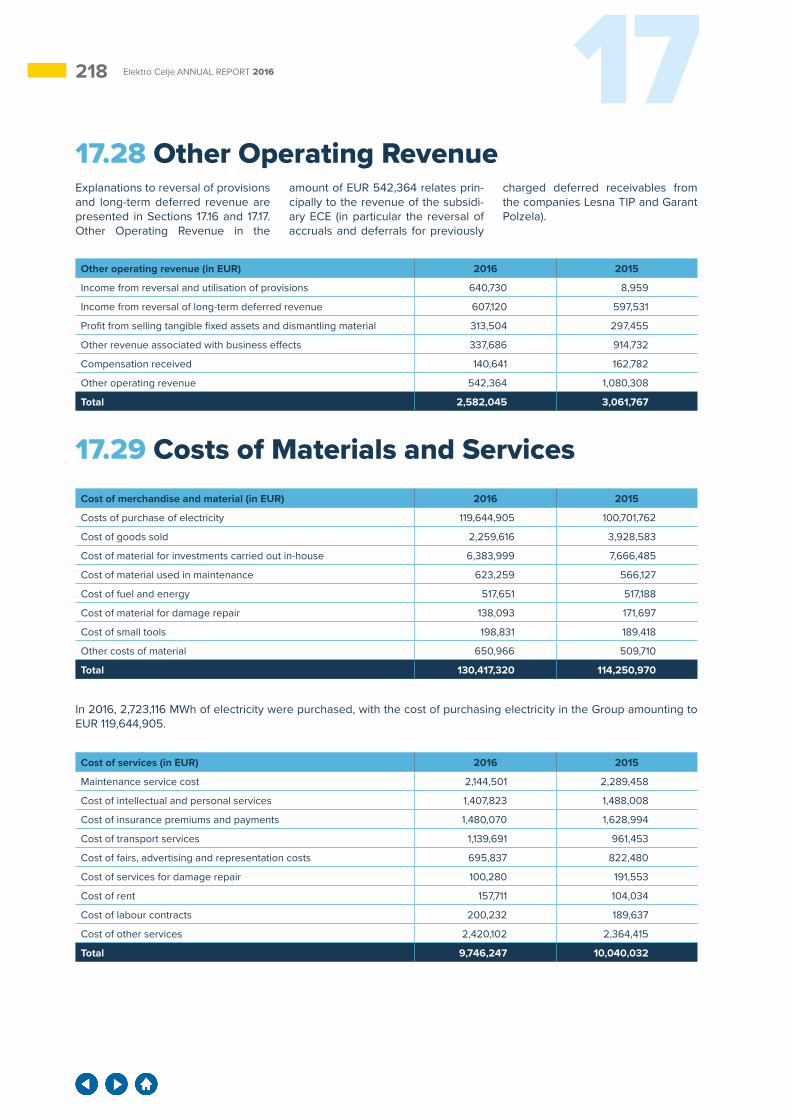
218 17Elektro Celje ANNUAL REPORT 2016
17.28 Other Operating RevenueExplanations to reversal of provisions and long-term deferred revenue are presented in Sections 17.16 and 17.17. Other Operating Revenue in the
amount of EUR 542,364 relates prin-cipally to the revenue of the subsidi-ary ECE (in particular the reversal of accruals and deferrals for previously
charged deferred receivables from the companies Lesna TIP and Garant Polzela).
17.29 Costs of Materials and Services
In 2016, 2,723,116 MWh of electricity were purchased, with the cost of purchasing electricity in the Group amounting to EUR 119,644,905.
Other operating revenue (in EUR) 2016 2015
Income from reversal and utilisation of provisions 640,730 8,959
Income from reversal of long-term deferred revenue 607,120 597,531
Profit from selling tangible fixed assets and dismantling material 313,504 297,455
Other revenue associated with business effects 337,686 914,732
Compensation received 140,641 162,782
Other operating revenue 542,364 1,080,308
Total 2,582,045 3,061,767
Cost of merchandise and material (in EUR) 2016 2015
Costs of purchase of electricity 119,644,905 100,701,762
Cost of goods sold 2,259,616 3,928,583
Cost of material for investments carried out in-house 6,383,999 7,666,485
Cost of material used in maintenance 623,259 566,127
Cost of fuel and energy 517,651 517,188
Cost of material for damage repair 138,093 171,697
Cost of small tools 198,831 189,418
Other costs of material 650,966 509,710
Total 130,417,320 114,250,970
Cost of services (in EUR) 2016 2015
Maintenance service cost 2,144,501 2,289,458
Cost of intellectual and personal services 1,407,823 1,488,008
Cost of insurance premiums and payments 1,480,070 1,628,994
Cost of transport services 1,139,691 961,453
Cost of fairs, advertising and representation costs 695,837 822,480
Cost of services for damage repair 100,280 191,553
Cost of rent 157,711 104,034
Cost of labour contracts 200,232 189,637
Cost of other services 2,420,102 2,364,415
Total 9,746,247 10,040,032
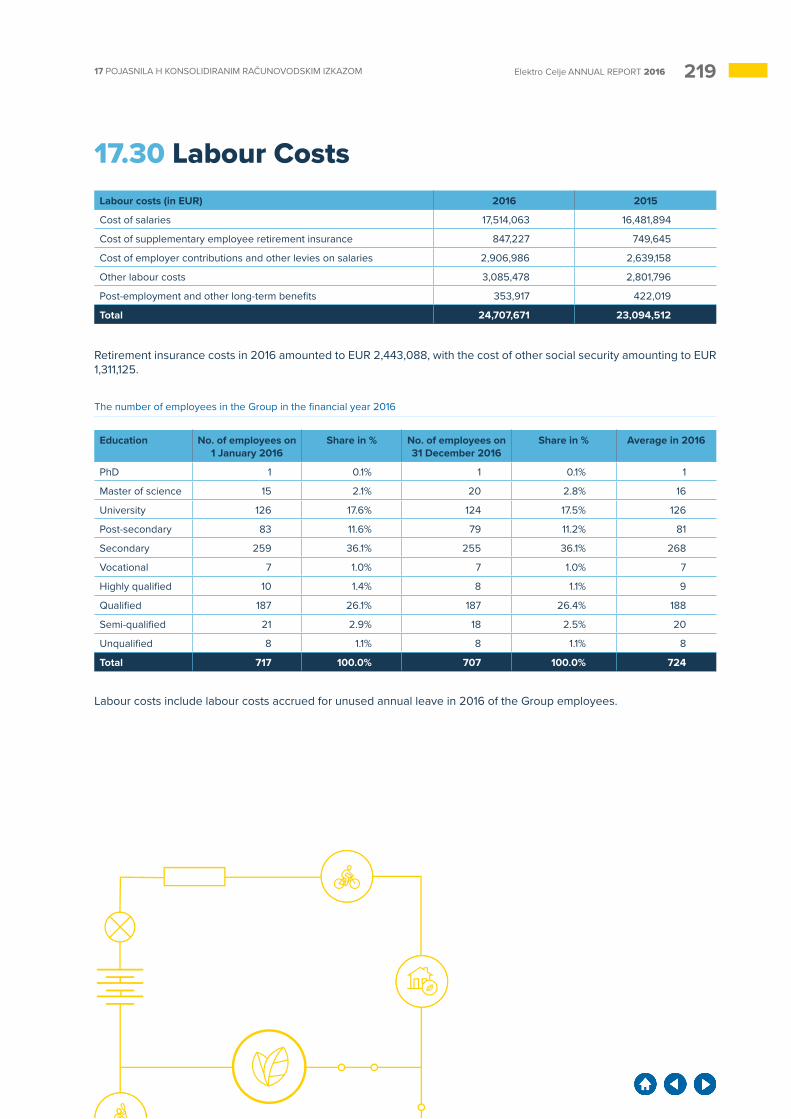
21917 POJASNILA H KONSOLIDIRANIM RAČUNOVODSKIM IZKAZOM Elektro Celje ANNUAL REPORT 2016
17.30 Labour Costs
Retirement insurance costs in 2016 amounted to EUR 2,443,088, with the cost of other social security amounting to EUR 1,311,125.
Labour costs (in EUR) 2016 2015
Cost of salaries 17,514,063 16,481,894
Cost of supplementary employee retirement insurance 847,227 749,645
Cost of employer contributions and other levies on salaries 2,906,986 2,639,158
Other labour costs 3,085,478 2,801,796
Post-employment and other long-term benefits 353,917 422,019
Total 24,707,671 23,094,512
The number of employees in the Group in the financial year 2016
Labour costs include labour costs accrued for unused annual leave in 2016 of the Group employees.
Education No. of employees on 1 January 2016
Share in % No. of employees on 31 December 2016
Share in % Average in 2016
PhD 1 0.1% 1 0.1% 1
Master of science 15 2.1% 20 2.8% 16
University 126 17.6% 124 17.5% 126
Post-secondary 83 11.6% 79 11.2% 81
Secondary 259 36.1% 255 36.1% 268
Vocational 7 1.0% 7 1.0% 7
Highly qualified 10 1.4% 8 1.1% 9
Qualified 187 26.1% 187 26.4% 188
Semi-qualified 21 2.9% 18 2.5% 20
Unqualified 8 1.1% 8 1.1% 8
Total 717 100.0% 707 100.0% 724
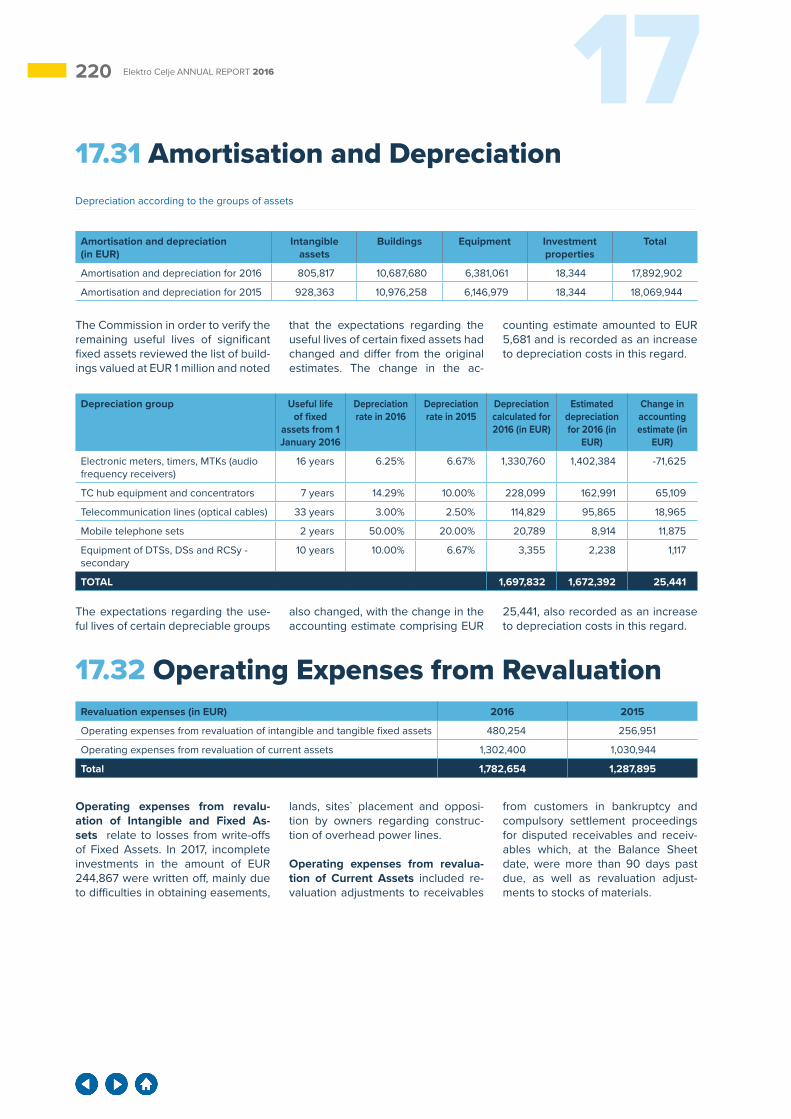
220 17Elektro Celje ANNUAL REPORT 2016
The Commission in order to verify the remaining useful lives of significant fixed assets reviewed the list of build-ings valued at EUR 1 million and noted
that the expectations regarding the useful lives of certain fixed assets had changed and differ from the original estimates. The change in the ac-
counting estimate amounted to EUR 5,681 and is recorded as an increase to depreciation costs in this regard.
The expectations regarding the use-ful lives of certain depreciable groups
also changed, with the change in the accounting estimate comprising EUR
25,441, also recorded as an increase to depreciation costs in this regard.
17.32 Operating Expenses from Revaluation
Operating expenses from revalu-ation of Intangible and Fixed As-sets relate to losses from write-offs of Fixed Assets. In 2017, incomplete investments in the amount of EUR 244,867 were written off, mainly due to difficulties in obtaining easements,
lands, sites` placement and opposi-tion by owners regarding construc-tion of overhead power lines.
Operating expenses from revalua-tion of Current Assets included re-valuation adjustments to receivables
from customers in bankruptcy and compulsory settlement proceedings for disputed receivables and receiv-ables which, at the Balance Sheet date, were more than 90 days past due, as well as revaluation adjust-ments to stocks of materials.
17.31 Amortisation and DepreciationDepreciation according to the groups of assets
Depreciation group Useful life of fixed
assets from 1 January 2016
Depreciation rate in 2016
Depreciation rate in 2015
Depreciation calculated for 2016 (in EUR)
Estimated depreciation for 2016 (in
EUR)
Change in accounting estimate (in
EUR)
Electronic meters, timers, MTKs (audio frequency receivers)
16 years 6.25% 6.67% 1,330,760 1,402,384 -71,625
TC hub equipment and concentrators 7 years 14.29% 10.00% 228,099 162,991 65,109
Telecommunication lines (optical cables) 33 years 3.00% 2.50% 114,829 95,865 18,965
Mobile telephone sets 2 years 50.00% 20.00% 20,789 8,914 11,875
Equipment of DTSs, DSs and RCSy - secondary
10 years 10.00% 6.67% 3,355 2,238 1,117
TOTAL 1,697,832 1,672,392 25,441
Amortisation and depreciation (in EUR)
Intangible assets
Buildings Equipment Investment properties
Total
Amortisation and depreciation for 2016 805,817 10,687,680 6,381,061 18,344 17,892,902
Amortisation and depreciation for 2015 928,363 10,976,258 6,146,979 18,344 18,069,944
Revaluation expenses (in EUR) 2016 2015
Operating expenses from revaluation of intangible and tangible fixed assets 480,254 256,951
Operating expenses from revaluation of current assets 1,302,400 1,030,944
Total 1,782,654 1,287,895
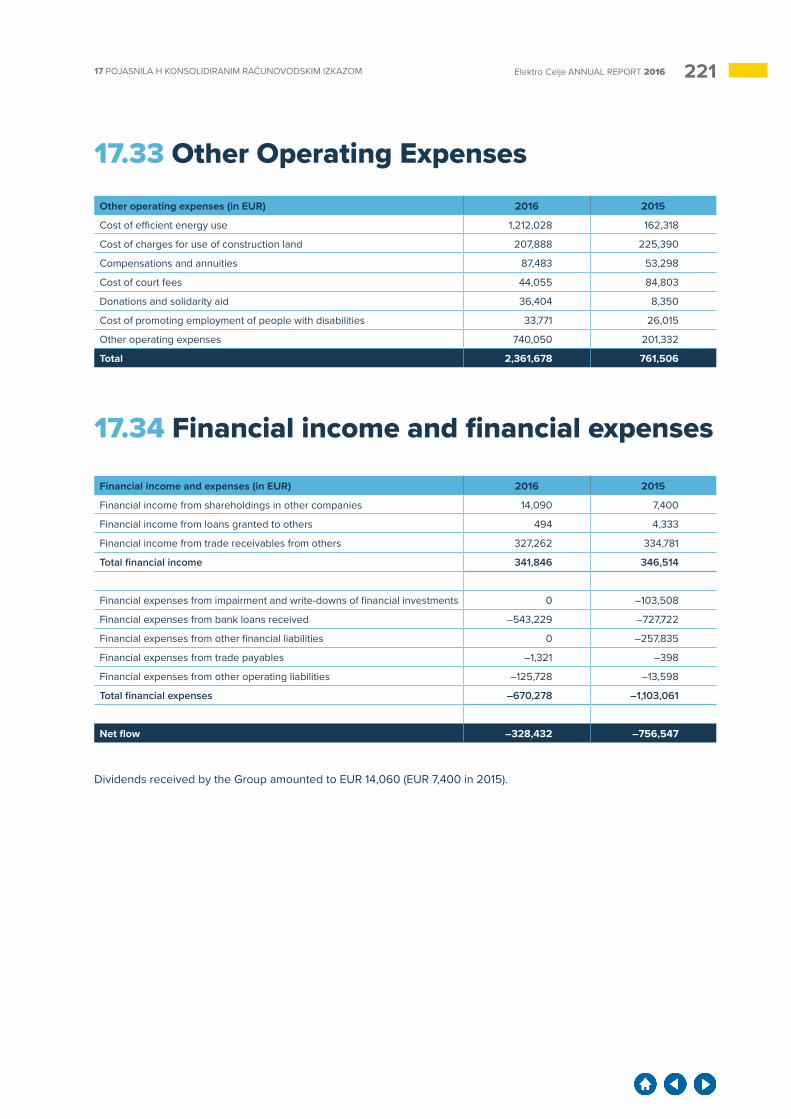
22117 POJASNILA H KONSOLIDIRANIM RAČUNOVODSKIM IZKAZOM Elektro Celje ANNUAL REPORT 2016
Other operating expenses (in EUR) 2016 2015
Cost of efficient energy use 1,212,028 162,318
Cost of charges for use of construction land 207,888 225,390
Compensations and annuities 87,483 53,298
Cost of court fees 44,055 84,803
Donations and solidarity aid 36,404 8,350
Cost of promoting employment of people with disabilities 33,771 26,015
Other operating expenses 740,050 201,332
Total 2,361,678 761,506
Financial income and expenses (in EUR) 2016 2015
Financial income from shareholdings in other companies 14,090 7,400
Financial income from loans granted to others 494 4,333
Financial income from trade receivables from others 327,262 334,781
Total financial income 341,846 346,514
Financial expenses from impairment and write-downs of financial investments 0 –103,508
Financial expenses from bank loans received –543,229 –727,722
Financial expenses from other financial liabilities 0 –257,835
Financial expenses from trade payables –1,321 –398
Financial expenses from other operating liabilities –125,728 –13,598
Total financial expenses –670,278 –1,103,061
Net flow –328,432 –756,547
17.33 Other Operating Expenses
17.34 Financial income and financial expenses
Dividends received by the Group amounted to EUR 14,060 (EUR 7,400 in 2015).
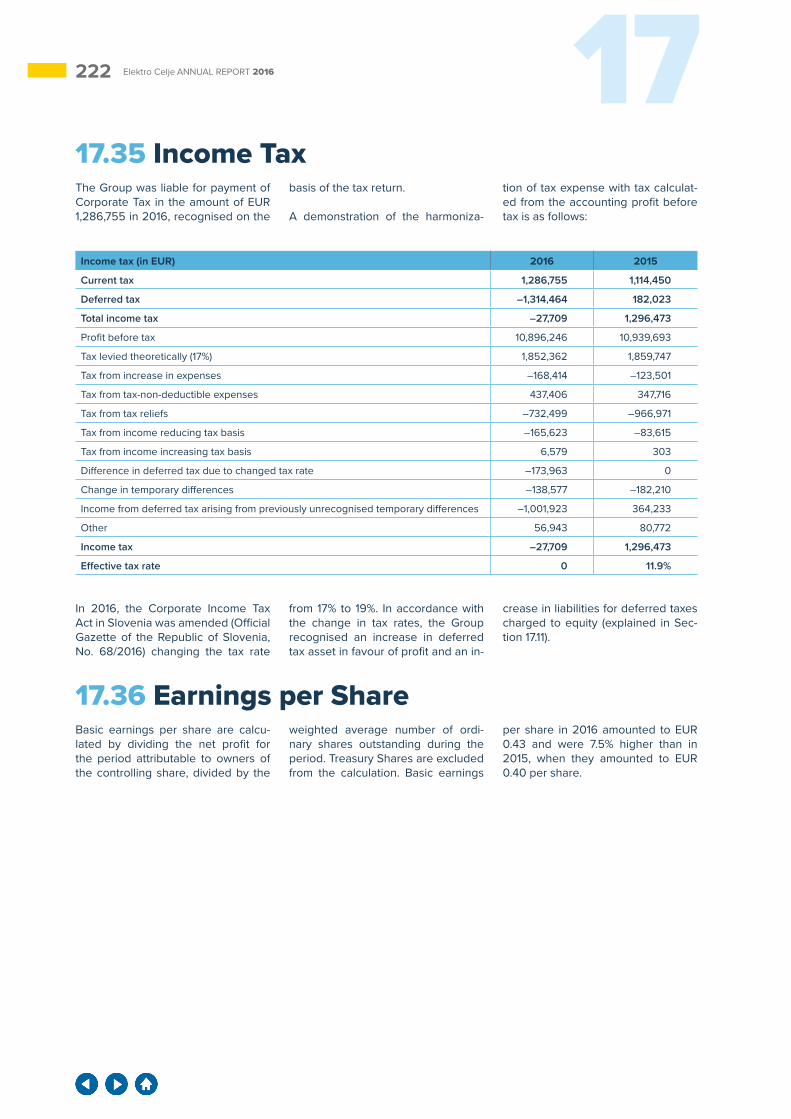
222 17Elektro Celje ANNUAL REPORT 2016
17.35 Income TaxThe Group was liable for payment of Corporate Tax in the amount of EUR 1,286,755 in 2016, recognised on the
basis of the tax return.
A demonstration of the harmoniza-
tion of tax expense with tax calculat-ed from the accounting profit before tax is as follows:
Income tax (in EUR) 2016 2015
Current tax 1,286,755 1,114,450
Deferred tax –1,314,464 182,023
Total income tax –27,709 1,296,473
Profit before tax 10,896,246 10,939,693
Tax levied theoretically (17%) 1,852,362 1,859,747
Tax from increase in expenses –168,414 –123,501
Tax from tax-non-deductible expenses 437,406 347,716
Tax from tax reliefs –732,499 –966,971
Tax from income reducing tax basis –165,623 –83,615
Tax from income increasing tax basis 6,579 303
Difference in deferred tax due to changed tax rate –173,963 0
Change in temporary differences –138,577 –182,210
Income from deferred tax arising from previously unrecognised temporary differences –1,001,923 364,233
Other 56,943 80,772
Income tax –27,709 1,296,473
Effective tax rate 0 11.9%
In 2016, the Corporate Income Tax Act in Slovenia was amended (Official Gazette of the Republic of Slovenia, No. 68/2016) changing the tax rate
from 17% to 19%. In accordance with the change in tax rates, the Group recognised an increase in deferred tax asset in favour of profit and an in-
crease in liabilities for deferred taxes charged to equity (explained in Sec-tion 17.11).
17.36 Earnings per ShareBasic earnings per share are calcu-lated by dividing the net profit for the period attributable to owners of the controlling share, divided by the
weighted average number of ordi-nary shares outstanding during the period. Treasury Shares are excluded from the calculation. Basic earnings
per share in 2016 amounted to EUR 0.43 and were 7.5% higher than in 2015, when they amounted to EUR 0.40 per share.
22317 POJASNILA H KONSOLIDIRANIM RAČUNOVODSKIM IZKAZOM Elektro Celje ANNUAL REPORT 2016
17.37 Disclosure of Items in the Consolidated Statement of Cash FlowsThe net cash flow in the period Jan-uary-December 2016 amounted to EUR 724,138. The opening balance
on 1 January 2016 amounted to EUR 1,856,869, with the closing balance as of 31 December 2016, amounting
to EUR 2,581,007.
17.37.1 Inflows from Operating ActivitiesInflows from Operating Activities in 2016 amounted to EUR 354,653,888, which is 91.5% of the total inflows of the Group. They refer mainly to in-flows from sales of electricity in the
amount of EUR 253,452,963, inflows from the Lease and Service Agree-ment concluded with SODO d.o.o. in the amount of EUR 55,030,558, and inflows from the use of the network
in the amount of EUR 39,945,187. Other inflows from Operating Activi-ties of the Group amounted to EUR 1,786,192. They included mainly in-flows from compensations.
17.37.2 Outflows from Operating ActivitiesOutflows from Operating Activities in the amount of EUR 339,071,293 include outflows for the purchase of materials and services, salaries, in-cluding contributions and taxes, and other expenses. The largest share is held by outflows for the purchase of
materials and services and expenses for salaries (93.8%).
The surplus of inflows from Operating Activities stood at EUR 15,582,595. The Group’s operation, within its main activity, was in the black and, in 2016,
the Group was able to settle all its li-abilities related to the repayment of principal and interest of long-term investment loans, and partly invest-ment expenses, as well.
17.37.3 Inflows from Investing ActivitiesInflows from Investing Activities amounted to EUR 389,556 and in-cluded inflows from received inter-
est on deposits and shares of profit of other companies in the amount of EUR 14,618 and inflows from dis-
posal of Tangible Fixed Assets in the amount of EUR 374,938.
17.37.4 Outflows from Investing ActivitiesOutflows from Investing Activities in the amount of EUR 7,494,338 included expenses for the acquisition of Intangible and Tangible Fixed Assets.
17.37.5 Inflows from Financing ActivitiesInflows from financing activities in the amount of EUR 32,736,000 included the use of long-term loans; in 2016 these comprised use of the long-term
loan of EIB to finance investments in the amount of EUR 11 million, in-flows from long-term loans to refi-nance existing loans in the amount
of EUR 5,086,000 and inflows from multiple drawing of the long-term re-volving credit in the amount of EUR 16,650,000.
17.37.6 Outflows from Financing ActivitiesOutflows from Financing Activities in the amount of EUR 40,489,675 in-clude outflows for interest paid in the amount of EUR 557,661, outflows for purchasing Treasury Shares in the amount of EUR 541,833, repayments
of investment loans in the amount of EUR 12,393,417, repayments for refi-nancing existing loans in the amount of EUR 5,086,000, repayments of the revolving loan taken amounting to EUR 15,676,000, the repayment
of short-term loans totalling EUR 2 million and outflows for the payment of dividends in the amount of EUR 4,234,764.
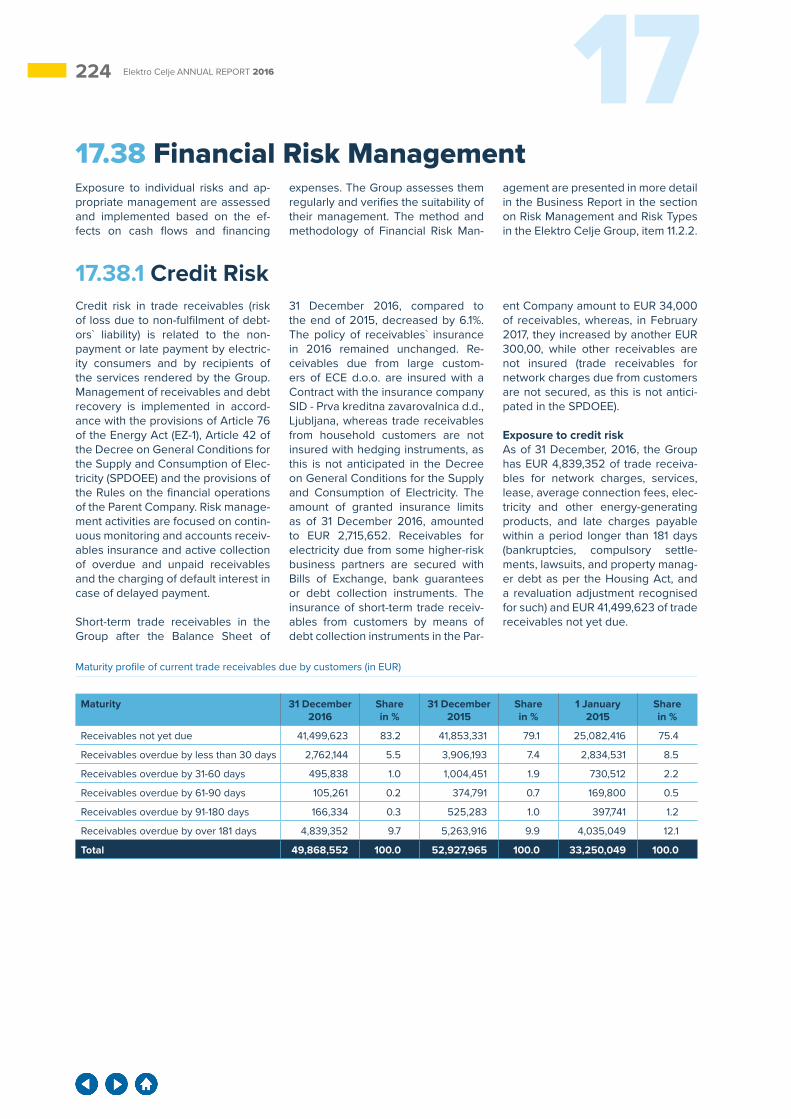
224 17Elektro Celje ANNUAL REPORT 2016
17.38 Financial Risk ManagementExposure to individual risks and ap-propriate management are assessed and implemented based on the ef-fects on cash flows and financing
expenses. The Group assesses them regularly and verifies the suitability of their management. The method and methodology of Financial Risk Man-
agement are presented in more detail in the Business Report in the section on Risk Management and Risk Types in the Elektro Celje Group, item 11.2.2.
17.38.1 Credit RiskCredit risk in trade receivables (risk of loss due to non-fulfilment of debt-ors` liability) is related to the non-payment or late payment by electric-ity consumers and by recipients of the services rendered by the Group. Management of receivables and debt recovery is implemented in accord-ance with the provisions of Article 76 of the Energy Act (EZ-1), Article 42 of the Decree on General Conditions for the Supply and Consumption of Elec-tricity (SPDOEE) and the provisions of the Rules on the financial operations of the Parent Company. Risk manage-ment activities are focused on contin-uous monitoring and accounts receiv-ables insurance and active collection of overdue and unpaid receivables and the charging of default interest in case of delayed payment.
Short-term trade receivables in the Group after the Balance Sheet of
31 December 2016, compared to the end of 2015, decreased by 6.1%. The policy of receivables` insurance in 2016 remained unchanged. Re-ceivables due from large custom-ers of ECE d.o.o. are insured with a Contract with the insurance company SID - Prva kreditna zavarovalnica d.d., Ljubljana, whereas trade receivables from household customers are not insured with hedging instruments, as this is not anticipated in the Decree on General Conditions for the Supply and Consumption of Electricity. The amount of granted insurance limits as of 31 December 2016, amounted to EUR 2,715,652. Receivables for electricity due from some higher-risk business partners are secured with Bills of Exchange, bank guarantees or debt collection instruments. The insurance of short-term trade receiv-ables from customers by means of debt collection instruments in the Par-
ent Company amount to EUR 34,000 of receivables, whereas, in February 2017, they increased by another EUR 300,00, while other receivables are not insured (trade receivables for network charges due from customers are not secured, as this is not antici-pated in the SPDOEE).
Exposure to credit riskAs of 31 December, 2016, the Group has EUR 4,839,352 of trade receiva-bles for network charges, services, lease, average connection fees, elec-tricity and other energy-generating products, and late charges payable within a period longer than 181 days (bankruptcies, compulsory settle-ments, lawsuits, and property manag-er debt as per the Housing Act, and a revaluation adjustment recognised for such) and EUR 41,499,623 of trade receivables not yet due.
Maturity profile of current trade receivables due by customers (in EUR)
Maturity 31 December 2016
Share in %
31 December 2015
Share in %
1 January 2015
Share in %
Receivables not yet due 41,499,623 83.2 41,853,331 79.1 25,082,416 75.4
Receivables overdue by less than 30 days 2,762,144 5.5 3,906,193 7.4 2,834,531 8.5
Receivables overdue by 31-60 days 495,838 1.0 1,004,451 1.9 730,512 2.2
Receivables overdue by 61-90 days 105,261 0.2 374,791 0.7 169,800 0.5
Receivables overdue by 91-180 days 166,334 0.3 525,283 1.0 397,741 1.2
Receivables overdue by over 181 days 4,839,352 9.7 5,263,916 9.9 4,035,049 12.1
Total 49,868,552 100.0 52,927,965 100.0 33,250,049 100.0
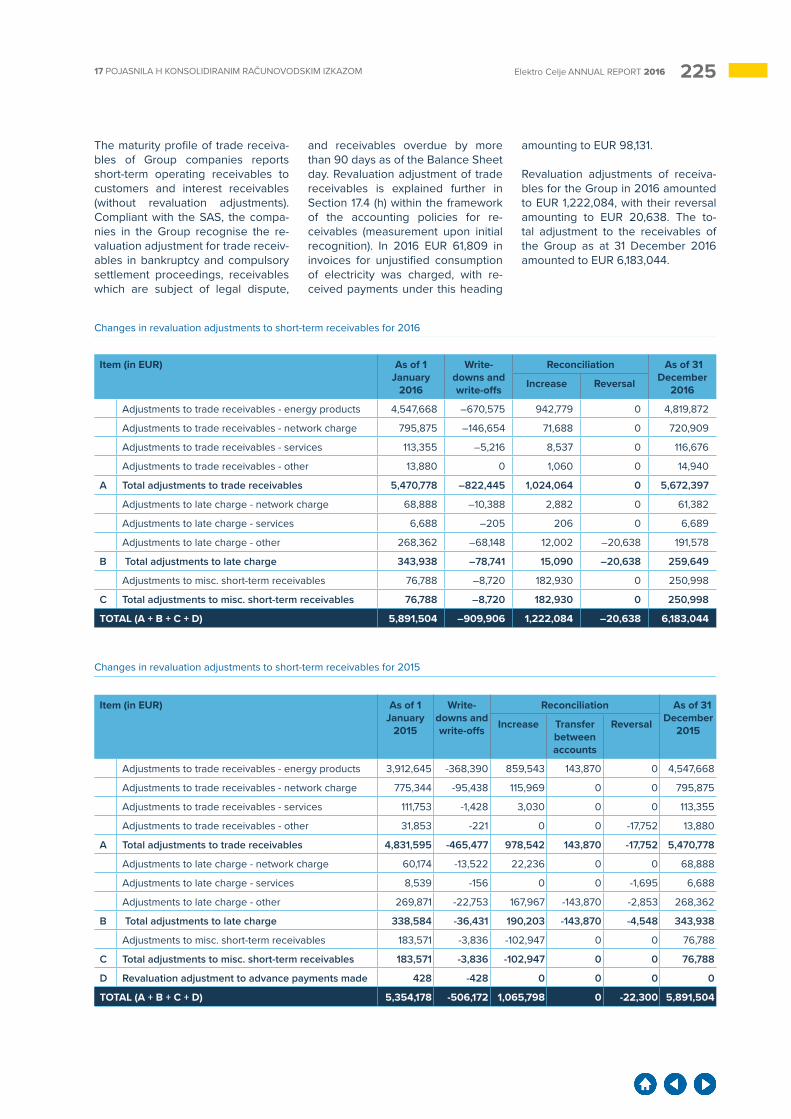
22517 POJASNILA H KONSOLIDIRANIM RAČUNOVODSKIM IZKAZOM Elektro Celje ANNUAL REPORT 2016
Changes in revaluation adjustments to short-term receivables for 2016
Changes in revaluation adjustments to short-term receivables for 2015
The maturity profile of trade receiva-bles of Group companies reports short-term operating receivables to customers and interest receivables (without revaluation adjustments). Compliant with the SAS, the compa-nies in the Group recognise the re-valuation adjustment for trade receiv-ables in bankruptcy and compulsory settlement proceedings, receivables which are subject of legal dispute,
and receivables overdue by more than 90 days as of the Balance Sheet day. Revaluation adjustment of trade receivables is explained further in Section 17.4 (h) within the framework of the accounting policies for re-ceivables (measurement upon initial recognition). In 2016 EUR 61,809 in invoices for unjustified consumption of electricity was charged, with re-ceived payments under this heading
amounting to EUR 98,131.
Revaluation adjustments of receiva-bles for the Group in 2016 amounted to EUR 1,222,084, with their reversal amounting to EUR 20,638. The to-tal adjustment to the receivables of the Group as at 31 December 2016 amounted to EUR 6,183,044.
Item (in EUR) As of 1 January
2016
Write-downs and write-offs
Reconciliation As of 31 December
2016Increase Reversal
Adjustments to trade receivables - energy products 4,547,668 –670,575 942,779 0 4,819,872
Adjustments to trade receivables - network charge 795,875 –146,654 71,688 0 720,909
Adjustments to trade receivables - services 113,355 –5,216 8,537 0 116,676
Adjustments to trade receivables - other 13,880 0 1,060 0 14,940
A Total adjustments to trade receivables 5,470,778 –822,445 1,024,064 0 5,672,397
Adjustments to late charge - network charge 68,888 –10,388 2,882 0 61,382
Adjustments to late charge - services 6,688 –205 206 0 6,689
Adjustments to late charge - other 268,362 –68,148 12,002 –20,638 191,578
B Total adjustments to late charge 343,938 –78,741 15,090 –20,638 259,649
Adjustments to misc. short-term receivables 76,788 –8,720 182,930 0 250,998
C Total adjustments to misc. short-term receivables 76,788 –8,720 182,930 0 250,998
TOTAL (A + B + C + D) 5,891,504 –909,906 1,222,084 –20,638 6,183,044
Item (in EUR) As of 1 January
2015
Write-downs and write-offs
Reconciliation As of 31 December
2015Increase Transfer between accounts
Reversal
Adjustments to trade receivables - energy products 3,912,645 -368,390 859,543 143,870 0 4,547,668
Adjustments to trade receivables - network charge 775,344 -95,438 115,969 0 0 795,875
Adjustments to trade receivables - services 111,753 -1,428 3,030 0 0 113,355
Adjustments to trade receivables - other 31,853 -221 0 0 -17,752 13,880
A Total adjustments to trade receivables 4,831,595 -465,477 978,542 143,870 -17,752 5,470,778
Adjustments to late charge - network charge 60,174 -13,522 22,236 0 0 68,888
Adjustments to late charge - services 8,539 -156 0 0 -1,695 6,688
Adjustments to late charge - other 269,871 -22,753 167,967 -143,870 -2,853 268,362
B Total adjustments to late charge 338,584 -36,431 190,203 -143,870 -4,548 343,938
Adjustments to misc. short-term receivables 183,571 -3,836 -102,947 0 0 76,788
C Total adjustments to misc. short-term receivables 183,571 -3,836 -102,947 0 0 76,788
D Revaluation adjustment to advance payments made 428 -428 0 0 0 0
TOTAL (A + B + C + D) 5,354,178 -506,172 1,065,798 0 -22,300 5,891,504
226 17Elektro Celje ANNUAL REPORT 2016
Credit risk arising from investments refers to the risk of higher fluctuations in the value of financial instruments. Reduced creditworthiness affects the liquidity of financial instruments and complicates the possible sale of the investment. In extreme cases, credit risk may lead to an investment being worthless. Financial assets the prices of which are quoted in an active mar-
ket and whose fair value can be reli-ably measured, are measured at fair value (i.e. 5,624 shares of Zavaroval-nica Triglav d.d. in the amount of EUR 130,477), while others are valued at cost. On the Balance Sheet date, the management of a Group company establishes whether there are any objective reasons for impairment as-sessment of a financial investment
into an equity instrument. The value that best represents the maximum ex-posure to such risk is the total value of the investment. Hedging instru-ments cannot be used for reducing the exposure to the risk of decrease in the value of long-term financial in-vestments below their cost (present-ed in section 17.4 (h)).
17.38.2 Market RiskWithin the market risks, the Group is most exposed to the risk of changes in interest rates on loans received. Exposure to interest rate risk rep-resents (un) favourable movement of the EURIBOR reference interest rate. The group Company does not secure fluctuations in EURIBOR in-terest rates by financial instruments. The interest rate risk of the Group has been assessed as low, as only 15.1% of the assets are financed with bank loans. In 2017, the Group also does not expect any major increase in EURIBOR, which is projected to remain negative, but the Group has, in the past, managed to reduce the EURIBOR margin several times un-der the existing Contracts. In 2016 the effect of the reduction in mark-ups under existing contracts on profit before tax amounted to EUR 14,680, or to a total of EUR 137,916 until the expiry of these contracts (in 2015 the effect of the reduction in profit before tax amounted to EUR 123,403 or EUR
584,759 until the expiry of these con-tracts). However, where a reduction in the mark-up could not be reached, the Parent Company decided to refi-nance the existing loan (the effect of lower interest rates amounted to EUR 132,225 until the expiry of the con-tracts).
Sensitivity analysisSensitivity to changes in interest rates is assessed using the sensitiv-ity analysis method. Given the volume of acquired loans as at 31 December 2016, an interest rate change of 0.1% (10 basis points) would result in a EUR 3,005 change in cash flow, an inter-est rate change of 0.2% (20 basis points) would result in a EUR 5,895 change in cash flow, and an interest rate change of 0.3% (30 basis points) would result in a EUR 16,269 higher expenses for interest paid (the proba-bility of larger change in the EURIBOR is estimated as low).
The analysis rests on the assumption that all other variables remain the same.
As a precaution, the Group rejects all terms of Contracts that would al-low the lender to change interest rates (increased costs clauses) sub-sequently due to changed conditions in the money and capital markets, changes in Regulations and instruc-tions by any governmental, fiscal or monetary authorities, changes in the borrower’s credit ranking, etc. The controlling company acts in accord-ance with the Decree on the Terms and Conditions and Methods of Bor-rowing by Legal Entities from Article 87 of the Public Finance Act. Pursuant to the Decree, consent by the Minis-try of Finance is required for any and each borrowing procedure and sign-ing agreements with banks.
17.38.3 Liquidity RiskElektro Celje Group measures the exposure to Liquidity Risk based on the balance of cash inflows and cash outflows, while an important element in Liquidity Risk Management is also cash flow planning. The Group’s cash flow risk is affected by the amount of collected network charges, for, due to the deficit in network charges for 2014 and 2015, the payments pursuant to the preliminary reconciliations of
SODO contractual liabilities which, on 31 December, 2016, amounted to EUR 6,107,477, will only be made in future regulatory periods, EUR 1,286,916 n 2017, EUR 1,394,170 in 2018 and EUR 3,426,391 in the regulatory period 2019-2021 (in thirds) when the Energy Agency calculates them into Tariff Rates for network charges payable by the customers.
To ensure daily liquidity and for the event of increased liquidity demand, in 2016, the Group signed a long-term bank credit agreement for a revolving credit amounting to EUR 3.145 million. In 2015, the Parent Company entered into a Contract with the EIB for EUR 28 million to finance investments in the period 2015-2017.
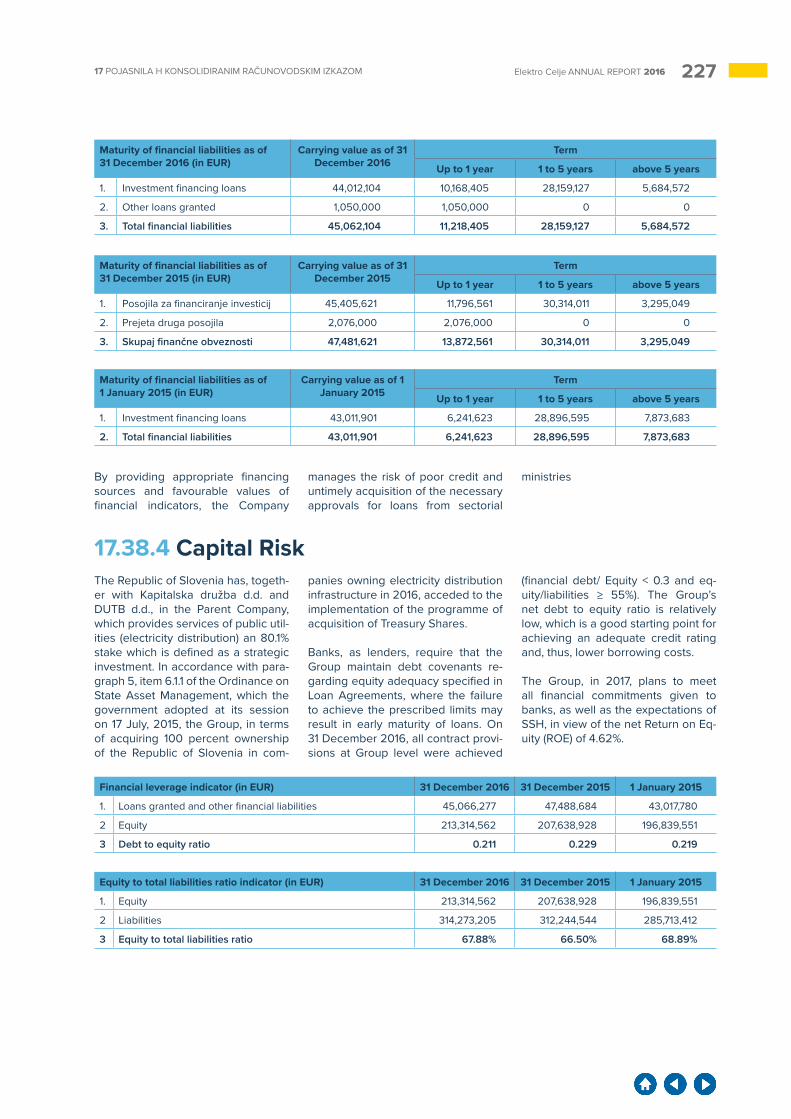
22717 POJASNILA H KONSOLIDIRANIM RAČUNOVODSKIM IZKAZOM Elektro Celje ANNUAL REPORT 2016
By providing appropriate financing sources and favourable values of financial indicators, the Company
manages the risk of poor credit and untimely acquisition of the necessary approvals for loans from sectorial
ministries
17.38.4 Capital RiskThe Republic of Slovenia has, togeth-er with Kapitalska družba d.d. and DUTB d.d., in the Parent Company, which provides services of public util-ities (electricity distribution) an 80.1% stake which is defined as a strategic investment. In accordance with para-graph 5, item 6.1.1 of the Ordinance on State Asset Management, which the government adopted at its session on 17 July, 2015, the Group, in terms of acquiring 100 percent ownership of the Republic of Slovenia in com-
panies owning electricity distribution infrastructure in 2016, acceded to the implementation of the programme of acquisition of Treasury Shares.
Banks, as lenders, require that the Group maintain debt covenants re-garding equity adequacy specified in Loan Agreements, where the failure to achieve the prescribed limits may result in early maturity of loans. On 31 December 2016, all contract provi-sions at Group level were achieved
(financial debt/ Equity < 0.3 and eq-uity/liabilities ≥ 55%). The Group’s net debt to equity ratio is relatively low, which is a good starting point for achieving an adequate credit rating and, thus, lower borrowing costs.
The Group, in 2017, plans to meet all financial commitments given to banks, as well as the expectations of SSH, in view of the net Return on Eq-uity (ROE) of 4.62%.
Maturity of financial liabilities as of 31 December 2016 (in EUR)
Carrying value as of 31 December 2016
Term
Up to 1 year 1 to 5 years above 5 years
1. Investment financing loans 44,012,104 10,168,405 28,159,127 5,684,572
2. Other loans granted 1,050,000 1,050,000 0 0
3. Total financial liabilities 45,062,104 11,218,405 28,159,127 5,684,572
Maturity of financial liabilities as of 31 December 2015 (in EUR)
Carrying value as of 31 December 2015
Term
Up to 1 year 1 to 5 years above 5 years
1. Posojila za financiranje investicij 45,405,621 11,796,561 30,314,011 3,295,049
2. Prejeta druga posojila 2,076,000 2,076,000 0 0
3. Skupaj finančne obveznosti 47,481,621 13,872,561 30,314,011 3,295,049
Maturity of financial liabilities as of 1 January 2015 (in EUR)
Carrying value as of 1 January 2015
Term
Up to 1 year 1 to 5 years above 5 years
1. Investment financing loans 43,011,901 6,241,623 28,896,595 7,873,683
2. Total financial liabilities 43,011,901 6,241,623 28,896,595 7,873,683
Financial leverage indicator (in EUR) 31 December 2016 31 December 2015 1 January 2015
1. Loans granted and other financial liabilities 45,066,277 47,488,684 43,017,780
2 Equity 213,314,562 207,638,928 196,839,551
3 Debt to equity ratio 0.211 0.229 0.219
Equity to total liabilities ratio indicator (in EUR) 31 December 2016 31 December 2015 1 January 2015
1. Equity 213,314,562 207,638,928 196,839,551
2 Liabilities 314,273,205 312,244,544 285,713,412
3 Equity to total liabilities ratio 67.88% 66.50% 68.89%
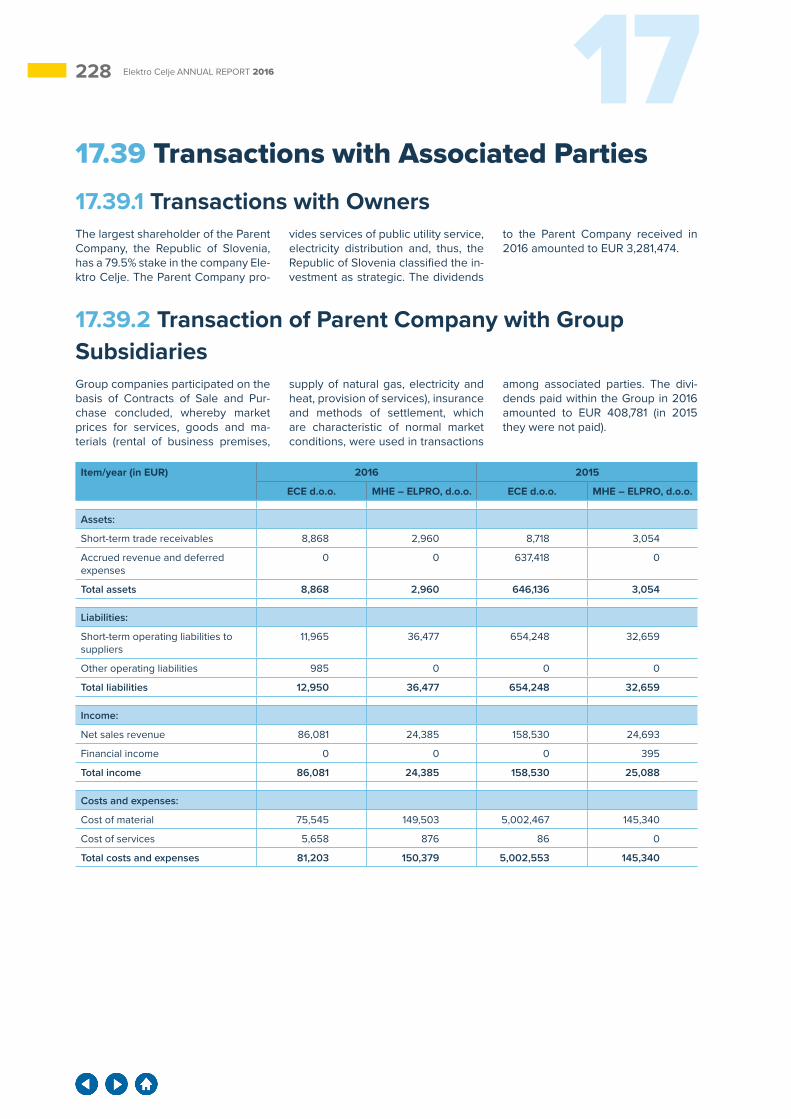
228 17Elektro Celje ANNUAL REPORT 2016
Item/year (in EUR) 2016 2015
ECE d.o.o. MHE – ELPRO, d.o.o. ECE d.o.o. MHE – ELPRO, d.o.o.
Assets:
Short-term trade receivables 8,868 2,960 8,718 3,054
Accrued revenue and deferred expenses
0 0 637,418 0
Total assets 8,868 2,960 646,136 3,054
Liabilities:
Short-term operating liabilities to suppliers
11,965 36,477 654,248 32,659
Other operating liabilities 985 0 0 0
Total liabilities 12,950 36,477 654,248 32,659
Income:
Net sales revenue 86,081 24,385 158,530 24,693
Financial income 0 0 0 395
Total income 86,081 24,385 158,530 25,088
Costs and expenses:
Cost of material 75,545 149,503 5,002,467 145,340
Cost of services 5,658 876 86 0
Total costs and expenses 81,203 150,379 5,002,553 145,340
17.39 Transactions with Associated Parties17.39.1 Transactions with OwnersThe largest shareholder of the Parent Company, the Republic of Slovenia, has a 79.5% stake in the company Ele-ktro Celje. The Parent Company pro-
vides services of public utility service, electricity distribution and, thus, the Republic of Slovenia classified the in-vestment as strategic. The dividends
to the Parent Company received in 2016 amounted to EUR 3,281,474.
17.39.2 Transaction of Parent Company with Group SubsidiariesGroup companies participated on the basis of Contracts of Sale and Pur-chase concluded, whereby market prices for services, goods and ma-terials (rental of business premises,
supply of natural gas, electricity and heat, provision of services), insurance and methods of settlement, which are characteristic of normal market conditions, were used in transactions
among associated parties. The divi-dends paid within the Group in 2016 amounted to EUR 408,781 (in 2015 they were not paid).
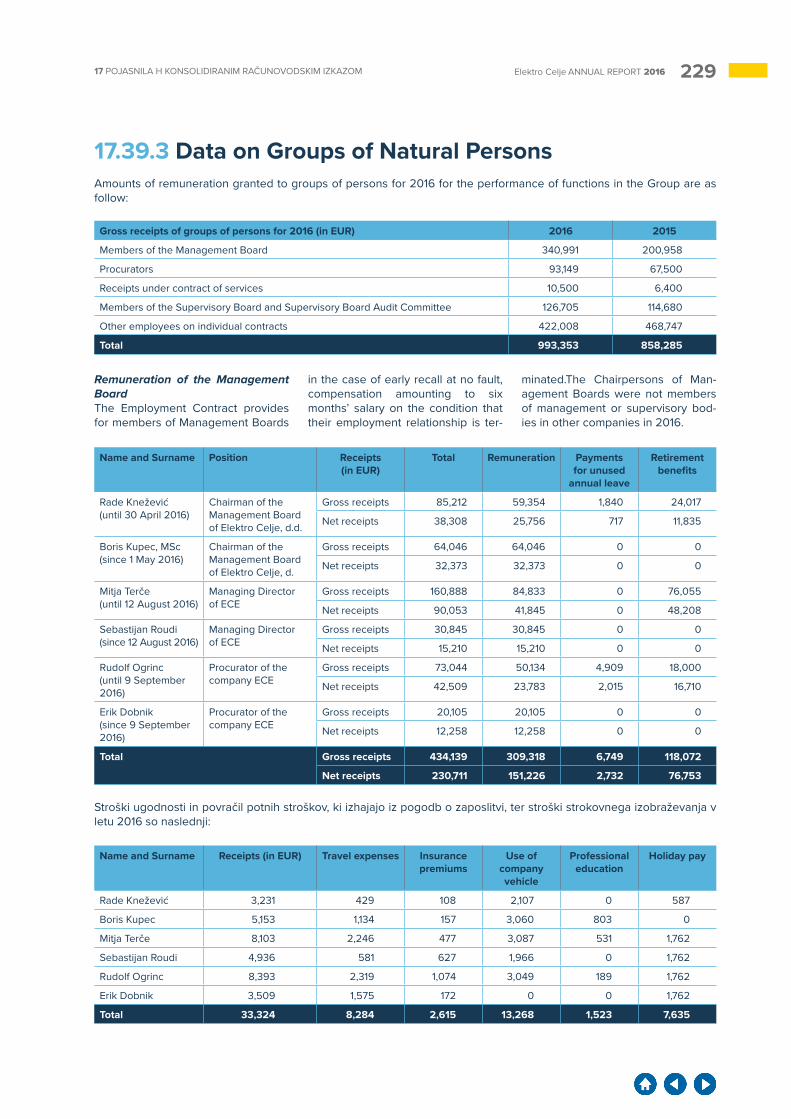
22917 POJASNILA H KONSOLIDIRANIM RAČUNOVODSKIM IZKAZOM Elektro Celje ANNUAL REPORT 2016
17.39.3 Data on Groups of Natural PersonsAmounts of remuneration granted to groups of persons for 2016 for the performance of functions in the Group are as follow:
Remuneration of the Management BoardThe Employment Contract provides for members of Management Boards
in the case of early recall at no fault, compensation amounting to six months’ salary on the condition that their employment relationship is ter-
minated.The Chairpersons of Man-agement Boards were not members of management or supervisory bod-ies in other companies in 2016.
Stroški ugodnosti in povračil potnih stroškov, ki izhajajo iz pogodb o zaposlitvi, ter stroški strokovnega izobraževanja v letu 2016 so naslednji:
Gross receipts of groups of persons for 2016 (in EUR) 2016 2015
Members of the Management Board 340,991 200,958
Procurators 93,149 67,500
Receipts under contract of services 10,500 6,400
Members of the Supervisory Board and Supervisory Board Audit Committee 126,705 114,680
Other employees on individual contracts 422,008 468,747
Total 993,353 858,285
Name and Surname Position Receipts (in EUR)
Total Remuneration Payments for unused
annual leave
Retirement benefits
Rade Knežević (until 30 April 2016)
Chairman of the Management Board of Elektro Celje, d.d.
Gross receipts 85,212 59,354 1,840 24,017
Net receipts 38,308 25,756 717 11,835
Boris Kupec, MSc (since 1 May 2016)
Chairman of the Management Board of Elektro Celje, d.
Gross receipts 64,046 64,046 0 0
Net receipts 32,373 32,373 0 0
Mitja Terče (until 12 August 2016)
Managing Director of ECE
Gross receipts 160,888 84,833 0 76,055
Net receipts 90,053 41,845 0 48,208
Sebastijan Roudi (since 12 August 2016)
Managing Director of ECE
Gross receipts 30,845 30,845 0 0
Net receipts 15,210 15,210 0 0
Rudolf Ogrinc (until 9 September 2016)
Procurator of the company ECE
Gross receipts 73,044 50,134 4,909 18,000
Net receipts 42,509 23,783 2,015 16,710
Erik Dobnik (since 9 September 2016)
Procurator of the company ECE
Gross receipts 20,105 20,105 0 0
Net receipts 12,258 12,258 0 0
Total Gross receipts 434,139 309,318 6,749 118,072
Net receipts 230,711 151,226 2,732 76,753
Name and Surname Receipts (in EUR) Travel expenses Insurance premiums
Use of company vehicle
Professional education
Holiday pay
Rade Knežević 3,231 429 108 2,107 0 587
Boris Kupec 5,153 1,134 157 3,060 803 0
Mitja Terče 8,103 2,246 477 3,087 531 1,762
Sebastijan Roudi 4,936 581 627 1,966 0 1,762
Rudolf Ogrinc 8,393 2,319 1,074 3,049 189 1,762
Erik Dobnik 3,509 1,575 172 0 0 1,762
Total 33,324 8,284 2,615 13,268 1,523 7,635
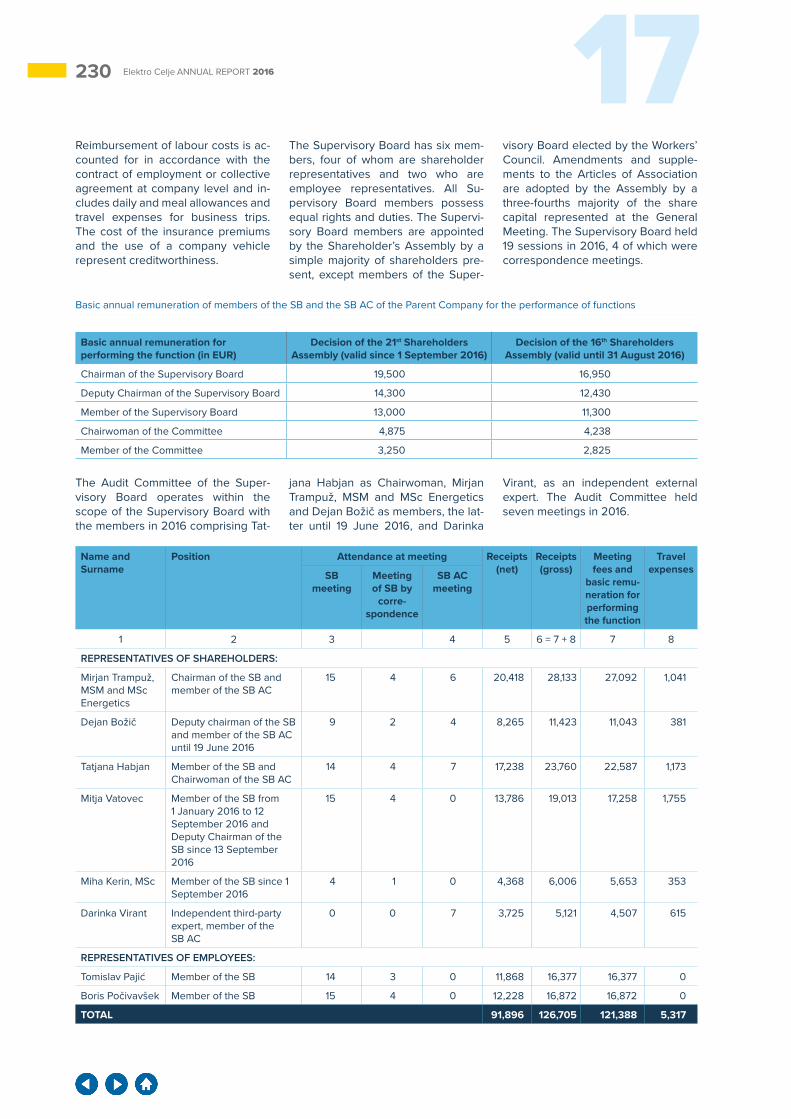
230 17Elektro Celje ANNUAL REPORT 2016
Basic annual remuneration of members of the SB and the SB AC of the Parent Company for the performance of functions
Reimbursement of labour costs is ac-counted for in accordance with the contract of employment or collective agreement at company level and in-cludes daily and meal allowances and travel expenses for business trips. The cost of the insurance premiums and the use of a company vehicle represent creditworthiness.
The Supervisory Board has six mem-bers, four of whom are shareholder representatives and two who are employee representatives. All Su-pervisory Board members possess equal rights and duties. The Supervi-sory Board members are appointed by the Shareholder’s Assembly by a simple majority of shareholders pre-sent, except members of the Super-
visory Board elected by the Workers’ Council. Amendments and supple-ments to the Articles of Association are adopted by the Assembly by a three-fourths majority of the share capital represented at the General Meeting. The Supervisory Board held 19 sessions in 2016, 4 of which were correspondence meetings.
The Audit Committee of the Super-visory Board operates within the scope of the Supervisory Board with the members in 2016 comprising Tat-
jana Habjan as Chairwoman, Mirjan Trampuž, MSM and MSc Energetics and Dejan Božič as members, the lat-ter until 19 June 2016, and Darinka
Virant, as an independent external expert. The Audit Committee held seven meetings in 2016.
Basic annual remuneration for performing the function (in EUR)
Decision of the 21st Shareholders Assembly (valid since 1 September 2016)
Decision of the 16th Shareholders Assembly (valid until 31 August 2016)
Chairman of the Supervisory Board 19,500 16,950
Deputy Chairman of the Supervisory Board 14,300 12,430
Member of the Supervisory Board 13,000 11,300
Chairwoman of the Committee 4,875 4,238
Member of the Committee 3,250 2,825
Name and Surname
Position Attendance at meeting Receipts (net)
Receipts (gross)
Meeting fees and
basic remu-neration for performing the function
Travel expensesSB
meetingMeeting of SB by
corre-spondence
SB AC meeting
1 2 3 4 5 6 = 7 + 8 7 8
REPRESENTATIVES OF SHAREHOLDERS:
Mirjan Trampuž, MSM and MSc Energetics
Chairman of the SB and member of the SB AC
15 4 6 20,418 28,133 27,092 1,041
Dejan Božič Deputy chairman of the SB and member of the SB AC until 19 June 2016
9 2 4 8,265 11,423 11,043 381
Tatjana Habjan Member of the SB and Chairwoman of the SB AC
14 4 7 17,238 23,760 22,587 1,173
Mitja Vatovec Member of the SB from 1 January 2016 to 12 September 2016 and Deputy Chairman of the SB since 13 September 2016
15 4 0 13,786 19,013 17,258 1,755
Miha Kerin, MSc Member of the SB since 1 September 2016
4 1 0 4,368 6,006 5,653 353
Darinka Virant Independent third-party expert, member of the SB AC
0 0 7 3,725 5,121 4,507 615
REPRESENTATIVES OF EMPLOYEES:
Tomislav Pajić Member of the SB 14 3 0 11,868 16,377 16,377 0
Boris Počivavšek Member of the SB 15 4 0 12,228 16,872 16,872 0
TOTAL 91,896 126,705 121,388 5,317
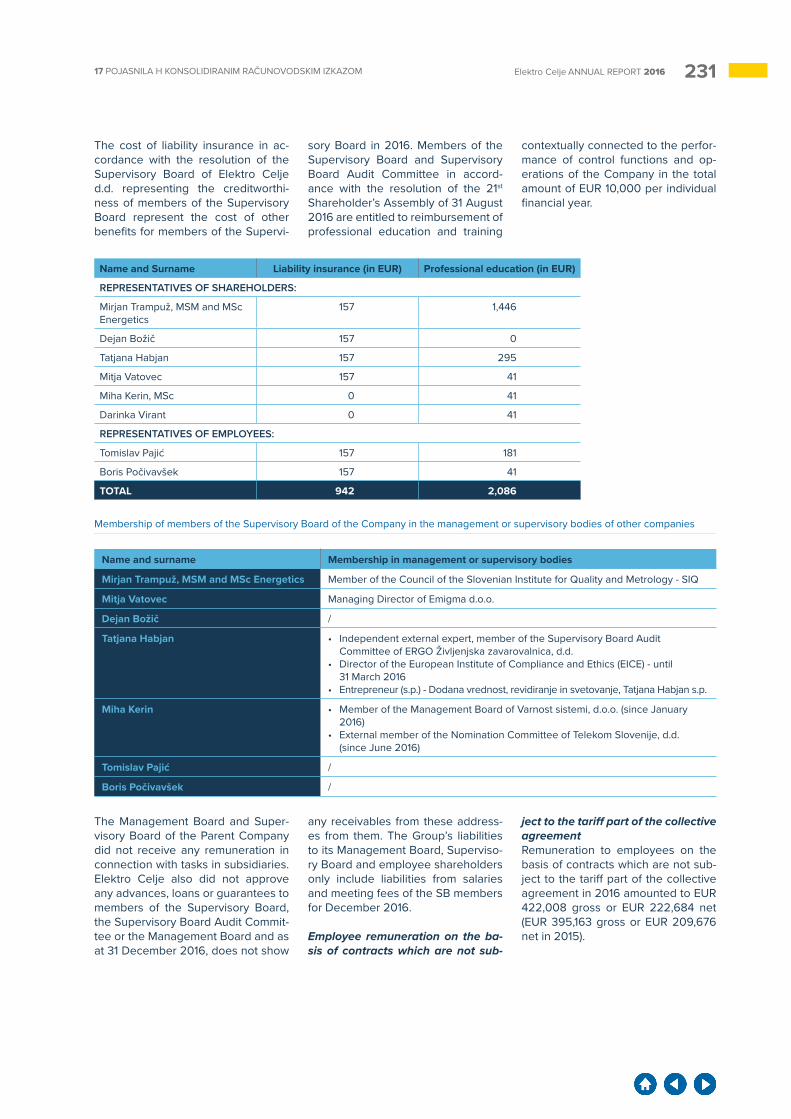
23117 POJASNILA H KONSOLIDIRANIM RAČUNOVODSKIM IZKAZOM Elektro Celje ANNUAL REPORT 2016
Membership of members of the Supervisory Board of the Company in the management or supervisory bodies of other companies
Name and surname Membership in management or supervisory bodies
Mirjan Trampuž, MSM and MSc Energetics Member of the Council of the Slovenian Institute for Quality and Metrology - SIQ
Mitja Vatovec Managing Director of Emigma d.o.o.
Dejan Božič /
Tatjana Habjan • Independent external expert, member of the Supervisory Board Audit Committee of ERGO Življenjska zavarovalnica, d.d.
• Director of the European Institute of Compliance and Ethics (EICE) - until 31 March 2016
• Entrepreneur (s.p.) - Dodana vrednost, revidiranje in svetovanje, Tatjana Habjan s.p.
Miha Kerin • Member of the Management Board of Varnost sistemi, d.o.o. (since January 2016)
• External member of the Nomination Committee of Telekom Slovenije, d.d. (since June 2016)
Tomislav Pajić /
Boris Počivavšek /
The cost of liability insurance in ac-cordance with the resolution of the Supervisory Board of Elektro Celje d.d. representing the creditworthi-ness of members of the Supervisory Board represent the cost of other benefits for members of the Supervi-
sory Board in 2016. Members of the Supervisory Board and Supervisory Board Audit Committee in accord-ance with the resolution of the 21st
Shareholder’s Assembly of 31 August 2016 are entitled to reimbursement of professional education and training
contextually connected to the perfor-mance of control functions and op-erations of the Company in the total amount of EUR 10,000 per individual financial year.
Name and Surname Liability insurance (in EUR) Professional education (in EUR)
REPRESENTATIVES OF SHAREHOLDERS:
Mirjan Trampuž, MSM and MSc Energetics
157 1,446
Dejan Božič 157 0
Tatjana Habjan 157 295
Mitja Vatovec 157 41
Miha Kerin, MSc 0 41
Darinka Virant 0 41
REPRESENTATIVES OF EMPLOYEES:
Tomislav Pajić 157 181
Boris Počivavšek 157 41
TOTAL 942 2,086
The Management Board and Super-visory Board of the Parent Company did not receive any remuneration in connection with tasks in subsidiaries. Elektro Celje also did not approve any advances, loans or guarantees to members of the Supervisory Board, the Supervisory Board Audit Commit-tee or the Management Board and as at 31 December 2016, does not show
any receivables from these address-es from them. The Group’s liabilities to its Management Board, Superviso-ry Board and employee shareholders only include liabilities from salaries and meeting fees of the SB members for December 2016.
Employee remuneration on the ba-sis of contracts which are not sub-
ject to the tariff part of the collective agreement Remuneration to employees on the basis of contracts which are not sub-ject to the tariff part of the collective agreement in 2016 amounted to EUR 422,008 gross or EUR 222,684 net (EUR 395,163 gross or EUR 209,676 net in 2015).
232 17Elektro Celje ANNUAL REPORT 2016
17.40 Auditor CostsThe contractual value of Annual Re-port auditing services performed for the Group by the company BDO Re-vizija d.o.o. in 2016, amounted to EUR 15,300 excl. VAT (EUR 14,320 in 2015),
with the value of assurance services amounting to EUR 1,300 excl. VAT (auditing the appropriateness of the criteria for managing separate ac-counting records by individual ac-
tivities in accordance with the Energy Act (EZ-1) and auditing the Report on Relations to Related Companies).
23318 STATEMENT OF THE MANAGEMENT BOARD Elektro Celje ANNUAL REPORT 2016
18 STATEMENT OF THE MANAGEMENT BOARDThe Management Board of the com-pany Elektro Celje hereby confirms the Financial Statements disclosed and presented in this Annual Report, and all other components thereof.The Management Board of Elektro Celje is responsible for compiling the Financial Statements and presenting them to the interested public in such a way that the statements present a faithful and fair account of the finan-cial position and performance of the company Elektro Celje and the Elek-tro Celje Group.
The Management Board hereby de-clares that:• All Financial Statements have been
compiled in compliance with pro-fessional standards and legislation regulating operation, accounting, taxation, and finance;
• The Financial Statements of the company and group have been pre-pared under the assumption of go-ing concern;
• The selected accounting policies are implemented consistently, and any changes in such policies are duly disclosed;
• The accounting estimates are pre-pared with the prudence and dili-gence befitting a good manager;
• The Financial Statements do not include any material or immaterial errors made in order to achieve a particular presentation of the com-pany’s financial position, financial performance or cash flows.
On 21 April 2017, the company Man-agement Board confirmed and adopt-ed the Financial Statements and the Annual Report for the year 2016.
Chairman of the Management BoardBoris Kupec, MSc
234 Elektro Celje ANNUAL REPORT 2016
LIST OF ABBREVIATIONS
AD As-built DesignAMI Advanced Meter InfrastructureBD Basic Design (PGD)BDoc Bidding DocumentsCA Construction ActCApp Connection ApprovalCD Conceptual Design (IDZ)CHPP Combined Heat and Power PlantD.D. Public Limited Company (Joint-Stock Company)D.O.O. Limited Liability CompanyDCC Distribution Control CentreDD Detailed Design (PZI)DER Distributed Energy ResourcesDMD Dynamic Mimic DiagramDMS Distribution Management SystemDNSO Distribution Network System OperatorDS Distribution SubstationDTD Database of Technical DataDTS Distribution Transformer SubstationDU Distribution UnitEA Energy ActEAgen Energy Agency of the Republic of SloveniaEAM Enterprise Asset ManagementEDC Electricity Distribution CompanyEDI Electricity Distribution InfrastructureEDS Electricity Distribution SystemEIB European Investment BankEIMV Milan Vidmar Electric Power Research InstituteELES Elektro – Slovenija, d.o.o. (ELES, Ltd., Electricity Transmission System Operator)EMS Environmental Management SystemEP Electric PowerEPS Electric Power System of the Republic of SloveniaERP Enterprise Resource PlanningFS Fire SafetyGDP Gross Domestic ProductGIS Geographic Information SystemGPS Global Positioning SystemGURS Surveying and Mapping Authority of the Republic of SloveniaGWh Gigawatt HourHEP Hrvatska elektroprivreda d.d. (Croatian National Electricity Company – HEP d.d.)HV High VoltageHVUC High-voltage Underground CableIP Internet Protocol
235SEZNAM UPORABLJENIH KRATIC Elektro Celje ANNUAL REPORT 2016
ISO International Organization for Standardizationkm KilometrekV KilovoltkW KilowattkWh Kilowatt HourLV Low VoltageLVUC Low-voltage Underground CableMDSP Municipal Detailed Spatial PlanMV Medium VoltageMW MegawattMWh Megawatt HourNEP National Energy ProgrammeOHS Occupational Health and SafetyOHSAS Occupational Health and Safety Management Systems (BS OHSAS 18001) 18001OMS Outage Management SystemOPL Overhead Power LinePD Preliminary Design (IDP)PQ Power QualityPRSPO Slovenian Business Excellence PrizePSI Software Solution for Distribution Control CentresPUS Public Utility ServicePX3 A scheme where the generation source produces electricity for its own consumptionQMS Quality Management SystemRCC Regional Control CentreRCC Regional Control CentreRCS Remote-Controlled SwitchgearRCSy Remote control systemRES Renewable Energy SourcesRS Republic of SloveniaSAIDI System Average Interruption Duration IndexSAIFI System Average Interruption Frequency IndexSB Supervisory BoardSB AC Supervisory Board Audit CommitteeSCADA Supervisory Control and Data AcquisitionSCS Security and Control SystemSHP Small Hydropower PlantSICAD Geographic Information System Software SolutionSPS Small-scale Photovoltaic SystemSSH Slovenski državni holding, d.d. (Slovenian Sovereign Holding)TC TelecommunicationTIS Technical Information SystemTR TransformerTS Transformer SubstationUC Underground Cable
236 Elektro Celje ANNUAL REPORT 2016
Editing and copywriting: Elektro Celje, d.d.Design and typesetting: AV studio d.o.o.Photographic art: Elektro Celje photography section, shutterstock.comYear of publication: 2017

237Elektro Celje ANNUAL REPORT 2016