ANNUAL REPORT 2020 - First Pacific Company Limited
240
Stock Code: 00142 ANNUAL REPORT 2020
-
Upload
khangminh22 -
Category
Documents
-
view
0 -
download
0
Transcript of ANNUAL REPORT 2020 - First Pacific Company Limited

Stock Code: 00142
ANNUAL REPORT 2020

Corporate Profile
2 First Pacific Annual Report 2020
Corporate Profile
Contents
FIRST PACIFIC is a Hong Kong-based investment management and
holding company with operations located in Asia-Pacific. Our principal
businesses relate to consumer food products, telecommunications,
infrastructure and natural resources.
Our mission is to unlock value in our operating companies by:
■ Delivering dividend/distribution returns to shareholders
■ Delivering share price/value appreciation of First Pacific and its operating companies
■ Making further investments in value-enhancing businesses, taking into consideration all relevant criteria, including Environmental, Social and Governance (“ESG”) factors to better manage risk and generate sustainable long-term returns
Our investment criteria are clear:
■ Investments must be located in or trading with the fast-growing economies of emerging Asia
■ They must be related to our four industry sectors (consumer food products, telecommunications, infrastructure and natural resources)
■ Companies invested in must have a strong or dominant market position in their respective sectors
■ They must possess the potential for substantial cash flows
■ First Pacific must obtain management control or significant influence to ensure our goals can be met
Our strategies are threefold:
■ Identify undervalued or underperforming assets with strong growth potential and possible synergies
■ Manage businesses by setting strategic direction, developing business plans and defining targets
■ Raise reporting and ESG standards to world-class levels at First Pacific and its operating companies
Inside Front
Corporate Profile
2 Ten-year Statistical Summary
4 Financial Highlights
6 Review of Operations
6 First Pacific
9 Indofood
14 PLDT
18 MPIC
23 Philex
28 FPM Power/PLP
30 FP Natural Resources/RHI
33 Chairman’s Letter
34 Managing Director and Chief Executive Officer’s Letter
35 Board of Directors and Senior Executives
42 Corporate Social Responsibility Report

1 First Pacific Annual Report 2020
First Pacific’s business represents a balance of assets in our core industries and markets in PT Indofood Sukses Makmur Tbk
(“Indofood”), PLDT Inc. (“PLDT”) and Metro Pacific Investments Corporation (“MPIC”). Indofood is the largest vertically integrated
food company in Indonesia and PLDT is the dominant integrated telecommunications and digital services provider in the Philippines
with the largest fixed broadband network and the largest, most modern, and most sophisticated wireless network in the country. MPIC
is a leading infrastructure investment management and holding company in the Philippines, with holdings in the country’s largest
electricity distributor, toll road operator, water distributor, and hospital group. MPIC also holds assets in the storage of petroleum
products and in the largest electricity generator in the Visayas region of the Philippines.
First Pacific is also invested in Philex Mining Corporation (“Philex”), PXP Energy Corporation (“PXP”), PacificLight Power Pte. Ltd.
(“PLP”) and Roxas Holdings, Inc. (“RHI”). Philex is one of the largest metal mining companies in the Philippines, producing gold,
copper and silver. PXP is an upstream oil and gas company with a number of service contracts in the Philippines and Peru. PLP is the
operator of one of Singapore’s most efficient gas-fired power plants and RHI runs a sugar and ethanol business in the Philippines.
Listed in Hong Kong, First Pacific’s shares are also available for trading in the United States through American Depositary Receipts.
As at 29 March 2021, First Pacific’s economic interest in Indofood is 50.1%, in PLDT 25.6%, in MPIC 43.1%, in Philex 31.2%(1), in PXP 35.7%(1)(2), in FPM Power Holdings Limited (“FPM Power”) 67.8%(3) and in FP Natural Resources Limited (“FP Natural Resources”) 80.8%(4).
(1) Two Rivers Pacific Holdings Corporation (“Two Rivers”), a Philippine affiliate of First Pacific, holds additional 15.0% and 6.7% economic interests in Philex and PXP, respectively.
(2) Includes a 14.0% effective economic interest in PXP held through First Pacific’s indirect interests in Philex.
(3) Includes a 7.8% effective economic interest in FPM Power held through First Pacific’s indirect interests in Manila Electric Company (“Meralco”).
(4) Includes a 10.8% effective economic interest in FP Natural Resources held through First Pacific’s indirect interests in Indofood Agri Resources Ltd. (“IndoAgri”). FP Natural Resources holds 32.7% in RHI, and its Philippine affiliate First Agri Holdings Corporation (“FAHC”) holds an additional 30.2% economic interest in RHI.
54 Corporate Governance Report
54 Governance Framework
65 Communications with Shareholders
67 Continuing Connected Transactions and Connected Transactions
80 Risk Management and Internal Control
88 Remuneration Policy
89 Financial Review
89 Financial Performance and Position
92 Liquidity and Financial Resources
96 Financial Risk Management
100 Adjusted NAV Per Share
101 Statutory Reports, Consolidated Financial Statements and Notes to the Consolidated Financial Statements
231 Glossary of Terms
234 Information for Investors
235 Summary of Principal Investments
Inside Back
Corporate Structure

Ten-year Statistical Summary
2 First Pacific Annual Report 2020
2020 2019 2018 2017 2016 2015 2014 2013 2012 2011
Results (US$ millions)
Turnover 7,130.5 7,585.0 7,233.3 7,037.9 6,779.0 6,437.0 6,841.3 6,005.8 5,990.8 5,684.1
Profit for the year 667.6 121.1 608.7 561.3 517.8 418.9 503.2 620.9 834.9 1,097.4
Profit/(loss) attributable to owners of
the parent 201.6 (253.9) 131.8 120.9 103.2 80.6 75.7 235.3 353.3 574.0
Contribution from operations 409.7 395.6 393.9 420.5 400.2 426.5 455.7 467.2 460.8 511.8
Recurring profit 321.2 290.0 289.5 300.0 264.9 287.5 316.9 327.1 358.0 423.0
Ordinary share distributions/dividends 81.0 75.2 74.8 74.7 74.5 74.2 115.7 116.1 103.8 109.8
Per Ordinary Share Data (U.S. cents)
Basic earnings/(loss) 4.65 (5.85) 3.04 2.80 2.42 1.89 1.76 5.66 9.01 14.49
Basic recurring earnings 7.40 6.68 6.68 6.96 6.21 6.74 7.39 7.87 9.13 10.68
Distributions/dividends 1.86 1.73 1.73 1.73 1.73 1.73 2.70 2.70 2.70 2.85
Equity attributable to owners of the parent 72.27 67.41 71.02 74.32 72.68 71.93 78.08 81.44 84.65 78.50
Total assets 620.12 503.64 481.38 471.08 402.07 402.93 378.67 360.68 362.80 327.55
Tangible assets 383.21 372.50 359.45 361.58 300.82 305.12 295.40 281.00 281.45 251.57
Net cash flows from operating activities 23.86 33.51 16.91 17.96 17.11 15.21 19.48 17.41 25.54 16.22
Financial Ratios
Gross margin (%) 32.37 30.11 28.02 29.34 29.57 27.86 27.59 29.31 31.08 31.21
Recurring return on average net assets (%) 8.98 10.47 9.00 9.47 9.23 9.24 10.13 10.18 11.83 15.01
Recurring return on average equity
attributable to owners of the parent (%) 10.59 9.65 9.17 9.47 8.57 8.96 9.24 9.69 11.43 15.11
Distribution/dividend payout ratio (%) 25.22 25.93 25.84 25.03 28.12 25.81 36.51 35.49 28.99 25.96
Distribution/dividend cover (times) 3.97 3.86 3.87 4.02 3.56 3.87 2.74 2.82 3.45 3.85
Distribution/dividend yield (%) 5.87 5.09 4.45 2.53 2.50 2.64 2.74 2.38 2.49 2.75
Interest cover (times) 3.99 4.24 4.06 4.31 4.18 3.87 4.29 4.77 6.29 7.18
Current ratio (times) 1.24 1.12 1.03 1.32 1.24 1.39 1.69 1.72 1.78 1.57
Gearing ratio (times)
– Consolidated 0.77 0.68 0.78 0.66 0.54 0.64 0.47 0.43 0.30 0.26
– Head Office 0.81 0.76 0.76 0.83 0.75 0.79 0.56 0.51 0.67 0.71

3 First Pacific Annual Report 2020
2020 2019 2018 2017 2016 2015 2014 2013 2012 2011
Consolidated Statement of
Financial Position Data (US$ millions)
Total assets 26,943.6 21,882.5 20,901.5 20,454.5 17,215.4 17,199.0 16,233.4 15,544.1 13,886.7 12,611.8
Net debt 8,205.6 5,978.4 6,783.9 5,731.4 4,338.0 4,667.9 3,455.9 3,182.5 2,145.8 1,764.8
Total liabilities 16,315.1 13,124.5 12,191.1 11,712.0 9,181.1 9,864.6 8,822.1 8,064.6 6,636.0 5,732.6
Net current assets 1,147.7 525.3 120.2 1,041.0 646.9 1,186.2 1,944.6 1,672.3 1,613.9 1,193.0
Total assets less current liabilities 22,112.8 17,385.2 16,761.2 17,198.5 14,493.6 14,130.4 13,420.2 13,213.4 11,817.1 10,508.8
Equity attributable to owners of the parent 3,140.0 2,928.7 3,083.6 3,227.1 3,112.0 3,070.2 3,347.2 3,509.9 3,240.0 3,022.7
Total equity 10,628.5 8,758.0 8,710.4 8,742.5 8,034.3 7,334.4 7,411.3 7,479.5 7,250.7 6,879.2
Consolidated Statement of
Cash Flows Data (US$ millions)
Net cash flows from operating activities 1,036.6 1,455.5 734.1 776.1 731.4 650.0 835.8 723.9 1,002.0 642.5
Capital expenditure 1,065.6 1,376.5 1,236.0 1,063.0 696.7 830.8 636.4 899.7 701.6 561.7
Other Information (at 31 December)
Head Office net debt (US$ millions) 1,319.5 1,330.6 1,550.2 1,521.8 1,511.3 1,675.3 1,227.5 1,160.3 1,133.8 1,170.3
Number of shares in issue (millions) 4,344.9 4,344.9 4,342.0 4,342.0 4,281.7 4,268.5 4,287.0 4,309.7 3,827.6 3,850.4
Weighted average number of shares
in issue during the year (millions) 4,344.9 4,344.1 4,342.0 4,320.2 4,275.8 4,274.2 4,299.1 4,157.4 3,922.7 3,961.8
Share price (HK$)
– After rights issue 2.47 2.65 3.02 5.30 5.42 5.14 7.69 8.82 8.32 7.90
– Before rights issue N/A N/A N/A N/A N/A N/A N/A N/A 8.51 8.08
Adjusted NAV per share (HK$)
– After rights issue 7.23 6.30 7.26 10.26 10.45 9.67 13.24 12.57 15.09 13.09
– Before rights issue N/A N/A N/A N/A N/A N/A N/A N/A 15.43 13.38
Share price discount to adjusted NAV
per share (%) 65.8 57.9 58.4 48.3 48.1 46.8 41.9 29.8 44.8 39.6
Market capitalization (US$ millions) 1,375.9 1,476.2 1,681.1 2,950.3 2,975.2 2,812.8 4,226.5 4,873.3 4,176.0 3,988.6
Number of shareholders 4,478 4,494 4,500 4,530 4,760 4,796 4,853 4,884 4,606 4,503
Number of employees 103,127 101,836 110,394 102,530 94,189 96,446 98,107 91,874 80,941 73,582
See pages 231 to 233 for a glossary of terms
Note: In December 2020, the Group has classified Global Business Power Corporation (“GBPC”) as a disposal group held for sale and as a discontinued operation. As a result, the comparative amounts of (i) turnover and (ii) gross margin for 2017 to 2019 have been restated to reflect this change as the Group has consolidated GBPC since June 2017. In July 2013, the Company completed a rights issue, offering its shareholders one rights share for every eight existing shares held at a subscription price of HK$8.10 per rights share. Accordingly, the comparative amounts of (i) basic earnings per share, (ii) basic recurring earnings per share, (iii) net cash flows from operating activities per share, (iv) weighted average number of shares in issue during the year, (v) share price (after rights issue) and (vi) adjusted NAV per share (after rights issue) for 2011 and 2012 have been restated to reflect the effects of this rights issue in order to provide a more meaningful comparison.

4 First Pacific Annual Report 2020
By country
53%
45% 33% 20% 2%
48%
-1%
Profit Contribution from Operations at US$409.7m
By sector
PhilippinesUS$217.8m
Consumer food productsUS$184.5m
TelecommunicationsUS$134.9m
InfrastructureUS$82.3m
Natural resourcesUS$8.0m
IndonesiaUS$194.4m
Singapore–US$2.5m
US$7.1bTurnover 6%
US$321.2mRecurring profit 11%
US$26.9bTotal assets 23%
US$1.4bMarket capitalization 7%
US$3.1bEquity attributable to owners
of the parent 7%
US$201.6mTurnaround to net profit
Financial Highlights

5 First Pacific Annual Report 2020
Distribution payout at US$81.0 million
Distribution payout at 25% of recurring profit
Head Office dividend and fee income from operating companies at US$189.9 million
Five-year Data(Per share)
Head Office net debt at US$1.3 billion
Head Office net interest expense at US$60.0 million
Redeemed and repurchased US$307.4 million principal amount of bonds
Basic
Recurring Earnings
Total Assets
Equity attributable to
owners of the parent
Share Price vs
Adjusted NAV
0
2
4
6
8
10
U.S. cents
16 17 18 19 20
3.5
4.0
4.5
5.0
5.5
6.0
6.5
US$
Dec16
Dec17
Dec18
Dec19
Dec
20
0.5
0.6
0.7
0.8
US$
Dec16
Dec17
Dec18
Dec19
Dec
20
0
5
10
15
HK$
Adjusted NAV
10.45
5.42
7.23
2.47
Share price
Dec16
Dec17
Dec18
Dec19
Dec
20

Review of Operations
6 First Pacific Annual Report 2020
Below is an analysis of results by individual company.
Contribution and Profit Summary
Turnover
Contribution to
Group profit(i)
For the year ended 31 December 2020 2019 2020 2019
US$ millions (Restated)
(ii)
Indofood 5,583.1 5,414.4 194.4 163.4
PLDT(iii) – – 134.9 119.3
MPIC 825.5 1,239.8 84.8 126.8
Philex(iii) – – 8.0 1.0
FPM Power 571.0 713.4 (2.5) (10.5)
FP Natural Resources 150.9 217.4 (9.9) (7.2)
FPW(iv) – – – 2.8
Contribution from Operations(v) 7,130.5 7,585.0 409.7 395.6
Head Office items:
– Corporate overhead (19.7) (20.8)
– Net interest expense (60.0) (76.5)
– Other expenses (8.8) (8.3)
Recurring Profit(vi) 321.2 290.0
Foreign exchange and derivative gains, net(vii) 34.1 6.8
Gain on changes in fair value of biological assets 0.1 3.0
Non-recurring items(viii) (153.8) (553.7)
Profit/(Loss) Attributable to Owners of the Parent 201.6 (253.9)
(i) After taxation and non-controlling interests, where appropriate.(ii) The Group has restated its 2019 turnover to US$7,585.0 million from US$8,054.7 million following the
classification of GBPC as a disposal group held for sale and a discontinued operation in December 2020. Details of the change are set out in Note 7 to the Consolidated Financial Statements.
(iii) Associated companies.(iv) FPW Singapore Holdings Pte. Ltd. (“FPW”), a joint venture and was sold on 16 December 2019.(v) Contribution from operations represents the recurring profit contributed to the Group by its operating companies.(vi) Recurring profit represents the profit/(loss) attributable to owners of the parent excluding the effects of foreign
exchange and derivative gains, gain on changes in fair value of biological assets and non-recurring items.(vii) Foreign exchange and derivative gains, net represent the net gains on foreign exchange translation differences
on the Group’s unhedged foreign currency denominated net assets/liabilities and the changes in the fair values of derivatives.
(viii) Non-recurring items represent certain items, through occurrence or size, which are not considered as usual operating items. 2020’s non-recurring losses of US$153.8 million mainly represent (a) the Group’s impairment provisions for assets, including investments in RHI, property, plant and equipment, goodwill, deferred costs and others (US$74.1 million), loss on disposal of RHI’s sugar mill, ethanol plant and other assets in La Carlota, Negros Occidental (“La Carlota assets”) (US$15.8 million) and debt refinancing costs (US$7.5 million), and (b) PLDT’s manpower reduction costs (US$9.5 million) and accelerated amortization for Sun trademark (US$6.8 million), and PLP’s provisions for take-or-pay obligation and onerous contracts (US$7.4 million). 2019’s non-recurring losses of US$553.7 million mainly represent (a) the Group’s loss on disposal of Goodman Fielder Pty Limited (“Goodman Fielder”) (US$308.3 million), (b) impairment provisions for the Group’s investments in PLP (US$249.5 million) and Philex’s mining assets (US$37.5 million), and MPIC’s investments in Maynilad Water Services Inc. (“Maynilad”), MetroPac Movers, Inc. and other water investments (US$124.2 million), (c) PLDT’s manpower reduction costs (US$11.5 million), PLP’s provision for onerous contracts (US$6.9 million) and RHI’s write-off of deferred tax assets (US$6.7 million), partly offset by MPIC’s gain on deconsolidation of Metro Pacific Hospital Holdings, Inc. (“MPHHI”) (US$210.6 million).
Contribution
by Country
(50)
0
50
100
150
200
250
300
Philippines Indonesia Others
US$ millions
19 20 19 20 19 20

7 First Pacific Annual Report 2020
Firs
t P
acificIn 2020, First Pacific recorded a rise in contribution from operations and recurring profit, and a turnaround to net profit from a net
loss notwithstanding the business and social consequences of the global COVID-19 pandemic, reflecting the Group’s well managed
businesses in sectors vital to economies in lockdown.
Turnover down 6% to US$7.1
billion from US$7.6 billion
(restated)
higher revenues at Indofood reflecting the consolidation of Pinehill Company Limited
(“Pinehill”) since September 2020
lower revenues at MPIC and FP Natural Resources due to COVID-19 related community
quarantine
lower revenues at FPM Power due to lower average selling price of electricity as a result of a
decline in oil prices
Recurring profit up 11% to
US$321.2 million from
US$290.0 million
higher profit contributions from Indofood, PLDT and Philex
lower losses at FPM Power
lower Head Office net interest expenses and corporate overhead
partly offset by a lower profit contribution from MPIC and a higher loss at FP Natural
Resources
Non-recurring losses down
72% to US$153.8 million from
US$553.7 million
reflecting the absence of the Group’s loss on disposal of Goodman Fielder and impairment
provisions for PLP and Maynilad
partly offset by impairment provisions for the Group’s investments in RHI and other assets,
and the absence of MPIC’s gain on deconsolidation of MPHHI
Reported profit of US$201.6
million versus reported loss of
US$253.9 million
higher recurring profit
lower non-recurring losses
The Group’s operating results are denominated in local currencies, principally the rupiah, the peso and the Singapore dollar (S$),
which are translated and consolidated to provide the Group’s results in U.S. dollar. The changes of these currencies against the U.S.
dollar are summarized below.
Closing exchange rates against the U.S. dollar At 31 December 2020 2019
One yearchange
Rupiah 14,105 13,901 -1.4%
Peso 48.02 50.64 +5.5%
S$ 1.322 1.346 +1.8%
Average exchange rates against the U.S. dollarFor the year ended 31 December 2020 2019
One year change
Rupiah 14,639 14,146 -3.4%Peso 49.49 51.57 +4.2%S$ 1.377 1.363 -1.0%
During 2020, the Group recorded net foreign exchange and derivative gains of US$34.1 million (2019: US$6.8 million), which can be
further analyzed as follows:
US$ millions 2020 2019
Head Office 3.7 3.2Indofood 26.8 0.8PLDT 5.0 1.1MPIC (3.7) (1.4)Philex 0.6 0.5FPM Power 1.7 1.0FPW – 1.6 Total 34.1 6.8

8 First Pacific Annual Report 2020
Review of Operations
DistributionsFirst Pacific’s Board of Directors, taking into consideration cash flow trends and following prudent risk management practices,
declared a final distribution of HK 7.5 cents (U.S. 0.96 cent) (2019: HK 7.0 cents (U.S. 0.90 cent)) per share which brings the total
distribution for 2020 to HK 14.5 cents (U.S. 1.86 cents), up 7% from HK 13.5 cents (U.S. 1.73 cents) in 2019. The total distribution
represents a payout ratio of approximately 25% (2019: 26%) of recurring profit, marking the 11th consecutive year that First Pacific
has distributed at least 25% of recurring profit to its shareholders.
Debt ProfileFirst Pacific’s proactive liability management program achieved lower borrowing costs, longer maturities, and a smooth debt maturity
profile during 2020.
On 11 September 2020, First Pacific’s wholly-owned subsidiary, FPC Resources Limited, issued US$350 million of 7-year unsecured
guaranteed bonds at a coupon of 4.375%, with over three times subscription.
On 28 September 2020, First Pacific redeemed its last remaining secured bond with an outstanding principal amount of US$251.8
million on maturity. This 10-year US$400 million bond was First Pacific’s most expensive borrowing at the time of redemption with a
coupon of 6.375%.
In 2020, First Pacific bought back and cancelled a total of US$55.6 million of bonds, principally US$54.5 million of the 5.75% 7-year
bond with maturity on 30 May 2025.
As at 31 December 2020, Head Office gross debt stood at approximately US$1.4 billion with an average maturity of 3.9 years. Net
debt was little changed at approximately US$1.3 billion. Approximately 74% of the Head Office borrowings were at fixed rates while
floating rate bank loans comprised the remainder. The blended interest rate was approximately 3.5% per annum. All Head Office
borrowings are unsecured.
As at 29 March 2021, the principal amounts of the following bonds remained outstanding:
US$357.8 million 10-year at 4.5% coupon with maturity on 16 April 2023
US$120.5 million 7-year at 5.75% coupon with maturity on 30 May 2025
US$350.0 million 7-year at 4.375% coupon with maturity on 11 September 2027
There is no Head Office recourse for the borrowings of subsidiary or associated companies.
Interest CoverIn 2020, Head Office operating cash inflow before interest expense and tax was US$172.6 million. Net cash interest expense declined
24% to US$55.2 million, reflecting lower blended interest costs and higher interest income. For the 12 months ended 31 December
2020, cash interest cover was approximately 3.1 times.
Interest Rate HedgingTo manage floating interest rate risk, First Pacific entered into an interest rate swap in 2020 to fix the interest rate for a US$130 million
tranche of a US$200 million syndicated loan until its maturity in May 2024.
Foreign Currency HedgingThe Company actively reviews the potential benefits of hedging based on forecast dividend income and enters into hedging
arrangements for managing its foreign currency exposures in respect of dividend income and payments in foreign currencies.
OutlookLooking ahead to a new normal following the COVID-19 pandemic which began in 2020 and has continued into the first months of
2021, First Pacific’s core holdings of Indofood, PLDT and MPIC are expected to grow and are forecast to expand their earnings over
the medium to long term. First Pacific’s US$100 million 3-year share repurchase program aims to achieve a share price that better
reflects the value of what it represents – large holdings in some of the finest companies in Southeast Asia.

9 First Pacific Annual Report 2020 9999999999999FirFirFFirFirFiFirFirFirF st ststst st st s PacPacacacacacacPacPacaccacifiififiifiifiifiifiii ccccccccccc AnAnnAnnAnnAnnAnnAnnAA ualualualaluuaual RReReReReReRReReReeeeReeeeeeeeeeeeeepppppopopopopopoporpororororororppopopopoporororpopoorpopopopopoorpooorpooororopooorroororooorppopooorpppppp ttttt t t t 2t 22t 22ttt 2t t 2tt 20200202002020020020020200000
PROFIT
CONTRIBUTION
US$194.4 million

10 First Pacific Annual Report 2020
Review of Operations
The Indonesian government announced a partial lockdown from April 2020 in response to the COVID-19 outbreak, resulting in a substantial reduction in economic activity in the affected areas. Despite the challenging situation, Indofood’s resilient business model supported its growth momentum in 2020. This is reflected in Indofood’s ability to achieve sales and profit growth, as well as respond to rapid changes in the market, staying relevant to rapidly changing consumer demands in a trying year.
Indofood’s contribution to the Group increased 19% to US$194.4 million (2019: US$163.4 million) principally reflecting higher core profit.
Core profit up 22% to 6.0 trillion rupiah (US$407.1 million) from 4.9 trillion rupiah (US$346.3 million)
mainly reflecting strong performance of the Consumer Branded Products (“CBP”) group included four months contribution from Pinehill following its acquisition by PT Indofood
CBP Sukses Makmur Tbk (“ICBP”) at the end of August 2020 improved performance of Bogasari and Agribusiness groups
Net income up 32% to 6.5 trillion rupiah (US$441.0 million) from 4.9 trillion rupiah (US$347.0 million)
reflecting higher core profit
higher net foreign exchange gain partly offset by higher non-recurring losses from impairment provision for investment in RHI
and a lower gain from changes in fair value of biological assets
Consolidated net sales up 7% to 81.7 trillion rupiah (US$5.6 billion) from 76.6 trillion rupiah (US$5.4 billion)
driven by higher sales of all business groups
the consolidation of Pinehill from September 2020
Gross profit margin to 32.7% from 29.7%
mainly driven by higher average selling prices at the CBP and Agribusiness groups
Consolidated operating expenses up 8% to 13.9 trillion rupiah (US$947.0 million) from 12.9 trillion rupiah (US$910.9 million)
reflecting higher selling and general and administrative expenses
partly offset by an operating foreign exchange gain versus a loss in 2019
EBIT margin to 15.8% from 12.8% reflecting higher gross profit margin
Debt ProfileAs at 31 December 2020, Indofood recorded gross debt of 53.3 trillion rupiah (US$3.8 billion) reflecting higher borrowings for funding investments, up 132% from 23.0 trillion rupiah (US$1.7 billion) as at 31 December 2019. Of this total, 28% matures within one year and the remainder matures between 2022 and August 2028, while 37% was denominated in rupiah and the remaining 63% was denominated in foreign currencies.
Additional InvestmentsAcquisition of PinehillOn 27 August 2020, ICBP completed the acquisition of the entire issued share capital of Pinehill for a consideration of US$2,998 million from Pinehill Corpora Limited and Steele Lake Limited. ICBP paid US$2,348 million upon the completion of the acquisition in August 2020 and retained the remaining US$650 million pending the release of the audited net profits of Pinehill for 2020 and 2021, under the terms of a minimum profit guarantee by the sellers.
The acquisition was approved by First Pacific’s independent shareholders on 17 July 2020, and approved by ICBP shareholders on 3 August 2020.
Pinehill primarily manufactures and sells instant noodles in Saudi Arabia, Nigeria, Egypt, Turkey, Serbia, Ghana, Morocco and Kenya under the “Indomie” brand licensed from Indofood. The total population in these eight countries is approximately 550 million people, increasing to 885 million after including export markets. Pinehill has 12 factories with an annual production capacity of approximately 10 billion packs of instant noodles, serving markets that growing rapidly.
Other investmentsOn 31 December 2020, Indofood’s subsidiary PT Salim Ivomas Pratama Tbk (“SIMP”) announced to increase its effective economic interest in PT Mentari Subur Abadi to approximately 80% from approximately 60% for a consideration of 807 billion rupiah (US$57.2 million). The transaction was completed in January 2021.
On 17 February 2021, ICBP completed the acquisition of 49% interest in PT Indofood Fritolay Makmur (“IFL”) for a consideration of approximately 494 billion rupiah (US$35.0 million) from Fritolay Netherlands Holding B.V. Post the transaction, ICBP’s interest in IFL increased to 100% from 51%.
From 1 January 2020 to 29 March 2021, Indofood acquired a total of approximately 25.6 million shares of Indofood Agri Resources Ltd. (“IndoAgri”) from the open market for a total consideration of approximately S$7.5 million (US$5.6 million), increasing Indofood’s effective interest in IndoAgri to 71.8% from 70.0% as at 31 December 2019.

11 First Pacific Annual Report 2020
Indofo
odConsumer Branded Products
The CBP group produces and markets a wide range of consumer branded products, offering everyday solutions to consumers of all ages across different market segments. This business group comprises the Noodles, Dairy, Snack Foods, Food Seasonings, Nutrition & Special Foods, and Beverages divisions. With over 60 plants located in key markets across Indonesia, CBP’s products are available across the country and are exported to more than 80 markets around the world. Through its wholly-owned subsidiary, Pinehill, CBP group also owns 12 production facilities in eight countries in Africa, the Middle East and Southeastern Europe.
Indofood’s Noodles division is one of the world’s largest producers of instant noodles and is the market leader in Indonesia, Saudi Arabia, Egypt, Kenya, Serbia, Morocco, Turkey, Nigeria, and Ghana. Its annual production capacity is around 30 billion packs, across a broad range of instant noodle varieties.
The Dairy division has an annual production capacity of more than 800,000 tonnes and is one of the largest dairy manufacturers in Indonesia. It produces and markets UHT milk, sterilized bottled milk, sweetened condensed creamer, evaporated milk, pasteurized liquid milk, multicereal milk, milk flavored drinks, powdered milk, ice cream and butter.
The Snack Foods division has an annual production capacity of around 50,000 tonnes, producing western and modernized traditional snacks, and extruded snacks, making it the market leader in the modern snack category in Indonesia.
The Food Seasonings division has an annual production capacity of more than 150,000 tonnes, manufacturing and marketing a wide range of culinary products, including soy sauces, chili sauces, tomato sauces, recipe mixes, and stock soups as well as syrups.
Indofood’s Nutrition & Special Foods division is one of the market leaders in Indonesia’s baby food industry. This division has an annual production capacity of 25,000 tonnes, producing baby cereals, baby snacks such as rice puffs, crunchies, biscuits and puddings, and noodle soup for infants and toddlers, cereal snacks for children, and cereal powdered drinks for the whole family, as well as milk products for expectant and lactating mothers.
The Beverages division produces a wide range of ready-to-drink teas, packaged water and fruit-flavored drinks with a combined annual production capacity of approximately three billion liters.
Despite the challenges of 2020, CBP group sales rose 10% to 47.0 trillion rupiah (US$3.2 billion), growing across all business divisions except Beverages, and the EBIT margin improved to 19.4% from 16.8%. This performance included four months of contribution by Pinehill following its acquisition at the end of August 2020. Key to this success was the CBP group’s focus on ensuring the high availability of products online and offline, increasing consumer mindshare for its brands, improving the competitiveness of its products and providing a safe working environment for its employees in both domestic and overseas markets.
As one of Indonesia’s leading consumer goods producers, CBP group provides daily foods solutions to consumers. CBP group’s strategy remains maintaining a balance between volume growth and profitability. For the domestic market, CBP group will focus on maintaining consumer loyalty, ensuring product availability, improving service levels to retailers and focusing on product innovation to respond to market trends and consumer demand. In its overseas markets, the objective is to drive volume growth through expanding the distribution network and increasing stock-keeping units to bring consumers more choice. CBP group will also focus on productivity and efficiency improvements to increase its competitiveness and will continue to safeguard its people.
Turnover 2020*
US$ millions
Consumer Branded Products 3,208.5
Bogasari 1,568.8
Agribusiness 994.0
Distribution 311.6
Total 6,082.9
* Before inter-segment elimination
53%
26%
16%
5%
Operating Profit 2020*
US$ millions
Consumer Branded Products 622.7
Bogasari 122.2
Agribusiness 102.0
Distribution 11.1
Unallocated other operating income 22.5
Total 880.5
* Before inter-segment elimination
71%
14%
11%1%3%

12 First Pacific Annual Report 2020
Review of Operations
BogasariBogasari is the largest integrated flour miller in Indonesia,
operating four flour mills with total combined annual production
capacity of approximately 4.1 million tonnes. Bogasari produces
a wide range of wheat flour products and pasta for domestic
and international markets.
Its sales increased slightly to 23.0 trillion rupiah (US$1.6
billion), reflecting higher sales volume but partly offset by lower
average selling prices. The EBIT margin improved to 7.8% from
7.1% largely as a result of lower wheat costs.
Overall industry demand for flour increased during the year
despite the implementation of social distancing measures during
the COVID-19 pandemic such as the closure of restaurants
and food outlets, with small and medium-sized enterprises most affected. Despite the current uncertain situation, Indofood expects
improved macroeconomic conditions and increasing affluence in Indonesia’s expanding middle class to drive demand growth for flour-
based foods.
AgribusinessThe diversified and vertically integrated Agribusiness group is one of Indonesia’s largest producers of palm oil with a leading market share in branded edible oils and fats. It consists of two divisions: Plantations and Edible Oils & Fats (“EOF”), which operate through IndoAgri and its main operating subsidiaries, SIMP and PT Perusahaan Perkebunan London Sumatra Indonesia Tbk (“Lonsum”) in Indonesia. In Brazil, IndoAgri has equity investments in sugar and ethanol operations in Companhia Mineira de Açúcar e Álcool Participações (“CMAA”) and land assets in Bússola Empreendimentos e Participações S.A (“Bússola”). It has also invested in Roxas Holdings, Inc. in the Philippines.
Sales rose 7% to 14.6 trillion rupiah (US$994.0 million), mainly reflecting higher sales and higher prices of crude palm oil (“CPO”) and EOF products. Due to lower fresh fruit bunch (“FFB”) production and external purchases, sales volume of CPO fell 15% to 748,000 tonnes, whilst palm kernel (“PK”) related products sales volume declined 17% to 183,000 tonnes.
PlantationsThe total planted area rose slightly to 303,149 hectares from year-end 2019, of which oil palm accounted for 83% while rubber, sugar cane, timber, cocoa and tea accounted for the remainder. IndoAgri’s oil palms have an average age of approximately 16 years, while around 18% of its oil palms are younger than seven years. This division has a total annual processing capacity of 7.0 million tonnes of FFB.
In 2020, the Plantations division recorded a 2% increase in sales to 8.5 trillion rupiah (US$577.7 million) as a result of higher prices for CPO and PK products.
FFB nucleus production declined 9% to 3.0 million tonnes, mainly reflecting lower production arising from the replanting of old palms in Riau and North Sumatra and adverse weather conditions. CPO production declined 12% to 737,000 tonnes on lower FFB nucleus and purchases from external parties. The CPO extraction rate declined slightly to 21.0%.
In South Sumatra, Indonesia, the total planted area of rubber declined 5% to 15,976 hectares. The planted area of sugar cane rose 5% to 14,153 hectares, though sugar production declined 16% to 51,000 tonnes due to lower sugar rendement caused by wet weather during the harvesting period. IndoAgri’s sugar factory in Central Java, produced 19,000 tonnes of sugar, of which 4,000 tonnes belonged to IndoAgri, and the remainder to the smallholder suppliers.
Age Profile of
Oil Palm Plantations
Hectares
Immature areas 41,435
4–6 years 5,129
7–20 years 123,332
Above 20 years 83,165
Total 253,061
49%
16%
2%33%

13 First Pacific Annual Report 2020
Indofo
od
At the end of September 2020, IndoAgri completed the consolidation of its sugar assets and operations in Brazil under CMAA, and all the freehold land assets under a separate legal entity, Bú ssola. Both CMAA and Bússola were 50.00%, 36.21% and 13.79% owned by JF Family, IndoAgri and Rio Grande Investment Pte. Ltd., respectively. CMAA’s sugar cane planted area increased 13% from year-end 2019 to 106,945 hectares, and the sugar cane harvest rose 26% to 7.7 million tonnes. The combined annual cane crushing capacity of CMAA is 8.8 million tonnes. IndoAgri’s share of profit from its Brazilian mills rose 663% to 126.7 billion rupiah (US$8.7 million) from 16.6 billion rupiah (US$1.2 million) reflecting higher prices of sugar and ethanol, and higher sales volumes of sugar.
Edible Oils & FatsThis division manufactures cooking oils, margarines and shortenings. It has an annual CPO refinery capacity of 1.7 million tonnes. Approximately 72% of this division’s CPO requirements were sourced from the Plantations division in 2020, while it was 75% in 2019.
In 2020, the EOF division recorded a 12% increase in sales to 11.5 trillion rupiah (US$782.2 million) driven by higher average selling prices arising from higher CPO prices offset by lower sales volumes owing to lower demand from the hotels, restaurants and catering (the hospitality industry or HORECA) segment. By contrast, the EOF division’s consumer branded cooking oils and margarine products recorded positive growth, with more families cooking and dining at home during the pandemic.
IndoAgri will continue to prioritize capital expenditure in areas of growth and focus on cost-controls and other innovations to increase productivity and yields. The replanting of older palms in North Sumatra and Riau is ongoing, with newer and higher yielding varieties developed by the group’s seed breeding programme. The expansion of milling facilities in East Kalimantan continues, alongside new efficiency measures.
EOF division’s marketing strategy continues through digital platforms and e-commerce channels, aiming to further strengthen Bimoli’s leading market position through competitive pricing as well as increasing production capacity to meet increasing demand growth.
DistributionThe Distribution group is a strategic component of Indofood’s Total Food Solutions chain of vertically integrated operations as it has one of the most extensive nationwide distribution networks in Indonesia, covering all densely populated areas. It is well connected to both traditional and modern grocery outlets to ensure the ready availability of Indofood products to consumers across the country.
The Distribution group’s sales improved 10% to 4.6 trillion rupiah (US$311.6 million) mainly supported by the growth in demand for the products of Indofood and those of other consumer food companies this group provides services to. The EBIT margin declined to 3.5% from 5.1%.
As a strategic asset that forms a vital part of Indofood’s vertically integrated operations, the Distribution group continues to focus on ensuring the availability of Indofood products to the market as well as improving operational excellence. With its 1,300 stock points across Indonesia, the Distribution group has unrivaled flexibility in accessing traditional and modern grocery outlets, and reacting quickly to evolving consumer purchasing patterns.
OutlookThe Indonesian government forecasts a return to growth in 2021 following a contraction in 2020 that was the worst since the Asian Financial Crisis of the late 1990s. Indofood is optimistic about the wider economic recovery while remaining cautious about the pandemic headwinds, and expects to see continuing sales growth overall in 2021. Embarking on its next growth phase in local and overseas markets, Indofood’s strategy will be to strengthen its vertically integrated business model, build on its past achievements, and evolve to address new opportunities and challenges.
CPO Production
0
200
400
600
800
1,000
Thousand tonnes
16 17 18 19 20

14 First Pacific Annual Report 2020
Review of Operations
14 First Pacific Annual Report 2020020
PROFIT
CONTRIBUTION
US$134.9 million

15 First Pacific Annual Report 2020
PLD
T
PLDT’s transformation and network integration over recent years delivered the robustness and capacity it needed to ensure all services
remained available to subscribers even during the substantial surge in network traffic brought on by the lockdown response to the
COVID-19 pandemic. Its committed management and people, especially frontline staff, played a vital role in keeping operations smooth.
Once mandatory mobility restrictions were eased, PLDT accelerated its network buildout and repairs and installations at its Home
business. It also accelerated a shift towards online payments and other forms of cashless payment systems to reduce contact between
staff and customers as part of social-distancing measures to ensure community and staff health and safety.
PLDT’s contribution to the Group increased 13% to US$134.9 million (2019: US$119.3 million) reflecting higher consolidated core
net income.
Telco core net income up 4%
to 28.1 billion pesos (US$567.5
million) from 27.1 billion pesos
(US$525.1 million)
reflecting higher EBITDA driven by strong growth in service revenues
lower provision for income tax
partly offset by higher cash operating expenses, depreciation and amortization, and higher
net financing costs in connection with PLDT’s capital expenditure program
Consolidated core net income
up 8% to 27.1 billion pesos
(US$548.2 million) from 25.1
billion pesos (US$486.9 million)
reflecting higher telco core net income
partly offset by equity loss from Voyager
Reported net income up 8% to
24.3 billion pesos (US$490.7
million) from 22.5 billion pesos
(US$436.7 million)
reflecting higher core net income
inclusive of a gain from the sale of Smart Tower
partly offset by higher manpower rightsizing program expenses, accelerated depreciation
related to network transformation, amortization of the Sun trademark, a fair value loss of the
investment valuation and a realized loss on sales of Rocket Internet SE shares
Consolidated service revenues
(net of interconnection costs)
up 9% to 171.5 billion pesos
(US$3.5 billion) from 157.7
billion pesos (US$3.1 billion)
reached an all-time high, reflecting sustained year-on-year increases in the Individual,
Enterprise and Home business segments
strong growth in mobile data and home broadband revenues
partly offset by lower revenues from the International and Carrier business
Individual, Home and Enterprise service revenues grew 15%, 11% and 5%, respectively,
and accounted for 48%, 24% and 24% of consolidated service revenues, respectively
data and broadband remained main growth drivers, with combined revenues up 18% and
representing 73% (2019: 67%) of consolidated service revenues
EBITDA up 8% to 86.2 billion
pesos (US$1.7 billion) from
79.8 billion pesos (US$1.5
billion)
reflecting higher service revenues
partly offset by higher cash operating expenses
EBITDA margin to 50% from
49%
mainly due to higher EBITDA
wireless and fixed line EBITDA margin to 61% and 34% from 58% and 38%, respectively
Capital ExpendituresOver the past 10 years, PLDT invested approximately 460.7 billion pesos (US$9.6
billion) in capital expenditures to expand the reach and capacity of its network
infrastructure and transform its IT platforms. These investments have enabled PLDT
to deliver superior customer experience across all of its business segments and lift
its market share in every market it serves.
PLDT operates the Philippines’ largest and fully integrated fixed and wireless
network, enabling it to absorb a substantial surge in demand for data during the
pandemic with no consequences for customer experience, testifying to the value of
its investments in network capacity, coverage and resiliency over the years.

16 First Pacific Annual Report 2020
Review of Operations
The superior quality of the PLDT network has been recognized by various third
party surveys. Ookla’s latest report again recognized PLDT and Smart’s fixed
and mobile networks as the fastest in the Philippines. Open Signal’s latest
country report announced that Smart’s 4G availability, video experience, and
download and upload speeds continues to outperform other service providers
in the Philippines.
In 2020, capital expenditures amounted to 71.9 billion pesos (US$1.5 billion)
focused mainly on network upgrades and technology-related expansions such
as last-mile and equipment for customer premises for the home broadband
business, all in the service of superior customer experience.
Despite the challenges of limited mobility, total homes passed by PLDT’s fixed-line fiber optic network rose 25% to 9 million, port
capacity rose 16% to 4.1 million, and the fiber footprint expanded by 33% to 429.3 thousand cable kilometers from end-2019 levels.
On the wireless network, the number of Smart 5G base stations reached 489, LTE base stations increased 23% to over 30,200, while
the number of 3G base stations increased 18% to 16,200. This brought the total base station count to over 59 thousand, including the
2G base stations. PLDT’s 4G and 3G network coverage expanded to reach over 96% of the Philippines’ population.
The capital expenditures guidance for 2021 is in the range of 88 billion
pesos (US$1.8 billion) to 92 billion pesos (US$1.9 billion), which is demand-
driven, covering network capacity expansion and IT platform advancement
for supporting growth in mobile data demand, as well as the last mile and
customer premises equipment to serve the growing home broadband
business. PLDT plans to increase the number of its 5G and 4G base stations
by over 3,800 and 4,000, respectively, to increase port capacity by over 1.7
million and to lay an additional 125,000 kilometers of fiber optic network in
2021.
Debt ProfileOn 23 June 2020, PLDT issued US$600 million of dual tranche Senior Unsecured Notes (“the Notes”). The first tranche of US$300.0
million long 10-year Notes have a 2.5% coupon and the second tranche of US$300.0 million 30-year Notes have a 3.45% coupon.
The Notes were 17 times oversubscribed in an issuance that was recognized by International Financing Review as the Philippines’
Capital Deal of the Year. It is the first-ever 30-year offering from a corporate in the Philippines. The issuance of the Notes extended
PLDT’s debt maturity profile, with 56% of the total debt now due to mature after 2025.
As at 31 December 2020, PLDT’s consolidated net debt was US$3.8 billion while net debt-to-EBITDA was at 2.05 times. Total gross
debt stood at US$4.7 billion, of which 19% was denominated in U.S. dollars. Only 6% of the total debt was unhedged after taking into
account available U.S. dollar cash on hand and currency hedges allocated for debt. After interest rate swaps, 86% of the total debt are
fixed-rate borrowings. The average pre-tax interest cost for the full year declined to 4.66% from 4.8%.
As at the end of December 2020, PLDT’s credit ratings remained at investment grade at S&P Global and Moody’s, the international
credit rating agencies.
DividendsPLDT’s dividend policy is to pay 60% of its telco core net income to shareholders. On 4 March 2021, the PLDT Board of Directors
approved a final regular cash dividend of 40 pesos (US$0.83) (2019: 39 pesos (US$0.77)) per share payable on 6 April 2021
to shareholders on record as of 18 March 2021. Together with the interim dividend of 38 pesos (US$0.76) per share paid on 4
September 2020, total dividends for 2020 amounted to 78 pesos (US$1.59) (2019: 75 pesos (US$1.47)) per share.
Service Revenues by Business SegmentData and broadband services continued to drive revenue growth in 2020, rising 18% to 124.5 billion pesos (US$2.5 billion), led by
29% and 16% revenue increases in mobile internet and home broadband to 62.2 billion pesos (US$1.3 billion) and 33.0 billion pesos
(US$666.8 million), respectively. The corporate data and ICT businesses recorded 2% and 3% revenue growth to 20.8 billion pesos
(US$420.3 million) and 4.2 billion pesos (US$84.9 million), respectively.

17 First Pacific Annual Report 2020
PLD
T
Growth in the Individual business continued, primarily reflecting strong demand for wireless data, particularly during the quarantine period. This resulted from a combination of higher usage of data including access to video, gaming and social media, simplified product offerings designed to address customer passion points, marketing promotions and content enrichment through partnerships, growth in digital productivity requirements from work – and study-from-home arrangements, expansion of distribution channels through digital platforms, and increased smartphone ownership.
The increase was supported by Smart’s data network and product offers such as, GigaWork, GigaStudy, Giga K-Video, GigaLife and more. Average daily top-ups for 2020 rose 18% to an all-time high. 78% of handsets on the network are smartphones and over half of its subscribers are regular data users.
Individual service revenues for 2020 rose 15% to 82.7 billion pesos (US$1.7 billion) of which 75% (2019: 69%) were data revenues. Mobile data traffic volume rose 79% to 2,881 Petabytes from 2019.
The PLDT group’s combined wireless subscriber base reached 72.9 million as at the end of December 2020.
The pandemic accelerated the awareness and adoption of digital payments and e-commerce, providing the group, through Voyager, an opportunity to expand its role as a key player in enabling end-to-end cashless solutions.
Home service revenues rose 11% to 41.4 billion pesos (US$836.5 million) reflecting unprecedented demand for home broadband services driven by work-from-home arrangements, e-learning and e-entertainment, and improved installation capabilities. Data and broadband accounted for 80% (2019: 77%) of Home service revenues.
Compared to the end of 2019, PLDT’s total fixed line and broadband subscribers rose 10% and 43% respectively to 3.0 million and 3.1 million. Among the net additions of 928,634 broadband subscribers during 2020, 342,269 were fixed broadband and 586,365 were fixed wireless broadband customers.
The home broadband market penetration in the Philippines remains relatively low. PLDT’s network advantage in terms of quality, breadth, and the acceleration of installation capability allows its services to reach previously unserved people.
Enterprise service revenues rose 5% to 41.2 billion pesos (US$832.5 million) in 2020, reflecting the acceleration in demand for digital transformation services from corporates and small and medium-sized enterprises, the importance of which was highlighted by the community quarantine. Growth was driven by higher demand from wireless and information and technology services as more companies adopted work-from-home arrangements. Data and broadband accounted for 70% (2019: 67%) of Enterprise service revenues.
The challenges of the pandemic opened new opportunities for innovative solutions and services and accelerated the pace of digital adoption. Enterprise teams are actively pursuing additional business in the areas of e-learning, telemedicine, e-commerce, and telecommuting through its fixed, wireless, and information and technology pillars. Increased interest in data centers from hyperscalers is also a growth area under exploration.
OutlookPLDT is optimistic that it will see continuing strong growth across all three main customer segments of Individual, Home and Enterprise in 2021 underpinned by unabated demand for data and broadband. To support this, PLDT has earmarked 88-92 billion pesos in capital expenditures to continue expanding data capacity, coverage, and network resilience to deliver superior customer experience and maintain network leadership. PLDT’s strong integrated network advantage is key to defending its market leadership against challengers in the mobile and home broadband spaces. Telco core income is expected to rise to 29-30 billion pesos in 2021. If all goes as planned, PLDT is prepared to consider a 5% special dividend payout on 2021 earnings in addition to the regular payout ratio of 60% of telco core income.

18 First Pacific Annual Report 2020
Review of Operations
PROFIT
CONTRIBUTION
US$84.8 million

19 First Pacific Annual Report 2020
MP
IC
The financial and operational performance of MPIC group was adversely impacted by quarantine measures implemented since
March 2020 imposed by the Philippine Government in response to the COVID-19 outbreak. The measures reduced toll road traffic,
decreased commercial and industrial demand for water and power, involved mandated suspension and subsequent reduction in
ridership capacity for its light rail services, and resulting in a lower contribution from operations. MPIC directed its focus towards
service continuity throughout the pandemic. It also prioritized preservation of the balance sheet and optimization of capital allocation
as evidenced by asset monetization via the partial sell-down of Light Rail Manila Corporation (“LRMC”) and the sale of Global Business
Power Corporation (“GBPC”) in the Philippines, and Don Muang Tollway Public Company Limited (“DMT”) in Thailand.
By powering industry, commerce and households, delivering clean and affordable water, connecting people and places, and making
excellent healthcare available to everyone, MPIC is doing its part in contributing to national progress and improving the quality of life of
the Filipino people.
MPIC’s contribution to the Group declined 33% to US$84.8 million (2019: US$126.8 million), reflecting lower core net income.
Consolidated core net income
down 34% to 10.2 billion pesos
(US$206.9 million) from 15.6
billion pesos (US$302.5 million)
reflecting the impacts of limited mobility and economic contraction following the
implementation of quarantine measures
power, water and toll roads businesses remained profitable, accounting for 69%, 20%
and 16%, respectively, of the consolidated profit contribution to MPIC, while a negative
contribution of 5% was recorded from other businesses
partly offset by lower MPIC head office net interest expense driven by debt reduction and
refinancing
a 9% decrease in contribution from the power business to 10.5 billion pesos (US$213.1
million) due to lower commercial and industrial power demand
a 14% decline in contribution from the water business to 3.1 billion pesos (US$62.3
million) reflecting a lower average tariff, and lower demand from commercial and industrial
customers
a 53% decline in contribution from the toll roads business to 2.4 billion pesos (US$49.4
million) reflecting a substantial fall in traffic volumes caused by mobility restrictions
a net loss of 709 million pesos (US$14.3 million) from light rail and other businesses,
versus a net profit contribution of 515 million pesos (US$10.0 million) in 2019, reflecting
a substantial decline in service demand caused by the pandemic. For hospitals, in-patient
admissions and out-patient visits dropped 46% and 36%, respectively. The average daily
ridership of the light rail business declined 58% during the operating periods due to
mandated operating capacity limitations
Consolidated reported net
income down 80% to 4.7 billion
pesos (US$95.9 million) from
23.9 billion pesos (US$462.6
million)
reflecting lower core net income
impairment provisions for various investments/assets, while it was a non-recurring gain of 8.3
billion pesos (US$160.1 million) in 2019 mainly due to the divestment of hospitals business
Consolidated revenues down
17% to 40.9 billion pesos
(US$825.5 million) from 49.3
billion pesos (US$955.5 million)
(restated)
reflecting lower revenues recorded across all businesses
Debt ProfileAs at 31 December 2020, MPIC’s consolidated debt declined 7% to 231.4 billion pesos (US$4.8 billion) from 249.9 billion pesos
(US$4.9 billion) as at 31 December 2019 mainly reflecting reclassification of 28.5 billion pesos (US$593.9 million) of GBPC’s debt to
liabilities included within a disposal group and debt reduction exercise at MPIC head office level. Of the total, 92% was denominated
in pesos. Fixed-rate borrowings accounted for 90% of the total, the average interest rate was approximately 6.14% and debt maturity
ranged from 2021 to 2037.

20 First Pacific Annual Report 2020
Review of Operations
Capital ManagementDividendsMPIC’s Board of Directors declared a final regular cash dividend of 0.0481 peso (U.S. 0.10 cent) per share and a special cash dividend of 0.0279 peso (U.S. 0.06 cent) per share, both to be paid on 31 March 2021 to shareholders on record as of 18 March 2021. Together with the interim dividend of 0.0345 peso (U.S. 0.07 cent) per share paid on 3 September 2020, total dividends for 2020 amounted to 0.1105 peso (U.S. 0.23 cent) per share. It represented a record high dividend payout ratio of 33% (2019: 22%) of core net income per share despite the ongoing pandemic.
Share Buyback ProgramsFor the purpose of enhancing shareholder value and strengthening shareholders’ confidence in MPIC’s prospects, on 26 February 2020, MPIC’s Board of Directors approved a share buyback program of up to 5.0 billion pesos (US$101.0 million) for a three-month period ended 26 May 2020. Under this program, MPIC bought back a total of 213.5 million shares from the open market at a total cost of 706 million pesos (US$14.3 million).
On 1 October 2020, MPIC’s Board of Directors approved a new share buyback program of up to 5.0 billion pesos (US$101.0 million) which is valid until the total amount is being utilized or until otherwise determined by MPIC’s Board of Directors. By 29 March 2021, MPIC had bought back a total of 687.0 million shares from the open market under this program with a total expenditure of 2.7 billion pesos (US$54.9 million).
From 27 February 2020 to 29 March 2021, MPIC bought back a total of 900.5 million shares at a total cost of 3.4 billion pesos (US$69.2 million).
Additional Investment/DivestmentsOn 8 May 2020, Metro Pacific Tollways Corporation’s (“MPTC”) wholly-owned subsidiary, CIIF Infrastructure Holdings Sdn. Bhd. (“CIIF”) completed the divestment of its 10.32% interest in PT Margautama Nusantara (“MUN”) to West Nippon Expressway, Japan Expressway International Co., Ltd., and Japan Overseas Infrastructure Investment Corporation for Transport & Urban Development for a consideration of US$35.2 million. These strategic partners’ expertise in toll roads is expected to contribute to the improvement of MUN’s operational efficiencies.
On 28 May 2020, MPIC completed the divestment of approximately 34.9% interest in Metro Pacific Light Rail Corporation (“MPLRC”) to Sumitomo Corporation for a consideration of approximately 3.0 billion pesos (US$61.5 million). Following the transaction, MPIC’s interest in MPLRC decreased to approximately 65.1% and its effective economic interest in LRMC decreased to approximately 35.8% from 55%. MPLRC has an aggregate 55% interest in LRMC which is the operator of Light Rail Transit 1 (“LRT1”).
On 29 January 2021, KM Infrastructure Holdings, Inc. (“KMIH”), a 50:50 joint venture between Keppel Infrastructure Fund Management Pte. Ltd. (“KIT”) and MPIC, completed the acquisition of a 100% interest in Philippine Tank Storage International Holdings Inc. (“PTSI”) from Philippine Investment Alliance for Infrastructure for a consideration of approximately US$333.8 million. PTSI wholly owns Philippine Coastal Storage and Pipeline Corporation, the largest independent petroleum product storage facility and import terminal in the Philippines, located in the Subic Bay Freeport Zone. The equity investment of MPIC in a 50% interest in KMIH amounted to approximately US$143 million. KIT, MPIC and KMIH also entered into a shareholders’ agreement for the purpose of regulating the management of the business of PTSI and the relationship between shareholders. KIT and MPIC shall enjoy equal voting rights and bear equal obligations in respect of PTSI’s business. The shareholders’ agreement includes a non-competition provision under which each shareholder of KMIH must refer any new business opportunity within PTSI group’s agreed scope of business (owning, operating and maintaining petroleum, oil products or liquid chemicals storage facilities in the Philippines) to KMIH, and may only pursue such opportunity independently if the board of KMIH does not approve such new opportunity within a specified period and the referring shareholder’s nominated directors on KMIH board have voted in favor of KMIH pursuing such new opportunity.
On 19 February 2021, MPTC completed the disposal of its entire approximately 29.45% indirect interest in DMT to a group of investors in Thailand for a consideration of approximately US$149.3 million.
On 2 March 2021, First Pacific’s shareholders approved MPIC’s wholly-owned indirect subsidiary Beacon PowerGen Holdings Inc. (“Beacon PowerGen”) to dispose approximately 56% interest in GBPC for a consideration of 22.4 billion pesos (US$466.6 million) to Meralco PowerGen Corporation (“MGen”). The transaction is expected to be completed by the end of March 2021. 60% of the consideration to be received on the completion date, with the remaining 40% to be received in two equal installments on the dates falling six months and eighteen months after the completion date, respectively. The strategy of the transaction is to unify power distribution and generation assets under Manila Electric Company (“Meralco”).
Contribution from
Operations 2020
(50)
0
50
100
150
200
250
Power Water Hospitals,Rails and
Others
US$ millions
19 20 19 20Toll Roads
19 20 19 20

21 First Pacific Annual Report 2020
MP
IC
PowerDuring the year, Meralco further strengthened its provision of stable electricity supply in its franchise area, supporting the community and the government’s fight against the pandemic while prioritizing serving its customers and keeping its workforce safe and healthy. To ease financial pressures caused by the pandemic, Meralco offered a wide range of payment relief measures to customers, including the suspension of disconnection activities for non-payment of bills, refund of certain reading charges and offering interest-free installment payments.
The volume of electricity sold declined 7% to 43,572 gigawatt hours, reflecting a 20% fall in commercial sales volume, an 11% decline in industrial sales volume, and a 13% increase in residential sales volume with more people working and studying from or staying at home. Residential, commercial and industrial sales volumes accounted for 38%, 34% and 28% of the total sales volume, respectively.
Revenues declined 14% to 275.3 billion pesos (US$5.6 billion) reflecting lower energy sales volume and lower pass-through fuel charges. The number of billed customers rose 4% to 7.1 million in 2020.
Capital expenditure rose 3% to 20.8 billion pesos (US$421.0 million) primarily for adding new connections, asset renewals and capacity expansion.
Meralco is adopting to the new normal in the Philippines and preparing for economic recovery through its continuing investment in the power system. It also provides personal protective equipment and COVID-19 testing for its 5,700 work force and other support.
At GBPC, revenues fell 13% to 21.1 billion pesos (US$425.7 million) reflecting lower pass-through fuel charges despite a 2% increase in the volume of energy sold rose to 4,929 gigawatt hours. Capital expenditure fell 48% to 370 million pesos (US$7.5 million) following the completion of various land and building improvements in 2019.
Energy from WasteConstruction continues for the Surallah and Polomolok waste-to-energy biogas plants for Dole Philippines after securing authority from the local government to resume work with the plants slated for completion by year-end 2021. Under Japan’s Joint Credit Mechanism Program for carbon reduction, this project was granted a 50% capital expenditure subsidy through cash distributions which are expected in 2021 and 2022 from Japan’s Ministry of the Environment.
MetPower Venture Partners Holdings, Inc., a wholly-owned subsidiary of MPIC, is investing in a carbon dioxide recovery facility, co-located at the Polomolok site, which is expected to become Mindanao’s first indigenous source of food-grade carbon dioxide.
WaterMaynilad Water Services, Inc. (“Maynilad”) is the biggest water utility in the Philippines, operating a concession for water distribution and sewerage and sanitation services for the West Zone of Metro Manila.
In 2020, Maynilad’s average non-revenue water measured at the District Metered Area improved further to 26.1% from 26.4% in 2019. Revenues decreased 4% to 22.9 billion pesos (US$463.5 million) reflecting a lower average tariff. Higher residential consumption at a lower average tariff partly offset lower commercial and industrial demand.
Maynilad’s 24-hour water coverage improved to 98% in 2020 from 59% a year earlier following improvement in the water supply. Capital expenditure declined 37% to 7.8 billion pesos (US$157.6 million) in the year, mainly owing to movement restriction brought by the pandemic.
MetroPac Water Investments Corporation (“MPW”) is MPIC’s investment vehicle for expanding water investments outside the Maynilad concession area. MPW has investments in Metro Pacific Iloilo Water Inc. (“MPIWI”) and Metro Pacific Dumaguete Water Services Inc. (“MPDW”) in the Philippines, and in BOO Phu Ninh Water Treatment Plant Joint Stock Company (“PNW”) in Vietnam.

22 First Pacific Annual Report 2020
Review of Operations
In 2020, MPW’s revenues rose 14% to 1.5 billion pesos (US$30.3 million), reflecting higher billed volumes across its businesses. Capital expenditure fell 56% to 0.4 billion pesos (US$8.1 million) as certain project activities were delayed due to quarantine measures in the Philippines.
Toll RoadsMPTC operates the North Luzon Expressway (“NLEX”), the Manila-Cavitex Toll Expressway (“CAVITEX”), the Subic Clark Tarlac Expressway (“SCTEX”) and the Cavite-Laguna Expressway (“CALAX”) in the Philippines and is a shareholder in PT Nusantara Infrastructure Tbk (“PT Nusantara”) in Indonesia, CII Bridges and Roads Investment Joint Stock Company in Vietnam, and until 19 February 2021 in DMT in Thailand.
In 2020, MPTC’s revenues fell 27% to 13.6 billion pesos (US$274.1 million) reflecting reduced traffic on most of its toll roads due to mobility restrictions during quarantine periods.
Average daily vehicle entries on MPTC’s toll roads decreased 27% to 689,287, reflecting a decline of 28% to 388,820 in the Philippines and a 26% fall to 300,467 for regional toll roads.
Capital expenditure was down 11% to 23.3 billion pesos (US$470.8 million) mainly reflecting delay in road projects owing to the pandemic. Despite such challenges, MPTC completed construction and introduced into full commercial operation the first sub-section of CALAX and opened an additional section of the NLEX Harbour Link.
In the Philippines, MPTC plans to spend approximately 125.2 billion pesos (US$2.6 billion) on projects for the NLEX-SLEX Connector Road (“Connector Road”), the Cebu Cordova Link Expressway (“CCLEX”), additional segments of CAVITEX, CALAX, NLEX Citi Link and others, with a total length of 72.1 kilometers and expected completion between 2021 and 2023.
MPTC is also enhancing and expanding its electronic toll collection systems to allow for the full implementation of cashless payment systems on its toll roads.
In the region, Pettarani toll road in Indonesia and the Hanoi highway in Vietnam are expected to commence commercial operation in the first half of 2021.
Light RailLRMC’s farebox revenues fell 62% to 1.3 billion pesos (US$25.5 million) reflecting a 58% decrease in average daily ridership to 186,021 passengers during operating periods due to compulsory operating capacity limitations. LRT1’s operations were suspended in two periods in 2020 for a total of 91 days. In compliance with regulatory guidelines, the operations of LRT1 was limited to 13% of capacity after services resumed in June and August in 2020, and gradually increased to 30% from October 2020.
During the year, LRMC’s capital expenditure fell 53% to 3.9 billion pesos (US$78.8 million), and was spent mainly on the rehabilitation of the train system, structural repairs and improvements, and the construction of LRT1’s Cavite Extension.
HealthcareThe healthcare sector is facing enormous challenges during the COVID-19 pandemic. Revenues decreased 7% to 14.8 billion pesos (US$299.1 million) reflecting limited clinic operations and deferral of non-critical medical treatments. Inpatient admissions fell 46% to 106,546 while outpatient visits were down 36% to 2,501,698. Despite these challenges, MPHHI remained profitable and is currently increasing COVID-19 testing capacity and available beds.
OutlookMPIC’s businesses began to gradually recover from the third quarter of 2020 and expect revenues and earnings to continue improving in 2021. The domestic toll roads business will return to growth and organic expansion as ongoing construction projects result in new roads to meet growing demand for smooth road transport. Meralco’s electricity distribution business is expected to see a rebalancing of demand as industrial and commercial demand both rise and residential demand declines as a share of the total supply distributed. The electricity generation business under MGen will benefit from increased demand for electricity as the Philippine economy returns to growth. Maynilad expects resolution of its tariff regime to result in stable earnings while other water businesses foresee continuing growth in billed volumes.

PROFIT
CONTRIBUTION
US$8.0 million

24 First Pacific Annual Report 2020
Review of Operations
As an export-oriented enterprise, Philex was permitted by both local and
national government agencies to continue operating the Padcal mine
during the COVID-19 related community quarantine in the Philippines
that started in March 2020.
The pandemic has proven Philex’s flexibility to adapt to change and
continue delivering its commitments to its customers. The community
quarantine slightly disrupted the flow of critical materials and supplies
and was resolved through the acquisition of alternative suppliers, and
the flow returned to normal from early April 2020. Since then Philex
has adjusted its supply chain model to secure the flow of materials and
supplies for the operation of the Padcal mine and its milling facilities.
For the protection of its employees and their family members’ health and financial
wellbeing, Philex has been implementing strict measures at its head office and at
the Padcal mine site in compliance with the government’s quarantine guidelines.
Among them are limited curfew hours, the wearing of face masks, social distancing at
workplaces and residential quarters, and the establishment of a quarantine facility for
taking care of employees infected by COVID-19. Padcal mine’s underground operations
were suspended for a three-day period in October 2020 for a mass COVID-19 testing of
miners and to contain the virus from local transmission.
Philex’s contribution to the Group rose eight-fold to US$8.0 million (2019: US$1.0
million), reflecting higher average realized metal prices and higher volumes of
production as a result of higher ore grades, partly offset by lower tonnage mined and
milled.
In 2020, the average realized price of gold rose 27% to US$1,757 per ounce while the
price of copper increased 6% to US$2.87 per pound.
Total ore milled declined 3% to 7.8 million tonnes. The average gold grade rose 7% to
0.283 grams per tonne (2019: 0.264 grams per tonne) and the average copper grade
improved 6% to 0.187% (2019: 0.177%). As a result, gold production increased 6%
to 56,000 ounces and copper production rose 2% to 26.4 million pounds, resulting in
higher volumes of metal sold.
Core net income up 645% to 1.2
billion pesos (US$23.5 million)
from 156 million pesos (US$3.0
million)
reflecting higher revenue
lower operating costs
Net income of 1.2 billion pesos
(US$24.8 million) versus
net loss of 648 million pesos
(US$12.6 million)
reflecting the substantial improvement of core net income
2019 net loss mainly due to the impairment provision for Padcal mine assets
Revenue (net of smelting
charges) up 15% to 7.8 billion
pesos (US$158.3 million) from
6.8 billion pesos (US$131.7
million)
reflecting higher realized metal prices
higher metal output resulting from higher ore grades
partly offset by lower tonnage
revenues from gold, copper and silver contributed 57%, 42% and 1% of the total,
respectively
Operating Cost Per
Tonne of Ore Milled 2020
Pesos
Materials & supplies 213
Depreciation & amortization 160
Power 136
Labor 115
Smelting charges 79
Excise tax and royalties 69
Others 74
Total 846
19%
25%
16%
14%
9%
8%
9%

25 First Pacific Annual Report 2020
Philex
EBITDA up 62% to 2.7 billion
pesos (US$54.6 million) from
1.7 billion pesos (US$32.3
million)
reflecting higher revenue
Operating cost per tonne of ore
milled down 1% to 846 pesos
(US$17.1) from 852 pesos
(US$16.5)
reflecting improvement in operational efficiencies and prudent cost management
lower costs for materials and supplies, power and purchase contracts
partly offset by higher excise tax and royalties due to higher revenue and labour costs
Capital expenditure (including
exploration costs) down 30%
to 1.2 billion pesos (US$24.4
million) from 1.7 billion pesos
(US$33.0 million)
reflecting the slowdown in mine development and schedule of special projects at Padcal
mine due to supply disruptions in relation to COVID-19, which affected the delivery of
machinery and equipment ordered
The mine life of Philex’s major operating mining asset, Padcal mine, is projected to end in 2022. However, Philex is exploring
opportunities to sustain and maximize the potential of the Padcal mine operations and is pursuing a search for additional mining assets
to develop within or in the vicinity of the Padcal mine area.
Debt ProfileAs at 31 December 2020, Philex had 10.0 billion pesos (US$207.4 million) of borrowings, comprising bonds and short-term bank
loans. Short-term bank loans declined 30% to 1.8 billion pesos (US$37.0 million) from year-end 2019. The average interest cost was
approximately 3.5%.
DividendPhilex’s Board of Directors declared a final dividend of 0.059 peso (U.S. 0.12 cent) per share payable on 26 March 2021 to
shareholders on record as at 24 February 2021, representing a payout ratio of 25% of core net income.
Silangan ProjectThe Silangan Project is a large-scale gold and copper mining
project located in Surigao del Norte, at the northeastern tip of
Mindanao in the Philippines.
On 7 December 2020, the Department of Environment and
Natural Resources (“DENR”) approved the renewal of the
Mineral Production Sharing Agreement for Silangan Mindanao
Mining Co., Inc. (“SMMCI”) for an additional 25 years to be
commenced from 29 December 2024 with the same terms and
conditions. SMMCI is a wholly-owned subsidiary of Philex and is
the holding company for the Silangan Project.
The project contains a total of 571 million tonnes of mineral resources comprising the Boyongan, Bayugo-Silangan and Bayugo-
Kalayaan ore deposits. The definitive feasibility study for Boyongan, the first phase of the Silangan Project, was completed in July
2019. This phase anticipates mineable reserves of 81 million tonnes with expected high ore grades of 0.63% copper and 1.20 grams
of gold per tonne from mineral resources of 279 million tonnes.
Commercial operations from underground sub-level cave mining at Boyongan is expected to begin after two and a half years of
development, with an estimated mine life of 22 years at an annual average production of 4 million tonnes of ore. The estimated capital
expenditure of approximately US$750 million for the development of Boyongan is expected to be funded by project finance and the
entry of a strategic partner.

26 First Pacific Annual Report 2020
Review of Operations
Philex is still pursuing the completion of feasibility studies for the Bayugo-Silangan and Bayugo-Kalayaan deposits, the second phase
of the Silangan Project, as focus is directed to the search for a strategic partner for the project.
The earn-in-period in the Kalayaan Copper-Gold Resources, Inc. (“KCGRI”) farm-in agreement ended on 11 May 2021 and was
renewed on 17 December 2020 for another two years to 11 May 2023 by Philex and Manila Mining Corporation. KCGRI holds the
rights to develop the Bayugo-Kalayaan deposits.
The project is fully compliant with all existing regulations and is ready for development and related construction once a strategic
partner is identified.
PXPIn 2020, petroleum revenue declined 58% to 30 million pesos (US$0.6 million) (2019: 72 million pesos (US$1.4 million)) reflecting
a 24% decrease in liftings to 750,506 barrels (2019: 993,761 barrels) and a 40% drop in average crude oil sale prices. During the
year, output declined 7% to 695,247 barrels following a normal rate of decline in production at the Galoc oil field. Costs and expenses
fell 48% to 99 million pesos (US$2.0 million) (2019: 191 million pesos (US$3.7 million)), reflecting lower depletion and oil production
costs in Galoc, lower overhead and the absence of plug and abandonment costs for the Nido wells in 2019.
PXP’s core net loss declined 43% to 46 million pesos (US$0.9 million) from 80 million pesos (US$1.5 million), while reported net
loss declined 74% to 76 million pesos (US$1.5 million) from 297 million pesos (US$5.8 million), reflecting a higher provision for
impairment of the Galoc oil field made in 2019 and a decline in cost and expenses, partly offset by lower oil revenues.
SC 72Forum Energy Limited (“FEL”), a subsidiary of PXP, holds a 70% interest in SC72, which covers an area of 8,800 square kilometers
in the West Philippine Sea. Its second Sub-Phase (“SP”) of exploration activities was suspended due to a Force Majeure since 15
December 2014, which was lifted by the Philippine Department of Energy (“DOE”) on 14 October 2020. FEL is required to drill a
minimum of two wells as part of its work commitment under SP 2 of SC 72 in a 20-month period starting from 14 October 2020.
On 10 February 2021, the DOE approved the work program and budget to be conducted from 2021 until the first half of 2022.
FEL commissioned an Australia-based geophysical contractor to reprocess the 3D dataset (565 square kilometers) over the
Sampaguita Field, using broadband Pre-Stack Depth Migration (“PSDM”). The reprocessing commenced in October 2018 and was
completed in June 2019. This was followed by an interpretation of the newly reprocessed seismic data and the formulation of an
appraisal program for the Sampaguita Field, the results of which are expected to be available in the first half of 2021.
SC 74At SC 74 Linapacan Block, several geological and geophysical
studies are ongoing as part of the work commitment under SP
3 which will expire on 13 September 2021.
A joint Well Feasibility and Rock Physics project with the SC
14C2 consortium over the Linapacan and West Linapacan
areas was completed in October 2019, and PXP completed
a Quantitative Interpretation (“QI”) study over a 400 square
kilometer 3D area that includes a number of old wells.
PXP’s in-house seismic interpretation of the 3D seismic data
incorporating the results of the QI study and the final report
on biostratigraphy and geochemistry study are expected to be
completed in the first half of 2021. Upon completion of the
geological and geophysical studies, an offshore and onshore
data integration and prospects generation will subsequently
commence in late March 2021.

27 First Pacific Annual Report 2020
Philex
SC 75At SC 75 Northwest Palawan block, all exploration activities have been suspended since 27 December 2015 due to the imposed Force
Majeure until its lifting by the DOE on 14 October 2020.
A work program for 2021, includes the acquisition of at least 1,000 square kilometers of 3D seismic data later this year, was submitted
to the DOE in December 2020 and approval has not yet been received.
Peru Block Z-38Peru Block Z-38 is a joint venture project between Pitkin Petroleum Limited (“Pitkin”), Karoon Energy Ltd (“Karoon”, formerly Karoon
Gas Australia Ltd) and Tullow Oil Plc. (UK) (“Tullow”). The initial economic interests of Pitkin, Tullow and Karoon in Peru Block Z-38
were 25%, 35% and 40%, respectively. Following the withdrawal of Tullow from the joint venture project effective 31 December 2020,
Karoon’s economic interest in Peru Block Z-38 increased to 75% from 40%. Pitkin is not required to share the drilling cost of the
remaining well under a farm-in agreement signed with Karoon in 2009.
The block is under the Third Exploration Period (“EP”). Drilling of exploratory well Marina-1X was completed in February 2020. The
well encountered thin water bearing sands with no oil and only minor gas shows, and indicated that there is no prospectivity at this
location. The post-well analysis of results and the reprocessing of vintage 2D seismic data were completed in the fourth quarter
of 2020. The Peruvian authorities have extended the expiration of the Third EP to 27 July 2021 from 27 November 2020 due to
COVID-19.
The assessment of the development prospects of Block Z-38 is ongoing. Karoon has until June 2021 to decide whether to proceed to
the Fourth EP.
OutlookPhilex will continue to focus on optimizing the contribution from the Padcal mine while actively pursuing a strategic business partner
to develop its Silangan Project. The favourable trend in gold and copper prices continues to drive positive financial results at Philex.
Philex is continuously adjusting its mining plan to maximize metal output. Exploratory drilling works have been completed around the
periphery of the Sto. Tomas ore body and Philex is finalizing a technical and financial study for the possible extension of the Padcal’s
mine life beyond 2022.

28 First Pacific Annual Report 2020
Review of Operations
SHARE
OF LOSS
US$2.5 million
FPM Power /

29 First Pacific Annual Report 2020
FPM
Pow
er
/ P
LP
Singapore implemented circuit breaker measures for COVID-19 on 7 April 2020, which were progressively lifted from 2 June 2020.
Electricity demand increased in the second half of the year with the gradual resumption of economic activity. This limited to overall
decline in electricity demand to 2.5% for the full year. The volume of PLP’s electricity generation reflected the national trend as
generation in the second half of 2020 outpaced the first half by 32%.
Most employees apart from critical frontline officers continued to work from home. Online services were strengthened to meet the
needs of business as the retail arm of PLP was accredited the Data Protection Trustmark to assure the protection of customers’
personal data.
First Pacific’s share of PLP’s loss narrowed to US$2.5 million (2019: US$10.5 million) in 2020, reflecting a lower core net loss at PLP.
PLP is one of the most efficient power plants in Singapore. In 2020, the plant’s system availability remained high at 96.7% (2019: 97.8%)
in spite of scheduled maintenance work in February. The heat rate was slightly higher than the target level due to a lower level of
generation. The plant remained highly reliable despite Unit 10 recording its first incident of operational forced outage since May 2016;
Unit 20 has had no operational forced outage since March 2017.
In 2020, the volume of electricity sold declined 3% to 4,942 gigawatt hours (2019: 5,102 gigawatt hours), of which 86% (2019: 92%)
was for contracted sales and vesting contracts, and the remaining 14% (2019: 8%) was for pool market sales. PLP’s generation
market share for the year was approximately 9% (2019: 9%).
Core net loss down 44% to
S$33.6 million (US$24.4
million) from S$60.5 million
(US$44.4 million)
reflecting higher non-fuel margin from electricity sales
lower interest and marketing expenses
partly offset by a lower reversal of provision for onerous contracts and higher maintenance
expenses
Net loss down 1% to S$81.0
million (US$58.8 million)
from S$81.6 million (US$59.9
million)
reflecting a lower core net loss
a higher foreign exchange gain on U.S. dollar-denominated shareholders’ loans
partly offset by higher non-recurring losses
Revenues down 19% to
S$786.3 million (US$571.0
million) from S$972.4 million
(US$713.4 million)
reflecting lower average selling price per unit of electricity as a result of low oil prices
lower sales volume associated with the circuit breaker measures
Operating expenses down 4%
to S$23.4 million (US$17.0
million) from S$24.4 million
(US$17.9 million)
reflecting lower marketing expenses
partly offset by lower other income and higher staff benefit
EBITDA up 171% to S$11.4
million (US$8.3 million) from
S$4.2 million (US$3.1 million)
reflecting improvement in non-fuel margin for electricity sales
Debt ProfileIn October 2020, PLP completed the refinancing of S$613.0 million (US$445.2 million) of term loans, with maturity extended to
December 2026.
As at 31 December 2020, FPM Power’s net debt stood at US$468.4 million while gross debt stood at US$497.0 million. All of the
borrowings were floating-rate bank loans.
OutlookSingapore’s economy is forecast to expand by 4% to 6% in 2021 and electricity demand is expected to continue its upward trend
along with strong growth in the electricity-hungry data center industry. PLP will continue the optimisation of fuel and operating costs,
and leveraging its high efficiency to strengthen its market position.

30 First Pacific Annual Report 2020
Review of Operations
SHARE
OF LOSS
US$9.9 million
FP Natural Resources /

31 First Pacific Annual Report 2020
FP N
atu
ral R
eso
urc
es
/ R
HIThe COVID-19 related community quarantine in the Philippines
started in March 2020, limiting personal mobility and business
activities. This substantially reduced demand for fuel and ethanol
additives and triggered a shutdown of ethanol processing plants,
already suffering from higher feedstock costs, four months
earlier than planned. While RHI’s sugar business units were
not significantly impacted by COVID-19, the sugar operations
in Batangas were affected by the eruption of the Taal Volcano
in January 2020 and a decline in cane availability in the area.
This also hampered production of refined sugar due to limited
supplies of bagasse.
During the community quarantine period, all employees of the RHI head office (which primarily performs management support
functions) performed their functions under work-from-home arrangements. Production plants involving essential food manufacturing
and fuel supplies were exempted from the community quarantine and thus remained operational. To maintain operations, RHI’s plants
employed a skeletal workforce practicing social distancing as mandated by law. In addition, to further limit the number of people
physically present at the plants, work-from-home arrangements and shortened working hours were implemented for certain support
roles, as ordered by the local government.
Recognizing the need to support government efforts to curtail the spread of virus, RHI Group, as well as in partnership with Tulong
Kapatid extended assistance to the government, hospitals and other organizations through the donation of 93,796 litres of 70%
alcohol solutions for sterilization purposes.
In 2020, FP Natural Resources’ loss widened to US$9.9 million
(2019: US$7.2 million), reflecting a higher core loss at RHI.
RHI’s sugar production in 2020 (including the 9-month
production from La Carlota assets) accounted for approximately
7% of the Philippines’ domestic sugar production. Its sugar mill
in Batangas has milling capacity of 12,000 tonnes of sugar cane
per day and refinery capacity of 18,000 LKg per day (one LKg is
equal to one 50-kilogram bag of sugar), and its ethanol plant in
San Carlo City has a daily production capacity of approximately
100,000 liters.
In 2020, RHI’s sugar business milled 1.7 million tonnes of cane, down 27% from 2019 mainly due to lower production associated
with the sale of its sugar mill, ethanol plant and other investment properties in La Carlota, Negros Occidental (“La Carlota assets”) on
30 September 2020. It sold 1.4 million LKg (2019: 1.5 million LKg) of raw sugar; 585 thousand LKg (2019: 1.4 million LKg) of refined
sugar; and 1 thousand LKg (2019: 213 thousand LKg) of premium raw sugar. Alcohol sales volume declined 35% to 42.3 million liters
(2019: 65.0 million liters).
Core net loss up 33% to
1.1 billion pesos (US$21.8
million) from 814 million pesos
(US$15.8 million)
reflecting a negative alcohol margin associated with higher cost of molasses and lower
production and sales volume of alcohol due to community quarantine
lower production and sales volume of refined sugar due to decline in cane availability and
limited supply of bagasse
partly offset by lower operating expenses incurred by the assets sold on 30 September
2020 and lower finance costs
Reported net loss up 141%
to 4.1 billion pesos (US$83.3
million) from 1.7 billion pesos
(US$32.7 million)
reflecting higher core net loss
a loss on disposal of La Carlota assets and an impairment provision for goodwill in San
Carlos Bioenergy, Inc.

32 First Pacific Annual Report 2020
Review of Operations
Revenues down 33% to 7.5
billion pesos (US$150.9
million) from 11.2 billion pesos
(US$217.4 million)
reflecting lower sales volumes of alcohol and sugar products
absence of sales generated from La Carlota assets following the disposal on 30 September
2020
partly offset by higher alcohol prices
Operating expenses down 9%
to 904 million pesos (US$18.3
million) from 994 million pesos
(US$19.3 million)
reflecting absence of operating expense incurred by La Carlota assets
EBITDA up 173% to 71 million
pesos (US$1.4 million) from 26
million pesos (US$0.5 million)
reflecting lower operating expenses, despite lower gross profit
EBITDA margin to 1% from 0.2% reflecting higher EBITDA
lower revenue
Asset DisposalOn 30 September 2020, the disposal of La Carlota assets to Universal Robina Corporation for a consideration of 4.9 billion pesos
(US$101.0 million) was completed. RHI prepaid its long-term debt and reduced short-term debt by a total of 3.9 billion pesos (US$80.4
million) using the net proceeds.
Debt ProfileAs at 31 December 2020, long-term debt of RHI stood at 1.3 billion pesos (US$26.1 million) with maturities up until December 2027
at an annual interest rate of approximately 6.0%. Short-term debt stood at 4.0 billion pesos (US$84.3 million) with an average interest
rate of approximately 6.9%.
OutlookDespite the prevailing uncertainties due to the pandemic, RHI is striving to fast-track recovery and implement a wide-ranging
transformation strategy to rebuild its sugar mill and refinery in Batangas, and help the Philippines minimize importation of refined
sugar needed by beverage and food manufacturers, while boosting its alcohol business in Negros Occidental and strengthening the
agribusiness with more targeted programs to help farmers increase their yields.

Chairman’s Letter
33 First Pacific Annual Report 2020
Dear fellow shareholders
We had long looked forward to celebrating our 40th anniversary
in 2021 with a review of our accomplishments over the years
and optimism as we enter our fifth decade. But then, well, you
know what happened. We did not expect, instead of honouring
our history, to be struggling against a once-a-century COVID-19
pandemic and its social and economic consequences for all of us
everywhere.
Yes, we are stronger and wiser for our experience of this difficult
year yet we are fewer than we were with every business touched
by loss and every family met by hardship. We have endured and
now we begin to see the hazy outline of a post-COVID world.
In this world, we see our core holdings of Indofood, PLDT and
MPIC continue to grow. We expect rising dividend income from
these core businesses. We have reduced our borrowings and the
cost of what remains. We have every expectation that our sound
liquidity and strengthening finances will enable First Pacific to
further improve our balance sheet.
I join our Managing Director in confidence for the future of First
Pacific as we look to the medium and long term. Indofood and
PLDT operate in very different businesses and have arrived from
different directions at the winning combination of cost and quality
to win consumer loyalty. MPIC’s provision of basic services like
electricity, water and roads continues to improve the lives of ever-
growing numbers of Filipinos even as it expands its portfolio. It’s
been a difficult year, but right here and right now, First Pacific is
where it wants to be.
Anthoni Salim
Chairman
30 March 2021

Managing Director and Chief Executive Officer’s Letter
34 First Pacific Annual Report 2020
Dear shareholders,
It’s been quite a year, one unlike any we have seen in our lifetimes. However, there is continuity from before this extraordinary period of COVID-19 pandemic to after. First Pacific’s businesses remain strong and diversified in Asia, across consumer food products, telecommunications, infrastructure and natural resources, with a broad commitment to earning our income from delivering the products and services that consumers in the growing economies of Asia want. This has been our strength in the 40 years of our existence, and it is our strength now.
Our model sustains us in difficult times when demand is low, and raises our earnings in periods of economic upswing. It has served us well for four decades culminating in 2020 when we delivered earnings growth in spite of a very difficult time.
The First Pacific Group of companies have acquitted themselves well in an extraordinary year. Our operating companies have proved resilient in the face of this unprecedented crisis and our staff and management across the Group have revealed strengths that perhaps many did not know they have. I am proud of all our people and join them in recalling our losses even as we look to the future of a new post-COVID world.
Just last year, Indofood achieved a record top line as strong demand for our Consumer Branded Products was boosted by our acquisition of Pinehill late in the year. PLDT, the highest-quality telecommunications and data services provider in the Philippines, saw its top line raised to a record high by surging demand for data services. MPIC observed a shift in demand for its electricity and water businesses from commerce and industry to residential consumers as COVID-19 community quarantines changed how many Filipinos live and work. Its hospitals business, now 18 hospitals strong, stepped up to lead a response to the pandemic of which I and all of us at First Pacific can only be proud.
Having adapted to the new conditions of a difficult year, our companies are well positioned as First Pacific enters its fifth decade. Indofood is seeing continuing appetite for its high-quality food products as foreign expansion increases its scope for growth. After several years of billion-dollar capital expenditures, PLDT is firmly placed as the largest and highest-quality telecommunications provider in the Philippines. The businesses of MPIC are poised for a return to growth as the end of lockdown reopens transportation and commercial and industrial demand for water and electricity even as it invests in new businesses such as the storage of petroleum products for diversified growth.
I am proud of all our First Pacific people and join them in recalling our losses even as we look to the future of a new post-COVID world. As we look forward, we can be confident that the businesses of First Pacific are well positioned to take advantage of economic growth in our markets. Our 2020 results demonstrate that we are competitive, providing products and services that our customers want as First Pacific marks its 40th anniversary and enters its fifth decade in a position of strength.
As I said to you one year ago, before we had a complete understanding of the difficulties we would face in 2020, I am confident in expecting steady and strong earnings growth in the years ahead. I remain so today.
Manuel V Pangilinan
Managing Director and Chief Executive Officer
30 March 2021

Board of Directors and Senior Executives
35 First Pacific Annual Report 2020
Board of Directors
Anthoni Salim
Chairman
Manuel V. Pangilinan
Managing Director and Chief Executive Officer
Age 71, Mr. Salim graduated from Ewell County Technical
College in Surrey, England. He is the President and CEO of
the Salim Group, President Director and CEO of PT Indofood
Sukses Makmur Tbk and PT Indofood CBP Sukses Makmur Tbk,
and holds positions as Commissioner and Director in various
companies.
Mr. Salim serves on the Boards of Advisors of several
multinational companies. He was a member of the GE
International Advisory Board and the International Advisory Board
of Allianz SE. Mr. Salim is a member of the Food & Agribusiness
Advisory Board of Rabobank Asia and, since 2004 the Asia
Business Council.
Mr. Salim has served as a Director of First Pacific since 1981
and assumed the role of Chairman in June 2003.
Age 74, Mr. Pangilinan graduated cum laude from the Ateneo de
Manila University, with a Bachelor of Arts degree in Economics.
He received his MBA degree from the Wharton School at the
University of Pennsylvania. In Manila, he worked for Philippine
Investment Management Consultants Inc. (PHINMA) in the
Philippines, and in Hong Kong with Bancom International
Limited and American Express Bank. Thereafter he founded First
Pacific in May 1981.
Mr. Pangilinan served as Managing Director of First Pacific since
its founding in 1981 until 1999. He was appointed Executive
Chairman until June 2003, after which he was named Managing
Director and Chief Executive Officer. He holds the positions of
President Commissioner of PT Indofood Sukses Makmur Tbk in
Indonesia. In the Philippines, Mr. Pangilinan is the Chairman,
President and Chief Executive Officer of PLDT Inc. (PLDT),
Chairman of Smart Communications, Inc. (Smart), ePLDT, Inc.,
PLDT Communications and Energy Ventures, Inc., Metro Pacific
Investments Corporation (MPIC), Manila Electric Company
(Meralco), Global Business Power Corporation, Maynilad
Water Services, Inc., Metro Pacific Tollways Corporation, NLEX
Corporation, Philex Mining Corporation, PXP Energy Corporation,
Landco Pacific Corporation, Medical Doctors, Inc. (Makati
Medical Center), Davao Doctors, Inc., Colinas Verdes Corporation
(Cardinal Santos Medical Center), Mediaquest Holdings, Inc.
and Associated Broadcasting Corporation (TV 5), and the Vice
Chairman of Roxas Holdings, Inc.

36 First Pacific Annual Report 2020
Board of Directors and Senior Executives
Christopher H. Young
Executive Director and Chief Financial Officer
In 2006, the Office of the President of the Philippines awarded
Mr. Pangilinan the Order of Lakandula, rank of Komandante in
recognition of his contributions to the country. He was named
Management Man of the Year 2005 by the Management
Association of the Philippines. Mr. Pangilinan was awarded
the First Honorary Doctorates Degree in Management by Asian
Institute of Management in 2016, Honorary Doctorates in
Science by Far Eastern University in 2010, in Humanities by
Holy Angel University in 2008, by Xavier University in 2007 and
by San Beda College in 2002 in the Philippines. He was formerly
Chairman of the Board of Trustees of the Ateneo de Manila
University and was a member of the Board of Overseers of the
Wharton School.
In civic duties, Mr. Pangilinan sits as Chairman of the Philippine
Business for Social Progress (PBSP), PLDT-Smart Foundation
Inc., One Meralco Foundation Inc., and Co-Chairman of the
Philippine Disaster Resilience Foundation (PDRF), and is a
Director of the Philippine Business for Education (PBED). He
is Chairman of the Board of Trustees of San Beda College, Co-
Chairperson of the Board of Trustees of Stratbase Albert del
Rosario Institute and the U.S.– Philippine Society.
In sports, Mr. Pangilinan is Chairman of the MVP Sports
Foundation, Inc., Chairman Emeritus of the Samahang Basketbol
ng Pilipinas and Chairman of the Amateur Boxing Association of
the Philippines (ABAP).
Age 63, Mr. Young graduated from Waid Academy in Scotland
and received a Master of Arts (Honors) degree in Economics
from St. Andrews University.
He is currently a Director of Metro Pacific Investments
Corporation, PacificLight Power Pte. Ltd., Roxas Holdings,
Inc. and FPM Power Holdings Limited, and a member of the
Advisory Board of PLDT Inc. He also serves as Commissioner of
PT Indofood Sukses Makmur Tbk and a Trustee of IdeaSpace
Foundation, Inc.
Mr. Young worked for PricewaterhouseCoopers in London and
Hong Kong from 1979 until 1987, at which time he joined First
Pacific in Hong Kong as Group Financial Controller. He joined
Metro Pacific Corporation in 1995 as Finance Director, a position
he held until he joined PLDT as its Chief Financial Advisor in
November 1998. Mr. Young returned to First Pacific in 2015
as Chief Financial Officer and joined the First Pacific Board in
August 2017.

37 First Pacific Annual Report 2020
Professor Edward K.Y. Chen GBS, CBE, JP
Independent Non-executive Director
Age 75, educated at the University
of Hong Kong and Oxford University,
Professor Chen is an Independent Non-
executive Director of Wharf Holdings
Limited. He has served as President
of Lingnan University; Professor and
Director of the Centre of Asian Studies of
the University of Hong Kong; Chairman
of Hong Kong’s Consumer Council; as
an Executive Councillor of the Hong
Kong Government; and as a Legislative
Councillor. He is now the Chairman of the
HKU SPACE Board of Directors, a Board
Director of the Hong Kong Institute for
Monetary Research of the Hong Kong
Monetary Authority, a Distinguished
Fellow of the Hong Kong Institute for the
Humanities and Social Sciences at the
University of Hong Kong, and Honorary
Professor of the Open University of Hong
Kong. Professor Chen joined First Pacific’s
Board in 1993.
Philip Fan Yan HokIndependent Non-executive Director
Age 71, Mr. Fan holds a Bachelor’s
Degree in Industrial Engineering, a
Master’s Degree in Operations Research
from Stanford University and a Master’s
Degree in Management Science from
Massachusetts Institute of Technology.
Mr. Fan had been an Executive Director
of CITIC Pacific Limited in charge of
industrial projects in China. Prior to his
retirement as the Executive Director and
General Manager of China Everbright
International Limited, he made significant
contribution to the company’s leadership
position in the Chinese Waste-to-energy
industry.
Mr. Fan is also an Independent Non-
executive Director of China Everbright
Environment Group Limited (formerly
China Everbright International Limited),
Hysan Development Company Limited,
China Aircraft Leasing Group Holdings
Limited and PFC Devices Inc. He joined
First Pacific’s Board in December 2012.
Madeleine Lee Suh ShinIndependent Non-executive Director
Age 58, Ms. Lee graduated with a
Bachelor of Arts Honours in Economics
and Accounting from the University of
Leeds, UK and a Master of Business
Administration from the University of
Bradford, UK. She obtained her Chartered
Financial Analyst qualification in 1989.
Ms. Lee has spent 35 years in investment
management. She worked with the
Government of Singapore Investment
Corporation, Chase Manhattan, Morgan
Grenfell and as Managing Director at
Commerzbank Asset Management Asia.
In 2002, she was made a Fellow of
the Eisenhower Exchange Fellowship.
From 2005 to 2007, Ms. Lee was the
Deputy Chief Investment Officer of
the Investment Office of the National
University of Singapore. In 2008, she
founded Athenaeum Limited, a boutique
investment manager of Asian Pacific
funds. The funds business was sold
to Azimut Group in 2016. Since 2018,
Ms. Lee has started an advisory and
consultancy partnership to cater to Asian
Family Offices.
Ms. Lee has served on the board of
directors of Mapletree Investments Pte
Ltd, Aetos Security Pte Ltd and ECICS
Holdings of the Temasek Holdings stable
of companies. She was on Monetary
Authority of Singapore’s Financial Sector
Review Committee on the Liberalisation
of the Stockbroking Industry and the
Business Development Review Group for
the Merged Exchange.
Ms. Lee currently serves on the Board
of The Arts House Ltd, and Singapore
Institute of Management. She joined First
Pacific’s Board in September 2015.
Margaret Leung Ko May Yee SBS, JP
Independent Non-executive Director
Age 68, Mrs. Leung holds a Bachelor’s
Degree in Economics, Accounting
and Business Administration from the
University of Hong Kong. She was the
Vice-Chairman and CEO of Hang Seng
Bank Limited and Chairman of Hang
Seng Bank (China) Limited prior to her
retirement on 30 June 2012. Mrs. Leung
also held various pivotal positions in
HSBC Holdings Plc and The Hongkong
and Shanghai Banking Corporation
Limited from February 1978 until 30 June
2012. She was the Deputy Chairman
and Managing Director of Chong Hing
Bank Limited from February 2014 to
May 2018. She was also an Independent
Non-executive Director of the Hong Kong
listed Swire Pacific Limited, Hutchison
Whampoa Limited, China Construction
Bank Limited, Hong Kong Exchanges
and Clearing Limited, and Li & Fung

38 First Pacific Annual Report 2020
Board of Directors and Senior Executives
Limited. Mrs. Leung was the Chairman
of the Board of Governors of Hang Seng
Management College and Hang Seng
School of Commerce until March 2013,
and a Member of the Advisory Board and
Chairman of the Investment Committee of
the Hong Kong Export Credit Insurance
Corporation until December 2010.
Mrs. Leung is a council member and
Treasurer of the University of Hong
Kong, the Vice-Chairman of the Advisory
Committee on Arts Development, a
member of the Public Service Commission
and the Advisory Committee on Post-office
Employment for Former Chief Executives
and Politically Appointed Officials. She is
an Independent Non-executive Director
of Sun Hung Kai Properties Limited and
Agricultural Bank of China Limited. Mrs.
Leung joined First Pacific’s Board in
December 2012.
Blair C. PickerellIndependent Non-executive Director
Aged 64, Mr. Pickerell holds a BA degree
in Political Science and an MA degree
in East Asian Studies from Stanford
University and an MBA degree from
Harvard Business School.
Mr. Pickerell joined Jardine Matheson
Holdings Group in 1984 and held various
positions at Jardine Matheson Holdings
Group and at Jardine Fleming Holdings,
including as Managing Director of Jardine
Pacific Limited. In 2003, he joined HSBC
Investments (Hong Kong) Limited as the
Chief Executive Officer, Asia Pacific. From
2007 to 2010, he served as Managing
Director and Chief Executive Officer,
Asia of Morgan Stanley Investment
Management. Mr. Pickerell joined Nikko
Asset Management Group in 2010 as
Head of Asia and subsequently served as
Chairman, Asia until July 2015. He was
an Independent Non-executive Director of
Dah Sing Financial Holdings Limited.
He is currently an Independent Director
of Principal Financial Group, Inc., and an
Independent Non-executive Director of
Link Real Estate Investment Trust, Dah
Sing Banking Group Limited and Dah
Sing Bank, Limited.
Mr. Pickerell is also a member of the
Supervisory Committee of Tracker
Fund of Hong Kong, Chairman of the
Harvard Business School Association of
Hong Kong Limited, Strategic Advisor
to CreditEase Holdings (HK) Ltd., and
a member of the International Advisory
Council of the Faculty of Business and
Economics of The University of Hong
Kong.
Mr. Pickerell joined First Pacific’s Board
in March 2020.
Tedy DjuharNon-executive Director
Age 69, Mr. Djuhar received a Bachelor
of Economics degree from the University
of New England in Australia. He has also
completed the EMBA program at Cheung
Kong School of Business Beijing in
June 2014. Mr. Djuhar is Vice President
Commissioner of PT Indocement Tunggal
Prakarsa Tbk, a Director of Pacific
Industries and Development Limited and
a number of other Indonesian companies.
He joined First Pacific’s Board in 1981.
Axton SalimNon-executive Director
Age 41, Mr. Salim obtained a Bachelor of
Science degree in Business Administration
from the University of Colorado, USA.
Mr. Salim has had wide exposure
across various industries and extensive
experience in managing companies
in the fast-moving consumer goods
sector. He has served in various senior
positions since joining Indofood Group
in 2004. Mr. Salim heads the Dairy
Division of PT Indofood Sukses Makmur
Tbk (“Indofood”) and is concurrently a
Director of Indofood and PT Indofood CBP
Sukses Makmur Tbk, a Non-Executive
Director of Indofood Agri Resources
Ltd. and Gallant Venture Ltd., as well
as a Commissioner of PT Perusahaan
Perkebunan London Sumatra Indonesia
Tbk and PT Salim Ivomas Pratama Tbk.
He also serves as a Co-Chair of the United
Nations Scaling Up Nutrition (SUN)
Movement, and has been a Coordinator
of the SUN Business Network Indonesia
since 2014, as well as an Advisory Board
Member of the Nanyang Business School
since 2020.
Mr. Salim is the son of Mr. Anthoni Salim.
He joined First Pacific’s Board in March
2020.

39 First Pacific Annual Report 2020
Benny S. SantosoNon-executive Director
Age 62, Mr. Santoso graduated from
Ngee Ann College in Singapore. He serves
as a Commissioner of PT Indofood Sukses
Makmur Tbk, a President Commissioner
of PT Nippon Indosari Corpindo Tbk, a
Commissioner of PT Fast Food Indonesia
Tbk, a Director of PT Indocement
Tunggal Prakarsa Tbk and PT Nusantara
Infrastructure, Tbk, and as a member of
the Advisory Board of PLDT Inc. He joined
First Pacific’s Board in 2003.
Senior Executives
Marilyn A. Victorio-AquinoAssociate Director
Age 65, Ms. Aquino was educated at the
University of Santo Tomas (A.B.) and
University of the Philippines (LL.B., cum
laude) and qualified as a barrister in the
Philippines in 1981. She joined Sycip
Salazar Hernandez and Gatmaitan Law
Offices in the Philippines in 1980 where
she became a partner in 1989. Ms.
Aquino’s practice focused on banking,
finance and securities, construction and
infrastructure, investments, mergers and
acquisitions, and mining and natural
resources.
Ms. Aquino is the President of First
Coconut Manufacturing Inc. and a
Director of Philex Mining Corporation,
Philex Gold Philippines, Inc., PXP Energy
Corporation, Silangan Mindanao Mining
Company Inc., Lepanto Consolidated
Mining Company and Maynilad Water
Services, Inc. She was appointed Chief
Legal Counsel of PLDT in December
2018.
Ms. Aquino joined First Pacific in 2012.
Ray C. EspinosaAssociate Director
Age 64, Mr. Espinosa has a Master
of Laws degree from the University of
Michigan Law School and is a member of
the Integrated Bar of the Philippines. He
was a partner of SyCip Salazar Hernandez
& Gatmaitan from 1982 to 2000, a
foreign associate at Covington and Burling
(Washington, D.C., USA) from 1987 to
1988, and a law lecturer at the Ateneo de
Manila School of Law from 1983 to 1985
and 1989.
Mr. Espinosa is the President and Chief
Executive Officer of Manila Electric
Company (Meralco), a Director of PLDT
Inc. (PLDT), Smart Communications,
Inc., Roxas Holdings, Inc., Metro Pacific
Investments Corporation, Meralco
PowerGen Corporation and Global
Business Power Corporation. He also
serves as an Independent Director of
Lepanto Consolidated Mining Company
(Lepanto) and Maybank Philippines,
Inc. (Maybank Philippines). He is the
Chairman of the Audit Committee and
Nomination Committee of Lepanto and
the Risk Management Committee of
Maybank Philippines, and a member of
the Technology Strategy Committee of
PLDT.
Mr. Espinosa also acts as Senior Advisor
to the President and Chief Executive
Officer of PLDT. He is also a trustee of
the Beneficial Trust Fund of PLDT. Mr.
Espinosa joined First Pacific in 2013.
He is First Pacific Group’s Head of
Government and Regulatory Affairs and
Head of Communications Bureau for the
Philippines.
Joseph H.P. NgAssociate Director
Age 58, Mr. Ng received an MBA and
a Professional Diploma in Accountancy
from Hong Kong Polytechnic University.
He is a member of the Hong Kong
Institute of Certified Public Accountants,
the Association of Chartered Certified
Accountants and the Institute of Chartered
Accountants in England and Wales. Mr.
Ng is a Commissioner of PT Indofood
Sukses Makmur Tbk and a Non-executive
Director of Philex Mining Corporation and
PXP Energy Corporation, which are First
Pacific Group subsidiary and associates.
He joined First Pacific in 1988 from
PriceWaterhouse’s audit and business
advisory department in Hong Kong. Mr.
Ng was appointed as Associate Director in
April 2019. Prior to that he was Executive
Vice President of Group Finance and
served in several senior finance positions
within the Group, including as the Head
of Finance of the Group’s regional telecom
division and a director of a number of the
Group’s telecom joint ventures in India,
Indonesia and China.

40 First Pacific Annual Report 2020
Board of Directors and Senior Executives
John W. RyanAssociate Director
Age 55, Mr. Ryan received a Bachelor
of Arts degree from the University of
Connecticut and completed a Master
of Philosophy course on Slavonic and
East European Studies at St. Antony’s
College, Oxford University. He spent
several years as a financial journalist,
opening and leading Bloomberg’s
Moscow bureau for five years in the early
1990s and later joining Dow Jones as
Bureau Chief over the period 1998–2004
in Moscow and Hong Kong. Mr. Ryan
subsequently served as Head of Corporate
Communications, Asia Pacific for HSBC’s
wholesale bank. He joined First Pacific
in 2010. Prior to his appointment as
Associate Director in April 2019, Mr.
Ryan was Executive Vice President of
Group Corporate Communications.
He is currently Group Chief Investor
Relations and Sustainability Officer, and
a Commissioner of PT Indofood Sukses
Makmur Tbk.
Victorico P. VargasAssociate Director
Age 68, Mr. Vargas was educated at
Ateneo de Manila and University of Santo
Tomas.
Prior to his appointment as Associate
Director of First Pacific, Mr. Vargas was
the President and Chief Executive Officer
at Maynilad Water Services, Inc. He joined
PLDT Inc. (“PLDT”) in 2000 as its Human
Resources Group Head and through his
stay at PLDT got involved in managing
the PLDT Business Transformation
Office, Asset Protection and Management
Group, and the PLDT International Carrier
Business. He has worked in senior roles
at Union Carbide, Pepsico, Colgate
Palmolive and Citigroup.
He is a Director of Meralco, Smart
Communications, Inc., PLDT Global,
Inc., PLDT Subic Telecom, Inc. and
PLDT Clark Telecom, Inc., President and
Member of the Board of Trustees of the
First Pacific Leadership Academy, Trustee
of the MVP Sports Foundation, PLDT-
Smart Foundation, Inc. and IdeaSpace
Foundation and President of the PhilPop
Music Fest Foundation.
Mr. Vargas joined First Pacific in January
2016, overseeing First Pacific Group
businesses operating in the Philippines
and its region, particularly focus leading
the Business Transformation of PLDT.
Richard P.C. ChanExecutive Vice President
Group Financial Controller
Age 51, Mr. Chan received a BBA
(Hons) degree from Hong Kong Baptist
University and an MBA from the Chinese
University of Hong Kong. He is a Certified
Public Accountant (Practising), a CFA
charterholder and a Fellow of the
Hong Kong Institute of Certified Public
Accountants and the Association of
Chartered Certified Accountants. He has
experience in auditing, accounting, finance
and management spanning a diverse
range of business activities. He serves as
a Non-executive Director of Philex Mining
Corporation since January 2019, which is
First Pacific Group associate.
Mr. Chan joined First Pacific in 1996
from KPMG. Prior to his appointment as
Executive Vice President, Group Financial
Controller in April 2019, Mr. Chan was Vice
President, Group Financial Controller.
Maisie M.S. LamExecutive Vice President
Group Human Resources
Age 66, Ms. Lam received a Diploma from
the Hong Kong Polytechnic University/
Hong Kong Management Association. She
joined First Pacific in 1983.
Peter T.H. LinExecutive Vice President
Group Treasury and Tax
Age 51, Mr. Lin received a MSc in
Management Sciences from the
University of Southampton and a BSc in
Economics and Statistics from Coventry
University. He is a Fellow of the Institute
of Chartered Accountants in England and
Wales, Hong Kong Institute of Certified

41 First Pacific Annual Report 2020
Public Accountants and the Association of
Chartered Certified Accountants. Mr. Lin
joined First Pacific in 1998 from KPMG
where he was a Tax Manager. Prior to his
appointment as Executive Vice President,
Group Treasury and Tax in April 2019,
Mr. Lin was Deputy Treasurer and Vice
President of Group Tax.
Stanley H. YangExecutive Vice President
Group Corporate Development
Age 44, Mr. Yang received a Bachelor
of Science degree in Economics from
the Wharton School of the University of
Pennsylvania. He oversees First Pacific’s
corporate development activities including
mergers and acquisitions, joint ventures,
strategic partnerships, and other group
strategic initiatives. Prior to joining First
Pacific, Mr. Yang worked at Deutsche
Bank where he led investment banking
coverage in Asia for the industrials sector.
He also previously served as director of
Deutsche Bank’s mergers and acquisitions
department where he advised clients on
mergers and acquisitions, divestitures and
leveraged investments across Asia and
the United States. Mr. Yang began his
career in New York gaining transaction
experience in principal investing and
investment banking, and he transferred
to Hong Kong in 2007. He joined First
Pacific in 2013 and is currently a Director
of PacificLight Power Pte. Ltd.
Sara S.K. CheungVice President, Group Corporate
Communications
Age 57, Ms. Cheung received a BA in
Business Economics from the University
of California, Los Angeles and an
MBA from Southern Illinois University,
Carbondale. She is a member of the Hong
Kong Investor Relations Association.
She joined First Pacific in 1997 from
the Public Affairs department of Wharf
Limited and Wheelock and Company.
Nancy L.M. LiVice President
Company Secretary
Age 63, Ms. Li received a BA from
McMaster University in Canada and
a MSc in Corporate Governance and
Directorship from Hong Kong Baptist
University. She is a Fellow of both The
Chartered Governance Institute (formerly
known as The Institute of Chartered
Secretaries and Administrators) and
The Hong Kong Institute of Chartered
Secretaries, holding dual designations
of Chartered Secretary and Chartered
Governance Professional. Ms. Li joined
First Pacific in 1987 from the Hong
Kong Polytechnic University’s academic
secretariat. Prior to that, she worked in
the company secretarial department of
Coopers & Lybrand. Ms. Li was appointed
as First Pacific’s Company Secretary in 2003.

Corporate Social Responsibility Report
1
Winning photos of the 6th First Pacific Group photo competition
2
4
3
5

43 First Pacific Annual Report 2020
The corporate social responsibility (“CSR”) focuses of the Group’s key operating companies and foundations are highlighted below.
Supports the Hong Kong community with a focus on: Environmental care Education Sharing and caring Well-being development
Offers a framework for seamless coordination among First Pacific Group companies (including associated companies) to: Share information, resources and volunteers for
collective impact Eliminate inefficient duplication and identify
synergies Present First Pacific Group companies as trusted
partners in nation-building in the Philippines
The MVP Sports Foundation is the driving force in the development of world class Filipino sports champions, as well as promoting the culture of sports at all levels. The Foundation’s activities include:
Providing aid to the development of National Team Programs and National Athletes, supporting nine core sports: badminton, basketball, golf, rugby, boxing, taekwondo, football, weightlifting and cycling, as well as the others
Enhancing grassroots youth sports development programs of the allied groups of National Sports Associations, to identify, develop and monitor potential athletes
Partnering with schools, communities and local government units to integrate, enhance and sustain sports youth programs
Participation in, providing support and promotion to athletes of world class sporting events
In collaboration with Smart and the Philippine Badminton Association, hosted the 2020 Badminton Asia Team Championships in Manila
Supported potential athletes in their respective bids for the Tokyo 2020 Olympics
Assisted allied group of National Sports Associations in adjusting efforts amidst the pandemic
Promotes technology and science-based entrepreneurship in the Philippines:
Conducts an annual national startup competition Offers financial support and training to
technology and technology-enabled start-ups Established and manages the first innovation
hub for the Philippines, QBO Innovation Hub, a public-private partnership spearheaded by IdeaSpace in partnership with JP Morgan, the Department of Science and Technology and the Department of Trade and Industry
Supports corporate innovation programs through innovation workshops
Social and community activities are embodied in Indofood’s five CSR pillars:
Building human capital Nutrition for All Strengthening economic value Protecting the environment Solidarity and humanity
Funds and develops programs that promote digital inclusion and connectivity in:
Education – with a focus on development of teachers and fostering innovation in education
Livelihood and social enterprise Disaster response and recovery Youth and arts Sports development Local economic and social development
Promotes environmental awareness and livelihood for coastal communities through Shore It Up! (“SIU”)
Partners with Tulong Kapatid to provide calamity and disaster response
Promotes sustainability and food security through Bayan Tanim!
Provides funding and practical support for: COVID-19 related programs and activities Health, education, livelihood, public
infrastructure and socio-cultural projects Reforestation, water and air quality monitoring,
and hazardous waste management Science-based research for environment and
social development, to develop and implement Biodiversity Conservation Management Plan and enhance Social Development and Management Program
Taking part in environmental advocacy and sustainability through both financial and practical assistance:
By engaging in socially responsible and ethical acts in the environment of Singapore
Raising funds from staff to support disadvantaged groups impacted by COVID-19
Supporting recycling and educational outreach to the community
Focusing on social and environmental initiatives: Poverty alleviation through health care,
education, and livelihood assistance environmental stewardship volunteerism and local partnerships
Leads programs which focus on: Electrification of low-income households in the
Meralco franchise area and public schools in remote and island communities throughout the Philippines
Energy education Environmental protection and preservation
through sustainable reforestation Electrical facilities rehabilitation of public
schools Youth development through education, sports
and the arts Community relations and employee
volunteerism Power restoration support in disaster areas and
relief efforts
Leads initiatives and forges partnerships that promote: W.A.S.H. (water, sanitation and hygiene)
programs as pandemic response Rehabilitation of water resources Social entrepreneurship and community
development
Supports activities that lead to improvements in: Road safety and safe expressway driving The environment Education Health
Forges Public-Private Partnerships for the organizational strengthening of public hospitals, military medical treatment facilities and provincial/local government unit hospitals
Conducts in-house surgical-medical missions and adopts indigent patients through the Health Heroes Program
Responds to pandemic, disaster and emergency preparedness challenges during both natural and man-made calamities through the PPPPREPared (Public-Private Partnerships for Pandemic and Emergency Response Preparedness) Program
Facilitates donation of hospital equipment and medical supplies through the EQUIPPP (Equipment Upgrade and Improvement through Public-Private Partnerships) Program

44 First Pacific Annual Report 2020
Corporate Social Responsibility Report
A Culture of Responsibility and Sustainable AdvancementFirst Pacific Group serving with compassion and care despite COVID-19 challengesThe First Pacific Group, including subsidiaries, affiliated companies and associates, employs over 123,900 people with most located
in Southeast Asia. The outbreak of COVID-19 in early 2020 generated unprecedented challenges to business and to CSR initiatives.
Our operating companies remain committed to providing support to our communities, with appropriate safety arrangements in place
for employees, customers and other stakeholders, and in compliance with the local regulations and movement restrictions.
Details of our major operating companies’ COVID-19-related and key CSR outreach activities are available on their websites.
First PacificFirst Pacific Group companies further strengthened support within and across the Group during the pandemic. In February 2020,
Indofood sourced face masks from Indonesia for First Pacific employees in Hong Kong, and First Pacific donated thousands of masks
to the operating companies’ frontliners in the Philippines in May 2020.
In addition to regular employee benefits, First Pacific also offered work-from-home options and a special Employee Assistance
Program (“EAP”) to support the emotional and physical well-being of staff. The EAP provides 24/7 professional support for employees’
mental and physical health issues. The services including counselling, connecting to local resources, health-related advice and more.
Community supportFirst Pacific’s Code of Conduct policies are actively realized in the communities we operate in, through volunteering initiatives by staff,
contributions to charities and non-governmental organizations, and investments made in social programs.
Details of the 15 policies under the Code of Conduct are available on
www.firstpacific.com under Sustainability/Policies/Policies under the
Code of Conduct tabs.
We continue to support environmental stewardship, quality education,
entrepreneurship, disaster response and recovery, well-being development
and more, both at the Hong Kong Head Office and throughout our operating
companies.
In Hong Kong, we supported:
Hong Kong Green Day 2020 hosted by the Green Council
The Society for the Relief of Disabled Children
Scholarships at Lingnan University
First Pacific also supported the communities around our operating companies
through:
First Pacific Leadership Academy
MPIF’s Bayan Tanim! sustainable community food program
Donating usable items to The Salvation ArmyIn December 2020, a total of nine large bags of good quality clothes, shoes and
books donated by First Pacific employees were delivered to The Salvation Army
Hong Kong.
Staff trainingDuring the year, we arranged a mandatory training in “Corruption Prevention and Ethics” for all staff, conducted by the Independent
Commission Against Corruption.
First Pacific Group employee engagementWe encourage the management and staff of the First Pacific Group of companies to participate in activities that foster team spirit and
bonding, to communicate through formal and informal channels, CSR outreach and group-wide activities.

45 First Pacific Annual Report 2020
Photo competitionCreativity continues in the new normal. The 6th First Pacific Group photo competition salutes all our Group employees, who have
worked continuously to keep themselves, their families and customers safe and productive.
In light of the pandemic and with concern for the safety of the Group’s employees, the themes of the 6th Photo Competition were:
Work-from-home
e-Learning from home
My neighborhood (subject to local movement restrictions)
Serving our customers in the new normal
We received a total of 573 quality photos from the Group’s talented photographers from 29 operating companies. The following five
winning photos are on page 42:
1 Champion: e-Learning from home by Satrio Utomo, from Indofood
2 1st Runner-up winner: Social distancing by Gene Marc D. Esparagoza, from St. Elizabeth Hospital
3 2nd Runner-up winner: New normal fashion by Heinz Reimann D. Orais, from MPT South Corporation
4 3rd Runner-up winner: e-Learning while selling rujak bebek by Keleri Ginting, from Indofood
5 4th Runner-up winner: Endeavor by Kenneth Clor Horique, from Asian Hospital & Medical Center
The View magazineIn the May and November 2020 issues, The View featured extensive coverage of efforts by First Pacific Group companies’
management and employees – especially the frontliners – to tackle the pandemic challenges. We reported on the remarkable support
for each other and our communities, and the accelerating efforts to employ technology and innovative approaches to get through this
difficult time together.
A more sustainable futureFirst Pacific Group holds firm to its core values and mission to create long-term value in Asia for a more sustainable future. 2020
provided the challenges to which we have risen, maintaining vital services and supplies, managing risk and proving our agility in rolling
out innovations and serving our communities with dedication.
Tulong KapatidGroup companies join hands to helpFirst Pacific Group companies, foundations and affiliates in the Philippines unite
through Tulong Kapatid (Brotherly Help) in the fight against COVID-19. The CSR
group raises funds, organizes and distributes supplies and services from operating
companies.
PPE and food reliefTulong Kapatid supports frontliner waste management teams in Metro Manila.
Metro Pacific Investments Foundation (“MPIF”), One Meralco Foundation
(“OMF”), PLDT Smart Foundation (“PSF”) and Maynilad provided food and
care packages, PPEs, hygiene kits and bottled water to frontline workers and
communities.
Tulong Kapatid also supported the Department of Health’s (“DOH”) BIDA
campaign to encourage Filipinos to take an active role in the fight against
COVID-19, deploying teams to educate communities.
In December 2020, Tulong Kapatid led a nationwide donation drive, “Tuloy Pa
Rin Ang Pasko” to fund Noche Buena (Christmas Eve) food packs, essentials and
children’s toys for over 10,000 families, teachers, farmers, public hospitals and
communities.

46 First Pacific Annual Report 2020
Corporate Social Responsibility Report
Livelihood opportunitiesPLDT Enterprise provided a stimulus package to small and medium enterprises with BEYOND FIBER. Smart rolled out its Digital
Farmers Program to empower the rural poor and promote food security amid the pandemic. The program is now adopted in over 15
provinces in the Philippines. Smart’s “Kalye Mabunga” online series was mounted in partnership with the Department of Agriculture
– Agricultural Training Institute, and a #BuyLocalBuySmart rice campaign in partnership with social enterprise, Cropital. With the
Philippine Business for Social Progress (“PBSP”), PLDT launched a livelihood program for the female community in Payatas. Through
the SOW Livelihood Program, PLDT distributed 2,000 hygiene kits from PLDT-adopted schools and communities.
IndofoodIndofood strives to operate sustainably and responsibly. It continues to leverage its resources, expertise and innovation to mitigate the
impact of global challenges and provide benefits to the community across its value chain. However, the world was caught by surprise
when COVID-19 struck in early 2020. Indofood responds by striving to safeguard its business, including thousands of employees, its
supply chain and distribution, its consumers and communities at large.
Protecting the Indonesian food supply chain and the peopleAs one of the key stakeholders of the Indonesian food system, Indofood and its
operating companies actively support government measures to ensure a seamless
supply of food to consumers, under COVID-19 pandemic mitigation measures.
Each Indofood factory obtained an Industry Operational and Mobility License issued
by the Ministry of Industry. The license also extends to Indofood’s distributors, to
ensure smooth order fulfilment from warehouses to stores or distribution centers.
Indofood also boosted distribution through e-commerce platforms to meet the
surge of online demand.
Indofood has taken safety measures across all its operations to prioritize the safety
of its people and products. It also established safety policies for employees and
vendors, implemented all food safety guidelines published by the government,
continued to ensure that products safely reach customers who rely on them, and
supported various government and civil society efforts to help local communities
during the pandemic.
Indofood established a cross-organizational COVID-19 Task Force to identify,
coordinate and manage – as well as monitoring and reporting – the day-to-day
COVID-19 prevention measures. Task Force Teams in each strategic business
group facilitate crucial and timely decisions on the ground. The teams are
responsible for the implementation of mitigation measures in line with the Indonesian government protocol across all operating units
and are equipped with COVID-19 Standard Operating Policies and Procedures (“SOPPs”) issued by Indofood as a guidance for
conducting business activities.
Ensuring food safetyAll of Indofood’s products processing, packaging, and distribution operations
have adopted the Guidelines for Production and Distribution of Processed Food
during the Health Emergency Status of COVID-19, issued by the Indonesian
Food and Drug Authority (BPOM RI). The Guidelines stipulate comprehensive
requirements for food sanitation, personnel hygiene, physical distancing, as well
as specific, directed communication to reinforce awareness and understanding
of the requirements. Indofood upholds the highest standards of food safety,
including the use of Good Processed Food Production Methods, principles of
Hazard Analysis and Critical Control Point (“HACCP”), and stringent standards of
employee hygiene and health, physical distancing and disinfection.
During the pandemic, Indofood and its subsidiaries were able to build on the occupational health and safety (“OHS”) structures in
place, enlarging and enhancing the structure with a stronger team to mitigate health and safety risks more effectively.

47 First Pacific Annual Report 2020
Standing in solidarity with the communityIndofood is committed to support its community through this challenging time.
Its humanitarian relief efforts included:
Indofood, teamed with several organizations, funded and distributed medical
equipment to hospitals throughout Indonesia through the National Disaster
Management Agency
Provided food to disadvantaged families
Provided disinfecting assistance to the communities around Indofood’s
operating units
In collaboration with hospitals and other leading companies, Indofood
supported the setting-up of patient rooms for COVID-19 patients
Emerging stronger for the futureIndofood’s and its operating units’ proven policies and systems are equipped for adapting fast-changing situations during the
pandemic. It continues to monitor closely, and promptly respond to, the changing environment, with the priority of keeping its people
and communities healthy and protected.
PLDTPLDT rolls out #stayHome measures and servicesPLDT Group implemented vital measures to safeguard its network: boosting speed,
increasing capacity and offering new services and packages to help its customers
in their time of need. It provided free internet connectivity and free landline calls in
critical areas. PLDT Home initiated its #StayHome campaign, providing free services
to subscribers. PLDT, Smart, Meralco, and Cignal TV offered payment extensions on
bills that came due during quarantine.
PLDT provided digital productivity solutions for businesses working remotely –
helping them transition to a new normal and PLDT Home rolled out free speed boost
for Luzon.
PLDT and Smart are providing free access to online education services by the
Philippine Department of Education (“DepEd”). Students and teachers can access the complete curriculum at the DepEd Commons
site.
Lifelines to government, patients and frontlinersPLDT and Meralco donated millions of pesos’ worth of medical equipment to East
Avenue Medical Center (“EAMC”) for its new COVID facilities. Last December,
EAMC also inaugurated its own molecular laboratory. The PSF and OMF donation is
a grant of 2 RT-PCR machines and 1 Natch CS automated RNA extractor, vital for a
COVID-19 referral hospital.
Smart extended fast, free and reliable communications assistance kits to the
frontliners of various government departments and medical facilities for COVID-19
patients, such as the DOH, the Armed Forces of the Philippines (“AFP”), and
others. PLDT, Smart and ePLDT also developed COVID-19 emergency hotlines
in partnership with the DOH. PLDT provided internet connectivity to the Laguna
Incident Command Center and boosted connectivity to fast-track the processing of
COVID-19 test results. Smart free WiFi is available in campuses that are housing
COVID-19 frontliners, as well as hospitals, supermarkets and convenience stores.
PLDT also donated cars for frontliners, and 30 vehicles to the AFP.
PLDT Enterprise and Smart equipped frontliners with 540 pre-loaded smartphones
to enable them to pass swiftly through Metro Manila’s quarantine checkpoints.

48 First Pacific Annual Report 2020
Corporate Social Responsibility Report
In partnership with the Makati Medical Center Foundation, PLDT donated 200 scrub suits for frontliners at AFP quarantine and
swabbing facilities. PLDT also distributed disposable facemasks and face shields, relief packs and snack packs to typhoon victims.
PLDT-Smart Foundation (“PSF”) donated over 118,000 PPE sets as well as surgical and reusable facemasks and hazmat suits to
various hospitals and frontliners nationwide. PSF gave over 72,000 vitamin C tablets to frontline workers and communities. Along with
other members of Tulong Kapatid, PSF and OMF distributed over 60,000 liters of alcohol to government partner hospitals, agencies
and communities. PSF also donated extraction machines with PCR consumable test kits for Baguio General Hospital, Vicente Sotto
Memorial Medical Center (Cebu City), Diosdado P. Macapagal Memorial Hospital (Pampanga) in partnership with the Go Negosyo.
PSF distributed over 16,000 relief packs to families affected by Typhoons Rolly and Ulysses and deployed three rescue boats to
the AFP for their search and rescue operations after Typhoon Ulysses. Through PSF, MPIC and its logistic arm MMI, Pacific Global
One and OMF, AFP also received additional rescue boats, trucks, and a helicopter to aid in their disaster preparedness and rescue
operations.
FundraisingPLDT, through its PBSP-Motolite Balik Baterya funds, supported the Bayanihan
Musikahan musical fundraiser online, and distributed over 2,300 food packs and
vitamins to underprivileged families in Metro Manila and Cebu. Through the PBSP,
PLDT also built a handwashing facility for families in Metro Manila. PLDT also
supports Kaagapay: Protect our Healthcare Heroes project, led by the Philippine
Disaster Resilience Foundation.
Throughout COVID-19, Tulong Kapatid raised funds via PayMaya and MVP Rewards
to purchase food packs, hygiene kits, and care packages distributed to medical and
uniformed frontliners. In October 2020, it also ran a blood donation campaign with
the Department of Health Philippine Blood Center.
PayMaya and partners launched a one-stop digital donation service #OneAgainst Covid19, to channel donations to relief agencies and
charities.
An initiative of PSF and PLDT-Smart employees called “Kapit Kapatid” raised over 6.6 million pesos for PPEs and grocery packs for
medical frontline workers and the AFP, and meals for over 8,000 underprivileged individuals via the AFP Mobile Kitchen. PSF and
Smart also ran a Text-to-Donate drive for COVID-19 frontliners and communities most impacted by the pandemic.
PSF, PLDT and Smart: supporting quality educationPandemic-resilient e-LearningPLDT group has developed pandemic-resilient educational services
and solutions for the DepEd. These include learning management
systems, digital infrastructure and connectivity, wireless and fiber
plans, and digital devices for the 1.2 million teachers and 32 million
students in the Philippines. Smart also assists teachers to use an
innovative learning system – the CVIF Dynamic Learning Program –
which can be used in modular, online and on-air learning settings.
No Learner Left BehindPSF’s No Learner Left Behind campaign aims to enable students and teachers to adapt to the new blended learning strategy. PLDT
Home and PSF held a benefit online concert #AtHomeWithPLDT for the campaign. Over 1.5 million pesos were raised, including
donations from PLDT Home and PLDT Enterprise, which enabled the donation of five School-in-a-Bag (“SIAB”) turned over to the
DepEd, pocket WiFi and load cards to teachers of DepEd, scholars of AHA Learning Center, San Beda College Alumni Foundation,
students from Isla Verde, Batangas, and athletes from the Philippine Sports Commission.
Webinar seriesPLDT collaborated with UP Open University (“UPOU”) to reach out to more students, out-of-school youths and teachers through the
PLDT Infoteach webinar series. The new training module drew over 58,000 participants and 288,800 views on Facebook. Since its
inception in 2004, the program has produced over 30,000 graduates. The PLDT Infoteach webinar series includes tailored content for
teachers, students, local government partners, parents and the public.

49 First Pacific Annual Report 2020
School-in-a-BagSIAB is a portable digital classroom designed to support teachers and students
in distance learning, even in remote areas without electricity and internet
connectivity.
Each water-resistant backpack carries 20 student tablets, pre-loaded with
educational content – including award-winning mother-tongue based interactive
apps developed by Smart and academic partners, a teacher’s laptop, a pocket
WiFi kit, and more. The total value of each SIAB is 200,000 pesos. In 2020, PLDT
donated 70 SIAB packages, 15 of which to the DepEd. These resulted from joint
efforts among broadband services PLDT Home, PLDT Enterprise, PSF, Smart’s
flagship CSR: Smart Communities, and an employee fund-raising initiative, Smart
Saturdays.
In July 2020, Mr. Pangilinan led the turnover of SIAB donation to North Bay Boulevard North Elementary School in Navotas, Metro
Manila. The SIAB donation forms part of the grant from Huawei Technologies Philippines, Inc. to PSF. Mr. Pangilinan also donated 66
tablets for graduating Grade 6 students of the public schools.
PLDT, Smart and donors have provided 300 SIABs to DepEd schools, bridging the digital divide for over 80,000 underserved students
and over 2,000 teachers nationwide.
Gabay GuroGabay Guro is the 13-year-old joint program of PSF and the PLDT Managers Club
Inc. which aims to support and honor teachers through scholarship grants, teacher’s
training, digital innovations, classroom and computer donations and livelihood,
teachers’ tribute, housing and other programs.
On 3 October 2020, more than 500,000 beloved teachers attended the PLDT Gabay
Guro Virtual Grand Gathering. This get-together is the annual culmination of Gabay
Guro’s appreciation of educators nationwide.
Gabay Guro launched its one-stop app for digital educational resources in time
for World Teachers’ Day 2020. Teachers may also access DepEd platforms and
curriculum. Gabay Guro also launched its Learning Never Stops campaign, with
1-hour sessions featuring noteworthy speakers and resources available, free-of-charge, to teachers nationwide. Gabay Guro has
conducted 27 e-Learning sessions on Facebook with over 456,000 views.
Online Thanksgiving ConcertIn appreciation of the commitment and contributions from the Groups’ employees during a challenging 2020, PLDT organized an
online Thanksgiving Concert in December, exclusively for First Pacific Group Companies’ employees and families.
MPICMPIC companies at the vanguardMetro Pacific Hospital Holdings Inc. (“MPHHI”) has been at the forefront of
the government’s efforts during COVID-19. Three of MPHHI’s 17 hospitals are
designated for COVID-19 patients and extended their bed capacities. Under the
new normal, MPHHI member hospitals are strictly implementing and continuously
improving patient and healthcare workers’ processes. Volunteers from Group
hospitals answered the call for frontliners to assist the COVID facilities.
In July 2020, the MPHHI COVID Crisis Management Team initiated free webinars
for the medical profession, sharing best practices in infection control, protocols and
engineering interventions.

50 First Pacific Annual Report 2020
Corporate Social Responsibility Report
MPHHI increased its laboratory testing capacity and adopted new strategies such as Makati Medical Center’s teleconsultation via
mobile and video conferencing. MPHHI also offers services like e-pharmacy, mobile laboratories and remote patient monitoring.
MetroPac Movers Inc. distributed over 14,000 liters of 70% ethyl alcohol from Roxas Holdings Inc, to hospitals in April 2020.
Safeguarding transportation, providing reliefMetro Pacific Tollways Corporation (“MPTC”) provided free toll fees for medical and government frontliners, on its major North
Luzon (“NLEX”) and Subic-Clark-Tarlac Expressways (“SCTEX”). NLEX Corporation conducts rapid mass testing for COVID-19 for all
employees and frontliners, to assure its people and motorists’ safety.
MPTC provided relief goods, PPEs, livelihood projects and hospital beds to government, communities and hospitals in Metro Manila.
MPTC also provides livelihood projects and food for communities in Cebu and Cordova. NLEX, the Department of Public Works and
Highways, and religious group Iglesia ni Cristo partnered to complete a 300-bed We Heal as One COVID-19 quarantine center at the
Philippine Arena in Bulacan.
Light Rail Manila Corporation (“LRMC”) provided free alcohol and thermometers to all LRT1 merchants and commuters, and
disinfection and sanitation services for all trains and public transport vehicles. It waived various service fees for its merchants.
Meralco offers power, accommodationThe Medical City in Manila is a COVID-19 facility in proximity to the Meralco Center. Meralco created comfortable accommodation for
medical frontliners in the Meralco Fitness Center. Accommodation includes bedding, amenity kits, home-cooked hot meals, internet
access and more.
Meralco, with Maynilad and Smart, provide free WiFi, electricity and water
to the quarantine/temporary health centers in the Ninoy Aquino Stadium,
Rizal Memorial Stadium, Philippine International Convention Center, the
World Trade Center and Macapagal Terminal-South Harbor. At the Ninoy
Aquino Stadium quarantine facility, Meralco provides free power; Maynilad,
free water; and MPTC donated an initial 350 hospital beds. MPIC provided
ventilators, PPEs, face masks, ECG machines, defibrillators, mobile X-rays
and components for a mobile laboratory. Meralco provides lighting for the
300-bed We Heal as One Philippine Arena quarantine facility.
Meralco, together with PLDT, also donated 32 million pesos’ worth of
medical equipment to East Avenue Medical Center for its new COVID
facility.
Relief response for Taal volcano eruptionMetro Pacific Investments Foundation (“MPIF”) organized a relief support program for victims of the Taal volcano eruption and
mobilized resources to distribute blankets, mats, shirts, food, and water filters. MPIF provided quality medical consultations to
residents, through the Makati Medical Center’s doctors and healthcare staff.
Working with Tulong Kapatid, the corporate social responsibility alliance of foundations and companies under the First Pacific
Group of Companies, the group identified communities that have received little to no assistance from other companies. It redirected
undistributed surplus from some evacuation centers, to more than 1,000 affected residents of barangays in Mabini, Batangas.
Thank You for Being Our Heroes : MPIF’s support for frontliners’ PPE distribution
As healthcare community faced PPE supply shortages, MPIF initiated a PPE Distribution Program for frontliners. Mobilizing its
centralized purchasing network and logistical capacity, MPIF delivered PPEs to healthcare facilities across Metro Manila and in
Mindanao – outside of MPHHI’s hospital units.
MPIF delivered approximately 5,000 PPEs to over 14 institutions. Items provided include 1,000 virus specimen test tubes, 500 boxes
of Clusivol, 400 coveralls, 100 pairs of protective eyewear, 800 pairs of gloves, over 1,000 PPE kits, 10 Tulip Tabletop water filters,
and 300 face shields.

51 First Pacific Annual Report 2020
Kaya Natin ‘To : MPIF’s relief support for the marginalized sector
Kaya Natin ‘To is a relief program launched during the onset of the Enhanced
Community Quarantine, to help marginalized and vulnerable sectors cope with the
impact on livelihood of the COVID-19 pandemic, by providing basic needs such
as food and personal care items. MPIF delivered more than 3,700 relief packs,
including over 8,000 kgs of vegetables sourced directly from Agrea Agricultural
System International Inc., supporting the livelihood of farmers from Nueva Ecija.
Aside from tourism workers and low-income households, the program also
prioritized the vulnerable population comprised of persons with disabilities, informal
settlers, senior citizens, pregnant and lactating mothers, and indigenous minorities –
particularly, the remote Aeta community in Zambales.
Bayan Tanim! : MPIF’s fundraising drive for sustainable living
Bayan Tanim! forms the third phase of MPIF’s COVID-19 response strategy.
The initiative taps the potential of small-scale gardening to help disadvantaged
communities cope with the adverse impacts of the pandemic, providing them the
resources to cultivate food sustainably. It was designed to distribute planting crates
containing essentials such as seeds, seedlings, fertilizer, and potting mix. Through
Bayan Tanim!, beneficiaries can become self-sufficient with food thereby improving
their food security and long-term resilience.
This program delivered over 400 crates in seven communities – benefitting an
estimated 800 households across Metro Manila. MPIF intends to carry on the initiative through community markets as livelihood in the
future, and to expand distribution.
Calamity response for typhoons’ victimsAfter the successive onslaught of typhoons Quinta, Rolly, Siony, Tonyo and Ulysses during the COVID-19 pandemic, many provinces
experienced losses of billions of pesos in damages and millions of families lost their homes, livelihoods, and their loved ones.
MPIF immediately responded to calls for assistance around Metro Manila and surrounding areas by providing over 250 food relief
packs to victims, in partnership with other foundations.
In coordination with Tulong Kapatid, MPIF distributed 500 kgs of vegetables to boatmen, crew, and their families in Batangas. 500
bottles of water from Maynilad and 200 grocery packs from One Meralco Foundation (“OMF”) were also distributed to these typhoon
victims who had already lost their livelihoods due to the subsequent lockdowns.
Tuloy Pa Rin Ang PaskoDespite the pandemic challenges, MPIF brought Christmas cheer and hope to households, boatmen and dive resort personnel in
the coastal barangays of Mabini, Batangas which were badly hit by the COVID-19 pandemic and Typhoon Quinta. Tuloy Pa Rin Ang
Pasko, the Noche Buena gift-giving initiative is a partnership with OMF and other foundations.
MPIF continued its support for its Shore It Up! frontliners – the Mangrove Eco-guides in Siargao; and the Marine Protection,
Inspection, and Conservation guardians in Oriental Mindoro – by providing them and their local government unit counterparts with
Noche Buena packs.

52 First Pacific Annual Report 2020
Corporate Social Responsibility Report
PhilexPadcal minePhilex mine’s COVID-19 assistance was a response to call for unified
action from the mining industry by the Mines and Geosciences Bureau
of the Department of Environment and Natural Resources. Philex’s Social
Development and Management Program supported its host and neighboring
communities with food packs, PPEs, disinfectants, sanitation spraying
equipment and more, benefiting around 5,600 families.
Philex’s Community COVID-19 Task Force brought together village leaders,
cooperatives and vendors’ associations, local transport groups, teachers,
religious groups, the local government units and police, with the focus of
protecting employees, their family members and mine camp residents.
In addition to complying with the government’s safety and health protocols, Philex expanded its on-site COVID testing program,
contact tracing, isolation facilities, necessities and medical needs for its employees, their family members and mine camp residents.
The communal spirit at Padcal mine and its host communities was strong, with contributions from volunteers.
Silangan ProjectDespite limited resources, Silangan Mindanao Mining Co., Inc. (“SMMCI”)
partnered with First Pacific Group companies in the Philippines to provide
timely CSR support to its host communities to ease the adverse impacts
from the pandemic.
SMMCI continues its support for education. In 2020, its e-Learning program
benefited 4,600 students from 11 elementary and three secondary schools,
located in 11 host mining communities.
SMMCI also provided food packages, 70% ethyl alcohol, facemasks, surgical PPEs to over 540 frontline workers. Fifty-seven modified
hand wash stations were distributed to public schools, day care centers, barangay halls and municipal facilities in 11 host mining
communities.
PLPHealth & Wellness FundraiserDuring Singapore’s pandemic lockdown from March to June 2020, staff came together via a socially distanced Health & Wellness
Fundraiser to promote wellness and bonding, which comprised “Taking Positive Steps” and “PacificLight Fitness Bingo”. The funds
raised were donated to Dignity Kitchen, a social enterprise staffed by disabled individuals who prepare snacks and meals for health
workers, migrant workers, the elderly and low-income families. A total of 140 snack boxes were distributed to elderly recipients in low-
income neighborhoods.
MyFirstSkool eco-journal, sticker booklet and competitionIn 2020, PLP expanded its affinity for sustainability with partner MyFirstSkool, one of Singapore’s leading pre-school and childcare
providers with 145 preschools island wide. We jointly developed and produced an eco-journal and sticker booklet, with over 36,000
copies distributed to students. Students also worked in groups to create artworks based on famous Singapore landmarks. Made from
recycled materials, the students’ art pieces were exhibited to the public at the Singapore Sustainable Gallery. By creatively engaging
children through play, PLP hopes to inspire students to lead a more environmentally friendly lifestyle.
The inaugural “Draw An Energy Hero” competition also encouraged students to be thinkers and do-ers by learning and practicing how
to living sustainably.
Accelerating Your Energy Efficiency Program webinarPLP organized its first-ever energy efficiency webinar on 21 August 2020. Joined by the company’s specialist partners from
government agencies, organizations, clean energy providers and global banks, the webinar gave a compelling case for why going
green is an intuitive step to help businesses reduce their energy consumption and in turn, lower costs.

53 First Pacific Annual Report 2020
PLP virtual heritage tour with My Community FestivalIn December 2020, PLP Deputy General Manager (Special Projects) Mr. Kwong hosted the first of two iterations of a virtual heritage
tour, as part of the My Community Festival.
Mr. Kwong shared his fascinating experience to an audience of over 260 participants, detailing how it felt being part of Singapore’s
energy story for the past 40 years and spurring its transformation to the world-class industry it is today.
Educational outreachPLP continued to reach out to students, adapting to a more socially distanced format via virtual engagement. Students from
Orchid Park Secondary School had the opportunity to go on a physical tour in January 2020 prior to the pandemic, students from
Commonwealth Secondary School got to learn more about pursuing a career in the electricity industry during their Career Day. PLP
also worked with Dazhong Primary School to develop an environmental focus in the school’s curriculum. Lastly, seven graduating
classes from Kuo Chuan Presbyterian Primary School were given a virtual tour of the power plant.
RHIIn support of the United Nations Sustainable Development Goals, RHI and its
operating units continue their social and environmental assistance to local and
neighboring communities, despite the challenges from the pandemic.
Central Azucarera Don Pedro, Inc. (“CADPI”) partnered with various
organizations and local government units, providing cooked meals, bottled
water, hygiene kits, face masks, used clothes, rice, sleeping mats, kitchen
wares and blankets to approximately 2,000 evacuees and over 500 families
affected by the eruption of Taal Volcano in January of 2020.
In response to the global pandemic, CADPI donated thousands of masks;
hundreds of hygiene items, food packs, rice, sugar and disinfectant alcohol to sugarcane cutters and their families; medical, safety
and security services to frontliners and local government units in Nasugbu, Tuy and Balayan in Batangas.
CADPI also donated grocery packs and vitamin supplements to children of
sugarcane workers in four barangays in Nasugbu and Tuy, Batangas.
In 2020, San Carlos Bioenergy, Inc. (“SCBI”) planted over 6,400 seedlings
under its Brigada Kalinisan Program, donated health monitoring items to
three health centers in the surrounding barangays, and 300 N95 masks to
Punao Small Coconut Farmers Agriculture Cooperative. With support from 31
volunteers, SCBI collected approximately 1.5 tonnes of garbage from coastal
and other cleanup activities. Eighty volunteers participated in SCBI’s blood
donation activity.
In support of the local community in San Carlos in its fight against the pandemic, SCBI donated five hands-free alcohol dispensers to
the Department of Education and the City Health Office, and 25 units to public elementary and high schools.
One hundred children were fed from the plant’s Share-A-Meal project and 61 students at Don Juan Ledesma Elementary School were
provided with Supplemental Feeding. Another 100 students benefited from the Hakbang Tungo sa Pangarap program.
SCBI extended assistance to 150 sugarcane planters and 150 of their children were supported by its Project REAP: Rapid
Engagement and Assistance to Planters. SCBI also donated hundreds of N95 masks and offered assistance to over 430 planters.
Wider COVID-19 relief operations included donating approximately a thousand liters of ethyl alcohol to 31 government and 28 non-
government agencies, and over 49,000 liters to the MPIC Foundation and Alagang Kapatid Foundation. Sacks of rice were donated to
100 pedicab drivers in partnership with the San Carlos Borromeo Cathedral Parish.

Corporate Governance Report
54 First Pacific Annual Report 2020
Governance FrameworkFirst Pacific is committed to building and maintaining high standards of corporate governance. The Company’s Corporate Governance
Committee, comprising of a majority of Independent Non-executive Directors (INEDs), was delegated with the responsibility to
supervise the Company’s corporate governance functions.
During the year ended 31 December 2020, Mr. Axton Salim was appointed as a new Non-executive Director with effect from 25 March
2020 and as a member of the Corporate Governance Committee on 10 December 2020. Mr. Blair Chilton Pickerell was appointed as
a new INED and a member of the Finance Committee and the Corporate Governance Committee, all with effect from 25 March 2020.
The Corporate Governance Committee reviewed the Company’s corporate governance practices in respect of the year ended 31
December 2020 to ensure their compliance with the Listing Rules. This Committee is also tasked with the responsibility of overseeing
Environmental, Social and Governance (ESG) reporting in compliance with Listing Rule requirements. As recommended by the
Corporate Governance Committee, the Board approved the Company’s ESG report for publication on the websites of The Stock
Exchange of the Hong Kong Limited (SEHK) and the Company.
The Company has adopted its own Code on Corporate Governance Practices (the First Pacific Code), which incorporates the principles
and requirements set out in the Corporate Governance Code contained in Appendix 14 of the Main Board Listing Rules (the CG
Code). The First Pacific Code is updated from time to time to follow relevant amendments to the Listing Rules in order to strengthen
the transparency and accountability of the Board and the respective Board committees and to ensure that the Company is in line with
international and local corporate governance best practices.
Throughout the current financial year, First Pacific has applied the principles and complied with most provisions of the CG Code and,
where appropriate, adopted the Recommended Best Practices contained in the CG Code with the following exceptions:
Code Provision B.1.5: Issuers should disclose details of any remuneration payable to members of senior management by band in their
annual reports. Recommended Best Practice B.1.8: Issuers should disclose details of any remuneration payable to members of senior
management, on an individual and named basis, in their annual reports.
The Company does not disclose details of any remuneration payable to members of senior management, either by band or on an
individual and named basis as a large number of the senior executives employed by the Group are employed in jurisdictions that do
not require disclosure of such information. It would create inequality across the Group if only the remuneration of the senior executives
at the head office were disclosed.
Recommended Best Practices C.1.6 and C.1.7: An issuer should announce and publish quarterly financial results within 45 days after
the end of the relevant quarter.
The Company does not issue quarterly financial results as most of our major operating units already issue quarterly reports. As such,
we believe that the relevant information is already available in the public domain.
Code Provision C.2.5: The Issuer should have an internal audit function. Issuers without an internal audit function should review the
need for one on an annual basis and should disclose the reasons for the absence of such a function in the Corporate Governance
Report.
As an investment management and holding company, the Company does not have a separate internal audit department but has a
Risk Assessment Committee consisting of one Executive Director and six senior executives which oversees risk management at the
Head Office. Also, each of the Group’s major operating companies are required to have their own internal audit and risk management
functions responsible for the implementation and monitoring of effective internal control systems for operational, financial and
regulatory compliance, and risk management. The Company obtains, as part of its regular internal reporting processes, written reports
and confirmations from our major operating units’ audit and/or risk management committees regarding the work they undertake and
any significant matters arising therefrom. The reports and confirmations received from the individual audit and/or risk management
committees are collated by the Company’s Risk Assessment Committee and presented to and discussed with the Company’s Audit
and Risk Management Committee bi-annually. In addition, the Company’s management also attends and participates directly in a
number of the major operating units’ audit and/or risk management committees. Accordingly, the Company relies on a combination of
its regular internal reporting processes and Group resources to provide internal audit and risk management functions and, therefore,
does not consider it necessary to maintain a separate internal audit function. The Company will review the need for such a function on
an annual basis.

55 First Pacific Annual Report 2020
Compliance of the Model Code for Securities Transactions by Directors of Listed IssuersThe Company has adopted its own Model Code for Securities Transactions by Directors (the Model Code) on terms no less exacting
than the required standards of the Model Code for Securities Transactions by Directors of Listed Issuers as set out in Appendix 10 of
the Listing Rules. All Directors have confirmed, following specific enquiries by the Company, that they have complied with the required
standards set out in the Model Code for the year ended 31 December 2020.
Directors’ interest in securities of the Company and its associated corporations as at 31 December 2020 have been disclosed in the
Report of the Directors as set out in this Annual Report.
Whistleblowing PolicyTo promote good governance, the Company has put in place a Whistleblowing Policy, which is intended to assist employees and those
who deal with the Group to disclose information relevant to any suspected misconduct, malpractice or irregularity which he/she has
become aware of or genuinely suspects that the Group has been or may become involved in. Any suspected cases can be reported
through a confidential reporting channel directed to the Chairman of the Audit and Risk Management Committee. The policy is
regularly reviewed to ensure its effectiveness and is posted on the Company’s website (www.firstpacific.com). In 2020, the Company
did not receive any disclosure under the Whistleblowing Policy.
Board of DirectorsAs at the date of this Annual Report, the Board is comprised of eleven Directors, of whom two are Executive Directors, nine are NEDs,
of whom five are INEDs. Since five out of our current eleven-member Board are INEDs, the Company complies with the Listing Rule
requirements that INEDs shall represent at least one-third of the Board. The composition of our current Board is as follows:
Non-executive Directors Independent Non-executive Directors Executive Directors
Anthoni Salim (Chairman)
Term of Re-appointment: 5 June 2018
(re-elected) to 2021 AGM
Prof. Edward K.Y. Chen, GBS, CBE, JP
Term of Re-appointment: 21 June 2019
(re-elected) to 2022 AGM
Manuel V. Pangilinan
Term of Re-appointment: 21 June 2019
(re-elected) to 2022 AGM
Benny S. Santoso
Term of Re-appointment: 16 June 2020
(re-elected) to 2023 AGM
Margaret Leung Ko May Yee, SBS, JP
Term of Re-appointment: 21 June 2019
(re-elected) to 2022 AGM
Christopher H. Young
Term of Re-appointment: 5 June 2018
(re-elected) to 2021 AGM
Tedy Djuhar
Term of Re-appointment: 16 June 2020
(re-elected) to 2021 AGM
Philip Fan Yan Hok
Term of Re-appointment: 5 June 2018
(re-elected) to 2021 AGM
Axton Salim
Term of Re-appointment: 16 June 2020
(re-elected) to 2023 AGM
Madeleine Lee Suh Shin
Term of Re-appointment: 21 June 2019
(re-elected) to 2021 AGM
Blair Chilton Pickerell
Term of Re-appointment: 16 June 2020
(re-elected) to 2023 AGM
Note: Mr. Blair Chilton Pickerell and Mr. Axton Salim were appointed on 25 March 2020.
Board ProcessThe Board meets formally at least five times a year to review operational performance and financial plans, monitor the implementation
of strategy and any other significant matters that affect the operations of the Group, and approve matters specifically reserved to the
Board for decision.
The schedule for regular Board and Board Committee meetings in each year (subject to amendment) is made available to all
Directors/Board Committee members before the end of the preceding year, in order to provide sufficient notice to enable Directors
to attend. In addition, notice of at least 14 days will be given for a regular Board meeting to give all Directors an opportunity to attend
meeting. For all other Board and Board Committee meetings or special meetings, reasonable notice will be given. Apart from attending
the scheduled meetings, all Directors use their best endeavors to attend ad-hoc meetings, even on short notice, either in person, by
teleconference or by video conference, when necessary.

56 First Pacific Annual Report 2020
Corporate Governance Report
Meeting agendas for regular Board meetings are set after consultation with the Chairman and the Executive Directors. All Directors
are given an opportunity to include matters in the agenda. Directors have access to the advice and services of the Company Secretary
to ensure that Board procedures and all applicable rules and regulations are followed. Adequate and appropriate information in the
form of agendas, Board papers and related materials, are prepared and provided to the Directors prior to the scheduled date for these
meetings.
Since March 2014 the Company has distributed Board and Committee papers through an electronic platform to those Directors who
choose to access Board/Board Committee papers through this means. The electronic platform ensures timely and secure provision of
information to Directors while reducing paper usage.
Minutes of Board and Board Committee meetings are kept by the Company Secretary. Minutes are open for inspection by any
Director.
Minutes of the Board and Board Committee meetings are recorded and include matters considered in such meetings, decisions
reached, any concerns raised and any dissenting views expressed. Draft and final versions of the minutes of these meetings are sent
to all Directors and Committee members for their review and their records after each meeting. Chairs of Board Committees report on
issues discussed and reviewed by the Board Committees at each Board meeting.
In addition to the regular financial performance reports submitted to the Board at its regular meetings, the Directors also receive
monthly financial and business updates with information on the Group’s latest financial performance. Directors therefore possess an
up-to-date assessment of the Group’s performance, financial position and prospects throughout the year.
The Board reviews and evaluates its work effectiveness annually with a view to identifying areas for improvement and further
enhancement. In October 2020, due to the worldwide travel restriction under COVID-19 pandemic, the meeting between the INEDs
and the Chairman, without the presence of Executive Directors and management, was conducted via video conference.
Under the bye-laws of the Company, a Director should not vote or be counted in the quorum in respect of any contract, arrangement,
transaction or other proposal in which he/she or his/her close associate(s) is/are materially interested.
Board EvaluationThe Company believes that good corporate governance involves a strong and effective Board, one that understands its role and
responsibilities, provides leadership and strategic guidance for the Company, establishes effective controls, oversees management and
sets the Company’s values and standards. In this respect, it is important to measure the effectiveness of the Board through a proper
Board Evaluation process on a regular basis.
As instructed by the Corporate Governance Committee, the FY2020 Board Evaluation was internally administered through an online
questionnaire. The Directors indicated that they are clear about the role and function of the Board and their responsibilities as a
Director. They considered that the Board works cohesively and effectively together, with an open and candid exchange of ideas among
the Board and Board Committee members. There is a good diversity of talents, especially at the independent non-executive director
level, with expertise in accounting and finance, investments, banking, academia, and general management.
The Directors are generally satisfied with the oversight of performance of the Company and its operating companies, integrity of
financial statements, discussions on risk management issues, and worked closely and effectively with management with regard
to some major projects in the past year. The Directors suggested devoting more time to focus on the overall corporate strategic
direction and investment planning for the next 3-5 years, investment strategy and performance evaluation processes, post-acquisition
monitoring, and succession planning. It was considered that some of these suggestions can be addressed by refinements in Board
processes, including more timely release of Board materials and minutes, more transparency in investment processes, specific
sessions allocated for the discussion regarding strategy and succession planning. Directors’ training can be focused on ESG,
international and regional developments, specific industry or sector prospects, and technological development trends. The Directors
considered that periodic site visits to overseas business divisions would also help in understanding their operations.

57 First Pacific Annual Report 2020
Attendance RecordsThe Board held five regular meetings in 2020. The attendance records of the Board and Board Committee meetings as well as
the AGM and SGM held in 2020 are shown in the following table, noting that there was no meeting held by the Ad Hoc Selection
Committee during the year. The overall attendance rate of Directors at Board Meetings was 98% while for the Board Committee
meetings it was approximately 95.5%. The high attendance record at the Board and Board Committee meetings in 2020 demonstrates
our Directors’ strong commitment to the Company.
Meetings held in 2020
Regular
Board
Audit and
Risk
Management
Committee
Corporate
Governance
Committee
Remuneration
Committee
Nomination
Committee
Finance
Committee
Independent
Board
Committee
2020
AGM SGM
Number of Meetings 5 4 4 2 2 4 3 1 1
Executive Directors
Manuel V. Pangilinan 5/5 – – – 1/2 4/4 2/3# 1/1 1/1
Christopher H. Young 5/5 4/4# 4/4# 2/2# 2/2# 4/4# 3/3# 1/1 1/1
Non-executive Directors
Anthoni Salim 5/5 – – 1/2 2/2 – – 1/1 0/1^
Benny S. Santoso 5/5 – – – – – – 1/1 1/1
Tedy Djuhar 4/5 – – – – – – 1/1 1/1
Axton Salim*1 4/4 – 1/1 – – – – 1/1 0/1^
Independent Non-executive Directors
Prof. Edward K.Y. Chen, GBS, CBE, JP 5/5 4/4 – 2/2 2/2 4/4 3/3 1/1 1/1
Margaret Leung Ko May Yee, SBS, JP 5/5 4/4 4/4 – – 4/4 3/3 1/1 1/1
Philip Fan Yan Hok 5/5 – 4/4 2/2 2/2 4/4 3/3 1/1 1/1
Madeleine Lee Suh Shin 5/5 4/4 4/4 – 2/2 4/4 3/3 1/1 1/1
Blair Chilton Pickerell*2 4/4 – 3/3 – – 4/4 3/3 1/1 1/1
Average Attendance Rate 98% 100% 100% 83% 90% 100% 100% 100% 82%
# Not a member of the respective Board Committees but attended the Committee meetings to provide information from management’s perspective.*1 Mr. Axton Salim was appointed as a new Non-executive Director of the Company on 25 March 2020 and a member of the Corporate Governance Committee
on 10 December 2020.*2 Mr. Blair Chilton Pickerell was appointed as a new INED of the Company, a member of the Finance Committee and the Corporate Governance Committee,
all with effect from 25 March 2020.^ Mr. Anthoni Salim and Mr. Axton Salim did not join the SGM as they were required to abstain from voting due to conflict of interest.
Board DiversityThe Directors are collectively responsible for promoting the success of the Company by directing and supervising the Company’s
affairs. The Board has a balance of skills and experience appropriate for the requirements of the Group’s businesses.
As at the date of this Annual Report, members of the Board came from different background, with a diverse range of academic,
business and professional expertise. Brief biographical information of each of our Directors is set out in the section “Board of Directors
and Senior Executives” on pages 35 to 39 of this Annual Report.
The Board considers that its diversity is a vital asset to its businesses. In August 2013, the Board adopted a Board Diversity Policy,
which is available on the Company’s website (www.firstpacific.com) under the Corporate Governance Section. Board appointments are
based on merit and candidates are considered against objective criteria, having due regard for the benefits of diversity on the Board,
including but not limited to gender, age, cultural and educational background, ethnicity, professional experience, skills, knowledge
and length of service. The Company remains committed to meritocracy in the Board room, which requires a diverse and inclusive
culture where Directors believe that their views are heard, their concerns are attended to and they serve in an environment where bias,
discrimination and harassment are not tolerated.

58 First Pacific Annual Report 2020
Corporate Governance Report
An analysis of the Board’s current composition is set out in the following chart:
Number of Directors
0
2
4
6
8
10
12
Male(9)
Female(2)
ED(2)
Non-Chinese
(7)
71 yearsold andabove
(4)
Chinese(4)
80-99%(1)
below 60years old
(2)
100%(10)
21 yearsand
above(4)
11-20years(1)
0-10years(6)
61-70yearsoid(5)
NED(4)
INED(5)
Gender Designation Ethnicity Age Group Length of serviceon First Pacific
Board
Attendancerate at Board
meetings in 2020
The Company maintains on its website (www.firstpacific.com) and on the designated issuer website of the SEHK (www.hkexnews.hk)
an updated list of its Directors identifying their roles and functions and whether they are INEDs. INEDs are also identified as such in all
corporate communications that disclose the names of the Company’s Directors.
Chairman and Chief ExecutiveThe roles of the Chairman and Chief Executive Officer of the Company are separate, with a clear division of responsibilities.
Currently, Mr. Anthoni Salim, a Non-executive Director, is the Chairman of the Company and Mr. Manuel V. Pangilinan, an Executive
Director, is the Managing Director and Chief Executive Officer of the Company. The division of responsibilities between the Chairman
and the Chief Executive Officer of the Company are set out in the First Pacific Code.
Responsibilities of DirectorsThe Board is responsible for the success of the Company by directing and supervising its affairs in a responsible and effective manner.
Each Director has a duty to act in good faith and in the best interests of the Company. Directors are expected to devote sufficient time
and attention to performing their duties and responsibilities. The Directors are aware of their collective and individual responsibilities to
all shareholders for the manner in which the affairs of the Company are managed, controlled and operated.
The Executive Directors, led by the Managing Director and Chief Executive Officer, are responsible for the day-to-day management
of the Company’s operations. In addition, there are regular meetings with the senior management of subsidiaries and associated
companies at which operating strategies and policies are formulated, discussed and settled.

59 First Pacific Annual Report 2020
The Company has established a policy enabling all Directors to seek independent professional advice in appropriate circumstances, at
the Company’s expense. The Board will arrange separate independent professional advice to Directors to assist the relevant Director or
Directors to discharge their duties to the Company as and when requested or necessary.
The Company has arranged Directors’ and Officers’ Liability Insurance for a total liability limit of US$45 million, renewable annually in
May of each year. The underwriters are Berkshire Hathaway Specialty Insurance Company and AIG Insurance Hong Kong Limited,
who are both specialists in the Directors’ and Officers’ Liability Insurance market.
If a substantial shareholder or a Director has a conflict of interest in a matter to be considered by the Board, which the Board has
determined to be material, the matter should be dealt with by a physical board meeting rather than a written resolution. INEDs who,
and whose close associates, have no material interest in the transaction should be present at that board meeting.
Appointment and Re-election of DirectorsThe Company’s Ad Hoc Selection Committee uses a formal and transparent procedure for the appointment of new Directors. Before
a prospective Director’s name is formally proposed by an international talent search firm or recommended by other Directors, the
opinions of the existing Directors (including the NEDs and INEDs) will be solicited.
In accordance with the Company’s bye-laws, any new Director appointed by the Board to fill a casual vacancy shall remain a Director
of the Company until the next AGM and then he or she shall be eligible for re-election at that meeting. During the year, both Mr. Blair
Chilton Pickerell and Mr. Axton Salim (who were appointed as new directors with effect from 25 March 2020) were re-elected at the
2020 AGM for a fixed term of approximately three years until the 2023 AGM.
In accordance with the Company’s bye-laws and the First Pacific Code, every Director, including NEDs and INEDs and those
appointed for a specific term, shall be subject to retirement by rotation at least once every three years. A retiring Director is eligible for
re-election at the AGM.
Each year, the Nomination Committee receives an annual confirmation of each INED’s independence. The independence of the INEDs
has been assessed in accordance with the guidelines set out in Rule 3.13 of the Listing Rules. As a standard corporate governance
practice, each Nomination Committee member abstains from assessing his/her own independence.
Following such assessment, the Nomination Committee affirmed and the Board concurred, that all the INEDs continued to
demonstrate strong independence in judgment, free from any business or other relationship which could interfere with their ability to
discharge their duties effectively, and are therefore considered independent. Each INED is required to inform the Company as soon
as practicable if there is any change in their own personal particulars that may affect their independence. No such notification was
received during 2020.
Other than Mr. Anthoni Salim, who is the father of Mr. Axton Salim, none of the Directors have any financial, business, family, or
other material/relevant relationship with each other. Non-executive Directors (including INEDs) have the same duties of care and skill
and fiduciary duties as Executive Directors. The biographies of Directors are set out in the section “Board of Directors and Senior
Executives” on pages 35 to 39 of this Annual Report.
Succession PlanningThe Board recognizes the importance of having continuity in the senior management (including directors), maintaining leaders with
appropriate skills and experience to support the delivery of the Group’s strategic priorities. In order to mitigate the succession planning
risk, the Company has made it a regular Board agenda item and to review progress on an annual basis. Mr. Axton Salim (son of Mr.
Anthoni Salim) was appointed as a Non-executive Director of the Company on 25 March 2020 to become familiar with the operations
of the Company and its major operating units. The Group has also continued the search process to identify potential talents from
within and outside the Group for succession planning at both the operating company and Company level.

60 First Pacific Annual Report 2020
Corporate Governance Report
Directors’ TrainingThe Board is informed of updates of current Listing Rules, accounting practices and disclosure requirements, as and when necessary.
Further, all Directors are provided with briefings and training on an annual basis to ensure that they have a proper understanding of
the Company’s operations and business and are fully aware of their responsibilities under applicable laws, rules and regulations. Such
briefings and training are provided at the Company’s expense.
During the year, the Company arranged for a Directors’ training provided by our external legal counsel in relation to Legal and
Regulatory Update and minimizing legal risks in cyber incidents. The Directors’ training was attended by a majority of Directors and
senior management.
Furthermore, some Directors also attended external seminars on topics relevant to their duties as Directors, including topics such as
governance, leadership, climate change and cyber security. The Company maintains proper records of the training provided to and
received by its Directors.
Board CommitteeThe Board has six Board Committees, namely the Audit and Risk Management Committee, Remuneration Committee, Nomination
Committee, Corporate Governance Committee, Finance Committee and Ad Hoc Selection Committee, in order to assist the Board in
carrying out its responsibilities. The current composition of the six Board Committees is as follows:
BOARD
Audit and Risk
Management Committee
Madeleine Lee Suh ShinΔ*Prof. Edward K.Y. Chen*Margaret Leung Ko May Yee*
Remuneration Committee
Prof. Edward K.Y. ChenΔ*Philip Fan Yan Hok*Anthoni Salim#
Nomination Committee
Philip Fan Yan HokΔ*Prof. Edward K.Y. Chen*Madeleine Lee Suh Shin*Anthoni Salim#
Manuel V. Pangilinan°
Corporate Governance
Committee
Margaret Leung Ko May YeeΔ*Philip Fan Yan Hok*Madeleine Lee Suh Shin*Blair Chilton Pickerell*Axton Salim#
Finance Committee
Margaret Leung Ko May YeeΔ*Prof. Edward K.Y. Chen*Philip Fan Yan Hok*Madeleine Lee Suh Shin*Blair Chilton Pickerell*Manuel V. Pangilinan°
Ad Hoc Selection Committee
Philip Fan Yan HokΔ*Prof. Edward K.Y. Chen*Margaret Leung Ko May Yee*Madeleine Lee Suh Shin*Anthoni Salim#
Δ
*
#
Chairman of the CommitteeINEDNED
° ED
During the year, Mr. Blair Chilton Pickerell was appointed as a member of the Finance Committee and the Corporate Governance
Committee with effect from 25 March 2020. In addition, Mr. Axton Salim was appointed as a member of the Corporate Governance
Committee on 10 December 2020.
Each of these Board Committees has specific written terms of reference, which set out in detail their respective authorities and duties.
Each Board Committee regularly reviews its terms of reference and effectiveness. The terms of reference of all the Board Committees
have been made available on the websites of the SEHK (www.hkexnews.hk) and the Company (www.firstpacific.com).
All Board Committees are comprised of a majority of INEDs and chaired by an INED. The Board Committees report to the Board
following each Committee meeting, drawing the Board’s attention to significant issues or matters of which the Board should be aware
of, identifying any matters in respect of which it considers requiring action or improvement, and making relevant recommendations.
Board Committees may invite any Director, senior executive, consultant or other relevant party to provide advice in this respect, if
necessary.

61 First Pacific Annual Report 2020
Audit and Risk Management CommitteeThe Audit and Risk Management Committee currently comprises of all INEDs, and is chaired by Ms. Madeleine Lee Suh Shin, who
possesses appropriate professional qualifications and experience in financial matters. The other two members, Mrs. Margaret Leung
and Prof. Edward Chen, also possess relevant qualification and experience in accounting and financial matters. The biographical
information of the three members is set out in the section “Board of Directors and Senior Executive” on pages 37 and 38 of this
Annual Report. This is in compliance with Rule 3.21 of the Listing Rules.
The Audit and Risk Management Committee’s written terms of reference, which describe its authorities and duties, are regularly
reviewed and updated by the Committee and approved by the Board. Reporting to the Board, the Audit and Risk Management
Committee reviews matters such as interim and annual financial statements, risk management and internal control systems, in order
to protect the interests of the Company’s shareholders. The Committee may invite any Director, senior executive, consultant or other
relevant party to provide advice in this respect, as necessary.
Members of the Audit and Risk Management Committee meet at least twice a year with the Company’s independent auditor and
hold one separate session per year in the absence of management. The Audit and Risk Management Committee discusses the audit
process, accounting issues and reviews the effectiveness of risk management and internal control systems. Special meetings are also
convened, where appropriate, to review significant financial issues. In 2020, there were two regular meetings to review the interim/
annual results of the Company and two regular meetings to focus on matters relating to risk management. Minutes of the Audit and
Risk Management Committee meetings are prepared with details of the matters considered and decisions reached at the meetings.
The Audit and Risk Management Committee reports to the Board following each Committee meeting, drawing the Board’s attention to
issues or matters of which the Board should be aware, identifying any matters of significance requiring action or improvement, and
making relevant recommendations.
During the year, the Audit and Risk Management Committee held four meetings. The attendance record of each Committee member
is shown in the section headed “Attendance Records” on page 57 of this Annual Report. Major work performed by the Audit and Risk
Management Committee during the year was as follows:
reviewed the Company’s annual results and financial statements for the year ended 31 December 2019 and the related
documents, financial reporting and audit issues noted by the Company’s independent auditor;
reviewed the Company’s interim results and financial statements for the six months ended 30 June 2020 and the related
documents, financial reporting and accounting issues noted by the Company’s independent auditor;
considered the 2020 Audit Plan for the First Pacific Group and the audit fee arrangement;
reviewed the report from the Risk Assessment Committee on First Pacific’s Head Office Risk Matrix on a semi-annual basis;
reviewed new and revised accounting standards and the impact on the Group’s financial statements;
conducted regular reviews of the Group’s continuing connected transactions and annual review pursuant to Rule 14A(55) of the
Listing Rules;
reviewed the engagement of the Company’s independent auditor, its independence and objectivity, and the effectiveness of the
audit process;
recommended the re-appointment of independent auditor for shareholders’ approval at the 2020 AGM;
reviewed the adequacy of resources, qualifications and experience of staff of the Company’s accounting and financial reporting
functions, and their training programmes and budgets;
exercised oversight over the Group’s financial reporting system, risk management and internal control systems;
exercised oversight over the audit and/or risk management committees of the Company’s major operating companies;
reviewed the Audit and Risk Management Committee’s effectiveness in discharging its role and responsibilities and made
recommendations to the Board for any changes;
reviewed the need for cybersecurity insurance for the Head Office;
reviewed the Directors’ and Officers’ Liability Insurance cover; and
adopted the revised Risk Management Policies and Procedures.

62 First Pacific Annual Report 2020
Corporate Governance Report
Remuneration CommitteeThe Remuneration Committee is currently comprised of a majority of INEDs, and chaired by Prof. Edward Chen, an INED. It has terms
of reference which set out clearly with its authorities and duties. The terms of reference of the Remuneration Committee include the
specific authorities and duties set out in paragraphs B.1.3(a) to (j) of the First Pacific Code, with appropriate modifications, where
necessary.
In determining the Company’s remuneration policy, the Remuneration Committee takes into account the Company’s business
objectives, people strategy, short-term and long-term performance, business and economic conditions, market practices, and
compliance and risk controls in order to ensure that remuneration aligns with business and individual performance, promotes effective
risk management, facilitates retention of quality personnel and is competitive in the market. The Committee may invite any Director,
senior executive, consultant or other relevant party to provide advice in this respect, if necessary.
The Remuneration Committee reports to the Board following each Committee meeting, drawing the Board’s attention to significant
issues or matters of which the Board should be aware, identifying any matters in respect of which it considers action or improvement is
needed, and making relevant recommendations.
During the year, the Remuneration Committee held two meetings with the Company’s Head of Human Resources. The attendance
record of each Committee member is shown in the section headed “Attendance Records” on page 57 of this Annual Report. Major
work performed by the Remuneration Committee during the year was as follows:
made recommendations to the Board on the Company’s policy and structure for Directors’ and senior management’s
remuneration;
assessed the performance of Executive Directors and approved the terms of Executive Directors’ service contracts;
reviewed and approved the management’s remuneration proposals with reference to the Board’s corporate goals and objectives;
determined, with delegated responsibility, the remuneration packages of individual Executive Directors and senior management;
reviewed the revised 2020 salary budget and 2019 annual bonus;
reviewed the 2021 salary budget and 2020 annual bonus;
reviewed the Company’s Guidebook on Human Resources’ policies and procedures for staff;
reviewed the possible recruitment of a new Executive Director; and
reviewed the Remuneration Committee’s effectiveness in discharging its role and responsibilities and made recommendations to
the Board for any changes.
Nomination CommitteeThe Nomination Committee is currently comprised of a majority of INEDs, and chaired by Mr. Philip Fan, an INED. It has terms of
reference which deal clearly with its authorities and duties. The terms of reference of the Nomination Committee include specific
authorities and duties set out in paragraphs A.5.2(a) to (d) of the First Pacific Code, with appropriate modifications, where necessary.
The Nomination Committee reports to the Board following each Committee meeting, drawing the Board’s attention to significant issues
or matters of which the Board should be aware, identifying any matters which it considers require action or improvement, and making
relevant recommendations. The Committee may invite any Director, senior executive, consultant or other relevant party to provide
advice in this respect, as necessary.
During the year, the Nomination Committee held two meetings. The attendance record of each Committee member is shown in the
section headed “Attendance Records” on page 57 of this Annual Report. Major work performed by the Nomination Committee during
the year was as follows:
reviewed the structure, size and composition of the Board and existing Board Committees;
considered the appointment of Mr. Blair Chilton Pickerell as an INED and Mr. Axton Salim as a Non-executive Director;
reviewed and confirmed the independence of INEDs (details of which are set out in the section headed “Appointment and Re-
election of Directors” on page 59 of this Annual Report);
nominated the retiring Directors to stand for re-election at the 2020 AGM;
reviewed succession planning for the Board and senior management;
reviewed the Nomination Committee’s effectiveness in discharging its role and responsibilities and its terms of reference and
made recommendation to the Board for any changes; and
recommended the addition of a new member to the Corporate Governance Committee.

63 First Pacific Annual Report 2020
Corporate Governance CommitteeThe Corporate Governance Committee is currently comprised of a majority of INEDs and chaired by Mrs. Margaret Leung, an INED. It has terms of reference which deal clearly with its authorities and duties. Mr. Blair Chilton Pickerell and Mr. Axton Salim were appointed as members of the Corporate Governance Committee on 25 March 2020 and 10 December 2020 respectively. The terms of reference of the Corporate Governance Committee include the specific authorities and duties set out in paragraphs D.3.3(a) to (e) of the First Pacific Code, with appropriate modifications, where necessary.
The Corporate Governance Committee reports to the Board following each Committee meeting, drawing the Board’s attention to significant issues or matters of which the Board should be aware, identifying any matters which it considers require action or improvement, and making relevant recommendations. The Committee may invite any Director, senior executive, consultant or other relevant party to provide advice in this respect, as necessary.
During the year, the Corporate Governance Committee held four meetings. The attendance record of each Committee member is shown in the section headed “Attendance Records” on page 57 of this Annual Report. Major work performed by the Corporate Governance Committee during the year was as follows:
reviewed the Company’s policies and practices on corporate governance and made recommendations to the Board; reviewed and monitored the Company’s policies and practices on compliance with legal and regulatory requirements; reviewed the Company’s compliance with the Corporate Governance Code as set out in Appendix 14 of the Listing Rules for
disclosure in this Corporate Governance Report; reviewed the Corporate Governance Committee’s effectiveness in discharging its role and responsibilities and made
recommendations to the Board for any changes; approved the publication of the 2019 ESG report and reviewed the proposed plan for 2020 ESG reporting; considered the results of the Board Evaluation exercise for FY2019 and to suggest corresponding refinements in board processes
and to devote more time to strategy; considered the possible change of service provider for sharing documents and information due to the Company’s recent IT
upgrade; reviewed the latest regulatory developments in ESG and guidance for the Company’s 2020 ESG reporting, in response to
increased demands from major asset owners, institutional asset managers and regulators; considered formal ESG targets for 2020-2022, including the development of a Responsible Investing Policy, improving ESG
ratings, and starting to adopt the new HKEX ESG guidelines in the 2020 ESG Report; considered the proposals for FY2020 Board Evaluation and approved the option of a self-administered online questionnaire; approved the appointment of Mr. Blair Chilton Pickerell and Mr. Axton Salim as new members of the Committee; considered and approved new and revised policies relating to the Code of Business Practice and related policies and
Responsible Investment Policy; and reviewed current ESG ratings by key proxy advisors.
Finance CommitteeThe Finance Committee is currently comprised of a majority of INEDs, and chaired by Mrs. Margaret Leung, an INED. Mr. Blair Chilton Pickerell was appointed as a member of the Finance Committee with effect from 25 March 2020. It has terms of reference which deal clearly with its authorities and duties.
During the year, the Finance Committee held four meetings. The attendance record of each Committee member is shown in the section headed “Attendance Records” on page 57 of this Annual Report. Major work performed by the Finance Committee during the year was as follows:
reviewed and monitored the Group’s major investments; reviewed the long-term business plan and key strategic priorities of the Company and its major operating units; reviewed the impact of the COVID-19 pandemic on the Company and its major operating companies, and considered the specific
COVID-19 initiatives being undertaken by those units; reviewed the Group’s M&A initiatives, including the very substantial acquisition of Pinehill Company Limited (Pinehill) by PT
Indofood CBP Sukses Makmur Tbk (ICBP), MPIC’s sale of its interest in Light Rail Manila Corporation (LRMC) to Sumitomo Corp., and other MPIC initiatives;
reviewed the PLP situation and refinancing plan; reviewed the Company’s cash flow projections and debt refinancing plan, including the proposed launch of a new 7/10-year
bond; and reviewed the Company’s share repurchase program and dividend/distribution policy.

64 First Pacific Annual Report 2020
Corporate Governance Report
Ad Hoc Selection CommitteeThe Ad Hoc Selection Committee is currently comprised of a majority of INEDs, and chaired by Mr. Philip Fan, an INED. It has specific
written terms of reference which deal clearly with its authorities and duties.
After the appointments of two new directors in March 2020, the Ad Hoc Selection Committee did not consider it necessary to hold any
meeting during the year.
Independent Board CommitteeThe Independent Board Committee is currently comprised of all INEDs, and chaired by Prof. Edward Chen, an INED. It has specific
written terms of reference which deal clearly with its authorities and duties.
During the year, the Independent Board Committee held two meetings to consider the Very Substantial Acquisition and Connected
Transaction relating to the proposed acquisition of the entire issued share capital of Pinehill by ICBP. After taking into account the
advice from the Independent Financial Adviser, the Independent Board Committee made a recommendation to the Independent
Shareholders to vote in favour of the resolution to be proposed at the SGM to be convened to approve the proposed acquisition.
Directors’ Service ContractsNo Director has an unexpired service contract with the Company which is not determinable by the Company within one year without
payment of compensation, other than statutory compensation.
Disclosure of Inside InformationThe Company has put in place a policy for the disclosure of inside information in compliance with the Securities and Futures
Ordinance of Hong Kong, which has been uploaded to the website of the Company (www.firstpacific.com). The policy sets out the
procedures for the handling and dissemination of inside information in a timely manner so as to allow shareholders, staff and other
stakeholders to understand major developments within the Company and its major operating companies. The framework and its
effectiveness are subject to review on a regular basis in accordance with established procedures.
Dividend or Distribution PolicyThe policy on the payment of dividends or distributions is determined and reviewed by the Finance Committee and the Board from
time to time, taking into account the Group’s performance and financial conditions as well as the cashflow of the Company. This is
disclosed in the Company’s annual reports and is available on the website of the Company (www.firstpacific.com).
Barring unforeseen circumstances, the Company is currently paying dividends or distributions of not less than 25% of the Group’s
recurring profit every year. This is paid to our shareholders twice a year through one interim dividend or distribution in respect of the
six months ended 30 June and a final dividend or distribution in respect of the full year ended 31 December. Details of the dividend
or distribution payments in respect of the current financial year, including the ex-dividend/distribution dates and record dates of the
dividends/distributions, can also be found on the Company’s website (www.firstpacific.com).
Financial ReportingIn order to enable the Directors to present a balanced, clear and comprehensive assessment of the Company’s performance,
financial position and prospects to its shareholders, financial reports with adequate information and explanations are prepared by the
Company’s management and sent to the Board on a timely and regular basis.
Directors’ Responsibility for the Financial StatementsThe Hong Kong Companies Ordinance requires the Directors to prepare financial statements for each financial year that give a true
and fair view of the Company’s state of affairs as at the end of the financial year and of its results and cash flows for the year then
ended. In preparing the financial statements, the Directors are required to:
select suitable accounting policies and apply them on a consistent basis, making judgments and estimates that are prudent, fair
and reasonable;
state the reasons for any significant departure from relevant accounting standards; and
prepare the financial statements on a going concern basis, unless it is not appropriate to presume that the Company will
continue in business for the foreseeable future.

65 First Pacific Annual Report 2020
The Directors are responsible for keeping proper accounting records, for safeguarding the assets of the Company and for taking
reasonable steps to prevent and detect fraud and other irregularities.
Auditor’s RemunerationAn analysis of auditor’s remuneration in respect of audit and non-audit services is as follows:
US$ millions 2020 2019
Auditor’s remuneration
– Audit services 4.8 4.5
– Non-audit services(i) 1.0 1.5
Total 5.8 6.0
(i) Pertains due diligence, review of continuing connected transactions and other transactions relating to the Group’s business development
Company SecretaryAll Directors have access to the advice and services of the Company Secretary, who is an employee of the Company and reports to
the Executive Directors on Board governance matters. She is responsible for ensuring that Board procedures are followed and for
facilitating communications among Directors as well as with shareholders and management.
The Company Secretary’s biography is set out on page 41 in the “Board of Directors and Senior Management” section of the 2020
Annual Report. During 2020, the Company Secretary undertook over 15 hours of professional training to update her skills and
knowledge in company secretarial practices, corporate governance, shareholder activism and recent changes to the Listing Rules.
Constitutional DocumentsDuring 2020, there was no change in the constitutional documents. These documents are available on the SEHK’s and the Company’s
websites at www.hkexnews.hk and www.firstpacific.com respectively.
Communications with ShareholdersEffective CommunicationFirst Pacific encourages an active and open dialogue with all of its shareholders, private and institutional, large and small. The Board
acknowledges that its role is to represent and promote the interests of the Company as a whole and that its members are accountable
to shareholders for the performance and activities of the Company. First Pacific is always responsive to the views and requests of its
shareholders.
The formal channels of communicating with shareholders are the annual and interim reports, press releases, published
announcements, shareholders’ circulars and shareholder meetings. The annual and interim reports seek to communicate
developments in the Company’s businesses to shareholders and the wider investor community. All of these initiatives are designed to
better inform shareholders and potential investors about the Company’s activities and strategic direction.
The AGM is the principal forum for formal dialogue with shareholders. The Company’s Chairman, Executive Directors, Chairs of Board
Committees and NEDs (including INEDs), are present at the AGM either in person, by teleconference or video conference, in order to
answer questions from shareholders about specific resolutions proposed at the meeting and also about the Group in general.
Other than the 2020 AGM, the Company convened an SGM on 17 July 2020 to solicit independent shareholders’ approval of a Very
Substantial Acquisition and Connected Transaction relating to the proposed acquisition of Pinehill by ICBP, which was subsequently
approved by the independent shareholders.
In order to promote effective communication, the Company also maintains a website (www.firstpacific.com) which includes information
relating to the Group and its businesses.

66 First Pacific Annual Report 2020
Corporate Governance Report
Voting by PollThe Company’s shareholders are informed of the procedures for and their rights to demand voting by poll in shareholders’ meetings at
which their approvals are sought through disclosure in the Company’s circulars. All voting at general meetings are conducted by poll.
At the 2020 AGM and SGM, the chairman demanded a poll on all resolutions. The procedures for demanding a poll by shareholders
were incorporated in the respective AGM circular and SGM circular sent to shareholders in the time stipulated. Computershare Hong
Kong Investor Services Limited, the Company’s Hong Kong Branch Registrar, was engaged as scrutineer to ensure the votes were
properly counted.
Shareholders Communication PolicyThe Company has put in place a Shareholders Communication Policy to ensure that Shareholders are provided with ready, equal
and timely access to information about the Company. The policy is regularly reviewed to ensure its effectiveness and is posted on the
Company’s website (www.firstpacific.com).
Calling a Special General MeetingShareholders holding at the date of the deposit of the requisition not less than one-tenth of the paid-up capital of the Company
carrying the right of voting at general meetings of the Company shall at all times have the right, by written requisition to the Company,
to require a SGM to be called by the Board for the transaction of any business specified in such requisition.
The requisition:
must be in writing and state the purposes of the meeting;
must be signed by all the Shareholders concerned;
may consist of several documents in like form each signed by one or more Shareholders concerned; and
may either be deposited at the principal office of the Company at 24th Floor, Two Exchange Square, 8 Connaught Place, Central,
Hong Kong in hard copy form or sent by email to [email protected].
Details of the abovementioned procedures are set out in a document titled “Rights and procedures for shareholders to convene
meetings/put forward proposals” available on the Company’s website (www.firstpacific.com).
Putting Forward Proposals at General Meetings
Shareholders can request to circulate a resolution at a general meeting or circulate a statement (of not more than one thousand words)
in connection with a proposed resolution or the business to be dealt with at a general meeting; the number of shareholders necessary
for such requisition shall be:
(a) shareholders representing not less than one-twentieth of the total voting rights of all shareholders having at the date of the
requisition a right to vote at the meeting to which the requisition relates; or
(b) not less than one hundred shareholders of the Company.
A copy or copies of requisition signed by all requisitionists shall be deposited, with a sum reasonably sufficient to meet the Company’s
expenses in giving notice of the proposed resolution or circulating any necessary statement, either at the principal office of the
Company at 24th Floor, Two Exchange Square, 8 Connaught Place, Central, Hong Kong in hard copy form or sent by email to
[email protected] in the case of:
(a) a requisition requiring notice of a resolution, not less than six weeks before the meeting; and
(b) any other requisition, not less than one week before the meeting.
Details of the abovementioned procedures are set out in a document titled “Rights and procedures for shareholders to convene
meetings/put forward proposals” available on the website of the Company.

67 First Pacific Annual Report 2020
Further, a shareholder may propose a person other than a Director of the Company for election as a Director of the Company at a
general meeting at which elections to the office of directors are to be considered. For such purpose, the shareholder must send to the
Company’s principal address (for the attention of the Company Secretary) (i) a written notice of intention to propose a resolution at the
general meeting; and (ii) a notice signed by the proposed candidate of his/her willingness to be elected, together with that candidate’s
information as required to be disclosed under the Listing Rules and such other information as required by the Company, and the
candidate’s written consent to the publication of personal data. Such notice must be sent within a period of not less than seven days
before the date of the general meeting. Procedures for shareholders to propose a person for election as a Director of the Company are
also available on the website of the Company.
Putting Enquiries to the Board
Shareholders may send enquiries requiring the Board’s attention to the Company Secretary at the Company’s principal
office located at 24th Floor, Two Exchange Square, 8 Connaught Place, Central, Hong Kong in hard copy form or by email to
[email protected]. Questions concerning the procedures for convening or putting forward proposals at an AGM or
SGM may also be put to the Company Secretary in the same manner.
Continuing Connected Transactions and Connected TransactionsDuring the year, the INEDs agreed with the Directors in relation to the following continuing connected transactions (CCTs) and
connected transactions and approved the disclosure of those transactions in the form of published announcements and/or circular:
29 January 2020 announcement: following the Company’s previous announcement published on 10 October 2019 in relation
to, among other things, the revised Framework Agreement between D.M. Consunji, Inc. (Consunji) and Maynilad Water Services,
Inc. (Maynilad), which holds an exclusive concession granted by Metropolitan Waterworks and Sewerage System (MWSS)
on behalf of the Philippine Government, to provide water and sewerage services in the West Zone of the MWSS service area,
the Company announced that Maynilad and the AA-DMCI Laguna Lake Consortium (a consortium between Acciona Agua,
S.A. and Consunji), entered into a service contract pursuant to the terms of the Framework Agreement on 28 January 2020
(Service Contract), in relation to the design and build of a 150-MLD (million liters per day) Laguna Water Treatment Plant in the
Philippines.
As the term of the Service Contract exceeds a period of three years, under Rule 14A.52 of the Listing Rules, an Independent
Financial Adviser (IFA) was appointed to review and issue an independent opinion to explain the reasons for the Service Contract
requiring a duration longer than three years and to confirm that it is a normal business practice for agreements of this type to be
of such duration.
24 March 2020 announcement: NLEX Corporation (NLEX) and Consunji entered into a Construction Contract, pursuant to
which Consunji has agreed to construct and complete the civil works for the NLEX-SLEX Connector Road – Section 1 project in
the Philippines, which covers the construction of a 4-lane carriageway and two interchanges located at C3 Road/5th Avenue,
Caloocan City and España in Manila (the Project) in accordance with the terms of the Construction Contract. The contract price
for the Project is Php7.98 billion (equivalent to approximately US$155.0 million or HK$1.2 billion), inclusive of taxes, subject to
adjustments as provided for in the Construction Contract.
The Construction Contract was awarded by NLEX to Consunji following a detailed competitive bidding process conducted
by NLEX. The contract price was determined pursuant to such detailed competitive bidding process and after arm’s length
negotiations between NLEX and Consunji and was based on normal commercial terms with reference to the expertise, experience
and market position of Consunji, and the complexity, design, quality and quantity of the works for the Project, and the allocation
of risks under the Construction Contract.

68 First Pacific Annual Report 2020
Corporate Governance Report
At the time of the announcement, the Group has an approximately 55.2% voting interest and an approximately 42.2% economic
interest in Metro Pacific Investments Corporation (MPIC), which in turn indirectly owns NLEX as to approximately 75.0%. The
Group also has an approximately 51.3% economic interest in Maynilad Water Holdings Company Inc. (MWHC), the holding
company of Maynilad. DMCI Holdings Inc. (DMCI), being the 27.2% shareholder of MWHC, is a connected person of the
Company. Consunji is a subsidiary of DMCI and is, therefore, a connected person of the Company. Accordingly, the entering into
of the Construction Contract constitutes a connected transaction for the Company under the Listing Rules.
22 May 2020 announcement: the Company announced that PT Indofood CBP Sukses Makmur Tbk (ICBP) entered into an
agreement with Pinehill Corpora Limited (Pinehill Corpora) and Steele Lake Limited (collectively the Sellers) pursuant to which
ICBP has conditionally agreed to purchase, and the Sellers have conditionally agreed to sell, the entire issued share capital of
Pinehill Company Limited (Pinehill), for a consideration of US$2,998 million (equivalent to approximately HK$23.4 billion) (subject
to adjustment) (Proposed Acquisition).
In addition, Pinehill Corpora, which is the seller of 51% of the issued share capital of Pinehill, is a consortium indirectly owned
as to 49% by Mr. Anthoni Salim. As a result of the indirect beneficial ownership of Mr. Salim in Pinehill Corpora, Pinehill Corpora
is a connected person of the Company. The Proposed Acquisition is therefore a connected transaction for the Company. The
Proposed Acquisition also constitutes a very substantial acquisition for the Company as one or more of the applicable percentage
ratios calculated in accordance with the Listing Rules exceeds 100%, which is subject to the reporting, announcement and
Independent Shareholders’ approval requirements under the Listing Rules. Steele Lake and its ultimate beneficial owners are
third parties independent of the Company.
23 June 2020 circular (the Circular): following the Company’s announcement made on 22 May 2020 in relation to the Proposed
Acquisition, the Company provided its Shareholders with a Circular which contained, among other things, (i) further information
relating to the Proposed Acquisition; (ii) the recommendation of the Independent Board Committee (IBC) to the independent
Shareholders in respect of the Proposed Acquisition; (iii) the advice of the IFA in respect of Proposed Acquisition to the IBC and
the Independent Shareholders and as to how the Independent Shareholders should vote at the special general meeting of the
Company to be held on 17 July 2020 (SGM); and other information as required to be disclosed under the Listing Rules.
At the Company’s SGM, a majority of the Independent Shareholders approved the Proposed Acquisition and completion of the
Proposed Acquisition took place on 27 August 2020. Following Completion, Pinehill became a wholly-owned subsidiary of ICBP
and the financial results of the Pinehill Group will be consolidated in the financial results of the First Pacific Group.
15 October 2020 announcement: the Company announced that upon Pinehill becoming a wholly-owned subsidiary of ICBP
and a consolidated subsidiary of each of Indofood and the Company, certain existing Distribution Business transactions relating
to the sale of noodles products, which were entered into prior to the Pinehill Acquisition (being the acquisition by ICBP of the
Pinehill Group), became continuing connected transactions of the Company. The Pinehill Group is a party to certain continuing
connected transactions with Said Bawazir Trading Corp. and Tasali Jordan Trading Institute (counterparties to the Distribution
Business Transactions) relating to the sale of noodles products, which were entered into prior to the Pinehill Acquisition, such
Distribution Business Transactions became continuing connected transactions of the Company as a result of completion of the
Pinehill Acquisition.

69 First Pacific Annual Report 2020
23 December 2020 announcement: MPIC, through its subsidiary, Beacon Powergen Holdings Inc. (Beacon Powergen) (as
seller) and Meralco PowerGen Corporation (MGen) (a wholly-owned subsidiary of Meralco and an associated company of the
Group) (as buyer) entered into the share purchase agreement (SPA), pursuant to which Beacon Powergen conditionally agreed
to sell (or procure the sale of), and MGen conditionally agreed to purchase, the Sale Shares representing approximately 56% of
the total issued and outstanding capital stock of Global Business Power Corporation (GBPC), for an aggregate purchase price of
Php 22,443 million (equivalent to approximately US$466.6 million or HK$3.6 billion) (subject to adjustment), which will be paid
by MGen to Beacon Powergen in cash in three instalments (Proposed Disposal).
As at the date of the announcement, MPIC holds a 100% economic interest in Beacon Powergen. MPIC is a Philippine affiliate
of the Company in which the Group indirectly holds a 43.1% economic interest. FPM Power Holdings Limited (FPM Power) is a
60% owned subsidiary of the Company. MGen, being a 40% shareholder of FPM Power, is a connected person of the Company
as a substantial shareholder of FPM Power. The Proposed Disposal is, therefore, a connected transaction for the Company under
Chapter 14A of the Listing Rules. The Proposed Disposal is also a major transaction for the Company under Chapter 14 of the
Listing Rules and is, therefore, subject to the notification, announcement, circular and Shareholders’ approval requirements for a
major transaction under the Listing Rules.
A special general meeting has been convened on 2 March 2021 and the Shareholders approved the Proposed Disposal.
Following the Closing, the financial results of GBPC will be deconsolidated and be equity accounted for in the financial
statements of the Group.
4 January 2021 announcement: the Company announced that pursuant to a resolution of the shareholders of PT Mentari Subur
Abadi (MSA) passed on 31 December 2020, the shareholders of MSA have approved (i) an increase in the authorized share
capital of MSA and (ii) the issuance and allotment by MSA and the subscription by PT Salim Ivomas Pratama Tbk (SIMP) of the
806,897 new shares in MSA to be issued and allotted by MSA to SIMP (MSA Subscription Shares), for the Subscription Price of
Rp806,897 million (equivalent to approximately US$57.1 million or HK$445.4 million), to be satisfied by SIMP in cash.
Prior to completion of the MSA Subscription, the Group has an economic interest of approximately 29.9% in SIMP and
accordingly, an economic interest of approximately 17.9% in MSA. Following completion of the MSA Subscription, the issued
share capital of MSA, as enlarged by the allotment and issuance of the MSA Subscription Shares, will be directly and indirectly
owned as to approximately 80% by SIMP, and directly and indirectly owned as to approximately 20% by the Salim Group.
Following completion of the MSA Subscription, the Company will have an indirect economic interest of approximately 23.9% in
MSA and MSA will remain as an indirect non-wholly owned subsidiary of each of SIMP and the Company.
As at the date of the announcement, the Group has an approximate 50.1% economic interest in Indofood, which has an
approximate 71.7% effective economic interest in IndoAgri, which in turn owns 73.5% in SIMP. Together with the Indofood
Group’s 7.0% direct interest in SIMP, Indofood has an effective economic interest of approximately 59.6% in SIMP. Accordingly,
SIMP is a subsidiary of Indofood (and, therefore, of the Company). MSA is a connected subsidiary of the Company as it is a non-
wholly owned subsidiary of SIMP (and, therefore, of the Company) and Mr. Salim and companies controlled by him control 10%
or more of its voting power. Accordingly, the MSA Subscription by SIMP constitutes a connected transaction for the Company
under the Listing Rules.

70 First Pacific Annual Report 2020
Corporate Governance Report
I. Details of those continuing connected transactions relating to the Indofood Group, which are required to be specified by Rule
14A.49 of the Listing Rules are set out below:
A. Transactions relating to the Noodles Business of the Indofood Group
Parties to the agreement/arrangement
Nature of agreement/arrangement
Period covered by the
agreement/arrangement
Transaction amount for
the year ended
31 December 2020
(US$ millions)
Name of entity
of the group
Name of connected
party and relationship
between the parties
From To
PT Indofood Sukses Makmur Tbk (ISM)/PT Indofood CBP Sukses Makmur Tbk (ICBP)
Dufil Prima Foods PLC (Dufil), an associate of Mr. Salim
ISM/ICBP(1) grants an exclusive licence in respect of the
“Indomie” trademark in Nigeria;
(2) provides technical services in connection with instant noodle manufacturing operations in Nigeria; and
(3) sells and supplies ingredients, noodle seasonings and packaging used for instant noodle products
to Dufil
1 January 2020 31 December 2022 27.4#
ISM/ICBP Pinehill Arabian Food Ltd. (Pinehill), an associate of Mr. Salim
ISM/ICBP(1) grants an exclusive license in respect of
the “Indomie”, “Supermi” and “Pop Mie” trademarks in certain countries in the Middle East;
(2) provides technical services in connection with instant noodle manufacturing operations in certain countries in the Middle East; and
(3) sells and supplies ingredients, noodle seasonings and packaging used for instant noodle products
to Pinehill
1 January 2020 31 December 2022 53.4#
ISM/ICBP Salim Wazaran Group Limited (SAWAZ)# and/or Golden Coast Group Limited, an associate of Mr. Salim
ISM/ICBP(1) grants a non-exclusive licence in respect
of the “Indomie” trademark in certain countries in the Middle East and Africa;
(2) provides technical services in connection with instant noodle manufacturing operations in certain countries in the Middle East and Africa; and
(3) sells and supplies ingredients, noodle seasonings and packaging used for instant noodle products
to SAWAZ and/or Golden Coast Group Limited
1 January 2020 31 December 2022 49.9

71 First Pacific Annual Report 2020
Parties to the agreement/arrangement
Nature of agreement/arrangement
Period covered by the
agreement/arrangement
Transaction amount for
the year ended
31 December 2020
(US$ millions)
Name of entity
of the group
Name of connected
party and relationship
between the parties
From To
ISM and its subsidiaries PT Indomobil Sukses Internasional Tbk (Indomobil) and its subsidiaries, an associate of Mr. Salim
Indomobil and its subsidiaries sell and rent vehicles, provide vehicle services and sell spare parts to ISM and its subsidiaries
1 January 2020 31 December 2022 1.7
ISM and its subsidiaries PT Indotirta Suaka (PTIS), an associate of Mr. Salim
ISM and its subsidiaries sell scrap product to PTIS 1 January 2020 31 December 2022 –
ISM and its subsidiaries Shanghai Resources International Trading Co. Ltd. (Shanghai Resources), an associate of Mr. Salim
ISM and its subsidiaries sell noodle products to Shanghai Resources
1 January 2020 31 December 2022 4.5
Aggregated transaction amount 136.9
# The transaction amount for the year was recorded up to 27 August 2020, which is the acquisition date of the Pinehill Group by the ISM/ICBP Group.
B. Transactions relating to the Plantations Business of the Indofood Group
Parties to the agreement/arrangement
Nature of agreement/arrangement
Period covered by the
agreement/arrangement
Transaction amount for
the year ended
31 December 2020
(US$ millions)
Name of entity
of the group
Name of connected
party and relationship
between the parties
From To
PT Salim Ivomas Pratama Tbk (SIMP) and its subsidiaries
PT Sarana Tempa Perkasa (STP), an associate of Mr. Salim
STP provides pumping services to SIMP and its subsidiaries to load crude palm oil and other derivative products to vessels
1 January 2020 31 December 2022 0.5
SIMP and its subsidiaries PT Cipta Subur Nusa Jaya (CSNJ), an associate of Mr. Salim
SIMP and its subsidiaries rent infrastructure from CSNJ, and vice versa
1 January 2020 31 December 2022 0.0
SIMP and its subsidiaries PT Rimba Mutiara Kusuma (RMK), an associate of Mr. Salim
SIMP and its subsidiaries(1) lease heavy equipment and buy building
materials from RMK;
(2) rent office space, trucks and tug boats from RMK;
(3) use transportation services from RMK; and
(4) purchase road reinforcement services from RMK
1 January 2020 31 December 2022 0.4
A. Transactions relating to the Noodles Business of the Indofood Group (continued)

72 First Pacific Annual Report 2020
Corporate Governance Report
Parties to the agreement/arrangement
Nature of agreement/arrangement
Period covered by the
agreement/arrangement
Transaction amount for
the year ended
31 December 2020
(US$ millions)
Name of entity
of the group
Name of connected
party and relationship
between the parties
From To
SIMP and its subsidiaries IndoInternational Green Energy Resources Pte. Ltd. (IGER Group), an associate of Mr. Salim
SIMP and its subsidiaries(1) provide operational services to IGER Group;
(2) sell seedlings to IGER Group;
(3) buy prefabricated housing materials from IGER Group;
(4) sell fertilizer products to IGER Group;
(5) lease office space to IGER Group; and
(6) buy palm oil and its derivatives products from IGER Group
1 January 2020 31 December 2022 38.2
ISM and its subsidiaries Indomobil and its subsidiaries, an associate of Mr. Salim
Indomobil and its subsidiaries sell and rent vehicles, provide vehicle services and sell spare parts to ISM and its subsidiaries
1 January 2020 31 December 2022 5.4
SIMP Shanghai Resources, an associate of Mr. Salim
SIMP sells palm oil and its derivative products to Shanghai Resources
1 January 2020 31 December 2022 34.4
SIMP Nippon Indosari Corpindo (NIC), an associate of Mr. Salim
SIMP sells margarine to NIC 1 January 2020 31 December 2022 1.3
ISM Lajuperdana Indah (LPI), an associate of Mr. Salim
ISM grants an exclusive license of its “Indosugar” trademark related to sugar to LPI
1 January 2020 31 December 2022 0.4
PT Inti Abadi Kemasindo (IAK) LPI, an associate of Mr. Salim
IAK sells packaging materials to LPI 1 January 2020 31 December 2022 0.5
SIMP and its subsidiaries PT Indomarco Prismatama (Indomaret), an associate of Mr. Salim
SIMP and its subsidiaries sell finished goods to Indomaret
1 January 2020 31 December 2022 59.8
SIMP and its subsidiaries PT Inti Cakrawala Citra (Indogrosir), an associate of Mr. Salim
SIMP and its subsidiaries sell finished goods to Indogrosir
1 January 2020 31 December 2022 44.3
SIMP and its subsidiaries PTIS, an associate of Mr. Salim
Indofood and its subsidiaries sell crude palm oil to PTIS
1 January 2020 31 December 2022 –
Aggregated transaction amount 185.2
B. Transactions relating to the Plantations Business of the Indofood Group (continued)

73 First Pacific Annual Report 2020
C. Transactions relating to the Distribution Business of the Indofood Group
Parties to the agreement/arrangement
Nature of agreement/arrangement
Period covered by the
agreement/arrangement
Transaction amount for
the year ended
31 December 2020
(US$ millions)
Name of entity
of the group
Name of connected
party and relationship
between the parties
From To
PT Indomarco Adi Prima (IAP) PT Lion Superindo (LS), an associate of Mr. Salim
IAP distributes various consumer products to LS 1 January 2020 31 December 2022 21.9
IAP PT Fast Food Indonesia Tbk (FFI), an associate of Mr. Salim
IAP sells sauces, seasonings and dairy products to FFI
1 January 2020 31 December 2022 0.5
PT Putri Daya Usahatama (PDU)
LS, an associate of Mr. Salim PDU distributes various consumer products to LS 1 January 2020 31 December 2022 1.5
ISM and its subsidiaries Indomobil and its subsidiaries, an associate of Mr. Salim
Indomobil and its subsidiaries sell and rent vehicles, sell spare parts and provide vehicle services to ISM and its subsidiaries
1 January 2020 31 December 2022 3.8
ISM and its subsidiaries PT Sumberdaya Dian Mandiri (SDM), an associate of Mr. Salim
ISM and its subsidiaries use human resources outsourcing services from SDM
1 January 2020 31 December 2022 15.5
IAP Indomaret, an associate of Mr. Salim
IAP sells finished goods to Indomaret 1 January 2020 31 December 2022 160.4
IAP Indogrosir, an associate of Mr. Salim
IAP sells finished goods to Indogrosir 1 January 2020 31 December 2022 63.3
PDU Indomaret, an associate of Mr. Salim
PDU sells finished goods to Indomaret 1 January 2020 31 December 2022 8.0
PDU Indogrosir, an associate of Mr. Salim
PDU sells finished goods to Indogrosir 1 January 2020 31 December 2022 3.9
IAP Indomaret, an associate of Mr. Salim
Indomaret rents space from IAP 1 January 2020 31 December 2022 –
IAP LS, an associate of Mr. Salim LS rents space from IAP 1 January 2020 31 December 2022 0.3
IAP PT Indolife Pensiontama (Indolife), an associate of Mr. Salim
IAP’s pension plan assets are managed by Indolife 1 January 2020 31 December 2022 0.3
IAP LPI, an associate of Mr. Salim
IAP buys sugar from LPI 1 January 2020 31 December 2022 3.2
IAP PT IDmarco Perkasa Indonesia (IDP), an associate of Mr. Salim
IAP pays commission fee to IDP 1 January 2020 31 December 2022 0.0
IAP ING, an associate of Mr. Salim
IAP buys product from ING 1 January 2020 31 December 2022 –
Aggregated transaction amount 282.6

74 First Pacific Annual Report 2020
Corporate Governance Report
D. Transactions relating to the Flour Business of the Indofood Group
Parties to the agreement/arrangement
Nature of agreement/arrangement
Period covered by the
agreement/arrangement
Transaction amount for
the year ended
31 December 2020
(US$ millions)
Name of entity
of the group
Name of connected
party and relationship
between the parties
From To
PT Indofood Sukses Makmur
Tbk-Bogasari Division
(Bogasari)
NIC, an associate of
Mr. Salim
Bogasari sells flour to NIC 1 January 2020 31 December 2022 14.9
Bogasari FFI, an associate of
Mr. Salim
Bogasari sells spaghetti and flour to FFI 1 January 2020 31 December 2022 0.5
ISM and its subsidiaries Indotek Konsultan Utama
(IKU), an associate of
Mr. Salim
IKU provides consulting services to ISM and its
subsidiaries
1 January 2020 31 December 2022 0.1
ISM and its subsidiaries Indomobil and its
subsidiaries, an associate
of Mr. Salim
Indomobi and its subsidiaries sell and rent
vehicles, sell spare parts and provide vehicle
services to ISM and its subsidiaries
1 January 2020 31 December 2022 4.4
ISM and its subsidiaries SDM, an associate of
Mr. Salim
ISM and its subsidiaries use human resources
outsourcing services from SDM
1 January 2020 31 December 2022 5.9
ISM and its subsidiaries PT Primajasa Tunas Mandiri
(PTM), an associate of
Mr. Salim
ISM and its subsidiaries use human resources
outsourcing services from PTM
1 January 2020 31 December 2022 2.5
Bogasari Indogrosir, an associate of
Mr. Salim
Bogasari sells finished goods to Indogrosir 1 January 2020 31 December 2022 7.8
Bogasari Shanghai Resources, an
associate of Mr. Salim
Bogasari sells pasta products to Shanghai
Resources
1 January 2020 31 December 2022 –
Bogasari Indomaret, an associate of
Mr. Salim
Bogasari sells finished goods to Indomaret 1 January 2020 31 December 2022 5.2
ISM and its subsidiaries PTIS, an associate of
Mr. Salim
ISM and its subsidiaries sell by-product to PTIS 1 January 2020 31 December 2022 –
ISM and its subsidiaries Interflour Group Pte. Ltd.
(Interflour) and its
subsidiaries (including
Eastern Pearl Flour Mills
and Interflour Vietnam
Ltd.) (Interflour Group),
an associate of Mr. Salim
Interflour Group provides manufacturing services
to ISM and its subsidiaries. ISM and its
subsidiaries sell finished goods to Interflour
Group
1 January 2020 31 December 2022 2.2
ISM and its subsidiaries IDP, an associate of
Mr. Salim
ISM and its subsidiaries sell finished goods to IDP 1 January 2020 31 December 2022 0.3
Aggregated transaction amount 43.8

75 First Pacific Annual Report 2020
E. Transactions relating to the Insurance Policies of the Indofood Group
Parties to the agreement/arrangement
Nature of agreement/arrangement
Period covered by the
agreement/arrangement
Transaction amount for
the year ended
31 December 2020
(US$ millions)
Name of entity
of the group
Name of connected
party and relationship
between the parties
From To
ISM and its subsidiaries PT Asuransi Central, Asia
(ACA), an associate of
Mr. Salim
ACA provides vehicle, property and other assets
insurance services to ISM and its subsidiaries
1 January 2020 31 December 2022 6.0
ISM and its subsidiaries PT A.J. Central Asia Raya
(CAR), an associate of
Mr. Salim
CAR provides insurance services for personal
accident and health to ISM and its subsidiaries
1 January 2020 31 December 2022 4.2
ISM and its subsidiaries PT Indosurance Broker
Utama (IBU), an associate
of Mr. Salim
IBU provides insurance services to ISM and its
subsidiaries
1 January 2020 31 December 2022 0.3
Aggregated transaction amount 10.5
F. Transactions relating to the Beverage Business of the Indofood Group
Parties to the agreement/arrangement
Nature of agreement/arrangement
Period covered by the
agreement/arrangement
Transaction amount for
the year ended
31 December 2020
(US$ millions)
Name of entity
of the group
Name of connected
party and relationship
between the parties
From To
PT Anugerah Indofood Barokah
Makmur (AIBM)
SDM, an associate of
Mr. Salim
AIBM uses human resources outsourcing services
from SDM
1 January 2020 31 December 2022 0.8
AIBM Indomobil and its
subsidiaries, an associate
of Mr. Salim
Indomobil and its subsidiaries sell and rent
vehicles, sell spare parts and provide vehicle
services to AIBM
1 January 2020 31 December 2022 0.8
AIBM FFI, an associate of
Mr. Salim
AIBM sells drinking products to FFI 1 January 2020 31 December 2022 0.4
AIBM PTM, an associate of
Mr. Salim
AIBM uses human resources outsourcing services
from PTM
1 January 2020 31 December 2022 –
Aggregated transaction amount 2.0

76 First Pacific Annual Report 2020
Corporate Governance Report
G. Transactions relating to the Dairy Business of the Indofood Group
Parties to the agreement/arrangement
Nature of agreement/arrangement
Period covered by the
agreement/arrangement
Transaction amount for
the year ended
31 December 2020
(US$ millions)
Name of entity
of the group
Name of connected
party and relationship
between the parties
From To
ISM and its subsidiaries Indomobil and its
subsidiaries, an associate
of Mr. Salim
Indomobil and its subsidiaries sell and rent
vehicles, provide vehicle services and sell spare
parts to ISM and its subsidiaries
1 January 2020 31 December 2022 2.0
ISM and its subsidiaries SDM, an associate of
Mr. Salim
ISM and its subsidiaries use human resources
outsourcing services from SDM
1 January 2020 31 December 2022 1.7
PT Indolakto (Indolakto) Indomaret, an associate of
Mr. Salim
Indolakto sells finished goods to Indomaret 1 January 2020 31 December 2022 2.3
Indolakto Indogrosir, an associate of
Mr. Salim
Indolakto sells finished goods to Indogrosir 1 January 2020 31 December 2022 0.0
Indolakto LS, an associate of Mr. Salim Indolakto sells finished goods to LS 1 January 2020 31 December 2022 –
Indolakto NIC, an associate of
Mr. Salim
Indolakto sells finished goods to NIC 1 January 2020 31 December 2022 2.1
Indolakto FFI, an associate of
Mr. Salim
Indolakto sells finished goods to FFI 1 January 2020 31 December 2022 0.2
Aggregated transaction amount 8.3
H. Transactions relating to the Revolving Loan Facility of the Indofood Group
Parties to the agreement/arrangement
Nature of agreement/arrangement
Period covered by the
agreement/arrangement
Transaction amount for
the year ended
31 December 2020
(US$ millions)
Name of entity
of the group
Name of connected
party and relationship
between the parties
From To
SIMP IGER Group, an associate of
Mr. Salim
SIMP provides a revolving loan facility to IGER
Group
1 January 2020 31 December 2022 37.6
Aggregated transaction amount 37.6

77 First Pacific Annual Report 2020
I. Transactions relating to the Customer Relationship Management Business of the Indofood Group
Parties to the agreement/arrangement
Nature of agreement/arrangement
Period covered by the
agreement/arrangement
Transaction amount for
the year ended
31 December 2020
(US$ millions)
Name of entity
of the group
Name of connected
party and relationship
between the parties
From To
ISM and its subsidiaries PT Transcosmos Indonesia
(Transcosmos), an
associate of Mr. Salim
Transcosmos provides call center services to ISM
and its subsidiaries
1 January 2020 31 December 2022 0.3
ISM and its subsidiaries PT Data Arts Xperience, an
associate of Mr. Salim
ISM and its subsidiaries use digital media buying
services from PT Data Arts Xperience
1 January 2020 31 December 2022 0.5
ISM and its subsidiaries PT Popbox Asia, an associate
of Mr. Salim
ISM and its subsidiaries brand on PT Popbox Asia’s
lockers
1 January 2020 31 December 2022 0.2
Aggregated transaction amount 1.0
J. Transactions relating to the Packaging Business of the Indofood Group
Parties to the agreement/arrangement
Nature of agreement/arrangement
Period covered by the
agreement/arrangement
Transaction amount for
the year ended
31 December 2020
(US$ millions)
Name of entity
of the group
Name of connected
party and relationship
between the parties
From To
PT Surya Rengo Containers
(SRC)
FFI, an associate of
Mr. Salim
SRC sells carton box packaging to FFI 1 January 2020 31 December 2022 0.0
ISM and its subsidiaries Indomobil and its
subsidiaries, an associate
of Mr. Salim
Indomobil and its subsidiaries sell and rent
vehicles, provide vehicle services and sell
spare parts to ISM and its subsidiaries
1 January 2020 31 December 2022 0.9
ISM and its subsidiaries SDM, an associate of
Mr. Salim
ISM and its subsidiaries use human resources
outsourcing services from SDM
1 January 2020 31 December 2022 1.0
ISM and its subsidiaries PTM, an associate of
Mr. Salim
ISM and its subsidiaries use human resources
outsourcing services from PTM
1 January 2020 31 December 2022 0.2
ICBP-Packaging NIC, an associate of
Mr. Salim
ICBP-Packaging sells packaging materials to NIC 1 January 2020 31 December 2022 –
ICBP-Packaging Indomaret and its
subsidiaries, an associate
of Mr. Salim
ICBP-Packaging sells packaging materials to
Indomaret and its subsidiaries
1 January 2020 31 December 2022 0.0
ICBP-Packaging LPI, an associate of
Mr. Salim
ICBP-Packaging sells packaging materials to LPI 1 January 2020 31 December 2022 –
Aggregated transaction amount 2.1

78 First Pacific Annual Report 2020
Corporate Governance Report
K. Transactions relating to the Property Business of the Indofood Group
Parties to the agreement/arrangement
Nature of agreement/arrangement
Period covered by the
agreement/arrangement
Transaction amount for
the year ended
31 December 2020
(US$ millions)
Name of entity
of the group
Name of connected
party and relationship
between the parties
From To
PT Aston Inti Makmur (AIM) Indomaret, an associate of
Mr. Salim
Indomaret rents space from AIM 1 January 2020 31 December 2022 0.0
AIM PT Central Asia Financial, an
associate of Mr. Salim
PT Central Asia Financial rents space from AIM 1 January 2020 31 December 2022 0.1
AIM IDP, an associate of
Mr. Salim
IDP rents space from AIM 1 January 2020 31 December 2022 0.1
AIM PT Ciptabuana Sukses
Lestari, an associate of
Mr. Salim
PT Ciptabuana Sukses Lestari rents space from
AIM
1 January 2020 31 December 2022 0.3
AIM CAR, an associate of
Mr. Salim
CAR rents space from AIM 1 January 2020 31 December 2022 0.1
AIM Transcosmos, an associate
of Mr. Salim
Transcosmos rents space from AIM 1 January 2020 31 December 2022 0.1
AIM Bank INA Persada, an
associate of Mr. Salim
Bank INA Persada rents space from AIM 1 January 2020 31 December 2022 0.5
Aggregated transaction amount 1.2
L. Transactions relating to the Snack Business of the Indofood Group
Parties to the agreement/arrangement
Nature of agreement/arrangement
Period covered by the
agreement/arrangement
Transaction amount for
the year ended
31 December 2020
(US$ millions)
Name of entity
of the group
Name of connected
party and relationship
between the parties
From To
ISM and its subsidiaries Indomobil and its
subsidiaries, an associate
of Mr. Salim
Indomobil and its subsidiaries sell and rent
vehicles, provide vehicle services and sell
spare parts to ISM and its subsidiaries
1 January 2020 31 December 2022 0.7
Aggregated transaction amount 0.7
M. Transactions relating to the Sponsorship Business of the Indofood Group
Parties to the agreement/arrangement
Nature of agreement/arrangement
Period covered by the
agreement/arrangement
Transaction amount for
the year ended
31 December 2020
(US$ millions)
Name of entity
of the group
Name of connected
party and relationship
between the parties
From To
ISM and its subsidiaries PT Citra Swara Kreasindo, an
associate of Mr. Salim
ISM and its subsidiaries provide sponsorship for
branding on PT Citra Swara Kreasindo’s events
1 January 2020 31 December 2022 0.2
Aggregated transaction amount 0.2

79 First Pacific Annual Report 2020
N. Transactions with Substantial Shareholders relating to the Distribution Business of the Indofood Group
Parties to the agreement/arrangement
Nature of agreement/arrangement
Period covered by the
agreement/arrangement
Transaction amount for
the year ended
31 December 2020
(US$ millions)
Name of entity
of the group
Name of connected
party and relationship
between the parties
From To
ISM and its subsidiaries Said Bawazir Trading Corp
(SBTC), a substantial
shareholder of Indofood
Group
ISM and its subsidiaries sell finished goods to
SBTC
1 January 2020 31 December 2022* 71.6
ISM and its subsidiaries Tasali Jordan Trading
Institute, an affiliate
of SBTC
ISM and its subsidiaries sell finished goods to
Tasali Jordan Trading Institute
1 January 2020 31 December 2022* 3.3
Aggregated transaction amount 74.9
* Upon completion of Pinehill acquisition on 27 August 2020, the Pinehill Group became a wholly-owned subsidiary company held by ICBP and a consolidated subsidiary of Indofood. The transaction amount for the year was recorded from 27 August 2020 to 31 December 2020.
II. Details of those continuing connected transactions entered into between Maynilad and DMCI Holdings, which are required to be
specified by Rule 14A.49 of the Listing Rules are set out below:
Parties to the agreement/arrangement
Nature of agreement/arrangement
Period covered by the
agreement/arrangement
Transaction amount for
the year ended
31 December 2020
(US$ millions)
Name of entity
of the group
Name of connected
party and relationship
between the parties
From To
Maynilad Water Services, Inc.
(Maynilad)
D.M. Consunji, Inc. (DMCI),
a subsidiary of DMCI
Holdings, Inc.
Design and Build of 150 MLD Laguna Lake
Treatment Plant
28 January 2020 6 July 2023 100.0
Maynilad DMCI, a subsidiary of DMCI
Holdings, Inc.
Supplemental Contract for the 2018 Partial Pipe
Relocation due to PNR North Construction
Project in Valenzuela City
1 January 2020 14 July 2020 0.1
Maynilad DMCI, a subsidiary of DMCI
Holdings, Inc.
Construction of 900mm Diversion Line from
Raw Water Inlet to Clarified Channel (La Mesa
Treatment Plant 2)
1 January 2020 28 December 2020 0.7
Aggregated transaction amount 100.8
In respect of the financial year ended 31 December 2020, each of the continuing connected transactions has been subject to annual
review by the INEDs of the Company pursuant to Rule 14A.55 of the Listing Rules and confirmation of the auditor of the Company
pursuant to Rule 14A.56 of the Listing Rules.
The INEDs of the Company have concluded that each continuing connected transaction has been entered into:
in the ordinary and usual course of business of the Company;
either on normal commercial terms or, in those instances where there are no sufficient comparable transactions to judge whether
they are on normal commercial terms, on terms no less favorable to the Indofood group or to Maynilad than terms available to or
from (as appropriate) independent third parties;
in accordance with the relevant agreements governing them, or the relevant written memorandum recording their terms; and
on terms that are fair and reasonable and in the interests of the shareholders of the Company as a whole.

80 First Pacific Annual Report 2020
Corporate Governance Report
Ernst & Young, the Company’s independent auditor, was engaged to report on the Group’s continuing connected transactions in
accordance with Hong Kong Standard on Assurance Engagements 3000 “Assurance Engagements Other Than Audits or Reviews
of Historical Financial Information” and with reference to Practice Note 740 “Auditor’s Letter on Continuing Connected Transactions
under the Hong Kong Listing Rules” issued by the Hong Kong Institute of Certified Public Accountants. Ernst & Young have issued
their unqualified letter containing their findings and conclusions in respect of the continuing connected transactions disclosed by the
Group in accordance with Rule 14A.56 of the Listing Rules. A copy of the auditor’s letter has been provided by the Company to SEHK
in accordance with the Listing Rule requirements.
Risk Management and Internal ControlAs an investment management and holding company, the Company does not have a separate internal audit department but has a
Risk Assessment Committee consisting of one Executive Director and six senior executives which oversees risk management at the
Head Office. Also, each of the Group’s major operating companies are required to have their own internal audit and risk management
functions responsible for the implementation and monitoring of effective internal control systems for operational, financial and
regulatory compliance, and risk management. Their effectiveness is continuously evaluated and enhanced by the respective operating
companies’ audit committees and/or risk committees, which are reviewed by the Company’s Risk Assessment Committee and Audit
and Risk Management Committee on a semi-annual basis.
As a decentralized organization in which local management have substantial autonomy to run and develop their respective company
business, the Group views well developed reporting systems and internal controls as essential. The Board is responsible for
maintaining an adequate system of risk management and internal controls in the Group and plays a key role in the implementation
and monitoring of internal controls. Their responsibilities include:
conducting regular board meetings to focus on business strategy, operational issues and financial performance;
active participation on the boards of subsidiaries and associated companies;
participating in the approval of annual budgets for each operating company covering strategy, financial and business
performance, key risks and opportunities;
monitoring the compliance with applicable laws and regulations, and also with the First Pacific Code;
monitoring the quality, timeliness, and content of internal and external reporting; and
monitoring risks and the effectiveness of internal controls.
In respect of the financial year ended 31 December 2020, the Board confirmed that it has received confirmations from the operating
companies’ audit committees, risk committees and/or internal auditors/chief risk officers on the effectiveness of their risk management
and internal control systems and that there was no significant area of concern to be disclosed.
The key controls and risk management measures undertaken by the operating companies for the year ended 31 December 2020 are
summarized below:
Operational Controls The Directors and senior executives of the Company actively participate in various Boards of Directors of the operating
companies (which includes attending Board Meetings) and such Boards oversee operating companies’ operations and financial
activities, approve annual budgets, monitor compliance with applicable laws and regulations and the quality of internal and
external reporting.
Prior to investments in new businesses, extensive due diligence regarding the operational, financial, regulatory and ESG aspects
and risk management of the concerned businesses are conducted. Risks to investment returns are calibrated and specific
measures to manage these risks are also determined.
Quality and timely monthly management reports and regular Board papers and financial packages, with appropriate analysis
of actual operational and financial performance against budgets, forecasts and prior periods, are prepared by the operating
companies’ management and submitted to their directors for review.
The management teams of the operating companies continuously evaluate the performances of their businesses and provide
periodic operational and financial reforecasts to the Executive Directors and senior executives of the Company for their review.

81 First Pacific Annual Report 2020
The Executive Directors and senior executives of the Company review monthly management reports and conduct regular
meetings with the management teams of the operating companies to understand their businesses’ actual operational and
financial performances against budgets and forecasts, and business risks and strategies.
To promote good governance, whistleblowing policies and procedures are in place in certain operating companies, which provide
stakeholders with clearly defined processes to report concerns to their audit committees about any suspected misconduct,
malpractice or irregularity which he/she has become aware of or genuinely suspects that operating companies may have been
involved in.
Financial Controls The management of each of the operating companies ensures that an efficient capital structure is maintained. Information about
the Group’s capital management is set out in Note 40 to the Consolidated Financial Statements.
The finance and treasury teams in each of the operating companies undertake the management of the financial risks relating to
foreign exchange, interest rates, liquidity and commodities. Information about the Group’s management of its financial risks is
set out in the “Financial Review – Financial Risk Management” section and Note 40 to the Consolidated Financial Statements.
Compliance Controls The Company Secretary and the legal teams in the operating companies undertake the monitoring of compliance with relevant
laws, rules and regulations. In some of the regulated businesses, specific regulatory management groups are established to
mitigate risks arising from potential differences with regulators in the interpretation of relevant laws, rules and regulations.
The financial reporting teams and audit committees in the operating companies ensure that the financial statements of their
companies comply with relevant regulatory requirements, financial reporting and accounting standards, and that they are based
on suitable accounting policies as well as prudent and reasonable judgments and estimates.
The treasury teams in the operating companies undertake the monitoring of compliance with relevant covenants for their
borrowings.
Risk Management The Risk Assessment Committee comprises of one Executive Director and six senior executives of the Company and oversees
the Head Office risk management. The Risk Assessment Committee maintains a Risk Matrix with reference to the probability
and potential consequences of major risks identified at the Head Office. The Risk Matrix is reviewed by the Audit and Risk
Management Committee and the Board on a semi-annual basis.
During the year, the Audit and Risk Management Committee reviewed and adopted revised Enterprise Risk Management
Policies and Procedures for the Company, which comply with the International Standards Organization ISO 31000: 2018 Risk
Management – Guidelines (ISO 31000) and are consistent with the risk management policies of the larger Group companies.
The Company recognizes four categories of risk which are classified into: Strategic, Financial, Operational and Compliance.
The major Strategic Risks identified during the year include succession planning, country/political risk in the Philippines and
Indonesia, the Company’ share price, disposal of non-core assets by the Company and acquisitions and additional investments
by the Company. As for Financial Risks, these include currency risk (in particular the Peso and Rupiah exchange rates),
constraints on capital raising, impairment, liquidity risk, loan covenants compliance risk and interest rate risk. Operational Risks
mainly relate to operating performance of the underlying businesses and pandemic risk. Compliance Risks relate to regulatory
risk, ESG risk and cybersecurity risk.
In order to mitigate the succession planning risk, the Company has made it a regular Board agenda item and appointed Mr.
Axton Salim (son of Mr. Anthoni Salim) as a Non-executive Director of the Company on 25 March 2020. The Group has also
continued the search process to identify potential talents from within and outside the Group at both the operating company and
Company level.

82 First Pacific Annual Report 2020
Corporate Governance Report
In order to minimize short-term currency risk, the Company hedges expected dividends to be received in the following six
months, as well as any consideration or proceeds to be paid/received should a decision to acquire or sell an asset be made.
Operating companies try, as far as practicable, to match foreign currency borrowings with corresponding foreign currency
denominated revenue/income to reduce the currency mismatch exposure.
Additionally, through participation in the operating units’ Board meetings, the Company can regularly review their performance,
raise areas of concerns and propose solution/suggestion for improvement. The Company also maintained a good loan covenants
compliance track record with a strong monitoring and control system to ascertain compliance.
To ensure effective implementation of risk management and internal control systems, risk management processes are conducted
according to the operating companies’ prescribed risk management policies and procedures, based on a risk management
framework carefully defined for the effective management of risks at all levels across all operating and functional units in the
operating companies.
Telecommunications – The PLDT Board, with the assistance of its Risk Committee, fulfills its oversight responsibilities for the
company’s assessment and management of enterprise risks. It reviews and discusses with Management PLDT’s major risk
exposures and the corresponding risk mitigation measures. PLDT’s Risk Committee assists the Board in the performance of
its functions to: (i) oversee Management’s adoption and implementation of a system for identifying, assessing, monitoring and
managing key risk areas; (ii) review Management’s reports on PLDT’s major risk exposures; and (iii) review Management’s plans
and actions to minimize, control or manage the impact of such risks.
PLDT’s Group Enterprise Risk Management Department (GRMD), under the leadership of its Chief Risk Management Officer,
implements an integrated risk management program with the goal of identifying, analyzing and managing the PLDT Group’s
risks to an acceptable level, so as to enhance opportunities, reduce threats, and thus sustain competitive advantage. The
implementation of the enterprise risk management (ERM) process ensures that critical risks are well understood and effectively
managed across all functions and units within the PLDT Group. The GRMD sets guidelines for the identification and analysis of
key risk exposures relating to economic, environmental, social and governance factors and the achievement of the organization’s
strategic objectives, evaluates and categorizes identified risks. It assists on the development of risk mitigation plans for the most
important risks of the company. It communicates and reports significant risk exposures, including business risks, control issues
and risk mitigation plan to the Risk Committee. The ERM process used by the GRMD is based on the ISO 31000 standard on
risk management. The GRMD Head supervises the entire ERM process and spearheads the development, implementation,
maintenance and continuous improvement of ERM processes and documentation, and communicates the top risks and status of
implementation of risk management strategies and action plans to the Risk Committee and the Board.
Since 2019, the GRMD engaged an external industry consultant with the aim of updating its policies and processes and helping
navigate an ever-changing risk landscape. The consultant conducted an assessment of the GRMD’s current ERM practices
and proposed solutions on how PLDT could best move forward with improving its ERM practice as a whole. As a result of this
engagement, an updated ERM framework was adopted and related processes and policies were redeveloped accordingly.
Enhancements include a revised approach to the implementation of the Risk Appetite and the adoption of the 3 Lines of Defense
Model – a regulated framework designed to facilitate an effective risk management system by clarifying roles of management,
various risk control and compliance oversight functions and Internal Audit. To aid in the implementation of the updated
ERM Framework, a new Governance, Risk, and Compliance (GRC) platform was developed to improve the collection of risk
information and enhance risk analysis/monitoring capabilities. Implementation of the restructured policies, processes, and tools
began in late 2020 with full implementation expected by the end of 2021. These enhancements will help the GRMD to meet
regulatory requirements, develop an intelligent risk culture within the company, promote active risk assessment and monitoring,
and facilitate real-time reporting of risks.

83 First Pacific Annual Report 2020
The GRMD promulgates and encourages the adoption of a standard risk evaluation process focused on the need to properly
identify, analyze, evaluate, treat and monitor risks that may affect the achievement of business objectives. A risk assessment
exercise was undertaken by the Top Management Team to identify and prioritize the most important risks affecting the PLDT
Group for 2020. The top risks, listed in no particular order of criticality, were: (i) prolonged pandemic (ii) customer experience
issues and reputational risks; (iii) delivery of transformation initiatives; (iv) competitive situation and economic conditions;
(v) rapid speed of disruptive innovations and new technologies; (vi) regulatory changes/political scrutiny; (vii) cyber security
incidents and data privacy breaches; (viii) people risks; (ix) inability to design and prepare future mode of operations; and
(x) regular occurrence of natural disasters. Treatment strategies have been developed, and mitigation initiatives have been put
in place. Risk management activities are continuously monitored and reviewed to ensure that critical risks are appropriately
addressed across the organization.
Consumer food products – Enterprise risk management (ERM) is undertaken through a top-down approach that involves the
BOD in the evaluation of high-level risks and a bottom-up approach where subsidiaries and business units assess risks specific
to their operations. The Corporate ERM team consolidates the key risks to get a holistic view of Indofood’s risks, and reports
to the BOD and the Audit Committee periodically. The top risks were (i) pandemic risk arising from current virus outbreak
that might result in severe health problems to workers, closure of facilities, disturbance of operational activities and negative
publicity; (ii) health and safety risks; (iii) food safety and quality risk; (iv) raw material risk; (v) competition risk; (vi) publicity and
reputational risks; (vii) environmental risk; (viii) sustainability risk; (ix) talent and people risk; and (x) system and information risk.
As a packaged food and beverage producer, Indofood is exposed to food safety risks for the products it produces and markets.
Indofood imposes stringent controls across all stages of raw material sourcing, manufacturing, and product distribution.
Indofood’s standard operating procedures embody the principles of good manufacturing practices and adhere to international
quality and food safety standards such as ISO 9001, ISO 22000, and FSSC 22000. All Indofood’s products are halal certified.
Indofood mitigates risks by complying with applicable governmental regulations and protocols, conducting preventive procedures
and safety measures, monitoring and auditing health and safety compliance, maintaining buffer stock of raw material,
and monitoring material price fluctuations. In addressing the competition risk, Indofood launches competitive marketing
advertisement, builds strong brand awareness and brand loyalty, increases sales means through e-commerce, undertakes new
product innovation and improves product quality. Indofood manages sustainability risk through strict monitoring of environmental
implementation through Indonesian Sustainable Palm Oil (ISPO) certification mechanism, implementation of health and safety
among workers, implementing policy relating to prohibition of child labor, protecting freedom of association and collective
bargaining, promoting diversity and equal employment opportunity, and protecting employees from all forms of harassment
and abuse. Indofood’s daily operational activities rely on digital technologies that open to the risk of cyber-attacks. Indofood
remains vigilant by implementing a security platform with firewall, automated intrusion prevention system, endpoint security
software, availability of demilitarized zone, manage access rights to systems, and conducts IT general controls audits and testing
periodically. For contingency planning, a disaster recovery system has been established to ensure business continuity in the
event of system disruptions.
Infrastructure – MPIC, through its Risk Management Committee (RMC), oversees and monitors MPIC Management’s adoption
of a risk management system. MPIC’s RMC has conducted a review of the effectiveness of the MPIC Group’s (including its
subsidiaries, major associated companies and joint ventures) Enterprise Risk Management (ERM) systems, covering all material
strategic, financial operational and compliance risks.
Specific key risks identified by the MPIC Group and approved by the RMC include: (i) regulatory and political; (ii) liquidity;
(iii) human capital; (iv) climate change and related issues; (v) operational execution of investee companies; (vi) business
transformation; (vii) cybersecurity; (viii) value realization; (ix) business development; and (x) competition.

84 First Pacific Annual Report 2020
Corporate Governance Report
In terms of regulatory and political risks, the majority of MPIC’s invested capital is deployed into businesses which are
directly regulated by arms of the state: electricity distribution; water supply and distribution along with sewage treatment; toll
roads and light rail. Each of these businesses has concession or franchise agreements which involve a degree of operating
performance obligation in order to retain their rights and earn the expected returns. To manage these risks, the operating
companies have dedicated regulatory management groups with experienced personnel. Their duty is to monitor changes in the
political and regulatory landscape. They intensify initiatives of its group to support the Government during the pandemic and
strengthen alliances with various government leaders, personnel and government counterparts. They proactively seek workable
compromises with the government and monitor status of arbitrations, material disputes, regulation and potential changes in the
regulatory bodies. They also actively engage with regulators to ensure the preservation of key provisions of contracts of MPIC’s
various businesses.
In terms of liquidity risk, MPIC regularly reviews and updates the cashflow projections, scenario planning and analysis.
They continuously explore fairly-priced asset sales or opportunistic sale of investments/assets. They also closely monitor the
performance and operations of investee companies. In terms of human capital risk, MPIC successfully implements vaccination
plans for employees, dependents and other household members of its group. They improve talent attraction and retention
strategy and regularly review succession planning. In terms of climate change and related matter, they strengthen carbon off-
setting and environmental stewardship initiatives, they use clean technologies in their coal operations and increase investment in
more efficient water cleaning technology.
In order to minimize recurring losses of smaller investee companies, MPIC ensures operating effectiveness and implementation
of controls for newly acquired companies by instituting an MPIC Transition “SWAT” team. They stringently monitor key
performance indicators of the existing operating companies. For business transformation risk, MPIC conducts benchmarking
with global and local market leaders, embrace disruptive technologies and new business models. They create a “Crisis
Management Playbook” and provide training opportunities. In terms of cybersecurity risk, MPIC institutionalizes and enhances
current cybersecurity processes across the Group. They consider buying cybersecurity insurance and ensure compliance with
the requirements of “Data Privacy Act” on effective leadership and public relations. For value realization risk, MPIC thoroughly
screens investments and conducts due diligence while negotiating for the most optimal acquisition value. In terms of business
development risk, they present investment proposals to the Finance Committee of the Board for stringent review and exercise
strong discipline on bidding and hold operating teams accountable for meeting bid assumptions. As for competition risk, MPIC
implements “Demand creation strategy” and enters into long-term supply contracts with new customers. They also appoint
management teams in businesses acquired who have expertise in those business segments.
For Meralco, the key risks include adverse court decisions on pending legal cases and proceedings, retroactive application of
4RP reset and prospective lower than expected tariff for 5RP, change in regulation on system loss, delayed approval or non-
approval of pass-through related charges; persistent cybersecurity threats and attacks; inability to recover and resume business
in case of emergencies, disasters or pandemic, investments in power generation projects that are capital intensive with long
gestation periods under a very competitive market, adverse impact on corporate image and reputation of consumer reactions
on customer care service, liquidity and cash flow constraints, service downtime/disruption due to aging critical ICT systems
and infrastructure, improper handling of personal data and delayed completion and recovery of costs of government relocation
projects.
Key mitigation strategies for Meralco’s legal risk include closely monitoring the development in recent pending cases, to exhaust
legal remedies and to conduct legal research, coordinating with line organizations/experts, engagement and briefing of external
counsel, interface/cooperation with industry stakeholders with similar interests, and/or collation of documentary and testimonial
evidence. As for regulatory risk, Meralco participates in the deliberations of ERC on proposed rule changes, coalesces with other
stakeholders involving PBR, engages qualified/competent technical consultants to conduct study covering comparable locations
and operating environment, various manifestation through appearances during public hearings, submission of position papers
and briefing materials; and meeting with other DUs and ERC officials. It has also participated in the deliberations with regulators
and legislative inquiries at both Congress and Senate to advocate the development of fair and just rules for system loss cap
setting. The other thing Meralco has done was to sign up for TCFD which work Meralco will embark on in 2021 to quantify and
proactively monitor Meralco’s climate-related risks that will have both operational and financial impact to Meralco’s businesses.

85 First Pacific Annual Report 2020
In terms of cybersecurity risk, Meralco continues to implement Information Security policies and procedures, which are aligned
with international standards and the Philippine Data Privacy Act. They regularly conduct awareness campaigns and training
such as phishing and cyber crisis simulation to ensure that all employees are aware of the ISMS policies and procedures, as well
as the new threats to Meralco’s cybersecurity landscape. For business interruption risk, Meralco develops and/or maintains the
Busines Continuity Management Systems of the different OL1s organizations and subsidiaries to be aligned with the Corporate
Business Continuity Strategy. There is a continuous review and updating of existing disaster recovery procedures and response
protocols like Incident Command System and Emergency Operations Center. For investment risk, Meralco has stringent project
screening and will only invest in tier 1 projects. It negotiates delayed capital infusion and minimize development risk by limiting
site preparation works until an off-taker is definite. For Sustainability, Meralco crafts and articulates long-term sustainability
aspirations across Environmental, Social and Governance areas and strategically reduces absolute emissions and emissions
intensity over time by greenifying power supply portfolio and driving key initiatives to reduce Scope 1 and 2 emissions.
For GBPC, their key risks include re-contracting risk of coal contracts under MORE (62MW), PEDC-Meralco (70MW), MEZ (30MW)
and Carmen Copper (15MW), expiring in 2021; capital projects and expansions risks due to new risk drivers coming from
GBPC’s new solar ventures: Project Satellite and Project Rope; regulatory risk relating to the potential nullification of the Panay
Guimaras 22MW contract; potential loss due to possible retroactive application of CITIRA/CREATE law, delay or non-payment of
all of the financial obligations of their customers, exposure of employees to COVID-19 and increasing insurance premium due to
shrinking capacity of their power generation and coal plants.
GBPC’s mitigation strategies include participating in the CSPs, demand creation strategy by entering into a long-term supply
contract with new customers, negotiating and asking for a waiver from the banks should a breach of debt covenants occurs,
lower fuel cost and overall headline rate by using low grade coal, and to look for an immediate replacement contract. Meralco will
work closely with the local LGU to explore options to ease the acquisition, and to work together with EPC contractor to establish a
shorter construction period. It will actively monitor and ensure quick submission of requirements for permits processing.
MPTC’s key risks relate to foreign exchange fluctuations due to economic/market and regulatory reaction to the COVID-19
pandemic, possible non-compliance or delay in compliance with new laws, rules and regulations in response to COVID-19 or
technology developments and trends, business interruption, cloud servers and services breakdown, major destruction of IT Data
Center, structural weakening of Roadway Bridges, delay in completion of construction projects, potential unfavorable resolution
of the arbitration case against the government on unrealized and future toll rate adjustments, non-compliance with Data Privacy
Law, and cybersecurity.
MPTC’s mitigation measures include hedging of funds received, close network with DOLE, strict monitoring of processes, close
coordination with clients/customers on compliance with “no-employer-employee” relationship, implementation of Business
Continuity Plan, strengthening of existing assets, regular maintenance, improvement of Flood Control and measures, conduct
periodic and post structural assessment of assets, continuous dialogue with nearby communities, retain insurance coverage
of assets against AON and business interruption, set up Disaster Recovery Site, update Business Continuity Plan and develop/
review Disaster Recovery Plans, conduct regular inspections and roadway safety audits, convene regular meetings held by the
MPTC Group Level project Team and engaged external counsels where necessary.
For Maynilad, their major risks relate to negative political outlook to water concessionaires due to arising critical issues, passage
of a bill transferring the regulation of water service providers to a national body, implementation of regulations imposing penalties
for certain obligations in the Concession Agreement (CA), deterioration of volume mix, poor quality of Laguna Lake and Angat
Dam water, collection challenges, CA issues, biological hazard from COVID-19 Pandemic, such as longer processing of project
permits due to LGU, limited working hours as imposed by LGUs, unplanned equipment and asset downtime due to low or no
water supply to our customers, increase in non-revenue water and inefficiencies on water and waste water treatment, external
and internal threats to intrusion, system vulnerabilities and DPA non-conformities/issues, inability of third party to cope with the
COVID-19 risk factors.

86 First Pacific Annual Report 2020
Corporate Governance Report
In order to mitigate the risks, Maynilad maintains open communication lines with the CA Review Committee to ensure that the
amendments to the CA are fair and reasonable, participate in the hearings of the Committee on Government Reorganization,
adopt efforts to improve efficiency in the performance of Service Obligations under the CA, coordinate with the RO and provide
them with their own inputs, clarifications and suggested changes, reduce water production from Laguna Lake and Angat Dam
water to sustain the quality that complies with the PNSDW, intensify collection of tariff by attaining 110% collection efficiency
for 2021, manage 2021 capex and opex budget to ensure sufficient funds to cover trade payables and debt service obligations,
create COVID-19 TWG – responsible for the preparation and implementation of COVID-19 health and safety protocols,
prioritization and continuity of project paper works and documentation, revise operational procedures to adapt to the current
situation, continuing improvement and upgrade of Asset Registry, Asset Hierarchy, Asset Information and Asset criticality,
engage cybersecurity advisory and conduct regular update on improving cyber security, engage third party service provide to
evaluate the financial capacity of contractors, conduct Vendor due diligence, create standard procedure in managing vendor-
related complaints and concerns.
LRMC’s major risks relate to health and safety, which have been exacerbated by the pandemic and other infectious diseases,
together with business interruption, catastrophe due to natural and manmade events, claims due from the government, terror
and malicious acts, spare parts and equipment, infrastructure obsolescence, train and railways accidents, price fluctuations and
right of way.
LRMC mitigates these risks by issuance and dissemination of the virus and health precautions, establishing protocols for
disinfection and preventive measures, establishing crisis management procedures and system in-pace, establishing Business
Continuity Management Program and Disaster Recovery Plan, formalizing and documenting business continuity set-up,
establishing crisis management procedures and systems, pushing for the fulfilment on concession agreement deliverables,
strengthening internal controls to prevent, detect and mitigate natural/manmade events, establishing comprehensive
maintenance protocol and critical spare plan for secondary KPI related equipment, conducting regular inspection and continuous
maintenance of infrastructure, establishing crisis management procedure and system in-place, monitoring and including price
fluctuation effects in financial forecasting.
Electricity generation – in order to ensure that it has a robust system of internal controls and risk management framework
in place, PLP has established an Audit and Risk Committee (ARC) to oversee the adequacy of internal controls and risk
management in the company. The Head of Risk Management (HRM) reports to the ARC and manages PLP’s risk management
process, which includes oversight of the risk register and risk map, audit of internal controls and the whistle-blowing process. An
external auditor has been appointed to audit the internal controls established by the company who will report its findings to the
HRM and the ARC regularly.
During the year, PLP identified potential risks which may affect its ability to (i) hedge underlying exposures at targeted price to
lock in projected retail margins; (ii) remain competitive and profitable notwithstanding significant change in regulations;
(iii) generate electricity at full capacity; (iv) continue business operations despite disaster events, pandemic outbreak, terrorist attack,
cyber-attack and high attrition rate; (v) export electricity due to unplanned plant outage; and (vi) meet budgeted spark spread.
To manage the identified risks, PLP establishes relationship with potential trading counterpart to expand the current panel list of
trading counterparty. PLP strives to improve its financials and positive net worth, which could help improve PLP’s credit standing
with counterparties. PLP regularly reviews its key supply contracts to ensure their competitiveness. PLP joined as a founding
member of the Industry Association which will be a platform to advance advocacy. Regular preventive maintenance and critical
spares are kept ensuring that the generation units can run at optimal level. In addition, PLP has in place various response plans
such as Emergency Response Plan, Pandemic Readiness and Response plan and Cybersecurity Incident and Data Breach
Incident Response Plan to manage the business interruption events identified. Annual BCP exercise is conducted to reinforce
the BCP plans and assess its effectiveness. PLP has also bought adequate insurance for business interruption to mitigate the
cost/losses. Compensation and benefits are reviewed annually to ensure that it is competitive within the industry.
Natural resources – Philex has undertaken a risk management program for physical, social, ecological and economic risks
inherent in its mining business, thereby ensuring a productive and efficient operation. It employs a comprehensive, integrated
risk management program, effected across all levels of the organization, with the goal of identifying, analyzing and managing
risks to an acceptable level, so as to increase productivity, enhance opportunities, reduce threats, and thus sustain competitive
advantage.

87 First Pacific Annual Report 2020
The current global threat of COVID-19 pandemic could create significant negative impact to the operations of Philex as the
exposure of Philex’s employees to COVID-19 would result in a slowing down of operations, delay in the performance of works
and non-attainment of production targets that would put the sustainability of cash flows at risk. Other associated risks relate to
suppliers and business partners affected by COVID-19 were also identified, which would translate to additional costs to Philex
and would lead to delay or inefficient production process. Considering the evolving nature of this pandemic, Philex cannot
determine at this time the impact to its financial position, performance and cash flows. But as an initial and immediate response
to the declaration made by the Philippine government on March 16, 2020, through the issuance of Presidential Proclamation
No. 929, putting the entire area where the Philex workforce and business are located under Enhanced Community Quarantine,
Philex has imposed guidelines and preventive measures against its employees’ exposure to COVID-19 and programs to mitigate
the risks to Philex’s operations.
In terms of Regulatory risk, pending mining Bills in the Philippine Congress and changes in regulatory policies could result in an
imposition of new taxes in the mining industry, or renewal of the Mineral Production Sharing Agreement No. 149 (MPSA
No. 149), which can adversely impact the financial viability of the upcoming new projects, such as the Silangan project.
In terms of Strategic risk, mining operations are constrained by an ore body’s life of mine and its sustainability depends largely
on the pipeline of commercially viable mining deposits. There can be no assurance that the exploration of mining tenements,
where Philex has legal and valid interests in, will result in the establishment of commercially viable mining operations. In terms of
extending Padcal’s life of mine, while there are exploration activities ongoing for new ore sources within the surrounding areas of
Padcal, Philex is contending with various issues in identifying potential sites causing unforeseen delays in exploration timelines.
There is also a delay in the launching of the Silangan project due to the lukewarm investors’ sentiment over the mining industry
in the Philippines under the current regulatory environment.
In terms of Financial risks, there are events that could have an impact on Philex’s financial performance, cash flows, and
financial position. It relates to the ability of the company to achieve both production and financial targets due to lower metal
prices, higher operating costs related to ageing equipment, and pillar instability underground and that can cause stoppage
of its mining operations. There is a possible write-off of mine and mining assets. Philex maintains critical mining equipment
spare parts and supplies that may not be totally used at the end of mine life. In addition, the company has a number of mining
tenements in various areas nationwide. These assets are the subject of provisions, which can have material impact on Philex’s
financial position.
Philex’s operational risks are developments that could disrupt normal operations and affect the overall occupational health
and safety and financial performance at the Padcal Mine, whether natural or man-made: including (i) acts of terrorism and
insurgency threats which may affect the transport of ore from the Padcal mine site to the Poro Port installation for shipment;
(ii) possible structural failure or physical damage to Tailings Dam (TSF 3) that may be caused by the occurrence of an
earthquake stronger than the 1990 earthquake with magnitude of 7.8.
In order to mitigate those risks, Philex will continue to process and follow up with the submitted application for early
renewal of MPSA No. 149, prior to its expiration by 2024. Philex has regular and timely liaison with suppliers and respective
government agencies to ensure potential effect to suppliers of new stringent government measures will be addressed ahead
of its implementation. Philex management will implement the agreed structural reinforcement of the TSF 3 and raising of the
embankment based on the design prepared by external consultants. It will closely monitor the progress and quality of works on
TSF 3. In order to mitigate the risk of COVID-19, Philex will implement strict community quarantine guidelines as defined by the
Inter-Agency Task Force (IATF) and Department of Health (DOH), including heightened control of exit and entry of community
members, social distancing, home quarantine and no visitor policy.
Risk assessments are conducted regularly by each operating company’s management team and reported to its audit and/or
risk committee and its board of directors. The audit and/or risk committees of the operating companies meet with internal and
external auditors as well as the operating companies’ management teams regularly to communicate on issues regarding the
operating companies’ risks in order to ensure accuracy of risk assessment reports and proper implementation of the reported
risk mitigation strategies and controls.

88 First Pacific Annual Report 2020
Corporate Governance Report
During the year ended 31 December 2020, the Audit and Risk Management Committee reviewed and advised that:
The risk management and internal control systems of the Group function are effective and are designed to provide reasonable
assurance that material assets are protected, business risks attributable to the Group are identified and monitored, material
transactions are executed in accordance with management’s authorization and the financial statements are reliable for
publication and compliant with all relevant laws and regulations.
There are processes in place for identifying, evaluating and managing the material business risks faced by the Group. Such
processes are incorporated in all the Group’s businesses.
There are adequate resources, qualified and experienced staff, training programs and budget for the Group’s accounting and
financial reporting function.
Remuneration PolicyDetails of Directors’ remuneration for the year are set out in Note 37 to the Consolidated Financial Statements. The remuneration of
senior executives, including Directors, consists of the following:
Salary and BenefitsSalary reflects an executive’s experience, responsibility and market value. Salary adjustments are based on effective management
of the Company and on increased responsibility, with consideration of cost of living and the expected pay increases in the market.
Benefits principally comprise housing allowance, educational support and health care, and are consistent with those provided by
comparable companies.
Bonus and Long-term IncentivesBonuses are based on the achievement of performance targets, and normally correlate with annual profit movements. Long-term
incentives comprise monetary payments, share options and/or share awards that link reward to the achievement of predetermined
objectives, such as, retention of key employees for the Group’s operations and future development, achievement of recurring profit
targets. The value of the long-term incentive offered to each executive is related to job grade and contribution to the management of
the business.
FeesIt is the Company’s policy that it does not pay any fees to the Company’s Executive Directors for attending Board or Board Committee
meetings, and shareholder meetings. As for the Company’s NEDs (including the INEDs), they are paid the sum of US$7,000 for each
meeting of the Board (which he or she attends in person or by telephone conference call) and each general meeting of shareholders
(which he or she attends in person); and the sum of US$6,000 for each meeting of Board Committees (which he or she attends in
person or by telephone conference call).
Pension ContributionsThe Company operates defined contribution schemes, in respect of which contributions are determined on the basis of basic salary
and length of service.

Financial Review
89 First Pacific Annual Report 2020
Financial Performance and PositionAnalysis of Consolidated Income StatementAn analysis of the Group’s 2020 reported results compared with 2019’s follows.
For the year ended 31 DecemberUS$ millions
2020 2019(Restated)
%Change
Turnover 7,130.5 7,585.0 -6.0
Gross profit 2,308.3 2,283.8 +1.1
Operating expenses (1,223.9) (1,241.9) -1.4
Other operating expenses, net (50.5) (526.9) -90.4
Net finance costs (373.8) (361.5) +3.4
Share of profits less losses of associated companies and joint ventures 280.0 327.0 -14.4
Taxation (341.6) (444.4) -23.1
Profit for the year from a discontinued operation 69.1 85.0 -18.7
Non-controlling interests (466.0) (375.0) +24.3
Recurring profit 321.2 290.0 +10.8
Profit/(loss) attributable to owners of the parent 201.6 (253.9) –
Significant changes in the consolidated income statement items are explained as follows:
Turnover – decreased by 6.0%, mainly reflecting the decrease in MPIC’s revenues and the impact of the depreciation in the average rupiah exchange rate against the U.S. dollar of 3.4%, partly offset by the growth in Indofood’s sales and the impact of the appreciation in the average peso exchange rate against the U.S. dollar of 4.2%. The decrease in MPIC’s revenues mainly reflects the impacts of community quarantine restrictions and the deconsolidation of MPHHI from December 2019, while the increase in Indofood’s sales mainly reflects an increase in average selling prices for all major products and the consolidation of Pinehill since September 2020.
Gross profit – increased by 1.1%, mainly reflecting an increase in gross profit at Indofood and the impact of the appreciation in the average peso exchange rate against the U.S. dollar, partly offset by the decrease in gross profits at MPIC and RHI, and the impact of the depreciation in the average rupiah exchange rate against the U.S. dollar. The increase in gross margin (2020: 32.4% vs 2019: 30.1% (Restated)) mainly reflects an increase in Indofood’s gross margin (2020: 32.7% vs 2019: 29.7%) as a result of a higher average selling price and sales volume of noodles.
Operating expenses – decreased by 1.4%, mainly reflecting the deconsolidation of MPHHI and the deprecation in the average rupiah exchange rate against the U.S. dollar, partly offset by higher promotion and employee expenses at Indofood, consolidation of Pinehill, and the appreciation in the average peso exchange rate against the U.S. dollar.
Other operating expenses, net – the decrease mainly reflects lower impairment provisions, and the absence of the Group’s loss on disposal of Goodman Fielder, partly offset by the absence of MPIC’s gain on deconsolidation of MPHHI.
Net finance costs – increased by 3.4%, mainly reflecting higher finance costs from Indofood’s acquisition loans for Pinehill and higher average debt level at MPIC for its investments and capital expenditure, a lower interest income and the appreciation in the average peso exchange rate against the U.S. dollar, partly offset by the depreciation in the average rupiah exchange rate against the U.S. dollar.
Share of profits less losses of associated companies and joint ventures – decreased by 14.4%, mainly reflecting the lower profit contribution from Meralco, partly offset by higher profit contributions from PLDT and Philex, and the appreciation in the average peso exchange rate against the U.S. dollar.
Taxation – decreased by 23.1%, principally reflecting a lower taxable profit at MPIC, the absence of MPIC’s provision for capital gains tax in respect of MPHHI transaction, and the depreciation in the average rupiah exchange rate against the U.S. dollar, partly offset by a higher taxable profit at Indofood and the appreciation in the average peso exchange rate against the U.S. dollar.
Profit for the year from a discontinued operation – decreased by 18.7%. The amount represents GBPC’s profit for the year which is classified as a discontinued operation in December 2020. The decrease mainly reflects a lower energy fee and a higher staff cost, partly offset by a higher share of profit from its associated company.

90 First Pacific Annual Report 2020
Financial Review
Non-controlling interests – increased by 24.3%, mainly attributable to consolidation of Pinehill and a higher profit at Indofood, partly
offset by a lower profit at MPIC.
Recurring profit – increased by 10.8%, mainly reflecting higher recurring profit contributions from Indofood, PLDT and Philex, a lower
loss at PLP, and lower Head Office net interest expenses and corporate overhead, partly offset by a lower recurring profit contribution
from MPIC and a higher loss from RHI.
Profit/(loss) attributable to owners of the parent – a profit instead of a loss mainly reflecting a higher recurring profit and lower
non-recurring losses.
Analysis of Consolidated Statement of Financial PositionAn analysis of the Group’s consolidated statement of financial position at 31 December 2020 compared with 31 December 2019‘s
follows.
At 31 December
US$ millions
2020 2019 %
change
Property, plant and equipment 4,038.1 4,938.7 -18.2
Associated companies and joint ventures 5,314.4 4,787.7 +11.0
Goodwill 4,366.3 693.2 +529.9
Other intangible assets 5,927.3 5,004.7 +18.4
Cash and cash equivalents(i) 2,428.0 2,952.4 -17.8
Other assets 4,869.5 3,505.8 +38.9
Total Assets 26,943.6 21,882.5 +23.1
Borrowings 10,633.6 8,930.8 +19.1
Other liabilities 5,681.5 4,193.7 +35.5
Total Liabilities 16,315.1 13,124.5 +24.3
Net Assets 10,628.5 8,758.0 +21.4
Equity attributable to owners of the parent 3,140.0 2,928.7 +7.2
Non-controlling interests 7,488.5 5,829.3 +28.5
Total Equity 10,628.5 8,758.0 +21.4
(i) Includes short-term deposits and restricted cash
Significant changes in the consolidated statement of financial position items are explained as follows:
Property, plant and equipment – decreased by 18.2%, mainly reflecting the classification of GBPC’s property, plant and equipment to
assets classified as held for sale, depreciation, disposal of La Carlota assets, impairment provisions made during the year, partly offset
by capital expenditure incurred by Indofood and MPIC, Indofood’s consolidation of Pinehill and investments in newly planted area and
maintenance of immature plantations, and a retranslation effect (mainly reflecting the appreciation of the closing exchange rates of the
peso and S$ against the U.S. dollar of 5.5% and 1.8%, respectively, partly offset by the depreciation of the closing exchange rate of
the rupiah against the U.S. dollar of 1.4%).
Associated companies and joint ventures – increased by 11.0%, mainly reflecting Indofood’s equity account for Dufil Prima Foods Plc
(“DUFIL”), an associated company of Pinehill, the Group’s share of net profits from Meralco and PLDT, and a retranslation effect (mainly
reflecting the appreciation of the closing exchange rate of the peso against the U.S. dollar), partly offset by payments of dividends by
the associated companies.
Goodwill – increased by 529.9%, mainly reflecting the provisional goodwill arising from Indofood’s acquisition of Pinehill.

91 First Pacific Annual Report 2020
Other intangible assets – increased by 18.4%, mainly reflecting MPIC’s capital expenditure for its water, toll road and rail concessions,
and a retranslation effect (mainly reflecting the appreciation of the closing exchange rate of the peso against the U.S. dollar), partly
offset by amortization.
Cash and cash equivalents – decreased by 17.8%, mainly reflecting the Group’s payments for the acquisition of Pinehill and other
investments, capital expenditure, distributions/dividends to shareholders of the Company and non-controlling shareholders of
its subsidiary companies, and MPIC’s shares buyback, partly offset by operating cash inflows from Indofood and MPIC, net new
borrowings, dividends from associated companies, proceeds from MPIC’s divestments of a 19.2% interest in LRMC and a 10.3%
interest in MUN, the receipts of second and final instalments from the divestment of a 40.1% interest in MPHHI, and a retranslation
effect (mainly reflecting the appreciation of the closing exchange rate of the peso against the U.S. dollar, partly offset by the
depreciation of the closing exchange rate of the rupiah against the U.S. dollar).
Other assets – comprising biological assets, investment properties, accounts receivable, other receivables and prepayments, financial
assets at fair value through other comprehensive income, deferred tax assets, other non-current assets, inventories and assets
classified as held for sale, increased by 38.9%, mainly reflecting the increase in assets classified as held for sale following the
classification of GBPC as a disposal group held for sale, Indofood’s consolidation of Pinehill and a retranslation effect (mainly reflecting
the appreciation of the closing exchange rate of the peso against the U.S. dollar, partly offset by the depreciation of the closing
exchange rate of the rupiah against the U.S. dollar), partly offset by the utilization of Indofood’s advances for acquisition of property,
plant and equipment and the receipt of second and final instalments from the divestment of a 40.1% interest in MPHHI.
Borrowings – increased by 19.1%, mainly reflecting Indofood’s net new borrowings for financing its acquisition of Pinehill and capital
expenditure, MPIC’s net new borrowings for financing its investments and capital expenditure, and a retranslation effect (mainly
reflecting the appreciation of the closing exchange rate of the peso against the U.S. dollar, partly offset by the depreciation of the
closing exchange rate of the rupiah against the U.S. dollar), partly offset by the reclassification of GBPC’s borrowings to liabilities
directly associated with the assets classified as held for sale and RHI’s early repayment of borrowings with the proceeds from disposal
of La Carlota assets.
Other liabilities – comprising accounts payable, other payables and accruals, provision for taxation, deferred liabilities, provisions
and payables, liabilities directly associated with the assets classified as held for sale and deferred tax liabilities, increased by 35.5%,
mainly reflecting ICBP’s retention payable in relating to acquisition of Pinehill and consolidation of Pinehill, increase in liabilities
directly associated with the assets classified as held for sale following the classification of GBPC as a disposal group held for sale, and
a retranslation effect (mainly reflecting the appreciation of the closing exchange rate of the peso against the U.S. dollar, partly offset
by the depreciation of the closing exchange rate of the rupiah against the U.S. dollar), partly offset by MPIC’s instalment payments
for its acquisition of 50% interest in Beacon Electric Asset Holdings, Inc. (“Beacon Electric”) from PLDT Communications and Energy
Ventures, Inc. (“PCEV”).
Equity attributable to owners of the parent – increased by 7.2%, mainly reflecting the Group’s net profit for 2020 (US$201.6 million)
and a favorable movement in the Group’s exchange reserve (mainly reflecting the appreciation of the closing exchange rate of the
peso against the U.S. dollar, partly offset by the depreciation of the closing exchange rate of the rupiah against the U.S. dollar), partly
offset by the Company’s payments for 2019 final distribution (US$39.2 million) and 2020 interim distribution (US$39.2 million).
Non-controlling interests – increased by 28.5%, mainly reflecting Indofood’s consolidation of Pinehill, the share of profits by non-
controlling shareholders, and a retranslation effect (mainly reflecting the appreciation of the closing exchange rate of the peso against
the U.S. dollar, partly offset by the depreciation of the closing exchange rate of the rupiah against the U.S. dollar), partly offset by
dividends paid to non-controlling shareholders by Indofood, MPIC and their subsidiary companies, the Group’s increase in its effective
interest in MPIC, and Indofood’s acquisition of additional interests in IndoAgri.

92 First Pacific Annual Report 2020
Financial Review
Liquidity and Financial ResourcesAnalysis of Consolidated Statement of Cash FlowsAn analysis of the Group’s 2020 consolidated statement of cash flows compared with 2019’s follows.
For the year ended 31 December
US$ millions
2020 2019 %
change
Operating Activities
Net cash flows from operating activities 1,036.6 1,455.5 -28.8
Investing Activities
Dividends received 262.5 270.7 -3.0
Net capital expenditure (957.2) (1,357.7) -29.5
Acquisitions, investments and disposals (2,253.2) 753.3 –
Financing Activities
Net new borrowings 2,010.4 234.9 +755.9
Dividends/distributions paid (329.6) (301.7) +9.2
Other financing cash flows (115.4) (67.4) +71.2
Net (Decrease)/Increase in Cash and Cash Equivalents (345.9) 987.6 –
Cash and cash equivalents at 1 January(i) 2,650.8 1,613.4 +64.3
Exchange translation 58.3 49.8 +17.1
Cash and Cash Equivalents at 31 December(i) 2,363.2 2,650.8 -10.8
(i) Includes short-term deposits, bank overdrafts, and cash and cash equivalents attributable to a discontinued operation, but excludes short-term deposits with original maturity of more than three months
Significant changes in the consolidated statement of cash flows items are explained as follows:
Net cash flows from operating activities – decreased by 28.8%, mainly reflecting decrease in operating cash inflow at MPIC largely
attributable to the decline in operating activities under quarantine measures imposed by the Philippine Government in responses to
the COVID-19 outbreak, partly offset by the increase in operating cash inflow at Indofood.
Dividends received – decreased by 3.0%, mainly reflecting the absence of dividend income from Goodman Fielder after the disposal in
2019.
Net capital expenditure – decreased by 29.5%, mainly reflecting lower capital expenditure on service concession assets and property,
plant and equipment at MPIC due to the delay in projects caused by the pandemic, and the proceeds from disposal of La Carlota assets.
Acquisitions, investments and disposals – 2020’s net cash outflow principally relates to Indofood’s acquisition of Pinehill (US$2,253.8
million) and MPIC’s instalment payments for its acquisition of 50% interest in Beacon Electric from PCEV (US$114.1 million), partly
offset by the receipts of second and final instalments from the divestment of a 40.1% interest in MPHHI (US$80.9 million). 2019’s net
cash inflow principally relates to the net proceeds from the divestment in MPHHI (US$430.2 million), and the disposal of Goodman
Fielder (US$275.0 million) and Hawaiian-Philippine Company Inc. (US$16.7 million), proceeds from Indofood’s disposal of financial
assets at fair value through other comprehensive income (US$306.3 million) and receipt of the final instalment for its disposal of the
remaining 29.9% interest in China Minzhong Food Corporation Limited (US$47.6 million), partly offset by the Group’s investments
in short-term deposits with original maturity of more than three months (US$183.0 million) and MPIC’s instalment payments for its
acquisition of 50% interest in Beacon Electric from PCEV (US$86.3 million).
Net new borrowings – increased by 755.9%. 2020’s net cash inflow principally relates to net proceeds from borrowings at Indofood
(mainly for the acquisition of Pinehill) (US$2,131.0 million) and net proceeds from borrowings at MPIC (US$218.4 million), partly
offset by Head Office’s redemption and repurchase of bonds maturing in September 2020 (US$251.8 million) and in May 2025
(US$58.5 million), respectively, and RHI’s early repayment of borrowings with the proceeds from disposal of La Carlota assets (US$83.3
million). 2019’s net cash inflow principally relates to net proceeds from borrowings at MPIC (US$692.9 million), partly offset by
Indofood’s net repayment of borrowings (US$409.1 million).

93 First Pacific Annual Report 2020
Dividends/distributions paid – increased by 9.2%. The amount represents the payments of 2019 final distribution and 2020 interim
distribution by the Company to its shareholders and the payments of dividends by its subsidiary companies to their non-controlling
shareholders. The increase principally reflects increases in distributions paid by the Company and dividends paid by Indofood and its
subsidiary companies, partly offset by a decrease in dividends paid by MPIC’s subsidiary companies.
Other financing cash flows – increased by 71.2%. 2020’s net cash outflow mainly relates to MPTC’s and Maynilad’s payments of
concession fees payable (US$117.2 million), MPIC’s shares buyback (US$69.2 million), the Group’s settlement of principal portion
of lease payments (US$34.1 million) and Indofood’s acquisition of additional interests in IndoAgri (US$5.1 million), partly offset by
proceeds from divestments of a 19.2% interest in LRMC and a 10.3% interest in MUN (US$94.0 million) and capital contributions
from non-controlling shareholders (US$16.8 million). 2019’s net cash outflow mainly relates to MPIC’s acquisition of additional
interests in MUN (US$67.1 million), Indofood’s acquisition of additional interests in IndoAgri (US$23.8 million), Maynilad’s payment of
concession fees payable (US$32.4 million) and the Group’s settlement of principal portion of lease payments (US$20.0 million), partly
offset by capital contributions from non-controlling shareholders (US$82.7 million).
Net Debt and Gearing(A) Head Office Net Debt
The decrease in net debt mainly reflects an increase in net cash inflow from operating activities as a result of increased dividend
income and reduction in interest expense. The Head Office’s borrowings at 31 December 2020 comprise bonds of US$824.8
million (with an aggregated face value of US$828.3 million) which are due for redemption between April 2023 and September
2027, and bank loans of US$606.1 million (with a principal amount of US$610.0 million) which are due for repayment between
January 2022 and June 2029.
Changes in Head Office Net Debt
US$ millions BorrowingsCash and cash
equivalents Net debt
At 1 January 2020 1,655.6 (325.0) 1,330.6
Movement (224.7) 213.6 (11.1)
At 31 December 2020 1,430.9 (111.4) 1,319.5
Head Office Cash Flow
For the year ended 31 DecemberUS$ millions
2020 2019
Dividend and fee income 189.9 165.1
Head Office overhead expense (17.3) (17.8)
Net cash interest expense (55.2) (72.5)
Tax paid (0.6) (0.4)
Net Cash Inflow from Operating Activities 116.8 74.4
(Net investments)/net proceeds on sale of investment(i) (14.2) 218.8
Financing activities
– Distributions paid (78.4) (66.6)
– (Repayment of)/new borrowings, net (234.3) 13.5
– Others(ii) (3.5) (4.6)
Net (Decrease)/Increase in Cash and Cash Equivalents (213.6) 235.5
Cash and cash equivalents at 1 January 325.0 89.5
Cash and Cash Equivalents at 31 December 111.4 325.0
(i) Principally represent net proceeds from disposal of Goodman Fielder less investments in PLP in 2019(ii) Mainly payments for lease liabilities and to the trustee for share purchase scheme

94 First Pacific Annual Report 2020
Financial Review
(B) Group Net Debt and Gearing
An analysis of net debt and gearing for principal consolidated and associated companies follows.
Consolidated
US$ millions
Net
debt(i)
2020
Total
equity
2020
Gearing
(times)
2020
Netdebt(i)
2019
Totalequity2019
Gearing(times)
2019
Head Office 1,319.5 1,621.2 0.81x 1,330.6 1,740.0 0.76x
Indofood 2,548.1 5,598.2 0.46x 664.2 3,886.0 0.17x
MPIC 3,762.8 5,079.5 0.74x 3,361.0 4,842.5 0.69x
FPM Power 468.4 (42.9) – 448.5 – –
FP Natural Resources 106.8 55.3 1.93x 174.1 167.0 1.04x
Group adjustments(ii) – (1,682.8) – – (1,877.5) –
Total 8,205.6 10,628.5 0.77x 5,978.4 8,758.0 0.68x
Associated Companies
US$ millions
Net
debt(i)
2020
Total
equity
2020
Gearing
(times)
2020
Netdebt(i)
2019
Totalequity2019
Gearing(times)
2019
PLDT 3,801.1 2,492.0 1.53x 3,321.2 2,296.6 1.45x
Philex 182.6 504.5 0.36x 187.2 453.6 0.41x
(i) Includes short-term deposits and restricted cash(ii) Group adjustments mainly represents elimination of goodwill arising from acquisitions prior
to 1 January 2001 against the Group’s retained earnings and other standard consolidation adjustments to present the Group as a single economic entity.
Head Office’s gearing increased because of a decrease in its equity during the year and the Company’s distributions to shareholders.
Indofood’s gearing increased because of an increase in its net debt as a result of acquisition loans for Pinehill and its payments for capital expenditure, despite its operating cash inflow, partly offset by an increase in its equity reflecting Indofood’s consolidation of Pinehill and profit recorded during the year.
MPIC’s gearing increased because of an increase in its net debt as a result of its payments for capital expenditure and concession fees, shares buyback and instalment payments for its acquisition of 50% interest in Beacon Electric from PCEV, despite a reclassification of GBPC’s bank borrowings to liabilities of a disposal group, its operating cash inflow, dividends received from Meralco and proceeds from divestments of a 19.2% interest in LRMC and a 10.3% interest in MUN, and the second and final instalments received from the divestment of a 40.1% interest in MPHHI, partly offset by an increase in its equity as a result of its profit recorded during the year.
FPM Power’s net debt increased because of an appreciation of the S$ against U.S. dollar during the year. The deficit mainly reflects PLP’s loss recorded during the year.
FP Natural Resources’ gearing increased because of a decrease in its equity reflecting the Group’s impairment provisions for investment in RHI and loss on disposal of La Carlota assets, partly offset by a decrease in its net debt reflecting the early repayment of bank loans with the proceeds from disposal of La Carlota assets.
Net Debt and Gearing
0
2
4
6
8
10
0.2
0.4
0.6
0.8
Net debtUS$ billions
Gearing(times)
31 December 2020
GearingNet debt
31 December 2019
19 20
1.0

95 First Pacific Annual Report 2020
The Group’s gearing increased to 0.77 times because of a higher net debt level
mainly as a result of Indofood’s acquisition loans to finance the investment in
Pinehill and the Group’s payments for investments and capital expenditure,
despite an increase in the Group’s equity reflecting the consolidation of Pinehill
and the Group’s profit for the year.
PLDT’s gearing increased mainly because of an increase in its net debt reflecting
its payments for capital expenditure. Philex’s gearing decreased mainly because of
a decrease in its net debt reflecting its operating cash inflow.
Maturity ProfileThe maturity profile of debt of consolidated and associated companies follows.
Consolidated
Carrying amounts Nominal values
US$ millions 2020 2019 2020 2019
Within one year 1,659.7 2,262.8 1,662.5 2,268.2
One to two years 867.9 710.0 874.2 713.3
Two to five years 4,113.2 2,597.6 4,127.4 2,617.3
Over five years 3,992.8 3,360.4 4,016.3 3,369.2
Total 10,633.6 8,930.8 10,680.4 8,968.0
The change in the Group’s debt maturity profile from 31 December 2019 to 31
December 2020 mainly reflects a shift in long-term borrowings among the different
maturity periods for the Group, Head Office’s redemption and repurchase of bonds,
the Group’s net new borrowings, especially for the acquisition of Pinehill, and the
reclassification of GBPC’s bank borrowings to liabilities of a disposal group. At 31
December 2019, PLP did not meet its financial covenants and as a result, its secured
bank loans with principal amount of S$613.0 million (US$445.2 million) became
repayable on demand and were classified entirely as current liabilities. In October 2020,
PLP completed its negotiations with its lenders and the refinanced bank loans are now
classified as non-current liabilities and will mature in December 2026.
Associated Companies
PLDT Philex
Carrying amounts Nominal values Carrying amounts Nominal values
US$ millions 2020 2019 2020 2019 2020 2019 2020 2019
Within one year 365.9 389.5 368.8 391.7 37.0 50.0 37.0 50.0
One to two years 312.4 444.9 315.1 446.4 170.4 – 179.3 –
Two to five years 1,366.1 1,103.2 1,373.3 1,106.8 – 152.9 – 165.0
Over five years 2,594.6 1,864.8 2,608.1 1,867.2 – – – –
Total 4,639.0 3,802.4 4,665.3 3,812.1 207.4 202.9 216.3 215.0
The change in PLDT’s debt maturity profile from 31 December 2019 to 31 December
2020 mainly reflects new notes of US$600.0 million issued and borrowings arranged to
finance capital expenditure and/or refinance its loan obligations which were utilized for
service improvements and expansion programs, and loan repayments. The increase in
Philex’s debt mainly reflects an appreciation of the peso against U.S. dollar on the peso
denominated Silangan Mindanao Exploration Co., Ltd. (“SMECI”)’s notes during the
year, partly offset by loan repayments.
Maturity Profile of
Consolidated Debt 2020
US$ millions
Within one year 1,659.7
One to two years 867.9
Two to five years 4,113.2
Over five years 3,992.8
Total 10,633.6
39%
16%
8%37%
Maturity Profile of
Consolidated Debt 2019
US$ millions
Within one year 2,262.8
One to two years 710.0
Two to five years 2,597.6
Over five years 3,360.4
Total 8,390.8
29%
25%
8%
38%

96 First Pacific Annual Report 2020
Financial Review
Financial Risk ManagementForeign Currency Risk(A) Company Risk
As the Head Office debts are currently denominated in U.S. dollars, foreign currency risk relates mainly to the receipt of cash
dividends and to the translation of non-U.S. dollar denominated investments in subsidiary and associated companies.
The Company actively reviews the potential benefits of hedging based on forecast dividend flows and enters into hedging
arrangements (including the use of forward exchange contracts) for managing its foreign currency exposure in respect of
dividend income and payments in foreign currencies on a transactional basis. However, the Company does not actively seek
to hedge risks arising on the translation of foreign currency denominated investments due to (i) the non-cash nature of such
exposure until the values of the investments are realized and (ii) the high costs associated with such hedging. Accordingly, the
Company is exposed to the impact of foreign currency fluctuations on the translated U.S. dollar value of its foreign currency
denominated investments.
With the exception of the Head Office, the principal components of the Group’s NAV mainly relate to investments denominated
in the rupiah and the peso. Accordingly, any change in these currencies, against their respective 31 December 2020 exchange
rates, would have an effect on the Group’s NAV in U.S. dollar terms.
The following table illustrates the estimated effect on the Group’s adjusted NAV for a one per cent change of the rupiah and peso
exchange rates against the U.S. dollar.
Effect on
adjusted NAV
Effect on
adjusted NAV
per share
Company Basis US$ millions HK cents
Indofood (i) 21.3 3.83
PLDT (i) 15.4 2.77
MPIC (i) 11.8 2.12
Philex (i) 2.4 0.42
PXP (i) 1.3 0.23
FP Natural Resources (ii) 0.3 0.05
Head Office – Other assets (iii) 1.0 0.19
Total 53.5 9.61
(i) Based on quoted share prices at 31 December 2020 applied to the Group’s economic interests(ii) Based on quoted share price of RHI at 31 December 2020 applied to the Group’s effective economic interest(iii) Represents the carrying amount of SMECI’s notes

97 First Pacific Annual Report 2020
(B) Group Risk
The results of the Group’s operating entities are denominated in local currencies,
principally the rupiah, the peso and S$, which are translated and consolidated to
give the Group’s results in U.S. dollars.
Net Debt by Currency
It is often necessary for operating entities to borrow in U.S. dollars, which results
in the risk of a translation impact on local currency results. A summary of
consolidated and associated companies’ net debt by currency follows.
Consolidated
US$ millions US$ Rupiah Peso S$ Others Total
Total borrowings 3,572.6 1,544.3 4,551.3 522.8 442.6 10,633.6
Cash and cash equivalents(i) (629.5) (690.5) (1,041.0) (20.1) (46.9) (2,428.0)
Net Debt 2,943.1 853.8 3,510.3 502.7 395.7 8,205.6
Representing:
Head Office 1,341.8 – (19.9) – (2.4) 1,319.5
Indofood 1,494.9 741.1 – 22.7 289.4 2,548.1
MPIC 119.3 112.7 3,422.1 – 108.7 3,762.8
FPM Power (11.6) – – 480.0 – 468.4
FP Natural Resources (1.3) – 108.1 – – 106.8
Net Debt 2,943.1 853.8 3,510.3 502.7 395.7 8,205.6
Associated Companies
US$ millions US$ Peso Others Total
Net Debt
PLDT 521.2 3,287.1 (7.2) 3,801.1
Philex 18.3 164.3 – 182.6
(i) Includes short-term deposits and restricted cash
Details of changes in Head Office net debt are set out on page 93.
Maynilad carries certain U.S. dollar debts which were arranged for financing its
capital expenditure. Under its concession agreement with MWSS of the Philippine
government for the provision of water and sewerage services in the area of West
Metro Manila, Maynilad is entitled to rate adjustments which enable Maynilad to
recover/account for present and future foreign exchange losses/gains until the
expiration date of the concession on a quarterly basis.
Analysis of
Total Borrowings
by Currency
US$ millions
US$ 3,572.6
Rupiah 1,544.3
Peso 4,551.3
S$ 522.8
Others 442.6
Total 10,633.6
43%
34%
14%
5%4%

98 First Pacific Annual Report 2020
Financial Review
Meralco’s debt is substantially denominated in peso. Therefore, any change of the
U.S. dollar to peso exchange rate will not have a significant impact on Meralco’s
principal and interest payments. In addition, Meralco is allowed to recover foreign
exchange differences on foreign currency denominated loans through adjustments
in its customers’ billing in accordance with its local regulations.
As a result of unhedged U.S. dollar net debt, the Group’s results are sensitive
to fluctuations in U.S. dollar exchange rates. The following table illustrates the
estimated effect on the Group’s reported profitability for a one per cent change in
the principal operating currencies of subsidiary and associated companies. This
does not reflect the indirect effect of fluctuating exchange rates on revenues and
input costs at the operating company level.
US$ millions
Total US$
exposure
Hedged
amount
Unhedged
amount
Profit effect
of 1%
change in
currency
Group
net profit
effect
Head Office(i) 1,341.8 – 1,341.8 – –
Indofood 1,494.9 – 1,494.9 15.0 5.8
MPIC 119.3 – 119.3 1.2 0.4
FPM Power (11.6) – (11.6) (0.1) (0.0)
FP Natural Resources (1.3) – (1.3) (0.0) (0.0)
PLDT 521.2 (17.7) 503.5 5.0 0.9
Philex 18.3 – 18.3 0.2 0.1
Total 3,482.6 (17.7) 3,464.9 21.3 7.2
(i) As the Group reports its results in U.S. dollars, unhedged U.S. dollar net debt at Head Office does not give rise to any significant exchange exposure.
Equity Market RiskAs the majority of the Company’s investments are listed, the Company is exposed to
fluctuations in the equity market values of such investments. In addition, the value of
the Company’s investments may be impacted by sentiment towards specific countries.
First Pacific’s listed investments are located in Indonesia, the Philippines and Singapore.
Accordingly, in addition to operating factors within the Company’s control, the Company
also has an equity market risk in respect of general investor sentiment towards these
countries. Changes in the stock market indices of Indonesia, the Philippines and
Singapore are summarized as follows:
Jakarta
Composite
Index
Philippine
Composite
Index
Singapore
Straits Times
Index
At 31 December 2019 6,300 7,815 3,223
At 31 December 2020 5,979 7,140 2,844
Decrease during 2020 –5.1% –8.6% –11.8%
At 29 March 2021 6,167 6,608 3,176
Change during 1 January 2021 to 29 March 2021 +3.1% –7.5% +11.7%
Singapore Dollars
Closing Rates Against
the U.S. Dollars
1.50
1.45
1.40
1.35
1.30
1.25
S$
Dec19
Mar20
Jun20
Sep20
Dec
20
Mar21
Rupiah and Peso
Closing Rates Against
the U.S. Dollars
17,000
16,200
15,400
14,600
13,800
13,000
Rupiah Peso
RupiahPeso
Dec19
Mar20
Jun20
Sep20
Dec
20
Mar21
52
51
50
49
48
47
Stock Market
Indices
1,000
2,000
3,000
4,000
5,000
6,000
7,000
8,000
9,000
Dec19
Mar20
Jun20
Sep20
Dec
20
Mar21
Philippine Composite Index (PCI)Jakarta Composite Index (JCI)
Singapore Straits Times Index (SSTI)
JCI/PCI/SSTI

99 First Pacific Annual Report 2020
Interest Rate RiskThe Company and its operating entities are exposed to changes in interest rates to the
extent that they impact the cost of variable interest rate borrowings. An analysis of this
for consolidated and associated companies follows.
Consolidated
US$ millions
Fixed
interest rate
borrowings(i)
Variable
interest rate
borrowings(i)
Cash
and cash
equivalents(ii) Net debt
Head Office 1,052.7 378.2 (111.4) 1,319.5
Indofood 141.6 3,635.6 (1,229.1) 2,548.1
MPIC 4,317.2 500.9 (1,055.3) 3,762.8
FPM Power – 497.0 (28.6) 468.4
FP Natural Resources 84.3 26.1 (3.6) 106.8
Total 5,595.8 5,037.8 (2,428.0) 8,205.6
Associated Companies
US$ millions
Fixed
interest rate
borrowings(i)
Variable
interest rate
borrowings(i)
Cash
and cash
equivalents(ii) Net debt
PLDT 3,992.5 646.5 (837.9) 3,801.1
Philex 170.4 37.0 (24.8) 182.6
(i) Reflects certain interest rate swap agreements which effectively changed variable interest rate borrowings to fixed interest rate borrowings at Head Office and PLDT
(ii) Includes short-term deposits and restricted cash
The following table illustrates the estimated effect on the Group’s reported profitability
for a one per cent change in average annual interest rates in respect of the variable
interest rate borrowings.
US$ millions
Total variable
interest rate
borrowings
Profit effect of
1% change
in interest
rates
Group
net profit
effect
Head Office 378.2 3.8 3.8
Indofood 3,635.6 36.3 14.2
MPIC 500.9 5.0 1.5
FPM Power 497.0 5.0 1.7
FP Natural Resources 26.1 0.3 0.1
PLDT 646.5 6.4 1.2
Philex 37.0 0.4 0.1
Total 5,721.3 57.2 22.6
Interest Rate Profile
US$ millions
Fixed 5,595.8
Variable 5,037.8
Total 10,633.6
53%47%

100 First Pacific Annual Report 2020
Financial Review
Adjusted NAV Per ShareThere follows a calculation of the Group’s underlying worth.
At 31 December
US$ millions Basis
2020 2019
Indofood (i) 2,134.9 2,506.2
PLDT (i) 1,541.5 1,077.8
MPIC (i) 1,178.5 908.7
Philex (i) 235.2 127.5
PXP (i) 127.3 94.8
FP Natural Resources (ii) 27.1 25.5
Head Office – Other assets (iii) 104.9 99.5
– Net debt (1,319.5) (1,330.6)
Total Valuation 4,029.9 3,509.4
Number of Ordinary Shares in Issue (millions) 4,344.9 4,344.9
Value per share – U.S. dollars 0.93 0.81
– HK dollars 7.23 6.30
Company’s closing share price (HK$) 2.47 2.65
Share price discount to HK$ value per share (%) 65.8 57.9
(i) Based on quoted share prices applied to the Group’s economic interests(ii) Based on quoted share price of RHI applied to the Group’s effective economic interest(iii) Represents the carrying amount of SMECI’s notes
Share Price vs
Adjusted NAV Per Share
0
5
10
15
HK$
Adjusted NAV
10.45
5.42
7.23
2.47
Share price
Dec16
Dec17
Dec18
Dec19
Dec
20

Statutory Reports, Consolidated Financial Statementsand Notes to the Consolidated Financial Statements
101 First Pacific Annual Report 2020
Contents
Statutory Reports
Report of the Directors 102
Independent Auditor’s Report 108
Consolidated Financial Statements
Consolidated Income Statement 112
Consolidated Statement of Comprehensive Income 113
Consolidated Statement of Financial Position 114
Consolidated Statement of Changes in Equity 115
Consolidated Statement of Cash Flows 116
Notes to the Consolidated Financial Statements
General Information
1. Corporate and Group Information 118
2. Basis of Preparation and Summary of
Principal Accounting Policies 118
3. Significant Accounting Judgments and Estimates 145
Consolidated Income Statement
4. Turnover and Operating Segmental Information 149
5. Profit before Taxation from Continuing Operations 154
6. Taxation 155
7. A Discontinued Operation 156
8. Profit/(Loss) Attributable to Owners of the Parent 158
9. Earnings/(Loss) Per Share Attributable to
Owners of the Parent 158
10. Ordinary Share Distribution 159
Consolidated Statement of Financial Position
11. Property, Plant and Equipment 160
12. Biological Assets 161
13. Associated Companies and Joint Ventures 164
14. Goodwill 167
15. Other Intangible Assets 169
16. Investment Properties 177
17. Accounts Receivable, Other Receivables and
Prepayments 177
18. Financial Assets at Fair Value through
Other Comprehensive Income 179
19. Deferred Tax 180
20. Restricted Cash 181
21. Other Non-current Assets 181
22. Cash and Cash Equivalents and Short-term Deposits 182
23. Inventories 182
24. Assets Classified as Held for Sale and
Liabilities Directly Associated with the
Assets Classified as Held for Sale 182
25. Accounts Payable, Other Payables and Accruals 183
26. Borrowings 183
27. Provision for Taxation 186
28. Deferred Liabilities, Provisions and Payables 186
29. Share Capital 187
30. Shares Held for Share Award Scheme 188
31. Other Components of Equity 191
32. Non-controlling Interests 193
33. Other Comprehensive (Loss)/Income Attributable to
Owners of the Parent 195
Consolidated Statement of Cash Flows
34. Notes to the Consolidated Statement of Cash Flows 195
Other Financial Information
35. Commitments and Contingent Liabilities 199
36. Employees’ Benefits 200
37. Directors’ and Senior Executives’ Remuneration 205
38. Related Party Transactions 212
39. Financial Instruments 218
40. Capital and Financial Risk Management 221
41. Statement of Financial Position of the Company 228
42. Events after the Reporting Period 229
43. Comparative Amounts 230
44. Approval of the Consolidated Financial Statements 230

Statutory Reports
102 First Pacific Annual Report 2020
Report of the DirectorsThe Directors present their report and the audited financial statements of First Pacific Company Limited (the Company) and its
subsidiary companies (together, the Group) (the Consolidated Financial Statements) for the year ended 31 December 2020.
Principal Business Activities, Geographical Market Analysis of Operations and Business Review
First Pacific Company Limited is a Hong Kong-based investment management and holding company with operations located in Asia-
Pacific. Its principal business interests relate to consumer food products, telecommunications, infrastructure and natural resources.
During the year, there were no significant changes in the nature of the Group’s principal business activities.
An analysis of the Group’s turnover and operating segmental information for the year is set out in Note 4 to the Consolidated Financial
Statements, and a summary of its principal investments is set out on pages 235 and 236.
Further discussion and analysis of the Group’s activities as required by Schedule 5 to the Hong Kong Companies Ordinance, including
a description of the principal risks and uncertainties facing the Group, an indication of likely future development in the Group’s
business and the Group’s environmental policies and performance, can be found in the “Review of Operations”, “Chairman’s Letter”,
“Managing Director and Chief Executive Officer’s Letter”, “Corporate Social Responsibility Report” and “Corporate Governance Report”
sections set out on pages 6 to 34 and pages 42 to 88 of this annual report. Those discussions form part of this Report of the Directors.
Incorporation
The Company was incorporated on 25 May 1988 in Bermuda with limited liability.
Share Capital, Shares Held for Share Award Scheme and Share Options
Details of movements in the Company’s share capital, shares held for share award scheme and share options issued by the Group
during the year, together with their reasons, are set out in Notes 29, 30 and 37(D) to the Consolidated Financial Statements.
Reserves
Details of movements in the reserves of the Group and the Company during the year are set out in the Consolidated Financial
Statements on page 115 and page 229, respectively.
Purchase, Sale or Redemption of Listed Securities of the Company
During the year ended 31 December 2020, the Company has not repurchased any of its ordinary shares (2019: Nil) listed on The
Stock Exchange of Hong Kong Limited (SEHK).
During the year ended 31 December 2020, the Company repurchased the following bonds:
1. US$0.1 million (2019: Nil) of the US$400 million 6.375% Guaranteed Secured Bonds due September 2020 issued by FPT
Finance Limited (2020 Bonds) at an aggregate consideration of approximately US$0.1 million (2019: Nil) in January 2020;
2. US$1.0 million (2019: Nil) of the US$400 million 4.5% Guaranteed Bonds due April 2023 issued by FPC Treasury Limited at an
aggregate consideration of approximately US$1.0 million (2019: Nil) in April 2020; and
3. US$54.5 million (2019: Nil) of the US$175 million 5.75% Guaranteed Bonds due May 2025 issued by FPC Capital Limited at an
aggregate consideration of approximately US$58.5 million (2019: Nil) in September and October 2020.
Upon maturity in September 2020, the then total outstanding US$251.8 million of the 2020 Bonds were fully redeemed at an
aggregate consideration of US$251.8 million.
In September 2020, FPC Resources Limited (a wholly-owned subsidiary of the Company) issued US$350 million 4.375% Guaranteed
Bonds due September 2027, which were subsequently approved for listing on the SEHK.

103 First Pacific Annual Report 2020
During the year ended 31 December 2020, the independent trustee managing the Company’s share award scheme bought, at
the Company’s cost, through the SEHK a total of 3,228,000 shares (2019: 5,418,000 shares) of the Company at an aggregate
consideration of approximately US$0.9 million (2019: US$2.0 million). There was no subscription of new shares during the year ended
31 December 2020 by the independent trustee under the Company’s share award scheme (2019: 2,944,076 shares at an aggregate
consideration of approximately US$1.1 million) at the Company’s cost.
Except as disclosed above, neither the Company, nor any of its subsidiary companies, has made any purchase, sale or redemption of
any of the Company’s listed securities during the year.
Results and Appropriations
The consolidated results of the Group for the year ended 31 December 2020 and the Group’s consolidated financial position at that
date are set out in the Consolidated Financial Statements on pages 112 to 230.
An interim distribution of HK7.00 cents (U.S. 0.90 cents) (2019: HK6.50 cents or U.S. 0.83 cents) per ordinary share, totaling
US$39.2 million (2019: US$36.0 million), was paid on 28 September 2020. The Directors recommended the payment of a final
distribution of HK7.50 cents (U.S. 0.96 cents) (2019: HK7.00 cents or U.S. 0.90 cents) per ordinary share, totaling US$41.8 million
(2019: US$39.2 million). The total distribution per ordinary share for 2020 equals to HK14.5 cents (U.S. 1.86 cents) (2019: HK13.50
cents or U.S. 1.73 cents), totaling US$81.0 million (2019: US$75.2 million).
Charitable Contributions
In 2020, the Group made charitable contributions totaling US$28.7 million (2019: US$21.9 million).
Property, Plant and Equipment
Details of movements in the Group’s property, plant and equipment during the year are provided in Note 11 to the Consolidated
Financial Statements.
Borrowings
Details of the borrowings of the Group are provided in Note 26 to the Consolidated Financial Statements.
Distributable Reserves
At 31 December 2020, the Company’s reserves available for distribution, calculated in accordance with the provisions of the
Companies Act 1981 of Bermuda (as amended) amounted to US$1,620.6 million (2019: US$1,699.0 million), representing the
Company’s contributed surplus account. In addition, the Company’s share premium account of US$63.1 million (2019: US$63.1
million) may be distributed in the form of fully paid bonus shares.
Pre-emptive Rights
There is no provision for pre-emptive rights under the Company’s bye-laws or the laws of Bermuda which would oblige the Company
to offer new shares on a pro rata basis to existing shareholders.
Directors
The names and biographical details of the Directors of the Company who held office during the year and up to the date of this report
are set out on pages 35 to 39. Details of the remuneration policy and other details are provided in the Corporate Governance Report
on page 88 and Note 37(A) to the Consolidated Financial Statements, respectively.
Interests of Directors in the Company and its Associated Corporations
As at 31 December 2020, the interests and short positions of the Directors and chief executive of the Company in the shares of the
Company, underlying shares and debentures of the Company or any of its associated corporations (within the meaning of Part XV of
the Securities and Futures Ordinance (Chapter 571 of the Laws of Hong Kong) (SFO)) which (a) were recorded in the register required
to be kept under section 352 of the SFO; or (b) were notified to the Company and SEHK pursuant to the Model Code for Securities
Transactions by Directors of Listed Issuers as adopted by the Company (Model Code) were as follows:

104 First Pacific Annual Report 2020
Statutory Reports
(A) Long Positions in Shares in the Company
Name Ordinary shares
Approximate
percentage of
issued share
capital (%)
Ordinary
share options
Anthoni Salim 1,925,474,957(C)(i) 44.32 –
Manuel V. Pangilinan 70,493,078(P)(ii) 1.62 –
Christopher H. Young 8,385,189(P)(iii) 0.19 –
Benny S. Santoso – – 5,167,600
Prof. Edward K.Y. Chen, GBS, CBE, JP 2,946,559(P)(iv) 0.07 –
Margaret Leung Ko May Yee, SBS, JP 2,088,652(P)(v) 0.05 –
Philip Fan Yan Hok 8,168,652(P)(vi) 0.19 –
Madeleine Lee Suh Shin 600,000(P) 0.01 3,828,000
Blair Chilton Pickerell 957,000(P)(vii) 0.02 –
(C) = Corporate interest, (P) = Personal interest
(i) Anthoni Salim indirectly owns 100% of First Pacific Investments (B.V.I.) Limited, his indirect interests in First Pacific Investments (B.V.I.) Limited are held through Salerni International Limited (a company of which Anthoni Salim directly holds 100% of the issued share capital). First Pacific Investments (B.V.I.) Limited and Salerni International Limited are interested in 633,186,599 shares and 502,058,994 shares respectively in the Company. Anthoni Salim also owns 83.84% of First Pacific Investments Limited which, in turn, is interested in 790,229,364 shares in the Company. Of this, 4.04% is held by Anthoni Salim directly, 20.19% by Salerni International Limited and 59.61% by Asian Capital Finance Limited (a company in which Anthoni Salim owns 100% share interests). The remaining 16.16% interest in First Pacific Investments Limited is owned as to 12.12% by the late Sutanto Djuhar (a former Non-executive Director of the Company) and 4.04% by Tedy Djuhar (a Non-executive Director of the Company).
(ii) It included Mr. Pangilinan’s interests in 29,033,817 shares transferred to certain family trusts.(iii) It included Mr. Young’s interests in 3,220,566 awarded shares granted pursuant to the Company’s Share Award Scheme as adopted by the Board on
19 March 2013 (Share Award Scheme) which remain unvested.(iv) It included Prof. Chen’s interests in 638,000 awarded shares granted pursuant to the Share Award Scheme which remain unvested.(v) It included Mrs. Leung’s interests in 638,000 awarded shares granted pursuant to the Share Award Scheme which remain unvested.(vi) It included Mr. Fan’s interests in 638,000 awarded shares granted pursuant to the Share Award Scheme which remain unvested.(vii) It represented Mr. Pickerell’s interests in 957,000 awarded shares granted pursuant to the Share Award Scheme which remain unvested.
(B) Long positions in Shares in associated corporations
Manuel V. Pangilinan owned (a) 31,622,404 common shares(P) (0.10%)* in MPIC; (b) 269,494 common shares(P) (0.12%)*
in PLDT as beneficial owner and a further 15,417 common shares (less than 0.01%)* in PLDT as nominee; (c) 4,655,000
common shares(P) (0.09%)* in Philex; (d) 1,603,465 common shares(P) (0.08%)* in PXP; (e) 55,000 common shares(P) (less
than 0.01%)* in Meralco; as well as (f) 61,547 common shares(P) (less than 0.01%)* in RHI; as well as (g) US$1,000,000
of bonds due 2027 issued by FPC Resources Limited, which is a wholly-owned subsidiary of the Company.
Christopher H. Young owned (a) 54,313 common shares(P) (0.02%)* in PLDT and (b) 61,547 common shares(P) (less than
0.01%)* in RHI.
Tedy Djuhar owned 15,520,335 ordinary shares(C) (0.18%)* in Indofood.
Anthoni Salim owned (a) 1,329,770 ordinary shares(P) (0.02%)* in Indofood and an indirect interest of 4,396,103,450
Indofood shares(C) (50.07%)* through the Company’s group companies; (b) an indirect interest of 2,007,788 shares(C)
(0.14%)* in IndoAgri through his controlled corporations other than the Company and an indirect interest of 1,161,618,030
IndoAgri shares(C) (83.22%)* through the Company’s group companies; and (c) an indirect interest of 20,483,364 shares(C)
(0.13%)* in SIMP through his controlled corporations other than the Company and an indirect interest of 12,471,746,400
SIMP shares(C) (78.85%)* through the Company’s group companies.
(P) = Personal interest, (C) = Corporate interest* Approximate percentage of the issued capital of the respective class of shares in the respective associated corporations as at 31 December 2020.
Save for those disclosed above, as at 31 December 2020, none of the Directors and chief executive of the Company had any interests
or short positions in respect of shares, underlying shares or debentures of the Company or any of its associated corporations (within
the meaning of Part XV of the SFO) as recorded in the register required to be kept under Section 352 of the SFO, or as otherwise
notified to the Company pursuant to the Model Code.

105 First Pacific Annual Report 2020
Interests of Substantial Shareholders in the Company
The interests and short positions of substantial shareholders in the shares and underlying shares of the Company as at 31 December
2020 as recorded in the register required to be kept under Section 336 of the SFO are set out below:
(a) Salerni International Limited (Salerni), which was incorporated in the British Virgin Islands, was interested in 1,135,245,593
ordinary shares of the Company at 31 December 2020, representing approximately 26.13% of the Company’s issued share
capital at that date, by way of 502,058,994 ordinary shares of the Company held, representing approximately 11.56% of the
Company’s issued share capital at that date and also its 100% interest in First Pacific Investments (B.V.I.) Limited (FPIL-BVI).
Anthoni Salim, Chairman of the Company, beneficially owns the entire issued share capital of Salerni and, accordingly, is taken
to be interested in the shares owned by Salerni.
(b) Asian Capital Finance Limited (ACFL), which was incorporated in the British Virgin Islands, was interested in 790,229,364
ordinary shares of the Company at 31 December 2020, representing approximately 18.19% of the Company’s issued share
capital at that date, by way of its 59.61% interest in First Pacific Investments Limited (FPIL-Liberia). Anthoni Salim, Chairman of
the Company, beneficially owns the entire issued share capital of ACFL and, accordingly, is taken to be interested in the shares
owned by ACFL.
(c) FPIL-Liberia, which was incorporated in the Republic of Liberia, beneficially owned 790,229,364 ordinary shares at 31
December 2020, representing approximately 18.19% of the Company’s issued share capital at that date. FPIL-Liberia is owned
by Salerni, ACFL, Anthoni Salim (Chairman of the Company), Tedy Djuhar (a Non-executive Director of the Company) and the
late Sutanto Djuhar (a former Non-executive Director of the Company), in the proportion specified in note (i) of the table on page
104. Anthoni Salim, Chairman of the Company, is taken to be interested in the shares owned by FPIL-Liberia.
(d) FPIL-BVI, which was incorporated in the British Virgin Islands, beneficially owned 633,186,599 ordinary shares at 31 December
2020, representing approximately 14.57% of the Company’s issued share capital at that date. Anthoni Salim, Chairman of the
Company, indirectly owns the entire issued share capital of FPIL-BVI and, accordingly, is taken to be interested in the shares
owned by FPIL-BVI.
(e) Brandes Investment Partners L.P. (Brandes), a United States incorporated company, notified the Company that it held
347,502,767 ordinary shares of the Company as at 30 October 2020, representing approximately 7.99% of the Company’s issued
share capital at that date. At 31 December 2020, the Company has not received any other notification from Brandes of any
change to such holding.
(f) Citigroup Inc. (Citigroup), a United States incorporated company, notified the Company that it held ordinary shares of the
Company as follows: 220,252,505 (long position), 769,000 (short position) and 219,444,153 (lending pool) on 3 April 2020,
representing approximately 5.07% (long position), 0.02% (short position) and 5.05% (lending pool) of the Company’s issued
share capital at that date. The long position in shares held by the Citigroup is held in the capacities of Interest of corporation
controlled (relating to 808,352 ordinary shares) and Approved lending agent (relating to 219,444,153 ordinary shares). At 31
December 2020, the Company has not received any other notification from Citigroup of any change to such holding.
(g) Northern Trust Corporation, a United States incorporated company, and its 100% controlled corporation, The Northern Trust
Company (ALA), a United States incorporated company (collectively Northern Trust), notified the Company that they held
260,925,507 ordinary shares of the Company (lending pool) on 2 June 2020, representing approximately 6.01% (lending pool)
of the Company’s issued share capital at that date. At 31 December 2020, the Company has not received any other notification
from Northern Trust of any change to such holding.
Other than as disclosed above, the Company had not been notified of any person at 31 December 2020 who had an interest or short
position in the shares or underlying shares of the Company to be recorded in the register required to be kept under Section 336 of the
SFO.

106 First Pacific Annual Report 2020
Statutory Reports
Transactions, Arrangements or Contracts of Significance
Except for the related party transactions set out in Note 38 to the Consolidated Financial Statements, there were no transactions,
arrangements or contracts of significance in relation to the Company’s business to which the Company or its subsidiary companies
were parties, and in which a Director of the Company had a material interest, whether directly or indirectly, subsisted at the end of the
year or at any time during the year.
Apart from as disclosed above, none of the Directors nor a connected entity of a Director had any direct or indirect interest in any assets
which have been acquired, disposed of by, or leased to, or are proposed to be acquired or disposed of by, or leased to the Company
or any of its subsidiary companies at the end of the year or at any time during the year.
Directors’ Rights to Acquire Shares or Debentures
Apart from as disclosed under the heading “Interests of Directors in the Company and its Associated Corporations” above, “Shares
Held for Share Award Scheme” and “Share Options” in Notes 30 and 37(D)(a) to the Consolidated Financial Statements, at no
time during the year was the Company or any of its subsidiary companies a party to any arrangement to enable the Directors of the
Company to acquire benefits by means of the acquisition of shares in, or debentures of, the Company or any other body corporate and
none of the Directors of the Company or their spouses or minor children had any right to subscribe for securities of the Company, or
had exercised any such right during the year.
Summary Financial Information
A summary of the published results, assets, liabilities and non-controlling interests, and various information and financial ratios of the
Company and the Group for the last ten financial years, as extracted from the audited Consolidated Financial Statements and restated/
reclassified as appropriate, is set out on pages 2 and 3. This summary does not form part of the audited Consolidated Financial
Statements.
Major Customers and Suppliers
In 2020, sales to the Group’s five largest customers accounted for less than 30% of the total sales for the year, whereas purchases
from the Group’s five largest suppliers accounted for 26% (2019: 28% (Restated)) of the total purchases for the year of which
purchases from the largest supplier included therein accounted for 12% (2019: 12% (Restated)) of the total purchases.
Continuing Connected Transactions and Connected Transactions
Continuing connected transactions and connected transactions required to be disclosed in accordance with Chapter 14A of the Listing
Rules, are disclosed in the Corporate Governance Report on pages 67 to 80.
Sufficiency of Public Float
Based on information that is publicly available to the Company and within the knowledge of the Directors, at least 25% of the
Company’s total number of issued shares were held by the public at both 31 December 2020 and the date of this report.
Directors’ and Officers’ Liability Insurance
During the year, the Company has maintained appropriate Directors’ and Officers’ Liability Insurance for all Directors and officers
of the Company and its related companies, set out in the Corporate Governance Report on page 59, save in those instances where
individual companies have maintained their own coverage.

107 First Pacific Annual Report 2020
Employment Policy
The Company has a policy of non-discrimination in respect of the age, religion, gender, race, disability or marital status of employees
and prospective employees. This ensures that individuals are treated equally, given their skills and abilities, in terms of career
development and opportunities for advancement.
Auditor
Ernst & Young retire and a resolution for their reappointment as auditor of the Company will be proposed at the forthcoming AGM.
On behalf of the Board of Directors
Nancy L.M. Li
Company Secretary
Hong Kong
30 March 2021

108 First Pacific Annual Report 2020
Statutory Reports
Independent Auditor’s Report
TO THE SHAREHOLDERS OF FIRST PACIFIC COMPANY LIMITED
(Incorporated in Bermuda with limited liability)
Opinion
We have audited the consolidated financial statements of First Pacific Company Limited (the “Company”) and its subsidiaries (the
“Group”) set out on pages 112 to 230, which comprise the consolidated statement of financial position as at 31 December 2020, and
the consolidated income statement, the consolidated statement of comprehensive income, the consolidated statement of changes
in equity and the consolidated statement of cash flows for the year then ended, and notes to the consolidated financial statements,
including a summary of significant accounting policies.
In our opinion, the consolidated financial statements give a true and fair view of the consolidated financial position of the Group
as at 31 December 2020, and of its consolidated financial performance and its consolidated cash flows for the year then ended
in accordance with Hong Kong Financial Reporting Standards (“HKFRSs”) issued by the Hong Kong Institute of Certified Public
Accountants (“HKICPA”) and have been properly prepared in compliance with the Hong Kong Companies Ordinance.
Basis for opinion
We conducted our audit in accordance with Hong Kong Standards on Auditing (“HKSAs”) issued by the HKICPA. Our responsibilities
under those standards are further described in the Auditor’s responsibilities for the audit of the consolidated financial statements
section of our report. We are independent of the Group in accordance with the HKICPA’s Code of Ethics for Professional Accountants
(the “Code”), and we have fulfilled our other ethical responsibilities in accordance with the Code. We believe that the audit evidence
we have obtained is sufficient and appropriate to provide a basis for our opinion.
Key audit matters
Key audit matters are those matters that, in our professional judgment, were of most significance in our audit of the consolidated
financial statements of the current period. These matters were addressed in the context of our audit of the consolidated financial
statements as a whole, and in forming our opinion thereon, and we do not provide a separate opinion on these matters. For each
matter below, our description of how our audit addressed the matter is provided in that context.
We have fulfilled the responsibilities described in the Auditor’s responsibilities for the audit of the consolidated financial statements
section of our report, including in relation to these matters. Accordingly, our audit included the performance of procedures designed
to respond to our assessment of the risks of material misstatement of the consolidated financial statements. The results of our
audit procedures, including the procedures performed to address the matters below, provide the basis for our audit opinion on the
accompanying consolidated financial statements.
109 First Pacific Annual Report 2020
Independent Auditor’s Report (continued)
Key audit matter How our audit addressed the key audit matter
Impairment assessment of goodwill, intangible assets with indefinite useful life and concession assets not yet available for use
(collectively, the “Intangible Assets”)
The Intangible Assets and their carrying amounts were allocated
to the Group’s respective cash-generating units (“CGUs”) for
impairment testing. Impairment was determined by assessing the
recoverable amount of the CGU to which each of the Intangible
Assets relates and whether the recoverable amount of the CGU
was less than the carrying amount. For the year under review,
the recoverable amounts of the respective CGUs have been
determined based on value-in-use calculations using cash flow
projections specific to each CGU and applying discount rates
which reflected specific risks relating to the relevant CGUs.
The impairment testing of the Intangible Assets required
management to make significant assumptions and estimates that
would affect the reported amounts of the Intangible Assets and
related disclosures in the consolidated financial statements.
Related disclosures are included in Notes 3, 14 and 15 to the
consolidated financial statements.
We evaluated management’s assessment of impairment of the
Intangible Assets. Our audit procedures included evaluating the
methodologies, assumptions and estimates used by the Group.
In particular, for each relevant CGU, we assessed the historical
accuracy of the prior years’ assumptions and estimates, and
obtained an understanding of the current and expected future
developments of the Group and its environment. Certain key
assumptions, including the discount rate, expected market
development and long term growth rates, were assessed with
the assistance from our valuation experts with relevant expertise
and with external information sources. We also evaluated the
management’s assessment about the reasonably possible change
in the relevant key assumptions.
Amortisation of concession assets using unit-of-production method
The concession assets of the Group which were amortised using
the unit-of-production method related to toll roads and certain
water distribution businesses. The amortisation of toll road
concession assets was based on the ratio of actual traffic volume
to the total expected traffic volume of the underlying toll roads
over the remaining concession period, while the amortisation of
the water distribution concession assets was based on the actual
billed volume over the estimated billable water volume for the
period over which the concession agreement was in force.
The amortisation method required management to make
significant estimates on the total expected volume of traffic
and total volume of billable water over the period for which the
corresponding concession assets were in force. These estimates
affected the reported amount of amortisation expenses and
related disclosures in the consolidated financial statements.
Related disclosures are included in Notes 3 and 15 to the
consolidated financial statements.
We evaluated management’s schedule of amortisation of
concession assets and related assumptions and estimates used
by the Group with reference to industry data and information
related to the estimated total traffic, billable water volume,
historical traffic and billed water volume. We also evaluated
the competence and objectivity of management’s specialists
who estimated the forecasted volumes. We recalculated the
amortisation expense for the year and the amount of the
concession assets as of year-end based on the estimated billable
water volume and traffic volume.

110 First Pacific Annual Report 2020
Statutory Reports
Independent Auditor’s Report (continued)
Other information included in the Annual Report
The directors of the Company are responsible for the other information. The other information comprises the information included in
the Annual Report, other than the consolidated financial statements and our auditor’s report thereon.
Our opinion on the consolidated financial statements does not cover the other information and we do not express any form of assurance
conclusion thereon.
In connection with our audit of the consolidated financial statements, our responsibility is to read the other information and, in doing
so, consider whether the other information is materially inconsistent with the consolidated financial statements or our knowledge
obtained in the audit or otherwise appears to be materially misstated. If, based on the work we have performed, we conclude that there is
a material misstatement of this other information, we are required to report that fact. We have nothing to report in this regard.
Responsibilities of the directors for the consolidated financial statements
The directors of the Company are responsible for the preparation of the consolidated financial statements that give a true and fair
view in accordance with HKFRSs issued by the HKICPA and the Hong Kong Companies Ordinance, and for such internal control
as the directors determine is necessary to enable the preparation of consolidated financial statements that are free from material
misstatement, whether due to fraud or error.
In preparing the consolidated financial statements, the directors of the Company are responsible for assessing the Group’s ability
to continue as a going concern, disclosing, as applicable, matters related to going concern and using the going concern basis of
accounting unless the directors of the Company either intend to liquidate the Group or to cease operations or have no realistic
alternative but to do so.
The directors of the Company are assisted by the Audit and Risk Management Committee in discharging their responsibilities for
overseeing the Group’s financial reporting process.
Auditor’s responsibilities for the audit of the consolidated financial statements
Our objectives are to obtain reasonable assurance about whether the consolidated financial statements as a whole are free from
material misstatement, whether due to fraud or error, and to issue an auditor’s report that includes our opinion. Our report is made
solely to you, as a body, in accordance with section 90 of the Bermuda Companies Act 1981, and for no other purpose. We do not
assume responsibility towards or accept liability to any other person for the contents of this report.
Reasonable assurance is a high level of assurance, but is not a guarantee that an audit conducted in accordance with HKSAs will
always detect a material misstatement when it exists. Misstatements can arise from fraud or error and are considered material if,
individually or in the aggregate, they could reasonably be expected to influence the economic decisions of users taken on the basis of
these consolidated financial statements.
As part of an audit in accordance with HKSAs, we exercise professional judgment and maintain professional scepticism throughout
the audit. We also:
Identify and assess the risks of material misstatement of the consolidated financial statements, whether due to fraud or error,
design and perform audit procedures responsive to those risks, and obtain audit evidence that is sufficient and appropriate to
provide a basis for our opinion. The risk of not detecting a material misstatement resulting from fraud is higher than for one
resulting from error, as fraud may involve collusion, forgery, intentional omissions, misrepresentations, or the override of internal
control.
Obtain an understanding of internal control relevant to the audit in order to design audit procedures that are appropriate in the
circumstances, but not for the purpose of expressing an opinion on the effectiveness of the Group’s internal control.
Evaluate the appropriateness of accounting policies used and the reasonableness of accounting estimates and related
disclosures made by the directors.

111 First Pacific Annual Report 2020
Independent Auditor’s Report (continued)
Conclude on the appropriateness of the directors’ use of the going concern basis of accounting and, based on the audit evidence
obtained, whether a material uncertainty exists related to events or conditions that may cast significant doubt on the Group’s
ability to continue as a going concern. If we conclude that a material uncertainty exists, we are required to draw attention in
our auditor’s report to the related disclosures in the consolidated financial statements or, if such disclosures are inadequate, to
modify our opinion. Our conclusions are based on the audit evidence obtained up to the date of our auditor’s report. However,
future events or conditions may cause the Group to cease to continue as a going concern.
Evaluate the overall presentation, structure and content of the consolidated financial statements, including the disclosures, and
whether the consolidated financial statements represent the underlying transactions and events in a manner that achieves fair
presentation.
Obtain sufficient appropriate audit evidence regarding the financial information of the entities or business activities within the
Group to express an opinion on the consolidated financial statements. We are responsible for the direction, supervision and
performance of the group audit. We remain solely responsible for our audit opinion.
We communicate with the Audit and Risk Management Committee regarding, among other matters, the planned scope and timing of
the audit and significant audit findings, including any significant deficiencies in internal control that we identify during our audit. We
also provide the Audit and Risk Management Committee with a statement that we have complied with relevant ethical requirements
regarding independence and to communicate with them all relationships and other matters that may reasonably be thought to bear on
our independence, and where applicable, actions taken to eliminate threats or safeguards applied.
From the matters communicated with the Audit and Risk Management Committee, we determine those matters that were of most
significance in the audit of the consolidated financial statements of the current period and are therefore the key audit matters.
We describe these matters in our auditor’s report unless law or regulation precludes public disclosure about the matter or when,
in extremely rare circumstances, we determine that a matter should not be communicated in our report because the adverse
consequences of doing so would reasonably be expected to outweigh the public interest benefits of such communication.
The engagement partner on the audit resulting in this independent auditor’s report is Catherine Yen Kai Shun.
ERNST & YOUNG
Certified Public Accountants
22/F CITIC Tower
1 Tim Mei Avenue
Central, Hong Kong
30 March 2021

Consolidated Financial Statements
112 First Pacific Annual Report 2020
Consolidated Income Statement
For the year ended 31 December 2020 2019
US$ millions Notes (Restated)(i)
Turnover 4 7,130.5 7,585.0
Cost of sales (4,822.2) (5,301.2)
Gross Profit 2,308.3 2,283.8
Selling and distribution expenses (619.0) (606.2)
Administrative expenses (604.9) (635.7)
Other operating expenses, net 5(A) (50.5) (526.9)
Interest income 68.8 76.7
Finance costs 5(B) (442.6) (438.2)
Share of profits less losses of associated companies and joint ventures 280.0 327.0
Profit before Taxation from Continuing Operations 5 940.1 480.5
Taxation 6 (341.6) (444.4)
Profit for the Year from Continuing Operations 598.5 36.1
Profit for the year from a discontinued operation 7 69.1 85.0
Profit for the Year 667.6 121.1
Profit/(Loss) Attributable to:
Owners of the Parent 8 201.6 (253.9)
Non-controlling Interests 466.0 375.0
667.6 121.1
Profit/(Loss) Attributable to Owners of the Parent arising from:
Continuing operations 181.1 (269.7)
A discontinued operation 20.5 15.8
201.6 (253.9)
Earnings/(Loss) Per Share Attributable to Owners of the Parent (U.S. cents) 9
Basic
Continuing operations 4.18 (6.21)
A discontinued operation 0.47 0.36
4.65 (5.85)
Diluted
Continuing operations 4.17 (6.21)
A discontinued operation 0.47 0.36
4.64 (5.85)
(i) Refer to Note 43
Details of the distribution proposed for the year are disclosed in Note 10 to the Consolidated Financial Statements.
The Notes on pages 118 to 230 form an integral part of the Consolidated Financial Statements.
113 First Pacific Annual Report 2020
Consolidated Statement of Comprehensive Income
For the year ended 31 December 2020 2019
US$ millions
Profit for the Year 667.6 121.1
Other Comprehensive Income/(Loss)
Items that will be Reclassified Subsequently to Profit or Loss:
Exchange differences on translating foreign operations 318.2 334.5
Unrealized (losses)/gains on debt investments at fair value through
other comprehensive income (0.3) 1.3
Unrealized (losses)/gains on cash flow hedges (58.9) 29.0
Realized losses on cash flow hedges 44.5 11.1
Income tax related to cash flow hedges 0.7 (6.8)
Share of other comprehensive (loss)/income of associated companies and joint ventures (47.2) 9.1
Reclassification adjustment for foreign operations disposed of during the year – 59.0
Items that will not be Reclassified to Profit or Loss:
Changes in fair value of equity investments at fair value through other comprehensive income 30.2 52.2
Actuarial gains/(losses) on defined benefit pension plans 21.6 (5.5)
Share of other comprehensive loss of associated companies and joint ventures (53.4) (63.4)
Other Comprehensive Income for the Year, Net of Tax 255.4 420.5
Total Comprehensive Income for the Year 923.0 541.6
Income/(Loss) Attributable to:
Owners of the parent 269.9 (83.5)
Non-controlling interests 653.1 625.1
923.0 541.6

114 First Pacific Annual Report 2020
Consolidated Financial Statements
Consolidated Statement of Financial Position
US$ millions Notes
At 31 December
2020
At 31 December
2019
Non-current AssetsProperty, plant and equipment 11 4,038.1 4,938.7Biological assets 12 22.2 22.6Associated companies and joint ventures 13 5,314.4 4,787.7Goodwill 14 4,366.3 693.2Other intangible assets 15 5,927.3 5,004.7Investment properties 16 9.3 13.4Accounts receivable, other receivables and prepayments 17 63.9 37.4Financial assets at fair value through other comprehensive income 18 426.0 385.9Deferred tax assets 19 110.1 156.4Other non-current assets 21 687.5 819.9
20,965.1 16,859.9 Current Assets
Cash and cash equivalents and short-term deposits 22 2,377.8 2,846.4Restricted cash 20 50.2 106.0Financial assets at fair value through other comprehensive income 18 3.3 9.9Accounts receivable, other receivables and prepayments 17 1,073.9 1,070.7Inventories 23 835.6 799.0Biological assets 12 55.7 52.0
4,396.5 4,884.0Assets classified as held for sale 24 1,582.0 138.6
5,978.5 5,022.6 Current Liabilities
Accounts payable, other payables and accruals 25 1,552.8 1,569.3Short-term borrowings 26 1,659.7 2,262.8Provision for taxation 27 180.6 97.3Current portion of deferred liabilities, provisions and payables 28 593.9 542.5
3,987.0 4,471.9Liabilities directly associated with the assets classified as held for sale 24 843.8 25.4
4,830.8 4,497.3 Net Current Assets 1,147.7 525.3 Total Assets Less Current Liabilities 22,112.8 17,385.2 Equity
Issued share capital 29 43.4 43.4Shares held for share award scheme 30 (2.4) (3.2)Retained earnings 1,604.4 1,401.4Other components of equity 31 1,494.6 1,487.1 Equity attributable to owners of the parent 3,140.0 2,928.7Non-controlling interests 32 7,488.5 5,829.3
Total Equity 10,628.5 8,758.0 Non-current Liabilities
Long-term borrowings 26 8,973.9 6,668.0Deferred liabilities, provisions and payables 28 2,111.3 1,535.3Deferred tax liabilities 19 399.1 423.9
11,484.3 8,627.2 22,112.8 17,385.2
The Notes on pages 118 to 230 form an integral part of the Consolidated Financial Statements.
On behalf of the Board of Directors
MANUEL V. PANGILINAN CHRISTOPHER H. YOUNG
Managing Director and Chief Executive Officer Executive Director and Chief Financial Officer
30 March 2021

115 First Pacific Annual Report 2020
Consolidated Statement of Changes in Equity
Equity attributable to owners of the parent
US$ millions Notes
Issued
share
capital
Shares
held for
share
award
scheme
Share
premium
Employee
share-based
compensation
reserve
Other
comprehensive
(loss)/income
(Note 33)
Differences
arising from
changes in
equities of
subsidiary
companies
Reserves
for assets
classified
as held
for sale
Capital
and other
reserves
Contributed
surplus
Retained
earnings Total
Non-
controlling
interests
Total
equity
At 1 January 2019 43.4 (4.9) 62.0 57.3 (886.9) 452.4 – 12.6 1,765.6 1,576.5 3,078.0 5,625.2 8,703.2
(Loss)/profit for the year – – – – – – – – – (253.9) (253.9) 375.0 121.1
Other comprehensive income for the year – – – – 170.4 – – – – – 170.4 250.1 420.5
Total comprehensive income/(loss) for the year – – – – 170.4 – – – – (253.9) (83.5) 625.1 541.6
Purchase of shares under share award scheme 30 – (2.0) – – – – – – – – (2.0) – (2.0)
Issue of shares under share award scheme 30 – (1.1) 1.1 – – – – – – – – – –
Shares vested under share award scheme 30 – 4.8 – (5.2) – – – – – 0.4 – – –
Cancelation of share options – – – (40.3) – – – – – 40.3 – – –
Employee share-based compensation benefits – – – (0.9) – (1.7) – – – 2.3 (0.3) 4.1 3.8
Acquisition, divestment and dilution of interests
in subsidiary companies – – – – – 3.1 – – – – 3.1 (92.7) (89.6)
Deconsolidation of a subsidiary company – – – – 0.3 (46.5) – – – 46.2 – (176.6) (176.6)
Disposal of an associated company – – – – 0.1 – – – – (0.1) – – –
Disposal of a joint venture – – – – – 10.3 – – – (10.3) – – –
2018 final distribution paid – – – – – – – – (30.6) – (30.6) – (30.6)
2019 interim distribution paid 10 – – – – – – – – (36.0) – (36.0) – (36.0)
Acquisition of a subsidiary company 34(C) – – – – – – – – – – – 4.1 4.1
Capital contributions from non-controlling
shareholders – – – – – – – – – – – 82.7 82.7
Dividends declared to non-controlling
shareholders – – – – – – – – – – – (242.6) (242.6)
At 31 December 2019 43.4 (3.2) 63.1 10.9 (716.1) 417.6 – 12.6 1,699.0 1,401.4 2,928.7 5,829.3 8,758.0
At 1 January 2020 43.4 (3.2) 63.1 10.9 (716.1) 417.6 – 12.6 1,699.0 1,401.4 2,928.7 5,829.3 8,758.0
Profit for the year – – – – – – – – – 201.6 201.6 466.0 667.6
Other comprehensive income for the year – – – – 68.3 – – – – – 68.3 187.1 255.4
Total comprehensive income for the year – – – – 68.3 – – – – 201.6 269.9 653.1 923.0
Purchase of shares under share award scheme 30 – (1.0) – – – – – – – – (1.0) – (1.0)
Shares vested under share award scheme 30 – 1.8 – (1.7) – – – – – (0.1) – – –
Lapse of share options – – – (1.4) – – – – – 1.4 – – –
Employee share-based compensation benefits – – – 1.5 – – – – – – 1.5 0.8 2.3
Attributable to a discontinued operation 7(B) – – – – (1.1) – 1.1 – – – – – –
Transfer to retained earnings – – – – (0.1) – – – – 0.1 – – –
Acquisition and divestment of
interests in subsidiary companies – – – – (2.8) 30.1 – – – – 27.3 (5.7) 21.6
Recognition of a financial liability on
non-controlling interests put option 28 – – – – – (8.0) – – – – (8.0) (66.3) (74.3)
2019 final distribution paid 10 – – – – – – – – (39.2) – (39.2) – (39.2)
2020 interim distribution paid 10 – – – – – – – – (39.2) – (39.2) – (39.2)
Acquisition of a subsidiary company 34(C) – – – – – – – – – – – 1,302.0 1,302.0
Capital contributions from non-controlling
shareholders – – – – – – – – – – – 16.8 16.8
Dividends declared to non-controlling
shareholders – – – – – – – – – – – (241.5) (241.5)
At 31 December 2020 43.4 (2.4) 63.1 9.3 (651.8) 439.7 1.1 12.6 1,620.6 1,604.4 3,140.0 7,488.5 10,628.5
The Notes on pages 118 to 230 form an integral part of the Consolidated Financial Statements.

116 First Pacific Annual Report 2020
Consolidated Financial Statements
Consolidated Statement of Cash Flows
For the year ended 31 December 2020 2019US$ millions Notes (Restated)
(i)
Profit before Taxation
From continuing operations 940.1 480.5From a discontinued operation 89.1 107.5
Adjustments for:Finance costs 478.0 477.4Depreciation 422.7 404.4Amortization of other intangible assets 130.2 128.8Provisions for impairment losses 126.7 858.3Loss/(gain) on disposal of property, plant and equipment, net 5(A) 32.7 (0.7)Write-down of inventories to net realizable value 5(C) 13.0 9.0Employee share-based compensation benefit expenses 36(A) 3.0 3.2Share of profits less losses of associated companies and joint ventures (298.8) (335.1)Interest income (71.6) (85.7)(Reversal of)/provision for onerous contracts, net 5(C) (13.2) 3.2Gain on changes in fair value of biological assets 5(A) (0.2) (13.5)Loss on disposal of a joint venture 5(A) – 308.3Gain on deconsolidation of a subsidiary company 5(A) – (621.0)Gain on disposal of an associated company 5(A) – (6.3)Gain on disposal of assets classified as held for sale – (2.9)Others (1.9) 7.7
1,849.8 1,723.1(Increase)/decrease in accounts receivable, other receivables and prepayments (125.5) 53.9(Increase)/decrease in inventories (48.8) 149.7(Decrease)/increase in accounts payable, other payables and accruals (2.2) 168.0 Net cash generated from operations 1,673.3 2,094.7Interest received 75.8 88.5Interest paid (426.7) (417.5)Taxes paid 27 (285.8) (310.2) Net Cash Flows From Operating Activities 1,036.6 1,455.5
(i) Refer to Note 43
continued/…

117 First Pacific Annual Report 2020
For the year ended 31 December 2020 2019US$ millions Notes (Restated)
(i)
Proceeds from disposal of financial assets at fair value through other comprehensive income 358.2 306.3
Dividends received from associated companies and a joint venture 257.1 265.2Proceeds from disposal of property, plant and equipment 34(A) 104.5 18.8Proceeds from instalment payments for disposal of a subsidiary company 34(B) 80.9 47.6Decrease/(increase) in short-term deposits with original maturity of
more than three months 26.9 (183.0)Decrease/(increase) in restricted cash 13.1 (2.8)Dividends received from financial assets at fair value through
other comprehensive income 5.4 5.5Proceeds from disposal of investment properties 3.9 –Acquisition of subsidiary companies 34(C) (2,255.1) (0.2)Investments in other intangible assets (689.6) (942.2)Payments for purchases of property, plant and equipment (362.7) (421.1)Acquisition of financial assets at fair value through other comprehensive income (353.1) (0.8)Increased investments in joint ventures 34(D) (66.6) (69.8)Instalment payment for acquisition of a subsidiary company 34(E) (49.5) (47.5)Investments in biological assets (13.3) (13.2)Increased investments in associated companies (8.0) (7.7)Proceeds from disposal of a subsidiary company 34(F) – 430.2
Proceeds from disposal of a joint venture 34(G) – 275.0Proceeds from disposal of an associated company – 16.7Advances to a joint venture – (10.7) Net Cash Flows Used in Investing Activities (2,947.9) (333.7) Proceeds from new bank borrowings and other loans 34(H) 6,017.2 4,078.5Proceeds from divestments of interests in subsidiary companies 34(I) 94.0 –Capital contributions from non-controlling shareholders 16.8 82.7Loans from non-controlling shareholders 34(H) 0.4 5.8Repayment of bank borrowings and other loans 34(H) (4,007.2) (3,849.4)Dividends paid to non-controlling shareholders by subsidiary companies 34(H) (251.2) (235.1)Payments for concession fees payable 34(H) (117.2) (32.4)Distributions paid to shareholders 34(H) (78.4) (66.6)Repurchase of a subsidiary company’s shares 34(J) (69.2) (0.1)Principal portion of lease payments 34(H) (34.1) (20.0)Increased investments in subsidiary companies (5.1) (98.0)Payments for purchase and subscription of shares under a long-term incentive plan (0.6) (3.1)Proceeds from shares issued to non-controlling shareholders by subsidiary companies – 2.4Proceeds from the issue of shares under a long-term incentive plan – 1.1 Net Cash Flows From/(Used in) Financing Activities 1,565.4 (134.2) Net (Decrease)/Increase in Cash and Cash Equivalents (345.9) 987.6Cash and cash equivalents at 1 January 2,650.8 1,613.4Exchange translation 58.3 49.8 Cash and Cash Equivalents at 31 December 2,363.2 2,650.8 Representing
Cash and cash equivalents and short-term deposits as stated in the consolidated statement of financial position 22 2,377.8 2,846.4
Add: cash and cash equivalents attributable to a discontinued operation 7(B) 138.6 –Less: bank overdrafts (0.5) (1.3)Less: short-term deposits with original maturity of more than three months (152.7) (194.3) Cash and Cash Equivalents at 31 December 2,363.2 2,650.8
(i) Refer to Note 43
The Notes on pages 118 to 230 form an integral part of the Consolidated Financial Statements.
Consolidated Statement of Cash Flows (continued)

Notes to the Consolidated Financial Statements
118 First Pacific Annual Report 2020
1. Corporate and Group InformationFirst Pacific Company Limited (“First Pacific” or the “Company”) is a Hong Kong-based investment management and
holding company with operations located in Asia-Pacific. Its principal business interests relate to consumer food products,
telecommunications, infrastructure and natural resources.
The Company is a limited liability company incorporated in Bermuda. As at 31 December 2020, the address of its registered
office is Clarendon House, 2 Church Street, Hamilton HM11, Bermuda.
The Company’s ordinary shares are listed on the SEHK. Its shares are also available for trading in the United States through
ADRs (Level 1).
The Group comprises the Company and its subsidiary companies. Details of the principal subsidiary companies of the Company
which, in the opinion of the Directors, materially affect the results or net assets of the Group, are set out on pages 235 and 236.
2. Basis of Preparation and Summary of Principal Accounting Policies(A) Basis of Preparation
The Consolidated Financial Statements have been prepared in accordance with HKFRSs (which include all HKFRSs,
HKASs and HK(IFRIC)-Ints) issued by the HKICPA, Hong Kong GAAP and the disclosure requirements of the Hong Kong
Companies Ordinance. The Consolidated Financial Statements also comply with the applicable disclosure provisions of the
Listing Rules. The Consolidated Financial Statements have been prepared on a historical cost basis, except for biological
assets, investment properties, financial assets/liabilities at fair value, derivative financial instruments and pension scheme
assets which, as disclosed in the accounting policies below, are stated at fair value. Assets classified as held for sale are
stated at the lower of their carrying amounts and fair values less costs to sell. These Consolidated Financial Statements are
presented in U.S. dollar and all values are rounded to the nearest million (“US$ millions”) with one decimal place except
when otherwise indicated.
(B) Amendments Adopted by the Group
During 2020, the Group has adopted the “Conceptual Framework for Financial Reporting 2018” (“Conceptual Framework”)
and the following revised HKFRSs (which include all HKFRSs, HKASs and HK(IFRIC)-Ints) effective for annual periods
commencing on or after 1 January 2020 issued by the HKICPA.
HKAS 1 and HKAS 8 Amendments “Definition of Material”
HKAS 39, HKFRS 7 and HKFRS 9 Amendments “Interest Rate Benchmark Reform”
HKFRS 3 Amendments “Definition of a Business”
HKAS 39, HKFRS 7 and HKFRS 9 Amendments address issues affecting financial reporting on hedge accounting in the
period before the replacement of an existing interest rate benchmark with an alternative risk-free rate (“RFR”). It is not
known when hedged items and hedging instruments will be amended to the alternative RFRs, or how this will change the
fair values and cash flows on these instruments, which cast uncertainty on the prospective assessment of the effectiveness
of hedge accounting. Accordingly, the amendments provide temporary reliefs which enable hedge accounting to continue
during the period of uncertainty before the introduction of the alternative RFR. The Group has applied the temporary reliefs
and therefore assumed that the debt related cash flow hedges with interest rate swaps based on hedged risk of United
States dollar London Interbank Offered Rate (“LIBOR”) are not altered by the Interest Rate Benchmark Reform and has
not discontinued the hedges. Information of the hedging relationships to which the Group applies the temporary reliefs is
disclosed in Note 40(B) to the Consolidated Financial Statements.
In addition, the Group has elected to early adopt HKFRS 16 Amendment “COVID-19-Related Rent Concessions” with
effect from 1 January 2020. The HKFRS 16 Amendment provides a practical expedient for lessees to elect not to apply
lease modification accounting for rent concessions arising as a direct consequence of the COVID-19 pandemic. The
practical expedient applies only to rent concessions occurring as a direct consequence of the pandemic and only if (i) the
change in lease payments results in revised consideration for the lease that is substantially the same as, or less than, the
consideration for the lease immediately preceding the change; (ii) any reduction in lease payments affects only payments
originally due on or before 30 June 2021; and (iii) there is no substantive change to other terms and conditions of the
lease.

119 First Pacific Annual Report 2020
During the year ended 31 December 2020, certain lease payments of the Group’s leases have been reduced by the lessors
as a result of the pandemic and there are no other changes to the terms of the leases. Accordingly, reductions of lease
payments arising from the rent concessions have been accounted for as a variable lease payment by derecognizing part of
the lease liabilities and crediting to profit or loss for the year ended 31 December 2020.
The Group’s adoption of the Conceptual Framework and the above pronouncements has had no material effect on both the
profit/loss attributable to owners of the parent for the years ended 31 December 2020 and 2019 and the equity attributable
to owners of the parent at 31 December 2020 and 2019.
(C) Issued But Not Yet Effective HKFRSs
The Group has not applied the following new and revised HKFRSs, which have been issued but are not yet effective, in
these Consolidated Financial Statements.
HKAS 1 Amendments “Classification of Liabilities as Current or Non-current”(iii)
HKAS 16 Amendments “Property, Plant and Equipment: Proceeds before Intended Use”(ii)
HKAS 37 Amendments “Onerous Contracts – Cost of Fulfilling a Contract”(ii)
HKAS 39, HKFRS 4, HKFRS 7, HKFRS 9 and
HKFRS 16 Amendments
“Interest Rate Benchmark Reform – Phase 2”(i)
HKFRS 3 Amendments “Reference to the Conceptual Framework”(ii)
HKFRS 10 and HKAS 28 (2011) Amendments “Sale or Contribution of Assets between an Investor and its Associate or
Joint Venture”(iv)
HKFRS 17 “Insurance Contracts”(iii)
HKFRS 17 Amendments “Insurance Contracts”(iii)
Improvements to HKFRSs Annual Improvements to HKFRSs 2018–2020 Cycle(ii)
(i) Effective for annual periods commencing on or after 1 January 2021(ii) Effective for annual periods commencing on or after 1 January 2022(iii) Effective for annual periods commencing on or after 1 January 2023(iv) No mandatory effective date yet determined but available for adoption
Further information about these HKFRSs is as follows:
HKAS 1 Amendments clarify the requirements for classifying liabilities as current or non-current. The amendments specify
that if an entity’s right to defer settlement of a liability is subject to the entity complying with specified conditions, the entity
has a right to defer settlement of the liability at the end of the reporting period if it complies with those conditions at that
date. Classification of a liability is unaffected by the likelihood that the entity will exercise its right to defer settlement of the
liability. The amendments also clarify the situations that are considered a settlement of a liability. The amendments are
effective for annual periods beginning on or after 1 January 2023 and shall be applied retrospectively. Earlier application is
permitted.
HKAS 16 Amendments prohibit deducting from the cost of an item of property, plant and equipment, any proceeds from
selling items produced while bringing that asset to the location and condition necessary for it to be capable of operating
in the manner intended by management. Instead, an entity recognizes the proceeds from selling any such items, and the
cost of those items, in profit or loss. The amendments are effective for annual periods beginning on or after 1 January 2022
and shall be applied retrospectively only to items of property, plant and equipment made available for use on or after the
beginning of the earliest period presented in the financial statements in which the entity first applies the amendments.
Earlier application is permitted.

120 First Pacific Annual Report 2020
Notes to the Consolidated Financial Statements
HKAS 37 Amendments clarify that for the purpose of assessing whether a contract is onerous under HKAS 37 “Provisions,
Contingent Liabilities and Contingent Assets”, the cost of fulfilling the contract comprises the costs that relate directly
to the contract. Costs that relate directly to a contract include both the incremental costs of fulfilling that contract (e.g.,
direct labour and materials) and an allocation of other costs that relate directly to fulfilling that contract (e.g., an allocation
of the depreciation charge for an item of property, plant and equipment used in fulfilling the contract as well as contract
management and supervision costs). General and administrative costs do not relate directly to a contract and are excluded
unless they are explicitly chargeable to the counterparty under the contract. The amendments are effective for annual
periods beginning on or after 1 January 2022 and shall be applied to contracts for which an entity has not yet fulfilled all
its obligations at the beginning of the annual reporting period in which it first applies the amendments. Earlier application is
permitted. Any cumulative effect of initially applying the amendments shall be recognized as an adjustment to the opening
equity at the date of initial application without restating the comparative information.
HKAS 39, HKFRS 4, HKFRS 7, HKFRS 9 and HKFRS 16 Amendments address issues not dealt with in the previous
amendments which affect financial reporting when an existing interest rate benchmark is replaced with an alternative
RFR. The Phase 2 amendments provide a practical expedient to allow the effective interest rate to be updated without
adjusting the carrying amount when accounting for changes in the basis for determining the contractual cash flows of
financial assets and liabilities, if the change is a direct consequence of the interest rate benchmark reform and the new
basis for determining the contractual cash flows is economically equivalent to the previous basis immediately preceding
the change. In addition, the amendments permit changes required by the interest rate benchmark reform to be made to
hedge designations and hedge documentation without the hedging relationship being discontinued. Any gains or losses
that could arise on transition are dealt with through the normal requirements of HKFRS 9 to measure and recognize hedge
ineffectiveness. The amendments also provide a temporary relief to entities from having to meet the separately identifiable
requirement when an RFR is designated as a risk component. The relief allows an entity, upon designation of the hedge, to
assume that the separately identifiable requirement is met, provided the entity reasonably expects the RFR risk component
to become separately identifiable within the next 24 months. Furthermore, the amendments require an entity to disclose
additional information to enable users of financial statements to understand the effect of interest rate benchmark reform
on an entity’s financial instruments and risk management strategy. The amendments are effective for annual periods
beginning on or after 1 January 2021 and shall be applied retrospectively, but entities are not required to restate the
comparative information.
HKFRS 3 Amendments are intended to replace a reference to the previous “Framework for the Preparation and
Presentation of Financial Statements” with a reference to the Conceptual Framework without significantly changing its
requirements. The amendments also add to HKFRS 3 “Business Combinations” an exception to its recognition principle for
an entity to refer to the Conceptual Framework to determine what constitutes an asset or a liability. The exception specifies
that, for liabilities and contingent liabilities that would be within the scope of HKAS 37 or HK(IFRIC)-Int 21 “Levies” if they
were incurred separately rather than assumed in a business combination, an entity applying HKFRS 3 should refer to
HKAS 37 or HK(IFRIC)-Int 21 respectively instead of the Conceptual Framework. Furthermore, the amendments clarify that
contingent assets do not qualify for recognition at the acquisition date. The Group will adopt the amendments prospectively
from 1 January 2022. Since the amendments apply prospectively to business combinations for which the acquisition date is
on or after the date of first application, the Group will not be affected by these amendments on the date of transition.
HKFRS 10 and HKAS 28 (2011) Amendments address an inconsistency between the requirements in HKFRS 10
“Consolidated Financial Statements” and in HKAS 28 (2011) “Investments in Associates and Joint Ventures” in dealing
with the sale or contribution of assets between an investor and its associate or joint venture. The amendments require a full
recognition of a gain or loss when the sale or contribution of assets between an investor and its associate or joint venture
constitutes a business. For a transaction involving assets that do not constitute a business, a gain or loss resulting from the
transaction is recognized in the investor’s profit or loss only to the extent of the unrelated investor’s interest in that associate
or joint venture. The previous mandatory effective date of amendments to HKFRS 10 and HKAS 28 (2011) was removed
by the HKICPA in January 2016 and a new mandatory effective date will be determined after the completion of a broader
review of accounting for associates and joint ventures. However, the amendments are available for adoption now.

121 First Pacific Annual Report 2020
HKFRS 17 is a comprehensive new accounting standard for insurance contracts covering recognition and measurement,
presentation and disclosure. Once effective, HKFRS 17 will replace the existing HKFRS 4 “Insurance Contracts”. The
standard applies to all types of insurance contracts (i.e., life, non-life, direct insurance and re-insurance), regardless of the
type of entities that issue them, as well as to certain guarantees and financial instruments with discretionary participation
features. A few scope exceptions will apply. The overall objective of the standard is to provide an accounting model for
insurance contracts that is more useful and consistent for insurers. In contrast to the requirements in HKFRS 4, which
are largely based on grandfathering previous local accounting policies, the standard provides a comprehensive model for
insurance contracts, covering all relevant accounting aspects. The core of the standard is the general model, supplemented
by (i) a specific adaptation for contracts with direct participation features (the variable fee approach); and (ii) a simplified
approach (the premium allocation approach) mainly for short-duration contracts.
HKFRS 17 Amendments include changes to simplify certain requirements in the standard and make financial performance
easier to explain. The amendments also provide additional reliefs to reduce the effort required for the transition to HKFRS
17. In addition, the amendments defer the effective date of HKFRS 17 to annual reporting periods beginning on or after 1
January 2023 with earlier application permitted. As a result of the deferral, the HKICPA issued the amendments to HKFRS
4 to extend the temporary exemption that permits insurers to apply HKAS 39 rather than HKFRS 9 for annual periods
beginning before 1 January 2023.
“Annual Improvements to HKFRSs 2018–2020 Cycle” set out amendments to a number of HKFRSs and HKASs, which
include certain changes that may result in accounting changes for presentation, recognition or measurement purposes.
The amendments are effective for annual periods beginning on or after 1 January 2022. Earlier application is permitted.
The key amendments of “Annual Improvements to HKFRSs 2018–2020 Cycle” are summarized as follows:
The HKAS 41 amendment removes the requirement to exclude cash flows for taxation when measuring the fair value of
assets within the scope of HKAS 41.
The HKFRS 1 amendment permits a subsidiary that elects to apply paragraph D16(a) of HKFRS 1 “First-time Adoption
of Hong Kong Financial Reporting Standards” to measure cumulative translation differences using the amounts reported
by the parent, based on the parent’s date of transition to HKFRSs. This amendment also applies to an associate or joint
venture that elects to apply paragraph D16(a) of HKFRS 1.
The HKFRS 9 amendment clarifies the fees that an entity includes when assessing whether the terms of a new or modified
financial liability are substantially different from the terms of the original financial liability. These fees include only those
paid or received between the borrower and the lender, including fees paid or received by either the borrower or lender on
the other’s behalf. An entity applies the amendment to financial liabilities that are modified or exchanged on or after the
beginning of the annual reporting period in which the entity first applies the amendment.
The HKFRS 16 amendment removes the illustration of payments from the lessor relating to leasehold improvements in
Illustrative Example 13 accompanying HKFRS 16. This removes potential confusion regarding the treatment of lease
incentives when applying HKFRS 16.
The Group has not early adopted the above new and revised HKFRSs for the year ended 31 December 2020. Based on the
Group’s assessment completed to date, these new and revised HKFRSs are not expected to have a significant impact on
the results of operations and financial position and presentation of the Consolidated Financial Statements. The assessment
of HKAS 39, HKFRS 4, HKFRS 7, HKFRS 9 and HKFRS 16 Amendments is described below.
At 31 December 2020, the Group had certain interest-bearing bank borrowings denominated in United States dollars and
foreign currencies based on the LIBOR and various Interbank Offered Rates, respectively. If the interest rates of these
borrowings are replaced by RFRs in a future period, the Group will apply the practical expedient upon the modification of
these borrowings when the “economically equivalent” criterion is met and expects that no significant modification gain or
loss will arise as a result of applying the amendments to these changes. In addition, the Group currently has applied cash
flow hedge to manage the cash flow interest rate risk of bank borrowings, denominated in United States dollars based
on LIBOR, by using interest rate swaps. The Group will amend the formal designation of that hedging relationship upon
modification of the interest rate swap and the bank borrowing.

122 First Pacific Annual Report 2020
Notes to the Consolidated Financial Statements
(D) Summary of Principal Accounting Policies
(a) Basis of consolidation
(I) Basis of consolidation
The Consolidated Financial Statements for the year ending 31 December 2020 comprise the Company and its
subsidiary companies (together referred to as the “Group”) and the Group’s interests in associated companies
and joint ventures.
A subsidiary company is an entity, directly or indirectly, controlled by the Company. Control exists when the
Company has exposure, or rights, to variable returns from its involvement with the entity and the ability to use
its power over the entity to affect the amount of those returns. When the Company has, directly or indirectly,
less than a majority of the voting or similar rights of an investee, the Group considers all relevant facts and
circumstances in assessing whether it has power over an investee, including: (i) the contractual arrangement
with the other vote holders of the investee, (ii) rights arising from other contractual arrangements, (iii) the
Group’s voting rights and potential voting rights and (iv) other factors which enable the Company to direct the
relevant activities of the investee unilaterally, such as the existence of control, through majority representatives
appointed, over the board of directors of the investee by the Company. Potential voting rights that are substantive
(i.e., practically exercisable by the Company considering all facts and circumstances), where applicable to
certain Philippine affiliates of the Company, are taken into account in determining whether an entity should be
consolidated. The Group reassesses whether or not it controls an investee if facts and circumstances indicate
that there are changes in the elements of control described above.
The results of subsidiary companies are included in the consolidated income statement from the effective
date of acquisition, being the date on which the Group obtains control, or up to the effective date of disposal,
as appropriate. Adjustments are made to bring into line any dissimilar accounting policies that may exist.
All significant intra-group transactions and balances within the Group are eliminated on consolidation. Total
comprehensive losses are attributed to the non-controlling interests even if it results in a deficit balance. Non-
controlling interests represent the interests of non-controlling shareholders not held by the Group in the results
and net position of the Company’s subsidiary companies.
A change in the ownership interest of a subsidiary company, without a change of control, is accounted for
as an equity transaction. For an unexercised put option held by a non-controlling shareholder of the Group’s
subsidiary company, which allows the non-controlling shareholder to sell all of its interest in the Group’s
subsidiary company to the Group under certain specific circumstances, the Group continues to recognize the
non-controlling interest, including an update to reflect allocations of profit or loss, allocation of changes in other
comprehensive income and dividends declared for the reporting period, as required by HKFRS 10 “Consolidated
Financial Statements”. However, the carrying amount of the non-controlling interest is derecognized at the end
of each reporting period and the difference between the derecognized non-controlling interest and changes in
measurement of a financial liability recognized in relation to the put option is recorded in equity as an equity
transaction. See Note (l) for details of the accounting policies in relation to the financial liability recognized in
relation to the put option.
If the Group loses control over a subsidiary company, it (i) derecognizes the assets (including goodwill) and
liabilities of the former subsidiary company at their carrying amounts, (ii) derecognizes the carrying amount
of any non-controlling interests in the former subsidiary company, (iii) derecognizes the components of other
comprehensive income (e.g., cumulative exchange reserve) recorded in equity attributable to the former
subsidiary company, (iv) recognizes the fair value of the consideration received, (v) recognizes the fair value of
any investment in the former subsidiary company retained, (vi) recognizes any resulting difference as a gain
or loss on disposal in profit or loss, (vii) reclassifies the parent’s share of components of the former subsidiary
company previously recognized in other comprehensive income (except revaluation reserve) to profit or loss,
(viii) transfers the parent’s share of the former subsidiary company’s revaluation reserve previously recognized in
other comprehensive income directly to retained earnings and (ix) transfers the related differences arising from
changes in shareholdings of subsidiary companies without a change of control previously recognized as other
reserves directly to retained earnings.

123 First Pacific Annual Report 2020
(II) Business combinations and goodwill
Business combinations are accounted for using the acquisition method. This method involves allocating the
consideration transferred to the vendor to the fair value of the identifiable assets acquired, and liabilities and
contingent liabilities assumed at the date of acquisition. The consideration transferred is measured at the
aggregate of the fair value of the assets given, equity instruments issued, and liabilities incurred or assumed at
the date of exchange. For each business combination, the Group elects whether to measure the non-controlling
interests in the acquiree (that are present ownership interests and entitle their holders to a proportionate share
of the net assets in the event of liquidation) at the non-controlling interests’ proportionate share of the acquiree’s
net identifiable assets or at fair value. All acquisition-related costs are recognized as expenses in profit or loss.
The Group determines that it has acquired a business when the acquired set of activities and assets includes an
input and a substantive process that together significantly contribute to the ability to create outputs.
For step acquisitions, the Group’s previously held equity interests are remeasured at its acquisition date fair
value and any resulting gain or loss is recognized in profit or loss. Contingent consideration is measured at fair
value at the acquisition date. Contingent consideration classified as an asset or liability is measured at fair value
with changes in fair value recognized in profit or loss. Contingent consideration that is classified as equity is not
remeasured and subsequent settlement is accounted for within equity.
Goodwill is initially measured at cost, being the excess of the aggregate of the fair value of the consideration
transferred, the amount of any non-controlling interest in the acquiree and any fair value of the Group’s
previously held equity interest in the acquiree over the net fair value of the identifiable assets acquired, liabilities
and contingent liabilities assumed. If the sum of this consideration and other items is lower than the net fair
value of the identifiable assets acquired, liabilities and contingent liabilities assumed, the difference is, after
reassessment, recognized in profit or loss as a gain on bargain purchase. In the case of associated companies
and joint ventures, goodwill is included in the carrying amount thereof, rather than as a separately identified asset
in the consolidated statement of financial position.
If the initial accounting for business combination can be determined only provisionally by the end of the period
in which the combination is effected because the fair values to be assigned to the acquiree’s identifiable assets
and liabilities can be determined only provisionally, the Group accounts for the combination using provisional
amounts. During the measurement period, which is not longer than one year from the acquisition date, the
provisional amounts recognized at acquisition date are retrospectively adjusted to reflect new information
obtained about facts and circumstances that existed as of the acquisition date and, if known, would have
affected the measurement of the amounts recognized as of that date. Goodwill or any gain recognized shall be
adjusted from the acquisition date by an amount equal to the adjustment to the fair value at the acquisition date
of the identifiable assets, liabilities or contingent liabilities being recognized or adjusted.
After initial recognition, goodwill is measured at cost less any accumulated impairment losses. Goodwill is tested
for impairment annually or more frequently if events or changes in circumstances indicate that the carrying
value may be impaired. For the purpose of impairment testing, goodwill acquired in a business combination is,
from the acquisition date, allocated to each of the Group’s cash-generating units (“CGU”), or group of CGUs,
that are expected to benefit from the synergies of the combination, irrespective of whether other assets or
liabilities of the Group are assigned to those units or group of units. Impairment is determined by assessing the
recoverable amount of the CGU (group of CGUs) to which the goodwill relates. Where the recoverable amount
of the CGU (group of CGUs) is less than the carrying amount, an impairment loss is recognized. An impairment
loss recognized for goodwill is not reversed in a subsequent period.

124 First Pacific Annual Report 2020
Notes to the Consolidated Financial Statements
For business combinations involving entities or businesses under common control (a business combination
in which all of the combining entities or businesses are ultimately controlled by the same party or parties both
before and after the business combination, and that control is not transitory), they are accounted for applying
the principles of merger accounting which is consistent with Accounting Guideline 5 “Merger Accounting for
Common Control Combinations” issued by the Hong Kong Institute of Certified Public Accountants. The method
requires the combined entity to recognize the assets, liabilities and equity of the combining entities or businesses
at the carrying amounts (i.e., existing book values from the controlling parties’ perspective) in the Consolidated
Financial Statements of the controlling party or parties prior to the common control combination. There is no
recognition of any goodwill or excess of the acquirer’s interest in the net fair value of the acquiree’s identifiable
assets, liabilities and contingent liabilities over the cost at the time of the common control combination to the
extent of the controlling party’s or parties’ interests.
Where goodwill has been allocated to a CGU (group of CGUs) and part of the operation within that unit is
disposed of, the goodwill associated with the operation disposed of is included in the carrying amount of the
operation when determining the gain or loss on the disposal. Goodwill disposed of in these circumstances is
measured based on the relative value of the operation disposed of and the portion of the CGU retained.
(b) Property, plant and equipment
(I) Freehold land and other property, plant and equipment
Freehold land is stated at cost and is not depreciated. Other property, plant and equipment, other than
construction in progress, are stated at cost less accumulated depreciation and any impairment losses,
calculated on the straight-line basis at annual rates estimated to write off their book values to residual values (if
any) over their expected useful lives. Details of depreciation rates are given as follows:
The principal annual rates of depreciation:
Freehold land Nil
Buildings 2.5% to 20.0%
Machinery, equipment and vessels 3.3% to 50.0%
Construction in progress Nil
When an item of property, plant and equipment is classified as held for sale or when it is part of a disposal
group classified as held for sale, it is not depreciated and measured at the lower of its carrying amount and fair
value less costs to sell.
The initial cost of property, plant and equipment comprises its purchase price and any directly attributable
costs of bringing the asset to its working condition and location for its intended use. Cost also includes asset
retirement obligations, interest on borrowed funds used during the construction period and qualified finance
costs from foreign exchange losses related to foreign currency denominated liabilities used to acquire such assets.
Major costs incurred in restoring property, plant and equipment to their normal working condition are normally
charged to the consolidated income statement. Where the recognition criteria are satisfied, improvements
are capitalized and depreciated over their expected useful lives to the Group. When assets are sold or retired,
their costs and accumulated depreciation, amortization and impairment losses, if any, are eliminated from the
accounts and any gain or loss resulting from their disposal is included in the consolidated income statement.
Where parts of an item of property, plant and equipment have different useful lives, the cost of that item is
allocated on a reasonable basis among the parts and each part is depreciated separately. Residual values (if
any), useful lives and the depreciation method are reviewed periodically to ensure that the periods and method
of depreciation are consistent with the expected pattern of economic benefits from items of property, plant and
equipment.

125 First Pacific Annual Report 2020
Construction in progress is stated at cost less any impairment losses, and is not depreciated. Cost comprises
the direct costs of construction and capitalized finance and other costs incurred in connection with the
borrowing of funds, including exchange differences arising from foreign currency borrowings, during the period
of construction. Construction in progress is reclassified to the appropriate category of property, plant and
equipment when completed and ready for use.
(II) Bearer plants
Bearer plants are living plants used in the production or supply of agricultural produce. They are expected to
bear produce for more than one period and have a remote likelihood of being sold as agricultural produce,
except for incidental scrap sales.
The Group’s bearer plants comprise oil palm, rubber and sugar cane plantations. The Group elects to account
for its bearer plants using the cost model under HKAS 16 “Property, Plant and Equipment”. Immature bearer
plants are accounted for at accumulated cost, which consist mainly of the accumulated cost of land clearing,
planting, fertilizing, up-keeping and maintaining the plantations, and allocations of indirect overhead costs up
to the time the plants become commercially productive and available for harvest. Costs also include capitalized
borrowing costs and other charges incurred in connection with the financing of the development of immature
bearer plants. Immature bearer plants are not depreciated.
Immature bearer plants are reclassified to mature bearer plants when they are commercially productive and
available for harvest. In general, an oil palm plantation takes about three to four years to reach maturity from the
time of planting the seedlings, while a rubber plantation takes about five to six years to reach maturity. A sugar
cane plantation takes about a year to reach maturity and can be harvested for an average of three times after
the initial planting.
Mature bearer plants are stated at cost, and are depreciated using the straight-line method over their
estimated useful lives of 25 years for oil palm plantations and rubber plantations, and four years for sugar cane
plantations. The useful lives and depreciation method are reviewed at each year end and adjusted prospectively,
if necessary.
The carrying amounts of bearer plants are reviewed for impairment when events or changes in circumstances
indicate that the carrying values may not be fully recoverable.
The carrying amount of an item of bearer plants is derecognized upon disposal or when no future economic
benefits are expected from its use or disposal. Any gain or loss arising from derecognition of the asset (calculated
as the difference between the net disposal proceeds and the carrying amount of the asset) is directly included in
the profit or loss when the item is derecognized.
Upkeep and maintenance costs are recognized in the profit or loss when they are incurred. The cost of major
renovation and restoration is included in the carrying amount of the related asset when it is probable that future
economic benefits in excess of the originally assessed standard of performance of the existing asset will flow to
the Group, and is depreciated over the remaining useful life of the related asset.
(c) Asset retirement obligations
The net present value of legal obligations associated with the retirement of an item of property, plant and equipment
that resulted from the acquisition, construction or development of property, plant and equipment is recognized in
the period in which the obligations arise. The obligations are reviewed and adjusted, if appropriate, at least at each
financial year end.

126 First Pacific Annual Report 2020
Notes to the Consolidated Financial Statements
(d) Biological assets
The Group’s biological assets comprise timber plantations and agricultural produce of the bearer plants, which
primarily comprise fresh fruit bunches, oil palm seeds, rubber and sugar cane.
The Group recognizes the fair value of biological assets in accordance with HKAS 41 “Agriculture”. Biological assets
are stated at fair value less costs to sell. Gains or losses arising on initial recognition of biological assets and from the
change in fair value of biological assets at each reporting date are recognized in the profit or loss for the period in
which they arise.
For the valuation of unharvested produce of oil palm and rubber plantations, the Group has applied the actual harvest
data subsequent to the year end and applicable market prices to derive the fair value. For the valuation of sugar cane
and oil palm seeds, the Group has applied discounted cash flow models to derive the fair value.
For timber plantations, the Group appoints an independent valuer to determine the fair value of timber trees at the
year end and any resultant gains or losses arising from the changes in fair values are recognized in the profit or loss.
The independent valuer adopts the income approach for the valuation of timber trees using a discounted cash flow
model.
(e) Associated companies and joint ventures
An associated company is an entity in which the Group has a long-term interest of generally not less than 20% of the
equity voting rights and over it is in a position to exercise significant influence. Significant influence is the power to
participate in the financial and operating policy decisions of the investee, but is not control or joint control over those
policies.
A joint venture is a type of joint arrangement whereby the parties that have joint control of the arrangement have rights
to the net assets of the joint venture. Joint control is the contractually agreed sharing of control of an arrangement
which exists only when decisions about the relevant activities require the unanimous consent of the parties sharing
control.
Investments in associated companies and joint ventures are accounted for in the Consolidated Financial Statements
under the equity method, less any impairment losses. Adjustments are made to bring into line any dissimilar
accounting policies that may exist. The Group’s investments in associated companies and joint ventures include
goodwill (net of any accumulated impairment losses) identified on acquisition. The Group’s share of its associated
companies’ and joint ventures’ post-acquisition profits and losses is recognized in the consolidated income statement
as the Group’s share of profits less losses of associated companies and joint ventures, and its share of post-
acquisition other comprehensive income is recognized in the Group’s consolidated other comprehensive income and
when applicable in the consolidated statement of changes in equity. The cumulative post-acquisition movements are
adjusted against the carrying amount of the investment.
Unrealized gains and losses resulting from transactions between the Group and its associated companies or joint
ventures are eliminated to the extent of the Group’s investments in the associated companies or joint ventures, except
where unrealized losses provide evidence of an impairment of the assets transferred.
Equity accounting is discontinued when the Group’s interest in an associated company or a joint venture reaches
zero, unless the Group has incurred obligations or guaranteed obligations in respect of the associated company or
joint venture. For this purpose, the Group’s interest is the carrying amount of the investment under the equity method,
together with any other long-term interests that in substance form part of the Group’s net investment in the associated
company or the joint venture (after applying the expected credit loss (“ECL”) model to such other long-term interests
when applicable (see Note (k)(IV)).

127 First Pacific Annual Report 2020
After application of the equity method, the Group determines whether it is necessary to recognize an impairment loss
on its investments in associated companies and joint ventures. At each reporting date, the Group determines whether
there is objective evidence that the investment in an associated company or a joint venture is impaired. If there is
such evidence, the Group calculates the amount of impairment as the difference between the recoverable amount
of the associated company or joint venture and its carrying value, and then recognizes the loss in the consolidated
income statement.
If an investment in an associated company becomes an investment in a joint venture or vice versa, the retained
interest is not remeasured. Instead, the investment continues to be accounted for under the equity method. In
all other cases, when the Group discontinues the use of the equity method from the date when it ceases to have
significant influence over an associated company or joint control over a joint venture, the Group measures at fair value
any investment that the Group retains in the former associated company or joint venture. The Group recognizes in the
consolidated income statement any difference between (i) the fair value of any retained investment and any proceeds
from disposing of part of the interest in the associated company or joint venture and (ii) the carrying amount of the
investment at the date when significant influence or joint control is lost.
(f) Intangible assets (other than goodwill)
Intangible assets acquired separately are measured on initial recognition at cost. The cost of intangible assets
acquired in a business combination is the fair value at the date of acquisition. Additions of service concession assets
subsequent to business combinations are initially measured at present value of any additional estimated future
concession fee payments pursuant to the concession agreements and/or the costs of rehabilitation works incurred
or additional constructions. Service concession assets acquired other than through business combinations include
capitalized upfront payments and expenditures directly attributable to the acquisition of the service concession.
Payments to the governments over the concession period are capitalized at their present value using the incremental
borrowing rate determined at inception date and are included as part of the initial recognition of the service
concession asset with a corresponding liability recognized as service concession fee payable. Borrowing cost in
relation to service concession assets that are considered as qualifying assets forms part of the cost of the service
concession asset. Following initial recognition, intangible assets are carried at cost less any accumulated amortization
and any accumulated impairment loss. The useful lives of intangible assets are assessed to be either finite or
indefinite.
Intangible assets with finite useful lives are amortized over the useful economic life and assessed for impairment
whenever there is an indication that the intangible asset may be impaired. The amortization period and the
amortization method for an intangible asset with a finite useful life are reviewed at least at the end of each reporting
period. Changes in the expected useful life or the expected pattern of consumption of future economic benefits
embodied in the intangible assets are considered to modify the amortization period or method, as appropriate, and
are treated as changes in accounting estimates.
The Group’s concession assets represent the fair value of concessions of rights granted by governments to charge
users for public services provided. The Group’s concession assets for the water distribution business are amortized
using either the unit of production method or the straight-line method over the term of the concessions. The Group’s
concession assets for the toll road business are amortized using the unit of production method over the term of the
concessions. The Group’s concession assets for the rail business are amortized using the straight-line method over
the term of the concession. The Group’s brands represent the brands for its various milk related products and are
amortized using the straight-line method over their estimated useful lives. The Group’s customer list and licenses for
the wastewater and sewage treatment business are amortized using the straight-line method over their estimated useful
lives. The Group’s bilateral contracts represent contracts for its supply of electricity to customers and are amortized
using the straight-line method. The Group’s vesting contract is a commitment to produce a specified quantity of
electricity at a specified price, limiting the Group’s exposure to volatility in the electricity prices, providing certainty
on cost recovery for a portion of the electricity generated. The vesting contract is amortized using the straight-line
method. The Group’s software is amortized using the straight-line method over its estimated useful life.

128 First Pacific Annual Report 2020
Notes to the Consolidated Financial Statements
Intangible assets with indefinite useful lives are not amortized, but are tested for impairment annually, or whenever
there is an indication that the intangible asset may be impaired. The assessment of indefinite useful life is reviewed
annually to determine whether the indefinite useful life continues to be supportable. If not, the change in useful
life from indefinite to finite is made on a prospective basis from the date of change. The Group’s intangible assets
with indefinite useful lives mainly consist of the registered brand name, distribution and customer networks and
water licenses of its packaged drinking water business, for which (i) the brand name and licenses can be renewed
indefinitely at no significant costs; (ii) the Group has the intention to renew the brand name and maintain the licenses
and the networks indefinitely; and (iii) the Group does not expect to incur significant expenses to maintain the future
economic benefits that can be generated from these assets.
Intangible assets not yet available for use are tested for impairment annually or more frequently when events or
changes in circumstances indicate that the carrying values may be impaired. The intangible assets not yet available
for use mainly relate to concession agreements signed with the relevant government authorities as regards to the
building and operation of water, toll roads and rail businesses for which constructions have not been completed.
(g) Investment properties
Investment properties are interests in land and buildings (including the leasehold property held as a right-of-use asset)
held to earn rental income and/or for capital appreciation, rather than for use in the production or supply of goods or
services or for administrative purposes; or for sale in the ordinary course of business. Such properties are measured
initially at cost, including transaction costs. Subsequent to initial recognition, investment properties are stated at fair
value, which reflects market conditions at the end of each reporting period.
Gains or losses arising from changes in the fair values of investment properties are included in the consolidated
income statement in the period in which they arise.
Any gains or losses on the retirement or disposal of an investment property are recognized in the consolidated income
statement in the period of the retirement or disposal.
Transfers are made to (or from) investment properties only when there is a change in use. For a transfer from an
investment property to an owner-occupied property, the deemed cost for subsequent accounting is the fair value at
the date of change in use. If an owner-occupied property becomes an investment property, the Group accounts for
such property in accordance with the policy stated under property, plant and equipment for owned property and/or
accounts for such property in accordance with the policy stated under right-of-use assets for property held as a right-
of-use asset up to the date of change in use.
(h) Fair value measurement
The Group measures its biological assets, investment properties, financial assets classified as fair value through other
comprehensive income or profit or loss, derivative financial instruments and pension scheme assets at fair value at
the end of each reporting period. Fair value is the price that would be received to sell an asset or paid to transfer a
liability in an orderly transaction between market participants at the measurement date.
The fair value measurement is based on the presumption that the transaction to sell the asset or transfer the liability
takes place either in the principal market for the asset or liability, or in the absence of a principal market, in the most
advantageous market for the asset or liability. The principal or the most advantageous market must be accessible by
the Group. The fair value of an asset or a liability is measured using the assumptions that market participants would use
when pricing the asset or liability, assuming that market participants act in their economic best interest.
A fair value measurement of a non-financial asset takes into account a market participant’s ability to generate
economic benefits by using the asset in its highest and best use or by selling it to another market participant that
would use the asset in its highest and best use.
The Group uses valuation techniques that are appropriate in the circumstances and for which sufficient data
are available to measure fair value, maximizing the use of relevant observable inputs and minimizing the use of
unobservable inputs.

129 First Pacific Annual Report 2020
(i) Impairment of non-financial assets
An assessment is made at the end of each reporting period as to whether there is an indication of impairment of assets
including property, plant and equipment, other intangible assets and other non-current assets, or whether there is an
indication that an impairment loss previously recognized for an asset may no longer exist or may have decreased. If
such an indication exists, or when annual impairment testing for an asset is required, the asset’s recoverable amount
is estimated. An asset’s recoverable amount is the higher of the asset’s fair value less costs of disposal and value
in use, and is determined for an individual asset, unless the asset does not generate cash inflows that are largely
independent of those from other assets or group of assets, in which case the recoverable amount is determined for
the CGU to which the asset belongs.
An impairment loss is recognized only if the carrying amount of an asset exceeds its recoverable amount. An
impairment loss is charged to the consolidated income statement in the period in which it arises.
A previously recognized impairment loss of an asset other than goodwill is reversed only if there has been a change in
the estimates used to determine the recoverable amount of that asset. However, this is limited and will not give rise to
an amount higher than the carrying amount that would have been determined (net of any depreciation/amortization),
had no impairment loss been recognized for the asset in prior years.
A reversal of such an impairment loss is credited to the consolidated income statement in the period in which it
arises.
(j) Cash and cash equivalents, short-term deposits and restricted cash
For the purpose of the consolidated statement of financial position, cash and cash equivalents comprise cash on
hand and at banks, including term deposits, which are not restricted as to use, whereas short-term deposits are
highly liquid money market placements with maturities of more than three months but less than one year from the
dates of acquisition. Cash restricted as to use represents cash which is restricted from being exchanged or used to
settle a liability.
For the purpose of the consolidated statement of cash flows, cash and cash equivalents comprise cash on hand and
demand deposits, and short-term highly liquid investments which are readily convertible into known amounts of cash,
are subject to an insignificant risk of changes in value, and have a short maturity of generally within three months
when acquired, less bank overdrafts which are repayable on demand and form an integral part of the Group’s cash
management.
(k) Financial assets
(I) Initial recognition and measurement
Financial assets are classified, at initial recognition, as subsequently measured at amortized cost, fair value
through other comprehensive income (“FVOCI”) and fair value through profit or loss (“FVPL”).
The classification of financial assets at initial recognition depends on the financial assets’ contractual cash flow
characteristics and the Group’s business model for managing them. With the exception of accounts receivable
that do not contain a significant financing component or for which the Group has applied the practical expedient
of not adjusting the effect of a significant financing component, the Group initially measures a financial asset
at its fair value, plus in the case of a financial asset not at FVPL, transaction costs. Accounts receivable that
do not contain a significant financing component or for which the Group has applied the practical expedient
are measured at the transaction price determined under HKFRS 15 in accordance with the policies set out for
“Turnover and revenue recognition” below.

130 First Pacific Annual Report 2020
Notes to the Consolidated Financial Statements
In order for a financial asset to be classified and measured at amortized cost or FVOCI, it needs to give rise to
cash flows that are solely payments of principal and interest (“SPPI”) on the principal amount outstanding.
Financial assets with cash flows that are not SPPI are classified and measured at FVPL, irrespective of the
business model. Financial assets classified and measured at amortized cost are held within a business model
with the objective to hold financial assets in order to collect contractual cash flows, while financial assets
classified and measured at FVOCI are held within a business model with the objective of both holding to collect
contractual cash flows and selling. Financial assets which are not held within the aforementioned business
models are classified and measured at FVPL.
The Group’s business model for managing financial assets refers to how it manages its financial assets in order
to generate cash flows. The business model determines whether cash flows will result from collecting contractual
cash flows, selling the financial assets, or both.
All regular way purchases and sales of financial assets are recognized on the trade date, that is, the date that
the Group commits to purchase or sell the asset. Regular way purchases or sales are purchases or sales of
financial assets that require delivery of assets within the period generally established by regulation or convention
in the marketplace.
(II) Subsequent measurement
The subsequent measurement of financial assets depends on their classification as follows:
(i) Financial assets at amortized cost (debt investments)
Financial assets at amortized cost are subsequently measured using the effective interest method and are
subject to impairment. Gains and losses are recognized in the consolidated income statement when the
asset is derecognized, modified or impaired.
(ii) Financial assets at FVOCI (debt investments)
For debt investments at FVOCI, interest income, foreign exchange revaluation and impairment losses
or reversals are recognized in the consolidated income statement and computed in the same manner
as for financial assets measured at amortized cost. The remaining fair value changes are recognized in
other comprehensive income. Upon derecognition, the cumulative fair value change recognized in other
comprehensive income is recycled to the consolidated income statement.
(iii) Financial assets designated at FVOCI (equity investments)
Upon initial recognition, the Group can elect to classify irrevocably its equity investments as equity
investments designated at FVOCI when they meet the definition of equity under HKAS 32 “Financial
Instruments: Presentation” and are not held for trading. The classification is determined on an instrument-
by-instrument basis.
Gains and losses on these financial assets are never recycled to the consolidated income statement.
Dividends are recognized as other income in the consolidated income statement when the right of payment
has been established, it is probable that the economic benefits associated with the dividend will flow to
the Group and the amount of the dividend can be measured reliably, except when the Group benefits
from such proceeds as a recovery of part of the cost of the financial asset, in which case, such gains are
recorded in other comprehensive income. Equity investments designated at FVOCI are not subject to
impairment assessment.

131 First Pacific Annual Report 2020
(iv) Financial assets at FVPL
Financial assets at FVPL are carried in the consolidated statement of financial position at fair value with net
changes in fair value recognized in the consolidated income statement.
This category includes derivative instruments and equity investments which the Group had not irrevocably
elected to classify at FVOCI. Dividends on equity investments classified as financial assets at FVPL are also
recognized as other operating income in the consolidated income statement when the right of payment
has been established, it is probable that the economic benefits associated with the dividend will flow to the
Group and the amount of the dividend can be measured reliably.
A derivative embedded in a hybrid contract, with a financial liability or non-financial host, is separated
from the host and accounted for as a separate derivative if the economic characteristics and risks are not
closely related to the host; a separate instrument with the same terms as the embedded derivative would
meet the definition of a derivative; and the hybrid contract is not measured at FVPL. Embedded derivatives
are measured at fair value with changes in fair value recognized in the consolidated income statement.
Reassessment only occurs if there is either a change in the terms of the contract that significantly modifies
the cash flows that would otherwise be required or a reclassification of a financial asset out of the FVPL
category.
A derivative embedded within a hybrid contract containing a financial asset host is not accounted for
separately. The financial asset host together with the embedded derivative is required to be classified in its
entirety as a financial asset at FVPL.
(III) Derecognition
A financial asset (or, where applicable, a part of a financial asset or part of a group of similar financial assets)
is primarily derecognized (i.e. removed from the Group’s consolidated statement of financial position) when (i)
the rights to receive cash flows from the asset have expired; or (ii) the Group has transferred its rights to receive
cash flows from the asset or has assumed an obligation to pay the received cash flows in full without material
delay to a third party under a “pass-through” arrangement; and either the Group has transferred substantially
all the risks and rewards of the asset, or the Group has neither transferred nor retained substantially all the risks
and rewards of the asset, but has transferred control of the asset.
When the Group has transferred its rights to receive cash flows from an asset or has entered into a pass-through
arrangement, it evaluates if, and to what extent, it has retained the risks and rewards of ownership of the asset.
When it has neither transferred nor retained substantially all the risks and rewards of the asset nor transferred
control of the asset, the asset is recognized to the extent of the Group’s continuing involvement in the asset. In
that case, the Group also recognizes an associated liability. The transferred asset and the associated liability are
measured on a basis that reflects the rights and obligations that the Group has retained.
Continuing involvement that takes the form of a guarantee over the transferred asset is measured at the lower
of the original carrying amount of the asset and the maximum amount of consideration that the Group could be
required to repay.

132 First Pacific Annual Report 2020
Notes to the Consolidated Financial Statements
(IV) Impairment
The Group recognizes an allowance for ECLs for all debt investments not held at FVPL. ECLs are based on
the difference between the contractual cash flows due in accordance with the contract and all the cash flows
that the Group expects to receive, discounted at the original effective interest rate. The expected cash flows
will include cash flows from the sale of collateral held or other credit enhancements that are integral to the
contractual terms.
(i) General approach
ECLs are recognized in two stages. For credit exposures for which there has not been a significant increase
in credit risk since initial recognition, ECLs are provided for credit losses that result from default events that
are possible within the next 12-months (a “12-month ECL”). For those credit exposures for which there
has been a significant increase in credit risk since initial recognition, a loss allowance is required for credit
losses expected over the remaining life of the exposure, irrespective of the timing of the default (a “lifetime
ECL”).
At each reporting date, the Group assesses whether the credit risk on a financial asset has increased
significantly since initial recognition. When making the assessment, the Group compares the risk of a
default occurring on the financial asset as at the reporting date with the risk of a default occurring on the
financial asset as at the date of initial recognition and considers reasonable and supportable information
that is available without undue cost or effort, including historical and forward-looking information.
For debt investments at FVOCI, the Group applies the low credit risk simplification. At each reporting
date, the Group evaluates whether the debt investments are considered to have low credit risk using all
reasonable and supportable information that is available without undue cost or effort. In making that
evaluation, the Group reassesses the past due status of the debt investments in which the Group considers
that there has been a significant increase in credit risk when contractual payments are more than 30 days
past due.
The Group considers a financial asset in default when contractual payments are more than 60 to 180 days
past due. However, in certain cases, the Group may also consider a financial asset to be in default when
internal or external information indicates that the Group is unlikely to receive the outstanding contractual
amounts in full before taking into account any credit enhancements held by the Group. A financial asset
is written off when there is no reasonable expectation of recovering the contractual cash flows. This is
generally the case when the Group determines that the debtor does not have assets or sources of income
that could generate sufficient cash flows to repay the amounts subject to the write-off.
Debt investments at FVOCI and financial assets at amortized cost are subject to impairment under the
general approach and they are classified within the following stages for measurement of ECLs except for
accounts receivable and contract assets which apply the simplified approach as detailed below:
Stage 1 – Financial assets for which credit risk has not increased significantly since initial recognition
and for which the loss allowance is measured at an amount equal to 12-month ECLs;
Stage 2 – Financial assets for which credit risk has increased significantly since initial recognition but
that are not credit-impaired financial assets and for which the loss allowance is measured at
an amount equal to lifetime ECLs;
Stage 3 – Financial assets that are credit-impaired at the reporting date (but that are not purchased or
originated credit-impaired) and for which the loss allowance is measured at an amount equal
to lifetime ECLs.

133 First Pacific Annual Report 2020
Evidence that a financial asset is credit-impaired includes the following observable events:
Significant financial difficulties of the debtor;
A breach of contract, such as a default or delinquency in interest or principal repayments;
It becoming probable that the borrower will enter into bankruptcy or other financial reorganization;
Significant changes in the technological, market, economic or legal environment that have an adverse
effect on the debtor; or
The disappearance of an active market for a security because of financial difficulties of the issuer.
(ii) Simplified approach
For accounts receivable and contract assets that do not contain a significant financing component or when the
Group applies the practical expedient of not adjusting the effect of a significant financing component, the Group
applies the simplified approach in calculating ECLs. Under the simplified approach, the Group does not track
changes in credit risk, but instead recognizes a loss allowance based on lifetime ECLs at each reporting date.
The Group has established a provision matrix that is based on its historical credit loss experience, adjusted for
forward-looking factors specific to the debtors and the economic environment.
(l) Financial liabilities
(I) Initial recognition and measurement
Financial liabilities are classified, at initial recognition, as financial liabilities at FVPL, loans and borrowings,
payables, or as derivatives designated as hedging instruments in an effective hedge, as appropriate.
Financial liabilities are recognized initially at fair value and, in the case of loans and borrowings and payables,
net of directly attributable transaction costs.
In respect of a put option held by a non-controlling shareholder of the Group’s subsidiary company, which
allows the non-controlling shareholder to sell all of its interest in the Group’s subsidiary company to the Group
under certain specific circumstances and thus gives rise to a contractual obligation for the Group to purchase its
own equity instruments when the put option is exercised, a financial liability is initially recognized at the present
value of the amount payable on exercise of the put option by the non-controlling shareholder and the carrying
amount of the non-controlling interest is derecognized with the resulting differences recorded in equity.
(II) Subsequent measurement
The subsequent measurement of financial liabilities depends on their classification as follows:
(i) Financial liabilities at FVPL
Financial liabilities at FVPL include financial liabilities held for trading and financial liabilities designated
upon initial recognition as at FVPL.
Financial liabilities are classified as held for trading if they are incurred for the purpose of repurchasing
in the near term. This category includes derivative financial instruments entered into by the Group that
are not designated as hedging instruments in hedge relationships as defined by HKFRS 9. Separated
embedded derivatives are also classified as held for trading unless they are designated as effective
hedging instruments. Gains or losses on liabilities held for trading are recognized in the consolidated
income statement. The net fair value gain or loss recognized in the consolidated income statement does
not include any interest charged on these financial liabilities.

134 First Pacific Annual Report 2020
Notes to the Consolidated Financial Statements
Financial liabilities designated upon initial recognition as at FVPL are designated at the initial date of
recognition, and only if the criteria in HKFRS 9 are satisfied. Gains or losses on liabilities designated at
FVPL are recognized in the consolidated income statement, except for the gains or losses arising from
the Group’s own credit risk which are presented in other comprehensive income with no subsequent
reclassification to the consolidated income statement. The net fair value gain or loss recognized in the
consolidated income statement does not include any interest charged on these financial liabilities.
(ii) Financial liabilities at amortized cost
After initial recognition, the following financial liabilities are measured at amortized cost using the effective
interest method: (i) loans and borrowings, and (ii) payables. Amortized cost is calculated taking into
account any discount or premium on acquisition and includes fees that are an integral part of the effective
interest rate and transaction costs.
In respect of a put option held by a non-controlling shareholder of the Group’s subsidiary company, while
the put option remains unexercised, the Group derecognizes the carrying value of the non-controlling
interest as if the put option is exercised at the end of the reporting period and recognizes a financial liability
at the present value of the amount payable on exercise of the put option, with the difference recorded in
equity as an equity transaction.
(iii) Financial guarantee contracts
Financial guarantee contracts issued by the Group are those contracts that require a payment to be made
to reimburse the holder for a loss it incurs because the specified debtor fails to make a payment when due
in accordance with the terms of a debt instrument. A financial guarantee contract is recognized initially
as a liability at fair value, adjusted for transaction costs that are directly attributable to the issuance of the
guarantee. Subsequent to initial recognition, the Group measures the financial guarantee contracts at the
higher of: (i) the ECL allowance determined in accordance with the policy as set out in Note k(IV); and (ii)
the amount initially recognized less, when appropriate, the cumulative amount of income recognized.
(III) Derecognition
A financial liability is derecognized when the obligation under the liability is discharged or canceled, or expires.
When an existing financial liability is replaced by another from the same lender on substantially different terms,
or the terms of an existing liability are substantially modified, such an exchange or modification is treated
as a derecognition of the original liability and a recognition of a new liability, and the difference between the
respective carrying amounts is recognized in the consolidated income statement.
(m) Derivative instruments and hedge accounting
The Group uses derivative financial instruments such as currency swaps, foreign currency forwards, interest rate
swaps, commodity swaps and electricity futures to hedge its risks associated with foreign currency, interest rate and
commodity price fluctuations. Such derivative financial instruments are stated at fair value.
For the purpose of hedge accounting, hedges are classified as (i) fair value hedges where they hedge the exposure
to changes in fair value of a recognized asset or liability or an unrecognized firm commitment, (ii) cash flow hedges
where they hedge the exposure to variability in cash flows that is attributable to a particular risk associated with all, or
a component of, a recognized asset or liability, a highly probable forecast transaction, or a foreign currency risk in an
unrecognized firm commitment, or (iii) hedges of a net investment in a foreign operation. The Group does not have
any fair value hedges and hedges of a net investment in a foreign operation.
At the inception of a hedge relationship, the Group formally designates and documents the hedge relationship to
which the Group wishes to apply hedge accounting, the risk management objective and its strategy for undertaking
the hedge.

135 First Pacific Annual Report 2020
The documentation includes identification of the hedging instrument, the hedged item, the nature of the risk being
hedged and how the Group will assess whether the hedging relationship meets the hedge effectiveness requirements
(including the analysis of sources of hedge ineffectiveness and how the hedge ratio is determined). A hedging
relationship qualifies for hedge accounting if it meets all of the following effectiveness requirements: (i) there is “an
economic relationship” between the hedged item and the hedging instrument, (ii) the effect of credit risk does not
“dominate the value changes” that result from that economic relationship, and (iii) the hedge ratio of the hedging
relationship is the same as that resulting from the quantity of the hedged item that the Group actually hedges and the
quantity of the hedging instrument that the Group actually uses to hedge that quantity of hedged item.
The Group has adopted HKAS 39, HKFRS 7, and HKFRS 9 Amendments which include a number of reliefs, that
apply to all hedging relationships directly affected by interest rate benchmark reform. The reliefs apply during the
year before the replacement of an existing interest rate benchmark with an alternative RFR. A hedging relationship is
affected if interest rate benchmark reform gives rise to uncertainties about the timing and or amount of benchmark-
based cash flows of the hedged item or the hedging instrument. The reliefs cease to apply once certain conditions
are met. These include when the uncertainty arising from interbank offered rate reform is no longer present with
respect to the timing and amount of the benchmark-based cash flows of the hedged item, if the hedging relationship is
discontinued or once amounts in the cash flow hedge reserve have been released.
In relation to cash flow hedges, the portion of the gain or loss on the hedging instrument that is determined to be an
effective hedge is recognized in other comprehensive income and the ineffective portion is recognized immediately
in the consolidated income statement. The cash flow hedge reserve is adjusted to the lower of the cumulative gain or
loss on the hedging instrument and the cumulative change in fair value of the hedged item.
The amounts accumulated in other comprehensive income are accounted for, depending on the nature of the
underlying hedged transaction. If the hedged transaction subsequently results in the recognition of a non-financial
item, the amount accumulated in equity is removed from the separate component of equity and included in the initial
cost or other carrying amount of the hedged asset or liability. This is not a reclassification adjustment and will not be
recognized in other comprehensive income for the period. This also applies where the hedged forecast transaction
of a non-financial asset or non-financial liability subsequently becomes a firm commitment to which fair value hedge
accounting is applied.
For any other cash flow hedges, the amount accumulated in other comprehensive income is reclassified to the
consolidated income statement as a reclassification adjustment in the same period or periods during which the
hedged cash flows affect the consolidated income statement.
If cash flow hedge accounting is discontinued, the amount that has been accumulated in other comprehensive
income must remain in accumulated other comprehensive income if the hedged future cash flows are still expected
to occur. Otherwise, the amount will be immediately reclassified to the consolidated income statement as a
reclassification adjustment. After the discontinuation, once the hedged cash flows occur, any amount remaining in
accumulated other comprehensive income is accounted for depending on the nature of the underlying transaction as
described above.
For derivatives that do not qualify for hedge accounting, any gains or losses arising from changes in fair value are
recognized directly in the consolidated income statement.
(n) Inventories
Inventories are stated at the lower of cost and net realizable value. Cost is calculated using the first-in, first-out
method, the weighted average method or the moving average method, and in the case of work in progress and
finished goods, comprises direct materials, direct labor and an appropriate proportion of overheads. The cost of goods
purchased for resale includes costs incurred in bringing the goods to their present location. Depending on the nature
of the inventory, net realizable value is based on either estimated selling prices less any estimated costs to be incurred
to completion and disposal, or the current replacement cost. The Group provides allowance for obsolescence and/or
decline in market values of inventories based on periodic reviews of the physical conditions and net realizable value.

136 First Pacific Annual Report 2020
Notes to the Consolidated Financial Statements
(o) Provisions, contingent liabilities and assets
A provision is recognized when the Group has a present legal or constructive obligation as a result of a past event, it
is probable that an outflow of resources will be required to settle the obligation, and a reliable estimate of the amount
can be made. When the Group expects some or all of a provision to be reimbursed, for example, under an insurance
contract, the reimbursement is recognized as a separate asset, but only when the reimbursement is virtually certain.
The expense relating to a provision is presented in the consolidated income statement net of any reimbursement.
When the effect of discounting is material, the amount recognized for a provision is the present value, at the end of
the reporting period, of the future expenditures expected to be required to settle the obligation. The increase in the
discounted present value amount, arising from the passage of time, is included in finance costs in the consolidated
income statement.
Where it is not probable that an outflow of economic benefits will be required, or the amount cannot be estimated
reliably, the obligation is disclosed as a contingent liability, unless the probability of outflow is remote.
A contingent liability recognized in a business combination is initially measured at its fair value. Subsequently, it
is measured at the higher of (i) the amount that would be recognized in accordance with the general policy for
provisions above and (ii) the amount initially recognized less, when appropriate, the amount of income recognized in
accordance with the general guidance for revenue recognition.
Contingent assets represent assets arising from unplanned or unexpected events that give rise to the possibility of an
inflow of economic benefits to the Group. Contingent assets are not recognized in the Group’s Consolidated Financial
Statements but are disclosed where an inflow of economic benefits is probable.
(p) Income tax
Income tax comprises current and deferred taxes. Income tax relating to items recognized outside profit or loss is
recognized outside profit or loss, either in other comprehensive income or directly in equity.
Current tax assets and liabilities are measured at the amount expected to be recovered from or paid to the taxation
authorities. The tax rates (and tax laws) used to compute the amounts are those that are enacted or substantively
enacted, by the end of the reporting period, in the countries where the Group operates and generates taxable income.
Deferred tax is provided, using the liability method, on all temporary differences arising between the tax bases of assets
and liabilities and their carrying values for financial reporting purposes.
Deferred tax liabilities are recognized for all taxable temporary differences (with limited exceptions) while deferred
tax assets are recognized for all deductible temporary differences, and the carry-forward of unused tax credits and
unused tax losses to the extent that it is probable that taxable profit will be available against which the deductible
temporary differences, and the carry-forward of unused tax credits and unused tax losses can be utilized (with limited
exceptions). For deferred tax liabilities for the withholding taxes that would be payable on unremitted earnings that
are subject to withholding taxes, the Group fully recognizes the amounts for its associated companies and recognizes
the amounts to the extent representing the earnings to be distributed as dividends for its subsidiary companies. The
carrying amount of deferred tax assets is reviewed at the end of the reporting period and reduced to the extent that
it is no longer probable that sufficient taxable profit will be available to allow all or part of the deferred tax asset to be
recovered. Conversely, previously unrecognized deferred tax assets are recognized to the extent that it is probable
that sufficient taxable profit will be available to allow all or part of the deferred tax asset to be recovered.
Deferred tax assets and deferred tax liabilities are measured at the tax rates that are expected to apply to the period
when the asset is realized or the liability is settled, based on tax rates (and tax laws) that have been enacted or
substantively enacted at the end of the reporting period.
Deferred tax assets and deferred tax liabilities are offset if and only if the Group has a legally enforceable right to
set off current tax assets and current tax liabilities and the deferred tax assets and deferred tax liabilities relate to
income taxes levied by the same taxation authority on either the same taxable entity or different taxable entities which
intend either to settle current tax liabilities and assets on a net basis, or to realize the assets and settle the liabilities
simultaneously, in each future period in which significant amounts of deferred tax liabilities or assets are expected to
be settled or recovered.

137 First Pacific Annual Report 2020
(q) Distributions/Dividends
Final distributions/dividends proposed by the Directors are recognized as a liability when they have been declared
and approved by the shareholders in an annual general meeting. Proposed final distributions/dividends are disclosed
in the notes to the Consolidated Financial Statements.
Interim distributions/dividends (including special distributions/dividends, if any) are simultaneously proposed and
declared, because the Company’s memorandum and bye-laws grant the Directors the authority to declare interim
distributions/dividends. Consequently, interim distributions/dividends are recognized immediately as a liability when
they are proposed and declared.
(r) Turnover and revenue recognition
Revenue from contracts with customers is recognized when control of goods or services is transferred to the
customers at an amount that reflects the consideration to which the Group expects to be entitled in exchange for
those goods or services.
When the consideration in a contract includes a variable amount, the amount of consideration is estimated to
which the Group will be entitled in exchange for transferring the goods or services to the customer. The variable
consideration is estimated at contract inception and constrained until it is highly probable that a significant revenue
reversal in the amount of cumulative revenue recognized will not occur when the associated uncertainty with the
variable consideration is subsequently resolved.
When the contract contains a financing component which provides the customer with a significant benefit of financing
the transfer of goods or services to the customer for more than one year, revenue is measured at the present value of
the amount receivable, discounted using the discount rate that would be reflected in a separate financing transaction
between the Group and the customer at contract inception. When the contract contains a financing component
which provides the Group with a significant financial benefit for more than one year, revenue recognized under the
contract includes the interest expense accreted on the contract liability under the effective interest method. For a
contract where the period between the payment by the customer and the transfer of the promised goods or services
is one year or less, the transaction price is not adjusted for the effects of a significant financing component, using the
practical expedient in HKFRS 15.
Turnover represents the amounts received and receivable net of discounts, rebates and value-added tax from the
sales of goods and electricity, and the rendering of services to third parties, falling within the ordinary activities of the
Group’s businesses. Turnover is measured by allocating the transaction price including variable considerations to
each performance obligation on a relative stand-alone selling price basis and taking into account contractually defined
terms of payment.
(I) Turnover from the sale of goods
Turnover from the sale of goods is recognized at the point in time when control of the goods is transferred to the
customer, generally on delivery of the goods. Delivery occurs when the goods have been shipped to the location
specified by the customer, the risks of obsolescence and loss have been transferred to the customer, and either
the customer has accepted the goods in accordance with the sales contract, the acceptance provisions have
lapsed, or the Group has objective evidence that all criteria for acceptance have been satisfied.
Some contracts for the sale of goods provide customers with rights of return and volume rebates. The rights of
return and volume rebates give rise to variable consideration.

138 First Pacific Annual Report 2020
Notes to the Consolidated Financial Statements
(i) Rights of return
For contracts which provide a customer with a right to return the goods within a specified period, the
expected value method is used to estimate the goods that will not be returned because this method
best predicts the amount of variable consideration to which the Group will be entitled. The requirements
in HKFRS 15 on constraining estimates of variable consideration are applied in order to determine
the amount of variable consideration that can be included in the transaction price. For goods that are
expected to be returned, instead of revenue, a refund liability is recognized. A right-of-return asset (and
the corresponding adjustment to cost of sales) is also recognized for the right to recover products from a
customer.
(ii) Volume rebates
Retrospective volume rebates may be provided to certain customers once the quantity of products
purchased during the period exceeds a threshold specified in the contract. Rebates are offset against
amounts payable by the customer. To estimate the variable consideration for the expected future rebates,
the most likely amount method is used for contracts with a single-volume threshold and the expected value
method for contracts with more than one volume threshold. The selected method that best predicts the
amount of variable consideration is primarily driven by the number of volume thresholds contained in the
contract. The requirements on constraining estimates of variable consideration are applied and a refund
liability for the expected future rebates is recognized.
(II) Turnover from the sale of electricity
Turnover from the sale of electricity is recognized over time upon supply and in the amount the Group has a
right to invoice, because the customer simultaneously receives and consumes the benefits provided by the
Group.
(III) Turnover from the rendering of services
Turnover from the rendering of services is recognized over time when the said services are rendered. Customers
are charged upon the completion of services or on a regular basis that corresponds directly with the value to the
customer of the Group’s performance to date.
(IV) Dividend income
Dividend income is recognized when the Group’s right to receive payment has been established.
(V) Interest income
Interest income is recognized as it accrues, taking into account the principal amount outstanding and the
effective interest rate.
(s) Contract assets and contract liabilities
A contract asset is the right to consideration in exchange for goods or services transferred to the customer. If the
Group performs by transferring goods or services to a customer before the customer pays consideration or before
payment is due, a contract asset is recognized for the earned consideration that is conditional. Contract assets are
subject to impairment assessment, details of which are included in the accounting policies for impairment of financial
assets (see Note (k)(IV)).
A contract liability is recognized when a payment is received or a payment is due (whichever is earlier) from a
customer before the Group transfers the related goods or services. Contract liabilities are recognized as revenue when
the Group performs under the contract (i.e. transfers control of the related goods or services to the customer).

139 First Pacific Annual Report 2020
(t) Employee benefits
(I) Pension obligations
The Group operates defined contribution and defined benefit retirement schemes.
Contributions to defined contribution schemes by the Group and employees are calculated as a percentage
of the employees’ basic salaries. The Group’s contributions to defined contribution schemes are expensed as
incurred and are reduced by contributions forfeited by those employees who leave the schemes prior to the
contributions vesting fully.
The Group’s net obligations in respect of defined benefit schemes is calculated by fair value of the pension
scheme assets and estimates of the effects of future events on the actuarial present value of accrued pension
obligations, and are determined on the basis of actuarial valuations using the projected unit credit method.
Remeasurements comprising actuarial gains and losses, return on plan assets and any change in the effect
of the asset ceiling (excluding net interest on defined benefit liability) are recognized immediately in other
comprehensive income in the period in which they arise. Remeasurements are not reclassified to profit or loss
in subsequent periods. Past service costs are recognized in the consolidated income statement at the earlier of
the date of (i) when the plan amendment occurs and (ii) when the related restructuring or termination costs are
recognized. Interest on net defined benefit obligation is calculated using the discount rate used to measure the
pension benefit obligation and recognized in the consolidated income statement.
(II) Long service payments
Certain of the Group’s employees are eligible for long service payments in the event of the termination of their
employment. A provision is recognized in respect of the probable future long service payments expected to be
made. The provision is the best estimate of the present value of probable future payments, calculated using the
projected unit credit method, that have been earned by the employees from their service to the Group at the
end of the reporting period.
(III) Equity-settled transactions
The cost of equity-settled transactions with employees is measured by reference to the fair values of the share
options and awarded shares at the date at which they are granted.
For grants of share options, the total amount to be expensed is determined by reference to the fair value of the
options granted by using option-pricing models, which include the impact of market performance conditions
but excludes the impact of service conditions and non-market performance conditions. For grants of awarded
shares, the total amount to be expensed is determined by reference to the market performance conditions at the
grant date, taking into account all non-vesting conditions associated with the grants.
The cost of equity-settled transactions is recognized in employee benefit expenses, together with a
corresponding increase in the employee share-based compensation reserve, over the period in which the
performance conditions are fulfilled. The cumulative expense recognized for equity-settled transactions at each
reporting period end until the vesting date reflects the extent to which the vesting period has expired and the
number of awards that will ultimately vest, based on the best available estimate.
Upon the exercise of share options, the related amount accumulated in the employee share-based
compensation reserve is transferred to share premium. Upon the vesting and transfer to the awardees, the
related costs of the awarded shares are credited to shares held for the share award scheme, and the related fair
value of the shares is debited to the employee share-based compensation reserve. The difference between the
cost and the fair value of the vested awarded shares is credited to retained earnings if the fair value is higher
than the cost or debited against retained earnings if the fair value is less than the cost.

140 First Pacific Annual Report 2020
Notes to the Consolidated Financial Statements
Service and non-market performance conditions are not taken into account when determining the grant date fair
value of awards, but the likelihood of the conditions being met is assessed as part of the Group’s best estimate
of the number of equity instruments that will ultimately vest. Market performance conditions are reflected
within the grant date fair value. Any other conditions attached to an award, but without an associated service
requirement, are considered to be non-vesting conditions. Non-vesting conditions are reflected into fair value of
an award and lead to an immediate expensing of an award unless there are also services and/or performance
conditions.
For awards that do not ultimately vest because non-market performance and/or service conditions have not
been met, no expense is recognized. Where awards include a market or non-vesting condition, the transactions
are treated as vesting irrespective of whether the market or non-vesting condition is satisfied, provided that all
other performance and/or service conditions are satisfied.
Where the terms of an equity-settled award are modified, an expense, as a minimum, is recognized as if
the terms had not been modified if the original terms of the award are met. An expense is recognized for
any increase in the fair value of the transactions as a result of the modification, as measured at the date of
modification. If the modification occurs during the vesting period, the incremental fair value granted is included
in the measurement of the amount recognized for services received over the period from the modification date
until the date when the modified equity instruments vest, in addition to the amount based on the grant date fair
value of the original equity instruments, which is recognized over the remainder of the original vesting period.
If the modification occurs after vesting date, the incremental fair value granted is recognized immediately, or
over the vesting period if the employee is required to complete an additional period of service before becoming
unconditionally entitled to those modified equity instruments.
Where an equity-settled award is canceled, it is treated as if it had vested on the date of cancelation, and any
expense not yet recognized for the award is recognized immediately. This includes any award where non-
vesting conditions within the control of either the Group or the employee are not met. However, if a new award
is substituted for the canceled award, and designated as a replacement award on the date that it is granted, the
canceled and new awards are treated as if they were a modification of the original award, as described in the
previous paragraph.
(IV) Cash long-term employee benefits
The Group’s long-term incentive plans (“LTIP”) grant cash incentives to eligible key employees, which are
contingent upon the achievement of approved targets, such as recurring profit/core income over a performance
cycle, usually three years, with payments usually made at the end of the performance cycle. Liability under LTIP
is determined using the projected unit credit method. Employee benefit costs include current service costs,
interest cost, past service costs, and actuarial gains and losses. Current service costs, interest cost and past
service costs are recognized immediately in the consolidated income statement when they occur, while actuarial
gains and losses are recognized immediately in other comprehensive income when they occur.
(V) Paid leave carried forward
The Group provides paid annual leave to its employees under their employment contracts on a calendar year
basis. Under certain circumstances, such leave which remains untaken as at the end of the reporting period
is permitted to be carried forward and utilized by the respective employees in the following year. An accrual is
made at the end of the reporting period for the expected future cost of such paid leave earned during the year
by the employees and carried forward.

141 First Pacific Annual Report 2020
(VI) Termination benefits
Termination benefits are employee benefits provided in exchange for the termination of an employee’s
employment as a result of either an entity’s decision to terminate an employee’s employment before the normal
retirement date or an employee’s decision to accept an offer of benefits in exchange for the termination of
employment.
Termination benefits are recognized at the earlier of (i) when the Group can no longer withdraw the offer of those
benefits and (ii) when the Group recognizes the related restructuring costs. Initial recognition and subsequent
changes to termination benefits are measured in accordance with the nature of the employee benefit, as either
post-employment benefits, short term employee benefits, or other long-term employee benefits.
(VII) Short-term employee benefits
Employee benefits are classified as short-term if the expected timing of settlement is within 12 months after the
end of the reporting period.
(u) Leases
The Group assesses at contract inception whether a contract is, or contains, a lease. A contract is, or contains, a
lease if the contract conveys the right to control the use of an identified asset for a period of time in exchange for
consideration.
(I) As a lessee
The Group applies a single recognition and measurement approach for all leases, except for short-term leases
and leases of low-value assets. The Group recognizes lease liabilities to make lease payments and right-of-
use assets representing the right to use the underlying assets. At inception or on reassessment of a contract
that contains a lease component and non-lease component(s), the Group adopts the practical expedient not
to separate non-lease component(s) and to account for the lease component and the associated non-lease
component(s) (e.g., property management services for leases of properties) as a single lease component.
(i) Right-of-use assets
Right-of-use assets are recognized at the commencement date of the lease (that is the date the underlying
asset is available for use). Right-of-use assets are measured at cost, less any accumulated depreciation
and any impairment losses, and adjusted for any remeasurement of lease liabilities. The cost of right-
of-use assets includes the amount of lease liabilities recognized, initial direct costs incurred, and lease
payments made at or before the commencement date less any lease incentives received. Right-of-use assets
are depreciated on a straight-line basis over the shorter of the lease terms and the estimated useful lives of
the assets.
If ownership of the leased asset transfers to the Group by the end of the lease term or the cost reflects the
exercise of a purchase option, depreciation is calculated using the estimated useful life of the asset.
When a right-of-use asset meets the definition of investment property, it is included in investment
properties. The corresponding right-of-use asset is initially measured at cost, and subsequently measured
at fair value, in accordance with the Group’s policy for investment properties (see Note (g)).

142 First Pacific Annual Report 2020
Notes to the Consolidated Financial Statements
(ii) Lease liabilities
Lease liabilities are recognized at the commencement date of the lease at the present value of lease
payments to be made over the lease term. The lease payments include fixed payments (including in-
substance fixed payments) less any lease incentives receivable, variable lease payments that depend on
an index or a rate, and amounts expected to be paid under residual value guarantees. The lease payments
also include the exercise price of a purchase option reasonably certain to be exercised by the Group and
payments of penalties for termination of a lease, if the lease term reflects the Group exercising the option to
terminate the lease. The variable lease payments that do not depend on an index or a rate are recognized as
an expense in the period in which the event or condition that triggers the payment occurs.
In calculating the present value of lease payments, the Group uses its incremental borrowing rate at the
lease commencement date because the interest rate implicit in the lease is not readily determinable. After
the commencement date, the amount of lease liabilities is increased to reflect the accretion of interest and
reduced for the lease payments made. In addition, the carrying amount of lease liabilities is remeasured if
there is a modification that is not accounted for as a separate lease, a change in the lease term, a change
in lease payments (e.g., a change to future lease payments resulting from a change in an index or rate) or
a change in assessment of an option to purchase the underlying asset. The lease liability is remeasured
based on the revised lease payments and lease term using a revised discount rate at the effective date of
the modification. The only exceptions are any rent concessions which (i) arose as a direct consequence of
the COVID-19 pandemic, (ii) the changes in lease payments result in revised consideration for the lease
that is substantially the same as, or less than, the consideration for the lease immediately preceding the
change, (iii) any reduction in lease payments affects only payments originally due on or before 30 June
2021, and (iv) there is no substantive change to other terms and conditions of the lease. In such cases,
the Group took advantage of the practical expedient and recognized the change in consideration as if it
was not a lease modification.
The Group’s lease liabilities are included in deferred liabilities, provisions and payables.
(iii) Short-term leases and leases of low-value assets
The Group applies the short-term lease recognition exemption to its certain short-term leases (that is those
leases that have a lease term of 12 months or less from the commencement date and do not contain a
purchase option). When the Group enters into a lease in respect of a low-value asset (i.e. asset with a
value, when new, of US$5 thousand or less), the Group decides whether to capitalize the lease on a lease-
by-lease basis. Lease payments on short-term leases and leases of low-value assets are recognized as an
expense on a straight-line basis over the lease term.
(II) As a lessor
When the Group acts as a lessor, it classifies at lease inception (or when there is a lease modification) each of
its leases as either an operating lease or a finance lease.
Leases in which the Group does not transfer substantially all the risks and rewards incidental to ownership of
an asset are classified as operating leases. When a contract contains lease and non-lease components, the
Group allocates the consideration in the contract to each component on a relative stand-alone selling price
basis. Rental income is accounted for on a straight-line basis over the lease terms and is recognized in the
consolidated income statement. Initial direct costs incurred in negotiating and arranging an operating lease
are added to the carrying amount of the leased asset and recognized over the lease term on the same basis as
rental income. Contingent rents are recognized in the consolidated income statement in the period in which they
are earned.
Leases that transfer substantially all the risks and rewards incidental to ownership of an underlying asset to the
lessee are accounted for as finance leases.

143 First Pacific Annual Report 2020
(v) Finance costs
Finance costs are interest expenses calculated using the effective interest method and other costs incurred in
connection with the borrowing of funds and lease liabilities. Other costs include exchange differences on foreign
currency borrowings. Exchange differences arising from foreign currency borrowings are included in finance costs to
the extent that they are regarded as an adjustment to interest costs.
Finance costs are expensed in the consolidated income statement in the period in which they are incurred, except
to the extent that they are capitalized as being directly attributable to the acquisition, construction or production of
qualifying assets (principally the assets classified as property, plant and equipment and concession assets classified
as intangible assets for the Group) which necessarily take a substantial period of time to prepare for their intended use
or sale. The capitalization of such borrowing costs ceases when the assets are substantially ready for their intended use
or sale.
(w) Foreign currencies
(I) Functional and presentation currency
Items included in the financial statements of each of the Group’s entities are measured using the currency of
the primary economic environment in which the entity operates (functional currency, principally the rupiah, the
peso and S$). The Consolidated Financial Statements are presented in the currency of the United States dollar,
which is the Company’s functional currency.
(II) Transactions and balances
Foreign currency transactions are translated into the functional currency using the exchange rates prevailing
at the dates of the transactions. Foreign exchange gains and losses resulting from the settlement of such
transactions and from the translation at year-end exchange rates of monetary assets and liabilities denominated
in foreign currencies are recognized in the consolidated income statement (except for those which will be
refunded or billed to customers through billings as approved by governments under service concession
arrangements). Non-monetary items that are measured in terms of historical cost in a foreign currency are
translated using the exchange rates at the dates of the initial transactions. Non-monetary items measured at
fair value in a foreign currency are translated using the exchange rates at the date when the fair value was
measured. The gain or loss arising on translation of a non-monetary item measured at fair value is treated in line
with the recognition of the gain or loss on change in fair value of the item.
In determining the exchange rate on initial recognition of the related asset, expense or income on the
derecognition of a non-monetary asset or non-monetary liability relating to an advance consideration, the date
of initial transaction is the date on which the Group initially recognizes the non-monetary asset or non-monetary
liability arising from the advance consideration. If there are multiple payments or receipts in advance, the Group
determines the transaction date for each payment or receipt of the advance consideration.
(III) Group companies
The results and financial position of all the Group entities (none of which has the currency of a hyperinflationary
economy) that have a functional currency other than the United States dollar are translated into the United
States dollar as follows:
(i) assets and liabilities for each consolidated statement of financial position presented are translated at the
closing rate at the end of the reporting period;
(ii) income and expenses for each consolidated income statement and consolidated statement of
comprehensive income presented are translated at average exchange rates of the period; and
(iii) all resulting exchange differences are recognized in other comprehensive income. On consolidation,
exchange differences arising from the translation of the net investment in foreign entities are taken to
equity. When a foreign operation is sold, such exchange differences are recognized in the consolidated
income statement as part of the gain or loss on disposal.

144 First Pacific Annual Report 2020
Notes to the Consolidated Financial Statements
Goodwill and fair value adjustments arising on the acquisition of a foreign entity are treated as assets and
liabilities of the foreign entity and are translated at the rates at the dates of the transactions.
(IV) Consolidated statement of cash flows
For the purpose of the consolidated statement of cash flows, the cash flows of overseas subsidiary companies
are translated into United States dollars at the average exchange rates of the period.
(x) Operating segmental information
An operating segment is a component of the Group that engages in business activities from which it may earn
revenues and incur expenses (including revenues and expenses relating to transactions with other components of
the Group), whose operating results are regularly reviewed by the Group’s chief operating decision maker who makes
decisions about how resources are to be allocated to the segment and to assess its performance, and for which
discrete financial information is available.
Segment revenue, expenses, results, assets and liabilities include items directly attributable to a segment as well as
those that can be allocated on a reasonable basis to that segment. They are determined before intragroup balances
and intragroup transactions are eliminated as part of the consolidation process.
(y) Related parties
A related party is considered as a person or an entity that is related to the Group if:
(I) A person or a close member of that person’s family is related to the Group if that person:
(i) has control or joint control over the Group;
(ii) has significant influence over the Group; or
(iii) is a member of the key management personnel of the Group;
or
(II) An entity is related to the Group if any of the following conditions applies:
(i) the entity and the Group are members of the same group (which means that parent, each subsidiary
company and each fellow subsidiary company is related to the others);
(ii) one entity is an associated company or a joint venture of the other entity (or an associated company or a
joint venture of a member of a group of which the other entity is a member);
(iii) the entity and the Group are joint ventures of the same third party;
(iv) one entity is a joint venture of a third entity and the other entity is an associated company of the third
entity;
(v) the entity is a post-employment benefit plan for the benefit of employees of either the Group or an entity
related to the Group;
(vi) the entity is controlled or jointly controlled by a person identified in (I);
(vii) a person identified in (I)(i) has significant influence over the entity or is a member of the key management
personnel of the entity (or of a parent of the entity); or
(viii) the entity, or any member of a group of which it is a part, provides key management personnel services to
the Group or to the parent of the Group.
Key management personnel are those persons having the authority and responsibility for planning, directing and
controlling the activities of the Group, directly or indirectly.

145 First Pacific Annual Report 2020
(z) Assets and disposal groups held for sale and discontinued operations
Non-current assets and disposal groups are classified as held for sale if their carrying amounts will be recovered
principally through a sale transaction rather than through continuing use. For this to be the case, the assets or
disposal groups must be available for immediate sale in their present condition subject only to terms that are usual
and customary for the sale of such assets or disposal groups and their sale must be highly probable. All assets and
liabilities of a subsidiary company classified as a disposal group are reclassified as held for sale regardless of whether
the Group retains a non-controlling interest in its former subsidiary company after the sale.
Non-current assets and disposal groups (other than investment properties, deferred tax assets, assets arising from
employee benefits and financial assets) classified as held for sale are measured at the lower of their carrying amounts
and fair values less costs to sell. Property, plant and equipment and intangible assets classified as held for sale are
not depreciated or amortized.
For non-current assets and disposal groups (other than investment properties, deferred tax assets, assets arising from
employee benefits and financial assets) that cease to be classified as held for sale are measured at the lower of their
carrying amounts before the assets or disposal groups were classified as held for sale, adjusted for any depreciation
or amortization that would have been recognized had the assets or disposal groups not been classified as held for
sale, and their recoverable amounts at the date of the subsequent decision not to sell.
A disposal group qualifies as a discontinued operation if it is a component of an entity that either has been disposed
of, or is classified as held for sale, and (i) represents a separate major line of business or geographical area of
operations; (ii) is part of a single co-ordinated plan to dispose of a separate major line of business or geographical
area of operations: or (iii) is a subsidiary acquired exclusively with a view to resale.
Discontinued operations are excluded from the results of continuing operations and are presented as a single amount
as profit or loss after tax from discontinued operations in the consolidated income statement.
3. Significant Accounting Judgments and EstimatesThe preparation of the Group’s Consolidated Financial Statements requires management to make judgments, estimates and
assumptions that affect the reported amounts of revenues, expenses, assets and liabilities, and the accompanying disclosures,
and the disclosure of contingent liabilities. The estimates and underlying assumptions are reviewed on an ongoing basis.
Revisions to accounting estimates are recognized in the period in which the estimate is revised if the revision affects only that
period, or in the period of the revision and future periods if the revision affects both current and future periods. Uncertainty about
these assumptions and estimates could result in outcomes that could require a material adjustment to the carrying amounts of
the assets or liabilities affected in the future.
(A) Judgments
In the process of applying the Group’s accounting policies, management has made the following judgments, apart from
those involving estimations, which have the most significant effect on the amounts recognized in the Consolidated Financial
Statements:
(a) Service concession arrangements
In applying HK(IFRIC)-Int 12 “Service Concession Arrangements” to the service concession arrangements of the
Group’s water (Maynilad, PNW, MPIWI, Philippine Hydro, Inc. (“PHI”), Metro Iloilo Bulk Water Supply Corporation
(“MIBWSC”), PT Nusantara and MPDW), toll road (NLEX Corporation, Cavitex Infrastructure Corporation (“CIC”),
MPCALA Holdings, Inc. (“MPCALA”), Cebu Cordova Link Expressway Corporation (“CCLEC”) and PT Nusantara)
and rail (LRMC) businesses, the Group has made judgments that these arrangements qualify for the application of
the intangible asset model. The methods of amortization that the Group uses depend on which method best reflects
the pattern of consumption of the concession assets. Maynilad, NLEX Corporation, CIC and PT Nusantara use the
unit of production method for amortizing water and toll road service concession assets. The Group annually reviews
the actual billed volume and the estimated billable water volume, in the case of the water concession, and the actual
traffic volume and the expected traffic volume, in the case of the toll concession, based on factors that include market
conditions such as population growth and consumption of water/usage of the toll facility, and the status of the Group’s
projects. It is possible that future results of operations could be materially affected by changes in the Group’s estimates
brought about by changes in the aforementioned factors.

146 First Pacific Annual Report 2020
Notes to the Consolidated Financial Statements
In applying HKAS 23 to the Group’s service concession arrangements undergoing rehabilitation (in the case of
the existing LRT1) and pre/on-going construction (in the case of the construction of the CALAX, Connector Road,
CCLEX and LRT1 extension) as qualifying assets, the Group capitalizes borrowing costs that are directly attributable
to the acquisition or construction of the qualifying asset as part of the cost of that asset using the specific borrowing
approach, as the Group uses specific borrowings to finance its qualifying assets. Capitalization of borrowing costs
ceases when substantially all the activities necessary to prepare the components of the service concession asset for
its intended use are completed. Details of the Group’s accounting policy in respect of intangible assets (other than
goodwill) are set out in Note 2(D)(f) to the Consolidated Financial Statements.
(b) Classification of financial assets and financial liabilities
The Group determines the classification of certain assets and liabilities as financial assets and financial liabilities by
judging whether they meet the definition of financial assets and financial liabilities set out in HKFRS 9. Accordingly,
the financial assets and financial liabilities are accounted for in accordance with the Group’s accounting policies set
out in Notes 2(D)(k) and 2(D)(l) to the Consolidated Financial Statements, respectively.
(c) Power to exercise significant influence or control
Where the Group holds less than 20% of voting interest in an investee but the Group has the power to exercise
significant influence, such an investment is treated as an associated company. See Note 13(D) to the Consolidated
Financial Statements for application of the above judgment.
For the period ended 9 December 2019, where the Group held less than 50% of voting interest in DDH but the Group
had the power to exercise control, such an investment was treated as a subsidiary company because the Group was
the single largest shareholder of DDH with a 49.9% interest and the remaining 50.1% interest was widely held by
many other shareholders. The Group was also unaware of any formal arrangements or agreements among the other
shareholders to consult and made collective actions.
(d) Significant judgment in determining the lease term of contracts with renewal options
The Group has several lease contracts that include extension and termination options. The Group applies judgment
in evaluating whether or not to exercise the option to renew or terminate the lease. That is, it considers all relevant
factors that create an economic incentive for it to exercise either the renewal or termination. After the commencement
date, the Group reassesses the lease term if there is a significant event or change in circumstances that is within
its control and affects its ability to exercise or not to exercise the option to renew or to terminate (e.g., a change in
business strategy).
(B) Estimation Uncertainty
The key assumptions concerning the future and other key sources of estimation uncertainty at the end of the reporting
period that have a significant risk of causing a material adjustment to the carrying amounts of the assets and liabilities
within the next financial year are described below.
(a) Estimating useful lives and residual values of property, plant and equipment
The Group estimates the useful lives and residual values of its property, plant and equipment based on the period
over which the assets are expected to be available for use. The estimated useful lives and residual values of the
property, plant and equipment are reviewed annually and are updated if expectations differ from previous estimates
due to physical wear and tear, technical or commercial obsolescence and legal or other limits on the use of the assets.
In addition, the Group’s estimation of the useful lives and residual values of its property, plant and equipment is based
on its collective assessment of industry practice, internal technical evaluation and experience with similar assets. It is
possible, however, that future results of operations could be materially affected by changes in those estimates brought
about by changes in factors mentioned above. The amounts and timing of recorded expenses for any period would be
affected by changes in these factors and circumstances. A reduction in the estimated useful lives and residual values
of the Group’s property, plant and equipment would increase its recorded depreciation expenses and decrease its
non-current assets.

147 First Pacific Annual Report 2020
(b) Measurement of fair value of biological assets
The Group recognizes its timber plantations and agricultural produce of bearer plants at fair value less costs to sell,
which requires the use of accounting estimates and assumptions.
The significant assumptions applied to determine the fair value of biological assets included the projected selling
prices, production yields, discount rate, inflation rate and exchange rates. For the valuation of unharvested fruit
bunches of oil palm and latex of rubber, the Group has applied the actual harvest data subsequent to year end and
the market selling prices at year end to derive the fair value of unharvested produce of oil palm and rubber at year
end. For the valuation of oil palm seeds, sugar cane and timber, the Group has applied discounted cash flow models
to derive their fair values.
The amount of changes in fair values would differ if there are changes to the assumptions used. Any changes in
fair values of these agricultural produces would affect the Group’s consolidated profit or loss and equity. The key
assumptions applied in the determination of fair value of biological assets including a sensitivity analysis are disclosed
and further explained in Note 12 to the Consolidated Financial Statements.
(c) Purchase price allocation and impairment of non-financial assets
Acquisition accounting requires an extensive use of accounting estimates to allocate the purchase price to the fair
market values of the assets and liabilities purchased, including intangible assets and contingent liabilities. Determining
the fair value of property, plant and equipment, biological assets, and intangible assets (other than goodwill) at the
date of acquisition of business requires the Group to make estimates and assumptions that can materially affect its
Consolidated Financial Statements.
Any difference in the purchase price and the fair values of the net identifiable assets acquired is recorded as either
goodwill in the consolidated statement of financial position or a gain on bargain purchase in profit or loss. The Group’s
business acquisitions have resulted in goodwill, which is subject to yearly impairment testing and whenever there is
an indication that goodwill may be impaired. The Group also assesses whether there are any indicators of impairment
for all non-financial assets (including the right-of-use assets) at the end of each reporting period. Intangible assets
with indefinite useful lives and intangible assets that have not yet been brought into use are tested for impairment
annually and at other times when such an indicator exists.
Other non-financial assets are tested for impairment when there are indicators that the carrying amounts may not
be recoverable. An impairment exists when the carrying value of an asset or a CGU exceeds its recoverable amount,
which is the higher of its fair value less costs of disposal and its value in use. The calculation of the fair value less
costs of disposal is based on available data from binding sales transactions in an arm’s length transaction of similar
assets or observable market prices less incremental costs for disposing of the asset. Estimating the value in use
requires the Group to make an estimate of the expected future cash flows from the CGUs and also to choose a
suitable discount rate in order to calculate the present value of those cash flows.
The preparation of estimated future cash flows involves significant estimations. While the Group believes that
its assumptions are appropriate and reasonable, significant changes in its assumptions may materially affect its
assessment of recoverable values and may lead to future additional impairment charges. Any resulting impairment
loss would affect directly the Group’s consolidated profit or loss and equity.
(d) Estimating useful lives of brands
The Group estimates the useful lives of the brands for its packaged drinking water and various milk-related products.
The estimated useful lives of the brands are reviewed annually and are updated if expectations differ from previous
estimates due to changes in market situations or other limits. It is possible, however, that future results of operations
could be materially affected by changes in those estimates brought about by changes in the factors mentioned
above. The amounts and timing of recorded expenses for any period would be affected by changes in these factors
and circumstances. A reduction in the estimated useful lives of the Group’s brands would increase its recorded
amortization expenses and decrease its other intangible assets.

148 First Pacific Annual Report 2020
Notes to the Consolidated Financial Statements
(e) Measurement of fair value of financial assets and liabilities
HKFRS requires that the Group carries certain of its financial assets and liabilities at fair value, which requires
extensive use of accounting estimates. While significant components of fair value measurement were determined using
verifiable objective evidence (i.e., foreign exchange rates and interest rates), the amount of changes in fair value
would differ if the Group utilized different valuation methodologies. Any changes in fair value of these financial assets
and liabilities would affect directly the Group’s consolidated profit or loss and equity.
(f) Provision for expected credit losses on accounts receivable and contract assets
The Group uses a provision matrix to calculate ECLs for accounts receivable and contract assets. The provision
rates are based on days past due for groupings of various customer segments that have similar loss patterns (i.e.,
by geography, product type, customer type and rating, and coverage by letters of credit and other forms of credit
insurance). The provision matrix is initially based on the Group’s historical observed default rates. The Group will
calibrate the matrix to adjust the historical credit loss experience with forward-looking information. At each reporting
date, the historical observed default rates are updated and changes in the forward-looking estimates are analyzed.
The assessment of the correlation among historical observed default rates, forecast economic conditions and ECLs
is a significant estimate. The amount of ECLs is sensitive to changes in circumstances and forecast economic
conditions. The Group’s historical credit loss experience and forecast of economic conditions may also not be
representative of a customer’s actual default in the future. The information about the ECLs on the Group’s accounts
receivable and contract assets is disclosed in Note 17 to the Consolidated Financial Statements.
(g) Estimating allowances for inventories
The Group estimates the allowance for inventories based on the best available facts and circumstances, including but
not limited to, the inventories’ own conditions (i.e., whether they are damaged or become wholly or partially obsolete),
their market selling prices, estimated costs of completion and estimated costs to be incurred for their sale. The
allowances are re-evaluated and adjusted as additional information received affects the amount estimated.
(h) Taxes
Uncertainties exist with respect to the interpretation of complex tax regulations, changes in tax laws, and the amount
and timing of future taxable income. Given the diversity of the Group’s businesses and the long-term nature and
complexity of existing contractual agreements or the nature of the business itself, changes in differences arising
between the actual results and the assumptions made, or future changes to such assumptions, could necessitate
future adjustments to tax income and expense already recorded.
The Group establishes provisions, based on reasonable estimates, for possible consequences of audits by the
tax authorities in which the Group operates. The amount of such provisions is based on various factors, such
as experience of previous tax audits and differing interpretations of tax regulations by the taxable entity and the
responsible tax authority. Such differences in interpretation may arise for a wide variety of issues depending on the
conditions prevailing in the respective domicile or to the operations of the Group.
The Group reviews the carrying amounts at the end of each reporting period and reduces deferred tax assets to the
extent that it is no longer probable that sufficient taxable profit will be available to allow all or part of the deferred tax
assets to be utilized based on the likely timing and level of future taxable profits together with future tax planning
strategies. However, there is no assurance that the Group will generate sufficient taxable profit to allow all or part of its
recognized deferred tax assets to be utilized.

149 First Pacific Annual Report 2020
(i) Provisions
The Group recognizes provisions based on estimates of whether it is probable that an outflow of resources will be
required to settle an obligation. Where the final outcome of these matters is different from the amounts that were
initially recognized, such differences will impact the financial performance in the period in which such determination is
made.
(j) Pension and other retirement benefits
The determination of the Group’s obligation, fair value of plan assets and cost for defined benefits is performed by
independent actuaries engaged by the Group and dependent on the selection of certain assumptions used by them in
calculating such amounts. Those assumptions include among others, discount rates, expected returns on plan assets,
future annual salary increases and the average remaining working life of employees. In accordance with the Group’s
accounting policy for pension obligations, actual results that differ from the Group’s assumptions are recognized
immediately in other comprehensive income as and when they occur. While the Group believes that the actuaries’
assumptions are reasonable and appropriate, significant differences in the Group’s actual experience or significant
changes in the Group’s assumptions may materially affect its pension and other retirement obligations.
(k) Employee benefit expenses
HKFRS 2 “Share-based Payment” requires that the Group measures its share options and awarded shares at fair
value at the date at which they are granted, which requires the extensive use of estimates. The determination of
such fair value is performed by an independent valuer engaged by the Group or based on management’s estimates.
Significant components of fair value measurement were determined using assumptions including the expected
volatility and dividend yield and the average risk-free interest rate for share options, and expected dividend payments
during the vesting period for share awards. The amount of fair value determined at the date on which the share
options and awarded shares are granted would differ if the Group utilized different assumptions. Any changes in fair
value of the share options and awarded shares determined at the date on which they are granted would affect directly
the Group’s consolidated profit or loss and equity in subsequent periods when these fair values are recognized as
expenses over the vesting period of the share options and awarded shares.
The cost of cash LTIP is determined using the projected unit credit method based on prevailing discount rates and
estimated achievement of recurring profit/core income targets. While management’s assumptions are believed to be
reasonable and appropriate, significant differences in actual results or changes in assumptions may materially affect
the Group’s consolidated profit or loss and equity.
4. Turnover and Operating Segmental Information
2020 2019
US$ millions (Restated)
Turnover
Sale of goods
– Consumer Food Products 5,637.8 5,528.8
– Infrastructure – 76.9
Sale of electricity
– Infrastructure 577.7 721.7
Rendering of services
– Consumer Food Products 96.2 103.0
– Infrastructure 818.8 1,154.6
Total 7,130.5 7,585.0

150 First Pacific Annual Report 2020
Notes to the Consolidated Financial Statements
Performance obligations
Information about the Group’s performance obligations is summarized below:
Sale of goods
The performance obligation is satisfied upon delivery of the goods and payment is generally due within 30 to 60 days from
delivery for consumer food products. Prior year amount also included delivery of medicine to MPIC’s hospital customers of which
the charges were collected upon delivery. Certain contracts provide customers with cash incentives, rights of return and volume
rebates which give rise to variable consideration. For the year ended 31 December 2020, revenue recognized of US$19.8 million
(2019: US$17.1 million) relates to the carried-forward contract liabilities arising from the consumer food products business and
the infrastructure business.
Sale of electricity
The performance obligation is satisfied over time as the customer simultaneously receives and consumes the electricity provided
by the Group and payment is generally due within 30 days from the date of billing for PLP’s customers.
Rendering of services
The performance obligation is satisfied over time as services are rendered and payment is generally due within seven to 60 days
from the date of billing for MPIC’s water and sewerage service customers, 45 to 60 days from the date of billing for MPIC’s bulk
water supply customers. Prior year amount also included services rendered to MPIC’s hospital customers of which the charges
were collected when services were rendered, except for certain corporate customers which are allowed an average of 30 days of
credit.
Operating Segmental Information
An operating segment is a component of the Group that engages in business activities from which it may earn revenues and
incur expenses (including revenues and expenses relating to transactions with other components of the Group), whose operating
results are regularly reviewed by the Group’s most senior executive management who makes decisions about how resources are
to be allocated to the segment and assesses its performance, and for which discrete financial information is available to them.
The Board of Directors considers the business of the Group from both product or service and geographical perspectives. From
the product or service perspective, the Group’s business interests are divided into four segments, which are consumer food
products, telecommunications, infrastructure and natural resources. Geographically, the Board of Directors considers that the
businesses of the Group are mainly operating in Indonesia, the Philippines, Singapore, the Middle East, Africa and others, and
the turnover information is based on the locations of the customers. Details of the Group’s principal investments are provided on
pages 235 and 236.
The Board of Directors assesses the performance of the operating segments based on a measure of recurring profit. This basis
measures the profit/loss attributable to owners of the parent excluding the effects of foreign exchange and derivative gains/losses,
gain/loss on changes in fair value of biological assets and non-recurring items. Non-recurring items represent certain items,
through occurrence or size, which are not considered as usual operating items. The amounts provided to the Board of Directors
with respect to total assets and total liabilities are measured in a manner consistent with that of the Consolidated Financial
Statements. These assets and liabilities are allocated based on the operations of the segment and the physical location of the
assets.

151 First Pacific Annual Report 2020
By Principal Business Activity – 2020
For the year ended/at 31 December Consumer Telecom- Natural Head 2020
US$ millions Food Products munications Infrastructure Resources Office Total
Revenue
Turnover– Point in time 5,637.8 – – – – 5,637.8
– Over time 96.2 – 1,396.5 – – 1,492.7
Total 5,734.0 – 1,396.5 – – 7,130.5
Results
Recurring profit 184.5 134.9 82.3 8.0 (88.5) 321.2
Assets and Liabilities
Non-current assets (other than financial instruments and deferred tax assets)– Associated companies and joint ventures 578.5 1,201.5 3,373.5 160.9 – 5,314.4
– Others 8,043.0 – 6,896.6 – 10.1 14,949.7
8,621.5 1,201.5 10,270.1 160.9 10.1 20,264.1
Other assets 3,253.1 – 1,600.4 – 244.0 5,097.5
Segment assets 11,874.6 1,201.5 11,870.5 160.9 254.1 25,361.6
Assets classified as held for sale – – 1,582.0 – – 1,582.0
Total assets 11,874.6 1,201.5 13,452.5 160.9 254.1 26,943.6
Borrowings 3,887.6 – 5,315.1 – 1,430.9 10,633.6
Other liabilities 2,270.4 – 2,430.5 – 136.8 4,837.7
Segment liabilities 6,158.0 – 7,745.6 – 1,567.7 15,471.3
Liabilities directly associated with the assets classified as held for sale – – 843.8 – – 843.8
Total liabilities 6,158.0 – 8,589.4 – 1,567.7 16,315.1
Other Information
Depreciation and amortization (307.2) – (165.6) – (5.4) (478.2)
Gain on changes in fair value of biological assets 0.2 – – – – 0.2
Impairment losses (74.5) – (47.4) – – (121.9)
Interest income 34.4 – 24.8 – 9.6 68.8
Finance costs (142.8) – (229.8) – (70.0) (442.6)
Share of profits less losses of associated companies and joint ventures (0.6) 126.2 172.7 (18.3) – 280.0
Taxation (246.6) – (78.5) – (16.5) (341.6)
Additions to non-current assets (other than financial instruments and deferred tax assets) 897.1 – 811.6 – – 1,708.7
By Geographical Market – 2020
For the year ended/at 31 DecemberUS$ millions Indonesia
ThePhilippines Singapore
The Middle East, Africa
& Others2020
Total
Revenue
Turnover– Consumer Food Products 4,736.7 173.2 51.7 772.4 5,734.0
– Infrastructure 33.5 792.0 571.0 – 1,396.5
Total 4,770.2 965.2 622.7 772.4 7,130.5
Assets
Non-current assets (other than financial instruments and deferred tax assets) 3,867.3 11,479.6 579.4 4,337.8 20,264.1

152 First Pacific Annual Report 2020
Notes to the Consolidated Financial Statements
By Principal Business Activity – 2019
For the year ended/at 31 December
Consumer Telecom- Natural Head
2019
(Restated)
US$ millions Foods Products munications Infrastructure Resources Office Total
Revenue
Turnover
– Point in time 5,528.8 – 76.9 – – 5,605.7
– Over time 103.0 – 1,876.3 – – 1,979.3
Total 5,631.8 – 1,953.2 – – 7,585.0
Results
Recurring profit 159.0 119.3 116.3 1.0 (105.6) 290.0
Assets and Liabilities
Non-current assets (other than
financial instruments and deferred tax assets)
– Associated companies and joint ventures 94.9 1,154.1 3,369.1 169.6 – 4,787.7
– Others 4,357.0 – 7,018.5 – 13.1 11,388.6
4,451.9 1,154.1 10,387.6 169.6 13.1 16,176.3
Other assets 2,824.0 – 2,299.2 – 444.4 5,567.6
Segment assets 7,275.9 1,154.1 12,686.8 169.6 457.5 21,743.9
Assets classified as held for sale 138.6 – – – – 138.6
Total assets 7,414.5 1,154.1 12,686.8 169.6 457.5 21,882.5
Borrowings 1,839.0 – 5,436.2 – 1,655.6 8,930.8
Other liabilities 1,455.6 – 2,580.9 – 131.8 4,168.3
Segment liabilities 3,294.6 – 8,017.1 – 1,787.4 13,099.1
Liabilities directly associated with the assets
classified as held for sale 25.4 – – – – 25.4
Total liabilities 3,320.0 – 8,017.1 – 1,787.4 13,124.5
Other Information
Depreciation and amortization (269.4) – (195.5) – (6.3) (471.2)
Gain on changes in fair value of biological assets 13.5 – – – – 13.5
Gain on deconsolidation of a subsidiary company – – 621.0 – – 621.0
Loss on disposal of a joint venture (308.3) – – – – (308.3)
Gain on disposal of an associated company 6.3 – – – – 6.3
Impairment losses (31.7) – (831.5) – – (863.2)
Interest income 33.7 – 35.8 – 7.2 76.7
Finance costs (137.3) – (220.7) – (80.2) (438.2)
Share of profits less losses of
associated companies and joint ventures (8.7) 115.4 257.7 (37.4) – 327.0
Taxation (194.6) – (236.1) – (13.7) (444.4)
Additions to non-current assets (other than
financial instruments and deferred tax assets) 346.2 – 1,220.4 – 12.6 1,579.2

153 First Pacific Annual Report 2020
By Geographical Market – 2019
For the year ended/at 31 December
Indonesia
The
Philippines Singapore Others
2019
(Restated)
TotalUS$ millions
Revenue
Turnover
– Consumer Food Products 4,817.5 241.1 51.9 521.3 5,631.8
– Infrastructure 41.7 1,198.1 713.4 – 1,953.2
Total 4,859.2 1,439.2 765.3 521.3 7,585.0
Assets
Non-current assets (other than
financial instruments and deferred tax assets) 3,932.5 11,494.3 681.1 68.4 16,176.3
There was no revenue from transactions with a single customer that accounted for 10% or more of the Group’s consolidated
revenue during the year (2019: None).
A reconciliation between profit before taxation as shown in the consolidated income statement and recurring profit is as follows:
2020 2019
US$ millions (Restated)
Profit before taxation
Continuing operations 940.1 480.5
A discontinued operation (Note 7(A)) 89.1 107.5
Exclusion of:
– Foreign exchange and derivative gains, net (Note 8) (91.4) (5.4)
– Gain on changes in fair value of biological assets (Note 5(A)) (0.2) (13.5)
– Non-recurring items 280.1 720.5
Deduction of attributable taxation and non-controlling interests (896.5) (999.6)
Recurring Profit 321.2 290.0

154 First Pacific Annual Report 2020
Notes to the Consolidated Financial Statements
5. Profit before Taxation from Continuing OperationsProfit before taxation from continuing operations is arrived at after charging/(crediting):
(A) Other Operating Expenses, Net
2020 2019
US$ millions (Restated)
Loss/(gain) on disposal of property, plant and equipment, net 32.7 (0.7)
Impairment losses
– Goodwill (Note 14) 37.5 407.5
– Property, plant and equipment (Note 11) 24.0 206.0
– Associated companies and joint ventures 22.3 6.0
– Other receivables 11.2 10.0
– Other intangible assets (Note 15) 1.3 221.8
Foreign exchange and derivative gains, net (92.5) (6.6)
Dividend income from financial assets at FVOCI (Note 18) (5.4) (5.5)
Loss/(gain) on changes in fair value of biological assets (Note 4) (0.2) (13.5)
Loss on disposal of a joint venture – 308.3
Gain on deconsolidation of a subsidiary company – (621.0)
Gain on disposal of an associated company – (6.3)
Other expenses 19.6 20.9
Total 50.5 526.9
(B) Finance Costs
2020 2019
US$ millions (Restated)
Finance costs on
– Bank borrowings and other loans 632.0 537.9
– Lease liabilities 4.3 4.3
Less: Finance costs capitalized in
– Other intangible assets (185.4) (97.2)
– Property, plant and equipment (8.3) (6.8)
Total 442.6 438.2
The weighted average capitalization rate of borrowings costs for 2020 was 36.4% (2019 (Restated): 24.7%).

155 First Pacific Annual Report 2020
(C) Other items
2020 2019
US$ millions (Restated)
Cost of inventories sold 2,722.1 2,829.6
Cost of services rendered 995.0 1,288.3
Employees’ remuneration (Note 36(A)) 803.2 851.0
Depreciation 348.0 342.1
Amortization of other intangible assets(i) 127.2 125.9
Expenses relating to short-term leases and other leases with
remaining lease terms ended on or before 31 December 2019 13.8 13.0
Write-down of inventories to net realizable value(ii) (Note 23(B)) 13.0 9.0
Impairment losses on accounts receivable(iii) 12.6 2.9
Auditor’s remuneration
– Audit services 4.6 4.4
– Non-audit services(iv) 1.0 1.5
Expenses relating to leases of low-value assets 0.6 0.3
(Reversal of)/provision for onerous contracts, net (13.2) 3.2
(i) US$110.8 million (2019 (Restated): US$109.6 million) included in cost of sales, US$13.3 million (2019: US$13.7 million) included in other operating expenses, net, and US$3.1 million (2019 (Restated): US$2.6 million) included in administrative expenses
(ii) Included in cost of sales(iii) Included in selling and distribution expenses(iv) Pertained to due diligence, review of continuing connected transactions and other transactions relating to the Group’s business development
6. TaxationNo Hong Kong profits tax (2019: Nil) has been provided as the Group had no estimated assessable profits (2019: Nil) arising in
Hong Kong for the year. Taxation on assessable profits generated outside Hong Kong has been provided at the rates of taxation
prevailing in the countries in which the Company’s subsidiary companies operate.
2020 2019
US$ millions (Restated)
Subsidiary Companies – Overseas
Current taxation 326.8 323.4
Deferred taxation 14.8 121.0
Total 341.6 444.4
Included within the share of profits less losses of associated companies and joint ventures is taxation of US$107.4 million (2019
(Restated): US$110.8 million) which is analyzed as follows:
2020 2019
US$ millions (Restated)
Associated Companies and Joint Ventures – Overseas
Current taxation 119.8 128.6
Deferred taxation (12.4) (17.8)
Total 107.4 110.8

156 First Pacific Annual Report 2020
Notes to the Consolidated Financial Statements
A reconciliation between profit before taxation multiplied by the applicable tax rates and the taxation amount is as follows:
2020 2019
(Restated)
US$ millions % %
Profit before Taxation
Continuing operations 940.1 480.5
A discontinued operation 89.1 107.5
1,029.2 588.0
Notional tax on profit before taxation, calculated at the rates
applicable to profits in the tax countries concerned 232.3 22.6 255.0 43.4
Tax effect of:
– Non-deductible expenses 61.1 5.9 136.4 23.2
– Income not subject to tax (34.1) (3.3) (23.3) (4.0)
– Sh are of profits less losses of associated companies
and joint ventures (63.7) (6.2) (79.2) (13.5)
– Effect on opening deferred tax of decrease in tax rate 10.5 1.0 – –
– Others 155.5 15.1 178.0 30.3
Taxation at the Group’s effective tax rate 361.6 35.1 466.9 79.4
Taxation arising from continuing operations 341.6 444.4
Taxation arising from a discontinued operation (Note 7(A)) 20.0 22.5
Total 361.6 466.9
In March 2020, the corporate income tax rates in Indonesia have been reduced from the rate of 25% to 22% for fiscal years
2020 and 2021, and further to 20% starting 2022.
7. A Discontinued OperationOn 23 December 2020, MPIC, through its wholly-owned subsidiary company, Beacon PowerGen, entered into a sale and
purchase agreement to sell its 56% interest in GBPC to MGen, a wholly-owned subsidiary company of Meralco and an associated
company of the Group, for an aggregate consideration of approximately Pesos 22.4 billion (US$466.6 million), of which 60%
of the aggregate consideration will be payable by MGen in cash upon the completion of the transaction. The balance of 40%
of the aggregate consideration will be payable in cash in equal instalment by MGen after six months and 18 months following
the completion of the transaction. The financial results of GBPC will also be deconsolidated and be equity accounted for in the
Group’s Consolidated Financial Statements through the Group’s investment in Meralco after the closing of the transaction.
Accordingly, GBPC was classified as a disposal group held for sale as at 31 December 2020 and a discontinued operation in the
Group’s 2020 Consolidated Financial Statements. Prior to the classification as a discontinued operation, the power generation
business of GBPC was reported under the Group’s infrastructure business segment and the Philippines geographical segment.
The transaction was approved by the Company’s independent shareholders on 2 March 2021 and is expected to be completed
on 31 March 2021. For details, please refer to Note 42(D) to the Consolidated Financial Statements.

157 First Pacific Annual Report 2020
(A) The results of GBPC for the years ended 31 December 2020 and 2019 are presented below:
US$ millions 2020 2019
Turnover 425.7 469.7
Cost of sales and services (274.3) (305.2)
Gross Profit 151.4 164.5
Administrative expenses (47.2) (37.5)
Other operating (expenses)/income, net (1.3) 2.6
Interest income 2.8 9.0
Finance costs (35.4) (39.2)
Share of profits less losses of associated companies and joint ventures 18.8 8.1
Profit before Taxation from a Discontinued Operation (Note 4) 89.1 107.5
Taxation (Note 6) (20.0) (22.5)
Profit for the Year from a Discontinued Operation 69.1 85.0
(B) The major class of assets and liabilities of GBPC classified as held for sale as at 31 December 2020 are as follows:
US$ millions 2020
Assets
Property, plant and equipment (Note 11) 1,010.7
Investments in associated companies and joint ventures 105.0
Other intangible assets (Note 15) 49.2
Deferred tax assets (Note 19) 19.8
Other non-current assets 9.4
Cash and cash equivalents 138.6
Short-term deposits with original maturity of more than three months 14.8
Restricted cash 42.7
Accounts receivable, other receivables and prepayments (Current) 141.3
Inventories 50.5
Assets of a Disposal Group Classified as Held for Sale (Note 24) 1,582.0
Liabilities
Accounts payable, other payables and accruals 129.0
Short-term borrowings (Note 34(H)) 156.6
Provision for taxation (Note 27) 7.9
Long-term borrowings (Note 34(H)) 437.2
Deferred liabilities, provisions and payables (Note 28) 64.2
Deferred tax liabilities (Note 19) 48.9
Liabilities Directly Associated with the Assets Classified as Held for Sale (Note 24) 843.8
Net Assets Directly Associated with the Disposal Group 738.2
Reserves
Actuarial gains on defined benefit pension plans 1.1
Reserves Directly Associated with the Disposal Group 1.1

158 First Pacific Annual Report 2020
Notes to the Consolidated Financial Statements
(C) The net cash flows incurred by GBPC are as follows:
US$ millions 2020 2019
Operating activities 112.4 123.5
Investing activities (2.5) (3.7)
Financing activities (143.5) (134.4)
Net Cash Outflow (33.6) (14.6)
8. Profit/(Loss) Attributable to Owners of the ParentThe profit/(loss) attributable to owners of the parent includes net foreign exchange and derivative gains of US$34.1 million
(2019: US$6.8 million), which represent the foreign exchange translation differences on the Group’s unhedged foreign currency
denominated net assets/liabilities and the changes in the fair values of derivatives, gain on changes in fair value of biological assets
of US$0.1 million (2019: US$3.0 million) and non-recurring losses of US153.8 million (2019: US$553.7 million).
Analysis of Foreign Exchange and Derivative Gains/(Losses), Net
US$ millions 2020 2019
Foreign exchange and derivative gains/(losses)
– Subsidiary companies 92.1 6.3
– Associated companies and joint ventures (0.7) (0.9)
Subtotal (Note 4) 91.4 5.4
Attributable to taxation and non-controlling interests (57.3) 1.4
Total 34.1 6.8
The non-recurring losses represent certain items, through occurrence or size, which are not considered as usual operating items.
For the year ended 31 December 2020, non-recurring losses of US$153.8 million mainly represent (a) the Group’s impairment
provisions for assets, including investments in RHI, goodwill, property, plant and equipment, deferred costs and others (US$74.1
million), loss on disposal of La Carlota assets (US$15.8 million) and debt refinancing costs (US$7.5 million), and (b) PLDT’s
manpower reduction costs (US$9.5 million) and accelerated amortization for Sun trademark (US$6.8 million), and PLP’s
provisions for take-or-pay obligation and onerous contracts (US$7.4 million).
9. Earnings/(Loss) Per Share Attributable to Owners of the ParentThe calculation of the basic earnings/(loss) per share is based on the profit/(loss) for the year attributable to owners of the parent,
and the weighted average number of ordinary shares of 4,344.9 million (2019: 4,344.1 million) in issue less the weighted
average number of ordinary shares held for a share award scheme of 6.1 million (2019: 5.1 million) during the year.
The calculation of the diluted earnings/(loss) per share is based on the profit/(loss) for the year attributable to owners of the
parent, adjusted to reflect the dilutive impact of share options and the restricted stock unit plan of the Group’s subsidiary and
associated companies, where applicable. The weighted average number of ordinary shares used in the calculation is based on
the number of ordinary shares used in the basic earnings/(loss) per share calculation adjusted for the dilutive effect of share
options and awarded shares of the Company, where applicable.

159 First Pacific Annual Report 2020
The calculations of basic and diluted earnings/(loss) per share are based on:
2020 2019
US$ millions (Restated)
Earnings/(Loss)
Profit/(loss) attributable to owners of the parent used in the basic and diluted
earnings/(loss) per share calculation
Continuing operations 181.1 (269.7)
A discontinued operation 20.5 15.8
201.6 (253.9)
Number of shares
Millions 2020 2019
Shares
Weighted average number of ordinary shares issued during the year 4,344.9 4,344.1
Less: Weighted average number of ordinary shares held for a share award scheme (6.1) (5.1)
Weighted average number of ordinary shares used in the basic earnings/(loss)
per share calculation 4,338.8 4,339.0
Add: Dilutive impact of awarded shares on the weighted average number of ordinary shares 6.5 –
Weighted average number of ordinary shares used in the diluted earnings/(loss)
per share calculation 4,345.3 4,339.0
For the year ended 31 December 2020, the effect of share options (2019: share options and awarded shares) of the Company
on the weighted average number of ordinary shares was anti-dilutive and therefore not included in the above calculation of
diluted earnings/(loss) per share.
10. Ordinary Share Distribution
U.S. cents per ordinary share US$ millions
2020 2019 2020 2019
Interim 0.90 0.83 39.2 36.0
Proposed final/final 0.96 0.90 41.8 39.2
Total 1.86 1.73 81.0 75.2
The proposed final distribution for the year ended 31 December 2020 is subject to the approval of the Company’s shareholders
at the forthcoming AGM.

160 First Pacific Annual Report 2020
Notes to the Consolidated Financial Statements
11. Property, Plant and Equipment
Right-of-use assets
US$ millions
Land and
buildings
Machinery
and
equipment
Freehold
land and
buildings
Machinery,
equipment
and vessels
Bearer
plants
Construction
in progress Total
Cost
At 1 January 2020 559.4 19.0 1,214.2 4,396.0 1,164.5 159.9 7,513.0
Exchange translation (0.6) 0.5 4.2 69.5 (15.1) (3.7) 54.8
Additions 130.2 9.8 101.4 84.4 51.5 70.4 447.7
Acquisition of a subsidiary company (Note 34(C)) 1.5 0.5 50.5 39.4 – 1.3 93.2
Disposals (2.1) (0.4) (45.7) (138.8) – (9.1) (196.1)
Reclassification(i) – – 53.3 62.1 (3.3) (115.4) (3.3)
Reclassification from assets classified as held for sale
(Note 24) – – 71.8 68.5 – 1.3 141.6
Other movements – – (34.1) 5.1 – – (29.0)
Attributable to a discontinued operation (Note 7(B)) (1.5) – (37.9) (1,206.1) – – (1,245.5)
At 31 December 2020 686.9 29.4 1,377.7 3,380.1 1,197.6 104.7 6,776.4
Accumulated Depreciation and Impairment
At 1 January 2020 36.8 11.2 362.4 1,789.4 374.5 – 2,574.3
Exchange translation 1.8 0.4 (2.3) 14.0 (4.1) – 9.8
Depreciation for the year 36.8 11.4 53.2 286.4 34.9 – 422.7
Impairment for the year (Note 5(A)) – – – 24.0 – – 24.0
Disposals (0.3) (0.2) (10.1) (46.3) – – (56.9)
Other movements – – (0.8) – – – (0.8)
Attributable to a discontinued operation (Note 7(B)) (1.3) – (4.8) (228.7) – – (234.8)
At 31 December 2020 73.8 22.8 397.6 1,838.8 405.3 – 2,738.3
Net Carrying Amount at 31 December 2020 613.1 6.6 980.1 1,541.3 792.3 104.7 4,038.1
(i) Reclassification from bearer plants to other non-current assets

161 First Pacific Annual Report 2020
Right-of-use assets
US$ millionsLand and buildings
Machinery and
equipment
Freehold land andbuildings
Machinery,equipment
and vesselsBearer plants
Construction in progress Total
Cost
At 1 January 2019 544.9 17.5 1,254.2 4,224.9 1,062.1 186.9 7,290.5Exchange translation 21.6 0.6 50.9 166.3 45.3 7.1 291.8Additions 7.9 1.0 105.1 136.6 63.2 67.2 381.0Acquisition of subsidiary companies (Note 34(C)) – – – 0.2 – – 0.2Disposals (0.6) (0.1) (2.0) (43.7) (0.7) – (47.1)Deconsolidation of a subsidiary company (14.4) – (232.8) (168.2) – – (415.4)Reclassification(i) – – 27.3 71.2 (5.4) (101.3) (8.2)Reclassification from assets classified as held for sale
(Note 24) – – 11.5 8.7 – – 20.2 At 31 December 2019 559.4 19.0 1,214.2 4,396.0 1,164.5 159.9 7,513.0 Accumulated Depreciation and Impairment
At 1 January 2019 – – 328.9 1,336.3 327.7 – 1,992.9Exchange translation 0.6 0.1 9.0 90.3 14.3 – 114.3Depreciation for the year 32.1 11.1 65.7 265.6 29.9 – 404.4Impairment for the year (Note 5(A)) 5.3 – 1.8 196.3 2.6 – 206.0Disposals – – (0.3) (28.0) – – (28.3)Deconsolidation of a subsidiary company (1.2) – (42.7) (71.1) – – (115.0) At 31 December 2019 36.8 11.2 362.4 1,789.4 374.5 – 2,574.3 Net Carrying Amount at 31 December 2019 522.6 7.8 851.8 2,606.6 790.0 159.9 4,938.7
(i) Reclassification from freehold land and buildings to investment properties and from bearer plants to other non-current asset
For the year ended 31 December 2020, an impairment loss of US$24.0 million was recognized in respect of the property, plant and equipment for the Group’s alcohol business.
For the year ended 31 December 2019, impairment losses of US$191.2 million, US$8.5 million and US$6.3 million were recognized in respect of the property, plant and equipment for the Group’s power, logistics and plantation businesses, respectively.
Property, plant and equipment with a net carrying amount of US$619.0 million (2019: US$1,778.0 million) were pledged as security for certain of the Group’s banking facilities (Note 26(E)).
12. Biological Assets
Timber plantations
Agricultural produce
of bearer plants Total
US$ millions 2020 2019 2020 2019 2020 2019
At 1 January 22.6 22.7 52.0 36.1 74.6 58.8Exchange translation (0.3) 0.9 (0.5) 1.7 (0.8) 2.6Additions 0.8 0.5 17.4 17.5 18.2 18.0Decreases due to harvest (0.3) (0.9) (14.0) (17.4) (14.3) (18.3)(Loss)/gain on changes in fair value of
biological assets, net (0.6) (0.6) 0.8 14.1 0.2 13.5 At 31 December 22.2 22.6 55.7 52.0 77.9 74.6 Presented as:
Non-current Portion 22.2 22.6 – – 22.2 22.6Current Portion – – 55.7 52.0 55.7 52.0 Total 22.2 22.6 55.7 52.0 77.9 74.6
162 First Pacific Annual Report 2020
Notes to the Consolidated Financial Statements
(A) The Group’s biological assets primarily comprise timber plantations and unharvested agricultural produce of bearer plants
owned by Indofood. For timber plantations, the Group appointed an independent valuer, Kantor Jasa Penilai Publik
Benedictus Darmapuspita dan Rekan, to determine their fair values annually and any resultant gains or losses arising from
the changes in fair values are recognized in profit or loss. The independent valuer measured the fair value of timber using a
discounted cash flow model. For the unharvested agricultural produce of bearer plants, which mainly comprise FFB, latex,
sugar cane and oil palm seeds, the Group has applied the actual harvest data subsequent to the year end and applicable
market prices to derive the fair value of FFB and latex, and discounted cash flow models to derive the fair values of sugar
cane and oil palm seeds.
(B) Timber plantations – Key assumptions applied in determining the fair values of the timber plantations are as follows:
(a) Timber trees are available for harvest only once about eight years from initial planting.
(b) The discount rate used represents the asset specific rate for the Group’s timber plantation operations which is applied
in the discounted future cash flows calculation.
(c) The projected selling price of logs over the projection period are based on the actual domestic price of the produce
which is extrapolated based on changes of plywood log price published by the World Bank.
(C) FFB and latex – Key assumptions applied in determining the fair values of FFB and latex are as follows:
(a) Estimated volume of subsequent harvest as of the reporting date.
(b) Selling prices of FFB and latex based on the market prices at the year end.
(D) Sugar cane – Key assumptions applied in determining the fair values of the sugar cane are as follows:
(a) Cane trees are available for annual harvest for 12 months after initial planting, and subsequently up to three more
annual harvests.
(b) The discount rate used represents the asset specific rate for the Group’s sugar cane which is applied in the
discounted future cash flows calculation.
(c) The projected selling price of sugar over the projection period is based on the extrapolation of market prices and the
forecasted price trend from the World Bank, but not exceeding the highest retail price imposed by the Ministry of
Trade of Indonesia.
(E) Oil palm seeds – Key assumptions applied in determining the fair values of the oil palm seeds are as follows:
(a) Estimated volume of six months subsequent harvest as of the reporting date.
(b) The discount rate used represents the asset specific rate for the oil palm seed which is applied in the discounted
future cash flows calculation.
(c) The projected selling price of oil palm seeds over the projection period is based on the extrapolation of market prices.
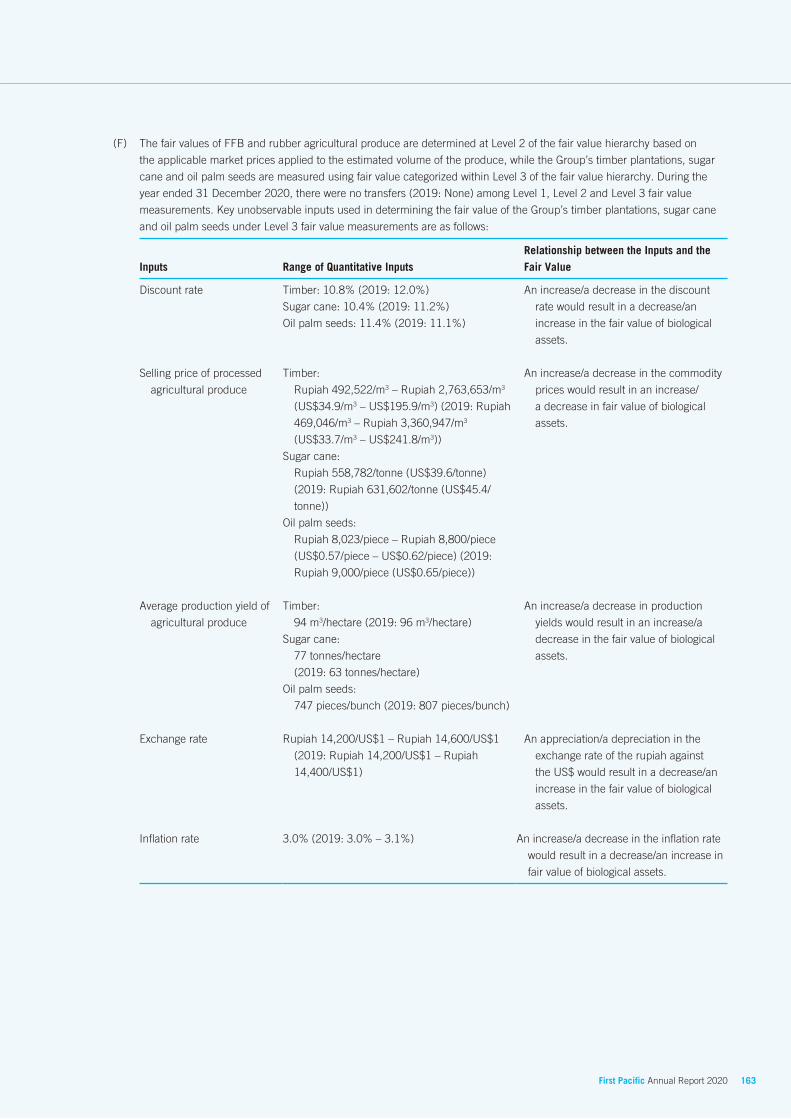
163 First Pacific Annual Report 2020
(F) The fair values of FFB and rubber agricultural produce are determined at Level 2 of the fair value hierarchy based on
the applicable market prices applied to the estimated volume of the produce, while the Group’s timber plantations, sugar
cane and oil palm seeds are measured using fair value categorized within Level 3 of the fair value hierarchy. During the
year ended 31 December 2020, there were no transfers (2019: None) among Level 1, Level 2 and Level 3 fair value
measurements. Key unobservable inputs used in determining the fair value of the Group’s timber plantations, sugar cane
and oil palm seeds under Level 3 fair value measurements are as follows:
Inputs Range of Quantitative Inputs
Relationship between the Inputs and the
Fair Value
Discount rate Timber: 10.8% (2019: 12.0%)
Sugar cane: 10.4% (2019: 11.2%)
Oil palm seeds: 11.4% (2019: 11.1%)
An increase/a decrease in the discount
rate would result in a decrease/an
increase in the fair value of biological
assets.
Selling price of processed
agricultural produce
Timber:
Rupiah 492,522/m3 – Rupiah 2,763,653/m3
(US$34.9/m3 – US$195.9/m3) (2019: Rupiah
469,046/m3 – Rupiah 3,360,947/m3
(US$33.7/m3 – US$241.8/m3))
Sugar cane:
Rupiah 558,782/tonne (US$39.6/tonne)
(2019: Rupiah 631,602/tonne (US$45.4/
tonne))
Oil palm seeds:
Rupiah 8,023/piece – Rupiah 8,800/piece
(US$0.57/piece – US$0.62/piece) (2019:
Rupiah 9,000/piece (US$0.65/piece))
An increase/a decrease in the commodity
prices would result in an increase/
a decrease in fair value of biological
assets.
Average production yield of
agricultural produce
Timber:
94 m3/hectare (2019: 96 m3/hectare)
Sugar cane:
77 tonnes/hectare
(2019: 63 tonnes/hectare)
Oil palm seeds:
747 pieces/bunch (2019: 807 pieces/bunch)
An increase/a decrease in production
yields would result in an increase/a
decrease in the fair value of biological
assets.
Exchange rate Rupiah 14,200/US$1 – Rupiah 14,600/US$1
(2019: Rupiah 14,200/US$1 – Rupiah
14,400/US$1)
An appreciation/a depreciation in the
exchange rate of the rupiah against
the US$ would result in a decrease/an
increase in the fair value of biological
assets.
Inflation rate 3.0% (2019: 3.0% – 3.1%) An increase/a decrease in the inflation rate
would result in a decrease/an increase in
fair value of biological assets.

164 First Pacific Annual Report 2020
Notes to the Consolidated Financial Statements
(G) The unaudited non-financial measure and output of agricultural produce are as follows:
The Group has timber plantation concession rights of 72,875 hectares (2019: 72,875 hectares) which are valid until 2035
and 2049. The total area of timber plantations as at 31 December 2020 was 15,955 hectares (2019: 16,134 hectares).
The physical quantities of agricultural produce of FFB, latex, sugar cane and oil palm seeds harvested from oil palm
plantations, rubber plantations, cane plantations and mother palm plantations, respectively, during the year are as follows:
Unit of measurement 2020 2019
FFB Thousand tonnes 2,986 3,300
Latex Thousand tonnes 8 8
Sugar cane Thousand tonnes 895 804
Oil palm seeds Million pieces 6.7 7.2
13. Associated Companies and Joint Ventures
Associated companies Joint ventures Total
US$ millions 2020 2019 2020 2019 2020 2019
Shares, at cost
– Listed 5,384.2 5,248.1 – – 5,384.2 5,248.1
– Unlisted 1,184.7 727.6 90.9 102.5 1,275.6 830.1
Share of post-acquisition reserves (Note 31) (1,318.6) (1,312.4) (26.8) (35.8) (1,345.4) (1,348.2)
Amounts due from associated companies and joint ventures – 37.1 – 20.6 – 57.7
Total 5,250.3 4,700.4 64.1 87.3 5,314.4 4,787.7
(A) At 31 December 2020 and 2019, both the listed and unlisted investments were located outside Hong Kong.
(B) At 31 December 2020, the aggregate market value of listed investments in associated companies was US$5,020.0 million
(2019: US$4,507.8 million) based on quoted market prices. The dividends received from associated companies during
the year ended 31 December 2020 amounted to US$257.1 million (2019: US$265.2 million received from associated
companies and a joint venture).
(C) Additional details of the Group’s associated companies, PLDT and Philex, are set out on page 235.
(D) PLDT was incorporated under the laws of the Philippines on 28 November 1928 to provide telephone services in the
Philippines. PLDT’s charter was initially limited to a period of 50 years but has since been extended twice for 25 years
each, the last extension being for an additional 25-year period ending in 2028. Under its amended charter, which became
effective on 24 August 1991, PLDT is authorized to provide virtually every type of telecommunications services, both within
the Philippines and between the Philippines and other countries. PLDT operates under the jurisdiction of the Philippine
National Telecommunications Commission which jurisdiction extends, among other things, to approving major services
offered by PLDT and certain rates charged by PLDT.

165 First Pacific Annual Report 2020
In October 2012, PLDT issued 150 million shares of Voting Preferred Stock with a par value of Peso 1 each to BTF
Holdings, Inc., a company wholly-owned by the Board of Trustees for the Account of PLDT’s Beneficial Trust Fund, which
reduced the voting interest of the Group and its Philippine affiliates in PLDT from approximately 25.6% to approximately
15.1%. Nevertheless, the economic interests of the Group and its Philippine affiliates in PLDT remain at approximately
25.6%. Notwithstanding that the Group and its Philippine affiliates have less than a 20% voting interest in PLDT, the Group
and its Philippine affiliates have sufficient representatives in PLDT’s current 13-member board of directors to exercise
significant influence over the operating and financial policy decisions of PLDT. Therefore, the Group continues to account
for PLDT as an associated company after the said transaction.
(E) Philex was incorporated under the laws of the Philippines in 1955 to engage in mining activities. Philex is primarily engaged
in large-scale exploration, development and utilization of mineral resources. Philex has operated for the past 62 years at
the deposit at Padcal (Tuba Benguet Province, Island of Luzons) for producing gold, copper and silver as its main products
and owns the deposits at Boyongan and Bayugo (Surigao del Norte, the Northern of Mindanao) (the Silangan Project), of
which the definitive feasibility study for the deposit at Boyongan has been completed in July 2019. The Silangan Project
is ready for development once a strategic partner is identified. In addition, Philex shall increase its interest in Kalayaan
Copper Resources, Inc. from 5% to 60%, by solely funding all pre-development expenses of the deposit at Placer, Surigao
del Norte.
(F) Meralco was incorporated under the laws of the Philippines in 1903 and was granted a franchise to provide electric power
distribution services in the Philippines. In June 2003, Meralco was granted a new 25-year franchise to construct, operate,
and maintain an electric distribution system in the cities and municipalities of Bulacan, Cavite, Metro Manila, and Rizal and
certain cities, municipalities, and barangays in Batangas, Laguna, Pampanga, and Quezon. Meralco is subject to the rate-
setting regulations and regulatory policies of the Philippine Energy Regulatory Commission.
(G) MPHHI was incorporated under the laws of the Philippines in 2004, and together with its subsidiary companies, associated
companies and joint ventures, is the largest private hospital group in the Philippines and focused on delivering high-quality
healthcare solutions to patients in the Philippines. MPHHI was originally a subsidiary company of the Group; however, it
has become an associated company of the Group following the deconsolidation on 9 December 2019 upon the loss of
control.
(H) At 31 December 2019, amounts due from associated companies and joint ventures were unsecured, interest-free and had
no fixed terms of repayment.
(I) The Group’s associated companies and joint ventures are involved in certain legal, contractual and regulatory matters
arising from the ordinary course of business. The management of the associated companies and joint ventures, together
with their legal counsels, reassess these matters regularly to consider any new relevant information and estimates.

166 First Pacific Annual Report 2020
Notes to the Consolidated Financial Statements
(J) Additional financial information under HKFRSs in respect of the Group’s major associated companies measured using the
equity method, PLDT, Philex, Meralco and MPHHI, is set out below.
PLDT Philex Meralco MPHHI
For the year ended/ at 31 December 2020 2019 2020 2019 2020 2019 2020 2019
US$ millions
Statements of Comprehensive Income
Turnover 3,657.4 3,280.7 158.3 131.6 5,562.8 6,172.5 299.3 308.7
Profit/(loss) for the year 496.7 441.8 24.8 (12.6) 326.3 453.2 6.8 24.0
Other comprehensive (loss)/income (86.7) (119.8) 1.6 (1.6) (86.9) (58.1) (0.5) (1.5)
Total Comprehensive Income/(Loss) 410.0 322.0 26.4 (14.2) 239.4 395.1 6.3 22.5
Dividends Received 84.1 76.0 0.4 – 156.3 159.6 – –
Statements of Financial Position
Current assets 1,820.9 1,492.4 71.7 57.7 2,673.5 2,324.0 135.4 158.7
Non-current assets 10,170.9 8,875.6 739.2 690.7 5,453.7 4,726.1 606.5 430.3
Current liabilities (4,446.8) (4,037.3) (87.9) (97.3) (2,969.5) (2,518.9) (139.2) (116.3)
Non-current liabilities (5,053.0) (4,034.1) (218.5) (197.5) (3,476.5) (2,847.9) (89.2) (34.6)
Non-controlling interests (88.7) (85.0) – – (31.1) (20.0) (124.9) (63.1)
Net Assets 2,403.3 2,211.6 504.5 453.6 1,650.1 1,663.3 388.6 375.0
Reconciliation to Carrying Amounts of the Group’s Interests in the Major Associated Companies
PLDT Philex Meralco MPHHI
At 31 December 2020 2019 2020 2019 2020 2019 2020 2019
US$ millions
Net assets 2,403.3 2,211.6 504.5 453.6 1,650.1 1,663.3 388.6 375.0
Economic interest 25.6% 25.6% 46.2% 46.2% 45.5% 45.5% 20.0% 20.0%
Group’s share of net assets 615.2 566.2 233.1 209.6 750.8 756.8 77.7 75.0
Purchase price allocation and other adjustments 586.3 587.9 (72.2) (40.0) 1,939.1 1,823.8 269.6 253.6
Carrying Amount of the Investment 1,201.5 1,154.1 160.9 169.6 2,689.9 2,580.6 347.3 328.6
Quoted Fair Value of the Investment 1,541.6 1,077.8 235.2 127.5 3,115.9 3,207.7 N/A N/A
(K) Aggregate financial information of the Group’s share of the amounts of its associated companies and joint ventures that are
not individually material is set out below.
Associated companies Joint ventures
For the year ended 31 December 2020 2019 2020 2019
US$ millions
Share of profit/(loss) for the year 14.9 22.8 8.5 (1.8)
Share of other comprehensive (loss)/income (24.7) 8.4 (15.0) (6.5)
Share of Total Comprehensive (Loss)/Income (9.8) 31.2 (6.5) (8.3)
Aggregate carrying amount of the Group’s investments 850.7 430.4 64.1 66.7
Amounts due from associated companies and joint ventures – 37.1 – 20.6
Aggregate Carrying Amount of the Group’s Investments 850.7 467.5 64.1 87.3

167 First Pacific Annual Report 2020
14. Goodwill
US$ millions 2020 2019
Cost
At 1 January 1,192.2 1,197.9
Exchange translation 177.5 39.9
Acquisition of subsidiary companies (Note 34(C)) 3,554.2 6.5
Deconsolidation of a subsidiary company – (38.1)
Other movements (3.7) (14.0)
At 31 December 4,920.2 1,192.2
Accumulated Impairment
At 1 January 499.0 86.4
Exchange translation 17.4 5.1
Impairment for the year (Note 5(A)) 37.5 407.5
At 31 December 553.9 499.0
Net Carrying Amount at 31 December 4,366.3 693.2
Attributable to the Businesses of:
Indofood – Noodles 3,703.0 –
– Plantations 223.8 231.7
– Dairy 113.6 115.3
MPIC – Toll roads 305.7 291.1
Others 20.2 55.1
Total 4,366.3 693.2
(A) Goodwill is allocated to the Group’s CGUs identified under different reportable segments. Goodwill at 31 December 2020
and 2019 mainly related to (a) Indofood’s businesses (principally noodles, plantations and dairy (2019: plantations and
dairy)) which contributed to the Group’s consumer food products business segment mainly located in the Middle East
and Africa, and Indonesia (2019: Indonesia), and (b) MPIC’s businesses (principally toll roads) which contributed to the
Group’s infrastructure business segment located in the Philippines and Indonesia.
(B) Goodwill in relation to Indofood’s noodles business arising from the acquisition of Pinehill of US$3,703.0 million at
31 December 2020 is provisional as the purchase price allocation exercise has not yet been finalized. The Group considers
that the assumptions used in the valuation are still valid and there are no triggering events which would indicate an
impairment of the goodwill at 31 December 2020.
(C) In assessing the impairment for goodwill, the Group compares the carrying amounts of the CGUs to which goodwill has
been allocated against their recoverable amounts (the higher of the CGUs’ fair value less costs of disposal and their
value in use). The recoverable amounts of Indofood’s and MPIC’s businesses have been determined based on value in
use calculations, using cash flow projections covering periods from 5 years (for established plantations and the dairy
companies) (2019: 5 years) up to 10 years (for the plantation estates in early development stage) (2019: 10 years) for
Indofood’s businesses, and 8 to 28 years (2019: 9 to 29 years) of the remaining concession lives for MPIC’s toll road
business. The discount rates applied to cash flow projections range from 6.3% to 13.0% (2019: 6.8% to 13.4%) for
Indofood’s businesses, and 9.4% to 12.0% (2019: 13.9% to 20.0%) for MPIC’s toll road business. The discount rates used
are pre-tax and reflect specific risks relating to the relevant businesses.

168 First Pacific Annual Report 2020
Notes to the Consolidated Financial Statements
In the assessment of the recoverable amount of Indofood’s plantation businesses, the projected prices of CPO are based
on the World Bank forecast for the projection period; the projected selling prices of RSS1 and other rubber products of the
Group over the projection period are based on the extrapolation of historical selling prices and the forecasted price trend
from the World Bank; the sugar prices used in the projection are based on the extrapolation of historical selling prices
and the forecasted price trend from the World Bank, but not exceeding the highest retail price imposed by the Ministry of
Trade of Indonesia; and, the projected selling price of logs over the projection period are based on actual domestic price
of produce which is extrapolated based on changes of plywood log price published by World Bank. The forecasted periods
for Indofood’s plantation businesses in an early development stage are more than five years as the plantations, mainly
comprising oil palm plantations, are either in an immature stage or early state of maturity and will only reach maturity in
the fourth year. The cash flows beyond the projection periods are extrapolated using an estimated average terminal growth
rates ranging from 3.0% to 5.3% (2019: 5.2%) which does not exceed the long-term average growth rate of the industry in
Indonesia where the businesses operate.
In the assessment of the recoverable amount of Indofood’s dairy businesses, their values in use were calculated based
on their cash flow projections as per the most recent financial budgets and forecasts, which management believes are
reasonable and are management’s best estimates of the ranges of economic conditions that will exist over the forecast
period. The cash flows beyond the projection periods are extrapolated using an estimated terminal growth rate of 5.0%
(2019: 5.0%) which does not exceed the long-term average growth rate of the industry in Indonesia where the businesses
operate.
In the assessment of the recoverable amount of MPIC’s toll road businesses, their values in use were calculated based
on their cash flow projections as per the most recent financial budgets and forecasts, which management believes are
reasonable and are management’s best estimates of the ranges of economic conditions that will exist over the forecast
period. The forecasted periods are more than five years as management can reliably estimate the cash flows for their entire
concession periods. The cash flows during the projection periods are derived using estimated average growth rates ranging
from 2.5% to 4.8% (2019: 2.6% to 23.0%) which do not exceed the long-term average growth rates of the industries in the
Philippines and Indonesia where the businesses operate.
Changes to the assumptions used by management to determine the recoverable amounts, in particular the discount
and growth rates, can have a significant impact on the results of the assessment. Management is of the opinion that no
reasonably possible change in any of the key assumptions stated above would cause the carrying amounts of the goodwill
for each of the CGUs to materially exceed the recoverable amounts.
For the year ended 31 December 2020, the Group recognized an aggregate impairment loss of US$37.5 million (2019:
US$61.0 million) mainly relating to the goodwill arising from Indofood’s plantations, PNW’s water distribution, MPIC’s
logistics and RHI’s alcohol businesses (2019: Indofood’s plantations, PHI’s water distribution, MPIC’s logistics and other
businesses) as the recoverable amounts were lower than the carrying amounts.
For the year ended 31 December 2019, the Group recognized an impairment loss of US$214.6 million in relation to the
CGU of PLP’s power business. The impairment loss arose mainly due to (a) continuous intense competition as a result of
over-supply of electricity in the Singapore electricity market, (b) the low crude oil prices affecting the price competitiveness
of PLP (which is only fueled by liquefied natural gas (“LNG”)) owing to the different pricing mechanisms between piped
natural gas (“PNG”) and LNG, the impending effect of IMO 2020 further widened the spread between PNG and LNG, (c)
higher business risks as PLP continues to incur operating losses, record deteriorating non-fuel margins over the past few
years, and require shareholders’ equity injections to help in meeting the debt covenant, and (d) negotiate with the lenders
to suspend the debt covenant testing and principal repayment through a standstill arrangement.
For the year ended 31 December 2019, the Group also recognized an impairment loss of US$131.9 million in relation to
the CGU of Maynilad’s water distribution business. The impairment loss arose mainly due to potential adverse changes to
the terms of the concession agreement and higher business risks in view of the political and regulatory environment where
Maynilad operates.

169 First Pacific Annual Report 2020
15. Other Intangible Assets
US$ millions
Concession
assets
– Water
distribution
Concession
assets
– Toll roads
Concession
assets
– Rail
Brands
– Dairy
Brands,
networks
and
licenses
– Packaged
drinking
water
Customer
list and
licenses –
Wastewater
and sewage
treatment
Bilateral
and
vesting
contracts
– Power
Software
and others Total
Cost
At 1 January 2020 2,852.9 2,402.4 492.3 291.2 98.2 11.3 83.4 18.5 6,250.2
Exchange translation 159.8 127.0 30.4 (4.2) (1.4) 0.6 4.0 0.8 317.0
Additions 180.3 536.9 117.0 – – – – 1.0 835.2
Other movements 7.4 – – – – – – – 7.4
Attributable to a discontinued operation (Note 7(B)) – – – – – – (71.0) (0.8) (71.8)
At 31 December 2020 3,200.4 3,066.3 639.7 287.0 96.8 11.9 16.4 19.5 7,338.0
Accumulated Amortization and Impairment
At 1 January 2020 807.7 190.2 – 167.2 38.3 2.0 27.6 12.5 1,245.5
Exchange translation 46.5 10.3 – (1.8) (0.5) 0.1 1.3 0.4 56.3
Amortization for the year 81.2 27.9 – 14.0 – 0.8 4.4 1.9 130.2
Impairment for the year (Note 5(A)) – – – 1.2 0.1 – – – 1.3
Attributable to a discontinued operation (Note 7(B)) – – – – – – (22.0) (0.6) (22.6)
At 31 December 2020 935.4 228.4 – 180.6 37.9 2.9 11.3 14.2 1,410.7
Net Carrying Amount at 31 December 2020 2,265.0 2,837.9 639.7 106.4 58.9 9.0 5.1 5.3 5,927.3
US$ millions
Concession
assets
– Water
distribution
Concession
assets
– Toll roads
Concession
assets
– Rail
Brands
– Dairy
Brands,
networks
and
licenses
– Packaged
drinking
water
Customer
list and
licenses –
Wastewater
and sewage
treatment
Bilateral
and
vesting
contracts
– Power
Software
and others Total
Cost
At 1 January 2019 2,437.2 1,796.9 308.2 279.5 93.7 10.8 80.7 34.2 5,041.2
Exchange translation 97.9 78.4 14.9 11.7 4.0 0.5 2.7 0.9 211.0
Acquisition of subsidiary companies (Note 34(C)) 26.4 – – – – – – – 26.4
Additions 291.4 527.1 169.2 – 0.5 – – 2.7 990.9
Deconsolidation of a subsidiary company – – – – – – – (4.1) (4.1)
Other movements – – – – – – – (15.2) (15.2)
At 31 December 2019 2,852.9 2,402.4 492.3 291.2 98.2 11.3 83.4 18.5 6,250.2
Accumulated Amortization and Impairment
At 1 January 2019 488.1 150.9 – 146.3 36.7 1.3 22.5 12.9 858.7
Exchange translation 24.1 6.4 – 6.4 1.6 0.2 0.7 0.3 39.7
Amortization for the year 74.1 32.9 – 14.5 – 0.5 4.4 2.4 128.8
Deconsolidation of a subsidiary company – – – – – – – (3.1) (3.1)
Impairment for the year (Note 5(A)) 221.4 – – – – – – 0.4 221.8
Other movements – – – – – – – (0.4) (0.4)
At 31 December 2019 807.7 190.2 – 167.2 38.3 2.0 27.6 12.5 1,245.5
Net Carrying Amount at 31 December 2019 2,045.2 2,212.2 492.3 124.0 59.9 9.3 55.8 6.0 5,004.7

170 First Pacific Annual Report 2020
Notes to the Consolidated Financial Statements
(A) Concession assets – Water distribution represents the exclusive rights granted to Maynilad, PNW, MPIWI, PHI, MIBWSC,
PT Sarana Catur Tirta Kelola (“PT SCTK”) and MPDW to provide water distribution, sewerage services and water production
in the Philippines, Vietnam and Indonesia, and charge users for these services during their concession periods.
Additions to the concession assets for water distribution include costs of rehabilitation, construction costs, concession fees
paid, payable for expansion projects and capitalized borrowing costs.
(a) Maynilad
In February 1997, Maynilad entered into a concession agreement with MWSS, with respect to the MWSS West
Service Area. Under the concession agreement, MWSS grants Maynilad, the sole right to manage, operate, repair,
decommission and refurbish all fixed and movable assets required to provide water and sewerage services in the
West Service Area for 25 years ending in 2022. In September 2009, MWSS approved an extension of its concession
agreement with Maynilad for another 15 years to 2037. The legal titles to all property, plant and equipment
contributed to the existing MWSS system by Maynilad during the concession period remain with Maynilad until the
expiration date at which time, all rights, titles and interests in such assets will automatically vest to MWSS.
Under the concession agreement, Maynilad is entitled to (a) an annual standard rate adjustment to compensate for
increases in the consumer price index subject to a rate adjustment limit; (b) an extraordinary price adjustment to
account for the financial consequences of the occurrence of certain unforeseen events subject to grounds stipulated
in the concession agreement; and (c) a rate rebasing mechanism which allows rates to be adjusted every five years to
enable Maynilad to efficiently and prudently recover expenditures incurred, Philippine business taxes and payments
corresponding to debt services on concession fees and Maynilad loans incurred to finance such expenditure.
On 11 December 2019, Maynilad received a letter from MWSS informing Maynilad that the MWSS Board of
Trustees (“MWSS Board”) passed a resolution in its special meeting on 5 December 2019 to revoke the extension of
Maynilad’s concession period from its original expiry in 2022 to 2037 (the “Subject Resolution”). Subsequently, when
Maynilad formally asked MWSS and the Regulatory Office what the effect of the Subject Resolution is, the Regulatory
Office stated that “as of to date, the 25-year Concession Agreement that covers the years 1997 to 2022 and the
Memorandum of Agreement that provides for the 15-year extension of the concession period from year 2022 to 2037
have not yet been cancelled” in a letter to Maynilad dated 23 December 2019.
However, the Philippine government has still ordered a review and amendment to Maynilad’s concession agreement.
As a result, the rate adjustments of Pesos 1.95/cubic meter originally effective on 1 January 2020 and 2021,
respectively, were not implemented. Also, on 2 January 2020, Maynilad executed the Release From and Waiver of
Claim on Arbitral Award (“Waiver”) in favor of the Philippine government. In this Waiver, Maynilad waived its claim
against the Philippine government for its accumulated revenues losses for the period from 11 March 2015 to 31
December 2017. The potential amendments to the concession agreement may affect, among others, future tariff
increases and service commitments, and the concession period. Any future amendments to the provisions of the
concession agreement will be reflected in the Consolidated Financial Statements as these are determined. As at
the date of these financial statements, Maynilad has not been advised of any amendments to the provisions of the
concession agreement.
(b) PNW
In September 2019, MPW increased its interest in PNW to 52.5% by acquiring an additional 7.5% interest and had
started consolidation of PNW since then. Pursuant to a 50-year Build-Own-Operate contract with the Chu Lai Open
Economic Zone Authority of Vietnam, PNW is licensed to develop a water supply system that will meet clean water
demand in the Chu Lai Open Economic Zone, and urban areas, industrial zones and adjacent rural areas in Quang
Nam province in Vietnam. PNW commenced operations in July 2019.

171 First Pacific Annual Report 2020
(c) MPIWI
On 13 November 2018, MPW entered into a joint venture agreement with Metro Iloilo Water District (“MIWD”) for the
rehabilitation, operation, maintenance and expansion of MIWD’s existing water distribution system and construction
of wastewater facilities (the “Project”). On 17 January 2019, MPIWI, 80% owned by MPW and 20% owned by MIWD,
was established pursuant to the joint venture agreement. MPIWI shall implement the Project and will have the right
to bill and collect tariff for the water supply and wastewater services provided to the customers in the service area of
MIWD with an initial term of 25 years from commencement date. MPIWI commenced operations in July 2019.
(d) PHI
In August 2012, Maynilad acquired a 100% interest in PHI, which engages in the water distribution business in
central and southern Luzon. PHI is granted the sole right to distribute water in these areas under certain concession
agreements granted by the Philippine government for 25 years to 2035.
(e) MIBWSC
On 4 July 2016, pursuant to a joint venture agreement between MetroPac Iloilo Holdings Corporation, a wholly-
owned subsidiary company of MPW, and MIWD of the Philippines, created and established MIBWSC, to implement
a 170 MLD Bulk Water Supply Project (“BWS Project”). The BWS Project covers (i) the rehabilitation and upgrading
of MIWD’s existing 55 MLD water facilities, (ii) the expansion and construction of new water facilities to increase
production to up to 115 MLD and (iii) delivery of contracted water demand to MIWD in accordance with the bulk
water supply agreement. The BWS Project covers an initial 25-year period and shall be extended for an additional 25
years counted from the date of completion of the agreed upon expansion obligation, but in no event shall exceed an
aggregate of 50 years. MIWD retains ownership of the existing facilities subject to the right of MIBWSC to access and
use. MIBWSC in turn retains ownership of the new facilities but is required to hand back the BWS Project, including
transfer of the full ownership of the new facilities, at the end of the concession period. On 5 July 2016, MIBWSC
officially took over operations from the MIWD.
(f) PT SCTK
PT SCTK, a subsidiary company of PT Nusantara, was granted by the Indonesian government rights to treat and
distribute clean water in the Serang District, Banten in Indonesia by (i) operating the existing water treatment plant
with capacity of 9 MLD for a 30-year concession period from 1996 to 2026 and (ii) building and operating two
additional water treatment plants with capacity of 15 MLD and 9 MLD, respectively, for a 25-year concession period
from 2014 to 2039.
(g) MPDW
On 3 September 2019, MPW signed a joint venture agreement with Dumaguete City Water District (“DCWD”).
Pursuant to the provisions set in the joint venture agreement, MPDW was incorporated on 22 October 2019 which
is 80% owned by MPW and 20% owned by DCWD. MPDW shall implement the project and will have the right to bill
and collect tariff for the water supply and wastewater services provided to the customers in the service area of DCWD.
The joint venture agreement shall be effective for a term commencing on the commencement date and ending on
the 25th anniversary thereof and may be renewed for another 25 years at the option of MPDW for as long as MPDW
is not then in default under any of its material obligations under the joint venture agreement and provided, further,
that the initial and renewal terms of joint venture agreement shall in no event exceed an aggregate of 50 years from
commencement date. On 30 October 2019, MPDW signed a service contract agreement with DCWD. This grants
MPDW the exclusive right and privilege to undertake the project. MPDW commenced operations on 1 February 2021.
(B) Concession assets – Toll roads represent the concession comprising the rights, interests and privileges to finance, design,
construct, operate and maintain toll roads, toll facilities and other facilities generating toll-related and non-toll related
income held by (a) NLEX Corporation in respect of the NLEX, SCTEX and Connector Road, (b) CIC in respect of CAVITEX,
(c) MPCALA in respect of CALAX, (d) CCLEC in respect of CCLEX, (e) PT Jalan Tol Seksi Empat (“PT JTSE”) in respect of
Makassar Section IV Toll Road, (f) PT Bosowa Marga Nusantara (“PT BMN”) in respect of Ujung Pandang Section I and
II Toll Road, and (g) PT Bintaro Serpong Damai (“PT BSD”) in respect of Pondok Aren – Serpong Toll Road during their
concession periods.

172 First Pacific Annual Report 2020
Notes to the Consolidated Financial Statements
Additions to the concession assets for toll roads include payments for both ongoing construction costs, pre-construction
costs for various toll road projects and payable for new projects.
(a) NLEX Corporation’s NLEX
In August 1995, First Philippine Infrastructure Development Corporation, the parent company of NLEX Corporation,
entered into a joint venture agreement with Philippine National Construction Corporation (“PNCC”), in which PNCC
assigned its rights, interests and privileges under its franchise to construct, operate and maintain toll facilities in the
NLEX and its extensions, stretches, linkages and diversions in favour of NLEX Corporation, including the design,
funding, construction, rehabilitation, refurbishing and modernization and selection and installation of an appropriate
toll collection system therein during the concession period subject to prior approval by the President of the
Philippines. In April 1998, the Philippine government, acting through the TRB as the grantor, PNCC as the franchisee
and NLEX Corporation as the concessionaire, executed a Supplemental Toll Operation Agreement (“STOA”) whereby
the Philippine government recognized and accepted the assignment by PNCC of its usufructuary rights, interests
and privileges under its franchise in favor of NLEX Corporation as approved by the President of the Philippines and
granted NLEX Corporation concession rights, obligations and privileges including the authority to finance, design,
construct, operate and maintain the NLEX project roads as toll roads commencing upon the date on which the STOA
comes into effect until 31 December 2030 or 30 years after the issuance of the Toll Operation Permit for the last
completed phase, whichever is earlier. In October 2008, the concession agreement was extended for another seven
years to 2037. Pursuant to the STOA, NLEX Corporation is required to pay franchise fees to PNCC and to pay for the
government’s project overhead expenses based on certain percentages of construction costs and maintenance works
on the project roads. Upon expiry of the concession period, NLEX Corporation shall handover the project roads to the
Philippine government without cost, free from any and all liens and encumbrances and fully operational and in good
working condition, including any and all existing land required, works, toll road facilities and equipment found therein
directly related to and in connection with the operation of the toll road facilities.
(b) NLEX Corporation’s SCTEX
On 9 February 2015, NLEX Corporation received a notice of award from the Philippine Bases Conversion and
Development Authority (“BCDA”) for the management, operation and maintenance of the 94-kilometer SCTEX subject
to compliance with specific conditions. The notice of award was issued by the BCDA following the results of the price
challenge held on 30 January 2015. On 26 February 2015, NLEX Corporation and the BCDA entered into a business
agreement involving the assignment of the BCDA’s rights and obligations relating to the management, operation and
maintenance of SCTEX as provided in the SCTEX concession. The assignment includes the exclusive right to use
the SCTEX toll road facilities and the right to collect toll until 30 October 2043. On 22 May 2015, the Supplementary
Toll Operation Agreement was executed by and among the Philippine government and the BCDA and NLEX
Corporation. At the end of the contract term, the SCTEX, as well as the as-built plans, specification and operation/
repair/maintenance manuals relating to the same shall be turned over to the BCDA or its successor-in-interest. At a
consideration of Pesos 3.5 billion (US$76.7 million) upfront cash payment, the operation and management of the
SCTEX was officially turned over to NLEX Corporation on 27 October 2015. NLEX Corporation shall also pay the BCDA
monthly concession fees amounting to 50% of the audited gross toll revenues of SCTEX for the relevant month from
the effective date of 27 October 2015 to 30 October 2043.
(c) NLEX Corporation’s Connector Road
On 23 November 2016, NLEX Corporation and the Philippine government acting through the Department of Public
Works and Highways (“DPWH”) signed a concession agreement for the design, financing, construction, operation
and maintenance of the Connector Road. The Connector Road is a four lane toll expressway structure with a length
of eight kilometers all passing through and above the right of way of the Philippine National Railways starting NLEX
Segment 10 in C3 Road Caloocan City and seamlessly connecting to the South Luzon Expressway (“SLEX”) through
the Metro Manila Skyway Stage 3 Project. The concession period shall commence on the commencement date of its
construction, and shall end on its thirty-seventh anniversary, unless otherwise extended or terminated in accordance
with the concession agreement. The Connector Road Project, with an estimated project cost of Pesos 19.6 billion
(US$408.2 million), commenced construction in February 2019 and is expected to be completed by 2022.
Under the concession agreement, NLEX Corporation shall pay the DPWH periodic payments as the consideration for
the grant of the right of way for the project.

173 First Pacific Annual Report 2020
(d) CIC’s CAVITEX
Pursuant to a toll operation agreement and an operations and maintenance agreement which CIC signed in November
1996 and 2006, respectively with the Philippine Reclamation Authority and the TRB of the Philippines, CIC was
responsible for the design, financing, construction and supervision of the operation and maintenance of CAVITEX.
The concession for CAVITEX extends to 2033 for its R-1 Expressway and to 2046 for its R-1 Extension. Upon expiry
of the concession period, CIC shall hand over the project roads to the Philippine government. In July 2019, the first
section of CAVITEX’s C-5 Link Expressway, the 2.2-kilometer flyover crossing SLEX traversing Taguig and Pasay City,
was opened.
(e) MPCALA’s CALAX
On 10 July 2015, MPCALA signed a concession agreement for the CALAX Project with DPWH of the Philippines.
Under the concession agreement, MPCALA is granted the concession to design, finance, construct, operate and
maintain the CALAX, including the right to collect toll fees, over a 35-year concession period (including construction
period). The CALAX is a closed-system tolled expressway connecting the CAVITEX and the SLEX. The CALAX Project
was awarded to MPCALA following a competitive public bidding process where MPCALA was declared as the highest
complying bidder with its offer to pay the Philippine government concession fees amounting to Pesos 27.3 billion
(US$568.5 million) over nine years. On 3 July 2017, MPCALA commenced the construction works for the project
which is expected to be completed and fully operational by 2023. In October 2019, the first 10.7-kilomter of the
CALAX, a portion of the CALAX Laguna Segment, was opened. On 6 July 2020, MPCALA paid the second tranche of
CALAX concession fee amounting to Pesos 4.4 billion (US$88.3 million) to DPWH.
(f) CCLEC’s CCLEX
On 3 October 2016, CCLEC, the Cebu City and Municipality of Cordova (as the grantors) signed the concession
agreement for the CCLEX. CCLEX consists of the main alignment starting from the Cebu South Coastal Road and
ending at the Mactan Circumferential Road, inclusive of interchange ramps aligning the Guadalupe River, the main
span bridge, approaches, viaducts, causeways, low-height bridges, at-grade road, toll plazas and toll operations
center.
Under the concession agreement, CCLEC is granted the concession to design, finance, construct, operate and
maintain the CCLEX, including the right to collect toll fees over a 35-year concession period (including construction
period). CCLEX is estimated to cost Pesos 30.5 billion (US$635.2 million). No upfront payments or concession fees
are to be paid but the grantors shall share 2% of the project’s revenue. On 4 July 2018, CCLEC commenced the
construction works for the project which is expected to be completed by 2022.
(g) PT JTSE’s Makassar Section IV Toll Road
In May 2006, PT JTSE, a subsidiary company of PT Nusantara, entered into a toll road concession agreement with
the Department of Public Works of Indonesia (“DPU”) as the concessionaire of Makassar Section IV Toll Road. Under
the concession agreement, DPU appointed and assigned PT JTSE to develop and operate the toll road on behalf of
the Indonesian government, and to conduct toll road management at its own risk and cost for a concession period
of 35 years including the construction period to 2041. PT JTSE has started to operate the toll road since 2008. At
the expiry of the concession period, PT JTSE should hand over the toll road to The Toll Road Authority of Indonesia
(“BPJT”) of DPU.
(h) PT BMN’s Ujung Pandang Section, I and II Toll Road
On 31 August 2010, PT BMN, a subsidiary company of PT Nusantara, entered into a toll road concession agreement
with BPJT of DPU. Under the concession agreement, BPJT appointed and granted PT BMN rights to operate Ujung
Pandang Sections I and II Toll Road with a concession period until 12 April 2028. On 23 October 2017, PT BMN
obtained Minister Decree from DPU, which granted an amendment for the toll road concession plans for Ujung
Pandang Sections I and II with a concession period extended until 12 April 2043.

174 First Pacific Annual Report 2020
Notes to the Consolidated Financial Statements
(i) PT BSD’s Pondok Aren – Serpong Toll Road
On 31 August 2010, PT BSD, a subsidiary company of PT Nusantara, entered into a toll road concession agreement
with BPJT of DPU. Under the concession agreement, BPJT appointed and granted PT BSD rights to operate Pondok
Aren – Serpong Toll Road with a concession period until 1 October 2028.
NLEX Corporation and CIC derive substantially all of their revenues from toll collections from the users of the toll roads. The
concession agreements establish toll rate formulas and adjustment procedures for setting the appropriate toll rates. Subject
to the TRB of the Philippines validating and approving the calculation of the toll rate adjustments in accordance with the
formulas, toll rate adjustments for NLEX, SCTEX and CAVITEX are scheduled periodically.
As at the date of these financial statements, the Philippine government has not yet implemented the toll rate adjustments
for NLEX Corporation and CIC in respect of NLEX, SCTEX and CAVITEX which should have been effective from 1 January
2017, 1 January 2019 and 1 January 2020 for NLEX, 1 January 2013, 1 January 2014, 1 January 2016 and 1 January
2017 for SCTEX, 1 January 2012, 1 January 2015 and 1 January 2018 for CAVITEX’s R-1 Expressway, and 1 January
2014 and 1 January 2018 for CAVITEX’s R-1 Extension.
On 5 March 2019, NLEX Corporation received the TRB’s order to publish the adjusted toll rates for NLEX (the “Order”).
The Order contains the adjusted authorized toll prices for the entire NLEX, incorporating the first tranche of the approved
final periodic adjustments for the whole NLEX due in 2013 and 2015 constituting 50% of the approved adjustment (with
the remaining adjustments to be implemented in subsequent years), and the provisional add-on toll rate for the NLEX
open system due to the opening of the NLEX Harbor Link Project (Segments 9 and 10). On 29 March 2019, the TRB also
granted a toll rate adjustment of Peso 0.51/km for SCTEX in relation to a petition filed by BCDA in 2011. However, CIC has
yet to receive regulatory approval for all the petitions filed on the periodic toll rate adjustments. NLEX Corporation and CIC
are in constructive discussions with the Philippine government to resolve overdue toll rate adjustments.
(C) Concession assets – Rail represents concession comprising the exclusive right during the concession period to operate and
maintain the current LRT1 system, collect farebox revenue and construct the LRT1 Extension.
Additions to the concession assets for rail include costs of rehabilitation of the current LRT1 system, and the construction
activities for the LRT1 Extension.
On 2 October 2014, LRMC signed together with the Department of Transportation (“DOTr”) and the Light Rail Transit
Authority (“LRTA”) (the “grantors”) a concession agreement for the Light Rail Transit Line 1 Cavite Extension and
Operations & Maintenance Project (“LRT1 Project”). Under the concession agreement, LRMC will operate and maintain
the existing 20.7-kilometer LRT1 (“Existing System”) and construct an 11.7-kilometer extension from the present end-
point at Baclaran to the Niog area in Bacoor, Cavite. A total of eight new stations will be built along the extension, which
traverses the cities of Parañaque and Las Piñas up to Bacoor, Cavite. The concession agreement is for a period of 32 years
commencing from the effective date of 12 September 2015 when LRMC took over of the LRT1 operations.
In accordance with the LRT1 Project concession agreement, LRMC is entitled to the reimbursement of the unavoidable
increment costs that it will incur to restore the Existing System to the level necessary to meet all of the baseline Existing
System Requirements (“ESR”) as certified by an independent consultant. Further, LRMC is entitled to compensation
for the cost incurred for restoration of the structural defect (“SDR”) as certified by an independent consultant. LRMC is
also entitled to receive compensation from the grantors if the grantors do not make available a minimum of 100 light rail
vehicles (“LRVs”) on the effective date of the turnover of the system. On the turnover date of the system on 12 September
2015, LRMC only received 72 LRVs.
On various dates in 2015 through 2020, LRMC submitted letters to the DOTr and the LRTA representing its claim for
ESR and SDR costs, and LRV shortfall on the premise of the grantor’s obligation in relation to the condition of the Existing
System prior or as of the effective date of the turnover of the system by the grantors to LRMC. In addition, LRMC requested
the grantors compensation for the revenue loss arising from the grantors’ implementation of fare increases below the
concession agreement fares. The above claims were still undergoing discussion as at the date of these financial statements.

175 First Pacific Annual Report 2020
(D) Brands – Dairy represent the brands, with a useful life of 20 years, held by Indolakto for its various milk-related products,
which include Indomilk, Cap Enaak, Tiga Sapi, Kremer, Indoeskrim and Milkuat.
(E) Brands, networks and licenses – Packaged drinking water represent (i) the registered brand name, CLUB, (ii) the
distribution and customer networks, and (iii) the water licenses of Indofood’s packaged drinking water business.
The brands, networks and licenses are determined to have indefinite useful lives as (i) the brands and licenses can be
renewed indefinitely at no significant costs; (ii) Indofood has the intention to renew the brands and maintain the licenses
and networks indefinitely; and (iii) no significant expenses are expected to be incurred to maintain the future economic
benefits that can be generated from these assets.
In assessing the impairment for brands, networks and licenses with indefinite useful life, the Group compares the carrying
amounts of the intangible assets against their recoverable amounts (the higher of the assets’ fair value less costs of disposal
and their value in use).
The recoverable amounts of brands, networks and licenses have been determined based on value-in-use calculations using
cash flow projections as per the most recent financial budgets and forecasts, which management believes are reasonable
and are management’s best estimates of the ranges of economic conditions that will exist over the forecast period of 10
years for brands (2019: 10 years) and 5 years for the licenses (2019: 5 years). The forecast period is more than five years
for brands to reflect a legal life of 10 years which may be renewed upon expiration at minimal cost. The discount rate
applied to cash flow projections was ranged from 10.3% to 11.9% (2019: 10.9% to 12.4%), which reflects the weighted
average cost of capital. The cash flows beyond the projection periods are extrapolated using an estimated terminal growth
rate of 5.0% (2019: 3.8% to 5.0%) which does not exceed the long-term average growth rate of the industry in Indonesia
where the businesses operate.
(F) Customer list and licenses – Wastewater and sewage treatment represents ESTII’s customer relationship, contracts and licenses for intellectual property rights over patents and utility models.
(G) Bilateral and vesting contracts – Power represents the electricity supply agreement entered by PLP and GBPC.
(a) PLP’s vesting contractIt represents an agreement entered into between PLP and a Singapore government agency, which requires PLP to sell electricity at a specified volume and a specified price to the agency over a period of 10 years from 1 July 2013 to 30 June 2023.
(b) GBPC’s bilateral contractsGBPC, through its operating generation subsidiary companies, entered into bilateral off-take arrangements with power off-takers, such as distribution utilities, electric cooperatives, retail electricity suppliers and directly connected industrial customers, for the supply of electricity over a period of 10 to 25 years. Following the classification of GBPC as a disposal group held for sale in December 2020, the balance in relation to these bilateral contracts were reclassified to assets held for sale.

176 First Pacific Annual Report 2020
Notes to the Consolidated Financial Statements
(H) The useful lives for amortization:
Concession assets – Water distribution – Maynilad Remaining concession life of 29 years since acquisition in 2008– PNW Remaining concession life of 46 years since acquisition in 2019– MPIWI Concession life of 25 years since commencement in 2019– PHI Remaining concession life of 23 years since acquisition in 2012– MIBWSC Concession life of 36 years subsequent to the completion of its
rehabilitation in 2019 and expansion expected in 2030– PT SCTK Remaining concession life of 8 years (for the existing water
treatment plant) and 21 years (for the additional water treatment plants) since acquisition in 2018
– MPDW Concession life of 25 years since commencement in 2021Concession assets – Toll roads – NLEX Remaining concession life of 29 years since acquisition in 2008
– SCTEX Concession life of 28 years since acquisition in 2015– Connector
RoadRemaining concession life of 34 years subsequent to the
completion of its construction expected in 2022– CAVITEX Remaining concession life of 21 years (for the R-1 Expressway)
and 34 years (for the R-1 Extension) since acquisition in 2013– CALAX Remaining concession life of 27 years subsequent to the
completion of its construction expected in 2023– CCLEX Remaining concession life of 29 years subsequent to the
completion of its construction expected in 2022– PT JTSE Remaining concession life of 23 years since acquisition in 2018– PT BMN Remaining concession life of 25 years since acquisition in 2018– PT BSD Remaining concession life of 10 years since acquisition in 2018
Concession assets – Rail Remaining concession life of 26 years subsequent to the completion of the rehabilitation works of its existing LRT1 system expected in 2022 and 24 years subsequent to the completion of its construction of the LRT1 Extension expected in 2024
Brands – Dairy 20 yearsBrands, networks and licenses –
Packaged drinking waterIndefinite
Customer list and licenses – Wastewater and sewage treatment
20 years
Bilateral contracts – Power 10 to 25 yearsVesting contract – Power 10 yearsSoftware 3 to 5 years
(I) For the year ended 31 December 2020, impairment losses of US$1.3 million (2019: US$221.4 million) were recognized in respect of brand name under Indofood’s dairy business and water licenses under Indofood’s packaged drinking water business (2019: concessions assets for the water distribution business operated by Maynilad and PHI).
(J) The carrying amounts and the respective key assumptions used to determine the recoverable amounts for the other
intangible assets not yet available for use are summarized below:
Toll roads Rail Water
2020 2019 2020 2019 2020 2019
Carrying value (US$ millions) 1,358.8 875.8 639.7 492.3 57.5 20.6
Net carrying amount (US$ millions) 968.2 441.6 567.0 422.4 57.5 20.6
Average growth rate 1.0% to 15.7% 1.0% to 15.7% 6.0% 8.5% 7.4% to 15.7% 8.1%
Average forecast period 26 to 36 years 29 to 37 years 27 years 28 years 34 to 45 years 35 years
Pre-tax discount rate 10.1% to 11.2% 11.0% to 14.7% 10.9% 12.0% 9.0% to 11.3% 13.5%

177 First Pacific Annual Report 2020
At 31 December 2020, the aggregate carrying amount of these intangible assets of US$2,056.0 million (2019: US$1,388.7
million) was included in the carrying amounts of concession assets of toll roads, rail and water. For the purpose of
impairment testing as at 31 December 2020 and 2019, the carrying amounts that were compared to their recoverable
amounts were the net carrying amounts, which were net of the present value of the related future concession fees payment
that formed part of the initial costs of these concession assets. The average growth rate represents expected growth in
traffic for the toll roads business, ridership for the rail business and billed volume for the water business. The average
forecast period is consistent with the period covered by the concession agreements.
16. Investment Properties
US$ millions 2020 2019
At 1 January 13.4 9.5
Exchange translation 0.4 0.5
Disposals (3.9) –
(Loss)/gain on changes in fair value of investment properties (0.7) 0.6
Reclassification(i) 0.1 2.8
At 31 December 9.3 13.4
(i) Reclassification from assets classified as held for sale (2019: property, plant and equipment)
The Group’s investment properties comprise lands being leased out under operating leases to earn rental income and vacant
land held for the purpose of capital appreciation. The fair values of the investment properties are measured annually using the
market comparison approach by reference to recent sales and other market data of comparable properties which is publicly
available, as determined by professionally qualified independent appraisers. The fair value measurement for the investment
properties has been categorized as Level 2. There was no transfer between the fair value hierarchy during the year.
At 31 December 2020, land included in investment properties with an aggregate carrying amount of US$3.0 million (2019:
US$3.0 million) was right-of-use assets.
17. Accounts Receivable, Other Receivables and Prepayments
US$ millions 2020 2019
Accounts receivable 679.7 642.9
Other receivables 387.3 392.7
Prepayments 70.8 72.5
Total 1,137.8 1,108.1
Presented as:
Non-current Portion 63.9 37.4
Current Portion 1,073.9 1,070.7
Total 1,137.8 1,108.1
(A) The carrying amounts of accounts receivable, other receivables and prepayments approximate their fair values.
(B) At 31 December 2020, included in other receivables was US$21.9 million (2019: US$24.2 million) of unbilled revenue
arising from the Group’s provision of services under the infrastructure segment. The balance is expected to be reclassified
to accounts receivable within one year when the rights to consideration become unconditional.

178 First Pacific Annual Report 2020
Notes to the Consolidated Financial Statements
(C) An aging profile based on the invoice dates of accounts receivable, net of loss allowance, is analyzed below:
US$ millions 2020 2019
0 to 30 days 431.8 464.8
31 to 60 days 113.1 93.2
61 to 90 days 38.7 18.2
Over 90 days 96.1 66.7
Total 679.7 642.9
(D) The movements in the loss allowance for impairment of accounts receivable are as follows:
US$ millions 2020 2019
At 1 January 41.4 33.0
Exchange translation 1.6 1.4
Amount written off as uncollectible (15.5) –
Charge for the year 30.5 7.0
Attributable to a discontinued operation (16.3) –
At 31 December 41.7 41.4
(E) An impairment analysis is performed using a provision matrix to measure expected credit losses for accounts receivable
and contract assets attributable to the consumer food products business and infrastructure business, respectively. The
provision rates are based on days past due for groupings of various customer segments with similar loss patterns (i.e.,
by geographical region, product type, customer type and rating, and coverage by letters of credit or other forms of credit
insurance). The calculation reflects the probability-weighted outcome, the time value of money and reasonable and
supportable information that is available at the reporting date about past events, current conditions and forecasts of future
economic conditions. Generally, accounts receivable are written off if past due for more than one year and are not subject
to enforcement activity.
Set out below is the information about the credit risk exposure on the Group’s accounts receivable and contract assets
attributable to the consumer food products business and infrastructure business using the corresponding provision matrix:
Past due
Consumer food products business Current 0 to 30 days 31 to 60 days 61 to 90 days Over 90 days
2020
Total
Expected credit loss rate 0% 0% 0% 0% 29.2% 2.1%
Gross carrying amounts (US$ millions)
– accounts receivable 315.9 91.9 28.7 13.4 34.3 484.2
Expected credit losses (US$ millions) – – – – 10.0 10.0
Past due
Infrastructure business Current 0 to 30 days 31 to 60 days 61 to 90 days Over 90 days
2020
Total
Expected credit loss rate 1.7% 5.4% 42.1% 26.0% 26.4% 12.2%
Gross carrying amounts (US$ millions)
– accounts receivable 109.7 27.7 10.7 10.4 78.7 237.2
– contract assets 21.9 – – – – 21.9
Expected credit losses (US$ millions) 2.2 1.5 4.5 2.7 20.8 31.7

179 First Pacific Annual Report 2020
Past due
Consumer food products business Current 0 to 30 days 31 to 60 days 61 to 90 days Over 90 days
2019
Total
Expected credit loss rate 0.1% 0.3% 0% 0% 29.6% 2.4%
Gross carrying amounts (US$ millions)
– accounts receivable 297.5 69.4 8.0 5.0 30.7 410.6
Expected credit losses (US$ millions) 0.4 0.2 – – 9.1 9.7
Past due
Infrastructure business Current 0 to 30 days 31 to 60 days 61 to 90 days Over 90 days
2019
Total
Expected credit loss rate 0.8% 2.9% 10.1% 23.3% 39.1% 10.6%
Gross carrying amounts (US$ millions)
– accounts receivable 162.8 27.4 8.9 4.3 70.3 273.7
– contract assets 24.2 – – – – 24.2
Expected credit losses (US$ millions) 1.5 0.8 0.9 1.0 27.5 31.7
(F) As the Group’s accounts receivable and contract assets relate to a large number of diversified customers, there is no
concentration of credit risk.
(G) Accounts and other receivable with an aggregate carrying amount of US$76.8 million (2019: US$59.0 million) were
pledged as security for certain of the Group’s banking facilities (Note 26(E)).
18. Financial Assets at Fair Value through Other Comprehensive Income
US$ millions 2020 2019
Listed investments, at fair value:
– Equity investments – Overseas 276.9 251.0
– Debentures with a fixed interest rate of 2.1% to 5.8%
and a maturity date of between June 2020 and August 2023 – Overseas – 3.2
Unlisted investments, at fair value:
– SMECI’s notes 125.3 115.3
– Equity investments – Overseas 23.0 23.3
– Club debentures – Hong Kong 4.1 3.0
Total 429.3 395.8
Presented as:
Non-Current Portion 426.0 385.9
Current Portion 3.3 9.9
Total 429.3 395.8
The above equity investments were irrevocably designated at FVOCI as the Group considers these investments to be strategic in
nature. Dividend income from these investments during the year ended 31 December 2020 amounted to US$5.4 million (2019:
US$5.5 million) (Note 5(A)).
The fair values of the listed equity investments and debentures are based on quoted market prices. The fair value of the
unlisted investment in SMECI’s notes is estimated by reference to valuations of the underlying assets supplied by independent
sources. The fair values of the unlisted equity investments and club debentures have been estimated by a discounted cash flow
model and by reference to recent market transaction prices, respectively. The Directors believe that the estimated fair values
by reference to the above bases, which are recorded in the carrying amounts of the financial assets at FVOCI, and the related
changes in fair values, which are recorded directly in the Group’s other comprehensive income, are reasonable, and that they
were the most appropriate values at the end of the reporting period.

180 First Pacific Annual Report 2020
Notes to the Consolidated Financial Statements
19. Deferred TaxThe movements in deferred tax assets and deferred tax liabilities during the year are as follows:
US$ millions
Tax losses carried forward
Credit loss allowance
Liabilities for employee retirement
benefits Others Total
Deferred Tax Assets
At 1 January 2019 56.4 1.4 87.0 50.7 195.5Exchange translation 2.1 0.1 2.3 0.5 5.0Deconsolidation of a subsidiary company – – (0.6) (10.5) (11.1)(Charged)/credited to the consolidated
income statement (45.7) 5.0 0.2 (7.4) (47.9)(Charged)/credited to other comprehensive income – – 1.4 (6.8) (5.4)Other movements 33.6 – – (13.3) 20.3 At 31 December 2019 46.4 6.5 90.3 13.2 156.4 At 1 January 2020 46.4 6.5 90.3 13.2 156.4
Exchange translation (1.4) 0.1 (0.2) 1.5 –
(Charged)/credited to the consolidated income statement (17.3) 1.8 (5.7) 0.8 (20.4)
Charged to other comprehensive income – – (7.1) – (7.1)
Acquisition of a subsidiary company (Note 34(C)) – 0.4 – 0.6 1.0
Attributable to a discontinued operation (Note 7(B)) – – (6.5) (13.3) (19.8)
At 31 December 2020 27.7 8.8 70.8 2.8 110.1
US$ millions
Allowance in excess of related
depreciation of property,
plant and equipment
Changes in fair value of
biological assets Brands
Withholding taxes on
undistributed earnings of
subsidiary and associated companies Others Total
Deferred Tax Liabilities
At 1 January 2019 (142.3) (12.0) (36.6) (37.5) (96.7) (325.1)Exchange translation (12.2) (0.5) (1.4) (0.7) (9.6) (24.4)Deconsolidation of a subsidiary company 10.0 – – – – 10.0(Charged)/credited to the consolidated
income statement (24.6) – 8.7 (7.6) (46.5) (70.0)Other movements – – – 5.9 (20.3) (14.4) At 31 December 2019 (169.1) (12.5) (29.3) (39.9) (173.1) (423.9) At 1 January 2020 (169.1) (12.5) (29.3) (39.9) (173.1) (423.9)
Exchange translation (2.1) 0.2 0.8 (0.4) (14.0) (15.5)
Credited/(charged) to the consolidated income statement 6.3 1.4 7.5 (9.0) 7.5 13.7
Credited to other comprehensive income – – – – 0.7 0.7
Acquisition of a subsidiary company (Note 34(C)) (1.0) – – – – (1.0)
Attributable to a discontinued operation (Note 7(B)) – – – – 48.9 48.9
Reclassification from held for sale (Note 24) – – – – (24.6) (24.6)
Other movements – – – 2.6 – 2.6
At 31 December 2020 (165.9) (10.9) (21.0) (46.7) (154.6) (399.1)
Pursuant to the income tax laws of the Philippines and Indonesia, withholding taxes of 5% to 15% are levied on dividends
declared to foreign investors. Singapore has a one-tier corporate tax system whereby tax charged at the corporate level is the
final tax. Dividends paid by Singapore resident companies under the one-tier corporate tax system are exempted from further
Singapore tax in the hands of shareholders.

181 First Pacific Annual Report 2020
The Group had fully recognized the deferred tax liabilities for the withholding taxes that would be payable on unremitted
earnings that are subject to withholding taxes of its associated companies established in the Philippines. However, except for
those earnings to be distributed as dividends, no deferred tax liabilities had been recognized for withholding taxes that would
be payable on the unremitted earnings of the Group’s subsidiary companies established in the Philippines and Indonesia. In
the opinion of the Directors, it is not probable that these subsidiary companies will distribute such earnings in the foreseeable
future. The aggregate amount of temporary differences associated with investments in subsidiary companies in the Philippines
and Indonesia for which deferred tax liabilities have not been recognized amounted to approximately US$46.0 million at 31
December 2020 (2019: US$41.9 million).
Deferred tax assets are recognized in respect of tax losses carried forward to the extent that realization of the related tax benefits
through future taxable profit is probable. The Group has tax losses arising from Singapore of US$417.2 million (2019: US$383.5
million), the Philippines of US$603.0 million (2019: US$385.9 million) and Indonesia of US$108.7 million (2019: US$48.6
million) that may be carried forward indefinitely for Singapore, three years for the Philippines (except for tax losses of 2020
and 2021 which are allowed to carry over for five years as a result of COVID-19 relief measure) and five years for Indonesia,
respectively, for offsetting against future taxable profits of the companies in which the losses arose.
There are no income tax consequences attaching to the payment of dividends by the Company to its shareholders.
20. Restricted CashAt 31 December 2020, the Group had cash of US$41.4 million (2019: US$99.0 million) set aside mainly to cover principal and
interest payments of certain borrowings in compliance with loan agreements, and US$8.8 million (2019: US$7.0 million) held
under margin accounts by brokers against open contracts for hedging purpose.
21. Other Non-current Assets
US$ millions 2020 2019
Deposits for acquisition of property, plant and equipment 191.9 284.4
Prepayments 144.6 210.4
Plasma receivables 110.9 105.3
Deferred project costs 64.1 54.8
Long-term deposits 20.6 20.3
Claims for tax refund 7.8 18.7
Others 147.6 126.0
Total 687.5 819.9
(A) The deposits for acquisition of property, plant and equipment are mainly attributable to Indofood.
(B) The prepayments mainly represent MPIC’s advances to contractors for construction projects.
(C) The plasma receivables represent the accumulated costs to develop FFB which are currently self-financed by Indofood
less the funds received from banks and advances made by Indofood to plasma farmers in relation to arrangements for the
farmers’ production of FFB.
(D) The deferred project costs comprise costs directly attributable to the acquisition of service concessions prior to the
commencement of concession terms.
(E) The long-term deposits mainly represent MPIC’s deposits paid to contractors for repair and maintenance of its toll roads.
(F) The claims for tax refund relate to the tax payment in advance made by Indofood in respect of importation of raw materials
which is creditable against Indofood’s corporate income tax payable.

182 First Pacific Annual Report 2020
Notes to the Consolidated Financial Statements
22. Cash and Cash Equivalents and Short-term Deposits
US$ millions 2020 2019
Cash at banks and on hand 1,353.8 599.0Short-term time deposits 1,024.0 2,247.4 Total 2,377.8 2,846.4
(A) Cash at banks earns interest at floating rates based on daily bank deposit rates. Short-term time deposits are made for varying periods depending on the immediate cash requirements of the Group, and earn interest at the respective short-term time deposit rates. The bank balances and time deposits are deposited with creditworthy banks with no history of default. The carrying amounts of the cash and cash equivalents and short-term deposits approximate their fair values.
(B) Cash and cash equivalents of US$16.9 million (2019: US$45.5 million) were charged to banks in accordance with the terms of certain of the Group’s banking facilities (Note 26(E)).
23. Inventories
US$ millions 2020 2019
Raw materials 511.6 413.2Work in progress 11.9 14.2Finished goods 312.1 371.6 Total 835.6 799.0
(A) At 31 December 2020, inventories with an aggregate carrying amount of US$127.9 million (2019: US$144.4 million) were carried at net realizable value.
(B) During the year ended 31 December 2020, write-downs of inventories to net realizable value amounted to US$13.0 million (2019: US$9.0 million) (Note 5(C)).
(C) At 31 December 2020, inventories with an aggregate carrying amount of US$20.0 million (2019: US$19.4 million) were pledged as security for certain of the Group’s banking facilities (Note 26(E)).
24. Assets Classified as Held for Sale and Liabilities Directly Associated with the Assets Classified as Held for Sale
US$ millions 2020 2019
Assets Classified as Held for Sale
Assets of a disposal group classified as held for sale 1,582.0 138.6 Liabilities Directly Associated with the Assets Classified as Held for Sale 843.8 25.4
(A) The balances at 31 December 2020 represented the carrying amounts of assets and liabilities of GBPC. Details of these assets and liabilities are set out in Note 7(B) to the Consolidated Financial Statements.
The balances at 31 December 2019 represented the carrying amounts of assets and liabilities of RHI’s sugar milling and refining operations in Batangas. On 23 May 2018, RHI entered into an asset purchase agreement with a buyer for the sale of RHI’s sugar milling and refining operations in Batangas. The consummation of the proposed sale transaction was subject to the parties being able to secure the requisite regulatory approvals, corporate approvals, and other third-party consents. On 12 February 2019, the regulatory body issued a decision disapproving the proposed sale transaction. Nonetheless, RHI had remained committed to sell the assets in Batangas and was negotiating with a prospective buyer at 31 December 2019; therefore, these assets were continued to be classified as held for sale at 31 December 2019. On 30 September 2020, following the sale of La Carlota assets, RHI ceased the plan to sell its sugar milling and refining operations in Batangas and these assets were no longer classified as assets held for sale at 31 December 2020.
(B) At 31 December 2020, assets classified as held for sale with an aggregate carrying amount of US$978.8 million (2019: US$138.6 million) were pledged as security for certain of the Group’s banking facilities (Note 26(E)).

183 First Pacific Annual Report 2020
25. Accounts Payable, Other Payables and Accruals
US$ millions 2020 2019
Accounts payable 420.6 460.4
Accrued expenses 696.8 638.2
Other payables 435.4 470.7
Total 1,552.8 1,569.3
The aging profile based on the invoice dates of accounts payable is analyzed as follows:
US$ millions 2020 2019
0 to 30 days 347.2 389.8
31 to 60 days 12.4 16.9
61 to 90 days 13.1 2.6
Over 90 days 47.9 51.1
Total 420.6 460.4
All of the accounts payable, other payables and accruals are expected to be settled within one year. The carrying amounts of the
Group’s accounts payable, other payables and accruals approximate their fair values.
26. Borrowings
US$ millions Effective interest rate (%) Maturity Notes 2020 2019
Short-term
Bank loans 0.5–9.0 (2019: 1.8–10.0) 2021 (2019: 2020) 1,568.1 1,981.2
Other loans 5.1 (2019: 2.1–6.5) 2021 (2019: 2020) (A) 91.6 281.6
Subtotal 1,659.7 2,262.8
Long-term
Bank loans 0.9–12.5 (2019: 1.2–12.5) 2022-2037 (2019: 2021–2037) (B) 7,830.2 5,738.4
Other loans 4.5–8.8 (2019: 5.3–8.7) 2022-2028 (2019: 2021–2028) (C) 1,143.7 929.6
Subtotal 8,973.9 6,668.0
Total 10,633.6 8,930.8
The maturity profile of the Group’s borrowings is as follows:
Bank loans Other loans Total
US$ millions 2020 2019 2020 2019 2020 2019
Not exceeding one year 1,568.1 1,981.2 91.6 281.6 1,659.7 2,262.8
More than one year but not exceeding two years 867.3 623.7 0.6 86.3 867.9 710.0
More than two years but not exceeding five years 3,359.4 1,966.8 753.8 630.8 4,113.2 2,597.6
More than five years 3,603.5 3,147.9 389.3 212.5 3,992.8 3,360.4
Total 9,398.3 7,719.6 1,235.3 1,211.2 10,633.6 8,930.8

184 First Pacific Annual Report 2020
Notes to the Consolidated Financial Statements
The carrying amounts of the borrowings are denominated in the following currencies:
US$ millions 2020 2019
U.S. dollar 3,572.6 1,921.0
Peso 4,551.3 4,716.4
Rupiah 1,544.3 1,602.3
S$ 522.8 527.1
Others 442.6 164.0
Total 10,633.6 8,930.8
An analysis of the carrying amounts of borrowings into fixed and variable interest rates is as follows:
US$ millions 2020 2019
Fixed interest rate 5,595.8 5,765.6
Variable interest rate 5,037.8 3,165.2
Total 10,633.6 8,930.8
The carrying amounts and fair values of the non-current portion of long-term borrowings are as follows:
Carrying amounts Fair values
US$ millions 2020 2019 2020 2019
Bank loans 7,830.2 5,738.4 8,451.5 5,785.0
Other loans 1,143.7 929.6 1,224.5 973.1
Total 8,973.9 6,668.0 9,676.0 6,758.1
The fair values are based on published price quotations for listed bonds issued by the Group and projected cash flows
discounted using the borrowing rates ranging from 1.1% to 7.5% (2019: 3.1% to 8.6%) for the other fixed interest rate
borrowings. The carrying amounts of the Group’s variable interest rate borrowings approximate their fair values due to frequent
repricing.
The carrying amounts of the short-term borrowings approximate their fair values. Details of the borrowings are set out below:
(A) Short-term Other Loans
The balance at 31 December 2020 represented unsecured Peso bonds of Peso 4.4 billion (US$91.6 million) (2019: Pesos
4.4 billion (US$86.0 million)) issued by NLEX Corporation in March 2014, with a coupon rate of 5.07% per annum, which
are payable quarterly, and will mature in March 2021. The bonds were classified under long-term other loans as at 31
December 2019.
The balance as at 31 December 2019 included:
(a) Secured bonds of US$251.6 million (with a face value of US$251.9 million) issued by FPT Finance Limited in
September 2010, with a coupon rate of 6.375% per annum, were payable semi-annually, guaranteed by the
Company and secured by a 12% interest in PLDT. These bonds were fully redeemed in September 2020.
(b) Unsecured bonds of US$30.0 million (with a face value of US$30.0 million) issued by MPTC in September 2019,
with a coupon rate of 2.0645% per annum, and were fully redeemed in September 2020.
(B) Long-term Bank Loans
The balance at 31 December 2020 included unsecured bank loans of US$606.1 million (with a face value of US$610.0
million) (2019: US$872.6 million (with a face value of US$880.0 million)) drawn for refinancing purpose by wholly-owned
subsidiary companies of the Company, guaranteed by the Company, which are repayable between January 2022 and June
2029 (2019: between March 2021 and June 2029).

185 First Pacific Annual Report 2020
(C) Long-term Other Loans
The balance at 31 December 2020 mainly included bonds issued by wholly-owned subsidiary companies of the Company, Indofood and MPIC. Details are summarized as follows:
(a) Unsecured bonds of US$356.6 million (with a face value of US$357.8 million) (2019: US$357.1 million (with a face value of US$358.8 million)) issued by FPC Treasury Limited in April 2013, with a coupon rate of 4.5% per annum, are payable semi-annually, and will mature in April 2023. The bonds are guaranteed by the Company.
During the year ended 31 December 2020, the Company repurchased US$1.0 million of the above-mentioned bonds at an aggregate consideration of US$1.0 million. These repurchased bonds were subsequently canceled.
(b) Unsecured bonds of US$120.2 million (with a face value of US$120.5 million) (2019: US$174.3 million (with a face value of US$175.0 million)) issued by FPC Capital Limited in May 2018, with a coupon rate of 5.75% per annum, are payable semi-annually, and will mature in May 2025. The bonds are guaranteed by the Company.
During the year ended 31 December 2020, the Company repurchased US$54.5 million of the above-mentioned bonds at an aggregate consideration of US$57.5 million. These repurchased bonds were subsequently canceled.
(c) Unsecured bonds of US$348.0 million (with a face value of US$350.0 million) issued by FPC Resources Limited in September 2020, with a coupon rate of 4.375% per annum, are payable semi-annually, and will mature in September 2027. The bonds are guaranteed by the Company.
(d) Unsecured Rupiah bonds of Rupiah 2.0 trillion (US$141.6 million) (2019: US$143.5 million) issued by Indofood in May 2017, with a coupon rate of 8.7% per annum, are payable quarterly, and will mature in May 2022.
(e) Unsecured Peso bonds of Pesos 2.6 billion (US$53.7 million) (2019: US$50.8 million) issued by NLEX Corporation in March 2014, with a coupon rate of 5.5% per annum, are payable quarterly, and will mature in March 2024.
(f) Unsecured Peso bonds of Pesos 4.0 billion (US$82.1 million) (2019: US$78.2 million) issued by NLEX Corporation in July 2018, with a coupon rate of 6.64% per annum, are payable quarterly, and will mature in July 2025.
(g) Unsecured Peso bonds of Pesos 2.0 billion (US$41.0 million) (2019: US$39.1 million) issued by NLEX Corporation in July 2018, with a coupon rate of 6.9% per annum, are payable quarterly, and will mature in July 2028.
(D) Current Portion of Long-term Borrowings
The balance of short-term borrowings also included current portion of long-term borrowings of US$517.9 million (2019: US$670.0 million).
At 31 December 2019, PLP did not meet its financial covenants and as a result, its secured bank loans of S$613.0 million (US$463.7 million) became repayable on demand and were classified entirely as current liabilities. In October 2020, PLP completed its negotiations with its lenders and the refinanced loans are now classified as non-current liabilities and will mature in December 2026.
At 31 December 2019, AIF Toll Roads Holdings (Thailand) Limited (“AIF Toll Roads”)’s long-term borrowings of US$17.8 million were reclassified as current liabilities as AIF Toll Roads did not meet the minimum required debt service coverage ratio of at least 1.1 times on 31 December 2019. AIF Toll Roads obtained waivers from the lenders subsequently in January 2020.
(E) Charges on Group Assets
At 31 December 2020, certain bank and other borrowings, including those reclassified to liabilities of a disposal group, were secured by the Group’s property, plant and equipment, accounts and other receivables, cash and cash equivalents, inventories and assets classified as held for sale amounting to net book values of US$1,711.5 million (2019: US$2,040.5 million) and the interests of the Group’s 56% (2019: 56%) in GBPC, 55% (2019: 55%) in LRMC, 100% (2019: 100%) in MPCALA, 100% (2019: 100%) in CCLEC, 35% (2019: 35%) in PT Jakarta Lingkar Baratsatu, 88.9% (2019: 88.9%) in PT BSD, 99.5% (2019: 99.5%) in PT BMN, 99.4% (2019: 99.4%) in PT JTSE, 61.2% in PT Inpola Meka Energi (2019: Nil),
70% (2019: 70%) in PLP, Nil (2019: 12%) in PLDT, Nil (2019: 100%) in AIF Toll Roads and Nil (2019: 29.5%) in DMT.

186 First Pacific Annual Report 2020
Notes to the Consolidated Financial Statements
27. Provision for Taxation
US$ millions 2020 2019
At 1 January 97.3 57.3
Exchange translation 4.6 5.5
Provision for taxation on estimated assessable profits for the year 354.9 349.0
Taxes paid (285.8) (310.2)
Acquisition of a subsidiary company (Note 34(C)) 17.5 –
Attributable to a discontinued operation (Note 7(B)) (7.9) –
Deconsolidation of a subsidiary company – (4.3)
At 31 December 180.6 97.3
An analysis of the taxes paid for the years ended 31 December 2020 and 2019 by geographical market is set out below:
US$ millions 2020 2019
Indonesia 147.9 166.9
The Philippines 119.5 137.4
Others 18.4 5.9
Total 285.8 310.2
28. Deferred Liabilities, Provisions and Payables
US$ millions
Lease
liabilities
Long-term
liabilities Pension
Loans
from non-
controlling
shareholders Others 2020 2019
At 1 January 59.1 827.2 538.1 212.8 440.6 2,077.8 1,984.0
Exchange translation 2.1 63.7 (1.8) (0.5) 24.3 87.8 63.9
Additions 50.2 69.4 27.3 5.0 169.8 321.7 294.2
Payment and utilization (38.4) (263.5) (40.0) – (51.5) (393.4) (278.4)
Acquisition of subsidiary companies (Note 34(C)) 1.9 650.0 10.9 12.7 – 675.5 0.5
Deconsolidation of a subsidiary company – – – – – – 13.6
Attributable to a discontinued operation (Note 7(B)) – – (21.0) – (43.2) (64.2) –
At 31 December 74.9 1,346.8 513.5 230.0 540.0 2,705.2 2,077.8
Presented as:
Non-current Portion 57.6 1,175.7 513.5 103.8 260.7 2,111.3 1,535.3
Current Portion 17.3 171.1 – 126.2 279.3 593.9 542.5
Total 74.9 1,346.8 513.5 230.0 540.0 2,705.2 2,077.8
The lease liabilities represent the present value of future lease payments in relation to the Group’s right-of-use assets. The
maturity analysis of lease liabilities is disclosed in Note 40(B)(c) to the Consolidated Financial Statements.
The long-term liabilities mainly relate to (a) ICBP’s retention payable for its acquisition of 100% interest in Pinehill in August
2020, which is subject to a profit guarantee adjustment, (b) MPCALA’s concession fees payable to the Philippine government in
respect of CALAX, (c) NLEX Corporation’s concession fees payable to the Philippine government in respect of Connector Road,
(d) Maynilad’s concession fees payable to MWSS, including a provision for certain additional concession fees payable and related
interest amounts in dispute between Maynilad and MWSS, (e) LRMC’s concession fees payable to the Philippine government in
respect of LRT1, (f) MPIC’s outstanding payable for its acquisition of the remaining 25% interest in Beacon Electric from PCEV
in June 2017, for which PCEV shall retain the 25% voting rights (except the decisions or policies affecting dividend payouts
to be made by Beacon Electric) over these shares until full payment of the total consideration in June 2021, and (g) MPIWI’s
concession fees payable to MIWD.

187 First Pacific Annual Report 2020
In respect of ICBP’s retention payable, it was initially recognized at fair value at the acquisition date and subsequently measured at fair value through profit or loss. For the basis of determining the amount of payment, please refer to Note 34(C) to the Consolidated Financial Statements. In respect of the disputed amounts between Maynilad and MWSS, no final resolution has been reached at 31 December 2020.
The pension relates to accrued liabilities in relation to defined benefit retirement schemes and long service payments.
The loans from non-controlling shareholders represent unsecured loans provided by non-controlling shareholders of FPM Power, PLP, and subsidiary companies of IndoAgri and Pinehill.
The others mainly represent (a) Maynilad’s real property tax payables on certain common purpose facilities, (b) a financial liability recognized by MPIC in relation to a put option held by Sumitomo Corporation (“Sumitomo”), (c) provisions for various claims and potential claims against the Group, (d) estimated tax warranties and indemnities in relation to the disposal of a 40.1% interest in MPHHI in December 2019, (e) contract liabilities, (f) contractual obligations of NLEX Corporation and CIC to restore their service concession assets to a specified level of serviceability during their service concession periods and to maintain these assets in good conditions prior to the handover of these assets to the Philippine government at the end of their concession periods, (g) the Group’s payables on LTIP, and (h) derivative liabilities arising from fuel swaps, interest rate swaps, electricity futures and foreign exchange forward contracts.
On 28 May 2020, MPIC entered into an agreement with Sumitomo to divest its 34.9% interest in MPLRC, which holds a 55% interest in LRMC, to Sumitomo. The agreement also contains a call option of MPIC that allows MPIC to purchase all of Sumitomo’s MPLRC shares, and a put option of Sumitomo that allows Sumitomo to sell all of its MPLRC shares to MPIC, in the event of a deadlock (following unsuccessful mediation procedures) and in the event of MPIC’s or Sumitomo’s default on its obligations under the agreement. As a result, MPIC recognized a financial liability at the present value of the amount payable on exercise of the put option by Sumitomo, which is determined based on the fair value of MPLRC shares. At 31 December 2020, the financial liability amounting to US$74.3 million was recognized in relation to the put option and included in the current portion of deferred liabilities, provisions and payables, and the carrying amount of Sumitomo’s non-controlling interests was derecognized with the resulting differences recorded in equity.
At 31 December 2020, US$34.6 million (2019: US$28.5 million) of receipt in advance from customers mainly arising from advance payments relating to future sales of CPO, upfront payments for water connection and installation fees and the unused portion of toll fees received in advance through the electric toll collection media. The obligations to the customers are expected to be fulfilled within one year, except for the obligations in relation to water connection and installation fees to be fulfilled over the remaining concession period. The increase in the balance in 2020 was mainly due to the increase in upfront payments and advances received from customers in relation to water connection and installation services, and sales of consumer food products, respectively.
At the end of the reporting period, the Group is a party to other cases and claims arising from the ordinary course of business filed by third parties, which are either pending decisions by the courts or are subject to settlement agreements. The outcome of these claims cannot be presently determined. In the opinion of the Directors and/or legal counsels, the eventual liability from these lawsuits or claims, if any, will not have a material adverse effect on the Consolidated Financial Statements. Other disclosures required by HKAS 37 were not provided as it may prejudice the Group’s position in ongoing claims, litigations and assessments.
29. Share Capital
US$ millions 2020 2019
Authorized
6,000,000,000 (2019: 6,000,000,000) ordinary shares of U.S. 1 cent each 60.0 60.0 Issued and fully paid
4,344,931,044 (2019: 4,344,931,044) ordinary shares of U.S. 1 cent each 43.4 43.4
There were no movements in the Company’s share capital during the year ended 31 December 2020.
During the year ended 31 December 2019, 2,944,076 new ordinary shares of U.S. 1 cent each were issued for a total cash consideration of HK$8.4 million (US$1.1 million) under the Company’s share award scheme. Details of the Company’s share
award scheme are set out in Note 30 to the Consolidated Financial Statements.

188 First Pacific Annual Report 2020
Notes to the Consolidated Financial Statements
30. Shares Held for Share Award Scheme
Number of
allocated shares
held for
Number of
unallocated shares
held for
Shares
held for
Shares Award
Purchase
Awards
Subscription
Awards
Subscription
Awards
Scheme
US$ millions
At 1 January 2019 6,884,174 1,599,824 223,020 (4.9)Purchased 5,418,000 – – (2.0)Granted and reallocated – 223,020 (223,020) –Granted and issued – 2,944,076 – (1.1)Vested and transferred (6,881,652) (1,599,824) – 4.8 At 31 December 2019 5,420,522 3,167,096 – (3.2) At 1 January 2020 5,420,522 3,167,096 – (3.2)
Purchased 3,228,000 – – (1.0)
Vested and transferred (3,708,843) (1,055,697) – 1.8
At 31 December 2020 4,939,679 2,111,399 – (2.4)
For the Purchase Awards, during the year ended 31 December 2020, the independent trustee managing the Company’s share award scheme purchased 3,228,000 (2019: 5,418,000) shares of the Company at an aggregate consideration of HK$7.1 million (US$1 million) (2019: HK$15.8 million (US$2 million)) from the open market at the cost of the Company.
For the Subscription Awards, during the year ended 31 December 2020, there was no subscription of new shares by the independent trustee managing the Company’s share award scheme. During the year ended 31 December 2019, the independent trustee subscribed 2,944,076 new shares issued by the Company at an aggregate consideration of HK$8.4 million (US$1.1 million), and 223,020 shares previously forfeited due to the resignation of a beneficiary were reallocated to eligible employees.
Particulars of the share awards of the Company granted to the Directors and senior executives of the Company at 31 December 2020 are set out below:
(A) Particulars of the Company’s Purchase Awards
Shares granted and
unvested shares held at
1 January 2020
Shares granted during
the year
Shares vested and transferred
during the year
Shares
granted and
unvested
shares held at
31 December
2020 Grant date Vesting period(i)
Executive Director
Christopher H. Young, Chief Financial Officer 4,830,849 – (1,610,283) 3,220,566 8 April 2019 April 2020 to April 2022
Independent Non-executive Directors
Prof. Edward K.Y. Chen, GBS, CBE, JP 957,000 – (319,000) 638,000 8 April 2019 April 2020 to April 2022
Margaret Leung Ko May Yee, SBS, JP 957,000 – (319,000) 638,000 8 April 2019 April 2020 to April 2022
Philip Fan Yan Hok 957,000 – (319,000) 638,000 8 April 2019 April 2020 to April 2022
Blair Chilton Pickerell(ii) – 957,000 – 957,000 25 March 2020 March 2022 to March 2023
Senior Executives 3,424,683 – (1,141,560) 2,283,123 8 April 2019 April 2020 to April 2022
Total 11,126,532 957,000 (3,708,843) 8,374,689
(i) The vesting periods of the awarded shares are as follows:(a) For the 2019 grants, the shares would be vested in three equal tranches from the first to the third year after the shares are granted.(b) For the 2020 grant, the shares would be vested in two equal tranches in the second and the third years after the shares are granted.
(ii) Mr. Blair Chilton Pickerell was appointed as an Independent Non-executive Director with effect from 25 March 2020.

189 First Pacific Annual Report 2020
Shares
granted and
unvested
shares held at
1 January
2019
Shares
granted
during
the year
Shares
vested and
transferred
during
the year
Shares
forfeited
during
the year
Shares
granted and
unvested
shares held at
31 December
2019 Grant date Vesting period(i)
Executive Directors
Manuel V. Pangilinan, 1,488,460 – (1,488,460) – – – –
Managing Director and Chief Executive Officer
Christopher H. Young, Chief Financial Officer 1,184,780 – (1,184,780) – – – –
– 4,830,849 – – 4,830,849 8 April 2019 April 2020 to
April 2022
Non-executive Directors
Benny S. Santoso 148,844 – (148,844) – – – –
Ambassador Albert F. del Rosario(ii) 297,690 – (297,690) – – – –
– 957,000 – (957,000) – – –
Independent Non-executive Directors
Prof. Edward K.Y. Chen, GBS, CBE, JP 297,690 – (297,690) – – – –
– 957,000 – – 957,000 8 April 2019 April 2020 to
April 2022
Margaret Leung Ko May Yee, SBS, JP 297,690 – (297,690) – – – –
– 957,000 – – 957,000 8 April 2019 April 2020 to
April 2022
Philip Fan Yan Hok 297,690 – (297,690) – – – –
– 957,000 – – 957,000 8 April 2019 April 2020 to
April 2022
Madeleine Lee Suh Shin 357,228 – (357,228) – – – –
Senior Executives 2,511,580 – (2,511,580) – – – –
– 3,424,683 – – 3,424,683 8 April 2019 April 2020 to
April 2022
Total 6,881,652 12,083,532 (6,881,652) (957,000) 11,126,532
(i) The awarded shares would be vested in three equal tranches from the first to the third year after the shares are granted.(ii) Ambassador Albert F. del Rosario resigned from the Board of Directors with effect from 1 July 2019 and his unvested awarded shares were
forfeited.

190 First Pacific Annual Report 2020
Notes to the Consolidated Financial Statements
(B) Particulars of the Company’s Subscription Awards
Shares
granted and
unvested
shares held at
1 January
2020
Shares
vested and
transferred
during
the year
Shares
granted and
unvested
shares held at
31 December
2020 Grant date Vesting period(i)
Senior Executives 3,167,096 (1,055,697) 2,111,399 8 April 2019 April 2020 to April 2022
(i) The awarded shares would be vested in three equal tranches from the first to the third year after the shares are granted.
Shares
granted and
unvested
shares held at
1 January
2019
Shares
granted
during
the year
Shares
vested and
transferred
during
the year
Shares
granted and
unvested
shares held at
31 December
2019 Grant date Vesting period(ii)
Senior Executives 172,000 – (172,000) – – –
1,360,653 – (1,360,653) – – –
67,171 – (67,171) – – –
– 3,167,096 – 3,167,096 8 April 2019 April 2020 to April 2022
Total 1,599,824 3,167,096 (1,599,824) 3,167,096
(ii) The awarded shares would be vested in three equal tranches from the first to the third year after the shares are granted.
On 19 March 2013, the Board resolved to adopt a share award scheme (the “Share Award Scheme”), which has a validity period
of 15 years. Directors and Employees of the Group are eligible to participate. Under the Share Award Scheme, the Board can
select grantees of awards and determine the number of the Company’s shares (the “Shares”) to be awarded. An independent
trustee (the “Trustee”) has been appointed to administer the Share Award Scheme. The Trustee will, depending on the form
of the awards made, either subscribe for new Shares to be issued by the Company at the relevant benchmarked price as
stipulated in the Listing Rules or purchase existing Shares on the SEHK, in each case, at the cost of the Company. Those Shares
purchased and held by the Trustee were not canceled. The Trustee will hold the Shares on trust for the grantees of awards, until
the Shares become vested. The awards vest progressively over the vesting period, provided that the relevant grantee remains
employed by the Group. Vested Shares will be transferred to the grantees at no cost. Directors of the Group are not eligible to be
granted awards of new Shares to be subscribed by the Trustee and issued by the Company, but are eligible to be granted awards
of existing Shares to be purchased by the Trustee. The Share Award Scheme also limits the aggregate number of Shares that
may be awarded to no more than three percent of the outstanding shares of the Company.
On 8 April 2019, 12,083,532 share awards were granted as Purchase Awards and 3,167,096 share awards were granted as
Subscription Awards under the Company’s Share Award Scheme. The average fair value of shares granted as calculated by
Towers Watson Hong Kong Limited, by adjusting the closing share price at the grant date by the present value of expected
dividend payments during the vesting period, was HK$2.72 per share or an aggregate value of US$5.3 million for all shares
granted. The assumptions used were as follows:

191 First Pacific Annual Report 2020
Share price at the date of grant HK$2.86 per share
Expected dividend yield 2.5% per annum
Average risk-free interest rate (based on the Hong Kong Exchange Fund Notes) 1.5% per annum
On 25 March 2020, 957,000 share awards were granted as Purchase Awards under the Company’s Share Award Scheme. The
average fair value of shares granted as calculated by Towers Watson Hong Kong Limited, by adjusting the closing share price
at the grant date by the present value of expected dividend payments during the vesting period, was HK$1.26 per share or an
aggregate value of US$0.2 million for all shares granted. The assumptions used were as follows:
Share price at the date of grant HK$1.36 per share
Expected dividend yield 2.9% per annum
Average risk-free interest rate (based on the Hong Kong Exchange Fund Notes) 0.78% per annum
31. Other Components of EquityThe Group’s other components of equity comprise share premium, employee share-based compensation reserve, exchange
reserve, fair value reserve of financial assets at FVOCI, unrealized gains/losses on cash flow hedges, income tax related to cash
flow hedges, actuarial gains/losses on defined benefit pension plans, share of other comprehensive income/loss of associated
companies and joint ventures, differences arising from changes in equities of subsidiary companies, reserves for assets classified
as held for sale, capital and other reserves, and contributed surplus.
The share premium relates to the amount of fund received by the Company in excess of the par value of its shares issued. It may
be used for repurchase of the Company’s shares, distribution in the form of fully paid bonus shares and write-off of expenses
related to issue of shares by the Company.
The employee share-based compensation reserve arises from the amortization of costs of share options and awarded shares
granted under the share option schemes and the share award schemes adopted by the Company and the Group’s subsidiary
and associated companies over the vesting period. Upon the exercise of share options, the related amount accumulated in the
employee share-based compensation reserve is transferred to share premium. Upon the vesting and transfer of the awarded
shares to the awardees, the related costs are credited to shares held for share award scheme, and the related fair value of the
shares is debited to the employee share-based compensation reserve. The difference between the cost and the fair value of
the vested awarded shares is credited to retained earnings if the fair value is higher than the cost or debited against retained
earnings if the fair value is less than the cost.
The exchange reserve represents the resulting exchange differences arising from the translation of results and financial position
of the Group’s foreign operations that have functional currencies different from the Company’s presentation currency. An analysis
of the Group’s exchange reserve, by principal operating company, is set out below:
US$ millions 2020 2019
Indofood (400.0) (384.5)
PLDT (61.3) (94.0)
MPIC (67.7) (147.9)
Philex (3.9) (12.7)
Others (4.7) (4.1)
Total (537.6) (643.2)
The fair value reserve of financial assets at FVOCI relates to changes in the fair value of financial assets at FVOCI of the Company
and the Group’s subsidiary companies.

192 First Pacific Annual Report 2020
Notes to the Consolidated Financial Statements
The unrealized gains/losses on cash flow hedges and income tax related to cash flow hedges relate to the effective portion of
changes in fair value of cash flow hedges of the Company and the Group’s subsidiary companies.
The actuarial gains/losses on defined benefit pension plans relate to changes in the present value of defined benefit pension
obligations resulting from experience adjustments (the effects of differences between the previous actuarial assumptions and
what has actually occurred) and the effects of changes in actuarial assumptions.
Share of other comprehensive income/loss of associated companies and joint ventures relates to the Group’s share of its associated
companies and joint ventures’ exchange reserve, fair value reserve of financial assets at FVOCI, unrealized gains/losses on cash
flow hedges, income tax related to cash flow hedges, actuarial gains/losses on defined benefit pension plans and revaluation
reserve.
The differences arising from changes in equities of subsidiary companies relate to a change in the Group’s subsidiary, associated
companies’ ownership interest in their subsidiary companies without a change of control.
The reserves for assets classified as held for sale pertain to the Group’s share of the disposal group’s reserves.
The capital and other reserves include capital reserves arising from reorganization activities in some of the Group’s subsidiary
companies and the Group’s share of the equity component of convertible notes issued by an associated company.
The contributed surplus of the Group arose from (a) the Company’s reallocation of its entire amount of share premium balance
of US$1,785.2 million on 28 June 2016 to the distributable reserve, following the approval obtained from the Company’s
shareholders during the adjourned annual general meeting, by way of a share premium reduction to nil and a subsequent
transfer of the credit amount arising therefrom to the contributed surplus account and (b) a reorganization of the Group in 1988
and represents the difference between the nominal value of the share capital issued by the Company and the aggregate net
asset value of the subsidiary companies acquired at the date of acquisition. Under the Companies Act 1981 of Bermuda (as
amended), the Company may make distributions to its shareholders out of the contributed surplus provided certain conditions
are met.
An analysis of the accumulated reserves of associated companies and joint ventures, included within consolidated reserves, is
set out below:
Associated Companies Joint Ventures Total
US$ millions 2020 2019 2020 2019 2020 2019
Associated Companies and Joint Ventures
Revenue reserve (1,053.2) (1,026.2) (27.1) (34.5) (1,080.3) (1,060.7)
Exchange reserve (66.3) (107.8) 0.3 (1.3) (66.0) (109.1)
Fair value reserve of financial assets at FVOCI (1.1) (1.1) – – (1.1) (1.1)
Unrealized losses on cash flow hedges (3.0) (1.5) – – (3.0) (1.5)
Actuarial losses on defined benefit pension plans (202.9) (183.7) – – (202.9) (183.7)
Differences arising from changes in equities
of subsidiary companies (7.1) (7.1) – – (7.1) (7.1)
Capital and other reserves 15.0 15.0 – – 15.0 15.0
Total (Note 13) (1,318.6) (1,312.4) (26.8) (35.8) (1,345.4) (1,348.2)

193 First Pacific Annual Report 2020
32. Non-controlling InterestsDetails of the Group’s subsidiary companies that have material non-controlling interests are set out below:
US$ millions 2020 2019
Percentage of equity interest held by non-controlling interests– Indofood 49.9% 49.9%– MPIC 56.9% 58.1%– FPM Power 32.2% 32.4%– FP Natural Resources 19.2% 19.5%
US$ millions 2020 2019
Profit/(loss) for the year allocated to non-controlling interests– Indofood 355.9 229.0– MPIC 169.3 328.9– FPM Power (16.1) (173.7)– FP Natural Resources (43.1) (9.2)
Total 466.0 375.0 Dividends paid to non-controlling interests
– Indofood 146.9 86.4– MPIC 104.3 148.7
Total 251.2 235.1 Balances of non-controlling interests at 31 December
– Indofood 4,116.8 2,543.9– MPIC 3,412.4 3,260.3– FPM Power (104.2) (79.3)– FP Natural Resources 63.5 104.4
Total 7,488.5 5,829.3
The following table illustrates the summarized financial information under HKFRS of the above subsidiary companies. The amounts disclosed are before any inter-company eliminations.
Indofood MPIC FPM Power FP Natural Resources
For the year ended/at 31 December US$ millions
2020 2019 2020 2019 (Restated)
2020 2019 2020 2019
Statements of Comprehensive Income
Turnover 5,583.1 5,414.4 825.5 1,239.8 571.0 713.4 150.9 217.4 Profit/(loss) for the year 570.8 398.0 207.1 539.5 (26.3) (488.8) (115.8) (24.5)Other comprehensive income/(loss) 33.4 48.5 (89.2) (28.6) (14.7) 33.4 (1.8) (3.1) Total Comprehensive Income/(Loss) 604.2 446.5 117.9 510.9 (41.0) (455.4) (117.6) (27.6) Statements of Financial Position
Non-current assets 8,845.7 4,687.1 9,890.0 10,002.8 456.0 474.1 207.9 220.4Current assets 2,728.2 2,256.0 2,975.4 2,078.1 116.6 138.6 43.9 223.9Non-current liabilities (3,992.4) (1,272.3) (5,369.7) (5,738.8) (571.3) (100.9) (62.1) (62.7)Current liabilities (1,983.3) (1,784.8) (2,407.3) (1,483.4) (408.8) (876.4) (134.4) (214.6) Net Assets/(Liabilities) 5,598.2 3,886.0 5,088.4 4,858.7 (407.5) (364.6) 55.3 167.0 Statements of Cash Flows
Net cash from/(used in) operating activities 945.0 937.7 239.9 603.2 (8.3) (6.5) (8.1) 25.5Net cash (used in)/from investing activities (2,565.9) (5.0) (734.1) (533.3) (0.1) (4.5) 83.1 14.4Net cash from/(used in) financing activities 1,860.2 (572.2) (11.3) 93.2 (19.1) 40.2 (83.8) (41.6) Net Increase/(Decrease)
in Cash and Cash Equivalents 239.3 360.5 (505.5) 163.1 (27.5) 29.2 (8.8) (1.7)

194 First Pacific Annual Report 2020
Notes to the Consolidated Financial Statements
Effects of Material Transactions with Non-controlling Interests
During the year ended 31 December 2020, Indofood had purchased an aggregate 23.8 million shares (2019: 100.1 million
shares) of IndoAgri from the open market at a total cost of S$6.9 million (US$5.1 million) (2019: S$32.5 million or US$23.8
million). As a result of these transactions, Indofood’s effective interest in IndoAgri increased to 71.7% from 70.0% (2019:
increased to 70.0% from 62.8%). The Group recorded a credit balance of US$5.8 million (2019: US$19.2 million) in differences
arising from changes in equities of subsidiary companies within the Group’s equity in respect of these transactions.
During the year ended 31 December 2020, MPIC had bought back an aggregate 900.5 million of its shares from the open
market at an aggregate consideration of approximately Pesos 3.4 billion (US$69.2 million). As a result of these transactions, the
Group’s effective economic interest and voting interest in MPIC increased to 43.1% and 56.1%, respectively, from 41.9% and
54.9%, respectively. The Group recorded a credit balance of US$20.1 million in differences arising from changes in equities of
subsidiary companies within the Group’s equity in respect of these transactions.
In May 2020, MPIC’s subsidiary company, CIIF completed the divestment of its 10.3% interest in MUN to West Nippon
Expressway, Japan Expressway International Co., Ltd., and Japan Overseas Infrastructure Investment Corporation for Transport
& Urban Development for a consideration of US$35.2 million. As a result of this transaction, MPIC’s effective interest in MUN
decreased to 71.5% from 81.8%. The Group recorded a credit balance of US$2.3 million in differences arising from changes in
equities of subsidiary companies within the Group’s equity in respect of this transaction.
In May 2020, MPIC also completed the divestment of its 34.9% interest in MPLRC to Sumitomo and a put option was also
granted to Sumitomo following the completion of the divestment which allows Sumitomo to sell all of its MPLRC shares to MPIC
under certain circumstances pursuant to the sale and purchase agreement. As a result, the Group recorded a net debit balance
of US$6.3 million in differences arising from changes in equities of subsidiary companies within the Group’s equity in respect of
the divestment and the put option.
In August 2019, Indofood’s subsidiary company, PT Sukses Artha Jaya (“SAJ”), acquired an 8.8% interest in PT Tirta Sukses
Perkasa (“TSP”) at a consideration of Rupiah 88 billion (US$6.2 million). As a result of this transaction, Indofood’s effective
interest in TSP increased to 79.3% from 72.4%. The Group recorded a debit balance of US$3.4 million in differences arising
from changes in equities of subsidiary companies within the Group’s equity in respect of this transaction.
In September 2019, MPIC’s subsidiary company, MPT Asia, completed the acquisition of a 24.98% interest in MUN at a
consideration of US$67.0 million. As a result of this transaction, MPIC’s effective interest in MUN increased to 81.8% from
56.9%. The Group recorded a debit balance of US$3.6 million in differences arising from changes in equities of subsidiary
companies within the Group’s equity in respect of this transaction.

195 First Pacific Annual Report 2020
33. Other Comprehensive (Loss)/Income Attributable to Owners of the Parent
US$ millions
Exchange
reserve
Fair value
reserve of
financial
assets at
FVOCI
Unrealized
(losses)/
gains on
cash flow
hedges
Income tax
related to
cash flow
hedges
Actuarial
(losses)/gains
on defined
benefit
pension
plans
Share of other
comprehensive
(loss)/income
of associated
companies and
joint ventures Total
At 1 January 2019 (814.9) 86.4 (19.3) 2.7 (15.1) (126.7) (886.9)
Other comprehensive income/(loss) for the year 171.7 23.7 19.1 (3.2) (1.8) (39.1) 170.4
Deconsolidation of a subsidiary company – – – – 0.3 – 0.3
Disposal of an associated company – – – – – 0.1 0.1
At 31 December 2019 (643.2) 110.1 (0.2) (0.5) (16.6) (165.7) (716.1)
At 1 January 2020 (643.2) 110.1 (0.2) (0.5) (16.6) (165.7) (716.1)
Other comprehensive income/(loss) for the year 108.4 13.8 (8.4) 0.5 8.5 (54.5) 68.3
Attributable to a discontinued operation (Note 7(B)) – – – – (1.1) – (1.1)
Transfer to retained earnings – 0.1 – – (0.2) – (0.1)
Acquisition of an interest in a subsidiary company (2.8) – – – – – (2.8)
At 31 December 2020 (537.6) 124.0 (8.6) – (9.4) (220.2) (651.8)
34. Notes to the Consolidated Statement of Cash Flows(A) Proceeds from Disposal of Property, Plant and Equipment
2020’s cash inflow of US$104.5 million mainly relates to proceeds from disposal of La Carlota assets.
(B) Proceeds from Instalment Payments for Disposal of a Subsidiary Company
2020’s cash inflow of US$80.9 million relates to the second and final instalment payments received for the disposal of a
40.1% interest in MPHHI.
2019’s cash inflow of US$47.6 million related to the final instalment payment received for the disposal of a 29.9% interest
in China Minzhong Corporation Limited.

196 First Pacific Annual Report 2020
Notes to the Consolidated Financial Statements
(C) Acquisition of Subsidiary Companies
Fair value recognized on acquisition
US$ millions
Indofood’s
acquisition
of Pinehill(i)
MPIC’s
acquisition
of Dibztech(i)
2020
Total
2019
Total
Consideration
Cash and cash equivalents 2,348.0 1.3 2,349.3 3.3
Associated companies and joint ventures(ii) – – – 8.8
Deferred liabilities, provisions and payables(iii) (Note 28) 650.0 – 650.0 –
Total 2,998.0 1.3 2,999.3 12.1
Net Assets
Property, plant and equipment (Note 11) 93.1 0.1 93.2 0.2
Associated companies and joint ventures 448.7 – 448.7 –
Other intangible assets (Note 15) – – – 26.4
Deferred tax assets (Note 19) 1.0 – 1.0 –
Other non-current assets 0.9 – 0.9 0.7
Cash and cash equivalents 94.2 – 94.2 3.1
Accounts receivable, other receivables
and prepayments (Current) 173.0 – 173.0 1.3
Inventories 52.7 – 52.7 –
Accounts payable, other payables and accruals (72.3) (0.3) (72.6) (5.4)
Provision for taxation (Note 27) (17.5) – (17.5) –
Current portion of deferred liabilities,
provisions and payables (Note 28) (12.9) – (12.9) (0.1)
Long-term borrowings (Note 34(H)) – – – (16.1)
Deferred liabilities, provisions and payables (Note 28) (12.6) – (12.6) (0.4)
Deferred tax liabilities (Note 19) (1.0) – (1.0) –
Total Net Identifiable Assets/(Liabilities) Acquired/(Assumed) 747.3 (0.2) 747.1 9.7
Less: Non-controlling interests(iv) (1,302.0) – (1,302.0) (4.1)
Add: Goodwill (Note 14) 3,552.7 1.5 3,554.2 6.5
2,998.0 1.3 2,999.3 12.1
Net Cash Outflow per the
Consolidated Statement of Cash Flows (2,253.8) (1.3) (2,255.1) (0.2)
(i) Provisional amounts determined based on management’s estimates of the fair values of the identifiable assets acquired, liabilities and contingent liabilities assumed, and subject to revision upon their further assessment
(ii) 2019’s amount represented the fair value of a 45% interest in PNW previously held by MPIC.(iii) Represents the retention amount payable due in April 2022(iv) The non-controlling interests were measured at fair value (2019: the proportionate share of their interests in the acquiree’s identifiable net
assets).

197 First Pacific Annual Report 2020
On 22 May 2020, ICBP, entered into a conditional shares sale and purchase agreement with Pinehill Corpora Limited
(“Pinehill Corpora”) and Steele Lake Limited (“Steele Lake”) (collectively the “Sellers”) in relation to the acquisition of
the entire issued share capital of Pinehill, which is engaged in the manufacture and sale of instant noodles, for a total
consideration of US$2,998.0 million, of which US$2,348.0 million would be payable in cash upon the completion of
the acquisition. A retention amount of US$650.0 million shall be retained by ICBP until 30 April 2022 and subject to a
profit guarantee adjustment undertaken by the Sellers. The transaction was approved by the Company’s independent
shareholders and ICBP’s shareholders in July and August 2020, respectively, and completed on 27 August 2020.
Under the shares sale and purchase agreement, the Sellers have undertaken a profit guarantee that if the actual average
audited consolidated net profit after tax of Pinehill for the years ended and ending 31 December 2020 and 2021,
respectively, is less than 95% of the guaranteed profit, i.e. US$128.5 million, a price adjustment will be triggered to reduce
the retention amount and the adjustment is based on the whole shortfall, multiplied by the price earnings multiple of 23
times.
The fair value of Pinehill’s receivables was US$173.0 million, while the gross contractual amounts of receivables was
US$177.7 million. The transaction costs of US$3.3 million incurred for this business combination have been recognized as
administrative expenses in the consolidated income statement.
On 1 December 2020, MPTC acquired a 100% interest in Dibztech, Inc. (“Dibztech”), which owns and operates the Dibz
Mobile Application as a platform that allows drivers to search for, reserve and locate a parking space before arriving at their
destinations, for a consideration of approximately Pesos 64 million (US$1.3 million).
The net assets/liabilities of the acquired subsidiary companies recognized in the Group’s 2020 Consolidated Financial
Statements were based on provisional assessments of the fair values while the Group is still evaluating the fair values of
the assets acquired and liabilities and contingent liabilities assumed. The valuation and assessment had still been ongoing
by the date of these financial statements. If new information obtained within one year of the acquisition date about facts
and circumstances that existed at the acquisition date identifies adjustments to the above provisional amounts, or any
provisions that existed at the acquisition dates, then the accounting for the acquisition will be revised.
The goodwill arising from Indofood’s acquisition of Pinehill and MPIC’s acquisition of Dibztech pertains to, but is not limited
to, the expected synergies in the Group arising from the acquisition. None of the goodwill recognized is expected to be
deductible for income tax purposes.
Since the dates of acquisition, the above acquired subsidiary companies recorded in aggregate a turnover of US$247.1
million and profit for the period of US$67.3 million which are included in the consolidated income statement of the Group.
If the acquisitions had taken place on 1 January 2020, the turnover and profit for the year ended 31 December 2020 of the
Group would have been US$7,531.4 million and US$785.2 million, respectively.
2019’s net cash outflow of US$0.2 million mainly related to MPIC’s acquisition of a 100% interest in Southbend Express
Services Inc. and an additional 7.5% interest in PNW.

198 First Pacific Annual Report 2020
Notes to the Consolidated Financial Statements
(D) Increased Investments in Joint Ventures
2020’s cash outflow of US$66.6 million mainly relates to MPIC’s last instalment payment to PCEV for its acquisition of a
25% interest in Beacon Electric in May 2016.
2019’s cash outflow of US$69.8 million mainly related to MPIC’s instalment payment to PCEV for its acquisition of a 25%
interest in Beacon Electric in May 2016, Head Office’s capital injection into Goodman Fielder and Indofood’s capital
injections into Oji Indo Makmur Perkasa and Canápolis Holding S.A.
(E) Instalment Payment for Acquisition of a Subsidiary Company
2020’s cash outflow of US$49.5 million (2019: US$47.5 million) relates to MPIC’s instalment payment to PCEV for its
acquisition of the remaining 25% interest in Beacon Electric in June 2017.
(F) Proceeds from Disposal of a Subsidiary Company
2019’s cash inflow of US$430.2 million related to MPIC’s disposal of a 40.1% interest in MPHHI.
(G) Proceeds from Disposal of a Joint Venture
2019’s cash inflow of US$275.0 million related to the Group’s disposal of its 50% interest in FPW.
(H) Reconciliation of Liabilities Arising from Financing Activities
US$ millions
Loans from
non-controlling
shareholders
Service
concession
fees payable Borrowings
Lease
liabilities
Dividends/
distribution
payable Total
At 1 January 2019 200.6 582.7 8,517.9 75.3 47.8 9,424.3
Exchange translation 1.4 20.8 221.6 2.0 2.0 247.8
Changes in financing cash flows 5.8 (32.4) 229.1 (20.0) (301.7) (119.2)
Finance costs 5.0 11.3 7.4 4.4 – 28.1
Dividends/distribution declared – – – – 309.2 309.2
Acquisition of subsidiary companies – – 16.1 – – 16.1
Deconsolidation of a subsidiary company – – (24.7) (6.1) – (30.8)
Interest paid classified as operating cash flows – – – (4.4) – (4.4)
Other non-cash movements – 67.2 (36.6) 7.9 – 38.5
At 31 December 2019 212.8 649.6 8,930.8 59.1 57.3 9,909.6
At 1 January 2020 212.8 649.6 8,930.8 59.1 57.3 9,909.6
Exchange translation (0.5) 31.2 263.3 2.1 1.7 297.8
Changes in financing cash flows 0.4 (117.2) 2,010.0 (34.1) (329.6) 1,529.5
Finance costs 4.6 12.7 25.2 4.3 – 46.8
Dividends/distribution declared – – – – 319.9 319.9
Acquisition of a subsidiary company 12.7 – – 1.9 – 14.6
Attributable to a discontinued operation – – (593.8) – (38.7) (632.5)
Interest paid classified as operating cash flows – – – (4.3) – (4.3)
Other non-cash movements – 36.7 (1.9) 45.9 – 80.7
At 31 December 2020 230.0 613.0 10,633.6 74.9 10.6 11,562.1
(I) Proceeds from Divestments of Interests in Subsidiary Companies
2020’s cash inflow of US$94.0 million relates to proceeds from MPIC’s divestment of a 19.2% interest in LRMC and a
10.3% interest in MUN in May 2020.
(J) Repurchase of a Subsidiary Company’s Shares
2020’s cash outflow of US$69.2 million relates to MPIC’s shares buyback in March and October 2020.

199 First Pacific Annual Report 2020
(K) Total Cash Outflow for Leases
The total cash outflow for leases included in the consolidated statement of cash flows is as follows:
US$ millions 2020 2019
Within operating activities 19.2 18.0
Within financing activities 34.1 20.0
Total 53.3 38.0
(L) Major non-cash transaction
For the year ended 31 December 2020, the Group had non-cash additions to (i) right-of-use assets and lease liabilities
of US$45.9 million (2019: US$7.9 million) and US$45.9 million (2019: US$7.9 million), respectively, in respect of lease
arrangements for buildings, and machinery and equipment, and (ii) service concession assets and service concession fees
payable of US$42.0 million (2019: US$68.7 million) and US$42.0 million (2019: US$68.7 million), respectively, in respect
of MPIC’s certain service concession arrangements.
35. Commitments and Contingent Liabilities(A) Capital Expenditure
US$ millions 2020 2019
Commitments in respect of subsidiary companies:
– Authorized, but not contracted for 1,401.6 1,704.1
– Contracted, but not provided for 533.6 666.9
Total 1,935.2 2,371.0
The Group’s capital expenditure commitments principally relate to Indofood’s, MPIC’s, RHI’s and PLP’s purchase of
property, plant and equipment, and construction of infrastructures for Maynilad’s and MPW’s water and sewerage
businesses, MPTC’s toll road business and LRMC’s rail business.
(B) Contingent Liabilities
At 31 December 2020, except for guarantees of US$30.8 million (2019: US$41.3 million) given by Indofood for loan
facilities obtained by certain plantation farmers in relation to arrangements for those farmers’ production and sale of fresh
fruit bunches to Indofood, the Group had no significant contingent liabilities (2019: Nil).

200 First Pacific Annual Report 2020
Notes to the Consolidated Financial Statements
36. Employees’ Benefits(A) Remuneration
US$ millions
2020 2019
(Restated)
Basic salaries 498.5 511.3
Bonuses 184.1 189.6
Benefits in kind 103.8 115.4
Pension contributions 36.3 53.3
Retirement and severance allowances 6.3 1.8
Employee share-based compensation benefit expenses/LTIP 3.0 3.2
Total 832.0 874.6
Arising from:
Continuing operations (Note 5(A)) 803.2 851.0
A discontinued operation 28.8 23.6
832.0 874.6
Average Number of Employees
Continuing operations 101,534 110,487
A discontinued operation 959 961
102,493 111,448
The above includes the remuneration of the Directors. Detailed disclosures in respect of the Directors’ remuneration are set
out in Note 37(A) to the Consolidated Financial Statements.
(B) Retirement Benefits
The Group operates both defined contribution and defined benefit schemes. In addition, the Group has made provisions for
estimated liabilities for employee benefits for meeting the minimum benefits required to be paid to the qualified employees as
required under the Philippines Republic Act (R.A.) No. 7641 (“R.A. 7641”) and the Indonesian Labor Law.
Under R.A. 7641, companies are required to pay a minimum benefit of equivalent to one-half month’s salary for every year
of service, with six months or more of service considered as one year, to employees with at least five years of services. As
some of the entities of the Group operate in the Philippines, they provide for either a defined contribution retirement plan or
a defined benefit plan that consider the minimum benefit guarantee mandated under R.A. 7641.
Under the Indonesian Labor Law, companies are required to pay separation, appreciation and compensation benefits
to their employees if the conditions specified in the Indonesian Labor Law are met. Some of the Group’s Indonesian
subsidiary companies maintain and operate formal pension plans for the benefit of their employees, additional provisions
for the estimated liabilities for employee service entitlement benefits are made on top of the benefits provided under their
respective pension plans, if necessary, in order to meet and cover the minimum benefits required to be paid to employees
under the Indonesian Labor Law.

201 First Pacific Annual Report 2020
Under the Central Provident Fund Act in Singapore, the Singapore companies in the Group are required to make
contributions to the Central Provident Fund scheme in Singapore, which is a defined contribution pension scheme.
Contributions to defined contribution pension schemes are made based on a percentage of the employees’ basic salaries
and charged to the income statement as they become payable in accordance with the rules of the respective schemes.
Under the Mandatory Provident Fund Schemes Ordinance and the Occupational Retirement Schemes Ordinance in
Hong Kong, the Hong Kong companies in the Group are required to make contributions to the Mandatory Provident
Fund retirement scheme and the occupational retirement scheme in Hong Kong, which are defined contribution pension
schemes. Contributions are made based on a percentage of the employees’ basic salaries and charged to the consolidated
income statement as they become payable in accordance with the rules of the respective schemes.
(a) Defined contribution schemes
The Group operates 12 (2019: 12) defined contribution schemes covering approximately 13,706 (2019: 14,222)
employees. The assets of these schemes are held separately and are administered by independent trustees.
Contributions to the schemes, either by the Group or by the employees, are determined by reference to the
employees’ salaries and length of service and range from 0% to 40% (2019: 0% to 40%). Under the terms of the
schemes, the Group cannot be requested to make additional payments over and above these levels of contributions.
In seven (2019: seven) of the schemes, forfeited contributions may be used to reduce the existing levels of employer
contributions and, in 2020, no amount (2019: Nil) was used for this purpose. There were no significant forfeited
contributions at 31 December 2020 and 2019.
The Group’s Indonesian and Singapore subsidiary companies have defined contribution retirement plans covering
substantially all of their qualified permanent employees. The related liability arising from the difference between
the cumulative funding since the establishment of the program and the cumulative pension costs charged to
the consolidated income statement during the same period is recognized as employee benefit liabilities in the
consolidated statement of financial position.
Although the Group’s Philippine operating companies operate defined contribution schemes, they are covered under
R.A. 7641 which provides for its qualified employees under a defined benefit minimum guarantee. The defined
minimum guarantee is equivalent to a certain percentage of the monthly salary payment to an employee at the normal
retirement age with the required credited years of service based on the provisions of R.A. 7641. The Philippine
operating companies account for the retirement obligation under the higher of defined benefit obligation relating to
the minimum guarantee and the obligation arising from the defined contribution plan.
(b) Defined benefit schemes and estimated liabilities for employee benefits
The Group operates 19 (2019: 21) defined benefit schemes covering 8,101 (2019: 10,284) employees. 11 (2019:
12) of the plans are unfunded where the Group meets the benefit payment obligations as they fall due while eight
(2019: nine) of the defined benefit payments are from trustee-administered funds. For unfunded schemes, the Group
engages the services of actuaries to conduct valuation studies to determine the retirement obligations to ensure that
these maturing obligations and expected benefit payments are covered and budgeted for. For the funded schemes,
the assets are held separately from the Group and are administered by independent trustees. Benefits are determined
by reference to employees’ final salaries and length of service, and the schemes have undergone independent
valuations on an annual basis. These actuarial valuations, performed by the actuaries of PT Kappa Konsultan Utama
and PT Dayamandiri Dharmakonsilindo (members of the Actuarial Consultant Association of Indonesia), Institutional
Synergy, Inc., E.M. Zalamea Actuarial Services, Inc. and Key Actuarial Intelligence, Inc. (members of the Actuary
Society of the Philippines), were based on the projected unit credit method. The plan assets do not include any
financial instruments of the Group or property occupied by, or other assets used by, the Group. At 31 December
2020, the Group’s level of funding in respect of its defined benefit schemes was 54.0% (2019: 50.9%).

202 First Pacific Annual Report 2020
Notes to the Consolidated Financial Statements
The Group’s plan assets mainly comprise debt securities, equities, cash in banks, time deposits and unit trust funds.
Thus, the cash flows from the assets alter in accordance with the change of equity prices and interest rates, and the
assets are subject to various risks including credit, investment and liquidity risks. While the Group does not perform
any asset-liability matching study, the risks arising from the nature of the assets comprising the fund, are mitigated
by limiting the investments in financial assets only to the good quality instruments as recommended by the trust
managers, investing in reputable equity shares with good fair values and contributing to the respective fund from time
to time, based on the recommendations of their actuaries with the objective of maintaining their respective funds in a
sound condition.
The Group has also made provisions for estimated liabilities for employee benefits covering the employees of its
Indonesian subsidiary companies. The amounts of such provisions were determined by reference to employees’ final
salaries and length of service and mainly based on actuarial computations prepared by the actuaries of PT Kappa
Konsultan Utama (a member of the Actuarial Consultant Association of Indonesia) using the projected unit credit
method.
(I) The amounts of liability under defined benefit schemes and estimated liabilities for employee benefits included
in the consolidated statement of financial position are as follows:
US$ millions
Defined
benefit
Schemes
Estimated
liabilities for
employee
benefits
Total
2020 2019
Present value of defined benefit obligations (74.8) (479.0) (553.8) (581.6)
Fair value of plan assets 40.3 – 40.3 43.5
Liability in the Consolidated Statement of
Financial Position (34.5) (479.0) (513.5) (538.1)
(II) The changes in the present value of the obligations under defined benefit schemes and estimated liabilities for
employee benefits during the year are as follows:
US$ millions
Defined
benefit
schemes
Estimated
liabilities for
employee
benefits
Total
2020 2019
At 1 January (88.3) (493.3) (581.6) (518.5)
Exchange translation (5.2) 9.4 4.2 (20.0)
Current service cost (8.9) (28.1) (37.0) (42.7)
Past service cost (0.6) 10.6 10.0 (0.8)
Interest cost on obligation (4.1) (36.0) (40.1) (43.2)
Actuarial (losses)/gains arising from:
– Changes in demographic assumptions (2.4) 0.2 (2.2) 1.3
– Changes in financial assumptions (6.5) 15.5 9.0 (21.9)
– Experience adjustments 0.1 22.6 22.7 14.3
Acquisition of a subsidiary company – (10.9) (10.9) –
Attributable to a discontinued operation 32.1 – 32.1 –
Deconsolidation of a subsidiary company – – – 14.2
Benefits paid and others 9.0 31.0 40.0 35.7
At 31 December (74.8) (479.0) (553.8) (581.6)

203 First Pacific Annual Report 2020
(III) The changes in the fair value of plan assets under the defined benefit schemes during the year are as follows:
US$ millions 2020 2019
At 1 January 43.5 40.5
Exchange translation 2.4 1.7
Interest income included in net interest cost 2.1 3.3
Return on plan assets (excluding amount included in net interest cost) (0.8) (0.6)
Contributions by employers 11.3 11.7
Attributable to a discontinued operation (11.1) –
Deconsolidation of a subsidiary company – (8.4)
Benefits paid and others (7.1) (4.7)
At 31 December 40.3 43.5
(IV) The major categories of plan assets as a percentage of the fair value of the total plan assets under the defined
benefit schemes are as follows:
2020 2019
Philippine debt securities 56% 56%
Philippine equities 30% 23%
Indonesian debt securities 1% 1%
Indonesian equities 1% 1%
Cash in banks and time deposits 5% 4%
Unit trust funds and others 7% 15%
(V) The amount recognized in the consolidated income statement and consolidated statement of comprehensive
income is analyzed as follows:
US$ millions
Defined
benefit
schemes
Estimated
liabilities for
employee
benefits
Total
2020 2019
Current service cost(i) 8.9 28.1 37.0 42.7
Past service cost(i) 0.6 (10.6) (10.0) 0.8
Interest cost on obligation(i) 4.1 36.0 40.1 43.2
Interest income on plan assets(i) (2.1) – (2.1) (3.3)
Actuarial losses/(gains) arising from
– Changes in demographic assumptions(ii) 2.4 (0.2) 2.2 (1.3)
– Changes in financial assumptions(ii) 6.5 (15.5) (9.0) 21.9
– Experience adjustments(ii) (0.1) (22.6) (22.7) (14.3)
Return on plan assets (excluding amount
included in net interest cost)(ii) 0.8 – 0.8 0.6
Total 21.1 15.2 36.3 90.3
Actual Return on Plan Assets 3% 7%
(i) Included in cost of sales, selling and distribution expenses and administrative expenses(ii) Included in other comprehensive income

204 First Pacific Annual Report 2020
Notes to the Consolidated Financial Statements
(VI) Principal actuarial assumptions (weighted average) at 31 December are as follows:
2020 2019
Discount rate 6% 7%
Future annual salary increases 6% 8%
(VII) The calculation of the defined benefit obligation is sensitive to the assumptions set above. The following table
summarizes how the present value of the defined benefit obligation at the end of the reporting period would
have increased or decreased as a result of changes in the respective assumptions:
US$ millions
Increase/
(decrease)
(Decrease)/
increase at
31 December
2020
Increase/
(decrease)
(Decrease)/
increase at
31 December
2019
Annual discount rate (%) 1.0 (28.6) 1.0 (24.9)
(1.0) 33.6 (1.0) 29.5
Future annual salary increases (%) 1.0 33.9 1.0 30.0
(1.0) (29.2) (1.0) (25.7)
(VIII) The following table provides the maturity analysis of the undiscounted benefit payments as at 31 December:
US$ millions 2020 2019
Less than one year 47.7 43.1
One year to five years 161.8 167.8
More than five years 3,060.7 4,322.2
Total expected benefit payments 3,270.2 4,533.1
The weighted average duration of the defined benefit obligation is 12 years (2019: 11 years).
(IX) The Group expects to contribute US$6.7 million (2019: US$5.4 million) to its defined benefit pension plans next
year.
(C) Loans to Officers
During the years ended 31 December 2020 and 2019, there were no loans made by the Group to officers which required
disclosure pursuant to section 383(1)(d) of the Hong Kong Companies Ordinance and Part 3 of the Companies (Disclosure
of Information about Benefits of Directors) Regulation.

205 First Pacific Annual Report 2020
37. Directors’ and Senior Executives’ Remuneration(A) Directors’ Remuneration
The remuneration of Directors and chief executive of the Company for the year ended 31 December 2020, disclosed on an
individual basis and pursuant to the Appendix 16 paragraph 24 of the Listing Rules, section 383 (1)(a), (b), (c) and (f) of
the Hong Kong Companies Ordinance and Part 2 of the Companies (Disclosure of Information about Benefits of Directors)
Regulation, is as follows:
Directors’ Remuneration – 2020
Non-performance based
US$’000 Salaries
Other
benefits
Pension
contributions
Performance
based
payments(i)
Employee
share-based
compensation
benefit
expenses/LTIP Fees(ii) Total
Chairman
Anthoni Salim 3,057 – – – – 53 3,110
Executive Directors
Manuel V. Pangilinan,
Managing Director and Chief Executive Officer 5,718 529 198 528 2,709 – 9,682
Christopher H. Young, Chief Financial Officer 1,629 267 159 392 1,626 – 4,073
Non-executive Directors
Tedy Djuhar – – – – – 28 28
Benny S. Santoso – – – – 92 90 182
Axton Salim(iii) 1,615 – – – – 41 1,656
Independent Non-executive Directors
Prof. Edward K.Y. Chen, GBS, CBE, JP – – – – 123 139 262
Margaret Leung Ko May Yee, SBS, JP – – – – 123 139 262
Philip Fan Yan Hok – – – – 123 145 268
Madeleine Lee Suh Shin – – – – 92 137 229
Blair Chilton Pickerell(iv) – – – – 48 103 151
Total 12,019 796 357 920 4,936 875 19,903
(i) Performance based payments comprise performance bonuses and long-term monetary incentive awards.(ii) For meetings attended(iii) Mr. Axton Salim was appointed as a Non-executive Director with effect from 25 March 2020.(iv) Mr. Blair Chilton Pickerell was appointed as an Independent Non-executive Director with effect from 25 March 2020.

206 First Pacific Annual Report 2020
Notes to the Consolidated Financial Statements
Directors’ Remuneration – 2019
Non-performance based
US$’000 Salaries
Other
benefits
Pension
contributions
Performance
based
payments(i)
Employee
share-based
compensation
benefit
expenses/LTIP Fees(ii) Total
Chairman
Anthoni Salim 3,106 – – – – 66 3,172
Executive Directors
Manuel V. Pangilinan,
Managing Director and Chief Executive Officer 4,707 523 198 4,470 2,704 – 12,602
Christopher H. Young, Chief Financial Officer 1,623 258 159 235 1,799 – 4,074
Non-executive Directors
Tedy Djuhar – – – – – 28 28
Benny S. Santoso – – – – 124 104 228
Ambassador Albert F. del Rosario(iii) – – – – 79 64 143
Independent Non-executive Directors
Prof. Edward K.Y. Chen, GBS, CBE, JP – – – – 167 178 345
Margaret Leung Ko May Yee, SBS, JP – – – – 167 166 333
Philip Fan Yan Hok – – – – 167 177 344
Madeleine Lee Suh Shin – – – – 130 152 282
Total 9,436 781 357 4,705 5,337 935 21,551
(i) Performance based payments comprise performance bonuses and long-term monetary incentive awards.(ii) For meetings attended(iii) Ambassador Albert F. del Rosario resigned from the Board of Directors with effect from 1 July 2019.
Included within the total Directors’ remuneration is an amount of US$2.1 million (2019: US$1.3 million) paid by PLDT, an
associated company, in respect of the services of the Managing Director and Chief Executive Officer of the Company.
(B) Senior Executives’ Remuneration
As similar remuneration schemes operate for the senior executives of the Group, their remuneration may exceed those
of the Company’s Directors. One (2019: Two) senior executive was among the Group’s five highest earning employees
during the year ended 31 December 2020. The remaining four (2019: three) of the five highest earning employees are the
Company’s Directors. Details of the remuneration for one (2019: two) senior executive are as follows:
US$’000 2020 2019
Non-performance based
– Salaries and benefits 1,230 2,600
Performance based
– Bonuses and long-term monetary incentive awards – 12,676
Retirement benefit payments 4,336 –
Total 5,566 15,276
The remuneration of one (2019: two) senior executive who was among the Group’s five highest earning employees in 2020 is
within the following bands:
Remuneration bands
2020
Number
2019
Number
US$5,508,000 – US$5,572,000 1 –
US$7,364,000 – US$7,428,000 – 1
US$7,876,000 – US$7,940,000 – 1
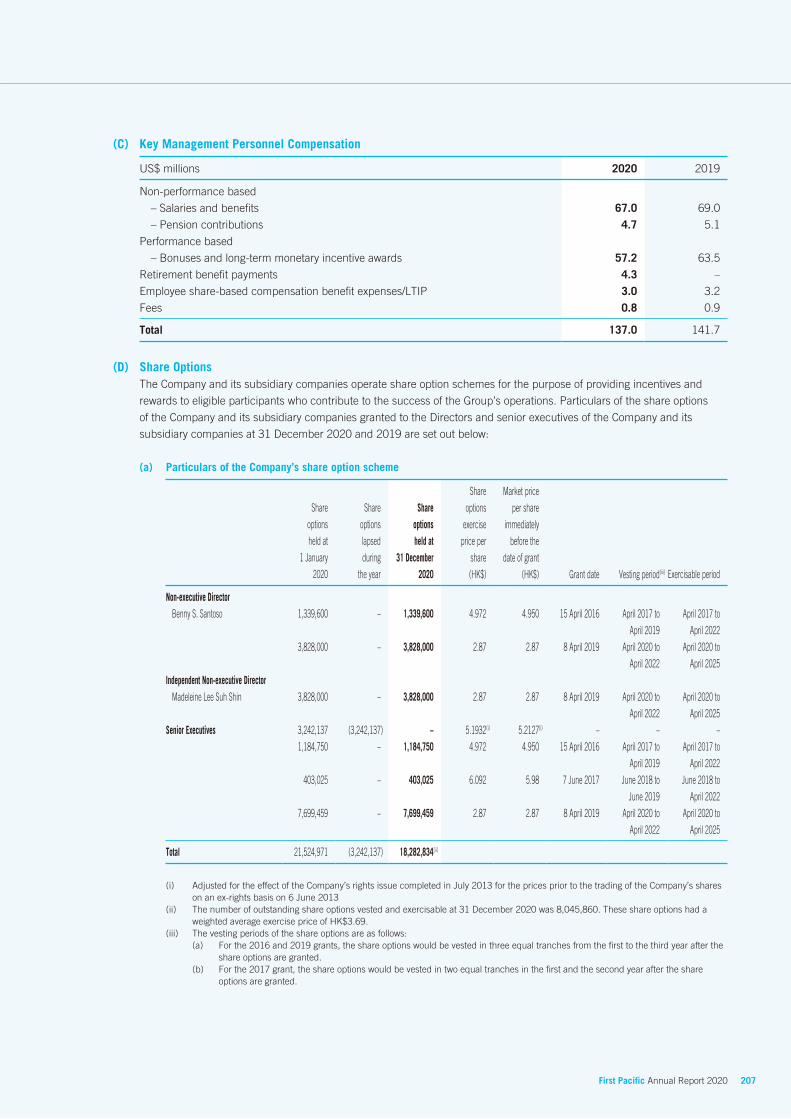
207 First Pacific Annual Report 2020
(C) Key Management Personnel Compensation
US$ millions 2020 2019
Non-performance based
– Salaries and benefits 67.0 69.0
– Pension contributions 4.7 5.1
Performance based
– Bonuses and long-term monetary incentive awards 57.2 63.5
Retirement benefit payments 4.3 –
Employee share-based compensation benefit expenses/LTIP 3.0 3.2
Fees 0.8 0.9
Total 137.0 141.7
(D) Share Options
The Company and its subsidiary companies operate share option schemes for the purpose of providing incentives and
rewards to eligible participants who contribute to the success of the Group’s operations. Particulars of the share options
of the Company and its subsidiary companies granted to the Directors and senior executives of the Company and its
subsidiary companies at 31 December 2020 and 2019 are set out below:
(a) Particulars of the Company’s share option scheme
Share
options
held at
1 January
2020
Share
options
lapsed
during
the year
Share
options
held at
31 December
2020
Share
options
exercise
price per
share
(HK$)
Market price
per share
immediately
before the
date of grant
(HK$) Grant date Vesting period(iii) Exercisable period
Non-executive Director
Benny S. Santoso 1,339,600 – 1,339,600 4.972 4.950 15 April 2016 April 2017 to
April 2019
April 2017 to
April 2022
3,828,000 – 3,828,000 2.87 2.87 8 April 2019 April 2020 to
April 2022
April 2020 to
April 2025
Independent Non-executive Director
Madeleine Lee Suh Shin 3,828,000 – 3,828,000 2.87 2.87 8 April 2019 April 2020 to
April 2022
April 2020 to
April 2025
Senior Executives 3,242,137 (3,242,137) – 5.1932(i) 5.2127(i) – – –
1,184,750 – 1,184,750 4.972 4.950 15 April 2016 April 2017 to
April 2019
April 2017 to
April 2022
403,025 – 403,025 6.092 5.98 7 June 2017 June 2018 to
June 2019
June 2018 to
April 2022
7,699,459 – 7,699,459 2.87 2.87 8 April 2019 April 2020 to
April 2022
April 2020 to
April 2025
Total 21,524,971 (3,242,137) 18,282,834(ii)
(i) Adjusted for the effect of the Company’s rights issue completed in July 2013 for the prices prior to the trading of the Company’s shares on an ex-rights basis on 6 June 2013
(ii) The number of outstanding share options vested and exercisable at 31 December 2020 was 8,045,860. These share options had a weighted average exercise price of HK$3.69.
(iii) The vesting periods of the share options are as follows:(a) For the 2016 and 2019 grants, the share options would be vested in three equal tranches from the first to the third year after the
share options are granted.(b) For the 2017 grant, the share options would be vested in two equal tranches in the first and the second year after the share
options are granted.

208 First Pacific Annual Report 2020
Notes to the Consolidated Financial Statements
Share
options
held at
1 January
2019
Share
options
granted
during
the year
Share
options
canceled
during
the year(i)
Share
options
held at
31 December
2019
Share
options
exercise
price per
share
(HK$)
Market price
per share
immediately
before the
date of grant
(HK$) Grant date Vesting period(iv) Exercisable period
Executive Director
Manuel V. Pangilinan 10,224,972 – (10,224,972) – 10.2299(ii) 10.4450(ii) – – –
Non-executive Director
Benny S. Santoso 715,748 – (715,748) – 10.2299(ii) 10.4450(ii) – – –
1,097,139 – (1,097,139) – 10.2729(ii) 9.7213(ii) – –
715,748 – (715,748) – 10.2299 7.72 – – –
1,339,600 – – 1,339,600 4.972 4.950 15 April 2016 April 2017 to
April 2019
April 2017 to
April 2022
– 3,828,000 – 3,828,000 2.87 2.87 8 April 2019 April 2020 to
April 2022
April 2020 to
April 2025Independent Non-executive Directors
Prof. Edward K.Y. Chen, GBS, CBE, JP 1,097,139 – (1,097,139) – 10.2729(ii) 9.7213(ii) – – –
Margaret Leung Ko May Yee, SBS, JP 715,748 – (715,748) – 10.2299(ii) 10.4450(ii) – – –
1,097,139 – (1,097,139) – 10.2729(ii) 9.7213(ii) – – –
Philip Fan Yan Hok 715,748 – (715,748) – 10.2299(ii) 10.4450(ii) – – –
1,097,139 – (1,097,139) – 10.2729(ii) 9.7213(ii) – – –
Madeleine Lee Suh Shin – 3,828,000 – 3,828,000 2.87 2.87 8 April 2019 April 2020 to
April 2022
April 2020 to
April 2025
Senior Executives 3,242,137 – – 3,242,137 5.1932(ii) 5.2127(ii) 18 June 2010 June 2012 to
June 2015
June 2012 to
June 2020
24,130,933 – (24,130,933) – 10.2299(ii) 10.4450(ii) – – –
44,227,095 – (44,227,095) – 10.2729(ii) 9.7213(ii) – – –
5,112,486 – (5,112,486) – 10.2299 7.72 – – –
14,638,000 – (14,638,000) – 10.2514 7.72 – – –
7,538,000 – (7,538,000) – 10.2514 9.24 – – –
1,184,750 – – 1,184,750 4.972 4.950 15 April 2016 April 2017 to
April 2019
April 2017 to
April 2022
403,025 – – 403,025 6.092 5.98 7 June 2017 June 2018 to
June 2019
June 2018 to
April 2022
– 7,699,459 – 7,699,459 2.87 2.87 8 April 2019 April 2020 to
April 2022
April 2020 to
April 2025
Total 119,292,546 15,355,459 (113,123,034) 21,524,971(iii)
(i) On 8 April 2019, First Pacific’s Board of Directors approved to rescind and cancel a total of 113,123,034 share options granted by the Company to the Directors and senior executives of the Company during the period from March 2013 to July 2014 at exercise prices ranging from HK$10.2299 to HK$10.2729. The corresponding amounts accumulated in the employee share-based compensation reserve for these share options were credited to retained earnings upon cancelation.
(ii) Adjusted for the effect of the Company’s rights issue completed in July 2013 for the prices prior to the trading of the Company’s shares on an ex-rights basis on 6 June 2013
(iii) The number of outstanding share options vested and exercisable at 31 December 2019 was 6,169,512. These share options had a weighted average exercise price of HK$5.16.
(iv) The vesting periods of the share options are as follows:(a) For the 2010 grant, the share options would be vested in four tranches (40% from the second year after the share options are
granted and 20% each from the third to the fifth year after the grant).(b) For the 2016 and 2019 grants, the share options would be vested in three equal tranches from the first to the third year after the
share options are granted.(c) For the 2017 grant, the share options would be vested in two equal tranches in the first and the second year after the share
options are granted.

209 First Pacific Annual Report 2020
At the AGM held on 24 May 2004, the Company’s shareholders approved a share option scheme (the “Scheme”)
under which the Directors may, at their discretion, at any time during the life of the Scheme, grant Directors and
executives of the Company’s share options as part of the Company’s LTIP. The Scheme, which complies with the
provisions set out in Chapter 17 of the Listing Rules, became effective on 24 May 2004. The Scheme was valid for 10
years and expired on 23 May 2014.
The maximum number of shares on which options may be granted may not exceed 10% of the Company’s issued
share capital as at the date of approval of the Scheme by the shareholders, which equaled to 318,599,300 shares.
The maximum number of shares in respect of which options may be granted under the Scheme to any one participant
in any 12-month period is limited to 1% of the aggregate number of shares of the Company in issue at the time of the
proposed grant of options to such participant.
The exercise price in relation to each share option offer shall be determined by the Directors at their absolute
discretion, but in any event shall not be less than the highest of (i) the closing price of the Company’s shares as stated
in the daily quotation sheet of the SEHK on the date of grant; (ii) the average of the closing prices of the Company’s
shares as stated in the daily quotation sheets of the SEHK for the five trading days immediately preceding the date
of grant; and (iii) the nominal value of the Company’s share on the date of grant. The terms of the Scheme provide
that subject to any other restrictions on vesting imposed by the Directors, share options may be exercised under the
Scheme at any time from the date of acceptance until the date of expiry. All options presently outstanding under the
Scheme are subject to certain restrictions on exercise including a prohibition on exercise for a certain period after
the date on which any option is accepted. Share options vest progressively over the vesting period, provided that the
relevant grantee remains employed by the Group. Options which lapse or are canceled prior to their expiry date are
deleted from the register of options. After the adoption of the new share option scheme in 2012, no further share
options were granted pursuant to the Scheme before it expired or was terminated.
On 18 June 2010, 5,400,000 share options under the Company’s Scheme were granted. The average fair value of
options granted as calculated by Towers Watson Hong Kong Limited, based on the binomial model, was HK$2.28
each or an aggregate value of US$1.6 million for all options granted. The assumptions used were as follows:
Share price at the date of grant (before adjusting for the effect of
the Company’s 2013 rights issue) HK$5.31 per share(i)
Exercise price (before adjusting for the effect of the Company’s 2013 rights issue) HK$5.31 per share(i)
Expected volatility (based on historical volatility of the Company’s shares
commensurate with the average expected life of the options granted) 45%
Option life 10 years
Expected dividend yield 2.0% per annum
Average risk-free interest rate (based on the Hong Kong Exchange Fund Notes) 2.3% per annum
Taking into account the expected turnover rate of the senior executives and the early exercise behavior, the average
expected life of the options granted was estimated to be around 8 years. The early exercise behavior assumes that
option holders will exercise the options when the share price is at least 250% of the exercise price. No other feature
of the option granted was incorporated into the measurement of fair value.
(i) HK$5.1932 after adjusting for the effect of the Company’s rights issue in 2013
At the AGM held on 31 May 2012, the Company’s shareholders approved a new share option scheme (the “New
Scheme”) under which the Directors may, at their discretion, at any time during the life of the New Scheme, grant
Directors and executives of the Company’s share options as part of the Company’s LTIP. The New Scheme, which
complies with the provisions set out in Chapter 17 of the Listing Rules, became effective on 31 May 2012. The New
Scheme will be valid for 10 years and will expire on 30 May 2022.

210 First Pacific Annual Report 2020
Notes to the Consolidated Financial Statements
The maximum number of shares on which options may be granted may not exceed 10% of the Company’s issued
share capital as at the date of approval of the New Scheme by the shareholders, which equaled to 382,827,354
shares. The maximum number of shares in respect of which options may be granted under the New Scheme to any
one participant in any 12-month period is limited to 1% of the aggregate number of shares of the Company in issue at
the time of the proposed grant of options to such participant.
The exercise price in relation to each share option offer shall be determined by the Directors at their absolute
discretion, but in any event shall not be less than the highest of (i) the closing price of the Company’s shares as stated
in the daily quotation sheet of the SEHK on the date of grant; (ii) the average of the closing prices of the Company’s
shares as stated in the daily quotation sheets of the SEHK for the five trading days immediately preceding the date of
grant; and (iii) the nominal value of the Company’s share on the date of grant. The terms of the New Scheme provide
that subject to any other restrictions on vesting imposed by the Directors, share options may be exercised under the
New Scheme at any time from the date of acceptance until the date of expiry. Any options granted under the New
Scheme are subject to certain restrictions on exercise including a prohibition on exercise for a certain period after
the date on which any option is accepted. Share options vest progressively over the vesting period, provided that the
relevant grantee remains employed by the Group. Options which lapse or are canceled prior to their expiry date are
deleted from the register of options.
On 15 April 2016, 2,524,350 share options under the Company’s New Scheme were granted. The average fair value
of options granted as calculated by Towers Watson Hong Kong Limited, based on the binomial model, was HK$1.05
each or an aggregate value of US$0.3 million for all options granted. The assumptions used were as follows:
Share price at the date of grant HK$4.95 per share
Exercise price HK$4.972 per share
Expected volatility (based on historical volatility of the Company’s shares
commensurate with the average expected life of the options granted) 29%
Option life 6 years
Expected dividend yield 2.4% per annum
Average risk-free interest rate (based on the Hong Kong Exchange Fund Notes) 1.0% per annum
Taking into account the expected turnover rate of the senior executives and the early exercise behavior, the average
expected life of the options granted was estimated to be around 5 years. The early exercise behavior assumes that
option holders will exercise the options when the share price is at least 150% of the exercise price. No other feature
of the option granted was incorporated into the measurement of fair value.
On 7 June 2017, 403,025 share options under the Company’s New Scheme were granted. The average fair value
of options granted as calculated by Towers Watson Hong Kong Limited, based on the binomial model, was HK$1.03
each or an aggregate value of US$0.1 million for all options granted. The assumptions used were as follows:
Share price at the date of grant HK$5.98 per share
Exercise price HK$6.092 per share
Expected volatility (based on historical volatility of the Company’s shares
commensurate with the average expected life of the options granted) 26%
Option life 4.85 years
Expected dividend yield 2.4% per annum
Average risk-free interest rate (based on the Hong Kong Exchange Fund Notes) 0.8% per annum
Taking into account the expected turnover rate of the senior executives and the early exercise behavior, the average
expected life of the options granted was estimated to be around 4 years. The early exercise behavior assumes that
option holders will exercise the options when the share price is at least 150% of the exercise price. No other feature
of the options granted was incorporated into the measurement of fair value.

211 First Pacific Annual Report 2020
On 8 April 2019, 15,355,459 share options under the Company’s New Scheme were granted. The average fair value of options granted as calculated by Towers Watson Hong Kong Limited, based on the binomial lattice model, was HK$0.51 per share or an aggregate value of US$1.0 million for all options granted. The assumptions used were as follows:
Share price at the date of grant HK$2.86 per shareExercise price HK$2.87 per shareExpected volatility (based on historical volatility of the Company’s shares
commensurate with the average expected life of the options granted) 24%Option life 6 yearsExpected dividend yield 2.5% per annumAverage risk-free interest rate (based on the Hong Kong Exchange Fund Notes) 1.47% per annum
Taking into account the expected turnover rate of the Directors and senior executives and the early exercise behavior, the average expected life of the options granted was estimated to be around 4.5 years. The early exercise behavior assumes that option holders will exercise the options when the share price is at least 140% of the exercise price. No other feature of the options granted was incorporated into the measurement of fair value.
The binomial model, applied for determining the estimated values of the share options granted under the Scheme and the New Scheme, was developed for use in estimating the fair value of the traded options that are fully transferable. Such an option pricing model requires input of highly subjective assumptions, including the expected share price volatility. As the Company’s share options have characteristics significantly different from those of the traded options, changes in the subjective input assumptions can materially affect the estimated value of the options granted.
As at the date of these financial statements, the Company had 18,282,834 share options outstanding under the Company’s share option schemes, which represented approximately 0.4% of the Company’s shares in issue as at that date.
Details of the Group’s accounting policy in respect of the share options granted are set out in Note 2(D)(t)(III) to the Consolidated Financial Statements.
(b) Particulars of MPIC’s share option scheme
There were no new share options granted under MPIC’s share option scheme during the year ended 31 December 2020. All outstanding share options granted under MPIC’s share option scheme in 2013 lapsed in October 2019 and MPIC’s share option scheme was replaced by a restricted stock unit plan (“RSUP”).
(c) Particulars of RHI’s share option scheme
There were no new share options granted under RHI’s share option scheme during the year ended 31 December 2020. All outstanding share options granted under RHI’s share option scheme in 2014 lapsed in April 2019.
(E) MPIC’s Restricted Stock Unit Plan
On 14 July 2016, the Compensation Committee of MPIC approved a RSUP as part of MPIC’s LTIP. The RSUP, which has a validity period of 10 years, replaced MPIC’s share option scheme. The RSUP is designed, among others, to reward the directors and certain key officers of MPIC who contribute to its growth to stay with MPIC for the long term. Under the RSUP, MPIC will purchase its common shares at its cost from the open market and reserve those treasury shares for transferring to the eligible participants as determined by MPIC’s Compensation Committee. The RSUP also limits the aggregate number of shares that may be subject to award to no more than three percent of the outstanding common shares of MPIC.
On 31 January 2020, the Compensation Committee of MPIC approved a RSUP covering cycle 2019 to 2021 and a total of 31.8 million shares were granted to senior executives of the Group. MPIC shall secure exemption ruling from the Philippine SEC on the share award, which is necessary for MPIC to reacquire its common shares in the market. The fair value of the share award was determined based on the market closing price of Pesos 3.21 per share on the date of grant. One third of the awarded shares would be vested at the end of each year until full vesting by December 2021 and transferred at no cost to the eligible participants on the full vesting date.
In relation to the RSUP covering cycle 2016 to 2018, the vested shares were transferred to the grantees in June 2019.

212 First Pacific Annual Report 2020
Notes to the Consolidated Financial Statements
38. Related Party TransactionsSignificant related party transactions entered into by the Group during the years ended 31 December 2020 and 2019 are
disclosed as follows:
(A) On 22 May 2020, ICBP entered into a conditional shares sale and purchase agreement with Pinehill Corpora and Steele
Lake in relation to the acquisition of the entire issued share capital of Pinehill for a total consideration of US$2,998 million.
Pinehill Corpora, which is the seller of 51% interest in Pinehill, is a consortium indirectly owned as to 49% by Mr. Anthoni
Salim, the Chairman and a substantial shareholder of the Company. The transaction was approved by the Company’s
independent shareholders in July 2020 and completed on 27 August 2020. For details, please refer to Note 34(C) to the
Consolidated Financial Statements.
At 31 December 2020, a retention payable due to Pinehill Corpora of US$331.5 million (2019: Nil) was included in the
non-current portion of deferred liabilities, provisions and payables (Note 28).
(B) On 23 December 2020, MPIC, through its wholly-owned subsidiary company, Beacon PowerGen, entered into a sale
and purchase agreement to sell its 56% interest in GBPC to MGen, a wholly-owned subsidiary company of Meralco and
associated company of the Group, for an aggregate consideration of approximately Pesos 22.4 billion (equivalent to
approximately US$466.6 million). The transaction was approved by the Company’s shareholders on 2 March 2021 and is
expected to be completed on 31 March 2021. For details, please refer to Note 7 to the Consolidated Financial Statements.
(C) In March 2013, MGen, through its wholly-owned subsidiary company, MPG Asia Limited (“MPG Asia”), provided a loan of
US$110.0 million to FPM Power. In June 2014, MPG Asia provided an additional loan of US$3.5 million to FPM Power.
The loans are unsecured, interest-free and repayable on demand. The loans of US$113.5 million (2019: US$113.5 million)
remained outstanding at 31 December 2020 and were included in the current portion of deferred liabilities, provisions and
payables (Note 28).
For the year ended 31 December 2019, MPG Asia made pro-rata capital injections to FPM Power of US$17.6 million.
There was no change in shareholdings in FPM Power following the capital injections.
(D) At 31 December 2020, Petronas Power Sdn. Bhd. (“Petronas”), the 30% shareholder of PLP, had outstanding loans due
from PLP of approximately US$67.2 million (2019: US$62.6 million), which were included in the non-current portion of
deferred liabilities, provisions and payables (Note 28). The loans are unsecured, subject to a variable London Interbank
Offered Rate and are payable semi-annually. The tenor for each loan shall be 10 years. For the year ended 31 December
2020, PLP accrued interest expenses of US$4.6 million (2019: US$5.1 million) to Petronas, which were capitalized as part
of the outstanding loans from Petronas. At 31 December 2020, PLP had outstanding interest payable of approximately
US$11,682 (2019: US$13,771) due to Petronas, which was included in accounts payable, other payables and accruals.
For the year ended 31 December 2019, Petronas made pro-rata capital injections to PLP of S$25.4 million (US$18.6
million). There was no change in shareholdings in PLP following the capital injections.
(E) FPM Power has a support service agreement with MGen with effect from 1 January 2015. Under the agreement, FPM
Power shall pay MGen for its support services rendered under the agreement until terminated in writing by MGen and FPM
Power.
For the year ended 31 December 2020, the fees under the above arrangement amounted to US$1.0 million (2019: US$1.0
million). At 31 December 2020, FPM Power had outstanding service fees payable of US$0.4 million (2019: US$0.3 million)
to MGen, which was included in accounts payable, other payables and accruals.

213 First Pacific Annual Report 2020
(F) On 1 March 2018, First Pacific Investment Management Limited (“FPIML”), a wholly-owned subsidiary company of the
Company, entered into an advisory services agreement with Smart. The agreement is for a period of one year subject
to a 12-month automatic renewal unless either party notifies the other party of its intent not to renew the agreement.
FPIML provides advisory and related services in connection with the operation of Smart’s business of providing mobile
communications services, high-speed internet connectivity, and access to digital services and content. The agreement
provides that Smart shall pay a monthly service fee of US$0.25 million and any additional fee shall be mutually agreed
upon by both parties on a monthly basis. On 26 March 2020, Smart and FPIML mutually agreed to reduce the monthly
service fee to US$0.1 million from US$0.25 million in consideration of the services provided under this agreement, effective
1 April 2020. The fees under this agreement amounted to US$1.65 million for the year ended 31 December 2020 (2019:
US$3.0 million). At 31 December 2020, FPIML had outstanding receivable of US$0.2 million (2019: Nil) from Smart under
this agreement.
(G) In December 2014, Asia Link B.V. (“ALBV”), a wholly-owned subsidiary company of the Company, entered into a
subscription agreement with SMECI, a wholly-owned subsidiary company of Philex, in respect of the subscription for the
SMECI’s notes with a principal amount of Pesos 5.04 billion (US$105.0 million) (out of the total Pesos 7.2 billion (US$149.9
million) SMECI’s notes), principally for financing capital expenditure of the Silangan project and repaying the advances
from Philex. The SMECI’s notes bear interest at a coupon rate of 1.5%, payable semi-annually every 18 June and 18
December and has a maturity of 8 years. A redemption premium, payable at a rate of 3% per annum, retroactively from the
issue date and compounded semi-annually, will apply upon the maturity of the SMECI’s notes. During the year ended 31
December 2020, ALBV accrued interest income of US$5.2 million (2019: US$4.8 million) on these notes. At 31 December
2020, ALBV had outstanding interest receivable of approximately US$56,847 (2019: US$53,915) due from SMECI.
(H) On 27 June 2017, MPIC acquired from PCEV, a subsidiary company of PLDT, the remaining 25% interest in Beacon
Electric’s common and preferred shares at a consideration of Pesos 21.8 billion (US$435.6 million), of which Pesos
12.0 billion (US$239.8 million) was settled in cash upfront and Pesos 7.35 billion (US$143.9 million) was settled up to
December 2020. The outstanding payable of Pesos 2.45 billion (US$51.0 million) (with a present value of US$49.7 million)
at 31 December 2020 was included in the current portion of deferred liabilities, provisions and payables (Note 28) and will
be due in June 2021.
On 30 May 2016, MPIC acquired from PCEV, a 25% interest in Beacon Electric’s common shares and preferred shares at
a total consideration of Pesos 26.2 billion (US$549.6 million), of which Pesos 17.0 billion (US$356.6 million) was settled in
cash upfront and the remaining Pesos 9.2 billion (US$181.7 million) was fully settled in June 2020.
(I) In September 2020, Mr. Manuel V. Pangilinan, who is the Managing Director and Chief Executive Officer of the Company,
subscribed US$1,000,000 of bonds due 2027 issued by FPC Resources Limited, a wholly-owned subsidiary company
of the Company. At 31 December 2020, Mr. Pangilinan owned US$1,000,000 of bonds due 2027 and earned interest
income of US$13,490 from these bonds for the period from 11 September 2020 to 31 December 2020.
(J) Under certain framework agreements, Indofood has engaged in trade transactions in the ordinary course of business with
certain of its associated companies, joint ventures and affiliated companies which are related to the Salim Family either
through its control or joint control. Mr. Anthoni Salim is the Chairman and a substantial shareholder of the Company and is
the President Director and Chief Executive Officer of Indofood.

214 First Pacific Annual Report 2020
Notes to the Consolidated Financial Statements
All significant transactions with related parties, whether or not conducted under normal terms and conditions similar to
those with non-related parties, are disclosed as follows:
Nature of Transactions
For the year ended 31 December 2020 2019
US$ millions
Income Statement Items
Sales of finished goods
– to affiliated companies 564.0 575.3
Purchases of raw materials and finished goods
– from a joint venture 19.2 9.6
– from affiliated companies 2.2 3.0
Outsourcing expenses
– to affiliated companies 27.6 27.3
Insurance expenses
– to affiliated companies 10.5 11.1
Rental expenses
– to affiliated companies –(i) 0.9
Pump services expenses
– to affiliated companies 0.5 0.5
Royalty and technical income
– from affiliated companies 16.1 22.4
Rental income
– from affiliated companies 1.5 1.8
(i) Indofood no longer records the lease arrangement with affiliated companies as rental expenses upon the renewal of lease contracts for three years from 1 January 2020 to 31 December 2022 under HKFRS 16 “Leases”. For the year ended 31 December 2020, Indofood made lease payments of US$0.4 million to affiliated companies for the settlement of lease liabilities recognized.
Approximately 10% (2019: 11%) of Indofood’s sales and 0.6% (2019: 0.3%) of its purchases were transacted with these
related parties.
Nature of Balances
At 31 December 2020 2019
US$ millions
Statement of Financial Position Items
Accounts receivable – trade
– from affiliated companies 78.9 91.9
Accounts receivable – non-trade
– from an associated company 27.6 –
– from affiliated companies 15.1 16.3
Accounts payable – trade
– to an associated company 0.4 5.2
– to affiliated companies 5.2 5.5
Accounts payable – non-trade
– to affiliated companies 36.6 36.7
Certain of the above Indofood’s related party transactions also constitute continuing connected transactions as defined in
Chapter 14A of the Listing Rules and their details are disclosed in the Corporate Governance Report on pages 70 to 79.

215 First Pacific Annual Report 2020
(K) In March 2018, Maynilad, a subsidiary company of MPIC, renewed the framework agreement with D.M. Consunji, Inc.
(“Consunji”), a subsidiary company of DMCI Holdings, Inc. (a 27.2% shareholder of Maynilad Water Holding Company,
Inc., Maynilad’s parent company) for the period from 1 January 2018 to 31 December 2020 on substantially the same
terms as the previous framework agreement in relation to the provision of engineering, procurement and/or construction
services by Consunji to Maynilad. In October 2019, the estimated annual caps for years 2019 and 2020 under the
aforesaid framework agreement were revised due to existing pressure to accelerate water and wastewater infrastructure
projects in the Philippines, particularly, after the widespread water service interruptions and near-drought conditions and
historically low water levels at the primary water source, which conditions are anticipated to occur more frequently because
of climate change. In February 2021, the framework agreement was further renewed for the period from 19 February 2021
to 31 December 2023.
All significant transactions with Consunji, whether or not conducted under normal terms and conditions similar to those
with non-related parties, are disclosed as follows:
Nature of Transactions
For the year ended 31 December 2020 2019
US$ millions
Capital Expenditure Item
Construction services for water infrastructure 100.8 126.6
(L) In January 2020, NLEX Corporation, a subsidiary company of MPIC, entered into a construction contract with Consunji
pursuant to which Consunji has agreed to construct and complete the civil works for Section 1 of the Connector Road in the
Philippines, which covers the construction of a 4-lane carriageway and two interchanges located at C3 Road/5th Avenue,
Caloocan City and España in Manila.
All significant transactions with Consunji, whether or not conducted under normal terms and conditions similar to those
with non-related parties, are disclosed as follows:
Nature of Transactions
For the year ended 31 December 2020 2019
US$ millions
Capital Expenditure Item
Construction services 155.0 –
(M) MPIC, RHI and their subsidiary companies were charged for electricity expenses by Meralco, an associated company of the
Group.
All significant transactions with Meralco, whether or not conducted under normal terms and conditions similar to those with
non-related parties, are disclosed as follows:
Nature of Transactions
For the year ended 31 December 2020 2019
US$ millions
Income Statement Item
Electricity expenses 21.0 32.0
Nature of Balances
At 31 December 2020 2019
US$ millions
Statement of Financial Position Item
Accounts payable – trade 2.5 1.6

216 First Pacific Annual Report 2020
Notes to the Consolidated Financial Statements
(N) MPIC, RHI and their subsidiary companies were charged for voice and data services provided by PLDT, an associated
company of the Group.
All significant transactions with PLDT, whether or not conducted under normal terms and conditions similar to those with
non-related parties, are disclosed as follows:
Nature of Transactions
For the year ended 31 December 2020 2019
US$ millions
Income Statement Item
Voice and data service expenses 1.6 1.8
Nature of Balances
At 31 December 2020 2019
US$ millions
Statement of Financial Position Item
Accounts payable – trade 1.9 2.3
(O) MPIC and its subsidiary companies had the following transactions with Indra Philippines Inc. (“Indra”), an associated
company of the Group.
All significant transactions with Indra, whether or not conducted under normal terms and conditions similar to those with
non-related parties, are disclosed as follows:
Nature of Transactions
For the year ended 31 December 2020 2019
US$ millions
Income Statement Item
Information technology management and consultancy service expenses 7.7 6.6
Nature of Balances
At 31 December 2020 2019
US$ millions
Statement of Financial Position Item
Accounts payable – trade – 0.1
(P) MPIC and its subsidiary companies had the following balance with Landco Pacific Corporation (“Landco”), a joint venture
of the Group.
All significant transactions with Landco, whether or not conducted under normal terms and conditions similar to those with
non-related parties, are disclosed as follows:

217 First Pacific Annual Report 2020
Nature of Balances
At 31 December 2020 2019
US$ millions
Statement of Financial Position Item
Amounts due from associated companies and joint ventures 53.6 50.8
Less: Impairment provisions (53.6) (30.2)
– 20.6
During the year ended 31 December 2020, the Group recognized an additional impairment loss of US$21.1 million (2019:
Nil) to fully write down the amount due from Landco by reference to a discounted cash flow model.
(Q) MPIC and its subsidiary companies had the following balance with Alsons Thermal Energy Corporation (“ATEC”), an
associated company of the Group.
All significant transactions with ATEC, whether or not conducted under normal terms and conditions similar to those with
non-related parties, are disclosed as follows:
Nature of Balances
At 31 December 2020 2019
US$ millions
Statement of Financial Position Item
Amounts due from associated companies and joint ventures 39.1(i) 37.1
(i) Following the classification of GBPC as a disposal group held for sale in December 2020, the amount is included under assets held for sale.
(R) GBPC sold electricity to Meralco, an associated company of the Group.
All significant transactions with Meralco, whether or not conducted under normal terms and conditions similar to those with
non-related parties, are disclosed as follows:
Nature of Transactions
For the year ended 31 December 2020 2019
US$ millions
Income Statement Item
Sale of electricity 36.7 34.6
Nature of Balances
At 31 December 2020 2019
US$ millions
Statement of Financial Position Item
Accounts receivable – trade 8.9(ii) 6.7
(ii) Following the classification of GBPC as a disposal group held for sale in December 2020, the amount is included under assets held for sale.
(S) On 26 March 2019, ICBP entered into a share sale and purchase agreement with JC Comsa Corporation (“JCC”) in relation
to the acquisition of JCC’s 35% interest in PT Indofood Comsa Sukses Makmur (“ICSM”), a subsidiary company of ICBP,
at a total consideration of Rupiah 8.6 billion (US$0.6 million). As a result, ICBP’s interest in ICSM increased to 86% from
51%.

218 First Pacific Annual Report 2020
Notes to the Consolidated Financial Statements
(T) FPIML had a service agreement with Goodman Fielder for FPIML to provide Goodman Fielder with management, advisory
and financial services with effect from 17 March 2015 and subject to an annual review on the terms and conditions
between the parties. The agreement was terminated on 30 April 2019.
For the period ended 30 April 2019, the fees under the above arrangement amounted to Australian dollar 0.2 million (US$0.1
million).
(U) During the period ended 30 June 2019, Ambassador Albert F. del Rosario, who was a Non-executive Director of the
Company up till 1 July 2019, earned interest income of US$5,750 on bonds of US$200,000 due 2025 issued by FPC
Capital Limited, a wholly-owned subsidiary company of the Company, on 30 May 2018.
(V) Disclosures pursuant to Chapter 14A.72 of the Listing Rules:
(I) Related party transactions numbered (A), (B), (H), (J), (K) and (L) are connected transactions, or continuing
connected transactions, under Chapter 14A of the Listing Rules. The Company has complied with the disclosure
requirements for such connected transactions, or continuing connected transactions, in accordance with Chapter
14A of the Listing Rules.
(II) Related party transactions numbered (C), (D), (E), (F), (I), (M), (N), (R), (S) and (U) are connected transactions, or
continuing connected transactions, under Chapter 14A of the Listing Rules, but are fully exempted from all disclosure
requirements.
(III) Related party transactions numbered (G), (O), (P), (Q) and (T) are not connected transactions, or continuing
connected transactions, under Chapter 14A of the Listing Rules.
39. Financial Instruments(A) Financial Instruments by Category
(a) Financial assets
The following table summarizes the Group’s financial assets at the end of the reporting period:
2020 2019
US$ millions
Financial
assets at
amortized
cost
Financial
assets at
FVOCI
Derivative
instruments(i) Total
Financial
assets at
amortized
cost
Financial
assets at
FVOCI
Derivative
instruments(i) Total
Accounts and other receivables
(Non-current) 52.2 – 1.8 54.0 28.6 – 0.3 28.9
Financial assets at FVOCI
(Non-current) – 426.0 – 426.0 – 385.9 – 385.9
Other non-current assets 110.9 – – 110.9 112.4 – – 112.4
Cash and cash equivalents and
short-term deposits 2,377.8 – – 2,377.8 2,846.4 – – 2,846.4
Restricted cash 50.2 – – 50.2 106.0 – – 106.0
Financial assets at FVOCI
(Current) – 3.3 – 3.3 – 9.9 – 9.9
Accounts and other receivables
(Current) 837.0 – 6.0 843.0 817.3 – 7.5 824.8
Total 3,428.1 429.3 7.8 3,865.2 3,910.7 395.8 7.8 4,314.3
(i) Represents derivative assets designated as hedging instruments

219 First Pacific Annual Report 2020
(b) Financial liabilities
The following table summarizes the Group’s financial liabilities at the end of the reporting period:
2020 2019
US$ millions
Financial
liabilities at
amortized
cost
Financial
liabilities at
FVPL
Derivative
instruments(i) Total
Financial
liabilities at
amortized
cost
Derivative
instruments(i) Total
Accounts payable, other payables and accruals 1,348.2 – – 1,348.2 1,353.2 – 1,353.2
Short-term borrowings 1,659.7 – – 1,659.7 2,262.8 – 2,262.8
Current portion of deferred liabilities,
provisions and payables 395.3 – 10.5 405.8 300.5 2.8 303.3
Long-term borrowings 8,973.9 – – 8,973.9 6,668.0 – 6,668.0
Deferred liabilities, provisions and payables
(Non-current) 739.7 650.0 2.9 1,392.6 804.8 2.1 806.9
Total 13,116.8 650.0 13.4 13,780.2 11,389.3 4.9 11,394.2
(i) Represents derivative liabilities designated as hedging instruments
(B) Fair Values of Financial Instruments
The fair values of the financial assets and liabilities are determined as the price that would be received to sell an asset or
paid to transfer a liability in an orderly transaction between market participants at the measurement date. The following
methods and assumptions were used to estimate the fair value of each class of financial instruments:
Fair values of cash and cash equivalents and short-term deposits, restricted cash, current accounts and other
receivables, accounts payable, other payables and accruals, short-term borrowings and other current liabilities
approximate their carrying amounts largely due to the short-term maturities of these instruments.
Fair values of non-current accounts and other receivables and other non-current assets are evaluated based on the
discounted values of the expected future cash flows using the prevailing market rates for similar types of assets.
Fair values of listed investments included in financial assets at FVOCI are derived from quoted market prices in active
markets.
Fair values of unlisted investments included in financial assets at FVOCI are measured by discounted cash flow
models, by reference to the most recent transaction prices, market comparable companies or valuations of the
underlying assets supplied by independent sources.
Long-term borrowings with fixed interest rates and other non-current financial liabilities are evaluated based on the
discounted value of the expected future cash flows using the prevailing market rates for similar types of liabilities.
Fair values of long-term borrowings with variable interest rates approximate their carrying amounts because of regular
repricing based on market conditions. Fair values of listed bonds are derived from quoted market prices in active
markets.
Derivative assets/liabilities in respect of derivative financial instruments, such as foreign exchange forward contracts,
fuel swaps, electricity futures and interest rate swaps, are valued using valuation techniques with market observable
inputs. The most frequently applied valuation techniques include the use of present value calculations of future cash
flows by reference to current forward exchange rates and fuel prices for contracts with similar maturity profiles and
market values for similar instruments with similar maturity profiles.

220 First Pacific Annual Report 2020
Notes to the Consolidated Financial Statements
The following table shows a comparison between the carrying amounts and fair values of the Group’s financial instruments
with carrying amounts not equal or reasonably approximating their fair values at the end of the reporting period. The
Group’s financial instruments with carrying amounts equal or reasonably approximating their fair values at 31 December
2020 and 2019 and lease liabilities are not included in this table.
2020 2019
US$ millions
Carrying
amount
Fair
value
Carrying
amount
Fair
value
Financial Liabilities
Long-term borrowings 8,973.9 9,676.0 6,668.0 6,758.1
Deferred liabilities, provisions and payables
(Non-current) (other than lease liabilities) 682.1 736.1 759.9 811.0
Total 9,656.0 10,412.1 7,427.9 7,569.1
(C) Fair Value Hierarchy
The Group uses the following hierarchy for determining and disclosing the fair values of financial instruments:
Level 1: fair values measured based on quoted prices (unadjusted) in active markets for identical assets or liabilities
Level 2: fair values measured based on valuation techniques for which all inputs which have a significant effect on the
recorded fair values are observable, either directly or indirectly
Level 3: fair values measured based on valuation techniques for which any inputs which have a significant effect on
the recorded fair values that are not based on observable market data (unobservable inputs)
The Group held the following financial instruments measured at fair value at the end of the reporting period:
2020 2019
US$ millions Level 1 Level 2 Level 3 Total Level 1 Level 2 Level 3 Total
Financial assets at FVOCI
– Listed equity investments 276.9 – – 276.9 251.0 – – 251.0
– Listed debentures – – – – 3.2 – – 3.2
– Unlisted investments – 133.2 19.2 152.4 – 125.8 15.8 141.6
Derivative assets(i) 0.6 7.2 – 7.8 0.7 7.1 – 7.8
Derivative liabilities(ii) – (13.4) – (13.4) – (4.9) – (4.9)
Financial liabilities at FVPL(ii) – – (650.0) (650.0) – – – –
Net Amount 277.5 127.0 (630.8) (226.3) 254.9 128.0 15.8 398.7
(i) Included within accounts receivable, other receivables and prepayments(ii) Included within deferred liabilities, provisions and payables
The fair values of unlisted investments, derivative assets and derivative liabilities in Level 2 are measured by reference to
the most recent transaction prices, valuation of the underlying assets supported by independent sources and using the
discounted cash flow models as described in Note 39(B) to the Consolidated Financial Statements, respectively.

221 First Pacific Annual Report 2020
The fair values of certain unlisted equity investments included in unlisted investments in the above table are categorized
within Level 3 and are determined using the EBITDA multiple of comparable listed companies adjusted for lack of
marketability discount up to 30% (2019: 30%) and adjusted for the net debt of the investee, if applicable. The movements
during the year are as follows:
Unlisted equity investments
US$ millions 2020 2019
At 1 January 15.8 16.2
Changes in fair value 2.5 (1.1)
Exchange translation 0.9 0.7
At 31 December 19.2 15.8
The fair value of financial liabilities at FVPL categorized within Level 3 are determined based on the present value of the
expected payment under a discounted cash flow method. There is no other movement in the balance during the year.
For financial instruments that are recognized at fair value on a recurring basis, the Group determines whether transfers
have occurred between Levels in the hierarchy by re-assessing categorization (based on the lowest level input that is
significant to the fair value measurement as a whole) at the end of each reporting period. During the years ended 31
December 2020 and 2019, there were no transfers of fair value measurements among Level 1, Level 2 and Level 3.
40. Capital and Financial Risk Management(A) Capital Management
The primary objectives of the Group’s capital management are to safeguard the Group’s ability to continue as a going
concern and to ensure that it maintains an optimal capital structure for supporting the stability and growth of its business
and maximizing shareholders’ value.
The Group manages its capital structure and makes adjustments to it in light of changes in economic conditions. To
maintain or adjust the capital structure, the Group may adjust the distribution payment to shareholders, return capital
to shareholders, repurchase shares or issue new shares. The Group is not subject to any externally imposed capital
requirements. No changes were made in the objectives, policies or processes for managing capital during the years ended
31 December 2020 and 2019.
The Group monitors capital using a gearing ratio. The Group’s policy is to keep the gearing ratio at an optimal level which
supports its business. The Group’s net debt includes short-term borrowings and long-term borrowings, less cash and cash
equivalents and short-term deposits, and restricted cash. The total equity includes equity attributable to owners of the
parent and non-controlling interests.
US$ millions 2020 2019
Short-term borrowings 1,659.7 2,262.8
Long-term borrowings 8,973.9 6,668.0
Less: Cash and cash equivalents and short-term deposits (2,377.8) (2,846.4)
Less: Restricted cash (50.2) (106.0)
Net debt 8,205.6 5,978.4
Equity attributable to owners of the parent 3,140.0 2,928.7
Non-controlling interests 7,488.5 5,829.3
Total equity 10,628.5 8,758.0
Gearing ratio (times) 0.77 0.68

222 First Pacific Annual Report 2020
Notes to the Consolidated Financial Statements
(B) Financial Risk Management
The Group’s principal financial instruments include various financial assets (which comprise accounts receivable,
other receivables, financial assets at FVOCI, cash and cash equivalents and short-term deposits, and restricted cash)
and financial liabilities (which comprise accounts payable, other payables and accruals, short-term borrowings, long-
term borrowings, and deferred liabilities and provisions). The main purpose of the cash and cash equivalents and short-
term deposits, and short-term and long-term borrowings is to finance the Group’s operations and investments. The other
financial assets and liabilities, such as accounts receivable and accounts payable, mainly arise directly from its operations.
The Group also issues fixed interest rate bonds, arranges borrowings in local currencies and enters into derivative
transactions, including principally fuel swaps, foreign currency forwards, interest rate swaps and electricity futures. The
purpose is to manage the price, currency and interest rate risks arising from the Group’s operations, investments and its
sources of finance.
The fuel swaps are used to manage the risk arising from fluctuations in fuel costs. Under the fuel swaps, the Group agrees
with other parties or clears through Intercontinental Exchange to exchange, at specified intervals, the difference between
fixed rate and floating rate amounts calculated by reference to the agreed notional purchase quantity. The fair value of fuel
swaps is calculated by reference to current forward fuel prices for contracts with similar maturity profiles.
The foreign currency forwards are used to manage the risk arising from fluctuations in foreign exchange rates. Under the
foreign currency forwards, the Group contracts with other parties to exchange at the maturity date the foreign currency
amounts at the agreed exchange rates. The terms of the foreign currency forwards have been negotiated based on the
expected highly probable forecast transactions. If changes in circumstances affect the terms of the hedged item such
that the critical terms no longer match exactly with the critical terms of the hedging instrument, the Group will assess
the ineffectiveness. The hedge ratio is determined to be 1:1. The fair value of foreign currency forwards is calculated by
reference to current forward exchange rates for contracts with similar maturity profiles.
The interest rate swaps are used to manage the risk arising from fluctuations in interest rates. Under the interest rate
swaps, the Group agrees with other parties to exchange at the maturity date the difference between the fixed interest rate
and floating interest rate of the notional amount. The Group determines the economic relationship between the borrowings
and the derivatives by matching the critical terms of the hedging instruments with the terms of the hedged items. There
were no expected sources of ineffectiveness as the critical terms of the interest rate swaps match exactly with the terms
of the hedged items. The fair value of interest rate swap contracts is determined by reference to forward interest rates for
similar instruments with similar maturity profiles.
The electricity futures are used to manage the risk arising from fluctuations in prices of electricity. Under the electricity
futures, the Group clears through SGX to exchange, at the maturity date the difference between the fixed rate and floating
rate of electricity prices on the notional quantity. The fair value of electricity futures is calculated by reference to Uniform
Singapore Energy Price monthly or quarterly base load electricity futures prices quoted on SGX.
The Group applies hedge accounting for those contracts which qualify as effective hedges. For the purpose of hedge
accounting, these hedges are classified as cash flow hedges, as the contracts are used to hedge exposure to variability of
cash flows that is either attributable to a particular risk associated with a recognized asset or liability or a highly probable
forecast transaction.
Following the decision by global regulators to phase out the existing interest rate benchmarks and replace them with
alternative RFRs, the Group is evaluating the impact on its existing hedge relationships. The Group has adopted the
temporary reliefs provided by the amendments to HKAS 39, HKFRS 7 and HKFRS 9 which enable the hedge accounting
of the Group to continue during the period of uncertainty, which is before the replacement of an existing interest rate
benchmark with an alternative RFR.

223 First Pacific Annual Report 2020
The table below indicates the notional amount and maturity of derivatives in hedging relationships that may be affected by
the interest rate benchmark reform, analysed by interest rate benchmarks. The derivative hedging instruments provide a
close approximation to the extent of the risk exposure that the Group manages through hedging relationships.
2020
US$ millions
Notional
amount Maturity
Interest rate swaps:
United States dollar LIBOR 130.0 2024
Details of the fair value of the Group’s fuel swaps, foreign currency forwards, electricity futures and interest rate swaps at
the end of the reporting period are set out below:
2020 2019
US$ millions Assets Liabilities Assets Liabilities
Cash flow hedges
– Fuel swaps 7.1 4.5 7.0 1.9
– Foreign currency forwards 0.1 5.9 0.1 3.0
– Electricity futures 0.6 – 0.7 –
– Interest rate swaps – 3.0 – –
Total 7.8 13.4 7.8 4.9
Presented as:
Non-current portion 1.8 2.9 0.3 2.1
Current portion 6.0 10.5 7.5 2.8
Total 7.8 13.4 7.8 4.9
The notional amount of the Group’s fuel swaps, foreign currency forwards, electricity futures and interest rate swaps at the
end of the reporting period are set out below:
US$ millions 2020 2019
Cash flow hedges
– Fuel swaps 242.0 180.6
– Foreign currency forwards 171.9 232.3
– Electricity futures 7.3 14.3
– Interest rate swaps 130.0 –
Total 551.2 427.2
Presented as:
Non-current portion 182.0 97.5
Current portion 369.2 329.7
Total 551.2 427.2
The movements of the Group’s unrealized gains/losses on cash flow hedges attributable to owners of the parent in relation
to the above derivative financial instruments are disclosed in Note 33. The Group’s accounting policies in relation to
derivatives are set out in Note 2(D)(m) to the Consolidated Financial Statements.
The main risks arising from the Group’s financial instruments are market risk (including currency risk and price risk), credit
risk, liquidity risk and fair value and cash flow interest rate risks. The Company’s Board of Directors reviews and agrees
policies for managing each of these risks and they are summarized below:

224 First Pacific Annual Report 2020
Notes to the Consolidated Financial Statements
(a) Market risk
(I) Currency risk
To manage the Group’s foreign exchange risk arising from future commercial transactions, recognized assets
and liabilities, and to improve investment and cash flow planning, in addition to natural hedges, the Group
enters into and engages in foreign exchange contracts for the purpose of managing its foreign exchange rate
exposures emanating from business, transaction specific, as well as currency translation risks and reducing
and/or managing the adverse impact of changes in foreign exchange rates on the Group’s operating results and
cash flows.
The following table summarizes the Group’s exposure at the end of the reporting period to currency risk
arising from recognized financial assets and liabilities denominated in a currency different from the functional
currencies of the Group’s subsidiary companies.
US$ millions 2020 2019
Accounts receivable and other receivables 80.1 88.6
Cash and cash equivalents and short-term deposits 542.3 486.9
Short-term borrowings and long-term borrowings (2,568.9) (265.3)
Accounts payable, other payables and accruals (16.8) (95.4)
Deferred liabilities, provisions and payables (800.3) (63.7)
Net Amount (2,763.6) 151.1
The following table demonstrates the sensitivity arising from the Group’s financial assets and liabilities as listed
above to a reasonably possible change in the exchange rates of the Rupiah, Peso and S$, with all other variables
held constant, of the Group’s profit/loss attributable to owners of the parent and retained earnings. There is no
significant impact on the other components of the Group’s equity.
2020 2019
US$ millions
Depreciation
against the
U.S. dollar
(%)
Decrease
in profit
attributable
to owners of
the parent
Decrease
in retained
earnings
Depreciation
against the
U.S. dollar
(%)
Decrease/
(increase)
in loss
attributable
to owners of
the parent
Increase/
(decrease)
in retained
earnings
Rupiah (2.7) (25.8) (25.8) (4.6) 3.2 3.2
Peso (4.0) (3.3) (3.3) (2.1) (0.9) (0.9)
S$ (2.4) (1.1) (1.1) (1.3) (0.3) (0.3)
(II) Price risk
The Group is primarily exposed to securities price risk which principally relates to the changes in the market
value of its listed equity investments, which include the Group’s investments in principal operating subsidiary
and associated companies in the Philippines, Indonesia and Singapore and the other listed equity investments
held by the Group and classified as financial assets at FVOCI on the Group’s consolidated statement of financial
position.
In addition, the Group is also exposed to commodity price risk for its consumer food products and power
businesses due to certain factors, such as weather, government policies, level of demand and supply in the
market and the global economic environment. Such exposure mainly arises from its purchases of wheat flour,
cooking oil, skim milk powder and CPO (which are the main raw materials used to produce consumer food
products) and the usage of fuel in the generation of energy where the profit margins on the sales of its consumer
food products and electricity may be affected if the costs of wheat flour, cooking oil, skim milk powder and CPO,
and fuel increase and the Group is unable to pass on such cost increases to its customers, and the selling price
of electricity supplied to the merchant market by its power generation business, respectively.

225 First Pacific Annual Report 2020
The Group’s policy is to minimize the risks of its raw material costs arising from the fluctuations in the commodity prices by maintaining an optimum inventory level of wheat flour, cooking oil and skim milk powder for a continuous production and increasing self-sufficiency in the supply of CPO for the refinery operations (through the purchase of CPO from the Group’s own plantations). In addition, the Group may seek to mitigate its risks by periodically adjusting the prices of the consumer food products. For the years ended 31 December 2020 and 2019, no hedging in the said commodity price risk have been undertaken.
The Group has entered into fuel swap contracts that for its power generation business oblige it to make payments for fuel at fixed prices on an agreed notional purchase quantity and receive payments for fuel at floating prices on the same amounts.
The Group has entered into electricity futures that oblige it to make or receive payments for electricity futures at fixed rates of electricity prices on a notional quantity and receive or make payments for electricity futures at floating rates of electricity prices on the same quantity.
At 31 December 2020, if the fuel and electricity prices increased/decreased by 10% (2019: 10%), the Group’s unrealized cash flow hedge reserve and equity attributable to owners of the parent would have been US$6.1 million (2019: US$8.4 million) higher/lower, with all other variables being held constant.
(b) Credit risk
For the consumer food products business, the Group has credit risk arising from the credit given to the customers, but it has policies in place to ensure that wholesales of products are made to creditworthy customers with an appropriate credit history. The Group has policies that limit the amount of credit exposure to any particular customer, such as requiring sub-distributors to provide bank guarantees. For the water distribution business, the Group generally allows seven to 60 days of credit for its water and sewerage service customers, and 45 to 60 days of credit for its bulk water supply customers. In addition, receivable balances are monitored on an ongoing basis to reduce the Group’s exposure to bad debts. For the power generation business, the Group generally allows 15 to 30 days of credit to its customers. PLP also requires deposits and/or guarantees from creditworthy financial institutions to secure substantial obligations of its customers.
Maximum exposure and year-end staging:
The tables below show the credit quality and the maximum exposure to credit risk based on the Group’s credit policy, which is mainly based on past due information unless other information is available without undue cost or effort, and year-end staging classification as at 31 December. The amounts presented are gross carrying amounts for financial assets and the exposure to credit risk for the financial guarantee contracts.
12-monthECLs Lifetime ECLs
US$ millions Stage 1 Stage 2 Stage 3Simplified approach
2020
Total
Debt investments at FVOCI– Not yet past due 129.4 – – – 129.4
Accounts receivable(i) – – – 721.4 721.4
Contract assets(i) – – – 21.9 21.9
Financial assets included in other receivables and other non-current assets– Not yet past due 320.4 – – – 320.4
Restricted cash– Not yet past due 50.2 – – – 50.2
Cash and cash equivalents and short-term deposits– Not yet past due 2,377.8 – – – 2,377.8
Guarantees for planation farmers’ loan facilities– Not yet past due 30.8 – – – 30.8
Total 2,908.6 – – 743.3 3,651.9
(i) For accounts receivable and contract assets to which the Group applies the simplified approach for impairment, information based on the provision matrix is disclosed in Note 17 to the Consolidated Financial Statements.

226 First Pacific Annual Report 2020
Notes to the Consolidated Financial Statements
12-month
ECLs Lifetime ECLs
US$ millions Stage 1 Stage 2 Stage 3
Simplified
approach
2019
Total
Debt investments at FVOCI
– Not yet past due 121.5 – – – 121.5
Accounts receivable(i) – – – 684.3 684.3
Contract assets(i) – – – 24.2 24.2
Financial assets included in other
receivables and other non-current assets
– Not yet past due 315.4 – – – 315.4
Restricted cash
– Not yet past due 106.0 – – – 106.0
Cash and cash equivalents and short-term
deposits
– Not yet past due 2,846.4 – – – 2,846.4
Guarantees for planation farmers’ loan facilities
– Not yet past due 41.3 – – – 41.3
Total 3,430.6 – – 708.5 4,139.1
(i) For accounts receivable and contract assets to which the Group applies the simplified approach for impairment, information based on the provision matrix is disclosed in Note 17 to the Consolidated Financial Statements.
(c) Liquidity risk
The Group manages its liquidity profile to be able to finance its capital expenditure and service its maturing debts by
maintaining sufficient cash and marketable securities, and the availability of funding through an adequate amount of
committed credit facilities.
The Group regularly evaluates its projected and actual cash flow information and continuously assesses conditions
in the financial markets for opportunities to pursue fund-raising initiatives. These initiatives may include bank loans,
debt capital and equity capital issues.
The maturity profile of the Group’s financial liabilities based on the contractual undiscounted payments, including
future interest payments, and contingent liabilities in terms of guarantees given at the end of the reporting period, is as
follows:
Accounts payable,
other payables and
accruals Borrowings
Deferred liabilities
and provisions (other
than lease liabilities) Lease liabilities
Guarantees for
plantation farmers’
loan facilities Total
US$ millions 2020 2019 2020 2019 2020 2019 2020 2019 2020 2019 2020 2019
Not exceeding one year 1,348.2 1,353.2 1,852.8 2,641.5 394.7 354.4 18.3 17.9 2.9 3.9 3,616.9 4,370.9
More than one year but not
exceeding two years – – 1,068.7 960.5 775.2 141.3 14.0 12.5 3.6 4.8 1,861.5 1,119.1
More than two years but not
exceeding five years – – 4,532.9 3,144.2 241.2 376.4 23.7 21.2 14.8 19.9 4,812.6 3,561.7
More than five years – – 4,106.8 3,703.0 379.1 418.9 28.7 20.4 9.5 12.7 4,524.1 4,155.0
Total 1,348.2 1,353.2 11,561.2 10,449.2 1,790.2 1,291.0 84.7 72.0 30.8 41.3 14,815.1 13,206.7

227 First Pacific Annual Report 2020
(d) Fair value and cash flow interest rate risks
The Group’s interest rate risk arises from interest-bearing borrowings, cash and cash equivalents and short-term
deposits, and restricted cash. Borrowings and cash and cash equivalents with variable interest rate terms expose the
Group to cash flow interest rate risk. Borrowings with fixed interest rate terms expose the Group to fair value interest
rate risk. At 31 December 2020, 52.6% (2019: 64.6%) of the Group’s borrowings were effectively at fixed interest
rates.
The following table demonstrates the sensitivity arising from the Group’s financial assets and liabilities at the end of
the reporting period to a reasonably possible change in interest rates, with all other variables held constant, of the
Group’s profit/loss attributable to owners of the parent and retained earnings (through the impact on variable rate
borrowings and cash and cash equivalents). There is no significant impact on the other components of the Group’s
equity. The assumed basis point increase or decrease represents management’s assessment of a reasonably possible
change in those interest rates of which the Group is mainly exposed to, namely, the U.S. dollar, Rupiah, Peso and S$
interest rates, over the period until the ending date of the next annual reporting period.
2020 2019
US$ millions
Increase/
(decrease)
(Basis points)
(Decrease)/
increase
in profit
attributable
to owners of
the parent
(Decrease)/
increase
in retained
earnings
Decrease
(Basis points)
Decrease/
(increase)
in loss
attributable
to owners of
the parent
Increase/
(decrease)
in retained
earnings
Interest rates for
– U.S. dollar 5 (0.5) (0.5) (100) 4.2 4.2
– Rupiah (25) 0.7 0.7 (50) 0.8 0.8
– Peso 50 1.2 1.2 (75) (3.1) (3.1)
– S$ 5 (0.1) (0.1) (50) 1.2 1.2

228 First Pacific Annual Report 2020
Notes to the Consolidated Financial Statements
41. Statement of Financial Position of the CompanyThe Company’s statement of financial position is as follows:
At 31 December 2020 2019
US$ millions
Non-current Assets
Subsidiary companies 189.7 190.1
Financial assets at FVOCI 1.1 –
190.8 190.1
Current Assets
Cash and cash equivalents 99.4 312.2
Amounts due from subsidiary companies 2,831.7 2,924.1
Other receivables and prepayments 1.6 0.3
2,932.7 3,236.6
Current Liabilities
Amounts due to subsidiary companies 82.9 288.2
Other payables and accruals 3.3 3.4
86.2 291.6
Net Current Assets 2,846.5 2,945.0
Total Assets Less Current Liabilities 3,037.3 3,135.1
Equity
Issued share capital 43.4 43.4
Shares held for share award scheme (2.4) (3.2)
Accumulated losses (106.7) (66.3)
Other components of equity(i) 1,686.9 1,766.1
Equity attributable to owners of the parent 1,621.2 1,740.0
Non-current Liabilities
Loans from subsidiary companies 1,414.3 1,394.6
Other payables 1.8 0.5
1,416.1 1,395.1
3,037.3 3,135.1
(i) The Company’s other components of equity comprise share premium, employee share-based compensation reserve, fair value reserve of financial assets at FVOCI and contributed surplus (Note 31).

229 First Pacific Annual Report 2020
The Company’s statement of changes in equity is as follows:
US$ millions
Issued
share
capital
Shares
held for
share award
scheme
Share
premium
Employee
share-based
compensation
reserve
Fair value
reserve of
financial
assets at
FVOCI
Contributed
surplus
Retained
earnings/
(accumulated
losses) Total
At 1 January 2019 43.4 (4.9) 62.0 46.4 – 1,765.6 127.2 2,039.7
Loss and total comprehensive loss for the year – – – – – – (234.2) (234.2)
Purchase of shares under share award scheme – (2.0) – – – – – (2.0)
Issue of shares under share award scheme – (1.1) 1.1 – – – – –
Shares vested under share award scheme – 4.8 – (5.2) – – 0.4 –
Cancelation of share options – – – (40.3) – – 40.3 –
Employee share-based compensation benefits – – – 3.1 – – – 3.1
2018 final distribution paid – – – – – (30.6) – (30.6)
2019 interim distribution paid – – – – – (36.0) – (36.0)
At 31 December 2019 43.4 (3.2) 63.1 4.0 – 1,699.0 (66.3) 1,740.0
At 1 January 2020 43.4 (3.2) 63.1 4.0 – 1,699.0 (66.3) 1,740.0
Loss for the year – – – – – – (41.3) (41.3)
Other comprehensive loss for the year – – – – (0.4) – – (0.4)
Total comprehensive loss for the year – – – – (0.4) – (41.3) (41.7)
Purchase of shares under share award scheme – (1.0) – – – – – (1.0)
Shares vested under share award scheme – 1.8 – (1.7) – – (0.1) –
Lapse of share options – – – (1.0) – – 1.0 –
Employee share-based compensation benefits – – – 2.3 – – – 2.3
2019 final distribution paid – – – – – (39.2) – (39.2)
2020 interim distribution paid – – – – – (39.2) – (39.2)
At 31 December 2020 43.4 (2.4) 63.1 3.6 (0.4) 1,620.6 (106.7) 1,621.2
42. Events after the Reporting Period(A) On 8 December 2020, MPIC and KIT entered into a sale and purchase agreement (“SPA”) with Government Service
Insurance System, Langoer Investments Holdings B.V. and Macquarie Infrastructure Holdings (Philippines) Pte. Limited
(collectively “the Sellers”) to acquire a 100% interest in PTSI, which wholly owns Philippine Coastal Storage and Pipeline
Corporation, the largest petroleum import terminal in the Philippines, strategically located in the Subic Bay Freeport Zone in
the Philippines, for a total consideration of approximately US$333.8 million.
In accordance with the SPA, MPIC purchased 20% interest of PTSI for a consideration of approximately US$66.8 million
and KIT purchased the remaining 80% interest of PTSI for a consideration of approximately US$267.0 million, through
Hyperion Storage Holdings Corporation (“Philippines Holdco”), which MPIC and KIT are interested in 20% and 80%,
respectively. The completion of the SPA took place on 29 January 2021.
Immediately following the completion of the SPA, MPIC purchased an approximately 30% interest in Philippines Holdco
from KIT for an aggregate consideration of approximately Pesos 4.1 billion (US$85.8 million). As a result, MPIC is
interested in approximately 50% of PTSI through its interest in Philippines Holdco, and the financial results of PTSI will be
equity accounted for as a joint venture in the Group’s consolidated financial statements.

230 First Pacific Annual Report 2020
Notes to the Consolidated Financial Statements
(B) On 16 February 2021, FPM Tollway (Thailand) Limited (“FPM Tollway”), a subsidiary company of MPTC, entered into
share purchase agreements with a group of Thailand investors/buyers to sell FPM Tollway’s 100% interest in AIF Toll
Roads, which in turn owns an approximate 29.5% interest in DMT, for an aggregate cash consideration of approximately
US$149.3 million. The transaction was completed on 19 February 2021. Following the completion of the transaction, AIF
Toll Roads and DMT have ceased to be a subsidiary and associated company of the Group, respectively. A net gain on
disposal of approximately US$9.0 million attributable to owners of the parent will be recognized in profit or loss for the year
ending 31 December 2021.
(C) On 17 February 2021, ICBP acquired an additional 49% interest in IFL, a subsidiary company of ICBP, for a total
consideration of Rupiah 494 billion (US$35.0 million). As a result, ICBP’s interest in IFL increased to 100% from 51%
and IFL has become a wholly-owned subsidiary company of ICBP. The Group expects to record a debit amount of
approximately US$3.0 million directly into equity as there was no change in control in IFL.
(D) On 2 March 2021, the Company held a Special General Meeting and obtained the approval from the Company’s
shareholders for the proposed disposal of a 56% interest in GBPC by Beacon PowerGen to MGen. The transaction is
expected to be completed on 31 March 2021. As a result, GBPC will be deconsolidated and equity accounted for as an
associated company in the Group’s 2021 Consolidated Financial Statements. Also, a net gain on disposal of approximately
US$30.0 million attributable to owners of the parent will be recognized in profit or loss for the year ending 31 December
2021.
(E) On 26 March 2021, the Corporate Recovery and Tax Incentives for Enterprises (“CREATE”) bill was signed into law by the
President of the Philippines. The CREATE bill would reduce the corporate income tax rate for the Group’s major operating
subsidiary and associated companies in the Philippines to 25% from 30% with retroactive effect from 1 July 2020. As a
result, the Group’s Philippine operating subsidiary and associated companies have remeasured their current and deferred
tax assets and liabilities as at 31 December 2020 with an estimated net charge of approximately US$5.0 million to profit or
loss attributable to owners of the parent for the year ending 31 December 2021.
(F) On 30 March 2021, the Board of Directors approved a three-year share repurchase program to buy back up to US$100.0
million of First Pacific shares by way of “open market repurchases”.
43. Comparative AmountsThe comparative consolidated income statement, consolidated statement of cash flows and certain notes to the Consolidated
Financial Statements have been re-presented as if the operation of GBPC discontinued in December 2020 had been
discontinued at the beginning of the year of 2019 (Note 7).
44. Approval of the Consolidated Financial StatementsThe audited Consolidated Financial Statements of the Company were approved and authorized for issue by the Board of
Directors on 30 March 2021.

Glossary of Terms
231 First Pacific Annual Report 2020
Financial Terms
CONCESSION ASSETS Value of concessions of right granted by governments under service concession arrangements to charge users of public service provided
DEFINED BENEFIT SCHEME A retirement scheme in which the rules specify the benefits to be paid and the scheme is financed accordingly. Generally, benefits are determined using actuarial valuations that takes into account of the final salary and the number of years of service of each member
DEFINED CONTRIBUTION SCHEME A retirement scheme under which the benefits are directly determined by the value of contributions paid in respect of each member
DISCOUNTED CASH FLOW MODEL A cash flow model estimates the relevant future cash flows which are expected to be generated over the project period and discounted to the present value by using a discount rate
EBIT Earnings Before Interest and Tax
EBITDA Earnings Before Interest, Tax, Depreciation and Amortization
GAV Gross Asset Value, which represents the total market value of listed investments, carrying amounts or fair value of unlisted investments and other assets of First Pacific Head Office
IMPAIRMENT PROVISION Provision made to reduce the carrying amount of an asset to its recoverable amount
NAV Net Asset Value, which represents GAV less net debt of First Pacific Head Office
NET ASSETS Total assets less total liabilities, equivalent to total equity
NET CURRENT ASSETS Current assets less current liabilities
NET DEBT Total of short-term and long-term borrowings, net of cash and cash equivalents and short-term deposits and restricted cash
NON-RECURRING ITEMS Certain items, through occurrence or size, are not considered usual operating items
RECURRING PROFIT Profit attributable to owners of the parent excluding foreign exchange and derivative gains/losses, gain/loss on changes in fair value of biological assets and non-recurring items
TOTAL EQUITY Equity attributable to owners of the parent and non-controlling interests

232 First Pacific Annual Report 2020
Glossary of Terms
Financial Ratios
ADJUSTED NAV PER SHARE NAV divided by the number of shares in issue
BASIC EARNINGS/LOSS PER SHARE Profit/loss attributable to owners of the parent divided by the weighted average number of shares in issue during the year
CASH INTEREST COVER Dividend and fee income less overhead expense divided by net cash interest expense
CURRENT RATIO Current assets divided by current liabilities
DILUTED EARNINGS/LOSS PER SHARE Profit/loss attributable to owners of the parent adjusted for the effect of assumed conversion of all dilutive potential ordinary shares divided by the weighted average number of shares in issue during the year plus the weighted average number of ordinary shares which would be issued on the assumed conversion of all dilutive potential ordinary shares
DISTRIBUTION/DIVIDEND COVER Recurring profit divided by ordinary share distributions/dividends paid and recommended
DISTRIBUTION/DIVIDEND PAYOUT RATIO Ordinary share distributions/dividends paid and recommended divided by recurring profit
DISTRIBUTION/DIVIDEND YIELD Distributions/dividends per share divided by closing share price on the last trading day of the reporting period
EBIT MARGIN EBIT divided by turnover
EBITDA MARGIN EBITDA divided by turnover
GEARING RATIO Net debt divided by total equity
GROSS MARGIN Gross profit divided by turnover
INTEREST COVER Profit before taxation (excluding foreign exchange and derivative gains/losses, gain/loss on changes in fair value of biological assets and non-recurring items) and net finance costs divided by net finance costs
NET CASH FLOWS FROM OPERATING ACTIVITIES PER ORDINARY SHARE Net cash flows from operating activities divided by the weighted
average number of shares in issue during the year
RECURRING RETURN ON AVERAGE EQUITY ATTRIBUTABLE TO OWNERS OF THE PARENT Recurring profit divided by average equity
attributable to owners of the parent
RECURRING RETURN ON AVERAGE NET ASSETS Recurring profit divided by average net assets
SHARE PRICE DISCOUNT TO ADJUSTED NAV PER SHARE Shortfall between share price and adjusted NAV per share divided by adjusted
NAV per share
TANGIBLE ASSETS PER ORDINARY SHARE Total assets (excluding goodwill and other intangible assets) divided by the number of shares
in issue
TOTAL ASSETS PER ORDINARY SHARE Total assets divided by the number of ordinary shares in issue

233 First Pacific Annual Report 2020
Other
ADR American Depositary Receipts
AGM Annual General Meeting
CPO Crude Palm Oil
FFB Fresh Fruit Bunches
GAAP Generally Accepted Accounting Principles
HKAS Hong Kong Accounting Standard
HKFRS Hong Kong Financial Reporting Standard
HKICPA Hong Kong Institute of Certified Public Accountants
HK(IFRIC)-Int Hong Kong (International Financial Reporting Interpretations Committee) – Interpretation
IDX Indonesia Stock Exchange
ISO International Organization for Standardization
LISTING RULES The Rules Governing the Listing of Securities on SEHK
LTE Long Term Evolution high speed wireless phone technology
N/A Not Applicable
NYSE The New York Stock Exchange
PSE The Philippine Stock Exchange, Inc.
RSS1 Rubber Smoke Sheet 1
SEHK The Stock Exchange of Hong Kong Limited
SGM Special General Meeting
SGX Singapore Exchange Securities Trading Limited
UHT Ultra High Temperature processing
3G The third generation of wireless network technology
4G The fourth generation of wireless network technology
5G The fifth generation of wireless network technology

Information for Investors
234 First Pacific Annual Report 2020
Financial Diary
Preliminary announcement of 2020 results 30 March 2021
Annual report posted to shareholders 29 April 2021
2021 Annual General Meeting 10 June 2021
Last day to register for final distribution 22 June 2021
Payment of final distribution 5 July 2021
Preliminary announcement of
2021 interim results 25 August 2021*
Interim report posted to shareholders 21 September 2021*
Financial year-end 31 December 2021
Preliminary announcement of 2021 results 29 March 2022*
* Subject to confirmation
Head Office
24th Floor, Two Exchange Square
8 Connaught Place
Central, Hong Kong SAR
Telephone : +852 2842 4388
Fax : +852 2845 9243
Email : [email protected]
Registered Office
Clarendon House, 2 Church Street
Hamilton HM11, Bermuda
Telephone : +1 441 295 1422
Fax : +1 441 295 4720
Website
www.firstpacific.com
Share Information
First Pacific shares are listed on The Stock Exchange of Hong
Kong Limited and are traded over the counter in the United
States in the form of American Depositary Receipts
Listing date : 12 September 1988
Par value : U.S.1 cent per share
Lot size : 2,000 shares
Number of ordinary
shares issued
: 4,344,931,044
Stock Codes
HKSE : 00142
Bloomberg : 142 HK
Thomson Reuters : 0142.HK
American Depositary Receipts (ADRs) Information
Level: 1
ADRs Code: FPAFY
CUSIP reference number: 335889200
ADRs to ordinary shares ratio: 1:5
ADRs depositary bank: Deutsche Bank Trust Company Americas
To Consolidate Shareholdings
Write to our principal share registrar and
transfer office in Bermuda at:
Conyers Corporate Services (Bermuda) Limited
Clarendon House, 2 Church Street
Hamilton HM11, Bermuda
Or the Hong Kong branch registrar at:
Computershare Hong Kong Investor Services Limited
Registrar Office
17M Floor, Hopewell Centre
183 Queen’s Road East, Wanchai, Hong Kong SAR
Telephone : +852 2862 8555
Fax : +852 2865 0990/+852 2529 6087
Enquiry : www.computershare.com/hk/contact
Transfer Office
Shops 1712–1716, 17th Floor, Hopewell Centre
183 Queen’s Road East, Wanchai, Hong Kong SAR
A Chinese Version of this Report, or Additional Information
Available at:
www.firstpacific.com
Or contact:
Sara Cheung
Vice President
Group Corporate Communications
First Pacific Company Limited
24th Floor, Two Exchange Square
8 Connaught Place
Central, Hong Kong SAR
Telephone : +852 2842 4317
Email : [email protected]
Auditor
Ernst & Young
Certified Public Accountants
Registered Public Interest Entity Auditor
22nd Floor, CITIC Tower
1 Tim Mei Avenue, Central, Hong Kong SAR
Solicitor
Gibson, Dunn & Crutcher
32nd Floor, Gloucester Tower, The Landmark
15 Queen’s Road Central, Hong Kong SAR
Principal Bankers
Bank of China (Hong Kong) Limited
China Banking Corporation
Mizuho Bank, Ltd.
Sumitomo Mitsui Banking Corporation
The Hongkong & Shanghai Banking Corporation Limited

Summary of Principal Investments
235 First Pacific Annual Report 2020
As at 31 December 2020
PT Indofood Sukses Makmur TbkIndofood (IDX: INDF) is a leading Total Food Solutions company with operations in all stages of food manufacturing from the production of raw materials and their processing through to the manufacture of consumer food and beverage products and their distribution to the market. It is based and listed in Indonesia while its Consumer Branded Products subsidiary PT Indofood CBP Sukses Makmur Tbk and Agribusiness subsidiaries PT Salim Ivomas Pratama Tbk and PT Perusahaan Perkebunan London Sumatra Indonesia Tbk are also listed in Indonesia. Another subsidiary, Indofood Agri Resources Ltd., is listed in Singapore, and an Agribusiness associate, Roxas Holdings, Inc., is listed in the Philippines. Through its four complementary Strategic Business groups, Indofood manufactures and distributes a wide range of food and beverage products from its business groups: Consumer Branded Products (noodles, dairy, snack foods, food seasonings, nutrition & special foods, and beverages), Bogasari (wheat flour and pasta), Agribusiness (seed breeding, oil palm cultivation and milling, branded cooking oils, margarine and shortening, and the cultivation and processing of rubber, sugar cane and other crops) and Distribution.
Indofood is one of the world’s largest manufacturers by volume of wheat-based instant noodles, one of the largest plantation companies by area and the largest flour miller in Indonesia. Indofood also has an extensive distribution network across Indonesia.
Sector : Consumer Food ProductsPlace of incorporation/business area : IndonesiaIssued number of shares : 8.8 billionParticulars of issued shares held : Shares of Rupiah 100 par valueEconomic and voting interests : 50.1%
Further information on Indofood can be found at www.indofood.com.
PLDT Inc.PLDT (PSE: TEL; NYSE: PHI) is the largest fully integrated telecommunications company in the Philippines. Its shares are listed on the Philippine Stock Exchange and its American Depositary Shares are listed on the New York Stock Exchange. Through its principal business groups – fixed line, wireless and others – PLDT offers a wide range of telecommunications and digital services across the Philippines’ most extensive fiber optic backbone, and fixed line and mobile networks.
Sector : TelecommunicationsPlace of incorporation/business area : The PhilippinesOutstanding number of shares : 216.1 millionParticulars of outstanding shares held : Common shares of Pesos 5 par valueEconomic/voting interest : 25.6%/15.1%
Further information on PLDT can be found at www.pldt.com.
Metro Pacific Investments CorporationMPIC (PSE: MPI; ADR code: MPCIY) is a Philippine-listed investment management and holding company focused on infrastructure development.
Sector : Infrastructure, Utilities and HospitalsPlace of incorporation/business area : The PhilippinesOutstanding number of shares : 30.7 billionParticulars of issued shares held : Common shares of Peso 1 par valueEconomic/voting interest : 43.1%/56.1%
Further information on MPIC can be found at www.mpic.com.ph.
Philex Mining CorporationPhilex (PSE: PX) is a Philippine-listed company engaged in the exploration and mining of mineral resources, and holds a 30.4% interest in PXP Energy Corporation.
Sector : Natural ResourcesPlace of incorporation/business area : The PhilippinesIssued number of shares : 4.9 billionParticulars of issued shares held : Common shares of Peso 1 par valueEconomic and voting interests : 31.2%(1)
(1) Two Rivers Pacific Holdings Corporation, a Philippine affiliate of First Pacific, holds an additional 15.0% economic and voting interests in Philex.
Further information on Philex can be found at www.philexmining.com.ph.

236 First Pacific Annual Report 2020
Summary of Principal Investments
PXP Energy CorporationPXP (PSE: PXP) is a Philippine-listed company engaged in energy and hydrocarbon exploration and production.
Sector : Natural ResourcesPlace of incorporation/business area : The PhilippinesIssued number of shares : 2.0 billionParticulars of issued shares held : Common shares of Peso 1 par valueEconomic and voting interests : 35.7%(2)(3)/21.7%(3)
(2) Includes a 14.0% effective economic interest in PXP held by First Pacific through its indirect interests in Philex.(3) Two Rivers Pacific Holdings Corporation, a Philippine affiliate of First Pacific, holds an additional 6.7% economic and voting interests in PXP.
Further information on PXP can be found at www.pxpenergy.com.ph.
FPM Power Holdings LimitedFPM Power controls PLP.
Sector : Infrastructure/UtilitiesPlace of incorporation/business area : British Virgin Islands/SingaporeIssued number of shares : 12,195Particulars of issued shares held : Shares of US$1 par valueEconomic/voting interest : 67.8%(4)/60.0%
(4) Includes a 7.8% effective economic interest in FPM Power held by First Pacific through its indirect interest in Meralco.
PacificLight Power Pte. Ltd.PLP operates one of Singapore’s most efficient power plants, housing an 800-megawatt natural gas-fired combined cycle facility. Its wholly-owned subsidiary PacificLight Energy Pte. Ltd. offers customized price packages for retail electricity customers in Singapore.
Sector : Infrastructure/UtilitiesPlace of incorporation/business area : SingaporeIssued number of shares : 568.8 millionParticulars of issued shares held : Ordinary shares with no par valueEconomic/voting interest : 47.5%(5)/70.0%
(5) Represents a 42.0% effective economic interest in PLP held by First Pacific through its interest in FPM Power and a 5.5% effective economic interest in PLP held by First Pacific through its indirect interests in Meralco.
Further information on PLP can be found at www.pacificlight.com.sg.
FP Natural Resources LimitedFP Natural Resources together with its Philippine affiliate, First Agri Holdings Corporation, hold interests in RHI.
Sector : Consumer Food ProductsPlace of incorporation/business area : British Virgin Islands/The PhilippinesIssued number of shares : 15,100Particulars of issued shares held : Shares of US$1 par valueEconomic/voting interest : 80.8%(6)/100%(7)
(6) Includes a 10.8% effective economic interest in FP Natural Resources held by First Pacific through its indirect interests in IndoAgri.(7) Includes a 30.0% voting interest in FP Natural Resources held by First Pacific through its indirect interests in IndoAgri.
Roxas Holdings, Inc.RHI (PSE: ROX) is a Philippine-listed sugar and ethanol producer.
Sector : Consumer Food ProductsPlace of incorporation/business area : The PhilippinesOutstanding number of shares : 1.5 billionParticulars of outstanding shares held : Common shares of Peso 1 par valueEconomic/voting interest : 26.4%(8)(9)/32.7%(9)
(8) Represents a 22.9% effective economic interest in RHI held by First Pacific through its interest in FP Natural Resources and a 3.5% effective economic interest in RHI held by First Pacific through its indirect interests in IndoAgri.
(9) FAHC, a Philippine affiliate of FP Natural Resources, holds an additional 30.2% economic and voting interests in RHI.
Further information on RHI can be found at www.roxasholdings.com.ph.

As at 29 March 2021
Corporate Structure
First Pacific Annual Report 2020
Intermediate investment holding subsidiaries and affiliates
Digital Telecommunications Philippines, Inc.
Smart Communications, Inc.
100.0%
MetroPac Water InvestmentsCorporation
25.6%(1)(7)
43.1%(1)(7)
100.0%
99.6%
45.5%(1)
Global Business Power Corporation62.4%(1)(3)
100.0%
20.0%(1)
35.8%(1)
Metro Pacific Hospital Holdings, Inc.
Light Rail Manila Corparation
PT Indomarco Adi Prima
80.5%
71.8%(1)
100.0%
Digitel Mobile Philippines, Inc.
50.1%(1)(7)
80.8%(1)(5)
FP Natural Resources Limited
67.8%(1)(4)
31.2%(1)(2)(7)
PacificLight Energy Pte. Limited
FPM Power Holdings Limited
100.0%
30.4%
32.7%(6)
70.0% 100.0%
Silangan Mindanao Mining Co., Inc.
100.0%
100.0%
53.4%
77.7%(1)Forum (GSEC 101) Limited
Pitkin Petroleum Limited
Forum Energy Limited
(7)
Silangan Mindanao Exploration Company, Inc.
PT Indofood CBP Sukses Makmur Tbk
Indofood Agri Resources Ltd.
21.7%(1)(2)
PT Perusahaan Perkebunan London Sumatra Indonesia Tbk
35.6%(1)
PT Salim Ivomas Pratama Tbk59.7%(1)
100% Pinehill Company Limited
99.1%(1)
MetroPac Movers, Inc.
Metro Pacific Tollways Corporation
Philippine Coastal Storage &Pipeline Corporation
99.9%
Maynilad Water Services, Inc.52.8%(1)
50.0%(1)
(7)
(7)
(7)
(7)
(7)
(7)
(7)
Manila Electric Company(7)
(1) Economic interest.(2) Two Rivers, a Philippine affiliate of First Pacic, holds additional 15.0% and 6.7% economic interests in Philex and PXP, respectively.(3) Includes a 6.4% effective economic interest in GBPC through MPIC’s indirect interests in Meralco.(4) Includes a 7.8% effective economic interest in FPM Power held through First Pacific’s indirect interests in Meralco.(5) Includes a 10.8% effective economic interest in FP Natural Resources held through First Pacific’s indirect interests in IndoAgri.(6) FAHC, a Philippine affiliate of FP Natural Resources, holds an additional 30.2% economic interest in RHI.(7) Listed company.

Stock Code: 00142
ANNUAL REPORT 2020
24/F Two Exchange Square8 Connaught Place, CentralHong Kong SARTelephone: +852 2842 4388Email: info@�rstpaci�c.comWebsite: www.�rstpaci�c.com
(Incorporated with limited liability under the laws of Bermuda)
Concept and design: iONE Financial Press Limited
A Chinese version of this report is available at www.�rstpaci�c.com or from the Company on request.本報告之中文版可瀏覽 www.�rstpaci�c.com 或向本公司索取。