First Pacific Company Limited
81
FIRST PACIFIC COMPANY LIMITED ANNUAL REPORT 2002
-
Upload
khangminh22 -
Category
Documents
-
view
5 -
download
0
Transcript of First Pacific Company Limited
FIRST PACIFIC COMPANY LIMITED
A N N U A L R E P O R T 2 0 0 2
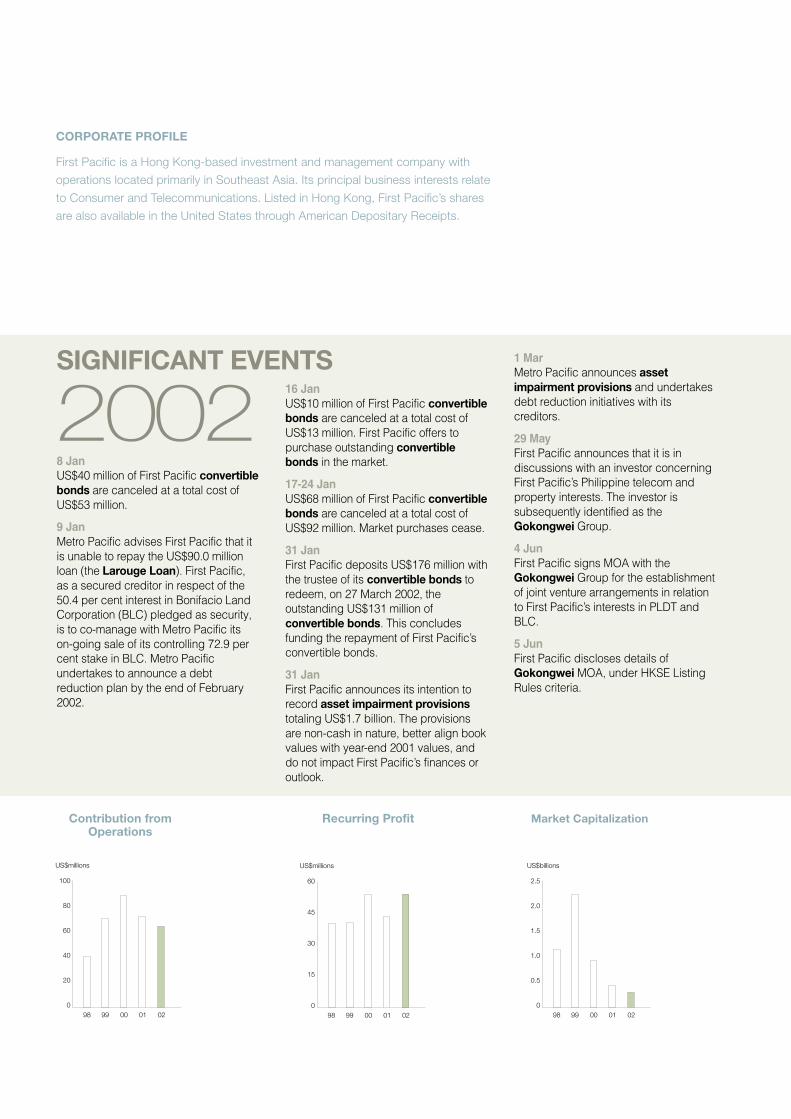
2002SIGNIFICANT EVENTS
Contribution fromOperations
Recurring Profit Market Capitalization
CORPORATE PROFILE
First Pacific is a Hong Kong-based investment and management company with
operations located primarily in Southeast Asia. Its principal business interests relate
to Consumer and Telecommunications. Listed in Hong Kong, First Pacific’s shares
are also available in the United States through American Depositary Receipts.
8 JanUS$40 million of First Pacific convertiblebonds are canceled at a total cost ofUS$53 million.
9 JanMetro Pacific advises First Pacific that itis unable to repay the US$90.0 millionloan (the Larouge Loan). First Pacific,as a secured creditor in respect of the50.4 per cent interest in Bonifacio LandCorporation (BLC) pledged as security,is to co-manage with Metro Pacific itson-going sale of its controlling 72.9 percent stake in BLC. Metro Pacificundertakes to announce a debtreduction plan by the end of February2002.
16 JanUS$10 million of First Pacific convertiblebonds are canceled at a total cost ofUS$13 million. First Pacific offers topurchase outstanding convertiblebonds in the market.
17-24 JanUS$68 million of First Pacific convertiblebonds are canceled at a total cost ofUS$92 million. Market purchases cease.
31 JanFirst Pacific deposits US$176 million withthe trustee of its convertible bonds toredeem, on 27 March 2002, theoutstanding US$131 million ofconvertible bonds. This concludesfunding the repayment of First Pacific’sconvertible bonds.
31 JanFirst Pacific announces its intention torecord asset impairment provisionstotaling US$1.7 billion. The provisionsare non-cash in nature, better align bookvalues with year-end 2001 values, anddo not impact First Pacific’s finances oroutlook.
1 MarMetro Pacific announces assetimpairment provisions and undertakesdebt reduction initiatives with itscreditors.
29 MayFirst Pacific announces that it is indiscussions with an investor concerningFirst Pacific’s Philippine telecom andproperty interests. The investor issubsequently identified as theGokongwei Group.
4 JunFirst Pacific signs MOA with theGokongwei Group for the establishmentof joint venture arrangements in relationto First Pacific’s interests in PLDT andBLC.
5 JunFirst Pacific discloses details ofGokongwei MOA, under HKSE ListingRules criteria.
US$millions
99 00 01 02980
45
15
30
60100
80
60
20
40
099 00 01 0298
US$millions US$billions
99 00 01 0298
2.0
1.5
0.5
1.0
0
2.5
1 Annual Report 2002
2003
CONTENTS
inside front cover Significant Events
2 Executive Chairman’s Letter
4 Goals
5 Board of Directors and Senior Executives
7 Review of Operations
16 Financial Review
24 Statement on Corporate Governance
Contribution by Country Adjusted Net Asset Valueby Country 2002
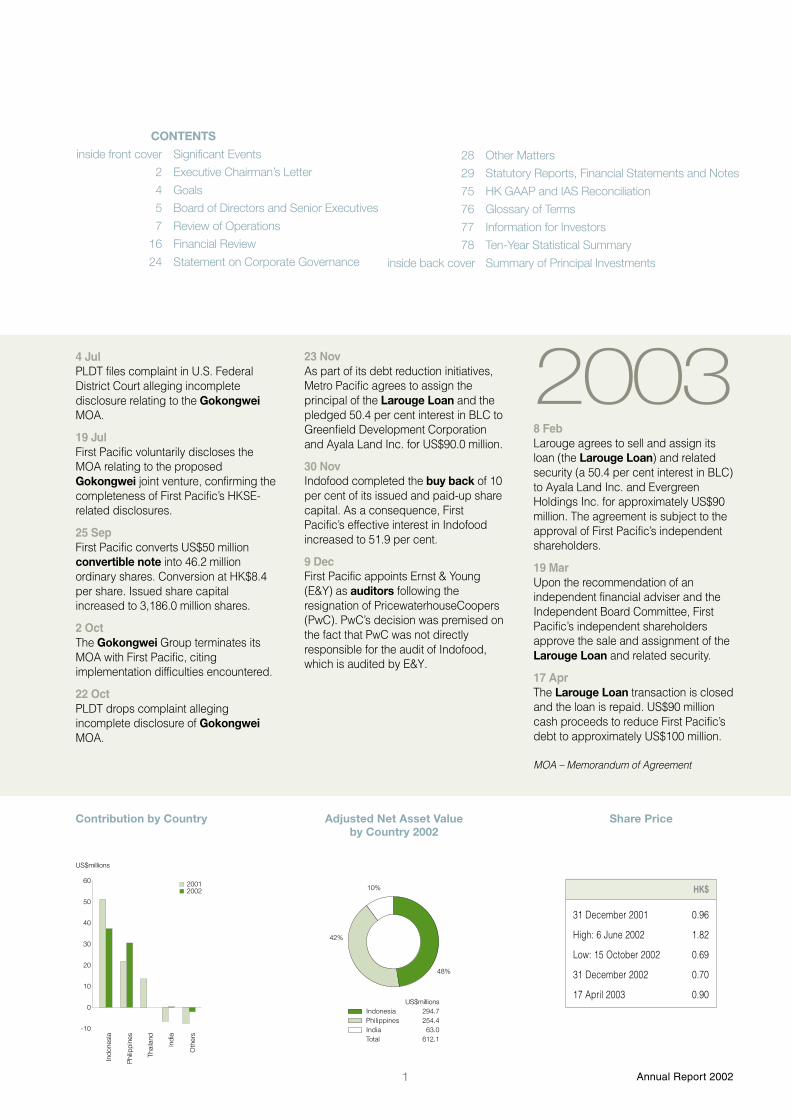
4 JulPLDT files complaint in U.S. FederalDistrict Court alleging incompletedisclosure relating to the GokongweiMOA.
19 JulFirst Pacific voluntarily discloses theMOA relating to the proposedGokongwei joint venture, confirming thecompleteness of First Pacific’s HKSE-related disclosures.
25 SepFirst Pacific converts US$50 millionconvertible note into 46.2 millionordinary shares. Conversion at HK$8.4per share. Issued share capitalincreased to 3,186.0 million shares.
2 OctThe Gokongwei Group terminates itsMOA with First Pacific, citingimplementation difficulties encountered.
22 OctPLDT drops complaint allegingincomplete disclosure of GokongweiMOA.
23 NovAs part of its debt reduction initiatives,Metro Pacific agrees to assign theprincipal of the Larouge Loan and thepledged 50.4 per cent interest in BLC toGreenfield Development Corporationand Ayala Land Inc. for US$90.0 million.
30 NovIndofood completed the buy back of 10per cent of its issued and paid-up sharecapital. As a consequence, FirstPacific’s effective interest in Indofoodincreased to 51.9 per cent.
9 DecFirst Pacific appoints Ernst & Young(E&Y) as auditors following theresignation of PricewaterhouseCoopers(PwC). PwC’s decision was premised onthe fact that PwC was not directlyresponsible for the audit of Indofood,which is audited by E&Y.
28 Other Matters
29 Statutory Reports, Financial Statements and Notes
75 HK GAAP and IAS Reconciliation
76 Glossary of Terms
77 Information for Investors
78 Ten-Year Statistical Summary
inside back cover Summary of Principal Investments
8 FebLarouge agrees to sell and assign itsloan (the Larouge Loan) and relatedsecurity (a 50.4 per cent interest in BLC)to Ayala Land Inc. and EvergreenHoldings Inc. for approximately US$90million. The agreement is subject to theapproval of First Pacific’s independentshareholders.
19 MarUpon the recommendation of anindependent financial adviser and theIndependent Board Committee, FirstPacific’s independent shareholdersapprove the sale and assignment of theLarouge Loan and related security.
17 AprThe Larouge Loan transaction is closedand the loan is repaid. US$90 millioncash proceeds to reduce First Pacific’sdebt to approximately US$100 million.
MOA – Memorandum of Agreement
60
50
40
30
10
20
0
-10
Indo
nesi
a
US$millions
Phi
lippi
nes
Thai
land
Indi
a
Oth
ers
20022001
48%
42%
10%
IndonesiaPhilippinesIndiaTotal
US$millions294.7254.463.0
612.1
HK$
31 December 2001 0.96
High: 6 June 2002 1.82
Low: 15 October 2002 0.69
31 December 2002 0.70
17 April 2003 0.90
Share Price
2First Pacific Company Limited
EXECUTIVE CHAIRMAN’S LETTER
To My Fellow Shareholders
I attempt, each year, to distil for you the salient factors that have challengedand shaped First Pacific during that year. Reflecting on one of the mostcomplex and tumultuous years in First Pacific’s history, the Gokongweitransaction clearly dominated our affairs in 2002. I do not propose to rehashhere the details of this transaction but I would like to take this opportunity tocomment about it, even briefly, particularly in light of my dual roles at FirstPacific and PLDT.
Upon being advised of the terms and conditions of the deal, I made it clear tothe Board that the commercial benefits of the transaction for First Pacific couldbe significant, and that it offered a value for PLDT which reflected its inherentworth at that time.
However, I had concerns relating to the terms of the transaction, to the hurdles– legal and otherwise – that it faced, and the time frame within which it wascontemplated to be completed. The issue was also raised about securingadequate assurances that First Pacific would realize payment in full over thedeferred payment period for both the shares in PLDT and in Bonifacio LandCorporation. At the strategic plane, relinquishing control over our telecomsinvestment at a time when it was clear that profits and cash flow were about toaccelerate gave me pause. I have repeatedly raised these matters with ourBoard, and on separate occasions, with the Gokongwei Group itself.
To assure objectivity of process, I complied with the decision of our Board toform a “Transaction Committee” of which I would not be part. Also I agreed notto involve myself in the consideration of the transaction, and not be privy toconfidential information relating to all aspects of it.
Over at PLDT, I took pains not to participate in Board proceedings wheresignificant decisions affecting the deal were made by its own Board.
Events played themselves out and in the end, the Gokongwei deal wasterminated.
We now bring with us the distressing lessons learned from this particular event,as the Board and Management head towards agreeing and executing a newstrategy for First Pacific.
Indeed, I recognize that a number of the issues which prompted theGokongwei transaction lie ahead of us still.
In this light, Management is now intently focused on charting a future for theCompany that will, in time, address these issues. The working title for thisstrategy is ‘Direction, Decisions’ and it centres on three primary objectives:
• stability in First Pacific’s financial position;
• clarity in First Pacific’s underlying principles and strategic direction;
• cohesion in First Pacific’s internal relationships.
We anticipate achieving these objectives by nurturing and developingsustainable value growth at Indofood and PLDT, First Pacific’s core assets. Theenhancement of the Group’s investment in these enterprises, whether it isachieved organically or through acquisition, will underpin and ensure First
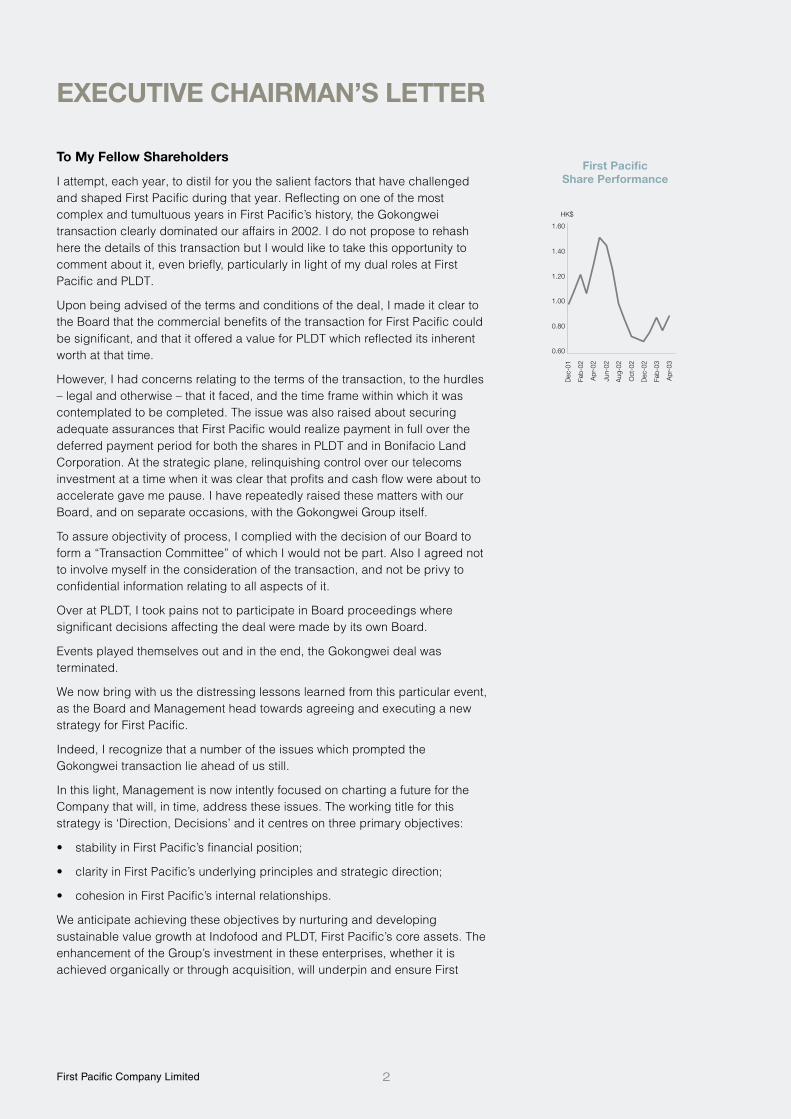
Dec
-01
Feb-
02
Apr
-02
Jun-
02
Aug
-02
Oct
-02
Dec
-02
Feb-
03
Apr
-03
HK$
1.60
1.40
1.20
1.00
0.80
0.60
First PacificShare Performance

Annual Report 20023
EXECUTIVE CHAIRMAN’S LETTER
Pacific’s future growth. The specifics of the final plan, its implementationprocess and timetable, and the metrics by which progress and success will bemeasured, will be outlined in due course.
In closing, I would like to draw your attention to the achievements of 2002 thatwere overshadowed by other matters.
Operationally, the Group returned solid growth, despite the effects of disposalsand regional risk concerns, and returned to profit, recording an attributableprofit for 2002 of US$40.1 million. In tandem, tangible progress was made inaddressing debt-related issues across the Group: First Pacific repaid itsUS$350 million convertible bonds; PLDT made headway in terming out its nearterm debt by raising US$644 million and significantly reducing capital andoperational expenditure; Indofood secured over US$600 million of competitivefinancing to replace existing debt and more efficiently meet ongoing workingcapital and capital expenditure needs. On 17th April 2003, the US$90 millionLarouge loan was repaid in full as Metro Pacific reduced its total debt by 80percent since 2002. In addition, Indofood successfully completed its share buyback program in November 2002, and maintained a thirty per cent dividendpayout.
In 2003, we will continue to pursue financing related matters: having paid downFirst Pacific’s debt to approximately US$100 million, we will focus onrefinancing the remaining debt, while both PLDT and Metro Pacific will forgeahead with their respective liability management plans. I am confident that thepursuit of this important goal, augmented by the ’Direction, Decisions’ strategythat will be finalized and rolled out during the year, will ensure that First Pacificcan again, as in the past where it saw setbacks, be revitalized.
I thank you most sincerely for your patience as we close what may have been aregrettable part of our story in 2002. It is my hope that with such closure, aproductive beginning can be made for First Pacific, and a more composed andconfident future achieved.
Sincerely
MANUEL V. PANGILINANExecutive Chairman
17 April 2003

4First Pacific Company Limited
GOALS
REVIEW OF 2002 GOALS
FIRST PACIFIC• Enhance recurrent cash flows at
Head OfficePartially achieved. Cost savingmeasures have been implemented;Indofood dividend inflow hasimproved.
• Refinance or repay existing two-year loan with longer-term fundingPartially achieved. Debt reduced toapproximately US$100 millionfollowing the repayment of theLarouge Loan principal.
• Conclude value enhancingstrategy for the Group’sinvestments in Escotel andMetroselPartially achieved. Weaker telecomsector sentiment, regional tensionsand an unpredictable businessenvironment have hampereddefinitive progress with regards toEscotel. The Company hasexchanged its 35.0 per centinterest in Metrosel for a 14.6 percent interest in PT Mobile-8Telecom, which is to operate aCDMA network in most ofIndonesia.
INDOFOOD• Pursue core business strategy to
focus on value enhancementAchieved. Marketing focus on thepromotion of higher marginproducts; sales volumes andrevenues improved.
• Improve share price performanceNot achieved. Declined by four percent to close 2002 at Rupiah 600.
• Maintain dividend payout ratio of30 per centAchieved. 30 per cent payout inrespect of 2001 earnings.
• Complete share buy back programAchieved. By 30 November 2002,Indofood had completed the buyback of 915.6 million shares,representing 10 per cent of itsissued and paid-up capital.
• Implement employee stockownership planAchieved. 228.9 million shares wereissued in May 2002, completing thefirst phase.
PLDT• Pursue and complete liability
management programAchieved. Refinanced US$644million of 2002 to 2004 maturingdebts, and reduced debt byUS$127 million from internal freecash flows and dividends fromSmart of Pesos 1.54 billion(US$29.8 million).
• Improve share price performanceNot achieved. Declined by 35 percent to close 2002 at Pesos 270.
• Smart to manage ARPUs throughvalue added servicesAchieved. Stable ARPUs recorded,coupled with a 40 per cent growthin prepaid subscribers.
• Develop data and network relatedoperations to become longer-termdrivers of valueAchieved. Data and network pesorevenues are up 15 per cent, nowcontributing 12 per cent of FixedLine’s total revenues.
• Build and strengthen the operationsand financial position of ePLDTPartially achieved. Peso revenuesincreased by 101 per cent, but thestart-up nature of ePLDT’soperations resulted in an increasedoperating loss of Pesos 483 million(US$9.4 million).
METRO PACIFIC• Conclude debt reduction
programIn progress. Through anaggressive and comprehensivedebt reduction and restructuringprogram, Metro Pacificaddressed US$163.6 million ofdebt by year end 2002. On 17April 2003, US$90 million repaidto Larouge.
• Conclude the merger of Firste-BankIn progress. Local commercialbank, Banco de Oro, agreed toassume First e-Bank’s bankingbusiness, as well as certainassets and liabilities. Thistransaction was approved byFirst e-Bank shareholders inDecember 2002, and isanticipated to close during thesecond quarter of 2003.
ESCOTEL• Retain market leadership in
view of anticipated competitionAchieved. Continues to holdmarket-leading positions in allthree circles.
• Maximize network availabilityand utilizationIn progress. Escotel’s efforts toenhance its network werecompromised by the decision ofEscotel’s existing equipmentsupplier, Lucent, to exit theGSM equipment supplybusiness. Escotel is currently inthe process of securing a newvendor.
• Grow revenues and EBITDA toachieve full break-evenAchieved. Escotel hasenhanced EBITDA and reportedits first profit contribution.
GOALS FOR 2003
FIRST PACIFIC• Reduce costs and increase
recurrent cash flows at HeadOffice
• Refinance or repay US$100 milliondebt, which matures in December2003, with longer-term funding
INDOFOOD• Strengthen cash flows• Build and develop brands• Complete the second phase (114.5
million shares) of the employeestock ownership program
• Improve share price performance• Maintain dividend payout of 30 per
cent
PLDT• Improve share price performance• Generate sufficient free cash flow at
the PLDT level and increasedividend payout from Smart, toenable PLDT to further reducedebts
• Smart to increase overall level ofrevenues, EBITDA and profits
METRO PACIFIC• Conclude debt reduction program
• Conclude Banco de Oro’spurchase of First e-Bank’sbanking business, as well ascertain assets and liabilities
• Improve profitability at Landcoand Nenaco
ESCOTEL• Maximize network availability
and utilization upon theappointment of new equipmentsupplier
• Grow subscriber base andretain market leadership in allthree circles
• Continue to grow EBITDA
Annual Report 20025
BOARD OF DIRECTORS AND SENIOR EXECUTIVES
BOARD OF DIRECTORS AND SENIOR EXECUTIVES
BOARD OF DIRECTORS
MANUEL V. PANGILINANExecutive Chairman
Age 56, born in the Philippines.Mr. Pangilinan received a BA fromAteneo de Manila University and anMBA from University of Pennsylvania’sWharton School before working in thePhilippines and Hong Kong for thePHINMA Group, Bancom InternationalLimited and American Express Bank.He served as First Pacific’s ManagingDirector after founding the company in1981, and was appointed ExecutiveChairman in February 1999.Mr. Pangilinan also serves asPresident and CEO of PLDT; Chairmanof Smart Communications, Inc.;President Commissioner of Indofood;Chairman, President and CEO ofMetro Pacific; Chairman of LandcoPacific Inc.; and as a Director ofEscotel and of Negros Navigation Inc.He is Chairman of the non-profitorganization, Philippine Business forSocial Progress; sits on the Board ofOverseers of the Wharton School andon the Board of Trustees of Ateneo deManila University. He was awarded anHonorary Doctorate in Humanities bySan Beda College in the Philippines inJanuary 2002. Mr. Pangilinan is basedin the Philippines.
ANTHONI SALIMExecutive Director
Age 53, born in Indonesia. Mr. Salim isthe son of Soedono Salim and is thePresident and CEO of the SalimGroup. Mr. Salim is a Commissioner ofIndofood; a Board member of FuturisCorporation Limited; a member of theAdvisory Board for ALLIANZ Group;and has served as a Director of FirstPacific since 1981.
RONALD A. BROWNExecutive Director, General Counsel andCompany Secretary
Age 56, born in the United States.Mr. Brown received an AB fromDartmouth College and a JD and MPAfrom Harvard University. He is amember of the California State Bar andthe District of Columbia Bar. He servedat the Board of Governors of theFederal Reserve System’s Washington,D.C., legal office before joining theBank of America, where he ultimatelybecame head of its Asia Division LegalOffice in Hong Kong. Mr. Brown joinedFirst Pacific in 1986 as Vice President,General Counsel and CompanySecretary and was named anExecutive Director in February 1999.He also serves as a Commissioner ofIndofood and as a Director of Escotel.
EDWARD K.Y. CHEN, CBE, JPNon-executive Director
Age 57, born in Hong Kong andeducated at the University of HongKong and Oxford University. Prof.Chen serves as President of LingnanUniversity; a Director of Asia SatelliteTelecommunications and Eaton VanceManagement Funds; and a Non-executive Director of Wharf HoldingsLimited. Formerly, he served asChairman of Hong Kong’s ConsumerCouncil; as an Executive Councilor ofthe Hong Kong Government; and as aLegislative Councilor. Prof. Chenjoined First Pacific’s Board in 1993.
SUTANTO DJUHARNon-executive Director
Age 74, born in Indonesia. Mr. Djuharhas founded numerous Indonesiancompanies involved primarily in realestate development. He is aCommissioner of PT Kartika Chandraand serves as a Director of PTBogasari Flour Mills and PacificIndustries and Development Ltd.Mr. Djuhar, who is the father of TedyDjuhar, joined First Pacific’s Board in1981.
TEDY DJUHARNon-executive Director
Age 51, born in Indonesia.Mr. Djuhar is the Vice PresidentDirector of PT Indocement TunggalPrakarsa Tbk., Director of PacificIndustries and Development Ltd.,and a number of other Indonesiancompanies. He is the son ofSutanto Djuhar. Mr. Djuhar joinedFirst Pacific’s Board in 1981.
MICHAEL J.A. HEALYFinance Director
Age 42, born in Scotland. Mr. Healyreceived a Bachelor of Arts Degreein Economics in 1980 and aDiploma in Accountancy in 1981from the University of Stirling,Scotland. He is a member of theInstitute of Chartered Accountantsof Scotland and the Hong KongSociety of Accountants. Mr. Healyserved as a member of theFinancial Accounting StandardsCommittee of the Hong KongSociety of Accountants from 1996to 2000. Mr. Healy joined FirstPacific in 1994, having served inPrice Waterhouse’s UnitedKingdom and Hong Kong audit andbusiness advisory departments.Prior to his appointment as FinanceDirector in February 1999,Mr. Healy held several seniorfinance positions and, in January2000, he assumed the additionalresponsibilities of Chief OperatingOfficer. He also serves as aCommissioner of Indofood and as aDirector of Escotel.
IBRAHIM RISJADNon-executive Director
Age 68, born in Indonesia.Mr. Risjad serves as aCommissioner of PT IndocementTunggal Prakarsa Tbk. and as VicePresident of the Board ofCommissioners of Indofood. Hejoined First Pacific’s Board in 1981.

6First Pacific Company Limited
BOARD OF DIRECTORS AND SENIOR EXECUTIVES
BOARD OF DIRECTORS (CONT’D)
DAVID W.C. TANG, OBENon-executive Director
Age 48, born in Hong Kong. Mr. Tangis the founder of the Shanghai Tangstores and the China Clubs in HongKong, Beijing and Singapore, as wellas The Pacific Cigar Company Limited.He holds Hong Kong directorships onthe Boards of Lai Sun DevelopmentLimited and Free Duty Limited; Londondirectorships include the Boards ofAsprey Limited and Garrard Limited;and the International Advisory Board ofThe Savoy Group of London. Mr. Tangjoined First Pacific’s Board in 1989.
EDWARD A. TORTORICIExecutive Director
Age 63, born in the United States.Mr. Tortorici received a BS from NewYork University and an MS fromFairfield University. He found EAEdwards Associates, an internationalmanagement and consulting firm withoffices worldwide. Mr. Tortorici joinedFirst Pacific as an Executive Director in1987, becoming responsible fororganization and strategic planning.Mr. Tortorici also serves as a Directorof Indofood, Metro Pacific, BonifacioLand Corporation, Fort BonifacioDevelopment Corporation and ACeS.
ADVISORS
SOEDONO SALIMHonorary Chairman andAdvisor to the Board
Age 86, born in China. Mr. Salimserved as First Pacific’s Chairman from1981 until February 1999, when heassumed his current titles. He servesas Chairman of the Salim Group, and isa Commissioner or Director ofnumerous other Indonesiancompanies.
SUDWIKATMONOAdvisor to the Board
Age 68, born in Indonesia.Mr. Sudwikatmono served as a Directorof First Pacific from 1981 until February1999, when he assumed his currenttitle. He is a Director of PT BogasariFlour Mills, Vice PresidentCommissioner of PT IndocementTunggal Prakarsa Tbk., and holdsBoard positions with a number of otherIndonesian companies.
SENIOR EXECUTIVES
REBECCA G. BROWNExecutive Vice President,Group Corporate Communications
Age 38, born in Zimbabwe.Ms. Brown qualified in the UnitedKingdom and is a fellow of theAssociation of Chartered CertifiedAccountants and a member of theNational Investor Relations Institute.After eight years in London withShell International, she joined FirstPacific in 1996 and served inseveral senior finance positions. InSeptember 1999, Ms. Brown wasnamed Executive Vice President,Group Corporate Communications.
MAISIE M.S. LAMExecutive Vice President,Group Human Resources
Age 48, born in Hong Kong.Ms. Lam received a Diploma fromHong Kong Polytechnic University/Hong Kong ManagementAssociation. She joined First Pacificin 1983 from Citicorp’s merchantbanking arm in Hong Kong.
JOSEPH H.P. NGExecutive Vice President,Group Finance
Age 40, born in Hong Kong. Mr. Ngreceived an MBA and aProfessional Diploma inAccountancy from the Hong KongPolytechnic University. He is amember of the Hong Kong Societyof Accountants and of theAssociation of Chartered CertifiedAccountants. Mr. Ng joined FirstPacific in 1988 from PriceWaterhouse’s audit and businessadvisory department in Hong Kong.Prior to his appointment asExecutive Vice President, GroupFinance in May 2002, Mr. Ng wasGroup Treasurer of the Group andserved in several senior financepositions within the First PacificGroup. Mr. Ng also serves as aCommissioner of Indofood and as aDirector of Escotel.
Annual Report 20027
REVIEW OF OPERATIONS
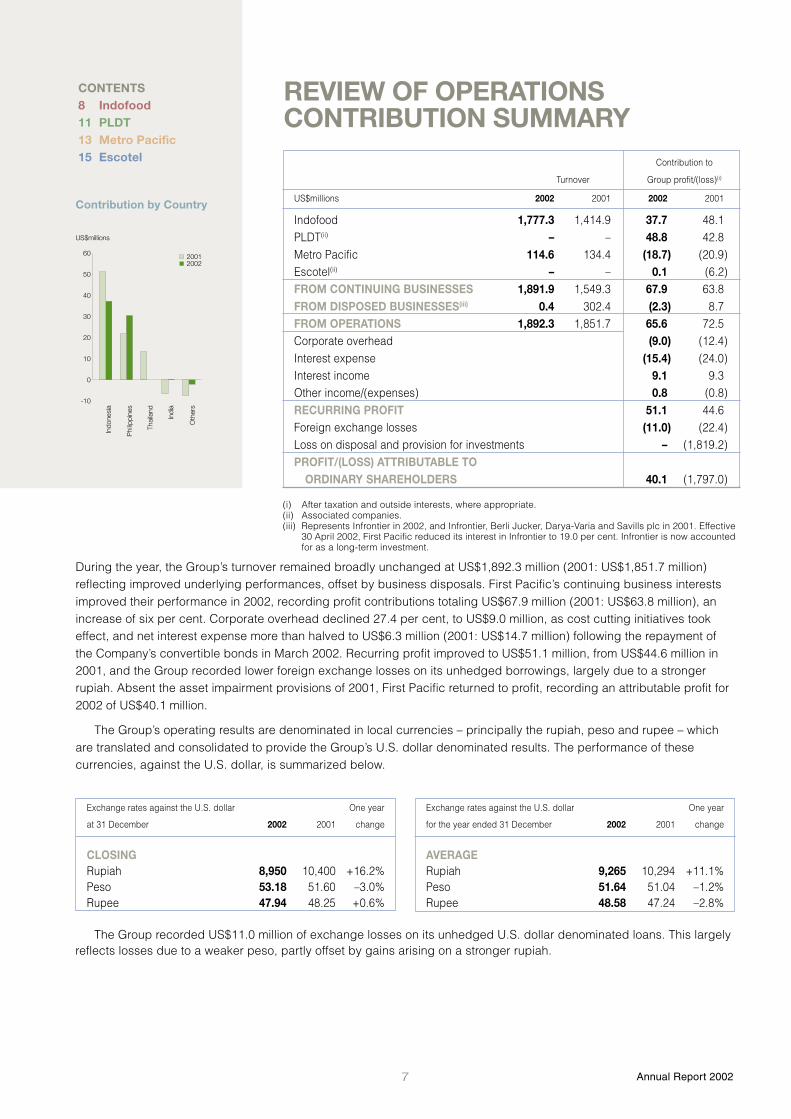
During the year, the Group’s turnover remained broadly unchanged at US$1,892.3 million (2001: US$1,851.7 million)reflecting improved underlying performances, offset by business disposals. First Pacific’s continuing business interestsimproved their performance in 2002, recording profit contributions totaling US$67.9 million (2001: US$63.8 million), anincrease of six per cent. Corporate overhead declined 27.4 per cent, to US$9.0 million, as cost cutting initiatives tookeffect, and net interest expense more than halved to US$6.3 million (2001: US$14.7 million) following the repayment ofthe Company’s convertible bonds in March 2002. Recurring profit improved to US$51.1 million, from US$44.6 million in2001, and the Group recorded lower foreign exchange losses on its unhedged borrowings, largely due to a strongerrupiah. Absent the asset impairment provisions of 2001, First Pacific returned to profit, recording an attributable profit for2002 of US$40.1 million.
The Group’s operating results are denominated in local currencies – principally the rupiah, peso and rupee – whichare translated and consolidated to provide the Group’s U.S. dollar denominated results. The performance of thesecurrencies, against the U.S. dollar, is summarized below.
(i) After taxation and outside interests, where appropriate.(ii) Associated companies.(iii) Represents Infrontier in 2002, and Infrontier, Berli Jucker, Darya-Varia and Savills plc in 2001. Effective
30 April 2002, First Pacific reduced its interest in Infrontier to 19.0 per cent. Infrontier is now accountedfor as a long-term investment.
REVIEW OF OPERATIONSCONTRIBUTION SUMMARY
Contribution to
Turnover Group profit/(loss)(i)
US$millions 2002 2001 2002 2001
Indofood 1,777.3 1,414.9 37.7 48.1PLDT(ii) – – 48.8 42.8Metro Pacific 114.6 134.4 (18.7) (20.9)Escotel(ii) – – 0.1 (6.2)FROM CONTINUING BUSINESSES 1,891.9 1,549.3 67.9 63.8FROM DISPOSED BUSINESSES(iii) 0.4 302.4 (2.3) 8.7FROM OPERATIONS 1,892.3 1,851.7 65.6 72.5Corporate overhead (9.0) (12.4)Interest expense (15.4) (24.0)Interest income 9.1 9.3Other income/(expenses) 0.8 (0.8)RECURRING PROFIT 51.1 44.6Foreign exchange losses (11.0) (22.4)Loss on disposal and provision for investments – (1,819.2)PROFIT/(LOSS) ATTRIBUTABLE TO
ORDINARY SHAREHOLDERS 40.1 (1,797.0)
The Group recorded US$11.0 million of exchange losses on its unhedged U.S. dollar denominated loans. This largelyreflects losses due to a weaker peso, partly offset by gains arising on a stronger rupiah.
Contribution by Country
60
50
40
30
10
20
0
-10
Indo
nesi
a
US$millions
Phi
lippi
nes
Thai
land
Indi
a
Oth
ers
20022001
CONTENTS8 Indofood11 PLDT13 Metro Pacific15 Escotel
Exchange rates against the U.S. dollar One year
at 31 December 2002 2001 change
CLOSINGRupiah 8,950 10,400 +16.2%Peso 53.18 51.60 –3.0%Rupee 47.94 48.25 +0.6%
Exchange rates against the U.S. dollar One year
for the year ended 31 December 2002 2001 change
AVERAGERupiah 9,265 10,294 +11.1%Peso 51.64 51.04 –1.2%Rupee 48.58 47.24 –2.8%

8First Pacific Company Limited
REVIEW OF OPERATIONS
INDOFOODPT Indofood Sukses Makmur Tbk (Indofood) is the leading processed-foods group inIndonesia. Noodles, Flour and Edible Oils & Fats are the principal businesses of Indofood, andit also has interests in Distribution, Food Seasonings, Baby Foods and Snack Foodsbusinesses.
Indofood’s operations are denominated in rupiah, which averaged Rupiah 9,265(2001: 10,294) to the U.S. dollar, and its financial results are prepared under IndonesianGAAP and reported in rupiah. First Pacific’s financial results are prepared under HongKong GAAP and reported in U.S. dollars. Accordingly, certain adjustments need to bemade to Indofood’s reported rupiah results to ensure compliance with Hong Kong GAAP.An analysis of these adjustments follows.
2002 2001
Rupiah mln Rupiah mln
Net income under Indonesian GAAP 802,633 746,330Differing accounting treatments(i)
– Foreign exchange accounting 54,434 54,434– Others (3,415) (27,642)
Adjusted net income under Hong Kong GAAP 853,652 773,122Foreign exchange(ii) (151,318) 258,695Indofood’s net income as reported by First Pacific 702,334 1,031,817
US$ mln US$ mln
Translated into U.S. dollars at prevailing average ratesof 2002: Rupiah 9,265 and 2001: Rupiah 10,294 75.8 100.2
Contribution to First Pacific Group profit, at an averageshareholding of 2002: 49.8% and 2001: 48.0%(iii) 37.7 48.1
Share Price Rupiah
31 December 2001 625High: 14 June 2002 1,250Low: 15 October 2002 47531 December 2002 60017 April 2003 725
(i) Differences in accounting treatment under Indonesian GAAP, compared with Hong Kong GAAP. The principaladjustment is:• Foreign exchange accounting: The adjustment relates to the reversal of the amortization of foreign exchange
losses that were previously capitalized by Indofood on certain fixed assets under construction.(ii) To illustrate the underlying operational results and profit contribution, exchange differences (net of related tax)
are excluded and presented separately.(iii) As a consequence of Indofood’s share buy back program, First Pacific’s shareholding in Indofood increased to
51.9 per cent by 31 December 2002. First Pacific’s average shareholding during 2002 was 49.8 per cent.
Annual Report 20029
REVIEW OF OPERATIONS
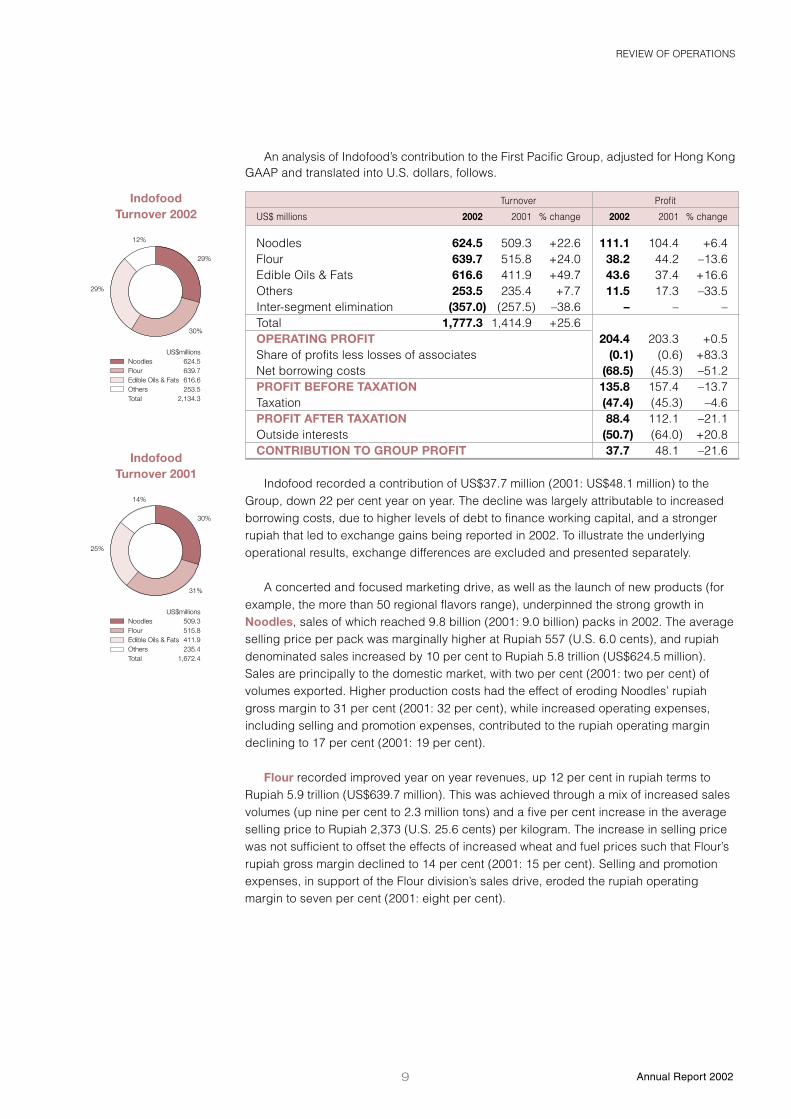
An analysis of Indofood’s contribution to the First Pacific Group, adjusted for Hong KongGAAP and translated into U.S. dollars, follows.
Turnover Profit
US$ millions 2002 2001 % change 2002 2001 % change
Noodles 624.5 509.3 +22.6 111.1 104.4 +6.4Flour 639.7 515.8 +24.0 38.2 44.2 –13.6Edible Oils & Fats 616.6 411.9 +49.7 43.6 37.4 +16.6Others 253.5 235.4 +7.7 11.5 17.3 –33.5Inter-segment elimination (357.0) (257.5) –38.6 – – –Total 1,777.3 1,414.9 +25.6OPERATING PROFIT 204.4 203.3 +0.5Share of profits less losses of associates (0.1) (0.6) +83.3Net borrowing costs (68.5) (45.3) –51.2PROFIT BEFORE TAXATION 135.8 157.4 –13.7Taxation (47.4) (45.3) –4.6PROFIT AFTER TAXATION 88.4 112.1 –21.1Outside interests (50.7) (64.0) +20.8CONTRIBUTION TO GROUP PROFIT 37.7 48.1 –21.6
IndofoodTurnover 2002
Indofood recorded a contribution of US$37.7 million (2001: US$48.1 million) to theGroup, down 22 per cent year on year. The decline was largely attributable to increasedborrowing costs, due to higher levels of debt to finance working capital, and a strongerrupiah that led to exchange gains being reported in 2002. To illustrate the underlyingoperational results, exchange differences are excluded and presented separately.
A concerted and focused marketing drive, as well as the launch of new products (forexample, the more than 50 regional flavors range), underpinned the strong growth inNoodles, sales of which reached 9.8 billion (2001: 9.0 billion) packs in 2002. The averageselling price per pack was marginally higher at Rupiah 557 (U.S. 6.0 cents), and rupiahdenominated sales increased by 10 per cent to Rupiah 5.8 trillion (US$624.5 million).Sales are principally to the domestic market, with two per cent (2001: two per cent) ofvolumes exported. Higher production costs had the effect of eroding Noodles’ rupiahgross margin to 31 per cent (2001: 32 per cent), while increased operating expenses,including selling and promotion expenses, contributed to the rupiah operating margindeclining to 17 per cent (2001: 19 per cent).
Flour recorded improved year on year revenues, up 12 per cent in rupiah terms toRupiah 5.9 trillion (US$639.7 million). This was achieved through a mix of increased salesvolumes (up nine per cent to 2.3 million tons) and a five per cent increase in the averageselling price to Rupiah 2,373 (U.S. 25.6 cents) per kilogram. The increase in selling pricewas not sufficient to offset the effects of increased wheat and fuel prices such that Flour’srupiah gross margin declined to 14 per cent (2001: 15 per cent). Selling and promotionexpenses, in support of the Flour division’s sales drive, eroded the rupiah operatingmargin to seven per cent (2001: eight per cent).
30%
29%
29%
12%
US$millionsNoodles 624.5Flour 639.7Edible Oils & Fats 616.6Others 253.5Total 2,134.3
IndofoodTurnover 2001
31%
30%
25%
14%
US$millionsNoodles 509.3Flour 515.8Edible Oils & Fats 411.9Others 235.4Total 1,672.4

10First Pacific Company Limited
REVIEW OF OPERATIONS
Edible Oils & Fats recorded strong revenue growth, up 35 per cent to Rupiah 5.7trillion (US$616.6 million). Cooking Oil & Fats, Trading and Plantation sales revenues wereup 25 per cent, 41 per cent and 37 per cent, respectively, with increased sales volumesand higher average selling prices contributing to this growth. However, this wasinsufficient to fully offset the significant increase in the cost of crude palm oil and copraand, accordingly, the rupiah gross margins of Cooking Oil & Fats and Trading declined tosix per cent (2001: 15 per cent) and four per cent (2001: five per cent), respectively.Plantation’s rupiah margins improved to 57 per cent (2001: 52 per cent) gross, and 44 percent (2001: 41 per cent) operating.
Others represents the collective results of Indofood’s Distribution, Food Seasonings,Baby Foods, Snack Foods and Other business interests. The performance of Others waslargely affected by a decline in Distribution’s sales revenues, as well as increasedcompetition in the Snack Foods market. Notwithstanding this, the remaining businessesrecorded stronger sales revenues, through volume and price increases, such that therupiah gross margin for Others remained unchanged at 29 per cent. However, this wasinsufficient to offset higher selling and promotion expenses, which resulted in a lowerrupiah operating margin of four per cent (2001: seven per cent).
During 2002, Indofood raised a two-year US$100.0 million loan facility, repayable onan installment basis, and various short to medium term rupiah denominated borrowings,totaling approximately Rupiah 2.0 trillion (US$223.5 million), for working capital andcapital expenditure purposes. In addition, US$280.0 million of five-year Euro bonds wereissued and used to replace existing debt. Approximately US$422.4 million of debt,comprising Rupiah 685.6 billion (US$76.6 million) debt and US$345.8 million U.S. dollardebt, was repaid during 2002.
Indofood’s share buy back program was completed on schedule on 30 November2002, with 915.6 million shares having been repurchased at an average price ofapproximately Rupiah 807. Similarly, progress was also made with the employee stockownership program (ESOP). This program covers 457.8 million shares, representing fiveper cent of Indofood’s issued and paid-up share capital, and is being implemented instages through to May 2004. The first stage, representing 50 per cent of the ESOP, wascompleted on schedule in May 2002. The second and third stages, each representing 25per cent of the ESOP, are to be completed in May 2003 and May 2004, respectively.
Indofood plans to continue to focus on its operational strengths in 2003, with aparticular emphasis on accelerating organic growth. Capital expenditure and debt willcontinue to be managed to ensure that these remain at optimal levels.
IndofoodOperating Profit 2002
19%
54%21%
6%
US$millionsNoodles 111.1Flour 38.2Edible Oils & Fats 43.6Others 11.5Total 204.4
IndofoodOperating Profit 2001
22%
51%18%
9%
US$millionsNoodles 104.4Flour 44.2Edible Oils & Fats 37.4Others 17.3Total 203.3

Annual Report 200211
REVIEW OF OPERATIONS
PLDTPhilippine Long Distance Telephone Company (PLDT) is the largest and most diversifiedtelecommunications company in the Philippines. Its businesses are organized into three mainsegments: Wireless (principally through wholly-owned subsidiary Smart Communications(Smart)), Fixed Line (principally through PLDT), and Information and CommunicationsTechnology (principally through wholly-owned subsidiary ePLDT).
PLDT’s operations are principally denominated in pesos, which averaged Pesos 51.64(2001: 51.04) to the U.S. dollar, and its financial results are prepared under PhilippineGAAP and reported in pesos. First Pacific’s financial results are prepared under HongKong GAAP and reported in U.S. dollars. Accordingly, certain adjustments need to bemade to PLDT’s reported peso results to ensure compliance with Hong Kong GAAP. Ananalysis of these adjustments follows.
2002 2001
Pesos mln Pesos mln
Net income under Philippine GAAP(i) 3,118 3,418Preference dividends(ii) (1,683) (1,670)Net income attributable to common shareholders 1,435 1,748Differing accounting treatments(iii)
– Foreign exchange accounting (146) (164)– Fair values on acquisition 3,475 3,670– Reversal of provision for Piltel 4,110 600– Others (1,377) 220
Intragroup items(iv) 275 275Adjusted net income under Hong Kong GAAP 7,772 6,349Foreign exchange(v) 2,546 2,564PLDT’s net income as reported by First Pacific 10,318 8,913
US$ mln US$ mln
Translated into U.S. dollars at prevailing average ratesof 2002: Pesos 51.64 and 2001: Pesos 51.04 200.0 174.6
Contribution to First Pacific Group profit, at an averageshareholding of 2002: 24.4% and 2001: 24.5% 48.8 42.8
(i) PLDT has restated its net income for 2001 from Pesos 3,418 million to Pesos 2,828 million after changing therevenue recognition policy for prepaid cards from sale to usage. As First Pacific has already adjusted for thisin prior years’ GAAP adjustments, no further adjustment is required.
(ii) First Pacific presents net income after the deduction of preference dividends.(iii) Differences in accounting treatment under Philippine GAAP, compared with Hong Kong GAAP. The principal
adjustments include:• Foreign exchange accounting: Under Philippine GAAP, PLDT is permitted to capitalize and amortize
exchange differences. Hong Kong GAAP requires the recognition of such differences, even thoughunrealized, in the profit and loss statement. The adjustment reverses the amortization of PLDT’scapitalized foreign exchange differences, as the originating exchange difference has already been writtenoff by First Pacific.
• Fair values on acquisition: First Pacific made certain fair value adjustments at the time of its acquisition ofPLDT, such that certain PLDT assets are held at different values in First Pacific’s accounts. Accordingly,the adjustment reverses the depreciation on assets that First Pacific has already written down.
• Reversal of provision for Piltel: PLDT made full provision against its investment, under the Letter ofSupport arrangement, in Piltel preference shares. As First Pacific has already made full provision for this,the adjustment reverses PLDT’s provision.
(iv) These are standard consolidation adjustments to ensure that transactions between Group companies areeliminated to present the Group as a single economic entity.
(v) To illustrate the underlying operational results and profit contribution, exchange differences (net of related tax)are excluded and presented separately.
Share Price Pesos
31 December 2001 417.5High: 3 April 2002 565.0Low: 23 October 2002 209.031 December 2002 270.017 April 2003 382.5

12First Pacific Company Limited
REVIEW OF OPERATIONS
An analysis of PLDT’s contribution to the First Pacific Group, adjusted for Hong KongGAAP and translated into U.S. dollars, follows.
Turnover Profit
US$ millions 2002 2001 % change 2002 2001 % change
Fixed Line 881.5 918.4 –4.0 372.4 395.7 –5.9Wireless 652.8 513.9 +27.0 181.4 110.3 +64.5ICT* 18.2 9.2 +97.8 (10.4) (6.1) –70.5Total 1,552.5 1,441.5 +7.7OPERATING PROFIT 543.4 499.9 +8.7Share of profits less losses of associates (1.0) 0.8 –Net borrowing costs (262.1) (267.9) +2.2PROFIT BEFORE TAXATION 280.3 232.8 +20.4Taxation (49.0) (47.5) –3.2PROFIT AFTER TAXATION 231.3 185.3 +24.8Outside interests 0.4 19.4 –97.9PROFIT FOR THE YEAR 231.7 204.7 +13.2Preference share dividends (31.7) (30.1) –5.3PROFIT ATTRIBUTABLE TO ORDINARY SHAREHOLDERS 200.0 174.6 +14.5Average shareholding (%) 24.4 24.5 –CONTRIBUTION TO GROUP PROFIT 48.8 42.8 +14.0
PLDTTurnover 2002
* Information and Communications Technology
PLDT recorded a contribution of US$48.8 million (2001: US$42.8 million) to the Group,up 14 per cent year on year.
PLDT’s year on year growth was underpinned by its Wireless business, which nowaccounts for 42 per cent of PLDT’s peso revenues. Smart and Piltel grew their jointsubscriber base by 2.2 million subscribers in 2002 to end the year with 8.6 millionsubscribers, equating to 57 per cent market share. On a stand-alone basis, Smart closedthe year as the market leader with 6.8 million (2001: 4.6 million) GSM subscribers, or 45per cent of the market.
Revenues from Wireless voice services increased by 41 per cent to Pesos 17.4 billion(US$336.9 million) (2001: Pesos 12.3 billion; US$241.0 million), representing 53 per centof Smart’s cellular revenues. Revenues from Wireless data services likewise grew by 82per cent to Pesos 12.2 billion (US$236.3 million) (2001: Pesos 6.7 billion; US$131.3million), accounting for 37 per cent of cellular revenues. Short Messaging Service (SMS)remains the largest contributor to Wireless data service revenues, with 16.5 billionoutbound messages handled over 2002, up one-third year on year. Outbound SMSactivity exceeded thirty-one thousand messages every minute. In tandem with growing itssubscriber base and subscriber revenues, Smart has focused on paring back subscriberacquisition costs while minimising product subsidies. Smart’s net income for 2002improved by 74 per cent to Pesos 6.1 billion (US$118.1 million) (2001: Pesos 3.5 billion;US$67.8 million), despite incurring a depreciation charge of Pesos 3.1 billion (US$60.0million) on the closing of Smart’s analog network. In December 2002, Smart paid its firstcash dividend - Pesos 1.54 billion (US$29.8 million) – to PLDT.
Smart’s dividend was utilised in the debt liability management program that has been central to the 2002 activities ofPLDT’s Fixed Line business. Phase One of this program, which raised US$644 million to term out debt obligations thatmature between 2002 and 2004, was completed in September 2002 and, in tandem, a number of cost cutting initiativesfreed up cash flow for debt-related activities. These included reducing capital expenditure by 28 per cent to Pesos 6.9
57%42%
1%
US$millionsFixed Line 881.5Wireless 652.8ICT 18.2Total 1,552.5
PLDTTurnover 2001
64%35%
1%
US$millionsFixed Line 918.4Wireless 513.9ICT 9.2Total 1,441.5

Annual Report 200213
REVIEW OF OPERATIONS
billion (US$133.6 million), cash operating expenses by four per cent to Pesos 15.7 billion (US$304.0 million), andsignificantly curtailing investments in subsidiaries and affiliates (2002: Pesos 2.2 billion (US$42.6 million); 2001: Pesos4.4 billion (US$86.2 million)). Operationally, the stability of the Fixed Line’s local exchange revenues and the expansion ofdata and other network services have offset pressure on the national and international long distance businesses. Nationallong distance revenues have suffered through the increased substitution of wireless services, and International revenuesare down due to lower direct dialling and settlement rates.
Revenue from the Information and Communications Technology (ICT) businesses continues to grow, with ePLDT’scall centre businesses recording significant growth year on year such that these now account for almost one third of totalICT revenues.
In 2003, PLDT will continue its debt liability management activities and, to this end, will seek to enhance operationalcash inflows. It is anticipated that debt maturities in 2003 and 2004 will be funded through internal free cash flows anddividends from Smart. Wireless will grow through Smart’s innovative data services products, with a view to maintainingsubscribers and improving margins.
Share Price Peso
31 December 2001 0.30High: 19 February 2002 0.43Low: 4 December 2002 0.1431 December 2002 0.1617 April 2003 0.20
METRO PACIFICMetro Pacific Corporation (Metro Pacific) is based and separately listed in Manila andprincipally holds interests in property developers Bonifacio Land Corporation (BLC), PacificPlaza Towers and Landco Pacific Corporation (Landco). It also holds an interest in NegrosNavigation Company (Nenaco), a shipping enterprise.
Metro Pacific’s operations are denominated in pesos, which averaged Pesos 51.64(2001: 51.04) to the U.S. dollar, and its financial results are prepared under PhilippineGAAP and reported in pesos. First Pacific’s financial results are prepared under HongKong GAAP and reported in U.S. dollars. Accordingly, certain adjustments need to bemade to Metro Pacific’s reported peso results to ensure compliance with Hong KongGAAP. An analysis of these adjustments follows.
2002 2001
Pesos mln Pesos mln
Net loss under Philippine GAAP (11,713) (23,211)Differing accounting treatments(i)
– Reversal of impairment provision 8,706 20,918– Others 1,802 696
Adjusted net loss under Hong Kong GAAP (1,205) (1,597)Foreign exchange(ii) 8 273Metro Pacific’s net loss as reported by First Pacific (1,197) (1,324)
US$ mln US$ mln
Translated into U.S. dollars at prevailing average ratesof 2002: Pesos 51.64 and 2001: Pesos 51.04 (23.2) (25.9)
Contribution to First Pacific Group profit, at an averageshareholding of 2002: 80.6% and 2001: 80.6% (18.7) (20.9)
(i) Differences in accounting under Philippine GAAP, compared with Hong Kong GAAP. Principal adjustmentsinclude:• Reversal of impairment provision: Adjustment to reverse Metro Pacific’s 2002 impairment provision of
Pesos 8.7 billion (2001: Pesos 20.9 billion) in respect of its investment in BLC. First Pacific has, throughits 2001 impairment provisions, already fully provided against this asset.
• Others: The 2002 adjustment includes the one-off release of a Pesos 0.8 billion Group level provisionrelating to Metro Pacific’s loss on a property disposal.
(ii) To illustrate the underlying operational results and profit contributions, exchange differences (net of relatedtax) are excluded and presented separately.
14First Pacific Company Limited
REVIEW OF OPERATIONS
Turnover Profit
US$ millions 2002 2001 % change 2002 2001 % change
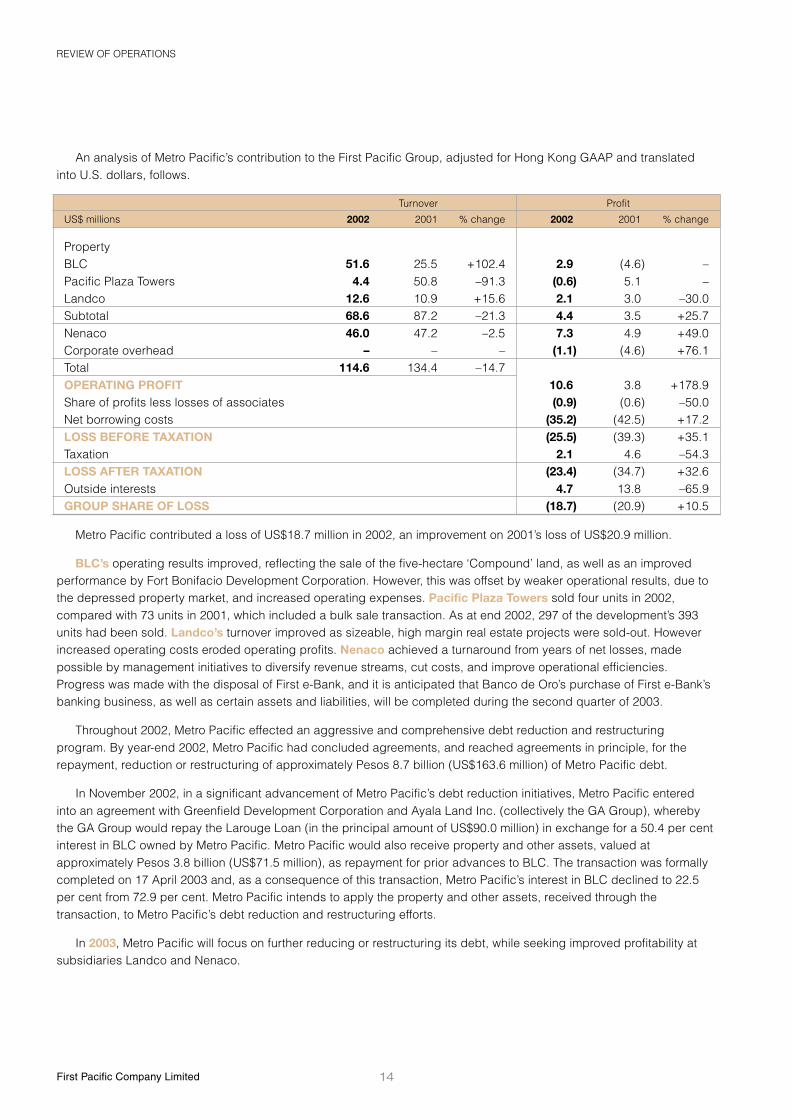
PropertyBLC 51.6 25.5 +102.4 2.9 (4.6) –Pacific Plaza Towers 4.4 50.8 –91.3 (0.6) 5.1 –Landco 12.6 10.9 +15.6 2.1 3.0 –30.0Subtotal 68.6 87.2 –21.3 4.4 3.5 +25.7Nenaco 46.0 47.2 –2.5 7.3 4.9 +49.0Corporate overhead – – – (1.1) (4.6) +76.1Total 114.6 134.4 –14.7OPERATING PROFIT 10.6 3.8 +178.9Share of profits less losses of associates (0.9) (0.6) –50.0Net borrowing costs (35.2) (42.5) +17.2LOSS BEFORE TAXATION (25.5) (39.3) +35.1Taxation 2.1 4.6 –54.3LOSS AFTER TAXATION (23.4) (34.7) +32.6Outside interests 4.7 13.8 –65.9GROUP SHARE OF LOSS (18.7) (20.9) +10.5
An analysis of Metro Pacific’s contribution to the First Pacific Group, adjusted for Hong Kong GAAP and translatedinto U.S. dollars, follows.
Metro Pacific contributed a loss of US$18.7 million in 2002, an improvement on 2001’s loss of US$20.9 million.
BLC’s operating results improved, reflecting the sale of the five-hectare ‘Compound’ land, as well as an improvedperformance by Fort Bonifacio Development Corporation. However, this was offset by weaker operational results, due tothe depressed property market, and increased operating expenses. Pacific Plaza Towers sold four units in 2002,compared with 73 units in 2001, which included a bulk sale transaction. As at end 2002, 297 of the development’s 393units had been sold. Landco’s turnover improved as sizeable, high margin real estate projects were sold-out. Howeverincreased operating costs eroded operating profits. Nenaco achieved a turnaround from years of net losses, madepossible by management initiatives to diversify revenue streams, cut costs, and improve operational efficiencies.Progress was made with the disposal of First e-Bank, and it is anticipated that Banco de Oro’s purchase of First e-Bank’sbanking business, as well as certain assets and liabilities, will be completed during the second quarter of 2003.
Throughout 2002, Metro Pacific effected an aggressive and comprehensive debt reduction and restructuringprogram. By year-end 2002, Metro Pacific had concluded agreements, and reached agreements in principle, for therepayment, reduction or restructuring of approximately Pesos 8.7 billion (US$163.6 million) of Metro Pacific debt.
In November 2002, in a significant advancement of Metro Pacific’s debt reduction initiatives, Metro Pacific enteredinto an agreement with Greenfield Development Corporation and Ayala Land Inc. (collectively the GA Group), wherebythe GA Group would repay the Larouge Loan (in the principal amount of US$90.0 million) in exchange for a 50.4 per centinterest in BLC owned by Metro Pacific. Metro Pacific would also receive property and other assets, valued atapproximately Pesos 3.8 billion (US$71.5 million), as repayment for prior advances to BLC. The transaction was formallycompleted on 17 April 2003 and, as a consequence of this transaction, Metro Pacific’s interest in BLC declined to 22.5per cent from 72.9 per cent. Metro Pacific intends to apply the property and other assets, received through thetransaction, to Metro Pacific’s debt reduction and restructuring efforts.
In 2003, Metro Pacific will focus on further reducing or restructuring its debt, while seeking improved profitability atsubsidiaries Landco and Nenaco.
Annual Report 200215
REVIEW OF OPERATIONS
ESCOTELEscotel Mobile Communications Limited (Escotel) is a GSM cellular telephone servicesprovider based in New Delhi that commenced operations in 1996. Escotel operates in threecircles: Uttar Pradesh (West), Haryana and Kerala.
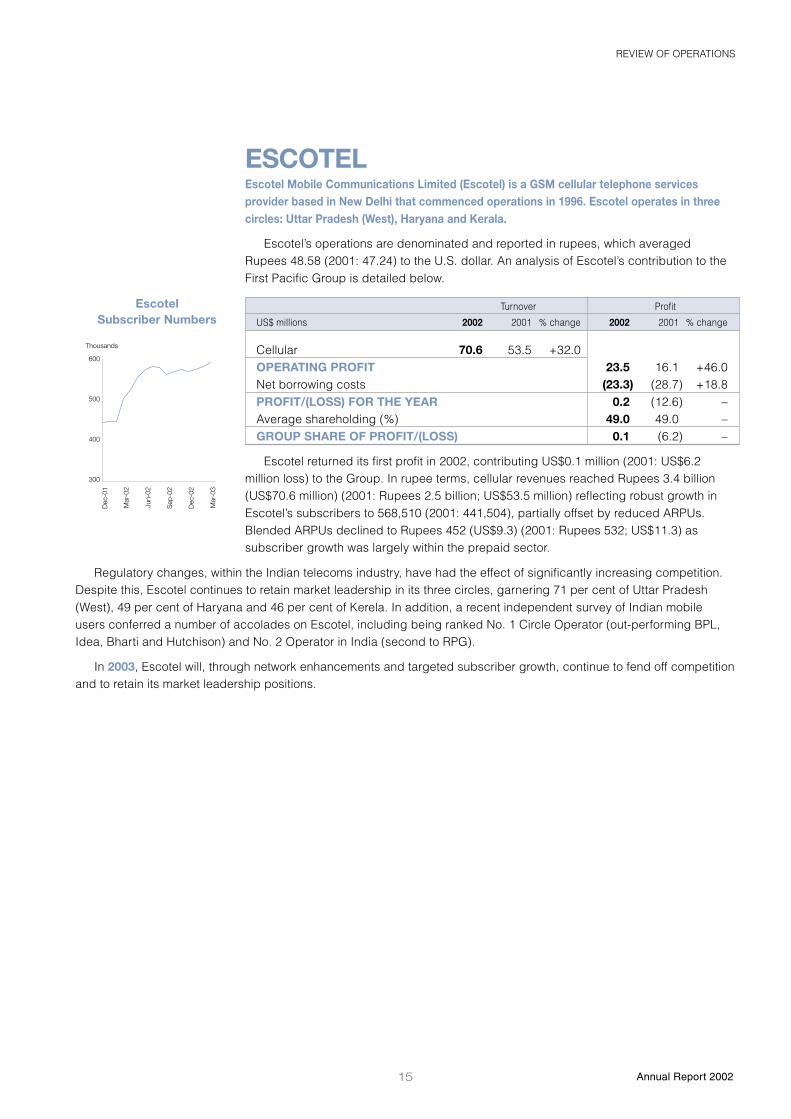
Escotel’s operations are denominated and reported in rupees, which averagedRupees 48.58 (2001: 47.24) to the U.S. dollar. An analysis of Escotel’s contribution to theFirst Pacific Group is detailed below.
Turnover Profit
US$ millions 2002 2001 % change 2002 2001 % change
Cellular 70.6 53.5 +32.0OPERATING PROFIT 23.5 16.1 +46.0Net borrowing costs (23.3) (28.7) +18.8PROFIT/(LOSS) FOR THE YEAR 0.2 (12.6) –Average shareholding (%) 49.0 49.0 –GROUP SHARE OF PROFIT/(LOSS) 0.1 (6.2) –
Escotel returned its first profit in 2002, contributing US$0.1 million (2001: US$6.2million loss) to the Group. In rupee terms, cellular revenues reached Rupees 3.4 billion(US$70.6 million) (2001: Rupees 2.5 billion; US$53.5 million) reflecting robust growth inEscotel’s subscribers to 568,510 (2001: 441,504), partially offset by reduced ARPUs.Blended ARPUs declined to Rupees 452 (US$9.3) (2001: Rupees 532; US$11.3) assubscriber growth was largely within the prepaid sector.
EscotelSubscriber Numbers
600
500
400
300
Dec
-01
Mar
-02
Jun-
02
Sep
-02
Dec
-02
Mar
-03
Thousands
Regulatory changes, within the Indian telecoms industry, have had the effect of significantly increasing competition.Despite this, Escotel continues to retain market leadership in its three circles, garnering 71 per cent of Uttar Pradesh(West), 49 per cent of Haryana and 46 per cent of Kerela. In addition, a recent independent survey of Indian mobileusers conferred a number of accolades on Escotel, including being ranked No. 1 Circle Operator (out-performing BPL,Idea, Bharti and Hutchison) and No. 2 Operator in India (second to RPG).
In 2003, Escotel will, through network enhancements and targeted subscriber growth, continue to fend off competitionand to retain its market leadership positions.

16First Pacific Company Limited
FINANCIAL REVIEW
FINANCIAL REVIEW
CONTENTS16 Liquidity and Financial Resources19 Financial Risk Management23 Adjusted Net Asset Value (NAV) Per Share
LIQUIDITY ANDFINANCIAL RESOURCES
(A) COMPANY NET DEBT
The outstanding convertible bonds, which were issued by the Company in March 1997,amounting to US$331.7 million including a redemption premium of US$82.5 million, werefully redeemed in March 2002 by utilizing a bank loan of US$190.0 million and cashresources. The increase in net debt is, therefore, attributable mainly to the redemptionpremium that was previously classified within accruals. The Head Office’s borrowings at31 December 2002 comprise a bank loan of US$187.4 million, which is repayable inDecember 2003.
CHANGES IN HEAD OFFICE NET DEBT
Cashand bank Net
Borrowings balances debtUS$m US$m US$m
At 1 January 2002 297.8 (214.5) 83.3Movement (110.4) 179.2 68.8
AT 31 DECEMBER 2002 187.4 (35.3) 152.1
HEAD OFFICE CASH FLOW
2002 2001US$m US$m
Net cash outflow from operating activities (3.8) (6.4)Net cash outflow from servicing of finance (9.6) (4.2)Dividends paid to shareholders – (4.0)Investments (7.8) (117.5)(Expenses)/proceeds on disposal (5.5) 204.2Financing activities– Convertible bonds repayment (331.7) (25.5)– Net bank loan drawdowns 187.4 –– Loan facility expenses (8.2) –
(DECREASE)/INCREASE IN CASH AND BANK BALANCES (179.2) 46.6
17 Annual Report 2002
FINANCIAL REVIEW
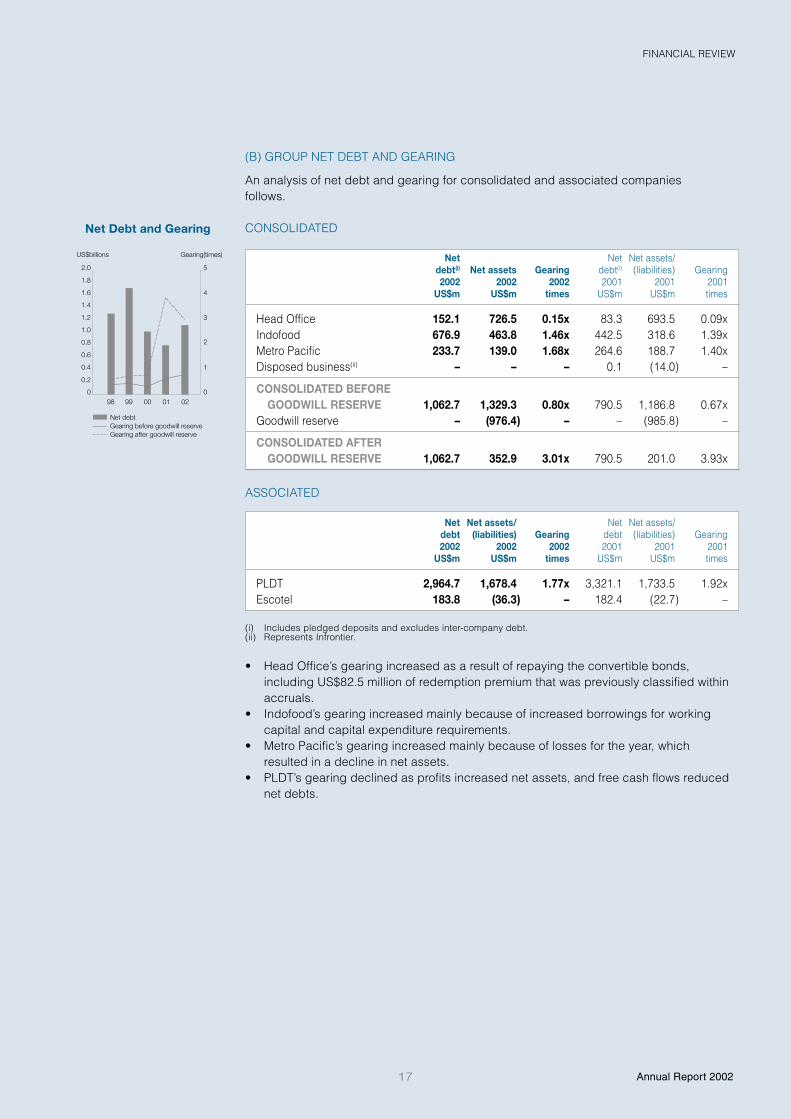
(B) GROUP NET DEBT AND GEARING
An analysis of net debt and gearing for consolidated and associated companiesfollows.
CONSOLIDATED
Net Net Net assets/debt(i) Net assets Gearing debt(i) (liabilities) Gearing2002 2002 2002 2001 2001 2001
US$m US$m times US$m US$m times
Head Office 152.1 726.5 0.15x 83.3 693.5 0.09xIndofood 676.9 463.8 1.46x 442.5 318.6 1.39xMetro Pacific 233.7 139.0 1.68x 264.6 188.7 1.40xDisposed business(ii) – – – 0.1 (14.0) –
CONSOLIDATED BEFOREGOODWILL RESERVE 1,062.7 1,329.3 0.80x 790.5 1,186.8 0.67x
Goodwill reserve – (976.4) – – (985.8) –
CONSOLIDATED AFTERGOODWILL RESERVE 1,062.7 352.9 3.01x 790.5 201.0 3.93x
ASSOCIATED
Net Net assets/ Net Net assets/debt (liabilities) Gearing debt (liabilities) Gearing2002 2002 2002 2001 2001 2001
US$m US$m times US$m US$m times
PLDT 2,964.7 1,678.4 1.77x 3,321.1 1,733.5 1.92xEscotel 183.8 (36.3) – 182.4 (22.7) –
(i) Includes pledged deposits and excludes inter-company debt.(ii) Represents Infrontier.
• Head Office’s gearing increased as a result of repaying the convertible bonds,including US$82.5 million of redemption premium that was previously classified withinaccruals.
• Indofood’s gearing increased mainly because of increased borrowings for workingcapital and capital expenditure requirements.
• Metro Pacific’s gearing increased mainly because of losses for the year, whichresulted in a decline in net assets.
• PLDT’s gearing declined as profits increased net assets, and free cash flows reducednet debts.
Net Debt and Gearing
2.0 5
4
3
2
1
1.8
1.6
1.4
1.2
1.0
0.4
0.2
0.8
0.6
0 099
Net debt Gearing before goodwill reserve Gearing after goodwill reserve
00 01 0298
US$billions Gearing(times)
18First Pacific Company Limited
FINANCIAL REVIEW
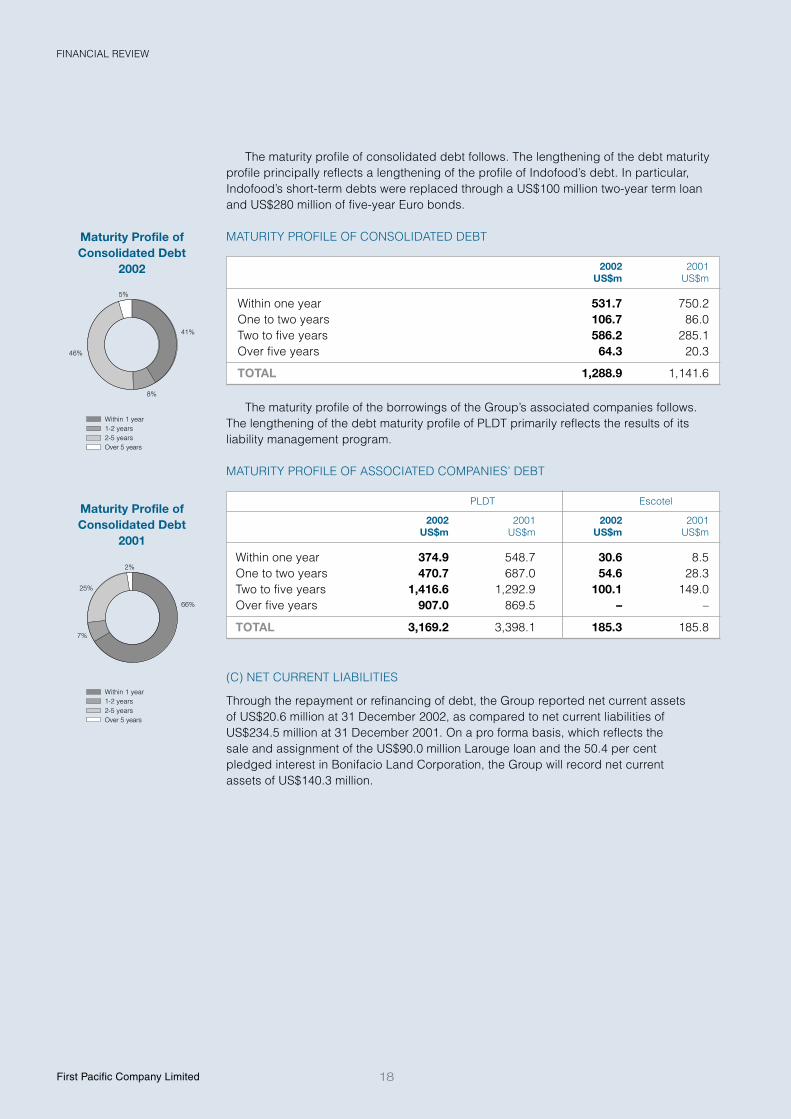
The maturity profile of consolidated debt follows. The lengthening of the debt maturityprofile principally reflects a lengthening of the profile of Indofood’s debt. In particular,Indofood’s short-term debts were replaced through a US$100 million two-year term loanand US$280 million of five-year Euro bonds.
MATURITY PROFILE OF CONSOLIDATED DEBT
2002 2001US$m US$m
Within one year 531.7 750.2One to two years 106.7 86.0Two to five years 586.2 285.1Over five years 64.3 20.3
TOTAL 1,288.9 1,141.6
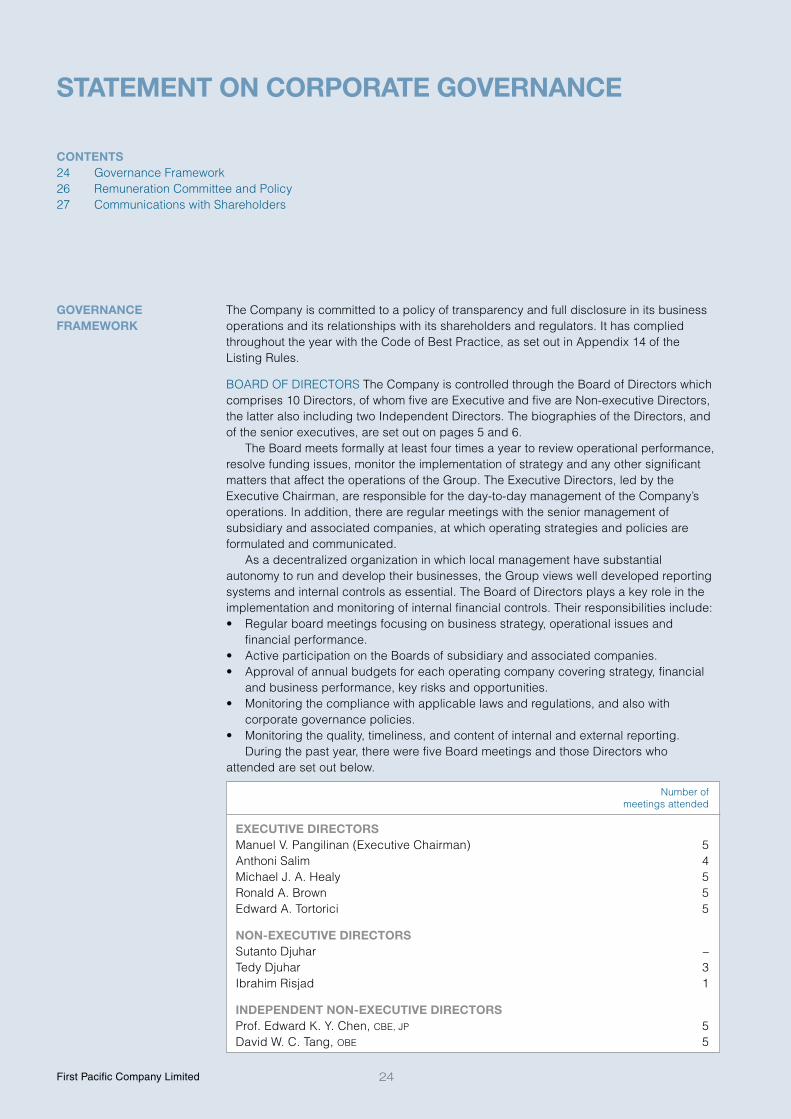
The maturity profile of the borrowings of the Group’s associated companies follows.The lengthening of the debt maturity profile of PLDT primarily reflects the results of itsliability management program.
MATURITY PROFILE OF ASSOCIATED COMPANIES’ DEBT
PLDT Escotel
2002 2001 2002 2001US$m US$m US$m US$m
Within one year 374.9 548.7 30.6 8.5One to two years 470.7 687.0 54.6 28.3Two to five years 1,416.6 1,292.9 100.1 149.0Over five years 907.0 869.5 – –
TOTAL 3,169.2 3,398.1 185.3 185.8
(C) NET CURRENT LIABILITIES
Through the repayment or refinancing of debt, the Group reported net current assetsof US$20.6 million at 31 December 2002, as compared to net current liabilities ofUS$234.5 million at 31 December 2001. On a pro forma basis, which reflects thesale and assignment of the US$90.0 million Larouge loan and the 50.4 per centpledged interest in Bonifacio Land Corporation, the Group will record net currentassets of US$140.3 million.
Maturity Profile ofConsolidated Debt
2002
46%
8%
41%
5%
Within 1 year1-2 years2-5 yearsOver 5 years
25%
7%
66%
2%
Within 1 year1-2 years2-5 yearsOver 5 years
Maturity Profile ofConsolidated Debt
2001

19 Annual Report 2002
FINANCIAL REVIEW
FOREIGN CURRENCY RISK(A) COMPANY RISK
As the US$187.4 million Head Office bank loan is denominated in HK dollars (which ispegged to the U.S. dollar at a fixed exchange rate), foreign currency risk relates mainly tothe receipt of cash dividends and to the translation of non-U.S. dollar denominatedinvestments in subsidiary and associated companies.
The Company actively reviews the potential benefits of hedging based on forecastdividend flows. However, the Company does not actively seek to hedge risks arising onthe translation of foreign currency denominated investments, due to the non-cash natureof such investments and the high costs associated with such hedging. Accordingly,First Pacific is exposed to the impact of foreign currency fluctuations on the translatedU.S. dollar value of its foreign currency denominated investments.
With the exception of Escotel and the Head Office, the principal components of theCompany’s adjusted net asset value (NAV) relate to investments denominated in rupiah orpesos. Accordingly, any depreciation of these currencies, against their respective 31December 2002 exchange rates, would have a negative impact on the Company’s NAV inU.S. dollar terms.
The following table illustrates the estimated impact on the Company’s adjusted NAV fora one per cent depreciation of the rupiah and peso against the U.S. dollar.
Effect onEffect on adjusted NAV
adjusted NAV(i) per shareCompany US$m HK cents
Indofood (2.95) (0.72)PLDT (2.09) (0.51)Metro Pacific (0.45) (0.11)
TOTAL(ii) (5.49) (1.34)
(i) Adjusted NAV is based on quoted share prices applied to the Company’s economic interest.(ii) The NAV of the Group’s investment in Escotel is based on its historic U.S. dollar cost and, accordingly, any
depreciation of the rupee would not affect the Company’s adjusted NAV.
(B) GROUP RISK
The Group’s operating results are denominated in local currencies – principally the rupiah,peso and rupee – which are translated and consolidated to give the Group’s results inU.S. dollars.
FINANCIAL RISKMANAGEMENT

20First Pacific Company Limited
FINANCIAL REVIEW
NET DEBT BY CURRENCY
First Pacific’s policy is for each operating entity to borrow in local currency where possible.However, it is often necessary for companies to borrow in U.S. dollars, which results in therisk of a translation impact on local currency results. A summary of consolidated andassociated company net debt by currency follows.
CONSOLIDATED
US$ Peso Rupiah HK$ TotalUS$m US$m US$m US$m US$m
Total borrowings 462.7 251.1 387.7 187.4 1,288.9Cash and bank balances(i) (56.5) (13.6) (151.5) (4.6) (226.2)
NET DEBT 406.2 237.5 236.2 182.8 1,062.7
REPRESENTING:Head Office (30.5) (0.2) – 182.8 152.1Indofood 440.7 – 236.2 – 676.9Metro Pacific(ii) (4.0) 237.7 – – 233.7
NET DEBT 406.2 237.5 236.2 182.8 1,062.7
ASSOCIATED
US$ Peso Yen Rupee TotalUS$m US$m US$m US$m US$m
PLDT 2,867.1 (117.3) 214.9 – 2,964.7Escotel 74.0 – – 109.8 183.8
(i) Includes pledged deposits.(ii) Excludes Head Office inter-company loan of US$90.0 million.
Details of Head Office net debt are set out on page 16.Indofood hedges its U.S. dollar debt through foreign currency swap agreements,
export revenues and U.S. dollar deposits. During the year, Indofood raised a US$100million two-year term loan facility for working capital purposes, and US$280 millionthrough competitively priced five-year Euro bonds, the proceeds of which were used toreplace existing debts, principally U.S. dollar denominated. At the end of 2002, Indofood’sUS$440.7 million of U.S. dollar denominated net borrowings were partly hedged throughforeign currency swap agreements totaling US$310.0 million, which mature on variousdates in 2005 and 2007.
PLDT carries U.S. dollar debt primarily because international vendors oftelecommunications equipment quote prices and require payment in U.S. dollars. Inaddition, large funding requirements often cannot be satisfied in local currency due toinherent constraints within the financial markets in the Philippines. As a result, financingfrequently needs to be sourced from the international capital market, principally in U.S.dollars. Although it is not possible to hedge significant U.S. dollar balances in thePhilippines, PLDT has actively hedged approximately 22 per cent of its U.S. dollarborrowings. However, substantial revenues of PLDT are either denominated in, or linkedto, the U.S. dollar. For example, PLDT’s U.S. dollar denominated international inboundrevenue accounted for approximately US$163.9 million, or 10.6 per cent, of PLDT’s totalrevenues in 2002. In addition, under certain circumstances, PLDT is able to adjust themonthly recurring rates for its fixed line service by one per cent for every Peso 0.1 changein the U.S. dollar exchange rate.
Escotel carries U.S. dollar borrowings for reasons similar to PLDT. Approximately 57per cent of its U.S. dollar debt has been hedged into rupees.
Analysis of TotalBorrowingsby Currency
19%
30%
36%
15%
US$millionsUS$ 462.7Rupiah 387.7Peso 251.1HK$ 187.4Total 1,288.9

21 Annual Report 2002
FINANCIAL REVIEW
As a result of unhedged U.S. dollar net debt, the Group’s results are sensitive tofluctuations in the U.S. dollar exchange rate. The following table illustrates the estimatedimpact on the Group’s reported profitability for a one per cent depreciation in the principaloperating currencies of subsidiary and associated companies. This does not reflect theindirect impact of fluctuating exchange rates on input costs at the operating companylevel.
Profit impactof 1%
Total US$ Hedged Unhedged currency Group profitexposure amount(i) amount(i) depreciation impact(ii)
US$m US$m US$m US$m US$m
PLDT 2,867.1 (638.7) 2,228.4 (22.3) (3.7)Metro Pacific(iii) 86.0 – 86.0 (0.9) (0.5)
TOTAL PHILIPPINES 2,953.1 (638.7) 2,314.4 (23.2) (4.2)Indofood (Indonesia) 440.7 (310.0) 130.7 (1.3) (0.5)Escotel (India) 74.0 (42.0) 32.0 (0.3) (0.1)Head Office(iv) (30.5) – (30.5) – –
TOTAL 3,437.3 (990.7) 2,446.6 (24.8) (4.8)
(i) Excludes the impact of “natural hedges”.(ii) Net of tax effect.(iii) Includes Head Office inter-company loan of US$90.0 million.(iv) As the Group reports its results in U.S. dollars, unhedged HK dollar debt at the Head Office does not give
rise to any significant exchange exposure.
INTEREST RATE RISK The Company and its operating entities are exposed to changes ininterest rates to the extent that they impact the cost of variable interest rate borrowings.An analysis of this follows, together with details for associated companies.
CONSOLIDATED
Fixed Variable Cash andinterest rate interest rate bankborrowings borrowings balances(i) Net debt
US$m US$m US$m US$m
Head Office – 187.4 (35.3) 152.1Indofood 418.9 431.6 (173.6) 676.9Metro Pacific(ii) 103.9 147.1 (17.3) 233.7
CONSOLIDATED 522.8 766.1 (226.2) 1,062.7
ASSOCIATED
Fixed Variable Cash andinterest rate interest rate bankborrowings borrowings balances Net debt
US$m US$m US$m US$m
PLDT 2,106.1 1,063.1 (204.5) 2,964.7Escotel 139.3 46.0 (1.5) 183.8
(i) Includes pledged deposits.(ii) Excludes Head Office inter-company loan of US$90.0 million.
Rupiah and PesoClosing Rates Against the
U.S. Dollar
Interest Rate Profile
49 8,000
8,500
9,000
9,500
10,000
10,500
50
51
52
54
53
55 11,000
Peso Rupiah
Dec
01
Mar
02
Jun
02
Sep
02
Dec
02
Mar
03
Peso Rupiah
41%
59%
US$millionsFloating 766.1Fixed 522.8Total 1,288.9

22First Pacific Company Limited
FINANCIAL REVIEW
The following table illustrates the estimated impact on the Group’s reported profitabilityfor a one per cent increase in average annual interest rates.
Profit impactVariable of 1%
interest rate increase in Group profitborrowings interest rates impact(i)
US$m US$m US$m
Head Office 187.4 (1.9) (1.9)Indofood 431.6 (4.3) (1.6)Metro Pacific 147.1 (1.5) (0.8)PLDT 1,063.1 (10.6) (1.8)Escotel 46.0 (0.5) (0.1)
TOTAL 1,875.2 (18.8) (6.2)
(i) Net of tax effect.
EQUITY MARKET RISK As the majority of the Company’s investments are listed, theCompany is exposed to fluctuations in the equity market values of such investments. Inaddition, the value of the Company’s investments may be impacted by sentiment towardsspecific countries.
First Pacific’s listed investments are located in Indonesia and the Philippines.Accordingly, in addition to operating factors within the Company’s control, the Companyalso has an equity market risk in respect of general investor sentiment towards thesecountries. Changes in the stock market indices of Indonesia and the Philippines issummarized as follows:
Jakarta PhilippineComposite Composite
Index Index
At 31 December 2001 392.04 1,168.08At 31 December 2002 424.95 1,018.41Change over 2002 8.4% –12.8%At 17 April 2003 443.86 1,122.33Increase over 2003 to 17 April 2003 4.4% 10.2%
1,500 600
550
500
450
400
350
300
250
1,400
1,300
1,200
1,000
1,100
900 200
Philippine Composite Index (PCI)Jakarta Composite Index (JCI)
Dec
01
Mar
02
Jun
02
Sep
02
Dec
02
Mar
03
PCI JCI
Stock Market Indices

23 Annual Report 2002
FINANCIAL REVIEW
There follows a calculation of the Group’s underlying worth, as assessed by calculatingthe adjusted NAV of each of the Group’s investments. For listed investments, this is basedon quoted share prices; for unlisted investments, it is based on the book carrying cost.
17 April 2003 31 December 2002Adjusted Adjusted Invested
NAV NAV capital(i)
Basis US$m US$m US$m
Indofood (ii) 365.4 294.7 706.6PLDT (ii) 301.5 209.3 1,240.7Metro Pacific (ii) 57.3 45.1 648.8Escotel (iii) 71.2 63.0 63.0HEAD OFFICE– Net debt (70.3) (152.1) (152.1)– Receivable (iv) – 90.0 90.0
TOTAL VALUATION (v) 725.1 550.0 2,597.0
NUMBER OF ORDINARY SHARESIN ISSUE (millions) 3,186.0 3,186.0 3,186.0
Value per share– U.S. dollar 0.23 0.17 0.82– HK dollars 1.78 1.35 6.36Company’s closing share price (HK$) 0.90 0.70 0.70Share price discount to HK$ value per share (%) 49.4 48.1 89.0
(i) Before impairment provisions effected in 2001.(ii) Adjusted NAV is based on quoted share prices applied to the Company’s economic interest.(iii) Adjusted NAV is based on investment cost.(iv) Represents the inter-company loan to Metro Pacific.(v) No value has been attributed to the Group’s investment in Infrontier and Metrosel.
Share Price vs AdjustedNet Asset Value
Per Share
7
5.38
1.35
0.70
3.70
6
5
4
1
3
2
0
Share priceAdjusted net asset value per share
Dec
98
Dec
99
Dec
00
Dec
01
Dec
02
HK$
ADJUSTED NET ASSETVALUE (NAV) PER SHARE
24First Pacific Company Limited
STATEMENT ON CORPORATE GOVERNANCE
STATEMENT ON CORPORATE GOVERNANCE
CONTENTS24 Governance Framework26 Remuneration Committee and Policy27 Communications with Shareholders
GOVERNANCEFRAMEWORK
The Company is committed to a policy of transparency and full disclosure in its businessoperations and its relationships with its shareholders and regulators. It has compliedthroughout the year with the Code of Best Practice, as set out in Appendix 14 of theListing Rules.
BOARD OF DIRECTORS The Company is controlled through the Board of Directors whichcomprises 10 Directors, of whom five are Executive and five are Non-executive Directors,the latter also including two Independent Directors. The biographies of the Directors, andof the senior executives, are set out on pages 5 and 6.
The Board meets formally at least four times a year to review operational performance,resolve funding issues, monitor the implementation of strategy and any other significantmatters that affect the operations of the Group. The Executive Directors, led by theExecutive Chairman, are responsible for the day-to-day management of the Company’soperations. In addition, there are regular meetings with the senior management ofsubsidiary and associated companies, at which operating strategies and policies areformulated and communicated.
As a decentralized organization in which local management have substantialautonomy to run and develop their businesses, the Group views well developed reportingsystems and internal controls as essential. The Board of Directors plays a key role in theimplementation and monitoring of internal financial controls. Their responsibilities include:• Regular board meetings focusing on business strategy, operational issues and
financial performance.• Active participation on the Boards of subsidiary and associated companies.• Approval of annual budgets for each operating company covering strategy, financial
and business performance, key risks and opportunities.• Monitoring the compliance with applicable laws and regulations, and also with
corporate governance policies.• Monitoring the quality, timeliness, and content of internal and external reporting.
During the past year, there were five Board meetings and those Directors whoattended are set out below.
Number ofmeetings attended
EXECUTIVE DIRECTORSManuel V. Pangilinan (Executive Chairman) 5Anthoni Salim 4Michael J. A. Healy 5Ronald A. Brown 5Edward A. Tortorici 5
NON-EXECUTIVE DIRECTORSSutanto Djuhar –Tedy Djuhar 3Ibrahim Risjad 1
INDEPENDENT NON-EXECUTIVE DIRECTORSProf. Edward K. Y. Chen, CBE, JP 5David W. C. Tang, OBE 5

25 Annual Report 2002
STATEMENT ON CORPORATE GOVERNANCE
At the Company’s AGM, it is the Company’s policy that all Directors retire and offerthemselves for re-election, on an annual basis. No Director has a service contract with theCompany that is not determinable within one year without payment of compensation,other than statutory compensation.
AUDIT COMMITTEE The Company’s Audit Committee is composed of the twoIndependent Non-executive Directors. The written terms of reference which describe theauthority and duties of the Audit Committee are regularly reviewed and updated by theBoard. Neither member of the Committee has any personal financial interests, conflicts ofinterests arising from cross-directorships or day-to-day involvement in the running of thebusiness. Reporting to the Board of Directors, the Audit Committee reviews matters withinthe purview of audit, such as Financial Statements and internal controls, to protect theinterests of the Company’s shareholders. The Audit Committee also performs anindependent review of the interim and annual Financial Statements.
The Audit Committee meets regularly with the Company’s external auditors to discussthe audit process and accounting issues, and review the effectiveness of internal controlsand risk evaluation. Special meetings are also convened, where appropriate, to reviewsignificant financial or internal control issues. Three meetings were held during the 2002financial year.
INDEPENDENT BOARD COMMITTEE Where there are matters involving connectedtransactions, an Independent Board Committee, comprising wholly the Independent Non-executive Directors, will be established and independent experts will be appointed toadvise shareholders on how to vote.
OTHER DEVELOPMENTS In line with the HKSE’s ongoing efforts to strengthen thecorporate governance practices in Hong Kong and to align with the best currentinternational practices, the Company will review its existing practices and implement, asconsidered appropriate, the new practices to be adopted by the HKSE before 30 June2003. These include:• To adopt a Board level Nomination Committee to establish recruitment, selection and
nomination strategies to attract the right individuals to become Independent Directors.• To appoint a new Independent Non-executive Director in 2003, to increase the total
number of Independent Non-executive Directors to three, who will compriseapproximately one-third of the current Board. The newly appointed IndependentNon-executive Director should possess appropriate professional qualifications orexperience in financial matters and will also be appointed as a third member of theAudit Committee.
• To separate the roles of the Chairman and Chief Executive Officer.• To obtain shareholders’ approval at the AGM for any Directors’ service contracts with a
duration exceeding three years or that either have a notice period exceeding one yearor require payment of compensation exceeding one year’s remuneration upontermination of that contract.
• To promote transparency and ensure a timely flow of relevant information to themarket, the Company is considering the early adoption of quarterly reporting, which isto be mandatory in 2005.
• To disclose Directors’ remuneration on an individual and named basis, each year.The Company’s Directors are fully aware of the importance of good corporate
governance practices and will continue to strengthen their commitments to achieve highstandards of board and corporate governance standards and practices.

26First Pacific Company Limited
STATEMENT ON CORPORATE GOVERNANCE
Remuneration of Executive Directors and senior executives is determined by theExecutive Chairman who is advised by compensation and benefits consultants. TheExecutive Chairman’s remuneration is subject to the review of the Non-executive Directorsrepresenting the major shareholder. The fees and emoluments of Non-executive Directorsare determined by the Executive Chairman based on the recommendations fromcompensation and benefits consultants. The Company will restructure the RemunerationCommittee to be composed of at least a majority of Independent Non-executive Directorsto make recommendations to the Board regarding the remuneration of the ExecutiveDirectors.
Starting from 2003, in implementing best corporate practice that will promotetransparency on remuneration matters, the Company will disclose Directors’ remunerationon an individual and named basis. Details of Directors’ remuneration for the year are setout in Note 29(A) to the Financial Statements.
The remuneration of senior executives, including Executive Directors, consists of thefollowing:
SALARY AND BENEFITS Salary reflects an executive’s experience, responsibility andmarket value. Increases are based on effective management of the Company and onincreased responsibility. Benefits principally comprise housing allowance, educationalsupport and health care, and are consistent with those provided by comparablecompanies.
BONUS AND LONG-TERM INCENTIVES Bonuses are based on the achievement ofindividual performance targets, and do not necessarily correlate with annual profitmovements. Long-term incentives comprise monetary payments and/or share options thatlink reward to the achievement of pre-determined objectives. The value of the long-termincentive offered to each executive is related to job grade and contribution to themanagement of the business. Long-term monetary incentive awards are disclosed oncevested, and are apportioned over the performance cycle. As at 31 December 2002, theCompany had no outstanding long-term incentive plans, as the share options thenoutstanding were cancelled on 7 February 2003.
FEES Fees are paid to two Independent Non-executive Directors in accordance with theCompany’s Memorandum of Association and Bye-laws. It is the Company’s policy that itpays no fees to the Company’s Executive Directors.
PENSION CONTRIBUTIONS The Company operates a defined contribution scheme, inrespect of which contributions are determined on the basis of basic salaries and length ofservice.
SHARE OPTIONS Share options are granted to Executive Directors and senior executivesunder the Non-Qualified Stock Option Plan and the Incentive Stock Option Plan (whichexpired on 16 June 1999), and the existing share option scheme approved byshareholders at the 1999 AGM.
Under the existing share option scheme, the Board of Directors can grant to full-timeexecutives of the Company options to subscribe in aggregate for shares representing upto 10 per cent of the issued share capital of the Company from time to time. Alloutstanding options are exercisable within 10 years of their various dates of issue, afterwhich time the options expire to the extent that they are not exercised.
The aggregate number of options awarded, individual entitlements and optionexercise prices were determined by a Special Compensation Committee of the Board ofDirectors.
REMUNERATIONCOMMITTEE ANDPOLICY
27 Annual Report 2002
STATEMENT ON CORPORATE GOVERNANCE
On 7 February 2003, the Company’s Board of Directors approved the cancellation ofall the outstanding share options of the Company. The Directors will consider alternativelong-term incentive arrangements for senior management, in 2003.
First Pacific encourages an active and open dialogue with all of its shareholders; privateand institutional, large and small. The Board of Directors acknowledges that its role is torepresent and promote the interests of shareholders and that its members areaccountable to shareholders for the performance and activities of the Company. As suchFirst Pacific is always responsive to the views and requests of its shareholders.
The formal channels of communicating with shareholders are the annual and interimreports, press releases, published announcements, shareholders’ circulars and the AGM.The annual and interim reports seek to communicate, both to shareholders and the widerinvestment community, developments in the Company’s businesses. In addition, theannual report sets out strategic goals for the coming year and management’sperformance against predetermined objectives are reported and assessed. All of theseinitiatives are designed to better inform shareholders and potential investors about theCompany’s activities and strategic direction.
The AGM is the principal forum for formal dialogue with shareholders, where the Boardis available to answer questions about specific resolutions being proposed at the meetingand also about the Group in general. In addition, where appropriate, the Companyconvenes Special General Meetings to approve transactions in accordance with theListing Rules and the Company’s corporate governance procedures. These providefurther opportunities for shareholders to comment and vote on specific transactions.
In order to promote effective communication, outside the traditional methods offinancial reports and press releases, the Company also maintains a website (www.firstpacco.com) which includes past and present information relating to the Group and itsbusinesses.
On behalf of the Board of Directors
MANUEL V. PANGILINANExecutive Chairman
17 April 2003
COMMUNICATIONS WITHSHAREHOLDERS

28First Pacific Company Limited
First Pacific has received shareholder inquiries on the status of certain matters that either do or may involve the
Company or its directors. In order to keep shareholders fully apprised of such matters, these are summarized below
and will be updated in all subsequent annual and interim reports.
PLDT has already included similar disclosures, concerning Manuel V. Pangilinan, President and Chief Executive
Officer of PLDT, in previous proxy statements to PLDT shareholders, as well as in various documents filed with both
the Philippine and United States securities regulators.
PHILIPPINE OMBUDSMAN’S INVESTIGATION OF MANUEL V. PANGILINAN, EXECUTIVE CHAIRMAN
In January 2001, during the Philippine government’s impeachment hearings against former Philippine President
Joseph Estrada, a Philippine newspaper article revealed information concerning monies deposited in a bank account
allegedly owned by former President Estrada, under the fictitious name, “Jose Velarde” (the Velarde Account).
On 2 February 2001, a group of private Philippine lawyers filed a criminal complaint with the Philippines Office of
the Ombudsman (the Ombudsman) against former President Estrada and certain other individuals, including Mr.
Pangilinan. The complaint alleged that the defendants were involved in acts involving direct bribery, indirect bribery,
corruption of public officials, illegal giving or offering of gifts to public officials, and/or “economic plunder”, all of
which are crimes under various Philippine laws.
In Mr. Pangilinan’s case, the complaint also alleged that a Pesos 20 million check issued by Mr. Pangilinan was
deposited in the Velarde Account.
The Ombudsman, by Order dated 6 April 2001, directed the defendants to file counter-affidavits in response to the
complaint. Mr. Pangilinan’s counter-affidavit, dated 2 May 2001, denied all of the allegations made against him.
Specifically, Mr. Pangilinan stated that his Pesos 20 million check payment was a lawful election campaign
contribution paid out of his personal funds, which he earned lawfully as a professional and which were not ill-gotten.
On 13 September 2001, the Ombudsman issued a Resolution dismissing charges against some but not all of the
persons named in the original private lawyers’ complaint. Specifically, in Mr. Pangilinan’s case, the Ombudsman
stated that, while there was no independent corroboration of the political campaign contribution made to an Estrada
associate, there also was insufficient evidence to warrant a prima facie finding of wrongdoing against Mr. Pangilinan.
As a result, the Ombudsman referred Mr. Pangilinan’s case to the Ombudsman’s Fact-Finding Intelligence Bureau
for further fact-finding investigation. The Ombudsman’s investigation into the matters raised by the private lawyers’
complaint and the Ombudsman’s prosecution of former President Estrada continues.
OTHER MATTERS
29 Annual Report 2002
STATUTORY REPORTS
CONTENTS
STATUTORY REPORTS
30 Report of the Directors35 Report of the Auditors
FINANCIAL STATEMENTS
36 Principal Accounting Policies42 Consolidated Profit and Loss Statement43 Consolidated Balance Sheet44 Company Balance Sheet45 Consolidated and Company Statement of Changes
in Shareholders’ Equity/(Deficit)46 Consolidated Cash Flow Statement
NOTES TO THE FINANCIAL STATEMENTS
CONSOLIDATED PROFIT AND LOSS STATEMENT
47 1. Turnover and Segmental Information49 2. Operating Profit/(Loss)49 3. Net Borrowing Costs50 4. Taxation50 5. Profit/(Loss) Attributable to Ordinary
Shareholders51 6. Basic Earnings/(Loss) per Share51 7. Ordinary Share Dividends
COMPANY BALANCE SHEET
51 8. Property and Equipment52 9. Subsidiary Companies52 10. Associated Companies55 11. Long-term Receivables and Prepayments55 12. Goodwill55 13. Short-term Investments56 14. Accounts Receivable, Other Receivables
and Prepayments56 15. Inventories57 16. Accounts Payable, Other Payables and
Accruals57 17. Short-term Borrowings58 18. Provision for Taxation58 19. Share Capital58 20. Outside Interests59 21. Loan Capital and Long-term Borrowings60 22. Deferred Liabilities and Provisions61 23. Deferred Taxation61 24. Reserves
CONSOLIDATED CASH FLOW STATEMENT
62 25. Notes to Consolidated Cash Flow Statement
OTHER FINANCIAL INFORMATION
64 26. Discontinued Operations64 27. Commitments and Contingent Liabilities66 28. Employee Information67 29. Directors and Senior Executives Remuneration71 30. Connected and Related Party Transactions73 31. Subsequent Events74 32. Comparative Figures74 33. Approval of Financial Statements
STATUTORY REPORTS, FINANCIAL STATEMENTS AND NOTES

30First Pacific Company Limited
STATUTORY REPORTS
STATUTORY REPORTS
REPORT OF THE DIRECTORS
PRINCIPAL BUSINESS ACTIVITIES AND GEOGRAPHICAL MARKETS ANALYSIS OF OPERATIONS
First Pacific Company Limited (the Company) is a Hong Kong-based investment and management company with operations located
primarily in Southeast Asia. Its principal business interests relate to Consumer, Telecommunications and Property. There were no
significant changes in the nature of the Group’s principal business activities during the year.
An analysis of the Group’s turnover and segmental information for the year, by principal business activities and principal
geographical markets, is set out in Note 1 to the Financial Statements, and a summary of its principal investments is set out on the
inside back cover.
INCORPORATION
The Company was incorporated on 25 May 1988 in Bermuda with limited liability.
DIRECTORS’ RESPONSIBILITY FOR THE FINANCIAL STATEMENTS
The Companies Ordinance requires the Directors to prepare Financial Statements for each financial year that give a true and fair view
of the Company’s state of affairs as at the end of the financial year and of its profit or loss for the year then ended. In preparing the
Financial Statements, the Directors are required to:
(A) select suitable accounting policies and apply them on a consistent basis, making judgements and estimates that are prudent, fair
and reasonable;
(B) state the reasons for any significant departure from accounting standards; and
(C) prepare the Financial Statements on the going concern basis, unless it is not appropriate to presume that the Company will
continue in business for the foreseeable future.
The Directors are responsible for keeping proper accounting records, for safeguarding the assets of the Company and for taking
reasonable steps for the prevention and detection of fraud and other irregularities.
SHARE CAPITAL AND SHARE OPTIONS
Details of movements in the Company’s share capital and share options during the year, together with the reasons therefor, are set out
in Notes 19 and 29(C) to the Financial Statements.
RESERVES
Details of movements in the reserves of the Group and the Company are set out in the consolidated and Company statement of
changes in shareholders’ equity/(deficit) of the Financial Statements.
PURCHASE, SALE OR REDEMPTION OF LISTED SECURITIES
On 25 September 2002, the Company issued 46,220,238 shares at HK$8.4 per share upon the conversion of a US$50 million
Convertible Note, at a fixed exchange rate of HK$7.765: US$1.
Except as described above, neither the Company, nor any of its subsidiary companies, has made any purchase, sale or
redemption of any of the Company’s listed securities during the year.
In January 2002, the Group repurchased and canceled US$117.3 million of the two per cent 2002 convertible bonds for a total
consideration of US$157.5 million. The remaining convertible bonds, totaling US$130.5 million, were redeemed at a total consideration
of US$176.3 million on 27 March 2002.
During the year, Indofood repurchased approximately 790.2 million common shares from the market at an average price of
approximately Rupiah 840 per share.
31 Annual Report 2002
STATUTORY REPORTS
On 15 May 2002, under its employee stock ownership program, Indofood granted 457,800 options to qualified employees to
purchase 228.9 million common shares at an exercise price of Rupiah 825 per share. The options were fully exercised by the
employees on 15 May 2002 and Indofood issued 228.9 million new common shares.
Except as described or referred to above, there has been no issue, redemption or conversion of any convertible securities or
options in issue by the Company’s subsidiary companies during the year.
RESULTS AND APPROPRIATIONS
The consolidated results of the Group for the year ended 31 December 2002 and the state of affairs of the Company and the Group at
that date are set out in the Financial Statements on pages 36 to 74.
The Directors do not recommend the payment of a dividend.
CHARITABLE CONTRIBUTIONS
The Group made charitable contributions totaling US$2.0 million in 2002 (2001: US$2.6 million).
PROPERTY AND EQUIPMENT
Details of changes in the Group’s property and equipment are provided in Note 8 to the Financial Statements.
BANK LOANS, LOAN CAPITAL AND OTHER BORROWINGS
Particulars of the bank loans, loan capital and other borrowings of the Company and the Group are provided in Notes 17 and 21 to the
Financial Statements.
FINANCIAL ASSISTANCE TO AN ASSOCIATED COMPANY
Particulars of the Company’s guarantees for credit facilities to an associated company and its condensed balance sheet, disclosed
pursuant to paragraphs 3.3 and 3.10 of Practice Note 19 of the Listing Rules, are respectively provided in Note 30(C) and Note 10(G)
to the Financial Statements.
DISTRIBUTABLE RESERVES
At 31 December 2002, the Company’s reserves available for distribution, calculated in accordance with the provisions of the
Companies Act 1981 of Bermuda (as amended), amounted to US$29.6 million (2001: US$29.9 million). In addition, the Company’s
share premium, in the amount of US$958.2 million (2001: US$908.7 million), may be distributed in the form of fully-paid bonus shares.
PRE-EMPTIVE RIGHTS
No pre-emptive rights exist in Bermuda in respect of the Company’s share capital.
SUMMARY FINANCIAL INFORMATION
A summary of the published results, assets and liabilities, and various information and financial ratios of the Company and the Group
for the last ten financial years, as extracted from the audited Financial Statements and reclassified as appropriate, is set out on page
78. This summary does not form part of the audited Financial Statements.
DIRECTORS
The names of the Directors who held office at 31 December 2002 are set out in the table below. Details of Directors’ contracts are
provided in the Statement of Corporate Governance, and remuneration details are provided in Note 29(A) to the Financial Statements.

32First Pacific Company Limited
STATUTORY REPORTS
INTERESTS OF THE EXECUTIVE CHAIRMAN AND OTHER DIRECTORS IN THE COMPANY
Information in respect of the interests of the Executive Chairman and other Directors in the share capital of the Company at
31 December 2002, disclosed pursuant to Section 29 of the Securities (Disclosure of Interests) Ordinance (SDI Ordinance), is detailed
below.
Ordinary
Ordinary shares share options(i)
Sutanto Djuhar 30.0 per cent interest
Tedy Djuhar 10.0 per cent interest
Ibrahim Risjad 10.0 per cent interest
Anthoni Salim 10.0 per cent interest
all via First Pacific Investments Limited(ii) 790,229,364 (C) –
Anthoni Salim 33.3 per cent interest
via First Pacific Investments (BVI) Limited(iii) 628,296,599 (C) –
Manuel V. Pangilinan 6,026,759 (P) 12,498,000 (P)
Michael J.A. Healy 877,991 (P) 2,968,000 (P)
Ronald A. Brown 3,452,640 (P) 3,864,000 (P)
Edward A. Tortorici 13,132,129 (P) 6,476,000 (P)
Prof. Edward K. Y. Chen, CBE, JP – –
David W.C. Tang, OBE – –
(C) = Corporate interest, (P) = Personal interest(i) All of the ordinary share options were canceled on 7 February 2003.(ii) Soedono Salim, the former Chairman, and Sudwikatmono, a former Non-executive Director, respectively own a 30.0 per cent and a 10.0 per cent interest in First
Pacific Investments Limited.(iii) Soedono Salim, the former Chairman, owns a 33.3 per cent interest in First Pacific Investments (BVI) Limited.
INTERESTS OF THE EXECUTIVE CHAIRMAN AND OTHER DIRECTORS IN THE COMPANY’S ASSOCIATED CORPORATIONS
The interests of the Executive Chairman and other Directors in the capital of the Company’s associated corporations (within the
meaning of the SDI Ordinance) at 31 December 2002 were as follows.
• Manuel V. Pangilinan owned 15,048,064 common shares(P) in Metro Pacific Corporation (MPC) and 40,000 common shares(P) in
Philippine Long Distance Telephone Company (PLDT) and 300,000 common shares(P) in Pilipino Telephone Corporation. In
addition, he is entitled to 97,571 stock options(P) in PLDT.
• Anthoni Salim owned 632,370 ordinary shares(P) in PT Indofood Sukses Makmur Tbk (Indofood).
• Michael J.A. Healy owned 625,000 ordinary shares(P) in Indofood.
• Ronald A. Brown owned 582,500 ordinary shares(P) in Indofood.
• Edward A. Tortorici owned 3,051,348 common shares(P) in MPC, 96,880 common shares(P) in PLDT and 2,450,000 ordinary
shares(P) in Indofood.
• Sutanto Djuhar owned 15,520,335 ordinary shares(C) in Indofood.
• Tedy Djuhar owned 15,520,335 ordinary shares(C) in Indofood.
• Ibrahim Risjad owned 6,406,180 ordinary shares(P) in Indofood.
(C) = Corporate interest, (P) = Personal interest
In addition to the above, certain Directors have non-beneficial personal equity interests in certain subsidiary and associated
companies held solely for the benefit of the Company for the purpose of complying with various statutory and other minimum
company membership requirements.
33 Annual Report 2002
STATUTORY REPORTS
INTERESTS OF SUBSTANTIAL SHAREHOLDERS, OTHER THAN THE EXECUTIVE CHAIRMAN AND OTHER DIRECTORS, IN
THE COMPANY
The register of substantial shareholders maintained under Section 16(1) of the SDI Ordinance shows that at 31 December 2002, the
Company had been notified of the following shareholders’ interests, being 10.0 per cent or more of the Company’s issued share
capital.
(A) First Pacific Investments Limited (FPIL-Liberia), which is incorporated in the Republic of Liberia, beneficially owned
790,229,364 ordinary shares at 31 December 2002. FPIL-Liberia is majority owned by four Non-executive Directors of the Company.
Their beneficial indirect interests in the Company, through FPIL-Liberia, at 31 December 2002, were: Sutanto Djuhar 7.44 per cent,
Tedy Djuhar 2.48 per cent, Ibrahim Risjad 2.48 per cent, and Anthoni Salim 2.48 per cent.
(B) First Pacific Investments (BVI) Limited (FPIL-BVI), which is incorporated in the British Virgin Islands, beneficially owned
628,296,599 ordinary shares at 31 December 2002, and is 33.3 per cent owned by one Non-executive Director of the Company,
Anthoni Salim. His beneficial indirect interest in the Company, through FPIL-BVI, at 31 December 2002, was 6.57 per cent.
HKSCC Nominees Limited, Credit Suisse First Boston (Singapore Branch) and Horsford Nominees Limited, at 31 December 2002,
were the registered owners of 1,034,755,725 ordinary shares, 80,000,000 ordinary shares and 75,700,000 ordinary shares,
representing 32.48 per cent, 2.51 per cent and 2.38 per cent respectively, of the total issued share capital in the Company, as
pledged by FPIL-Liberia and FPIL-BVI to secure certain credit facilities. In addition, at 31 December 2002, FPIL-Liberia and FPIL-BVI
have pledged 159,400,000 ordinary shares and 68,080,238 ordinary shares, representing 5.00 per cent and 2.14 per cent
respectively, of the total issued share capital in the Company, registered in their own names, respectively, to secure certain credit
facilities.
Commencing on 1 April 2003, new Hong Kong statutory requirements have lowered the threshold for this disclosure to five per
cent or more, which will be reflected in the Company’s future disclosures.
DIRECTORS’ INTERESTS
No contracts of significance in relation to the Company’s business to which the Company or its subsidiary companies were parties,
and in which a Director of the Company had a material interest, whether directly or indirectly, subsisted at the end of the year or at any
time during the year.
DIRECTORS’ RIGHTS TO ACQUIRE SHARES OR DEBENTURES
Apart from as disclosed under the headings “Interests of the Executive Chairman and Other Directors in the Company” above and
“Share Options” in Note 29(C) to the Financial Statements, at no time during the year were rights to acquire benefits by means of the
acquisition of shares or debentures in the Company granted to any Director or their respective spouse or children under 18 years of
age, or were any such rights exercised by them; or was the Company, its holding company, or any of its subsidiary companies or
fellow subsidiary companies a party to any arrangement to enable the Directors to acquire such rights in any other body corporate.
MAJOR CUSTOMERS AND SUPPLIERS
In 2002, sales to the Group’s five largest customers, and purchases from the Group’s five largest suppliers, respectively accounted for
less than 30 per cent of total sales and total purchases for the year.
CONNECTED TRANSACTIONS
Significant related party transactions, which also constitute connected transactions under the Listing Rules, requiring to be disclosed
in accordance with Chapter 14 of the Listing Rules, are disclosed in Notes 30(A) to (C) to the Financial Statements.
34First Pacific Company Limited
STATUTORY REPORTS
DIRECTORS’ AND OFFICERS’ LIABILITY INSURANCE
Previously, the Company maintained appropriate coverage for all Directors and officers of the Company and its related companies,
save in those instances where individual companies have maintained their own coverage. In light of the recent surge in premia
payable for insurance coverage, the Company is self-insuring, but continues to monitor premia in this coverage area.
EMPLOYMENT POLICIES
The Company has a policy of non-discrimination in respect of the age, religion, gender, disability or marital status of employees and
prospective employees. This ensures that individuals are treated equally, given their skills and abilities, in terms of career
development and opportunities for advancement.
SUBSEQUENT EVENTS
Details of the significant subsequent events of the Group are set out in Note 31 to the Financial Statements.
AUDITORS
During the year, PricewaterhouseCoopers resigned as auditors of the Company, and Ernst & Young were appointed by the Directors
to fill the casual vacancy so arising. There has been no other change of auditors in the past three years. A resolution for the
reappointment of Ernst & Young as auditors of the Company will be proposed at the forthcoming AGM.
On behalf of the Board of Directors
MANUEL V. PANGILINAN
Executive Chairman
17 April 2003

35 Annual Report 2002
STATUTORY REPORTS
REPORT OF THE AUDITORS
TO THE SHAREHOLDERS OF FIRST PACIFIC COMPANY LIMITED
(INCORPORATED IN BERMUDA WITH LIMITED LIABILITY)
We have audited the Financial Statements on pages 36 to 74 which have been prepared in accordance with accounting principles
generally accepted in Hong Kong.
RESPECTIVE RESPONSIBILITIES OF DIRECTORS AND AUDITORS
The Company’s Directors are responsible for the preparation of Financial Statements which give a true and fair view. In preparing
Financial Statements which give a true and fair view it is fundamental that appropriate accounting policies are selected and applied
consistently. It is our responsibility to form an independent opinion, based on our audit, on those Financial Statements and to report
our opinion to you.
BASIS OF OPINION
We conducted our audit in accordance with Statements of Auditing Standards issued by the Hong Kong Society of Accountants. An
audit includes an examination, on a test basis, of evidence relevant to the amounts and disclosures in the Financial Statements. It also
includes an assessment of the significant estimates and judgments made by the Directors in the preparation of the Financial
Statements, and of whether the accounting policies are appropriate to the Company’s and the Group’s circumstances, consistently
applied and adequately disclosed.
We planned and performed our audit so as to obtain all the information and explanations which we considered necessary in order
to provide us with sufficient evidence to give reasonable assurance as to whether the Financial Statements are free from material
misstatement. In forming our opinion we also evaluated the overall adequacy of the presentation of information in the Financial
Statements. We believe that our audit provides a reasonable basis for our opinion.
OPINION
In our opinion the Financial Statements give a true and fair view of the state of affairs of the Company and of the Group as at 31
December 2002 and of the profit and cash flows of the Group for the year then ended and have been properly prepared in
accordance with the disclosure requirements of the Hong Kong Companies Ordinance.
ERNST & YOUNG
Certified Public Accountants
Hong Kong
17 April 2003
36First Pacific Company Limited
FINANCIAL STATEMENTS
PRINCIPAL ACCOUNTING POLICIES
The Group comprises First Pacific Company Limited and its subsidiary companies.
(A) BASIS OF PREPARATION
The Financial Statements have been prepared in accordance with accounting principles generally accepted in Hong Kong and
comply with accounting standards issued by the HKSA, the disclosure requirements of the Hong Kong Companies Ordinance and the
Listing Rules. The Financial Statements have been prepared under the historical cost convention except for short-term investments
and derivative instruments which, as disclosed in the accounting policies below, are stated at fair value.
During 2002, certain of the accounting policies have been revised following the adoption of the following new or revised
Statements of Standard Accounting Practice (SSAPs) issued by the HKSA, which are effective for accounting periods commencing
on, or after, 1 January 2002:
• SSAP 1 (Revised): Presentation of Financial Statements prescribes the basis for the presentation of Financial Statements and
sets out guidelines for their structure and minimum requirements for the content thereof. The principal impact of the revision to
this SSAP is that a consolidated statement of changes in shareholders’ equity/(deficit) is now presented in place of the
consolidated statement of recognized gains and losses that was previously required and in place of the Group’s reserves note.
• SSAP 11 (Revised): Foreign Currency Translation prescribes the basis for the translation of foreign currency transactions and
Financial Statements of overseas subsidiary and associated companies.
• SSAP 33: Discontinuing Operations prescribes the disclosure of certain information relating to a discontinuing operation.
• SSAP 34: Employee Benefits prescribes the recognition and measurement criteria which applied to employee benefits,
together with the required disclosures in respect thereof. In addition, disclosures are now required in respect of the Group’s
share option schemes, which are similar to existing disclosure requirements of the Listing Rules.
The Group has also adopted SSAP 35 “Accounting for Government Grants and Disclosure of Government Assistance”, which is
effective for annual accounting periods commencing on or after 1 July 2002. SSAP 35 prescribes the accounting for, and disclosure
of, government grants, and the disclosure of other forms of government assistance.
The adoption of these new, or revised, SSAPs has no significant effect on the Group’s results or shareholders’ equity.
In addition, the Group has also adopted the HKSA’s Interpretation 16: “Disclosure - Service Concession Arrangements”, which
became effective on 30 June 2002. The Interpretation 16 prescribes the disclosure of certain information relating to arrangements to
provide services that give the public access to major economic and social facilities. The adoption of Interpretation 16 gives rise to
additional disclosures as set out in Note 10(H).
(B) BASIS OF CONSOLIDATION
The consolidated Financial Statements include the accounts of the Company and its subsidiary companies made up to 31 December.
All significant intercompany transactions and balances within the Group are eliminated on consolidation.
A subsidiary is an enterprise controlled by the Company. Control exists when the Company has the power to govern the financial
and operating policies of an enterprise so as to obtain benefits from its activities. Even in the absence of a majority shareholding or
voting interest, the Group has the power to govern the financial and operating policies of Indofood so as to obtain benefits from its
activities. Therefore, because of this ability to exercise control, Indofood has been accounted for as a subsidiary company since its
acquisition pursuant to SSAP 32 “Consolidated Financial Statements and Accounting for Investments in Subsidiaries”.
The results of subsidiary companies acquired or disposed of during the year are included in the consolidated profit and loss
statement from the effective date of acquisition or up to the effective date of disposal, as appropriate. The gain or loss on the disposal
of a subsidiary company represents the difference between the proceeds of the sale and the Group’s share of its net assets, together
with any goodwill that was not previously charged or recognized in the consolidated profit and loss statement.
FINANCIAL STATEMENTS

37 Annual Report 2002
FINANCIAL STATEMENTS
Outside interests represent the interests of outside shareholders in the operating results and net assets of subsidiary companies.
In the Company’s balance sheet, investments in subsidiary companies are stated at cost less any provision for impairment losses.
The results of subsidiary companies are accounted for by the Company on the basis of dividends received and receivable.
(C) CASH AND CASH EQUIVALENTS
For the purposes of the balance sheet, cash and bank balances comprise cash on hand and at banks, including term deposits, which
are not restricted as to use.
For the purposes of the consolidated cash flow statement, cash and cash equivalents comprise cash on hand and demand
deposits, and short-term highly liquid investments (which are readily convertible into known amounts of cash, are subject to an
insignificant risk of changes in value, and have a short maturity of generally less than three months when acquired), less bank
overdrafts (which are repayable on demand and which form an integral part of the Group’s cash management).
(D) INVENTORIES
Inventories are stated at the lower of cost and net realizable value. Cost is calculated using the first-in first-out basis, the weighted-
average basis or moving average method. The cost of goods purchased for resale includes costs incurred in bringing the goods to
their present location. Net realizable value is determined on the basis of current anticipated sales prices less estimates of costs to
completion and selling expenses.
(E) PROPERTY AND EQUIPMENT
Freehold land is stated at cost and is not depreciated. Other property and equipment is stated at cost less accumulated impairment
losses and accumulated depreciation, calculated on the straight-line basis at annual rates estimated to write off their book values over
their expected useful lives. Details of depreciation rates are given in Note 8(A).
Major costs incurred in restoring fixed assets to their normal working condition are charged to the consolidated profit and loss
statement. Improvements are capitalized and depreciated over their expected useful lives to the Group.
The gain or loss on disposal of property and equipment is the difference between the net sales proceeds and the carrying amount
of the relevant asset, and is recognized in the consolidated profit and loss statement.
(F) DEVELOPMENT PROPERTIES
Development properties are investments in land and buildings under construction, and are carried at cost less provision for
impairment losses. Cost includes the original cost of the land and buildings, borrowing costs incurred in respect of development,
construction expenditure and other direct costs. Profit is recognized on sales of properties as a percentage of the total estimated
profit to completion, with the percentage used being the proportion of costs incurred to the estimated total costs to the extent of
deposits received. Under this method, the gross profit on sale is recognized as the related obligation is fulfilled. Unrealized gross
profit on sale of development properties is deferred and shown as deferred income under “Deferred liabilities and provisions” account
in the consolidated balance sheet.
(G) ASSOCIATED COMPANIES
An associated company is a company, not being a subsidiary company, in which the Group has a substantial long-term interest in the
equity voting rights and over whose management of the Group is in a position to exercise significant influence, including participation
in the financial and operating policy decisions.

38First Pacific Company Limited
FINANCIAL STATEMENTS
Investments in associated companies are stated in the consolidated balance sheet at the Group’s share of net assets of the
associated companies under the equity method of accounting, together with related goodwill (net of accumulated impairment losses)
or negative goodwill on acquisition, which was not previously eliminated or recognized in the consolidated reserves, and in the
Company’s balance sheet at cost less provision for impairment losses. Income from associated companies is stated in the
consolidated profit and loss statement as the Group’s share of profits less losses of associated companies, and in the Company’s
profit and loss statement to the extent of dividends received and receivable.
Equity accounting is discontinued when the carrying amount of the investment in an associated company reaches zero, unless the
Group has incurred obligations or guaranteed obligations in respect of the associated company.
(H) SHORT-TERM INVESTMENTS
Short-term investments are securities held for dealing purposes and are stated at fair value. At each balance sheet date, the
unrealized gains and losses arising from changes in fair values of short-term investments are recognized in the profit and loss
statement.
The gains or losses on the disposals of short-term investments, representing the difference between the net sales proceeds and
the carrying amount of the investments, are recognized in the profit and loss statement as they arise.
(I) DEFERRED TAXATION
Deferred taxation is provided using the liability method, on all significant timing differences between profit as computed for taxation
purposes and profit as stated in the Financial Statements, except where it is considered that no liability will arise in the foreseeable
future. A deferred tax asset is not recognized until its realization is assured beyond reasonable doubt.
(J) PROVISIONS AND CONTINGENT LIABILITIES
Provisions are recognized when the Group has a present legal or constructive obligation as a result of past events, it is probable that
an outflow of resources will be required to settle the obligation, and a reliable estimate of the amount can be made. When the effect of
discounting is material, the amount recognized for a provision is the present value, at the balance sheet date, of the future
expenditures expected to be required to settle the obligation. The increase in the discounted present value amount arising from the
passage of time, is included in net borrowing costs in the profit and loss statement.
Where it is not probable that an outflow of economic benefits will be required, or the amount cannot be estimated reliably, the
obligation is disclosed as a contingent liability, unless the probability of outflow is remote.
(K) IMPAIRMENT OF ASSETS
An assessment is made at each balance sheet date of whether there is any indication of impairment of any asset, or whether there is
any indication that an impairment loss previously recognized for an asset in prior years may no longer exist or may have decreased. If
any such indication exists, the asset’s recoverable amount is estimated. An asset’s recoverable amount is calculated as the higher of
the asset’s value in use or its net selling price.
An impairment loss is recognized only if the carrying amount of an asset exceeds its recoverable amount. An impairment loss is
charged to the profit and loss statement in the period in which it arises, unless the asset is carried at a revalued amount, then the
impairment loss is accounted for in accordance with the relevant accounting policy for that revalued asset.
A previously recognized impairment loss is reversed only if there has been a change in the estimates used to determine the
recoverable amount of the asset. However this is limited, and will not give rise to an amount higher than the carrying amount that
would have been determined (net of any depreciation/amortization), had no impairment loss been recognized for the asset in prior
years.
A reversal of an impairment loss is credited to the profit and loss statement in the period in which it arises, unless the asset is
carried at a revalued amount, in which case the reversal of the impairment loss is accounted for in accordance with the relevant
accounting policy for that revalued asset.
39 Annual Report 2002
FINANCIAL STATEMENTS
(L) ACCOUNTING ACQUISITIONS FOR AND DISPOSALS
(i) RESULTS The results of subsidiary or associated companies acquired or sold are accounted for from or to the effective date of
acquisition or disposal.
(ii) FAIR VALUE ADJUSTMENTS On the acquisition of a subsidiary company or an interest in an associated company, the acquisition
cost is allocated to the fair value of the separable net assets acquired.
(iii) GOODWILL represents the excess of the cost of the acquisition over the Group’s share of the fair values of the identifiable assets
and liabilities acquired as at the date of acquisition.
Goodwill arising on acquisition is recognized in the consolidated balance sheet as an asset and amortized on the straight-line
basis over its estimated useful life of 20 years. In the case of associated companies, any unamortized goodwill is included in the
carrying amount thereof, rather than as a separately identified asset on the consolidated balance sheet.
SSAP 30 “Business combinations” was adopted as at 1 January 2001. Prior to that date, goodwill arising on acquisitions was
eliminated against consolidated reserves in the year of acquisition. On the adoption of SSAP 30, the Group applied the transitional
provision of SSAP 30 that permitted such goodwill, to remain eliminated against consolidated reserves. Goodwill on acquisitions
subsequent to 1 January 2001 is treated according to the SSAP 30 goodwill accounting policy above.
On the disposal of subsidiary and associated companies, the gain or loss on disposal is calculated by reference to the net assets
at the date of disposal, including the attributable amount of goodwill that remains unamortized, and any relevant reserves, as
appropriate. Any attributable goodwill previously eliminated against consolidated reserves at the time of acquisition is written back
and included in the calculation of the gain or loss on disposal.
The carrying amount of goodwill, including goodwill remaining eliminated against consolidated reserves, is reviewed annually and
written down for impairment when it is considered necessary. A previously recognized impairment loss for goodwill is not reversed
unless the impairment loss was caused by a specific external event of an exceptional nature that was not expected to recur, and
subsequent external events have occurred which have reversed the effect of that event.
(M) FOREIGN CURRENCIES
On consolidation, the financial statements of overseas subsidiary and associated companies are translated into U.S. dollars using the
net investment method. The profit and loss statements of overseas subsidiary and associated companies are translated into U.S.
dollars using average rates of exchange for the year. Balance sheets are translated at closing rates. The resulting translation
differences are included in the exchange reserve. Where hedging arrangements are in place, the transactions to which they relate are
translated at the rate determined by those arrangements. For the purposes of the consolidated cash flow statement, the cash flows of
overseas subsidiary companies are translated into U.S. dollars at the average rates of exchange for the year.
Exchange differences, arising on the retranslation at closing rates of the opening net assets and the profits for the year retained by
overseas subsidiary and associated companies, and on foreign currency borrowings used to finance long-term foreign equity
investments, are taken to reserves.
Foreign currency transactions are translated into U.S. dollars at rates approximating those prevalent at the relevant transaction
dates. Monetary assets and liabilities are translated at the rates of exchange prevailing at the balance sheet date.
Exchange differences are included in the carrying amount of an asset and are recognized in the consolidated profit and loss
statement when the asset is disposed of, or over the expected useful life of the asset under the following conditions:
(i) where exchange differences fall within the definition of borrowing costs (see (R) below); or
(ii) where it is not practically feasible to hedge a foreign currency and this affects liabilities arising directly on the recent
acquisition of the related asset invoiced in the foreign currency.
All other exchange differences are dealt with in the consolidated profit and loss statement.

40First Pacific Company Limited
FINANCIAL STATEMENTS
(N) TURNOVER AND REVENUE RECOGNITION
Turnover represents the amounts received and receivable from the sale of goods and the rendering of services to third parties, falling
within the ordinary activities of the Group’s businesses. Turnover from sales is recognized when the ownership of goods sold has
transferred to the buyer. Turnover from services is recognized when it can be measured reliably by reference to stages of completion
for the rendering of the said services.
(O) SEGMENTAL INFORMATION
A segment is a distinguishable component of the Group that is engaged either in providing products or services (business segment),
or in providing products or services within a particular economic environment (geographical segment), which is subject to risks and
rewards that are different from those of other segments.
Segment revenue, expenses, results, assets and liabilities include items directly attributable to a segment as well as those that
can be allocated on a reasonable basis to that segment. They are determined before intra-group balances, and intra-group
transactions are eliminated as part of the consolidation process.
Segment capital expenditure is the total cost incurred during the year to acquire segment assets that are expected to be used for
more than one year.
Head Office and other items mainly comprise Head Office assets, borrowings and overheads.
(P) OPERATING LEASES
Leases, where substantially all of the risks and rewards of ownership of assets remain with the lessor, are accounted for as operating
leases. Rentals payable under operating leases are recorded in the consolidated profit and loss statement on a straight-line basis
over the lease term.
(Q) EMPLOYEE BENEFITS
(i) PENSION OBLIGATIONS The Group operates defined contribution and defined benefit retirement schemes.
Contributions to defined contribution schemes by the Group and employees are calculated as a percentage of the employees’
basic salaries. The Group’s contributions to defined contribution schemes are expensed as incurred and are reduced by
contributions forfeited by those employees who leave the schemes prior to vesting fully in the contributions.
Contributions to defined benefit schemes are determined based on the value of the retirement scheme assets and estimates of the
effects of future events on the actuarial present value of accrued pension obligations, and are determined on the basis of actuarial
valuations using the projected unit credit method. The costs of defined benefit schemes are charged against profit on a
systematic basis, with any surpluses and deficits allocated so as to be spreaded over the expected remaining service lives of the
employees affected. Actuarial gains and losses are recognized immediately in the profit and loss statement as and when occured.
(ii) LONG SERVICE PAYMENTS Certain of the Group’s employees are eligible for long service payments in the event of the
termination of their employment. A provision is recognized in respect of the probable future long service payments expected to be
made. The provision is the best estimate of the probable future payments that have been earned by the employees from their
service to the Group at the balance sheet date.
41 Annual Report 2002
FINANCIAL STATEMENTS
(iii) SHARE OPTION SCHEMES The Group operates three share option schemes for the purpose of providing incentives and rewards
to eligible participants who contribute to the success of the Group’s operations. The financial impact of share options granted
under the share option schemes are not recorded in the Group’s balance sheet until such time as the options are exercised, and
no charge is recorded in the profit and loss statement or balance sheet for their cost. Upon the exercise of share options, the
resulting shares issued are recorded by the Company and subsidiary companies as additional share capital at the nominal value
of the shares, and the excess of the exercise price per share over the nominal value of the shares is recorded in the share
premium account. Options which are canceled prior to their exercise date, or which lapse, are deleted from the register of
outstanding options.
(iv) PAID LEAVE CARRIED FORWARD The Group provides paid annual leave to its employees under their employment contracts on a
calendar year basis. Under certain circumstances, such leave which remains untaken as at the balance sheet date is permitted to
be carried forward and utilized by the respective employees in the following year. An accrual is made at the balance sheet date
for the expected future cost of such paid leave earned during the year by the employees and carried forward.
(R) BORROWING COSTS
Borrowing costs are interest and other costs incurred in connection with the borrowing of funds. Other costs include exchange
differences on foreign currency borrowings and redemption premiums on convertible instruments. Exchange differences arising from
foreign currency borrowings are included in borrowing costs to the extent that they are regarded as an adjustment to interest costs,
and/or where borrowings in local currency are not available and it is not practically feasible to hedge the foreign currency borrowings.
Redemption premiums on convertible instruments are provided for over the life of the instruments when it is probable that the
premiums will become payable.
Borrowing costs are expensed in the consolidated profit and loss statement in the year in which they are incurred, except to the
extent that they are capitalized as being directly attributable to the acquisition, construction or production of an asset which
necessarily takes a substantial period of time to prepare for its intended use or sale.
Other ancillary costs incurred in connection with the arrangement of borrowings are charged to the consolidated profit and loss
statement in the year in which they are incurred.
(S) DERIVATIVE INSTRUMENTS
Derivative instruments, which includes currency swaps and foreign exchange contracts entered into for the purpose of managing
foreign currency exposures but which are not qualified as hedging for accounting purposes, are recognized as either an asset or
liability based on the fair value of each contract. The gains or losses arising from changes in the fair values of these derivative
instruments, are recognized in the consolidated profit and loss statement.
(T) RELATED PARTIES
Related parties are individuals and corporate entities where the individual or corporate entity has the ability, directly or indirectly, to
control the other party or exercise significant influence over the other party in making financial and operating decisions, or where two
parties are subject to common control or common significant influence.
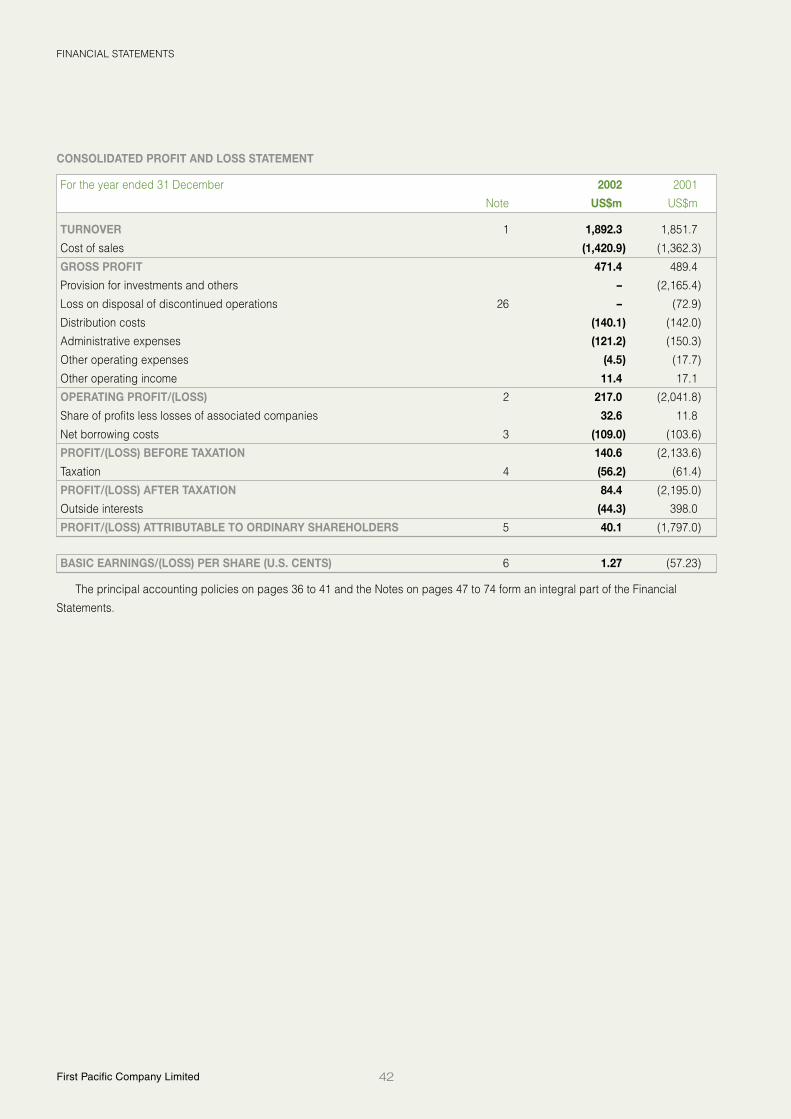
42First Pacific Company Limited
FINANCIAL STATEMENTS
CONSOLIDATED PROFIT AND LOSS STATEMENT
For the year ended 31 December 2002 2001
Note US$m US$m
TURNOVER 1 1,892.3 1,851.7
Cost of sales (1,420.9) (1,362.3)
GROSS PROFIT 471.4 489.4
Provision for investments and others – (2,165.4)
Loss on disposal of discontinued operations 26 – (72.9)
Distribution costs (140.1) (142.0)
Administrative expenses (121.2) (150.3)
Other operating expenses (4.5) (17.7)
Other operating income 11.4 17.1
OPERATING PROFIT/(LOSS) 2 217.0 (2,041.8)
Share of profits less losses of associated companies 32.6 11.8
Net borrowing costs 3 (109.0) (103.6)
PROFIT/(LOSS) BEFORE TAXATION 140.6 (2,133.6)
Taxation 4 (56.2) (61.4)
PROFIT/(LOSS) AFTER TAXATION 84.4 (2,195.0)
Outside interests (44.3) 398.0
PROFIT/(LOSS) ATTRIBUTABLE TO ORDINARY SHAREHOLDERS 5 40.1 (1,797.0)
BASIC EARNINGS/(LOSS) PER SHARE (U.S. CENTS) 6 1.27 (57.23)
The principal accounting policies on pages 36 to 41 and the Notes on pages 47 to 74 form an integral part of the Financial
Statements.
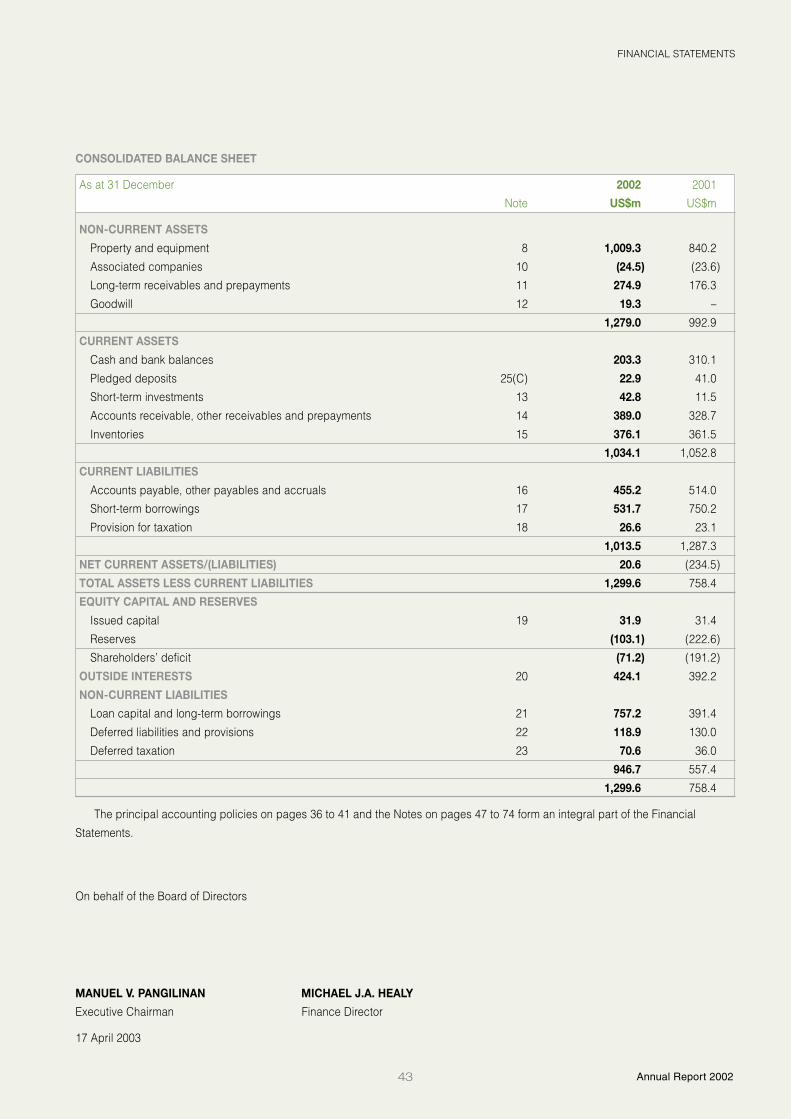
43 Annual Report 2002
FINANCIAL STATEMENTS
CONSOLIDATED BALANCE SHEET
As at 31 December 2002 2001
Note US$m US$m
NON-CURRENT ASSETS
Property and equipment 8 1,009.3 840.2
Associated companies 10 (24.5) (23.6)
Long-term receivables and prepayments 11 274.9 176.3
Goodwill 12 19.3 –
1,279.0 992.9
CURRENT ASSETS
Cash and bank balances 203.3 310.1
Pledged deposits 25(C) 22.9 41.0
Short-term investments 13 42.8 11.5
Accounts receivable, other receivables and prepayments 14 389.0 328.7
Inventories 15 376.1 361.5
1,034.1 1,052.8
CURRENT LIABILITIES
Accounts payable, other payables and accruals 16 455.2 514.0
Short-term borrowings 17 531.7 750.2
Provision for taxation 18 26.6 23.1
1,013.5 1,287.3
NET CURRENT ASSETS/(LIABILITIES) 20.6 (234.5)
TOTAL ASSETS LESS CURRENT LIABILITIES 1,299.6 758.4
EQUITY CAPITAL AND RESERVES
Issued capital 19 31.9 31.4
Reserves (103.1) (222.6)
Shareholders’ deficit (71.2) (191.2)
OUTSIDE INTERESTS 20 424.1 392.2
NON-CURRENT LIABILITIES
Loan capital and long-term borrowings 21 757.2 391.4
Deferred liabilities and provisions 22 118.9 130.0
Deferred taxation 23 70.6 36.0
946.7 557.4
1,299.6 758.4
The principal accounting policies on pages 36 to 41 and the Notes on pages 47 to 74 form an integral part of the Financial
Statements.
On behalf of the Board of Directors
MANUEL V. PANGILINAN MICHAEL J.A. HEALY
Executive Chairman Finance Director
17 April 2003

44First Pacific Company Limited
FINANCIAL STATEMENTS
COMPANY BALANCE SHEET
As at 31 December 2002 2001
Note US$m US$m
NON-CURRENT ASSETS
Subsidiary companies 9 1,049.4 860.9
Amounts due from subsidiary companies 9(A) 760.2 1,464.1
Associated companies 10(A) 31.4 31.0
1,841.0 2,356.0
CURRENT ASSETS
Cash and bank balances 26.2 38.5
Receivables and prepayments 0.4 0.6
26.6 39.1
CURRENT LIABILITIES
Payables and accruals 14.0 0.8
NET CURRENT ASSETS 12.6 38.3
TOTAL ASSETS LESS CURRENT LIABILITIES 1,853.6 2,394.3
EQUITY CAPITAL AND RESERVES
Issued capital 19 31.9 31.4
Reserves 987.8 938.6
Shareholders’ equity 1,019.7 970.0
NON-CURRENT LIABILITIES
Amounts due to subsidiary companies 9(B) 833.9 1,374.3
Loan capital 21(B) – 50.0
833.9 1,424.3
1,853.6 2,394.3
The principal accounting policies on pages 36 to 41 and the Notes on pages 47 to 74 form an integral part of the Financial
Statements.
On behalf of the Board of Directors
MANUEL V. PANGILINAN MICHAEL J.A. HEALY
Executive Chairman Finance Director
17 April 2003

45 Annual Report 2002
FINANCIAL STATEMENTS
CONSOLIDATED AND COMPANY STATEMENT OF CHANGES IN SHAREHOLDERS’ EQUITY/(DEFICIT)
Property Exchange Revenue
Issued Share revaluation reserve reserve
capital premium reserve (Note 24) (Note 24) Total
CONSOLIDATED US$m US$m US$m US$m US$m US$m
Balance at 1 January 2001 31.4 908.7 1.3 (332.5) (239.4) 369.5
Net losses not recognized in
the profit and loss statement
– Exchange translation – – – (14.9) – (14.9)
Transfer to profit and loss statement – – – 264.0 874.0 1,138.0
Disposal and divestment of interests in
subsidiary and associated companies – – (1.3) 63.2 55.3 117.2
Net loss for the year
– Company – – – – (589.1) (589.1)
– Subsidiary companies – – – – (1,206.0) (1,206.0)
– Associated companies – – – – (1.9) (1.9)
Dividends – – – – (4.0) (4.0)
BALANCE AT 31 DECEMBER 2001 31.4 908.7 – (20.2) (1,111.1) (191.2)
Shares issued upon conversion
of a Convertible Note (Note 19) 0.5 49.5 – – – 50.0
Net gains not recognized in
the profit and loss statement
– Exchange translation – – – 20.1 – 20.1
Dilution of interests in a subsidiary
and an associated company – – – 0.4 9.4 9.8
Net profit for the year
– Company – – – – (0.3) (0.3)
– Subsidiary companies – – – – 14.1 14.1
– Associated companies – – – – 26.3 26.3
BALANCE AT 31 DECEMBER 2002 31.9 958.2 – 0.3 (1,061.6) (71.2)
Contributed
Issued Share surplus Revenue
capital premium (Note 24) reserve Total
COMPANY US$m US$m US$m US$m US$m
Balance at 1 January 2001 31.4 908.7 173.8 449.2 1,563.1
Net loss for the year – – – (589.1) (589.1)
Dividends – – – (4.0) (4.0)
BALANCE AT 31 DECEMBER 2001 31.4 908.7 173.8 (143.9) 970.0
Share issued upon conversion
of a Convertible Note (Note 19) 0.5 49.5 – – 50.0
Net loss for the year – – – (0.3) (0.3)
BALANCE AT 31 DECEMBER 2002 31.9 958.2 173.8 (144.2) 1,019.7
The principal accounting policies on pages 36 to 41 and the Notes on pages 47 to 74 form an integral part of the Financial
Statements.

46First Pacific Company Limited
FINANCIAL STATEMENTS
CONSOLIDATED CASH FLOW STATEMENT
For the year ended 31 December 2002 2001
Note US$m US$m
NET CASH (OUTFLOW)/INFLOW FROM OPERATING ACTIVITIES 25(A) (24.0) 116.7
Purchase of property and equipment (87.2) (132.4)
Purchase of short-term investments (28.5) (13.5)
Sale of property and equipment 8.0 18.8
Disposals of
– subsidiary companies 25(B) (6.7) 129.4
– associated companies – 48.2
– short-term investments – 19.0
Loans repaid by/(to) associated companies 7.3 (4.3)
Dividends received from associated companies – 2.7
NET CASH (OUTFLOW)/INFLOW FROM INVESTING ACTIVITIES (107.1) 67.9
Proceeds of new borrowings 886.9 340.4
Borrowings repaid (809.4) (549.3)
Payments in connection with the shares repurchased by a subsidiary company (71.6) (7.5)
Shares issued to outside interests by a subsidiary company 20.4 –
Dividends paid to
– outside interests by a subsidiary company (13.2) (8.6)
– shareholders – (4.0)
NET CASH INFLOW/(OUTFLOW) FROM FINANCING ACTIVITIES 13.1 (229.0)
DECREASE IN CASH AND CASH EQUIVALENTS (118.0) (44.4)
Cash and cash equivalents at 1 January 310.1 360.6
Exchange translation 11.2 (6.1)
CASH AND CASH EQUIVALENTS AT 31 DECEMBER 203.3 310.1
REPRESENTING
Cash and bank balances 203.3 310.1
The principal accounting policies on pages 36 to 41 and the Notes on pages 47 to 74 form an integral part of the Financial
Statements.
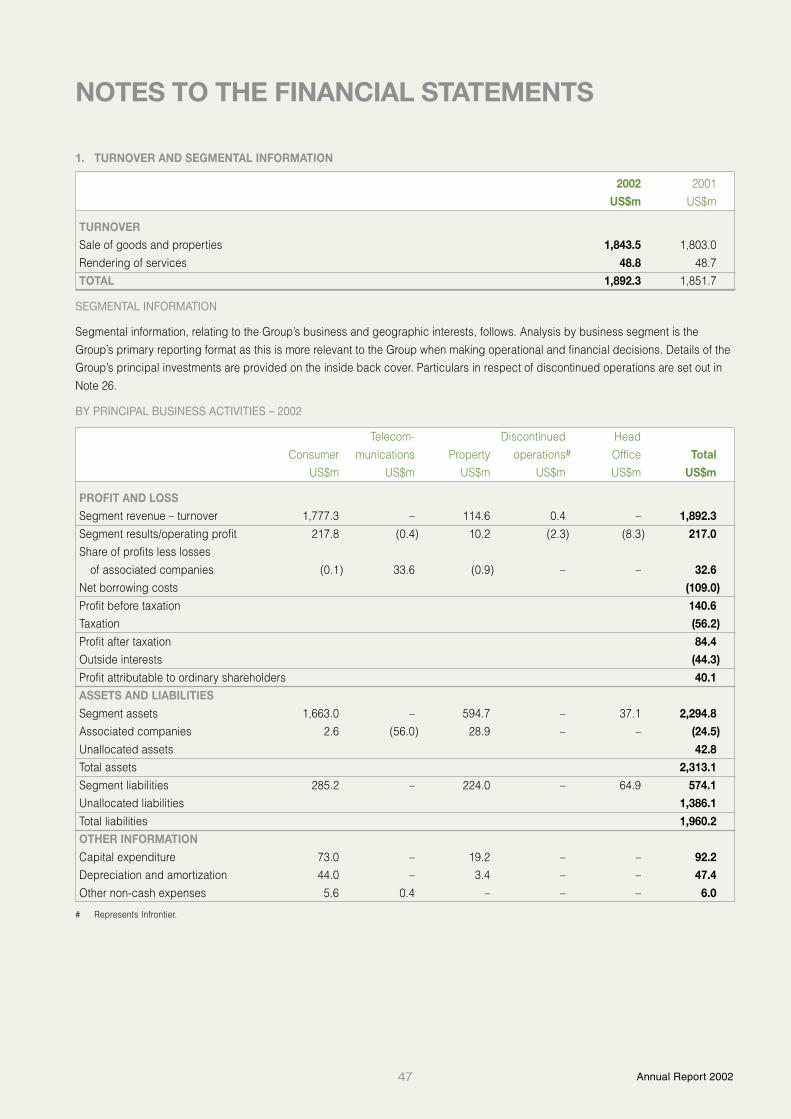
47 Annual Report 2002
NOTES TO THE FINANCIAL STATEMENTS
NOTES TO THE FINANCIAL STATEMENTS
1. TURNOVER AND SEGMENTAL INFORMATION
2002 2001
US$m US$m
TURNOVER
Sale of goods and properties 1,843.5 1,803.0
Rendering of services 48.8 48.7
TOTAL 1,892.3 1,851.7
SEGMENTAL INFORMATION
Segmental information, relating to the Group’s business and geographic interests, follows. Analysis by business segment is the
Group’s primary reporting format as this is more relevant to the Group when making operational and financial decisions. Details of the
Group’s principal investments are provided on the inside back cover. Particulars in respect of discontinued operations are set out in
Note 26.
BY PRINCIPAL BUSINESS ACTIVITIES – 2002
Telecom- Discontinued Head
Consumer munications Property operations# Office Total
US$m US$m US$m US$m US$m US$m
PROFIT AND LOSS
Segment revenue – turnover 1,777.3 – 114.6 0.4 – 1,892.3
Segment results/operating profit 217.8 (0.4) 10.2 (2.3) (8.3) 217.0
Share of profits less losses
of associated companies (0.1) 33.6 (0.9) – – 32.6
Net borrowing costs (109.0)
Profit before taxation 140.6
Taxation (56.2)
Profit after taxation 84.4
Outside interests (44.3)
Profit attributable to ordinary shareholders 40.1
ASSETS AND LIABILITIES
Segment assets 1,663.0 – 594.7 – 37.1 2,294.8
Associated companies 2.6 (56.0) 28.9 – – (24.5)
Unallocated assets 42.8
Total assets 2,313.1
Segment liabilities 285.2 – 224.0 – 64.9 574.1
Unallocated liabilities 1,386.1
Total liabilities 1,960.2
OTHER INFORMATION
Capital expenditure 73.0 – 19.2 – – 92.2
Depreciation and amortization 44.0 – 3.4 – – 47.4
Other non-cash expenses 5.6 0.4 – – – 6.0
# Represents Infrontier.

48First Pacific Company Limited
NOTES TO THE FINANCIAL STATEMENTS
BY PRINCIPAL GEOGRAPHICAL MARKETS – 2002
The Discontinued HeadIndonesia Philippines India operations# Office Total
US$m US$m US$m US$m US$m US$m
Segment revenue – turnover 1,777.3 114.6 – 0.4 – 1,892.3Segment assets 1,663.0 594.7 – – 37.1 2,294.8Associated companies 2.6 109.3 (136.4) – – (24.5)Unallocated assets 42.8Total assets 2,313.1Capital expenditure 73.0 19.2 – – – 92.2
# Represents Infrontier.
BY PRINCIPAL BUSINESS ACTIVITIES – 2001
Telecom– Discontinued HeadConsumer munications Property operations* Office Total
US$m US$m US$m US$m US$m US$m
PROFIT AND LOSSSegment revenue – turnover 1,414.9 – 134.4 302.4 – 1,851.7Segment results/operating loss** (104.4) (565.8) (1,201.1) (57.0) (113.5) (2,041.8)Share of profits less losses of
associated companies (0.6) 9.5 (0.6) 3.5 – 11.8Net borrowing costs (103.6)Loss before taxation (2,133.6)Taxation (61.4)Loss after taxation (2,195.0)Outside interests 398.0Loss attributable to ordinary shareholders (1,797.0)ASSETS AND LIABILITIESSegment assets 1,196.7 – 637.6 5.3 218.2 2,057.8Associated companies 2.4 (75.7) 49.7 – – (23.6)Unallocated assets 11.5Total assets 2,045.7Segment liabilities 260.8 – 215.2 1.5 166.5 644.0Unallocated liabilities 1,200.7Total liabilities 1,844.7OTHER INFORMATIONCapital expenditure 76.1 – 61.8 10.3 – 148.2Impairment charge 299.6 565.8 1,188.5 – 100.0 2,153.9Depreciation and amortization 34.4 – 8.7 17.3 0.1 60.5Other non-cash expenses 1.5 – 6.0 0.1 – 7.6
BY PRINCIPAL GEOGRAPHICAL MARKETS – 2001
The Discontinued HeadIndonesia Philippines India operations* Office Total
US$m US$m US$m US$m US$m US$m
Segment revenue – turnover 1,414.9 134.4 – 302.4 – 1,851.7Segment assets 1,196.7 637.6 – 5.3 218.2 2,057.8Associated companies 2.4 103.3 (129.3) – – (23.6)Unallocated assets 11.5Total assets 2,045.7Capital expenditure 76.1 61.8 – 10.3 – 148.2
* Represents Infrontier, Berli Jucker, Darya-Varia and Savills plc.** Balance included provision for investments and others of US$2,165.4 million and loss on disposal of discontinued operations of US$72.9 million.

49 Annual Report 2002
NOTES TO THE FINANCIAL STATEMENTS
2. OPERATING PROFIT/(LOSS)
2002 2001
US$m US$m
OPERATING PROFIT/(LOSS) IS STATED AFTER (CHARGING)/CREDITING
Cost of inventories sold (1,139.2) (1,254.9)
Depreciation (47.0) (60.5)
Operating lease rentals
– Land and buildings (9.6) (7.4)
– Hire of plant and equipment (1.0) (1.1)
– Other – (0.3)
Loss on dilution of interests in a subsidiary and an associated company (4.2) (6.7)
Doubtful debt provisions (1.8) (7.6)
Loss on sale of property and equipment (0.7) (2.1)
Auditors’ remuneration
– Audit services (1.1) (1.1)
– Other services (0.1) (0.5)
Unrealized (losses)/gains on short-term investments (0.9) 0.5
Amortization of goodwill (included in other operating expenses) (0.4) –
Net exchange gains/(losses) on monetary items 10.7 (15.2)
Dividends from unlisted investments – 0.1
3. NET BORROWING COSTS
2002 2001
US$m US$m
Loan capital
– wholly repayable within five years 2.3 10.1
– not wholly repayable within five years 0.7 1.0
Subtotal 3.0 11.1
Bank loans and other loans
– wholly repayable within five years 118.1 97.1
– not wholly repayable within five years 6.1 11.1
Subtotal 124.2 108.2
TOTAL INTEREST EXPENSE 127.2 119.3
Other borrowing costs
– Redemption premium on convertible instruments 3.7 20.4
TOTAL BORROWING COSTS 130.9 139.7
Less borrowing costs capitalized in development properties – (9.8)
Less interest income (21.9) (26.3)
NET BORROWING COSTS 109.0 103.6
The capitalization rate applied to funds borrowed for general purposes and used for the development of property is nil (2001: 18.1
per cent per annum) for the year.
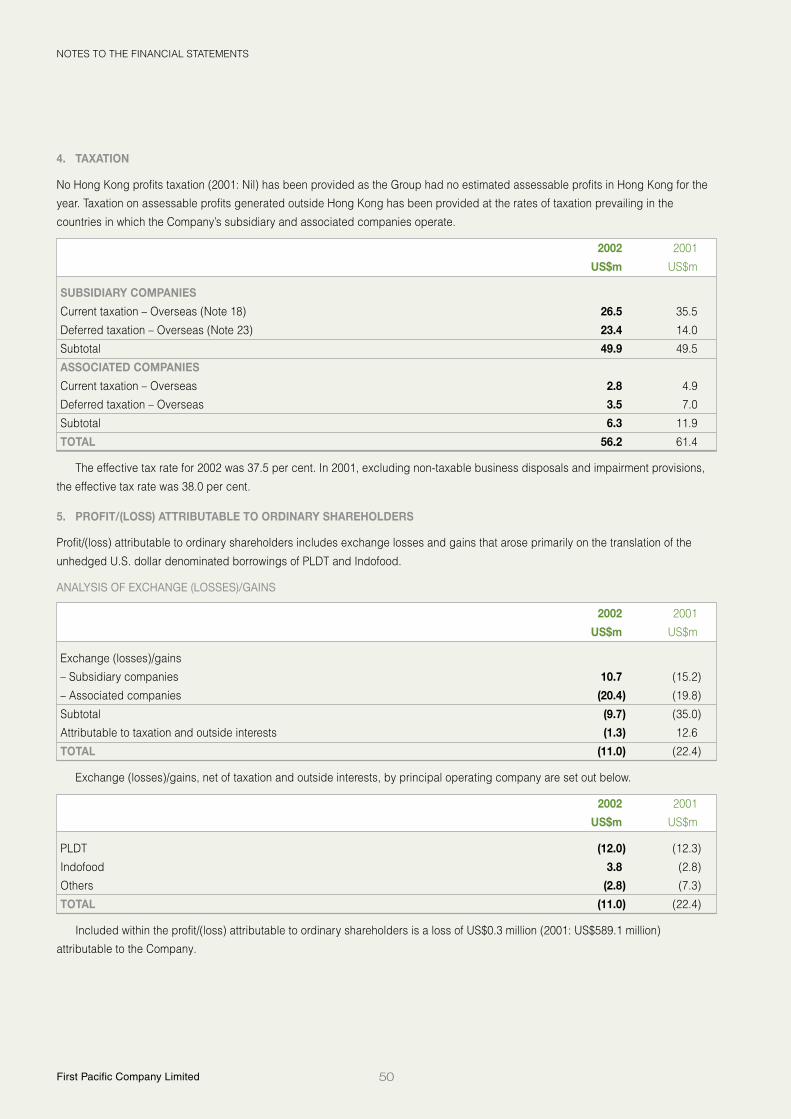
50First Pacific Company Limited
NOTES TO THE FINANCIAL STATEMENTS
4. TAXATION
No Hong Kong profits taxation (2001: Nil) has been provided as the Group had no estimated assessable profits in Hong Kong for the
year. Taxation on assessable profits generated outside Hong Kong has been provided at the rates of taxation prevailing in the
countries in which the Company’s subsidiary and associated companies operate.
2002 2001
US$m US$m
SUBSIDIARY COMPANIES
Current taxation – Overseas (Note 18) 26.5 35.5
Deferred taxation – Overseas (Note 23) 23.4 14.0
Subtotal 49.9 49.5
ASSOCIATED COMPANIES
Current taxation – Overseas 2.8 4.9
Deferred taxation – Overseas 3.5 7.0
Subtotal 6.3 11.9
TOTAL 56.2 61.4
The effective tax rate for 2002 was 37.5 per cent. In 2001, excluding non-taxable business disposals and impairment provisions,
the effective tax rate was 38.0 per cent.
5. PROFIT/(LOSS) ATTRIBUTABLE TO ORDINARY SHAREHOLDERS
Profit/(loss) attributable to ordinary shareholders includes exchange losses and gains that arose primarily on the translation of the
unhedged U.S. dollar denominated borrowings of PLDT and Indofood.
ANALYSIS OF EXCHANGE (LOSSES)/GAINS
2002 2001
US$m US$m
Exchange (losses)/gains
– Subsidiary companies 10.7 (15.2)
– Associated companies (20.4) (19.8)
Subtotal (9.7) (35.0)
Attributable to taxation and outside interests (1.3) 12.6
TOTAL (11.0) (22.4)
Exchange (losses)/gains, net of taxation and outside interests, by principal operating company are set out below.
2002 2001
US$m US$m
PLDT (12.0) (12.3)
Indofood 3.8 (2.8)
Others (2.8) (7.3)
TOTAL (11.0) (22.4)
Included within the profit/(loss) attributable to ordinary shareholders is a loss of US$0.3 million (2001: US$589.1 million)
attributable to the Company.

51 Annual Report 2002
NOTES TO THE FINANCIAL STATEMENTS
6. BASIC EARNINGS/(LOSS) PER SHARE
2002 2001
Basic earnings/(loss) per share is based on
– profit/(loss) attributable to ordinary shareholders of (US$m) 40.1 (1,797.0)
– and an average number of shares in issue of (millions) 3,152.2 3,139.8
resulting in earnings/(loss) per share of (U.S. cents) 1.27 (57.23)
No diluted earnings/(loss) per share for the years ended 31 December 2002 and 2001 have been presented as the outstanding
convertible bonds, convertible notes and convertible preferred shares of the Company, a subsidiary and an associated company
have anti-dilutive effects on the basic earnings/(loss) per share for these years. In addition, no diluting events existed in respect of the
outstanding share options of the Company, a subsidiary and an associated company during these years.
7. ORDINARY SHARE DIVIDENDS
(A) No interim dividend was paid for 2002 (2001: Nil).
(B) At a meeting held on 17 April 2003, the Directors did not recommend the payment of a final dividend for 2002 (2001: Nil).
8. PROPERTY AND EQUIPMENT
Machinery,
Development Land and equipment Consolidated
properties buildings and vessels Total
US$m US$m US$m US$m
COST
At 1 January 2002 914.9 261.7 620.7 1,797.3
Exchange translation (27.1) 29.6 80.9 83.4
Additions 10.2 29.7 52.3 92.2
Disposals (4.9) (3.4) (4.3) (12.6)
Disposal of a subsidiary company – – (2.7) (2.7)
Reclassification(i) 82.7 (41.7) (4.7) 36.3
AT 31 DECEMBER 2002 975.8 275.9 742.2 1,993.9
ACCUMULATED DEPRECIATION AND IMPAIRMENT
At 1 January 2002 679.2 39.3 238.6 957.1
Exchange translation (20.1) 7.1 19.8 6.8
Charge for the year – 8.5 38.5 47.0
Disposals – (1.4) (2.5) (3.9)
Disposal of a subsidiary company – – (0.6) (0.6)
Reclassification(i) – 1.3 (23.1) (21.8)
AT 31 DECEMBER 2002 659.1 54.8 270.7 984.6
NET BOOK AMOUNT AT 31 DECEMBER 2002 316.7 221.1 471.5 1,009.3
Net book amount at 31 December 2001 235.7 222.4 382.1 840.2
(i) Reclassified from/(to) inventories.
(A) Principal annual rates of depreciation:
Development properties and freehold land Nil
Freehold buildings 2.5% to 20.0%
Leasehold land and buildings Lesser of period of lease, or 2.5%
Machinery, equipment and vessels 2.5% to 50.0%
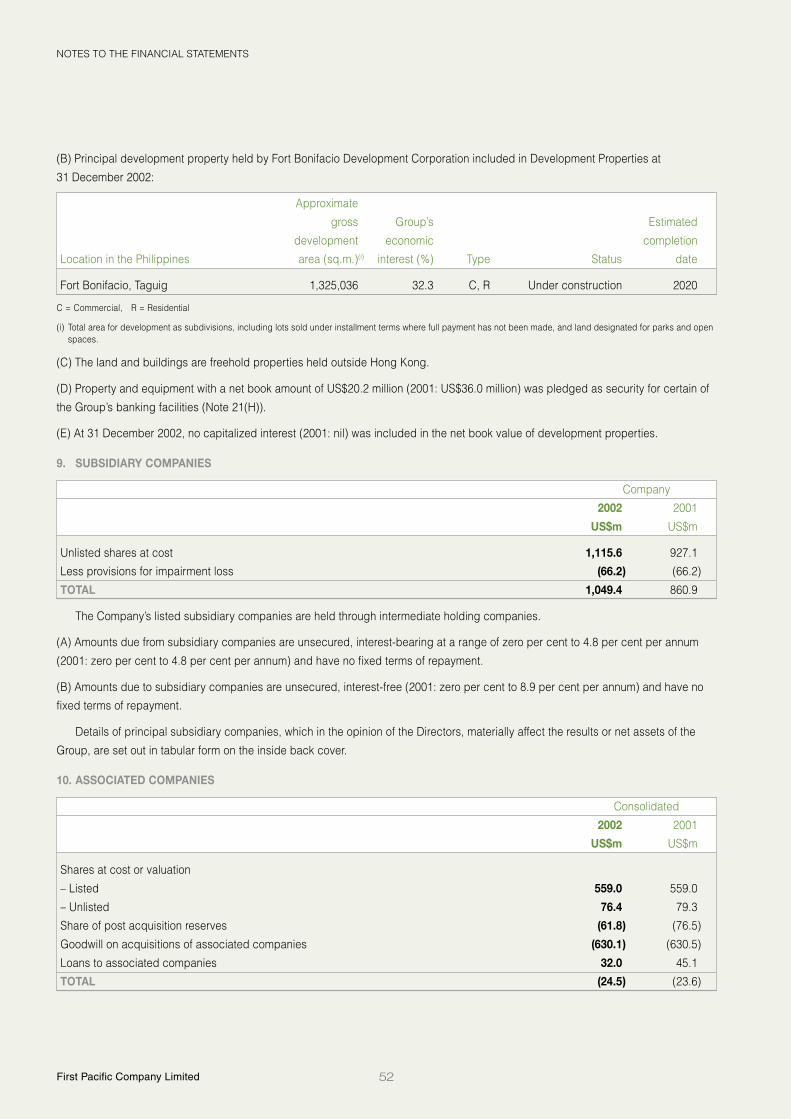
52First Pacific Company Limited
NOTES TO THE FINANCIAL STATEMENTS
(B) Principal development property held by Fort Bonifacio Development Corporation included in Development Properties at
31 December 2002:
Approximate
gross Group’s Estimated
development economic completion
Location in the Philippines area (sq.m.)(i) interest (%) Type Status date
Fort Bonifacio, Taguig 1,325,036 32.3 C, R Under construction 2020
C = Commercial, R = Residential
(i) Total area for development as subdivisions, including lots sold under installment terms where full payment has not been made, and land designated for parks and openspaces.
(C) The land and buildings are freehold properties held outside Hong Kong.
(D) Property and equipment with a net book amount of US$20.2 million (2001: US$36.0 million) was pledged as security for certain of
the Group’s banking facilities (Note 21(H)).
(E) At 31 December 2002, no capitalized interest (2001: nil) was included in the net book value of development properties.
9. SUBSIDIARY COMPANIES
Company
2002 2001
US$m US$m
Unlisted shares at cost 1,115.6 927.1
Less provisions for impairment loss (66.2) (66.2)
TOTAL 1,049.4 860.9
The Company’s listed subsidiary companies are held through intermediate holding companies.
(A) Amounts due from subsidiary companies are unsecured, interest-bearing at a range of zero per cent to 4.8 per cent per annum
(2001: zero per cent to 4.8 per cent per annum) and have no fixed terms of repayment.
(B) Amounts due to subsidiary companies are unsecured, interest-free (2001: zero per cent to 8.9 per cent per annum) and have no
fixed terms of repayment.
Details of principal subsidiary companies, which in the opinion of the Directors, materially affect the results or net assets of the
Group, are set out in tabular form on the inside back cover.
10. ASSOCIATED COMPANIES
Consolidated
2002 2001
US$m US$m
Shares at cost or valuation
– Listed 559.0 559.0
– Unlisted 76.4 79.3
Share of post acquisition reserves (61.8) (76.5)
Goodwill on acquisitions of associated companies (630.1) (630.5)
Loans to associated companies 32.0 45.1
TOTAL (24.5) (23.6)

53 Annual Report 2002
NOTES TO THE FINANCIAL STATEMENTS
(A) The Company’s interest in associated companies includes unlisted investment of US$31.4 million (2001: US$31.0 million) located
outside Hong Kong.
(B) At 31 December 2002, both the listed and unlisted investments were located outside Hong Kong.
(C) At 31 December 2002, the market valuation of listed investments was US$212.9 million (2001: US$341.6 million) and dividends
received and receivable were nil (2001: US$1.8 million).
(D) Loans to associated companies are unsecured, interest-bearing at a range of zero per cent to 16.0 per cent per annum (2001:
zero per cent to 14.5 per cent per annum) and have no fixed terms of repayment.
(E) Principal development properties held by the associated companies of Metro Pacific and Landco Pacific, which is a 61.3 per cent
owned subsidiary company of Metro Pacific, at 31 December 2002:
Approximate
gross Group’s Estimated
development economic completion
Location in the Philippines area (sq.m.)(i) interest (%) Type Status date
Costa De Madera, San Juan, Batangas 3,720,000 37.1 Ro Planning –
San Fernando, Pampanga 2,349,120 23.4 R Under construction 2006
Lakewood, Cabanatuan 2,141,537 7.3 R Under construction 2005
Calasiao, Pangasinan 1,860,000 39.5 R Planning –
Urdaneta, Pangasinan 298,275 7.3 R Under construction 2004
Ro = Resort , R = Residential
(i) Total area for development and sale as subdivisions, including lots sold under installment terms where full payment has not been made, and land designated for parksand open spaces.
(F) Details of principal associated companies, which in the opinion of the Directors materially affect the results or net assets of the
Group, are set out in tabular form on the inside back cover.
(G) Additional financial information in respect of the Group’s principal associated companies, as prepared under HK GAAP, is set out
below.
PLDT Escotel
2002 2001 2002 2001
US$m US$m US$m US$m
OPERATING RESULTS
Turnover 1,552.5 1,707.9 70.6 53.5
Profit/(loss) before taxation 193.7 357.3 (13.4) (22.4)
Profit/(loss) after taxation 167.9 311.8 (13.4) (22.4)
Net profit/(loss) 168.4 59.0 (13.4) (22.4)
NET ASSETS/(LIABILITIES)
Current assets 724.6 596.7 9.5 21.4
Long-term assets 3,860.2 4,066.8 83.4 142.8
TOTAL ASSETS 4,584.8 4,663.5 92.9 164.2
Current liabilities (822.3) (875.6) (73.5) (52.2)
Long-term liabilities and provisions (3,416.0) (3,552.3) (344.3) (421.3)
TOTAL LIABILITIES (4,238.3) (4,427.9) (417.8) (473.5)
Outside interests (17.0) (16.2) – –
AT 31 DECEMBER 329.5 219.4 (324.9) (309.3)

54First Pacific Company Limited
NOTES TO THE FINANCIAL STATEMENTS
Escotel has a financial accounting period ending on 31 March, which is not coterminous with the Group. Total net liabilities of
Escotel arose principally as a consequence of the Group’s accounting policy of attributing to goodwill the excess of the acquisition
cost of the telecommunications business, over the fair value of its separable net assets. This attributes no value to the acquired
telecommunications licenses.
(H) PLDT was incorporated under the law of the Philippines on 28 November 1928 to provide telephone services in the Philippines.
PLDT’s charter was initially limited to a period of 50 years but has since been extended twice for 25 years each, the last extension
being for an additional 25-year period ending 2028. Under its amended charter, which became effective on 24 August 1991, PLDT is
authorized to provide virtually every type of telecommunications service, both within the Philippines and between the Philippines and
other countries.
PLDT operates under the jurisdiction of the Philippine National Telecommunications Commission which jurisdiction extends,
among other things, to approving major services offered by PLDT and certain rates charged by PLDT.
Escotel, incorporated in May 1995, was granted three non-exclusive 10-year GSM licenses, in December 1995, by the Department
of Telecommunication of India to build and operate cellular telephone services in Uttar Pradesh (West), Haryana and Kerala. The initial
10-year licenses were based on a fixed amount to be paid to the Indian Government. In August 1999, the Indian Government issued a
New Telecom Policy that allows cellular operators to migrate to a revenue sharing mechanism from the previous basis of a fixed
license fee. Under the revenue sharing mechanism, Escotel is required to pay license fees to the Indian Government on a quarterly
basis, calculated at 10 per cent of gross revenue, and spectrum charges, calculated at two to three per cent of gross revenue,
depending on the region of operation. In addition, the license period for all licenses was extended to 20 years (previously 10 years)
from the date of initial award; thus Escotel’s runs to 2015.
(I) On 4 May 2000, on the condition that Metro Pacific would infuse Pesos 2 billion (US$37.6 million) of fresh equity into First e-Bank,
the Philippine Deposit and Insurance Corporation (PDIC) granted Pesos 2 billion (US$37.6 million) of low-cost financial assistance to
First e-Bank. Pesos 1 billion (US$18.8 million) of the financial assistance has been invested in government securities and pledged,
together with a pool of non-performing assets with a book value of Pesos 2 billion (US$37.6 million), to PDIC.
On 14 August 2001, Metro Pacific’s Board of directors resolved to procure a surety bond of Pesos 2 billion (US$37.6 million) in
favour of PDIC. This was to guarantee Metro Pacific’s undertaking to indemnify PDIC should First e-Bank not receive the Pesos 2
billion (US$37.6 million) equity infusion, or not enter into a firm agreement for a merger or other corporate combination within the
period prescribed by PDIC.
In accordance with the requirements of PDIC, Metro Pacific converted Pesos 1.8 billion (US$33.9 million) of convertible preferred
shares, issued by First e-Bank, into common shares in October 2001. As a result of this conversion, Metro Pacific’s interest in First
e-Bank increased to 83.2 per cent from 31.8 per cent. As Metro Pacific’s control of First e-Bank was intended to be temporary, First
e-Bank continued to be accounted for as an associated company of Metro Pacific. In September 2002, First e-Bank obtained approval
from the Philippine Monetary Board for its sale, to Banco de Oro, of its banking business, as well as certain assets and liabilities, up to
Pesos 10.0 billion (US$188.1 million) (the Bank Transaction). The Bank Transaction is expected to be completed during the second
quarter of 2003. Upon the completion of the Bank Transaction, First e-Bank will cease its banking operations, and Metro Pacific’s
intention is to retain only a non-controlling minority stake in the shell company after the Bank Transaction.
Upon the completion of the Bank Transaction, Metro Pacific will assign a property of approximately 700 hectares, together with
First e-Bank’s remaining assets, to fully repay the Pesos 2 billion (US$37.6 million) financial assistance. Metro Pacific’s directors
believe that once the Pesos 2 billion (US$37.6 million) financial assistance extended by PDIC to First e-Bank is fully settled, the equity
infusion commitment of Metro Pacific will be automatically extinguished and, accordingly, no provision is required.
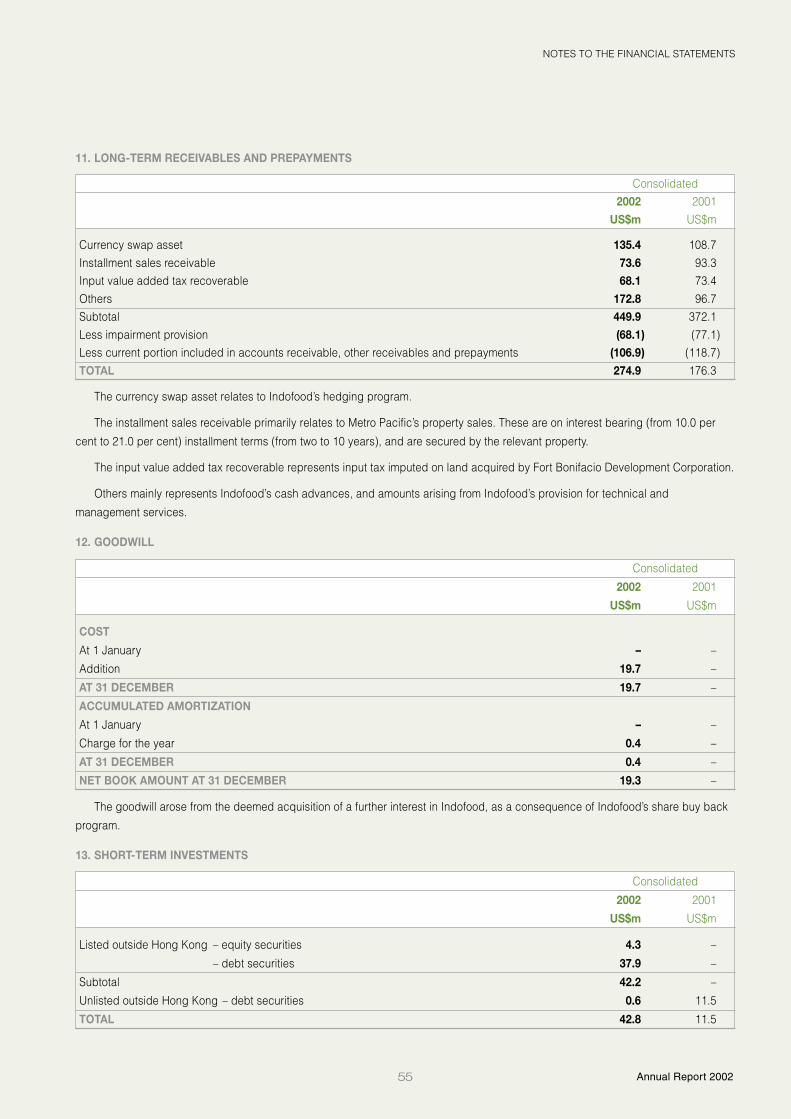
55 Annual Report 2002
NOTES TO THE FINANCIAL STATEMENTS
11. LONG-TERM RECEIVABLES AND PREPAYMENTS
Consolidated
2002 2001
US$m US$m
Currency swap asset 135.4 108.7
Installment sales receivable 73.6 93.3
Input value added tax recoverable 68.1 73.4
Others 172.8 96.7
Subtotal 449.9 372.1
Less impairment provision (68.1) (77.1)
Less current portion included in accounts receivable, other receivables and prepayments (106.9) (118.7)
TOTAL 274.9 176.3
The currency swap asset relates to Indofood’s hedging program.
The installment sales receivable primarily relates to Metro Pacific’s property sales. These are on interest bearing (from 10.0 per
cent to 21.0 per cent) installment terms (from two to 10 years), and are secured by the relevant property.
The input value added tax recoverable represents input tax imputed on land acquired by Fort Bonifacio Development Corporation.
Others mainly represents Indofood’s cash advances, and amounts arising from Indofood’s provision for technical and
management services.
12. GOODWILL
Consolidated
2002 2001
US$m US$m
COST
At 1 January – –
Addition 19.7 –
AT 31 DECEMBER 19.7 –
ACCUMULATED AMORTIZATION
At 1 January – –
Charge for the year 0.4 –
AT 31 DECEMBER 0.4 –
NET BOOK AMOUNT AT 31 DECEMBER 19.3 –
The goodwill arose from the deemed acquisition of a further interest in Indofood, as a consequence of Indofood’s share buy back
program.
13. SHORT-TERM INVESTMENTS
Consolidated
2002 2001
US$m US$m
Listed outside Hong Kong – equity securities 4.3 –
– debt securities 37.9 –
Subtotal 42.2 –
Unlisted outside Hong Kong – debt securities 0.6 11.5
TOTAL 42.8 11.5

56First Pacific Company Limited
NOTES TO THE FINANCIAL STATEMENTS
14. ACCOUNTS RECEIVABLE, OTHER RECEIVABLES AND PREPAYMENTS
Included in accounts receivable, other receivables and prepayments are trade receivables of US$201.1 million (2001: US$169.0
million), with an ageing profile as below.
2002 2001
US$m US$m
Less than 30 days 160.3 144.2
31-60 days 11.8 7.7
61-90 days 8.3 4.2
Over 90 days 20.7 12.9
TOTAL 201.1 169.0
Indofood allows sub-distributors/wholesalers 60 days of credit, and other customers between 15-60 days of credit. Metro Pacific
collects contract receivables by installments over periods ranging from two to 10 years.
15. INVENTORIES
Consolidated
2002 2001
US$m US$m
Properties held for sale 118.4 244.9
Finished goods 93.9 72.3
Raw materials 208.7 133.2
Work in progress 4.6 5.2
Less provisions (49.5) (94.1)
TOTAL 376.1 361.5
At 31 December 2002, the carrying amount of inventories carried at net realizable value amounted to US$68.9 million (2001:
US$150.8 million).
Principal properties held by Metro Pacific, Landco Pacific and Fort Bonifacio Development Corporation are included in Properties
Held for Sale at 31 December 2002:
Approximate Group’s Estimated
gross economic completion
Location in the Philippines area (sq.m.)(i) interest (%) Type Status date
Batulao, Batangas 2,107,500 52.3 R Planning –
Lemery, Batangas 786,372 49.2 F Under construction 2004
Punta Fuego 1, Batangas 455,811 27.4 R, Ro Under construction 2003
Punta Fuego 2, Batangas 356,761 17.7 R, Ro Under construction 2005
Stonecrest, San Pedro, Laguna 300,448 25.0 R Under construction 2003
Talisay, Cebu 276,640 24.2 R Under construction 2005
Waterwood, Bulacan 122,835 33.0 R Under construction 2003
Legaspi City, Albay 47,533 24.2 C Completed –
Lucena City, Quezon 43,598 69.3 C Under construction 2003
Fort Bonifacio, Taguig 13,202 32.3 C, R Under construction 2020
Pacific Plaza Towers 4,851 80.6 R Under construction 2003
R = Residential, F = Farm , Ro = Resort, C = Commercial
(i) Total area for sale as subdivisions, including lots sold under installment terms where full payment has not been made, and land designated for parks and open spaces.
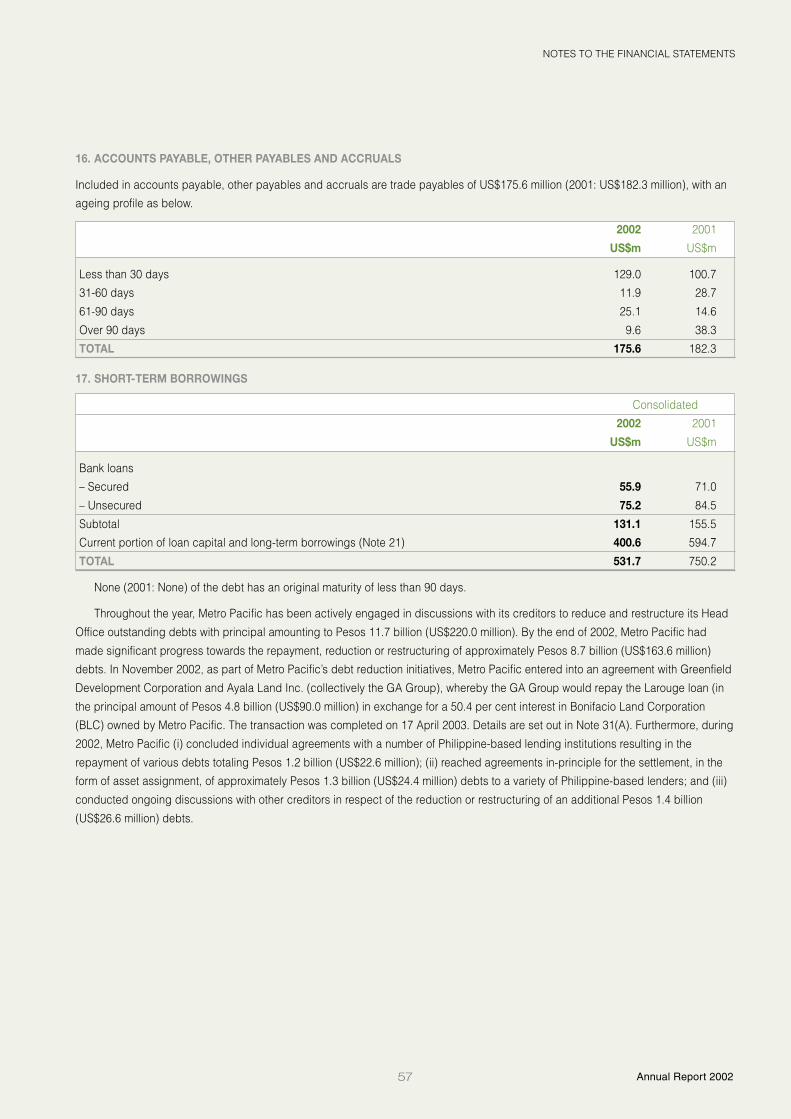
57 Annual Report 2002
NOTES TO THE FINANCIAL STATEMENTS
16. ACCOUNTS PAYABLE, OTHER PAYABLES AND ACCRUALS
Included in accounts payable, other payables and accruals are trade payables of US$175.6 million (2001: US$182.3 million), with an
ageing profile as below.
2002 2001
US$m US$m
Less than 30 days 129.0 100.7
31-60 days 11.9 28.7
61-90 days 25.1 14.6
Over 90 days 9.6 38.3
TOTAL 175.6 182.3
17. SHORT-TERM BORROWINGS
Consolidated
2002 2001
US$m US$m
Bank loans
– Secured 55.9 71.0
– Unsecured 75.2 84.5
Subtotal 131.1 155.5
Current portion of loan capital and long-term borrowings (Note 21) 400.6 594.7
TOTAL 531.7 750.2
None (2001: None) of the debt has an original maturity of less than 90 days.
Throughout the year, Metro Pacific has been actively engaged in discussions with its creditors to reduce and restructure its Head
Office outstanding debts with principal amounting to Pesos 11.7 billion (US$220.0 million). By the end of 2002, Metro Pacific had
made significant progress towards the repayment, reduction or restructuring of approximately Pesos 8.7 billion (US$163.6 million)
debts. In November 2002, as part of Metro Pacific’s debt reduction initiatives, Metro Pacific entered into an agreement with Greenfield
Development Corporation and Ayala Land Inc. (collectively the GA Group), whereby the GA Group would repay the Larouge loan (in
the principal amount of Pesos 4.8 billion (US$90.0 million) in exchange for a 50.4 per cent interest in Bonifacio Land Corporation
(BLC) owned by Metro Pacific. The transaction was completed on 17 April 2003. Details are set out in Note 31(A). Furthermore, during
2002, Metro Pacific (i) concluded individual agreements with a number of Philippine-based lending institutions resulting in the
repayment of various debts totaling Pesos 1.2 billion (US$22.6 million); (ii) reached agreements in-principle for the settlement, in the
form of asset assignment, of approximately Pesos 1.3 billion (US$24.4 million) debts to a variety of Philippine-based lenders; and (iii)
conducted ongoing discussions with other creditors in respect of the reduction or restructuring of an additional Pesos 1.4 billion
(US$26.6 million) debts.

58First Pacific Company Limited
NOTES TO THE FINANCIAL STATEMENTS
18. PROVISION FOR TAXATION
Consolidated
2002 2001
US$m US$m
At 1 January 23.1 27.6
Exchange translation 0.5 (1.1)
Disposal of subsidiary companies – (3.3)
Provision for taxation on estimated assessable profits for the year (Note 4) 26.5 35.5
Transfer to deferred taxation (Note 23) – (0.2)
Reclassification – (4.4)
TOTAL 50.1 54.1
Tax paid (23.5) (31.0)
AT 31 DECEMBER 26.6 23.1
19. SHARE CAPITAL
Consolidated and Company
2002 2001
US$m US$m
Authorized
3,499,000,000 (2001: 3,499,000,000) ordinary shares of U.S. 1 cent each 35.0 35.0
Issued and fully paid
At 1 January 31.4 31.4
Shares issued upon conversion of a Convertible Note 0.5 –
At 31 December
3,185,993,003 (2001: 3,139,772,765) ordinary shares of U.S. 1 cent each 31.9 31.4
In September 2002, 46,220,238 ordinary shares of US$0.01 each were issued at a value of HK$8.4 per share upon the conversion
of a US$50.0 million Convertible Note (Note 21(B)).
Details of Directors’ and employees’ share options are set out in Note 29(C).
20. OUTSIDE INTERESTS
An analysis of the Group’s outside interests, by principal operating company, is set out below.
Consolidated
2002 2001
US$m US$m
Indofood 271.8 204.8
Metro Pacific 152.3 187.4
TOTAL 424.1 392.2
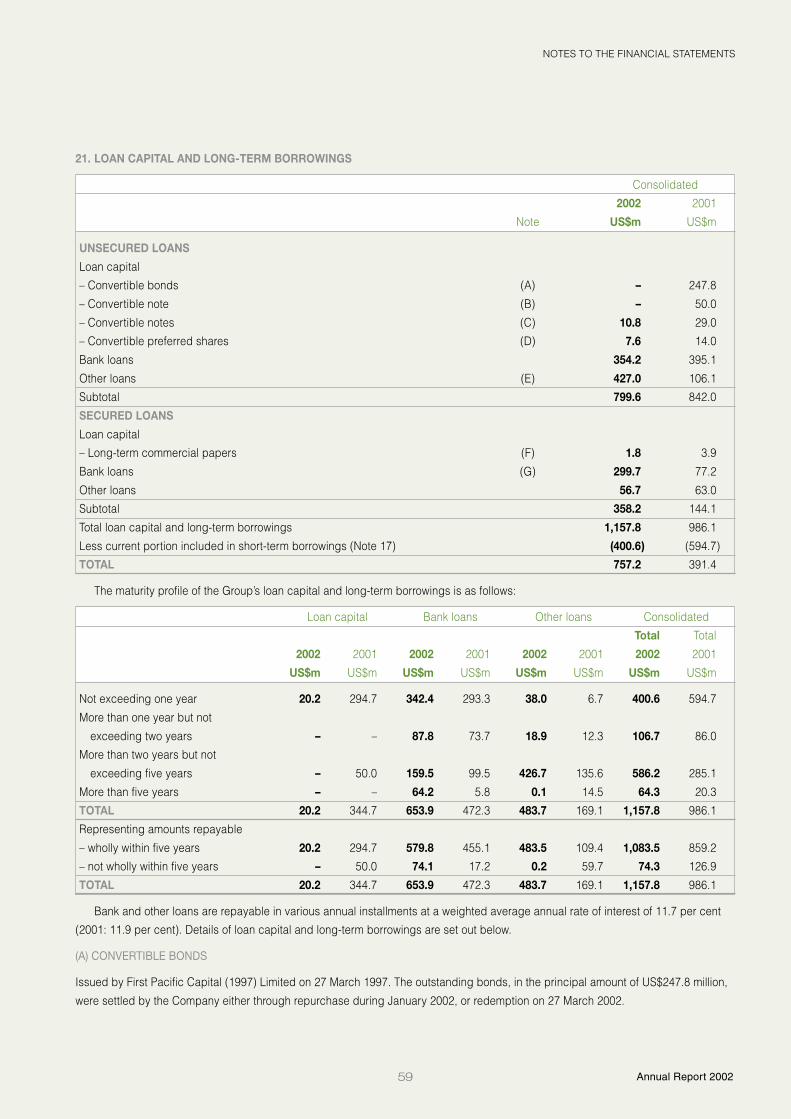
59 Annual Report 2002
NOTES TO THE FINANCIAL STATEMENTS
21. LOAN CAPITAL AND LONG-TERM BORROWINGS
Consolidated
2002 2001
Note US$m US$m
UNSECURED LOANS
Loan capital
– Convertible bonds (A) – 247.8
– Convertible note (B) – 50.0
– Convertible notes (C) 10.8 29.0
– Convertible preferred shares (D) 7.6 14.0
Bank loans 354.2 395.1
Other loans (E) 427.0 106.1
Subtotal 799.6 842.0
SECURED LOANS
Loan capital
– Long-term commercial papers (F) 1.8 3.9
Bank loans (G) 299.7 77.2
Other loans 56.7 63.0
Subtotal 358.2 144.1
Total loan capital and long-term borrowings 1,157.8 986.1
Less current portion included in short-term borrowings (Note 17) (400.6) (594.7)
TOTAL 757.2 391.4
The maturity profile of the Group’s loan capital and long-term borrowings is as follows:
Loan capital Bank loans Other loans Consolidated
Total Total
2002 2001 2002 2001 2002 2001 2002 2001
US$m US$m US$m US$m US$m US$m US$m US$m
Not exceeding one year 20.2 294.7 342.4 293.3 38.0 6.7 400.6 594.7
More than one year but not
exceeding two years – – 87.8 73.7 18.9 12.3 106.7 86.0
More than two years but not
exceeding five years – 50.0 159.5 99.5 426.7 135.6 586.2 285.1
More than five years – – 64.2 5.8 0.1 14.5 64.3 20.3
TOTAL 20.2 344.7 653.9 472.3 483.7 169.1 1,157.8 986.1
Representing amounts repayable
– wholly within five years 20.2 294.7 579.8 455.1 483.5 109.4 1,083.5 859.2
– not wholly within five years – 50.0 74.1 17.2 0.2 59.7 74.3 126.9
TOTAL 20.2 344.7 653.9 472.3 483.7 169.1 1,157.8 986.1
Bank and other loans are repayable in various annual installments at a weighted average annual rate of interest of 11.7 per cent
(2001: 11.9 per cent). Details of loan capital and long-term borrowings are set out below.
(A) CONVERTIBLE BONDS
Issued by First Pacific Capital (1997) Limited on 27 March 1997. The outstanding bonds, in the principal amount of US$247.8 million,
were settled by the Company either through repurchase during January 2002, or redemption on 27 March 2002.

60First Pacific Company Limited
NOTES TO THE FINANCIAL STATEMENTS
(B) CONVERTIBLE NOTE
Issued by the Company on 17 September 1999, this note was mandatorily converted into 46,220,238 ordinary shares of the Companyat HK$8.4 per share, at a fixed exchange rate of HK$7.765:US$1, on 25 September 2002. Details regarding the conversion of thisNote is set out in Note 19.
(C) CONVERTIBLE NOTES
Issued by Metro Pacific totaling Pesos 1.5 billion (US$29.0 million) during September and October 1999, these notes were due forredemption, at a premium of 8.7 per cent of the par value, in October 2002. At 31 December 2002, Pesos 560.7 million (US$10.8million) of these notes, together with the related redemption premium of Pesos 48.8 million (US$0.9 million), remained outstanding andwere included in deferred liabilities and provisions.
(D) CONVERTIBLE PREFERRED SHARES
Issued by Metro Pacific totaling Pesos 720.0 million (US$14.0 million) on 23 July 1999, these preferred shares were due forredemption, with a cumulative yield of 15 per cent, in July 2002. At 31 December 2002, Pesos 401.9 million (US$7.6 million) of thesepreferred shares, together with the related redemption premium of Pesos 60.3 million (US$1.1 million), remained outstanding and wereincluded in deferred liabilities and provisions.
(E) OTHER UNSECURED LOANS
Principally includes US$280.0 million five-year Euro bonds, and Rupiah 1.0 trillion (US$111.7 million) of non-convertible bonds(Rupiah-bonds) issued by Indofood in June 2002 and July 2000, respectively. The Euro bonds have a coupon rate of 10.375 per cent,are payable semi-annually, and mature in June 2007. The Rupiah-bonds are subject to interest of 16 per cent, and have a five yearmaturity to July 2005.
(F) LONG-TERM COMMERCIAL PAPERS
Issued by Metro Pacific totaling Pesos 200.0 million (US$3.9 million), these papers are secured over shares of a subsidiary companyof Metro Pacific. At 31 December 2002, Pesos 95.8 million (US$1.8 million) remained outstanding.
(G) SECURED BANK LOANS
Includes a US$187.4 million bank loan facility provided by ING Bank N.V. to the Company. It is subject to an interest rate of HIBOR(Hong Kong Inter-bank Offer Rates) plus three per cent, and is repayable on 31 December 2003. Following the repayment of theLarouge Loan, the outstanding balance will decline to approximately US$100 million.
(H) PLEDGE OF ASSETS
At 31 December 2002, certain bank and other borrowings were secured by the Group’s property and equipment, accountsreceivables and inventories equating to a net book value of US$95.0 million (2001: US$163.7 million). Apart from these, the HeadOffice’s US$187.4 million bank loan, as described in Note (G) above, is principally secured by the Group’s interests in Indofood, PLDTand Metro Pacific of 51.9 per cent, 15.8 per cent and 80.6 per cent, respectively.
22. DEFERRED LIABILITIES AND PROVISIONS
Redemptionpremium on Consolidated
Deferred Long-term convertible Total Totalincome payables instruments Pension Others 2002 2001
US$m US$m US$m US$m US$m US$m US$m
At 1 January 35.1 47.0 84.0 35.3 66.8 268.2 282.5Exchange translation (0.1) (1.6) (0.1) 5.2 (0.4) 3.0 (5.2)Additions 6.3 6.3 3.7 9.2 21.7 47.2 108.9Payment and utilization (4.3) (1.7) (85.6) (18.3) (0.6) (110.5) (71.1)Reversal – – – – (37.6) (37.6) –Disposal of subsidiary companies – – – – – – (7.6)Reclassification – – – – (8.1) (8.1) (39.3)Subtotal 37.0 50.0 2.0 31.4 41.8 162.2 268.2Less current portion included in
accounts payable, other payablesand accruals (1.3) (24.8) (2.0) – (15.2) (43.3) (138.2)
AT 31 DECEMBER 35.7 25.2 – 31.4 26.6 118.9 130.0

61 Annual Report 2002
NOTES TO THE FINANCIAL STATEMENTS
Deferred income relates to the gross profit arising on property sales.
Long-term payables relate to liabilities for property development.
Redemption premium on convertible instruments relates to loan capital issued. Loan capital details are set out in Notes 21(A), (C)
and (D).
Pension relates to accrued liabilities in relation to retirement schemes.
Others mainly relates to provisions for severance payments and warranty claims.
23. DEFERRED TAXATION
Consolidated
2002 2001
US$m US$m
At 1 January 36.0 29.8
Exchange translation 3.1 (2.0)
Disposal of subsidiary companies – (5.0)
Additions (Note 4) 23.4 14.0
Transfer from provision for taxation (Note 18) – 0.2
Reclassification 8.1 –
Utilization – (1.0)
AT 31 DECEMBER 70.6 36.0
Provision is made for the tax that is expected to be payable in respect of planned distributions of retained profits of overseas
subsidiary and associated companies. No deferred tax has been provided on earnings retained overseas. Except for the matters
described below, deferred taxation has been fully provided for.
At 31 December 2002, taxation losses available to reduce future income tax, arising in the entities to which they relate, amounted
to US$30.8 million (2001: US$153.7 million) in respect of non-Hong Kong tax losses, and US$40.7 million (2001: US$47.9 million) in
respect of Hong Kong tax losses. No deferred tax assets have been recognized in respect of these losses.
24. RESERVES
An analysis of the exchange reserve by principal operating company is set out below.
Consolidated
2002 2001
US$m US$m
PLDT (43.5) (38.3)
Indofood 1.3 (24.2)
Escotel 41.3 42.3
Others 1.2 –
TOTAL 0.3 (20.2)
An analysis of the goodwill reserve, included within revenue reserves, by principal operating company is set out below.
Consolidated
2002 2001
US$m US$m
PLDT (466.7) (467.1)
Indofood (346.3) (355.3)
Escotel (163.4) (163.4)
TOTAL (976.4) (985.8)

62First Pacific Company Limited
NOTES TO THE FINANCIAL STATEMENTS
The 2002 reduction in goodwill reserve for PLDT (US$0.4 million) and Indofood (US$9.0 million), represents the amounts reinstated
upon the dilution of the Group’s interests in these investments.
An analysis of the accumulated reserves of associated companies, included within consolidated reserves, is set out below.
2002 2001
US$m US$m
Revenue reserve (59.6) (80.5)
Exchange reserve (2.2) 4.0
TOTAL (61.8) (76.5)
The contributed surplus of the Company arose from a reorganization of the Group in 1988 and represents the difference between
the nominal value of the share capital issued by the Company and the aggregate net asset value of the subsidiary companies
acquired at the date of acquisition. Under the Companies Act 1981 of Bermuda (as amended), the Company may make distributions
to its shareholders out of the contributed surplus provided certain conditions are met.
25. NOTES TO CONSOLIDATED CASH FLOW STATEMENT
(A) RECONCILIATION OF OPERATING PROFIT/(LOSS) TO NET CASH (OUTFLOW)/INFLOW FROM OPERATING ACTIVITIES
2002 2001
US$m US$m
Operating profit/(loss) 217.0 (2,041.8)
Provision for investments and others – 2,165.4
Loss on disposal of discontinued operations – 72.9
Foreign exchange (gains)/losses, net (10.7) 15.2
Loss on dilution of interest in a subsidiary and an associated company 4.2 6.7
Depreciation 47.0 60.5
Dividend income – (0.1)
Payments in respect of deferred liabilities and provisions (6.9) (28.4)
Loss on sale of property and equipment 0.7 2.1
Increase in long-term receivables and prepayments (28.4) (45.8)
Decrease in pledged deposits 23.3 14.1
Increase in accounts receivable, other receivables and prepayments (64.5) (1.4)
Increase in inventories (73.4) (13.3)
Increase in accounts payable, other payables and accruals 0.6 62.9
Others (16.6) (12.1)
Net cash inflow generated from operations 92.3 256.9
Interest received* 21.9 30.1
Interest paid (114.7) (139.3)
Tax paid (23.5) (31.0)
NET CASH (OUTFLOW)/INFLOW FROM OPERATING ACTIVITIES (24.0) 116.7
* In accordance with current year presentation, the interest received of US$30.1 million in 2001 has been reclassified to operating activities from investing activitiesbecause, in the opinion of the Directors, such presentation better reflects the underlying nature of the balance.
Changes in working capital are stated excluding movements due to acquisitions and disposals of subsidiary companies.
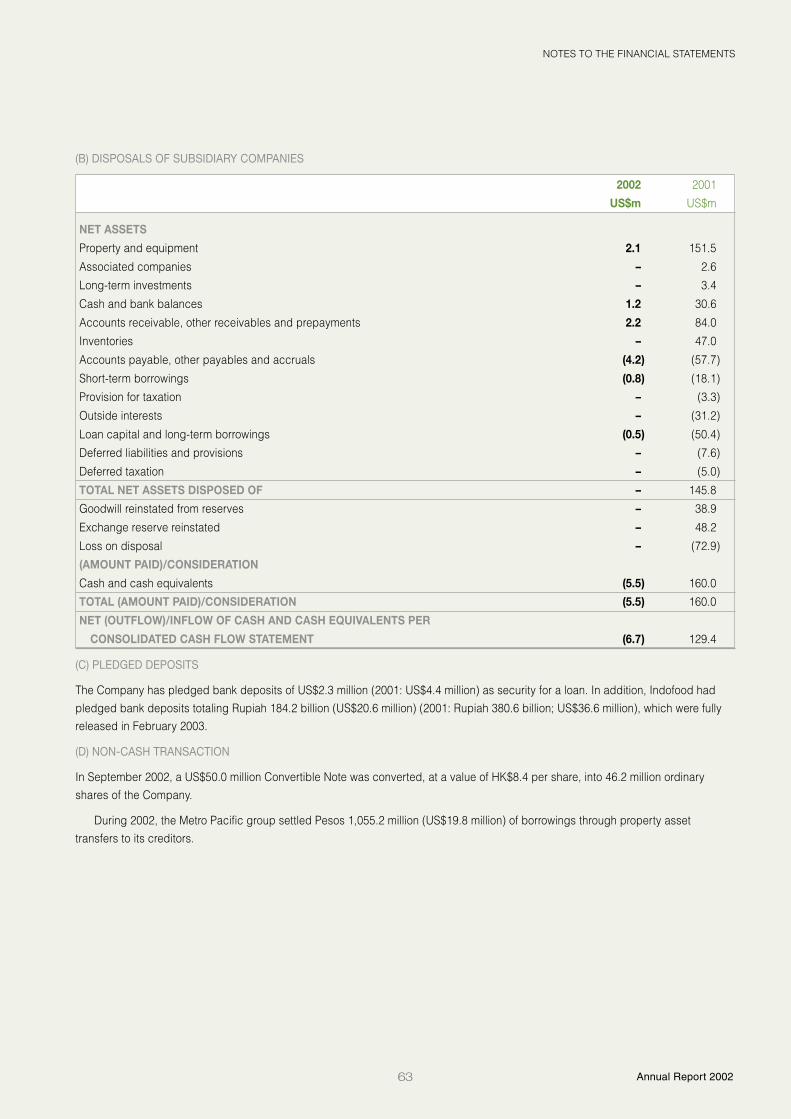
63 Annual Report 2002
NOTES TO THE FINANCIAL STATEMENTS
(B) DISPOSALS OF SUBSIDIARY COMPANIES
2002 2001
US$m US$m
NET ASSETS
Property and equipment 2.1 151.5
Associated companies – 2.6
Long-term investments – 3.4
Cash and bank balances 1.2 30.6
Accounts receivable, other receivables and prepayments 2.2 84.0
Inventories – 47.0
Accounts payable, other payables and accruals (4.2) (57.7)
Short-term borrowings (0.8) (18.1)
Provision for taxation – (3.3)
Outside interests – (31.2)
Loan capital and long-term borrowings (0.5) (50.4)
Deferred liabilities and provisions – (7.6)
Deferred taxation – (5.0)
TOTAL NET ASSETS DISPOSED OF – 145.8
Goodwill reinstated from reserves – 38.9
Exchange reserve reinstated – 48.2
Loss on disposal – (72.9)
(AMOUNT PAID)/CONSIDERATION
Cash and cash equivalents (5.5) 160.0
TOTAL (AMOUNT PAID)/CONSIDERATION (5.5) 160.0
NET (OUTFLOW)/INFLOW OF CASH AND CASH EQUIVALENTS PER
CONSOLIDATED CASH FLOW STATEMENT (6.7) 129.4
(C) PLEDGED DEPOSITS
The Company has pledged bank deposits of US$2.3 million (2001: US$4.4 million) as security for a loan. In addition, Indofood had
pledged bank deposits totaling Rupiah 184.2 billion (US$20.6 million) (2001: Rupiah 380.6 billion; US$36.6 million), which were fully
released in February 2003.
(D) NON-CASH TRANSACTION
In September 2002, a US$50.0 million Convertible Note was converted, at a value of HK$8.4 per share, into 46.2 million ordinary
shares of the Company.
During 2002, the Metro Pacific group settled Pesos 1,055.2 million (US$19.8 million) of borrowings through property asset
transfers to its creditors.

64First Pacific Company Limited
NOTES TO THE FINANCIAL STATEMENTS
26. DISCONTINUED OPERATIONS
During 2002 and 2001, the Group disposed of certain subsidiary and associated companies. Details of these disposals are as follows.
Subsidiary/associated Percentage Percentage Consideration Loss on disposal
Date of disposal company held (%) sold (%) US$m US$m
April 2002 Infrontier 100.0 81.0 – –
December 2001 Berli Jucker 83.5 83.5 125.0 66.6
December 2001 Darya-Varia 89.5 89.5 35.0 6.3
March 2001 Savills plc 19.6 19.6 41.6 –
Infrontier is a business solutions provider specializing in supply chain management in Asia. Details of the disposal of Infrontier are
provided in Note 30(B). Berli Jucker is engaged in the business of manufacturing, distribution and marketing of glass, consumer,
technical and imaging products in Thailand. Darya-Varia is a fully-integrated healthcare company engaged in the manufacture,
marketing and distribution of prescription and over-the-counter medicines in Indonesia. Savills plc is an international property
consultant providing advice across all aspects of the property market in the United Kingdom, Continental Europe and Asia.
The turnover, results, cash flows, assets and liabilities of the discontinued operations attributable to the Group were as follows.
2002 2001
US$m US$m
PROFIT AND LOSS
Turnover 0.4 302.4
Operating expenses (2.7) (359.4)
Operating loss (2.3) (57.0)
Share of profits less losses of associated companies – 3.5
Net borrowing costs – (1.9)
Loss before taxation (2.3) (55.4)
Taxation – (7.3)
LOSS AFTER TAXATION FOR THE YEAR (2.3) (62.7)
CASH FLOW
Net operating cash (outflow)/inflow (2.8) 20.8
Net investing cash (outflow)/inflow (6.7) 125.2
Net financing cash outflow (0.2) (9.3)
TOTAL NET CASH (OUTFLOW)/INFLOW FOR THE YEAR (9.7) 136.7
ASSETS AND LIABILITIES
Total assets – 5.3
Total liabilities – (3.1)
AT 31 DECEMBER – 2.2
27. COMMITMENTS AND CONTINGENT LIABILITIES
(A) CAPITAL EXPENDITURE
Consolidated
2002 2001
US$m US$m
Commitments in respect of subsidiary companies:
Authorized but not contracted for 13.6 20.6
Contracted but not provided for 23.9 26.9
TOTAL 37.5 47.5
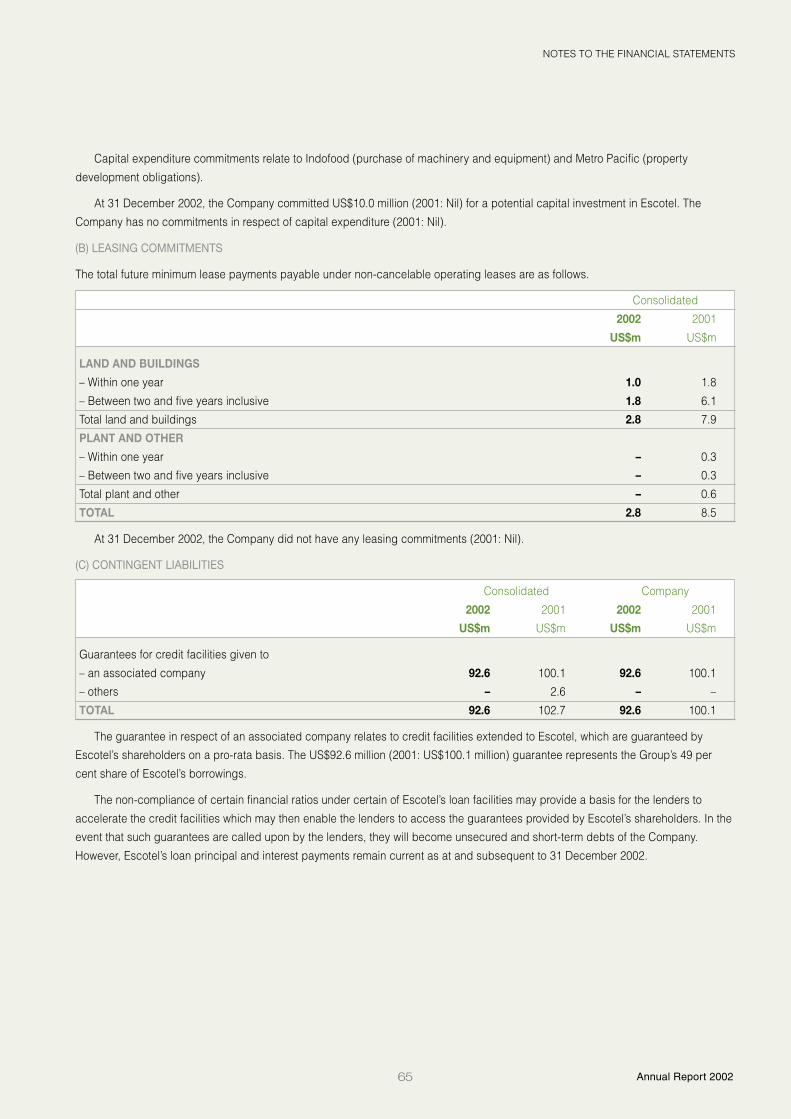
65 Annual Report 2002
NOTES TO THE FINANCIAL STATEMENTS
Capital expenditure commitments relate to Indofood (purchase of machinery and equipment) and Metro Pacific (property
development obligations).
At 31 December 2002, the Company committed US$10.0 million (2001: Nil) for a potential capital investment in Escotel. The
Company has no commitments in respect of capital expenditure (2001: Nil).
(B) LEASING COMMITMENTS
The total future minimum lease payments payable under non-cancelable operating leases are as follows.
Consolidated
2002 2001
US$m US$m
LAND AND BUILDINGS
– Within one year 1.0 1.8
– Between two and five years inclusive 1.8 6.1
Total land and buildings 2.8 7.9
PLANT AND OTHER
– Within one year – 0.3
– Between two and five years inclusive – 0.3
Total plant and other – 0.6
TOTAL 2.8 8.5
At 31 December 2002, the Company did not have any leasing commitments (2001: Nil).
(C) CONTINGENT LIABILITIES
Consolidated Company
2002 2001 2002 2001
US$m US$m US$m US$m
Guarantees for credit facilities given to
– an associated company 92.6 100.1 92.6 100.1
– others – 2.6 – –
TOTAL 92.6 102.7 92.6 100.1
The guarantee in respect of an associated company relates to credit facilities extended to Escotel, which are guaranteed by
Escotel’s shareholders on a pro-rata basis. The US$92.6 million (2001: US$100.1 million) guarantee represents the Group’s 49 per
cent share of Escotel’s borrowings.
The non-compliance of certain financial ratios under certain of Escotel’s loan facilities may provide a basis for the lenders to
accelerate the credit facilities which may then enable the lenders to access the guarantees provided by Escotel’s shareholders. In the
event that such guarantees are called upon by the lenders, they will become unsecured and short-term debts of the Company.
However, Escotel’s loan principal and interest payments remain current as at and subsequent to 31 December 2002.

66First Pacific Company Limited
NOTES TO THE FINANCIAL STATEMENTS
28. EMPLOYEE INFORMATION
(A) REMUNERATION
Consolidated
2002 2001
US$m US$m
Basic salaries 110.6 118.3
Bonuses 14.9 18.7
Benefits in kind 22.3 18.2
Pension contributions 3.3 4.2
TOTAL 151.1 159.4
AVERAGE NUMBER OF EMPLOYEES 46,422 52,252
The above includes the remuneration of Directors. Detailed disclosures in respect of Directors’ remuneration are set out in Note
29(A).
(B) RETIREMENT BENEFITS
The Group operates both defined contribution and defined benefit schemes covering approximately 22,863 (2001: 21,072)
employees.
(i) DEFINED CONTRIBUTION SCHEMES The Group operates seven (2001: nine) defined contribution schemes covering
approximately 21,391 (2001: 18,806) employees. The assets of all of the schemes are held separately from the Group and are
administered by independent trustees. Contributions to the schemes, either by the Group or by the employees, are determined by
reference to the employees’ salaries and length of service and range from zero per cent to 10 per cent (2001: zero to 10 per cent).
Under the terms of the schemes, the Group cannot be requested to make additional payments over and above these levels of
contributions. In one (2001: four) of the schemes, forfeited contributions may be used to reduce the existing levels of employer
contributions and, in 2002, US$0.1 million (2001: US$0.1 million) was used for this purpose. At 31 December 2002, the forfeited
contributions had been fully utilized.
(ii) DEFINED BENEFIT SCHEMES The Group operates two (2001: three) defined benefit schemes covering approximately 1,472 (2001:
1,526) employees. The assets of these schemes are held separately from the Group and are administered by independent trustees.
Benefits are determined by reference to employees’ final salaries and length of service, and the schemes have undergone an
independent valuation at the balance sheet date. These actuarial valuations were based on the projected unit credit method. The plan
assets do not include any financial instruments of the Group or property occupied by, or other assets used by, the Group.
The amount of deficit under defined benefit schemes included in the balance sheet is as follows.
2002 2001
US$m US$m
Present value of defined benefit obligations 9.5 7.8
Fair value of plan assets (5.1) (4.4)
LIABILITY IN BALANCE SHEET 4.4 3.4
The movement of deficit under defined benefit schemes included in balance sheet during 2002 is as follows.
2002
US$m
At 1 January 3.4
Exchange translation 0.1
Net pension scheme cost recognized in the profit and loss statement 2.3
Payment (1.4)
AT 31 DECEMBER 4.4
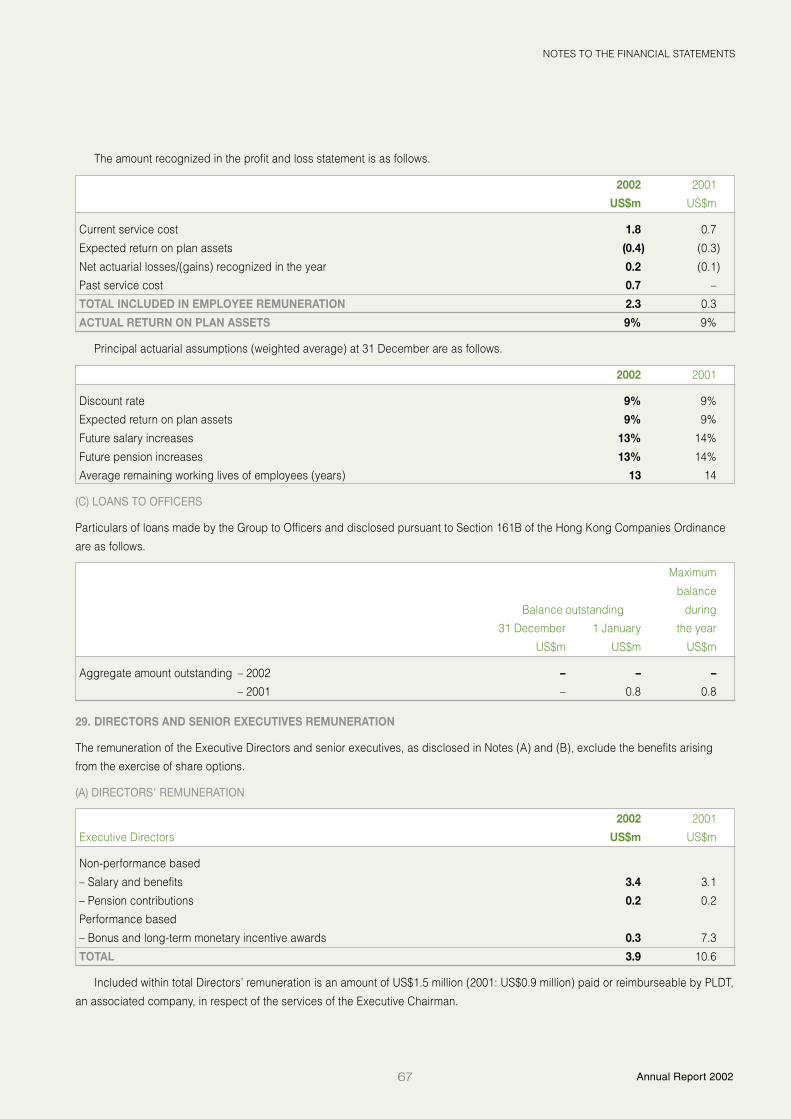
67 Annual Report 2002
NOTES TO THE FINANCIAL STATEMENTS
The amount recognized in the profit and loss statement is as follows.
2002 2001
US$m US$m
Current service cost 1.8 0.7
Expected return on plan assets (0.4) (0.3)
Net actuarial losses/(gains) recognized in the year 0.2 (0.1)
Past service cost 0.7 –
TOTAL INCLUDED IN EMPLOYEE REMUNERATION 2.3 0.3
ACTUAL RETURN ON PLAN ASSETS 9% 9%
Principal actuarial assumptions (weighted average) at 31 December are as follows.
2002 2001
Discount rate 9% 9%
Expected return on plan assets 9% 9%
Future salary increases 13% 14%
Future pension increases 13% 14%
Average remaining working lives of employees (years) 13 14
(C) LOANS TO OFFICERS
Particulars of loans made by the Group to Officers and disclosed pursuant to Section 161B of the Hong Kong Companies Ordinance
are as follows.
Maximum
balance
Balance outstanding during
31 December 1 January the year
US$m US$m US$m
Aggregate amount outstanding – 2002 – – –
– 2001 – 0.8 0.8
29. DIRECTORS AND SENIOR EXECUTIVES REMUNERATION
The remuneration of the Executive Directors and senior executives, as disclosed in Notes (A) and (B), exclude the benefits arising
from the exercise of share options.
(A) DIRECTORS’ REMUNERATION
2002 2001
Executive Directors US$m US$m
Non-performance based
– Salary and benefits 3.4 3.1
– Pension contributions 0.2 0.2
Performance based
– Bonus and long-term monetary incentive awards 0.3 7.3
TOTAL 3.9 10.6
Included within total Directors’ remuneration is an amount of US$1.5 million (2001: US$0.9 million) paid or reimburseable by PLDT,
an associated company, in respect of the services of the Executive Chairman.

68First Pacific Company Limited
NOTES TO THE FINANCIAL STATEMENTS
The Company’s Independent Non-executive Directors received a total of US$55,000 (2001: US$92,000) in fees for meetings
attended in 2002, and emoluments of US$76,923 (2001: US$76,923) for consultancy services provided to the Company in 2002. No
fees or emoluments have been received by the other Non-executive Directors.
The table below shows the number of Directors whose remuneration was within the bands stated.
2002 2001
Remuneration bands Number Number
US$NIL – US$125,000 6 6
US$125,001 – US$189,000 – 1
US$573,001 – US$637,000 – 1
US$637,001 – US$701,000 – 1
US$701,001 – US$765,000 1 –
US$765,001 – US$829,000 1 –
US$893,001 – US$957,000 1 –
US$1,341,001 – US$1,405,000 – 1
US$1,469,001 – US$1,533,000 1 –
US$1,789,001 – US$1,853,000 – 1
US$2,749,001 – US$2,813,000 – 1
US$3,133,001 – US$3,197,000 – 1
TOTAL 10 13
Messrs. James C. Ng, David G. Eastlake and Ricardo S. Pascua resigned as Directors of the Company on 20 March 2001, 19
April 2001 and 31 December 2001, respectively.
(B) SENIOR EXECUTIVES’ REMUNERATION
As similar remuneration schemes operate for the senior executives of the Group, their remuneration may exceed that of the
Company’s Directors. One (2001: Two) senior executive was among the Group’s five highest earning employees. The remaining four
(2001: three), of the five highest earning employees, are the Company’s Directors.
2002 2001
US$m US$m
Non-performance based
– Salary and benefits 0.4 0.3
– Compensation for contract severance(i) – 4.9
Performance based
– Bonus and long-term monetary incentive awards – 0.2
TOTAL 0.4 5.4
(i) Represents the amount paid to two senior executives upon the disposal of a subsidiary company in 2001.
The table below shows the remuneration of the one (2001: two) senior executive who was among the Group’s five highest earning
employees in 2002.
2002 2001
Remuneration bands Number Number
US$381,001 – US$445,000 1 –
US$1,981,001 – US$2,045,000 – 1
US$3,389,001 – US$3,453,000 – 1
TOTAL 1 2
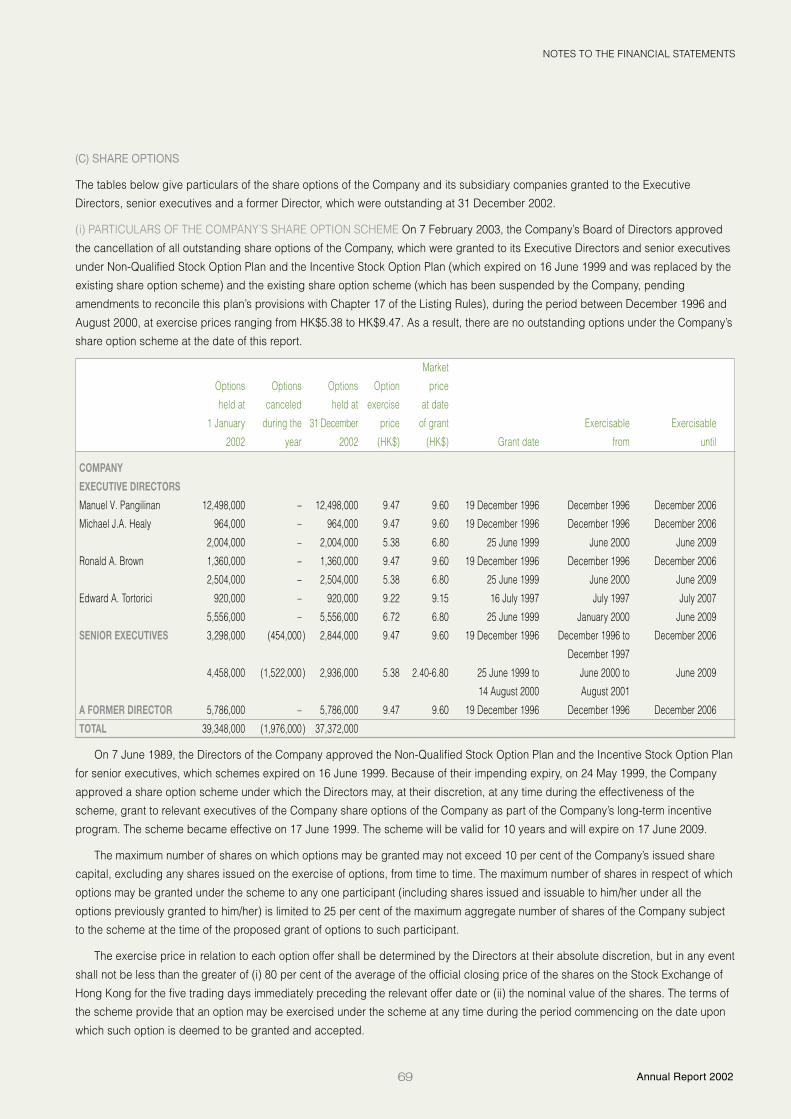
69 Annual Report 2002
NOTES TO THE FINANCIAL STATEMENTS
(C) SHARE OPTIONS
The tables below give particulars of the share options of the Company and its subsidiary companies granted to the Executive
Directors, senior executives and a former Director, which were outstanding at 31 December 2002.
(i) PARTICULARS OF THE COMPANY’S SHARE OPTION SCHEME On 7 February 2003, the Company’s Board of Directors approved
the cancellation of all outstanding share options of the Company, which were granted to its Executive Directors and senior executives
under Non-Qualified Stock Option Plan and the Incentive Stock Option Plan (which expired on 16 June 1999 and was replaced by the
existing share option scheme) and the existing share option scheme (which has been suspended by the Company, pending
amendments to reconcile this plan’s provisions with Chapter 17 of the Listing Rules), during the period between December 1996 and
August 2000, at exercise prices ranging from HK$5.38 to HK$9.47. As a result, there are no outstanding options under the Company’s
share option scheme at the date of this report.
Market
Options Options Options Option price
held at canceled held at exercise at date
1 January during the 31 December price of grant Exercisable Exercisable
2002 year 2002 (HK$) (HK$) Grant date from until
COMPANY
EXECUTIVE DIRECTORS
Manuel V. Pangilinan 12,498,000 – 12,498,000 9.47 9.60 19 December 1996 December 1996 December 2006
Michael J.A. Healy 964,000 – 964,000 9.47 9.60 19 December 1996 December 1996 December 2006
2,004,000 – 2,004,000 5.38 6.80 25 June 1999 June 2000 June 2009
Ronald A. Brown 1,360,000 – 1,360,000 9.47 9.60 19 December 1996 December 1996 December 2006
2,504,000 – 2,504,000 5.38 6.80 25 June 1999 June 2000 June 2009
Edward A. Tortorici 920,000 – 920,000 9.22 9.15 16 July 1997 July 1997 July 2007
5,556,000 – 5,556,000 6.72 6.80 25 June 1999 January 2000 June 2009
SENIOR EXECUTIVES 3,298,000 (454,000) 2,844,000 9.47 9.60 19 December 1996 December 1996 to December 2006
December 1997
4,458,000 (1,522,000) 2,936,000 5.38 2.40-6.80 25 June 1999 to June 2000 to June 2009
14 August 2000 August 2001
A FORMER DIRECTOR 5,786,000 – 5,786,000 9.47 9.60 19 December 1996 December 1996 December 2006
TOTAL 39,348,000 (1,976,000) 37,372,000
On 7 June 1989, the Directors of the Company approved the Non-Qualified Stock Option Plan and the Incentive Stock Option Plan
for senior executives, which schemes expired on 16 June 1999. Because of their impending expiry, on 24 May 1999, the Company
approved a share option scheme under which the Directors may, at their discretion, at any time during the effectiveness of the
scheme, grant to relevant executives of the Company share options of the Company as part of the Company’s long-term incentive
program. The scheme became effective on 17 June 1999. The scheme will be valid for 10 years and will expire on 17 June 2009.
The maximum number of shares on which options may be granted may not exceed 10 per cent of the Company’s issued share
capital, excluding any shares issued on the exercise of options, from time to time. The maximum number of shares in respect of which
options may be granted under the scheme to any one participant (including shares issued and issuable to him/her under all the
options previously granted to him/her) is limited to 25 per cent of the maximum aggregate number of shares of the Company subject
to the scheme at the time of the proposed grant of options to such participant.
The exercise price in relation to each option offer shall be determined by the Directors at their absolute discretion, but in any event
shall not be less than the greater of (i) 80 per cent of the average of the official closing price of the shares on the Stock Exchange of
Hong Kong for the five trading days immediately preceding the relevant offer date or (ii) the nominal value of the shares. The terms of
the scheme provide that an option may be exercised under the scheme at any time during the period commencing on the date upon
which such option is deemed to be granted and accepted.

70First Pacific Company Limited
NOTES TO THE FINANCIAL STATEMENTS
No share options have been granted or exercised during the year in respect of the Company’s share option scheme. Accordingly,
no value in respect of share options granted has been charged to the profit and loss statement, or is otherwise included in the
Directors’ remuneration and the five highest paid employees’ remuneration disclosures as set out in Notes (A) and (B) above.
(ii) PARTICULARS OF INDOFOOD’S SHARE OPTION SCHEME
Market Market
Options Options Options Options Option price price
held at granted exercised held at exercise at date at date
1 January during the during the 31 December price of grant of exercise Exercisable Exercisable
2002 year year 2002 (Rupiah) (Rupiah) (Rupiah) Grant date from until
INDOFOOD
SENIOR EXECUTIVES – 457,800 (457,800) – 412,500 500,000 500,000 15 May 2002 May 2002 May 2002
On 16 May 2001, Indofood established an Employee Stock Ownership Programme (ESOP), which is to be implemented in three
phases ending on 15 May 2004, for appreciation purposes. Under this programme, certain persons who have been employees,
including senior executives and employees cooperatives, of Indofood for a minimum of one year are entitled to receive non-
transferable options to purchase Indofood’s common shares with a par value of Rupiah 100 each, exercisable in the relevant period
up to 15 May 2004. The programme has authorized the granting of up to 915,600 options to purchase 500 common shares each,
representing in aggregate 457,800,000 common shares or five per cent of the issued and outstanding share capital of Indofood at 16
May 2001, at an exercise price of Rupiah 825 per share. The exercise price was determined as the average closing price of the
Indofood’s shares during 25 consecutive trading days prior to 16 May 2001. The options were granted to three groups of employees,
namely Group A (Executive Management) with a maximum portion of 48 per cent, Group B (Other Executive Management and staff)
with a maximum portion of 50 per cent, and Group C (Employees’ Cooperatives) with a maximum portion of 2 per cent, in each phase.
The offer of the grant of options may be accepted by a participant within 3 days after the qualified employees received the
notification. The options are exercisable when they are granted within the relevant ESOP phases. If the consideration is payable to or
based on loans, they must be paid or repaid within 3 years. At 31 December 2001, no options had been granted under the ESOP. On
15 May 2002, 457,800 options were granted and all of these have been exercised. The market value of Indofood shares, at the date
the options were granted, was Rupiah 1,000 per share.
In March 2003, 228,900 options under Phase II of the ESOP were granted and became rights of the qualified employees. Based
on the said total number of options under Phase II, a total of 114,450,000 new shares of Indofood are available for subscription by the
qualified employees at the established exercise price of Rupiah 825 per share. At the date of this report, no shares were issued
through the exercise of options granted under Phase II of the ESOP. As at the date of this report, the number of shares issuable under
share options granted under Indofood’s share option scheme was 114,450,000, which represented approximately 1.2 per cent of
Indofood’s shares in issue.
The Directors are of the view that the value of options granted during the year depends on a number of variables, which are either
difficult to ascertain or which can only be ascertained subject to a number of theoretical bases and speculative assumptions.
Accordingly, the Directors believe that any calculation of the value of options will not be meaningful to shareholders.

71 Annual Report 2002
NOTES TO THE FINANCIAL STATEMENTS
(iii) PARTICULARS OF METRO PACIFIC’S SHARE OPTION SCHEME
Market
Options Options Options Option price
held at canceled held at exercise at date
1 January during the 31 December price of grant Exercisable Exercisable
2002 year 2002 (Pesos) (Pesos) Grant date from until
METRO PACIFIC
SENIOR EXECUTIVES 16,856,923 (7,067,368) 9,789,555 1.69 1.76 2 November 1993 November 1994 November 2003
9,808,471 – 9,808,471 1.91 2.37 16 April 1995 April 1996 April 2005
674,236 – 674,236 4.38 5.19 15 April 1996 April 1997 April 2006
10,018,750 – 10,018,750 3.46 3.57 1 August 1997 August 1997 August 2007
TOTAL 37,358,380 (7,067,368) 30,291,012
On May 15, 1990, Metro Pacific approved a share option scheme under which the directors may, at their discretion, invite
executives of Metro Pacific upon the regularization of employment of eligible executives, to take up share options of Metro Pacific to
obtain an ownership interest in Metro Pacific and for the purpose of long-term employment motivation. The scheme became effective
on May 15, 1990. The scheme shall be valid for an indefinite period of time.
The maximum number of shares on which options may be granted may not exceed 10% per cent of the issued share capital of
Metro Pacific, excluding any shares issued on the exercise of options, from time to time. As at the date of this report, the number of
shares issuable under share options granted under Metro Pacific’s share option scheme was 30,291,012, which represented
approximately 0.1 per cent of Metro Pacific’s shares in issue at that date. The maximum number of shares in respect of which options
may be granted under the scheme to any one participant (including shares issued and issuable to him/her under all the options
previously granted to him/her) is limited to 30% per cent of the maximum aggregate number of shares of Metro Pacific subject to the
scheme at the time of the proposed grant of options to such participant.
The exercise price in relation to each option offer shall be determined by the directors at their absolute discretion, but in any event
shall not be less than the (i) average of the official closing price of the shares on the Philippine Stock Exchange for the twenty trading
days immediately preceding the relevant offer date or (ii) the nominal value of the shares.
No share options have been granted or exercised during the year in respect of Metro Pacific’s share option scheme.
30. CONNECTED AND RELATED PARTY TRANSACTIONS
Significant related party transactions entered into by the Group during the year ended 31 December 2002, which also constitute
connected transactions under the Listing Rules, are disclosed in Notes (A) to (C). Other related party transactions, which do not
constitute connected transactions under the Listing Rules, are disclosed in Notes (D) to (F).
(A) Larouge, a wholly-owned subsidiary of the Company, extended a US$90.0 million loan to Metro Pacific in April 2001. The loan was
secured by a pledge over a 50.4 per cent interest of Bonifacio Land Corporation shares that Metro Pacific owned. The loan was
repaid on 17 April 2003. For details, please refer to Note 31(A).
(B) Under an agreement dated 19 August 2002, First Pacific has transferred an 81 per cent controlling stake in Infrontier Limited to the
incumbent management, with effect from 30 April 2002. First Pacific has retained a minority stake of 19 per cent.
(C) Since December 1995, the Company has provided guarantees, on a pro-rata basis to its shareholding, in respect of the credit
facilities extended to Escotel. Details are provided in Note 27(C). The purpose of the guarantees is to facilitate Escotel’s financing
activities.
(D) On 25 September 2002, First Pacific exercised its option to convert a US$50 million Convertible Note into 46,220,238 newly issued
ordinary shares of First Pacific at HK$8.4 per share, at a fixed exchange rate of HK$7.765: US$1.
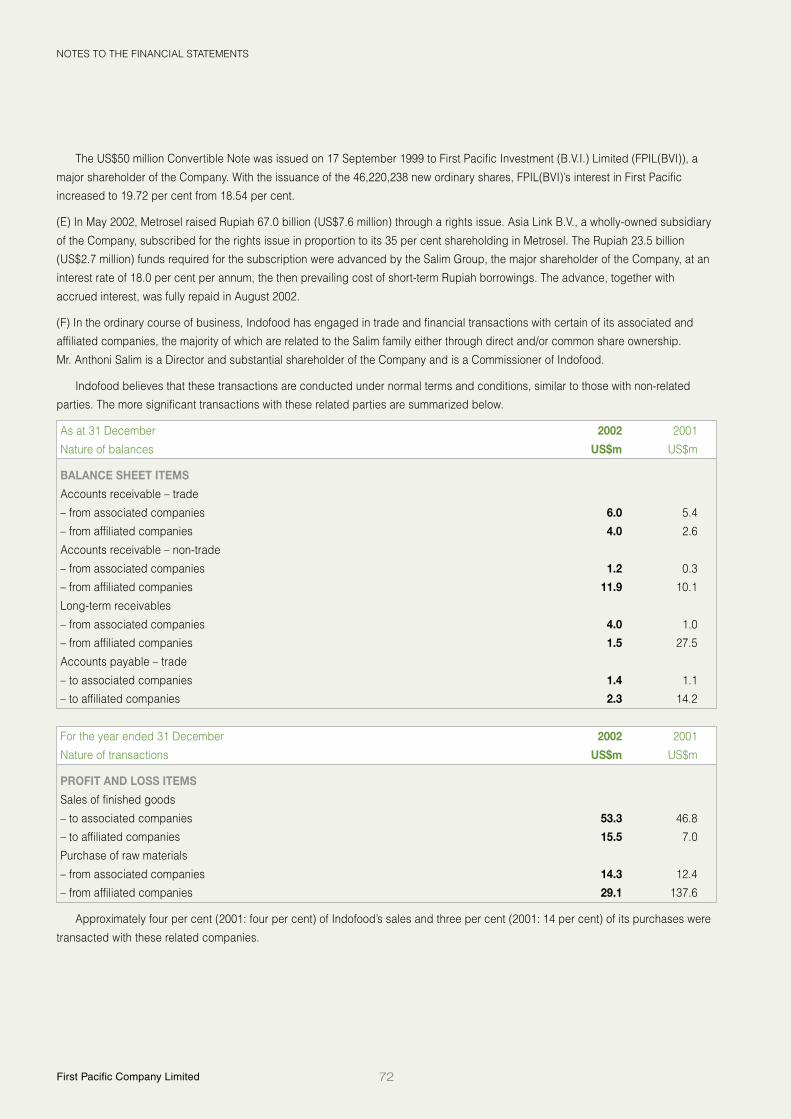
72First Pacific Company Limited
NOTES TO THE FINANCIAL STATEMENTS
The US$50 million Convertible Note was issued on 17 September 1999 to First Pacific Investment (B.V.I.) Limited (FPIL(BVI)), a
major shareholder of the Company. With the issuance of the 46,220,238 new ordinary shares, FPIL(BVI)’s interest in First Pacific
increased to 19.72 per cent from 18.54 per cent.
(E) In May 2002, Metrosel raised Rupiah 67.0 billion (US$7.6 million) through a rights issue. Asia Link B.V., a wholly-owned subsidiary
of the Company, subscribed for the rights issue in proportion to its 35 per cent shareholding in Metrosel. The Rupiah 23.5 billion
(US$2.7 million) funds required for the subscription were advanced by the Salim Group, the major shareholder of the Company, at an
interest rate of 18.0 per cent per annum, the then prevailing cost of short-term Rupiah borrowings. The advance, together with
accrued interest, was fully repaid in August 2002.
(F) In the ordinary course of business, Indofood has engaged in trade and financial transactions with certain of its associated and
affiliated companies, the majority of which are related to the Salim family either through direct and/or common share ownership.
Mr. Anthoni Salim is a Director and substantial shareholder of the Company and is a Commissioner of Indofood.
Indofood believes that these transactions are conducted under normal terms and conditions, similar to those with non-related
parties. The more significant transactions with these related parties are summarized below.
As at 31 December 2002 2001
Nature of balances US$m US$m
BALANCE SHEET ITEMS
Accounts receivable – trade
– from associated companies 6.0 5.4
– from affiliated companies 4.0 2.6
Accounts receivable – non-trade
– from associated companies 1.2 0.3
– from affiliated companies 11.9 10.1
Long-term receivables
– from associated companies 4.0 1.0
– from affiliated companies 1.5 27.5
Accounts payable – trade
– to associated companies 1.4 1.1
– to affiliated companies 2.3 14.2
For the year ended 31 December 2002 2001
Nature of transactions US$m US$m
PROFIT AND LOSS ITEMS
Sales of finished goods
– to associated companies 53.3 46.8
– to affiliated companies 15.5 7.0
Purchase of raw materials
– from associated companies 14.3 12.4
– from affiliated companies 29.1 137.6
Approximately four per cent (2001: four per cent) of Indofood’s sales and three per cent (2001: 14 per cent) of its purchases were
transacted with these related companies.

73 Annual Report 2002
NOTES TO THE FINANCIAL STATEMENTS
31. SUBSEQUENT EVENTS
(A) On 23 November 2002, Metro Pacific entered into an agreement with Greenfield Development Corporation and Ayala Land Inc.,
which anticipated the sale and assignment by Larouge B.V. (Larouge), a wholly-owned subsidiary company of the Company, of its
US$90.0 million loan (the Larouge Loan) to Metro Pacific and its 50.4 per cent pledged interest in Bonifacio Land Corporation (BLC), a
72.9 per cent owned subsidiary company of Metro Pacific, for a consideration of US$90.0 million (the Transaction). The Larouge Loan
was extended by Larouge to Metro Pacific in April 2001 and became due and payable on 31 October 2001, which date was extended
by First Pacific to 31 December 2001, but remained unpaid.
On 8 February 2003, Larouge entered into an assignment agreement with Evergreen Holdings Inc., Ayala Land Inc. and
Greenfield Development Corporation, which provided for the transfer of the Larouge Loan as part of the Transaction. The closing of
the Transaction required the fulfillment or waiver of various conditions precedent.
On the same date, Larouge also entered into an agreement with Metro Pacific which provided that the interest payable under the
Larouge Loan would be re-calculated based on Larouge’s actual cost of funds, up to the closing of the Transaction, approximating
Pesos 700 million (US$13.2 million), which resulted in approximately US$20.1 million of interest payable being waived by Larouge
upon the closing of the Transaction.
On 19 March 2003, the proposed Transaction was unanimously approved by the Company’s independent shareholders at a
Special General Meeting.
On 17 April 2003, the Transaction was formally completed and US$90 million cash was received. The proceeds will be used to
partially repay the Company’s US$187.4 million bank loan. After this partial repayment, the Company will have approximately
US$100.0 million of outstanding bank loan, which it intends to refinance within the next six months prior to its maturity in December
2003.
As a consequence of the Larouge Loan Transaction, Metro Pacific’s interest in BLC has declined to 22.5 per cent from 72.9 per
cent. Accordingly, BLC, which was a subsidiary company of the Group, is now accounted for as an associated company. A pro forma
consolidated balance sheet, as if the Transaction had been completed on 31 December 2002, follows.
Disposal of 50.4 Repayment of
per cent BLC the Company
Actual by Metro Pacific debt Pro forma
US$m US$m US$m US$m
NON-CURRENT ASSETS
Property and equipment 1,009.3 (337.3) – 672.0
Associated companies (24.5) 13.6 – (10.9)
Other non-current assets 294.2 (28.1) – 266.1
1,279.0 (351.8) – 927.2
CURRENT ASSETS
Cash and bank balances (including pledged deposits) 226.2 76.4 (90.0) 212.6
Other current assets 807.9 (68.1) – 739.8
1,034.1 8.3 (90.0) 952.4
CURRENT LIABILITIES 1,013.5 (111.4) (90.0) 812.1
NET CURRENT ASSETS 20.6 119.7 – 140.3
TOTAL ASSETS LESS CURRENT LIABILITIES 1,299.6 (232.1) – 1,067.5
SHAREHOLDERS’ DEFICIT (71.2) – – (71.2)
OUTSIDE INTERESTS 424.1 (145.0) – 279.1
NON-CURRENT LIABILITIES 946.7 (87.1) – 859.6
1,299.6 (232.1) – 1,067.5

74First Pacific Company Limited
NOTES TO THE FINANCIAL STATEMENTS
(B) On 7 February 2003, the Company’s Board of Directors approved the cancellation of all the outstanding share options of the
Company, which were granted to its Executive Directors and senior executives under the Non-Qualified Stock Option Plan and the
Incentive Stock Option Plan (which expired on 16 June 1999 and was replaced by the existing share option scheme) and the existing
share option scheme (which has been suspended by the Company, pending amendments to reconcile this plan’s provisions with
Chapter 17 of the Listing Rules), during the period between December 1996 and August 2000, at exercise prices ranging from
HK$5.38 to HK$9.47. As a result, there are no outstanding options under the Company’s share option scheme at the date of these
Financial Statements.
(C) On 21 March 2003, Asia Link B.V., a wholly-owned subsidiary company of the Company, exchanged its 35.0 per cent interest in
Metrosel for 14.6 per cent interest in PT Mobile-8 Telecom (Mobile-8). Mobile-8, through its subsidiary companies, Metrosel and
Komselindo, plans to build and operate a CDMA cellular telephone network and provide mobile telephone services in most of
Indonesia.
32. COMPARATIVE FIGURES
Due to the adoption of certain new and revised Statements of Standard Accounting Practice issued by the HKSA during 2002, the
presentation of certain items and balances in the Financial Statements have been revised to comply with the new requirements.
Accordingly, certain comparative figures have been reclassified to conform with the current year’s presentation.
33. APPROVAL OF FINANCIAL STATEMENTS
The Financial Statements were approved and authorized for issue by the Board of Directors on 17 April 2003.
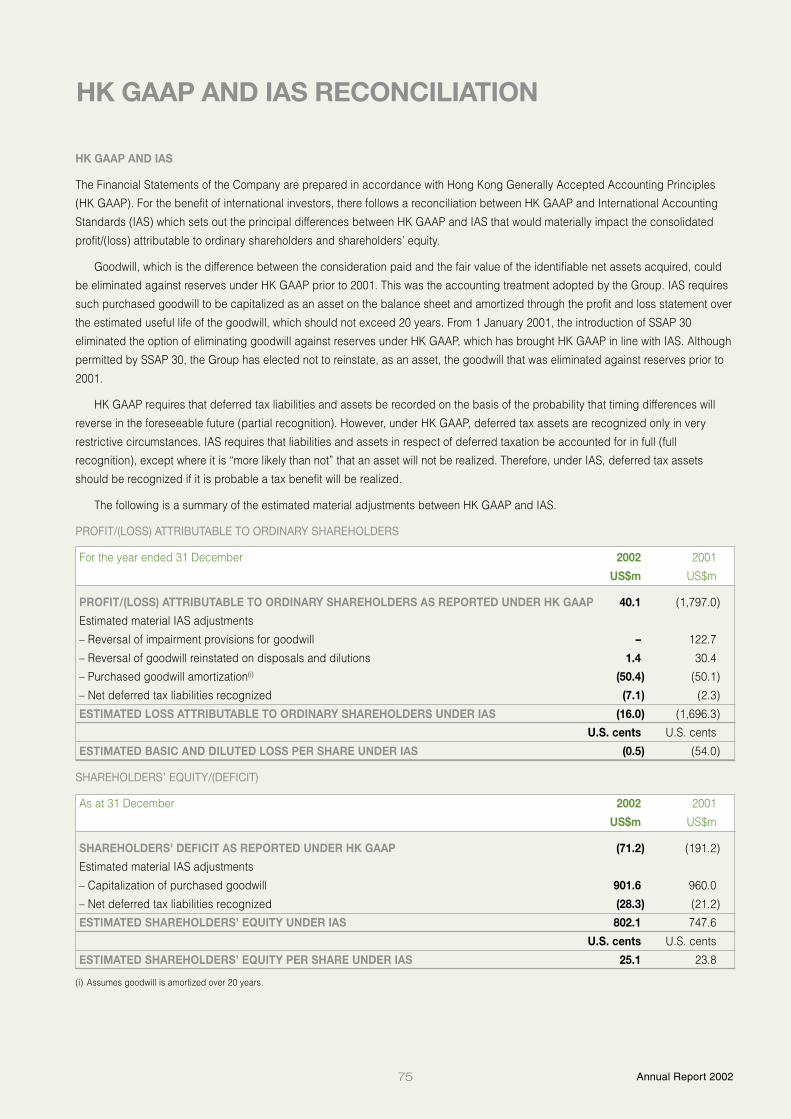
75 Annual Report 2002
HK GAAP AND IAS
The Financial Statements of the Company are prepared in accordance with Hong Kong Generally Accepted Accounting Principles
(HK GAAP). For the benefit of international investors, there follows a reconciliation between HK GAAP and International Accounting
Standards (IAS) which sets out the principal differences between HK GAAP and IAS that would materially impact the consolidated
profit/(loss) attributable to ordinary shareholders and shareholders’ equity.
Goodwill, which is the difference between the consideration paid and the fair value of the identifiable net assets acquired, could
be eliminated against reserves under HK GAAP prior to 2001. This was the accounting treatment adopted by the Group. IAS requires
such purchased goodwill to be capitalized as an asset on the balance sheet and amortized through the profit and loss statement over
the estimated useful life of the goodwill, which should not exceed 20 years. From 1 January 2001, the introduction of SSAP 30
eliminated the option of eliminating goodwill against reserves under HK GAAP, which has brought HK GAAP in line with IAS. Although
permitted by SSAP 30, the Group has elected not to reinstate, as an asset, the goodwill that was eliminated against reserves prior to
2001.
HK GAAP requires that deferred tax liabilities and assets be recorded on the basis of the probability that timing differences will
reverse in the foreseeable future (partial recognition). However, under HK GAAP, deferred tax assets are recognized only in very
restrictive circumstances. IAS requires that liabilities and assets in respect of deferred taxation be accounted for in full (full
recognition), except where it is “more likely than not” that an asset will not be realized. Therefore, under IAS, deferred tax assets
should be recognized if it is probable a tax benefit will be realized.
The following is a summary of the estimated material adjustments between HK GAAP and IAS.
PROFIT/(LOSS) ATTRIBUTABLE TO ORDINARY SHAREHOLDERS
For the year ended 31 December 2002 2001
US$m US$m
PROFIT/(LOSS) ATTRIBUTABLE TO ORDINARY SHAREHOLDERS AS REPORTED UNDER HK GAAP 40.1 (1,797.0)
Estimated material IAS adjustments
– Reversal of impairment provisions for goodwill – 122.7
– Reversal of goodwill reinstated on disposals and dilutions 1.4 30.4
– Purchased goodwill amortization(i) (50.4) (50.1)
– Net deferred tax liabilities recognized (7.1) (2.3)
ESTIMATED LOSS ATTRIBUTABLE TO ORDINARY SHAREHOLDERS UNDER IAS (16.0) (1,696.3)
U.S. cents U.S. cents
ESTIMATED BASIC AND DILUTED LOSS PER SHARE UNDER IAS (0.5) (54.0)
SHAREHOLDERS’ EQUITY/(DEFICIT)
As at 31 December 2002 2001
US$m US$m
SHAREHOLDERS’ DEFICIT AS REPORTED UNDER HK GAAP (71.2) (191.2)
Estimated material IAS adjustments
– Capitalization of purchased goodwill 901.6 960.0
– Net deferred tax liabilities recognized (28.3) (21.2)
ESTIMATED SHAREHOLDERS’ EQUITY UNDER IAS 802.1 747.6
U.S. cents U.S. cents
ESTIMATED SHAREHOLDERS’ EQUITY PER SHARE UNDER IAS 25.1 23.8
(i) Assumes goodwill is amortized over 20 years.
HK GAAP AND IAS RECONCILIATION

76First Pacific Company Limited
GLOSSARY OF TERMS
FINANCIAL TERMS
DEFINED BENEFIT SCHEME A retirement scheme in which the rules specify the benefits to be paid and the scheme is financedaccordingly. Generally, benefits are determined by a formula that takes account of the years of service and final salary of eachmember.
DEFINED CONTRIBUTION SCHEME A retirement scheme under which the benefits are directly determined by the value ofcontributions paid in respect of each member.
EBITDA Earnings before interest, tax, depreciation and amortization.
GAAP Generally accepted accounting principles.
IAS International accounting standards.
IMPAIRMENT PROVISION Provision made to reduce the carrying amount of an asset to its recoverable amount.
NET ASSETS Total assets less total liabilities, equivalent to the sum of shareholders’ (deficit)/equity and outside interests.
NET CURRENT ASSETS Current assets less current liabilities.
NET DEBT Total of short-term and long-term borrowings, including loan capital, net of cash and bank balances and pledged deposits.
RECURRING PROFIT Profit attributable to ordinary shareholders excluding gain/loss on disposal and provision for investments andexchange differences.
FINANCIAL RATIOS
CURRENT RATIO Current assets/current liabilities.
DIVIDEND PAYOUT RATIO Ordinary share dividends paid/recurring profit.
EARNINGS PER SHARE (BASIC) Profit attributable to ordinary shareholders/weighted average number of shares outstanding duringthe year.
GEARING RATIO Net debt/net assets.
INTEREST COVER Profit before taxation (excluding gain/loss on disposal and provision for investments and exchange differences)and net financing charges/net financing charges.
ORDINARY SHAREHOLDERS’ (DEFICIT)/EQUITY PER SHARE Ordinary shareholders’ (deficit)/equity/year-end outstanding number ofordinary shares.
RETURN ON AVERAGE NET ASSETS Profit after taxation (excluding gain/loss on disposal and provision for investments andexchange differences)/average net assets.
RETURN ON AVERAGE ORDINARY SHAREHOLDERS’ EQUITY Recurring profit/average ordinary shareholders’ equity before goodwillreserve.
OTHERS
AGM Annual General Meeting.
ARPU Average Revenue Per User. A measure of earnings per subscriber.
HKSA Hong Kong Society of Accountants.
HKSE The Stock Exchange of Hong Kong Limited.
LISTING RULES Rules Governing the Listing of Securities issued by the Stock Exchange of Hong Kong Limited.
MOA Memorandum of Agreement.
77 Annual Report 2002
INFORMATION FOR INVESTORS
FINANCIAL DIARY
Announcement of 2002 results 17 April 2003
Annual report posted to shareholders 30 April 2003
Annual General Meeting 2 June 2003
Preliminary announcement of
2003 interim results 8 September 2003*
Interim report posted to shareholders 22 September 2003*
Financial year-end 31 December 2003
Preliminary announcement of 2003 results 1 March 2004*
*Subject to confirmation
HEAD OFFICE
24th Floor, Two Exchange Square
8 Connaught Place
Central, Hong Kong SAR
Telephone: (852) 2842 4388
Fax: (852) 2845 9243
E-mail: [email protected]
REGISTERED OFFICE
Cedar House, 41 Cedar Avenue
Hamilton HM12, Bermuda
Telephone: (1 441) 295 2244
Fax: (1 441) 292 8666
TO CONSOLIDATE SHAREHOLDINGS
Write to our principal share registrar and transfer office
in Bermuda at:
Butterfield Fund Services (Bermuda) Limited
Rosebank Centre
11 Bermudiana Road
Pembroke, Bermuda
Or the Hong Kong branch at:
Computershare Hong Kong Investor Services Limited
Rooms 1901-5, Hopewell Centre
183 Queen’s Road East
Wanchai, Hong Kong SAR
SHARE LISTINGS
First Pacific’s shares are listed on The Stock Exchange of
Hong Kong and are traded over-the-counter in the U.S. in the
form of American Depositary Receipts issued by The Bank of
New York.
STOCK CODES
The Stock Exchange of Hong Kong: 142
Bloomberg: 142 HK
Reuters: 0142.HK
ADR Code: FPAFY
CUSIP reference number: 335889200
TO RECEIVE A CHINESE VERSION OF THIS REPORT, OR
ADDITIONAL INFORMATION, CONTACT
Group Corporate Communications
First Pacific Company Limited
24th Floor, Two Exchange Square
8 Connaught Place
Central, Hong Kong SAR
Telephone: (852) 2842 4374
Fax: (852) 2845 9243
E-mail: [email protected]
WEB SITE
www.firstpacco.com
AUDITORS
Ernst & Young
15th Floor, Hutchison House
10 Harcourt Road
Central, Hong Kong SAR
SOLICITORS
Richards Butler
20th Floor, Alexandra House
Central, Hong Kong SAR
PRINCIPAL BANKERS
ING Bank NV
Credit Suisse First Boston
Standard Chartered Bank
ABN AMRO Bank NV
JPMorgan

78First Pacific Company Limited
2002 2001 2000 1999 1998 1997 1996 1995 1994 1993
RESULTS (US$millions)Turnover 1,892.3 1,851.7 2,299.2 1,671.9 2,894.4 8,308.4 7,025.7 5,249.7 3,804.6 3,217.8Profit/(loss) for the year 40.1 (1,797.0) 51.2 138.2 360.5 212.0 204.7 260.5 135.3 101.2Profit/(loss) attributable to
ordinary shareholders 40.1 (1,797.0) 51.2 138.2 360.5 212.0 204.2 257.0 130.3 94.5Recurring profit 51.1 44.6 51.0 41.4 40.5 166.2 201.7 152.5 109.5 79.4Ordinary share dividends paid – 4.0 11.2 13.7 32.0 64.1 57.3 39.9 29.7 21.2
PER ORDINARY SHARE DATA (U.S.cents)Earnings/(loss)– Basic 1.27 (57.23) 1.75 5.34 15.21 8.98 8.73 12.50 7.06 5.88– Diluted 1.27 (57.23) 1.75 5.32 15.12 8.89 8.59 11.78 6.37 4.54– Basic recurring 1.62 1.42 1.74 1.60 1.71 7.04 8.62 7.42 5.93 4.94– Diluted recurring N/A N/A N/A 1.59 1.70 6.99 8.49 7.06 5.40 3.88Dividends paid – 0.13 0.39 0.52 1.35 2.71 2.44 1.98 1.60 1.34Ordinary shareholders’ (deficit)/equity (2.23) (6.09) 11.77 20.58 34.45 3.76 10.03 20.06 11.45 9.14
FINANCIAL RATIOSReturn on average net assets (%) 7.95 4.47 4.59 3.47 3.39 14.59 18.26 18.20 18.40 18.18Return on average ordinaryshareholders’ equity (%) 6.22 2.90 2.21 2.00 2.55 11.60 14.54 14.96 16.40 15.61Dividend payout ratio (%) – – 15.09 36.26 34.14 31.25 31.80 32.61 31.42 32.11Dividend cover (times) – – 6.63 2.76 2.93 3.20 3.14 3.07 3.18 3.11Interest cover (times) 2.46 2.53 3.47 2.96 2.38 3.65 4.78 5.02 4.98 5.25Current ratio (times) 1.02 0.82 1.23 0.95 0.90 1.18 1.07 1.36 1.25 1.24Gearing ratio (times)– Consolidated before goodwill reserve 0.80 0.67 0.32 0.44 0.41 0.91 0.84 0.59 0.64 0.63– Consolidated after goodwill reserve 3.01 3.93 0.78 0.78 0.59 1.52 1.74 0.97 1.10 1.07– Company 0.15 0.09 0.10 0.28 0.38 0.80 0.39 0.15 0.32 0.34
CONSOLIDATED BALANCE SHEETDATA (US$millions)
Capital expenditure 92.2 148.2 255.1 314.7 374.1 887.3 500.9 388.1 218.8 132.6Total assets 2,313.1 2,045.7 3,455.8 8,200.9 7,646.3 11,386.3 8,491.8 6,821.1 6,089.6 4,996.1Net debt 1,062.7 790.5 1,016.4 1,719.6 1,296.3 2,937.1 2,024.8 1,238.6 817.8 634.7Total liabilities 1,960.2 1,844.7 2,150.7 5,999.7 5,442.8 9,463.3 7,325.1 5,537.6 5,343.6 4,400.8Net current assets/(liabilities) 20.6 (234.5) 216.4 (81.6) (106.0) 569.0 210.2 653.3 295.4 198.5Total assets less current liabilities 1,299.6 758.4 2,500.8 6,449.8 6,598.5 8,257.2 5,651.5 5,030.4 4,900.4 4,170.1Net assets 352.9 201.0 1,305.1 2,201.2 2,203.5 1,923.0 1,166.7 1,283.5 746.0 595.3Shareholders’ equity before
goodwill reserve 905.2 794.6 2,283.4 2,343.1 1,794.3 1,378.0 1,486.2 1,312.7 834.9 683.6Shareholders’ (deficit)/equity (71.2) (191.2) 369.5 599.0 818.3 88.9 236.6 488.3 305.2 266.6
COMPANY BALANCE SHEETDATA (US$millions)
Total assets 1,867.6 2,395.1 2,938.0 2,568.9 1,904.6 1,921.0 1,172.1 949.1 659.3 549.6Net debt(i) 152.1 83.3 150.0 416.2 408.0 880.3 326.9 118.5 159.2 139.9Total liabilities 847.9 1,425.1 1,374.9 1,081.6 820.5 819.6 327.8 160.2 157.2 122.2Shareholders’ equity 1,019.7 970.0 1,563.1 1,487.3 1,084.1 1,101.4 844.3 788.9 502.1 427.4
OTHER INFORMATION (at 31 December)Number of shares in issue (millions) 3,186.0 3,139.8 3,139.8 2,910.8 2,375.6 2,367.3 2,358.2 2,310.0 1,936.2 1,822.4Weighted average number of
shares in issue (millions)– Basic 3,152.2 3,139.8 2,923.9 2,586.9 2,370.9 2,362.2 2,339.0 2,056.8 1,846.8 1,606.7– Diluted N/A N/A N/A 2,603.3 2,383.7 2,416.1 2,375.0 2,212.3 2,125.4 2,176.5Share price (HK$) 0.700 0.960 2.225 6.000 3.700 3.750 10.050 8.600 5.650 4.225Market capitalization (US$millions) 285.9 386.4 895.6 2,239.1 1,126.9 1,138.1 3,038.4 2,546.9 1,402.5 987.1Number of shareholders 5,576 5,581 5,581 5,632 6,116 5,077 4,897 5,063 5,479 6,000Number of employees 44,820 48,046 49,493 60,972 30,673 51,270 52,880 45,911 30,808 26,060
N/A: Not applicable(i) Includes the net debt of certain wholly-owned financing and holding companies.See page 76 for a glossary of terms.
TEN-YEAR STATISTICAL SUMMARY

PT Indofood Sukses Makmur TbkIndofood is the leading processed-foods group in Indonesia. It is based in Jakarta, and is listed on the Jakarta andSurabaya Stock Exchanges. Noodles, Flour, and Edible Oils & Fats are the principal businesses of Indofood, and it alsohas interests in Distribution, Food Seasonings, Baby Foods and Snack Foods businesses.
Sector: ConsumerPlace of incorporation/business area: IndonesiaIssued number of shares: 9.4 billionEconomic interest/voting interest: 51.9 per cent*
* As a consequence of Indofood’s share buy back program, First Pacific’s shareholding in Indofood increased to 51.9 per cent as at 31 December2002. First Pacific’s average shareholding during 2002 was 49.8 per cent.
Further information on Indofood can be found at www.indofood.co.id
Philippine Long Distance Telephone CompanyPLDT is the leading telecommunications provider in the Philippines. It is based in Manila, and has common shares listedon the Philippine Stock Exchange and ADRs listed on the New York Stock Exchange and on the Pacific Exchangelocated in San Francisco, California. Through its three principal business groups – Wireless, Fixed Line and Informationand Communications Technology – PLDT offers a wide range of telecommunications services across the Philippine’smost extensive fiber optic backbone, cellular and fixed line network.
Sector: TelecommunicationsPlace of incorporation/business area: PhilippinesIssued number of shares: 169.4 millionEconomic interest/voting interest: 24.3 per cent/31.4 per cent
Further information on PLDT can be found at www.pldt.com.ph
Metro Pacific CorporationMetro Pacific is based and listed in Manila, and principally holds interests in property developers Bonifacio LandCorporation (BLC), Pacific Plaza Towers and Landco Pacific Corporation (Landco). It also holds a majority interest inNegros Navigation Company (Nenaco), a shipping enterprise.
Sector: PropertyPlace of incorporation/business area: PhilippinesIssued number of shares: 18.6 billionEconomic interest/voting interest: 80.6 per cent
Further information on Metro Pacific can be found at www.metropacific.com
Escotel Mobile Communications LimitedEscotel is based in New Delhi, India and provides GSM cellular telephone services in Uttar Pradesh (West), Haryana andKerala.
Sector: TelecommunicationsPlace of incorporation/business area: IndiaIssued number of shares: 366.0 millionEconomic interest/voting interest: 49.0 per cent
Further information on Escotel can be found at www.escotelmobile.com
SUMMARY OF PRINCIPAL INVESTMENTSAs at 31 December 2002
Designed and printed by iOne Financial Press Limited, Hong KongA Chinese version of this annual report is available from the Company upon request. 如有需要,可向本公司索取本年報之中文版本。