Annual Report 2020-21 - Grasim Industries
173
-
Upload
khangminh22 -
Category
Documents
-
view
1 -
download
0
Transcript of Annual Report 2020-21 - Grasim Industries

Dear Shareholders,
The COVID-19 pandemic has touched every aspect of our lives across the world. It has altered mindsets, perceptions, and strategies for businesses and beyond. If there is one abiding lesson, it is that sustainable growth and development involves holistic nurturing of human, natural, and financial capital. 2020 is a year that will only gain in significance when viewed through the perspective lens of time.
The Global Economy
The world has been fighting the COVID-19 pandemic for more than a year now, and the struggle has had deleterious economic effects. In 2020, the global economy contracted by 3.3%, the largest contraction on record, at least since World War II. Much of it was concentrated in the first half of FY21, as several countries enforced strict lockdowns. Economies bounced back – albeit at differentiated speeds – in subsequent quarters, on the back of large fiscal stimulus packages, especially in the developed countries, restocking demand after dilution of lockdowns, and improved confidence levels following the start of vaccination programmes. As per the recent forecasts from the International Monetary Fund (IMF), the US and China are expected to record a strong recovery in 2021, resulting in a net positive expansion of their economies over the 2019 levels. These two engines of growth are expected to boost demand for exports from other countries. Even the other two large economies, the EU and Japan, are expected to expand.
Mr. Aditya Vikram Birla
We live by his values.
Integrity, Commitment, Passion, Seamlessness and Speed. Kumar Mangalam Birla
Chairman
CHAIRMAN’S LET TER TO SHAREHOLDERS

In response to the pandemic, central banks resorted to strongly supportive monetary policies in most developed economies, causing interest rates to go down to record lows. At the same time, another consequence of this policy has been a surfeit of liquidity. That has led to a strong rally in prices of many industrial commodities, which has also been supported by the evolving economic recovery, stimulus-related demand expectations and certain supply-side disruptions. This has caused inflationary pressures on the cost dynamics of several manufacturing industries.
The latest IMF forecast suggests a strong 6% growth in global GDP in 2021. But the occurrence of second and third waves of COVID in different parts of the world and reports of virus mutations have created downside risks to the outlook of a strong growth rebound. Recovery remains uneven and uncertain, with the extent of fiscal support and level of vaccination being key differentiators of the short-term economic outlook across countries.
Indian Economy
The Indian economy, which was firmly on the path of recovery in the second half of FY21, was hit by a rather unexpectedly virulent second wave of COVID-19. That caused a severe strain on healthcare facilities in many parts of the country, leading to localised lockdowns and a fall in mobility to levels seen a year ago. This may lead to some reassessment of growth estimates for FY22.
As a silver lining, disruptions to production and supply chains have been far less severe during the second wave than during the first wave. Vaccinations are picking up pace, which would support faster normalisation of mobility levels and of related economic activities. Continued accommodative monetary policy of the RBI and the expected increase in capex from the Government are factors that will support growth recovery. In addition, global growth prospects provide us with exports as an additional strong driver of growth.
The longer-term prospects for the Indian economy continue to be robust. Various initiatives, including privatisation of public sector enterprises, monetisation of assets, implementation of National Infrastructure Pipeline, targeted investment incentives through the Production-Linked Incentives Scheme and the new Labour Code, are likely to spur a virtuous cycle of investments and growth in the medium term.
Aditya Birla Group in Perspective
Like for many other organisations, the COVID crisis brought out challenges of many forms. Economic impact and business disruptions apart, many members of our extended family – our employees and their near ones, our value chain partners, our neighbourhoods – faced health emergencies. The pandemic also caused deep psychological scars as people had to adjust to new ways of living and working. Notwithstanding these challenges, our employees have displayed the highest possible resilience in coping with personal concerns and yet staying focused on the customers and the business. Our business results convey only a small part of the story of our employee courage, compassion, community spirit and cultural strength.
As the lockdowns took a firm grip on people’s lives and constraints mounted in the early part of the financial year, our leadership teams rose to the occasion with robust planning and continuous communication with people at all levels through the organisation. Personally, it was energising for me to engage at scale with employees globally through a series of digital townhalls that instilled confidence in employees and
reinforced the power of ‘One ABG’. The ‘Respond, Recover and Re-imagine’ framework underpinned several new initiatives. These included close coordination among HR teams across the Group units to respond to local-level challenges by leveraging the organisational resources and a thrust on disseminating relevant information through all digital channels about the resources lined up to help the extended ABG family deal with the emergencies.
COVID warriors were trained, and voluntary networks were formed to assist our employees and their families in need. Preferential tie-ups with local hospitals and a central coordination centre with an external party were set up to provide special assistance to our employees through Doctors’ network, telemedicine and other COVID-related health assistance. Workplace health, hygiene and COVID-appropriate behaviour remained the focus of our managers at all levels helping the organisation to stay ever vigilant. ‘Test, Treat and Trace’ was the mantra of protection and well-being followed scrupulously.
Apart from focusing on health emergencies, initiatives for mental agility and continuous learning were taken to maintain organisational morale. A learning programme christened as ‘Chairman’s Invitation Series’ was curated to bring the best insights on a changing world from the world’s leading thought leaders. There was an increased thrust on online education, recognition, and knowledge sharing sessions.
These well-rounded initiatives on the people front also helped our business performance to bounce back strongly. The focus on customers and costs remained undiminished through the year. Critical business processes such as new line commissioning, new product launches, new system and technology implementation– all happened seamlessly and presented a unique human story of innovation and fortitude bringing alive the values of commitment and passion. People learnt new skills and new behaviour at work while not being at office or at the workplace as one knows. People engagement, team trust and Group values proved to be the energy and the glue for our performance.
In the spirit of not letting a crisis go to waste, our HR teams globally collaborated to create a long-term HR Strategy for the Group and individual businesses. This was achieved even while working remotely; 150 of the HR leaders came together digitally over a four-month period to craft a coherent HR strategy to reflect both Group aspirations and the business needs. Premised on creating an avant garde HR strategy, the work focused on employee experience and business productivity
The longer-term prospects for the Indian economy continue to be robust. Various initiatives, including privatisation of public sector enterprises, monetisation of assets, implementation of National Infrastructure Pipeline, targeted investment incentives through the Production-Linked Incentives Scheme and the new Labour Code, are likely to spur a virtuous cycle of investments and growth in the medium term.
COVID warriors were trained, and voluntary networks were formed to assist our employees and their families in need. Preferential tie-ups with local hospitals and a central coordination centre with an external party were set up to provide special assistance to our employees through Doctors’ network, telemedicine and other COVID-related health assistance.
in a balanced mix with growth, technology, and talent as other critical pillars. This HR strategy is under dissemination to various stakeholders and an annual action agenda is being rolled out at all levels. This has been a signature example of collaboration, thought leadership and determined action – ingredients that usually make up most successful organisations.
Sustainable Focus
The experience of the past year reinforces the criticality and importance of sustainable businesses. At Aditya Birla Group, sustainable business model needs to have three pillars – responsible stewardship, stakeholder engagement and future proofing. We use four dimensions of Business sector, Geography of operation, Value chain and Time horizons to identify issues that are material to the sustainability of our businesses; and then create approaches to balance risks and opportunities for all those material issues. For example, on environment, energy conservation initiatives help us to mitigate risks, while solar energy and climate-resilient products help us to pursue opportunities. Since transparency is fundamental to our approach to Sustainability, most of the ABG companies have consciously begun their journey to ‘mainstream’ ESG reporting.
CHAIRMAN’S LET TER TO SHAREHOLDERS

Your Company’s Performance
The cement industry witnessed a de-growth of 10-12% due to the COVID-19 pandemic. The COVID-induced nationwide lockdown from late March to end-April 2020 was a huge challenge for all manufacturing industries. However, with the central and state governments taking measured steps towards unlocking the economy, some encouraging trends were seen from the latter part of May 2020.
Since then, the industry has been on a volume growth path driven mainly by the government’s ‘Housing for All by 2022’ mission and large infrastructure projects. Government spending on infrastructure projects and affordable housing schemes such as the Pradhan Mantri Awas Yojana with enhanced budgetary allocations remain the primary drivers of growth for the cement industry.
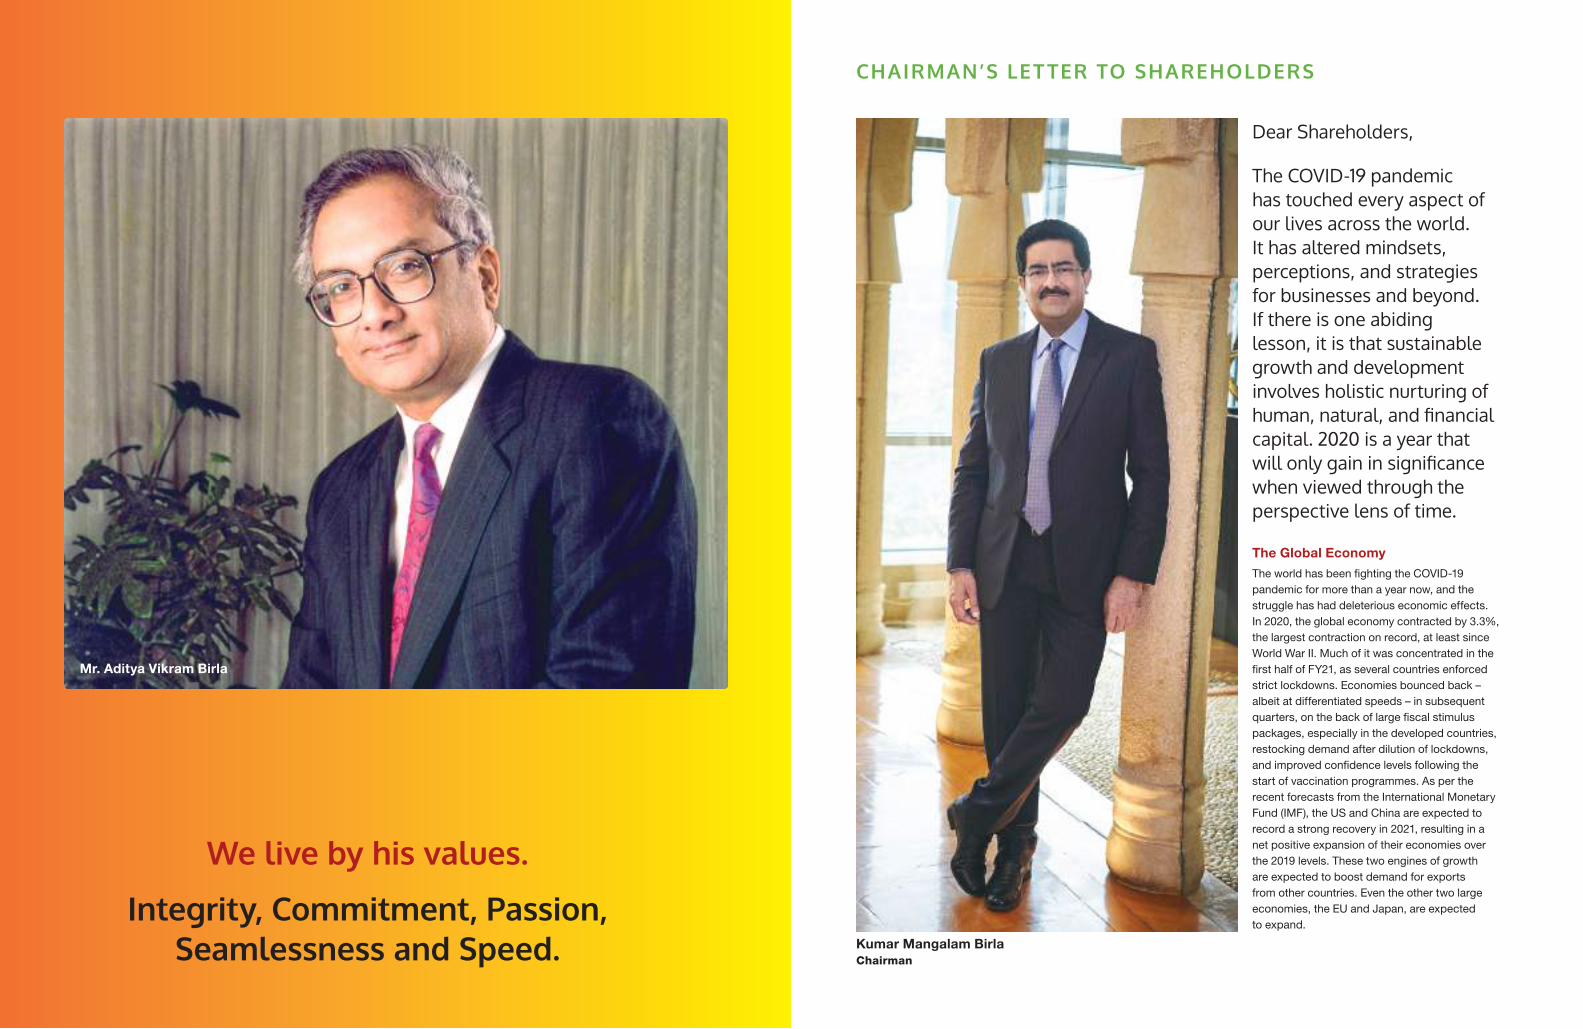
During FY21, your Company recorded net revenues of US$ 6.0 billion (` 44,726 crores) and an EBITDA of US$ 1.66 billion (` 12,302 crores).
Your Company’s Board of Directors also approved a fresh capex of ` 5,477 crores towards increasing capacity by 12.8 MTPA with a mix of brownfield and greenfield expansions. The additional capacity will be created in the fast-growing markets of the east, central, and northern regions of the country. This expansion is in addition to your Company’s 6.7 MTPA capacity expansion currently underway in Uttar Pradesh, Odisha, Bihar and West Bengal. Commercial production from these capacities is expected to go on stream in a phased manner during FY22 and FY23. This significant investment in a core infrastructure sector will accelerate the wheels of economic activity and aid the kickstart of the private investment cycle. Our capex ambition is fortified both by the strength of UltraTech’s balance sheet and our conviction on India’s inherent growth potential.
Upon completion of the latest round of expansion, your Company’s capacity will grow to 136.25 MTPA, reinforcing its position as the third-largest cement company in the world, outside of China.
In FY21, your Company also set new benchmarks on sustainability. Your Company raised US$ 400 million (~` 2,900 crores), by way of issuance of senior unsecured US$ denominated notes, in the form of sustainability-linked bonds. UltraTech is the first company in India and the second in Asia to issue sustainability-linked bonds.
Sustainable growth is an integral part of your Company’s business ethos. It continuously strives to enhance environmental conservation measures while ensuring that business growth and profitability are concomitant with its contribution to societal well-being.
Conclusion
The year-long response to the pandemic, across the globe, exhibited all that is noble and uplifting in the human spirit. A spirit that was also in display in your Company’s actions and performance during the year.
Through this pandemic, your Company’s people and systems have been battle tested and even better prepared to face any competitive challenge or serious external disruption. It has strengthened the bonds within, opened better vistas of co-operation and convinced our stakeholders that our people deliver – no matter what! That is our best assurance of sustainability and continued collective prosperity.
Yours sincerely,
Kumar Mangalam Birla
Chairman
CHAIRMAN’S LET TER TO SHAREHOLDERS CONTENTS
Welcome to UltraTech6 Prelude 14 FY21 Highlights 16 Corporate Identity 18 Product Universe 20 Operational Presence 22 Five-year Progress
REIMAGINING A NEW FUTURE
Empowering people PG 8
Helping heal the planet PG 10
Fuelling prosperity for all PG 12
Value creation approach 26 Value Creation Model28 Operating Context30 Business Strategy
Growth enablers 34 Capacity Expansion36 Cost Leadership38 Digitisation Drive42 Extensive Distribution
ESG commitments46 Environment50 Social: People 54 Social: Community 58 Governance59 Board of Directors
60 Corporate information
Statutory Reports62 Financial Highlights64 Directors' Report and Management Discussion and Analysis110 Report on Corporate Governance131 Shareholder Information142 Social Report147 Sustainability and Business Responsibility Report
Financial Statements161 Independent Auditors' Report172 Standalone Balance Sheet173 Standalone Statement of Profit and Loss176 Standalone Statement of Cash Flow178 Notes to Standalone Financial Statements247 Consolidated Financial Statements
Being a signatory to the Task Force on Climate-Related Financial Disclosures (TCFD), your Company has undertaken a climate change risk and opportunities assessment study as per TCFD recommendations. These findings have been integrated with the long-term business strategy, risk management and business planning.
The Science-Based Target initiative (SBTi) has validated your Company’s GHG reduction targets, which covers the target to lower its CO2 intensity in cement to 462 kg net CO2 per ton of cementitious material (net CO2/t.cem.) by 2032.
Sustainable growth is an integral part of your Company’s business ethos. It continuously strives to enhance environmental conservation measures while ensuring that business growth and profitability are concomitant with its contribution to societal well-being.

PEOPLE - PLANET - PROSPERITYREIMAGINING A NEW FUTURE
At UltraTech Cement, we are developing innovative building solutions that addresses aspirations of millions of customers. As India’s largest cement manufacturer, we are actively contributing to nation building and strengthening
our capabilities for a better and bolder tomorrow.
By integrating sustainability in every aspect of our operations, we are reimagining a new future with a tech-enabled, smarter and leaner ecosystem which engages seamlessly and responds proactively to dynamic market trends and customer aspirations. Further, it enables us to anticipate stakeholder expectations, identify future business opportunities and future-proof the business.
We have devised a clear roadmap for accelerating the adoption of low-carbon technologies and processes across our value chain and thus reduce carbon footprint over the lifecycle. We are India’s first company and the second in Asia to issue sustainability-linked bonds.
Over the years, we have built a strong foundation to propel our growth ambitions through a judicious mix of greenfield and brownfield expansions, cost leadership, fiscal discipline, robust distribution network, while contributing relentlessly towards protecting the planet, empowering our people and the communities surrounding our facilities, thereby building a virtuous cycle of prosperity.
6U
ltra
Tech
Cem
ent
Lim
ited
7A
nnua
l Rep
ort
202
0-21

Empowering people
NURTURING OUR TEAM
SPREADING JOY ACROSS COMMUNITIES
3,86,422Total training hours
21 lakhsLives benefited through community commitments
Recognised among ‘India’s 30 Best Workplaces in Manufacturing – 2021’ by Great Place To Work® Institute.
507Villages covered
Empowerment lies at the heart of sustainable progress. At UltraTech Cement, we provide holistic learning and development opportunities to our people, which enable employees to choose their individual growth path aligned with the organisation’s objectives. We are creating a workplace where diversity is appreciated and diverse perspectives form the foundation for innovation and growth.
At the same time, we are developing sustainable communities through our focused interventions across education and capacity building, infrastructure, healthcare, and social reforms to transform life and livelihood opportunities. Our aim is to enable these communities reap the benefits of the nation’s rapid economic growth and become active participants in the exciting journey ahead.
8U
ltra
Tech
Cem
ent
Lim
ited
9A
nnua
l Rep
ort
202
0-21

POSITIVE FOOTPRINT
596.59*Specific net CO2 emissions
1.63%Reduction in power consumption
Our score in S&P’s Dow Jones Sustainability Index (DJSI) has improved by 9 points to 68
Retained our CDP score for Climate as ‘B’ - highest in the Indian cement sector
*kg/tonne of cementitious material
3.9xWater positive
273 MWGreen power capacity
Helping heal the planetAt UltraTech Cement, we are committed to building a low-carbon future. We have adopted an internal carbon price and TCFD framework to consistently reduce our environmental footprint.
We are calibrating our product mix towards lowering clinker usage in cement manufacturing as well as other resources. Across our operations, we are increasing usage of alternative fuel and clean energy and deploying best available technologies. We are a signatory to the GCCA Climate Ambition, a sectoral aspiration to deliver carbon neutral concrete by 2050.
10U
ltra
Tech
Cem
ent
Lim
ited
11A
nnua
l Rep
ort
202
0-21

VALUE CREATED
VALUE DISTRIBUTED AND RETAINED
` 54,598 crores
` 1,068 croresDividend to shareholders
` 32,147 croresUsed in operations
` 2,353 croresWages, salaries and welfare for employees
` 121 croresCSR investments
` 4,394 croresRetained for investments
` 1,486 crores Paid to lenders
13,030 croresPaid to exchequer
Fuelling prosperity for allAt UltraTech Cement, we are focused on creating value for all our stakeholders.
By producing world-class products that provide comprehensive solutions to India’s aspirations of delivering sustained profitable growth, we are enhancing our contribution to drive the inclusive development agenda.
12U
ltra
Tech
Cem
ent
Lim
ited
13A
nnua
l Rep
ort
202
0-21
FY21 HIGHLIGHTS
Strengthening foundations for future growth
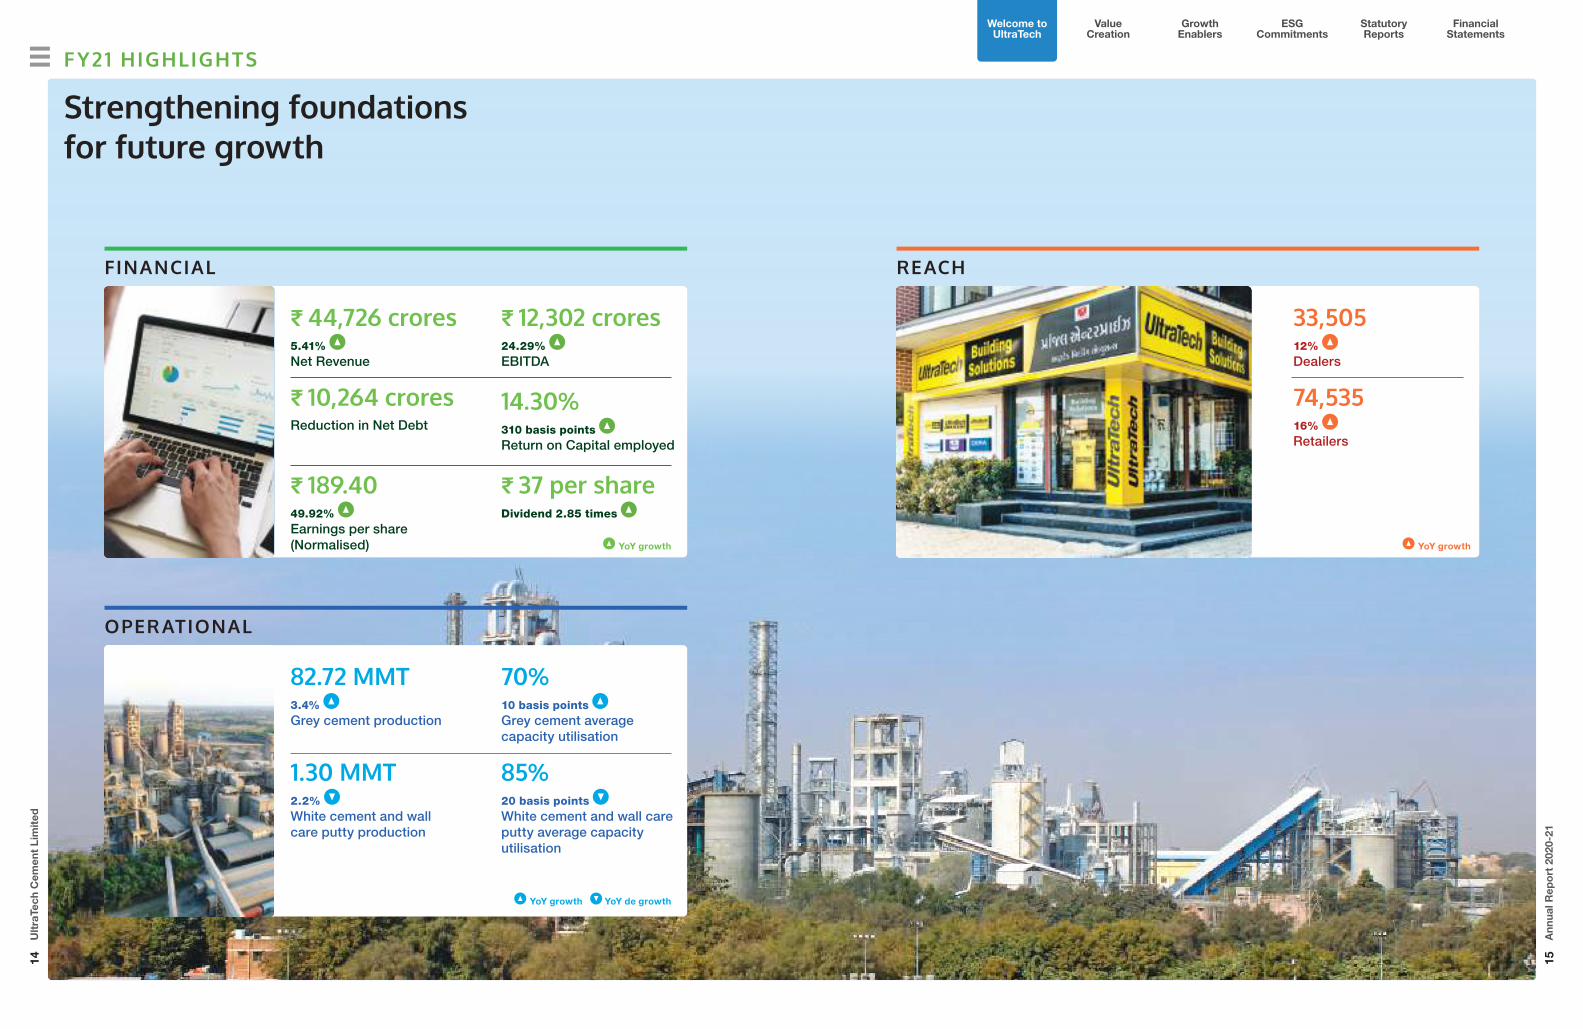
FINANCIAL REACH
OPER ATIONAL
K 44,726 crores5.41% Net Revenue
82.72 MMT3.4% Grey cement production
K 12,302 crores24.29% EBITDA
33,50512% Dealers
74,53516% Retailers
70%10 basis points Grey cement average capacity utilisation
1.30 MMT2.2% White cement and wall care putty production
14.30%310 basis points Return on Capital employed
85%20 basis points White cement and wall care putty average capacity utilisation
K 10,264 croresReduction in Net Debt
YoY growth
YoY growth YoY de growth
YoY growth
K 189.4049.92% Earnings per share (Normalised)
K 37 per shareDividend 2.85 times
14U
ltra
Tech
Cem
ent
Lim
ited
15A
nnua
l Rep
ort
202
0-21
Welcome to UltraTech
Value Creation
Growth Enablers
Statutory Reports
Financial Statements
ESG Commitments

CORPOR ATE IDENTIT Y
Embodying strength, reliability and innovation
UltraTech Cement is a preferred cement provider in the construction of homes, buildings and structures that define the aspirational India of today and tomorrow. We are also one of the leading cement producers globally and the only company in the world (outside China) to have 100+ MTPA of manufacturing capacity in a single country.
*22 Integrated Units in India and 1 clinkerisation unit outside India | **23 in India and 4 outside | #6 in India and 1 in Sri Lanka | ^Waste Heat Recovery System
^As on 31st March, 2021
Pan India presence
Extensive distribution network
Industry leading brand
Experienced and talented management
PG 42-43 PG 20-21 PG 18-19 PG 58-59
VISION
To be The Leader in building solutions
MISSION
To deliver superior value to our stakeholders on the four pillars of:
OUR CORE STRENGTHS
Customer Centricity
Team Empowerment
InnovationSustainability
OUR SCALEOUR STATURE
116.8 MTPAGrey cement capacity
~21%Capacity share in India’s grey cement industry
1.5 MTPAWhite Cement (one unit) and Wall Care (one unit) capacity
~1.7 billionBags of cement produced every year
1,170 MWCaptive power capacity
` 1,94,493 crores^
Highest market capitalisation in India’s cement industry
23*World-class integrated manufacturing and clinkerisation units
130+ Ready Mix Concrete (RMC) plants across 41 cities
273 MW Green power capacity (WHRS^+Wind Mill+Solar)
27**Grinding units
7#
Bulk packaging terminals (Sea + Rail)
16U
ltra
Tech
Cem
ent
Lim
ited
17A
nnua
l Rep
ort
202
0-21
Welcome to UltraTech
Value Creation
Growth Enablers
Statutory Reports
Financial Statements
ESG Commitments

Solutions aligned with evolving preferences
We provide a wide range of innovative solutions that cater to various aspects of construction, from foundation to finish. Our product suite seamlessly covers the conventional that positions cement at the core of all construction and the contemporary that provides a bouquet of related construction products and services.
CONVENTIONAL
India’s largest cement selling brand
Grey cement products• Ordinary Portland Cement• Portland Pozzolona Cement• UltraTech Super• UltraTech Composite Cement• UltraTech Weather Plus• UltraTech Slag
White cement products• White cement• Wall care putty• White cement-based product
#1 in white cement and cement-based Putty
Ready mix concrete solutions• Tailor-made concrete solutions
with 35 specialty concretes, based on application
#1 RMC player in India with 130+ plants
CONTEMPOR ARY
Building productsWide portfolio of building solution products such as:
Dry mix mortars• Plasters mortars• Adhesives and sealants• Flooring• Repair and rehabilitation
Waterproofing• Liquid Waterproofing• Cementitious Waterproofing
Re-engineered products from the house of UltraTech
First and largest single brand retail chain across India
Addressing diverse requirements• One-stop building solution for
different stages of construction life cycle, catering to the retail customer with 2,500+ outlets in 21 States
• Over 70% of outlets in rural and Tier 3 geographies
• Partners leading brands to provide quality construction products for individual home builders
PRODUCT UNIVERSE18
Ult
raTe
ch C
emen
t Li
mit
ed
19A
nnua
l Rep
ort
202
0-21
Welcome to UltraTech
Value Creation
Growth Enablers
Statutory Reports
Financial Statements
ESG Commitments

Integrated Unit
Grinding Unit
Bulk Terminal
Jetty
White Cement & Putty UnitsMap is only used for representation purpose.
OPER ATIONAL PRESENCE
Closer to customers across markets
GLOBAL CAPACITIES
1 MTPABahrain
1.5 MTPASri Lanka*
4.4 MTPAUAE
5.4 MTPATotal capacity
4%Revenue share in FY21
OUR NET WORK
HIGHLY DIVERSIFIED PAN- INDIA PRESENCE
33,505Dealers
74,535Retailers
2,500+UBS outlets
23.8 MTPA
23.3 MTPA
16.1 MTPA
27.7 MTPA
20.5 MTPA
21%
21%
15%
25%
18%
Proportion of our total capacity
Our capacity
North
Central
East
West
South
23%
20%
17%
22%
18%
Revenue share in FY21
*Cement packaging capacity 20U
ltra
Tech
Cem
ent
Lim
ited
21A
nnua
l Rep
ort
202
0-21
Welcome to UltraTech
Value Creation
Growth Enablers
Statutory Reports
Financial Statements
ESG Commitments

Proven track record of value creation
Over the years, we have steadily evolved from being just a cement manufacturer to a building solutions provider with focus on innovative and sustainable business processes. Our market presence also continued to grow with better distribution network and customer engagement. The result of this transformation is evident in our financial performance, when seen across a broad 5-year timeline.
FIVE-YEAR PROGRESS
Profit and loss
Balance sheet
YoY growth
YoY growth
Operational
Net Revenue(` in crores)
12%5 year CAGR
5%
28,6
46
31,8
72
41,6
09
42,4
30
44,7
26
2016-17 2017-18 2018-19 2019-20 2020-21
EBITDA per tonne(`)
7%5 year CAGR
20%
1,09
1
1,04
2
908
1,19
1
1,42
42016-17 2017-18 2018-19 2019-20 2020-21
52.4
0
63.2
8
85.0
5
81.8
1
85.1
0
2016-17 2017-18 2018-19 2019-20 2020-21
Sales volume – Grey Cement(MMT)
35,6
49
49,0
51
65,6
05
66,9
76
70,7
02
2016-17 2017-18 2018-19 2019-20 2020-21
Capital Employed(` in crores)
19%5 year CAGR
6%
12.8
9.7
9.4
11.2
14.3
2016-17 2017-18 2018-19 2019-20 2020-21
ROCE(%)
3%5 year CAGR
28%
12.3
9.1
8.3
12.1
15.4
2016-17 2017-18 2018-19 2019-20 2020-21
ROE*(%)
6%5 year CAGR
28%
Normalised EPS(`)
18%5 year CAGR
50%
98.9
1
80.9
4
84.0
2
126.
34
189.
40
2016-17 2017-18 2018-19 2019-20 2020-21
PAT after minority interest-normalised(` in crores)
19%5 year CAGR
50%
2,71
5
2,22
2
2,40
4
3,64
4
5,46
3
2016-17 2017-18 2018-19 2019-20 2020-21
Book Value(`)
15%5 year CAGR
13%
889
961
1,17
0
1,35
3
1,53
1
2016-17 2017-18 2018-19 2019-20 2020-21
Valuation
Production – Grey Cement(MMT)
2020-21
82.7
2
61.0
8
2019-20
80.0
0
61.5
8
2018-19
81.2
5
63.3
3
2017-18
60.7
9
48.1
1
2016-17
51.0
0
39.8
0
Cement Clinker
Market Capitalisation (` in crores)
2020-21
1,94
,474
1,94
,493
2019-20
93,9
26
93,6
55
2018-19
1,09
,831
1,09
,812
2017-18
1,08
,413
1,08
,473
2016-17
1,09
,527
1,09
,385
BSE NSE
(0.0
1)
0.53
0.65
0.43
0.15
2016-17 2017-18 2018-19 2019-20 2020-21
Net Debt to Equity (times)
(0.0
4)
2.09
2.83
1.72
2016-17 2017-18 2018-19 2019-20 2020-21
Net Debt / EBITDA(times)
0.55
EBITDA and EBITDA Margin (` in crores)
20%5 year CAGR
24%
5,86
1
6,73
4
7,81
1
9,89
8
12,3
02
2016-17 2017-18 2018-19 2019-20 2020-21
20%21%
23%
28%
19%
*Excluding goodwill
22U
ltra
Tech
Cem
ent
Lim
ited
23A
nnua
l Rep
ort
202
0-21
Welcome to UltraTech
Value Creation
Growth Enablers
Statutory Reports
Financial Statements
ESG Commitments

As part of its societal commitment, UltraTech Cement has undertaken various initiatives during the year to support the country in its fight against the pandemic.
The Company continues to give primacy to the safety and wellbeing of its employees and business partners. It has also undertaken a vaccination programme for all its employees and their dependents.
Our teams across our facilities in India are working with relevant Government authorities and the local administration to support the fight against COVID-19.
Standing by the nation in testing times
4.25 lakhs+Free meals provided
3,000Antigen kits distributed
2.50 lakhs+Masks and hand sanitisers distributed
1,900+Awareness camps in 300 villages
24U
ltra
Tech
Cem
ent
Lim
ited
25A
nnua
l Rep
ort
202
0-21

Raw Material Mining - Limestone Quarrying - Limestone Crushing - Storage of raw material
Cement and Concrete Manufacturing
- Raw material preparation - Clinkerisation - Grinding - Cement Storage - Transit Mixers - Curing - Finishing
Marketing - Distribution - Sales - Building Solutions
Associate Functions - Finance - Human Resource - Technical Services - Logistics - Procurement - Information Technology - Legal
VALUE CREATION MODEL
CAPITALS VALUE CREATED. VALUE SHARED.
Human capitalHuman capital is greatly valued at UltraTech Cement. Our people are the strength behind our ability to deliver. Our operations require people with specialised skill sets for which we employ qualified engineering, geology, mining experts along with management experts for support functions. We support, encourage, and empower them through our culture of learning and development, safety, gender equality, diversity, mutual respect, and inclusivity.
Human capital - Employee Productivity 4,060 tonnes/FTE - Attrition rate 5.63% - Lost time Injury 0.03 per million man hours (Directly Employed)
- 2 fatalities
Intellectual capitalInnovation is the driving force of our product stewardship, benefiting not just our consumers but the industry as a whole. Our portfolio of building materials encouraging sustainability is expanding constantly, backed by best-in-class technology and our continuous customer outreach.
Intellectual capital - 3 products developed
Financial capitalWe are committed to maximising our asset utilisation, optimising our capital allocation and maintaining a strong balance sheet with free cash flows. We continue to look for opportunities to further rationalise costs across the board, so as to create greater value for all stakeholders.
Financial capital - Net Revenue ` 44,726 crores - EBITDA ` 12,302 crores - Profit after Tax ` 5,463 crores - Earnings per share ` 189.40 - Return on Capital Investment 14.3%
Social and relationship capitalWe continue to successfully strengthen our partnerships through close engagement with diverse stakeholder groups. We communicate transparently, backed by disclosures that we continue to enhance; we listen to our shareholders and lenders, suppliers and contractors, employees, governments, communities and civil societies carefully and respond to them in a timely manner.
Social and relationship capital - Customer Satisfaction Assessment - Net promoter's score in FY21: 72
- People benefiting from our community investments 21 lakhs
Manufactured capitalOur best-in-class machinery and equipment across all our manufacturing facilities helps us to deliver to our stakeholders’ expectations. We focus on ensuring that our people operate these facilities in the safest manner possible.
Manufactured capital - Capacity Utilisation 70% - Clinker Factor improvement (clinker/cement%): 73.30%
Natural capitalMineral resources are key requirements for our operations. Our topmost priority is to utilise these resources in a sustainable and eco-conscious manner. Our aim is to increasingly use alternative fuels to power our processes. We continue to optimise our logistics operations. We are also strongly committed to water recycling at all of our facilities.
Natural capital - 613.34 Specific GHG emission (Kg CO2 per tonne cementitious material – includes Scope 1 and 2)
- Thermal substitution rate 3.10% - Alternative raw material rate 18.24% of total raw material
- Water recycled 12.12%
INDICATOR AND KEY INPUTS
BUSINESSAC TIVITIES
KEY VALUE DRIVERS
- Total employee salaries, wages and expenses ` 2,353 crores
- Total training hours 3,22,594 - Total employees 21,909 - Safety training hours 4,08,237
Innovate and excel
A culture of product and process innovation, reflected in the launch of premium products, improving capacity utilisation, clinker to cement blending ratio and focus on development of new products and processes with a moderated carbon footprint.
Cost advantage
Leveraging procurement and other economies to enhance cost-effectiveness.
Supplier of choice
A value proposition that extends beyond the product. We create our niche with superior product quality, customised grades and application assistance.
Sustainable growth
Leveraging procurement and other economies to enhance cost-effectiveness.
Robust people practices
Our employees are central to our business, driven by passion, commitment, innovation, and performance.
Responsible corporate citizenship
We work in the villages surrounding our locations. Needs of the community drive our efforts. We aim to enrich lives we touch.
Focus on value creation
We cater to the quality conscious and premium cement consumer. Our innovative products deliver superior value.
- Net Capex ` 1,859 crores - Net Fixed Assets (including CWIP and Capital advances) ` 51,711 crores
- Net working capital ` (1,878) crores
- Cost of Raw Materials and Fuel (including power) ` 14,125 crores
- Amount spent on CSR projects ` 121 crores
- CSR voluntary hours 54,479
- Total production capacity 116.75 tonne per annum of grey cement
- Physical Assets: 59 locations
- Energy from WHRS 2,157.73 TJ - Renewable Energy 686.47 TJ - Specific Energy consumption 724.80 Kcal/Kg of clinker
- Water Consumption* 180.14 L/Tonnes of cementitious production) *(excluding colony & horticulture)
- Natural raw material procured 91 MMT
- Total spent on R&D ` 26.25 crore - Product Stewardship and LCA (No. of initiatives): 4
Sustain, develop and transform
26U
ltra
Tech
Cem
ent
Lim
ited
27A
nnua
l Rep
ort
202
0-21
Welcome to UltraTech
Value Creation
Growth Enablers
Statutory Reports
Financial Statements
ESG Commitments
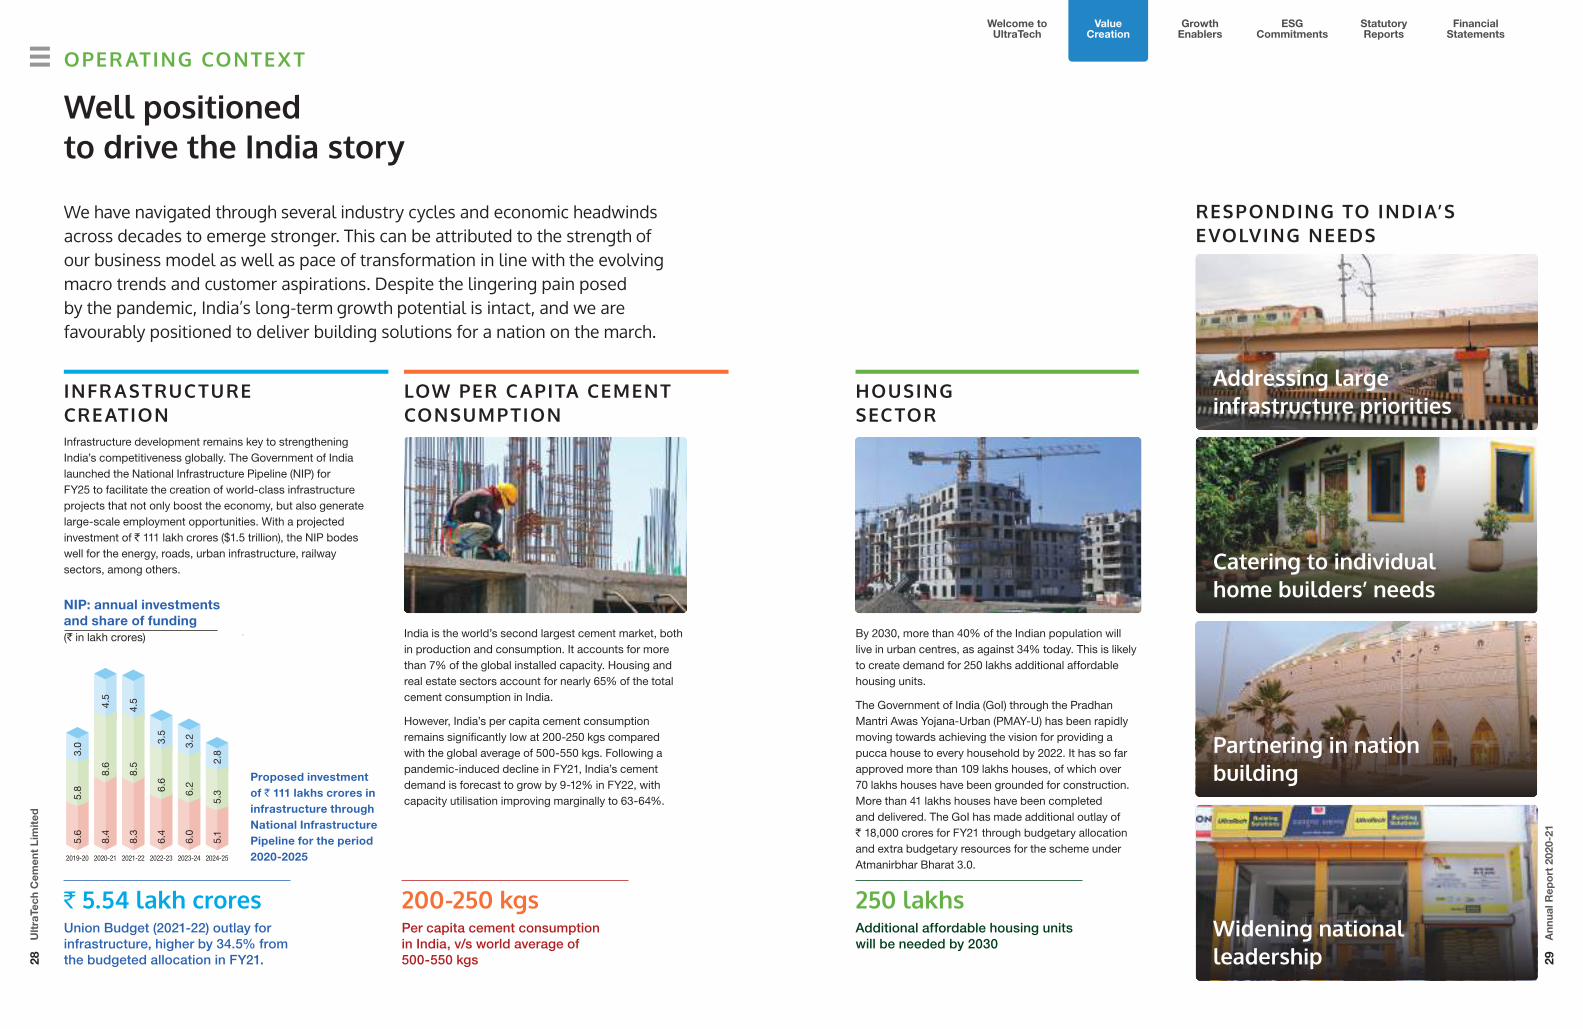
By 2030, more than 40% of the Indian population will live in urban centres, as against 34% today. This is likely to create demand for 250 lakhs additional affordable housing units.
The Government of India (GoI) through the Pradhan Mantri Awas Yojana-Urban (PMAY-U) has been rapidly moving towards achieving the vision for providing a pucca house to every household by 2022. It has so far approved more than 109 lakhs houses, of which over 70 lakhs houses have been grounded for construction. More than 41 lakhs houses have been completed and delivered. The GoI has made additional outlay of ` 18,000 crores for FY21 through budgetary allocation and extra budgetary resources for the scheme under Atmanirbhar Bharat 3.0.
India is the world’s second largest cement market, both in production and consumption. It accounts for more than 7% of the global installed capacity. Housing and real estate sectors account for nearly 65% of the total cement consumption in India.
However, India’s per capita cement consumption remains significantly low at 200-250 kgs compared with the global average of 500-550 kgs. Following a pandemic-induced decline in FY21, India’s cement demand is forecast to grow by 9-12% in FY22, with capacity utilisation improving marginally to 63-64%.
Infrastructure development remains key to strengthening India’s competitiveness globally. The Government of India launched the National Infrastructure Pipeline (NIP) for FY25 to facilitate the creation of world-class infrastructure projects that not only boost the economy, but also generate large-scale employment opportunities. With a projected investment of ` 111 lakh crores ($1.5 trillion), the NIP bodes well for the energy, roads, urban infrastructure, railway sectors, among others.
We have navigated through several industry cycles and economic headwinds across decades to emerge stronger. This can be attributed to the strength of our business model as well as pace of transformation in line with the evolving macro trends and customer aspirations. Despite the lingering pain posed by the pandemic, India’s long-term growth potential is intact, and we are favourably positioned to deliver building solutions for a nation on the march.
OPER ATING CONTEX T
Well positioned to drive the India story
` 5.54 lakh croresUnion Budget (2021-22) outlay for infrastructure, higher by 34.5% from the budgeted allocation in FY21.
250 lakhs Additional affordable housing units will be needed by 2030
200-250 kgsPer capita cement consumption in India, v/s world average of 500-550 kgs
HOUSING SECTOR
LOW PER CAPITA CEMENT CONSUMPTION
INFR ASTRUCTURE CREATION
RESPONDING TO INDIA’S EVOLVING NEEDS
Catering to individual home builders’ needs
Widening national leadership
Proposed investment of ` 111 lakhs crores in infrastructure through National Infrastructure Pipeline for the period 2020-2025
NIP: annual investments and share of funding(` in lakh crores)
5.6
5.8
3.0
8.4
8.6
4.5
8.3
8.5
4.5
6.4
6.6
3.5
6.0
6.2
3.2
5.1
5.3
2.8
2019-20 2020-21 2021-22 2022-23 2023-24 2024-25
Addressing large infrastructure priorities
Partnering in nation building
28U
ltra
Tech
Cem
ent
Lim
ited
29A
nnua
l Rep
ort
202
0-21
Welcome to UltraTech
Value Creation
Growth Enablers
Statutory Reports
Financial Statements
ESG Commitments

BUSINESS STR ATEGY
A blueprint for building a better future
Enhance Stakeholder Value
Key elements of strategy
Integration of Environmental, Social, Governance parameters
KEY ELEMENTS OF STR ATEGY
Enhance balance sheet strength
Enhance balance sheet strength
Low capex expansion
Without endangering the
environment
1. Largely brownfield expansion2. Targeted average capex cost of
<US$ 60 per tonne3. Targeted average capex outflow of
~US$ 600 mn annually including growth capex
Without endangering the environment
Profitable growth
Market leader
Strong financials
Premium brand
Socially responsible 1. 12.8 MTPA expansion approved
and under commissioning (75% brownfield)
2. Brownfield expansion will lead to faster commissioning of projects. (low duration than greenfield projects: ~6 months)
1. WHRS power generation increased by 21% over FY20.
2. Green power share in power mix raised to 13% (LY 11.5%)
3. Conversion ratio improved by 2% over FY20.
4. Water positivity of 3.9x (compared to 2.8x for FY20)
1. Waste Heat Recovery System (WHRS) to address 40% power requirement of expanded capacity
2. Higher blended percentage as majority of capacity expansion to cater to East and Central demand
3. Conversion ratio to improve
1. Funding through internal accruals2. Prioritise plants having substantial
locational advantage to reduce lead time and increase EBITDA
3. Ideal clinker locations and their grinding units
4. Strengthening overall ROCE
Low cost expansion
Aligned with our vision, we have developed a robust growth strategy to deliver superior value to all our stakeholders based on the four pillars of Sustainability, Innovation, Customer Centricity, Team Empowerment. 1. Proposed expansion will help to lower
all India lead by ~17 kilometres and by ~63 kilometres in East Zone.
2. Grinding unit expansions within market proximity (<250 kilometres)
3. ROCE (Ex Goodwill) for consolidated operations for FY21 increased to 15.3% (vis-à-vis 12% for FY20)
Progress in 2020-21
Progress in 2020-21
Progress in 2020-21
30U
ltra
Tech
Cem
ent
Lim
ited
31A
nnua
l Rep
ort
202
0-21
Welcome to UltraTech
Value Creation
Growth Enablers
Statutory Reports
Financial Statements
ESG Commitments

We built UltraTech Cement through a balanced growth approach driven by organic and inorganic expansion.
A journey of grit, determination and courage
Capacity evolution
(In MTPA) Organic Inorganic
1983 1999 2004 2008 2011
116.8
2020
42.9
31.8
67.7
51.8
35.031.0
1.0
9.6
2016
24.8
20.0
50.5
66.3
17.0
13.0
18.0
18.0
1.0
8.5
1.1
1.0 MTPA- 1st cement plant set up for Grasim
(Vikram Cement) and Indian Rayon (Rajashree Cement)
- White cement launched in 198831.0 MTPA- Acquisition of L&T Cement
Business (17 MTPA)
- Listing of UltraTech Cement as part of acquisition
51.8 MTPA- Organic Capacity addition: 15 MTPA
- Group Cement business under one roof
- Acquisition of Star Cement: 3 MTPA
- Building Products launched in 2012
8.5 MTPA- Merger of Indian Rayon and
Grasim cement business
- Ready-Mix Concrete launched in 1998
35.0 MTPA- Focus on Cost Leadership between 2005-2009
- Synergy of Cement Businesses of Aditya Birla Group under one roof
- Investment in TPPs - 80% power self -sufficient
- UltraTech Building Solutions launched in 2007
67.7 MTPA- Organic Capacity addition: 11.1 MTPA
- Inorganic Capacity addition: 4.8 MTPA
116.8 MTPA- Added 49.1 MTPA capacity1
- #3 global cement player by capacity (ex. China)
1Incremental capacity from Mar-16 to Dec-20
2016
2011
1983-88
1998
2004
2020
2008
32U
ltra
Tech
Cem
ent
Lim
ited
33A
nnua
l Rep
ort
202
0-21
CAPACIT Y EXPANSION
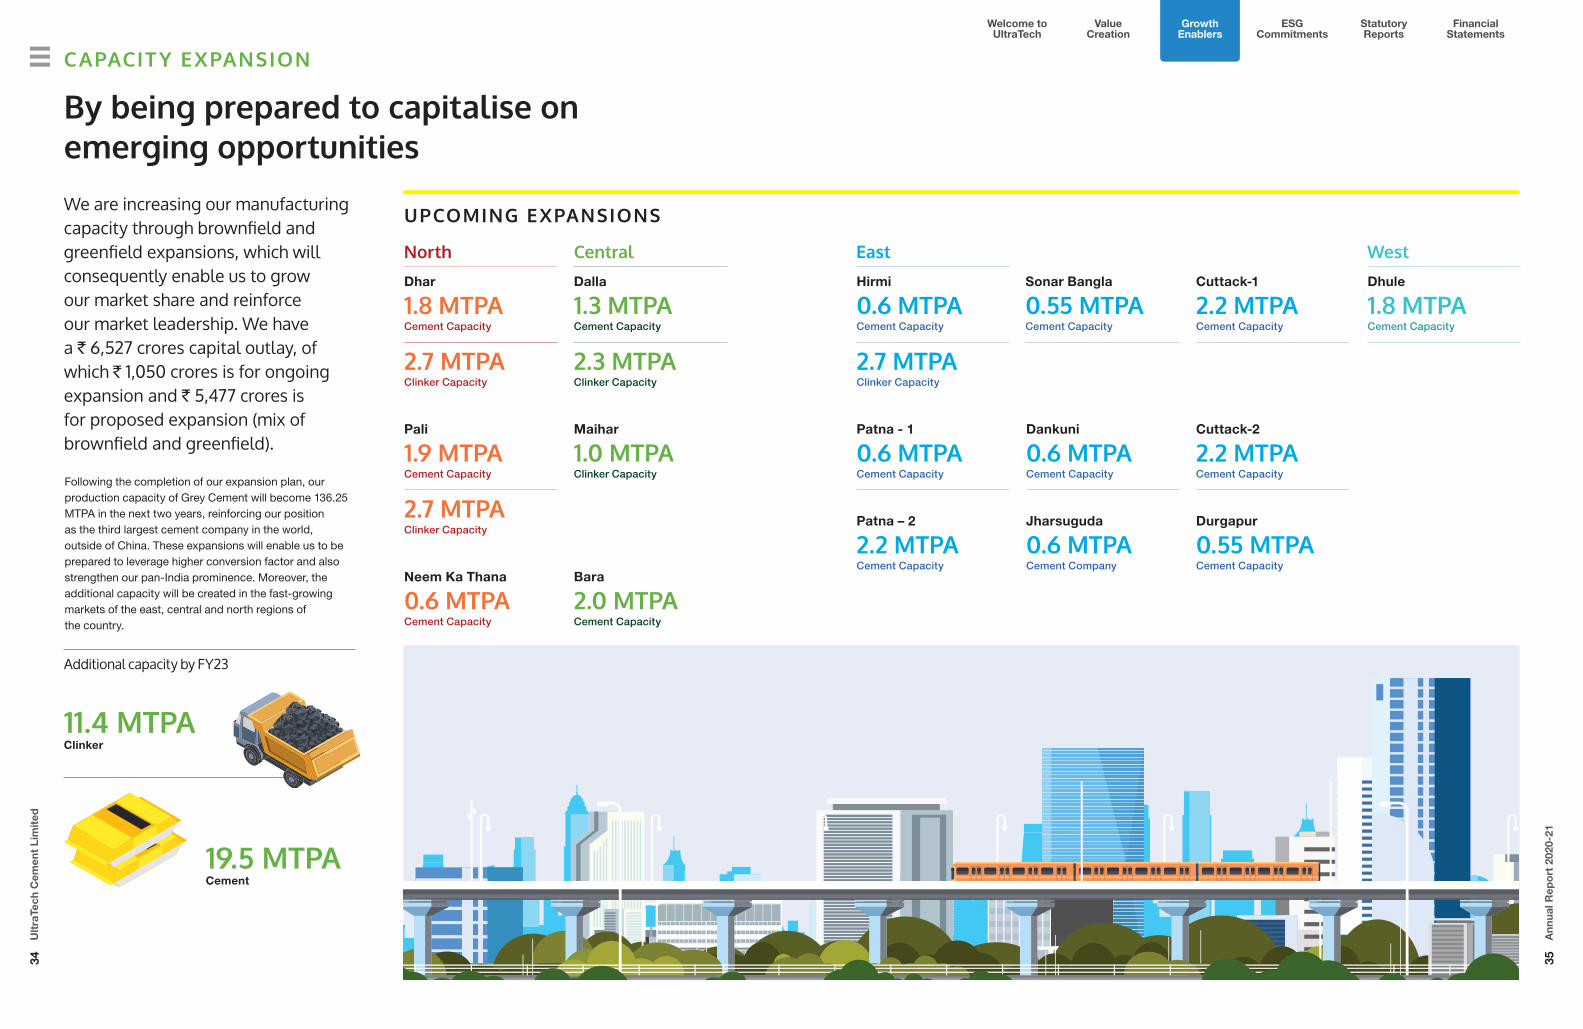
By being prepared to capitalise onemerging opportunitiesWe are increasing our manufacturing capacity through brownfield and greenfield expansions, which will consequently enable us to grow our market share and reinforce our market leadership. We have a ` 6,527 crores capital outlay, of which ` 1,050 crores is for ongoing expansion and ` 5,477 crores is for proposed expansion (mix of brownfield and greenfield).
Following the completion of our expansion plan, our production capacity of Grey Cement will become 136.25 MTPA in the next two years, reinforcing our position as the third largest cement company in the world, outside of China. These expansions will enable us to be prepared to leverage higher conversion factor and also strengthen our pan-India prominence. Moreover, the additional capacity will be created in the fast-growing markets of the east, central and north regions of the country.
North Central East West
UPCOMING EXPANSIONS
Dhar
1.8 MTPACement Capacity
2.7 MTPAClinker Capacity
Dalla
1.3 MTPACement Capacity
2.3 MTPAClinker Capacity
Hirmi
0.6 MTPACement Capacity
2.7 MTPAClinker Capacity
Dhule
1.8 MTPACement Capacity
Sonar Bangla
0.55 MTPACement Capacity
Cuttack-1
2.2 MTPACement Capacity
Durgapur
0.55 MTPACement Capacity
Pali
1.9 MTPACement Capacity
2.7 MTPAClinker Capacity
Maihar
1.0 MTPAClinker Capacity
Patna - 1
0.6 MTPACement Capacity
Dankuni
0.6 MTPACement Capacity
Cuttack-2
2.2 MTPACement Capacity
Neem Ka Thana
0.6 MTPACement Capacity
Bara
2.0 MTPACement Capacity
Patna – 2
2.2 MTPACement Capacity
Jharsuguda
0.6 MTPACement Company
Additional capacity by FY23
11.4 MTPAClinker
19.5 MTPACement
34U
ltra
Tech
Cem
ent
Lim
ited
35A
nnua
l Rep
ort
202
0-21
Welcome to UltraTech
Value Creation
Growth Enablers
Statutory Reports
Financial Statements
ESG Commitments

By improving operational efficiency
Cost leadership remains our priority across every aspect of operations. We have adopted best-in-class technologies to rationalise costs and strengthen margins.
• Explore captive limestone deposits in detail in terms of its lateral and vertical mineralisation for reassessment of the resource/reserve potential and optimisation of raw mix design and fuel
• Initiate the assessment of topographic map and resource/reserve digitally, utilising drones and mine planning software
• Procure new technology equipment driving fuel and cost efficiency
• Incorporate safety features / devices at the time of procurement of equipment to ensure safety in operations and maintenance
• Roll out mining operations productivity improvement through data analytics
• Prioritise land purchase in mineral bearing area in a continuous manner
Packing bags
We have started entering into long-term sourcing contracts for packing bags to securitise seamless supply of quality packaging materials. These contracts are also expected to lower the cost, compared to ongoing market prices.
Petcoke substitution
Our geographically diverse global vendor base, strategic partnerships and close monitoring of market dynamics enabled us to counter the supply disruption in petcoke by switching over with agility to other competitive fuels from multiple origins.
UltraTech RMC received a patent for a vibrating sieve- an assembly for improving downstream controlled flow of raw materials through a feed hopper. We replaced existing sieve with an inclined spring mounted sieve shaker attached at the top of ground feeding hopper with reduced size and auto operated. This innovation helped in low plant maintenance cost due to an increase in the life of aggregate gates, mixer machine, concrete pumps, reduced rejection and waste of concrete on account of quality and improved safety.
Unusual times, unique solutions Our logistics team rolled out Project Raftaar, one among many initiatives, which helped to overcome paucity of drivers at plant locations, bringing back 100+ drivers to the plant from their villages in Bihar, allaying their fears and apprehensions. We ensured complete safety in line with COVID protocol, while getting them back.
We also used advanced technology (GPS) to identify stranded trucks/drivers and help them reach safer destinations with the support of local authorities.
COST LEADERSHIP
MINING PR ACTICES DRIVING EFFICIENCY
COST SAVING ON KEY INPUTS
To meet demand spurts and overcome material availability challenges we displayed agility and responsiveness by strategically moving material from different geographies thereby protecting market share and improving profitability.
• Focussed on clinker movement at optimal cost by collaborating with railways, augmenting fleet capability at specific geographies
• Adopted technology as the key enabler for supply chain excellence and addressing complexities of wide distribution network, increasing product variations, catering varying order sizes from 2 MT to 40 MT and ensuring last mile delivery at customer doorsteps
• Deployed differentiated supply and service strategies to serve different customer segments of rural and urban markets
• Continued focus on enhancing bulk movement to strengthen sustainability initiatives and better service to institutional customers
• Maintained multimodal transportation network comprising Rail, Road and Sea ensuring smooth, timely deliveries to all customers at all times across Trade and Institutional segments
• Leveraged our vast production capability and distribution network to fuel further growth of new products
SCALING UP OUR LOGISTIC BACKBONE
Growing domestic sales(MMT)
13.50 18.46 22.15 25.95Q1 FY21 Q2 FY21 Q3 FY21 Q4 FY21
36U
ltra
Tech
Cem
ent
Lim
ited
37A
nnua
l Rep
ort
202
0-21
Welcome to UltraTech
Value Creation
Growth Enablers
Statutory Reports
Financial Statements
ESG Commitments
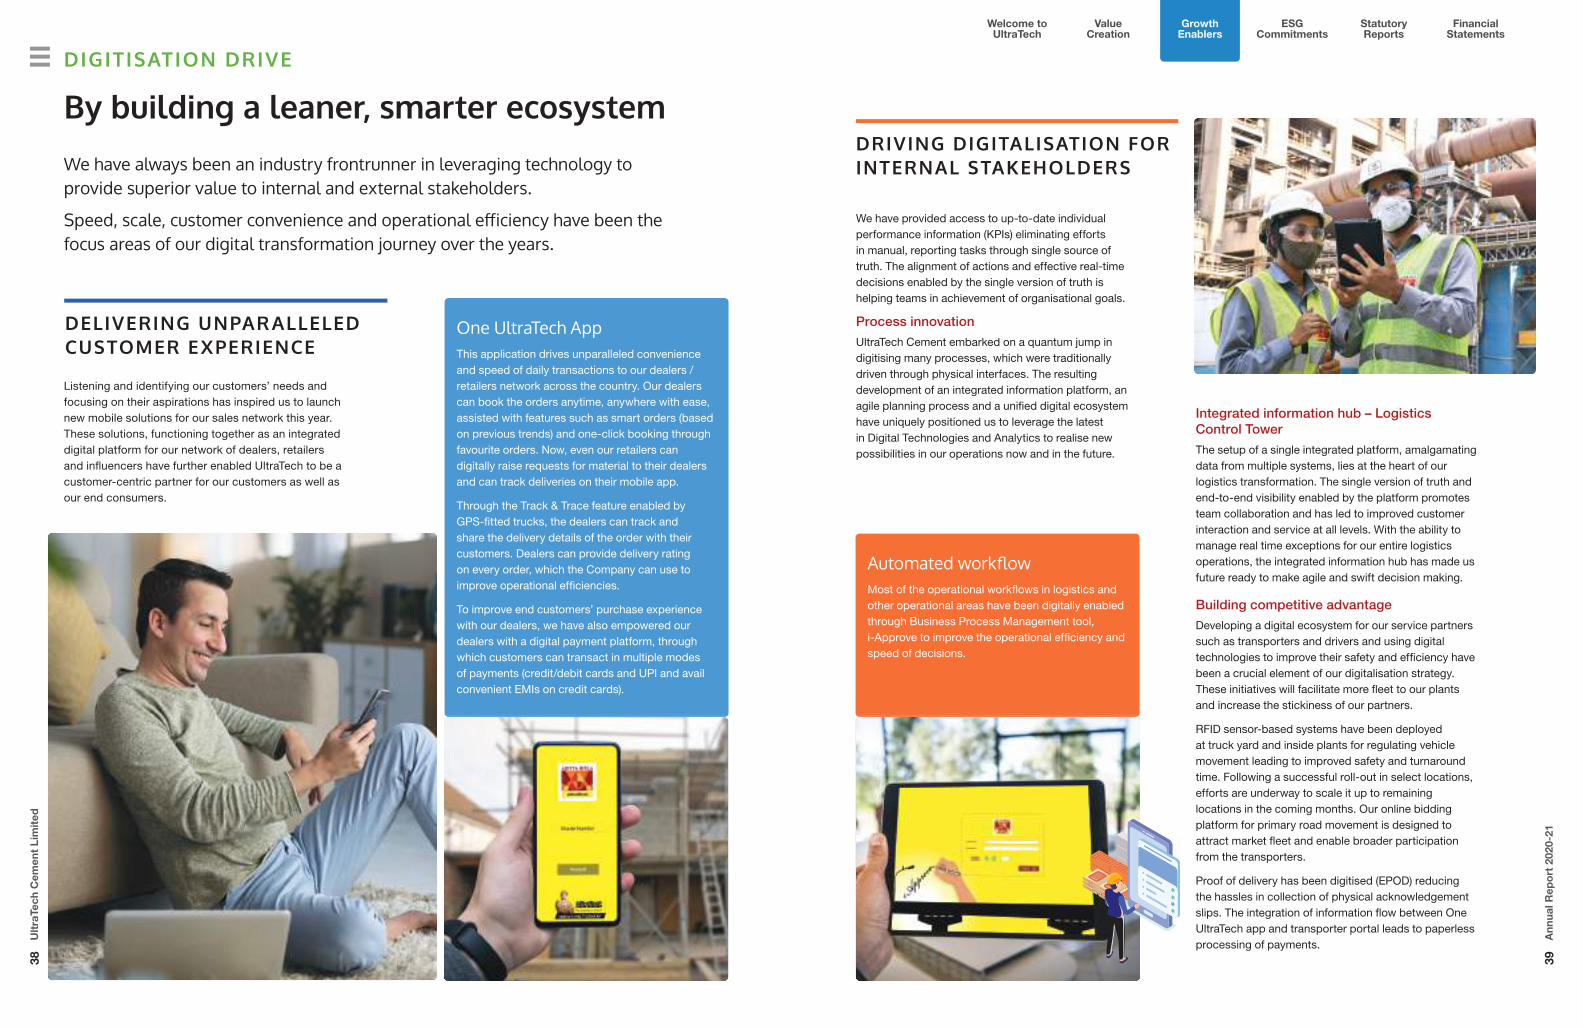
Listening and identifying our customers’ needs and focusing on their aspirations has inspired us to launch new mobile solutions for our sales network this year. These solutions, functioning together as an integrated digital platform for our network of dealers, retailers and influencers have further enabled UltraTech to be a customer-centric partner for our customers as well as our end consumers.
DELIVERING UNPAR ALLELED CUSTOMER EXPERIENCE
We have provided access to up-to-date individual performance information (KPIs) eliminating efforts in manual, reporting tasks through single source of truth. The alignment of actions and effective real-time decisions enabled by the single version of truth is helping teams in achievement of organisational goals.
Process innovation
UltraTech Cement embarked on a quantum jump in digitising many processes, which were traditionally driven through physical interfaces. The resulting development of an integrated information platform, an agile planning process and a unified digital ecosystem have uniquely positioned us to leverage the latest in Digital Technologies and Analytics to realise new possibilities in our operations now and in the future.
By building a leaner, smarter ecosystemWe have always been an industry frontrunner in leveraging technology to provide superior value to internal and external stakeholders.
Speed, scale, customer convenience and operational efficiency have been the focus areas of our digital transformation journey over the years.
Integrated information hub – Logistics Control Tower
The setup of a single integrated platform, amalgamating data from multiple systems, lies at the heart of our logistics transformation. The single version of truth and end-to-end visibility enabled by the platform promotes team collaboration and has led to improved customer interaction and service at all levels. With the ability to manage real time exceptions for our entire logistics operations, the integrated information hub has made us future ready to make agile and swift decision making.
Building competitive advantage
Developing a digital ecosystem for our service partners such as transporters and drivers and using digital technologies to improve their safety and efficiency have been a crucial element of our digitalisation strategy. These initiatives will facilitate more fleet to our plants and increase the stickiness of our partners.
RFID sensor-based systems have been deployed at truck yard and inside plants for regulating vehicle movement leading to improved safety and turnaround time. Following a successful roll-out in select locations, efforts are underway to scale it up to remaining locations in the coming months. Our online bidding platform for primary road movement is designed to attract market fleet and enable broader participation from the transporters.
Proof of delivery has been digitised (EPOD) reducing the hassles in collection of physical acknowledgement slips. The integration of information flow between One UltraTech app and transporter portal leads to paperless processing of payments.
DIGITISATION DRIVE
One UltraTech App This application drives unparalleled convenience and speed of daily transactions to our dealers / retailers network across the country. Our dealers can book the orders anytime, anywhere with ease, assisted with features such as smart orders (based on previous trends) and one-click booking through favourite orders. Now, even our retailers can digitally raise requests for material to their dealers and can track deliveries on their mobile app.
Through the Track & Trace feature enabled by GPS-fitted trucks, the dealers can track and share the delivery details of the order with their customers. Dealers can provide delivery rating on every order, which the Company can use to improve operational efficiencies.
To improve end customers’ purchase experience with our dealers, we have also empowered our dealers with a digital payment platform, through which customers can transact in multiple modes of payments (credit/debit cards and UPI and avail convenient EMIs on credit cards).
Automated workflow Most of the operational workflows in logistics and other operational areas have been digitally enabled through Business Process Management tool, i-Approve to improve the operational efficiency and speed of decisions.
DRIVING DIGITALISATION FOR INTERNAL STAKEHOLDERS
38U
ltra
Tech
Cem
ent
Lim
ited
39A
nnua
l Rep
ort
202
0-21
Welcome to UltraTech
Value Creation
Growth Enablers
Statutory Reports
Financial Statements
ESG Commitments

PROJECT ‘ONE FINANCE’
Our Shared Services Centre - UltraTech Knowledge Service Centre (UKSC) at Pune is centralising our accounting processes, enabling us to standardise and make our systems agile. This year we have completed migration of all our transactional accounting processes from our manufacturing and marketing office locations to UKSC. The main objectives of UKSC are to strengthen financial discipline, enable uniform practices in finance and accounting processes and build a digitally-enabled Centre of Excellence.
We embarked on digital transformation during the year that has the potential to decouple emissions and resource use from economic growth as well as making our operations sustainable, safer and more reliable.
The digital transformation projects undertaken in the last 12-18 months have given us immense benefits in the areas of operational efficiency/productivity, improved customer convenience and employee collaboration.
The digital transformation journey at UltraTech Cement will further gather momentum in the coming years in view of immense learnings and success achieved in the challenging year.
DIGITISATION DRIVE
Digitalisation in manufacturing operations has had a profound impact on sectors and companies to undergo structural change and fundamentally alter traditional business models. We are leading from the front on applying digital solutions in manufacturing activities to gain advantages in digital enablement of operations and we see digitalisation as a driver of sustainability.
We have done successful pilots leveraging digital and Artificial Intelligence (AI) across manufacturing value chain of cement plant, thermal power plant, safety, mines etc.
The key themes of digital investments have helped us drive sustainability to the next level:
MAKING MANUFACTURING SMARTER
Reliable operations
Safer operations
Enhanced productivity
Energy optimisation
Process stability
40U
ltra
Tech
Cem
ent
Lim
ited
41A
nnua
l Rep
ort
202
0-21
Welcome to UltraTech
Value Creation
Growth Enablers
Statutory Reports
Financial Statements
ESG Commitments

TECHNICAL SERVICESTechnical Services is one of the major differentiators in ensuring that the brand be the first choice of customers and influencers. We have a professional team across the country to provide technical support to home builders, engineers, architects, masons and contractors. Mobile Concrete Labs are providing on-site testing, product demonstration, construction tips and advisories. During FY21, our teams have connected with over 5 lakhs Individual Home Builders (IHBs) through digital mode to provide product/service support.
By strengthening our reach and impact
As the leading cement player, we have extensively developed our dealer and retainer network to deepen our presence across India. Our nationwide reach is supported by strong logistic arrangements. Apart from providing high-quality cement, we offer a wide range of value-added services to our customers, influencers and other key stakeholders.
Today, we have a dealer and retail network of 1,00,000+ channel partners across the country, with a market reach extending across more than 80% Indian cities and towns.
Digital Connect We have various platforms to engage with dealers, retailers, masons, contractors and architects giving instant access to latest information along with updates on events and contests.
8,500Daily truck movement
30+Daily rake movement
900+Warehouses and 260+ railheads
Roads
73% Railways
25% SEA
2%
At UltraTech Cement, we are transporting daily 4.40 million bags across 24,000 destinations (catering to 31,000 orders daily) through a judicious mix of rail, road and sea routes. We are one of the few cement companies in India to utilise captive jetties to service coastal demand.
24,000+Destinations served
37,500Truck fleet
Mix of transportation
A preferred destination of home builders for building repair products, tile adhesives, sanitary and fittings, waterproofing products and services and solutions needed for building their homes. We offer products, services and solutions as part of our portfolio across 2,500+ outlets enabling us to increase the share of customer wallet.
EX TENSIVE DISTRIBUTION
NATIONWIDE REACH WITH STRONG LOGISTICS PRESENCE ACROSS INDIA
We provide technical assistance during concreting to
ensure quality and consistency in concrete. This service is
provided at the site through a van manned by a qualified and
trained civil engineer
42U
ltra
Tech
Cem
ent
Lim
ited
43A
nnua
l Rep
ort
202
0-21
Welcome to UltraTech
Value Creation
Growth Enablers
Statutory Reports
Financial Statements
ESG Commitments

Disclaimer: UltraTech Cement is one of the key building material suppliers and the savings estimated are for the project as a whole over its life
*Best estimates based on fuel savings projected from the project
Durgam Cheruvu Cable Bridge in Hyderabad is a critical infrastructure that
reduces environmental impact by easing congestion. The project will help
reduce ~4.38* million tonnes of CO2 emissions over its life.
Nagpur Metro helps reduce environmental impact by reducing on-road
congestion and emissions. The project is likely to reduce ~1.1 million tonnes of
CO2 emissions over its life, benefiting society.
Atal Tunnel, Rohtang is another important infrastructure that reduces environmental
impact and helps protect the endemic ecology of the valley. The project will help
avoid approximately 4.02* million tonnes of CO2 over its life.
Cementing a low-carbon pathway
44U
ltra
Tech
Cem
ent
Lim
ited
45A
nnua
l Rep
ort
202
0-21
44U
ltra
Tech
Cem
ent
Lim
ited
45A
nnua
l Rep
ort
202
0-21

Protecting the natural ecosystem We are committed to minimising the adverse impact of our operations on the natural environment. As part of that commitment, we joined the growing list of companies getting their targets validated by Science-Based Target initiative (SBTi). Our targets will equip our business to adhere to the Paris Agreement of the United Nations Framework Convention on Climate Change.
ENVIRONMENT
We are a signatory to the Task Force on Climate-Related Financial Disclosures (TCFD) and have undertaken a climate change risk and opportunities assessment study in accordance with TCFD recommendations. Our sustainability and roadmap for climate action clearly defines the targets aligned with the prioritised strategic areas to build a low-carbon future and high resiliency to climate change.
• Carbon offset projects in community
• Internal carbon pricing• Increasing share of
renewable energy• Focus on low-carbon
products
Climate change, energy and emissions
• Water recycling• Groundwater recycling• Rainwater harvesting• Water-efficient
technologies• Zero water discharge
Water Management
• Waste management• Industrial waste to
blended cements• Industrial waste as
alternative fuel• Concrete recycling• Municipal solid waste
as alternative fuel
Circular Economy
• Environmental Impact Assessments
• No Net Loss
Biodiversity
Key climate change-related metrics, targets and progress
Scope 1 CO2 intensity
(kgCO2 per tonne of cementitious product)(%)
6.0
2020-21
2.8
2019-20
Target: Reduce the intensity by 27% by 2032 from the base year of 2017
Share of green energy in power mix(%)
10
2019-20
13
2020-21
Target: Increase the share to 34% by FY2024
Water Positive Index
(times)
2.8
2019-20
3.9
2020-21
Target: 5 times by 2024
Climate change, energy and emissions
We have also developed a strategic roadmap to reduce our carbon footprints to achieve sustainable growth.
• Established Internal Carbon Price (ICP) – a cost to reduce carbon emissions. We commenced valuation of carbon emissions with the introduction of shadow price of US$ 10/tonne CO2.
• Utilising the heat released from the system for the generation of electricity for our own operations. Currently, we have 125 MW Waste Heat Recovery capacity.
We have reduced our carbon emissions by 25% upto FY21, from FY06 level. 6% reduction has been achieved so far. These targets have been validated by SBTi.
We have continuous emissions monitoring systems and ambient air quality monitoring systems installed at all our cement manufacturing facilities for the measurement of dust, NOx, and SOx. We have installed world-class equipment to keep our emissions well under permissible range.
3%Of our energy requirement is
met through renewable energy capacity
46U
ltra
Tech
Cem
ent
Lim
ited
47A
nnua
l Rep
ort
202
0-21
Welcome to UltraTech
Value Creation
Growth Enablers
Statutory Reports
Financial Statements
ESG Commitments

Water management
We have integrated the recycling of water, rainwater harvesting, recharging of groundwater and employing water efficient technology as mainstream practices. We became 3.9 times water positive in FY21, which means we return back 3.9 times the amount of water we consume, to the community. We optimise our water consumption, discharge zero waste water and recycle water for use. We increase water availability by creating water storage structures and rainwater harvesting structures in the community.
71+ million m3of water harvested, recharged,
recycled and reused across our manufacturing
locations in FY21
We evaluate our water related risks, with the help of Indian Water Tool (IWT) which combines data from Indian government agencies and water stress indicators from World Resources Institute and Columbia Water Centre. This is used to understand and assess the future water related risks and helps us prioritise our actions for ensuring sustainable water management.
All our facilities are adhering to the zero-water discharge. We are also exploring the possibilities of conducting rigorous independent studies on watershed mapping, aquifer quality and impacts of groundwater recharge in and around our plants. Integrated watershed management projects around few of our facilities are underway.
Circular economy
As a founding member of the Global Cement and Concrete Association (GCCA) India chapter, we promote principles of circular economy across the industry. We aim to reduce the waste we generate and dispose the same responsibly.
• Currently, 100% fly ash generated at the power plants at our manufacturing facilities is utilised for manufacturing cement
• We are using industrial waste to produce blended cements – the blended cements we produce include PPC (Portland Pozzolana Cement), PSC (Portland Blast Furnace Slag Cement), PPC Super and Composite cement
• Over 3 lakhs+ MT of hazardous and non-hazardous wastes from other industries are utilised in kilns thus substituting the use of fossil fuels
• We are supporting 80 municipal corporations across India by helping them reduce the waste headed for landfills. This initiative complements the Swachh Bharat programmed of the Government of India.
Sustainability Linked bonds Issued sustainability linked bonds, the first ever such bonds in India.
We linked our sustainability targets performance with a financial penalty. Under this target, we aim to emit no more than 557 kg of carbon dioxide for every tonne of cementitious material produced by 31st March, 2030, which would be a 22.2% reduction from March 2017.
The coupon will step up by 75 basis points if the Company misses its sustainability target.
ENVIRONMENT
Biodiversity
We conduct extensive biodiversity assessments across our integrated plants to assess the presence of flora, fauna, Ecologically Sensitive Areas (ESAs) and animal corridors, along with ecosystem service review, community/stakeholder’s conservation efforts review. We have created biodiversity maps, biodiversity index and ecosystem services in the area. Based on these assessments, we implement biodiversity management plans across our facilities and mines. We have a proactive approach towards conserving natural habitats. We are also committed to No Net loss in line with our Biodiversity Policy.
48U
ltra
Tech
Cem
ent
Lim
ited
49A
nnua
l Rep
ort
202
0-21
Welcome to UltraTech
Value Creation
Growth Enablers
Statutory Reports
Financial Statements
ESG Commitments

SOCIAL : PEOPLE
Creating an empowered workforce
Our culture focuses on empowering people to be passionate and entrepreneurial in a respectful and inclusive way. It is free, fair, open, inclusive, performance driven and collaborative. Our strength lies in the diversity of our people, their thoughts and their experiences.
We are among ‘India’s 30 Best Workplaces in Manufacturing’ UltraTech Cement has been recognised as one of the 30 best organisation in 'India's best workplaces in Manufacturing 2021' list published by Great Place To Work® Institute.
PerformNEXT– our performance management system focuses on systematic planning of team and individual goals that collectively helps to deliver on planned organisation results.
Employee Engagement survey
We seek employee feedback and opinions through 'Vibes' – our biennial employee engagement survey. The last survey was rolled our in 2019, and basis employees' feedback, action plans were identified with involvement of employees and implemented.
Engagement and motivation
We believe that an engaged workforce produces extraordinary business results. Our people practices focus on ‘Engage to Excel’. We endevour to create an environment where employees experience a sense of belongingness, pride and opportunity to deliver to the best of their potential.
We have adopted a holistic approach to work, workplace and individual well-being to ensure an enabling, rewarding and enriching work environment that is continuously innovating and improving customer satisfaction, productivity and sustainability. Notwithstanding the current environment or restriction caused by COVID-19 pandemic, engagement continues stronger through Connect, Communication, Care and Collaboration. Several initiatives that enable mixed ways of working viz. at site, in the field, in offices and from home, that balances well with the business and individual requirements have been provided. Policies that support care for employees and family members affected by COVID-19 as well as measures to prevent being affected are in force.
Succession planning
Succession planning is done for all key positions in the organisation and these are reviewed regularly by the talent council comprising the top leadership team. Movements into the key positions are also prioritised, basis the finalised succession plan. Ongoing development support through an individual Development Plan covering critical exposures through assignments, special projects and coaching by professional coaches are provided to employees in the succession pipeline.
Performance evaluation
The Performance Management in any organisation needs to continuously evolve and align with the current and future needs of the business. PerformNEXT– our performance management system focuses on systematic planning of team and individual goals that collectively helps to deliver on planned organisation results. This follows periodic reviews of actual performance against these goals, performance conversations, course corrections and development feedback that drives continuous improvements in individual and team performance which helps raise the bar of organisational performance.
50U
ltra
Tech
Cem
ent
Lim
ited
51A
nnua
l Rep
ort
202
0-21
Welcome to UltraTech
Value Creation
Growth Enablers
Statutory Reports
Financial Statements
ESG Commitments

Employee learning and development
The Talent Management process focuses on identified Talent. These individuals are closely supported in their development journey through interventions like Development assessment centres followed by focused My Development Plans (MDPs). These MDPs are driven using the 70-20-10 philosophy of development. Progress of these employees are reviewed regularly by the Manager, Human Resources team and the Talent Council. Identified employees are also nominated for Accelerated Development Programs to fast forward development journeys.
Employee safety
We aim for ‘Zero harm’ for all our people. Our interventions are categorised as: Leading, Proactive and Corrective measures. Leading interventions help in identification of areas of concern, and build capability for continuous enhancement of systems for incident reduction at our plants. Proactive interventions help us identify and eliminate any probable risks of accidents by engaging with our people continually. Corrective actions are taken for management and changes in our systems and processes to reduce recurrence of incidents.
Empowering our women employees Our ‘Springboard’ programme is creating a diverse leadership pipeline for us, since 2016. It is a learning intervention conceptualised exclusively for women leaders in middle management and facilitates retention of 'high potential' women employees.
Our management trainee programme ‘Ulchemies’ and ‘UltraTechies’, keep a regular inflow of talent from campuses and includes a significant proportion of women. They are trained on various functions and groomed to take up frontline leadership roles.
Diversity and inclusion
We believe that ‘Together We Excel’. A diverse set of people can make this happen and we together build a workplace that creates a sense of belonging for everyone working at UltraTech Cement. Strong leadership and a diverse human resource pipeline have been critical for our success. We are focussing on building gender diversity through women employee hires and investing in their development for career enhancement. We have been taking several steps to create an inclusive work environment. As a result, the representation of women has been increasing.
We have a policy of zero-tolerance towards any form of sexual harassment and conform to the Aditya Birla Group policy on prevention of sexual harassment at workplaces. During the year, there have been four grievances, as per our special Complaints Committee that has been set up at our Units, Business and Group Levels, which have been acted upon.
We have women employees in core manufacturing and field sales and have a regular inflow to the workplace through campuses. During the outbreak of COVID-19, our women doctors have been at the frontline, providing timely medical care not only to our employees and their families but also to the local community to help combat the pandemic.
0.14LTIFR for all employees
(both direct and indirect) for FY21
SOCIAL : PEOPLE52
Ult
raTe
ch C
emen
t Li
mit
ed
53A
nnua
l Rep
ort
202
0-21
Welcome to UltraTech
Value Creation
Growth Enablers
Statutory Reports
Financial Statements
ESG Commitments

Enabling prosperity through focused actions
We are actively contributing to the social and economic development of the communities in which we operate. We are doing so in sync with the United Nations Sustainable Development Goals to build a better, sustainable way of life for the weaker sections of society and raise the country’s human development index.
Our CSR activities touch 500+ villages around our facilities, ensuring the upliftment of the communities we operate in.
Education and capacity building
Our endeavour is to spark the desire for learning and knowledge at every stage of growth and development of a child through anganwadis, formal schools and colleges to informal vocational training centres. We provide students from within communities surrounding our manufacturing locations, with tools for quality elementary education along with scholarships to encourage meritorious students. We support education for the girl child through facilities targeted at helping them stay in school. We support in providing mid-day meals and transport facilities to ensure that parents continue to send their children to schools.
Healthcare
We provide a diverse range of healthcare facilities. Hospitals and healthcare centres comprise our channel partners. Several healthcare projects are spread across our manufacturing facilities and communities. We organise medical camps and immunisation programmes regularly, as well as help immunise children against polio.
CSR impact
Working with the community for the most vulnerable during COVID 19 • Enhancing awareness on the COVID-19 spread and
prevention along with social distancing practices • Engaged with local communities across 300 villages
and nearby urban centres • Distributed over 2,50,000 masks and hand sanitizers• Distributed 4,28,620 meals (cooked and dry ration) • Sanitised 300 villages and 6 urban slums• Supported local hospitals and local quarantine centres
(ventilators, drinking water facilities, medicines and other essentials)
Education and capacity building
Infrastructure Development
Healthcare
Social Reform
Sustainable Livelihoods
Focus areas SDGs impacted
507Villages covered
21 lakhs Beneficiaries
Community investment(` in crores)
74.9
6
2018-19
124.
51
2019-20
120.
68
2020-21
We provide support in treatment of disabilities such as cleft lip surgery and cochlear implant surgery for children, which have a life-changing impact. We also help provide artificial limbs for the physically challenged. We are working to provide medical help to the nearly blind, also extending support for carrying out cataract surgeries. We conduct preventive healthcare programmes for awareness about HIV/AIDS. We are also working to make villages open defecation-free by joining hands with the local governments to set up toilet facilities.
SOCIAL : COMMUNIT Y54
Ult
raTe
ch C
emen
t Li
mit
ed
55A
nnua
l Rep
ort
202
0-21
Welcome to UltraTech
Value Creation
Growth Enablers
Statutory Reports
Financial Statements
ESG Commitments

Infrastructure development
Infrastructure is a key enabler for provision of essential services in any society. We support communities with housing facilities, safe drinking water, health and hygiene and renewable source energy. Across the country, we have helped build community halls, school blocks, playgrounds, approach roads, installed solar lights, water harvesting structures, hand pumps, facilitated village drainage.
Social empowerment
We engage with communities in order to help enhance social cohesion and well-being. We run awareness programmes to advocate and support dowry-less marriages and widow remarriages. We also run de-addiction campaigns espousing basic moral values and gender equality.
Sustainable livelihoods
We have formed Self-Help Groups (SHGs) across villages to enhance livelihood opportunities. These SHGs transform lives by running small scale businesses, providing employment to local villagers. These businesses are set up by consulting the locals based on their needs. Our programmes cover women empowerment, skill enhancement and vocational training, agriculture development, animal husbandry, soil and water conservation, watershed development and agro-forestry.
In addition, we focus on skill development for urban youth. Through our Multi Skill Multi Sector Training Centres, we provide short-term training programmes in hospitality, computers, electronics, electrical repair, cosmetology, etc. We also run an Applicators Training Programme which provides special training to masons and others in the construction sector.
In a collaborative project with the Confederation of Indian Industries and Sector Skills Council – Pradhan Mantri Kaushal Vikas Yojana (PMKVY), we run skill centres to provide training in automobile repairing, electrical services, IT enabled services, beauty and wellness, retail sales, garment designing, courier services and logistics.
We work in collaboration with NABARD, MYRADA, ICRISAT, AFPRO and Aide et Action to increase the water positivity in the villages. We improved animal husbandry practices in collaboration with the Government, BAIF and JK Trust to augment income of the villagers.
Model villages
At UltraTech Cement, we recognise the village economy as vital to the stability and growth of the Indian economy. Encouraging development of these areas ensures lower rates of migration, thus containing a growing problem of overpopulation in cities and exploitation resulting from it. We help create model villages in rural India. For such a transformative project, we have chosen 100 villages. We aim to help the villages become self-reliant in every aspect over a five-year timeframe. We help them move out of the ‘below poverty line’ status. So far, more than 80 villages in India's hinterland have already achieved this milestone across Tamil Nadu, Karnataka, Chhattisgarh, Maharashtra, Gujarat, Madhya Pradesh, and Rajasthan.
SOCIAL : COMMUNIT Y56
Ult
raTe
ch C
emen
t Li
mit
ed
57A
nnua
l Rep
ort
202
0-21
Welcome to UltraTech
Value Creation
Growth Enablers
Statutory Reports
Financial Statements
ESG Commitments

GOVERNANCE
Demonstrating responsible leadership Board of Directors
Philosophy on corporate governance
We are always committed to the adoption of best governance practices and their adherence in true spirit. We abide by equitable treatment of all stakeholders, which have evolved over the years and helped us in maintaining their trust and appreciation.
We continuously strive to achieve excellence in corporate governance through its values – Integrity, Commitment, Passion, Seamlessness and Speed, which are reinforced at all levels of the organisation.
Code of conduct
To ensure fairness, transparency, and uniformity within the organisation, we follow a comprehensive Code of Conduct, to which all our organisational policies are also aligned.
Board diversity
We recognise and embrace the benefits of having a diverse Board to enhance quality of our performance. Our Board comprises ten Directors.
50% Independent Directors on the
Board including two women
3Non-executive Directors
2Executive Directors
~8 yearsAverage tenure of Directors
30%Women Directors
>90%Board Attendance
>90%Committee Attendance
Governance
Mr. Kumar Mangalam BirlaChairman
Mrs. Rajashree BirlaNon-Executive Director
Mr. Arun AdhikariIndependent Director
Ms. Alka BharuchaIndependent Director
Mr. Sunil DuggalIndependent Director
Mrs. Sukanya KripaluIndependent Director
Mr. S B MathurIndependent Director
Mr. K. K. MaheshwariVice Chairman and Non-Executive Director
Mr. K. C. JhanwarManaging Director
UltraTech Cement Board Committees
A Audit Committee
C Corporate Social Responsibility Committee
F Finance Committee
N Nomination, Remuneration and Compensation Committee
R Risk Management and Sustainability Committee
S Stakeholders Relationship Committee
A A
AC
A
N
N
N F
S S
S
C
C R R
CF
Mr. Atul DagaWhole-time Director and Chief Financial Officer
RF
Under the Board are various sub-committees to implement the Board decisions. These sub-committees maintain continuous oversight of key business functions through rigorous reviews of the implementation of policies and procedures.
The above can be accessed from https://www.ultratechcement.com/investors/corporate-governance
• Board Diversity Policy • Sustainability Policy
• Code of Conduct for Board and Senior management • Human Rights Policy
• Code of Conduct for employees • Safety Policy
• CSR Policy • Occupational Health Policy
• Dividend Distribution Policy • Energy and Carbon Policy
• Policy on materiality of information • Water Stewardship Policy
• Policy on Related Party Transactions • Biodiversity Policy
• Policy for material subsidiary • Internal Audit Charter
• Whistleblower Policy • Supplier Code of Conduct
• Code of Practices and Procedures of Fair Disclosure of UPSI • Archival Policy
• Tax Policy
Significant policies governing our business
58U
ltra
Tech
Cem
ent
Lim
ited
59A
nnua
l Rep
ort
202
0-21
Welcome to UltraTech
Value Creation
Growth Enablers
Statutory Reports
Financial Statements
ESG Commitments

Senior ManagementVivek AgrawalChief Marketing Officer
E R Raj NarayananChief Manufacturing Officer
Ashish DwivediCEO - Birla White
Pramod Rajgaria President - International Operations
Ramesh MitragotriChief Human Resource Officer
Sujeet JainChief Legal Officer
Company SecretarySanjeeb Kumar Chatterjee
Statutory AuditorsBSR & Co. LLP,Chartered Accountants, MumbaiKhimji Kunverji & Co., LLP,Chartered Accountants, Mumbai
Cost AuditorsD. C. Dave & Co.,Cost Accountants, MumbaiN. D. Birla & Co.,Cost Accountants, Ahmedabad
Secretarial AuditorMakarand M Joshi & Co.,Company Secretaries, Mumbai
Registered Office‘B’ Wing, Ahura Centre, 2nd Floor,Mahakali Caves Road, Andheri (East),Mumbai 400 093Tel: (022) 6691 7800/2926 7800Fax: (022) 6692 8109Website: www.ultratechcement.comwww.adityabirla.comCIN: L26940MH2000PLC128420
Registrar & Transfer AgentKFin Technologies Private LimitedSelenium Tower B,Plot Nos. 31 & 32,Financial District NanakramgudaSerilingampally Mandal,Hyderabad - 500 032Toll Free No.: 1800 5724 001Fax: (040) 2342 0814
CORPOR ATE INFORMATION
Statutory Reports62 Financial Highlights64 Directors' Report and Management Discussion and Analysis110 Report on Corporate Governance131 Shareholder Information142 Social Report147 Sustainability and Business Responsibility Report
Financial Statements161 Independent Auditors' Report172 Standalone Balance Sheet173 Standalone Statement of Profit and Loss176 Standalone Statement of Cash Flow178 Notes to Standalone Financial Statements247 Consolidated Financial Statements
60U
ltra
Tech
Cem
ent
Lim
ited
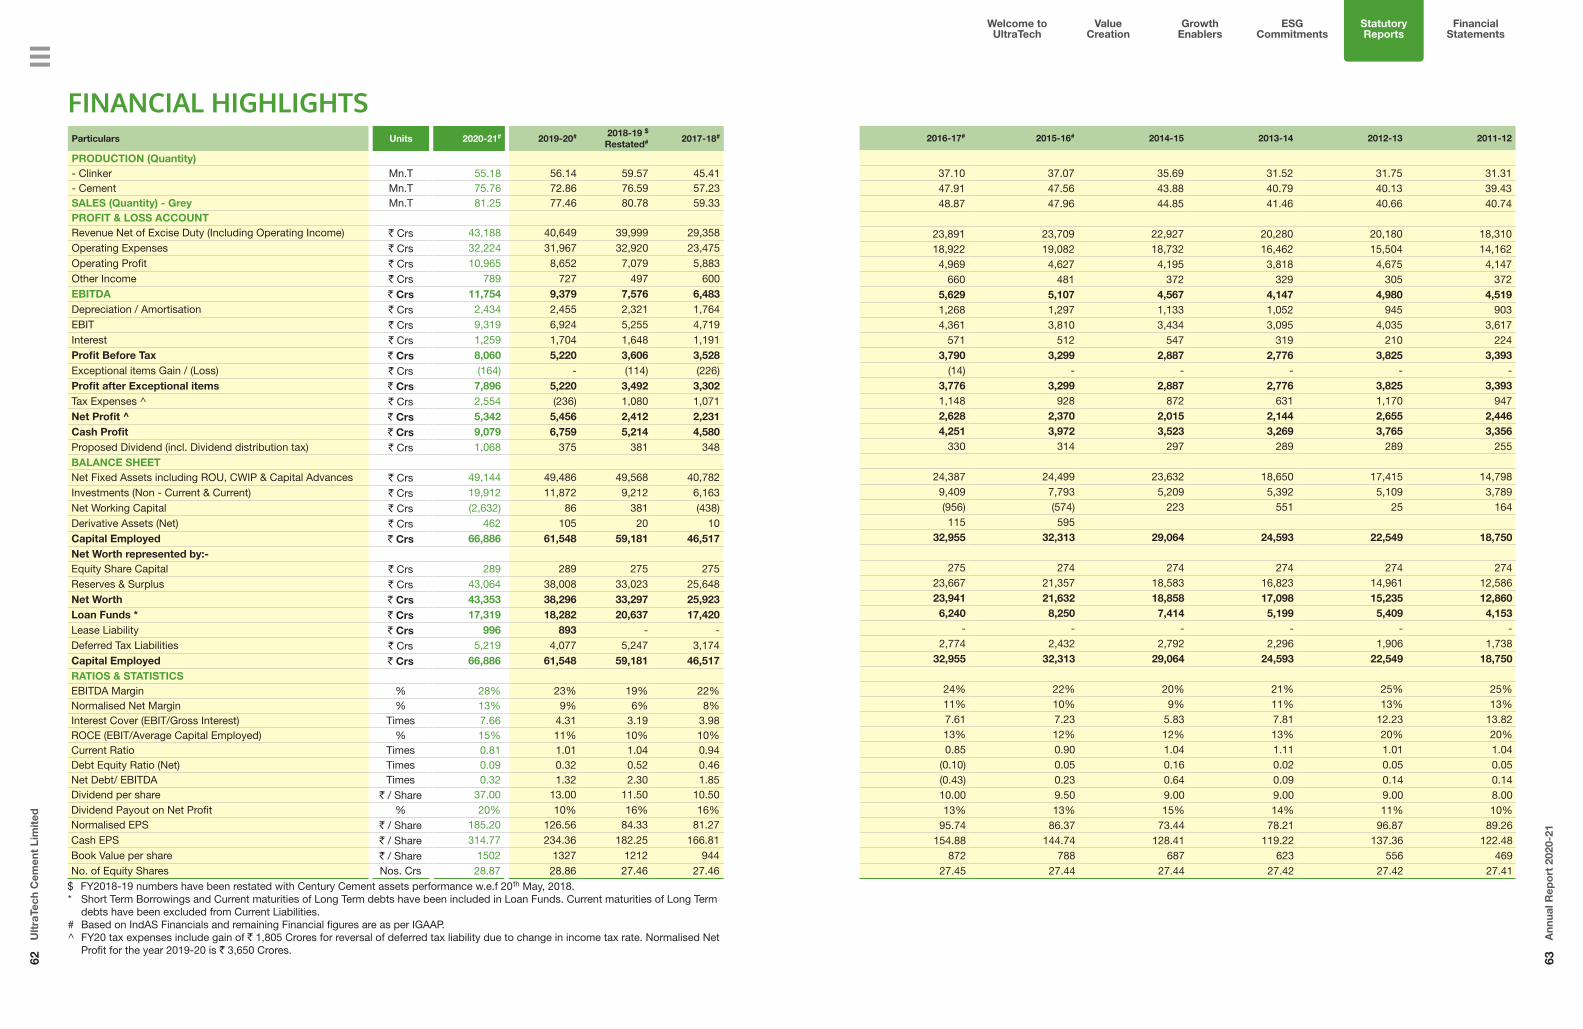
Welcome to UltraTech
Value Creation
Growth Enablers
Statutory Reports
Financial Statements
ESG Commitments
62U
ltra
Tech
Cem
ent
Lim
ited
63A
nnua
l Rep
ort
202
0-21
FINANCIAL HIGHLIGHTSParticulars Units 2020-21# 2019-20# 2018-19 $
Restated# 2017-18#
PRODUCTION (Quantity)- Clinker Mn.T 55.18 56.14 59.57 45.41- Cement Mn.T 75.76 72.86 76.59 57.23SALES (Quantity) - Grey Mn.T 81.25 77.46 80.78 59.33PROFIT & LOSS ACCOUNTRevenue Net of Excise Duty (Including Operating Income) ` Crs 43,188 40,649 39,999 29,358Operating Expenses ` Crs 32,224 31,967 32,920 23,475Operating Profit ` Crs 10,965 8,652 7,079 5,883Other Income ` Crs 789 727 497 600EBITDA ` Crs 11,754 9,379 7,576 6,483Depreciation / Amortisation ` Crs 2,434 2,455 2,321 1,764EBIT ` Crs 9,319 6,924 5,255 4,719Interest ` Crs 1,259 1,704 1,648 1,191Profit Before Tax ` Crs 8,060 5,220 3,606 3,528Exceptional items Gain / (Loss) ` Crs (164) - (114) (226)Profit after Exceptional items ` Crs 7,896 5,220 3,492 3,302Tax Expenses ^ ` Crs 2,554 (236) 1,080 1,071Net Profit ^ ` Crs 5,342 5,456 2,412 2,231Cash Profit ` Crs 9,079 6,759 5,214 4,580Proposed Dividend (incl. Dividend distribution tax) ` Crs 1,068 375 381 348BALANCE SHEETNet Fixed Assets including ROU, CWIP & Capital Advances ` Crs 49,144 49,486 49,568 40,782Investments (Non - Current & Current) ` Crs 19,912 11,872 9,212 6,163Net Working Capital ` Crs (2,632) 86 381 (438)Derivative Assets (Net) ` Crs 462 105 20 10Capital Employed ` Crs 66,886 61,548 59,181 46,517Net Worth represented by:-Equity Share Capital ` Crs 289 289 275 275Reserves & Surplus ` Crs 43,064 38,008 33,023 25,648Net Worth ` Crs 43,353 38,296 33,297 25,923Loan Funds * ` Crs 17,319 18,282 20,637 17,420Lease Liability ` Crs 996 893 - -Deferred Tax Liabilities ` Crs 5,219 4,077 5,247 3,174Capital Employed ` Crs 66,886 61,548 59,181 46,517RATIOS & STATISTICSEBITDA Margin % 28% 23% 19% 22%Normalised Net Margin % 13% 9% 6% 8%Interest Cover (EBIT/Gross Interest) Times 7.66 4.31 3.19 3.98ROCE (EBIT/Average Capital Employed) % 15% 11% 10% 10%Current Ratio Times 0.81 1.01 1.04 0.94Debt Equity Ratio (Net) Times 0.09 0.32 0.52 0.46Net Debt/ EBITDA Times 0.32 1.32 2.30 1.85Dividend per share ` / Share 37.00 13.00 11.50 10.50Dividend Payout on Net Profit % 20% 10% 16% 16%Normalised EPS ` / Share 185.20 126.56 84.33 81.27Cash EPS ` / Share 314.77 234.36 182.25 166.81Book Value per share ` / Share 1502 1327 1212 944No. of Equity Shares Nos. Crs 28.87 28.86 27.46 27.46
$ FY2018-19 numbers have been restated with Century Cement assets performance w.e.f 20th May, 2018.* Short Term Borrowings and Current maturities of Long Term debts have been included in Loan Funds. Current maturities of Long Term
debts have been excluded from Current Liabilities.# Based on IndAS Financials and remaining Financial figures are as per IGAAP.^ FY20 tax expenses include gain of ` 1,805 Crores for reversal of deferred tax liability due to change in income tax rate. Normalised Net
Profit for the year 2019-20 is ` 3,650 Crores.
2016-17# 2015-16# 2014-15 2013-14 2012-13 2011-12
37.10 37.07 35.69 31.52 31.75 31.3147.91 47.56 43.88 40.79 40.13 39.4348.87 47.96 44.85 41.46 40.66 40.74
23,891 23,709 22,927 20,280 20,180 18,31018,922 19,082 18,732 16,462 15,504 14,162
4,969 4,627 4,195 3,818 4,675 4,147660 481 372 329 305 372
5,629 5,107 4,567 4,147 4,980 4,5191,268 1,297 1,133 1,052 945 9034,361 3,810 3,434 3,095 4,035 3,617
571 512 547 319 210 2243,790 3,299 2,887 2,776 3,825 3,393
(14) - - - - -3,776 3,299 2,887 2,776 3,825 3,3931,148 928 872 631 1,170 9472,628 2,370 2,015 2,144 2,655 2,4464,251 3,972 3,523 3,269 3,765 3,356
330 314 297 289 289 255
24,387 24,499 23,632 18,650 17,415 14,7989,409 7,793 5,209 5,392 5,109 3,789(956) (574) 223 551 25 164115 595
32,955 32,313 29,064 24,593 22,549 18,750
275 274 274 274 274 27423,667 21,357 18,583 16,823 14,961 12,58623,941 21,632 18,858 17,098 15,235 12,860
6,240 8,250 7,414 5,199 5,409 4,153- - - - - -
2,774 2,432 2,792 2,296 1,906 1,73832,955 32,313 29,064 24,593 22,549 18,750
24% 22% 20% 21% 25% 25%11% 10% 9% 11% 13% 13%7.61 7.23 5.83 7.81 12.23 13.8213% 12% 12% 13% 20% 20%0.85 0.90 1.04 1.11 1.01 1.04
(0.10) 0.05 0.16 0.02 0.05 0.05(0.43) 0.23 0.64 0.09 0.14 0.1410.00 9.50 9.00 9.00 9.00 8.0013% 13% 15% 14% 11% 10%
95.74 86.37 73.44 78.21 96.87 89.26154.88 144.74 128.41 119.22 137.36 122.48
872 788 687 623 556 46927.45 27.44 27.44 27.42 27.42 27.41
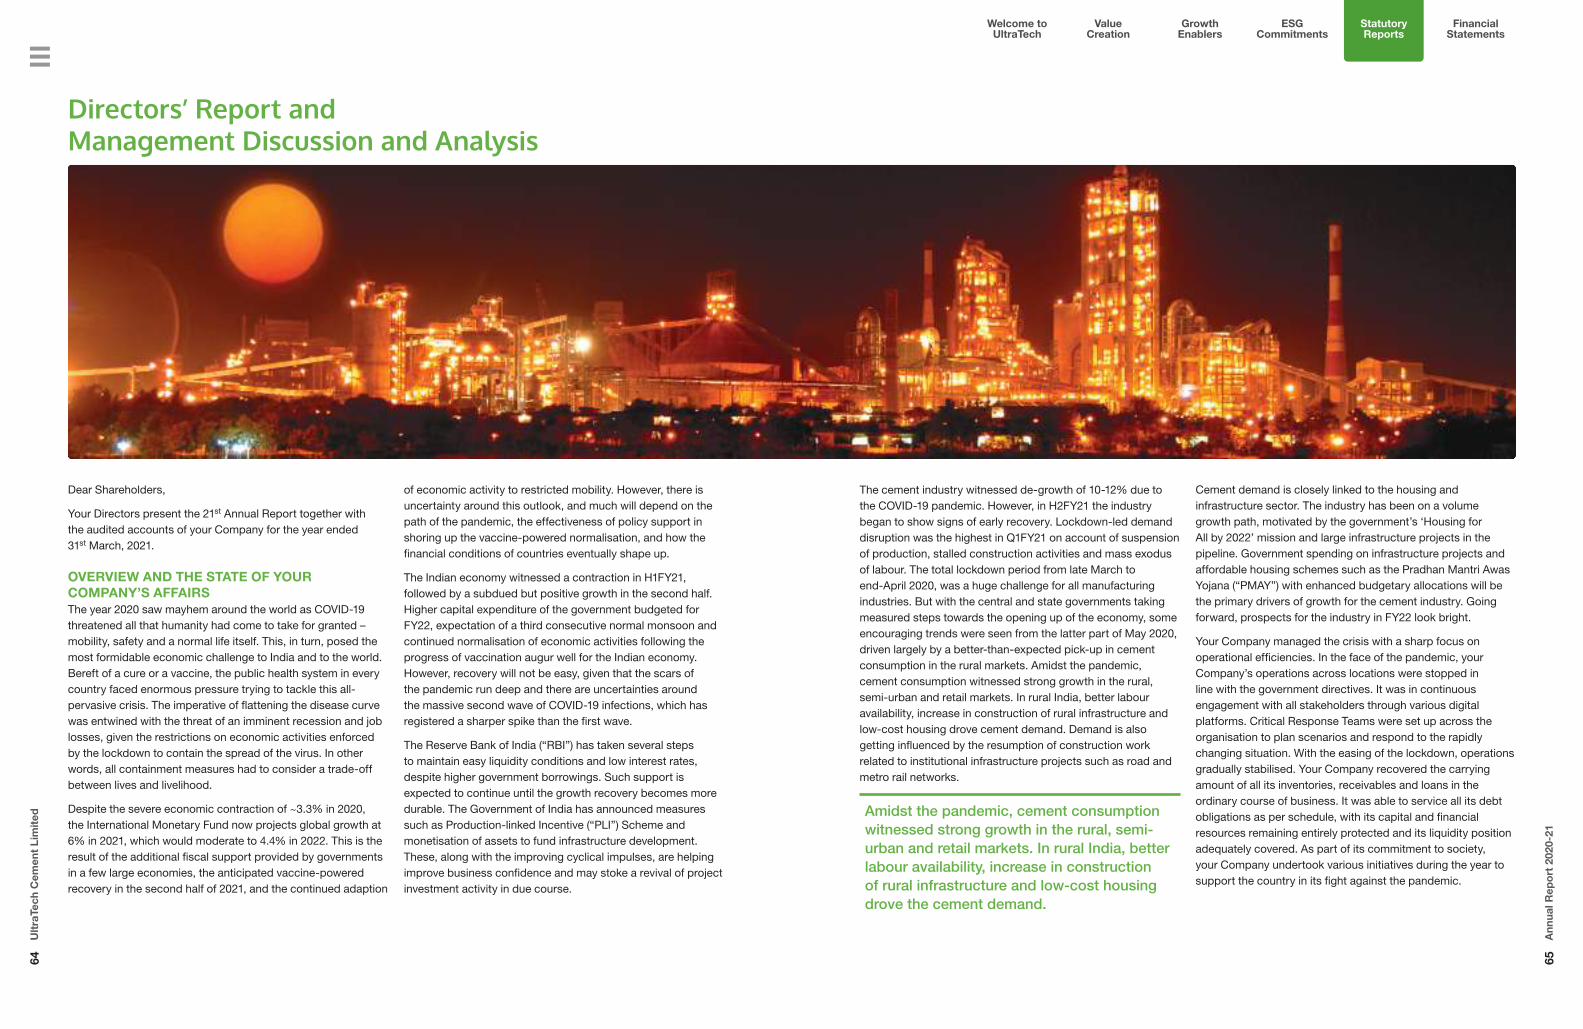
Welcome to UltraTech
Value Creation
Growth Enablers
Statutory Reports
Financial Statements
ESG Commitments
64U
ltra
Tech
Cem
ent
Lim
ited
65A
nnua
l Rep
ort
202
0-21
Dear Shareholders,
Your Directors present the 21st Annual Report together with the audited accounts of your Company for the year ended 31st March, 2021.
OVERVIEW AND THE STATE OF YOUR COMPANY’S AFFAIRSThe year 2020 saw mayhem around the world as COVID-19 threatened all that humanity had come to take for granted – mobility, safety and a normal life itself. This, in turn, posed the most formidable economic challenge to India and to the world. Bereft of a cure or a vaccine, the public health system in every country faced enormous pressure trying to tackle this all-pervasive crisis. The imperative of flattening the disease curve was entwined with the threat of an imminent recession and job losses, given the restrictions on economic activities enforced by the lockdown to contain the spread of the virus. In other words, all containment measures had to consider a trade-off between lives and livelihood.
Despite the severe economic contraction of ~3.3% in 2020, the International Monetary Fund now projects global growth at 6% in 2021, which would moderate to 4.4% in 2022. This is the result of the additional fiscal support provided by governments in a few large economies, the anticipated vaccine-powered recovery in the second half of 2021, and the continued adaption
of economic activity to restricted mobility. However, there is uncertainty around this outlook, and much will depend on the path of the pandemic, the effectiveness of policy support in shoring up the vaccine-powered normalisation, and how the financial conditions of countries eventually shape up.
The Indian economy witnessed a contraction in H1FY21, followed by a subdued but positive growth in the second half. Higher capital expenditure of the government budgeted for FY22, expectation of a third consecutive normal monsoon and continued normalisation of economic activities following the progress of vaccination augur well for the Indian economy. However, recovery will not be easy, given that the scars of the pandemic run deep and there are uncertainties around the massive second wave of COVID-19 infections, which has registered a sharper spike than the first wave.
The Reserve Bank of India (“RBI”) has taken several steps to maintain easy liquidity conditions and low interest rates, despite higher government borrowings. Such support is expected to continue until the growth recovery becomes more durable. The Government of India has announced measures such as Production-linked Incentive (“PLI”) Scheme and monetisation of assets to fund infrastructure development. These, along with the improving cyclical impulses, are helping improve business confidence and may stoke a revival of project investment activity in due course.
The cement industry witnessed de-growth of 10-12% due to the COVID-19 pandemic. However, in H2FY21 the industry began to show signs of early recovery. Lockdown-led demand disruption was the highest in Q1FY21 on account of suspension of production, stalled construction activities and mass exodus of labour. The total lockdown period from late March to end-April 2020, was a huge challenge for all manufacturing industries. But with the central and state governments taking measured steps towards the opening up of the economy, some encouraging trends were seen from the latter part of May 2020, driven largely by a better-than-expected pick-up in cement consumption in the rural markets. Amidst the pandemic, cement consumption witnessed strong growth in the rural, semi-urban and retail markets. In rural India, better labour availability, increase in construction of rural infrastructure and low-cost housing drove cement demand. Demand is also getting influenced by the resumption of construction work related to institutional infrastructure projects such as road and metro rail networks.
Amidst the pandemic, cement consumption witnessed strong growth in the rural, semi-urban and retail markets. In rural India, better labour availability, increase in construction of rural infrastructure and low-cost housing drove the cement demand.
Cement demand is closely linked to the housing and infrastructure sector. The industry has been on a volume growth path, motivated by the government’s ‘Housing for All by 2022’ mission and large infrastructure projects in the pipeline. Government spending on infrastructure projects and affordable housing schemes such as the Pradhan Mantri Awas Yojana (“PMAY”) with enhanced budgetary allocations will be the primary drivers of growth for the cement industry. Going forward, prospects for the industry in FY22 look bright.
Your Company managed the crisis with a sharp focus on operational efficiencies. In the face of the pandemic, your Company’s operations across locations were stopped in line with the government directives. It was in continuous engagement with all stakeholders through various digital platforms. Critical Response Teams were set up across the organisation to plan scenarios and respond to the rapidly changing situation. With the easing of the lockdown, operations gradually stabilised. Your Company recovered the carrying amount of all its inventories, receivables and loans in the ordinary course of business. It was able to service all its debt obligations as per schedule, with its capital and financial resources remaining entirely protected and its liquidity position adequately covered. As part of its commitment to society, your Company undertook various initiatives during the year to support the country in its fight against the pandemic.
Directors’ Report and Management Discussion and Analysis

Welcome to UltraTech
Value Creation
Growth Enablers
Statutory Reports
Financial Statements
ESG Commitments
66U
ltra
Tech
Cem
ent
Lim
ited
67A
nnua
l Rep
ort
202
0-21
Net TurnoverYour Company’s Net Turnover at ` 42,677 crores is 7% higher than the previous year.
Other IncomeOther income is marginally lower mainly on account of lower government grants compared to the previous year.
Operating Profit (PBIDT) and MarginPBIDT for the year at ` 11,754 crores is 25% higher than the previous year. Operating margin improved on account of volume growth and better sales realisation.
Cost Highlights(i) Energy Cost
Overall energy cost declined 3.5% from ` 985/t in the previous year to ` 950/t, mainly on account of saving in power consumption and increase in green power mix. Furthermore, your Company continuously works towards efficiency improvement. Key initiatives in this regard are:
− Commissioning of 7 MW Waste Heat Recovery System (“WHRS”) capacity. Your Company will commission another 72 MW of WHRS capacity during FY22, taking the total WHRS capacity to 197 MW. There is plan to further increase this to 302 MW by FY24, which will cater to 26% of the total power requirement.
− Increase solar and wind power capacity from 125 MW to >350 MW by the end of FY22 and cater to ~7% of the total power requirement.
− Use low-cost fuel viz. industrial waste.
− Continuous improvement in thermal power plant efficiency by reducing auxiliary consumption power.
(ii) Input Material Cost Raw material cost rose marginally from ` 493/t to ` 504/t
due to an increase in additive and fly ash prices. Increase in diesel prices impacted inbound transportation, resulting in higher raw material cost.
Your Company is continuously working on improving share of blended and premium products in its product mix, leading to an improvement in overall profitability.
(iii) Freight and Forwarding Expenses Logistics cost saw marginal increase from ` 1,144/t to
` 1,158/t, due to increase in diesel cost and lead distance on account of change in market mix. Synergies arising out of the integration of acquired assets aided in lowering the impact.
Employee CostsEmployee cost stood at ` 2,182 crores as compared to ` 2,336 crores in the previous year. This is a one-time gain on account of lower expenses towards retirement benefits and staff welfare expenses, during the year.
DepreciationAt ` 2,434 crores, depreciation for the year is lower by ` 21 crores over the previous year, mainly on account of few assets being fully depreciated.
Finance CostReduction in finance cost from ` 1,704 crores to ` 1,259 crores was mainly on account of lower borrowings and interest rates during the financial year.
Directors’ Report and Management Discussion and Analysis (Contd.)
Your Company undertook various initiatives during the year to support the country in its fight against the pandemic.
Your Company has the unique advantage of being able to cater to demand in different parts of the country and its focus on conserving cash continues unabated. All this has resulted in your Company emerging stronger and well prepared in the wake of the ongoing pandemic.
Your Company is closely monitoring the impact of the second wave of the pandemic on its operations while giving primacy to the safety and well-being of its employees and business partners. It has also undertaken a vaccination programme for all its employees and their dependents. With its focus on operational efficiencies and cost control and its continuing concern for its employees and all other stakeholders, your Company is better prepared for any resulting slowdown in the economy.
BUSINESS PERFORMANCE
Production and capacity utilisation (grey cement):Particulars FY21 FY20 % change
Installed capacity in India (MTPA) 111.35 111.35 -
Production (MMT) 79.70 76.57 4
Capacity Utilisation 71% 69% 2
MTPA – Million Metric Tonnes Per Annum MMT– Million Metric Tonnes
Cement production at 79.70 million tonnes in FY21 was higher by 4% as compared to the previous year. This is despite the lower cement consumption during Q1FY21 due to the outbreak of the pandemic across the country. Capacity utilisation was higher at 71% as compared to 69% last year.
Sales Volume:(Figures in MMT)
Particulars FY21 FY20 % change
Domestic Sales 80.18 76.40 5
Exports & Others 2.38 2.36 1
Total Sales Volume 82.56 78.76 5
Domestic sales volume registered a growth of 5%, after registering a 32% de-growth in Q1FY21. Cement consumption started improving from Q2FY21 on the back of consistent rural demand and pick-up in infrastructure activities during H2FY21.
FINANCIAL PERFORMANCE (` in crores)
Standalone Consolidated
FY21 FY20 FY21 FY20
Net Turnover 42,677 40,033 44,239 41,781
Domestic 42,363 39,706 42,264 39,597
Exports 314 327 1,975 2,183
Other Income 1,300 1,343 1,221 1,300
Total Expenditure 32,224 31,997 33,158 33,183Profit before Interest, Depreciation and Tax (PBIDT) 11,754 9,379 12,302 9,898Depreciation 2,434 2,455 2,700 2,723
Profit before Interest and Tax (PBIT) 9,319 6,924 9,602 7,176Interest 1,259 1,704 1,486 1,992
Profit before Impairment and Tax Expenses / share in profit of Associates
8,060 5,220 8,116 5,184
Rates and Taxes (164) - (164) -
Impairment on Advances Given - - (97) -
Share in Profit / (Loss) of Associates and Joint Venture (net of tax) - - 2 (1)
Profit before Tax Expenses 7,896 5,220 7,858 5,183Normalised Tax Expenses 2,554 1,570 2,539 1,543
Reversal of Deferred Tax Liability - (1,805) - (2,112)
Profit after Tax 5,342 5,456 5,319 5,751Profit Attributable to Non-controlling Interest - - (1) (4)
Profit Attributable to Owner of the Parent - - 5,320 5,755

Welcome to UltraTech
Value Creation
Growth Enablers
Statutory Reports
Financial Statements
ESG Commitments
68U
ltra
Tech
Cem
ent
Lim
ited
69A
nnua
l Rep
ort
202
0-21
Credit RatingYour Company has adequate liquidity and a strong balance sheet. CRISIL and India Ratings and Research have reaffirmed their credit rating as CRISIL AAA / Stable and IND AAA / Stable for Long Term and CRISIL A1+ and IND A1+ for Short Term, respectively. This is an acknowledgement of your Company’s ability to service its financial obligations in time and its sound financial management abilities.
Your Company has also obtained its credit rating for its foreign currency issuances from Fitch and Moody’s and has been rated by them as BBB- and Baa3 respectively.
Income TaxNormalised income tax expenses increased in line with an increase in taxable income.
Net ProfitNormalised Profit after Tax increased by 46% from ` 3,650 crores to ` 5,342 crores.
Significant changes in key financial ratios, along with detailed explanations:
Particulars FY21 FY20%
Change
Debtors Turnover (Days) 18 19 8
Inventory Turnover (Days) 32 35 7
Interest Coverage Ratio 7.66 4.31 78
Current Ratio 0.81 1.01 20
Debt Equity Ratio (Gross) 0.40 0.48 16
Debt Equity Ratio (Net) 0.09 0.32 73
Operating Profit Margin (%) 26 22 4
Net Profit Margin (%) 12.5 9.1 3.4
Return on Net Worth (%) 13.1 10.2 2.9
Return on Capital Employed (ROCE) (%)
15 11.4 3.5
Earnings per Share (EPS) 185 127 46
Detailed explanation of ratios
(i) Debtors Turnover (Days) is used to quantify a company’s effectiveness in collecting its receivables or money owed by customers. The ratio shows how well a company uses and manages the credit it extends to customers. The ratio is calculated by dividing average trade receivables by average per day turnover.
(ii) Inventory Turnover (Days) represents the average number of days a company holds its inventory before selling it. It is calculated by dividing average inventory by average per day turnover.
(iii) Interest Coverage Ratio measures how many times a company can cover its current interest payment with its available earnings. It is calculated by dividing PBIT by finance cost. Your Company’s Interest Coverage Ratio improved by 78% over the previous year mainly on account of increase in PBIT and lower interest outgo.
(iv) Current Ratio is a liquidity ratio that measures a company’s ability to pay short-term obligations or those due within one year. It is calculated by dividing the current assets by current liabilities.
(v) Debt Equity Ratio is used to evaluate a company’s financial leverage. It is a measure of the degree to which a company is financing its operations through debt versus wholly-owned funds. It is calculated by dividing a company’s total liabilities by its shareholder’s equity. Your Company’s Debt Equity Ratio (Net) has improved by 45% mainly on account of reduction in Net Debt during the year.
(vi) Operating Profit Margin (%) is a profitability or performance ratio used to calculate the percentage of profit a company generates from its operations. It is calculated by dividing the PBIDT (excluding Other Income) by turnover. Your Company’s Operating Profit Margin improved by 4% mainly on account of lower costs and higher realisations during the year.
(vii) Net Profit Margin (%) is equal to how much net income or profit is generated as a percentage of revenue. It is calculated by dividing the profit for the year by turnover. Your Company’s Net Profit Margin improved by 3% mainly on account of lower costs, lower interest outgo and higher realisations during the year.
(viii) Return on Net Worth (“RONW”) is a measure of profitability of a company expressed in percentage. It is calculated by dividing Net Profit from continuing operations for the year by average Net Worth during the year. The ratio for your Company improved by 2.8% mainly on account of increase in its profitability.
(ix) Return on Capital Employed (“ROCE”) is a financial ratio that measures a company’s profitability and the efficiency with which its capital is used. In other words, the ratio measures how well a company is generating profits from its capital. It is calculated by dividing profit before interest, exceptional items and tax by average capital employed during the year. This ratio improved by 2.8% for your Company mainly on account of increase in its profitability.
(x) Earnings Per Share (“EPS”) is the portion of a company’s profit allocated to each share. It serves as an indicator of a company’s profitability. It is calculated by dividing profit for the year by weighted average number of shares outstanding during the year. For your Company, the EPS improved on account of increase in Net Profit by 46% over that of the previous year.
Cash Flow Statement(` in crores)
FY21 FY20
SOURCES OF CASH
Cash from Operations 9,569 7,826
Non-operating Cash Flow 172 259
Proceeds from Issue of Share Capital 7 3
Decrease in Working Capital 1,982 433
Total 11,730 8,521
USES OF CASH
Net Capital Expenditure 1,726 1,577
Increase in Investments 7,433 2,633
Repayment of Borrowings (net) 891 2,468
Repayment of Lease Liability including Interest thereof
121 112
(Issue) / Sale of Treasury Shares (net) (7) 3
Interest 1,213 1,631
Dividend 375 380
Total 11,752 8,804
Increase / (Decrease) in Cash & Cash Equivalents
(21) (283)
Sources of CashCash from OperationsCash from operations was higher compared to the previous year on account of higher volume, and sales realisation.
Non-Operating Cash FlowCash from other activities was lower due to reduced interest income on bank deposits as a result of lower bank deposits.
Decrease in Working CapitalWorking capital decreased on account of increase in trade payables mainly on account of better credit terms and payment through letter of credit.
Uses of CashNet Capital ExpenditureYour Company spent ` 1,726 crores on various capex during the year, primarily towards:
• WHRS at various locations
• Cuttack Grinding Unit
• Patliputra Grinding Unit
• Dankuni Grinding Unit
Directors’ Report and Management Discussion and Analysis (Contd.) • Pali Integrated Unit
• Bicharpur Coal Block
• Other normal capex schemes for efficiency improvement and compliance with the changing regulatory framework
• Plant modernisation and maintenance
Increase in InvestmentsYour Company’s higher operating cash flows, resulted in an increase in liquid investment during the year.
Repayment of BorrowingIn line with its endeavour to maintain optimal capital structure, your Company repaid high-cost, long-term debt amounting to ` 5,227 crores and also repaid short-term loans as per due dates.
The loan repayments have been done through free cash flows that your Company has generated over the last few quarters, despite the challenging circumstances and severe business interruptions during the first quarter of the current fiscal year. The aforesaid steps have resulted in improved Net Debt Equity ratio and Net Debt/EBITDA ratio.
Transfer to General ReservesYour Company proposes to transfer an amount of ` 4,500 crores to the General Reserves.
DIVIDENDPrudent working capital management and control on cash flows, resulted in your Company’s strong performance, even during trying times. Aided by deft financial management, your Company was able to successfully reduce Consolidated Net Debt/EBITDA ratio to 0.55x from 1.72x as on 31st March, 2020.
With adequate cash flows and the confidence of sustaining its performance going forward, your Directors have recommended a dividend of ` 37 per equity share (as compared to ` 13 per equity share in the previous year) of ` 10 each for the year ended 31st March, 2021. Except for unforeseen circumstances or the need to retain cash for its operations, your Company will endeavour to maintain this trend in future years as well.
The recommended dividend is in line with your Company’s dividend policy, which is given in Annexure I of this Report and is also available on your Company’s website.
In terms of the provisions of the Finance Act, 2020, dividend shall be taxed in the hands of shareholders at applicable rates of tax and your Company shall withhold tax at source appropriately.
Unclaimed dividend for the year ended 31st March, 2013, aggregating to ` 1.30 crores has been transferred to the Investor Education and Protection Fund (“IEPF”). Your Company has also credited to the IEPF set up by the Government of India, equity shares in respect of which dividend had remained unpaid/unclaimed for a period of seven consecutive years within the timelines laid down by the Ministry
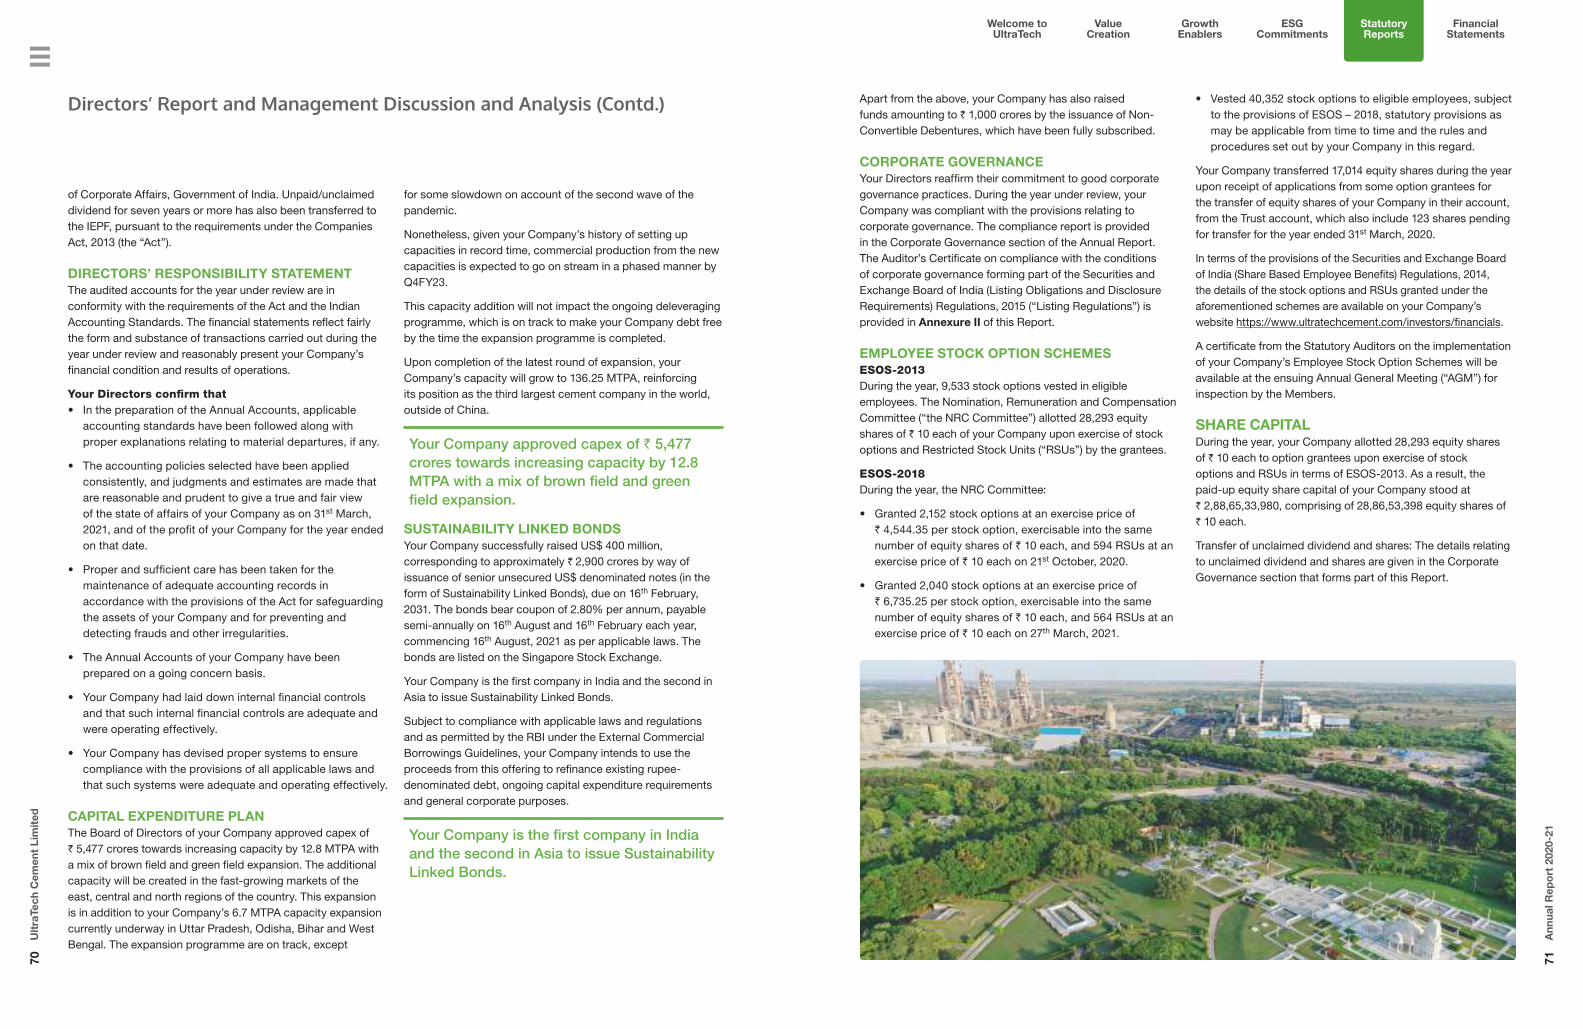
Welcome to UltraTech
Value Creation
Growth Enablers
Statutory Reports
Financial Statements
ESG Commitments
70U
ltra
Tech
Cem
ent
Lim
ited
71A
nnua
l Rep
ort
202
0-21
of Corporate Affairs, Government of India. Unpaid/unclaimed dividend for seven years or more has also been transferred to the IEPF, pursuant to the requirements under the Companies Act, 2013 (the “Act”).
DIRECTORS’ RESPONSIBILITY STATEMENTThe audited accounts for the year under review are in conformity with the requirements of the Act and the Indian Accounting Standards. The financial statements reflect fairly the form and substance of transactions carried out during the year under review and reasonably present your Company’s financial condition and results of operations.
Your Directors confirm that• In the preparation of the Annual Accounts, applicable
accounting standards have been followed along with proper explanations relating to material departures, if any.
• The accounting policies selected have been applied consistently, and judgments and estimates are made that are reasonable and prudent to give a true and fair view of the state of affairs of your Company as on 31st March, 2021, and of the profit of your Company for the year ended on that date.
• Proper and sufficient care has been taken for the maintenance of adequate accounting records in accordance with the provisions of the Act for safeguarding the assets of your Company and for preventing and detecting frauds and other irregularities.
• The Annual Accounts of your Company have been prepared on a going concern basis.
• Your Company had laid down internal financial controls and that such internal financial controls are adequate and were operating effectively.
• Your Company has devised proper systems to ensure compliance with the provisions of all applicable laws and that such systems were adequate and operating effectively.
CAPITAL EXPENDITURE PLANThe Board of Directors of your Company approved capex of ` 5,477 crores towards increasing capacity by 12.8 MTPA with a mix of brown field and green field expansion. The additional capacity will be created in the fast-growing markets of the east, central and north regions of the country. This expansion is in addition to your Company’s 6.7 MTPA capacity expansion currently underway in Uttar Pradesh, Odisha, Bihar and West Bengal. The expansion programme are on track, except
for some slowdown on account of the second wave of the pandemic.
Nonetheless, given your Company’s history of setting up capacities in record time, commercial production from the new capacities is expected to go on stream in a phased manner by Q4FY23.
This capacity addition will not impact the ongoing deleveraging programme, which is on track to make your Company debt free by the time the expansion programme is completed.
Upon completion of the latest round of expansion, your Company’s capacity will grow to 136.25 MTPA, reinforcing its position as the third largest cement company in the world, outside of China.
Your Company approved capex of ` 5,477 crores towards increasing capacity by 12.8 MTPA with a mix of brown field and green field expansion.
SUSTAINABILITY LINKED BONDSYour Company successfully raised US$ 400 million, corresponding to approximately ` 2,900 crores by way of issuance of senior unsecured US$ denominated notes (in the form of Sustainability Linked Bonds), due on 16th February, 2031. The bonds bear coupon of 2.80% per annum, payable semi-annually on 16th August and 16th February each year, commencing 16th August, 2021 as per applicable laws. The bonds are listed on the Singapore Stock Exchange.
Your Company is the first company in India and the second in Asia to issue Sustainability Linked Bonds.
Subject to compliance with applicable laws and regulations and as permitted by the RBI under the External Commercial Borrowings Guidelines, your Company intends to use the proceeds from this offering to refinance existing rupee-denominated debt, ongoing capital expenditure requirements and general corporate purposes.
Your Company is the first company in India and the second in Asia to issue Sustainability Linked Bonds.
Apart from the above, your Company has also raised funds amounting to ` 1,000 crores by the issuance of Non-Convertible Debentures, which have been fully subscribed.
CORPORATE GOVERNANCEYour Directors reaffirm their commitment to good corporate governance practices. During the year under review, your Company was compliant with the provisions relating to corporate governance. The compliance report is provided in the Corporate Governance section of the Annual Report. The Auditor’s Certificate on compliance with the conditions of corporate governance forming part of the Securities and Exchange Board of India (Listing Obligations and Disclosure Requirements) Regulations, 2015 (“Listing Regulations”) is provided in Annexure II of this Report.
EMPLOYEE STOCK OPTION SCHEMESESOS-2013During the year, 9,533 stock options vested in eligible employees. The Nomination, Remuneration and Compensation Committee (“the NRC Committee”) allotted 28,293 equity shares of ` 10 each of your Company upon exercise of stock options and Restricted Stock Units (“RSUs”) by the grantees.
ESOS-2018During the year, the NRC Committee:
• Granted 2,152 stock options at an exercise price of ` 4,544.35 per stock option, exercisable into the same number of equity shares of ` 10 each, and 594 RSUs at an exercise price of ` 10 each on 21st October, 2020.
• Granted 2,040 stock options at an exercise price of ` 6,735.25 per stock option, exercisable into the same number of equity shares of ` 10 each, and 564 RSUs at an exercise price of ` 10 each on 27th March, 2021.
• Vested 40,352 stock options to eligible employees, subject to the provisions of ESOS – 2018, statutory provisions as may be applicable from time to time and the rules and procedures set out by your Company in this regard.
Your Company transferred 17,014 equity shares during the year upon receipt of applications from some option grantees for the transfer of equity shares of your Company in their account, from the Trust account, which also include 123 shares pending for transfer for the year ended 31st March, 2020.
In terms of the provisions of the Securities and Exchange Board of India (Share Based Employee Benefits) Regulations, 2014, the details of the stock options and RSUs granted under the aforementioned schemes are available on your Company’s website https://www.ultratechcement.com/investors/financials.
A certificate from the Statutory Auditors on the implementation of your Company’s Employee Stock Option Schemes will be available at the ensuing Annual General Meeting (“AGM”) for inspection by the Members.
SHARE CAPITALDuring the year, your Company allotted 28,293 equity shares of ` 10 each to option grantees upon exercise of stock options and RSUs in terms of ESOS-2013. As a result, the paid-up equity share capital of your Company stood at ` 2,88,65,33,980, comprising of 28,86,53,398 equity shares of ` 10 each.
Transfer of unclaimed dividend and shares: The details relating to unclaimed dividend and shares are given in the Corporate Governance section that forms part of this Report.
Directors’ Report and Management Discussion and Analysis (Contd.)

Welcome to UltraTech
Value Creation
Growth Enablers
Statutory Reports
Financial Statements
ESG Commitments
72U
ltra
Tech
Cem
ent
Lim
ited
73A
nnua
l Rep
ort
202
0-21
pollution abatement and carbon capture, nanotechnology of cement and concrete, concrete durability, concrete rheology, 3D printable concrete, Geopolymer concrete, modelling cement and concrete hydration and chemical admixtures for cement and concrete, including process innovation for improving manufacturing efficiency. Your Company’s R&D has also collaborated with the Aditya Birla Science and Technology Company Private Limited and the academia, and the organisation is represented by its R&D unit in the national and international scientific and technical forums.
SUSTAINABILITYSustainable growth is an integral part of your Company’s business ethos and it continuously strives to enhance environmental conservation measures while ensuring that business growth and profitability are concomitant with its contribution to societal well-being. Your Company’s sustainability initiatives include efforts to reduce carbon emissions, increase the use of alternative materials and fuels, increase green power capacity, adopt best practices to remain water positive, conservation of the ecosystem through the implementation of its Biodiversity Management Plan (“BMP”). Apart from strengthening the brand reputation, these measures have enabled your Company to push the industry towards greater sustainable practices.
A Board-level Risk and Sustainability Committee oversees your Company’s Environmental, Social, Governance (“ESG”) strategy, with the senior management closely involved in driving sustainability across the organisation. The structure ensures adherence, implementation, and monitoring of the sustainability initiatives. Moreover, performance assessment, including that of the senior management, is closely linked to ESG and sustainability outcomes.
Your Company has aligned its sustainability strategy to the UN Sustainable Development Goals (“SDGs”), which address critical issues such as climate change, poverty, gender equality, health and well-being, consumption and biodiversity.
As a founding member of the Global Cement and Concrete Association, your Company is committed to decarbonising its footprint and its aim to deliver carbon-neutral concrete by 2050 by working across the build environment value chain. It also aims to be 5x water positive by 2023, which means that it will replenish five times the amount of water it consumes. The total volume of water consumed has been replenished ~160% over four-years (from 27.4 million m3 in FY17 to 72.3 million m3 in FY21). For these efforts and others, your Company has scored 71% higher than the industry average on the Dow Jones Sustainability Index (“DJSI”). In FY20, it ranked among the top 10 companies on the DJSI Index under the ‘Construction Material’ category globally.
Directors’ Report and Management Discussion and Analysis (Contd.)
RESEARCH AND DEVELOPMENTYour Company’s Research and Development (“R&D”) efforts stand on the five pillars of – Customers, Sustainability, Innovation, Quality, and Profitability. These pillars have contributed to the upgradation and optimisation of processes and helped your Company unlock bottlenecks. These have also been instrumental in your Company’s efforts towards preservation of mineral resources and use of alternative fuels and raw materials. Your Company has developed premium products that reduce limestone consumption, thus conserving fossil fuels and use of water in cement and concrete applications, while ensuring top-notch functionality.
Your Company’s continuing endeavour to address current and future customer needs and provide unmatched scientific and technical support to its manufacturing units and customers have led to greater focus on the development of new products, processes, and technologies, while adopting sustainable means of operations to further reduce emissions.
The R&D unit was granted a patent this year for the invention of ‘A Mineral-Based Composition for Use as a Binder in the Manufacture of Cement’ as an alternative to the available supplementary cementitious material (“SCM”).
Your Company has been granted a patent on safety sieve for its ability to control flow in raw material hopper. The safety sieve offers the following benefits - safety of labour; maintaining quality of raw material; ensuring smooth operations among others.
Your Company is also the first Company to conceptualise and implement a zero discharge Ready-Mix Concrete (“RMC”) plant, the first of its kind RMC in the world.
The R&D unit was granted a patent this year for the invention of ‘A Mineral-Based Composition for Use as a Binder in the Manufacture of Cement’ as an alternative to the available supplementary cementitious material (“SCM”).
To remain competitive and make desirable scientific and technical progress, all global developments in the field of cement, concrete, and construction materials are tracked in a continuing manner.
Your Company’s R&D is accredited by the National Accreditation Board for Testing and Calibration Laboratories (“NABL”), making the organisation future-ready and enhancing its capabilities in
AwardsYour Company’s constant endeavour to optimise operational procedures and build greater efficiencies continues to win recognition and prestigious awards. Some of those conferred during the year are:
• The Mother Teresa Corporate Citizenship Award by the Loyola Institute of Business Administration, Chennai.
• Apex India Foundation: Apex India Quality Excellence Award 2020 Platinum Award, Aditya Cement Works.
• Maharashtra Energy Development Agency: 1st Prize in Cement Sector (2019-20) for Energy Conservation, Awarpur Cement Works.
• Bureau of Energy Efficiency (National Energy Conservation Award – 2000): 1st Prize in Thermal Power Plant (Coal and Gas based <100 MW), Awarpur Cement Works.
• Confederation of Indian Industry (“CII”): Excellent Energy Efficient Unit, Dalla Cement Works.
• CII: 21st National Award for Excellence in Energy Management, 2020, Kotputli Cement Works.
• Apex India Foundation: Gold Award in Apex India Green Leaf & CSR Award Excellence Award 2020, Jhajjar Cement Works.
• World Safety Forum: Global Safety Summit CSR Award, Sidhi Cement Works.
• Golden Peacock Occupational Health & Safety Award for the year 2020, Birla White.
• Advertiser of the Year in Prime-Time Awards hosted by Exchange4Media to honour excellence in Television Advertising.
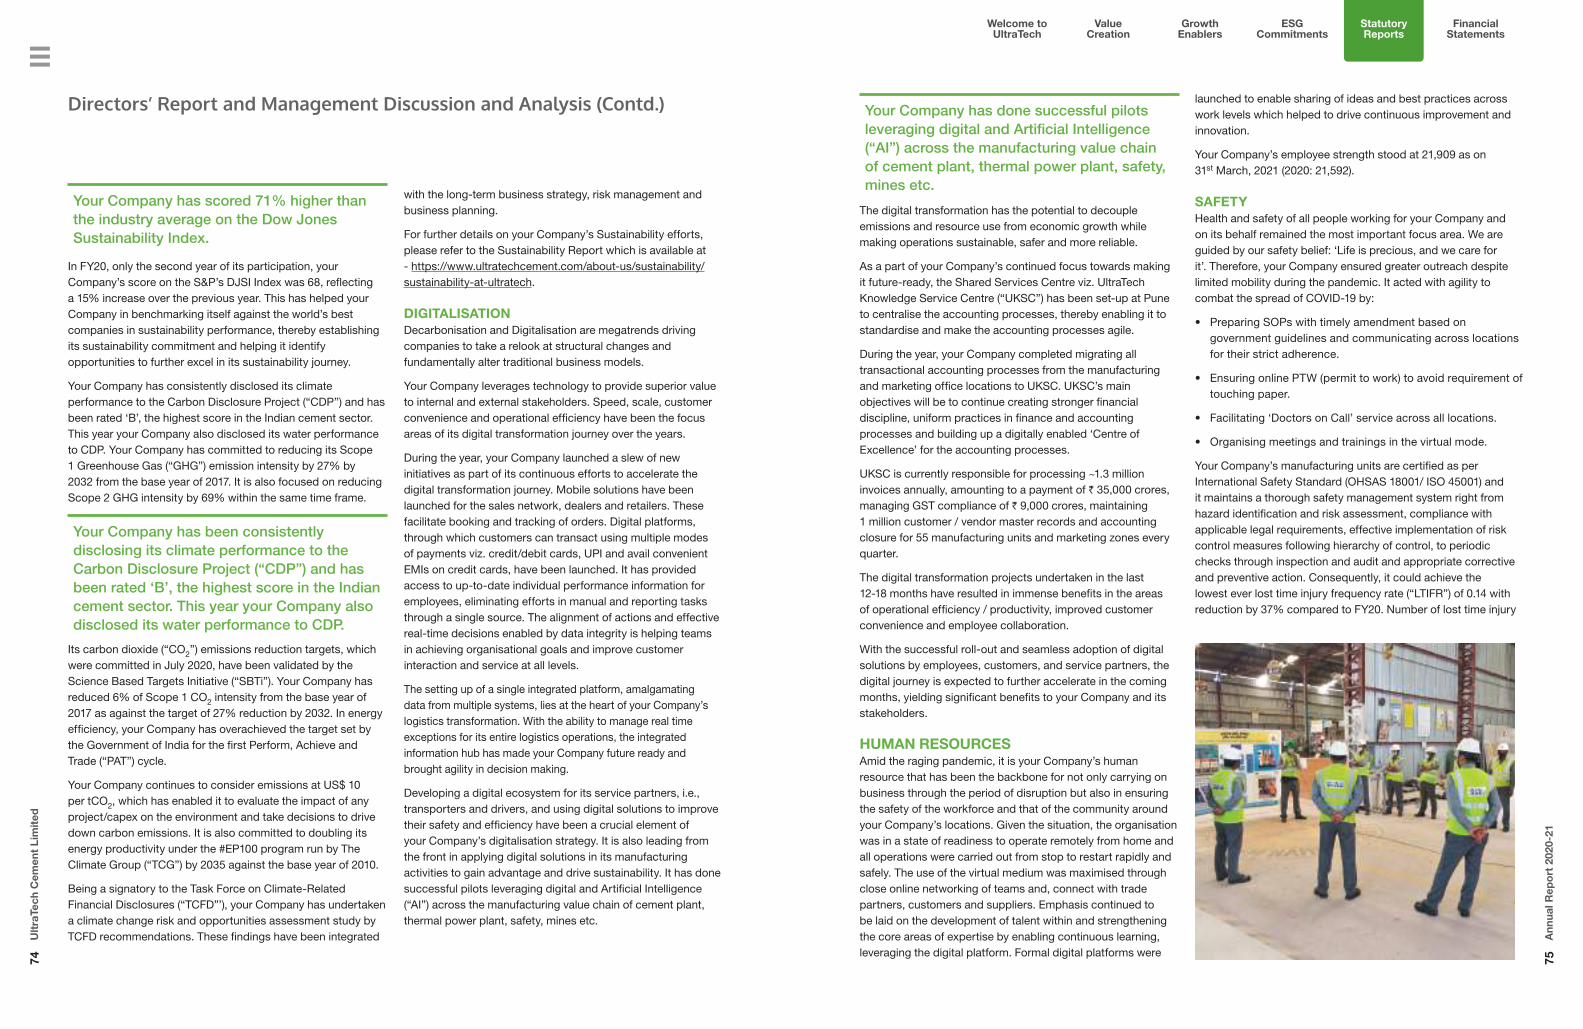
Welcome to UltraTech
Value Creation
Growth Enablers
Statutory Reports
Financial Statements
ESG Commitments
74U
ltra
Tech
Cem
ent
Lim
ited
75A
nnua
l Rep
ort
202
0-21
Your Company has scored 71% higher than the industry average on the Dow Jones Sustainability Index.
In FY20, only the second year of its participation, your Company’s score on the S&P’s DJSI Index was 68, reflecting a 15% increase over the previous year. This has helped your Company in benchmarking itself against the world’s best companies in sustainability performance, thereby establishing its sustainability commitment and helping it identify opportunities to further excel in its sustainability journey.
Your Company has consistently disclosed its climate performance to the Carbon Disclosure Project (“CDP”) and has been rated ‘B’, the highest score in the Indian cement sector. This year your Company also disclosed its water performance to CDP. Your Company has committed to reducing its Scope 1 Greenhouse Gas (“GHG”) emission intensity by 27% by 2032 from the base year of 2017. It is also focused on reducing Scope 2 GHG intensity by 69% within the same time frame.
Your Company has been consistently disclosing its climate performance to the Carbon Disclosure Project (“CDP”) and has been rated ‘B’, the highest score in the Indian cement sector. This year your Company also disclosed its water performance to CDP.
Its carbon dioxide (“CO2”) emissions reduction targets, which were committed in July 2020, have been validated by the Science Based Targets Initiative (“SBTi”). Your Company has reduced 6% of Scope 1 CO2 intensity from the base year of 2017 as against the target of 27% reduction by 2032. In energy efficiency, your Company has overachieved the target set by the Government of India for the first Perform, Achieve and Trade (“PAT”) cycle.
Your Company continues to consider emissions at US$ 10 per tCO2, which has enabled it to evaluate the impact of any project/capex on the environment and take decisions to drive down carbon emissions. It is also committed to doubling its energy productivity under the #EP100 program run by The Climate Group (“TCG”) by 2035 against the base year of 2010.
Being a signatory to the Task Force on Climate-Related Financial Disclosures (“TCFD”’), your Company has undertaken a climate change risk and opportunities assessment study by TCFD recommendations. These findings have been integrated
with the long-term business strategy, risk management and business planning.
For further details on your Company’s Sustainability efforts, please refer to the Sustainability Report which is available at - https://www.ultratechcement.com/about-us/sustainability/sustainability-at-ultratech.
DIGITALISATIONDecarbonisation and Digitalisation are megatrends driving companies to take a relook at structural changes and fundamentally alter traditional business models.
Your Company leverages technology to provide superior value to internal and external stakeholders. Speed, scale, customer convenience and operational efficiency have been the focus areas of its digital transformation journey over the years.
During the year, your Company launched a slew of new initiatives as part of its continuous efforts to accelerate the digital transformation journey. Mobile solutions have been launched for the sales network, dealers and retailers. These facilitate booking and tracking of orders. Digital platforms, through which customers can transact using multiple modes of payments viz. credit/debit cards, UPI and avail convenient EMIs on credit cards, have been launched. It has provided access to up-to-date individual performance information for employees, eliminating efforts in manual and reporting tasks through a single source. The alignment of actions and effective real-time decisions enabled by data integrity is helping teams in achieving organisational goals and improve customer interaction and service at all levels.
The setting up of a single integrated platform, amalgamating data from multiple systems, lies at the heart of your Company’s logistics transformation. With the ability to manage real time exceptions for its entire logistics operations, the integrated information hub has made your Company future ready and brought agility in decision making.
Developing a digital ecosystem for its service partners, i.e., transporters and drivers, and using digital solutions to improve their safety and efficiency have been a crucial element of your Company’s digitalisation strategy. It is also leading from the front in applying digital solutions in its manufacturing activities to gain advantage and drive sustainability. It has done successful pilots leveraging digital and Artificial Intelligence (“AI”) across the manufacturing value chain of cement plant, thermal power plant, safety, mines etc.
Your Company has done successful pilots leveraging digital and Artificial Intelligence (“AI”) across the manufacturing value chain of cement plant, thermal power plant, safety, mines etc.
The digital transformation has the potential to decouple emissions and resource use from economic growth while making operations sustainable, safer and more reliable.
As a part of your Company’s continued focus towards making it future-ready, the Shared Services Centre viz. UltraTech Knowledge Service Centre (“UKSC”) has been set-up at Pune to centralise the accounting processes, thereby enabling it to standardise and make the accounting processes agile.
During the year, your Company completed migrating all transactional accounting processes from the manufacturing and marketing office locations to UKSC. UKSC’s main objectives will be to continue creating stronger financial discipline, uniform practices in finance and accounting processes and building up a digitally enabled ‘Centre of Excellence’ for the accounting processes.
UKSC is currently responsible for processing ~1.3 million invoices annually, amounting to a payment of ` 35,000 crores, managing GST compliance of ` 9,000 crores, maintaining 1 million customer / vendor master records and accounting closure for 55 manufacturing units and marketing zones every quarter.
The digital transformation projects undertaken in the last 12-18 months have resulted in immense benefits in the areas of operational efficiency / productivity, improved customer convenience and employee collaboration.
With the successful roll-out and seamless adoption of digital solutions by employees, customers, and service partners, the digital journey is expected to further accelerate in the coming months, yielding significant benefits to your Company and its stakeholders.
HUMAN RESOURCESAmid the raging pandemic, it is your Company’s human resource that has been the backbone for not only carrying on business through the period of disruption but also in ensuring the safety of the workforce and that of the community around your Company’s locations. Given the situation, the organisation was in a state of readiness to operate remotely from home and all operations were carried out from stop to restart rapidly and safely. The use of the virtual medium was maximised through close online networking of teams and, connect with trade partners, customers and suppliers. Emphasis continued to be laid on the development of talent within and strengthening the core areas of expertise by enabling continuous learning, leveraging the digital platform. Formal digital platforms were
Directors’ Report and Management Discussion and Analysis (Contd.) launched to enable sharing of ideas and best practices across work levels which helped to drive continuous improvement and innovation.
Your Company’s employee strength stood at 21,909 as on 31st March, 2021 (2020: 21,592).
SAFETYHealth and safety of all people working for your Company and on its behalf remained the most important focus area. We are guided by our safety belief: ‘Life is precious, and we care for it’. Therefore, your Company ensured greater outreach despite limited mobility during the pandemic. It acted with agility to combat the spread of COVID-19 by:
• Preparing SOPs with timely amendment based on government guidelines and communicating across locations for their strict adherence.
• Ensuring online PTW (permit to work) to avoid requirement of touching paper.
• Facilitating ‘Doctors on Call’ service across all locations.
• Organising meetings and trainings in the virtual mode.
Your Company’s manufacturing units are certified as per International Safety Standard (OHSAS 18001/ ISO 45001) and it maintains a thorough safety management system right from hazard identification and risk assessment, compliance with applicable legal requirements, effective implementation of risk control measures following hierarchy of control, to periodic checks through inspection and audit and appropriate corrective and preventive action. Consequently, it could achieve the lowest ever lost time injury frequency rate (“LTIFR”) of 0.14 with reduction by 37% compared to FY20. Number of lost time injury

Welcome to UltraTech
Value Creation
Growth Enablers
Statutory Reports
Financial Statements
ESG Commitments
76U
ltra
Tech
Cem
ent
Lim
ited
77A
nnua
l Rep
ort
202
0-21
incidents reduced by 39%, from 32 in FY20 to 20 this year. The organisational goal of ‘zero harm’ gained momentum with 80% of your Company’s sites having no lost time injury.
Achieve the lowest ever lost time injury frequency rate (“LTIFR”) of 0.14 with reduction by 37% compared to FY20. Number of lost time injury incidents reduced by 39%, from 32 in FY20 to 20 this year. The organisational goal of ‘zero harm’ gained momentum with 80% of your Company’s sites having no lost time injury.
Initiatives for the improvement in safety performance and culture were centered around the following five major elements, viz. System and Processes; Capability Building; Behavioural Safety; Assurance and Logistics Safety.
92.5% in its cement subsidiary and has recorded net gain on divestment of ` 437.68 crores.
UNCL’s subsidiary, Star Super Cement Industries LLC, UAE (“SSCI”) was previously classified as ‘held for sale’. During the year, it was decided to make it a part of the continuing operations considering the synergies available with the existing capacity. Consequently, UNCL has divested SSCI to UCMEIL.
In terms of the order of the National Company Law Appellate Tribunal (“NCLAT”) dated 14th November, 2018, approving the Resolution Plan submitted by your Company under the Insolvency and Bankruptcy Code, 2016 for acquisition of Binani Cement Limited, subsequently renamed UNCL, a loan of US$ 230.4 million in 3B Binani Glassfibre SARL, (“3B”) a company registered in Luxembourg, was assigned to UNCL from IDBI Bank Limited. Assignment of the loan was along with securities, which included pledge over all assets and shares of 3B in various forms in favour of UNCL. Since 3B was in continuous default in servicing the loan, UNCL enforced its pledge of 3B shares, consequent to which UNCL became owner of 100% equity of 3B w.e.f 12th March, 2021. 3B’s Board has also been re-constituted. UNCL has taken this step to safeguard and expedite the recovery of its loan from 3B. Till the time UNCL is able to recover its loan, the investment in 3B will be treated as investment held for sale.
In accordance with the provisions of Section 129(3) of the Act read with the Companies (Accounts) Rules, 2014, a report on the performance and financial position of each of the subsidiaries, joint venture and associate companies is provided in Annexure IV to this Report.
Consequently, Dakshin stood dissolved and ceased to be a subsidiary of the Company.
PARTICULARS OF LOAN, GUARANTEE AND INVESTMENTDetails of Loan, Guarantee and Investment covered under the provisions of Section 186 of the Act read with the Companies (Meetings of Board and its Powers) Rules, 2014 are given in Notes to the standalone financial statements.
ENERGY, TECHNOLOGY AND FOREIGN EXCHANGEInformation on conservation of energy, technology absorption and foreign exchange earnings and outgo, required to be disclosed pursuant to Section 134(3)(m) of the Act read with the Companies (Accounts) Rules, 2014, is given in Annexure V to this Report.
PARTICULARS OF EMPLOYEESDisclosures pertaining to remuneration and other details as required under Section 197(12), read with the Companies (Appointment and Remuneration of Managerial Personnel) Rules, 2014, are given in Annexure VI. In accordance with the provisions of the aforementioned section, the names and other particulars of employees drawing remuneration in excess of
Directors’ Report and Management Discussion and Analysis (Contd.)
Key highlights of these elements include: • Monthly campaigns on selected safety themes.
• Walkthrough inspections through structured section-wise checklists.
• Formulating effective barriers for critical risks through Bow Tie tool; HAZOP study for AFR operations.
• Incident investigation through tap-root software.
• Application of video analytics and data analytics to pinpoint improvement areas.
• Safety training through AI-based platform; safety behaviour observation.
• Virtual safety audit using head-mounted device connected through internet by trained inter-unit auditors.
• Structural stability assessment by trained experts.
• Romberg test facility created to test whether drivers are under influence of alcohol.
• Geo fencing done at critical terrain; monitoring of GPS data of logistics fleet; defensive driving training imparted to drivers.
CORPORATE SOCIAL RESPONSIBILITYIn terms of the provisions of Section 135 of the Act read with the Companies (Corporate Social Responsibility Policy) Rules, 2014, the Board of Directors of your Company has constituted a Corporate Social Responsibility (“CSR”) Committee chaired by Mrs. Rajashree Birla. Other Members of the Committee are Mrs. Sukanya Kripalu, Independent Director; Mr. K. K. Maheshwari, Vice Chairman and Non-Executive Director. Dr. (Mrs.) Pragnya Ram, Group Executive President, CSR, Legacy, Documentation & Archives is a permanent invitee to the Committee. Your Company also has in place a CSR Policy which is available at - https://www.ultratechcement.com/investors/corporate-governance.
Your Company’s CSR activities are focused on Social Empowerment and Welfare, Infrastructure Development, Sustainable Livelihood, Healthcare and Education. Various activities across these segments have been initiated during the year around its plant locations and the neighbouring villages. During the year, ` 120.68 crores was spent on CSR activities, which constitutes over 3.3% of the average net profits of the last three financial years.
A report on CSR activities is provided in Annexure III which forms part of this Report.
SUBSIDIARIES, JOINT VENTURES AND ASSOCIATE COMPANIESThe audited financial statements of your Company’s subsidiaries and joint ventures viz. Dakshin Cements Limited (“Dakshin”), Harish Cement Limited, Gotan Lime Stone Khanij Udyog Private Limited, Bhagwati Lime Stone Company Private Limited, UltraTech Nathdwara Cement Limited (“UNCL”), UltraTech Cement Middle East Investments Limited (“UCMEIL”), UltraTech Cement Lanka (Private) Limited, PT UltraTech Mining Indonesia and PT UltraTech Investments Indonesia and their related information are available on your Company’s website and also available for inspection. Any Member who is interested in obtaining a copy of the audited financial statements of your Company’s subsidiaries may write to the Company Secretary.
The name of Dakshin was struck off from the register of companies maintained by the Registrar of Companies, Hyderabad with effect from 9th April, 2021. This was on an application made by Dakshin in terms of the provisions of the Act. Consequently, Dakshin stood dissolved and ceased to be a subsidiary of your Company.
During the year, UNCL through its subsidiary, Krishna Holdings Pte. Ltd, (“Krishna”), a company incorporated in Singapore has completed the divestment of its entire equity shareholding of
the limits set out in the aforesaid rules form part of this Report. However, in line with the provisions of Section 136(1) of the Act, the Report and Accounts as set out therein, are being sent to all Members of your Company, excluding the aforesaid information. Any Member, who is interested in obtaining these particulars, may write to the Company Secretary.
BUSINESS RESPONSIBILITY REPORTIn terms of Regulation 34(2)(f) of the Listing Regulations, a Business Responsibility Report forms part of the Annual Report.
CONTRACT AND ARRANGEMENT WITH RELATED PARTIESDuring the financial year, your Company entered into related party transactions completely on an arm’s length basis and in the ordinary course of business. There are no material transactions with any related party, as defined under Section 188 of the Act read with the Companies (Meetings of Board and its Powers) Rules, 2014. All related party transactions have been approved by the Audit Committee of your Company and are reviewed by it on a periodic basis. The policy on Related Party Transactions, as approved by the Audit Committee and the Board, is available at https://www.ultratechcement.com/investors/corporate-governance.
The details of contracts and arrangements with related parties of your Company for the financial year ended 31st March, 2021 is given in Note No. 39 to the standalone financial statements of your Company.
RISK MANAGEMENTRisk is an integral and unavoidable component of business. Given the challenging and dynamic environment of your Company’s operations, it is committed to proactively managing risk in accomplishing its ambitious goals. Though risks cannot be eliminated, an effective risk management program ensures that risks are reduced, avoided, mitigated or shared. To maintain oversight of your Company’s risks, the Risk Management and Sustainability Committee (“RMS Committee”) of your Company is mandated to review its Enterprise Risk Management Framework (including plan / process), analyse the risks more deeply and define risk mitigation actions, where necessary.
Through the Annual Risk Report processes, which are based upon the business environment, operational controls and compliance procedures, your Company aims to assess and prioritise risks, according to their significance and likelihood. The key risks identified by your Company include economic environment and market demand; inflation and cost of production; legal and compliance with local laws; financial and accounting; environment, climate and sustainability; information technology and talent management. Needless to mention, with the challenges presented by the COVID-19 outbreak, pandemic and epidemic-related business risks have also been identified by your Company.

Welcome to UltraTech
Value Creation
Growth Enablers
Statutory Reports
Financial Statements
ESG Commitments
78U
ltra
Tech
Cem
ent
Lim
ited
79A
nnua
l Rep
ort
202
0-21
The risk horizon considered includes long-term strategic risks, short to medium-term risks as well as single events. The risks are analysed considering likelihood and impact as a basis to determine their management.
Key Business Risks identified by your Company:
Economic Environment and Market DemandThe demand for construction material is fundamentally driven by the economic growth in the country. Economic slowdown and subdued infrastructural development might lead to a slowdown in construction projects, thus leading to a reduction in cement consumption in the country. The growth in construction activity in the country has been slow over the last few years, impacting the cement consumption. In a scenario where incremental capacity addition exceeds incremental cement demand, the government’s push for infrastructure and housing will aid the growth in cement consumption and reduce the overcapacity gap.
The cement industry in India is an aggregation of small and large companies. In such an environment, the risk of protecting market share is optimal. With the expanding capacities of existing players and the emergence of new entrants, competition is a sustained risk. To mitigate this, continuous endeavours to enhance brand equity through innovative marketing activities, enhancement in the product portfolio and value-add services have been the thrust areas for your Company. The engineering expertise of your Company and its emphasis on quality also minimise its risk against market fluctuations considerably.
Inflation and Cost of ProductionYour Company faces the risk of inflation and fluctuations in the market-driven cost of coal, pet coke, power, and other fuels. Since the cement industry is extremely energy intensive, changes in fuel prices can significantly impact production cost. To de-risk, your Company has established specific policies of long deliveries and it continuously optimises its fuel mix and energy efficiency, while exploring the use of alternative fuels. The procurement of raw materials at an economical cost or of suitable quality faces a high degree of inflationary certainty. Your Company mitigates this risk through the establishment of exhaustive policies for procurement of specific raw materials and stores and those amenable to just in time inventories. Limestone being the primary raw material required to produce cement, its continuous and long-term availability is critical, particularly under the dynamic regulatory environment. Your Company currently possesses sufficient limestone reserves. Securing additional reserves is critical to address your
Company’s expansion plans. Apart from the preservation and extension of existing reserves, a range of measures including strategic sourcing and changing input mix are adopted by your Company to mitigate the risk of unavailability of limestone.
Legal and ComplianceThis comprises the risk if your Company is found to have inadvertently violated laws covering business conduct.
The country’s regulatory framework is ever-evolving and the risk of non-compliance and penalties may increase for your Company, leading to reputational risks. A comprehensive risk-based compliance programme, involving inclusive training and adherence to the Code of Conduct, is thus institutionalised by your Company.
As a step to mitigate the legal and compliance risk, your Company’s management encourages its employees to place their reliance on professional guidance and opinion to discuss the impact of any changes in laws and regulations to ensure total compliance. Periodic and ad-hoc reporting to various internal committees for oversight ensures the effectiveness of such a programme.
FinancialThis comprises the risk of exposure to interest rates, foreign exchange rates and commodity price fluctuations. The risk management strategy is to identify the risk exposure, measure and evaluate the financial impact, and decide on steps to mitigate the risks together with ensuring regular monitoring and reporting.
With the objective of minimising risks arising from uncertainty and volatility of foreign exchange fluctuations, an elaborate financial risk management policy is followed for every transaction undertaken in foreign currency. Your Company’s policies to counter such risks are reviewed periodically and constantly aligned with the financial market practices and regulations.
Changing laws, rules, regulations and standards relating to accounting, corporate governance, public disclosure and listing regulations are generating newer and unforeseen risks for companies. The new or changed laws, regulations and standards may lack precedence and are subject to varying interpretations. Their application in practice may evolve as new guidance is provided by regulatory and governing bodies. Thus your Company maintains a high standard of corporate governance and public disclosure to de-risk itself from such dynamic regulatory changes.
EnvironmentThis comprises risks associated with environmental pollution through the discharge of waste and GHG emissions, which may cause damage to the local ecology and environment. Various initiatives such as sewage treatment plants, recycling of industrial wastewater, bag-house, WHRS and extensive plantation and creation of green belts have been undertaken by your Company to de-risk and protect the environment. Apart from a targeted reduction of CO2 emissions (Scope 1 by 27% and Scope 2 by 69% by 2032), your Company’s risk mitigation strategy includes a change in product mix, energy efficiency, use of alternative fuels and raw materials, WHRS and the increased use of renewable energy. Your Company has also adopted measures such as rainwater harvesting and water recharge that help it overcome challenges related to water availability.
Climate and Sustainability Sustainability-related climate change risks and opportunities are assessed in line with your Company’s risk management policy and have been integrated in its multi-disciplinary Risk Management Framework. Classified as ESG risks, these relate to energy, emissions and water, among other issues. Sectoral review and relevant stakeholder interactions are conducted regularly to develop a list of climate-related risks specific to business and location. Identified risks are then mapped to your Company’s risk matrix, which classifies the risk according to its impact and likelihood.
Prioritised climate risks are managed through Unit-level committees. Unit and Functional Heads are responsible for identifying risks, developing mitigation plans, updating and reviewing their respective risk registers as per the defined process. The consolidated risk report is submitted to the Board-level committee.
Scenario based analysis has been conducted for physical as well as transition risks. For physical risks, four scenarios
have been considered that are linked to Representative Concentration Pathway (“RCP”), which is a GHG concentration trajectory adopted by the Intergovernmental Panel on Climate Change (“IPCC”). These include RCP 8.5, RCP 6, RCP 4.5 and RCP 2.6 scenarios. The pathways describe four possible climate futures on the basis of the volume of GHG emitted in the coming years. All four scenarios have been considered to assess the impact of temperature and precipitation changes in areas where your Company operates. Maximum possible impact has been considered based on projections up to the year 2100.
Your Company has conducted risk assessment exercise to identify climate-related physical and transition risks. Risks are assessed based on the defined time horizons over short term (0-3 years), medium term (3-10 years) and long term (10-30 years). The categorisation of risks into physical and transition risks has been done in alignment with TCFD guidelines.
In case of assessing the impact of transition risks on your Company, scenario analysis has been conducted in alignment with ETP B2DS and IPCC 1.5-degree scenarios. The potential impact of the evolution of climate policies has been considered under both scenarios to assess the resilience of your Company, as well as the potential pathways for decarbonisation so that it can comply with policy mechanisms such as emission trading schemes.
Product mix is an important variable in managing climate-related risks. Your Company’s products are not only sustainable but also aim to embed sustainability in the entire construction value chain. As many as 73 UltraTech products are certified by GreenPro, the largest Ecolabel in India, which enables end users in the built environment sector to choose sustainable materials for reducing the environmental impact during construction, operation as well as use phase of buildings.
Directors’ Report and Management Discussion and Analysis (Contd.)

Welcome to UltraTech
Value Creation
Growth Enablers
Statutory Reports
Financial Statements
ESG Commitments
80U
ltra
Tech
Cem
ent
Lim
ited
81A
nnua
l Rep
ort
202
0-21
Your Company’s approach is highlighted below:
• Enhancing resilience of the building sector: Extreme weather events due to climate change, such as floods, cyclones and heat waves, may impact the building sector considerably. To mitigate the impact of physical risks on the building sector and society at large, your Company is working with the built environment sector to make buildings more resilient to climate change effects.
• Your Company is committed to developing products and solutions that reduce carbon emissions throughout the lifecycle of the built environment sector. It offers building products and solutions that lead to optimisation of concrete mixing, improving overall quality and strength of construction, and thus alleviating the impact of physical risks.
• Your Company has introduced many new products that are designed to make buildings more resilient to dampness.
This also leads to reduced wear and tear of buildings, increasing longevity, thereby reducing the use of input materials and natural resources during their entire lifetime.
Physical risksAcute physical risks: Such risks can potentially impact sales volumes because of disruption of business operations due to interruption in supply chain, rise in logistics costs, power outage, infrastructure damages, manpower shortage, among other aspects.
Few sites of your Company have been exposed to extreme weather events during the last few years, such as floods and cyclones. In the last three years, sites located in Bhubaneswar, Chennai and Gujarat have been impacted due to extreme weather events. Some of your Company’s sites are in geographies that are susceptible to periodic heat waves. However, your Company has implemented several measures to mitigate the impact of physical risks.
Given its pan-India presence, your Company’s sites are highly diversified geographically. If a manufacturing plant faces business disruption or shutdown due to extreme weather events, alternative plants in other locations can serve the market need. Also, its wide logistics network, with warehouses across different parts of the country, enable flexibility in your Company’s operations.
Annual weather forecasts are considered in supply chain decisions in order to mitigate the risk of delays in sourcing of fuels. Your company has developed strategic partnerships with geographically diverse global vendors for fuels. Regular monitoring of environmental, political and regulatory developments, coupled with flexible contracts mitigate risks of supply chain disruptions. Inventory norms for fuels are periodically reviewed considering probability and expected impact of likely supply chain disruptions due to above developments. Insurance coverage is in place to protect against damages to business assets or loss of material in warehouses due to extreme weather events.
Your Company has not witnessed any impact of heat waves on its facilities. Nevertheless, it ensures that its employees are protected during peak summer days. It is committed to the WASH Pledge, ensuring adequate availability of safe drinking water to workers. Warehouses are also secured with early morning and late evening operational hours. Disaster management plans, health and safety protocols and adequate communication protocols during extreme weather events ensure safety at sites and minimise the impact on the workforce.
The financial impact of physical risks is estimated to be less than 1% of EBITDA. Risk mitigation measures have largely insulated your Company from the impact of extreme weather events.
Chronic physical risks: Your Company’s vast geographical presence makes it vulnerable to long-term chronic physical risks, such as variation in temperature, precipitation and water scarcity. Potential impact of variation in temperature and precipitation patterns has been assessed through scenario analysis across all four scenarios. Less than a quarter of your Company’s cement plants are in sites with extremely high water-stress, combined with a projected long-term decrease in precipitation patterns.
Your Company has implemented several measures which protect the business from the identified chronic risks. Rainwater harvesting systems have also been installed across sites. Harvested rainwater is either used within the sites or recharged into the ground for raising groundwater levels. In addition, your Company’s manufacturing sites are Zero Liquid Discharge (“ZLD”) and they reuse 100% of treated water within the sites. As a result, nearly 41 out of 58 sites are water positive. The endeavour is to make all sites water positive, enabling your Company to be future-ready for mitigating risks of water stress.
Transitional risksEmerging climate-related regulations and carbon pricing mechanisms may financially impact business in the long run. For example, Emission Trading Scheme (“ETS”) and Carbon Tax have been adopted in several geographies around the world. India has committed to reducing its emission intensity by 33-35% by 2030 and is on track to achieve this target five years in advance (2025). National level commitments may, in the future, cascade down to various industry sectors through the introduction of new climate change policies. The estimated impact of a policy such as ETS on your Company is estimated to be less than 1% of EBITDA, considering commitments already made to decarbonise the business.
Your Company is prepared to mitigate emerging risks pertaining to climate change policy changes through its existing voluntary GHG reduction targets which are SBTi validated, sustainability-linked bonds, its commitment to the GCCA announced ‘2050 Climate Ambition’ and so on.
Delay in adopting low-carbon technologies may lead to increased indirect operating costs. This could be through early retirement of existing assets. Your Company has strategically reduced its dependence on coal-based power generation and is focused on increasing the share of WHRS and renewable energy. Further, initiatives to utilise waste or by-products from other industries, and reducing clinker ratio are driving down emissions intensity. There are also efforts to track the technology and cost trends in emerging areas such as carbon capture, utilisation and storage (“CCUS”), and hydrogen and kiln electrification. Also, your Company is committed to aligning with the Paris Agreement Goals and is judiciously monitoring climate change performance at the Board-level, Unit-level and across all relevant functions.
Information Technology RisksThis comprises risks related to Information Technology (“IT”) systems; data integrity and physical assets. Your Company deploys IT systems, including ERP, SCM, Data Historian, and Mobile Solutions to support its business processes, communications, sales, logistics, and production. Risks could primarily arise from the unavailability of systems and/or loss or manipulation of information. To mitigate these risks, your Company uses backup procedures and stores information at two different locations. Systems are upgraded regularly with the latest security standards. For critical applications, security policies and procedures are updated periodically, and users are educated on adherence to the policies to eliminate data leakages.
Talent ManagementYour Company’s growth has been driven by its ability to attract and retain top-quality talent and effectively engage them in the right jobs. The risks in talent management are mitigated by following a policy of being an employer of choice and inculcating a sense of belonging. Specialised training courses
Directors’ Report and Management Discussion and Analysis (Contd.)
Risk Matrix
• Environment• Climate and sustainability • Information Technology• Economic Environment• Market Demand
• Legal and Compliance• Inflation and Cost of
Production
• Financial Risk• Talent Management
• Pandemic linked
Probable
Occasional
Remote
Minor Moderate High
High Moderate MinorRisk classes
Pro
bab
ility
of o
ccur
ence
Amount of damage

Welcome to UltraTech
Value Creation
Growth Enablers
Statutory Reports
Financial Statements
ESG Commitments
82U
ltra
Tech
Cem
ent
Lim
ited
83A
nnua
l Rep
ort
202
0-21
are adopted to enhance and reskill the employees to prepare them for future roles and create a talent pipeline.
Pandemic-linked Disruptions in Global MarketsThe COVID-19 outbreak has been declared a pandemic by the World Health Organization, and has caused a huge impact on people’s lives, families and communities. The pandemic presents a serious threat, impacting organisations in numerous concurrent ways, and potentially limiting their options around recovery if other companies are also affected or challenged by logistical constraints. There are several associated risks viz. cyber and fraud risks, operations risks, supply chain risks, health and safety, among others. Your Company has assessed these risks as part of the risk identification and mitigation process and is considering the impact thereof while making business decisions.
Amid the COVID-19 crisis, your Company is updating and expanding its crisis management and business continuity plans with an emphasis on employees, customers, supply chain, contacts, other stakeholders and business assets. Your Company currently operates in 53 locations in India and five overseas locations. Managing the risk of a multicultural and diverse workforce is extremely critical to the sustained growth of your Company. Continuous dissemination of your Company’s Values and strict adherence to the Code of Conduct for the employees are reiterated through various forums to contain this risk.
INTERNAL CONTROL SYSTEM AND THEIR ADEQUACYYour Company has put in place adequate internal control systems that are commensurate with the size of its operations. Internal control systems comprising policies and procedures are designed to ensure sound management of your Company’s operations, safekeeping of its assets, optimal utilisation of resources, reliability of its financial information, and compliance. Clearly defined roles and responsibilities have been institutionalised, and systems and procedures are periodically reviewed to keep pace with the growing size and complexity of your Company’s operations.
DIRECTORSRetiring by rotation and continuing as DirectorIn accordance with the provisions of the Act and Articles of Association of your Company, Mr. Kumar Mangalam Birla (DIN: 00012813) retires by rotation, and being eligible, offers himself for re-appointment.
Resolution seeking his re-appointment along with a brief profile forms part of the Notice convening the AGM.
Independent DirectorsYour Company’s Independent Directors have submitted requisite declarations confirming that they continue to meet the criteria of independence as prescribed under Section 149(6) of the Act and Regulation 16(1)(b) of the Listing Regulations. The Independent Directors have also confirmed that they have complied with Schedule IV of the Act and the Company’s Code of Conduct. Your Company’s Board is of the opinion that the Independent Directors possess requisite qualifications, experience, and expertise in industry knowledge; innovation; financial expertise; information technology; corporate governance; strategic expertise; marketing; legal and compliance; sustainability; risk management; human resource development and general management, and they hold highest standards of integrity. All Independent Directors of your Company have registered their name in the data bank maintained with the Indian Institute of Corporate Affairs, Manesar in terms of the provisions of the Companies (Appointment and Qualification of Directors) Rules, 2014.
Formal Annual EvaluationThe evaluation framework for assessing the performance of the Directors of your Company comprises contributions at meetings and strategic perspective or inputs regarding the growth and performance of your Company, among others. The NRC Committee and the Board have laid down the way in which formal annual evaluation of the performance of the Board, its Committees and individual Directors has to be made. It includes circulation of evaluation forms separately for evaluation of the Board and its Committees, Independent Directors / Non-Executive Directors / Executive Directors and the Chairman of your Company. The process of the annual performance evaluation broadly comprises:
Board and Committee EvaluationEvaluation of the Board as a whole and the Committees is done by individual Directors, which is collated for submission to the NRC Committee and feedback to the Board.
Independent / Non-Executive Directors EvaluationEvaluation done by Board members, excluding the Director, is submitted to the Chairman of your Company and individual feedback is provided to each Director. The evaluation of the Chairman / Executive Director as done by the individual Directors is submitted to the Chairman of the NRC Committee and subsequently to the Board. The evaluation framework focused on various aspects of the Board and Committees such as review, timely information from management etc. Also, performance of individual Directors was divided into Executive, Non-Executive and Independent Directors and based on parameters such as contribution, attendance, decision-making, action-oriented, external knowledge etc.
A brief summary of the evaluation exercise is as follows: The Board as a whole functions as a cohesive body. The Committees function well in their respective areas and the
recommendations of the Committees have been accepted by the Board. The Directors bring to the table their knowledge and experience. Independent Directors are rated high in understanding your Company’s business and expressing their views freely during deliberations. The Non-Executive Directors score well in all aspects. Executives Directors are action oriented and good in implementing Board decisions. The Chairman leads the Board effectively and encourages active participation and contribution by all Board members.
The details of the programme for familiarisation of Independent Directors of your Company are available at https://www.ultratechcement.com/about-us/leadership-team.
Policy on Appointment and Remuneration of Directors and Key Managerial Personnel and Remuneration PolicyYour Company’s Directors are appointed / re-appointed by the Board on the recommendations of the NRC Committee and approval of the shareholders.
In accordance with the Articles of Association of your Company, provisions of the Act and the Listing Regulations, all Directors, except the Executive Directors and Independent Directors, are liable to retire by rotation and, if eligible, offer themselves for re-appointment. The Executive Directors are appointed for a fixed tenure and are not liable to retire by rotation. The Independent Directors can serve a maximum of two terms of five years each and their appointment and tenure are governed by provisions of the Act and the Listing Regulations.
The NRC Committee has formulated the remuneration policy of your Company, which is provided in Annexure VII to this Report.
KEY MANAGERIAL PERSONNELIn terms of the provisions of Section 203 of the Act, Mr. K. C. Jhanwar, Managing Director; Mr. Atul Daga, Whole-time Director and Chief Financial Officer and Mr. Sanjeeb Kumar Chatterjee, Company Secretary are the Key Managerial Personnel of your Company.
AUDIT COMMITTEEThe Audit Committee comprises of Mr. S. B. Mathur, Mr. Arun Adhikari, Mrs. Alka Bharucha and Mr. K. K. Maheshwari. The Committee comprises majority of Independent Directors with Mr. Mathur being the Chairman. Mr. K. C. Jhanwar, Managing Director and Mr. Atul Daga, Whole-time Director and CFO, are permanent invitees. Further details relating to the Audit Committee are provided in the Report on Corporate Governance, which forms part of the Annual Report. During the year under review, all recommendations made by the Audit Committee were accepted by the Board.
Directors’ Report and Management Discussion and Analysis (Contd.)
Appointment of DirectorBased on the recommendation of the NRC Committee, the Board on 14th August, 2020 appointed Mr. Sunil Duggal (DIN:00041825) as an Additional Director (Independent).
Resolution seeking the appointment of Mr. Duggal as an Independent Director of your Company for a term of five years commencing 14th August, 2020 along with his brief profile forms part of the Notice convening the AGM.
Appointment of Whole-time DirectorThe existing term of Mr. Atul Daga (DIN: 06416619), Whole-time Director and Chief Financial Officer is upto 8th June, 2021. The Board at its meeting held on 7th May, 2021, based on the recommendation of the NRC Committee and considering the contributions made by Mr. Daga during his term of appointment, re-appointed Mr. Daga for a further period of three years from 9th June, 2021.
Resolutions seeking his re-appointment along with a brief profile forms part of the Notice convening the AGM.
Meetings of the BoardThe Board of Directors of your Company met five times during the year to deliberate on various matters. The meetings were held on 20th May, 2020; 28th July, 2020; 21st October, 2020; 3rd December, 2020, and 23rd January, 2021. Additional details relating to the meetings of the Board of Directors are provided in the Report on Corporate Governance, which forms part of the Annual Report.
Your Company has the following six Board-level Committees, which have been established in compliance with the requirements of the business and relevant provisions of applicable laws and statutes:
• Audit Committee
• Nomination, Remuneration and Compensation Committee
• Stakeholders Relationship Committee
• Corporate Social Responsibility Committee
• Risk Management and Sustainability Committee
• Finance Committee
The details with respect to the composition, terms of reference, number of meetings held, etc. of the above Committees are included in the Report on Corporate Governance, which forms part of the Annual Report.
Welcome to UltraTech
Value Creation
Growth Enablers
Statutory Reports
Financial Statements
ESG Commitments
84U
ltra
Tech
Cem
ent
Lim
ited
85A
nnua
l Rep
ort
202
0-21
VIGIL MECHANISM / WHISTLE BLOWER POLICYYour Company has in place a vigil mechanism for the Directors and employees to report instances and concerns about unethical behaviour, actual or suspected fraud, or violation of your Company’s Code of Conduct. Adequate safeguards are provided against victimisation of those who avail of the mechanism and direct access to the Chairman of the Audit Committee, in exceptional cases, is provided to them.
The vigil mechanism/whistle blower policy is available at https://www.ultratechcement.com/investors/corporate-governance.
SIGNIFICANT AND MATERIAL ORDERS PASSED BY THE REGULATORSYour Company had filed appeals against the orders of the Competition Commission of India (“CCI”) dated 31st August, 2016. The NCLAT disallowed the appeal against the CCI order filed by your Company. The Hon’ble Supreme Court has, by its order dated 5th October, 2018 granted a stay against the NCLAT order. Consequently, your Company has deposited an amount of ` 144.95 crores equivalent to 10% of the penalty amount (including the acquired Cement Division of Century Textiles and Industries Limited). Your Company, backed by legal opinions, believes that it has a good case in the said matters and accordingly no provision has been made in the accounts.
AUDITORSStatutory AuditorsIn terms of the provisions of Section 139 of the Act and the Companies (Audit and Auditors) Rules, 2014, M/s. BSR & Co. LLP, Chartered Accountants, Mumbai (Registration No: 101248W/W-100022) (“BSR”) were re-appointed as Joint Statutory Auditors for a second term of five years from the conclusion of the 20th AGM held on 12th August, 2020 up to the conclusion of the 25th AGM to be held in 2025.
The first term of M/s. Khimji Kunverji & Co. LLP, Chartered Accountants, Mumbai (Registration No: 105146W/W-100621) (“KKC”), the other Joint Statutory Auditor is up to the conclusion of the 21st AGM. They are eligible for re-appointment for a second term of five years as provided under Section 139 of the Act read with the Companies (Audit and Auditors) Rules, 2014.
KKC has confirmed that they are eligible to be re-appointed in accordance with the provisions of the Act and Rules made thereunder. KKC, registered with the Institute of Chartered
Accountants of India (“ICAI”), was established in 1936 and is led by 10 partners. The firm provides a range of services, including audit and assurance, taxation, advisory and accounting. The firm has significant experience in providing auditing, taxation and advisory services to leading banks and corporates in the manufacturing, services and financial services sectors. The signing partner heads the Assurance vertical of the firm. He also holds a Diploma in Information System Audit and IFRS Certification of ICAI. In the past, he was a member of various committees of ICAI related to auditing and accounting. Your Company’s Board of Directors, upon the recommendation of the Audit Committee, proposes their re-appointment for a second term, subject to the approval of Members. Resolution seeking their re-appointment forms part of the Notice convening the AGM.
The observations made in the Auditor’s Report are self-explanatory and, therefore, do not call for any further comments under Section 134(3)(f) of the Act.
Cost AuditorsThe Cost Accounts and records as required to be maintained under Section 148 (1) of the Act are duly made and maintained by your Company.
In terms of the provisions of Section 148 of the Act read with the Companies (Cost Records and Audit) Rules, 2014, the Board of Directors of your Company have, on the recommendation of the Audit Committee, appointed M/s. D. C. Dave & Co., Cost Accountants, Mumbai and M/s. N. D. Birla & Co., Cost Accountants, Ahmedabad, to conduct the Cost Audit of your Company for the financial year ending 31st March, 2022, at a remuneration as mentioned in the Notice convening the AGM.
As required under the Act, the remuneration payable to the Cost Auditors has to be placed before the Members at a general meeting for ratification. Hence, a resolution for the same forms part of the Notice convening the AGM.
Secretarial AuditorsIn terms of the provisions of Section 204 of the Act read with the Companies (Appointment and Remuneration of Managerial Personnel) Rules, 2014, the Board had appointed M/s. Makarand M Joshi & Co. LLP, Company Secretaries as Secretarial Auditors for conducting Secretarial Audit of your Company for the financial year ended 31st March, 2021.
The report of the Secretarial Auditor is provided in Annexure VIII. The Secretarial Audit Report does not contain any qualification, reservation or adverse remark.
Compliance with Secretarial StandardsYour Company is compliant with the Secretarial Standards specified by the Institute of Company Secretaries of India. Your Company has complied with all applicable provisions of Secretarial Standard – 1 and Secretarial Standard – 2 relating to ‘Meetings of the Board of Directors’ and ‘General Meetings’ respectively, issued by the Institute of Company Secretaries of India.
ANNUAL RETURNIn terms of the provisions of Section 92 and Section 134 of the Act read with Rule 12 of the Companies (Management and Administration) Rules, 2014, the Annual Return is available at - https://www.ultratechcement.com/investors/financials.
OTHER DISCLOSURES• No material changes and commitments affected the
financial position of your Company between the end of the financial year and the date of this Report.
• Your Company has not issued any shares with differential voting rights.
• There was no revision in the financial statements.
• There has been no change in the nature of business of your Company.
• Your Company has not issued any sweat equity shares.
Disclosures as per the Sexual Harassment of Women at Workplace (Prevention, Prohibition and Redressal) Act, 2013 (“POSH Act”):
Your Company has adopted zero tolerance for sexual harassment at workplace and has formulated a policy on prevention, prohibition and redressal of sexual harassment at workplace, in line with the provisions of the POSH Act and the rules framed thereunder, for prevention and redressal of complaints of sexual harassment at workplace. Your Company has complied with provisions relating to the constitution of the Internal Committee under the POSH Act. During the year under review, your Company received four complaints of sexual harassment, of which for two complaints, there were no evidence of harassment, one complaint has been resolved and one complaint is under investigation.
CAUTIONARY STATEMENTStatements in the Directors’ Report and the Management Discussion and Analysis describing your Company’s objectives, projections, estimates, expectations or predictions and plans for navigating the COVID-19 impact on your Company’s performance, its employees, customers and other stakeholders may be ‘forward-looking statements’ within the meaning of applicable securities laws and regulations.
Actual results could differ materially from those expressed or implied. Important factors that could make a difference to your Company’s operations include global and Indian demand-supply conditions, finished goods prices, feed stock availability and prices, cyclical demand and pricing in your Company’s principal markets, changes in government regulations, tax regimes, economic developments within India and the countries within which your Company conducts business, risks related to an economic downturn or recession in India, the efforts of the government and other measures seeking to contain the spread of COVID-19 and other factors such as litigation and labour negotiations. Your Company is not obliged to publicly amend, modify or revise any forward-looking statements on the basis of any subsequent development, information or events, or otherwise.
ACKNOWLEDGEMENTYour Directors express their deep sense of gratitude to the banks, financial institutions, stakeholders, business associates, central and state governments for their support, and look forward to their continued assistance in the future. We thank our employees for their contribution to your Company’s performance. We applaud them for their superior levels of competence, dedication, and commitment to your Company.
For and on behalf of the Board
Kumar Mangalam BirlaChairman
(DIN: 00012813)
Mumbai,7th May, 2021
Directors’ Report and Management Discussion and Analysis (Contd.)

86U
ltra
Tech
Cem
ent
Lim
ited
87A
nnua
l Rep
ort
202
0-21
Welcome to UltraTech
Value Creation
Growth Enablers
Statutory Reports
Financial Statements
ESG Commitments
Annexure I
DIVIDEND DISTRIBUTION POLICY AUDITORS’ CERTIFICATE ON CORPORATE GOVERNANCE
Annexure II
1.0 Introduction
1.1 As per the SEBI (Listing Obligations and Disclosure Requirements) Regulations, 2015, as amended, the Company is required to formulate and disclose its Dividend Distribution Policy. Accordingly, the Board of Directors of the Company (‘the Board’) has approved this Dividend Distribution Policy.
1.2 The objective of this policy is to provide clarity to stakeholders on the dividend distribution framework to be adopted by the Company. The Board of Directors shall recommend dividend in compliance with this policy, the provisions of the Companies Act, 2013 and Rules made thereunder and other applicable legal provisions.
2.0 Target Dividend Payout
2.1 Dividend will be declared out of the current year’s Profit after Tax of the Company.
2.2 Only in exceptional circumstances including but not limited to loss after tax in any particular financial year, the Board may consider utilising retained earnings for declaration of dividends, subject to applicable legal provisions.
2.3 Other Comprehensive Income’ (as per applicable Accounting Standards) which mainly comprises of unrealized gains / losses, will not be considered for the purpose of declaration of dividend.
2.4 The Board will endeavor to achieve a dividend payout ratio (gross of dividend distribution tax) in the range of 15% to 25% of the Standalone Profit after Tax, net of dividend payout to preference shareholders, if any.
3.0 Factors to be considered for Dividend Payout
The Board will consider various internal and external factors, including but not limited to the following before making any recommendation for dividend:
- Stability of earnings
- Cash flow position from operations
- Future capital expenditure, inorganic growth plans and reinvestment opportunities
- Industry outlook and stage of business cycle for underlying businesses
- Leverage profile and capital adequacy metrics
- Overall economic / regulatory environment
- Contingent liabilities
- Past dividend trends
- Buyback of shares or any such alternate profit distribution measure
- Any other contingency plans
4.0 General
Retained earnings will be used for the Company’s growth plans, working capital requirements, debt repayments and other contingencies.
5.0 Review
This policy would be subject to revision / amendment on a periodic basis, as may be necessary.
6.0 Disclosure
This policy (as amended from time to time) will be available on the Company’s website and in the annual report.
To the Members ofUltraTech Cement Limited
We have examined the compliance of conditions of Corporate Governance by UltraTech Cement Limited (the ‘Company’), for the year ended March 31, 2021, as per the relevant provisions of the Securities and Exchange Board of India (Listing Obligations and Disclosure Requirements) Regulations, 2015 as amended (‘Listing Regulations’).
The compliance of conditions of Corporate Governance is the responsibility of the management. This responsibility includes the design, implementation, and maintenance of internal control and procedures to ensure the compliance with the conditions of the Corporate Governance stipulated in Listing Regulations.
Our responsibility is limited to examining the procedures and implementation thereof, adopted by the Company for ensuring compliance with the conditions of Corporate Governance. It is neither an audit nor an expression of opinion on the financial statements of the Company.
We have examined the books of account and other relevant records and documents maintained by the Company for the purposes of providing reasonable assurance on the compliance with Corporate Governance requirements by the Company.
We have carried out an examination of the relevant records of the Company in accordance with the Guidance Note on Certification of Corporate Governance issued by the Institute of the Chartered Accountants of India (the ICAI), the Standards on Auditing specified under Section 143(10) of the Companies Act, 2013, in so far as applicable for the purpose of this certificate and as per the Guidance Note
on Reports or Certificates for Special Purposes issued by the ICAI which requires that we comply with the ethical requirements of the Code of Ethics issued by the ICAI.
We have complied with the relevant applicable requirements of the Standard on Quality Control (SQC) 1, Quality Control for Firms that Perform Audits and Reviews of Historical Financial Information, and Other Assurance and Related Services Engagements.
Based on our examination of the relevant records and according to the information and explanations given to us, we certify that the Company has complied with the conditions of Corporate Governance as stipulated in the above-mentioned Listing Regulations.
We further state that such compliance is neither an assurance as to the future viability of the Company nor the efficiency or effectiveness with which the management has conducted the affairs of the Company.
For Khimji Kunverji & Co LLPChartered AccountantsFRN: 105146W/W100621
Ketan VikamseyPartnerMembership No: 044000ICAI UDIN: 21044000AAAAAL9218
MumbaiDate: May 07, 2021

88U
ltra
Tech
Cem
ent
Lim
ited
89A
nnua
l Rep
ort
202
0-21
Welcome to UltraTech
Value Creation
Growth Enablers
Statutory Reports
Financial Statements
ESG Commitments
Annexure III
ANNUAL REPORT ON CSR ACTIVITIES[Pursuant to Section 135 of the Companies Act, 2013 read with
Companies (Corporate Social Responsibility Policy) Rules, 2014, as amended]
1. Brief outline on CSR Policy of the Company:
The Company is actively contributing to the social and economic development of the communities in which it operates. The Company is doing so in sync with the United Nations Sustainable Development Goals to build a better, sustainable way of life for the weaker sections of society and raise the country’s human development index.
The Company’s Corporate Social Responsibility (“CSR”) policy conforms to the National Voluntary Guidelines on Social, Environment and Economic Responsibilities of Business released by the Ministry of Corporate Affairs, Government of India.
Scope
The CSR Policy encompasses formulation, implementation, monitoring, evaluation, documentation and reporting of CSR activities taken up by the Company.
2. Composition of CSR Committee:
Sl. No.
Name of Director Designation / Nature of Directorship
Number of meetings of CSR Committee held during the year
Number of meetings of CSR Committee attended during the year
1 Mrs. Rajashree Birla Chairperson 1 1
2 Mrs. Sukanya Kripalu Independent Director 1 1
3 Mr. K. K. Maheshwari Non-Executive Director 1 1
Permanent Invitee: Dr. (Mrs.) Pragnya Ram, Group Executive President, CSR, Legacy, Documentation & Archives
3. Provide the web-link where Composition of CSR committee, CSR Policy and CSR projects approved by the board are disclosed on the website of the Company:
Composition of CSR Committee : https://www.ultratechcement.com/about-us/board-committees
CSR Policy and CSR Projects: https://www.ultratechcement.com/investors/corporate-governance
4. Provide the details of Impact assessment of CSR projects carried out in pursuance of sub-rule (3) of rule 8 of the Companies (Corporate Social Responsibility Policy) Rules, 2014, if applicable (attach the report):
The Company has been voluntarily conducting impact assessments through Independent Agencies to screen and evaluate select CSR programs. The Company takes cognizance of sub-rule 3 of rule 8 of the Companies (Corporate Social Responsibility Policy) Rules, 2014 and shall initiate steps to conduct impact assessment of all applicable CSR projects.
5. Details of the amount available for set-off in pursuance of sub-rule (3) of rule 7 of the Companies (Corporate Social Responsibility Policy) Rules, 2014 and amount required for set-off for the financial year, if any:
Sl. No.
Financial Year Amount available for set-off from preceding financial years (` in crores)
Amount required to be set-off for the financial year, if any (` in crores)
- - - -
6. Average net profit of the Company as per section 135(5) : ` 3,686 crores
7. (a) Two percent of average net profit of the Company as per section 135(5) : ` 73.72 crores
(b) Surplus arising out of the CSR projects or programmes or activities of the previous financial years
: Nil
(c) Amount required to be set-off for the financial year, if any : Nil
(d) Total CSR obligation for the financial year (7a + 7b - 7c). : ` 73.72 crores
8. (a) CSR amount spent or unspent for the financial year:
Total Amount Spent for the Financial Year
(` in crore)
Amount Unspent (` in crore)
Total Amount transferred to Unspent CSR Account as per section 135(6)
Amount transferred to any fund specified under Schedule VII as per second proviso to section 135(5)
Amount Date of transfer Name of the Fund Amount Date of transfer
120.68 - - - - -
(b) Details of CSR amount spent against ongoing projects for the financial year:
1 2 3 4 5 6 7 8 9 10 11
Sl. No.
Name of the Project
Item from the list of
activities in Schedule VII
to the Act
Local area (Yes/No)
Location of the project
Project duration
Amount allocated
for the project
(` in crores)
Amount spent in
the current financial
year(` in crores)
Amount transferred to Unspent CSR
Account for the project as per Section 135(6)
(` in crores)
Mode ofImplementation
- Direct(Yes/No)
Mode of Implementation - Through Implementing
Agency
State District Name CSR Registration
number
- - - - - - - - - - - - -
(c) Details of CSR amount spent against other than ongoing projects for the financial year:
1 2 3 4 5 6 7 8
Sl. No.
Name of the Project Item from the list of
activities in Schedule VII to the
Act
Local area(Yes/No)
Location of the project Amount spent for the
project(` in crores)
Mode of Implementation
- Direct(Yes/No)
Mode of Implementation - Through Implementing
Agency
State District Name CSR Registration
number
1 Preschool education projectAnganwadies / playschools / crèches, strengthening anganwadi centre
(ii) Yes Rajasthan
Madhya Pradesh
Gujarat
Maharashtra
Chhattisgarh
Karnataka
Andhra Pradesh
Jodhpur, Nagaur, Jaipur, Chittorgarh, Jhalawar, Baran, Sirohi, Pali
Neemuch, Dhar, Rewa
Amreli, Bhuj
Chandrapur, Solapur
Baloda Bazaar, Raipur
Gulbarga
Kurnool, Anantapur
1.36 Both (Direct and through Implementing Agency)
UltraTech Community Welfare Foundation (“UCWF”)
CSR00006050
School Education ProgramEnrollment awareness programs/ event, formal schools outside campus (company run), education material (study materials, uniform, books etc), scholarship (merit and need based assistance), school competitions / best teacher award, cultural events, quality of education (support teachers, improve education methods), specialised coaching, exposure visits / awareness, formal schools inside campus, support to midday meal project
(ii) Yes Rajasthan
Madhya Pradesh
Gujarat
Maharashtra
Chhattisgarh
Karnataka
Andhra Pradesh
Himachal Pradesh
Uttar Pradesh
Tamil Nadu
Jodhpur, Nagaur, Jaipur, Chittorgarh, Sirohi, Pali
Neemuch, Dhar, Rewa, Siddhi, Satna
Amreli, Bhuj
Chandrapur, Solapur
Baloda Bazaar, Raipur
Gulbarga,
Kurnool, Anantapur
Solan
Sonebhadra
Arriyallur
28.62 Both (Direct and through Implementing Agency)
UCWF CSR00006050

90U
ltra
Tech
Cem
ent
Lim
ited
91A
nnua
l Rep
ort
202
0-21
Welcome to UltraTech
Value Creation
Growth Enablers
Statutory Reports
Financial Statements
ESG Commitments
1 2 3 4 5 6 7 8
Sl. No.
Name of the Project Item from the list of
activities in Schedule VII to the
Act
Local area(Yes/No)
Location of the project Amount spent for the
project(` in crores)
Mode of Implementation
- Direct(Yes/No)
Mode of Implementation - Through Implementing
Agency
State District Name CSR Registration
number
Education support programsKnowledge centre and library, adult and non formal education, celebration of national days / international days, computer education, reducing drop-out and continuing education (kasturba balika/ bridge courses / counseling), career counseling and orientation.
(ii) Yes Rajasthan
Madhya Pradesh
Gujarat
Maharashtra
Chhattisgarh
Karnataka
Andhra Pradesh
Himachal Pradesh
Uttar Pradesh
Tamil Nadu
West Bengal
Odisha
Haryana
Jodhpur, Nagaur, Jaipur, Chittorgarh, Sirohi, Pali
Neemuch, Dhar, Rewa, Siddhi, Satna
Amreli, Bhuj
Chandrapur, Solapur
Baloda Bazaar, Raipur
Gulbarga
Kurnool, Anantapur
Solan
Sonebhadra
Arriyallur
Hoogly, Bolpur
Jharsuguda
Jhajjar, Panipat
0.25 Both (Direct and through Implementing Agency)
UCWF CSR00006050
Vocational and Technical EducationStrengthening ITI’s, skills based individual training program
(ii) Yes Madhya Pradesh
Gujarat
Chhattisgarh
Karnataka
Andhra Pradesh
Uttar Pradesh
Neemuch, Dhar, Rewa, Siddhi,
Amreli, Bhuj
Baloda Bazaar, Raipur
Gulbarga
Kurnool, Anantapur
Sonebhadra
0.29 Both (Direct and through Implementing Agency)
UCWF CSR00006050
School InfrastructureBuildings and civil structures (new), buildings and civil structures (renovation and maintenance), school sanitation / drinking water, school facilities and fixtures (furniture/blackboards/computers)
(ii) Yes Rajasthan
Madhya Pradesh
Gujarat
Maharashtra
Chhattisgarh
Karnataka
Andhra Pradesh
Himachal Pradesh
Uttar Pradesh
Tamil Nadu
West Bengal
Odisha
Haryana
Jodhpur, Nagaur, Jaipur, Chittorgarh, Sirohi, Pali
Neemuch, Dhar, Rewa, Siddhi, Satna
Amreli, Bhuj
Chandrapur, Solapur
Baloda Bazaar, Raipur
Gulbarga
Kurnool, Anantapur
Solan
Sonebhadra
Arriyallur
Hoogly, Bolpur
Jharsuguda
Jhajjar, Panipat
2.14 Both (Direct and through Implementing Agency)
UCWF CSR00006050
2 Preventive Health CareImmunisation, pulse polio immunisation, health check- up camps, ambulance mobile dispensary program, malaria / diarrhoea / control programs, health & hygiene awareness programs, school health / eye / dental camps, yoga / fitness classes
(i) Yes Rajasthan
Madhya Pradesh
Gujarat
Maharashtra
Chhattisgarh
Karnataka
Andhra Pradesh
Himachal Pradesh
Uttar Pradesh
Tamil Nadu
Jodhpur, Nagaur, Jaipur, Chittorgarh, Sirohi, Pali
Neemuch, Dhar, Rewa, Siddhi, Satna
Amreli, Bhuj
Chandrapur, Solapur
Baloda Bazaar, Raipur
Gulbarga
Kurnool, Anantapur
Solan
Sonebhadra
Arriyallur
0.80 Both (Direct and through Implementing Agency)
UCWF CSR00006050
1 2 3 4 5 6 7 8
Sl. No.
Name of the Project Item from the list of
activities in Schedule VII to the
Act
Local area(Yes/No)
Location of the project Amount spent for the
project(` in crores)
Mode of Implementation
- Direct(Yes/No)
Mode of Implementation - Through Implementing
Agency
State District Name CSR Registration
number
Curative Health Care General health camps, specialised health camps, eye camps, treatment camps (skin, cleft, etc.), cleft camp, homeopathic / ayurvedic camps, surgical camps, tuberculosis / leprosy company operated hospitals/ dispensaries / clinic.
(i) Yes Rajasthan
Madhya Pradesh
Gujarat
Maharashtra
Chhattisgarh
Karnataka
Andhra Pradesh
Himachal Pradesh
Uttar Pradesh
Tamil Nadu
Jodhpur, Nagaur, Jaipur, Chittorgarh, Sirohi, Pali
Neemuch, Dhar, Rewa, Siddhi, Satna
Amreli, Bhuj
Chandrapur, Solapur
Baloda Bazaar, Raipur
Gulbarga
Kurnool, Anantapur
Solan
Sonebhadra
Arriyallur
16.03 Both (Direct and through Implementing Agency)
UCWF CSR00006050
Reproductive and Child Health mother and child health care (ante natal care, pre natal care and neonatal care), adolescent health care, infant and child health (healthy baby competition), support to family planning / camps, nutritional programs for mother/child.
(i) Yes Rajasthan
Madhya Pradesh
Gujarat
Maharashtra
Chhattisgarh
Karnataka
Andhra Pradesh
Himachal Pradesh
Uttar Pradesh
Tamil Nadu
Jodhpur, Nagaur, Jaipur, Chittorgarh, Sirohi, Pali
Neemuch, Dhar, Rewa, Siddhi, Satna
Amreli, Bhuj
Chandrapur, Solapur
Baloda Bazaar, Raipur
Gulbarga
Kurnool, Anantapur
Solan
Sonebhadra
Arriyallur
0.41 Both (Direct and through Implementing Agency)
UCWF CSR00006050
Quality/ Support Program Referral services treatment of BPL, old age or needy patient, HIV- AIDS awareness program, RTI/ STD awareness program, support for differently abled, ambulance services, blood donation camps, blood grouping
(i) Yes Rajasthan
Madhya Pradesh
Gujarat
Maharashtra
Chhattisgarh
Karnataka
Andhra Pradesh
Himachal Pradesh
Uttar Pradesh
Tamil Nadu
Jodhpur, Nagaur, Jaipur, Chittorgarh, Sirohi, Pali
Neemuch, Dhar, Rewa, Siddhi, Satna
Amreli, Bhuj
Chandrapur
Baloda Bazaar, Raipur
Gulbarga
Kurnool, Anantapur
Solan
Sonebhadra
Arriyallur
0.05 Both (Direct and through Implementing Agency)
UCWF CSR00006050
Health Infrastructure Buildings and civil structures (new), buildings and civil structures (renovation and maintenance), village community sanitation (toilets/ drainage), individual toilets, drinking water new sources, (hand pump/ RO/ water tank/ well), drinking water existing sources (operation/ maintenance), water source purification.
(i) Yes Rajasthan
Madhya Pradesh
Gujarat
Maharashtra
Chhattisgarh
Karnataka
Andhra Pradesh
Himachal Pradesh
Uttar Pradesh
Tamil Nadu
Jodhpur, Nagaur, Jaipur, Chittorgarh, Sirohi, Pali
Neemuch, Dhar, Rewa, Siddhi, Satna
Amreli, Bhuj
Chandrapur
Baloda Bazaar, Raipur
Gulbarga
Kurnool, Anantapur
Solan
Sonebhadra
Arriyallur
2.01 Both (Direct and through Implementing Agency)
UCWF CSR00006050
3 Agriculture and Farm BasedAgriculture and horticulture training program/ farmers group transfer of technology-demonstration plots, support for horticulture plots, seeds improvement program, support for improved
(iv) Yes Rajasthan
Madhya Pradesh
Gujarat
Maharashtra
Chhattisgarh
Karnataka
Jodhpur, Nagaur, Jaipur, Chittorgarh, Sirohi, Pali
Neemuch, Dhar, Rewa, Siddhi, Satna
Amreli, Bhuj
Chandrapur
Baloda Bazaar, Raipur
Gulbarga
0.22 Both (Direct and through Implementing Agency)
UCWF CSR00006050
Annexure III (Contd.)

92U
ltra
Tech
Cem
ent
Lim
ited
93A
nnua
l Rep
ort
202
0-21
Welcome to UltraTech
Value Creation
Growth Enablers
Statutory Reports
Financial Statements
ESG Commitments
1 2 3 4 5 6 7 8
Sl. No.
Name of the Project Item from the list of
activities in Schedule VII to the
Act
Local area(Yes/No)
Location of the project Amount spent for the
project(` in crores)
Mode of Implementation
- Direct(Yes/No)
Mode of Implementation - Through Implementing
Agency
State District Name CSR Registration
number
agriculture equipment and inputs, exposure visits / support for agricultural mela, integrated agricultural/ horticultural improvement program/ productivity improvement programs, soil health and organic farming.
Andhra Pradesh
Himachal Pradesh
Uttar Pradesh
Tamil Nadu
Kurnool, Anantapur
Solan
Sonebhadra
Arriyallur
Animal Husbandry Based Treatment and vaccination, breed improvement productivity, improvement programs and train.
(iv) Yes Rajasthan
Madhya Pradesh
Gujarat
Maharashtra
Chhattisgarh
Karnataka
Andhra Pradesh
Jodhpur, Nagaur, Jaipur, Chittorgarh, Sirohi, Pali
Neemuch, Dhar, Rewa, Siddhi, Satna
Amreli, Bhuj
Chandrapur
Baloda Bazaar, Raipur
Gulbarga
Kurnool, Anantapur
0.67 Both (Direct and through Implementing Agency)
UCWF CSR00006050
Non-farm & Skills based Income generation programCapacity building program-tailoring, beauty parlour, mechanical, rural enterprise development & income generation programs, support to SHGs for entrepreneurial activities.
(iii) Yes Rajasthan
Madhya Pradesh
Gujarat
Maharashtra
Chhattisgarh
Karnataka
Andhra Pradesh
Himachal Pradesh
Uttar Pradesh
Tamil Nadu
Jodhpur, Nagaur, Jaipur, Chittorgarh, Sirohi, Pali
Neemuch, Dhar, Rewa, Siddhi, Satna
Amreli, Bhuj
Chandrapur
Baloda Bazaar, Raipur
Gulbarga
Kurnool, Anantapur
Solan
Sonebhadra
Arriyallur
0.45 Both (Direct and through Implementing Agency)
UCWF CSR00006050
Natural Resource conservation programs & Non-conventional EnergyBio gas support program, solar energy support and other energy support programs - (low smoke wood stoves / sky light), plantation / green belt development / roadside plantation, soil conservation / land improvement, water conservation and harvesting (small structures/ bigger structures), community pasture land development / orchard development.
(iv) Yes Rajasthan
Madhya Pradesh
Gujarat
Maharashtra
Chhattisgarh
Karnataka
Andhra Pradesh
Himachal Pradesh
Uttar Pradesh
Tamil Nadu
Jodhpur, Nagaur, Jaipur, Chittorgarh, Sirohi, Pali
Neemuch, Dhar, Rewa, Siddhi, Satna
Amreli, Bhuj
Chandrapur
Baloda Bazaar, Raipur
Gulbarga
Kurnool, Anantapur
Solan
Sonebhadra
Arriyallur
1.31 Both (Direct and through Implementing Agency)
UCWF CSR00006050
1 2 3 4 5 6 7 8
Sl. No.
Name of the Project Item from the list of
activities in Schedule VII to the
Act
Local area(Yes/No)
Location of the project Amount spent for the
project(` in crores)
Mode of Implementation
- Direct(Yes/No)
Mode of Implementation - Through Implementing
Agency
State District Name CSR Registration
number
Livelihood Infrastructure (iv) Yes Rajasthan
Madhya Pradesh
Gujarat
Maharashtra
Chhattisgarh
Karnataka
Andhra Pradesh
Himachal Pradesh
Uttar Pradesh
Tamil Nadu
Jodhpur, Nagaur, Jaipur, Chittorgarh, Sirohi, Pali
Neemuch, Dhar, Rewa, Siddhi, Satna
Amreli, Bhuj
Chandrapur
Baloda Bazaar, Raipur
Gulbarga
Kurnool, Anantapur
Solan
Sonebhadra
Arriyallur
0.18 Both (Direct and through Implementing Agency)
UCWF CSR00006050
4 Rural Infrastructure Development other than for the purpose of health / education / livelihoodNew roads / culverts / bridges / bus stands, repair roads/ culverts / bridges / bus stands community halls / housing, other community assets and shelters, support for repairing roads / culverts / bridges / community halls / street lights and other community infrastructure
(x) Yes Rajasthan
Madhya Pradesh
Gujarat
Maharashtra
Chhattisgarh
Karnataka
Andhra Pradesh
Himachal Pradesh
Uttar Pradesh
Jodhpur, Nagaur, Jaipur, Chittorgarh, Sirohi, Pali
Neemuch, Dhar, Rewa, Siddhi, Satna
Amreli, Bhuj
Chandrapur
Baloda Bazaar, Raipur
Gulbarga
Kurnool, Anantapur
Solan
Sonebhadra
11.88 Both (Direct and through Implementing Agency)
UCWF CSR00006050
5 Promotion of culture/ sportsSupport to rural cultural program, festivals & melas support to rural sports.
(vii) Yes Rajasthan
Madhya Pradesh
Gujarat
Maharashtra
Chhattisgarh
Karnataka
Andhra Pradesh
Himachal Pradesh
Uttar Pradesh
Jodhpur, Nagaur, Jaipur, Chittorgarh, Sirohi, Pali
Neemuch, Dhar, Rewa, Siddhi, Satna
Amreli, Bhuj
Chandrapur
Baloda Bazaar, Raipur
Gulbarga
Kurnool, Anantapur
Solan
Sonebhadra
0.40 Both (Direct and through Implementing Agency)
UCWF CSR00006050
Institutional building and strengtheningStrengthening / formation of community based organisation (SHGs), support to development organizations, oldage home, orphanage
(iii) Yes 0.09 Both (Direct and through Implementing Agency)
UCWF CSR00006050
Social Security and support to OrganisationsSupport to old age / widow / physically challenged person / poor insurance, pension scheme
(iii) Yes 0.04 Both (Direct and through Implementing Agency)
UCWF CSR00006050
Awareness programsCommunity awareness program, awareness campaign social abuse early marriage / HIV prevention
(i) Yes 0.03 Both (Direct and through Implementing Agency)
UCWF CSR00006050
Social events to minimise causes of povertySupport to mass marriage/ widow remarriage, national/ international day celebrations with community, support with basic necessities.
(iii) Yes 0.18 Both (Direct and through Implementing Agency)
UCWF CSR00006050
Annexure III (Contd.)
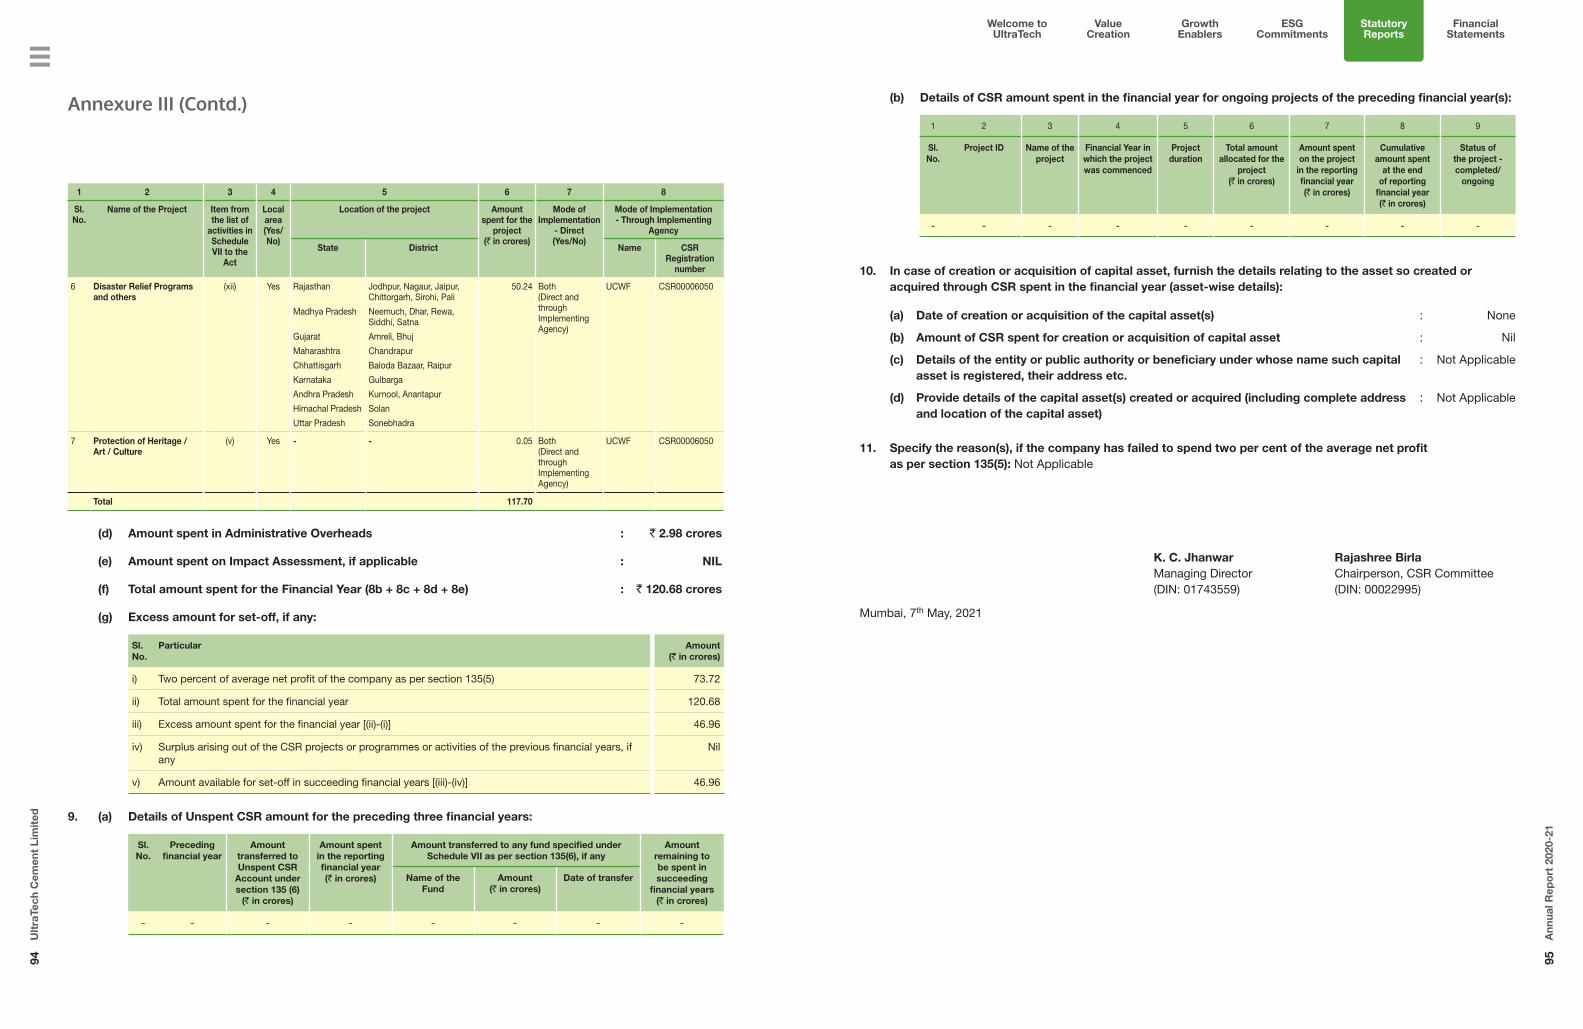
94U
ltra
Tech
Cem
ent
Lim
ited
95A
nnua
l Rep
ort
202
0-21
Welcome to UltraTech
Value Creation
Growth Enablers
Statutory Reports
Financial Statements
ESG Commitments
Annexure III (Contd.)
1 2 3 4 5 6 7 8
Sl. No.
Name of the Project Item from the list of
activities in Schedule VII to the
Act
Local area(Yes/No)
Location of the project Amount spent for the
project(` in crores)
Mode of Implementation
- Direct(Yes/No)
Mode of Implementation - Through Implementing
Agency
State District Name CSR Registration
number
6 Disaster Relief Programs and others
(xii) Yes Rajasthan
Madhya Pradesh
Gujarat
Maharashtra
Chhattisgarh
Karnataka
Andhra Pradesh
Himachal Pradesh
Uttar Pradesh
Jodhpur, Nagaur, Jaipur, Chittorgarh, Sirohi, Pali
Neemuch, Dhar, Rewa, Siddhi, Satna
Amreli, Bhuj
Chandrapur
Baloda Bazaar, Raipur
Gulbarga
Kurnool, Anantapur
Solan
Sonebhadra
50.24 Both (Direct and through Implementing Agency)
UCWF CSR00006050
7 Protection of Heritage / Art / Culture
(v) Yes - - 0.05 Both (Direct and through Implementing Agency)
UCWF CSR00006050
Total 117.70
(d) Amount spent in Administrative Overheads : ` 2.98 crores
(e) Amount spent on Impact Assessment, if applicable : NIL
(f) Total amount spent for the Financial Year (8b + 8c + 8d + 8e) : ` 120.68 crores
(g) Excess amount for set-off, if any:
Sl. No.
Particular Amount(` in crores)
i) Two percent of average net profit of the company as per section 135(5) 73.72
ii) Total amount spent for the financial year 120.68
iii) Excess amount spent for the financial year [(ii)-(i)] 46.96
iv) Surplus arising out of the CSR projects or programmes or activities of the previous financial years, if any
Nil
v) Amount available for set-off in succeeding financial years [(iii)-(iv)] 46.96
9. (a) Details of Unspent CSR amount for the preceding three financial years:
Sl. No.
Preceding financial year
Amount transferred to Unspent CSR
Account under section 135 (6)
(` in crores)
Amount spent in the reporting financial year(` in crores)
Amount transferred to any fund specified under Schedule VII as per section 135(6), if any
Amount remaining to be spent in succeeding
financial years(` in crores)
Name of the Fund
Amount(` in crores)
Date of transfer
- - - - - - - -
(b) Details of CSR amount spent in the financial year for ongoing projects of the preceding financial year(s):
1 2 3 4 5 6 7 8 9
Sl. No.
Project ID Name of the project
Financial Year in which the project was commenced
Projectduration
Total amount allocated for the
project(` in crores)
Amount spent on the project
in the reporting financial year(` in crores)
Cumulative amount spent
at the end of reporting
financial year(` in crores)
Status of the project - completed/
ongoing
- - - - - - - - -
10. In case of creation or acquisition of capital asset, furnish the details relating to the asset so created or acquired through CSR spent in the financial year (asset-wise details):
(a) Date of creation or acquisition of the capital asset(s) : None
(b) Amount of CSR spent for creation or acquisition of capital asset : Nil
(c) Details of the entity or public authority or beneficiary under whose name such capital asset is registered, their address etc.
: Not Applicable
(d) Provide details of the capital asset(s) created or acquired (including complete address and location of the capital asset)
: Not Applicable
11. Specify the reason(s), if the company has failed to spend two per cent of the average net profit as per section 135(5): Not Applicable
K. C. JhanwarManaging Director(DIN: 01743559)
Rajashree BirlaChairperson, CSR Committee(DIN: 00022995)
Mumbai, 7th May, 2021

96U
ltra
Tech
Cem
ent
Lim
ited
97A
nnua
l Rep
ort
202
0-21
Welcome to UltraTech
Value Creation
Growth Enablers
Statutory Reports
Financial Statements
ESG Commitments
Ann
exur
e IV
Form
AO
C -
1P
ursu
ant
to fi
rst
pro
viso
to
sub
- se
ctio
n (3
) of
Sec
tio
n 12
9 o
f th
e C
om
pan
ies
Act
, 201
3 re
ad w
ith
Rul
e 5
of
Co
mp
anie
s (A
cco
unts
) Rul
es, 2
014
Par
t “A
” -
Sub
sid
iari
es S
tate
men
t co
ntai
ning
sal
ient
fea
ture
s o
f th
e fi
nanc
ial s
tate
men
ts o
f su
bsi
dia
ries
/ a
sso
ciat
e co
mp
anie
s /
join
t ve
ntur
es
Am
oun
t in
Cro
res
Sr.
No.
Nam
e of
the
Subs
idia
ry
Com
pani
esYe
arC
urre
ncy
Shar
e C
apita
l In
clud
ing
Shar
e ap
plic
atio
n M
oney
Res
erve
s an
d Su
rplu
s
Tota
l Ass
ets
(Non
C
urre
nt A
sset
s +
Cur
rent
Ass
ets
+ D
efer
red
Tax
Ass
ets)
ex
clud
ing
Cur
rent
and
N
on-C
urre
nt
Inve
stm
ents
Tota
l Li
abili
ties
(Non
Cur
rent
Li
abili
ties
+ C
urre
nt
Liab
ilitie
s +
Def
erre
d ta
x Li
abili
ties)
Det
ails
of
Cur
rent
and
N
on C
urre
nt
Inve
stm
ents
(e
xclu
ding
in
vest
men
t in
the
subs
idia
ry
com
pani
es) -
Tr
easu
ry B
ill
Net
Tu
rnov
erP
rofit
/ (L
oss)
be
fore
Ta
xatio
n
Pro
visi
on
for
Taxa
tion
Pro
fit /
(Los
s)
afte
r Ta
xatio
n
Pro
pose
d D
ivid
end
(incl
udin
g C
orpo
rate
D
ivid
end
Tax)
% o
f sh
areh
oldi
ng
1D
aksh
in C
emen
ts L
imite
d ^
2020
-21
`0.
05(0
.05)
--
--
--
--
100%
2019
-20
0.05
(0.0
5)-
--
-`
35,9
60-
` 35
,960
-10
0%
2H
aris
h C
emen
t Lim
ited
2020
-21
`0.
2515
4.15
156.
772.
37-
-`
(6,5
50)
-`
(6,5
50)
-10
0%
2019
-20
0.25
154.
1515
6.80
2.40
--
` (6
,520
)-
` (6
,520
)-
100%
3G
otan
Lim
esto
ne K
hani
j Udy
og
Priv
ate
Lim
ited
2020
-21
`2.
3317
.19
20.6
01.
08-
-(0
.63)
-(0
.63)
-10
0%
2019
-20
2.33
17.8
321
.04
0.88
--
(0.4
1)-
(0.4
1)-
100%
4B
hagw
ati L
ime
Sto
ne
Com
pany
Priv
ate
Lim
ited
2020
-21
`0.
011.
662.
620.
95-
0.71
(0.0
5)-
(0.0
5)-
100%
2019
-20
0.01
1.70
2.45
0.74
-1.
36(0
.06)
-(0
.06)
-10
0%
5U
ltraT
ech
Cem
ent L
anka
(Pvt
) Li
mite
d20
20-2
1S
LR50
.00
27.0
583
1.07
754.
01-
1,83
5.71
(20.
32)
(4.3
9)(1
5.93
)-
80%
`18
.38
9.95
305.
5427
7.21
-72
2.72
(8.0
0)(1
.73)
(6.2
7)-
2019
-20
SLR
50.0
043
.40
637.
0554
3.65
-1,
639.
29(6
6.24
)(1
0.85
)(5
5.38
)-
80%
`20
.00
17.3
625
4.82
217.
46-
647.
94(2
6.18
)(4
.29)
(21.
89)
-
6U
ltraT
ech
Cem
ent M
iddl
e Ea
st
Inve
stm
ent L
imite
d (“
UC
MEI
L”)
(Sta
ndal
one)
2020
-21
AED
34.3
719
.83
105.
8051
.61
--
0.63
-0.
63-
100%
`68
4.12
394.
622,
105.
991,
027.
25-
-12
.69
-12
.69
-
2019
-20
AED
25.1
313
.91
103.
8564
.81
--
(0.1
1)-
(0.1
1)-
100%
`51
7.66
286.
602,
139.
271,
335.
02-
-(2
.11)
-(2
.11)
-
7S
tar C
emen
t Co
LLC
, Dub
ai @
2020
-21
AED
1.50
(22.
55)
38.6
959
.74
-21
.26
(2.9
3)-
(2.9
3)-
100%
`29
.86
(448
.91)
770.
051,
189.
10-
429.
78(5
9.20
)-
(59.
20)
-
2019
-20
AED
1.50
(19.
59)
37.8
955
.98
-27
.16
(1.2
9)-
(1.2
9)-
100%
`30
.90
(403
.53)
780.
641,
153.
26-
524.
31(2
4.81
)-
(24.
81)
-
8A
rabi
an C
emen
t Ind
ustr
y LL
C,
Abu
Dha
bi @
2020
-21
AED
1.00
(7.9
9)12
.91
19.9
1-
16.3
8(0
.23)
-(0
.23)
-10
0%`
19.9
1(1
59.1
3)25
7.05
396.
28-
331.
02(4
.68)
-(4
.68)
-
2019
-20
AED
1.00
(7.7
4)16
.93
23.6
7-
21.0
6(0
.44)
-(0
.44)
-10
0%`
20.6
0(1
59.4
8)34
8.71
487.
59-
406.
52(8
.53)
-(8
.53)
-
Am
oun
t in
Cro
res
Sr.
No.
Nam
e of
the
Subs
idia
ry
Com
pani
esYe
arC
urre
ncy
Shar
e C
apita
l In
clud
ing
Shar
e ap
plic
atio
n M
oney
Res
erve
s an
d Su
rplu
s
Tota
l Ass
ets
(Non
C
urre
nt A
sset
s +
Cur
rent
Ass
ets
+ D
efer
red
Tax
Ass
ets)
ex
clud
ing
Cur
rent
and
N
on-C
urre
nt
Inve
stm
ents
Tota
l Li
abili
ties
(Non
Cur
rent
Li
abili
ties
+ C
urre
nt
Liab
ilitie
s +
Def
erre
d ta
x Li
abili
ties)
Det
ails
of
Cur
rent
and
N
on C
urre
nt
Inve
stm
ents
(e
xclu
ding
in
vest
men
t in
the
subs
idia
ry
com
pani
es) -
Tr
easu
ry B
ill
Net
Tu
rnov
erP
rofit
/ (L
oss)
be
fore
Ta
xatio
n
Pro
visi
on
for
Taxa
tion
Pro
fit /
(Los
s)
afte
r Ta
xatio
n
Pro
pose
d D
ivid
end
(incl
udin
g C
orpo
rate
D
ivid
end
Tax)
% o
f sh
areh
oldi
ng
9S
tar C
emen
t Co
LLC
, Ras
Al
Kha
imah
@20
20-2
1A
ED0.
5022
.89
57.6
834
.29
-37
.49
5.72
-5.
72-
100%
`9.
9545
5.62
1,14
8.05
682.
48-
757.
7511
5.64
-11
5.64
-
2019
-20
AED
0.50
17.1
752
.12
34.4
5-
35.4
13.
89-
3.89
-10
0%`
10.3
035
3.75
1,07
3.70
709.
65-
683.
6075
.01
-75
.01
-
10A
l Nak
hla
Cru
sher
s LL
C,
Fuja
irah
@20
20-2
1A
ED0.
205.
756.
961.
02-
5.05
1.60
-1.
60-
100%
`3.
9811
4.38
138.
6120
.25
-10
2.08
32.2
7-
32.2
7-
2019
-20
AED
0.20
4.16
5.06
0.70
-4.
511.
16-
1.16
-10
0%`
4.12
85.6
910
4.28
14.4
7-
87.1
422
.43
-22
.43
-
11U
ltraT
ech
Cem
ent B
ahra
in
Com
pany
WLL
, Bah
rain
@20
20-2
1B
HD
0.03
1.33
1.69
0.33
-1.
080.
13-
0.13
-10
0%`
5.82
257.
2032
7.15
64.1
3-
212.
1225
.49
-25
.49
-
2019
-20
BH
D0.
031.
311.
680.
34-
1.07
0.07
-0.
07-
100%
`6.
0226
3.28
337.
9768
.66
-20
1.15
13.3
2-
13.3
2-
12P
T U
ltraT
ech
Min
ing
Indo
nesi
a20
20-2
1ID
R1,
158.
90(1
,038
.26)
120.
64-
--
--
--
80%
`5.
63(5
.05)
0.58
--
--
--
-
2019
-20
IDR
1,15
8.90
(1,0
38.2
6)12
0.64
--
--
--
-80
%`
5.63
(5.0
5)0.
58-
--
--
--
13P
T U
ltraT
ech
Inve
stm
ent
Indo
nesi
a20
20-2
1ID
R1,
992.
4034
.07
2,03
7.01
10.5
4-
--
--
-10
0%`
9.68
0.16
9.90
0.06
--
--
--
2019
-20
IDR
1,99
2.40
34.0
72,
037.
0110
.54
--
--
--
100%
`9.
680.
169.
900.
06-
--
--
-
14P
T U
ltraT
ech
Cem
ent
Indo
nesi
a20
20-2
1ID
R2,
033.
46(1
,382
.29)
648.
950.
78-
--
--
-99
%`
9.87
(6.7
2)3.
150.
00-
--
--
-
2019
-20
IDR
2,03
3.46
(1,3
82.2
9)64
8.95
0.78
--
--
--
99%
`9.
87(6
.72)
3.15
0.00
--
--
--
15U
ltraT
ech
Nat
hdw
ara
Cem
ent
Lim
ited
(“U
NC
L”)
2020
-21
`3,
400.
00(4
,586
.54)
2,57
3.38
3,75
9.92
-1,
253.
726.
83-
6.83
-10
0%
2019
-20
3,40
0.00
(4,5
93.9
8)3,
615.
994,
809.
97-
1,36
6.69
49.2
4-
49.2
4-
100%

98U
ltra
Tech
Cem
ent
Lim
ited
99A
nnua
l Rep
ort
202
0-21
Welcome to UltraTech
Value Creation
Growth Enablers
Statutory Reports
Financial Statements
ESG Commitments
Am
oun
t in
Cro
res
Sr.
No.
Nam
e of
the
Subs
idia
ry
Com
pani
esYe
arC
urre
ncy
Shar
e C
apita
l In
clud
ing
Shar
e ap
plic
atio
n M
oney
Res
erve
s an
d Su
rplu
s
Tota
l Ass
ets
(Non
C
urre
nt A
sset
s +
Cur
rent
Ass
ets
+ D
efer
red
Tax
Ass
ets)
ex
clud
ing
Cur
rent
and
N
on-C
urre
nt
Inve
stm
ents
Tota
l Li
abili
ties
(Non
Cur
rent
Li
abili
ties
+ C
urre
nt
Liab
ilitie
s +
Def
erre
d ta
x Li
abili
ties)
Det
ails
of
Cur
rent
and
N
on C
urre
nt
Inve
stm
ents
(e
xclu
ding
in
vest
men
t in
the
subs
idia
ry
com
pani
es) -
Tr
easu
ry B
ill
Net
Tu
rnov
erP
rofit
/ (L
oss)
be
fore
Ta
xatio
n
Pro
visi
on
for
Taxa
tion
Pro
fit /
(Los
s)
afte
r Ta
xatio
n
Pro
pose
d D
ivid
end
(incl
udin
g C
orpo
rate
D
ivid
end
Tax)
% o
f sh
areh
oldi
ng
16K
rishn
a H
oldi
ngs
Pte
. Ltd
.(“
KH
L”) #
$20
20-2
1
US
D0.
090.
030.
120.
00-
-0.
190.
40(0
.21)
-U
NC
L -
55.5
4%
MH
L -
44.4
6%
`6.
792.
289.
100.
03-
-14
.11
29.7
7(1
5.66
)-
2019
-20
US
D6.
190.
327.
490.
98-
-(0
.04)
-(0
.04)
-U
NC
L -
55.5
4%
MH
L -
44.4
6%
`46
8.65
23.9
756
6.79
74.1
7-
-(2
.55)
-(2
.55)
-
17M
ukun
dan
Hol
ding
s Lt
d.
(“M
HL”
) # $
2020
-21
US
D7.
70(7
.22)
0.48
0.00
--
(5.6
2)-
(5.6
2)-
100%
`56
2.98
(527
.72)
35.2
90.
03-
-(4
16.9
8)-
(416
.98)
-
2019
-20
US
D7.
70(1
.60)
10.2
64.
16-
-0.
23-
0.23
-10
0%`
582.
66(1
21.0
2)77
6.32
314.
68-
-16
.22
-16
.22
-
18M
urar
i Hol
ding
s Lt
d.(“
MU
HL”
) # $
2020
-21
US
D5.
48(5
.48)
0.02
0.02
--
(4.7
2)-
(4.7
2)-
100%
`40
0.68
(400
.65)
1.51
1.48
--
(350
.08)
-(3
50.0
8)-
2019
-20
US
D5.
48(0
.80)
7.98
3.29
--
(0.0
0)-
(0.0
0)-
100%
`41
4.68
(60.
19)
603.
6024
9.12
--
(0.0
5)-
(0.0
5)-
19S
wis
s M
erch
andi
se
Infra
stru
ctur
e Li
mite
d #
2020
-21
`0.
051.
9059
.83
57.8
8-
-0.
01-
0.00
-10
0%
2019
-20
0.05
1.89
60.1
658
.21
--
0.02
-0.
01-
100%
20M
erit
Pla
za L
imite
d #
2020
-21
`0.
05(3
5.74
)7.
3042
.99
--
(38.
82)
(0.5
6)(3
8.26
)-
100%
2019
-20
0.05
2.52
46.4
343
.87
--
0.02
(0.3
1)0.
33-
100%
21B
hum
i Res
ourc
es (S
inga
pore
) P
te. L
td (“
Bhu
mi”
) # $
2020
-21
US
D1.
50(1
.48)
0.02
0.00
--
(1.3
7)-
(1.3
7)-
100%
`10
9.67
(107
.96)
1.75
0.04
--
(101
.53)
-(1
01.5
3)-
2019
-20
US
D1.
50(0
.11)
1.40
0.01
--
(0.0
8)-
(0.0
8)-
100%
`11
3.50
(8.2
1)10
5.94
0.65
--
(5.5
9)-
(5.5
9)-
22S
tar S
uper
Cem
ent I
ndus
trie
s LL
C (“
SS
CI”
) @@
2020
-21
AED
3.19
(0.1
4)18
.33
15.2
8-
15.2
14.
67-
4.67
-U
CM
EIL
- 10
0%`
63.5
8(2
.81)
364.
8530
4.08
-30
7.39
94.3
4-
94.3
4-
2019
-20
AED
3.19
(4.7
6)22
.47
24.0
4-
17.7
7(2
.95)
-(2
.95)
-M
UH
L -
51%
MH
L -
49%
`65
.80
(98.
05)
462.
8949
5.14
-34
3.12
(56.
88)
-(5
6.88
)-
23S
moo
th E
nerg
y P
rivat
eLi
mite
d #
^^20
20-2
1`
0.01
(0.0
1)-
--
--
--
-10
0%
2019
-20
0.01
(0.0
1)-
--
-(0
.03)
-(0
.03)
-10
0%
Am
oun
t in
Cro
res
Sr.
No.
Nam
e of
the
Subs
idia
ry
Com
pani
esYe
arC
urre
ncy
Shar
e C
apita
l In
clud
ing
Shar
e ap
plic
atio
n M
oney
Res
erve
s an
d Su
rplu
s
Tota
l Ass
ets
(Non
C
urre
nt A
sset
s +
Cur
rent
Ass
ets
+ D
efer
red
Tax
Ass
ets)
ex
clud
ing
Cur
rent
and
N
on-C
urre
nt
Inve
stm
ents
Tota
l Li
abili
ties
(Non
Cur
rent
Li
abili
ties
+ C
urre
nt
Liab
ilitie
s +
Def
erre
d ta
x Li
abili
ties)
Det
ails
of
Cur
rent
and
N
on C
urre
nt
Inve
stm
ents
(e
xclu
ding
in
vest
men
t in
the
subs
idia
ry
com
pani
es) -
Tr
easu
ry B
ill
Net
Tu
rnov
erP
rofit
/ (L
oss)
be
fore
Ta
xatio
n
Pro
visi
on
for
Taxa
tion
Pro
fit /
(Los
s)
afte
r Ta
xatio
n
Pro
pose
d D
ivid
end
(incl
udin
g C
orpo
rate
D
ivid
end
Tax)
% o
f sh
areh
oldi
ng
24S
hand
ong
Bin
ani R
onga
n C
emen
t Co.
Lim
ited
(“S
BR
CC
”), C
hina
# $
(Cea
sed
w.e
.f31
st J
uly,
202
0)
2020
-21
RM
B-
--
--
19.5
9(0
.00)
0.75
(0.7
5)-
0%`
--
--
-20
9.72
(0.0
3)7.
99(8
.02)
-
2019
-20
RM
B45
.00
6.14
66.9
115
.77
-54
.80
14.5
33.
7810
.75
-K
HL-
92
.5%
`48
0.51
65.5
771
4.49
168.
41-
574.
1915
2.24
39.6
011
2.64
-
25P
T A
ngga
na E
nerg
y R
esou
rces
# $
2020
-21
IDR
14.2
392
2.62
951.
3114
.47
--
(61.
69)
-(6
1.69
)-
Bhu
mi-
10
0%`
0.07
4.64
4.79
0.07
--
(0.3
2)-
(0.3
2)-
2019
-20
IDR
546.
30(1
03.0
9)99
5.90
552.
69-
-3.
49-
3.49
-B
hum
i- 10
0%`
2.52
(0.4
8)4.
602.
55-
-0.
02-
0.02
-
26B
C T
rade
link
Lim
ited
## $
2020
-21
TZS
TZS
2,00
0.00
2.42
2.42
--
--
--
-SS
CI-
10
0%`
` 63
.52
0.08
0.08
--
--
--
-
2019
-20
TZS
TZS
2,
000.
002.
422.
420.
00-
--
--
-S
SC
I-
100%
``
64.5
40.
080.
080.
00-
--
--
-
27B
inan
i Cem
ent T
anza
nia
Lim
ited
## $
2020
-21
TZS
3.20
314.
9329
0.92
(27.
20)
--
--
--
SSC
I-
100%
`0.
1010
.00
9.24
(0.8
6)-
--
--
-
2019
-20
TZS
3.20
(408
.67)
290.
9269
6.40
--
--
--
SS
CI-
10
0%`
0.10
(13.
19)
9.39
22.4
7-
--
--
-
28B
inan
i Cem
ent (
Uga
nda)
Li
mite
d ##
$20
20-2
1
UG
XU
GX
2,
000.
000.
5950
.55
49.9
7-
--
--
-SS
CI -
10
0%`
` 39
.77
0.01
1.01
0.99
--
--
--
2019
-20
UG
XU
GX
2,00
0.00
0.59
50.5
549
.97
--
--
--
SS
CI -
10
0%`
` 38
.90
0.01
0.98
0.97
--
--
--
29B
ahar
Rea
dy M
ix C
oncr
ete
Lim
ited
# ^^
2020
-21
`6.
21(6
.21)
--
--
--
--
100%
2019
-20
6.21
(6.2
1)-
--
-3.
41-
3.41
-10
0%
303B
Bin
ani G
lass
fibre
Sar
l, Lu
xem
bour
g (“
3B”)
*$20
20-2
1EU
R10
.01
(7.3
5)29
.60
26.9
4-
-1.
21-
1.21
-10
0%`
858.
31(6
30.6
8)2,
538.
022,
310.
40-
-10
4.50
-10
4.50
-
2019
-20
--
--
--
--
--
--
--
--
--
--
-
Annexure IV (Contd.)
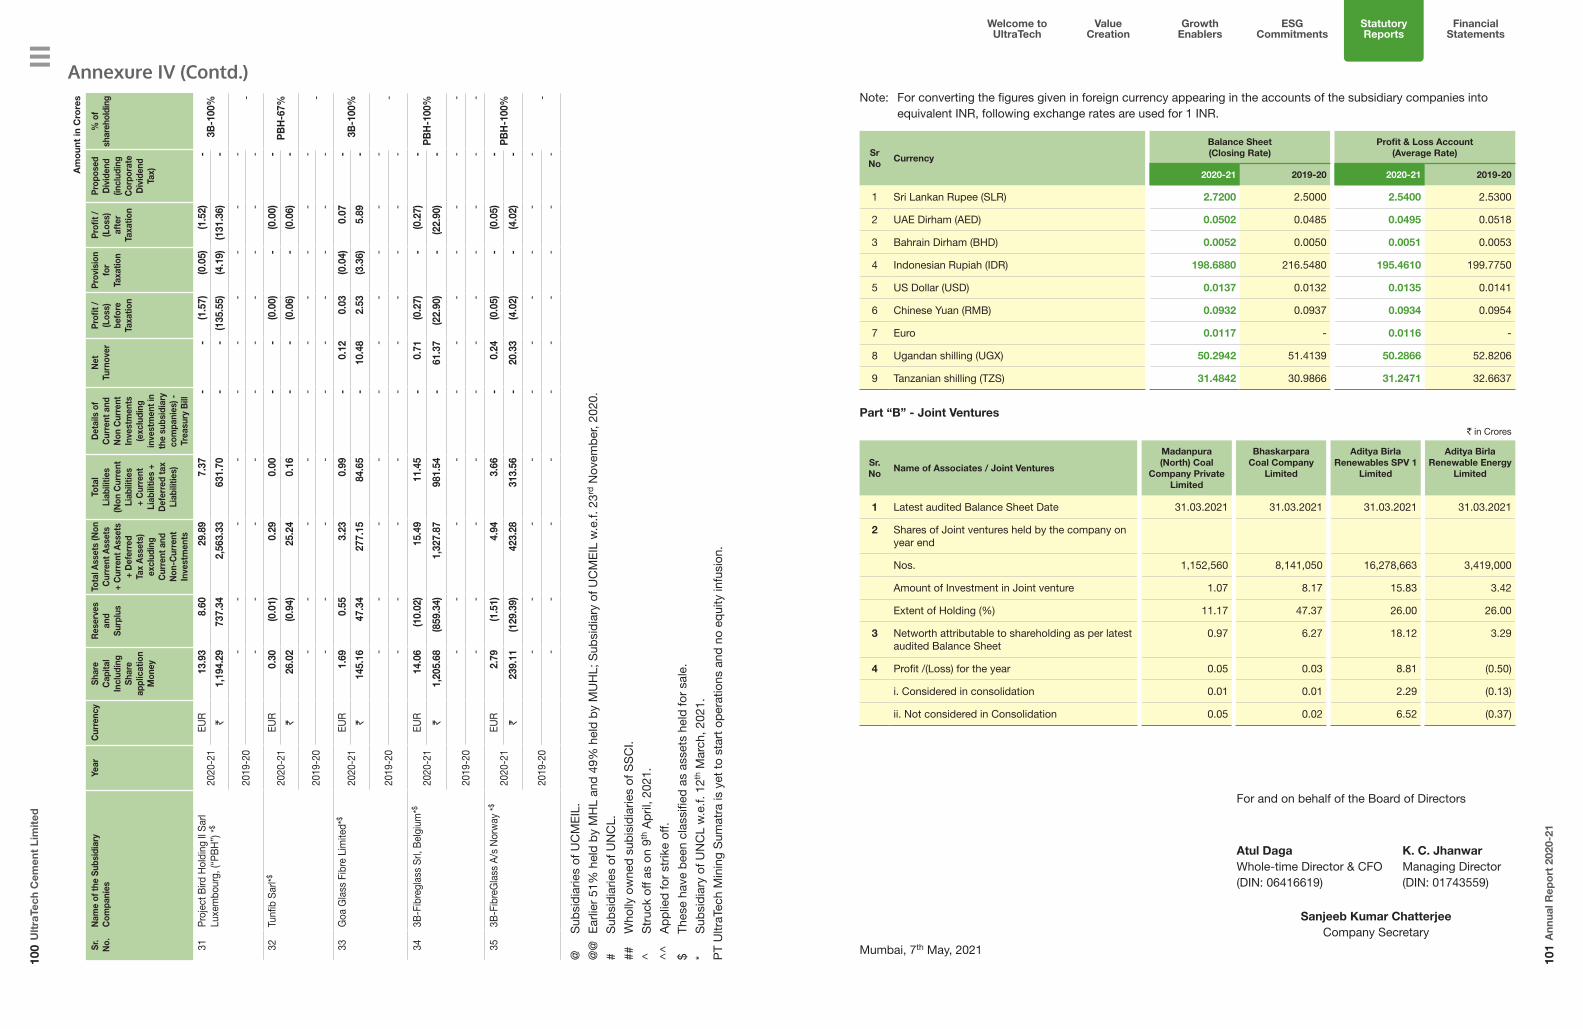
100
Ult
raTe
ch C
emen
t Li
mit
ed
101
Ann
ual R
epo
rt 2
020-
21
Welcome to UltraTech
Value Creation
Growth Enablers
Statutory Reports
Financial Statements
ESG Commitments
Am
oun
t in
Cro
res
Sr.
No.
Nam
e of
the
Subs
idia
ry
Com
pani
esYe
arC
urre
ncy
Shar
e C
apita
l In
clud
ing
Shar
e ap
plic
atio
n M
oney
Res
erve
s an
d Su
rplu
s
Tota
l Ass
ets
(Non
C
urre
nt A
sset
s +
Cur
rent
Ass
ets
+ D
efer
red
Tax
Ass
ets)
ex
clud
ing
Cur
rent
and
N
on-C
urre
nt
Inve
stm
ents
Tota
l Li
abili
ties
(Non
Cur
rent
Li
abili
ties
+ C
urre
nt
Liab
ilitie
s +
Def
erre
d ta
x Li
abili
ties)
Det
ails
of
Cur
rent
and
N
on C
urre
nt
Inve
stm
ents
(e
xclu
ding
in
vest
men
t in
the
subs
idia
ry
com
pani
es) -
Tr
easu
ry B
ill
Net
Tu
rnov
erP
rofit
/ (L
oss)
be
fore
Ta
xatio
n
Pro
visi
on
for
Taxa
tion
Pro
fit /
(Los
s)
afte
r Ta
xatio
n
Pro
pose
d D
ivid
end
(incl
udin
g C
orpo
rate
D
ivid
end
Tax)
% o
f sh
areh
oldi
ng
31P
roje
ct B
ird H
oldi
ng ll
Sar
l Lu
xem
bour
g, (“
PB
H”)
*$20
20-2
1EU
R13
.93
8.60
29.8
97.
37-
-(1
.57)
(0.0
5)(1
.52)
-3B
-100
%`
1,19
4.29
737.
342,
563.
3363
1.70
--
(135
.55)
(4.1
9)(1
31.3
6)-
2019
-20
--
--
--
--
--
--
--
--
--
--
-
32Tu
nfib
Sar
l*$
2020
-21
EUR
0.30
(0.0
1)0.
290.
00-
-(0
.00)
-(0
.00)
-P
BH
-67%
`26
.02
(0.9
4)25
.24
0.16
--
(0.0
6)-
(0.0
6)-
2019
-20
--
--
--
--
--
--
--
--
--
--
-
33G
oa G
lass
Fib
re L
imite
d*$
2020
-21
EUR
1.69
0.55
3.23
0.99
-0.
120.
03(0
.04)
0.07
-3B
-100
%`
145.
1647
.34
277.
1584
.65
-10
.48
2.53
(3.3
6)5.
89-
2019
-20
--
--
--
--
--
--
--
--
--
--
-
343B
-Fib
regl
ass
Srl,
Bel
gium
*$
2020
-21
EUR
14.0
6(1
0.02
)15
.49
11.4
5-
0.71
(0.2
7)-
(0.2
7)-
PB
H-1
00%
`1,
205.
68(8
59.3
4)1,
327.
8798
1.54
-61
.37
(22.
90)
-(2
2.90
)-
2019
-20
--
--
--
--
--
-
--
--
--
--
--
-
353B
-Fib
reG
lass
A/s
Nor
way
*$
2020
-21
EUR
2.79
(1.5
1)4.
943.
66-
0.24
(0.0
5)-
(0.0
5)-
PB
H-1
00%
`23
9.11
(129
.39)
423.
2831
3.56
-20
.33
(4.0
2)-
(4.0
2)-
2019
-20
--
--
--
--
--
--
--
--
--
--
-
@
Sub
sid
iarie
s of
UC
ME
IL.
@@
E
arlie
r 51
% h
eld
by
MH
L an
d 4
9% h
eld
by
MU
HL;
Sub
sid
iary
of U
CM
EIL
w.e
.f. 2
3rd N
ovem
ber
, 202
0.
# S
ubsi
dia
ries
of U
NC
L.
##
Who
lly o
wne
d s
ubis
idia
ries
of S
SC
I.
^
Str
uck
off a
s on
9th
Ap
ril, 2
021.
^^
A
pp
lied
for
strik
e of
f.
$ Th
ese
have
bee
n cl
assi
fied
as
asse
ts h
eld
for
sale
.
* S
ubsi
dia
ry o
f UN
CL
w.e
.f. 1
2th M
arch
, 202
1.
PT
Ultr
aTec
h M
inin
g S
umat
ra is
yet
to
star
t op
erat
ions
and
no
equi
ty in
fusi
on.
Annexure IV (Contd.)Note: For converting the figures given in foreign currency appearing in the accounts of the subsidiary companies into
equivalent INR, following exchange rates are used for 1 INR.
Sr No
Currency
Balance Sheet(Closing Rate)
Profit & Loss Account(Average Rate)
2020-21 2019-20 2020-21 2019-20
1 Sri Lankan Rupee (SLR) 2.7200 2.5000 2.5400 2.5300
2 UAE Dirham (AED) 0.0502 0.0485 0.0495 0.0518
3 Bahrain Dirham (BHD) 0.0052 0.0050 0.0051 0.0053
4 Indonesian Rupiah (IDR) 198.6880 216.5480 195.4610 199.7750
5 US Dollar (USD) 0.0137 0.0132 0.0135 0.0141
6 Chinese Yuan (RMB) 0.0932 0.0937 0.0934 0.0954
7 Euro 0.0117 - 0.0116 -
8 Ugandan shilling (UGX) 50.2942 51.4139 50.2866 52.8206
9 Tanzanian shilling (TZS) 31.4842 30.9866 31.2471 32.6637
Part “B” - Joint Ventures
` in Crores
Sr. No
Name of Associates / Joint Ventures
Madanpura (North) Coal
Company Private Limited
BhaskarparaCoal Company
Limited
Aditya Birla Renewables SPV 1
Limited
Aditya Birla Renewable Energy
Limited
1 Latest audited Balance Sheet Date 31.03.2021 31.03.2021 31.03.2021 31.03.2021
2 Shares of Joint ventures held by the company on year end
Nos. 1,152,560 8,141,050 16,278,663 3,419,000
Amount of Investment in Joint venture 1.07 8.17 15.83 3.42
Extent of Holding (%) 11.17 47.37 26.00 26.00
3 Networth attributable to shareholding as per latest audited Balance Sheet
0.97 6.27 18.12 3.29
4 Profit /(Loss) for the year 0.05 0.03 8.81 (0.50)
i. Considered in consolidation 0.01 0.01 2.29 (0.13)
ii. Not considered in Consolidation 0.05 0.02 6.52 (0.37)
For and on behalf of the Board of Directors
Atul DagaWhole-time Director & CFO(DIN: 06416619)
K. C. JhanwarManaging Director(DIN: 01743559)
Sanjeeb Kumar ChatterjeeCompany Secretary
Mumbai, 7th May, 2021

102
Ult
raTe
ch C
emen
t Li
mit
ed
103
Ann
ual R
epo
rt 2
020-
21
Welcome to UltraTech
Value Creation
Growth Enablers
Statutory Reports
Financial Statements
ESG Commitments
Annexure V
DISCLOSURE OF PARTICULARS WITH RESPECT TO CONSERVATION OF ENERGY, TECHNOLOGY ABSORPTION AND FOREIGN EXCHANGE EARNINGS AND OUTGO AS PRESCRIBED UNDER RULE 8(3) OF THE COMPANIES (ACCOUNTS) RULES, 2014.
A. CONSERVATION OF ENERGY:
a) Steps taken or impact on the conservation of energy
• Focused drive on improving energy consumption footprint by the continual deployment of state-of-art energy-efficient technologies.
• Operational optimisation of Pyro Process, Mills, and Thermal Power plants for overall energy optimisation using expert automation systems and data analytics.
• Retrofit or replacing of old generation coolers, coal dosing systems, and kiln seals to improve kiln heat rate to achieve best in class performance.
• Continual deployment of novel technology for improving energy efficiency in CPP boilers.
• Continuing optimisation of grinding media, including size, quality, and quantity to reduce power consumption and product quality improvement.
• Redesigning of the low efficiency process fan impellers with high efficiency impellers to improve energy efficiency and process stability.
• Cyclones and ducts modification with CFD analysis to reduce pressure drop to reduce energy consumption, improve process efficiencies.
• Boilers, burners, and calciners modification with CFD analysis to improve heat rate, reduce emissions, and lower heat consumptions.
• Continuing the installation of low and high voltage variable speed drives and energy efficient motors.
b) Steps taken by the Company for utilising alternative sources of energy
• The Company has prioritised and is using
b) Benefits derived like product improvement, cost reduction, product development, or import substitution
• Continuous reduction in specific energy consumption in milling and pyro-processing.
• Over achieved energy conservation targets assigned under PAT-Cycle-II (Perform, Achieve, and Trade) targets.
• Improvement in the environmental performance of the manufacturing facilities and meeting all the emission norms.
• Meeting the product quality and customer satisfaction, including offering technical support.
• Develop R&D personnel with the aim to face future challenges such as carbon capturing and its usage in construction materials.
• Reserves assessment and Raw Mix optimisation for enhancing the life of limestone reserves and other natural resources.
• Use of waste materials from various industries as a substitute for natural raw materials to achieve circular economy goals.
various waste materials as substitute for fossil fuels in its kilns and TPP.
• Significant investment is made to improve infrastructure for safe handling, storage, testing, pre-processing, and usage of waste materials as an alternative energy source and is being augmented at plants in a phased manner.
• Continuing installation of WHR systems to generate the energy by utilising the hot waste gases from the pyro process at cement plants and reducing carbon footprints significantly.
• Increased utilisation of renewable energy sources, mainly solar power, at most operational locations.
c) The capital investment on energy conservation equipment
• During the year, the Company has made ` 220.02 crores investment on equipment or various capital schemes for conserving the energy resources.
B. TECHNOLOGY ABSORPTION:
a) Efforts made towards technology absorption
• Developed in-house sonic energy separation technology for better particle size distribution to improve product quality and milling efficiency.
• Adoption of digitalisation and AI / ML techniques for plant operation, processes, safety, and reliability enhancement.
• In-house modification in advanced process control systems at cement plants and power plants.
• Redesigned the architect of asset reliability system by incorporating modules for life cycle improvement of critical equipment.
• Six pulse rectifiers with three-phase transformer technology in electrostatic precipitators.
• Implemented a new Electro Chemical battery technology for battery life enhancement.
• Participation in national / international seminars.
• Design and development of new application-based building materials to meet the requirement of advance construction technology and customer needs to increase the market share and profitability.
• Improvement in packaging bags quality to improve handling and environment through systematic studies, including benchmarking.
• New and existing vendor development for best cost procurement.
• Getting R&D future-ready by creating new capabilities in the area of new cement and concrete product development, CO2 abatement, new supplementary cementitious materials, and process optimisation.
• Working with external and statutory agencies (such as NCCBM, CMA, BIS, DPIIT, and others) to develop, validate and support, new initiatives for new construction materials codes and standards.
c) In the case of imported technology (imported during the last three years reckoned from the beginning of the financial year)
Nil
d) Expenditure incurred on Research and Development (R&D)
(` in crores)
2020-21 2019-20
I For In-house R&D:
Capital Expenditure 0.30 1.12
Recurring Expenditure 15.25 16.34
Total In-house R&D Expenditure 15.55 17.46
II Contribution to Scientific Research Company 10.70 7.5
III Total R&D Expenditure (I+II) 26.25 24.96
IV R&D Expenditure as % of turnover 0.06 0.06
C. FOREIGN EXCHANGE EARNINGS AND OUTGO:
• Foreign exchange earnings for the year ended 31st March, 2021: ` 397.21 crores.
• Foreign exchange outgo for the year ended 31st March, 2021: ` 4,022.11 crores.
For and on behalf of the Board
Kumar Mangalam BirlaChairman
(DIN: 00012813)Mumbai, 7th May, 2021

104
Ult
raTe
ch C
emen
t Li
mit
ed
105
Ann
ual R
epo
rt 2
020-
21
Welcome to UltraTech
Value Creation
Growth Enablers
Statutory Reports
Financial Statements
ESG Commitments
Details pertaining to remuneration as required under section 197(12) of the Companies Act, 2013 read with rule 5(1) of the Companies (Appointment and Remuneration of Managerial Personnel) Rules, 2014
i. The percentage increase in remuneration of each Director, Chief Financial Officer and Company Secretary during the financial year 2020-21, ratio of the remuneration of each Director to the median remuneration of the employees of the Company for the financial year 2020-21 are as under:
Sr. No.
Name of Director / Key Managerial Personnel (“KMP”) and Designation
Remuneration* of Director / KMP for financial year
2020-21(` in crores)
% increase in remuneration in
the financial year 2020-21
Ratio of remuneration of
each Director /to median
remuneration of employees
1 Kumar Mangalam Birla, Chairman and Non-Executive Director - Not Applicable -
2 Mrs. Rajashree Birla, Non-Executive Director 4.94 304.92 80.9
3 Arun Adhikari, Independent Director 1.40 438.46 22.9
4 Mrs. Alka Bharucha, Independent Director 0.72 157.14 11.8
5 Mrs. Sukanya Kripalu, Independent Director 0.90 350.00 14.7
6 S. B. Mathur, Independent Director 1.64 349.32 26.9
7 Sunil Duggal, Independent Director (from 14th August, 2020 ) 0.40 Not Applicable 6.6
8 K. K. Maheshwari, Vice Chairman and Non-Executive Director ** - Not Applicable -
9 K. C. Jhanwar, Managing Director 8.61 34.45 140.9
10 Atul Daga, Whole-time Director and Chief Financial Officer 3.33 27.55 54.6
11 Sanjeeb Kumar Chatterjee, Company Secretary 1.32 3.43 Not Applicable
* Remuneration includes commission payable to Directors for the financial year ended 31st March, 2021 which is subject to the approval of the Members of the Company.
** ` 28.34 lakhs per month has been paid to Mr. K. K. Maheshwari as pension for his past services as Managing Director.
ii. The median remuneration of employees of the Company during the financial year was ` 6.11 lakhs.
iii. In the financial year, there was no increase in the median remuneration of employees.
iv. There were 21,909 permanent employees on the rolls of the Company as on 31st March, 2021.
v. Average percentage increase made in the salaries of employees other than the managerial personnel in the last financial year i.e. 2020-21 was 2% whereas increase in the managerial remuneration for the same financial year is 46%.
vi. It is hereby affirmed that the remuneration paid is as per the Remuneration Policy for Directors, KMP and other Employees.
For and on behalf of the Board
Kumar Mangalam BirlaChairman
Mumbai, 7th May, 2021 (DIN: 00012813)
Annexure VI Annexure VII
UltraTech Cement Limited (“the Company”) an Aditya Birla Group Company adopts / shall adopt this Executive Remuneration Philosophy / Policy as applicable across Group Companies. This philosophy / policy is detailed below.
Aditya Birla Group: Executive Remuneration Philosophy / Policy
At the Aditya Birla Group, we expect our executive team to foster a culture of growth and entrepreneurial risk-taking. Our Executive Remuneration Philosophy / Policy supports the design of programs that align executive rewards – including incentive programs, retirement benefit programs, promotion and advancement opportunities – with the long-term success of our stakeholders.
Our business and organisational model
Our Group is a conglomerate and organised in a manner such that there is sharing of resources and infrastructure. This results in uniformity of business processes and systems thereby promoting synergies and exemplary customer experiences.
I. Objectives of the Executive Remuneration Program
Our executive remuneration program is designed to attract, retain, and reward talented executives who will contribute to our long-term success and thereby build value for our shareholders.
Our executive remuneration program is intended to:
1. Provide for monetary and non-monetary remuneration elements to our executives on a holistic basis.
2. Emphasize “Pay for Performance” by aligning incentives with business strategies to reward executives who achieve or exceed Group, business and individual goals.
II. Executives
Our Executive Remuneration Philosophy / Policy applies to the following:
1. Directors of the Company.
2. Key Managerial Personnel: Chief Executive Officer and equivalent (eg: Deputy Managing
Director), Chief Financial Officer and Company Secretary.
3. Senior Management: as may be decided by the Board of Directors.
III. Business and Talent Competitors
We benchmark our executive pay practices and levels against peer companies in similar industries, geographies and of similar size. In addition, we look at secondary reference (internal and external) benchmarks in order to ensure that pay policies and levels across the Group are broadly equitable and support the Group’s global mobility objectives for executive talent. Secondary reference points bring to the table, the executive pay practices and pay levels in other markets and industries, to appreciate the differences in levels and medium of pay and build in as appropriate for decision making.
IV. Executive Pay Positioning
We aim to provide competitive remuneration opportunities to our executives by positioning target total remuneration (including perks and benefits, annual incentive pay-outs, long term incentive pay-outs at target performance) and target total cash compensation (including annual incentive pay-outs) at target performance directionally between median and top quartile of the primary talent market. We recognise the size and scope of the role and the market standing, skills and experience of incumbents while positioning our executives.
We use secondary market data only as a reference point for determining the types and amount of remuneration while principally believing that target total remuneration packages should reflect the typical cost of comparable executive talent available in the sector.
V. Executive Pay-Mix
Our executive pay-mix aims to strike the appropriate balance between key components: (i) Fixed Cash compensation (Basic Salary + Allowances) (ii) Annual Incentive Plan (iii) Long-Term Incentives (iv) Perks and Benefits.
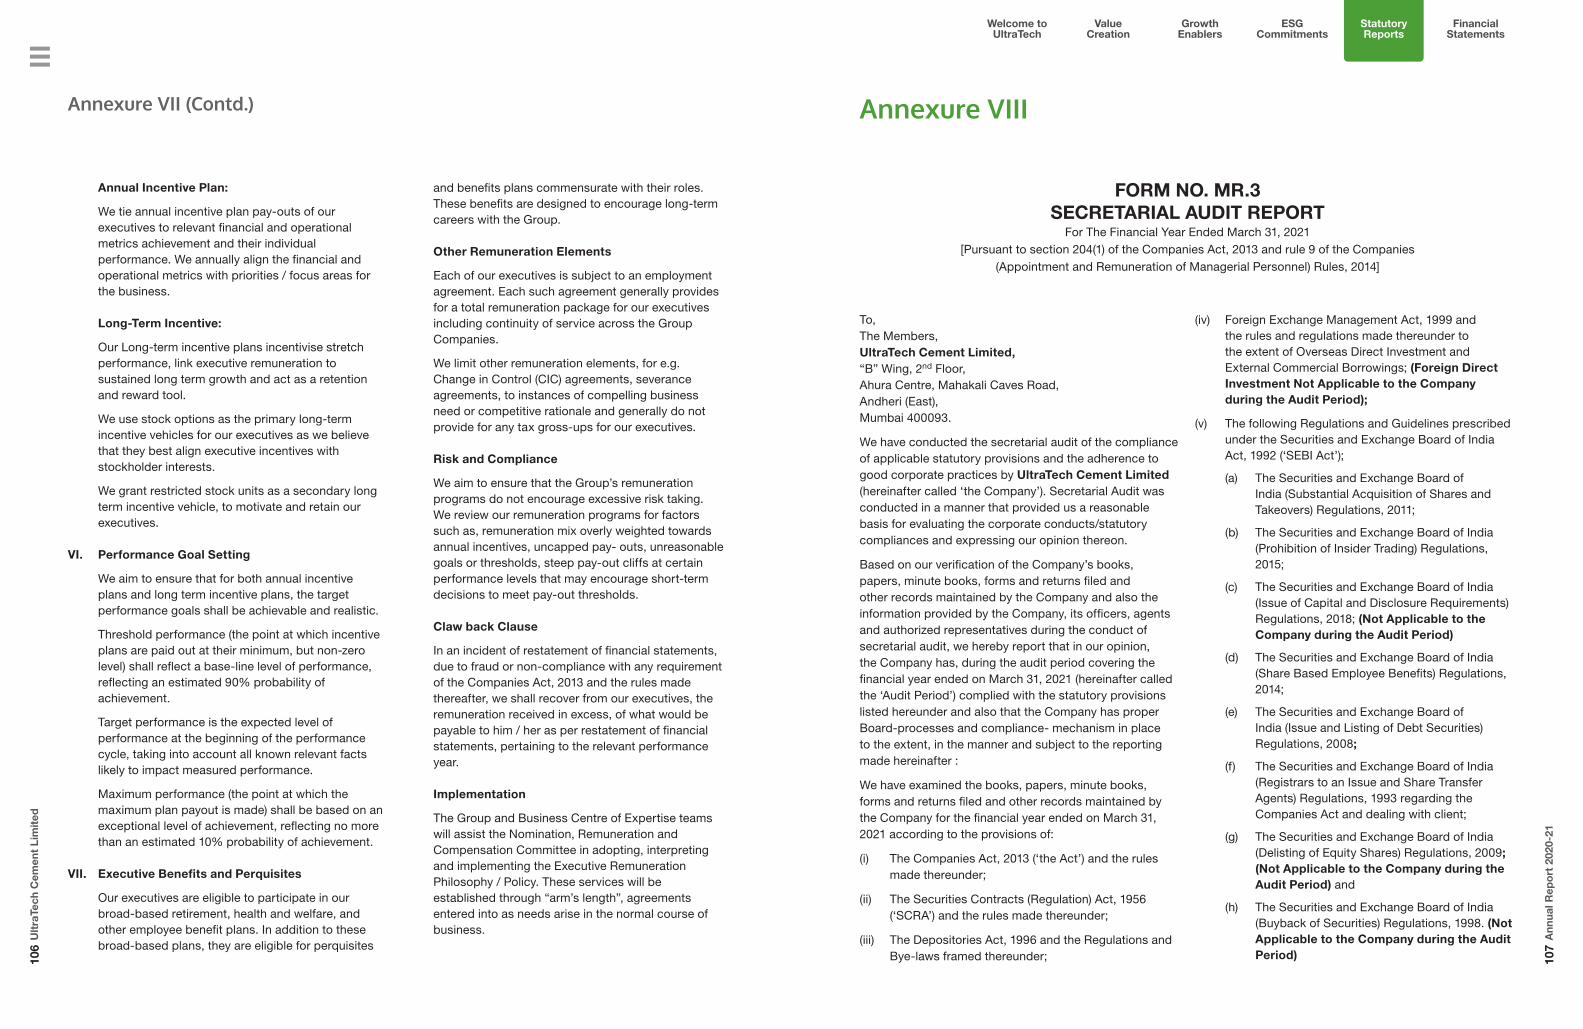
106
Ult
raTe
ch C
emen
t Li
mit
ed
107
Ann
ual R
epo
rt 2
020-
21
Welcome to UltraTech
Value Creation
Growth Enablers
Statutory Reports
Financial Statements
ESG Commitments
and benefits plans commensurate with their roles. These benefits are designed to encourage long-term careers with the Group.
Other Remuneration Elements
Each of our executives is subject to an employment agreement. Each such agreement generally provides for a total remuneration package for our executives including continuity of service across the Group Companies.
We limit other remuneration elements, for e.g. Change in Control (CIC) agreements, severance agreements, to instances of compelling business need or competitive rationale and generally do not provide for any tax gross-ups for our executives.
Risk and Compliance
We aim to ensure that the Group’s remuneration programs do not encourage excessive risk taking. We review our remuneration programs for factors such as, remuneration mix overly weighted towards annual incentives, uncapped pay- outs, unreasonable goals or thresholds, steep pay-out cliffs at certain performance levels that may encourage short-term decisions to meet pay-out thresholds.
Claw back Clause
In an incident of restatement of financial statements, due to fraud or non-compliance with any requirement of the Companies Act, 2013 and the rules made thereafter, we shall recover from our executives, the remuneration received in excess, of what would be payable to him / her as per restatement of financial statements, pertaining to the relevant performance year.
Implementation
The Group and Business Centre of Expertise teams will assist the Nomination, Remuneration and Compensation Committee in adopting, interpreting and implementing the Executive Remuneration Philosophy / Policy. These services will be established through “arm’s length”, agreements entered into as needs arise in the normal course of business.
Annual Incentive Plan:
We tie annual incentive plan pay-outs of our executives to relevant financial and operational metrics achievement and their individual performance. We annually align the financial and operational metrics with priorities / focus areas for the business.
Long-Term Incentive:
Our Long-term incentive plans incentivise stretch performance, link executive remuneration to sustained long term growth and act as a retention and reward tool.
We use stock options as the primary long-term incentive vehicles for our executives as we believe that they best align executive incentives with stockholder interests.
We grant restricted stock units as a secondary long term incentive vehicle, to motivate and retain our executives.
VI. Performance Goal Setting
We aim to ensure that for both annual incentive plans and long term incentive plans, the target performance goals shall be achievable and realistic.
Threshold performance (the point at which incentive plans are paid out at their minimum, but non-zero level) shall reflect a base-line level of performance, reflecting an estimated 90% probability of achievement.
Target performance is the expected level of performance at the beginning of the performance cycle, taking into account all known relevant facts likely to impact measured performance.
Maximum performance (the point at which the maximum plan payout is made) shall be based on an exceptional level of achievement, reflecting no more than an estimated 10% probability of achievement.
VII. Executive Benefits and Perquisites
Our executives are eligible to participate in our broad-based retirement, health and welfare, and other employee benefit plans. In addition to these broad-based plans, they are eligible for perquisites
Annexure VII (Contd.)
FORM NO. MR.3SECRETARIAL AUDIT REPORT
For The Financial Year Ended March 31, 2021[Pursuant to section 204(1) of the Companies Act, 2013 and rule 9 of the Companies
(Appointment and Remuneration of Managerial Personnel) Rules, 2014]
Annexure VIII
To,The Members,UltraTech Cement Limited,“B” Wing, 2nd Floor,Ahura Centre, Mahakali Caves Road,Andheri (East),Mumbai 400093.
We have conducted the secretarial audit of the compliance of applicable statutory provisions and the adherence to good corporate practices by UltraTech Cement Limited (hereinafter called ‘the Company’). Secretarial Audit was conducted in a manner that provided us a reasonable basis for evaluating the corporate conducts/statutory compliances and expressing our opinion thereon.
Based on our verification of the Company’s books, papers, minute books, forms and returns filed and other records maintained by the Company and also the information provided by the Company, its officers, agents and authorized representatives during the conduct of secretarial audit, we hereby report that in our opinion, the Company has, during the audit period covering the financial year ended on March 31, 2021 (hereinafter called the ‘Audit Period’) complied with the statutory provisions listed hereunder and also that the Company has proper Board-processes and compliance- mechanism in place to the extent, in the manner and subject to the reporting made hereinafter :
We have examined the books, papers, minute books, forms and returns filed and other records maintained by the Company for the financial year ended on March 31, 2021 according to the provisions of:
(i) The Companies Act, 2013 (‘the Act’) and the rules made thereunder;
(ii) The Securities Contracts (Regulation) Act, 1956 (‘SCRA’) and the rules made thereunder;
(iii) The Depositories Act, 1996 and the Regulations and Bye-laws framed thereunder;
(iv) Foreign Exchange Management Act, 1999 and the rules and regulations made thereunder to the extent of Overseas Direct Investment and External Commercial Borrowings; (Foreign Direct Investment Not Applicable to the Company during the Audit Period);
(v) The following Regulations and Guidelines prescribed under the Securities and Exchange Board of India Act, 1992 (‘SEBI Act’);
(a) The Securities and Exchange Board of India (Substantial Acquisition of Shares and Takeovers) Regulations, 2011;
(b) The Securities and Exchange Board of India (Prohibition of Insider Trading) Regulations, 2015;
(c) The Securities and Exchange Board of India (Issue of Capital and Disclosure Requirements) Regulations, 2018; (Not Applicable to the Company during the Audit Period)
(d) The Securities and Exchange Board of India (Share Based Employee Benefits) Regulations, 2014;
(e) The Securities and Exchange Board of India (Issue and Listing of Debt Securities) Regulations, 2008;
(f) The Securities and Exchange Board of India (Registrars to an Issue and Share Transfer Agents) Regulations, 1993 regarding the Companies Act and dealing with client;
(g) The Securities and Exchange Board of India (Delisting of Equity Shares) Regulations, 2009; (Not Applicable to the Company during the Audit Period) and
(h) The Securities and Exchange Board of India (Buyback of Securities) Regulations, 1998. (Not Applicable to the Company during the Audit Period)
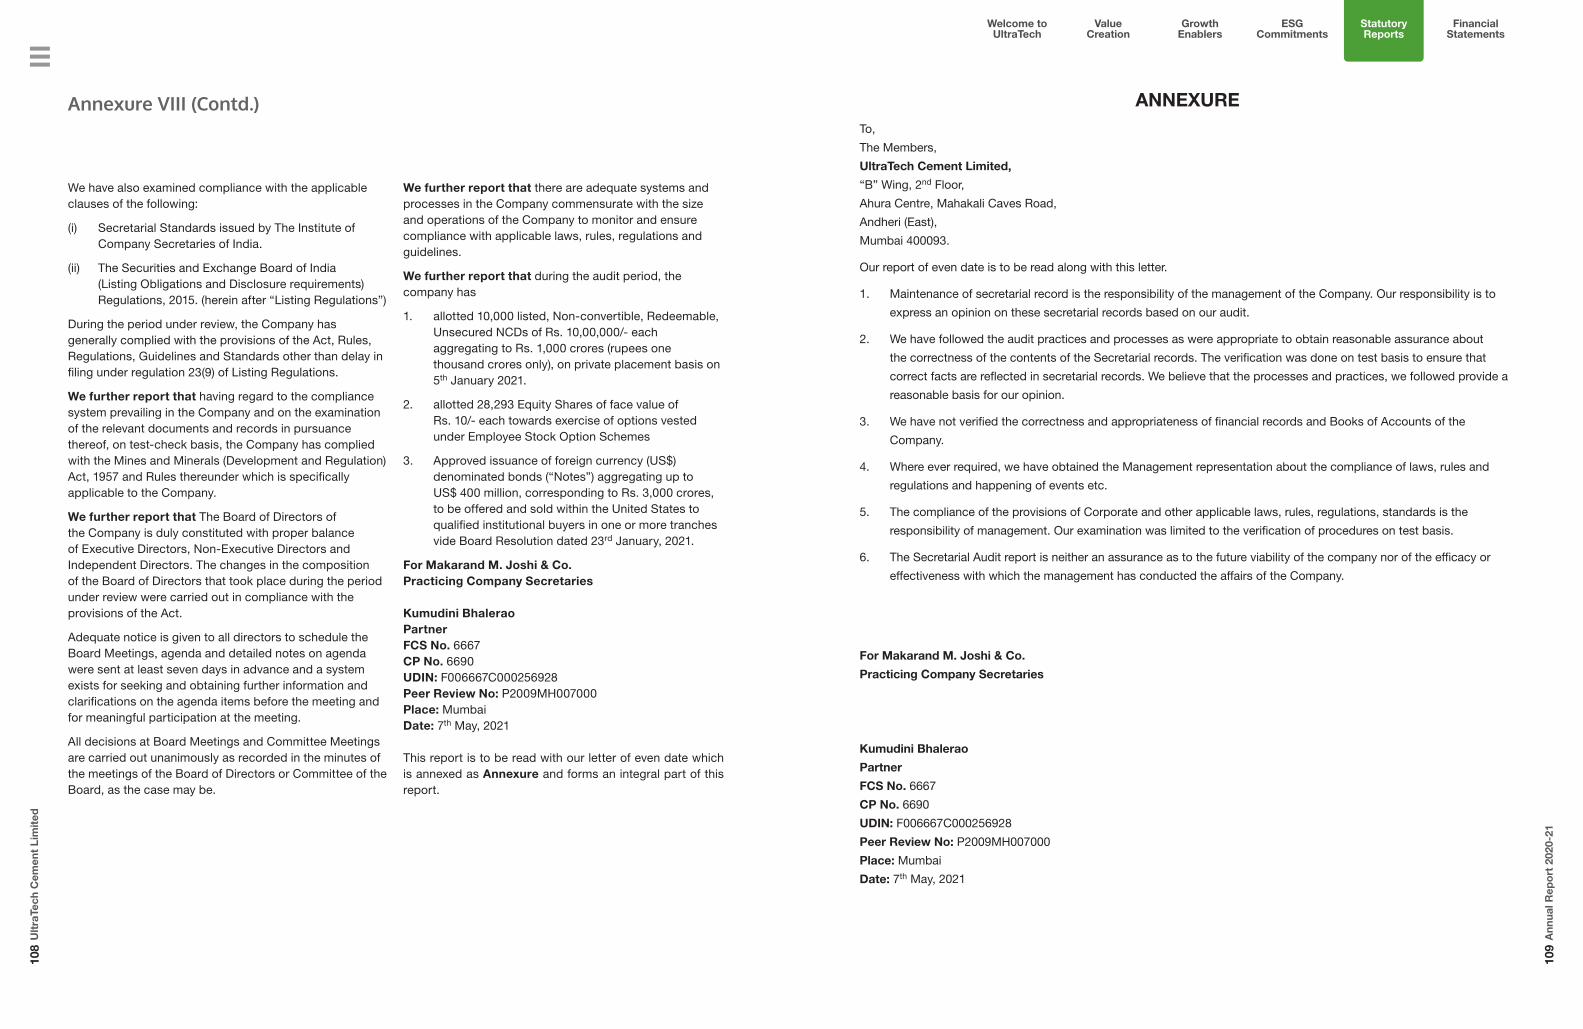
108
Ult
raTe
ch C
emen
t Li
mit
ed
109
Ann
ual R
epo
rt 2
020-
21
Welcome to UltraTech
Value Creation
Growth Enablers
Statutory Reports
Financial Statements
ESG Commitments
We have also examined compliance with the applicable clauses of the following:
(i) Secretarial Standards issued by The Institute of Company Secretaries of India.
(ii) The Securities and Exchange Board of India (Listing Obligations and Disclosure requirements) Regulations, 2015. (herein after “Listing Regulations”)
During the period under review, the Company has generally complied with the provisions of the Act, Rules, Regulations, Guidelines and Standards other than delay in filing under regulation 23(9) of Listing Regulations.
We further report that having regard to the compliance system prevailing in the Company and on the examination of the relevant documents and records in pursuance thereof, on test-check basis, the Company has complied with the Mines and Minerals (Development and Regulation) Act, 1957 and Rules thereunder which is specifically applicable to the Company.
We further report that The Board of Directors of the Company is duly constituted with proper balance of Executive Directors, Non-Executive Directors and Independent Directors. The changes in the composition of the Board of Directors that took place during the period under review were carried out in compliance with the provisions of the Act.
Adequate notice is given to all directors to schedule the Board Meetings, agenda and detailed notes on agenda were sent at least seven days in advance and a system exists for seeking and obtaining further information and clarifications on the agenda items before the meeting and for meaningful participation at the meeting.
All decisions at Board Meetings and Committee Meetings are carried out unanimously as recorded in the minutes of the meetings of the Board of Directors or Committee of the Board, as the case may be.
Annexure VIII (Contd.) ANNEXURETo,
The Members,
UltraTech Cement Limited,
“B” Wing, 2nd Floor,
Ahura Centre, Mahakali Caves Road,
Andheri (East),
Mumbai 400093.
Our report of even date is to be read along with this letter.
1. Maintenance of secretarial record is the responsibility of the management of the Company. Our responsibility is to
express an opinion on these secretarial records based on our audit.
2. We have followed the audit practices and processes as were appropriate to obtain reasonable assurance about
the correctness of the contents of the Secretarial records. The verification was done on test basis to ensure that
correct facts are reflected in secretarial records. We believe that the processes and practices, we followed provide a
reasonable basis for our opinion.
3. We have not verified the correctness and appropriateness of financial records and Books of Accounts of the
Company.
4. Where ever required, we have obtained the Management representation about the compliance of laws, rules and
regulations and happening of events etc.
5. The compliance of the provisions of Corporate and other applicable laws, rules, regulations, standards is the
responsibility of management. Our examination was limited to the verification of procedures on test basis.
6. The Secretarial Audit report is neither an assurance as to the future viability of the company nor of the efficacy or
effectiveness with which the management has conducted the affairs of the Company.
For Makarand M. Joshi & Co.
Practicing Company Secretaries
Kumudini Bhalerao
Partner
FCS No. 6667
CP No. 6690
UDIN: F006667C000256928
Peer Review No: P2009MH007000
Place: Mumbai
Date: 7th May, 2021
We further report that there are adequate systems and processes in the Company commensurate with the size and operations of the Company to monitor and ensure compliance with applicable laws, rules, regulations and guidelines.
We further report that during the audit period, the company has
1. allotted 10,000 listed, Non-convertible, Redeemable, Unsecured NCDs of Rs. 10,00,000/- each aggregating to Rs. 1,000 crores (rupees one thousand crores only), on private placement basis on 5th January 2021.
2. allotted 28,293 Equity Shares of face value of Rs. 10/- each towards exercise of options vested under Employee Stock Option Schemes
3. Approved issuance of foreign currency (US$) denominated bonds (“Notes”) aggregating up to US$ 400 million, corresponding to Rs. 3,000 crores, to be offered and sold within the United States to qualified institutional buyers in one or more tranches vide Board Resolution dated 23rd January, 2021.
For Makarand M. Joshi & Co.Practicing Company Secretaries
Kumudini BhaleraoPartnerFCS No. 6667CP No. 6690UDIN: F006667C000256928 Peer Review No: P2009MH007000Place: MumbaiDate: 7th May, 2021
This report is to be read with our letter of even date which is annexed as Annexure and forms an integral part of this report.

110
Ult
raTe
ch C
emen
t Li
mit
ed
111
Ann
ual R
epo
rt 2
020-
21
Welcome to UltraTech
Value Creation
Growth Enablers
Statutory Reports
Financial Statements
ESG Commitments
Report on Corporate Governance
The Report on Corporate Governance as prescribed by the Securities and Exchange Board of India (Listing Obligations and Disclosure Requirements) Regulations, 2015, as amended, (“the Listing Regulations”) is given below:
Company’s Philosophy on Corporate Governance
UltraTech Cement Limited (“Your Company”) is always committed to the adoption of best governance practices and their adherence in true spirit. Your Company’s philosophy on Corporate Governance enshrines the goal of achieving the highest levels of transparency, accountability, sustainability, ethical behaviour and safety in all spheres of its operations. Your Company subscribes to equitable treatment of all its stakeholders, which has helped in maintaining their trust and appreciation.
Your Company’s Board of Directors (“the Board”) comprises of Executive, Non-Executive and Independent Directors. The Board provides strategic guidance to your Company in all areas of its operations, while focusing on optimum utilisation of resources; governance and sustainability. All of this is done keeping in mind the interest of all stakeholders and the philosophy enshrined in your Company’s Vision-Mission statement.
The management team, led by the Managing Director, who reports to the Board, is responsible for implementing the strategies and achieving the goals and targets set by the Board.
Your Company continuously strives to achieve excellence in corporate governance through its values – Integrity, Commitment, Passion, Seamlessness and Speed, which are reinforced at all levels of the organisation.
In terms of the Listing Regulations, the details of compliance for the year ended 31st March, 2021 are as follows:
I. Board of Directors
The Board is responsible for and committed to sound principles of Corporate Governance in your Company. The Board plays a crucial role in overseeing how the management serves the short and long-term interests of all stakeholders.
• Composition:
As on 31st March, 2021, your Company’s Board comprised of ten Directors.
Five Directors, i.e 50% of the Board comprises of Independent Directors, of which two are women. Of the remaining five, three are Non-Executive and two are Executive. The average tenure of the Directors on your Company’s Board is ~ 8 years.
The Chairman of your Company’s Board is Non-Executive and Non-Independent and the role between the Chairman and the Managing Director is split.
Details of Directors as on 31st March, 2021 are as follows:
NameKumarMangalamBirla
RajashreeBirla
ArunAdhikari
AlkaBharucha
SunilDuggal
Sukanya Kripalu
Sunil Behari Mathur
Krishna Kishore Maheshwari
Kailash Chandra Jhanwar
AtulDaga
DIN 00012813 00022995 00591057 00114067 00041825 06994202 00013239 00017572 01743559 06416619
Category Chairman, Non-Executive and Non-Independent Director
Non-Executive and Non-Independent Director
Independent Director
Independent Director
Independent Director
Independent Director
Independent Director
Vice Chairman and Non- Executive Director
Managing Director
Whole-time Director and CFO
Age 54 76 67 64 64 61 77 66 64 55
Date of Appointment
14.05.2004 14.05.2004 03.12.2013 09.06.2016 14.08.2020 11.10.2014 10.09.2008 01.04.2016 19.10.2018 09.06.2016
Term ending date Liable to retire by rotation
Liable to retire by rotation
17.07.2024 08.06.2026 13.08.2025 10.10.2024 17.07.2024 Liable to retire by rotation
31.12.2022 08.06.2021
Tenure*(in years)
17 17 7 5 1 6 13 5 2 5
Shareholding 1,90,360 41,701 NIL NIL NIL NIL NIL 5,840 8,315 9,900
NameKumarMangalamBirla
RajashreeBirla
ArunAdhikari
AlkaBharucha
SunilDuggal
Sukanya Kripalu
Sunil Behari Mathur
Krishna Kishore Maheshwari
Kailash Chandra Jhanwar
AtulDaga
Board Memberships - Indian listed companies
1. Aditya Birla Capital Limited: Non-Executive Director
2. Aditya Birla Fashion and Retail Limited: Non-Executive Director
3. Century Textiles and Industries Limited: Non-Executive Director
4. Grasim Industries Limited: Non-Executive Director
5. Hindalco Industries Limited: Non-Executive Director
6. Vodafone Idea Limited: Non-Executive Director
1. Century Enka Limited:
Non-Executive Director
2. Century Textiles and Industries Limited:
Non-Executive Director
3. Grasim Industries Limited:
Non-Executive Director
4. Hindalco Industries Limited:
Non-Executive Director
5. Pilani Investment and Industries Corporation Limited:
Non-Executive Director
1. Aditya Birla Capital Limited: Independent Director
2. Vodafone Idea Limited: Independent Director
3. Voltas Limited: Independent Director
1. Birlasoft Limited: Independent Director
2. Hindalco Industries Limited: Independent Director
3. Honda India Power Products Limited: Independent Director
4. Orient Electric Limited: Independent Director
NIL 1. Aditya Birla Fashion and Retail Limited: Independent Director
2. Colgate-Palmolive (India) Limited: Independent Director
3. Entertain- ment Network
(India) Limited: Independent Director
1. DCM Shriram Industries Limited: Independent Director
2. ITC Limited: Independent Director
3. Thomas Cook (India) Limited: Independent Director
NIL NIL NIL
Directorship(s) in public companies
9 5 4 8 NIL 4 7 NIL 3 NIL
Committee positionChairman NIL NIL NIL 3 NIL NIL 1 NIL NIL NILMember NIL NIL 2 8 NIL 6 7 NIL 1 NILArea of Skills/ Expertise/ Competence
* Rounded off
Skills / expertise / competencies of the Board of Directors pursuant to Schedule V of the Listing Regulations:
Industry knowledge Marketing Innovation, technology & digitisation
Financial literacy & Risk Management Sustainability Human Resource Development
Corporate Governance, Legal & Compliance Strategic expertise General Management
1. No Director is related to any other Director on the Board, except for Mr. Kumar Mangalam Birla and Mrs. Rajashree Birla, who are son and mother respectively.2. The number of directorships and committee positions is excluding your Company.3. Based on the recommendation of the Nomination, Remuneration and Compensation Committee (“the NRC Committee”), the Board appointed
Mr. Sunil Duggal as Additional Director (Independent) effective 14th August, 2020 for a period of five years, subject to the approval of the members. The notice of the 21st Annual General Meeting (“AGM”) sets out the details of his appointment.
4. Resolution seeking approval for re-appointment of Mr. Atul Daga forms part of the Notice of the AGM.5. In terms of Regulation 26(1) of the Listing Regulations: • Foreign companies, private limited companies and companies under section 8 of the Companies Act, 2013 (“the Act”) are excluded for the purpose of
considering the limit of committees. • The committees considered for the purpose are audit committee and stakeholders’ relationship committee. • None of the Directors held membership in more than ten public limited companies and were members of more than ten committees or chairperson of
more than five committees across all listed companies in which they were Directors.

112
Ult
raTe
ch C
emen
t Li
mit
ed
113
Ann
ual R
epo
rt 2
020-
21
Welcome to UltraTech
Value Creation
Growth Enablers
Statutory Reports
Financial Statements
ESG Commitments
Report on Corporate Governance (Contd.)
• Appointment and Tenure of Directors:
The composition of the Board is balanced, well diversified and compliant with the provisions of the Act, the Rules made thereunder and the Listing Regulations.
The Directors of your Company are appointed / re-appointed by the Board on the recommendations of the NRC Committee and approval of the members. The NRC Committee inter alia considers qualifications, positive attributes, areas of expertise and number of directorship(s) held in various committees of other companies of individuals, as part of its recommendation to the Board.
In accordance with the Articles of Association of your Company, provisions of the Act and the Listing Regulations, all Directors, except the Executive Directors and Independent Directors, are liable to retire by rotation and, if eligible, offer themselves for re-appointment. The Executive Directors are appointed for a fixed tenure.
The Independent Directors can serve a maximum of two terms of five years each and their appointment and tenure are governed by provisions of the Act and the Listing Regulations.
• Independent Directors:
‘Independence’ of Directors is derived basis the relevant provisions of the Act and the Listing Regulations.
Your Company issues formal letters of appointment to them and the terms and conditions of their appointment are available on the following weblink https://www.ultratechcement.com/about-us/leadership-team. All the Independent Directors are independent of your Company’s management and are not related to any director or key managerial personnel.
None of the Independent Directors serve as independent directors in more than seven listed companies in line with the requirements of the Listing Regulations.
• Declaration of independence:
Your Company has received necessary declarations from each Independent Director confirming that they meet the criteria of independence as provided in
Section 149(6) of the Act and Regulation 16(1) (b) of the Listing Regulations and that they are not debarred from holding the office of director by virtue of any order passed by the Securities and Exchange Board of India (“SEBI”) or any other such authorities.
Based on the declarations received from directors and supported by a certificate dated 5th May, 2021 from Makarand M. Joshi & Co. Practicing Company Secretaries, in terms of the provisions of Regulation 25(8) of the Listing Regulations, the Board confirms, that the Independent Directors fulfil the conditions as specified under Schedule V of the Listing Regulations and are independent of the management.
• Reasons for resignation of Independent Director:
Mrs. Usha Sangwan, Independent Director, stepped down from your Company’s Board on 16th May, 2020, due to personal and health reasons. As confirmed by her, there were no other reasons for her stepping down.
• Board Diversity:
Your Company recognises the benefits of having a diverse Board. In designing the Board composition, number of factors are considered, which include educational background; professional experience; gender; skills; knowledge; among others.
• Board Competency and Skills:
The Directors are professionals, possessing wide experience and expertise in their areas of function, viz. strategy; finance; governance; legal; marketing; insurance; information technology; general management; among others.
The Board members display the following personal qualities:
- Integrity: fulfilling a director’s duties and responsibilities.
- Curiosity and courage: ask questions and persistence in challenging management and fellow board members where necessary.
- Interpersonal skills: work well in a group, listen well, tactful and ability to communicate point of view frankly.
- Interest: in the organisation, its business and the people.
- Instinct: good business instincts and acumen, ability to get to the crux of the issue quickly.
- Believer in gender diversity.
- Active participation: at deliberations in the meeting.
The Directors bring to the table their individual perspective for deliberations at the Board and Committee meetings, which together with their collective wisdom reflect cohesiveness and drives your Company’s growth.
A description of the business experience of each of the directors is provided below:
Mr. Kumar Mangalam Birla is the Chairman of the Board of Directors of your Company and the Chairman of Aditya Birla Group (“Group”), which operates in 36 countries across six continents. He is a chartered accountant and holds an MBA degree from the London Business School.
Mr. Birla chairs the Boards of all major Group companies in India and globally. In the 25 years that he has been at the helm of the Group, he has accelerated growth, built meritocracy, and enhanced stakeholder value. In the process he has raised the Group’s turnover by over 20 times.
He has been the architect of over 40 acquisitions in India and globally, among the highest by any Indian multinational. Under his stewardship, the Group enjoys a position of leadership in all the major sectors in which it operates, from cement to chemicals, metals to textiles, and apparels to financial services. Over the years, Mr. Birla has built a highly successful meritocratic organisation, anchored by an extraordinary force of 120,000 employees belonging to 42 different nationalities.
Outside the Group, Mr. Birla has held several key positions on various regulatory and professional Boards. He was a Director on the Central Board of Directors of the Reserve Bank of India. He was Chairman of the Advisory Committee constituted by the Ministry of Company Affairs and also served on the Prime Minister of India’s Advisory Council on Trade and Industry. As the Chairman of the SEBI Committee on Corporate Governance, he framed the first-ever governance code for Corporate India.
He is also the first Indian Industrialist to be conferred an Honorary degree by the Institute of Company Secretaries of India.
Mr. Birla is deeply engaged with Educational Institutions. He is the Chancellor of the Birla Institute of Technology & Science (“BITS”) with campuses in Pilani, Goa, Hyderabad and Dubai. He is also the Chairman of India’s premier management institute — Indian Institute of Management, Ahmedabad.
On the global arena, Mr. Birla serves on the London Business School’s Asia Pacific Advisory Board and is an Honorary Fellow of the London Business School. In 2019, Mr. Birla constituted a £15mn scholarship programme at the London Business School in memory of his grandfather, Mr. B. K. Birla, marking the largest ever endowed scholarship gift to a European Business School.
A firm practitioner of the trusteeship concept, Mr. Birla has institutionalised the concept of caring and giving at the Group. With his mandate, the Group is involved in meaningful welfare driven activities that distinctively impact the quality of life of weaker sections of society.
Mrs. Rajashree Birla is an exemplar in the area of community initiatives and rural development. Mrs. Birla spearheads the Aditya Birla Centre for Community Initiatives and Rural Development, the Group apex body responsible for development projects.
She oversees the social and welfare driven work across all the Group’s major companies. The footprint of the Centre’s work straddles over 7,000 villages, reaching out to 9 million people. The Group runs 20 hospitals and 56 schools where quality education is imparted to over 46,500 children. Both its hospitals as well as schools are ‘Not For Profit’ institutions. Mrs. Birla is the Chairperson of the FICCI – Aditya Birla CSR Centre for Excellence, Habitat for Humanity (India) and is on the Board of the Asia Pacific Committee as well as Habitat’s Global Committee.
She is the Chairperson of FICCI’s first ever Expert Committee on CSR. She is on the Board of BAIF Development Research Foundation, Pune and also serves on the Board of Directors of the CSR Committee of the State Bank of India. As a patron of arts and culture, she heads the “Sangit Kala Kendra”, a Centre for performing arts, as its President.
In recognition of the exemplary work done by Mrs. Rajashree Birla, leading national and international organisations have showered accolades upon her. Among these the most outstanding one has been that of the Government of India which bestowed the “Padma Bhushan” Award in 2011 on Mrs. Rajashree Birla in the area of “Social Work”.
114
Ult
raTe
ch C
emen
t Li
mit
ed
115
Ann
ual R
epo
rt 2
020-
21
Welcome to UltraTech
Value Creation
Growth Enablers
Statutory Reports
Financial Statements
ESG Commitments
Report on Corporate Governance (Contd.)
In recognition of Mrs. Birla’s unrelenting endeavours towards polio eradication, she was honoured with the much coveted “Polio Eradication Champion” Award by the Government of India. Likewise, the “Global Golden Peacock Award for CSR” was conferred upon her by Dr. Ola Ullsten, the Former Prime Minister of Sweden in Portugal. Among other distinctive awards received by Mrs. Birla, feature the Economic Times’ prestigious Award: Corporate Citizen of the Year, twice in a decade, first in 2003 and again in 2012; the All India Management Association’s “Corporate Citizen of the Year Award”, the IOD’s “Distinguished Fellowship Award” and the “FICCI FLO Golden Laurel Award”.
Mr. Arun Adhikari is an independent director on your Company’s Board. He is an alumnus of the Indian Institute of Technology, Kanpur and the Indian Institute of Management, Calcutta. He joined Hindustan Lever Limited as a management trainee in 1977 and worked with the Unilever Group in India, UK, Japan and Singapore. His areas of responsibility included sales and marketing, culminating in general management and leadership roles. Mr. Adhikari retired from Unilever in January, 2014 following which he was a Senior Advisor with McKinsey and Company for four years.
Mrs. Alka Bharucha is an independent director on your Company’s Board. She has obtained a bachelor’s degree in law from the University of Bombay and a master’s degree in law from the University of London. An advocate in the High Court in Mumbai and a solicitor in the Supreme Court of England and Wales, she began her career with Mulla & Mulla & Craigie Blunt & Caroe, a law firm in India, before joining Amarchand & Mangaldas as partner in 1992. In 2008, she co-founded Bharucha & Partners which, upon inception, was ranked by RSG Consulting, London among the top 15 firms in India. Mrs. Bharucha has been ranked by Chambers Global, Legal 500 and Who’s Who Legal as being among India’s leading lawyers. She chairs the transactions practice at Bharucha & Partners. Her core areas of expertise are mergers and acquisitions, joint ventures, private equity, banking and finance.
Mr. Sunil Duggal is an independent director on the Board of your Company. He has obtained
a Bachelor of Technology (Honours) degree in electrical engineering from BITS, Pilani and holds a postgraduate diploma in Business Management (Marketing) from the Indian Institute of Management, Calcutta.
Mr. Duggal joined Dabur India Limited in 1994 and served as its longest-serving CEO for 17 years from 2002 to 2019. Mr. Duggal has chaired and co-chaired numerous committees such as Indo-Turkish JBC and FICCI Committee on Food Processing. He was awarded numerous accolades such as FMCG CEO of the year three times. He was also honored with the Distinguished Alumnus Award by the Indian Institute of Management, Calcutta in 2019 for achievements in the business and social fields.
Mrs. Sukanya Kripalu is an independent director on the Board of your Company. She is an alumnus of St. Xavier’s College and the Indian Institute of Management, Calcutta. She is a consultant in the fields of marketing, strategy, advertising and market research. Her experience includes working with leading companies such as Nestle India Limited and Cadbury India Limited. She was also the CEO of Quadra Advisory, a WPP plc group company.
Mr. S. B. Mathur is an independent director on your Company’s Board. He is a chartered accountant who has served as the Chairman of the Life Insurance Corporation of India from August, 2002 to October, 2004. He has held trusteeships, advisory and administrative roles on various government bodies, authorities and corporations.
Mr. K. K. Maheshwari is the vice-chairman and non-executive director on your Company’s Board. He is a proven leader with expertise in strategy and finance, a passion for building outstanding teams and a disciplined focus on innovation and excellence in operations. In a distinguished career spanning four decades, of which 36 years have been with the Group, Mr. Maheshwari has held several key leadership roles, including that of steering the Group’s chemicals, international trading, pulp and fibre, textiles and cement business. Mr. Maheshwari is credited with steering the growth of each of the businesses towards a more competitive and sustainable model and has overseen various greenfield and brownfield expansions as well as strategic acquisitions globally.
Mr. Maheshwari holds a master’s degree in commerce (business administration) and is a Fellow Member of the Institute of Chartered Accountants of India.
Mr. K. C. Jhanwar is the Managing Director of your Company. He is a chartered accountant with over 41 years’ experience, 40 of them with the Group. He has held various roles in finance, operations and general management across the cement and chemicals business of the Group, including greenfield and brownfield projects.
Mr. Atul Daga, is Whole-time Director and Chief Financial Officer of your Company. He is a chartered accountant with over 34 years’ experience, of which over 29 years have been with the Group. His ability to penetrate deep into business areas and his understanding of the dynamics has been his constant strength.
His key responsibilities include risk management, audit and compliance, planning, information technology, capital structuring and capital allocation and best use of financial reporting. He has undertaken several initiatives such as creating a robust platform for managing investor relations, acquisitions of over US$ 5 billion and setting new benchmarks for raising long-term borrowings in the domestic financial markets. He has also successfully set up a world class 700 seat shared services centre for your Company. Development of financial strategy and monitoring of control systems, internal audit and actively participating in your Company’s growth strategy are also part of his portfolio.
• Other provisions of Board and Committees:
Your Company’s Board plays a pivotal role in ensuring good governance and functioning of your Company. The Board has unfettered and complete access to any information within your Company. Members of the Board freely express their views on the meeting agenda and discuss pertinent issues at the meeting with the permission of the Chairman. They provide valuable guidance and advice on various aspects of business, policy, direction, governance and compliance. The Board is kept updated on regulatory / statutory amendments applicable to your Company.
As a result of the outbreak of COVID-19, the Ministry of Corporate Affairs, Government of India and SEBI
extended several relaxations to corporates. These included, among others, convening of meetings of the Board; Committees thereof and general meetings through Video Conferencing (“VC”) and Other Audio-Visual Means (“OAVM”). All meetings of the Board and Committees were convened through VC and OAVM. The maximum interval between any two meetings was within the maximum allowed gap of 120 days.
The notice and agenda of the Board and Committee Meetings are circulated well in advance. The agenda covers items set out in the Listing Regulations to the extent they are relevant and applicable and includes detailed notes on items to be discussed at the meeting, to enable the Directors take informed decisions. Prior approval is obtained from the Board for circulating agenda items with shorter notice for matters that are in the nature of Unpublished Price Sensitive Information (“UPSI”).
In addition to the quarterly meetings, the Board also meets to address specific needs and business requirements of your Company. In case of special and urgent business needs, the Board’s approval is obtained by passing resolutions by circulation, as permitted by law, which are noted and confirmed in the subsequent board meeting.
The business deliberated and considered at the meetings of the Board and Committees, generally include consideration of important corporate actions and events including:
• quarterly and annual results announcements;
• oversight of the performance of the business;
• declaration of dividend;
• development and approval of overall business strategy;
• approving the annual plan and capital expenditure;
• approval of related party transactions;
• review of the functioning of the Committees; and
• other strategic, transactional and governance matters as required under the Act, the Listing Regulations and other applicable legislations.

116
Ult
raTe
ch C
emen
t Li
mit
ed
117
Ann
ual R
epo
rt 2
020-
21
Welcome to UltraTech
Value Creation
Growth Enablers
Statutory Reports
Financial Statements
ESG Commitments
The details of attendance of each Director at the Board meetings and the last AGM are as follows:
Name of DirectorAttendance at meeting held on Attendance
%Attended Last
[email protected] 28.07.2020 21.10.2020 03.12.2020 23.01.2021
Kumar Mangalam Birla ü ü ü ü ü 100 ü
Mrs. Rajashree Birla ü ü ü ü ü 100 ü
Arun Adhikari ü ü ü ü ü 100 ü
Mrs. Alka Bharucha Leave of Absence ü ü ü Leave of Absence 60 ü
Mrs. Sukanya Kripalu ü ü ü ü ü 100 ü
S. B. Mathur ü ü ü ü ü 100 ü
Sunil Duggal$ Not Applicable Not Applicable ü ü ü 100 Not Applicable
K. K. Maheshwari ü ü ü ü ü 100 ü
K. C. Jhanwar ü ü ü ü ü 100 ü
Atul Daga ü ü ü ü ü 100 ü
@ AGM was held on 12th August, 2020 through VC / OAVM at the deemed venue i.e. the Registered Office of your Company.$ Mr. Sunil Duggal was appointed as Independent Director w.e.f. 14th August, 2020.
The evaluation is based on criteria which includes, among others, attendance and preparedness for the meetings, contribution at meetings, effective decision making ability, role of the Committees. Structured questionnaires were circulated to the Directors for providing feedback on functioning of the Board, Committees and the Chairman of the Board. Based on the inputs received, action plans are drawn up in consultation with the Directors to encourage greater participation and deliberations at the meetings and bringing to the table their experience and guidance in further improving the performance of your Company.
The performance of the Independent Directors is evaluated, with emphasis on:
- Time invested in understanding your Company and its unique requirements;
- External knowledge and perspective;
- Views expressed on the issues discussed at the Board; and
- Keeping updated on areas and issues that are likely to be discussed at the Board.
• Succession Planning:
The NRC Committee works with the Board on the leadership succession plan to ensure orderly succession in appointments to the Board and senior management. Your Company strives to maintain an appropriate balance of skills and experience within
Report on Corporate Governance (Contd.)
• Code of Conduct:
The Board has laid down a Code of Conduct (“the Code”) for all Board members and senior management personnel of your Company. The Code is available on the following weblink https://www.ultratechcement.com/investors/code-of-conduct.
All Board members and senior management personnel have confirmed compliance with the Code. A declaration to that effect signed by the Managing Director is attached and forms part of this Report.
• Induction and training:
A letter of appointment together with an induction kit is provided to Independent Directors at the time of their appointment, setting out their roles, functions, duties and responsibilities. In terms of the Listing Regulations, the terms and conditions of appointment of Independent Directors are available on the following weblink https://www.ultratechcement.com/about-us/leadership-team.
The Directors are familiarised with your Company’s business and its operations. Interactions are held between the Directors and senior management of your Company. Directors are familiarised with the organisational set-up, functioning of various
departments, internal control processes and relevant information pertaining to your Company. They are periodically updated on the industry scenario, changes in regulatory framework and the impact thereof on the working of your Company, peer review - based on information which is publicly available, business risks and mitigation plans among others. Familiarisation programme imparted to Directors of your Company is available on the following weblink https://www.ultratechcement.com/about-us/leadership-team.
• Board Evaluation:
Your Company has devised a framework for performance evaluation of the Board, its Committees and individual directors in compliance with the provisions of the Act, the Listing Regulations and the Nomination Policy of your Company.
The Board carried out evaluation of its own performance and that of its Committees and individual directors. The performance evaluation of Non-Independent Directors and the Board as a whole was carried out by the Independent Directors. The performance of the Chairman of the Board was also reviewed, taking into account the views of the executive, non-executive and independent directors.
the organisation, with an endeavour to introduce new perspectives while maintaining experience and continuity.
• Independent Director’s meeting:
At the meeting of the Independent Directors, held during the year, the Directors had discussions relating to performance of the Board, Non-independent Directors and the management of your Company. They also assessed the quality, quantity and timeliness of flow of necessary information between the management and the Board, required for the Board to effectively and reasonably perform its duties. The Independent Directors expressed satisfaction on the Board’s freedom to express views on matters transacted at meetings and the manner in which the management discusses various subject matters specified in the agenda of meetings. The suggestions made by the Independent Directors were discussed at the Board meeting and are being implemented.
II. Audit Committee
• Composition, meetings, attendance during the year and sitting fees paid:
The composition of the Audit Committee complies with the requirements of Section 177 of the Act and Regulation 18 of the Listing Regulations. The Audit Committee comprises four Directors, of which three are independent directors. All the members of the Audit Committee are financially literate.
The composition of the Audit Committee as on 31st March, 2021 and details of the member’s participation at the meetings of the Committee are as under:
Name of Member CategoryAttendance at meeting held on Attendance
%Sitting Fees(` in lakhs)20.05.2020 28.07.2020 21.10.2020 23.01.2021 10.03.2021
S. B. Mathur - Chairman Independent ü ü ü ü ü 100 1.25
Arun Adhikari Independent ü ü ü ü ü 100 1.25
Mrs. Alka Bharucha Independent Leave of Absence
ü ü Leave of Absence
ü 60 0.75
K. K. Maheshwari Non-Executive,Non-Independent
ü ü ü ü ü 100 1.25
Other Invitees / Attendees: Mr. K. C. Jhanwar, Managing Director and Mr. Atul Daga, Whole-time Director & CFO are permanent invitees to the Audit Committee meetings. The Statutory and Internal Auditors of your Company also attend the Audit Committee meetings. The Company Secretary acts as the Secretary to the Committee.
The Audit Committee acts as a link between the
management, the statutory and internal auditors and
the Board.
The Audit Committee monitors and effectively
supervises your Company’s financial reporting
process with a view to provide accurate, timely and

118
Ult
raTe
ch C
emen
t Li
mit
ed
119
Ann
ual R
epo
rt 2
020-
21
Welcome to UltraTech
Value Creation
Growth Enablers
Statutory Reports
Financial Statements
ESG Commitments
proper disclosure and maintain the integrity and quality of financial reporting. The Audit Committee also reviews from time to time, the audit and internal control procedures, the accounting policies of your Company, oversight of your Company’s financial reporting process so as to ensure that the financial statements are correct, sufficient and credible.
• Role:
1. Oversight of the Company’s financial reporting process and the disclosure of its financial information to ensure that the financial statement is correct, sufficient and credible.
2. Recommendation for appointment, remuneration and terms of appointment of auditors of the Company.
3. Approval of payment to statutory auditors for any other services rendered by the statutory auditors.
4. Reviewing, with the management, the annual financial statements and auditor’s report thereon before submission to the Board for approval, with particular reference to:
i. Matters required to be included in the Director’s Responsibility Statement to be included in the Board’s report in terms of clause (c) of sub-section 3 of section 134 of the Act;
ii. Changes, if any, in accounting policies and practices and reasons for the same;
iii. Major accounting entries involving estimates based on the exercise of judgment by management;
iv. Significant adjustments made in the financial statements arising out of audit findings;
v. Compliance with listing and other legal requirements relating to financial statements;
vi. Disclosure of any related party transactions;
vii. Modified opinion(s) in the draft audit report
5. Reviewing, with the management, the quarterly financial statements before submission to the Board for approval.
6. Reviewing, with the management, the statement of
uses / application of funds raised through an issue
(public issue, rights issue, preferential issue, etc.),
the statement of funds utilised for purposes other
than those stated in the offer document / prospectus
/ notice and the report submitted by the monitoring
agency monitoring the utilisation of proceeds of
a public or rights issue, and making appropriate
recommendations to the Board to take up steps in this
matter.
7. Reviewing and monitoring the auditor’s independence
and performance, and effectiveness of audit process.
8. Approval or any subsequent modification of
transactions of the Company with related parties.
9. Scrutiny of inter-corporate loans and investments.
10. Valuation of undertakings or assets of the Company,
wherever it is necessary.
11. Evaluation of internal financial controls and risk
management systems.
12. Reviewing, with the management, performance of
statutory and internal auditors, adequacy of the
internal control systems.
13. Reviewing the adequacy of internal audit function,
if any, including the structure of the internal audit
department, staffing and seniority of the official
heading the department, reporting structure coverage
and frequency of internal audit.
14. Discussion with internal auditors of any significant
findings and follow up there on.
15. Reviewing the findings of any internal investigations
by the internal auditors into matters where there is
suspected fraud or irregularity or a failure of internal
control systems of a material nature and reporting the
matter to the Board.
16. Discussion with statutory auditors before the audit
commences, about the nature and scope of audit as
well as post-audit discussion to ascertain any area of
concern.
17. To look into the reasons for substantial defaults in the payment to the depositors, debenture holders, shareholders (in case of non-payment of declared dividends) and creditors.
18. To review the functioning of the Whistle Blower mechanism.
19. Approval of appointment of CFO after assessing the qualifications, experience and background, etc. of the candidate.
20. Carrying out any other function as is mentioned in the terms of reference of the Audit Committee.
21. Reviewing the utilisation of loans and / or advances from / investment by the holding Company in the subsidiary exceeding Rs. 100 crores or 10% of the asset size of the subsidiary, whichever is lower including existing loans / advances / investments existing as on the date of coming into force of this provision.
• The Audit Committee reviews the following information:
1. Management Discussion and Analysis of financial condition and results of operations.
2. Statement of significant related party transactions submitted by management.
Report on Corporate Governance (Contd.) 3. Management letters / letters of internal control weaknesses issued by the Statutory Auditors.
4. Internal audit reports relating to internal control weaknesses.
5. The appointment, removal and terms of remuneration of the Chief Internal Auditor.
6. Statement of deviations:
(a) quarterly statement of deviation(s) including report of monitoring agency, if applicable, submitted to stock exchange(s) in terms of Regulation 32(1) of the Listing Regulations.
(b) Annual statement of funds utilised for purposes other than those stated in the offer document / prospectus / notice in terms of Regulation 32(7) of the Listing Regulations.
III. Nomination, Remuneration and Compensation Committee
• Composition, meetings, attendance during the year and sitting fees paid:
The NRC Committee is constituted in line with the provisions of Regulation 19 of the Listing Regulations and Section 178 of the Act. The committee comprises of three Directors of which two are independent directors.
The composition of the NRC Committee as on 31st March, 2021 and details of the member’s participation at the meetings of the Committee are as under:
Name of Member CategoryAttendance at meeting held on Attendance
%Sitting Fees(` in lakhs)20.05.2020 21.10.2020
Kumar Mangalam Birla Non-Executive/Non-Independent
ü ü 100 0.40
Arun Adhikari - Chairman Independent ü ü 100 0.40
Mrs. Alka Bharucha Independent ü ü 100 0.40
The Company Secretary acts as the Secretary to the NRC Committee.
• Terms of reference of the NRC Committee:
The NRC Committee is authorised to:
- set the level and composition of remuneration
which is reasonable and sufficient to attract,
retain and motivate Directors and senior
management of the quality required to run the
Company successfully.
- set the relationship of remuneration to
performance.
- check whether the remuneration provided to
Directors and senior management includes
a balance between fixed and incentive pay
reflecting short and long-term performance
objectives appropriate to the working of the
Company and its goals.

120
Ult
raTe
ch C
emen
t Li
mit
ed
121
Ann
ual R
epo
rt 2
020-
21
Welcome to UltraTech
Value Creation
Growth Enablers
Statutory Reports
Financial Statements
ESG Commitments
- formulate appropriate policies, institute processes which enable the identification of individuals who are qualified to become Directors and who may be appointed in senior management and recommend the same to the Board.
- review and implement succession and development plans for Managing Director,
to strike an appropriate balance between Fixed Cash
compensation (Basic Salary + Allowances); Annual
Incentive Plan; Long-Term Incentives and Perks and
Benefits.
IV. Risk Management
In terms of the provisions of Regulation 21 of the
Listing Regulations, your Company has constituted
a Risk Management and Sustainability Committee
(“RMS Committee”).
The composition of the RMS Committee as on
31st March, 2021 and details of the member’s
participation at the meeting of the Committee is as
under:
Name of Member Category
Attendance at meeting held
onAttendance
%
28.09.2020
K. K. Maheshwari Non-Executive/ Non-Independent
Leave of Absence
Nil
K. C. Jhanwar Executive/Non-Independent
ü 100
Atul Daga Executive/Non-Independent
ü 100
Other Invitees / Attendees: The Company Secretary acts as the Secretary to the RMS Committee. The Chief Sustainability Officer of your Company also attends meetings of the RMS Committee.
The RMS Committee is mandated to review the risk management and sustainability process of your Company and to provide oversight and stewardship to your Company’s sustainability performance, manage risks, leverage opportunities, create stakeholder value.
Your Company has established a robust governance framework to oversee strategies for driving sustainability and climate change related actions, addressing risks and opportunities and ensuring accountability. The RMS Committee is mandated to review the risk management and sustainability process of your Company and to provide oversight and stewardship to your Company’s sustainability performance, manage risks, leverage opportunities, create stakeholder value.
The objectives and scope of the RMS Committee broadly include:
- Overall responsibility to monitor and approve risk management and sustainability framework;
- Set climate change and sustainability strategy and targets;
- Implement strategies and targets through Corporate and Unit-level Risk Management and Sustainability Committees;
- Review progress of climate change and sustainability related targets, KPIs and issues on a regular basis;
- Monitor and approve risk management and sustainability framework;
- Review various business risks, including climate change risks, and recommend action plan to mitigate the identified risks;
- Review and monitor operational, strategic and cyber risks;
- Assist the Board in determining measures that can be adopted to mitigate risk, ensure balance between risk and reward and create value for your Company’s stakeholders.
The Committee oversees progress against climate change related targets and commitments and reviews developments in external environment and climate-related risks and opportunities. During the year, discussions and review were conducted on topics, including sustainability-linked bonds, Global Cement and Concrete Association (“GCCA”) climate ambition, renewable energy targets, science-based target initiative (“SBTi”) and water positivity targets.
Company-level targets, commitments and action plans pertaining to sustainability and climate change are also reviewed by Unit-level Committees. The Corporate Sustainability Team ensures that key decisions and commitments at the Board-level are relayed to Unit-level Committees. The Unit-level Committees are led by the Unit Head and consists of senior management at respective Units. Their role is to translate targets and commitments at Company level, such as commitment to science-based targets, renewable energy, water positivity targets, etc. to site-specific action plans.
Your Company has integrated climate change and sustainability targets in the key responsibility areas (“KRAs”) of the CXOs, senior management and Unit-heads. Thus, emission reduction targets and other improvement targets related to climate change are linked with the incentives provided to senior management.
The Directors’ Report and Management Discussion and Analysis sets out the risks identified and the mitigation plans thereof.
Report on Corporate Governance (Contd.)
Executive Directors and senior management.
- devise a policy on Board diversity.
- formulate the criteria for determining qualifications, positive attributes and independence of Directors.
- recommend to the Board, all remuneration, in whatever form, payable to senior management.
• Employee Stock Option Scheme:
Scheme
Grant Vested@ Allotted^
StockOptions
Restricted Stock Units
StockOptions
Restricted Stock Units
StockOptions
Restricted Stock Units
Employee Stock Option Scheme – 2013 (“ESOS-2013”)
Not Applicable
Not Applicable
9,533 Nil 25,603 2,690
Employee Stock Option Scheme – 2018 (“ESOS-2018”)
4,192* 1,158# 40,690 Nil 17,014$ Nil
@ Stock options are vested to eligible employees, subject to the provisions of the Stock Option schemes, statutory provisions as may be applicable from time to time and the rules and procedures set out by your Company in this regard.
^ The allotted Stock Options and Restricted Stock Units (“RSUs”) are exercisable into the same number of equity shares of ` 10/- each of your Company.
* Out of 4,192 Stock Options, 2,152 and 2,040 Stock Options were granted on 21st October, 2020 and 27 th March, 2021 respectively. # Out of 1,158 RSUs, 594 and 564 RSUs were granted on 21st October, 2020 and 27 th March, 2021 respectively. $ Applications were received from some option grantees for transfer of equity shares of your Company into their account, from
the UltraTech Employee Welfare Trust account, which also includes 123 equity shares pending for transfer for the year ended 31 st March, 2020.
• Remuneration Policy:
Your Company has adopted Executive Remuneration
Philosophy / Policy which forms part of this Annual
Report. The remuneration involves a balance between
fixed and incentive pay, reflecting short and long-term
performance objectives appropriate to the working of
your Company and its goals.
The remuneration program is designed to attract,
retain, and reward talented executives who will
contribute to your Company’s long-term success and
thereby build value for all stakeholders.
The remuneration policy is intended to provide
for monetary and non-monetary remuneration
elements on a holistic basis and emphasise “Pay for
Performance” by aligning incentives with business
strategies to reward executives who achieve or
exceed Company and individual goals.
The remuneration policy is applicable to Directors;
Key Managerial Personnel and Senior Management of
your Company.
The remuneration policy aims to provide competitive
remuneration opportunities by positioning target
total remuneration (including perks and benefits,
annual incentive pay-outs, long term incentive pay-
outs at target performance) and target total cash
compensation (including annual incentive pay-outs)
at target performance directionally between median
and top quartile of the primary talent market. It aims

122
Ult
raTe
ch C
emen
t Li
mit
ed
123
Ann
ual R
epo
rt 2
020-
21
Welcome to UltraTech
Value Creation
Growth Enablers
Statutory Reports
Financial Statements
ESG Commitments
V. Remuneration of Directors
Based on the recommendation of the NRC Committee, all decisions relating to remuneration of Directors are taken by the Board of your Company in accordance with the shareholder’s approval, wherever necessary.
The NRC Committee while recommending to the
Board the remuneration of Executive Directors,
considers the performance of the business, individual
performance, practices followed in other similar sized
companies, among others, while also ensuring that
the remuneration is in compliance with the terms
and conditions of appointment as approved by the
members. All decisions relating to the remuneration
of Executive Directors is taken by the Board based on
the remuneration policy and in terms of the resolution
passed / to be passed by the members of your
Company.
a) Mr. K. C. Jhanwar was paid ` 1.70 crores towards
performance linked incentive for achievement of
targets for the year 2019-20.
b) Mr. Atul Daga was paid ` 1.12 crores towards
performance linked incentive for achievement of
targets for the year 2019-20.
c) Appointment of Mr. K. C. Jhanwar as Managing
Director and Mr. Atul Daga as Whole-time
Director & CFO are subject to termination by
three months’ notice in writing on either side.
d) In terms of ESOS-2013, 2,143 Stock Options have
vested in Mr. K. C. Jhanwar.
Report on Corporate Governance (Contd.)
Members have approved payment of commission to the Non-Executive Directors of an amount not exceeding 1% per annum of the net profit of your Company. Based on the performance evaluation of each Director and the remuneration policy, the Board has recommended an amount of ` 10 crores as commission to be paid to the Non-Executive Directors for 2020-21.
• Details of remuneration paid / to be paid to the Directors for attending Board meetings are as under:
Name of DirectorSitting fees paid
(` in lakhs)Commission payable@
(` in lakhs)
Kumar Mangalam Birla 2.50 -
Mrs. Rajashree Birla 2.50 494.00
Arun Adhikari 2.50 140.00
Mrs. Alka Bharucha 1.50 72.00
Sunil Duggal$ 1.50 40.00
Mrs. Sukanya Kripalu 2.50 90.00
S. B. Mathur 2.50 164.00
K. K. Maheshwari# 2.50 -
K. C. Jhanwar - -
Atul Daga - -
@ subject to the approval of the members of your Company. $ Mr. Sunil Duggal was appointed as Independent Director of your Company w.e.f. 14th August, 2020. # In addition to the above, Mr. K. K. Maheshwari has been paid an amount of ` 28.34 lakhs per month as pension for his past services
as Managing Director.
None of the Directors hold any convertible instruments of your Company.
• Non-Executive Directors’ compensation and disclosures:
Sitting fees and commission paid to the Non-Executive Directors and Independent Directors are recommended by the NRC Committee of the Board and approved by the Board and members.
• Executive Directors’ Remuneration:
The details of remuneration paid to the Executive Directors is as follows:
Executive DirectorRelationship
with other Directors
Remuneration during 2020-21
All elements of remuneration package i.e. salary, benefits,
pensions etc.
Performance linked incentives, alongwith performance criteria
(a) and (b)
Service contracts, notice period, severance fee
Stock Option details, if any
K. C. JhanwarManaging Director
- 6.91 1.70
See notes (c)See notes(d) and (e)Atul Daga
Whole-time Director & CFO- 2.21 1.12
e) In terms of ESOS-2018, 3,296 Stock Options have vested in Mr. K. C. Jhanwar and 1,062 Stock Options vested in Mr. Atul Daga, during the year.
There were no pecuniary relationships or transactions between your Company and Non-Executive Directors during the year. For further details, please refer to the Directors’ Report and Management Discussion and Analysis.
• D&O Insurance for Directors:
In line with the requirements of Regulation 24(10) of the Listing Regulations, your Company has a Directors and Officers Insurance policy (“D&O”) for all its Directors and members of the senior management for such quantum and for such risks as determined by the Board.
VI. Stakeholder Relationship Committee
• Composition, meeting, attendance and sitting fees paid during the year:
The composition of the Stakeholder Relationship Committee (“SRC”) complies with the requirements of Section 178 of the Act and Regulation 20 of the Listing Regulations.
The composition of the SRC as on 31st March, 2021 and details of the member’s participation at the meetings of the Committee are as under:
Name of Members CategoryAttendance at meeting held on
Attendance %
Sitting Fees (` In lakhs)20.05.2020 28.07.2020 21.10.2020 23.01.2021
S. B. Mathur - Chairman Independent ü ü ü ü 100 0.80
Mrs. Sukanya Kripalu Independent ü ü ü ü 100 0.80
K. C. Jhanwar Executive/Non-Independent
ü ü ü ü 100 -
The Company Secretary acts as Secretary to the SRC and is also the Compliance Officer.
• Role:
- To monitor complaints received by the Company
from its Shareholders, Debenture holders,
other security holders, SEBI, Stock Exchanges,
Registrar of Companies etc. and action taken by
the Company for redressing the same.
- To approve allotment of shares, debentures or any
other securities as per the authority conferred / to
be conferred to the SRC by the Board from time to
time.
- To approve requests for transposition, deletion,
consolidation, sub-division, change of name,
dematerialisation, rematerialisation etc. of shares,
debentures and other securities.
- To authorise officers of the Company to approve requests for transposition, deletion, consolidation, sub-division, change of name, dematerialisation, rematerialisation etc. of shares, debentures and other securities.
- To approve and ratify the action taken by the authorised officers of the Company in compliance

124
Ult
raTe
ch C
emen
t Li
mit
ed
125
Ann
ual R
epo
rt 2
020-
21
Welcome to UltraTech
Value Creation
Growth Enablers
Statutory Reports
Financial Statements
ESG Commitments
to the requests received from the shareholders / investors for issue of duplicate / replacement / consolidation / sub-division, dematerialisation, rematerialisation and other purposes for the shares, debentures and other securities of the Company.
- To monitor and expedite the status and process of dematerialisation and rematerialisation of shares, debentures and other securities of the Company.
- To give directions for monitoring the stock of blank stationery and for printing of stationery required by the Secretarial Department of the Company from time to time for issuance of share certificates, debenture certificates, allotment letters, dividend warrants, pay orders, cheques and other related stationery.
- To review the measures taken to reduce the quantum of unclaimed dividend / interest and ensuring timely receipt of dividend warrants / annual reports / statutory notices by the shareholders of the Company.
- Resolving grievances of security holders including complaints related to transfers / transmission of shares, non-receipt of annual report, non-receipt of declared dividends, issue of new / duplicate certificates, general meetings etc.
- Review measures taken for effective exercise of voting rights by shareholders.
VIII. Corporate Social Responsibility Committee
The Corporate Social Responsibility Committee (“CSR Committee”) is constituted in line with the provisions of Section 135 of the Act. The CSR
Report on Corporate Governance (Contd.)
- Review of adherence to the service standards adopted by the listed entity in respect of various services being rendered by the Registrar & Transfer Agent.
- To perform such other acts, deeds, and things as may be delegated to the SRC by the Board from time to time.
• Shareholders Complaints:
Details of complaints received, number of shares transferred during the year, time taken for effecting these transfers and the number of share transfers pending are furnished in the “Shareholder Information” section of this Annual Report.
VII. Finance Committee
A “Finance Committee” has been constituted at the Board level, under the Chairmanship of an Independent Director. The Finance Committee is authorised to exercise all powers and discharge all functions relating to working capital management, foreign currency contracts, operation of bank accounts and authorising officers of your Company to deal in matters relating to excise, GST, income tax, customs and other judicial or quasi-judicial authorities.
• Composition, meeting, attendance and sitting fees paid during the year:
The composition of the Finance Committee as on 31st March, 2021 and details of the member’s participation at the meetings of the Committee are as under:
Name of Members CategoryAttendance at meeting held on Attendance
%Sitting Fees (` in lakhs)03.02.2021 08.02.2021 16.02.2021
Arun Adhikari - Chairman
Independent ü ü ü 100 0.60
Mrs. Alka Bharucha Independent Leave of Absence Leave of Absence Leave of Absence 0 -
Atul Daga Executive/Non-Independent
ü ü ü 100 -
The Company Secretary acts as Secretary to the Finance Committee.
Committee recommends to the Board the activities to be undertaken during the year and amount to be spent on these activities. The Annual Report on CSR activities forms part of this Annual Report.
• Composition, meeting, attendance and sitting fees paid during the year:
The composition of the CSR Committee as on 31st March, 2021 and details of the member’s participation at the meetings of the Committee are as under:
Name of Members Category
Attendance at meeting held on Attendance
%Sitting Fees(` In lakhs)
30.03.2021
Mrs. Rajashree Birla - Chairperson
Non-Executive/Non-Independent
ü 100 0.20
Mrs. Sukanya Kripalu Independent ü 100 0.20
K. K. Maheshwari Non- Executive/Non-Independent
ü 100 0.20
Other Invitee/ Attendee: Dr. Pragnya Ram, Group
Executive President, CSR is a permanent invitee to
the CSR Committee. The Company Secretary acts as
Secretary to the CSR Committee.
• Prevention of Insider Trading:
In terms of the provisions of the Securities and
Exchange Board of India (Prohibition of Insider
Trading) Regulations, 2015 (“Insider Trading
Regulations”), as amended, your Company has
adopted a ‘Code of Conduct to regulate, monitor
and report trading by designated persons in listed or
proposed to be listed securities’ of your Company
(“the Code”) and the ‘Code of Practices and
Procedures for Fair Disclosure of Unpublished Price
Sensitive Information’ (“Code of Fair Disclosure”).
The Code aims at preserving and preventing misuse
of UPSI. All Designated Persons of your Company are
covered under the Code, which provides inter alia for
periodical disclosures and obtaining pre-clearances
for trading in securities of your Company. PAN based
online tracking mechanism for monitoring of the trade
in your Company’s securities by the “Designated
Persons” and their relatives is in place to ensure real
time detection and taking appropriate action, in case
of any non-compliance with the provisions of the
Code.
The Board has also formulated a policy for determination of ‘legitimate purposes’ as a part of the Code of Fair Disclosure in terms of the provisions of the Insider Trading Regulations. The Board, designated persons and other connected persons have affirmed compliance with the Code.
IX. Disclosures
• Management:
- The Management Discussion and Analysis forms part of the Directors’ Report and is in accordance with the requirements of the Listing Regulations.
- No material transaction has been entered into by your Company with the promoters, directors or the management or relatives, etc. that may have a potential conflict with interests of your Company.
• Related Party Transactions:
Related party transactions entered by your Company during the year were on arm’s length basis and in the ordinary course of business. All related party transactions have prior approval of the Audit Committee and are reviewed by the Audit Committee on a quarterly basis. During the year, there were no material transactions with any related party as defined under the Act and the Listing Regulations.

126
Ult
raTe
ch C
emen
t Li
mit
ed
127
Ann
ual R
epo
rt 2
020-
21
Welcome to UltraTech
Value Creation
Growth Enablers
Statutory Reports
Financial Statements
ESG Commitments
The policy on Related Party Transactions as approved by the Audit Committee and the Board is available on the following weblink https://www.ultratechcement.com/investors/corporate-governance.
No material transaction has been entered into by your Company with its related parties that may have a potential conflict with interests of your Company. Particulars of related party transactions are listed out in Note No. 39 to the Standalone Financial Statements of your Company.
• Details of non-compliance by the Company, penalties and strictures imposed on the Company by stock exchanges or the SEBI or any other Statutory Authority, on any matter relating to capital markets, during the year:
There has been no instance of non-compliance by the Company on any matter related to capital markets during the year under review and hence no strictures / penalties have been imposed on your Company by the stock exchanges or the SEBI or any Statutory Authority.
• Vigil Mechanism / Whistle Blower Policy:
Your Company has in place a vigil mechanism pursuant to which a Values Committee has been constituted for addressing complaints received from Directors and employees concerning unethical behaviour, actual or suspected fraud and violation of the Code of Conduct or Ethics Policy of your Company. The policy has also been amended to make employees aware of the existence of policies and procedures for inquiry in case of leakage of UPSI to enable them report on leakages, if any, of such information. The policy provides for adequate safeguards against victimisation and all personnel have access to the Audit Committee. The policy is available on the following weblink https://www.ultratechcement.com/investors/corporate-governance.
• Report On Corporate Governance:
Your Company has complied with the Corporate Governance requirements specified in Regulations
17 to 27 and clauses (b) to (i) of sub-regulation (2) of Regulation 46 of the Listing Regulations.
• Status of Compliances of Non – Mandatory Requirements:
Your Company maintains a separate office for its Non-Executive Chairman. All necessary infrastructure and assistance is made available to enable him to discharge his responsibilities effectively.
1. The position of the Chairman of the Board of Directors and the Managing Director are separate.
2. The Internal Auditors report to the Audit Committee.
3. During the period under review, there is no audit qualification in the financial statement.
• Subsidiary Company:
Your Company does not have any material non-listed Indian subsidiary company. The Audit Committee and Board reviews the financial statements, significant transactions and working of the unlisted subsidiary companies and the minutes are placed before the Board. Your Company has unlisted subsidiary companies in Sri Lanka, Middle East and Indonesia. The financial results of these companies are presented to your Company’s Board. The policy for determining material subsidiaries is available on the following weblink https://www.ultratechcement.com/investors/corporate-governance.
• Members:
Details of the Directors seeking re-appointment / appointment at the ensuing AGM, are provided in the Notice convening the AGM.
• Proceeds from public issues, rights issues, preferential issues:
During the year, your Company did not raise any funds by way of public issues, rights issues, preferential issues etc.
• Accounting Standards:
Your Company has followed all relevant accounting standards while preparing the financial statements.
• Prevention of Sexual Harassment of Women at Workplace:
Your Company has zero tolerance for sexual harassment at workplace and has adopted a policy on prevention, prohibition and redressal of sexual harassment at workplace in line with the provisions of the Sexual Harassment of Women at Workplace (Prevention, Prohibition and Redressal) Act, 2013 (“POSH”) and the Rules thereunder for prevention and redressal of complaints of sexual harassment at workplace.
Disclosures in relation to POSH:
a) number of complaints filed during the financial year: 4
b) number of complaints disposed of during the financial year: 3
c) number of complaints pending as at the end of the financial year: 1
• Fees paid to Statutory Auditors:
Total fees for all services paid by your Company and its subsidiaries, on a consolidated basis, to the statutory auditors and all entities in the network firm /
Report on Corporate Governance (Contd.) network entity of which the statutory auditor is a part is ` 6.20 crores.
X. Compliance
• A certificate from the statutory auditors confirming compliance with the conditions of Corporate Governance as stipulated in the Listing Regulations forms part of this Annual Report.
• A Certificate by the Company Secretary in Practice that none of the directors have been debarred or disqualified from being appointed or continuing as directors in the companies by SEBI / the Ministry of Corporate Affairs or any such statutory authority forms part of this Report.
• During the year under review, the Board has accepted the recommendations, which are required to be made by the Committee’s constituted.
XI. CEO / CFO Certification
The Managing Director and Whole-time Director & CFO of your Company have issued necessary certificate pursuant to the provisions of Regulation 17(8) of the Listing Regulations and the same forms part of this Report.
XII. General Body Meetings
Date and time of the AGMs, held during the preceding 3 years and the Special Resolution(s) passed thereat are as follows:
Year Venue Day, Date and Time Special Resolutions Passed
2020 Through VC / OAVM Wednesday, 12.08.2020;3.00 p.m.
• Continuation of directorship of Mrs. Rajashree Birla as a Non-Executive Director.
• Re-appointment of Mrs. Alka Bharucha as an Independent Director.
2019 Ravindra Natya Mandir,P. L. Deshpande Maharashtra Kala Academy,Near Siddhivinayak Temple, Sayani Road, Prabhadevi,Mumbai – 400 025.
Thursday,18.07.2019;3.30 p.m.
• Re-appointment of Mr. Arun Adhikari as an Independent Director.
• Re-appointment of Mr. S. B. Mathur as an Independent Director.
• Re-appointment of Mrs. Sukanya Kripalu as an Independent Director.
• Re-appointment of Mrs. Renuka Ramnath as an Independent Director.
• Increase in borrowing limits from ` 6,000 crores over and above the aggregate of the paid-up share capital and free reserves of the Company to ` 8,000 crores over and above the aggregate of the paid-up share capital, free reserves and securities premium of the Company.
• Creation of charge on the movable and immovable properties of the Company, both present and future, in respect of borrowings.
2018 Wednesday;18.07.2018;3.30 p.m.
• Issue of Redeemable Non-Convertible Debentures secured or unsecured in one or more series / tranches aggregating to an amount not exceeding ` 9,000 crores.

128
Ult
raTe
ch C
emen
t Li
mit
ed
129
Ann
ual R
epo
rt 2
020-
21
Welcome to UltraTech
Value Creation
Growth Enablers
Statutory Reports
Financial Statements
ESG Commitments
• Whether any special resolution passed last year through postal ballot:
No resolution was passed through postal ballot during the year 2020-21.
XIII. Means of Communication
• Financial results:
Your Company’s quarterly / half-yearly / annual financial results (“results”) are filed with the stock exchanges. They are also available on the website of your Company www.ultratechcement.com and www.adityabirla.com.
The results are published in the following newspapers:
Newspaper Cities of Publication
Business Standard All editions
Free Press Journal Mumbai
Navshakti Mumbai
• News releases, presentations, etc.:
Official news and media releases are filed with the stock exchanges and displayed on your Company’s website www.ultratechcement.com. Press releases are also available on the website of the Group www.adityabirla.com.
• Presentations to institutional investors / analysts:
Your Company actively engages with investors – both domestic and global, keeping them updated on your Company’s strategy, outlook, risks and opportunities. These efforts help investors arrive at a fair valuation of your Company’s shares.
Financial results are intimated to the stock exchanges, published in newspapers, emailed to analysts and investors, and posted on the weblink https://www.ultratechcement.com/investors/financials. Investor calls are held after the announcement of every financial results during which highlights of the performance during the quarter are shared with the analysts and queries raised by them are addressed. Transcripts of the calls are also available on the following weblink https://www.ultratechcement.com/investors/financials. All material developments are informed to the stock exchanges and relevant disclosures, including presentations, corporate dossiers are filed with the stock exchanges and uploaded on your Company’s website www.ultratechcement.com.
The table below provides the number of investor and analyst interactions held during FY21:
Particulars Q1 Q2 Q3 Q4 FY21
Investor Updates
Meetings and calls 26 33 12 24 95
Financial Results
Nos. 1 1 2 1 5
Participants 550 470 655 297 1,972
Roadshow*
Nos. - - - 1 1
Participants - - - 92 92
* relating to issuance of sustainability bonds.
XIV. Website Disclosures
The information as required to be disseminated on your Company’s website www.ultratechcement.com
pursuant to the Listing Regulations have been uploaded.
Report on Corporate Governance (Contd.) CODE OF CONDUCTDECLARATION
As provided under the Securities and Exchange Board of India (Listing Obligations and Disclosure Requirements) Regulations, 2015, the Board of Directors and the Senior Management Personnel have confirmed compliance with the Code of Conduct for the year ended 31st March, 2021.
K. C. JhanwarMumbai Managing Director7th May, 2021 (DIN:01743559)
CEO / CFO CERTIFICATIONThe Board of DirectorsUltraTech Cement Limited
We certify that:
1. We have reviewed the financial statement, read with the cash flow statement of UltraTech Cement Limited (“the Company”) for the year ended 31st March, 2021 and to best of our knowledge and belief:
(i) these statements do not contain any materially untrue statement or omit any material fact or contain statements that might be misleading;
(ii) these statements together present a true and fair view of the Company’s affairs and are in compliance with existing accounting standards, applicable laws and regulations.
2. There are, to the best of our knowledge and belief, no transactions entered into by the Company during the year which are fraudulent, illegal or violative of the Company’s Code of Conduct;
3. We are responsible for establishing and maintaining internal controls for financial reporting and we have evaluated the effectiveness of the internal control systems of the Company pertaining to financial reporting and have disclosed to the Company’s Auditors and the Audit Committee of the Company’s Board of Directors deficiencies in the design or operation of internal controls, if any, of which we are aware and the steps taken or proposed to be taken to rectify the deficiencies.
4. We have indicated to the Auditors and the Audit Committee:
a) significant changes in the Company’s internal control over financial reporting during the year.
b) significant changes in accounting policies during the year, if any, and that the same have been disclosed in the notes to the financial statements.
c) instances of significant fraud of which we have become aware and involvement therein if any of management or other employees having a significant role in the Company’s internal control system over financial reporting.
K. C. Jhanwar Atul DagaMumbai Managing Director Whole-time Director & CFO7th May, 2021 (DIN: 01743559) (DIN: 06416619)

130
Ult
raTe
ch C
emen
t Li
mit
ed
131
Ann
ual R
epo
rt 2
020-
21
Welcome to UltraTech
Value Creation
Growth Enablers
Statutory Reports
Financial Statements
ESG Commitments
Shareholder Information
1. Annual General Meeting:
Date and Time Deemed Venue Book Closure Dividend Payment Date
Wednesday,18th August, 2021 at3.00 p.m. (IST) throughvideo conferencing (“VC”) / other audio-visual means (“OAVM”)
Registered Office of the Company:UltraTech Cement Limited‘B’ Wing, Ahura Centre, 2nd Floor,Mahakali Caves Road,Andheri (East), Mumbai – 400 093.Tel.: (022) 6691 7800 / 2926 7800Fax: (022) 6692 8109Email: [email protected]: www.ultratechcement.com / www.adityabirla.comCIN: L26940MH2000PLC128420
Wednesday,4th August, 2021toWednesday,18th August, 2021(both days inclusive)
On or after Thursday,19th August, 2021
2. Financial Calendar (1st April to 31st March):
Financial reporting for the quarter ending 30th June, 2021 End July, 2021
Financial reporting for the half year ending 30th September, 2021 End October, 2021
Financial reporting for the quarter ending 31st December, 2021 End January, 2022
Financial reporting for the year ending 31st March, 2022 End April, 2022
Annual General Meeting for the year ending 31st March, 2022 End July / August, 2022
3. Listing Details:
a) Equity Shares
Stock Exchange ISIN Stock Code Reuters Bloomberg
BSE Limited (“BSE”)Phiroze Jeejeebhoy Towers,Dalal Street, Mumbai – 400 001
INE481G01011
532538 ULTC.BO UTCEM IB
National Stock Exchange of India Limited (“NSE”)“Exchange Plaza”, Plot No. C-1,Block G, Bandra-Kurla Complex,Bandra (East), Mumbai - 400 051
ULTRACEMCO ULTC.NS UTCEM IS
b) Global Depository Receipts (“GDRs”)
Stock Exchange ISIN Overseas Depository Domestic Custodian Bloomberg
Luxembourg Stock Exchange (“LSE”)35A, Boulevard Joseph II, L-1840Luxembourg
144A GDRs -US90403E1038
Citibank N. A.Depository Receipt Services388, 6th Floor, Greenwich Street, New York,NY - 10013United States of America
Citibank N. A.Custody Services FIFC,9th Floor, C-54 & 55, G Block,Bandra-Kurla Complex,Bandra (East),Mumbai – 400 098
UTCEM LX
Level 1 GDRs -US90403E2028
CERTIFICATE OF NON-DISQUALIFICATION OF DIRECTORS(Pursuant to Regulation 34(3) and Schedule V Para C Clause (10)(i) of SEBI
(Listing Obligations and Disclosure Requirements) Regulations, 2015)
To,The MembersUltraTech Cement LimitedB-Wing Ahura Centre, 2nd FloorMahakali Caves Road,Andheri East, Mumbai – 400093
We have examined the relevant disclosures provided by the Directors (as enlisted in Table A) of UltraTech Cement Limited having CIN L26940MH2000PLC128420 and having registered office at B-Wing Ahura Centre, 2nd Floor, Mahakali Caves Road, Andheri East, Mumbai – 400093 (hereinafter referred to as ‘the Company’) for the purpose of issuing this Certificate, in accordance with Regulation 34(3) read with Schedule V Para C clause 10(i) of the Securities and Exchange Board of India (Listing Obligations and Disclosure Requirements) Regulations, 2015.
In our opinion and to the best of our information and documents available on the website of the Ministry of Corporate Affairs and Stock Exchanges as on 31st March, 2021, and according to the verifications (including Directors Identification Number (DIN) status at the portal www.mca.gov.in) as considered necessary and based on the disclosures of the Directors, we hereby certify that none of the Directors on the Board of the Company (as enlisted in Table A) have been debarred or disqualified from being appointed or continuing as Directors of the companies by the Securities and Exchange Board of India, Ministry of Corporate Affairs or any such other Statutory Authority.
Table A
Sr. No.
Name of the DirectorsDirector Identification
NumberDate of appointment in
Company
1 Mr. Kumar Manglam Birla 00012813 14/05/2004
2 Mrs. Rajashree Birla 00022995 14/05/2004
3 Mr. Arun Kumar Adhikari 00591057 03/12/2013
4 Mrs. Alka Marezban Bharucha 00114067 09/06/2016
5 Mr. Sunil Duggal 00041825 14/08/2020
6 Mrs. Sukanya Kripalu 06994202 11/10/2014
7 Mr. Sunil Behari Mathur 00013239 10/09/2008
8 Mr. Krishna Kishore Maheshwari 00017572 01/04/2016
9 Mr. Kailash Chandra Jhanwar 01743559 19/10/2018
10 Mr. Atul Daga 06416619 09/06/2016
For Makarand M. Joshi & Co.Practicing Company Secretaries
Kumudini BhaleraoPartnerFCS No. 6667CP No. 6690 Place: MumbaiUDIN: F006667C000245235 Date: 5th May 2021
Report on Corporate Governance (Contd.)

132
Ult
raTe
ch C
emen
t Li
mit
ed
133
Ann
ual R
epo
rt 2
020-
21
Welcome to UltraTech
Value Creation
Growth Enablers
Statutory Reports
Financial Statements
ESG Commitments
c) Sustainability Linked Bonds
Stock Exchange ISIN
Singapore Exchange Limited2 Shenton Way, #02-02, SGX Centre 1,Singapore 068804
US90403YAA73 USY9048BAA18
d) Non-Convertible Debentures
The non-convertible debentures (“NCDs”) issued by the Company are listed on NSE. The details are as under:
Type Series Year of Issue
ISIN Principal Amount(` in crore)
Maturity Date Debenture Trustee
Secured
7.57% NCDs 2016 INE481G07182 250 06.08.2021 SBICAP TrusteeCompany LimitedMistry Bhavan, 4th Floor,122, Dinshaw Vachha Road, Churchgate,Mumbai – 400 020
7.15% NCDs 2016 INE481G07208 300 18.10.2021
7.53% NCDs 2016 INE481G07190 500 21.08.2026
Unsecured
6.99% NCDs 2016 INE481G08024 400 24.11.2021
6.93% NCDs 2016 INE481G08032 250 25.11.2021
8.36% NCDs 2018 INE481G08057 360 07.06.2021
7.64% NCDs 2019 INE481G08065 250 04.06.2024
6.72% NCDs 2019 INE481G08073 250 09.12.2022
6.68% NCDs 2020 INE481G08081 250 20.02.2025
4.57% NCDs 2021 INE481G08099 1,000 29.12.2023
e) Commercial Papers
In terms of Securities and Exchange Board of India (“SEBI”) Circular no. SEBI/HO/DDHS/DDHS/CIR/P/2019/115 dated 22nd October, 2019 and SEBI Circular no. SEBI/HO/DDHS/DDHS/CIR/P/2019/167 dated 24th December, 2019, the Commercial Papers issued by the Company are listed on NSE.
4. Credit Ratings:
The Company’s financial discipline and prudence is reflected in the strong credit ratings ascribed by rating agencies as given below:
Instrument Rating Agency Rating
Non-Convertible Debentures CRISIL CRISIL AAA / Stable
India Ratings and Research (Ind-Ra) IND AAA / Stable
External Commercial Borrowing CRISIL CRISIL AAA / Stable
Commercial Paper CRISIL CRISIL A1+
India Ratings and Research (Ind-Ra) IND A1+
Rupee Term Loan CRISIL CRISIL AAA / Stable
Working Capital Limits India Ratings and Research (Ind-Ra) IND AAA / Stable IND A1+
Short Term Loan India Ratings and Research (Ind-Ra) IND A1+
5. Payment of annual listing fees:
Annual listing fees for the financial year 2021-22 has been paid to both the stock exchanges i.e. BSE and NSE. Listing fee for the GDRs has been paid to LSE for the calendar year 2021. One time listing fees has been paid to Singapore Stock Exchange.
Shareholder Information (Contd.) 6. Stock Data:
• Market Prices
Month
BSE NSE LSE
High Low Close Volume High Low Close Volume High Low Close
(In `) (In Nos.) (In `) (In Nos.) (In USD)
Apr-20 3,673.65 3,029.00 3,532.50 5,44,369 3,674.00 3,025.00 3,534.30 1,22,62,672 48.00 39.80 46.80
May-20 3,936.35 3,235.00 3,901.80 3,93,664 3,940.00 3,231.00 3,904.85 1,54,53,013 51.50 42.80 51.50
Jun-20 4,015.65 3,614.25 3,894.75 4,03,063 4,016.00 3,600.00 3,893.55 1,17,95,388 52.00 45.00 51.50
Jul-20 4,285.60 3,736.80 4,124.55 5,42,979 4,287.35 3,735.00 4,117.30 1,26,28,139 56.50 49.60 55.00
Aug-20 4,220.85 3,886.30 3,906.10 7,64,508 4,224.00 3,882.85 3,903.85 1,12,19,919 56.50 53.00 53.50
Sep-20 4,103.80 3,755.00 4,047.00 5,19,185 4,102.70 3,753.90 4,049.55 99,30,056 55.00 51.00 55.00
Oct-20 4,731.80 4,029.90 4,573.85 6,26,838 4,735.55 4,031.05 4,574.05 1,86,35,501 63.00 55.00 61.00
Nov-20 4,977.35 4,501.00 4,802.75 3,64,114 4,979.00 4,501.05 4,802.00 1,10,49,207 66.50 60.50 65.00
Dec-20 5,397.95 4,802.75 5,284.65 6,77,521 5,400.00 4,805.00 5,288.15 2,08,43,514 73.00 66.00 72.50
Jan-21 5,829.90 5,248.00 5,325.20 7,65,912 5,831.80 5,245.05 5,327.25 1,45,69,530 77.50 65.00 73.00
Feb-21 6,586.05 5,261.80 6,114.60 6,91,537 6,589.00 5,260.00 6,115.00 1,60,53,225 89.00 72.00 82.50
Mar-21 6,959.15 5,727.90 6,737.30 5,73,322 6,958.75 6,170.60 6,737.95 1,31,67,392 95.50 86.50 92.00
• Stock Performance and Returns
(In Percentage)Absolute Returns Annualised Returns
1 Year 3 Years 5 Years 1 Year 3 Years 5 Years
UltraTech 107.65 71.20 110.08 107.65 19.63 16.01
Sensex 66.09 35.70 83.82 66.09 10.71 12.95
Nifty 70.87 45.26 89.84 70.87 13.25 13.68
BSE Sensex UltraTech
Ap
r-20
May
-20
Jun-
20
Jul-
20
Aug
-20
Sep
-20
Oct
-20
Nov
-20
Dec
-20
Jan-
21
Feb
-21
Mar
-21
BSE Sensex v/s UltraTech
200
150
100
50
0
NSE Nifty UltraTech
200
150
100
50
0
Ap
r-20
May
-20
Jun-
20
Jul-
20
Aug
-20
Sep
-20
Oct
-20
Nov
-20
Dec
-20
Jan-
21
Feb
-21
Mar
-21
NSE Nifty v/s UltraTech
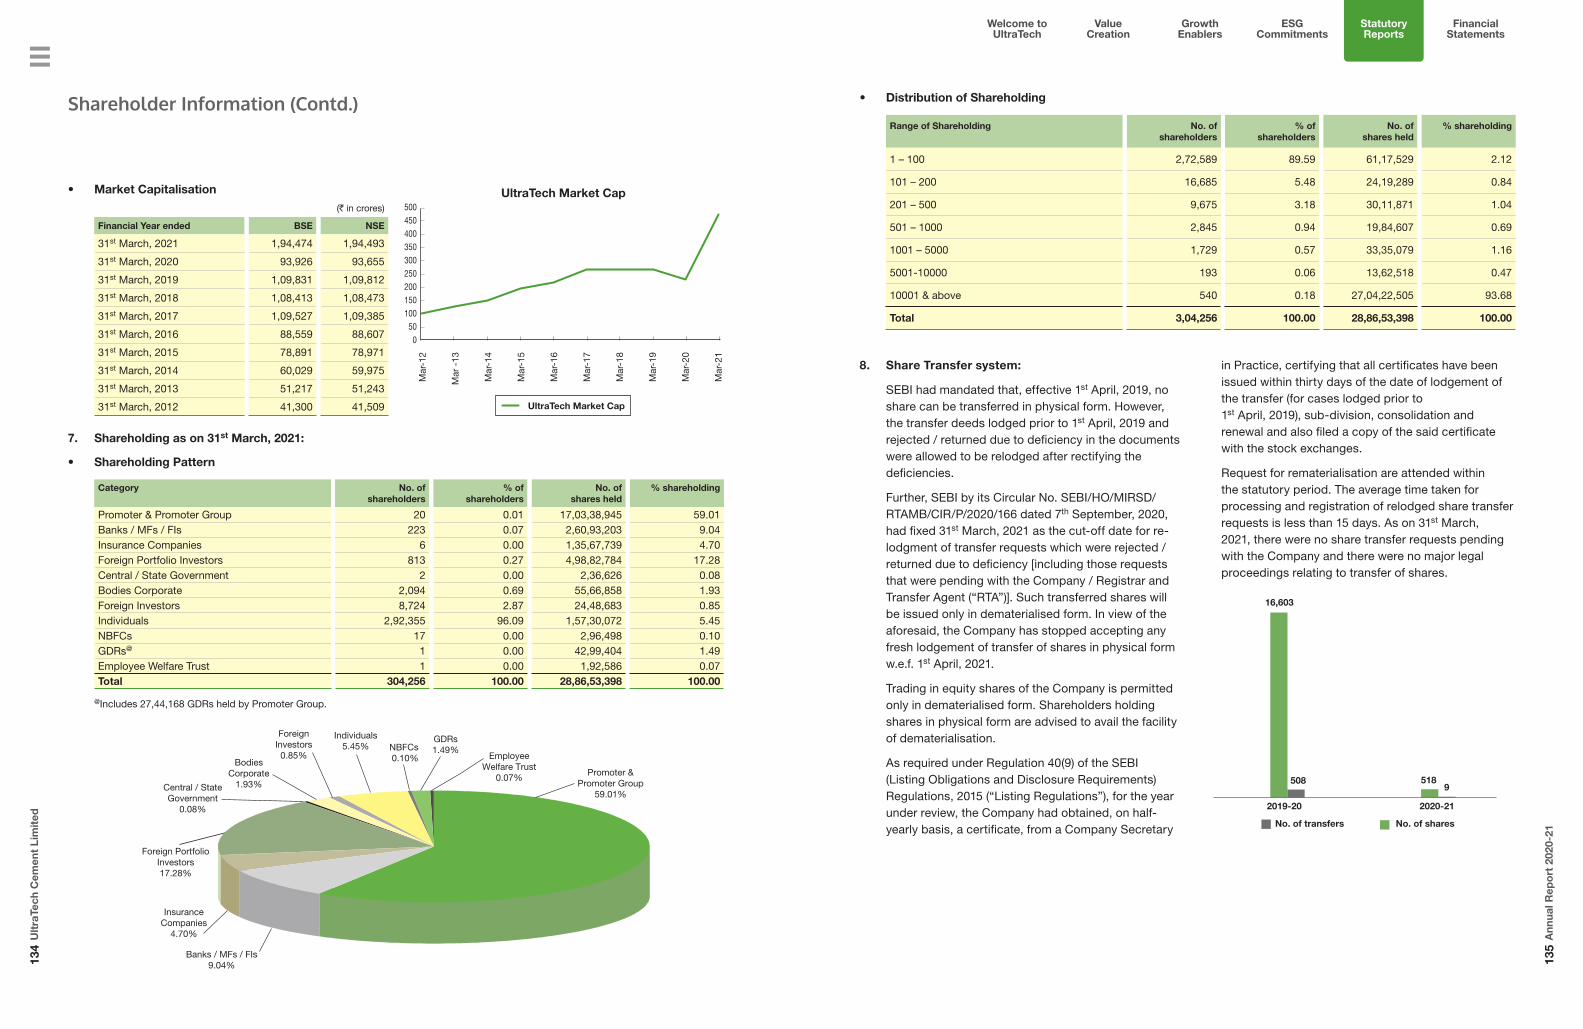
134
Ult
raTe
ch C
emen
t Li
mit
ed
135
Ann
ual R
epo
rt 2
020-
21
Welcome to UltraTech
Value Creation
Growth Enablers
Statutory Reports
Financial Statements
ESG Commitments
7. Shareholding as on 31st March, 2021:
• Shareholding Pattern
Category No. of shareholders
% ofshareholders
No. ofshares held
% shareholding
Promoter & Promoter Group 20 0.01 17,03,38,945 59.01Banks / MFs / FIs 223 0.07 2,60,93,203 9.04Insurance Companies 6 0.00 1,35,67,739 4.70Foreign Portfolio Investors 813 0.27 4,98,82,784 17.28Central / State Government 2 0.00 2,36,626 0.08Bodies Corporate 2,094 0.69 55,66,858 1.93Foreign Investors 8,724 2.87 24,48,683 0.85Individuals 2,92,355 96.09 1,57,30,072 5.45NBFCs 17 0.00 2,96,498 0.10GDRs@ 1 0.00 42,99,404 1.49Employee Welfare Trust 1 0.00 1,92,586 0.07Total 304,256 100.00 28,86,53,398 100.00
@Includes 27,44,168 GDRs held by Promoter Group.
InsuranceCompanies
4.70%
Central / StateGovernment
0.08%
BodiesCorporate
1.93%
ForeignInvestors
0.85%
Individuals5.45% NBFCs
0.10%
GDRs1.49%
EmployeeWelfare Trust
0.07% Promoter &Promoter Group
59.01%
Banks / MFs / FIs9.04%
Foreign PortfolioInvestors17.28%
• Market Capitalisation
(` in crores)
Financial Year ended BSE NSE
31st March, 2021 1,94,474 1,94,493
31st March, 2020 93,926 93,655
31st March, 2019 1,09,831 1,09,812
31st March, 2018 1,08,413 1,08,473
31st March, 2017 1,09,527 1,09,385
31st March, 2016 88,559 88,607
31st March, 2015 78,891 78,971
31st March, 2014 60,029 59,975
31st March, 2013 51,217 51,243
31st March, 2012 41,300 41,509
500450400350300250200150100500
Mar
-12
Mar
-13
Mar
-14
Mar
-15
Mar
-16
Mar
-17
Mar
-18
Mar
-19
Mar
-20
Mar
-21
UltraTech Market Cap
UltraTech Market Cap
Shareholder Information (Contd.) • Distribution of Shareholding
Range of Shareholding No. of shareholders
% ofshareholders
No. ofshares held
% shareholding
1 – 100 2,72,589 89.59 61,17,529 2.12
101 – 200 16,685 5.48 24,19,289 0.84
201 – 500 9,675 3.18 30,11,871 1.04
501 – 1000 2,845 0.94 19,84,607 0.69
1001 – 5000 1,729 0.57 33,35,079 1.16
5001-10000 193 0.06 13,62,518 0.47
10001 & above 540 0.18 27,04,22,505 93.68
Total 3,04,256 100.00 28,86,53,398 100.00
8. Share Transfer system:
SEBI had mandated that, effective 1st April, 2019, no share can be transferred in physical form. However, the transfer deeds lodged prior to 1st April, 2019 and rejected / returned due to deficiency in the documents were allowed to be relodged after rectifying the deficiencies.
Further, SEBI by its Circular No. SEBI/HO/MIRSD/RTAMB/CIR/P/2020/166 dated 7th September, 2020, had fixed 31st March, 2021 as the cut-off date for re-lodgment of transfer requests which were rejected / returned due to deficiency [including those requests that were pending with the Company / Registrar and Transfer Agent (“RTA”)]. Such transferred shares will be issued only in dematerialised form. In view of the aforesaid, the Company has stopped accepting any fresh lodgement of transfer of shares in physical form w.e.f. 1st April, 2021.
Trading in equity shares of the Company is permitted only in dematerialised form. Shareholders holding shares in physical form are advised to avail the facility of dematerialisation.
As required under Regulation 40(9) of the SEBI (Listing Obligations and Disclosure Requirements) Regulations, 2015 (“Listing Regulations”), for the year under review, the Company had obtained, on half-yearly basis, a certificate, from a Company Secretary
in Practice, certifying that all certificates have been issued within thirty days of the date of lodgement of the transfer (for cases lodged prior to 1st April, 2019), sub-division, consolidation and renewal and also filed a copy of the said certificate with the stock exchanges.
Request for rematerialisation are attended within the statutory period. The average time taken for processing and registration of relodged share transfer requests is less than 15 days. As on 31st March, 2021, there were no share transfer requests pending with the Company and there were no major legal proceedings relating to transfer of shares.
No. of transfers No. of shares
508 518
2020-212019-20
9
16,603
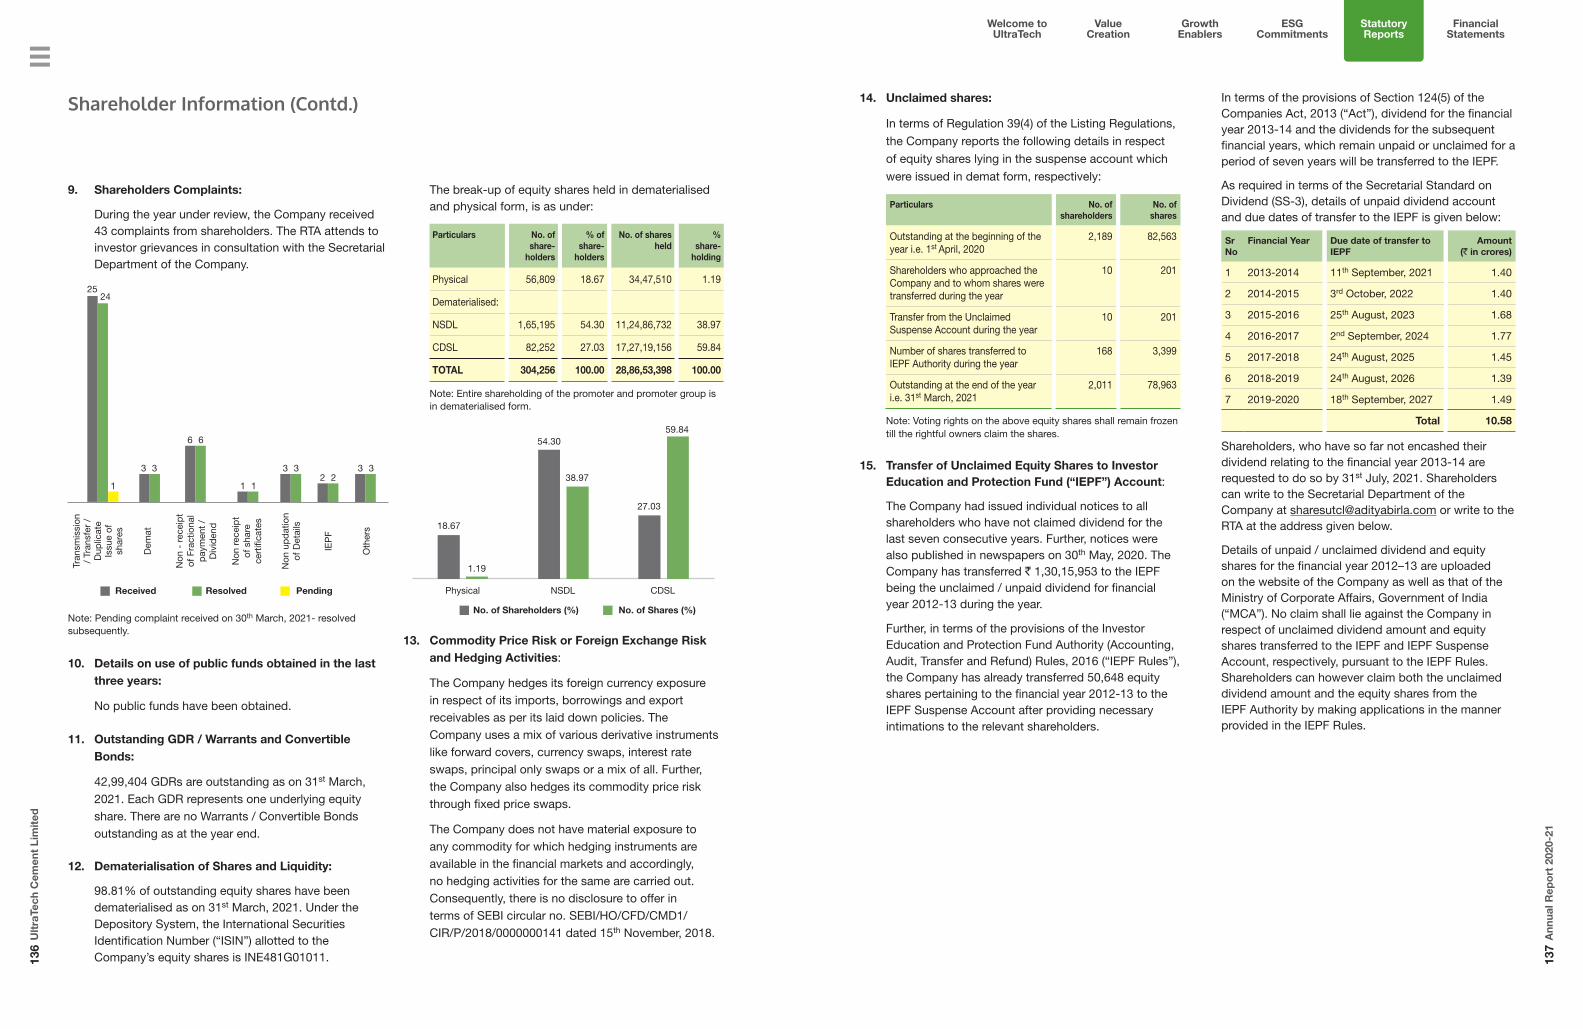
136
Ult
raTe
ch C
emen
t Li
mit
ed
137
Ann
ual R
epo
rt 2
020-
21
Welcome to UltraTech
Value Creation
Growth Enablers
Statutory Reports
Financial Statements
ESG Commitments
9. Shareholders Complaints:
During the year under review, the Company received 43 complaints from shareholders. The RTA attends to investor grievances in consultation with the Secretarial Department of the Company.
Received Resolved Pending
Oth
ers
Tran
smis
sion
/
Tran
sfer
/
Dup
licat
e Is
sue
of
shar
es
Dem
at
Non
- r
ecei
pt
of F
ract
iona
l p
aym
ent
/ D
ivid
end
2524
1
Non
rec
eip
t of
sha
re
cert
ifica
tes
Non
up
dat
ion
of D
etai
ls
IEP
F
3 3
6 6
3 3 3 3
1 12 2
Note: Pending complaint received on 30th March, 2021- resolved subsequently.
10. Details on use of public funds obtained in the last three years:
No public funds have been obtained.
11. Outstanding GDR / Warrants and Convertible Bonds:
42,99,404 GDRs are outstanding as on 31st March, 2021. Each GDR represents one underlying equity share. There are no Warrants / Convertible Bonds outstanding as at the year end.
12. Dematerialisation of Shares and Liquidity:
98.81% of outstanding equity shares have been dematerialised as on 31st March, 2021. Under the Depository System, the International Securities Identification Number (“ISIN”) allotted to the Company’s equity shares is INE481G01011.
The break-up of equity shares held in dematerialised and physical form, is as under:
Particulars No. of share-
holders
% ofshare-
holders
No. of shares held
%share-
holding
Physical 56,809 18.67 34,47,510 1.19
Dematerialised:
NSDL 1,65,195 54.30 11,24,86,732 38.97
CDSL 82,252 27.03 17,27,19,156 59.84
TOTAL 304,256 100.00 28,86,53,398 100.00
Note: Entire shareholding of the promoter and promoter group is in dematerialised form.
18.67
1.19
Physical
54.30
38.97
NSDL
27.03
59.84
CDSL
No. of Shareholders (%) No. of Shares (%)
13. Commodity Price Risk or Foreign Exchange Risk and Hedging Activities:
The Company hedges its foreign currency exposure in respect of its imports, borrowings and export receivables as per its laid down policies. The Company uses a mix of various derivative instruments like forward covers, currency swaps, interest rate swaps, principal only swaps or a mix of all. Further, the Company also hedges its commodity price risk through fixed price swaps.
The Company does not have material exposure to any commodity for which hedging instruments are available in the financial markets and accordingly, no hedging activities for the same are carried out. Consequently, there is no disclosure to offer in terms of SEBI circular no. SEBI/HO/CFD/CMD1/CIR/P/2018/0000000141 dated 15th November, 2018.
Shareholder Information (Contd.) 14. Unclaimed shares:
In terms of Regulation 39(4) of the Listing Regulations,
the Company reports the following details in respect
of equity shares lying in the suspense account which
were issued in demat form, respectively:
Particulars No. of shareholders
No. ofshares
Outstanding at the beginning of the year i.e. 1st April, 2020
2,189 82,563
Shareholders who approached the Company and to whom shares were transferred during the year
10 201
Transfer from the Unclaimed Suspense Account during the year
10 201
Number of shares transferred to IEPF Authority during the year
168 3,399
Outstanding at the end of the year i.e. 31st March, 2021
2,011 78,963
Note: Voting rights on the above equity shares shall remain frozen till the rightful owners claim the shares.
15. Transfer of Unclaimed Equity Shares to Investor Education and Protection Fund (“IEPF”) Account:
The Company had issued individual notices to all shareholders who have not claimed dividend for the last seven consecutive years. Further, notices were also published in newspapers on 30th May, 2020. The Company has transferred ` 1,30,15,953 to the IEPF being the unclaimed / unpaid dividend for financial year 2012-13 during the year.
Further, in terms of the provisions of the Investor Education and Protection Fund Authority (Accounting, Audit, Transfer and Refund) Rules, 2016 (“IEPF Rules”), the Company has already transferred 50,648 equity shares pertaining to the financial year 2012-13 to the IEPF Suspense Account after providing necessary intimations to the relevant shareholders.
In terms of the provisions of Section 124(5) of the Companies Act, 2013 (“Act”), dividend for the financial year 2013-14 and the dividends for the subsequent financial years, which remain unpaid or unclaimed for a period of seven years will be transferred to the IEPF.
As required in terms of the Secretarial Standard on Dividend (SS-3), details of unpaid dividend account and due dates of transfer to the IEPF is given below:
Sr No
Financial Year Due date of transfer to IEPF
Amount(` in crores)
1 2013-2014 11th September, 2021 1.40
2 2014-2015 3rd October, 2022 1.40
3 2015-2016 25th August, 2023 1.68
4 2016-2017 2nd September, 2024 1.77
5 2017-2018 24th August, 2025 1.45
6 2018-2019 24th August, 2026 1.39
7 2019-2020 18th September, 2027 1.49
Total 10.58
Shareholders, who have so far not encashed their dividend relating to the financial year 2013-14 are requested to do so by 31st July, 2021. Shareholders can write to the Secretarial Department of the Company at [email protected] or write to the RTA at the address given below.
Details of unpaid / unclaimed dividend and equity shares for the financial year 2012–13 are uploaded on the website of the Company as well as that of the Ministry of Corporate Affairs, Government of India (“MCA”). No claim shall lie against the Company in respect of unclaimed dividend amount and equity shares transferred to the IEPF and IEPF Suspense Account, respectively, pursuant to the IEPF Rules. Shareholders can however claim both the unclaimed dividend amount and the equity shares from the IEPF Authority by making applications in the manner provided in the IEPF Rules.

138
Ult
raTe
ch C
emen
t Li
mit
ed
139
Ann
ual R
epo
rt 2
020-
21
Welcome to UltraTech
Value Creation
Growth Enablers
Statutory Reports
Financial Statements
ESG Commitments
16. Plant Locations:
Integrated Units:
Aditya Cement Works Andhra Pradesh Cement Works Awarpur Cement Works
Adityapuram,Sawa – Shambhupura Road,District: Chittorgarh,Rajasthan – 312 622
Bhogasamudram,Tadipatri Mandal,District: Anantapur,Andhra Pradesh – 515 413
P.O. Awarpur,Taluka: Korpana,District: Chandrapur,Maharashtra – 442 917
Baga Cement Works Baikunth Cement Works Balaji Cement Works
Village Baga, P.O. Kandhar,Tehsil Arki, District: Solan,Himachal Pradesh – 171 102
P.O. BaikunthDistrict: Raipur,Chhattisgarh - 493 116
Survey No. 99,Vill. + Post BudawadaMandal - Jaggaiahpet,District: Krishna,Andhra Pradesh – 521 175
Bela Cement Works Dalla Cement Works Dhar Cement Works
Jaypee PuramP.O. Jaypee Puram,District: Rewa,Madhya Pradesh – 486 450
SH-5, Kota,Post: Dalla,District: Sonebhadra,Uttar Pradesh – 231 207
Village: Tonki;Tehsil: Manawar,District: Dhar,Madhya Pradesh – 454 446
Gujarat Cement Works Hirmi Cement Works Jafrabad Cement Works
P.O. Kovaya,Taluka: Rajula,District: Amreli,Gujarat – 365 541
Village & Post: HirmiTaluka: Simga,District: Baloda Bazar, Bhatapara,Chhattisgarh – 493 195
P. B. No. 10, Village: Babarkot,Taluka: Jafrabad,District: Amreli,Gujarat – 365 540
Kotpuli Cement Works Maihar Cement Works Manikgarh Cement Works
V & P. O. Mohanpura,Tehsil: Kotputli,District: Jaipur,Rajasthan - 303 108
P. O. Sarla Nagar,Tehsil Maihar,District: Satna,Madhya Pradesh - 485 772
At post Gadchandur,Tehsil : Korpana,District: Chandrapur,Maharashtra - 442 908
Rajashree Cement Works Rawan Cement Works Reddipalayam Cement Works
Adityanagar, Malkhed Road,Taluk: Sedam,District: KalaburagiKarnataka – 585 292
Village: Rawan,PO: Grasim Vihar, Tehsil: Simga,District: Baloda Bazar–Bhatapara, Chhattisgarh - 493 196
Reddipalayam P.O.District: Ariyalur,Tamil Nadu – 621 704
Sewagram Cement Works Sidhi Cement Works Vikram Cement Works
Village: Vayor, Taluka Abdasa,District: Kutch,Gujarat – 370 511
Aditya Vihar, Majhigawan,P.O. Bharatpur,Tehsil – Rampur Naikin,Sidhi, Madhya Pradesh – 486 776
Vikram Nagar, P.O. Khor,Tehsil - Jawad,District: Neemuch,Madhya Pradesh – 458 470
Shareholder Information (Contd.) Grinding Units:
Aligarh Cement Works Arakkonam Cement Works Bagheri Cement Works
Village: Kasimpur,Tehsil: Koel, District: Aligarh,Uttar Pradesh – 202 127
Chitteri post,Arakkonam, District: Vellore,Tamil Nadu – 631 003
Village - Pandiyana, P.O.- Khillian,Tehsil Nalagarh, Solan,Himachal Pradesh – 174 101
Bara Cement Works Bathinda Cement Works Dadri Cement Works
Village : Lohgara,Tahsil : Bara,District : PrayagrajUttar Pradesh - 212 107
Behind G.H.T.P.Lehra Mohabbat,Tehsil – Rampuraphul,District: Bathinda,Punjab - 151 111
Village: Ranuali,Latiffpur, Post Vidyutnagar,Tehsil: Dadri,District: Gautambudh Nagar,Uttar Pradesh – 201 008
Dankuni Cement Works Ginigera Cement Works Hotgi Cement Works
JL-80, Village: Panchghara,P.O.: Panchghara Bazar,PS: Chanditala,District: Hooghly,West Bengal – 712 306
Gangavathi Road,Ginigera,District: Koppal,Karnataka – 583 228
Village/ Post: Hotgi Station,South Solapur,District: Solapur,Maharashtra – 413 215
Jhajjar Cement Works Jharsuguda Cement Works Magdalla Cement Works
Village: Jharli,Tehsil: Matanhail,District: Jhajjar,Haryana – 124 106
Near Dhutra Railway Station,P.O. Arda,District: Jharsuguda,Odisha – 768 202
Magdalla Port,Dumas Road,Surat,Gujarat – 395 007
Nagpur Cement Works Panipat Cement Works Patliputra Cement Works
Village: Ashti,Navegaon and Tarsa,Tehsil: Mauda, District: Nagpur,Maharashtra – 441 106
Village: Karad,Israna Pardhana Road,Israna, Panipat,Haryana – 132 107
Village: Shajahnapur,Near Sigariyawan Station, Daniyawana Hilsa Road,Patna, Bihar – 801 305.
Ratnagiri Cement Works Roorkee Cement Works Sikandarabad Cement Works
MIDC Indl. Estate,Zadgaon Block,Ratnagiri,Maharashtra – 415 639
Village - Nalheri Dehviran,Tehsil – Roorkee,Post - Nalhera Anantapur,District: Haridwar,Uttarakhand – 247 668
19-20, Industrial Area,Post: Sikandrabad,District: Bulandshahr,Uttar Pradesh – 203 205
Sonar Bangla Cement Works Tanda Cement Works Wanakbori Cement Works
Village-Dhalo, P.O. Gankar Block,Raghunathganj -1,District: Murshidabad,West Bengal - 742227
Post: Hussainpur Sudhana Tanda,District: Ambedkarnagar,Uttar Pradesh – 224 190
Village: Sangol,Post. Sonipur, Taluka: Thasra,District: Kheda,Gujarat – 388 245
West Bengal Cement Works
Near EPIP Plot,P.O. - Rajbandh,Muchipara, Durgapur,West Bengal – 713 212

140
Ult
raTe
ch C
emen
t Li
mit
ed
141
Ann
ual R
epo
rt 2
020-
21
Welcome to UltraTech
Value Creation
Growth Enablers
Statutory Reports
Financial Statements
ESG Commitments
Bulk Terminals:
Birla Super Bulk Terminal Cochin Bulk Terminal Mangalore Bulk Terminal
Near Railway StationVeerapura, Doddaballapur,District: Bengaluru,Karnataka – 561 163
Survey No. 2578 / 4Indira Gandhi Road,Willingdon Island, Kochi,Kerala – 682 003
Post Box No. 17Beach Road,Panambur, Mangaluru,Karnataka – 575 010
Navi Mumbai Bulk Terminal Pune Bulk Terminal Shankarpalli Bulk Terminal
Sector-1, Dronagiri Indl. Area Uran,Navi Mumbai,Maharashtra – 400 707
Tah-Haveli,Village: Peth Naygaon,District: Pune,Maharashtra – 412 110
Village: Fathepur,Shankarpalli Mandal,District: Rangareddy,Telangana – 501 203
White Cement:
Birla White Birla White Unit: Katni Birla White Unit: GRC
Birla White Rajashree Nagar,P.O. Kharia Khangar,Tehsil: Bhopalgarh,District: Jodhpur,Rajasthan – 342 606
Village: Pati – Jharela,Post: Bijori,Tehsil: Badwara,District: Katni,Madhya Pradesh – 483 773
Plot No.14,GIDC Estate Village: Manjusar,Taluka: Savli,District: Vadodara,Gujarat – 391 775
17. Other Useful Information for Shareholders:
Rights and Restrictions attached to Shares The Company has only one class of equity shares
having face value of ` 10 each. The holder of the equity share is entitled to dividend right and voting right in the same proportion as the capital paid-up on such equity share bears to the total paid-up equity share capital of the Company.
Unpaid / Unclaimed Dividend Warrants Dividend warrants in respect of the dividend declared
in August, 2020 have been despatched to the shareholders at the addresses registered with the Company. Those shareholders who have not yet received the dividend warrants may please write to the Company or its RTA for further information in this behalf. Shareholders who have not encashed the warrants are requested to do so by getting them revalidated from the Registered Office of the Company or its RTA.
Payment of dividend Keeping in mind the interest of its shareholders
including speedy credit of dividend, the Company provides the facility for direct credit of dividend to the shareholders’ bank account. Shareholders are therefore urged to avail the facility of electronic transfer of dividend into their bank accounts, by updating their
bank account details, if not done already, with the Company or the Depository Participant (“DP”), as the case, may be. Where the Company is unable to pay the dividend to any shareholder by electronic mode, due to non-availability of the details of the shareholders’ bank account, the Company will dispatch the dividend warrant to such shareholders by post.
Shareholders may also note that the Income Tax Act, 1961 amended by the Finance Act, 2020, mandates that dividend paid or distributed by a Company on or after 1st April, 2020 shall be taxable in the hands of the shareholders. The Company will deduct tax at source, wherever applicable, at the applicable rates at the time of making the payment of dividend.
Non-Resident Shareholders Non-resident Indian shareholders are requested to
immediately inform the Company / RTA, if shares are held in physical mode or to their DP, if the holding is in electronic mode, regarding change in the residential status on return to India for permanent settlement and/or the particulars of the NRE account with a bank in India, if not furnished earlier.
Nomination As per the provision of Section 72 of the Act, facility
for making nomination(s) is available to individuals
Shareholder Information (Contd.) holding shares in the Company. Shareholders holding shares in physical form may obtain the nomination form from the Company’s website. Shareholders holding shares in demat mode should file their nomination with their DPs for availing this facility.
Update contact details Shareholders are requested to update changes, if any, pertaining to their name, postal address, e-mail address,
telephone / mobile numbers, with necessary documentary evidence, to the Company / RTA, if shares are held in physical mode or to their DP, if the holding is in electronic mode.
Shareholders Handbook A shareholders handbook is available on the website of the Company www.ultratechcement.com. Shareholders
who are keen to know the procedures relating to dematerialisation, rematerialisation, dividend, IEPF, duplicate share certificates, transmission of shares, unclaimed suspense account, nomination can go through the handbook.
Redressal agencies for shareholdersMinistry of Corporate Affairs (MCA) Securities and Exchange Board of India (SEBI)‘A’ Wing, Shastri Bhawan,Rajendra Prasad Road,New Delhi – 110 001Tel.: (011) 23381295Web: www.mca.gov.in
Plot No.C4-A, ‘G’ Block,Bandra Kurla Complex,Bandra (East), Mumbai – 400 051Tel.: (022) 26449000 / 40459000Fax: (022) 26449019 - 22Web: www.sebi.gov.in
BSE Limited (BSE) National Stock Exchange of India Limited (NSE)Phiroze Jeejeebhoy Towers,Dalal Street,Mumbai – 400 001Tel.: (022) 22721233 / 34Fax: (022) 22721919Web: www.bseindia.com
“Exchange Plaza”, Plot No. C-1,Block G, Bandra-Kurla Complex,Bandra (East), Mumbai – 400 051Tel.: (022) 26598100 - 8114Fax: (022) 26598120Web: www.nseindia.com
National Securities Depository Limited (NSDL) Central Depository Services (India) Limited (CDSL)Trade World, ‘A’ Wing, 4th Floor,Kamala Mills Compound,Lower Parel, Mumbai – 400 013Tel.: (022) 24994200Toll Free No.: 1800 1020 990 / 1800 224 430Web: www.nsdl.co.in
Marathon Futurex, A-Wing, 25th Floor,N. M. Joshi Marg,Lower Parel, Mumbai – 400 013Tel.: (022) 2305 8640Web: www.cdslindia.com
18. Correspondence with the Company:
Shareholders / Beneficial Owners are requested to quote their Folio Number / DP & Client ID Numbers as the case may be, in all correspondence with the Company. All correspondence regarding equity shares and NCDs of the Company should be addressed to the Company or its RTA at the addresses mentioned below :
Registered Office Registrar & Share Transfer Agent
UltraTech Cement Limited‘B’ Wing, Ahura Centre, 2nd Floor,Mahakali Caves Road,Andheri (East), Mumbai – 400 093.Tel: (022) 6691 7800 / 2926 7800Fax: (022) 6692 8109Website: www.ultratechcement.comEmail: [email protected];[email protected] Person: Ms. Swati Patil
KFin Technologies Private LimitedSelenium Tower B,Plot Nos. 31 & 32,Financial District, Nanakramguda,Serilingampally Mandal, Hyderabad – 500 032.Toll Free No. 1800 309 4001Website: www.kfintech.comEmail:[email protected];[email protected] Person: Mr. Satish Poojary
Email for investor correspondence under SEBI requirements: [email protected]

142
Ult
raTe
ch C
emen
t Li
mit
ed
143
Ann
ual R
epo
rt 2
020-
21
Welcome to UltraTech
Value Creation
Growth Enablers
Statutory Reports
Financial Statements
ESG Commitments
Social Report
“India’s COVID case load has been the highest. We are all collectively struggling, to stem this extremely challenging,
and huge calamity. The Government, NGOs, corporates and other key stakeholders, have coalesced to bring COVID
relief measures. Even at the cost of being repetitive, let us acknowledge our nation’s doctors, medical and paramedical
workers. They have and continue, to go beyond the line of duty, to bring succor to the COVID afflicted. Our population
and the size of our country is beyond comparison. Enormous challenges confront us. We can overcome them with a
strong sense of solidarity.
I would like to apprise you of the various initiatives we have taken through multiple channels. I will focus on the relief
measures executed by us at FICCI Aditya Birla CSR Centre for Excellence. We took cognizance, of the immediate
needs that were COVID driven. First and foremost, was the need to address the problem of getting food for the
marginalised. We worked with ISKCON, and distributed cooked meals, for lunch and supper in Delhi, Mumbai, and
Noida. We reached out to thousands of families. Likewise, we distributed ration kits, in partnership with Goonj,
to thousands of families in 11 states. We arranged for 90,000 PPE kits, for frontline health workers in six states.
COVID-19 is also a livelihood disaster. More so for the informal sector workers, migrants, small land holding farmers,
returnee migrants, villages youths and tribal women. So, with the Nudge Foundation, we launched a 3-year project,
themed on “Creating Resilient Communities” in Odisha, West Bengal, Delhi NCR, Uttar Pradesh, Jharkhand,
Karnataka and Maharashtra. We have impacted 4 lakh families.
If you recall we had already shared with you the immediate COVID steps taken after the outbreak of the pandemic.
Besides contributing over ` 500 crores, we tried to address related issues at every level. Here is an update:
• Providing 5,000 jumbo cylinders pan India.
• We have ordered 36 oxygen Pressure Swing Adsorption (“PSA”) plants. Of these, six PSA plants have been
delivered (Gujarat and eastern UP). These plants produce a liter of oxygen every 60 seconds and are integral to
meet the oxygen shortage.
• Additionally, 2,000 oxygen concentrators, based on the Hub & Spoke model have been instituted in the major
state capitals, which then pan out to the smaller towns.
• 1,000 oxygen concentrators supplied by Novelis, distributed to hospitals and communities.
• In addition, liquid oxygen plants are on stream across the nation at our plant sites. To give you a feel, the Birla
Copper Plant in Dahej, has been supplying 25 tonnes of liquid oxygen day in and day out to bridge the gap.
Up until now 1,600 tonnes of liquid oxygen has been supplied to the Gujarat Government.
• We are importing cryogenic tanks.
• Furthermore, specially designed 40 mobile cardiac ambulances are in service all over the country.
• More than 500 beds have been earmarked across locations.
• Proactive engagements with local communities, and other stakeholders, is an ongoing activity.
• Over a million triple layer surgical masks, have been distributed, along with personal protective equipment.
• To reinforce COVID prevention messages, such as using mask, social distancing, and sanitising, are unending.
Your Company has contributed significantly to this humongous effort supporting - oxygen concentrators, PSA
plants, liquid oxygen and more. A gist of UltraTech’s endeavours apart from the initiatives cited above:
• 9 COVID treatment / quarantine centers with equipped 296 beds.
• 628 oxygen cylinders.
• 90 oxygen concentrators.
• 4 oxygen plants at Dhar, Neemuch, Nathdwara and Maihar.
• 3,000 antigen kits.
• 25 fully equipped ambulances in a state of readiness at locations pan India.
• More than 1,900 awareness camps in 300 villages.
• 2,11,140 masks.
• 41,000 hand sanitisers and hand wash supported to the people.
• Sprayed 2,800 liters of sodium hypochlorite.
• 4,28,538 food packets to migrants. Additionally, nutrients such as protein powder were given.
• 805 PPE kits to health / frontline workers.
• 3 ventilators (Chandrapur and Siddhi), machine for Blood Cell Counts.
• Drinking water support. Reverse Osmosis machines at the local hospitals in Dhar.
• Remdesvir injections.
Consequent to the extended lockdowns, our ground level activities in the 507 villages which service over a million
people were constrained. Still good work is done. The spotlight continues to be on education, healthcare, sustainable
livelihood, infrastructure development and social reform, in sync with the major United Nations Sustainable
Development Goals (“SDG”) goals.
Mrs. Rajashree Birla
Chairperson,
Aditya Birla Centre for Community Initiatives and Rural Development
Chairperson, UltraTech Corporate Social Responsibility Board
A summary of our work:
SDG-1: To rid poverty across all nations by 2030
This has been our unrelenting battle for decades. Your
Company is engaged in 16 states where our CSR work has
made a difference. The percentage of Below Poverty Line
(“BPL”) families has dropped significantly.
SDG-2: To end all forms of hunger and malnutrition by 2030
Your Company has a holistic developmental model that
addresses this issue. Sustainable agriculture, supporting
particularly small-scale farmers with access to land,
technology and markets are our major themes. Your
Company leverages Government Schemes and the
services rendered by the District Authorities, including
Collectors and Block Development Officers. Your
Company has made reasonable progress. Nevertheless,
your Company had to reset its target, extending it to
5% (3%) in the next 5 years.
Water positivity
Water positivity is one of the most important tasks
before us. Your Company subscribes to the Watershed
Management processes in Dhar (Madhya Pradesh),
Malkhed (Karnataka), Tadipatri (Andhra Pradesh) and Baga
(Himachal Pradesh). Your Company has collaborated with
National Bank for Agriculture and Rural Development
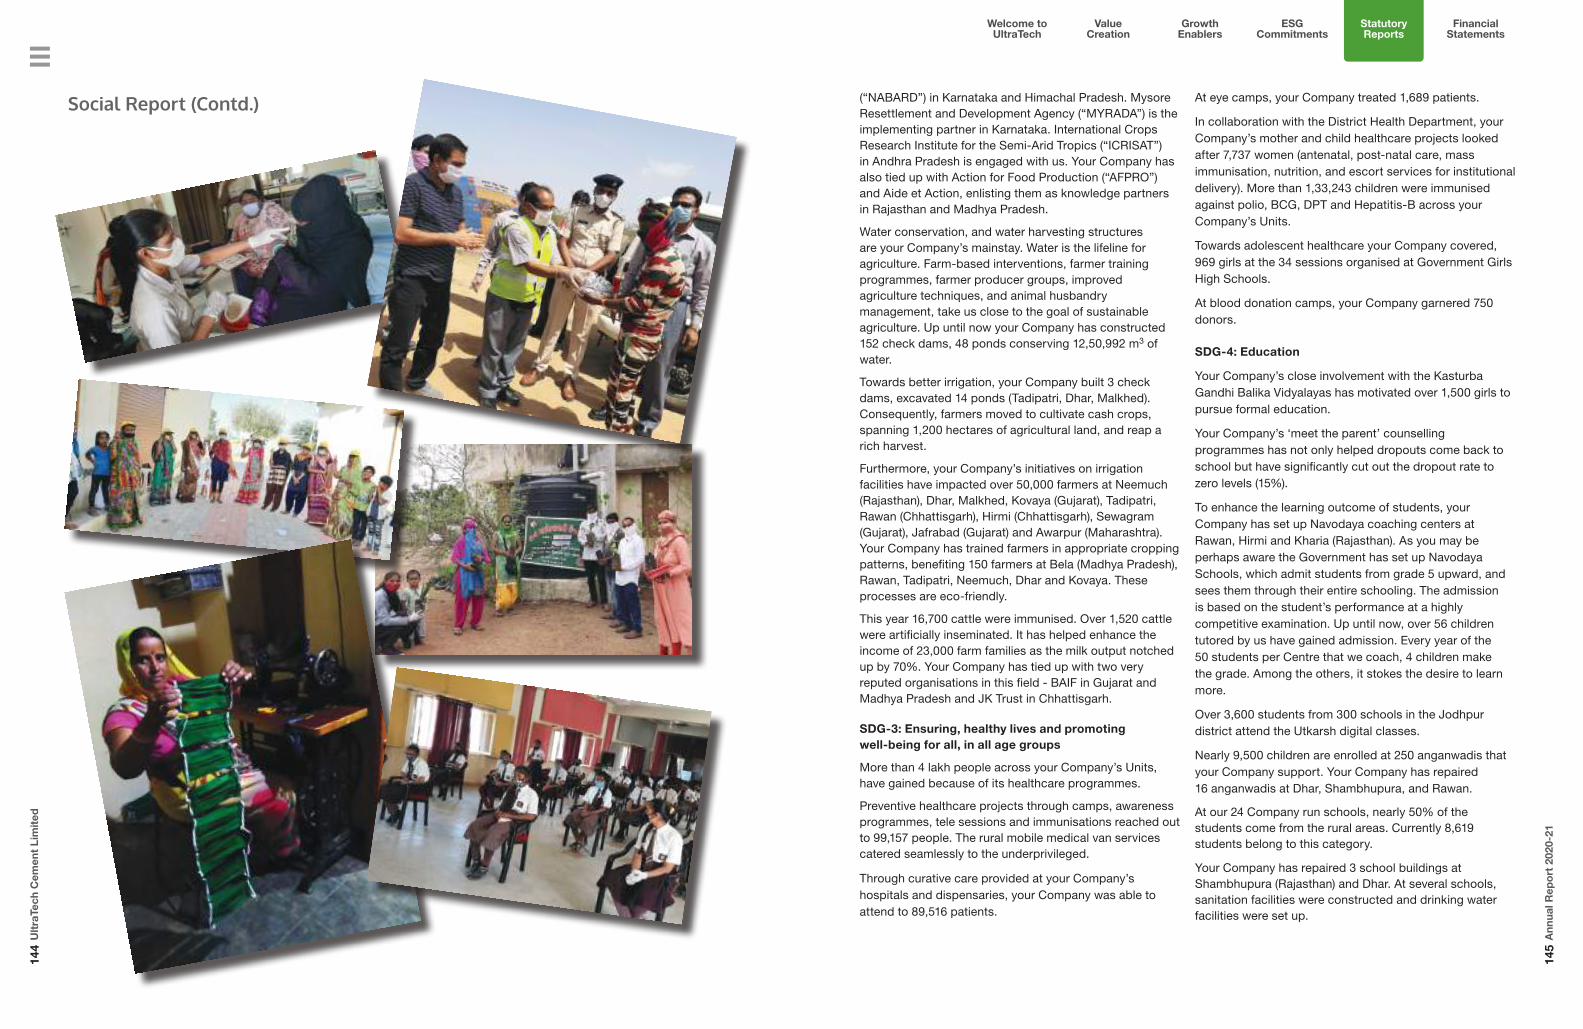
144
Ult
raTe
ch C
emen
t Li
mit
ed
145
Ann
ual R
epo
rt 2
020-
21
Welcome to UltraTech
Value Creation
Growth Enablers
Statutory Reports
Financial Statements
ESG Commitments
(“NABARD”) in Karnataka and Himachal Pradesh. Mysore Resettlement and Development Agency (“MYRADA”) is the implementing partner in Karnataka. International Crops Research Institute for the Semi-Arid Tropics (“ICRISAT”) in Andhra Pradesh is engaged with us. Your Company has also tied up with Action for Food Production (“AFPRO”) and Aide et Action, enlisting them as knowledge partners in Rajasthan and Madhya Pradesh.
Water conservation, and water harvesting structures are your Company’s mainstay. Water is the lifeline for agriculture. Farm-based interventions, farmer training programmes, farmer producer groups, improved agriculture techniques, and animal husbandry management, take us close to the goal of sustainable agriculture. Up until now your Company has constructed 152 check dams, 48 ponds conserving 12,50,992 m3 of water.
Towards better irrigation, your Company built 3 check dams, excavated 14 ponds (Tadipatri, Dhar, Malkhed). Consequently, farmers moved to cultivate cash crops, spanning 1,200 hectares of agricultural land, and reap a rich harvest.
Furthermore, your Company’s initiatives on irrigation facilities have impacted over 50,000 farmers at Neemuch (Rajasthan), Dhar, Malkhed, Kovaya (Gujarat), Tadipatri, Rawan (Chhattisgarh), Hirmi (Chhattisgarh), Sewagram (Gujarat), Jafrabad (Gujarat) and Awarpur (Maharashtra). Your Company has trained farmers in appropriate cropping patterns, benefiting 150 farmers at Bela (Madhya Pradesh), Rawan, Tadipatri, Neemuch, Dhar and Kovaya. These processes are eco-friendly.
This year 16,700 cattle were immunised. Over 1,520 cattle were artificially inseminated. It has helped enhance the income of 23,000 farm families as the milk output notched up by 70%. Your Company has tied up with two very reputed organisations in this field - BAIF in Gujarat and Madhya Pradesh and JK Trust in Chhattisgarh.
SDG-3: Ensuring, healthy lives and promoting well-being for all, in all age groups
More than 4 lakh people across your Company’s Units, have gained because of its healthcare programmes.
Preventive healthcare projects through camps, awareness programmes, tele sessions and immunisations reached out to 99,157 people. The rural mobile medical van services catered seamlessly to the underprivileged.
Through curative care provided at your Company’s hospitals and dispensaries, your Company was able to attend to 89,516 patients.
At eye camps, your Company treated 1,689 patients.
In collaboration with the District Health Department, your Company’s mother and child healthcare projects looked after 7,737 women (antenatal, post-natal care, mass immunisation, nutrition, and escort services for institutional delivery). More than 1,33,243 children were immunised against polio, BCG, DPT and Hepatitis-B across your Company’s Units.
Towards adolescent healthcare your Company covered, 969 girls at the 34 sessions organised at Government Girls High Schools.
At blood donation camps, your Company garnered 750 donors.
SDG-4: Education
Your Company’s close involvement with the Kasturba Gandhi Balika Vidyalayas has motivated over 1,500 girls to pursue formal education.
Your Company’s ‘meet the parent’ counselling programmes has not only helped dropouts come back to school but have significantly cut out the dropout rate to zero levels (15%).
To enhance the learning outcome of students, your Company has set up Navodaya coaching centers at Rawan, Hirmi and Kharia (Rajasthan). As you may be perhaps aware the Government has set up Navodaya Schools, which admit students from grade 5 upward, and sees them through their entire schooling. The admission is based on the student’s performance at a highly competitive examination. Up until now, over 56 children tutored by us have gained admission. Every year of the 50 students per Centre that we coach, 4 children make the grade. Among the others, it stokes the desire to learn more.
Over 3,600 students from 300 schools in the Jodhpur district attend the Utkarsh digital classes.
Nearly 9,500 children are enrolled at 250 anganwadis that your Company support. Your Company has repaired 16 anganwadis at Dhar, Shambhupura, and Rawan.
At our 24 Company run schools, nearly 50% of the students come from the rural areas. Currently 8,619 students belong to this category.
Your Company has repaired 3 school buildings at Shambhupura (Rajasthan) and Dhar. At several schools, sanitation facilities were constructed and drinking water facilities were set up.
Social Report (Contd.)

146
Ult
raTe
ch C
emen
t Li
mit
ed
147
Ann
ual R
epo
rt 2
020-
21
Welcome to UltraTech
Value Creation
Growth Enablers
Statutory Reports
Financial Statements
ESG Commitments
Sustainability and Business Responsibility Report
Building Sustainable Businesses at the Aditya Birla Group: At the Aditya Birla Group (“Group”), we endeavour
to become the leading Indian conglomerate for sustainable
business practices across our global operations. We define
a “Sustainable Business” as one that can continue to
survive and thrive within the growing needs and tightening
legal and resource constraints of a “Sustainable World”.
We believe that this means that as we go forward towards
the constrained operating environments of 2030 and
2050 that for a continued “Sustainable World”, it can
increasingly only contain “Sustainable Businesses”. To
achieve our Group vision, we are innovating away from the
traditional sustainability models to one consistent with our
vision to build sustainable businesses capable of operating
in the next three decades. It is in our own interests to
mitigate our own impact in every way we can as this is a
direct assistance to creating a sustainable planet. It also
prepares us for further mitigation and the need to adapt to
a world that is aligned to below 1.5° C scenario in line with
the Paris Agreement.
We began our quest with the question, “If everyone and
every business followed the law as written today, is the
planet sustainable.” We quickly concluded that around
the year 2050, when the Earth’s population reaches
an estimated 9 billion, climate change, water scarcity,
pollution, biodiversity loss and an overload of waste,
if left unchecked, would set the planet on a possibly
irreversible unsustainable course. It is therefore intuitive
that leaders must find ways to transform industries such
that international bodies can codify and governments
can legislate over time to reduce the damage and it is
imperative that the Group remains ahead of the curve.
The first step of our programme to build sustainable
businesses is focused on increasing the capability of our
business management systems. Under this programme
called “Responsible Stewardship” we try to move
from merely complying with current legal standards to
conforming to the international standards set by the global
bodies of the International Finance Corporation (“IFC”), the
Organisation for Economic Co-operation and Development
(“OECD”), the International Standards Organisation
(“ISO”), Occupational Health and Safety Advisory Services
(“OHSAS”), the Global Reporting Initiative (“GRI”), the
Forestry Stewardship Council and others. To support our
businesses in this endeavour, we have created the Group’s
Sustainable Business Framework of Policies, Technical
Standards, and Guidance Notes to give our leaders,
managers, employees and contract employees the chance
to train, learn, understand, and apply improvement
techniques to help our businesses reach higher standards
of performance. Our Group Sustainable Business
Framework is currently certified to 14 international
standards (http://sustainability.adityabirla.com/). So far,
we have had much success with respect to reductions in
accidents, energy use, water use, and have implemented
our first Biodiversity plans. Our programme to achieve the
World Business Council for Sustainable Development’s
Water and Sanitation and Hygiene pledge (“WASH”) to
ensure that we provide safe drinking water, sanitation and
hygiene in all our operations has resulted in our building
over 600 new bathrooms, many for women and differently
abled people. Each of these achievements helps reduce
and mitigate our impact on the planet and are imperative
to building the sustainable business platform for our future.
If we are to create fully sustainable business models and
systems for the future then “Responsible Stewardship” by
itself is not enough. We need other components to help us
with a greater transformation. We need to understand the
global mega-trends and their effect on us; geographically,
physically, technologically and how the legal system
(including regulations and tax) will need to change in
order to motivate business to create a sustainable world.
Our performance will need to be improved further to
meet the changes needed to mitigate and adapt to these
External Factors. By talking to our Strategic Stakeholders
knowledgeable in these issues, we can scan the horizon to
better understand their likely risk to our business. With this
information, we enhance our business models, strategies
and risk profiles in order to “Future Proof” them and
our value chains in the medium to long term. Since only
“Sustainable” business can exist in a Sustainable World
then a Sustainable Value Chain can also only contain these
businesses and so it becomes imperative to map our value
chains to look for vulnerabilities. Our goal is to create not
only Sustainable Businesses but also Sustainable Value
Chains of which we can be a key member. We are helping
our leaders to understand which external changes might
heavily influence our value chains and business models
in the future and what might be expected of our products
Remedial classes, and special coaching classes reached out to 986 students in Kharia, Hirmi, Awarpur and Malkhed.
SDG-5: Women empowerment and gender equality
Your Company’s 840 self-help groups comprising of 8,000 women enthusiasts has all been transformed into competent and confident women, engaged in meaningful work that earns them a livelihood.
Your Company is working to broaden the base and provide the last mile linkage. In many locations the SHGs compete to become successful vendors and graduate to taking orders from the industry.
A special mention must be made of the ‘Ulhas Utsav’ at Awarpur. This is a competitive sports event of women, by women, and for women. Most of the rural families from Awarpur, the District Officials, and our teams are their cheerleaders. The joy and the camaraderie are perceptible, as they shatter the myth that women do not wear pants in the villages. Meritocracy is celebrated and the change is evident. The programme could not be organised this year due to the pandemic like situation, but your Company is hopeful things will improve and the process would be replicated with great vigor.
Overall, your Company reached out to 3,67,320 people through the initiatives in the domains cited.
The sixth, seventh and eighth SDGs, centre on water and sanitation, reliable, sustainable, modern energy, decent work and economic growth.
Towards providing accessibility to safe drinking water, up until now we have installed 29 Reverse Osmosis (“RO”) plants. This year your Company helped in resolving maintenance issues. Furthermore, your Company set up 2 solar based and 7 gravity-based drinking water systems, installed 24 and repaired 21 handpumps. Pipelines and borewells provide access to water, benefiting more than 85,000 villagers.
Imparting vocational training, skills training, coupled with our farm / non-farm-based programmes and SHGs, meet with these goals. Collectively your Company has touched the lives of nearly 6,347 people.
The thrust continues to be on computer literacy, training in repair of electric and electronic goods, handicrafts, bag making, beautician, tailoring and knitting. Ways to enhance agricultural output and veterinary services drew 122 aspirants.
SDG-9: Build resilient infrastructure
Your Company’s infrastructure projects: connectivity, road repairs, community halls and assets, rest places, installation of solar lights, construction of water tanks and installation of piped water supply, have bettered the lives of 278,012 people.
Finally, on Model Villages. Of the 507 villages in your Company’s CSR projects, 100 villages have been earmarked for a transformative process. Up until now, 44 villages have made the cut. Impact assessment studies are generally carried out by external agencies which certify and commend the transformation of these villages.
Accolades / Awards received:
The output of your Company’s commitment to CSR is assuring. Evident from the several accolades conferred upon us. A gist:
- The Mother Teresa Corporate Citizenship Award by The Loyola Institute of Business Administration, Chennai;
- Mahatma Gandhi Award for Corporate Social Responsibility and Sustainability by the CSR Live Week;
- Social Impact Award from Indian Chamber of Commerce Kolkata for the Project – Health for all to Birla White;
- Bhamashah Award by Government of Rajasthan for Education Projects to Birla White and Kotputli Cement Works;
- Fame India’s Fame Excellence Gold Award 2020 for Excellence in Education to Sewagram Cement Works;
- FICCI Certificate of Commendation for CSR initiatives to Vikram Cement Works;
- National CSR Award by the Global Safety Summit to Siddhi Cement Works.
CSR spends
This year, your Company invested ` 120.68 crores. In addition, your Company mobilised over ` 38.22 crores through Government Schemes.
Your Company has come this far because of the unflinching support of your Company’s Chairman, Board of Directors, Management, leadership teams, CSR team and each and every colleague from your Company. All of them are a source of constant stimulation to aim even higher.
Social Report (Contd.)

148
Ult
raTe
ch C
emen
t Li
mit
ed
149
Ann
ual R
epo
rt 2
020-
21
Welcome to UltraTech
Value Creation
Growth Enablers
Statutory Reports
Financial Statements
ESG Commitments
and brands. For example, the world will need businesses that are able to mitigate and adapt to climate change, with robust and sustainable supply chains that are also impervious to all external forces that will inevitably begin to affect us in the future. To build sustainable businesses will take time, particularly when we consider some of our very complex value chains but by pushing to be a leader today, we are giving our businesses the best possible chance of achieving long-term success not only for ourselves but also for our value chains and hence for our planet.
It has always been the Company’s endeavour to enhance its environment conservation measures, continue to be profitable and sensitive towards societal wellbeing. The Company has been consistently adopting new technologies that are cleaner and greener. The Company’s plants and processes are constantly driven to become more energy efficient, given its quest to become better stewards of natural resources. With its thrust on the use of alternative fuels, the Company has been relentlessly striving to reduce consumption of fossil fuels by substituting these with wastes from other industries. These efforts have resulted in around 3.1% of the Company’s fuel requirements being met through the use of alternative fuels. The Company has reinforced its commitments and has taken further strides towards being a more sustainable business. The Company continues to scale up its contribution to the circular economy by utilising 20.29 million tonnes of Alternative Raw Material (“ARM”) as part of its production operations. The Company also continues to increase the use of renewable energy as part of its energy mix and has increased the consumption of renewable energy by more than 50% as compared to previous year. It is currently exploring further opportunities for purchase of green power as well as investment in solar and wind generation.
The Company’s carbon dioxide (“CO2”) emissions reduction targets, which were committed in July 2020, have been validated by the Science Based Targets Initiative (“SBTi”). The Company has reduced 6% of Scope 1 CO2 intensity from the base year of 2017 as against the target of 27% reduction by 2032. In energy efficiency, the Company has overachieved the target set by the Government of India for the first Perform, Achieve and Trade (“PAT”) cycle.
As a founding member of the Global Cement and Concrete
Association (“GCCA”), the Company has committed to
the ‘2050 Climate Ambition’, which is the Company’s
commitment to drive down the CO2 footprint of its
operations and products, and the collective aspiration to
deliver society with carbon neutral concrete by 2050. In
FY20, being only the second year of its participation, the
Company’s score on the S&P’s Dow Jones Sustainability
Index (“DJSI”) was 68, reflecting a 15% increase over
that of the previous year. This disclosure has helped the
Company to benchmark itself against the world’s best
companies in sustainability performance and will be using
this to identify opportunities to excel in sustainability
performance.
As part of its continuing initiatives in sustainable growth,
the Company has completed Life Cycle Assessment
(“LCA”) studies for four products. The Company is
amongst few companies to conduct the LCA study and
has used this as input to identify hotspots over the value
chain to reduce environmental impact. The Company has
73 products with GreenPro Certification. This is one of the
largest green product portfolio in building material industry
in India.
This year, the Company became the first company in
India and the second company in Asia to issue dollar-
based sustainability linked bonds. This year, the Company
adopted recommendation of Task Force for Climate
related Financial Disclosure (“TCFD”) and through this
recommendation have integrated the findings into risk
management, business planning and strategy. This year
the Company continued consideration of carbon
US$ 10 per tCO2 which has enabled it to consider the
impact on environment of project / capex in its evaluation
and decision making.
The Company has embarked on digital transformation
during the year that has the potential to decouple
emissions and resource use from economic growth as
well as making its operations safer and more reliable.
The Company launched its Sustainability Culture building
program – ‘Project Jagruti’ and under the program
sustainability awareness sessions were held across more
than 50 manufacturing locations covering over 7,500
employees across our manufacturing vertical.
Section A : General Information about the Company
1. Corporate Identity Number (CIN) of the
Company
L26940MH2000PLC128420
2. Name of the Company UltraTech Cement Limited
3. Registered address B Wing, Ahura Centre, 2nd Floor, Mahakali Caves Road, Andheri (East),
Mumbai 400 093
4. Website www.ultratechcement.com
5. E-mail id [email protected]
6. Financial Year reported 1st April, 2020 to 31st March, 2021
7. Sector(s) that the Company is engaged in
(industrial activity code-wise)Group Class Sub Class Description
239 2394 2394123942
Manufacture of cement
8. List three key products/services that the
Company manufactures/provides
(as in balance sheet)
(i) Ordinary Portland and Portland Pozzolana Cement
(ii) Ready-Mix Concrete
(iii) White Cement and Wall Care Putty
9. Total number of locations where business
activity is undertaken by the Company
i. Number of International Locations (Provide details of major 5):
• United Arab Emirates
• Sri Lanka
• Bahrain
ii. Number of National Locations:
22 Integrated Cement Units; 23 Grinding Units; 1 White Cement Unit;
1 Wall Care Putty; 6 Bulk Terminals; over 130 Ready Mix Concrete Units,
Registered Office and Zonal Marketing Offices
10. Markets served by the Company Local State National International
P P P P
Section B: Financial Details of the Company
1. Paid-up Capital (INR) ` 289 crores
2. Total Turnover (INR) ` 42,677 crores
3. Total Profits after taxes (INR) ` 5,342 crores
4. Total Spending on Corporate Social Responsibility (CSR) as percentage of profit after tax (%)
The Company has spent ` 120.68 crores during FY21 which amounts to over 3.3% of the average profit after taxes in the previous three financial years.
5. List of activities in which expenditure in 4 above has been incurred
a. Educationb. Health Carec. Women empowermentd. Sustainable Livelihoode. Infrastructure Developmentf. Social Welfareg. COVID-19
Business Responsibility Report
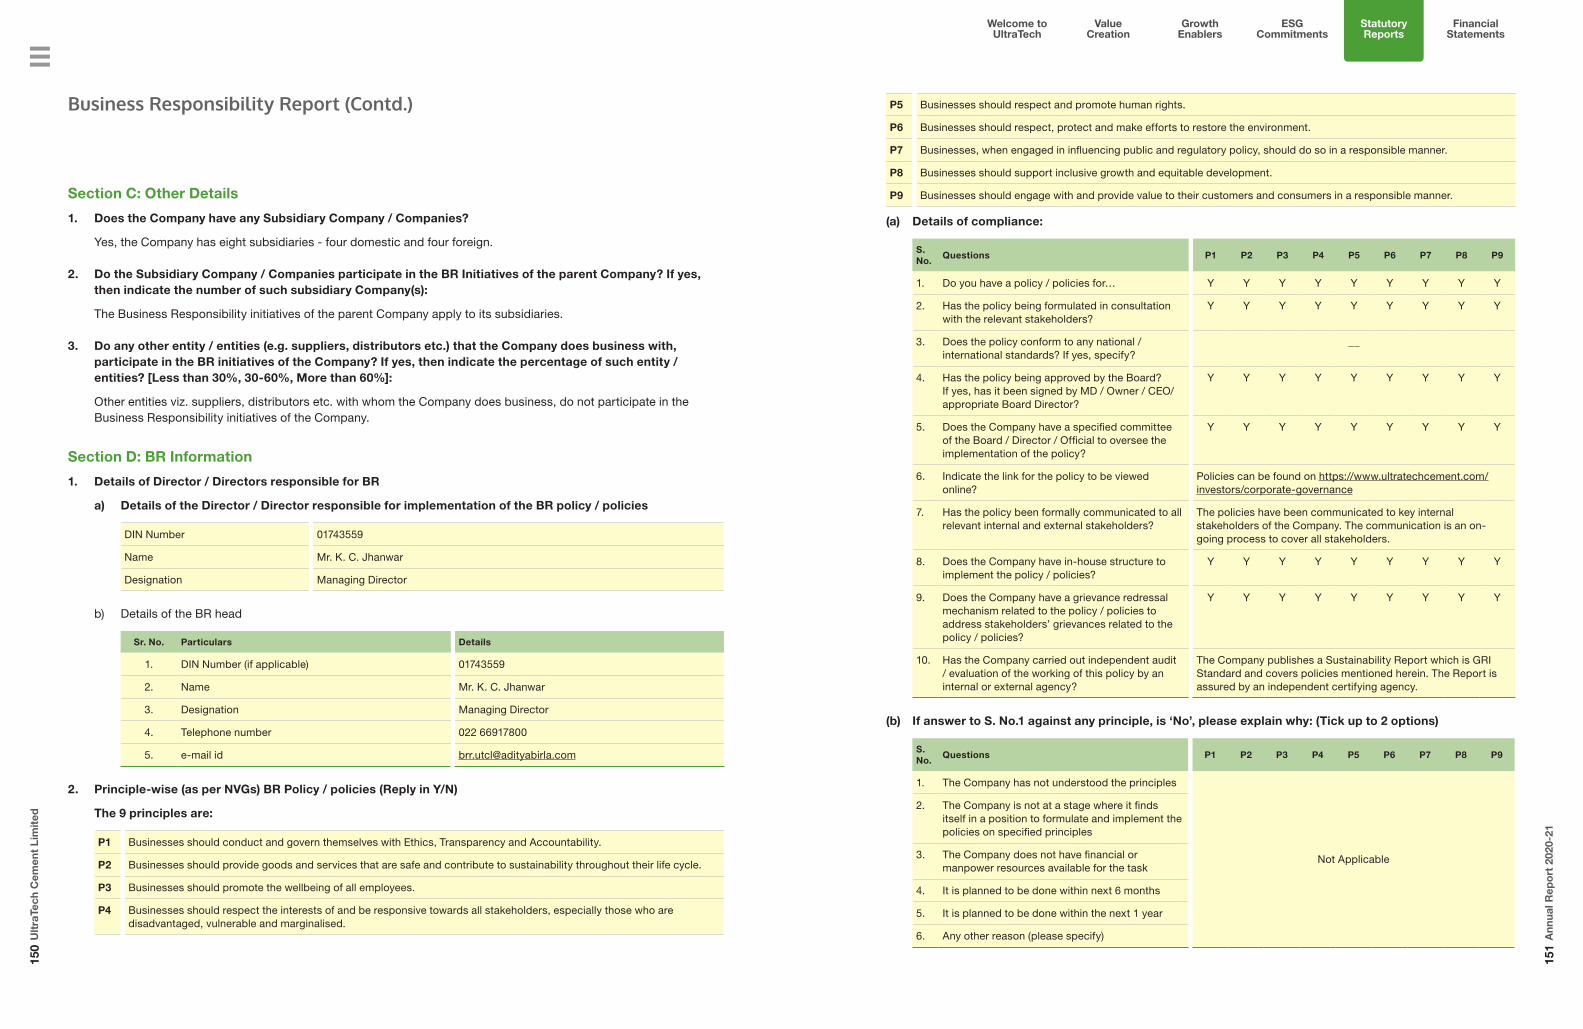
150
Ult
raTe
ch C
emen
t Li
mit
ed
151
Ann
ual R
epo
rt 2
020-
21
Welcome to UltraTech
Value Creation
Growth Enablers
Statutory Reports
Financial Statements
ESG Commitments
Section C: Other Details
1. Does the Company have any Subsidiary Company / Companies?
Yes, the Company has eight subsidiaries - four domestic and four foreign.
2. Do the Subsidiary Company / Companies participate in the BR Initiatives of the parent Company? If yes, then indicate the number of such subsidiary Company(s):
The Business Responsibility initiatives of the parent Company apply to its subsidiaries.
3. Do any other entity / entities (e.g. suppliers, distributors etc.) that the Company does business with, participate in the BR initiatives of the Company? If yes, then indicate the percentage of such entity /entities? [Less than 30%, 30-60%, More than 60%]:
Other entities viz. suppliers, distributors etc. with whom the Company does business, do not participate in the Business Responsibility initiatives of the Company.
Section D: BR Information
1. Details of Director / Directors responsible for BR
a) Details of the Director / Director responsible for implementation of the BR policy / policies
DIN Number 01743559
Name Mr. K. C. Jhanwar
Designation Managing Director
b) Details of the BR head
Sr. No. Particulars Details
1. DIN Number (if applicable) 01743559
2. Name Mr. K. C. Jhanwar
3. Designation Managing Director
4. Telephone number 022 66917800
5. e-mail id [email protected]
2. Principle-wise (as per NVGs) BR Policy / policies (Reply in Y/N)
The 9 principles are:
P1 Businesses should conduct and govern themselves with Ethics, Transparency and Accountability.
P2 Businesses should provide goods and services that are safe and contribute to sustainability throughout their life cycle.
P3 Businesses should promote the wellbeing of all employees.
P4 Businesses should respect the interests of and be responsive towards all stakeholders, especially those who are disadvantaged, vulnerable and marginalised.
P5 Businesses should respect and promote human rights.
P6 Businesses should respect, protect and make efforts to restore the environment.
P7 Businesses, when engaged in influencing public and regulatory policy, should do so in a responsible manner.
P8 Businesses should support inclusive growth and equitable development.
P9 Businesses should engage with and provide value to their customers and consumers in a responsible manner.
(a) Details of compliance:
S. No.
Questions P1 P2 P3 P4 P5 P6 P7 P8 P9
1. Do you have a policy / policies for… Y Y Y Y Y Y Y Y Y
2. Has the policy being formulated in consultation with the relevant stakeholders?
Y Y Y Y Y Y Y Y Y
3. Does the policy conform to any national / international standards? If yes, specify?
__
4. Has the policy being approved by the Board? If yes, has it been signed by MD / Owner / CEO/ appropriate Board Director?
Y Y Y Y Y Y Y Y Y
5. Does the Company have a specified committee of the Board / Director / Official to oversee the implementation of the policy?
Y Y Y Y Y Y Y Y Y
6. Indicate the link for the policy to be viewed online?
Policies can be found on https://www.ultratechcement.com/investors/corporate-governance
7. Has the policy been formally communicated to all relevant internal and external stakeholders?
The policies have been communicated to key internal stakeholders of the Company. The communication is an on-going process to cover all stakeholders.
8. Does the Company have in-house structure to implement the policy / policies?
Y Y Y Y Y Y Y Y Y
9. Does the Company have a grievance redressal mechanism related to the policy / policies to address stakeholders’ grievances related to the policy / policies?
Y Y Y Y Y Y Y Y Y
10. Has the Company carried out independent audit / evaluation of the working of this policy by an internal or external agency?
The Company publishes a Sustainability Report which is GRI Standard and covers policies mentioned herein. The Report is assured by an independent certifying agency.
(b) If answer to S. No.1 against any principle, is ‘No’, please explain why: (Tick up to 2 options)
S. No.
Questions P1 P2 P3 P4 P5 P6 P7 P8 P9
1. The Company has not understood the principles
Not Applicable
2. The Company is not at a stage where it finds itself in a position to formulate and implement the policies on specified principles
3. The Company does not have financial or manpower resources available for the task
4. It is planned to be done within next 6 months
5. It is planned to be done within the next 1 year
6. Any other reason (please specify)
Business Responsibility Report (Contd.)

152
Ult
raTe
ch C
emen
t Li
mit
ed
153
Ann
ual R
epo
rt 2
020-
21
Welcome to UltraTech
Value Creation
Growth Enablers
Statutory Reports
Financial Statements
ESG Commitments
3. Governance related to BR
(a) Indicate the frequency with which the Board of Directors, Committee of the Board or CEO to assess the BR performance of the Company. Within 3 months, 3-6 months, Annually, More than 1 year
The Business Responsibility performance of the Company is assessed periodically by the management.
(b) Does the Company publish a BR or a Sustainability Report? What is the hyperlink for viewing this report? How frequently it is published?
The Company publishes its Sustainability Report annually. The Report is compliant with the international standard – Global Reporting Initiative (“GRI”) Standard. The Report is assured by an independent certifying agency and will be available on the following weblink https://www.ultratechcement.com/about-us/sustainability/sustainability-performance
Section E: Principle-wise performance
Principle 1 – Businesses should conduct and govern themselves with Ethics, Transparency and Accountability
1. Does the policy relating to ethics, bribery and corruption cover only the Company? Yes/ No. Does it extend to the Group / Joint Ventures / Suppliers / Contractors / NGOs / Others?
The Company’s governance structure guides the organisation keeping in mind the core values of Integrity, Commitment, Passion, Seamlessness and Speed. The Corporate Principles and Code of Conduct cover the Company and its subsidiaries and is applicable to all the employees of the Company and its subsidiaries.
2. How many stakeholder complaints have been received in the past financial year and what percentage was satisfactorily resolved by the management? If so, provide details thereof, in about 50 words or so.
No complaints were received during the year.
Principle 2 – Businesses should provide goods and services that are safe and contribute to sustainability throughout their life cycle.
1. List up to 3 of your products or services whose design has incorporated social or environmental concerns, risks and / or opportunities.
The Company is strategically focusing on development of products and services that help customers build sustainable structures which are more durable, resource-efficient, cost-effective, and conducive to human lifestyle. It manufactures a range of products that cater to construction needs from foundation to finish. These include Ordinary Portland Cement (“OPC”), Portland Composite Cement (“PCC”), Portland Pozzolana Cement (“PPC”), Portland Pozzolana Cement Super (“PPCS”), White Cement and White Cement based Products, Ready Mix Concrete including Specialty Concrete, building products like AAC bricks and jointing mortars and a host of others in Retail Formats. It continuously works towards developing products which are greener in nature and less resource intensive.
The cornerstone of the Company’s product stewardship is emphasis on ensuring that the product life-cycle is optimised for efficiency in the use of resources, end-to-end. These efforts are backed with focus on health and safety throughout the manufacturing process. This is ensured through LCA of four types of cement produced - OPC, PCC, PSC, and PPC. The LCA is a methodology for assessment of environmental impact associated at all stages of the product life-cycle, process, or service. Through these, various hotspots are identified in the entire production value chain.
Five cement brands of PPC and PCC have been certified as green products by CII-Green Product and service council. The Company uses waste materials such as fly ash and slag for manufacturing blended cements (PPC, PCC and PPCS), that helps in the substitution of natural resource such as limestone. These products are also less carbon and energy intensive.
The Company is the first commercial Ready-Mix Concrete (“RMC”) manufacturer in India to adopt concrete recycling technology and create the first ‘zero discharge’ concrete plant. More than 50% of raw material from unused concrete is recycled
for making fresh concrete and used back in the process. It is also India’s first concrete Company to meet the requirement of Leadership in Energy and Environmental Design (“LEED”) and other green building rating systems as recognised by the Indian Green Building Council (“IGBC”).
The Company’s Building Products Division (“BPD”) also manufactures number of products which are smarter in nature and help in saving natural resources. Some of these are listed below:
• Super Stucco - a self-curing no water curing plaster.
• Power Grout – a self-curing Industrial grout for anchoring / grouting applications.
• Seal & Dry – water proofing systems which helps in water conservations (arresting leakages) in water storage tanks and canals, thus preserving water.
• Repair mortars and concrete under the name of Basekrete and Microkrete are self- curing (no water curing required) variants, which are used in repair of buildings.
• C’rete Pro - a liquid system for mortar and concrete modifier, which also reduces the water intake into the cement mixes used for preparing mortars, plasters and concrete (10 - 15% water reduction possible).
In addition to the above, other sustainable products such as Xtralite (AAC blocks) and Readiplast also cater to the Company’s customers.
Some of the Company’s BPD products are also listed in the Indian Green Building Council Directory of green products under the category of ‘energy efficiency’ and ‘low emitting materials’. White Cement, Wall Care Putty, Textura & Level Plast have been recognised by IGBC for use in Green Building.
Currently, 73 products have received GreenPro Certification. This is one of the largest green product portfolio in building material industry in India. The Company is focusing on different options to reduce its carbon footprint and other emissions such as replacing traditional fuels with alternative fuels, improving energy efficiency of its products, using clinker additives, implementing Waste Heat Recovery Systems (“WHRS”) wherever possible. This will eventually reflect in lower carbon footprint of its products (OPC, PPC etc).
The Company has also taken initiatives for educating its stakeholders on the sustainable aspects of its
products. The Technical Services Department educates the users of cement like masons and Individual House Builder (“IHB”) on using cement optimally and reducing wastage.
The Company also informs government agencies about the advantages of using cement for mass housing and roads and the benefits of using blended cement. Several seminars have been conducted on concrete roads and white toping to impress on the environmental benefits of switching from bituminous roads.
2. For each such product, provide the following details in respect of resource use (energy, water, raw material etc.) per unit of product (optional):
i. Reduction during sourcing / production / distribution achieved since the previous year throughout the value chain?
The Company has adopted movement towards a circular economy. It has accelerated the adoption of key levers like low clinker products, use of alternative raw materials and fuels, energy efficiency, renewable energy, and WHRS. The Company consumes alternative materials like flyash, chemical gypsum, slag, red mud, among others which help in conserving natural raw materials used for the cement production. A major initiative was the partnership with Hindalco Industries Limited (“Hindalco”) to use red mud, a waste by-product of aluminum manufacturing, in the cement manufacturing process. The Company has found a use for red mud as a replacement for mined minerals such as laterite and lithomarge. It has successfully replaced up to 3% of its clinker raw mix volume thereby reducing its dependence on natural resources. The Company utilises around 1.2 million metric tonnes of red mud annually from Hindalco which will help conserve more than one million tonne of mined natural resources.
Alternative fuels are also used for thermal energy generation which help in the substitution of fossil fuels and allow better management of industrial waste. The use of municipal waste as an alternative fuel and raw material is a big step in the circular economy model. Recycling water, rainwater harvesting and recharging of ground water are standard operating procedures at all manufacturing sites. All the manufacturing locations are zero water discharge.
The Company has taken aggressive efforts in scaling up green energy in its energy mix. It
Business Responsibility Report (Contd.)

154
Ult
raTe
ch C
emen
t Li
mit
ed
155
Ann
ual R
epo
rt 2
020-
21
Welcome to UltraTech
Value Creation
Growth Enablers
Statutory Reports
Financial Statements
ESG Commitments
has made significant investments and tie ups to increase the WHRS and renewable energy over the previous year. There has been a 25% increase in consumption of green energy as compared to the previous year. The Company is committed to increase share of green energy to 34% by FY24.
The Company has joined initiatives like EP100 where the target is to double its energy productivity (revenue / GJ) by 2035, compared to its 2010 baseline. The Company has also adopted tools like SBTi, Internal Carbon Price (“ICP”) to accelerate decarbonisation efforts in line with the Paris Agreement.
ii. Reduction during usage by consumers (energy, water) has been achieved since the previous year?
Cement is one of the key components in building the nation’s infrastructure. These critical infrastructure result in benefits like distance reduction, congestion reduction and related carbon emission savings. The Company’s products deliver carbon emission savings through critical infrastructure projects. For example, the recently commissioned Atal Tunnel is one classic example of critical infrastructure that reduces the environmental impact of the sensitive ecology of the Kashmir valley. The project will benefit society by carbon emission savings of ~ 4.021 million tons of CO2 over its life.
3. Does the company have procedures in place for sustainable sourcing (including transportation)? If yes, what percentage of your inputs was sourced sustainably? Also, provide details thereof, in about 50 words or so.
The Company has commenced a supply-chain sustainability initiative named Project Sahyog, aimed towards achieving environmental and social sustainability across the supply chain through a collaborative and consultative approach. As part of this project, it has developed an Environmental, Social, and Corporate Governance (“ESG”) framework
which shall guide the activities to be undertaken for accomplishing the desired objectives of the project.
Procurement practices and selection criteria by the Company are focused on protection of environment, societal interest and cost-effective procurement seeking resources efficiency, improving the quality of products and services and ultimately optimising cost. The criteria for procurement of equipment are based upon resource efficiency, mainly comprising of but not limited to energy efficiency, fuel efficiency, emission control, waste minimisation etc. The impact of the product / services being procured is considered over its whole life-cycle i.e. from cradle to grave, including due weightage to the disposal aspect also, e.g. e-waste / hazardous waste is disposed of in an environmental friendly manner and no compromise, whatsoever, is made on the same. As regard social aspect, the emphasis is made on ethical issues at the time of vendor evaluation stage itself. The vendor registration form of the Company requires its potential vendors to specify their commitment on the following social aspects:
1. Child Labour
2. Forced and Compulsory Labour
3. Health and Society
4. Working Hours
5. Statutory Compliances
6. Human Rights
7. Environment
8. Ethical Conduction
The Company believes that sustainability in logistics may be achieved by using less polluting and less fuel consuming transport options or selecting vendors who are close to the manufacturing locations. The Company imports fuel in bulk size vessels with full cost advantage of freight. This consumes lesser fuel as compared to smaller size shipment in terms of per ton of material shipped. The Company also maps the Polypropylene (“PP”) bags suppliers across the country to minimise distance between supplier plants and Units across the country. The Company also encourages and empoweres the PP bag suppliers to achieve 9001 : 2008 certification.
1 The Company is one of the key building material supplier and estimated savings are for the project as a whole, over its life.
E-procurement has made the sourcing process more transparent and efficient. An upgraded web-based supplier portal with features like Request For Quote (“RFQ”), submission of offers by the suppliers, generation of comparative charts and the release of orders has been installed. The module is integrated with the Company’s SAP system. A reverse auction process of real time competitive bidding for buying and transportation of material, adds to the efficacy of the process.
E-procurement has resulted in more effective communication with vendors and enabled significant reduction in paper work as well as travel hours.
4. Has the company taken any steps to procure goods and services from local and small producers, including communities surrounding their place of work?
If yes, what steps have been taken to improve their capacity and capability of local and small vendors?
The Company has consistently increased the breadth of vendors across goods and services through vendor base enhancement. The objective is to focus on indigenous suppliers, mutual collaboration and partnership for long-term growth.
The Company has always given preference to local vendors when it comes to sourcing materials. It procures majority of its raw materials and other essentials locally, even when operating from some of the remotest parts of the country. Responsible sourcing on the Company’s part also creates major gains for the communities and creates employment and business opportunities and contributes locally. In case of PP packing bags vendors, the Company has optimised the vendors located near to its cement plants, based on their capability and capacity. Sourcing of PP bag from vendors located close to the plants has resulted in lower fuel consumption.
The Company also believes in long-term partnership with the vendors by having rate contracts with them and providing periodical feedback on their performances in terms of quality, delivery, services, environmental health and safety etc., which helps the vendors to improve their performance by taking corrective actions on the parameters where they are found lacking. Transparency and fair approach are maintained while dealing with the vendors during the entire procurement cycle. The Company uses information technology efficiently for reducing the
procurement cycle time and is launching an upgraded vendor portal which will not only reduce the cycle time but also empower vendors to make use of its useful features like knowing the approval status of their material, payment status, posting advance shipping notification etc. It will also help in reduction of paper usage as most of the activities / documentation are done in electronic format. The Company has a zero-tolerance policy for safety compromise and business is done only with those vendors who are approved on stringent safety parameters.
The Company has taken several steps to enhance capacity and capability of the suppliers. It has organised virtual supplier summit during the year to inform them about sustainable procurement practices, supplier code of conduct, and to outline the expectations on sustainability performance. The event also exposed the suppliers to the best practices in supply chain sustainability and enabled them to enhance their knowledge on sustainability. The Company also conducted virtual assessment of the suppliers and this engagement was meant to also spread knowledge on topics like climate change, water management, waste management, biodiversity, health and safety etc.
5. Does the Company have a mechanism to recycle products and waste? If yes what is the percentage of recycling of products and waste (separately as <5%, 5-10%, >10%). Also, provide details thereof, in about 50 words or so.
The cement manufacturing process is a net consumer of waste not only of its own but also waste from various other industries. Maximum amount of own waste generated is used in its own manufacturing process. For e.g., the fly ash generated from the captive power plants are utilised in blended cement. The Company also uses alternative materials such as fly ash, chemical gypsum, slag, red mud etc. that are waste materials generated from other industries to substitute the raw material required for cement production. Waste material is also used as fuel in the kilns which helps in substitution of fossil fuels such as coal and pet coke. The amount of recycled materials consumed in overall manufacturing process is >18%.
Principle 3 – Businesses should promote the wellbeing of all employees
1. Please indicate the total number of employees.
21,909
Business Responsibility Report (Contd.)

156
Ult
raTe
ch C
emen
t Li
mit
ed
157
Ann
ual R
epo
rt 2
020-
21
Welcome to UltraTech
Value Creation
Growth Enablers
Statutory Reports
Financial Statements
ESG Commitments
2. Please indicate the total number of employees hired on temporary / contractual / casual basis.
40,800
3. Please indicate the number of permanent women employees.
467
4. Please indicate the number of permanent employees with disabilities.
36
5. Do you have an employee association that is recognised by management.
The Company’s workmen from respective manufacturing plants are unionised. Recognition has been granted in conformity to the applicable laws.
6. What percentage of your permanent employees is members of this recognised employee association?
Around 26.53% of the permanent employees are members of the above-mentioned trade unions.
7. Please indicate the number of complaints relating to child labour, forced labour, involuntary labour, sexual harassment in the last financial year and pending, as on the end of the financial year.
Sr. No.
Category No of complaints filed during the financial
year
No of complaints pending as
at end of the financial year
1. Child labour / forced labour / involuntary labour
NIL NIL
2. Sexual harassment 04 013. Discriminatory
employment NIL NIL
8. What percentage of your under mentioned employees were given safety & skill up-gradation training in the last year?
Safety Skill upgradation
Permanent Employees (Management)
94% 95.8%
Permanent Women Employees 96% 90.6%Casual / Temporary / Contractual Employees
99% 8.4%
Employees with Disabilities 100% 88.2%
Principle 4 – Businesses should respect the interests of and be responsive towards all stakeholders, especially those who are disadvantaged, vulnerable and marginalised.
1. Has the Company mapped its internal and external stakeholders? Yes/No
Yes, the Company has mapped its internal as well as external stakeholders.
2. Out of the above, has the company identified the disadvantaged, vulnerable & marginalised stakeholders?
The Company has identified the disadvantaged, vulnerable and marginalised stakeholders viz. communities around its manufacturing Units and its workers / contractual workers.
3. Are there any special initiatives taken by the Company to engage with the disadvantaged, vulnerable and marginalised stakeholders. If so, provide details thereof, in about 50 words or so.
The Company’s endeavor to bring in inclusive growth are channelised through the Aditya Birla Centre for Community Initiatives and Rural Development.
Several initiatives such as health care, education, infrastructure, watershed management, safe drinking water and sanitation, sustainable livelihood, self-help groups and income generation etc. are extended to the Company’s contract workers and people living near to the Company’s manufacturing Units.
The Company has adopted safety as a culture. It has engaged employees at all levels – whether employees, contractors, suppliers or the community and has taken a structured approach, through leadership involvement, in order to bring about a culture change that views safety as non-negotiable.
Principle 5 – Businesses should respect and promote human rights.
1. Does the policy of the Company on human rights cover only the Company or extend to the Group / Joint Ventures / Suppliers / Contractors / NGOs /Others?
The Company has a Human Rights Policy which is also applicable to its subsidiaries.
2. How many stakeholder complaints have been received in the past financial year and what percent was satisfactorily resolved by the management?
No complaints were received during the last financial year.
Principle 6 – Businesses should respect, protect and make efforts to restore the environment.
1. Does the policy related to Principle 6 cover only the Company or extends to the Group / Joint Ventures / Suppliers / Contractors / NGOs / others.
The Company’s policy on Safety, Health and Environment extends to its subsidiaries as well.
2. Does the Company have strategies / initiatives to address global environmental issues such as climate change, global warming, etc? Y/N. If yes, please give hyperlink for webpage etc.
As a founding member of the GCCA, the Company has committed to the ‘2050 Climate Ambition’, which is a commitment to drive down the CO2 footprint of the Company’s operations and products, and a collective aspiration to deliver society with carbon neutral concrete by 2050.
SBTi has validated the Company’s CO2 emissions reduction targets. In July 2020, the Company had committed to set ‘science-based targets’ to reduce its greenhouse gas (“GHG”) emissions. It has also committed to reduce Scope 1 GHG intensity by 27% by 2032 from the base year of 2017 and Scope 2 GHG intensity by 69% within the same time frame. SBTi has validated the Company’s GHG reduction targets which covers the target to lower its CO2 intensity in cement to 462 kg net CO2 per ton of cementitious material (net CO2/t.cem.) by 2032. As per SBTi, the targets are acceptable and consistent with the global effort to limit temperature rise below the ‘2° C’ threshold in line with the Paris Agreement.
The Company has issued sustainability-linked bonds thereby tapping sustainable finance for creating a sustainable business. It is the first company in India and the second company in Asia to issue sustainability-linked bonds.
The Company is one of the best in industry in terms of specific thermal energy consumption. It has developed a roadmap focusing on key areas such as reducing specific energy consumption, increasing fly ash and slag utilisation, thermal substitution rate,
share of power from renewable energy sources and WHRS. Currently the installed WHRS capacity stands at 125 MW which is expected to increase to more than 300 MW by FY24. The Company has committed to EP100 to double the energy productivity by 2035 from 2009-10 levels. It has adopted an internal carbon price of US$ 10/ton of carbon emissions. Please refer to the sustainability reports for more details on the following weblink https://www.ultratechcement.com/about-us/sustainability/sustainability-performance.
3. Does the Company identify and assess potential environmental risks? Y/N
The Company follows a structured risk management approach which encompasses identifying potential risks, assessing their impact, mitigating them through taking timely action and continuous monitoring. The Company uses various tools such as Aqueduct / India Water Tool, Integrated Biodiversity Assessment Tool (“IBAT”) to assess the potential water and biodiversity risks arising out of its operations and takes necessary actions to mitigate the same. The Company will also be using the recently launched GeoSust Tool developed by the Group Sustainability Cell to identify climate change related risks for its operations. Being a signatory to the TCFD, the Company has undertaken a climate change risk and opportunities assessment study in accordance with TCFD recommendations. These findings have been integrated with the long-term business strategy, risk management and business planning.
The Company has already undertaken biodiversity assessments at 8 of its Integrated Units and has taken a target to complete the assessment by 2024 for all its Integrated Units.
4. Does the Company have any project related to Clean Development Mechanism? If so, provide details thereof, in about 50 words or so. Also, if Yes, whether any environmental compliance report is filed?
Yes, the Company has two registered projects under Clean Development Mechanism (“CDM”).
• use of alternative fuels at Reddipalayam Cement Works, Tamil Nadu.
• Waste Heat Recovery (“WHR”) based power generation at Andhra Pradesh Cement Works – Tadipatri, Andhra Pradesh. Five other WHR projects are registered.
Business Responsibility Report (Contd.)
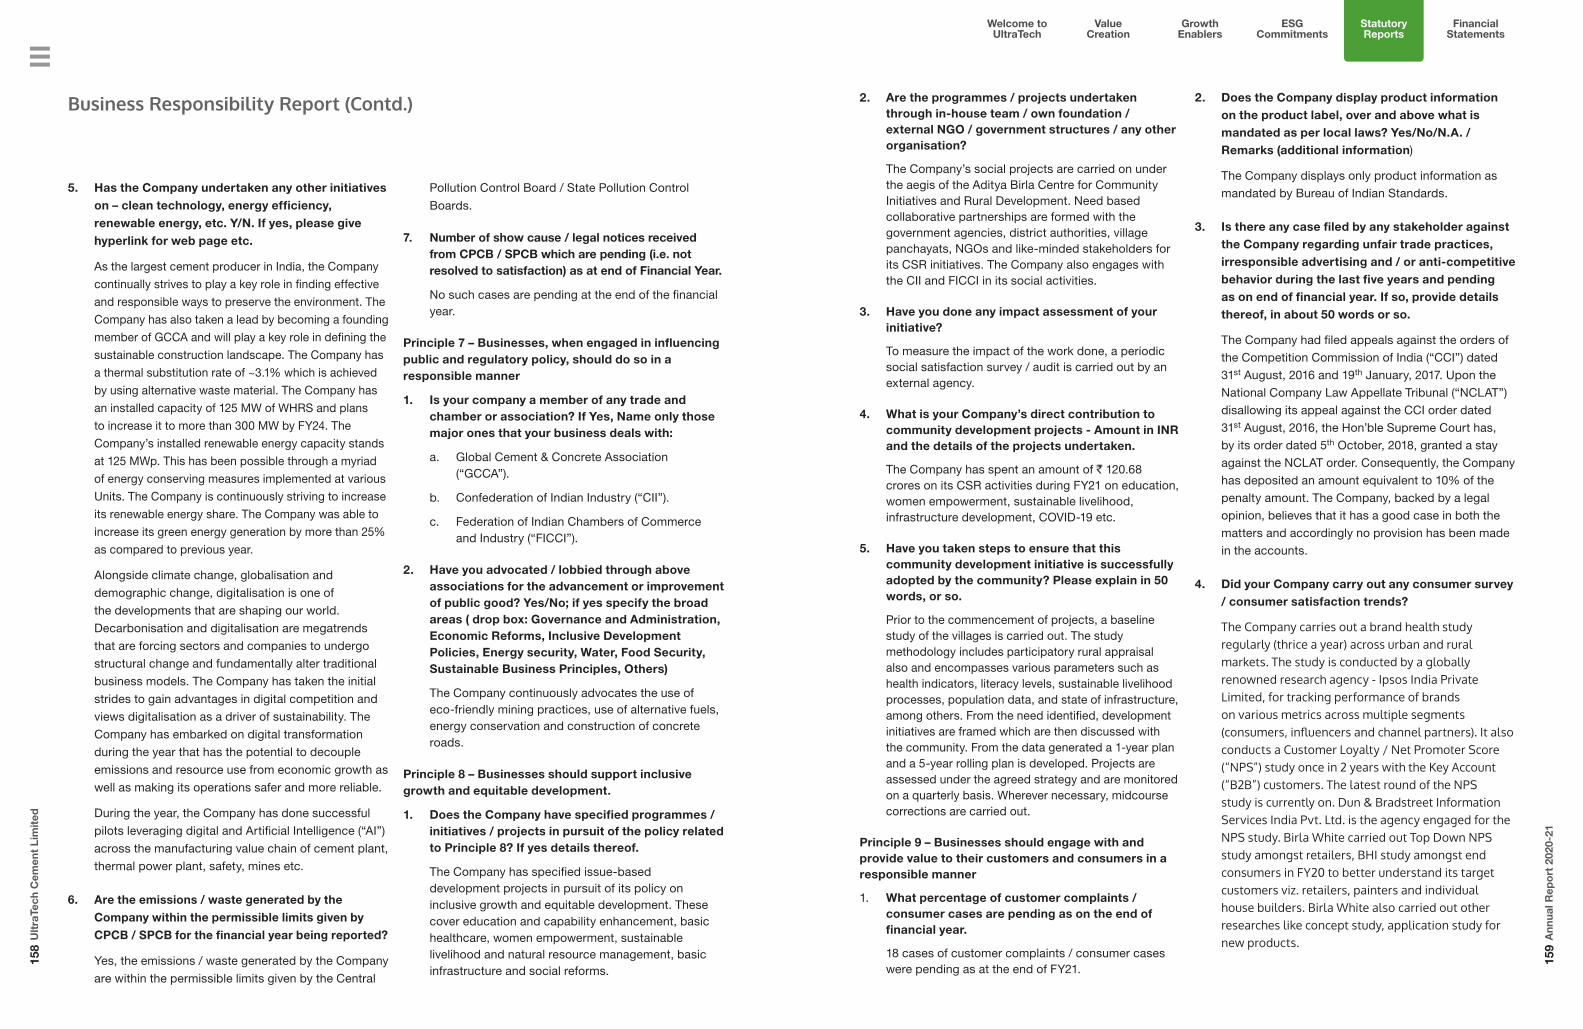
158
Ult
raTe
ch C
emen
t Li
mit
ed
159
Ann
ual R
epo
rt 2
020-
21
Welcome to UltraTech
Value Creation
Growth Enablers
Statutory Reports
Financial Statements
ESG Commitments
5. Has the Company undertaken any other initiatives on – clean technology, energy efficiency, renewable energy, etc. Y/N. If yes, please give hyperlink for web page etc.
As the largest cement producer in India, the Company
continually strives to play a key role in finding effective
and responsible ways to preserve the environment. The
Company has also taken a lead by becoming a founding
member of GCCA and will play a key role in defining the
sustainable construction landscape. The Company has
a thermal substitution rate of ~3.1% which is achieved
by using alternative waste material. The Company has
an installed capacity of 125 MW of WHRS and plans
to increase it to more than 300 MW by FY24. The
Company’s installed renewable energy capacity stands
at 125 MWp. This has been possible through a myriad
of energy conserving measures implemented at various
Units. The Company is continuously striving to increase
its renewable energy share. The Company was able to
increase its green energy generation by more than 25%
as compared to previous year.
Alongside climate change, globalisation and
demographic change, digitalisation is one of
the developments that are shaping our world.
Decarbonisation and digitalisation are megatrends
that are forcing sectors and companies to undergo
structural change and fundamentally alter traditional
business models. The Company has taken the initial
strides to gain advantages in digital competition and
views digitalisation as a driver of sustainability. The
Company has embarked on digital transformation
during the year that has the potential to decouple
emissions and resource use from economic growth as
well as making its operations safer and more reliable.
During the year, the Company has done successful
pilots leveraging digital and Artificial Intelligence (“AI”)
across the manufacturing value chain of cement plant,
thermal power plant, safety, mines etc.
6. Are the emissions / waste generated by the Company within the permissible limits given by CPCB / SPCB for the financial year being reported?
Yes, the emissions / waste generated by the Company
are within the permissible limits given by the Central
Pollution Control Board / State Pollution Control
Boards.
7. Number of show cause / legal notices received from CPCB / SPCB which are pending (i.e. not resolved to satisfaction) as at end of Financial Year.
No such cases are pending at the end of the financial year.
Principle 7 – Businesses, when engaged in influencing public and regulatory policy, should do so in a responsible manner
1. Is your company a member of any trade and chamber or association? If Yes, Name only those major ones that your business deals with:
a. Global Cement & Concrete Association (“GCCA”).
b. Confederation of Indian Industry (“CII”).
c. Federation of Indian Chambers of Commerce and Industry (“FICCI”).
2. Have you advocated / lobbied through above associations for the advancement or improvement of public good? Yes/No; if yes specify the broad areas ( drop box: Governance and Administration, Economic Reforms, Inclusive Development Policies, Energy security, Water, Food Security, Sustainable Business Principles, Others)
The Company continuously advocates the use of eco-friendly mining practices, use of alternative fuels, energy conservation and construction of concrete roads.
Principle 8 – Businesses should support inclusive growth and equitable development.
1. Does the Company have specified programmes / initiatives / projects in pursuit of the policy related to Principle 8? If yes details thereof.
The Company has specified issue-based development projects in pursuit of its policy on inclusive growth and equitable development. These cover education and capability enhancement, basic healthcare, women empowerment, sustainable livelihood and natural resource management, basic infrastructure and social reforms.
2. Are the programmes / projects undertaken through in-house team / own foundation /external NGO / government structures / any other organisation?
The Company’s social projects are carried on under the aegis of the Aditya Birla Centre for Community Initiatives and Rural Development. Need based collaborative partnerships are formed with the government agencies, district authorities, village panchayats, NGOs and like-minded stakeholders for its CSR initiatives. The Company also engages with the CII and FICCI in its social activities.
3. Have you done any impact assessment of your initiative?
To measure the impact of the work done, a periodic social satisfaction survey / audit is carried out by an external agency.
4. What is your Company’s direct contribution to community development projects - Amount in INR and the details of the projects undertaken.
The Company has spent an amount of ` 120.68 crores on its CSR activities during FY21 on education, women empowerment, sustainable livelihood, infrastructure development, COVID-19 etc.
5. Have you taken steps to ensure that this community development initiative is successfully adopted by the community? Please explain in 50 words, or so.
Prior to the commencement of projects, a baseline study of the villages is carried out. The study methodology includes participatory rural appraisal also and encompasses various parameters such as health indicators, literacy levels, sustainable livelihood processes, population data, and state of infrastructure, among others. From the need identified, development initiatives are framed which are then discussed with the community. From the data generated a 1-year plan and a 5-year rolling plan is developed. Projects are assessed under the agreed strategy and are monitored on a quarterly basis. Wherever necessary, midcourse corrections are carried out.
Principle 9 – Businesses should engage with and provide value to their customers and consumers in a responsible manner
1. What percentage of customer complaints / consumer cases are pending as on the end of financial year.
18 cases of customer complaints / consumer cases were pending as at the end of FY21.
2. Does the Company display product information on the product label, over and above what is mandated as per local laws? Yes/No/N.A. /Remarks (additional information)
The Company displays only product information as
mandated by Bureau of Indian Standards.
3. Is there any case filed by any stakeholder against the Company regarding unfair trade practices, irresponsible advertising and / or anti-competitive behavior during the last five years and pending as on end of financial year. If so, provide details thereof, in about 50 words or so.
The Company had filed appeals against the orders of
the Competition Commission of India (“CCI”) dated
31st August, 2016 and 19th January, 2017. Upon the
National Company Law Appellate Tribunal (“NCLAT”)
disallowing its appeal against the CCI order dated
31st August, 2016, the Hon’ble Supreme Court has,
by its order dated 5th October, 2018, granted a stay
against the NCLAT order. Consequently, the Company
has deposited an amount equivalent to 10% of the
penalty amount. The Company, backed by a legal
opinion, believes that it has a good case in both the
matters and accordingly no provision has been made
in the accounts.
4. Did your Company carry out any consumer survey / consumer satisfaction trends?
The Company carries out a brand health study regularly (thrice a year) across urban and rural markets. The study is conducted by a globally renowned research agency - Ipsos India Private Limited, for tracking performance of brands on various metrics across multiple segments (consumers, influencers and channel partners). It also conducts a Customer Loyalty / Net Promoter Score (“NPS”) study once in 2 years with the Key Account (“B2B”) customers. The latest round of the NPS study is currently on. Dun & Bradstreet Information Services India Pvt. Ltd. is the agency engaged for the NPS study. Birla White carried out Top Down NPS study amongst retailers, BHI study amongst end consumers in FY20 to better understand its target customers viz. retailers, painters and individual house builders. Birla White also carried out other researches like concept study, application study for new products.
Business Responsibility Report (Contd.)

Welcome to UltraTech
Value Creation
Growth Enablers
Statutory Reports
Financial Statements
ESG Commitments
161
Ann
ual R
epo
rt 2
020-
21
Independent Auditors’ Report
To the Members of UltraTech Cement Limited
Report on the Audit of the Standalone Financial Statements
Opinion
We have audited the standalone financial statements of UltraTech Cement Limited (“the Company”), which comprise the standalone balance sheet as at 31 March 2021, and the standalone statement of profit and loss (including other comprehensive income), standalone statement of changes in equity and standalone statement of cash flows for the year then ended, and notes to the standalone financial statements, including a summary of the significant accounting policies and other explanatory information (hereinafter referred to as “the standalone financial statements”).
In our opinion and to the best of our information and according to the explanations given to us, the aforesaid standalone financial statements give the information required by the Companies Act, 2013 (“Act”) in the manner so required and give a true and fair view in conformity with the accounting principles generally accepted in India, of the state of affairs of the Company as at 31 March 2021, and profit and other comprehensive income, changes in equity and its cash flows for the year ended on that date.
Basis for Opinion
We conducted our audit in accordance with the Standards on Auditing (SAs) specified under section 143(10) of the Act. Our responsibilities under those SAs are further described in the Auditor’s Responsibilities for the Audit of the Standalone Financial Statements section of our report. We are independent of the Company in accordance with the Code of Ethics issued by the Institute of Chartered Accountants of India together with the ethical requirements that are relevant to our audit of the standalone financial statements under the provisions of the Act and the Rules thereunder, and we have fulfilled our other ethical responsibilities in accordance with these requirements and the Code of Ethics. We believe that the audit evidence we have obtained is sufficient and appropriate to provide a basis for our opinion on the standalone financial statements.
Emphasis of matters
We draw attention to Note 33(b) (i) of the standalone financial statements, which refers to the following matters:
(a) In terms of Order issued by the Competition Commission of India (‘CCI’) against the Company including Demerged Cement Division of Century Textiles and Industries Limited (“Demerged Cement Division”) dated 31 August 2016, the CCI had imposed penalty of Rs. 1,449.51 crores for alleged contravention of the provisions of the Competition Act, 2002 by the Company (including Demerged Cement Division). The Company (including Demerged Cement Division) had filed an appeal against the CCI Order before the Competition Appellate Tribunal (‘COMPAT’) which was subsequently transferred to the National Company Law Appellate Tribunal (“NCLAT”). In July 2018, NCLAT completed its hearing on the matter and disallowed the appeal filed by the Company (including Demerged Cement Division) against the CCI order. Aggrieved by the order of NCLAT, the Company (including Demerged Cement Division) has filed an appeal before the Honorable Supreme Court, which has granted a stay against the NCLAT order on the condition that the Company (including Demerged Cement Division) deposits 10% of the penalty amounting to Rs.144.95 crores which has been deposited. Based on a competent legal opinion obtained by the Company (and Demerged Cement Division), the Company believes that it has a good case in this matter. Considering the uncertainty relating to the outcome of this matter, no provision has been considered in the books of account. Our opinion is not modified in respect of this matter.
(b) In terms of Order dated 19 January 2017, the CCI had imposed penalty of Rs.68.30 crores pursuant to a reference filed by the Government of Haryana for alleged contravention of the provisions of the Competition Act, 2002 in August 2012 by the Company. The Company had filed an appeal before COMPAT and received the stay order dated 10 April 2017. Consequent to reconstitution of Tribunals by the Government, this matter was transferred to the NCLAT for
Standalone Financial Statements161 Independent Auditors' Report172 Standalone Balance Sheet173 Standalone Statement of Profit and Loss176 Standalone Statement of Cash Flow178 Notes to Standalone Financial Statements

Welcome to UltraTech
Value Creation
Growth Enablers
Statutory Reports
Financial Statements
ESG Commitments
162
Ult
raTe
ch C
emen
t Li
mit
ed
163
Ann
ual R
epo
rt 2
020-
21
which hearing is pending. Based on a competent legal opinion, the Company believes that it has a good case in this matter. Considering the uncertainty relating to the outcome of this matter, no provision has been considered in the books of account. Our opinion is not modified in respect of this matter.
Key Audit Matters
Key audit matters are those matters that, in our professional judgement, were of most significance in our audit of the standalone financial statements of the current period. These matters were addressed in the context of our audit of the standalone financial statements as a whole, and in forming our opinion thereon, and we do not provide a separate opinion on these matters.
Description of Key Audit Matter
The key audit matter How the matter was addressed in our audit
Revenue recognition – Discounts, incentives and rebates
[Refer note 1(B)(o) and 53 to the standalone financial statements]
• Revenue is measured net of discounts, incentives, rebates etc. given to the customers on the Company’s sales.
• The Company’s presence across different marketing regions within the country and the competitive business environment makes the assessment of various types of discounts, incentives and rebates as complex and judgmental.
• Therefore, there is a risk of revenue being misstated as a result of variations in the assessment of discounts, incentives and rebates.
• Given the complexity and judgement required to assess the provision for discounts, incentives and rebates, this is a key audit matter.
Our audit procedures included:
• We have assessed the Company’s accounting policies relating to revenue, discounts, incentives and rebates by comparing with applicable accounting standards.
• We have assessed the design and implementation and tested the operating effectiveness of Company’s internal controls over the provisions, approvals and disbursements of discounts, incentives and rebates.
• We have assessed the Company’s computations for accrual of discounts, incentives and rebates, on a sample basis, and compared the accruals made with the approved schemes and underlying documents.
• We have verified, on a sample basis, the underlying documentation for discounts, incentives and rebates recorded and disbursed during the year.
• We have compared the historical trend of payments and reversal of discounts, incentives and rebates to provisions made to assess the current year accruals.
• We have examined the manual journals posted to discounts, rebates and incentives to identify unusual or irregular items.
Regulations - Litigations and claims
[Refer note 33 to the standalone financial statements]
• The Company operates in various States within India and is exposed to different Central and State/Local laws, regulations and interpretations thereof. In this regulatory environment, there is an inherent risk of litigations and claims.
• Consequently, provisions and contingent liability disclosures may arise from indirect tax proceedings, legal proceedings, including regulatory and other government/ department proceedings, as well as investigations by authorities and commercial claims.
Our audit procedures included:
• We have gained an understanding of outstanding litigations against the Company from the Company’s in-house legal counsel and other key managerial personnel who have knowledge of these matters.
• We have read the correspondence between the Company and the various tax/legal authorities and the legal opinions of external legal advisors, where applicable, for significant matters.
• We have tested the completeness of the litigations and claims by examining, on a sample basis, the Company’s legal expenses and minutes of the board meetings.
Independent Auditors’ Report (Continued)
The key audit matter How the matter was addressed in our audit
• The Company applies significant judgement in estimating the likelihood of the future outcome in each case and in determining the provisions or disclosures required for each matter.
• Resolution of tax and legal proceedings may span over multiple years due to the highly complex nature and magnitude of the legal matters involved and may involve protracted negotiation or litigation.
• These estimates could change significantly over time as new facts emerge and each legal case progresses.
• Given the inherent complexity and magnitude of potential exposures and the judgement necessary to estimate the amount of provisions required or to determine required disclosures, this is a key audit matter.
• We have challenged the Company’s estimate of the possible outcome of the disputed cases based on applicable tax laws and legal precedence by involving our tax specialists.
• We have assessed the adequacy of the Company’s disclosures in respect of contingent liabilities for tax and legal matters.
Recognition and measurement of Income Taxes
[Refer notes 18 and 40 to the standalone financial statements]
• The Company operates in a complex tax jurisdiction and is subject to periodic challenges by tax authorities on various matters relating to claims for tax exemptions / deductions.
• The determination of provision for income tax and deferred taxes including write backs of provisions involves significant judgements and estimates and interpreting the prevailing tax laws and rules.
• These also involve significant judgment to determine the possible outcome of the uncertain tax positions, consequently having an impact on related accounting and disclosures in the standalone financial statements.
• Considering the complexity and significant level of estimation and judgement, this is a key audit matter.
Our audit procedures included:
• We have obtained an understanding of key tax matters.
• We have read and analysed select key correspondences, external legal opinions/ consultations obtained by the Company for key tax matters.
• We have critically challenged the key assumptions made by the Company in estimating current and deferred taxes by involving our tax specialists.
• We have challenged the Company’s estimate of the possible outcome of the disputed tax cases by considering legal precedence and other judicial rulings by involving our tax specialists.
• We have assessed the adequacy of the Company’s disclosures for income taxes in the standalone financial statements.
Other Information
The Company’s management and Board of Directors are responsible for the other information. The other information comprises the information included in the Company’s annual report, but does not include the standalone financial statements and our auditors’ report thereon.
Our opinion on the standalone financial statements does not cover the other information and we do not express any form of assurance conclusion thereon.
In connection with our audit of the standalone financial statements, our responsibility is to read the other information and, in doing so, consider whether the other information is materially inconsistent with the standalone financial statements or our knowledge obtained in the audit or otherwise appears to be materially misstated. If, based on the work we have performed, we conclude that there is a material misstatement of this other information, we are required to report that fact. We have nothing to report in this regard.
Independent Auditors’ Report (Continued)

Welcome to UltraTech
Value Creation
Growth Enablers
Statutory Reports
Financial Statements
ESG Commitments
164
Ult
raTe
ch C
emen
t Li
mit
ed
165
Ann
ual R
epo
rt 2
020-
21
Management’s and Board of Directors’ Responsibility for the Standalone Financial Statements
The Company’s Management and Board of Directors are responsible for the matters stated in section 134(5) of the Act with respect to the preparation of these standalone financial statements that give a true and fair view of the state of affairs, profit/loss and other comprehensive income, changes in equity and cash flows of the Company in accordance with the accounting principles generally accepted in India, including the Indian Accounting Standards (Ind AS) specified under section 133 of the Act. This responsibility also includes maintenance of adequate accounting records in accordance with the provisions of the Act for safeguarding of the assets of the Company and for preventing and detecting frauds and other irregularities; selection and application of appropriate accounting policies; making judgments and estimates that are reasonable and prudent; and design, implementation and maintenance of adequate internal financial controls that were operating effectively for ensuring accuracy and completeness of the accounting records, relevant to the preparation and presentation of the standalone financial statements that give a true and fair view and are free from material misstatement, whether due to fraud or error.
In preparing the standalone financial statements, the Management and Board of Directors are responsible for assessing the Company’s ability to continue as a going concern, disclosing, as applicable, matters related to going concern and using the going concern basis of accounting unless the Board of Directors either intends to liquidate the Company or to cease operations, or has no realistic alternative but to do so.
The Company’s Management and the Board of Directors are also responsible for overseeing the Company’s financial reporting process.
Auditor’s Responsibilities for the Audit of the Standalone Financial Statements
Our objectives are to obtain reasonable assurance about whether the standalone financial statements as a whole are free from material misstatement, whether due to fraud or error, and to issue an auditor’s report that includes our opinion. Reasonable assurance is a high level of assurance, but is not a guarantee that an audit conducted in accordance with SAs will always detect a material misstatement when it exists. Misstatements can arise from fraud or error and are considered material if, individually or in the aggregate, they could reasonably be expected to influence the economic decisions of users taken on the basis of these standalone financial statements.
As part of an audit in accordance with SAs, we exercise professional judgment and maintain professional skepticism throughout the audit. We also:
• Identify and assess the risks of material misstatement of the standalone financial statements, whether due to fraud or error, design and perform audit procedures responsive to those risks, and obtain audit evidence that is sufficient and appropriate to provide a basis for our opinion. The risk of not detecting a material misstatement resulting from fraud is higher than for one resulting from error, as fraud may involve collusion, forgery, intentional omissions, misrepresentations, or the override of internal control.
• Obtain an understanding of internal control relevant to the audit in order to design audit procedures that are appropriate in the circumstances. Under section 143(3)(i) of the Act, we are also responsible for expressing our opinion on whether the company has adequate internal financial controls with reference to standalone financial statements in place and the operating effectiveness of such controls.
• Evaluate the appropriateness of accounting policies used and the reasonableness of accounting estimates and related disclosures in the standalone financial statements made by the Management and Board of Directors.
• Conclude on the appropriateness of the Management and Board of Directors use of the going concern basis of accounting and, based on the audit evidence obtained, whether a material uncertainty exists related to events or conditions that may cast significant doubt on the Company’s ability to continue as a going concern. If we conclude that a material uncertainty exists, we are required to draw attention in our auditor’s report to the related disclosures in the standalone financial statements or, if such disclosures are inadequate, to modify our opinion. Our conclusions are
Independent Auditors’ Report (Continued)
based on the audit evidence obtained up to the date of our auditor’s report. However, future events or conditions may cause the Company to cease to continue as a going concern.
• Evaluate the overall presentation, structure and content of the standalone financial statements, including the disclosures, and whether the standalone financial statements represent the underlying transactions and events in a manner that achieves fair presentation.
We communicate with those charged with governance regarding, among other matters, the planned scope and timing of the audit and significant audit findings, including any significant deficiencies in internal control that we identify during our audit.
We also provide those charged with governance with a statement that we have complied with relevant ethical requirements regarding independence, and to communicate with them all relationships and other matters that may reasonably be thought to bear on our independence, and where applicable, related safeguards.
From the matters communicated with those charged with governance, we determine those matters that were of most significance in the audit of the standalone financial statements of the current period and are therefore the key audit matters. We describe these matters in our auditors’ report unless law or regulation precludes public disclosure about the matter or when, in extremely rare circumstances, we determine that a matter should not be communicated in our report because the adverse consequences of doing so would reasonably be expected to outweigh the public interest benefits of such communication.
Report on Other Legal and Regulatory Requirements
1. As required by the Companies (Auditors’ Report) Order, 2016 (“the Order”) issued by the Central Government in terms of section 143 (11) of the Act, we give in the “Annexure A” a statement on the matters specified in paragraphs 3 and 4 of the Order, to the extent applicable.
2. (A) As required by Section 143(3) of the Act, we report that:
a) We have sought and obtained all the information and explanations which to the best of our knowledge and belief were necessary for the purposes of our audit;
b) In our opinion, proper books of account as required by law have been kept by the Company so far as it appears from our examination of those books;
c) The standalone balance sheet, the standalone statement of profit and loss (including other comprehensive income), the standalone statement of changes in equity and the standalone statement of cash flows dealt with by this Report are in agreement with the books of account;
d) In our opinion, the aforesaid standalone financial statements comply with the Ind AS specified under section 133 of the Act;
e) On the basis of the written representations received from the directors as on 31 March 2021 taken on record by the Board of Directors, none of the directors is disqualified as on 31 March 2021 from being appointed as a director in terms of Section 164(2) of the Act; and
f) With respect to the adequacy of the internal financial controls with reference to standalone financial statements of the Company and the operating effectiveness of such controls, refer to our separate Report in “Annexure B”.
(B) With respect to the other matters to be included in the Auditors’ Report in accordance with Rule 11 of the Companies (Audit and Auditors) Rules, 2014, in our opinion and to the best of our information and according to the explanations given to us:
i. The Company has disclosed the impact of pending litigations as at 31 March 2021 on its financial position in its standalone financial statements - Refer Note 33 to the standalone financial statements;
Independent Auditors’ Report (Continued)
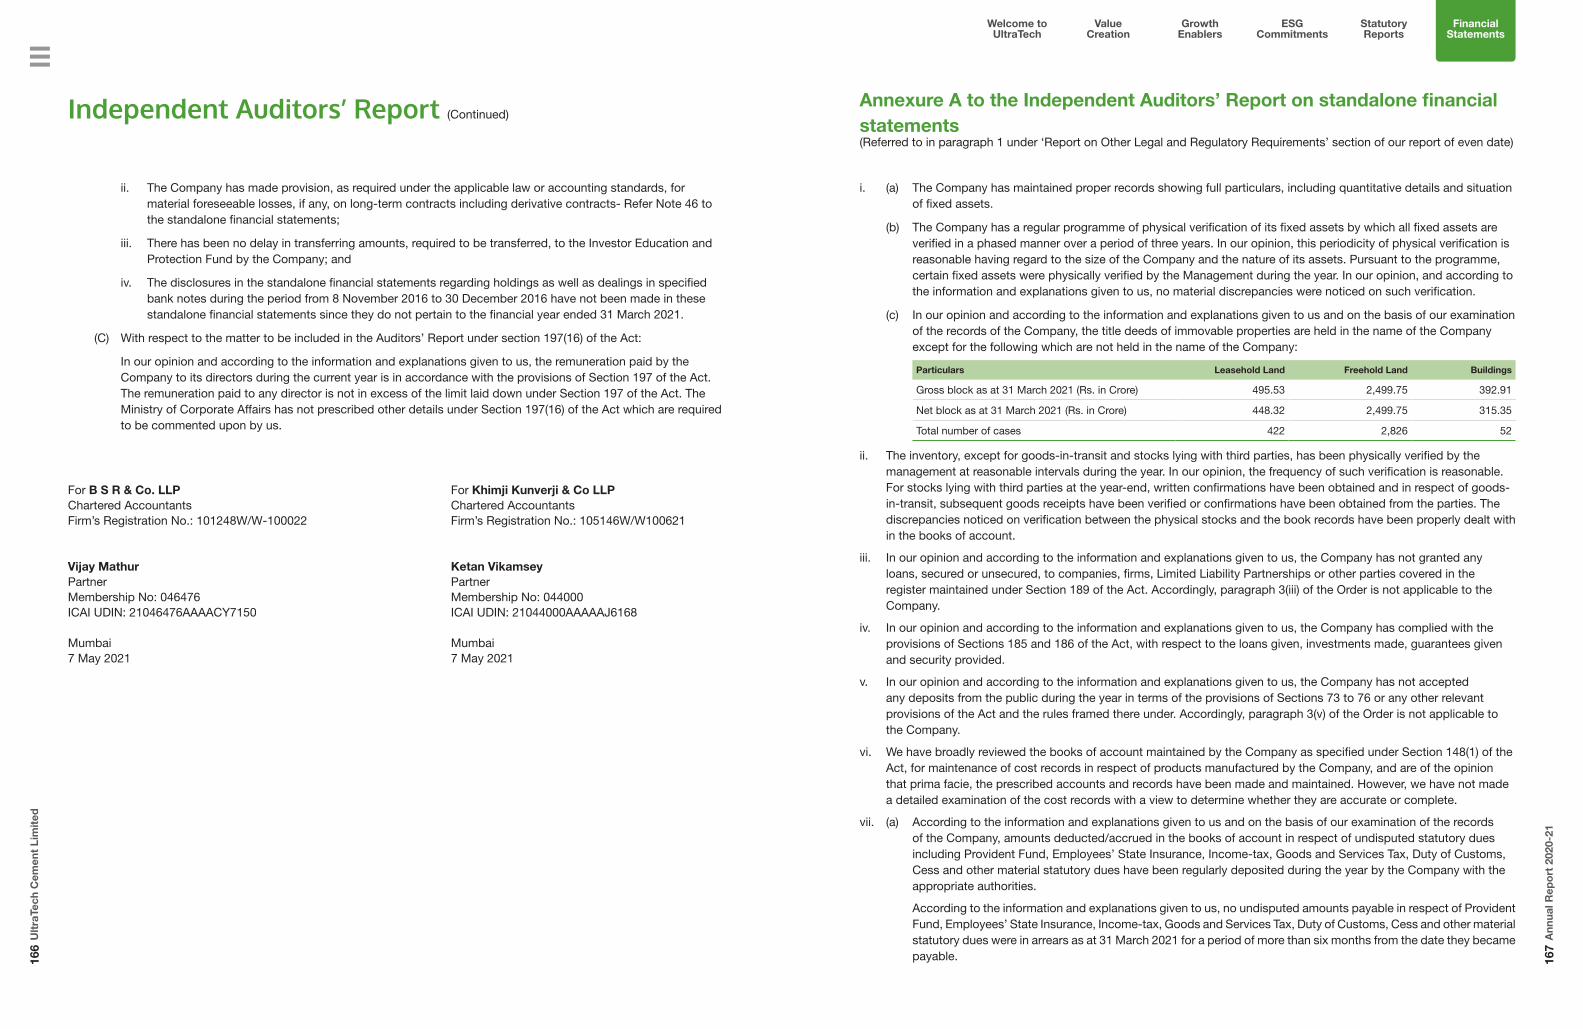
Welcome to UltraTech
Value Creation
Growth Enablers
Statutory Reports
Financial Statements
ESG Commitments
166
Ult
raTe
ch C
emen
t Li
mit
ed
167
Ann
ual R
epo
rt 2
020-
21
ii. The Company has made provision, as required under the applicable law or accounting standards, for material foreseeable losses, if any, on long-term contracts including derivative contracts- Refer Note 46 to the standalone financial statements;
iii. There has been no delay in transferring amounts, required to be transferred, to the Investor Education and Protection Fund by the Company; and
iv. The disclosures in the standalone financial statements regarding holdings as well as dealings in specified bank notes during the period from 8 November 2016 to 30 December 2016 have not been made in these standalone financial statements since they do not pertain to the financial year ended 31 March 2021.
(C) With respect to the matter to be included in the Auditors’ Report under section 197(16) of the Act:
In our opinion and according to the information and explanations given to us, the remuneration paid by the Company to its directors during the current year is in accordance with the provisions of Section 197 of the Act. The remuneration paid to any director is not in excess of the limit laid down under Section 197 of the Act. The Ministry of Corporate Affairs has not prescribed other details under Section 197(16) of the Act which are required to be commented upon by us.
For B S R & Co. LLP For Khimji Kunverji & Co LLP Chartered Accountants Chartered AccountantsFirm’s Registration No.: 101248W/W-100022 Firm’s Registration No.: 105146W/W100621
Vijay Mathur Ketan Vikamsey Partner Partner Membership No: 046476 Membership No: 044000 ICAI UDIN: 21046476AAAACY7150 ICAI UDIN: 21044000AAAAAJ6168
Mumbai Mumbai 7 May 2021 7 May 2021
Independent Auditors’ Report (Continued)
i. (a) The Company has maintained proper records showing full particulars, including quantitative details and situation of fixed assets.
(b) The Company has a regular programme of physical verification of its fixed assets by which all fixed assets are verified in a phased manner over a period of three years. In our opinion, this periodicity of physical verification is reasonable having regard to the size of the Company and the nature of its assets. Pursuant to the programme, certain fixed assets were physically verified by the Management during the year. In our opinion, and according to the information and explanations given to us, no material discrepancies were noticed on such verification.
(c) In our opinion and according to the information and explanations given to us and on the basis of our examination of the records of the Company, the title deeds of immovable properties are held in the name of the Company except for the following which are not held in the name of the Company:
Particulars Leasehold Land Freehold Land Buildings
Gross block as at 31 March 2021 (Rs. in Crore) 495.53 2,499.75 392.91
Net block as at 31 March 2021 (Rs. in Crore) 448.32 2,499.75 315.35
Total number of cases 422 2,826 52
ii. The inventory, except for goods-in-transit and stocks lying with third parties, has been physically verified by the management at reasonable intervals during the year. In our opinion, the frequency of such verification is reasonable. For stocks lying with third parties at the year-end, written confirmations have been obtained and in respect of goods-in-transit, subsequent goods receipts have been verified or confirmations have been obtained from the parties. The discrepancies noticed on verification between the physical stocks and the book records have been properly dealt with in the books of account.
iii. In our opinion and according to the information and explanations given to us, the Company has not granted any loans, secured or unsecured, to companies, firms, Limited Liability Partnerships or other parties covered in the register maintained under Section 189 of the Act. Accordingly, paragraph 3(iii) of the Order is not applicable to the Company.
iv. In our opinion and according to the information and explanations given to us, the Company has complied with the provisions of Sections 185 and 186 of the Act, with respect to the loans given, investments made, guarantees given and security provided.
v. In our opinion and according to the information and explanations given to us, the Company has not accepted any deposits from the public during the year in terms of the provisions of Sections 73 to 76 or any other relevant provisions of the Act and the rules framed there under. Accordingly, paragraph 3(v) of the Order is not applicable to the Company.
vi. We have broadly reviewed the books of account maintained by the Company as specified under Section 148(1) of the Act, for maintenance of cost records in respect of products manufactured by the Company, and are of the opinion that prima facie, the prescribed accounts and records have been made and maintained. However, we have not made a detailed examination of the cost records with a view to determine whether they are accurate or complete.
vii. (a) According to the information and explanations given to us and on the basis of our examination of the records of the Company, amounts deducted/accrued in the books of account in respect of undisputed statutory dues including Provident Fund, Employees’ State Insurance, Income-tax, Goods and Services Tax, Duty of Customs, Cess and other material statutory dues have been regularly deposited during the year by the Company with the appropriate authorities.
According to the information and explanations given to us, no undisputed amounts payable in respect of Provident Fund, Employees’ State Insurance, Income-tax, Goods and Services Tax, Duty of Customs, Cess and other material statutory dues were in arrears as at 31 March 2021 for a period of more than six months from the date they became payable.
Annexure A to the Independent Auditors’ Report on standalone financial statements(Referred to in paragraph 1 under ‘Report on Other Legal and Regulatory Requirements’ section of our report of even date)

Welcome to UltraTech
Value Creation
Growth Enablers
Statutory Reports
Financial Statements
ESG Commitments
168
Ult
raTe
ch C
emen
t Li
mit
ed
169
Ann
ual R
epo
rt 2
020-
21
(b) According to the information and explanations given to us and on the basis of our examination of the records of the Company, details of dues of Income-tax, Sales- tax, Service tax, Duty of Customs, Duty of Excise and Value added tax which have not been deposited as at 31 March 2021 on account of disputes are given below:
Name of the Statute Nature of the Dues Forum where disputeis pending
Period to which amount relates (Assessment Year)
Amount*(Rs. in Crore)
Sales Tax/ Value Added Tax (VAT)
Sales Tax, VAT, Interest and Penalty
Supreme Court 2000 to 2017 493.20
High Court 1988 to 2017 75.84
Tribunal(s) 1985 to 2016 146.41
Appellate Authorities 1990 to 2020 105.51
Assessing Officers 1997 to 2017 2.12
Customs Act, 1962 Customs Duty, Interest and Penalty
High Court 2002 to 2006 53.05
Tribunal(s) 2000 to 2014 249.01
Appellate Authorities 2003 to 2015 0.14
Central Excise Act, 1944 Excise Duty, Interest and Penalty
Supreme Court 1994 to 2018 108.72
High Court 1996 to 2016 40.90
Tribunal(s) 1994 to 2018 1,428.41
Appellate Authorities 1998 to 2018 13.50
Finance Act, 1994 Service Tax, Interest and Penalty
Supreme Court 2004 to 2008 22.20
High Court 2004 to 2014 13.33
Tribunal(s) 2005 to 2018 210.80
Appellate Authorities 2005 to 2018 13.12
Income Tax Act, 1961 Income Tax, Interest and Penalty
High Court 2001 to 2019 11.77
Tribunal(s) 2015 to 2016 0.03
Appellate Authorities 2010 to 2019 43.23
viii. According to the information and explanations given to us, and based on the records of the Company, the Company has not defaulted in the repayment of loans or borrowings to financial institutions, banks, government and dues to debenture holders.
ix. According to the information and explanations given to us, monies raised by the Company by way of:
(a) Debentures and term loans have been applied by the Company during the year for the purposes for which they were obtained; and
(b) Bonds have been applied by the Company during the year for the purposes for which they were obtained, except for pending utilization of the balance funds, which the Company has temporarily deposited in fixed deposits or liquid funds as at 31 March 2021.
Other than above, the Company did not raise money by way of initial public offer or further public offer during the year.
x. According to the information and explanations given to us, no material fraud by the Company or on the Company by its officers or employees has been noticed or reported during the course of our audit.
xi. According to the information and explanations given to us and based on our examination of the records of the Company, the Company has paid/provided for managerial remuneration in accordance with the requisite approvals mandated by the provisions of Section 197 read with Schedule V to the Act.
xii. In our opinion and according to the information and explanations given to us, the Company is not a Nidhi company. Accordingly, paragraph 3(xii) of the Order is not applicable to the Company.
Annexure A to the Independent Auditors’ Report on standalone financial statements (Continued)
xiii. According to the information and explanations given to us and based on our examination of the records of the Company, transactions with the related parties are in compliance with Sections 177 and 188 of the Act where applicable and details of such transactions have been disclosed in the standalone financial statements as required by the applicable accounting standards.
xiv. According to the information and explanations given to us and based on our examination of the records of the Company, the Company has not made any preferential allotment or private placement of shares or fully or partly convertible debentures during the year. Accordingly, paragraph 3(xiv) of the Order is not applicable to the Company.
xv. According to the information and explanations given to us and based on our examination of the records of the Company, the Company has not entered into non-cash transactions with directors or persons connected with them. Accordingly, paragraph 3(xv) of the Order is not applicable to the Company.
xvi. According to the information and explanations given to us, the Company is not required to be registered under Section 45 - IA of the Reserve Bank of India Act, 1934. Accordingly, paragraph 3(xvi) of the Order is not applicable to the Company.
For B S R & Co. LLP For Khimji Kunverji & Co LLP Chartered Accountants Chartered AccountantsFirm’s Registration No.: 101248W/W-100022 Firm’s Registration No.: 105146W/W100621
Vijay Mathur Ketan Vikamsey Partner Partner Membership No: 046476 Membership No: 044000 ICAI UDIN: 21046476AAAACY7150 ICAI UDIN: 21044000AAAAAJ6168
Mumbai Mumbai 7 May 2021 7 May 2021
Annexure A to the Independent Auditors’ Report on standalone financial statements (Continued)

Welcome to UltraTech
Value Creation
Growth Enablers
Statutory Reports
Financial Statements
ESG Commitments
170
Ult
raTe
ch C
emen
t Li
mit
ed
171
Ann
ual R
epo
rt 2
020-
21
Annexure B to the Independent Auditors’ report on the standalone financial statements of UltraTech Cement Limited for the year ended31 March 2021.(Referred to in paragraph 2(A)(f) under ‘Report on Other Legal and Regulatory Requirements’ section of our report of even date)
Report on the internal financial controls with reference to the aforesaid standalone financial statements under Clause (i) of Sub-section 3 of Section 143 of the Companies Act, 2013
Opinion
We have audited the internal financial controls with reference to standalone financial statements of UltraTech Cement Limited (“the Company”) as of 31 March 2021 in conjunction with our audit of the standalone financial statements of the Company for the year ended on that date.
In our opinion, the Company has, in all material respects, adequate internal financial controls with reference to standalone financial statements and such internal financial controls were operating effectively as at 31 March 2021, based on the internal financial controls with reference to financial statements criteria established by the Company considering the essential components of internal control stated in the Guidance Note on Audit of Internal Financial Controls Over Financial Reporting issued by the Institute of Chartered Accountants of India (the “Guidance Note”).
Management’s Responsibility for Internal Financial Controls
The Company’s management and the Board of Directors are responsible for establishing and maintaining internal financial controls based on the internal financial controls with reference to standalone financial statements criteria established by the Company considering the essential components of internal control stated in the Guidance Note. These responsibilities include the design, implementation and maintenance of adequate internal financial controls that were operating effectively for ensuring the orderly and efficient conduct of its business, including adherence to company’s policies, the safeguarding of its assets, the prevention and detection of frauds and errors, the accuracy and completeness of the accounting records, and the timely preparation of reliable financial information, as required under the Companies Act, 2013 (hereinafter referred to as “the Act”).
Auditors’ Responsibility
Our responsibility is to express an opinion on the Company’s internal financial controls with reference to standalone financial statements based on our audit. We conducted our audit in accordance with the Guidance Note and the Standards on Auditing, prescribed under section 143(10) of the Act, to the extent applicable to an audit of internal financial controls with reference to standalone financial statements. Those Standards and the Guidance Note require that we comply with ethical requirements and plan and perform the audit to obtain reasonable assurance about whether adequate internal financial controls with reference to standalone financial statements were established and maintained and whether such controls operated effectively in all material respects.
Our audit involves performing procedures to obtain audit evidence about the adequacy of the internal financial controls with reference to standalone financial statements and their operating effectiveness. Our audit of internal financial controls with reference to standalone financial statements included obtaining an understanding of such internal financial controls, assessing the risk that a material weakness exists, and testing and evaluating the design and operating effectiveness of internal control based on the assessed risk. The procedures selected depend on the auditor’s judgement, including the assessment of the risks of material misstatement of the standalone financial statements, whether due to fraud or error.
We believe that the audit evidence we have obtained is sufficient and appropriate to provide a basis for our audit opinion on the Company’s internal financial controls with reference to standalone financial statements.
Meaning of Internal Financial controls with Reference to standalone Financial Statements
A company’s internal financial controls with reference to standalone financial statements is a process designed to provide reasonable assurance regarding the reliability of financial reporting and the preparation of standalone financial statements for external purposes in accordance with generally accepted accounting principles. A company’s internal financial controls with reference to standalone financial statements include those policies and procedures that (1) pertain to the maintenance of records that, in reasonable detail, accurately and fairly reflect the transactions and dispositions of the assets of
the company; (2) provide reasonable assurance that transactions are recorded as necessary to permit preparation of standalone financial statements in accordance with generally accepted accounting principles, and that receipts and expenditures of the company are being made only in accordance with authorisations of management and directors of the company; and (3) provide reasonable assurance regarding prevention or timely detection of unauthorised acquisition, use, or disposition of the company’s assets that could have a material effect on the standalone financial statements.
Inherent Limitations of Internal Financial controls with Reference to standalone Financial Statements
Because of the inherent limitations of internal financial controls with reference to standalone financial statements, including the possibility of collusion or improper management override of controls, material misstatements due to error or fraud may occur and not be detected. Also, projections of any evaluation of the internal financial controls with reference to standalone financial statements to future periods are subject to the risk that the internal financial controls with reference to standalone financial statements may become inadequate because of changes in conditions, or that the degree of compliance with the policies or procedures may deteriorate.
For B S R & Co. LLP For Khimji Kunverji & Co LLP Chartered Accountants Chartered AccountantsFirm’s Registration No.: 101248W/W-100022 Firm’s Registration No.: 105146W/W100621
Vijay Mathur Ketan Vikamsey Partner Partner Membership No: 046476 Membership No: 044000 ICAI UDIN: 21046476AAAACY7150 ICAI UDIN: 21044000AAAAAJ6168
Mumbai Mumbai 7 May 2021 7 May 2021
Annexure B to the Independent Auditors’ report on the standalone financial statements of UltraTech Cement Limited for the year ended31 March 2021. (Continued)

Welcome to UltraTech
Value Creation
Growth Enablers
Statutory Reports
Financial Statements
ESG Commitments
172
Ult
raTe
ch C
emen
t Li
mit
ed
173
Ann
ual R
epo
rt 2
020-
21
Standalone Balance Sheetas at March 31, 2021
` in Crores
ParticularsNote No.
As at March 31, 2021
As at March 31, 2020
ASSETSNon-Current AssetsProperty, Plant and Equipment 2 38,270.94 39,662.39Capital Work-in-Progress 2 1,522.07 860.01Right of Use Assets 3 1,109.44 1,007.94Goodwill 36 2,208.82 2,208.82Other Intangible Assets 2 3,876.92 3,896.14Intangible Assets under Development 2 5.72 10.07
46,993.91 47,645.37Financial Assets: Investments 4 6,757.67 5,838.93 Loans 5 144.35 141.94 Other Financial Assets 6 552.03 7,454.05 397.05Income Tax Assets (Net) 311.74 278.23Other Non-Current Assets 7 2,664.03 2,763.88Total Non-Current Assets 57,423.73 57,065.40Current AssetsInventories 8 3,722.05 3,833.88Financial Assets Investments 9 10,812.01 4,243.69 Trade Receivables 10 2,285.99 1,848.28 Cash and Cash Equivalents 11 118.58 140.06 Bank Balances other than Cash and Cash
Equivalents12 1,757.97 170.46
Loans 5 897.18 1,903.53 Other Financial Assets 6 1,754.15 17,625.88 1,068.93Other Current Assets 13 1,634.99 1,505.32Total Current Assets 22,982.92 14,714.15Non-Current Assets classified as held for sale 52 9.45 37.37TOTAL ASSETS 80,416.10 71,816.92EQUITY AND LIABILITIESEQUITYEquity Share Capital 14 (a) 288.65 288.63Other Equity 14 (b) 43,063.99 38,007.69
43,352.64 38,296.32LIABILITIESNon-Current LiabilitiesFinancial Liabilities Borrowings 15 10,684.56 14,147.63 Other Financial Liabilities 16 1,237.99 11,922.55 813.78Provisions 17 329.08 213.13Deferred Tax Liabilities (Net) 18 5,219.14 4,076.88Other Non-Current Liabilities 19 4.93 5.88Total Non-Current Liabilities 17,475.70 19,257.30Current LiabilitiesFinancial Liabilities Borrowings 20 4,230.15 3,953.21 Trade Payables Total Outstanding Dues of Micro Enterprises
and Small Enterprises56 65.26 53.21
Total Outstanding Dues of Creditors other than Micro Enterprises and Small Enterprises
21 4,314.92 2,985.57
Other Financial Liabilities 16 5,209.76 13,820.09 2,685.79Other Current Liabilities 22 4,549.21 3,449.92Provisions 17 506.76 534.51Current Tax Liabilities (Net) 711.70 601.09Total Current Liabilities 19,587.76 14,263.30TOTAL EQUITY AND LIABILITIES 80,416.10 71,816.92Significant Accounting Policies 1
The accompanying notes form an integral part of the Standalone Financial Statements.
In terms of our report attached. For and on behalf of the Board of Directors
For B S R & Co. LLPChartered AccountantsFirm Registration No: 101248W/W-100022
For Khimji Kunverji & Co LLPChartered AccountantsFirm Registration No: 105146W/W-100621
VIJAY MATHURPartnerMembership No: 46476
KETAN VIKAMSEYPartnerMembership No: 44000
ATUL DAGAWhole-time Director and CFODIN: 06416619
K. C. JHANWARManaging DirectorDIN: 01743559
Mumbai: May 07, 2021S. K. CHATTERJEECompany Secretary
` in Crores
Particulars Note No.
Year ended March 31, 2021
Year ended March 31, 2020
Revenue from Operations 23 43,188.34 40,649.17
Other Income 24 788.68 726.58
TOTAL INCOME (I) 43,977.02 41,375.75
EXPENSES
Cost of Materials Consumed 25 5,174.94 4,960.81
Purchases of Stock-in-Trade 26 1,936.70 2,262.78
Changes in Inventories of Finished Goods, Stock-in-Trade and Work-in-Progress 27 426.44 (362.74)
Employee Benefits Expense 28 2,181.99 2,336.17
Finance Costs 29 1,259.08 1,704.22
Depreciation and Amortisation Expense 30 2,434.35 2,454.90
Power and Fuel 7,552.02 7,703.19
Freight and Forwarding Expense 31 9,939.56 9,631.85
Other Expenses 32 5,035.28 5,479.11
35,940.36 36,170.29
Less: Captive Consumption of Cement (23.41) (14.30)
TOTAL EXPENSES (II) 35,916.95 36,155.99
Profit before Exceptional Items and Tax Expense (I)-(II) 8,060.07 5,219.76
Exceptional Items
Rates and Taxes 55 (164.00) -
Profit before Tax Expense 7,896.07 5,219.76
Tax Expense:
Current Tax 1,415.05 915.38
Short / (Excess) Tax Provision related to prior years - 3.25
Deferred Tax Charge / (Credit) 18 1,138.95 (1,154.41)
Total Tax Expense 2,554.00 (235.78)
Profit for the Year (III) 5,342.07 5,455.54
Other Comprehensive Income
A (i) Items that will not be reclassified to Profit or Loss - Remeasurement Gain / (Loss) on defined benefit plan
82.61 (59.21)
(ii) Income Tax Relating to Items that will not be reclassified to Profit or Loss (28.87) 20.69
B (i) Items that will be reclassified to Profit or Loss - Cash Flow Hedge 13.15 (10.78)
(ii) Income Tax Relating to Items that will be reclassified to Profit or Loss (3.31) 0.63
Other Comprehensive Income for the year (IV) 63.58 (48.67)
Total Comprehensive Income for the year (III+IV) 5,405.65 5,406.87
Earnings Per Equity Share (Face Value ` 10 each) 41
Basic (in `) 185.20 189.15
Diluted (in `) 185.13 189.10
Significant Accounting Policies 1
The accompanying notes form an integral part of the Standalone Financial Statements.
In terms of our report attached. For and on behalf of the Board of Directors
For B S R & Co. LLPChartered AccountantsFirm Registration No: 101248W/W-100022
For Khimji Kunverji & Co LLPChartered AccountantsFirm Registration No: 105146W/W-100621
VIJAY MATHURPartnerMembership No: 46476
KETAN VIKAMSEYPartnerMembership No: 44000
ATUL DAGAWhole-time Director and CFODIN: 06416619
K. C. JHANWARManaging DirectorDIN: 01743559
Mumbai: May 07, 2021S. K. CHATTERJEECompany Secretary
Standalone Statement of Profit and Lossfor the Year ended March 31, 2021

Welcome to UltraTech
Value Creation
Growth Enablers
Statutory Reports
Financial Statements
ESG Commitments
174
Ult
raTe
ch C
emen
t Li
mit
ed
175
Ann
ual R
epo
rt 2
020-
21
Standalone Statement of Changes in Equityfor the Year ended March 31, 2021
A. Equity Share Capital
For the Year ended March 31, 2021` in Crores
Balance as at April 01, 2020 Changes in Equity Share Capital during the Year Balance as at March 31, 2021
288.63 0.02 288.65
For the Year ended March 31, 2020
Balance as at April 01, 2019 Changes in Equity Share Capital during the Year Balance as at March 31, 2020
274.64 13.99 288.63
B. Other Equity
For the Year ended March 31, 2021` in Crores
Particulars
Reserves & Surplus Cash Flow
Hedge Reserve
Total Other EquityCapital
ReserveSecurities Premium
Debenture Redemption
Reserve
General Reserve
Share Option Outstanding
Reserve#
Treasury Shares@@
Retained Earnings
Balance as at April 01, 2020 170.72 5,458.65 247.50 26,830.41 35.83 (84.29) 5,372.82 (23.95) 38,007.69
Profit for the year - - - - - - 5,342.07 - 5,342.07
Other Comprehensive Income / (Loss) for the year
Remeasurement Gain / (Loss) on defined benefit plan
- - - - - - 53.74* - 53.74
Effective portion of Gains / (Loss) on hedging instruments
- - - - - - - 9.84@ 9.84
Total Comprehensive Income / (Loss) for the year
- - - - - - 5,395.81 9.84 5,405.65
Purchase of Treasury Shares - - - - - - - - -
Issue of Treasury Shares - - - - - 6.79 - - 6.79
Contribution by and Distribution to Owners
Dividends - - - - - - (374.95)## - (374.95)
Transfer from Retained Earnings - - - 4,500.00 - - (4,500.00) - -
Employees Stock Options Exercised - 11.02 - - (4.05) - - - 6.97
Employees Stock Options Granted - - - - 11.84 - - - 11.84
Total Contribution by and Distribution to Owners
- 11.02 - 4,500.00 7.79 - (4,874.95) - (356.14)
Balance as at March 31, 2021 170.72 5,469.67 247.50 31,330.41 43.62 (77.50) 5,893.68 (14.11) 43,063.99
# Net of Deferred Employees Compensation Expenses ` 11.29 Crores. @@ The Company has formed an Employee Welfare Trust for purchasing Company’s share to be allotted to eligible employees under Employees Stock
Options Scheme, 2018 (ESOS 2018). As per Ind AS 32 - Financial Instruments: Presentation, Reacquired equity shares of the Company are called Treasury Shares and deducted from equity.
* Net of Tax amounting to ` 28.87 Crores. @ Net of Deferred Tax amounting to ` 3.31 Crores.
## Dividend of ` 13/- per share
For the Year ended March 31, 2020` in Crores
Particulars
Reserves & Surplus Cash Flow
Hedge Reserve
Total Equity
Capital Reserve
Securities Premium
Debenture Redemption
Reserve
General Reserve
Share Option Outstanding
Reserve#
Treasury Shares@@
Retained Earnings
Balance as at April 01, 2019 170.72 77.97 416.27 21,830.41 23.00 (81.21) 5,211.00 (13.80) 27,634.36
Transition Impact of Ind AS 116 Leases (Refer Note 3)
- - - - - - (43.41)^ - (43.41)
Profit for the year - - - - - - 5,455.54 - 5,455.54
Other Comprehensive Income / (Loss) for the year
Remeasurement Gain / (Loss) on defined benefit plan
- - - - - - (38.52)* - (38.52)
Effective portion of Gains / (Loss) on hedging instruments
- - - - - - - (10.15)@ (10.15)
Total Comprehensive Income / (Loss) for the year
- - - - - - 5,417.02 (10.15) 5,406.87
Purchase of Treasury Shares - - - - - (3.59) - - (3.59)
Issue of Treasury Shares - - - - - 0.51 - - 0.51
Contribution by and Distribution to Owners
Dividends (includes Dividend Distribution Tax)
- - - - - - (380.56)## - (380.56)
Issue of Shares to shareholders of Century Textiles and Industries Ltd pursuant to scheme of Demerger (Note 36)
- 5,373.75 - - - - - - 5,373.75
Transfer to Retained Earnings - - (168.77) - - - 168.77 - -
Transfer from Retained Earnings - - - 5,000.00 - - (5,000.00) - -
Employees Stock Options Exercised - 6.93 - - (3.57) - - - 3.36
Employees Stock Options Granted - - - - 16.40 - - - 16.40
Total Contribution by and Distribution to Owners
- 5,380.68 (168.77) 5,000.00 12.83 - (5,211.79) - 5,012.95
Balance as at March 31, 2020 170.72 5,458.65 247.50 26,830.41 35.83 (84.29) 5,372.82 (23.95) 38,007.69
# Net of Deferred Employees Compensation Expenses ` 23.14 Crores.@@ The Company has formed an Employee Welfare Trust for purchasing Company’s share to be allotted to eligible employees under Employees Stock Options
Scheme, 2018 (ESOS 2018). As per Ind AS 32 - Financial Instruments: Presentation, Reacquired equity shares of the Company are called Treasury Shares and deducted from equity.
* Net of Tax amounting to ` 20.69 Crores.@ Net of Deferred Tax amounting to ` 0.63 Crores.^ Net of Deferred Tax amounting to ` 14.60 Crores.## Dividend of ` 11.50/- per share and including Dividend Distribution Tax of ` 64.93 Crores.
Significant Accounting Policies Note 1
Standalone Statement of Changes in Equityfor the Year ended March 31, 2021 (Continued)
The accompanying notes form an integral part of the Standalone Financial Statements.
In terms of our report attached. For and on behalf of the Board of Directors
For B S R & Co. LLPChartered AccountantsFirm Registration No: 101248W/W-100022
For Khimji Kunverji & Co LLPChartered AccountantsFirm Registration No: 105146W/W-100621
VIJAY MATHURPartnerMembership No: 46476
KETAN VIKAMSEYPartnerMembership No: 44000
ATUL DAGAWhole-time Director and CFODIN: 06416619
K. C. JHANWARManaging DirectorDIN: 01743559
Mumbai: May 07, 2021S. K. CHATTERJEECompany Secretary

Welcome to UltraTech
Value Creation
Growth Enablers
Statutory Reports
Financial Statements
ESG Commitments
176
Ult
raTe
ch C
emen
t Li
mit
ed
177
Ann
ual R
epo
rt 2
020-
21
` in Crores
ParticularsYear ended
March 31, 2021Year ended
March 31, 2020
(A) Cash Flow from Operating Activities:
Profit Before tax 7,896.07 5,219.76
Adjustments for:
Depreciation and Amortisation 2,434.35 2,454.90
Gain on Fair Valuation of Investments (419.55) (289.12)
Gain on Fair Valuation of VAT Deferment Loan (48.83) -
Provision for Exceptional item (Refer note 55) 136.57 -
Compensation Expenses under Employees Stock Options Scheme 11.84 16.40
Allowances for Credit Losses on Advances / Debts (net) (1.58) 15.32
Impairment in value of Investments 0.05 -
Bad Debts Written-off 0.35 0.83
Excess Provision written back (net) (65.34) (66.56)
Interest and Dividend Income (185.71) (280.12)
Finance Costs 1,259.08 1,704.22
(Profit) / Loss on Sale / Retirement of Property, Plant and Equipment (net) (3.96) 2.84
(Profit) on Sale of Current and Non-Current Investments (net) (154.10) (64.74)
10,859.24 8,713.73
Movements in working capital:
Increase in Trade payables and other Liabilities 2,908.16 123.62
Increase in Provisions 47.44 12.60
(Increase)/ Decrease in Trade receivables (447.46) 487.72
Decrease/(Increase) in Inventories 111.83 (46.41)
(Increase) in Financial and Other Assets (638.16) (144.90)
Cash generated from Operations 12,841.05 9,146.36
Taxes paid (net of refunds) (1,290.05) (887.57)
Net Cash generated from Operating Activities (A) 11,551.00 8,258.79
(B) Cash Flow from Investing Activities:
Purchase of Property, Plant and Equipment (1,805.62) (1,573.26)
Sale of Property, Plant and Equipment 82.17 72.37
Payment for Cost of transfer of Assets (2.71) (76.53)
Purchase/ Sale of Liquid Investment (net) 1,673.14 66.13
Purchase of Investments (12,668.00) (6,085.57)
Sale of Investments 5,427.68 3,366.07
Redemption / (Investment) in Non-Current Bank Fixed deposits 61.69 (41.72)
(Investment) / Redemption in Other Bank deposits (1,587.51) 62.53
Investment in Subsidiaries / Joint Venture and Associates (1,325.15) (6.12)
Investment in other Corporate Bodies (21.13) (4.76)
Inter Corporate Deposit repaid by Subsidiary 1,006.54 10.55
Dividend Received - 32.47
Interest Received 172.37 226.98
Net Cash used in Investing Activities (B) (8,986.53) (3,950.86)
(C) Cash Flow from Financing Activities:
Proceeds from Issue of Share Capital on Exercise of ESOS 6.99 2.74
Purchase of Treasury Shares - (3.59)
Issue of Treasury Shares 6.79 0.51
Repayment of Non-Current Borrowings (5,183.29) (3,946.10)
Standalone Statement of Cash Flowfor the Year ended March 31, 2021
` in Crores
ParticularsYear ended
March 31, 2021Year ended
March 31, 2020
Proceeds from Non-Current Borrowings 4,014.89 1,111.77
Proceeds/ (Repayment) of Current Borrowings (net) 276.94 366.39
Repayment of Principal towards Lease Liability (83.00) (74.90)
Interest Paid on Lease Liability (37.71) (37.56)
Interest Paid (1,212.76) (1,630.63)
Dividend Paid Including Dividend Distribution Tax (374.80) (379.98)
Net Cash used in Financing Activities (C) (2,585.95) (4,591.35)
Net Increase/ (Decrease) in Cash and Cash Equivalents (A + B + C) (21.48) (283.42)
Cash and Cash Equivalents at the beginning of the year 140.06 423.48
Cash and Cash Equivalents at the end of the year (Refer Note 11) 118.58 140.06
Notes:
1. The Statement of Cash flows has been prepared under the indirect method as set out in Ind AS - 7 specified under Section 133 of the Act.
2. Purchase of Property, Plant and Equipment includes movements of capital work-in-progress (including capital advances) during the year.
3. The Scheme of demerger amongst Century Textiles and Industries Limited and the Company and their respective shareholders does not involve any cash outflow and the consideration has been discharged through issue of Equity Shares during the previous year ended March 31, 2020.
4. Changes in liabilities arising from financing activities:` in Crores
ParticularsAs at
March 31, 2020Cashflows Non-Cash changes
Foreign Exchange ratesAs at
March 31, 2021
Non-Current Borrowing (including current maturities of Non-Current Borrowings)
14,328.33 (1,168.40) (71.51) 13,088.42
Current Borrowing 3,953.21 276.94 - 4,230.15
18,281.54 (891.46) (71.51) 17,318.57
ParticularsAs at
March 31, 2019Cashflows Non-Cash changes
Foreign Exchange ratesAs at
March 31, 2020
Non-Current Borrowing (including current maturities of Non-Current Borrowings)
17,049.97 (2,834.33) 112.69 14,328.33
Current Borrowing 3,586.82 366.39 - 3,953.21
20,636.79 (2,467.94) 112.69 18,281.54
5. Cashflow from Operating Activities includes ` 433.53 Crores (March 31, 2020 ` 441.79 Crores) towards short-term lease payments, payments for leases of low-value assets and variable lease payments not included in the measurement of the lease liability.
Significant Accounting Policies Note 1
The accompanying notes form an integral part of the Standalone Financial Statements.
Standalone Statement of Cash Flowfor the Year ended March 31, 2021 (Continued)
In terms of our report attached. For and on behalf of the Board of Directors
For B S R & Co. LLPChartered AccountantsFirm Registration No: 101248W/W-100022
For Khimji Kunverji & Co LLPChartered AccountantsFirm Registration No: 105146W/W-100621
VIJAY MATHURPartnerMembership No: 46476
KETAN VIKAMSEYPartnerMembership No: 44000
ATUL DAGAWhole-time Director and CFODIN: 06416619
K. C. JHANWARManaging DirectorDIN: 01743559
Mumbai: May 07, 2021S. K. CHATTERJEECompany Secretary

Welcome to UltraTech
Value Creation
Growth Enablers
Statutory Reports
Financial Statements
ESG Commitments
178
Ult
raTe
ch C
emen
t Li
mit
ed
179
Ann
ual R
epo
rt 2
020-
21
Notes to the Standalone Financial Statements for the year ended March 31, 2021
Note 1: Company Overview and Significant Accounting Policies:
1 (A) Company Overview
UltraTech Cement Limited (“the Company”) is a Public Limited Company incorporated in India having its registered office at Mumbai, Maharashtra, India. The Company is engaged in the manufacture and sale of Cement and Cement related products. The Company’s shares are listed on the Bombay Stock Exchange (BSE), India, and the National Stock Exchange (NSE), India, Global Depository Receipts are listed on the Luxembourg Stock Exchange and Bonds are listed on the Singapore Exchange Securities Trading Limited.
1 (B) Significant Accounting Policies
(a) Statement of Compliance
These standalone financial statements (hereinafter referred to as “financial statements”) are prepared in accordance with the Indian Accounting Standards (“Ind AS”) as per the Companies (Indian Accounting Standards) Rules, 2015 notified under Section 133 of Companies Act, 2013 (“the Act’’), amendments thereto and other relevant provisions of the Act and guidelines issued by the Securities and Exchange Board of India (“SEBI”), as applicable.
The financial statements were authorised for issue by the Board of Directors of the Company at their meeting held on May 07, 2021.
(b) Basis of Preparation and Presentation:
Basis of Preparation
The financial statements have been prepared on a historical cost basis, except for the following assets and liabilities:
(i) Derivative Financial Instruments measured at fair value
(ii) Certain financial assets and liabilities measured at fair value (refer accounting policy regarding financial instruments)
(iii) Assets held for disposal – measured at the lower of its carrying amount and fair value less costs to sell
(iv) Employee’s Defined Benefit Plan as per actuarial valuation.
(v) Assets and liabilities acquired under Business Combination measured at fair value; and
(vi) Employee share based payments measured at fair value.
Fair value is the price that would be received to sell an asset or paid to transfer a liability in an orderly transaction between market participants at the measurement date under current market conditions, regardless of whether that price is directly observable or estimated using another valuation technique. In determining the fair value of an asset or a liability, the Company takes into account the characteristics of the asset or liability if market participants would take those characteristics into account when pricing the asset or liability at the measurement date.
Functional and Presentation Currency
(i) The financial statements are presented in Indian Rupees, which is the functional currency of the Company and the currency of the primary economic environment in which the Company operates.
(ii) Figures less than ` 50,000 have been shown at actual, wherever statutorily required to be disclosed, all other figures have been rounded off to the nearest ` in lakhs, unless otherwise stated.
Classification of Assets and Liabilities into Current/Non-Current
The Company has ascertained its operating cycle as twelve months for the purpose of Current / Non-Current classification of its Assets and Liabilities.
For the purpose of Balance Sheet, an asset is classified as current if:
(i) It is expected to be realised, or is intended to be sold or consumed, in the normal operating cycle; or
(ii) It is held primarily for the purpose of trading; or
(iii) It is expected to realise the asset within twelve months after the reporting period; or
Notes to the Standalone Financial Statementsfor the year ended March 31, 2021 (Continued)
(iv) The asset is a cash or cash equivalent unless it is restricted from being exchanged or used to settle a liability for at least twelve months after the reporting period.
All other assets are classified as non-current.
Similarly, a liability is classified as current if:
(i) It is expected to be settled in the normal operating cycle; or
(ii) It is held primarily for the purpose of trading; or
(iii) It is due to be settled within twelve months after the reporting period; or
(iv) The Company does not have an unconditional right to defer the settlement of the liability for at least twelve months after the reporting period. Terms of a liability that could result in its settlement by the issue of equity instruments at the option of the counterparty does not affect this classification.
All other liabilities are classified as non-current.
Deferred tax assets and liabilities are classified as non-current only.
(c) Property, Plant and Equipment (PPE):
The initial cost of PPE comprises its purchase price net of any trade discounts and rebates, including import duties and non-refundable purchase taxes, and any directly attributable costs of bringing an asset to working condition and location for its intended use, including relevant borrowing costs and any expected costs of decommissioning.
Subsequent costs are included in the asset’s carrying amount or recognized as a separate asset, as appropriate, only when it is probable that future economic benefits associated with the item will flow to the Company and the cost of the item can be measured reliably. All other repairs and maintenance cost are charged to the Statement of Profit and Loss during the period in which they were incurred.
If significant parts of an item of PPE have different useful lives, then they are accounted for as separate items (major components) of PPE.
Material items such as spare parts, stand-by equipment and service equipment are classified as
PPE when they meet the definition of PPE as specified in Ind AS 16 – Property, Plant and Equipment.
Any gain or loss on disposal of an item of PPE is recognised in the Statement of Profit and Loss.
PPE except freehold land are stated at their cost of acquisition/installation or construction net of accumulated depreciation, and impairment losses, if any. Freehold land is stated at cost less impairment losses, if any.
Expenditure during construction period:
Expenditure/ Income during construction period (including financing cost related to borrowed funds for construction or acquisition of qualifying PPE) is included under Capital Work-in-Progress, and the same is allocated to the respective PPE on the completion of their construction. Advances given towards acquisition or construction of PPE outstanding at each reporting date are disclosed as Capital Advances under “Other non-current Assets”.
(d) Depreciation:
Depreciation is the systematic allocation of the depreciable amount of PPE over its useful life and is provided on a straight-line basis over the useful lives as prescribed in Schedule II to the Act or as per technical assessment. Freehold Land with indefinite life is not depreciated.
Depreciable amount for PPE is the cost of PPE less its estimated residual value. The useful life of PPE is the period over which PPE is expected to be available for use by the Company, or the number of production or similar units expected to be obtained from the asset by the Company.
In case of certain classes of PPE, the Company uses different useful lives than those prescribed in Schedule II to the Act. The useful lives have been assessed based on technical advice, taking into account the nature of the PPE and the estimated usage of the asset on the basis of management’s best estimation of obtaining economic benefits from those classes of assets. The estimated useful life is reviewed periodically, with the effect of any changes in estimate being accounted for on a prospective basis.

Welcome to UltraTech
Value Creation
Growth Enablers
Statutory Reports
Financial Statements
ESG Commitments
180
Ult
raTe
ch C
emen
t Li
mit
ed
181
Ann
ual R
epo
rt 2
020-
21
Such classes of assets and their estimated useful lives are as under:
No Nature Estimated Useful life
1 Buildings 3-60 Years
2 Plant & Equipment 8-50 Years
3 Railway Siding 4-30 Years
4 Leasehold Land Over the lease agreement
5 Office Equipment 4-7 Years
6 Furniture and Fixtures 7-12 Years
7 Mobile Phones 3 Years
8 Company Vehicles (other than those provided to the employees)
5-12 Years
9 Motor Cars given to the employees as per the Company’s Scheme
4-5 Years
10 Servers and Networks 3 Years
11 Stores and Spares in the nature of PPE
8-30 Years
12 Assets individually costing less than or equal to Rs.10,000
Fully Depreciated in the year of purchase
Depreciation on additions is provided on a pro-rata basis from the month of installation or acquisition and in case of Projects from the date of commencement of commercial production. Depreciation on deductions/disposals is provided on a pro-rata basis up to the month preceding the month of deduction/disposal.
(e) Intangible Assets and Amortisation:
• Internally generated Intangible Assets:
Expenditure pertaining to research is expensed out as and when incurred. Expenditure incurred on development is capitalised if such expenditure leads to creation of an asset, otherwise such expenditure is charged to the Statement of Profit and Loss.
• Intangible Assets acquired separately:
Intangible assets with finite useful lives that are acquired separately are carried at cost less accumulated amortisation and accumulated impairment loss, if any. Cost comprises the
purchase price (net of tax / duty credits availed wherever applicable) and any directly attributable cost of bringing the assets to its working condition for its intended use. The Company determines the amortisation period as the period over which the future economic benefits will flow to the Company after taking into account all relevant facts and circumstances. The estimated useful life and amortisation method are reviewed periodically, with the effect of any changes in estimate being accounted for on a prospective basis.
• Class of intangible assets and their estimated useful lives / basis of amortisation are as under:
No Nature Estimated Useful life / Basis of amortization
1 Jetty Rights Over the period of the relevant agreement such that the cumulative amortisation is not less than the cumulative rebate availed by the Company.
2 Mining Rights Over the period of the respective mining agreement
3 Mining Reserve On the basis of mineral material extraction (proportion of mineral material extracted per annum to total estimated mining reserve)
4 Software 3 Years
5 Brand Rights 18 months
An intangible asset is derecognised on disposal, or when no future economic benefits are expected from its use or disposal. Gains or losses arising from derecognition of an item of intangible asset are measured as the difference between the net disposal proceeds and the carrying amount of such item of intangible asset and are recognised in the Statement of Profit and Loss when the asset is derecognised.
(f) Non-current assets (or disposal groups) classified as held for sale:
The Company classifies non-current assets as held for sale if their carrying amounts will be recovered principally through a sale transaction rather than through continuing use. This condition is regarded as met only when the asset is available for immediate
Notes to the Standalone Financial Statementsfor the year ended March 31, 2021 (Continued)
sale in its present condition subject only to terms that are usual and customary for sales of such asset and its sale is highly
probable. Such assets or group of assets / liabilities are presented separately in the Balance Sheet, in the line “Assets / Disposal groups held for sale” and “Liabilities included in disposal group held for sale” respectively. Once classified as held for sale, intangible assets and PPE are no longer amortised or depreciated.
Such assets or disposal groups held for sale are stated at the lower of carrying amount and fair value less costs to sell.
(g) Impairment of Non-Financial Assets
At the end of each reporting period, the Company reviews the carrying amounts of non-financial assets to determine whether there is any indication that those assets have suffered an impairment loss. If any such indication exists, the recoverable amount of the asset is estimated in order to determine the extent of the impairment loss (if any). When it is not possible to estimate the recoverable amount of an individual asset, the Company estimates the recoverable amount of the cash-generating unit to which the asset belongs. When a reasonable and consistent basis of allocation can be identified, corporate assets are also allocated to individual cash-generating units, or otherwise they are allocated to the smallest group of cash-generating units for which a reasonable and consistent allocation basis can be identified.
Intangible assets with indefinite useful lives and intangible assets not yet available for use are tested for impairment at least annually, and whenever there is an indication that the asset may be impaired.
Recoverable amount is the higher of fair value less costs of disposal and value in use. In assessing value in use, the estimated future cash flows are discounted to their present value using a pre-tax discount rate that reflects current market assessments of the time value of money and the risks specific to the asset for which the estimates of future cash flows have not been adjusted.
If the recoverable amount of an asset (or cash-generating unit) is estimated to be less than its carrying amount, the carrying amount of the asset (or
cash-generating unit) is reduced to its recoverable amount. An impairment loss is recognised immediately in Statement of Profit and Loss.
When an impairment loss subsequently reverses, the carrying amount of the asset (or a cash-generating unit) is increased to the revised estimate of its recoverable amount, but so that the increased carrying amount does not exceed the carrying amount that would have been determined had no impairment loss been recognised for the asset (or cash-generating unit) in prior years. A reversal of an impairment loss is recognised immediately in the Statement of Profit and Loss.
(h) Inventories:
Inventories are valued as follows:
• Raw materials, fuel, stores & spares and packing materials:
Valued at lower of cost and net realisable value (NRV). However, these items are considered to be realisable at cost, if the finished products, in which they will be used, are expected to be sold at or above cost. Cost is determined on weighted average basis which includes expenditure incurred for acquiring inventories like purchase price, import duties, taxes (net of tax credit) and other costs incurred in bringing the inventories to their present location and condition
• Work-in- progress (WIP), finished goods, stock-in-trade and trial run inventories:
Valued at lower of cost and NRV. Cost of Finished goods and WIP includes cost of raw materials, cost of conversion and other costs incurred in bringing the inventories to their present location and condition. Cost of Stock-in Trade includes cost of purchase and other costs incurred in bringing the inventories to the present location and condition. Cost of inventories is computed on weighted average basis.
• Waste / Scrap:
Waste / Scrap inventory is valued at NRV.
Net realisable value is the estimated selling price in the ordinary course of business, less the estimated costs of completion and the estimated costs necessary to make the sale.
Notes to the Standalone Financial Statementsfor the year ended March 31, 2021 (Continued)

Welcome to UltraTech
Value Creation
Growth Enablers
Statutory Reports
Financial Statements
ESG Commitments
182
Ult
raTe
ch C
emen
t Li
mit
ed
183
Ann
ual R
epo
rt 2
020-
21
(i) Employee Share based payments:
Equity- settled share-based payments to employees are measured at the fair value of the employee stock options at the grant date using an appropriate valuation model.
The fair value determined at the grant date of the equity-settled share-based payments is amortised over the vesting period, based on the Company’s estimate of equity instruments that will eventually vest, with a corresponding increase in equity.
At the end of each reporting period, the Company revises its estimate of the number of equity instruments expected to vest. The impact of the revision of the original estimates, if any, is recognised in the Statement of Profit and Loss such that the cumulative expense reflects the revised estimate, with a corresponding adjustment to the equity-settled employee benefits reserve.
For Stock Appreciation Rights (“SARs”) which are cash-settled share-based payments, the fair value of liability is recognised for the services acquired over the period that the employees unconditionally become entitled to the payment. At the end of each reporting period until the liability is settled, and at the date of settlement, the liability is re-measured based on the fair value of the SAR’s and any changes in fair value of the liability are recognised in the Statement of Profit and Loss.
(j) Treasury Shares:
The Company has formed an Employee Welfare Trust for purchasing the Company’s shares to be allotted to eligible employees under Employee Stock Options Scheme, 2018. The Company has considered the said Employee Welfare Trust as its extension and shares held by the Trust is treated as Treasury Shares. As per Ind AS 32, the consideration paid for treasury shares including any directly attributable incremental cost is presented as a deduction from total equity, until they are cancelled, sold or reissued.
(k) Borrowing Costs:
General and specific borrowing costs that are attributable to the acquisition, construction or production of a qualifying asset are capitalised as part of the cost of such asset till such time the asset
is ready for its intended use and borrowing costs are being incurred. A qualifying asset is an asset that necessarily takes a substantial period of time to get ready for its intended use. All other borrowing costs are recognised as an expense in the period in which they are incurred.
Borrowing cost includes interest expense, amortization of discounts, hedge related cost incurred in connection with foreign currency borrowings, ancillary costs incurred in connection with borrowing of funds and exchange difference arising from foreign currency borrowings to the extent they are regarded as an adjustment to the Interest cost.
(l) Government Grants:
Government grants, related to assets, are recognised in the Statement of Profit and Loss on a systematic basis over the periods in which the Company recognises the related costs for which the grants are intended to compensate.
Government grants related to income under State Investment Promotion Scheme linked with VAT / GST payment, are recognised in the Statement of Profit and Loss in the period in which they become receivable.
Government grants are not recognised until there is reasonable assurance that the Company will comply with the conditions attached to them and that the grants will be received.
The benefit of a government loan at a below-market rate of interest is treated as a government grant, measured as the difference between proceeds received and the fair value of the loan based on prevailing market interest rates and is being recognised in the Statement of Profit and Loss.
(m) Provisions, Contingent Liabilities and Contingent Assets:
Provisions are recognised when the Company has a present obligation (legal or constructive) as a result of a past event and it is probable that an outflow of resources, that can be reliably estimated, will be required to settle such an obligation.
If the effect of the time value of money is material, provisions are determined by discounting the expected future cash flows to net present value using
Notes to the Standalone Financial Statementsfor the year ended March 31, 2021 (Continued)
an appropriate pre-tax discount rate that reflects current market assessments of the time value of money and, where appropriate, the risks specific to the liability. Unwinding of the discount is recognised in the Statement of Profit and Loss as a finance cost. Provisions are reviewed at each reporting date and are adjusted to reflect the current best estimate.
A present obligation that arises from past events where it is either not probable that an outflow of resources will be required to settle or a reliable estimate of the amount cannot be made, is disclosed as a contingent liability. Contingent liabilities are also disclosed when there is a possible obligation arising from past events, the existence of which will be confirmed only by the occurrence or non-occurrence of one or more uncertain future events not wholly within the control of the Company.
Claims against the Company where the possibility of any outflow of resources in settlement is remote, are not disclosed as contingent liabilities.
Contingent assets are not recognised in financial statements since this may result in the recognition of income that may never be realised. However, when the realisation of income is virtually certain, then the related asset is not a contingent asset and is recognised. A contingent asset is disclosed, in financial statements, where an inflow of economic benefits is probable.
(n) Mines Restoration Provision:
An obligation for restoration, rehabilitation and environmental costs arises when environmental disturbance is caused by the development or ongoing extraction from mines. Costs arising from restoration at closure of the mines and other site preparation work are provided for based on their discounted net present value, with a corresponding amount being capitalised at the start of each project. The amount provided for is recognised, as soon as the obligation to incur such costs arises. These costs are charged to the Statement of Profit and Loss over the life of the operation through the depreciation of the asset and the unwinding of the discount on the provision. The costs are reviewed periodically and are adjusted to reflect known developments which may have an impact on the cost or life of operations. The cost of the related asset is adjusted for changes
in the provision due to factors such as updated cost estimates, new disturbance and revisions to discount rates. The adjusted cost of the asset is depreciated prospectively over the lives of the assets to which they relate. The unwinding of the discount is shown as a finance cost in the Statement of Profit and Loss.
(o) Revenue Recognition:
(i) Revenue from Contracts with Customers
• Revenue is recognized on the basis of approved contracts regarding the transfer of goods or services to a customer for an amount that reflects the consideration to which the entity expects to be entitled in exchange for those goods or services.
• Revenue is measured at the fair value of consideration received or receivable taking into account the amount of discounts, incentives, volume rebates, and outgoing taxes on sales. Any amounts receivable from the customer are recognised as revenue after the control over the goods sold are transferred to the customer which is generally on dispatch/delivery of goods.
• Variable consideration - This includes incentives, volume rebates, discounts etc. It is estimated at contract inception considering the terms of various schemes with customers and constrained until it is highly probable that a significant revenue reversal in the amount of cumulative revenue recognised will not occur when the associated uncertainty with the variable consideration is subsequently resolved. It is reassessed at end of each reporting period.
• Significant financing component - Generally, the Company receives short-term advances from its customers. Using the practical expedient in Ind AS 115, the Company does not adjust the promised amount of consideration for the effects of a significant financing component if it expects, at contract inception, that the period between the transfer of the promised good or service to the customer and when the customer pays for that good or service will be one year or less.
Notes to the Standalone Financial Statementsfor the year ended March 31, 2021 (Continued)

Welcome to UltraTech
Value Creation
Growth Enablers
Statutory Reports
Financial Statements
ESG Commitments
184
Ult
raTe
ch C
emen
t Li
mit
ed
185
Ann
ual R
epo
rt 2
020-
21
(ii) Dividend income is accounted for when the right to receive the income is established.
(iii) Interest income is recognised using the Effective Interest Method.
(p) Lease :
The Company assesses whether a contract contains a lease, at the inception of the contract. A contract is, or contains, a lease if the contract conveys the right to control the use of an identified asset for a period of time in exchange for consideration. To assess whether a contract conveys the right to control the use of an identified asset, the Company assesses whether
(i) the contract involves the use of identified asset;
(ii) the Company has substantially all of the economic benefits from the use of the asset through the period of lease and;
(iii) the Company has the right to direct the use of the asset.
As a lessee
The Company recognizes a right-of-use asset (“ROU”) and a lease liability at the lease commencement date. The ROU is initially measured at cost, which comprises the initial amount of the lease liability adjusted for any lease payments made at or before the commencement date, plus any initial direct costs incurred and an estimate of costs to dismantle and remove the underlying asset or to restore the underlying asset or the site on which it is located, less any lease incentives received.
Certain lease arrangements include the option to extend or terminate the lease before the end of the lease term. The right-of-use assets and lease liabilities include these options when it is reasonably certain that the option will be exercised.
The ROU is subsequently depreciated using the straight-line method from the commencement date to the end of the lease term.
The lease liability is initially measured at the present value of the lease payments that are not paid at the commencement date, discounted using the interest rate implicit in the lease or, if that rate cannot be readily determined, the company’s incremental
borrowing rate. Generally, the Company uses its incremental borrowing rate as the discount rate.
Lease payments included in the measurement of the lease liability comprises fixed payments, including in-substance fixed payments, amounts expected to be payable under a residual value guarantee and the exercise price under a purchase option that the Company is reasonably certain to exercise, lease payments in an optional renewal period if the Company is reasonably certain to exercise an extension option.
The lease liability is subsequently measured at amortised cost using the effective interest method, except those which are payable other than functional currency which is measured at fair value through profit or loss. It is remeasured when there is a change in future lease payments arising from a change in an index or rate, if there is a change in the company’s estimate of the amount expected to be payable under a residual value guarantee, or if company changes its assessment of whether it will exercise a purchase, extension or termination option.
When the lease liability is remeasured in this way, a corresponding adjustment is made to the carrying amount of the ROU, or is recorded in Statement of Profit or Loss if the carrying amount of the ROU has been reduced to zero.
Lease Liabilities have been presented in ‘Other Financial Liabilities’ and the ‘ROU’ have been presented separately in the Balance Sheet. Lease payments have been classified as financing activities in the Statement of Cash Flows.
Short-term leases and leases of low-value assets
The Company has elected not to recognise ROU and lease liabilities for short term leases that have a lease term of 12 months or lower and leases of low value assets. The Company recognises the lease payments associated with these leases as an expense over the lease term. The related cash flows are classified as Operating activities in the Statement of Cash Flows.
As a lessor
When the Company is an intermediate lessor, it accounts for its interests in the head lease and the sublease separately. The sublease is classified as a
Notes to the Standalone Financial Statementsfor the year ended March 31, 2021 (Continued)
finance or operating lease by reference to the right of use asset arising from the head lease.
(q) Employee benefits:
Defined Benefit Plans:
For defined benefit plans, the cost of providing benefits is determined using the Projected Unit Credit Method, with actuarial valuations being carried out by a qualified independent actuary at the end of each annual reporting period. Re-measurement, comprising actuarial gains and losses, the effect of the changes to the asset ceiling (if applicable) and the return on plan assets (excluding net interest), is reflected immediately in the Balance Sheet with a charge or credit recognised in Other Comprehensive Income (OCI) in the period in which they occur. Past service cost, both vested and unvested, is recognised as an expense on the plan amendment or when the curtailment or settlement occurs. The gain or loss on curtailment or settlement, is recognized immediately in the profit or loss account when the plan amendment or when a curtailment or settlement occurs.
The retirement benefit obligations recognised in the balance sheet represents the present value of the defined benefit obligations reduced by the fair value of scheme assets. Any asset resulting from this calculation is limited to the present value of available refunds and reductions in future contributions to the scheme. The Company provides benefits such as gratuity, pension and provident fund to its employees which are treated as defined benefit plans.
Defined contribution plans:
Contributions to defined contribution plans are recognised as expense when employees have rendered services entitling them to such benefits. The Company provides benefits such as superannuation, provident fund (other than Company managed fund) to its employees which are treated as defined contribution plans.
Gratuity
The gratuity, a defined benefit plan, payable to the employees is the based on the Employees’ service and last drawn salary at the time of the leaving of the
services of the Company and is in accordance with the Rules of the Company for payment of Gratuity. Past service cost is recognised in the Statement of Profit and Loss in the period of a plan amendment. Interest is calculated by applying the discount rate at the beginning of the period to the net defined benefit liability or asset and is recognised in the Statement of Profit and Loss. Defined benefit costs are categorised as follows:
service cost (including current service cost, past service cost, as well as gains and losses on curtailments and settlements); net interest expense or income; and re-measurement
The present value of the defined benefit plan liability is calculated using a discount rate which is determined by reference to market yields at the end of the reporting period on government bonds.
The defined benefit obligation recognised in the Balance Sheet represents the actual deficit or surplus in the Company’s defined benefit plans. Any surplus resulting from this calculation is limited to the present value of any economic benefits available in the form of refunds from the plans or reductions in future contributions to the plans.
Superannuation
Certain employees of the Company are eligible for participation in defined contribution plans such superannuation and national pension fund. Contributions towards these funds are recognized as an expense periodically based on the contribution by the Company, since Company has no further obligation beyond its periodic contribution.
Provident Fund
The eligible employees of the Company are entitled to receive benefits in respect of provident fund, which is a defined benefit plan, for which both the employees and the Company make monthly contributions at a specified percentage of the covered employees’ salary. The contributions as specified under the law are made to the approved provident fund which is set up by the Company. The Company is liable for annual contributions and any shortfall in the fund assets based on the government specified minimum rates of return and recognises such contributions and shortfall, if any, as an expense in the year incurred.
Notes to the Standalone Financial Statementsfor the year ended March 31, 2021 (Continued)

Welcome to UltraTech
Value Creation
Growth Enablers
Statutory Reports
Financial Statements
ESG Commitments
186
Ult
raTe
ch C
emen
t Li
mit
ed
187
Ann
ual R
epo
rt 2
020-
21
Other employee benefits
A liability is recognised for benefits accruing to employees in respect of wages and salaries, annual leave and sick leave in the period the related service is rendered.
Liabilities recognised in respect of short-term employee benefits are measured at the undiscounted amount of the benefits expected to be paid in exchange for the related service.
Liabilities recognised in respect of other long-term employee benefits are measured using the projected unit credit method by a qualified independent actuary at the end of each annual reporting period, at the present value of the estimated future cash outflows expected to be made by the Company in respect of services provided by employees up to the reporting date. With reference to some employees, liability of other fixed long-term employee benefits is recognised at the present value of the future cash outflows expected to be made by the Company.
Remeasurement gains / losses are recognised in the Statement of Profit and Loss in the period in which they arise.
(r) Income Taxes:
Income Tax expenses comprise current tax and deferred tax charge or credit.
Current Tax is measured on the basis of estimated taxable income for the current accounting period in accordance with the applicable tax rates and the provisions of the Income-tax Act, 1961 and other applicable tax laws.
Deferred tax liabilities are recognised for taxable temporary differences and deferred tax asset are recognised for deductible temporary differences, carry forward of unused tax losses, carry forward of unused tax credits at the reporting date. Deferred tax assets and liabilities are measured at the tax rates that are expected to be applied to the taxable temporary differences when they reverse, based on the laws that have been enacted or substantively enacted at the reporting date. Tax relating to items recognised directly in equity or OCI is recognised in equity or OCI and not in the Statement of Profit and Loss. Minimum Alternate Tax (MAT) Credits are in the
form of unused tax credits that are carried forward by the Company for a specified period of time, hence it is grouped with Deferred Tax Asset. MAT is recognised as an asset only when and to the extent there is convincing evidence that the Company will pay normal income tax during the specified period.
Current tax assets and current tax liabilities are offset when there is a legally enforceable right to set off the recognised amounts and there is an intention to settle the asset and the liability on a net basis. Deferred tax assets and deferred tax liabilities are offset when there is a legally enforceable right to set off current tax assets against current tax liabilities; and the deferred tax assets and the deferred tax liabilities relate to income taxes levied by the same taxation authority.
A deferred tax asset is recognised to the extent that it is probable that future taxable profits will be available against which the temporary difference can be utilized except:
a) When the deferred tax asset relating to the deductible temporary difference arises from the initial recognition of an asset or liability in a transaction that is not a business combination and, at the time of the transaction, affects neither the accounting profit nor taxable profit or loss; and
b) In respect of deductible temporary differences associated with investments in subsidiaries, associates and interests in joint ventures, deferred tax assets are recognised only to the extent that it is probable that the temporary differences will reverse in the foreseeable future and taxable profit will be available against which the temporary differences can be utilised.
Deferred tax assets are reviewed at each reporting date and are recognised / reduced to the extent that it is probable / no longer probable respectively that the related tax benefit will be realised.
The Government of India, on September 20, 2019, vide the Taxation Laws (Amendment) Ordinance 2019, inserted a new Section 115BAA in the Income Tax Act, 1961, which provides an option to the Company for paying Income Tax at reduced rates as per the provisions/conditions defined in the said section. The Company is continuing with higher income tax rate
Notes to the Standalone Financial Statementsfor the year ended March 31, 2021 (Continued)
option, based on the available outstanding MAT credit entitlement and different exemptions and deduction enjoyed by the Company. However, the Company has estimated and applied the lower income tax rate on the deferred tax assets / liabilities to the extent these are expected to be realized or settled in the future period when the Company may be subjected to lower tax rate.
(s) Earnings Per Share:
Basic Earnings Per Share (“EPS”) is computed by dividing the net profit / (loss) after tax for the year attributable to the equity shareholders by the weighted average number of equity shares outstanding during the year. The weighted average number of equity shares outstanding during the year is adjusted for treasury shares.
For the purpose of calculating diluted earnings per share, net profit / (loss) after tax for the year attributable to the equity shareholders is divided by the weighted average number of equity shares which could have been issued on the conversion of all dilutive potential equity shares and is adjusted for the treasury shares held by the Company to satisfy the exercise of the share options by the employees.
(t) Foreign Currency transactions:
Transactions in currencies other than the Company’s functional currency (i.e. foreign currencies) are recognised at the rates of exchange prevailing at the dates of the transactions. At the end of each reporting period, monetary items denominated in foreign currencies are translated at the rates prevailing at that date. Non-monetary items carried at fair value that are denominated in foreign currencies are translated at the rates prevailing at the date when the fair value was determined. Non-monetary items that are measured in terms of historical cost in a foreign currency are translated using the exchange rate as at the date of initial transactions.
Exchange differences on monetary items are recognised in the Statement of Profit and Loss in the period in which they arise except for:
• exchange differences on foreign currency borrowings relating to assets under construction for future productive use, which are included in
the cost of those assets when they are regarded as an adjustment to interest costs on those foreign currency borrowings;
• exchange differences relating to qualifying effective cash flow hedges and qualifying net investment hedges in foreign operations which are recognised in OCI.
(u) Investment in Subsidiaries, Associates and Joint Ventures:
The Company’s investment in its subsidiaries, associates and Joint Ventures are carried at cost net of accumulated impairment loss, if any.
On disposal of the Investment, the difference between the net disposal proceeds and the carrying amount is charged or credited to the Statement of Profit and Loss.
(v) Financial Instruments:
A Financial Instrument is any contract that gives rise to a financial asset of one entity and a financial liability or equity instrument of another entity. Financial assets and financial liabilities are recognised when a Company becomes a party to the contractual provisions of the instruments.
Initial Recognition:
Financial assets and financial liabilities are initially measured at fair value. Transaction costs that are directly attributable to the acquisition or issue of financial assets and financial liabilities (other than financial assets and financial liabilities at fair value through profit or loss and ancillary costs related to borrowings) are added to or deducted from the fair value of the financial assets or financial liabilities, as appropriate, on initial recognition. Transaction costs directly attributable to the acquisition of financial assets or financial liabilities at fair value through profit or loss are charged to the Statement of Profit and Loss over the tenure of the financial assets or financial liabilities.
Classification and Subsequent Measurement: Financial Assets
The Company classifies financial assets as subsequently measured at amortised cost, Fair Value
Notes to the Standalone Financial Statementsfor the year ended March 31, 2021 (Continued)

Welcome to UltraTech
Value Creation
Growth Enablers
Statutory Reports
Financial Statements
ESG Commitments
188
Ult
raTe
ch C
emen
t Li
mit
ed
189
Ann
ual R
epo
rt 2
020-
21
through Other Comprehensive Income (“FVOCI”) or Fair Value through Profit or Loss (“FVTPL”) on the basis of following:
• the entity’s business model for managing the financial assets and
• the contractual cash flow characteristics of the financial asset.
Amortised Cost:
A financial asset shall be classified and measured at amortised cost if both of the following conditions are met:
• the financial asset is held within a business model whose objective is to hold financial assets in order to collect contractual cash flows and
• the contractual terms of the financial asset give rise on specified dates to cash flows that are solely payments of principal and interest on the principal amount outstanding.
In case of financial assets classified and measured at amortised cost, any interest income, foreign exchange gains or losses and impairment are recognised in the Statement of Profit and Loss.
Fair Value through OCI:
A financial asset shall be classified and measured at fair value through OCI if both of the following conditions are met:
• the financial asset is held within a business model whose objective is achieved by both collecting contractual cash flows and selling financial assets and
• the contractual terms of the financial asset give rise on specified dates to cash flows that are solely payments of principal and interest on the principal amount outstanding.
Fair Value through Profit or Loss:
A financial asset shall be classified and measured at fair value through profit or loss unless it is measured at amortised cost or at fair value through OCI.
All recognised financial assets are subsequently measured in their entirety at either amortised cost
or fair value, depending on the classification of the financial assets.
For financial assets at FVTPL, net gains or losses, including any interest or dividend income, are recognised in the Statement of Profit and Loss.
Classification and Subsequent Measurement: Financial liabilities
Financial liabilities are classified as either financial liabilities at FVTPL or ‘other financial liabilities’.
Financial Liabilities at FVTPL:
Financial liabilities are classified as at FVTPL when the financial liability is held for trading or is a derivative (except for effective hedge) or are designated upon initial recognition as FVTPL:
Gains or Losses, including any interest expense on liabilities held for trading are recognised in the Statement of Profit and Loss.
Other Financial Liabilities:
Other financial liabilities (including borrowings and trade and other payables) are subsequently measured at amortised cost using the effective interest method.
The effective interest rate is the rate that exactly discounts estimated future cash payments (including all fees and points paid or received that form an integral part of the effective interest rate, transaction costs and other premiums or discounts) through the expected life of the financial liability, or (where appropriate) a shorter period, to the amortised cost on initial recognition.
Interest expense (based on the effective interest method), foreign exchange gains and losses, and any gain or loss on derecognition is recognised in the Statement of Profit and Loss.
Impairment of financial assets:
Expected credit losses are recognized for all financial assets subsequent to initial recognition other than financials assets in FVTPL category. For financial assets other than trade receivables, as per Ind AS 109, the Company recognises 12 month expected credit losses for all originated or acquired financial
Notes to the Standalone Financial Statementsfor the year ended March 31, 2021 (Continued)
assets if at the reporting date the credit risk of the financial asset has not increased significantly since its initial recognition. The expected credit losses are measured as lifetime expected credit losses if the credit risk on financial asset increases significantly since its initial recognition.
The Company’s trade receivables do not contain significant financing component and as per simplified approach, loss allowances on trade receivables are measured using provision matrix at an amount equal to life time expected losses i.e. expected cash shortfall.
The impairment losses and reversals are recognised in Statement of Profit and Loss.
Derecognition of financial assets and financial liabilities:
The Company derecognises a financial asset when the contractual rights to the cash flows from the asset expire, or when it transfers the financial asset and substantially all the risks and rewards of ownership of the asset to another party. If the Company neither transfers nor retains substantially all the risks and rewards of ownership and continues to control the transferred asset, the Company recognises its retained interest in the asset and an associated liability for amounts it may have to pay. If the Company retains substantially all the risks and rewards of ownership of a transferred financial asset, the Company continues to recognise the financial asset and also recognises an associated liability for amounts it has to pay.
On derecognition of a financial asset, the difference between the asset’s carrying amount and the sum of the consideration received and receivable and the cumulative gain or loss that had been recognised in OCI and accumulated in equity is recognised in the Statement of Profit and Loss.
The Company de-recognises financial liabilities when and only when, the Company’s obligations are discharged, cancelled or have expired. The difference between the carrying amount of the financial liability de-recognised and the consideration paid and payable is recognised in the Statement of Profit and Loss.
Financial Guarantee Contract Liabilities
Financial Guarantee Contract Liabilities are disclosed in financial statements in accordance with Ind AS 37 – Provisions, Contingent Liabilities and Contingent Assets.
(w) Cash and cash equivalents:
Cash and cash equivalents in the Balance Sheet comprise cash at bank and in hand and short-term deposits with banks that are readily convertible into cash which are subject to insignificant risk of changes in value and are held for the purpose of meeting short-term cash commitments.
(x) Financial liabilities and equity instruments:
• Classification as debt or equity
Debt and equity instruments issued by the Company are classified as either financial liabilities or as equity in accordance with the substance of the contractual arrangements and the definitions of a financial liability and an equity instrument.
• Equity instruments
An equity instrument is any contract that evidences a residual interest in the assets of an entity after deducting all of its liabilities. Equity instruments issued by a Company are recognised at the proceeds received.
(y) Derivative financial instruments:
The Company enters into derivative financial instruments viz. foreign exchange forward contracts, interest rate swaps and cross currency swaps to manage its exposure to interest rate, foreign exchange rate risks and commodity prices. The Company does not hold derivative financial instruments for speculative purposes.
Derivatives are initially recognised at fair value at the date the derivative contracts are entered into and are subsequently remeasured to their fair value at the end of each reporting period. The resulting gain or loss is recognised in profit or loss immediately excluding derivatives designated as cashflow hedge.
Notes to the Standalone Financial Statementsfor the year ended March 31, 2021 (Continued)

Welcome to UltraTech
Value Creation
Growth Enablers
Statutory Reports
Financial Statements
ESG Commitments
190
Ult
raTe
ch C
emen
t Li
mit
ed
191
Ann
ual R
epo
rt 2
020-
21
(z) Hedge accounting:
The Company designates certain hedging instruments in respect of foreign currency risk, interest rate risk and commodity price risk as cash flow hedges. At the inception of the hedge relationship, the entity documents the relationship between the hedging instrument and the hedged item, along with its risk management objectives and its strategy for undertaking various hedge transactions. Furthermore, at the inception of the hedge and on an ongoing basis, the Company documents whether the hedging instrument is highly effective in offsetting changes in fair values or cash flows of the hedged item attributable to the hedged risk.
The effective portion of changes in the fair value of the designated portion of derivatives that qualify as cash flow hedges is recognised in OCI and accumulated under equity. The gain or loss relating to the ineffective portion is recognised immediately in the statement of profit and loss.
Amounts previously recognised in OCI and accumulated in equity relating to effective portion as described above are reclassified to Statement of Profit and Loss in the periods when the hedged item affects the Statement of Profit or Loss, in the same line as the recognised hedged item. However, when the hedged forecast transaction results in the recognition of a non-financial asset or a non-financial liability, such gains and losses are transferred from equity and included in the initial measurement of the cost of the non-financial asset or non-financial liability.
Hedge accounting is discontinued prospectively when the hedging instrument expires or is sold, terminated, or exercised, or when it no longer qualifies for hedge accounting. Any gain or loss recognised in OCI and accumulated in equity at that time remains in equity and is recognised when the forecast transaction is ultimately recognised the Statement of Profit and Loss. When a forecast transaction is no longer expected to occur, the gain or loss accumulated in equity is recognised immediately in the Statement of Profit and Loss.
(aa) Segment Reporting - Identification of Segments:
An operating segment is a component of the Company that engages in business activities from
which it may earn revenues and incur expenses, whose operating results are regularly reviewed by the company’s Chief Operating Decision Maker (“CODM”) to make decisions for which discrete financial information is available. Based on the management approach as defined in Ind AS 108, the CODM evaluates the Company’s performance and allocates resources based on an analysis of various performance indicators by business segments and geographic segments.
(bb) Cash Flow Statement:
Cash flows are reported using the indirect method, whereby the net profit before tax is adjusted for the effects of transactions of a non-cash nature, any deferrals or accruals of past or future operating cash receipts or payments and item of income or expenses associated with investing or financing cash flows. The cash flows from operating, investing and financing activities of the Company are segregated.
(cc) Business Combination:
The Company applies the acquisition method in accounting for business combinations. The consideration transferred by the Company to obtain control of a business is calculated as the sum of the fair values of assets transferred, liabilities incurred and the equity interests issued by the Company as at the acquisition date i.e. date on which it obtains control of the acquiree which includes the fair value of any asset or liability arising from a contingent consideration arrangement. Acquisition-related costs are recognised in the statement of profit and loss as incurred, except to the extent related to the issue of debt or equity securities.
Identifiable assets acquired and liabilities assumed in a business combination are measured initially at their fair values on acquisition-date.
Intangible Assets acquired in a Business Combination and recognised separately from Goodwill are initially recognised at their fair value at the acquisition date (which is regarded as their cost).
Subsequent to initial recognition, intangible Assets acquired in a Business Combination are reported at cost less accumulated amortisation and accumulated impairment losses, on the same basis as intangible assets that are acquired separately.
Notes to the Standalone Financial Statementsfor the year ended March 31, 2021 (Continued)
Goodwill is measured as the excess of the aggregate of the consideration transferred and the amount recognised for non-controlling interests, and any previous interest held, over the net identifiable assets acquired and liabilities assumed. Such goodwill is tested annually for impairment. If the fair value of the net assets acquired is in excess of the aggregate consideration transferred, the excess is termed as bargain purchase.
In case of a bargain purchase, before recognizing a gain in respect thereof, the Company determines whether there exists clear evidence of the underlying reasons for classifying the business combination as a bargain purchase thereafter, the Company reassesses whether it has correctly identified all the assets acquired and liabilities assumed and recognises any additional assets or liabilities that are so identified, any gain thereafter is recognised in OCI and accumulated in equity as Capital Reserve. If there does not exist clear evidence of the underlying reasons for classifying the Business combination as a bargain purchase, the Company recognises the gain, after reassessing and reviewing, directly in equity as Capital Reserve.
Contingent consideration is classified either as equity or financial liability. Amount classified as financial liability are subsequently re-measured to fair value with changes in fair value recognised in statement of profit and loss.
Note 1(C) Critical accounting judgements and key sources of estimation uncertainty:
The preparation of the Company’s financial statements requires management to make judgements, estimates and assumptions that affect the reported amounts of revenues, expenses, assets and liabilities, and the accompanying disclosures, and the disclosure of contingent liabilities. Uncertainty about these assumptions and estimates could result in outcomes that require a material adjustment to the carrying amount of assets or liabilities affected in future periods.
(a) Critical judgments in applying accounting policies:
In the process of applying the Company’s accounting policies, management has made the following
judgments, which have the most significant effect on the amounts recognised in the standalone financial statements.
(i) Classification of Madanpur (North) Coal Company Private Limited as Investment in an Associate:
A Joint Venture Company (JV) “Madanpur (North) Coal Company Private Limited” was formed by allocatees of Madanpur North Coal Block. As per Ind AS 111, when all the parties, or a group of parties, considered collectively, are able to direct the activities that significantly affect the returns of the arrangement (i.e. the relevant activities), the parties control the arrangement collectively. Also, joint control exists only when decisions about the relevant activities require the unanimous consent of all the parties. In terms of the JV agreement between the parties, each JV partner has right to nominate one director on the board of JV and major decisions shall be taken by a majority of 75% of the directors present. Since there is no unanimous consent required from the parties, in the judgement of the management the Company does not have joint control over the JV. However, considering the Company’s representation in the board and the extent of its ability to exercise the influence over the decision over the relevant activities, the JV has been considered as an associate and accounted under the equity method.
(b) Key assumptions:
The key assumptions concerning the future and other key sources of estimation uncertainty at the reporting date, that have a significant risk of causing a material adjustment to the carrying amounts of assets and liabilities within the next financial year, are described below. The Company based its assumptions and estimates on parameters available when the financial statements were prepared. Existing circumstances and assumptions about future developments, however, may change due to market changes or circumstances arising that are beyond the control of the Company. Such changes are reflected in the assumptions when they occur.
Notes to the Standalone Financial Statementsfor the year ended March 31, 2021 (Continued)

Welcome to UltraTech
Value Creation
Growth Enablers
Statutory Reports
Financial Statements
ESG Commitments
192
Ult
raTe
ch C
emen
t Li
mit
ed
193
Ann
ual R
epo
rt 2
020-
21
(i) Useful Lives of Property, Plant & Equipment and Intangible Assets:
The Company uses its technical expertise along with historical and industry trends for determining the economic life of an asset/component of an asset. The useful lives are reviewed by management periodically and revised, if appropriate. In case of a revision, the unamortised depreciable amount is charged over the remaining useful life of the assets. In case of certain mining rights, the amortisation is based on the extracted quantity to the total mineral reserve.
(ii) Recognition and measurement of deferred tax assets and liabilities:
Deferred tax assets and liabilities are recognised for deductible temporary differences and unused tax losses for which there is probability of utilisation against the future taxable profit. The Company uses judgement to determine the amount of deferred tax liability / asset that can be recognised, based upon the likely timing and the level of future taxable profits and business developments.
(iii) Income Taxes:
The Company calculates income tax expense based on reported income and estimated exemptions / deduction likely available to the Company. The Company is continuing with higher income tax rate option, based on the available outstanding MAT credit entitlement and different exemptions & deduction enjoyed by the Company. However, the Company has applied the lower income tax rates on the deferred tax assets / liabilities to the extent these are expected to realised or settled in the future when the Company may be subject to lower tax rate based on the future financials projections.
(iv) Fair value measurement of financial instruments:
When the fair values of financial assets and financial liabilities recorded in the balance sheet cannot be measured based on quoted prices in active markets, their fair value is measured using
valuation techniques including the Discounted Cash Flow model. The inputs to these models are taken from observable markets where possible, but where this is not feasible, a degree of judgement is required in establishing fair values. Judgements include considerations of inputs such as liquidity risk, credit risk and volatility.
(v) Defined benefit plans:
The cost of the defined benefit gratuity plan, provident fund and other post-employment medical benefits and the present value of the gratuity and provident fund obligation are determined using actuarial valuations. An actuarial valuation involves making various assumptions that may differ from actual developments in the future. These include the determination of the discount rate, future salary increases and mortality rates. Due to the complexities involved in the valuation and its long-term nature, a defined benefit obligation is highly sensitive to changes in these assumptions. All assumptions are reviewed at each reporting date.
(vi) Mines Restoration Obligation:
In determining the fair value of the Mines Restoration Obligation, assumptions and estimates are made in relation to discount rates, the expected cost of mines restoration and the expected timing of those costs.
(vii) Share-based payments:
The Company measures the cost of equity-settled transactions with employees using Black-Scholes model and cash settled transactions with employees using binomial tree model to determine the fair value of the liability incurred on the grant date. Estimating fair value for share-based payment transactions requires determination of the most appropriate valuation model, which is dependent on the terms and conditions of the grant.
This estimate also requires determination of the most appropriate inputs to the valuation model including the expected life of the share option, volatility and dividend yield and making assumptions about them.
Notes to the Standalone Financial Statementsfor the year ended March 31, 2021 (Continued)
The assumptions and models used for estimating fair value for share-based payment transactions are disclosed in Note 44.
(viii) Business Combination:
(a) Fair Valuation of Intangibles:
Mining Rights:
The Company has used royalty saved method for value analysis of limestone mining rights. The method estimates the value of future savings in royalty payments over the life of the mine accruing to the Company, by virtue of the transaction instead of obtaining the mining rights via the Government e-auction process.
The resulting post-tax cash flows for each of the years are recognised at their present value using a Weighted Average Cost of Capital (‘WACC’) relating to the risk of achieving the mine’s projected savings.
Brand:
The Company has used relief from royalty method for value analysis of Brand. The method estimates the value as the present value of the after-tax projected revenues cash flows attributable to the Brand value.
The resulting post-tax cash flows for each of the years are recognised at their present value using a Weighted Average Cost of Capital (‘WACC’) relating to the risk associated with the Brand Name.
(b) Fair Valuation of Tangibles:
Freehold land:
Freehold land was valued using the sales comparison method using prevailing rates of similar plots of land, circle rates provided by department of revenue and general market intelligence based on the size of land parcel.
Leasehold land:
Leasehold land was valued basis the leasehold interest for the remaining duration of the lease.
Other Assets:
The cost approach has been adopted for fair valuing all the assets except vehicles which have been measured at the old book values less depreciation.
The cost approach includes calculation of replacement cost using price trends applied to historical cost and capitalisation of all the indirect cost, these trends are on the basis of price indices obtained from recognized sources such as the RBI/ OEA or market intelligence. In the case of buildings in cement plants, appropriate weightages have been applied to cement, iron & steel and labour indices to arrive at the escalation factor and depreciating the same for past usage based on estimated total and remaining useful life of the asset.
(ix) Classification of Lease Ind AS 116:
Ind AS 116 Leases requires a lessee to determine the lease term as the non-cancellable period of a lease adjusted with any option to extend or terminate the lease, if the use of such option is reasonably certain. The Company makes an assessment on the expected lease term on lease by lease basis and thereby assesses whether it is reasonably certain that any options to extend or terminate the contract will be exercised. In evaluating the lease term, the Company considers factors such as any significant leasehold improvements undertaken over the lease term, costs relating to the termination of lease and the importance of the underlying lease to the Company’s operations taking into account the location of the underlying asset and the availability of the suitable alternatives. The lease term in future periods is reassessed to ensure that the lease term reflects the current economic circumstances. The discount rate is generally based on the incremental borrowing rate specific to the lease being evaluated or for a portfolio of leases with similar characteristics.
Notes to the Standalone Financial Statementsfor the year ended March 31, 2021 (Continued)

Welcome to UltraTech
Value Creation
Growth Enablers
Statutory Reports
Financial Statements
ESG Commitments
194
Ult
raTe
ch C
emen
t Li
mit
ed
195
Ann
ual R
epo
rt 2
020-
21
Note 2: Property, Plant and Equipment and Other Intangible Assets` in Crores
Particulars
Gross Block Accumulated Depreciation and Amortisation Net BlockAs at
April 01, 2020
Additions Deductions/Adjustments/
Held for Disposal
As atMarch 31,
2021
As atApril 01,
2020
For theyear
Deductions/Adjustments/
Held for Disposal
As atMarch 31,
2021
As atMarch 31,
2021
(A) Tangible Assets * Land: Freehold Land 6,044.40 114.12 11.25 6,147.27 - - - - 6,147.27 Leasehold Land 855.72 134.20 0.91 989.01 121.88 52.51 - 174.39 814.62 Buildings 5,100.56 108.96 4.86 5,204.66 816.72 211.35 3.20 1,024.87 4,179.79 Railway Sidings 867.80 53.22 - 921.02 198.34 53.20 - 251.54 669.48 Plant and Equipment: Own 34,271.06 365.04 88.93 34,547.17 6,671.52 1,772.58 58.41 8,385.69 26,161.48 Given on Lease 174.64 - - 174.64 59.23 11.03 - 70.26 104.38 Office Equipment 259.36 29.07 5.14 283.29 139.83 40.67 3.85 176.65 106.64 Furniture and Fixtures 99.69 1.39 2.32 98.76 63.53 10.09 1.40 72.22 26.54 Vehicles 112.24 22.03 10.65 123.62 52.03 18.01 7.16 62.88 60.74 Total Tangible Assets 47,785.47 828.03 124.06 48,489.44 8,123.08 2,169.44 74.02 10,218.50 38,270.94(B) Capital Work-in-Progress 1,522.07(C) Other Intangible Assets Software 85.28 36.49 9.54 112.23 63.21 18.15 9.54 71.82 40.41 Mining Rights 181.73 50.93 0.25 232.41 53.77 5.98 - 59.75 172.66 Mining Reserve 3,770.84 3.52 - 3,774.36 199.84 94.35 - 294.19 3,480.17 Jetty Rights 212.68 11.75 - 224.43 37.57 3.18 - 40.75 183.68 Brand Rights 155.21 - - 155.21 155.21 - - 155.21 - Total Intangible Assets 4,405.74 102.69 9.79 4,498.64 509.60 121.66 9.54 621.72 3,876.92(D) Intangible Assets under
Development5.72
Total Assets (A+B+C+D) 52,191.21 930.72 133.85 52,988.08 8,632.68 2,291.10 83.56 10,840.22 43,675.65
* Net Block of Tangible Assets, amounting to ` 20,688.46 Crores (March 31, 2020 ` 23,913.79 Crores) were pledged as security against the Secured Borrowings.
Notes to the Standalone Financial Statementsfor the year ended March 31, 2021 (Continued)
` in Crores
Particulars
Gross Block Accumulated Depreciation and Amortisation Net BlockAs at
April 01, 2019
Additions Deductions/Adjustments/
Held for Disposal
As atMarch 31,
2020
As atApril 01,
2019
For theyear
Deductions/Adjustments/
Held for Disposal
As atMarch 31,
2020
As atMarch 31,
2020
(A) Tangible Assets Land: Freehold Land 5,973.64 196.95 126.19 6,044.40 - - - - 6,044.40 Leasehold Land 964.73 31.05 140.06 855.72 87.68 43.23 9.03 121.88 733.84 Buildings 4,878.29 224.46 2.19 5,100.56 604.87 212.83 0.98 816.72 4,283.84 Railway Sidings 853.42 14.53 0.15 867.80 146.68 51.74 0.08 198.34 669.46 Plant and Equipment: Own 33,211.37 1,148.81 89.12 34,271.06 4,967.02 1,755.51 51.01 6,671.52 27,599.54 Given on Lease 174.64 - - 174.64 48.49 10.74 - 59.23 115.41 Office Equipment 203.82 58.38 2.84 259.36 103.59 38.32 2.08 139.83 119.53 Furniture and Fixtures 93.49 7.27 1.07 99.69 50.67 13.63 0.77 63.53 36.16 Vehicles 101.78 22.83 12.37 112.24 41.36 18.16 7.49 52.03 60.21 Total Tangible Assets 46,455.18 1,704.28 373.99 47,785.47 6,050.36 2,144.16 71.44 8,123.08 39,662.39(B) Capital Work-in-Progress 860.01(C) Other Intangible Assets Software 64.76 20.55 0.03 85.28 50.71 12.53 0.03 63.21 22.07 Mining Rights 175.39 7.66 1.32 181.73 50.02 5.07 1.32 53.77 127.96 Mining Reserve 3,770.16 0.68 - 3,770.84 105.68 94.16 - 199.84 3,571.00 Jetty Rights 182.86 29.82 - 212.68 29.32 8.25 - 37.57 175.11 Brand Rights 155.21 - - 155.21 89.54 65.67 - 155.21 - Total Intangible Assets 4,348.38 58.71 1.35 4,405.74 325.27 185.68 1.35 509.60 3,896.14(D) Intangible Assets under
Development10.07
Total Assets (A+B+C+D) 50,803.56 1,762.99 375.34 52,191.21 6,375.63 2,329.84 72.79 8,632.68 44,428.61
Notes to the Standalone Financial Statementsfor the year ended March 31, 2021 (Continued)
` in Crores
ParticularsYear ended
March 31, 2021Year ended
March 31, 2020
A) Depreciation and Amortisation for the year 2,291.10 2,329.84
Add: Obsolescence 50.12 30.88
Less: Depreciation transferred to Pre-operative Expenses (0.82) (0.04)
Add: Depreciation on ROU (Refer Note 3) 93.95 94.22
Depreciation as per Statement of Profit and Loss 2,434.35 2,454.90
B) 1. Tangible Assets include assets for which ownership is not in the name of the Company - Gross Block of ` 442.04 Crores (March 31, 2020 ` 406.72 Crores).
2. Buildings include ` 12.13 Crores (March 31, 2020 ` 12.13 Crores) being cost of Debentures and Shares in a company entitling the right of exclusive occupancy and use of certain premises.
3. Opening Gross Block includes Research and Development Assets (Building, Plant and Equipment, Furniture and Fixtures, Office Equipment and Intangible Assets) of 43.19 Crores (March 31, 2020 44.54 Crores) and Net Block of ` 21.19 Crores (March 31, 2020 ` 24.65 Crores). Addition for the Research and Development Assets during the year is ` 0.30 Crores (March 31, 2020 ` 1.12 Crores).
4. Title of immovable properties having Gross Block of ` 3,388.19 Crores (March 31, 2020 ` 3,568.28 Crores) and Net Block of 3,263.42 Crores (March 31, 2020 3,418.88 Crores) is yet to be transferred in the name of the Company.
5. The amount of expenditures recognised in the carrying amount of an item of PPE in the course of its construction:
` in Crores
ParticularsYear ended
March 31, 2021Year ended
March 31, 2020
Pre-operative expenses pending allocation:
Raw Materials Consumed 0.06 11.75
Power and Fuel Consumed 0.58 1.70
Salary, Wages, Bonus, Ex-gratia and Provisions 12.09 9.77
Insurance 0.25 0.60
Depreciation on ROU 5.88 5.00
Depreciation 0.82 0.04
Finance Costs 2.06 0.93
Miscellaneous expenses 44.71 19.31
Total Pre-operative expenses 66.45 49.10
Less: Sale of Products / Other Income - (14.41)
Less: Trial Run production transferred to Inventory - (4.78)
Add: Brought forward from Previous Year 51.47 32.52
Less: Capitalised / Charged during the Year (1.68) (5.96)
Balance included in Capital Work-in-Progress 116.24 56.47

Welcome to UltraTech
Value Creation
Growth Enablers
Statutory Reports
Financial Statements
ESG Commitments
196
Ult
raTe
ch C
emen
t Li
mit
ed
197
Ann
ual R
epo
rt 2
020-
21
Note 3: Leases (Ind AS 116)As a lessee
(a) Following are the carrying value of Right of Use Assets as at March 31, 2021:
` in Crores
Particulars
Gross Block Accumulated Depreciation and Amortisation Net Block
As atApril 01,
2020
Additions Deductions As atMarch 31,
2021
As atApril 01,
2020
For theyear
Deductions As atMarch 31,
2021
As atMarch 31,
2021
Leasehold Land 436.63 3.15 - 439.78 24.75 16.50 - 41.25 398.53
Leasehold Building 90.73 14.46 14.85 90.34 17.92 17.84 9.55 26.21 64.13
Plant and Machinery 13.42 64.44 - 77.86 2.82 6.61 - 9.43 68.43
Ships 575.24 136.44 11.86 699.82 62.59 58.88 - 121.47 578.35
Total 1,116.02 218.49 26.71 1,307.80 108.08 99.83 9.55 198.36 1,109.44
Less: Depreciation transferred to CWIP 5.88
Net Depreciation Charged to Statement of Profit & Loss
93.95
` in Crores
Particulars
Gross Block Accumulated Depreciation and Amortisation Net Block
As atApril 01,
2019
Reclassifiedon account
of Ind AS 116
Additions Deductions As atMarch 31,
2020
As atApril 01,
2019
Reclassifiedon account
of Ind AS 116
Additions Deductions As atMarch 31,
2020
As atMarch 31,
2020
Leasehold Land 60.17 254.01 122.45 - 436.63 - 8.86 15.89 - 24.75 411.88
Leasehold Building 89.64 - 1.09 - 90.73 - - 17.92 - 17.92 72.81
Plant and Machinery 4.84 - 8.58 - 13.42 - - 2.82 - 2.82 10.60
Ships 575.24 - - - 575.24 - - 62.59 - 62.59 512.65
Total 729.89 254.01 132.12 - 1,116.02 - 8.86 99.22 - 108.08 1,007.94
Less: Depreciation transferred to CWIP
5.00
Net Depreciation Charged to Statement of Profit & Loss
94.22
(b) Lease Expenses recognized in Statement of Profit and Loss not included in the measurement of lease liabilities:
` in Crores
ParticularsYear ended
March 31, 2021Year ended
March 31, 2020
Variable lease payments 56.43 42.20
Expenses relating to short-term leases 359.96 397.13
Expenses relating to leases of low-value assets, excluding short-term leases of low value assets
26.18 15.39
Notes to the Standalone Financial Statementsfor the year ended March 31, 2021 (Continued)
(c) Maturity analysis of lease liabilities– contractual undiscounted cash flows:
` in Crores
ParticularsAs at
March 31, 2021As at
March 31, 2020
Less than one year 137.01 125.92
One to five years 563.54 455.02
More than five years 785.98 772.87
Total undiscounted lease liabilities 1,486.53 1,353.81
Discounted Lease liabilities included in the statement of financial position 995.80 893.09
Current lease liability 90.00 79.31
Non-Current lease liability 905.80 813.78
(d) The Company had implemented Indian Accounting Standard for Leases (“Ind AS 116”) with effect from April 1, 2019 using the modified retrospective approach, under which the cumulative effect of Initial application is recognized in retained earnings as on April 1, 2019. The effect of initial recognition as per Ind AS 116 is as follows:
` in Crores
ParticularsAs on
March 31, 2019
Lease liability 787.90
Right of Use (ROU) asset 729.89
Deferred tax assets 14.60
Net Impact on Retained Earnings 43.41
(e) The difference between the future minimum lease rental commitments towards non-cancellable operating leases and finance leases reported as at March 31, 2019 compared to the lease liability as accounted as at April 1, 2019 is primarily due to contracts reassessed as lease contracts under Ind AS 116, reduction due to discounting of the lease liabilities as per the requirement of Ind AS 116 and exclusion of the commitments for the leases to which the Company has chosen to apply the practical expedient as per the standard.
` in Crores
Particulars Amount
Lease commitments as at 31 March 2019 13.07
Add: Impact of assessment of opening lease commitments under Ind AS 116 13.23
Add/(less): contracts reassessed as lease contracts 761.60
Lease liabilities as on 1 April 2019 787.90
(f) The Weighted average incremental borrowing rate of 9.16% p.a. for local currency borrowings and 3.27% p.a. for foreign currency borrowings has been applied for measuring the lease liability at the date of initial application.
(g) The total cash outflow for leases for year ended March 31, 2021 is ` 120.70 Crores (March 31, 2020 ` 112.46 Crores).
(h) Income from sub leasing of Right to use assets is for year ended March 31, 2021 is ` 61.28 Crores (March 31, 2020 ` 64.87 Crores).
Notes to the Standalone Financial Statementsfor the year ended March 31, 2021 (Continued)

Welcome to UltraTech
Value Creation
Growth Enablers
Statutory Reports
Financial Statements
ESG Commitments
198
Ult
raTe
ch C
emen
t Li
mit
ed
199
Ann
ual R
epo
rt 2
020-
21
Notes to the Standalone Financial Statementsfor the year ended March 31, 2021 (Continued)
Note 4: Investments` in Crores
Particulars As at March 31, 2021 As at March 31, 2020
Nos. Amount Nos. Amount
Unquoted:
Investments measured at Cost:
Equity Instruments:
Subsidiaries:
Face value of ` 10 each fully paid:
Dakshin Cements Limited 50,000 0.05 50,000 0.05
Less: Provision for Impairment in value of Investment
(0.05) -
- 0.05
Harish Cement Limited 2,47,601 154.22 2,47,601 154.22
Bhagwati Lime Stone Company Private Limited 11,900 13.03 11,900 13.03
Gotan Lime Stone Khanij Udyog Private Limited (Refer Note 35)
23,15,780 184.48 23,15,780 184.48
UltraTech Nathdwara Cement Limited (UNCL) 3,40,00,00,000 3,429.20 3,40,00,00,000 3,429.20
Face value of ` 10 each partly paid:
Gotan Lime Stone Khanij Udyog Private Limited (Refer Note 35)
23,000 0.98 23,000 0.98
Harish Cement Limited 578 0.23 578 0.23
Face Value of Sri Lankan Rupee 10 each fully paid:
UltraTech Cement Lanka (Private) Limited 4,00,00,000 23.03 4,00,00,000 23.03
Face Value of UAE Dirham 10 each fully paid:
UltraTech Cement Middle East Investments Limited 3,43,69,140 643.56 2,51,28,890 345.37
Face Value of Indonesian Rupiah 8,923 each fully paid:
PT UltraTech Mining Indonesia 9,87,069 4.75 9,87,069 4.75
Face Value of Indonesian Rupiah 9,163 each fully paid:
PT UltraTech Investment Indonesia 19,00,000 11.46 19,00,000 11.46
Less: Provision for Impairment in value of Investment in both Indonesian Subsidiaries
(13.69) (13.69)
4,451.25 4,153.11
Joint Ventures:
Face value of ` 10 each fully paid:
Bhaskarpara Coal Company Limited 81,41,050 8.14 81,41,050 8.14
Less: Provision for Impairment in value of Investment
(1.65) (1.65)
6.49 6.49
Associates:
Face value of ` 10 each fully paid:
Madanpur (North) Coal Company Private Limited 11,52,560 1.15 11,52,560 1.15
Less: Provision for Impairment in value of Investment
(0.22) (0.22)
0.93 0.93
Aditya Birla Renewables SPV 1 Limited 1,62,78,663 16.60 1,62,78,663 16.60
Aditya Birla Renewables Energy Limited 34,19,000 3.42 - -
Notes to the Standalone Financial Statementsfor the year ended March 31, 2021 (Continued)
` in Crores
Particulars As at March 31, 2021 As at March 31, 2020
Nos. Amount Nos. Amount
Investments measured at Fair value through Profit or Loss:
Equity Instruments:
Face value of ` 10 each fully paid:
Raj Mahal Coal Mining Limited 10,00,000 1.00 10,00,000 1.00
Green Infra Wind Power 1,92,000 0.19 1,44,000 0.14
NU Power Wind Farm 39,548 0.04 39,548 0.04
Watsun Infrabuild Private Limited 2,96,000 0.30 1,82,053 0.18
Amplus Sunshine Private Limited 38,67,848 4.80 38,67,848 4.80
SBG Cleantech Energy Eight Private Limited(For FY 2019-20: Equity shares of ` 10 each aggregating to ` 200)
- - 20 -
Amplus Coastal Power Private Limited 17,12,279 1.76 - -
SBE Renewables Twenty Two C1 Private Limited (Equity shares of ` 10 each aggregating to ` 260)
26 - - -
SBE Renewables Twenty Two C2 Private Limited (Equity shares of ` 10 each aggregating to ` 260)
26 - - -
SBE Renewables Twenty Two C3 Private Limited (Equity shares of ` 10 each aggregating to ` 130)
13 - - -
VSN Onsight Private Limited 21,25,387 2.75 - -
Lalganj Power Private Limited 1,21,21,212 16.00 - -
Amplus Dakshin Private Limited 4,59,000 0.46 - -
27.30 6.16
Preference Shares:
Subsidiaries:
0.5% Cumulative Compulsory Redeemable Preference Shares Face Value of UAE Dirham 10 each fully paid:
UltraTech Cement Middle East Investments Limited 5,14,22,000 1,023.54 - -
7% Non Cumulative Non-Convertible Redeemable Preference Shares of ` 100 each fully paid
Aditya Birla Health Services Limited 20,00,000 17.69 20,00,000 17.60
Units of Debt schemes of Various Mutual Funds 62.58 928.77
56,09.80 5,129.66
Quoted:
Investments measured at Fair value through Profit or Loss:
Tax free Bonds 290.44 283.83
Taxable Corporate Bonds 857.43 425.44
6,757.67 5,838.93
Aggregate Book Value of:
Quoted Investments 1,147.87 709.27
Unquoted Investments 5,609.80 5,129.66
6,757.67 5,838.93
Aggregate Market Value of Quoted Investments 1,147.87 709.27
Aggregate amount of impairment in value of investment
15.61 15.56

Welcome to UltraTech
Value Creation
Growth Enablers
Statutory Reports
Financial Statements
ESG Commitments
200
Ult
raTe
ch C
emen
t Li
mit
ed
201
Ann
ual R
epo
rt 2
020-
21
Notes to the Standalone Financial Statementsfor the year ended March 31, 2021 (Continued)
Note 5: Loans` in Crores
Particulars Non-Current Current
As at March 31, 2021
As at March 31, 2020
As at March 31, 2021
As at March 31, 2020
Considered good, Secured:
Loans against House Property (Secured by way of title deeds)
- 0.01 0.01 0.07
Considered good, Unsecured:
Security Deposits 139.81 132.89 109.43 107.25
Loans to Related Parties (Refer Note 39) - - 782.66 1,789.20
Loans to Employees 4.54 9.04 5.08 7.01
144.35 141.94 897.18 1,903.53
Note 5.1 Disclosure of Loans and Advances given to subsidiaries as per Regulation 34 (3) and 53 (f) of the SEBI (Listing Obligations and Disclosure Requirements) Regulations, 2015 and Section 186 of the Companies Act, 2013:
` in Crores
Name of the Subsidiary CompanyAmount Outstanding
as atMaximum Balance Outstanding
during the year ended
Investment by Subsidiary in Shares of the Company
(No. of Shares)
March 31, 2021 March 31, 2020 March 31, 2021 March 31, 2020 March 31, 2021 March 31, 2020
UltraTech Nathdwara Cement Limited (avg. interest rate 1 month MCLR) (For discharging the liabilities in UNCL upon its acquisition)
782.66 1,789.20 1,789.20 1,799.75 - -
Note 5.2 No loans are due from directors or other officers of the Company or any of them either severally or jointly with any other person. Further, no loans are due from firms or private companies in which any director is a partner, a director or a member.
Note 6: Other Financial Assets
` in Crores
Particulars Non-Current Current
As at March 31, 2021
As at March 31, 2020
As at March 31, 2021
As at March 31, 2020
Derivative Assets 384.53 104.53 77.59 -
Interest Accrued on Deposits and Investments - - 51.65 38.31
Fixed Deposits with Bank with Maturity Greater than twelve Months^
0.40 62.09 - -
Government Grants Receivable 167.10 230.43 1,152.90 989.59
Others (Includes Insurance Claims, Railway Claims and Other Receivables)
- - 472.01 41.03
552.03 397.05 1,754.15 1,068.93
^ Lodged as Security with Government Departments : ` 0.04 Crores (March 31, 2020: ` 19.32 Crores)
Note 7: Other Non-Current Assets` in Crores
ParticularsAs at
March 31, 2021 As at
March 31, 2020
Capital Advances 2,168.51 1,869.74
Less: Provision for Impairment (18.56) (29.54)
2,149.95 1,840.20
Balance with Government Authorities 513.33 922.64
Prepaid Expenses 0.75 1.04
2,664.03 2,763.88
Note 8: Inventories: (Valued at lower of cost and net realisable value, unless otherwise stated)` in Crores
ParticularsAs at
March 31, 2021 As at
March 31, 2020
Raw Materials {includes in transit ` 52.36 Crores, (March 31, 2020: ` 12.22 Crores)} 435.81 308.61
Work-in-Progress 602.79 743.47
Finished Goods {includes in transit ` 96.52 Crores, (March 31, 2020: ` 84.57 Crores)} 426.74 709.66
Packing Goods - -
Stock-in-trade {includes in transit ` 6.99 Crores, (March 31, 2020: ` 2.67 Crores)} 13.87 16.71
Stores & Spares {includes in transit ` 15.52 Crores, (March 31, 2020: ` 6.43 Crores)} 1,041.17 1,125.87
Fuel {includes in transit ` 278.36 Crores, (March 31, 2020: ` 92.24 Crores)} 1,046.99 839.32
Packing Materials {includes in transit ` 0.47 Crores, (March 31, 2020: ` Nil)} 146.40 79.54
Scrap (valued at net realisable value) 8.28 10.70
3,722.05 3,833.88
The Company follows suitable provisioning norms for writing down the value of Inventories towards slow moving, non-moving and surplus inventory. Provision as on date is ` 50.62 Crores (March 31, 2020 ` 34.09 Crores).
Note 9: Current Investments` in Crores
ParticularsAs at
March 31, 2021 As at
March 31, 2020
Quoted:
Investments measured at Fair value through Profit or Loss:
Taxable Corporate Bonds 50.23 75.96
Tax Free Bonds 5.89 -
Unquoted:
Investments measured at amortised Cost:
Fixed Deposits with Financial Institution with Maturity less than twelve months 300.00 100.00
Investments measured at Fair value through Profit or Loss:
Units of Debt Schemes of Various Mutual Funds 10,455.89 4,067.73
10,812.01 4,243.69
Aggregate Book Value of:
Quoted Investments 56.12 75.96
Unquoted Investments 10,755.89 4,167.73
10,812.01 4,243.69
Aggregate Market Value of Quoted Investments 56.12 75.96
Notes to the Standalone Financial Statementsfor the year ended March 31, 2021 (Continued)

Welcome to UltraTech
Value Creation
Growth Enablers
Statutory Reports
Financial Statements
ESG Commitments
202
Ult
raTe
ch C
emen
t Li
mit
ed
203
Ann
ual R
epo
rt 2
020-
21
Note 10: Trade Receivables` in Crores
ParticularsAs at
March 31, 2021 As at
March 31, 2020
Considered good, Secured 394.94 253.89
Considered good, Unsecured 1,891.05 1,594.39
Significant increase in Credit Risk 83.35 73.95
2,369.34 1,922.23
Less: Allowances for credit losses (83.35) (73.95)
2,285.99 1,848.28
Note 11: Cash and Cash Equivalents` in Crores
ParticularsAs at
March 31, 2021 As at
March 31, 2020
Balance with banks (Current Account) 89.43 138.55
Cheques on hand 28.19 0.24
Cash on hand 0.96 1.27
118.58 140.06
Note 12: Bank Balances other than Cash and Cash Equivalents` in Crores
ParticularsAs at
March 31, 2021 As at
March 31, 2020
Fixed Deposits with Banks (Maturity more than three months and upto twelve months ) ^ 1,747.39 160.04
Earmarked Balance with Bank for Unpaid Dividends 10.58 10.42
1,757.97 170.46
^ Lodged as security with Government Departments ` 21.22 Crores (March 31, 2020 ` 0.52 Crores). Earmarked for specific purpose ` 144.95 Crores (March 31, 2020 ` 144.95 Crores).
Note 13: Other Current Assets` in Crores
ParticularsAs at
March 31, 2021 As at
March 31, 2020
Advances to related parties (Refer Note 39) 197.82 141.15
Balance with Government Authorities 590.80 613.55
Advances to Suppliers 518.17 618.76
Prepaid Expenses 121.89 42.91
Others (Receivable from Gratuity Trust and Other Receivables) 206.31 88.95
1,634.99 1,505.32
Notes to the Standalone Financial Statementsfor the year ended March 31, 2021 (Continued)
Note 14 (a): Equity Share Capital` in Crores
Particulars As at March 31, 2021 As at March 31, 2020
No. of Shares Amount No. of Shares Amount
Authorised
Equity Shares of ` 10 each 78,00,00,000 780.00 78,00,00,000 780.00
Issued, Subscribed and Fully Paid-up
Equity Shares of ` 10 each fully paid-up 28,86,53,398 288.65 28,86,25,105 288.63
(a) Reconciliation of the Shares Outstanding at the beginning and at the end of the year
Outstanding at the beginning of the year 28,86,25,105 288.63 27,46,42,720 274.64
Add: Shares issued under Employees Stock Options Scheme (ESOS)
28,293 0.02 20,425 0.03
Add: Shares issued to the shareholders of Century Textiles & Industries Limited pursuant to the Scheme of Demerger
(Refer Note 36)
- - 1,39,61,960 13.96
Outstanding at the end of the year 28,86,53,398 288.65 28,86,25,105 288.63
(b) Shares held by Holding Company
Grasim Industries Limited 16,53,35,150 165.34 16,53,35,150 165.34
(c) List of shareholders holding more than 5% of Paid-up Equity Share Capital
No. of Shares % Holding No. of Shares % Holding
Grasim Industries Limited 16,53,35,150 57.28% 16,53,35,150 57.28%
No. of Shares Amount No. of Shares Amount
(d) Equity Shares of ` 10 each reserved for issue under ESOS
59,380 0.06 88,002 0.09
(e) Aggregate number of Shares issued for consideration other than cash during the period of five years immediately preceding the reporting date
Equity Shares of ` 10 each issued as fully paid up to the shareholders of Century Textiles and Industries Limited, pursuant to the Scheme of Demerger (Refer Note 36)
1,39,61,960 13.96 1,39,61,960 13.96
(f) The Company has only one class of Equity Shares having a par value of ` 10 per share. Each shareholder is eligible for one vote per share held except for Global Depository Receipts. The dividend proposed by the Board of Directors is subject to the approval of the shareholders in the ensuing Annual General Meeting, except in case of interim dividend. In the event of liquidation, the equity shareholders are eligible to receive the remaining assets of the Company after distribution of all preferential amounts, in proportion to their shareholding.
Notes to the Standalone Financial Statementsfor the year ended March 31, 2021 (Continued)
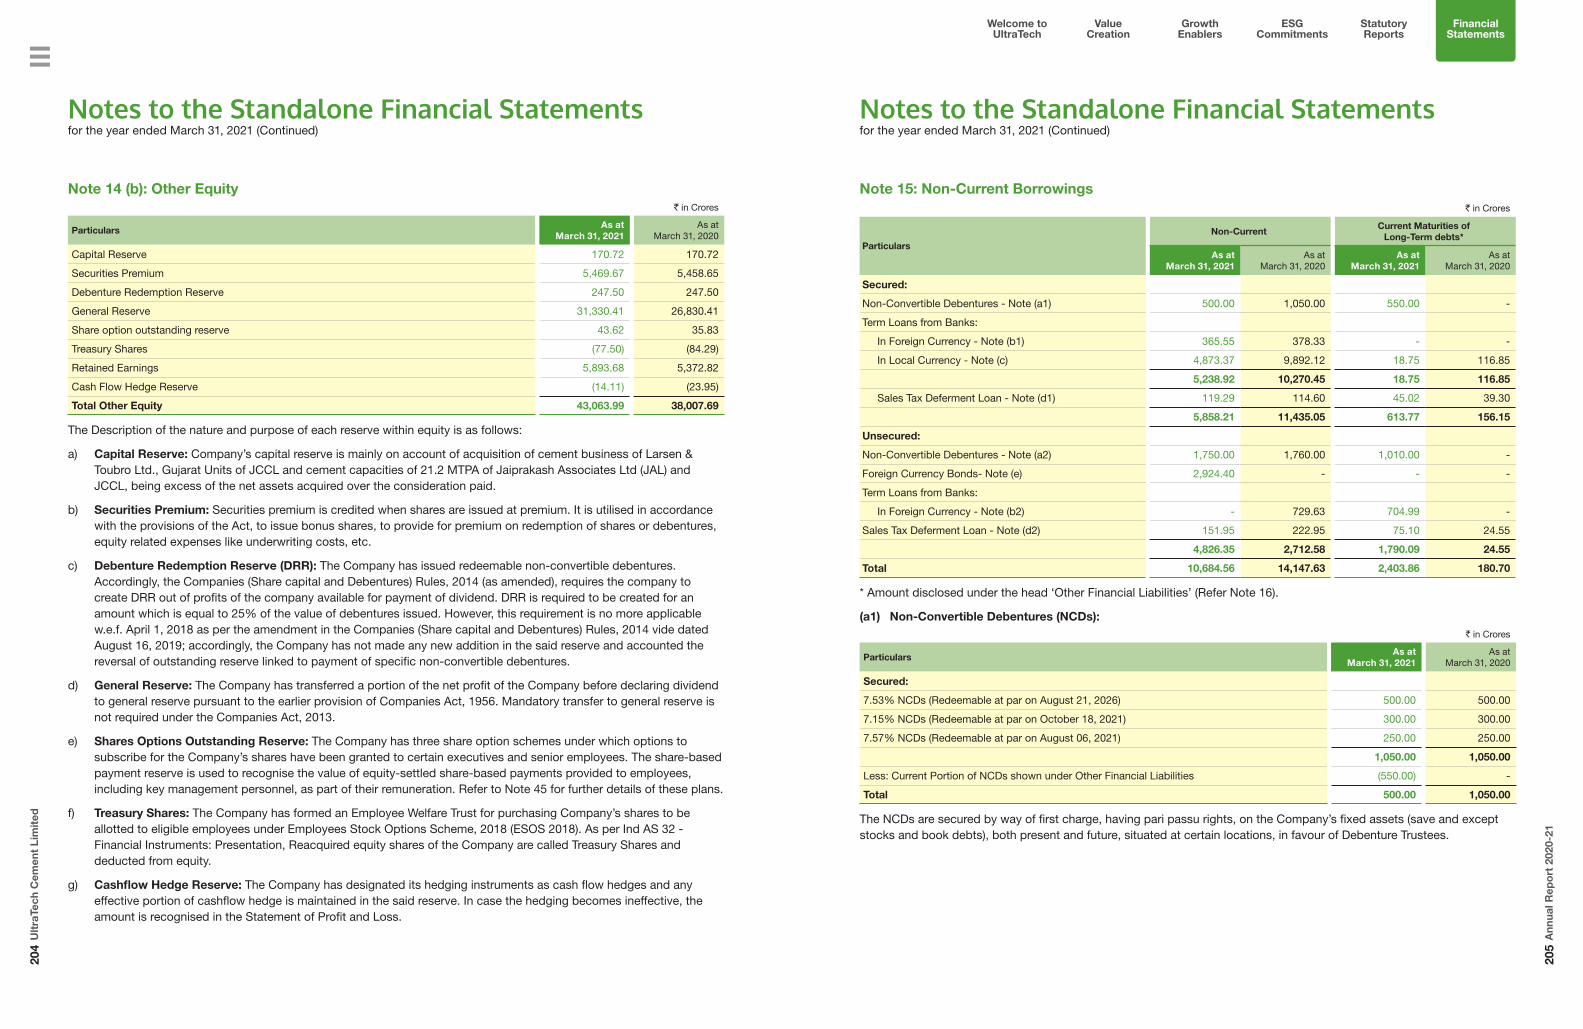
Welcome to UltraTech
Value Creation
Growth Enablers
Statutory Reports
Financial Statements
ESG Commitments
204
Ult
raTe
ch C
emen
t Li
mit
ed
205
Ann
ual R
epo
rt 2
020-
21
Note 14 (b): Other Equity` in Crores
ParticularsAs at
March 31, 2021 As at
March 31, 2020
Capital Reserve 170.72 170.72
Securities Premium 5,469.67 5,458.65
Debenture Redemption Reserve 247.50 247.50
General Reserve 31,330.41 26,830.41
Share option outstanding reserve 43.62 35.83
Treasury Shares (77.50) (84.29)
Retained Earnings 5,893.68 5,372.82
Cash Flow Hedge Reserve (14.11) (23.95)
Total Other Equity 43,063.99 38,007.69
The Description of the nature and purpose of each reserve within equity is as follows:
a) Capital Reserve: Company’s capital reserve is mainly on account of acquisition of cement business of Larsen & Toubro Ltd., Gujarat Units of JCCL and cement capacities of 21.2 MTPA of Jaiprakash Associates Ltd (JAL) and JCCL, being excess of the net assets acquired over the consideration paid.
b) Securities Premium: Securities premium is credited when shares are issued at premium. It is utilised in accordance with the provisions of the Act, to issue bonus shares, to provide for premium on redemption of shares or debentures, equity related expenses like underwriting costs, etc.
c) Debenture Redemption Reserve (DRR): The Company has issued redeemable non-convertible debentures. Accordingly, the Companies (Share capital and Debentures) Rules, 2014 (as amended), requires the company to create DRR out of profits of the company available for payment of dividend. DRR is required to be created for an amount which is equal to 25% of the value of debentures issued. However, this requirement is no more applicable w.e.f. April 1, 2018 as per the amendment in the Companies (Share capital and Debentures) Rules, 2014 vide dated August 16, 2019; accordingly, the Company has not made any new addition in the said reserve and accounted the reversal of outstanding reserve linked to payment of specific non-convertible debentures.
d) General Reserve: The Company has transferred a portion of the net profit of the Company before declaring dividend to general reserve pursuant to the earlier provision of Companies Act, 1956. Mandatory transfer to general reserve is not required under the Companies Act, 2013.
e) Shares Options Outstanding Reserve: The Company has three share option schemes under which options to subscribe for the Company’s shares have been granted to certain executives and senior employees. The share-based payment reserve is used to recognise the value of equity-settled share-based payments provided to employees, including key management personnel, as part of their remuneration. Refer to Note 45 for further details of these plans.
f) Treasury Shares: The Company has formed an Employee Welfare Trust for purchasing Company’s shares to be allotted to eligible employees under Employees Stock Options Scheme, 2018 (ESOS 2018). As per Ind AS 32 - Financial Instruments: Presentation, Reacquired equity shares of the Company are called Treasury Shares and deducted from equity.
g) Cashflow Hedge Reserve: The Company has designated its hedging instruments as cash flow hedges and any effective portion of cashflow hedge is maintained in the said reserve. In case the hedging becomes ineffective, the amount is recognised in the Statement of Profit and Loss.
Notes to the Standalone Financial Statementsfor the year ended March 31, 2021 (Continued)
Note 15: Non-Current Borrowings` in Crores
Particulars
Non-CurrentCurrent Maturities of
Long-Term debts*
As at March 31, 2021
As at March 31, 2020
As at March 31, 2021
As at March 31, 2020
Secured:
Non-Convertible Debentures - Note (a1) 500.00 1,050.00 550.00 -
Term Loans from Banks:
In Foreign Currency - Note (b1) 365.55 378.33 - -
In Local Currency - Note (c) 4,873.37 9,892.12 18.75 116.85
5,238.92 10,270.45 18.75 116.85
Sales Tax Deferment Loan - Note (d1) 119.29 114.60 45.02 39.30
5,858.21 11,435.05 613.77 156.15
Unsecured:
Non-Convertible Debentures - Note (a2) 1,750.00 1,760.00 1,010.00 -
Foreign Currency Bonds- Note (e) 2,924.40 - - -
Term Loans from Banks:
In Foreign Currency - Note (b2) - 729.63 704.99 -
Sales Tax Deferment Loan - Note (d2) 151.95 222.95 75.10 24.55
4,826.35 2,712.58 1,790.09 24.55
Total 10,684.56 14,147.63 2,403.86 180.70
* Amount disclosed under the head ‘Other Financial Liabilities’ (Refer Note 16).
(a1) Non-Convertible Debentures (NCDs):` in Crores
ParticularsAs at
March 31, 2021 As at
March 31, 2020
Secured:
7.53% NCDs (Redeemable at par on August 21, 2026) 500.00 500.00
7.15% NCDs (Redeemable at par on October 18, 2021) 300.00 300.00
7.57% NCDs (Redeemable at par on August 06, 2021) 250.00 250.00
1,050.00 1,050.00
Less: Current Portion of NCDs shown under Other Financial Liabilities (550.00) -
Total 500.00 1,050.00
The NCDs are secured by way of first charge, having pari passu rights, on the Company’s fixed assets (save and except stocks and book debts), both present and future, situated at certain locations, in favour of Debenture Trustees.
Notes to the Standalone Financial Statementsfor the year ended March 31, 2021 (Continued)

Welcome to UltraTech
Value Creation
Growth Enablers
Statutory Reports
Financial Statements
ESG Commitments
206
Ult
raTe
ch C
emen
t Li
mit
ed
207
Ann
ual R
epo
rt 2
020-
21
(a2) Non-Convertible Debentures (NCDs):` in Crores
ParticularsAs at
March 31, 2021 As at
March 31, 2020
Unsecured:
6.68% NCDs (Redeemable at par on February 20, 2025) 250.00 250.00
7.64% NCDs (Redeemable at par on June 04, 2024) 250.00 250.00
6.72% NCDs (Redeemable at par on December 09, 2022) 250.00 250.00
6.93% NCDs (Redeemable at par on November 25, 2021) 250.00 250.00
6.99% NCDs (Redeemable at par on November 24, 2021) 400.00 400.00
8.36% NCDs (Redeemable at par on June 07, 2021) 360.00 360.00
4.57% NCDs (Redeemable at par on December 29, 2023) 1,000.00 -
2,760.00 1,760.00
Less: Current Portion of NCDs shown under Other Financial Liabilities (1,010.00) -
Total 1,750.00 1,760.00
(b1) Term Loans from Banks in Foreign Currency:` in Crores
Particulars Repayment ScheduleAs at
March 31, 2021 As at
March 31, 2020
Secured:
State Bank of India, New York(US Dollar: 1.00 Crores; March 31, 2020: 1.00 Crores)
March 2023 73.11 75.67
State Bank of India, New York(US Dollar: 2.00 Crores; March 31, 2020: 2.00 Crores)
February 2023 146.22 151.33
State Bank of India, New York(US Dollar: 2.00 Crores; March 31, 2020: 2.00 Crores)
February 2023 146.22 151.33
Total 365.55 378.33
The above mentioned loans are secured by way of first charge, having pari passu rights, on the Company’s fixed assets, both present and future, situated at certain locations, in favour of Company’s lenders / trustees.
(b2) Term Loans from Banks in Foreign Currency:` in Crores
Particulars Repayment ScheduleAs at
March 31, 2021 As at
March 31, 2020
Unsecured:
Export Development, Canada(US Dollar: 4.64 Crores; March 31, 2020: 4.64 Crores)
June 2021 339.44 351.30
Export Development, Canada(US Dollar: 5.00 Crores; March 31, 2020: 5.00 Crores)
May 2021 365.55 378.33
704.99 729.63
Less: Current Portion of Foreign Currency Loans shown under Other Financial Liabilities
(704.99) -
Total - 729.63
Notes to the Standalone Financial Statementsfor the year ended March 31, 2021 (Continued)
(c) Term Loans from Banks in Local Currency:` in Crores
Particulars Repayment ScheduleAs at
March 31, 2021 As at
March 31, 2020
Secured:
Axis Bank Ltd 20 quarterly installments beginning December 2022 507.08 507.08
HDFC Bank Ltd 60 quarterly installments beginning September 2022 1,803.79 3,331.91
State Bank of India 4 Half yearly installments beginning May 2022 300.00 300.00
State Bank of India 60 quarterly installments beginning September 2022 2,000.00 4,000.00
HDFC Bank Ltd Repaid in March 2021 - 1,494.38
Axis Bank Ltd Bullet repayment in September 2027 150.00 150.00
HDFC Bank Ltd Repaid in December 2020 - 75.60
HDFC Bank Ltd 32 quarterly installments beginning June 2020 131.25 150.00
4,892.12 10,008.97
Less: Current Portion of Term Loans shown under Other Financial Liabilities (18.75) (116.85)
Total 4,873.37 9,892.12
The above mentioned loans are secured by way of first charge, having pari passu rights, on the Company’s fixed assets, both present and future, situated at certain locations, in favour of Company’s lenders / trustees.
(d1) Sales Tax Deferment Loan:` in Crores
Particulars Repayment ScheduleAs at
March 31, 2021 As at
March 31, 2020
Secured:
Uttar Pradesh Financial Corporation Varied Annual Payments from August 2019 to December 2024
123.76 153.90
Department of Industries and Commerce, Karnataka Bullet payment on August ‘2032 40.55 -
164.31 153.90
Less: Current Portion of Sales Tax Deferment loan shown under Other Financial Liabilities (45.02) (39.30)
Total 119.29 114.60
Sales Tax Deferment Loan is secured by bank guarantee backed by hypothecation of Inventories and Book debts of the Company.
(d2) Sales Tax Deferment Loan:` in Crores
Particulars Repayment ScheduleAs at
March 31, 2021 As at
March 31, 2020
Unsecured:
Department of Industries and Commerce, Haryana Varied Annual Payments from January 2017 to March 2022
58.43 61.33
Commercial Tax Department, Hyderabad Varied Annual payments from October 2012 to October 2026
164.60 182.03
Commercial Tax Department, Chhattisgarh Payable on Assessment 4.02 4.14
227.05 247.50
Less: Current Portion of Sales tax deferment loan shown under Other Financial Liabilities (75.10) (24.55)
Total 151.95 222.95
Notes to the Standalone Financial Statementsfor the year ended March 31, 2021 (Continued)

Welcome to UltraTech
Value Creation
Growth Enablers
Statutory Reports
Financial Statements
ESG Commitments
208
Ult
raTe
ch C
emen
t Li
mit
ed
209
Ann
ual R
epo
rt 2
020-
21
Notes to the Standalone Financial Statementsfor the year ended March 31, 2021 (Continued)
(e) Foreign Currency Bonds:` in Crores
Particulars Repayment ScheduleAs at
March 31, 2021 As at
March 31, 2020
Unsecured:
2.80% Sustainability Linked Bonds(US Dollar: 40.00 Crores; March 31, 2020: Nil)
February 2031 2,924.40 -
Total 2,924.40 -
The Company has issued unsecured fixed rate US Dollar denominated notes (in the form of “Sustainability Linked Bonds”), aggregating to USD 400 million, due on February 16,2031, bearing coupon of 2.80% per annum payable semi-annually. The Bonds are linked to ‘Sustainability Performance Target (SPT)’ of reducing Scope 1 GHG emissions by 22.2% from a 2017 baseline. If SPT is not achieved by observation date in 2030, the coupon will step-up by 0.75% for last two coupons.The Bonds are listed on the Singapore Exchange Securities Trading Limited.
Note 16: Other Financial Liabilities` in Crores
ParticularsNon-Current Current
As at March 31, 2021
As at March 31, 2020
As at March 31, 2021
As at March 31, 2020
Current maturities of long-term debts (Refer Note 15) - - 2,403.86 180.70
Interest Accrued but not due on Borrowings - - 165.76 176.68
Deferred Premium Payable 332.19 - 27.21 -
Liability for Capital Goods - - 178.59 161.92
Security Deposits - - 1,787.04 1,624.15
Salaries, Wages, Bonus and Other Employee Payables - - 296.07 240.10
Investor Education and Protection Fund, will be credited with the following amounts (as and when due)
Unpaid Dividends - - 10.59 10.44
Unpaid Fractional liability on issue of shares pursuant to scheme of Demerger
- - 0.42 0.42
Lease Liability 905.80 813.78 90.00 79.31
Others (Retention money, Liquidated Damages, etc.) - - 250.22 212.07
1,237.99 813.78 5,209.76 2,685.79
Note 17: Provisions` in Crores
ParticularsNon-Current Current
As at March 31, 2021
As at March 31, 2020
As at March 31, 2021
As at March 31, 2020
For Employee Benefits (Refer Note 37) 38.02 48.15 254.54 279.58
Others:
For Mines Restoration Expenditure 291.06 164.98 - -
For Cost of transfer of Assets - - 252.22 254.93
329.08 213.13 506.76 534.51
Notes to the Standalone Financial Statementsfor the year ended March 31, 2021 (Continued)
Note 17.1 Movement of provisions during the year as required by Ind AS - 37 “Provisions, Contingent Liabilities and Contingent Assets” specified under Section 133 of the Companies Act, 2013:
(a) Mines Restoration Expenditure:
` in Crores
ParticularsAs at
March 31, 2021 As at
March 31, 2020
Opening Balance 164.98 137.35
Add: Provision / (Reversal) during the year 106.27 17.15
Add: Unwinding of discount on Mine Restoration Provision 19.81 10.56
Less: Utilisation during the year 0.00 (0.08)
Closing Balance 291.06 164.98
(b) Provision for Cost of Transfer of Assets:
` in Crores
ParticularsAs at
March 31, 2021 As at
March 31, 2020
Opening Balance 254.93 331.46
Less: Utilisation during the year (2.71) (76.53)
Closing Balance 252.22 254.93
Note 18: Deferred Tax Liabilities (Net)` in Crores
Particulars As at
March 31, 2021 As at
March 31, 2020
Recognised in Statement of
Profit and Loss
Recognisedin OCI
Recognised directly in
Other Equity
Deferred Tax Assets:
MAT Credit Entitlement - (1,047.25) 1,047.25 - -
Provision allowed under tax on payment basis
(235.16) (182.16) (53.00) - -
Others (105.69) (148.55) 39.55 3.31 -
(340.85) (1,377.96) 1,033.80 3.31 -
Deferred Tax Liabilities:
Tangible and Intangible Assets 5,455.27 5,370.14 85.13 - -
Fair valuation of Investments 88.54 73.64 14.90 - -
Others 16.18 11.06 5.12 - -
5,559.99 5,454.84 105.15 - -
Net Deferred Tax Liability 5,219.14 4,076.88 1,138.95 3.31 -
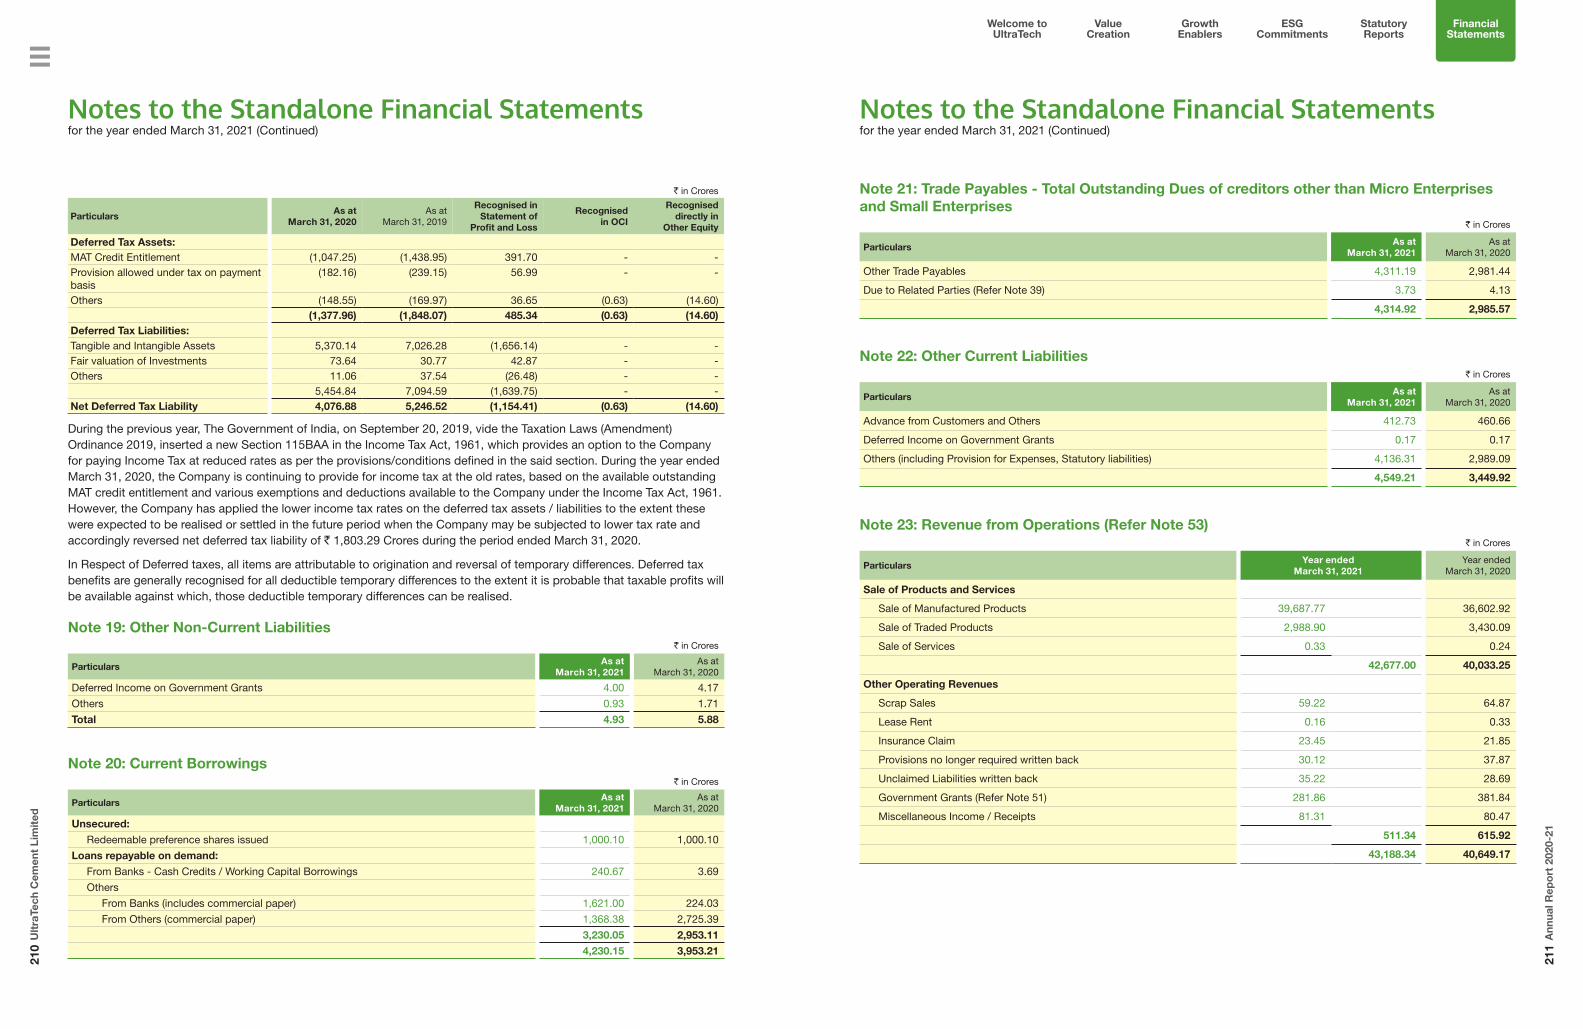
Welcome to UltraTech
Value Creation
Growth Enablers
Statutory Reports
Financial Statements
ESG Commitments
210
Ult
raTe
ch C
emen
t Li
mit
ed
211
Ann
ual R
epo
rt 2
020-
21
Notes to the Standalone Financial Statementsfor the year ended March 31, 2021 (Continued)
` in Crores
ParticularsAs at
March 31, 2020 As at
March 31, 2019
Recognised in Statement of
Profit and Loss
Recognisedin OCI
Recognised directly in
Other Equity
Deferred Tax Assets:MAT Credit Entitlement (1,047.25) (1,438.95) 391.70 - -Provision allowed under tax on payment basis
(182.16) (239.15) 56.99 - -
Others (148.55) (169.97) 36.65 (0.63) (14.60)(1,377.96) (1,848.07) 485.34 (0.63) (14.60)
Deferred Tax Liabilities:Tangible and Intangible Assets 5,370.14 7,026.28 (1,656.14) - -Fair valuation of Investments 73.64 30.77 42.87 - -Others 11.06 37.54 (26.48) - -
5,454.84 7,094.59 (1,639.75) - -Net Deferred Tax Liability 4,076.88 5,246.52 (1,154.41) (0.63) (14.60)
During the previous year, The Government of India, on September 20, 2019, vide the Taxation Laws (Amendment) Ordinance 2019, inserted a new Section 115BAA in the Income Tax Act, 1961, which provides an option to the Company for paying Income Tax at reduced rates as per the provisions/conditions defined in the said section. During the year ended March 31, 2020, the Company is continuing to provide for income tax at the old rates, based on the available outstanding MAT credit entitlement and various exemptions and deductions available to the Company under the Income Tax Act, 1961. However, the Company has applied the lower income tax rates on the deferred tax assets / liabilities to the extent these were expected to be realised or settled in the future period when the Company may be subjected to lower tax rate and accordingly reversed net deferred tax liability of ` 1,803.29 Crores during the period ended March 31, 2020.
In Respect of Deferred taxes, all items are attributable to origination and reversal of temporary differences. Deferred tax benefits are generally recognised for all deductible temporary differences to the extent it is probable that taxable profits will be available against which, those deductible temporary differences can be realised.
Note 19: Other Non-Current Liabilities` in Crores
ParticularsAs at
March 31, 2021 As at
March 31, 2020
Deferred Income on Government Grants 4.00 4.17
Others 0.93 1.71
Total 4.93 5.88
Note 20: Current Borrowings` in Crores
ParticularsAs at
March 31, 2021 As at
March 31, 2020
Unsecured:
Redeemable preference shares issued 1,000.10 1,000.10
Loans repayable on demand:
From Banks - Cash Credits / Working Capital Borrowings 240.67 3.69
Others
From Banks (includes commercial paper) 1,621.00 224.03
From Others (commercial paper) 1,368.38 2,725.39
3,230.05 2,953.11
4,230.15 3,953.21
Notes to the Standalone Financial Statementsfor the year ended March 31, 2021 (Continued)
Note 21: Trade Payables - Total Outstanding Dues of creditors other than Micro Enterprises and Small Enterprises
` in Crores
ParticularsAs at
March 31, 2021 As at
March 31, 2020
Other Trade Payables 4,311.19 2,981.44
Due to Related Parties (Refer Note 39) 3.73 4.13
4,314.92 2,985.57
Note 22: Other Current Liabilities` in Crores
ParticularsAs at
March 31, 2021 As at
March 31, 2020
Advance from Customers and Others 412.73 460.66
Deferred Income on Government Grants 0.17 0.17
Others (including Provision for Expenses, Statutory liabilities) 4,136.31 2,989.09
4,549.21 3,449.92
Note 23: Revenue from Operations (Refer Note 53)` in Crores
ParticularsYear ended
March 31, 2021 Year ended
March 31, 2020
Sale of Products and Services
Sale of Manufactured Products 39,687.77 36,602.92
Sale of Traded Products 2,988.90 3,430.09
Sale of Services 0.33 0.24
42,677.00 40,033.25
Other Operating Revenues
Scrap Sales 59.22 64.87
Lease Rent 0.16 0.33
Insurance Claim 23.45 21.85
Provisions no longer required written back 30.12 37.87
Unclaimed Liabilities written back 35.22 28.69
Government Grants (Refer Note 51) 281.86 381.84
Miscellaneous Income / Receipts 81.31 80.47
511.34 615.92
43,188.34 40,649.17

Welcome to UltraTech
Value Creation
Growth Enablers
Statutory Reports
Financial Statements
ESG Commitments
212
Ult
raTe
ch C
emen
t Li
mit
ed
213
Ann
ual R
epo
rt 2
020-
21
Notes to the Standalone Financial Statementsfor the year ended March 31, 2021 (Continued)
Note 24: Other Income` in Crores
ParticularsYear ended
March 31, 2021 Year ended
March 31, 2020
Interest Income on
Government and Other Securities 19.22 19.46
Bank and Other Accounts 165.37 228.19
184.59 247.65
Dividend Income on
Current Investments - Mutual Fund - 32.47
Non-Current Investment - From a Subsidiary Company 1.12 -
1.12 32.47
Exchange Gain (net) - 42.09
Profit on Sale of Property, plant and equipment (net) 3.96 -
Gain on Fair valuation of Investments through Profit or Loss 419.55 289.12
Profit on Sale of Current and Non-Current Investments (net) 154.10 64.74
Others 25.36 50.51
788.68 726.58
Note 25: Cost of Materials Consumed` in Crores
ParticularsYear ended
March 31, 2021 Year ended
March 31, 2020
Opening Stock 308.61 375.26
Purchases 5,302.14 4,894.16
5,610.75 5,269.42
Less: Closing Stock 435.81 308.61
5,174.94 4,960.81
Note 26: Purchases of Stock-in-Trade` in Crores
ParticularsYear ended
March 31, 2021 Year ended
March 31, 2020
Grey Cement 1,475.09 1,847.41
Others (UltraTech Building Solution) 461.61 415.37
1,936.70 2,262.78
Notes to the Standalone Financial Statementsfor the year ended March 31, 2021 (Continued)
Note 27: Changes in Inventories of Finished Goods, Stock-in-Trade and Work-in-Progress` in Crores
ParticularsYear ended
March 31, 2021 Year ended
March 31, 2020
Closing Inventories
Work-in-progress 602.79 743.47
Finished Goods 426.74 709.66
Stock in Trade 13.87 16.71
1,043.40 1,469.84
Opening Inventories
Work-in-progress 743.47 654.85
Finished Goods 709.66 415.93
Stock in Trade 16.71 31.54
1,469.84 1,102.32
(Increase) / Decrease in Inventories 426.44 (367.52)
Add: Stock Transfer from Pre-Operative Account - 4.78
426.44 (362.74)
Note 28: Employee Benefits Expense` in Crores
ParticularsYear ended
March 31, 2021 Year ended
March 31, 2020
Salaries, Wages and Bonus 1,977.40 2,081.13
Contribution to Provident and Other Funds
Contribution to Gratuity and Other Defined Benefit Plans 105.89 102.73
Contribution to Superannuation and Other Defined Contribution Funds 22.48 24.72
Expenses on Employees Stock Options Scheme 11.84 16.40
Staff Welfare Expenses 64.38 111.19
2,181.99 2,336.17
Note 29: Finance Costs` in Crores
ParticularsYear ended
March 31, 2021 Year ended
March 31, 2020
Interest Expense:
On Borrowings (at amortised cost) 1,119.60 1,479.35
Others (including interest on deposits from dealers and contractors) 96.46 126.06
Interest on Lease Liability 37.71 37.56
Unwinding of discount on Mine Restoration Provision 19.81 10.56
1,273.58 1,653.53
Exchange (Gain)/ Loss on revaluation of Lease Liability (15.63) 47.97
Other Borrowing Cost (Finance Charges) 3.19 3.65
Less: Finance Costs Capitalised (2.06) (0.93)
1,259.08 1,704.22
Borrowing costs are capitalised using rates based on specific borrowings ranging from 4.57 % to 7.86% per annum. (For the year ended March 31, 2020: 7.50% to 7.86% per annum)
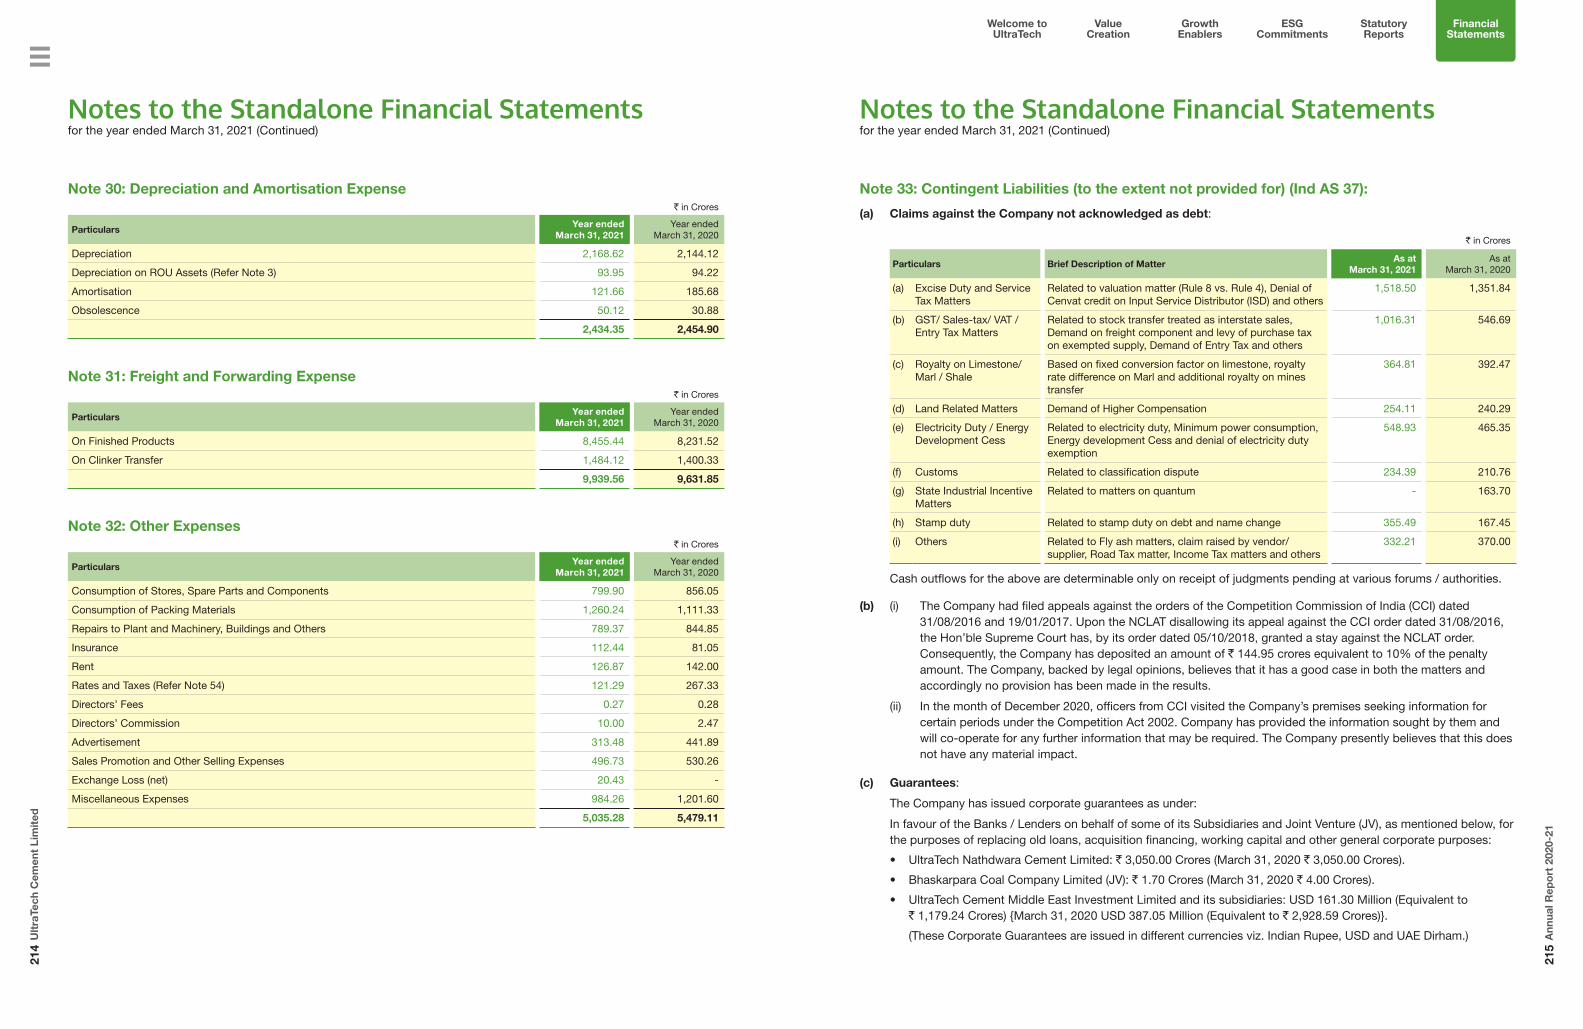
Welcome to UltraTech
Value Creation
Growth Enablers
Statutory Reports
Financial Statements
ESG Commitments
214
Ult
raTe
ch C
emen
t Li
mit
ed
215
Ann
ual R
epo
rt 2
020-
21
Notes to the Standalone Financial Statementsfor the year ended March 31, 2021 (Continued)
Note 30: Depreciation and Amortisation Expense` in Crores
ParticularsYear ended
March 31, 2021 Year ended
March 31, 2020
Depreciation 2,168.62 2,144.12
Depreciation on ROU Assets (Refer Note 3) 93.95 94.22
Amortisation 121.66 185.68
Obsolescence 50.12 30.88
2,434.35 2,454.90
Note 31: Freight and Forwarding Expense` in Crores
ParticularsYear ended
March 31, 2021 Year ended
March 31, 2020
On Finished Products 8,455.44 8,231.52
On Clinker Transfer 1,484.12 1,400.33
9,939.56 9,631.85
Note 32: Other Expenses` in Crores
ParticularsYear ended
March 31, 2021 Year ended
March 31, 2020
Consumption of Stores, Spare Parts and Components 799.90 856.05
Consumption of Packing Materials 1,260.24 1,111.33
Repairs to Plant and Machinery, Buildings and Others 789.37 844.85
Insurance 112.44 81.05
Rent 126.87 142.00
Rates and Taxes (Refer Note 54) 121.29 267.33
Directors’ Fees 0.27 0.28
Directors’ Commission 10.00 2.47
Advertisement 313.48 441.89
Sales Promotion and Other Selling Expenses 496.73 530.26
Exchange Loss (net) 20.43 -
Miscellaneous Expenses 984.26 1,201.60
5,035.28 5,479.11
Notes to the Standalone Financial Statementsfor the year ended March 31, 2021 (Continued)
Note 33: Contingent Liabilities (to the extent not provided for) (Ind AS 37):
(a) Claims against the Company not acknowledged as debt:
` in Crores
Particulars Brief Description of MatterAs at
March 31, 2021As at
March 31, 2020
(a) Excise Duty and Service Tax Matters
Related to valuation matter (Rule 8 vs. Rule 4), Denial of Cenvat credit on Input Service Distributor (ISD) and others
1,518.50 1,351.84
(b) GST/ Sales-tax/ VAT / Entry Tax Matters
Related to stock transfer treated as interstate sales, Demand on freight component and levy of purchase tax on exempted supply, Demand of Entry Tax and others
1,016.31 546.69
(c) Royalty on Limestone/ Marl / Shale
Based on fixed conversion factor on limestone, royalty rate difference on Marl and additional royalty on mines transfer
364.81 392.47
(d) Land Related Matters Demand of Higher Compensation 254.11 240.29
(e) Electricity Duty / Energy Development Cess
Related to electricity duty, Minimum power consumption, Energy development Cess and denial of electricity duty exemption
548.93 465.35
(f) Customs Related to classification dispute 234.39 210.76
(g) State Industrial Incentive Matters
Related to matters on quantum - 163.70
(h) Stamp duty Related to stamp duty on debt and name change 355.49 167.45
(i) Others Related to Fly ash matters, claim raised by vendor/ supplier, Road Tax matter, Income Tax matters and others
332.21 370.00
Cash outflows for the above are determinable only on receipt of judgments pending at various forums / authorities.
(b) (i) The Company had filed appeals against the orders of the Competition Commission of India (CCI) dated 31/08/2016 and 19/01/2017. Upon the NCLAT disallowing its appeal against the CCI order dated 31/08/2016, the Hon’ble Supreme Court has, by its order dated 05/10/2018, granted a stay against the NCLAT order. Consequently, the Company has deposited an amount of ` 144.95 crores equivalent to 10% of the penalty amount. The Company, backed by legal opinions, believes that it has a good case in both the matters and accordingly no provision has been made in the results.
(ii) In the month of December 2020, officers from CCI visited the Company’s premises seeking information for certain periods under the Competition Act 2002. Company has provided the information sought by them and will co-operate for any further information that may be required. The Company presently believes that this does not have any material impact.
(c) Guarantees:
The Company has issued corporate guarantees as under:
In favour of the Banks / Lenders on behalf of some of its Subsidiaries and Joint Venture (JV), as mentioned below, for the purposes of replacing old loans, acquisition financing, working capital and other general corporate purposes:
• UltraTech Nathdwara Cement Limited: ` 3,050.00 Crores (March 31, 2020 ` 3,050.00 Crores).
• Bhaskarpara Coal Company Limited (JV): ` 1.70 Crores (March 31, 2020 ` 4.00 Crores).
• UltraTech Cement Middle East Investment Limited and its subsidiaries: USD 161.30 Million (Equivalent to ` 1,179.24 Crores) {March 31, 2020 USD 387.05 Million (Equivalent to ` 2,928.59 Crores)}.
(These Corporate Guarantees are issued in different currencies viz. Indian Rupee, USD and UAE Dirham.)

Welcome to UltraTech
Value Creation
Growth Enablers
Statutory Reports
Financial Statements
ESG Commitments
216
Ult
raTe
ch C
emen
t Li
mit
ed
217
Ann
ual R
epo
rt 2
020-
21
Note 34: Capital and other commitments:
Estimated amount of contracts remaining to be executed on capital account not provided for (net of advances) 2,230.08 Crores. (March 31, 2020 ` 832.59 Crores).
Note 35:
The Supreme Court of India has allowed an appeal filed by the State of Rajasthan in a matter relating to transfer of mining lease in the name of the Company’s wholly owned subsidiary, Gotan Lime Stone Khanij Udyog Private Limited (“GKUPL”) and has directed the State of Rajasthan to frame and notify its policy relating to transfer of mining lease and thereafter pass appropriate order in respect of the mining lease of GKUPL. State Government has notified the new policy related to transfer of new mining lease, based on which the Company has requested the State Government to consider reinstatement of the mines in its favour.
Note 36: Scheme of Demerger of Cement Business of Century Textiles and Industries Limited (Ind AS 103):
(A) The Scheme of Demerger amongst Century Textiles and Industries Limited (“CTIL” or ‘the Demerged Undertaking’) and the Company and their respective shareholders and creditors (“the Scheme”) was made effective from October 1, 2019. The National Company Law Tribunal, Mumbai Bench (“NCLT”) had approved the Scheme by its Order dated July 3, 2019 and fixed May 20, 2018 as the Appointed Date. Consequently, the Company had included the financial results/information of the Demerged Undertaking in its standalone financial statements with effect from May 20, 2018 (which is deemed to be the acquisition date for purpose of Ind AS 103 – Business Combinations) to include the financial results/information of the acquired Cement Business Division of CTIL (‘the Demerged Undertaking’).
(B) The assets of the Demerged Undertaking comprising of 3 Integrated Units with a total capacity of 12.6 MTPA and 1 Grinding Unit with a grinding capacity of 2.0 MTPA have an enterprise valuation of ` 8,387.71 Crores. The acquisition of the Demerged undertaking continues to support the Company to strengthen its presence in the Eastern & the Central markets and extend its footprint in Western and Southern markets. This also provide synergies in manufacture and distribution process and logistics alignment leading to economies of scale and creation of efficiency by reducing time to market and benefiting customers. The acquisition continues to create value for its shareholders by acquiring ready to use assets which creates operational efficiencies and reducing time to markets vis-à-vis greenfield projects which are time consuming due to challenges in acquisition of land and limestone mining leases.
(C) Fair Value of the Consideration transferred:
As per Ind AS 103 – Business Combinations, purchase consideration has been allocated on the basis of fair valuation determined by an independent valuer. Costs related to acquisition (including stamp duty on assets transferred) had been charged to Statement of Profit and Loss on the appointed date.
Against the total enterprise value of ` 8,387.71 Crores, the Company had taken over borrowings of ` 3,000.00 Crores from CTIL. After taking these liabilities into account, effective purchase consideration of ` 5,387.71 Crores had been discharged on October 16, 2019, being the Record Date in terms of the Scheme, by issue of 1 (one) equity share of the Company of face value ` 10/- each for every 8 (eight) equity shares of CTIL of face value ` 10/- each to the shareholders of CTIL. The Fair value of the shares issued is ` 5,387.71 crores which had been determined based on the last closing price prior to the Appointed Date.
Notes to the Standalone Financial Statementsfor the year ended March 31, 2021 (Continued)
The Fair Value of identifiable assets acquired, and liabilities assumed as on the acquisition date:
` in Crores
Particulars Amount
Property, Plant and Equipment 6,146.28
Capital Work-In-Progress 11.23
Intangible assets
Limestone mining reserves 1,054.29
Brand Right 155.21
Others 1.80
Intangible assets under development 0.75
Other non-current financial assets 235.81
Other Non-Current Assets 88.86
Inventories 740.35
Trade and Other receivables 293.06
Cash and Cash Equivalents 12.39
Other bank balances 31.94
Other Financial Assets 162.93
Other Current Assets 356.84
Total Assets 9,291.74
Non-Current & Current Borrowings 3,000.00
Non-Current Provisions 6.73
Deferred Tax Liabilities 1,710.25
Trade Payables 506.70
Other Financial Liabilities 375.71
Other Current Provisions 244.20
Other Current Liabilities 269.26
Total Liabilities 6,112.85
Total Fair Value of the Net Assets 3,178.89
(D) Amount recognised as Goodwill:
` in Crores
Particulars Amount
Fair value of consideration transferred 5,387.71
Less: Fair value of the net assets acquired 3,178.89
Goodwill 2,208.82
This goodwill is attributed to the expected synergies in cement prices and in costs, as described in paragraph (A) above.
Notes to the Standalone Financial Statementsfor the year ended March 31, 2021 (Continued)
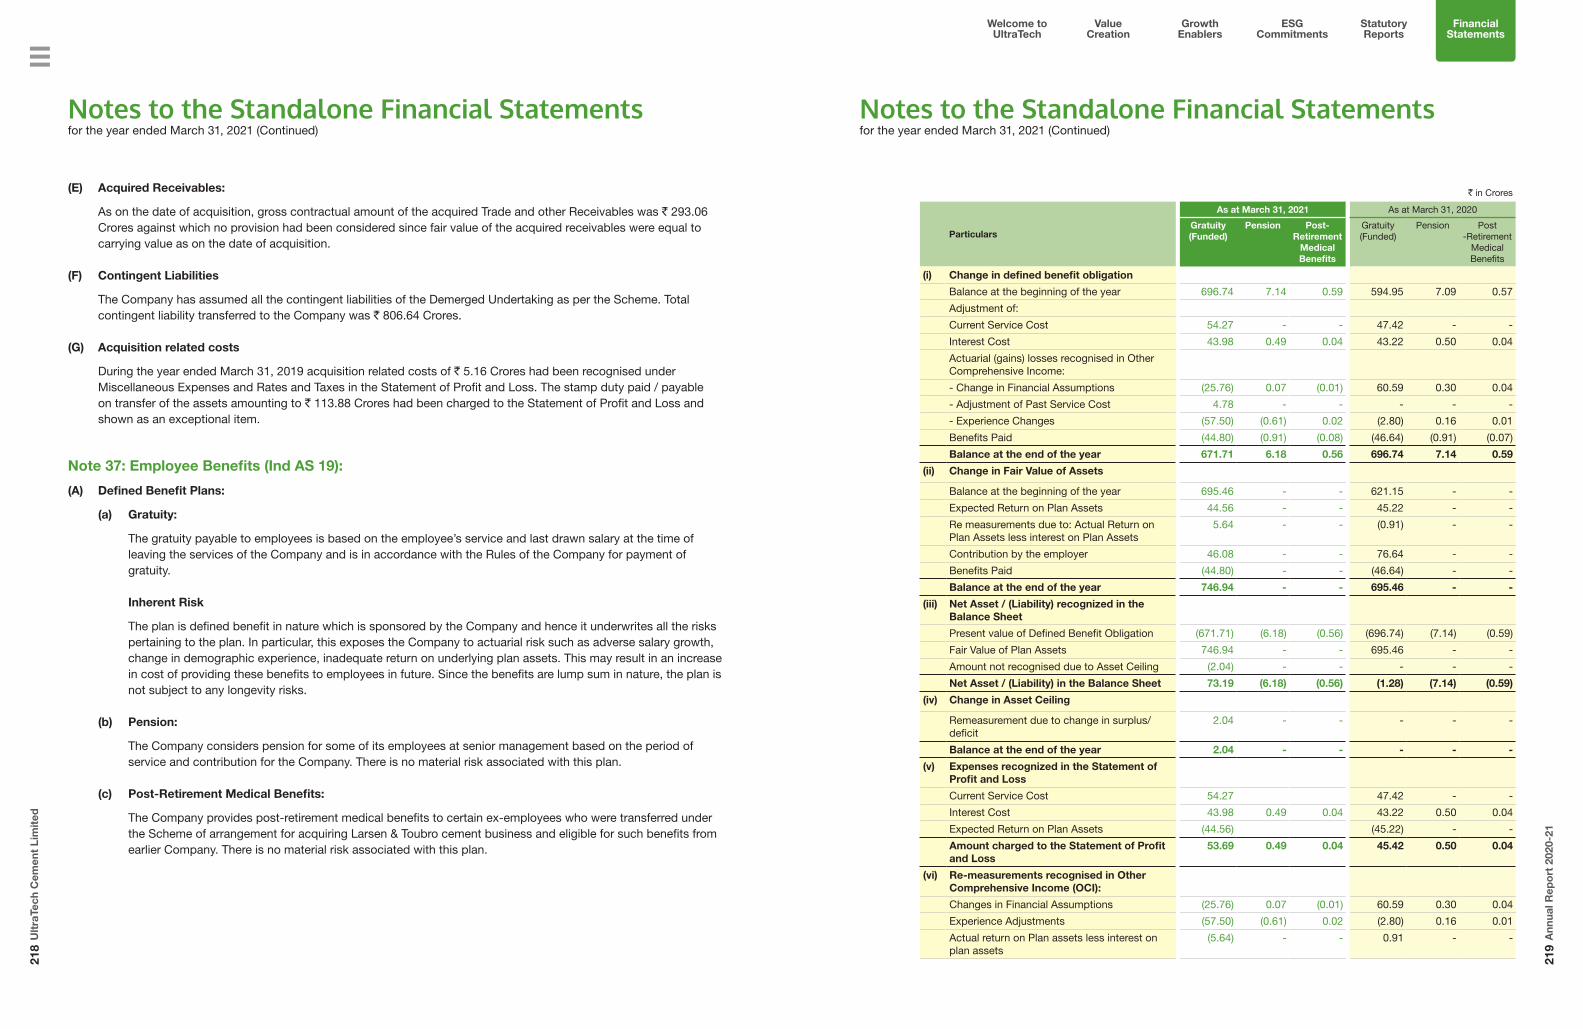
Welcome to UltraTech
Value Creation
Growth Enablers
Statutory Reports
Financial Statements
ESG Commitments
218
Ult
raTe
ch C
emen
t Li
mit
ed
219
Ann
ual R
epo
rt 2
020-
21
(E) Acquired Receivables:
As on the date of acquisition, gross contractual amount of the acquired Trade and other Receivables was ` 293.06 Crores against which no provision had been considered since fair value of the acquired receivables were equal to carrying value as on the date of acquisition.
(F) Contingent Liabilities
The Company has assumed all the contingent liabilities of the Demerged Undertaking as per the Scheme. Total contingent liability transferred to the Company was ` 806.64 Crores.
(G) Acquisition related costs
During the year ended March 31, 2019 acquisition related costs of ` 5.16 Crores had been recognised under Miscellaneous Expenses and Rates and Taxes in the Statement of Profit and Loss. The stamp duty paid / payable on transfer of the assets amounting to ` 113.88 Crores had been charged to the Statement of Profit and Loss and shown as an exceptional item.
Note 37: Employee Benefits (Ind AS 19):
(A) Defined Benefit Plans:
(a) Gratuity:
The gratuity payable to employees is based on the employee’s service and last drawn salary at the time of leaving the services of the Company and is in accordance with the Rules of the Company for payment of gratuity.
Inherent Risk
The plan is defined benefit in nature which is sponsored by the Company and hence it underwrites all the risks pertaining to the plan. In particular, this exposes the Company to actuarial risk such as adverse salary growth, change in demographic experience, inadequate return on underlying plan assets. This may result in an increase in cost of providing these benefits to employees in future. Since the benefits are lump sum in nature, the plan is not subject to any longevity risks.
(b) Pension:
The Company considers pension for some of its employees at senior management based on the period of service and contribution for the Company. There is no material risk associated with this plan.
(c) Post-Retirement Medical Benefits:
The Company provides post-retirement medical benefits to certain ex-employees who were transferred under the Scheme of arrangement for acquiring Larsen & Toubro cement business and eligible for such benefits from earlier Company. There is no material risk associated with this plan.
Notes to the Standalone Financial Statementsfor the year ended March 31, 2021 (Continued)
` in Crores
Particulars
As at March 31, 2021 As at March 31, 2020
Gratuity (Funded)
Pension Post-Retirement
Medical Benefits
Gratuity (Funded)
Pension Post -Retirement
Medical Benefits
(i) Change in defined benefit obligation
Balance at the beginning of the year 696.74 7.14 0.59 594.95 7.09 0.57
Adjustment of:
Current Service Cost 54.27 - - 47.42 - -
Interest Cost 43.98 0.49 0.04 43.22 0.50 0.04
Actuarial (gains) losses recognised in Other Comprehensive Income:
- Change in Financial Assumptions (25.76) 0.07 (0.01) 60.59 0.30 0.04
- Adjustment of Past Service Cost 4.78 - - - - -
- Experience Changes (57.50) (0.61) 0.02 (2.80) 0.16 0.01
Benefits Paid (44.80) (0.91) (0.08) (46.64) (0.91) (0.07)
Balance at the end of the year 671.71 6.18 0.56 696.74 7.14 0.59
(ii) Change in Fair Value of Assets
Balance at the beginning of the year 695.46 - - 621.15 - -
Expected Return on Plan Assets 44.56 - - 45.22 - -
Re measurements due to: Actual Return on Plan Assets less interest on Plan Assets
5.64 - - (0.91) - -
Contribution by the employer 46.08 - - 76.64 - -
Benefits Paid (44.80) - - (46.64) - -
Balance at the end of the year 746.94 - - 695.46 - -
(iii) Net Asset / (Liability) recognized in the Balance Sheet
Present value of Defined Benefit Obligation (671.71) (6.18) (0.56) (696.74) (7.14) (0.59)
Fair Value of Plan Assets 746.94 - - 695.46 - -
Amount not recognised due to Asset Ceiling (2.04) - - - - -
Net Asset / (Liability) in the Balance Sheet 73.19 (6.18) (0.56) (1.28) (7.14) (0.59)
(iv) Change in Asset Ceiling
Remeasurement due to change in surplus/deficit
2.04 - - - - -
Balance at the end of the year 2.04 - - - - -
(v) Expenses recognized in the Statement of Profit and Loss
Current Service Cost 54.27 47.42 - -
Interest Cost 43.98 0.49 0.04 43.22 0.50 0.04
Expected Return on Plan Assets (44.56) (45.22) - -
Amount charged to the Statement of Profit and Loss
53.69 0.49 0.04 45.42 0.50 0.04
(vi) Re-measurements recognised in Other Comprehensive Income (OCI):
Changes in Financial Assumptions (25.76) 0.07 (0.01) 60.59 0.30 0.04
Experience Adjustments (57.50) (0.61) 0.02 (2.80) 0.16 0.01
Actual return on Plan assets less interest on plan assets
(5.64) - - 0.91 - -
Notes to the Standalone Financial Statementsfor the year ended March 31, 2021 (Continued)

Welcome to UltraTech
Value Creation
Growth Enablers
Statutory Reports
Financial Statements
ESG Commitments
220
Ult
raTe
ch C
emen
t Li
mit
ed
221
Ann
ual R
epo
rt 2
020-
21
` in Crores
Particulars
As at March 31, 2021 As at March 31, 2020
Gratuity (Funded)
Pension Post-Retirement
Medical Benefits
Gratuity (Funded)
Pension Post -Retirement
Medical Benefits
Adjustment of Past Service Cost 4.78
Adjustment to recognise the asset ceiling impact 2.04 - - - - -Loss / (Gain) recognised in Other Comprehensive Income (OCI):
(82.08) (0.54) 0.01 58.70 0.46 0.05
(vii) Maturity profile of defined benefit obligation:Within the next 12 months 68.69 1.10 0.06 80.15 0.99 0.06Between 1 and 5 years 214.81 3.49 0.24 221.30 3.27 0.24Between 5 and 10 years 237.04 2.54 0.22 230.76 2.55 0.2210 Years and above 1,014.72 2.21 0.42 994.61 3.93 0.46
(viii) Sensitivity analysis for significant assumptions:*Increase/(Decrease) in present value of defined benefits obligation at the end of the year1% increase in discount rate (57.84) (0.35) (0.03) (60.61) (0.35) (0.03)1% decrease in discount rate 67.62 0.40 0.04 70.99 0.37 0.041% increase in salary escalation rate 65.86 - - 69.03 - -1% decrease in salary escalation rate (57.55) - - (60.19) - -1% increase in employee turnover rate (22.66) - - (20.41) - -1% decrease in employee turnover rate 26.75 - - 22.66 - -
(ix) The major categories of plan assets as a percentage of total plan @Insurer Managed Funds 88% N.A N.A 88% N.A N.ADebt, Equity & Other Instruments 12% N.A N.A 12% N.A N.A
(x) Actuarial Assumptions:
Discount Rate (p.a.) 7.05% 7.05% 7.05% 6.65% 6.65% - 6.75%
6.65%
Turnover Rate 1.5 % - 8.00%
1.5% - 8.00%
- -
Mortality tables Indian Assured
Lives Mortality (2012-14)
S1PA mortality table adjusted suitably
Indian Assured
Lives Mortality (2012-14)
S1PA mortality table adjusted suitably
Salary Escalation Rate (p.a.) 8.00% - - 8.00% - -Retirement age:Management -Non-Management-
60 Yrs. 58 Yrs.
- -60 Yrs. 58 Yrs.
- -
(xi) Weighted Average duration of Defined benefit obligation
9.3 Yrs 6.1 Yrs 5.8 Yrs 9.3 Yrs 6.7 Yrs 6.2 Yrs
* These Sensitivities have been calculated to show the movement in defined benefit obligation in isolation and assuming there are no other changes in market conditions at the accounting date. There have been no changes from the previous periods in the methods and assumptions used in preparing the sensitivity analyses.
@ The plan does not invest directly in any property occupied by the Company nor in any financial securities issued by the Company.
Notes to the Standalone Financial Statementsfor the year ended March 31, 2021 (Continued)
(xii) Discount Rate:
The discount rate is based on the prevailing market rates of Indian government securities for the estimated term of obligations.
(xiii) Salary Escalation Rate:
The estimates of future salary increases are considered taking into account inflation, seniority, promotion and other relevant factors.
(xiv) Asset Liability matching strategy:
The money contributed by the Company to the Gratuity fund to finance the liabilities of the plan has to be invested.
The trustees of the plan have outsourced the investment management of the fund to an insurance Company. The insurance Company in turn manages these funds as per the mandate provided to them by the trustees and the asset allocation which is within the permissible limits prescribed in the insurance regulations. Due to the restrictions in the type of investments that can be held by the fund, it is not possible to explicitly follow an asset liability matching strategy.
There is no compulsion on the part of the Company to fully prefund the liability of the Plan. The Company’s philosophy is to fund these benefits based on its own liquidity and the level of underfunding of the plan.
(xv) The Company’s expected contribution during next year is ` Nil. (March 31, 2020 ` 30.00 Crores).
(d) Provident Fund:
The Company is liable for any shortfall in the fund assets based on the Government specified rate of return. Such shortfall, if any, is recognised in the Statement of Profit and Loss as an expense in the year of incurring the same.
Amount recognized as an expense under the head “Contribution to Provident and other Funds” of Statement of Profit and Loss ` 88.10 Crores (March 31, 2020 ` 90.36 Crores).
The actuary has provided for a valuation and based on the below provided assumptions there is no shortfall as at March 31, 2021 (March 31, 2020: ` 0.68 Crores):
` in Crores
ParticularsAs at
March 31, 2021As at
March 31, 2020
(a) Plan Assets at Fair Value 1,736.24 1,589.35
(b) Present value of defined benefit obligation at year end 1,730.75 1,590.13
(c) Surplus available - 0.10
(d) Liability recognised in Balance Sheet (net) Nil 0.68
(e) Assumptions used in determining the present value obligation of interest rate guarantee under the Deterministic Approach
Government of India bond yield for the outstanding term of liabilities 7.05% 6.65%
Remaining term of the maturity of Investment Portfolio 13.03 Yrs 11.76- 13.50 Yrs.
Discount Rate for the remaining term of the maturity of Investment Portfolio 8.30% 7.85%-8.43%
Expected Guaranteed Interest Rate 8.50% 8.50%
Notes to the Standalone Financial Statementsfor the year ended March 31, 2021 (Continued)

Welcome to UltraTech
Value Creation
Growth Enablers
Statutory Reports
Financial Statements
ESG Commitments
222
Ult
raTe
ch C
emen
t Li
mit
ed
223
Ann
ual R
epo
rt 2
020-
21
(e) Contribution to Other Funds:
Amount recognized as an expense under the head “Contribution to Other Funds” of Statement of Profit and Loss ` 28.47 Crores (March 31, 2020 ` 30.32 Crores).
(B) Amount recognized as an expense in respect of Compensated Absences is ` (8.04) Crores (March 31, 2020 ` 59.52 Crores).
(C) Amount recognized as expense for other long-term employee benefits is ` 0.86 Crores (March 31, 2020 ` 44.18 Crores).
Note 38: Segment Reporting (Ind AS 108):
The Company has presented segment information in the consolidated financial statements. Accordingly, as per Ind AS 108 ‘Operating Segments’, no disclosures related to segments are presented in these standalone financial statements.
Note 39: Related party disclosures (Ind AS 24):
(A) List of Related Parties where control exists:
Name of the Related PartyPrincipal Place of
Business
% Shareholding and Voting Power
As atMarch 31, 2021
As atMarch 31, 2020
(i) Holding Company:Grasim Industries Limited
India NA NA
(ii) Subsidiary Companies:
(a) Dakshin Cements Limited (struck off w.e.f. April 9, 2021)
India 100% 100%
(b) UltraTech Cement Lanka Private Limited (UCLPL) Sri Lanka 80% 80%
(c) Harish Cement Limited India 100% 100%
(d) PT UltraTech Mining Indonesia Indonesia 80%! 80%!
(e) PT UltraTech Investments Indonesia Indonesia 100%& 100%&
(f) UltraTech Cement Middle East Investments Limited (UCMEIL)
United Arab Emirates 100% 100%
(g) Star Cement Co. LLC, Dubai * United Arab Emirates 100%$ 100%$
(h) Star Cement Co. LLC, Ras-Al-Khaimah * United Arab Emirates 100%$ 100%$
(i) Al Nakhla Crusher LLC, Fujairah * United Arab Emirates 100%$ 100%$
(j) Arabian Cement Industry LLC, Abu Dhabi * United Arab Emirates 100%$ 100%$
(k) UltraTech Cement Bahrain Company WLL, Bahrain * Bahrain 100%^ 100%^
(l) PT UltraTech Mining Sumatera # Indonesia 100% 100%
(m) UltraTech Nathdwara Cement Limited (UNCL) India 100% 100%
(n) Smooth Energy Private Limited @ India 100%!! 100%!!
(o) Bahar Ready Mix Concrete Limited @ India 100%!! 100%!!
(p) Merit Plaza Limited India 100%!! 100%!!
(q) Swiss Merchandise Infrastructure Limited India 100%!! 100%!!
(r) Krishna Holdings PTE Limited (KHPL) Singapore 100%&& 100%&&
(s) Bhumi Resources PTE Limited (BHUMI) Singapore 100%!! 100%!!
(t) Murari Holdings Limited (MUHL) British Virgin Islands 100%!! 100%!!
(u) Mukundan Holdings Limited (MHL) British Virgin Islands 100%!! 100%!!
(v) Star Super Cement Industries LLC (formerly known as Binani Cement Factory LLC) (SSCILLC) $
United Arab Emirates 100% @@ 100%**
Notes to the Standalone Financial Statementsfor the year ended March 31, 2021 (Continued)
Name of the Related PartyPrincipal Place of
Business
% Shareholding and Voting Power
As atMarch 31, 2021
As atMarch 31, 2020
(w) Binani Cement (Tanzania) Limited Tanzania 100%*** 100%***
(x) BC Tradelink Limited., Tanzania Tanzania 100%*** 100%***
(y) Shandong Binani Rongan Cement Company Limited (SBRCC), China (Up to July 30, 2020)
Republic of China - 92.5%^^
(z) PT Anggana Energy resources (Anggana), Indonesia Indonesia 100%^^^ 100%^^^
(aa) Binani Cement (Uganda) Limited Uganda 100%*** 100%***
(ab) Bhagwati Limestone Company Private Limited (BLCPL)
India 100% 100%
(ac) Gotan Limestone Khanij Udyog Private Limited India 100% 100%
(ad) PT UltraTech Cement Indonesia# Indonesia 99% 99%
(ae) 3B Binani Glassfibre Sarl (3B) **** Luxembourg 100%!! -
(af) Project Bird Holding ll Sarl **** (merged with 3B w.e.f. April 12, 2021)
Luxembourg 100%## -
(ag) 3B-Fibreglass Srl **** Belgium 100%### -
(ah) 3B-FibreGlass Norway as **** Norway 100%### -
(ai) Tunfib Sarl **** Tunisia 67%!!! -
(aj) Goa Glass Fibre Ltd. **** India 100%## -
(ak) Emirates Power Company Limited, Bangladesh* (Up to December, 2019)
Bangladesh - -
(al) Emirates Cement Bangladesh Limited, Bangladesh* (Up to December, 2019)
Bangladesh - -
(ak) Awam Minerals LLC, Oman* (Upto December 10, 2019)
Oman - -
! 4% Shareholding of UCMEIL & 5% Shareholding of UCMEIL * Subsidiaries of UCMEIL $ 51% held by nominee as required by local law for beneficial interest of the Company ^ 1 share held by employee as nominee for the beneficial interest of the Company # Subsidiary of PT UltraTech Investments Indonesia !! Wholly owned subsidiary of UNCL && 55.54% held by UNCL and 44.46% held by MHL ** 51% held by MHL through nominee as required by local law for beneficial interest of the Company and 49%
held by MUHL *** Wholly owned subsidiary of SSCILLC ^^ Subsidiary of KHPL ^^^ Wholly owned subsidiary of BHUMI @ Applied for strike off @@ Earlier 51% held by MHL through nominee as required by local law for beneficial interest of the Company and
49% held by MUHL; Subsidiary of UCMEIL w.e.f. November 23, 2020 **** With effect from March 12,2021 ## Wholly owned subsidiary of 3B Binani Glassfibre Sarl ### Wholly owned subsidiary of Project Bird Holding II Sarl !!! 67% held by Project Bird Holding II Sarl
Notes to the Standalone Financial Statementsfor the year ended March 31, 2021 (Continued)

Welcome to UltraTech
Value Creation
Growth Enablers
Statutory Reports
Financial Statements
ESG Commitments
224
Ult
raTe
ch C
emen
t Li
mit
ed
225
Ann
ual R
epo
rt 2
020-
21
(B) List of Related Parties with significant influence:
Name of the Related PartyPrincipal Place of
Business
% Shareholding and Voting Power
As atMarch 31, 2021
As atMarch 31, 2020
(i) Joint Venture:Bhaskarpara Coal Company Limited (BCCL)
India 47.37% 47.37%
(ii) Associate:
(a) Madanpur (North) Coal Company Private Limited (MNCCPL)
India 11.17% 11.17%
(b) Aditya Birla Renewable Energy Limited(w.e.f. April 13, 2020)
India 26.00% -
(c) Aditya Birla Renewable SPV 1 Limited India 26.00% 26.00%
(C) Other Related Parties with whom there were transactions during the year:
Name of the Related Party Relationship
Samruddhi Swastik Trading and Investments Limited Fellow Subsidiary
Aditya Birla Sun Life Insurance Company Limited (formerly known as Birla Sun Life Insurance Company Limited)
Fellow Subsidiary
Aditya Birla Health Insurance Limited Fellow Subsidiary
ABNL Investment Limited Fellow Subsidiary
UltraTech Cemco Provident Fund Post-Employment Benefit Plan
Bharucha & Partners Other related party in which Director is interested
Aditya Birla Management Corporation Private Limited Other related party in which Directors are interested
Mr. Kumar Mangalam Birla – Non-Executive Chairman Key Management Personnel (KMP)
Mrs. Rajashree Birla – Non-Executive Director Key Management Personnel (KMP)
Mr. Arun Adhikari – Independent Director Key Management Personnel (KMP)
Mrs. Alka Bharucha - Independent Director Key Management Personnel (KMP)
Mrs. Sukanya Kripalu - Independent Director Key Management Personnel (KMP)
Mr. S.B. Mathur - Independent Director Key Management Personnel (KMP)
Mrs. Usha Sangwan- Independent Director (from January 10,2020 till May 16, 2020)
Key Management Personnel (KMP)
Mr. Sunil Duggal – Independent Director (w.e.f. August 14, 2020) Key Management Personnel (KMP)
Mr. K.K. Maheshwari – Vice Chairman and Non-Executive Director (Managing Director till December 31, 2019)
Key Management Personnel (KMP)
Mr. K.C. Jhanwar – Managing Director w.e.f January 1,2020 Key Management Personnel (KMP)
Mr. Atul Daga - Whole-time Director and CFO Key Management Personnel (KMP)
Mrs. Kritika Daga Relative of KMP (Wife of Mr. Atul Daga)
Notes to the Standalone Financial Statementsfor the year ended March 31, 2021 (Continued)
(a) The following transactions were carried out with the related parties in the ordinary course of business:
` in Crores
Nature of Transaction/Related PartiesYear Ended
March 31, 2021Year Ended
March 31, 2020
Sale of Goods:
Grasim Industries Limited 8.76 18.24
UltraTech Nathdwara Cement Limited 313.87 170.33
UltraTech Cement Lanka Private Limited 292.45 293.10
Total 615.08 481.67
Purchase of Goods:
Grasim Industries Limited 1.56 2.30
UltraTech Nathdwara Cement Limited 1,603.56 1,650.35
Bhagwati Limestone Company Private Limited - 0.34
Aditya Birla Renewables Energy Limited 0.54 -
Aditya Birla Renewables SPV 1 30.63 22.32
Total 1,636.29 1,675.31
Sale of Property, Plant and Equipment:
Grasim Industries Limited 0.03 0.07
UltraTech Nathdwara Cement Limited 3.33 0.64
Total 3.36 0.71
Purchase of Property, Plant and Equipment:
Grasim Industries Limited 0.30 -
UltraTech Nathdwara Cement Limited 3.79 0.04
Aditya Birla Management Corporation Private Limited - 0.03
Total 4.09 0.07
Services received from:
Grasim Industries Limited 0.78 0.75
UltraTech Nathdwara Cement Limited 0.11 -
Bhagwati Limestone Company Private Limited - 0.04
Samruddhi Swastik Trading and Investments Limited 0.96 0.96
Aditya Birla Health Insurance Limited (0.28) 9.04
ABNL Investment Limited 2.30 2.30
Aditya Birla Sun Life Insurance Company Limited 4.42 5.28
Aditya Birla Renewables Energy Limited 0.01 -
KMP 26.93 44.54
Bharucha & Partners - 0.53
Aditya Birla Management Corporation Private Limited 231.19 189.97
Relative of KMP 0.08 0.30
Total 266.50 253.71
Notes to the Standalone Financial Statementsfor the year ended March 31, 2021 (Continued)

Welcome to UltraTech
Value Creation
Growth Enablers
Statutory Reports
Financial Statements
ESG Commitments
226
Ult
raTe
ch C
emen
t Li
mit
ed
227
Ann
ual R
epo
rt 2
020-
21
` in Crores
Nature of Transaction/Related PartiesYear Ended
March 31, 2021Year Ended
March 31, 2020
Services rendered to:
Grasim Industries Limited 1.22 3.05
UltraTech Nathdwara Cement Limited 0.45 1.48
UltraTech Cement Lanka Private Limited 61.26 64.85
UltraTech Cement Middle East Investments Limited - 0.02
Bhagwati Limestone Company Private Limited 0.23 0.36
Aditya Birla Management Corporation Private Limited 0.06 -
Total 63.22 69.76
Dividend and Interest Income:
UltraTech Nathdwara Cement Limited 90.05 146.40
UltraTech Cement Middle East Investments Limited 1.12 -
Total 91.17 146.40
Dividend Paid:
Grasim Industries Limited 214.94 190.14
Contribution to:
Post-Employment Benefit Plan 49.58 43.54
Investments:
Harish Cement Limited - 0.38
Equity Investment in UltraTech Cement Middle East Investments Limited 298.19 -
Preference Shares in UltraTech Cement Middle East Investments Limited 1,023.54 -
Aditya Birla Renewable SPV 1 Limited - 5.75
Aditya Birla Renewable Energy Limited 3.42 -
Total 1,325.15 6.13
Loans repaid by Subsidiary:
UltraTech Nathdwara Cement Limited 1,006.54 10.55
Advances against Supply:
UltraTech Nathdwara Cement Limited 156.32 81.02
Advances from Customer:
UltraTech Cement Lanka Private Limited 20.37 -
Corporate Guarantees on behalf of subsidiaries:
Released during the year - UltraTech Cement Middle East Investments Limited 1,650.46 61.03
Corporate Guarantees on behalf of Joint Venture:
Released during the year- Bhaskarpara Coal Company Limited 2.30 -
Notes to the Standalone Financial Statementsfor the year ended March 31, 2021 (Continued)
(b) Outstanding balances:
` in Crores
Nature of Transaction/Related PartiesAs at
March 31, 2021As at
March 31, 2020
Loans and Advances:
Grasim Industries Limited 3.48 0.44
UltraTech Nathdwara Cement Limited 938.98 1,871.14
UltraTech Cement Middle East Investments Limited - 0.02
Bhagwati Limestone Company Private Limited 0.85 0.52
Samruddhi Swastik Trading and Investments Limited 0.37 0.37
Aditya Birla Health Insurance Limited 0.07 8.13
ABNL Investment Limited 1.68 1.68
Aditya Birla Renewable SPV 1 Limited 0.25 -
Aditya Birla Sun Life Insurance Company Limited 0.11 0.14
Bhaskarpara Coal Company Limited 2.49 2.49
KMP 2.60 3.00
Aditya Birla Management Corporation Private Limited 29.60 45.42
Total 980.48 1,933.35
Investment in Preference Shares:
UltraTech Cement Middle East Investments Limited 1,023.54 -
Interest receivable:
UltraTech Nathdwara Cement Limited - 10.74
Trade Receivables:
Grasim Industries Limited 0.60 1.15
UltraTech Cement Lanka Private Limited 137.74 88.06
Total 138.34 89.21
Trade Payables:
Grasim Industries Limited 0.37 0.47
UltraTech Nathdwara Cement Limited 0.56 1.75
Bhagwati Limestone Company Private Limited - 0.07
Aditya Birla Renewable Energy Limited 0.20
Aditya Birla Renewables SPV 1 2.60 1.84
Total 3.73 4.13
Advance from Customers:
UltraTech Cement Lanka Private Limited 20.37 -
Deposit:
Relative of KMP 5.00 5.00
Total 5.00 5.00
Corporate Guarantees:
UltraTech Nathdwara Cement Limited 3,050.00 3,050.00
UltraTech Cement Middle East Investments Limited 1,179.24 2,928.59
Bhaskarpara Coal Company Limited 1.70 4.00
Total 4,230.94 5,982.59
Notes to the Standalone Financial Statementsfor the year ended March 31, 2021 (Continued)

Welcome to UltraTech
Value Creation
Growth Enablers
Statutory Reports
Financial Statements
ESG Commitments
228
Ult
raTe
ch C
emen
t Li
mit
ed
229
Ann
ual R
epo
rt 2
020-
21
(c) Compensation of KMP of the Company:
` in Crores
Nature of transactionYear Ended
March 31, 2021Year Ended
March 31, 2020
Short-term employee benefits 13.26 23.22
Post-employment benefits 3.40 19.26
Share based payment 3.39 3.30
Total compensation paid to KMP 20.05 45.78
Compensation for March 31, 2020 includes compensation of Mr. K. K. Maheshwari, who was Managing Director till December 31, 2019 and was designated as Vice Chairman and Non-Executive Director w.e.f January, 01, 2020. Post- retirement benefits included amount paid to him for Gratuity and Leave Encashment of ` 8.27 Crores. Further the Board had approved one-time payout of ` 9.45 Crores and pension of ` 28,34,000 per month with effect from January 1, 2020 for his past services as Managing Director, which is also part of the above Post-employment benefits.
Based on the recommendation of the Nomination, Remuneration and Compensation Committee, all decisions relating to the remuneration of the Directors are taken by the Board of Directors of the Company, in accordance with shareholders’ approval, wherever necessary.
Terms and Conditions of transactions with Related Parties:
The sales to and purchases from related parties including fixed Assets are made in the normal course of business and on terms equivalent to those that prevail in arm’s length transactions. Outstanding balances at the year-end are unsecured and interest free and settlement occurs in cash.
The Company’s inter corporate loan to its subsidiary which is repayable on demand, for the current year the rate of interest is 1 month MCLR. (March 31,2020: 1 month MCLR)
For the year ended March 31, 2021, the Company has not recorded any impairment of receivables relating to amounts owed by related parties. This assessment is undertaken each financial year through examining the financial position of the related party and the market in which the related party operates.
Note 40: Income Taxes (Ind AS 12):
Reconciliation of Effective Tax Rate:in %
ParticularsYear Ended
March 31, 2021Year Ended
March 31, 2020
Applicable tax rate 34.94 34.94
Effect of Tax-Exempt Income (0.08) (0.35)
Effect of Non-Deductible expenses 0.60 0.61
Effect of Allowances for tax purpose (1.19) (2.70)
Effect of Tax paid at a lower rate (1.36) (0.87)
Effect of changes in tax rate (deferred) (0.73) (1.41)
Effect of Previous year adjustments 0.04 (0.02)
Others 0.13 (0.13)
Effective Tax Rate 32.35 30.07
Effect of Reversal of Opening Deferred Tax Liability for change in income tax rates(Refer Note 18)
- (34.59)
Net Effective Tax Rate 32.35 (4.52)
Notes to the Standalone Financial Statementsfor the year ended March 31, 2021 (Continued)
Note 41: Earnings per Share (EPS) (Ind AS 33):
` in Crores
ParticularsYear Ended
March 31, 2021Year Ended
March 31, 2020
(A) Basic EPS:
(i) Net Profit attributable to Equity Shareholders 5,342.07 5,455.54
(ii) Weighted average number of Equity Shares outstanding (Nos.) 288,641,300 288,626,496
(iii) Less: Treasury Shares acquired by the Company under Trust (192,586) (209,477)
(iv) Weighted average number of Equity Shares outstanding for calculation of Basic EPS (Face value ` 10/ share) (ii+iii)
288,448,714 288,417,019
Basic EPS (`) (i)/(iv) 185.20 189.15
(B) Diluted EPS:
(i) Weighted average number of Equity Shares Outstanding (Nos.) 288,448,714 288,417,019
(ii) Add: Potential Equity Shares on exercise of options (Nos.) 103,823 85,507
(iii) Weighted average number of Equity Shares Outstanding for calculation of Dilutive EPS (i+ii) (Face Value ` 10/ share)
288,552,537 288,502,526
Diluted EPS (`) {(A) (i) /(B) (iii)} 185.13 189.10
Note 42: Auditors’ remuneration (excluding service tax/GST) and expenses:` in Crores
ParticularsYear Ended
March 31, 2021Year Ended
March 31, 2020
(a) Statutory Auditors:
Audit fees (including Quarterly Limited Reviews) 3.74 3.63
Tax audit fees 0.18 0.18
Fees for other services 1.88 0.58
Fees for Taxation matters 0.02 -
Expenses reimbursed 0.02 0.14
(b) Cost Auditors:
Audit fees 0.29 0.29
Expenses reimbursed (FY 2021: ` 15,000) 0.00 0.01
Note 43:
The following expenses are included in the different heads of expenses in the Statement of Profit and Loss:
` in Crores
Particulars
Year Ended March 31, 2021 Year Ended March 31, 2020
Raw Materials
Consumed
Power and Fuel
Consumed
Total Raw Materials
Consumed
Power and Fuel
Consumed
Total
Stores and Spares Consumed 92.34 45.45 137.79 101.36 54.77 156.13
Royalty and Cess 1076.85 - 1076.85 1,053.58 - 1,053.58
Notes to the Standalone Financial Statementsfor the year ended March 31, 2021 (Continued)
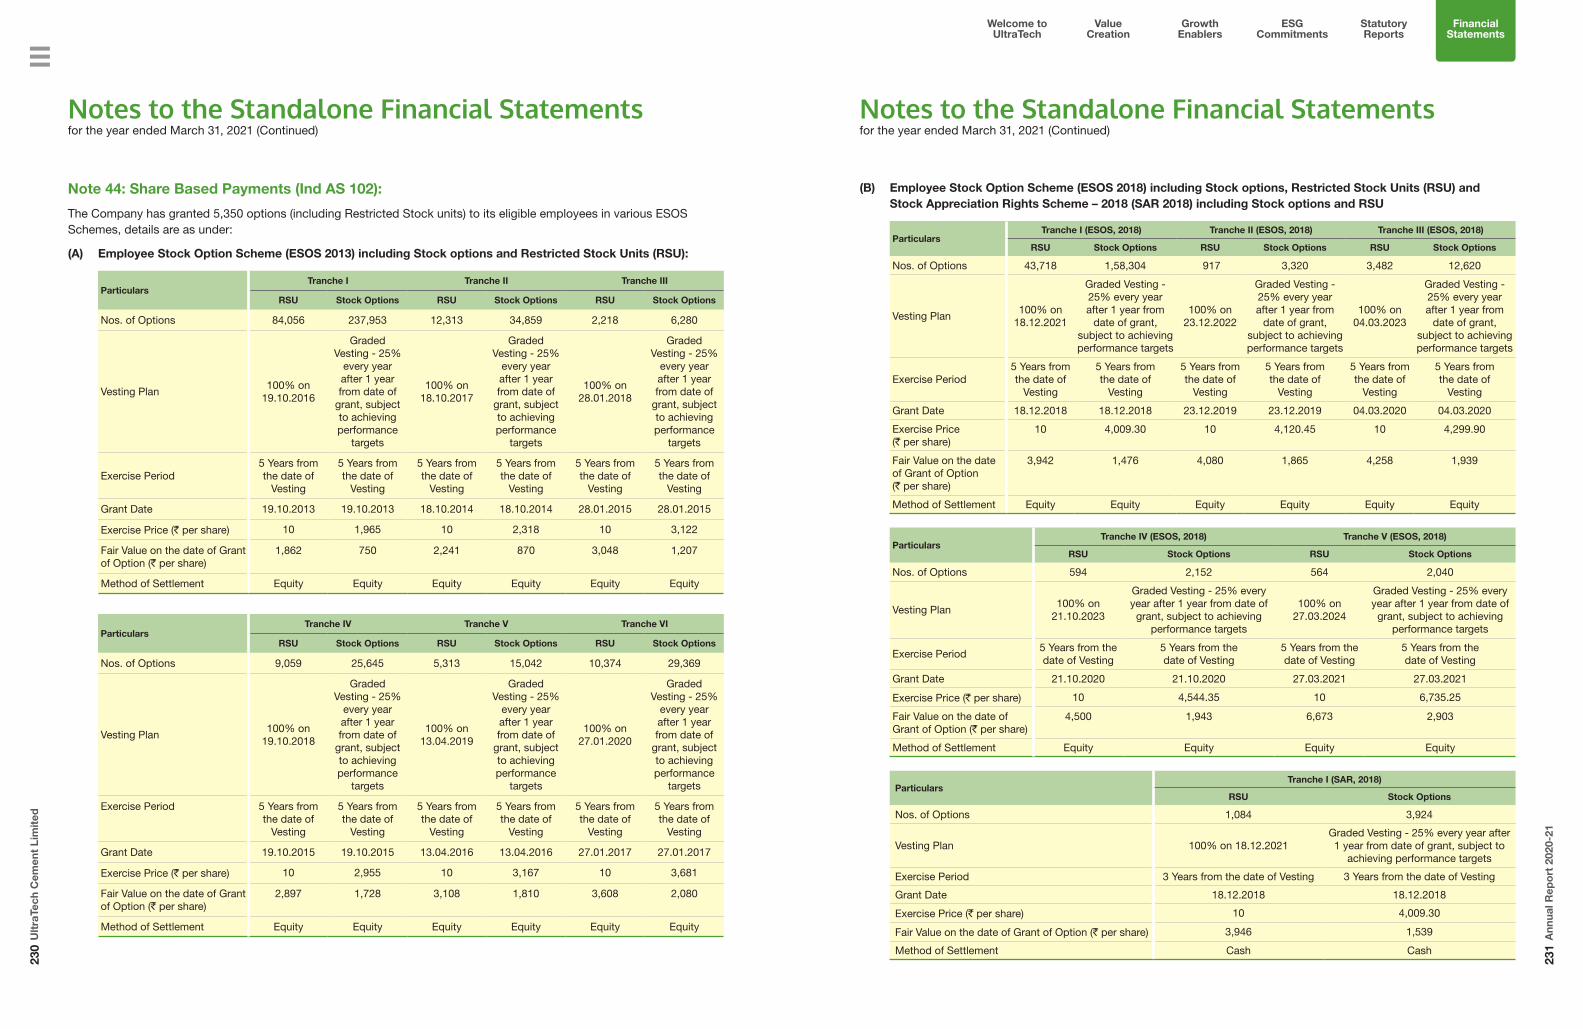
Welcome to UltraTech
Value Creation
Growth Enablers
Statutory Reports
Financial Statements
ESG Commitments
230
Ult
raTe
ch C
emen
t Li
mit
ed
231
Ann
ual R
epo
rt 2
020-
21
Note 44: Share Based Payments (Ind AS 102):
The Company has granted 5,350 options (including Restricted Stock units) to its eligible employees in various ESOS Schemes, details are as under:
(A) Employee Stock Option Scheme (ESOS 2013) including Stock options and Restricted Stock Units (RSU):
ParticularsTranche I Tranche II Tranche III
RSU Stock Options RSU Stock Options RSU Stock Options
Nos. of Options 84,056 237,953 12,313 34,859 2,218 6,280
Vesting Plan100% on
19.10.2016
Graded Vesting - 25%
every year after 1 year from date of
grant, subject to achieving performance
targets
100% on 18.10.2017
Graded Vesting - 25%
every year after 1 year from date of
grant, subject to achieving performance
targets
100% on 28.01.2018
Graded Vesting - 25%
every year after 1 year from date of
grant, subject to achieving performance
targets
Exercise Period5 Years from the date of
Vesting
5 Years from the date of
Vesting
5 Years from the date of
Vesting
5 Years from the date of
Vesting
5 Years from the date of
Vesting
5 Years from the date of
Vesting
Grant Date 19.10.2013 19.10.2013 18.10.2014 18.10.2014 28.01.2015 28.01.2015
Exercise Price (` per share) 10 1,965 10 2,318 10 3,122
Fair Value on the date of Grant of Option (` per share)
1,862 750 2,241 870 3,048 1,207
Method of Settlement Equity Equity Equity Equity Equity Equity
ParticularsTranche IV Tranche V Tranche VI
RSU Stock Options RSU Stock Options RSU Stock Options
Nos. of Options 9,059 25,645 5,313 15,042 10,374 29,369
Vesting Plan100% on
19.10.2018
Graded Vesting - 25%
every year after 1 year from date of
grant, subject to achieving performance
targets
100% on 13.04.2019
Graded Vesting - 25%
every year after 1 year from date of
grant, subject to achieving performance
targets
100% on 27.01.2020
Graded Vesting - 25%
every year after 1 year from date of
grant, subject to achieving performance
targets
Exercise Period 5 Years from the date of
Vesting
5 Years from the date of
Vesting
5 Years from the date of
Vesting
5 Years from the date of
Vesting
5 Years from the date of
Vesting
5 Years from the date of
Vesting
Grant Date 19.10.2015 19.10.2015 13.04.2016 13.04.2016 27.01.2017 27.01.2017
Exercise Price (` per share) 10 2,955 10 3,167 10 3,681
Fair Value on the date of Grant of Option (` per share)
2,897 1,728 3,108 1,810 3,608 2,080
Method of Settlement Equity Equity Equity Equity Equity Equity
Notes to the Standalone Financial Statementsfor the year ended March 31, 2021 (Continued)
(B) Employee Stock Option Scheme (ESOS 2018) including Stock options, Restricted Stock Units (RSU) and Stock Appreciation Rights Scheme – 2018 (SAR 2018) including Stock options and RSU
ParticularsTranche I (ESOS, 2018) Tranche II (ESOS, 2018) Tranche III (ESOS, 2018)
RSU Stock Options RSU Stock Options RSU Stock Options
Nos. of Options 43,718 1,58,304 917 3,320 3,482 12,620
Vesting Plan100% on
18.12.2021
Graded Vesting - 25% every year after 1 year from
date of grant, subject to achieving performance targets
100% on 23.12.2022
Graded Vesting - 25% every year after 1 year from
date of grant, subject to achieving performance targets
100% on 04.03.2023
Graded Vesting - 25% every year after 1 year from
date of grant, subject to achieving performance targets
Exercise Period5 Years from the date of
Vesting
5 Years fromthe date of
Vesting
5 Years from the date of
Vesting
5 Years fromthe date of
Vesting
5 Years from the date of
Vesting
5 Years fromthe date of
Vesting
Grant Date 18.12.2018 18.12.2018 23.12.2019 23.12.2019 04.03.2020 04.03.2020
Exercise Price(` per share)
10 4,009.30 10 4,120.45 10 4,299.90
Fair Value on the date of Grant of Option(` per share)
3,942 1,476 4,080 1,865 4,258 1,939
Method of Settlement Equity Equity Equity Equity Equity Equity
ParticularsTranche IV (ESOS, 2018) Tranche V (ESOS, 2018)
RSU Stock Options RSU Stock Options
Nos. of Options 594 2,152 564 2,040
Vesting Plan100% on
21.10.2023
Graded Vesting - 25% every year after 1 year from date of
grant, subject to achieving performance targets
100% on27.03.2024
Graded Vesting - 25% every year after 1 year from date of
grant, subject to achieving performance targets
Exercise Period5 Years from the date of Vesting
5 Years from thedate of Vesting
5 Years from the date of Vesting
5 Years from thedate of Vesting
Grant Date 21.10.2020 21.10.2020 27.03.2021 27.03.2021
Exercise Price (` per share) 10 4,544.35 10 6,735.25
Fair Value on the date of Grant of Option (` per share)
4,500 1,943 6,673 2,903
Method of Settlement Equity Equity Equity Equity
ParticularsTranche I (SAR, 2018)
RSU Stock Options
Nos. of Options 1,084 3,924
Vesting Plan 100% on 18.12.2021Graded Vesting - 25% every year after 1 year from date of grant, subject to
achieving performance targets
Exercise Period 3 Years from the date of Vesting 3 Years from the date of Vesting
Grant Date 18.12.2018 18.12.2018
Exercise Price (` per share) 10 4,009.30
Fair Value on the date of Grant of Option (` per share) 3,946 1,539
Method of Settlement Cash Cash
Notes to the Standalone Financial Statementsfor the year ended March 31, 2021 (Continued)

Welcome to UltraTech
Value Creation
Growth Enablers
Statutory Reports
Financial Statements
ESG Commitments
232
Ult
raTe
ch C
emen
t Li
mit
ed
233
Ann
ual R
epo
rt 2
020-
21
(C) Movement of Options Granted including RSU along with weighted average exercise price (WAEP):
` in Crores
ParticularsAs at March 31, 2021 As at March 31, 2020
Nos. WAEP (`) Nos. WAEP (`)
Outstanding at the beginning of the year 297,479 2963.45 316,974 2,843.64
Granted during the year 5,350 4398.30 20,339 3,342.77
Exercised during the year (45,184) 3049.39 (21,711) 1,799.42
Forfeited during the year (8,191) 2980.46 (18,123) 2,688.20
Outstanding at the end of the year 249,454 2978.09 297,479 2,963.45
Options exercisable at the end of the year 123,620 3237.00 118,919 2,875.80
The weighted average share price at the date of exercise for options was ` 5,759.93 per share (March 31, 2020 ` 4,181.12 per share) and weighted average remaining contractual life for the share options outstanding as at March 31, 2021 was 5.10 years (March 31,2020: 5.12 years).
The weighted average remaining contractual life for SAR is 3.22 years (March 31, 2020: 4.22 years).
The exercise price for outstanding options and SAR is ` 10 per share for RSU’s and ranges from ` 1,965 per share to ` 6,735 per share for options.
(D) Fair Valuation:
5,350 share options were granted during the year. Weighted Average Fair value of the options granted during the year is ` 3,091.60 per share (March 31, 2020 ` 2,682.45 per share).
The fair value of option has been done by an independent firm of Chartered Accountants on the date of grant using the Black-Scholes Model/ Binomial Model.
The Key assumptions in the Black-Scholes Model for calculating fair value as on the date of grant:
(a) For ESOS 2013:
1. Risk Free Rate - 8.5% (Tranche I), 7.8% (Tranche II-III), 8.56% (Tranche IV)7.6% (Tranche V), 6.74% (Tranche VI)
2. Option Life - (a) For Options - Vesting period (1 Year) + Average of exercise period(b) For RSU – Vesting period (3 Years) + Average of exercise period
3. Expected Volatility* - Tranche-I: 0.29, Tranche-II: 0.27, Tranche-III: 0.28, Tranche-IV: 0.60Tranche–V: 0.60, Tranche–VI: 0.61
4. Expected Growth in Dividend - Tranche -I: 20%, Tranche II-III: 15%, Tranche-IV: 5%, Tranche-V: 5%,Tranche-VI: 5%
(b) For ESOS 2018:
1. Risk Free Rate - 7.47% (Tranche I)
2. Option Life - (a) For Options - Vesting period (1 Year) + Average of exercise period(b) For RSU – Vesting period (3 Years) + Average of exercise period
3. Expected Volatility* - Tranche-I: 0.24
4. Dividend Yield - Tranche -I: 0.46%
*Expected volatility on the Company’s stock price on National Stock Exchange based on the data commensurate with the expected life of the options/RSU’s up to the date of grant.
Notes to the Standalone Financial Statementsfor the year ended March 31, 2021 (Continued)
The Key assumptions in the Binomial Tree Model for calculating fair value as on the date of grant:
(a) For ESOS – SAR - 2018:
1. Risk Free Rate - 7.47% (Tranche I)
2. Option Life - (a) For Options - Vesting period (1 Year) + Average of exercise period(b) For RSU – Vesting period (3 Years) + Average of exercise period
3. Expected Volatility* - Tranche-I: 0.25,
4. Dividend Yield - Tranche -I: 0.46%
(b) For ESOS 2018:
1. Risk Free Rate - 6.78% (Tranche II), 6.72% (Tranche III), 5.84% (Tranche IV & V)
2. Option Life - (a) For Options - Vesting period (1 Year) + Average of exercise period(b) For RSU – Vesting period (3 Years) + Average of exercise period
3. Expected Volatility* - Tranche-II: 0.26, Tranche- III: 0.26, Tranche- IV & V: 0.26
4. Dividend Yield - Tranche -II & III: 0.27%; Tranche IV & V: 0.27%
*Expected volatility on the Company’s stock price on National Stock Exchange based on the data commensurate with the expected life of the options/RSU’s up to the date of grant.
Note 45 (A): Classification of Financial Assets and Liabilities (Ind AS 107):
` in Crores
ParticularsAs at March 31, 2021 As at March 31, 2020
Carrying Value Fair Value Carrying Value Fair Value
Financial Assets at amortised cost
Trade Receivables 2,285.99 2,285.99 1,848.28 1,848.28
Loans 1,041.53 1,041.53 2,045.47 2,045.47
Cash and Bank Balances 1,876.55 1,876.55 310.52 310.52
Investments 300.00 300.00 100.00 100.00
Other Financial Assets 1,844.06 1,844.06 1,361.45 1,361.45
Financial Assets at fair value through Profit or Loss
Investments 12,790.99 12,790.99 5,805.49 5,805.49
Fair Value Hedging Instruments
Derivative Assets 462.12 462.12 104.53 104.53
Total 20,601.24 20,601.24 11,575.74 11,575.74
Financial liabilities at amortised cost
Non-Convertible Debentures 3,810.00 3,859.27 2,810.00 2,809.77
Term Loan from Banks 4,892.12 4,892.12 10,008.97 10,008.97
Cash Credits / Working Capital Borrowing 240.67 240.67 3.69 3.69
Commercial Papers and others 2,989.38 2,989.38 2,949.42 2,949.42
Sales Tax Deferment Loan 391.36 391.36 401.40 401.40
Redeemable Preference Shares 1,000.10 1,000.10 1,000.10 1,000.10
Trade Payables 4,380.18 4,380.18 3,038.78 3,038.78
Other Financial Liabilities 3,048.09 3,048.09 2,425.78 2,425.78
Notes to the Standalone Financial Statementsfor the year ended March 31, 2021 (Continued)

Welcome to UltraTech
Value Creation
Growth Enablers
Statutory Reports
Financial Statements
ESG Commitments
234
Ult
raTe
ch C
emen
t Li
mit
ed
235
Ann
ual R
epo
rt 2
020-
21
` in Crores
ParticularsAs at March 31, 2021 As at March 31, 2020
Carrying Value Fair Value Carrying Value Fair Value
Foreign Currency Borrowings 1,070.54 1,070.54 1,107.96 1,107.96
Foreign Currency Bonds 2,924.40 2,758.59 - -
Lease Liability 405.83 405.83 357.51 357.51
Financial Liability at fair value through Profit or Loss
Lease Liability payable in Foreign Currency 589.97 589.97 535.58 535.58
Total 25,742.64 25,626.10 24,639.19 24,638.96
Investment in Subsidiaries, Joint ventures and Associates amounting to ` 4,478.69 Crores (March 31, 2020 ` 4,177.13 Crores) are measured at Cost in accordance with Ind AS 27.
Note 45 (B): Fair Value measurements (Ind AS 113):
The fair values of the financial assets and liabilities are included at the amount at which the instrument could be exchanged in an orderly transaction in the principal (or most advantageous) market at measurement date under the current market condition regardless of whether that price is directly observable or estimated using other valuation techniques.
The Company has established the following fair value hierarchy that categorizes the values into 3 levels. The inputs to valuation techniques used to measure fair value of financial instruments are:
Level 1: This hierarchy uses quoted (unadjusted) prices in active markets for identical assets or liabilities. The fair value of all bonds which are traded in the stock exchanges is valued using the closing price or dealer quotations as at the reporting date.
Level 2: The fair value of financial instruments that are not traded in an active market (For example traded bonds, over the counter derivatives) is determined using valuation techniques which maximize the use of observable market data and rely as little as possible on company specific estimates. The mutual fund units are valued using the closing Net Asset Value. If all significant inputs required to fair value an instrument are observable, the instrument is included in Level 2.
Level 3: If one or more of the significant inputs is not based on observable market data, the instrument is included in Level 3.
` in Crores
Particulars
Fair Value
As atMarch 31, 2021
As atMarch 31, 2020
Financial Assets at fair value through profit or loss
Investments – Level 2 11,722.46 5,781.73
Investments – Level 3 1,068.53 23.76
Fair Value Hedging Instruments
Derivative assets – Level 2 462.12 104.53
Total 13,253.11 5,910.02
The management assessed that cash and bank balances, trade receivables, loans, trade payables, cash credits, commercial papers and other financial assets and liabilities approximate their carrying amounts largely due to the short-term maturities of these instruments.
Notes to the Standalone Financial Statementsfor the year ended March 31, 2021 (Continued)
The following methods and assumptions were used to estimate the fair values:
(a) The fair values of the quoted investments/units of mutual fund schemes are based on market price/net asset value at the reporting date.
(b) The fair value of interest rate swaps is calculated as the present value of the estimated future cash flows based on observable yield curves and an appropriate discount factor.
(c) The fair value of forward foreign exchange contracts is calculated as the present value determined using forward exchange rates and interest rate curve of the respective currencies.
(d) The fair value of currency swap is calculated as the present value determined using forward exchange rates, currency basis spreads between the respective currencies, interest rate curves and an appropriate discount factor.
(e) The fair value of foreign currency option contracts is determined using the Black Scholes valuation model.
(f) The fair value of the remaining financial instruments is determined using discounted cash flow analysis. The discount rates used is based on management estimates.
The significant unobservable inputs used in the fair value measurement of the fair value hierarchy together with a quantitative sensitivity analysis as at March 31, 2021 and March 31, 2020 are as shown below:
Description of significant unobservable inputs to valuation:
ParticularsValuation Technique
Significant unobservable inputs
Discounting Rate Sensitivity of the input to fair value.
Investments in Unquoted instruments accounted for as fair value through Profit and Loss
DCF method Average Cost of Borrowings to arrive at discount rate.
March 31, 2021: 8.50% March 31, 2020: 8.50%
0.5% (March 31 2020: 0.5%)increase (decrease) would result in increase (decrease) in fair value by` (0.69) Crores (March 31 2020:` (0.73) Crores)
Reconciliation of Level 3 Fair Value Measurements:
` in Crores
Particulars Amount
Balance as at March 31, 2019 17.40
Add: Change in Value of Investment in Preference Shares measured at FVTPL 1.60
Add: Purchase of Investment during the year 4.82
Less: Sale of Investment during the year (0.06)
Balance as at March 31, 2020 23.76
Add: Change in Value of Investment in Preference Shares measured at FVTPL 0.09
Add: Investment during the year 1,044.68
Less: Sale of Investment during the year -
Balance as at March 31, 2021 1,068.53
Note 46: Financial Risk Management Objectives (Ind AS 107):
The Company’s principal financial liabilities, other than derivatives, comprises of borrowings, trade and other payables. The main purpose of these financial liabilities is to finance the Company’s operations. The Company’s principal financial assets, other than derivatives include trade and other receivables, investments and cash and cash equivalents that derive directly from its operations.
Notes to the Standalone Financial Statementsfor the year ended March 31, 2021 (Continued)
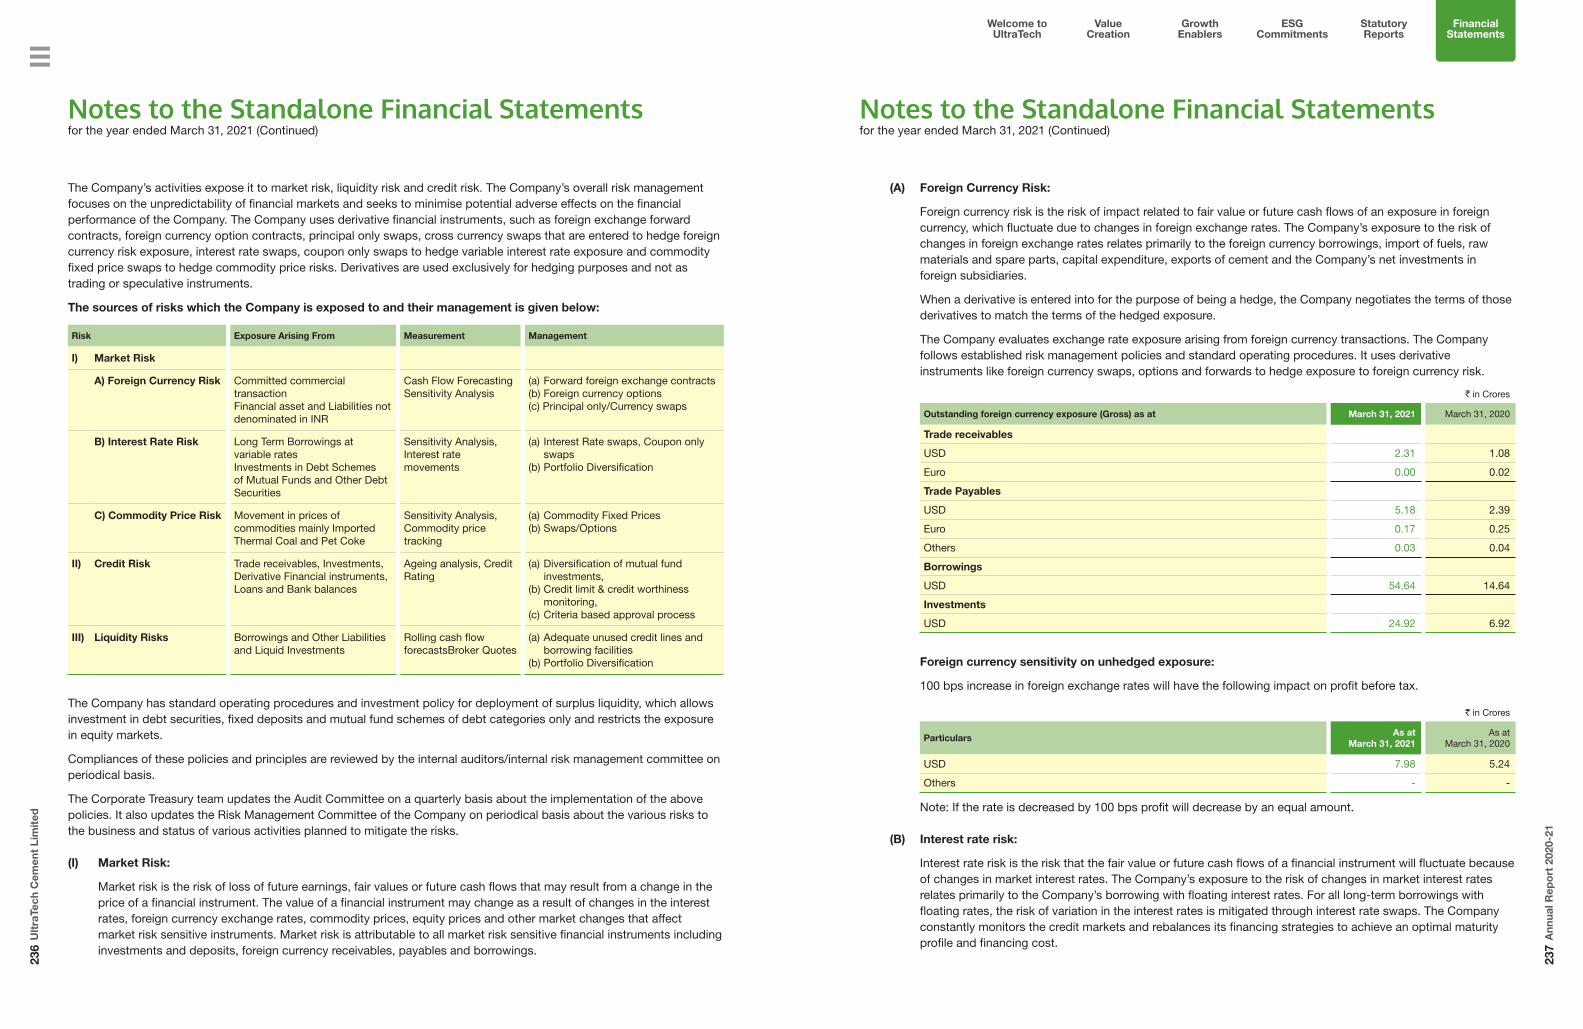
Welcome to UltraTech
Value Creation
Growth Enablers
Statutory Reports
Financial Statements
ESG Commitments
236
Ult
raTe
ch C
emen
t Li
mit
ed
237
Ann
ual R
epo
rt 2
020-
21
The Company’s activities expose it to market risk, liquidity risk and credit risk. The Company’s overall risk management focuses on the unpredictability of financial markets and seeks to minimise potential adverse effects on the financial performance of the Company. The Company uses derivative financial instruments, such as foreign exchange forward contracts, foreign currency option contracts, principal only swaps, cross currency swaps that are entered to hedge foreign currency risk exposure, interest rate swaps, coupon only swaps to hedge variable interest rate exposure and commodity fixed price swaps to hedge commodity price risks. Derivatives are used exclusively for hedging purposes and not as trading or speculative instruments.
The sources of risks which the Company is exposed to and their management is given below:
Risk Exposure Arising From Measurement Management
I) Market Risk
A) Foreign Currency Risk Committed commercial transaction Financial asset and Liabilities not denominated in INR
Cash Flow Forecasting Sensitivity Analysis
(a) Forward foreign exchange contracts(b) Foreign currency options(c) Principal only/Currency swaps
B) Interest Rate Risk Long Term Borrowings at variable rates Investments in Debt Schemes of Mutual Funds and Other Debt Securities
Sensitivity Analysis, Interest rate movements
(a) Interest Rate swaps, Coupon only swaps
(b) Portfolio Diversification
C) Commodity Price Risk Movement in prices of commodities mainly Imported Thermal Coal and Pet Coke
Sensitivity Analysis, Commodity price tracking
(a) Commodity Fixed Prices(b) Swaps/Options
II) Credit Risk Trade receivables, Investments, Derivative Financial instruments, Loans and Bank balances
Ageing analysis, Credit Rating
(a) Diversification of mutual fund investments,
(b) Credit limit & credit worthiness monitoring,
(c) Criteria based approval process
III) Liquidity Risks Borrowings and Other Liabilities and Liquid Investments
Rolling cash flow forecastsBroker Quotes
(a) Adequate unused credit lines and borrowing facilities
(b) Portfolio Diversification
The Company has standard operating procedures and investment policy for deployment of surplus liquidity, which allows investment in debt securities, fixed deposits and mutual fund schemes of debt categories only and restricts the exposure in equity markets.
Compliances of these policies and principles are reviewed by the internal auditors/internal risk management committee on periodical basis.
The Corporate Treasury team updates the Audit Committee on a quarterly basis about the implementation of the above policies. It also updates the Risk Management Committee of the Company on periodical basis about the various risks to the business and status of various activities planned to mitigate the risks.
(I) Market Risk:
Market risk is the risk of loss of future earnings, fair values or future cash flows that may result from a change in the price of a financial instrument. The value of a financial instrument may change as a result of changes in the interest rates, foreign currency exchange rates, commodity prices, equity prices and other market changes that affect market risk sensitive instruments. Market risk is attributable to all market risk sensitive financial instruments including investments and deposits, foreign currency receivables, payables and borrowings.
Notes to the Standalone Financial Statementsfor the year ended March 31, 2021 (Continued)
(A) Foreign Currency Risk:
Foreign currency risk is the risk of impact related to fair value or future cash flows of an exposure in foreign currency, which fluctuate due to changes in foreign exchange rates. The Company’s exposure to the risk of changes in foreign exchange rates relates primarily to the foreign currency borrowings, import of fuels, raw materials and spare parts, capital expenditure, exports of cement and the Company’s net investments in foreign subsidiaries.
When a derivative is entered into for the purpose of being a hedge, the Company negotiates the terms of those derivatives to match the terms of the hedged exposure.
The Company evaluates exchange rate exposure arising from foreign currency transactions. The Company follows established risk management policies and standard operating procedures. It uses derivative instruments like foreign currency swaps, options and forwards to hedge exposure to foreign currency risk.
` in Crores
Outstanding foreign currency exposure (Gross) as at March 31, 2021 March 31, 2020
Trade receivables
USD 2.31 1.08
Euro 0.00 0.02
Trade Payables
USD 5.18 2.39
Euro 0.17 0.25
Others 0.03 0.04
Borrowings
USD 54.64 14.64
Investments
USD 24.92 6.92
Foreign currency sensitivity on unhedged exposure:
100 bps increase in foreign exchange rates will have the following impact on profit before tax.
` in Crores
ParticularsAs at
March 31, 2021As at
March 31, 2020
USD 7.98 5.24
Others - -
Note: If the rate is decreased by 100 bps profit will decrease by an equal amount.
(B) Interest rate risk:
Interest rate risk is the risk that the fair value or future cash flows of a financial instrument will fluctuate because of changes in market interest rates. The Company’s exposure to the risk of changes in market interest rates relates primarily to the Company’s borrowing with floating interest rates. For all long-term borrowings with floating rates, the risk of variation in the interest rates is mitigated through interest rate swaps. The Company constantly monitors the credit markets and rebalances its financing strategies to achieve an optimal maturity profile and financing cost.
Notes to the Standalone Financial Statementsfor the year ended March 31, 2021 (Continued)
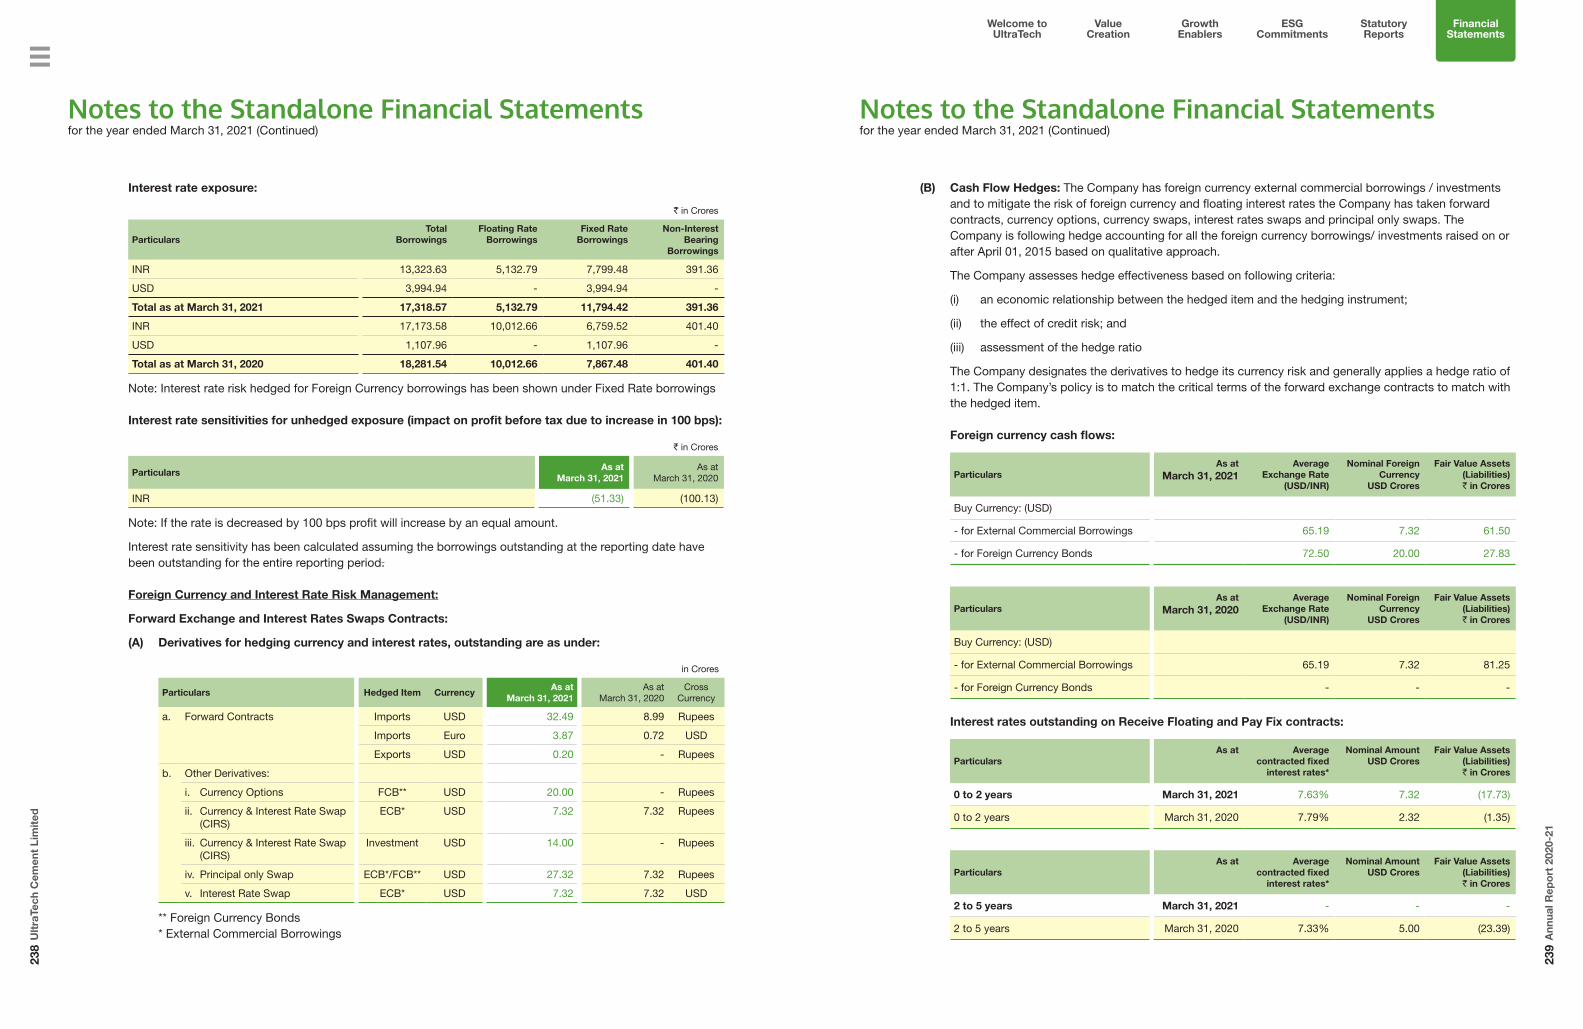
Welcome to UltraTech
Value Creation
Growth Enablers
Statutory Reports
Financial Statements
ESG Commitments
238
Ult
raTe
ch C
emen
t Li
mit
ed
239
Ann
ual R
epo
rt 2
020-
21
Interest rate exposure:
` in Crores
ParticularsTotal
BorrowingsFloating Rate
BorrowingsFixed Rate
BorrowingsNon-Interest
Bearing Borrowings
INR 13,323.63 5,132.79 7,799.48 391.36
USD 3,994.94 - 3,994.94 -
Total as at March 31, 2021 17,318.57 5,132.79 11,794.42 391.36
INR 17,173.58 10,012.66 6,759.52 401.40
USD 1,107.96 - 1,107.96 -
Total as at March 31, 2020 18,281.54 10,012.66 7,867.48 401.40
Note: Interest rate risk hedged for Foreign Currency borrowings has been shown under Fixed Rate borrowings
Interest rate sensitivities for unhedged exposure (impact on profit before tax due to increase in 100 bps):
` in Crores
ParticularsAs at
March 31, 2021As at
March 31, 2020
INR (51.33) (100.13)
Note: If the rate is decreased by 100 bps profit will increase by an equal amount.
Interest rate sensitivity has been calculated assuming the borrowings outstanding at the reporting date have been outstanding for the entire reporting period.
Foreign Currency and Interest Rate Risk Management:
Forward Exchange and Interest Rates Swaps Contracts:
(A) Derivatives for hedging currency and interest rates, outstanding are as under:
in Crores
Particulars Hedged Item CurrencyAs at
March 31, 2021As at
March 31, 2020Cross
Currency
a. Forward Contracts Imports USD 32.49 8.99 Rupees
Imports Euro 3.87 0.72 USD
Exports USD 0.20 - Rupees
b. Other Derivatives:
i. Currency Options FCB** USD 20.00 - Rupees
ii. Currency & Interest Rate Swap (CIRS)
ECB* USD 7.32 7.32 Rupees
iii. Currency & Interest Rate Swap (CIRS)
Investment USD 14.00 - Rupees
iv. Principal only Swap ECB*/FCB** USD 27.32 7.32 Rupees
v. Interest Rate Swap ECB* USD 7.32 7.32 USD
** Foreign Currency Bonds * External Commercial Borrowings
Notes to the Standalone Financial Statementsfor the year ended March 31, 2021 (Continued)
(B) Cash Flow Hedges: The Company has foreign currency external commercial borrowings / investments and to mitigate the risk of foreign currency and floating interest rates the Company has taken forward contracts, currency options, currency swaps, interest rates swaps and principal only swaps. The Company is following hedge accounting for all the foreign currency borrowings/ investments raised on or after April 01, 2015 based on qualitative approach.
The Company assesses hedge effectiveness based on following criteria:
(i) an economic relationship between the hedged item and the hedging instrument;
(ii) the effect of credit risk; and
(iii) assessment of the hedge ratio
The Company designates the derivatives to hedge its currency risk and generally applies a hedge ratio of 1:1. The Company’s policy is to match the critical terms of the forward exchange contracts to match with the hedged item.
Foreign currency cash flows:
ParticularsAs at
March 31, 2021Average
Exchange Rate (USD/INR)
Nominal Foreign Currency
USD Crores
Fair Value Assets (Liabilities)` in Crores
Buy Currency: (USD)
- for External Commercial Borrowings 65.19 7.32 61.50
- for Foreign Currency Bonds 72.50 20.00 27.83
ParticularsAs at
March 31, 2020Average
Exchange Rate (USD/INR)
Nominal Foreign Currency
USD Crores
Fair Value Assets (Liabilities)` in Crores
Buy Currency: (USD)
- for External Commercial Borrowings 65.19 7.32 81.25
- for Foreign Currency Bonds - - -
Interest rates outstanding on Receive Floating and Pay Fix contracts:
ParticularsAs at Average
contracted fixed interest rates*
Nominal AmountUSD Crores
Fair Value Assets (Liabilities)` in Crores
0 to 2 years March 31, 2021 7.63% 7.32 (17.73)
0 to 2 years March 31, 2020 7.79% 2.32 (1.35)
ParticularsAs at Average
contracted fixed interest rates*
Nominal Amount USD Crores
Fair Value Assets (Liabilities)` in Crores
2 to 5 years March 31, 2021 - - -
2 to 5 years March 31, 2020 7.33% 5.00 (23.39)
Notes to the Standalone Financial Statementsfor the year ended March 31, 2021 (Continued)
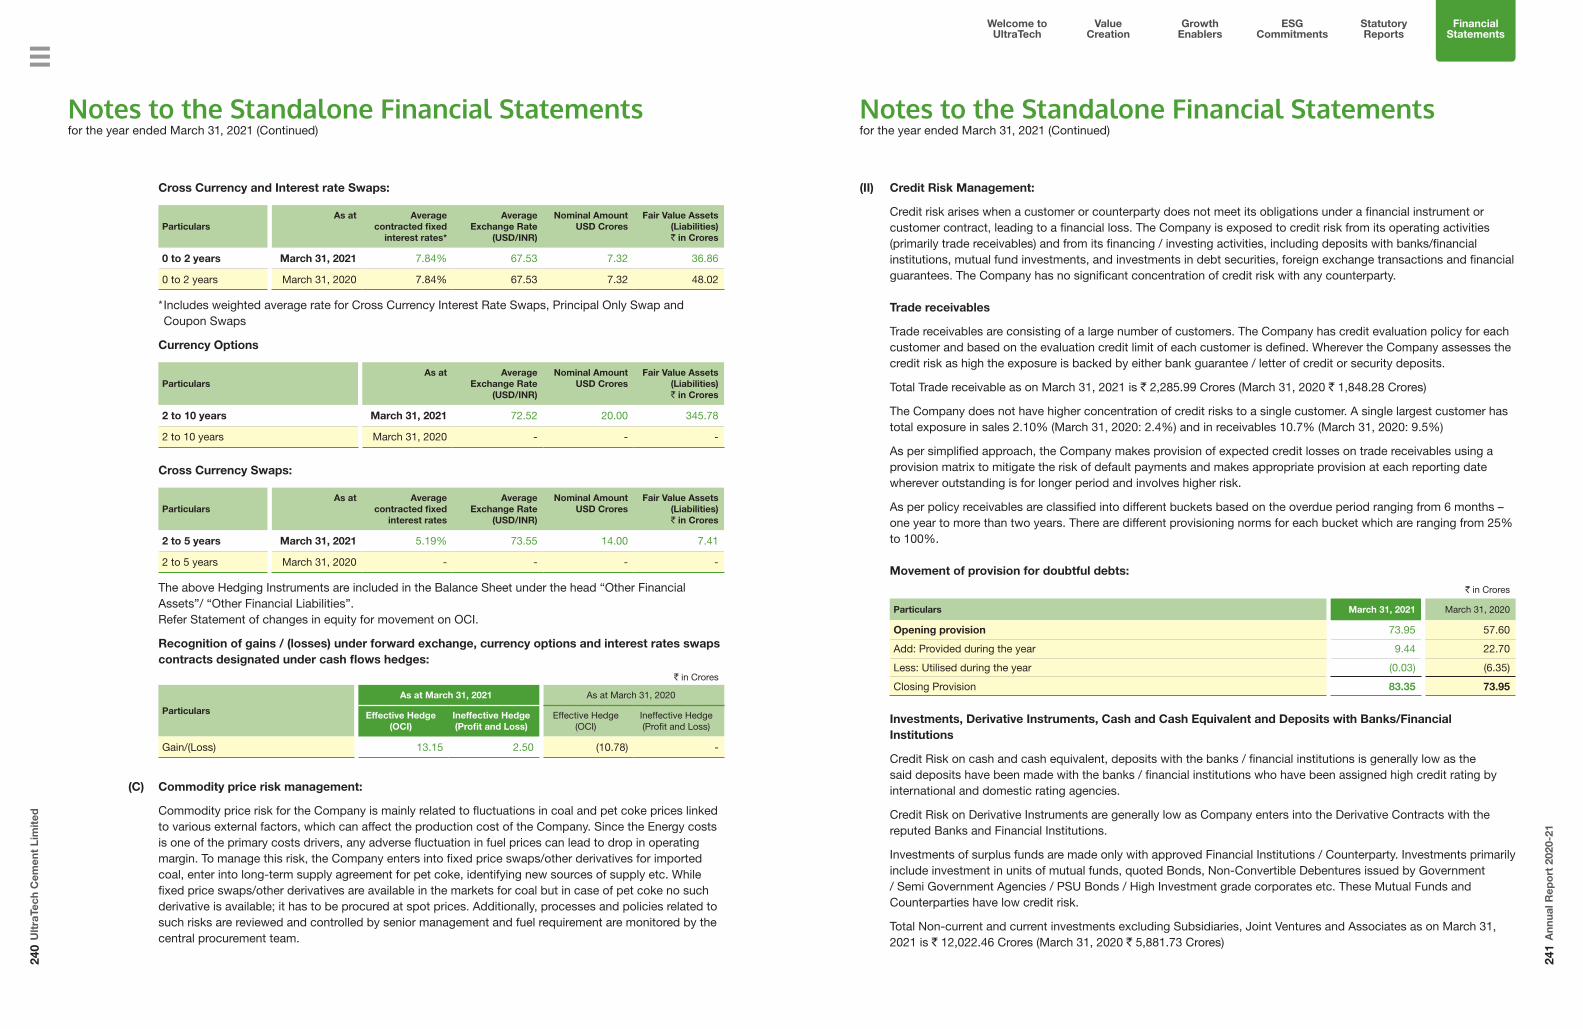
Welcome to UltraTech
Value Creation
Growth Enablers
Statutory Reports
Financial Statements
ESG Commitments
240
Ult
raTe
ch C
emen
t Li
mit
ed
241
Ann
ual R
epo
rt 2
020-
21
Cross Currency and Interest rate Swaps:
ParticularsAs at Average
contracted fixed interest rates*
Average Exchange Rate
(USD/INR)
Nominal Amount USD Crores
Fair Value Assets (Liabilities)` in Crores
0 to 2 years March 31, 2021 7.84% 67.53 7.32 36.86
0 to 2 years March 31, 2020 7.84% 67.53 7.32 48.02
* Includes weighted average rate for Cross Currency Interest Rate Swaps, Principal Only Swap and Coupon Swaps
Currency Options
ParticularsAs at Average
Exchange Rate (USD/INR)
Nominal Amount USD Crores
Fair Value Assets (Liabilities)` in Crores
2 to 10 years March 31, 2021 72.52 20.00 345.78
2 to 10 years March 31, 2020 - - -
Cross Currency Swaps:
ParticularsAs at Average
contracted fixed interest rates
Average Exchange Rate
(USD/INR)
Nominal Amount USD Crores
Fair Value Assets (Liabilities)` in Crores
2 to 5 years March 31, 2021 5.19% 73.55 14.00 7.41
2 to 5 years March 31, 2020 - - - -
The above Hedging Instruments are included in the Balance Sheet under the head “Other Financial Assets”/ “Other Financial Liabilities”.
Refer Statement of changes in equity for movement on OCI.
Recognition of gains / (losses) under forward exchange, currency options and interest rates swaps contracts designated under cash flows hedges:
` in Crores
Particulars
As at March 31, 2021 As at March 31, 2020
Effective Hedge (OCI)
Ineffective Hedge (Profit and Loss)
Effective Hedge (OCI)
Ineffective Hedge (Profit and Loss)
Gain/(Loss) 13.15 2.50 (10.78) -
(C) Commodity price risk management:
Commodity price risk for the Company is mainly related to fluctuations in coal and pet coke prices linked to various external factors, which can affect the production cost of the Company. Since the Energy costs is one of the primary costs drivers, any adverse fluctuation in fuel prices can lead to drop in operating margin. To manage this risk, the Company enters into fixed price swaps/other derivatives for imported coal, enter into long-term supply agreement for pet coke, identifying new sources of supply etc. While fixed price swaps/other derivatives are available in the markets for coal but in case of pet coke no such derivative is available; it has to be procured at spot prices. Additionally, processes and policies related to such risks are reviewed and controlled by senior management and fuel requirement are monitored by the central procurement team.
Notes to the Standalone Financial Statementsfor the year ended March 31, 2021 (Continued)
(II) Credit Risk Management:
Credit risk arises when a customer or counterparty does not meet its obligations under a financial instrument or customer contract, leading to a financial loss. The Company is exposed to credit risk from its operating activities (primarily trade receivables) and from its financing / investing activities, including deposits with banks/financial institutions, mutual fund investments, and investments in debt securities, foreign exchange transactions and financial guarantees. The Company has no significant concentration of credit risk with any counterparty.
Trade receivables
Trade receivables are consisting of a large number of customers. The Company has credit evaluation policy for each customer and based on the evaluation credit limit of each customer is defined. Wherever the Company assesses the credit risk as high the exposure is backed by either bank guarantee / letter of credit or security deposits.
Total Trade receivable as on March 31, 2021 is ` 2,285.99 Crores (March 31, 2020 ` 1,848.28 Crores)
The Company does not have higher concentration of credit risks to a single customer. A single largest customer has total exposure in sales 2.10% (March 31, 2020: 2.4%) and in receivables 10.7% (March 31, 2020: 9.5%)
As per simplified approach, the Company makes provision of expected credit losses on trade receivables using a provision matrix to mitigate the risk of default payments and makes appropriate provision at each reporting date wherever outstanding is for longer period and involves higher risk.
As per policy receivables are classified into different buckets based on the overdue period ranging from 6 months – one year to more than two years. There are different provisioning norms for each bucket which are ranging from 25% to 100%.
Movement of provision for doubtful debts:
` in Crores
Particulars March 31, 2021 March 31, 2020
Opening provision 73.95 57.60
Add: Provided during the year 9.44 22.70
Less: Utilised during the year (0.03) (6.35)
Closing Provision 83.35 73.95
Investments, Derivative Instruments, Cash and Cash Equivalent and Deposits with Banks/Financial Institutions
Credit Risk on cash and cash equivalent, deposits with the banks / financial institutions is generally low as the said deposits have been made with the banks / financial institutions who have been assigned high credit rating by international and domestic rating agencies.
Credit Risk on Derivative Instruments are generally low as Company enters into the Derivative Contracts with the reputed Banks and Financial Institutions.
Investments of surplus funds are made only with approved Financial Institutions / Counterparty. Investments primarily include investment in units of mutual funds, quoted Bonds, Non-Convertible Debentures issued by Government / Semi Government Agencies / PSU Bonds / High Investment grade corporates etc. These Mutual Funds and Counterparties have low credit risk.
Total Non-current and current investments excluding Subsidiaries, Joint Ventures and Associates as on March 31, 2021 is ` 12,022.46 Crores (March 31, 2020 ` 5,881.73 Crores)
Notes to the Standalone Financial Statementsfor the year ended March 31, 2021 (Continued)

Welcome to UltraTech
Value Creation
Growth Enablers
Statutory Reports
Financial Statements
ESG Commitments
242
Ult
raTe
ch C
emen
t Li
mit
ed
243
Ann
ual R
epo
rt 2
020-
21
Financial Guarantees
The Company has given corporate guarantees amounting to ` 4,230.94 Crores in favour of its subsidiaries and joint ventures (Refer note 33 (c).
(III) Liquidity risk management:
Liquidity risk is defined as the risk that the Company will not be able to settle or meet its obligations on time or at reasonable price. Prudent liquidity risk management implies maintaining sufficient cash and marketable securities and the availability of funding through an adequate amount of credit facilities to meet obligations when due. The Company’s treasury team is responsible for liquidity, funding as well as settlement management. In addition, processes and policies related to such risks are overseen by senior management. Management monitors the Company’s liquidity position through rolling forecasts on the basis of expected cash flows.
The table below provides details regarding the remaining contractual maturities of financial liabilities and investments held for managing the risk at the reporting date based on contractual undiscounted payments.
` in Crores
As at March 31, 2021 Less than1 Year
1 to 5 Years More than5 Years
Total
Borrowings (including current maturities of long-term debts)
6,634.01 3,812.27 6,872.29 17318.57
Trade Payables 4,380.18 4,380.18
Interest accrued but not due on borrowings 165.76 - - 165.76
Lease Liabilities 137.01 563.54 785.98 1,486.53
Other Financial Liabilities (excluding Derivative Liability)
2,522.93 - - 2,522.93
Deferred Premium Payable 47.82 191.14 238.95 477.91
Investments 10,812.01 896.18 314.27 12,022.46
` in Crores
As at March 31, 2020 Less than1 Year
1 to 5 Years More than5 Years
Total
Borrowings (including current maturities of long-term debts)
4,133.91 5,391.25 8,756.38 18,281.54
Trade Payables 3,038.78 - - 3,038.78
Interest accrued but not due on borrowings 176.68 - - 176.68
Lease Liabilities 125.92 455.02 772.87 1,353.81
Other Financial Liabilities (excluding Derivative Liability)
2,249.10 - - 2,249.10
Investments 4,243.69 1,360.17 277.87 5,881.73
Notes to the Standalone Financial Statementsfor the year ended March 31, 2021 (Continued)
Note 47: Distribution made and proposed (Ind AS 1):` in Crores
ParticularsYear Ended
March 31, 2021Year Ended
March 31, 2020
Proposed dividends on Equity shares:
Final dividend for the year ended on March 31, 2021: ` 37.00 per share(March 31, 2020: ` 13.00 per share)
1,068.02 375.21
Proposed dividends on Preference shares:
Final dividend for the year 0.01 0.01
Total Dividend proposed 1,068.03 375.22
Proposed dividends on equity shares are subject to approval at the annual general meeting and are not recognised as a liability as at March 31.
Note 48: Capital Management (Ind AS 1):
The Capital management objective of the Company is to (a) maximise shareholder value and provide benefits to other stakeholders and (b) maintain an optimal capital structure to reduce the cost of capital.
For the purposes of the Company’s capital management, capital/equity includes issued equity share capital, share premium and all other equity.
The Company monitors capital using debt-equity ratio, which is total debt less liquid investments and bank deposits divided by total equity.
` in Crores
ParticularsAs at
March 31, 2021As at
March 31, 2020
Total Debt (Bank and other borrowings) 17,318.57 18,281.54
Equity 43,352.64 38,296.32
Liquid Investments and bank deposits 13,770.25 6,103.86
Debt to Equity (Net) 0.08 0.32
In addition, the Company has financial covenants relating to the borrowing facilities that it has taken from the lenders to manage interest coverage service ratio, Debt to EBITDA, etc. which is maintained by the Company.
Note 49: Research and Development:
Revenue expenditure on Research and Development included in different heads of expenses in the Statement of Profit and Loss is ` 15.25 Crores. (March 31, 2020 ` 16.34 Crores).
Note 50: Corporate Social Responsibility:
Expenditure incurred in cash on Corporate Social Responsibility activities, included in different heads of expenses in the Statement of Profit and Loss is ` 120.68 Crores (March 31, 2020 ` 123.55 Crores) and on account of capital expenditure Nil (March 31, 2020 ` 0.96 Crores). The said capital expenditure is incurred on acquiring and owning assets which are being used for the purpose of Corporate Social Responsibility. The amount required to be spent under Section 135 of the Companies Act, 2013 for the year ended March 31, 2021 is ` 73.72 Crores (March 31, 2020 ` 63.50 Crores) i.e. 2% of average net profits for last three financial years, calculated as per section 198 of the Companies Act, 2013.
Notes to the Standalone Financial Statementsfor the year ended March 31, 2021 (Continued)

Welcome to UltraTech
Value Creation
Growth Enablers
Statutory Reports
Financial Statements
ESG Commitments
244
Ult
raTe
ch C
emen
t Li
mit
ed
245
Ann
ual R
epo
rt 2
020-
21
Note 51: Government Grant (Ind AS 20):
(a) Other Operating Revenues include Incentives against capital investments, under State Investment Promotion Scheme of ` 233.03 Crores (March 31, 2020 ` 381.84 Crores).
(b) Sales Tax deferment loan granted under State Investment Promotion Scheme has been considered as a government grant and the difference between the fair value and nominal value as on date is recognized as an income. Accordingly, an amount of ` 48.83 Crores (March 31, 2020: ` Nil Crores) has been recognized as an income. Every year change in fair value is accounted for as an interest expense.
(c) Repairs and maintenance are net of subsidy received, under State Investment Promotion Scheme of ` 0.37 Crores. (March 31, 2020 ` 0.32 Crores).
(d) Cost of materials consumed are net of grants received towards royalty expense amounting to ` 12.26 Crores (March 31, 2020 ` 23.44 Crores)
Note 52: Assets held for Disposal (Ind AS 105):
The Company has identified certain assets like Land, Aggregate Mines, Coal Washery etc. which are available for sale in its present condition. The Company is committed to plan the sale of asset and an active programme to locate a buyer and complete the plan have been initiated. The Company expects to dispose off these assets in the due course.
Note 53: Revenue (Ind AS 115)
(A) The Company is primarily in the Business of manufacture and sale of cement and cement related products. The product shelf life being short, all sales are made at a point in time and revenue recognised upon satisfaction of the performance obligations which is typically upon dispatch/ delivery. The Company has a credit evaluation policy based on which the credit limits for the trade receivables are established, the Company does not give significant credit period resulting in no significant financing component. The Company, however, has a policy for replacement of the damaged goods.
(B) Revenue recognised from Contract liability (Advances from Customers):
` in Crores
ParticularsYear Ended
March 31, 2021Year Ended
March 31, 2020
Closing Contract liability 412.73 460.66
The Contract liability outstanding at the beginning of the year has been recognised as revenue during the year ended March 31, 2021.
(C) Reconciliation of revenue as per contract price and as recognised in Statement of Profit or Loss:
` in Crores
ParticularsYear Ended
March 31, 2021Year Ended
March 31, 2020
Revenue as per Contract price 47,980.88 44,498.45
Less: Discounts and incentives (5,303.88) (4,465.20)
Revenue as per statement of profit and loss 42,677.00 40,033.25
Notes to the Standalone Financial Statementsfor the year ended March 31, 2021 (Continued)
Note 54:
Under the Sabka Vishwas (Legacy Dispute Resolution) Scheme 2019, announced by the Government of India, the Company has provided a one-time expense of ` 130.66 Crores as part of Rates and Taxes, against various disputed liabilities during the year ended March 31, 2020.
Note 55:
Exceptional item of ` 164.00 crores for the year ended March 31, 2021 represents a one-time expense upon receiving an order dated July 17, 2020, issued by the Hon’ble Supreme Court denying the Company’s claim of capital investment subsidy, sanctioned in 2010 under Rajasthan Investment Promotion Scheme -2003.
Note 56: Information as per the requirement of Section 22 of The Micro, Small and Medium Enterprises Development Act, 2006
` in Crores
ParticularsAs at
March 31, 2021As at
March 31, 2020
(a) (i) The principal amount remaining unpaid to any supplier at the end of accounting year included in trade payables
65.26 53.21
(ii) The interest due on above 0.02 0.01
The total of (i) & (ii) 65.28 53.22
(b) The amount of interest paid by the buyer in terms of section 16 of the Act - -
(c) The amount of the payment made to the supplier beyond the appointed day during the year - -
(d) The amounts of interest accrued and remaining unpaid at the end of financial year 0.02 0.01
(e) The amount of interest due and payable for the period of delay in making payment (which have been paid but beyond the due date during the year) but without adding the interest specified under this Act.
- -
(f) the amount of further interest remaining due and payable even in the succeeding years, until such date when the interest dues above are actually paid to the small enterprise, for the purpose of disallowance of a deductible expenditure under section 23 of the Micro, Small and Medium Enterprises Development Act, 2006.
- -
The above information has been determined to the extent such parties have been identified on the basis of information available with the Company and the same has been relied upon by the auditors.
Note 57: COVID-19 (Global Pandemic)
In the face of COVID – 19 pandemic the Company’s operations across locations were stopped in line with the Government directives. This had an adverse impact on revenues during the quarter ended June 30, 2020, as expected.
Even before the formal announcement of the national lockdown, keeping in mind the well-being of its employees, the Company enabled ‘work from home’ for its employees and taken all necessary steps to ensure a seamless transition to the new ways of working for employees, while at the same time ensuring business continuity. The Company was in continuous engagement with all its stakeholders through various digital platforms. Critical Response Teams were set up across the organisation to plan scenarios and respond to the rapidly changing situation.
Notes to the Standalone Financial Statementsfor the year ended March 31, 2021 (Continued)

Consolidated Financial Statements248 Independent Auditors' Report258 Consolidated Balance Sheet259 Consolidated Statement of Profit and Loss262 Consolidated Statement of Cash Flow264 Notes to Consolidated Financial Statements
246
Ult
raTe
ch C
emen
t Li
mit
ed
With the Government allowing select activities to operate, the Company gradually resumed operations at its establishments after obtaining necessary government approvals and ensuring compliance with the statutory guidelines in line with the standard operating procedure (SOP) announced by the Ministry of Home Affairs, Government of India.
With the easing of lockdown, operations gradually stabilised. The Company has the unique advantage of being able to cater to demand in different parts of the country.
The Company recovered the carrying amount of all its assets including inventory, receivables and loans in the ordinary course of business. The Company’s capital and financial resources remained entirely protected and its liquidity position remain adequately covered. The Company was able to service its debt obligations as per schedule and on due dates.
Note 58:
Previous year figures have been regrouped / reclassified wherever necessary to correspond with current year classification/ disclosure.
Signatures to Note ‘1’ to ‘58’
In terms of our report attached. For and on behalf of the Board of Directors
For B S R & Co. LLPChartered AccountantsFirm Registration No: 101248W/W-100022
For Khimji Kunverji & Co LLPChartered AccountantsFirm Registration No: 05146W/W-100621
VIJAY MATHURPartnerMembership No: 46476
KETAN VIKAMSEYPartnerMembership No: 44000
ATUL DAGAWhole-time Director and CFODIN: 06416619
K. C. JHANWARManaging DirectorDIN: 01743559
Mumbai: May 07, 2021S. K. CHATTERJEECompany Secretary
Notes to the Standalone Financial Statementsfor the year ended March 31, 2021 (Continued)
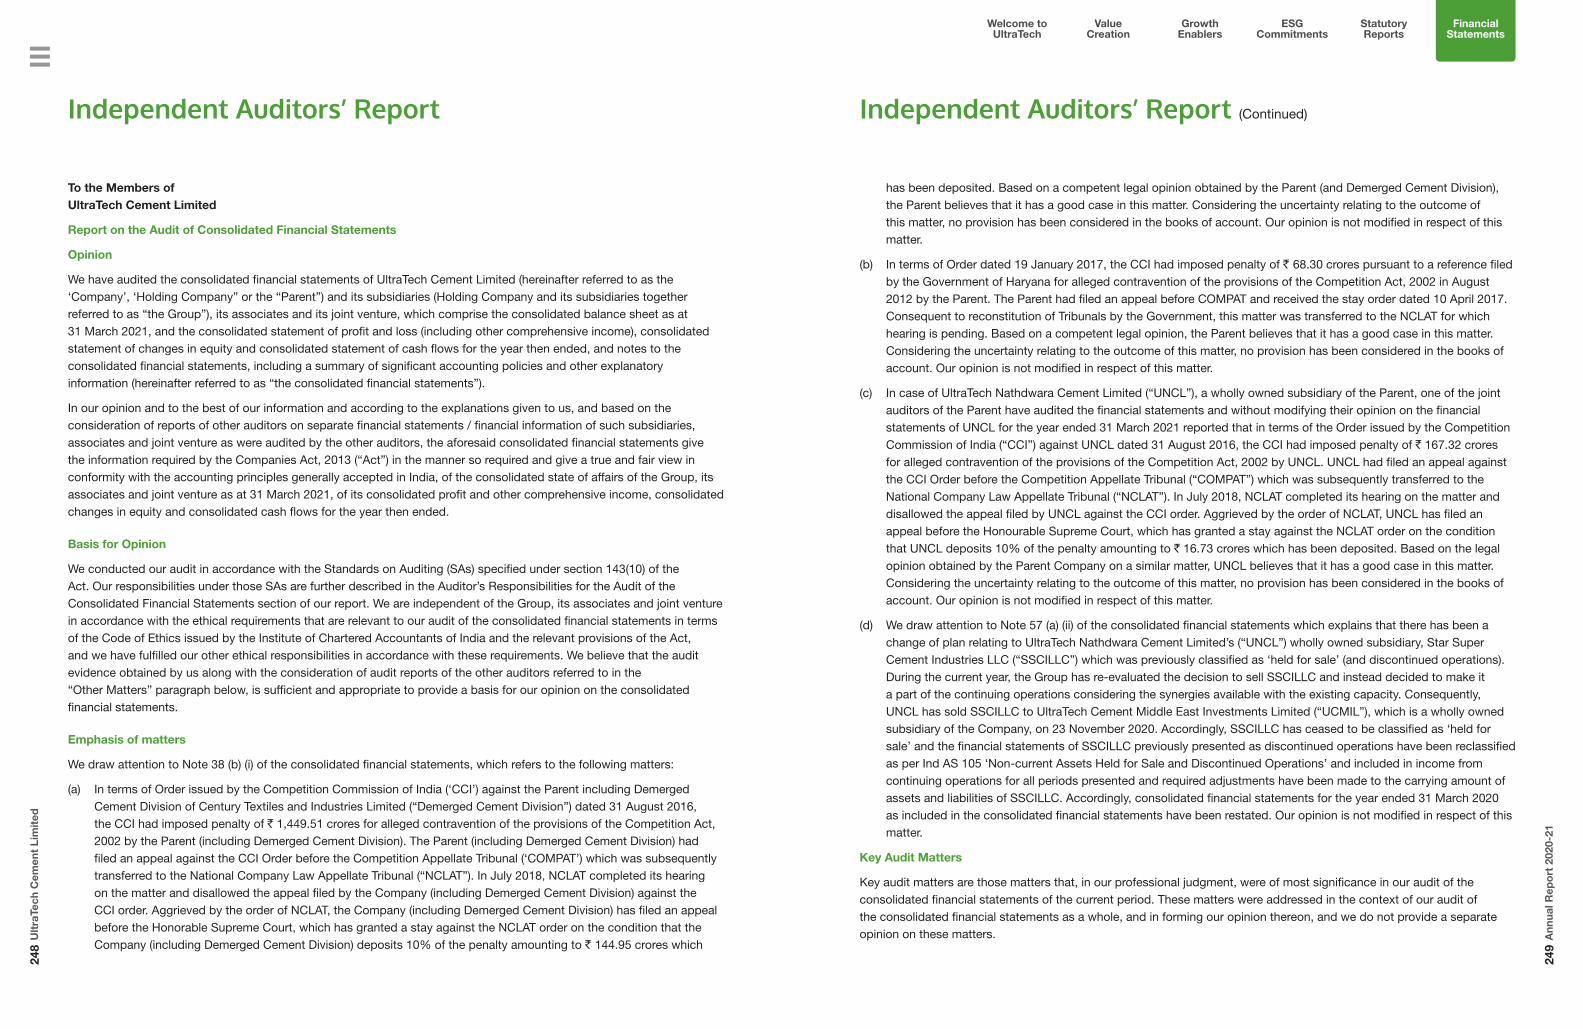
248
Ult
raTe
ch C
emen
t Li
mit
ed
249
Ann
ual R
epo
rt 2
020-
21
Welcome to UltraTech
Value Creation
Growth Enablers
Statutory Reports
Financial Statements
ESG Commitments
To the Members of UltraTech Cement Limited
Report on the Audit of Consolidated Financial Statements
Opinion
We have audited the consolidated financial statements of UltraTech Cement Limited (hereinafter referred to as the ‘Company’, ‘Holding Company” or the “Parent”) and its subsidiaries (Holding Company and its subsidiaries together referred to as “the Group”), its associates and its joint venture, which comprise the consolidated balance sheet as at 31 March 2021, and the consolidated statement of profit and loss (including other comprehensive income), consolidated statement of changes in equity and consolidated statement of cash flows for the year then ended, and notes to the consolidated financial statements, including a summary of significant accounting policies and other explanatory information (hereinafter referred to as “the consolidated financial statements”).
In our opinion and to the best of our information and according to the explanations given to us, and based on the consideration of reports of other auditors on separate financial statements / financial information of such subsidiaries, associates and joint venture as were audited by the other auditors, the aforesaid consolidated financial statements give the information required by the Companies Act, 2013 (“Act”) in the manner so required and give a true and fair view in conformity with the accounting principles generally accepted in India, of the consolidated state of affairs of the Group, its associates and joint venture as at 31 March 2021, of its consolidated profit and other comprehensive income, consolidated changes in equity and consolidated cash flows for the year then ended.
Basis for Opinion
We conducted our audit in accordance with the Standards on Auditing (SAs) specified under section 143(10) of the Act. Our responsibilities under those SAs are further described in the Auditor’s Responsibilities for the Audit of the Consolidated Financial Statements section of our report. We are independent of the Group, its associates and joint venture in accordance with the ethical requirements that are relevant to our audit of the consolidated financial statements in terms of the Code of Ethics issued by the Institute of Chartered Accountants of India and the relevant provisions of the Act, and we have fulfilled our other ethical responsibilities in accordance with these requirements. We believe that the audit evidence obtained by us along with the consideration of audit reports of the other auditors referred to in the “Other Matters” paragraph below, is sufficient and appropriate to provide a basis for our opinion on the consolidated financial statements.
Emphasis of matters
We draw attention to Note 38 (b) (i) of the consolidated financial statements, which refers to the following matters:
(a) In terms of Order issued by the Competition Commission of India (‘CCI’) against the Parent including Demerged Cement Division of Century Textiles and Industries Limited (“Demerged Cement Division”) dated 31 August 2016, the CCI had imposed penalty of ` 1,449.51 crores for alleged contravention of the provisions of the Competition Act, 2002 by the Parent (including Demerged Cement Division). The Parent (including Demerged Cement Division) had filed an appeal against the CCI Order before the Competition Appellate Tribunal (‘COMPAT’) which was subsequently transferred to the National Company Law Appellate Tribunal (“NCLAT”). In July 2018, NCLAT completed its hearing on the matter and disallowed the appeal filed by the Company (including Demerged Cement Division) against the CCI order. Aggrieved by the order of NCLAT, the Company (including Demerged Cement Division) has filed an appeal before the Honorable Supreme Court, which has granted a stay against the NCLAT order on the condition that the Company (including Demerged Cement Division) deposits 10% of the penalty amounting to ` 144.95 crores which
Independent Auditors’ Report
has been deposited. Based on a competent legal opinion obtained by the Parent (and Demerged Cement Division), the Parent believes that it has a good case in this matter. Considering the uncertainty relating to the outcome of this matter, no provision has been considered in the books of account. Our opinion is not modified in respect of this matter.
(b) In terms of Order dated 19 January 2017, the CCI had imposed penalty of ` 68.30 crores pursuant to a reference filed by the Government of Haryana for alleged contravention of the provisions of the Competition Act, 2002 in August 2012 by the Parent. The Parent had filed an appeal before COMPAT and received the stay order dated 10 April 2017. Consequent to reconstitution of Tribunals by the Government, this matter was transferred to the NCLAT for which hearing is pending. Based on a competent legal opinion, the Parent believes that it has a good case in this matter. Considering the uncertainty relating to the outcome of this matter, no provision has been considered in the books of account. Our opinion is not modified in respect of this matter.
(c) In case of UltraTech Nathdwara Cement Limited (“UNCL”), a wholly owned subsidiary of the Parent, one of the joint auditors of the Parent have audited the financial statements and without modifying their opinion on the financial statements of UNCL for the year ended 31 March 2021 reported that in terms of the Order issued by the Competition Commission of India (“CCI”) against UNCL dated 31 August 2016, the CCI had imposed penalty of ` 167.32 crores for alleged contravention of the provisions of the Competition Act, 2002 by UNCL. UNCL had filed an appeal against the CCI Order before the Competition Appellate Tribunal (“COMPAT”) which was subsequently transferred to the National Company Law Appellate Tribunal (“NCLAT”). In July 2018, NCLAT completed its hearing on the matter and disallowed the appeal filed by UNCL against the CCI order. Aggrieved by the order of NCLAT, UNCL has filed an appeal before the Honourable Supreme Court, which has granted a stay against the NCLAT order on the condition that UNCL deposits 10% of the penalty amounting to ` 16.73 crores which has been deposited. Based on the legal opinion obtained by the Parent Company on a similar matter, UNCL believes that it has a good case in this matter. Considering the uncertainty relating to the outcome of this matter, no provision has been considered in the books of account. Our opinion is not modified in respect of this matter.
(d) We draw attention to Note 57 (a) (ii) of the consolidated financial statements which explains that there has been a change of plan relating to UltraTech Nathdwara Cement Limited’s (“UNCL”) wholly owned subsidiary, Star Super Cement Industries LLC (“SSCILLC”) which was previously classified as ‘held for sale’ (and discontinued operations). During the current year, the Group has re-evaluated the decision to sell SSCILLC and instead decided to make it a part of the continuing operations considering the synergies available with the existing capacity. Consequently, UNCL has sold SSCILLC to UltraTech Cement Middle East Investments Limited (“UCMIL”), which is a wholly owned subsidiary of the Company, on 23 November 2020. Accordingly, SSCILLC has ceased to be classified as ‘held for sale’ and the financial statements of SSCILLC previously presented as discontinued operations have been reclassified as per Ind AS 105 ‘Non-current Assets Held for Sale and Discontinued Operations’ and included in income from continuing operations for all periods presented and required adjustments have been made to the carrying amount of assets and liabilities of SSCILLC. Accordingly, consolidated financial statements for the year ended 31 March 2020 as included in the consolidated financial statements have been restated. Our opinion is not modified in respect of this matter.
Key Audit Matters
Key audit matters are those matters that, in our professional judgment, were of most significance in our audit of the consolidated financial statements of the current period. These matters were addressed in the context of our audit of the consolidated financial statements as a whole, and in forming our opinion thereon, and we do not provide a separate opinion on these matters.
Independent Auditors’ Report (Continued)

250
Ult
raTe
ch C
emen
t Li
mit
ed
251
Ann
ual R
epo
rt 2
020-
21
Welcome to UltraTech
Value Creation
Growth Enablers
Statutory Reports
Financial Statements
ESG Commitments
Independent Auditors’ Report (Continued)
Description of Key Audit Matter
The key audit matter How the matter was addressed in our audit
Revenue recognition – Discounts, incentives and rebates
[Refer note 1(B)(o) and 58 to the consolidated financial statements]
• Revenue is measured net of discounts, incentives, rebates etc. given to the customers on the Company’s sales.
• The Company’s presence across different marketing regions within the country and the competitive business environment makes the assessment of various types of discounts, incentives and rebates as complex and judgmental.
• Therefore, there is a risk of revenue being misstated as a result of variations in the assessment of discounts, incentives and rebates.
• Given the complexity and judgement required to assess the provision for discounts, incentives and rebates, this is a key audit matter.
Our audit procedures included:
• We have assessed the Company’s accounting policies relating to revenue, discounts, incentives and rebates by comparing with applicable accounting standards.
• We have assessed the design and implementation and tested the operating effectiveness of Company’s internal controls over the provisions, approvals and disbursements of discounts, incentives and rebates.
• We have assessed the Company’s computations for accrual of discounts, incentives and rebates, on a sample basis, and compared the accruals made with the approved schemes and underlying documents.
• We have verified, on a sample basis, the underlying documentation for discounts, incentives and rebates recorded and disbursed during the year.
• We have compared the historical trend of payments and reversal of discounts, incentives and rebates to provisions made to assess the current year accruals.
• We have examined the manual journals posted to discounts, rebates and incentives to identify unusual or irregular items.
Regulations - Litigations and claims
[Refer note 38 to the consolidated financial statements]
• The Company operates in various States within India and is exposed to different Central and State/Local laws, regulations and interpretations thereof. In this regulatory environment, there is an inherent risk of litigations and claims.
• Consequently, provisions and contingent liability disclosures may arise from indirect tax proceedings, legal proceedings, including regulatory and other government/ department proceedings, as well as investigations by authorities and commercial claims.
• The Company applies significant judgement in estimating the likelihood of the future outcome in each case and in determining the provisions or disclosures required for each matter.
• Resolution of tax and legal proceedings may span over multiple years due to the highly complex nature and magnitude of the legal matters involved and may involve protracted negotiation or litigation.
Our audit procedures included:
• We have gained an understanding of outstanding litigations against the Company from the Company’s inhouse legal counsel and other key managerial personnel who have knowledge of these matters.
• We have read the correspondence between the Company and the various tax/legal authorities and the legal opinions of external legal advisors, where applicable, for significant matters.
• We have tested the completeness of the litigations and claims by examining, on a sample basis, the Company’s legal expenses and minutes of the board meetings.
• We have challenged the Company’s estimate of the possible outcome of the disputed cases based on applicable tax laws and legal precedence by involving our tax specialists.
• We have assessed the adequacy of the Company’s disclosures in respect of contingent liabilities for tax and legal matters.
Other Information
The Holding Company’s management and Board of Directors are responsible for the other information. The other information comprises the information included in the holding Company’s annual report, but does not include the consolidated financial statements and our auditors’ report thereon.
Our opinion on the consolidated financial statements does not cover the other information and we do not express any form of assurance conclusion thereon.
In connection with our audit of the consolidated financial statements, our responsibility is to read the other information and, in doing so, consider whether the other information is materially inconsistent with the consolidated financial statements or our knowledge obtained in the audit or otherwise appears to be materially misstated. If, based on the work we have performed and based on the work done/ audit report of other auditors, we conclude that there is a material misstatement of this other information, we are required to report that fact. We have nothing to report in this regard.
Management’s and Board of Directors’ Responsibilities for the Consolidated Financial Statements
The Holding Company’s Management and Board of Directors are responsible for the preparation and presentation of these consolidated financial statements in term of the requirements of the Act that give a true and fair view of the consolidated state of affairs, consolidated profit/ loss and other comprehensive income, consolidated statement of changes in equity and consolidated cash flows of the Group including its associates and joint venture in accordance with the accounting
Independent Auditors’ Report (Continued)
The key audit matter How the matter was addressed in our audit
• These estimates could change significantly over time as new facts emerge and each legal case progresses.
• Given the inherent complexity and magnitude of potential exposures and the judgement necessary to estimate the amount of provisions required or to determine required disclosures, this is a key audit matter.
Recognition and measurement of Income Taxes
[Refer notes 20 and 45 to the consolidated financial statements]
• The Company operates in a complex tax jurisdiction and is subject to periodic challenges by tax authorities on various matters relating to claims for tax exemptions / deductions.
• The determination of provision for income tax and deferred taxes including write backs of provisions involves significant judgements and estimates and interpreting the prevailing tax laws and rules.
• These also involve significant judgment to determine the possible outcome of the uncertain tax positions, consequently having an impact on related accounting and disclosures in the consolidated financial statements.
• Considering the complexity and significant level of estimation and judgement, this is a key audit matter.
Our audit procedures included:
• We have obtained an understanding of key tax matters.·
• We have read and analysed select key correspondences, external legal opinions/ consultations obtained by the Company for key tax matters.
• We have critically challenged the key assumptions made by the Company in estimating current and deferred taxes by involving our tax specialists.
• We have challenged the Company’s estimate of the possible outcome of the disputed tax cases by considering legal precedence and other judicial rulings by involving our tax specialists.
We have assessed the adequacy of the Company’s disclosures for income taxes in the consolidated financial statements.

252
Ult
raTe
ch C
emen
t Li
mit
ed
253
Ann
ual R
epo
rt 2
020-
21
Welcome to UltraTech
Value Creation
Growth Enablers
Statutory Reports
Financial Statements
ESG Commitments
principles generally accepted in India, including the Indian Accounting Standards (Ind AS) specified under section 133 of the Act. The respective Management and Board of Directors of the companies included in the Group and of its associates and joint venture are responsible for maintenance of adequate accounting records in accordance with the provisions of the Act for safeguarding the assets of each company. and for preventing and detecting frauds and other irregularities; the selection and application of appropriate accounting policies; making judgments and estimates that are reasonable and prudent; and the design, implementation and maintenance of adequate internal financial controls, that were operating effectively for ensuring accuracy and completeness of the accounting records, relevant to the preparation and presentation of the consolidated financial statements that give a true and fair view and are free from material misstatement, whether due to fraud or error, which have been used for the purpose of preparation of the consolidated financial statements by the Management and Directors of the Holding Company, as aforesaid.
In preparing the consolidated financial statements, the respective Management and Board of Directors of the companies included in the Group and of its associates and joint venture are responsible for assessing the ability of each company to continue as a going concern, disclosing, as applicable, matters related to going concern and using the going concern basis of accounting unless the respective Board of Directors either intends to liquidate the Company or to cease operations, or has no realistic alternative but to do so.
The respective Company’s Management and the Board of Directors of the companies included in the Group and of its associates and joint venture is responsible for overseeing the financial reporting process of each company.
Auditor’s Responsibilities for the Audit of the Consolidated Financial Statements
Our objectives are to obtain reasonable assurance about whether the consolidated financial statements as a whole are free from material misstatement, whether due to fraud or error, and to issue an auditor’s report that includes our opinion. Reasonable assurance is a high level of assurance, but is not a guarantee that an audit conducted in accordance with SAs will always detect a material misstatement when it exists. Misstatements can arise from fraud or error and are considered material if, individually or in the aggregate, they could reasonably be expected to influence the economic decisions of users taken on the basis of these consolidated financial statements.
As part of an audit in accordance with SAs, we exercise professional judgment and maintain professional skepticism throughout the audit. We also:
• Identify and assess the risks of material misstatement of the consolidated financial statements, whether due to fraud or error, design and perform audit procedures responsive to those risks, and obtain audit evidence that is sufficient and appropriate to provide a basis for our opinion. The risk of not detecting a material misstatement resulting from fraud is higher than for one resulting from error, as fraud may involve collusion, forgery, intentional omissions, misrepresentations, or the override of internal control.
• Obtain an understanding of internal control relevant to the audit in order to design audit procedures that are appropriate in the circumstances. Under section 143(3)(i) of the Act, we are also responsible for expressing our opinion on the internal financial controls with reference to the consolidated financial statements and the operating effectiveness of such controls based on our audit.
• Evaluate the appropriateness of accounting policies used and the reasonableness of accounting estimates and related disclosures made by the Management and Board of Directors.
• Conclude on the appropriateness of Management and Board of Directors use of the going concern basis of accounting in preparation of consolidated financial statements and, based on the audit evidence obtained, whether a material uncertainty exists related to events or conditions that may cast significant doubt on the appropriateness of this assumption. If we conclude that a material uncertainty exists, we are required to draw attention in our auditor’s report to the related disclosures in the consolidated financial statements or, if such disclosures are inadequate, to modify our opinion. Our conclusions are based on the audit evidence obtained up to the date of our auditor’s report. However, future events or conditions may cause the Group and its associates and joint venture to cease to continue as a going concern.
Independent Auditors’ Report (Continued)
• Evaluate the overall presentation, structure and content of the consolidated financial statements, including the disclosures, and whether the consolidated financial statements represent the underlying transactions and events in a manner that achieves fair presentation.
• Obtain sufficient appropriate audit evidence regarding the financial information of such entities or business activities within the Group and its associates and joint venture to express an opinion on the consolidated financial statements. We are responsible for the direction, supervision and performance of the audit of financial information of such entities included in the consolidated financial statements of which we are the independent auditors. For the other entities included in the consolidated financial statements, which have been audited by other auditors, such other auditors remain responsible for the direction, supervision and performance of the audits carried out by them. We remain solely responsible for our audit opinion. Our responsibilities in this regard are further described in para (a) of the section titled ‘Other Matters’ in this audit report.
We believe that the audit evidence obtained by us along with the consideration of audit reports of the other auditors referred to in the “Other Matters” paragraph below, is sufficient and appropriate to provide a basis for our audit opinion on the consolidated financial statements.
We communicate with those charged with governance of the Holding Company and such other entities included in the consolidated financial statements of which we are the independent auditors regarding, among other matters, the planned scope and timing of the audit and significant audit findings, including any significant deficiencies in internal control that we identify during our audit.
We also provide those charged with governance with a statement that we have complied with relevant ethical requirements regarding independence, and to communicate with them all relationships and other matters that may reasonably be thought to bear on our independence, and where applicable, related safeguards.
From the matters communicated with those charged with governance, we determine those matters that were of most significance in the audit of the consolidated financial statements of the current period and are therefore the key audit matters. We describe these matters in our auditors’ report unless law or regulation precludes public disclosure about the matter or when, in extremely rare circumstances, we determine that a matter should not be communicated in our report because the adverse consequences of doing so would reasonably be expected to outweigh the public interest benefits of such communication.
Other Matters
(a) The consolidated financial statements include the audited financial statements of eighteen subsidiaries, whose financial statements/financial results/ financial information reflect Group’s share of total assets (before consolidation adjustments) of ` 8,459.36 Crores as at 31 March 2021, Group’s share of total revenue (before consolidation adjustments) of ` 3,149.45 crores and Group’s share of total net profit after tax (before consolidation adjustments) of ` 209.39 crores and Group’s share of net cash inflows (before consolidation adjustments) of ` 85.02 crores for the year / period ended on that date, as considered in the consolidated financial statements, which have been audited by their respective independent auditors. The consolidated financial statements also include the Group’s share of net profit after tax (before consolidation adjustments) of ` 2.54 crores for the year ended 31 March 2021, as considered in the consolidated financial statements, of two associates and one joint venture whose financial statements/financial results/ financial information have been audited by their respective independent auditors. The independent auditors’ reports on financial statements/ financial results/financial information of these entities have been furnished to us by the management and our opinion on the consolidated financial statements, in so far as it relates to the amounts and disclosures included in respect of these entities, is based solely on the reports of such auditors and the procedures performed by us as stated in the paragraph above.
(b) The consolidated financial statements include the audited financial statements of one subsidiary whose financial statements reflect Group’s share of total assets (before consolidation adjustments) of ` 2,573.28 crores as at 31 March 2021, Group’s share of total revenue (before consolidation adjustments) of ` 1278.97 crores and Group’s share of total net profit after tax (before consolidation adjustments) of ` 6.83 crores and Group’s share of net cash inflows (before consolidation adjustments) of Rs (1.68) crores for the year ended on that date, as considered in the consolidated financial statements, which have been audited by one of the joint auditors of the Parent.
Independent Auditors’ Report (Continued)

254
Ult
raTe
ch C
emen
t Li
mit
ed
255
Ann
ual R
epo
rt 2
020-
21
Welcome to UltraTech
Value Creation
Growth Enablers
Statutory Reports
Financial Statements
ESG Commitments
The independent auditors’ report on the financial statements of this entity has been furnished to us by the management and our opinion on the consolidated financial statements, in so far as it relates to the amounts and disclosures included in respect of this entity, is based solely on the report of such auditors and the procedures performed by us as stated in the paragraph above. The comparative financial statements of this subsidiary for the year ended 31 March 2020 included in the consolidated financial statements had been audited by the predecessor auditor who had expressed an unmodified opinion thereon as per their report dated 12 May 2020 which have been furnished to us by the Management and have been relied upon by us for the purpose of our audit of the consolidated financial statements.
(c) The consolidated financial statements include the unaudited financial statements of seventeen subsidiaries, whose financial statements/financial results/ financial information reflect Group’s share of total assets (before consolidation adjustments) of ` 123.31 Crores as at 31 March 2021, Group’s share of total revenue (before consolidation adjustments) of ` 173.49 crores and Group’s share of total net profit/(loss) (before consolidation adjustments) after tax of ` (707.25) crores, and Group’s share of net cash outflows inflows (before consolidation adjustments) of Rs 30.61 crores for the year ended on that date, as considered in the consolidated financial statements. The consolidated financial statements also include the Group’s share of net profit after tax (before consolidation adjustments) of ` 0.01 crores for the year ended 31 March 2021, as considered in the consolidated financial statements, of one associate. These unaudited financial statements/financial results/ financial information have been furnished to us by the Management and our opinion on the consolidated financial statements, in so far as it relates to the amounts and disclosures included in respect of these subsidiaries and associate is based solely on such unaudited annual financial statements/financial results/financial information. In our opinion and according to the information and explanations given to us by the Management, these financial statements/financial results / financial information are not material to the Group.
Our opinion on the consolidated financial statements is not modified in respect of the above matters with respect to our reliance on the work done and the reports of one of the joint auditors of the Parent and other auditors and the financial statements/financial information certified by the Management.
Report on Other Legal and Regulatory Requirements
A. As required by Section 143(3) of the Act, based on our audit and on the consideration of audit reports of the other auditors on separate financial statements of such subsidiaries, associates and joint venture as were audited by other auditors and audit report of one of the joint auditors of the Parent, as noted in the ‘Other Matters’ paragraph, we report, to the extent applicable, that:
a) We have sought and obtained all the information and explanations which to the best of our knowledge and belief were necessary for the purposes of our audit of the aforesaid consolidated financial statements;
b) In our opinion, proper books of account as required by law relating to preparation of the aforesaid consolidated financial statements have been kept so far as it appears from our examination of those books and the reports of the other auditors;
c) The consolidated balance sheet, the consolidated statement of profit and loss (including other comprehensive income), the consolidated statement of changes in equity and the consolidated statement of cash flows dealt with by this Report are in agreement with the relevant books of account maintained for the purpose of preparation of the consolidated financial statements;
d) In our opinion, the aforesaid consolidated financial statements comply with the Ind AS specified under section 133 of the Act;
e) On the basis of the written representations received from the directors of the Holding Company as on 31 March 2021 taken on record by the Board of Directors of the Holding Company and the reports of the statutory auditors of its subsidiary companies, associate companies and joint venture incorporated in India, none of the directors of the Group companies, its associate companies, and joint venture incorporated in India is disqualified as on 31 March 2021 from being appointed as a director in terms of Section 164(2) of the Act; and
Independent Auditors’ Report (Continued)
f) With respect to the adequacy of the internal financial controls with reference to consolidated financial statements of the Holding Company, its subsidiary companies, associate companies and joint venture incorporated in India and the operating effectiveness of such controls, refer to our separate Report in “Annexure A”.
B. With respect to the other matters to be included in the Auditor’s Report in accordance with Rule 11 of the Companies (Audit and Auditor’s) Rules, 2014, in our opinion and to the best of our information and according to the explanations given to us and based on the consideration of audit reports of the other auditors on separate financial statements of such subsidiaries, associates and joint venture and audit report of one of the joint auditors of the Parent, as noted in the ‘Other Matters’ paragraph:
i. The consolidated financial statements disclose the impact of pending litigations as at 31 March 2021 on the consolidated financial position of the Group, its associates and joint venture. Refer Note 38 to the consolidated financial statements;
ii. Provision has been made in the consolidated financial statements, as required under the applicable law or Ind AS, for material foreseeable losses, on long-term contracts including derivative contracts. Refer Note 51 to the consolidated financial statements in respect of such items as it relates to the Group, its associates and joint venture;
iii. There has been no delay in transferring amounts to the Investor Education and Protection Fund by the Holding Company or its subsidiary companies, associate companies and joint venture incorporated in India during the year ended 31 March 2021; and
iv. The disclosures in the consolidated financial statements regarding holdings as well as dealings in specified bank notes during the period from 8 November 2016 to 30 December 2016 have not been made in the consolidated financial statements since they do not pertain to the financial year ended 31 March 2021.
C. With respect to the matter to be included in the Auditor’s report under Section 197(16) of the Act:
In our opinion and according to the information and explanations given to us and based on the reports of the statutory auditors of such subsidiary companies, associate companies and joint venture incorporated in India which were not audited by us and audit report of one of the joint auditors of the Parent, the remuneration paid during the current year by the Holding Company, its subsidiary companies, associate companies and joint venture incorporated in India to its directors is in accordance with the provisions of Section 197 of the Act. The remuneration paid to any director by the Holding Company, its subsidiary companies, associate companies and joint venture incorporated in India is not in excess of the limit laid down under Section 197 of the Act. The Ministry of Corporate Affairs has not prescribed other details under Section 197(16) of the Act which are required to be commented upon by us.
For B S R & Co. LLP For Khimji Kunverji & Co LLP Chartered Accountants Chartered AccountantsFirm’s Registration No.: 101248W/W-100022 Firm’s Registration No.: 105146W/W100621
Vijay Mathur Ketan Vikamsey Partner Partner Membership No: 046476 Membership No: 044000 ICAI UDIN: 21046476AAAACW1179 ICAI UDIN: 21044000AAAAAK8007
Mumbai Mumbai 7 May 2021 7 May 2021
Independent Auditors’ Report (Continued)

256
Ult
raTe
ch C
emen
t Li
mit
ed
257
Ann
ual R
epo
rt 2
020-
21
Welcome to UltraTech
Value Creation
Growth Enablers
Statutory Reports
Financial Statements
ESG Commitments
Report on the internal financial controls with reference to the aforesaid consolidated financial statements under Clause (i) of Sub-section 3 of Section 143 of the Companies Act, 2013
Opinion
In conjunction with our audit of the consolidated financial statements of the UltraTech Cement Limited as of and for the year ended 31 March 2021, we have audited the internal financial controls with reference to consolidated financial statements of UltraTech Cement Limited (hereinafter referred to as “the Holding Company”) and such companies incorporated in India under the Companies Act, 2013 which are its subsidiary companies, its associate companies and its joint venture company, as of that date.
In our opinion, the Holding Company and such companies incorporated in India which are its subsidiary companies, its associate companies and joint venture company, have, in all material respects, adequate internal financial controls with reference to consolidated financial statements and such internal financial controls were operating effectively as at 31 March 2021, based on the internal financial controls with reference to consolidated financial statements criteria established by such companies considering the essential components of such internal controls stated in the Guidance Note on Audit of Internal Financial Controls Over Financial Reporting issued by the Institute of Chartered Accountants of India (the “Guidance Note”).
Management’s Responsibility for Internal Financial Controls
The respective Company’s management and the Board of Directors are responsible for establishing and maintaining internal financial controls with reference to consolidated financial statements based on the criteria established by the respective company considering the essential components of internal control stated in the Guidance Note. These responsibilities include the design, implementation and maintenance of adequate internal financial controls that were operating effectively for ensuring the orderly and efficient conduct of its business, including adherence to the respective company’s policies, the safeguarding of its assets, the prevention and detection of frauds and errors, the accuracy and completeness of the accounting records, and the timely preparation of reliable financial information, as required under the Companies Act, 2013 (hereinafter referred to as “the Act”).
Auditors’ Responsibility
Our responsibility is to express an opinion on the internal financial controls with reference to consolidated financial statements based on our audit. We conducted our audit in accordance with the Guidance Note and the Standards on Auditing, prescribed under section 143(10) of the Act, to the extent applicable to an audit of internal financial controls with reference to consolidated financial statements. Those Standards and the Guidance Note require that we comply with ethical requirements and plan and perform the audit to obtain reasonable assurance about whether adequate internal financial controls with reference to consolidated financial statements were established and maintained and if such controls operated effectively in all material respects.
Our audit involves performing procedures to obtain audit evidence about the adequacy of the internal financial controls with reference to consolidated financial statements and their operating effectiveness. Our audit of internal financial controls with reference to consolidated financial statements included obtaining an understanding of internal financial controls with reference to consolidated financial statements, assessing the risk that a material weakness exists, and testing and evaluating the design and operating effectiveness of the internal controls based on the assessed risk. The procedures selected depend on the auditor’s judgement, including the assessment of the risks of material misstatement of the consolidated financial statements, whether due to fraud or error.
We believe that the audit evidence we have obtained and the audit evidence obtained by the other auditors of the relevant subsidiary companies, associate companies and joint venture company in terms of their reports referred to in the Other Matters paragraph below, is sufficient and appropriate to provide a basis for our audit opinion on the internal financial controls with reference to consolidated financial statements.
Annexure A to the Independent Auditors’ report on the consolidated financial statements of UltraTech Cement Limited for the year ended 31 March 2021.(Referred to in paragraph (A)(f) under ‘Report on Other Legal and Regulatory Requirements’ section of our report of even date)
Meaning of Internal Financial controls with Reference to Consolidated Financial Statements
A company’s internal financial controls with reference to consolidated financial statements is a process designed to provide reasonable assurance regarding the reliability of financial reporting and the preparation of financial statements for external purposes in accordance with generally accepted accounting principles. A company’s internal financial controls with reference to consolidated financial statements includes those policies and procedures that (1) pertain to the maintenance of records that, in reasonable detail, accurately and fairly reflect the transactions and dispositions of the assets of the company; (2) provide reasonable assurance that transactions are recorded as necessary to permit preparation of consolidated financial statements in accordance with generally accepted accounting principles, and that receipts and expenditures of the company are being made only in accordance with authorisations of management and directors of the company; and (3) provide reasonable assurance regarding prevention or timely detection of unauthorised acquisition, use, or disposition of the company’s assets that could have a material effect on the consolidated financial statements.
Inherent Limitations of Internal Financial controls with Reference to consolidated Financial Statements
Because of the inherent limitations of internal financial controls with reference to consolidated financial statements, including the possibility of collusion or improper management override of controls, material misstatements due to error or fraud may occur and not be detected. Also, projections of any evaluation of the internal financial controls with reference to consolidated financial statements to future periods are subject to the risk that the internal financial controls with reference to consolidated financial statements may become inadequate because of changes in conditions, or that the degree of compliance with the policies or procedures may deteriorate.
Other Matters
Our aforesaid report under Section 143(3)(i) of the Act on the adequacy and operating effectiveness of the internal financial controls with reference to consolidated financial statements insofar as it relates to nine subsidiary companies, two associate companies and one joint venture company, which are companies incorporated in India, is based on the corresponding reports of the auditors of such companies incorporated in India.
For B S R & Co. LLP For Khimji Kunverji & Co LLP Chartered Accountants Chartered AccountantsFirm’s Registration No.: 101248W/W-100022 Firm’s Registration No.: 105146W/W100621
Vijay Mathur Ketan Vikamsey Partner Partner Membership No: 046476 Membership No: 044000 ICAI UDIN: 21046476AAAACW1179 ICAI UDIN: 21044000AAAAAK8007
Mumbai Mumbai 7 May 2021 7 May 2021
Annexure A to the Independent Auditors’ report on the consolidated financial statements of UltraTech Cement Limited for the year ended 31 March 2021. (Continued)

258
Ult
raTe
ch C
emen
t Li
mit
ed
259
Ann
ual R
epo
rt 2
020-
21
Welcome to UltraTech
Value Creation
Growth Enablers
Statutory Reports
Financial Statements
ESG Commitments
Consolidated Balance Sheetas at March 31, 2021
` in Crores
ParticularsNote No.
As at March 31, 2021
As at March 31, 2020
(Restated)ASSETSNon-Current Assets
Property, Plant and Equipment 2 42,291.09 44,007.99Capital Work-in-Progress 2 1,680.96 909.52 Right of Use Assets 3 1,334.26 1,273.41 Goodwill 2 6,219.85 6,252.49 Other Intangible Assets 2 5,566.41 5,617.07 Intangible Assets under development 2 5.72 10.07
57,098.29 58,070.55 Investments Accounted using Equity Method 4 28.80 23.20 Financial Assets
Investments 5 1,255.44 1,661.80 Loans 6 167.14 1,231.67 Other Financial Assets 7 554.58 1,977.16 399.76
Income Tax Assets (Net) 314.31 279.83 Deferred Tax Assets (Net) 8 7.16 5.98 Other Non-Current Assets 9 2,707.50 2,825.54
Total Non-Current Assets 62,133.22 64,498.33 Current Assets
Inventories 10 4,017.97 4,183.35Financial Assets
Investments 11 10,893.87 4,243.69 Trade Receivables 12 2,571.73 2,383.22 Cash and Cash Equivalents 13 177.21 147.23 Bank Balances other than Cash and Cash Equivalents 14 1,830.34 392.68 Loans 6 114.65 197.73 Other Financial Assets 7 1,899.65 17,487.45 1,060.88
Current Tax Assets (Net) 0.10 0.09Other Current Assets 15 1,548.17 1,506.47
Total Current Assets 23,053.69 14,115.34 Non-Current Assets/ Disposal Group held for sale 57 996.60 606.12 TOTAL ASSETS 86,183.51 79,219.79 EQUITY AND LIABILITIESEQUITY
Equity Share Capital 16 (a) 288.65 288.63 Other Equity 16 (b) 43,886.03 38,755.13 Non-Controlling Interest 5.72 7.52
44,180.40 39,051.28 LIABILITIESNon-Current Liabilities
Financial LiabilitiesBorrowings 17 13,548.45 17,367.52Other Financial Liabilities 18 1,451.24 14,999.69 1,057.61
Provisions 19 365.49 244.53 Deferred Tax Liabilities (Net) 20 6,040.68 4,911.99 Other Non-Current Liabilities 21 5.53 6.28
Total Non-Current Liabilities 21,411.39 23,587.93Current Liabilities
Financial LiabilitiesBorrowings 22 4,235.13 4,106.12 Trade Payables
Total Outstanding Dues of Micro Enterprises and Small Enterprises
61 69.33 56.39
Total Outstanding Dues of Creditors other than Micro Enterprises and Small Enterprises
23 4,629.95 3,306.50
Other Financial Liabilities 18 5,578.98 14,513.39 4,208.91Other Current Liabilities 24 4,600.78 3,513.63 Provisions 19 521.85 548.44 Current Tax Liabilities (Net) 711.74 601.14 Total Current Liabilities 20,347.76 16,341.13 Non-Current Liabilities/ Disposal Group held for sale 57 243.96 239.45 TOTAL EQUITY AND LIABILITIES 86,183.51 79,219.79 Significant Accounting Policies 1
The accompanying notes form an integral part of the Consolidated Financial Statements.In terms of our report attached. For and on behalf of the Board of Directors
For B S R & Co. LLPChartered AccountantsFirm Registration No: 101248W/W-100022
For Khimji Kunverji & Co LLPChartered AccountantsFirm Registration No: 105146W/W-100621
VIJAY MATHURPartnerMembership No: 46476
KETAN VIKAMSEYPartnerMembership No: 44000
ATUL DAGAWhole-time Director and CFODIN: 06416619
K. C. JHANWARManaging DirectorDIN: 01743559
Mumbai: May 07, 2021S. K. CHATTERJEECompany Secretary
Consolidated Statement of Profit and Lossfor the year ended March 31, 2021
` in Crores
ParticularsNote No.
Year ended March 31, 2021
Year ended March 31, 2020
(Restated)Continuing OperationsRevenue from Operations 25 44,725.80 42,429.89 Other Income 26 734.17 651.06 TOTAL INCOME (I) 45,459.97 43,080.95 EXPENSESCost of Materials Consumed 27 5,793.67 5,727.98 Purchases of Stock-in-Trade 28 841.99 1,147.91 Changes in Inventories of Finished Goods, Stock-in-Trade and Work-in-Progress 29 450.15 (357.83)Employee Benefits Expense 30 2,353.02 2,519.86 Finance Costs 31 1,485.65 1,991.65 Depreciation and Amortisation Expense 32 2,700.23 2,722.66 Power and Fuel 8,331.18 8,516.87 Freight and Forwarding Expense 33 10,043.32 9,733.19 Other Expenses 34 5,367.97 5,909.01
37,367.18 37,911.30 Less: Captive Consumption of Cement (23.41) (14.30)TOTAL EXPENSES (II) 37,343.77 37,897.00 Profit from Continuing Operations before Exceptional Items and Tax Expense (I)-(II) 8,116.20 5,183.95 Exceptional ItemsRates and Taxes 60 (164.00) - Impairment on advances 60 (96.74) - Profit from Continuing Operations before Tax Expense and Share in Profit / (Loss) of Associate and Joint Venture
7,855.46 5,183.95
Share in Profit / (Loss) of Associate and Joint Venture (net of Tax expense) 2.18 (1.23)Profit from Continuing Operations before Tax Expense 7,857.64 5,182.72 Tax Expense of continuing operations:
Current Tax 1,415.05 917.08 Short Tax Provision related to prior years - 3.25 Deferred Tax Charge/ (Credit) 20 1,123.65 (1,488.49)Total Tax Expense 2,538.70 (568.16)
Profit for the Year from continuing operations (III) 5,318.94 5,750.88 Profit / (Loss) attributable to Non-Controlling Interest (1.25) (4.38)Profit attributable to Owners of the Parent 5,320.19 5,755.26
Discontinued OperationsProfit before tax from discontinued operations 17.35 149.06 Exceptional Item (Net) 57 166.50 - Tax expense of discontinued operations 15.21 36.63 Less : Provision for Impairment of disposal group classified as held for sale (25.73) (112.43)
Profit after tax from discontinued operations (IV) 142.91 - Profit for the year (V = III + IV) 5,461.85 5,750.88
Profit / (Loss) attributable to Non-Controlling Interest (1.25) (4.38)Profit attributable to Owners of the Parent 5,463.10 5,755.26
Other Comprehensive Income/(Loss)A (i) Items that will not be reclassified to Profit or Loss - Remeasurement Gain / (Loss) on Defined Benefit Plan
79.34 (54.30)
(ii) Income Tax Relating to Items that will not be reclassified to Profit or Loss (28.82) 20.71 B (i) Items that will be reclassified to Profit or Loss - Cash flow Hedge and Foreign Currency Translation Reserve (FCTR)
(30.61) 15.83
(ii) Income Tax Relating to Items that will be reclassified to Profit or Loss (3.31) 0.63 Other Comprehensive Income/(Loss) for the Year (VI) 16.60 (17.13)
Other Comprehensive Income/ (Loss) attributable to Non-Controlling Interest (0.55) 0.08 Other Comprehensive Income/(Loss) attributable to Owners of the Parent 17.15 (17.21)
Total Comprehensive Income for the Year (V+VI) 5,478.45 5,733.75 Total Comprehensive Loss attributable to Non-Controlling Interest (1.80) (4.30)Total Comprehensive Income attributable to Owners of the Parent 5,480.25 5,738.05
Earnings Per Equity Share (Face Value ` 10 each) - Continuing Operations 46 Basic (in `) 184.44 199.55 Diluted (in `) 184.38 199.49
Earnings Per Equity Share (Face Value ` 10 each) - Discontinued Operations 46Basic (in `) 4.95 - Diluted (in `) 4.95 -
Earnings Per Equity Share (Face Value ` 10 each) - Continuing & Discontinued Operations 46 Basic (in `) 189.40 199.55 Diluted (in `) 189.33 199.49
Significant Accounting Policies 1
The accompanying notes form an integral part of the Consolidated Financial Statements.
In terms of our report attached. For and on behalf of the Board of Directors
For B S R & Co. LLPChartered AccountantsFirm Registration No: 101248W/W-100022
For Khimji Kunverji & Co LLPChartered AccountantsFirm Registration No: 105146W/W-100621
VIJAY MATHURPartnerMembership No: 46476
KETAN VIKAMSEYPartnerMembership No: 44000
ATUL DAGAWhole-time Director and CFODIN: 06416619
K. C. JHANWARManaging DirectorDIN: 01743559
Mumbai: May 07, 2021S. K. CHATTERJEECompany Secretary

260
Ult
raTe
ch C
emen
t Li
mit
ed
261
Ann
ual R
epo
rt 2
020-
21
Welcome to UltraTech
Value Creation
Growth Enablers
Statutory Reports
Financial Statements
ESG Commitments
Consolidated Statement of Changes in Equityfor the year ended March 31, 2021
A . Equity Share Capital
For the year ended March 31, 2021 ` in Crores
Balance as at April 01, 2020 Changes in Equity Share Capital during the year Balance as at March 31, 2021
288.63 0.02 288.65
For the year ended March 31, 2020
Balance as at April 01, 2019 Changes in Equity Share Capital during the year Balance as at March 31, 2020
274.64 13.99 288.63
B. Other Equity
For the year ended March 31, 2021 ` in Crores
Particulars
Attributable to Owners of the Parent Attributable to Non
Controlling Interest
Total Other EquityReserves & Surplus Cash
Flow Hedge
Reserve
Exchange differences
on translating the financial statements of foreign operations
Total Other Equity
Attributable to Owners
of the Parent
Capital Reserve
Securities Premium
Debenture Redemption
Reserve
General Reserve
Share Option
Outstanding Reserve #
Treasury Shares
@@
Retained Earnings
Balance as at April 01, 2020 (Restated) (Refer Note 57)
170.72 5,458.65 247.50 26,824.73 35.83 (84.29) 5,934.89 (30.54) 197.64 38,755.13 7.52 38,762.65
Profit for the period - - - - - - 5,463.10 - - 5,463.10 (1.25) 5,461.85
Other Comprehensive Income / (Loss) for the period
Remeasurement gain / (loss) on defined benefit plan
- - - - - - 50.52* - - 50.52 - 50.52
Effective portion of gains / (loss) on hedging instruments and FCTR
- - - - - - - 7.69@ (41.06) (33.37) (0.55) (33.92)
Total Comprehensive Income / (Loss) for the period
- - - - - - 5,513.62 7.69 (41.06) 5,480.25 (1.80) 5,478.45
Issue of Treasury Shares - - - - - 6.79 - - - 6.79 - 6.79
Contribution by and Distribution to Owners
Dividends - - - - - - (374.95)## - - (374.95) - (374.95)
Transfer from Retained Earnings - - - 4,500.00 - - (4,500.00) - - - - -
Employees Stock Options Exercised - 11.02 - - (4.05) - - - - 6.97 - 6.97
Employees Stock Options Granted - - - - 11.84 - - - - 11.84 - 11.84
Total Contribution by and Distribution to Owners
- 11.02 - 4,500.00 7.79 - (4,874.95) - - (356.14) - (356.14)
Balance as at March 31, 2021 170.72 5,469.67 247.50 31,324.73 43.62 (77.50) 6,573.56 (22.85) 156.58 43,886.03 5.72 43,891.75
# Net of Deferred Employees Compensation Expenses ` 11.29 Crores.
@@ The Company has formed an Employee Welfare Trust for purchasing Company’s share to be allotted to eligible employees under Employees Stock Option Scheme, 2018 (ESOS 2018). As per Ind AS 32 - Financial Instruments: Presentation, Reaquired equity shares of the Company are called Treasury shares and deducted from equity.
* Net of Tax amounting to ` 28.82 Crores.
@ Net of Deferred Tax amounting to ` 3.31 Crores.
## Dividend of ` 13/- per share.
Consolidated Statement of Changes in Equityfor the year ended March 31, 2021 (Continued)
For the year ended March 31, 2020 (Restated) ` in Crores
Particulars
Attributable to Owners of the Parent Attributable to Non
Controlling Interest
Total Other EquityReserves & Surplus Cash
Flow Hedge
Reserve
Exchange differences
on translating the financial statements of foreign operations
Total Other Equity
Attributable to Owners of
the Parent
Capital Reserve
Securities Premium
Debenture Redemption
Reserve
General Reserve
ShareOption
Outstanding Reserve#
Treasury Shares
@@
Retained Earnings
Balance as at April 01, 2019 170.72 77.97 416.27 21,824.73 23.00 (81.21) 5,497.48 32.21 126.48 28,087.65 12.15 28,099.80
Due to Classification of Discontinuing operations to Continuing Operations (Refer Note 57)
- - - - - - (12.69) - - (12.69) - (12.69)
Transition Impact of Ind AS 116 Leases (Refer Note 3)
- - - - - - (59.73)^ - - (59.73) (0.33) (60.06)
Profit for the year - - - - - - 5,755.26 - - 5,755.26 (4.38) 5,750.88
Other Comprehensive Income / (Loss) for the year
Remeasurement gain / (loss) on defined benefit plan - - - - - - (33.59)* - - (33.59) - (33.59)
Effective portion of gains / (loss) on hedging instruments and FCTR
- - - - - - - (62.75)@ 79.13 16.38 0.08 16.46
On account of deconsolidation of fellow subsidiary - - - - - - (0.05) - (7.97) (8.02) - (8.02)
Total Comprehensive Income / (Loss) for the year - - - - - - 5,721.62 (62.75) 71.16 5,730.03 (4.30) 5,725.73
Purchase of Treasury Shares - - - - - (3.59) - - - (3.59) - (3.59)
Issue of Treasury Shares - - - - - 0.51 - - - 0.51 - 0.51
Contribution by and Distribution to Owners
Dividends (includes Dividend Distribution Tax) - - - - - - (380.56)## - - (380.56) - (380.56)
Issue of Shares pursuant to scheme of Demerger - 5,373.75 - - - - - - - 5,373.75 - 5,373.75
Transfer to Retained Earnings - - (168.77) - - - 168.77 - - - - -
Transfer from Retained Earnings - - - 5,000.00 - - (5,000.00) - - - - -
Employees Stock Options Exercised - 6.93 - - (3.57) - - - - 3.36 - 3.36
Employees Stock Options Granted - - - - 16.40 - - - - 16.40 - 16.40
Total Contribution by and distribution to owners - 5,380.68 (168.77) 5,000.00 12.83 - (5,211.79) - - 5,012.95 - 5,012.95
Balance as at March 31, 2020 170.72 5,458.65 247.50 26,824.73 35.83 (84.29) 5,934.89 (30.54) 197.64 38,755.13 7.52 38,762.65
# Net of Deferred Employees Compensation Expenses ` 23.14 Crores.@@ The Company has formed an Employee Welfare Trust for purchasing Company’s share to be allotted to eligible employees under Employees Stock Option
Scheme, 2018 (ESOS 2018). As per Ind AS 32 - Financial Instruments: Presentation, Reaquired equity shares of the Company are called Treasury shares and deducted from equity.
* Net of Tax amounting to ` 20.71 Crores.@ Net of Deferred Tax amounting to ` 0.63 Crores.^ Net of Deferred Tax amounting to ` 15.23 Crores## Dividend of ` 11.50/- per share and including Dividend Distribution Tax of ` 64.93 Crores.
Significant Accounting Policies Note 1
The accompanying notes form an integral part of the Consolidated Financial Statements.In terms of our report attached. For and on behalf of the Board of Directors
For B S R & Co. LLPChartered AccountantsFirm Registration No: 101248W/W-100022
For Khimji Kunverji & Co LLPChartered AccountantsFirm Registration No: 105146W/W-100621
VIJAY MATHURPartnerMembership No: 46476
KETAN VIKAMSEYPartnerMembership No: 44000
ATUL DAGAWhole-time Director and CFODIN: 06416619
K. C. JHANWARManaging DirectorDIN: 01743559
Mumbai: May 07, 2021S. K. CHATTERJEECompany Secretary

262
Ult
raTe
ch C
emen
t Li
mit
ed
263
Ann
ual R
epo
rt 2
020-
21
Welcome to UltraTech
Value Creation
Growth Enablers
Statutory Reports
Financial Statements
ESG Commitments
Consolidated Statement of Cash Flowsfor the year ended March 31, 2021
` in Crores
ParticularsYear ended
March 31, 2021Year ended
March 31, 2020 (Restated)
(A) Cash Flow from Operating Activities:Profit Before tax 7,857.64 5,182.72Adjustments for:Depreciation and Amortisation 2,700.23 2,722.66Gain on Fair Valuation of Investments (419.55) (289.12)Gain on Fair Valuation of VAT Deferment Loan (48.83) -Unrealised Exchange (Gain)/ Loss (11.02) 31.57Share in (Profit) / Loss on equity accounted investment (2.18) 1.23Compensation Expenses under Employees Stock Options Scheme 12.11 16.79Allowances for credit losses on Advances / debts (net) 1.64 60.87Bad Debts Written-off 0.35 0.83Excess Provision written back (net) (85.34) (150.04)Provision for Rates and Taxes (Exceptional Item- Refer Note 60) 136.57 -Impairment on Advances Given (Exceptional Item- Refer Note 60) 96.74 -Interest and Dividend Income (100.76) (142.22)Finance Costs 1,485.65 1,991.65(Profit) / Loss on Sale / Retirement of Property, Plant and Equipment (net) (4.11) 2.84(Profit) on Sale of Current and Non-Current Investments (net) (154.10) (81.63)
11,465.04 9,348.15Movements in working capital:Increase in Trade payables and other Liabilities 2,870.29 279.43Increase in Provisions 49.97 18.97(Increase)/ Decrease in Trade Receivables (201.48) 472.68Decrease/(Increase) in Inventories 165.38 (64.16)(Increase) in Financial and Other Assets (555.25) (191.20)Cash generated from Operations 13,793.95 9,863.87Taxes paid (net of refund) (1,291.00) (891.44)Net Cash generated from Operating Activities (A) 12,502.95 8,972.43
(B) Cash Flow from Investing Activities:Purchase of Property, Plant and Equipment (1,924.87) (1,689.29)Sale of Property, Plant and Equipment 86.19 79.02Payment for Cost of transfer of Assets (2.71) (76.53)Sale of Liquid Investment (net) 1,673.14 74.06Purchase of Investments (12,668.00) (6,085.57)Sale of Investments 5,427.68 3,366.07Redemption/ (Investment) in Non-Current Bank deposits 61.85 (42.29)Investment in Joint Venture and Associates (3.42) (5.75)Investment in Other Bank deposits (1,565.06) (92.60)(Investment)/ disinvestment in other Corporate Bodies (21.13) 2.75Sales Consideration from Disposal of Fellow Subsidiary - 156.69Dividend Received - 32.47Interest Received 77.33 88.55Net Cash used in Investing Activities (B) (8,859.00) (4,192.42)
(C) Cash Flow from Financing Activities:Proceeds from Issue of Share Capital on exercise of ESOS 6.99 2.74Purchase of Treasury Shares - (3.59)Issue of Treasury Shares 6.79 0.51Repayment of Non-Current Borrowings (6,499.28) (4,154.19)Proceeds from Non-Current Borrowings 3,974.34 1,113.54Proceeds from Current Borrowings (net) 128.43 396.09Repayment of Lease Liability (118.40) (100.84)Payment of Interest on Lease Liability (49.72) (50.14)Interest Paid (1,430.82) (1,900.02)Dividend Paid Including Dividend Distribution Tax (374.80) (379.98)Net Cash used in Financing Activities (C) (4,356.47) (5,075.88)
` in Crores
ParticularsYear ended
March 31, 2021Year ended
March 31, 2020 (Restated)
(D) Net Decrease in Cash and Cash Equivalents (A + B + C) (712.52) (295.87)(E) Cash and Cash Equivalents at the Beginning of the year 147.23 442.63(F) Effect of Exchange rate fluctuation on Cash and Cash Equivalents 0.33 0.47(G) Cash flow from Continuing Operations (564.96) 147.23(H) Cashflow from Discontinued Operations:
Opening Cash & Cash Equivalents 31.12 23.68Cash flows from Operating activities of discontinued operations 3.00 53.00Cash flows from Investing activities of discontinued operations 740.32 (8.56)Cash flows from Financing activities of discontinued operations (32.27) (37.00)Net cash inflows (H) 711.05 7.44
(I) Closing Cash & Cash Equivalents 742.17 31.12(J) Net Cash Flow Transferred from Discontinued Operations to Continuing Operations
on account of Proceeds from sale of disposal group(742.17) -
(K) Reclassified to asset held for sale - (31.12)Cashflow from Discontinued Operations (I + J +K) - -Cash and Cash Equivalents at the end of the year (G+J) (Refer Note 13) 177.21 147.23
Notes:1. Cash flow statement has been prepared under the indirect method as set out in Ind AS - 7 specified under Section 133 of the Act.2. Purchase of Property, Plant and Equipment includes movements of capital work-in-progress (including capital advances) during the year.3. For year ended March 31,2020, the Scheme of demerger amongst Century Textiles and Industries Limited and the Company and their
respective shareholders does not involve any cash outflow and the consideration has been discharged thorugh issue of equity shares.4. Changes in liabilities arising from financing activities
ParticularsAs at
March 31, 2020 (Restated)
Cashflows Non-Cash Changes On account of foreign
exchanges rates
As atMarch 31, 2021
Non-Current Borrowing (including current maturities of Non-Current Borrowing)
18,912.84 (2,524.94) (135.26) 16,252.64
Current Borrowing 4,106.12 128.43 0.58 4,235.13
23,018.96 (2,396.51) (134.68) 20,487.77
ParticularsAs at
March 31, 2019 (Restated)
Cashflows Impact of deconsolidation of Fellow Subsidiary
Non-Cash Changes On account of foreign
exchanges rates
As atMarch 31, 2020
(Restated)
Non-Current Borrowing (including current maturities of Non-Current Borrowing)
21,668.60 (3,040.65) - 284.89 18,912.84
Current Borrowing 3,786.47 396.09 (68.76) (7.68) 4106.12
25,455.07 (2,644.56) (68.76) 277.21 23,018.96
5. Cashflow from Operating Activities includes `180.01 Crores (March 31, 2020 `159.90 Crores) towards short-term lease payments, payments for leases of low-value assets and variable lease payments not included in the measurement of the lease liability.
Significant Accounting Policies Note 1
Consolidated Statement of Cash Flowsfor the year ended March 31, 2021 (Continued)
The accompanying notes form an integral part of the Consolidated Financial Statements.
In terms of our report attached. For and on behalf of the Board of Directors
For B S R & Co. LLPChartered AccountantsFirm Registration No: 101248W/W-100022
For Khimji Kunverji & Co LLPChartered AccountantsFirm Registration No: 105146W/W-100621
VIJAY MATHURPartnerMembership No: 46476
KETAN VIKAMSEYPartnerMembership No: 44000
ATUL DAGAWhole-time Director and CFODIN: 06416619
K. C. JHANWARManaging DirectorDIN: 01743559
Mumbai: May 07, 2021S. K. CHATTERJEECompany Secretary

264
Ult
raTe
ch C
emen
t Li
mit
ed
265
Ann
ual R
epo
rt 2
020-
21
Welcome to UltraTech
Value Creation
Growth Enablers
Statutory Reports
Financial Statements
ESG Commitments
Notes to the Consolidated Financial Statements for the year ended March 31, 2021
Note 1: Company Overview and Significant Accounting Policies:
1 (A) Company Overview
UltraTech Cement Limited (“the Holding Company”) is a Public Limited Company incorporated in India having its registered office at Mumbai, Maharashtra, India. The Holding Company and its subsidiaries are engaged in the manufacture and sale of Cement and Cement related products. The Holding Company, its subsidiaries, associates, and joint venture together referred to as “the Company” or “the Group”. The Company’s shares are listed on the Bombay Stock Exchange (BSE), India, and the National Stock Exchange (NSE), India, Global Depository Receipts are listed on the Luxembourg Stock Exchange and Bonds are listed on the Singapore Exchange Securities Trading Limited.
1 (B) Significant Accounting Policies
(a) Statement of Compliance & Basis of Preparation and Presentation:
These consolidated financial statements (hereinafter referred to as “financial statements”) are prepared in accordance with the Indian Accounting Standards (“Ind AS”) as per the Companies (Indian Accounting Standards) Rules, 2015 notified under Section 133 of Companies Act, 2013 (“the Act’’) and amendments thereto, other relevant provisions of the Act and guidelines issued by the Securities and Exchange Board of India (“SEBI”), as applicable.
The financial statements were authorised for issue by the Board of Directors of the Company at their meeting held on May 07, 2021.
Basis of Preparation
The financial statements have been prepared on a historical cost basis, except for the following assets and liabilities:
(i) Derivative Financial Instruments measured at fair value
(ii) Certain financial assets and liabilities measured at fair value (refer accounting policy regarding financial instruments)
(iii) Assets held for disposal – measured at the lower of its carrying amount and fair value less costs to sell
(iv) Employee’s Defined Benefit Plan as per actuarial valuation.
(v) Assets and liabilities acquired under Business Combination measured at fair value; and
(vi) Employee share based payments measured at fair value.
Fair value is the price that would be received to sell an asset or paid to transfer a liability in an orderly transaction between market participants at the measurement date under current market conditions, regardless of whether that price is directly observable or estimated using another valuation technique. In determining the fair value of an asset or a liability, the Company takes into account the characteristics of the asset or liability if market participants would take those characteristics into account when pricing the asset or liability at the measurement date.
Functional and Presentation Currency
(i) The financial statements are presented in Indian Rupees, which is the functional currency of the Company and the currency of the primary economic environment in which the Company operates.
(ii) Figures less than ` 50,000 have been shown at actual, wherever statutorily required to be disclosed, all other figures have been rounded off to the nearest ` in lakhs, unless otherwise stated.
Classification of Assets and Liabilities into Current/Non-Current
The Company has ascertained its operating cycle as twelve months for the purpose of Current / Non-Current classification of its Assets and Liabilities.
For the purpose of Balance Sheet, an asset is classified as current if:
(i) It is expected to be realised, or is intended to be sold or consumed, in the normal operating cycle; or
(ii) It is held primarily for the purpose of trading; or
(iii) It is expected to realise the asset within twelve months after the reporting period; or
(iv) The asset is a cash or cash equivalent unless it is restricted from being exchanged or used to settle a liability for at least twelve months after the reporting period.
Notes to the Consolidated Financial Statements for the year ended March 31, 2021 (Continued)
All other assets are classified as non-current.
Similarly, a liability is classified as current if:
(i) It is expected to be settled in the normal operating cycle; or
(ii) It is held primarily for the purpose of trading; or
(iii) It is due to be settled within twelve months after the reporting period; or
(iv) The Company does not have an unconditional right to defer the settlement of the liability for at least twelve months after the reporting period. Terms of a liability that could result in its settlement by the issue of equity instruments at the option of the counterparty does not affect this classification.
All other liabilities are classified as non-current.
Deferred tax assets and liabilities are classified as non-current only.
(b) Property, Plant and Equipment (PPE):
The initial cost of PPE comprises its purchase price, net of any trade discounts and rebates, including import duties and non-refundable purchase taxes, and any directly attributable costs of bringing an asset to working condition and location for its intended use, including relevant borrowing costs and any expected costs of decommissioning.
Subsequent costs are included in the asset’s carrying amount or recognized as a separate asset, as appropriate, only when it is probable that future economic benefits associated with the item will flow to the Company and the cost of the item can be measured reliably. All other repairs and maintenance cost are charged to the Statement of Profit and Loss during the period in which they were incurred.
If significant parts of an item of PPE have different useful lives, then they are accounted for as separate items (major components) of PPE.
Material items such as spare parts, stand-by equipment and service equipment are classified as PPE when they meet the definition of PPE as specified
in Ind AS 16 – Property, Plant and Equipment.
Any gain or loss on disposal of an item of PPE is recognised in the Statement of Profit and Loss.
PPE except freehold land are stated at their cost of acquisition/installation or construction net of accumulated depreciation, and impairment losses, if any. Freehold land is stated at cost less impairment losses, if any.
(c) Expenditure during construction period:
Expenditure/ Income during construction period (including financing cost related to borrowed funds for construction or acquisition of qualifying PPE) is included under Capital Work-in-Progress and the same is allocated to the respective PPE on the completion of their construction. Advances given towards acquisition or construction of PPE outstanding at each reporting date are disclosed as Capital Advances under “Other non-current Assets”.
(d) Depreciation:
Depreciation is the systematic allocation of the depreciable amount of PPE over its useful life and is provided on a straight-line basis over the useful lives as prescribed in Schedule II to the Act or as per technical assessment. Freehold Land with indefinite life is not depreciated.
Depreciable amount for PPE is the cost of PPE less its estimated residual value. The useful life of PPE is the period over which PPE is expected to be available for use by the Company, or the number of production or similar units expected to be obtained from the asset by the Company.
In case of certain classes of PPE, the Company uses different useful lives than those prescribed in Schedule II to the Act. The useful lives have been assessed based on technical advice, taking into account the nature of the PPE and the estimated usage of the asset on the basis of management’s best estimation of obtaining economic benefits from those classes of assets. he estimated useful life are reviewed periodically, with the effect of any changes in estimate being accounted for on a prospective basis.

266
Ult
raTe
ch C
emen
t Li
mit
ed
267
Ann
ual R
epo
rt 2
020-
21
Welcome to UltraTech
Value Creation
Growth Enablers
Statutory Reports
Financial Statements
ESG Commitments
Such classes of assets and their estimated useful lives are as under:
No. Nature Estimated Useful life
1 Buildings 3-60 Years
2 Leasehold land Over the lease agreement
3 Plant & Equipment 8-50 Years
4 Railway Sidings 4-30 Years
5 Office Equipment 4-7 Years
6 Furniture and Fixtures 7-12 Years
7 Mobile Phones 3 Years
8 Company Vehicles (other than those provided to the employees)
5-12 Years
9 Motor Cars given to the employees as per the Company’s Scheme
4-5 Years
10 Servers and Networks 3 Years
11 Stores and Spares in the nature of PPE
8-30 Years
12 Assets individually costing less than or equal to ` 10,000
Fully Depreciated in the year of purchase
Depreciation on additions is provided on a pro-rata basis from the month of installation or acquisition and in case of Projects from the date of commencement of commercial production. Depreciation on deductions/disposals is provided on a pro-rata basis up to the month preceding the month of deduction/disposal.
(e) Intangible Assets and Amortisation:
• Internally generated Intangible Assets:
Expenditure pertaining to research is expensed out as and when incurred. Expenditure incurred on development is capitalised if such expenditure leads to creation of an asset, otherwise such expenditure is charged to the Statement of Profit and Loss.
• Intangible Assets acquired separately:
Intangible assets with finite useful lives that are acquired separately are carried at cost less accumulated amortisation and accumulated
impairment loss, if any. Cost comprises the purchase price (net of tax / duty credits availed wherever applicable) and any directly attributable cost of bringing the assets to its working condition for its intended use. The Company determines the amortisation period as the period over which the future economic benefits will flow to the Company after taking into account all relevant facts and circumstances. The estimated useful life and amortisation method are reviewed periodically, with the effect of any changes in estimate being accounted for on a prospective basis. Class of intangible assets and their estimated useful lives / basis of amortisation are as under:
No. Nature Estimated Useful life / Basis of amortization
1 Jetty Rights Over the period of the relevant agreement such that the cumulative amortisation is not less than the cumulative rebate availed by the Company.
2 Mining Rights
Over the period of the respective mining agreement
3 Mining Reserve
On the basis of mineral material extraction (proportion of mineral material extracted per annum to total estimated mining reserve)
4 Software 3 Years
5 Brand Rights
18 Months
An intangible asset is derecognised on disposal, or when no future economic benefits are expected from its use or disposal. Gains or losses arising from derecognition of an item of intangible asset are measured as the difference between the net disposal proceeds and the carrying amount of such item of intangible asset and are recognised in the Statement of Profit and Loss when the asset is derecognised.
(f) Non-Current Assets/ Disposal Group classified as held for sale:
The Company classifies non-current assets as held for sale if their carrying amounts will be recovered principally through a sale transaction rather than through continuing use. This condition is regarded as
Notes to the Consolidated Financial Statements for the year ended March 31, 2021 (Continued)
met only when the asset is available for immediate sale in its present condition subject only to terms that are usual and customary for sales of such asset and its sale is highly probable. Such assets or group of assets / liabilities are presented separately in the Balance Sheet, in the line “Assets / Disposal groups held for sale” and “Liabilities included in disposal group held for sale” respectively. Once classified as held for sale, intangible assets and PPE are no longer amortised or depreciated.
Such assets or disposal groups held for sale are stated at the lower of carrying amount and fair value less costs to sell.
(g) Impairment of Non-Financial Assets
At the end of each reporting period, the Company reviews the carrying amounts of non-financial assets to determine whether there is any indication that those assets have suffered an impairment loss. If any such indication exists, the recoverable amount of the asset is estimated in order to determine the extent of the impairment loss (if any). When it is not possible to estimate the recoverable amount of an individual asset, the Company estimates the recoverable amount of the cash-generating unit to which the asset belongs. When a reasonable and consistent basis of allocation can be identified, corporate assets are also allocated to individual cash-generating units, or otherwise they are allocated to the smallest group of cash-generating units for which a reasonable and consistent allocation basis can be identified.
Intangible assets with indefinite useful lives and intangible assets not yet available for use are tested for impairment at least annually, and whenever there is an indication that the asset may be impaired.
Recoverable amount is the higher of fair value less costs of disposal and value in use. In assessing value in use, the estimated future cash flows are discounted to their present value using a pre-tax discount rate that reflects current market assessments of the time value of money and the risks specific to the asset for which the estimates of future cash flows have not been adjusted.
If the recoverable amount of an asset (or cash-generating unit) is estimated to be less than its carrying amount, the carrying amount of the asset (or cash-generating unit) is reduced to its recoverable
amount. An impairment loss is recognised immediately in Statement of Profit and Loss.
When an impairment loss subsequently reverses, the carrying amount of the asset (or a cash-generating unit) is increased to the revised estimate of its recoverable amount, but so that the increased carrying amount does not exceed the carrying amount that would have been determined had no impairment loss been recognised for the asset (or cash-generating unit) in prior years. A reversal of an impairment loss is recognised immediately in the Statement of Profit and Loss.
(h) Inventories:
Inventories are valued as follows:
• Raw materials, fuel, stores & spares and packing materials:
Valued at lower of cost and net realisable value (NRV). However, these items are considered to be realisable at cost, if the finished products, in which they will be used, are expected to be sold at or above cost. Cost is determined on weighted average basis which includes expenditure incurred for acquiring inventories like purchase price, import duties, taxes (net of tax credit) and other costs incurred in bringing the inventories to their present location and condition.
• Work-in- progress (WIP), finished goods, stock-in-trade and trial run inventories:
Valued at lower of cost and NRV. Cost of Finished goods and WIP includes cost of raw materials, cost of conversion and other costs incurred in bringing the inventories to their present location and condition. Cost of Stock-in Trade includes cost of purchase and other costs incurred in bringing the inventories to the present location and condition. Cost of inventories is computed on weighted average basis.
• Waste / Scrap:
Waste / Scrap inventory is valued at NRV.
Net realisable value is the estimated selling price in the ordinary course of business, less the estimated costs of completion and the estimated costs necessary to make the sale.
Notes to the Consolidated Financial Statements for the year ended March 31, 2021 (Continued)

268
Ult
raTe
ch C
emen
t Li
mit
ed
269
Ann
ual R
epo
rt 2
020-
21
Welcome to UltraTech
Value Creation
Growth Enablers
Statutory Reports
Financial Statements
ESG Commitments
(i) Employee Share based payments:
Equity-settled share-based payments to employees are measured at the fair value of the employee stock options at the grant date using an appropriate valuation model.
The fair value determined at the grant date of the equity-settled share-based payments is amortised over the vesting period, based on the Company’s estimate of equity instruments that will eventually vest, with a corresponding increase in equity.
At the end of each reporting period, the Company revises its estimate of the number of equity instruments expected to vest. The impact of the revision of the original estimates, if any, is recognised in the Statement of Profit and Loss such that the cumulative expense reflects the revised estimate, with a corresponding adjustment to the equity-settled employee benefits reserve.
For Stock Appreciation Rights (“SARs”) which are cash-settled share-based payments, the fair value of liability is recognised for the services acquired over the period that the employees unconditionally become entitled to the payment. At the end of each reporting period until the liability is settled, and at the date of settlement, the liability is re-measured based on fair value of the SAR’s and any changes in fair value of the liability are recognised in the Statement of Profit and Loss.
(j) Treasury Shares:
The Company has formed an Employee Welfare Trust for purchasing the Company’s shares to be allotted to eligible employees under Employee Stock Options Scheme, 2018. The Company has considered the said Employee Welfare Trust as its extension and shares held by the Trust is treated as Treasury Shares. As per Ind AS 32, the consideration paid for treasury shares including any directly attributable incremental cost is presented as a deduction from total equity, until they are cancelled, sold or reissued.
(k) Borrowing Costs:
General and specific borrowing costs that are attributable to the acquisition, construction or production of a qualifying asset are capitalised as part of the cost of such asset till such time the asset
is ready for its intended use and borrowing costs are being incurred. A qualifying asset is an asset that necessarily takes a substantial period of time to get ready for its intended use. All other borrowing costs are recognised as an expense in the period in which they are incurred.
Borrowing cost includes interest expense, amortization of discounts, hedge related cost incurred in connection with foreign currency borrowings, ancillary costs incurred in connection with borrowing of funds and exchange difference arising from foreign currency borrowings to the extent they are regarded as an adjustment to the Interest cost.
(l) Government Grants:
Government grants, related to assets, are recognised in the Statement of Profit and Loss on a systematic basis over the periods in which the Company recognises the related costs for which the grants are intended to compensate.
Government grants related to income under State Investment Promotion Scheme linked with VAT / GST payment, are recognised in the Statement of Profit and Loss in the period in which they become receivable.
Government grants are not recognised until there is reasonable assurance that the Company will comply with the conditions attached to them and that the grants will be received.
The benefit of a government loan at a below-market rate of interest is treated as a government grant, measured as the difference between proceeds received and the fair value of the loan based on prevailing market interest rates and is being recognised in the Statement of Profit and Loss.
(m) Provisions, Contingent Liabilities and Contingent Assets:
Provisions are recognised when the Company has a present obligation (legal or constructive) as a result of a past event and it is probable that an outflow of resources, that can be reliably estimated, will be required to settle such an obligation.
If the effect of the time value of money is material, provisions are determined by discounting the expected future cash flows to net present value using
Notes to the Consolidated Financial Statements for the year ended March 31, 2021 (Continued)
an appropriate pre-tax discount rate that reflects current market assessments of the time value of money and, where appropriate, the risks specific to the liability. Unwinding of the discount is recognised in the Statement of Profit and Loss as a finance cost. Provisions are reviewed at each reporting date and are adjusted to reflect the current best estimate.
A present obligation that arises from past events where it is either not probable that an outflow of resources will be required to settle or a reliable estimate of the amount cannot be made, is disclosed as a contingent liability. Contingent liabilities are also disclosed when there is a possible obligation arising from past events, the existence of which will be confirmed only by the occurrence or non-occurrence of one or more uncertain future events not wholly within the control of the Company.
Claims against the Company where the possibility of any outflow of resources in settlement is remote, are not disclosed as contingent liabilities.
Contingent assets are not recognised in financial statements since this may result in the recognition of income that may never be realised. However, when the realisation of income is virtually certain, then the related asset is not a contingent asset and is recognised. A contingent asset is disclosed, in financial statements, where an inflow of economic benefits is probable.
(n) Mines Restoration Provision:
An obligation for restoration, rehabilitation and environmental costs arises when environmental disturbance is caused by the development or ongoing extraction from mines. Costs arising from restoration at closure of the mines and other site preparation work are provided for based on their discounted net present value, with a corresponding amount being capitalised at the start of each project. The amount provided for is recognised, as soon as the obligation to incur such costs arises. These costs are charged to the Statement of Profit and Loss over the life of the operation through the depreciation of the asset and the unwinding of the discount on the provision. The cost are reviewed periodically and are adjusted to reflect known developments which may have an impact on the cost or life of operations. The cost of the related asset is adjusted for changes in the provision
due to factors such as updated cost estimates, new disturbance, and revisions to discount rates. The adjusted cost of the asset is depreciated prospectively over the lives of the assets to which they relate. The unwinding of the discount is shown as a finance cost in the Statement of Profit and Loss.
(o) Revenue Recognition:
(i) Revenue from Contracts with Customers
• Revenue is recognized on the basis of approved contracts regarding the transfer of goods or services to a customer for an amount that reflects the consideration to which the entity expects to be entitled in exchange for those goods or services.
• Revenue is measured at the fair value of consideration received or receivable taking into account the amount of discounts, incentives, volume rebates and outgoing taxes on sales. Any amounts receivable from the customer are recognised as revenue after the control over the goods sold are transferred to the customer which is generally on dispatch / delivery of goods.
• Variable consideration - This includes incentives, volume rebates, discounts etc. It is estimated at contract inception considering the terms of various schemes with customers and constrained until it is highly probable that a significant revenue reversal in the amount of cumulative revenue recognised will not occur when the associated uncertainty with the variable consideration is subsequently resolved. It is reassessed at end of each reporting period.
• Significant financing component - Generally, the Company receives short-term advances from its customers. Using the practical expedient in Ind AS 115, the Company does not adjust the promised amount of consideration for the effects of a significant financing component if it expects, at contract inception, that the period between the transfer of the promised good or service to the customer and when the customer pays for that good or service will be one year or less.
Notes to the Consolidated Financial Statements for the year ended March 31, 2021 (Continued)

270
Ult
raTe
ch C
emen
t Li
mit
ed
271
Ann
ual R
epo
rt 2
020-
21
Welcome to UltraTech
Value Creation
Growth Enablers
Statutory Reports
Financial Statements
ESG Commitments
(ii) Dividend income is accounted for when the right to receive the income is established.
(iii) Interest income is recognised using the Effective Interest Method.
(p) Lease :
The Company assesses whether a contract contains a lease, at the inception of the contract. A contract is, or contains, a lease if the contract conveys the right to control the use of an identified asset for a period of time in exchange for consideration. To assess whether a contract conveys the right to control the use of an identified asset, the Company assesses whether
(i) the contract involves the use of identified asset;
(ii) the Company has substantially all of the economic benefits from the use of the asset through the period of lease and;
(iii) the Company has the right to direct the use of the asset.
As a lessee
The Company recognizes a right-of-use asset (“ROU”) and a lease liability at the lease commencement date. The ROU is initially measured at cost, which comprises the initial amount of the lease liability adjusted for any lease payments made at or before the commencement date, plus any initial direct costs incurred and an estimate of costs to dismantle and remove the underlying asset or to restore the underlying asset or the site on which it is located, less any lease incentives received.
Certain lease arrangements include the option to extend or terminate the lease before the end of the lease term. The right-of-use assets and lease liabilities include these options when it is reasonably certain that the option will be exercised.
The ROU is subsequently depreciated using the straight-line method from the commencement date to the end of the lease term.
The lease liability is initially measured at the present value of the lease payments that are not paid at the commencement date, discounted using the interest rate implicit in the lease or, if that rate cannot be readily determined, the company’s incremental borrowing rate. Generally, the company uses its incremental borrowing rate as the discount rate.
Lease payments included in the measurement of the lease liability comprises fixed payments, including in-substance fixed payments, amounts expected to be payable under a residual value guarantee and the exercise price under a purchase option that the Company is reasonably certain to exercise, lease payments in an optional renewal period if the Company is reasonably certain to exercise an extension option.
The lease liability is subsequently measured at amortised cost using the effective interest method, except those which are payable other than functional currency which is measured at fair value through profit or loss. It is remeasured when there is a change in future lease payments arising from a change in an index or rate, if there is a change in the company’s estimate of the amount expected to be payable under a residual value guarantee, or if company changes its assessment of whether it will exercise a purchase, extension or termination option.
When the lease liability is remeasured in this way, a corresponding adjustment is made to the carrying amount of the ROU or is recorded in Statement of Profit or Loss if the carrying amount of the right-of-use asset has been reduced to zero.
Lease Liabilities have been presented in ‘Financial Liabilities’ and the ‘ROU’ have been presented separately in the Balance Sheet. Lease payments have been classified as financing activities in the Statement of Cash Flows.
Short-term leases and leases of low-value assets
The Company has elected not to recognise ROU and lease liabilities for short term leases that have a lease term of 12 months or lower and leases of low value assets. The Company recognises the lease payments associated with these leases as an expense over the lease term. The related cash flows are classified as Operating activities in the Statement of Cash Flows.
As a lessor
When the Company is an intermediate lessor, it accounts for its interests in the head lease and the sublease separately. The sublease is classified as a finance or operating lease by reference to the right of use asset arising from the head lease.
Notes to the Consolidated Financial Statements for the year ended March 31, 2021 (Continued)
(q) Employee benefits:
Defined Benefit Plans:
For defined benefit plans, the cost of providing benefits is determined using the Projected Unit Credit Method, with actuarial valuations being carried out by a qualified independent actuary at the end of each annual reporting period. Re-measurement, comprising actuarial gains and losses, the effect of the changes to the asset ceiling (if applicable) and the return on plan assets (excluding net interest), is reflected immediately in the Balance Sheet with a charge or credit recognised in Other Comprehensive Income (OCI) in the period in which they occur. Past service cost, both vested and unvested, is recognised as an expense on the plan amendment or when the curtailment or settlement occurs. The gain or loss on curtailment or settlement, is recognized immediately in the profit or loss account when the plan amendment or when a curtailment or settlement occurs.
The retirement benefit obligations recognised in the balance sheet represents the present value of the defined benefit obligations reduced by the fair value of scheme assets. Any asset resulting from this calculation is limited to the present value of available refunds and reductions in future contributions to the scheme. The Company provides benefits such as gratuity, pension and provident fund to its employees which are treated as defined benefit plans.
Defined contribution plans:
Contributions to defined contribution plans are recognised as expense when employees have rendered services entitling them to such benefits. The Company provides benefits such as superannuation, provident fund (other than Company managed fund) to its employees which are treated as deûned contribution plans.
Gratuity
The gratuity, a defined benefit plan, payable to the employees is based on the Employees’ service and last drawn salary at the time of the leaving of the services of the Company and is in accordance with the Rules of the Company for payment of Gratuity. Past service cost is recognised in the Statement of Profit and Loss in the period of a plan amendment.
Interest is calculated by applying the discount rate at the beginning of the period to the net defined benefit liability or asset and is recognised in the Statement of Profit and Loss. Defined benefit costs are categorised as follows:
• service cost (including current service cost, past service cost, as well as gains and losses on curtailments and settlements);
• net interest expense or income; and
• re-measurement
The present value of the defined benefit plan liability is calculated using a discount rate which is determined by reference to market yields at the end of the reporting period on government bonds.
The defined benefit obligation recognised in the Balance Sheet represents the actual deficit or surplus in the Company’s defined benefit plans. Any surplus resulting from this calculation is limited to the present value of any economic benefits available in the form of refunds from the plans or reductions in future contributions to the plans.
Superannuation
Certain employees of the Company are eligible for participation in defined contribution plans such as superannuation and national pension fund. Contributions towards these funds are recognized as an expense periodically based on the contribution by the Company, since Company has no further obligation beyond its periodic contribution.
Provident Fund
The eligible employees of the Company are entitled to receive benefits in respect of provident fund, which is a defined benefit plan, for which both the employees and the Company make monthly contributions at a specified percentage of the covered employees’ salary. The contributions as specified under the law are made to the approved provident fund which is set up by the Company. The Company is liable for annual contributions and any shortfall in the fund assets based on the government specified minimum rates of return and recognises such contributions and shortfall, if any, as an expense in the year incurred.
Notes to the Consolidated Financial Statements for the year ended March 31, 2021 (Continued)

272
Ult
raTe
ch C
emen
t Li
mit
ed
273
Ann
ual R
epo
rt 2
020-
21
Welcome to UltraTech
Value Creation
Growth Enablers
Statutory Reports
Financial Statements
ESG Commitments
Other employee benefits
A liability is recognised for benefits accruing to employees in respect of wages and salaries, annual leave and sick leave in the period the related service is rendered.
Liabilities recognised in respect of short-term employee benefits are measured at the undiscounted amount of the benefits expected to be paid in exchange for the related service.
Liabilities recognised in respect of other long-term employee benefits are measured using the projected unit credit method by a qualified independent actuary at the end of each annual reporting period, at the present value of the estimated future cash outflows expected to be made by the Company in respect of services provided by employees up to the reporting date. With reference to some employees, liability of other fixed long-term employee benefits is recognised at the present value of the future cash outflows expected to be made by the Company.
Remeasurement gains / losses are recognised in the Statement of Profit and Loss in the period in which they arise.
(r) Income Taxes:
Income Tax expenses comprise current tax and deferred tax charge or credit.
Current Tax is measured on the basis of estimated taxable income for the current accounting period in accordance with the applicable tax rates and the provisions of the Income-tax Act, 1961 and other applicable tax laws.
Deferred tax liabilities are recognised for taxable temporary differences and deferred tax asset are recognised for deductible temporary differences, carry forward of unused tax losses, carry forward of unused tax credits at the reporting date. Deferred tax assets and liabilities are measured at the tax rates that are expected to be applied to the temporary differences when they reverse, based on the laws that have been enacted or substantively enacted at the reporting date. Tax relating to items recognised directly in equity or OCI is recognised in equity or OCI and not in the Statement of Profit and Loss. Minimum Alternate Tax (MAT) Credits are in the form of unused tax credits that
are carried forward by the Company for a specified period of time, hence it is grouped with Deferred Tax Asset. MAT is recognised as an asset only when and to the extent there is convincing evidence that the Company will pay normal income tax during the specified period.
Current tax assets and current tax liabilities are offset when there is a legally enforceable right to set off the recognised amounts and there is an intention to settle the asset and the liability on a net basis. Deferred tax assets and deferred tax liabilities are offset when there is a legally enforceable right to set off current tax assets against current tax liabilities; and the deferred tax assets and the deferred tax liabilities relate to income taxes levied by the same taxation authority.
A deferred tax asset is recognised to the extent that it is probable that future taxable profits will be available against which the temporary difference can be utilized except:
a) When the deferred tax asset relating to the deductible temporary difference arises from the initial recognition of an asset or liability in a transaction that is not a business combination and, at the time of the transaction, affects neither the accounting profit nor taxable profit or loss; and
b) In respect of deductible temporary differences associated with investments in subsidiaries, associates and interests in joint ventures, deferred tax assets are recognised only to the extent that it is probable that the temporary differences will reverse in the foreseeable future and taxable profit will be available against which the temporary differences can be utilised.
Deferred tax assets are reviewed at each reporting date and are recognised / reduced to the extent that it is probable / no longer probable respectively that the related tax benefit will be realised.
The Government of India, on September 20, 2019, vide the Taxation Laws (Amendment) Ordinance 2019, inserted a new Section 115BAA in the Income Tax Act, 1961, which provides an option to the Company for paying Income Tax at reduced rates as per the provisions/conditions defined in the said section. The Company is continuing with higher income tax rate option, based on the available outstanding MAT credit
Notes to the Consolidated Financial Statements for the year ended March 31, 2021 (Continued)
entitlement and different exemptions & deduction enjoyed by the Company. However, the Company has estimated and applied the lower income tax rate on the deferred tax assets / liabilities to the extent these are expected to be realized or settled in the future period when the Company may be subjected to lower tax rate.
(s) Earnings Per Share:
Basic Earnings Per Share (“EPS”) is computed by dividing the net profit / (loss) after tax for the year attributable to the equity shareholders by the weighted average number of equity shares outstanding during the year. The weighted average number of equity shares outstanding during the year is adjusted for treasury shares.
For the purpose of calculating diluted earnings per share, net profit / (loss) after tax for the year attributable to the equity shareholders is divided by the weighted average number of equity shares which could have been issued on the conversion of all dilutive potential equity shares and is adjusted for the treasury shares held by the Company to satisfy the exercise of the share options by the employees.
(t) Foreign Currency transactions:
Transactions in currencies other than the Company’s functional currency (i.e. foreign currencies) are recognised at the rates of exchange prevailing at the dates of the transactions. At the end of each reporting period, monetary items denominated in foreign currencies are translated at the rates prevailing at that date. Non-monetary items carried at fair value that are denominated in foreign currencies are translated at the rates prevailing at the date when the fair value was determined. Non-monetary items that are measured in terms of historical cost in a foreign currency are translated using the exchange rate as at the date of initial transactions.
Exchange differences on monetary items are recognised in the Statement of Profit and Loss in the period in which they arise except for:
• exchange differences on foreign currency borrowings relating to assets under construction for future productive use, which are included in the cost of those assets when they are regarded
as an adjustment to interest costs on those foreign currency borrowings;
• exchange differences relating to qualifying effective cash flow hedges and qualifying net investment hedges in foreign operations which are recognised in OCI.
(u) Foreign operations:
The assets and liabilities of foreign operations including goodwill and fair value adjustments arising on acquisition are translated into INR, the functional currency of the Company, at the exchange rates at the reporting date. The income and expenses of foreign operations are translated into INR at the exchange rates at the dates of the transactions or an average rate if the average rate approximates the actual rate at the date of the transaction. Exchange differences are recognized in OCI and accumulated in equity (as exchange differences on translating the financial statements of a foreign operation), except to the extent that the exchange differences are allocated to NCI.
When a foreign operation is disposed of in its entirety or partially such that control, significant influence or joint control is lost, the cumulative amount of exchange differences related to that foreign operation recognized in OCI is reclassified to Statement of Profit and Loss as part of the gain or loss on disposal. If the Group disposes of part of its interest in a subsidiary but retains control, then the relevant proportion of the cumulative amount is re-allocated to NCI. When the Group disposes of only a part of its interest in an associate or a joint venture while retaining significant influence or joint control, the relevant proportion of the cumulative amount is reclassified to Statement of Profit and Loss.
(v) Financial Instruments:
A Financial Instrument is any contract that gives rise to a financial asset of one entity and a financial liability or equity instrument of another entity. Financial assets and financial liabilities are recognised when a Company becomes a party to the contractual provisions of the instruments.
Initial Recognition:
Financial assets and financial liabilities are initially measured at fair value. Transaction costs that are
Notes to the Consolidated Financial Statements for the year ended March 31, 2021 (Continued)

274
Ult
raTe
ch C
emen
t Li
mit
ed
275
Ann
ual R
epo
rt 2
020-
21
Welcome to UltraTech
Value Creation
Growth Enablers
Statutory Reports
Financial Statements
ESG Commitments
directly attributable to the acquisition or issue of financial assets and financial liabilities (other than financial assets and financial liabilities at fair value through profit or loss and ancillary costs related to borrowings) are added to or deducted from the fair value of the financial assets or financial liabilities, as appropriate, on initial recognition. Transaction costs directly attributable to the acquisition of financial assets or financial liabilities at fair value through profit or loss are charged to the Statement of Profit and Loss over the tenure of the financial assets or financial liabilities.
Classification and Subsequent Measurement: Financial Assets
The Company classifies financial assets as subsequently measured at amortised cost, Fair Value through Other Comprehensive Income (“FVOCI”) or Fair Value through Profit or Loss (“FVTPL”) on the basis of following:
• the entity’s business model for managing the financial assets and
• the contractual cash flow characteristics of the financial asset.
Amortised Cost:
A financial asset shall be classified and measured at amortised cost if both of the following conditions are met:
• the financial asset is held within a business model whose objective is to hold financial assets in order to collect contractual cash flows and
• the contractual terms of the financial asset give rise on specified dates to cash flows that are solely payments of principal and interest on the principal amount outstanding.
In case of financial assets classified and measured at amortised cost, any interest income, foreign exchange gains or losses and impairment are recognised in the Statement of Profit and Loss.
Fair Value through OCI:
A financial asset shall be classified and measured at fair value through OCI if both of the following conditions are met:
• the financial asset is held within a business model whose objective is achieved by both collecting contractual cash flows and selling financial assets and
• the contractual terms of the financial asset give rise on specified dates to cash flows that are solely payments of principal and interest on the principal amount outstanding.
Fair Value through Profit or Loss:
A financial asset shall be classified and measured at fair value through profit or loss unless it is measured at amortised cost or at fair value through OCI.
All recognised financial assets are subsequently measured in their entirety at either amortised cost or fair value, depending on the classification of the financial assets.
For financial assets at FVTPL, net gains or losses, including any interest or dividend income, are recognised in the Statement of Profit and Loss.
Classification and Subsequent Measurement: Financial liabilities
Financial liabilities are classified as either financial liabilities at FVTPL or ‘other financial liabilities.
Financial Liabilities at FVTPL:
Financial liabilities are classified as at FVTPL when the financial liability is held for trading or is a derivative (except for effective hedge) or are designated upon initial recognition as FVTPL.
Gains or Losses, including any interest expense on liabilities held for trading are recognised in the Statement of Profit and Loss.
Other Financial Liabilities:
Other financial liabilities (including borrowings and trade and other payables) are subsequently measured at amortised cost using the effective interest method.
The effective interest rate is the rate that exactly discounts estimated future cash payments (including all fees and points paid or received that form an integral part of the effective interest rate, transaction costs and other premiums or discounts) through the expected life of the financial liability, or (where appropriate) a shorter period, to the amortised cost on initial recognition.
Notes to the Consolidated Financial Statements for the year ended March 31, 2021 (Continued)
Interest expense (based on the effective interest method), foreign exchange gains and losses, and any gain or loss on derecognition is recognised in the Statement of Profit and Loss.
Impairment of financial assets:
Expected credit losses are recognized for all financial assets subsequent to initial recognition other than financials assets in FVTPL category. For financial assets other than trade receivables, as per Ind AS 109, the Company recognises 12 month expected credit losses for all originated or acquired financial assets if at the reporting date the credit risk of the financial asset has not increased significantly since its initial recognition. The expected credit losses are measured as lifetime expected credit losses if the credit risk on financial asset increases significantly since its initial recognition.
The Company’s trade receivables do not contain significant financing component and as per simplified approach, loss allowances on trade receivables are measured using provision matrix at an amount equal to life time expected losses i.e. expected cash shortfall.
The impairment losses and reversals are recognised in Statement of Profit and Loss.
Derecognition of financial assets and financial liabilities:
The Company derecognises a financial asset when the contractual rights to the cash flows from the asset expire, or when it transfers the financial asset and substantially all the risks and rewards of ownership of the asset to another party. If the Company neither transfers nor retains substantially all the risks and rewards of ownership and continues to control the transferred asset, the Company recognises its retained interest in the asset and an associated liability for amounts it may have to pay. If the Company retains substantially all the risks and rewards of ownership of a transferred financial asset, the Company continues to recognise the financial asset and recognises an associated liability for amounts it has to pay.
On derecognition of a financial asset, the difference between the asset’s carrying amount and the sum of the consideration received and receivable and the cumulative gain or loss that had been recognised in OCI and accumulated in equity is recognised in the Statement of Profit and Loss.
The Company de-recognises financial liabilities when and only when, the Company’s obligations are discharged, cancelled or have expired. The difference between the carrying amount of the financial liability de-recognised and the consideration paid and payable is recognised in the Statement of Profit and Loss.
Financial Guarantee Contract Liabilities
Financial Guarantee Contract Liabilities are disclosed in financial statements in accordance with Ind AS 37 - Provisions, Contingent Liabilities and Contingent Assets.
(w) Cash and cash equivalents:
Cash and cash equivalents in the Balance Sheet comprise cash at bank and in hand and short-term deposits with banks that are readily convertible into cash which are subject to insignificant risk of changes in value and are held for the purpose of meeting short-term cash commitments.
(x) Financial liabilities and equity instruments:
• Classification as debt or equity
Debt and equity instruments issued by the Company are classified as either financial liabilities or as equity in accordance with the substance of the contractual arrangements and the definitions of a financial liability and an equity instrument.
• Equity instruments
An equity instrument is any contract that evidences a residual interest in the assets of an entity after deducting all of its liabilities. Equity instruments issued by a Company are recognised at the proceeds received.
(y) Derivative financial instruments:
The Company enters into derivative financial instruments viz. foreign exchange forward contracts, interest rate swaps and cross currency swaps to manage its exposure to interest rate, foreign exchange rate risks and commodity prices. The Company does not hold derivative financial instruments for speculative purposes.
Derivatives are initially recognised at fair value at the date the derivative contracts are entered into and are
Notes to the Consolidated Financial Statements for the year ended March 31, 2021 (Continued)

276
Ult
raTe
ch C
emen
t Li
mit
ed
277
Ann
ual R
epo
rt 2
020-
21
Welcome to UltraTech
Value Creation
Growth Enablers
Statutory Reports
Financial Statements
ESG Commitments
subsequently remeasured to their fair value at the end of each reporting period. The resulting gain or loss is recognised in profit or loss immediately excluding derivatives designated as cashflow hedge.
(z) Hedge accounting:
The Company designates certain hedging instruments in respect of foreign currency risk, interest rate risk and commodity price risk as cash flow hedges. At the inception of the hedge relationship, the entity documents the relationship between the hedging instrument and the hedged item, along with its risk management objectives and its strategy for undertaking various hedge transactions. Furthermore, at the inception of the hedge and on an ongoing basis, the Company documents whether the hedging instrument is highly effective in offsetting changes in fair values or cash flows of the hedged item attributable to the hedged risk.
The effective portion of changes in the fair value of the designated portion of derivatives that qualify as cash flow hedges is recognised in OCI and accumulated under equity. The gain or loss relating to the ineffective portion is recognised immediately in profit or loss.
Amounts previously recognised in OCI and accumulated in equity relating to effective portion as described above are reclassified to Statement of Profit or Loss in the periods when the hedged item affects the Statement of Profit or Loss, in the same line as the recognised hedged item. However, when the hedged forecast transaction results in the recognition of a non-financial asset or a non-financial liability, such gains and losses are transferred from equity and included in the initial measurement of the cost of the non-financial asset or non-financial liability.
Hedge accounting is discontinued prospectively when the hedging instrument expires or is sold, terminated, or exercised, or when it no longer qualifies for hedge accounting. Any gain or loss recognised in OCI and accumulated in equity at that time remains in equity and is recognised when the forecast transaction is ultimately recognised in the Statement of Profit and Loss. When a forecast transaction is no longer expected to occur, the gain or loss accumulated in equity is recognised immediately in the Statement of Profit and Loss.
(aa) Segment Reporting: Identification of Segments:
An operating segment is a component of the Company that engages in business activities from which it may earn revenues and incur expenses, whose operating results are regularly reviewed by the company’s Chief Operating Decision Maker (“CODM”) to make decisions for which discrete financial information is available. Based on the management approach as defined in Ind AS 108, the CODM evaluates the Company’s performance and allocates resources based on an analysis of various performance indicators by business segments and geographic segments.
(bb) Goodwill:
Goodwill arising out of Consolidation of financial statements of subsidiaries are tested for impairment at each reporting date.
(cc) Cash Flow Statement:
Cash flows are reported using the indirect method, whereby the net profit before tax is adjusted for the effects of transactions of a non-cash nature, any deferrals or accruals of past or future operating cash receipts or payments and item of income or expenses associated with investing or financing cash flows. The cash flows from operating, investing and financing activities of the Company are segregated.
(dd) Business Combination:
The Company applies the acquisition method in accounting for business combinations. The consideration transferred by the Company to obtain control of a business is calculated as the sum of the fair values of assets transferred, liabilities incurred and the equity interests issued by the Company as at the acquisition date i.e. date on which it obtains control of the acquiree which includes the fair value of any asset or liability arising from a contingent consideration arrangement. Acquisition-related costs are recognised in the statement of profit and loss as incurred, except to the extent related to the issue of debt or equity securities.
Identifiable assets acquired and liabilities assumed in a business combination are measured initially at their fair values on acquisition-date.
Notes to the Consolidated Financial Statements for the year ended March 31, 2021 (Continued)
Intangible Assets acquired in a Business Combination and recognised separately from Goodwill are initially recognised at their fair value at the acquisition date (which is regarded as their cost).
Subsequent to initial recognition, intangible Assets acquired in a Business Combination are reported at cost less accumulated amortisation and accumulated impairment losses, on the same basis as intangible assets that are acquired separately.
Goodwill is measured as the excess of the aggregate of the consideration transferred and the amount recognised for non-controlling interests, and any previous interest held, over the net identifiable assets acquired and liabilities assumed. Such goodwill is tested annually for impairment. If the fair value of the net assets acquired is in excess of the aggregate consideration transferred, the excess is termed as bargain purchase.
In case of a bargain purchase, before recognizing a gain in respect thereof, the Company determines whether there exists clear evidence of the underlying reasons for classifying the business combination as a bargain purchase thereafter, the Company reassesses whether it has correctly identified all the assets acquired and liabilities assumed and recognises any additional assets or liabilities that are so identified, any gain thereafter is recognised in OCI and accumulated in equity as Capital Reserve. If there does not exist clear evidence of the underlying reasons for classifying the Business combination as a bargain purchase, the Company recognises the gain, after reassessing and reviewing, directly in equity as Capital Reserve.
Contingent consideration is classified either as equity or financial liability. Amount classified as financial liability are subsequently re-measured to fair value with changes in fair value recognised in statement of profit and loss.
(ee) Discontinued Operations:
A discontinued operation is a component of the Group’s business, the operations and cashflows of which can be clearly distinguished from those of the rest of the Group and which represents a separate major line of business or geographical area of operations and
- Is a part of single coordinated plan to dispose of a separate major line of business or geographical area of operations; or
- Is a subsidiary acquired exclusively with a view to re-sale.
Classification as a discontinued operation occurs upon disposal or when the operation meets the criteria to be classified as held for sale, if earlier.
When an operation is classified as a discontinued operation, the comparative Statement of Profit and Loss is represented as if the operation had been discontinued from the start of the comparative period.
Note 1(C) Critical accounting judgements and key sources of estimation uncertainty:
The preparation of the Company’s financial statements requires management to make judgements, estimates and assumptions that affect the reported amounts of revenues, expenses, assets and liabilities, and the accompanying disclosures, and the disclosure of contingent liabilities. Uncertainty about these assumptions and estimates could result in outcomes that require a material adjustment to the carrying amount of assets or liabilities affected in future periods.
(a) Critical judgments in applying accounting policies:
In the process of applying the Company’s accounting policies, management has made the following judgments, which have the most significant effect on the amounts recognised in the consolidated financial statements.
(i) Classification of Madanpur (North) Coal Company Private Limited as Investment in an Associate:
A Joint Venture Company (JV) “Madanpur (North) Coal Company Limited” was formed by allocatees of Madanpur North Coal Block. As per Ind AS 111, when all the parties, or a group of parties, considered collectively, are able to direct the activities that significantly affect the returns of the arrangement (i.e. the relevant activities), the parties control the arrangement collectively. Also, joint control exists only when decisions about the relevant activities require the unanimous consent of all the parties. In terms of the JV agreement between the parties, each JV partner has right
Notes to the Consolidated Financial Statements for the year ended March 31, 2021 (Continued)
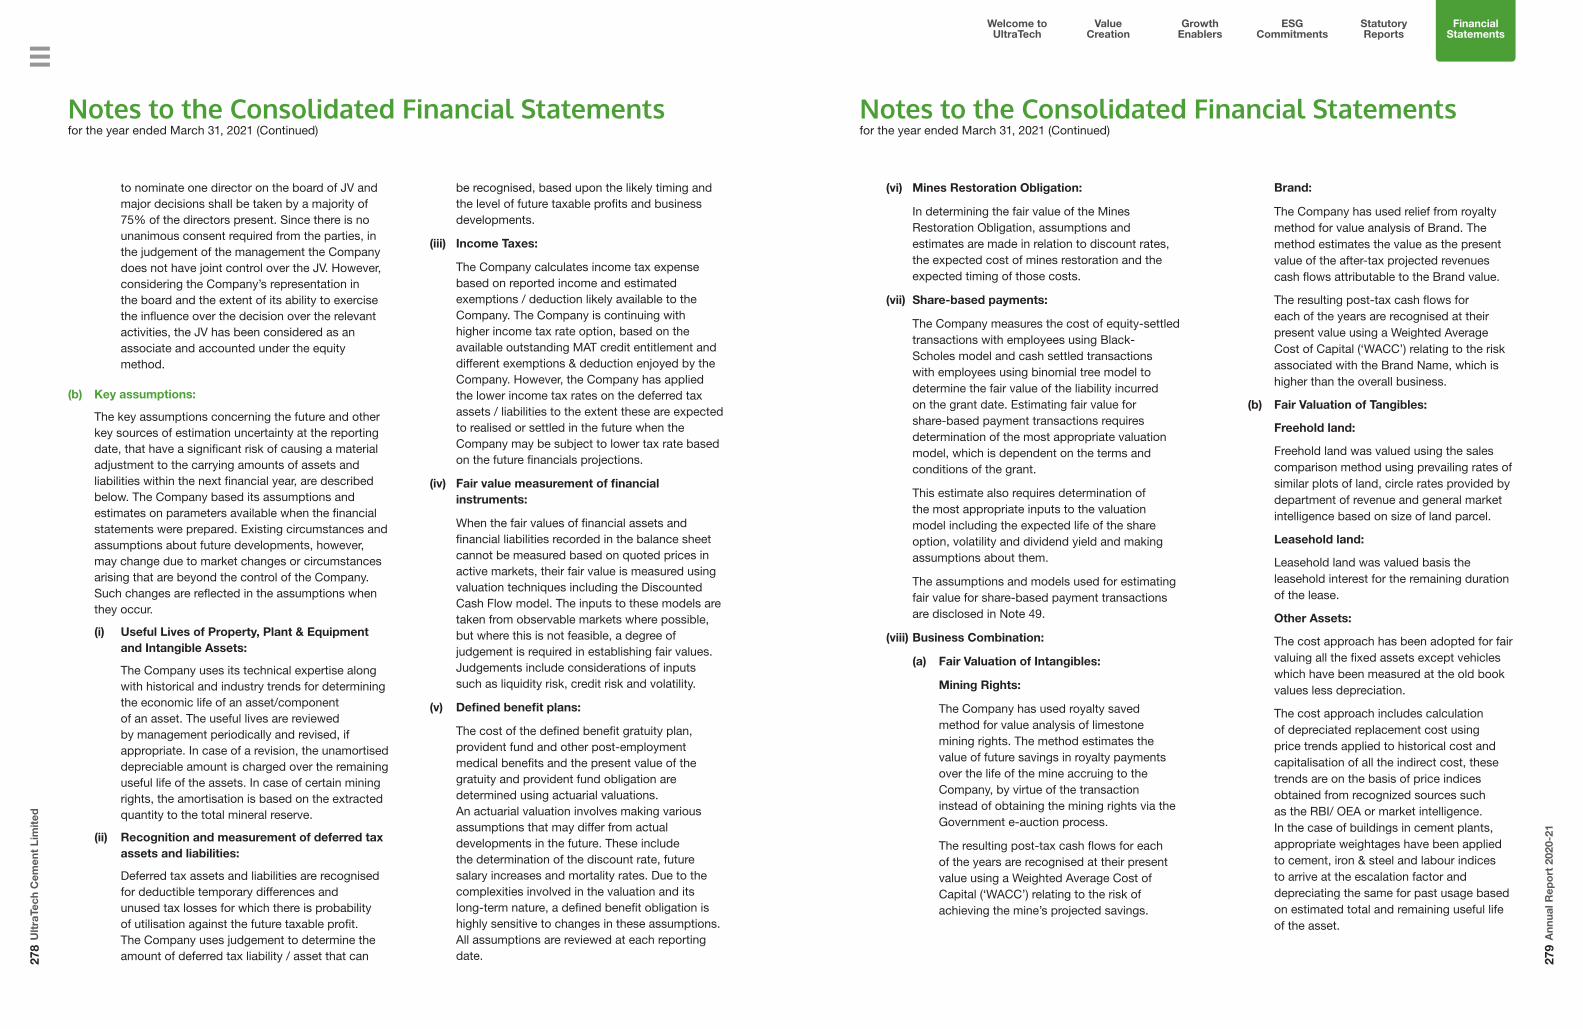
278
Ult
raTe
ch C
emen
t Li
mit
ed
279
Ann
ual R
epo
rt 2
020-
21
Welcome to UltraTech
Value Creation
Growth Enablers
Statutory Reports
Financial Statements
ESG Commitments
to nominate one director on the board of JV and major decisions shall be taken by a majority of 75% of the directors present. Since there is no unanimous consent required from the parties, in the judgement of the management the Company does not have joint control over the JV. However, considering the Company’s representation in the board and the extent of its ability to exercise the influence over the decision over the relevant activities, the JV has been considered as an associate and accounted under the equity method.
(b) Key assumptions:
The key assumptions concerning the future and other key sources of estimation uncertainty at the reporting date, that have a significant risk of causing a material adjustment to the carrying amounts of assets and liabilities within the next financial year, are described below. The Company based its assumptions and estimates on parameters available when the financial statements were prepared. Existing circumstances and assumptions about future developments, however, may change due to market changes or circumstances arising that are beyond the control of the Company. Such changes are reflected in the assumptions when they occur.
(i) Useful Lives of Property, Plant & Equipment and Intangible Assets:
The Company uses its technical expertise along with historical and industry trends for determining the economic life of an asset/component of an asset. The useful lives are reviewed by management periodically and revised, if appropriate. In case of a revision, the unamortised depreciable amount is charged over the remaining useful life of the assets. In case of certain mining rights, the amortisation is based on the extracted quantity to the total mineral reserve.
(ii) Recognition and measurement of deferred tax assets and liabilities:
Deferred tax assets and liabilities are recognised for deductible temporary differences and unused tax losses for which there is probability of utilisation against the future taxable profit. The Company uses judgement to determine the amount of deferred tax liability / asset that can
be recognised, based upon the likely timing and the level of future taxable profits and business developments.
(iii) Income Taxes:
The Company calculates income tax expense based on reported income and estimated exemptions / deduction likely available to the Company. The Company is continuing with higher income tax rate option, based on the available outstanding MAT credit entitlement and different exemptions & deduction enjoyed by the Company. However, the Company has applied the lower income tax rates on the deferred tax assets / liabilities to the extent these are expected to realised or settled in the future when the Company may be subject to lower tax rate based on the future financials projections.
(iv) Fair value measurement of financial instruments:
When the fair values of financial assets and financial liabilities recorded in the balance sheet cannot be measured based on quoted prices in active markets, their fair value is measured using valuation techniques including the Discounted Cash Flow model. The inputs to these models are taken from observable markets where possible, but where this is not feasible, a degree of judgement is required in establishing fair values. Judgements include considerations of inputs such as liquidity risk, credit risk and volatility.
(v) Defined benefit plans:
The cost of the defined benefit gratuity plan, provident fund and other post-employment medical benefits and the present value of the gratuity and provident fund obligation are determined using actuarial valuations. An actuarial valuation involves making various assumptions that may differ from actual developments in the future. These include the determination of the discount rate, future salary increases and mortality rates. Due to the complexities involved in the valuation and its long-term nature, a defined benefit obligation is highly sensitive to changes in these assumptions. All assumptions are reviewed at each reporting date.
Notes to the Consolidated Financial Statements for the year ended March 31, 2021 (Continued)
(vi) Mines Restoration Obligation:
In determining the fair value of the Mines Restoration Obligation, assumptions and estimates are made in relation to discount rates, the expected cost of mines restoration and the expected timing of those costs.
(vii) Share-based payments:
The Company measures the cost of equity-settled transactions with employees using Black-Scholes model and cash settled transactions with employees using binomial tree model to determine the fair value of the liability incurred on the grant date. Estimating fair value for share-based payment transactions requires determination of the most appropriate valuation model, which is dependent on the terms and conditions of the grant.
This estimate also requires determination of the most appropriate inputs to the valuation model including the expected life of the share option, volatility and dividend yield and making assumptions about them.
The assumptions and models used for estimating fair value for share-based payment transactions are disclosed in Note 49.
(viii) Business Combination:
(a) Fair Valuation of Intangibles:
Mining Rights:
The Company has used royalty saved method for value analysis of limestone mining rights. The method estimates the value of future savings in royalty payments over the life of the mine accruing to the Company, by virtue of the transaction instead of obtaining the mining rights via the Government e-auction process.
The resulting post-tax cash flows for each of the years are recognised at their present value using a Weighted Average Cost of Capital (‘WACC’) relating to the risk of achieving the mine’s projected savings.
Brand:
The Company has used relief from royalty method for value analysis of Brand. The method estimates the value as the present value of the after-tax projected revenues cash flows attributable to the Brand value.
The resulting post-tax cash flows for each of the years are recognised at their present value using a Weighted Average Cost of Capital (‘WACC’) relating to the risk associated with the Brand Name, which is higher than the overall business.
(b) Fair Valuation of Tangibles:
Freehold land:
Freehold land was valued using the sales comparison method using prevailing rates of similar plots of land, circle rates provided by department of revenue and general market intelligence based on size of land parcel.
Leasehold land:
Leasehold land was valued basis the leasehold interest for the remaining duration of the lease.
Other Assets:
The cost approach has been adopted for fair valuing all the fixed assets except vehicles which have been measured at the old book values less depreciation.
The cost approach includes calculation of depreciated replacement cost using price trends applied to historical cost and capitalisation of all the indirect cost, these trends are on the basis of price indices obtained from recognized sources such as the RBI/ OEA or market intelligence. In the case of buildings in cement plants, appropriate weightages have been applied to cement, iron & steel and labour indices to arrive at the escalation factor and depreciating the same for past usage based on estimated total and remaining useful life of the asset.
Notes to the Consolidated Financial Statements for the year ended March 31, 2021 (Continued)

280
Ult
raTe
ch C
emen
t Li
mit
ed
281
Ann
ual R
epo
rt 2
020-
21
Welcome to UltraTech
Value Creation
Growth Enablers
Statutory Reports
Financial Statements
ESG Commitments
(ix) Disposal Groups:
The Company has used comparable market multiple approach to assess the fair value of the disposal group.
Under the market multiple approach, enterprise value of a company is determined by using multiples derived from valuations of comparable companies, as manifested through stock market valuations of listed companies considering Enterprise Value/ Revenue and Enterprise value/ EBITDA multiples based on their market price and latest published financial information.
Appropriate adjustments are made (e.g. for debt and surplus assets) to arrive at the equity value of the disposal group.
(x) Classification of Lease Ind AS 116:
Ind AS 116 Leases requires a lessee to determine the lease term as the non-cancellable period of a lease adjusted with any option to extend
or terminate the lease, if the use of such option is reasonably certain. The Company makes an assessment on the expected lease term on lease by lease basis and thereby assesses whether it is reasonably certain that any options to extend or terminate the contract will be exercised. In evaluating the lease term, the Company considers factors such as any significant leasehold improvements undertaken over the lease term, costs relating to the termination of lease and the importance of the underlying lease to the Company’s operations taking into account the location of the underlying asset and the availability of the suitable alternatives. The lease term in future periods is reassessed to ensure that the lease term reflects the current economic circumstances. The discount rate is generally based on the incremental borrowing rate specific to the lease being evaluated or for a portfolio of leases with similar characteristics.
Notes to the Consolidated Financial Statements for the year ended March 31, 2021 (Continued)
Note 2: Property, Plant and Equipment & Other Intangible Assets ` in Crores
Particulars
Gross Block Depreciation and Amortisation Net BlockAs at
April 1, 2020
(Restated)
OtherAdjustments*
Additions Deductions/Adjustments/
Held for disposal
As atMarch 31,
2021
As atApril 1, 2020
(Restated)
OtherAdjustments*
For theyear
Deductions/Adjustments/
Held for disposal
As atMarch 31,
2021
As atMarch 31,
2021
(A) Tangible Assets@ Land: Freehold Land 6,456.53 (0.15) 115.57 107.99 6,463.96 - - - - - 6,463.96 Leasehold Land 992.93 - 134.63 0.91 1,126.65 125.17 - 54.41 - 179.58 947.07 Buildings 5,420.70 (9.24) 109.40 4.86 5,516.00 861.43 (2.76) 228.78 3.20 1,084.25 4,431.75 Railway Sidings 905.51 - 53.22 - 958.73 201.39 - 55.42 - 256.81 701.92 Plant and Equipment: Own 38,227.86 (59.38) 379.74 93.09 38,455.13 7,151.44 (23.41) 1,948.75 59.00 9,017.78 29,437.35 Given on Lease 174.64 - - - 174.64 59.23 - 11.03 - 70.26 104.38 Office Equipment 264.53 (0.11) 29.90 5.14 289.18 141.74 (0.09) 41.83 3.85 179.63 109.55 Furniture and Fixtures 112.29 (0.45) 1.82 2.33 111.33 70.28 (0.31) 11.56 1.41 80.12 31.21 Vehicles 122.12 (0.38) 23.30 11.70 133.34 58.44 (0.33) 19.28 7.95 69.44 63.90 Total Tangible Assets 52,677.11 (69.71) 847.58 226.02 53,228.96 8,669.12 (26.90) 2,371.06 75.41 10,937.87 42,291.09(B) Capital Work-in-Progress 1,680.96(C) Intangible Assets Software 85.58 - 36.49 9.54 112.53 63.35 - 18.23 9.54 72.04 40.49 Mining Rights 183.01 - 50.93 0.25 233.69 54.47 - 6.13 - 60.60 173.09 Brand 155.21 - - - 155.21 155.21 - - - 155.21 - Mining Reserve 5,483.35 - 3.51 - 5,486.86 232.45 - 120.53 - 352.98 5,133.88 Jetty Rights 212.68 - 11.75 - 224.43 37.57 - 3.18 - 40.75 183.68 Power Line Rights 59.25 (2.00) - - 57.25 18.96 (0.69) 3.71 - 21.98 35.27 Total Intangible Assets 6,179.08 (2.00) 102.68 9.79 6,269.97 562.01 (0.69) 151.78 9.54 703.56 5,566.41(D) Intangible Assets under Development
5.72
Total Assets (A+B+C+D) 58,856.19 (71.71) 950.26 235.81 59,498.93 9,231.13 (27.59) 2,522.84 84.95 11,641.43 49,544.18
@Net Block of Tangible Assets, amounting to ` 20,688.46 Crores (March 31, 2020 ` 23,913.79 Crores) were pledged as security against the Secured Borrowings.
Particulars
Gross Block Depreciation and Amortisation Net BlockAs at
April 1, 2019
(Restated)
OtherAdjustments*
Additions Deductions/Adjustments/
Held for disposal
As atMarch 31,
2020
As atApril 1, 2019
(Restated)
OtherAdjustments*
For theyear
Deductions/Adjustments/
Held for disposal
As atMarch 31,
2020
As atMarch 31,
2020
(A) Tangible Assets Land: Freehold Land 6,389.67 0.83 196.95 130.92 6,456.53 - - - - - 6,456.53 Leasehold Land 1,102.60 - 31.05 140.72 992.93 89.28 (0.03) 45.12 9.20 125.17 867.76 Buildings 5,197.20 3.16 231.70 11.36 5,420.70 631.04 2.65 230.55 2.81 861.43 4,559.27 Railway Sidings 889.53 1.60 14.53 0.15 905.51 147.52 (0.01) 53.96 0.08 201.39 704.12 Plant and Equipment Own 37,045.09 142.75 1,217.51 177.49 38,227.86 5,267.89 29.57 1,931.01 77.03 7,151.44 31,076.42 Given on Lease 174.64 - - - 174.64 48.49 - 10.74 - 59.23 115.41 Office Equipment 208.00 (0.17) 59.54 2.84 264.53 104.49 (0.02) 39.35 2.08 141.74 122.79 Furniture and Fixtures 106.34 1.19 8.56 3.80 112.29 57.56 0.71 15.22 3.21 70.28 42.01 Vehicles 110.79 0.69 24.41 13.77 122.12 46.95 0.40 19.55 8.46 58.44 63.68 Total Tangible Assets 51,223.86 150.05 1,784.25 481.05 52,677.11 6,393.22 33.27 2,345.50 102.87 8,669.12 44,007.99 (B) Capital Work-in-Progress 909.52 (C) Intangible Assets Software 64.77 0.29 20.55 0.03 85.58 50.72 0.04 12.62 0.03 63.35 22.23 Mining Rights 176.67 - 7.66 1.32 183.01 50.58 - 5.21 1.32 54.47 128.54 Brand 155.21 - - - 155.21 89.54 - 65.67 - 155.21 - Mining Reserve 5,482.66 - 0.69 - 5,483.35 111.37 - 121.08 - 232.45 5,250.90 Jetty Rights 182.86 - 29.82 - 212.68 29.32 - 8.25 - 37.57 175.11 Power Line Rights 64.88 5.10 - 10.73 59.25 17.53 1.56 3.55 3.68 18.96 40.29 Total Intangible Assets 6,127.05 5.39 58.72 12.08 6,179.08 349.06 1.60 216.38 5.03 562.01 5,617.07 (D) Intangible Assets under Development
10.07
Total Assets (A+B+C+D) 57,350.91 155.44 1,842.97 493.13 58,856.19 6,742.28 34.87 2,561.88 107.90 9,231.13 50,544.65* On account of Foreign Currency Translation
Notes to the Consolidated Financial Statements for the year ended March 31, 2021 (Continued)

282
Ult
raTe
ch C
emen
t Li
mit
ed
283
Ann
ual R
epo
rt 2
020-
21
Welcome to UltraTech
Value Creation
Growth Enablers
Statutory Reports
Financial Statements
ESG Commitments
` in Crores
ParticularsYear ended
March 31, 2021Year ended
March 31, 2020 (Restated)
(A) Depreciation and Amortisation 2,522.84 2,561.88
Add: Obsolescence 54.62 37.49
Less: Depreciation transferred to Pre-operative Expenses (0.82) (0.04)
Add: Depreciation on ROU (Refer Note 3) 123.59 123.33
Depreciation as per Statement of Profit and Loss 2,700.23 2,722.66
(B) 1. Tangible Assets include assets for which ownership is not in the name of the Company - Gross Block of ` 543.54 Crores (March 31, 2020 ` 563.66 Crores).
2. Buildings include ` 12.13 Crores (March 31, 2020 ` 12.13 Crores) being cost of Debentures and Shares in a company entitling the right of exclusive occupancy and use of certain premises.
3. Opening Gross Block includes Research and Development Assets (Building, Plant and Equipment, Furniture and Fixtures, Office Equipment and Intangible Assets) of ` 43.19 Crores (March 31, 2020 ` 44.54 Crores) and Net Block of ` 21.19 Crores (March 31, 2020 ` 24.65 Crores). Addition for the Research and Development Assets during the year is ` 0.30 Crores (March 31, 2020 ` 1.12 Crores).
4. Title of immovable properties having Gross Block of ` 3,388.19 Crores (March 31, 2020 ` 3,568.28 Crores) and Net Block of ` 3,263.42 Crores (March 31, 2020 ` 3,418.88 Crores) is yet to be transferred in the name of the Company.
5. The amount of expenditures recognised in the carrying amount of an item of PPE in the course of its construction:
` in Crores
ParticularsYear ended
March 31, 2021Year ended
March 31, 2020 (Restated)
Pre-operative expenses pending allocation:Raw Materials Consumed - 11.75 Power and Fuel Consumed - 1.70 Salary, Wages, Bonus, Ex-gratia and Provisions 12.09 9.77 Insurance 0.25 0.60 Depreciation on ROU 5.88 5.00 Depreciation 0.83 0.04 Finance Costs 2.06 0.93 Miscellaneous expenses 45.70 19.50 Total Pre-operative expenses 66.81 49.29 Less: Sale of Products / Other Income - (14.41)Less: Trial Run production transferred to Inventory - (4.79)Add: Brought forward from Previous Year 74.44 50.31 Less: Capitalised / Charged during the Year (0.82) (5.96)Balance included in Capital Work-in-Progress 140.43 74.44
Movement in Goodwill: ` in Crores
ParticularsYear ended
March 31, 2021Year ended
March 31, 2020 (Restated)
Opening Balance 6,252.49 6,223.34 Less: Derecognised Goodwill on loss of Control (Refer Note 37) - (57.99)Add: Exchange difference recognised in foreign currency translation reserve (32.64) 87.14 Closing Balance 6,219.85 6,252.49
Notes to the Consolidated Financial Statements for the year ended March 31, 2021 (Continued)
Note 3: ROU Schedule As on March 31, 2021:As a lessee (Ind AS 116)
(a ) Following are the carrying value of Right of Use Assets as at March 31, 2021:` in Crores
Particulars
Gross Block Depreciation and Amortisation Net Block
As atApril 01,
2020(Restated)
Other Adjustments
Additions Deductions As atMarch 31,
2021
As atApril 01,
2020(Restated)
Other Adjustments
For the year
Deductions As atMarch 31,
2021
As atMarch 31,
2021
Leasehold Land 493.39 (2.32) 3.15 - 494.22 28.65 (0.56) 19.32 - 47.41 446.81
Leasehold Building 89.99 - 14.46 (14.85) 89.60 17.18 - 17.84 (9.55) 25.47 64.13
Plant and Machinery 140.98 (5.99) 64.44 - 199.43 44.48 (3.64) 20.16 - 61.00 138.43
Ships 716.74 (11.21) 136.44 (11.86) 830.11 77.38 (4.31) 72.15 - 145.22 684.89
Total 1,441.10 (19.52) 218.49 (26.71) 1,613.36 167.69 (8.51) 129.47 (9.55) 279.10 1,334.26
Less: Depreciation transferred to CWIP
5.88
Net Depreciation Charged to Statement of Profit & Loss
123.59
As at March 31, 2020 (Restated) ` in Crores
Particulars
Gross Block Depreciation and Amortisation Net BlockAs at
April 01, 2019
(Restated)
Reclassified on account
of Ind AS 116
Other Adjustments
Additions Deductions As atMarch
31, 2020 (Restated)
As atApril 01,
2019 (Restated)
Reclassified on account
of Ind AS 116
Other Adjustments
For the year Deductions As atMarch
31, 2020 (Restated)
As atMarch
31, 2020( Restated)
Leasehold Land 108.56 254.67 5.42 124.74 - 493.39 - 9.03 1.02 18.60 - 28.65 464.74
Leasehold Building 90.83 - - 1.09 (1.93) 89.99 - - - 18.11 (0.93) 17.18 72.81
Plant and Machinery 70.59 46.48 15.33 8.58 - 140.98 - 20.00 8.61 15.87 - 44.48 96.50
Ships 708.51 - 8.23 - - 716.74 - - 1.28 75.75 0.35 77.38 639.36
Total 978.49 301.15 28.98 134.41 (1.93) 1,441.10 - 29.03 10.91 128.33 (0.58) 167.69 1,273.41
Less: Depreciation transferred to CWIP
5.00
Net Depreciation Charged to Statement of Profit & Loss
123.33
(b) Lease Expenses recognized in Statement of Profit and Loss, not included in the measurement of lease liabilities:
` in Crores
ParticularsYear Ended
March 31, 2021Year Ended
March 31, 2020 (Restated)
Variable lease payments 56.43 42.20
Expenses relating to short-term leases 106.39 114.49
Expenses relating to leases of low-value assets, excluding short-term leases of low value assets
26.23 16.14
Notes to the Consolidated Financial Statements for the year ended March 31, 2021 (Continued)

284
Ult
raTe
ch C
emen
t Li
mit
ed
285
Ann
ual R
epo
rt 2
020-
21
Welcome to UltraTech
Value Creation
Growth Enablers
Statutory Reports
Financial Statements
ESG Commitments
(c) Maturity analysis of lease liabilities– contractual undiscounted cash flows:` in Crores
ParticularsYear Ended
March 31, 2021Year Ended
March 31, 2020 (Restated)
Less than one year 169.97 161.77
One to five years 708.86 605.19
More than five years 930.51 958.43
Total undiscounted lease liabilities 1809.33 1725.39
Discounted Lease liabilities included in the statement of financial position 1231.62 1161.00
Current lease liability 112.57 103.39
Non-Current lease liability 1119.05 1057.61
(d) The Company had implemented Indian Accounting Standard for Leases (“Ind AS 116”) with effect from April 1, 2019 using the modified retrospective approach, under which the cumulative effect of Initial application is recognized in retained earnings as on April 1, 2019. The effect of initial recognition as per Ind AS 116 is as follows:
` in Crores
ParticularsAs on
April 01, 2019 (Restated)
Lease liability 1,055.86
Right of Use (ROU) asset 980.57
Deferred tax assets 15.23
Net Impact on Retained Earnings 60.06
(e) The difference between the future minimum lease rental commitments towards non-cancellable operating leases and finance leases reported as at March 31, 2019 compared to the lease liability as accounted as at April 1, 2019 is primarily due to contracts reassessed as lease contracts under Ind AS 116, reduction due to discounting of the lease liabilities as per the requirement of Ind AS 116 and exclusion of the commitments for the leases to which the Company has chosen to apply the practical expedient as per the standard.
` in Crores
ParticularsAs on
April 01, 2019 (Restated)
Lease commitments as at 31 March 2019 180.94
Add/ (Less): Impact of discounting on assessment of opening lease commitments under Ind AS 116 (31.90)
Add/(less): contracts reassessed as lease contracts 904.74
Lease liabilities as on 1 April 2019 1,053.78
(f) The Weighted average incremental borrowing rate of 9.16% p.a. for local currency borrowings and 3.27% p.a. for foreign currency borrowings has been applied for measuring the lease liability at the date of initial application.
(g) The total cash outflow for leases for year ended March 31, 2021 is ` 168.11 Crores (March 31, 2020 : ` 150.98 Crores)
Notes to the Consolidated Financial Statements for the year ended March 31, 2021 (Continued)
Note 4: Investments accounted for using Equity method` in Crores
ParticularsAs at March 31, 2021 As at March 31, 2020 (Restated)
Nos. Amount Nos. Amount
Unquoted:
Equity Instruments:
Associates:
Face value of ` 10 each fully paid:
Madanpur (North) Coal Company (P) Limited 11,52,560 1.07 11,52,560 1.06
Add: Share in Profit / (Loss) of Associate 0.01 0.01
Less: Provision for impairment in value of Investment
(0.22) (0.22)
0.86 0.85
Aditya Birla Renewables SPV 1 Limited 1,62,78,663 15.83 1,62,78,663 17.08
Add: Share in Profit / (Loss) of Associate 2.29 (1.25)
18.12 15.83
Aditya Birla Renewable Energy Limited 34,19,000 3.42 - -
Add: Share in Profit / (Loss) of Associate (0.13) -
3.29 -
22.27 16.68
Joint Venture:
Face value of ` 10 each fully paid:
Bhaskarpara Coal Company Limited 81,41,050 8.17 81,41,050 8.16
Add: Share in Profit of Joint Venture 0.01 0.01
Less: Provision for impairment in value of Investment
(1.65) (1.65)
6.53 6.52
28.80 23.20
Aggregate Value of:
Unquoted Investments 28.80 23.20
Aggregate amount of impairment in value of investment
1.87 1.87
Notes to the Consolidated Financial Statements for the year ended March 31, 2021 (Continued)

286
Ult
raTe
ch C
emen
t Li
mit
ed
287
Ann
ual R
epo
rt 2
020-
21
Welcome to UltraTech
Value Creation
Growth Enablers
Statutory Reports
Financial Statements
ESG Commitments
Note 5: Investments` in Crores
Particulars As at March 31, 2021 As at March 31, 2020
Nos. Amount Nos. Amount
Investments measured at Fair value through Profit or Loss
Equity Instruments:
Face value of ` 10 each fully paid:
Raj Mahal Coal Mining Limited 10,00,000 1.00 10,00,000 1.00
Green Infra Wind Power 1,92,000 0.19 1,20,000 0.14
NU Power Wind Farm 39,548 0.04 39,548 0.04
Watsun Infrabuild Private Limited 2,96,000 0.30 1,82,053 0.18
Amplus Sunshine Pvt Ltd 38,67,848 4.80 38,67,848 4.80
SBG Cleantech Energy Eight Pvt Ltd (For FY2019-20:Equity shares of ` 10 each aggregating to ` 200)
- - 20 -
Amplus Coastal Power Private Limited 17,12,279 1.76 - -
SBE Renewables Twenty Two C1 Private Limited(Equity shares of ` 10 each aggregating to ` 260)
26 - - -
SBE Renewables Twenty Two C2 Private Limited(Equity shares of ` 10 each aggregating to ` 260)
26 - - -
SBE Renewables Twenty Two C3 Private Limited(Equity shares of ` 10 each aggregating to ` 130)
13 - - -
VSN Onsight Private Limited 21,25,387 2.75 - -
Lalganj Power Private Limited 1,21,21,212 16.00 - -
Amplus Dakshin Private Limited 4,59,000 0.46 - -
27.30 6.16
Preference Shares:
7% Non-Cumulative Non-Convertible Redeemable Preference Shares of ` 100 each fully paid
Aditya Birla Health Services Limited 20,00,000 17.69 20,00,000 17.60
Units of Debt schemes of Various Mutual Funds 62.58 928.77
107.57 952.53
Quoted:
Investments measured at Fair value through Profit or Loss
Tax Free Bonds 290.44 283.83
Taxable Corporate Bonds 857.43 425.44
1,255.44 1,661.80
Aggregate Value of:
Quoted Investments 1,147.87 709.27
Unquoted Investments 107.57 952.53
1,255.44 1,661.80
Aggregate Market Value of Quoted Investments 1,147.87 709.27
Notes to the Consolidated Financial Statements for the year ended March 31, 2021 (Continued)
Note 6: Loans` in Crores
Particulars
Non-current Current
As at March 31, 2021
As atMarch 31, 2020
(Restated)
As atMarch 31, 2021
As atMarch 31, 2020
(Restated)
Considered good, Secured:
Loans against House Property (Secured by way of title deeds)
- 0.01 0.01 0.07
Loans to Others (Secured by way of shares on lien with the Company)
- 1,066.37 - 83.23
Considered good, Unsecured:
Security Deposits 162.60 156.25 109.43 107.25
Loans to Employees 4.54 9.04 5.21 7.18
167.14 1,231.67 114.65 197.73
No loans are due from directors or other officers of the Company or any of them either severally or jointly with any other person. Further, no loans are due from firms or private companies in which any director is a partner, a director or a member.
Note 7: Other Financial Assets` in Crores
Particulars
Non-Current Current
As at March 31, 2021
As atMarch 31, 2020
(Restated)
As atMarch 31, 2021
As atMarch 31, 2020
(Restated)
Derivative Assets 384.53 104.53 84.94 -
Interest Accrued on Deposits and Investments - - 52.20 28.77
Fixed Deposits with Bank with maturity greater than twelve months*
2.95 64.80 - -
Government grants receivable 167.10 230.43 1,152.90 989.59
Advances to Body Corporate - - 138.07 -
Others (Includes Insurance Claims, Railway Claims and Other Receivables)
- - 471.54 42.52
554.58 399.76 1,899.65 1,060.88
* Lodged as Security with Government Departments - ` 0.36 Crores (March 31, 2020: ` 19.64 Crores)
Notes to the Consolidated Financial Statements for the year ended March 31, 2021 (Continued)
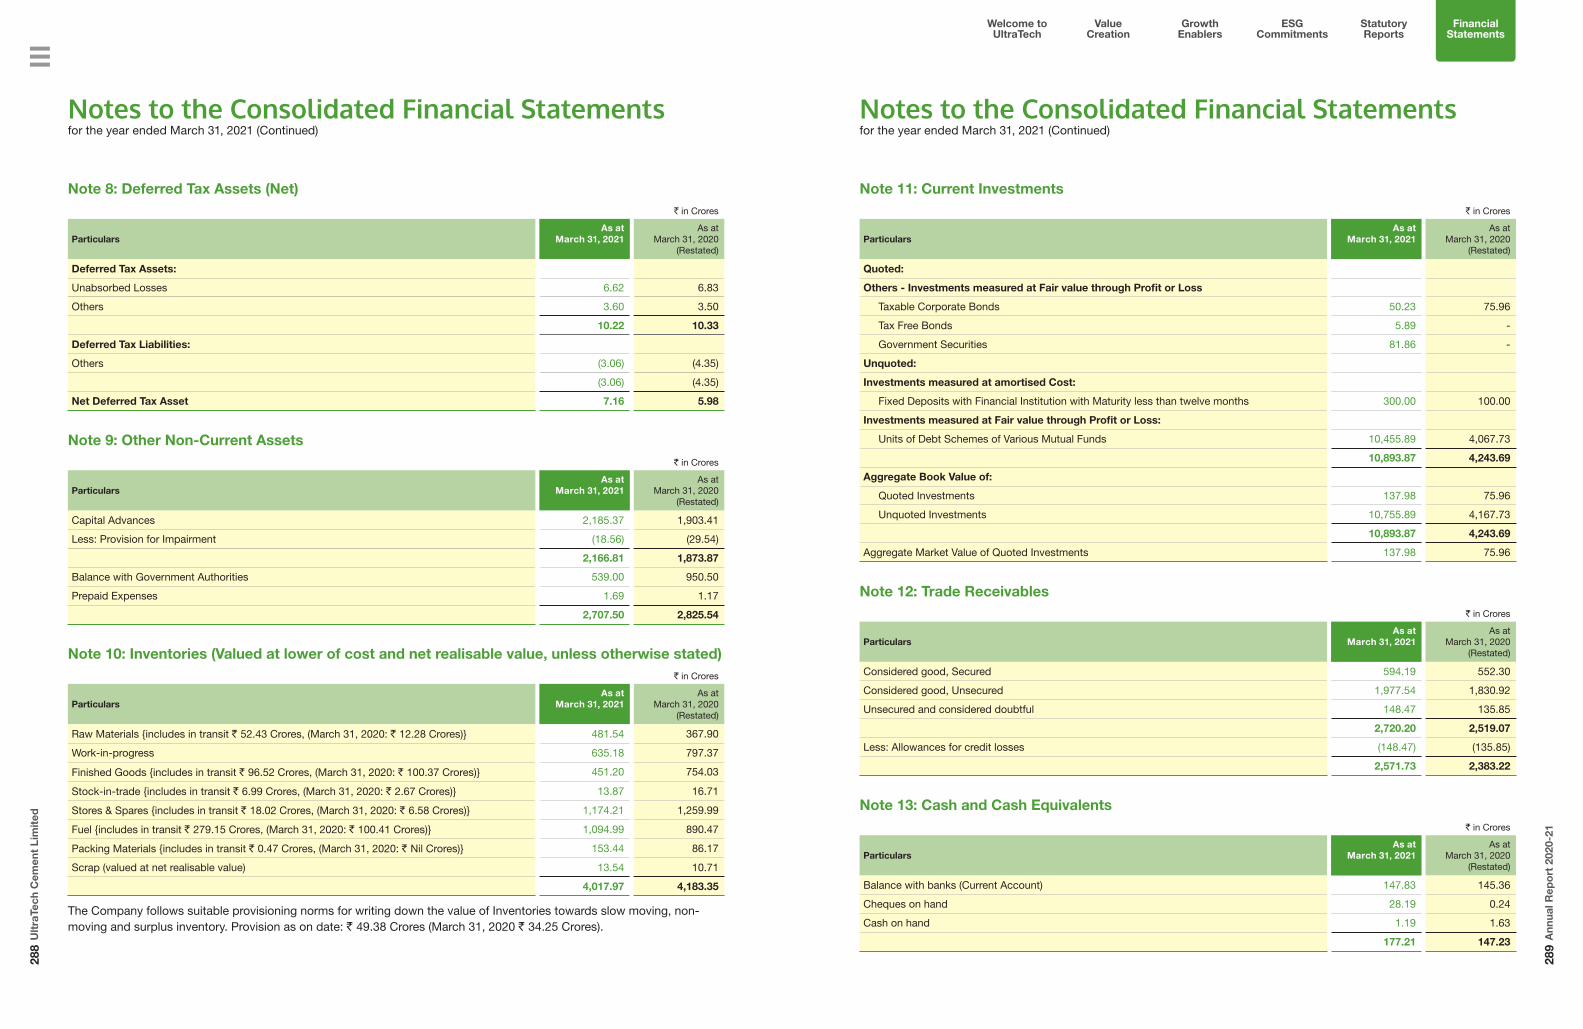
288
Ult
raTe
ch C
emen
t Li
mit
ed
289
Ann
ual R
epo
rt 2
020-
21
Welcome to UltraTech
Value Creation
Growth Enablers
Statutory Reports
Financial Statements
ESG Commitments
Note 8: Deferred Tax Assets (Net)` in Crores
ParticularsAs at
March 31, 2021 As at
March 31, 2020 (Restated)
Deferred Tax Assets:
Unabsorbed Losses 6.62 6.83
Others 3.60 3.50
10.22 10.33
Deferred Tax Liabilities:
Others (3.06) (4.35)
(3.06) (4.35)
Net Deferred Tax Asset 7.16 5.98
Note 9: Other Non-Current Assets` in Crores
ParticularsAs at
March 31, 2021 As at
March 31, 2020 (Restated)
Capital Advances 2,185.37 1,903.41
Less: Provision for Impairment (18.56) (29.54)
2,166.81 1,873.87
Balance with Government Authorities 539.00 950.50
Prepaid Expenses 1.69 1.17
2,707.50 2,825.54
Note 10: Inventories (Valued at lower of cost and net realisable value, unless otherwise stated)` in Crores
ParticularsAs at
March 31, 2021 As at
March 31, 2020 (Restated)
Raw Materials {includes in transit ` 52.43 Crores, (March 31, 2020: ` 12.28 Crores)} 481.54 367.90
Work-in-progress 635.18 797.37
Finished Goods {includes in transit ` 96.52 Crores, (March 31, 2020: ` 100.37 Crores)} 451.20 754.03
Stock-in-trade {includes in transit ` 6.99 Crores, (March 31, 2020: ` 2.67 Crores)} 13.87 16.71
Stores & Spares {includes in transit ` 18.02 Crores, (March 31, 2020: ` 6.58 Crores)} 1,174.21 1,259.99
Fuel {includes in transit ` 279.15 Crores, (March 31, 2020: ` 100.41 Crores)} 1,094.99 890.47
Packing Materials {includes in transit ` 0.47 Crores, (March 31, 2020: ` Nil Crores)} 153.44 86.17
Scrap (valued at net realisable value) 13.54 10.71
4,017.97 4,183.35
The Company follows suitable provisioning norms for writing down the value of Inventories towards slow moving, non-moving and surplus inventory. Provision as on date: ` 49.38 Crores (March 31, 2020 ` 34.25 Crores).
Notes to the Consolidated Financial Statements for the year ended March 31, 2021 (Continued)
Note 11: Current Investments` in Crores
ParticularsAs at
March 31, 2021 As at
March 31, 2020 (Restated)
Quoted:
Others - Investments measured at Fair value through Profit or Loss
Taxable Corporate Bonds 50.23 75.96
Tax Free Bonds 5.89 -
Government Securities 81.86 -
Unquoted:
Investments measured at amortised Cost:
Fixed Deposits with Financial Institution with Maturity less than twelve months 300.00 100.00
Investments measured at Fair value through Profit or Loss:
Units of Debt Schemes of Various Mutual Funds 10,455.89 4,067.73
10,893.87 4,243.69
Aggregate Book Value of:
Quoted Investments 137.98 75.96
Unquoted Investments 10,755.89 4,167.73
10,893.87 4,243.69
Aggregate Market Value of Quoted Investments 137.98 75.96
Note 12: Trade Receivables` in Crores
ParticularsAs at
March 31, 2021 As at
March 31, 2020 (Restated)
Considered good, Secured 594.19 552.30
Considered good, Unsecured 1,977.54 1,830.92
Unsecured and considered doubtful 148.47 135.85
2,720.20 2,519.07
Less: Allowances for credit losses (148.47) (135.85)
2,571.73 2,383.22
Note 13: Cash and Cash Equivalents` in Crores
ParticularsAs at
March 31, 2021 As at
March 31, 2020 (Restated)
Balance with banks (Current Account) 147.83 145.36
Cheques on hand 28.19 0.24
Cash on hand 1.19 1.63
177.21 147.23
Notes to the Consolidated Financial Statements for the year ended March 31, 2021 (Continued)
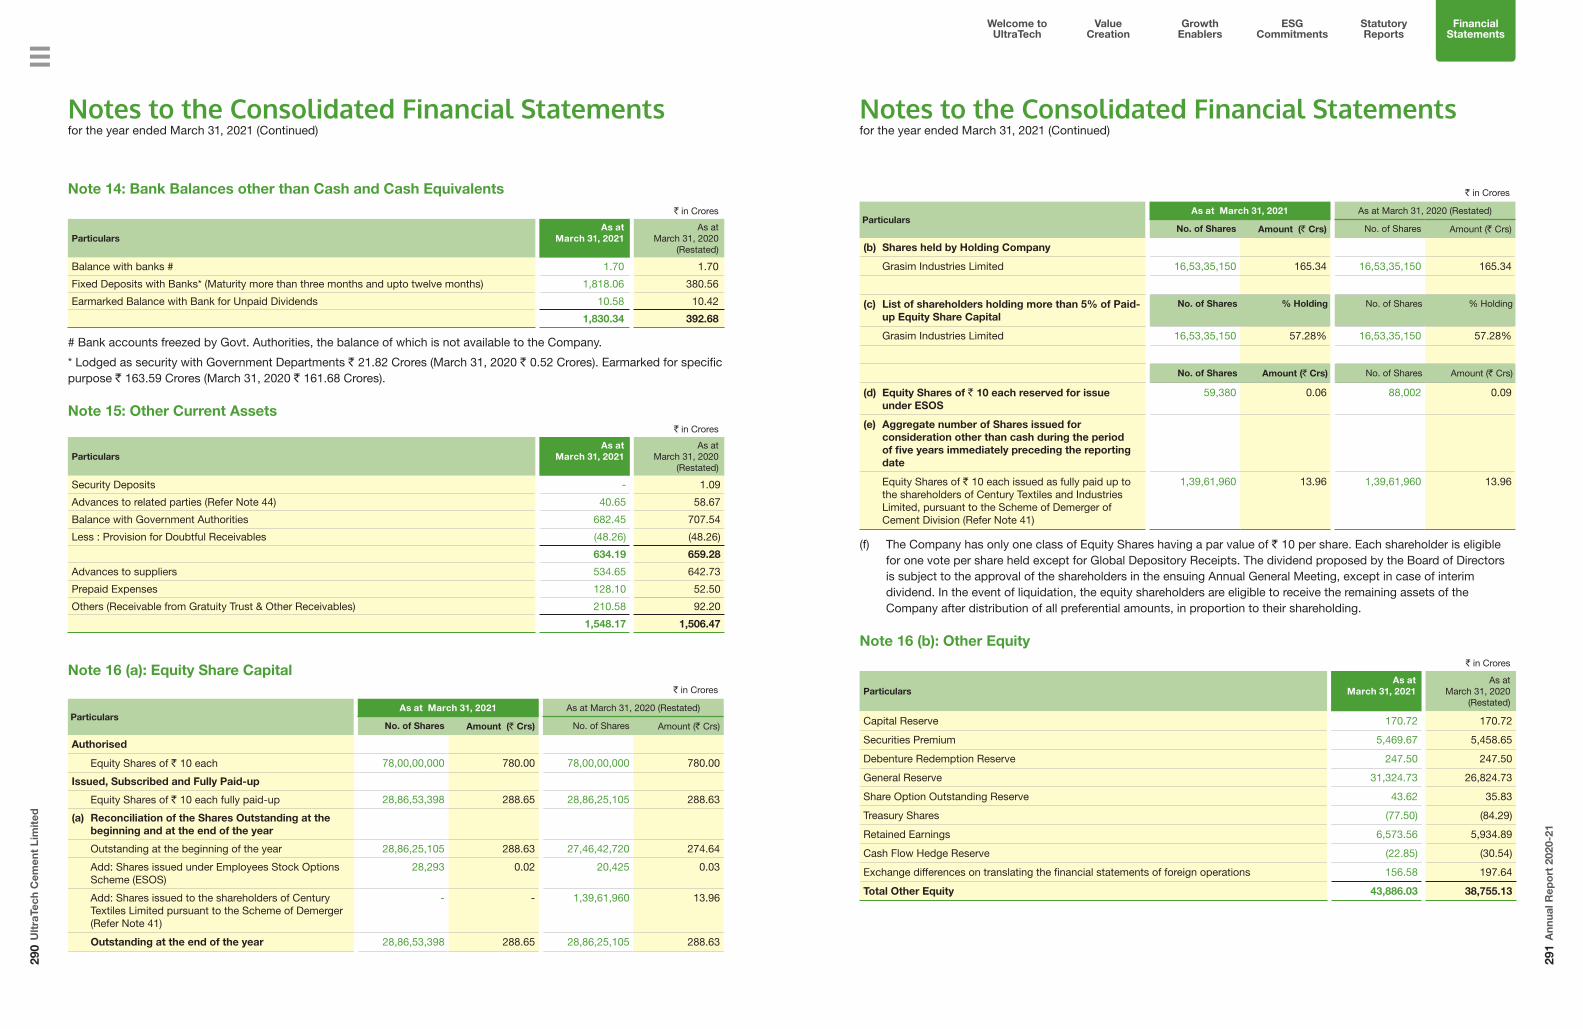
290
Ult
raTe
ch C
emen
t Li
mit
ed
291
Ann
ual R
epo
rt 2
020-
21
Welcome to UltraTech
Value Creation
Growth Enablers
Statutory Reports
Financial Statements
ESG Commitments
Note 14: Bank Balances other than Cash and Cash Equivalents` in Crores
ParticularsAs at
March 31, 2021 As at
March 31, 2020 (Restated)
Balance with banks # 1.70 1.70
Fixed Deposits with Banks* (Maturity more than three months and upto twelve months) 1,818.06 380.56
Earmarked Balance with Bank for Unpaid Dividends 10.58 10.42
1,830.34 392.68
# Bank accounts freezed by Govt. Authorities, the balance of which is not available to the Company.
* Lodged as security with Government Departments ` 21.82 Crores (March 31, 2020 ` 0.52 Crores). Earmarked for specific purpose ` 163.59 Crores (March 31, 2020 ` 161.68 Crores).
Note 15: Other Current Assets` in Crores
ParticularsAs at
March 31, 2021 As at
March 31, 2020 (Restated)
Security Deposits - 1.09
Advances to related parties (Refer Note 44) 40.65 58.67
Balance with Government Authorities 682.45 707.54
Less : Provision for Doubtful Receivables (48.26) (48.26)
634.19 659.28
Advances to suppliers 534.65 642.73
Prepaid Expenses 128.10 52.50
Others (Receivable from Gratuity Trust & Other Receivables) 210.58 92.20
1,548.17 1,506.47
Note 16 (a): Equity Share Capital` in Crores
Particulars As at March 31, 2021 As at March 31, 2020 (Restated)
No. of Shares Amount (` Crs) No. of Shares Amount (` Crs)
Authorised
Equity Shares of ` 10 each 78,00,00,000 780.00 78,00,00,000 780.00
Issued, Subscribed and Fully Paid-up
Equity Shares of ` 10 each fully paid-up 28,86,53,398 288.65 28,86,25,105 288.63
(a) Reconciliation of the Shares Outstanding at the beginning and at the end of the year
Outstanding at the beginning of the year 28,86,25,105 288.63 27,46,42,720 274.64
Add: Shares issued under Employees Stock Options Scheme (ESOS)
28,293 0.02 20,425 0.03
Add: Shares issued to the shareholders of Century Textiles Limited pursuant to the Scheme of Demerger (Refer Note 41)
- - 1,39,61,960 13.96
Outstanding at the end of the year 28,86,53,398 288.65 28,86,25,105 288.63
Notes to the Consolidated Financial Statements for the year ended March 31, 2021 (Continued)
` in Crores
Particulars As at March 31, 2021 As at March 31, 2020 (Restated)
No. of Shares Amount (` Crs) No. of Shares Amount (` Crs)
(b) Shares held by Holding Company
Grasim Industries Limited 16,53,35,150 165.34 16,53,35,150 165.34
(c) List of shareholders holding more than 5% of Paid-up Equity Share Capital
No. of Shares % Holding No. of Shares % Holding
Grasim Industries Limited 16,53,35,150 57.28% 16,53,35,150 57.28%
No. of Shares Amount (` Crs) No. of Shares Amount (` Crs)
(d) Equity Shares of ` 10 each reserved for issue under ESOS
59,380 0.06 88,002 0.09
(e) Aggregate number of Shares issued for consideration other than cash during the period of five years immediately preceding the reporting date
Equity Shares of ` 10 each issued as fully paid up to the shareholders of Century Textiles and Industries Limited, pursuant to the Scheme of Demerger of Cement Division (Refer Note 41)
1,39,61,960 13.96 1,39,61,960 13.96
(f) The Company has only one class of Equity Shares having a par value of ` 10 per share. Each shareholder is eligible for one vote per share held except for Global Depository Receipts. The dividend proposed by the Board of Directors is subject to the approval of the shareholders in the ensuing Annual General Meeting, except in case of interim dividend. In the event of liquidation, the equity shareholders are eligible to receive the remaining assets of the Company after distribution of all preferential amounts, in proportion to their shareholding.
Note 16 (b): Other Equity` in Crores
ParticularsAs at
March 31, 2021 As at
March 31, 2020 (Restated)
Capital Reserve 170.72 170.72
Securities Premium 5,469.67 5,458.65
Debenture Redemption Reserve 247.50 247.50
General Reserve 31,324.73 26,824.73
Share Option Outstanding Reserve 43.62 35.83
Treasury Shares (77.50) (84.29)
Retained Earnings 6,573.56 5,934.89
Cash Flow Hedge Reserve (22.85) (30.54)
Exchange differences on translating the financial statements of foreign operations 156.58 197.64
Total Other Equity 43,886.03 38,755.13
Notes to the Consolidated Financial Statements for the year ended March 31, 2021 (Continued)

292
Ult
raTe
ch C
emen
t Li
mit
ed
293
Ann
ual R
epo
rt 2
020-
21
Welcome to UltraTech
Value Creation
Growth Enablers
Statutory Reports
Financial Statements
ESG Commitments
The Description of the nature and purpose of each reserve within equity is as follows:
a) Capital Reserve: Company’s capital reserve is mainly on account of acquisition of cement business of Larsen & Toubro Ltd., Gujarat Units of Jaypee Cement Corporation Ltd (JCCL) and cement capacities of 21.2 MTPA of Jaiprakash Associates Ltd (JAL) and JCCL, being excess of the net assets acquired over the consideration paid.
b) Securities Premium: Securities premium is credited when shares are issued at premium. It is utilised in accordance with the provisions of the Act, to issue bonus shares, to provide for premium on redemption of shares or debentures, equity related expenses like underwriting costs, etc.
c) Debenture Redemption Reserve (DRR): The Company has issued redeemable non-convertible debentures. Accordingly, the Companies (Share capital and Debentures) Rules, 2014 (as amended), requires the company to create DRR out of profits of the company available for payment of dividend. DRR is required to be created for an amount which is equal to 25% of the value of debentures issued. However, this requirement is no more applicable w.e.f. April 1, 2018 as per the amendment in the Companies (Share capital and Debentures) Rules, 2014 vide dated August 16, 2019; accordingly the Company has not made any new addition in the said reserve and accounted the reversal of outstanding reserve linked to payment of specific non-convertible debentures.
d) General reserve: The Company has transferred a portion of the net profit of the Company before declaring dividend to general reserve pursuant to the earlier provision of Companies Act, 1956. Mandatory transfer to general reserve is not required under the Act.
e) Shares Options Outstanding Reserve: The Company has three share option schemes under which options to subscribe for the Company’s shares have been granted to certain executives and senior employees. The share-based payment reserve is used to recognise the value of equity-settled share-based payments provided to employees, including key management personnel, as part of their remuneration.
f) Treasury Shares : The Company has formed an Employee Welfare Trust for purchasing Company’s shares to be allotted to eligible employees under Employees Stock Options Scheme, 2018 (ESOS 2018). As per Ind AS 32 - Financial Instruments: Presentation, Reacquired equity shares of the Company are called Treasury Shares and deducted from equity.
g) Cashflow Hedge Reserve: The Company has designated its hedging instruments as cash flow hedges and any effective portion of cashflow hedge is maintained in the said reserve. In case the hedging becomes ineffective, the amount is recognised to the Statement of Profit and Loss.
h) Exchange differences on translating the financial statements of foreign operations: Exchange variation in Opening Equity Share Capital, Reserves and Surplus, Assets and Liabilities of UltraTech Cement Lanka (Pvt.) Ltd, UltraTech Cement Middle East Investments Ltd, PT UltraTech Mining Indonesia and PT UltraTech Investment Indonesia is accounted under this reserve.
Notes to the Consolidated Financial Statements for the year ended March 31, 2021 (Continued)
Note 17: Non-Current Borrowings` in Crores
Particulars
Non - Current Current Maturities of Long-Term debts*
As at March 31, 2021
As atMarch 31, 2020
(Restated)
As atMarch 31, 2021
As atMarch 31, 2020
(Restated)
Secured:
Non-Convertible Debentures - Note (a1) 500.00 1,050.00 550.00 -
Term Loans from Banks:
In Foreign Currency - Note (b1) 365.55 378.33 - -
In Local Currency - Note (c) 7,444.81 12,544.53 99.75 157.35
7,810.36 12,922.86 99.75 157.35
Sales Tax Deferment Loan - Note (d1) 119.29 114.60 45.02 39.30
8,429.65 14,087.46 694.77 196.65
Unsecured:
Non-Convertible Debentures - Note (a2) 1,750.00 1,760.00 1,010.00 -
Foreign Currency Bonds- Note (e) 2,924.40 - - -
Term Loans from Banks:
In Foreign Currency - Note (b2) 292.45 1,297.11 924.32 1,324.12
Sales Tax Deferment Loan - Note (d2) 151.95 222.95 75.10 24.55
5,118.80 3,280.06 2,009.42 1,348.67
Total 13,548.45 17,367.52 2,704.19 1,545.32
*Amount disclosed under the head ‘Other Financial Liabilities’ (Refer Note 18).
(a1) Non-Convertible Debentures (NCDs)` in Crores
ParticularsAs at
March 31, 2021 As at
March 31, 2020 (Restated)
Secured:
7.53% NCDs (Redeemable at par on August 21, 2026) 500.00 500.00
7.15% NCDs (Redeemable at par on October 18, 2021) 300.00 300.00
7.57% NCDs (Redeemable at par on August 06, 2021) 250.00 250.00
1,050.00 1,050.00
Less: Current Portion of NCDs shown under Other Financial Liabilities (550.00) -
Total 500.00 1,050.00
The NCDs are secured by way of first charge, having pari passu rights, on the Company’s fixed assets (save and except stocks and book debts), both present and future, situated at certain locations, in favour of Debenture Trustees.
Notes to the Consolidated Financial Statements for the year ended March 31, 2021 (Continued)

294
Ult
raTe
ch C
emen
t Li
mit
ed
295
Ann
ual R
epo
rt 2
020-
21
Welcome to UltraTech
Value Creation
Growth Enablers
Statutory Reports
Financial Statements
ESG Commitments
(a2) Non-Convertible Debentures (NCDs)` in Crores
ParticularsAs at
March 31, 2021 As at
March 31, 2020 (Restated)
Unsecured:
6.68% NCDs (Redeemable at par on February 20, 2025) 250.00 250.00
7.64% NCDs (Redeemable at par on June 04, 2024) 250.00 250.00
6.72% NCDs (Redeemable at par on December 09, 2022) 250.00 250.00
6.93% NCDs (Redeemable at par on November 25, 2021) 250.00 250.00
6.99% NCDs (Redeemable at par on November 24, 2021) 400.00 400.00
8.36% NCDs (Redeemable at par on June 07, 2021) 360.00 360.00
4.57% NCDs (Redeemable at par on December 29, 2023) 1,000.00 -
2,760.00 1,760.00
Less: Current Portion of NCDs shown under Other Financial Liabilities (1,010.00) -
Total 1,750.00 1,760.00
(b1) Term Loans from Banks in Foreign Currency` in Crores
Particulars Repayment ScheduleAs at
March 31, 2021 As at
March 31, 2020 (Restated)
Secured:
State Bank of India, New York(US Dollar: 1.00 Crores; March 31, 2020: 1.00 Crores)
March 2023 73.11 75.67
State Bank of India, New York(US Dollar: 2.00 Crores; March 31, 2020: 2.00 Crores)
February 2023 146.22 151.33
State Bank of India, New York(US Dollar: 2.00 Crores; March 31, 2020: 2.00 Crores)
February 2023 146.22 151.33
Total 365.55 378.33
The above mentioned loans are secured by way of first charge, having pari passu rights, on the Company’s fixed assets , both present and future, situated at certain locations, in favour of Company’s lenders / trustees.
(b2) Term Loans from Banks in Foreign Currency` in Crores
Particulars Repayment ScheduleAs at
March 31, 2021 As at
March 31, 2020 (Restated)
Unsecured:
Export Development, Canada(US Dollar: 4.64 Crores; March 31, 2020: 4.64 Crores)
June 2021 339.44 351.30
Export Development, Canada(US Dollar: 5.00 Crores; March 31, 2020: 5.00 Crores)
May 2021 365.55 378.33
Standard Chartered Bank(US Dollar: Nil ; March 31,2020: 17.50 Crores)
Repaid in January 2021
- 1,324.12
Export Development Canada(USD Dollars: 7.00 Crores; March 31, 2020: 7.50 Crores)
2 Annual installments beginning June 2021
511.78 567.48
1,216.77 2,621.23
Less: Current Portion of Foreign Currency Loans shown under Other Financial Liabilities (924.32) (1,324.12)
Total 292.45 1,297.11
Notes to the Consolidated Financial Statements for the year ended March 31, 2021 (Continued)
(c) Term Loans from Banks in Local Currency - Secured` in Crores
Particulars Repayment ScheduleAs at
March 31, 2021 As at
March 31, 2020 (Restated)
Axis Bank Ltd 20 quarterly installments beginning December 2022 507.08 507.08
HDFC Bank Ltd 60 quarterly installments beginning September 2022 1,803.79 3,331.91
State Bank of India 4 Half yearly installments beginning May 2022 300.00 300.00
State Bank of India 60 quarterly installments beginning September 2022 2,000.00 4,000.00
HDFC Bank Ltd Repaid in March 2021 - 1,494.38
Axis Bank Ltd Bullet repayment in September 2027 150.00 150.00
HDFC Bank Ltd Repaid in December 2020 - 75.60
HDFC Bank Ltd 32 quarterly installments beginning June 2020 131.25 150.00
HDFC Bank Ltd 76 quarterly installments beginning February 2020 2,652.44 2,692.91
7,544.56 12,701.88
Less: Current Portion of Term Loans shown under Other Financial Liabilities (99.75) (157.35)
Total 7,444.81 12,544.53
The above mentioned loans are secured by way of first charge, having pari passu rights, on the Company’s fixed assets, both present and future, situated at certain locations, in favour of Company’s lenders / trustees.
(d1) Sales Tax Deferment Loan:` in Crores
Particulars Repayment ScheduleAs at
March 31, 2021 As at
March 31, 2020 (Restated)
Secured:
Uttar Pradesh Financial Corporation Varied Annual Payments from August 2019 to December 2024
123.76 153.90
Department of Industries and Commerce, Karnataka Bullet payment on August 2032 40.55 -
Less: Current Portion of Sales Tax Deferment Loan shown under Other Financial Liabilities (45.02) (39.30)
Total 119.29 114.60
Sales Tax Deferment Loan is secured by bank guarantee backed by hypothecation of Inventories and book debts of the Company.
(d2) Sales Tax Deferment Loan:` in Crores
Particulars Repayment ScheduleAs at
March 31, 2021 As at
March 31, 2020 (Restated)
Unsecured:
Department of Industries and Commerce, Haryana Varied Annual Payments from January 2017 to March 2022
58.43 61.33
Commercial Tax Department, Hyderabad Varied Annual payments from October 2012 to October 2026
164.60 182.03
Commercial Tax Department, Chhattisgarh Payable on Assessment 4.02 4.14
227.05 247.50
Less: Current Portion of Sales tax deferment loan shown under Other Financial Liabilities (75.10) (24.55)
Total 151.95 222.95
Notes to the Consolidated Financial Statements for the year ended March 31, 2021 (Continued)

296
Ult
raTe
ch C
emen
t Li
mit
ed
297
Ann
ual R
epo
rt 2
020-
21
Welcome to UltraTech
Value Creation
Growth Enablers
Statutory Reports
Financial Statements
ESG Commitments
(e) Foreign Currency Bonds:` in Crores
Particulars Repayment ScheduleAs at
March 31, 2021 As at
March 31, 2020 (Restated)
Unsecured:
2.80% Sustainability Linked Bonds(US Dollar: 40.00 Crores; March 31, 2020: Nil)
February 2031 2,924.40 -
Total 2,924.40 -
The Company has issued unsecured fixed rate US Dollar denominated notes (in the form of “Sustainability Linked Bonds”), aggregating to USD 400 million, due on February 16, 2031, bearing coupon of 2.80% per annum payable semi-annually. The Bonds are linked to ‘Sustainability Performance Target (SPT)’ of reducing Scope 1 GHG emissions by 22.2% from a 2017 baseline. If SPT is not achieved by observation date in 2030, the coupon will step-up by 0.75% for last two coupons. The Bonds are listed on the Singapore Exchange Securities Trading Limited.
Note 18: Other Financial Liabilities` in Crores
Particulars
Non-Current Current
As at March 31, 2021
As atMarch 31, 2020
(Restated)
As at March 31, 2021
As atMarch 31, 2020
(Restated)
Current maturities of long-term debts (Refer Note 17) - - 2,704.19 1,545.32
Interest Accrued but not due on Borrowings - - 180.79 198.89
Deferred Premium Payable 332.19 - 27.21 -
Derivative Liability - - 6.34 54.51
Liability for Corporate/Bank Guarantee - - - 49.37
Liability for Capital Goods - - 184.27 164.36
Security Deposit - - 1,790.56 1,625.96
Salary, Wages, Bonus and Other Employee Payables - - 298.78 241.67
Investor Education and Protection Fund, will be credited with following amounts (as and when due)
Unpaid Dividends - - 10.59 10.44
Unpaid Fractional liability on issue of shares pursuant to scheme of Demerger
- - 0.42 0.42
Lease liability 1,119.05 1,057.61 112.57 103.39
Others (Retention money, Liquidated Damages, etc.) - - 263.26 214.58
1,451.24 1,057.61 5,578.98 4,208.91
Note 19: Provisions` in Crores
Particulars
Non-Current Current
As at March 31, 2021
As atMarch 31, 2020
(Restated)
As at March 31, 2021
As atMarch 31, 2020
(Restated)
For Employee Benefits (Refer Note 42) 69.47 74.96 269.63 293.51
Others:
For Mines Restoration Expenditure 296.02 169.57 - -
For Cost of transfer of Assets - - 252.22 254.93
365.49 244.53 521.85 548.44
Notes to the Consolidated Financial Statements for the year ended March 31, 2021 (Continued)
Note 19.1 Movement of provisions during the year as required by Ind AS - 37 “Provisions, Contingent Liabilities and Contingent Assets” specified under Section 133 of the Companies Act, 2013:
(a) Mines Restoration Expenditure:
` in Crores
ParticularsAs at
March 31, 2021 As at
March 31, 2020 (Restated)
Opening Balance 169.57 141.60
Add: Provision / (Reversal) during the year 106.27 17.15
Add: Unwinding of discount on Mine Restoration Provision 20.18 10.90
Less: Utilisation during the year 0.00 (0.08)
Closing Balance 296.02 169.57
(b) Provision for Cost of Transfer of Assets:
` in Crores
ParticularsAs at
March 31, 2021 As at
March 31, 2020 (Restated)
Opening Balance 254.93 331.46
Less: Utilisation during the year (2.71) (76.53)
Closing Balance 252.22 254.93
Note 20: Deferred Tax Liabilities (Net)` in Crores
Particulars As at
March 31, 2021 As at
March 31, 2020 (Restated)
Recognised in Statement of
Profit and Loss
Recognisedin OCI
Recognised directly in
Other Equity
Deferred Tax Assets:
MAT Credit Entitlement - (1,047.25) 1,047.25 - -
Provision allowed under tax on payment basis
(235.34) (182.34) (53.00) - -
Others (105.69) (148.55) 39.55 3.31 -
(341.03) (1,378.14) 1,033.80 3.31 -
Deferred Tax Liabilities:
Tangible and Intangible Assets 6,274.39 6,203.25 71.14 - -
Fair valuation of Investments 88.54 73.64 14.90 - -
Others 18.78 13.24 5.54 - -
6,381.71 6,290.13 91.58 - -
Net Deferred Tax Liability 6,040.68 4,911.99 1,125.38 3.31 -
Notes to the Consolidated Financial Statements for the year ended March 31, 2021 (Continued)

298
Ult
raTe
ch C
emen
t Li
mit
ed
299
Ann
ual R
epo
rt 2
020-
21
Welcome to UltraTech
Value Creation
Growth Enablers
Statutory Reports
Financial Statements
ESG Commitments
` in Crores
ParticularsAs at
March 31, 2020 (Restated)
As at March 31, 2019
Recognised in Statement of
Profit and Loss
Recognisedin OCI
Recognised directly in
Other Equity
Deferred Tax Assets:
MAT Credit Entitlement (1,047.25) (1,438.95) 391.70 - -
Provision allowed under tax on payment basis
(182.34) (239.33) 56.99 - -
Others (148.55) (169.97) 36.65 (0.63) (14.60)
(1,378.14) (1,848.25) 485.34 (0.63) (14.60)
Deferred Tax Liabilities:
Tangible and Intangible Assets 6,203.25 8,187.83 (1,984.58) - -
Fair valuation of Investments 73.64 30.77 42.87 - -
Others 13.24 41.07 (27.83) - -
6,290.13 8,259.67 (1,969.54) - -
Net Deferred Tax Liability 4,911.99 6,411.42 (1,484.20) (0.63) (14.60)
The Government of India, on September 20, 2019, vide the Taxation Laws (Amendment) Ordinance 2019, inserted a new Section 115BAA in the Income Tax Act, 1961, which provides an option to the Company for paying Income Tax at reduced rates as per the provisions/conditions defined in the said section. During the year ended March 31, 2020, the Company is continuing to provide for income tax at old rates, based on the available outstanding MAT credit entitlement and various exemptions and deductions available to the Company under the Income Tax Act, 1961. However, the Company had applied the lower income tax rates on the deferred tax assets / liabilities to the extent these are expected to be realised or settled in the future period when the Company may be subjected to lower tax rate and accordingly reversed net deferred tax liability of ` 2,109.46 Crores for March 31, 2020.
In Respect of Deferred taxes, all items are attributable to orignation and reversal of temporary differences. Deferred tax benefits are generally recognised for all deductible temporary differences to the extent it is probable that taxable profits will be available against which, those deductible temporary differences can be realised.
Note 21: Other Non-Current Liabilities` in Crores
ParticularsAs at
March 31, 2021 As at
March 31, 2020 (Restated)
Deferred Income on Government Grants 4.00 4.17
Others (Including Employee Share based payments) 1.53 2.11
Total 5.53 6.28
Notes to the Consolidated Financial Statements for the year ended March 31, 2021 (Continued)
Note 22: Current Borrowings` in Crores
ParticularsAs at
March 31, 2021 As at
March 31, 2020 (Restated)
Secured:
Loans repayable on demand:
From Banks - Cash Credits / Working Capital Borrowings 4.14 124.44
Unsecured:
Redeemable preference shares issued 1,000.10 1,000.10
Loans repayable on demand: From Banks - Cash Credits / Working Capital Borrowings 241.51 15.03
Others
From Banks (includes commercial paper) 1,621.00 241.16
From Others (commercial paper) 1,368.38 2,725.39
4,230.99 3,981.68
4,235.13 4,106.12
Note 23: Trade Payables-Total Outstanding Dues of Creditors other than Micro Enterprises and Small Enterprises
` in Crores
ParticularsAs at
March 31, 2021 As at
March 31, 2020 (Restated)
Other Trade Payables (other than Micro and Small Enterprises) 4,583.88 3,270.99
Due to Related Party (Refer Note 44) 3.17 2.31
Due to Others 42.90 33.20
4,629.95 3,306.50
Note 24: Other Current Liabilities` in Crores
ParticularsAs at
March 31, 2021 As at
March 31, 2020 (Restated)
Advance from Customers and Others 397.30 464.32
Deferred Revenue 0.17 0.17
Others (including Provision for Expenses, Statutory liabilities) 4,203.31 3,049.14
4,600.78 3,513.63
Notes to the Consolidated Financial Statements for the year ended March 31, 2021 (Continued)

300
Ult
raTe
ch C
emen
t Li
mit
ed
301
Ann
ual R
epo
rt 2
020-
21
Welcome to UltraTech
Value Creation
Growth Enablers
Statutory Reports
Financial Statements
ESG Commitments
Note 25: Revenue From Operations (Refer Note 58)` in Crores
ParticularsYear ended
March 31, 2021 Year ended
March 31, 2020 (Restated)
Sale of Products and Services
Sale of Manufactured Products 41,250.10 38,350.22
Sale of Traded Products 2,988.90 3,430.09
Sale of Services 0.33 0.24
44,239.33 41,780.55
Other Operating Revenues
Scrap Sales 72.31 71.59
Lease Rent 0.16 0.33
Insurance Claim 23.45 21.85
Provisions no longer required written back 50.12 116.76
Unclaimed Liabilities written back 35.22 33.28
Government Grants 281.86 381.84
Miscellaneous Income / Receipts 23.35 23.69
486.47 649.34
44,725.80 42,429.89
Note 26: Other Income` in Crores
ParticularsYear ended
March 31, 2021 Year ended
March 31, 2020 (Restated)
Interest Income on
Government and Other Securities 21.70 19.62
Bank and Other Accounts 79.06 90.13
100.76 109.75
Dividend Income on
Current Investments - Mutual Fund - 32.47
Exchange Gain (net) 24.65 84.06
Profit on Sale of Property, plant and equipment (net) 4.11 -
Gain on Fair valuation of Investments through Profit or loss 419.55 289.12
Profit on Sale of Current and Non-Current Investments 154.10 81.63
Others 31.00 54.03
734.17 651.06
Notes to the Consolidated Financial Statements for the year ended March 31, 2021 (Continued)
Notes to the Consolidated Financial Statements for the year ended March 31, 2021 (Continued)
Note 27: Cost of Materials Consumed` in Crores
ParticularsYear ended
March 31, 2021 Year ended
March 31, 2020 (Restated)
Opening Stock 367.90 443.20
Add: Exchange rate fluctuation on account of average rate transferred to currency translation reserve
(0.64) 1.07
Purchases 5,908.84 5,657.76
6,276.10 6,102.03
Less: Exchange rate fluctuation on account of average rate transferred to currency translation reserve
0.89 (4.50)
Less: Closing Stock of Subsidiary sold off during the year - 10.65
Less: Closing Stock 481.54 367.90
5,793.67 5,727.98
Note 28: Purchases of Stock-in-Trade` in Crores
ParticularsYear ended
March 31, 2021 Year ended
March 31, 2020 (Restated)
Grey Cement 286.84 619.58
Others (Ultratech Building Solution) 555.15 528.33
841.99 1,147.91
Note 29: Changes in Inventories of Finished Goods, Work-in-Progress and Stock-in-Trade` in Crores
ParticularsYear ended
March 31, 2021 Year ended
March 31, 2020 (Restated)
Closing Inventories
Work-in-progress 635.18 797.37
Finished Goods 451.20 738.22
Stock in Trade 13.87 16.71
Add / (Less): Exchange rate fluctuation on account of average rate transferred to currency translation reserve
0.98 (2.77)
1,101.23 1,549.53
Opening Inventories
Work-in-progress 797.37 707.36
Finished Goods 738.22 443.19
Stock in Trade 16.71 37.04
Add / (Less): Exchange rate fluctuation on account of average rate transferred to currency translation reserve
(0.92) 1.19
1,551.38 1,188.78
(Increase) / Decrease in Inventories 450.15 (360.75)
Less : Closing stock on deconsolidation of Fellow Subsidiaries - (1.86)
Add: Stock Transfer from Pre-Operative Account - 4.78
450.15 (357.83)

302
Ult
raTe
ch C
emen
t Li
mit
ed
303
Ann
ual R
epo
rt 2
020-
21
Welcome to UltraTech
Value Creation
Growth Enablers
Statutory Reports
Financial Statements
ESG Commitments
Notes to the Consolidated Financial Statements for the year ended March 31, 2021 (Continued)
Note 30: Employee Benefits Expense` in Crores
ParticularsYear ended
March 31, 2021 Year ended
March 31, 2020 (Restated)
Salaries, Wages and Bonus 2,131.71 2,243.03
Contribution to Provident and Other Funds
Contribution to Gratuity Fund and Other Defined Benefit Plans 111.09 111.73
Contribution to Superannuation and Other Defined Contribution Funds 26.63 29.12
Expenses on Employees Stock Options Scheme 12.11 16.79
Staff Welfare Expenses 71.48 119.19
2,353.02 2,519.86
Note 31: Finance Costs` in Crores
ParticularsYear ended
March 31, 2021 Year ended
March 31, 2020 (Restated)
Interest Expense:
On Borrowings (at amortised cost) 1,327.20 1,740.84
Others (including interest on deposits from dealers and contractors) 97.80 127.62
Interest on Lease Liability 49.72 50.14
Unwinding of discount on Mine Restoration Provision 20.18 10.90
1,494.90 1,929.50
Exchange (Gain)/ Loss on revaluation of Lease Liability (12.32) 55.19
Other Borrowing Cost (Finance Charges) 5.13 7.89
Less: Finance Costs Capitalised (2.06) (0.93)
1,485.65 1,991.65
Borrowing costs are capitalised using rates based on specific borrowings ranging from 4.57 % to 7.86% per annum. (For the year ended March 31, 2020: 7.50% to 7.86% per annum)
Note 32: Depreciation and Amortisation Expense` in Crores
ParticularsYear ended
March 31, 2021 Year ended
March 31, 2020 (Restated)
Depreciation 2,370.24 2,345.48
Depreciation on ROU Assets (Refer Note 3) 123.59 123.33
Amortisation 151.78 216.36
Obsolescence 54.62 37.49
2,700.23 2,722.66
Notes to the Consolidated Financial Statements for the year ended March 31, 2021 (Continued)
Note 33: Freight and Forwarding Expense` in Crores
ParticularsYear ended
March 31, 2021 Year ended
March 31, 2020 (Restated)
On Finished Products 8,542.68 8,313.06
On Clinker Transfer 1,500.64 1,420.13
10,043.32 9,733.19
Note 34: Other Expenses` in Crores
ParticularsYear ended
March 31, 2021 Year ended
March 31, 2020 (Restated)
Consumption of Stores, Spare Parts and Components 865.37 947.64
Consumption of Packing Materials 1,358.28 1,208.45
Repairs to Plant and Machinery, Building and Others 843.73 901.51
Insurance 122.24 89.60
Rent 127.39 144.31
Rates and Taxes (Refer note 59) 152.58 291.57
Directors’ Fees 0.31 0.31
Directors’ Commission 10.00 2.47
Advertisement 313.83 442.91
Sales Promotion and Other Selling Expenses 498.39 535.74
Provision for expected credit loss on Receivables/Advances - 49.32
Miscellaneous Expenses 1,075.85 1,295.18
5,367.97 5,909.01
Note 35: Principles of Consolidation:
These consolidated financial statements are prepared on the following basis in accordance with Ind AS on “Consolidated Financial Statements” (Ind AS – 110), “Investments in Associates and Joint Ventures” (Ind AS – 28) and “Disclosure of interests in other entities” (Ind AS – 112), specified under Section 133 of the Companies Act, 2013.
(i) Subsidiaries
Subsidiaries are entities controlled by the Group. The Group controls an entity when it is exposed to, or has rights to, variable returns from its involvement with the entity and has the ability to affect those returns through its power over the entity. The financial statements of subsidiaries are included in these consolidated financial statements from the date on which control commences until the date on which control ceases.
(ii) Non-controlling interest (NCI)
NCI are measured at their proportionate share of the acquiree’s net identifiable assets at the date of acquisition. Changes in the Group’s equity interest in a subsidiary that do not result in a loss of control are accounted for as equity transactions.

304
Ult
raTe
ch C
emen
t Li
mit
ed
305
Ann
ual R
epo
rt 2
020-
21
Welcome to UltraTech
Value Creation
Growth Enablers
Statutory Reports
Financial Statements
ESG Commitments
Notes to the Consolidated Financial Statements for the year ended March 31, 2021 (Continued)
(iii) Loss of control
When the Company loses control over a subsidiary, it derecognizes the assets and liabilities of the subsidiary, and any related NCI and other components of equity. Any interest retained in the former subsidiary is measured at fair value at the date the control is lost. Any resulting gain or loss is recognized in profit or loss.
(iv) Equity accounted investees
The Group’s interests in equity accounted investees comprise interest in associates and joint venture.
An associate is an entity in which the Group has significant influence, but not control or joint control, over the financial and operating policies. A joint venture is an arrangement in which the Group has joint control and has rights to the net assets of the arrangement, rather than rights to its assets and obligations for its liabilities.
Interests in associates and joint venture are accounted for using equity method. They are initially recognized at cost which includes transaction costs. Subsequent to initial recognition, the consolidated financial statements include the Group’s share of profit or loss and OCI of equity accounted investees until the date on which significant influence or joint control ceases.
(v) Transactions eliminated on consolidation
The financial statements of the Company, its Subsidiaries, Joint Venture and Associates used in the consolidation procedure are drawn upto the same reporting date i.e. March 31, 2021.
The consolidated financial statements of the Group and its subsidiary companies are combined on a line-by-line basis by adding together the book values of like items of assets, liabilities, income and expenses. Intra-group balances and transactions, and any unrealized income and expenses arising from intra-group transactions, are eliminated. Unrealized losses are eliminated in the same way as unrealized gains, but only to the extent that there is no evidence of impairment. The Group follows uniform accounting policies for like transactions and other events in similar circumstances.
The Consolidated Financial Statements are comprised of the financial statements of the members of the Group as under:
Name of the CompanyPrincipal Place of
Business
% Shareholding and Voting Power
As atMarch 31, 2021
As atMarch 31, 2020
(Restated)
(i) Subsidiary Companies:
(a) Dakshin Cements Limited(struck off w.e.f. April 9, 2021)
India 100% 100%
(b) UltraTech Cement Lanka Private Limited (UCLPL) Sri Lanka 80% 80%
(c) Harish Cement Limited India 100% 100%
(d) PT UltraTech Mining Indonesia Indonesia 80%! 80%!
(e) PT UltraTech Investments Indonesia Indonesia 100%& 100%&
(f) UltraTech Cement Middle East Investments Limited (UCMEIL)
United Arab Emirates 100% 100%
(g) Star Cement Co. LLC, Dubai * United Arab Emirates 100%$ 100%$
(h) Star Cement Co. LLC, Ras-Al-Khaimah* United Arab Emirates 100%$ 100%$
(i) Al Nakhla Crusher LLC, Fujairah* United Arab Emirates 100%$ 100%$
(j) Arabian Cement Industry LLC, Abu Dhabi* United Arab Emirates 100%$ 100%$
Notes to the Consolidated Financial Statements for the year ended March 31, 2021 (Continued)
Name of the CompanyPrincipal Place of
Business
% Shareholding and Voting Power
As atMarch 31, 2021
As atMarch 31, 2020
(Restated)
(k) UltraTech Cement Bahrain Company WLL, Bahrain * Bahrain 100%^ 100%^
(l) Bhagwati Limestone Company Private Limited (BLCPL)
India 100% 100%
(m) Gotan Limestone Khanij Udyog Private Limited India 100% 100%
(n) PT UltraTech Cement Indonesia# Indonesia 99% 99%
(o) PT UltraTech Mining Sumatera # Indonesia 100% 100%
(p) UltraTech Nathdwara Cement Limited (UNCL) India 100% 100%
(q) Smooth Energy Private Limited @ India 100%!! 100%!!
(r) Bahar Ready Mix Concrete Limited @ India 100%!! 100%!!
(s) Merit Plaza Limited India 100%!! 100%!!
(t) Swiss Merchandise Infrastructure Limited India 100%!! 100%!!
(u) Krishna Holdings PTE Limited (KHPL) Singapore 100%&& 100%&&
(v) Bhumi Resources PTE Limited (BHUMI) Singapore 100%!! 100%!!
(w) Murari Holdings Limited (MUHL) British Virgin Islands 100%!! 100%!!
(x) Mukundan Holdings Limited (MHL) British Virgin Islands 100%!! 100%!!
(y) Star Super Cement Industries LLC (SSCILLC) $ United Arab Emirates 100% @@ 100%**
(z) Binani Cement (Tanzania) Limited Tanzania 100%*** 100%***
(aa) BC Tradelink Limited., Tanzania Tanzania 100%*** 100%***
(ab) Shandong Binani Rongan Cement Company Limited (SBRCC), China (Up to July 30, 2020)
Republic of China - 92.5%^^
(ac) PT Anggana Energy resources (Anggana), Indonesia Indonesia 100%^^^ 100%^^^
(ad) Binani Cement (Uganda) Limited Uganda 100%*** 100%***
(ae) 3B Binani Glassfibre Sarl (3B)**** Luxembourg 100%!! -
(af) Project Bird Holding ll Sarl ****(merged with 3B w.e.f. April 12, 2021)
Luxembourg 100%## -
(ag) 3B-Fibreglass Srl **** Belgium 100%### -
(ah) 3B-FibreGlass Norway as **** Norway 100%### -
(ai) Tunfib Sarl **** Tunisia 67%!!! -
(aj) Goa Glass Fibre Ltd. **** India 100%## -
(ak) Emirates Power Company Limited, Bangladesh*
(Up to December, 2019)Bangladesh - -
(al) Emirates Cement Bangladesh Limited, Bangladesh* (Up to December, 2019)
Bangladesh - -
(am) Awam Minerals LLC, Oman *
(Up to December 10,2019)Oman - -
(ii) Joint Operations:
Bhaskarpara Coal Company Limited (BCCL) India 47.37% 47.37%

306
Ult
raTe
ch C
emen
t Li
mit
ed
307
Ann
ual R
epo
rt 2
020-
21
Welcome to UltraTech
Value Creation
Growth Enablers
Statutory Reports
Financial Statements
ESG Commitments
Notes to the Consolidated Financial Statements for the year ended March 31, 2021 (Continued)
Name of the CompanyPrincipal Place of
Business
% Shareholding and Voting Power
As atMarch 31, 2021
As atMarch 31, 2020
(Restated)
(iii) Associate:
(a) Madanpur (North) Coal Company Private Limited (MNCCPL)
India 11.17% 11.17%
(b) Aditya Birla Renewable Energy Limited (w.e.f. April 13, 2020)
India 26.00% -
(c) Aditya Birla Renewable SPV 1 Limited India 26.00% 26.00%
! 4% Shareholding of UCMEIL & 5% Shareholding of UCMEIL * Subsidiaries of UCMEIL $ 51% held by nominee as required by local law for beneficial interest of the Company ^ 1 share held by employee as nominee for the beneficial interest of the Company # Subsidiary of PT UltraTech Investments Indonesia !! Wholly owned subsidiary of UNCL && 55.54% held by UNCL and 44.46% held by MHL ** 51% held by MHL through nominee as required by local law for beneficial interest of the Company and 49%
held by MUHL *** Wholly owned subsidiary of SSCILLC ^^ Subsidiary of KHPL ^^^ Wholly owned subsidiary of BHUMI @ Applied for strike off @@ Earlier 51% held by MHL through nominee as required by local law for beneficial interest of the Company and
49% held by MUHL; Subsidiary of UCMEIL w.e.f. November 23, 2020 **** With effect from March 12,2021 ## Wholly owned subsidiary of 3B Binani Glassfibre Sarl ### Wholly owned subsidiary of Project Bird Holding II Sarl !!! 67% held by Project Bird Holding II Sarl
Note 36: Goodwill on Consolidation:
Goodwill represents the difference between the Company’s share in the net worth of subsidiaries and the cost of acquisition at each point of time of making the investment in the subsidiaries. For this purpose, the Company’s share of net worth is determined on the basis of the latest financial statements prior to the acquisition after making necessary adjustments for material events between the date of such financial statements and the date of respective acquisition.
Note 37: Sale of Non-Current Investments:
a) During the year ended March 31, 2020, the Company’s wholly-owned subsidiary UltraTech Cement Middle East Investments Limited (“UCMEIL”), divested its entire shareholding in Emirates Cement Bangladesh Limited (“ECBL”) and Emirates Power Company Limited (“EPCL”) to Heidelberg Cement Bangladesh Limited at a final Enterprise Value of BDT equivalent USD 30.2 Million and included the gain on divestment of ` 8.96 crores in other income.
b) The Company also sold its 37% stake in Awam Minerals LLC on December 10, 2019 for ` 21.87 crores at a profit of ` 14.17 crores.
Notes to the Consolidated Financial Statements for the year ended March 31, 2021 (Continued)
Note 38: Contingent Liabilities (to the extent not provided for) (Ind AS 37):
(a) Claims against the Group not acknowledged as debt:
` in Crores
Particulars Brief Description of MatterAs at
March 31, 2021As at
March 31, 2020 (Restated)
(a) Excise Duty and Service Tax Matters
Related to valuation matter (Rule 8 vs. Rule 4), Denial of Cenvat credit on Input Service Distributor and others
1518.50 1,351.84
(b) GST/ Sales-tax / VAT / Entry Tax Matters
Related to stock transfer treated as interstate sales, Demand on freight component and levy of purchase tax on exempted supply, Demand of Entry Tax and others
1016.31 546.69
(c) Royalty on Limestone/ Marl / Shale
Based on fixed conversion factor on limestone, royalty rate difference on Marl and additional royalty on mines transfer
364.81 392.47
(d) Land Related Matters Demand of Higher Compensation 255.64 240.29
(e) Electricity Duty / Energy Development Cess
Related to electricity duty, Minimum power consumption, Energy development cess and denial of electricity duty exemption
548.93 465.35
(f) Customs Related to classification dispute 234.39 210.76
(g) State Industrial Incentive Matters
Related to matters on quantum - 163.70
(h) Stamp duty Related to stamp duty on debt and name change 355.49 167.45
(i) Others Related to Fly ash matters, claim raised by vendor/ supplier, Road Tax matter, Income Tax matters and others
334.85 370.00
Cash outflows for the above are determinable only on receipt of judgments pending at various forums / authorities.
(b) (i) The Company had filed appeals against the orders of the Competition Commission of India (CCI) dated 31/08/2016 and 19/01/2017. Upon the NCLAT disallowing its appeal against the CCI order dated 31/08/2016, the Hon’ble Supreme Court has, by its order dated 05/10/2018, granted a stay against the NCLAT order. Consequently, the Company has deposited an amount of ` 144.95 crores equivalent to 10% of the penalty amount. UltraTech Nathdwara Cement Ltd (UNCL) has also filed an appeal in the Hon’ble Supreme Court against a similar CCI order dated August 31, 2016 and has deposited an amount of ` 16.73 Crores equivalent to 10% of the penalty amount. The Company, backed by legal opinions, believes that it has a good case in said matters and accordingly no provision has been made in the accounts.
(ii) In the month of December 2020, officers from CCI visited the Company’s premises seeking information for certain periods under the Competition Act 2002. Company has provided the information sought by them and will co-operate for any further information that may be required. The Company presently believes that this does not have any material impact.
(c) Guarantees:
The Company has issued corporate guarantees as under:
(i) In favour of the Banks / Lenders on behalf of its Joint Venture (JV), as mentioned below, for general corporate purposes:
• Bhaskarpara Coal Company Limited (JV) ` 1.70 crores (March 31, 2020 ` 4.00 crores).
(d) In one of the case, UCLPL filed the appeal against the Director General of Customs and the inquiring officer appointed in terms of the Customs Ordinance for the customs case No PCAD/HQO/091/2016 initiated at the
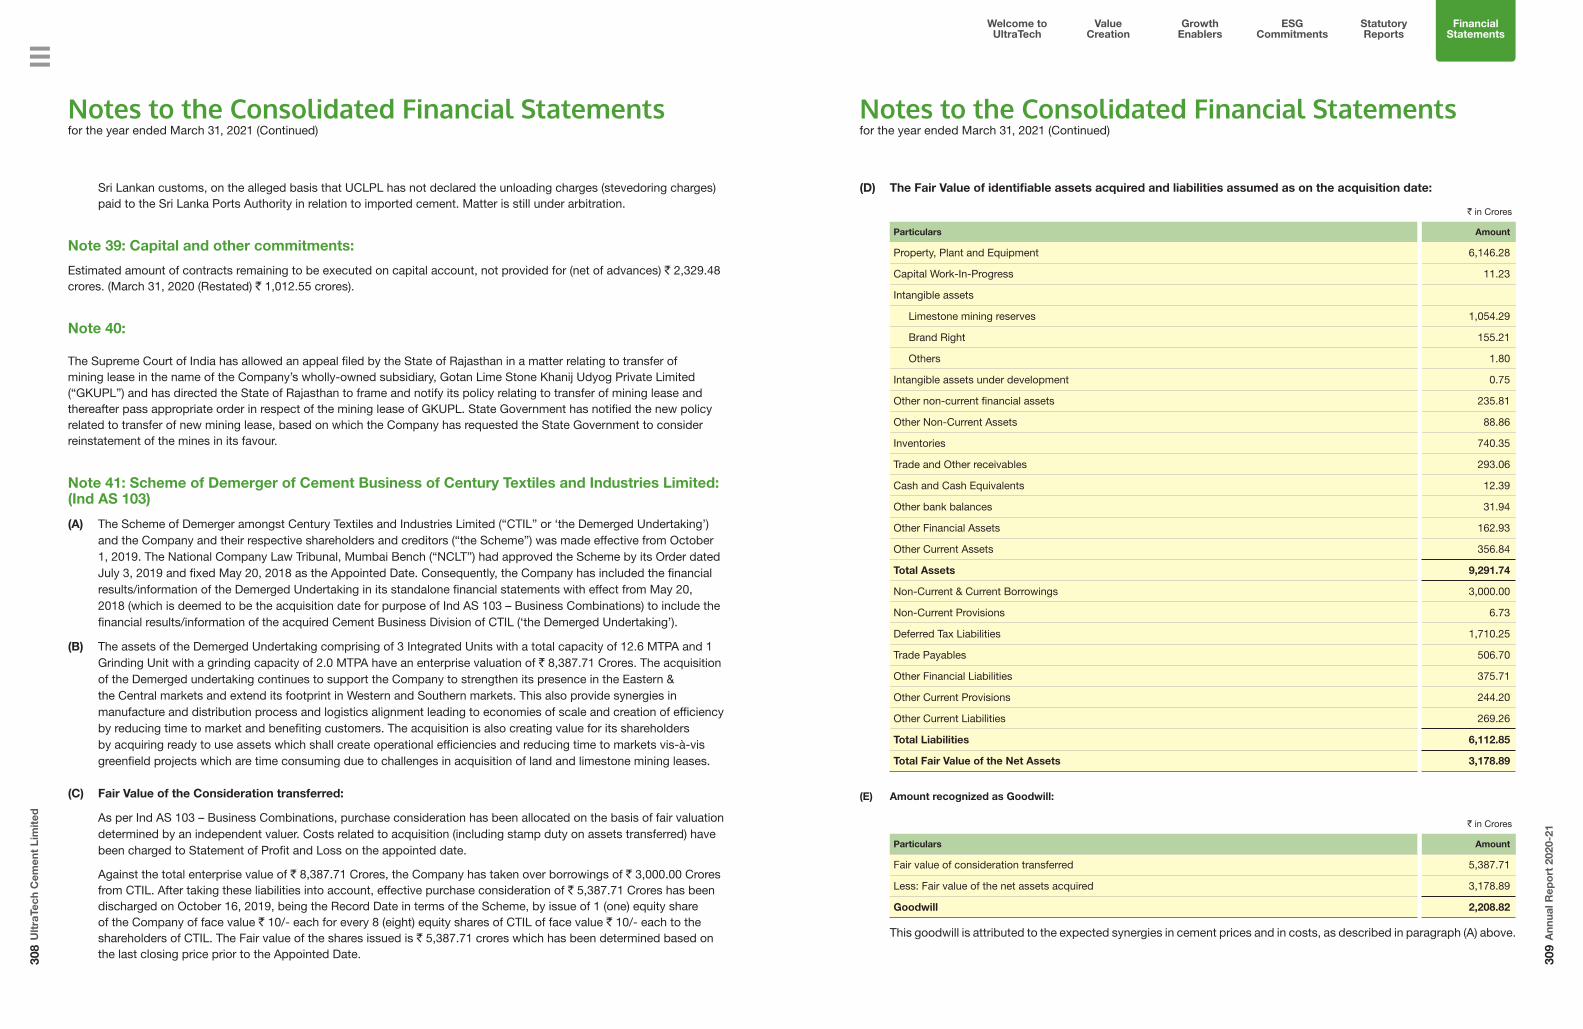
308
Ult
raTe
ch C
emen
t Li
mit
ed
309
Ann
ual R
epo
rt 2
020-
21
Welcome to UltraTech
Value Creation
Growth Enablers
Statutory Reports
Financial Statements
ESG Commitments
Sri Lankan customs, on the alleged basis that UCLPL has not declared the unloading charges (stevedoring charges) paid to the Sri Lanka Ports Authority in relation to imported cement. Matter is still under arbitration.
Note 39: Capital and other commitments:
Estimated amount of contracts remaining to be executed on capital account, not provided for (net of advances) ` 2,329.48 crores. (March 31, 2020 (Restated) ` 1,012.55 crores).
Note 40:
The Supreme Court of India has allowed an appeal filed by the State of Rajasthan in a matter relating to transfer of mining lease in the name of the Company’s wholly-owned subsidiary, Gotan Lime Stone Khanij Udyog Private Limited (“GKUPL”) and has directed the State of Rajasthan to frame and notify its policy relating to transfer of mining lease and thereafter pass appropriate order in respect of the mining lease of GKUPL. State Government has notified the new policy related to transfer of new mining lease, based on which the Company has requested the State Government to consider reinstatement of the mines in its favour.
Note 41: Scheme of Demerger of Cement Business of Century Textiles and Industries Limited: (Ind AS 103)
(A) The Scheme of Demerger amongst Century Textiles and Industries Limited (“CTIL” or ‘the Demerged Undertaking’) and the Company and their respective shareholders and creditors (“the Scheme”) was made effective from October 1, 2019. The National Company Law Tribunal, Mumbai Bench (“NCLT”) had approved the Scheme by its Order dated July 3, 2019 and fixed May 20, 2018 as the Appointed Date. Consequently, the Company has included the financial results/information of the Demerged Undertaking in its standalone financial statements with effect from May 20, 2018 (which is deemed to be the acquisition date for purpose of Ind AS 103 – Business Combinations) to include the financial results/information of the acquired Cement Business Division of CTIL (‘the Demerged Undertaking’).
(B) The assets of the Demerged Undertaking comprising of 3 Integrated Units with a total capacity of 12.6 MTPA and 1 Grinding Unit with a grinding capacity of 2.0 MTPA have an enterprise valuation of ` 8,387.71 Crores. The acquisition of the Demerged undertaking continues to support the Company to strengthen its presence in the Eastern & the Central markets and extend its footprint in Western and Southern markets. This also provide synergies in manufacture and distribution process and logistics alignment leading to economies of scale and creation of efficiency by reducing time to market and benefiting customers. The acquisition is also creating value for its shareholders by acquiring ready to use assets which shall create operational efficiencies and reducing time to markets vis-à-vis greenfield projects which are time consuming due to challenges in acquisition of land and limestone mining leases.
(C) Fair Value of the Consideration transferred:
As per Ind AS 103 – Business Combinations, purchase consideration has been allocated on the basis of fair valuation determined by an independent valuer. Costs related to acquisition (including stamp duty on assets transferred) have been charged to Statement of Profit and Loss on the appointed date.
Against the total enterprise value of ` 8,387.71 Crores, the Company has taken over borrowings of ` 3,000.00 Crores from CTIL. After taking these liabilities into account, effective purchase consideration of ` 5,387.71 Crores has been discharged on October 16, 2019, being the Record Date in terms of the Scheme, by issue of 1 (one) equity share of the Company of face value ` 10/- each for every 8 (eight) equity shares of CTIL of face value ` 10/- each to the shareholders of CTIL. The Fair value of the shares issued is ` 5,387.71 crores which has been determined based on the last closing price prior to the Appointed Date.
Notes to the Consolidated Financial Statements for the year ended March 31, 2021 (Continued)
(D) The Fair Value of identifiable assets acquired and liabilities assumed as on the acquisition date:
` in Crores
Particulars Amount
Property, Plant and Equipment 6,146.28
Capital Work-In-Progress 11.23
Intangible assets
Limestone mining reserves 1,054.29
Brand Right 155.21
Others 1.80
Intangible assets under development 0.75
Other non-current financial assets 235.81
Other Non-Current Assets 88.86
Inventories 740.35
Trade and Other receivables 293.06
Cash and Cash Equivalents 12.39
Other bank balances 31.94
Other Financial Assets 162.93
Other Current Assets 356.84
Total Assets 9,291.74
Non-Current & Current Borrowings 3,000.00
Non-Current Provisions 6.73
Deferred Tax Liabilities 1,710.25
Trade Payables 506.70
Other Financial Liabilities 375.71
Other Current Provisions 244.20
Other Current Liabilities 269.26
Total Liabilities 6,112.85
Total Fair Value of the Net Assets 3,178.89
(E) Amount recognized as Goodwill:
` in Crores
Particulars Amount
Fair value of consideration transferred 5,387.71
Less: Fair value of the net assets acquired 3,178.89
Goodwill 2,208.82
This goodwill is attributed to the expected synergies in cement prices and in costs, as described in paragraph (A) above.
Notes to the Consolidated Financial Statements for the year ended March 31, 2021 (Continued)

310
Ult
raTe
ch C
emen
t Li
mit
ed
311
Ann
ual R
epo
rt 2
020-
21
Welcome to UltraTech
Value Creation
Growth Enablers
Statutory Reports
Financial Statements
ESG Commitments
(F) Acquired Receivables:
As on the date of acquisition, gross contractual amount of the acquired Trade and other Receivables was ` 293.06 Crores against which no provision had been considered since fair value of the acquired receivables were equal to carrying value as on the date of acquisition.
(G) Contingent Liabilities
The Company has assumed all the contingent liabilities of the Demerged Undertaking as per the Scheme. Total contingent liability transferred to the Company was ` 806.64 Crores.
(H) Acquisition related costs
During the previous year acquisition related costs of ` 5.16 Crores had been recognised under Miscellaneous Expenses and Rates and Taxes in the Statement of Profit and Loss. The stamp duty paid / payable on transfer of the assets amounting to ` 113.88 Crores had been charged to the Statement of Profit and Loss and shown as an exceptional item.
Note 42: Employee Benefits (Ind AS 19):
(a) Gratuity:
The gratuity payable to employees is based on the employee’s service and last drawn salary at the time of leaving the services of the Company and is in accordance with the Rules of the Company for payment of gratuity.
Inherent Risk
The plan is defined benefit in nature which is sponsored by the Company and hence it underwrites all the risks pertaining to the plan. In particular, this exposes the Company to actuarial risk such as adverse salary growth, change in demographic experience, inadequate return on underlying plan assets. This may result in an increase in cost of providing these benefits to employee in future. Since the benefits are lump sum in nature the plan is not subject to any longevity risks.
(b) Pension:
The Company considers pension for some of its employees at senior management based on the period of service and contribution for the Company. There is no material risk associated with this plan.
(c) Post-Retirement Medical Benefits:
The Company provides post-retirement medical benefits to certain ex-employees who were transferred under the Scheme of arrangement for acquiring Larsen & Toubro cement business and eligible for such benefits from earlier Company. There is no material risk associated with this plan.
Notes to the Consolidated Financial Statements for the year ended March 31, 2021 (Continued)
` in Crores
Particulars
As at March 31, 2021 As at March 31, 2020 (Restated)
Gratuity Pension Post - Retirement
Medical Benefits
Gratuity Pension Post - Retirement
Medical Benefits
Funded Others Funded Others
(i) Change in defined benefit obligation
Balance at the beginning of the year
711.42 27.38 7.14 0.59 604.21 30.51 7.09 0.57
Adjustment of:
Current Service Cost 55.45 2.78 - - 50.76 3.26 - -
Past Service Cost 0.83 - - - 0.99 - - -
Interest Cost 44.98 1.32 0.49 0.04 44.20 1.56 0.50 0.04
Actuarial (gains) losses recognised in Other Comprehensive Income:
- Change in Financial Assumptions
(25.94) 5.31 0.07 (0.01) 61.50 (5.06) 0.30 0.04
- Adjustment for Past service cost
4.78 - - - - - - -
- Change in Demographic Assumptions
- - - - - (0.03) - -
- Experience Changes (58.06) (1.43) (0.61) 0.02 (2.99) (0.51) 0.16 0.01
Benefits Paid (45.73) (4.63) (0.91) (0.08) (47.25) (2.01) (0.91) (0.07)
Foreign Currency Fluctuation - (0.90) - - - 2.37 - -
Obligation reduction of Subsidiary disposal
- - - - - (2.71) - -
Balance at the end of the year 687.73 29.83 6.18 0.56 711.42 27.38 7.14 0.59
(ii) Change in Fair Value of Assets
Balance at the beginning of the year
709.00 - - - 634.08 - - -
Expected Return on Plan Assets 44.43 - - - 45.26 - - -
Re measurements due to: Actual Return on Plan Assets less interest on Plan Assets
6.71 - - - 0.27 - - -
Contribution by the employer 46.08 - - - 76.64 - - -
Benefits Paid (45.73) - - - (47.25) - - -
Balance at the end of the year 760.50 - - - 709.00 - - -
(iii) Net Asset / (Liability) recognised in the Balance Sheet
Present value of Defined Benefit Obligation
(687.73) (29.83) (6.18) (0.56) (711.42) (27.38) (7.14) (0.59)
Fair Value of Plan Assets 760.50 - - - 709.00 - - -
Amount not recognised due to Asset Ceiling
(2.04)
Net Asset / (Liability) in the Balance Sheet
70.73 (29.83) (6.18) (0.56) (2.42) (27.38) (7.14) (0.59)
(iv) Change in Asset Ceiling
Remeasurement due to change in surplus/deficit
2.04 - - - - - - -
Balance at the end of the year 2.04 - - - - - - -
Notes to the Consolidated Financial Statements for the year ended March 31, 2021 (Continued)
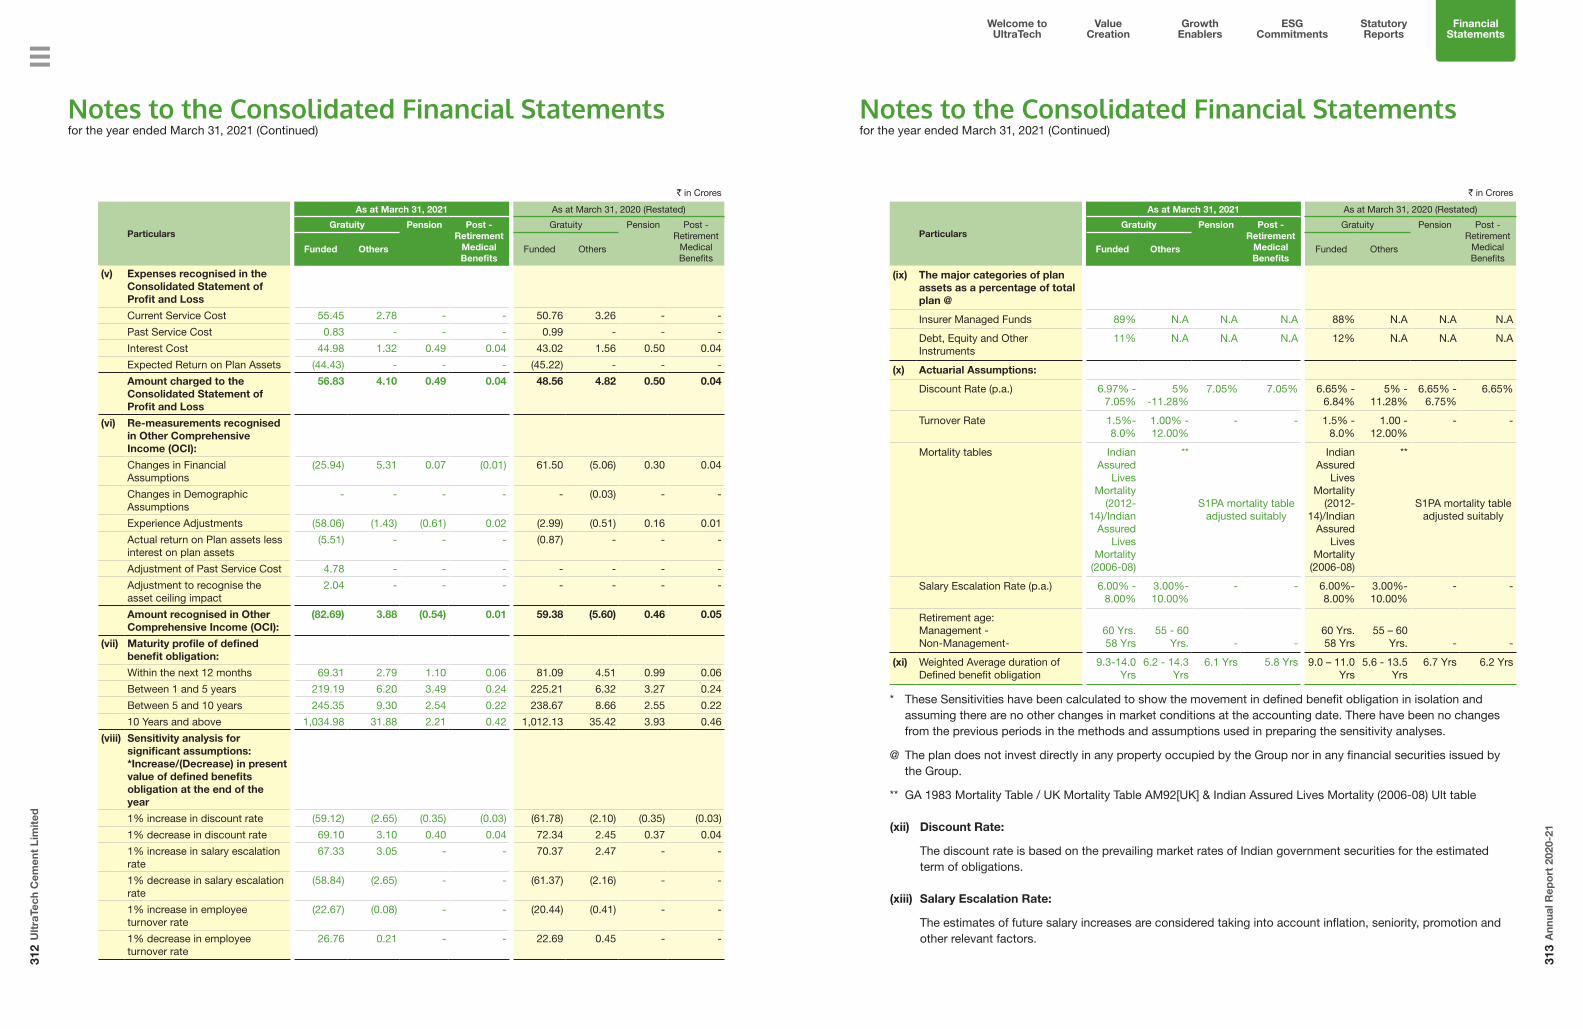
312
Ult
raTe
ch C
emen
t Li
mit
ed
313
Ann
ual R
epo
rt 2
020-
21
Welcome to UltraTech
Value Creation
Growth Enablers
Statutory Reports
Financial Statements
ESG Commitments
` in Crores
Particulars
As at March 31, 2021 As at March 31, 2020 (Restated)
Gratuity Pension Post - Retirement
Medical Benefits
Gratuity Pension Post - Retirement
Medical Benefits
Funded Others Funded Others
(v) Expenses recognised in the Consolidated Statement of Profit and Loss
Current Service Cost 55.45 2.78 - - 50.76 3.26 - -
Past Service Cost 0.83 - - - 0.99 - - -
Interest Cost 44.98 1.32 0.49 0.04 43.02 1.56 0.50 0.04
Expected Return on Plan Assets (44.43) - - - (45.22) - - -
Amount charged to the Consolidated Statement of Profit and Loss
56.83 4.10 0.49 0.04 48.56 4.82 0.50 0.04
(vi) Re-measurements recognised in Other Comprehensive Income (OCI):
Changes in Financial Assumptions
(25.94) 5.31 0.07 (0.01) 61.50 (5.06) 0.30 0.04
Changes in Demographic Assumptions
- - - - - (0.03) - -
Experience Adjustments (58.06) (1.43) (0.61) 0.02 (2.99) (0.51) 0.16 0.01
Actual return on Plan assets less interest on plan assets
(5.51) - - - (0.87) - - -
Adjustment of Past Service Cost 4.78 - - - - - - -
Adjustment to recognise the asset ceiling impact
2.04 - - - - - - -
Amount recognised in Other Comprehensive Income (OCI):
(82.69) 3.88 (0.54) 0.01 59.38 (5.60) 0.46 0.05
(vii) Maturity profile of defined benefit obligation:
Within the next 12 months 69.31 2.79 1.10 0.06 81.09 4.51 0.99 0.06
Between 1 and 5 years 219.19 6.20 3.49 0.24 225.21 6.32 3.27 0.24
Between 5 and 10 years 245.35 9.30 2.54 0.22 238.67 8.66 2.55 0.22
10 Years and above 1,034.98 31.88 2.21 0.42 1,012.13 35.42 3.93 0.46
(viii) Sensitivity analysis for significant assumptions: *Increase/(Decrease) in present value of defined benefits obligation at the end of the year
1% increase in discount rate (59.12) (2.65) (0.35) (0.03) (61.78) (2.10) (0.35) (0.03)
1% decrease in discount rate 69.10 3.10 0.40 0.04 72.34 2.45 0.37 0.04
1% increase in salary escalation rate
67.33 3.05 - - 70.37 2.47 - -
1% decrease in salary escalation rate
(58.84) (2.65) - - (61.37) (2.16) - -
1% increase in employee turnover rate
(22.67) (0.08) - - (20.44) (0.41) - -
1% decrease in employee turnover rate
26.76 0.21 - - 22.69 0.45 - -
Notes to the Consolidated Financial Statements for the year ended March 31, 2021 (Continued)
` in Crores
Particulars
As at March 31, 2021 As at March 31, 2020 (Restated)
Gratuity Pension Post - Retirement
Medical Benefits
Gratuity Pension Post - Retirement
Medical Benefits
Funded Others Funded Others
(ix) The major categories of plan assets as a percentage of total plan @
Insurer Managed Funds 89% N.A N.A N.A 88% N.A N.A N.A
Debt, Equity and Other Instruments
11% N.A N.A N.A 12% N.A N.A N.A
(x) Actuarial Assumptions:
Discount Rate (p.a.) 6.97% - 7.05%
5% -11.28%
7.05% 7.05% 6.65% - 6.84%
5% - 11.28%
6.65% - 6.75%
6.65%
Turnover Rate 1.5%-8.0%
1.00% - 12.00%
- - 1.5% - 8.0%
1.00 - 12.00%
- -
Mortality tables Indian Assured
Lives Mortality
(2012-14)/Indian
Assured Lives
Mortality (2006-08)
**
S1PA mortality table adjusted suitably
Indian Assured
Lives Mortality
(2012-14)/Indian
Assured Lives
Mortality (2006-08)
**
S1PA mortality table adjusted suitably
Salary Escalation Rate (p.a.) 6.00% - 8.00%
3.00%- 10.00%
- - 6.00%-8.00%
3.00%-10.00%
- -
Retirement age:Management -Non-Management-
60 Yrs. 58 Yrs
55 - 60 Yrs. - -
60 Yrs. 58 Yrs
55 – 60 Yrs. - -
(xi) Weighted Average duration of Defined benefit obligation
9.3-14.0 Yrs
6.2 - 14.3 Yrs
6.1 Yrs 5.8 Yrs 9.0 – 11.0 Yrs
5.6 - 13.5 Yrs
6.7 Yrs 6.2 Yrs
* These Sensitivities have been calculated to show the movement in defined benefit obligation in isolation and assuming there are no other changes in market conditions at the accounting date. There have been no changes from the previous periods in the methods and assumptions used in preparing the sensitivity analyses.
@ The plan does not invest directly in any property occupied by the Group nor in any financial securities issued by the Group.
** GA 1983 Mortality Table / UK Mortality Table AM92[UK] & Indian Assured Lives Mortality (2006-08) Ult table
(xii) Discount Rate:
The discount rate is based on the prevailing market rates of Indian government securities for the estimated term of obligations.
(xiii) Salary Escalation Rate:
The estimates of future salary increases are considered taking into account inflation, seniority, promotion and other relevant factors.
Notes to the Consolidated Financial Statements for the year ended March 31, 2021 (Continued)

314
Ult
raTe
ch C
emen
t Li
mit
ed
315
Ann
ual R
epo
rt 2
020-
21
Welcome to UltraTech
Value Creation
Growth Enablers
Statutory Reports
Financial Statements
ESG Commitments
(xiv) Asset Liability matching strategy:
The money contributed by the Group to the Gratuity fund to finance the liabilities of the plan has to be invested.
The trustees of the plan have outsourced the investment management of the fund to an insurance Company. The insurance Company in turn manages these funds as per the mandate provided to them by the trustees and the asset allocation which is within the permissible limits prescribed in the insurance regulations. Due to the restrictions in the type of investments that can be held by the fund, it is not possible to explicitly follow an asset liability matching strategy.
There is no compulsion on the part of the Group to fully prefund the liability of the Plan. The Group’s philosophy is to fund these benefits based on its own liquidity and the level of underfunding of the plan.
(xv) The Group’s expected contribution during next year is ` 2.40 Crores. (March 31, 2020 ` 30.46 Crores).
(d) Provident Fund:
The Company is liable for any shortfall in the fund assets based on the Government specified rate of return. Such shortfall, if any, is recognised in the Statement of Profit and Loss as an expense in the year of incurring the same.
Amount recognized as an expense under the head “Contribution to Provident and other Funds” of Statement of Profit and Loss ` 91.72 Crores (March 31, 2020 (Restated): ` 94.09 Crores).
The actuary has provided for a valuation and based on the below provided assumptions there is no shortfall as at March 31, 2021 (March 31, 2020 (Restated): ` 0.68 Crores)
` in Crores
ParticularsAs at
March 31, 2021As at
March 31, 2020 (Restated)
(a) Plan Assets at Fair Value 1,736.24 1,589.35
(b) Present value of defined benefit obligation at year end 1,730.75 1,590.13
(c) Surplus available - 0.10
(d) Liability recognised in Balance Sheet Nil 0.68
(e) Assumptions used in determining the present value obligation of interest rate guarantee under the Deterministic Approach
Government of India bond yield for the outstanding term of liabilities 7.05% 6.65%
Remaining term of the maturity of Investment Portfolio 13.03 Yrs 11.76-13.50 Yrs
Discount Rate for the remaining term of the maturity of Investment Portfolio 8.30% 7.85-8.43%
Expected Guaranteed Interest Rate 8.50% 8.50%
(e) Contribution to Other Funds:
Amount recognized as an expense under the head “Contribution to Other Funds” of Statement of Profit and Loss ` 28.98 Crores (March 31, 2020 (Restated): ` 30.88 Crores).
(A) Amount recognized as an expense in respect of Compensated Absences is ` (6.76) Crores (March 31, 2020 (Restated): ` 62.99 Crores).
(B) Amount recognized as expense for other long-term employee benefits is ` 0.86 Crores (March 31, 2020 (Restated): ` 44.18 Crores).
Notes to the Consolidated Financial Statements for the year ended March 31, 2021 (Continued)
Note 43: Segment Reporting (Ind AS 108):
The Group is exclusively engaged in the business of cement and cement related products. As per Ind AS 108 “Operating Segments”, there are no reportable segments applicable to the Group.
The Group’s revenue from continuing operations from external customers by location of operations and information about its non-current assets by location of assets are detailed below.
` in crores
Particulars
Revenue from External Customers Non-Current Assets
Year EndedMarch 31, 2021
Year EndedMarch 31, 2020
(Restated)
Year EndedMarch 31, 2021
As atMarch 31, 2020
(Restated)
India (Country of Domicile) 42,285.81 39,630.98 57,272.40 58,152.67
Others 1,953.52 2,149.57 2,533.39 2,743.42
Total 44,239.33 41,780.55 59,805.79 60,896.09
Note 44: Related party disclosures (Ind AS 24):
Names of Related Parties with whom transactions were carried out during the period:
Name of Related Party Relationship
Grasim Industries Limited Holding Company
Samruddhi Swastik Trading and Investments Limited Fellow Subsidiary
Aditya Birla Sun Life Insurance Company Limited (formerly known as Birla Sun Life Insurance Company Limited)
Fellow Subsidiary
Aditya Birla Health Insurance Limited Fellow Subsidiary
ABNL Investment Limited Fellow Subsidiary
Aditya Birla Renewable SPV 1 Limited Associate
Aditya Birla Renewable Energy Limited (w.e.f. April 13, 2020) Associate
Bhaskarpara Coal Company Limited Joint Venture
UltraTech Cemco Provident Fund Post-Employment Benefit Plan
Aditya Birla Management Corporation Private Limited Other related party in which Directors are interested
Bharucha & Partners Other related party in which Director is interested
Mr. Kumar Mangalam Birla – Non-Executive Chairman Key Management Personnel (KMP)
Mrs. Rajashree Birla – Non-Executive Director Key Management Personnel (KMP)
Mr. Arun Adhikari – Independent Director Key Management Personnel (KMP)
Mrs. Alka Bharucha - Independent Director Key Management Personnel (KMP)
Mrs. Sukanya Kripalu – Independent Director Key Management Personnel (KMP)
Mr. S.B. Mathur – Independent Director Key Management Personnel (KMP)
Mrs. Usha Sangwan- Independent Director (from January 10,2020 till May 16, 2020)
Key Management Personnel (KMP)
Mr Sunil Duggal – Independent Director (w.e.f. August 14, 2020) Key Management Personnel (KMP)
Mr. K.K. Maheshwari – Vice- Chairman and Non-Executive Director (Managing Director till December 31, 2019)
Key Management Personnel (KMP)
Mr. K.C. Jhanwar – Managing Director w.e.f January 1, 2020 Key Management Personnel (KMP)
Mr. Atul Daga - Whole-time Director and CFO Key Management Personnel (KMP)
Mrs. Kritika Daga Relative of KMP (Wife of Mr. Atul Daga)
Notes to the Consolidated Financial Statements for the year ended March 31, 2021 (Continued)

316
Ult
raTe
ch C
emen
t Li
mit
ed
317
Ann
ual R
epo
rt 2
020-
21
Welcome to UltraTech
Value Creation
Growth Enablers
Statutory Reports
Financial Statements
ESG Commitments
(a) The following transactions were carried out with the related parties in the ordinary course of business:
` in Crores
Nature of Transaction/RelationshipYear Ended
March 31, 2021Year Ended
March 31, 2020 (Restated)
Sale of Goods:
Grasim Industries Limited 8.76 18.24
Purchase of Goods:
Grasim Industries Limited 1.56 2.30
Aditya Birla Renewables SPV 1 30.63 22.32
Aditya Birla Renewables Energy Limited 0.54 -
Total 32.73 24.62
Sale of Property, Plant and Equipment:
Grasim Industries Limited 0.03 0.07
Purchase of Property, Plant and Equipment:
Grasim Industries Limited 0.30 -
Aditya Birla Management Corporation Private Limited - 0.03
Total 0.30 0.03
Services received from:
Grasim Industries Limited 0.78 0.75
Samruddhi Swastik Trading and Investments Limited 0.96 0.96
Aditya Birla Health Insurance Limited (0.28) 9.04
ABNL Investment Limited 2.30 2.30
Aditya Birla Renewables Energy Limited 0.01 -
Aditya Birla Sun Life Insurance Company Limited 4.42 5.28
KMP 26.93 44.57
Bharucha & Partners - 0.53
Aditya Birla Management Corporation Private Limited 231.19 189.97
Relative of KMP 0.08 0.30
Total 266.40 253.70
Services rendered to:
Grasim Industries Limited 1.22 3.05
Aditya Birla Management Corporation Private Limited 0.06 -
Total 1.28 3.05
Dividend Paid:
Grasim Industries Limited 214.94 190.14
Contribution to:
Post-Employment Benefit Plan 50.00 43.69
Investments:
Aditya Birla Renewables SPV 1 - 5.75
Aditya Birla Renewable Energy Limited 3.42 -
Total 3.42 5.75
Notes to the Consolidated Financial Statements for the year ended March 31, 2021 (Continued)
(b) Outstanding balances:
` in Crores
Nature of Transaction/RelationshipAs at
March 31, 2021As at
March 31, 2020 (Restated)
Loans and Advances:
Grasim Industries Limited 3.48 0.44
Aditya Birla Renewables SPV 1 0.25 -
Samruddhi Swastik Trading and Investments Limited 0.37 0.37
Aditya Birla Health Insurance Limited 0.07 8.13
ABNL Investment Limited 1.68 1.68
Aditya Birla Sun Life Insurance Company Limited 0.11 0.14
KMP 2.60 3.00
Aditya Birla Management Corporation Private Limited 29.60 45.42
Bhaskarpara Coal Company Limited 2.49 2.49
Total 40.65 61.67
Trade Receivables:
Grasim Industries Limited 0.60 1.15
Trade Payables:
Grasim Industries Limited 0.37 0.47
Aditya Birla Renewable Energy Limited 0.20 -
Aditya Birla Renewables SPV 1 2.60 1.84
Total 3.17 2.31
Deposit:
Relative of KMP 5.00 5.00
Corporate Guarantees:
Bhaskarpara Coal Company Limited 1.70 4.00
(c) Compensation of KMP of the Company:
` in Crores
Nature of transactionYear Ended
March 31, 2021Year Ended
March 31, 2020(Restated)
Short-term employee benefits 13.26 23.22
Post – employment benefits 3.40 19.26
Share based payment 3.39 3.30
Total compensation paid to KMP 20.05 45.78
Compensation for March 31, 2020 includes compensation of Mr. K. K. Maheshwari, who was Managing Director till December 31, 2019 and was designated as Vice Chairman and Non-Executive Director w.e.f January 01, 2020. Post- retirement benefits included amount paid to him for Gratuity and Leave Encashment of ` 8.27 Crores. Further the Board had approved one-time payout of ` 9.45 Crores and pension of ` 28,34,000 per month with effect from January 1, 2020 for his past services as Managing Director, which is also part of the above Post-employment benefits.
Notes to the Consolidated Financial Statements for the year ended March 31, 2021 (Continued)

318
Ult
raTe
ch C
emen
t Li
mit
ed
319
Ann
ual R
epo
rt 2
020-
21
Welcome to UltraTech
Value Creation
Growth Enablers
Statutory Reports
Financial Statements
ESG Commitments
Based on the recommendation of the Nomination, Remuneration and Compensation Committee, all decisions relating to the remuneration of the Directors are taken by the Board of Directors of the Company, in accordance with shareholder’s approval, wherever necessary.
Terms and Conditions of transactions with Related Parties:
The sales to and purchases from related parties are made in the normal course of business and on terms equivalent to those that prevail in arm’s length transactions. Outstanding balances at the end of the period are unsecured and interest free and settlement occurs in cash. There have been no guarantees provided or received for any related party receivables or payables.
For the year ended March 31, 2021 and March 31, 2020, the Group has not recorded any impairment of receivables relating to amounts owed by related parties. This assessment is undertaken each financial year through examining the financial position of the related party and the market in which the related party operates.
Note 45: Income Taxes (Ind AS 12):
(i) Reconciliation of effective tax rate:
in %
ParticularsYear Ended
March 31, 2021Year Ended
March 31, 2020 (Restated)
Applicable tax rate 34.94 34.94
Effect of Tax Exempt Income (0.09) (0.35)
Effect of Non-Deductible expenses 0.61 0.61
Effect of Allowances for tax purpose (1.20) (2.72)
Effect of Tax paid at a lower rate (1.36) (0.88)
Effect of changes in Tax rate (deferred) (0.73) (1.42)
Effect of Previous year adjustments 0.04 (0.02)
Effect of Lower Jurisdiction Tax Rate (0.39) (0.44)
Others 0.49 0.06
Effective Tax Rate 32.31 29.78
Effect of Reversal of Opening Deferred Tax Liability for change in income tax rates (Refer Note 20)
- (40.74)
Net Effective Tax Rate 32.31 (10.96)
(ii) At March 31, 2021 a deferred tax liability of ` 81.06 Crores (March 31, 2020 ` 69.83 Crores) in respect of temporary differences related to undistributed profit in subsidiaries has not been recognized because the Group controls the dividend policy of its subsidiaries and management is satisfied that they are not expecting to distribute profit in the foreseeable future.
(iii) The Company has not recognized Deferred Tax Assets on the unabsorbed Depreciation, business losses and other temporary differences amounting to ` 1205.90 Crores in respect of a Subsidiary, since it is not probable that future taxable income will be available wherein such deferred tax assets can be realized in normal course of business.
Notes to the Consolidated Financial Statements for the year ended March 31, 2021 (Continued)
Note 46: Earnings per Share (EPS) (Ind AS 33):` in Crores
ParticularsYear Ended
March 31, 2021Year Ended
March 31, 2020 (Restated)
Net Profit attributable to Equity Shareholders (i) Net Profit attributable to Equity Shareholders from Continuing Operations 5,320.19 5,755.26 (ii) Net Profit attributable to Equity Shareholders from Discontinued Operations 142.91 - (iii) Net Profit attributable to Equity Shareholders ((i) +(ii)) 5,463.10 5,755.26(A) Basic EPS: (i) Weighted average number of Equity Shares outstanding (Nos.) 28,86,41,300 288,626,496 (ii) Less: Treasury Shares acquired by the Company under Trust (1,92,586) (209,477) (iii) Weighted average number of Equity Shares outstanding for calculation of Basic EPS
(Face Value ` 10/Share)28,84,48,714 288,417,019
Basic EPS (`) – Continuing Operations {(i)/A(iii)} 184.44 199.55
Basic EPS (`) – Discontinued Operations {(ii)/A(iii)} 4.95 -
Basic EPS (`) – Continuing and Discontinued Operations {(iii)/A(iii)} 189.40 199.55(B) Diluted EPS: (i) Weighted average number of Equity Shares Outstanding (Nos.) 28,84,48,714 288,417,019 (ii) Add: Potential Equity Shares on exercise of options (Nos.) 1,03,823 85,507 (iii) Weighted average number of Equity Shares Outstanding for calculation of Dilutive EPS
(i+ii) (Face Value ` 10/Share)28,85,52,537 288,502,526
Diluted EPS (`) – Continuing Operations {(i)/B(iii)} 184.38 199.49
Diluted EPS (`) – Discontinued Operations {(ii)/B(iii)} 4.95 -
Diluted EPS (`) – Continuing and Discontinued Operations {(iii)/B(iii)} 189.33 199.49
Note 47: Summarised Financial information of individually immaterial Associates and Joint Ventures:
The Company’s interests in below mentioned associates and joint venture are accounted for using the equity method in the consolidated financial statements. The summarized financial information below represents amounts shown in the associate’s financial statements prepared in accordance with Ind AS adjusted by the Company for equity accounting purposes:
Madanpur (North) Coal Company Private Limited:` in Crores
ParticularsYear Ended
March 31, 2021Year Ended
March 31, 2020
Profit or Loss from continuing Operations 0.01 0.01Post-tax Profit or Loss from discontinued Operations - -Other Comprehensive Income - -Total Comprehensive Income 0.01 0.01
Aditya Birla Renewable SPV 1 Limited:` in Crores
ParticularsYear Ended
March 31, 2021Year Ended
March 31, 2020
Profit or Loss from continuing Operations 2.47 (0.84)Post-tax Profit or Loss from discontinued Operations - -Other Comprehensive Income (0.18) (0.41)Total Comprehensive Income 2.29 (1.25)
Notes to the Consolidated Financial Statements for the year ended March 31, 2021 (Continued)

320
Ult
raTe
ch C
emen
t Li
mit
ed
321
Ann
ual R
epo
rt 2
020-
21
Welcome to UltraTech
Value Creation
Growth Enablers
Statutory Reports
Financial Statements
ESG Commitments
Aditya Birla Renewable Energy Limited:` in Crores
ParticularsYear Ended
March 31, 2021Year Ended
March 31, 2020
Profit or Loss from continuing Operations 0.06 -
Post-tax Profit or Loss from discontinued Operations - -
Other Comprehensive Income (0.19) -
Total Comprehensive Income (0.13) -
Bhaskarpara Coal Company Limited:` in Crores
ParticularsYear Ended
March 31, 2021Year Ended
March 31, 2020
Profit or Loss from continuing Operations 0.01 0.01
Post-tax Profit or Loss from discontinued Operations - -
Other Comprehensive Income - -
Total Comprehensive Income 0.01 0.01
Note 48: Auditor’s remuneration including remuneration for Subsidiaries Auditors (excluding service tax/GST) and expenses:
` in Crores
ParticularsYear Ended
March 31, 2021Year Ended
March 31, 2020 (Restated)
(a) Statutory Auditors:
Audit fees (including Quarterly Limited Reviews) 5.61 5.52
Tax audit fees 0.28 0.28
Fees for other services 2.04 0.68
Fees for Taxation Matters 0.02 -
Expenses reimbursed 0.02 0.16
(b) Cost Auditors:
Audit fees 0.30 0.30
Expenses reimbursed (FY 2021: ` 15,000) 0.00 0.01
Note 49:
The following expenses are included in the different heads of expenses in the Consolidated Statement of Profit and Loss:
` in Crores
Particulars
Year Ended March 31, 2021 Year Ended March 31, 2020 (Restated)
Raw Materials
Consumed
Power and Fuel
Consumed
Total Raw Materials
Consumed
Power and Fuel
Consumed
Total
Stores and Spares Consumed 122.17 50.70 172.87 134.50 60.76 195.26
Royalty and Cess 1,123.10 - 1,123.10 1,098.22 - 1,098.22
Notes to the Consolidated Financial Statements for the year ended March 31, 2021 (Continued)
Note 50: Share Based Payments (Ind AS 102):
The Company has granted 5,350 options (including Restricted Stock units) to its eligible employees in various ESOS Schemes, details are as under:
(A) Employee Stock Option Scheme (ESOS 2013) including Stock options and Restricted Stock Units (RSU):
ParticularsTranche I Tranche II Tranche III
RSU Stock Options RSU Stock Options RSU Stock Options
Nos. of Options 84,056 237,953 12,313 34,859 2,218 6,280
Vesting Plan100% on
19.10.2016
Graded Vesting - 25%
every year after 1 year from date of
grant, subject to achieving performance
targets
100% on 18.10.2017
Graded Vesting - 25%
every year after 1 year from date of
grant, subject to achieving performance
targets
100% on 28.01.2018
Graded Vesting - 25%
every year after 1 year from date of
grant, subject to achieving performance
targets
Exercise Period5 Years from the date of
Vesting
5 Years from the date of
Vesting
5 Years from the date of
Vesting
5 Years from the date of
Vesting
5 Years from the date of
Vesting
5 Years from the date of
Vesting
Grant Date 19.10.2013 19.10.2013 18.10.2014 18.10.2014 28.01.2015 28.01.2015
Exercise Price (` per share) 10 1,965 10 2,318 10 3,122
Fair Value on the date of Grant of Option (` per share)
1,862 750 2,241 870 3,048 1,207
Method of Settlement Equity Equity Equity Equity Equity Equity
ParticularsTranche IV Tranche V Tranche VI
RSU Stock Options RSU Stock Options RSU Stock Options
Nos. of Options 9,059 25,645 5,313 15,042 10,374 29,369
Vesting Plan100% on
19.10.2018
Graded Vesting - 25%
every year after 1 year from date of
grant, subject to achieving performance
targets
100% on 13.04.2019
Graded Vesting - 25%
every year after 1 year from date of
grant, subject to achieving performance
targets
100% on 27.01.2020
Graded Vesting - 25%
every year after 1 year from date of
grant, subject to achieving performance
targets
Exercise Period5 Years from the date of
Vesting
5 Years from the date of
Vesting
5 Years from the date of
Vesting
5 Years from the date of
Vesting
5 Years from the date of
Vesting
5 Years from the date of
Vesting
Grant Date 19.10.2015 19.10.2015 13.04.2016 13.04.2016 27.01.2017 27.01.2017
Exercise Price (` per share) 10 2,955 10 3,167 10 3,681
Fair Value on the date of Grant of Option (` per share)
2,897 1,728 3,108 1,810 3,608 2,080
Method of Settlement Equity Equity Equity Equity Equity Equity
Notes to the Consolidated Financial Statements for the year ended March 31, 2021 (Continued)

322
Ult
raTe
ch C
emen
t Li
mit
ed
323
Ann
ual R
epo
rt 2
020-
21
Welcome to UltraTech
Value Creation
Growth Enablers
Statutory Reports
Financial Statements
ESG Commitments
(B) Employee Stock Option Scheme (ESOS 2018) including Stock options, Restricted Stock Units (RSU) and Stock Appreciation Rights Scheme – 2018 (SAR 2018) including Stock options and RSU
ParticularsTranche I (ESOS, 2018) Tranche II (ESOS, 2018) Tranche III (ESOS, 2018)
RSU Stock Options RSU Stock Options RSU Stock Options
Nos. of Options 43,718 1,58,304 917 3,320 3,482 12,620
Vesting Plan100% on
18.12.2021
Graded Vesting - 25% every year after 1 year from
date of grant, subject to achieving performance targets
100% on 23.12.2022
Graded Vesting - 25% every year after 1 year from
date of grant, subject to achieving performance targets
100% on 04.03.2023
Graded Vesting - 25% every year after 1 year from
date of grant, subject to achieving performance targets
Exercise Period5 Years from the date of
Vesting
5 Years fromthe date of
Vesting
5 Years fromthe date of
Vesting
5 Years fromthe date of
Vesting
5 Years fromthe date of
Vesting
5 Years fromthe date of
Vesting
Grant Date 18.12.2018 18.12.2018 23.12.2019 23.12.2019 04.03.2020 04.03.2020
Exercise Price(` per share)
10 4,009.30 10 4,120.45 10 4,299.90
Fair Value on the date of Grant of Option(` per share)
3,942 1,476 4,080 1,865 4,258 1,939
Method of Settlement Equity Equity Equity Equity Equity Equity
ParticularsTranche IV (ESOS, 2018) Tranche V (ESOS, 2018)
RSU Stock Options RSU Stock Options
Nos. of Options 594 2,152 564 2,040
Vesting Plan100% on
21.10.2023
Graded Vesting - 25% every year after 1 year from date of
grant, subject to achieving performance targets
100% on 27.03.2024
Graded Vesting - 25% every year after 1 year from date of
grant, subject to achieving performance targets
Exercise Period5 Years from the date of Vesting
5 Years from thedate of Vesting
5 Years from the date of Vesting
5 Years from thedate of Vesting
Grant Date 21.10.2020 21.10.2020 27.03.2021 27.03.2021
Exercise Price (` per share) 10 4,544.35 10 6,735.25
Fair Value on the date of Grant of Option (` per share)
4,500 1,943 6,673 2,903
Method of Settlement Equity Equity Equity Equity
ParticularsTranche I (SAR, 2018)
RSU Stock Options
Nos. of Options 1,084 3,924
Vesting Plan 100% on 18.12.2021Graded Vesting - 25% every year after 1 year from date of grant, subject to
achieving performance targets
Exercise Period 3 Years from the date of Vesting 3 Years from the date of Vesting
Grant Date 18.12.2018 18.12.2018
Exercise Price (` per share) 10 4,009.30
Fair Value on the date of Grant of Option (` per share) 3,946 1,539
Method of Settlement Cash Cash
Notes to the Consolidated Financial Statements for the year ended March 31, 2021 (Continued)
(C) Movement of Options Granted including RSU along with weighted average exercise price (WAEP):
` in Crores
ParticularsAs at March 31, 2021 As at March 31, 2020 (Restated)
Nos. WAEP (`) Nos. WAEP (`)
Outstanding at the beginning of the year 2,97,479 2963.45 316,974 2843.64
Granted during the year 5,350 4398.30 20,339 3342.77
Exercised during the year (45,184) 3049.39 (21,711) 1799.42
Forfeited during the year (8,191) 2980.46 (18,123) 2688.20
Outstanding at the end of the year 2,49,454 2978.09 297,479 2963.45
Options exercisable at the end of the year 1,23,620 3237.00 118,919 2875.80
The weighted average share price at the date of exercise for options was ` 5,759.93 per share (March 31, 2020 ` 4,181.12 per share) and weighted average remaining contractual life for the share options outstanding as at March 31, 2021 was 5.10 years (March 31,2020: 5.12 years).
The weighted average remaining contractual life for SAR is 3.22 years (March 31, 2020: 4.22 years).
The exercise price for outstanding options and SAR is ` 10 per share for RSU’s and ranges from ` 1,965 per share to ` 6,735 per share for options.
(D) Fair Valuation:
5,350 share options were granted during the year. Weighted Average Fair value of the options granted during the year is ` 3,091.60 per share (March 31, 2020 ` 2,682.45 per share).
The fair value of option has been done by an independent firm of Chartered Accountants on the date of grant using the Black-Scholes Model / Binomial Model.
The Key assumptions in the Black-Scholes Model for calculating fair value as on the date of grant:
(a) For ESOS 2013:
1. Risk Free Rate - 8.5% (Tranche I), 7.8% (Tranche II-III), 8.56% (Tranche IV)7.6% (Tranche V), 6.74% (Tranche VI)
2. Option Life - (a) For Options - Vesting period (1 Year) + Average of exercise period (b) For RSU – Vesting period (3 Years) + Average of exercise period
3. Expected Volatility* - Tranche-I: 0.29, Tranche-II: 0.27, Tranche-III: 0.28, Tranche-IV: 0.60 Tranche–V: 0.60, Tranche–VI: 0.61
4. Expected Growth in Dividend - Tranche -I: 20%, Tranche II-III: 15%, Tranche-IV: 5%, Tranche-V: 5%, Tranche-VI: 5%
(b) For ESOS 2018:
1. Risk Free Rate - 7.47% (Tranche I)
2. Option Life - (a) For Options - Vesting period (1 Year) + Average of exercise period (b) For RSU – Vesting period (3 Years) + Average of exercise
3. Expected Volatility* - Tranche-I: 0.24
4. Dividend Yield - Tranche -I: 0.46%
*Expected volatility on the Company’s stock price on National Stock Exchange based on the data commensurate with the expected life of the options/RSU’s up to the date of grant.
Notes to the Consolidated Financial Statements for the year ended March 31, 2021 (Continued)

324
Ult
raTe
ch C
emen
t Li
mit
ed
325
Ann
ual R
epo
rt 2
020-
21
Welcome to UltraTech
Value Creation
Growth Enablers
Statutory Reports
Financial Statements
ESG Commitments
The Key assumptions in the Binomial Tree Model for calculating fair value as on the date of grant:
(c) For ESOS – SAR - 2018:
1. Risk Free Rate - 7.47% (Tranche I)
2. Option Life - (a) For Options - Vesting period (1 Year) + Average of exercise period (b) For RSU – Vesting period (3 Years) + Average of exercise period
3. Expected Volatility* - Tranche-I: 0.25,
4. Dividend Yield - Tranche -I: 0.46%
(d) For ESOS 2018:
1. Risk Free Rate - 6.78% (Tranche II), 6.72% (Tranche III), 5.84% (Tranche IV & V)
2. Option Life - (a) For Options - Vesting period (1 Year) + Average of exercise period (b) For RSU – Vesting period (3 Years) + Average of exercise period
3. Expected Volatility* - Tranche-II: 0.26, Tranche- III: 0.26, Tranche-IV & V: 0.26
4. Dividend Yield - Tranche -II & III: 0.27%; Tranche IV & V: 0.27%
*Expected volatility on the Company’s stock price on National Stock Exchange based on the data commensurate with the expected life of the options/RSU’s up to the date of grant.
(E) Details of Liabilities arising from Company’s cash settled share based payment transactions:
` in Crores
ParticularsMarch 31, 2021 March 31, 2020
(Restated)
Other non-current liabilities 0.60 0.40
Other current liabilities 0.20 0.15
Total carrying amount of liabilities 0.80 0.55
Note 50 (A): Classification of Financial Assets and Liabilities (Ind AS – 107):
` in Crores
ParticularsAs at March 31, 2021 As at March 31, 2020 (Restated)
Carrying Value Fair Value Carrying Value Fair Value
Financial Assets at amortised cost
Trade Receivables 2,571.73 2,571.73 2,383.22 2,383.22
Loans 281.79 281.79 1,429.40 1,429.40
Investments 300.00 300.00 100.00 100.00
Cash and Bank Balances 2,007.55 2,007.55 539.91 539.91
Other Financial Assets 1,984.76 1,984.76 1,356.11 1,356.11
Financial Assets at fair value through profit or loss
Investments 11,849.31 11,849.31 5,805.49 5,805.49
Fair Value Hedging Instruments
Derivative Assets 469.47 469.47 104.53 104.53
Total 19,464.61 19,464.61 11,718.66 11,718.66
Notes to the Consolidated Financial Statements for the year ended March 31, 2021 (Continued)
` in Crores
ParticularsAs at March 31, 2021 As at March 31, 2020 (Restated)
Carrying Value Fair Value Carrying Value Fair Value
Financial liabilities at amortised cost
Non-Convertible Debentures 3,810.00 3,859.27 2,810.00 2,809.77
Term Loan from Banks 7,544.56 7,544.56 12,701.88 12,701.88
Cash Credits / Working Capital Borrowing 245.65 245.65 139.47 139.47
Commercial Papers and others 2,989.38 2,989.38 2,966.55 2,966.55
Sales Tax Deferment Loan 391.36 391.36 401.40 401.40
Trade Payables 4,699.28 4,699.28 3,362.89 3,362.89
Preference Shares 1,000.10 1,000.10 1,000.10 1,000.10
Other Financial Liabilities 3,088.07 3,088.07 2,505.69 2,505.69
Foreign Currency Borrowings 1,582.32 1,582.32 2,999.56 2,999.56
Foreign Currency Bonds 2,924.40 2,758.59 - -
Lease Liability 405.83 405.83 359.03 359.03
Financial Liability at fair value through Profit or Loss
Lease Liability payable in Foreign Currency 825.79 825.79 801.97 801.97
Fair Value Hedging Instrument
Derivative Liability 6.34 6.34 54.51 54.51
Total 29,513.08 29,396.54 30,103.05 30,102.82
Note 50 (B): Fair Value Measurements (Ind AS 113):
The fair values of the financial assets and liabilities are included at the amount at which the instrument could be exchanged in an orderly transaction in the principal (or most advantageous) market at measurement date under the current market condition regardless of whether that price is directly observable or estimated using other valuation techniques.
The Group has established the following fair value hierarchy that categorizes the values into 3 levels. The inputs to valuation techniques used to measure fair value of financial instruments are:
Level 1: This hierarchy uses quoted (unadjusted) prices in active markets for identical assets or liabilities. The fair value of all bonds which are traded in the stock exchanges is valued using the closing price or dealer quotations as at the reporting date.
Level 2: The fair value of financial instruments that are not traded in an active market (For example traded bonds, over the counter derivatives) is determined using valuation techniques which maximize the use of observable market data and rely as little as possible on company specific estimates. The mutual fund units are valued using the closing Net Asset Value. If all significant inputs required to fair value an instrument are observable, the instrument is included in Level 2.
Level 3: If one or more of the significant inputs is not based on observable market data, the instrument is included in Level 3.
Notes to the Consolidated Financial Statements for the year ended March 31, 2021 (Continued)
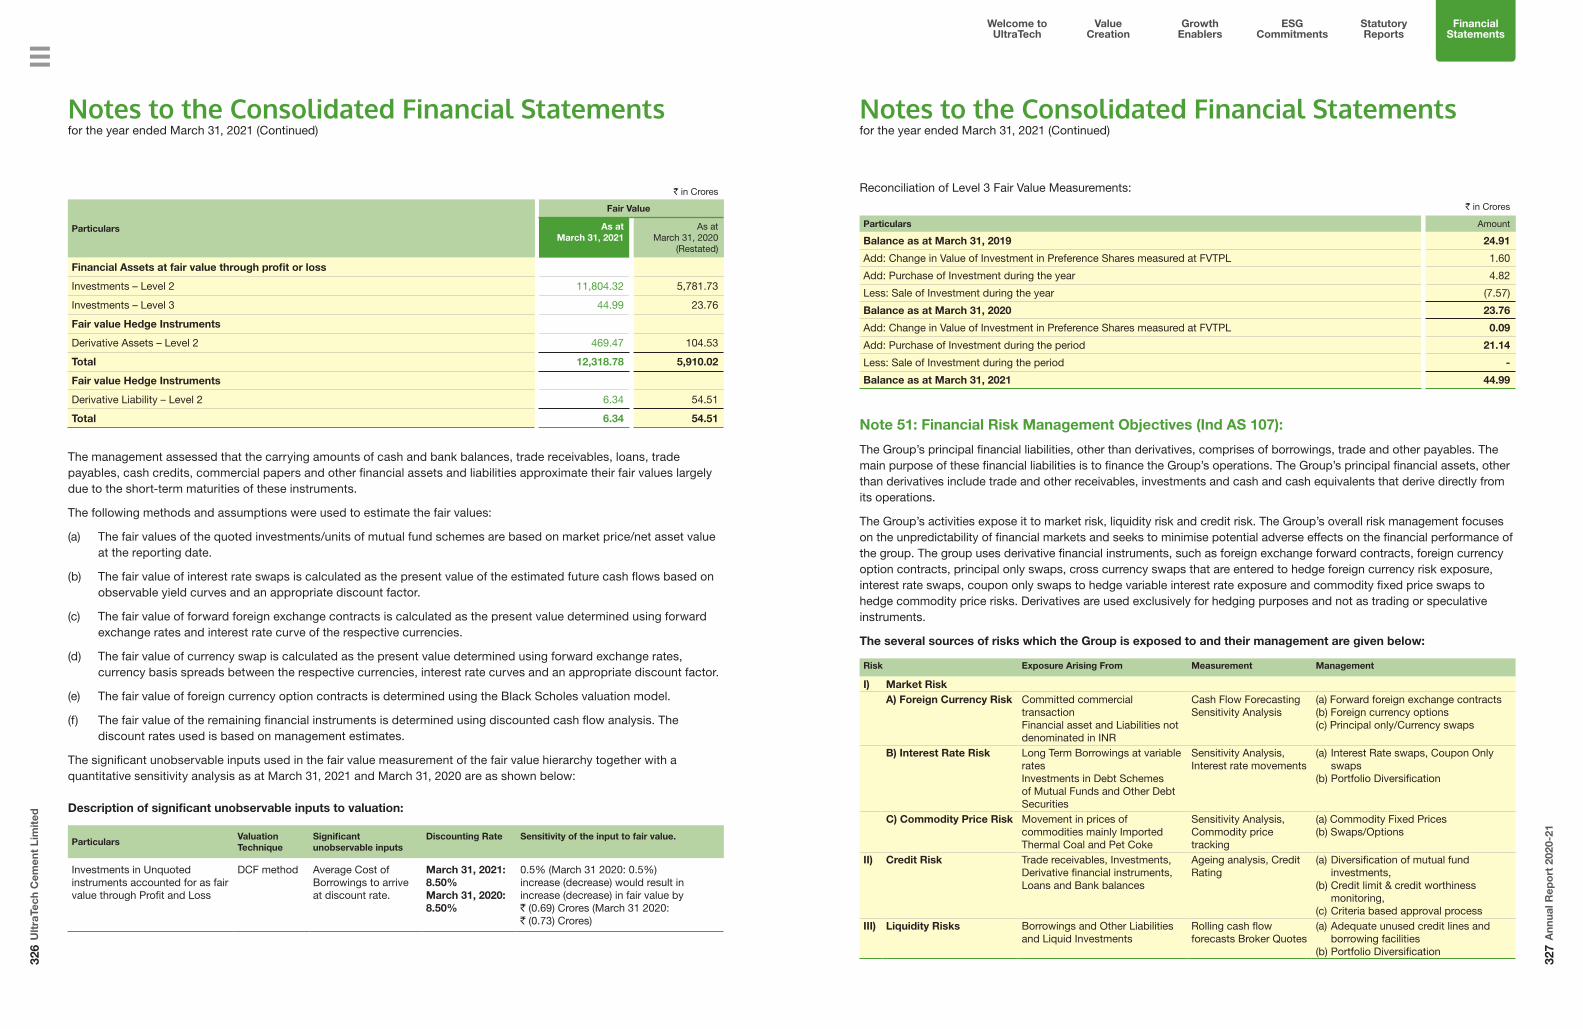
326
Ult
raTe
ch C
emen
t Li
mit
ed
327
Ann
ual R
epo
rt 2
020-
21
Welcome to UltraTech
Value Creation
Growth Enablers
Statutory Reports
Financial Statements
ESG Commitments
` in Crores
Particulars
Fair Value
As atMarch 31, 2021
As atMarch 31, 2020
(Restated)
Financial Assets at fair value through profit or loss
Investments – Level 2 11,804.32 5,781.73
Investments – Level 3 44.99 23.76
Fair value Hedge Instruments
Derivative Assets – Level 2 469.47 104.53
Total 12,318.78 5,910.02
Fair value Hedge Instruments
Derivative Liability – Level 2 6.34 54.51
Total 6.34 54.51
The management assessed that the carrying amounts of cash and bank balances, trade receivables, loans, trade payables, cash credits, commercial papers and other financial assets and liabilities approximate their fair values largely due to the short-term maturities of these instruments.
The following methods and assumptions were used to estimate the fair values:
(a) The fair values of the quoted investments/units of mutual fund schemes are based on market price/net asset value at the reporting date.
(b) The fair value of interest rate swaps is calculated as the present value of the estimated future cash flows based on observable yield curves and an appropriate discount factor.
(c) The fair value of forward foreign exchange contracts is calculated as the present value determined using forward exchange rates and interest rate curve of the respective currencies.
(d) The fair value of currency swap is calculated as the present value determined using forward exchange rates, currency basis spreads between the respective currencies, interest rate curves and an appropriate discount factor.
(e) The fair value of foreign currency option contracts is determined using the Black Scholes valuation model.
(f) The fair value of the remaining financial instruments is determined using discounted cash flow analysis. The discount rates used is based on management estimates.
The significant unobservable inputs used in the fair value measurement of the fair value hierarchy together with a quantitative sensitivity analysis as at March 31, 2021 and March 31, 2020 are as shown below:
Description of significant unobservable inputs to valuation:
ParticularsValuation Technique
Significant unobservable inputs
Discounting Rate Sensitivity of the input to fair value.
Investments in Unquoted instruments accounted for as fair value through Profit and Loss
DCF method Average Cost of Borrowings to arrive at discount rate.
March 31, 2021: 8.50%March 31, 2020: 8.50%
0.5% (March 31 2020: 0.5%)increase (decrease) would result in increase (decrease) in fair value by` (0.69) Crores (March 31 2020:` (0.73) Crores)
Notes to the Consolidated Financial Statements for the year ended March 31, 2021 (Continued)
Reconciliation of Level 3 Fair Value Measurements:
` in Crores
Particulars Amount
Balance as at March 31, 2019 24.91
Add: Change in Value of Investment in Preference Shares measured at FVTPL 1.60
Add: Purchase of Investment during the year 4.82
Less: Sale of Investment during the year (7.57)
Balance as at March 31, 2020 23.76
Add: Change in Value of Investment in Preference Shares measured at FVTPL 0.09
Add: Purchase of Investment during the period 21.14
Less: Sale of Investment during the period -
Balance as at March 31, 2021 44.99
Note 51: Financial Risk Management Objectives (Ind AS 107):
The Group’s principal financial liabilities, other than derivatives, comprises of borrowings, trade and other payables. The main purpose of these financial liabilities is to finance the Group’s operations. The Group’s principal financial assets, other than derivatives include trade and other receivables, investments and cash and cash equivalents that derive directly from its operations.
The Group’s activities expose it to market risk, liquidity risk and credit risk. The Group’s overall risk management focuses on the unpredictability of financial markets and seeks to minimise potential adverse effects on the financial performance of the group. The group uses derivative financial instruments, such as foreign exchange forward contracts, foreign currency option contracts, principal only swaps, cross currency swaps that are entered to hedge foreign currency risk exposure, interest rate swaps, coupon only swaps to hedge variable interest rate exposure and commodity fixed price swaps to hedge commodity price risks. Derivatives are used exclusively for hedging purposes and not as trading or speculative instruments.
The several sources of risks which the Group is exposed to and their management are given below:
Risk Exposure Arising From Measurement Management
I) Market RiskA) Foreign Currency Risk Committed commercial
transactionFinancial asset and Liabilities not denominated in INR
Cash Flow ForecastingSensitivity Analysis
(a) Forward foreign exchange contracts(b) Foreign currency options(c) Principal only/Currency swaps
B) Interest Rate Risk Long Term Borrowings at variable ratesInvestments in Debt Schemes of Mutual Funds and Other Debt Securities
Sensitivity Analysis, Interest rate movements
(a) Interest Rate swaps, Coupon Only swaps
(b) Portfolio Diversification
C) Commodity Price Risk Movement in prices of commodities mainly Imported Thermal Coal and Pet Coke
Sensitivity Analysis, Commodity price tracking
(a) Commodity Fixed Prices(b) Swaps/Options
II) Credit Risk Trade receivables, Investments, Derivative financial instruments, Loans and Bank balances
Ageing analysis, Credit Rating
(a) Diversification of mutual fund investments,
(b) Credit limit & credit worthiness monitoring,
(c) Criteria based approval processIII) Liquidity Risks Borrowings and Other Liabilities
and Liquid InvestmentsRolling cash flow forecasts Broker Quotes
(a) Adequate unused credit lines and borrowing facilities
(b) Portfolio Diversification
Notes to the Consolidated Financial Statements for the year ended March 31, 2021 (Continued)

328
Ult
raTe
ch C
emen
t Li
mit
ed
329
Ann
ual R
epo
rt 2
020-
21
Welcome to UltraTech
Value Creation
Growth Enablers
Statutory Reports
Financial Statements
ESG Commitments
The Group has standard operating procedures and investment policy for deployment of surplus liquidity, which allows investment in debt securities, fixed deposits and mutual fund schemes of debt categories only and restricts the exposure in equity markets.
Compliances of these policies & principles are reviewed by the internal auditors on periodical basis.
The Corporate Treasury team updates the Audit Committee on a quarterly basis about the implementation of the above policies. It also updates the Risk Management Committee of the Group on periodical basis about the various risks to the business and status of various activities planned to mitigate the risks.
I) Market Risk:
Market risk is the risk of loss of future earnings, fair values or future cash flows that may result from a change in the price of a financial instrument. The value of a financial instrument may change as a result of changes in the interest rates, foreign currency exchange rates, commodity prices, equity prices and other market changes that affect market risk sensitive instruments. Market risk is attributable to all market risk sensitive financial instruments including investments and deposits, foreign currency receivables, payables and borrowings.
A) Foreign Currency Risk:
Foreign currency risk is the risk of impact related to fair value or future cash flows of an exposure in foreign currency, which fluctuate due to changes in foreign exchange rates. The Company’s exposure to the risk of changes in foreign exchange rates relates primarily to the foreign currency borrowings, import of fuels, raw materials & spare parts, capital expenditure, exports of cement and the Company’s net investments in foreign subsidiaries.
When a derivative is entered into for the purpose of being a hedge, the Company negotiates the terms of those derivatives to match the terms of the hedged exposure.
The Company evaluates exchange rate exposure arising from foreign currency transactions. The Company follows established risk management policies and standard operating procedures. It uses derivative instruments like foreign currency swaps and forwards to hedge exposure to foreign currency risk.
` in Crores
Outstanding foreign currency exposure (Gross) as atMarch 31, 2021 March 31, 2020
(Restated)
Trade and advances receivables
USD 2.31 1.08
Euro - 0.02
Trade Payables
USD 5.21 3.65
Euro 0.20 0.26
Others 0.06 0.10
Borrowings
USD 54.64 14.64
Investments
USD 24.92 6.92
Notes to the Consolidated Financial Statements for the year ended March 31, 2021 (Continued)
Foreign currency sensitivity on unhedged exposure:
100 bps increase in foreign exchange rates will have the following impact on profit before tax.
` in Crores
ParticularsAs at
March 31, 2021As at
March 31, 2020 (Restated)
USD 7.98 5.24
Note: If the rate is decreased by 100 bps profit will decrease by an equal amount.
B) Interest rate risk:
Interest rate risk is the risk that the fair value or future cash flows of a financial instrument will fluctuate because of changes in market interest rates. The Group’s exposure to the risk of changes in market interest rates relates primarily to the Group’s short term borrowing (excluding commercial paper) with floating interest rates. For all long-term borrowings with floating rates, the risk of variation in the interest rates is mitigated through interest rate swaps. The Group constantly monitors the credit markets and rebalances its financing strategies to achieve an optimal maturity profile and financing cost.
Interest rate exposure` in Crores
ParticularsTotal
borrowingsFloating rate
borrowingsFixed rate
borrowingsNon-Interest
bearing borrowings
INR 15,980.21 7,789.37 7,799.48 391.36
USD 4,506.72 - 4,506.72 -
BHD 0.84 0.84 - -
Total as at March 31, 2021 20,487.77 7,790.21 12,306.20 391.36
INR 19,869.90 12,708.98 6,759.52 401.40
USD 2,999.56 - 2,999.56 -
AED 138.16 138.16 - -
LKR 11.34 11.34 - -
Total as at March 31, 2020 23,018.96 12,858.48 9,759.08 401.40
Note: Interest rate risk hedged for foreign currency borrowings has been shown under Fixed Rate borrowings.
Interest rate sensitivities for unhedged exposure (impact on profit before tax due to increase in 100 bps):
` in Crores
ParticularsAs at
March 31, 2021As at
March 31, 2020 (Restated)
INR (77.89) (127.09)
BHD (0.01) -
AED - (1.50)
LKR - (0.11)
Note: If the rate is decreased by 100 bps profit will increase by an equal amount.
Interest rate sensitivity has been calculated assuming the borrowings outstanding at reporting date have been outstanding for the entire reporting period.
Notes to the Consolidated Financial Statements for the year ended March 31, 2021 (Continued)

330
Ult
raTe
ch C
emen
t Li
mit
ed
331
Ann
ual R
epo
rt 2
020-
21
Welcome to UltraTech
Value Creation
Growth Enablers
Statutory Reports
Financial Statements
ESG Commitments
Foreign Currency and Interest Rate Risk Management:
Forward Exchange and Interest Rates Swaps Contracts:
(A) Derivatives for hedging currency and interest rates, outstanding are as under:in Crores
Particulars Hedged Item CurrencyAs at
March 31, 2021As at
March 31, 2020 (Restated)
Cross Currency
a. Forward Contracts Loan Receivable
USD 43.49 15.20 Rupees
Imports USD - 9.29 Rupees
Imports Euro - 0.01 Rupees
Imports Euro 3.87 0.72 USD
Exports USD 0.20 - Rupees
b. Other Derivatives:
i. Currency Options FCB** USD 20.00 - Rupees
ii. Currency & Interest Rate Swap (CIRS)
ECB* USD 7.32 7.32 Rupees
iii. Principal only Swap ECB*/FCB** USD 27.32 7.32 Rupees
iv. Interest Rate SwapECB* USD 7.32 7.32 USD
ECB* USD 7.00 25.00 AED
** Foreign Currency Bonds
*External Commercial Borrowings
(B) Cash Flow Hedges: The Company has raised foreign currency external commercial borrowings and to mitigate the risk of foreign currency and floating interest rates, the Company has taken forward contracts, currency swaps, interest rates swaps and principal only swaps. The Company is following hedge accounting for all the foreign currency borrowings raised on or after April 01, 2015 based on qualitative approach.
The Company assesses hedge effectiveness based on following criteria:
(i) an economic relationship between the hedged item and the hedging instrument;
(ii) the effect of credit risk; and
(iii) assessment of the hedge ratio
The Company designates the derivatives to hedge its currency risk and generally applies a hedge ratio of 1:1. The Company’s policy is to match the critical terms of the forward exchange contracts to match with the hedged item.
Foreign currency cash flows:
Particulars As atAverage
Exchange Rate (USD/INR)
Nominal Foreign Currency
USD Crores
Fair Value Assets (Liabilities)` in Crores
Buy Currency: (USD) March 31, 2021
- for External Commercial Borrowings 65.19 7.32 61.50- for Foreign Currency Bonds 72.50 20.00 27.83Buy Currency : (USD) March 31, 2020- for External Commercial Borrowings 65.19 7.32 81.25- for Foreign Currency Bonds - - -
Notes to the Consolidated Financial Statements for the year ended March 31, 2021 (Continued)
Interest rates outstanding on Receive Floating and Pay Fix contracts:
Particulars As atAverage
contracted fixed interest rates*
Nominal AmountUSD Crores
Fair Value Assets (Liabilities)` in Crores
0 to 2 years March 31, 2021 5.36% 14.32 (21.51)
2 to 5 years March 31, 2021 - - -
0 to 2 years March 31, 2020 2.90% 23.57 (0.54)
2 to 5 years March 31, 2020 4.38% 8.75 (25.88)
Cross Currency and Interest rate Swaps:
Particulars As atAverage
contracted fixed interest rates*
Average Exchange Rate
(USD/INR)
Nominal Amount USD Crores
Fair Value Assets (Liabilities)` in Crores
2 to 5 years March 31, 2021 7.84% 67.53 7.32 36.86
2 to 5 years March 31, 2020 7.84% 67.53 7.32 48.02
Currency Options:
Particulars As atAverage
Exchange Rate (USD/INR)
Nominal Amount USD Crores
Fair Value Assets (Liabilities)` in Crores
2 to 10 years March 31, 2021 72.52 20.00 345.78
2 to 10 years March 31, 2020 - - -
*Includes weighted average rate for Cross Currency Interest Rate Swaps, Principal Only Swap and Coupon Swaps.
The above Hedging Instruments are included in the Balance Sheet under the head “Other Financial Assets”/ “Other Financial Liabilities”.
Refer Statement of changes in equity for movement on OCI.
Recognition of gains / (losses) under forward exchange, currency options and interest rates swaps contracts designated under cash flows hedges:
` in Crores
Particulars
As at March 31, 2021 As at March 31,2020 (Restated)
Effective Hedge (OCI)
Ineffective Hedge (Profit and Loss)
Effective Hedge (OCI)
Ineffective Hedge (Profit and Loss)
Gain/(Loss) 11.00 2.50 (63.38) -
C) Commodity price risk management:
Commodity price risk for the Company is mainly related to fluctuations in coal and pet coke prices linked to various external factors, which can affect the production cost of the Company. Since the Energy costs is one of the primary costs drivers, any fluctuation in fuel prices can lead to drop in operating margin. To manage this risk, the Company enters into forward covers for imported coal, enter into long-term supply agreement for pet coke, identifying new sources of supply etc. While forward covers are prevailing in
Notes to the Consolidated Financial Statements for the year ended March 31, 2021 (Continued)

332
Ult
raTe
ch C
emen
t Li
mit
ed
333
Ann
ual R
epo
rt 2
020-
21
Welcome to UltraTech
Value Creation
Growth Enablers
Statutory Reports
Financial Statements
ESG Commitments
the markets for coal but in case of pet coke no such derivative is available; it has to be procured at spot prices. Additionally, processes and policies related to such risks are reviewed and controlled by senior management and fuel requirement are monitored by the central procurement team.
II) Credit Risk Management:
Credit risk arises when a customer or counterparty does not meet its obligations under a financial instrument or customer contract, leading to a financial loss. The Group is exposed to credit risk from its operating activities (primarily trade receivables) and from its financing / investing activities, including deposits with banks/financial institutions, mutual fund investments, and investments in debt securities, foreign exchange transactions and financial guarantees. The Group has no significant concentration of credit risk with any counterparty.
Trade receivables
Trade receivables are consisting of a large number of customers. The Group has credit evaluation policy for each customer and based on the evaluation credit limit of each customer is defined. Wherever the Group assesses the credit risk as high, the exposure is backed by either bank guarantee / letter of credit or security deposits.
Total Trade receivables as on March 31, 2021 is ` 2,571.73 Crores (March 31, 2020 (Restated): ` 2,383.22 Crores)
The Group does not have higher concentration of credit risks to a single customer. Single largest customer has total exposure in sales of 2.00% (March 31, 2020 (Restated): 2.3%) and in receivables of 9.5% (March 31, 2020 (Restated): 7.4%).
As per simplified approach, the Company makes provision of expected credit losses on trade receivables using a provision matrix to mitigate the risk of default payments and makes appropriate provision at each reporting date wherever outstanding is for longer period and involves higher risk.
As per policy receivables are classified into different buckets based on the overdue period ranging from 6 months – one year to more than two years. There are different provisioning norms for each bucket which are ranging from 25% to 100%.
Movement of provision for doubtful debts:
` in Crores
ParticularsMarch 31, 2021 March 31, 2020
(Restated)
Opening provision 135.85 73.94
Add: Provided during the year 22.78 73.88
Less: Utilised during the year (8.20) (14.13)
Add: Effect of Foreign Currency Conversion (1.96) 2.16
Closing Provision 148.47 135.85
Investments, Derivative Instruments, Cash and Cash Equivalent and Bank Deposit
Credit Risk on cash and cash equivalent, deposits with the banks / financial institutions is generally low as the said deposits have been made with the banks / financial institutions who have been assigned high credit rating by international and domestic rating agencies.
Credit Risk on Derivative Instruments is generally low as Group enters into the Derivative Contracts with the reputed Banks and Financial Institutions.
Investments of surplus funds are made only with approved Financial Institutions / Counterparty. Investments primarily include investment in units of mutual funds, quoted Bonds, Non-Convertible Debentures issued by Government
Notes to the Consolidated Financial Statements for the year ended March 31, 2021 (Continued)
/ Semi Government Agencies / PSU Bonds / High Investment grade corporates etc. These Mutual Funds and Counterparties have low credit risk.
Total Non-current and current investments as on March 31, 2021 is ` 12,104.32 Crores (March 31, 2020 ` 5,881.73 Crores)
Financial Guarantees:
The company has given corporate guarantees of ` 1.70 crores. (Refer Note 38(c)).
III) Liquidity risk management:
Liquidity risk is defined as the risk that the Group will not be able to settle or meet its obligations on time or at reasonable price. Prudent liquidity risk management implies maintaining sufficient cash and marketable securities and the availability of funding through an adequate amount of credit facilities to meet obligations when due. The Group’s treasury team is responsible for liquidity, funding as well as settlement management. In addition, processes and policies related to such risks are overseen by senior management. Management monitors the Group’s liquidity position through rolling forecasts on the basis of expected cash flows.
The table below provides details regarding the remaining contractual maturities of financial liabilities and investments held for managing the risk at the reporting date based on contractual undiscounted payments.
` in Crores
As at March 31, 2021Less than
1 year1 to 5 years
More than5 Years
Total
Borrowings (including current maturities of long-term debts)
6,939.32 4,492.85 9,055.60 20,487.77
Trade Payables 4,699.28 - - 4,699.28
Interest accrued but not due on borrowings 180.79 - - 180.79
Lease Liability 169.97 708.86 930.51 1,809.33
Other Financial Liabilities (excluding Derivative Liability)
2,547.88 - - 2,547.88
Deferred Premium Payable 47.82 191.14 238.95 477.91
Derivative Liability 6.34 - - 6.34
Investments 10,893.87 896.18 314.27 12,104.32
` in Crores
As at March 31, 2020(Restated)
Less than1 year
1 to 5 yearsMore than
5 YearsTotal
Borrowings (including current maturities of long-term debts)
5,651.44 6,316.48 11,051.04 23,018.96
Trade Payables 3,362.89 - - 3,362.89
Interest accrued but not due on borrowings 198.89 - - 198.89
Lease Liability 161.77 605.19 958.43 1,725.39
Other Financial Liabilities (excluding Derivative Liability)
2,306.80 - - 2,306.80
Derivative Liability 54.51 - - 54.51
Investments 4,243.69 1,360.17 277.87 5,881.73
Notes to the Consolidated Financial Statements for the year ended March 31, 2021 (Continued)

334
Ult
raTe
ch C
emen
t Li
mit
ed
335
Ann
ual R
epo
rt 2
020-
21
Welcome to UltraTech
Value Creation
Growth Enablers
Statutory Reports
Financial Statements
ESG Commitments
Note 52: Distribution made and proposed (Ind AS 1):` in Crores
ParticularsYear Ended
March 31, 2021Year Ended
March 31, 2020 (Restated)
Proposed dividends on Equity shares:
Final dividend for the year ended on March 31, 2021: ` 37.00 per share(March 31, 2020: ` 13.00 per share)
1,068.02 375.21
Proposed dividends on Preference shares:
Final dividend for the year ended on March 31, 2021 0.01 0.01
Total Dividend proposed 1,068.03 375.22
Proposed dividends on equity shares are subject to approval at the annual general meeting and are not recognised as a liability as at March 31.
Note 53: Capital Management (Ind AS 1):
The capital management of the Company is to (a) maximise shareholder value and provide benefits to other stakeholders and (b) maintain an optimal capital structure to reduce the cost of capital.
For the purposes of the Group’s capital management, capital includes issued equity share capital, share premium and all other equity.
The Group monitors capital using debt-equity ratio, which is total debt less liquid investments and bank deposits divided by total equity.
` in Crores
ParticularsAs at
March 31, 2021As at
March 31, 2020 (Restated)
Total Debt (Bank and other Borrowings) 20,487.77 23,018.96
Equity 44,174.68 39,043.76
Liquid Investments and bank deposits 13,922.38 6,262.29
Debt to Equity (Net) 0.15 0.43
In addition, the Group has financial covenants relating to the borrowing facilities that it has taken from the lenders to manage interest coverage service ratio, Debt to EBITDA, etc. which is maintained by the Group.
Note 54: Research and Development:
Revenue expenditure on Research and Development included in different heads of expenses in the Statement of Profit and Loss is ` 15.25 Crores. (March 31, 2020 ` 16.34 Crores).
Note 55: Corporate Social Responsibility:
Expenditure incurred in cash on Corporate Social Responsibility activities, included in different heads of expenses in the Consolidated Statement of Profit and Loss is ` 120.68 Crores (March 31, 2020 ` 123.98 Crores) and on account of capital expenditure Nil (March 31, 2020 ` 0.96 Crores). The said capital expenditure is incurred on acquiring and owning assets which are being used for the purpose of Corporate Social Responsibility.
Notes to the Consolidated Financial Statements for the year ended March 31, 2021 (Continued)
The amount required to be spent under Section 135 of the Companies Act, 2013 for the year ended March 31, 2021 is ` 73.72 Crores (March 31, 2020 ` 63.50 Crores) i.e. 2% of average net profits for last three financial years, calculated as per section 198 of the Companies Act, 2013.
Note 56: Government Grant (Ind AS 20):
(a) Other Operating Revenues include Incentives against capital investments, under State Investment Promotion Scheme of ` 233.03 Crores (March 31, 2020 ` 381.84 Crores).
(b) Sales Tax deferment loan granted under State Investment Promotion Scheme has been considered as a government grant and the difference between the fair value and nominal value as on date is recognised as an income. Accordingly, an amount of ` 48.83 Crores (March 31, 2020: ` Nil Crores) has been recognised as an income. Every year change in fair value is accounted for as an interest expense.
(c) Repairs and maintenance are net of subsidy received, under State Investment Promotion Scheme of ` 0.37 Crores (March 31, 2020 ` 0.32 Crores).
(d) Cost of Materials consumed includes grants towards royalty expense amounting to ` 12.26 Crores (March 31, 2020 ` 23.44 Crores).
Note 57: Non Current Assets / Disposal group held for sale (Ind AS 105):
(a) Consequent to the acquisition of UltraTech Nathdwara Cement Limited (“UNCL”) during the year ended March 31, 2019, the Group had identified disposal groups (foreign subsidiaries of UNCL) that meet the criteria to be classified as held for sale on acquisition, as these were not considered core to the Group’s ongoing business activities and an active plan to locate a buyer was still in progress and the Group remained committed to sell these assets and continued to classify these assets as held for sale as per Ind AS 105. The disposal groups had also been considered as discontinued operations. During the year ended March 31, 2021:
(i) UNCL through its subsidiary, Krishna Holdings Pte. Ltd., a company incorporated in Singapore, has completed the divestment of its entire equity shareholding of 92.5% in its cement subsidiary which was classified as asset held for sale at a net consideration of USD 94.70 million and has recorded net gain on divestment of ` 437.68 crores.
(ii) UNCL’s wholly owned subsidiary, SSCILLC was previously classified as ‘held for sale’. During the period, it has been decided to make it a part of the continuing operations considering the synergies available with the existing capacity. Consequently, the Company has changed its plan to sell SSCILLC and instead continued its business operations. UNCL has sold SSCILLC to UltraTech Cement Middle East Investments Limited (“UCMEIL”), which is a wholly owned subsidiary of the Company, on November 23, 2020. Accordingly, SSCILLC has ceased to be classified as ‘held for sale’ and the financial results of SSCILLC previously presented as discontinued operations have been reclassified as per Ind AS 105 ‘Non-current Assets Held for Sale and Discontinued Operations’ and included in income from continuing operations for all periods presented and required adjustments have been made to the carrying amount of assets and liabilities of SSCILLC. Accordingly, financial statements for the year ended March 31, 2020 have been restated.
(iii) In terms of the National Company Law Appellate Tribunal’s (NCLAT) order dated 14th November 2018, approving the Resolution Plan submitted by the Company under the Insolvency and Bankruptcy Code, 2016 for acquisition of Binani Cement Limited, subsequently renamed UltraTech Nathdwara Cement Limited, (“UNCL”), a loan of USD 230.4 mn in 3B Binani Glassfibre SARL, (“3B”) a company registered in Luxembourg was assigned to UNCL from IDBI Bank Limited which has been classified as “Non-current Assets/ Disposal Group Held for Sale”. Assignment of the loan was along with securities which included pledge over certain assets and
Notes to the Consolidated Financial Statements for the year ended March 31, 2021 (Continued)

336
Ult
raTe
ch C
emen
t Li
mit
ed
337
Ann
ual R
epo
rt 2
020-
21
Welcome to UltraTech
Value Creation
Growth Enablers
Statutory Reports
Financial Statements
ESG Commitments
shares of 3B in various forms in favour of UNCL. Since 3B has been in continuous default in servicing the loan, UNCL has enforced its pledge of 3B shares, consequent to which 3B has become a wholly owned subsidiary of UNCL w.e.f March 12, 2021. The Company continues to classify the asset as “ Non-Current Assets/ Disposal Group Held for Sale” which is recorded at its fair value of ` 741.56 crores as on March 31, 2021 based on an independent valuation report after considering an impairment of ` 271.18 crores for the year ended March 31, 2021.
(b) The Company has identified certain assets like Land, Aggregate Mines, Coal Washery, Wagon Tippler, etc. which are available for sale in its present condition. The Company is committed to plan the sale of asset and an active programme to locate a buyer and complete the plan has been initiated. The Company expects to dispose off these assets in the due course.
(c) UCMEIL has identified one of the assets “Waste Heat Recovery System” (WHRS) which is not useful anymore as it is not productive and not giving the desired result. The realizable value after considering the impairment, scrap and dismantling cost is reclassified as assets for disposal. UCMEIL is committed to plan the sale of this asset and is in the process of discussion with vendors and contractor and expects the same to be disposed off within the due course.
Note 58: Revenue (Ind AS 115)
(A) The Company is primarily in the Business of manufacture and sale of cement and cement related products. The product shelf life being short, all sales are made at a point in time and revenue recognised upon satisfaction of the performance obligations which is typically upon dispatch/ delivery. The Company has a credit evaluation policy based on which the credit limits for the trade receivables are established, the Company does not give significant credit period resulting in no significant financing component. The Company, however, has a policy for replacement of the damaged goods.
(B) Reconciliation of revenue recognised from Contract liability:
` in Crores
ParticularsYear Ended
March 31, 2021Year Ended
March 31, 2020 (Restated)
Closing Contract liability-Advances from Customers 397.30 464.32
The Contract liability outstanding at the beginning of the year has been recognised as revenue during the year ended March 31, 2021.
(C) Reconciliation of revenue as per contract price and as recognised in statement of profit and loss:
` in Crores
ParticularsYear Ended
March 31, 2021Year Ended
March 31, 2020 (Restated)
Revenue as per Contract price 49,593.01 46,283.52
Less: Discounts and incentives (5,353.68) (4,502.97)
Revenue as per statement of profit and loss 44,239.33 41,780.55
Notes to the Consolidated Financial Statements for the year ended March 31, 2021 (Continued)
Note 59:
Under the Sabka Vishwas (Legacy Dispute Resolution) Scheme 2019, announced by the Government of India, the Company had provided a one-time expense of ` 130.66 crores as part of Other Expenses, against various disputed liabilities during the year ended March 31, 2020.
Note 60:
Exceptional item of ` 164.00 crores for the year ended March 31,2021 represents a one-time expense upon receiving an order dated July 17, 2020, issued by the Hon’ble Supreme Court denying the Company’s claim of capital investment subsidy, sanctioned in 2010 under Rajasthan Investment Promotion Scheme -2003 and an impairment provision of ` 96.74 crores has been made towards old advances for purchase of certain land wherein the Company has reassessed its ability to recover such advances for the year ended March 31,2021.
Note 61: Information as per the requirement of Section 22 of The Micro, Small and Medium Enterprises Development Act, 2006
` in Crores
ParticularsAs at
March 31, 2021As at
March 31, 2020 (Restated)
(a) (i) The principal amount remaining unpaid to any supplier at the end of accounting year included in trade payables
69.33 56.39
(ii) The interest due on above 0.02 0.01
(iii) The total of (i) & (ii) 69.35 56.40
(b) The amount of interest paid by the buyer in terms of section 16 of the Act - -
(c) The amount of the payment made to the supplier beyond the appointed day during the accounting year
- -
(d) The amounts of interest accrued and remaining unpaid at the end of financial year 0.02 0.01
(e) The amount of interest due and payable for the period of delay in making payment (which have been paid but beyond the due date during the year) but without adding the interest specified under this Act.
- -
(f) the amount of further interest remaining due and payable even in the succeeding years, until such date when the interest dues above are actually paid to the small enterprise, for the purpose of disallowance of a deductible expenditure under section 23 of the Micro, Small and Medium Enterprises Development Act, 2006.
- -
The above information has been determined to the extent such parties have been identified on the basis of information available with the Company and the same has been relied upon by the auditors.
Notes to the Consolidated Financial Statements for the year ended March 31, 2021 (Continued)

338
Ult
raTe
ch C
emen
t Li
mit
ed
339
Ann
ual R
epo
rt 2
020-
21
Welcome to UltraTech
Value Creation
Growth Enablers
Statutory Reports
Financial Statements
ESG Commitments
Note 62: Additional Information as required by Paragraph 2 of Part III - General Instruction for Preparation of CFS of Schedule III of the Companies Act, 2013.
Sr. No
Name of the entity in the group
Net Assets i.e. total assets minus total liabilities
Share in profit or loss Share in Other Comprehensive Income
(OCI)
Share in Total Comprehensive Income
(TCI)
As % of consolidated
net assets
Amount(` Crores)
As % of consolidated
profit / loss
Amount(` Crores)
As % of consolidated
OCI
Amount(` Crores)
As % of consolidated
TCI
Amount(` Crores)
1 Parent 95.49% 42,185.68 98.46% 5,377.79 222.41% 36.92 98.84% 5,414.71
2 Subsidiaries
Indian
(i) Dakshin Cements Limited 0.00% - 0.00% - 0.00% - 0.00% -
(ii) Harish Cement Limited 0.35% 154.45 0.00% - 0.00% - 0.00% -
(iii) Bhagwati Limestone Company Private Limited
0.01% 2.52 0.00% (0.05) 0.00% - 0.00% (0.05)
(iv) Gotan Lime Stone Khanij Udyog Private Limited
0.04% 19.52 (0.01)% (0.63) 0.00% - (0.01)% (0.63)
(v) Ultratech Nathdwara Cement Limited
0.79% 351.16 0.08% 4.30 3.67% 0.61 0.09% 4.91
Foreign
(i) UltraTech Cement Lanka (Private) Limited
0.38% 166.90 (0.09)% (5.02) (0.84)% (0.14) (0.09)% (5.16)
(ii) UltraTech Cement Middle East Investments Limited
2.86% 1,265.25 1.66% 90.62 (125.06)% (20.76) 1.28% 69.86
(iii) PT UltraTech Mining Indonesia 0.00% 0.46 0.00% - 0.00% - 0.00% -
(iv) PT UltraTech Investment Indonesia 0.00% (0.06) 0.00% - 0.00% - 0.00% -
(v) Star Super Cement Industries LLC (Refer Note 57)
0.00% - (0.11)% (6.09) 0.00% - (0.11)% (6.09)
3 Non-Controlling Interests in Subsidiaries
Foreign
(i) UltraTech Cement Lanka (Private) Limited
0.01% 5.67 (0.02)% (1.25) (0.18)% (0.03) (0.02)% (1.28)
(ii) PT UltraTech Mining Indonesia 0.00% 0.12 0.00% - 0.00% - 0.00% -
(iii) PT UltraTech Investment Indonesia 0.00% (0.07) 0.00% - 0.00% - 0.00% -
4 Joint Venture-Indian
Bhaskarpara Coal Company Limited 0.01% 6.53 0.00% 0.01 0.00% - 0.00% 0.01
5 Associate-Indian
(i) Madanpur (North) Coal Company Private Limited
0.00% 0.86 0.00% 0.01 0.00% - 0.00% 0.01
(ii) Aditya Birla Renewable SPV 1 Limited
0.04% 18.12 0.04% 2.29 0.00% - 0.04% 2.29
(iii) Aditya Birla Renewable Energy Limited
0.01% 3.29 0.00% (0.13) 0.00% 0.00% (0.13)
Total 100.00% 44,180.40 100.00% 5,461.85 100.00% 16.60 100.00% 5,478.45
Notes to the Consolidated Financial Statements for the year ended March 31, 2021 (Continued)
Note 63: COVID-19 (Global Pandemic)
In the face of COVID – 19 pandemic the Company’s operations across locations were stopped in line with the Government directives. This had an adverse impact on revenues during Q1FY21, as expected.
Even before the formal announcement of the national lockdown, keeping in mind the well-being of its employees, the Company enabled ‘work from home’ for its employees and had taken all necessary steps to ensure a seamless transition to the new ways of working for employees, while at the same time ensuring business continuity. The Company was in continuous engagement with all its stakeholders through various digital platforms. Critical Response Teams were set up across the organization to plan scenarios and respond to the rapidly changing situation.
With the Government allowing select activities to operate, the Company gradually resumed operations at its establishments after obtaining necessary government approvals and ensuring compliance with the statutory guidelines in line with the standard operating procedure (SOP) announced by the Ministry of Home Affairs, Government of India.
With the easing of lockdown, operations gradually stabilised. The Company has the unique advantage of being able to cater to demand in different parts of the country.
The Company recovered the carrying amount of all its assets including inventory, receivables and loans in the ordinary course of business. The Company’s capital and financial resources remained entirely protected and its liquidity position remain adequately covered. The Company was able to service its debt obligations as per schedule and on due dates. It did not avail the moratorium extended by the banks as per the Reserve Bank of India guidelines.
Note 64:
Previous year figures have been regrouped / reclassified wherever necessary to correspond with current year classification / disclosure and have been restated wherever required to give effect to Note 57a (ii).
Signatures to Note ‘1’ to ‘64’
In terms of our report attached. For and on behalf of the Board of Directors
For B S R & Co. LLPChartered AccountantsFirm Registration No: 101248W/W-100022
For Khimji Kunverji & Co LLPChartered AccountantsFirm Registration No: 105146W/W-100621
VIJAY MATHURPartnerMembership No: 46476
KETAN VIKAMSEYPartnerMembership No: 44000
ATUL DAGAWhole-time Director and CFODIN: 06416619
K. C. JHANWARManaging DirectorDIN: 01743559
Mumbai: May 07, 2021S. K. CHATTERJEECompany Secretary
Notes to the Consolidated Financial Statements for the year ended March 31, 2021 (Continued)

340
Ult
raTe
ch C
emen
t Li
mit
ed
Note

UltraTech Cement Limited
B Wing, Ahura Centre, 2nd Floor, Mahakali Caves Road, Andheri (East), Mumbai - 400 093
www.ultratechcement.com