Annual Report 2015 Flowering the world.
143
Royal FloraHolland Jaarverslag 2015 XXXXXX XXX 1 •••••••••• | •••••••••••••••• Annual Report 2015 Flowering the world. Dutch
-
Upload
khangminh22 -
Category
Documents
-
view
3 -
download
0
Transcript of Annual Report 2015 Flowering the world.

Royal FloraHolland Jaarverslag 2015
XXXXXXXXX
1 •••••••••• | ••••••••••••••••
Annual Report 2015
Flowering the world.
Dutch

Royal FloraHolland2 Annual Report 2015 | Note to readers
This annual report is available in electronic
form only. The most important information on
2015 can be found on this website. The complete
annual report consists of:
– the Management Board report;
– the Supervisory Board report;
– the GMM Committee report;
– the financial statements.
Collectively, these documents are the basis for
the decision of the General Members’ Meeting
(GMM) on 2 June 2016. Each document can be
accessed or printed via a separate link on each
page of this report.
The following terms are used in this annual
report: Koninklijke Coöperatieve Bloemenveiling
FloraHolland U.A. (‘Royal FloraHolland’ or ‘the
cooperative’).
The annual report of Royal FloraHolland was
prepared by the Management Board of the
cooperative on 13 April 2016. The report
was also approved by the Supervisory Board
on 13 April 2016. The annual report will
be submitted for adoption by the General
Members’ Meeting on 2 June 2016.
Disclaimer
This report includes forward-looking statements
based on current expectations, estimates and
projections by the management of Royal
FloraHolland. The information available at the
time of preparation of this annual report does
not offer any certainty that the expectations,
estimates and projections will be realised.
Note to readers Report of the GMM Committee
SupervisoryBoard Report
Management Board Report
2020 strategy
Facts & figures
Financial statements

Royal FloraHolland3 Annual Report 2015 | Contents
Foreword 4
Our long-term vision 6
Our right to exist 7
Our facts and figures 8
Turnover 9
Import and export 12
Financial key figures 17
Facilities 18
Cut flowers 21
House plants 23
Garden plants 25
Sustainability 27
Employees 29
Safety 30
Strategy for Royal FloraHolland in 2020 31
Consumer Programme 33
The New Auction Programme 36
Improving Together Programme 37
World Flower Exchange Programme 38
FLOW Programme 39
Cooperative Programme 2020 40
Management Board Report 41
The Statutory Management Board 41
Structure of Royal FloraHolland 41
The Management Board and the Royal FloraHolland Management Team
42
Royal FloraHolland, a cooperative of active members
43
Advisory Council for Flowers 44
Advisory Council for Plants 45
Customer platform 48
Results in 2015 51
Financing of the cooperative 55
Being a good employer 58
Safety and sustainability on the agenda 60
Targets for 2020 61
Corporate governance 62
Risk schedule 64
Risk management and control 65
Supervisory Board Report 68
Members of the Supervisory Board 69
Report of the Audit Committee 73
Report of the Selection and Remuneration Committee
74
Report of the Cooperative Committee 75
Advice from the Supervisory Board 76
Report of the GMM Committee 77
Financial Statements 2015 80
Consolidated balance sheet 81
Consolidated profit and loss account
83
Consolidated cash flow statement 84
Consolidated statement of comprehensive income
86
Notes to the consolidated figures
87
Notes to the consolidated balance sheet
94
Notes to the consolidated profit and loss account
107
Company balance sheet 113
Company profit and loss account 114
Notes to the company figures 115
Notes to the company balance sheet 116
Other information 128
Appendice: list of participating interests 139
Addresses 141
Colophon 143
Contents Report of the GMM Committee
SupervisoryBoard Report
Management Board Report
2020 strategy
Facts & figures
Financial statements

Royal FloraHolland4 Annual Report 2015 | Foreword
Foreword
First of all I would like to thank the members,
their customers and our employees for placing
their trust in us in the past year. In particular,
I wish to thank the members and customers who
helped to successfully formulate the strategy
of Royal FloraHolland 2020 at the regional
meetings, Advisory Councils and customer
platforms. This confidence and improved
cooperation have already borne fruit in 2015.
I would like to personally thank our CFO Rens
Buchwaldt for more than 9 years of involvement
in and commitment to the cooperative and his
keen eye for detail.
Growers and their customers can generally look
back on a positive year. Royal FloraHolland
closed the year with a turnover of €4.6 billion,
a slight increase of 1.4% compared to 2014.
Total volume traded was up 0.5%. This slight
increase in volume contributed to the higher
turnover. There were variations between product
groups, but the growers received a price for their
flowers and plants which was an average of 0.9%
higher than in the previous year.
The operation of Royal FloraHolland developed
positively. A decline in income was offset by
lower costs, so that the financial result was
ultimately above budget.
2015 was also memorable because customers
once again decided to contribute to the promotion
of flowers and plants by Bloemenbureau
Holland. This was a direct result of the faith and
confidence that Royal FloraHolland has regained
from this group. 2015 was also the year in which
the strategy of Royal FloraHolland for 2020 was
developed with a number of programmes
designed to boost our ambitions of ‘better
margins for our members and their customers’
and ‘more consumers buying more flowers and
plants’. The first practical steps have been taken.
Further details of the progress of these
programmes are provided in this annual report.
The changes have been energetically initiated,
and in line with the strategy of Royal
FloraHolland for 2020, will continue to do so
within the cooperation.
Report of the GMM Committee
SupervisoryBoard Report
Management Board Report
2020 strategy
Facts & figures
Financial statements

Royal FloraHolland
We need to implement changes decisively, since
the environment is changing at an unbelievable
pace. 2016 will be a year in which acceleration is
the central theme. We will increase the tempo of
the existing programmes and will add two others.
In the Cooperative 2020 programme we will
define the shape of tomorrow’s cooperative
together. We are looking at several forms of
membership and also at our rate structures.
The Flow Programme aims to find answers as
to how we can design the logistics flow towards
our marketplace more efficiently.
We will also step up the pace with respect to
information technology. We will expand old
systems, outsource a large part of our ICT
department and work hard on the digital
strategy for Royal FloraHolland and the sector.
All this means that Royal FloraHolland is
undergoing a transformation. The connection
with our members, their customers and our
employees is crucial in this respect. That is why
we are focusing more on the workloads of our
employees and the interaction with members
and customers. The essential issue is still how we
can better reflect the wishes of our members
and customers in 2016, for instance by ending
services that have become irrelevant and
developing new ones.
Our target is to increase turnover in 2016 by
€142 million. We expect to achieve the initial
results by strengthening and increasing our
physical and digital marketplaces and
conquering new markets in Europe and beyond.
And of course by developing additional
promotional activities so that consumers ignore
the gift voucher and choose to give flowers and
plants instead.
I look forward to the future with confidence and
hope to meet you regularly either in person or
through other communication.
I hope you enjoy reading this annual report.
Lucas Vos
CEO Royal FloraHolland
‘We expect to book the initial results by strengthening and increasing our physical and digital marketplaces and conquering new markets in Europe and beyond.’
5 Annual Report 2015 | Foreword
Foreword Report of the GMM Committee
SupervisoryBoard Report
Management Board Report
2020 strategy
Facts & figures
Financial statements
Royal FloraHollandRoyal FloraHolland
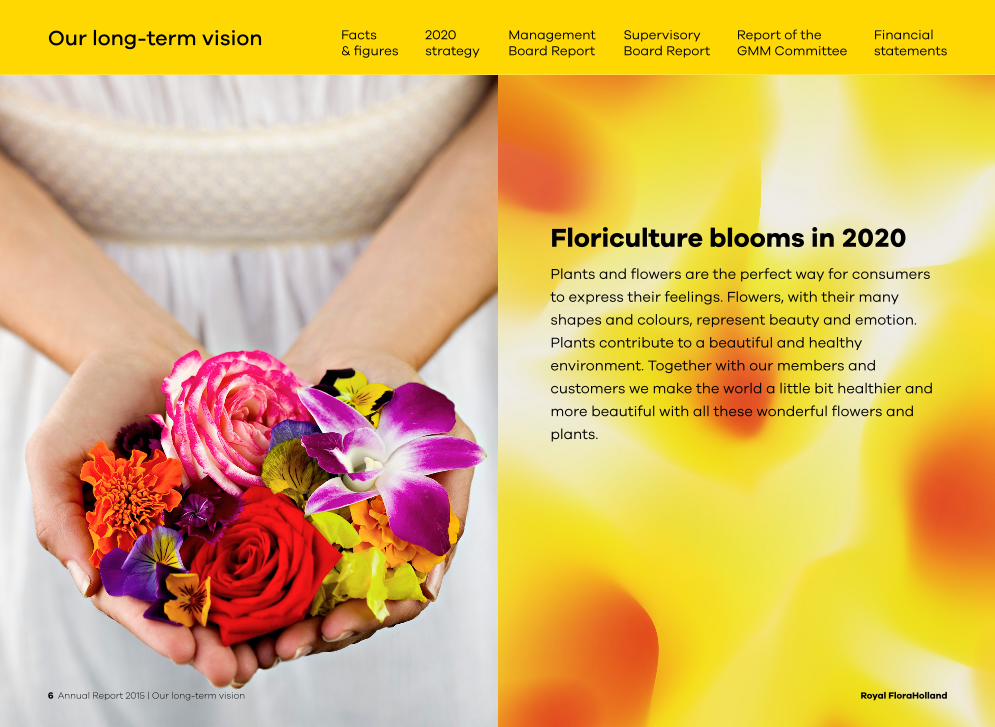
Plants and flowers are the perfect way for consumers
to express their feelings. Flowers, with their many
shapes and colours, represent beauty and emotion.
Plants contribute to a beautiful and healthy
environment. Together with our members and
customers we make the world a little bit healthier and
more beautiful with all these wonderful flowers and
plants.
Floriculture blooms in 2020
Our long-term vision
6 Annual Report 2015 | Our long-term vision
Report of the GMM Committee
SupervisoryBoard Report
Management Board Report
2020 strategy
Facts & figures
Financial statements

Royal FloraHolland
Flowering the World Together, Planting Seeds of Opportunity for our Members
Together with growers and their customers,
Royal FloraHolland has been making the world more
beautiful and healthier with flowers and plants for
more than 100 years. With 100,000 transactions a day
and 400,000 types of flowers and plants, we are the
international marketplace and knowledge partner that
contributes to the success of the growers and their
customers. Through streamlined logistics, these
wonderful products quickly find their way across the
world. So consumers can express their gratitude, their
love, wishes for good health, apologies, wishes for good
luck and expressions of consolation.
Flowering the world.
Our right to exist
Royal FloraHolland7 Annual Report 2015 | Our right to exist
Report of the GMM Committee
SupervisoryBoard Report
Management Board Report
2020 strategy
Facts & figures
Financial statements

Royal FloraHolland
XXXXXXXXX
8 Annual Report 2015 | Directieverslag
Directieverslag
Royal FloraHolland8 Annual Report 2015 | Reporting framework
Veiligheid
Duurzaamheid
Medewerkers
Omzet en aanvoer
Financiële kengetallen
Faciliteiten
Snijbloemen
Kamerplanten
Tuinplanten
Import en Export
Sustainability
Employees
Turnover
Financial key figures
Facilities
Cut flowers
House plants
Garden plants
Imports and exportsSafety
Our facts and figures Report of the GMM Committee
SupervisoryBoard Report
Management Board Report
2020 strategy
Financial statements

Royal FloraHolland
XXXXXXXXX
9 Annual Report 2015 | Directieverslag
Directieverslag
In units supplied by clock ↓4.7%(number x M)
7,129*
Total turnover ↑1.5%(in € M)
4,602*
Turnover via(in € M)
Turnover (total)
* Consolidated turnover.
** Turnover excluding participating interests.
* Consolidated turnover.
** Turnover excluding participating interests.
2,130Clock ↓1.0%
2,335 Direct ↑3.8%
2,556** 1,557** 352**
Cut flowers ↑2.8%
House plants ↓0.4%
Garden plants ↑0.3%
6,649** 318** 163**
Cut flowers ↓4.8%
House plants ↑1.0%
Garden plants ↓7.9%
9 Annual Report 2015 | Turnover
Report of the GMM Committee
SupervisoryBoard Report
Management Board Report
2020 strategy
Financial statements

Royal FloraHolland
XXXXXXXXX
10 Annual Report 2015 | Directieverslag Royal FloraHolland
Total suppliers ↓4.6%
6,153Of which: members in the Netherlands ↓2.3%
Of which:members abroad↓3.6%
Of which: non-members↓9.8%
3,775 638 1,740
61%
10%
29%
Customers and relations
Total customers↑4.7%
2,43910 Annual Report 2015 | Customers and relations
Report of the GMM Committee
SupervisoryBoard Report
Management Board Report
2020 strategy
Financial statements

DirectieverslagTurnover and supply
44.556
35.057
20.280
4.905
4.675
Aalsmeer ↑0.1%
Naaldwijk ↓1.0%
Rijnsburg ↓0.6%
Eelde ↓↑0.0%
Clock sales ↓1.0%
FloraHolland Connect ↑3.8%
Total ↑1.5%
1,078
4,465
703
2,335
325
2,130
24
767
1,401
486
147
1
8.7
27.2
2.0
Turnoverper day(in € mln.)↓1.0%
Number of units of flowers per day (clock)(number x mln.)↓4.8%
Number of units of plants per day (clock)(number x mln.)↓2.2%
44.556
35.057
20.280
4.905
4.675
Aalsmeer ↑0.1%
Naaldwijk ↓1.0%
Rijnsburg ↓0.6%
Eelde ↓↑0.0%
Clock sales ↓1.0%
FloraHolland Connect ↑3.8%
Total ↑1.5%
1,078
4,465
703
2,335
325
2,130
24
767
1,401
486
147
1
Royal FloraHolland11 Annual Report 2015 | Turnover and supply
Turnover per location (in € M)
Turnover RP(Remote Purchases)(in € M)
50.6% 54.7%33.0% 34.7%
15.3%10.5%
1.1% 0.1%
20152015 2015
Turnover and number of units by clock per day(in M)
Report of the GMM Committee
SupervisoryBoard Report
Management Board Report
2020 strategy
Financial statements

XXXXXXXXX
Directieverslag
Value of exports in 2015
Share of total exports
Value of exports in 2014
Share of total exports
Germany 1,557 27.9% 1,619 30.0%
United Kingdom 925 16.6% 809 15.0%
France 753 13.5% 687 12.7%
Other countries 484 8.7% 430 8.0%
Italy 304 5.5% 283 5.3%
Belgium 232 4.2% 225 4.2%
Switzerland 183 3.3% 176 3.3%
Sweden 176 3.2% 173 3.2%
Poland 174 3.1% 153 2.8%
Russia 169 3.0% 227 4.2%
Austria 130 2.3% 149 2.8%
Denmark 113 2.0% 111 2.1%
United States 88 1.6% 61 1.1%
Czech Republic 82 1.5% 79 1.5%
Spain 75 1.4% 69 1.3%
Norway 75 1.3% 84 1.5%
Finland 57 1.0% 59 1.1%12 Annual Report 2015 | Major export destinations
Source: Floridata
Major export destinations (in € M)
€5,577 MTotal exports ↑3.4%
Report of the GMM Committee
SupervisoryBoard Report
Management Board Report
2020 strategy
Financial statements
Directieverslag
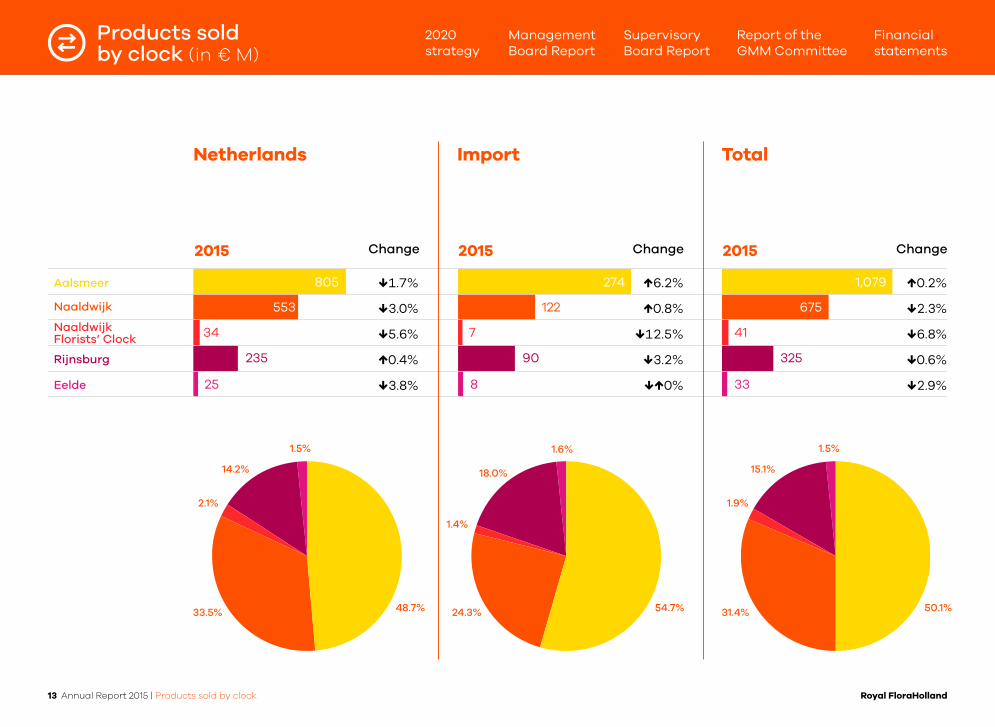
235
34
25
7
8
1,079
675
325
41
33
Aalsmeer
Naaldwijk
NaaldwijkFlorists’ Clock
Rijnsburg
Eelde
805
553
274
122
90
Royal FloraHolland13 Annual Report 2015 | Products sold by clock
Products soldby clock (in € M)
↓1.7% ↑6.2% ↑0.2%
↓3.0% ↑0.8% ↓2.3%
↓5.6% ↓12.5% ↓6.8%
↑0.4% ↓3.2% ↓0.6%
↓3.8% ↓↑0% ↓2.9%
Netherlands Import Total
48.7% 54.7% 50.1%33.5% 24.3% 31.4%
2.1%
1.4%
1.9%
14.2% 18.0% 15.1%
1.5% 1.6% 1.5%
2015 ChangeChangeChange 2015 2015
Report of the GMM Committee
SupervisoryBoard Report
Management Board Report
2020 strategy
Financial statements

Royal FloraHolland
XXXXXXXXX
14 Annual Report 2015 | Directieverslag
Directieverslag
Royal FloraHolland
Aalsmeer
25.4%
Eelde
24.2%
Naaldwijk
18.1%
Rijnsburg27.7%
Naaldwijk Florists’ Clock
17. 1%
Share of imports per location
(in % of total turnover per location)
14 Annual Report 2015 | Share of imports per location
Report of the GMM Committee
SupervisoryBoard Report
Management Board Report
2020 strategy
Financial statements

XXXXXXXXX
15 Annual Report 2015 | Directieverslag
Directieverslag
Royal FloraHolland
Top 10 import countries (in € M)
Turnover2015
Turnover2014
Turnover change
Share of imports
Kenya 330 315 ↑4.8% 43.7%
Ethiopia 180 178 ↑1.1% 23.8%
Israel 59 60 ↓1.7% 7.8%
Belgium 39 37 ↑5.4% 5.2%
Germany 32 33 ↓3.0% 4.2%
Zimbabwe 20 28 ↓28.6% 2.6%
Denmark 18 17 ↑5.9% 2.4%
Spain 18 17 ↑5.9% 2.4%
Italy 13 13 0.0% 1.7%
Ecuador 11 11 0.0% 1.5%
Other 35 40 ↓12.5% 4.6%
€755 MTotal top 10 import countries↑0.8%
15 Annual Report 2015 | Top 10 import countries
Report of the GMM Committee
SupervisoryBoard Report
Management Board Report
2020 strategy
Financial statements

Royal FloraHolland16 Annual Report 2015 | Directieverslag
Directieverslag
Royal FloraHolland
Top 10 import products
Turnover 2015
451 21 19 17 11 11 9 8 8 7
Turnover 2014
452 20 17 17 11 10 8 8 7 7
Change ↓0.2% ↑5.0% ↑11.8% 0.0% 0.0% ↑10.0% ↑12.5% 0.0% ↑14.3% 0.0%
Ro
sa R
ose
Hy
pe
ric
um
Gy
pso
ph
ilaB
ab
y’s
Bre
ath
Dia
nth
us
Ca
rna
tio
n
Lim
on
ium
Se
a L
ave
nd
er
Ch
am
ela
uc
ium
Wa
xfl
ow
er
Rh
od
od
en
dro
n
Ra
nu
nc
ulu
s
So
lida
go
Ve
ron
ica
1 2 3 4 5 6 7 8 9 10
(in € M)
16 Annual Report 2015 | Top 10 import products
Report of the GMM Committee
SupervisoryBoard Report
Management Board Report
2020 strategy
Financial statements

Royal FloraHolland
XXXXXXXXX
17 Annual Report 2015 | Directieverslag
DirectieverslagFinancial key figures
Turnover (in € M)
2015 4,6022014 4,537 ↑1.4%Result after tax (in € M)
2015 12.02014 9.6 ↑25.0%Cost-effective provision (net in %)
2015 3.72014 3.8 ↓2.6%
Revenue (in € M)
2015 3922014 393 ↓0.3%Total costs (in € M)
2015 3772014 384 ↓1.8%Investments - net (in € M)
2015 482014 41 ↑17.1%
Solvency (in %)
2015 24.82014 23.4 ↑6.0%Risk-bearing assets (in %)
2015 54.42014 49.4 ↑10.1%
Balance sheet total (in € M)
2015 8852014 903 ↓2.0%
17 Annual Report 2015 | Financial key figures
Report of the GMM Committee
SupervisoryBoard Report
Management Board Report
2020 strategy
Financial statements
Royal FloraHolland
XXXXXXXXX
18 Annual Report 2015 | Directieverslag
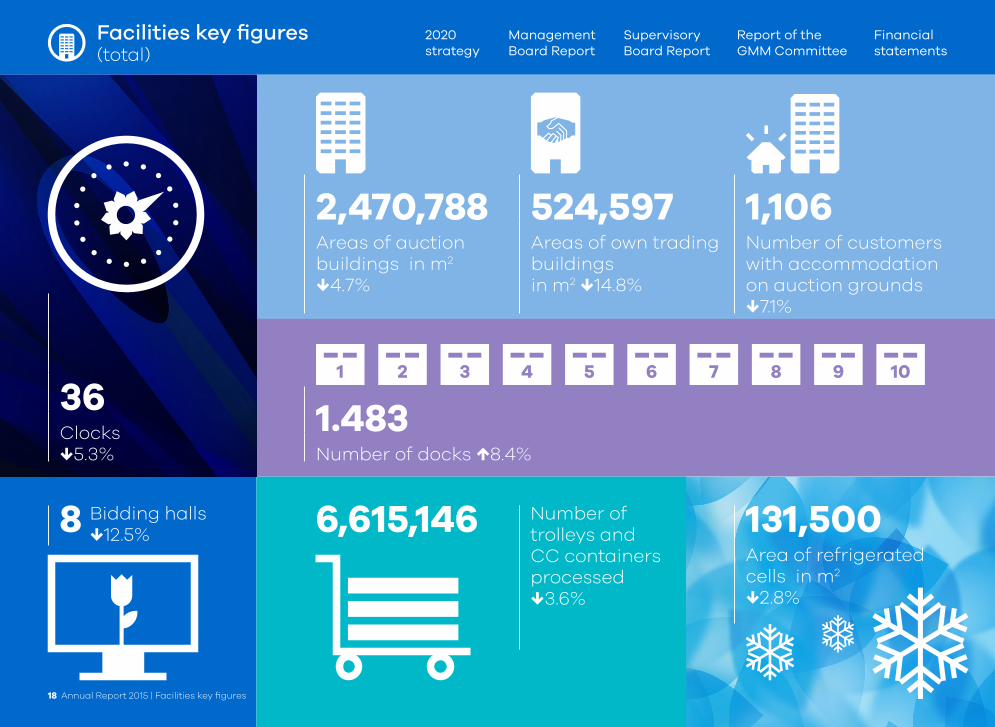
Facilities key figures (total)
36Clocks↓5.3%
2,470,788 524,597 1,106Areas of auction buildings in m2
↓4.7%
Areas of own trading buildings in m2 ↓14.8%
Number of customers with accommodation on auction grounds ↓7.1%
1 2 3 4 5 6 7 8 9 10
1.483Number of docks ↑8.4%
8 Bidding halls↓12.5% 6,615,146 Number of
trolleys and CC containers processed↓3.6%
131,500Area of refrigerated cells in m2
↓2.8%
18 Annual Report 2015 | Facilities key figures
Report of the GMM Committee
SupervisoryBoard Report
Management Board Report
2020 strategy
Financial statements

Clocks Bidding halls Area of auction buildings
Area of own trading buildings
Aalsmeer 14 3 1,287,813 m2 239,861 m2
Naaldwijk 12 3 736,000 m2 207,000 m2
Rijnsburg 7 1 400,000 m2 67,700 m2
Eelde 3 1 46,975 m2 10,036 m2
Number of customers with accommodation
on auction grounds
Area of refrigerated
cells
Number of trolleys and CC containers
processed
Number of docks
Aalsmeer 450 51,800 m2 3,469,373 530
Naaldwijk 450 40,380 m2 2,671,612 520
Rijnsburg 180 38,880 m2 866,321 296
Eelde 26 3,440 m2 77,320 22
Facilities key figures (per location)
Royal FloraHolland19 Annual Report 2015 | Facilities key figures
Report of the GMM Committee
SupervisoryBoard Report
Management Board Report
2020 strategy
Financial statements
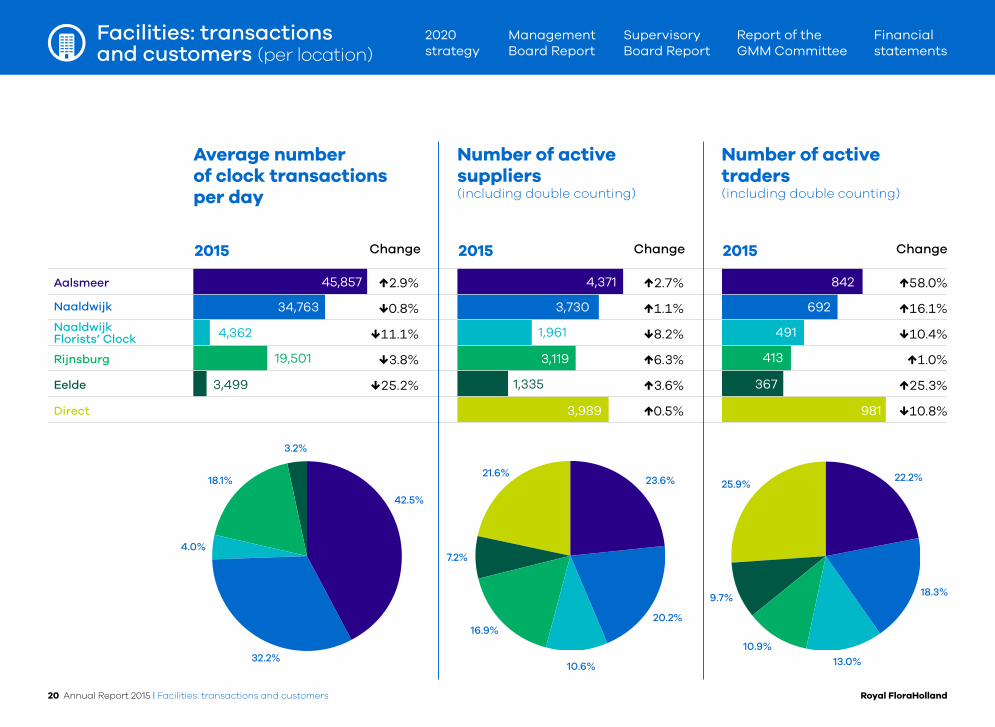
19,501
4,362
3,499 1,335
Aalsmeer
Naaldwijk
NaaldwijkFlorists’ Clock
Rijnsburg
Eelde
Direct
45,857
34,763
4,371
3,730
1,961
3,119
3,989
842
692
413
491
367
981
↑2.9% ↑2.7% ↑58.0%
↓0.8% ↑1.1% ↑16.1%
↓11.1% ↓8.2% ↓10.4%
↓3.8% ↑6.3% ↑1.0%
↓25.2% ↑3.6% ↑25.3%
↑0.5% ↓10.8%
Average number of clock transactions per day
Number of active suppliers (including double counting)
Number of active traders(including double counting)
42.5%
23.6%
18.3%
20.2%
13.0%32.2%
16.9%
9.7%
10.6%
10.9%
4.0%7.2%
25.9%18.1%21.6% 22.2%
3.2%
2015 Change ChangeChange2015 2015
Facilities: transactions and customers (per location)
Royal FloraHolland20 Annual Report 2015 | Facilities: transactions and customers
Report of the GMM Committee
SupervisoryBoard Report
Management Board Report
2020 strategy
Financial statements

Royal FloraHolland21 Annual Report 2015 | Directieverslag
Top 10 cut flowers sold
Top 10: Cut flowers
Ro
sa
Ro
se
Ch
rysa
nth
em
um
Ind
G
rp G
E
Ch
rysa
nth
em
um
(sp
ray)
Tulip
aTu
lip
Lili
um
L
ily
Ge
rbe
ra
Ch
rysa
nth
em
um
Ind
G
rp G
E C
hry
san
the
mu
m
(dis
bu
dd
ed
)
Cy
mb
idiu
m
Eu
sto
ma
ru
sse
llia
nu
m
Lis
ian
thu
s
Fre
esi
a
Hyd
ran
ge
a
Turnover* 735 300 295 159 138 63 58 52 52 45
Change ↓1.8% ↓1.1% ↑9.4% ↑4.5% ↓1.3% ↓9.7% ↑13.5% ↑1.4% ↓3.3% ↑8.3%
Units** 3,580 1,193 1,909 304 988 157 144 309 280 42
1 2 3 4 5 6 7 8 9 10
Average price (in €)
2015 0.23 ↑4.5%2014 0.22
* in € M ** in M
Royal FloraHolland21 Annual Report 2015 | Cut flowers: top 10
Report of the GMM Committee
SupervisoryBoard Report
Management Board Report
2020 strategy
Financial statements
Directieverslag
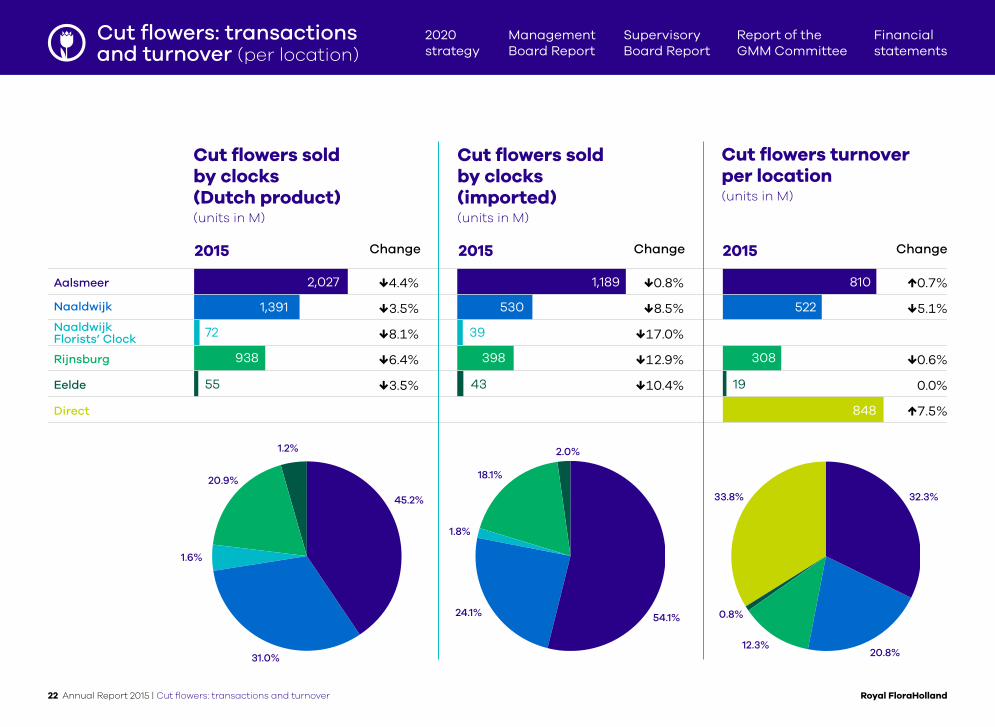
Aalsmeer
Naaldwijk
NaaldwijkFlorists’ Clock
Rijnsburg
Eelde
Direct
2,027
1,391
938
72
55
1,189
530
398
39
43
810
522
308
19
848
Cut flowers: transactionsand turnover (per location)
2015 2015 2015
↓4.4% ↓0.8% ↑0.7%
↓3.5% ↓8.5% ↓5.1%
↓8.1% ↓17.0%
↓6.4% ↓12.9% ↓0.6%
↓3.5% ↓10.4% 0.0%
↑7.5%
Cut flowers sold by clocks (Dutch product) (units in M)
Cut flowers sold by clocks(imported) (units in M)
Cut flowers turnover per location (units in M)
45.2% 32.3%
54.1%
20.8%31.0%
24.1% 0.8%
18.1%
12.3%
1.6%
1.8%
33.8%
20.9%
2.0%1.2%
Change ChangeChange
Royal FloraHolland22 Annual Report 2015 | Cut flowers: transactions and turnover
Report of the GMM Committee
SupervisoryBoard Report
Management Board Report
2020 strategy
Financial statements

Royal FloraHolland23 Annual Report 2015 | Directieverslag
Directieverslag
Top 10 house plants sold
Top 10: House plants
Turnover* 498 62 57 51 35 34 32 30 30 29
Change ↓0.1% ↑3.4% ↑1.3% ↑0.6% ↓4.7% ↑15.9% ↓1.6% ↓1.8% ↓2.2% ↓0.4%
Units** 137 90 47 17 41 9 51 10 12 16
Ph
ala
en
op
sis
Ka
lan
ch
oë
Ro
sa
Po
tte
d r
ose
An
thu
riu
m
Ch
rysa
nth
em
um
P
ott
ed
ch
rysa
nth
em
um
Hya
nc
inth
us
P
ott
ed
hya
cin
th
Hyd
ran
ge
a
Dra
ca
en
a
Fic
us
Mix
ed
pla
nts
1 2 3 4 5 6 7 8 9 10
Average price (in €)
2015 1.64 ↓1.8%2014 1.67
* in € M ** in M
Royal FloraHolland23 Annual Report 2015 | House plants: top 10
Report of the GMM Committee
SupervisoryBoard Report
Management Board Report
2020 strategy
Financial statements

Directieverslag
199Aalsmeer
Naaldwijk
NaaldwijkFlorists’ Clock
Rijnsburg
Eelde
Direct
165
112
6
6
3
12
8
5
4
3
145
13
9
1,191
House plants: transactionsand turnover (per location)
2015 2015 2015
↑1.9% 0.0% ↑2.5%
↑1.8% ↑14.3% ↓2.0%
↓45.5% ↑300%
↓45.5% ↓% 0.0%
↓50.0% ↓% 0.0%
↑0.8%
House plants sold by clocks(Dutch product)(units in M)
House plants sold by clocks (imported) (units in M)
House plants turnover per location (units in M)
56.5% 37.5%
38.4%
9.4%
76.5%25.0%
12.8%2.1%
12.5%
2.1%
15.6%
9.3%
0.8%0.6%
1.0%
Change ChangeChange
Royal FloraHolland24 Annual Report 2015 | House plants: transactions and turnover
Report of the GMM Committee
SupervisoryBoard Report
Management Board Report
2020 strategy
Financial statements

Royal FloraHolland25 Annual Report 2015 | Directieverslag
Directieverslag
Top 10 garden plants sold
Top 10: Garden plants
Turnover* 19 16 15 14 13 12 12 12 10 9
Change ↓3.7% ↑7.4% ↑28.5% ↓8.7% ↓4.9% ↓1.3% ↓9.5% ↓6.9% ↓6.7% ↑8.0%
Units** 25 5 6 41 21 9 5 4 15 10
Oth
er
be
dd
ing
pla
nts
Hyd
ran
ge
a
Pe
larg
om
ium
G
era
niu
m
Bu
xu
s
Oth
er
tre
es/
Sh
rub
s
La
ven
du
la
La
ven
de
r
Ost
eo
spe
rmu
mC
ap
e D
ais
y
De
co
rati
on
He
lleb
ore
s
Vio
la P
an
sy
1 2 3 4 5 6 7 8 9 10
Average price (in €)
2015 1.02 ↑6.3%2014 0.96
* in € M ** in M
Royal FloraHolland25 Annual Report 2015 | Garden plants: top 10
Report of the GMM Committee
SupervisoryBoard Report
Management Board Report
2020 strategy
Financial statements

Directieverslag
Aalsmeer
Naaldwijk
NaaldwijkFlorists’ Clock
Rijnsburg
Eelde
Direct
76
50
5
7
6
11
8
1
1
1
68
48
4
6
222
Garden plants: transactions and turnover (per location)
2015 2015 2015
↓5.0% ↓26.7% ↓2.9%
↓3.8% ↓20.0% 0.0%
↓30.0% 0.0%
0.0% 0.0% 0.0%
0.0% 0.0% 0.0%
↑0.4%
Garden plants sold by clocks (Dutch product)(units in M)
Garden plants sold by clocks (imported)(units in M)
Garden plants turnover per location(units in M)
52.7% 50.0%
13.8%
1.1%34.7% 36.4%
1.7%
4.9% 4.5%
63.8%
3.5% 4.5%19.5%
4.2% 4.5%
Change ChangeChange
Royal FloraHolland26 Annual Report 2015 | Garden plants: transactions and turnover
Report of the GMM Committee
SupervisoryBoard Report
Management Board Report
2020 strategy
Financial statements

Royal FloraHolland
XXXXXXXXX
DirectieverslagSustainability: key figures (total)
116,033 10,394,031 340,340Electricity use(MWh)
Gas use (m3)
Water use (procurement) (m3)
311,710Waste water discharge in sewerage (m3)
5,227Pollution units (p.u.)
77,906Electricity use at auctions (MWh)
38,127Electricity use by tenants (MWh)
27 Annual Report 2015 | Sustainability: key figures
Report of the GMM Committee
SupervisoryBoard Report
Management Board Report
2020 strategy
Financial statements

Royal FloraHolland
XXXXXXXXX
28 Annual Report 2015 | Directieverslag
Directieverslag
Other
413
Sustainability: waste flows (in tonnes)
Organic waste
12,519Unsorted waste
8,849
19,700Cardboard Plastic waste
3,095Separation percentage
81%
28 Annual Report 2015 | Sustainability: waste flows
Report of the GMM Committee
SupervisoryBoard Report
Management Board Report
2020 strategy
Financial statements

Royal FloraHolland
XXXXXXXXX
29 Annual Report 2015 | Directieverslag
Directieverslag
Full-time
Part-time
Total number of FTE
2,437 (2014: 2,547)↓4.3%
Absenteeism
5.3%
(2014: 5.8%) ↓
Starting employmentFTE
94 (2014: 54) ↑
Leaving employment FTE
213 (2014: 211) ↑
Education & Traininginvestment in euros
1,801,591
(2014: 1,340,844) ↑
IF rate
17.9 (2014: 20.0) ↓Norm 16.0
Total number of employees
3,051 (2014: 3,212)↓5.0%
Average age
48.5 (2014: 47.9)↑0.6
Employees: key figures
47.6% 52.4%
29 Annual Report 2015 | Employees: key figures
Report of the GMM Committee
SupervisoryBoard Report
Management Board Report
2020 strategy
Financial statements

Royal FloraHolland
0
5
10
15
20
25
30
35
Safety: injury frequency (per location)
35
30
25
20
15
10
5
0
Logistics Naaldwijk
Logistics Rijnsburg
Supply Chain
Facility Management
Operations
18.06
16.0
34.55
20.0
10.18
25.0
2.54
6.05.0
17.92
16.0
No
rm
No
rm
No
rm
No
rm
No
rm
No
rm
Logistics Aalsmeer
4.04
30 Annual Report 2015 | Safety: injury frequency
Report of the GMM Committee
SupervisoryBoard Report
Management Board Report
2020 strategy
Financial statements

Better margins for our members and their customers.
More consumers buying more flowers and plants.
These are the two ambitions of the Royal FloraHolland
strategy for 2020.
Strategy for Royal FloraHolland in 2020
Verslag van de directie2020 strategy
Royal FloraHolland31 Annual Report 2015 | Strategy for Royal FloraHolland in 2020
Facts & figures
Report of the GMM Committee
SupervisoryBoard Report
Management Board Report
Financial statements

Royal FloraHolland
To realise this strategy and its ambitions, we
initiated four programmes in 2015:
Consumer: better understanding of
consumers and meeting their wishes
and needs.
The New Auctioning a new and
affordable design for our physical
marketplace.
Improving Together: better
cooperation and more customer
orientation by employees.
World Flower Exchange: an online
platform for the floriculture sector
that will achieve one billion in turnover
in 2020 and contribute to better
exchange of knowledge in the sector.
Two other programmes will start in 2016:
FLOW: will offer solutions as to
how logistics flows to the Royal
FloraHolland marketplace can
be designed to be more efficient
and effective.
Cooperative 2020: looking for ways
in which membership of Royal Flora
Holland can remain attractive in the
future together with our members.
And establishing the types of member
ship, rates and governance that are
appropriate for the cooperative of
tomorrow.
These programmes are designed to achieve a 20%
increase in market share in Europe and to
increase European consumer spending by 20%
compared to the reference year of 2014. We will
achieve this through stable price formation and
by reducing our costs by one third.
Royal FloraHolland brings the links in the
floriculture chain together. Members and their
customers know us as the open marketplace
where they can meet each other and where you
will find the most knowledge of the floriculture
industry anywhere in the world.
The Royal FloraHolland management team (MT)
directs the 2020 programmes. Each programme
is sponsored by an MT member. The Programme
Management Office ensures that the
programmes are cohesive. In consultation with
the sponsor, the Programme Director formulates
policy, submits this to the MT and carries this out
with their programme team.
Royal FloraHolland
2020 strategy
32 Annual Report 2015 | Strategy for Royal FloraHolland in 2020
Facts & figures
Report of the GMM Committee
SupervisoryBoard Report
Management Board Report
Financial statements

Royal FloraHolland33 Annual Report 2015 | Directieverslag
Flowers and plants are ways to express all kinds of emotions and
make the world in which we live a healthier and more pleasant
place. To draw the attention of consumers to this in the right way,
the Consumer Programme is designed to study and encourage
consumer demand in Europe and beyond. In this way, we intend
to turn the tide of declining consumer spending in a positive
direction. This will succeed if we can give flowers and plants
a better position in the competitive playing field that includes
items such as chocolate, wine and gift vouchers.
The Consumer Programme will therefore study the motivation
of consumers, collect data and accumulate knowledge, because
even though people greatly enjoy flowers and plants, they are
increasingly turning to alternatives. This may apply in particular
to younger people, the so-called Millennials. They will soon become
the most important target group. Through the right marketing
communication strategy and offering attractive concepts,
the programme team aims to influence and attract potential
consumers.
Consumer Programme
What do consumers want?
Royal FloraHolland
2020 strategy
33 Annual Report 2015 | Strategy for Royal FloraHolland in 2020
Facts & figures
Report of the GMM Committee
SupervisoryBoard Report
Management Board Report
Financial statements

‘ In my garden I’ll go for a wide variety of colours.’
Consumer, Garden Centre The Hague
Royal FloraHolland34 Annual Report 2015 | Strategy for Royal FloraHolland in 2020
2020 strategy Facts & figures
Report of the GMM Committee
SupervisoryBoard Report
Management Board Report
Financial statements

‘ Every week, I buy twenty white roses. My husband loved them.’
Visitor, Flower market Utrecht
Royal FloraHolland35 Annual Report 2015 | Strategy for Royal FloraHolland in 2020
2020 strategy Facts & figures
Report of the GMM Committee
SupervisoryBoard Report
Management Board Report
Financial statements

Royal FloraHolland36 Annual Report 2015 | Directieverslag
The New Auction Programme
A strong marketplace for the future
Although turnover through the clock is slowly declining, a strong physical
marketplace is still important for setting prices according to supply and
demand. The marketplace also acts as a showcase for new and special
flowers. It is thus important for the sector to keep the clock, but at a lower
cost than before in order to keep the marketplace affordable. The New
Auction Programme will reinvent the physical marketplace.
Discussions of The New Auction Programme with members and
customers have led to four possibilities:
1. A return to physical auctions at all locations.
2. A single centralised location.
3. A direct day trading system that suits the demand-driven chain
and the need for customised work.
4. ‘From the Garden’: the sale of products in a day trading system
while they are still at the grower.
Because costs have to be reduced – and the target is a one-third
reduction by 2020 – the first two possibilities are not feasible. With
‘From the Garden’, growers can reflect demand and still participate
in day trading. They can offer and supply their products as customers
demand them. The programme team is currently giving further
consideration to the two last possibilities. This will lead to further
decisions in the spring of 2016.
Royal FloraHolland
2020 strategy
36 Annual Report 2015 | Strategy for Royal FloraHolland in 2020
Facts & figures
Report of the GMM Committee
SupervisoryBoard Report
Management Board Report
Financial statements

Royal FloraHolland37 Annual Report 2015 | Directieverslag
Improving Together Programme
A little better every day
The Improving Together Programme concerns the implementation
of one methodology and one working practice. This programme
aims to improve the working practices throughout the organisation
and make the Royal FloraHolland Strategy for 2020 possible.
Three principles apply in this respect:
• Listening to members and their customers. What do they need?
What is important to them? What does not add value is not
needed.
• Thinking in processes. Putting out a fire is a good idea, but
preventing them from starting in the first place is better.
Problems will be solved permanently by improving processes
throughout the business.
• Discussion on the basis of data. Through assessment, we can
gauge our performance and know what needs to be changed,
and what priority each improvement should be given.
Employees will be given more opportunity to make suggestions
for improvements, give each other more feedback on the state
of affairs and praise each other as a sign of appreciation.
This will enable employees to learn more from each other and
help us to improve our performance for our members and their
customers.
Royal FloraHolland
2020 strategy
37 Annual Report 2015 | Strategy for Royal FloraHolland in 2020
Facts & figures
Report of the GMM Committee
SupervisoryBoard Report
Management Board Report
Financial statements

Royal FloraHolland38 Annual Report 2015 | Directieverslag
World Flower Exchange Programme
The world is our playing field
The World Flower Exchange Programme focuses on existing and new
markets beyond Europe with the aim of generating additional
turnover of one billion euros by 2020. The programme team has great
expectations for China in particular.
Chinese people are hugely attracted to everything western, since it
represents quality to them. The purchasing power of the Chinese
population has also risen enormously. The total floriculture market
amounted to €5,577 million in 2015, with imports of 16.4%.
The proportion of imports originating from the Netherlands was 83.6%.
Young people are also interested in flowers and plants, and they want
to be able to buy them easily using their mobile phones. The first step
consists of making Chinese digital platforms for Dutch flowers and plants
accessible. The initial tests will be carried out in the first half of 2016.
This will show the amount of interest in supplies from the Netherlands.
The programme team is also exploring the potential for online sales
in the United States. Imports of flowers by the United States amount
to €1.2 billion, of which around 5% originates from the Netherlands
(€60 million). The programme team is working hard to improve this.
In the World Flower Exchange Programme, Royal FloraHolland will
represent the floriculture sector as a whole. Both members and
customers have indicated that they are pleased to see Royal
FloraHolland taking this opportunity on behalf of the sector.
Royal FloraHolland38 Annual Report 2015 | Strategy for Royal FloraHolland in 2020
2020 strategy Facts & figures
Report of the GMM Committee
SupervisoryBoard Report
Management Board Report
Financial statements
Royal FloraHolland39 Annual Report 2015 | Directieverslag
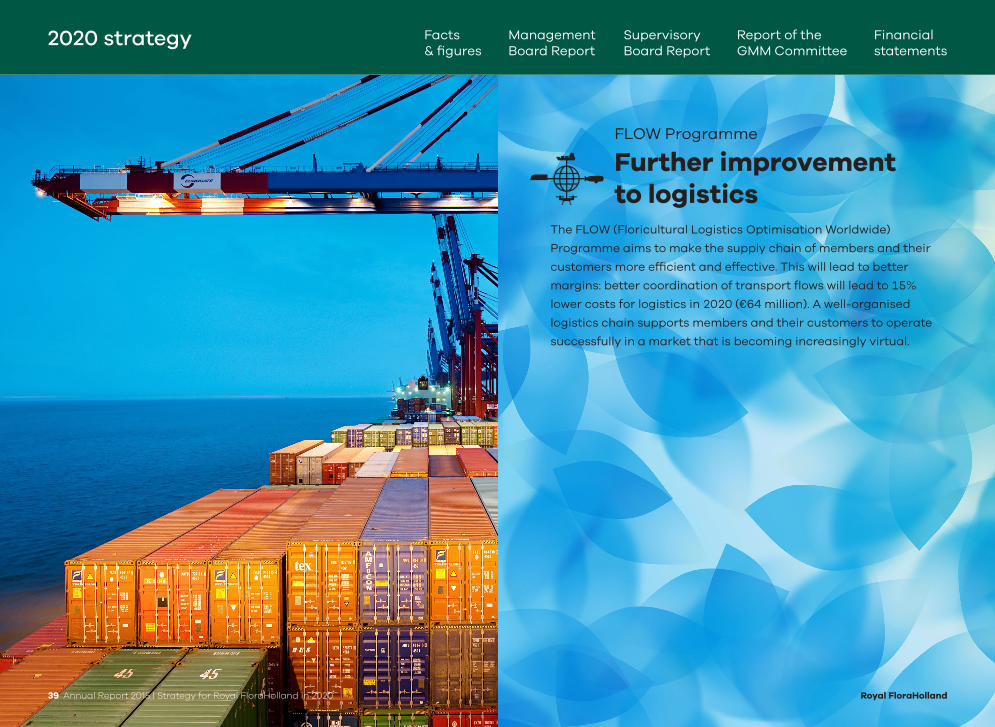
FLOW Programme
Further improvement to logistics
The FLOW (Floricultural Logistics Optimisation Worldwide)
Programme aims to make the supply chain of members and their
customers more efficient and effective. This will lead to better
margins: better coordination of transport flows will lead to 15%
lower costs for logistics in 2020 (€64 million). A well-organised
logistics chain supports members and their customers to operate
successfully in a market that is becoming increasingly virtual.
Royal FloraHolland39 Annual Report 2015 | Strategy for Royal FloraHolland in 2020
2020 strategy Facts & figures
Report of the GMM Committee
SupervisoryBoard Report
Management Board Report
Financial statements
Royal FloraHolland40 Annual Report 2015 | Directieverslag
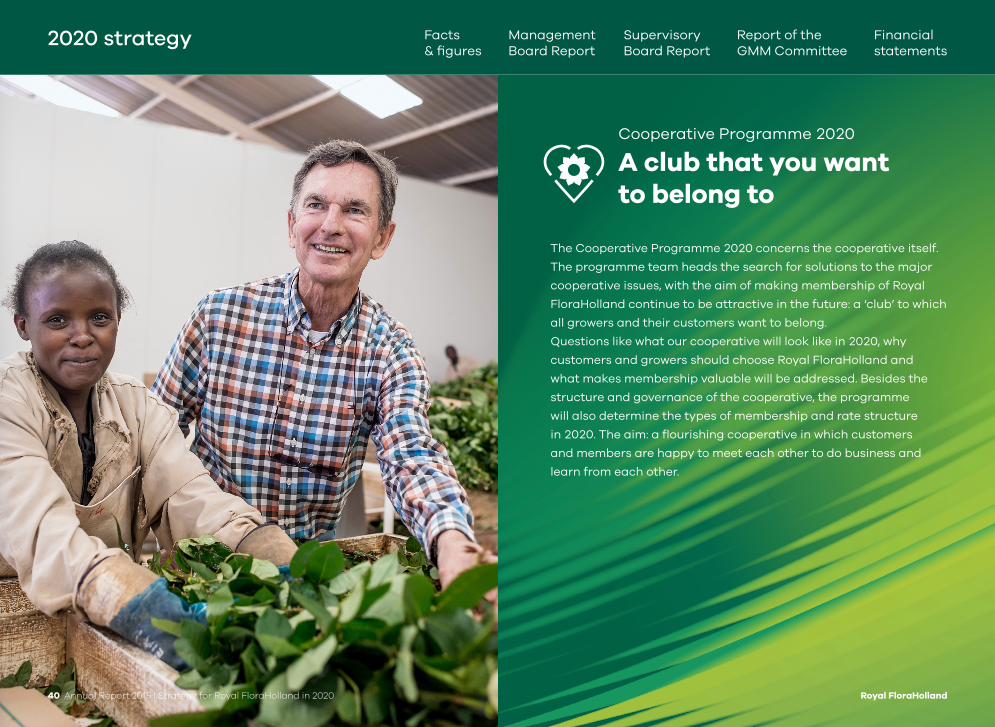
Cooperative Programme 2020
A club that you want to belong to
The Cooperative Programme 2020 concerns the cooperative itself.
The programme team heads the search for solutions to the major
cooperative issues, with the aim of making membership of Royal
FloraHolland continue to be attractive in the future: a ‘club’ to which
all growers and their customers want to belong.
Questions like what our cooperative will look like in 2020, why
customers and growers should choose Royal FloraHolland and
what makes membership valuable will be addressed. Besides the
structure and governance of the cooperative, the programme
will also determine the types of membership and rate structure
in 2020. The aim: a flourishing cooperative in which customers
and members are happy to meet each other to do business and
learn from each other.
Royal FloraHolland40 Annual Report 2015 | Strategy for Royal FloraHolland in 2020
2020 strategy Facts & figures
Report of the GMM Committee
SupervisoryBoard Report
Management Board Report
Financial statements

Royal FloraHolland41 Annual Report 2015 | Management Board Report
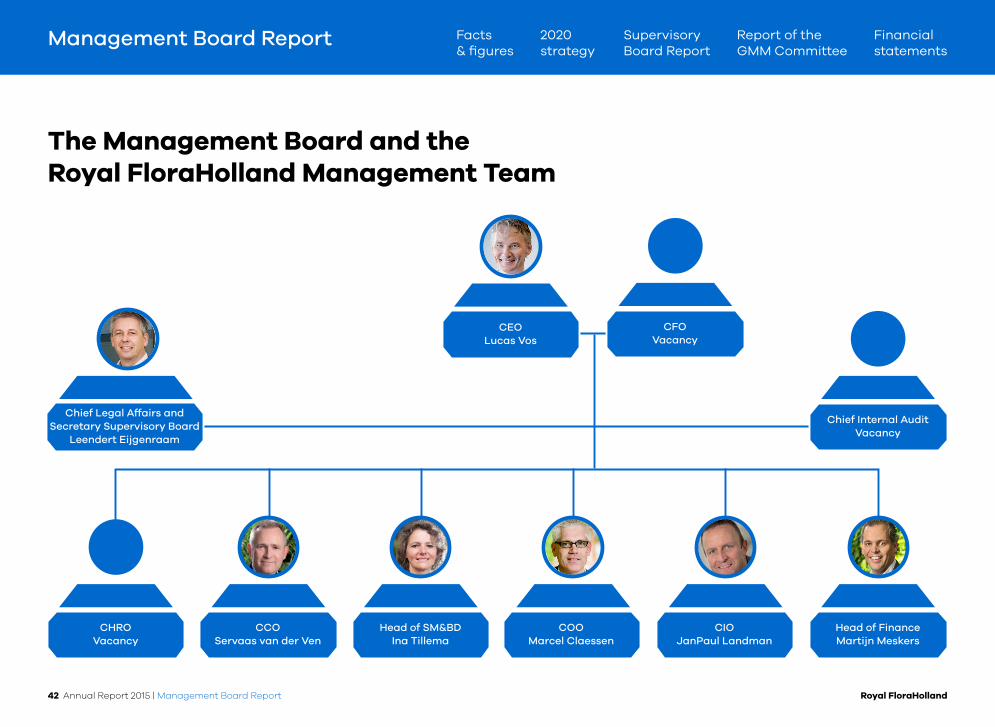
Management Board Report
The Statutory Management Board
The composition of the Management Board is
explained below. Additional positions held by
Board members are stated where applicable.
Board members are appointed for an indefinite
time period. The statutory Management
Board of Royal FloraHolland did not meet
the requirement concerning a balanced
composition of men and women (70/30) for
2015. This will be a focus with respect to future
appointments.
Lucas Vos (8 August 1967), Dutch citizen, CEO
as of 1 January 2014, statutory manager since
1 January 2014.
Additional positions: Member of the Amsterdam
Economic Board.
There is currently a vacancy for the position
of CFO.
Structure of Royal FloraHolland
The Management Board runs the business and
consists of the CEO and the CFO. Together with
the six division managers, they form the Royal
FloraHolland management team.
The Supervisory Board supervises the policy of
the Management Board and the general course
of business at Royal FloraHolland. The General
Members’ Meeting (GMM) is the highest
decision-making body of the cooperative.
Royal FloraHolland has an extensive
consultation structure with Advisory Councils,
Royal FloraHolland Product Committees (FPC),
Region Advisory Committees (RAC) and the
Customer Platform. Members submit individual
cases to the relevant divisions of the business.
This ensures broad-based support from the
members of the cooperative. Further details of
the operation of this structure are provided in
the section on Corporate Governance.
Advisory Councils
Management Board
Management
SB
Audit Committee Remuneration CommitteeCooperative Committee
FPCs and RACs GMM Committee
GMM
Members
ADVICE DECISION-MAKING
Members
Report of the GMM Committee
SupervisoryBoard Report
2020 strategy
Facts & figures
Financial statements
Royal FloraHolland
The Management Board and the Royal FloraHolland Management Team
CEOLucas Vos
CFOVacancy
Chief Internal AuditVacancy
Head of FinanceMartijn Meskers
CIOJanPaul Landman
COOMarcel Claessen
Head of SM&BDIna Tillema
CCOServaas van der Ven
CHROVacancy
Chief Legal Affairs and Secretary Supervisory Board
Leendert Eijgenraam
CEOLucas Vos
Head of SM&BD
Ina Tillema
ChiefOperations Officer
Marcel Claessen
Chief Commerce Officer
Servaas van der Ven
CFOVacature
Chief Legal Affairs and secretary
Supervisory Board
Leendert Eijgenraam
Management Team
Chief Information Officer
JanPaul Landman
Head ofFinance
Martijn Mesker
Chief HR Officer
Vacature
ChiefInternal Audit
Vacature
___
___
___
___
___
___
42 Annual Report 2015 | Management Board Report
Management Board Report Report of the GMM Committee
SupervisoryBoard Report
2020 strategy
Facts & figures
Financial statements

Royal FloraHolland
Royal FloraHolland, a cooperative of active membersRoyal FloraHolland consists of the 4,413 growers
who are members of the cooperative. They are
involved with Royal FloraHolland on many levels.
They are involved in the determination of
strategy and policy, and with good reason.
43 Annual Report 2015 | Management Board Report
Management Board Report Report of the GMM Committee
SupervisoryBoard Report
2020 strategy
Facts & figures
Financial statements

Royal FloraHolland
Advisory Council for Flowers
On the couch, from left to rightYidnekachew Ayele HabteyesHerman de JongJan MantelRick TesselaarJaap-Jan Kuyvenhoven
First row in front of the stairs, from left to rightPeter van de PolMarco MolPaul KoenraadtRik Degryse
Second row, from left to rightJaap EversPieter KolkWim Steur (has now left the Advisory Council)
Back row, from left to rightArjan AlblasErik van PaassenFred van Schagen
Behind the couch, first row, from left to rightWouter DuijvesteijnLeo van HolsteinMartien MiddelburgAndré ZuidgeestRonald OlsthoornFloris Olthof (employee of Royal FloraHolland)
Behind the couch, back row, from left to rightDirk-Jan Breugem (has now left the Advisory Council)Rob van HaasterMarcel van der LugtMarcel van TolUri Bruck
Not picturedRemco v.d. ArendPeter BarnhoornSimon van der BurgOri FroomEvert van HelvoortEric van Paasen Peter Smak
44 Annual Report 2015 | Management Board Report
Management Board Report Report of the GMM Committee
SupervisoryBoard Report
2020 strategy
Facts & figures
Financial statements

Advisory Council for Plants
Seated on the couch, from left to rightGoos HoflandSjaak BuijsWalter Zuijderwijk
Seated second row, from left to right Martin Smaal (now stepped down)Jochem Vreugdenhil (now stepped down)Robin van DijkFred van LuijkBert Schouten
Standing, from left to rightFrans van der BosOlaf van der Voort Henk van der SarLeon AmmerlaanMaarten van der Hoorn Emiel BarendseFloris Olthof
Not picturedBram Bernhard Fred BunnikNiels de Groot Goos Hofland Tom van der HouwenArnoud van der Knaap Wim Koolhaas Steef de LangeGerard van Langen Ewoud Meeuwissen Ed StofbergenRick van Woudenberg
Royal FloraHolland45 Annual Report 2015 | Management Board Report
Management Board Report Report of the GMM Committee
SupervisoryBoard Report
2020 strategy
Facts & figures
Financial statements

Royal FloraHolland
Advisory Councils for Flowers and Plants
The Advisory Councils for Flowers and Plants
are closely involved in the implementation of
Royal FloraHolland 2020 and its associated
programmes. In the World Flower Exchange
Programme, the Advisory Councils discussed the
development of commercial activities in China.
In the Consumer programme, the Advisory
Councils supported the participation of Royal
FloraHolland in the Dutch TV programme
‘Hollands Beste Bloemstylist’. And in The New
Auction programme, the Advisory Councils
expressed their support for separating price
formation and logistics. This enables new
types of auction (such as auctions from the
garden, see pages 36 and 49).
The Advisory Councils were also involved in
taking measures to prevent excesses in the clock
auctions. The agreements made support the
open nature of the marketplace and prevent
market disruptions due to sudden oversupply.
The Advisory Councils ensure that these
agreements are observed. A working group
from the Advisory Councils was closely involved
in the simplification and modernisation of
cooperative’s financing.
The Advisory Councils gave advice with respect
to the participation of Royal FloraHolland
in the Floriculture Industry Organisation
(Brancheorganisatie Sierteelt, hereinafter BO).
The BO is authorised to take decisions that
are generally binding for the entire sector.
This concerns issues that cannot be dealt
with individually, but can be dealt with
collectively, such as issues in the areas
of energy and collective research.
Royal FloraHolland Product Committees
The Royal FloraHolland Product Committees
(FPCs) prepared more than 100 recommenda-
tions for the Management Board. The various
FPCs have their own working groups for
promotion, quality and information. Many
product groups have renewed their product-
specific promotion plans for a new three-year
period. In total, there were 175 FPC meetings
and 20 product and theme meetings held in
2015.
46 Annual Report 2015 | Management Board Report
Management Board Report Report of the GMM Committee
SupervisoryBoard Report
2020 strategy
Facts & figures
Financial statements
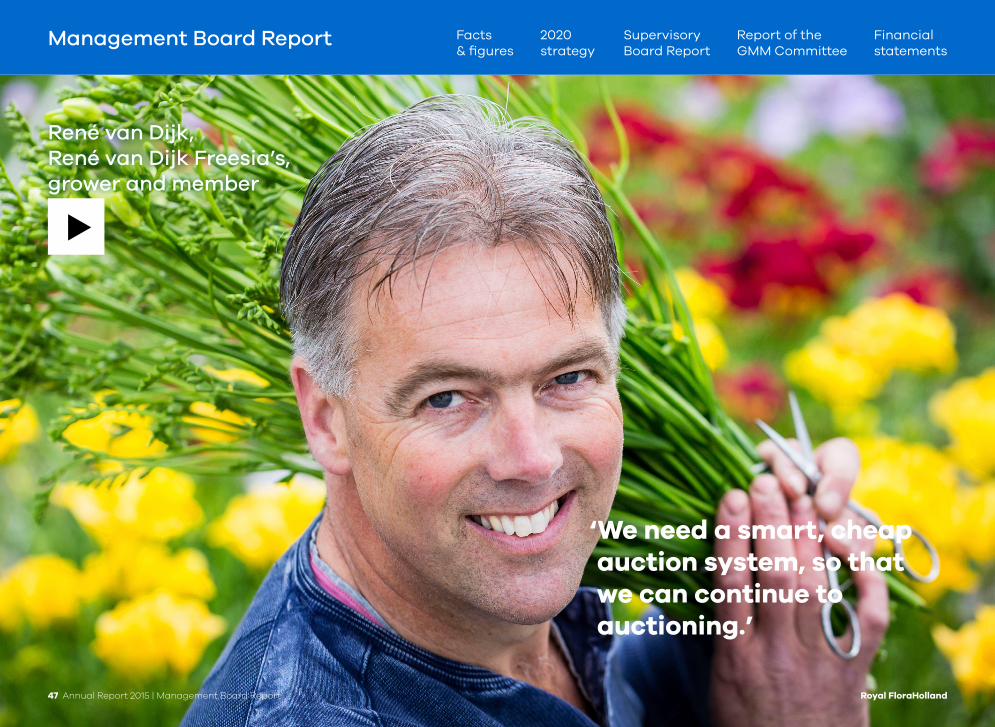
‘We need a smart, cheap auction system, so that we can continue to auctioning.’
Royal FloraHolland47 Annual Report 2015 | Management Board Report
Management Board Report
René van Dijk, René van Dijk Freesia’s, grower and member
Report of the GMM Committee
SupervisoryBoard Report
2020 strategy
Facts & figures
Financial statements

Royal FloraHolland
Front row, from left to rightPeter van Hoye (Floréac)Marius Dekker (De Gooijer International)Eddy den Dekker; inmiddels vervangen door Ron Toet (Eddy den Dekker)IJsbrand Guijt (Dingeman Hoek)Hendrico de Brabander (Noviflora)
Middle row, from left to rightMarco van Zijverden (Dutch Flower Group)Bob Moria (Waterdrinker)Lucas Vos (Royal FloraHolland)Frank Koenen (FleuraMetz)Leon van Dam now replaced by Richard Koenen (Piet van Dam)Reinier Weerman (Weerman)Servaas van der Ven (Royal FloraHolland)
Back row, from left to rightMarco Maasse (Vereniging Bloemist Winkeliers)Robert Roodenburg (Vereniging van Groot-handelaren in Bloemisterijproducten)Hans van der Plas (van der Plas groep)Gert-Jan Schoneveld (Hilverda de Boer)Evert Thielen (Westland Bloemen Export)Frits Jilderda (Jilderda Eelde)Floris Olthof (Royal FloraHolland)Wiebe van der Veen (Flower Trade Consult)Cees Heemskerk (Heemskerk)
Not picturedCees van der Meij (Royal Lemkes)Martijn van Noort (Verdel)
Customer platform
48 Annual Report 2015 | Management Board Report
Management Board Report Report of the GMM Committee
SupervisoryBoard Report
2020 strategy
Facts & figures
Financial statements
Royal FloraHolland
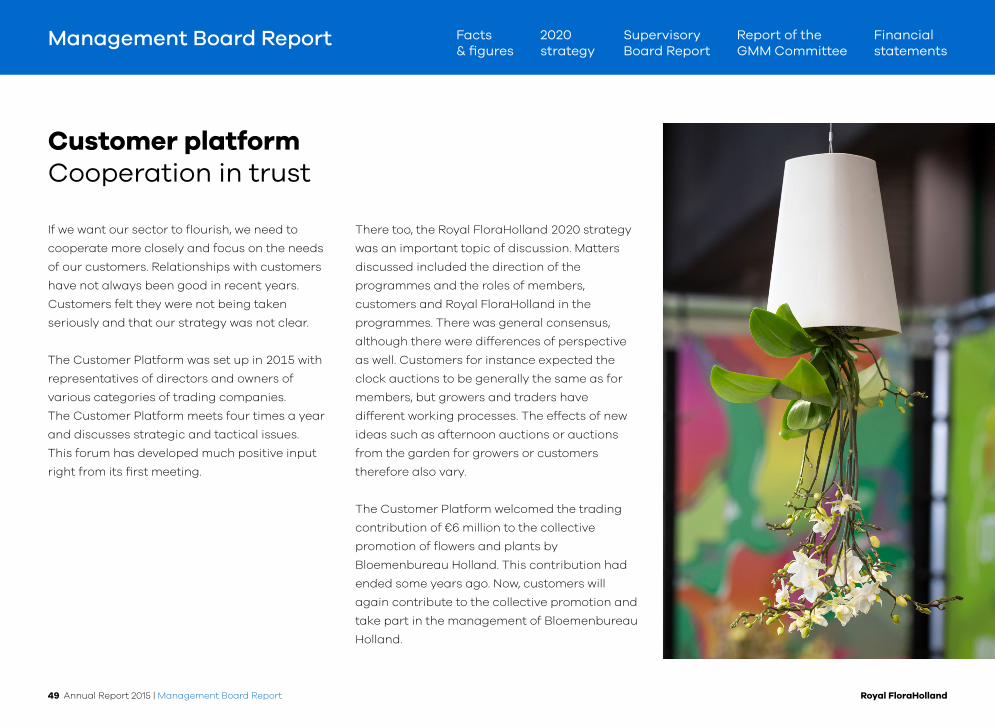
Customer platformCooperation in trust
If we want our sector to flourish, we need to
cooperate more closely and focus on the needs
of our customers. Relationships with customers
have not always been good in recent years.
Customers felt they were not being taken
seriously and that our strategy was not clear.
The Customer Platform was set up in 2015 with
representatives of directors and owners of
various categories of trading companies.
The Customer Platform meets four times a year
and discusses strategic and tactical issues.
This forum has developed much positive input
right from its first meeting.
There too, the Royal FloraHolland 2020 strategy
was an important topic of discussion. Matters
discussed included the direction of the
programmes and the roles of members,
customers and Royal FloraHolland in the
programmes. There was general consensus,
although there were differences of perspective
as well. Customers for instance expected the
clock auctions to be generally the same as for
members, but growers and traders have
different working processes. The effects of new
ideas such as afternoon auctions or auctions
from the garden for growers or customers
therefore also vary.
The Customer Platform welcomed the trading
contribution of €6 million to the collective
promotion of flowers and plants by
Bloemenbureau Holland. This contribution had
ended some years ago. Now, customers will
again contribute to the collective promotion and
take part in the management of Bloemenbureau
Holland.
49 Annual Report 2015 | Management Board Report
Management Board Report Report of the GMM Committee
SupervisoryBoard Report
2020 strategy
Facts & figures
Financial statements

‘ In my opinion, the consumer-based approach is a strong point in the strategy.’
Bob Moria,CEO Waterdrinker
Royal FloraHolland
Management Board Report
50 Annual Report 2015 | Management Board Report
Report of the GMM Committee
SupervisoryBoard Report
2020 strategy
Facts & figures
Financial statements

Royal FloraHolland
Results in 2015
Results in general
The turnover of Royal FloraHolland rose by 1.4%
to €4.6 billion, a record in the more than 100
years’ history of the cooperative. Cut flowers
were in especially high demand, increasing in
volume by 0.7% and an average improvement
in price of 2.1%. The supply of house plants rose
1.5%, but prices were on average lower, falling
by 1.9%. The supply of garden plants was down,
but prices rose. The individual results of member
businesses were also affected by factors such
as cultivation choices, product quality, weather
conditions, etc.
Total Dutch exports of flowers and plants were
up 3% to €5 billion. There was a decline in
German-speaking countries and Russia that
was significant in some cases. Exports to Russia
were affected by weakness in the Russian
economy and the restrictions on European
imports from the Russian government.
There was however growth in many other
markets, notably in the United Kingdom
and France. Europe continued to be the most
important buyer of our flowers and plants.
The weaker euro helped the competitive position
of Dutch members and customers. For members
outside the Eurozone – in Kenya, Ethiopia and
Israel, for instance – the weaker euro had a
negative effect on operating results.
Result from ordinary business operation
The result from ordinary business operation
was favourable and positive in 2015. Most of the
performance indicators were better than last
year, especially for the internal processes and
the financial results.
The result after tax of €12.0 million was
significantly higher than in the previous year.
Income was higher than in the previous year
due to increased turnover and more supply.
Expenses were lower than in the previous year,
partly due to the divestment of activities and
lower depreciation and interest expenses.
51 Annual Report 2015 | Management Board Report
Management Board Report
Total turnover (in € M)
4,602 ↑1.4% Cut flowers (supply volume)
↑0.7% House plants (supply volume)
↑1.5% Garden plants (supply volume)
↓5.7%
Report of the GMM Committee
SupervisoryBoard Report
2020 strategy
Facts & figures
Financial statements
Royal FloraHolland
While the product turnover increased in
comparison to the previous year, partly because
clock turnover fell by less than expected, Royal
FloraHolland did not achieve its target of better
price formation on the clocks. The aim is to
reduce the price difference between the clock
and direct sales in order to optimise and
stabilise price formation. For flowers, the price
difference declined in line with the objectives,
by 11% for the major product groups. For plants,
the counter stopped at 3.7%. This was mainly
due to increased supply of Phalaenopsis on the
clock that was sold at relatively low prices.
The total number of trolleys delivered for the
clocks declined by 5% to 5.7 million, while the
number of clock transactions fell by 1.4%.
The decline in transaction size continued
unabated in 2015. The logistics workflow –
lower due to fewer trolleys, but higher due to
more transactions – rose by a total of 3.1%.
Downsizing and divestment
Various activities that do not belong to our core
business were downsized or divested. Royal
FloraHolland withdrew for instance as a
shareholder from Frederique’s Choice and
Decorum Company. The logistics operations in
Bleiswijk were terminated. The operations of
Flower Handling Services in Rijnsburg were
closed. The Retail Services department will
continue only in association with customer
business programmes. The sale of the old
auction complex in Venlo was settled.
Royal FloraHolland employees
The Royal FloraHolland workforce declined by
a total of 5% to 2,437 FTE as at year-end 2015.
Nonetheless we welcomed around 100 new
employees that will contribute to the renewal
of our business. These new employees are
mainly employed in sales and for the Royal
FloraHolland programmes. At year-end 2015
there were 40 FTE, including a number of
self-employed persons, involved in the
programmes. The total expenditure on
these programmes came to €12.0 million in
2015, approximately €5.4 million of which was
due to reorganization costs.
Salary expenses for the ordinary business
operations declined by nearly 3%. The collective
bargaining agreements led to an increase of
approximately 1.75%. Lower volume, increased
efficiency and outsourcing of activities will lead
to a further decline in the workforce.
Royal FloraHolland total balance sheet
Primarily due to divestments and investments
(amounting to €47.5 million) that totalled less than
the amount of depreciation (€75.1 million), the
cooperative’s balance sheet ended 2015 at
€18.0 million below the level at year-end 2014.
The decline was limited by an increase in cash.
Adjusted for this effect, the decline amounts to
€62.6 million. This reduction in the total balance
sheet had a positive effect on the financial ratios.
We expect the annual level of investment on
renovation of real estate and ICT in the coming
year to amount to around €60 million.
In line with the principles of the Royal
FloraHolland 2020 strategy, the balance sheet is
expected to decline further in the coming years,
as the amounts invested will be less than the
costs of depreciation.
SMART setting of targets
The planning cycle of Royal FloraHolland has
changed radically as a result of the Royal
FloraHolland 2020 strategy. Programmes have
been designed for the implementation of the
strategy, but in the meantime the existing
organisation has its own role to play. Each part
of the organisation contributes to the realisation
52 Annual Report 2015 | Management Board Report
Management Board Report Report of the GMM Committee
SupervisoryBoard Report
2020 strategy
Facts & figures
Financial statements

Royal FloraHolland
of our strategic ambitions. These ambitions
have therefore been formulated in a SMART way.
For example: the target of reducing costs by
a third by 2020 translates into cost savings of
€104 million. The 2016 annual plan includes
savings of €14 million. The planning process
for 2016 has been conducted on the basis of
these SMART targets. The clear questions for
every employee are: How can you contribute
to achieving these ambitions, and what do you
need to do this?
Investing in renewal
Members and customers want a strong
marketplace, supported by effectively operating
logistics, financial and IT systems and processes.
Royal FloraHolland will continue to invest in this
as well as in the clock, which still represented
48% of our turnover in 2015. We are preparing
for the renovation of plant tribune G in Aalsmeer.
The plant clock and the florists’ clock in
Naaldwijk will be strengthened.
Many of our system renewals originate from the
daily business of our members and customers.
Suppliers state a minimum price with their
offering information. The price formation is now
fairer since the customer number on the clock
face has gone. We have started a pilot study of
multi-transaction auctions. A Quality Intervention
Team has been set up in response to complaints
regarding the quality provided by some clock
parties. The team calls suppliers whose product
quality is not up to standard to account.
Acceleration and simplification
FloraMondo is the online trading platform.
Growers can offer their entire stock in one place.
Customers can see the complete offering from
their suppliers, our members, with photographic
material and prices. Producers and buyers
confirm and administer their deals via the
FloraMondo systems.
The introduction of clear and straightforward
invoicing was accelerated in 2015. From 2016
members and customers will receive one
invoice per day of their sales and purchases
respectively. They receive a clear weekly
overview plus an invoice for services. The time
needed for administrative processes has also
been reduced. The logistics departments are
achieving improved productivity, partly due to
the development and application of general
standards for logistics processes.
53 Annual Report 2015 | Management Board Report
Management Board Report Report of the GMM Committee
SupervisoryBoard Report
2020 strategy
Facts & figures
Financial statements

Royal FloraHolland
Developing new concepts and markets
Royal FloraHolland undertook various initiatives
to develop new markets in 2015. In Turkey we are
attempting to strengthen the local floriculture
sector due to the country’s economic potential
and its young and well-educated consumers.
The Turkish government is planning to improve
the infrastructure for the floriculture sector.
Royal FloraHolland is raising the interest of its
members and customers by organising study
trips and by providing information on the local
possibilities available.
In 2015 CEO Lucas Vos was part of a trade
delegation that visited China led by King Willem-
Alexander. China is the most important growth
market for the World Flower Exchange
Programme. The online market offers
exceptional potential. Prosperity is rising rapidly,
so that an increasing number of households
have interest in and money available for
consumer goods, including Western consumer
goods.
Agreements of intent have already been
concluded with leading players in China.
Pilot studies will follow in 2016 to intensify
cooperation and discover further commercial
possibilities.
The Green Agenda programme is a joint
venture between Royal FloraHolland, iVerde
(representing the tree nursery sector) and
Wageningen UR. The Green Agenda supports
a healthy living, residential and working
environment through the development and
application of innovative concepts for plants
and tree nursery products. Academic research
has shown that green space in the living,
residential and working environment contributes
to public health and wellbeing. Practical green
concepts present additional market
opportunities to members and their customers.
Successful lobby
We are frequently involved with customers in
lobbying, for instance to retain the low VAT rate
for flowers and plants and to persuade Russia
to abandon its ban on imports of flowers and
plants.
54 Annual Report 2015 | Management Board Report
Management Board Report Report of the GMM Committee
SupervisoryBoard Report
2020 strategy
Facts & figures
Financial statements

Royal FloraHolland
Financing of the cooperative
A different financing arrangement for the
cooperative should improve its financial base.
The members currently finance the cooperative
through the members’ loan and the participation
reserve. The members’ loan is supplemented by
withholding 1% from member revenue (the
liquidity contribution) and in principle is returned
after eight years. If the cooperative makes a loss,
this is covered from the liquidity contribution.
The participation reserve and the related fee
consist of profit. This is added at the proposal
of the Management Board and is returned to
the member after 20 years.
Members’ financing should continue to be the
basis of the cooperative. Clear principles for the
financial ratios are desirable. The target for the
solvency ratio is 30%. For risk-bearing capital,
a bandwidth of between 45% and 55% applies.
This has already been achieved. Liquidity must be
at a level that bank financing can be maintained.
Royal FloraHolland wishes to abandon the system
of covering losses by the members. This will be
replaced by capital cover.
Solvency
Liquidity
Risk-bearing capital
55 Annual Report 2015 | Management Board Report
Management Board Report Report of the GMM Committee
SupervisoryBoard Report
2020 strategy
Facts & figures
Financial statements

Royal FloraHolland
Certificate A Certificate B
The members’ loan and participation reserve
mentioned above will be converted into Certificates
A and B. The 1% withholding from member revenue
will be retained. With the amounts withheld,
members will initially accumulate a Certificate A of
up to €20,000, that will be registered in their names
and remain within the cooperative for the duration of
their membership. Once the Certificate A is fully paid
up, members will then accumulate Certificates B.
These will also be registered by name, but in principle
will be returned to the member after eight years.
Certificates A will participate in the (annual) result,
while the Certificates B will be interest bearing, as
is the case for the current members’ loan.
If the cooperative’s risk-bearing capital falls below
the lower threshold of 45%, distribution is not
permitted and no payment on Certificates A and B
can be made. This maintains the cooperative’s
capital position at an appropriate level, while the
members retain their entitlement to their money.
If the equity rises above 55%, the Management
Board may propose to pay out an additional
annual tranche of Certificates B to the members.
56 Annual Report 2015 | Management Board Report
Management Board Report Report of the GMM Committee
SupervisoryBoard Report
2020 strategy
Facts & figures
Financial statements

Royal FloraHolland
Currently, both natural persons and legal persons
(public and private limited companies) can be
members of the cooperative. Now, all partners in a
general partnership (VOF), limited partnership (CV)
or other partnership have to register as members.
The new proposal concerns business membership
only. This is a significant simplification.
This proposal was extensively discussed in
2015, initially with the Supervisory Board and
a committee from the Advisory Councils
and subsequently at the regional meetings with
the members. The plans were further refined on
the basis of the responses received, and will be
discussed again with the members in the first half
of 2016. A decision will be taken at the General
Members’ Meeting on 2 June 2016. The proposal
involves an amendment to the Articles of
Association, meaning that a two-thirds majority of
votes in favour is required to pass the motion. If at
least two thirds of the votes are in favour, the new
system will be introduced with effect from 2017.
The proposal for the new financing structure has been extensively discussed and explained.
57 Annual Report 2015 | Management Board Report
Management Board Report Report of the GMM Committee
SupervisoryBoard Report
2020 strategy
Facts & figures
Financial statements

Royal FloraHolland
Being a good employer
The ambitions of the Royal FloraHolland 2020
strategy mean that the business is changing
radically. This also affects our employees. Jobs
are changing and some will be eliminated, while
new ones will be created. Royal FloraHolland is
becoming leaner and growing at the same time.
Everyone at the company has to continue to
develop to remain employable and help bring
about the change. We therefore talk to
employees at all levels about their employability
in a changing organisation. Transparently and
honestly. We cannot guarantee employment,
but we can offer support to increase people’s
opportunities in the employment market, so that
they have the skills they need to be and remain
employable.
Developing in order to progress
Various development programmes were started
in 2015. We will continue with this in 2016.
To encourage our employees to contribute to
the ambitions of Royal FloraHolland, the training
budget will be increased by one million euros
in 2016 and a Royal FloraHolland Academy will
be introduced with a career plan for employees.
Employees will be given the means to improve
their employability, either at Royal FloraHolland
or elsewhere. The employees make that decision
themselves and Royal FloraHolland supports
them. We want to enable our employees to work
towards the transition of our organisation and
on their own development at their own initiative.
More outsourcing
Royal FloraHolland will also organise its work
differently. ICT and Facility Management
were already outsourcing services in 2015.
Royal FloraHolland intends to increase this
in the coming years. Outsourcing will allow our
business to deal better with increasing variations
in labour supply and the rapid developments
in the outside world.
Reducing absenteeism
Though it was down from 2014, absenteeism
was still too high in 2015. Royal FloraHolland
aims to reduce this to a level that is similar to
comparable businesses. Policy is determined
on the basis of discussions with employees.
Discussing mental and physical employability
in a timely manner and offering support when
needed can greatly reduce absenteeism.
58 Annual Report 2015 | Management Board Report
Management Board Report Report of the GMM Committee
SupervisoryBoard Report
2020 strategy
Facts & figures
Financial statements

‘ We realise change must come, but we don’t know how exactly.’
Nienke Nijenhuis, Working Council Chair
Royal FloraHolland
Management Board Report
59 Annual Report 2015 | Management Board Report
Report of the GMM Committee
SupervisoryBoard Report
2020 strategy
Facts & figures
Financial statements
Royal FloraHolland
Safety and sustainabilityon the agenda
Royal FloraHolland operates as safely and
sustainably as possible in its own operations.
The cooperative is also involved in the
development of a sustainability infrastructure
for the floriculture sector.
Safety
Since 2010, Royal FloraHolland
has registered all accidents in the
BROS system. Reporting has been
standardised at all locations since 2012, thus
enabling good comparisons to be made. The
Injury Frequency (IF) index is used to relate the
number of accidents to the number of hours
worked. The IF enables objective comparison
between departments and locations.
The IF shows the number of accidents leading
to absenteeism per million hours worked and
is calculated as follows:
IF = (accidents leading to absenteeism > 1 day)
x 1,000,000 / number of hours worked per
department.
In 2015 the IF came to 17.9, in 2014 it was 20.0.
The norm is 16.0. The IF was thus higher than the
norm. Good scores were achieved by logistics
Rijnsburg, Facility Management and Supply
Chain. There were 66 accidents reported in 2015
(including involving temporary personnel),
an increase of 8.3% compared to 2014.
Additional attention was paid to the instruction
and education of temporary personnel in 2015.
The employment agencies were also informed
with respect to the risks at Royal FloraHolland.
This will improve safety management. Several
improvements have been introduced as a result of
a risk inventory and evaluation carried out in 2014,
including changes to the ramps, better entry
guides to prevent trolleys from toppling over on
entry and better lighting. All Royal FloraHolland
locations now possess a VCA* certificate. Additional
attention has also been devoted to the safety
of employees travelling abroad and further
improvements to the safety instructions and
compliance with them. The manage-ment has
also devoted further attention to safe working
conditions, also through the organisation of
a health and safety workshop for supervisors.
Other items of attention include refining the
contingency plan, toolbox meetings designed
to make employees more aware of potentially
dangerous situations in the immediate working
environment and expansion or improvement of the
sprinkler and evacuation installations. For further
information, see the special safety dashboard on
page 30 of this report.
Sustainability
Royal FloraHolland devotes
considerable attention to the
environment and the separated
disposal of its many waste flows.
In total, 35,727 tonnes of waste were separated
in 2015 (2014: 44,089 tonnes). The recycle
percentage came to 81% (2014: 81%).
This percentage shows that Royal FloraHolland
considers sustainability to be important and
is actively engaged in this issue. For further
information, see the special sustainability
dashboard on page 27 of this report.
60 Annual Report 2015 | Management Board Report
Management Board Report Report of the GMM Committee
SupervisoryBoard Report
2020 strategy
Facts & figures
Financial statements

Royal FloraHolland
The future
The above gives a clear impression of the
current state of affairs. However, as a world
market leader Royal FloraHolland aims to
engage more actively with stakeholders and
NGOs in making the floriculture chain more
sustainable and to taking a central role in this
process.
In 2020 Royal FloraHolland wishes to see that:
• floriculture products have a positive
sustainability image among consumers,
employers, members and their customers.
Sustainability is no longer a dissatisfier. Royal
FloraHolland also has a positive sustainability
image among these target groups;
• 5% of consumers spend 20% more on flowers
and plants in the highest sustainability
category. Sustainability pioneers are thus
rewarded for their efforts;
• transparency with respect to sustainability
leads to better margins for our members and
their customers. Royal FloraHolland wishes to
be among the most transparent companies
with respect to sustainability (measurable by
the Transparency Benchmark or ‘De Kristal’);
• the sustainability standards in the sector are
transparent to consumers because they are
clear and consistent.
In order to meet these targets we are making
baseline measurements, starting pilot studies
and developing common standards in concert
with other organisations. The project will be
coordinated by a CSR director.
Targets for 2020
A positive sustainability
image for floriculture
products
5% of consumers spend 20%
more on flowers and plants in
the highest sustainability
category
Royal FloraHolland aims to
be among the most
transparent companies with
respect to sustainability
Clear and consistent
sustainability norms and
standards
Targets for 2020
61 Annual Report 2015 | Management Board Report
Management Board Report Report of the GMM Committee
SupervisoryBoard Report
2020 strategy
Facts & figures
Financial statements

Royal FloraHolland
Corporate governance
By virtue of its scale, Royal FloraHolland is
structured as a cooperative body with a
Supervisory Board and a Works Council.
The General Members’ Meeting (GMM) is the
most senior decision-making body. The GMM
appoints the members of the Supervisory Board
and the members of the GMM Committee.
The GMM also adopts the financial statements,
sets the most important member rates and has
a right of approval with respect to investments
involving more than €20 million.
The members’ voting rights are based on the
member capital accrued during the years
of membership and thereby on the turnover
realised in the past. The GMM convened on
two occasions in 2015.
The GMM Committee is a committee formed
by the GMM whose members are not involved
in other committees. The GMM Committee
nominates or objects to new supervisory
directors, sets the remuneration of the
Supervisory Board and formulates the
remuneration policy for the Management Board.
The Management Board is the statutory
management of Royal FloraHolland and bears
ultimate responsibility for managing the
cooperative. In 2015 the Management Board
consisted of a Chief Executive Officer (CEO) and a
Chief Financial Officer (CFO). These officers met
with the group managers in the management team
(MT) of Royal FloraHolland at least once a week.
The Supervisory Board supervises the policy of
the Management Board and the general state of
affairs at the cooperative. The Supervisory Board
also has an advisory role. The Board has appointed
an Audit Committee, a Cooperative Committee
and a Selection and Remuneration Committee
from among its number. These committees are
not authorised to take decisions, but they prepare
items for discussion by the Supervisory Board.
The advisory structure of Royal FloraHolland
safeguards the members’ influence over the
policy of the Management Board. This influence
is exercised through the Royal FloraHolland
Product Committees (FPC), the Region Advisory
Committees (RAC) and the Advisory Councils for
Flowers and Plants. Each product group has an
FPC of cooperative members that advises the
Management Board on product-related issues.
Outside the Netherlands, the RACs in Israel,
Kenya and Ethiopia advise the Management
Board with respect to regional issues.
The Advisory Councils discuss general policy issues
and matters affecting multiple products, and
consist of members of the FPCs, supplemented
by a number of other members nominated by the
Advisory Councils themselves. The Management
Board submits items on the strategic agenda to
the Advisory Councils and receives advice either
on request or on the initiative of the Advisory
Councils on strategic and policy-related matters.
The Management Board either follows this advice
or gives its reasons for not doing so.
62 Annual Report 2015 | Management Board Report
Management Board Report Report of the GMM Committee
SupervisoryBoard Report
2020 strategy
Facts & figures
Financial statements

Royal FloraHolland
Royal FloraHolland follows the NCR corporate
governance code for cooperatives. On the basis
of the ‘apply or explain’ principle, we state where
we do not comply with this code and give our
reasons for not doing so on our website. A new
version of the code was published in 2015.
The test of compliance by Royal FloraHolland
was conducted on the basis of the NCR checklist
and discussed by the Audit Committee.
Strategic policy
Strategic policy is formulated as follows:
• The Management Board prepares the
strategic policy, translates this into plans
and is responsible for implementation.
• The Advisory Councils review the proposed
policy decisions of the Management Board.
This may lead to a formal recommendation
to the Management Board. In certain cases,
a committee formed by the Advisory Councils
prepares for this.
• The Supervisory Board approves the strategic
policy. The Board is actively and directly
involved in the process of formulating policy
with respect to strategic matters.
Remuneration policy
Royal FloraHolland values a transparent
remuneration policy. The GMM Committee sets
the remuneration of the supervisory directors
and sets frameworks for the remuneration of the
organisation’s senior management. Supervisory
directors receive a fixed annual remuneration
and no variable remuneration.
An external agency formulates a benchmark
every three years to establish whether the
remuneration of the Management Board is still
in line with the policy. The principle of the policy
is to offer the median (or average) remuneration
in the general market for directors with final
responsibility. The actual remuneration of the
Management Board is set by the Supervisory
Board. The remuneration of the Management
Board then follows the salary increases of the
collective labour agreement of Royal FloraHolland
and has a fixed and a variable component.
The variable remuneration of the CEO is capped
at 30% of fixed salary. For the CFO, the variable
remuneration is capped at 20% of fixed salary.
The members of the Management Board have
other employment benefits in addition to salary,
such as a pension, in line with the other
employees. The amounts of the remuneration
of the Management Board and the Supervisory
Board are stated in the financial statements.
Transparent remuneration policy
63 Annual Report 2015 | Management Board Report
Management Board Report Report of the GMM Committee
SupervisoryBoard Report
2020 strategy
Facts & figures
Financial statements

Royal FloraHolland
Risk schedule
Management of financial process risks
2020 strategy
Management of specific
operational risks
Management of tax risks
Management of ICT risks
Management of specific financial risks
64 Annual Report 2015 | Management Board Report
Management Board Report Report of the GMM Committee
SupervisoryBoard Report
2020 strategy
Facts & figures
Financial statements

Royal FloraHolland
Risk management and control
There are risks and uncertainties involved in
pursuing business objectives. Royal FloraHolland
strives to be cautious when incurring risks and
takes measures to control risks as effectively
as possible. We do this in order to protect the
interests of our members carefully at all times.
Risk management
The organisation of risk management at
Royal FloraHolland in 2015 was as follows:
• The Management Board is ultimately
responsible for risk management and the
operation of the control systems. Execution
is the responsibility of the Management
Board and the business, supervised by
the Supervisory Board.
• The Internal Audit department oversees
the internal controls and administrative
organisation of Royal FloraHolland by
performing audits, advice, risk inventories
and analyses based on an annual audit plan.
The manager of Internal Audit reports
regularly to the Audit Committee on risk
management and control.
• Royal FloraHolland appointed a compliance
officer in 2015 who oversees compliance with
legislation and regulations within the
cooperative. His duties focus on management
awareness, conducting compliance reviews
and promoting compliance-oriented behaviour.
His area of responsibility was further defined
in 2015 with a compliance charter and the
execution process was implemented.
A screening process of the major risks
was carried out by an external agency.
• The MTs of the business units and the MT
of Royal FloraHolland go through the
enterprise risk management cycle each year,
in which risks are identified and analysed.
Control of risks is tightened where necessary
and translated into additional measures that
are included as targets in annual plans.
• The audit firm EY has audited the financial
statements for 2015. The reporting on the
audit of the financial statements was
discussed with the Audit Committee
according to schedule.
Measures introduced for principal risks
The planning and governance cycle
Royal FloraHolland has a balanced planning and
governance cycle which places considerable
emphasis on the development of strategy and
policy in which members play an active role. The
strategy is translated into a multi-year plan that is
updated annually and forms the basis for annual
plans with annual budgets. The annual plans and
budgets are regularly compared to the actual
results and stated in financial reports. Forecasts
are made in the spring and autumn. After the
financial year, the financial statements and the
annual report are prepared and submitted
to the GMM for adoption. The planning and
management cycle operated satisfactorily in 2015.
Royal FloraHolland 2020
The Royal FloraHolland 2020 strategy shows
our position and direction for the coming years.
This strategy is implemented partly as a result
of strategic market risks. The transition from the
auction clock to direct flows will negatively affect
65 Annual Report 2015 | Management Board Report
Management Board Report Report of the GMM Committee
SupervisoryBoard Report
2020 strategy
Facts & figures
Financial statements

Royal FloraHolland
our earnings model and the role of the auction
clock as a price-setting instrument.
The shortening of the chain, services that are
too expensive, direct sourcing and declining
confidence in the strength of a cooperative
business are weakening the marketplace. New
services and internationalisation are leading to
complex challenges with respect to realisation
and gaining support from the members.
The programmes initiated in 2015 designed to
achieve the Royal FloraHolland 2020 strategy
will mitigate these market risks. The business
units are also directly linking their annual targets
to the Royal FloraHolland 2020 strategy and
therefore also to the mitigation of these market
risks.
There are also risks associated with the
realisation of the strategic objectives. There are
internal challenges regarding the organisation’s
ability to change, the development or obtaining
of the necessary competences and the
development strength of the ICT that is needed.
The external challenges concern obtaining
support from the stakeholders, addressing
competing market initiatives and obtaining
finance. The management of these risks is
included in the management cycle of the
Royal FloraHolland 2020 organisation.
Controlling financial process risks
Each business unit has a model
stating the management level of
financial risks. These models were
actively managed in 2015. Recommendations
for improvements form part of the annual
planning. The follow-up of these
recommendations is closely monitored and
reported to the management, the Management
Board and the Audit Committee.
Controlling specific financial risks
The CFO leads the treasury team,
which manages liquidity, credit,
interest rate and currency risks.
Risks are hedged using financial instruments on
the basis of the treasury policy. The energy team
mitigates price risks with respect to energy
procurement. The strategic debtor meeting
establishes the debt risk policy that is
implemented by the Finance and Sales
departments. The Real Estate Consultation
discusses the risks relating to real estate.
Controlling specific operational
risks
Operational risks such as accidents
and emergencies are covered by
Company First Aid, Company Security and the
Company Fire Brigade (in Aalsmeer and
Naaldwijk). Insurance portfolios are actively
managed. For the management of Occupational
Health & Safety and environmental risks, see the
2015 Occupational Health & Safety and the
Environment Annual Report published on the
website.
Up-to-date company emergency plans are in
place and there is a crisis management team
that takes responsibility in crisis situations.
The crisis management team was called upon
on one occasion in 2015 in connection with
an investigation by the Netherlands Food and
Consumer Product Safety Authority in 2015
into the spread of the Ralstonia Solanacearum
(brown rot) bacterium among rose growers and
cultivators. The possibility of infection via the
auction process was investigated, but turned out
to be unfounded. After this finding, the crisis
management team was disbanded.
66 Annual Report 2015 | Management Board Report
Management Board Report Report of the GMM Committee
SupervisoryBoard Report
2020 strategy
Facts & figures
Financial statements

Royal FloraHolland
Controlling tax risks
Audits were performed in 2015 on
VAT risks with respect to application
of the correct rates of VAT,
automatic processing in systems and the VAT
risks of participating interests. The follow-up of
the recommendations of these audits will be
actively monitored.
Controlling ICT risks
The ICT department adjusts the ICT
landscape according to schedule in
order to contribute optimally to
achieving the strategic objectives. Reducing
complexity and outsourcing are key concepts
in this area. EDP audits were performed in 2015
on order processing of the direct flows, security
of access to the internal network and the design
of the functional and technical management of
a number of important computer systems.
Important recommendations from the audits
were resolved immediately and the follow-up
of the other recommendations will be actively
monitored.
Impact if risks occur
Royal FloraHolland has a low risk appetite and
takes measures to control risks as effectively
as possible. Uncertainties do however remain.
For instance, the Royal FloraHolland 2020
programmes do not yet provide a clear picture
of the future business model, the future business
processes and the future requirement for real
estate. Investments in real estate that appear to
be necessary today may not be required in the
future. Given the financial interests involved, this
requires careful consideration.
Internationalisation is leading to more turnover
through Royal FloraHolland, but also to new
challenges regarding the management of debt
risk, especially for the direct flows. Traditional
measures may no longer be appropriate,
meaning that debt risk may occur. Finance and
Sales take account of this and regularly assess
policy and procedures in the light of the
changing playing field.
Declaration
No material shortcomings in the existing risk
management and control systems were
identified in 2015. These systems have not been
fundamentally changed. The appointment of a
compliance officer in 2015 has however led to
additional attention being devoted to the
management of risks arising from legislation
and regulations. Regarding the risks associated
with financial reporting, the Management Board
declares that the internal risk management and
control systems provide a reasonable degree of
assurance. The financial reporting does not
contain any material misstatements. Despite
these measures, Royal FloraHolland had to deal
with two cases of fraud in 2015 involving a total
amount of less than €0.1 million. The risk
management and control systems are operating
satisfactorily.
Aalsmeer, 13 April 2016
Lucas Vos
CEO Royal FloraHolland
67 Annual Report 2015 | Management Board Report
Management Board Report Report of the GMM Committee
SupervisoryBoard Report
2020 strategy
Facts & figures
Financial statements

All supervisory directors are Dutch citizens.
In the composition of the Supervisory
Board, we strive for an appropriate ratio
between and/or representation of:
• members and non-members of Royal
FloraHolland;
• men and women;
• national and international production;
• various product groups;
• knowledge and experience.
Royal FloraHolland68 Annual Report 2015 | Supervisory Board Report
Supervisory Board Report Report of the GMM Committee
Management Board Report
2020 strategy
Facts & figures
Financial statements

Members of the Supervisory Board
The members of the Supervisory Board are
shown below. The floriculture business to which
they belong is also indicated. Additional
positions are shown for all supervisory directors.
Bernard Oosterom
(7 June 1960)
Chair of the Supervisory Board since 2014,
administrative position within Royal
FloraHolland since 1989, member of the
Selection and Remuneration Committee.
Member business: Pot plant nursery Sjaloom B.V.
in Waddinxveen.
Additional roles:
• Chair of the Dutch Flower Auctions Association
(VBN).
• Chair of the National Cooperative Council
for Agriculture and Horticulture (NCR).
• Chair of the International Association of
Horticultural Producers (AIPH).
Mariëlle Ammerlaan
(2 June 1968)
Vice-Chair of the Supervisory Board since
2014, administrative position within Royal
FloraHolland since 2003, chair of the
Cooperative Committee.
Member business: Plaza Orchids Ammerlaan
in De Kwakel.
Additional roles: none.
Royal FloraHolland69 Annual Report 2015 | Supervisory Board Report
Supervisory Board Report Report of the GMM Committee
Management Board Report
2020 strategy
Facts & figures
Financial statements

Jan Andreae
(25 April 1946)
Member of the Supervisory Board since 2010,
member of the Cooperative Committee.
Additional roles:
• Director of Advanced Technology Industries.
• Advisory board member of Dirkzwager Group.
• Advisory board member of Amsterdam Village
Company.
Joris Elstgeest
(2 August 1976)
Member of the Supervisory Board since 2014,
administrative position within Royal
FloraHolland since 2006, member of the
Selection and Remuneration Committee.
Member business: Elstgeest Potplanten B.V.
in Nieuwe Wetering.
Additional roles:
• Board member of Platform Tuinbouw
Veenstreek.
• Member of Citizen’s Council of the Municipality
of Kaag & Braassem.
Jack Goossens
(18 March 1969)
Member of the Supervisory Board since
2014, administrative position within Royal
FloraHolland since 2012, member of the
Audit Committee.
Member business: Gova B.V. in Nispen.
Additional roles: none.
Jos ten Have
(13 November 1959)
Member of the Supervisory Board since 2004,
member of the Cooperative Committee.
Member business: J&P ten Have B.V.
Additional roles:
• Treasurer and member of the daily
management of Geopower B.V.
• Chair of Plantform.
Royal FloraHolland70 Annual Report 2015 | Supervisory Board Report
Supervisory Board Report Report of the GMM Committee
Management Board Report
2020 strategy
Facts & figures
Financial statements

Caroline Princen (9 November 1966)
Member of the Supervisory Board since 2015,
chair of the Selection and Remuneration
Committee.
Additional roles:
• Member of the board of supervision and member
of the audit committee of Filminstituut EYE.
• Member of the board of supervision and member
of the audit committee of the University Medical
Centre Utrecht.
• Member of the executive board of ABN AMRO.
• Board member of Stichting Steun
Alzheimercentrum VUmc.
• Chair of Stichting ABN AMRO Foundation.
• Member of the IMD Foundation Board.
Gerben Ravensbergen
(16 October 1974)
Member of the Supervisory Board since 2014,
member of the Audit Committee.
Member business: Gebr. P. & J. Ravensbergen C.V.
Additional roles:
• Treasurer, Stichting YourLily.
• Member of the Economic Board Duin- en
Bollenstreek.
• Entrepreneurs platform Green Meets Port.
Rosaline Zuurbier
(26 May 1977)
Member of the Supervisory Board since 2014,
member of the Cooperative Committee.
Member business: C.G. Zuurbier & Co.
International B.V./Bilashaka Flowers Ltd.
in Naivasha, Kenya.
Additional roles:
• Member of the members council of Rabobank
Alkmaar and environs.
Cees van Rijn
(4 May 1947)
Member of the Supervisory Board since 2012,
chair of the Audit Committee.
Additional roles:
• Member of the supervisory board of Plukon
Food Group.
• Member of the supervisory board of Detailresult
Group.
• Member of the supervisory board of ForFarmers.
• Member of the supervisory board of PwC.
• Member of the supervisory board of EQI.
• Member of the supervisory board of UTZ.
• Board member of Stichting Continuïteit SBM
Offshore.
Royal FloraHolland71 Annual Report 2015 | Supervisory Board Report
Supervisory Board Report Report of the GMM Committee
Management Board Report
2020 strategy
Facts & figures
Financial statements

The Supervisory Board (SB) is pleased with the
results achieved by Royal FloraHolland in 2015.
After closing a turbulent year in 2014 with the
positive reaction to the new Royal FloraHolland
2020 strategy, the first programmes were initiated
in 2015. Much energy has been devoted to this
and some elements have already been discussed
at length with the members. At the same time, the
business continued with its daily operations.
What is striking is that price formation has
improved somewhat, and turnover increased by
1.4%. This was achieved despite a number of
difficult developments in the market, such as
currency fluctuations, the situation in Russia and
the increased threat of terrorism. The operating
result was also better than expected and thereby
offers sufficient room to cover the investments
needed for Royal FloraHolland 2020.
We fully support the course embarked upon with
Royal FloraHolland 2020 and the current
governance structure. The SB sees that there
is broad support among all stakeholders for
the chosen direction and also sees that the
Management Board has addressed this with
much energy and enthusiasm. Of course there
are always items to discuss, but the basis is
strong.
There were however also issues that did not
proceed so smoothly in 2015, which required
the close attention of the SB. The issue discussed
most was the variable remuneration of the
Management Board, but also the departure of the
CFO Rens Buchwaldt should be mentioned even
though this was not announced until 2016. With
regard to the variable remuneration, additional
member meetings were held before and after the
spring GMM meeting, and this item also was a key
focus at the GMM itself. We then revisited this
matter, discussed the policy again with the GMM
Committee and explained the policy at the
regional meetings in the autumn. Regarding the
departure of Rens Buchwaldt, we can only
express our deep appreciation for everything that
Rens contributed to Royal FloraHolland in the
period from September 2006 to February 2016.
We are indebted to him and wish him every
success in his future career.
The SB met on eight occasions in 2015.
In addition, there were two conferences with
the Management Board (24-hour sessions),
we followed a Lean Six Sigma training course
and a delegation from the SB accompanied
Lucas Vos on a working visit to Turkey.
Furthermore, the supervisory directors were
frequently in attendance at the various member,
employee and customer meetings, and the
regional meetings in Kenya, Ethiopia and Israel.
A try-out is always held prior to each GMM
and series of regional meetings in which the
presentations are harmonised. The SB was in
contact with the Works Council and the GMM
Committee on several occasions in 2015.
Under the leadership of Rienk Goodijk, the spring
conference focused extensively on the
Reportof the Supervisory Board
Royal FloraHolland72 Annual Report 2015 | Supervisory Board Report
Supervisory Board Report Report of the GMM Committee
Management Board Report
2020 strategy
Facts & figures
Financial statements

governance structure of Royal FloraHolland and
the evaluation with the members, the
performance of the SB and the Management
Board and the mutual cooperation. The autumn
conference was fully devoted to the new
Cooperative 2020 strategy programme.
Every regular SB meeting is held with the
Management Board in attendance. Prior to the
regular meeting, we hold a discussion in which
we usually discuss the agenda and any current
issues raised by the Chair or the SB committees.
During the meeting, the Management Board
gives an update of the current issues at the
company, market developments and the most
important developments in the strategy
programmes. A Royal FloraHolland MT member
also explains their opinions and what they are
involved in. These are interesting discussions that
give us insight into the issues the management
has to address.
In addition to the above and the items that recur
each year, such as the annual plan (budget and
rates), the key performance indicators, the
financial statements and the management letter
from the auditor (EY) and the preparation for the
GMM, the following items were considered during
the meetings in 2015:
• Fire safety at Aalsmeer and Naaldwijk
• The governance of participating interests
• The Green Trade Centre (GTC) at Aalsmeer
• Royal FloraHolland’s policy in relation to real
estate
• The Greenport Horti Campus (GHC) at
Naaldwijk
• The Floriculture Industry Organisation
• The renovation of the parking roof at Aalsmeer
• The financing of the cooperative
• Office premises at Aalsmeer
• Evaluation of Floratino packaging
• Divestments of participating interests
• The Gartner study (ICT)
• The sale of the complex at Bleiswijk
• The new identity for Royal FloraHolland
(logo, house style, etc.)
• Engagement of the auditor (EY)
• Renovation of tribune G at Aalsmeer
• Geothermal energy at Naaldwijk
• Sale of the Prunus premises at Aalsmeer
Two supervisory directors were unable on one
occasion to attend a meeting in 2015. There was
also one occasion on which a supervisory director
arrived late at a meeting or had to leave early.
Caroline Princen was appointed supervisory
director at the GMM on 4 June 2015. She
succeeded Franswillem Briët who had previously
stepped down and in this capacity she also took
over as Chair of the Selection and Remuneration
Committee. At the GMM on 17 December 2015,
Jack Goossens and Mariëlle Ammerlaan were
reappointed as supervisory directors and
Louis Bouman stepped down after completing
a 12-year term. There will be no successor to
Louis Bouman. This is due to the decision taken
previously to reduce the number of supervisory
directors from 11 to 9 in 2015 and 2016. Mariëlle
Ammerlaan was reappointed Vice-Chair at the
spring conference in 2016. The Supervisory Board
of Royal FloraHolland did not comply with the
balanced composition requirement for men and
women (70/30) in 2015. This will be an item of
attention in future appointments.
Report of the Audit Committee
The Audit Committee met on six occasions in
2015. With the exception of one meeting at
which one member was unable to attend, all
committee members attended all committee
meetings. Meetings of the Audit Committee are
always held with the external auditor (EY), the
CFO and the Finance Manager in attendance.
The internal auditor was always present for part
of every meeting. The compliance officer
attended a number of meetings. External
experts and/or employees of the organisation
Royal FloraHolland73 Annual Report 2015 | Supervisory Board Report
Supervisory Board Report Report of the GMM Committee
Management Board Report
2020 strategy
Facts & figures
Financial statements

were invited, depending on the items being
discussed. The Audit Committee met on four
occasions with the external auditor without the
CFO or other employees of Royal FloraHolland
being in attendance.
The Audit Committee has established to its
satisfaction that the administrative processes
have visibly improved in several areas over
the past year. There is still room for improvement
in several areas, which were discussed with the
CFO and the Finance Manager.
There was much discussion of the future
financing of the cooperative in 2015. The
Management Board involved the Audit
Committee in the study of the various
alternatives for financing at an early stage.
This led to a proposal which was communicated
to the members at the regional meetings in the
autumn of 2015.
The following items were discussed during the
year under review:
• The financial statements and the auditor’s
report for 2014
• The follow-up of the findings in the
management letter from EY auditors
• The treasury policy
• The compliance policy and potential for fraud
• The risk policy
• The Gartner study of ICT at Royal FloraHolland
• The policy on reimbursement of expenses for
the Management Board and the Supervisory
Board
• The participating interests, including risk
assessments and proposals for disposals
• The financial organisation and the filling of
vacancies
• The financial reporting
• Investment proposals
• The budget for 2016
• The audit plan for 2015
• The audit charter
The Audit Committee consisted of Cees van Rijn
(Chair), Jack Goossens, Gerben Ravensbergen
and Louis Bouman in 2015.
Report of the Selection and Remuneration
Committee
The Selection and Remuneration Committee
(Remco) met on six occasions in 2015.
All meetings were held with the CEO and the HR
Manager in attendance. Depending on the items
to be discussed, the committee invites external
experts to attend. In 2015 these included Hay
Group and Egon Zehnder.
In the first half of 2015 the committee consisted
of only two members. This was due to the
premature departure of the committee Chair
Franswillem Briët. A successor was found in the
person of Caroline Princen. In her daily life,
Caroline Princen is a member of the executive
board of ABN AMRO. She has been a supervisory
director and Chair of the Remco at Royal
FloraHolland since 4 June 2015. Before Caroline
Princen assumed her position as Chair of the
Remco, Joris Elstgeest was the acting Chair.
All committee members attended each
committee meeting in 2015.
The report of the SB has already mentioned the
discussion of the variable remuneration of the
Management Board. This item was of course
also a key focus of this committee. It was
Royal FloraHolland74 Annual Report 2015 | Supervisory Board Report
Supervisory Board Report Report of the GMM Committee
Management Board Report
2020 strategy
Facts & figures
Financial statements

discussed on several occasions and there were
also discussions with the GMM Committee.
There were two developments in 2015. The first
concerned the manner and the amount with
which the Management Board should be
remunerated. The second was a public
discussion on the allocation of the variable
remuneration to the Management Board for
2014 based on a publication. Both these
discussions came together in the run-up to the
spring GMM meeting.
The internal discussion concerned the market
comparison which is carried out every three
years. This revealed that the remuneration of
the MB was below the median, or average.
The policy is that the remuneration should be
at the median level. This was also confirmed by
the GMM Committee. The proposal was that the
difference should partially be made up by
introducing a long-term variable remuneration.
Ultimately, this proposal was rejected.
The difference will be made up partly by an
increase in the fixed salary. This was explained
in detail at the regional meetings in the autumn.
The remuneration of the Management Board
therefore consists of a fixed component and
a variable component that is based only on
the short term. The percentage for the CEO
is capped at 30%, and for the CFO at 20%.
The SB decides the actual percentage for the
year in question on the basis of previously
established targets (KPIs). For 2015, the
allocation is 65% of the stated percentages.
The Remco also discussed the following matters
in 2015:
• The management development policy
• KPIs (evaluation for 2014 and establishment
for 2015 and 2016)
• Succession planning
• Employee engagement surveys
The Selection and Remuneration Committee
consisted of Caroline Princen (Chair with
effect from July), Joris Elstgeest (acting Chair
until the end of June) and Bernard Oosterom
in 2015.
Report of the Cooperative Committee
The Cooperative Committee met on four
occasions in 2015. All meetings were held with
the CEO, the Cooperative & Communications
Manager and the SB secretary in attendance.
Managers were invited to attend depending
on the items to be discussed. All committee
members attended each committee meeting
in 2015.
The most important task of the committee is to
monitor the interests of the cooperative and the
members with respect to all policy decisions by
the Management Board. Member policy and
member involvement are important themes for
the Cooperative Committee. Rates also fall
within the committee’s mandate, as well as the
commercial regulations, the latter referring to
internal procedures, management and
transparency. The committee never discusses
individual cases. The committee also fulfils the
function of an appeal body for disputes between
the Management Board and members.
There were no such instances in 2015.
The Chair of the Cooperative Committee is also
Chair of a working group that supervises the
development of the governance framework at
Royal FloraHolland. This includes consideration
of the introduction programmes for new
members and employees, and also the training
and development of FPC, RAC and Advisory
Council members. Generally, there is a need for
more attention to the policy concerning younger
employees.
Royal FloraHolland75 Annual Report 2015 | Supervisory Board Report
Supervisory Board Report Report of the GMM Committee
Management Board Report
2020 strategy
Facts & figures
Financial statements
The Cooperative Committee also reviews the
discussions and decision-making in the various
other bodies within Royal FloraHolland, in which
there needs to be adequate consistency. This
focus was also the basis for the committee’s
involvement in the design of the Cooperative
2020 strategic programme.
Other items discussed by the Cooperative
Committee in 2015 included:
• Remote voting
• Evaluation of GMM and regional meetings
• Development programme for governance
framework
• Commercial regulations
• Rates structure
• Cancellation of mandatory registration of
partners
• Contribution to trade promotion
• Autumn conference MT-SB
• The new NCR code
• Commercial strategy (implementation)
• Minutes of discussions of cooperative affairs
The Cooperative Committee consisted of
Mariëlle Ammerlaan (Chair), Jan Andreae,
Rosaline Zuurbier and Jos ten Have in 2015.
Advice from the Supervisory Board
The Supervisory Board has taken note of the
2015 Financial statements of Royal FloraHolland
prepared by the Management Board and
audited by the auditor. The financial statements
consist of the balance sheet as at 31 December
2015 and the profit and loss account for 2015
with the associated notes. Based on its
supervision, the Board has approved and signed
the financial statements included in this annual
report. It will be proposed that the General
Members’ Meeting should adopt the financial
statements for 2015, discharge the Management
Board of liability for the policy pursued in the
2015 financial year and discharge the
Supervisory Board of liability for its supervision
of this policy.
The supervisory directors wish to express their
appreciation to the Management Board and the
employees for the results achieved and the
company’s performance in 2015.
Aalsmeer, 13 April 2016
Bernard Oosterom
Chair
Royal FloraHolland76 Annual Report 2015 | Supervisory Board Report
Supervisory Board Report Report of the GMM Committee
Management Board Report
2020 strategy
Facts & figures
Financial statements

Directieverslag
Royal FloraHolland
From left to right
Leendert Eijgenraam
(Secretary of the Cooperative and the SB)
Eva van Etten
Matthijs Barendse
Sjaak van der Hulst
Ad van Marrewijk
Herman Stricker
Report of the GMM Committee
77 Annual Report 2015 | Report of the GMM Committee
SupervisoryBoard Report
Management Board Report
2020 strategy
Facts & figures
Financial statements

Directieverslag
Report of the GMM Committee
The GMM Committee met on five occasions in
2015. Meetings are usually held with the Chair
(or their replacement) of the Selection and
Remuneration Committee (Remco) and the
Secretary of the SB, who is also the Secretary
of the GMM Committee, in attendance.
As a result of the interim departure of one of
the committee members in March 2015, the
committee found a successor in Eva van Etten.
She was appointed by the GMM at the meeting
on 4 June 2015. The committee has made a
minor adjustment to its retirement rota as a
result of this change. Furthermore, Sjaak van der
Hulst was appointed for a second 3-year term at
the GMM on 17 December 2015.
The composition of the GMM Committee and
the retirement rota are now as follows:
• Herman Stricker 2016
• Matthijs Barendse 2017
• Sjaak van der Hulst 2018
• Ad van Marrewijk
(Chair) 2019
(reappointment in 2016)
• Eva van Etten 2021
(reappointment in 2018)
The committee, and in particular the Chair, was
closely involved in filling the vacancy on the SB.
This process led to the appointment of Caroline
Princen by the GMM at the meeting on 4 June
2015.
The committee has subsequently held several
discussions with the new Chair of the Remco
and is confident that cooperation in the coming
years will be fruitful.
In September the committee held discussions
with the existing supervisory directors Mariëlle
Ammerlaan and Jack Goossens, both of
whom had been nominated by the SB for
reappointment. The committee is entitled
to object to reappointments as well as new
appointments. Through the conduct of
such discussions, the committee has a good
impression of the people on the SB and the work
that they do. As a result of these discussions,
the committee informed the SB that it had
every confidence in the candidates.
In 2014 the GMM Committee established
the remuneration of the supervisory directors
for a period of three years. The committee
accordingly did not consider this matter in detail
in 2015, apart from the variable component of
the Chair of the Supervisory Board. The time
spent was a consideration in this respect.
Although the committee took the view that an
additional remuneration would be justified, it
was nevertheless decided to forgo introducing
this.
Royal FloraHolland
Report of the GMM Committee
78 Annual Report 2015 | Report of the GMM Committee
SupervisoryBoard Report
Management Board Report
2020 strategy
Facts & figures
Financial statements

The most important item considered by the
committee in 2015 concerned the remuneration
policy for the Management Board. The committee
approved the proposal from the SB to remunerate
the Management Board in accordance with the
median in the market in the Netherlands at the
beginning of the year.
Though this policy was already in place, the
actual remuneration proved to be lower than
the median. The SB proposed that this difference
should be made up through the introduction of a
long-term variable remuneration.
The committee agreed with this proposal.
There was further discussion of the remuneration
of the Management Board and in particular, the
variable component, in the run-up to the GMM on
4 June 2015. As a result of this, the SB submitted
a revised proposal to the GMM Committee in
October. The new proposal was forgo introducing
the additional variable remuneration and to
increase the fixed salary instead.
Taking everything into consideration,
the committee approved this.
The GMM Committee considers transparency
with respect to this matter to be of great
importance and was therefore pleased to see
how the SB explained the matter at the regional
meetings in the autumn of 2015. The committee
is also pleased to note the commitment of the
SB to include more explicit information in the
relevant disclosure in the financial statements.
Lastly, the GMM Committee is satisfied with the
new developments such as remote participation
and voting in the GMM. The committee was
moreover pleasantly surprised by the increasing
willingness to accept renewal by the GMM.
The committee wishes to compliment the
Management Board and the company in this
respect.
Aalsmeer, 13 April 2016
Ad van Marrewijk
Chair of the GMM Committee
Royal FloraHolland
Report of the GMM Committee
79 Annual Report 2015 | Report of the GMM Committee
SupervisoryBoard Report
Management Board Report
2020 strategy
Facts & figures
Financial statements
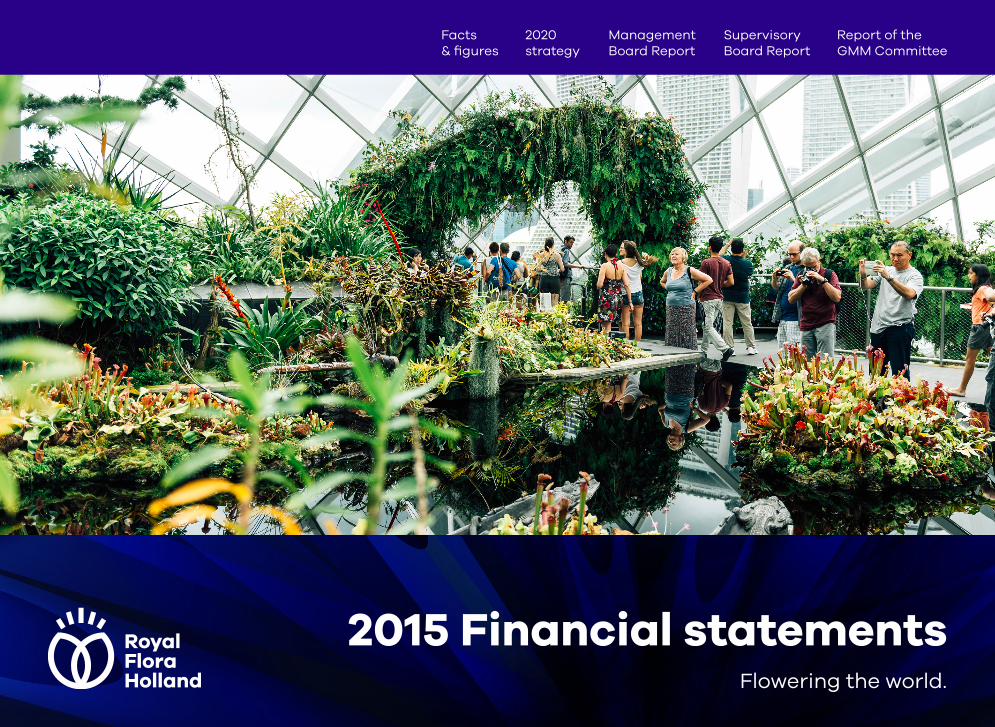
Royal FloraHolland Jaarverslag 2015
XXXXXXXXX
80 •••••••••• | ••••••••••••••••
2015 Financial statementsFlowering the world.
Report of the GMM Committee
SupervisoryBoard Report
Management Board Report
2020 strategy
Facts & figures

Royal FloraHolland
Financial statements 2015
81 Financial statements 2015 | Consolidated balance sheet as at 31 December 2015
Consolidated balance sheet as at 31 December 2015(Before proposed profit appropriation (amounts x €1,000))
Notes 2015 2014
Current assets
Receivables
Trade receivables 70,398 76,523
Amounts receivable from
participating interests 259 109
Deferred tax assets 1,548 1,250
Other receivables
and prepayments (4) 17,160 18,908
89,365 96,790
Cash at bank and in hand 54,401 9,872
Total 884,813 902,839
For a vertical view of the consolidated balance sheet,
click here.
Notes 2015 2014
ASSETS
Fixed assets
Intangible fixed assets (1) 55 496
Tangible fixed assets (2)
Land 112,253 113,198
Buildings 348,681 364,270
Machinery and equipment 83,126 92,685
Other fixed operating assets 68,399 78,182
Not used in business operations 112,766 127,251
725,225 775,586
Financial fixed assets (3)
Participating interests 12,072 15,202
Amounts receivable from
participating interests 3,350 4,778
Other receivables 345 115
15,767 20,095
Report of the GMM Committee
SupervisoryBoard Report
Management Board Report
2020 strategy
Facts & figures

Royal FloraHolland
Financial statements 2015
82 Financial statements 2015 | Consolidated balance sheet as at 31 December 2015
Notes 2015 2014
Current liabilities
Credit institutions including
repayment obligations (13) 1,703 76,916
Amounts payable to members/
non-members (14) 55,113 57,256
Other creditors 44,933 40,996
Deposits 82.936 81.474
Other liabilities and accruals (15) 61,500 60.203
246,185 316.845
Total 884,813 902,839
* Subordinated loans. Together with the group equity, these form the guarantee
capital. At year-end 2015, the guarantee capital amounted to €481.1 million
(2014: €446.1 million).
For a vertical view of the consolidated balance sheet,
click here.
Notes 2015 2014
LIABILITIES
Group equity
Equity (5) 219,263 211,224
Minority interests (6) 2,278 2,286
221,541 213,510
Provisions (7)
Provision for deferred tax 1,664 1,687
Provision for reorganization 1,748 7,367
Other provisions 5,605 5,942
9,017 14,996
Long-term liabilities
Members’ loans * (8) 202,072 175,382
Liquidity contribution * (9) 46,036 44,759
Voluntary (members’) loans * (10) 7,223 8,334
Supplier loans * (11) 6,514 6,442
Credit institutions (12) 146,225 122,571
408,070 357,488
Report of the GMM Committee
SupervisoryBoard Report
Management Board Report
2020 strategy
Facts & figures

Royal FloraHolland
Financial statements 2015
83 Financial statements 2015 | Consolidated profit and loss account for 2015
Notes 2015 2014
Operating income
Commission contributions 106,688 105,149
Membership fees 9,736 8,745
Lot and auction trolley charges 67,560 69,142
Transaction and service charges 24,791 24,655
Packaging 53,339 53,122
Trolley and CC (container) rentals 24,328 25,355
Letting of real estate 52,962 53,623
Other operating income 52,187 53,628
391,591 393,419
Operating costs
Wages and salaries (16) 147,598 141,738
Social security charges 17,474 21,357
Pension charges 13,303 13,593
Depreciation and other changes
in value of fixed assets 75,581 82,559
Other operating expenses (17) 108,867 109,398
362,823 368,645
Operating profit 28,768 24,774
Notes 2015 2014
Financial income and expenses
Interest expenses and similar
expenses –17,503 –18,747
Interest income and similar income 2,711 3,688
–14,792 –15,059
Profit before taxation 13,976 9,715
Share in profit of participating
interests 2,257 2,681
Income taxes (18) –3,991 –2,488
Minority interests –202 –349
Profit after taxation 12,040 9,559
* Costs of €12,047 are recognised in 2015 for the Royal FloraHolland 2020 strategy
(2014: 0). For further explanation of the figures, see notes 16 and 17 to the
consolidated profit and loss account.
Consolidated profit and loss account for 2015(amounts x €1.000)
Report of the GMM Committee
SupervisoryBoard Report
Management Board Report
2020 strategy
Facts & figures

Royal FloraHolland
Financial statements 2015
84 Financial statements 2015 | Consolidated cash flow statement for 2015
2015 2014
Operating activities
Operating profit 28,768 24,774
Depreciation and other changes
in value of fixed assets 76,481 82,559
Change provisions –5,558 –13,400
99,691 93,933
Change in working capital
Decrease/increase in trade receivables 6,125 –3,626
Decrease/increase in receivables
from participating interests –150 848
Decrease/increase in other receivables 1,761 8,250
Decrease/increase in payables
to members/non-members 13,112 –46,742
Decrease/increase in creditors 2,237 –8,452
Decrease/increase in payables
to participating interests – –156
Decrease/increase in deposits 1,462 3,975
Decrease/increase in other payables 839 2,158
25,386 –43,745
Consolidated cash flow statement for 2015 (amounts x €1,000)
2015 2014
Interest received 2,711 3,688
Dividend received 2,581 2,387
Interest paid –17,503 –19,027
Income tax paid –206 –1,061
–12,417 –14,013
Cash flow from operating activities 112,660 36,175
Investment activities
Additions to tangible fixed assets –45,810 –35,436
Disposals of tangible fixed assets 20,731 3,356
Acquisition of group companies – –3,442
Acquisition of non-consolidated
participating interests – –51
Disposals long-term receivables 1,458 –
Provision long-term receivables –260 –
Disposals of other financial fixed assets – 1,560
Cash flow from investment activities –23,881 –34,013
For a vertical view of the consolidated cash flow statement,
click here.
Report of the GMM Committee
SupervisoryBoard Report
Management Board Report
2020 strategy
Facts & figures

Royal FloraHolland
Financial statements 2015
85 Financial statements 2015 | Consolidated cash flow statement for 2015
2015 2014
Financing activities
Movement in current account
credit institutions –49,563 19,876
Repayment of long-term loans –27,360 –30,826
Additional repayment of long-term loans –25,000 –
Proceeds from long-term loans 50,000 –
Liquidity and capital contributions 46,036 44,759
Voluntary (members’) loan –1,111 –325
Repayment of members’ loan –30,327 – 26,938
Repayment of supplier loan –2,325 –3,364
Repayment of participation reserve –4,600 –4,724
Cash flow from financing activities –44,250 –1,542
Net cash flow 44,529 620
Cash at bank and in hand at 1 January 9,872 9,252
Cash at bank and in hand at 31 December 54,401 9,872
Increase in cash and cash equivalents 44,529 620
For a vertical view of the consolidated cash flow statement,
click here.
Report of the GMM Committee
SupervisoryBoard Report
Management Board Report
2020 strategy
Facts & figures

Royal FloraHolland
Financial statements 2015
2015 2014
Consolidated net profit after taxation 12,040 9,559
Net income and expenses recognised directly in group equity – –
Total recognised income and expenses 12,040 9,559
Consolidated statement of comprehensive income and expenses for 2015(amounts x €1,000)
86 Financial statements 2015 | Consolidated statement of recognised income and expenses for 2015
Report of the GMM Committee
SupervisoryBoard Report
Management Board Report
2020 strategy
Facts & figures

Royal FloraHolland
Financial statements 2015
87 Financial statements 2015 | Notes to the consolidated figures for 2015
Notes to the consolidated figures for 2015
The participation reserve formed from the profit realised in the
name of its members is part of the equity of the cooperative.
Following a proposal from the Management Board of the cooperative
and subject to approval by the General Members’ Meeting,
an annual amount in the participation reserve allocated from
a positive annual result can be made payable after twenty years.
In addition, each member of the cooperative participates in the
members’ loan by contributing a percentage of the sales of their
products settled via the cooperative. This percentage is based
on a proposal by the Management Board and determined by the
General Members’ Meeting. The members’ loan is subordinated
to claims of creditors and other providers of debt capital.
The payout of the members’ loan can be postponed, if proposed
by the Management Board and subject to approval by the General
Members’ Meeting, on the expiration of the loan term of the
respective year.
Standards applied
The financial statements have been prepared in accordance with
Part 9 of Book 2 of the Dutch Civil Code (BW). For the sake of clarity,
the presentation of the profit and loss account deviates from the
prescribed models in the Annual Accounts Models Decree because
of the special character of the operating activities.
GENERAL NOTES
Goals
The Koninklijke Coöperatieve Bloemenveiling FloraHolland U.A.,
hereinafter Royal FloraHolland, is a cooperative with excluded
liability for its members. The cooperative aims to achieve the
highest yields at the lowest realisable marketing costs for its
members by organising a series of marketplaces, both virtual
and physical, and related services and facilities. Members of the
cooperative can be natural persons and legal entities active in
one or more companies that grow ornamental plants or flowers.
Royal FloraHolland Aalsmeer’s registered office is in Aalsmeer
and the office address is: Legmeerdijk 313, 1430 BA Aalsmeer,
The Netherlands.
Liability of the members of the cooperative
Royal FloraHolland has a statutory exclusion of liability in favour
of its members. This means that the members of the cooperative
are not to be held responsible for unrecoverable losses other
than cooperative financing in the form of a participation reserve
and subordinated members’ loan.
Report of the GMM Committee
SupervisoryBoard Report
Management Board Report
2020 strategy
Facts & figures

Royal FloraHolland
Financial statements 2015
88 Financial statements 2015 | Notes to the consolidated figures for 2015
In the organisational structure, Royal FloraHolland has chosen to
include the activities that are directly subservient to its core
activities within the cooperative. Subservient activities not directly
linked to the company’s auction activities, together with a number
of other financial interests, were included in participating interests.
The consolidation base is shown in the Appendix. The following
participating interests were disposed of in 2015: Decorum Plants
B.V., Aucxis C.V.B.A., Fresh Chain Company B.V., Frederique’s Choice
B.V., Steen voor Steen B.V. and Verde Trade Parc B.V. The participating
interests FH Vastgoed 1 B.V. and Flower Chain Services B.V. were
liquidated in 2015. In addition, FH Services Italy S.r.l. was incorporated
in 2015.
ACCOUNTING POLICIES USED IN PREPARING THE CONSOLIDATED
FINANCIAL STATEMENTS
General
The accounting policies for valuation of assets and liabilities and
determining the results are based on historical costs. The assets
and liabilities are recorded at amortised cost, unless stated
otherwise. An asset is recorded in the balance sheet when it is
probable that future economic benefits will flow to the company
and its value can be reliably determined. A liability is recorded in
the balance sheet when it is probable that its settlement will go
hand in hand with the outflow of resources and the amount can
be reliably determined.
The amounts included in the notes are expressed in thousands of
euros, unless stated otherwise. The ‘result’ is taken to mean the
result including exceptional items, unless otherwise stated.
Basis of consolidation
Royal FloraHolland and its group companies, with which it forms an
organisational and economic entity (collectively known as ‘the
Group’), are included in the 2015 consolidated financial statements.
Group companies are companies in whose governance and financial
policies Royal FloraHolland has a direct or indirect controlling
interest. A controlling interest is assumed if Royal FloraHolland owns
more than 50% of the share capital or owns particular and special
rights, such as potential voting rights that can be exercised directly
so that such a company must be considered a group company.
The group companies are fully consolidated. The share of third
parties in the equity and results is listed separately. Inter-company
transactions and mutual claims and liabilities are eliminated.
Consolidation and de-consolidation take place as from the date on
which control is obtained respectively until the date that control no
longer exists.
The group companies are included in the consolidated financial
statements according to Royal FloraHolland’s accounting policies
for valuation and determination of the result.
Report of the GMM Committee
SupervisoryBoard Report
Management Board Report
2020 strategy
Facts & figures

Royal FloraHolland
Financial statements 2015
89 Financial statements 2015 | Notes to the consolidated figures for 2015
One third of the land available for sale on the open market in
Aalsmeer and Rijnsburg is allocated for sale to third parties not
being trading partners. Two thirds of land available for sale on the
open market is kept either for future sale to trading partners or for
the cooperatives own use. Of the land available for sale on the open
market in Naaldwijk, 38% is allocated for sale to third parties and
62% is kept either for future sale to trading partners or for the
cooperatives own use. The land either allocated for sale to trading
partners or for own use in Aalsmeer, Naaldwijk and Rijnsburg is
considered economically interchangeable. Future sale of land,
regardless of whether it is located in Aalsmeer, Naaldwijk or
Rijnsburg, will be based on average cost. The result (for financial
accounting purposes) comprises the difference between the sales
price and the number of square meters at an average cost price.
Land available for sale on the open market allocated for sale to
third parties is not considered economically interchangeable and
is valued at historical cost of acquisition per location net for
accumulated impairment losses.
Financial fixed assets
Participating interests on whose financial and operating policies
the group exercises significant influence are valued using the net
asset value. Significant influence is in any case assumed to be
present with a shareholding of more than 20%. The net asset value
is calculated in accordance with the accounting policies that apply
to these financial statements. If the net asset valuation of a
participating interest is lower than zero, the carrying value will be
kept nil. A provision is formed if and to the extent the company
stands surely for all or part of the debts of the participating interest
Intangible fixed assets
Intangible fixed assets are carried at cost of acquisition net of
accumulated amortisation and any accumulated impairment
losses. The annual straight line amortisation is based on the
estimated useful life of ten years. Impairment can occur if changes
or circumstances arise which suggest that the carrying amount
of an asset will not be (fully) recovered.
Tangible fixed assets
Tangible fixed assets are carried at the cost of acquisition or
production net of accumulated depreciation and where applicable
accumulated impairment losses. The annual straight line
depreciations are based on the expected economic useful life
of buildings and site facilities of 10-33 1/3 years, and of machinery
and equipment and other fixed operating assets of 5 to 10 years,
taking account of residual value. Assets not used in business
operations are not depreciated.
Costs of major maintenance are recognized under cost when
incurred and if the recognition criteria are met. The carrying
amount of the components to be replaced will be regarded as a
disposal and taken directly to the profit and loss account. All other
repair and maintenance costs are taken directly to the profit and
loss account.
Impairment losses can occur if changes or circumstances arise
which suggest that the carrying amount of an asset will not be
(fully) recovered. (See also the note on page 97, risks on impairment
of fixed assets.)
Report of the GMM Committee
SupervisoryBoard Report
Management Board Report
2020 strategy
Facts & figures
Royal FloraHolland
Financial statements 2015
90 Financial statements 2015 | Notes to the consolidated figures for 2015
Pensions
The group has two pension plans. Royal FloraHolland has a defined
benefit pension plan (a career average pension scheme), the
nominal entitlements of which have been insured using a separate
investment portfolio administered by an insurer. The defined
benefit pension entitlements will be funded by way of annual
pension payments to the insurer. The coverage ratio amounted
to 113.0% at year-end 2015, which is well above the minimum
target of 105.0% set by the Dutch Central Bank. Pensions were
not indexed in 2015. In addition, Hobaho Horti Groep BV has an
industrial sector pension fund to which the Suwas ruling applies.
In accordance with the current generally accepted accounting
policies, the commitments accounting policy is used. For both
pension plans, the contributions are recognised as an expense
in the year to which they relate.
Anniversaries
The anniversaries provision concerns costs of future anniversary
benefits attributable to past years of service, taking into account
the risk of interim retirement and death.
Deposit obligation
Deposit liabilities are carried at the deposit value of reusable
packaging in circulation at the balance sheet date, after deduction
of an estimated amount for packaging that will not return.
or if it has a constructive obligation to enable the participating
interest to repay its debts. Participating interests over whose
financial and operating policies no significant influence is
exercised are carried at cost less any impairment.
Receivables recognised under financial fixed assets are carried
at amortised cost price, less a provision for doubtful debts.
Receivables and cash at bank and in hand
Receivables are stated at their nominal value, less provision for
doubtful debts. Receivables and cash at bank and in hand are at
the cooperatives free disposal.
Inventories and projects in progress
Inventories are carried at acquisition costs, net for provisions for
unmarketable stocks.
Projects in progress, existing of rendered services to be invoiced,
are carried at their estimated sales value. Revenues and profit are
accounted for pro rata to the extent of work performed.
Provisions
Provisions are formed for obligations and losses that existed at
the balance sheet date, the amount of which is uncertain but can
reliably be estimated. The amount of the provision is determined
based on a best estimate of the amounts required to settle the
liabilities and losses concerned.
Report of the GMM Committee
SupervisoryBoard Report
Management Board Report
2020 strategy
Facts & figures

Royal FloraHolland
Financial statements 2015
91 Financial statements 2015 | Notes to the consolidated figures for 2015
Profit from participating interests
The group’s share in participating interests, over whose financial
and operating policies the group has no controlling interest is taken
to the profit and loss account based on net asset value. To the
extent the net asset value is not applied, the dividend from
participating interests is recognised as profit and value
adjustments are charged to the expenses.
Taxes
Income tax is calculated on the profit as disclosed in the profit and
loss account, allowing for tax-exempt items and wholly or partially
non-deductible expenses. For taxable timing differences,
a deferred tax liability or deferred tax asset is recognised.
The deferred tax asset will be recognised under current assets if it
is deemed to be eligible for future settlement. Insofar as a taxable
profit is available for settlement purposes in the future, a deferred
tax liability for available carry-forward losses was recognised.
The deferred tax assets and liabilities are stated at non-discounted
value, based on the current 25% tax rate.
Cash flow statement
The cash flow statement has been prepared in accordance with the
indirect method. The cash and cash equivalents in the statement
consist of cash at bank and in hand. Interest and taxes received
and paid are included under cash flow from operating activities.
Leasing
The assessment of whether an agreement contains a lease is
based on the substance at the inception date of the agreement.
The contract is classified as a financial lease agreement if the
fulfilment of the arrangement is dependent on the use of a specific
asset or if the contract includes the right of use of a specific asset.
In the case of operational leasing, the lease payments are to be
charged to the profit and loss account on a straight-line basis
over the term of the lease.
Determination of the result
The result, the net amount of the company’s operating income and
expenses for the financial year, is allocated to the year to which it
relates. Operating income (‘profits’) is taken into account insofar
as it is realised at the balance sheet date. Operating expenses
(‘losses’) which originate before the end of the year under review
are recognised if and insofar as they are known before completion
of the annual accounts.
Report of the GMM Committee
SupervisoryBoard Report
Management Board Report
2020 strategy
Facts & figures
Royal FloraHolland
Financial statements 2015
92 Financial statements 2015 | Notes to the consolidated figures for 2015
Credit risk management
To manage the risk of irrecoverable trade receivables, these
receivables are continuously monitored. Since the services
provided by Royal FloraHolland are spread over a large group
of customers, there is no question of a large concentration of
accounts receivable. A predominant portion of the accounts
receivable are covered by (un)limited non-reversible statements
and a credit insurance policy has been provided in case 14-day
credit is granted for Royal FloraHolland Connect transactions.
Risks of impairment of buildings and land
An important component in the strategy of Royal FloraHolland
is to offer attractive physical marketplaces in order to optimally
facilitate and bind ‘the trade’. This strategy calls for significant
investments in assets, in particular buildings and land. In this
regard, Royal FloraHolland has developed a long-term vision;
however, due to market conditions and developments in the
financial and real estate markets, medium and long-term
fluctuations in the valuation of fixed assets cannot be ruled out.
Despite this long-term vision, these fluctuations can therefore
lead to impairments.
Royal FloraHolland periodically assesses its policies on
depreciation, valuation principles and investments, in particular
in relation to investments in buildings and land, in order to reduce
the risk of impairment of assets. To assess whether impairment of
assets is required, Royal FloraHolland periodically assess the
carrying amount with the cash flows to be realised for each of
the following asset categories: 1) export location market centres;
Derivatives and financial risks
Derivatives
Royal FloraHolland neither holds nor issues financial instruments
for trading purposes.
Foreign exchange risk management
Transactions in foreign currencies take place only to a limited
extent. Assets and liabilities are also generally denominated
in euros. Accordingly, the foreign currency risk is limited.
Interest rate risk management
Royal FloraHolland follows market interest rate developments
closely. Its interest rate risk policy is intended to provide an early
awareness of interest rate fluctuations. These interest rate swaps
are part of an effective hedging relationship in which cost-price
hedge accounting is applied. Cost-price hedge accounting involves
valuation of the interest rate swaps during the term at historical
cost. Value adjustments are not accounted for in the profit and
loss account.
Liquidity risk management
Supplementary agreements on Royal FloraHolland’s credit ratings
have been made with credit institutions regarding bank financing,
as well as on the conditions under which bank financing is issued.
For bank financing no collaterals have been issued as security.
Report of the GMM Committee
SupervisoryBoard Report
Management Board Report
2020 strategy
Facts & figures

Royal FloraHolland
Financial statements 2015
93 Financial statements 2015 | Notes to the consolidated figures for 2015
2) domestic market centres; 3) land available for sale to trading
partners; 4) land available for sale to third parties; and 5) individual
properties at the marketplaces that can be identified and exploited
separately.
Report of the GMM Committee
SupervisoryBoard Report
Management Board Report
2020 strategy
Facts & figures
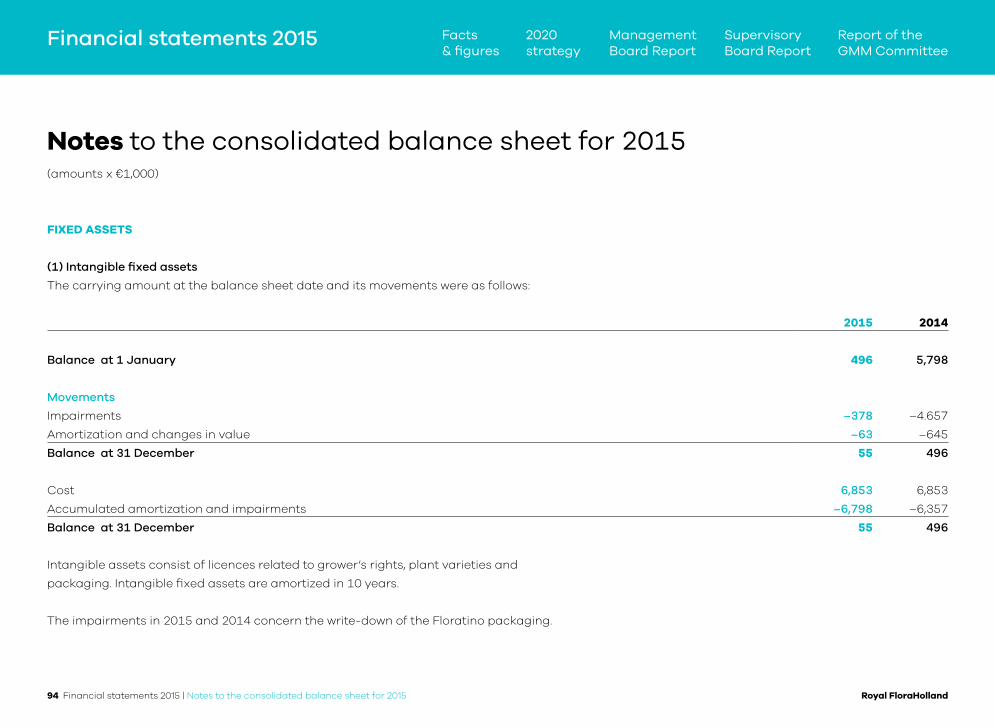
Royal FloraHolland
Financial statements 2015
Notes to the consolidated balance sheet for 2015(amounts x €1,000)
FIXED ASSETS
(1) Intangible fixed assets
The carrying amount at the balance sheet date and its movements were as follows:
2015 2014
Balance at 1 January 496 5,798
Movements
Impairments –378 –4.657
Amortization and changes in value –63 –645
Balance at 31 December 55 496
Cost 6,853 6,853
Accumulated amortization and impairments –6,798 –6,357
Balance at 31 December 55 496
Intangible assets consist of licences related to grower’s rights, plant varieties and
packaging. Intangible fixed assets are amortized in 10 years.
The impairments in 2015 and 2014 concern the write-down of the Floratino packaging.
94 Financial statements 2015 | Notes to the consolidated balance sheet for 2015
Report of the GMM Committee
SupervisoryBoard Report
Management Board Report
2020 strategy
Facts & figures

Royal FloraHolland
Financial statements 2015
95 Financial statements 2015 | Notes to the consolidated balance sheet for 2015
(2) Tangible fixed assets
The carrying amount at the balance sheet date and its movements were as follows:
Carrying amount
at beginning
of year Additions Transfers Reclassification
Depreciation
impairments Disposals
Carrying amount
at year-end
Land
Land 88,524 – – –79 – –3,264 85,181
Site facilities 24,674 3,638 886 – –2,126 – 27,072
Subtotals 113,198 3,638 886 –79 –2,126 –3,264 112,253
Buildings 364,270 10,851 12,378 3,159 –36,533 –5,444 348,681
Machinery & equipment 92,685 6,225 4,115 –3,159 –16,741 – 83,125
Other fixed operating assets
ICT equipment 14,911 3,345 722 – –6,107 – 12,871
Logistics resources and packaging 63,271 4,103 698 – –12,544 – 55,529
Subtotals 78,182 7,448 1,420 – –18,651 – 68,399
Not used in business operations
Land available for sale on the open market 77,368 18 37 79 –400 – 77,102
Assets under construction 21,240 18,754 –18,836 – – –285 20,873
Land and buildings available for sale on the open market 28,643 576 – – –689 –13,738 14,792
Subtotals 127,251 19,348 –18,799 79 –1,089 –14,023 112,766
2015 Totals 775,586 47,510 – – –75,140 –22,731 725,225
2014 Totals 819,148 40,723 – – –80,929 –3,356 775,586
Report of the GMM Committee
SupervisoryBoard Report
Management Board Report
2020 strategy
Facts & figures

Royal FloraHolland
Financial statements 2015
96 Financial statements 2015 | Notes to the consolidated balance sheet for 2015
Land Buildings
Machinery
& equipment
Other
fixed operating
assets
Not used
in business
operations2015 2014
Cost 151,121 1,003,517 349,020 192,848 126,855 1,823,361 1,798,528
Accumulated depreciation and impairments –38,868 –654,836 –265,894 –124,449 –14,089 –1,098,135 –1,022,941
Balance as at 31 December 112,253 348,681 83,126 68,399 112,766 725,225 775,586
The carrying amount at the balance sheet date of land available for sale on the open
market can be broken down as follows:
Number of m2
(x 1.000)
Carrying
amount
Royal FloraHolland 1,068 75,700
Greenparc V.O.F. 106 1,402
Balance at 31 December 1,174 77,102
The land available for sale on the open market consists of land that
is free to be sold to trading partners and third parties who are not
trading partners. Land available for sale to trading partners on
the open market is kept for future issuance to Royal FloraHolland
customers in support of the position as a central marketplace.
Assets under construction relate to assets which were not yet in
use at the balance sheet date. The assets taken into use during
the year are allocated to the applicable asset category via the
‘transfers’ column. Assets taken into use in 2015 include the
renovation of the parking level, contributions to the laying of
access roads, investments in fire alarm & evacuation systems
and the renovation of the cooling units. Additions that were not
yet taken into use by year-end 2015 include changes to the ramps,
investments in fire alarm & evacuation systems, preparation of land
for construction (Neptunus) and the renovation of the cooling units.
The ‘reclassification’ column concerns various assets that have
been further specified and therefore allocated to a different asset
category.
Report of the GMM Committee
SupervisoryBoard Report
Management Board Report
2020 strategy
Facts & figures
Royal FloraHolland
Financial statements 2015
97 Financial statements 2015 | Notes to the consolidated balance sheet for 2015
The impairments mainly concern the write-down of the carrying
amount of tribune F ‘cut flowers’ in Aalsmeer which was
discontinued at year-end 2015. This led to a write-down
of €2.5 million.
The major disposals in 2015 concern the sale of the real estate
in Venlo and the sale of the buildings on the Prunus in Aalsmeer.
Royal FloraHolland has no legal ownership with respect to
the capitalized contributions to the N231 and N201 in Aalsmeer
amounting to €3.3 million. Royal FloraHolland also made
a contribution of €1.7 million to improving the connection with
the A44. This amount has been capitalized and Royal FloraHolland
has no legal ownership.
The land and buildings available for sale on the open market
concern fixed assets for sale to trade partners and third parties
that are not trade partners. The tangible fixed assets of the
Bleiswijk location were included in this category.
Tangible fixed assets are depreciated on the basis of their
estimated useful lives:
- Assets not used in business operations will not be depreciated.
- Buildings and site facilities: depreciation in 10-33 1/3 years.
- Machinery and equipment & other fixed assets: depreciation
over 5-10 years.
Fixed assets no longer available with a carrying amount of nil have
been adjusted in the cumulative figures in 2015.
Report of the GMM Committee
SupervisoryBoard Report
Management Board Report
2020 strategy
Facts & figures

Royal FloraHolland
Financial statements 2015
98 Financial statements 2015 | Notes to the consolidated balance sheet for 2015
(3) Financial fixed assets
The carrying amount at the balance sheet date and its movements were as follows:
Participating
interests
Amounts
receivable from
participating
interests
Other
receivables
2015 2014
Balance as at 1 January 15,202 4,778 115 20,095 22,818
Movements
Acquisitions – – – – 51
Disposals –1,857 – – –1,857 –1,833
Profit of participating interests 2,257 – – 2,257 2,681
Movement in loans – – 260 260 –207
Repayments – –1,428 –30 –1,458 –
Impairments of assets –799 – – –799 –361
Dividend paid by participating interests –2,581 – – –2,581 –2,387
New consolidation – – – – –667
Balance as at 31 December 12,072 3,350 345 15,767 20,095
Participating interests
The impairments of the participating interests are recognised in the profit and loss account
under the item other operating expenses.
Amounts receivable from participating interests
This category includes ‘loans to participating interests’. These loans bear an average
interest of 4.4% (2014: 4.2%) and have a remaining term of less than five years.
Transactions with related parties
All transactions with participating interests are effected at normal market conditions.
Report of the GMM Committee
SupervisoryBoard Report
Management Board Report
2020 strategy
Facts & figures

Royal FloraHolland
Financial statements 2015
99 Financial statements 2015 | Notes to the consolidated balance sheet for 2015
CURRENT ASSETS
RECEIVABLES
(4) Other receivables and prepayments 2015 2014
Taxes and social security charges 2,024 3,087
Prepaid expenses 8,643 5,138
Inventory and projects in progress 731 940
Receivable related to real estate transactions – 1,306
Other receivables 4,714 7,287
Other prepayments 1,048 1,150
Balance at 31 December 17,160 18,908
(5) Equity
The equity amounts to €219.3 million at the balance sheet date (2014: €211.2 million).
For a detailed explanation, reference is made to the notes to the company balance sheet.
(6) Minority interests 2015 2014
Balance at 1 January 2,286 1,976
Movements
Share in result of participating interests 202 349
Dividend paid –152 –47
Adjustment to previous financial year –58 8
Balance at 31 December 2,278 2,286
Report of the GMM Committee
SupervisoryBoard Report
Management Board Report
2020 strategy
Facts & figures

Royal FloraHolland
Financial statements 2015
100 Financial statements 2015 | Notes to the consolidated balance sheet for 2015
(7) Provisions
Provision for
deferred taxation
liabilities
Provision for
reorganisation
Other
provisions
2015 2014
Balance at 1 January 1,687 7,367 5,942 14,996 30,560
Movements
Additions – 1,748 26 1,773 3,103
Charges –23 –6,158 –200 –6,381 –15,290
Release – –397 – –397 –
Reclassification – –812 –162 –974 –3,377
Balance as at 31 December 1,664 1,748 5,606 9,017 14,996
The provision for deferred taxation liabilities originates from differences between the
valuation of tangible fixed assets for financial accounting and tax purposes and a recorded
cost equalisation reserve. The provision for deferred taxation has been calculated on
the basis of a corporate income tax rate of 25.0% (2014: 25.0%).
The provisions generally have a remaining term of more than one year.
Report of the GMM Committee
SupervisoryBoard Report
Management Board Report
2020 strategy
Facts & figures

Royal FloraHolland
Financial statements 2015
101 Financial statements 2015 | Notes to the consolidated balance sheet for 2015
LONG-TERM LIABILITIES
(8) Members’ loans 2015 2014
Balance at 1 January 175,382 171,506
Movements
Addition liquidity contribution previous financial year 43,244 31,882
Payout due to death and resignation –7,746 –6,731
Repayment liability for current financial year recognised under current liabilities –9,429 –22,581
Transfers membership type to members’ loan 621 1,306
Balance at 31 December 202,072 175,382
Payout of the members’ loan is provided for by Article 17 of the Articles of Association.
Over 2015, interest was paid at a rate of 1.4% (2014: 1.6%). The balance at 31 December
2015 refers to the amounts added from 2009 to 2015. This also includes the amounts
added in 2007 of the Aalsmeer flower auction. €94.1 million (2014: €90.3 million) of the
total amount of €202.0 million (2014: €175.4 million) has a remaining term of more than
five years.
For the repayments related to loans existing on 31 December 2007, the repayment date
falls at the end of the term as it applied to the former Royal FloraHolland (i.e. after seven
years) and the former Aalsmeer flower auction (i.e. after nine years). For the repayments
related to loans as from 2008, the repayment date will fall at the end of a term of eight
years.
The members’ loans are subordinated to all third-party claims against Royal FloraHolland.
Report of the GMM Committee
SupervisoryBoard Report
Management Board Report
2020 strategy
Facts & figures

Royal FloraHolland
Financial statements 2015
102 Financial statements 2015 | Notes to the consolidated balance sheet for 2015
(9) Liquidity contribution 2015 2014
Balance at 1 January 44,759 32,914
Movements
Addition member and supplier loans previous financial year –44,759 –32,914
Withheld from members in current financial year 44,485 43,244
Withheld from non-members in current financial year 1,551 1,515
Balance at 31 December 46,036 44,759
The liquidity contribution consists of a withheld contribution of 1.0% of members’ and non-
members’ product sales. In 2015 the total amount of the withheld liquidity contribution was
€46.0 million (2014: €44.8 million). It will be proposed to the General Members’ Meeting that the
entire liquidity contribution for 2015, i.e. €46.0 million (2014: €44.8 million) will be added
to the members’ loan.
The liquidity contribution is subordinated to all third-party claims against Royal FloraHolland.
(10) Voluntary (members’) loans 2015 2014
Balance at 1 January 8,334 8,659
Movements
Additions 159 242
Repayments –1,270 –567
Balance at 31 December 7,223 8,334
Report of the GMM Committee
SupervisoryBoard Report
Management Board Report
2020 strategy
Facts & figures

Royal FloraHolland
Financial statements 2015
103 Financial statements 2015 | Notes to the consolidated balance sheet for 2015
The balance on 31 December 2015 refers to the amounts added
from 2009 to 2015. This also includes the amounts added in 2007
of the Aalsmeer flower auction. Over 2015 interest was paid at a
rate of 1.4% (2014: 1.6%),
The additions on supplier loans became interest-bearing on
1 January following the year in which they were added. For the
amounts added to the supplier loans up to and including the
annual amount for 2008, the repayment terms that were applicable
remain in effect, i.e. seven and ten years. For repayments related
to loans from 2009, the repayment period is the same as the
repayment period of the members’ loan (i.e. eight years). An amount
of €3.2 million (2014: €3.4 million) of the total balance
of €6.5 million (2014: €6.4 million) has a remaining term
of more than five years. An amount of €3.8 million
(2015: €3.8 million) is expected to be paid to former
members and non-members in 2016.
The supplier loans are subordinated to all third-party
receivables on Royal FloraHolland.
The added amounts to voluntary (members’) loans are repayable after five years. The balance of
€7.2 million (2014: €8.3 million) has a remaining term of less than five years. Over 2015, interest
was paid at a rate of 1.9% (2014: 2.1%).
The voluntary (members’) loan is subordinated to all third-party receivables on Royal FloraHolland.
(11) Supplier loans 2015 2014
Balance at 1 January 6,442 8,657
Movements
Addition contribution current financial year 1,515 1,380
Repayment due to death and resignation –449 –1,719
Transfer to members’ loan –621 –
Repayment liability for current financial year recognised under current liabilities –373 –1,876
Balance at 31 December 6,514 6,442
Report of the GMM Committee
SupervisoryBoard Report
Management Board Report
2020 strategy
Facts & figures

Royal FloraHolland
Financial statements 2015
104 Financial statements 2015 | Notes to the consolidated balance sheet for 2015
(12) Credit institutions 2015 2014
Balance at 1 January 122,571 150,288
Movements
Repayment liability for next financial year, recognised under current liabilities –1,703 –27,717
Repayment liability for previous year 357
Additional repayment during the year –25,000
New loans 50,000
Balance at 31 December 146,225 122,571
€141.9 million (2014: €119.1 million) of the total amount of
€146.2 million (2014: €122.6 million), has a remaining term of
less than five years. The 2016 repayment liability of €1.7 million
(2015: €27.7 million) is recognised under current liabilities.
These loans bearing an average interest rate of 1.9%
(2014: 2.4%). Long-term bank loans are concluded with
Rabobank, ING Bank and ABN AMRO.
CURRENT LIABILITIES
(13) Credit institutions including repayment liabilities
This includes the repayment liabilities on the long-term bank loans
of €1.7 million (2014: €27.7 million). No credit facilities at banks were
in use at year-end 2015 (2014: €49.2 million). The available credit
at banks amounts to €116.5 million (2014: €127.8 million).
(14) Amounts payable to members/non-members
This includes the product sales of 28, 29 and 30 December 2015
and the 2016 repayment liabilities on the members’ loan (2005
Aalsmeer flower auction addition; 2007 former Royal FloraHolland
addition). The repayment liabilities due in 2016 stemming from
the supplier loans and participation reserve are also recorded.
Report of the GMM Committee
SupervisoryBoard Report
Management Board Report
2020 strategy
Facts & figures

Royal FloraHolland
Financial statements 2015
105 Financial statements 2015 | Notes to the consolidated balance sheet for 2015
(15) Other liabilities and accruals 2015 2014
Taxes and social security charges 7,251 6,815
Holiday allowance and days off 14,243 15,306
Interest costs on banks and members’ loans 4,858 5,284
Accruals 8,407 8,301
Other amounts payable 26,741 24,497
Balance at 31 December 61,500 60,203
Financial instruments
As of 31 December 2015, the nominal value of Royal FloraHolland’s
interest rate swap contracts amounted to €293.9 million (2014:
€324.2 million), to cover bank loans and member and supplier
loans. Under these swaps, Royal FloraHolland receives a variable
interest rate and pays a fixed interest rate.
On 31 December 2015, Royal FloraHolland’s bank debt in terms
of long-term and short-term loans amounted to €149.1 million
(2014: €199.5 million) with a variable interest rate. To cover those,
interest rate swap contracts have been concluded. The fixed
interest rate of 3.4% (2014: 3.2%) is above the market level at
year-end 2015, so that the fair value of the swaps is negative
at the balance sheet date.
As of 31 December 2015, Royal FloraHolland’s member and
supplier loans totalled €261.9 million (2014: €234.9 million).
The interest rate is determined annually and is derived from the
yield on 8-year government bonds. To cover the member and
supplier loans, interest rate swap contracts have been concluded.
The fixed interest rate was 3.1% on average at year-end 2015
(2014: 3.5%).
The interest rate swaps has a negative fair value of €28.9 million
at the balance sheet date (2014: €39.4 million negative).
The 2015 financing costs amounted to €17.5 million (2014:
€18.8 million). Of this amount, €6.7 million (2014: €8.1 million)
relates to the costs on variable interest rate loans and €10.8 million
(2014: €10.7 million) relates to interest rate swap contracts to cover
the risk on variable interest rate loans. The average interest paid in
2015 as a percentage of the outstanding loans including interest
rate swap contracts is 4.3% (2014: 4.3%).
More than 70.0% of the interest rate risk on the current bank and
members’ loans is covered, and this will decline in the coming years.
At the balance sheet date, Royal FloraHolland has interest rate
swap contracts with maturities of up to 2021.
Report of the GMM Committee
SupervisoryBoard Report
Management Board Report
2020 strategy
Facts & figures

Royal FloraHolland
Financial statements 2015
106 Financial statements 2015 | Notes to the consolidated balance sheet for 2015
Since Royal FloraHolland has no margin calls included in interest
rate swap contracts, there are no possible liquidity risks in terms
of interest rate swap contracts
ARRANGEMENTS AND COMMITMENTS NOT SHOWN IN
THE BALANCE SHEET
Investment commitments
As of 31 December 2015, the investment commitments from
projects in progress amounted to €7.5 million (2014: €7.2 million).
For infrastructural adjustments aimed to improve the opening up
of the marketplaces, Royal FloraHolland entered into commitments
with government bodies and third parties for an ‘undisturbed
logistical connection’ (OLV) (location Aalsmeer), reconstruction of
the Middel Broekweg/Veilingroute crossing, and the construction
of noise barriers on and the broadening of the N213 (location
Naaldwijk) for a total of €7.1 million (2014: €11.1 million).
Repurchase commitments
In the past, Royal FloraHolland entered into contingent repurchase
commitments for real estate for a total of €250,000 (2014:
€1 million) for an office of a transport business and a service
station in Rijnsburg (DMO).
Lease payments
As of 31 December 2015, the lease payments with a term of less
than one year amounted to €1.6 million (2014: €1.6 million) and
lease payments with a term of one to five years amounted to
€2.5 million (2014: €1.5 million).
Rental obligations
As of 31 December 2015, the rental obligations amounted to
€2.5 million (2014: €3.2 million), of which €1.0 million (2014:
€1.0 million) with a remaining term of less than one year.
Guarantees
Royal FloraHolland has issued guarantees for local governments,
affiliated organisations and other parties for a total of €10.2 million
(2014: €3.0 million).
Other service contracts
As of 31 December 2015, these liabilities amounted to €25.9 million
(2014: €29.6 million), of which €16.3 million (2014: €17.3 million) with
a remaining term of less than one year.
Report of the GMM Committee
SupervisoryBoard Report
Management Board Report
2020 strategy
Facts & figures

Royal FloraHolland
Financial statements 2015
PRODUCT SALES (x €1 million) 2015 2014
Clock sales
Aalsmeer 1,078 1,077
Naaldwijk 703 704
Rijnsburg 325 327
Bleiswijk – 19
Eelde 24 24
Total clock sales 2,130 2,151
Royal FloraHolland Connect 2,335 2,250
Total sales Royal FloraHolland 4,465 4,401
Hobaho Horti Groep B.V. 137 135
Flower Chain Services B.V. – 1
Total group sales 4,602 4,537
Royal FloraHolland’s total share in clock sales was 47.7% in 2015
(2014: 48.9%). The share of Connect product sales in 2015 was
52.3% (2014: 51.1%). The product sales realised by Royal
FloraHolland’s members amounted to €4,228 million in 2015
(2014: €4,112 million) and product sales coming from other
suppliers totalled €237 million in 2015 (2014: €289 million).
107 Financial statements 2015 | Notes to the consolidated profit and loss account for 2015
Notes to the consolidated profit and loss account for 2015(amounts x €1,000, unless otherwise stated)
In 2015, members used the Temporary Exemption from Member
Obligations (TEMO), on which commission is charged by Royal
FloraHolland. Over an amount of €124 million (2014: €124 million)
product sales, a retrospective TEMO commission was paid by
members to Royal FloraHolland in 2015.
Report of the GMM Committee
SupervisoryBoard Report
Management Board Report
2020 strategy
Facts & figures

Royal FloraHolland
Financial statements 2015
108 Financial statements 2015 | Notes to the consolidated profit and loss account for 2015
OPERATING COSTS
(16) Wages and salaries 2015 2014
Salaries of own employees 123,782 121,928
Third-party staff 23,816 19,810
147,598 141,738
The wages and salaries item of €147.6 million includes a sum of
€7.0 million (2014: 0) in costs for the Royal FloraHolland 2020
strategy.
Compensation of the Supervisory Board, and Management Board
remuneration
The compensation of the Supervisory Board and the remuneration
of the Management Board are based on the amounts that were
charged to the results in the financial year.
Royal FloraHolland has had a statutory Management Board since
2014 and the Board of Members was incorporated in the
Supervisory Board. This is why there was no compensation
for the Board of Members in 2014 and 2015.
The compensation for the Supervisory Board (11 persons)
amounted to €454,000 (2014: €435,000 (11 persons)). This concerns
a fixed compensation for their activities. The Chair of the SB
receives €75,000 per year and the members receive €30,000 per
year. For membership of the committees, the Chair receives
€10,000 (in the case of the Audit Committee) or €7,500 (for the
other committees) per year and the members receive €5,000 or
€3,000. The supervisory board members are also reimbursed for
travel and accommodation expenses.
The regular remuneration for the Management Board totalled
€1,043,000 in 2015 (2014: €994,000 (2 persons)). The variable
remuneration for both members of the Management Board
together was €133,000 (2014: €174,000). For L.B. Vos this represents
19.5% of his fixed salary, and for L.A.C. Buchwaldt 13.0% of his fixed
salary. In connection with the termination of employment of L.A.C.
Buchwaldt, an additional sum of €558,000 is charged to 2015. This
payment consists of a non-recurring payment of €359,000 (one
year’s fixed annual salary, as stated in the employment contract)
for the dissolution of his employment contract and a payment for
non-observance of the six months’ notice period (€199,000) as
included in his employment contract. The non-recurring severance
payment and variable remuneration will be paid in 2016, but is
charged to the result in 2015. The salary costs for Mr L.A.C.
Buchwaldt in 2016 until the end date of his employment on 1 March
2016 will be charged to the result in 2016.
Report of the GMM Committee
SupervisoryBoard Report
Management Board Report
2020 strategy
Facts & figures
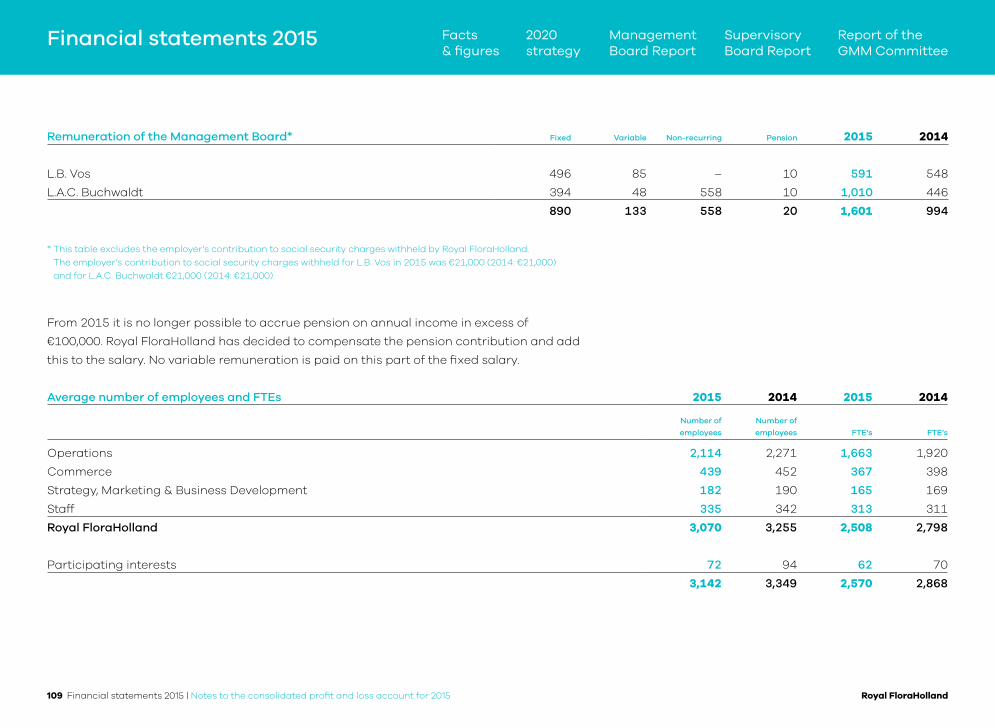
Royal FloraHolland
Financial statements 2015
109 Financial statements 2015 | Notes to the consolidated profit and loss account for 2015
Remuneration of the Management Board* Fixed Variable Non-recurring Pension 2015 2014
L.B. Vos 496 85 – 10 591 548
L.A.C. Buchwaldt 394 48 558 10 1,010 446
890 133 558 20 1,601 994
* This table excludes the employer’s contribution to social security charges withheld by Royal FloraHolland.
The employer’s contribution to social security charges withheld for L.B. Vos in 2015 was €21,000 (2014: €21,000)
and for L.A.C. Buchwaldt €21,000 (2014: €21,000).
From 2015 it is no longer possible to accrue pension on annual income in excess of
€100,000. Royal FloraHolland has decided to compensate the pension contribution and add
this to the salary. No variable remuneration is paid on this part of the fixed salary.
Average number of employees and FTEs 2015 2014 2015 2014
Number of
employees
Number of
employees FTE’s FTE’s
Operations 2,114 2,271 1,663 1,920
Commerce 439 452 367 398
Strategy, Marketing & Business Development 182 190 165 169
Staff 335 342 313 311
Royal FloraHolland 3,070 3,255 2,508 2,798
Participating interests 72 94 62 70
3,142 3,349 2,570 2,868
Report of the GMM Committee
SupervisoryBoard Report
Management Board Report
2020 strategy
Facts & figures
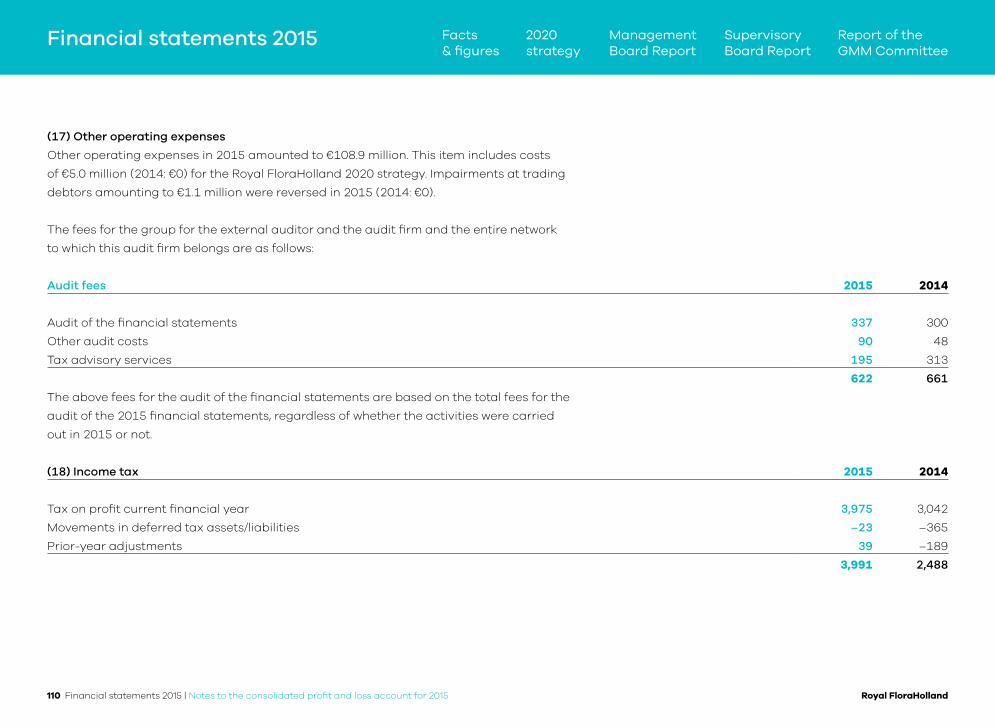
Royal FloraHolland
Financial statements 2015
110 Financial statements 2015 | Notes to the consolidated profit and loss account for 2015
(17) Other operating expenses
Other operating expenses in 2015 amounted to €108.9 million. This item includes costs
of €5.0 million (2014: €0) for the Royal FloraHolland 2020 strategy. Impairments at trading
debtors amounting to €1.1 million were reversed in 2015 (2014: €0).
The fees for the group for the external auditor and the audit firm and the entire network
to which this audit firm belongs are as follows:
Audit fees 2015 2014
Audit of the financial statements 337 300
Other audit costs 90 48
Tax advisory services 195 313
622 661
The above fees for the audit of the financial statements are based on the total fees for the
audit of the 2015 financial statements, regardless of whether the activities were carried
out in 2015 or not.
(18) Income tax 2015 2014
Tax on profit current financial year 3,975 3,042
Movements in deferred tax assets/liabilities –23 –365
Prior-year adjustments 39 –189
3,991 2,488
Report of the GMM Committee
SupervisoryBoard Report
Management Board Report
2020 strategy
Facts & figures

Royal FloraHolland
Financial statements 2015
111 Financial statements 2015 | Notes to the consolidated profit and loss account for 2015
Tax burden 2015 2014
Applicable tax rate 25.0% 25.0%
Effective tax rate 28.6% 27.6%
The higher effective tax rate in 2015 relative to the applicable rate is primarily the result
of non-deductible expenses, an adjustment to the participation exemption (€1.0 million)
and carry forward losses (€1.0 million).
Report of the GMM Committee
SupervisoryBoard Report
Management Board Report
2020 strategy
Facts & figures

Royal FloraHolland
Financial statements 2015
112 Financial statements 2015 | Company balance sheet at 31 December 2015
Company balance sheet at 31 December 2015(before proposed profit allocation (x €1,000))
Notes 2015 2014
ASSETS
Fixed assets
Intangible fixed assets (1) – 432
Tangible fixed assets (2)
Land 104,267 105,212
Buildings 344,282 359,585
Machinery and equipment 81,356 91,837
Other fixed operating assets 68,348 78,156
Not used in business operations 107,008 120,289
705,261 755,079
Financial fixed assets (3)
Participating interests
in group companies 25,792 22,465
Amounts receivable from
participating interests 3,175 3,966
Other amounts receivable 245 –
29,212 26,431
Notes 2015 2014
Current assets
Receivables
Trade receivables 41,822 47,267
Amounts receivable from
group companies 26,961 29,557
Amounts receivable from
participating interests 204 –
Other receivables
and prepayments (4) 13,603 16,995
82,590 93,819
Cash at bank and in hand 45,307 2,882
Total 862,370 878,643
For a vertical view of the company balance sheet,
click here.
Report of the GMM Committee
SupervisoryBoard Report
Management Board Report
2020 strategy
Facts & figures
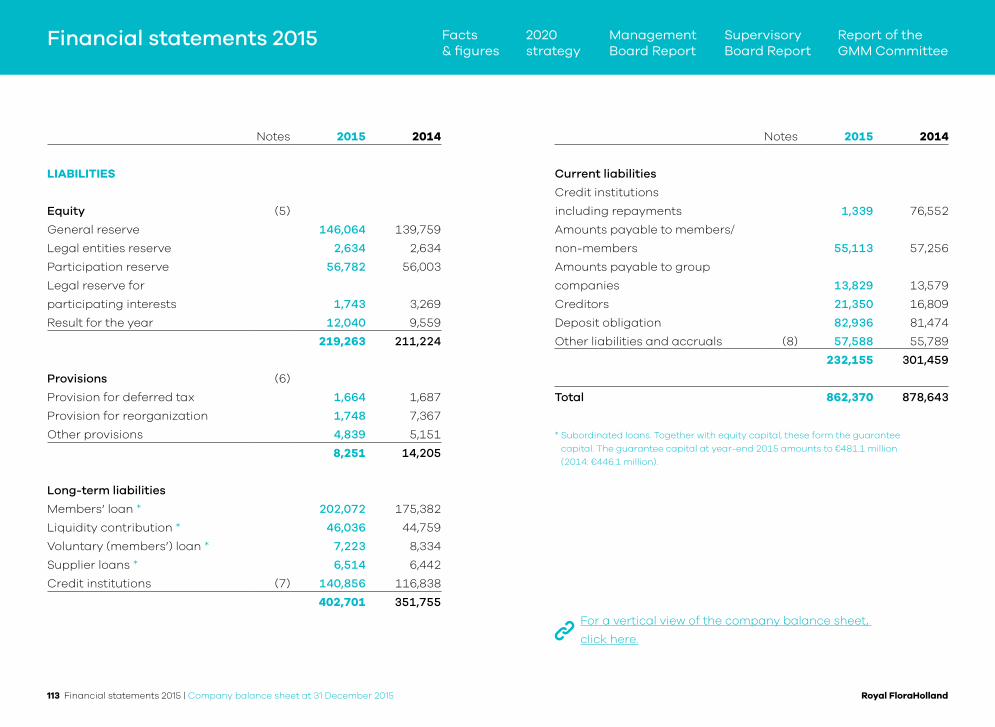
Royal FloraHolland
Financial statements 2015
113 Financial statements 2015 | Company balance sheet at 31 December 2015
Notes 2015 2014
Current liabilities
Credit institutions
including repayments 1,339 76,552
Amounts payable to members/
non-members 55,113 57,256
Amounts payable to group
companies 13,829 13,579
Creditors 21,350 16,809
Deposit obligation 82,936 81,474
Other liabilities and accruals (8) 57,588 55,789
232,155 301,459
Total 862,370 878,643
* Subordinated loans. Together with equity capital, these form the guarantee
capital. The guarantee capital at year-end 2015 amounts to €481.1 million
(2014: €446.1 million).
For a vertical view of the company balance sheet,
click here.
Notes 2015 2014
LIABILITIES
Equity (5)
General reserve 146,064 139,759
Legal entities reserve 2,634 2,634
Participation reserve 56,782 56,003
Legal reserve for
participating interests 1,743 3,269
Result for the year 12,040 9,559
219,263 211,224
Provisions (6)
Provision for deferred tax 1,664 1,687
Provision for reorganization 1,748 7,367
Other provisions 4,839 5,151
8,251 14,205
Long-term liabilities
Members’ loan * 202,072 175,382
Liquidity contribution * 46,036 44,759
Voluntary (members’) loan * 7,223 8,334
Supplier loans * 6,514 6,442
Credit institutions (7) 140,856 116,838
402,701 351,755
Report of the GMM Committee
SupervisoryBoard Report
Management Board Report
2020 strategy
Facts & figures
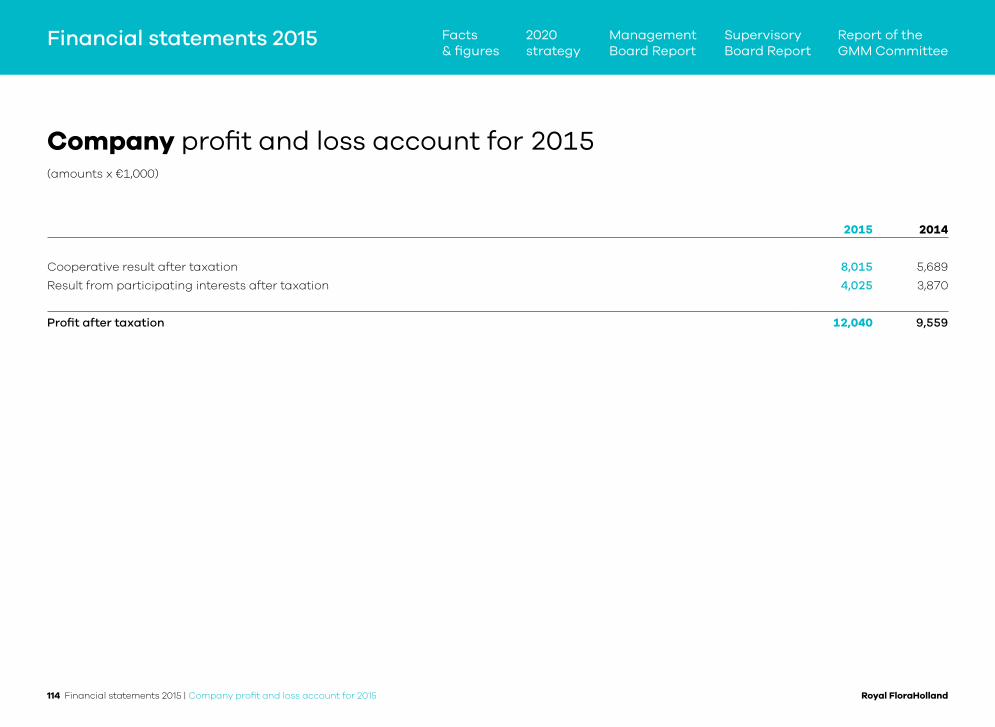
Royal FloraHolland
Financial statements 2015
114 Financial statements 2015 | Company profit and loss account for 2015
Company profit and loss account for 2015(amounts x €1,000)
2015 2014
Cooperative result after taxation 8,015 5,689
Result from participating interests after taxation 4,025 3,870
Profit after taxation 12,040 9,559
Report of the GMM Committee
SupervisoryBoard Report
Management Board Report
2020 strategy
Facts & figures

Royal FloraHolland
Financial statements 2015
115 Financial statements 2015 | Notes to the company figures for 2015
Notes to the company figures for 2015
GENERAL NOTES
The accounting policies used for valuation and for determining
results in the company and consolidated financial statements are
the same. For more information on the accounting policies, please
consult the notes to the consolidated financial statements.
The notes to the 2015 company financial statements include only
those items that deviate from the consolidated balance sheet.
The exemptions in Section 402 of Book 2 of the Dutch Civil Code
have been used in preparing the company profit and loss account.
Report of the GMM Committee
SupervisoryBoard Report
Management Board Report
2020 strategy
Facts & figures

Royal FloraHolland
Financial statements 2015
FIXED ASSETS
(1) Intangible fixed assets
The carrying amount at the balance sheet date and its movements were as follows:
2015 2014
Balance at 1 January 432 5,725
Movements
Impairments –378 –4,657
Amortization –54 –636
Balance at 31 December – 432
Cost 6,361 6,361
Accumulated amortization and impairments –6,361 –5,929
Balance at 31 December – 432
Intangible fixed assets relates to concessions for packaging. Intangible fixed assets
are amortized in ten years.
The impairments in 2014 and 2015 concern a write-down of the packaging concessions.
116 Financial statements 2015 | Notes to the company balance sheet as at 31 December 2015
Notes to the company balance sheet as at 31 December 2015(amounts x €1,000)
Report of the GMM Committee
SupervisoryBoard Report
Management Board Report
2020 strategy
Facts & figures

Royal FloraHolland
Financial statements 2015
117 Financial statements 2015 | Notes to the company balance sheet as at 31 December 2015
(2) Tangible fixed assets
The carrying amount at the balance sheet date and its movements were as follows:
Carrying amount
at beginning
of year Additions Transfers Reclassification
Depreciation
impairments Disposals
Carrying amount
at year-end
Land
Land 80,538 – – –79 – –3,264 77,195
Site facilities 24,674 3,638 886 – –2,126 – 27,072
Subtotals 105,212 3,638 886 –79 –2,126 –3,264 104,267
Buildings 359,585 10,851 12,378 3,159 –36,247 –5,444 344,282
Machinery & equipment 91,837 5,857 3,152 –3,159 –16,331 – 81,356
Other fixed operating assets
ICT equipment 14,885 3,335 722 – –6,100 – 12,842
Logistics resources and packaging 63,271 4,066 698 – –12,529 – 55,506
Subtotals 78,156 7,401 1,420 – –18,629 – 68,348
Not used in business operations
Land available for sale on the open market 75,966 18 37 79 –400 – 75,700
Assets under construction 20,153 18,754 –17,873 – – –285 20,749
Land and buildings available for sale on the open market 24,170 576 – – –449 –13,738 10,559
Subtotals 120,289 19,348 –17,836 79 –849 –14,023 107,008
2015 Totals 755,079 47,095 – – –74,182 –22,731 705,261
2014 Totals 802,318 34,491 – – –79,456 –2,274 755,079
Report of the GMM Committee
SupervisoryBoard Report
Management Board Report
2020 strategy
Facts & figures
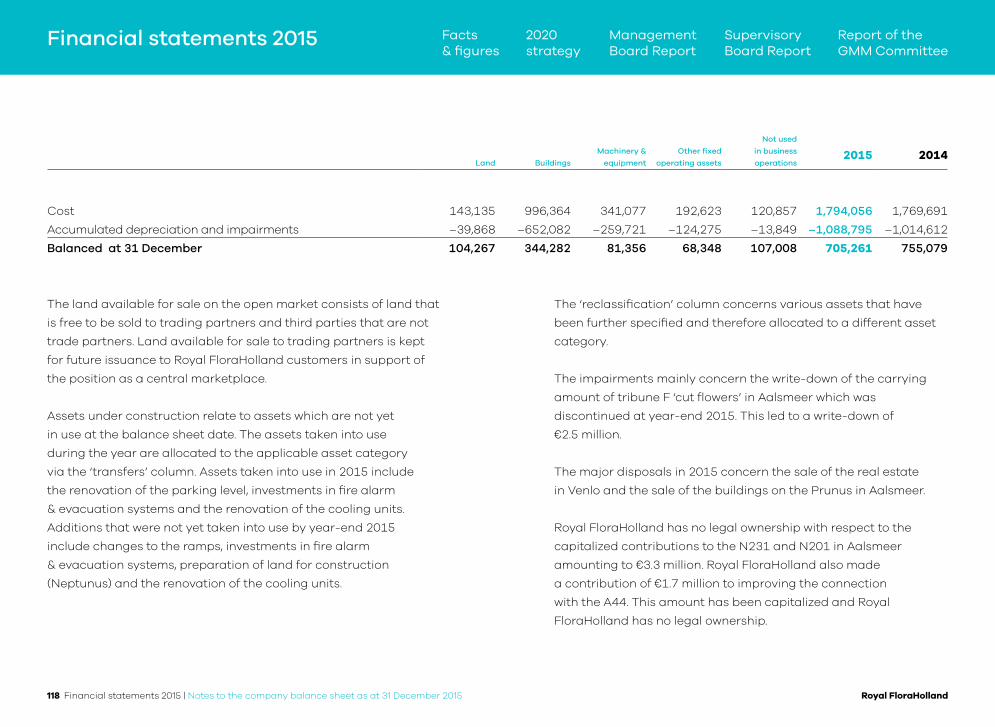
Royal FloraHolland
Financial statements 2015
118 Financial statements 2015 | Notes to the company balance sheet as at 31 December 2015
Land Buildings
Machinery &
equipment
Other fixed
operating assets
Not used
in business
operations2015 2014
Cost 143,135 996,364 341,077 192,623 120,857 1,794,056 1,769,691
Accumulated depreciation and impairments –39,868 –652,082 –259,721 –124,275 –13,849 –1,088,795 –1,014,612
Balanced at 31 December 104,267 344,282 81,356 68,348 107,008 705,261 755,079
The land available for sale on the open market consists of land that
is free to be sold to trading partners and third parties that are not
trade partners. Land available for sale to trading partners is kept
for future issuance to Royal FloraHolland customers in support of
the position as a central marketplace.
Assets under construction relate to assets which are not yet
in use at the balance sheet date. The assets taken into use
during the year are allocated to the applicable asset category
via the ‘transfers’ column. Assets taken into use in 2015 include
the renovation of the parking level, investments in fire alarm
& evacuation systems and the renovation of the cooling units.
Additions that were not yet taken into use by year-end 2015
include changes to the ramps, investments in fire alarm
& evacuation systems, preparation of land for construction
(Neptunus) and the renovation of the cooling units.
The ‘reclassification’ column concerns various assets that have
been further specified and therefore allocated to a different asset
category.
The impairments mainly concern the write-down of the carrying
amount of tribune F ‘cut flowers’ in Aalsmeer which was
discontinued at year-end 2015. This led to a write-down of
€2.5 million.
The major disposals in 2015 concern the sale of the real estate
in Venlo and the sale of the buildings on the Prunus in Aalsmeer.
Royal FloraHolland has no legal ownership with respect to the
capitalized contributions to the N231 and N201 in Aalsmeer
amounting to €3.3 million. Royal FloraHolland also made
a contribution of €1.7 million to improving the connection
with the A44. This amount has been capitalized and Royal
FloraHolland has no legal ownership.
Report of the GMM Committee
SupervisoryBoard Report
Management Board Report
2020 strategy
Facts & figures

Royal FloraHolland
Financial statements 2015
119 Financial statements 2015 | Notes to the company balance sheet as at 31 December 2015
The land and buildings available for sale on the open market concern fixed assets for sale
to trade partners and third parties that are no trade partners. The tangible fixed assets of
the Bleiswijk location are included in this category.
Carrying value per cash-generating unit Land Buildings Other Total
m2 land
(x 1,000)
Market centres all locations 52,942 304,843 176,775 534,560 2,284
Individual buildings and plots of land 24,254 39,439 – 63,693 168
Land available for sale on the open market 75,700 – – 75,700 1,068
Assets not used in business operations & assets under construction – 10,559 20,749 31,308
Totals 152,896 354,841 197,524 705,261
Tangible fixed assets are depreciated on the basis of their estimated useful lives:
- Assets not used in business operations are not depreciated.
- Buildings and site facilities: depreciation in 10-33 1/3 years.
- Machinery and equipment & other fixed assets: depreciation in 5-10 years.
Report of the GMM Committee
SupervisoryBoard Report
Management Board Report
2020 strategy
Facts & figures

Royal FloraHolland
Financial statements 2015
Financial fixed assets (3)
The carrying value at the balance sheet date and its movements were as follows:
Participating
interests
Amounts
receivable from
participating
interests
Other amounts
receivable
2015 2014
Balance at 1 January 22,465 3,966 – 26,431 23,364
Movements
Profit from participating interests 4,025 – – 4,025 3,870
Repayments – –791 – –791 –78
Loan movements – – 245 245 –
Dividend paid –698 – – –698 –725
Balance at 31 December 25,792 3,175 245 29,212 26,431
Breakdown of the carrying amount of participating interests at the balance sheet date:
2015 2014
FH Diensten Holding BV 3,410 1,820
FH Vastgoed Holding BV 10,064 9,880
FH Deelnemingen Holding BV 4,236 2,784
Other participating interests 8,082 7,981
Totals 25,792 22,465
Participating interests
For a summary of all participating interests, refer to the Appendix.
120 Financial statements 2015 | Notes to the company balance sheet as at 31 December 2015
Report of the GMM Committee
SupervisoryBoard Report
Management Board Report
2020 strategy
Facts & figures

Royal FloraHolland
Financial statements 2015
Amounts receivable from participating interests
This item includes loans to participating interests. These loans bear an average interest
of 4.4% (2014: 4.2%) and have a remaining term of less than five years.
Transactions with related parties
All transactions with related parties are effected at normal market conditions.
CURRENT ASSETS
RECEIVABLES
(4) Other receivables and prepayments 2015 2014
Taxes and social security charges 1,589 2,153
Prepaid expenses 8,635 5,132
Inventories 633 783
Receivables related to real estate transactions – 1,179
Other receivables 2,431 6,805
Other prepayments 315 943
Balance at 31 December 13,603 16,995
121 Financial statements 2015 | Notes to the company balance sheet as at 31 December 2015
Report of the GMM Committee
SupervisoryBoard Report
Management Board Report
2020 strategy
Facts & figures

Royal FloraHolland
Financial statements 2015
(5) Equity
General reserve 2015 2014
Balance at 1 January 139,759 155,504
Change in accounting policies – –1,555
New balance at 1 January 139,759 153,949
Movements
Addition to legal reserve for participating interests 1,526 1,391
Profit/loss appropriation of previous year 4,779 –15,581
Balance at 31 December 146,064 139,759
Royal FloraHolland changed its accounting policies related to RJ290 regulations in 2014.
This change in accounting policies resulted in a €1.6 million adjustment to the equity
opening balance 2014.
Legal entities reserve
The ‘legal entities reserve’ referred to in Article 35 of the Articles of Association (as at
31 December 2015: €2,634 million) was recorded in previous years from the corporate
income tax disadvantage settled with the member legal entities which resulted from the
fact that auction commission payments refunded to member legal entities are not tax
deductible. In the current financial year, no movements occurred.
122 Financial statements 2015 | Notes to the company balance sheet as at 31 December 2015
Report of the GMM Committee
SupervisoryBoard Report
Management Board Report
2020 strategy
Facts & figures
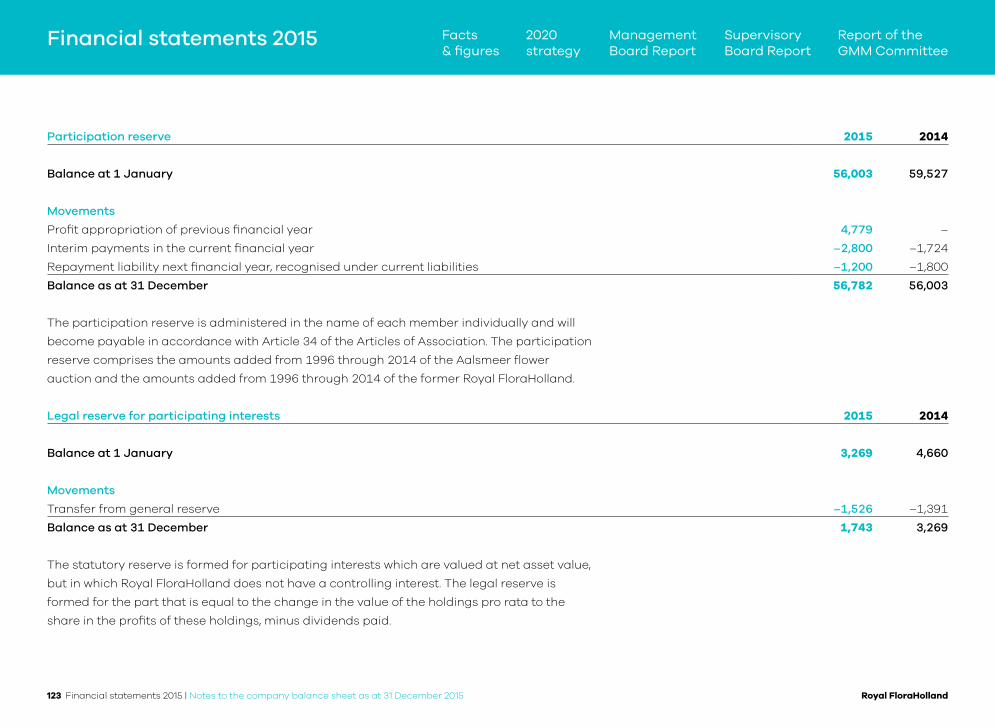
Royal FloraHolland
Financial statements 2015
Participation reserve 2015 2014
Balance at 1 January 56,003 59,527
Movements
Profit appropriation of previous financial year 4,779 –
Interim payments in the current financial year –2,800 –1,724
Repayment liability next financial year, recognised under current liabilities –1,200 –1,800
Balance as at 31 December 56,782 56,003
The participation reserve is administered in the name of each member individually and will
become payable in accordance with Article 34 of the Articles of Association. The participation
reserve comprises the amounts added from 1996 through 2014 of the Aalsmeer flower
auction and the amounts added from 1996 through 2014 of the former Royal FloraHolland.
Legal reserve for participating interests 2015 2014
Balance at 1 January 3,269 4,660
Movements
Transfer from general reserve –1,526 –1,391
Balance as at 31 December 1,743 3,269
The statutory reserve is formed for participating interests which are valued at net asset value,
but in which Royal FloraHolland does not have a controlling interest. The legal reserve is
formed for the part that is equal to the change in the value of the holdings pro rata to the
share in the profits of these holdings, minus dividends paid.
123 Financial statements 2015 | Notes to the company balance sheet as at 31 December 2015
Report of the GMM Committee
SupervisoryBoard Report
Management Board Report
2020 strategy
Facts & figures
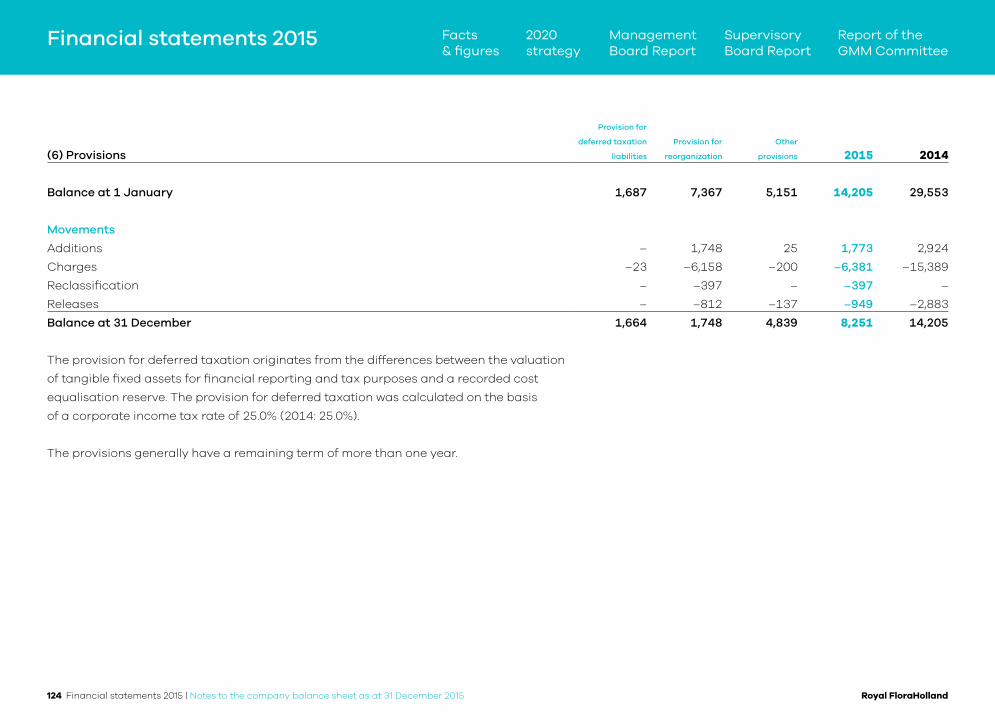
Royal FloraHolland
Financial statements 2015
(6) Provisions
Provision for
deferred taxation
liabilities
Provision for
reorganization
Other
provisions
2015 2014
Balance at 1 January 1,687 7,367 5,151 14,205 29,553
Movements
Additions – 1,748 25 1,773 2,924
Charges –23 –6,158 –200 –6,381 –15,389
Reclassification – –397 – –397 –
Releases – –812 –137 –949 –2,883
Balance at 31 December 1,664 1,748 4,839 8,251 14,205
The provision for deferred taxation originates from the differences between the valuation
of tangible fixed assets for financial reporting and tax purposes and a recorded cost
equalisation reserve. The provision for deferred taxation was calculated on the basis
of a corporate income tax rate of 25.0% (2014: 25.0%).
The provisions generally have a remaining term of more than one year.
124 Financial statements 2015 | Notes to the company balance sheet as at 31 December 2015
Report of the GMM Committee
SupervisoryBoard Report
Management Board Report
2020 strategy
Facts & figures

Royal FloraHolland
Financial statements 2015
125 Financial statements 2015 | Notes to the company balance sheet as at 31 December 2015
(7) Credit institutions 2015 2014
Balance at 1 January 116,838 143,827
Movements
Repayment liability for next financial year recognised under current liabilities –1,339 –26,989
Repayment liability from previous year 357 –
Additional repayment during the year –25,000
New loans 50,000 –
Balance at 31 December 140,856 116,838
€140.9 million (2014: €116.8 million) of the total amount of €140.9 million
(2014: €116.8 million) has a remaining term of less than five years.
The 2016 repayment liability of €1.3 million (2015: €27.0 million) is
recognized under current liabilities. These loans bear an average
interest rate of 1.9% (2014: 2.4%). Long-term bank loans are concluded
with Rabobank, ING Bank and ABN AMRO.
CURRENT LIABILITIES
(8) Other liabilities and accruals 2015 2014
Taxes and social security charges 6,108 5,535
Holiday allowance and days off 14,145 15,183
Interest costs bank and members’ loans 4,787 5,217
Accrued expenses 7,554 7,189
Other amounts payable 24,994 22,665
Balance at 31 December 57,588 55,789
Report of the GMM Committee
SupervisoryBoard Report
Management Board Report
2020 strategy
Facts & figures
Royal FloraHolland
Financial statements 2015
Financial instruments
As of 31 December 2015, the nominal value of Royal FloraHolland’s
interest rate swap contracts amounted to €290.0 million (2014:
€320.0 million), to cover bank loans and member and supplier
loans. Under these swaps, Royal FloraHolland receives a variable
interest rate and pays a fixed interest rate.
As of 31 December 2015, Royal FloraHolland’s bank debt in terms
of long-term and short-term loans amounted to €142.2 million
(2014: €193.4 million) with a variable interest rate. To cover this,
interest rate swap contracts have been concluded.
The fixed interest rate of 3.4% (2014: 3.2%) is above the market level
at year-end 2015, so that the real value of the swaps is negative at
the balance sheet date.
As of 31 December 2015, Royal FloraHolland’s member and supplier
loans totalled €261.9 million (2014: €234.9 million). The interest rate is
determined annually and is derived from the yield on 8-year
government bonds. To cover the member and supplier loans, interest
rate swap contracts have been concluded. The fixed interest rate
was 3.1% on average at year-end 2015 (2014: 3.5%).
The interest rate swaps has a negative fair value of €28.8 million
at the balance sheet date (2014: €39.1 million negative).
More than 70.0% of the interest rate risk on the current bank and
members’ loans is covered, and this will decline in the coming years.
At the balance sheet date, Royal FloraHolland had interest rate
swap contracts with maturities of up to 2021.
Since Royal FloraHolland has no margin calls included in interest
rate swap contracts, there are no possible liquidity risks in terms
of interest rate swap contracts.
ARRANGEMENTS AND COMMITMENTS NOT SHOWN
IN THE BALANCE SHEET
Investment commitments
As of 31 December 2015, the investment commitment from projects
in progress amounted to €6.1 million (2014: €7.2 million).
For infrastructural adjustments aimed to improve the opening up
of the marketplaces, Royal FloraHolland entered into commitments
with government bodies and third parties for an ‘undisturbed
logistical connection’ (OLV) (Aalsmeer location), reconstruction
of Middel Broekweg/Veilingroute crossing and the construction
of noise barriers on and the broadening of the N213 (Naaldwijk
location) for a total of €7.1 million (2014: €11.1 million).
Repurchase commitments
In the past Royal FloraHolland entered into contingent repurchase
commitments for real estate for a total of €250,000 (2014:
€1 million) for an office of a transport company and a service
station in Rijnsburg (DMO).
126 Financial statements 2015 | Notes to the company balance sheet as at 31 December 2015
Report of the GMM Committee
SupervisoryBoard Report
Management Board Report
2020 strategy
Facts & figures

Royal FloraHolland
Financial statements 2015
Lease payments
As of 31 December 2015, lease payments with a term of less than
one year amounted to €1.4 million (2014: €1.6 million) and lease
payments with a term of one to five years amounted to €2.2 million
(2014: €1.5 million).
Rental obligation
As of 31 December 2015, rental obligations amounted to
€1.5 million (2014: €1.7 million), of which €0.5 million (2014:
€0.7 million) has a remaining term of less than one year.
Guarantees
Royal FloraHolland has issued guarantees for local governments,
affiliated organisations and other parties for a total of €10.2 million
(2014: €3.0 million).
Other service contracts
As of 31 December 2015, these liabilities amounted to €25.9 million
(2014: €29.6 million), of which €16.3 million (2014: €17.3 million) has
a remaining term of less than one year.
127 Financial statements 2015 | Notes to the company balance sheet as at 31 December 2015
FISCAL UNIT
Royal FloraHolland is independently liable for corporate income
tax at year-end 2015. For purposes of value added tax, Royal
FloraHolland is part of a fiscal unit with its subsidiaries FH Diensten
Holding B.V., FloraHolland Flower Combination B.V., Flowerdome B.V.,
Groen Groep Eelde B.V. and Siervast B.V. Each of the entities
belonging to the fiscal unit is jointly and severally liable for the
value added tax liabilities of the fiscal unit.
Aalsmeer, 13 April 2016
Lucas Vos
CEO Royal FloraHolland
Report of the GMM Committee
SupervisoryBoard Report
Management Board Report
2020 strategy
Facts & figures

Royal FloraHolland
Financial statements 2015
128 Financial statements 2015 | Other information
Other information
ARTICLES OF ASSOCIATION PROVISIONS GOVERNING PROFIT
APPROPRIATION
Article 33 of the Articles of Association of the cooperative specifies
the following regarding profit allocation:
Article 33
1. If the operating account indicates a net profit, the General
Members’ Meeting, following a proposal by the Management
Board, will determine whether this balance or part thereof will
be added to the general reserve and which portion is available
for payment or addition to the reserve(s) stated below. If the
net income is not entirely added to the general reserve, the
portion to be added to the participation reserve by credit to
the participation accounts of the members and of those whose
membership ended in or at the end of the accounting year in
question will be determined first. The credit will be in proportion
to the commission becoming payable by each of them in
the accounting year in question.
2. From the net profit, or the balance thereof after application
of the terms of the preceding clause, the General Members’
Meeting, following a proposal by the Management Board,
may add to the members’ participation accounts, by way
of compensation, a percentage of the amount of the participation
accounts as they stand on the last day of the accounting year in
question (‘participation payment’), except as follows from terms
elsewhere in these articles stating otherwise. The percentage will
not exceed the percentage stated in Article 17(2).
3. Any net profit remaining after application of the preceding
clause may be allocated by the General Members’ Meeting,
following a proposal by the Management Board, for the benefit
of the members and those whose membership ended in or at
the end of the accounting year in question, either by
disbursement or by credit to the balance of each of the members’
loans, or partly by disbursement and partly by such credit. The
amount thus accruing to the members and former members will
be credited to each of them in proportion to the commission
becoming payable by them in the accounting year in question.
4. If the operating account shows a deficit, such deficit will first be
offset by charging it to the members’ liquidity contributions
withheld for the relevant accounting year by the cooperative,
unless the General Members’ Meeting decides on a different
method to offset the deficit following a proposal by the
Management Board. If a deficit remains after application
of the provision in the preceding sentence or the resolution
Report of the GMM Committee
SupervisoryBoard Report
Management Board Report
2020 strategy
Facts & figures

Royal FloraHolland
Financial statements 2015
129 Financial statements 2015 | Other information
of the General Members’ Meeting under the preceding sentence,
the General Members’ Meeting will then determine, on a proposal
by the Management Board, the portion thereof to be charged
to the general reserve and the portion to be charged to the
participation reserve. If a deficit is charged to the participation
reserve, the participation accounts of the members will be
debited in proportion to the size of the participation account of
each. Said debit will be allocated to the entire amount of each
participation account, in proportion to the amount added to it
annually in past years, including participation bonuses.
5. If a deficit cannot be offset by the means indicated in the
foregoing clauses, the General Members’ Meeting, following
a proposal by the Management Board, will decide how the deficit
is to be offset. The resolution may mean that all or part of the
deficit will be transferred to the members and those whose
membership ended in the relevant accounting year. The General
Members’ Meeting, following a proposal by the Management
Board, will then determine the measure according to which
each member’s share in the transfer will be determined.
6. By virtue of Article 23(2)(i) of these Articles of Association,
motions by the Management Board under this article require
approval from the Supervisory Board.
APPROPRIATION OF PROFIT
With due observance of the statutory provisions, the Management
Board proposes to allocate the profit over the 2015 financial year
as follows:
The Management Board will propose to the General Members’
Meeting to keep the net result of €12,040 million within the
cooperative and to partly add this amount to the participation
reserve and partly to the general reserve.
The addition to the participation reserve assumes a payment of
1.4% on the outstanding balance and an addition of 6.8% of the
member commission paid.
Report of the GMM Committee
SupervisoryBoard Report
Management Board Report
2020 strategy
Facts & figures

Royal FloraHolland
Financial statements 2015
130 Financial statements 2015 | Other information
2015
Allocation to the participation reserve
on the year’s outstanding balance 795
Allocation based on the commission
charged during the year 5,225
Subtotal 6,020
Allocation to the general reserve 6,020
Total profit after taxation 12,040
The General Members’ Meeting of 2 June 2016 will decide on
the profit allocation.
Report of the GMM Committee
SupervisoryBoard Report
Management Board Report
2020 strategy
Facts & figures

Royal FloraHolland
Financial statements 2015
131 Financial statements 2015 | Other information
INDEPENDENT AUDITOR’S REPORT ON FINANCIAL STATEMENTS
To: the supervisory board, members and management board
of Koninklijke Coöperatieve Bloemenveiling FloraHolland U.A.
(Aalsmeer)
Report on the audit of the financial statements 2015
Opinion
We have audited the financial statements 2015 of Koninklijke
Coöperatieve Bloemenveiling FloraHolland U.A. (the company),
based in Aalsmeer.
In our opinion the financial statements give a true and fair view of
the financial position of Koninklijke Coöperatieve Bloemenveiling
FloraHolland U.A. on December 31, 2015 and its financial result
in the year 2015 in accordance with Part 9 of Book 2 of the Dutch
Civil Code.
The financial statements comprise:
– the consolidated and company statement of financial position
as at December 31, 2015;
– the consolidated and company statement of profit and loss for
the year 2015; and
– the notes comprising a summary of the significant accounting
policies and other explanatory information.
Basis for our opinion
We conducted our audit in accordance with Dutch law, including
the Dutch Standards on Auditing. Our responsibilities under those
standards are further described in the “Our responsibilities for the
audit of the financial statements” section of our report.
We are independent of Koninklijke Coöperatieve Bloemenveiling
FloraHolland U.A. in accordance with the Verordening inzake de
onafhankelijkheid van accountants bij assurance-opdrachten (ViO)
and other relevant independence regulations in the Netherlands.
Furthermore we have complied with the Verordening gedrags- en
beroepsregels accountants (VGBA).
We believe the audit evidence we have obtained is sufficient and
appropriate to provide a basis for our opinion.
Materiality
Materiality €5,700,000
Benchmark used 1.5% of revenues
Additional explanation Considering the cooperative nature
of the entity we are of the opinion
revenues are a more important
performance indicator than net
result. The level of revenues is
a good indicator of the size of
the activities.
Report of the GMM Committee
SupervisoryBoard Report
Management Board Report
2020 strategy
Facts & figures

Royal FloraHolland
Financial statements 2015
We have also taken into account misstatements and/or possible
misstatements that in our opinion are material for the users of the
financial statements for qualitative reasons. We agreed with the
supervisory board that misstatements in excess of EUR 285,000,
which are identified during the audit, would be reported to them, as
well as misstatements below this threshold that in our view should
be reported on qualitative grounds.
Scope of the group audit
Koninklijke Coöperatieve Bloemenveiling FloraHolland U.A. is the
parent company of a group of entities. The financial information of
this group is included in the consolidated financial statements of
Koninklijke Coöperatieve Bloemenveiling FloraHolland U.A.
The group audit mainly focused on significant group activities,
being the most important activities included in entities Koninklijke
Coöperatieve Bloemenveiling FloraHolland U.A. and Hobaho Horti
Groep B.V. Both entities are audited by us. The abovementioned
procedures cover 95% of the total assets, 100% of the results and
93% of the revenues of the group.
By performing the procedures mentioned above at group entities,
together with additional procedures at group level, we have been
able to obtain sufficient and appropriate audit evidence about the
group’s financial information to provide an opinion about the
consolidated financial statements.
Our key audit matters
Key audit matters are those matters that, in our professional
opinion, were of most significance in our audit of the financial
statements. We have communicated the key audit matters to the
supervisory board. The key audit matters are not a comprehensive
reflection of all matters discussed.
These matters were addressed in the context of our audit on the
financial statements as a whole and in forming our opinion thereon.
As such, we do not provide a separate opinion on these matters.
132 Financial statements 2015 | Other information
Report of the GMM Committee
SupervisoryBoard Report
Management Board Report
2020 strategy
Facts & figures

Royal FloraHolland
Financial statements 2015
Risk Audit approach
Valuation of land and buildings
Considering the relative size of land and buildings, including land and
buildings of group companies, as part of the total assets, the valuation
of land and buildings is a significant part of our audit approach.
This also relates to the developments in the economic environment
and the commenced implementation of the new strategy FH2020.
The valuation of the land and buildings and related assets are complex
matters subject to assumptions and estimations, including future
developments.
To assess the valuation of land and buildings Koninklijke Coöperatieve
Bloemenveiling FloraHolland U.A. has prepared valuation analysis.
For land and buildings classified as in permanent use by Koninklijke
Coöperatieve Bloemenveiling FloraHolland U.A. at the date of preparation
of the financial statements, the management board has assessed the
extent in which it will be able to realize sufficient return on its investments.
For land and buildings classified as not in permanent use at the date
of preparation of the financial statements, appraisals have been made
by external specialists.
The disclosures regarding land and buildings are recorded on page 96
and 97 of the financial statements.
We have compared the calculation method used with the methods
commonly used in the real estate sector, taking into account the
cooperative nature of Koninklijke Coöperatieve Bloemenveiling
FloraHolland U.A. and the circumstances in its environment, including the
impact of the strategic reorientation. We have compared the parameters
used with the parameters used in the market, including land prices of
recent transactions or market valuations.
We have obtained information regarding the expertise and objectivity of
the external specialists, the calculation methods applied and parameters
used, including land prices, land suitable for building, rental prices and
contracts.
133 Financial statements 2015 | Other information
Report of the GMM Committee
SupervisoryBoard Report
Management Board Report
2020 strategy
Facts & figures

Royal FloraHolland
Financial statements 2015
Risk Audit approach
Implementing strategy FH2020
Koninklijke Coöperatieve Bloemenveiling FloraHolland U.A. has
commenced a process of strategic reorientation, named FH2020. In that
respect Koninklijke Coöperatieve Bloemenveiling FloraHolland U.A. enters
into commitments and obligations, incurs expenses and takes decisions
that impact results, especially relating to the valuation of assets and
to the possible lay-off of employees.
The disclosures regarding FH2020 elements are recorded on page 108
and 110 of the financial statements.
In our audit, we have paid special attention to the impact of FH2020
on the financial statements.
We have investigated the process which Koninklijke Coöperatieve
Bloemenveiling FloraHolland U.A. follows to determine which aspects
of the financial statements should be labeled as related to FH2020.
Further, we have determined that the reported costs, expenditures,
liabilities and commitments are correctly and suitably taken into account
in the financial statements of 2015.
134 Financial statements 2015 | Other information
Report of the GMM Committee
SupervisoryBoard Report
Management Board Report
2020 strategy
Facts & figures

Royal FloraHolland
Financial statements 2015
Risk Audit approach
Complexity of IT landscape
Koninklijke Coöperatieve Bloemenveiling FloraHolland U.A. is highly
dependent of the IT-infrastructure for the continuity of the operational
activities. The IT-landscape can be considered as complex and contains
many different applications.
To some extent, applications are outdated and are currently undergoing
limited maintenance.
Koninklijke Coöperatieve Bloemenveiling FloraHolland U.A. performs
various additional manual controls to ensure the correct and complete
processing of transactions. These measures mainly relate to
demonstrating the links of different parameters and to reconciling
data from different applications.
We have evaluated the reliability and continuity of the automatized data-
processing, only to the extent necessary within the context of the audit of
the financial statements. Specialized IT-auditors were part of our team for
this examination. Our procedures were mainly focused on understanding
and testing of internal controls regarding the IT-systems and –processes
relevant to our audit. As a result of these procedures we concluded
we could not rely on all internal controls we evaluated as relevant.
We have made recommendations to the management board in our
management letter, focused on possible further improvements on this
matter.
We have reviewed the manual internal controls and have performed
additional substantive procedures to obtain sufficient and appropriate
audit evidence.
Responsibilities of management and the supervisory board
for the financial statements
Management is responsible for the preparation and fair
presentation of the financial statements in accordance with Part 9
of Book 2 of the Dutch Civil Code, and for the preparation of the
management board report in accordance with Part 9 of Book 2
of the Dutch Civil Code. Furthermore, management is responsible
for such internal control as management determines is necessary
to enable the preparation of financial statements that are free
from material misstatement, whether due to fraud or error.
As part of the preparation of the financial statements,
management is responsible for assessing the company’s ability to
continue as a going concern. Based on the financial reporting
frameworks mentioned, management should prepare the financial
statements using the going concern basis of accounting unless
135 Financial statements 2015 | Other information
Report of the GMM Committee
SupervisoryBoard Report
Management Board Report
2020 strategy
Facts & figures

Royal FloraHolland
Financial statements 2015
management either intends to liquidate the company or to cease
operations, or has no realistic alternative but to do so. Management
should disclose events and circumstances that may cast significant
doubt on the company’s ability to continue as a going concern in
the financial statements.
The supervisory board is responsible for overseeing the company’s
financial reporting process.
Our responsibilities for the audit of the financial statements
Our objective is to plan and perform the audit assignment in
a manner that allows us to obtain sufficient and appropriate audit
evidence for our opinion.
Our audit has been performed with a high, but not absolute, level
of assurance, which means we may not have detected all errors
and fraud.
Misstatements can arise from fraud or error and are considered
material if, individually or in the aggregate, they could reasonably
be expected to influence the economic decisions of users taken on
the basis of these financial statements. The materiality affects the
nature, timing and extent of our audit procedures and the
evaluation of the effect of identified misstatements on our opinion.
We have exercised professional judgment and have maintained
professional skepticism throughout the audit, in accordance with
Dutch Standards on Auditing, ethical requirements and
independence requirements. Our audit included, e.g.:
– Identifying and assessing the risks of material misstatement of
the financial statements, whether due to fraud or error, designing
and performing audit procedures responsive to those risks, and
obtaining audit evidence that is sufficient and appropriate to
provide a basis for our opinion. The risk of not detecting a
material misstatement resulting from fraud is higher than for one
resulting from error, as fraud may involve collusion, forgery,
intentional omissions, misrepresentations, or the override of
internal control.
– Obtaining an understanding of internal control relevant to the
audit in order to design audit procedures that are appropriate in
the circumstances, but not for the purpose of expressing an
opinion on the effectiveness of the company’s internal control.
– Evaluating the appropriateness of accounting policies used and
the reasonableness of accounting estimates and related
disclosures made by management.
– Concluding on the appropriateness of management’s use of the
going concern basis of accounting, and based on the audit
evidence obtained, whether a material uncertainty exists related
to events or conditions that may cast significant doubt on the
company’s ability to continue as a going concern. If we conclude
that a material uncertainty exists, we are required to draw
attention in our auditor’s report to the related disclosures in the
financial statements or, if such disclosures are inadequate, to
modify our opinion. Our conclusions are based on the audit
evidence obtained up to the date of our auditor’s report.
However, future events or conditions may cause an the company
to cease to continue as a going concern.
136 Financial statements 2015 | Other information
Report of the GMM Committee
SupervisoryBoard Report
Management Board Report
2020 strategy
Facts & figures

Royal FloraHolland
Financial statements 2015
– Evaluating the overall presentation, structure and content
of the financial statements, including the disclosures
– Evaluating whether the financial statements represent the
underlying transactions and events in a manner that achieves
fair presentation.
Because we are ultimately responsible for the opinion, we are also
responsible for directing, supervising and performing the group
audit. In this respect we have determined the nature and extent of
the audit procedures to be carried out for group entities. Decisive
were the size and/or the risk profile of the group entities or
operations. On this basis, we selected group entities for which
an audit or review had to be carried out on the complete set
of financial information or specific items.
We communicate with the supervisory board regarding, among
other matters, the planned scope and timing of the audit and
significant audit findings, including any significant findings in
internal control that we identify during our audit.
We provide the supervisory board with a statement that we have
complied with relevant ethical requirements regarding
independence, and to communicate with them all relationships
and other matters that may reasonably be thought to bear on our
independence, and where applicable, related safeguards.
From the matters communicated with the supervisory board, we
determine those matters that were of most significance in the audit
of the financial statements of the current period and are therefore
the key audit matters. We describe these matters in our auditor’s
report unless law or regulation precludes public disclosure about
the matter or when, in extremely rare circumstances, not
communicating the matter is in the public interest.
Report on other legal and regulatory requirements
Report on the management board report and the other
information
Pursuant to legal requirements under Section 2:393 sub 5 at e and f
of the Dutch Civil Code (concerning our obligation to report about
the Management Board report and other information), we declare
that:
– We have no deficiencies to report as a result of our examination
whether the Management Board report, to the extent we can
assess, has been prepared in accordance with Part 9 of Book 2 of
this Code, and whether the information as required under Part 9
of Book 2 of this Code has been annexed.
– Further we report that the Management Board report, to the
extent we can assess, is consistent with the financial statements.
137 Financial statements 2015 | Other information
Report of the GMM Committee
SupervisoryBoard Report
Management Board Report
2020 strategy
Facts & figures

Royal FloraHolland
Financial statements 2015
Engagement
We were engaged by the former management board as auditor
of Koninklijke Coöperatieve Bloemenveiling FloraHolland U.A.
(Aalsmeer) as of the year 2008 and have operated as statutory
auditor ever since that date.
The supervisory board extended our engagement for one year
on June 24, 2015 for the year 2015. As of financial year 2014,
G.W. Hilverda has been acting as external auditor.
The Hague, April 13, 2016
Ernst & Young Accountants LLP
Was signed G.W. Hilverda
138 Financial statements 2015 | Other information
Report of the GMM Committee
SupervisoryBoard Report
Management Board Report
2020 strategy
Facts & figures

Royal FloraHolland
Appendix
139 Annual Report 2015 | Appendix: List of participating interests
Appendix: List of participating interests
Royal FloraHolland has a full or partial, direct or indirect interest in the following companies:
Registered office Shareholding (in %)
FH Diensten Holding B.V.* Naaldwijk 100
Agricultural Fulfilment Center B.V.* + Naaldwijk 100
Greenparc Ontwikkeling B.V.* Bleiswijk 100
Greenparc Ontwikkeling v.o.f.* Bleiswijk 50
Servi FloraHolland 2002 SL* Valencia, Spain 100
FH Flower Combination B.V.* + Aalsmeer 100
FH Consultancy Services Plc.* Addis Adeba, Ehtiopia 50
FH Services Colombia* Bogota, Colombia 50
FH Services Kenia Ltd* Nairobi, Kenya 1
Sivepo B.V.* Leiden 100
Hobaho Horti Groep B.V.* Lisse 100
Hobaho B.V. Lisse 100
Computer-Centrum Bollenstreek (C.C.B.) B.V. Lisse 100
Boeket Handelsmaatschappij B.V. Lisse 100
De Verenigde Koelhuizen Hobaho B.V. Hillegom 100
Testcentrum voor siergewassen B.V. Hillegom 100
Warmerdam - Lisse B.V. Lisse 100
Flowerbulbs Access B.V. Akersloot 100
Groen Groep Eelde B.V.* + Eelde 100
Flowerdome B.V.* Eelde 100FH Logistics Kenya B.V.* Honselersdijk 100
Q7 Air Cargo Broker Fzco. (Dubai)* Dubai 80 * Participating interest to be consolidated
+ A Section 403 BW statement has been issued
Report of the GMM Committee
SupervisoryBoard Report
Management Board Report
2020 strategy
Facts & figures
Royal FloraHolland140 Annual Report 2015 | Appendix: List of participating interests
Registered office Shareholding (in %)
FH Consultancy Services Plc.* Addis Abeba, Ethiopia 50
FH Services Colombia* Bogota, Colombia 50
FH Services Kenia Ltd* Nairobi, Kenya 99
FH Services Italy S.r.l. Milano, Italy 100
Trias Westland B.V. Honselersdijk 33.33
Stichting administratiekantoor Hubways Bunnik 25
FH Vastgoed Holding B.V.* Naaldwijk 100
Siervast B.V.* + Rijnsburg 100
FH Vastgoed V B.V.* Naaldwijk 100
Maatschap DZF Naaldwijk 20
C&C Bleiswijk* Bleiswijk 100
Metz Vastgoed I B.V. Honselersdijk 90
Metz Vastgoed II B.V. Honselersdijk 90
Toussaint Vastgoed B.V. ’s-Gravenzande 90
Javado Vastgoed B.V.* Naaldwijk 51
Plant Port I B.V. Aalsmeer 49.5
Florazon Vastgoed B.V. Venlo 33.25
Greenpark Boskoop B.V. Boskoop 50
HBC Beheer B.V. Naaldwijk 30
HBC Vastgoed B.V. Naaldwijk 100
ABC Westland Beheer B.V. Poeldijk 26.7
ABC Westland Beheer C.V. Poeldijk 26.7
FH Deelnemingen Holding B.V.* Naaldwijk 100
Plantion Holding B.V. Bemmel 35
Veiling Rhein Maas GmbH & Co KG Herongen 25
Sivepo C.V.* Leiden 100
Greenparc Ontwikkeling v.o.f.* Bleiswijk 50 * Participating interest to be consolidated
+ A Section 403 BW statement has been issued
Appendix Report of the GMM Committee
SupervisoryBoard Report
Management Board Report
2020 strategy
Facts & figures

Royal FloraHolland
Addresses
141 Annual Report 2015 | Addresses
Aalsmeer
Legmeerdijk 313
Postbus 1000 1430 BA Aalsmeer
The Netherlands
T +31 (0)88 789 89 89
Naaldwijk
Middel Broekweg 29
Postbus 220 2670 AE Naaldwijk
The Netherlands
T +31 (0)88 789 89 89
Rijnsburg
Laan van Verhof 3
Postbus 10 2230 AA Rijnsburg
The Netherlands
T +31 (0)88 789 89 89
Bleiswijk
Klappolder 130
Postbus 500 2665 ZM Bleiswijk
The Netherlands
T +31 (0)88 789 89 89
Eelde
Burg. J.G. Legroweg 80
9761 TD Eelde
The Netherlands
T +31 (0)50 309 77 77
Auction Rhein-Maas
47638 Straelen-Herongen
Germany
T +49 (0)2839 59 32 00
Report of the GMM Committee
SupervisoryBoard Report
Management Board Report
2020 strategy
Facts & figures

Royal FloraHolland
Addresses
142 Annual Report 2015 | Addresses
Royal FloraHolland Kenya
Royal FloraHolland Services (K) Ltd
PO Box 19279-00501
Nairobi, Kenya
Office +254731069092 / +254723699484
Royal FloraHolland Colombia
Camila Camacho Rocha
Local Area Manager Latin America
Royal FloraHolland
Colombia
T + 57 1 2352423
M +57 3102369429
Royal FloraHolland Spain
Maria José Martínez Sanz
Sourcing Manager
M +34 670903238
F +34 962413810
Royal FloraHolland Ethiopia
Royal FloraHolland Consultancy Services PLC
House no. 414, Meskel Flower Avenue
Central Printing Building, 4th Floor
Kirkos, Addis Ababa - Ethiopia
T +251 11 4-604063/69
M +251 93 000 3816
Royal FloraHolland Italy
Riccardo Spicuzza
Sourcing Manager Sicily
Italy
M +39 342 511 5303
T +39 095 779 6890
Report of the GMM Committee
SupervisoryBoard Report
Management Board Report
2020 strategy
Facts & figures

Royal FloraHolland143 Annual Report 2015 | Colophon
Publication
Royal FloraHolland
Text
Royal FloraHolland
Translation
C&F Report
Photography
Jeroen Dietz
Advice, concept, final editing and realisation
C&F Report / Total Identity
Colophon Report of the GMM Committee
SupervisoryBoard Report
Management Board Report
2020 strategy
Facts & figures