Annual Report 2011
68
Annual Report 2011
Transcript of Annual Report 2011

Annual Report 2011

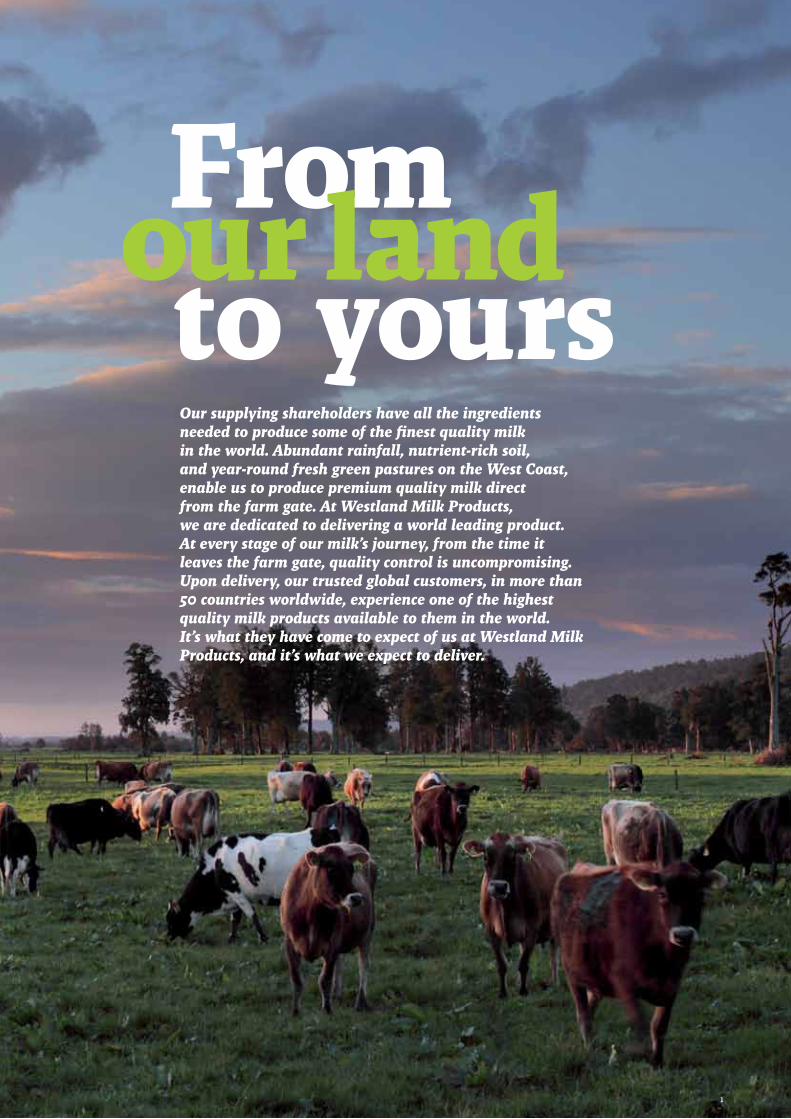
Our supplying shareholders have all the ingredients needed to produce some of the finest quality milk in the world. Abundant rainfall, nutrient-rich soil, and year-round fresh green pastures on the West Coast, enable us to produce premium quality milk direct from the farm gate. At Westland Milk Products, we are dedicated to delivering a world leading product. At every stage of our milk’s journey, from the time it leaves the farm gate, quality control is uncompromising. Upon delivery, our trusted global customers, in more than 50 countries worldwide, experience one of the highest quality milk products available to them in the world. It’s what they have come to expect of us at Westland Milk Products, and it’s what we expect to deliver.
1

Our Land of Plenty 4
Mission and Values 6
Season in Review (Facts/Highlights) 8
5 year trends 10
Chairman’s Report 12
CEO’s Report 14
From Our Team to Yours 18
Respect – Case Study 20
Corporate Governance Report 22
Audit Report 24
Directors’ Declaration 25
Financial Statements 26
Notes to Financial Statements 32
Statutory Information 59
Directory 65
Contents
2

3
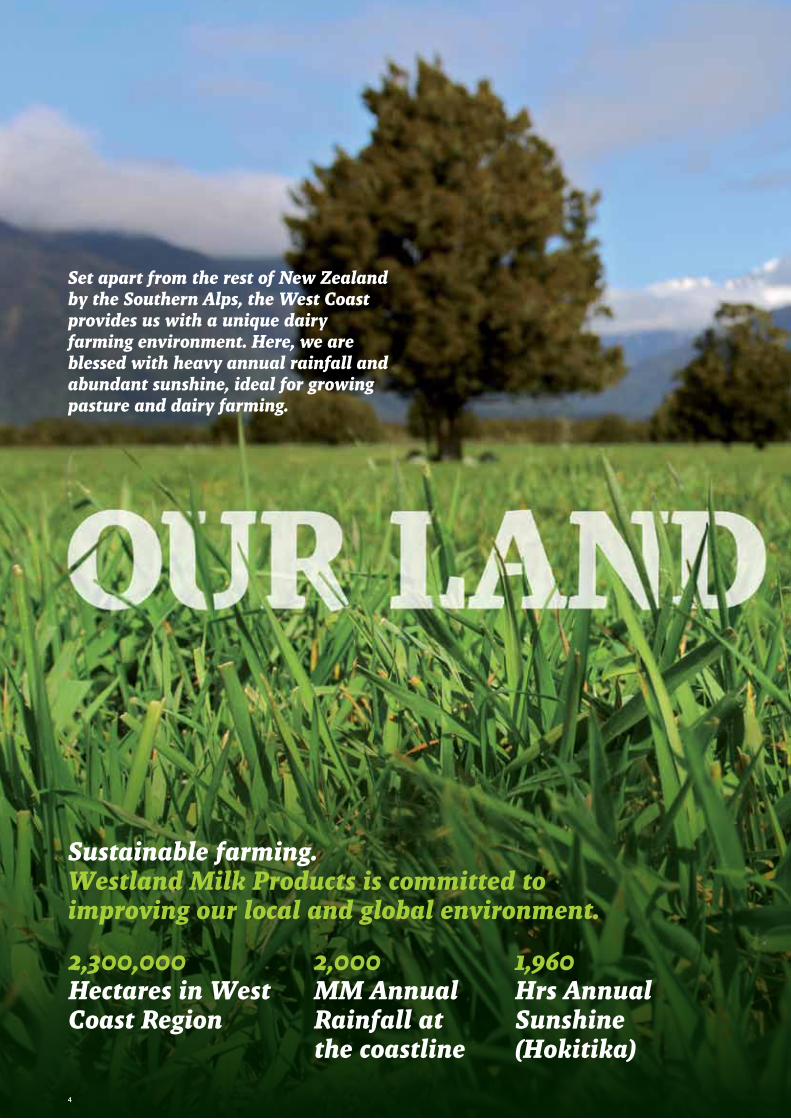
Sustainable farming. Westland Milk Products is committed to improving our local and global environment.
2,300,000Hectares in WestCoast Region
2,000MM AnnualRainfall at the coastline
1,960Hrs AnnualSunshine(Hokitika)
Set apart from the rest of New Zealand by the Southern Alps, the West Coast provides us with a unique dairy farming environment. Here, we are blessed with heavy annual rainfall and abundant sunshine, ideal for growing pasture and dairy farming.
4

ISO 14001 Environmental management systems
Work closely with local and regional government
Promote on farm best management practice
5

We are dedicated to providing a positive environment for the betterment of all
We come from a pioneering background where teamwork was and still is of paramount value
Our Mission is central to the way we act and the way we run
our company. Westland Milk Products’ Mission is;
Our Values
6
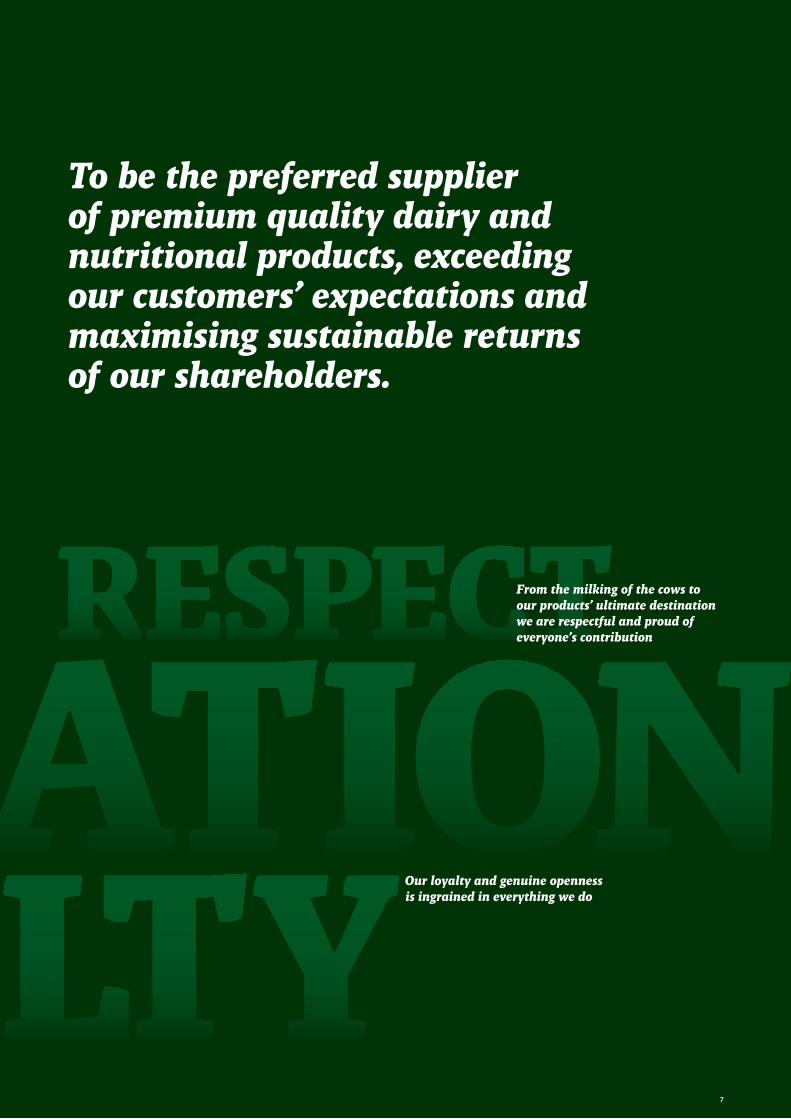
From the milking of the cows to our products’ ultimate destination we are respectful and proud of everyone’s contribution
Our loyalty and genuine openness is ingrained in everything we do
To be the preferred supplier of premium quality dairy and nutritional products, exceeding our customers’ expectations and maximising sustainable returns of our shareholders.
7

Land & Sustainability Facts Voluntary participation in the Emissions Trading Scheme.
8
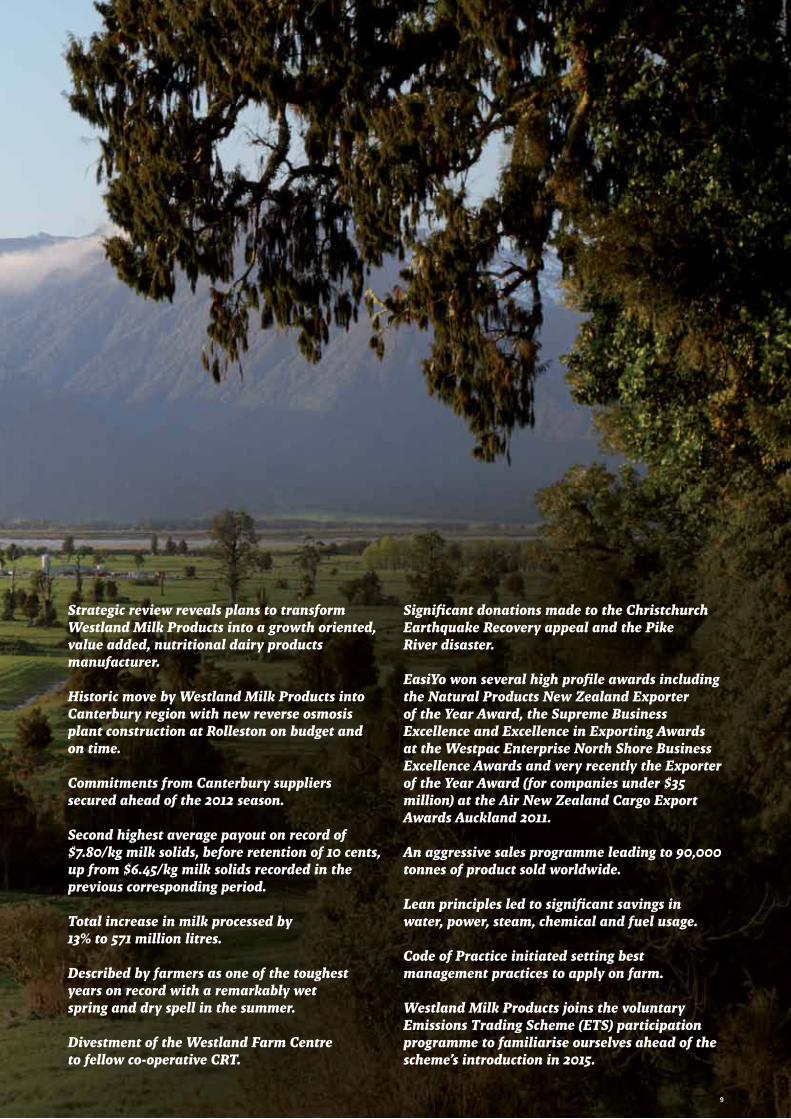
Strategic review reveals plans to transform Westland Milk Products into a growth oriented, value added, nutritional dairy products manufacturer.
Historic move by Westland Milk Products into Canterbury region with new reverse osmosis plant construction at Rolleston on budget and on time.
Commitments from Canterbury suppliers secured ahead of the 2012 season.
Second highest average payout on record of $7.80/kg milk solids, before retention of 10 cents, up from $6.45/kg milk solids recorded in the previous corresponding period.
Total increase in milk processed by 13% to 571 million litres.
Described by farmers as one of the toughest years on record with a remarkably wet spring and dry spell in the summer.
Divestment of the Westland Farm Centre to fellow co-operative CRT.
Significant donations made to the Christchurch Earthquake Recovery appeal and the Pike River disaster.
EasiYo won several high profile awards including the Natural Products New Zealand Exporter of the Year Award, the Supreme Business Excellence and Excellence in Exporting Awards at the Westpac Enterprise North Shore Business Excellence Awards and very recently the Exporter of the Year Award (for companies under $35 million) at the Air New Zealand Cargo Export Awards Auckland 2011.
An aggressive sales programme leading to 90,000 tonnes of product sold worldwide.
Lean principles led to significant savings in water, power, steam, chemical and fuel usage.
Code of Practice initiated setting best management practices to apply on farm.
Westland Milk Products joins the voluntary Emissions Trading Scheme (ETS) participation programme to familiarise ourselves ahead of the scheme’s introduction in 2015.
9

Finance highlights
NZIFRS NZIFRS NZIFRS NZIFRS NZIFRS
2011 2010 2009 2008 2007
Milk Received From Suppliers [M litres] 515 502 479 478 467
Milk Fat - Own Supplier [M kgs] 27.049 26.246 25.018 24.692 24.292
Protein - Own Supply [M kgs] 19.930 19.517 18.339 18.329 17.885
Milk Solids Received from Suppliers [M kgs] 46.979 45.763 43.358 43.022 42.178
Average Milk Solids per Farm [kgs] 121,080 119,175 113,503 113,516 111,582
Average Milk fat % 5.26 5.23 5.20 5.16 5.19
Average Protein % 3.87 3.89 3.80 3.83 3.82
Protein : Fat Ratio % 73.68 74.00 73.00 72.00 74.00
Finest Milk % 98.66 97.10 96.30 95.90 98.32
Production [Tonne] - Powder 51,920 47,114 42,831 51,279 46,192
Production [Tonne] - Butter 25,529 23,480 22,283 19,467 18,380
Production [Tonne] - Protein 4,380 4,017 3,762 2,502 1,607
Production [Tonne] - AMF 5,720 3,668 3,427 5,622 3,979
Turnover [$Million] 525 422 364 501 295
Total Assets [$Million] 351 335 284 326 314
Total Equity [$Million] (Incl. shares classified as liabilities) 190 182 172 181 186
Payout to Shareholders
- Fat [cents/kg] 511 443 301 533 306
- Protein [cents/kg] 1,112 962 654 1,158 666
- Operating Surplus [cents/kg] 780 645 411 829 472
- Retentions [cents/kg] (10) (30) 47 (30) 0
- Net Average Payout [cents/kg] 770 615 458 799 472
Equity : Assets Ratio [%] 54 54 60 55 59
Current Ratio [%] 130 133 77 116 156
Working Capital to Total Assets Ratio [%] 10 10 (8) 5 13
5 year trends
Land & Sustainability FactsLean principles resulting in reduced water, power, chemical and fuel usage across our operations.
10

TOTAL EQUITYIncl. shares classified as liabilities.(Dollars in Millions)
Financial Year
MILKSOLIDS(Million Kilograms)
Financial Year
18
6.1
7
PAYOUT TOSHAREHOLDERS(Cents per Kilogram)
Financial Year
18
2.5
0
18
6.1
7
18
0.6
5
17
1.5
4
11 10 09 08 07
18
2.5
0
18
6.1
7
18
0.6
5
17
1.5
4
19
0.2
2
11 10 09 08 07
770
11 10 09 08 07
45
.76
42
.18
43
.02
43
.36
46
.98
61
5
47
2
79
9
45
8
11
The 2011 season will be remembered for its volatility with the season beginning with a wet spring followed by a 100 year dry spell in some parts of the West Coast. The global stage was equally volatile with the rising exchange rate and commodity prices contributing to payout expectations shifting markedly from $6.50 - $6.90/kg milk solids in the beginning of the year to a final average payout of $7.70/kg milk solids after retention of 10 cents/kg milk solids.
The unpredictable global environment highlighted the importance of a strong balance sheet and it was therefore pleasing to end the year in a strong equity and reduced debt position.
During the year Westland Milk Products focused heavily on maximising value and efficiency in our core business, building on our existing and new relationships with global customers and expanding our milk processing capability. These efficiencies are delivering strong financial results for our suppliers.
Westland Milk Products’ long term strategy is to transform the Company into a growth oriented, value added, nutritional dairy products manufacturer with a view to maximising returns to our suppliers.
Increasingly our focus will be to produce nutritional milk products for
the paediatric, aged care and sports sector while continuing to leverage our core business offering of supplying high quality commodity milk product to the world.
The commencement of our strategic plan began to take shape in 2011 with the decision to source additional milk supply in Canterbury and build a reverse osmosis plant at Rolleston. This is a significant step for Westland Milk Products and the Board is extremely proud to be creating a pathway for future growth for Westland Milk Products.
The plan is set in stages with the first phase to establish milk reception facilities in Rolleston, followed by the drafting of a business case to support the expansion of our nutritional production capability at Hokitika.
Throughout the strategic planning process the Board and Management has recognised the special attributes of Westland Milk Products’ co-operative dairy company ownership structure. Maintaining the values of a supplier co-operative model will remain front of mind with all decisions made regarding future expansions, joint ventures, acquisitions and capital structures.
Towards the end of this last season we have seen the competition for milk reach the farm gate on the West Coast. We are confident that Westland Milk
Chairman’s ReportMatt O’Regan
2011 has been a significant year marking ten years since Westland Milk Products became an independent milk processor in 2001; a year in which the decision was made to source milk from the Canterbury region; and to expand our processing capability.
Matt O’Regan - Chairman Westland Milk Products
12

Products’ pure co-operative model, embodied in its constitution, with its nominal value share, returning profit to suppliers through payments for colostrum and milk supply, will continue to deliver the results demanded by suppliers to ensure Westland Milk Products remains the preferred processor for West Coast dairy farmers. It is a testament to this co-operative model that West Coast farmers have been able to grow Westland Milk Products’ milksolids supply by over 60% since independence while the Company has delivered an industry competitive payout.
Westland Milk Products retained 10 cents/kg milk solids to provide capital management stability and fund future growth initiatives. The Board reviews retentions on an annual basis, but it is a widely held view among the Senior Management Team and Board that retentions will continue to be made for the next five years to facilitate the execution of our on-going strategy. In 2011 Westland Milk Products has taken an active role in environmental practices on farm. Our customers are increasingly aware about environmental sustainability and our animal health practices and as such operating without a formalised environmental code of compliance has become no longer an option. Fortunately our suppliers have always taken sustainability practices seriously
and it is pleasing to be able to document this formally with a standard setting Code of Practice. We look forward to monitoring these standards on a regular basis and to illustrate our sustainable practices to the world.
It goes without saying that in 2011 West Coasters and Cantabrians experienced a number of significant and tragic events and our sympathies go to those personally affected. It has also been a time when we have witnessed the resilience and commitment of people on both sides of the alps to their regions and their employment. On behalf of the Board I would like to thank our valued Westland Milk Products’ employees, many of whom acted in a truly professional and selfless manner during unprecedented and trying circumstances.
The Board has been equally impressed with the professional approach of the newly embedded Senior Management Team and would like to acknowledge the confidence we have in them delivering the Company’s strategic plans. Without this confidence the strategic objective to position Westland Milk Products as an innovative, fast moving and preferred dairy processor in years to come would not be possible.
After ten years of service long standing independent director Sir Graeme
Harrison has stepped down from the Board. Sir Graeme joined the Board after Westland Milk Products became an independent co-operative in 2001 and during his tenure he has imparted significant knowledge and experience. The Board agrees it has been an honour to have Sir Graeme sit on our Board.
Looking ahead, while there may be an easing in commodity prices in the short term, the Board believes that increased demand for protein among the emerging economies will continue. We are fortunate to be part of such an exciting and dynamic industry with significant scope for increasing returns to suppliers. In 2012, the Board will remain focused on ensuring suppliers continue to benefit from Westland Milk Products’ business strategy while maintaining the highest standards of transparency and corporate governance.
In conclusion, I thank my fellow Directors for their support and dedication to the Company, and on behalf of the Board and Management, I would like to thank suppliers for their continued support and commitment to Westland Milk Products. We look forward to serving you again in the current year as Westland Milk Products realises the value of its expanded business platform.
13
The Result2011 has been described by many farmers as one of the toughest years yet with a remarkably wet spring and dry spell in the summer presenting difficult farming conditions. International competition, volatile exchange rates and commodity prices continued to make forecasting amongst the global and local events extremely challenging.
It is therefore a credit to our Board and Management Team that Westland Milk Products recorded an average payout of $7.80/kg milk solids before retention of 10 cents/kg milk solids, a 21 per cent improvement on last year’s payout of $6.45/kg milk solids. Record turnover of $525 million assisted by record volumes of milk processed and products sold led to the strong payout.
Westland Milk Products processed 571 million litres of milk supply, a 13 per cent increase on the previous year, 10 per cent of which is attributable to milk from external sources. Westland Milk Products’ shareholder supplied milk increased 2.5 per cent as a result of a strong autumn period with settled weather and a healthy payout signalled.
Colostrum in 2011 returned an average of 12 cents/kg milk solids to suppliers, a 33 per cent improvement on last year’s average of 9 cents/kg milk solids. We are pleased to report that colostrum is supplied by more than 75 per cent of our suppliers and that all suppliers have
the opportunity to participate. As global commodity prices strengthened throughout the financial year, so too did our payout projections which rose from $6.50 - $6.90/kg milk solids at the beginning of the season to the final average payout of $7.80/kg milk solids. An active hedging programme delivered a favourable average conversion rate of 70c versus an average spot rate of 77c. Our currency hedging programme was successful in smoothing out some of the volatility from the rising NZ dollar against a weakening US greenback.
Increasing efficiencies continued to be a high priority for Westland Milk Products during 2010/11. Lean principles were applied to all facets of the business and resulted in many successful cost saving initiatives including a reduction in water usage by 250 million litres, power and steam by 6.5 per cent, chemical usage by 20 per cent and fuel savings of 4 per cent. The increase in total milk processed resulted in an overall cost saving for suppliers of 9.5 cents/kg of milk solids processed.
Capital Westland Milk Products continues to actively manage its capital to ensure we are operating efficiently and prudently managing risk. We finished the financial year with a strong balance sheet and favourable equity position of 54 per cent, allowing Westland Milk Products to secure advantageous finance rates heading into the 2012 season.
CEO’s ReportRod Quin
Westland Milk Products performed strongly in 2011 recording our second highest payout despite experiencing some of the most challenging climatic and economic conditions on record. Our full year results demonstrate the strength of the business and Westland Milk Products’ ability to take advantage of opportunities for future growth.
Rod Quin Chief Executive OfficerWestland Milk Products
14
Marketing and Sales Our proactive sales programme led to 90,000 tonnes of product being sold across all markets. Of that figure, approximately 70 per cent was shipped to the Asia-Pacific region with Russia, the USA and the Middle East also showing promising signs of growth. We continue to take our successful product offerings to key customers around the world and in the process we are recognised as a leader in the provision of highest quality milk products to well-known international consumer brands.
We will continue to work closely with our end-use customers in 2011/12 to ensure mutual value-add activities are secured working with key customer relationships that continue to develop.
Strategic ReviewA strategic review, started early in the season, cemented our plan to transform Westland Milk Products from a medium sized, dairy commodity producer into a growth oriented, valued added and nutritional dairy products manufacturer and marketer.
The strategic review formed the catalyst to build a reverse osmosis plant at Rolleston and source additional share backed milk supply from Canterbury dairy farmers. The plant was completed on budget and commissioned on schedule for the 2011/2012 season.
The announcement of our planned move into Canterbury drew a positive reaction from interested dairy parties on the east coast and we are pleased with the number of milk commitments secured to date. We continue to receive supply enquiries and expect this to continue into the new season.
EasiYoIn 2011 our subsidiary and global yogurt business EasiYo contributed 3 cents/kg milk solids to the final supplier payout. Since moving to their new manufacturing facilities last year in Albany, Auckland, EasiYo has more than doubled its production capacity and produces approximately 1 million yogurt sachets per month and now has 75 per cent market share in the home made yogurt market in New Zealand, with 75 per cent of product made exported predominantly to Australia and the UK.
EasiYo’s entry into Italy, a new market this year, has been an outstanding success with sales going from zero to $2 million in under 12 months. This successful exporting opportunity was supported by New Zealand Trade and Enterprise which made a significant funding contribution. The relationship also led to EasiYo being invited by Trade and Enterprise to feature at the Rugby World Cup’s “The Cloud” facility on the new Queens Wharf development, Auckland. EasiYo’s tasting display stand at The Cloud will
expose the brand to the expected 85,000 Rugby World Cup visitors and the general public of New Zealand.
Testament to this year’s success, EasiYo won several awards during the year including the Natural Products New Zealand Exporter of the Year Award, the Supreme Business Excellence and Excellence in Exporting Awards at the Westpac Enterprise North Shore Business Excellence Awards and very recently the Exporter of the Year Award (for companies under $35 million) at the Air New Zealand Cargo Export Awards Auckland 2011.
SponsorshipsWestland Milk Products has always been a proud supporter of local initiatives but few were more important than this year’s donation to the Canterbury Earthquake Recovery appeal and the families of the Pike River Mine disaster.
Our donation to the Federated Farmers-led initiative “Farmy Army” helped remove hundreds of tonnes of liquefaction from suburbs of Christchurch while the contribution to the Pike River Mine fund provided much needed support to families of the tragedy. EasiYo also made a significant contribution to various relief centres in Christchurch following the earthquakes.
15
EasiYo has been a proud supporter of the Canterbury Tactix netball team, which put in a brave effort despite having a number of reduced home games due to the Christchurch earthquakes. The opportunity to link the brand to active lifestyles and the renaissance of at home food preparation was also developed with sponsorship of the Junior Master Chef Australia series.
We are also proud to have contributed to numerous other local charities and causes, making donations to various local schools and libraries, sports organisations and health charities including the Epilepsy Foundation and the Hokitika Cancer Support Group.
SustainabilityThis year marked a significant step forward in Westland Milk Products’ sustainability practices with the introduction of a new Code of Practice. The Code of Practice requires all Westland Milk Products’ suppliers to implement appropriate best management practices with regards to the environment, animal welfare and farm presentation.
We are pleased with the level of support for the initiative to date and, after a number of consultative meetings have been able to finalise a formal Code of Practice document. We look forward to implementing the new code in the coming season.
At the beginning of the calendar year, Westland Milk Products signed up to a Government run voluntary Emissions Trading Scheme (ETS) participation programme to familiarise ourselves with the scheme’s requirements for when it becomes obligatory in January 2015. As part of this programme we will be asking suppliers what the Emissions Trading Scheme means to them and the impact it may have on their farming activities. Suppliers will be represented at all levels of discussions with MAF and central government.
Sale of the Westland Farm CentreAt last year’s annual meeting we announced the sale of the Westland Farm Centre in Hokitika to fellow co-operative Combined Rural Traders (CRT). The decision to sell the Farm Centre was not an easy one, however a review of the business highlighted that it was peripheral to our core offering. By divesting the Farm Centre we were convinced suppliers would have even better support from a larger and dedicated farm supplies group. The divestment enabled Westland Milk Products to concentrate solely on our core operation of sourcing, processing and marketing milk products to our customers.
The Outlook The outlook for the dairy industry remains positive notwithstanding the on-going presence of volatility in global markets. Our suppliers can take great comfort that the dairy industry recovered quickly following the global financial crisis and that the demand for protein among emerging economies continues to strengthen. We anticipate dairy prices will continue to be volatile but on average settled higher than past long run averages. With a focus on farm input costs this should lead to on-going profitability over the medium and long term for NZ dairy farmers. In 2012 Westland Milk Products will continue to focus on improving operational performance and seek to improve returns to suppliers through expansion as we continue to become even more relevant to our customers.
AcknowledgementsI would like to take this opportunity to personally acknowledge the guidance and support of the Board and our Senior Management Team in 2011. We are fortunate to have talented, dedicated and loyal staff who are committed to achieving Westland Milk Products’ shared objectives.
I would also like to thank you, our suppliers, for your support during a milestone year and look forward to serving you again in the 2011/12 season.
CEO’s ReportContinued…
16

17
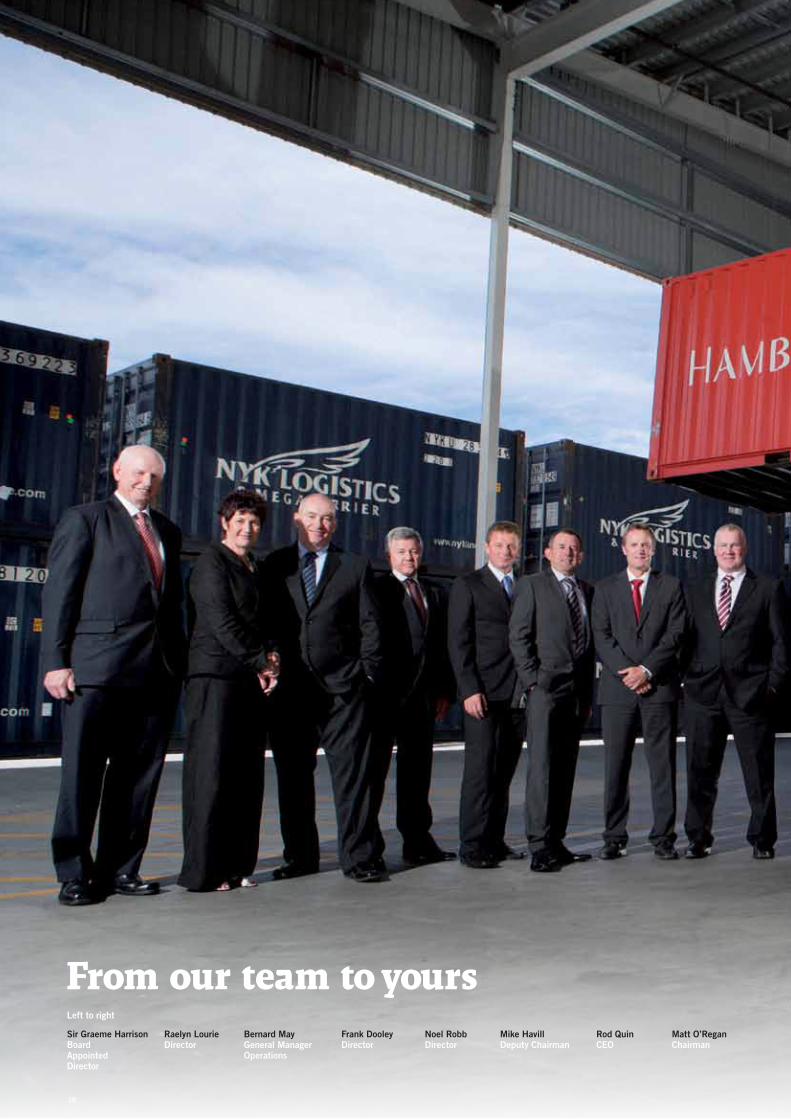
Sir Graeme HarrisonBoard Appointed Director
Raelyn Lourie Director
Bernard MayGeneral Manager Operations
Frank DooleyDirector
Noel RobbDirector
Mike Havill Deputy Chairman
Rod QuinCEO
Matt O’Regan Chairman
Left to right
From our team to yours
18
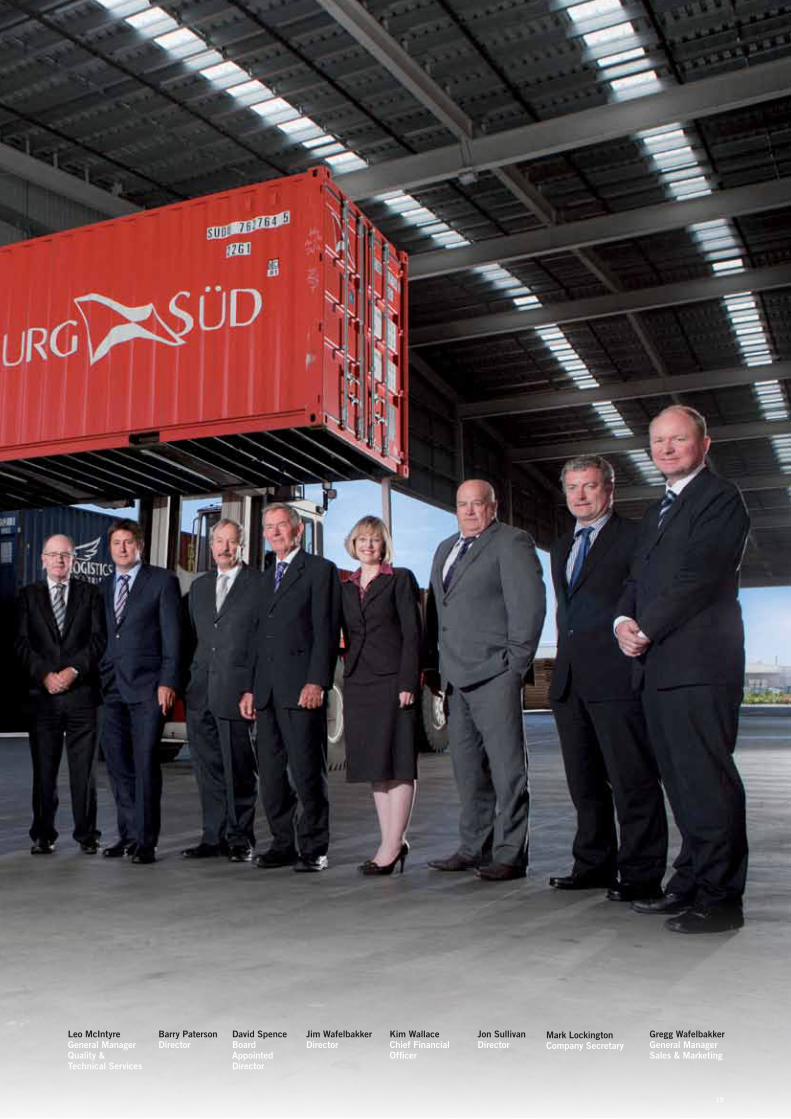
Leo McIntyreGeneral Manager Quality & Technical Services
Barry Paterson Director
David Spence Board Appointed Director
Jim Wafelbakker Director
Kim WallaceChief Financial Officer
Mark LockingtonCompany Secretary
Jon SullivanDirector
Gregg WafelbakkerGeneral Manager Sales & Marketing
19
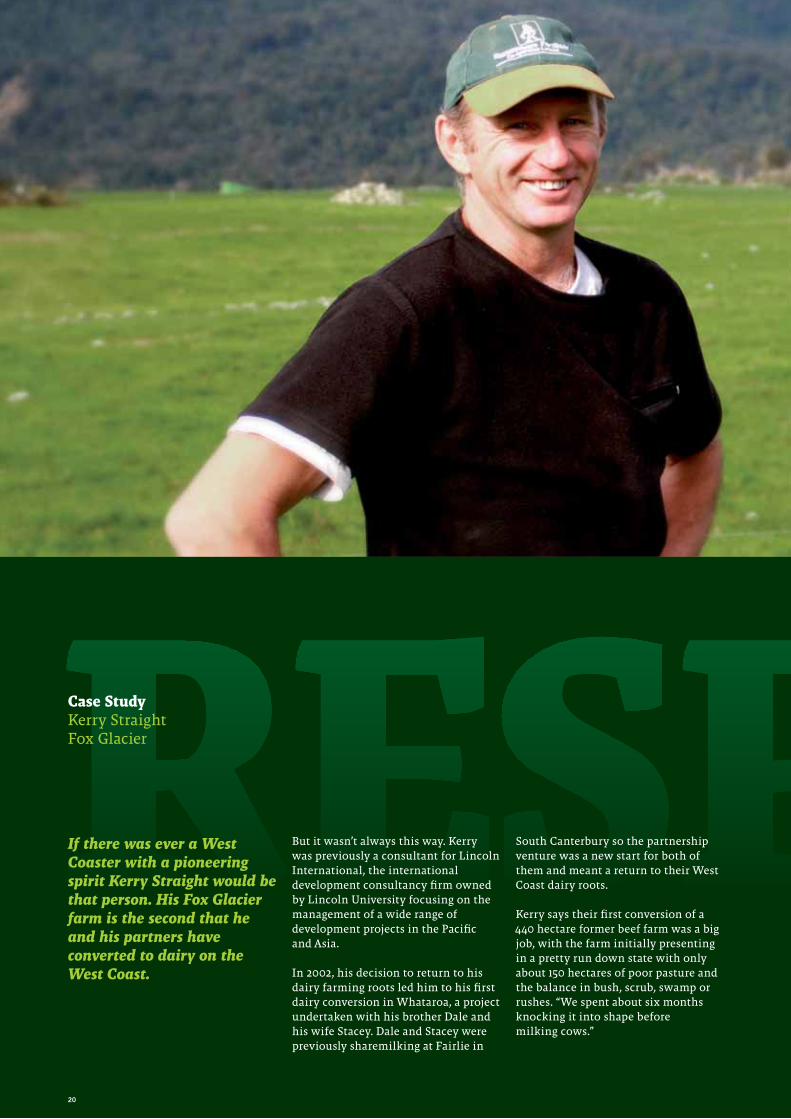
But it wasn’t always this way. Kerry was previously a consultant for Lincoln International, the international development consultancy firm owned by Lincoln University focusing on the management of a wide range of development projects in the Pacific and Asia.
In 2002, his decision to return to his dairy farming roots led him to his first dairy conversion in Whataroa, a project undertaken with his brother Dale and his wife Stacey. Dale and Stacey were previously sharemilking at Fairlie in
South Canterbury so the partnership venture was a new start for both of them and meant a return to their West Coast dairy roots.
Kerry says their first conversion of a 440 hectare former beef farm was a big job, with the farm initially presenting in a pretty run down state with only about 150 hectares of poor pasture and the balance in bush, scrub, swamp or rushes. “We spent about six months knocking it into shape before milking cows.”
Case StudyKerry StraightFox Glacier
If there was ever a West Coaster with a pioneering spirit Kerry Straight would be that person. His Fox Glacier farm is the second that he and his partners have converted to dairy on the West Coast.
20
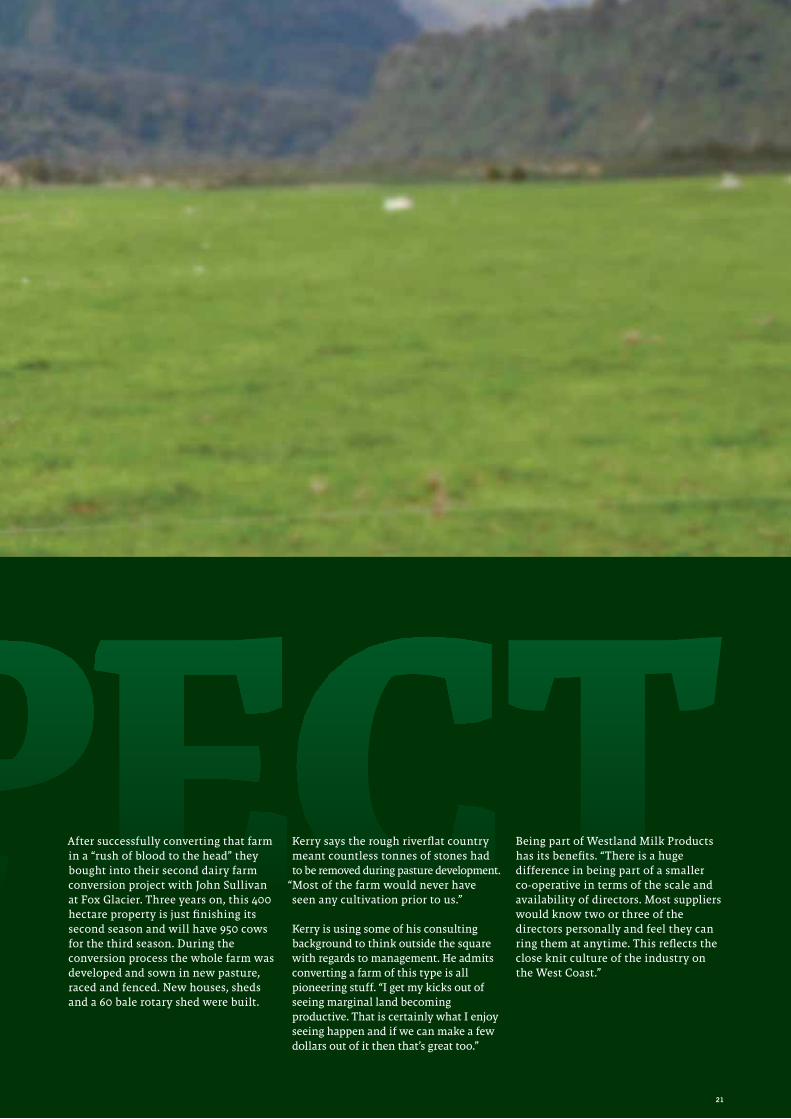
After successfully converting that farm in a “rush of blood to the head” they bought into their second dairy farm conversion project with John Sullivan at Fox Glacier. Three years on, this 400 hectare property is just finishing its second season and will have 950 cows for the third season. During the conversion process the whole farm was developed and sown in new pasture, raced and fenced. New houses, sheds and a 60 bale rotary shed were built.
Kerry says the rough riverflat country meant countless tonnes of stones had to be removed during pasture development.
“Most of the farm would never have seen any cultivation prior to us.”
Kerry is using some of his consulting background to think outside the square with regards to management. He admits converting a farm of this type is all pioneering stuff. “I get my kicks out of seeing marginal land becoming productive. That is certainly what I enjoy seeing happen and if we can make a few dollars out of it then that’s great too.”
Being part of Westland Milk Products has its benefits. “There is a huge difference in being part of a smaller co-operative in terms of the scale and availability of directors. Most suppliers would know two or three of the directors personally and feel they can ring them at anytime. This reflects the close knit culture of the industry on the West Coast.”
21
BoardThe company’s constitution provides for the parent Board to comprise eight directors nominated and elected by the supplying shareholders, two directors appointed by the Board and a Managing Director (if one is appointed).
Those eight directors comprise, five Ward Directors, one each elected by shareholders in the Southern, Central, Lower Grey Valley, Reefton/Inangahua and Buller/Karamea wards and three General Directors nominated and elected by supplying shareholders from the whole company.
Ward and General Directors retire from office at the annual meeting in the third year after their last election.
Each year the Board undertakes an evaluation of the performance of each director which may extend to identifying individual training and development plans where appropriate.
All new directors are inducted and receive the opportunity to undergo training and, along with other directors, undertake annual familiarisation tours to different divisions of the company across both the Hokitika and Rolleston locations.
Board CommitteesThe Board of Directors has two formally constituted committees:
Audit CommitteeThe Audit Committee is responsible for assisting the Board in discharging its responsibilities relative to financial reporting and regulatory conformance. In addition the Audit Committee is responsible for ensuring the recommendations of the external auditors are actioned by management, monitoring corporate risk assessment and the internal controls instituted by the company and supervising special investigations when requested by the Board. This committee is chaired by Appointed Director, David Spence, and currently comprises Chairman Matt O’Regan, General Director & Deputy Chairman Mike Havill and Ward Directors Noel Robb and Frank Dooley.
Remuneration CommitteeThe Remuneration Committee reviews the remuneration of the Senior Management Team. This committee is chaired by Chairman Matt O’Regan and currently comprises Appointed Director Sir Graeme Harrison, Deputy Chairman Mike Havill and Ward Director Raelyn Lourie.
Corporate Governance Report 2011
The company, the Board, each director and each shareholder of Westland Milk Products have the rights, powers, duties and obligations set out in the Companies Act 1993 and the Co-operative Companies Act 1996 except as these are negated or modified in accordance with these acts by the Constitution. The Constitution is registered and available on the Companies Office website or on request from the Company Secretary.
22

Westland Farm CentreThe Chairman of the Board, Chief Executive Officer and Chief Financial Officer of Westland Co-operative Dairy Company Limited sit on the Board of the wholly owned subsidiary company Westland Farm Centre Limited.
The Westland Farm Centre retail store and BP2Go service station businesses at Fitzherbert Street Hokitika were sold to CRT in early 2011. As the Westland Farm Centre has now ceased trading it is intended that this subsidiary company will be amalgamated with the parent company Westland Co-operative Dairy Company Limited during the 2011/2012 financial year.
EasiYo ProductsThe Chairman of the Board, one other Board Member and the Chief Executive Officer of Westland Co-operative Dairy Company Limited together with Director Maurice Eng sit on the Board of the wholly owned subsidiary company EasiYo Products Limited.
Board MeetingsThe Directors receive comprehensive information and reports on the company’s operations before each meeting including reporting on the activities of the subsidiary Westland Farm Centre Limited and the EasiYo group.
In March 2011 Freshfood Group Limited, Freshyo Products International Limited, Yolife South Korea Limited, and Easiyo Products Limited amalgamated to become Easiyo Products Limited. The Easiyo group of companies now includes Easiyo Products Limited, Arendal Investments Limited, Freshfood Systems Limited (UK) and Easiyo Limited (Delaware, USA).
The Board and its committees also meet from time to time in confidential sessions without senior management present. These sessions deal with management performance, remuneration and discussions with external auditors to promote a robust and independent audit process.
RemunerationShareholder DirectorsThe constitution provides that the Board may determine and authorise payment of remuneration, or the provision of other benefits by the company, to a director for services as a director, or in any other capacity if the Board is satisfied that to do so is fair to the company, provided that the shareholders by ordinary resolution authorise such remuneration or other benefits. Generally the Board reviews Shareholder Director remuneration annually.
Appointed DirectorsThe constitution provides that the Board may determine and authorise payment of remuneration, or the provision of other benefits by the company to an appointed director for services as a director, or in any other capacity if the Board is satisfied that to do so is fair to the company. Generally the Board reviews Appointed Director remuneration annually.
23
AuDIT REPORT
INDEPENDENT AuDITOR’S REPORTTO THE MEMBERS OF WESTLAND COOPERATIVE DAIRY COMPANY LIMITED
Report on the Financial StatementsWe have audited the financial statements of Westland Cooperative Dairy Company Limited and group on pages 26 to 58, which comprise the consolidated and separate balance sheet of Westland Cooperative Dairy Company Limited, as at 31 July 2011, the consolidated and separate income statements, statements of comprehensive income, statements of changes in members funds and statements of cash flows for the year then ended, and a summary of significant accounting policies and other explanatory information.
This report is made solely to the company’s members, as a body, in accordance with Section 205(1) of the Companies Act 1993. Our audit has been undertaken so that we might state to the company’s members those matters we are required to state to them in an auditor’s report and for no other purpose. To the fullest extent permitted by law, we do not accept or assume responsibility to anyone other than the company’s members as a body, for our audit work, for this report, or for the opinions we have formed.
Board of Directors’ Responsibility for the Financial StatementsThe Board of Directors is responsible for the preparation of financial statements in accordance with generally accepted accounting practice in New Zealand and that give a true and fair view of the matters to which they relate, and for such internal control as the Board of Directors determine is necessary to enable the preparation of financial statements that are free from material misstatement, whether due to fraud or error.
Auditor’s ResponsibilitiesOur responsibility is to express an opinion on these financial statements based on our audit. We conducted our audit in accordance with International Standards on Auditing and International Standards on Auditing (New Zealand). Those standards require that we comply with ethical requirements and plan and perform the audit to obtain reasonable assurance about whether the financial statements are free from material misstatement.
An audit involves performing procedures to obtain audit evidence about the amounts and disclosures in the financial statements. The procedures selected depend on the auditor’s judgement, including the assessment of the risks of material misstatement of the financial statements, whether due to fraud or error. In making those risk assessments, the auditor considers internal control relevant to the entity’s preparation of financial statements that give a true and fair view of the matters to which they relate in order to design audit procedures that are appropriate in the circumstances, but not for the purpose of expressing an opinion on the effectiveness of the entity’s internal control. An audit also includes evaluating the appropriateness of the accounting policies used and the reasonableness of accounting estimates, as well as the overall presentation of the financial statements. We believe that the audit evidence we have obtained is sufficient and appropriate to provide a basis for our audit opinion. Other than in our capacity as auditor and the provision of taxation advice, we have no relationship with or interests in Westland Cooperative Dairy Company Limited or any of its subsidiaries.
OpinionIn our opinion, the financial statements on pages 26 to 58:· comply with generally accepted accounting practice in New Zealand;· comply with International Financial Reporting Standards; and· give a true and fair view of the financial position of Westland Cooperative Dairy Company Limited and group as at 31 July 2011, and their financial performance and cash flows for the year then ended.
Report on Other Legal and Regulatory RequirementsWe also report in accordance with section 16 of the Financial Reporting Act 1993. In relation to our audit of the financial statements for the year ended 31 July 2011:· we have obtained all the information and explanations we have required; and· in our opinion proper accounting records have been kept by Westland Cooperative Dairy Company Limited as far as appears from our examination of those records.
Chartered Accountants7 October 2011Christchurch, New Zealand
This audit report relates to the financial statements of Westland Cooperative Dairy Company Limited and group for the year ended 31 July 2011 included on Westland Cooperative Dairy Company Limited‘s website. The Board of Directors is responsible for the maintenance and integrity of Westland Cooperative Dairy Company Limited’s website. We have not been engaged to report on the integrity of Westland Cooperative Dairy Company Limited‘s website. We accept no responsibility for any changes that may have occurred to the financial statements since they were initially presented on the website. The audit report refers only to the financial statements named above. It does not provide an opinion on any other information which may have been hyperlinked to/from these financial statements. If readers of this report are concerned with the inherent risks arising from electronic data communication they should refer to the published hard copy of the audited financial statements and related audit report dated 7 October 2011 to confirm the information included in the audited financial statements presented on this website. Legislation in New Zealand governing the preparation and dissemination of financial statements may differ from legislation in other jurisdictions.
24
DIRECTORS’ DECLARATION
In the opinion of the directors of Westland Co-operative Dairy Company Limited (“the Company”), the financial statements and notes, on pages 26 to 58:
• comply with New Zealand generally accepted accounting practice and give a true and fair view of the financial position of the Company and the Group as at 31 July 2011 and the results of their operations and cash flows for the 12 month period ended on that date.
• have been prepared using appropriate accounting policies, which have been consistently applied and supported by
reasonable judgements and estimates. The directors believe that proper accounting records have been kept which enable, with reasonable accuracy, the determination of the financial position of the Company and the Group and facilitate compliance of the financial statements with the Financial Reporting Act 1993.
The directors consider that they have taken adequate steps to safeguard the assets of the Company and the Group, and to prevent and detect fraud and other irregularities. Internal control procedures are also considered to be sufficient to provide a reasonable assurance as to the integrity and reliability of the financial statements. The directors are pleased to present the financial statements of Westland Co-operative Dairy Company Limited for the period ended 31 July 2011. For and on behalf of the Board of Directors:
M J O’Regan M T Havill Chairman Deputy Chairman 27 September 2011 27 September 2011
25
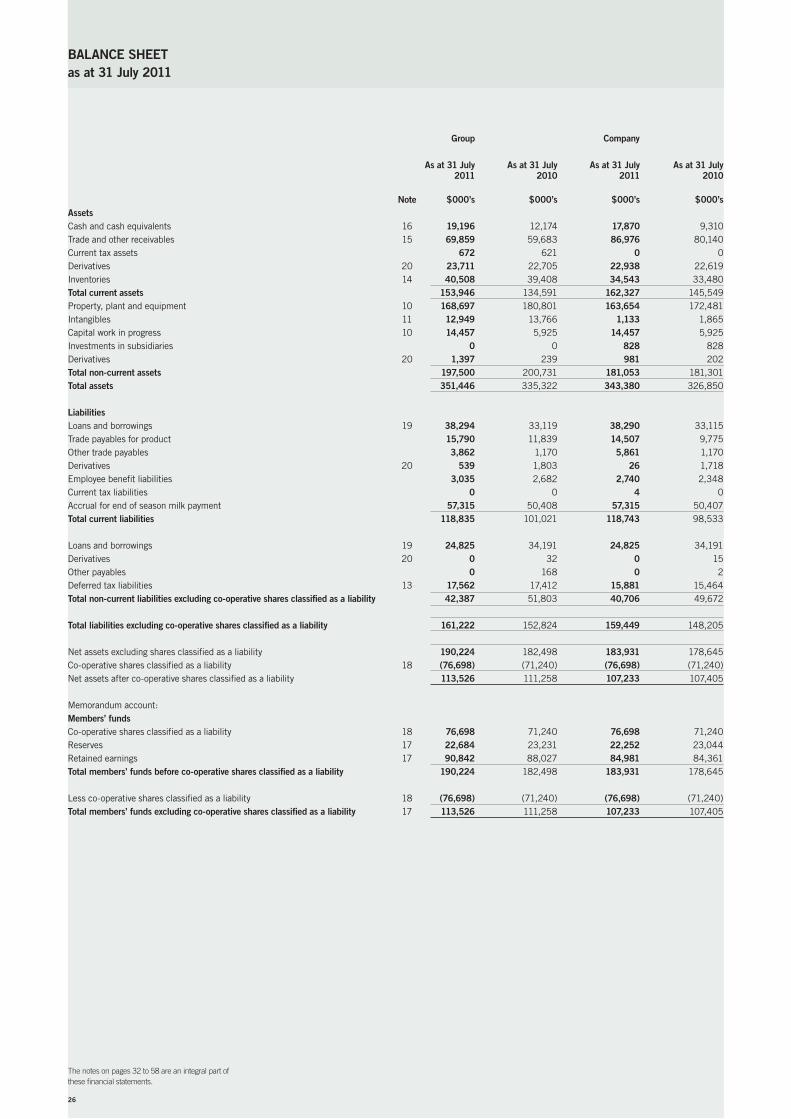
The notes on pages 32 to 58 are an integral part ofthese financial statements.
Group Company As at 31 July As at 31 July As at 31 July As at 31 July 2011 2010 2011 2010
Note $000’s $000’s $000’s $000’sAssets Cash and cash equivalents 16 19,196 12,174 17,870 9,310Trade and other receivables 15 69,859 59,683 86,976 80,140Current tax assets 672 621 0 0Derivatives 20 23,711 22,705 22,938 22,619Inventories 14 40,508 39,408 34,543 33,480Total current assets 153,946 134,591 162,327 145,549Property, plant and equipment 10 168,697 180,801 163,654 172,481Intangibles 11 12,949 13,766 1,133 1,865Capital work in progress 10 14,457 5,925 14,457 5,925Investments in subsidiaries 0 0 828 828Derivatives 20 1,397 239 981 202Total non-current assets 197,500 200,731 181,053 181,301Total assets 351,446 335,322 343,380 326,850 Liabilities Loans and borrowings 19 38,294 33,119 38,290 33,115Trade payables for product 15,790 11,839 14,507 9,775Other trade payables 3,862 1,170 5,861 1,170Derivatives 20 539 1,803 26 1,718Employee benefit liabilities 3,035 2,682 2,740 2,348Current tax liabilities 0 0 4 0Accrual for end of season milk payment 57,315 50,408 57,315 50,407Total current liabilities 118,835 101,021 118,743 98,533 Loans and borrowings 19 24,825 34,191 24,825 34,191Derivatives 20 0 32 0 15Other payables 0 168 0 2Deferred tax liabilities 13 17,562 17,412 15,881 15,464Total non-current liabilities excluding co-operative shares classified as a liability 42,387 51,803 40,706 49,672 Total liabilities excluding co-operative shares classified as a liability 161,222 152,824 159,449 148,205 Net assets excluding shares classified as a liability 190,224 182,498 183,931 178,645Co-operative shares classified as a liability 18 (76,698) (71,240) (76,698) (71,240)Net assets after co-operative shares classified as a liability 113,526 111,258 107,233 107,405 Memorandum account: Members’ funds Co-operative shares classified as a liability 18 76,698 71,240 76,698 71,240Reserves 17 22,684 23,231 22,252 23,044Retained earnings 17 90,842 88,027 84,981 84,361Total members’ funds before co-operative shares classified as a liability 190,224 182,498 183,931 178,645
Less co-operative shares classified as a liability 18 (76,698) (71,240) (76,698) (71,240)Total members’ funds excluding co-operative shares classified as a liability 17 113,526 111,258 107,233 107,405
as at 31 July 2011BALANCE SHEET
26
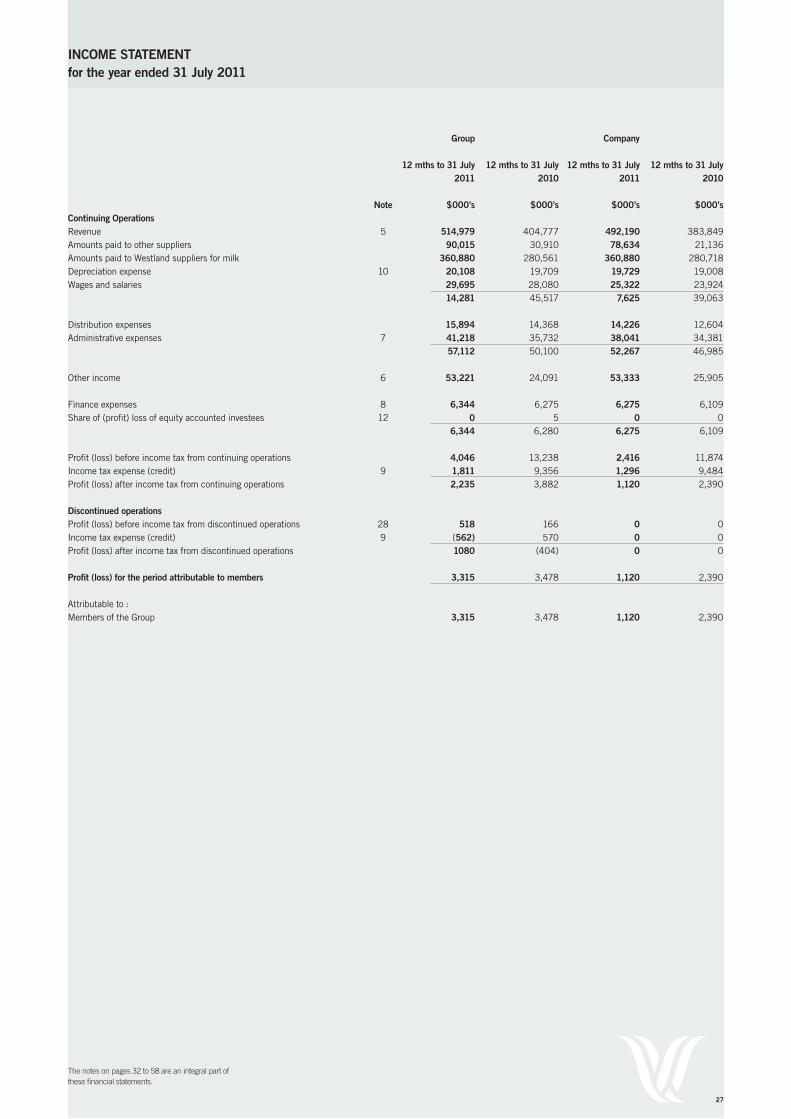
The notes on pages 32 to 58 are an integral part ofthese financial statements.
INCOME STATEMENT
Group Company 12 mths to 31 July 12 mths to 31 July 12 mths to 31 July 12 mths to 31 July 2011 2010 2011 2010
Note $000’s $000’s $000’s $000’sContinuing Operations Revenue 5 514,979 404,777 492,190 383,849Amounts paid to other suppliers 90,015 30,910 78,634 21,136Amounts paid to Westland suppliers for milk 360,880 280,561 360,880 280,718Depreciation expense 10 20,108 19,709 19,729 19,008Wages and salaries 29,695 28,080 25,322 23,924 14,281 45,517 7,625 39,063 Distribution expenses 15,894 14,368 14,226 12,604Administrative expenses 7 41,218 35,732 38,041 34,381 57,112 50,100 52,267 46,985 Other income 6 53,221 24,091 53,333 25,905 Finance expenses 8 6,344 6,275 6,275 6,109Share of (profit) loss of equity accounted investees 12 0 5 0 0 6,344 6,280 6,275 6,109 Profit (loss) before income tax from continuing operations 4,046 13,238 2,416 11,874Income tax expense (credit) 9 1,811 9,356 1,296 9,484Profit (loss) after income tax from continuing operations 2,235 3,882 1,120 2,390 Discontinued operations Profit (loss) before income tax from discontinued operations 28 518 166 0 0Income tax expense (credit) 9 (562) 570 0 0Profit (loss) after income tax from discontinued operations 1080 (404) 0 0 Profit (loss) for the period attributable to members 3,315 3,478 1,120 2,390 Attributable to : Members of the Group 3,315 3,478 1,120 2,390
for the year ended 31 July 2011
27
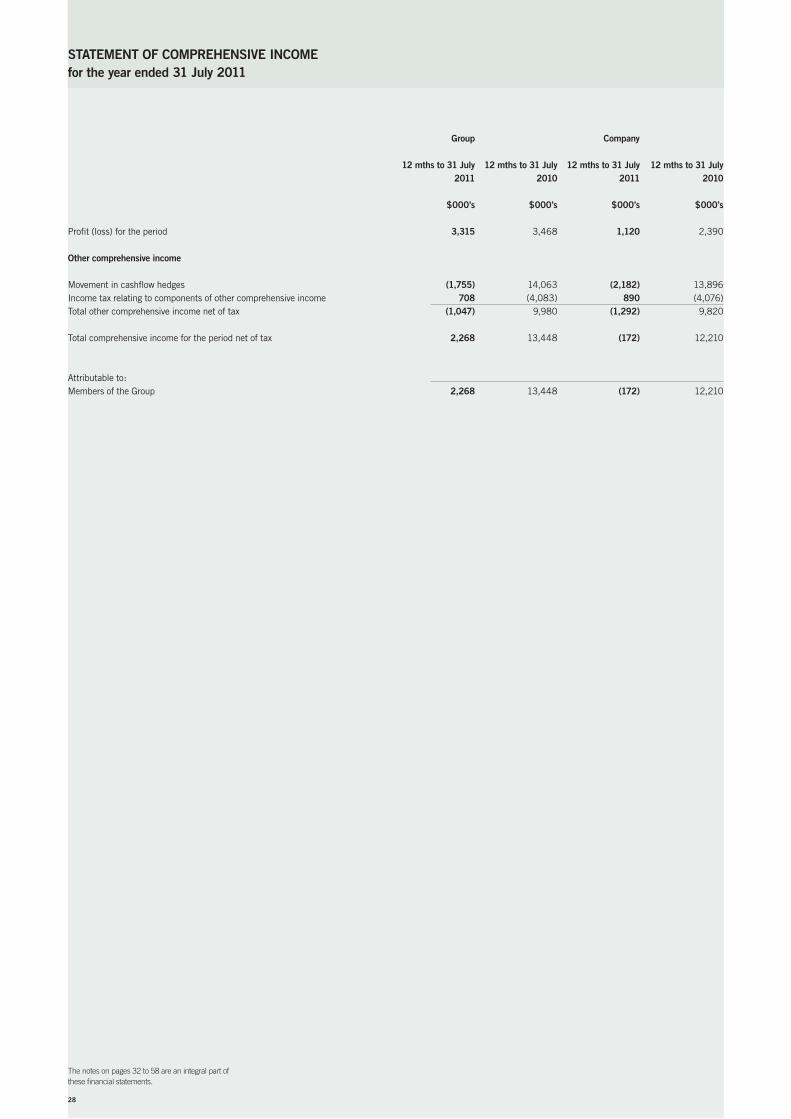
The notes on pages 32 to 58 are an integral part ofthese financial statements.
STATEMENT OF COMPREHENSIVE INCOME
Group Company 12 mths to 31 July 12 mths to 31 July 12 mths to 31 July 12 mths to 31 July 2011 2010 2011 2010
$000’s $000’s $000’s $000’s Profit (loss) for the period 3,315 3,468 1,120 2,390 Other comprehensive income Movement in cashflow hedges (1,755) 14,063 (2,182) 13,896Income tax relating to components of other comprehensive income 708 (4,083) 890 (4,076)Total other comprehensive income net of tax (1,047) 9,980 (1,292) 9,820 Total comprehensive income for the period net of tax 2,268 13,448 (172) 12,210 Attributable to: Members of the Group 2,268 13,448 (172) 12,210
for the year ended 31 July 2011
28
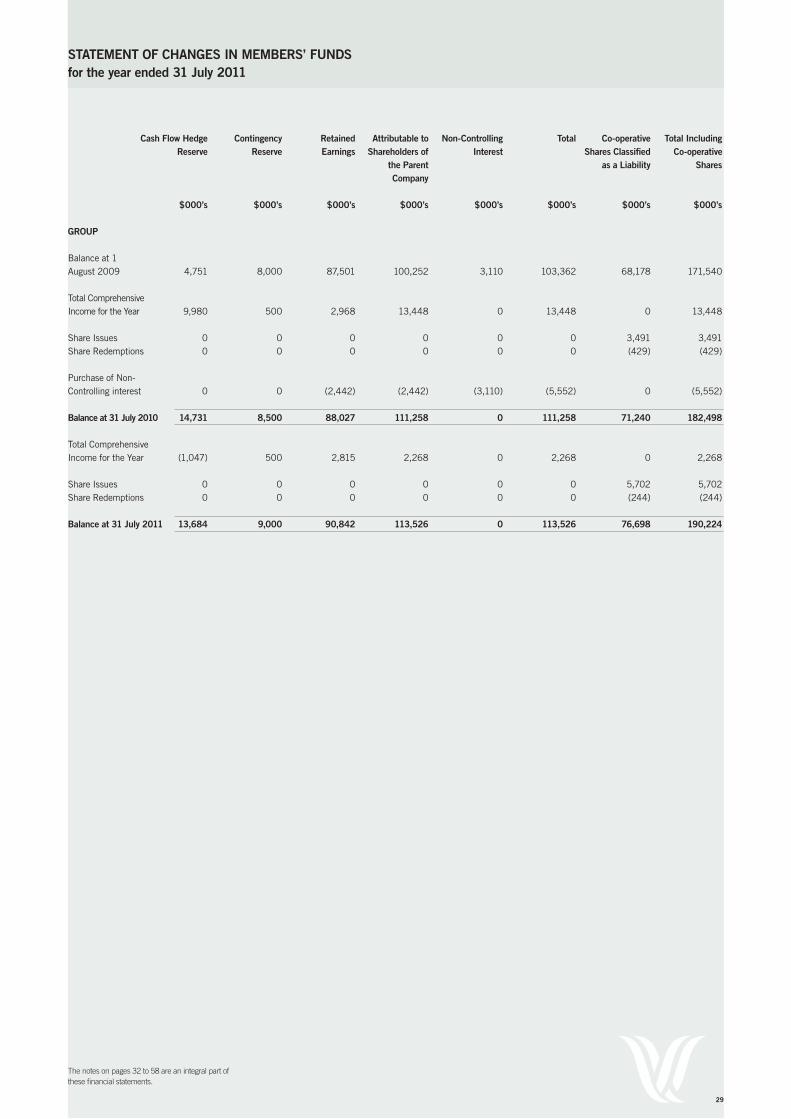
The notes on pages 32 to 58 are an integral part ofthese financial statements.
STATEMENT OF CHANGES IN MEMBERS’ FuNDS
Cash Flow Hedge Contingency Retained Attributable to Non-Controlling Total Co-operative Total Including Reserve Reserve Earnings Shareholders of Interest Shares Classified Co-operative the Parent as a Liability Shares Company $000’s $000’s $000’s $000’s $000’s $000’s $000’s $000’s
GROuP Balance at 1 August 2009 4,751 8,000 87,501 100,252 3,110 103,362 68,178 171,540 Total Comprehensive Income for the Year 9,980 500 2,968 13,448 0 13,448 0 13,448 Share Issues 0 0 0 0 0 0 3,491 3,491Share Redemptions 0 0 0 0 0 0 (429) (429) Purchase of Non-Controlling interest 0 0 (2,442) (2,442) (3,110) (5,552) 0 (5,552) Balance at 31 July 2010 14,731 8,500 88,027 111,258 0 111,258 71,240 182,498 Total Comprehensive Income for the Year (1,047) 500 2,815 2,268 0 2,268 0 2,268 Share Issues 0 0 0 0 0 0 5,702 5,702Share Redemptions 0 0 0 0 0 0 (244) (244) Balance at 31 July 2011 13,684 9,000 90,842 113,526 0 113,526 76,698 190,224
for the year ended 31 July 2011
29
The notes on pages 32 to 58 are an integral part ofthese financial statements.
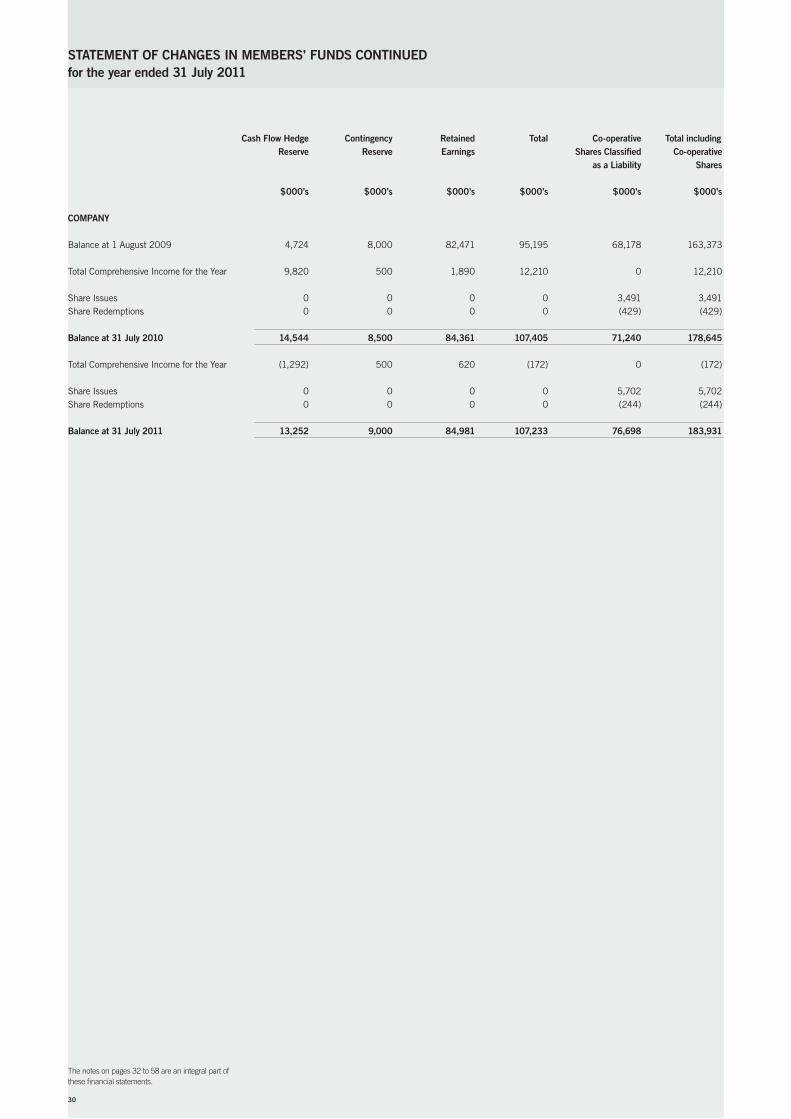
STATEMENT OF CHANGES IN MEMBERS’ FuNDS CONTINuED
Cash Flow Hedge Contingency Retained Total Co-operative Total including Reserve Reserve Earnings Shares Classified Co-operative as a Liability Shares $000’s $000’s $000’s $000’s $000’s $000’s COMPANY Balance at 1 August 2009 4,724 8,000 82,471 95,195 68,178 163,373 Total Comprehensive Income for the Year 9,820 500 1,890 12,210 0 12,210
Share Issues 0 0 0 0 3,491 3,491Share Redemptions 0 0 0 0 (429) (429) Balance at 31 July 2010 14,544 8,500 84,361 107,405 71,240 178,645 Total Comprehensive Income for the Year (1,292) 500 620 (172) 0 (172) Share Issues 0 0 0 0 5,702 5,702Share Redemptions 0 0 0 0 (244) (244) Balance at 31 July 2011 13,252 9,000 84,981 107,233 76,698 183,931
for the year ended 31 July 2011
30
The notes on pages 32 to 58 are an integral part ofthese financial statements.
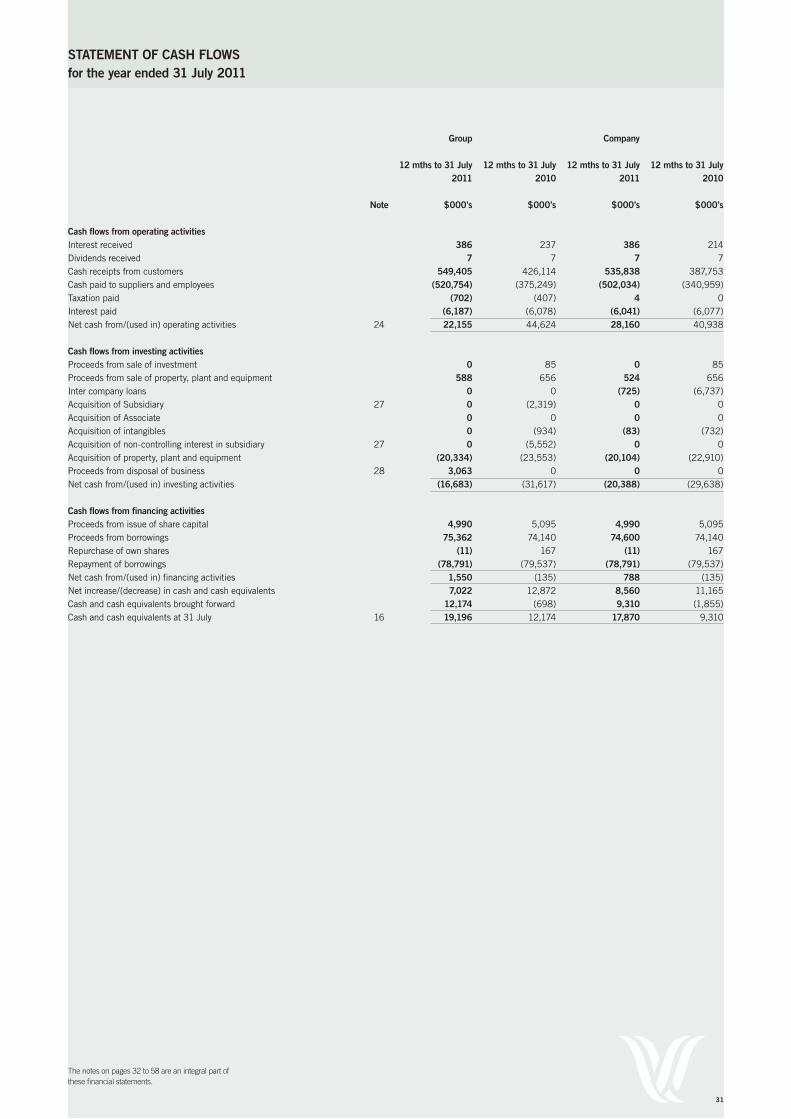
STATEMENT OF CASH FLOWS
Group Company 12 mths to 31 July 12 mths to 31 July 12 mths to 31 July 12 mths to 31 July 2011 2010 2011 2010
Note $000’s $000’s $000’s $000’s Cash flows from operating activities Interest received 386 237 386 214Dividends received 7 7 7 7Cash receipts from customers 549,405 426,114 535,838 387,753Cash paid to suppliers and employees (520,754) (375,249) (502,034) (340,959)Taxation paid (702) (407) 4 0Interest paid (6,187) (6,078) (6,041) (6,077)Net cash from/(used in) operating activities 24 22,155 44,624 28,160 40,938 Cash flows from investing activities Proceeds from sale of investment 0 85 0 85Proceeds from sale of property, plant and equipment 588 656 524 656Inter company loans 0 0 (725) (6,737)Acquisition of Subsidiary 27 0 (2,319) 0 0Acquisition of Associate 0 0 0 0Acquisition of intangibles 0 (934) (83) (732)Acquisition of non-controlling interest in subsidiary 27 0 (5,552) 0 0Acquisition of property, plant and equipment (20,334) (23,553) (20,104) (22,910)Proceeds from disposal of business 28 3,063 0 0 0Net cash from/(used in) investing activities (16,683) (31,617) (20,388) (29,638) Cash flows from financing activities Proceeds from issue of share capital 4,990 5,095 4,990 5,095Proceeds from borrowings 75,362 74,140 74,600 74,140Repurchase of own shares (11) 167 (11) 167Repayment of borrowings (78,791) (79,537) (78,791) (79,537)Net cash from/(used in) financing activities 1,550 (135) 788 (135)Net increase/(decrease) in cash and cash equivalents 7,022 12,872 8,560 11,165Cash and cash equivalents brought forward 12,174 (698) 9,310 (1,855)Cash and cash equivalents at 31 July 16 19,196 12,174 17,870 9,310
for the year ended 31 July 2011
31
1 Reporting entity Westland Co-operative Dairy Company Limited (the “Company”) is a profit oriented company incorporated and domiciled in
New Zealand, registered under the Companies Act 1993 and the Co-operative Companies Act 1996.
Financial statements for the Company and consolidated financial statements are presented. The consolidated financial statements of Westland Co-operative Dairy Company Limited as at and for the 12 month period ended 31 July 2011 comprise the Company and its subsidiaries and the Group’s interest in associates and jointly controlled entities (together referred to as the “Group”). Westland Co-operative Dairy Company Limited is primarily involved in the supply of dairy and nutritional products.
2 Basis of preparation (a) Statement of compliance The financial statements have been prepared in accordance with New Zealand Generally Accepted Accounting Practice
(“NZ GAAP”). They comply with New Zealand equivalents to International Financial Reporting Standards (“NZ IFRS”) and other applicable Financial Reporting Standards, as appropriate for profit-oriented entities. The financial statements also comply with International Financial Reporting Standards (“IFRS”).
The accounting policies set out below have been applied consistently to all periods presented in these financial statements.
The financial statements were approved by the Board of Directors on 27th September 2011.
(b) Basis of measurement The financial statements have been prepared on the historical cost basis except for derivative financial instruments
which are measured at fair value. The methods used to measure fair values are discussed further in note 4.
(c) Functional and presentation currency These financial statements are presented in New Zealand dollars ($), which is the Company’s functional currency. All financial information presented in New Zealand dollars has been rounded to the nearest thousand dollars.
(d) use of estimates and judgements The preparation of financial statements requires management to make judgements, estimates and assumptions that
affect the application of accounting policies and the reported amounts of assets, liabilities, income and expenses.
Actual results may differ from these estimates.
Estimates and underlying assumptions are reviewed on an ongoing basis. Revisions to accounting estimates are recognised in the period in which the estimate is revised and in any future periods affected.
In particular, information about significant areas of estimation uncertainty and critical judgements in applying accounting policies that have the most significant effect on the amounts recognised in the financial statements are described in Note 11 (Intangibles), Note 14 (Inventories) and Note 27 (Acquisition of subsidiaries and non-controlling interests).
3 Significant accounting policies (a) Basis of consolidation
(i) Subsidiaries Subsidiaries are entities controlled by the Group. Control exists when the Group has the power to govern the
financial and operating policies of an entity so as to obtain benefits from its activities. In assessing control, potential voting rights that presently are exercisable are taken into account. The financial statements of subsidiaries are included in the consolidated financial statements from the date that control commences until the date that control ceases.
(ii) Associates and joint ventures (equity accounted investees) Associates are those entities in which the Group has significant influence, but not control, over the financial and operating policies. Joint ventures are those entities over whose activities the Group has joint control, established by contractual agreement and requiring unanimous consent for strategic financial and operating decisions. Associates and joint ventures are accounted for using the equity method (equity accounted investees).
The consolidated financial statements include the Group’s share of the income and expenses of equity accounted investees, after adjustments to align the accounting policies with those of the Group, from the date that significant influence or joint control commences until the date that significant influence or joint control ceases.
for the year ended 31 July 2011NOTES TO THE FINANCIAL STATEMENTS
32
for the year ended 31 July 2011NOTES TO THE FINANCIAL STATEMENTS CONTINuED
(iii) Transactions eliminated on consolidation Intra-group balances, and any unrealised income and expenses arising from intra-group transactions, are eliminated in preparing the consolidated financial statements. Unrealised gains arising from transactions with equity accounted investees are eliminated against the investment to the extent of the Group’s interest in the investee. Unrealised losses are eliminated in the same way as unrealised gains, but only to the extent that there is no evidence of impairment.
(b) Foreign currency (i) Foreign currency transactions Transactions in foreign currencies are translated to the respective functional currencies of Group entities at
exchange rates at the dates of the transactions. Monetary assets and liabilities denominated in foreign currencies at the reporting date are retranslated to the functional currency at the exchange rate at that date. Non-monetary items carried at fair value that are denominated in foreign currencies are retranslated at the rates prevailing at the date when the fair value was determined. Non-monetary items that are measured in terms of historical cost in a foreign currency are not retranslated.
Foreign currency differences arising on retranslation are recognised in profit or loss.
(ii) Foreign operations The assets and liabilities of foreign operations, including fair value adjustments arising on acquisition, are
translated to New Zealand dollars at exchange rates at the reporting date. The income and expenses of foreign operations are translated to New Zealand dollars at exchange rates at the dates of the transactions.
(c) Financial instruments (i) Non-derivative financial instruments
Non-derivative financial instruments comprise investments, trade and other receivables, cash and cash equivalents, loans and borrowings including ordinary shares, and trade and other payables.
Non-derivative financial instruments are recognised initially at fair value plus, for financial assets not at fair value through profit or loss, any directly attributable transaction costs. For financial liabilities not recognised at fair value through profit and loss the liabilities are initially recognised inclusive of directly attributable transaction costs. A financial instrument is recognised if the Group becomes a party to the contractual provisions of the instrument.
Cash and cash equivalents comprise cash balances and call deposits.
Accounting for finance income and expense is discussed in note 3(l). Subsequent to initial recognition, other non-derivative financial instruments are measured using the methods
described below.
Investments in equity securities of subsidiaries, associates and joint ventures are measured at cost in the separate financial statements of the Company.
Trade and other receivables Trade and other receivables are stated at their amortised cost using the effective interest method less impairment losses.
Interest-bearing borrowings Interest-bearing borrowings are stated at amortised cost using the effective interest method, with interest expense
recognised on an effective interest basis. Trade and other payables Trade and other payables are stated at amortised cost using the effective interest rate method with interest expense
recognised on an effective interest basis. Ordinary shares The Company’s share capital is accounted for as a long term liability because under the Co-operative Companies Act 1996
under certain conditions specified in the Act shareholders have the right to surrender shares in the Company and receive payment.
(ii) Derivative financial instruments The Group uses derivative financial instruments to hedge its exposure to foreign exchange and interest rate risks arising from operational, financing and investment activities. In accordance with its treasury policy, the Group does not hold or issue derivative financial instruments for trading purposes. However, derivatives that do not qualify for hedge accounting are accounted for as trading instruments. Derivative financial instruments are recognised initially at fair value and transaction costs are expensed immediately. Subsequent to initial recognition, derivative financial instruments are stated at fair value. The gain or loss on remeasurement to fair value is recognised immediately in profit or loss. However, where derivatives qualify for hedge accounting, recognition of any resultant gain or loss depends on the nature of the hedging relationship (see below).
33
Cash flow hedges Changes in the fair value of the derivative hedging instruments designated as a cash flow hedge are recognised in other
comprehensive income and accumulated as a separate component of equity in the hedging reserve to the extent that the hedge is effective. To the extent that the hedge is ineffective, changes in fair value are recognised in profit or loss. If the hedging instrument no longer meets the criteria for hedge accounting, expires or is sold, terminated or exercised, then hedge accounting is discontinued prospectively. The cumulative gain or loss previously recognised in the hedging reserve remains there until the forecast transaction occurs. When the hedged item is a non-financial asset, the amount recognised in equity is transferred to the carrying amount of the asset when it is recognised. In other cases, the amount recognised in equity is transferred to finance gain or loss in profit or loss in the same period that the hedged item affects profit or loss (Note 8).
(d) Property, plant and equipment (i) Recognition and measurement
Items of property, plant and equipment are measured at cost less accumulated depreciation and impairment losses.
Cost includes expenditures that are directly attributable to the acquisition of the asset and include capitalised
borrowing costs where appropriate. The cost of self-constructed assets includes the cost of materials and direct labour, any other costs directly attributable to bringing the asset to a working condition for its intended use. Purchased software that is integral to the functionality of the related equipment is capitalised as part of that equipment. When parts of an item of property, plant and equipment have different useful lives, they are accounted for as separate items (major components) of property, plant and equipment.
(ii) Subsequent costs The cost of replacing part of an item of property, plant and equipment is recognised in the carrying amount of the
item if it is probable that the future economic benefits embodied within the part will flow to the Group and its cost can be measured reliably. The costs of the day-to-day servicing of property, plant and equipment are recognised in profit or loss as incurred.
(iii) Depreciation Depreciation is recognised in profit or loss on a straight-line basis over the estimated useful lives of each part of an
item of property, plant and equipment. Land is not depreciated.
The estimated useful lives for the current and comparative periods are as follows: · buildings 15-25 years · plant and equipment 3-15 years · motor vehicles 5-10 years
Depreciation methods, useful lives and residual values are reassessed at each reporting date.
(iv) Capital Work in Progress Amounts expended on Capital Work in Progress are capitalised until such time as the asset is placed in
service and then is transferred to property, plant and equipment and is depreciated from that date.
(e) Intangibles Computer Software
Acquired computer software licences are capitalised on the basis of the costs incurred to acquire and bring to use the specific software. These costs are amortised over their estimated useful lives, being 3 to 10 years, on a straight line basis.
Costs associated with developing or maintaining computer software programmes are recognised as an expense as incurred. Costs that are directly associated with the development of identifiable and unique software products controlled by the Group or Company, and that will generate probable economic benefits exceeding the costs beyond one year, are recognised as intangible assets.
Costs include the employee costs incurred as a result of developing software and an appropriate portion of relevant overheads. Computer software development costs recognised as assets are amortised over their estimated useful lives, not exceeding 3 to 10 years.
for the year ended 31 July 2011NOTES TO THE FINANCIAL STATEMENTS CONTINuED
34
Expenditure on research and development Expenditure on research activities, undertaken with the prospect of gaining new scientific or technical knowledge and understanding, is recognised in profit or loss when incurred. Development activities involve a plan or design for the production of new or substantially improved products and processes. Development expenditure is capitalised only if development costs can be measured reliably, the product or process is technically and commercially feasible, future economic benefits are probable, and the Group intends to and has sufficient resources to complete development and to use or sell the asset. Other development expenditure is recognised in profit or loss when incurred. Development expenditure is amortised over a useful economic life of between 3 and 5 years on a straight line basis.
(f) Leased Assets Leases in terms of which the Group assumes substantially all the risks and rewards of ownership are classified as finance leases. Upon initial recognition the leased asset is measured at an amount equal to the lower of its fair value and the present value of the minimum lease payments. Subsequent to initial recognition, the asset is accounted for in accordance with the accounting policy applicable to that asset.
Other leases are operating leases and the leased assets are not recognised on the Group or Company’s balance sheet. Payments made under operating leases are recognised in profit or loss on a straight-line basis over the term of the lease. Lease incentives received are recognised as an integral part of the total lease expense, over the term of the lease.
(g) Inventories Inventories are measured at the lower of cost and net realisable value, determined on the first-in first-out basis, after due allowance for damaged and obsolete stock. The net realisable value is the estimated selling price in the ordinary course of business, less the costs of completion and selling expenses. Freight and documentation costs are excluded. The cost of inventories includes expenditure incurred in acquiring the inventories and bringing them to their existing location and condition. The cost of dairy products manufactured from milk supplied is determined by including the payment to milk producers. The payment to milk suppliers is estimated based on the estimated returns that the products are expected to generate.
In the case of manufactured inventories and work in progress, cost includes an appropriate share of production overheads based on normal operating capacity.
(h) Impairment The carrying amounts of the Group’s assets are reviewed at each balance sheet date to determine whether there is any objective evidence of impairment.
An impairment loss is recognised whenever the carrying amount of an asset exceeds its recoverable amount. Impairment losses directly reduce the carrying amount of assets and are recognised in the income statement.
An impairment loss recognised for goodwill is not reversed in subsequent periods. (i) Impairment of debt instruments and receivables The recoverable amount of the Group or Company’s receivables carried at amortised cost is calculated as the
present value of estimated future cash flows, discounted at the original effective interest rate. Receivables with a short duration are not discounted.
Impairment losses on an individual basis are determined by an evaluation of the exposures on an instrument by
instrument basis. All individual instruments that are considered significant are subject to this approach and are subsequently assessed for impairment on a collective basis.
for the year ended 31 July 2011NOTES TO THE FINANCIAL STATEMENTS CONTINuED
35
(ii) Non-financial assets The carrying amounts of the Group or Company’s non-financial assets and deferred tax assets are reviewed at each
reporting date to determine whether there is any indication of impairment. If any such indication exists then the asset’s recoverable amount is estimated. For goodwill and intangible assets that have indefinite lives or that are not yet available for use, recoverable amount is estimated at each reporting date. Goodwill and indefinite life intangible assets are tested for impairment annually and whenever there is an indication that the asset may be impaired.
An impairment loss is recognised if the carrying amount of an asset or its cash-generating unit exceeds its
recoverable amount. A cash-generating unit is the smallest identifiable asset group that generates cash flows that are largely independent from other assets and groups. Impairment losses are recognised in profit or loss immediately, unless the relevant asset is carried at a revalued amount, in which case the impairment loss is treated as a revaluation decrease. Impairment losses recognised in respect of cash-generating units are allocated first to reduce the carrying amount of any goodwill allocated to the units and then to reduce the carrying amount of the other assets in the unit (group of units) on a pro rata basis.
The recoverable amount of an asset or cash-generating unit is the greater of its value in use and its fair value less costs to sell. In assessing value in use, the estimated future cash flows are discounted to their present value using a pre-tax discount rate that reflects current market assessments of the time value of money and the risks specific to the asset.
Where an impairment loss subsequently reverses, the carrying amount of the asset (or cash generating unit) is increased to the revised estimate of its recoverable amount, but so that the increased carrying amount does not exceed the carrying amount that would have been determined had no impairment loss been recognised for the asset (or cash-generating unit) in prior years. A reversal of an impairment loss is recognised immediately in profit or loss, unless the relevant asset is carried at a revalued amount, in which case the reversal of the impairment loss is treated as a revaluation increase. Impairment of goodwill is not reversed.
(i) Employee benefits
(i) Defined contribution plans Obligations for contributions to defined contribution pension plans are recognised as an expense in profit or loss
when they are due. (ii) Other long-term employee benefits Provisions made in respect of employee benefits which are not expected to be settled within 12 months are
measured as the present value of the estimated future cash outflows to be made by the Group in respect of services provided by employees up to the reporting date.
(iii) Termination benefits Termination benefits are recognised as an expense when the Group is demonstrably committed, without realistic
possibility of withdrawal, to a formal detailed plan to terminate employment before the normal retirement date.
Termination benefits for voluntary redundancies are recognised if the Group has made an offer encouraging voluntary redundancy, it is probable that the offer will be accepted, and the number of acceptances can be estimated reliably.
(iv) Short-term benefits Short-term employee benefit obligations are measured on an undiscounted basis and are expensed as the related
service is provided. A provision is recognised for the amount expected to be paid under short-term cash bonus or profit-sharing plans if
the Group has a present legal or constructive obligation to pay this amount as a result of past service provided by the employee and the obligation can be estimated reliably.
(j) Provisions
A provision is recognised if, as a result of a past event, the Group has a present legal or constructive obligation that can be estimated reliably, and it is probable that an outflow of economic benefits will be required to settle the obligation.
Provisions are determined by discounting the expected future cash flows at a pre-tax rate that reflects current market assessments of the time value of money and the risks specific to the liability.
for the year ended 31 July 2011NOTES TO THE FINANCIAL STATEMENTS CONTINuED
36
(k) Revenue Goods sold
Revenue from the sale of goods is measured at the fair value of the consideration received or receivable, net of returns and allowances, trade discounts and volume rebates. Revenue is recognised when the significant risks and rewards of ownership have been transferred to the buyer, recovery of the consideration is probable, the associated costs and possible return of goods can be estimated reliably, and there is no continuing management involvement with the goods. Transfers of risks and rewards vary depending on the individual terms of the contract of sale. For sales of milk products, transfer usually occurs when the product is despatched from the storage facility. For sales of consumables from the Hokitika store revenue is recognised when the goods are despatched from the store.
(l) Finance income and expenses Finance income comprises interest income on funds invested and gains on hedging instruments that are recognised in profit or loss. Interest income is recognised as it accrues, using the effective interest method. Finance expenses comprise interest expense on borrowings, bonus issues of share capital, and losses on hedging instruments that are recognised in profit or loss. Borrowing costs that relate to qualifying assets are capitalised into property, plant and equipment as required by NZ IAS 23: Borrowing Costs. All other borrowing costs are recognised in profit or loss using the effective interest method.
(m) Income tax Income tax expense comprises current and deferred tax. Income tax expense is recognised in profit or loss except to the extent that it relates to items recognised in other comprehensive income or directly in equity, in which case it is recognised in other comprehensive income or directly in equity. Current tax is the expected tax payable on the taxable income for the year, using tax rates enacted or substantively enacted at the reporting date, and any adjustment to tax payable in respect of previous years. Deferred tax is recognised using the balance sheet method, providing for temporary differences between the carrying amounts of assets and liabilities for financial reporting purposes and the amounts used for taxation purposes. Deferred tax is not recognised for the following temporary differences: the initial recognition of goodwill, the initial recognition of assets or liabilities in a transaction that is not a business combination and that affects neither accounting nor taxable profit, and differences relating to investments in subsidiaries and jointly controlled entities to the extent that they probably will not reverse in the foreseeable future where the company controls the reversal. Deferred tax is measured at the tax rates that are expected to be applied to the temporary differences when they reverse, based on the laws that have been enacted or substantively enacted by the reporting date. A deferred tax asset is recognised to the extent that it is probable that future taxable profits will be available against which temporary differences can be utilised. Deferred tax assets are reviewed at each reporting date and are reduced to the extent that it is no longer probable that the related tax benefit will be realised.
(n) Statement of Cash Flows For the purpose of the cash flow statement, cash and cash equivalents include bank balances and call deposits. The following terms are used in the statement of cash flows: · Operating activities: are the principal revenue producing activities of the Group and other activities that are not
investing or financing activities. · Investing activities: are the acquisition and disposal of long-term assets and other investments not included in
cash equivalents. · Financing activities: are activities that result in changes in the size and composition of the contributed equity and
borrowings of the entity.
for the year ended 31 July 2011NOTES TO THE FINANCIAL STATEMENTS CONTINuED
37

(o) Goods and service tax
Revenue, expenses and assets are recognised net of the amount of goods and services tax (GST), except for receivables and payables which are recognised inclusive of GST. The net amount of GST recoverable from, or payable to, the taxation authority is included as part of receivables or payables. Cashflows are included in the cashflow statement on a gross basis. The GST component of cash flows arising from investing and financing which is recoverable from, or payable to, the taxation authority is classified as operating cashflow.
(p) Goodwill Goodwill arising on the acquisition of a subsidiary or associate represents the excess of the cost of acquisition over the Group’s interest in the net fair value of the identifiable assets, liabilities and contingent liabilities of the subsidiary or associate recognised at the date of acquisition. Goodwill is initially recognised as an asset at cost and is subsequently measured at cost less any accumulated impairment losses.
For the purpose of impairment testing, goodwill is allocated to each of the Group’s cash-generating units expected to benefit from the synergies of the combination. Cash-generating units to which goodwill has been allocated are tested for impairment annually, or more frequently when there is an indication that the unit may be impaired. If the recoverable amount of the cash-generating unit is less than the carrying amount of the unit, the impairment loss is allocated first to reduce the carrying amount of any goodwill allocated to the unit and then to the other assets of the unit pro-rata on the basis of the carrying amount of each asset in the unit. An impairment loss recognised for goodwill is not reversed in a subsequent period.
(q) Brands and Patents Brand and patents acquired in a business combination are identified and recognised separately from goodwill where they satisfy the definition of an intangible asset and their fair values can be measured reliably. The cost of such intangible assets is their fair value at the acquisition date.
Brands and patents are considered to have indefinite useful lives due to the registered trademark protection and the continual investment in maintaining the brand and are tested for impairment annually, and whenever there is an indication that the asset may be impaired.
(r) Other Income Dividend income is recognised on the date that the Group’s right to receive payment is established.
(s) New accounting standards No standards have been adopted during the year which have had a material impact on these financial statements. The group has reviewed all Standards and Interpretations in issue not yet adopted and, with the exception of NZ IFRS 9 Financial Instruments which is effective for the financial year ending 30 June 2014, does not expect these standards to have any material impact on the financial statements of the Company and Group. It is likely that the changes arising from NZ IFRS 9 will affect the recognition and measurement, and classification of amounts recognised in the Group and Company financial statements, however it is not practical to provide a realistic estimate of that effect until a detailed review has been completed.
for the year ended 31 July 2011NOTES TO THE FINANCIAL STATEMENTS CONTINuED
38
4 Determination of fair values A number of the Group’s accounting policies and disclosures require the determination of fair value, for both financial and
non-financial assets and liabilities. Fair values have been determined for measurement and/or disclosure purposes based on the following methods. Where applicable, further information about the assumptions made in determining fair values is disclosed in the notes specific to that asset or liability.
(a) Derivatives
The fair value of forward exchange contracts is based on their quoted market price, if available. If a quoted market price is not available, then fair value is estimated by discounting the difference between the contractual forward price and the current forward price for the residual maturity and options of the contract using a market rate of interest. (Note 20).
(b) Carrying Amounts The directors consider that the carrying amounts of financial assets and financial liabilities recorded at amortised cost in the financial statements approximate their fair values.
(c) Financial Instruments An analysis of financial instruments that are measured subsequent to initial recognition at fair value has been performed with all financial instruments grouped into Levels 1 to 3 based on the degree to which the fair value is observable: · Level 1 fair value measurements are those derived from quoted prices (unadjusted) in active markets for identical
assets or liabilities; · Level 2 fair value measurements are those derived from inputs other than quoted prices included within Level 1 that
are observable for the asset or liability, either directly (i.e. as prices) or indirectly (i.e. derived from prices); and· Level 3 fair value measurements are those derived from valuation techniques that include inputs for the asset or
liability that are not based on observable market data (unobservable inputs).
The fair value of forward exchange contracts is derived using inputs supplied by third parties that are observable, either directly (i.e. prices) or indirectly (i.e. derived from prices). Therefore the Group has categorised these liabilities as Level 2.
for the year ended 31 July 2011NOTES TO THE FINANCIAL STATEMENTS CONTINuED
39
for the year ended 31 July 2011NOTES TO THE FINANCIAL STATEMENTS CONTINuED
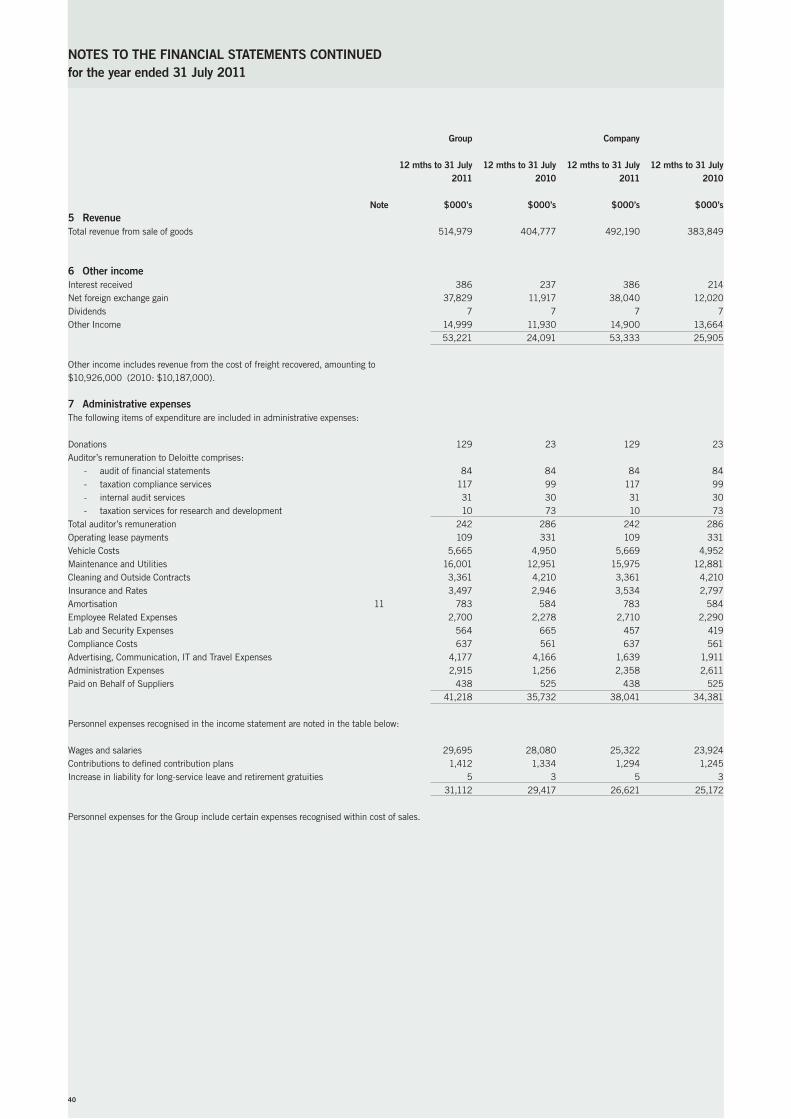
Group Company 12 mths to 31 July 12 mths to 31 July 12 mths to 31 July 12 mths to 31 July 2011 2010 2011 2010 Note $000’s $000’s $000’s $000’s5 Revenue Total revenue from sale of goods 514,979 404,777 492,190 383,849 6 Other income Interest received 386 237 386 214Net foreign exchange gain 37,829 11,917 38,040 12,020Dividends 7 7 7 7Other Income 14,999 11,930 14,900 13,664 53,221 24,091 53,333 25,905 Other income includes revenue from the cost of freight recovered, amounting to $10,926,000 (2010: $10,187,000).
7 Administrative expenses The following items of expenditure are included in administrative expenses: Donations 129 23 129 23Auditor’s remuneration to Deloitte comprises:
- audit of financial statements 84 84 84 84- taxation compliance services 117 99 117 99- internal audit services 31 30 31 30- taxation services for research and development 10 73 10 73
Total auditor’s remuneration 242 286 242 286Operating lease payments 109 331 109 331Vehicle Costs 5,665 4,950 5,669 4,952Maintenance and Utilities 16,001 12,951 15,975 12,881Cleaning and Outside Contracts 3,361 4,210 3,361 4,210Insurance and Rates 3,497 2,946 3,534 2,797Amortisation 11 783 584 783 584Employee Related Expenses 2,700 2,278 2,710 2,290Lab and Security Expenses 564 665 457 419Compliance Costs 637 561 637 561Advertising, Communication, IT and Travel Expenses 4,177 4,166 1,639 1,911Administration Expenses 2,915 1,256 2,358 2,611Paid on Behalf of Suppliers 438 525 438 525 41,218 35,732 38,041 34,381 Personnel expenses recognised in the income statement are noted in the table below: Wages and salaries 29,695 28,080 25,322 23,924Contributions to defined contribution plans 1,412 1,334 1,294 1,245Increase in liability for long-service leave and retirement gratuities 5 3 5 3 31,112 29,417 26,621 25,172 Personnel expenses for the Group include certain expenses recognised within cost of sales.
40
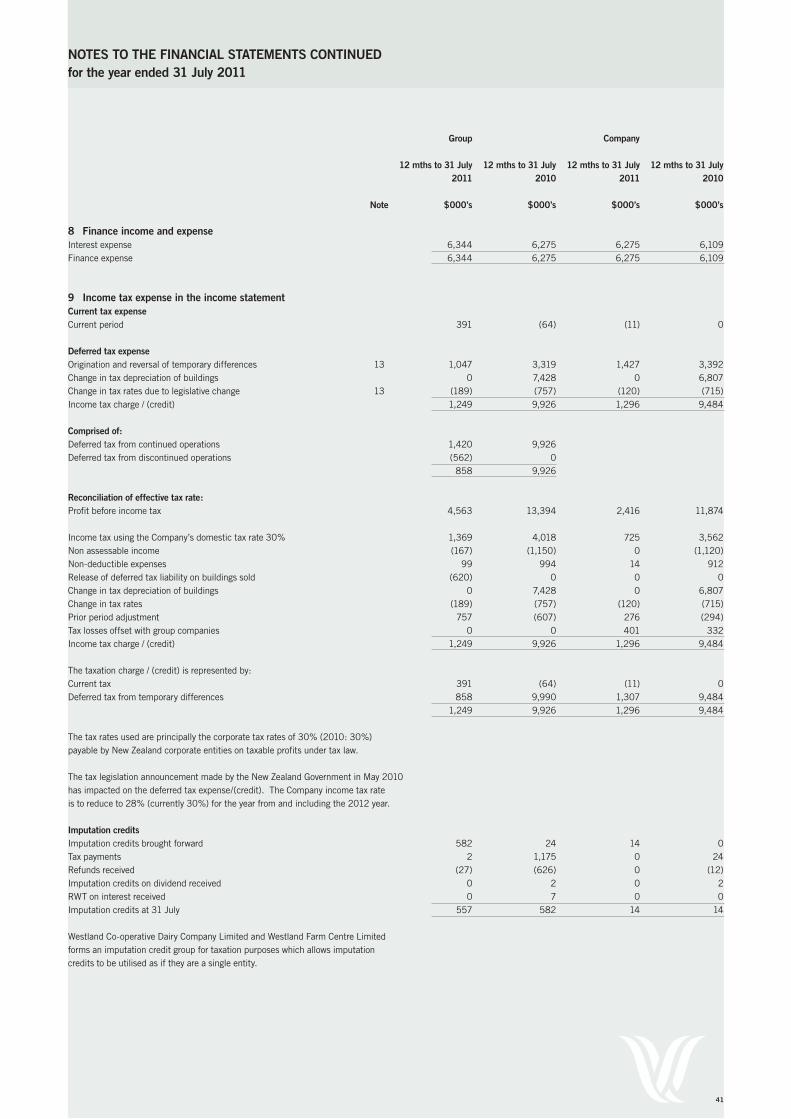
for the year ended 31 July 2011NOTES TO THE FINANCIAL STATEMENTS CONTINuED
Group Company 12 mths to 31 July 12 mths to 31 July 12 mths to 31 July 12 mths to 31 July 2011 2010 2011 2010 Note $000’s $000’s $000’s $000’s 8 Finance income and expense Interest expense 6,344 6,275 6,275 6,109Finance expense 6,344 6,275 6,275 6,109 9 Income tax expense in the income statement Current tax expense Current period 391 (64) (11) 0
Deferred tax expense Origination and reversal of temporary differences 13 1,047 3,319 1,427 3,392Change in tax depreciation of buildings 0 7,428 0 6,807Change in tax rates due to legislative change 13 (189) (757) (120) (715)Income tax charge / (credit) 1,249 9,926 1,296 9,484 Comprised of: Deferred tax from continued operations 1,420 9,926 Deferred tax from discontinued operations (562) 0 858 9,926 Reconciliation of effective tax rate: Profit before income tax 4,563 13,394 2,416 11,874 Income tax using the Company’s domestic tax rate 30% 1,369 4,018 725 3,562Non assessable income (167) (1,150) 0 (1,120)Non-deductible expenses 99 994 14 912Release of deferred tax liability on buildings sold (620) 0 0 0Change in tax depreciation of buildings 0 7,428 0 6,807Change in tax rates (189) (757) (120) (715)Prior period adjustment 757 (607) 276 (294)Tax losses offset with group companies 0 0 401 332Income tax charge / (credit) 1,249 9,926 1,296 9,484
The taxation charge / (credit) is represented by: Current tax 391 (64) (11) 0Deferred tax from temporary differences 858 9,990 1,307 9,484 1,249 9,926 1,296 9,484 The tax rates used are principally the corporate tax rates of 30% (2010: 30%) payable by New Zealand corporate entities on taxable profits under tax law.
The tax legislation announcement made by the New Zealand Government in May 2010 has impacted on the deferred tax expense/(credit). The Company income tax rate is to reduce to 28% (currently 30%) for the year from and including the 2012 year. Imputation credits Imputation credits brought forward 582 24 14 0Tax payments 2 1,175 0 24Refunds received (27) (626) 0 (12)Imputation credits on dividend received 0 2 0 2RWT on interest received 0 7 0 0Imputation credits at 31 July 557 582 14 14 Westland Co-operative Dairy Company Limited and Westland Farm Centre Limited forms an imputation credit group for taxation purposes which allows imputation credits to be utilised as if they are a single entity.
41

for the year ended 31 July 2011NOTES TO THE FINANCIAL STATEMENTS CONTINuED
Land and Plant and Motor Vehicles Capital Work in Total buildings equipment Progress $000’s $000’s $000’s $000’s $000’s
10 Property, plant and equipment Group Cost Balance at 1 August 2009 67,193 230,538 8,074 7,586 313,391Additions 0 0 0 26,949 26,949Transfers in 17,180 4,815 3,350 0 25,345Transfers out 0 0 0 (25,345) (25,345)Disposals (811) (5,351) (1,455) (3,265) (10,882)Balance at 31 July 2010 83,562 230,002 9,969 5,925 329,458 Balance at 1 August 2010 83,562 230,002 9,969 5,925 329,458Additions 2,985 8,695 984 8,532 21,196Disposals (2,757) (1,959) (702) 0 (5,418)Balance at 31 July 2011 83,790 236,738 10,251 14,457 345,236 Accumulated depreciation: Balance at 1 August 2009 19,302 103,921 6,860 0 130,083Depreciation for the year 2,508 15,933 1,268 0 19,709Disposals (290) (4,362) (2,408) 0 (7,060)Balance at 31 July 2010 21,520 115,492 5,720 0 142,732 Balance at 1 August 2010 21,520 115,492 5,720 0 142,732Depreciation for the year 2,791 15,941 1,376 0 20,108Disposals (33) (48) (677) 0 (758)Balance at 31 July 2011 24,278 131,385 6,419 0 162,082 Carrying amounts At 31 July 2010 62,042 114,510 4,249 5,925 186,726
At 31 July 2011 59,512 105,353 3,832 14,457 183,154 Company Cost Balance at 1 August 2009 60,192 225,757 7,787 4,321 298,057Other additions 1,255 0 0 26,949 28,204Transfers in 17,707 4,288 3,350 0 25,345Transfers out 0 0 0 (25,345) (25,345)Disposals (743) (3,750) (2,710) 0 (7,203)Balance at 31 July 2010 78,411 226,295 8,427 5,925 319,058 Balance at 1 August 2010 78,411 226,295 8,427 5,925 319,058Other additions 2,854 7,735 984 8,532 20,105Transfers in 0 0 0 11,573 11,573Transfers out 0 0 0 (11,573) (11,573)Disposals (599) (129) (702) 0 (1,430)Balance at 31 July 2011 80,666 233,901 8,709 14,457 337,733 Accumulated depreciation Balance at 1 August 2009 19,066 101,881 6,693 0 127,640Depreciation for the year 2,383 15,375 1,250 0 19,008Disposals (223) (3,365) (2,408) 0 (5,996)Balance at 31 July 2010 21,226 113,891 5,535 0 140,652 Balance at 1 August 2010 21,226 113,891 5,535 0 140,652Depreciation for the year 2,738 15,614 1,376 0 19,728Disposals (33) (48) (677) 0 (758)Balance at 31 July 2011 23,931 129,457 6,234 0 159,622 Carrying amounts At 31 July 2010 57,185 112,404 2,892 5,925 178,406 At 31 July 2011 56,735 104,444 2,475 14,457 178,111
42

for the year ended 31 July 2011NOTES TO THE FINANCIAL STATEMENTS CONTINuED
Security The bank facilities are secured by a first charge over the Company’s net assets and mortgage securities over its land and buildings. Borrowing costs capitalised During the period no borrowing costs have been capitalised (2010: $233,557 at an average borrowing rate of 3.73%). Software Goodwill Product Brand and Total development Patents costs $000’s $000’s $000’s $000’s $000’s11 IntangiblesGroup Cost Balance at 1 August 2009 2,533 4,358 1,653 5,831 14,375Acquisitions through business combinations 0 0 0 0 0Additions resulting from business combinations 0 1,457 0 255 1,712Additions 692 0 0 0 692Disposals 0 0 (180) 0 (180)Balance at 31 July 2010 3,225 5,815 1,473 6,086 16,599 Balance at 1 August 2010 3,225 5,815 1,473 6,086 16,599Acquisitions through business combinations 0 0 0 0 0Additions 85 0 0 0 85Disposals 0 0 (149) 0 (149)Balance at 31 July 2011 3,310 5,815 1,324 6,086 16,535 Accumulated amortisation and impairment losses Balance at 1 August 2009 1,308 0 1,120 0 2,428Amortisation for the year 508 0 76 0 584Disposals 0 0 (179) 0 (179)Balance at 31 July 2010 1,816 0 1,017 0 2,833 Balance at 1 August 2010 1,816 0 1,017 0 2,833Amortisation for the year 658 0 125 783Disposals 0 0 (30) 0 (30)Balance at 31 July 2011 2,474 0 1,112 0 3,586 Carrying amounts At 31 July 2010 1,409 5,815 456 6,086 13,766At 31 July 2011 836 5,815 212 6,086 12,949
43
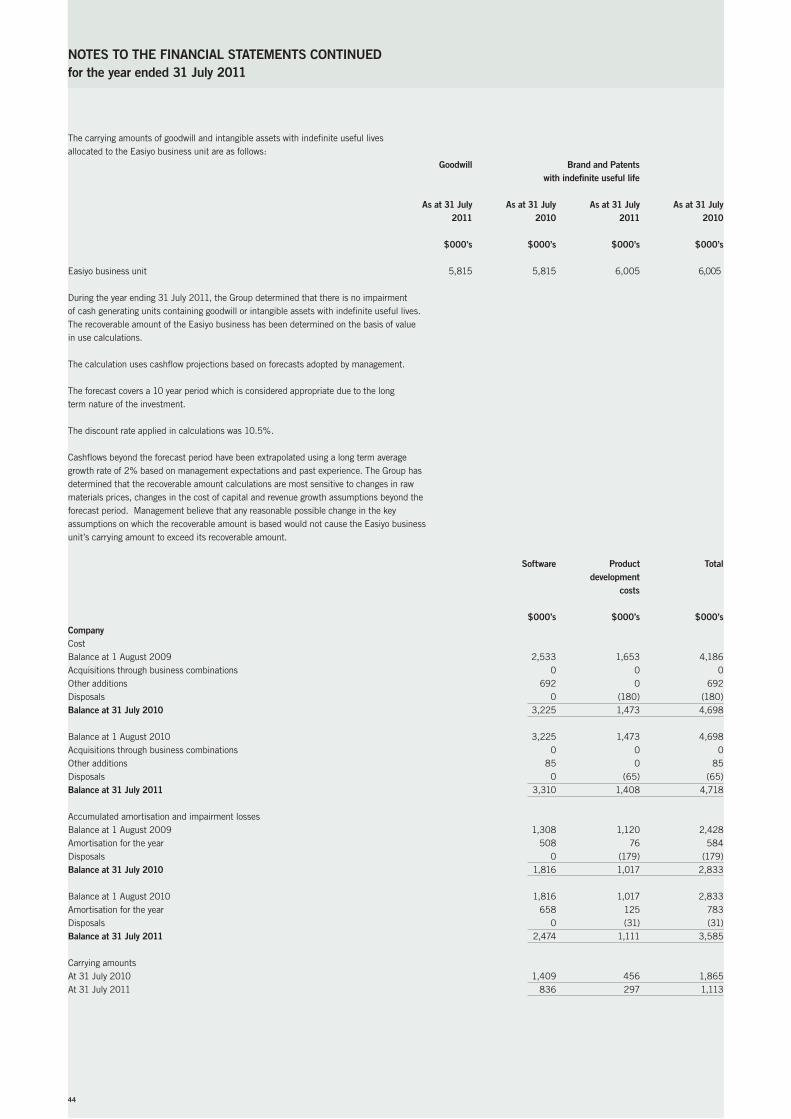
for the year ended 31 July 2011NOTES TO THE FINANCIAL STATEMENTS CONTINuED
The carrying amounts of goodwill and intangible assets with indefinite useful lives allocated to the Easiyo business unit are as follows: Goodwill Brand and Patents with indefinite useful life As at 31 July As at 31 July As at 31 July As at 31 July 2011 2010 2011 2010 $000’s $000’s $000’s $000’s Easiyo business unit 5,815 5,815 6,005 6,005 During the year ending 31 July 2011, the Group determined that there is no impairment of cash generating units containing goodwill or intangible assets with indefinite useful lives. The recoverable amount of the Easiyo business has been determined on the basis of value in use calculations.
The calculation uses cashflow projections based on forecasts adopted by management. The forecast covers a 10 year period which is considered appropriate due to the long term nature of the investment. The discount rate applied in calculations was 10.5%.
Cashflows beyond the forecast period have been extrapolated using a long term average growth rate of 2% based on management expectations and past experience. The Group has determined that the recoverable amount calculations are most sensitive to changes in raw materials prices, changes in the cost of capital and revenue growth assumptions beyond the forecast period. Management believe that any reasonable possible change in the key assumptions on which the recoverable amount is based would not cause the Easiyo business unit’s carrying amount to exceed its recoverable amount.
Software Product Total development costs
$000’s $000’s $000’sCompany Cost Balance at 1 August 2009 2,533 1,653 4,186Acquisitions through business combinations 0 0 0Other additions 692 0 692Disposals 0 (180) (180)Balance at 31 July 2010 3,225 1,473 4,698 Balance at 1 August 2010 3,225 1,473 4,698Acquisitions through business combinations 0 0 0Other additions 85 0 85Disposals 0 (65) (65)Balance at 31 July 2011 3,310 1,408 4,718 Accumulated amortisation and impairment losses Balance at 1 August 2009 1,308 1,120 2,428Amortisation for the year 508 76 584Disposals 0 (179) (179)Balance at 31 July 2010 1,816 1,017 2,833 Balance at 1 August 2010 1,816 1,017 2,833Amortisation for the year 658 125 783Disposals 0 (31) (31)Balance at 31 July 2011 2,474 1,111 3,585 Carrying amounts At 31 July 2010 1,409 456 1,865At 31 July 2011 836 297 1,113
44
12 Equity accounted investees Investment in the Group’s share of profit in its equity accounted investees for the year was NIL (2010: ($5)). Summary financial information for equity accounted investees, not adjusted for the percentage ownership held by the Group: Ownership Total assets Total liabilities Revenues Profit/ (loss) $000’s $000’s $000’s $000’s12 months to 31 July 2010 Westland Milk Products Japan Limited 0% 0 0 0 (5) 12 months to 31 July 2011 Westland Milk Products Japan Limited 0% 0 0 0 0 The Group provided management services to the investee in the prior financial year.
Group Group 12 mths to 31 July 12 mths to 31 July 2011 2010 $000’s $000’sMovements in carrying value of equity accounted investees. Opening balance 0 423Foreign Currency Translation 0 0Share of profit 0 (5)Transfer to investment in subsidiary 0 (418)Balance at 31 July 0 0
Amount of goodwill in carrying value of equity accounted investees. Opening balance 0 116Balance at 31 July 0 0 On 21st July 2010 Westland Milk Products Japan Limited was liquidated and the 50% shareholding was distributed to the equity partners. The cost of dissolution amounted to $5,470.
On 28th February 2010, the Group acquired the remaining 75% of the shares in Freshyo Products International Ltd (refer note 27).
for the year ended 31 July 2011NOTES TO THE FINANCIAL STATEMENTS CONTINuED
45

for the year ended 31 July 2011NOTES TO THE FINANCIAL STATEMENTS CONTINuED
13 Deferred tax assets and liabilities unrecognised deferred tax assets The Company and Group do not have any unrecognised deferred taxation assets. Recognised deferred tax assets and liabilities Deferred tax assets and liabilities are attributable to the following: Assets Liabilities Net As at 31 July As at 31 July As at 31 July As at 31 July As at 31 July As at 31 July 2011 2010 2011 2010 2011 2010
$000’s $000’s $000’s $000’s $000’s $000’s Group Intangible assets 0 0 (1,703) (2,107) (1,703) (2,107)Property, plant and equipment 0 0 (16,272) (17,317) (16,272) (17,317)Derivatives 0 0 (5,621) (6,328) (5,621) (6,328)Trade Debtors 0 0 0 0 0 0Provisions 1,069 1,241 0 0 1,069 1,241Tax losses 4,964 7,099 0 0 4,964 7,099Net tax assets/(liabilities) 6,033 8,340 (23,596) (25,752) (17,563) (17,412)
Company Intangible assets 0 0 (93) (382) (93) (382)Property, plant and equipment 0 0 (16,272) (16,728) (16,272) (16,728) Derivatives 0 0 (5,431) (6,321) (5,431) (6,321) Trade debtors 0 0 0 0 0 0Provisions 951 868 0 0 951 868Tax losses 4,964 7,099 0 0 4,964 7,099Net tax assets/(liabilities) 5,915 7,967 (21,796) (23,431) (15,881) (15,464)
Balance Recognised in Recognised in Recycled from Balance Recognised in Recognised in Recycled from Balance 31 July 2009 profit or loss comprehensive comprehensive 31 July 2010 profit or loss comprehensive comprehensive 31 July 2011 income income to income income to income income $000’s $000’s $000’s $000’s $000’s $000’s $000’s $000’s $000’sGroup Intangible assets (1,990) (117) 0 0 (2,107) 404 0 0 (1,703)Property, plant and equipment (12,589) (4,728) 0 0 (17,317) 1,045 0 0 (16,272)Provisions 1,160 81 0 0 1,241 (172) 0 0 1,069Derivatives (2,024) 0 (4,083) (221) (6,328) 0 708 0 (5,620)Tax loss carry-forwards 12,325 (5,226) 0 0 7,099 (2,135) 0 0 4,964 (3,118) (9,990) (4,083) (221) (17,412) (858) 708 0 (17,562) Company Intangible assets (265) (117) 0 0 (382) 289 0 0 (93)Property, plant and equipment (12,584) (4,144) 0 0 (16,728) 456 0 0 (16,272)Provisions 865 3 0 0 868 83 0 0 951Derivatives (2,024) 0 (4,076) (221) (6,321) 0 890 0 (5,431)Tax loss carry-forwards 12,325 (5,226) 0 0 7,099 (2,135) 0 0 4,964 (1,683) (9,484) (4,076) (221) (15,464) (1,307) 890 0 (15,881)
46
for the year ended 31 July 2011NOTES TO THE FINANCIAL STATEMENTS CONTINuED
Group Company
As at 31 July As at 31 July As at 31 July As at 31 July 2011 2010 2011 2010 $000’s $000’s $000’s $000’s14 InventoriesDairy Products 29,642 28,098 29,642 28,042Materials 4,901 5,438 4,901 5,438Retail 5,965 5,872 0 0Total Inventories 40,508 39,408 34,543 33,480 Inventories stated at net realisable value 30,094 20,520 30,094 20,520 In 2011 raw materials, consumables and changes in finished goods and work in process recognised as cost of sales amounted to $380,707,000 Group and $361,299,000 Company. (2010: $299,067,000 Group and $274,698,000 Company). In 2011 the write-down of inventories to net realisable value amounted to $452,000 (2010: $619,000). The determination of the cost of inventory is a significant area of estimation.
The key areas of estimation are: · Determination of the cost of milk product by estimation of the final milk payout.· Determination of the net realisable value of stock. · Determination of the allocation of overheads to units of product.
Group Company As at 31 July As at 31 July As at 31 July As at 31 July 2011 2010 2011 201015 Trade and other receivablesGross trade receivables 62,555 52,738 61,577 51,228Provisions for doubtful debt 0 0 0 0Loans to subsidiaries 0 0 18,520 22,230Supplier trading 989 (896) 989 (896)Supplier shares 2,119 3,001 2,119 3,001GST 4,196 4,840 3,771 4,577 69,859 59,683 86,976 80,140
See note 20 with respect to impairment of trade receivables. Receivables denominated in currencies other than the functional currency comprise USD $33,814,805 of trade receivables denominated in US dollars (2010: USD $21,046,599), AUD $4,647,317 of trade receivables denominated in Australian dollars (2010: AUD 4,007,314), and GBP620,395 of trade receivables denominated in Pounds Sterling (2010: GBP 434,400) and EUR 105,477 denominated in Euro (2010: NIL)
Loans to subsidiaries are repayable on demand and incur no interest. Movement in the allowance for doubtful debts Balance at 1 August 0 536 0 536Impairment losses recognised on receivables 0 0 0 0Amounts written off as uncollectable 0 (536) 0 (536)Amounts recovered during the year 0 0 0 0Impairment losses reversed 0 0 0 0 Balance at 31 July 0 0 0 0
47
for the year ended 31 July 2011NOTES TO THE FINANCIAL STATEMENTS CONTINuED
Group Company As at 31 July As at 31 July As at 31 July As at 31 July 2011 2010 2011 201016 Cash and cash equivalentsBank balances 13,185 6,171 11,859 3,307Call deposits 6,011 6,003 6,011 6,003Bank overdraft (note 19) 0 0 0 0Cash and cash equivalents in the statement of cash flows 19,196 12,174 17,870 9,310 The effective interest rate on call deposits in 2011 was 3.65% (2010: 3.15%). The deposits had an average maturity of 30 days (2010: 30 days). Hedging Contingency Retained Non-controlling Total Reserve Reserve Earnings Interest $000’s $000’s $000’s $000’s $000’s17 Capital and reserves Reconciliation of movement in capital and reserve Group Attributable to equity holders of the Group Balance at 1 August 2009 4,751 8,000 87,501 3,110 103,362Total comprehensive income 9,980 0 3,468 0 13,448Non-controlling interest acquired 0 0 (2,442) (3,110) (5,552)Transfer to Contingency Reserve 0 500 (500) 0 0Balance at 31 July 2010 14,731 8,500 88,027 0 111,258 Balance at 1 August 2010 14,731 8,500 88,027 0 111,258Total comprehensive income (1,047) 0 3,315 0 2,268Transfer to Contingency Reserve 0 500 (500) 0 0Balance at 31 July 2011 13,684 9,000 90,842 0 113,526
Hedging Contingency Retained Total Reserve Earnings Earnings
Company $000’s $000’s $000’s $000’sAttributable to equity holders of the Company Balance at 1 August 2009 4,724 8,000 82,472 95,196 Total comprehensive income 9,820 0 2,389 12,209 Transfer to Contingency Reserve 0 500 (500) 0 Balance at 31 July 2010 14,544 8,500 84,361 107,405
Balance at 1 August 2010 14,544 8,500 84,361 107,405 Total comprehensive income (1,292) 0 1,120 (172) Transfer to Contingency Reserve 0 500 (500) 0 Balance at 31 July 2011 13,252 9,000 84,981 107,233 Hedging reserve The hedging reserve comprises the effective portion of the cumulative net change in the fair value of cash flow hedging instruments related to highly probable forecast transactions. Contingency reserve The contingency reserve was ratified by the Board of Directors in March 2003 to set aside funds for uninsurable risks.
18 Co-operative shares classified as a liability As noted in the accounting policies the Company’s share capital is classified as a liability on the basis that under certain conditions specified in the Co-operative Companies Act 1996 shareholders have the right to surrender shares to the Company, and certain share classes have differing paid in amounts.
48
for the year ended 31 July 2011NOTES TO THE FINANCIAL STATEMENTS CONTINuED
The movement in shares for the Company and Group is as follows: Share capital Ordinary shares 31 July 2011 31 July 2010 $000’s $000’s On issue at 1 August 71,240 68,178 Net Issues for cash 5,458 3,062 On issue at 31 July 76,698 71,240 All issued shares are fully paid. Each supplier holds one share per kilogram of milk solids supplied to the Company. The Company has six classes of ordinary shares with the same rights attached to all. At year end, the Company was obligated to acquire $243,690 of shares (2010: $101,442) from shareholders under the Company’s constitution and the Co-operative Companies Act 1996.
The number of shares by class is as follows: 31 July 2011 31 July 2011 31 July 2010 31 July 2010 Value per share $000’s No. $000’s No.
“B” class shares $1.50 26,559 17,706,321 26,751 17,834,204“C” class shares $0.70 1,058 1,511,167 1,058 1,511,168“D” class shares $0.90 731 812,408 731 812,408“E” class shares $1.10 402 365,220 403 366,500“F” class shares $1.30 1,931 1,485,028 1,960 1,507,566“G” class shares $1.50 46,017 30,678,290 40,337 26,891,121 76,698 52,558,434 71,240 48,922,967 The co-operative shares are repayable under certain conditions, and will mature when shares are redeemed by the shareholder. Co-operative shares may be repaid when the shareholder has ceased trading as a shareholder. Shares may also be repaid if there has been a 5 year time lapse since the last transaction. Shares carry a right to dividends and a pro rata share of net assets on a wind up.
19 Loans and borrowings This note provides information about the contractual terms of the Group’s interest-bearing loans and borrowings. For more information about the Company’s exposure to interest rate and foreign currency risk, see note 20. Group Company 31 July 2011 31 July 2010 31 July 2011 31 July 2010 $000’s $000’s $000’s $000’s Non-current liabilities Secured bank loans 24,825 34,191 24,825 34,191 Current liabilities Secured bank loans 38,294 33,119 38,290 33,115Bank overdraft (note 16) 0 0 0 0 38,294 33,119 38,290 33,115 Terms and debt repayment schedule Terms and conditions of outstanding loans were as follows: Currency Nominal Period Carrying Carrying interest rate of maturity amount amount 31 July 2011 31 July 2010 $000’s $000’sGroupSecured bank loan NZD 4.87% < 12 mths 38,294 33,119 NZD 4.87% <2 years 24,825 34,191Company Secured bank loan NZD 4.87% < 12 mths 38,290 33,115 NZD 4.87% <2 years 24,825 34,191 Interest is charged on the secured bank loans at an interest rate between 3.75% and 5.40%. The bank borrowing facilities are secured by a first charge debenture over the Company’s net assets and mortgage securities over its land and buildings.
49

for the year ended 31 July 2011NOTES TO THE FINANCIAL STATEMENTS CONTINuED
20 Financial instruments Exposure to credit, interest rate, foreign currency, price and liquidity risks arises in the normal course of the Group and Company’s business.
The Group and Company manages commodity price risks through negotiated supply contracts and forward physical contracts. However, these contracts are for the purpose of the receipt in accordance with the Group and Company’s expected usage requirements only and are not accounted for as financial instruments. Credit risk In the normal course of business, the Group and Company is subject to credit risk from trade debtors and transactions with financial institutions. The Group and Company has a credit policy which has been issued to manage this exposure to credit risk. As part of this policy, limits on exposures with counter parties have been set and approved by the Board of Directors and are monitored on a regular basis. The Group and Company does not have any significant concentrations of credit risk. It does not require any collateral or security to support financial instruments as it only deposits with, or loans to, banks and other financial institutions with high credit ratings. Trade debtors are monitored closely for compliance with terms of trade. The Group and Company does not expect the non-performance of any obligations at balance date. The maximum credit risk is the carrying values of accounts receivables, bank accounts, short term deposits and derivative assets. Liquidity risk Liquidity risk represents the Group and Company’s ability to meet its contractual obligations. The Group and Company evaluates its liquidity requirements on an ongoing basis. In general, the Group and Company generates sufficient cash flows from its operating activities to meet its obligations arising from its financial liabilities and has credit lines in place to cover potential shortfalls. It is the Group and Company’s policy to provide credit and liquidity enhancement only to wholly owned subsidiaries Where core debt exceeds $50m, the Group and Company manage the funding risk to ensure that a maximum of 50% of its debt is due within 1 year, and a minimum of 50% of its debt is due between 2 and 5 years. The Group has access to financing facilities, the total unused amount of which is $19,000,000 at 31 July 2011 (2010: $19,423,280) (Company: $19,000,000 at 31 July 2011 (2010: $19,423,280)) with a maturity of 31 October 2012. Market risk The Group and Company enters into derivative arrangements in the ordinary course of business to manage foreign currency and interest rate risks. A financial risk management committee, composed of senior management, provides oversight for risk management and derivative activities. This committee determines the Group and Company’s financial risk policies and objectives, and provides guidelines for derivative instrument utilisation. This committee also establishes procedures for control and valuation, risk analysis, counterparty credit approval, and ongoing monitoring and reporting. Foreign currency risk The Group and Company is exposed to foreign currency risk on forecast sales and trade receivables and borrowings that are denominated in a currency other than the Group and Company’s functional currency, New Zealand dollars.
The currencies in which transactions are primarily denominated are US dollars and Australian dollars. The Group and Company’s treasury policy states that, between 70% and 100% of committed sales, should be covered by derivatives. The proportion of forecast sales that can be covered can range from 0% to 100% depending on the period in which the sales are expected to arise and the level of delegated authority received. The Group and Company uses forward exchange contracts and options to hedge its foreign currency risk. Most of the forward exchange contracts have maturities of less than one year at the balance sheet date.
Interest rate risk Where core debt exceeds $50m, the Group and Company has a policy of ensuring that its exposure to changes in interest rates on borrowings is fixed as follows:
· Less than 1 year 50% to 100%, · 1 to 3 years 30% to 80%, · 3 to 5 years 20% to 60%, · 5 to 10 years 0% to 50%.
Included in borrowings at year end is seasonal funding which is not considered core debt and amounts to $29,099,720 as at 31 July 2011 (2010: $24,576,720):
Quantitative disclosuresCredit risk The carrying amount of financial assets represents the Group or Company’s maximum credit exposure.
The Group has not renegotiated the terms of any financial assets which would result in the carrying amount no longer being past due or to avoid a possible past due status.
The Group or Company’s maximum exposure to credit risk for trade and other receivables by geographic regions is as follows:
50
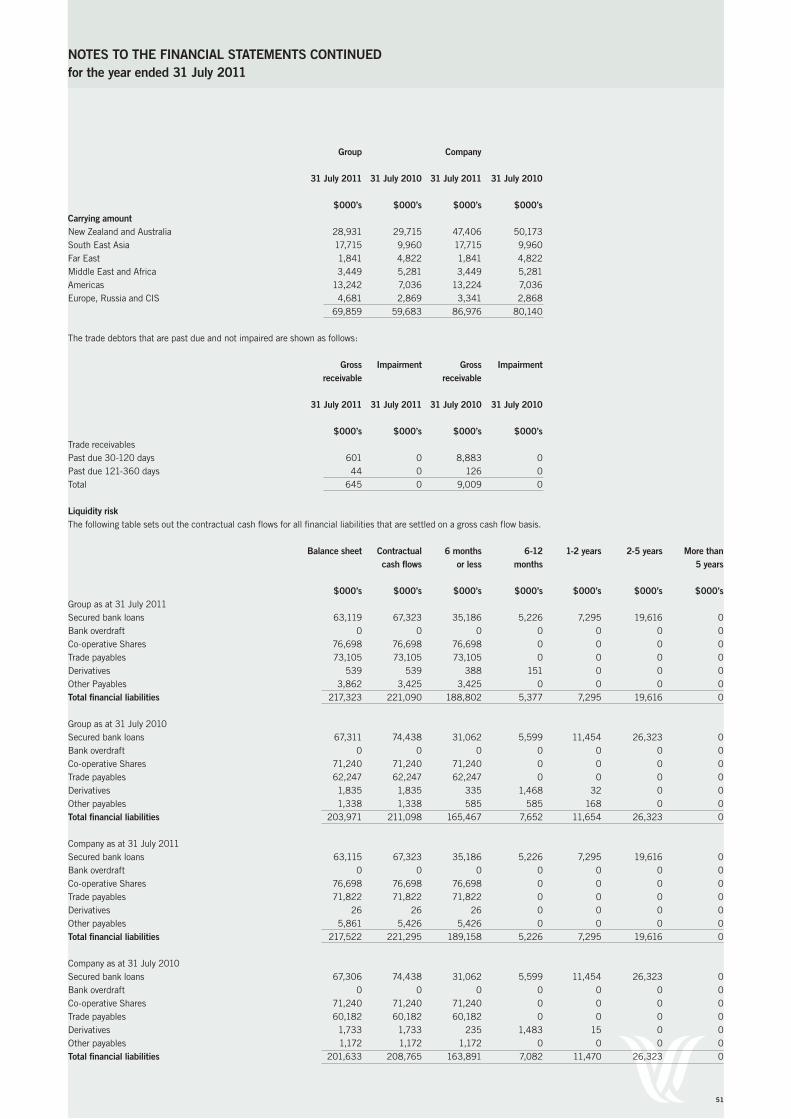
for the year ended 31 July 2011NOTES TO THE FINANCIAL STATEMENTS CONTINuED
Group Company 31 July 2011 31 July 2010 31 July 2011 31 July 2010 $000’s $000’s $000’s $000’sCarrying amount New Zealand and Australia 28,931 29,715 47,406 50,173South East Asia 17,715 9,960 17,715 9,960Far East 1,841 4,822 1,841 4,822Middle East and Africa 3,449 5,281 3,449 5,281Americas 13,242 7,036 13,224 7,036Europe, Russia and CIS 4,681 2,869 3,341 2,868 69,859 59,683 86,976 80,140
The trade debtors that are past due and not impaired are shown as follows: Gross Impairment Gross Impairment receivable receivable 31 July 2011 31 July 2011 31 July 2010 31 July 2010 $000’s $000’s $000’s $000’sTrade receivables Past due 30-120 days 601 0 8,883 0Past due 121-360 days 44 0 126 0Total 645 0 9,009 0 Liquidity risk The following table sets out the contractual cash flows for all financial liabilities that are settled on a gross cash flow basis. Balance sheet Contractual 6 months 6-12 1-2 years 2-5 years More than cash flows or less months 5 years
$000’s $000’s $000’s $000’s $000’s $000’s $000’sGroup as at 31 July 2011 Secured bank loans 63,119 67,323 35,186 5,226 7,295 19,616 0Bank overdraft 0 0 0 0 0 0 0Co-operative Shares 76,698 76,698 76,698 0 0 0 0Trade payables 73,105 73,105 73,105 0 0 0 0Derivatives 539 539 388 151 0 0 0Other Payables 3,862 3,425 3,425 0 0 0 0Total financial liabilities 217,323 221,090 188,802 5,377 7,295 19,616 0
Group as at 31 July 2010 Secured bank loans 67,311 74,438 31,062 5,599 11,454 26,323 0Bank overdraft 0 0 0 0 0 0 0Co-operative Shares 71,240 71,240 71,240 0 0 0 0Trade payables 62,247 62,247 62,247 0 0 0 0Derivatives 1,835 1,835 335 1,468 32 0 0Other payables 1,338 1,338 585 585 168 0 0Total financial liabilities 203,971 211,098 165,467 7,652 11,654 26,323 0 Company as at 31 July 2011 Secured bank loans 63,115 67,323 35,186 5,226 7,295 19,616 0Bank overdraft 0 0 0 0 0 0 0Co-operative Shares 76,698 76,698 76,698 0 0 0 0Trade payables 71,822 71,822 71,822 0 0 0 0Derivatives 26 26 26 0 0 0 0Other payables 5,861 5,426 5,426 0 0 0 0Total financial liabilities 217,522 221,295 189,158 5,226 7,295 19,616 0
Company as at 31 July 2010 Secured bank loans 67,306 74,438 31,062 5,599 11,454 26,323 0Bank overdraft 0 0 0 0 0 0 0Co-operative Shares 71,240 71,240 71,240 0 0 0 0Trade payables 60,182 60,182 60,182 0 0 0 0Derivatives 1,733 1,733 235 1,483 15 0 0Other payables 1,172 1,172 1,172 0 0 0 0Total financial liabilities 201,633 208,765 163,891 7,082 11,470 26,323 0
51

Co-operative shares have been included as being repayable within 6 months. Cashflows from settlement of this liability are expected to occur significantly further into the future than the shortest timeframe of the contractual cashflows.
Cashflow relating to variable interest rates has been determined using approximate interest rates at the balance date.
Foreign currency exchange risk The Group’s exposure to foreign currency risk can be summarised as follows: Group Company $000’s $000’s As at 31 July 2011 Trade receivables 46,106 43,724Forward exchange contracts and options 46,106 43,724Net Unhedged exposure 0 0 As at 31 July 2010 Trade receivables 34,975 33,247Forward exchange contracts and options 34,975 33,247Net Unhedged exposure 0 0 The Group’s exposure to foreign currency risk is limited to its trade receivable and forecast sales which are denominated in United States dollars, Australian dollars and Great British pounds. Interest rate risk – re-pricing analysis The Company and the Group is exposed to interest rate risk on borrowings (note 19) and call deposits (note 16).
The interest receivable on call deposits is fixed, but is re-priced within a period not exceeding 6 months.
The interest repayable on borrowings is variable based on the LIBOR rates. Capital management The Group’s capital includes share capital, including co-operative shares classified as liabilities, reserves and retained earnings. The Group’s policy is to maintain a strong capital base so as to maintain investor and creditor confidence and to sustain future development of the business. The impact of the level of capital on shareholders’ return is also recognised and the Group recognises the need to maintain a balance between the higher returns that might be possible with greater gearing and the advantages and security afforded by a sound capital position. The Group banking arrangements require the Group to comply with certain equity covenants. The Group had no breaches of its debtors cover bank covenant during the period. The Group is not subject to any other externally imposed capital requirements. The Group’s policies in respect of capital management and allocation are reviewed regularly by the Board of Directors. There have been no material changes in the Group’s management of capital during the period. Sensitivity analysis In managing interest rate and currency risks, the Group aims to reduce the impact of short-term fluctuations on the Group’s earnings. Over the longer-term, however, permanent changes in foreign exchange and interest rates will have an impact on profit. At 31 July 2011, it is estimated that a general increase of one percentage point in interest rates would decrease the Group’s profit before income tax by approximately $1,028,000 (2010: $964,000). This is before any assessment as to how the movement in interest rates would impact on the final supplier payout.
Management consider that the only material currency exposure is that of US dollars. It is estimated that a general increase of one cent in the value of the New Zealand dollar against the US dollar would have decreased the Group’s profit before income tax by approximately $6,385,419 for the period ended 31 July 2011 (2010: $4,838,287). The forward exchange contracts have been included in this calculation. This is before any assessment as to how the movement in exchange rate would impact on the final supplier payment.
for the year ended 31 July 2011NOTES TO THE FINANCIAL STATEMENTS CONTINuED
52
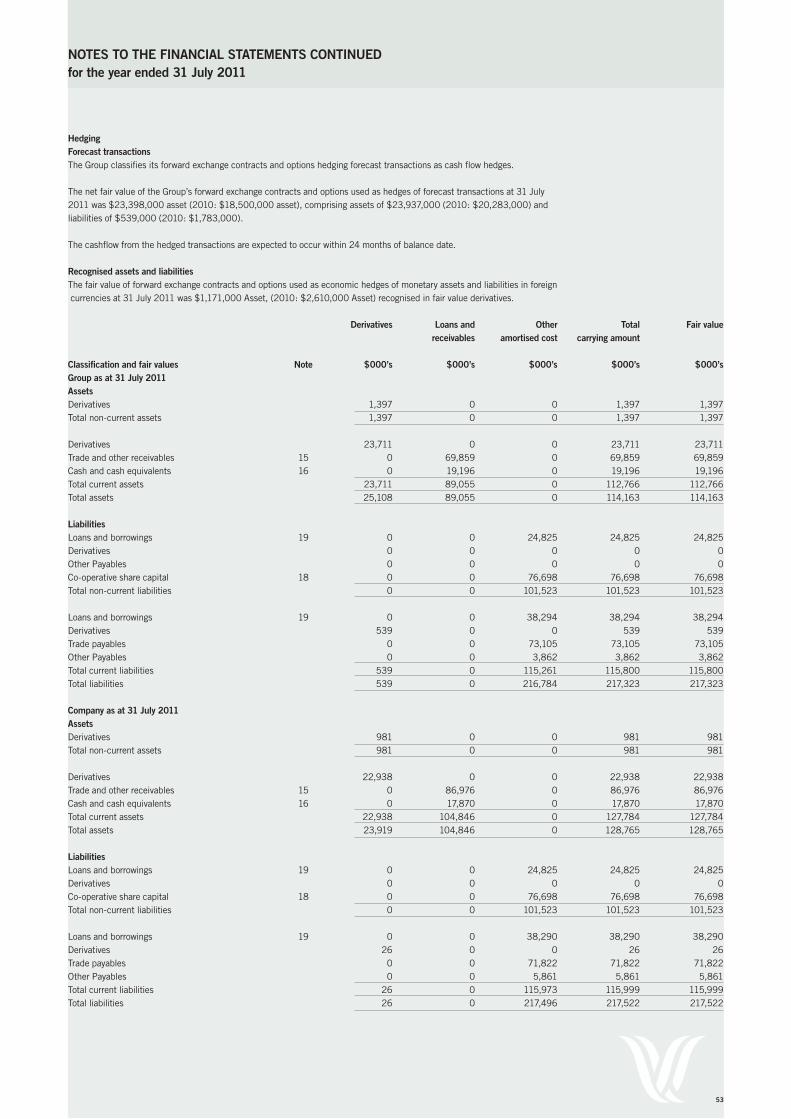
Hedging Forecast transactions The Group classifies its forward exchange contracts and options hedging forecast transactions as cash flow hedges.
The net fair value of the Group’s forward exchange contracts and options used as hedges of forecast transactions at 31 July 2011 was $23,398,000 asset (2010: $18,500,000 asset), comprising assets of $23,937,000 (2010: $20,283,000) and liabilities of $539,000 (2010: $1,783,000).
The cashflow from the hedged transactions are expected to occur within 24 months of balance date. Recognised assets and liabilities The fair value of forward exchange contracts and options used as economic hedges of monetary assets and liabilities in foreign currencies at 31 July 2011 was $1,171,000 Asset, (2010: $2,610,000 Asset) recognised in fair value derivatives.
Derivatives Loans and Other Total Fair value receivables amortised cost carrying amount Classification and fair values Note $000’s $000’s $000’s $000’s $000’sGroup as at 31 July 2011 Assets Derivatives 1,397 0 0 1,397 1,397Total non-current assets 1,397 0 0 1,397 1,397 Derivatives 23,711 0 0 23,711 23,711Trade and other receivables 15 0 69,859 0 69,859 69,859Cash and cash equivalents 16 0 19,196 0 19,196 19,196Total current assets 23,711 89,055 0 112,766 112,766Total assets 25,108 89,055 0 114,163 114,163 Liabilities Loans and borrowings 19 0 0 24,825 24,825 24,825Derivatives 0 0 0 0 0Other Payables 0 0 0 0 0Co-operative share capital 18 0 0 76,698 76,698 76,698Total non-current liabilities 0 0 101,523 101,523 101,523 Loans and borrowings 19 0 0 38,294 38,294 38,294Derivatives 539 0 0 539 539Trade payables 0 0 73,105 73,105 73,105Other Payables 0 0 3,862 3,862 3,862Total current liabilities 539 0 115,261 115,800 115,800Total liabilities 539 0 216,784 217,323 217,323
Company as at 31 July 2011 Assets Derivatives 981 0 0 981 981Total non-current assets 981 0 0 981 981 Derivatives 22,938 0 0 22,938 22,938Trade and other receivables 15 0 86,976 0 86,976 86,976Cash and cash equivalents 16 0 17,870 0 17,870 17,870Total current assets 22,938 104,846 0 127,784 127,784Total assets 23,919 104,846 0 128,765 128,765 Liabilities Loans and borrowings 19 0 0 24,825 24,825 24,825Derivatives 0 0 0 0 0Co-operative share capital 18 0 0 76,698 76,698 76,698Total non-current liabilities 0 0 101,523 101,523 101,523 Loans and borrowings 19 0 0 38,290 38,290 38,290Derivatives 26 0 0 26 26Trade payables 0 0 71,822 71,822 71,822Other Payables 0 0 5,861 5,861 5,861Total current liabilities 26 0 115,973 115,999 115,999Total liabilities 26 0 217,496 217,522 217,522
NOTES TO THE FINANCIAL STATEMENTS CONTINuEDfor the year ended 31 July 2011
53

for the year ended 31 July 2011NOTES TO THE FINANCIAL STATEMENTS CONTINuED
Derivatives Loans and Other Total carrying Fair value receivables amortised cost amount Classification and fair values Note $000’s $000’s $000’s $000’s $000’sGroup as at 31 July 2010 Assets Derivatives 239 0 0 239 239Total non-current assets 239 0 0 239 239 Derivatives 22,705 0 0 22,705 22,705Trade and other receivables 15 0 59,683 0 59,683 59,683Cash and cash equivalents 16 0 12,174 0 12,174 12,174Total current assets 22,705 71,857 0 94,562 94,562Total assets 22,944 71,857 0 94,801 94,801 Liabilities Loans and borrowings 19 0 0 34,191 34,191 34,191Derivatives 32 0 0 32 32Other Payables 0 0 168 168 168Co-operative share capital 18 0 0 71,240 71,240 71,240Total non-current liabilities 32 0 105,599 105,631 105,631 Loans and borrowings 19 0 0 33,119 33,119 33,119Derivatives 1,803 0 0 1,803 1,803Trade payables 0 0 62,246 62,246 62,246Other Payables 0 0 1,170 1,170 1,170Total current liabilities 1,803 0 96,535 98,338 98,338Total liabilities 1,834 0 202,134 203,969 203,969 Company as at 31 July 2010 Assets Derivatives 202 0 0 202 202Total non-current assets 202 0 0 202 202 Derivatives 22,619 0 0 22,619 22,619Trade and other receivables 15 0 80,140 0 80,140 80,140Cash and cash equivalents 16 0 9,310 0 9,310 9,310Total current assets 22,619 89,450 0 112,069 112,069Total assets 22,821 89,450 0 112,271 112,271 Liabilities Loans and borrowings 19 0 0 34,191 34,191 34,191Derivatives 15 0 0 15 15Co-operative share capital 18 0 0 71,240 71,240 71,240Total non-current liabilities 15 0 105,431 105,447 105,447 Loans and borrowings 19 0 0 33,115 33,115 33,115Derivatives 1,718 0 0 1,718 1,718Trade payables 0 0 60,182 60,182 60,182Other Payables 0 0 1,170 1,170 1,170Total current liabilities 1,718 0 94,467 96,185 96,185Total liabilities 1,734 0 199,898 201,631 201,631
54
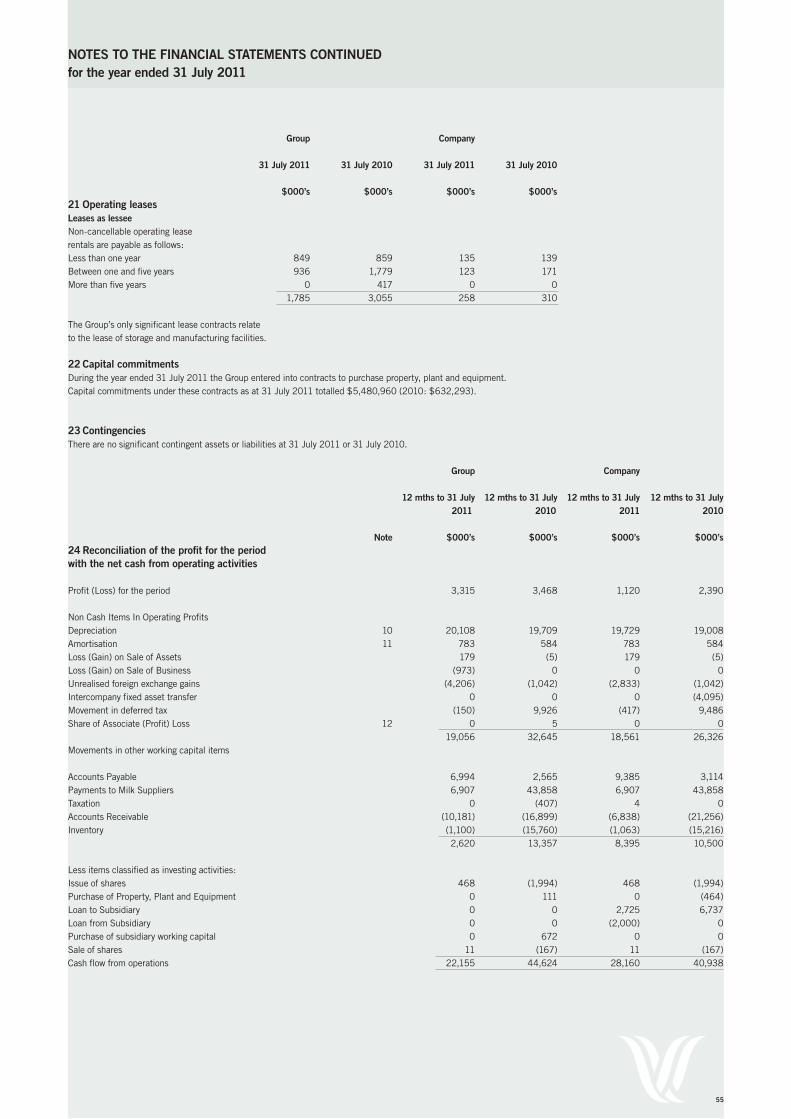
NOTES TO THE FINANCIAL STATEMENTS CONTINuEDfor the year ended 31 July 2011
Group Company 31 July 2011 31 July 2010 31 July 2011 31 July 2010 $000’s $000’s $000’s $000’s21 Operating leases Leases as lessee Non-cancellable operating lease rentals are payable as follows: Less than one year 849 859 135 139Between one and five years 936 1,779 123 171More than five years 0 417 0 0 1,785 3,055 258 310 The Group’s only significant lease contracts relate to the lease of storage and manufacturing facilities.
22 Capital commitments During the year ended 31 July 2011 the Group entered into contracts to purchase property, plant and equipment. Capital commitments under these contracts as at 31 July 2011 totalled $5,480,960 (2010: $632,293).
23 Contingencies There are no significant contingent assets or liabilities at 31 July 2011 or 31 July 2010. Group Company 12 mths to 31 July 12 mths to 31 July 12 mths to 31 July 12 mths to 31 July 2011 2010 2011 2010 Note $000’s $000’s $000’s $000’s24 Reconciliation of the profit for the period with the net cash from operating activities
Profit (Loss) for the period 3,315 3,468 1,120 2,390
Non Cash Items In Operating Profits Depreciation 10 20,108 19,709 19,729 19,008Amortisation 11 783 584 783 584Loss (Gain) on Sale of Assets 179 (5) 179 (5)Loss (Gain) on Sale of Business (973) 0 0 0Unrealised foreign exchange gains (4,206) (1,042) (2,833) (1,042)Intercompany fixed asset transfer 0 0 0 (4,095)Movement in deferred tax (150) 9,926 (417) 9,486Share of Associate (Profit) Loss 12 0 5 0 0 19,056 32,645 18,561 26,326Movements in other working capital items Accounts Payable 6,994 2,565 9,385 3,114Payments to Milk Suppliers 6,907 43,858 6,907 43,858Taxation 0 (407) 4 0Accounts Receivable (10,181) (16,899) (6,838) (21,256)Inventory (1,100) (15,760) (1,063) (15,216) 2,620 13,357 8,395 10,500 Less items classified as investing activities: Issue of shares 468 (1,994) 468 (1,994)Purchase of Property, Plant and Equipment 0 111 0 (464)Loan to Subsidiary 0 0 2,725 6,737Loan from Subsidiary 0 0 (2,000) 0Purchase of subsidiary working capital 0 672 0 0Sale of shares 11 (167) 11 (167)Cash flow from operations 22,155 44,624 28,160 40,938
55
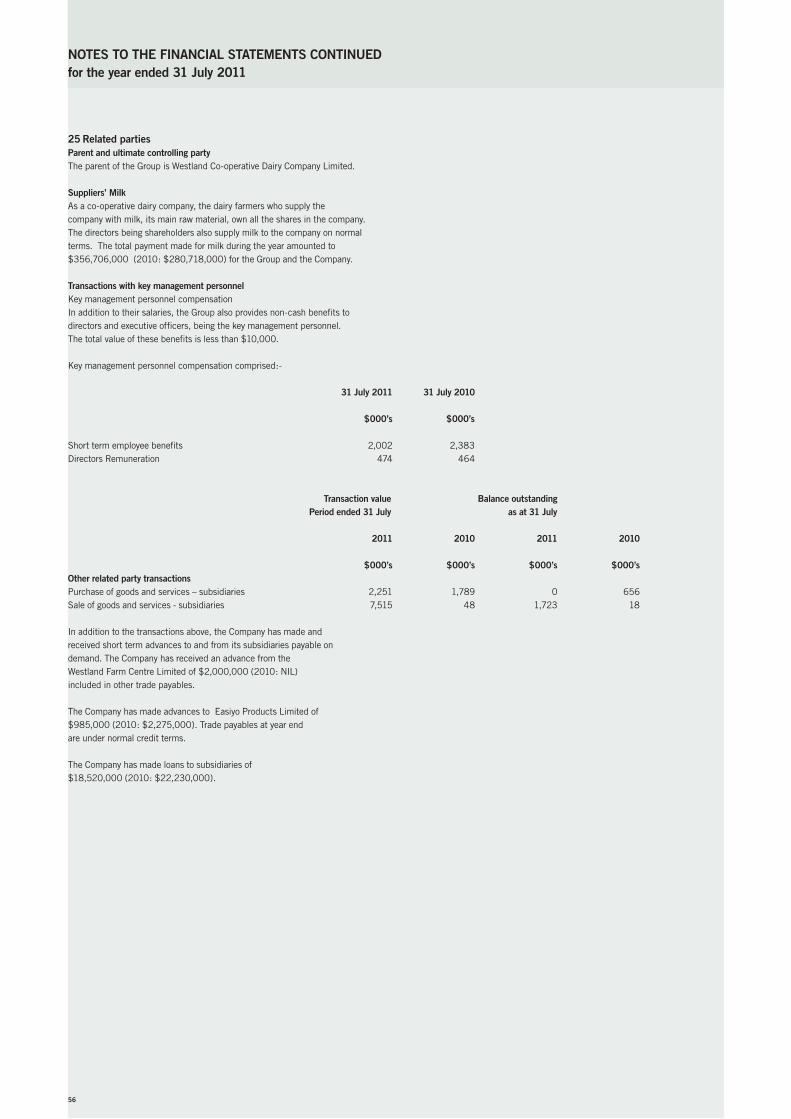
25 Related parties Parent and ultimate controlling party The parent of the Group is Westland Co-operative Dairy Company Limited. Suppliers’ Milk As a co-operative dairy company, the dairy farmers who supply the company with milk, its main raw material, own all the shares in the company. The directors being shareholders also supply milk to the company on normal terms. The total payment made for milk during the year amounted to $356,706,000 (2010: $280,718,000) for the Group and the Company.
Transactions with key management personnel Key management personnel compensation In addition to their salaries, the Group also provides non-cash benefits to directors and executive officers, being the key management personnel. The total value of these benefits is less than $10,000. Key management personnel compensation comprised:- 31 July 2011 31 July 2010 $000’s $000’s Short term employee benefits 2,002 2,383Directors Remuneration 474 464
Transaction value Balance outstanding Period ended 31 July as at 31 July
2011 2010 2011 2010 $000’s $000’s $000’s $000’s Other related party transactions Purchase of goods and services – subsidiaries 2,251 1,789 0 656 Sale of goods and services - subsidiaries 7,515 48 1,723 18 In addition to the transactions above, the Company has made and received short term advances to and from its subsidiaries payable on demand. The Company has received an advance from the Westland Farm Centre Limited of $2,000,000 (2010: NIL) included in other trade payables.
The Company has made advances to Easiyo Products Limited of $985,000 (2010: $2,275,000). Trade payables at year end are under normal credit terms.
The Company has made loans to subsidiaries of $18,520,000 (2010: $22,230,000).
for the year ended 31 July 2011NOTES TO THE FINANCIAL STATEMENTS CONTINuED
56
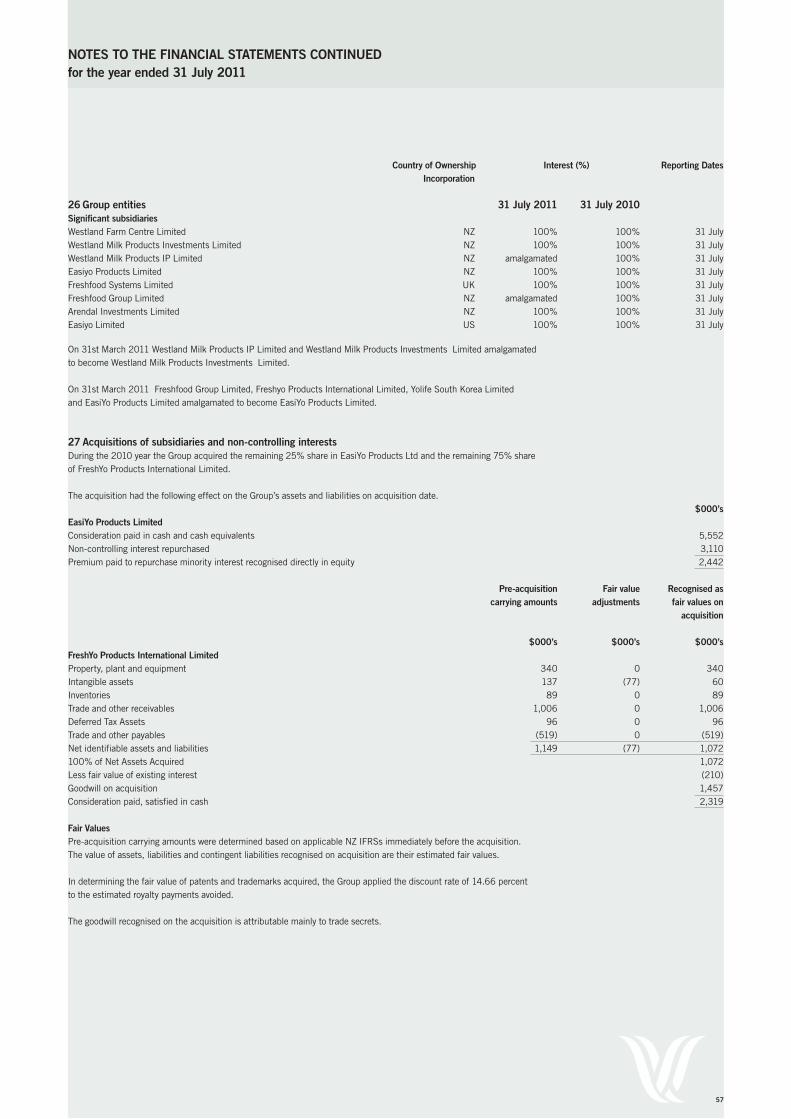
NOTES TO THE FINANCIAL STATEMENTS CONTINuEDfor the year ended 31 July 2011
Country of Ownership Interest (%) Reporting Dates Incorporation 26 Group entities 31 July 2011 31 July 2010 Significant subsidiaries Westland Farm Centre Limited NZ 100% 100% 31 JulyWestland Milk Products Investments Limited NZ 100% 100% 31 JulyWestland Milk Products IP Limited NZ amalgamated 100% 31 JulyEasiyo Products Limited NZ 100% 100% 31 JulyFreshfood Systems Limited UK 100% 100% 31 JulyFreshfood Group Limited NZ amalgamated 100% 31 JulyArendal Investments Limited NZ 100% 100% 31 JulyEasiyo Limited US 100% 100% 31 July On 31st March 2011 Westland Milk Products IP Limited and Westland Milk Products Investments Limited amalgamated to become Westland Milk Products Investments Limited. On 31st March 2011 Freshfood Group Limited, Freshyo Products International Limited, Yolife South Korea Limited and EasiYo Products Limited amalgamated to become EasiYo Products Limited.
27 Acquisitions of subsidiaries and non-controlling interests During the 2010 year the Group acquired the remaining 25% share in EasiYo Products Ltd and the remaining 75% share of FreshYo Products International Limited.
The acquisition had the following effect on the Group’s assets and liabilities on acquisition date. $000’sEasiYo Products Limited Consideration paid in cash and cash equivalents 5,552Non-controlling interest repurchased 3,110Premium paid to repurchase minority interest recognised directly in equity 2,442 Pre-acquisition Fair value Recognised as carrying amounts adjustments fair values on acquisition
$000’s $000’s $000’sFreshYo Products International Limited Property, plant and equipment 340 0 340Intangible assets 137 (77) 60Inventories 89 0 89Trade and other receivables 1,006 0 1,006Deferred Tax Assets 96 0 96Trade and other payables (519) 0 (519)Net identifiable assets and liabilities 1,149 (77) 1,072100% of Net Assets Acquired 1,072Less fair value of existing interest (210)Goodwill on acquisition 1,457Consideration paid, satisfied in cash 2,319 Fair Values Pre-acquisition carrying amounts were determined based on applicable NZ IFRSs immediately before the acquisition. The value of assets, liabilities and contingent liabilities recognised on acquisition are their estimated fair values. In determining the fair value of patents and trademarks acquired, the Group applied the discount rate of 14.66 percent to the estimated royalty payments avoided.
The goodwill recognised on the acquisition is attributable mainly to trade secrets.
57
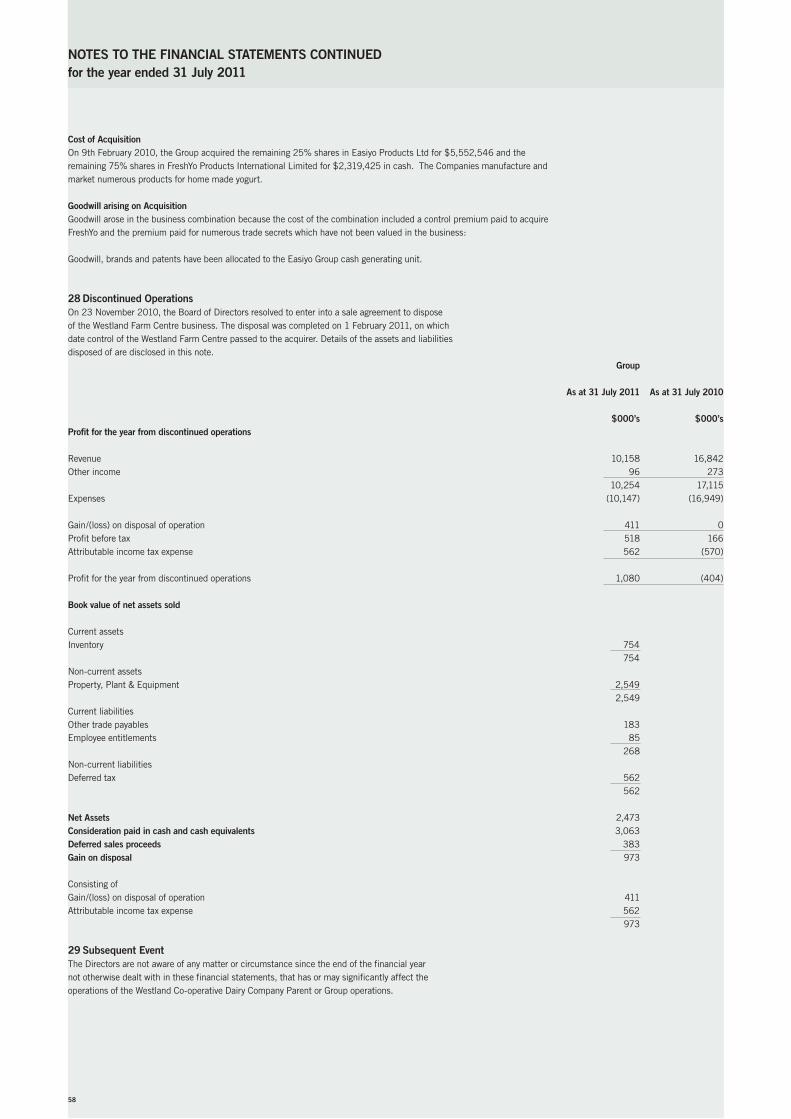
Cost of Acquisition On 9th February 2010, the Group acquired the remaining 25% shares in Easiyo Products Ltd for $5,552,546 and the remaining 75% shares in FreshYo Products International Limited for $2,319,425 in cash. The Companies manufacture and market numerous products for home made yogurt. Goodwill arising on Acquisition Goodwill arose in the business combination because the cost of the combination included a control premium paid to acquire FreshYo and the premium paid for numerous trade secrets which have not been valued in the business:
Goodwill, brands and patents have been allocated to the Easiyo Group cash generating unit.
28 Discontinued Operations On 23 November 2010, the Board of Directors resolved to enter into a sale agreement to dispose of the Westland Farm Centre business. The disposal was completed on 1 February 2011, on which date control of the Westland Farm Centre passed to the acquirer. Details of the assets and liabilities disposed of are disclosed in this note. Group As at 31 July 2011 As at 31 July 2010 $000’s $000’sProfit for the year from discontinued operations Revenue 10,158 16,842Other income 96 273 10,254 17,115Expenses (10,147) (16,949) Gain/(loss) on disposal of operation 411 0Profit before tax 518 166Attributable income tax expense 562 (570) Profit for the year from discontinued operations 1,080 (404) Book value of net assets sold Current assets Inventory 754 754Non-current assets Property, Plant & Equipment 2,549 2,549 Current liabilities Other trade payables 183 Employee entitlements 85 268 Non-current liabilities Deferred tax 562 562
Net Assets 2,473 Consideration paid in cash and cash equivalents 3,063 Deferred sales proceeds 383 Gain on disposal 973
Consisting of Gain/(loss) on disposal of operation 411 Attributable income tax expense 562 973 29 Subsequent Event The Directors are not aware of any matter or circumstance since the end of the financial year not otherwise dealt with in these financial statements, that has or may significantly affect the operations of the Westland Co-operative Dairy Company Parent or Group operations.
for the year ended 31 July 2011NOTES TO THE FINANCIAL STATEMENTS CONTINuED
58

1 DIRECTORS’ REMuNERATION The remuneration paid to Directors during the year was as follows:
Director Matt O’Regan (Chairman) $92,500Mike Havill (Deputy Chairman) $57,500Frank Dooley $40,000Sir Graeme Harrison $40,000Raelyn Lourie $40,000Basil Meyer (Retired November 2010) $13,333Barry Paterson (Appointed November 2010) $26,667Noel Robb $40,000David Spence $44,000Jon Sullivan $40,000Jim Wafelbakker $40,000
2 SuBSIDIARY COMPANY DIRECTORS The following companies were subsidiaries of Westland Co-operative Dairy Company Limited as at 31 July 2011. Directors who resigned during the year are denoted with an R. Westland Farm Centre Limited M O’Regan, R Quin, K Wallace Westland Milk Products Investments Limited M O’Regan, R Quin, K Wallace Easiyo Products Limited M Eng, M Havill (R), R Lourie, M O’Regan, R Quin Arendal Investments Limited R Quin, K Wallace Easiyo Limited [uSA] R Quin, K Wallace Freshfood Systems Limited [uK] R Quin, K Wallace
for the year ended 31 July 2011STATuTORY INFORMATION
59

for the year ended 31 July 2011STATuTORY INFORMATION CONTINuED
3 ENTRIES IN THE INTERESTS REGISTER Directors’ interests in transactions General disclosures of interest The following general disclosures of interest were made in the period from 1 August 2010 to 31 July 2011
Matt O’Regan Director of Mangawaro Enterprises 2004 Limited
Mike Havill Director of Kokomo Ahaura Limited
Frank Dooley Director and shareholder of FT Dooley Limited Director and shareholder of Yelood Properties Limited Chairman of Buller Electricity Limited Director of Buller Holdings Limited Director of Westport Harbour Limited Director of Westreef Services Limited Shareholder of Home Centre Furnishings Limited Trustee of Development West Coast
Sir Graeme Harrison Chairman of ANZCO Foods Limited and its subsidiaries Managing Director of Five Star Beef Limited Director of Kura Limited Director of Sealord Group Limited Managing Director of Itoham New Zealand Limited Director of JANZ Investments Limited Chairman of New Zealand International Business Forum
Raelyn Lourie District Sales Manager for CRV Ambreed NZ Limited Director of Bryndwyer Limited Director of Mark Dairies Limited
Barry Paterson Director of Aden Limited Director of Patersonrose Limited
Noel Robb Director of Robb Farms Limited and associated companies Director of Bold Head Farm Limited and associated companies Director and shareholder of Taramakau Farms Limited
David Spence Director of Nurse Maude and associated companies Director of Arrow International Group Limited and associated companies Director of Bremca Holdings Limited and associated companies Director of NZ Velvet Marketing Limited
Jim Wafelbakker Director of Matai Tree Farm Limited No transactions have been entered into with the company by any Directors other than on normal terms and conditions. Frank Dooley, Mike Havill and Matt O’Regan’s directorships fall due for rotation at the Annual General Meeting to be held in November 2011. All of these directors stood for re-election, and all have been re-elected unopposed for a further three year term effective from the Annual General Meeting.
60
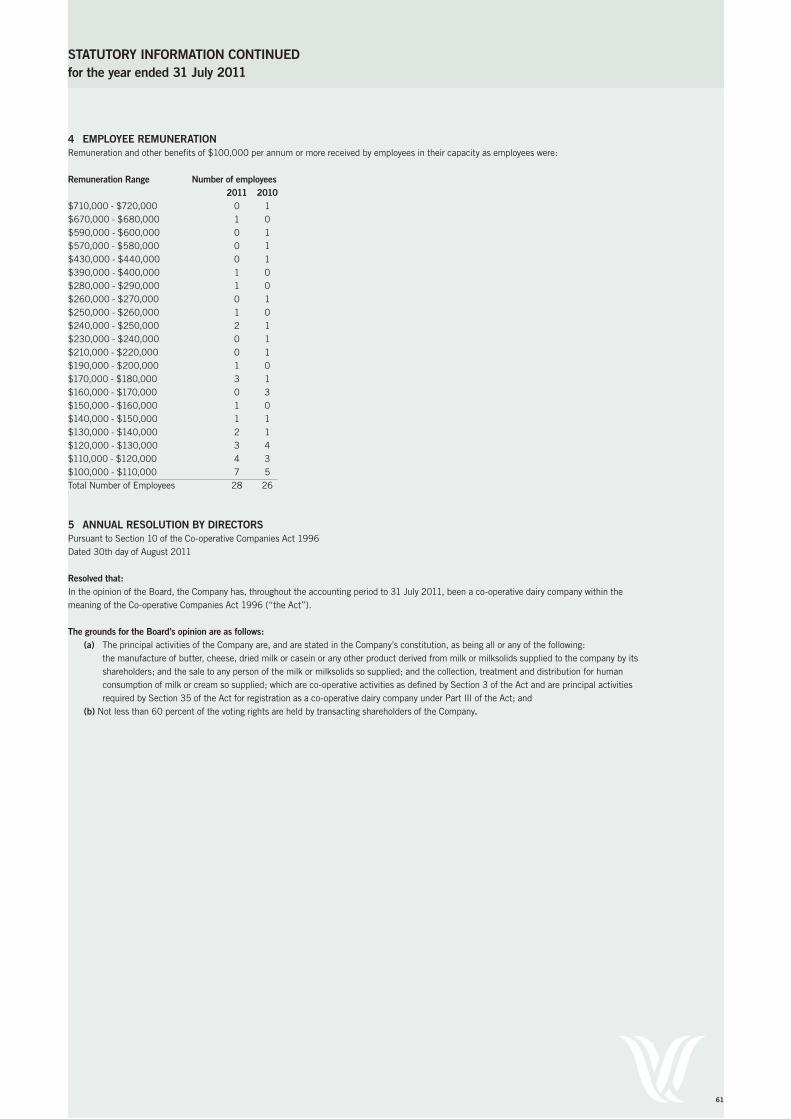
4 EMPLOYEE REMuNERATIONRemuneration and other benefits of $100,000 per annum or more received by employees in their capacity as employees were:
Remuneration Range Number of employees 2011 2010$710,000 - $720,000 0 1$670,000 - $680,000 1 0$590,000 - $600,000 0 1$570,000 - $580,000 0 1$430,000 - $440,000 0 1$390,000 - $400,000 1 0$280,000 - $290,000 1 0$260,000 - $270,000 0 1$250,000 - $260,000 1 0$240,000 - $250,000 2 1$230,000 - $240,000 0 1$210,000 - $220,000 0 1$190,000 - $200,000 1 0$170,000 - $180,000 3 1$160,000 - $170,000 0 3$150,000 - $160,000 1 0$140,000 - $150,000 1 1$130,000 - $140,000 2 1$120,000 - $130,000 3 4$110,000 - $120,000 4 3$100,000 - $110,000 7 5Total Number of Employees 28 26
5 ANNuAL RESOLuTION BY DIRECTORS Pursuant to Section 10 of the Co-operative Companies Act 1996 Dated 30th day of August 2011
Resolved that: In the opinion of the Board, the Company has, throughout the accounting period to 31 July 2011, been a co-operative dairy company within the meaning of the Co-operative Companies Act 1996 (“the Act”). The grounds for the Board’s opinion are as follows:
(a) The principal activities of the Company are, and are stated in the Company’s constitution, as being all or any of the following: the manufacture of butter, cheese, dried milk or casein or any other product derived from milk or milksolids supplied to the company by its shareholders; and the sale to any person of the milk or milksolids so supplied; and the collection, treatment and distribution for human consumption of milk or cream so supplied; which are co-operative activities as defined by Section 3 of the Act and are principal activities required by Section 35 of the Act for registration as a co-operative dairy company under Part III of the Act; and
(b) Not less than 60 percent of the voting rights are held by transacting shareholders of the Company.
for the year ended 31 July 2011STATuTORY INFORMATION CONTINuED
61
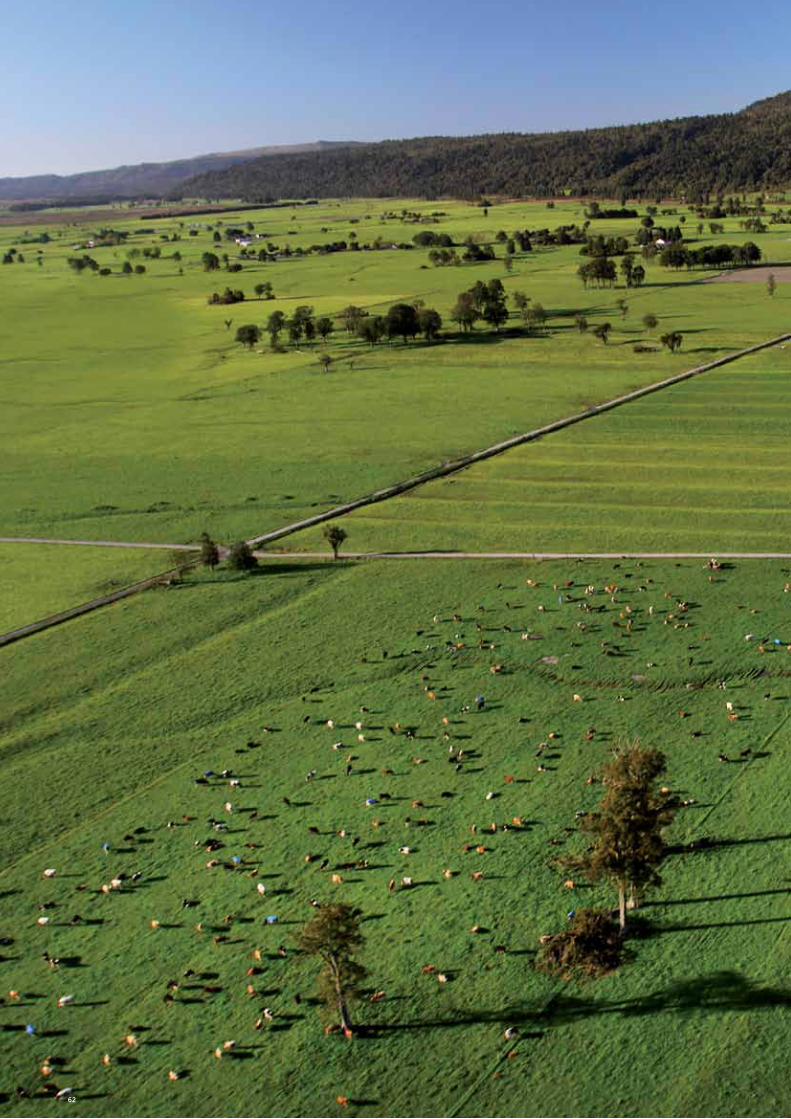
62

63

64

Directory
Registered Office 56 Livingstone Street Hokitika New Zealand Telephone +64 3 756 9800 Fax +64 3 755 8208
Chairman Matt O’Regan
Deputy Chairman Mike Havill
Directors Frank Dooley BCom/CA Sir Graeme Harrison MA (Hons) Raelyn Lourie Barry Paterson BCM, Pg Dip Marketing Noel Robb BCM David Spence MCom (Hons)/CA Jon Sullivan Jim Wafelbakker
Chief Executive Officer Rod Quin B.Tech (Hons)/Dip. Business (Operations)
General Manager Operations Bernard May NZ Certificate, Quality Assurance and Food Science
Chief Financial Officer Kim Wallace BBS - Accountancy
General Manager Gregg Wafelbakker B.TechSales & Marketing
General Manager Leo McIntyre Dip. Dairy TechnologyQuality & Technical Services
Company Secretary Mark Lockington NZCE/BCM/CA
Bankers HSBC, ASB, BNZ
Auditors Deloitte
Solicitors Morrison Daly, Baldwins
Insurance Brokers Willis NZ
65

Head OfficePO Box 9656 Livingstone StreetHokitika 7842New ZealandTelephone +64 3 756 9800Facsimile +64 3 755 8208
Rolleston OfficePO Box 138Izone Park41 Westland PlaceRolleston 7643New ZealandTelephone +64 3 371 1600Facsimile +64 3 347 4652