Annual Report 2011-12 Part 1 - Waverley Council
416
Waverley Council Annual Report 2011-12 Incorporating: • END OF TERM REPORT • PROGRESS REPORT ENVIRONMENTAL ACTION PLAN 2 • ANNUAL FINANCIAL STATEMENTS November 2012 A12/0465 A vibrant, welcoming and inspiring place to live, work and play
-
Upload
khangminh22 -
Category
Documents
-
view
3 -
download
0
Transcript of Annual Report 2011-12 Part 1 - Waverley Council
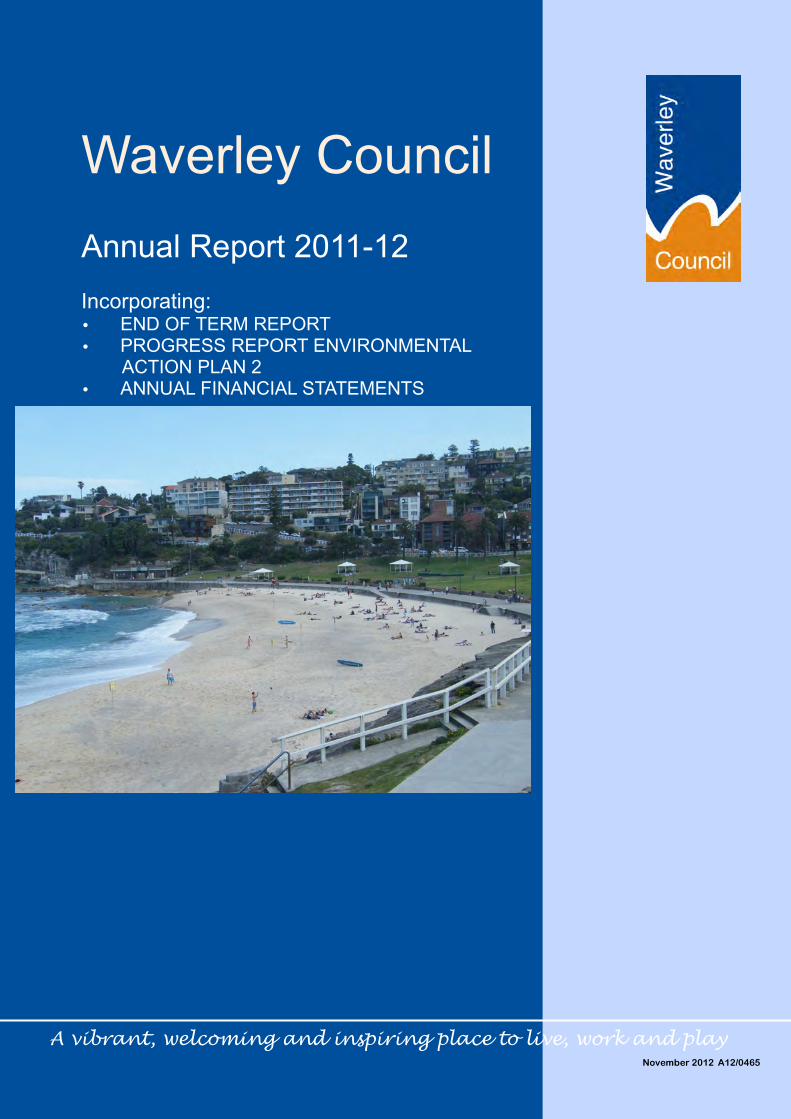
Waverley Council Annual Report 2011-12 Incorporating: • END OF TERM REPORT • PROGRESS REPORT ENVIRONMENTAL ACTION PLAN 2 • ANNUAL FINANCIAL STATEMENTS
November 2012 A12/0465
A vibrant, welcoming and inspiring place to live, work and play

2

3
Contents
WAVERLEY COUNCIL
Annual Report 2011—2012
TABLE OF CONTENTS
PART 1 WAVERLEY COUNCIL ANNUAL REPORT Page No.
SECTION 1 The Waverley Area 4
• Vision 5
• Mission 6
• A Profile of Waverley 7
SECTION 2 Waverley Council Overview 13
• Message from the Mayor 14
• Message from the General Manager 15
• Ward Boundaries 16
• Councillors 17
• Council & Council Committees 18
• How council is organised 20
SECTION 3 Measuring our Progress 23
• Integrated Planning & Reporting 24
• Did we do what we said we would do? - Highlights 32
• Measuring our Progress—Summary Overview 38
• Measuring our Progress 40
SECTION 4 Meeting our Statutory Requirements 125
• Condition of Public works 126
• Legal Proceedings 130
• Mayoral & Councillor Fees and Facilities 135
• Employment of Senior Staff 136
• Major Contracts Awarded by Council 136
• Bush Fire Reduction Activities 137
• Supporting our Multi-Cultural Community 138
• Works carried out on Private Land 151
• Contributions & Donations 152
• Human Resources Activities undertaken 2010-11 154
• External Bodies exercising Council Functions 164
• Controlling Interests in Companies 164
• Partnerships, Cooperatives & Joint Ventures 164
• Other Regulatory Information 164
SECTION 5 Glossary 179
PART 4 FINANCIAL STATEMENTS 307
PART 2 END OF TERM REPORT 185
PART 3 ENVIRONMENTAL ACTION PLAN 2—PROGRESS REPORT
289

4
WAVERLEY COUNCIL
Annual Report 2011—2012
PART 1
Section 1
The Waverley Area
5
WAVERLEY COUNCIL
Annual Report 2011—2012
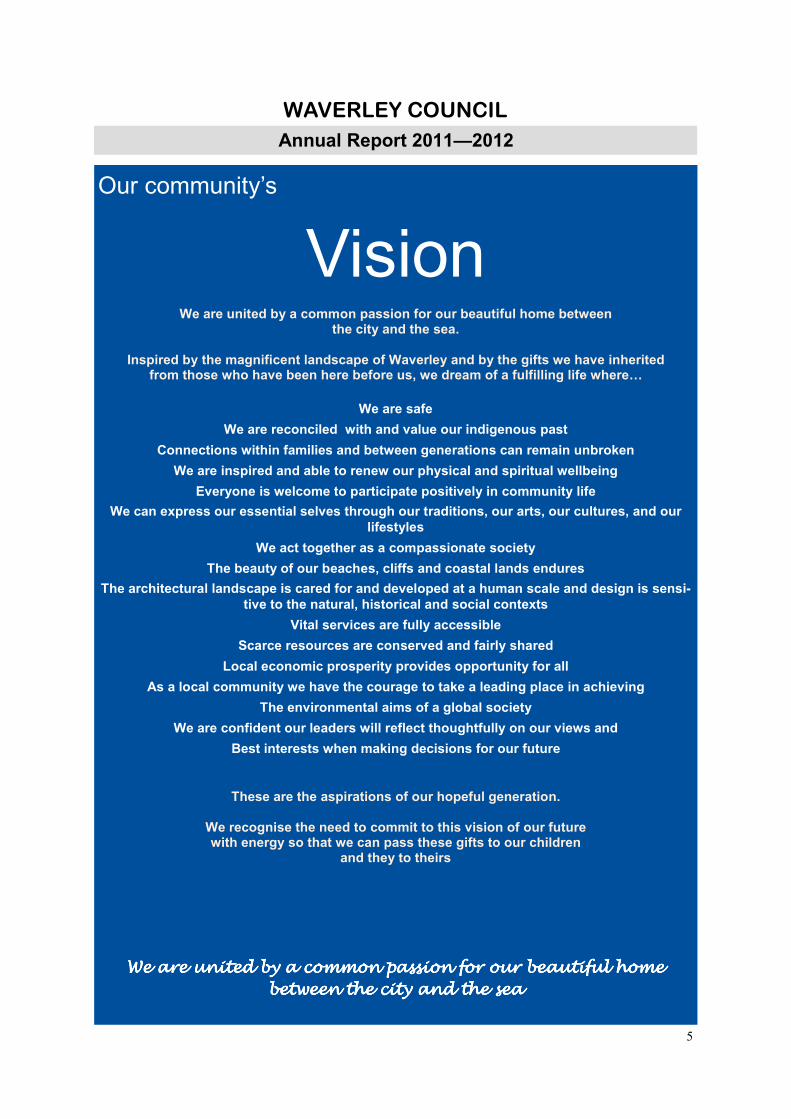
Our community’s
Vision
We are united by a common passion for our beautiful home between the city and the sea.
Inspired by the magnificent landscape of Waverley and by the gifts we have inherited
from those who have been here before us, we dream of a fulfilling life where…
We are safe We are reconciled with and value our indigenous past
Connections within families and between generations can remain unbroken We are inspired and able to renew our physical and spiritual wellbeing
Everyone is welcome to participate positively in community life We can express our essential selves through our traditions, our arts, our cultures, and our
lifestyles We act together as a compassionate society
The beauty of our beaches, cliffs and coastal lands endures The architectural landscape is cared for and developed at a human scale and design is sensi-
tive to the natural, historical and social contexts Vital services are fully accessible
Scarce resources are conserved and fairly shared Local economic prosperity provides opportunity for all
As a local community we have the courage to take a leading place in achieving The environmental aims of a global society
We are confident our leaders will reflect thoughtfully on our views and Best interests when making decisions for our future
These are the aspirations of our hopeful generation.
We recognise the need to commit to this vision of our future with energy so that we can pass these gifts to our children
and they to theirs
We are united by a common passion for our beautiful homeWe are united by a common passion for our beautiful homeWe are united by a common passion for our beautiful homeWe are united by a common passion for our beautiful home between the city and the seabetween the city and the seabetween the city and the seabetween the city and the sea

6
WAVERLEY COUNCIL
Annual Report 2011—2012
Waverley Council’s
Mission and Values
Through its detailed Integrated Engagement Strategy, Waverley Council has taken note of the breadth and depth of community priorities and articulated these in a Vision for the Waverley community. Council’s Mission is to take a leading role in partnership with other levels of government, businesses and community groups and individuals to make the community’s vision a reality. In doing this, we rely on our commitment to and cohesion as a professional, friendly and ethical Council that consults with and listens to the community. We pride ourselves on bringing the following values alive in our daily activities.
GREAT LEADERSHIP Great leadership is having the courage to make difficult decisions when they are for the benefit of the whole community and having the skills to engage our teams in providing quality service.
GREAT CUSTOMER SERVICE Great customer service is the willingness and ability to give priority to customers, delivering high quality services which meet their needs.
RESPECT FOR ALL Respect for all is treating each other and all members of the community in a friendly, fair and equitable way.
WORKING ETHICALLY Ethical behaviour is acting in ways that are consistent with the expectation of the organisation to be corruption free and transparent.
WORKING TOGETHER Working together is about everyone working in partnership (internally and with the community) to achieve common or shared goals.
GETTING THE JOB DONE SAFELY, SUSTAINABLY AND ON TIME Getting the job done means providing a service efficiently, effectively and in the safest possible manner within agreed timeframes and due regard for the environment.
We are united by a common passion for our beautiful homeWe are united by a common passion for our beautiful homeWe are united by a common passion for our beautiful homeWe are united by a common passion for our beautiful home between the city and the seabetween the city and the seabetween the city and the seabetween the city and the sea

7
WAVERLEY COUNCIL
The Waverley Area A Profile of Waverley The Waverley Local Government Area (LGA) is located on Sydney’s eastern seaboard, approximately seven kilometres from the city's central business district. With a popula-tion of 68,567 (2011 Census) it includes the suburbs of Bondi Junction, Queens Park, Bronte, Waverley, Bondi, North Bondi, Tamarama, Dover Heights and parts of Rose
Bay and Vaucluse. Waverley’s position be-tween the city and the sea is the key to its enormous attraction for residents and visi-tors. It lies just south of the beautiful Sydney Harbour, with the Tasman Sea defining its eastern boundary. Dover Heights, arguably its most affluent suburb, enjoys views of the Harbour Bridge while its beachside suburbs, Bondi, Tamarama and Bronte, are amongst the most popular in Australia. With an area of 9.2 square kilometres and a population density in 2011 of 68.42 people per hectare, Waverley is the most densely populated LGA in Australia after the City of Sydney. Waverley is a diverse area, which has become increasingly popular to visitors and those who wish to make their home here. It shares many features with Sydney and particularly with other parts of the Inner and Eastern Sydney areas. However, there are also significant differences which highlight Waverley’s distinctive character, including high density living; young families with a high proportion of working mothers; an ageing population; a large number of single person and group households; an influx of visitors and temporary residents; and the cost of living. All of these characteristics present potential challenges to a healthy, harmonious and sustainable community which will have
particular planning implications for Council over the coming years. Waverley’s population characteristics There are also a couple of important demographic characteristics, which differ significantly from other inner Sydney areas, making Waverley the socially and culturally diverse community it has become. Interesting features include: • The three largest ancestries in Waverley
Local Government Area (LGA) are English, Australian, and Irish.
• Just over 42% of dwellings are rented mak-ing a significant proportion of the population
vulnerable to dramatic rent increases which have occurred in the last decade; • 18% of people in Waverley come from
countries where English is not the first lan-guage.
• Home to a large Jewish population—17% of Waverley’s total population;
• In Waverley Local Government Area (LGA), 22% of households are made up of couples with children compared with 32% in New South Wales.
• 23,730 people living in Waverley Local Gov-ernment Area (LGA) were born overseas and 28% arrived in Australia within the last 5 years.
• 30% of Waverley Local Government Area (LGA)'s households contain only one per-son, compared with 23% in Greater Syd-ney.; and
• An ageing population particularly pro-nounced in post war immigrant communi-ties.
Waverley’s age pyramid and population projections Compared to Greater Sydney there was a lower proportion of people in the younger age groups (o to 17 years) as well as a lower proportion of peo-ple in the older age groups (60+ years). Overall 17.7% of the population was aged between 0 and 17 and 16.6% were aged 60 years and over, com-pared with 23% and 17.9% respectively for Greater Sydney. Waverley also had a larger per-centage of ‘young workforce’, a larger percentage of ‘parents and homebuilders’, a smaller percent-age of ‘Secondary schoolers’, and a smaller per-centage of ‘Older workers & pre-retirees’.
8
WAVERLEY COUNCIL
The Waverley Area
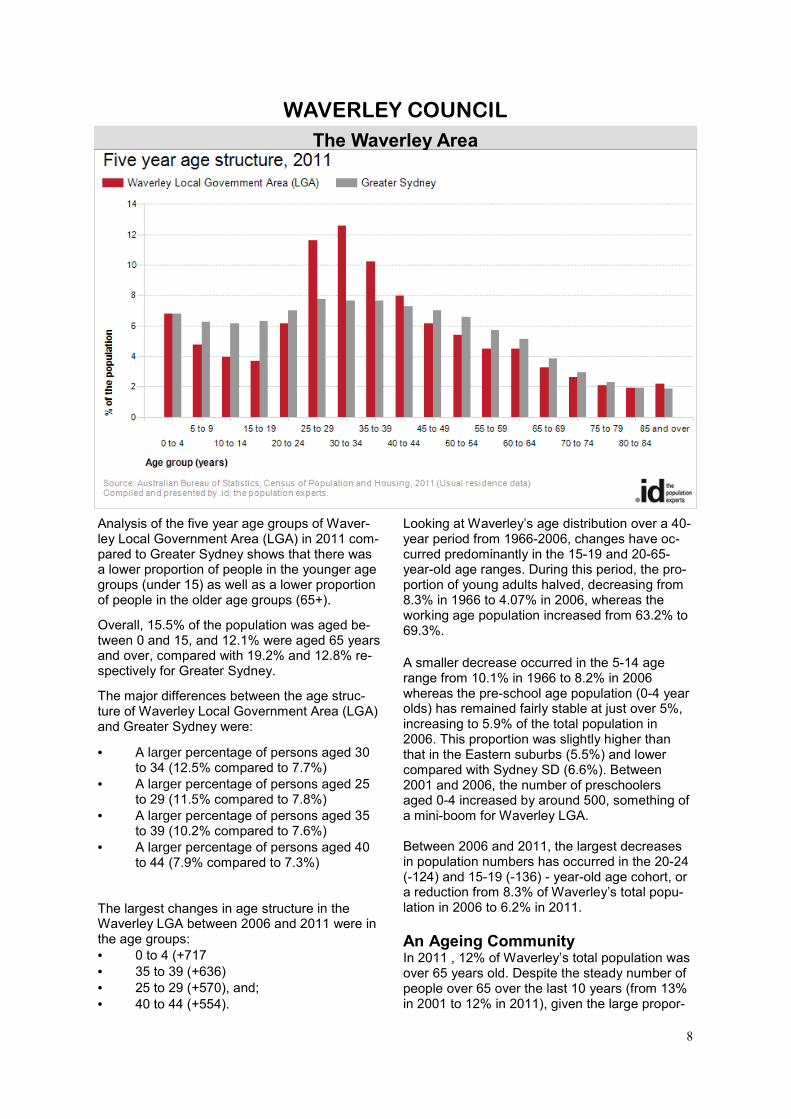
Analysis of the five year age groups of Waver-ley Local Government Area (LGA) in 2011 com-pared to Greater Sydney shows that there was a lower proportion of people in the younger age groups (under 15) as well as a lower proportion of people in the older age groups (65+).
Overall, 15.5% of the population was aged be-tween 0 and 15, and 12.1% were aged 65 years and over, compared with 19.2% and 12.8% re-spectively for Greater Sydney.
The major differences between the age struc-ture of Waverley Local Government Area (LGA) and Greater Sydney were:
• A larger percentage of persons aged 30 to 34 (12.5% compared to 7.7%)
• A larger percentage of persons aged 25 to 29 (11.5% compared to 7.8%)
• A larger percentage of persons aged 35 to 39 (10.2% compared to 7.6%)
• A larger percentage of persons aged 40 to 44 (7.9% compared to 7.3%)
The largest changes in age structure in the Waverley LGA between 2006 and 2011 were in the age groups: • 0 to 4 (+717 • 35 to 39 (+636) • 25 to 29 (+570), and; • 40 to 44 (+554).
Looking at Waverley’s age distribution over a 40-year period from 1966-2006, changes have oc-curred predominantly in the 15-19 and 20-65-year-old age ranges. During this period, the pro-portion of young adults halved, decreasing from 8.3% in 1966 to 4.07% in 2006, whereas the working age population increased from 63.2% to 69.3%. A smaller decrease occurred in the 5-14 age range from 10.1% in 1966 to 8.2% in 2006 whereas the pre-school age population (0-4 year olds) has remained fairly stable at just over 5%, increasing to 5.9% of the total population in 2006. This proportion was slightly higher than that in the Eastern suburbs (5.5%) and lower compared with Sydney SD (6.6%). Between 2001 and 2006, the number of preschoolers aged 0-4 increased by around 500, something of a mini-boom for Waverley LGA. Between 2006 and 2011, the largest decreases in population numbers has occurred in the 20-24 (-124) and 15-19 (-136) - year-old age cohort, or a reduction from 8.3% of Waverley’s total popu-lation in 2006 to 6.2% in 2011. An Ageing Community In 2011 , 12% of Waverley’s total population was over 65 years old. Despite the steady number of people over 65 over the last 10 years (from 13% in 2001 to 12% in 2011), given the large propor-

9
WAVERLEY COUNCIL
The Waverley Area
tion of residents moving towards retirement, this age group is projected to increase to 17% by 2031. Provisional population projections indicate that Waverley’s total population will decline over the next 22 years or so (population growth slowing to 0.1% by 2022), with the proportion of frail aged people (85 years or older) anticipated to increase from 2.1% to 3% by 2031. This age group increased from 2.1% to 2.3% of the total population since the last census was taken in 2001. The elderly to child ratio of 1.0 (10 elderly for every 10 children) is expected to increase by 2022 to 1.5 (or 15 elderly to every 10 children). Similar trends are occurring throughout Sydney. Waverley’s diversity Waverley’s population is made up of many different groups of people. Extremely wealthy families, successful single professionals in their thirties and empty nesters on high incomes; group households in run-down semis and older-style flats whose members share the high cost of living; sole parents; low income families and individuals (many of whom are aged 55 years or older); people caring for a family member with a disability; people experiencing housing stress by ever-increasing mortgages
and rents; middle-income families with pre-school kids intent on financial survival; isolated older people living alone; people suffering from mental illness; and homeless peo-ple. Following closely behind its neighbours Randwick and City of Sydney, Waverley ranks 19th of NSW LGAs with the highest proportion of overseas-born residents adding cultural richness to its social fabric. The following graph lists the top ten birth places for Waverley residents in 2011, compared to Sydney Statistical Division (SD).

10
WAVERLEY COUNCIL
The Waverley Area Waverley’s Jewish community is strong numbering about 10,876 in 2011, representing well over a quarter (28%) of all Jewish people in NSW. Many have migrated from Eastern European countries, the former USSR/Russian Federation and Ukraine, South Africa, and Israel (People of NSW, 2006.) Waverley is home to a large Russian speaking community and many smaller communities from Europe, North & South America, Asia and the Pacific. High housing costs have reduced the number of Maori families in Waverley but strong networks exist with those who have moved out. More recently, the South African community has had continued growing with another 4.2% in-crease between 2006 and 20011, making it Waverley’s 2nd largest group of people born overseas with nearly 2,667 residents. The following graph shows the changes between 2006 and 2011 that have occurred in the top ten birth places. The number of residents born in the UK and New Ireland, have increased significantly over that period. Households and families The composition of families has changed since the 2006 census - while previous population Figures recorded a mini baby boom with reports showing an increase in couples with children
(particularly young children) and a decrease in couple only families. Analysis of 2011 data com-pared to Greater Sydney shows that there was a lower proportion of couple families with children as well as a lower proportion of one-parent fami-lies. Overall, 21.8% of total families were couple families with child(ren), and 6.2% were one-parent families, compared with 34.8% and 10.8% respectively for Greater Sydney.
There were a higher proportion of Lone Person Households and a similar proportion of Couples without Children. Overall, the proportion of Lone Person households was 27.0% compared to 21.5% in Greater Sydney while the proportion of Couples without Children was 22.7% compared to 22.6% in Greater Sydney. here was a smaller proportion of households who owned their dwelling; a smaller proportion pur-chasing their dwelling; and a larger proportion who were renters.
Overall, 23.3% of the population owned their dwelling; 21.3% were purchasing, and 42.5% were renting, compared with 29.1%, 33.2% and 30.4% respectively for Greater Sydney. The most obvious feature of Waverley’s house-hold arrangements is the large number of people living alone (27% of all privately occupied dwell-ings) and in group households (10%), a much

11
WAVERLEY COUNCIL
The Waverley Area higher proportion compared to Sydney’s 22% and 4% respectively. Group households rose from 8.6% of all households in 2006 to 9.9% in 2011. As such, with a total of 2,778 Waverley still has a much higher proportion of group households com-pared to Sydney SD which recorded 4.1% of this household type in 2011. High cost of living, housing and rental stress Along with other eastern suburbs residents, people in Waverley earn high incomes. However, in 2011, nearly a 30% of residents aged 15 years or older were on low incomes, earning less than $400 per week ($20,828 pa). In 2011, the median weekly household income was $1,912 (compared to $1,442 in 2006) and 35% earned more than $2500. The loss of private rental stock and in particular affordable private rental accommodation is a significant issue for Waverley residents. Available housing stock does not always support the needs of the community through different stages of the housing life cycle. The Waverley LGA is one of the least affordable local government areas in NSW, both for rental and purchase. Mortgages and rents are significantly higher in Waverley compared to Sydney overall. The me-
dian weekly rent in 2011 for Waverley LGA was $500 and the median monthly housing loan repayment was $3,000.

12
WAVERLEY COUNCIL
The Waverley Area Analysis of the weekly housing rental payments of households in Waverley Local Government Area (LGA) compared to Greater Sydney shows that there was a larger proportion of households paying high rental payments ($400 per week or more), and a smaller proportion of households with low rental payments (less than $150 per week).
Overall, 71.3% of households were paying high rental payments, and 6.2% were paying low pay-ments, compared with 39.3% and 13.3% respec-tively in Greater Sydney.
The major differences between housing rental payments of Waverley LGA and Greater Sydney were:
• A larger percentage of $550 - $649 (15.1% compared to 7.1%)
• A larger percentage of $450 - $549 (20.9% compared to 13.2%)
• A larger percentage of $650 - $749 (9.5% compared to 3.7%)
A larger percentage of $950+ (6.4% compared to 2.2%)
Disability Client statistics indicate that Waverley is an area with a high number of people with a disability. This has been reported in previous Social Plans. It is difficult to obtain accurate data for people affected by a disability. ABS census and disabil-ity survey information provide at best glimpses of diverse population groups in the community and their needs. Client statistics collected for the Waverley LGA by the Information on Disability and Education Awareness (IDEAS) indicate that a high proportion of inquiries and requests for information and referrals are made by agencies and residents in Waverley. In 2008/09, the great majority of IDEAS clients (60%) lived in the postcode area 2026; a further 20% was recorded for people living in Bondi Junction/Queens Park (postcode area 2022) and Waverley/Bronte (postcode area 2024) respectively. Clients needed help with a range of issues, including allied health, counselling, employment and finance. However, the most frequent problem encountered was in the area of rights, law, and advocacy, followed by accommodation, support services, recreation and equipment. This is fairly consistent with Council’s findings from consultations and focus groups.
13
WAVERLEY COUNCIL
Waverley Council Overview
Section 2
Waverley Council Overview

14
WAVERLEY COUNCIL
Message from the Mayor
W elcome to Waverley Council’s 2011-2012 Annual Report which outlines the
organisation’s performance over the last financial year in meeting the targets identified in both its Delivery Program 2010-2013 and
Operational Plan 2011—2012. Overall Council has performed well during this period with 94% of its targets being met or on track for completion. Council only failed to meet 6% of its targets in 2011– 12 due largely to funding, staff shortages or priorities having to be changed. This shows that Council is tracking well in delivering services to the Waverley community. Our financial statements also show that Council is in a relatively healthy position with: • An Unrestricted Current Ratio of 4.35:1
which shows Council has sufficient assets on hand to meet its current liabilities com-pared to a NSW council average of 2.71:1, and
• A Debt Service Ratio of 1.55% which means Council has a very small debt level (compared to a NSW council average of 5%).
This year’s Report contains additional important information consisting of the End of Term Report and a progress report on Council’s Environmental Action Plan (EAP2). The End of Term Report is a requirement of the Integrated Planning & Reporting framework and: • Displays the progress made by the Waverley
community towards the achievement of their vision for quality of life during the term of office of the elected council (2008—2012) .
• Measures the performance and effectiveness of the strategies of Waverley Together 2 (our Community Strategic Plan) towards the targets and sustainability, and
• Sets out advice for achieving the Waverley community’s desired future sustainability.
Overall this report has shown that life did get better in Waverley and we are generally moving closer to achieving the community’s long term vision. However, there are areas in respect of development, economic opportunity, leadership and environmental sustainability where im-
provements can be made. Council is working to address these areas in its review of the Community Strategic Plan and the development of Waverley Together 3 and a new Delivery Program (Delivery Program 2013—17). The Environmental Action Plan Progress Report replaces our traditional State of the Environment Report. The Environmental Action Plan (EAP2) forms part of Council’s Resourcing which informs the Community Strategic Plan (Waverley To-gether 2) and our Delivery Program (Delivery Program 2010-2013) . With this in mind, Council no longer believes it is appropriate to have a stand alone State of the Environment Report as the quadruple bottom line (of which environmental sustainability is one of the ele-ments) is required to be reported upon within the Integrated Planning Framework. However, Council believes it is important that the community should be able to see how progress is going within EAP2 to move closer to their long term Vision as set out in Waverley Together 2. This report shows that: • Council continues to reduce its green-
house gas emissions on an annual basis; however
• Greenhouse gas emissions within the Waverley community have increased by 17% on the base year of 2003-04.
• The overall amount of waste collected from Waverley residents continues to decrease.
• Water use within the Waverley community continues to decrease, and
• Our beaches continue to receive a ‘good’ grading for their water quality except for those days immediately following heavy rain.
All this information shows that both Waverley and the Council are making positive progress in moving closer to achieving the community’s long term vision and we are delivering services which are contributing to improving the quality of life of our residents. Cr Sally Betts Mayor of Waverley

15
WAVERLEY COUNCIL
Message from the General Manager
T his year’s Annual Report provides the Waverley community with a report card on both the perform-
ance of the Council in delivering services and whether life is getting better for our residents or whether
we are moving closer or further away from achieving the community’s long term vision. Council delivers 22 main services consisting of 150 sub-services. This makes Waverley Coun-cil a key player in quality of life issues affecting our residents. These services cover a wide range of activities such as the provision of lifeguards, operating child care centres, maintaining our parks, operating a library, cleaning our streets, manag-ing cemeteries, collecting our rubbish, removing graffiti, providing community and cultural events, to maintaining our roads, footpaths and stormwater systems. This year’s report shows that Council is per-forming well in delivering these services. This year we have met 94% of our targets. Some of the more significant achievements during the year have been: • The completion and opening of the new
Margaret Whitlam Recreation Centre at Waverley Park.
• Providing nearly $522,000 in grants to community groups, services and organi-sations to assist with community programs across the local government area.
• The on-going program of playground and parks upgrades across the LGA which has seen improvements to Varna and Bronte Parks over this year.
• The construction of a new Children’s Learner Bicycle Track at Dudley Page Reserve.
• Spending $10.4 million on the mainte-nance and upgrading of city assets such as our roads, footpaths, buildings and stormwater infrastructure.
• The construction of a new Early Learning and Care Centre in Bondi Junction, and
• The on-going implementation of E-Planning services at Council which has seen the introduction of online Section 149Certificates, mapping and develop-ment application tracking.
The End of Term Report has shown that overall life did get better in Waverley during the term of the Council (2008—2012) and that we as a community are moving closer to achieving our quadruple bottom line of: • A sustainable community • A sustainable lifestyle • A Sustainable environment, and • Sustainable governance (good leadership) Some of the most positive aspects revealed in this report are: • There was a 19% increase in satisfaction
with community facilities. • There was a 44% increase in satisfaction
with childcare services but there is still some way to go to meet growing demand.
• Unemployment in our LGA remains low at around 3% which is almost half the national average.
• There was a 40% increase in residents who are happy with graffiti control.
• There was a 19% increase in satisfaction with Council’s environmental management and education activities, and
• 17% more people feel informed about Council activities.
However, the Report did highlight that although we are heading in the right direction there is more work to be done to achieve the targets identified in Waverley Together 2. Council is currently working on these new focus areas for policies as it moves to develop Waverley Together 3 and a new Delivery Program (Delivery Program 2013 - 17) for the recently elected Council. Tony Reed General Manager

16
WAVERLEY COUNCIL
Ward Councillors & Ward Boundaries

17
WAVERLEY COUNCIL
Ward Councillors & Ward Boundaries HUNTER WARD
BONDI WARD
LAWSON WARD
Sally Betts - (Mayor) Liberal
(H) 9130 3250
(M) 0425 363 530
Miriam Guttman-Jones - Independent
(H) 9371 1412
Leon Goltsman - Liberal
(H) 8006 2799
Dominic Wy Kanak - Greens
(W) 9369 8027
(H) 9130 8460
Joy Clayton - Liberal
(M) 0409 308 430
John Wakefield - Labor
(M) 0427 023 987
Angela Burrill—Liberal
(H) 9114 8981
Andrew Cusack - Liberal
(H) 9114 8986
Paula Masselos - Labor
(M) 0419 292 207
Tony Kay - (Deputy Mayor) Liberal
(H) 9365 7707
(F) 9365 7707
Bill Mouroukas - Liberal
(M) 0421 341 815
Ingrid Strewe - Labor
(H) 9389 7299
(F) 9389 4369
WAVERLEY WARD
18
WAVERLEY COUNCIL
Council & Council’s Committees Council is made up of twelve councillors elected by the ratepayers and residents of Waverley for a four-year term. The last Local Government election was held in September 2008 with the next one scheduled for September 8 2012. Councillors are elected by Ward (a geographical area). Waverley has four Wards. Three of these wards (Bondi, Waverley and Nelson [now Hunter Ward]) were established in 1860, with Lawson Ward being created in 1867. The positions of Mayor and Deputy Mayor are usually decided annually by a vote of all councillors. Councillor Sally Betts was elected Mayor and Councillor Tony Kay was elected Deputy Mayor in September 2012. The Waverley Council area is located in the State Parliamentary seats of Coogee and Vaucluse and the Federal Parliamentary seat of Wentworth. The State Members for the area are Mr Bruce Notley-Smith, M.P. (Member for Coogee - telephone 9389-6669) and Ms Gabrielle Upton, M.P. (Member for Vaucluse - telephone 9369-3017). The Federal Member for Wentworth is Mr Malcolm Turnbull, M.P. (telephone 9369 5221). Waverley Council encourages members of the community to attend meetings of Council. All meetings are open to the public and usually take place on the third floor of the Council Chambers. Members of the public can address Council on any issue included on the Agenda for the meeting, provided they notify Governance staff on 9369-8000 by 3.00pm on the day of the meeting. Addresses are limited to a three (3) minutes for one speaker for and another three (3) minutes for one speaker against each item. This time may be shared between speakers (eg. 2 speakers for 1.5 minutes each) and Council may permit a 3 minute extension. At Council Meetings the speaker is not permitted to question Councillors, or be questioned by them. Full Council Meetings are usually held on the third Tuesday of the month. Council also usually meets on the first Saturday of the month for Inspection Meetings. Council’s Committees meet on the first and fourth Tuesday of each month, except in December and January.
Copies of business papers are available before meetings at Waverley Library, our Customer Service Centre or on our internet site at www.waverley.nsw.gov.au and follow the link to Council meetings. Committee Meeting Times and Members (as at November 2012) Community, Housing, Environmental Services & Public Works Committee 1st Tuesday 8.00 p.m. Crs Betts (Mayor/Chair), Burrill, Clayton, Goltsman, Guttman-Jones, Kanak, Masselos, Mouroukas Finance, Ethics & Strategic Planning Committee 1st Tuesday 7.30 p.m. Crs Betts (Mayor/Chair), Burrill, Cusack, Goltsman, Guttman-Jones, Kay, Masselos, Wakefield Development Control Committee 4th Tuesday 7.00 p.m. Crs Kay (Chair), Betts (Mayor/Deputy Chair) and all other Councillors Council operates a committee structure which is based around a three tier system consisting of: • Standing Committees • Other Committees, and • Advisory Committees

19
WAVERLEY COUNCIL
Council & Council’s Committees
Finance, Ethics, Strategic Planning
Committee
Community, Housing,
Environmental Services & Public Works Committee
Development Control
Committee
STANDING COMMITTEES
OTHER COMMITTEES
ADVISORY COMMITTEES
Waverley Traffic Committee
Internal Audit Committee
Environmental Sustainability Advisory Committee Multicultural Advisory Committee Community Safety Advisory Committee Waverley Public Arts Committee Waverley Surf Life Saving Club Committee Waverley Housing Advisory Committee Waverley Access Committee Bondi Forum Legal Services Review Panel Bondi Junction Forum
Waverley Council’s Committee Structure
COUNCIL
Councillor Membership of Other and Advisory Committees Waverley Traffic Committee Environmental Sustainability Advisory Committee
Crs Kay (Chair), Mouroukas (Alternate) Cr Goltsman (Chair), Kay (Alternate) Strewe
Community Safety Advisory Committee Waverley Surf Life Saving Club Committee
Crs Burrill (Chair), Clayton (Alternate), Betts Crs Clayton (Chair), Goltsman (Alternate), Betts
Waverley Access Committee Multicultural Advisory Committee
Crs Clayton (Chair), Guttman-Jones (Alternate) and all other Councillors
Crs Goltsman (Chair), Guttman-Jones (Alternate) and all other Councillors
Waverley Public Arts Committee Waverley Housing Advisory Committee Crs Burrill (Chair), Clayton (Alternate), Masselos Crs Clayton (Chair), Burrill (Alternate) Betts, Kanak
Bondi Forum Bondi Junction Forum
Crs Clayton (Chair), Burrill (Alternate), Betts, Wakefield
Crs Burrill (Chair), Cusack (Alternate), Betts, Masselos
Internal Audit Committee Legal Services Review Panel Crs Mouroukas, Kay (Alternate) Crs Betts (Mayor), Cusack, Kay, Strewe
Councillor Membership of Standing Committees Finance, Ethics, Strategic Planning (FESP) Community Housing, Environmental Services &
Public Works Committee
Crs Betts (Mayor/Chair), Burrill, Cusack, Kay, Goltsman, Guttman-Jones, Masselos, Wakefield
Crs Betts (Mayor/Chair), Burrill, Clayton, Goltsman, Guttman-Jones, Kanak, Masselos, Mouroukas
Development Control Committee
Crs Kay (Chair), Betts (Mayor/Deputy Chair) and all other Councillors
20
WAVERLEY COUNCIL
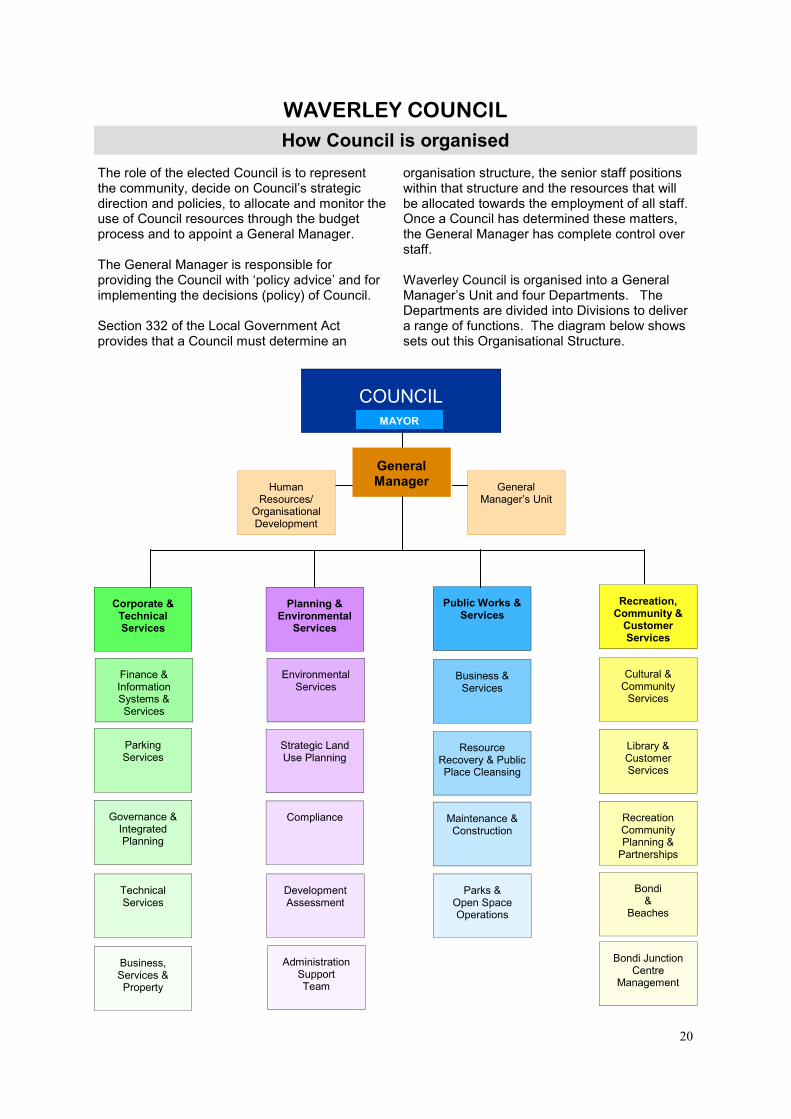
How Council is organised The role of the elected Council is to represent the community, decide on Council’s strategic direction and policies, to allocate and monitor the use of Council resources through the budget process and to appoint a General Manager. The General Manager is responsible for providing the Council with ‘policy advice’ and for implementing the decisions (policy) of Council. Section 332 of the Local Government Act provides that a Council must determine an
organisation structure, the senior staff positions within that structure and the resources that will be allocated towards the employment of all staff. Once a Council has determined these matters, the General Manager has complete control over staff. Waverley Council is organised into a General Manager’s Unit and four Departments. The Departments are divided into Divisions to deliver a range of functions. The diagram below shows sets out this Organisational Structure.
COUNCIL
General Manager
Human Resources/
Organisational Development
General Manager’s Unit
Corporate & Technical Services
Planning & Environmental
Services
Public Works & Services
Recreation, Community &
Customer Services
Finance & Information Systems & Services
Parking Services
Governance & Integrated Planning
Technical Services
Business, Services & Property
Environmental Services
Strategic Land Use Planning
Compliance
Development Assessment
Administration Support Team
Business & Services
Resource Recovery & Public Place Cleansing
Maintenance & Construction
Parks & Open Space Operations
Cultural & Community
Services
Library & Customer Services
Recreation Community Planning &
Partnerships
Bondi &
Beaches
Bondi Junction Centre
Management
MAYOR

21
WAVERLEY COUNCIL
How Council is organised
General Manager Tony Reed The General Manager is appointed by the elected Council and is responsible, under the Local Government Act, for the efficient and effective operation of the organisation and for ensuring
the implementation of decisions of the Council. This includes day-to-day management of Council operations, appointment and direction of staff, oversight of functions delegated by Council, and implementation of Council’s equal employment opportunity management plan. In addition, the General Manager is responsible for providing advice to the elected Council on strategic, policy and resource allocation issues and representing Council in its dealings with external organisations and bodies. The diagram below sets out he relationship between the Council and the General Manager.
The General Manager’s Unit comprises the Mayor’s Office and the General Manager’s Office. • The General Manager’s Office leads the
executive and organisation, leads long term strategic planning and new policy and program development.
• The Mayor’s Office provides support to the Mayor, is the central point for
Council’s media relations and organises Mayoral functions and civic events.
In addition, the Human Resources and Organisation Development Division reports directly to the General Manager. The Division
provides training and development for Council staff, provides leadership in organisation development and improving Council’s organisational capacity and assists in the recruitment, retention and management of high performing and professional staff. All of Council’s functions are achieved through the work of the General Manager and his staff and Council’s four departments: • Corporate and Technical Services • Recreation, Community and Customer
Services • Planning and Environmental Services • Public Works and Services What Our Departments Do Corporate & Technical Services
Bronwyn Kelly, Director
Our Corporate and Technical Services Department: • Develops and implements plans to effectively manage Council’s financial and
technical resources, and building, property and infrastructure assets. • Manages Council’s annual corporate
planning and reporting cycle including: - statutory management and financial planning and reporting, and - planning and monitoring of delivery of capital works. • Provides services to Council staff, manag-
ers and Councillors including: - corporate governance, - records management and - information access, - Council meeting agendas and minutes, and - information technology.
• Provides services to the community through the management and operation of roads, parking and transportation
systems. • Operates Council’s businesses and services including car parks, cemeteries,
property dealings and the management of leases/licences.
COUNCIL
GENERAL MANAGER
Sets Policy Allocates & monitors the use of resources
Provides Policy advice Implements Policy
Oversees the efficient and effective operation of the organisation Appoints and directs staff
Appoints the General Manager

22
WAVERLEY COUNCIL
How Council is organised
Recreation Community & Customer Services
Cathy Henderson, Director
Our Recreation, Community & Customer Services Department works to promote individual and community well-being through the direct provision of services including: • Providing face to face and on the telephone service to customers. • Providing services, programs and events
that act as a focus for community activities. • Undertake successful advocacy for the
community. • Acting as a gateway to the world’s information resources for all members of the community. • Providing an integrated approach to planning good social, recreational, cultural and open space outcomes. • Bondi Junction Town Centre management. • Bondi Beach area planning and Place
Management; • Being a major link between Council and
the community – often the voice and the face of the Council.
Planning & Environmental Services
Peter Monks, Director
Our Planning & Environmental Services Department: • Promotes the conservation of natural
resources in accordance with the principle of ecological sustainable
development. • Develops, promotes and implements strate-
gies for the enhancement of our natural and built environment.
• Provides a range of services in a profes-sional and caring way to Council and the public in the fields of planning and environ-mental services.
• Provides health and regulatory services to preserve the amenity and well-being of our community.
• Provides a range of planning and building services for the enhancement of our natural and built environment.
Public Works & Services
Mark Wood, Director
Our Public Works & Services Department provides a wide range of essential public services to a diverse mix of customers. These services include: • Managing our Capital Works. • Maintenance and construction works on our
roads, footpaths and other Council assets. • Managing Council’s parks and open space. • Management and maintenance of Council
vehicles and equipment. • Waste collection and public places cleansing. • Emergency management • Lifeguard services
23
WAVERLEY COUNCIL
How Council is organised
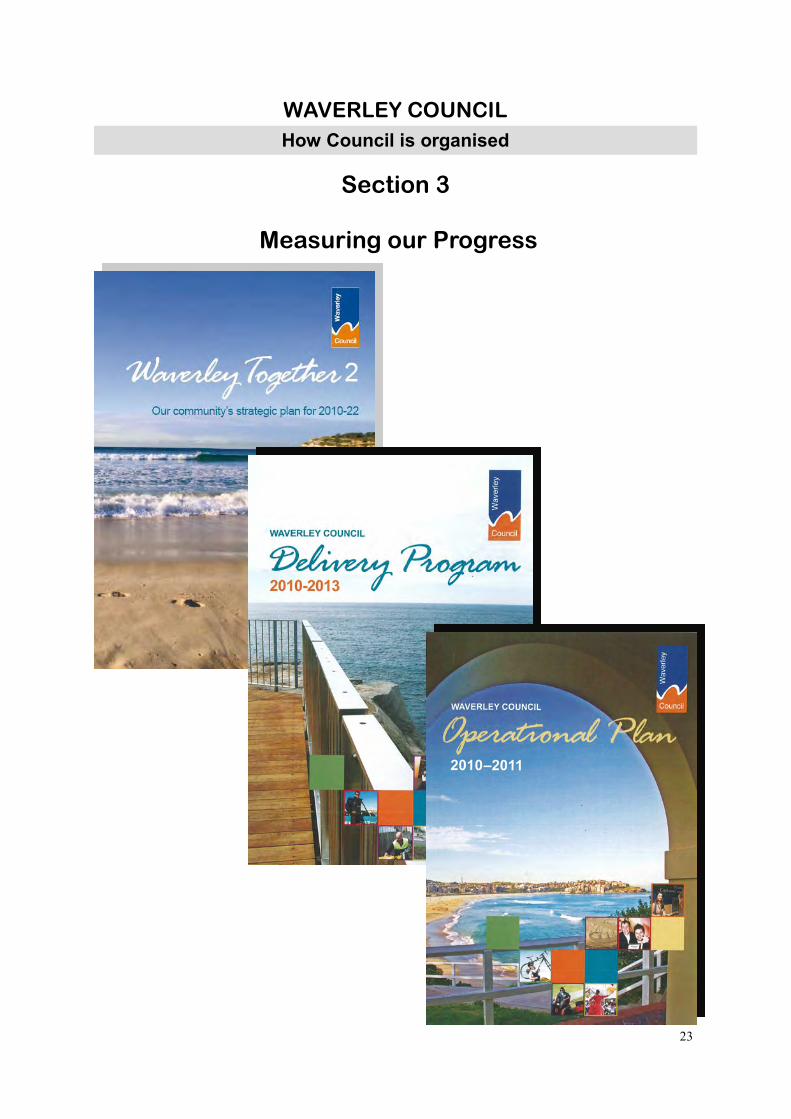
Section 3
Measuring our Progress
24
WAVERLEY COUNCIL
Integrated Planning & Reporting The NSW Government introduced a new way for councils to conduct their business called Integrated Planning and Reporting. This new system shows a commitment to creating a strong and sustainable local government system where communities can have a more direct say in what happens in their area. All councils are required to move into this new framework by 2012. Waverley Council is a Group 1 Council which meant we moved into this new system as of 1 July 2010. Underpinning this new framework is the requirement for councils to take a long-term view when making decisions and the need for them to consider the Quadruple Bottom Line (QBL) consisting of social, economic, environmental and civic leadership (governance) aspects for existing and future generations. Coupled with this, the Social Justice Principles of equity, access, participation and rights must also be taken into consideration when developing the new integrated plans. These principles are defined as:
Equity – fairness in decision-making, prioriti-sation and allocation of resources,
particularly for those in need. This principle provides for everyone to have a
fair opportunity to participate in the future of the community. It also requires the planning process to take particular care to involve and protect the interests of people in vulnerable circumstances.
Access – all people to have fair access to services, resources and opportunities to improve their quality of life.
Participation – everyone should have the maximum opportunity to genuinely par-ticipate in decisions that affect their lives.
Rights – equal rights should be established and promoted, with opportunities for people from diverse linguistic, cultural and religious backgrounds to participate in community life.
The new framework encourages councils to draw their various plans together, to understand how they interact and to get the maximum leverage from their efforts by planning holistically for the future. The diagram in the next column shows how all these components of Integrated Planning & Reporting interact in defining community aspirations which help to achieve Community Outcomes.
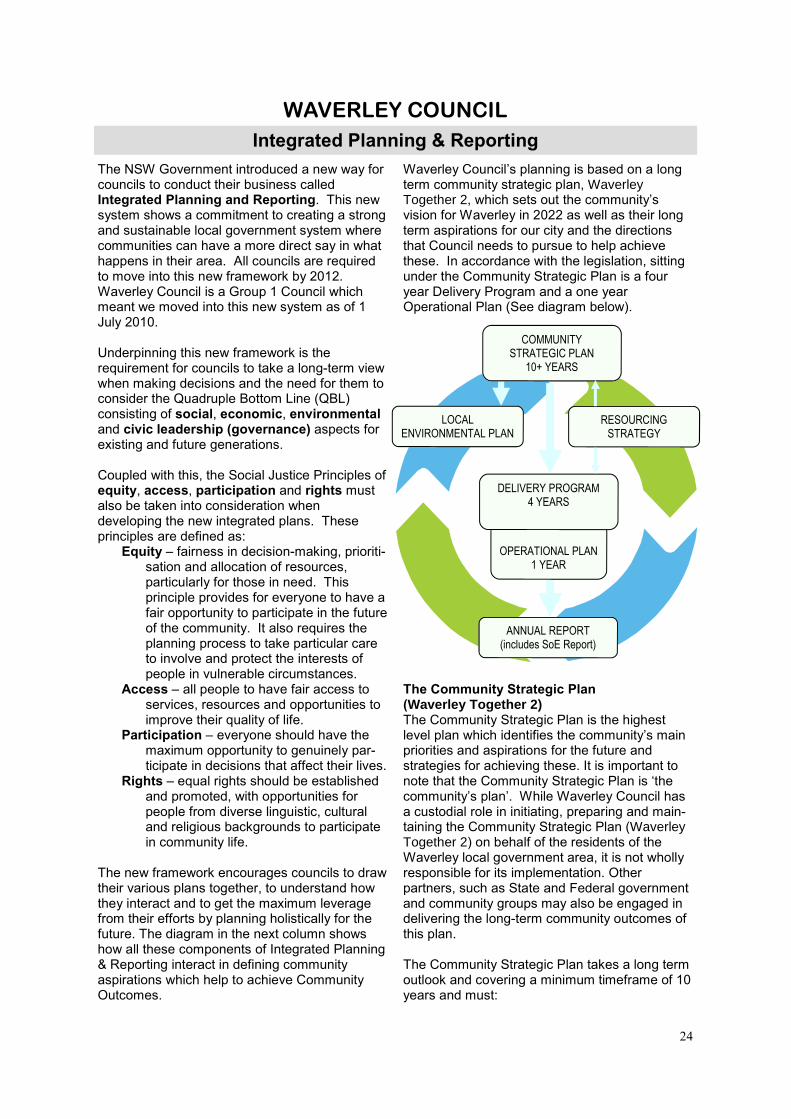
Waverley Council’s planning is based on a long term community strategic plan, Waverley Together 2, which sets out the community’s vision for Waverley in 2022 as well as their long term aspirations for our city and the directions that Council needs to pursue to help achieve these. In accordance with the legislation, sitting under the Community Strategic Plan is a four year Delivery Program and a one year Operational Plan (See diagram below).
The Community Strategic Plan (Waverley Together 2) The Community Strategic Plan is the highest level plan which identifies the community’s main priorities and aspirations for the future and strategies for achieving these. It is important to note that the Community Strategic Plan is ‘the community’s plan’. While Waverley Council has a custodial role in initiating, preparing and main-taining the Community Strategic Plan (Waverley Together 2) on behalf of the residents of the Waverley local government area, it is not wholly responsible for its implementation. Other partners, such as State and Federal government and community groups may also be engaged in delivering the long-term community outcomes of this plan. The Community Strategic Plan takes a long term outlook and covering a minimum timeframe of 10 years and must:
OPERATIONAL PLAN 1 YEAR
ANNUAL REPORT (includes SoE Report)
COMMUNITY STRATEGIC PLAN
10+ YEARS
LOCAL ENVIRONMENTAL PLAN
RESOURCING STRATEGY
DELIVERY PROGRAM 4 YEARS

25
WAVERLEY COUNCIL
Integrated Planning & Reporting • Establish strategic objectives together
with strategies to achieve those objectives.
• Address social, environmental, economic and civic leadership issues in an integrated manner.
• Be based on the social justice principles of equity, access, participa-tion and rights, and
• Give due regard to the NSW State Plan and other relevant state and regional plans.
Delivery Program & Resourcing Strategy Sitting beneath the Community Strategic Plan is the Delivery Program. The Delivery Program sets out the specific activities to be undertaken by Waverley Council during its term of office (normally 4 years) to implement the strategies outlined in the Community Strategic Plan. However, these strategies will not be achieved without sufficient resources – time, money, assets and people – to actually carry them out. Therefore the Community Strategic Plan and Delivery Program must be informed by a Resourcing Strategy which consists of three components: • A Long Term Financial Plan – setting out where the money comes from • A Workforce Management Plan – setting out staffing resources required to do the work • An Asset Management Plan – defining what assets or infrastructure are required. The Delivery Program is a statement of commitment to the community from each newly elected council. In preparing a Delivery Program,
Council is accounting for its stewardship of the community’s long-term goals, outlining what it intends to do towards achieving these goals and what its priorities will be. Operational Plan Supporting the Delivery Program is an annual Operational Plan which spells out the details of the Delivery Program. This plan outlines the individual activities (projects and programs) that will be undertaken each financial year to achieve the commitments made by the Council in its Delivery Program. The Operational Plan also identifies how Council will determine the effectiveness of the activities to be undertaken and is supported by a detailed budget. The Relationship between the Plans The diagram below illustrates how the Community Strategic Plan, Delivery Program and Operational Plan are related to each other. As can be seen here: • The Community Strategic Plan identifies
the outcomes the community wants to see and also identifies the broad strategies to achieve these.
• The Delivery Program sets out Council’s response to these outcomes by identifying the strategies and activities it will under-take during its four term of office.
• The Operational Plan identifies the specific activities that will be undertaken in each financial year.
Annual Report The Annual Report is the key point of account-ability between a Council and its community where it reports on the implementation of the Delivery Program and Operational Plan.
Community Strategic Plan 10+ year outlook
• Sets out community out-comes
• Outlines strategies and measures to achieve the outcomes
Delivery Program 4 Year outlook
• Council commitments and priorities during its term of office
• Progress towards the com-munity goals
Operational Plan 1 year outlook
• Details of activities (Services and Projects) Council will undertake during the finan-cial year to implement the Delivery Program
• Annual budget
OUTCOMES
STRATEGIES
SERVICES—ACTIVITIES
26
WAVERLEY COUNCIL
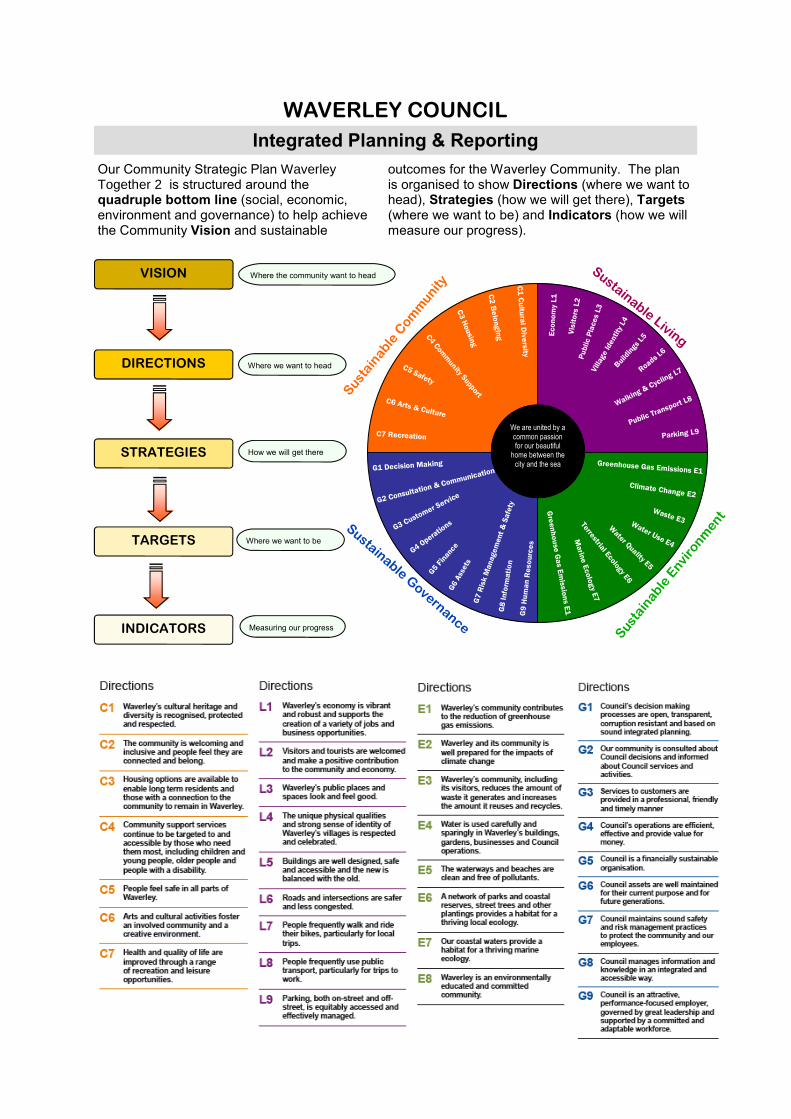
Integrated Planning & Reporting Our Community Strategic Plan Waverley Together 2 is structured around the quadruple bottom line (social, economic, environment and governance) to help achieve the Community Vision and sustainable
outcomes for the Waverley Community. The plan is organised to show Directions (where we want to head), Strategies (how we will get there), Targets (where we want to be) and Indicators (how we will measure our progress).
C1 Cultural Diversity
C2 Belonging
C3 Housing
C4 Community Support
C5 Safety
C6 Arts & Culture
C7 Recreation
We are united by a common passion for our beautiful
home between the city and the sea
G1 Decision Making
G6 Assets
G7 Risk Management & Safety
G8 Information
G4 Operations
G5 Finance
G3 Customer Service
G2 Consu
ltation & C
ommunica
tion
G9 Human Resources
Greenhouse Gas Emissions E1 Climate Change E2
Waste E3 Water Use E4
Water Quality E5
Terrestrial Ecology E6
Marine Ecology E7
Greenhouse Gas Emissions E1
Economy L1
Visitors L2
Public Places L3
Village Identity L4
Buildings L5
Roads L6
Walking & Cycling L7
Public T
ranspo
rt L8
Parking L9
DIRECTIONS
STRATEGIES
INDICATORS
TARGETS
Where we want to head
Measuring our progress
Where we want to be
How we will get there
Sus
tain
able
Com
munity
Sustainable Living
Sustainable Governance S
usta
inab
le E
nvi
ronm
ent
VISION Where the community want to head

27
WAVERLEY COUNCIL
Integrated Planning & Reporting—Our 12 Focus Areas A Community Engagement Strategy was employed by Council when developing Waverley Together 2. The outcome of this strategy was that the people of Waverley gave Council a clear picture of what they value as important and the direction they wish to take. Council received a multitude of demands and requests for services, programs
and outcomes all of which were rated by the community as important, very important or critical. Council was able to distil a list of the 12 focus areas and has selected and assembled key activities into areas of special effort to ensure Council directs its energies to increase our chances of meeting targets. These top 12 focus areas and areas of special effort are set out below.
1 Protecting and enjoying our beaches and costal open spaces
• Keeping up our great beach cleaning
program
• Continuing our world leading beach
lifeguard service
• Keeping our new coastal and cliff walks
as new
• Re-turfing the parks and installing
sustainable watering systems
• Taking a total catchment management
approach to reduce pollution from urban stormwater that drains to the coast
• Pursuing our targets for greenhouse gas
emission reductions to help prevent or slow sea level rises
• Developing climate change adaptation
strategies in asset management plans for coastal areas
2 Staying connected as a community
• Expanding our affordable and aged
housing programs
• Expanding and diversifying our
volunteering networks
• Providing childcare places at an
affordable price
• Maintaining our extensive array of family
support services
• Providing improved information,
services and facilities to our older community and people with disabilities
• Increasing the capacity of public trans-
port services
• Investing in upgrades of assets used for
walking and cycling, including establishing more greenlinks and bike routes
• Implementing the Bondi Junction
Pedestrian Access Mobility Plan
• Developing and implementing a Bondi
Beach Pedestrian Access Mobility Plan
• Improving pedestrian access to Bondi
Junction bus and rail interchange
3 Living with Urban Density
• Thinking about better road sharing by
cars and alternative transport by designing a long term plan for smarter travel routes into, through and out of the area
• Setting the right incentives in place—
including appropriate pricing and time limiting of parking—to reduce both
private car ownership and private car travel to more sustainable levels
• Promoting and developing attractive
transport alternatives, preferably funded by developers and other investors
• Expanding car share schemes
• Developing and agreeing on a long term
plan to solve the problem of Bondi Road congestion without impacting on busi-nesses and nearby residents
• Coming to an agreement about how
much parking should be provided in new developments to achieve a sustainable lifestyle and economy
• Thinking about changing community
attitudes to parking— it’s a scarce resource that needs to be fairly shared, not a right
• Ensuring planning controls consider
residential amenity impacts such as noise, solar access and privacy
• Utilising urban planning policies and
processes to improve public domains when creating new buildings
28
WAVERLEY COUNCIL
Integrated Planning & Reporting—Our 12 Focus Areas 4 Welcoming Visitors
• Developing great virtual and real visitor
information centres
• Continuing with our current highly coor-
dinated approach to event management involving State agencies and the com-munity in detailed planning for crowd management and safety during major events
• Coordinating event management with
transport and parking management
• Ensuring the extra people who will be
travelling to the LGA to work in the next 10 years use public transport
• Continuing our coordinated place
management services for Bondi Beach, especially in revising our Policy Statement on Tourism, making sure areas that attract heavy visitation do not overwhelm vital service areas for residents, and continuing to market Bondi as a destination with a difference—beachy, eclectic, relaxed but still fun, and safe
• Encouraging development of tourist
accommodation in the Bondi Junction commercial centre
• Pursue financial and other types of resource
support from State and Federal Govern-ments that assists Council in its visitor man-agement activities
5 Fostering our Cultural Diversity
• Developing our civic and open spaces to
provide multi-use venues that can cater for new types of cultural events
• Upgrading the Bondi Pavilion as a vi-
brant arts and entertainment centre, providing a diverse program of creative experiences, performances and visual arts
• Fostering indigenous and multicultural arts
festivals, performances and events
• Establishing a successful resident theatre
company at the Bondi Pavilion
• Turing our streets and reserves into venues
for inspiring sculptures
6 Renewing our health and well being
• Maintaining our community services to
help people stay in their homes for longer
• Ensuring as people age they have timely
access to information and programs about, and are appropriately referred to, health and other support services that would generally be provided by other levels of government and community organisations
• Building a new Waverley Pavilion as a
sports centre
• Developing our limited open spaces to
meet growing demands for sporting and active recreational activities, especially those that encourage participation by young people and women
• Maintaining other open spaces and infra-
structure such as memorial or sculpture parks and coastal reserves which are vital to passive recreation, enjoyment of natural beauty and spiritual renewal
• Building new works sub-depots in or close
to Waverley to bring our work teams for open space management maintenance closer to the parks and spaces they main-tain
• Developing an agreeing a plan for sustaining
Waverley Cemetery as a place of reflection, remembrance of those we have lost, and celebration of our history
7 Sprucing up our streets and villages
• Educating and regulating to prevent
rubbish dumping
• Picking up dumped rubbish quickly
when it occurs
• Removing graffiti and bill postering as
soon as it appears
• Sweeping up more frequently
• Renewing streets with smart landscap-
ing treatments that provide shade with-out loss of vistas
• Upgrading streetscapes around the main
gateways to Waverley to develop a distinct identity and a welcoming feel
• Developing the Bondi Road village into a
more effective strip shopping layout
• Improve the Bronte Beach centre by improv-
ing pedestrian access to Bronte Park

29
WAVERLEY COUNCIL
Integrated Planning & Reporting—Our 12 Focus Areas 8 Harmonising new and old design
• Preparing and implementing planning
policies which identify natural and built heritage items and conservation areas
• Recognising quality design outcomes
through annual heritage and urban design awards
• Providing expert heritage and urban
design advice to the community
• Making heritage and quality urban design a
strong focus in the development assessment process
• Ensuring new developments incorporate
sustainable building practices
• Ensuring policies and guidelines are in place
to deliver buildings which contribute to and respect the existing character, scale and
topography of the area
9 Feeling and being safe
• Increasing asset maintenance to reduce
hazards, especially in footpaths, play equipment, and around the many
retaining walls in the LGA
• Continuing road and parking safety
programs especially around schools
• Expanding fully designed 40km/hour
zones in loca streets where accidents occur
• Delivering major events with strong
safety planning
• Managing safe summers by annual promotions
of safe swimming, drinking, driving and parking
• Continuing our focus on regulation of villages,
beaches and major places to control anti-social behaviour
• Planning for integrated urban development,
zoning and design to minimise social disturbances and crime
• Building a culture of commitment to safety and
risk reduction in our workforce, especially in their daily routines in public spaces
10 Prospering through our economy
• Implementing key aspects of Council’s
adopted Investment Strategy including a new childcare centre at Bondi Junction
• Redeveloping unused parking spaces in
Eastgate Carpark to deliver increased custom to surrounding businesses by creating space for more people to work and shop in Bondi Junction
• Renewing building facades,
streetscapes and footpath treatments in Bondi Junction, particularly around Eastgate
• Making the dream of a bigger Bondi
Junction Mall within a well planned BJ
• Getting a north-south pedestrian connection
from Bondi Junction interchange to increase access to the western and central sectors of the Junction
• Increasing the potential for employment-
generating development in the Bondi Junction commercial centre
• Continually calibrating the parking system to
maximise its capacity and efficiency in delivering parking opportunities, particularly in Bondi Beach, while minimising or avoiding the need to increase supply
• Building the economic viability of our local
village centres by ensuring they service the needs of the local community
11 Venturing into new and sustainable environmental futures
• Working with neighbouring Councils to
investigate opportunities for the estab-lishment of regional alternative waste technologies that divert waste from land-fill
• Pursuing a partnership with Energy Aus-
tralia to upgrade street lighting with energy efficient alternatives
• Encouraging and facilitating district
cogeneration in new and existing com-mercial, retail and residential develop-ment
• Increasing coverage and connectivity of
identified wildlife habitat corridors by working with private and public land-holders
• Developing pricing policies to ensure
new developments in Bondi Junction are
• Investing and implementing programs
including discounts, bulk purchasing, brokerage, retrofit services and other incentives for encouraging uptake of energy and water efficient technologies and behaviours, efficient hot water alternatives (solar hot water and heat pumps), water harvesting and reuse, and solar PV
• Exploring partnerships with Sydney Water to
utilise treated effluent for district irrigation
• Amending planning instruments to protect all
areas of native vegetation and habitat
• Partnering with the community to reduce
household vehicle kilometres travelled
• Identifying all target groups within the
community and establishing ways to engage with them on sustainability issues
30
WAVERLEY COUNCIL
Integrated Planning & Reporting—Our 12 Focus Areas 12 Engaging everyone for far sighted and better decision making
• Implementing Integrated Planning, now
required by law, for a great QBL outcome, especially by integrating strategic asset management planning, environmental planning, urban land use planning under the Waverley LEP, ongoing social planning, human resource planning and long term financial planning
• Continuing to consult widely and deeply
about desired service levels for assets and programs to ensure our services are really delivering what’s most relevant to residents’ needs
• Building great information and
communications programs so that consultation especially on the most difficult or divisive issues can occur based on the best information
• Building a better website interface between the
community and Council including more interactive consultation pages, improved project e-tracking and search functionality, more e-trading and introducing e-planning
• Building a workforce that is committed to en-
gagement and excited by the prospect of un-derstanding desires and meeting them in clever and efficient ways
Waverley’s Integrated Plans—How our services achieve the Community Vision There is a direct connection between the services delivered by Waverley Council and the achievement of the Community Vision and Targets of the Community Strategic Plan
(Waverley Together 2). The diagram below sets out this relationship which shows how the services of the Council directly contribute to achieving the community’s Vision.
Activities Activities Activities Activities within within within within all our ...all our ...all our ...all our ...
SERVICES
DIRECTIONS &
STRATEGIES
contribute contribute contribute contribute to the to the to the to the implementation implementation implementation implementation of ...of ...of ...of ...
22 Main Services
150 Sub-services
(including capital Works Projects)
33 Directions
79 Strategies in Waverley
Together 2
assisting with assisting with assisting with assisting with the the the the commitment commitment commitment commitment to meet ...to meet ...to meet ...to meet ...
TARGETS
60 Targets/Indicators for the
Quadruple Bottomline in
Waverley Together 2
which if met, which if met, which if met, which if met, will enable the will enable the will enable the will enable the Community to Community to Community to Community to realise its ...realise its ...realise its ...realise its ...
VISION
14 Vision Elements of
Waverley by 2022

31
WAVERLEY COUNCIL
Integrated Planning & Reporting—Achieving the Community Vision The services Waverley Council delivers and the Directions they contribute to achieving are:
Waverley Council Services….
… contribute to achievement of Waverley Together 2
Directions/ Strategies …
Asset Management Services G6
Beach Services, Maintenance & Safety C5, L3
Cemetery Services C1, C2, G6
Child Care Services C4
Community Services C4, C5
Corporate Support Services G5, G7, G8, G9
Cultural Services C1, C2, C5, C6, L1, L2
Customer Services & Communication G1, G2, G3, G8
Development, Building & Health Services L4, L5
Emergency Management Services C5
Environmental Services E1, E2, E3, E4, E5, E6, E7, E8
Governance, Integrated Planning & Community Engagement C2, G1, G2, G3, G4, G5, G6, G7, G8
Library Services C1, C2, C4
Parking Services C2, C5, L1, L2, L6, L7, L8, L9
Parks Services & Maintenance C7, E1, E6, L3, L4
Place Management C2, C5, C6, C7, L1, L2, L3, L4, E3, G2, G6
Recreation Services C6, C7
Regulatory Services C5, E7, E5, L2, L3
Social & Affordable Housing C3, C4, C5
Traffic & Transport Services C2, C5, L1, L2, L6, L7, L8, L9
Urban Open Space Maintenance & Accessibility L3
Waste Services E3, L3
For details on the Directions see p.26

32
This section of our Annual Report aims to briefly outline the highlights of what we achieved in 2011-2012 measured against the targets we set in our Operational Plan 2011-2012. It shows the significant outcomes we
achieved in the four elements of the quadruple bottom line: • Sustainable Community • Sustainable Living • Sustainable Environment
WAVERLEY COUNCIL
Did we do what we said we would do? - Highlights
Sustainable Community
Deliverable A coordinated program of social, recreational and cultural events targeting diverse groups
Our Target Four events supporting multiculturalism and indigenous culture provided annually
What we achieved
• Festival of the Winds
• Ocean Pacifika
• Bondiesta 2012
• Chanukkah
• Russian Victory Day
• Reconciliation Week
Deliverable Programs which encourage volunteer-ing including civic pride and bushcare
Our Target Support and expand the bush care program
What we achieved
• Four Council programs involve volunteers in 2011-2012
Deliverable A range of current and equitable information and recreational Library resources and services
Our Target Provide a lending and reference library service for adults and children within Waverley
What we achieved
• 27,926 library member-ships in 2011-12
• 573,620 loans and 8.3 loans per capita
• 514,674 person visits to the library
Deliverable High quality affordable long day care
Our Target Provide long day care and family day care for children aged 0-5
What we achieved
• 174 children in long day care
• 97% of capacity utilised
• More than 170 children in family day care
Deliverable Financial and other support to the community to improve capacity
Our Target Provide funding through community grants program
What we achieved
• $521,966 provided in grants for 2011-12 to community groups,
services and organisations to provide services and activities across the local govern-ment area
Deliverable A program of Surf Awareness and Edu-cation Programs
Our Target Develop Surf Awareness & Education Programs
What we achieved
• 10 surf education pro-grams run
• One program aimed at vulnerable groups

33
WAVERLEY COUNCIL
Did we do what we said we would do?- Highlights
Sustainable Community Deliverable Financial support to arts & cultural programs
Our Target Fund arts prizes for annual competition at Waverley School of Arts
What we achieved
• $7000 provided for an-nual arts prizes
Deliverable Sports fields and other active recreation facilities upgraded
Our Target One improvement project from Plans of Management & Mas-ter Plans completed annually
What we achieved
• Plan of Management for Waverley Park com-pleted and adopted
• Works identified in Bronte Park POM under-taken
Deliverable Playgrounds upgraded
Our Target Upgrade Bronte Park playground upgrade and development of children’s bicycle track Dudley Page Reserve
What we achieved
• Upgrade of Bronte Park Playground completed
• Children’s Bicycle track Dudley Page Reserve
Deliverable Planning controls that support an increase in the number of units or monetary contributions towards affordable housing
Our Target Number of affordable housing units is steady or increasing
What we achieved
• 2 new Voluntary Plan-ning Agreements estab-lished in 2011-12
Sustainable Living Deliverable Annual Marketing and advertising program aimed at increased visitation and eco-nomic activity in Bondi Junction
Our Target Undertake marketing events and activities to reinforce Bondi Junction’s role as a centre
What we achieved
• Six marketing events undertaken annually
• Annual Business Awards
Deliverable Management of Companion Animals
Our Target Less animals im-pounded annually compared to base year of 2009-10
What we achieved
• 114 animals seized com-pared to 136 2010-11
• 50 animal infringements issued compared to 220 2010-11
Deliverable Footpath amenity and accessibility improved
Our Target Improving pedestrian links throughout the local government area
What we achieved
• Implementation of Stages 3 and 4 of the Green Links Pedestrian Network from Bondi Junction to Tamarama Park plus Waverley and Bronte Parks

34
WAVERLEY COUNCIL
Did we do what we said we would do?- Highlights Sustainable Living
Deliverable Ongoing public education program on heritage and good design
Our Target Conduct annual Heritage and Design Awards
What we achieved
• Heritage and Urban Design Awards held April 2012
Deliverable Bus shelters maintained and re-placed
Our Target Replacement of bus shelters undertaken in accordance with program
What we achieved
• 2 bus shelters replaced annually
Deliverable All public place areas including high profile gardens, landscaped traffic calming de-vices and village centres maintained
Our Target Landscaped traffic calming devices are maintained, streets and non landscaped traffic calming de-vices are cleaned
What we achieved
• Steam cleaning footpaths in Campbell Pde, Bondi Junc-tion Mall, Bondi Junction commercial precinct, Bondi Beach commercial precinct, Old South Head Rd, Bondi Rd & Bronte Rd
• 8 traffic calming devices replanted with new plants
Deliverable Beach cleaning and beach pool cleaning program undertaken
Our Target 95% of beach clean-ing and 80% of pool cleaning programs meet timeframe & standards set
What we achieved
• Beach Parks cleaned daily
• Deployment of Beach Rake daily at Bondi & weekly at Bronte & Tamarama beaches
• North Bondi pool emptied & cleaned weekly
Deliverable Parks & reserves cleaned and maintained
Our Target Major parks cleaned daily, other parks cleaned weekly 95% of the time and emer-gency cleaning un-
What we achieved
• Waverley Park, Thomas Hogan Reserve, Bronte Park & Marks Park cleaned daily
• All other parks & reserves cleaned weekly
Deliverable Inspection and removal of dumped rubbish and where appropriate enforce-ment action
Our Target All dumped rubbish removed within one week of notification
What we achieved
• 2011-12 381.94 tonnes ille-gally dumped rubbish re-moved by Council
Deliverable Approved develop-ments achieve high quality urban design outcomes
Our Target All development applications ap-proved in line with Council’s planning controls and policies
What we achieved
• 2011-12 898 development applications approved by Council
Deliverable Footpath amenity and accessibility improved
Our Target Cost within + or—10% of agreed budget and com-pleted within 3 months of agreed timetable
What we achieved
• 2011-12 $975,279 spent on footpath maintenance and construction

35
WAVERLEY COUNCIL
Did we do what we said we would do?- Highlights
Sustainable Environment
Deliverable Building regulation, inspection and com-pliance undertaken
Our Target Building Certificates issued within 14 days
What we achieved
• In October 2011, Council launched an on-line automated S149 Certifi-cate issuing system which allows the public to order the certificates on-line and receive via e-mail
Sustainable Living
Deliverable Renewable technol-ogy opportunities at Council’s top 5 green-house gas sites iden-tified and imple-mented
Our Target Reduce greenhouse gas emissions at these 5 sites
What we achieved
• Council purchases one quarter of power at these sites reducing gas emis-sions by 722 tonnes for 2011-12
Deliverable A domestic waste recycling service together with a public litter collection service
Our Target Decrease in tonnes of domestic waste collected annually
What we achieved
• 26,703 tonnes of waste collected ( 26,877 tonnes in 2010-11)
Deliverable Identify and investi-gate potential future impacts of climate change on the LGA
Our Target A climate change vulnerability assess-ment to be under-taken
What we achieved
• The Waverley Coastal Zone Risk & Hazards Vulnerability Assessment completed
Deliverable Encourage and support community involvement in our environmental program
Our Target Coordinate and sup-port community work-shops & provide up to date information to residents
What we achieved
• Environmental events and workshops attracted 4,233 participants in 2011-12
• 17 schools and 199 educators and parents participate in Eastern Suburbs Sustainable Schools Network
Deliverable Residential food waste reduction pro-gram implemented
Our Target Decrease in tonnes of domestic waste collected annually
What we achieved
• 785 Waverley residents are now active partici-pants in the Compost Revolution which is run in partnership with Wool-lahra Council.
• 240 people participated in Compost Week activities
36
WAVERLEY COUNCIL
Did we do what we said we would do?- Highlights Sustainable Environment
Deliverable Provide a domestic waste clean-up ser-vice
Our Target Reduction in the amount of waste sent to landfill
What we achieved
• 4129 mattresses were collected by Cou8ncil for recycling
Deliverable Local events & initia-tives that encourage recycling of other waste
Our Target Run workshops , e-waste collections and chemical clean-out
What we achieved
• 60 tonnes of e-waste was collected n 2011-12 for recycling via e-waste drop-off days in 2011-12.
Deliverable Pollution prevention devices installed and maintained through-out the LGA
Our Target Gross pollutant traps monitored and main-tained across the LGA
What we achieved Council maintains 7 gross pollutant traps along the coastline to prevent litter, leaves and sediment entering into Bondi, Tamarama and Bronte Beaches and the ocean near Dover Heights. Pit baskets are used to capture these pollutants further upstream
Deliverable Encourage the use of active travel (walking, cycling, car share and public transport) as an alternative to the private car
Our Target Increase car share availability within the LGA
What we achieved
• 61 car share spaces are currently available within the LGA
Sustainable Governance
Deliverable Advisory committees, Precinct Committees and community fo-rums supported and maintained
Our Target Provide support for the Precinct system
What we achieved
• 60 community committees and forums held in 2011-12 (including 3 combined Precinct Meetings)
Deliverable Irrigation efficiency at top five Council irriga-tion sites
Our Target Improved irrigation efficiency at Council sites
What we achieved
• Waverley Park stormwa-ter reuse system com-missioned in Sept 2011 will provide an estimated 35 ML of recycled water each year
• Bondi Park stormwater reuse system came online in March 2012
37
WAVERLEY COUNCIL
Did we do what we said we would do?- Highlights Sustainable Governance
Deliverable A regular professional produced and interesting newsletter
Our Target Newsletter produced and distributed
What we achieved
• 4 editions of Waverley in Fo-
cus produced in 2011-12
• 46 weekly Mayoral Columns published
• 29 media releases produced 2011-12
Deliverable A capital works program
Our Target 80% of priority capital works on budget and on time delivery
What we achieved
• Waverley Pavilion completed and opened
• Roads, footpaths & kerb & gutter on budget & time
Deliverable Compliance with Government Informa-tion Public Access & Privacy and Personal Information Protection Acts
Deliverable An annual asset maintenance program
Our Target 80% of adopted Annual Maintenance Programs on budget and on time delivery
What we achieved
• $1,994,000 spent on build-ings maintenance
• $1,560,000 on roads mainte-nance
• $1,180,000 on footpath main-tenance
• $866,000 spent on kerb & gutter
• $581,000 spent on drainage
Our Target All applications processed by Governance within legislative timeframe
What we achieved
• 48 Access to Information applications received in 2011-12
• All applications completed within statutory timeframe
Deliverable Professional & timely support and assistance to council-lors & meetings of Council and Council committees
Our Target 95% of minutes and agendas for Council and council commit-tees meet service standards set
What we achieved In 2010-11:
• 12Council meetings held
• 52 committee meetings held (including 11Council inspec-tion meetings)
Deliverable Significant govern-ance policies devel-oped and existing policies reviewed
Our Target Policies reviewed within required time-frame
What we achieved
• Councillors expenses & facili-ties policy reviewed Septem-ber 2011
• Complaint Handling Policy reviewed September 2011
• Credit Card Usage Policy developed August 2011
• All policies on Council web-site
38
WAVERLEY COUNCIL
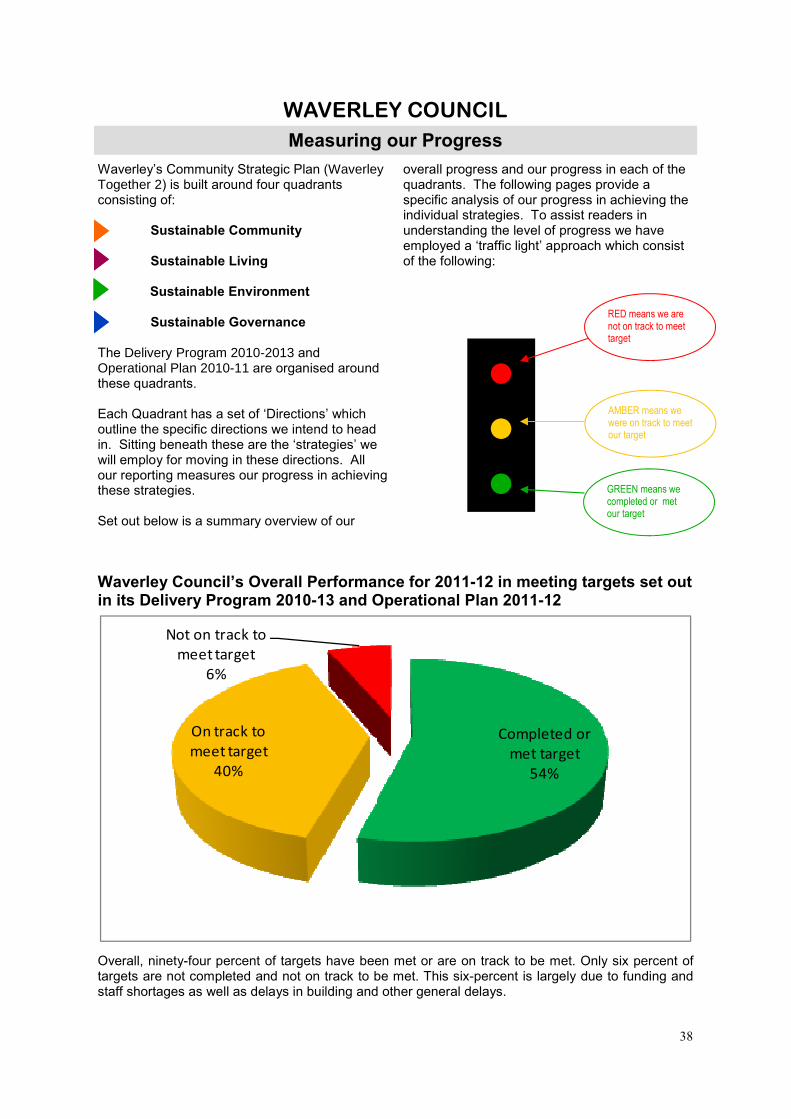
Measuring our Progress Waverley’s Community Strategic Plan (Waverley Together 2) is built around four quadrants consisting of:
Sustainable Community
Sustainable Living
Sustainable Environment
Sustainable Governance
The Delivery Program 2010-2013 and Operational Plan 2010-11 are organised around these quadrants. Each Quadrant has a set of ‘Directions’ which outline the specific directions we intend to head in. Sitting beneath these are the ‘strategies’ we will employ for moving in these directions. All our reporting measures our progress in achieving these strategies. Set out below is a summary overview of our
overall progress and our progress in each of the quadrants. The following pages provide a specific analysis of our progress in achieving the individual strategies. To assist readers in understanding the level of progress we have employed a ‘traffic light’ approach which consist of the following:
RED means we are not on track to meet target
AMBER means we were on track to meet our target
GREEN means we completed or met our target
Waverley Council’s Overall Performance for 2011-12 in meeting targets set out in its Delivery Program 2010-13 and Operational Plan 2011-12
Overall, ninety-four percent of targets have been met or are on track to be met. Only six percent of targets are not completed and not on track to be met. This six-percent is largely due to funding and staff shortages as well as delays in building and other general delays.
● ● ●
Completed or
met target
54%
On track to
meet target
40%
Not on track to
meet target
6%
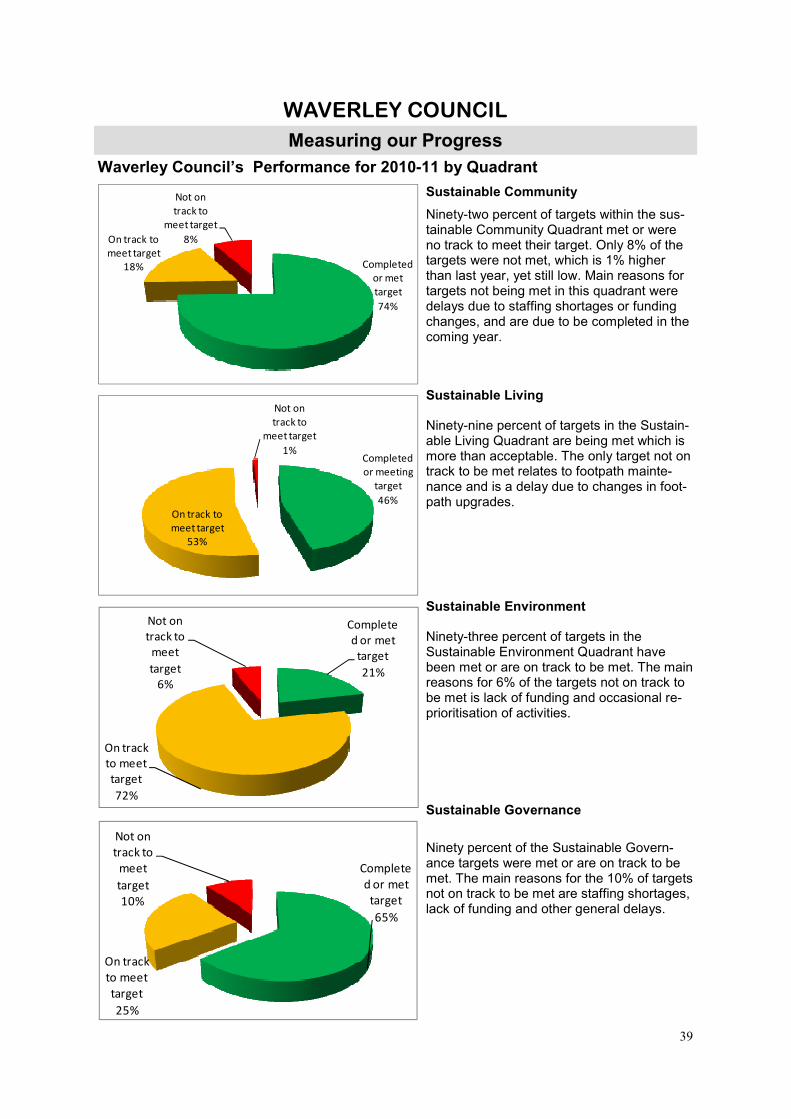
39
WAVERLEY COUNCIL
Measuring our Progress Waverley Council’s Performance for 2010-11 by Quadrant
Completed
or met
target
74%
On track to
meet target
18%
Not on
track to
meet target
8%
Completed
or meeting
target
46%
On track to
meet target
53%
Not on
track to
meet target
1%
Complete
d or met
target
21%
On track
to meet
target
72%
Not on
track to
meet
target
6%
Complete
d or met
target
65%
On track
to meet
target
25%
Not on
track to
meet
target
10%
Sustainable Community
Sustainable Living
Sustainable Environment
Sustainable Governance
Ninety-two percent of targets within the sus-tainable Community Quadrant met or were no track to meet their target. Only 8% of the targets were not met, which is 1% higher than last year, yet still low. Main reasons for targets not being met in this quadrant were delays due to staffing shortages or funding changes, and are due to be completed in the coming year.
Ninety-nine percent of targets in the Sustain-able Living Quadrant are being met which is more than acceptable. The only target not on track to be met relates to footpath mainte-nance and is a delay due to changes in foot-path upgrades.
Ninety-three percent of targets in the Sustainable Environment Quadrant have been met or are on track to be met. The main reasons for 6% of the targets not on track to be met is lack of funding and occasional re-prioritisation of activities.
Ninety percent of the Sustainable Govern-ance targets were met or are on track to be met. The main reasons for the 10% of targets not on track to be met are staffing shortages, lack of funding and other general delays.
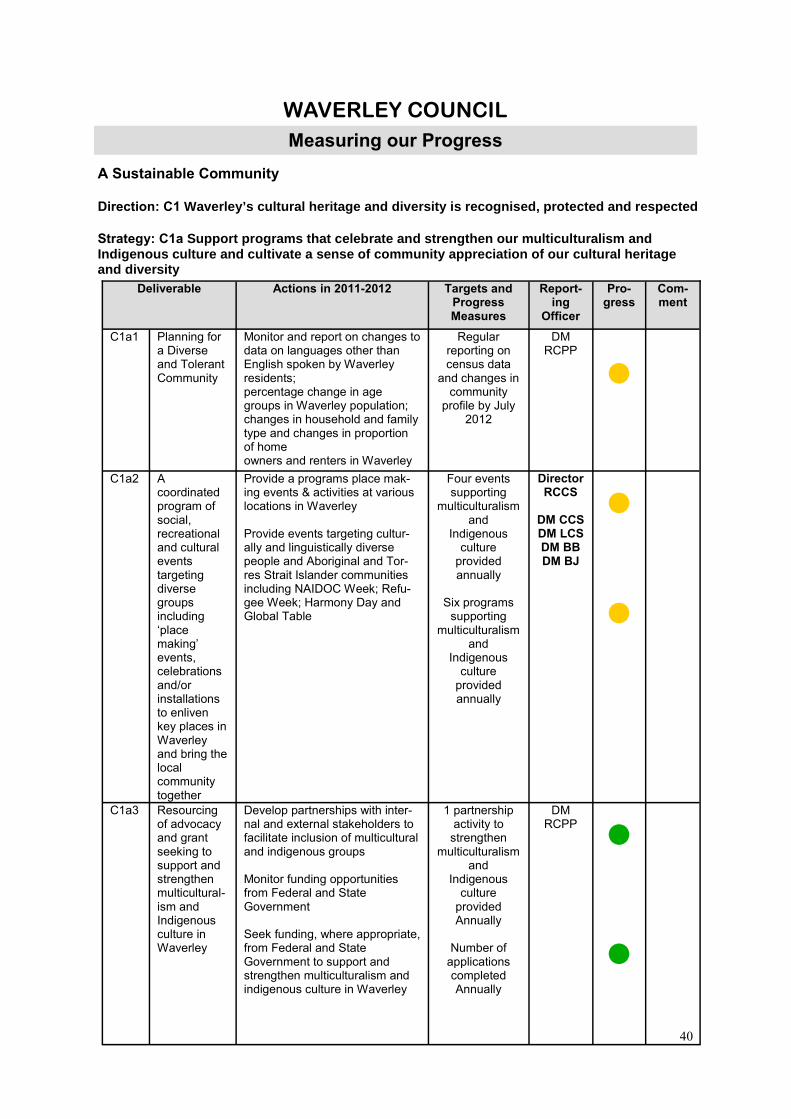
40
WAVERLEY COUNCIL
Measuring our Progress A Sustainable Community Direction: C1 Waverley’s cultural heritage and diversity is recognised, protected and respected Strategy: C1a Supp ort programs that celebrate and strengthen our multiculturalism and Indigenous culture and cultivate a sense of community appreciation of our cultural heritage and diversity
Deliverable Actions in 2011-2012 Targets and Progress Measures
Report-ing
Officer
Pro-gress
Com-ment
C1a1 Planning for
a Diverse and Tolerant Community
Monitor and report on changes to data on languages other than English spoken by Waverley residents; percentage change in age groups in Waverley population; changes in household and family type and changes in proportion of home owners and renters in Waverley
Regular reporting on census data
and changes in community
profile by July 2012
DM RCPP
●
C1a2 A coordinated program of social, recreational and cultural events targeting diverse groups including ‘place making’ events, celebrations and/or installations to enliven key places in Waverley and bring the local community together
Provide a programs place mak-ing events & activities at various locations in Waverley Provide events targeting cultur-ally and linguistically diverse people and Aboriginal and Tor-res Strait Islander communities including NAIDOC Week; Refu-gee Week; Harmony Day and Global Table
Four events supporting
multiculturalism and
Indigenous culture
provided annually
Six programs
supporting multiculturalism
and Indigenous
culture provided annually
Director RCCS
DM CCS DM LCS DM BB DM BJ
● ●
C1a3 Resourcing of advocacy and grant seeking to support and strengthen multicultural-ism and Indigenous culture in Waverley
Develop partnerships with inter-nal and external stakeholders to facilitate inclusion of multicultural and indigenous groups Monitor funding opportunities from Federal and State Government Seek funding, where appropriate, from Federal and State Government to support and strengthen multiculturalism and indigenous culture in Waverley
1 partnership activity to
strengthen multiculturalism
and Indigenous
culture provided Annually
Number of
applications completed Annually
DM RCPP
●
●
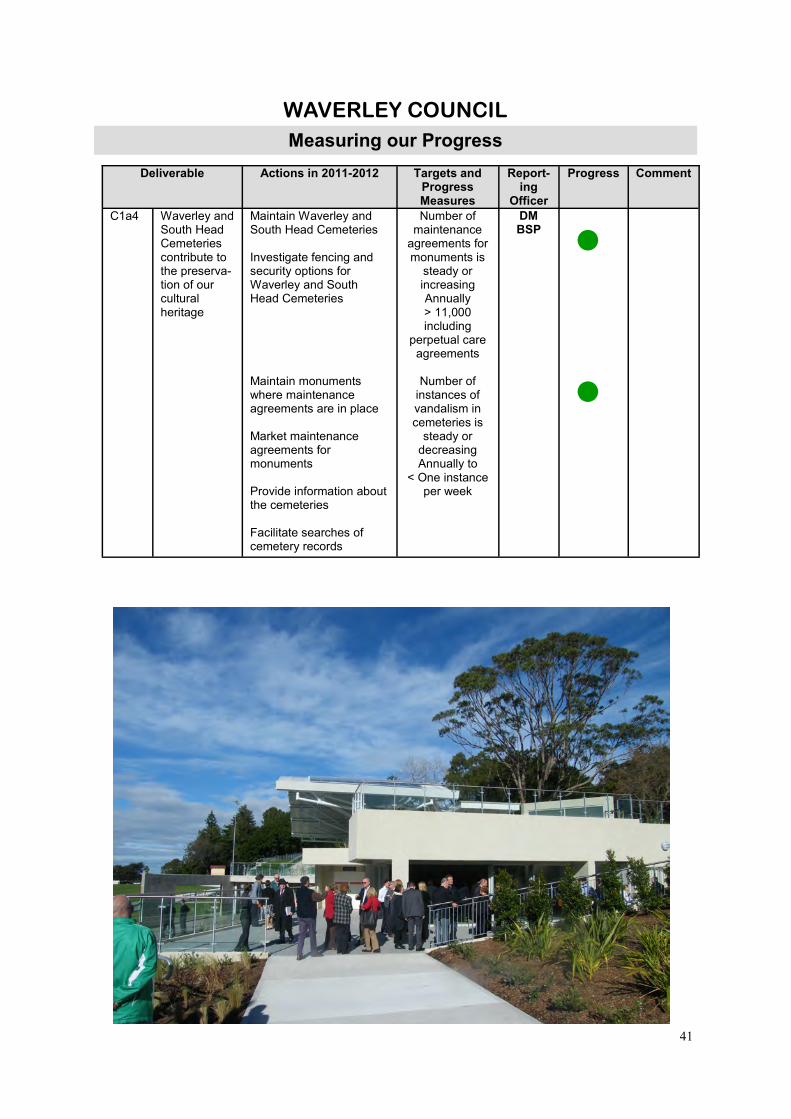
41
Deliverable Actions in 2011-2012 Targets and Progress Measures
Report-ing
Officer
Progress Comment
C1a4 Waverley and South Head Cemeteries contribute to the preserva-tion of our cultural heritage
Maintain Waverley and South Head Cemeteries Investigate fencing and security options for Waverley and South Head Cemeteries Maintain monuments where maintenance agreements are in place Market maintenance agreements for monuments Provide information about the cemeteries Facilitate searches of cemetery records
Number of maintenance
agreements for monuments is
steady or increasing Annually > 11,000 including
perpetual care agreements
Number of
instances of vandalism in cemeteries is
steady or decreasing Annually to
< One instance per week
DM BSP
●
●
WAVERLEY COUNCIL
Measuring our Progress

42
Direction: C2 The community is welcoming and inclusive, and people feel they are connected and belong Strategy: C2a Provide a broad range of relevant, affordable and accessible facilities, spaces, programs and activities that promote harmony, respect and togetherness
Deliverable Actions in 2011-2012 Targets and Progress Measures
Report-ing
Officer
Pro-gres
s
Comment
C2a1
Affordable and accessible community facilities
Provide spaces at the Mill Hill Centre for community groups Provide spaces at the Bondi School of Arts for local artists and community groups Provide spaces at Bondi Pavilion for community groups Provide buses for use by community groups Provide a community garden for use by residents and community organisations who lack access to a garden
More than 50% of available venue hours
used per week compared to
hours available
Community buses are used
at least five hours per day
90% of
community garden plots
regularly gardened
Director RCCS
DM
RCPP DM CCS
●
●
●
C2a2
A coordinated program of social, recreational and cultural events targeting diverse groups
Provide a coordinated program of events for identified target groups including children, youth, older people and people with disability Provide a range of adult and children’s public programs and exhibitions at Waverley Library Provide programs including music, art exhibitions, festivals, workshops and special events at Bondi Pavilion Develop recreation activities for young people at Bondi Junction Implement recreation activities for young people at Bondi Junction
15 events for different
groups held annually
48 library programs and
exhibitions annually
40 programs at
the Bondi Pavilion annually
Bondi Junction recreation
activities for young people
developed and implemented by June 2011
Director RCCS
DM
RCPP DM CCS
●
●
●
●
WAVERLEY COUNCIL
Measuring our Progress

43
Deliverable Actions in 2011-2012 Targets and Progress Measures
Report-ing
Officer
Pro-gress
Comment
C2a3
A range of current and equitable information and recreational Library resources and services A range of current and equitable information and recreational Library resources and services
Provide a lending and reference library service for adults and children Provide a local studies service Answering enquiries in person or via the website Provide publications in alternative formats
Over 28,000 library
memberships in 2011/12
Over 500,000
loans and over 9 loans per capita in
2010/11
Over 450,000 visits in per-son and over 50,000 visits to library via website in 2010/11
Over 80% of enquiries to the library
successfully completed on
same day
DM LCS
●
●
●
●
C2a4
Accessible cemetery services for internments, memorials and associated ceremonial Activities
Provide interments and associated services Investigate Cemetery pavilion construction (offset by loan to be repaid by entry into funeral business) (Service Plus Compo-nent 6—Providing more access to vital services)
Number of internment services
provided at our
cemeteries annually is
> 172
Community panel
established and
community meeting held by June 2012
DM BSP
● ●
WAVERLEY COUNCIL
Measuring our Progress

44
Strategy: C2b Encourage and foster community pride through volunteering initiatives such as the ‘Civic Pride’ program
Deliverable Actions in 2011-2012 Targets and Pro-gress Measures
Report-ing
Officer
Pro-gress
Comment
C2b1
Programs which encourage volunteering including civic pride and bushcare that enhance community cohesion.
Develop a Volunteering Strategy Provide a civic pride program Support and expand bush care program Develop a community garden management group
40% of Volunteering strategy
recommendations implemented
Garden group
established by June 2012
Four Council
programs involve volunteers in 2011/12
Program review
completed by June 2012
Two groups
established by December 2011
Two regeneration
projects targeted in partnership with
volunteers
DM RCPP
●
●
●
● ●
●
WAVERLEY COUNCIL
Measuring our Progress

45
Direction: C3 Housing options are available to enable long term residents and those with a connection to the community to remain in Waverley Strategy: C3a Promote a mix of housing types in new developments, including housing that is affordable and accessible
Deliverable Actions in 2011-2012 Targets and Progress Meas-
ures
Report-ing
Officer
Pro-gres
s
Com-ment
C3a1 Planning controls that support an increase in the number of units or monetary contributions towards affordable housing
Promote planning mechanisms for the generation of new affordable housing under the Waverley Affordable Housing Program (WAHP), SEPP (Affordable Rental Housing) 2009, or other housing policy Implement planning controls that seek to retain existing affordable housing
100 % of affordable
housing units (rent capped) provided under the WAHP complete term of
lease or equivalent value provided in cash
Number of affordable
housing units in Council
Ownership is retained of increased
100% of new
affordable housing
recommendations implemented
100% of
affordable housing units retained or mitigated for is
lost
DM SLUP
●
● ●
●
WAVERLEY COUNCIL
Measuring our Progress

46
Strategy: C3b Ensure Council’s own portfolio of housing is affordable and accessible
Deliverable Actions in 2011-2012 Targets and
Progress Measures
Report-ing
Officer
Pro-gress
Comment
C3b1
Social housing for older people, people with a disability and families on low to middle incomes
Provide a range of social housing options Where possible acquire additional units of social housing
Number of social
housing units is
steady or increasing
(currently 55 units)
DM RCPP
●
C3b2
Affordable housing for low to moderate incomes households who are unable to secure rental housing and who demonstrate a strong connection to the Waverley LGA
Provide a range of affordable housing options Where possible acquire additional units of affordable housing Collect data on tenant profile for social and affordable housing
Number of affordable housing units is
steady or increasing
(currently 32 units)
Tender process
complete by December
2011
DM RCPP
● ●
Several properties leased from owners have been handed back in the past 12 months thereby reducing numbers On track for completion by Sep 2012 due to staff vacancy.
WAVERLEY COUNCIL
Measuring our Progress

47
Strategy: C3c Investigate and pursue housing initiatives through joint venture and other forms of partnership opportunities
Deliverable Actions in 2011-2012 Targets and Progress Measures
Report-ing
Officer
Pro-gress
Comment
C3c1
Support for the operation of a Housing Advisory Committee that reports to Council
Provide administrative and other support to Housing Advisory Committee Report to Council on recommendation from Housing Advisory Committee
3 meetings held/ reports to Council by
Housing Advisory
Committee annually
Report
annually by June 2012
DM RCPP
● ●
Support for the provision of low cost housing through the Boarding House Rebate Scheme
Provide a Boarding House Rebate Scheme
Number of 41 boarding
houses in the Waverley
area maintained
DM SLUP ●
The Boarding House Scheme was completed for the 2010-2011 financial year and is no longer in operation.
C3c3
A working group to develop local and regional partnerships to address homelessness
Convene a meeting of internal partners to develop strategies to address homelessness
At least three partnerships
formed to support needs of homeless
people
DM RCPP
●
WAVERLEY COUNCIL
Measuring our Progress

48
Direction: C4 Community support services continue to be targeted to, and accessible by, those who need them most, including children and young people, older people and people with a disability Strategy: C4a Continue to resource family support services, afford able childcare and programs for young people, older people and people with a disability
Deliverable Actions in 2011-2012 Targets and Progress Measures
Report-ing
Officer
Pro-gress
Comment
C4a1
High quality affordable long day care and family day care for children aged 0-5 and holiday and recreational programs for preschool children
Provide long day care for children aged 0-5 years. Provide family day care for children aged 0-5 years Provide holiday and recreational programs for pre-school children
97% of capacity utilised
Minimum of 223 children in long day
care per day
More than 150 children in family day care per day
At least 20 children in
each holiday care program
All services
maintain accreditation
DM CCS
●
●
● ● ●
WAVERLEY COUNCIL
Measuring our Progress
49
Deliverable Actions in 2011-2012 Targets and Progress Measures
Report-ing
Officer
Pro-gress
Comment
C4a1
High quality affordable long day care and family day care for children aged 0-5 and holiday and recreational programs for preschool children
Council’s fees within +/- 15% of average of
other providers
At least 75% satisfaction score from
annual child care and family
day care services user
surveys
DM CCS
●
●
C4a2
Support to families and their children aged from birth to 5 years including parenting programs and counselling
Provide specific support to families and their children aged from birth to 5 years Coordinate a program of parenting education and support programs Provide places in Council’s Child Care Centres for children with additional needs Provide family case management and counselling Provide community information forums about children’s services
At least 80 families in parenting
education & support
programs annually
At least 25
spaces provided for children with
additional needs annually
At least 40
families in case management
and/or counselling
annually
100 participants at the ‘Transition
to School’ forum
DM CCS
●
●
●
●
WAVERLEY COUNCIL
Measuring our Progress

50
Deliverable Actions in 2011-2012 Targets and Progress Measures
Report-ing
Officer
Pro-gress
Comment
C4a3
An increase in the number of child care places provided by Council
Finalise operational plans for early Learning and Care Centre Construction of new Early Learning & Care Centre (Service Plus Compo-nent 6—Providing more and safer access to vital services)
Centre is operational
Finished cost is within + or - 10% of agreed
budget and completed
within 6 months of
agreed timetable
DM RCPP
DM M&C
● ●
Delays to construction from wet weather and remediation and other factors have meant that the OC will not be provided until June 2012. This will delay licensing process until later in 2012.
C4a4
An annual forum of young people organised by Council
Develop format and program for forum for young people Conduct forum of young people
50 young people
participate in engagement
activities
One annually
DM RCPP
●
●
This has been delayed until August to align with opening of new recreation centre.
C4a5
Recreational and social initiatives for young people
Develop new recrea-tion/social activities for young people Introduce new recrea-tion/social activities for young people
New recrea-tion/ social activities
developed for young people by December
2011
One new recreation/
social activity developed with young people
annually
DM RCPP
●
●
WAVERLEY COUNCIL
Measuring our Progress

51
WAVERLEY COUNCIL
Measuring our Progress Deliverable Actions in 2011-2012 Targets and
Progress Measures
Report-ing
Officer
Pro-gress
Comment
C4a6
High quality affordable services for frail older people including Meals on Wheels, Home Library Service and programs at Bondi Pavilion
Maintain HACC valida-tion for programs Provide a Meals on Wheels service Provide a shopping service Provide a Waverley Home Library Service Provide programs for older people at Bondi Pavilion
All services maintain
accreditation
At least 80 meals provided daily at home
for older People
At least 10 shopping
service user Clients
180 Home
Library Service users
18,000 loans per annum
Over 80%
satisfaction rating from
annual client survey
Home Library Service and
Meals on Wheels
deliveries fully integrated
Provide four programs at
Bondi Pavilion per month
Direc-tor
RCCS
DM CCS DM LCS
●
● ●
● ● ●
●
●
Program integration on hold pending the completion of a feasibility assessment of the proposal

52
Deliverable Actions in 2011-2012 Targets and Progress Measures
Report-ing
Officer
Pro-gress
Comment
C4a7
Services for the over fifties including a senior’s centre that offers recreational, physical, educational and social activities
Operate a senior centre Provide a varied program of activities and events for older people
Average monthly
attendance at Seniors Centre maintained or
increased from base (1700)
At least 30 programs/ activities
provided per week at
Seniors Centre for older people
DM CCS
●
●
C4a8
Services for adults with mild intellectual disability to promote independent living
Provide a program of classes and courses aimed at improving independent living skills for people with mild intellectual disability
12 life skills
courses held annually
DM CCS
●
C4a9
Individual support and medium term accommodation places for people with mild intellectual disability
Provide subsidised rental accommodation places for people with intellectual disability. Provide individual and group support and case management services for people with mild intellectual disability
Six people with intellectual disability
provided with subsidised
rental accommoda-tion places
12 people with mild intellectual
disability provided with
support annually
Satisfaction rating of at
least 75% in annual client
survey
DM CCS
●
●
●
WAVERLEY COUNCIL
Measuring our Progress

53
Strategy: C4b Provide support to community organisations to improve their ability to plan and deliver services to the community
Deliverable Actions in 2011-2012 Targets and Progress Measures
Report-ing
Officer
Pro-gress
Comment
C4b1
Financial and other support to the community to improve capacity and to support partnerships that enhance Council’s vision in relation to children, young people, older people, those with a disability and marginalised groups
Provide subsidised accommodation for identified groups Provide management support to community group Provide funding through the community grants program to organisations targeting children, young people, older people, those with a disability and the community generally Provide funding through the small grants program for community groups delivering cultural, recreational and social outcomes Monitor community grants program recipients to ensure that funding provided meets Social Plan priorities
All subsidised accommoda-tion provided
to priority groups
Review of
management support pro-vided com-pleted by
June 2012
Family and Community
organisations provided with
grants to $83,000
Children’s
organisations provided with
grants to $27,500
Youth
Services organisations provided with
grants to $110,000
Organisation
for Older People and those with a
Disability provided with
grants to $50,928
$79,000 provided annually
through small grants
program to community
groups
All grant recipients to meet Social
Plan priorities
DM RCPP
●
●
●
●
●
●
●
●
WAVERLEY COUNCIL
Measuring our Progress

54
Strategy: C4c Analyse and interpret emerging social trends, contemporary research and government initiatives to inform the services provided by Council and its partner agencies
Direction: C5 People feel safe in all parts of Waverley Strategy: C5a Maintain safety in public areas such as malls, parks and beaches and target safety and crime prevention in specific areas to address alcohol related issues and support vulnerable groups
Deliverable Actions in 2011-2012 Targets and Progress Measures
Report-ing
Officer
Pro-gress
Comment
C4c1
Up to date and accessible community profile and demographic information
Ensure Council’s online profile is reviewed regularly and supplemented with updates
Reviewed and updated by June 2012
DM RCPP
●
C4c2
Documented research on key issues including safety, housing, children, ageing
Completed social planning research for identified priority issues
Two social planning research reports
completed annually
DM RCPP
●
Deliverable Actions in 2011-2012 Targets and Progress Measures
Report-ing
Officer
Pro-gress
Comment
C5a1
Implementation of Community Safety Plan
Safety audits of Bondi and Bondi Junction Place undertaken Issues from audits that require attention actioned Current alcohol free zones reviewed Current alcohol free zones renewed or new zones implemented Alcohol free zones signs installed and maintained
At least two safety audits of
Bondi and Bondi Junction
undertaken annually
Alcohol free
zones in Bondi reviewed by June 2012
Alcohol free
zones in Bondi Junction
reviewed by October 2011
Condition and
location of alcohol free zone signs audited in
October and April annually
Director RCCS
DM BB DM BJ ●
●
●
●
WAVERLEY COUNCIL
Measuring our Progress

55
Deliverable Actions in 2011-2012 Targets and Progress Measures
Report-ing
Officer
Pro-gress
Comment
C5a2
Funding sought from other levels of government to develop and provide community safety programs
Identify external funding sources for community safety strategies Apply for funding to implement community safety strategies
50% of funding applications for
community safety grants
are successful annually
DM RCPP
●
C5a3
A summer strategy for Bondi to promote a safe and enjoyable environment at peak times
Safe Summer Initiative reviewed, and evaluated annually Safe Summer program implemented for 2011-12 Safe Summer Initiative model reviewed for 2012-15
Safe Summer Initiative
reviewed by September
Implemented by December
2010
Evaluation by April 2011
Model
reviewed march—
August 2011
DM BB
● ● ● ●
C5a4
Increased passive surveillance and night time security in Oxford Street mall
Encourage evening activities on Oxford Street Mall including late trading businesses
Four busi-nesses trading
after 5pm in Oxford Street
Mall
Less than 5% of survey
results show safety
concerns in Bondi Junction
DM BJ
●
●
WAVERLEY COUNCIL
Measuring our Progress

56
Strategy: C5b Continue to strengthen community safety and crime prevention partnerships with police, licensees, businesses, youth organisations, schools, regulatory and emergency services and other agencies
Deliverable Actions in 2011-2012 Targets and Progress Measures
Report-ing Offi-
cer
Pro-gress
Comment
C5b1
Support for the operation of a Community Safety Committee
Participate in and support community safety programs Provide administrative and other support to Community Safety Committee
At least two programs
undertaken with external
partners during 2011-
12
Community Safety
Committee includes
Police and at least three
other community
interest groups
Major project implemented
annually
DM RCPP
● ● ●
C5b2
Provision of emergency management including sup-port for Waverley/ Woollahra SES
Provide accommodation and other support for Waverley/Woollahra SES Meet regularly with Waverley/Woollahra SES Controller Maintain up to date Disaster Management Plans
Disaster Man-agement Plan
(DISPLAN) reviewed and
kept up to date
Director PW&S
●
WAVERLEY COUNCIL
Measuring our Progress

57
Strategy: C5c Maintain a high level of beach safety at Bondi, Bronte and Tamarama
Deliverable Actions in 2011-2012 Targets and Progress Measures
Report-ing Of-
ficer
Progress Comment
C5c1
A Life Guard Service, deploying Council Lifeguards and working with surf life saving clubs to safeguard the public and minimise risk to Council at Waverley’s beaches
Roster Lifeguards for year round operations at Council’s beaches Recruit and provide induction and training for casual Lifeguards for summer season Work with surf life saving clubs and volunteer lifesavers Undertake patrols of beaches to maintain surf safety Undertake rescues and provide first aid and other assistance on Council’s beaches
No lives lost by drowning on
Council’s beaches annually
Less serious injuries on Council’s
beaches in 2011/12
compared to 2010/11
Less rescues undertaken on
Council’s beaches in
2011/12 than 2010/11
Volunteer surf
life savers attend
Council’s beaches all
weekends and public holidays
DM BS
●
● ● ●
C5c2
A program of Surf Awareness/Education Programs
Develop Surf Awareness/Education Programs Present Surf Awareness/Education Programs Review the format, content and provision of Surf Awareness/Education Programs presented
At least 10 surf education programs
presented each year
including one targeted for vulnerable
groups
DM BS
●
C5c3
Financial and other support to surf lifesaving clubs in the Waverley area to support the pro-vision of volunteer lifesaving programs
Provide support to surf lifesaving clubs in the Waverley Support refurbishment works at North Bondi Surf club (Misc Buildings 05)
Provide at least $72,500 in
funding or in kind support to surf lifesaving clubs in the
Waverley area annually
Finished cost within 10% of agreed budget and completed within 6 months
of timetable
DM BS DM BSP
DM MC ● ●
WAVERLEY COUNCIL
Measuring our Progress

58
Strategy: C5d Assist in the maintenance of public health in Waverley
Direction: C6 Ar ts and cultural activities foster an involved community and a creative environment Strategy: C6a Enrich the cultural life of the community by providing and supporting a variety of cultural events and activities for residents and visitors
Deliverable Actions in 2011-2012 Targets and Progress Measures
Report-ing
Officer
Pro-gress
Comment
C5d1
Health, food and hygiene inspec-tions undertaken
Undertake inspections of registered food premises Undertake inspections of registered hair and beauty premises
80% of all required
inspections of prem-ises
undertaken
DM C
●
Deliverable Actions in 2011-2012 Targets and Progress Measures
Report-ing
Officer
Pro-gress
Comment
C6a1
A diverse and exciting range of arts and cultural events across Waverley
Provide arts events across Waverley including events provided in partnership Provide cultural events across Waverley including events provided in partner-ship
At least 40 arts/cultural events held
annually
20 partnership events
supported by Council held annually
DM CCS
●
●
C6a2
Financial and other support to arts and cultural programs in the Waverley area
Provide funding through the Community Grants Program to Waverley Band and Waverley Philharmonic Orchestra Fund arts prizes for annual competition at Waverley School of Arts
At least $7,700 funding provided to Waverley Band and
Waverley Philharmonic
Orchestra annually
At least $7,000 funding for annual
arts prizes
$10,000 to Sculpture by the Sea
$5,000 for an artist for Mayors Prize at
Sculpture by the Sea
Up to $8,000 to Kite flyers Association
DM RCPP
●
●
● ●
●
C6a3
Implementation of Artsplus Plan
Implement the Artist in Residence Program Implement the Resident Theatre Program
One arts, entertainment or cultural initiative
developed annually
Up to $70,000 funding
provided annually to resident
theatre company
DM RCPP
●
●
WAVERLEY COUNCIL
Measuring our Progress

59
Strategy: C6b Enco urage art in public places and public art in private developments
Deliverable Actions in 2011-2012 Targets and Progress Measures
Report-ing
Officer
Pro-gress
Comment
C6a4
Funding sought from other levels of government to develop and provide arts, entertainment and cultural events in Waverley
Identify opportunities for funding and awards to celebrate and support arts and cultural events Develop and submit submissions for funding and awards to celebrate and support arts and cultural events
Two awards received and grant funding
obtained annually
Director RCCS
DM
RCPP DM CCS
●
Deliverable Actions in 2011-2012 Targets and Progress Measures
Report-ing
Officer
Pro-gress
Comment
C6b1
Art in the public space.
Maintain public art inventory Implement public art maintenance plan Develop annual agreement with Sculpture by the Sea Encourage suitable public art in the private domain Develop public art in suitable locations in Waverley
Public art inventory and maintenance
plan completed by March 2011
Agreement on level of support
for Sculpture by the Sea
completed by August 2011
100% increase in public art in private domain
in Bondi Junction from
base year 2009/2010
Increase of public art in
public domain (at least one
piece annually)
DM RCPP
●
●
● ●
This will be developed as part of the process of developing SAMP4
C6b2
A public art trail in Waverley
Develop promotional material to make existing public art accessible through a planned ‘”trail”
Report on progress with
development of the public art trail by March
2012
DM RCPP
● This has been re-scheduled to be finalized by Dec 2012 following development of ArtsPlus
WAVERLEY COUNCIL
Measuring our Progress
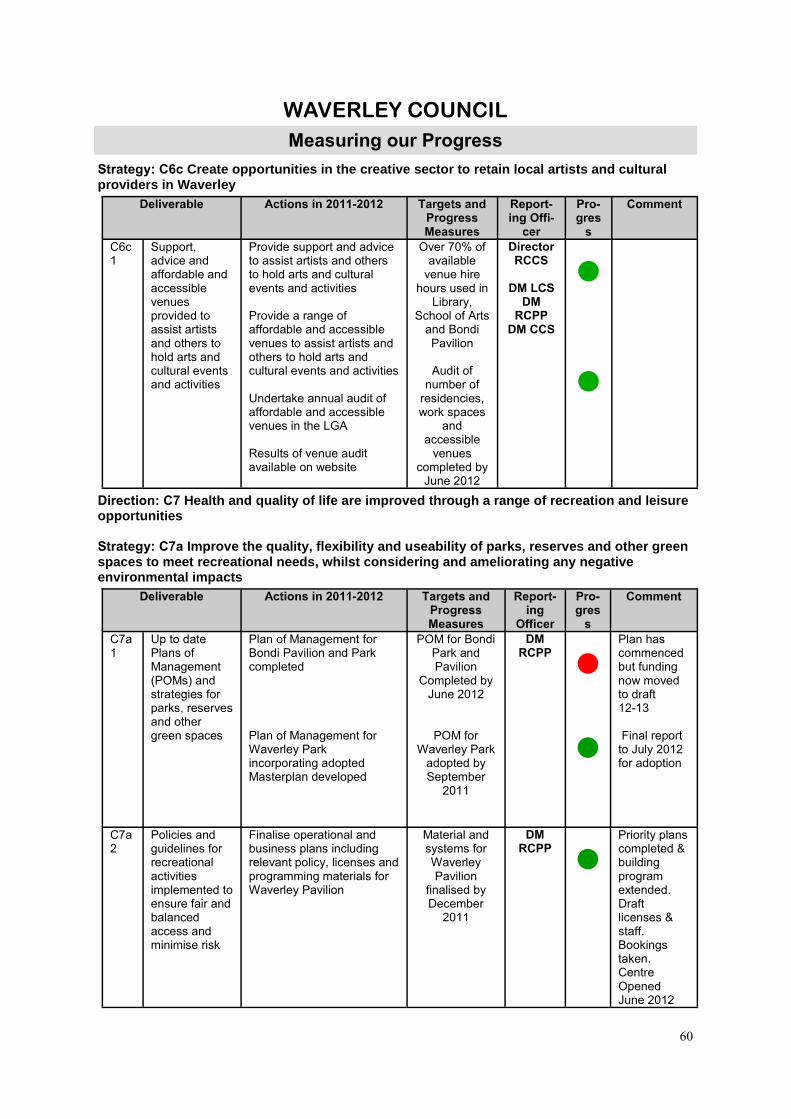
60
Strategy: C6c Create opportunities in the creative sector to retain local artists and cultural providers in Waverley
Direction: C7 Health and quality of life are improved through a range of recreation and leisure opportunities Strategy: C7a Improve the quality, flexibility and useability of parks, reserves and other green spaces to meet recreational needs, whilst considering and ameliorating any negative environmental impacts
Deliverable Actions in 2011-2012 Targets and Progress Measures
Report-ing Offi-
cer
Pro-gres
s
Comment
C6c1
Support, advice and affordable and accessible venues provided to assist artists and others to hold arts and cultural events and activities
Provide support and advice to assist artists and others to hold arts and cultural events and activities Provide a range of affordable and accessible venues to assist artists and others to hold arts and cultural events and activities Undertake annual audit of affordable and accessible venues in the LGA Results of venue audit available on website
Over 70% of available
venue hire hours used in
Library, School of Arts
and Bondi Pavilion
Audit of
number of residencies, work spaces
and accessible
venues completed by
June 2012
Director RCCS
DM LCS
DM RCPP
DM CCS
●
●
Deliverable Actions in 2011-2012 Targets and Progress Measures
Report-ing
Officer
Pro-gres
s
Comment
C7a1
Up to date Plans of Management (POMs) and strategies for parks, reserves and other green spaces
Plan of Management for Bondi Pavilion and Park completed Plan of Management for Waverley Park incorporating adopted Masterplan developed
POM for Bondi Park and Pavilion
Completed by June 2012
POM for Waverley Park
adopted by September
2011
DM RCPP
●
●
Plan has commenced but funding now moved to draft 12-13 Final report to July 2012 for adoption
C7a2
Policies and guidelines for recreational activities implemented to ensure fair and balanced access and minimise risk
Finalise operational and business plans including relevant policy, licenses and programming materials for Waverley Pavilion
Material and systems for Waverley Pavilion
finalised by December
2011
DM RCPP
● Priority plans completed & building program extended. Draft licenses & staff. Bookings taken. Centre Opened June 2012
WAVERLEY COUNCIL
Measuring our Progress

61
Strategy: C7b Determine and prioritise future recreation and leisure needs based on regional as well as local facilities
Deliverable Actions in 2011-2012 Targets and Progress Measures
Report-ing
Officer
Pro-gress
Comment
C7a3
2008 Recrea-tion Needs Study implemented
Continue to implement priority actions in relation to facilities in Waverley Park, Barracluff Park and Rodney Reserve
All priority actions for the
Recreation Needs Study
completed
DM RCPP
●
C7a4
A playground strategy to identify planned upgrades and improvements developed
Develop a play strategy Play strategy completed by
December 2011
DM RCPP
● Delayed due to increased Federal and State funding for playground development which took priority
Deliverable Actions in 2011-2012 Targets and Progress Measures
Report-ing
Officer
Pro-gress
Comment
C7b1
Recreation opportunities provided in response to community needs
Carry out activities which support local sport and recreation groups Develop programs for the new Waverley Park Pavilion
Mayor’s Bowls Cup held by
September 2011
Program for new Waverley
Pavilion for 2012 developed by
December 2011
DM RCPP
●
●
Staff recruitment delayed due to rate variation and extended timeframes for construction. Program has been developed in 2012.
WAVERLEY COUNCIL
Measuring our Progress
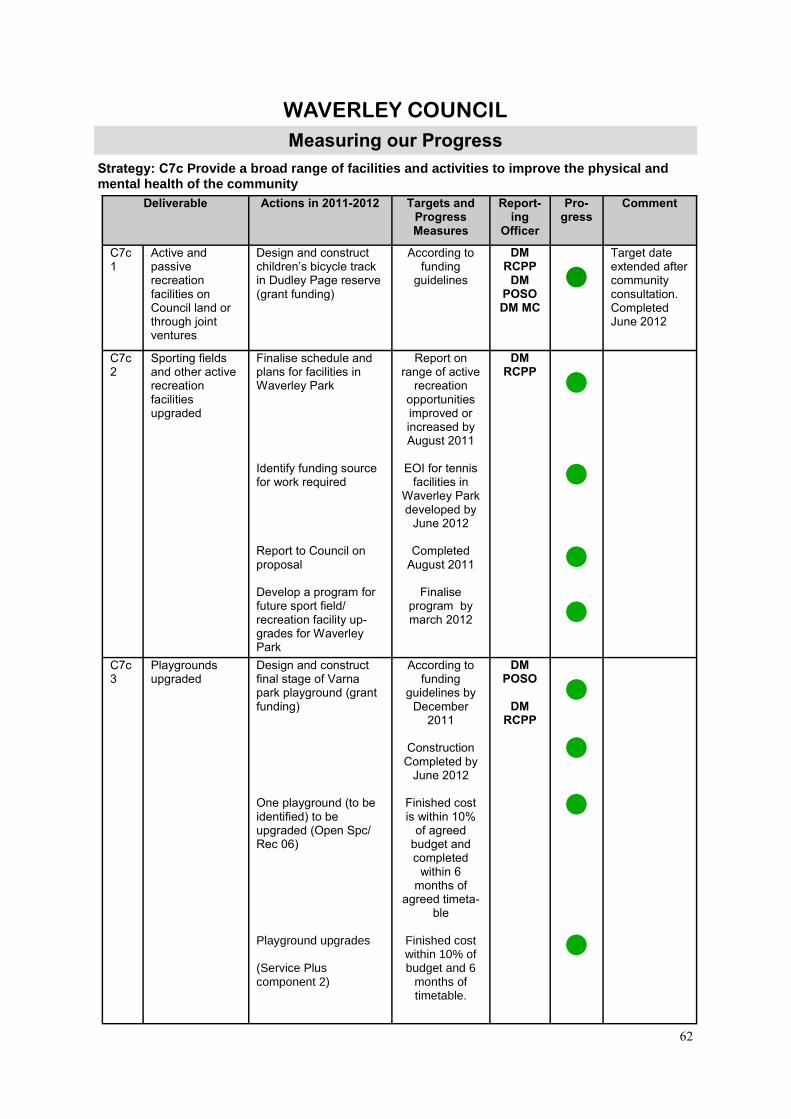
62
Strategy: C7c Provide a broad range of facilities and activities to improve the physical and mental health of the community
Deliverable Actions in 2011-2012 Targets and Progress Measures
Report-ing
Officer
Pro-gress
Comment
C7c1
Active and passive recreation facilities on Council land or through joint ventures
Design and construct children’s bicycle track in Dudley Page reserve (grant funding)
According to funding
guidelines
DM RCPP
DM POSO DM MC
● Target date extended after community consultation. Completed June 2012
C7c2
Sporting fields and other active recreation facilities upgraded
Finalise schedule and plans for facilities in Waverley Park Identify funding source for work required Report to Council on proposal Develop a program for future sport field/recreation facility up-grades for Waverley Park
Report on range of active
recreation opportunities improved or increased by August 2011
EOI for tennis
facilities in Waverley Park developed by
June 2012
Completed August 2011
Finalise
program by march 2012
DM RCPP
● ●
● ●
C7c3
Playgrounds upgraded
Design and construct final stage of Varna park playground (grant funding) One playground (to be identified) to be upgraded (Open Spc/Rec 06) Playground upgrades (Service Plus component 2)
According to funding
guidelines by December
2011
Construction Completed by
June 2012
Finished cost is within 10%
of agreed budget and completed
within 6 months of
agreed timeta-ble
Finished cost within 10% of budget and 6
months of timetable.
DM POSO
DM
RCPP
●
●
●
●
WAVERLEY COUNCIL
Measuring our Progress
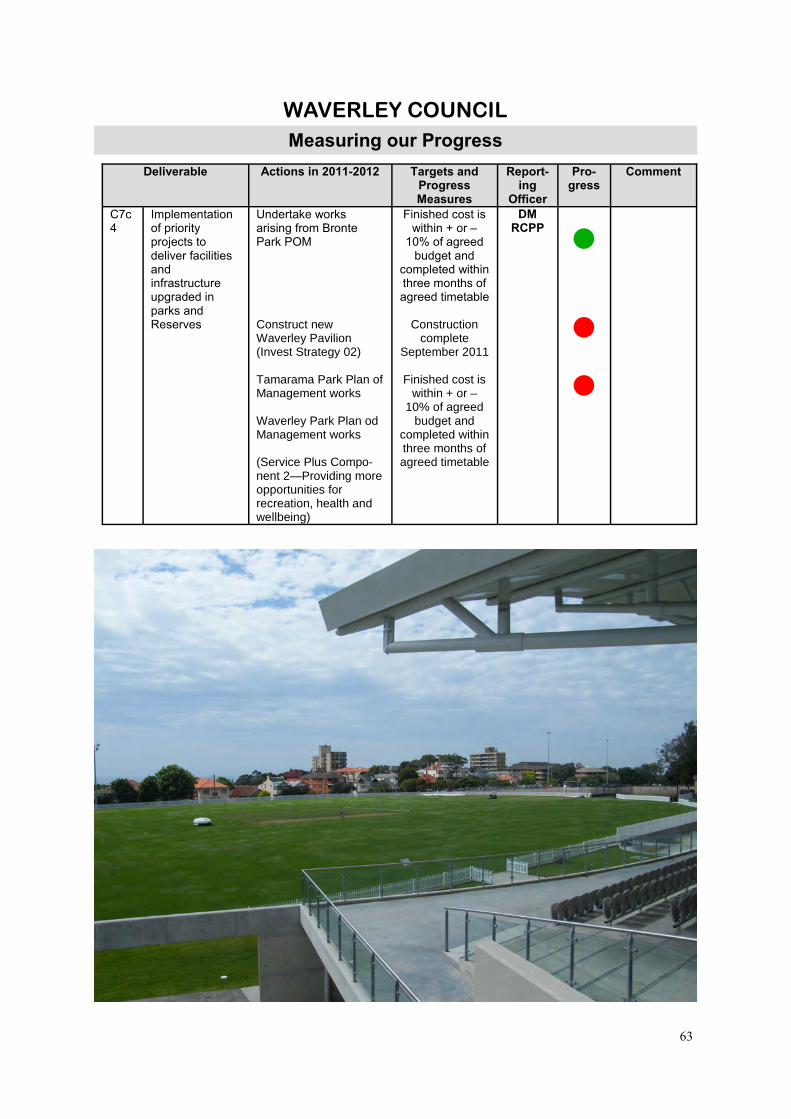
63
Deliverable Actions in 2011-2012 Targets and Progress Measures
Report-ing
Officer
Pro-gress
Comment
C7c4
Implementation of priority projects to deliver facilities and infrastructure upgraded in parks and Reserves
Undertake works arising from Bronte Park POM Construct new Waverley Pavilion (Invest Strategy 02) Tamarama Park Plan of Management works Waverley Park Plan od Management works (Service Plus Compo-nent 2—Providing more opportunities for recreation, health and wellbeing)
Finished cost is within + or –
10% of agreed budget and
completed within three months of agreed timetable
Construction
complete September 2011
Finished cost is
within + or – 10% of agreed
budget and completed within three months of agreed timetable
DM RCPP
●
●
●
WAVERLEY COUNCIL
Measuring our Progress

64
Sustainable Living Direction: L1 Waverley’s economy is vibrant and robust and supports the creation of a variety of jobs and business opportunities Strategy: L1a Reinforce Bondi Junction’s role as a regional centre and a focus for retail, hospitality, business, commercial and professional services and entertainment activities
Deliverable Actions in 2011-2012 Targets and Progress Measures
Report-ing
Officer
Pro-gress
Comment
L1a1
An annual marketing and advertising program aimed at Increased visitation and economic activity in Bondi Junction
Undertake marketing, events and activities to reinforce Bondi Junction’s role as a centre for retail, hospitality, business, commercial and professional services and entertainment Work with other organisations and groups to market and promote Bondi Junction Carry out regular Business Activity Audit and report results of these audits Undertake a survey of retailers annually Use annually retailer survey results to develop Bondi Junction marketing events/activities and advertising
At least six marketing events and activities
undertaken annually
At least two cooperative marketing
events/activities or advertising
undertaken each year including
Business Awards
Two Business Activity reports
and audits produced annually
indicating steady or improved
occupancy rates
All survey results from
annual retailer survey show
level or improved
satisfaction levels
DM BJ
●
●
●
●
L1a2
Improved communication with major Bondi Junction stakeholders
Support and attend meets of the Bondi Junction Forum Meet with other Bondi Junction business stakeholders regularly
At least four Bondi Junction Forums and six
Chamber of Commerce, BEC
and other business
stakeholder groups attended
annually
DM BJ
●
WAVERLEY COUNCIL
Measuring our Progress

65
WAVERLEY COUNCIL
Measuring our Progress
Deliverable Actions in 2011-2012 Targets and Progress Measures
Report-ing
Officer
Pro-gress
Comment
L1a3
Well utilised, integrated and welcoming public and private domains in Bondi Junction achieved through the development approval process
Development applications for works within the private and public domain in Bondi Junction commercial precinct assessed against relevant “Place Making Principles” and guidelines in Part F1 of Waverley DCP 2006
All development application
assessments for major private
developments within Bondi
Junction commercial precinct to
apply ‘Place Making’
principles
DM DA
●
L1a4
Bondi Junction Traffic and Transport study adopted recommendations implemented
Implement funded actions from Bondi Junction Traffic and Transport study Report regularly on progress
80% of Traffic and Transport recommenda-
tions implemented
as per schedule
DM TS
●
L1a5
Minimal disruption to commercial activity in the centre achieved through management of the impact of public domain works and private development works
Prior notification of commencement of Council works discussed with businesses in general location and potential impact business entrances resolved Enforcement of development approvals and building work compliance
Complaints received in relation to
public domain works and
private development
works in Bondi Junction less
than base year 2009/2010
DM C
TM TS ● ●
Increase the availability of commercial office space with good access to public transport facilities
Actions for this deliverable will be carried out in future years of this Delivery Program period (subject to available funding)
Improve the aesthetic appearance of one of Bondi Junction’s largest and central buildings
Actions for this deliverable will be carried out in future years of this Delivery Program period (subject to available funding)
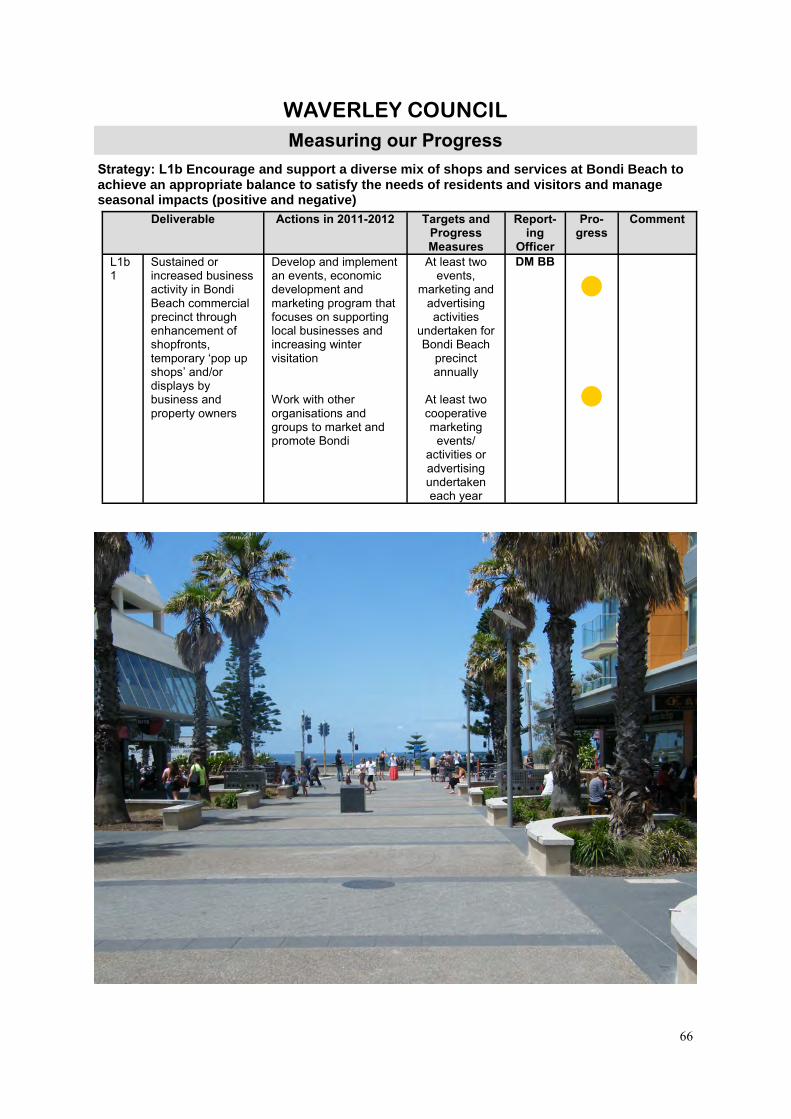
66
WAVERLEY COUNCIL
Measuring our Progress Strategy: L1b Enco urage and support a diverse mix of shops and services at Bondi Beach to achieve an appropriate balance to satisfy the needs of residents and visitors and manage seasonal impacts (positive and negative)
Deliverable Actions in 2011-2012 Targets and Progress Measures
Report-ing
Officer
Pro-gress
Comment
L1b1
Sustained or increased business activity in Bondi Beach commercial precinct through enhancement of shopfronts, temporary ‘pop up shops’ and/or displays by business and property owners
Develop and implement an events, economic development and marketing program that focuses on supporting local businesses and increasing winter visitation Work with other organisations and groups to market and promote Bondi
At least two events,
marketing and advertising activities
undertaken for Bondi Beach
precinct annually
At least two cooperative marketing
events/activities or advertising undertaken each year
DM BB
●
●
67
Deliverable Actions in 2011-2012 Targets and Progress Measures
Report-ing
Officer
Pro-gress
Comment
L1b1
Sustained or increased business activity in Bondi Beach commercial precinct through enhancement of shopfronts, temporary ‘pop up shops’ and/or displays by business and property owners
Undertake a survey of retailer annually Use annually retailer survey results to develop Bondi marketing events and activities Carry out regular Business Activity Audit and report results of these audits
Annual Retailer survey results are equal to or
improve on previous result
Two Business
Activity Reports and Audits for
Bondi conducted and indicate
steady or Improved
occupancy rates annually
Reports on
audits provided biannually
DM BB
●
●
●
L1b2
Improved communication with major Bondi stakeholders
Support and attend meets of the Bondi Forum Meet with other Bondi business stakeholders regularly
At least four Bondi Forum,
and five Chamber of
Commerce, BEC and other business
stakeholder groups attended
annually
DM BB
●
L1b3
Well utilised, integrated and welcoming public and private domains in Bondi achieved through the development approval process
Assess and approve development applications for Bondi place in line with Councils planning controls and policies
All development application
assessments for major private developments within Bondi’s commercial
precinct to apply ‘Place Making’
principles
DM DA
●
L1b4
Public domain works undertaken as part of overall Design Framework for Bondi Beach
Undertake Bondi Beach Design Framework public domain works Performance against budget and delivery timeline monitored closely and variances reported.
Finished cost is within + or - 10%
of agreed budget and
completed within three months of agreed timetable
Director PW&S
DM TS
DM MC
●
WAVERLEY COUNCIL
Measuring our Progress

68
Strategy: L1c Support the creation of jobs and business opportunities in Waverley commercial areas including its villages and neighbourhood centres
Deliverable Actions in 2011-2012 Targets and Progress Measures
Report-ing Offi-
cer
Pro-gress
Comment
L1b5
Minimal disruption to commercial activity achieved through management of the impact of public domain works and private development works
Prior notification of commencement of Council works discussed with businesses in general location and potential impact business entrances resolved Enforcement of development approvals and building work compliance
Less complaints received in
relation to public domain works
and private development
works at Bondi Beach
compared to base year 2009/2010
DM C
●
Deliverable Actions in 2011-2012
Targets and Progress Measures
Report-ing Offi-
cer
Pro-gress
Comment
L1c1
Sustained or increased business activity in commercial neighbour-hoods and Village Centres
Develop and implement an economic development and marketing program Meet with other business stakeholders regularly Carry out regular Business Activity Audit and report results of these audits
At least two cooperative
marketing events/activities or advertising undertaken
annually
Business Activity Audit shows
business activity in commercial
villages stable or increasing
At least six
meetings with business
stakeholders per annum
Director RCCS
DM BB DM BJ
● ●
●
WAVERLEY COUNCIL
Measuring our Progress

69
Direction: L2 Visitors and tourists are welcomed and make a positive contribution to the community and economy Strategy: L2a Develop and implement tourism initiatives to benefit the local economy and community
Deliverable Actions in 2011-2012
Targets and Progress Measures
Report-ing
Officer
Pro-gress
Comment
L2a1
Support for Indigenous enterprise opportunities in Waverley
Consultation with local Indigenous organisations and or representatives to discuss opportunities for indigenous enterprises in the Waverley area
At least two meetings held
with indigenous community
representatives annually
Director RCCS
DM BB DM BJ
●
L2a2
Improved visitor management and access to visitor information
Implement and report on 2010/2011 Visitor Management Action Plan Review 2010/2011 Visitor Management Action Plan Develop revised Visitor Management Action Plan for 2011/2012 Provide, monitor and maintain visitor information signs Develop formal visitor information points at Bondi Pavilion, Customer Service Centre Keep visitor information at visitor point up to date
85% of actions from Visitor
Management Action Plan
implemented annually
One condition
audit of information
signs conducted annually
Turnover of
100,000 + units of printed
material through Visitor
Information Points
Director RCCS
DM BB DM BJ
●
●
●
WAVERLEY COUNCIL
Measuring our Progress

70
Direction: L2 Visitors and tourists are welcomed and make a positive contribution to the community and economy Strategy: L2b Minimise the negative impacts of visitor related activities
Deliverable Actions in 2011-2012 Targets and Progress Measures
Report-ing Offi-
cer
Pro-gress
Comment
L2b1
An enhance visitor experience with negatives impacts mitigated through events, marketing and education initiatives
Develop events, marketing and education initiatives that enhance visitor experience whilst managing negative impacts Implement events, marketing and education initiatives that enhance visitor experience whilst managing negative impacts
At least three events,
marketing and education
initiatives held annually
Director RCCS
DM BB DM BJ
●
L2b2
Collaboration with various authorities and stakeholders to address visitor related issues
Seek out opportunities for joint tourism marketing initiatives for Waverley area Participate in joint tourism marketing initiatives for Waverley area
One joint tourism
marketing initiative
undertaken annually
Director RCCS
DM BB DM BJ
●
L2b3
An excessive noise compliance program
Receive and investigate noise complaints Issue fines or take other enforcement action under the Protection of the Environment Operations Act 1997 when required to deal with noise pollution
Noise complaints received annually
compared to base year 2009/2010
remain stable or reduce
Investigate 90% of complaints within seven
days of receipt
100% enforcement action for non compliance
DM C
● ●
●
WAVERLEY COUNCIL
Measuring our Progress
71
Direction: L3 Waverley’s public places and spaces look and feel good Strategy: L3a Ensure that public places are clean and well maintai ned throughout the year
Deliverable Actions in 2011-2012 Targets and Progress Measures
Reporting Officer
Pro-gress
Comment
L3a1
Improved co ordination of public place services to commercial villages and neighbour-hood centres
Review service standards annually Implement Service Level Agreements (SLAs) for Commercial Centres including Bondi and Bondi Junction Monitor and report on compliance with Service Level Agreements
Four audits of conditions and
compliance with SLA’s
undertaken annually
85% compliance
with SLA for maintenance
Director RCCS
DM BB DM BJ
●
●
L3a2
All public place areas including high profile gardens, landscaped traffic calming devices and village centres maintained
Planting and maintenance of parks high profile gardens undertaken Cleaning and maintenance of landscaped traffic calming devices undertaken Programmed cleaning of streets, village centres and non landscaped traffic calming devices undertaken in accordance with Public Place Cleansing Standards of Service. Programmed mowing of nature strips undertaken in accordance with Public Place Cleansing Standards of Service Hazards or item requiring maintenance reported and rectified
95% compliance with SLA
maintenance of parks and high profile gardens
At least 12 times per year:
Landscaped traffic
calming devices are
maintained Streets, village
centres and non
landscaped traffic calming
devices are cleaned
Programmed
maintenance of nature strips
undertaken at least four times
per year
Director PW&S
DM POSO
DM RR&PPC
●
●
●
●
WAVERLEY COUNCIL
Measuring our Progress
72
Deliverable Actions in 2011-2012 Targets and Progress Measures
Reporting Officer
Pro-gress
Comment
L3a3
Programmed cleaning and maintenance of Council assets undertaken
Undertake programmed cleaning of council assets including street furniture, signage and litterbins in accordance with adopted Service Level Agreement
90% compliance with SLA for
maintenance of Council assets
DM RR&PPC
●
L3a4
Graffiti and posters removed in accordance with Council’s Graffiti Management and Poster Removal Policy
Remove graffiti in accordance with Council’s Graffiti and Billposter Removal Policy Remove of billposters in accordance with Council’s Graffiti and Billposter Removal Policy Respond to customer requests to remove graffiti and billposters with Service Desk (customer request system) service Standards Increased graffiti removal (Service Plus Compo-nent 7—Providing more cleaning and greening of all the spaces we share)
90% compliance with established graffiti and bill poster removal
protocol
At least 890m3 graffiti removed
per quarter
DM RR&PPC
●
●
L3a5
Community awareness of and engagement with strategies to prevent/manage graffiti
Graffiti prevention/management program implemented in accordance with the Community Safety Plan
Street art strategy
developed by June 2012
Four civic pride sites maintained
per year
One new site added each year
DM RCPP
●
●
●
L3a6
Public place regulation and compliance programs undertaken
Undertake regular patrols of the area to ensure regulatory compliance in accordance with Service Level Agreements or in response to customer complaints or requests
90% of public place regulation and compliance programs meet
service standards
DM C
●
WAVERLEY COUNCIL
Measuring our Progress

73
Deliverable Actions in 2011-2012 Targets and Progress Measures
Reporting Officer
Pro-gress
Comment
L3a7
Abandoned cars removed
Identify abandon vehicles Arrange removal of abandon vehicles to Council depot and securely stored pending disposal Arrange return or disposal of abandon vehicles
All abandoned cars removed in accordance with the Impounding
Act
DM C
●
L3a8
Beach cleaning and beach pool cleaning program undertaken
Clean beach using both beach rake and cleaning staff in accordance with agree program Seasonal beach pool cleaning program developed and posted on Council’s webpage Clean beach pool in accordance with seasonal cleaning Program
95% of beach cleaning
program meets timeframe and standards set
80% of pool
cleaning meets timeframe and standards set
Director PW&S
DM POSO
DC MC
●
●
L3a9
Parks and reserves cleaned and maintained
Programmed cleaning and maintenance of major parks and coastal reserves undertaken Programmed cleaning and maintenance of other parks and reserves undertaken Emergency cleaning of parks and reserves undertaken Planting, landscaping or landscape maintenance in parks and reserves undertaken
Major parks and coastal reserves (Waverley Park, Thomas Hogan Reserve, Bronte
Park, Tamarama Park & Marks Park) cleaned daily
95% of the time
Other parks and reserves
cleaned weekly 95% of the time
All emergency
cleaning of Council reserves
undertaken within 24 hours
of customer Request
DM POSO
●
●
●
WAVERLEY COUNCIL
Measuring our Progress

74
Deliverable Actions in 2011-2012
Targets and Progress Meas-
ures
Reporting Officer
Pro-gress
Comment
L3a9
Parks and reserves cleaned and maintained
Check lists for parks completed Hazards in parks reported and rectified Hazards or item requiring maintenance reported and rectified
Landscape maintenance is completed in
Parks and reserves 95% of
time
DM POSO
●
L3a10
All playgrounds inspected and maintained regularly
Check and inspect high use playgrounds (Waverley Park & Bronte Park) daily and complete check list Check and inspect all other playgrounds monthly and complete check list
High use playgrounds
(Waverley Park and Bronte
Park) inspected daily
All other
playgrounds inspected monthly
DM POSO
●
●
L3a11
Trees in streets and reserves are maintained
Service Desk requests for maintenance of trees in streets or reserves assessed, locations inspected and works prioritised with regard to potential risk Work to maintain trees in streets or reserves undertaken
90% of customer requests for
maintenance of trees in streets or reserves met
DM POSO
●
L3a12
Management of companion animals
Ensure compliance with Companion Animals Act including control of dangerous dogs Deal with complaints about companion animals Provide companion animal reporting Deal with abandon companion animals
Less animals impounded
annually than base year 2009/2010
Investigate complaints
within 48 hours
Provide reporting as
required by the legislation within the required time
Investigate complaints regarding
abandoned animals within
24h
DM C
●
● ●
●
WAVERLEY COUNCIL
Measuring our Progress

75
Deliverable Actions in 2011-2012 Targets and Progress Measures
Reporting Officer
Pro-gress
Comment
L3a13
Inspection and removal of dumped rubbish and where appropriate enforcement action
Dumped rubbished identified and reported for inspection Dumped rubbish inspected for possible compliance action Remove dumped rubbish Undertake legal action in relation to dumped rubbish where possible
All dumped rubbish removed within one week
of notification
Number of reported
dumped rubbish less than base
year
Number of compliance
notices issued less than base
year
Number of dumped rubbish
collected less than base year
Tonnes of
dumped material collected less
than base year
DM RR&PPC
● ●
●
●
●
L3a14
‘Adopt a Tree Program’ continued
Program implemented in accordance with Street Tree Masterplan
80% of healthy trees maintained 12 months after planting season
DM RCPP
●
L3a15
Footpath garden program continued
Respond to requests for foot path gardens in accordance with policy
Five footpath gardens
approved and maintained
annually
DM RCPP
●
WAVERLEY COUNCIL
Measuring our Progress

76
Direction: L4 The unique physical qualities and strong sense of identity of Waverley’s villages is respected and celebrated Strategy: L4a Use planning and heritage policies and controls to protect and improve the unique built environment
Direction: L4 The unique physical qualities and strong sense of identity of Waverley’s villages is respected and celebrated Strategy: L4b Maintain a distinct sense of identity for individual village centres
Deliverable Actions in 2011-2012 Targets and Progress Measures
Report-ing
Officer
Pro-gress
Comment
L4a1
Approved developments maintain and enhance the identity of Waverley’s villages
Assess and approve development applications in line with Councils planning controls and policies.
All development applications
approved in line with Council’s
planning controls and
policies
DM DA
●
L4a2
All properties with heritage significance listed within LEP
Properties with heritage significance identified and reviewed Consultation undertaken, where required, into heritage listing Properties with heritage significance listed in LEP
All properties and areas with
heritage significance are identified within
LEP
DM SLUP
●
L4a3
Part H (Heritage) of Waverley DCP reviewed as part of Waverley Planning Review
Actions for this deliverable will be carried out in future years of this Delivery Program period (subject to available funding)
Deliverable Actions in 2011-2012 Targets and Progress Measures
Report-ing
Officer
Pro-gress
Comment
L4b1
Looking Good - streetscape improvement works undertaken
Consultation with key stakeholders including Place Managers undertaken Streetscape improvement works undertaken
Cost is within + or - 10% of
agreed budget and completed
within three months of
agreed timetable
DM TS
●
L4b2
Civic Pride village improvement project initiated
Consultation with key stakeholders including Place Managers Develop project at North Bondi Bus terminus with streetscape enhancement program Develop project at Murriverie Road with streetscape enhancement program
Two civic pride enhancements developed and implemented
annually
DM RCPP
● Delayed due to changes in the program for footpath upgrades
WAVERLEY COUNCIL
Measuring our Progress
77
Direction: L5 Buildings are well designed, safe and accessible and the new is balanced with the old Strategy: L5a Ensure planning and building controls for new buildings and building upgrades deliver high quality urban design that is safe and accessible, in which heritage and open space is recognised, respected and protected
Deliverable Actions in 2011-2012 Targets and Progress Measures
Report-ing
Officer
Pro-gress
Comment
L5a1
Approved developments achieve high quality urban design outcomes
Assess and approve development applications in line with Councils planning controls and policies
All development applications
approved in line with Council’s
planning controls and
policies
Median time (in days) to assess applications is in
line with other Group 2 Councils
DM DA
●
●
L5a2
New, comprehensive local environment plan (LEP) for Waverley in line with Council’s Land Use Strategy and the requirements of the NSW Department of Planning developed
Preparation of comprehensive LEP in line with Department of Planning Standard Instrument template Comprehensive LEP submitted to Department of Planning Arrange for LEP to be gazetted
New comprehensive
LEP gazetted by March 2012
DM SLUP
●
WAVERLEY COUNCIL
Measuring our Progress

78
Deliverable Actions in 2011-2012 Targets and Progress Measures
Report-ing
Officer
Pro-gress
Comment
L5a3
New comprehensive Development Control Plan (DCP) for Waverley de-veloped
Undertake review of Waverley Development Control Plan in line with new comprehensive LEP Develop revised Waverley Development Control Plan Submit revised plan to Council for adoption
New comprehensive
DCP adopted by Council by
March 2012
DM SLUP
● DCP to be Considered by Council separate to LEP (ie after March 2012)
L5a4
Strategic Land Use policies and plans reviewed regularly
Ensure all strategic land use policies and plans reviewed annually or as required Review and where necessary update Council land use policies and plans in light of new and amended state and federal government legislation and policies
All specific Strategic Land
Use policies and plans reviewed
DM SLUP
●
L5a5
Compliance with Council requests for new or amended planning policies and land use plans
Update existing or create new strategic land use policies when requested by Council
All Land Use plans/policies requested by
Council completed within
timeframe provided
DM SLUP
●
L5a6
Building regulation, inspection and compliance undertaken
Undertake building compliance inspections Respond to complaints about building compliance issues Undertake building fire safety inspections Issue building occupation certificates
Number of complaints
about building work received annually less
than or equal to base year 2009/2010
Building
certificates issued within 14
days
DM C
●
●
WAVERLEY COUNCIL
Measuring our Progress
79
Direction: L5 Buildings are well designed, safe and accessible and the new is balanced with the old Strategy: L5b Protect and maintain heritage significant buildings while ensuring they are fit for use
Strategy: L5c Consider the use of planning controls and agreements to provide improvements to built public infrastructure
Deliverable Actions in 2011-2012 Targets and Progress Measures
Report-ing
Officer
Pro-gress
Comment
L5b1
Expert heritage advice on development applications
Provide heritage advice to building applicants Provide heritage advice to Council officers to assist them in assessing building applications
90% of Heritage advice referrals
completed within service standard
(14 days)
DM SLUP
●
L5b2
An ongoing public education campaign on heritage and good design including annual Heritage and Urban Design Awards
Provide information to the public on heritage and good design Conduct Heritage and Urban Design Awards
Heritage and Urban Design
Awards conducted by
April 2012
DM SLUP
●
Deliverable Actions in 2011-2012 Targets and Progress Measures
Report-ing
Officer
Pro-gress
Comment
L5c1
Opportunities to deliver public infrastructure through Voluntary Planning Agreements (VPA)
Identify opportunities to deliver public infrastructure through Voluntary Planning Agreements Develop Voluntary Planning Agreements that deliver public infrastructure
Number of Voluntary Planning
Agreements (VPA) executed
annually increase from
base year 2009/10
DM SLUP
●
WAVERLEY COUNCIL
Measuring our Progress

80
Direction: L6 Roads and intersections are safer and less congested Strategy: L6a Reduce vehicle and pedestrian accidents by improving road and traffic safety measures
Deliverable Actions in 2011-2012
Targets and Progress Measures
Report-ing
Officer
Pro-gress
Comment
L6a1
Construction of traffic islands in the Council area
Traffic islands designed and documented Construction delivery in accordance with program
Number of accidents annually equal to or less than base year
2005: Vehicles – 252
Pedestrians – 24 Cyclists – 19
Cost within + or - 10% of agreed
budget and completed within three months of agreed
timetable
DM TS
●
L6a2
Black Spot funding applications submitted
Identify accident black spots Develop and submit funding applications for areas identified as suitable for black spot funding
Number of accidents annually equal to or less than base year
2005: Vehicles – 252
Pedestrians – 24 Cyclists – 19
DM TS
●
Deliverable Actions in 2011-2012
Targets and Progress Measures
Report-ing
Officer
Pro-gress
Com-ment
L6a3
Schools patrolled in am and pm peak to improve safety around schools
Undertake parking patrols around school zones Provide information to improve safety around schools Undertake enforcement action to ensure safety around schools
Minimum of five parking patrols a week conducted around schools
a week
DM PS
●
L6a4
Traffic and pedestrian accidents reviewed annually
Collect and collate traffic & pedestrian accident data Review traffic & pedestrian accident data Report and if required make recommendations on traffic & pedestrian accident data review
Number of accidents
annually equal to or less than base year 2005:
Vehicles – 252 Pedestrians – 24
Cyclists – 19
DM TS
●
WAVERLEY COUNCIL
Measuring our Progress

81
Direction: L6 Roads and intersections are safer and less congested Strategy: L6b Stabilise or reduce private passenger vehicle numbers or trips
Direction: L7 People frequently walk and ride their bikes, particularly for local trips Strategy: L7a Create safe and accessible pedestrian and cycle links into, out of and within Waverley
Deliverable Actions in 2011-2012 Targets and Progress Measures
Report-ing
Officer
Pro-gress
Comment
L6b1
Waverley Transport Review completed
Undertake review of Waverley Transport Review Report on results of review
Review completed by
June 2012
DM ES
●
Deliverable Actions in 2011-2012 Targets and Progress Measures
Report-ing
Officer
Pro-gress
Comment
L7a1
Availability of bicycle parking improved
Identify locations that require new or additional bicycle parking or other bicycle related facilities Provide bicycle parking or other bicycle related facilities
Annual increase in the number of bicycle parking spaces by 20 a
year
DM TS DM ES
●
L7a2
Footpath amenity and accessibility improved
Develop annual foot-path program in consultation with Access Committee Undertake adopted annual footpath Program Implement Bondi Junction Pedestrian Access and Mobility Plan stage 1 (PAMP 01) 10% increase in proportion of footpaths kept in top condition (Service Plus Compo-nent 4—Providing more and safer access to public spaces
Cost within + or - 10% of agreed
budget and completed within three months of agreed timetable
DM TS DM MC DMBB DMBJ ●
WAVERLEY COUNCIL
Measuring our Progress

82
Direction: L8 People frequently use public transport, particularly for trips to work Strategy: L8a Improve access to public transport into, out of and within Waverley
Deliverable Actions in 2011-2012
Targets and Progress Measures
Report-ing
Officer
Pro-gress
Comment
L8a1
Support for public buses to directly connect neighbour-hood centres
Bus operations reviewed annually with STA Report and if required make recommendations on traffic & pedestrian accident data review to assist with STA planning
Meeting held with STA by May
2011
DM TS
●
L8a2
Bus shelters maintained and replaced
Bus shelter replacement developed and adopted Bus shelters requiring maintenance identified Maintenance of bus shelters undertaken Replacement of bus shelters undertaken in accordance with program
At least two bus shelters replaces annually
Cost within + or - 10% of agreed budget and com-
pleted within three months of agreed timetable
DM TS
● ●
WAVERLEY COUNCIL
Measuring our Progress

83
Direction: L8 People frequently use public transport, particularly for trips to work Strategy: L8b Ensure bus stops and train stations are accessible for all users
Deliverable Actions in 2011-2012 Targets and Progress Measures
Report-ing
Officer
Pro-gress
Com-ment
L8a3
Information on Bondi Junction and Bondi promotes the use public transport
Provide information on the use of public transport in marketing material for events and activities at Bondi Junction and Bondi Ensure promoters for events at Bondi Junction and Bondi where Council is an event partner promotes the use of public transport in marketing/promotional material
All marketing material
promotes the use of public
transport
Director RCCS
DM BJ DM BB
●
L8a4
Parking patrol conducted along main roads during weekdays
Undertake parking patrols along main roads during weekdays Provide information to improve parking compliance along main roads Undertake enforcement action to ensure compliance along main roads
Two parking patrols
conducted each weekday along
main roads
DM PS
●
L8a5
Parking patrol conducted along transport corridors during weekends
Undertake parking patrols along transport corridors during weekends Provide information to improve parking compliance along transport corridors Undertake enforcement action to ensure compliance along trans-port corridors
Two parking patrols
conducted each day on
weekends along transport corridors
DM PS
●
Deliverable Actions in 2011-2012 Targets and Progress Measures
Report-ing
Officer
Pro-gress
Com-ment
L8b1
Our infrastructure provides access to public transport that complies with the Common-wealth Disability Standards for Accessible Public Transport 2002
Carry out audit of all bus stops in Waverley Prepare action plan to upgrade non-complying bus stop locations Carry out required work on non-complying bus stop locations
At least 55% of bus stops
comply with Commonwealth
Disability Standards for
Accessible Public Transport 2002 achieved by December
2012
DM TS
●
WAVERLEY COUNCIL
Measuring our Progress

84
Direction: L9 Parking, both on-street and off-street, is equitably accessed and effectively managed Strategy: L9a Ensure fair access to parking services through regul ar review of parking demand, fee structures, enforcement and facilities
Direction: L9 Parking, both on-street and off-street, is equitably accessed and effectively managed Strategy: L9b Increase the community's knowledge and awareness of safe parking practice s
Deliverable Actions in 2011-2012 Targets and Progress Measures
Report-ing
Officer
Pro-gress
Com-ment
L9a1
Parking patrols conducted in accordance with adopted program in commercial and residential areas
Identify priority areas to be patrolled Undertake parking patrols in commercial and residential areas Undertake enforcement action to ensure compliance
Improve local parking amenity by conducting the following parking patrols at
minimum: Commercial
areas Bondi Beach – 2/day
Bondi Junction – 2/day Bronte – 1/day
Local villages – 1/week Residential
areas Bondi Beach – 2/day on
weekends, 1/day on week-days
Bondi Junction – 1/day Bronte – 1/day
Local neighbourhoods – 1/week
DM PS
●
●
Replace old access and payment equipment with new to improve cus-tomer service and revenue management
Replace off-street parking access and payment equipment at Eastgate Carpark (Parking 05)
Finished cost and time to complete compared to
agreed budget and timetable
DM BSP ●
Deliverable Actions in 2011-2012 Targets and Progress Measures
Report-ing
Officer
Pro-gress
Com-ment
L9b1
Rolling education program to promote safe parking carried out
Identify parking and road safety issues that would benefit from further community education Produce educational material for identified risk areas Provide talks on parking and road safety issues to school and community organisations
At least two articles on safe parking
published annually
At least five talks on road safety provided to schools
or other organisations annually
DM PS
●
●
WAVERLEY COUNCIL
Measuring our Progress

85
A Sustainable Environment Direction: E1 Waverley’s community contributes to the reduction of greenhouse gas Emissions Strategy: E1a Encourage and support people to change their transport behaviour and minimise their reliance on cars
Deliverable Actions in 2011-2012 Targets and Progress Measures
Report-ing
Officer
Pro-gress
Comment
E1a1
Plans and policies that encourage active travel including but not limited to reducing parking availability and discouraging private car trips
Develop Waverley Bike Plan and implementation schedule Service Plus Component 10—Providing a more sustainable environment with increased protection from global warming (Other green-house—transport)
Plan to Council by June 2012
DM ES DM
SLUP DM TS ●
E1a2
Increased use of car sharing vehicles to reduce private vehicle ownership, vehicle kilometre travelled (VKT) and parking demand
Identify locations for additional car share spaces Create additional car share spaces Publicise car share scheme and additional car share spaces Investigate and prepare a report no the feasibility and quadruple bottom line impacts of Waverley’s current car-share agreements and alternate business models
Increase car-share spaces by
15% on previous year
Report
submitted to Council by June 2012
DM TS DM ES
● ●
E1a3
Education and promotion programs to encourage use of active travel (walking, cycling, car share, and public transport) as an alternative to the private car
Co ordinate local events, including Ride to Work Day and Walk to Schools Day, that promote sustainable transport Run community workshops, including bike proficiency and bike maintenance, that encourage cycling Prepare transport access guides for Council facilities Work with licensed and casual users of Waverly Park and pavilion to minimise car travel
Hold 3 events, 12 workshops
and provide 2 guides to
encourage sustainable
transport alternatives each year
Plan
completed and
implemented by June 2012
DM ES
●
●
E1a4
Improved quality and frequency of public transport in the LGA by working with state government and other agencies
Identify opportunities for greater pub-lic transport use Meet regularly with state government agencies to discuss possible improve-ments/changes to increase in public transport capacity in LGA
Increase in public
transport capacity from
base year
Meetings held with agencies twice a year
DM TS
●
●
WAVERLEY COUNCIL
Measuring our Progress

86
Direction: E1 Waverley’s community contributes to the reduction of greenhouse gas emissions Strategy: E1b Ensure all new and existing building stock minimise energy use
Deliverable Actions in 2011-2012 Targets and Progress Measures
Report-ing
Officer
Pro-gress
Com-ment
E1a5 An expanded bicycle network together with the provision of bike facilities throughout the LGA
Review and update the Waverley Bike Maps Produce and distribute revised bike maps Audit existing routes for signage and ensure all routes are fully signed Participate in the Inner Sydney regional Bike Plan discussions/workshops Establishment of Bike Consultative committee Formalise consultation with bicycle groups and local bike riders through the creation of a bicycle consultative committee
Update of bike maps completed by
April 2012
Maps printed June 2012
Audit complete December 2011
Attend 2 workshops annually
Framework and terms of reference
for committee approved June
2012
Plan Completed and being implemented
June 2012
DM ES
● ●
● ●
●
●
E1a6 Pedestrian networks which enable pe-destrians to enjoy safe, convenient and coherent independent mobility particularly around transit corridors and facilities
Actions for this deliver-able will be carried out in future years of the Delivery Program period (Subject to funding)
Report to Council by
February 2011
●
E1a7 State government lobbied to introduce light rail within the Eastern Suburbs
Attend meetings about light rail specifically light rail within the Eastern Suburbs
One meeting held annually by Council staff about light rail
within Eastern Suburbs
Direct- or PES
DM
SLUP DM ES
●
Deliverable Actions in 2011-2012 Targets and Progress Measures
Report-ing
Officer
Pro-gress
Com-ment
E1b1
State Heritage Office lobbied to develop a consistent policy to help facilitate installations of solar PV and solar hot water on heritage-listed buildings/areas
Lobby State Heritage Office to ensure streamlined development application process for installation of solar PV and hot water on heritage items or in heritage conservation areas
Discussions with State Heritage
Office held annually
Direct or PES
DM
SLUP DM ES
●
WAVERLEY COUNCIL
Measuring our Progress

87
Deliverable Actions in 2011-2012 Targets and Progress Measures
Report-ing
Officer
Pro-gress
Comment
E1b4
Information and education for residents on energy efficient technologies and behaviours in building design and construction, renovations and general retrofits
Coordinate community workshops that assist residents improve energy efficiency Provide up to date information to residents in a range of formats on energy efficient technologies and rebates
2 Sustainable Building
workshops run annually
Two solar PV
workshops run annually
Update website monthly
DM ES
● ● ●
E1b5
Opportunities for green roofs (and walls) investigated and ways to encourage integration into commercial and residential buildings developed
Develop green roof controls for integration within the Waverley Development Control Plan
Draft DCP to Council June
2011
DM ES DM
SLUP ●
E1b3
Incentives developed through the DA process to encourage sustainable build-ing design and construction be-yond BASIX
Implement trial of the free Sustainable Build-ing Advisory Service for Waverley residents in partnership with Archicentre
Pre-DA sustainability
advice provided to at
least 20 residents
DM ES
●
E1b2
Incentives developed to encourage sustainable retrofitting of existing building stock
Implement sustainability retrofit program of existing multi-unit developments (MUD) Service Plus Compo-nent 10—Providing a more sustainable environment with Increased protection from global warming—other greenhouse—community targets, brokering retrofits/decentralised energy
Program implemented in
2 MUD’s by June 2012
DM ES
●
This program is currently under-funded.
WAVERLEY COUNCIL
Measuring our Progress

88
Direction: Direction: E1 Waverley’s community contributes to the reduction of greenhouse gas emissions Strategy: E1c Minimise energy use in Council operations
Deliverable Actions in 2011-2012 Targets and Progress Measures
Report-ing
Officer
Pro-gress
Com-ment
E1c1
Energy saving and renewable technology opportunities at Council's top 5 greenhouse gas sites identified and implemented
Implement energy saving and renewable technologies at Bondi pavilion Implement energy saving and renewable technologies at Waverley library Implememnt energy asvings and renewable technologies at Eastgate Carpark Council buildings meet green-house reduction targets (more than offset by energy savings) (Service Plus Component 10)
10% energy reductions (kWh) from
selected Council
facilities from 2008/2009
levels
DM ES
●
Program currently under funded
E1c2
A partnerships with Energy Australia to upgrade street lighting with energy efficient alternatives (e.g. LED) explored
Commence discussions with Energy asustralia to undertake an LED street lighting trial in Waverley Street lighting luminaries retrofit-ted (Service Plus Component 10)
Meeting held by May 2012
DM TS DM ES
●
E1c3
Energy use minimised in new Council assets
Ensure that the design and construction of Waverley Pavilion minimises energy use and maximises renewable technologies Ensure that the design and construction of new Bondi Junction Child Care Centre minimises energy use and maximises renewable technologies
Involvement of Environ-
mental Services staff
in Project Control Group
Involvement
of Environ-mental
Services staff in Project Control Group
DM ES
●
●
WAVERLEY COUNCIL
Measuring our Progress

89
Direction: E1 Waverley’s community contributes to the reduction of greenhouse gas emissions Strategy: E1d Investigate and implement alternative energy technologies, such as solar power and cogeneration
Deliverable Actions in 2011-2012 Targets and Pro-gress Measures
Report-ing
Officer
Pro-gress
Com-ment
E1d1
Renewable technology opportunities at Council's top 5 greenhouse gas sites identified and Implemented
Install solar hot water system at Bondi Pavilion Install solar photovoltaic (PV) at Waverley Pavilion
Bondi Pavilion system installed by
August 2011
Waverley Pavilion system installed by
July 2011
Greenhouse gas emissions (tonnes
CO2e) reduced compared to base
year
DM ES
●
● ●
E1d2
Uptake of Green Power by residents and businesses in the LGA increased through promotions and retailer partnerships
Promote uptake of greenpower purchase in the community
% increase in greenpower usage
in LGA by June 2012
DM ES
●
E1d3
District cogeneration in new and existing residential, commercial and retail developments encouraged and facilitated
Commence implementation of cogeneration development strategy in Bondi Junction commercial centre Service Plus Component 10
Strategy Implementation commenced by
June 2012
DM ES
●
WAVERLEY COUNCIL
Measuring our Progress

90
Direction: E1 Waverley’s community contributes to the reduction of greenhouse gas emissions Strategy: E1e Encourage and support businesses, residents and schools to minimise their electricity use and minimise their reliance on coal powered electricity
Direction: E2 Waverley and its community is well prepared for the impacts of climate change Strategy: E2a Identify and investigate the potential future impacts of climate change on our LGA
Deliverable Actions in 2011-2012
Targets and Progress Measures
Report-ing
Officer
Pro-gress
Com-ment )
E1e1
Combined or individual programs (discounts/bulk purchasing/brokerage/retrofit services) to encourage uptake of: energy efficient technologies and behaviours; efficient hot water alternatives (solar hot water and heat pumps) and solar PV identified and implemented
Actions for this deliverable will be carried out in future years of this Delivery program period (subject to available funding)
E1e2
Existing Federal Government and State Government funded initiatives (e.g. Green Loans, Small Business Energy Efficiency programs) used and built upon to encourage uptake of energy efficient technologies and behaviours
Promote federal and state government funded initiatives that encourage the uptake of renewable and energy efficiency technologies
Website maintained with current
information at all times
DM ES
●
Deliverable Actions in 2011-2012
Targets and Progress Measures
Report-ing
Officer
Pro-gress
Com-ment
E2a1
A climate change vulnerability assessment for the Waverley area undertaken that includes impacts on our natural assets, built infrastructure and the community's health.
Integrate findings of the Waverley Coastal Hazard and Risk Assessment into Waverley Plan-ning review Integrate State planning policies relation to climate change into relevant Council Planning documents Other greenhouse—climate change adaption (Service Plus Component 10)
Planning instruments
updated February
2012
Planning instruments
updated June 2012
DM ES
●
●
E2a2
An appropriate climate adaptation plan developed with input from Sydney Coastal Councils Group, and other State/Federal Government Initiatives
Develop Coastal Management Plan and Climate Change Adaption policy for Waverley LGA Other greenhouse—climate change adaption (Service Plus Component 10)
Draft Plan to Council June
2012
DM ES
●
WAVERLEY COUNCIL
Measuring our Progress
91
Direction: E2 Waverley and its community is well prepared for the impacts of climate change Strategy: E2b Ensure Council and the community are aware of potential climate change impacts
Direction: E3 Waverley’s community, including its visitors, reduces the amount of waste it generates and increases the amount it reuses and recycles Strategy: E3a Improve waste avoidance and recycling practices in Council operations, homes, businesses, development sites and public places
Deliverable Actions in 2011-2012 Targets and Progress Measures
Report-ing
Officer
Pro-gress
Comment
E2b1
Outcomes of the climate change adaptation plan integrated into all relevant Council decision making and planning processes
Update council planning instruments with findings of the coastal risk assessment Other greenhouse—climate change adaption (Service Plus Component 10)
Planning instruments
updated February
2012
DM ES
●
E2b2
Community educated and informed about identified climate change risks
Undertake community education program on findings of the coastal risk assessment Other greenhouse—climate change adaption (Service Plus Component 10)
Program completed by
June 2012
DM ES
●
Deliverable Actions in 2011-2012 Targets and Progress Measures
Report-ing Offi-
cer
Pro-gress
Comment
E3a1
A domestic waste and recycling service, together with a public place litter collection service
Collect domestic waste weekly Collect domestic recycling weekly Collect domestic garden waste fortnightly Provide a domestic waste clean up service. Empty street litter bins
Decrease in tonnes
collected annually from previous year
Increase in tonnes
collected annually from previous year
Increase in tonnes
collected annually from previous year
DM RR&PPC
● ●
●
WAVERLEY COUNCIL
Measuring our Progress

92
Deliverable Actions in 2011-2012 Targets and Progress Meas-
ures
Report-ing
Officer
Pro-gress
Com-ment
E3a1
A domestic waste and recycling service, together with a public place litter collection service
Collect domestic waste weekly Collect domestic recycling weekly Collect domestic garden waste fortnightly Provide a domestic waste clean up service Empty street litter bins
Tonnes domestic waste
collected annually
decreases from previous year
Street litter bins less than 100% over 95% of the
time
Over 95% of domestic waste
services provided
compared to services missed
DM RR& PPC ●
●
●
E3a2
Work with businesses, schools and residents to increase recycling and recovery rates and decrease waste generation rates
Undertake trial program with residents in multi unit developments to improve recycling rates and reduce contamination rates Waste targets—community (Service Plus Component 10)
Trial program completed by
February 2012
Recycling increased annually
DM RR&PP
C DM ES DM BS DM MC
● ●
E3a3
Residential food waste reduction program implemented
Continue to run the Compost Revolution food waste program in partnership with Woollahra and Randwick Council’s Waste targets—community (Service Plus Component 10)
200 compost bins
distributed
Reduction in amount of waste
produced compared to
base year
DM ES
● ●
WAVERLEY COUNCIL
Measuring our Progress
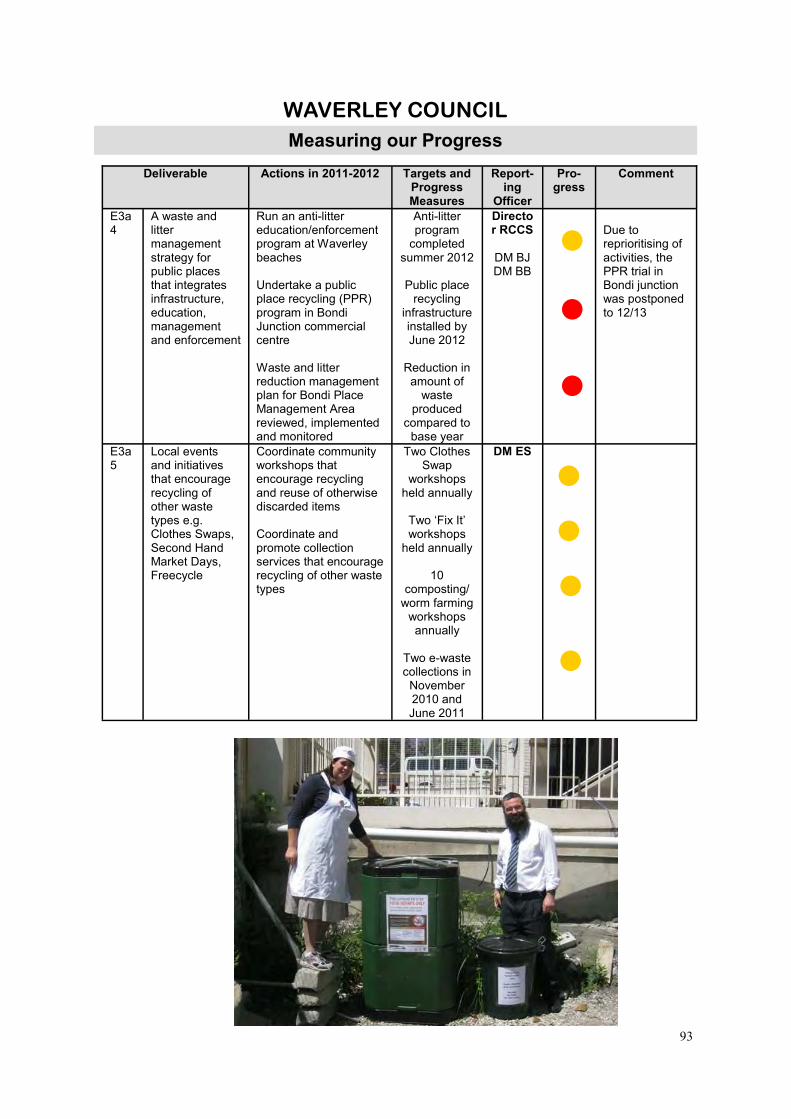
93
Deliverable Actions in 2011-2012 Targets and Progress Measures
Report-ing
Officer
Pro-gress
Comment
E3a4
A waste and litter management strategy for public places that integrates infrastructure, education, management and enforcement
Run an anti-litter education/enforcement program at Waverley beaches Undertake a public place recycling (PPR) program in Bondi Junction commercial centre Waste and litter reduction management plan for Bondi Place Management Area reviewed, implemented and monitored
Anti-litter program
completed summer 2012
Public place
recycling infrastructure installed by June 2012
Reduction in
amount of waste
produced compared to
base year
Director RCCS
DM BJ DM BB
●
●
●
Due to reprioritising of activities, the PPR trial in Bondi junction was postponed to 12/13
E3a5
Local events and initiatives that encourage recycling of other waste types e.g. Clothes Swaps, Second Hand Market Days, Freecycle
Coordinate community workshops that encourage recycling and reuse of otherwise discarded items Coordinate and promote collection services that encourage recycling of other waste types
Two Clothes Swap
workshops held annually
Two ‘Fix It’ workshops
held annually
10 composting/
worm farming workshops annually
Two e-waste collections in
November 2010 and June 2011
DM ES
● ● ●
●
WAVERLEY COUNCIL
Measuring our Progress

94
Direction: E3 Waverley’s community, including its visitors, reduces the amount of waste it generates and increases the amount it reuses and recycles Strategy: E3b Investigate and implement new technologies to stop waste from ending up as landfill
Direction: E4 Water is used carefully and sparingly in Waverley’s buildings, gardens, businesses and Council operation Strategy: E4a Ensure all new and existing building stock minimise water use
Deliverable Actions in 2011-2012 Targets and Progress Measures
Report-ing
Officer
Pro-gress
Com-ment
E3b1
Work with SSROC to investigate regional waste reuse, recovery and disposal opportunities
Participate in SSROC Regional Tender for Waste Disposal
Attend meetings twice
annually
DM RR&PP
C ●
E3b2
Local collection options for the responsible disposal or recycling of non-putrescible wastes e.g. batteries, paints, oil heaters investigated
Update Council’s website to provide up to date information of collection program for other waste types
Website maintained with
current information at
all times
Reduction in the amount of
waste to landfill compared to
base year
DM ES
●
●
Deliverable Actions in 2011-2012 Targets and Progress Measures
Report-ing
Officer
Pro-gress
Com-ment
E4a1
Work with body corporates to promote water efficiency/reuse in multi-unit dwellings
Promote installation of hot water recirculators in multi-unit dwellings (MUD)
Promotion Completed by
December 2011
DM ES
●
Deliverable Actions in 2011-2012 Targets and Progress Measures
Report-ing
Officer
Pro-gress
Com-ment
E4a3
Water conservation workshops giving practical advice for sustainable building design, renovations and water efficient technologies focusing on residents and businesses
Coordinate community workshops that assist residents improve water efficiency
2 Sustainable Building
workshops run annually
DM ES
●
E4a2
Water harvesting and reuse opportunities at sites with reliable harvesting potential (i.e. base flow or groundwater) and high demand for re-use water identified and projects designed and undertaken to harvest and reuse water
Complete Bondi Sustainable Water harvesting Project
Project Completed by
June 2012
DM ES
●
WAVERLEY COUNCIL
Measuring our Progress

95
Direction: E4 Water is used carefully and sparingly in Waverley’s buildings, gardens, businesses and Council operation Strategy: E4b Minimise water use in Council operations and facilities
Deliverable Actions in 2011-2012 Targets and Progress Measures
Report-ing
Officer
Pro-gress
Com-ment
E4b1
Reduction in potable water use in new Council assets
Integrate water harvesting system into the Waverley Pavilion. Integrate water harvesting system and water efficient appliances into the new Bondi Junction Child Care Centre
System included in
projects
DM RCPP
●
Deliverable Actions in 2011-2012 Targets and Progress Measures
Report-ing
Officer
Pro-gress
Com-ment
E4b2
Water efficiency and recycling technology at Council’s top five water consuming sites investigated and implemented
Install water efficient/recycling technologies at Bondi Park, Bondi Pavilion and Waverley Park Participate in Sydney Water’s Every Drop Counts program for Council’s major Facilities Water efficiency improvements on Council assets (Service Plus Component 11)
10% reduction in
potable water usage
compared to base year
Audit top 5
facilities annually
DM ES
●
●
E4b3
Irrigation efficiency at top five Council irrigation sites improved including soil and turf upgrades and watering regime in partnership with Sydney Water
Participate in the Sydney Water Irrigation Landscape Efficiency Project (ILEP) to reduce water use at: • Bondi Park • Waverley Park • Marks Park • Hugh Bamford
Improved irrigation
efficiency and park surfaces by June 2012
Reduced
potable water consumption
(kL) compared to
base year
DM ES
●
●
WAVERLEY COUNCIL
Measuring our Progress

96
Direction: E4 Water is used carefully and sparingly in Waverley’s buildings, gardens, businesses and Council operation Strategy: E4c Improve the capture and reuse of alternative water sources (greywater, stormwater, blackwater, groundwater) in Council operations, development sites, homes, businesses and public places
Direction: E4 Water is used carefully and sparingly in Waverley’s buildings, gardens, businesses and Council operation Strategy: E4d Encourage and support businesses, schools, and residents to minimise water consumption and reduce reliance on potable water supplies
Deliverable Actions in 2011-2012 Targets and Progress Measures
Report-ing
Officer
Pro-gress
Com-ment
E4c1
Communication and awareness activities on water efficient tips, rainwater harvesting and reuse, greywater reuse, blackwater systems, groundwater use and available rebates / discounts rolled out
Promote the use of hot water recirculators and water rebates available to the community Promote installation of rainwater tanks and rebates available to the community Promote other rebates and water savings programs offered by other government agencies
All information available on
Council’s website and
in promotional
materials
DM ES
●
Deliverable Actions in 2011-2012 Targets and Progress Measures
Report-ing Offi-
cer
Pro-gress
Com-ment
E4d1
Work with top twenty water consumers within the community to implement water reduction / efficiency Strategies
Participate in the Sustainable Business program with Sydney Water Audit 5 major water users and support installation of water efficient technologies Investigate options for water reduction at North Bondi Golf Course
Five major water users audited by June 2012
DM ES
●
E4d2
Combined or individual programs (discounts/bulk purchasing/brokerage/ subsidised services) to encourage the uptake of water efficient technologies identified and implemented
Promote the use of hot water recirculators and the rebates available to the Community
Promotion program
developed by June 2012
DM ES
●
E4d3
Existing Federal Government and State Government funded programs used or built on to encourage up-take of water efficient technologies and behaviours
Promotion of federal govt and Sydney Water re-bates for water tanks and other water saving de-vices.
Information available on
Council’s website, in promotional
materials and in sustainable
building workshops by
June 2012
DM ES
●
WAVERLEY COUNCIL
Measuring our Progress

97
Direction: E5 The waterways and beaches are clean and free of pollutants Strategy: E5a Maintain stormwater system to minimise pollutant loads through maintenance, education and enforcement
Deliverable Actions in 2011-2012 Targets and Pro-gress Measures
Report-ing
Officer
Pro-gress
Com-ment
E5a1
Pollution prevention devices installed and maintained throughout the LGA
Gross pollutant traps monitored and maintained across the LGA
5% reduction in the amount of pollutants removed from gross
pollution control devices each year
compared to 2008/09 base year
DM ES
●
E5a2
Stormwater Harvesting Infrastructure maintained
Maintain existing stormwater and groundwater infrastructure Monitor re-use water quality and improve quality of stormwater discharge
All maintenance reports
and water quality data monitored bi
monthly
DM M&C
●
E5a3
Water quality at key coastal sites is regularly monitored
Undertake water monitoring program
Water tested at two key spots every week
DM ES
●
E5a4
Targeted community environmental education and awareness program on stormwater pollution prevention undertaken
Run communications no the Bondi Sustainable Water Harvesting program during construction
Program conducted by June 2012
DM ES
●
E5a5
Inspections of LGA to ensure compliance with the Protection of the Environment Operations Act 1997 undertaken
Regular inspection of LGA undertaken to ensure compliance with Protection of the Environment Operations Act (POEO Act)1997 Follow up on reported pollution incidents Inspection of building sites to ensure compliance with POEO Act
Number of POEO Act inspections
undertaken greater than or equal to base
year 2009/10
DM C
●
WAVERLEY COUNCIL
Measuring our Progress

98
Direction: E5 The waterways and beaches are clean and free of pollutants Strategy: E5b Improve the quality of water entering receiving waters
Direction: E6 A network of parks and coastal reserves, street trees and other plantings provides a habitat for a thriving local ecology
Strategy: E6a Increase quantity and quality of habitat cover, and particularly the planting of native species, in public spaces and private properties to create a network of wildlife corridors throughout Waverley and into neighbouring areas
Deliverable Actions in 2011-2012 Targets and Progress Measures
Report-ing
Officer
Pro-gress
Comment
E5b1
Partnerships with external organisations to promote water quality improvement programs including Sewerfix, Don’t be a Tosser etc.
Participation in DECCW’s Beachwatch program Promote Sydney Water Sewer Fix monitoring program Complete monitoring of ocean pool quality in partnership with NSW Health
Council participate in at
least three programs annually
DM ES
●
Deliverable Actions in 2011-2012 Targets and Progress Measures
Report-ing Offi-
cer
Pro-gress
Comment
E6a1
A Tree Management Plan to maximise tree canopy cover in Waverley implemented
Plant trees over the winter months. Implement watering and maintenance program over the summer months.
Update and maintain street tree data base Improve public access to tree planning information on Council’s website Develop Tree Technical Manual
200 trees planted per year
by Council
80% of trees
planted annually by
Council survive
Update street tree database within three months of
removal or new planting of tree
TMM
commenced
DM POSO
DM RCPP
● ●
●
●
Commenced. 25 % completed but delayed 6 months due to urgent work required on DCP landscaping component
E6a2
Significant tree register maintained and updated
Process to provide access to Significant Tree Register developed including consultation with the community Report on proposed process completed and adopted
Process to access to
Significant Tree Register
adopted by March 2012
DM RCPP
●
E6a3
Endemic seed propagation program for local plantings implemented
Collect endemic seed from local bushcare areas. Program propagation to provide plants for projects
10% of plants propagated from local source in individual projects
DM RCPP
●
WAVERLEY COUNCIL
Measuring our Progress

99
Direction: E6 A network of parks and coastal reserves, street trees and other plantings provides a habitat for a thriving local ecology Strategy: E6b Increase local populations of native flora and fauna
Deliverable Actions in 2011-2012 Targets and Progress Measures
Report-ing
Officer
Pro-gress
Com-ment
E6a4
Outcomes from Waverley flora and fauna study integrated into Council plans and policies
Integrate findings from Waverley flora and fauna study into Council’s planning instruments
Planning instruments updated by
August 2011
DM ES
●
Deliverable Actions in 2011-2012 Targets and Progress Measures
Report-ing
Officer
Pro-gress
Com-ment
E6b1
Areas of threatened and endangered species Identified
Identify areas of threatened and endangered species in LEP map Service Plus Component 11
Maps prepared by December
2011
DM ES
●
E6b2
Council policy for the protection, restoration and enhancement of remnant vegetation and habitat taking note of statutory implications/ mapping issues/ potential of changes leading to damage of existing remnant vegetation Developed
Integrate Waverley Flora/Fauna findings into Parks Plans of Management Service Plus Component 11
Report to Council by July
2012
DM ES
●
Deliverable Actions in 2011-2012 Targets and Progress Measures
Report-ing
Officer
Pro-gress
Com-ment
E6b3
Remediation and restoration programs in Waverley including hydrological, contamination and geotechnical issues, weed management and native plantings identified and implemented
Actions for this deliverable will be carried out in future years of this Delivery Program
E6b4
Waverley Street Tree Planting program implemented
Plant trees in priority areas
Two priority areas planted by Council per
year
DM POSO
●
WAVERLEY COUNCIL
Measuring our Progress
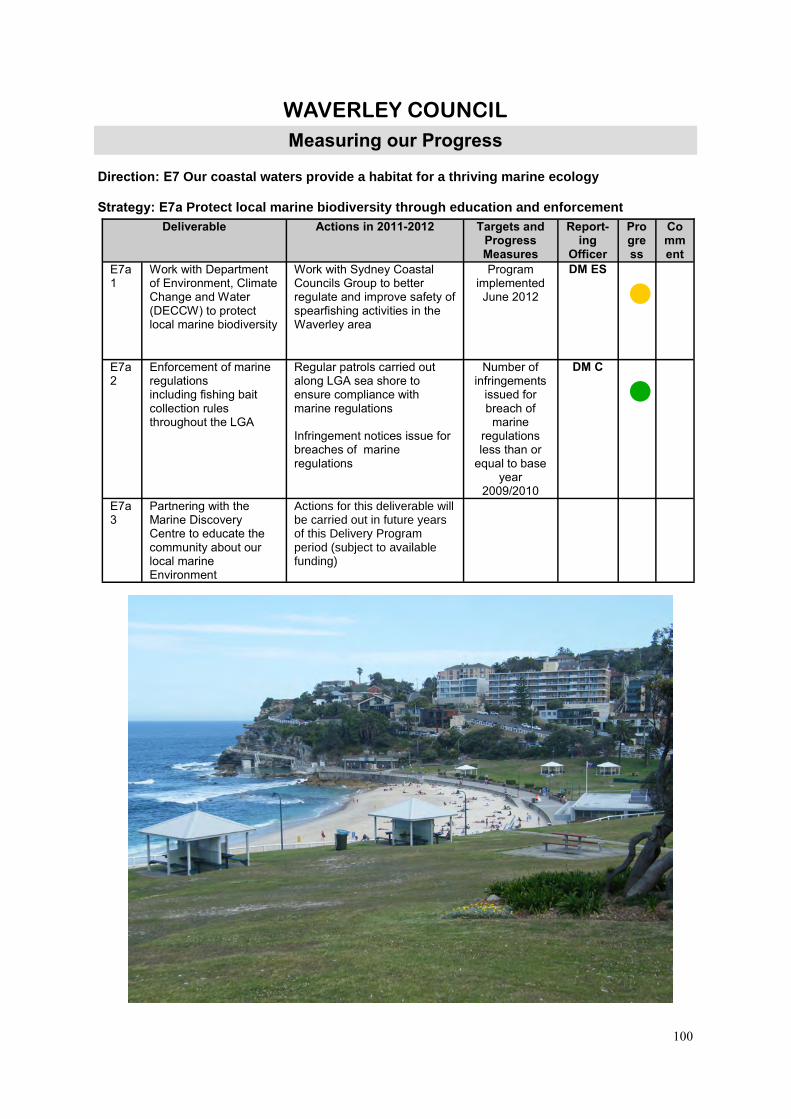
100
Direction: E7 Our coastal waters provide a habitat for a thriving marine ecology Strategy: E7a Protect local marine biodiversity through education and enforcement
Deliverable Actions in 2011-2012 Targets and Progress Measures
Report-ing
Officer
Progress
Comment
E7a1
Work with Department of Environment, Climate Change and Water (DECCW) to protect local marine biodiversity
Work with Sydney Coastal Councils Group to better regulate and improve safety of spearfishing activities in the Waverley area
Program implemented June 2012
DM ES
●
E7a2
Enforcement of marine regulations including fishing bait collection rules throughout the LGA
Regular patrols carried out along LGA sea shore to ensure compliance with marine regulations Infringement notices issue for breaches of marine regulations
Number of infringements
issued for breach of
marine regulations less than or
equal to base year
2009/2010
DM C
●
E7a3
Partnering with the Marine Discovery Centre to educate the community about our local marine Environment
Actions for this deliverable will be carried out in future years of this Delivery Program period (subject to available funding)
WAVERLEY COUNCIL
Measuring our Progress

101
Direction: E8 Waverley is an environmentally educated and committed community Strategy: E8a Encourage and support community involvement in our environmental program
Deliverable Actions in 2011-2012 Targets and Progress Measures
Report-ing
Officer
Pro-gress
Comment
E8a1
Groups within the community targeted and ways determined to engage with them identified
Develop and implement an Internal sustainability Education Program Report to Council on findings of the Community environment Group Survey
At least 1 program
Implemented annually
Report complete
July 2011
DM ES
●
●
E8a2
Communication and awareness activities on Council’s sustainability program rolled out
Deliver Councils Communications Strategy for Council’s Environmental Program
Strategy implemented by
June 2012
DM ES
●
E8a3
Coordination and support to the Eastern Suburbs Schools Environment Network so local teachers, parents, and students have the opportunity share experiences and increase their skills and Knowledge
Coordinate the Eastern Suburbs Schools Environment Network
Meetings held with all schools
quarterly
DM ES
●
E8a4
Work with local childcare centres to improve environmental skills and knowledge and deliver environmental outcomes
Implement the SSROC Little Green Steps Program at Waverley, Gardiner and Bronte Childcare Centres DM ES
At least two environmental
initiatives implemented at each childcare
centre
DM ES
●
E8a5
A Waverley Council Sustainable Schools Program
Implement Council’s Sustainable Schools Program Run Council’s Sustainable Schools Grants program
75% of schools in LGA
participating
Annual grants program
completed by February 2012
DM ES
●
●
WAVERLEY COUNCIL
Measuring our Progress
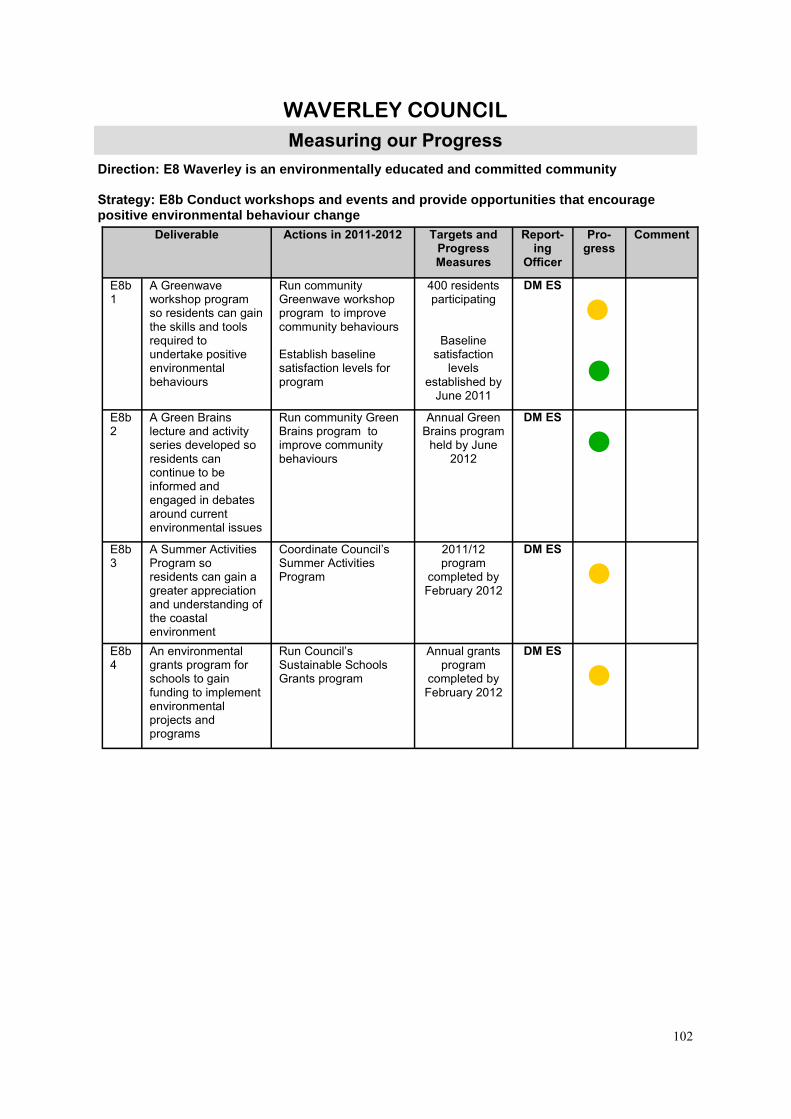
102
Direction: E8 Waverley is an environmentally educated and committed community Strategy: E8b Conduct workshops and events and provide opportunities that encourage positive environmental behaviour change
Deliverable Actions in 2011-2012 Targets and Progress Measures
Report-ing
Officer
Pro-gress
Comment
E8b1
A Greenwave workshop program so residents can gain the skills and tools required to undertake positive environmental behaviours
Run community Greenwave workshop program to improve community behaviours Establish baseline satisfaction levels for program
400 residents participating
Baseline satisfaction
levels established by
June 2011
DM ES
●
●
E8b2
A Green Brains lecture and activity series developed so residents can continue to be informed and engaged in debates around current environmental issues
Run community Green Brains program to improve community behaviours
Annual Green Brains program
held by June 2012
DM ES
●
E8b3
A Summer Activities Program so residents can gain a greater appreciation and understanding of the coastal environment
Coordinate Council’s Summer Activities Program
2011/12 program
completed by February 2012
DM ES
●
E8b4
An environmental grants program for schools to gain funding to implement environmental projects and programs
Run Council’s Sustainable Schools Grants program
Annual grants program
completed by February 2012
DM ES
●
WAVERLEY COUNCIL
Measuring our Progress

103
Sustainable Governance Direction: G1 Council’s decision making processes are open, transparent and corruption resistant and based on sound integrated planning Strategy: G1a Develop and maintain a framework of plans and policies t hat ensures open and transparent Council operations
Deliverable Actions in 2011-2012 Targets and Progress Measures
Report-ing
Officer
Pro-gress
Comment
G1a1
Significant govern-ance policies developed and existing policies reviewed regularly and access to Council’s policy register provided
Assess need for new policies and develop as need identified Develop a policy review program for all governance policies Undertake policy reviews Regularly review policies available on Council’s website to ensure currency
Councillor’s Expenses and Facilities reviewed by
November 2011
Sponsorship, Grants and Donations reviewed by
December 2012
Privacy Management Plan
reviewed by May 2012
Information Access reviewed by May 2012
GIPA Act—Publication Guide reviewed by
December 2011
All significant Council policies available on
Council’s website
DM G&IP
●
●
●
●
●
●
G1a2
A suite of integrated corporate plans that meet legislative require-ments developed and maintained
Ensure alignment of annual Operational Plan, business plans, budgets and other new plans with Directions and Strategies from the Community Strategic Plan Review Community Strategic Plan, Resourcing Strategy as required Develop an annual Operational Plan for adoption by Council annually Develop a Delivery Program for each new Council
Community strategic plan and workforce plan revised
every four years
LTFP revised annually
SAMP revised every four years
EAP & WFP revised every 4 years
Operation Plan adopted by Council annually
Delivery
Program adopted by Council every four years
Direc-tor
C&TS ●
●
●
●
●
WAVERLEY COUNCIL
Measuring our Progress

104
Direction: G1 Council’s decision making processes are open, transparent and corruption resistant and based on sound integrated planning Strategy: G1b Embed corruption prevention practices in Council operations
Deliverable Actions in 2011-2012 Targets and Progress Measures
Report-ing
Officer
Pro-gress
Comment
G1a3
Regular reporting to Council on progress with implementa-tion of integrated corporate plans
Prepare reports on progress with Delivery Program deliverables. Report to Council on progress every six months Report to outgoing Council on QBL out-comes
Six monthly reports provided to Council on progress with Delivery
Program
Report to outgoing Council by June 2012
Direc-tor
C&TS ●
●
Deliverable Actions in 2011-2012 Targets and Progress Measures
Report-ing
Officer
Pro-gress
Comment
G1b2
Internal audit function established and supported
Develop internal audit program Provide support to Internal Audit Committee Review internal audit program Audit Committee report to Council Audit Committee meetings are conducted regularly
Internal audit program developed and adopted
annually
Support Provided
Program reviewed and adopted annually
Report adopted by council Bi-annually
5 meetings held annually
DM G&IP
GMU ● ● ● ● ●
G1b1
Regular ethics and Code of Conduct training provided for Councillors and staff
Provide ethics and Code of Conduct training to Councillors Provide ethics and EEO training to all new employees Provide EEO refresher training to all existing employees
Two ethics and Code of Conduct
training events provided
annually to Councillors
90% of new employees undertake ethics and EEO training within three months
90% of staff who complete
refresher training every three years
DM G&IP
DM HR/OD
●
●
●
WAVERLEY COUNCIL
Measuring our Progress
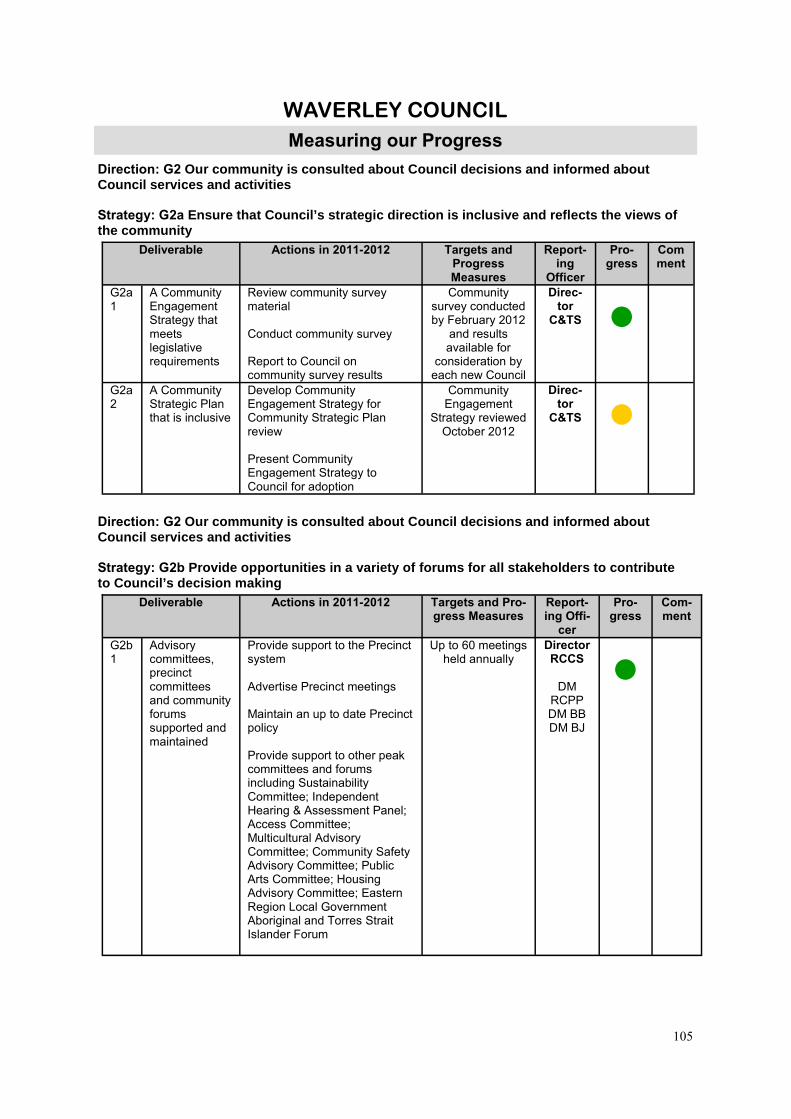
105
Direction: G2 Our community is consulted about Council decisions and informed about Council services and activities Strategy: G2a Ensure that Council’s strategic direction is inclusive and reflects the views of the community
Direction: G2 Our community is consulted about Council decisions and informed about Council services and activities Strategy: G2b Provide opportunities in a variety of forums for all stakeholders to contribute to Council’s decision making
Deliverable Actions in 2011-2012 Targets and Progress Measures
Report-ing
Officer
Pro-gress
Comment
G2a1
A Community Engagement Strategy that meets legislative requirements
Review community survey material Conduct community survey Report to Council on community survey results
Community survey conducted by February 2012
and results available for
consideration by each new Council
Direc-tor
C&TS ●
G2a2
A Community Strategic Plan that is inclusive
Develop Community Engagement Strategy for Community Strategic Plan review Present Community Engagement Strategy to Council for adoption
Community Engagement
Strategy reviewed October 2012
Direc-tor
C&TS ●
Deliverable Actions in 2011-2012 Targets and Pro-gress Measures
Report-ing Offi-
cer
Pro-gress
Com-ment
G2b1
Advisory committees, precinct committees and community forums supported and maintained
Provide support to the Precinct system Advertise Precinct meetings Maintain an up to date Precinct policy Provide support to other peak committees and forums including Sustainability Committee; Independent Hearing & Assessment Panel; Access Committee; Multicultural Advisory Committee; Community Safety Advisory Committee; Public Arts Committee; Housing Advisory Committee; Eastern Region Local Government Aboriginal and Torres Strait Islander Forum
Up to 60 meetings held annually
Director RCCS
DM
RCPP DM BB DM BJ
●
WAVERLEY COUNCIL
Measuring our Progress

106
Direction: G2 Our community is consulted about Council decisions and informed about Council services and activities Strategy: G2c Ensure that all Council communications are targeted, accessible and clearly branded
Deliverable Actions in 2011-2012 Targets and Progress Measures
Report-ing
Officer
Pro-gress
Comment
G2b2 A website that supports community comment and engagement and includes a ‘Have a Say’ portal
Place draft policy and plans on website for community comment during exhibition period Promote consultation events through ‘Have a Say” portal Place Precinct agenda and minutes on website
All draft plans and policies placed on website
All
consultation events placed
on website
DM RCPP
●
●
Deliverable Actions in 2011-2012 Targets and Progress Measures
Report-ing
Officer
Pro-gress
Comment
G2c1
A regular, professionally produced and interesting community newsletter
Theme identified and material collected for quarterly community newsletter Newsletter produced and distributed
5% increase in number of respondents that report
receiving and reading
Council’s community newsletter
GMU
●
There is currently no baseline to define outcome
G2c2
Council’s Communica-tions Action Plan Implemented
Implement the funded actions from the Communications Action Plan
80% of Plan implemented
annually
GMU
●
Due to staffing shortages this is not on track
WAVERLEY COUNCIL
Measuring our Progress

107
Direction: G3 Services to customers are provided in a professional, friendly and timely manner Strategy: G3a Ensure all staff are aware of, and trained in, the systems and procedures that support customer service
Deliverable Actions in 2011-2012 Targets and Progress Measures
Report-ing
Officer
Pro-gress
Comment
G2c3
Communica-tion provided in different formats and community languages including provision of language aide scheme and access to Telephone Interpreter Service
Provide a language aide service Support access to the Telephone Interpreter Service
Seven languages available
through the language
aide service
Number of incidents of
use annually of Telephone
Interpreter Service is equal to or
greater than base year 2005/2006
DM RCPP
●
●
Deliverable Actions in 2011-2012 Targets and
Progress Measures
Report-ing
Officer
Pro-gress
Comment
G3a1
Customer service training provided to staff
Provide customer service training to all new staff Provide customer service refresher training to all existing staff
90% of new staff trained in customer
service within three months of
joining Council
90% of
existing staff complete refresher training
every three years
DM HR/OD
●
●
G3a1
Training in systems and processes that support customer service provided to identified staff
Undertake a skills assessment of identified staff Develop training programs on customer service systems and processes Deliver training programs on customer service systems and processes
All identified staff trained in customer
service systems and processes
DM HR/OD
●
Awaiting results of skills assessment and identification of suitable staff for training. Resources will be evaluated at that juncture
WAVERLEY COUNCIL
Measuring our Progress

108
Direction: G3 Services to customers are provided in a professional, friendly and timely manner Strategy: G3b Monitor and report regularly against the service standards set for customer service
Deliverable Actions in 2011-2012
Targets and Progress Measures
Report-ing
Officer
Pro-gress
Comment
G3a3
Customer Service Charter Implmented
Develop and implement communication strategy for external customers Develop and implement program to ensure compliance with standards
80% performance
against specific customer
service charter targets
DM LCS
●
Many targets in the 2011/12 Strategy relate to the Community Engagement Strategy. This will need to be rescheduled in the 2nd, 3rd Qtr following staff changes in that area.
Deliverable Actions in 2011-2012
Targets and Progress Measures
Report-ing
Officer
Pro-gress
Comment
G3b1
Regular customer surveys conducted
Implement and report on Council wide Customer Satisfaction Surveys
At least 80% satisfaction
score in Mystery Shopper program
DM LCS
●
The community wide survey scheduled for the 3rd Qtr will take the place of the Mystery Shopper Program in 2011/12
G3b2
Perform-ance against standards for customer requests and complaints recorded in Council’s customer request system monitored and reported
Monitor number and percentage of customer requests and complaints recorded in Service Desk completed within and outside service standards Report regularly on performance against standards for customer requests and complaints including possible services improvements
At least 80% of Service Desk
requests completed
within service standard
DM LCS
●
WAVERLEY COUNCIL
Measuring our Progress

109
Direction: G4 Council’s operations are efficient, effective and provide value for money Strategy: G4a Regularly review Council services and ensure they are responsive to customer needs
Deliverable Actions in 2011-2012 Targets and Progress Measures
Report-ing
Officer
Pro-gress
Comment
G4a1
Regular reviews of Council services and improvement initiatives undertaken in accordance with program in Council’s Workforce Plan
Undertake reviews identified in annual program Report at the conclusion of each review Report half yearly on progress with program
80% of reviews undertaken
annually compared to
adopted program
DM HR/OD
●
Only 35% on target
G4a2
A program of continuous improvement in customer service
Implement revised Customer Service Strategy 2010/2013 Implement strategies identified through Library Service Review including staff technology training; purchase of shelf ready resources and implementation of RFID Technology Implement changes to service delivery Analysis to identify relevant gaps in library programs
Revised Customer
Service Strategy implemented by
June 2012
At least 70% of identified
collections in 2011/12 annual resource budget
At least 80% of annual loans via
self check
Gap analysis completed, programs identified,
developed, implemented by
June 2012
DM LCS
●
●
●
●
The gap analysis exercise will be included in a grant to the State Library in the 3rd Qtr.
WAVERLEY COUNCIL
Measuring our Progress

110
Direction: G4 Council’s operations are efficient, effective and provide value for money Strategy: G4b Provide a range of efficient and effective corporate support services
Deliverable Actions in 2011-2012 Targets and Progress Measures
Report-ing
Officer
Pro-gress
Comment
G4b1
Professional and timely support and assistance to Councillors and meetings of Council and Council committees
Provide agenda and minutes for meetings of Council and Council’s standing committees Provide staff for meetings of Council and Council’s standing committees Provide assistance and advice to Councillors on governance matters Provide support to Councillors to enable them to effectively carry out their official duties
95% of requests from Councillors completed within
seven days of receipt
95% of minutes and agenda for
Council and Council
committees meet service standards set
DM G&IP
●
●
G4b2
Council’s vehicle fleet and plant maintained
Manage Council’s vehicle fleet and equipment including fleet and equipment replacement and disposal Provide repairs and servicing for Council’s vehicle fleet and equipment
90% of Council’s vehicle fleet and plant available for use daily
Fleet utilisation rate above 75%
Fleet whole of
life costs, downtime costs,
maintenance failure records and flat rate
Equal to service Standards
DM BS
●
● ●
WAVERLEY COUNCIL
Measuring our Progress

111
Deliverable Actions in 2011-2012 Targets and Progress Measures
Report-ing
Officer
Pro-gress
Comment
G4b3
Computer and communications network availability ensured
Provide a computer network that supports the work of Council Maintain Council’s computer network Provide a communications network that supports the work of Council Maintain Council’s communications network
95% Computer network
availability (excluding planned
downtime)
95% Phone system
availability (excluding planned
downtime)
DM FISS
●
●
G4b4
An efficient and effective payroll service.
Produce weekly payroll and pay staff Process information including timesheets and leave forms
Staff paid on time every week
Staff paid Accurately 98%
of the time
DM HR/OD
● ●
G4b5
Efficient and effective corporate procurement services
Co ordinate tendering across Council Provide advise on purchasing Undertake audits of compliance with Council’s purchasing policy
At least 12 audits of
purchasing conducted annually
DM FISS
●
G4b6
Store operations that are efficient, effective and delivered in a timely manner
Identify items required regularly by Council Order items required regularly by Council Undertake stocktakes of items in store
Two stocktakes of items in store
undertaken annually
DM BS
●
G4b7
More services are provided on line
Identify areas where Council services can be provided on line Establish process to provide 149 certificates issued on line
Percentage of 149 certificates issued on line
increased compared to total issued in
base year 2009/10
DM SLUP
●
WAVERLEY COUNCIL
Measuring our Progress
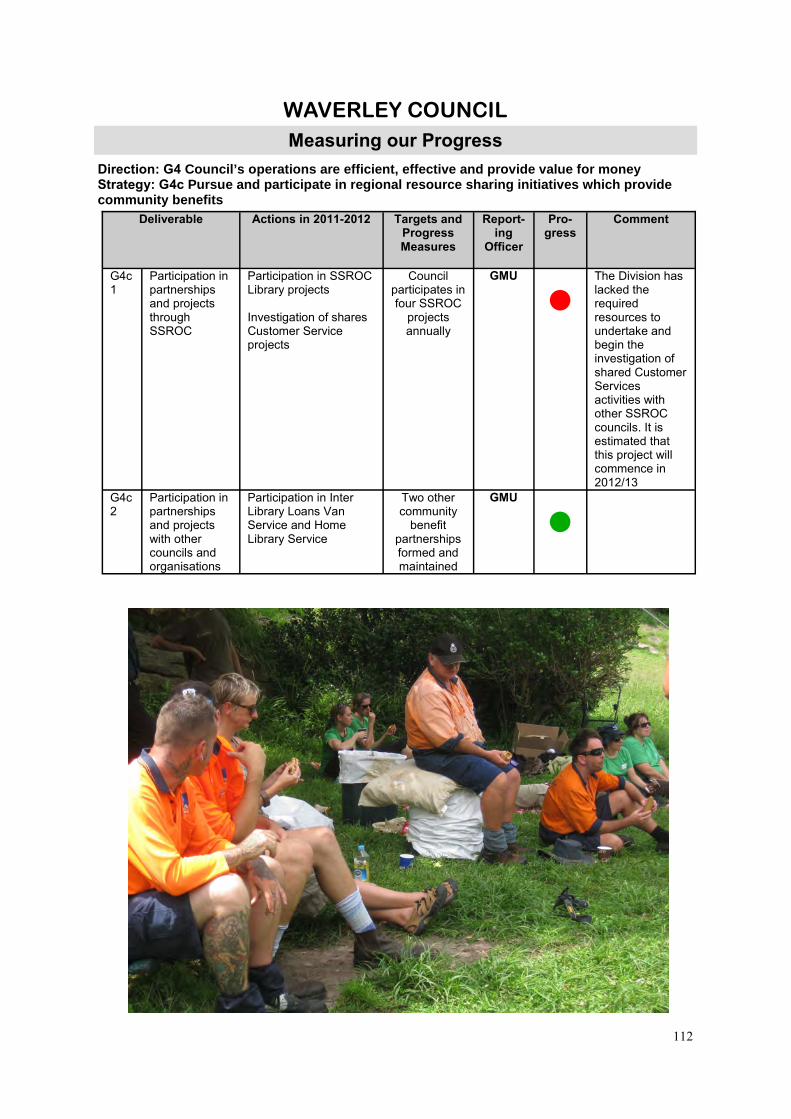
112
Direction: G4 Council’s operations are efficient, effective and provide value for money Strategy: G4c Pursue and participate in regional resource sharing initiatives which provide community benefits
Deliverable Actions in 2011-2012 Targets and Progress Measures
Report-ing
Officer
Pro-gress
Comment
G4c1
Participation in partnerships and projects through SSROC
Participation in SSROC Library projects Investigation of shares Customer Service projects
Council participates in four SSROC
projects annually
GMU
●
The Division has lacked the required resources to undertake and begin the investigation of shared Customer Services activities with other SSROC councils. It is estimated that this project will commence in 2012/13
G4c2
Participation in partnerships and projects with other councils and organisations
Participation in Inter Library Loans Van Service and Home Library Service
Two other community
benefit partnerships formed and maintained
GMU
●
WAVERLEY COUNCIL
Measuring our Progress

113
Direction: G5 Council is a financially sustainable organisation Strategy: G5a Provide financial services for the Council in an accurate, timely, open and honest manner
Direction: G5 Council is a financially sustainable organisation Strategy: G5b Undertake long term financial planning
Deliverable Actions in 2011-2012 Targets and Progress Measures
Report-ing
Officer
Pro-gress
Com-ment
G5a1
Financial advice and co ordination to ensure Council meets overall budget performance targets provided
Manage Council’s financial performance to achieve targets set Conduct and report on quarterly reviews of budget performance Ensure year end accounts are completed Issue rates notices quarterly and collect rates levied Achieve a return on Council’s cash investments
Annual budget targets met or
exceeded
At least seven green lights on
Local Government Finance
Health Check Indicators
Annual financial audit
completed and reported by October
All rates notices
issued in accordance with
legislative timetable
Less than 3.5% rates outstanding as a
percentage of rates collected.
Rate of return on cash exceeds UBS Warburg
AUD Bank Bill Index
DM FISS
●
●
●
●
●
●
Deliverable Actions in 2011-2012 Targets and Progress Measures
Report-ing
Officer
Pro-gress
Com-ment
G5b1
Four-year forecast prepared annually
Develop four-year forecast Report to Council annually on forecast
Four year forecast
completed and reported to Council in April each
year
DM FISS
●
G5b2
Ten year financial plan reviewed annually
Review LTFP each year based on four year forecast Report to Council annually on results of review
10 year financial plan review
completed and reported to Council in April each
year
DM FISS
●
WAVERLEY COUNCIL
Measuring our Progress

114
Deliverable Actions in 2011-2012 Targets and Progress Measures
Report-ing
Officer
Pro-gress
Comment )
G5b3
Council’s expenditure is funded sustainability
Ensure funding sources identified meet expenditure requirements
Surplus or balanced budget
achieved annually
DM FISS
●
G5b4
Council’s expenditure satisfies the needs of the community
Monitor expenditure to ensure it is in accordance with the expressed wishes of the community as articulated in the Community strategic plan Provide advice to Council to assist its decision making on changes to expenditure that are outside the adopted Delivery Program
100% of expenditure compared to
adopted program in
Delivery Program
Direc-tor
C&TS ●
G5b5
A revised Investment Strategy that is being implemented
Review Investment Strategy progress to date Continue with implementation of key projects in accordance with adopted implementation plan Report to Council regularly on progress of key Projects
Quarterly progress on Investment
Strategy projects
80% of projects
progressed in accordance
with implementation
plan
GMU ●
●
Deliverable Actions in 2011-2012 Targets and Progress Measures
Report-ing
Officer
Pro-gress
Comment
G5b6
A new Investment Strategy based on progress to date and revised financial and other modelling
Review current Investment Strategy Update financial modelling and other data that support strategy Undertake consultation on revised Investment Strategy Report to Council on proposed revised Investment Strategy
Review of current
Investment Strategy
completed by June 2011
New Investment
Strategy developed by
June 2012
GMU
●
●
.
WAVERLEY COUNCIL
Measuring our Progress

115
Direction: G5 Council is a financially sustainable organisation Strategy: G5c Establish and maintain commercial business operations that contribute to Council’s financial sustainability
Deliverable Actions in 2011-2012 Targets and Progress Measures
Report-ing
Officer
Pro-gress
Comment
G5c1
Budgeted financial performance for all commercial leases met or exceeded
Manage the leasing Council’s commercial property portfolio
Performance of Council’s business activities
greater than or equal to
budgeted financial
performance for all
commercial leases
DM BSP
●
G5c2
Budgeted financial performance for Cemetery business operations met or exceeded
Manage Council’s cemetery business unit
Performance of Council’s business activities
greater than or equal to
budgeted financial
performance for cemetery
business operations
DM BSP
●
Deliverable Actions in 2011-2012 Targets and Progress Measures
Report-ing
Officer
Pro-gress
Comment
G5c3
Budgeted financial performance for Council car park business operations met or exceeded
Manage Council’s car parks
Performance of Council’s business activities
greater than or equal to
budgeted financial
performance for Council car
parks operations
DM BSP
●
G5c4
Budgeted financial performance for commercial waste collection and recycling service
Manage Council’s commercial waste and recycling service
Performance of Council’s business activities
greater than or equal to
budget for commercial
waste operation
DM BS
●
WAVERLEY COUNCIL
Measuring our Progress

116
Direction: G6 Council assets are well maintained for their current purpose and for future generations Strategy: G6a Regularly revise Council’s Strategic Asset Management Plans and integrate with financial planning processes
Deliverable Actions in 2011-2012 Targets and Progress Measures
Report-ing
Officer
Pro-gress
Comment
G6a1
Cost effective Strategic Asset Management Plans (SAMPs) that are compliant with legislative requirements
Undertake review of SAMP 3 Carry out condition assessments for all asset categories currently not detailed in SAMP 3 Prepare SAMP 4
Strategic Asset Management
Plans updated by June 2012
DM TS
●
G6a2
Long Term Financial Plans (LTFPs) that reflect the full assessed cost of adopted Asset Management Plans
Incorporate asset management funding assessments into 4 year Delivery Program and 10 year financial plan (LTFP) Report to Council at least annually on asset management funding
Asset maintenance and renewal
estimated are shown in Long Term Financial
Plans and reported to
Council in April each year
DM FISS
●
WAVERLEY COUNCIL
Measuring our Progress
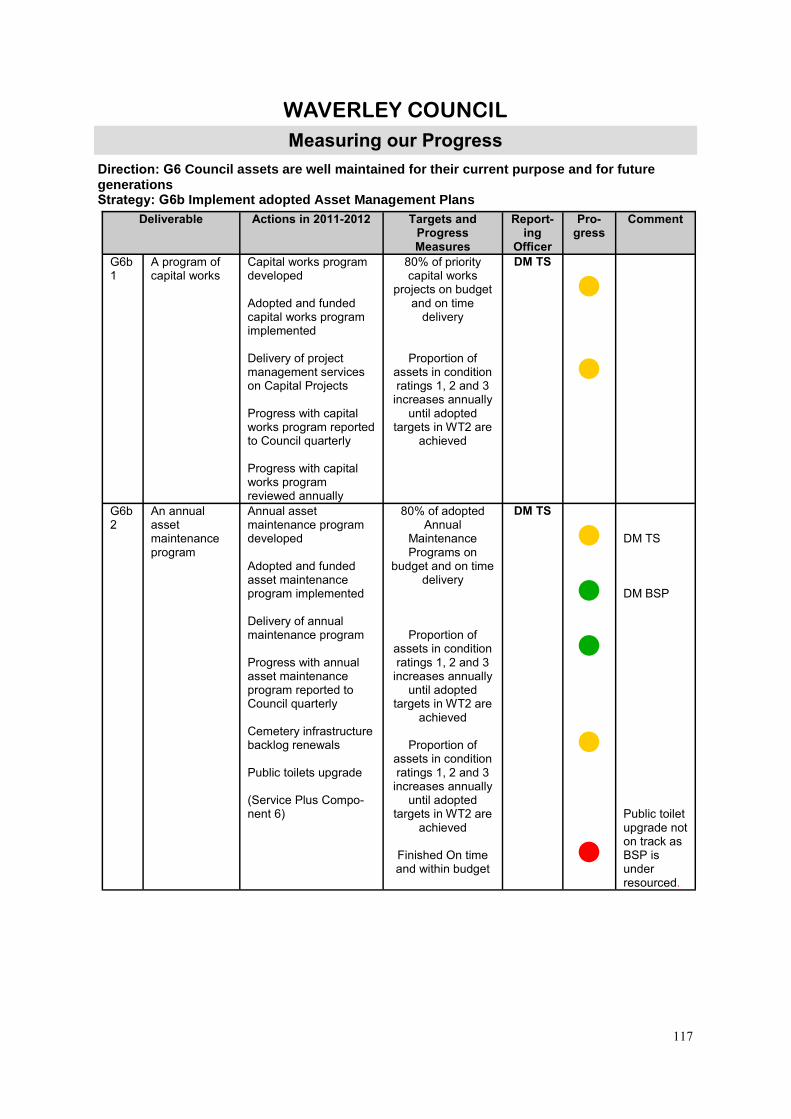
117
Direction: G6 Council assets are well maintained for their current purpose and for future generations Strategy: G6b Implement adopted Asset Management Plans
Deliverable Actions in 2011-2012 Targets and Progress Measures
Report-ing
Officer
Pro-gress
Comment
G6b1
A program of capital works
Capital works program developed Adopted and funded capital works program implemented Delivery of project management services on Capital Projects Progress with capital works program reported to Council quarterly Progress with capital works program reviewed annually
80% of priority capital works
projects on budget and on time
delivery
Proportion of assets in condition ratings 1, 2 and 3
increases annually until adopted
targets in WT2 are achieved
DM TS
●
●
G6b2
An annual asset maintenance program
Annual asset maintenance program developed Adopted and funded asset maintenance program implemented Delivery of annual maintenance program Progress with annual asset maintenance program reported to Council quarterly Cemetery infrastructure backlog renewals Public toilets upgrade (Service Plus Compo-nent 6)
80% of adopted Annual
Maintenance Programs on
budget and on time delivery
Proportion of assets in condition ratings 1, 2 and 3
increases annually until adopted
targets in WT2 are achieved
Proportion of
assets in condition ratings 1, 2 and 3
increases annually until adopted
targets in WT2 are achieved
Finished On time and within budget
DM TS
●
●
●
● ●
DM TS DM BSP Public toilet upgrade not on track as BSP is under resourced.
WAVERLEY COUNCIL
Measuring our Progress
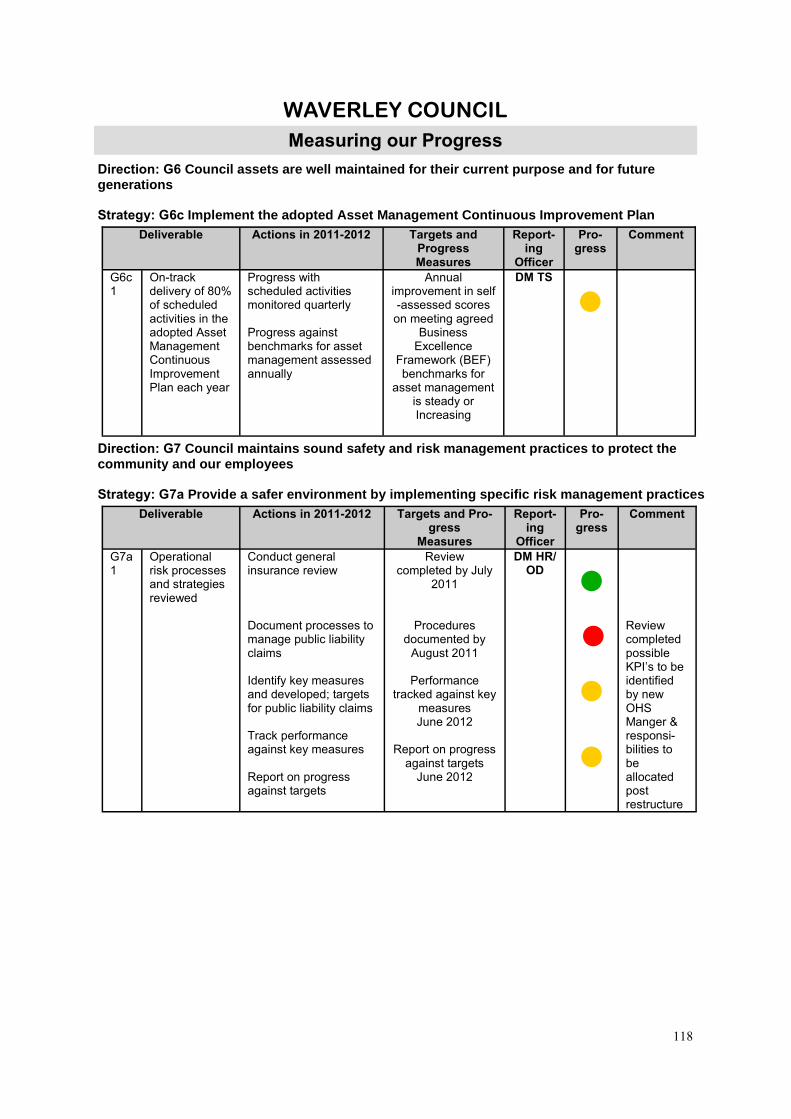
118
Direction: G6 Council assets are well maintained for their current purpose and for future generations Strategy: G6c Implement the adopted Asset Management Continuous Improvement Plan
Direction: G7 Council maintains sound safety and risk management practices to protect the community and our employees Strategy: G7a Provide a safer environment by implementing specific risk management practices
Deliverable Actions in 2011-2012 Targets and Progress Measures
Report-ing
Officer
Pro-gress
Comment
G6c1
On-track delivery of 80% of scheduled activities in the adopted Asset Management Continuous Improvement Plan each year
Progress with scheduled activities monitored quarterly Progress against benchmarks for asset management assessed annually
Annual improvement in self-assessed scores
on meeting agreed Business
Excellence Framework (BEF) benchmarks for
asset management is steady or Increasing
DM TS
●
Deliverable Actions in 2011-2012 Targets and Pro-gress
Measures
Report-ing
Officer
Pro-gress
Comment
G7a1
Operational risk processes and strategies reviewed
Conduct general insurance review Document processes to manage public liability claims Identify key measures and developed; targets for public liability claims Track performance against key measures Report on progress against targets
Review completed by July
2011
Procedures documented by
August 2011
Performance tracked against key
measures June 2012
Report on progress
against targets June 2012
DM HR/OD
●
● ●
●
Review completed possible KPI’s to be identified by new OHS Manger & responsi-bilities to be allocated post restructure
WAVERLEY COUNCIL
Measuring our Progress

119
Direction: G7 Council maintains sound safety and risk management practices to protect the community and our employees Strategy: G7b Maintain a safe workplace
Direction: G8 Council manages information and knowledge in an integrated and accessible way Strategy: G8a Improve the management of, and access to, information across Council
Deliverable Actions in 2011-2012 Targets and Progress Measures
Report-ing
Officer
Pro-gress
Comment
G7b1
Number of lost time injuries and incidents reduced
Develop and implement Claims and Rehabilitation Procedures and tools Monitor and report on lost time injuries, OH&S incidents and time to complete corrective actions Report on progress including operational improvements
5% reduction in lost time
injuries compared to
base year
5% reduction in incidents
compared to base year
60% of corrective
actions raised that are closed
DM HR/OD
●
●
●
G7b2
OHS Risk Management Plan implemented
OHS Risk Management Plan implemented Progress monitored Reporting on progress provided
70% of OHS plan completed
DM HR/OD
●
Deliverable Actions in 2011-2012 Targets and Progress Measures
Report-ing
Officer
Pro-gress
Comment
G8a1
Knowledge Management Action Plans implemented
Implement the funded actions from the adopted Knowledge Management Action Plans
80% of actions from Knowledge
Management Action Plans implemented
annually
GMU
●
Due to staffing shortages this is not on track
G8a2
Records management and information access services provided
Maintain Council’s records management system Provide records management services Provide advice and training in the use of Council’s records management system Audit and report on compliance with the use of Council’s records management system
90% of staff comply with
Council’s Records
Management Policy
DM G&IP
●
WAVERLEY COUNCIL
Measuring our Progress

120
Deliverable Actions in 2011-2012 Targets and Progress Meas-
ures
Report-ing
Officer
Pro-gress
Comment
G8a3
Compliance with Government Information (Public Access) and Privacy and Personal Information Protection Acts
Develop and implement program for compliance with Government Information (Public Access) Act Provide access to information under the Freedom of Information Act (the FOI Act) Provide access to information under Government Information (Public Access) Act (the GIPA Act) Manage requests and privacy complaints under Privacy and Personal Information Protection Act (the PPIP Act)
All applications under FOI, GIPA and PPIP Acts
processed annually in
accordance with legislative timeframe
DM G&IP
●
G8a4
Effectiveness of web site monitored
Maintain Council’s web site Monitor and report on use of web site
10% increase in visits to web site
each year
DM FISS
●
G8a5
Geographic information and mapping system across Council maintained
Maintain and update Council’s geographic information and mapping system Provide a publicly accessible digital mapping system
All software and mapping database updates
completed annually
Increase in
number of users accessing the
mapping website annually from
base year
DM SLUP
●
●
WAVERLEY COUNCIL
Measuring our Progress

121
Direction: G8 Council manages information and knowledge in an integrated and accessible way Strategy: G8b Provide statutory, financial and management information and reporting on time and with a high degree of accuracy
Deliverable Actions in 2011-2012 Targets and Progress Measures
Report-ing Offi-
cer
Pro-gress
Comment
G8b1
All reports required by legislation or requested by Government departments and agencies provided
Complete Operational Plan as required by legislation Complete and submit Annual Report by due date Submit annual audited financial accounts to DLG by due date Provide Companion Animal reporting as required
All reports required by legislation
provided on time and in
required format
Director C&TS
DM
G&IP
DM FISS
DM C
●
G8b2
Annual reports on key council's plans and policies completed
Report on access and equity policies in Council’s Annual Report
Information for Annual
Report provided in September
annually
DM RCPP
●
WAVERLEY COUNCIL
Measuring our Progress

122
Direction: G9 Council is an attractive, performance-focussed employer, governed by great leadership and supported by a committed and adaptable workforce Strategy: G9a Attract and retain highly skilled employees who take pride in delivering exceptional service to achieve the community’s vision
Deliverable Actions in 2011-2012 Targets and Progress Measures
Report-ing
Officer
Pro-gress
Comment
G9a1
Council’s Workforce Plan implemented
Undertake the activities scheduled in Council’s Workforce Plan
80% of activities from
Workforce Plan
completed annually
DM HR/OD
●
G9a2
Improvement in staff retention demonstrated
Review suite of selection skills tests eg: driving, functional assessments, computer tests, psychological suitability of new starters
Annual turnover rate of staff that have been
with Council for three
years and less is 14% or
lower
Overall staff turnover rate is reduced to 11% or less
DM HR/OD
● ●
G9a3
Recruitment process managed to limit the length of time to fill vacant positions
Undertake recruitment in accordance with guidelines Monitor recruitment process to identify issues or delays that may increase time to fill vacant positions Respond to any issues or delays identified
Recruitment cycle time six weeks or less
DM HR/OD
●
WAVERLEY COUNCIL
Measuring our Progress

123
Direction: G9 Council is an attractive, performance-focussed employer, governed by great leadership and supported by a committed and adaptable workforce Strategy: G9b Create a positive performance culture that builds skills in alignment with Council’s Mission and Values
Deliverable Actions in 2011-2012 Targets and Progress Measures
Report-ing
Officer
Pro-gress
Comment
G9b1
2011/2015 EEO Management Plan developed and implemented
Review 2006/2010 EEO Management Plan Develop 2011/2015 EEO Management Plan
2011/2015 EEO
Management Plan
completed by June 2011
DM HR/OD
●
G9b2
Staff reward and recognition program developed and implemented
Develop reward and recognition program Implement reward and recognition program Monitor implementation and operation of program Seek staff feedback on reward and recognition program
Rating at each three
yearly re-take of staff survey
against questions 9 and 16 is
increasing by June 2012
DM HR/OD
●
G9b3
Learning and Development (Training) Plan programs delivered
Develop Learning & Development Plan Implement Learning & Development Plan Seek feedback on Plan to assist in development of next Plan
80% of scheduled
components of Training
Plan delivered annually
85%
satisfaction rating scored
on training evaluation
DM HR/OD
●
●
WAVERLEY COUNCIL
Measuring our Progress

124
Deliverable Actions in 2011-2012 Targets and Progress Measures
Report-ing
Officer
Pro-gress
Comment
G9b4
Program of internal customer service surveys continued
Implement annual program Develop and implement improvement plans Monitor progress with improvement plans
5% increase on previous rating score achieved on
internal customer service surveys
compared to previous
rating
Overall rating of 75% or
above before or by the 3rd
re-take
DM HR/OD
● ●
BSP achieved target The Mechanical workshop is significantly behind even after 2nd retake. Need for further discussion and revised approach
G9b5
Business Excellence survey program with staff continued
Undertake survey Report results Identify possible areas of improvement
5% improvement
by Department
and organisation
wide on baseline rating on
score achieved on each retake of Business Excellence
Survey Target of
75% achieved or more by the 3rd retake
DM HR/OD
●
Overall 3% drop against base, 3 of 5 departments achieved or maintained required level & 2 did not. One department was significantly lower than previously.
WAVERLEY COUNCIL
Measuring our Progress

125
Section 4
Meeting our Statutory Requirements
WAVERLEY COUNCIL
Meeting our Statutory Requirements

126
WAVERLEY COUNCIL
Meeting our Statutory Requirements The following information is provided in accordance with the annual reporting requirements outlined in Section 428(2) of the Local Government act 1993. A. Statement of Expenses, Revenues and Assets This information can be found in Part 4 of this Annual Report B. Actual and Projected Performance Comparison This information can be found in Section 3 ’Measuring our Progress’ of this Annual Report. C. State of the Environment Report—How are we going? Waverley Council completed an Environmental Action Plan (EAP2) in 2009 which forms part of Council’s Resourcing Strategy as part implementation of the new Integrated Planning and Reporting Framework. This Resourcing Strategy informs the Community Strategic Plan (Waverley Together 2) and the Council’s Delivery Program (Delivery Program 2010-2013) . With this in mind, Council no longer believes it is appropriate to have a stand alone State of the Environment Report as the quadruple bottom line (of which environmental sustainability is one of the elements) is required to be reported upon within the Integrated Planning Framework. However, Council believes it is important that the community should be able to see how progress is going within the Environmental Action Plan (EAP2) in helping the community to move closer to their Vision as set out in the Community Strategic Plan (Waverley Together 2). Accordingly a separate report has been produced which outlines progress against EAP2 and Waverley Together 2. This report can be found in Part 3 of this Annual Report. D. Condition of Public Works Our Strategic Asset Management Plans (SAMP1, completed in March 2006, SAMP2, completed in December 2007 and SAMP3, completed in December 2009) provide a new and more accurate approach to assessing the cost of asset management and setting priorities for expenditure. Assets in Waverley are now rated in the Strategic Asset Management Plans according to the following condition hierarchy: • Condition 1: Good condition • Condition 2: Minor deterioration • Condition 3: Medium deterioration • Condition 4: Major deterioration • Condition 5: Unserviceable The methodology used to develop accurate estimates of costs to bring assets to a satisfactory standard, and keep them there, has been progressively developed and validated over a period of years since SAMP1. In 2010, in recognition of this work, Waverley Council won the Federal Government’s National Award for Local Government in Asset and Financial Management for this method. A complete description of the method is provided in SAMPs 2 and 3 at the flowing link: www.waverley.nsw.gov.au/your_council/planning_for_waverley_future In summary the methodology involves: • Gradually building up an accurate picture of the current condition of assets and developing estimates for restoring different proportions of them to top condition in defined cycles; and then • Checking with the community – using simple pictures – about what proportion of each asset category they really want to see in top condition at any one time. The process assumes it isn’t necessary to have all assets in absolutely top condition all of the time and there are acceptable intervals for asset renewal which will deliver both asset and financial sustainability. Because of the simple approach to communications, our community has now confirmed this assumption is acceptable.
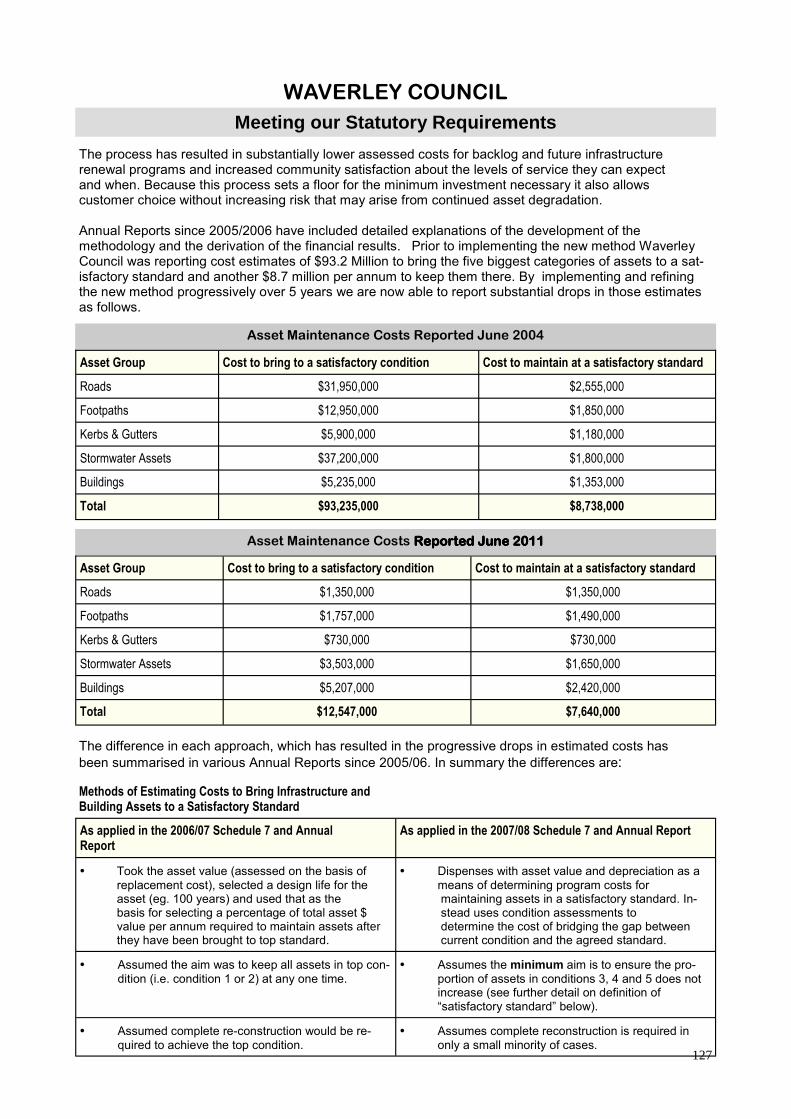
127
WAVERLEY COUNCIL
Meeting our Statutory Requirements
The process has resulted in substantially lower assessed costs for backlog and future infrastructure renewal programs and increased community satisfaction about the levels of service they can expect and when. Because this process sets a floor for the minimum investment necessary it also allows customer choice without increasing risk that may arise from continued asset degradation. Annual Reports since 2005/2006 have included detailed explanations of the development of the methodology and the derivation of the financial results. Prior to implementing the new method Waverley Council was reporting cost estimates of $93.2 Million to bring the five biggest categories of assets to a sat-isfactory standard and another $8.7 million per annum to keep them there. By implementing and refining the new method progressively over 5 years we are now able to report substantial drops in those estimates as follows.
Asset Maintenance Costs Reported June 2004
Asset Group Cost to bring to a satisfactory condition Cost to maintain at a satisfactory standard
Roads $31,950,000 $2,555,000
Footpaths $12,950,000 $1,850,000
Kerbs & Gutters $5,900,000 $1,180,000
Stormwater Assets $37,200,000 $1,800,000
Buildings $5,235,000 $1,353,000
Total $93,235,000 $8,738,000
Asset Group Cost to bring to a satisfactory condition Cost to maintain at a satisfactory standard
Roads $1,350,000 $1,350,000
Footpaths $1,757,000 $1,490,000
Kerbs & Gutters $730,000 $730,000
Stormwater Assets $3,503,000 $1,650,000
Buildings $5,207,000 $2,420,000
Total $12,547,000 $7,640,000
Asset Maintenance Costs Reported June 2011Reported June 2011Reported June 2011Reported June 2011
The difference in each approach, which has resulted in the progressive drops in estimated costs has been summarised in various Annual Reports since 2005/06. In summary the differences are:
Methods of Estimating Costs to Bring Infrastructure and Building Assets to a Satisfactory Standard
As applied in the 2006/07 Schedule 7 and Annual Report
As applied in the 2007/08 Schedule 7 and Annual Report
• Took the asset value (assessed on the basis of replacement cost), selected a design life for the asset (eg. 100 years) and used that as the basis for selecting a percentage of total asset $ value per annum required to maintain assets after they have been brought to top standard.
• Dispenses with asset value and depreciation as a means of determining program costs for maintaining assets in a satisfactory standard. In-stead uses condition assessments to determine the cost of bridging the gap between current condition and the agreed standard.
• Assumed the aim was to keep all assets in top con-dition (i.e. condition 1 or 2) at any one time.
• Assumes the minimum aim is to ensure the pro-portion of assets in conditions 3, 4 and 5 does not increase (see further detail on definition of “satisfactory standard” below).
• Assumed complete re-construction would be re-quired to achieve the top condition.
• Assumes complete reconstruction is required in only a small minority of cases.
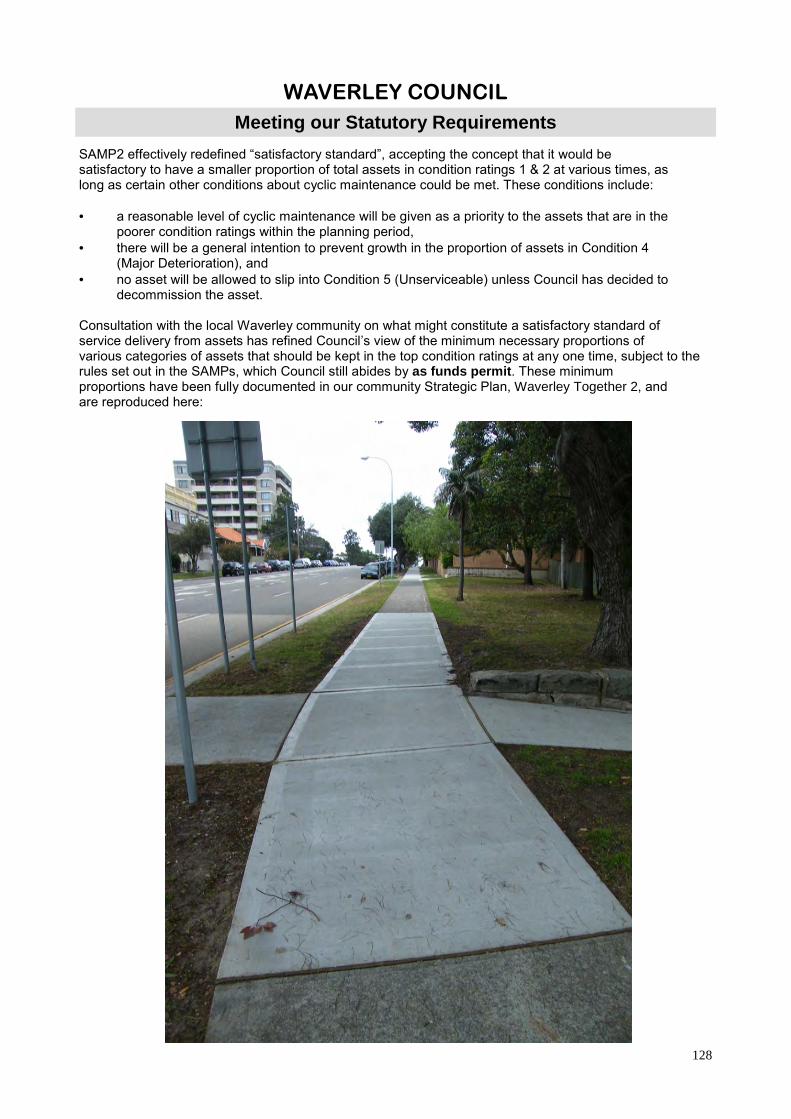
128
WAVERLEY COUNCIL
Meeting our Statutory Requirements
SAMP2 effectively redefined “satisfactory standard”, accepting the concept that it would be satisfactory to have a smaller proportion of total assets in condition ratings 1 & 2 at various times, as long as certain other conditions about cyclic maintenance could be met. These conditions include: • a reasonable level of cyclic maintenance will be given as a priority to the assets that are in the poorer condition ratings within the planning period, • there will be a general intention to prevent growth in the proportion of assets in Condition 4 (Major Deterioration), and • no asset will be allowed to slip into Condition 5 (Unserviceable) unless Council has decided to decommission the asset. Consultation with the local Waverley community on what might constitute a satisfactory standard of service delivery from assets has refined Council’s view of the minimum necessary proportions of various categories of assets that should be kept in the top condition ratings at any one time, subject to the rules set out in the SAMPs, which Council still abides by as funds permit . These minimum proportions have been fully documented in our community Strategic Plan, Waverley Together 2, and are reproduced here:

129
WAVERLEY COUNCIL
Meeting our Statutory Requirements
Target Condition Current Condition
Council assets should be capable of delivering the desired levels of service as measured by achieving the following asset condition ratings on an annual basis: In condition 1 or 2 • 79% of roads • 80% of footpaths • 73% of kerbs/gutters • 100% of stairs • 100% of fences & bollards • 100% bus shelters • 100% bus seats • 100% street seats • In Parks
• 100% of fences & bollards • 100% of footpaths • 100% of stairs • 100% of play equipment • 100% of signs
• In Waverley Cemetery • 100% of roads • 100% of gutters • 100% of paths • 100% of drains • 100% of fencing (internal) • 100% of fencing (external)
In 2009Council assets achieved the following condition ratings: In condition 1 or 2 • 81% of roads • 75% of footpaths • 74% of kerbs & gutters • 69% of stairs • 74% of fences and bollards • 97% of bus shelters • 79% of bus seats • 84% of street seats • 79% of fences and bollards in parks • 82% of footpaths in parks • 84% of stairs in parks • 65% of play equipment in parks • 90% of signs in parks • 2% of Waverley Cemetery roads • 65% of Waverley Cemetery gutters • 59% of Waverley Cemetery paths • 57% of Waverley Cemetery drains • 39% of Waverley Cemetery fencing (internal) & 21%
fencing (external)
The remaining Council assets should be capable of delivering the desired levels of service as measured by achieving the following asset condition ratings on an annual basis: In condition 1, 2 or 3 • 100% of buildings • 100% of pools • 100% of drains length • 100% of retaining walls in streets • 100% of seawalls • 100% of street bins • 100% of parking signs • In Parks
• 100% of furniture • 100% of lighting • 100% of retaining walls • 100% of irrigation • 94% of street trees
• In Waverley Cemetery • 100% of retaining walls
For the remaining Council assets, in 2009 Council achieved the following condition ratings: In condition 1, 2 or 3 • 93% of buildings • 100% of pools • 88% of drains length • 94% of retaining walls in streets • 90% of seawalls • 98% of street bins • 90% of parking signs • 95% of furniture in parks • 94% of lighting in parks • 93% of retaining walls in parks • 97% of irrigation in parks • 87% of street trees • 90% of Waverley Cemetery retaining walls
130
WAVERLEY COUNCIL
Meeting our Statutory Requirements Waverley Council Maintenance Program
2011-12
Buildings Council Offices $220,000
Works Depot $74,000
Council Halls $260,000
Council Houses $420,000
Library $355,000
Childcare Centres $233,000
Amenities/Toilets $402,000
Commercial $30,000
Total $1,994,000
Other Structures Assets not included in buildings
$4,535,000
Roads $1.560,000
Footpaths $1,180,000
Kerb & Gutter $866,000
Drainage Stormwater $353,000
Inlet & Junction Pits $143,000
Total $581,000
TOTAL—ALL ASSETS $10,415,000
E. Legal Proceedings In the period July 2011 to June 2012 Council spent a total of $737,096.28 on legal expenses (legal repre-sentation plus consultants) all of which related to planning matters under the provisions of the Environmental Planning & Assessment Act 1979. During the year 48 new appeals were commenced in the Land & Environment Court with 7 appeals being discontinued. The result of the matters determined is set out below: Land & Environment Court: • Appeals upheld with conditions 12 • S34 Agreements 13 • Appeals dismissed 3 More information on individual Land & Environment Court matters is included on the following pages. Local Court Prosecutions were undertaken for offences involving parking offences, offences under the Local Government Act, 1999, Environmental Planning and Assessment Act, 1979 and the Companion Animals Act, 1998. Of the 148 parking infringement cases appealed to the courts, 52 fines were imposed, 26 were withdrawn (by the appellant), 57 resulted in the offence being proven but no conviction being recorded (Section10), and 13 were dismissed in the appellant's favour. The number dismissed by the court in the appellant's fa-vour represents 0.015% of total parking fines issued during the year. Fines and costs ordered by the magistrate to be paid • Fines awarded in Council's favour: $9,517 • Costs awarded against Council: $Nil
131
WAVERLEY COUNCIL
Meeting our Statutory Requirements
Property Issue Comment
7 – 9 Hunter Street, Dover Heights
Class 1 –s96 - Refusal - Modification to base-ment level including widening garages and provision of additional bedroom at the rear first floor of each dwelling.
Appeal upheld with conditions.
153 Glenayr Avenue, Bondi Beach
Class 1 – Deemed Refusal - Construction of part 4/part 5 storey boarding house compris-ing 22 rooms, a garage and retail shop.
S34 Agreement.
102 – 104 Ebley Street, Bondi Junction
Class 1 – Deemed Refusal - Modify conditions of consent to extend trading hours to 10.00 am to 3.00 am (the following day) to existing brothel and permit eight (8) sex workers on-site.
Discontinued 22/11/11
56 Ocean Street, Bondi
Class 1 – Deemed refusal - Alterations and additions to dwelling to create a dual occu-pancy with part two storey at rear and front car parking spaces.
Appeal upheld with conditions.
152 Hastings Parade, North Bondi
Class 1 – s96 – Refusal - Modification to raise roof height by 400mm, reposition rear balcony and provide storage room at basement.
S34 Agreement
78 Hastings Parade, North Bondi Class 1 – refusal - Construction of hardstand carspace to front of dwelling.
S34 Agreement
14 Carlisle Street, Tamarama Class 1 – Deemed refusal - Alterations and additions including an additional storey to dwelling.
S34 Agreement
67 Edwards Street, Bondi Class 1 – s121B Order be set aside. Orders revoked with each party to pay their own costs. Discontinued 20/2/12
50 Watson Street, Bondi Class 1 - s121 B (s121ZK) Order be set aside Discontinued 12/3/12.
168 Wellington Street, Bondi Beach Class 1 – Refusal - Alterations to front of dwelling with provision of carspace and new fence.
Appeal dismissed
117 Henrietta Street, Queens Park Class 1 Application -s96 - Deemed refusal filed 28/10/11 -(approved 17/10/11 to architect applicant Crowley).
s34(3) Agreement
4 Glen Street, Bondi Class 1 - Alterations and additions to residen-tial flat building including two additional storeys containing two additional units.
s34 Agreement
19 Young Street & 13 Chris Bang Crescent, Vaucluse
Class 1 – Deemed refusal –Demolition of two dwellings and construction of three storey residential flat building with 14 units and attic and basement car parking.
s34 Agreement
Land & Environment Court Class 1 Appeals to the Land & Environment Court 2011-12

132
WAVERLEY COUNCIL
Meeting our Statutory Requirements
Property Issue Comment
48 – 50 Blenheim Street, Queens Park
Class 1 – Refusal – Alterations and additions to dwelling including provision of single carport and front fence.
Appeal upheld with conditions
39 – 41 Brisbane Street, Bondi Junction
Class 1 – deletion of 9 deferred commence-ment conditions - Alterations and additions to existing building including an attic addition and conversion to four residential units and strata subdivision.
Appeal upheld with conditions
24 Dudley Street, Bondi
Class 1 _ Deemed Refusal – Alterations and additions including additional storey to semi detached dwelling.
S34 (3) Agreement.
50 Watson Street, Bondi
Class 1 – Refusal – Modification to vary Conditions regarding car parking on property.
S34 Agreement.
163 Hastings Parade, North Bondi
Class 1 – Deemed Refusal –Rebuilding part 2/ part 3 storey dwelling with swimming pool at rear and Class 1 - Deemed Refusal – of Building Certificate
2 x Discontinued 5/3/12
96 – 100 Ebley Street, Bondi Junction
Class 1 – Refusal – Modification to delete Condition No.2 to allow for 24 hour, seven days trading for gymnasium.
Discontinued 8/2/12
31 Blenheim Street / 22 Isabella Lane, Queens Park
Class 1 – Refusal – Lodged with Council on 3 February 2011 for the construction of a three storey dwelling including double garage and pool on rear lot to be known as 22 Isabella Street.
Appeal upheld with conditions.
249 Birrell Street, Bronte
Class 1 – Deemed refusal – Modify proposal to alter roofing and rear wall cladding materials, locate garage closer to boundary, enlarge rear upstairs room and retain palm trees.
Appeal upheld in part with conditions.
40 Gardyne Street, Bronte
Class 1 – Deemed refusal - Construction of three storey dwelling and garage, single storey cabana/guest accommodation with garage under, swimming pool and landscaping - Amended plans.
Appeal upheld with conditions.
39 – 53 Campbell Parade, North Bondi
Class 1 – s96 – Deemed Refusal - Modifications to internal layout, strata modification and new stratum subdivision of building.
S34 Agreement.
36 Sir Thomas Mitchell Road, Bondi
Class 1 – Refusal - Construction of hardstand carspace to front of dwelling.
Appeal upheld with conditions.
105 Ramsgate Avenue, North Bondi
Class 1 – Deemed refusal Demolition of residential flat building and construction of dual occupancy of five storeys and basement, in-deck pool and on-site carparking.
S34 Agreement
133
WAVERLEY COUNCIL
Meeting our Statutory Requirements Property Issue Comment
3 Brae Street, Bronte
Class 1 – Refusal - Car parking space and new gates to front of dwelling. DBU: Refused
S34 Agreement
1- 3 Tipper Avenue, Bronte
Class 1 – Deemed refusal - Boundary adjust-ment between properties and construction of a two storey dwelling with single garage and a part one / part three storey dwelling with dou-ble garage and pool.
Appeal upheld with conditions
350 Birrell Street, Bondi
Class 1 - Refusal - Car parking space and front fence to dwelling - amended Plans.
Appeal Upheld with conditions
70 Fletcher Street, Bondi
Class 1 – Deemed Refusal - Alterations and additions to basement of residential flat building to accommodate car parking.
17 Wonderland Avenue, Tamarama
Class 1 – Deemed Refusal - Demolition of building with construction of 2x2 storey at-tached dwellings with basement parking and attics and land subdivision creating 2 lots.
Appeal upheld with conditions
21 Thompson Street, Tamarama
Class 1 - Deemed Refusal - Demolition of dwelling and construction of a part 2/part 4 storey dwelling and pool.
S34 Agreement
52 Fletcher Street, Bondi Beach
Class 1 – Refusal - Alterations and additions to a residential flat building including an addi-tional storey, balconies and a lift.
Appeal dismissed.
53 Glasgow Avenue, Bondi
Class 1 – Refusal - Erection of acoustic enclo-sure and screen around air conditioning and refrigeration units.
53 Glenayr Avenue, North Bondi
Class 1 – Deemed Refusal - Renovation of existing building and strata subdivision into 4 lots.
7/228 Campbell Parade, Bondi Beach
Class 1 – Refusal - Internal alterations to unit 7
Appeal dismissed.
3 Brae Street, Bronte COMPLIANCE
Class 1 – BC refusal – see adjoined appeal above.
S34 Agreement
22 – 26 Bronte Road, Bondi Junction
Class 1 – Refusal - Modification to extend trading hours for premises from 10am to 5am, seven days a week.
34 Imperial Avenue, Bondi COMPLIANCE s121B Order
Class 1 – Appeal against s121B Order – Cease using the premises for the purposes of a residential flat building.
Shops 7 & 8 767 – 771 Old South Head Road, Vaucluse
Class 1 – Refusal - Extension of operating hours of cafe to 7am-9pm Monday to Sunday.

134
WAVERLEY COUNCIL
Meeting our Statutory Requirements
Property Issue Comment
Shop 6 767 -771 Old South Head Road, Vaucluse
Class 1 – s96 - Modify proposal to extend trading hours on one year trial basis & to ex-tend exhaust stack. “10pm on Thursday, Friday and Sat. nights for a 1 year trial period.”
34 Imperial Avenue, Bondi
Class 1 – Deemed refusal - Alterations and additions including internal reconfiguration rear extension , swimming pool , convert ga-rage to cabana and window changes.
86 Blair Street, North Bondi
Class 1 – Refused - Alterations and additions to existing dual occupancy.
Corner Blake & Napier Streets, Do-ver Heights
Class 1 – Deemed refusal - Change of use of school building to childcare centre with asso-ciated landscaping works and acoustic fence.
405 Old South Head Road, North Bondi
Class 1 – Deemed Refusal - Demolish single dwelling and construct Three storey residential flat building with attic and basement parking for eight strata units.
The Beach Road Hotel 71 Beach Road / 99 Glenayr Avenue Bondi Beach
Class 1 – Refusal -Modification (s96AA) of court consent to delete Condition 4 regarding public meetings and Condition 19 to allow for the number of patrons on the first floor to be 650 permanently.
114 Curlewis Street, Bondi Beach
Class 1 – Deemed refusal - Demolition of existing house and Construction of 4 storey / part 5 storey boarding house.
16 Wallangra Road, Dover Heights
Class 1 – Refusal - Modification of Conditions 21, 23 and 24 regarding location of spa and design of balustrade.
61 Victoria Street, Waverley
Class 1 - Deemed Refusal - Major extensions and alterations including basement garage and carstacker, rebuild internal rooms and new roof garden.
Class 5 Appeals to the Land & Environment Court 2011-12 There were no Class 5 Appeals to the Land & Environment court in 2011-12.

135
WAVERLEY COUNCIL
Meeting our Statutory Requirements
F. Mayor & Councillor Fees and Facilities Council’s policy on expenses and the provision of facilities for use by Councillors was revised in November 2011 and commenced on 15 November 2011. Under the provisions of this policy Council provides the following reimbursements and facilities to Councillors: • Maximum reimbursement of $230 per month for telephone, PDA and internet costs and expenses. • Reimbursement for registration, travel and accommodation costs to attend conferences, seminars or for other official council business. • Reimbursement of reasonable costs incurred for the care of their children, elderly, disabled or sick. • Insurance cover for personal injury, professional indemnity and public liability. • Legal indemnity to cover reasonable legal expenses in relation to proceedings arising out of their
role/responsibilities as a councillor. • Reimbursement for the purchase of computer/telecommunications hardware and/or home office
equipment up to a maximum retail value of $5647 (inc gst) per electoral term. Councillors also receive the benefit of the following: • Use of official stationery and access to Council’s photocopiers and fax machines to discharge their Council functions; • Word processing of official correspondence, subject to the prior approval of the General Manager; • Postage of official correspondence; • Meals on evenings of Council and Committee meetings; • Access to a shared workstation with phone and a printer at the council chambers; In addition to the facilities provided to Councillors, the Mayor is entitled to receive the benefit of: • Use of a Council vehicle; • Secretarial and administrative assistance relating to the discharge of his/her civic functions; • A mobile phone. In 2011-12 Mayoral and Councillor fees and expenses were as follows:
• Councillor Fees (including Deputy Mayor) $199,679.04 • Mayoral Fees $36,319.92 • Councillor Expenses & Facilities Costs $99,389.35 Councillors’ Expenses and Facilities Costs included $23,904.50 for sustenance and $8,625.57 for printing as well as the following items: (a) Office equipment - Rental $644.78 - Minor Equipment $4,109.50 - Landline/Internet Access $7,627.43 - Maintenance $12.69 $13,887.77 (b) Telephone Calls - Mobile $4,855.17 - Landline $4,826.54 $9,681.71 © Conference & Seminars $14,545.97 (d) Training Expenses $0.00 (e) Interstate Visits $0.00 (f) Overseas Visits $0.00 (g) Spouse Expenses $0.00 (h) Child Care $0.00 (i) Travel costs/taxi fares $9867.48 (j) Legal costs $6,325.00

136
WAVERLEY COUNCIL
Meeting our Statutory Requirements G. Employment of Senior Staff Council has five senior staff as identified under the Local Government Act consisting of the General Manager and 4 Directors. The value of senior staff total remuneration as at 30 June 2012 was $1,243,754.99 consisting of: Salary $1,101,239.60 Superannuation $72,994.56 Vehicles $51,879.38 Fringe benefits tax $17,641.45 The total remuneration package for the General Manager in 2011-12 was $300,061.82 Note the above total remuneration packages contain the following: • Total value of the salary component of the package. • Total amount payable by Council by way of employer’s contribution or salary sacrifice to any superannuation scheme to which the member may be a contributor. • Total value of any non-cash benefits (note personal non cash benefits for motor vehicles are valued for this purpose by a formula used for calculating fringe benefit tax.) • Total amount payable by Council by way of fringe benefits tax for any non-cash benefits including items such as car parking H. Major Contracts Awarded by Council Council awarded 8 contracts in excess of $150,000 and one contract in excess of $100,000 during 2011-12 financial year. The table below sets out the details of these contracts. Description Contractor/Supplier Contract Value
Bondi Stormwater Harvesting Project
SAS Water Solutions Pty Ltd $988,895.60
SSROC Supply and Delivery of Ready-mixed Concrete
Concrite Pty Ltd
$240,000.00
Road Resheeting Works EDI Downer
$597,305.04
Road Resheeting Works Asphalt Layng Services Pty Ltd $427,935.00
Waverley Library Replacement Chiller
Hastie Services Pty Ltd $257,202.00
Land Purchase - Lot 2/362 Birrell St Tamarama Registration Plan: Lot 2 Plan DP 1163353
N/A $1,700,000.00
Disposal of Dry Waste Veolia Environmental Services $600,000.00 estimate
SSROC - Line-marking services Complete Linemarking Services
National Road Sealing Services
Avante Linemarking ervices
Approximately $100,000.00 per annum
Energy & Water Savings Retrofits
Ecosave Pty Ltd $801,145.00

137
WAVERLEY COUNCIL
Meeting our Statutory Requirements I. Bush Fire Reduction Activities The Waverley Council local government area is one of the most densely populated and urbanised areas of Australia and has few, if any, areas likely to be subject of bush fire activity. No bush fire reduction activities were carried out by Council during 2011– 12.
138
WAVERLEY COUNCIL
Meeting our Statutory Requirements
J. Multi-Cultural Services—Access & Equity Report July 2011—June 2012 Part 1 Supporting Multicultural communities Introduction Waverley Council’s Cultural Diversity Policy and Action Plan 2010-14 The Cultural Diversity Policy and Action Plan is Council’s blueprint for action and sets out our commitment to the principles of multiculturalism and social justice. Over the past year we continued with the implemen-tation of the 4 year action plan and achieved progress in all five key areas:
• Leadership • Community Harmony • Planning and Engagement • Access & Equity • Economic and Cultural Opportunities
Following are some of the highlights which illustrate examples of activities and events that occurred over the period July 2011-June 2012. Objective 1. Leadership Multicultural Advisory Committee (MAC) The MAC continued to be an active and engaged group of residents, service providers, Council employees and Councillors providing advice and input into Council’s policy, services and community activities. Three committee meetings were held this year and an active group email list has been maintained enabling mem-bers to share information on local events, services and issues. The MAC’s support for the Migration to Surf program continued and this year’s event attracted significant media attention on SBS radio and in the Wentworth Courier. The Bondi Surf Club have also expanded the program to include the involvement of the Cancer Council. We have engaged two new MAC members this year to reflect the interests and needs of our community. New members include Dr Astrid Perry – Area Manager of the Division of Population Health who has a par-ticular expertise in people over 65years from Culturally and Linguistically Diverse (CALD) communities and Margaret Duggin from the Irish Australian Welfare Bureau based in Bondi. Our guest speakers this year included the Refugee Council of Australia, and local resident Phillip Feinstein who volunteers at the Villa-wood Immigration Detention Centre. The Refugee Council of Australia acknowledged Waverley Council for our active contributions to Refugee Week activities and events. Community Worker- Multicultural The Community Worker-Multicultural continued to work on implementing the cultural diversity action plan, facilitating MAC meetings and coordinating activities to highlight multicultural themes in Waverley during Harmony Week and Refugee Week. This position is actively involved in and supports generalist and cultur-ally specific interagencies and networks including; The Inner and Eastern Sydney Migrant Interagency (IESMI), the Greater Sydney Multicultural Interagency (GSMI) and the Local Government Multicultural Workers Network (LGMWN) e-list. As a member of the GSMI steering committee this has enabled us to strengthen partnerships with other agencies working with CALD communities and with the State peak body the Ethnic Communities Council of NSW. The Community Worker - Multicultural officer has worked in partnership across Council on joint events and projects, supporting the development of CALD specific policies and programs. This position also supports our language aide service and assists with the translation of information to improve Council’s communications with CALD residents.

139
WAVERLEY COUNCIL
Meeting our Statutory Requirements
Waverley Housing for Older People (WHOP ) Council’s Community Worker (older people and access) facilitates access to the WHOP program and has responded to many complex housing queries involving residents from CALD backgrounds. Many of these interactions require the assistance of interpreters and translators which are always arranged. Finding appropriate and affordable housing continues to be a major challenge in Waverley and further ob-stacles can be faced by people from CALD backgrounds who often require extra support navigating this scheme. This financial year 70% of WHOP tenants were from a CALD background. Waverley Library Waverley Library promotes cultural diversity in several ways including:
• An extensive multicultural collection • Programs, activities and exhibitions • Support to artists, performers and others to host multicultural and Indigenous activities by mak-
ing available affordable and accessible venues The Library offers a total of 5,607 'all language' items, mainly books (adult and junior) but also some CDs and DVDs. These cover a range of languages including French, Chinese, Russian, Japanese, Hungarian, Italian and Polish. During the period July 2011 to June 2012, a total of 25,485 loans were registered from this collection, comprising items from both Waverley Library and the State Library of NSW. This reflects a healthy and robust community of multicultural borrowers. In delivering its ‘Remember When’ series, the Library also worked closely with Council’s Multicultural Advi-sory Committee seeking its recommendations and support. Waverley Community and Seniors Centre The Waverley Community and Seniors Centre continues to include programs in Languages Other Than English (LOTE) in the centre. Programs that specifically target CALD residents include: weekly Italian and Greek social and exercise groups, and weekly language classes offered in Spanish, French, Italian and German. Two Russian groups (Russian War Veterans and The Echo optimists) hold monthly meetings at the centre which are extremely well attended. Weekly Sahaja/Hatha & Iyengar Yoga/meditation classes are held at the Centre and are very popular amongst a diverse range of people. Childcare Centres & Family Day Care Respecting difference and valuing diversity is an important component of our curriculum. Childcare Centre staff and Family Day Care programs continue to create changing play environments that reflect the cultural diversity of our community. Books, stories, songs and celebrations introduce children to various cultures. Photo walls and images visually describe the many different family backgrounds that are so typical of our diverse community. Parents are actively included in the activities and are regularly invited to share their own cultural stories with the children. Familiarity with a range of languages is also taught and shared amongst the children. Family Day Care continues to promote the value of cultural awareness and diversity across its network of educators in Waverley. The program helps to support this through the provision of a range of culturally ap-propriate resources and information to all family carers. Community and Small Grants Council provides funds through the community grants program to assist community groups and agencies. Addressing the needs of our CALD communities is considered a priority in the selection criteria of the small grants program. Objective 2 Community Harmony Cultural Events Refugee Week 20 th June 2012 This year Waverley celebrated Refugee Week with the following activities: • Promotion of Refugee Week and related activities on our website • Display of Refugee Week banner at the front of the Council Chambers building
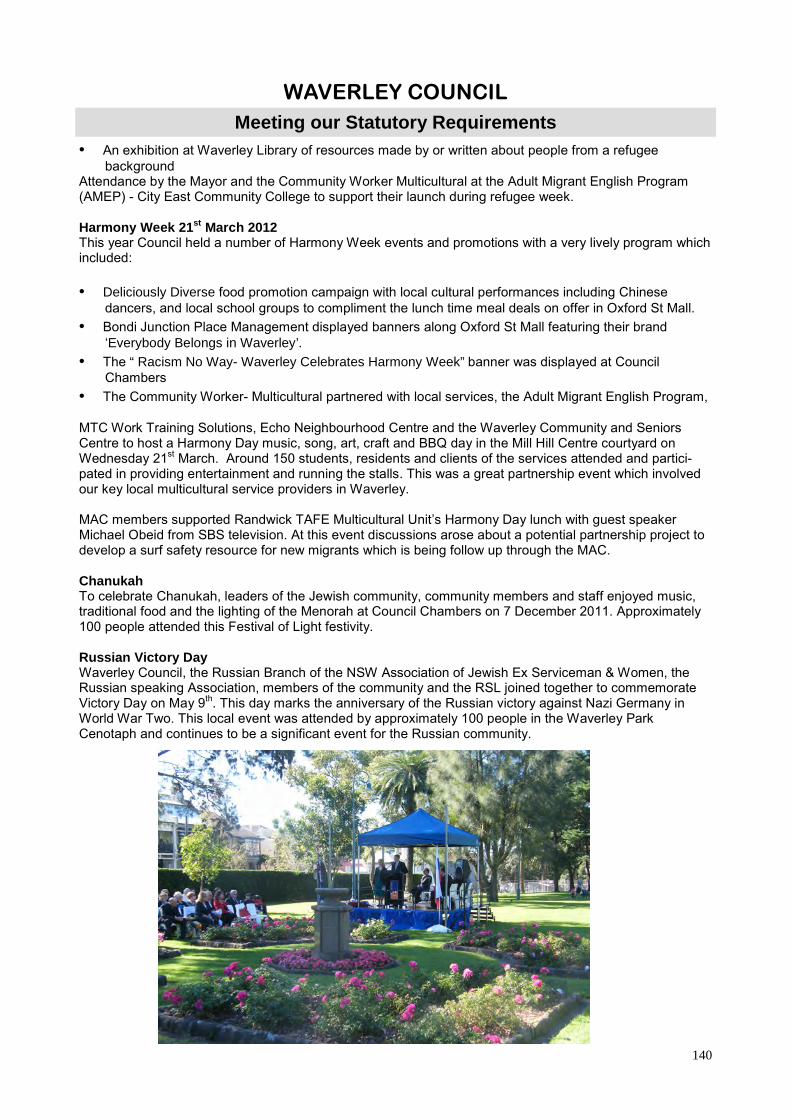
140
WAVERLEY COUNCIL
Meeting our Statutory Requirements • An exhibition at Waverley Library of resources made by or written about people from a refugee background Attendance by the Mayor and the Community Worker Multicultural at the Adult Migrant English Program (AMEP) - City East Community College to support their launch during refugee week. Harmony Week 21 st March 2012 This year Council held a number of Harmony Week events and promotions with a very lively program which included: • Deliciously Diverse food promotion campaign with local cultural performances including Chinese dancers, and local school groups to compliment the lunch time meal deals on offer in Oxford St Mall. • Bondi Junction Place Management displayed banners along Oxford St Mall featuring their brand ‘Everybody Belongs in Waverley’. • The “ Racism No Way- Waverley Celebrates Harmony Week” banner was displayed at Council Chambers • The Community Worker- Multicultural partnered with local services, the Adult Migrant English Program, MTC Work Training Solutions, Echo Neighbourhood Centre and the Waverley Community and Seniors Centre to host a Harmony Day music, song, art, craft and BBQ day in the Mill Hill Centre courtyard on Wednesday 21st March. Around 150 students, residents and clients of the services attended and partici-pated in providing entertainment and running the stalls. This was a great partnership event which involved our key local multicultural service providers in Waverley. MAC members supported Randwick TAFE Multicultural Unit’s Harmony Day lunch with guest speaker Michael Obeid from SBS television. At this event discussions arose about a potential partnership project to develop a surf safety resource for new migrants which is being follow up through the MAC. Chanukah To celebrate Chanukah, leaders of the Jewish community, community members and staff enjoyed music, traditional food and the lighting of the Menorah at Council Chambers on 7 December 2011. Approximately 100 people attended this Festival of Light festivity. Russian Victory Day Waverley Council, the Russian Branch of the NSW Association of Jewish Ex Serviceman & Women, the Russian speaking Association, members of the community and the RSL joined together to commemorate Victory Day on May 9th. This day marks the anniversary of the Russian victory against Nazi Germany in World War Two. This local event was attended by approximately 100 people in the Waverley Park Cenotaph and continues to be a significant event for the Russian community.
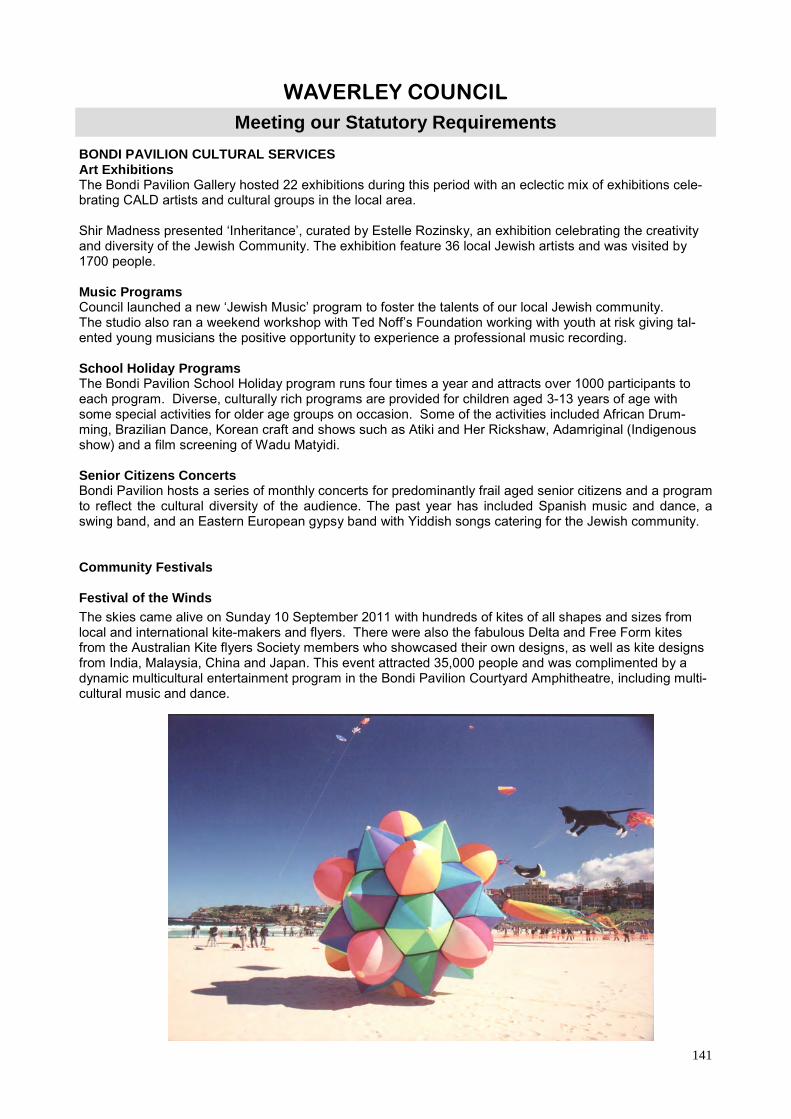
141
WAVERLEY COUNCIL
Meeting our Statutory Requirements
BONDI PAVILION CULTURAL SERVICES Art Exhibitions The Bondi Pavilion Gallery hosted 22 exhibitions during this period with an eclectic mix of exhibitions cele-brating CALD artists and cultural groups in the local area. Shir Madness presented ‘Inheritance’, curated by Estelle Rozinsky, an exhibition celebrating the creativity and diversity of the Jewish Community. The exhibition feature 36 local Jewish artists and was visited by 1700 people. Music Programs Council launched a new ‘Jewish Music’ program to foster the talents of our local Jewish community. The studio also ran a weekend workshop with Ted Noff’s Foundation working with youth at risk giving tal-ented young musicians the positive opportunity to experience a professional music recording. School Holiday Programs The Bondi Pavilion School Holiday program runs four times a year and attracts over 1000 participants to each program. Diverse, culturally rich programs are provided for children aged 3-13 years of age with some special activities for older age groups on occasion. Some of the activities included African Drum-ming, Brazilian Dance, Korean craft and shows such as Atiki and Her Rickshaw, Adamriginal (Indigenous show) and a film screening of Wadu Matyidi. Senior Citizens Concerts Bondi Pavilion hosts a series of monthly concerts for predominantly frail aged senior citizens and a program to reflect the cultural diversity of the audience. The past year has included Spanish music and dance, a swing band, and an Eastern European gypsy band with Yiddish songs catering for the Jewish community. Community Festivals Festival of the Winds The skies came alive on Sunday 10 September 2011 with hundreds of kites of all shapes and sizes from local and international kite-makers and flyers. There were also the fabulous Delta and Free Form kites from the Australian Kite flyers Society members who showcased their own designs, as well as kite designs from India, Malaysia, China and Japan. This event attracted 35,000 people and was complimented by a dynamic multicultural entertainment program in the Bondi Pavilion Courtyard Amphitheatre, including multi-cultural music and dance.

142
WAVERLEY COUNCIL
Meeting our Statutory Requirements Ocean Pacifika Festival
This festival was held on Ocean Care Day on Sunday November 27 2011 at Bondi Beach. The program included Pacific Island dance and music, children’s craft workshops, arts and crafts stalls and a host of in-formation and environment stalls helping the community learn about our beautiful oceans and how to make sure they stay that way.
Bondiesta 2012 The best of Sydney’s Latin artists had everyone non-stop entertained with their dynamic mix of traditional and contemporary music and dance entertainment, displays workshops, colourful costumes and irrepressi-ble talent. This 2000 person strong Festival included free dance workshops, arts and crafts, music and foods from across Central and South America, This year’s festival celebrated everything Latino including the cultures of Cuba, Bolivia, El Salvador, Brazil, Mexico, Bolivia, Colombia, and Argentina. As part of the Bondiesta Festival, Council partnered with Two Level Exhibitions to host an exhibition of Bra-zilian Artist Emmanuelle Bernard. Curated by Clay De Paula the artists were flown out from her hometown of Rio De Janiero for the exhibition and Festival. The Consulate General of Brazil opened the exhibition to a large crowd of South American cultural groups. Objective 3 Planning and Engagement Social Planning and New Census Data In the last ABS Census in 2011, 37% of Waverley’s population of 63,500 people indicated they were born overseas, while 18% were born in a country where English is not the first language. Russian was the language most commonly spoken other than English (2.6%). The 2011 census data shows us that in Waverley 51.0% of people were born in Australia. The most common countries of birth outside of this were England 6.8%, South Africa 4.2%, New Zealand 3.0%, Ireland 2.2% and United States of America 1.2%. The largest growing community in Waverley was the Republic of Ireland community which has doubled from 779 people in 2006 to 1409 people in 2011. The most common ancestries in Waverley were English 20.9%, Australian 16.1%, Irish 9.3%, Scottish 5.5% and Jewish 3.1%. In Waverley 31.6% of people had both parents born in Australia and 53.1% of people had both parents born overseas. Whilst 70.5% of people spoke only English at home, 25% of residents spoke two or more languages at home. The top five ‘Languages other than English’ (LOTE) spoken at home were Russian 2.6%, Hebrew 1.6%, Italian 1.4%, French 1.3% and Spanish 1.3%. Waverley continues to have a significantly high Jewish population with 17% of the community (10,876 peo-ple) identifying Judaism as their religious affiliation. This equates to around 10% of the national Jewish community which makes Waverley a very significant community for Jewish people. Using ethnic media to reach out Throughout the year media releases were sent to Jewish News and Horizon newspaper as a strategy to engage with and inform this community about Council activities. Council also advertises each year with the Jewish News Rosh Hashanah Supplement and the NSW Jewish Board of Deputies Diary. Directory of Multicultural Services and Groups 2011 The Community Worker- Multicultural in partnership with Mill Hill administration staff updated Council’s Di-rectory for Multicultural Services and Groups 2011. The services listed in this directory are either based in Waverley or outside the LGA but service the Waverley community. The directory is a useful source of infor-mation and referral points, and copies are available in the Mill Hill Centre, library and our website for any-one to access. The Telephone Interpreter Service (TIS) message appears in ten different languages in this directory. Multicultural Employment Expo – Randwick TAFE Waverley Council’s Human Resources department, in partnership with the Community Worker-
143
WAVERLEY COUNCIL
Meeting our Statutory Requirements
Multicultural, attended the Migrant and Refugee Employment Expo at Randwick TAFE on 22 May 2012. This was initiated by the Sydney Multicultural Community Services and supported by IESMI members. Around 150 people attended the expo along with approximately 20 job service providers; Eastern Suburbs based Government and non-government organisations, and private services. At the expo, Council promoted itself as an EEO employer with a particular emphasis upon diversity and inclusion for people from CALD backgrounds. Copies of the Waverley’s EEO Plan were widely distributed and potential barriers for employment at Council were discussed with expo participants. Objective 4 Access and Equity ACCESS TO SERVICES Waverley Community Living Program (WCLP) The WCLP policy and procedures manual was converted into an Easy English version in June 2012 to assist families from CALD backgrounds to understand more about what is involved in the program. ACCESS TO FACILITIES Access Guidelines for the Margaret Whitlam Recreation Centre Research and development of the access guidelines for this new recreation centre continues. These guide-lines will direct staff in ensuring that the facility provides good recreational and civic facilities and programs to the local community on an equitable and accessible basis. This will ensure that all groups including multi-cultural group’s needs are met. A key performance indicator relating to access and participation will be re-ported against every 6 months to ensure that equitable access is achieved. Parks and Sporting Fields : Multicultural groups continue to regularly use Councils parks for various sporting, social and religious occa-sions including Kesser Torah College, Maccabi, the Multicultural Bocce Association, and the Gaelic football/hurling clubs Clan Na Gael, Cormac McAnallan and the Central Coast. Mill Hill Centre A number of culturally diverse and religious groups continue to provide programs and activities for our di-verse community members at the Mill Hill Centre. Some of these groups include the Russian Veterans Group and social club, Jewish Care, Jewish National Fund Seniors, the Association of Jewish Engineers (English classes for Russian speakers), Echo Neighbourhood Centre (public speaking course for people with LOTE Backgrounds (LOTEB)) and the Indonesian Christian Group. The Sydney Eruv Council maintains various sections of the Sydney Eruv which are situated in the Waverley LGA, including cabling along Bondi Beach, parts of Bronte and Ben Buckler; and, hand rail fencing along Bondi Beach Promenade. This virtual fence, symbolises the community, and defines the area within which orthodox Jewish people are able to undertake various outdoor activities on the day of the Sabbath (Saturday). Without the Eruv, orthodox Jewish people would be restricted to staying inside their homes on the Sabbath. HUMAN RESOURCES The Equal Employment Opportunity Management Plan 2012-16 During 2011-12 the Equal Employment Opportunity Management Plan 2012-16 (EEO Plan) was developed following extensive consultation and endorsement from identified employees, senior managers, the Execu-tive Team and the General Manager. The report was formally adopted by Council, following a consultation process with interested councillors, the Mayor and the Access Committee. The EEO Plan will be implemented over the next four years through the achievement of identified actions to address multicultural engagement and diversity across Council’s workforce. Training for Council Employees All new Council employees undertook mandatory training on EEO/Harassment and Bullying prevention dur-ing 2011/2012 as part of Council’s corporate induction program. Current employees also undertook manda-tory training in 2011/2012 which involved an EEO/Harassment and Bullying prevention component. Customer service training is provided for all front line employees and includes information on communicat-ing with people from CALD backgrounds. Communicating effectively with our customers from LOTEB is a
144
WAVERLEY COUNCIL
Meeting our Statutory Requirements
part of our customer service charter. Cultural awareness training Council’s Working with Difference training program includes information about working with people from LOTEB and CALD backgrounds. The Community Worker- Multicultural worked in partnership with Learning and Development to deliver the cultural awareness training. This included updating the multicultural section of the training handbook to match the new 2011 census data. At the end of June 2012, 53 employees at Council had completed the Working with Difference course which incorporates a two hour session on Cultural Diversity training. MEDIA AND COMMUNICATIONS Language Aide Service Council maintains a pool of accredited language aides. These Council staff members receive an allowance when they provide services that assist Council officers in their communication with residents from a LOTEB. The pool currently consists of eight language aides, available to provide communication assistance in the following seven languages: Cantonese, Japanese, Mandarin, Polish, Portuguese, Russian and Spanish. The Community Worker- Multicultural and Community Planner reviewed the Language Aide program and made recommendations for improvements which were accepted by the Executive Team in March 2012. These improving are currently being rolled out in 2012-13. In July 2011- June 2012, Council’s language aides provided 71 recorded instances of use. (Our Polish language aide has been on extended sick leave during this period). Translating & Interpreting The standard message on how to contact Council with the help of the Translation and Interpreting Service (TIS) continues to be used regularly on Council materials and community newsletters. Key points from Waverley’s community newsletter Waverley in Focus were translated into Hungarian, Chinese, Spanish, Greek and Russian and included in the Newsletter. Waverley Housing for Older People (WHOP) The WHOP program was promoted in six different languages in the course of the year and advertised in ethnic media. Interpreters were used on a number of occasions when responding to complex tenancy mat-ters. Waverley Library Council’s Library staff worked with the Home Library Service Working Group to secure State Library of NSW funding for the production of generic flyers and posters promoting the Home Library Service to multi-cultural customers. Information about this valuable free service, were produced in Simplified Chinese, Ital-ian, Spanish, Greek, Vietnamese and Arabic and distributed throughout the Library and to customers. The Waverley Home Library Service flyer provides a translated section in Russian and delivers items to Russian, Hungarian, Italian and French residents of Waverley. Waverley Library prominently displays a range of translated material, produced by the State Library of NSW for Arabic, Vietnamese, Japanese, Italian, Persian, Thai, Korean and Croatian customers Objective 5 Economic & Cultural Opportunities Employment Council employs a permanent part-time Community Worker- Multicultural 3 days per week to support re-source and advise the organisation on policy issues and best practice in relation to cultural diversity and multiculturalism.

145
WAVERLEY COUNCIL
Meeting our Statutory Requirements
At the end of June 2012, 12.0% of Council’s workforce of 658 people identified themselves as being from a CALD background. Language Aide Service Council pays for the testing and training of employees to enable them to become language aides if they so nominate. Once they are accredited, they are provided with an allowance when they use their language skills as part of their employment duties. There are currently 3 language aides employed at Council who receive the CLAS allowance on a weekly basis, with the other 4 language aides receiving allowances when services are provided on a needs basis. PRODUCTIVE DIVERSITY Deliciously Diverse & Harmony Week Bondi Junction Place Management in partnership with the Community Worker-Multicultural continued to host the Deliciously Diverse food promotion campaign to highlight the range of diverse food outlets in Bondi Junction. This year 18 diverse food outlets in Bondi Junction agreed to offer special meal deals in celebra-tion of Harmony Week. Council promoted participating businesses through flyers, posters, and Council pro-motions. This year the program expanded to include lunch time performances by cultural groups including a school choir, Chinese dancers and an Aboriginal dance troupe. Citizenship Ceremonies Council conducts monthly Citizenship Ceremonies, welcoming an average of 50 new citizens a month. New citizens come from a range of countries including the United Kingdom, South Africa, Sweden, Ger-many, Italy, Ireland, Korea, Japan, India, Malaysia, and China. Local members of Parliament, Councillors and community groups join the Mayor in a ceremony to welcome the new citizens, their families and friends. The monthly ceremonies are held at Council Chambers. Part 2- Aboriginal and Torres Strait Islander Part 2 of this report sets out Waverley Council’s initiatives and activities in relation to and flowing from the Aboriginal and Torres Strait Islander Access and Equity Policy (1999), and action plan. Council is commit-ted to Reconciliation through action and the action plan sets out specific, measurable ways of working with Aboriginal and Torres Strait Islander people. Some of the highlights and achievements in 2011-12 follow. POLICY AND PLANNING Social Planning and New Census Data In the 2011 ABS census, there were 244 people who identified as being Aboriginal or Torres Strait Islander residing in the Waverley LGA comprising 0.38% of the total population. (NB: 6,802 people did not answer this question on the census). In our neighbouring communities; Randwick LGA 1,842 people identified as being Aboriginal or Torres Strait Islander (1.4% of the population) and in the City of Sydney 2,175 people (1.3% of population) The Indigenous community in Waverley has increased from 198 people in 2006 which matched trends across the country which shows a significant 20% increase in the number of Aboriginal and Torres Strait Islander people who are now being counted and identified on the census. Three people reported they spoke an Indigenous language very well at home in Waverley. Reconciliation Action Plan (RAP) Extensive groundwork, research and relationship building has been established in the development of our RAP. The engagement, consultation and planning process for our RAP is underway and the RAP will be finalised by 2013. The RAP will become the overarching policy and action plan for Aboriginal affairs within Council and the community. Community and Small Grants Council provided funds through the community grants program to assist community groups and agencies. Addressing the needs of our Aboriginal and Torres Strait Islander communities is considered a priority in the selection criteria.
146
WAVERLEY COUNCIL
Meeting our Statutory Requirements HUMAN RESOURCES Community Worker - Multicultural This role is responsible for work involving Aboriginal and Torres Strait Islander affairs in Waverley Council including:
• Developing and maintaining networks in our neighboring local Aboriginal communities, La Perouse and Redfern • Providing current and sound advice to Council on Aboriginal community issues and protocols • Engaging and informing the local Aboriginal community on Council projects/programs • Provision of information and referral services for residents interested in our Aboriginal culture,
heritage and communities This position also develops strategies, partnerships and policies within Council to support reconciliation, inclusion, information sharing and awareness raising of Indigenous needs and issues into Council proc-esses. Employment, Staff Profile At June 2012, 2.2% of Council’s workforce of 658 people identified themselves as being from Aboriginal or Torres Strait Islander background. Four (4) Council employees used their NAIDOC entitlement as a public holiday in 2012. The Equal Employment Opportunity Management Plan 2012-16 During 2011-12 the Equal Employment Opportunity Management Plan 2012-16 (EEO Plan) was developed following extensive consultation. The EEO Plan will be implemented over the next four years through the achievement of identified actions to address Aboriginal and Torres Strait Islander peoples engagement and diversity across Council’s workforce. EEO Partnerships Human Resources have worked closely with the Community Worker- Multicultural in developing a partner-ship approach to deliver the EEO action plan and support and deliver initiatives to raise the profile of Abo-riginal and Torres Strait Islander employees at Council and to encourage people who identify themselves as Aboriginal and Torres Strait Islander to work at Council. Discussions and information sharing about op-portunities for traineeships and apprenticeships for people from Aboriginal and Torres Strait Islander back-grounds will continue to be investigated over 2012-13. Council’s Human Resources and the Community Worker-Multicultural provided feedback via the ERLGAT-SIF into the Ministerial Taskforce on Aboriginal Affairs regarding employment strategies for engaging and retaining Aboriginal and Torres Strait Islander people into Local Government employment. Rebecca Gregory Indigenous Scholarship During 2011-12 Council supported an employee in our Planning and Environmental Services Department to submit an application for the Rebecca Gregory Indigenous Scholarship. The application was made on the basis of the leadership and dedication displayed by the employee and Aboriginal and Torres Strait Islander heritage. Council considers the applicant a role model for other Aboriginal and Torres Strait Islander em-ployees across Council. Cultural Awareness Training Council’s Working with Difference Training Program includes information about local Aboriginal heritage and cultural awareness relating to working with people from Aboriginal and Torres Strait Islander back-grounds. The Community Worker- Multicultural worked in partnership with Learning and Development to deliver the cultural awareness training. This included sourcing and engaging an appropriate trainer for the cultural awareness training and updating the Indigenous section of the training handbook to include 2011 census data. An Aboriginal owned and operated cultural awareness training company Bizdigenous Consulting has been employed to run this training with Council. At the end of June 2012, 53 employees at Council have completed the Working with Difference course.
147
WAVERLEY COUNCIL
Meeting our Statutory Requirements PROGRAMS AND EVENTS Reconciliation Week 27 May-3 June 2012 Waverley Council developed a sophisticated program of events called Let’s Talk Recognition- Just One Mob to highlight the many skills and talents of our Indigenous communities. This program was developed through internal and external Council partners including ERLGATSIF, Bondi Junction Place Management, Bondi Pavilion, Waverley Library, Environmental Services and the Community Worker- Multicultural. The Reconciliation Week Program began with the ERLGATSIF run Pauline Mcleod Awards and primary school art competition held at Leichhardt Town Hall with 12 winners from the Eastern and Sydney region acknowledged for their acts of reconciliation. This event included guest speaker Bronwyn Bancroft from Boomali Aboriginal Artist Corporation, Doonoch Dancers and Didgeridoo players and over 100 artworks from children from the six regions about their views on what reconciliation means to them. Those who were nominated for their work in Waverley and won were: • John Lennis- who chairs the Eastern Suburbs Organisation for Reconciliation and who guides our
Coastal Bush Tucker walks in Waverley. • Pat Zinn- a Waverley resident who has supported the Aboriginal Support Circle through the Older
Women’s network for many years. She is a long time supporter of the La Perouse community and an advocate for Reconciliation.
• Cathy Gill- a Bronte resident who volunteers her time with the Stop the Intervention Collective to
raise awareness about the impact of the Intervention on Aboriginal people, communities and culture in the Northern Territory.
• John Queripal- Chapel by the Sea minister who was nominated for his work promoting Aboriginal art
and culture in the region and advocating for a Keeping Place for Gordon Syron’s art collection. The other award winners were John Ogden, Lucy Porter, Shirley Murphy, Deni Langman, Sabine Kacha, Jocelyn Smith, Beth Jewell, and Linda Boney. Other Waverley reconciliation activities which were all well attended included: • Lets Talk Recognition Just One Mob in the Mall which will included a communal art workshop by
Walangari, Indigenous dance and Kool Purple Kooka’s Indigenous food workshops. Local schools Waverley Primary, La Perouse Public and WAYS POEM young people attended the celebration.
• Black Screen Film Festival- a series of short films from the National Film and Sound Archive • Aboriginal Astronomy and Rock Art in the Sydney Region facilitated by Duane Hamacher a research
associate in the Nura Gili Indigenous Centre at the University of New South Wales • Waverley Library themed children's story time activities and artworks with Aboriginal dreamtime
stories and displayed books and DVD’s made about or by Aboriginal and Torres Strait Islander people.
• The screening of the film Our Generation at the Bondi Pavilion, which highlighted the effects of the Intervention from a community’s perspective. Close the Gap Day 22 nd March 2012 Bondi Junction Place Management and the Community Worker- Multicultural organised an information stall and performances by the Darlington Aboriginal Dance Troupe in Oxford St Mall. Over 50 signatures were gathered and sent back to Oxfam in support of their campaign to reduce Indigenous disadvantage and Closing the Gap between Indigenous and non-Indigenous people’s life expectancy. This event highlighted Council’s commitment to Closing the Gap through Reconciliation. NAIDOC Week July 2011 Four (4) Council employees used their NAIDOC entitlement as a public holiday in 2012. Council incorporated NAIDOC themes into school holiday programs in the library and the Bondi Pavilion events. At the highly valued community event Bondi the Beautiful Sea Fair, La Perouse based contemporary Indigenous artists Esme Timbrey and Marilyn Russell ran shelling workshops for visitors at-tending the fair.
148
WAVERLEY COUNCIL
Meeting our Statutory Requirements
Koori Kids Koori Kids is a community organisation that engages young people in a range of school initiatives to promote education and awareness of Aboriginal and Torres Strait Islander culture. Each year Koori Kids conducts NAIDOC Week School Initiative competitions for local school aged children throughout NSW. The competition offers activities for primary and secondary school students including colouring-in, short story writing and creative and essay writing. Council continues to provide a financial contribution to this program which goes towards printing and distribution of information packs, posters and entry forms for colouring-in, short story writing and creative essay writing competitions held in schools across the local government area (LGA). These initiatives are designed to educate all students on cultural diversity and involve a whole of community approach in the spirit of reconciliation and bringing us 'all together as one community' CONSULTATION, PARTNERSHIPS AND ENGAGEMENT La Perouse Local Aboriginal Land Council (LPLALC) Council has strengthened relationships with our elected governing body on Aboriginal culture and heritage for our LGA, the LPLALC, by inviting their CEO Chris Ingrey to present the SACRED principles document at Council’s Australia Day Citizenship ceremony in January 2012. The Community Worker- Multicultural has informed and consulted with the LPLALC on a number of areas including cultural protocols, rock art sites in Waverley, Thomas Hogan Plan of Management and discussed developing better ways of communicating and consulting to get meaningful input without stretching their limited resources. Information about Land Council structures, roles and responsibilities has been relayed back to Council’s strategic planners and Environmental Service Manager to consider in their consultation processes. La Perouse Koori Interagency The Community Worker- Multicultural attends and supports the steering committee of the La Perouse Koori Interagency which is made up of agencies and service providers who work with the La Perouse Aboriginal community. As Waverley Council is a part of the La Perouse Local Aboriginal Land Council area, we are a part of this community. La Perouse Community Alliance This State Government model is the new consultative body for government organisations wanting to work with the La Perouse Aboriginal community. It is made up of the key community stakeholders, community Aboriginal organisations and community Aboriginal elders. It is intended as a model to support streamlining consultations to ensure all relevant bodies in the community are included. This Alliance feeds information into the La Perouse Koori Interagency. Eastern Region Local Government Aboriginal and Torres Strait Islander Forum (ERLGATSIF). This unique model to our region supports our Local Governments to work on Aboriginal affairs in a more regional approach, whilst providing employment for 10 hours per week for an Aboriginal person. This six Council partnership between City of Sydney, Waverley, Woollahra, Randwick, Botany, and Leichhardt Councils supports our work on specific Aboriginal focussed consultation, information, advocacy and recon-ciliation activities. The Community Worker- Multicultural attends this forum as the Waverley Council partner. Waverley Councillor Dominic WY Kanak continues to chair the ERLGATSIF. Achievements of the ERLGATSIF this year include;
• A successful Pauline Mcleod awards and primary school art competition with over 100 entries and 150 people attending the event. Waverley public school participated in this event.
• A benchmarking exercise to find out what policies and strategies each member Council has in relation to working with and for Aboriginal and Torres Strait Islander constituents and services.
• A response to State Government reviews and provision of Local Government input into the rec-ommendations on the Aboriginal Cultural Heritage reforms and the Ministerial Taskforce on Abo-riginal Affairs review.
• Ongoing input towards our RAP. Local Government Aboriginal Workers Network Waverley Councillor Dominic WY Kanak is on the executive committee of this State wide network which

149
WAVERLEY COUNCIL
Meeting our Statutory Requirements
supports, informs and connects Aboriginal and Torres Strait Islander employees and people working in Aboriginal affairs working in Local Government. The Community Worker- Multicultural is on the e-list of this network and disseminates and receives information which keeps Council up to date with current information. CULTURAL PROTOCOL Acknowledgment to Country Waverley received official wording endorsed from the La Perouse Local Aboriginal Land Council to use when staff do Acknowledgements to Country. The Community Worker- Multicultural sent this wording to all staff and Councillors and has updated new records to match the following wording.
“Waverly Council would like to acknowledge the Bidjigal and Gadigal people, who traditionally occupied the Sydney Coast. I would also like to acknowledge Aboriginal Elders both past and pre-sent.”
By informing Council staff of the appropriate wording it has raised many enquiries about cultural protocols when doing a Welcome or Acknowledgement to Country. This will be included in the Reconciliation Action Plan. INFORMATION SHARE AND PROMOTION The Community Worker-Multicultural maintained an active email list to help disseminate information and promote Aboriginal events and to keep community members abreast of emerging issues and current affairs. Posters, signs and banners highlighting key Indigenous events including Close the Gap, NAIDOC and Rec-onciliation Week campaigns are used across Council buildings and in Oxford St Mall. The Community Worker- Multicultural subscribes to the Koori Mail, Tracker newspaper and Reconciliation Australia newsletters to keep informed and distribute to networks. Waverley Library continues to subscribe to the Indigenous Times and the Koori Mail newspapers for library users to read. Part 3—People with Disability, Older People and Homeless People with a Disability The Access and Mobility Policy and Action Plan 2011 - 2015 was endorsed by Council. The policy ac-knowledges Council’s role in reducing and removing barriers to an accessible and inclusive environment and the need to work in partnership with the community and other agencies to improve access. Major achievements for 2011-12 included: • Margaret Whitlam Recreation Centre designed and built to Australian Standards for disability access.
Early Learning Child Care Centre designed to meet Australian Standards for disability access. • All footpath, kerb and gutter upgrades designed and built to meet Australian Standards for disability
access • Access and inclusion training was provided for staff with a focus on communication and responding
appropriately to the needs of people with disability, older people and people from diverse back-grounds
A new EEO Plan includes specific strategies and actions to ensure employment opportunities and support for people with disability and mature age workers. The Waverley Access Committee provided advice regarding access and mobility improvements for the above projects. The Committee also provided comment on other major community projects such as refurbishment of Surf Life Saving Clubs and an aged care facility. Council continued to operate the Waverley Community Living Program (WCLP). This service provides medium-term and time limited subsidised accommodation, independent living skills training and transition support to enable people with mild intellectual disability to move towards independent living in the Waverley community. Council supported 17 people with disability over the year and the program continues to operate well above our current full capacity of 12 people with disability. WCLP provided a minimum 5200 hours per annum of ‘face to face’ support (CSTDA MDS Statistics).

150
WAVERLEY COUNCIL
Meeting our Statutory Requirements
Council also offered 9 subsidised rental accommodation places for people with mild intellectual disability. As in previous years, all of these places were filled in 2011 -2012. More than 70 ‘Learning for Life’ courses were also conducted during the year which included a ‘Weekend Getaway’ retreat. The annual Carer’s Week was celebrated with a 3 course dinner. WCLP members actively participated in numerous focus groups throughout this period for example WCLP Members were approached by NSW Council for Intellectual Disability and the Australian Electoral Commission Focus group to develop the ‘Local Government Elections’ Easy English Booklets (3). The WCLP Policy and Procedures Manual is now available in an Easy English format which includes print, PDF and web access. The Waverley Children's Library offers weekly storytime sessions for children from the local Wairoa Special School for students aged 4-18 years with intellectual and multiple disabilities. Homeless People In recognising the need for a joint agency response to reduce homelessness in the area, Waverley Council established the Waverley Homeless Coalition in 2010. The Coalition is convened by Council and is made up of the small number of homeless services operating in the area and services that have a much broader community focus. The Coalition meets regularly to co-ordinate public space safety strategies and intensive support to help people living on the streets into accommodation and with support to maintain their tenan-cies. Four long term rough sleepers were provided with accommodation and daily living support during the year. A service mapping document was also produced to assist local workers to make referrals. Services for Older People Council continues to provide 53 units of social housing for older people. The Waverley Housing for Older People (WHOP) program was promoted in six different languages in the course of the year. Seniors Week was celebrated with a fair day in Oxford St Mall and a program of arts and cultural activities held in partnership with local community services. A booklet was produced listing the range of arts and cul-tural activities available for older people in the area. A wide range of events was held including free surfing lessons, a social dance, singing program and final concert and a photographic exhibition. Council continued to support a number of community projects that aim to benefit older people, for exam-ple, supporting the War Memorial Hospital to establish a mens’ shed on the hospital grounds; working with the RTA to conduct pedestrian safety workshops for older people, and supporting Accessible Arts to hold tactile tours of Sculpture by the Sea for people with disability. Council provides a range of information and support for local community services and residents. This in-cludes information and referral to community care and health services; maintaining email distribution net-works for services that cater to the needs of older people, people with disability and homeless people; pro-vision of a directory of services for older people and a directory of a services for hearing impaired people. An Aged and Disability Services Interagency is convened by Council in partnership with Randwick Council and Council staff regularly participate at the Eastern Area Home and Community Care (HACC) Forum. Waverley’s Community and Seniors Centre continued to provide weekly social and physical activities and low cost health services to people over 50, to Home and Community Care (HACC) clients and to cultur-ally and linguistically diverse groups (CALD groups). Average participation at the Centre in 2011/2012 was 1700 people per month. Over 50 social, health and lifestyle programs and activities were conducted at the Seniors Centre each week during the year. These included health and lifestyle programs such as tai chi, yoga, pilates, line dancing and various fitness and stretch/weights classes. A program for preventing falls included Step Steady classes and a specific exer-cise class for men. Educational and social activities included scrabble, painting and drawing and language classes. Health therapies included foot and remedial body massage. Home and Community Care (HACC) activities for the frail aged included bingo, gentle chair exercises, social meetings and a weekly social out-ing. Other activities included monthly coach tours, monthly social functions for Russian, Italian and Greek

151
WAVERLEY COUNCIL
Meeting our Statutory Requirements groups. A holiday tour was also organised and a Christmas Day Luncheon was open to all community members. At the Bondi Pavilion , more than 50 activities were held each month catering for a mix of older people, frail aged, homeless groups, youth at risk and people with a disability. These have included weekly music and ceramic workshops, free monthly concerts held for frail aged seniors, fitness and yoga classes. An outreach music program was extended this year to include a seniors’ singing group in Bondi Junction, concerts in local nursing homes and a successful music collaboration for at risk youth, with the Ted Noff’s Foundation. Senior artists from diverse backgrounds held exhibitions of their work at the Pavilion Gallery. Council also provided subsidised venues for community services and networks to hold events and activities such as Junction House Disability Service, Alcoholics and Narcotics Anonymous, MS Society and Norman Andrews House – homelessness drop in centre. The Meals on Wheels and Shopping Service continued to provide nutritious meals for older people, peo-ple with a disability and their carers living in the Waverley area. There was an average of 80 meals deliv-ered each day over the past year. The number of older residents using the home internet shopping service is growing and the recently introduced personal list shopping service is operating at capacity. It is expected that both the shopping services will grow in the future. Information sessions about the availability of multi-cultural meals were held in association with the Eastern Sydney Multicultural Access Project. The service is also investigating procuring food from non traditional sources so it can offer people meal options and vari-ety. Waverley Library continued to deliver high quality programs and services to older people and in 2011-12 offered a total of 54 programs which were attended by 374 people. The seniors programs included special events hosted by the Library's Home Library Service, participation in a Seniors Fair Day and Seniors Week Morning Tea, involvement in an oral history program for frail aged seniors, a ‘books and movies’ discussion group and regular book clubs. Seniors benefited from a number of free information programs investigating topics such as wills, power of attorney and probate, and local history walks and exhibitions. As well as popular programs, older residents also benefitted from the excellent resources offered by the Library - including a talking book collection for the visually impaired. In 2011-12 the Library Home Library Service - available to people who are unable to come in to the Library or carry books home due to age, illness or disability - had a total of 191 clients and offered a range of ser-vices including: a home delivery service for clients; visits to nursing homes and retirement villages to pro-vide books, CDs and DVDs and resources for residents and staff; and delivery of books to the homes of people able to come in to the Library but not able to carry books home. The Home Library Service offers its clients fiction and non-fiction titles in regular or large-print, audio books on CD, MP3 CD and Audio Read Navigator, CDs of popular and classical music, and DVDs such as movies, musicals, documentaries and TV series. The Home Library Service team produces a free newsletter for its clients with news, photos and information about the Home Library Service and its clients. A number of brochures and information pam-phlets about the service are widely available throughout the Library and the service is regularly promoted through local media. In April, the Home Library Service initiated a facilitated 'Books, DVDs and more' discussion group at the Library for seniors and Home Library Service clients, with transport provided to encourage broader partici-pation. At the same time, the Library extended its popular 'Remember When...' storytelling workshops for seniors, designed to help people capture their life stories with the help of a professional storyteller. K. Works carried out on Private Land Council undertook the following work on Private Land during 2011-12:
• Cleaning 356 sewer chokes as a result of Council owned trees. • Removing graffiti from fences, gates, garage doors and walls. 392 reports were acted upon during 2010-11.

152
WAVERLEY COUNCIL
Meeting our Statutory Requirements L. Contributions & Donations The following contributions and donations were made by Council during 2011-12.
Small Grants
Accessible Arts $5,500.00
Anglicare (UAB) $2,000.00
Bardic Studio $2,500.00
Bondi Beach Public School $3,000.00
Bondi Mizrachi Synagogue $1,000.00
Bondi Outreach Project $2,000.00
Bondi Youth Accommodation $2,500.00
Caretaker's Cottage - Options Youth Housing $2,000.00
Computer Pals For Seniors $2,500.00
Coogee Care Centre $2,000.00
Di Smith $2,000.00
Dolores Single Women’s Refuge $2,000.00
Dreamhouse Productions - Streamhouse $3,000.00
Emma Anna $1,400.00
James Rogers $5,000.00
Jewish Centre On Ageing $1,000.00
Jewish House Ltd $2,000.00
Marine Discovery Centre $1,500.00
Norman Andrews House $3,000.00
NSW Friendship Circle $2,000.00
Playgroup NSW $3,000.00
Russian Kids Group Bondi $2,100.00
Sustainability Street Waverley $3,000.00
Sydney Children's Hospital Foundation $2,500.00
The Actors Forum $1,000.00
The Lighthouse Community Inc $3,000.00
The Shalom Institute $2,000.00
Waverley Historical Society $2,850.00
WAYS Youth Services $6,074.00 Total Small Grants $73,424.00

153
WAVERLEY COUNCIL
Meeting our Statutory Requirements Community Grants
Australian Kiteflyers Society $8,000.00
Bondi Beach Cottage $7,049.00
Bondi Beach Playgroups $818.00
Bondi Community Street Project $42,970.00
Bondi Toy Library $15,797.00
Bronte OOSH $2,500.00
Eastern Area Tenancy Service $14,734.00
ECHO Neighbourhood Centre $16,529.00
Junction House $34,399.00
Mindfields $318.00
Norman Andrews $31,954.00
Randwick/Waverley Community Transport $15,900.00
Sculpture by the Sea $10,000.00
The Lighthouse $9,540.00
Waverley Bondi Beach Band $4,000.00
Waverley Randwick Philharmonic Society $3,700.00
WAYS Youth Services $64,938.00 Total Community Grants $283,146.00
Surf Club Grants
North Bondi Surf Club $15,000.00
Bondi Surf Club $15,000.00
Bronte Surf Club $15,000.00
Tamarama Surf Club $27,500.00 Total Surf Club Grants $72,500.00
Other Grants
Cancer Council of NSW $800.00
Randwick City Council $306.66
Tamarama Rock Surfers $75,000.00
Waverley Art Prize $7,000.00 Waverley Library Story Writing Competition
$60.00
Waverley Youth Art Award $4,200.00
Waverley Photographic Competition $100.00
Waverley Council Staff Social Club $5,250.00
Yeshiva Gala Dinner $180.00 Total Other Grants $92,896.66
Total Contributions and Donations $521,966.66

154
WAVERLEY COUNCIL
Meeting our Statutory Requirements
L. Human Resources Activities undertaken by Council during 2011-12 RISK MANAGEMENT Operational Risk Management Initiatives Key initiatives for managing operational risk included: • General Insurance Review undertaken and General Insurance Policy and Procedures developed. • Disaster Recovery & Business Resumption Plans partially drafted and consultation commenced. Work Health and Safety Activities The WHS Management System Strategic Plan continued to be implemented and the following projects were conducted: • Implementation of online Contractor and Volunteer Induction programs. • Implementation of general health & wellbeing initiatives and the development of a new program. • In house Return to Work Coordinator course delivered and attended by senior supervisors and managers. • Mock Court exercise conducted with Council Officers and senior managers to enforce their responsibilities, duty of care, and potential liability under the WHS Act. • 19 separate WHS training programs delivered with over 450 attendees. • 8 Health & Safety Committee meetings conducted. • Comprehensive physical risk audits completed at 4 Council sites. As a result of three (3) vacancies within the Risk & Safety Team, the opportunity to restructure roles and responsibilities was made available. After consideration and appropriate consultation a team restructure was implemented enabling a strategic focus on Injury Management and reducing Workers Compensation costs and a proactive approach to safety and risk management. HUMAN RESOURCE STRATEGIC PLAN ACTIVITIES • Development and implementation of new Annual Skills and Performance Assessment documentation including form and creation of “How to Guide”. Council values integrated into new Skills and Performance Assessment form. • Development and implementation of Equal Employment Opportunity Management Plan (2012 – 2016).
Consultation with staff members and key stakeholders to effect transition to a fortnightly pay arrangement. Successful transition from weekly pay to fortnightly pay.
• 122 recruitment drives undertaken. • Development and implementation of Annual Leave and Long Service Leave Guidelines, Sick Leave
and Carers Leave Guidelines, Reward and Recognition Guidelines and Religious/Ceremonial Leave Policy and Military & Civil Emergency Leave.
• Development of new Career and Professional Development Guidelines. • Creation of new communication HR tool – “Heads up from HR”. • Facilitated the change to roster arrangement for Parking Patrol Officers including increased working
hours on the weekend. • Attraction and recruitment of Director, Planning and Environmental Services and Director, Recreation,
Customer and Community Services. • Monitored and reported excess leave balances for staff and implemented strategy to reduce Council’s
leave liability. A reduction of excess leave balances was achieved. • Monitoring and recording of performance issues through our HRIS system. • Improved branding for all HR documentation including position descriptions, internal job alerts and external advertisements. • Centralised and updated all position descriptions into new template. • Streamlined recruitment administrative processes.

155
WAVERLEY COUNCIL
Meeting our Statutory Requirements
• Investigated employer of choice initiatives and recommended various options for consideration. • Introduction of psychological testing for selected positions. • Introduction of a Manager Induction Pack.
ORGANISATIONAL DEVELOPMENT 1. Implementation of Council’s Workforce Plan years 2011-2012 Council’s four year Workforce Plan (WP1) will endeavour to build an organisational culture and workforce that can meet the service delivery expectations for medium and long term which continues to attract and retain great staff. With a high performing culture Council will strengthen its relationship with the business community and other partners to deliver services efficiently and to a high standard. The implementation of WP1 commenced in July 2010. The annual target is that we deliver 80% and above of projects set out within the plan. In the year 2011-2012 we achieved 71% delivery of projects, 29% partial delivery of projects and one project was not achieved. Set out below is a summary of the 2011 to 2012 projects.
Workforce Plan 2010/2011 projects
Workforce Plan end of year results
RECRUITMENT & RETENTION
Review four-year recruitment plan and recruit in line with annual priorities Achieved – 21 of the 27 positions were recruited over the 4
year program. In 2010/2011 we didn’t recruit 3 bush care staff or 1.5 gardeners. The three gardener positions were re-worked into a new Parks Supervisor position. Target for 2010-11 was achieved
Review and improve Councils HR section on the website to promote Council as a great employer. (D)(2.1)
Partially achieved. The content pages have been devel-oped but need to be reviewed and fine tuned by our com-munications unit. The unit and position that looks after this work has been vacant. The work is on hold.
Streamline administration practices in relation to recruitment (E 1.1) Achieved
Review suite of selection skills tests e.g.: driving, functional assessments, com-puter tests, psychological suitability of new starters (E 2.1)
Achieved
Develop e-recruitment plan (E 4.2) Not achieved
Retain high performing staff and overall turnover below 14% (G9A) Achieved
Research and evaluated and evaluate organisations that determine organisa-tions of choice status (G9A)
Achieved

156
WAVERLEY COUNCIL
Meeting our Statutory Requirements
Workforce Plan 2010/2011 projects
Workforce Plan end of year results
REWARD & RECOGNITION
Implement reward and recognition program (2A 1.2) Achieved
CAREER PLANNING & PROFESSIONAL DEVELOPMENT
Review skills improvement plan as set by Senior Management Team for 2010- 2014 to determine priorities to integrate into annual learning and development schedule (3A 1.1)
Achieved
Deliver annual learning and development schedule (3A 1.2) Achieved
Roll out suite of Mandatory training to all staff Achieved – With a participation satisfaction level of 92%
PERFORMANCE MANAGEMENT
Integrate new values into documentation and performance systems across council (4A 1.1)
Achieved – Further to last years initiatives our Skills & Performance Assessment document has been rebuilt around our values and the appraisal process has to be improved. Our interview proc-esses now have a strong values based focus as does our internal performance management train-ing course.
Continually improved the quality and delivery of Balanced Scorecard measures and targets delivered (4A 2.1)
Achieved – The Executive team attended a re-fresher on Balanced Scorecards.
Review and improve performance guidelines and associated remuneration and rewards
Partially achieved - Rewards process has been reviewed and upgraded and Reward and Recogni-tion Guidelines created. Our performance guide-lines need to be reviewed and updated accordingly.
157
WAVERLEY COUNCIL
Meeting our Statutory Requirements
Workforce Plan 2010/2011 projects
Workforce Plan end of year results
ORGANISATIONAL DEVELOPMENT
Undertake business process reviews and improvement initiatives as pro-grammed (5A 2.1)
Year 1 Year2 14 initiatives 17 initiatives 9 achieved 9 achieved 1 partially achieved 7 partially achieved 4 not achieved 1 not achieved
Undertake reviews and revisions of Enterprise Agreements as scheduled and required to increase productivity (5A 4.1)
Partially achieved
Undertake organisation wide survey (5B 1.2) Achieved
Develop improvement plans in response the survey data (5B 1.2) Partially achieved
Update stakeholders on the progress of improvement initiatives (5B 1.3) Partially achieved
Undertake internal customer satisfaction surveys and develop plans as per schedule (5B 2.1)
Achieved – Business, Services and Proper-ties and for the Mechanical Workshop.
Report on effectiveness of the above survey program to Executive Team (5B 2.3)
Not achieved
Develop and implement a review schedule for key policies and workforce re-lated plans (5C 2.1)
Achieved
As part of the new CHRIS system – roll out Kiosk (5D 2.1) Partially achieved
Improve skills to support IT systems upgrades, changes and utilization Achieved – An upgrade of the TRIM system is being evaluated. A new IT Strategist was introduced and designed a new Business and Information Assessment and Proposed Strat-egy. This has been reviewed by the Executive Team and next steps discussed.

158
WAVERLEY COUNCIL
Meeting our Statutory Requirements
2. Staff Survey Every 3-4 years Council undertakes an organisational wide survey. The survey is designed to support the principles of Business Excellence survey. A retake of the survey occurred in 2011 the key findings are as follows:- Organisational Wide Results Overall the organisation is performing against the 7 Categories of Business Excellence at 62%
4%
8%
19%
34%
31%
6%8%
18%
30% 31%
0%
5%
10%
15%
20%
25%
30%
35%
40%
45%
50%
Strongly Disagree Disagree Mixed feeling Agree Strongly Agree
20072011
By Department Base line rating
2011 Result
Corporate and Technical services 62% 61% Target not achieved
Planning and Environmental Services 66% 72% Target achieved
Public Works and Services 66% 54% Target not achieved
Recreation, Customer, & Community Services 66% 71% Target achieved
General Managers Unit 77% 75% Target achieved
Organisational average 65% 62% Target not achieved
Breakdown of the Results
Overall Target—To achieve 75% by the third take in 2014

159
WAVERLEY COUNCIL
Meeting our Statutory Requirements
The Executive team and members of the senior management team are in the process of consulting and creating improvement plans with staff. There is a target of having these plans in place by October 2012. The Learning and Development Schedule The Learning and Development Schedule for 2011/2012 continued to focus on efficiencies and opportuni-ties for our team to conduct further in-house training. We were thereby able to expand our suite of man-agement development programs and job specific training. A key focus of the 2011/2012 schedule was the implementation of the new mandatory training program. As part of our efficiency program, staff are now required to attend mandatory refresher training every 3 years. In 2011, 34 sessions were facilitated by internal facilitators with 584 staff members attending. The following topics were covered in the refresher training: • Our Values & Customer Service • Our Community’s Plan • Harassment & Bullying Prevention • Ethics & our Code of Conduct • Drugs & Alcohol Awareness New initiatives introduced in 2011/2012: • Mandatory Refresher training for all staff consolidated into a one day program. This has created cost
savings and efficiencies in the Learning and Development Schedule as well as easing the disruption for each department. It also gave staff an opportunity to mix with colleagues from other areas of Council.
• 9 Staff members completed the Diploma of Government (Management) as part of our leadership & management development.
• 2 aspiring leaders in the organisation participated in the LGMA Mentoring program.
TOP FIVE rated questions
I know who my customers are
What is new into the top 5: - I support the values for which Council stand
I support the new values (created in 2010) for which Council stand
I am clear what is expected of me in my job
I know how to find the code of conduct and other Council related documents that effect me
What has moved out of the top 5: - Overall I am satisfied with the results of my work
I am well trained to do my current job
BOTTOM FIVE rated questions
Results of how we compare to other Councils are shared What is new into the bottom 5: - The future direction for my division is clearly communicated. - Results of how we compare to other Councils are shared
Council is doing a good job at retaining talented people
Communication between departments is good
Our information systems are valuable and easy to use What has moved out of the bottom 5: - Council encourages good performance and recognises and rewards staff with things other than money
The future direction for my division is clearly communicated.
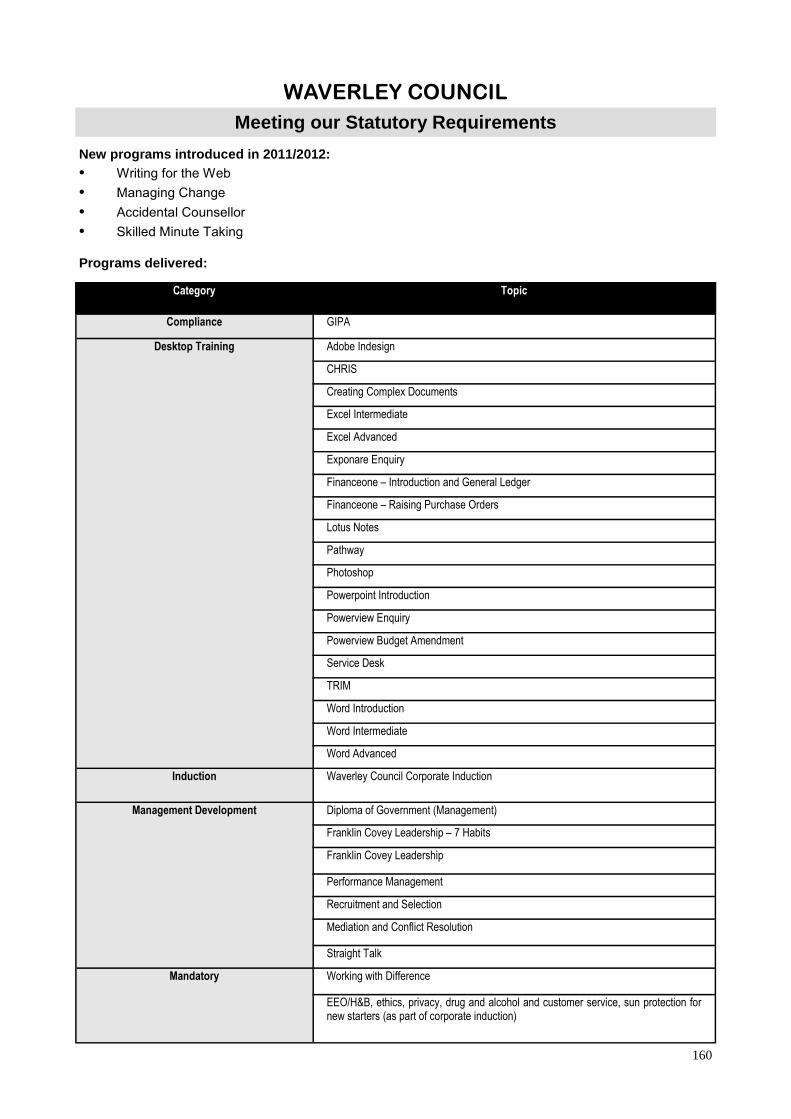
160
WAVERLEY COUNCIL
Meeting our Statutory Requirements
New programs introduced in 2011/2012: • Writing for the Web • Managing Change • Accidental Counsellor • Skilled Minute Taking Programs delivered:
Category Topic
Compliance GIPA
Desktop Training Adobe Indesign
CHRIS
Creating Complex Documents
Excel Intermediate
Excel Advanced
Exponare Enquiry
Financeone – Introduction and General Ledger
Financeone – Raising Purchase Orders
Lotus Notes
Pathway
Photoshop
Powerpoint Introduction
Powerview Enquiry
Powerview Budget Amendment
Service Desk
TRIM
Word Introduction
Word Intermediate
Word Advanced
Induction Waverley Council Corporate Induction
Management Development Diploma of Government (Management)
Franklin Covey Leadership – 7 Habits
Franklin Covey Leadership
Performance Management
Recruitment and Selection
Mediation and Conflict Resolution
Straight Talk
Mandatory Working with Difference
EEO/H&B, ethics, privacy, drug and alcohol and customer service, sun protection for new starters (as part of corporate induction)

161
WAVERLEY COUNCIL
Meeting our Statutory Requirements
In addition to the above programs, many staff attended job specific training as required in their role and in line with the needs of their division. Others continued their learning and development through our studies assistance program. EEO ACTIVITIES UNDERTAKEN DURING 2011/2012: The Equal Employment Opportunity Management Plan 2012-16 Waverley Council has had a series of Equal Employment Opportunity Management Plans since they were first required under legislation introduced in 1993. During 2011-12 the Equal Employment Opportunity Man-agement Plan 2012-16 (EEO Plan) was developed following extensive consultation and endorsement from identified employees, senior managers, the executive team and the General Manager. The EEO Plan was formally adopted by Council, following a consultation process with interested Councillors, the Mayor and the Access Committee. The EEO Plan will be implemented over the next four years through the achievement of identified actions to address engagement and diversity across Council’s workforce Components of the EEO Management Plan 2012-16: (a) Enhancing Understanding of EEO and Discrimination Issues:
In 2011-12 the following actions were undertaken to ensure that managers, supervisors and employees understood the importance of EEO and its significance in our daily work
Strategy Progress
To ensure that all new employees attend EEO Awareness Training. All new employees were enrolled in mandatory EEO training as re-quired.
To provide up to date information about EEO as well as training oppor-tunities in Pipeline, Council’s monthly newsletter.
Pipeline provides articles on a regular basis about EEO and training opportunities for all employees.
To provide Council Induction programs on a regular basis for all new employees, providing information on employment conditions, EEO and other important issues.
The Council Induction program covering EEO issues was conducted on the following dates, 20 August 2011, 21 September 2011, 7 December 2011, 15 and 16 February 2012, 16 and 17 May 2012 and 20 and 21 June 2012.
To conduct training and development programs which incorporate EEO issues, where appropriate.
Council facilitated 17 days of mandatory training between August and December 2011 as a refresher for all employees (584 employ-ees were trained) which included EEO and Harassment and Bullying issues.
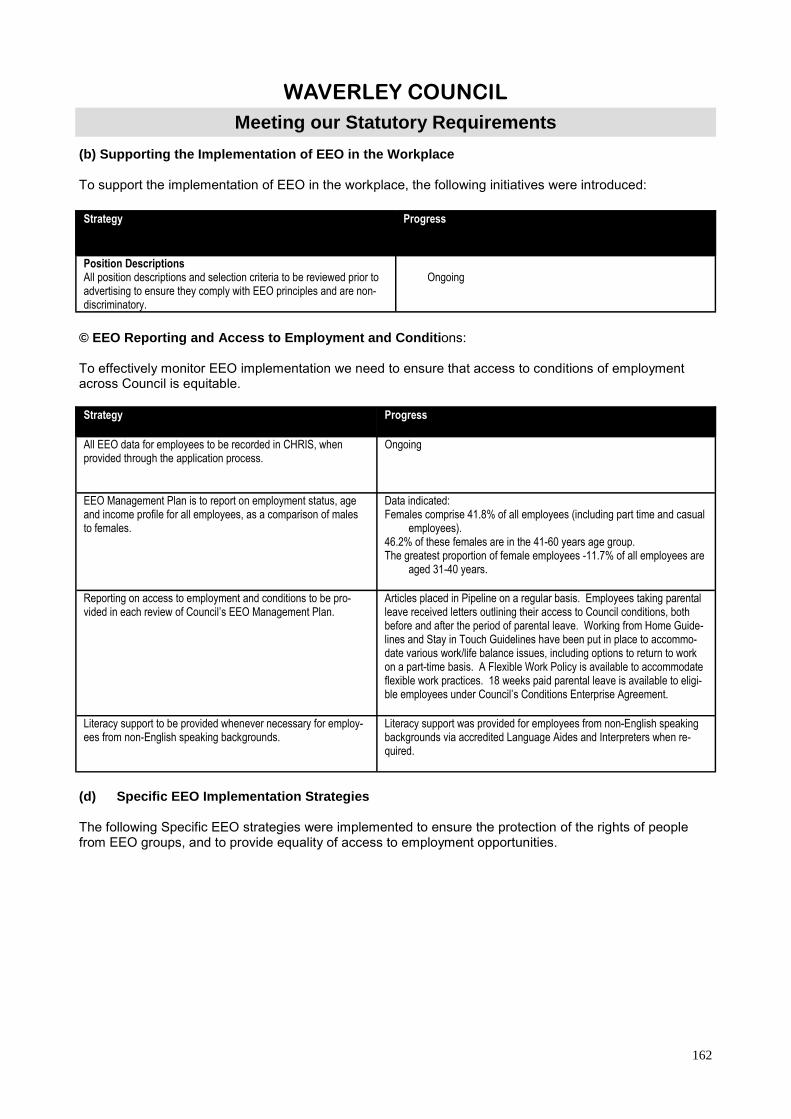
162
WAVERLEY COUNCIL
Meeting our Statutory Requirements
(b) Supporting the Implementation of EEO in the Workplace To support the implementation of EEO in the workplace, the following initiatives were introduced:
© EEO Reporting and Access to Employment and Conditi ons:
To effectively monitor EEO implementation we need to ensure that access to conditions of employment across Council is equitable.
(d) Specific EEO Implementation Strategies The following Specific EEO strategies were implemented to ensure the protection of the rights of people from EEO groups, and to provide equality of access to employment opportunities.
Strategy Progress
Position Descriptions All position descriptions and selection criteria to be reviewed prior to advertising to ensure they comply with EEO principles and are non-discriminatory.
Ongoing
Strategy Progress
All EEO data for employees to be recorded in CHRIS, when provided through the application process.
Ongoing
EEO Management Plan is to report on employment status, age and income profile for all employees, as a comparison of males to females.
Data indicated: Females comprise 41.8% of all employees (including part time and casual
employees). 46.2% of these females are in the 41-60 years age group. The greatest proportion of female employees -11.7% of all employees are
aged 31-40 years.
Reporting on access to employment and conditions to be pro-vided in each review of Council’s EEO Management Plan.
Articles placed in Pipeline on a regular basis. Employees taking parental leave received letters outlining their access to Council conditions, both before and after the period of parental leave. Working from Home Guide-lines and Stay in Touch Guidelines have been put in place to accommo-date various work/life balance issues, including options to return to work on a part-time basis. A Flexible Work Policy is available to accommodate flexible work practices. 18 weeks paid parental leave is available to eligi-ble employees under Council’s Conditions Enterprise Agreement.
Literacy support to be provided whenever necessary for employ-ees from non-English speaking backgrounds.
Literacy support was provided for employees from non-English speaking backgrounds via accredited Language Aides and Interpreters when re-quired.
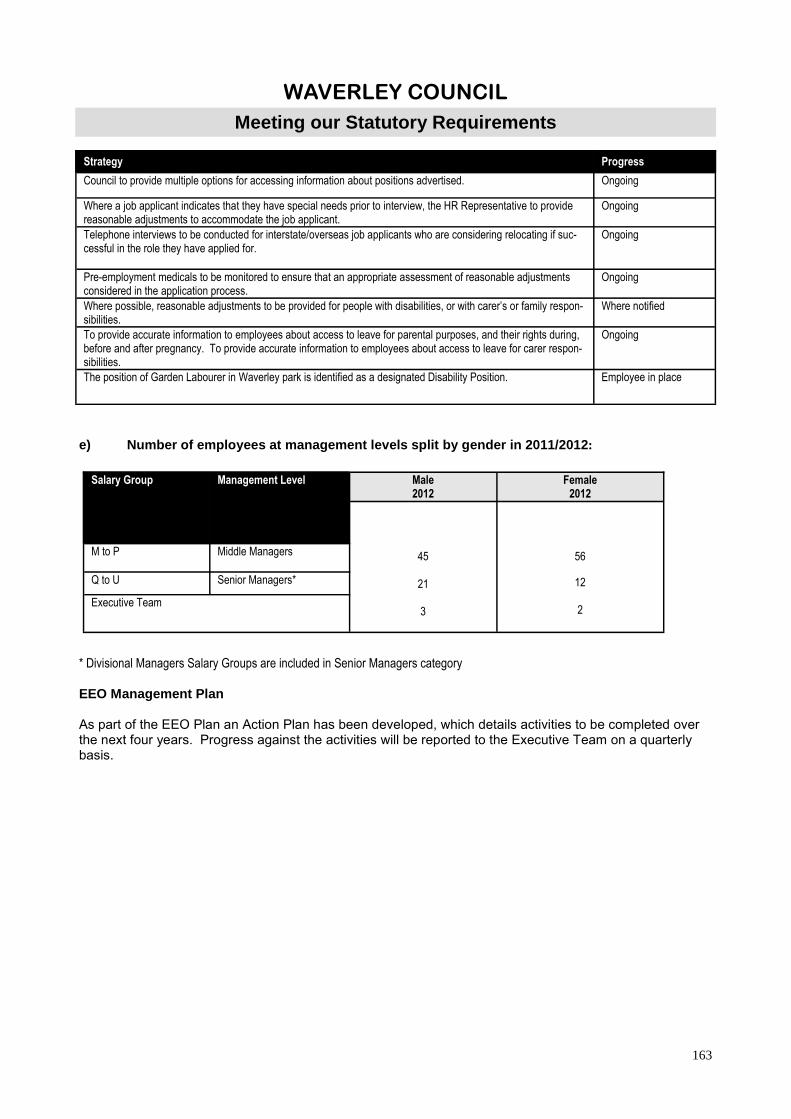
163
WAVERLEY COUNCIL
Meeting our Statutory Requirements
e) Number of employees at management levels split by gender in 2011/2012 :
* Divisional Managers Salary Groups are included in Senior Managers category EEO Management Plan As part of the EEO Plan an Action Plan has been developed, which details activities to be completed over the next four years. Progress against the activities will be reported to the Executive Team on a quarterly basis.
Salary Group Management Level Male 2012
Female 2012
45 21 3
56
12 2
M to P Middle Managers
Q to U Senior Managers*
Executive Team
Strategy Progress
Council to provide multiple options for accessing information about positions advertised. Ongoing
Where a job applicant indicates that they have special needs prior to interview, the HR Representative to provide reasonable adjustments to accommodate the job applicant.
Ongoing
Telephone interviews to be conducted for interstate/overseas job applicants who are considering relocating if suc-cessful in the role they have applied for.
Ongoing
Pre-employment medicals to be monitored to ensure that an appropriate assessment of reasonable adjustments considered in the application process.
Ongoing
Where possible, reasonable adjustments to be provided for people with disabilities, or with carer’s or family respon-sibilities.
Where notified
To provide accurate information to employees about access to leave for parental purposes, and their rights during, before and after pregnancy. To provide accurate information to employees about access to leave for carer respon-sibilities.
Ongoing
The position of Garden Labourer in Waverley park is identified as a designated Disability Position. Employee in place

164
WAVERLEY COUNCIL
Meeting our Statutory Requirements
N. External bodies exercising Council’s functions • Nil O. Controlling interests in Companies • Nil P. Partnerships, Co-operatives and Joint Ventures Waverley Council has a number of partnerships, co-operatives and joint ventures which have been in place for the 2011-12 year consisting of the following: • Council is a member of the Southern Sydney Regional Organisation of Councils (SSROC) and the
Sydney Coastal Councils. SSROC is an association of eleven local councils in the southern area of Sydney. SSROC provides a forum for the councils to deal with issues they have in common,
particularly those that cross boundaries. Key issues under consideration include planning, environment, transport, community development, sustainability, and local government management. • Waverley Library is currently partnering with four other SSROC libraries in the purchase and imple-
mentation of RFID equipment to facilitate patron self check in/ out and stock control. For the past six years including 2011-12 the Copyright Agency Limited (CAL) has sponsored the CAL Waverley
Library Award for Literature. • Waverly Library is in a collaborative partnership with five SSROC libraries for the purchase of shelf-
ready materials • The Sydney Coastal Councils includes councils located on Sydney’s coastline and aims to promote co-ordination on issues relating to the urban coastal environment and waterways. • Waverley Council in conjunction with Woollahra and Randwick Councils run the Regional Eco-
footprint Project which aims to deliver environmental projects within the region. • Council’s Library Services shares a document delivery van with all Libraries in the Sydney metropoli-
tan area. • Waverley Council with Botany Council runs a Home Library Service which provides a free
service delivering fortnightly or monthly, items chosen from the library to residents who are either temporarily or permanently housebound, due to age, illness or disablement and have no reasonable alternative to home delivery of library materials.
• Council hosts the Eastern Region Local Government Aboriginal and Torres Strait Islander Forum, a coalition of 6 Councils, the City of Botany Bay, City of Sydney, Leichhardt, Randwick Waverley and Woollahra • Council has a partnership with the Uniting Church which provides a building, Norman Andrews
House, through which the Church delivers services for homeless and disadvantaged people. • Waverley and Woollahra Council are in partnership to provide the State Emergency Service to the
local community. Q Other Regulatory Information (i) Overseas visits by Councillors and Senior Council Staff No overseas travel paid by Council was undertaken by Councillors or Senior Staff during 2010-11. (ii) Statement of Total Remuneration Council has five Senior Staff. Details of their total remuneration is provided in Section G on Page 136.
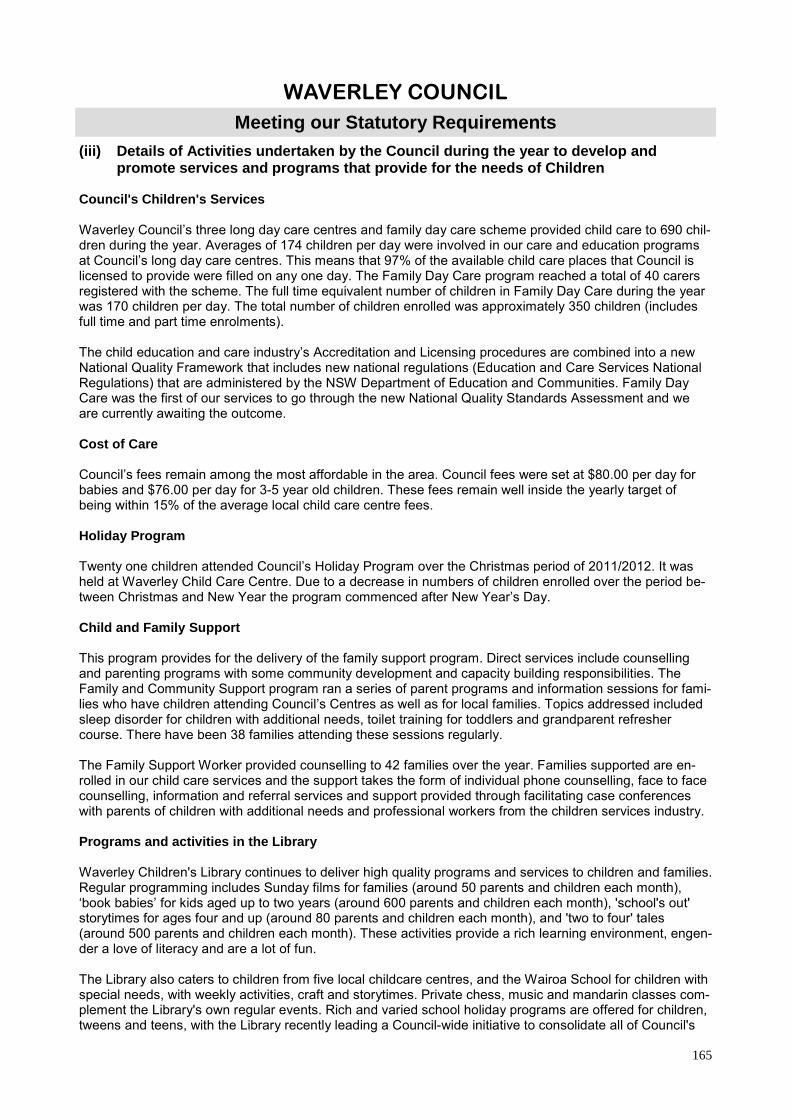
165
WAVERLEY COUNCIL
Meeting our Statutory Requirements (iii) Details of Activities undertaken by the Council during the year to develop and promote services and programs that provide for the needs of Children Council's Children's Services Waverley Council’s three long day care centres and family day care scheme provided child care to 690 chil-dren during the year. Averages of 174 children per day were involved in our care and education programs at Council’s long day care centres. This means that 97% of the available child care places that Council is licensed to provide were filled on any one day. The Family Day Care program reached a total of 40 carers registered with the scheme. The full time equivalent number of children in Family Day Care during the year was 170 children per day. The total number of children enrolled was approximately 350 children (includes full time and part time enrolments). The child education and care industry’s Accreditation and Licensing procedures are combined into a new National Quality Framework that includes new national regulations (Education and Care Services National Regulations) that are administered by the NSW Department of Education and Communities. Family Day Care was the first of our services to go through the new National Quality Standards Assessment and we are currently awaiting the outcome. Cost of Care Council’s fees remain among the most affordable in the area. Council fees were set at $80.00 per day for babies and $76.00 per day for 3-5 year old children. These fees remain well inside the yearly target of being within 15% of the average local child care centre fees. Holiday Program Twenty one children attended Council’s Holiday Program over the Christmas period of 2011/2012. It was held at Waverley Child Care Centre. Due to a decrease in numbers of children enrolled over the period be-tween Christmas and New Year the program commenced after New Year’s Day. Child and Family Support This program provides for the delivery of the family support program. Direct services include counselling and parenting programs with some community development and capacity building responsibilities. The Family and Community Support program ran a series of parent programs and information sessions for fami-lies who have children attending Council’s Centres as well as for local families. Topics addressed included sleep disorder for children with additional needs, toilet training for toddlers and grandparent refresher course. There have been 38 families attending these sessions regularly. The Family Support Worker provided counselling to 42 families over the year. Families supported are en-rolled in our child care services and the support takes the form of individual phone counselling, face to face counselling, information and referral services and support provided through facilitating case conferences with parents of children with additional needs and professional workers from the children services industry. Programs and activities in the Library Waverley Children's Library continues to deliver high quality programs and services to children and families. Regular programming includes Sunday films for families (around 50 parents and children each month), ‘book babies’ for kids aged up to two years (around 600 parents and children each month), 'school's out' storytimes for ages four and up (around 80 parents and children each month), and 'two to four' tales (around 500 parents and children each month). These activities provide a rich learning environment, engen-der a love of literacy and are a lot of fun. The Library also caters to children from five local childcare centres, and the Wairoa School for children with special needs, with weekly activities, craft and storytimes. Private chess, music and mandarin classes com-plement the Library's own regular events. Rich and varied school holiday programs are offered for children, tweens and teens, with the Library recently leading a Council-wide initiative to consolidate all of Council's
166
WAVERLEY COUNCIL
Meeting our Statutory Requirements
holiday activities into one, easy-to-read program for parents and carers, with easier and fairer booking sys-tems improving access to the programs. Children's Library staff continue to enthusiastically participate in nation-wide activities such as Children's Book Week and Library & Information Week, and in 2012 created programs and activities to support 2012 National Year of Reading. Management Support Council staff continued to assist with the development of local children services that need support to build their capacity and adjust to service changes and current challenges. These services include Kindamindi, Bondi Toy Library, local playgroups, Bondi Beach Cottage and the five OOSH Services in Waverley. . Council has identified that many of the childcare and early learning centres in the area are seeking for infor-mation, ideas and connections to effectively deliver meaningful education on Aboriginal and Torres Strait islander people and culture as required in the Early Years Learning Framework. Networking and information exchange Waverley Council staff continued to support and participate in a range of network meetings, Inter-agencies and working parties. Council promotes and provides information about local children’s ser-vices in a number of ways, including fliers, brochures, newsletters, the Mayor’s column in local newspapers, through a directory of children’s services, and via the library’s LINCS database. Council distributed about 1,500 copies of its children’s services directory in 2011-12. iv) Council’s Performance in Relation to Programs Undertaken during the Year to Promote Services and Access to Services for Residents and Other Users Of those Services. The main ways Council promotes its services are: • Regular advertising in local newspapers. • Producing and distributing publications, brochures, flyers and newsletters. • Displaying posters on noticeboards. • Holding public meetings, workshops and focus groups. • Regular mailouts to individuals and groups. • Supporting a resident Precinct Committee System. • Recorded messages on hold for phone calls. • Media releases. • Our Internet site. Regular Newspaper Advertising Council has a weekly advertising column in a local newspaper (The Wentworth Courier), which is distributed free of charge to all households in the Waverley area. This column includes public notices on development proposals and approvals, dates and times of Council and Precinct meetings, information about traffic management, changes to services and new services, draft policies being exhibited for public comment and other statutory notices. A Mayoral Column is printed alongside the advertising column each week, and covers items about the local community, Council initiatives and news about events, projects and programs of interest to local residents. Council advertises regularly in The Bondi View and The Beast, monthly free publications that are distributed in the Waverley area. Producing and Distributing Publications, Brochures, Fact Sheets, Flyers and Newsletters Publications include: Our Community Strategic Plan – Waverley Together 2. This plan contains the community’s vision for what Waverley will be like in 2022 and directions and strategies required to move towards this vision. The Community Strategic Plan also forms the basis for our integrated approach to planning. Council’s response to Waverley Together 2 Council has produced a four yearly Delivery Program 2010-2013 and an annual Operational Plan. These plans set out Council’s strategic response to the directions

167
WAVERLEY COUNCIL
Meeting our Statutory Requirements
identified by the Waverley Community and the specific activities the Council will undertake on an annual basis to help achieve the community’s long-term aspirations. The Operational Plan in particular sets out the budgets, performance targets and performance measures for the activities to be undertaken within each financial year. The Delivery Program and Operational Plan are available for public inspection at the Council Chambers, Library, offices of local State and Federal Members of Parliament and on our Website. In 2011-12 Council has also published an End of Term Report as part of its suite of Integrated Planning & reporting documents. This report sets out the progress made in moving towards or away from the long term Community Vision as set out in the Community Strategic Plan (Waverley Together 2). Waverley in Focus, our residents’ newsletter, is produced and distributed to all households in the Waverley area quarterly. The Waverley in Focus contains news about Council decisions and activities. It aims to let the community know what Council is doing, how they can participate and how they can contact their ward Councillors. Statement of Affairs – which is produced annually and includes information about the structure and functions of Council and how these affect members of the public; how the public can participate in Council’s policy development and decision making, and how to access Council’s information and records. The Statement of Affairs is available for public inspection at the Council Chambers, Library and on our Website. Summary of Affairs – published bi-annually, the Summary of Affairs includes a list of all Council Policy documents. Both the Statement of Affairs and Summary of Affairs were replaced in the latter art of 2010 by the produc-tion of a Publication Guide as required by the Government Information (Public Access) Act 2009. Brochures, Fact Sheets and Flyers. Council produces a range of brochures on many subjects. We maintain brochure stands at our Customer Service Centre, the Council Chambers, the Library, Bondi Pavilion and at the Community Services Offices for distribution purposes. We also produce flyers for letterboxing about various meetings, services and events. Newsletters. We produce a monthly Senior Citizens’ Newsletter and a bi-monthly newssheet called “What’s On at Bondi Pavilion!” Regular newsletters are also produced by the Waverley Library on their activities. Displaying Posters on Noticeboards We have community noticeboards located in Waverley streets and bus shelters as well as numerous other display boards in Council buildings. Information on these noticeboards is changed regularly to ensure up to date information about Council, local services and activities is available. Holding and Attending Public Meetings, Workshops and Focus Groups Council convenes public meetings on topics which are contentious or where public consultation is required. Council also regularly convenes working parties and focus group discussions to enable participa-tion in decision making by members of the community. Regular Mailouts to Individuals and Groups We regularly include additional information on our services and contact phone numbers in mailouts such as the Rates Notice, licensing reminders, waste accounts etc. We also correspond regularly with residents and ratepayers about our services. Supporting a Resident Precinct Committee System There are 13 Precinct Committees in Waverley which meet regularly to discuss matters of local interest. Council prepares regular mailouts to the Precincts about Development Applications, traffic mat-ters, Council plans, codes and policies and/or specific matters where information has been requested. Council staff and Councillors often attend these meetings to hear residents’ concerns and pro-vide information to members.

168
WAVERLEY COUNCIL
Meeting our Statutory Requirements
Recorded Messages on Hold on our phone system Callers placed on hold listen to music and messages about our services. Messages are updated or changed every three months. Media Releases Council regularly prepares media releases for local and metropolitan newspapers, radio and television. The subject of these releases varies in response to the current issues of concern to Council and the community. Our Internet Site Our website www.waverley.nsw.gov.au enables Council information to be placed quickly on the site for access by our community. Access to Services In addition to promoting its services widely, Council provides a range of services to specific identified groups in the Waverley community. (v) Category 1 Business Activities including their expenses, revenues and assets. Progress in implementing the principles of Competitive Neutrality, including complaints handling and complaints received.
Waverley Council operates two business units which are deemed as Category 1 businesses (i.e. income greater than $2,000,000 per annum) consisting of Property and Commercial Waste.
Total expenses, revenues and asset values for these businesses in 2011-12 were as follows
Competitive Neutrality Complaints 2011-12 No complaints have been received regarding competitive neutrality in relation to the business in the 2011-12 financial year. Council has a customer request tracking system (Service Desk) to handle all customer requests and complaints, including competitive neutrality complaints. This system records these complaints and tracks the progress in replying to these matters. (vi) Government Information (Public Access ) applications 2010-2011 The Government Information (Public Access) Act 2009 requires councils to prepare an annual report on their obligations under the Act. Set out on the following pages is a summary of Waverley Council’s access to information applications for 2011-12. • Details of the review carried out by the agency under Section 7 (3) of the Act during the reporting year and the details of any information made publicly available by the agency as a
result of the review During the reporting period undertook a review to examine the public release of information relating to Development applications and implemented an investigation into the inclusion of the agendas and minutes of Council’s community/advisory committees on its website. As a result of this review Waverley Council released the following information proactively:

169
WAVERLEY COUNCIL
Meeting our Statutory Requirements
• Actioned, after seeking legal opinion, to provide public access to internal plans of develop-ment applications. The legal opinion set out a case showing that there is an over-riding public interest in have internal plans available. As a result of this opinion Council now places the onus on the Applicant to put forward a case as to why the information should not be made publicly available.
• Agendas and minutes of Council’s Audit Committee are now available on Council’s website. • Inclusion of information on the ‘Have a Say’ page on Council’s website for inviting public
feedback. • The total number of access applications received by the agency during the reporting year
(including withdrawn applications but not including invalid applications) Council received a total of 48 formal access applications (including withdrawn applications but not invalid applications) during the reporting year. All access applications received were completed within the statutory timeframe requirement.
• The total number of applications received by the agency during the reporting year that the
agency refused, either wholly or partly, because the application was for the disclosure of in-formation referred to in Schedule 1 to the Act (Information for which there is conclusive pre-sumption of overriding public interest against disclosure). Of the total 48 formal access applications received 7 applications were refused because the information requested was information referred to in Schedule 1 to the GIPA Act. Of those applica-tions, 1 was refused in full and 6 were refused in part.
Table A: Number of applications by type of applicant and outcome*
Access
granted in full
Access granted in part
Access refused
in full
Informa-tion
not
held
Informa-tion
already
available
Refuse to
deal with
application
Refuse to
confirm/deny whether
information is held
Applica-tion
with-drawn
Media 0 0 0 0 0 0 0 0
Members of
Parliament
0 0 0 0 0 0 0 0
Private sector
business
17 0 0 0 14 0 0 0
Not for profit
organisations or
community groups
0 0 0 0 0 0 0 0
Members of the public (application by legal representative)
7 4 0 1 5 0 0 0
Members of the public (other)
13 4 1 1 7 0 0 0
*More than one decision can be made in respect of a particular access application. If so, a recording must be made in relation to each such decision. This also applies to Table B.

170
WAVERLEY COUNCIL
Meeting our Statutory Requirements
Table B: Number of applications by type of application and outcome
Access
granted
in full
Access granted
in part
Access
refused
in full
Informa-tion
not held
Informa-tion
already
available
Refuse to
deal
with
application
Refuse to
confirm/deny
whether
information
is held
Application
withdrawn
Personal
information applications*
0 0 0 0 0 0 0 0
Access
applications (other than personal
information applications)
37 8 1 2 26 0 0 0
Access applica-tions that are partly personal information applications and partly other
0 0 0 0 0 0 0 0
*A personal information application is an access application for personal information (as defined in clause 4 of Schedule 4 to the Act) about the applicant (the applicant being an individual).
The total number of decisions in Table B should be the same as Table A.
Table C: Invalid applications
Reason for invalidity Number of applications
Application does not comply with formal requirements (section 41 of the Act) 0
Application is for excluded information of the agency (section 43 of the Act) 0
Application contravenes restraint order (section 110 of the Act) 0
Total number of invalid applications received 0
Invalid applications that subsequently became valid applications 0

171
WAVERLEY COUNCIL
Meeting our Statutory Requirements Table D: Conclusive presumption of overriding public interest against disclosure:
Number of times consideration
Overriding secrecy laws 0
Cabinet information 0
Executive Council information 0
Contempt 0
Legal professional privilege 3
Excluded information 0
Documents affecting law enforcement and public safety 0
Transport safety 0
Adoption 0
Care and protection of children 0
Ministerial code of conduct 0
Aboriginal and environmental heritage 0
*More than one public interest consideration may apply in relation to a particular access application and, if so, each such consideration is to be recorded (but only once per application). This also applies in relation to Table E.
Table E: Other public interest considerations against disclosure:
matters listed in table to section 14 of the Act
Number of occasions when
application not successful
Responsible and effective government 0
Law enforcement and security 0
Individual rights, judicial processes and natural justice 8
Business interests of agencies and other persons 1
Environment, culture, economy and general matters 0
Secrecy provisions 0
Exempt documents under interstate Freedom of Information legislation 0
Table F: Timeliness
Number of applications
Decided within the statutory timeframe (20 days plus any extensions) 48
Decided after 35 days (by agreement with applicant) 0
Not decided within time (deemed refusal) 0
Total 0
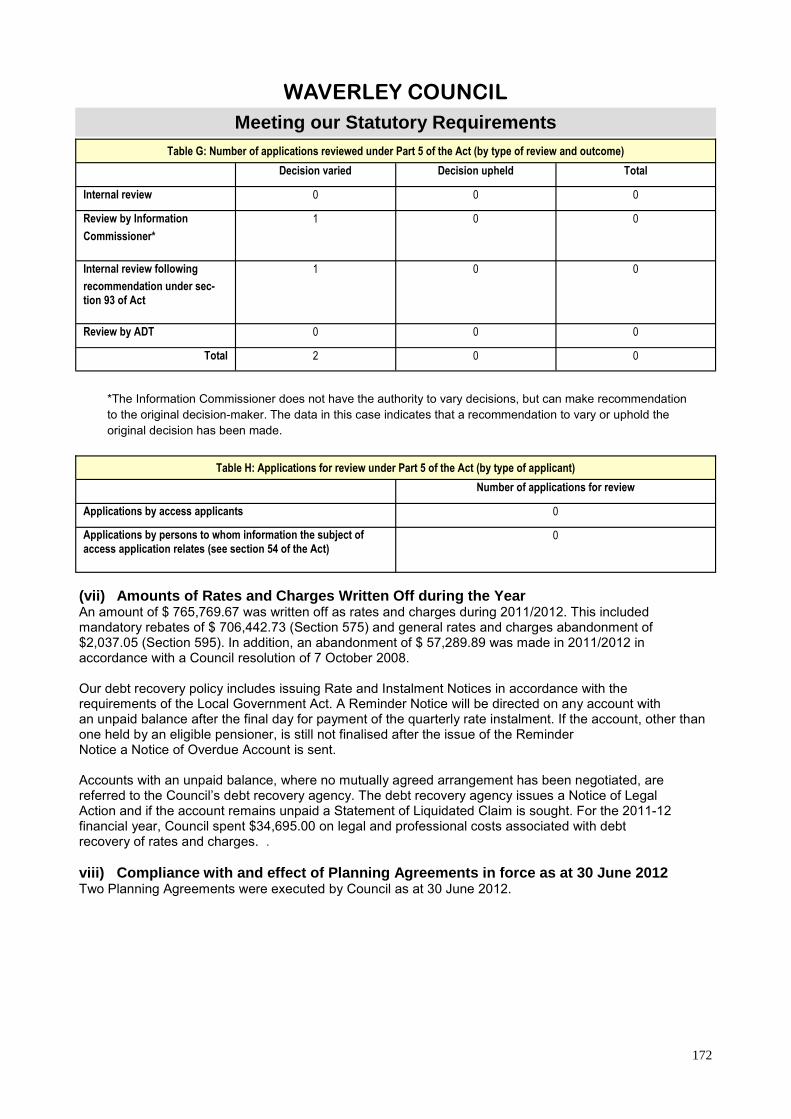
172
WAVERLEY COUNCIL
Meeting our Statutory Requirements Table G: Number of applications reviewed under Part 5 of the Act (by type of review and outcome)
Decision varied Decision upheld Total
Internal review 0 0 0
Review by Information
Commissioner*
1 0 0
Internal review following
recommendation under sec-tion 93 of Act
1 0 0
Review by ADT 0 0 0
Total 2 0 0
*The Information Commissioner does not have the authority to vary decisions, but can make recommendation to the original decision-maker. The data in this case indicates that a recommendation to vary or uphold the original decision has been made.
Table H: Applications for review under Part 5 of the Act (by type of applicant)
Number of applications for review
Applications by access applicants 0
Applications by persons to whom information the subject of access application relates (see section 54 of the Act)
0
(vii) Amounts of Rates and Charges Written Off during the Year An amount of $ 765,769.67 was written off as rates and charges during 2011/2012. This included mandatory rebates of $ 706,442.73 (Section 575) and general rates and charges abandonment of $2,037.05 (Section 595). In addition, an abandonment of $ 57,289.89 was made in 2011/2012 in accordance with a Council resolution of 7 October 2008. Our debt recovery policy includes issuing Rate and Instalment Notices in accordance with the requirements of the Local Government Act. A Reminder Notice will be directed on any account with an unpaid balance after the final day for payment of the quarterly rate instalment. If the account, other than one held by an eligible pensioner, is still not finalised after the issue of the Reminder Notice a Notice of Overdue Account is sent. Accounts with an unpaid balance, where no mutually agreed arrangement has been negotiated, are referred to the Council’s debt recovery agency. The debt recovery agency issues a Notice of Legal Action and if the account remains unpaid a Statement of Liquidated Claim is sought. For the 2011-12 financial year, Council spent $34,695.00 on legal and professional costs associated with debt recovery of rates and charges. . viii) Compliance with and effect of Planning Agreements in force as at 30 June 2012 Two Planning Agreements were executed by Council as at 30 June 2012.

173
WAVERLEY COUNCIL
Meeting our Statutory Requirements
(ix) Code of Conduct Complaints 2010-2011 Council’s Codes of Conduct for Councillors and Staff require annual reporting of code of conduct matters received and dealt with during the year. Code of Conduct Complaints—Councillors In 2011-12 12 Code of Conduct complaints were received regarding the conduct of councillors. The table below sets out nature of these complaints and their outcomes.
Code of Conduct Complaint Outcome of Investigation
Complaint against Cr Sally Betts regarding a letter in a local newspaper in April 2011 (August 2011)
Deemed not to have been a breach of the Code
Complaints against Cr John Wakefield alleging breaches of the Code of Conduct and Code of Meeting Practice at the March Council meeting (September 2011)
Deemed to have been a breach of the Code of Conduct and that Cr Wakefield be censured and be required to apologise and that all councillors receive training on the Code of Meeting Practice and Code of Conduct.
Complaint against Cr John Wakefield regarding comments made about another councillor in a media interview
Complaint to be withdrawn subject to letter of apology being sent to the Complainant. Letter yet to be sent at the time of this report.
Complaint against Cr Kerryn Sloan regarding comments made at the Bondi Junction Precinct Committee meeting on 23 November 2011
Deemed not to have been a breach of the Code
Complaint against Cr Sally Betts regarding comments made at the Bondi Junction Precinct Committee meeting on 23 November 2011
Deemed not to have been a breach of the Code
Complaint against Cr Leon Goltsman regarding comments made at a Council meeting
Deemed not to have been a breach of the Code. Facilitation offered to both parties.
Complaint against Cr Kerryn Sloan regarding comments made at a Council meeting
Deemed not to have been a breach of the Code. Facilitation offered to both parties.
Complaint against Cr Sally Betts for comments made at the Coun-cil meeting on 15 November 2011
Deemed not to have been a breach of the Code
Complaint against Cr Sally Betts for comments made at the Coun-cil meeting on 15 November 2011
Deemed not to have been a breach of the Code
Complaint against Cr John Wakefield alleging he breached Section 226 and 352 of the Local Government Act in a statement made at the Dover Heights Precinct Committee meeting of 21 November 2011.
Deemed not to have been a breach of the Code
Complaint against Cr John Wakefield alleging a breach of the Code of Conduct in respect of the planting of a tree at 350 Birrell Street
Deemed not to have been a breach of the Code
Complaint against Cr John Wakefield alleging a breach of the Code of Conduct in respect of the Council Meeting of 21 February 2012 and the handing of a councillor’s declaration of interest
Deemed not to have been a breach of the Code
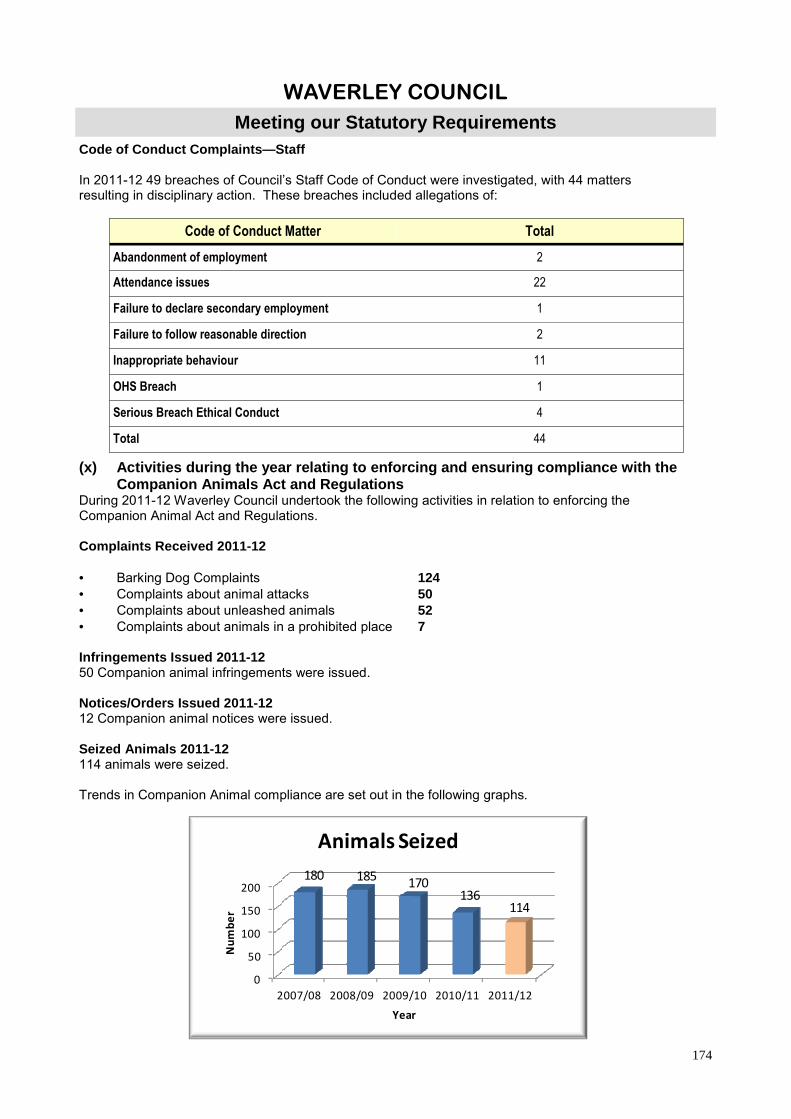
174
WAVERLEY COUNCIL
Meeting our Statutory Requirements
(x) Activities during the year relating to enforcing and ensuring compliance with the Companion Animals Act and Regulations
During 2011-12 Waverley Council undertook the following activities in relation to enforcing the Companion Animal Act and Regulations. Complaints Received 2011-12 • Barking Dog Complaints 124 • Complaints about animal attacks 50 • Complaints about unleashed animals 52 • Complaints about animals in a prohibited place 7 Infringements Issued 2011-12 50 Companion animal infringements were issued. Notices/Orders Issued 2011-12 12 Companion animal notices were issued. Seized Animals 2011-12 114 animals were seized. Trends in Companion Animal compliance are set out in the following graphs.
Code of Conduct Matter Total
Abandonment of employment 2
Attendance issues 22
Failure to declare secondary employment 1
Failure to follow reasonable direction 2
Inappropriate behaviour 11
OHS Breach 1
Serious Breach Ethical Conduct 4
Total 44
Code of Conduct Complaints—Staff In 2011-12 49 breaches of Council’s Staff Code of Conduct were investigated, with 44 matters resulting in disciplinary action. These breaches included allegations of:
0
50
100
150
200
2007/08 2008/09 2009/10 2010/11 2011/12
180 185170
136114
Nu
mb
er
Year
Animals Seized

175
WAVERLEY COUNCIL
Meeting our Statutory Requirements
0
50
100
150
200
250
2007/08 2008/09 2009/10 2010/11 2011/12
94
32
114
220
50
Nu
mb
er
Year
Infringements Issued
0
50
100
150
200
2007/08 2008/09 2009/10 2010/11 2011/12
170137
146 154124
Nu
mb
er
Year
Barking Dog Complaints
0
20
40
60
2007/08 2008/09 2009/10 2010/11 2011/12
39 39 40 3852
Nu
mb
er
Year
Complaints about unleashed
animals
0
5
10
15
20
2007/08 2008/09 2009/10 2010/11 2011/12
10 98
16
7
Nu
mb
er
Year
Complaints about Animals in a
Prohibited Place
0
10
20
30
40
50
60
2007/08 2008/09 2009/10 2010/11 2011/12
51
3935
4450
Nu
mb
er
Year
Complaints about Animal Attacks
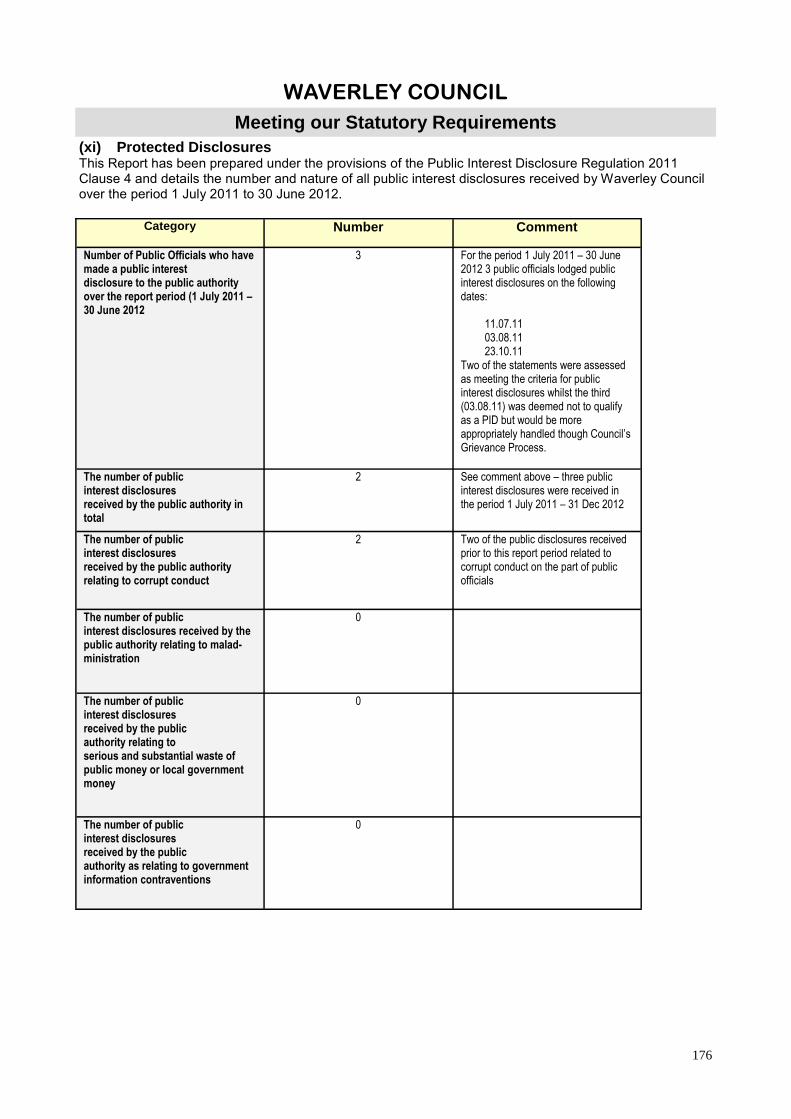
176
WAVERLEY COUNCIL
Meeting our Statutory Requirements (xi) Protected Disclosures This Report has been prepared under the provisions of the Public Interest Disclosure Regulation 2011 Clause 4 and details the number and nature of all public interest disclosures received by Waverley Council over the period 1 July 2011 to 30 June 2012.
Category
Number Comment
Number of Public Officials who have made a public interest disclosure to the public authority over the report period (1 July 2011 – 30 June 2012
3 For the period 1 July 2011 – 30 June 2012 3 public officials lodged public interest disclosures on the following dates:
11.07.11 03.08.11 23.10.11
Two of the statements were assessed as meeting the criteria for public interest disclosures whilst the third (03.08.11) was deemed not to qualify as a PID but would be more appropriately handled though Council’s Grievance Process.
The number of public interest disclosures received by the public authority in total
2 See comment above – three public interest disclosures were received in the period 1 July 2011 – 31 Dec 2012
The number of public interest disclosures received by the public authority relating to corrupt conduct
2 Two of the public disclosures received prior to this report period related to corrupt conduct on the part of public officials
The number of public interest disclosures received by the public authority relating to malad-ministration
0
The number of public interest disclosures received by the public authority relating to serious and substantial waste of public money or local government money
0
The number of public interest disclosures received by the public authority as relating to government information contraventions
0

177
WAVERLEY COUNCIL
Meeting our Statutory Requirements
(xii) Privacy and Personal Information Management Council adopted a revised Privacy Management Plan in February 2007. This replaced the previous Plan adopted in November 2002. The revised Privacy Management Plan is available on Council’s website. No privacy issue were raised in 2011-12. (xiii) Gift Registers Information Staff and Councillors 2011-12 Both the number and value of gifts recorded in 2011-12 decreased compared to 2010—11. In 2011-12 230 gifts were recorded with an assessed value of $3,853.50 compared to 281 gifts with an assessed value of $6,013.95 which were recorded in 2010-11. (See table below)
During 2011-12 a total of 12 gifts were registered in the Councillor’s Gift Register. The total value of gifts received and registered was $250. This is an increase from the previous year when eight gifts were registered with a total value of $95. None of the gifts registered by Councillors was valued at more
Category
Number Comment
The number of public interest disclosures received by the public authority local government pecuni-ary interest contraventions
0
The number of public interest disclosures finalised by the public authority
2 .
Whether the public authority has a public interest disclosures policy in place
Yes Council revised its policy in August 2011
What actions the head of the public authority has taken to ensure that his or her staff awareness responsi-bilities under section 6E (1) (b) of the Act have been met.
See actions as outlined in next column The following actions have been taken by Council meet the requirements of Section 6E (1)(b) of the Act:
• A revised policy was adopted to
ensure compliance with all aspects of the Act.
• The revised policy has been placed on Council’s intranet and internet.
• Briefings are provided to all new
staff as part of the induction proc-ess.
• Work Groups within the council
have been briefed on the new provisions as part of staff training
• A new public interest disclosures brochure has been produced.
Department Number of Gifts Nominal Value
GMU 12 $673.50
Councillors 12 $250
C&TS 7 $178
RCCS 189 $2522
PES 0 $0
PWS 10 $230
TOTAL 230 $3853.50
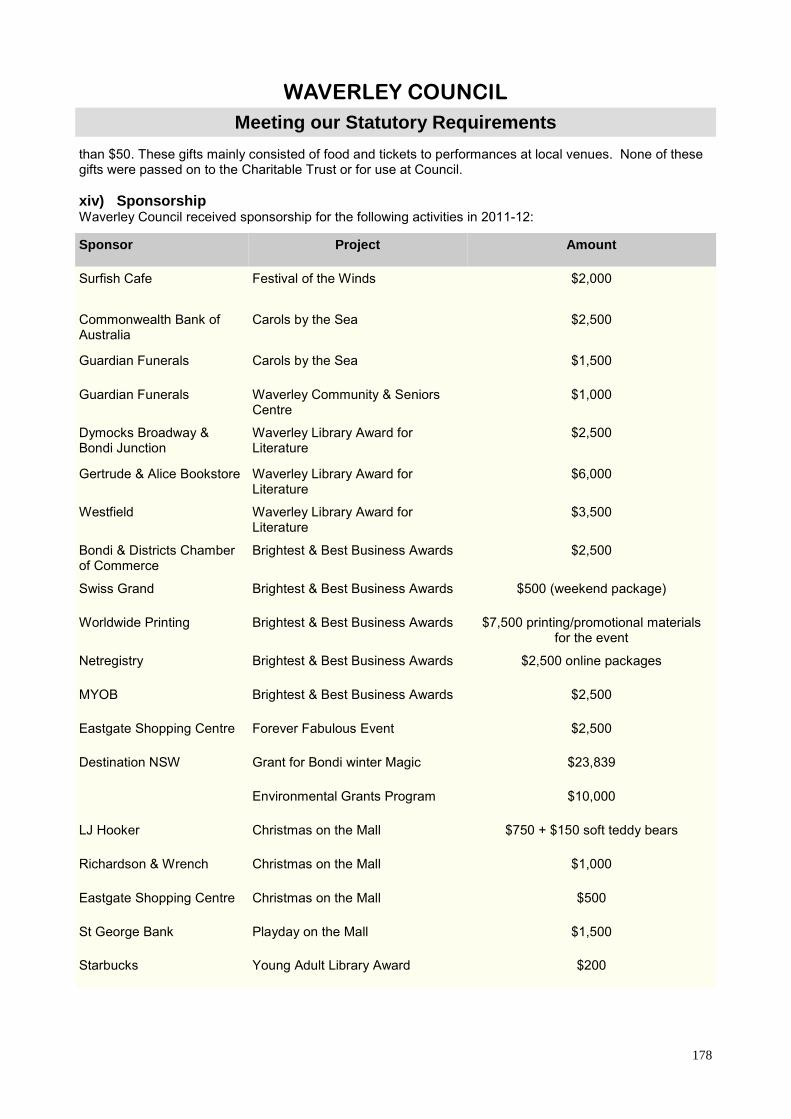
178
WAVERLEY COUNCIL
Meeting our Statutory Requirements
than $50. These gifts mainly consisted of food and tickets to performances at local venues. None of these gifts were passed on to the Charitable Trust or for use at Council. xiv) Sponsorship Waverley Council received sponsorship for the following activities in 2011-12:
Sponsor Project Amount
Surfish Cafe Festival of the Winds $2,000
Commonwealth Bank of Australia
Carols by the Sea $2,500
Guardian Funerals Carols by the Sea $1,500
Guardian Funerals Waverley Community & Seniors Centre
$1,000
Dymocks Broadway & Bondi Junction
Waverley Library Award for Literature
$2,500
Gertrude & Alice Bookstore Waverley Library Award for Literature
$6,000
Westfield Waverley Library Award for Literature
$3,500
Bondi & Districts Chamber of Commerce
Brightest & Best Business Awards $2,500
Swiss Grand Brightest & Best Business Awards $500 (weekend package)
Worldwide Printing Brightest & Best Business Awards $7,500 printing/promotional materials for the event
Netregistry Brightest & Best Business Awards $2,500 online packages
MYOB Brightest & Best Business Awards $2,500
Eastgate Shopping Centre Forever Fabulous Event $2,500
Destination NSW Grant for Bondi winter Magic $23,839
Environmental Grants Program $10,000
LJ Hooker Christmas on the Mall $750 + $150 soft teddy bears
Richardson & Wrench Christmas on the Mall $1,000
Eastgate Shopping Centre Christmas on the Mall $500
St George Bank Playday on the Mall $1,500
Starbucks Young Adult Library Award $200
179
WAVERLEY COUNCIL
Glossary
Section 5
Glossary

180
WAVERLEY COUNCIL
Glossary Activities Activities outline the means by which Council achieves its strategies. CALD Culturally and Linguistically Diverse. Capital Works Public works projects that result in provision of long term assets or
facilities for the community. This may include rehabilitation or improvement of existing assets as well as acquisition or construction of new assets. Funding for capital works projects is separate from annual funding for recurring operating costs.
Clients A regular user of Council services. Council may have a one to one relationship with a
client and receive special funding to assist in providing the service used by the client (see also customers).
Community Consultation The way we inform the community and ask them for their views and ideas about
Council's proposed actions, policies and priorities. Community Strategic Plan The Community Strategic Plan (Waverley Together 2) is the highest level of plan within
the Integrated Planning & Reporting hierarchy. This plan identifies the community’s main priorities and expectations (community directions) for the future and the strategies for achieving these directions. This plan must take a long term outlook covering a mini-mum timeframe of 10 years and addresses social, environmental, economic and civic leadership issues. This Plan includes: • A Community Vision Statement • A series of strategic directions for the community • Strategies for achieving the objectives, and • Targets and indicators to show where we want to be and how we will measure our
progress In order to ensure that the community directions identified in the Community Strategic Plan can be adequately delivered, the Plan must be informed by a Resourcing Strategy which consists of a Long Term Financial Plan, an Asset Manage-
ment Plan and a Workforce Management Plan. Council Area Replaces the older term municipality and refers to all land and property within the Waverley Council boundaries. Customer A person who uses Council’s services (see also client). DA Many renovations, new buildings, change of use of a building, land subdivisions and so on require approval from Councils which is sought by making a Development Application or DA. This allows Councils to control development in accordance with their plans and policies. DCP A Development Control Plan (DCP) provides more specific detail on
controlling development and which often relates to specific types of development eg. on units or commercial development or to ensure access or safety. Currently Waverley has one DCP covering the whole LGA.
181
WAVERLEY COUNCIL
Glossary Delivery Program The Delivery Program is a form of social contract between the Council and the commu-
nity detailing the activities it will undertake during its term in office to achieve the com-munity directions identified within the Community Strategic Plan (Waverley Together 2). The Delivery Program is the single point of reference for all activities undertaken by the Council during its four year term in office.
Department Refers to the main units of responsibility within Waverley Council’s organisation. We have four main Departments together with the General Manager’s Unit. Directions An ongoing purpose towards which Council’s effort is directed. Directions are ambitious. The Community Strategic Plan (Waverley Together 2) is organised
around 33 Directions which have been identified by the Waverley Community as being important to long term strategic direction of the community wishes to head.
EAP Environmental Action Plan. The EAP integrates Council’s environmental planning into
our broader strategic planning framework. The Plan is written around the key issues of Greenhouse Gas Emissions, Water, Waste and Biodiversity.
EEO Equal Employment Opportunity - Council’s policy of ensuring that every
job applicant and employee has fair access to all workplace opportunities and benefits, regardless of his or her gender, race, marital status, age, sexual preference, disability, or pregnancy. It ensures merit-based employment and support for our people, enabling them to do a good job and maximise their potential according to their skills and abilities.
End of Term Report The End of Term Report is a requirement of the Integrated Planning and Reporting
Framework where the Council must report on the achievements in implementing the Community Strategic Plan. Waverley’s End of Term Report: • Displays the progress made by the Waverley community towards achieve-
ment of their vision for quality of life during the term of office for the elected council;
• Takes measures of the performance and effectiveness of the strategies of the Community Strategic Plan ( Waverley Together 2 ) in progress towards the targets and sustainability; and
• Sets out advice for achieving the Waverley community’s desired future. ESD Environmentally Sustainable Design is development that minimises reliance on
natural resources and has less adverse impacts on the surrounding environment. It re-quires the effective integration of economic and environmental considerations in deci-sion-making processes. Its broad intent is to minimise the adverse impacts of develop-ment on the environment and is achieved through the implementation of a number of principles, such as inter-generational equity, and programs
Greenlinks A Council policy to create or improve pedestrian and cycle links between parks,
schools and other special places in and around Waverley. These links are green, safe, look and feel good and promote biodiversity. Such links create improved wellbeing in the community and protect, nurture and enhance our natural environment.
Integrated Planning & Reporting Integrated Planning & Reporting is a new framework developed by the NSW Government to ensure that councils are better reflecting community aspirations within
their activities. The framework is based around a new planning hierarchy which consists of:

182
WAVERLEY COUNCIL
Glossary
• A Community Strategic Plan which defines community aspirations and out-comes over the long term (a minimum of 10 years).
• A Delivery Program which sets out the specific activities a Council will undertake over its term in office (4 Years) to achieve the community outcomes identified in the Community Strategic Plan
• An Operational Plan which is a sub-plan of the Delivery Program which details the specific activities that will be undertaken by the Council within a particular
financial year • An Annual Report which details the financial performance of the Council and
how it is progressing in achieving the community outcomes for a [particular financial year.
LGA Local Government Area refers to all land and property that make up a Council Area. In
the case of Waverley this means all land and property within the Waverley Council boundaries. LEP A Local Environmental Plan is a planning document with legal status
that tells the community what land can be used for and controls development. Currently Waverley has two LEPs: the Waverley LEP 1996 and the Waverley and Woollahra Joint LEP 1991—Bondi Junction Commercial Centre. Council is currently in the process of finalising a Comprehensive LEP for Waverley.
LTFS The Long Term Financial Strategy is one of the key components of the Resourcing Strategy required within Integrated Planning and Reporting. Council’s LTFS is designed to show the financial impact of providing different levels of services, as well as different programs of capital works. The Strategy contains a set of long range finan-cial projections based on an informed set of assumptions the future.
Looking Good Strategy A Council strategy to create areas that look and feel good, and are clean, green
and well maintained with improved design and function. Measures The types of information which, when collected, will show whether we have been successful in achieving each. Mission Describes how the Council will contribute to the fulfilment of the Vision. Neighbourhood or Village The formal definition is an area with distinctive characteristics where people live near
one another. However, nowadays people often use ‘neighbourhood’ or ‘village’ to de-scribe interconnected local communities that have a strong sense of identity where day to day life is made easier by having a centre within walking distance where people can gather and have their basic shopping and service needs met.
Operational Plan The Operational Plan is a ‘sub-plan’ of the Delivery Program in that it supports the ser-
vices outlined in the Delivery Program. Whereas the Delivery Program takes a four year outlook, the Operational Plan is produced annually and focuses on the specific services that Council will undertake within each financial year. The Operational Plan also
includes the Council’s operational budget for the financial year. Pricing Policy A collection of the principles, which underlie the setting of a fee or charge for goods or
services provided by Council eg., user pays, cross subsidisation, equity, polluter pays, customer service etc. Waverley’s pricing policy includes a full list of fees and charges levied for various goods and services.

183
WAVERLEY COUNCIL
Glossary
Quadruple Bottom Line (QBL) The Community Strategic Plan must adequately address social, environmental, eco-
nomic and civic leadership (governance) considerations. This is known as the quad-ruple bottom line and aims to ensure that a holistic and balanced view is taken to deal-ing with issues within a local government area and that sustainable outcomes are achieved.
Resourcing Strategy Each council must have a long term Resourcing Strategy to assist in achieving the goals
set out in the Community Strategic Plan and the Delivery Program. The Resourcing Strategy consists of three components: • A Long Term Financial Plan • A Strategic Asset Management Plan • A Workforce Management Plan
Revenue Policy Provides details of the sources, amounts and bases of calculation of the revenue
(income) to be raised in the next year. Stakeholder Any group or individual who can affect or is affected by the achievement of the organisation’s objectives. Strategies Each Direction in the Community Strategic Plan (Waverley Together 2) sets out
where the community wishes to head. Underpinning the Directions are Strategies which sets out ‘how we will get there’.
SAMP Our Strategic Asset Management Plan is another key component of the Resourcing Strategy. It assists Council to achieve best practice in the management of its physical assets and infrastructure ensuring management is aligned
with Council’s objectives, is capable of supporting Council’s stated social environmental and financial outcomes, and meets the community’s needs.
Target The desired level of achievement for each activity according to the Measure selected. TIS The Telephone Interpreter Service (TIS) is a service operated by the Federal Government that provides on-call interpreter services. Values Underlying attitudes and beliefs which are highly regarded by the organisation. Vision Describes the long-term picture created by the community which sets out what
they want for the future of Waverley. The Waverley community’s vision consists of 14 elements which cover: • Safety • Reconciliation and Indigenous heritage • Connections between families and generations • Community life • Physical and spiritual well-being • Arts, culture and lifestyle • Compassion and inclusiveness • Physical environment • Heritage and development • Access to services • Conservation
184
WAVERLEY COUNCIL
Glossary • Economic prosperity • Environmental sustainability • Leadership
Workforce Management Plan Workforce planning is an important part of the new Integrated Planning and Reporting framework. Council’s workforce strategy will form part of the Resourcing Strategy, helping to meet the community’s priorities and aspirations, as ex-
pressed in the Community Strategic Plan, by having the right people in the right places with the right skills doing the right jobs at the right time. The
development of an effective workforce strategy will enable Council to plan its future workforce needs to deliver goals, focus on the medium- and long-term and also
provide a framework for dealing with immediate challenges in a consistent way. Year Means the financial year covering the period from July 1 to the following June 30.

Our community’s strategic plan for 2010-22
End of Term ReportElected Council 2008–12
Waverley Together2

Waverley Council End of Term Report on Progress Towards Waverley Together 2 Elected Council 2008 to 2012 June 2012
We are united by a common passion
for our beautiful home between the city and the sea.

2
Acknowledgement We acknowledge the Bidjigal and Cadigal people who have traditionally occupied the Sydney Coast. We also acknowledge Aboriginal Elders both past and present.
3
CONTENTS 1. Introduction ......................................................................................................... 4
1.1 Council’s reporting obligations .................................................................... 4 1.2 Reporting methodology ................................................................................ 5 1.3 Measurement methodology .......................................................................... 6 1.4 The outcome in summary ............................................................................. 8 1.5 The implications for Waverley Together 3 ................................................. 11
2. Progress towards the vision of Waverley Together 2 ..................................... 16 2.1 Perceptions of progress towards the vision ............................................. 18 2.2 Performance in approaching the vision ..................................................... 20
2.2.1 Vision element 1 ................................................................................... 20 2.2.2 Vision element 2 ................................................................................... 22 2.2.3 Vision element 3 ................................................................................... 23 2.2.4 Vision element 4 ................................................................................... 24 2.2.5 Vision element 5 ................................................................................... 27 2.2.6 Vision element 6 ................................................................................... 28 2.2.7 Vision element 7 ................................................................................... 29 2.2.8 Vision element 8 ................................................................................... 30 2.2.9 Vision element 9 ................................................................................... 32 2.2.10 Vision element 10 ............................................................................... 33 2.2.11 Vision element 11 ............................................................................... 34 2.2.12 Vision element 12 ............................................................................... 36 2.2.13 Vision element 13 ............................................................................... 38 2.2.14 Vision element 14 ............................................................................... 42
3. Progress towards the QBL targets of Waverley Together 2 ........................... 44 3.1 Overall progress towards QBL sustainability ........................................... 44 3.2 Movement towards a sustainable community ........................................... 46 3.3 Movement towards sustainable living ....................................................... 47 3.4 Movement towards a sustainable environment ......................................... 48 3.5 Movement towards sustainable governance ............................................. 50 3.6 Movement towards sustainable assets ...................................................... 52
4. Contribution of services to Waverley Together 2 ........................................... 57 4.1 Contribution of Council services ................................................................ 59
4.1.1 Progress with delivery of Service Plus ............................................... 61 4.2 Contribution of the services of other levels of government ..................... 84
5. Towards Waverley Together 3 .......................................................................... 85 5.1 Some policies and strategies to help address co ncerns .......................... 85 5.2 Reforms in governance to help achieve the visio n ................................... 90
Appendix 1: Map of Council’s services towards the v ision ............................... 92 Appendix 2: Full list of services in Service Plus ................................................. 99 References ........................................................................................................... 103

4
1. Introduction In 2009 the NSW State Parliament unanimously voted to introduce Integrated Planning and Reporting (IP&R) reforms within the Local Government Act. These reforms have made it compulsory, among other things, for councils to adopt long term Community Strategic Plans (CSPs) on behalf of their community. The plans are meant to express the entirety of their community’s aspirations for the future, not just those aspirations that a council may be able to satisfy. They are required to be genuinely long term with a life span of at least ten years. In February 2010, after extensive community engagement, Waverley Council adopted on behalf of the Waverley community, their first fully compliant Community Strategic Plan, Waverley Together 2. This plan has a 12 year time frame from 2010 to 2022 – the equivalent of three terms of office for an elected council. Under the legislation, each elected council is required to adopt its own 4 year Delivery Program which ideally should remain fixed for the length of its term of office. The intent of this is to ensure that each elected council works out the strategies most likely to make a positive contribution towards the achievement of the community’s vision for what life should be like by the end of the long term planning period – in Waverley’s case, by the year 2022. In its commitment to the Delivery Program, each elected council is generally required to take on neither more nor less that its fair share of burden for achieving the long term aims of the CSP. To maximise the community’s chances of making its lifestyle vision a reality over the long term and to enhance the effectiveness of the Delivery Program, an emphasis is placed on partnership with other levels of government, the business and not for profit sectors, and the community itself. Waverley Together 2 maps these partnerships. 1.1 Council’s reporting obligations Under the IP&R framework, councils are required to report on progress with their Delivery Programs twice a year. Waverley Council has been doing this since 2010. Every four years, however, councils are also required to report on how effective their Delivery Program and their partnerships with others have been in making an actual difference to their community’s quality of life as envisioned in the CSP. In other words:
1 Did life get better while we were in office? 2 Are we moving towards or away from having:
� a sustainable community,a sustainable community,a sustainable community,a sustainable community, � a sustainable lifestyle (including a sustainable economy), a sustainable lifestyle (including a sustainable economy), a sustainable lifestyle (including a sustainable economy), a sustainable lifestyle (including a sustainable economy), � a sustainable environment, anda sustainable environment, anda sustainable environment, anda sustainable environment, and � sustainable governance.sustainable governance.sustainable governance.sustainable governance.
3 Did our programs and partnerships help our community to make positive progress towards achieving their vision and targets?
5
In this process, elected councils can report to their communities on the effectiveness of their strategies and those of their partners and make recommendations for development of future plans to maximise the community’s chances of meeting their targets over the longer term, realising their vision and achieving quadruple bottom line sustainability (QBL). This report:
� displays the progress made by the Waverley community towards achievement of their vision for quality of life during the term of office of the 2008-2012 elected council;
� takes measures of the performance and effectiveness of the strategies of Waverley Together 2 in progress towards the targets and sustainability; and
� sets out advice for achieving the Waverley community’s desired future, sustainably.
1.2 Reporting methodology The reporting methodology will follow the structure of Waverley Together 2 by reporting on progress towards its adopted vision, targets and quadrants of sustainability. There are 14 elements within the vision and 60 targets or indicators of progress towards the vision and QBL sustainability. Baseline data for all 60 targets (except one) have been published in Waverley Together 2 so that the community can see where we were as a community when the plan was adopted. The baseline data generally date from 2009 and come from a variety of sources including: To measure progress towards targets for:
Data sources:
SSSSustainableustainableustainableustainable community,community,community,community, � 2009 Resident Survey1 by the Hunter Valley Research Foundation (HVRF)
� Australian Bureau of Statistics (ABS) � NSW Bureau of Crime Statistics � NSW Health Department
SSSSustainable lifestyleustainable lifestyleustainable lifestyleustainable lifestyle � 2009 HVRF Resident Survey � ABS � Roads and Maritime Services (RMS – formerly the RTA) � Waverley Council Business Activities Reports
SSSSustainable environmentustainable environmentustainable environmentustainable environment � ABS � Transport Data Centre � Office of Environment & Heritage (OEH) � Waverley Council’s CCAP system for modeling and
monitoring of greenhouse gas emissions � 2009 HVRF Resident Survey � Waverley Council internal statistics
SSSSustainable governanceustainable governanceustainable governanceustainable governance � 2009 HVRF Resident Survey � Waverley Council Annual Financial Statements � Waverley Council internal statistics � Waverley Council Business Excellence Framework
Organisation Staff Survey � Asset condition data in Council’s Strategic Asset
Management Plan 3 (SAMP3)
1 The 2009 statically valid survey of Waverley residents was independently conducted by Hunter Valley Research Foundation. See References section for details.

6
In reporting on progress towards the targets Council has revisited data sources listed above and sought updated figures. We have also engaged the Hunter Valley Research Foundation to conduct a second survey of residents, the 2012 HVRF Resident Survey2. For consistency and ease of graphic presentation, baseline data have been converted in most cases to percentages rather than mean scores. In the case of the HVRF Resident Survey results, the derived percentages exclude respondents who answered “don’t know” or “not applicable”. For this reason they may show as slightly different in some cases from the baseline data published in Waverley Together 2. However, the integrity of the data has been preserved and baselines have not been modified unless otherwise stated. Physical data, such as measures of environmental health, are also mostly represented as percentages.
Consistent colour coding has been used throughout the report to paint pictures of movement towards and away from sustainability. The key to symbols and colour coding is shown here. Note: References to “people” in the report mean “residents”. 1.3 Measurement methodology Just over 150 measures have been taken to quantify the progress towards or away from the 60 targets and 14 vision elements of Waverley Together 2. 51 of these targets are for community “outcomes” in their total quality of life. The remaining 9 targets are for Council “outputs”. It has been considered important to include measures of some Council outputs, even though this is a community plan, bearing in
2 The 2012 statically valid survey of Waverley residents was independently conducted by Hunter Valley Research Foundation. See References section for details.
2009/10 right direction ���� wrong direction
The format for reporting on results has been structured to show: � the direction of movement towards or away
from the vision and targets, and � the quantum of movement. Effectively a line has been drawn in the sand in 2009/10. Some baselines pre-date this year. Throughout the report graphical representation of movement towards or away from the vision and targets is shown as directional movements left and right of a central baseline. Where relevant, performance against absolute targets is also shown.
���� Movement away from sustainability
���� Movement towards sustainabiliy
� Delayed implementation
Predicted future movement towards sustainability
Key to symbols and colour coding
Waverley Together 2 End of Term Report
Target
Baseline data
Final data 2012
Final data not available for 2012
Predicted future movement away from sustainability

7
mind the community’s strong views on the centrality of Council’s contribution to their capacity to reach their vision. Relative movement from the baseline and absolute performance against targets have been measured: � either as an objective change in a physical target, such as tonnes of greenhouse
gas emitted, or � as a change in consensus about a subjective indicator of quality of life, such as
our sense of community. It is a basic premise of this measurement framework that residents’ feelings about quality of life are as vital and qualitative an indicator of progress as physical facts about the social economic, environmental and governance aspects of our lifestyle. Taken together the objective and subjective measures give the most accurate and holistic indication of quadruple bottom line or “QBL” sustainability. Measures used in the report have been dissected and aggregated in various combinations to paint pictures of both: � movement towards targets for and indicators of our vision for quality of life, and � movement towards or away from sustainability. This approach of dissection and aggregation of measures and targets has resulted in detailed pictures of diverse aspects of community wellbeing that that are instructive for policy and strategy development for the next version of Waverley Together, due to be adopted under legislation by June 2013.
60 targets and indicators
> 150 measures
Measures of consensus about quality of life
Physical measures of the environment, economy, social
capital and governance
Waverley Together 2Waverley Together 2Waverley Together 2Waverley Together 2Community indicators measurement systemCommunity indicators measurement systemCommunity indicators measurement systemCommunity indicators measurement systemMeasuring movement toward both sustainability
and our vision for quality of life

8
1.4 The outcome in summary
1. Did life get better while we were in office? In terms of the vision of Waverley Together 2, the general consensus of our community is that quality of life has improved on 11 out of 14 elements of the vision. The results of analysis of physical measures tend to confirm this perception as reliable in fact, with some qualifications as shown below:
The results show that there is some variance between our perceptions of movement towards our vision and actual progress on the last four of the 14 vision elements. For further detail on progress toward the vision, see Section 2.
VisionVisionVisionVisionPerception of
progress towards the vision
Progress taking into account perception
and physical measures
We are safe ���� ����We are reconciled with and value our indigenous past ���� ����
Connections within families and between generations can remain unbroken ���� ����Everyone is welcome to participate positively in community life ���� ����
We are inspired and able to renew our physical and spiritual wellbeing ���� ����We can express our essential selves through our traditions, our arts, our cultures, and
our lifestyles ���� ����
We act together as a compassionate society ���� ����The beauty of our beaches, cliffs and coastal lands endures ���� ����
The architectural landscape is cared for and developed at a human scale and design is sensitive to the natural, historical and social contexts ���� ����
Vital services are fully accessible ���� ����Scarce resources are conserved and fairly shared ���� ��������
Local economic prosperity provides opportunity for all ���� ��������As a local community we have the courage to take a leading place in achieving the
environmental aims of a global society ���� ��������
We are confident our leaders will reflect thoughtfully on our views and best interests when making decisions for our future ���� ��������
Perceived and actual progress Perceived and actual progress Perceived and actual progress Perceived and actual progress
Waverley Together 2 Vision Waverley Together 2 Vision Waverley Together 2 Vision Waverley Together 2 Vision
���� On balance, yes
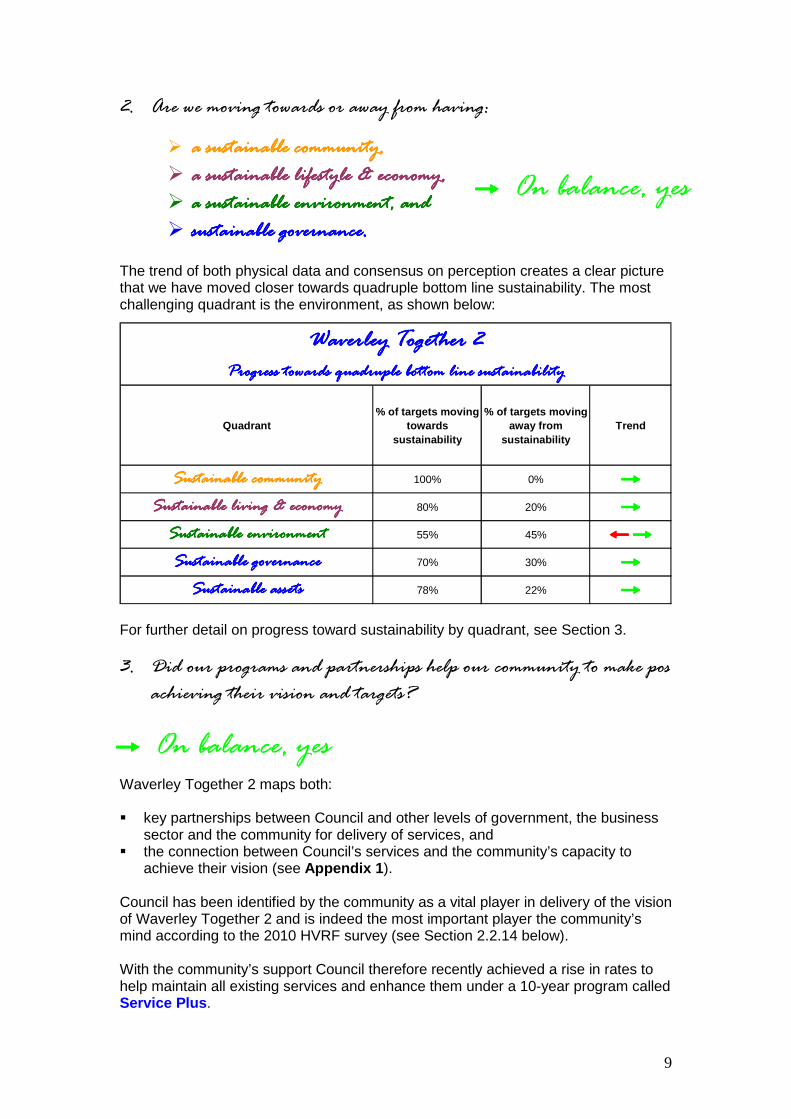
9
2. Are we moving towards or away from having:
� a sustainable community,a sustainable community,a sustainable community,a sustainable community, � a sustainable lifestyle a sustainable lifestyle a sustainable lifestyle a sustainable lifestyle & economy& economy& economy& economy, , , , � a sustainable environment, anda sustainable environment, anda sustainable environment, anda sustainable environment, and � sustainable governance.sustainable governance.sustainable governance.sustainable governance.
The trend of both physical data and consensus on perception creates a clear picture that we have moved closer towards quadruple bottom line sustainability. The most challenging quadrant is the environment, as shown below:
For further detail on progress toward sustainability by quadrant, see Section 3.
3. Did our programs and partnerships help our community to make positive progress towards achieving their vision and targets?
Waverley Together 2 maps both: � key partnerships between Council and other levels of government, the business
sector and the community for delivery of services, and � the connection between Council’s services and the community’s capacity to
achieve their vision (see Appendix 1 ). Council has been identified by the community as a vital player in delivery of the vision of Waverley Together 2 and is indeed the most important player the community’s mind according to the 2010 HVRF survey (see Section 2.2.14 below). With the community’s support Council therefore recently achieved a rise in rates to help maintain all existing services and enhance them under a 10-year program called Service Plus.
���� On balance, yes
���� On balance, yes
Quadrant% of targets moving
towards sustainability
% of targets moving away from
sustainabilityTrend
Sustainable communitySustainable communitySustainable communitySustainable community 100% 0% ����Sustainable living & economySustainable living & economySustainable living & economySustainable living & economy 80% 20% ����Sustainable environmentSustainable environmentSustainable environmentSustainable environment 55% 45% ��������Sustainable governanceSustainable governanceSustainable governanceSustainable governance 70% 30% ����
Sustainable assetsSustainable assetsSustainable assetsSustainable assets 78% 22% ����
Progress towards quadruple bottom line sustainabilityProgress towards quadruple bottom line sustainabilityProgress towards quadruple bottom line sustainabilityProgress towards quadruple bottom line sustainability
Waverley Together 2Waverley Together 2Waverley Together 2Waverley Together 2

10
The components of Service Plus are designed to help Council deliver priority activities in a set of Top 12 Focus Areas . The results of analysis of budgeted implementation of Service Plus in 2011/12 and 2012/13 show that more than half the enhancement items of Service Plus will have been commenced in the first two years of the 10 year program. Additionally, all existing services have been maintained as intended. This translates into strong performance in terms of the Top 12 Focus Areas as shown below.
Top 12 focus areasTop 12 focus areasTop 12 focus areasTop 12 focus areas ���� ���� ����1. Protecting and enjoying our beaches and coastal open spaces 88% 13% 0%
2. Staying connected as a community 90% 10% 0%
3. Living with urban density 91% 9% 0%
4. Welcoming visitors 100% 0% 0%
5. Fostering our cultural diversity 100% 0% 0%
6. Renewing our health and well being 100% 0% 0%
7. Sprucing up our streets and villages 75% 25% 0%
8. Harmonising new and old design 100% 0% 0%
9. Feeling and being safe 100% 0% 0%
10. Prospering through our economy 50% 50% 0%
11. Venturing into new and sustainable environmental futures 80% 20% 0%
12. Engaging everyone for far sighted and better decision making 80% 20% 0%
Total Activities 87% 13% 0%
Waverley Together 2Waverley Together 2Waverley Together 2Waverley Together 2Performance on Top 12 Focus Areas for Council
% of activities trending towards (green) or away (red) from sustainable implementation or delayed (orange)
Service Plus enhancements - Commencement ���� ���� ����Providing more opportunities for recreation, health and wellbeing 63% 38% 0%
Providing more opportunities for artistic and cultural expression 100% 0% 0%
Providing more and safer access to public places 29% 71% 0%
Providing more and safer access to transport 100% 0% 0%
Providing more and safer access to vital services 33% 67% 0%
Providing more cleaning and greening of all the spaces we share 50% 40% 10%
Providing more inviting streetscapes 25% 50% 25%
Providing more restful local neighbourhoods 100% 0% 0%Providing a more sustainable environment with increased protection from global warming
71% 29% 0%
Providing more preservation of natural resources and ecosystems 100% 0% 0%Partnering with a more engaged, connected and inspired community actively involved in decision making
88% 13% 0%
Total Activities 58% 39% 3%
Performance on commencement of Service Plus enhancements% of activities trending towards (green) or away (red) from sustainable implementation or
delayed (orange)
Waverley Together 2Waverley Together 2Waverley Together 2Waverley Together 2
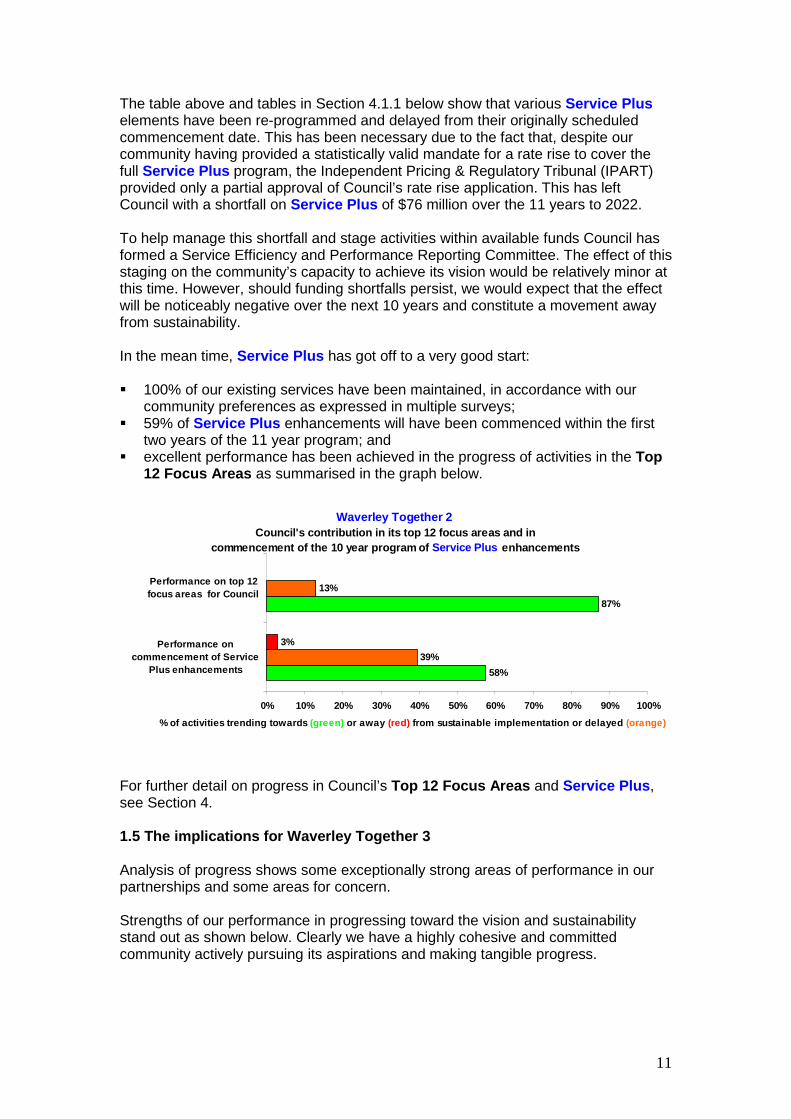
11
The table above and tables in Section 4.1.1 below show that various Service Plus elements have been re-programmed and delayed from their originally scheduled commencement date. This has been necessary due to the fact that, despite our community having provided a statistically valid mandate for a rate rise to cover the full Service Plus program, the Independent Pricing & Regulatory Tribunal (IPART) provided only a partial approval of Council’s rate rise application. This has left Council with a shortfall on Service Plus of $76 million over the 11 years to 2022. To help manage this shortfall and stage activities within available funds Council has formed a Service Efficiency and Performance Reporting Committee. The effect of this staging on the community’s capacity to achieve its vision would be relatively minor at this time. However, should funding shortfalls persist, we would expect that the effect will be noticeably negative over the next 10 years and constitute a movement away from sustainability. In the mean time, Service Plus has got off to a very good start: � 100% of our existing services have been maintained, in accordance with our
community preferences as expressed in multiple surveys; � 59% of Service Plus enhancements will have been commenced within the first
two years of the 11 year program; and � excellent performance has been achieved in the progress of activities in the Top
12 Focus Areas as summarised in the graph below.
For further detail on progress in Council’s Top 12 Focus Areas and Service Plus, see Section 4. 1.5 The implications for Waverley Together 3 Analysis of progress shows some exceptionally strong areas of performance in our partnerships and some areas for concern. Strengths of our performance in progressing toward the vision and sustainability stand out as shown below. Clearly we have a highly cohesive and committed community actively pursuing its aspirations and making tangible progress.
Waverley Together 2Council's contribution in its top 12 focus areas an d in
commencement of the 10 year program of Service Plus enhancements
58%
87%
39%
13%
3%
0% 10% 20% 30% 40% 50% 60% 70% 80% 90% 100%
Performance oncommencement of Service
Plus enhancements
Performance on top 12focus areas for Council
% of activities trending towards (green) or away (red) from sustainable implementation or delayed (orange)

12
Waverley Together 2Waverley Together 2Waverley Together 2Waverley Together 2 Strengths of our performance in achieving the visio n and sustainability
Vision Strengths We are safe � We feel safe, day and night, at the beaches and in
public facilities. � We have a low violent crime rate compared the rest
of NSW. We are reconciled with and value our indigenous past
� We have a good sense of community to build on in progressing towards reconciliation.
� We appreciate and enjoy diverse cultural and artistic expression.
Connections within families and between generations can remain unbroken
� We are happy that our community support groups and networks are growing.
� We strongly agree that living in Waverley gives us and our families excellent opportunities to achieve important life activities, relationships and fulfilment.
We are inspired and able to renew our physical and spiritual wellbeing
� We have great recreation and leisure opportunities. � Our sporting facilities are good and getting better
and meet most of our needs. � We can swim in clean waters. � Healthy lifestyle opportunities are available when we
want them. � Library services are fantastic. � Our coastal location is inspiring.
Everyone is welcome to participate positively in community life
� We know our neighbours. � We have good and fair opportunities to participate in
community life. � We have strong social cohesion and inclusive
attitudes. We can express our essential selves through our traditions, our arts, our cultures and our lifestyles
� We have good opportunities for cultural and artistic expression.
� We enjoy the urban vitality and good lifestyle quality in Waverley.
� We love our beachy culture. We act together as a compassionate society
� We live in a fair, harmonious, cohesive and inclusive society.
� We want to expand compassion in our society for the most vulnerable.
The beauty of our beaches, cliffs and coastal lands endures
� We strongly agree our coastal environment is retaining its beauty.
� Our beach facilities and parks are clean. � We respect the natural landscape. � We’re happy with pollution control. � We’re more satisfied with the removal of dumped
rubbish. The architectural landscape is cared for and developed at a human scale and design is sensitive to the natural, historical and social contexts
� Benefits of urban density in Waverley are good, although they are often outweighed by the disadvantages.
� The place is looking better in terms of preservation of architecture from graffiti.
� We’re more satisfied with Council’s building development and urban planning controls.

13
Waverley Together 2Waverley Together 2Waverley Together 2Waverley Together 2 Strengths of our performance in achieving the visio n and sustainability
Vision Strengths Vital services are fully accessible � Quality education is accessible.
� Hospital, medical and mental health services meet our needs.
� We are getting better opportunities to access affordable child care.
� We are more satisfied with all of Council’s services. Scarce resources are conserved and fairly shared
� Recycling, green waste and other household waste management services are well run.
Local economic prosperity provides opportunity for all
� In general we have a comparatively high level of socioeconomic advantage.
� We can find work close to home. � Our unemployment is low and dropping. � Retail and lifestyle service businesses are attracted
to commercial premises throughout Waverley. � Economic potential is being released by appropriate
planning. � We can share in the prosperity of our area.
As a local community we have the courage to take a leading place in achieving the environmental aims of a global society
� We value and respect the environment. � We are increasing use of renewable energy
sources. � We’re more satisfied with Council’s environmental
management, education and planning. We are confident our leaders will reflect thoughtfully on our views and best interests when making decisions for our future
� Our Council’s is showing quite a strong level of leadership in planning for a sustainable environment.
� More of us trust our Council. � When we call them for help, our Council’s staff are
willing to understand, knowledgeable and professional and handle our requests quite well.
� Our Council is providing services that we want and that are reasonably good value for money.
� We have good confidence in the fairness and efficiency of the justice system.
� We are reasonably optimistic that leaders and partners in government will be able to work together to deliver the vision for Waverley.
These are all great characteristics and results. In each area of the vision, however, we have residual aspirations and areas of concern that are not getting enough attention as shown below. It will be necessary to find ways to efficiently address these concerns in Waverley Together 3.

14
Waverley Together 2 Waverley Together 2 Waverley Together 2 Waverley Together 2 towards towards towards towards Waverley Together 3Waverley Together 3Waverley Together 3Waverley Together 3 Areas of concern in sustainability and development of policy and strategy
Vision Focus of concern We are safe � Safety in travel We are reconciled with and value our indigenous past
� Indigenous reconciliation and preservation of indigenous heritage
Connections within families and between generations can remain unbroken
� Housing affordability � Cost of living
We are inspired and able to renew our physical and spiritual wellbeing
� Access to healthy lifestyle opportunities by the disabled
� Low levels of active travel � Access to police services for those in stressed
personal wellbeing � Social exclusion � Unrestful or crowded lifestyles associated with high
density living Everyone is welcome to participate positively in community life
� Access and social inclusion opportunities for the disabled and for indigenous people
We can express our essential selves through our traditions, our arts, our cultures and our lifestyles
� Arts and entertainment facilities � Indigenous expression � Appreciation of local history and cultural
achievements We act together as a compassionate society
� Exclusion of those on the margins or in vulnerable circumstances
The beauty of our beaches, cliffs and coastal lands endures
� Streetscape appearance � Cleaning and greening � Dumped rubbish � Expected sea level rise � Increasing coastal erosion
The architectural landscape is cared for and developed at a human scale and design is sensitive to the natural, historical and social contexts
� Increasing density and population � Control of building activity � Congestion and amenity impacts associated with
density � Balance of benefits of high density living with
disadvantages Vital services are fully accessible � Access to services, shops and other facilities by the
disabled � Parking availability for the disabled � Misuse of the Mobility Parking Permit system � Access to disability support services � Access to child care services � Access to family support services
Scarce resources are conserved and fairly shared
� Excessive demand for and consumption of road and parking resources
� Unfair sharing of limited parking resources � Shortage of affordable housing � Waste conservation and resource recovery � Energy consumption � Water consumption
Local economic prosperity provides opportunity for all
� Capacity to realise the economic potential of newly adopted LEPs
� The narrowness of our services-based local economy

15
WWWWaverley Together 2 averley Together 2 averley Together 2 averley Together 2 towards towards towards towards Waverley Together 3Waverley Together 3Waverley Together 3Waverley Together 3 Areas of concern in sustainability and development of policy and strategy
Vision Focus of concern As a local community we have the courage to take a leading place in achieving the environmental aims of a global society
� Energy consumption � Water consumption � Modes of travel � Environmental leadership and partnerships
We are confident our leaders will reflect thoughtfully on our views and best interests when making decisions for our future
� Integrated planning within local government and between partners in government
� Industry structure for local government � Best practice governance by the Council � Community engagement � Incorporation of community views into development
of plans for reaching sustainability at the lowest long run cost
� Confidence in leadership across the different levels of government
Our capacity as a community to bridge the gap between the vision and current reality on these areas of concern is considered to be reasonably strong but is heavily dependent on: � the ability of all levels of government to sustain services and remain financially
viable, � the capacity of all levels of government to integrate their plans in the next decade
and lead with great and collegiate governance systems, and � the quality of engagement we develop to create productive partnerships between
government, business and the community. There is capacity to sustain services and renew assets to a standard that will deliver the desired levels of service – to a certain extent. Governments are healthy overall financially, although in the long term there is some vulnerability in parts of the Local Government sector. Waverley is one of the councils facing challenges in achieving financial sustainability over the longer term. However, we have excellent long term planning and community engagement processes in place and have the capacity in partnership with our community to overcome this issue. Increased investment in assets by all levels of government and some policy and strategy shifts will be required, along with excellent financial planning, investment performance and efficiency programming if we are to overcome these concerns. Section 5 provides some insights into how directions and strategies could be refined in Waverley Together 3 to assist our community to realise their vision and QBL sustainability by 2022. It also provides some insights into government sector reforms required to secure our contribution to the community’s vision. These too will need to be built into Waverley Together 3.
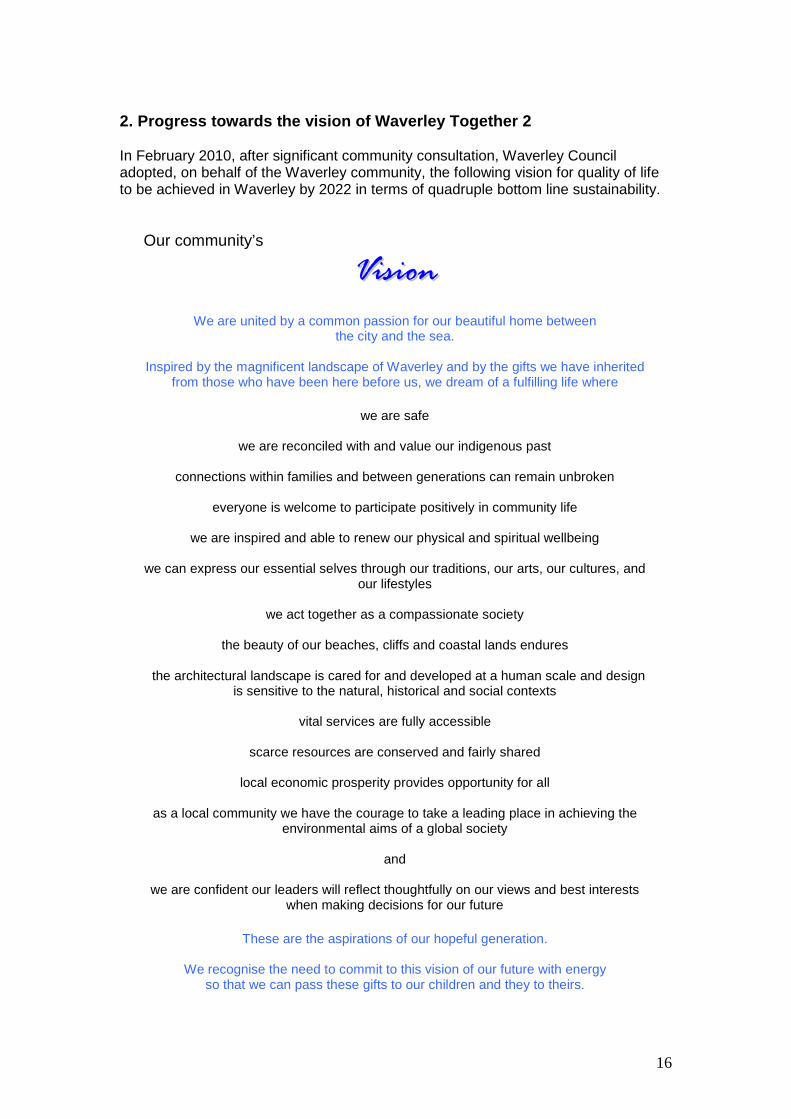
16
2. Progress towards the vision of Waverley Together 2 In February 2010, after significant community consultation, Waverley Council adopted, on behalf of the Waverley community, the following vision for quality of life to be achieved in Waverley by 2022 in terms of quadruple bottom line sustainability.
Our community’s
VViissiioonn
We are united by a common passion for our beautiful home between the city and the sea.
Inspired by the magnificent landscape of Waverley and by the gifts we have inherited
from those who have been here before us, we dream of a fulfilling life where
we are safe
we are reconciled with and value our indigenous past
connections within families and between generations can remain unbroken
everyone is welcome to participate positively in community life
we are inspired and able to renew our physical and spiritual wellbeing
we can express our essential selves through our traditions, our arts, our cultures, and our lifestyles
we act together as a compassionate society
the beauty of our beaches, cliffs and coastal lands endures
the architectural landscape is cared for and developed at a human scale and design
is sensitive to the natural, historical and social contexts
vital services are fully accessible
scarce resources are conserved and fairly shared
local economic prosperity provides opportunity for all
as a local community we have the courage to take a leading place in achieving the environmental aims of a global society
and
we are confident our leaders will reflect thoughtfully on our views and best interests
when making decisions for our future
These are the aspirations of our hopeful generation.
We recognise the need to commit to this vision of our future with energy so that we can pass these gifts to our children and they to theirs.

17
In late 2010, in association with community consultation about raising rates for services, Council engaged Hunter Valley Research Foundation to independently conduct a statistically valid community survey3 to, among other things, determine support for the above vision. The result was that almost 90% of the survey respondents supported the vision as a whole. In relation to the importance of the 14 individual elements of the vision the respondents gave them an average importance rating of 4.1 out of 5. In short, this vision is strongly supported by the Waverley community.
Waverley Together 2HVRF Community Survey 2010Importance of Vision elements
0.0 0.5 1.0 1.5 2.0 2.5 3.0 3.5 4.0 4.5 5.0
We are safe
Beauty of beaches
Vital services are accessible
Compassionate society
Architecture
Scrarce resources are shared
Welcoming positive participation
Economic opportunity for all
Confident in our leaders
Can express ourselves
Environmental leadership
Family connections
Inspired and renewed wellbeing
Indigenous reconciliation
Mean score
Perceptions of progress toward this vision have been monitored for this report via the 2012 HVRF Resident Survey. As stated above, progress on targets to meet the vision has also been calculated via a number of physical measures. Detailed results are as follows.
3 See References Section for details of the 2010 statically valid survey of Waverley residents by Hunter Valley Research Foundation.

18
2.1 Perceptions of progress towards the vision Residents generally rated quality of life in Waverley as having moved closer to the vision over the last three years. On all 14 elements of the vision the proportion of residents who said we had stayed the same or moved closer to the vision outweighed the proportion who felt we had moved away from the vision.
The most common response was that quality of life in Waverley has stayed the same over the last three years, or moved closer to the vision in terms of the enduring beauty of our beaches, cliffs and coastal lands, personal safety, participation in community life, and accessibility of services. This lines up with other data on physical measures for these items.
Have we moved closer to or further away from the vi sion of Waverley Together 2 ?
-40% -20% 0% 20% 40% 60% 80% 100%
We are confident our leaders will reflect thoughtfully on our views andbest interests when making decisions for our future
As a local community we have the courage to take a leading place inachieving the environmental aims of a global society
Local economic prosperity provides opportunity for all
Scarce resources are conserved and fairly shared
Vital services are fully accessible
The architectural landscape is cared for and developed at a human scale,and design is sensitive to the natural, historical and social contexts
The beauty of our beaches, cliffs and coastal lands endures
We act together as a compassionate society
We can express our essential selves through our traditions, our arts, ourcultures, and our lifestyles
Everyone is welcomed to participate positively in community life
We are inspired and able to renew our physical and spiritual wellbeing
Connections within families and between generations can remainunbroken
We are reconciled with and value our indigenous past
We are safe
% of community who feel we have moved further away from the vision
% of community who feel we have stayed the same
% of community who feel we have moved closer to the vision
Have we moved closer to or further away from the vi sion of Waverley Together 2 ?
-9%
51%
40%
-20% -10% 0% 10% 20% 30% 40% 50% 60%
% of community who feelwe have moved further
away from the vision
% of community who feelwe have stayed the same
% of community who feelwe have moved closer to
the vision

19
A clearer picture of the balance of opinion on each element is seen by simply considering those who feel an element of the vision has got worse against those who feel it has got better. This shows that on 11 of the 14 elements, the proportion of us who feel life has got better outweighs the proportion of us who don’t. However, on 3 of the elements the proportion of us who feel life has got worse outweighs those who feel it has got better. Those 3 elements are: � the architectural landscape is cared for and developed at a human scale and
design is sensitive to the natural, historical and social contexts; � local economic prosperity provides opportunity for all; and � we are confident our leaders will reflect thoughtfully on our views and best
interests when making decisions for our future.
These results only partly line up with other data in the report. That is, when all data are taken into account the reality is at odds with perceptions in the last four of the 14 vision elements as shown here. The following sections analyse this variation in detail.
Have we moved closer to or further away from the vi sion of Waverley Together 2 ?
-40% -20% 0% 20% 40% 60% 80%
We are confident our leaders will reflect thoughtfully on our views and bestinterests when making decisions for our future
As a local community we have the courage to take a leading place inachieving the environmental aims of a global society
Local economic prosperity provides opportunity for all
Scarce resources are conserved and fairly shared
Vital services are fully accessible
The architectural landscape is cared for and developed at a human scale,and design is sensitive to the natural, historical and social contexts
The beauty of our beaches, cliffs and coastal lands endures
We act together as a compassionate society
We can express our essential selves through our traditions, our arts, ourcultures, and our lifestyles
Everyone is welcomed to participate positively in community life
We are inspired and able to renew our physical and spiritual wellbeing
Connections within families and between generations can remain unbroken
We are reconciled with and value our indigenous past
We are safe
% of community who feel we have moved further away from the vision % of community who feel we have moved closer to the vision
Vision elements where data on percevied progress an d physical conditions don't align
Perception of progress towards
the vision
Progress taking into account perception
and physical measures
Scarce resources are conserved and fairly shared ���� ��������
Local economic prosperity provides opportunity for all ���� ��������As a local community we have the courage to take a leading place in achieving the
environmental aims of a global society ���� ��������We are confident our leaders will reflect thoughtfully on our views and best interests
when making decisions for our future ���� ��������
Waverley Together 2 Vision

20
2.2 Performance in approaching the vision Our community’s movement toward the quality of life we want is not uniform across the 14 elements of the vision. Details on movement towards sustainability are analysed below for each separate element of the vision as a guide to policy development for Waverley Together 3. 2.2.1 Vision element 1 Vision element: We are safe .
���� Overall our movement towards safety is going in the right direction. There is a consensus that we are feeling safer as a community. Crime and other data also indicate clearly that Waverley is quite a safe place to live, although safety in travel, particularly by cycling, is a concern.
Waverley Together 2 vision - We are safe
28%
84%
30%
66%
70%
66%
96%
69%
96%
57%
33%
84%
34%
76%
80%
85%
98%
17%
0%
12%
15%
14%
27%
3%
0% 10% 20% 30% 40% 50% 60% 70% 80% 90% 100%
The proportion of people who agree police services inWaverley are responsive and effective
The proportion of people who feel safe at Waverleybeaches
The proportion of people who feel that traffic systemsprovide for safe traffic flow
The proportion of people who are satisfied or verysatisfied with local traffic management.
Satisfaction rating with Council's control of buildingactivity.
The proportion of people who feel Waverley is a safearea for cyclists.
The proportion of people who feel Waverley is a safearea for pedestrians.
The proportion of people who feel safe at all timesusing public facilities.
The proportion of people who feel safe at night.
The proportion of people who feel safe during the day.
Baseline 2009 Final 2012 Movement towards/away from sustainability

21
In terms of physical measures of safety, the ratio of violent crime per head of population has worsened slightly compared to the ratio for NSW. However, overall this ratio for Waverley remains lower than the state average. Waverley is still quite a safe place in terms of violent crime. The ratio of property crime to population has improved but we are tracking at a higher property crime rate per head of poluation than NSW. Our ratios for crime in stealing from retail stores and persons are significantly higher than the NSW ratio, although they have improved markedly since 2008 when they were triple the ratios for NSW. Overall our safety appears to be most impacted by travel. Pedestrian and vehicle accidents have increased slightly compared to the base year. This would tend to verify the sense we have conveyed above about feeling less safe when cycling and in traffic than in other situations. There is a perception that safety in traffic has improved but the physical measures suggest there is still some way to go in achieving satisfactory levels of safety on the roads. Safety in the workplace at Council has also deteriorated slightly from the baseline year in terms of sheer numbers of lost time injuries. This trend obviously needs to be reversed.
Waverley Together 2 vision - We are safe
252
24
65
256
26
67
0 50 100 150 200 250 300
Vehicle accidents - averageannual numbers since 2005.
Pedestrian accidents - averageannual numbers since 2005.
No. of lost time workplaceinjuries for Waverley Council
workers - annual number in mostrecent year.
Baseline 2009 Final 2012
Waverley Together 2 vision - We are safe
-2%
-8%
-3%
-50% -30% -10% 10% 30% 50%
Vehicle accidents - averageannual numbers since 2005.
Pedestrian accidents - averageannual numbers since 2005.
No. of lost time workplaceinjuries for Waverley Councilworkers - annual number in
most recent year.
Movement towards/away from sustainability
Waverley Together 2 vision - We are safe
0.6
1.5
0.9
1.1
0.8
1.2
-28%
22%
-0.4 0.0 0.4 0.8 1.2 1.6
Ratio of violentcrime per 100,000
populationcompared to NSW
ratio
Ratio of propertycrime per 100,000
populationcompared the NSW
ratio
Baseline 2009 2010 Final 2011 Movement towards/away from sustainability

22
2.2.2 Vision element 2 Vision element: We are reconciled with and value our indigenous pas t.
���� Overall our movement towards reconciliation with and value of our indigenous past is going in the right direction.
The proportion of us who feel we have stayed the same or moved closer to indigenous reconciliation significantly outweighs the proportion of us who feel we have moved away from it. There has also been an improvement in the sense of community in Waverley, suggesting an increasingly inclusive society. And satisfaction with arts entertainment and cultural events and facilities has improved, implying that there are better opportunities for cultural cohesion involving both indigenous and multicultural groups. However, about half of the respondents in the 2012 HVRF Survey, when asked if they agreed that indigenous reconciliation and preservation of indigenous heritage is progressing, either didn’t know or were neutral, suggesting perhaps some continuing indigenous marginalisation. Data on these two aspects of indigenous inclusion constitute a good baseline for future monitoring of progress with reconciliation. This is an area for further policy consideration.
Waverley Together 2 visionWe are reconciled with and value our indigenous pas t
61%
44%
45%
69%
48%
57%
77%
65%
34%
37%
12%
10%
25%
0% 10% 20% 30% 40% 50% 60% 70% 80% 90%
The proportion of residents who agree that there is asense of community in Waverley.
The proportion of residents who agree they are satisfiedwith Council's arts, entertainment and cultural facilities.
The proportion of residents who agree they are satisfiedwith Council's arts, entertainment and cultural events.
Proportion of people who agree there is a good range ofopportunities for cultural and artistic activities and
expression
Proportion of people who agree the community in Waverleyis harmonious, cohesive and inclusive
Proportion of residents who agree that our indigenousheritage in Waverley is valued and being preserved.
Proportion of residents who agree that reconciliation withour indigenous population is progressing in Waverley.
Baseline 2009 Final 2012 Movement towards/away from sustainability
Waverley Together 2 visionWe are reconciled with and value our indigenous pas t
-12%
51%
37%
-20% -10% 0% 10% 20% 30% 40% 50% 60%
% of community whofeel we have moved
further away from thevision
% of community whofeel we have stayed the
same
% of community whofeel we have movedcloser to the vision

23
2.2.3 Vision element 3 Vision element: Connections within famil ies and between generations
can remain unbroken.
���� Overall our capacity to maintain connections within families and between generations is going in the right direction.
Waverley is an area with a high cost of living. This is a major influence on the capacity of families to ensure that they can continue to live in the area. Factors sufficing to assist successive generations to stay here include the good prospects for employment, the strong networks of community based support groups, clearly targeted and valued services for seniors and children, and the strong sense of community overall. Some challenges to maintenance of family connections obviously arise from affordability of housing, which is stressful for a significant majority (70%) of low and moderate income households. Additionally, the proportions of residents who feel they are able to afford reasonable standards of living and housing in Waverley are discouragingly low – both less than 50%. Family support services are considered to be accessible and adequate by 50% of people which may seem a poor score. However, 50% of respondents in the HVRF survey either didn’t know or were neutral on this item, suggesting that those who do need these services are able to access them and find them adequate.
Waverley Together 2 visionConnections within families and between generations can remain unbroken
70%
4%
34%
32%
45%
41%
39%
49%
61%
87%
50%
52%
49%
40%
70%
3%
49%
36%
57%
41%
52%
61%
69%
0%
14%
44%
12%
27%
0%
35%
26%
12%
-10% 0% 10% 20% 30% 40% 50% 60% 70% 80% 90% 100%
Proportion of residents who feel living in Waverley gives themand their family opportunities to achieve important life activities,
relationships and fulfilment
Proportion of residents who feel family support services areaccessible and adequte
Proportion of residents who feel the local economy provides awide range of work opportunities
Proportion of residents who feel the cost of living is affordable
Proportion of residents who feel able to afford a reasonablestandard of housing in Waverley
The proportion of low and moderate income households in theprivate rental market in Waverley that are in housing stress
(awaiting 2011 Census data)
Level of unemployment in Waverley
Proportion of residents who are satisfied that childcare servicesare adequate.
The proportion of residents who agree that facilities and servicesfor young people - 12 to 24 years - are satisfactory
The proportion of residents who agree that facilities and servicesfor children up to 11 years are satisfactory
The proportion of residents who agree that facilities and servicesfor people with a disability are satisfactory
The proportion of residents who agree that facilities and servicesfor older people are satisfactory
Proportion of residents satisfied that there is a good range ofcommunity groups and support networks.
The proportion of residents who agree that there is a sense ofcommunity in Waverley
Baseline 2009 Final 2012 Movement towards/away from sustainability
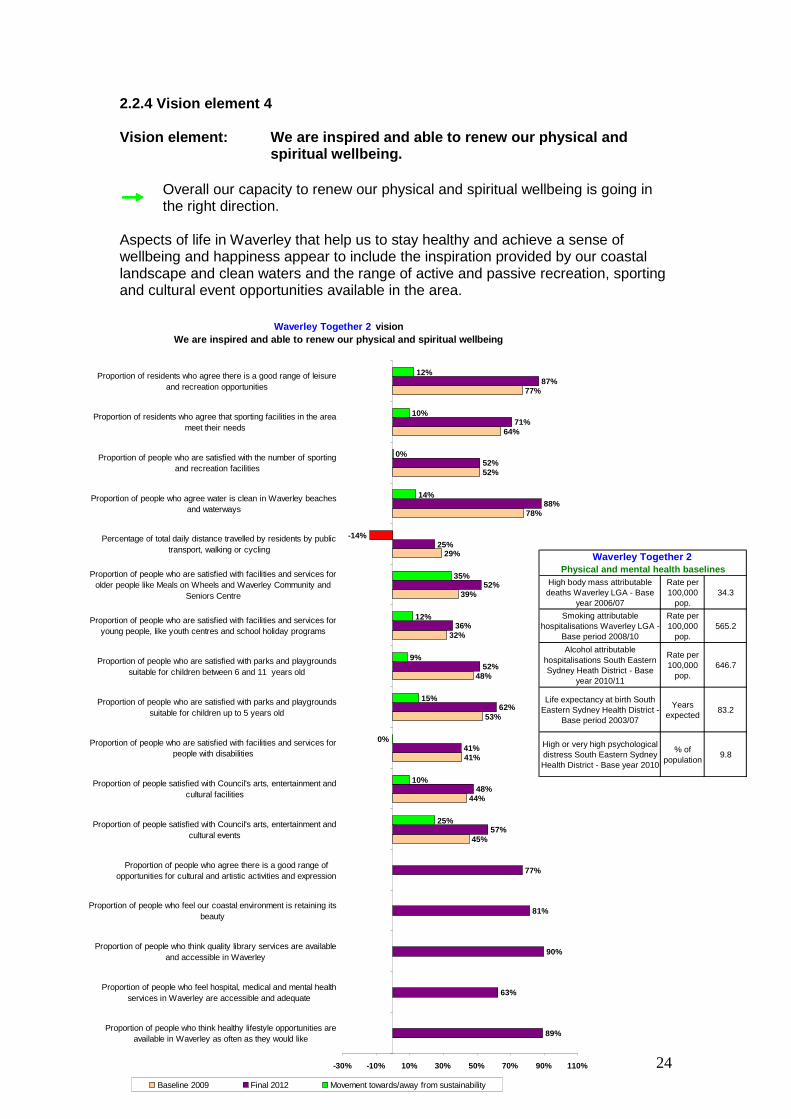
24
2.2.4 Vision element 4 Vision element: We are inspired and able to renew our physical and
spiritual wellbeing.
���� Overall our capacity to renew our physical and spiritual wellbeing is going in the right direction.
Aspects of life in Waverley that help us to stay healthy and achieve a sense of wellbeing and happiness appear to include the inspiration provided by our coastal landscape and clean waters and the range of active and passive recreation, sporting and cultural event opportunities available in the area.
Waverley Together 2 visionWe are inspired and able to renew our physical and spiritual wellbeing
45%
44%
41%
53%
48%
32%
39%
29%
78%
52%
64%
77%
89%
63%
90%
81%
77%
57%
48%
41%
62%
52%
36%
52%
25%
88%
52%
71%
87%
25%
10%
0%
15%
9%
12%
35%
-14%
14%
0%
10%
12%
-30% -10% 10% 30% 50% 70% 90% 110%
Proportion of people who think healthy lifestyle opportunities areavailable in Waverley as often as they would like
Proportion of people who feel hospital, medical and mental healthservices in Waverley are accessible and adequate
Proportion of people who think quality library services are availableand accessible in Waverley
Proportion of people who feel our coastal environment is retaining itsbeauty
Proportion of people who agree there is a good range ofopportunities for cultural and artistic activities and expression
Proportion of people satisfied with Council's arts, entertainment andcultural events
Proportion of people satisfied with Council's arts, entertainment andcultural facilities
Proportion of people who are satisfied with facilities and services forpeople with disabilities
Proportion of people who are satisfied with parks and playgroundssuitable for children up to 5 years old
Proportion of people who are satisfied with parks and playgroundssuitable for children between 6 and 11 years old
Proportion of people who are satisfied with facilities and services foryoung people, like youth centres and school holiday programs
Proportion of people who are satisfied with facilities and services forolder people like Meals on Wheels and Waverley Community and
Seniors Centre
Percentage of total daily distance travelled by residents by publictransport, walking or cycling
Proportion of people who agree water is clean in Waverley beachesand waterways
Proportion of people who are satisfied with the number of sportingand recreation facilities
Proportion of residents who agree that sporting facilities in the areameet their needs
Proportion of residents who agree there is a good range of leisureand recreation opportunities
Baseline 2009 Final 2012 Movement towards/away from sustainability
High body mass attributable deaths Waverley LGA - Base
year 2006/07
Rate per 100,000
pop.34.3
Smoking attributable hospitalisations Waverley LGA -
Base period 2008/10
Rate per 100,000
pop.565.2
Alcohol attributable hospitalisations South Eastern Sydney Heath District - Base
year 2010/11
Rate per 100,000
pop.646.7
Life expectancy at birth South Eastern Sydney Health District -
Base period 2003/07
Years expected
83.2
High or very high psychological distress South Eastern Sydney Health District - Base year 2010
% of population
9.8
Physical and mental health baselinesWaverley Together 2

25
In terms of our actual physical and mental health, we are in better health per 100,000 head of population than the average for NSW. However, there are still some areas of concern in our ability to maintain a healthy lifestyle, particularly for people with disabilities and young people. We also appear to be moving away from opportunities to engage in active travel. This would suggest that there is a need for: � service review and integrated planning to achieve more effective access to
government and community based services by people with disabilities; and � ongoing policy development, promotion and education in relation to active travel. 2.2.4.1 Personal wellbeing and community wellbeing in Waverley As part of the 2012 HVRF Resident Survey, Council has undertaken its first assessment of the personal wellbeing of Waverley residents. The reason for this study is that the measurement of personal wellbeing enables analysis of relationships between personal wellbeing and indicators of community wellbeing, such as employment status, self-rated poverty, health, relationship status, and the like. Understanding the relationship between personal wellbeing and community wellbeing in turn enables governments to fine tune policies that will make the most difference to the quality of people’s lives and overall happiness, especially for those with the lowest wellbeing. For instance, HVRF has conducted three waves of wellbeing studies in the Hunter Region. In each of these studies the same group of community indicators have been found to have significant relationships with personal wellbeing. In particular, being unemployed, perceiving themselves as poor or very poor, not satisfied with current accommodation, or not satisfied with neighbourhood, each significantly increased the odds of that person having a low wellbeing score. The HVRF Wellbeing Watch publications provide details of the rationale for the Index. The six dimensions of the Wellbeing Index are: � happiness with the overall circumstances of the respondent’s life in the past 4
weeks, � satisfaction with achievements, looking back on life, � overall, how valued they feel by others they know, � satisfaction with their current standard of living, � optimism about their future, and � satisfaction with life as a whole. The 2012 Waverley community survey included the HVRF Wellbeing Index questions, together with some related questions, on an experimental basis to explore similar relationships in Waverley, as potentially an additional and novel baseline for assessment of progress over time towards achievement of the community vision for quality of life by 2022. The additional questions addressed: � satisfaction with health, � satisfaction with personal relationships, and � feeling part of the community. Overall, based on results of the 2012 HVRF Resident Survey, personal wellbeing in Waverley appears to be slightly higher than average wellbeing across metropolitan NSW. The comparison group for these results excludes the Hunter and is dominated by the high proportion of the Sydney residents in the NSW population. This means it is effectively a comparison of Waverley residents’ views of their personal wellbeing compared to metropolitan Sydney residents.

26
The mean Wellbeing Scores of 4.1 for Waverley, and 4.03 for NSW excluding Hunter are both within the normal range for the HVRF Wellbeing Index, and suggest that overall wellbeing in Waverley in early 2012 was equal to or better than that for Sydney as a whole in mid-2009.
There were no significant differences in mean wellbeing score in Waverley by gender or length of residence. The youngest respondents (aged 16 to 24) had a significantly higher average wellbeing score than did those aged 25 to 49, although not significantly different from the average score for older respondents. This outcome was substantially affected by the significantly higher level of satisfaction among the youngest group with their standard of living. This is a likely reflection of the high proportion of respondents in this group who were living at home with family or in a property owned by family. Which community indicators affect personal wellbein g the most in Waverley? HVRF examined the relationship between personal wellbeing and community wellbeing in terms of the answers given by respondents in the survey on 16 different factors of community quality of life. The result was that those who reported the lowest personal wellbeing were statistically likely to have also disagreed that: � police service are responsive and effective, � high density benefits outweigh disadvantages, � there is a sense of community in Waverley, � they know their neighbours, � the cost of living is affordable, � the community is harmonious and cohesive, and � the community is supportive and compassionate. This implies that development of policies and services in the areas of urban living and management of the effects of density, affordability of housing and increasing community cohesion and inclusiveness would have some significant impact on quality of life for those with the lowest overall wellbeing in the community.
Wellbeing scores – Waverley (2012) and NSW (2009)

27
2.2.5 Vision element 5 Vision element: Everyone is welcome to participate positively in
community life.
���� Overall opportunity for positive participation in community life is going in the right direction. There is agreement that Waverley has a harmonious, inclusive and welcoming community.
Strengths in inclusiveness consist in the opportunities we have to enjoy leisure, sport, recreation and cultural activities together. Volunteering is also a strength with Waverley having a slightly higher proportion of volunteering (15.3%) than the Sydney average (14.8%), according to the ABS 2006 census. *Census data for 2011 are not yet available to update the 2006 baseline figure for volunteering. Creating access and social inclusion opportunities for the disabled and for indigenous people should continue as a priority for government agencies. Greater communication on the activities of government, particularly the Council, would also promote inclusiveness.
Waverley Together 2 visionEveryone is welcome to participate positively in co mmunity life
45%
77%
44%
45%
39%
41%
49%
77%
15%
61%
87%
47%
51%
37%
73%
65%
53%
87%
48%
57%
52%
41%
61%
83%
15%
69%
17%
12%
10%
25%
35%
0%
26%
8%
0%
12%
-10% 10% 30% 50% 70% 90% 110%
Proportion of people who agree that living in Waverley givesthem and their family opportunities to achieve important life
activities, relationships and fulfilment
Proportion of people who agree there is a good range ofmechanisms to become involved in decision making when
they wish
Proportion of people who agree Precinct committees givethem effective opportunities to raise issues of concern and to
influence decision makers
Proportion of residents who agree that reconciliation with ourindigenous population is progressing in Waverley
Proportion who agree people in Waverley have a fairopportunity to participate in community life
Proportion of people who agree the community in Waverley isharmonious, cohesive and inclusive
Proportion of people who are satisfied with being informedabout Council's activities
Proportion of people who agree there is a good range ofleisure and recreation opportunities
Proportion of people satisfied with Council's arts,entertainment and cultural facilities
Proportion of people satisfied with Council's arts,entertainment and cultural events
Proportion of people who are satisfied with facilities andservices for older people like Meals on Wheels and Waverley
Community and Seniors Centre
Proportion of people who are satisfied with facilities andservices for people with disabilities
Proportion of people who are satisfied that there is a goodrange of community groups and support networks
Proportion of people who say they know their neighbours
Proportion of people who volunteer to help in the community*
Proportion of people who agree that living in Waverley givesthem a sense of community
Baseline 2009 Final 2012 Movement towards/away from sustainability

28
2.2.6 Vision element 6 Vision element: We can express our essential selves through our
traditions, our arts, our cultures and our lifestyl es.
���� Overall our ability to express ourselves culturally, artistically and through our traditions and lifestyles is going in the right direction.
Clearly Waverley residents enjoy a vital lifestyle with capacity to define themselves through art and express the variety of their cultures and differences in an actively appreciative environment; and this is improving. Waverley also has a strong sporting culture and lifestyle as demonstrated particularly in things like commitment to the 100 year tradition of the surf life saving movement. These opportunities should be maintained through continued support of cultural and sporting facilities and events.
Waverley Together 2 visionWe can express ourselves through our traditions, ou r arts, our cultures and
our lifestyles
64%
77%
45%
39%
44%
45%
77%
87%
90%
73%
34%
71%
87%
57%
52%
48%
57%
10%
12%
27%
35%
10%
25%
0% 10% 20% 30% 40% 50% 60% 70% 80% 90% 100%
Proportion of people who agree there is a good range ofopportunities for cultural and artistic activities and expression
Proportion of residents who feel living in Waverley givesthem and their family opportunities to achieve important life
activities, relationships and fulfilment
Proportion of people who agree there is urban vitality and agood lifestyle quality in Waverley
Proportion who agree people in Waverley have a fairopportunity to participate in community life
Proportion of residents who agree that our indigenousheritage in Waverley is valued and being preserved.
Proportion of residents who agree that sporting facilities inthe area meet their needs
Proportion of residents who agree there is a good range ofleisure and recreation opportunities
Proportiion of people who are satisfied with facilities andservices for children, such as long day care, holiday
programs and the children's library
Proportion of people who are satisfied with facilities andservices for older people like Waverley Community and
Seniors Centre
Proportion of people satisfied with Council's arts,entertainment and cultural facilities
Proportion of residents satisfied with Council's arts,entertainment and cultural events.
Baseline 2009 Final 2012 Movement towards/away from sustainability

29
2.2.7 Vision element 7 Vision element: We act together as a compassionate society.
���� Overall our capacity and commitment to act together as a compassionate society going in the right direction.
The proportion of us who feel we have moved closer to our vision of acting together and compassionately, significantly outweighs the proportion who feel we have moved further away form this aspect of the vision. However, it would seem that only 47% of us feel the Waverley community is compassionate and supportive of the most vulnerable in society. Overall this implies that, while we’re moving in the right direction, we may still have some way to go to realise a compassionate and actively inclusive society for the most vulnerable. Data on inclusion of the most vulnerable in our society constitute a good baseline for future monitoring of our progress as a compassionate society. This is an area for further policy consideration.
Waverley Together 2 visionWe act together as a compassionate society
-16%
56%
28%
-30% -10% 10% 30% 50% 70%
% of community who feel we havemoved further away from the vision
% of community who feel we havestayed the same
% of community who feel we havemoved closer to the vision
Waverley Together 2 visionWe act together as a compassionate society
37%
49%
61%
15%
39%
50%
61%
69%
15%
37%
73%
65%
47%
8%
26%
12%
0%
0% 20% 40% 60% 80% 100%
Proportion of people who agree that Council adequatelyconsiders community concerns and views in making
decisions
Proportion of people who agree that family supportservices are accessible and adequate
Proportion of people who agree that there is a good rangeof community groups and support networks
Proportion of people who agree that there is a sense ofcommunity in Waverley
Proportion of people who volunteer to help in thecommunity*
Proportion of residents who agree that reconciliation withour indigenous population is progressing in Waverley
Proportion who agree that people in Waverley have fairopportunity to participate in community life
Proportion of people who agree the community inWaverley is harmonious, cohesive and inclusive
Proportion of people who agree that the Waverleycommunity is compassionate and supportive of the most
vulnerable in society
Baseline 2009 Final 2012 Movement towards/away from sustainability

30
2.2.8 Vision element 8 Vision elemen t: The beauty of our beaches, cliffs and coastal lands
endures.
���� The perception is that the beauty of our beaches, cliffs and coastal lands is enduring and we are moving in the right direction towards its protection.
On several measures Waverley is maintaining and improving its physical beauty. We clearly think the beaches, parks and streets are cleaner and looking better. However, less than half of us think management of the environment, particularly in terms of dumped rubbish and streetscape aesthetics is satisfactory. The place doesn’t yet look quite as good as we would like, but it’s getting there.
Waverley Together 2 visionThe beauty of our beaches, cliffs and coastal lands endures
64%
38%
57%
36%
56%
46%
49%
42%
64%
61%
67%
78%
79%
48%
72%
45%
64%
54%
52%
43%
74%
68%
73%
88%
81%
23%
25%
26%
27%
15%
17%
8%
4%
16%
11%
9%
14%
0% 10% 20% 30% 40% 50% 60% 70% 80% 90% 100%
Proportion of people who agree the natural environment isrespected
Proportion of people who are satisfied with environmentalmanagement and education
Proportion of people who agree pollution in Waverley isadequately controlled
Proportion of residents satisfied with the removal of dumpedrubbish
Proportion of residents who agree that littler is adequatelycontrolled
Proportion of people who are satisfied with kerb, gutter andstreet cleaning
Proportion of people who are satisfied with greening andtree maintenance
Proportion of people who are satisfied with maintenance ofthe streetscapes (street trees, public flower beds)
Proportion of people who are satisfied with cleanliness ofparks
Proportion of people who are satisfied with maintenance ofparks
Proportion of people who are satisfied with maintenance andcontrol of beaches and beach facilities
Proportion of people who agree that water is clean inWaverley beaches and waterways
Proportion of people who agree our coastal environment isretaining its beauty
Baseline 2009 Final 2012 Movement towards/away from sustainability

31
Beach water quality is staying steady and provides a good physical indicator that pollution from a variety of sources is being adequately controlled. Parks are also greener on a consistent basis due to recent installation of systems for retention and harvesting of stormwater and bore water in Bronte, Bondi, and various other reserves. Recent studies have shown, however, that the coastal environment, including our cliffs and seaside retaining walls, is under threat from climate change factors. This adds weight to the view that, regardless of perceptions and views on whether climate change is real, from a planning perspective precautionary steps should be taken to mitigate potential effects. A business as usual approach by government on this matter would not be in the interests of Waverley’s coastal assets.
In terms of protection of the ecology of the coastal landscape, baseline data for vegetation, and intertidal flora and fauna have been established since Waverley Together 2 was adopted. The next phase of monitoring against the baselines, due to commence in 2014 and 2015, should shed light on areas for attention in the next decade.
NSW Government Sea Level Policy - Expected sea level rise for NSW coast
40
90
0 20 40 60 80 100
Year 2050
Year 2100
Expected centimetres of sea level rise above 1990 mean sea levels
UNSW and DECC - Range of expected increase in 1 in 40-year rainfall events pa
-3%
12%
-5% 0% 5% 10% 15%
Lowestexpectedvariation
Highestexpectedvariation
Lowest expected variation Highest expected variation
Waverley Together 2 visionThe beauty of our beaches, cliffs and coastal
lands endures
68
46
10
6
68
46
10
6
0 20 40 60 80
No. of marine inter-tidal species(base year 1999)
No. of environmental weedinfestation (base year 2009/10)
No. of noxious weed infestation(base year 2009/10)
Hectares of native vegetation based on 2009/10 levels.
Baseline Final 2012
Waverley Together 2 Movement from baseline of 347 clean beach
days per annum
95%
100%
5%
-10% 10% 30% 50% 70% 90% 110%
Baseline
Final 2012
Movementtowards/away
from sustainability

32
2.2.9 Vision element 9 Vision element: The architectural landscape is cared for and develo ped at
a human scale and design is sensitive to the natura l, historical and social contexts.
���� Our perception is that architecture, design and urban density issues are improving in some respects but on balance the community is inclined to the view that we are moving in the wrong direction.
Waverley is the most densely populated LGA in Australia. Urban density and associated issues of high rise architecture, approvals of intensified development (with increased population density), congestion and the look and feel of buildings were of significant concern to the community when Waverley Together 2 was developed. They are still of concern now, in as much as the proportion of people who think we have moved away from sustainability on this factor slightly outweighs the proportion of people who think we have moved towards it.
The place is looking somewhat better in terms of defaced architecture (more of us are satisfied with graffiti removal). But otherwise less than half of us are tending to agree that urban aesthetics and increasing density are delivering the lifestyle we want. Only 51% of us agree that the benefits of living in a densely populated LGA offset the disadvantages and this prevails despite the significant advantages of a beachside location close to one of the world’s most magnificent cities. Traffic congestion and parking are of significant concern as effects of high density. Council’s and the state government’s influence on this factor is considerable and policy development in this area will be one of the biggest challenges.
Waverley Together 2 visionThe architectural landscape is cared for and
developed at a human scale and design is sensitive to the natural, historical and social contexts
-33%
37%
30%
-40% -30% -20% -10% 0% 10% 20% 30% 40% 50%
% of community whofeel we have movedfurther away from
the vision
% of community whofeel we have stayed
the same
% of community whofeel we have movedcloser to the vision
Waverley Together 2 visionThe architectural landscape is cared for and develo ped at a human scale and
design is sensitive to the natural, historical and social contexts
28%
37%
43%
40%
26%
28%
51%
90%
40%
57%
41%
36%
33%
39%
61%
50%
30%
31%
34%
39%
17%
8%
40%
25%
14%
13%
0% 20% 40% 60% 80% 100%
Proportion of people who agree that the benefits of the highdensity living in Waverley offset the disadvantages
Proportion of people who agree that there is urban vitalityand a good lifestyle quality in Waverley
Proportion of people who agree that state governmentplanning and leadership are contributing to a sustainable
environment in NSW
Proportion of people who agree that Waverley Council'splanning and leadership are contributing to a sustainable
environment in Waverley
Proportion of people who agree that decisions on planningand development are made through a sensible and fair
process
Proportion of people who agree that traffic systems providefor efficient traffic flow
Proportion of people who agree that local trafficmanagement is satisfactory
Proportion of people who agree that Waverley Counciladequately considers community concerns and views in
making decisions
Proportion of people who agree that graffiti is adequatelycontrolled.
Proportion of people who are satisfied with planning forshopping areas
Proportion of people who are satisfied with planning forresidential development
Proportion of people who are satisfied with control ofbuilding activity (overseeing the types of developments
happening in the area)
Proportion of people who agree that new commercialbuildings are helping to preserve an attractive urban
landscape and protect heritage
Proportion of people who agree that new residential buildingsare helping to preserve an attractive urban landscape and
protect heritage
Baseline 2009 Final 2012 Movement towards/away from sustainability

33
2.2.10 Vision element 10 Vision element: Vital services are fully accessible.
���� 38% of respondents in the 2012 HVRF survey felt that we had moved closer to the vision in terms of accessibility, and only 5% felt we had moved away from it. The balance of opinion is clearly that we are going in the right direction.
People tend to agree that they have reasonable access to quality education, health, policing, shopping and fairness through the justice system. Our ability to access vital services via public transport and active travel (walking and cycling) also seems to be satisfactory. However, we are clearly less satisfied with accessing services via private transport, i.e., by driving. Lack of on-street parking opportunities is seen as a major barrier to service access. Obviously, the physical difficulty of providing parking spaces close to vital services will continue as a major challenge until alternative forms of transport can free up spaces and increase on-street parking opportunities for those who need them most, including disabled and older people. Policies to equitably distribute access to what will always be a limited supply of on-street parking in both residential and commercial areas will be ongoing over the next 10 years, as will alternative transport options. Access to vital child care services is improving. However, as only about 50% of people agree that access to child care, disability services and family support services is satisfactory, it is clear we still have an undersupply of services in this area. Finding efficient ways of keeping pace with growing demand will be important for planners at all levels of government and in business.
Waverley Together 2 visionVital services are fully accessible
34%
39%
41%
20%
68%
66%
84%
63%
69%
90%
56%
61%
87%
49%
50%
63%
39%
52%
41%
34%
23%
73%
76%
44%
35%
0%
8%
15%
36%
-20% 0% 20% 40% 60% 80% 100%
Proportion of people who agree shops andservices in shopping areas meet residents'
needs
Proportion of people who say they haveconfidence in the fairness and efficiency of the
justice system
Proportion of people who agree police servicesin Waverley are responsive and effective
Proportion of people who agree that qualitylibrary services are available and accessible in
Waverley
Proportion of people who agree that qualitytertiary education is available and accessible in
Waverley
Proportion of people who agree that qualitysecondary education is available and accessible
in Waverley
Proportion of people who agree that qualityprimary education is available and accessible in
Waverley
Proportion of people who agree that childcareservices are adequate
Proportion of people who agree family supportservices are accessible and adequate
Proportion of people who agree hospital, medicaland mental health services in Waverley are
accessible and adequate
Proportion of people who are satisfied withmaintenance of public toilets
Proportion of people who are satisfied withfacilities and services for older people like Meals
on Wheels
Proportion of people who are satisfied withfacilities and services for people with disabilities
Proportion of people who agree that on-streetparking systems provide fair access to parking
Proportion of people satisfied with on-streetparking management (residential parking permits
and parking meters)
Proportion of people who agree that trafficsystems provide for efficient traffic flow
Proportion of people who agree public transportis adequate for their needs
Proportion of people who agree Waverley is asafe area for pedestrians
Baseline 2009 Final 2012 Movement towards/away from sustainability

34
2.2.11 Vision element 11 Vision element: Scarce resources are conserved and fairly shared.
�������� Overall the community is of the view that we are going in the right direction in terms of conserving and fairly sharing scarce resources. However, some physical data suggest that movement towards sustainability in this part of the vision is not uniformly positive.
The two big scarce resources in Waverley are an affordable home and a parking spot. Only 40% of Waverley residents feel they are able to afford a reasonable standard of housing in Waverley and according to the 2006 census, 70% of low and moderate income households in the private rental market are in housing stress. Government assistance in the form of public rental housing in Waverley is low compared to the rest of Sydney. Only 1.4% of people in Waverley live in rented government housing compared to 4.5% across Sydney (census 2006). With a portfolio of housing units provided over the years by developer contributions, Waverley Council contributes substantially to government resources in social and affordable housing. The portfolio is growing and is a significant contribution to maintenance of connections within families and between generations in Waverley. It is being managed and conserved with the assistance of an Affordable Housing Advisory Committee. The Committee will continue to foster policy development and portfolio conservation and expansion. With this in place we are at least moving closer to sustainability in housing. In terms of road space and parking resources, however, we are moving away from sustainability. Growth in vehicle ownership coupled with increasing population density is causing unsustainable competition for scarce road space both for travel and parking. Travel times are slowing and accessibility to services is declining. While the efficiency of the road and parking systems has been optimised by Council through a number of policy measures, the effectiveness of these strategies is being overwhelmed by a move away from use of public transport and active travel.
Waverley Together 2 visionScarce resources are conserved and fairly shared
Conservation and sharing of affordable housing reso urces
77
87
0 10 20 30 40 50 60 70 80 90 100
The number of units ofsocial and affordablehousing in Council’s
portfolio.
Baseline 2009 Final 2012
Waverley Together 2 visionScarce resources are conserved and fairly shared
Conservation and sharing of road and parking resour ces
11
10.6
0 2 4 6 8 10 12
Kilometres travelled perday by Waverley
residents per day byprivate car
Baseline 2009 Final 2012
Waverley Together 2 visionScarce resources are conserved and fairly shared
Conservation and sharing of road and parking resour ces
24%
-50%
-1%
-80% -60% -40% -20% 0% 20% 40%
Increase in motor cycles and scooters registered inWaverley
Increase in 4-wheel drive vehicles registered inWaverley
Increase in private passenger vehicles registered i nWaverley
Movement towards (green) / away (red) from sustainability
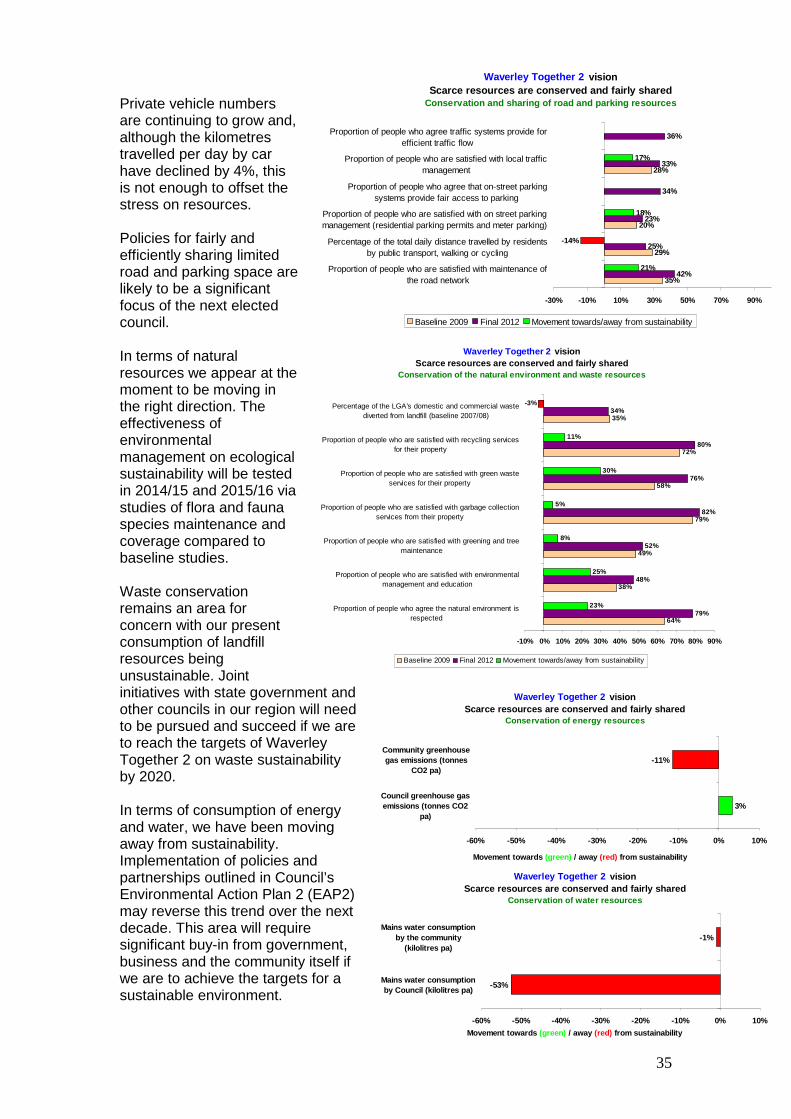
35
Private vehicle numbers are continuing to grow and, although the kilometres travelled per day by car have declined by 4%, this is not enough to offset the stress on resources. Policies for fairly and efficiently sharing limited road and parking space are likely to be a significant focus of the next elected council. In terms of natural resources we appear at the moment to be moving in the right direction. The effectiveness of environmental management on ecological sustainability will be tested in 2014/15 and 2015/16 via studies of flora and fauna species maintenance and coverage compared to baseline studies. Waste conservation remains an area for concern with our present consumption of landfill resources being unsustainable. Joint initiatives with state government and other councils in our region will need to be pursued and succeed if we are to reach the targets of Waverley Together 2 on waste sustainability by 2020. In terms of consumption of energy and water, we have been moving away from sustainability. Implementation of policies and partnerships outlined in Council’s Environmental Action Plan 2 (EAP2) may reverse this trend over the next decade. This area will require significant buy-in from government, business and the community itself if we are to achieve the targets for a sustainable environment.
Waverley Together 2 visionScarce resources are conserved and fairly shared
Conservation and sharing of road and parking resour ces
35%
29%
20%
28%
42%
25%
23%
34%
33%
36%
21%
-14%
18%
17%
-30% -10% 10% 30% 50% 70% 90%
Proportion of people who are satisfied with maintenance ofthe road network
Percentage of the total daily distance travelled by residentsby public transport, walking or cycling
Proportion of people who are satisfied with on street parkingmanagement (residential parking permits and meter parking)
Proportion of people who agree that on-street parkingsystems provide fair access to parking
Proportion of people who are satisfied with local trafficmanagement
Proportion of people who agree traffic systems provide forefficient traffic flow
Baseline 2009 Final 2012 Movement towards/away from sustainability
Waverley Together 2 visionScarce resources are conserved and fairly shared
Conservation of energy resources
3%
-11%
-60% -50% -40% -30% -20% -10% 0% 10%
Council greenhouse gasemissions (tonnes CO2
pa)
Community greenhousegas emissions (tonnes
CO2 pa)
Movement towards (green) / away (red) from sustainability
Waverley Together 2 visionScarce resources are conserved and fairly shared
Conservation of water resources
-53%
-1%
-60% -50% -40% -30% -20% -10% 0% 10%
Mains water consumptionby Council (kilolitres pa)
Mains water consumptionby the community
(kilolitres pa)
Movement towards (green) / away (red) from sustainability
Waverley Together 2 visionScarce resources are conserved and fairly shared
Conservation of the natural environment and waste r esources
64%
38%
49%
79%
58%
72%
35%
79%
48%
52%
82%
80%
34%
23%
25%
8%
5%
30%
11%
-3%
76%
-10% 0% 10% 20% 30% 40% 50% 60% 70% 80% 90%
Proportion of people who agree the natural environment isrespected
Proportion of people who are satisfied with environmentalmanagement and education
Proportion of people who are satisfied with greening and treemaintenance
Proportion of people who are satisfied with garbage collectionservices from their property
Proportion of people who are satisfied with green wasteservices for their property
Proportion of people who are satisfied with recycling servicesfor their property
Percentage of the LGA's domestic and commercial wastediverted from landfill (baseline 2007/08)
Baseline 2009 Final 2012 Movement towards/away from sustainability

36
2.2.12 Vision element 12 Vision element: Local economic prosperity provides opportunity for all.
�������� Based on survey results our community feels that when it comes to the economy and our opportunity to share in its benefits we are moving in the wrong direction. However, some vital indicators such as employment and business premises occupancy are going in the right direction.
Waverley is certainly an expensive place to live. Less than half of us seem to feel we can afford to live here and that we can afford a reasonable standard of housing. However, we are able to find work within and close to the local area. Almost 80% of us work with a 20-minute radius of Waverley by road.
And the proportion of us who are unemployed has dropped since 2009. At 3% it remains quite low compared to the national average of 5.2% (March 2012).
Until 2011 census data are available, we are unable to report on whether in terms of socioeconomic disadvantage we have dropped from our ranking of the 15th least disadvantaged LGA. However, in terms of employment we are clearly able to participate in the local economy; so a significant drop in rank is not expected.
Waverley Together 2 vision Local economic prosperity provides opportunity for all
Where do we find work?
In City of Sydney38%
In Waverley22%
In Other areas22%
In Botany Bay3%
In North Sydney4%
In Randwick5%
In Woollahra6%
Almost 80% of working Waverley residents work within a 20-minute drive from home
Index of Socioeconomic Disadvantage - Census 2006
876
922
927
945
955
962
966
967
972
973
987
993
1005
1006
1007
1012
1014
1022
1024
1027
1033
1045
1045
1045
1051
1054
1057
1077
1083
1084
1084
1099
1100
1100
1107
1108
1114
1117
1117
1122
1130
1143
Waverley, 1082
0 200 400 600 800 1000 1200
Fairfield
Auburn
Canterbury
Bankstown
Campbelltown
Botany Bay
Liverpool
Wyong
Holroyd
Blacktown
Parramatta
Rockdale
Burwood
Penrith
Marrickville
Gosford
Hurstville
Ashfield
Strathfield
Sydney
Hawkesbury
Wollondilly
Randwick
Kogarah
Blue Mountains
Ryde
Camden
Canada Bay
Waverley
Leichhardt
Sutherland Shire
Warringah
Hunter's Hill
Willoughby
Hornsby
Pittwater
Manly
North Sydney
Baulkham Hills
Lane Cove
Woollahra
Mosman
Ku-ring-gai
Waverley Together 2 visionLocal economic prosperity provides opportunity for all
Opportunities to share in prosperity
3.5%
40%
49%
52%
3%14%
0% 10% 20% 30% 40% 50% 60%
Proportion of people who agree they feelable to afford a reasonable standard of
housing in this area
Proportion of people who agree the costof living in Waverley is affordable for them
Proportion of people who agree the localeconomy provides a wide range of work
opportunities
Level of unemployment in the area
Baseline 2009 Final 2012 Movement towards/away from sustainability

37
In terms of future opportunities, only 57% of us agree that the area attracts and supports a variety of sustainable businesses. This may seem somewhat pessimistic but it is perhaps intuitively correct. Opportunities to participate in local economic wealth creation and share the benefits are highly available in Waverley but, compared to most LGAs, only in a reasonably narrow range. Waverley is a services sector economy and due to its land uses is unlikely to be anything else in the next century. The viability and diversity of the services sector will be a major factor in employment and wealth creation opportunities. Based on trends in occupancy of commercial premises, the services sector economy in Waverley appears quite robust. Our seaside location, openness to visitors and relatively high level of socioeconomic advantage are obvious attractors for investment by business. The services sector in Waverley has been flexible in responding to national trends of downturn in retail sales, particularly in clothing and footwear, by substituting it with increases in restaurants, cafes and personal services businesses in areas such as Bondi Beach village. The spread of land use zonings appears to have been flexible enough to allow Waverley’s services sector as a whole to remain buoyant despite the two speed economy that has emerged nationally. Waverley has recently adopted a new Local Environmental Plan (LEP) for Bondi Junction and is awaiting gazettal of our new consolidating LEP for the whole LGA. An active role by Council in helping us to realise the development potential of these LEPs will have a major influence on the ability of the local services sector to continue to provide opportunities for us to share in prosperity. Policy development for a creative economy, intensification of our economic planning capacity within Council, and active partnering with local businesses in such things as urban environmental investment (see Section 2.2.13) will be important.
Waverley Together 2 visionLocal economic prosperity provides opportunity for all
Business attractiveness and sustainabilityCommercial centres - premises occupancy rates
96%
100%
89%
97%
89%
90%
93%
91%
90%
94%
96%
97%
97%
94%
95%
95%
94%
95%
-2%
-4%
9%
0%
5%
5%
2%
4%
5%
-20% 0% 20% 40% 60% 80% 100% 120%
Rose Bay small villages - north and south
North Bondi neighbourhood centre
Bondi Road village
Charing Cross village
Campbell Pde, Bondi Beach
Gould Street, Bondi Beach
Hall Street, Bondi Beach
Bondi Beach commercial centre
Bondi Junction commercial centre
Movement towards/away from sustainabilityAverage occupancy since June 2009 baselineJune 2009 baseline occupancy
Waverley Together 2 visionLocal economic prosperity provides opportunity for all
Business attractiveness and sustainabilit y
84%
37%
57%
0% 10% 20% 30% 40% 50% 60% 70% 80% 90%
Proportion of people who agree shops andservices in shopping areas meet residents'
needs
Proportion of people who agree planning forlocal economic growth and development is
adequate
Proportion of people who agree theWaverley Council area attracts and
supports a variety of sustainable businesses
Baseline 2009 Final 2012 Movement towards/away from sustainability

38
2.2.13 Vision element 13 Vision element: As a local community we have the courage to take a
leading place in achieving the environmental aims o f a global society.
�������� Overall we feel we are moving towards environmental sustainability. However, on some significant aspects of environmental performance we are not yet moving in the right direction.
Environmental sustainability is an area of significant challenge for us. Our emphasis on the importance of the environment as an issue, and environmental management as a service, has dropped. In fact this is the only area where our sense of the importance of an issue and services has dropped to a statistically significant degree. In the 2012 HVRF survey, this shift in attitudes was common to respondents of all age groups, other than those aged under 25. Regrettably, the drop is consistent with research findings elsewhere in Australia and internationally that show the community has become less concerned about the impact of climate change on their daily lives. The change in our sense of urgency about the environment compared to 2009 would not seem to be warranted when contrasted against the variable physical performance on different aspects of environmental management. We are moving generally, albeit slowly, towards sustainability in domestic waste management (not commercial) and pollution control but away from it in most other respects. At the same time we do not seem to have confidence in our leaders on the environment, although it is pleasing to note that a clear majority of people (57%) agree Waverley Council is showing good planning and leadership for an environmentally sustainable Waverley. Opinions are less favourable on our state and federal governments’ leadership on the environment.
Waverley Together 2 vision for a sustainable environmentEnvironmental leadership, attitudes and commitment
38%
64%
95%
43%
40%
57%
48%
79%
91%
25%
23%
-5%
-20% 0% 20% 40% 60% 80% 100% 120%
Proportion of people who agree Federalgovernment planning & leadership are
contributing to a sustainable environment inAustralia
Proportion of people who agree Stategovernment planning and leadership are
contributing to a sustainable environment inNSW
Proportion of people who agree WaverleyCouncil planning and leadership are contributing
to a sustainable environment in Waverley
Proportion of residents satisfied with Council'senvironmental management and education
Proportion of people who agree the naturalenvironment is respected
Proportion of Waverley residents who agreeenvironmental management and education is an
important issue
Baseline 2009 Final 2012 Movement towards/away from sustainability
���� Community greenhouse gas emissions
���� Council greenhouse gas emissions
���� Electricity used in the LGA from renewable sources
���� Community water consumption
���� Council water consumption
���� Mode of travel
���� Waste minimisation and resource recovery
���� Pollution control
���� Environmental leadership, attitudes and commitment
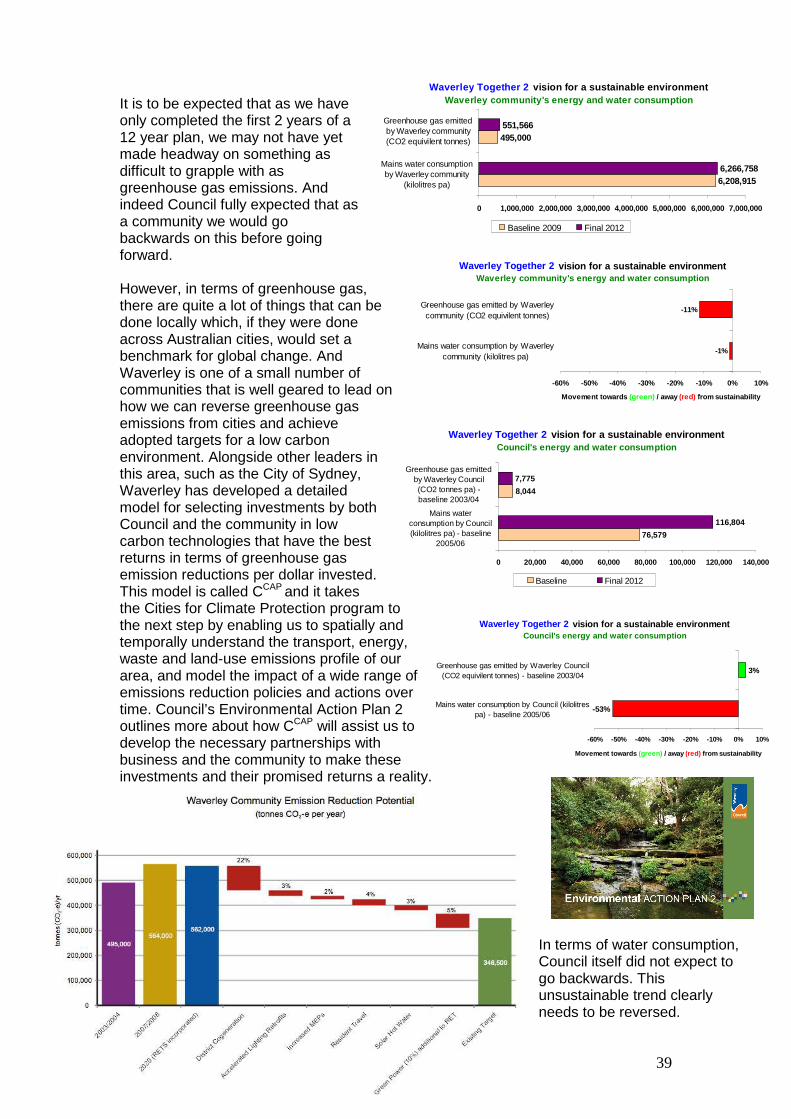
39
It is to be expected that as we have only completed the first 2 years of a 12 year plan, we may not have yet made headway on something as difficult to grapple with as greenhouse gas emissions. And indeed Council fully expected that as a community we would go backwards on this before going forward. However, in terms of greenhouse gas, there are quite a lot of things that can be done locally which, if they were done across Australian cities, would set a benchmark for global change. And Waverley is one of a small number of communities that is well geared to lead on how we can reverse greenhouse gas emissions from cities and achieve adopted targets for a low carbon environment. Alongside other leaders in this area, such as the City of Sydney, Waverley has developed a detailed model for selecting investments by both Council and the community in low carbon technologies that have the best returns in terms of greenhouse gas emission reductions per dollar invested. This model is called CCAP and it takes the Cities for Climate Protection program to the next step by enabling us to spatially and temporally understand the transport, energy, waste and land-use emissions profile of our area, and model the impact of a wide range of emissions reduction policies and actions over time. Council’s Environmental Action Plan 2 outlines more about how CCAP will assist us to develop the necessary partnerships with business and the community to make these investments and their promised returns a reality.
In terms of water consumption, Council itself did not expect to go backwards. This unsustainable trend clearly needs to be reversed.
Waverley Together 2 vision for a sustainable environmentWaverley community's energy and water consumption
6,208,915
495,000
6,266,758
551,566
0 1,000,000 2,000,000 3,000,000 4,000,000 5,000,000 6,000,000 7,000,000
Mains water consumptionby Waverley community
(kilolitres pa)
Greenhouse gas emittedby Waverley community(CO2 equivilent tonnes)
Baseline 2009 Final 2012
Waverley Together 2 vision for a sustainable environmentWaverley community's energy and water consumption
-1%
-11%
-60% -50% -40% -30% -20% -10% 0% 10%
Mains water consumption by Waverleycommunity (kilolitres pa)
Greenhouse gas emitted by Waverleycommunity (CO2 equivilent tonnes)
Movement towards (green) / away (red) from sustainability
Waverley Together 2 vision for a sustainable environmentCouncil's energy and water consumption
76,579
8,044
116,804
7,775
0 20,000 40,000 60,000 80,000 100,000 120,000 140,000
Mains waterconsumption by Council(kilolitres pa) - baseline
2005/06
Greenhouse gas emittedby Waverley Council(CO2 tonnes pa) -baseline 2003/04
Baseline Final 2012
Waverley Together 2 vision for a sustainable environmentCouncil's energy and water consumption
-53%
3%
-60% -50% -40% -30% -20% -10% 0% 10%
Mains water consumption by Council (kilolitrespa) - baseline 2005/06
Greenhouse gas emitted by Waverley Council(CO2 equivilent tonnes) - baseline 2003/04
Movement towards (green) / away (red) from sustainability
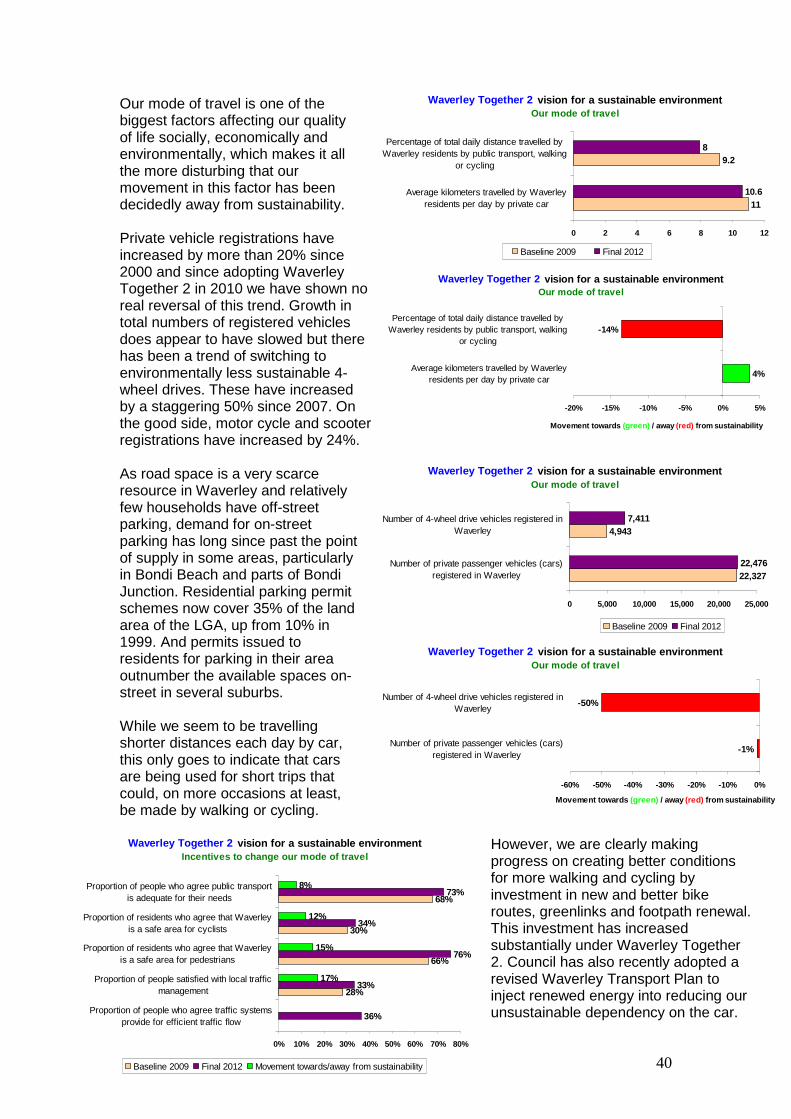
40
Our mode of travel is one of the biggest factors affecting our quality of life socially, economically and environmentally, which makes it all the more disturbing that our movement in this factor has been decidedly away from sustainability. Private vehicle registrations have increased by more than 20% since 2000 and since adopting Waverley Together 2 in 2010 we have shown no real reversal of this trend. Growth in total numbers of registered vehicles does appear to have slowed but there has been a trend of switching to environmentally less sustainable 4-wheel drives. These have increased by a staggering 50% since 2007. On the good side, motor cycle and scooter registrations have increased by 24%. As road space is a very scarce resource in Waverley and relatively few households have off-street parking, demand for on-street parking has long since past the point of supply in some areas, particularly in Bondi Beach and parts of Bondi Junction. Residential parking permit schemes now cover 35% of the land area of the LGA, up from 10% in 1999. And permits issued to residents for parking in their area outnumber the available spaces on-street in several suburbs. While we seem to be travelling shorter distances each day by car, this only goes to indicate that cars are being used for short trips that could, on more occasions at least, be made by walking or cycling.
However, we are clearly making progress on creating better conditions for more walking and cycling by investment in new and better bike routes, greenlinks and footpath renewal. This investment has increased substantially under Waverley Together 2. Council has also recently adopted a revised Waverley Transport Plan to inject renewed energy into reducing our unsustainable dependency on the car.
Waverley Together 2 vision for a sustainable environmentOur mode of travel
11
9.2
10.6
8
0 2 4 6 8 10 12
Average kilometers travelled by Waverleyresidents per day by private car
Percentage of total daily distance travelled byWaverley residents by public transport, walking
or cycling
Baseline 2009 Final 2012
Waverley Together 2 vision for a sustainable environmentOur mode of travel
4%
-14%
-20% -15% -10% -5% 0% 5%
Average kilometers travelled by Waverleyresidents per day by private car
Percentage of total daily distance travelled byWaverley residents by public transport, walking
or cycling
Movement towards (green) / away (red) from sustainability
Waverley Together 2 vision for a sustainable environmentOur mode of travel
22,327
4,943
22,476
7,411
0 5,000 10,000 15,000 20,000 25,000
Number of private passenger vehicles (cars)registered in Waverley
Number of 4-wheel drive vehicles registered inWaverley
Baseline 2009 Final 2012
Waverley Together 2 vision for a sustainable environmentOur mode of travel
-1%
-50%
-60% -50% -40% -30% -20% -10% 0%
Number of private passenger vehicles (cars)registered in Waverley
Number of 4-wheel drive vehicles registered inWaverley
Movement towards (green) / away (red) from sustainability
Waverley Together 2 vision for a sustainable environmentIncentives to change our mode of travel
28%
66%
30%
68%
36%
33%
76%
34%
73%
17%
15%
12%
8%
0% 10% 20% 30% 40% 50% 60% 70% 80%
Proportion of people who agree traffic systemsprovide for efficient traffic flow
Proportion of people satisfied with local trafficmanagement
Proportion of residents who agree that Waverleyis a safe area for pedestrians
Proportion of residents who agree that Waverleyis a safe area for cyclists
Proportion of people who agree public transportis adequate for their needs
Baseline 2009 Final 2012 Movement towards/away from sustainability

41
On pollution control it is clear we are doing well, both in terms of perception and physical evidence. But on waste minimisation we are showing mixed performance. Domestic waste volumes are growing only slowly and diversion of domestic waste from landfill is increasing, which is good. But in commercial waste, diversion rates are worsening.
The target for diversion of waste from landfill by 2020 is 75%. If we are to reach this target we will need to significantly improve the rate of recovery of recyclables, green waste and food waste from the domestic and commercial waste streams and be successful in implementation of current initiatives for processing and disposal. Waverley Council is currently participating with seven other SSROC councils in development of an Advanced Waste Treatment facility (AWT). Tenders for this facility are currently being assessed. The key to success in environmental sustainability is partnership and engagement. To this end Council has recently resolved to develop a map of potential community and business partnerships and a program for support and development of action plans that will assist us all to meet Waverley Together 2 environmental targets together. Waverley Together 3 needs to incorporate strategies for establishing the most effective partnerships for delivery.
Waverley Together 2 vision for a sustainable environmentPollution control
46%
56%
57%
78%
95%
81%
54%
64%
72%
88%
100%
17%
15%
26%
14%
5%
0% 20% 40% 60% 80% 100% 120%
Proportion of people who agree our coastalenvironment is retaining its beauty
Proportion of people who agree kerb, gutter andstreet cleaning
Proportion of people who agree litter isadequately controlled
Proportion of people who agree pollution inWaverley is adequately controlled
Proportion of people who agree water is clean inWaverley beaches and waterways
Clean beach days as rated by Beachwatch
Baseline 2009 Final 2012 Movement towards/away from sustainability
Waverley Together 2 vision for a sustainable environmentWaste minimisation and resource recovery
34,202
35,383
0 5,000 10,000 15,000 20,000 25,000 30,000 35,000 40,000
Tonnes of domestic andcommercial waste
generated compared to2007/08
Baseline 2007/08 Final 2012
Waverley Together 2 vision for a sustainable environmentWaste minimisation and resource recovery
72%
58%
35%
80%
76%
34%
11%
30%
-3%
-3%
-20% 0% 20% 40% 60% 80% 100%
Proportion of people who are satisfied withrecycling services for their property
Proportion of people who are satisfied with greenwaste services for their property
Percentage of LGA's domestic and commercialwaste diverted from landfill
Percentage change in tonnes of domestic andcommercial waste generated compared to
2004/05
Baseline 2009 Final 2012 Movement towards/away from sustainability
Waverley Together 2Progress towards sustainability in waste diverted f rom landfill
34%
75%
0% 10% 20% 30% 40% 50% 60% 70% 80% 90% 100%
75% of the LGA's domesticand commercial waste
diverted from landfill by 2020
Final 2010/11 Full extent of target
Waverley Together 2Change in waste generation and diversion
compared to 2007/08
-28%
-1%
8%
-4%
-40% -20% 0% 20%
Commercial waste diversionrate change
Total commercial waste volumechange
Domestic waste diversion ratechange
Total domestic waste volumechange
Movement towards (green) / away (red) from sustainability
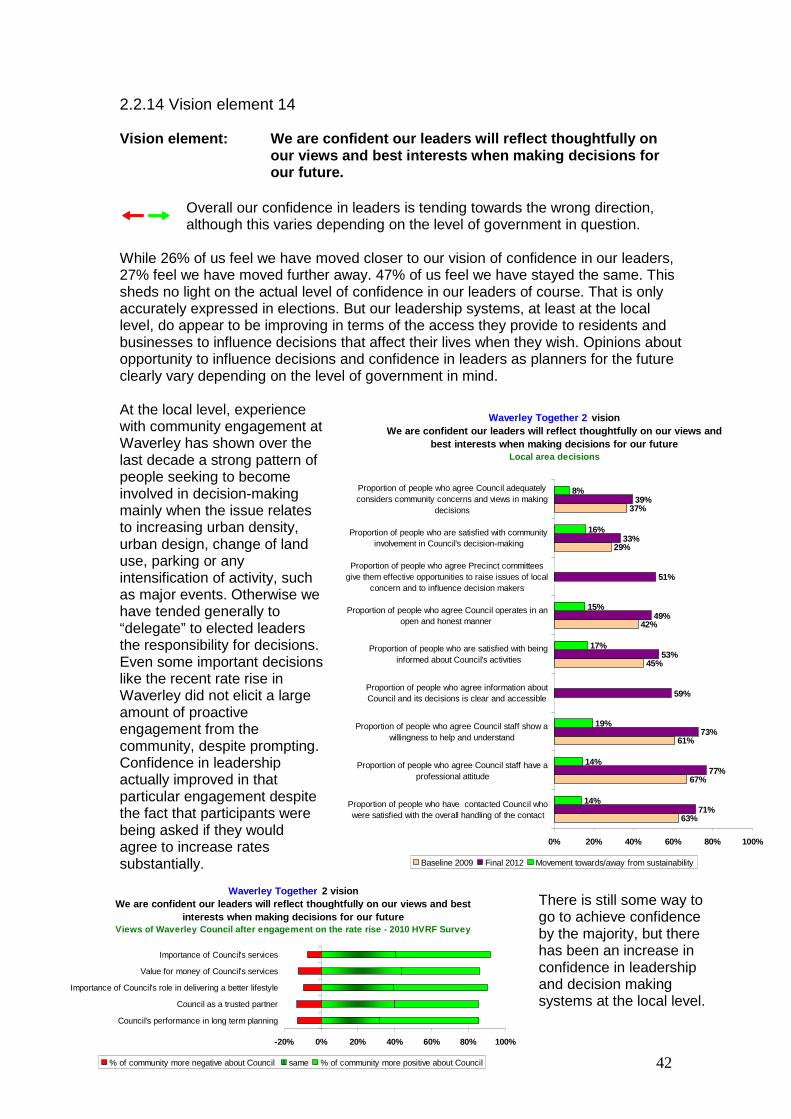
42
2.2.14 Vision element 14 Vision element: We are confident our leaders will reflect thoughtfu lly on
our views and best interests when making decisions for our future.
�������� Overall our confidence in leaders is tending towards the wrong direction, although this varies depending on the level of government in question.
While 26% of us feel we have moved closer to our vision of confidence in our leaders, 27% feel we have moved further away. 47% of us feel we have stayed the same. This sheds no light on the actual level of confidence in our leaders of course. That is only accurately expressed in elections. But our leadership systems, at least at the local level, do appear to be improving in terms of the access they provide to residents and businesses to influence decisions that affect their lives when they wish. Opinions about opportunity to influence decisions and confidence in leaders as planners for the future clearly vary depending on the level of government in mind. At the local level, experience with community engagement at Waverley has shown over the last decade a strong pattern of people seeking to become involved in decision-making mainly when the issue relates to increasing urban density, urban design, change of land use, parking or any intensification of activity, such as major events. Otherwise we have tended generally to “delegate” to elected leaders the responsibility for decisions. Even some important decisions like the recent rate rise in Waverley did not elicit a large amount of proactive engagement from the community, despite prompting. Confidence in leadership actually improved in that particular engagement despite the fact that participants were being asked if they would agree to increase rates substantially.
There is still some way to go to achieve confidence by the majority, but there has been an increase in confidence in leadership and decision making systems at the local level.
Waverley Together 2 visionWe are confident our leaders will reflect thoughtfu lly on our views and
best interests when making decisions for our futureLocal area decisions
63%
67%
61%
45%
42%
29%
37%
71%
77%
73%
59%
53%
49%
51%
33%
39%
14%
14%
19%
17%
15%
16%
8%
0% 20% 40% 60% 80% 100%
Proportion of people who have contacted Council whowere satisfied with the overall handling of the contact
Proportion of people who agree Council staff have aprofessional attitude
Proportion of people who agree Council staff show awillingness to help and understand
Proportion of people who agree information aboutCouncil and its decisions is clear and accessible
Proportion of people who are satisfied with beinginformed about Council's activities
Proportion of people who agree Council operates in anopen and honest manner
Proportion of people who agree Precinct committeesgive them effective opportunities to raise issues of local
concern and to influence decision makers
Proportion of people who are satisfied with communityinvolvement in Council's decision-making
Proportion of people who agree Council adequatelyconsiders community concerns and views in making
decisions
Baseline 2009 Final 2012 Movement towards/away from sustainability
Waverley Together 2 visionWe are confident our leaders will reflect thoughtfu lly on our views and best
interests when making decisions for our futureViews of Waverley Council after engagement on the r ate rise - 2010 HVRF Survey
-20% 0% 20% 40% 60% 80% 100%
Council's performance in long term planning
Council as a trusted partner
Importance of Council's role in delivering a better lifestyle
Value for money of Council's services
Importance of Council's services
% of community more negative about Council same % of community more positive about Council

43
In the 2010 HVRF survey for the rate rise, Council was rated by the community as the most important player in delivering our vision for quality of life under Waverley Together 2, over and above other levels of government, business and even the community itself. All our services are seen as highly relevant for this purpose (see section 4 below for results on importance of Council’s services in the 2012 HVRF Survey). Council’s leadership and culture is therefore a critical factor contributing to gains that might be made in quadruple bottom line sustainability. The governance systems and partnerships that we can foster to enhance our community’s capacity to deal with challenging local, regional, national and even global issues will be vital. Leadership on improved engagement with other levels of government, business and community groups, driven primarily by great Integrated Planning and Reporting (IP&R), should be a particular focus of the Council. This will help strategic partners understand the primacy of our Community’s Strategic Plans and integrate their own plans into ours to enhance our chances of reaching targets in Waverley Together 2. There is some way to go before a majority of our community register confidence across the board in leadership systems, quality and accountability. Data indicate that Council is leading the way in terms of QBL planning and environmental leadership and there is majority confidence that partners can work together to deliver the vision. Local government is also systematically re-structuring and developing as a sustainable sector under the State Government’s Destination 2036 Action Plan. This sets an optimistic outlook for partnerships and productivity increases for all levels of government. Council should ensure it takes a leading place in this reform program.
Waverley Together 2 visionWe are confident our leaders will reflect thoughtfu lly on our views
and best interests when making decisions for our fu tureImportance of leaders and partners in delivering th e vision
57%
68%
70%
79%
89%
0% 10% 20% 30% 40% 50% 60% 70% 80% 90% 100%
Federal Government
Local Business
State Government
Waverley Community
Waverley Council
Proportion who agree that the sector will be important in making the vision a reality
Waverley Together 2 visionWe are confident our leaders will reflect thoughtfu lly on our views and
best interests when making decisions for our futurePlanning and partnering for the future
49%
17%
58%
43%
40%
57%
37%
41%
63%
47%
0% 20% 40% 60% 80% 100%
Proportion of people who agree Council plans well tohelp secure the community's long term future
Proportion of people who are aware of the vision andCommunity Strategic Plan for Waverley Together
Proportion of people who agree leaders and partners ingovernment, business and the community will be able towork together to deliver the vision for Waverley (2010
HVRF Survey)
Proportion of people who agree Federal governmentplanning and leadership are contributing to a
sustainable environment in Australia and globally
Proportion of people who agree State governmentplanning and leadership are contributing to a
sustainable environment in NSW
Proportion of people who agree Waverley Council'splanning and leadership are contributing to a
sustainable environment in Waverley
Proportion of people who agree planning for localeconomic growth and development is adequate
Proportion of people who agree decisions on planningand development are made through a sensible and fair
process
Proportion of people who have confidence in thefairness and efficiency of the justice system
Proportion of people who agree there is a good range ofmechanisms and opportunities to become involved in
decision making when you wish
Final 2012

44
3. Progress towards the QBL targets of Waverley Together 2 Data on measures of movement towards sustainability can be organised to display not only movement towards the vision, but movement towards targets within the quadrants of sustainability in Waverley Together 2. In all cases the targets for the QBL have been set as the minimum necessary to achieve sustainability. However, in 38 out of the 60 targets the minimum is simply to maintain current performance and avoid moving backwards. By contrast, for the remaining 22 targets we have specified a required quantum of movement forward as the minimum necessary to achieve sustainability.
3.1 Overall progress towards QBL sustainability Results show that we are at least moving towards sustainability on 45 out of 60 targets, or 75%. In 57% of targets we have met sustainability. However, on the 22 targets where we have set a specified quantum of movement toward sustainability, we have not yet met the ultimate target. On only 2, or 9%, of the 22 targets where there is a specified required quantum of change have we actually reached the full extent of the target at this time. Nevertheless the trend is obviously and solidly towards QBL sustainability with the environment being the biggest quadrant of future challenge.
Measure change in consensus
Measure physical change
Subjective measure Objective measure Specified Not specified
Sustainable communitySustainable communitySustainable communitySustainable community 15 13 2 12 3 0 15
Sustainable living & economySustainable living & economySustainable living & economySustainable living & economy 15 15 0 10 5 3 12
Sustainable environmentSustainable environmentSustainable environmentSustainable environment 20 16 4 3 17 15 5
Sustainable governanceSustainable governanceSustainable governanceSustainable governance 10 7 3 7 3 4 6
Total 60 51 9 32 28 22 38
Required quantum of change
Waverley Together 2 - Composition of targets for QBL sustainabilityWaverley Together 2 - Composition of targets for QBL sustainabilityWaverley Together 2 - Composition of targets for QBL sustainabilityWaverley Together 2 - Composition of targets for QBL sustainability
QBL quadrantTotal targets /
indicatorsOutcomes
basedOutputs based
Quadrant% of targets moving
towards sustainability
% of targets moving away from
sustainabilityTrend
Sustainable communitySustainable communitySustainable communitySustainable community 100% 0% ����Sustainable living & economySustainable living & economySustainable living & economySustainable living & economy 80% 20% ����
Sustainable environmentSustainable environmentSustainable environmentSustainable environment 55% 45% ��������Sustainable governanceSustainable governanceSustainable governanceSustainable governance 70% 30% ����
Sustainable assetsSustainable assetsSustainable assetsSustainable assets 78% 22% ����
Progress towards quadruple bottom line sustainabilityProgress towards quadruple bottom line sustainabilityProgress towards quadruple bottom line sustainabilityProgress towards quadruple bottom line sustainability
Waverley Together 2Waverley Together 2Waverley Together 2Waverley Together 2
% of targets we are moving towards or
meeting
% of targets where we are
meeting sustainabiity
% of targets where a required quantum of
change is specified that are actually being met to their
full extent75% 57% 9%
Progress towards QBL sustainability
Waverley Together 2Waverley Together 2Waverley Together 2Waverley Together 2

45
Targets with a specified quantum of required change will obviously tend to be the most difficult. At this time, the gap between where we are now and where we need to be to achieve sustainability is reasonably large for 20 of the 22 targets where a quantum of required change is specified. On the good side we are moving in the right direction on 9 of the quantified targets. However, we have moved backwards on 13.
Of the quantified targets where we are moving in the wrong direction, clear strategies need to be followed to increase the prospects of realising the vision by 2022. Quite good and viable strategies are already in place for some of these, especially on the environment. We need to ensure they are adequately resourced in the next two terms of council.
Waverley Together 2Waverley Together 2Waverley Together 2Waverley Together 2 On which quantified targets are we moving in the wr ong direction?
No. of quantified targets moving in
the wrong direction
On which quantified targets are we moving in the wrong direction?
���� ����
Sustainable living & economy 3
� Vehicle and pedestrian accidents � Private passenger vehicles registered � 4-WD vehicles registered
Sustainable environment 8
� Community greenhouse gas emissions reduction targets
� Daily distance travelled by public transport, walking and cycling
� Total waste generated � Domestic and commercial waste diverted
from landfill � Community mains water consumption � Council mains water consumption � Community rating the environment as an
important issue
Sustainable governance 2
� Council staff lost time injuries � Staff satisfaction with Council’s progress
within the Business Excellence Framework
The following sections show progress towards sustainability in detail by quadrant.
� �9 13
Movement towards targets with a specified quantum of required change
Targets with a specified quantum of
change
Moving in right direction
We have met the full target
Moving in wrong direction
Sustainable communitySustainable communitySustainable communitySustainable community 0 NA NA 0
Sustainable living & economySustainable living & economySustainable living & economySustainable living & economy 3 0 0 3
Sustainable environmentSustainable environmentSustainable environmentSustainable environment 15 7 1 8
Sustainable governanceSustainable governanceSustainable governanceSustainable governance 4 2 1 2
Total 22 9 2 13
Waverley Together 2 - Movement towards targets with a specified quantum of required changeWaverley Together 2 - Movement towards targets with a specified quantum of required changeWaverley Together 2 - Movement towards targets with a specified quantum of required changeWaverley Together 2 - Movement towards targets with a specified quantum of required change
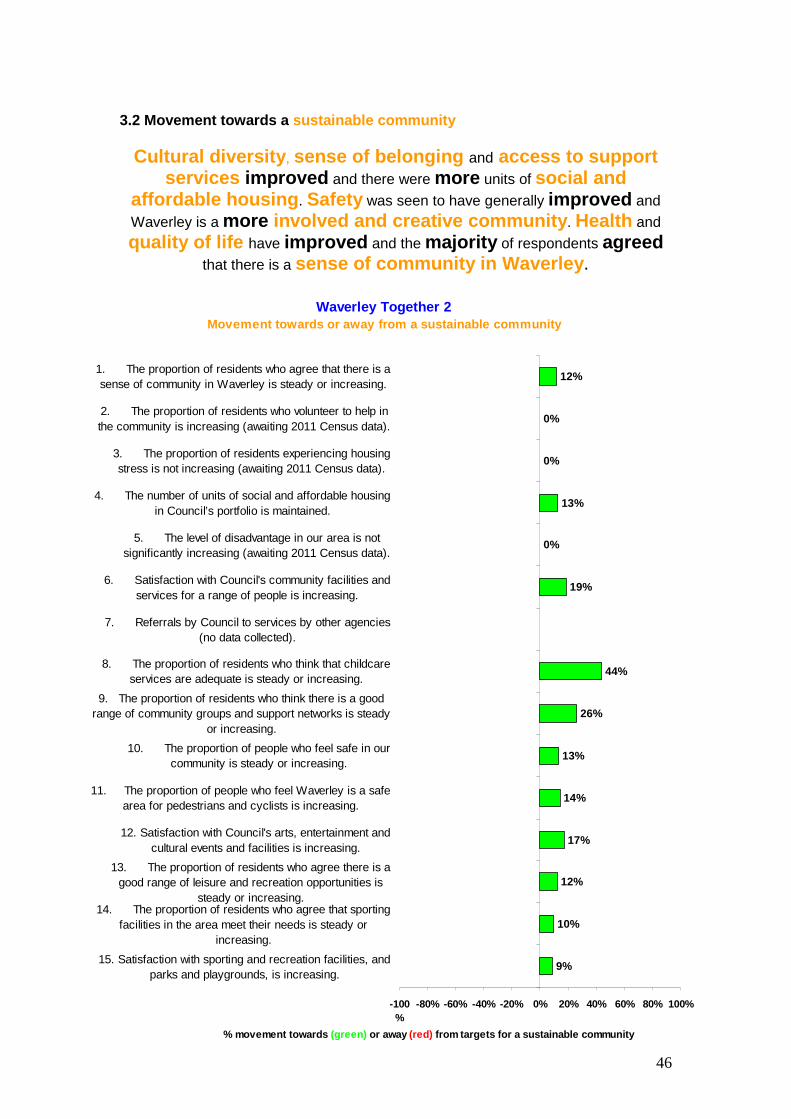
46
3.2 Movement towards a sustainable community
Cultural diversity , sense of belonging and access to support services improved and there were more units of social and
affordable housing . Safety was seen to have generally improved and
Waverley is a more involved and creative community . Health and
quality of life have improved and the majority of respondents agreed
that there is a sense of community in Waverley .
Waverley Together 2Movement towards or away from a sustainable communi ty
9%
10%
12%
17%
14%
13%
26%
44%
19%
0%
13%
0%
0%
12%
-100%
-80% -60% -40% -20% 0% 20% 40% 60% 80% 100%
15. Satisfaction with sporting and recreation facilities, andparks and playgrounds, is increasing.
14. The proportion of residents who agree that sportingfacilities in the area meet their needs is steady or
increasing.
13. The proportion of residents who agree there is agood range of leisure and recreation opportunities is
steady or increasing.
12. Satisfaction with Council's arts, entertainment andcultural events and facilities is increasing.
11. The proportion of people who feel Waverley is a safearea for pedestrians and cyclists is increasing.
10. The proportion of people who feel safe in ourcommunity is steady or increasing.
9. The proportion of residents who think there is a goodrange of community groups and support networks is steady
or increasing.
8. The proportion of residents who think that childcareservices are adequate is steady or increasing.
7. Referrals by Council to services by other agencies(no data collected).
6. Satisfaction with Council's community facilities andservices for a range of people is increasing.
5. The level of disadvantage in our area is notsignificantly increasing (awaiting 2011 Census data).
4. The number of units of social and affordable housingin Council’s portfolio is maintained.
3. The proportion of residents experiencing housingstress is not increasing (awaiting 2011 Census data).
2. The proportion of residents who volunteer to help inthe community is increasing (awaiting 2011 Census data).
1. The proportion of residents who agree that there is asense of community in Waverley is steady or increasing.
% movement towards (green) or away (red) from targets for a sustainable community

47
3.3 Movement towards sustainable living Waverley is a better place to live and do business . The local economy is
doing well . Employment is high . The place looks better and has a
stronger sense of identity . Pedestrians feel safe but cyclists feel unsafe . Satisfaction with public transport has improved but
traffic and parking satisfaction remain low . Overall the movement has been
towards sustainability .
Waverley Together 2Movement towards or away from sustainable living
18%
8%
12%
15%
-50%
-1%
17%
-2%
19%
40%
15%
27%
11%
2%
14%
-100% -50% 0% 50% 100%
30. Satisfaction with on-street parking management issteady or increasing.
29. Proportion of residents who think that publictransport is adequate for their needs is increasing.
28. Proportion of residents who view Waverley as a safearea for cyclists is increasing.
27. Proportion of residents who view Waverley as asafe area for pedestrians is steady or increasing.
26. 4-wheel drive vehicles registered in Waverley declinesby 5% by 2020 based on 2007 numbers.
25. The number of private passenger vehicles (cars)registered in Waverley is stabilised by 2020 at 2007 levels.
24. Satisfaction with local traffic management isincreasing.
23. The number of vehicle accidents and pedestrianaccidents per annum is equal to or less than the number in
2005 (2010 data).
22. Satisfaction with Council's building development,planning and controls is increasing.
21. The proportion of residents who think that graffiti isadequately controlled is steady or increasing.
20. The proportion of residents who think that litter isadequately controlled is steady or increasing.
19. Satisfaction with the removal of dumped rubbish isincreasing.
18. Satisfaction with the look of public places is steadyor increasing.
17. The level of business activity in each of our commercialcentres and villages is minimum of 85% (average
occupancy of commercial premises since base year).
16. The level of unemployment in our area remains low.
% movement towards (green) or away (red) from targets for a sustainable community
Waverley Together 2Performance against targets for
sustainable living
93%
95%
85%
0% 50% 100%
17. The level of businessactivity in each of our
commercial centres andvillages is minimum of 85%
(average occupancy ofcommercial premises since
base year).
Baseline Final 2012 Full extent of target
Waverley Together 2Performance against targets for
sustainable living
4,943
7,411
4696
0 2,000 4,000 6,000 8,000
26. 4-wheel drive vehiclesregistered in Waverley
declines by 5% by 2020based on 2007 numbers.
Baseline Final 2012 Full extent of target
���� Moving away from sustainability
Waverley Together 2 - key alertsIncreasing 4WD vehicle registrations
���� Exceeding target for sustainabiliy
Waverley Together 2 - key alertsCommecial space occupancy rates
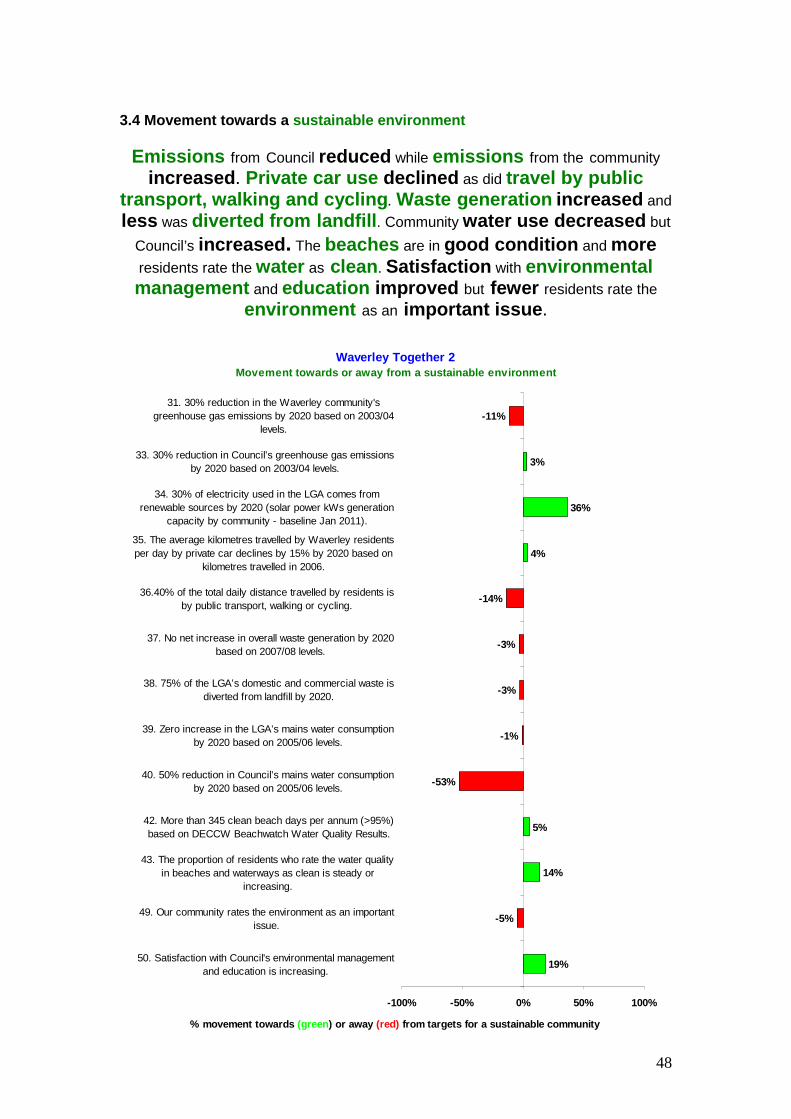
48
3.4 Movement towards a sustainable environment
Emissions from Council reduced while emissions from the community
increased . Private car use declined as did travel by public transport, walking and cycling . Waste generation increased and
less was diverted from landfill . Community water use decreased but
Council’s increased . The beaches are in good condition and more
residents rate the water as clean . Satisfaction with environmental management and education improved but fewer residents rate the
environment as an important issue .
Waverley Together 2Movement towards or away from a sustainable environ ment
19%
-5%
14%
5%
-53%
-1%
-3%
-3%
-14%
4%
36%
3%
-11%
-100% -50% 0% 50% 100%
50. Satisfaction with Council's environmental managementand education is increasing.
49. Our community rates the environment as an importantissue.
43. The proportion of residents who rate the water qualityin beaches and waterways as clean is steady or
increasing.
42. More than 345 clean beach days per annum (>95%)based on DECCW Beachwatch Water Quality Results.
40. 50% reduction in Council’s mains water consumptionby 2020 based on 2005/06 levels.
39. Zero increase in the LGA’s mains water consumptionby 2020 based on 2005/06 levels.
38. 75% of the LGA’s domestic and commercial waste isdiverted from landfill by 2020.
37. No net increase in overall waste generation by 2020based on 2007/08 levels.
36.40% of the total daily distance travelled by residents isby public transport, walking or cycling.
35. The average kilometres travelled by Waverley residentsper day by private car declines by 15% by 2020 based on
kilometres travelled in 2006.
34. 30% of electricity used in the LGA comes fromrenewable sources by 2020 (solar power kWs generation
capacity by community - baseline Jan 2011).
33. 30% reduction in Council’s greenhouse gas emissionsby 2020 based on 2003/04 levels.
31. 30% reduction in the Waverley community'sgreenhouse gas emissions by 2020 based on 2003/04
levels.
% movement towards (green ) or away (red) from targets for a sustainable community
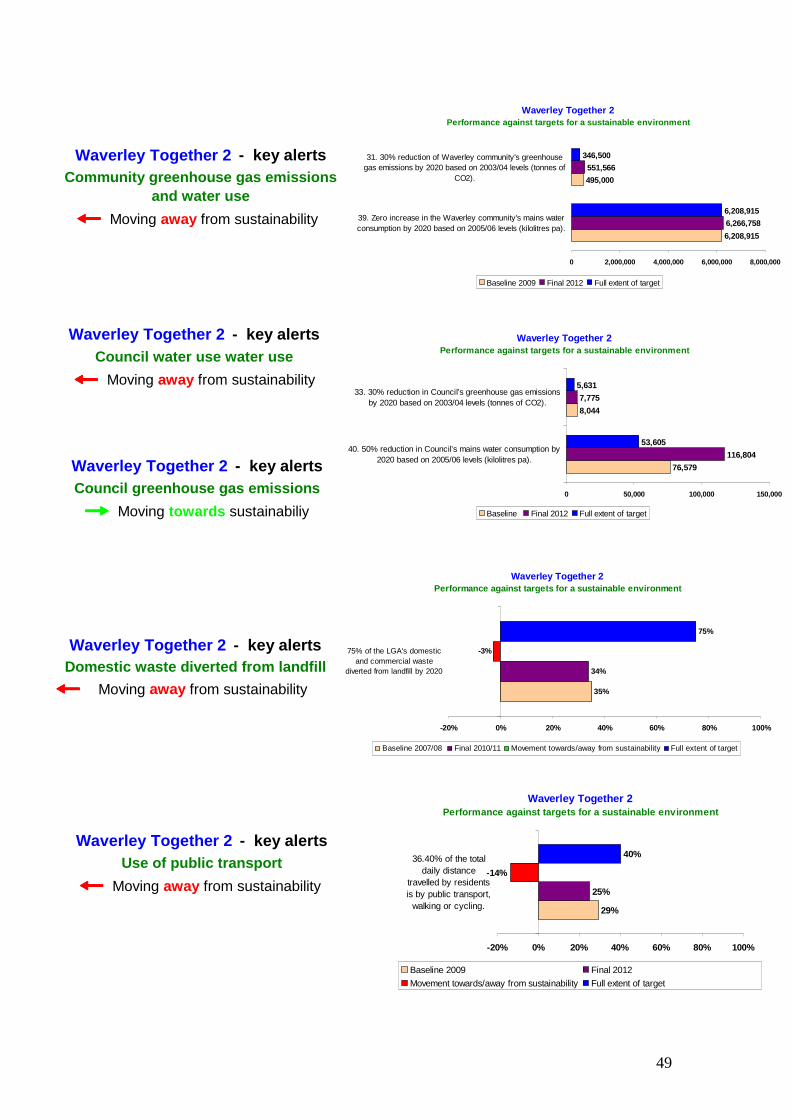
49
Waverley Together 2Performance against targets for a sustainable envir onment
6,208,915
495,000
551,566
6,208,915
346,500
6,266,758
0 2,000,000 4,000,000 6,000,000 8,000,000
39. Zero increase in the Waverley community's mains waterconsumption by 2020 based on 2005/06 levels (kilolitres pa).
31. 30% reduction of Waverley community's greenhousegas emissions by 2020 based on 2003/04 levels (tonnes of
CO2).
Baseline 2009 Final 2012 Full extent of target
Waverley Together 2Performance against targets for a sustainable envir onment
76,579
8,044
116,804
7,775
53,605
5,631
0 50,000 100,000 150,000
40. 50% reduction in Council’s mains water consumption by2020 based on 2005/06 levels (kilolitres pa).
33. 30% reduction in Council’s greenhouse gas emissionsby 2020 based on 2003/04 levels (tonnes of CO2).
Baseline Final 2012 Full extent of target���� Moving towards sustainabiliy
Waverley Together 2 - key alertsCouncil greenhouse gas emissions
���� Moving away from sustainability
Waverley Together 2 - key alertsCouncil water use water use
���� Moving away from sustainability
Waverley Together 2 - key alertsCommunity greenhouse gas emissions
and water use
Waverley Together 2Performance against targets for a sustainable envir onment
29%
25%
-14%
40%
-20% 0% 20% 40% 60% 80% 100%
36.40% of the totaldaily distance
travelled by residentsis by public transport,
walking or cycling.
Baseline 2009 Final 2012
Movement towards/away from sustainability Full extent of target
���� Moving away from sustainability
Waverley Together 2 - key alertsUse of public transport
Waverley Together 2Performance against targets for a sustainable envir onment
35%
34%
-3%
75%
-20% 0% 20% 40% 60% 80% 100%
75% of the LGA's domesticand commercial waste
diverted from landfill by 2020
Baseline 2007/08 Final 2010/11 Movement towards/away from sustainability Full extent of target
���� Moving away from sustainability
Waverley Together 2 - key alertsDomestic waste diverted from landfill

50
3.5 Movement towards sustainable governance
Satisfaction with asset maintenance increased , as did
customer service and information about Council activities. More people
believe they can have a say and that Council acts openly and honestly .
Council was declared financially sound . However, lost time injuries
increased and views keep changing on whether Council’s operations
provide good value for money .
Waverley Together 2Movement towards or away from sustainable governanc e
-5%
-3%
11%
1%
-6%
16%
17%
11%
15%
-100% -50% 0% 50% 100%
60. 75% of Council staff agree that the organisation isoperating effectively within the Business Excellence
Framework by 2013.
59. Lost Time injuries that occur in Council are reduced by57% by 2020, based on 2005/06 levels.
58. Satisfaction with maintenance of Council assets isincreasing.
57. Council assets are capable of delivering the desiredlevels of service as measured by achieving specified asset
condition ratings on an annual basis.
55. The proportion of residents who believe that Council'soperations are efficient, effective and provide value for
money is increasing.
54. Satisfaction with Council's customer service is steadyor increasing.
53. Satisfaction with being informed about Council activitiesis increasing.
52.The proportion of residents who believe they have theopportunity to have a say in what Council does is
increasing.
51. The proportion of residents who believe Council acts inan open and honest way is increasing.
% movement towards (green) or away (red) from targets for a sustainable community
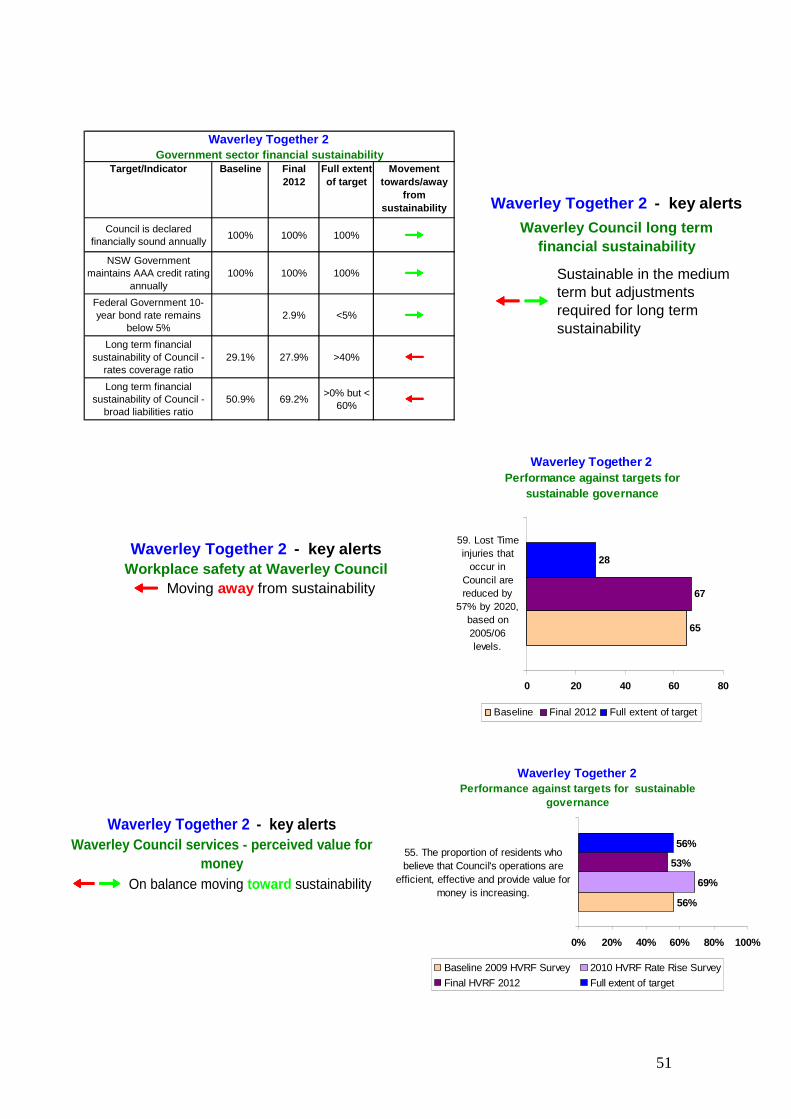
51
���� Moving away from sustainability
Waverley Together 2 - key alertsWorkplace safety at Waverley Council
Waverley Together 2Performance against targets for sustainable
governance
56%
69%
53%
56%
0% 20% 40% 60% 80% 100%
55. The proportion of residents whobelieve that Council's operations are
efficient, effective and provide value formoney is increasing.
Baseline 2009 HVRF Survey 2010 HVRF Rate Rise Survey
Final HVRF 2012 Full extent of target
�������� On balance moving toward sustainability
Waverley Together 2 - key alertsWaverley Council services - perceived value for
money
Waverley Together 2Performance against targets for
sustainable governance
65
67
28
0 20 40 60 80
59. Lost Timeinjuries that
occur inCouncil arereduced by
57% by 2020,based on2005/06levels.
Baseline Final 2012 Full extent of target
Target/Indicator Baseline Final 2012
Full extent of target
Movement towards/away
from sustainability
Council is declared financially sound annually
100% 100% 100% ����NSW Government
maintains AAA credit rating annually
100% 100% 100% ����
Federal Government 10-year bond rate remains
below 5%2.9% <5% ����
Long term financial sustainability of Council -
rates coverage ratio29.1% 27.9% >40% ����
Long term financial sustainability of Council -
broad liabilities ratio50.9% 69.2%
>0% but < 60% ����
Government sector financial sustainabilityWaverley Together 2
��������
Sustainable in the medium term but adjustments required for long term sustainability
Waverley Together 2 - key alerts
Waverley Council long term financial sustainability

52
3.6 Movement towards sustainable assets
Overall the actual condition of our assets has improved .
Assets with the biggest gap between current condition and target condition
are all in Waverley Cemetery . Our roads and kerbs are in slightly
better condition than the target. But in terms of total volume, 78% of assets
are within the target condition rating.
Waverley Together 2Movement towards or away from sustainable assets
For assets that can deliver acceptable service leve ls by being maintained in Condition 1 or 2
0%
0%
0%
0%
13%
0%
0%
7%
-1%
-1%
-6%
1%
-4%
2%
3%
-4%
1%
3%
3%
-100% -50% 0% 50% 100%
In Waverley Cemetery - fencing external
In Waverley Cemetery - fencing internal
In Waverley Cemetery - drains
In Waverley Cemetery - gutters
In Waverley Cemetery - paths
In Waverley Cemetery - roads
In parks - signs
In parks - playground equipment
In parks - stairs
In parks - fences and bollards
In parks - footpaths
Street seats
Bus seats
Bus shelters
Fences & bollards
Stairs
Kerbs & gutters
Footpaths
Roads
% movement towards (green) or away (red) from sustainability
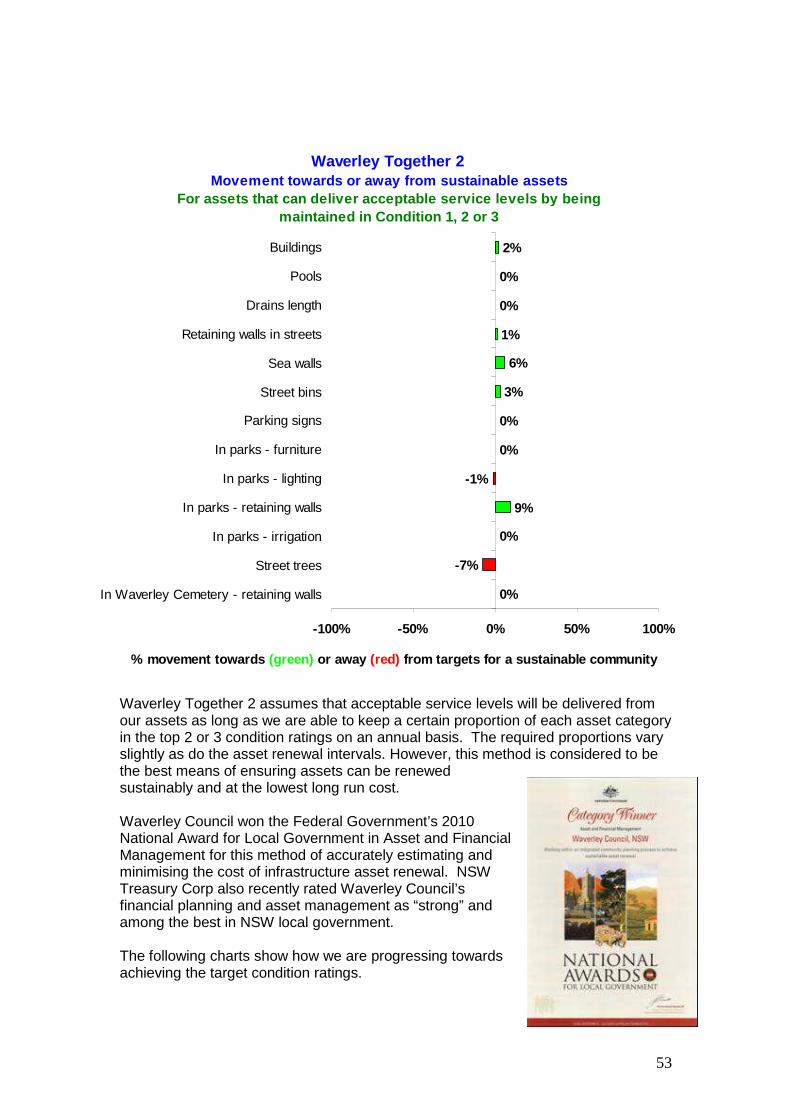
53
Waverley Together 2 assumes that acceptable service levels will be delivered from our assets as long as we are able to keep a certain proportion of each asset category in the top 2 or 3 condition ratings on an annual basis. The required proportions vary slightly as do the asset renewal intervals. However, this method is considered to be the best means of ensuring assets can be renewed sustainably and at the lowest long run cost. Waverley Council won the Federal Government’s 2010 National Award for Local Government in Asset and Financial Management for this method of accurately estimating and minimising the cost of infrastructure asset renewal. NSW Treasury Corp also recently rated Waverley Council’s financial planning and asset management as “strong” and among the best in NSW local government. The following charts show how we are progressing towards achieving the target condition ratings.
Waverley Together 2Movement towards or away from sustainable assets
For assets that can deliver acceptable service leve ls by being maintained in Condition 1, 2 or 3
0%
-7%
0%
9%
-1%
0%
0%
3%
6%
1%
0%
0%
2%
-100% -50% 0% 50% 100%
In Waverley Cemetery - retaining walls
Street trees
In parks - irrigation
In parks - retaining walls
In parks - lighting
In parks - furniture
Parking signs
Street bins
Sea walls
Retaining walls in streets
Drains length
Pools
Buildings
% movement towards (green) or away (red) from targets for a sustainable community

54
Waverley Together 2Performance against targets for sustainable assets
For assets that can deliver acceptable service leve ls by being maintained in Condition 1 or 2
21%
39%
57%
65%
52%
2%
90%
61%
85%
80%
87%
83%
82%
95%
72%
72%
73%
73%
79%
21%
39%
57%
65%
59%
2%
90%
65%
84%
79%
82%
84%
79%
97%
74%
69%
74%
75%
81%
100%
100%
100%
100%
100%
100%
100%
100%
100%
100%
100%
100%
100%
100%
100%
100%
73%
80%
79%
0% 20% 40% 60% 80% 100% 120%
In Waverley Cemetery -fencing external
In Waverley Cemetery -fencing internal
In Waverley Cemetery -drains
In Waverley Cemetery -gutters
In Waverley Cemetery -paths
In Waverley Cemetery -roads
In parks - signs
In parks - playgroundequipment
In parks - stairs
In parks - fences andbollards
In parks - footpaths
Street seats
Bus seats
Bus shelters
Fences & bollards
Stairs
Kerbs & gutters
Footpaths
Roads
Target for % of assets in Condition 1 & 2 on an annual basis
Final % of assets in Condition 1 & 2 in 2012
Baseline % of assets in Condition 1 & 2 in 2009
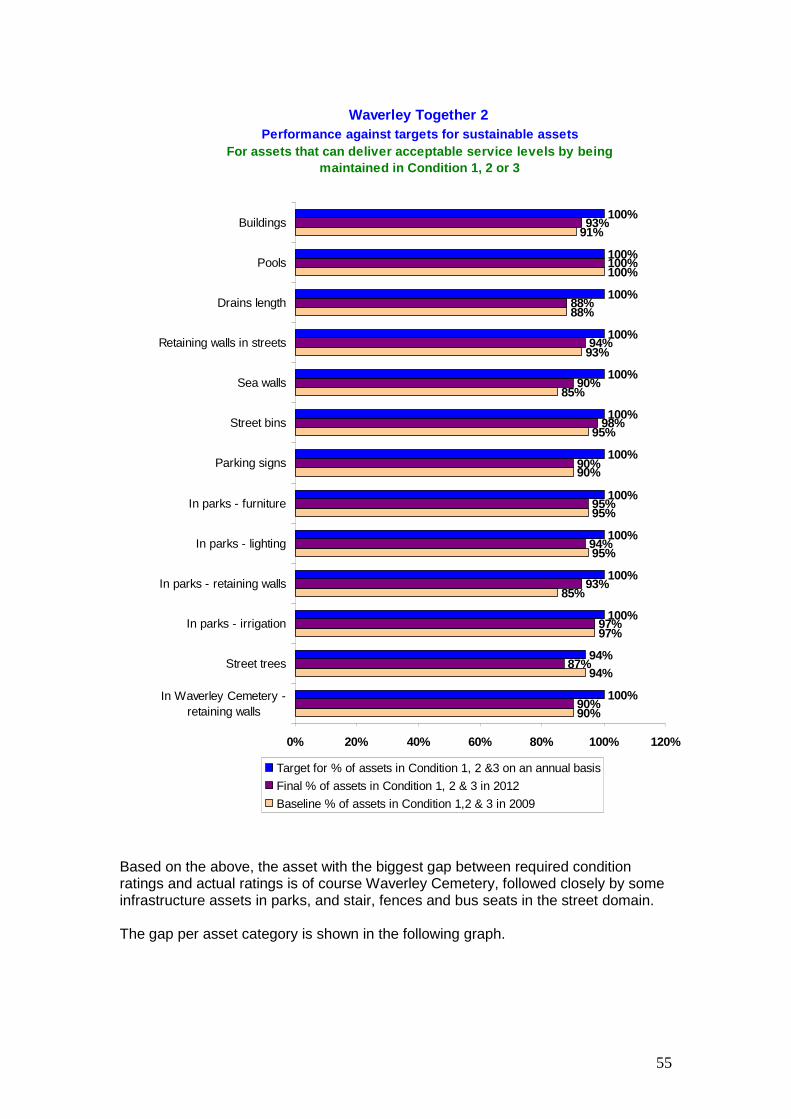
55
Based on the above, the asset with the biggest gap between required condition ratings and actual ratings is of course Waverley Cemetery, followed closely by some infrastructure assets in parks, and stair, fences and bus seats in the street domain. The gap per asset category is shown in the following graph.
Waverley Together 2Performance against targets for sustainable assets
For assets that can deliver acceptable service leve ls by being maintained in Condition 1, 2 or 3
90%
94%
97%
85%
95%
95%
90%
95%
85%
93%
88%
100%
91%
90%
87%
97%
93%
94%
95%
90%
98%
90%
94%
88%
100%
93%
100%
94%
100%
100%
100%
100%
100%
100%
100%
100%
100%
100%
100%
0% 20% 40% 60% 80% 100% 120%
In Waverley Cemetery -retaining walls
Street trees
In parks - irrigation
In parks - retaining walls
In parks - lighting
In parks - furniture
Parking signs
Street bins
Sea walls
Retaining walls in streets
Drains length
Pools
Buildings
Target for % of assets in Condition 1, 2 &3 on an annual basis
Final % of assets in Condition 1, 2 & 3 in 2012
Baseline % of assets in Condition 1,2 & 3 in 2009

56
The value of the backlog infrastructure renewal will be published in the annual Financial Statements in November 2012 but is expected to be in the order of $29 million. Our capacity to bridge this gap has been weakened somewhat by a lower than required rate rise granted by IPART in June 2011. This financial gap will need to be bridged if we are to renew assets to deliver appropriate service levels without having to cut the services themselves.
Waverley Together 2Performance against targets for sustainable assets
Gap to target for asset sustainability
-98%
-79%
-61%
-43%
-41%
-35%
-35%
-31%
-26%
-21%
-21%
-18%
-16%
-16%
-12%
-10%
-10%
-10%
-10%
-7%
-7%
-7%
-6%
-6%
-5%
-5%
-3%
-3%
-2%
0%
1%
2%
-120% -100% -80% -60% -40% -20% 0% 20%
In Waverley Cemetery - roads
In Waverley Cemetery - fencing external
In Waverley Cemetery - fencing internal
In Waverley Cemetery - drains
In Waverley Cemetery - paths
In Waverley Cemetery - gutters
In parks - playground equipment
Stairs
Fences & bollards
In parks - fences and bollards
Bus seats
In parks - footpaths
In parks - stairs
Street seats
Drains length
In parks - signs
In Waverley Cemetery - retaining walls
Parking signs
Sea walls
Street trees
In parks - retaining walls
Buildings
In parks - lighting
Retaining walls in streets
Footpaths
In parks - furniture
Bus shelters
In parks - irrigation
Street bins
Pools
Kerbs & gutters
Roads
% of asset category meeting (green) or not meeting (red) target

57
4. Contribution of services to Waverley Together 2 Successive statistically valid surveys in 2009, 2010 and 2012 have consistently confirmed that the community considers Waverley Council’s services to be central to their capacity to achieve the vision and targets of Waverley Together 2 and quadruple bottom line sustainability overall. Essentially, anything Council does is considered by the community to be highly likely to contribute in some degree, and often in significant degree, to the quality of life we desire. It is not possible to achieve basic quality of life, let alone the vision, without accessing the Council’s services on a daily basis.
Waverley Together 2HVRF survey results on importance of Waverley Counc il's services
3.8
3.7
3.8
4
4.1
4.3
4
4.1
4.2
4
4.2
4.2
4
4.2
4.2
4.2
4.2
4.3
4.2
4.3
4.4
4.4
4.4
4.5
4.6
4.5
4.5
4.7
3.6
3.6
3.7
3.9
3.9
4.0
4.0
4.0
4.0
4.0
4.0
4.0
4.0
4.0
4.1
4.1
4.1
4.2
4.2
4.2
4.2
4.2
4.3
4.3
4.3
4.3
4.4
4.4
4.5
4.6
0 1 2 3 4 5
Arts/entertainment events
Arts/entertainment facilities
Facilities, services for young people
Planning for shopping areas
Sporting facilities
Natural environment
Green waste services
Parks, playgrounds (age 6-11)
Council information
Greening, tree maintenance
Parks, playgrounds (children<6)
Community involvement
Streetscape maintenance
Services for children
Services for older people
Kerb, gutter and street cleaning
On-street parking management
Residential development
Services for disabilities
Maintenance of public toilets
Control of building activity
Local traffic management
Footpaths
Parks - maintenance
Roads, etc
Parks - cleanliness
Beaches
Dumped rubbish
Recycling
Rubbish/garbage collection
Baseline 2009 mean importance rating Final 2012 mean importance rating

58
If life has got better under Waverley Together 2, we can therefore be reasonably confident that it was at least partly because of something that Council did. In this context the relevance of our services is not in question in the minds of our community and Council can easily map a direct connection between our services, the deliverables we have set ourselves, and the community’s capacity to achieve the vision of Waverley Together 2. That map is summarised as shown below. Appendix 1 provides more detail on this map of Council’s services to vision. As yet, no map has been produced which shows how State or Federal Government services contribute to achievement of the vision. Nor, outside the mapping provided in Waverley Together 2, is there a map of partnerships between government, business and the community for achievement of the vision. This is the business of Integrated Planning & Reporting over the next decade. For the present report, it has been assumed that NSW State Government services and programs are vital and this report has attempted to integrate and shed light on their performance and future potential contribution.
Council’s services &
deliverables
Community outcomes
Service Plus 22 main service categories comprising 150 sub-services contribute directly to efficient implementation of …
Directions/Strategies the 33 Directions/Strategies in Waverley Together 2 to assist the community to meet …
Targets 60 Targets/Indicators for quadruple bottom line sustainability that, if met, will …
Vision enable the community to realise all 14 Vision elements of Waverley by 2022.
How do Council’s services help make the Vision of Waverley Together 2 a reality?

59
4.1 Contribution of Council services The efficiency and effectiveness with which all partners deliver these services obviously has a major effect on our capacity to reach community targets at the lowest long run cost. To ensure maximum effectiveness of Council’s services, Waverley recently reviewed and constructed a full package of services, including all its existing services, with some being enhanced in terms of how they can contribute to delivery of the vision. The enhancements were made at the request of a significant majority (66%) of the community and were for specific programs to achieve the following:
This package of services plus enhancements is called Service Plus. It is an 11 year program of expenditure of almost $1.5 billion on services and assets to 2022 which was developed in consultation with the Waverley community. Their ultimate support of it was confirmed via the mandate they provided in 2010/11 to raise rates to fund a $186 million shortfall on the package over 11 years. At present we have of course only just reached the end of our first year of the 11 year Service Plus program, so it is difficult to draw a correlation between the obvious improvements in quality of life under Waverley Together 2 and commencement of Service Plus. However, if satisfaction with our services is any measure of effectiveness, Waverley Council is at least moving in the right direction and we can expect that over the remaining decade to 2022 we should be able to stay on track to realise the vision, pending availability of funding. The following results of the 2012 HVRF Survey show that satisfaction with Council’s services has increased across the board since the 2009 HVRF survey.
Waverley Together 2HVRF 2010 Survey
How important is it to enhance services?
0% 10% 20% 30% 40% 50% 60% 70% 80% 90%
Partnering with a more engaged community activelyinvolved in decision making
More sustainable environment with increasedprotection from global warming and preservation of
ecosystems
More inviting streetscapes & restful localneighbourhoods
More cleaning & greening of spaces we share
More & safer access to public places, transport & v italservices
More recreation, health, wellbeing & artistic cultu ralexpression
% of respondents who said it was important or very important to enhance Council services% of respondents who said it was unimportant or very unimportant to enhance Council services

60
However, whether this contribution to the QBL is sustainable is still in doubt. While our community gave a clear mandate in 2011 of majority support for funding Service Plus in full via raising rates over 7 years, the approval authority, the Independent Pricing and Regulatory Tribunal (IPART), provided approval for Council to raise rates to cover only $110 million of the required $186 million shortfall over the 11 years of Waverley Together 2. As such we still have a $76 million shortfall over 11 years. This has recently been reduced to a $60 million shortfall over 10 years simply by delaying commencement
Waverley Together 2HVRF Community Survey Results 2009 & 2012
Service Satisfaction
-2 -1.5 -1 -0.5 0 0.5 1 1.5 2
Garbage/rubbish collection
Recycling services
Green waste services
Beach maintenance
Cleanliness of parks
Maintenance of parks
Parks, playgrounds (children <6)
Arts/entertainmentl events
Facilities/services for children
Facilities/services for older people
Parks, playgrounds (ages 6-11)
Sporting and recreational facilities
Kerb, gutter and street cleaning
Arts/entertainment facilities
Planning for shopping areas
Informing residents
Environmental management and education
Greening and tree maintenance
Facilities, services for people with disabilities
Facilities and services for young people [12-24 years]
Removal of dumped rubbish
Maintenance of streetscapes
Maintenance of road network
Maintenance of public toilets
Maintenance of footpaths
Community involvement in decision-making
Planning for residential development
Control of building activity
Local traffic management
On-street parking management
Green indicates majority agreement on satisfaction with services in 2012Red indicates majority disagreement on satisfaction wi th services in 2012
Satisfaction agreement 2009 Satisfaction agreement 2012
���� Moving towards sustainability
Waverley Together 2 - key alertsSatisfaction with Council services
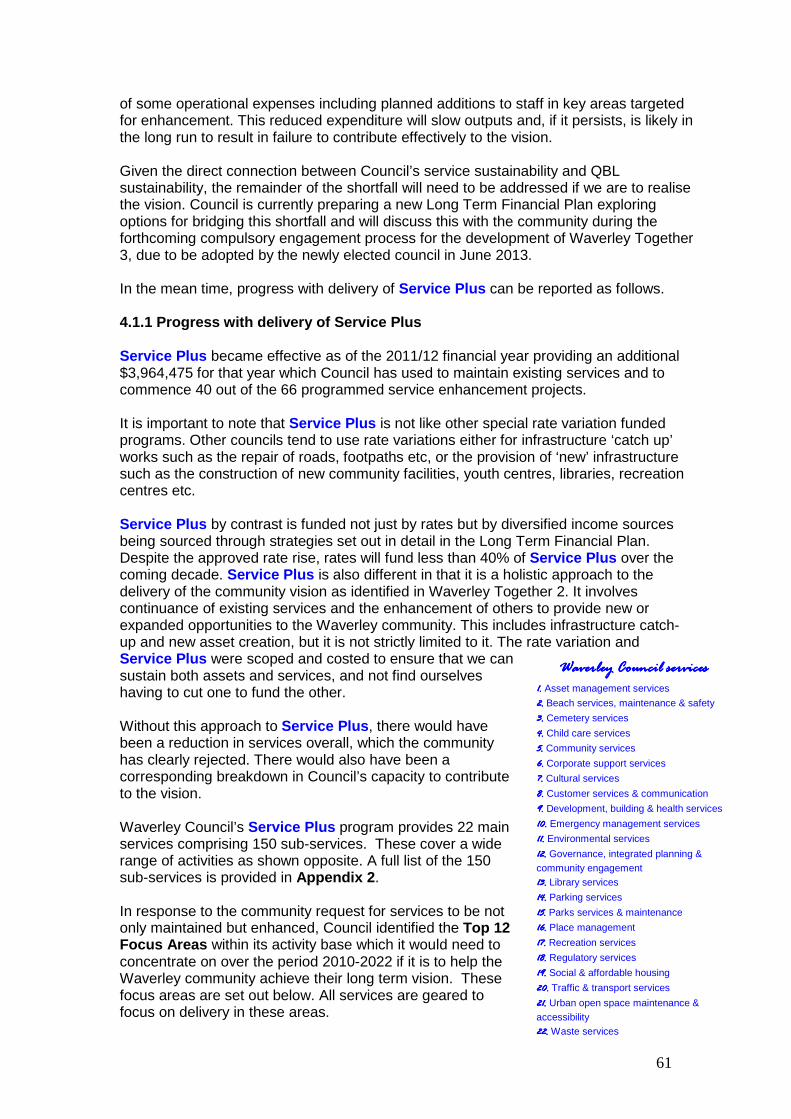
61
of some operational expenses including planned additions to staff in key areas targeted for enhancement. This reduced expenditure will slow outputs and, if it persists, is likely in the long run to result in failure to contribute effectively to the vision. Given the direct connection between Council’s service sustainability and QBL sustainability, the remainder of the shortfall will need to be addressed if we are to realise the vision. Council is currently preparing a new Long Term Financial Plan exploring options for bridging this shortfall and will discuss this with the community during the forthcoming compulsory engagement process for the development of Waverley Together 3, due to be adopted by the newly elected council in June 2013. In the mean time, progress with delivery of Service Plus can be reported as follows. 4.1.1 Progress with delivery of Service Plus Service Plus became effective as of the 2011/12 financial year providing an additional $3,964,475 for that year which Council has used to maintain existing services and to commence 40 out of the 66 programmed service enhancement projects. It is important to note that Service Plus is not like other special rate variation funded programs. Other councils tend to use rate variations either for infrastructure ‘catch up’ works such as the repair of roads, footpaths etc, or the provision of ‘new’ infrastructure such as the construction of new community facilities, youth centres, libraries, recreation centres etc. Service Plus by contrast is funded not just by rates but by diversified income sources being sourced through strategies set out in detail in the Long Term Financial Plan. Despite the approved rate rise, rates will fund less than 40% of Service Plus over the coming decade. Service Plus is also different in that it is a holistic approach to the delivery of the community vision as identified in Waverley Together 2. It involves continuance of existing services and the enhancement of others to provide new or expanded opportunities to the Waverley community. This includes infrastructure catch-up and new asset creation, but it is not strictly limited to it. The rate variation and Service Plus were scoped and costed to ensure that we can sustain both assets and services, and not find ourselves having to cut one to fund the other. Without this approach to Service Plus, there would have been a reduction in services overall, which the community has clearly rejected. There would also have been a corresponding breakdown in Council’s capacity to contribute to the vision. Waverley Council’s Service Plus program provides 22 main services comprising 150 sub-services. These cover a wide range of activities as shown opposite. A full list of the 150 sub-services is provided in Appendix 2 . In response to the community request for services to be not only maintained but enhanced, Council identified the Top 12 Focus Areas within its activity base which it would need to concentrate on over the period 2010-2022 if it is to help the Waverley community achieve their long term vision. These focus areas are set out below. All services are geared to focus on delivery in these areas.
Waverley Council servicesWaverley Council servicesWaverley Council servicesWaverley Council services1.1.1.1. Asset management services
2.�2.�2.�2.�Beach services, maintenance & safety
3.�3.�3.�3.�Cemetery services
4.4.4.4. Child care services
5.5.5.5. Community services
6.�6.�6.�6.�Corporate support services
7.7.7.7. Cultural services
8.8.8.8. Customer services & communication
9.9.9.9. Development, building & health services
10.10.10.10. Emergency management services
11.11.11.11. Environmental services
12.12.12.12. Governance, integrated planning & community engagement13.13.13.13. Library services
14.14.14.14. Parking services
15.15.15.15. Parks services & maintenance
16.16.16.16. Place management
17.17.17.17. Recreation services
18.18.18.18. Regulatory services
19.19.19.19. Social & affordable housing
20.�20.�20.�20.�Traffic & transport services
21.21.21.21. Urban open space maintenance & accessibility22.�22.�22.�22.�Waste services

62
Over the past year (2011 -12) Waverley Council has achieved a great start with the implementation of Service Plus. The following tables set out how Council is going in delivering Service Plus and how it is assisting in maintaining delivery of services within the Top 12 Focus Areas . As usual:
���� means the activities commenced or are still on track to commence as scheduled
���� means the activity has been delayed in the schedule or is not on track
���� means the activity is not going ahead at all or is failing in terms of sustainability.
1. Protecting and enjoying our beaches and coastal open
spaces
2. Staying connected as a community
3. Living with urban density
4. Welcoming visitors
5. Fostering our cultural diversity
6. Renewing our health and well being
7. Sprucing up our streets and villages
8. Harmonising new and old design
9. Feeling and being safe
10. Prospering through our economy
11. Venturing into new and sustainable environmental
futures
12. Engaging everyone for far sighted and better decision
making
WWWWWWWWaaaaaaaavvvvvvvveeeeeeeerrrrrrrrlllllllleeeeeeeeyyyyyyyy TTTTTTTTooooooooggggggggeeeeeeeetttttttthhhhhhhheeeeeeeerrrrrrrr 22222222 TThhee TToopp 1122 FFooccuuss AArreeaass ffoorr CCoouunncciill sseerrvviicceess aanndd aaccttiivviittiieess
WWee aarree uunniitteedd bbyy aa ccoommmmoonn ppaassssiioonn ffoorr oouurr bbeeaauuttiiffuull hhoommee bbeettwweeeenn tthhee cciittyy aanndd tthhee
sseeaa..

63
Waverley Together 2Waverley Together 2Waverley Together 2Waverley Together 2
Focus Area 1: Protecting and enjoying our beaches and coastal open spacesFocus Area 1: Protecting and enjoying our beaches and coastal open spacesFocus Area 1: Protecting and enjoying our beaches and coastal open spacesFocus Area 1: Protecting and enjoying our beaches and coastal open spaces Services delivered Achieved in
2011-12 Activities undertaken
Keeping up our great beach cleaning program ���� � Beaches cleaned using beach rake
and cleaning staff in accordance with agreed program
� Seasonal beach pool cleaning program
Continuing our world leading beach and lifeguard service
���� � Rostering lifeguards for year round
operations � Undertaking patrols of beaches to
maintain surf safety Cleaning up tired old public toilets and change rooms ���� � Public toilets upgrades
Keeping our new coastal and cliff walks as new ���� � Programmed cleaning &
maintenance of parks and coastal reserves
Re-turfing the parks and installing sustainable watering systems ���� � Programmed cleaning &
maintenance of parks and coastal reserves
Taking a total catchment management approach to reduce pollution from urban stormwater that drains to the coast
����
� Gross Pollutant Traps monitored and maintained
� Maintaining existing stormwater & groundwater infrastructure
Pursuing our targets for greenhouse gas emission reductions to help prevent or slow sea level rises
���� � Creating additional car share spaces � Promoting greater public transport
use � Education & promotion programs to
encourage active transport � Expanding bicycle network � Promoting energy efficiency � Reducing energy use in Council
operations Developing climate change adaptation strategies in asset management plans for coastal areas
����
� Development and implementation of Waverley Coastal Hazard & Risk Assessment

64
Waverley Together 2Waverley Together 2Waverley Together 2Waverley Together 2
Focus Area 2: Staying connected as a communityFocus Area 2: Staying connected as a communityFocus Area 2: Staying connected as a communityFocus Area 2: Staying connected as a community Services delivered Achieved in
2011-12 Activities undertake n
� Expanding our affordable and aged housing programs ����
� Promoting the generation of new affordable housing
� Providing a range of social housing options and acquiring additional social housing
� Expanding and diversifying our volunteering networks ����
� Implementing Volunteering Strategy � Supporting bushcare program
� Providing childcare places at an affordable price ����
� Providing long day and family day care
� Expanding childcare facilities � Maintaining our extensive
array of family support services
���� � Providing specific support to families
and their children from birth to 5 years
� Providing improved information, services and facilities to our older community and people with disabilities
���� � Providing high quality affordable
services for frail people including Meals on Wheels, Home Library Service and programs at Bondi Pavilion
� Operating a seniors centre � Providing programs aimed at
improving independent living skills for people with mild intellectual disability
� Increasing the capacity of public transport services ����
� Bus shelters maintained and replaced
� Promoting the use of public transport for Bondi Junction and Bondi Beach
� Undertake parking patrols to ensure parking compliance along transport corridors
� Investing in upgrades of assets used for walking and cycling, including establishing more greenlinks and bike routes
���� � Provision of bicycle parking and other
bicycle related facilities � Undertaking annual footpath
construction and maintenance program
� Implementing the Bondi Junction Pedestrian Access Mobility Plan
���� � Stage 1 (PAMP 01) commenced
� Developing and implementing a Bondi Beach Pedestrian Access Mobility Plan
���� � Delayed due to partial approval of
the rate rise
� Improving pedestrian access to Bondi Junction bus and rail interchange
���� � Negotiation to re-open Grafton Lane
entry to Bondi Junction Station from Rowe Street

65
Waverley Together 2Waverley Together 2Waverley Together 2Waverley Together 2
Focus AreFocus AreFocus AreFocus Area 3: Living with ua 3: Living with ua 3: Living with ua 3: Living with urban densityrban densityrban densityrban density Services delivered Achieved in
2011-12 Activities undertaken
� Thinking about better road sharing by cars and alternative transport by designing a long term plan for smarter travel routes into, through and out of the area
���� � Waverley Transport Review
� Setting the right incentives in place—including appropriate pricing and time limiting of parking—to reduce both private car ownership and private car travel to more sustainable levels
���� � Implementing the 82 adopted
recommendations of the 2009 Parking Review
� Undertaking parking patrols in commercial and residential areas
� Educational programs on parking and road safety
� Promoting and developing attractive transport alternatives, preferably funded by developers and other investors
���� � Developing Voluntary Planning
Agreements and other contributions that deliver public infrastructure
� Waverley Transport Review
� Expanding car share schemes ����
� Creating additional car share spaces
� Developing and agreeing on a long term plan to solve the problem of Bondi Road congestion without impacting on businesses and nearby residents
���� � Continuing to explore and discuss
possibilities for light rail. � Continuing engagement with
businesses � Waverley Transport Review
� Increasing the capacity of public transport services ����
� Bus operations reviewed annually with STA
� Coming to an agreement about how much parking should be provided in new developments to achieve a sustainable lifestyle and economy
���� � Developing a Comprehensive LEP � Developing a Comprehensive DCP � Adopting the new Transport Plan
� Thinking about changing community attitudes to parking— it’s a scarce resource that needs to be fairly shared, not a right
����
� Commencing a new review of Residential Preferential Parking Schemes
� Waverley Transport Review � Parking patrols in commercial and
residential areas � Developing and implementing
a Bondi Beach Pedestrian Access Mobility Plan
���� � Delayed due to partial approval of the
rate rise
� Ensuring planning controls consider residential amenity impacts such as noise, solar access and privacy
���� � Development applications assessed
and approved in line with Council’s planning controls and policies
� Utilising urban planning policies and processes to improve public domains when creating new buildings
����
� Development of Comprehensive LEP and Comprehensive DCP
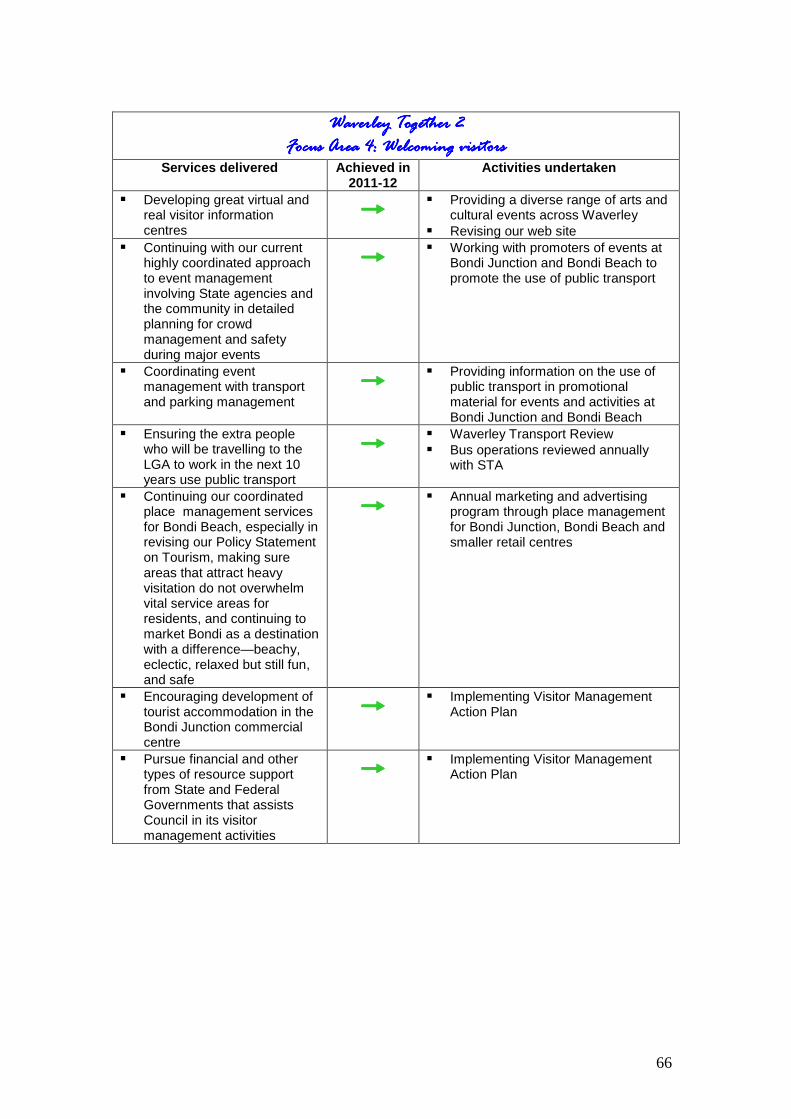
66
Waverley Together 2Waverley Together 2Waverley Together 2Waverley Together 2
Focus Area 4: Welcoming vFocus Area 4: Welcoming vFocus Area 4: Welcoming vFocus Area 4: Welcoming visitorsisitorsisitorsisitors Services delivered Achieved in
2011-12 Activities undertaken
� Developing great virtual and real visitor information centres
���� � Providing a diverse range of arts and
cultural events across Waverley � Revising our web site
� Continuing with our current highly coordinated approach to event management involving State agencies and the community in detailed planning for crowd management and safety during major events
���� � Working with promoters of events at
Bondi Junction and Bondi Beach to promote the use of public transport
� Coordinating event management with transport and parking management
���� � Providing information on the use of
public transport in promotional material for events and activities at Bondi Junction and Bondi Beach
� Ensuring the extra people who will be travelling to the LGA to work in the next 10 years use public transport
���� � Waverley Transport Review � Bus operations reviewed annually
with STA
� Continuing our coordinated place management services for Bondi Beach, especially in revising our Policy Statement on Tourism, making sure areas that attract heavy visitation do not overwhelm vital service areas for residents, and continuing to market Bondi as a destination with a difference—beachy, eclectic, relaxed but still fun, and safe
���� � Annual marketing and advertising
program through place management for Bondi Junction, Bondi Beach and smaller retail centres
� Encouraging development of tourist accommodation in the Bondi Junction commercial centre
���� � Implementing Visitor Management
Action Plan
� Pursue financial and other types of resource support from State and Federal Governments that assists Council in its visitor management activities
���� � Implementing Visitor Management
Action Plan

67
Waverley Together 2Waverley Together 2Waverley Together 2Waverley Together 2
Focus Area 5: Fostering our cultural vitalityFocus Area 5: Fostering our cultural vitalityFocus Area 5: Fostering our cultural vitalityFocus Area 5: Fostering our cultural vitality Services delivered Achieved in
2011-12 Activities undertaken
� Developing our civic and open spaces to provide multi-use venues that can cater for new types of cultural events
���� � Approving developments that
maintain and enhance the identity of Waverley’s villages
� Civic Pride village improvement project initiated
� Opportunities to deliver public infrastructure through Voluntary Planning Agreements
� Commencing a new business planning process for Waverley Cemetery
� Upgrading the Bondi Pavilion as a vibrant arts and entertainment centre, providing a diverse program of creative experiences, performances and visual arts
���� � Plan of Management for Bondi
Pavilion and Bondi Park
� Fostering indigenous and multicultural arts festivals, performances and events
���� � Providing events and promotions
targeting culturally and linguistically diverse people and Aboriginal & Torres Strait Islander communities
� Establishing a successful resident theatre company at the Bondi Pavilion
���� � Tamarama Rock Surfers Theatre
company established at Bondi Pavilion Theatre
� Providing support and advice to assist artists and other to hold arts and cultural events and activities
� Plan of Management for Bondi Pavilion and Bondi Park
� Turning our streets and reserves into venues for inspiring sculptures
���� � Developing public art in suitable
locations in Waverley

68
Waverley Together 2Waverley Together 2Waverley Together 2Waverley Together 2
Focus Area 6:Focus Area 6:Focus Area 6:Focus Area 6: Renewing our health and wellbeingRenewing our health and wellbeingRenewing our health and wellbeingRenewing our health and wellbeing Services delivered Achieved in
2011-12 Activities undertaken
� Maintaining our community services to help people stay in their homes for longer
����
� Providing Meals on Wheels service � Providing a shopping service � Providing a Waverley Home Library
Service � Providing programs for older people
at Bondi Pavilion � Ensuring as people age they
have timely access to information and programs about, and are appropriately referred to, health and other support services that would generally be provided by other levels of government and community organisations
����
� Operating a Senior Centre � Providing a varied program of
activities and events for older people
� Building a new Waverley Pavilion as a sports centre ����
� Pavilion completed and opened in June 2012
� Developing our limited open spaces to meet growing demands for sporting and active recreational activities, especially those that encourage participation by young people and women
����
� Development of Plans of Management for Bondi Pavilion, Bondi Park, Waverley Park
� Continuing to implement priority actions in relation to facilities in Waverley Park, Barracluff Park and Rodney Reserve
� Maintaining other open spaces and infrastructure such as memorial or sculpture parks and coastal reserves which are vital to passive recreation, enjoyment of natural beauty and spiritual renewal
���� � Programmed cleaning &
maintenance of parks and coastal reserves
� Building new works sub-depots in or close to Waverley to bring our work teams for open space management maintenance closer to the parks and spaces they maintain
���� � Syd Einfeld Drive Depot established
� Developing and agreeing a plan for sustaining Waverley Cemetery as a place of reflection, remembrance of those we have lost, and celebration of our history
���� � Maintaining Waverley and South
Head Cemeteries � Establishing a panel for development
of a business plan for Waverley Cemetery

69
Waverley Together 2Waverley Together 2Waverley Together 2Waverley Together 2
Focus Area 7: Sprucing up our streets and villagesFocus Area 7: Sprucing up our streets and villagesFocus Area 7: Sprucing up our streets and villagesFocus Area 7: Sprucing up our streets and villages Services delivered Achieved in
2011-12 Activities undertaken
� Educating and regulating to prevent rubbish dumping ����
� Deliver a waste and litter management strategy for public places that integrates infrastructure, education, management and enforcement
� Running local events and initiatives that encourage recycling of waste
� Picking up dumped rubbish quickly when it occurs ����
� Inspection and removal of dumped rubbish and where appropriate enforcement action
� Removing graffiti and bill postering as soon as it appears
����
� Graffiti and posters removed in accordance with Council’s Graffiti Management & Poster Removal Policy
� Increased graffiti removal per Quarter
� Sweeping up more frequently ����
� Task list to meet current needs of the major shopping/commercial districts
� All public place areas including high profile gardens, landscaped traffic calming devices and village centres are maintained
� Undertaking programmed cleaning of council assets including street furniture, signage and litter bins in accordance with adopted Service Level Agreement
� Renewing streets with smart landscaping treatments that provide shade without loss of vistas
����
� Annual program of works � Annual asset maintenance program � ‘Looking Good’ – streetscape
improvement works undertaken � Footpath garden program continued
� Upgrading streetscapes around the main gateways to Waverley to develop a distinct identity and a welcoming feel
����
� Implementation of Civic Pride village improvement project
� Developing the Bondi Road village into a more effective strip shopping layout
���� � Implementation of Civic Pride village
improvement project
� Improve the Bronte Beach centre by improving pedestrian access to Bronte Park
���� � Undertake works arising from Bronte
Park Plan of Management � Annual asset maintenance program

70
Waverley Together 2Waverley Together 2Waverley Together 2Waverley Together 2
Focus Area 8: Harmonising new and old designFocus Area 8: Harmonising new and old designFocus Area 8: Harmonising new and old designFocus Area 8: Harmonising new and old design Services delivered Achieved in
2011-12 Activities undertaken
� Preparing and implementing planning policies which identify natural and built heritage items and conservation areas
���� � All properties with heritage
significance listed within LEP
� Recognising quality design outcomes through annual heritage and urban design awards
���� � Conduct Heritage & Urban Design
Awards annually
� Providing expert heritage and urban design advice to the community
���� � Provide heritage advice to
development applicants � Provide information to the public on
heritage and good design � Making heritage and quality
urban design a strong focus in the development assessment process
���� � Provide heritage advice on
development applications
� Ensuring new developments incorporate sustainable building practices
���� � Assess and approve development
applications in line with Council’s controls and policies
� Ensuring policies and guidelines are in place to deliver buildings which contribute to and respect the existing character, scale and topography of the area
���� � Assess and approve development
applications in line with Council’s controls and policies

71
Waverley Together 2Waverley Together 2Waverley Together 2Waverley Together 2
Focus Area 9: Feeling and being safeFocus Area 9: Feeling and being safeFocus Area 9: Feeling and being safeFocus Area 9: Feeling and being safe Services delivered Achieved in
2011-12 Activities undertaken
� Increasing asset maintenance to reduce hazards, especially in footpaths, play equipment, and around the many retaining walls in the LGA
���� � Updating assessment of assets since
completion of SAMP3 � Incorporating asset management
funding assessments into 4 year Delivery Program and 10 year Long Term Financial Plan
� Implementing Capital works program � Implementing Annual asset
maintenance program � Continuing road and parking
safety programs especially around schools
���� � Undertaking parking patrols around
schools � Providing information to improve
safety around schools � Undertaking enforcement action to
ensure safety around schools � Expanding fully designed
40km/hour zones in local streets where accidents occur
���� � Collecting, collating and reviewing
traffic & pedestrian crash data
� Delivering major events with strong safety planning ����
� A diverse range of arts & cultural events across Waverley
� Managing safe summers by annual promotions of safe swimming, drinking, driving and parking
���� � Safety audits Bondi Beach and
Bondi Junction � Alcohol free zones reviewed and
managed � Implementing Safe Summer initiative � Participating in and support
community safety programs � Implementing Community Safety
Plan � Undertaking rescues and provide
first aid and other assistance on Council’s beaches
� Continuing our focus on regulation of villages, beaches and major places to control anti-social behaviour
���� � Implementing Community Safety
Plan
� Planning for integrated urban development, zoning and design to minimise social disturbances and crime
����
� Assess and approve development applications in line with Council’s controls and policies
� Updating existing and creating new strategic land use policies when requested by Council
� Building a culture of commitment to safety and risk reduction in our workforce, especially in their daily routines in public spaces
���� � OHS Risk Management Plan
implemented � Operational risk processes and
strategies reviewed
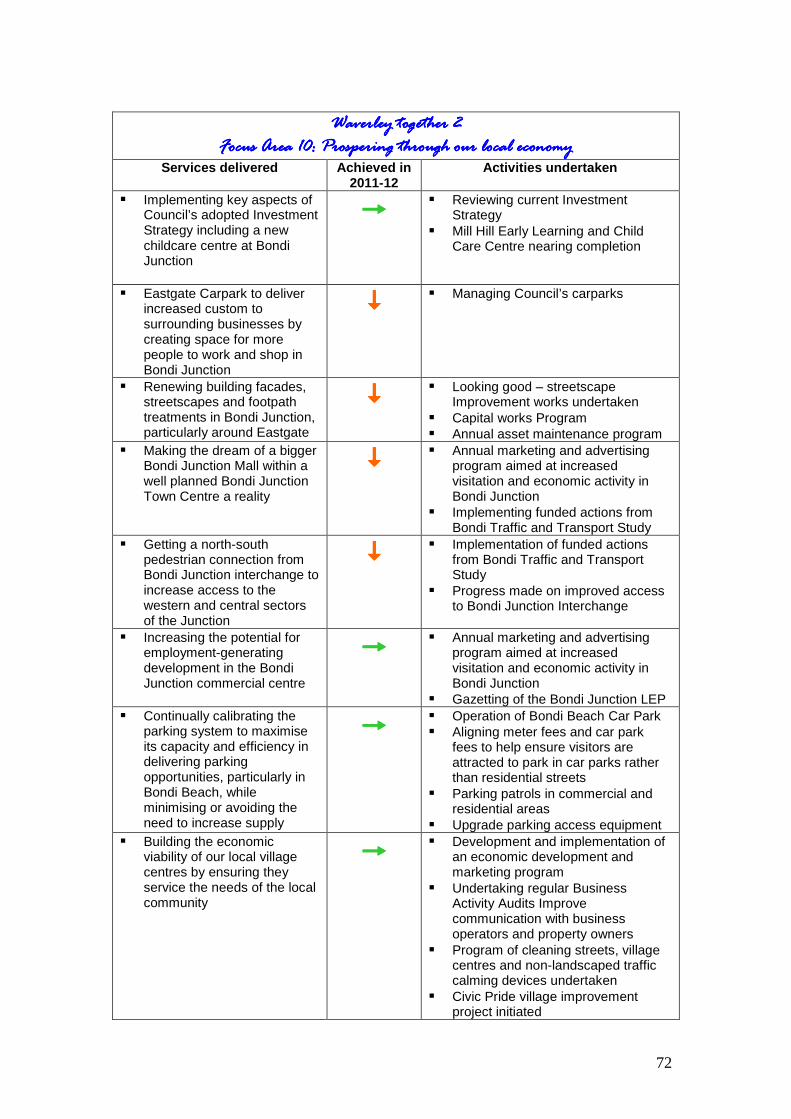
72
Waverley together 2Waverley together 2Waverley together 2Waverley together 2
Focus Area 10: Prospering through our local economyFocus Area 10: Prospering through our local economyFocus Area 10: Prospering through our local economyFocus Area 10: Prospering through our local economy Services delivered Achieved in
2011-12 Activities undertaken
� Implementing key aspects of Council’s adopted Investment Strategy including a new childcare centre at Bondi Junction
���� � Reviewing current Investment
Strategy � Mill Hill Early Learning and Child
Care Centre nearing completion
� Eastgate Carpark to deliver increased custom to surrounding businesses by creating space for more people to work and shop in Bondi Junction
���� � Managing Council’s carparks
� Renewing building facades, streetscapes and footpath treatments in Bondi Junction, particularly around Eastgate
���� � Looking good – streetscape
Improvement works undertaken � Capital works Program � Annual asset maintenance program
� Making the dream of a bigger Bondi Junction Mall within a well planned Bondi Junction Town Centre a reality
���� � Annual marketing and advertising
program aimed at increased visitation and economic activity in Bondi Junction
� Implementing funded actions from Bondi Traffic and Transport Study
� Getting a north-south pedestrian connection from Bondi Junction interchange to increase access to the western and central sectors of the Junction
���� � Implementation of funded actions
from Bondi Traffic and Transport Study
� Progress made on improved access to Bondi Junction Interchange
� Increasing the potential for employment-generating development in the Bondi Junction commercial centre
���� � Annual marketing and advertising
program aimed at increased visitation and economic activity in Bondi Junction
� Gazetting of the Bondi Junction LEP � Continually calibrating the
parking system to maximise its capacity and efficiency in delivering parking opportunities, particularly in Bondi Beach, while minimising or avoiding the need to increase supply
���� � Operation of Bondi Beach Car Park � Aligning meter fees and car park
fees to help ensure visitors are attracted to park in car parks rather than residential streets
� Parking patrols in commercial and residential areas
� Upgrade parking access equipment � Building the economic
viability of our local village centres by ensuring they service the needs of the local community
���� � Development and implementation of
an economic development and marketing program
� Undertaking regular Business Activity Audits Improve communication with business operators and property owners
� Program of cleaning streets, village centres and non-landscaped traffic calming devices undertaken
� Civic Pride village improvement project initiated
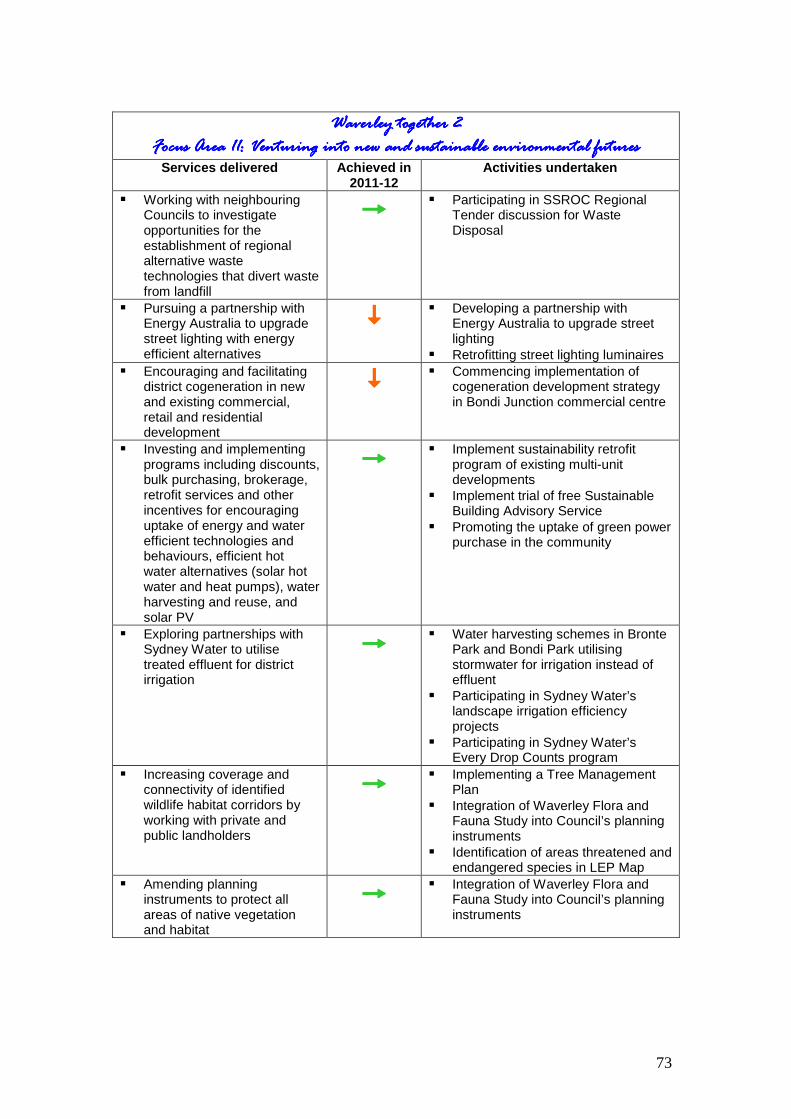
73
Waverley together 2Waverley together 2Waverley together 2Waverley together 2
Focus Area 11: Venturing into new and sustainable environmental futuresFocus Area 11: Venturing into new and sustainable environmental futuresFocus Area 11: Venturing into new and sustainable environmental futuresFocus Area 11: Venturing into new and sustainable environmental futures Services delivered Achieved in
2011-12 Activities undertaken
� Working with neighbouring Councils to investigate opportunities for the establishment of regional alternative waste technologies that divert waste from landfill
���� � Participating in SSROC Regional
Tender discussion for Waste Disposal
� Pursuing a partnership with Energy Australia to upgrade street lighting with energy efficient alternatives
���� � Developing a partnership with
Energy Australia to upgrade street lighting
� Retrofitting street lighting luminaires � Encouraging and facilitating
district cogeneration in new and existing commercial, retail and residential development
���� � Commencing implementation of
cogeneration development strategy in Bondi Junction commercial centre
� Investing and implementing programs including discounts, bulk purchasing, brokerage, retrofit services and other incentives for encouraging uptake of energy and water efficient technologies and behaviours, efficient hot water alternatives (solar hot water and heat pumps), water harvesting and reuse, and solar PV
���� � Implement sustainability retrofit
program of existing multi-unit developments
� Implement trial of free Sustainable Building Advisory Service
� Promoting the uptake of green power purchase in the community
� Exploring partnerships with Sydney Water to utilise treated effluent for district irrigation
���� � Water harvesting schemes in Bronte
Park and Bondi Park utilising stormwater for irrigation instead of effluent
� Participating in Sydney Water’s landscape irrigation efficiency projects
� Participating in Sydney Water’s Every Drop Counts program
� Increasing coverage and connectivity of identified wildlife habitat corridors by working with private and public landholders
���� � Implementing a Tree Management
Plan � Integration of Waverley Flora and
Fauna Study into Council’s planning instruments
� Identification of areas threatened and endangered species in LEP Map
� Amending planning instruments to protect all areas of native vegetation and habitat
���� � Integration of Waverley Flora and
Fauna Study into Council’s planning instruments
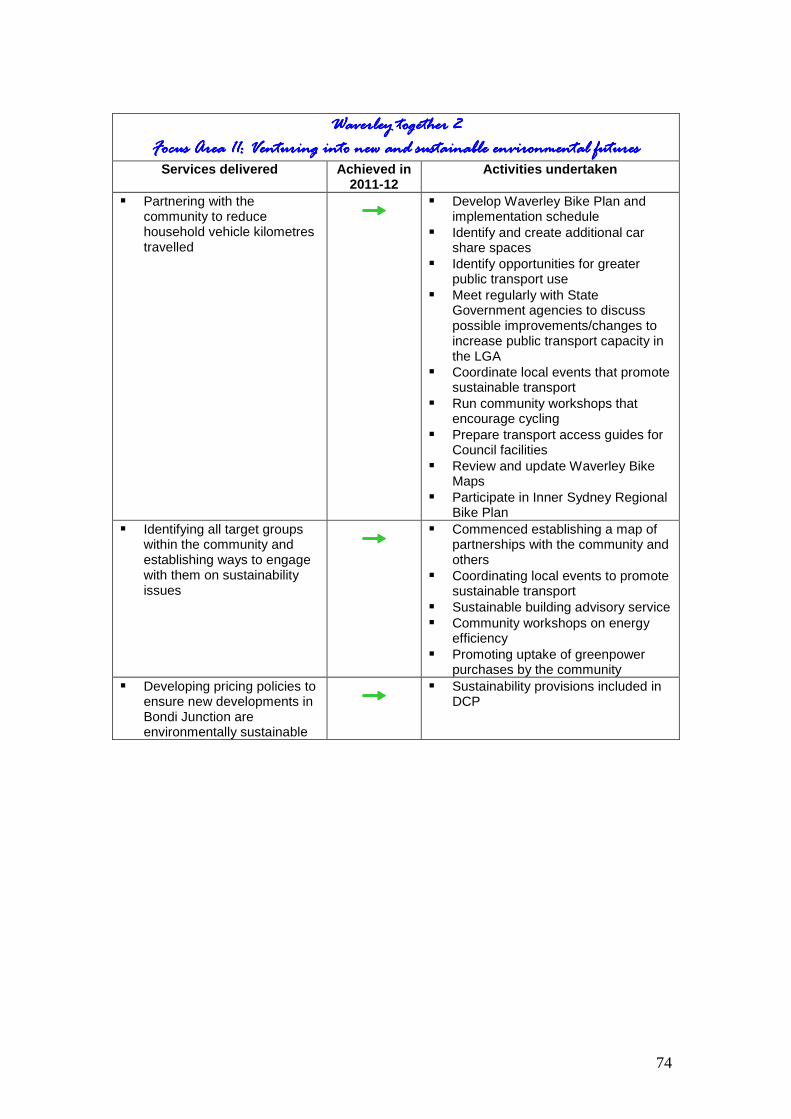
74
Waverley together 2Waverley together 2Waverley together 2Waverley together 2
Focus Area 11: Venturing into new and sustainablFocus Area 11: Venturing into new and sustainablFocus Area 11: Venturing into new and sustainablFocus Area 11: Venturing into new and sustainable environmental futurese environmental futurese environmental futurese environmental futures Services delivered Achieved in
2011-12 Activities undertaken
� Partnering with the community to reduce household vehicle kilometres travelled
���� � Develop Waverley Bike Plan and
implementation schedule � Identify and create additional car
share spaces � Identify opportunities for greater
public transport use � Meet regularly with State
Government agencies to discuss possible improvements/changes to increase public transport capacity in the LGA
� Coordinate local events that promote sustainable transport
� Run community workshops that encourage cycling
� Prepare transport access guides for Council facilities
� Review and update Waverley Bike Maps
� Participate in Inner Sydney Regional Bike Plan
� Identifying all target groups within the community and establishing ways to engage with them on sustainability issues
���� � Commenced establishing a map of
partnerships with the community and others
� Coordinating local events to promote sustainable transport
� Sustainable building advisory service � Community workshops on energy
efficiency � Promoting uptake of greenpower
purchases by the community � Developing pricing policies to
ensure new developments in Bondi Junction are environmentally sustainable
���� � Sustainability provisions included in
DCP

75
Waverley Together 2Waverley Together 2Waverley Together 2Waverley Together 2
FocuFocuFocuFocus Area 12: Engaging everyone for far sighted and better decision makings Area 12: Engaging everyone for far sighted and better decision makings Area 12: Engaging everyone for far sighted and better decision makings Area 12: Engaging everyone for far sighted and better decision making Services delivered Achieved in
2011-12 Activities undertaken
� Implementing Integrated Planning, now required by law, for a great QBL outcome, especially by integrating strategic asset management planning, environmental planning, urban land use planning under the Waverley LEP, ongoing social planning, human resource planning and long term financial planning
���� � Development of a suite of corporate
plans that meet legislative requirements
� Preparing reports on progress with Delivery Program deliverables, Annual Report and End of Term Report
� Continuing to consult widely and deeply about desired service levels for assets and programs to ensure our services are really delivering what’s most relevant to residents’ needs
���� � Development and implementation of
a Community Engagement Strategy that meets legislative requirements
� Building great information and communications programs so that consultation especially on the most difficult or divisive issues can occur based on the best information
���� � Development and implementation of
a Community Engagement Strategy that meets legislative requirements
� Provide support to Advisory committees, Precinct committees and community forums
� Building a better website interface between the community and Council including more interactive consultation pages, improved project e-tracking and search functionality, more e-trading and introducing e-planning
���� � Google search functionality
established on website improving � Rate rise and other consultation
programs based on interactive Bang the Table platforms
� e-planning proceeding � Web-based DA tracking installed
� Building a workforce that is committed to engagement and excited by the prospect of understanding desires and meeting them in clever and efficient ways
���� � Customer service training for staff � Customer Service Charter
implemented � A program of continuous
improvement in customer service � Precinct Policy reviewed � Award winning engagement on
Integrated Planning & Reporting (Waverley Council was the winner of the International Association for Public Participation’s 2011 NSW Core Values Award)
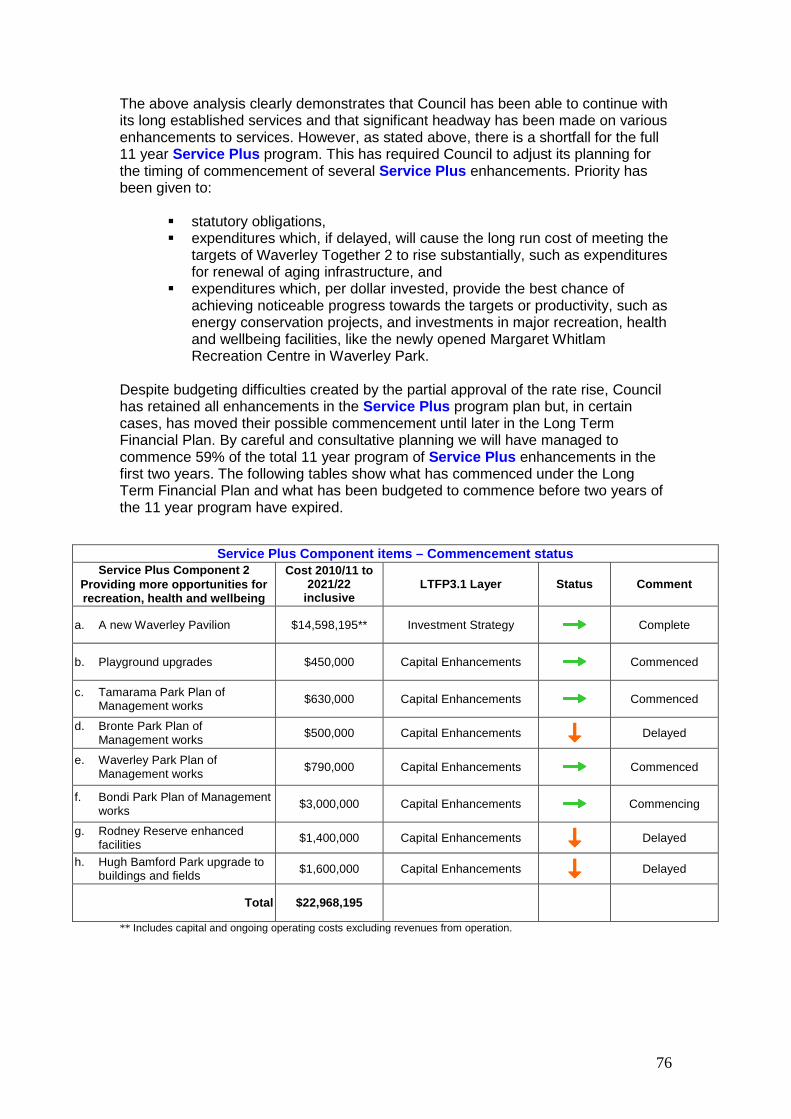
76
The above analysis clearly demonstrates that Council has been able to continue with its long established services and that significant headway has been made on various enhancements to services. However, as stated above, there is a shortfall for the full 11 year Service Plus program. This has required Council to adjust its planning for the timing of commencement of several Service Plus enhancements. Priority has been given to:
� statutory obligations, � expenditures which, if delayed, will cause the long run cost of meeting the
targets of Waverley Together 2 to rise substantially, such as expenditures for renewal of aging infrastructure, and
� expenditures which, per dollar invested, provide the best chance of achieving noticeable progress towards the targets or productivity, such as energy conservation projects, and investments in major recreation, health and wellbeing facilities, like the newly opened Margaret Whitlam Recreation Centre in Waverley Park.
Despite budgeting difficulties created by the partial approval of the rate rise, Council has retained all enhancements in the Service Plus program plan but, in certain cases, has moved their possible commencement until later in the Long Term Financial Plan. By careful and consultative planning we will have managed to commence 59% of the total 11 year program of Service Plus enhancements in the first two years. The following tables show what has commenced under the Long Term Financial Plan and what has been budgeted to commence before two years of the 11 year program have expired.
Service Plus Component items – Commencement status Service Plus Component 2
Providing more opportunities for recreation, health and wellbeing
Cost 2010/11 to 2021/22
inclusive LTFP3.1 Layer Status Comment
a. A new Waverley Pavilion $14,598,195** Investment Strategy ���� Complete
b. Playground upgrades $450,000 Capital Enhancements ���� Commenced
c. Tamarama Park Plan of Management works $630,000 Capital Enhancements ���� Commenced
d. Bronte Park Plan of Management works $500,000 Capital Enhancements ���� Delayed
e. Waverley Park Plan of Management works $790,000 Capital Enhancements ���� Commenced
f. Bondi Park Plan of Management works
$3,000,000 Capital Enhancements ���� Commencing
g. Rodney Reserve enhanced facilities $1,400,000 Capital Enhancements ���� Delayed
h. Hugh Bamford Park upgrade to buildings and fields $1,600,000 Capital Enhancements ���� Delayed
Total $22,968,195
** Includes capital and ongoing operating costs excluding revenues from operation.
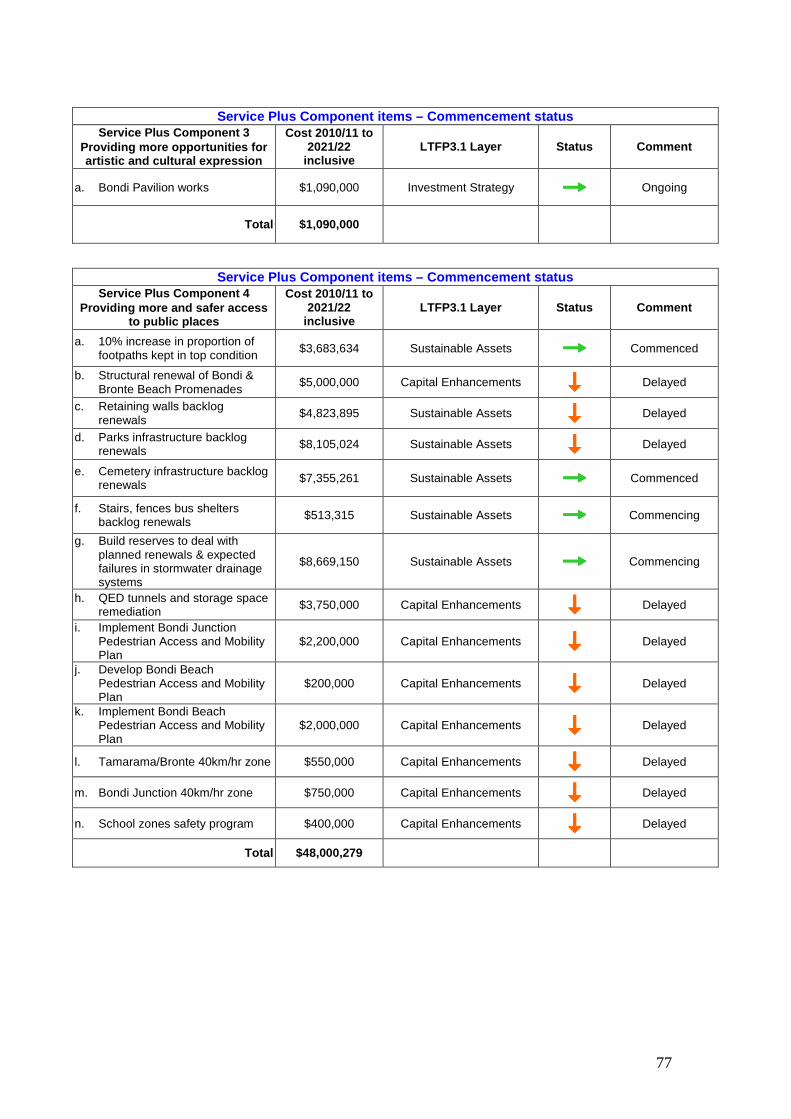
77
Service Plus Component items – Commencement status Service Plus Component 3
Providing more opportunities for artistic and cultural expression
Cost 2010/11 to 2021/22
inclusive LTFP3.1 Layer Status Comment
a. Bondi Pavilion works $1,090,000 Investment Strategy ���� Ongoing
Total $1,090,000
Service Plus Component items – Commencement status Service Plus Component 4
Providing more and safer access to public places
Cost 2010/11 to 2021/22
inclusive LTFP3.1 Layer Status Comment
a. 10% increase in proportion of footpaths kept in top condition $3,683,634 Sustainable Assets ���� Commenced
b. Structural renewal of Bondi & Bronte Beach Promenades
$5,000,000 Capital Enhancements ���� Delayed
c. Retaining walls backlog renewals
$4,823,895 Sustainable Assets ���� Delayed
d. Parks infrastructure backlog renewals $8,105,024 Sustainable Assets ���� Delayed
e. Cemetery infrastructure backlog renewals $7,355,261 Sustainable Assets ���� Commenced
f. Stairs, fences bus shelters backlog renewals $513,315 Sustainable Assets ���� Commencing
g. Build reserves to deal with planned renewals & expected failures in stormwater drainage systems
$8,669,150 Sustainable Assets ���� Commencing
h. QED tunnels and storage space remediation $3,750,000 Capital Enhancements ���� Delayed
i. Implement Bondi Junction Pedestrian Access and Mobility Plan
$2,200,000 Capital Enhancements ���� Delayed
j. Develop Bondi Beach Pedestrian Access and Mobility Plan
$200,000 Capital Enhancements ���� Delayed
k. Implement Bondi Beach Pedestrian Access and Mobility Plan
$2,000,000 Capital Enhancements ���� Delayed
l. Tamarama/Bronte 40km/hr zone $550,000 Capital Enhancements ���� Delayed
m. Bondi Junction 40km/hr zone $750,000 Capital Enhancements ���� Delayed
n. School zones safety program $400,000 Capital Enhancements ���� Delayed
Total $48,000,279
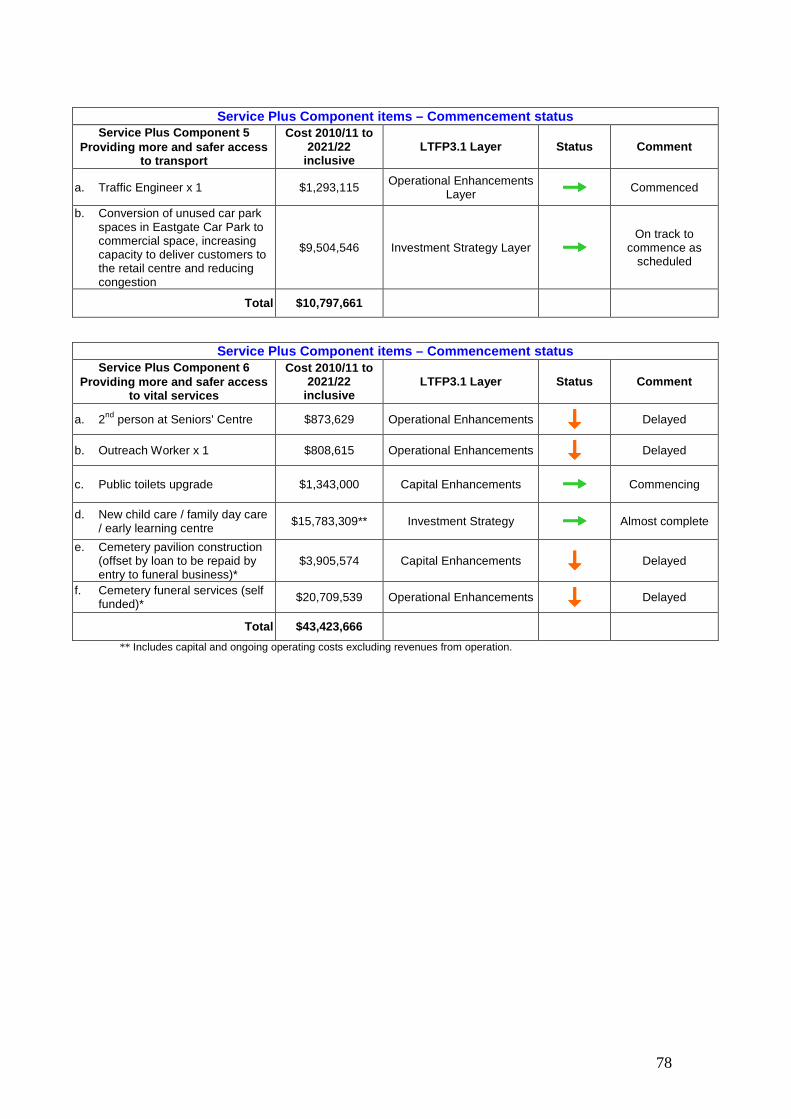
78
Service Plus Component items – Commencement status Service Plus Component 5
Providing more and safer access to transport
Cost 2010/11 to 2021/22
inclusive LTFP3.1 Layer Status Comment
a. Traffic Engineer x 1 $1,293,115 Operational Enhancements Layer ���� Commenced
b. Conversion of unused car park spaces in Eastgate Car Park to commercial space, increasing capacity to deliver customers to the retail centre and reducing congestion
$9,504,546 Investment Strategy Layer ����
On track to commence as
scheduled
Total $10,797,661
Service Plus Component items – Commencement status Service Plus Component 6
Providing more and safer access to vital services
Cost 2010/11 to 2021/22
inclusive LTFP3.1 Layer Status Comment
a. 2nd person at Seniors' Centre $873,629 Operational Enhancements ���� Delayed
b. Outreach Worker x 1 $808,615 Operational Enhancements ���� Delayed
c. Public toilets upgrade $1,343,000 Capital Enhancements ���� Commencing
d. New child care / family day care / early learning centre
$15,783,309** Investment Strategy ���� Almost complete
e. Cemetery pavilion construction (offset by loan to be repaid by entry to funeral business)*
$3,905,574 Capital Enhancements ���� Delayed
f. Cemetery funeral services (self funded)* $20,709,539 Operational Enhancements ���� Delayed
Total $43,423,666
** Includes capital and ongoing operating costs excluding revenues from operation.

79
Service Plus Component items – Commencement status Service Plus Component 7
Providing more cleaning and greening of all the spaces we
share
Cost 2010/11 to 2021/22
inclusive LTFP3.1 Layer Status Comment
a. Extra landscape maintenance - plants & materials $3,832,820 Operational Enhancements ���� Commencing
b. Three extra gardeners $3,054,282 Operational Enhancements ���� Commencing
c. Extra tree maintenance $680,191 Operational Enhancements ���� Delayed
d. Parks landscapes upgrades $1,305,599 Sustainable Assets ���� Delayed
e. Increased graffiti removal $652,800 Operational Enhancements ���� Commenced
f. Tree Compliance Officer x 1 $968,295 Operational Enhancements ���� Delayed
g. Depot/s within LGA for parks and street maintenance $19,500,000 Investment Strategy ��������
Small depots achieved. Larger
depot at Hugh Bamford Reserve
not proceeding
h. Centralised depot outside LGA $7,012,273 Investment Strategy ���� Commencing
i. Street trees improved $1,305,599 Sustainable Assets ���� Delayed
j. Cost of acquisition of land for open space in Bondi Junction which Council is likely to be compelled to acquire
$5,002,427 Capital Enhancements ���� Ongoing
Total $43,314,286
Service Plus Component items – Commencement status Service Plus Component 8
Providing more inviting streetscapes
Cost 2010/11 to 2021/22
inclusive LTFP3.1 Layer Status Comment
a. Local village improvements $3,000,000 Capital Enhancements Layer ���� Ongoing
b. Eastgate façade upgrade $1,600,000 Investment Strategy Layer ���� Delayed
c. Boot Factory remediation 0* Capital Enhancements Layer ���� Unfunded
d. Oxford Street East upgrade $2,000,000 Capital Enhancements Layer ���� Delayed
Total $6,600,000
* No cost estimate is available as yet for this item as there are too many variables to consider. For purposes of calculating shortfalls it will need to be assumed that this item is to be funded from capital works contingencies or sale of assets additional to those assets already earmarked for sale under Investment Strategy 2007.
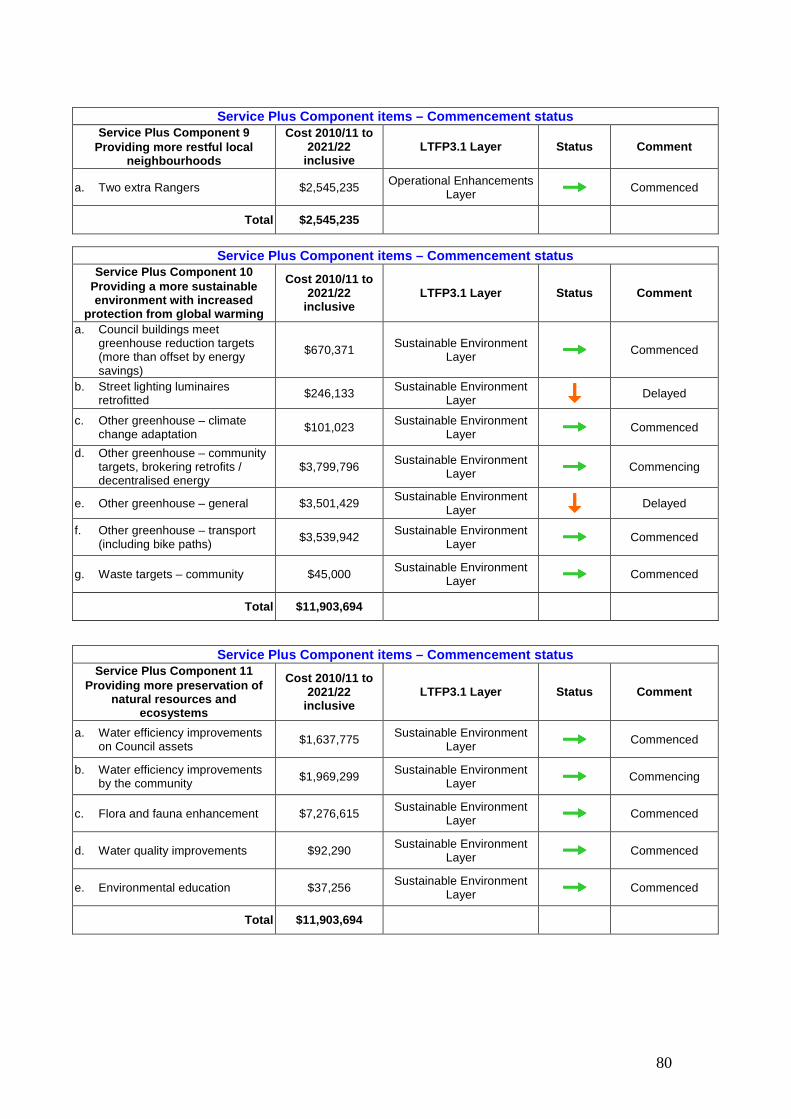
80
Service Plus Component items – Commencement status Service Plus Component 9
Providing more restful local neighbourhoods
Cost 2010/11 to 2021/22
inclusive LTFP3.1 Layer Status Comment
a. Two extra Rangers $2,545,235 Operational Enhancements Layer ���� Commenced
Total $2,545,235
Service Plus Component items – Commencement status Service Plus Component 10
Providing a more sustainable environment with increased
protection from global warming
Cost 2010/11 to 2021/22
inclusive LTFP3.1 Layer Status Comment
a. Council buildings meet greenhouse reduction targets (more than offset by energy savings)
$670,371 Sustainable Environment Layer ���� Commenced
b. Street lighting luminaires retrofitted $246,133 Sustainable Environment
Layer ���� Delayed
c. Other greenhouse – climate change adaptation $101,023 Sustainable Environment
Layer ���� Commenced
d. Other greenhouse – community targets, brokering retrofits / decentralised energy
$3,799,796 Sustainable Environment Layer ���� Commencing
e. Other greenhouse – general $3,501,429 Sustainable Environment
Layer ���� Delayed
f. Other greenhouse – transport (including bike paths)
$3,539,942 Sustainable Environment Layer ���� Commenced
g. Waste targets – community $45,000 Sustainable Environment Layer ���� Commenced
Total $11,903,694
Service Plus Component items – Commencement status Service Plus Component 11
Providing more preservation of natural resources and
ecosystems
Cost 2010/11 to 2021/22
inclusive LTFP3.1 Layer Status Comment
a. Water efficiency improvements on Council assets $1,637,775 Sustainable Environment
Layer ���� Commenced
b. Water efficiency improvements by the community $1,969,299 Sustainable Environment
Layer ���� Commencing
c. Flora and fauna enhancement $7,276,615 Sustainable Environment Layer ���� Commenced
d. Water quality improvements $92,290 Sustainable Environment Layer ���� Commenced
e. Environmental education $37,256 Sustainable Environment Layer ���� Commenced
Total $11,903,694
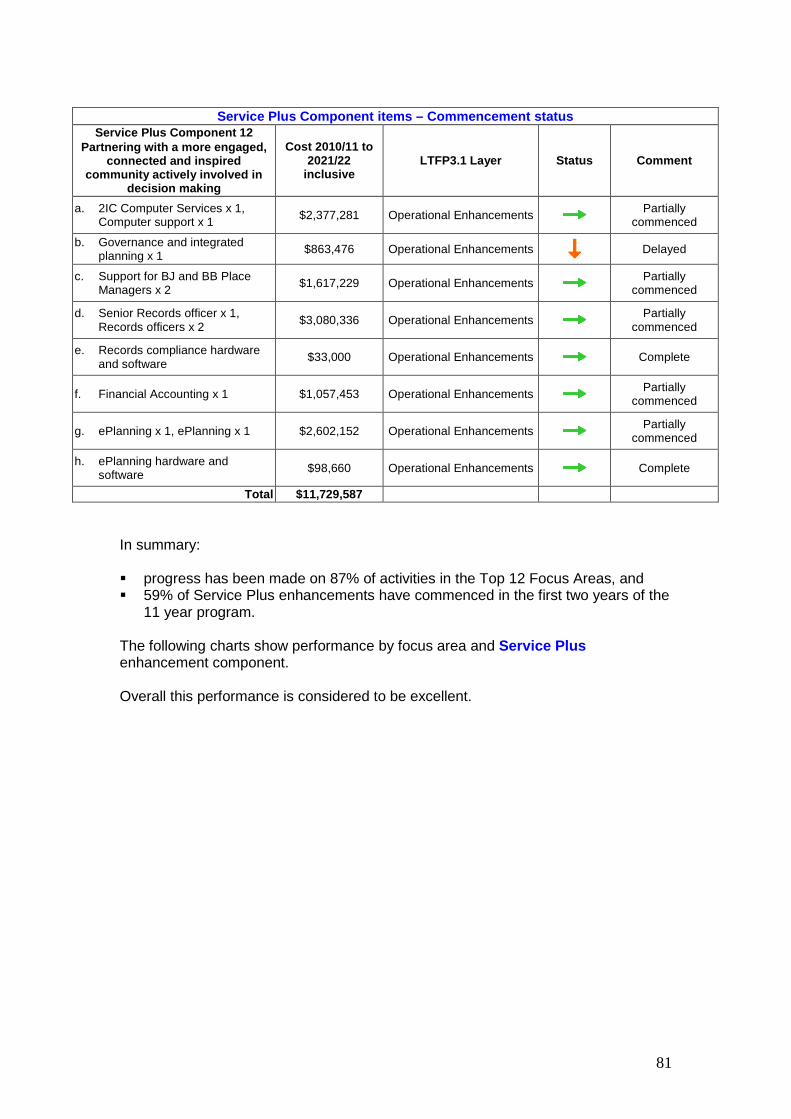
81
Service Plus Component items – Commencement status Service Plus Component 12
Partnering with a more engaged, connected and inspired
community actively involved in decision making
Cost 2010/11 to 2021/22
inclusive LTFP3.1 Layer Status Comment
a. 2IC Computer Services x 1, Computer support x 1 $2,377,281 Operational Enhancements ���� Partially
commenced
b. Governance and integrated planning x 1 $863,476 Operational Enhancements ���� Delayed
c. Support for BJ and BB Place Managers x 2 $1,617,229 Operational Enhancements ���� Partially
commenced
d. Senior Records officer x 1, Records officers x 2 $3,080,336 Operational Enhancements ���� Partially
commenced
e. Records compliance hardware and software
$33,000 Operational Enhancements ���� Complete
f. Financial Accounting x 1 $1,057,453 Operational Enhancements ���� Partially commenced
g. ePlanning x 1, ePlanning x 1 $2,602,152 Operational Enhancements ���� Partially commenced
h. ePlanning hardware and software $98,660 Operational Enhancements ���� Complete
Total $11,729,587 In summary: � progress has been made on 87% of activities in the Top 12 Focus Areas, and � 59% of Service Plus enhancements have commenced in the first two years of the
11 year program. The following charts show performance by focus area and Service Plus enhancement component. Overall this performance is considered to be excellent.

82
Waverley Together 2Performance on implementation of activities in the Top 12 Focus
Areas for Waverley Council services
80%
80%
50%
100%
100%
75%
100%
100%
100%
91%
90%
88%
20%
20%
50%
25%
0%
9%
10%
13%
0% 20% 40% 60% 80% 100% 120%
12. Engaging everyone for far sighted and betterdecision making
11. Venturing into new and sustainableenvironmental futures
10. Prospering through our economy
9. Feeling and being safe
8. Harmonising new and old design
7. Sprucing up our streets and villages
6. Renewing our health and well being
5. Fostering our cultural diversity
4. Welcoming visitors
3. Living with urban density
2. Staying connected as a community
1. Protecting and enjoying our beaches andcoastal open spaces
% of activities trending towards (green) / away (red) from sustainability or delayed (orange)

83
Waverley Together 2Performance on implementation of Service Plus enhancements
88%
100%
71%
100%
25%
50%
33%
100%
29%
100%
63%
13%
29%
50%
40%
67%
71%
38%
-25%
-10%
-40% 0% 40% 80% 120%
Partnering with a more engaged, connected andinspired community actively involved in decision
making
Providing more preservation of natural resourcesand ecosystems
Providing a more sustainable environment withincreased protection from global warming
Providing more restful local neighbourhoods
Providing more inviting streetscapes
Providing more cleaning and greening of all thespaces we share
Providing more and safer access to vital services
Providing more and safer access to transport
Providing more and safer access to public places
Providing more opportunities for artistic andcultural expression
Providing more opportunities for recreation,health and wellbeing
% of activities trending towards (green) / away (red) from sustainability or delayed (orange)

84
4.2 Contribution of the services of other levels of government The services of the NSW State Government also have a major influence on our community’s capacity to realise their vision under Waverley Together 2. NSW 2021 outlines 5 major areas of direct service in addition to the State Government’s natural roles in managing the state’s overall economy, major infrastructure, environment and governance. Their direct services focus is:
NSW 2021 Service focus Return quality services in:
� Transport � Health � Family and community services � Education � Police and justice
Based on our 2009 HVRF survey results and other data, it would appear that the Waverley community feels State Government services are accessible and generally satisfactory as follows:
�������� Transport
� Transport in Waverley is viewed as adequate but is at capacity. If more of us are to use it we need to achieve network efficiency and expansion, such as light rail implementation.
���� Health � Hospitals are considered accessible and adequate.
���� Family and community services
� Family and community services require expansion, especially for the disabled and families in crisis or stress.
���� Education � Education at primary, secondary and tertiary levels is accessible and adequate.
���� Police � It would be desirable to be able to achieve
greater access to police services by those who are most vulnerable.
���� Justice � We have confidence in the justice system.
The State Government’s current focus on the NSW economy and infrastructure investment is obviously imperative for Waverley. Strategies to place downward pressure on the cost of living, make provision for affordable housing and increase the competitiveness of the services sector are vital. Investment and engagement in environmental sustainability, however, is an area of NSW 2021 that should be revisited to design strategies for partnerships which will enable our community to reach its targets for Waverley Together 2 by 2022. Waverley residents clearly would like more leadership from State and Federal Government on environmental futures and metropolitan planning.

85
5. Towards Waverley Together 3 The results of this End of Term analysis show that we are moving clearly towards the vision for Waverley Together 2 and towards quadruple bottom line sustainability. Whether we will reach the targets in full by 2022 depends on our ability at all levels of government to sustain services, to plan and lead with great governance, and to create productive partnerships between government, business and the community. There is capacity to sustain services and renew assets to a standard that will deliver the desired levels of service, at least to a certain extent. Governments are healthy overall financially, although in the long term there is some vulnerability in parts of the Local Government sector. Waverley is one of the councils facing challenges in achieving financial sustainability over the longer term. However, we have excellent long term planning and community engagement processes in place and have the capacity in partnership with our community to overcome this issue. Detailed analysis of data in the report clearly indicates a lot of underlying strength in this community’s make-up and disposition towards realising its vision. Waverley is a highly committed community with a strong cohesion in its aspirations. The strengths of its performance are set out in Section 1 above. However, there are aspects of the vision for Waverley where we still have concern and we need to increase our attention on ways of overcoming these concerns. Increased investment in assets by all levels of government and some policy and strategy shifts will be required, along with excellent financial planning and efficiency programming if we are to overcome these concerns. Some attitudinal change in a couple of areas surrounding parking and travel choices will also be required and much of this is beyond the control of governments to influence without significant community buy-in. 5.1 Some policies and strategies to help address co ncerns The following tables summarise the focus of concerns and provide guidance about the direction of investment that will be necessary to resolve the concerns. The matters raised here should form part of the considerations for development of Waverley Together 3.
Waverley Together 2 towards Waverley Together 3 Areas of concern in sustainability and development of policy and strategy
Vision Focus of concern Potential new focus areas for p olicy , strategy and partnership
development We are safe � Safety in travel � Focus on making cycling safer.
� Close the gap on footpath condition ratings.
We are reconciled with and value our indigenous past
� Indigenous reconciliation and preservation of indigenous heritage
� Maintain and develop multicultural celebration and inclusion programs.
� Continue to develop creative economy initiatives promoting indigenous appreciation.

86
Waverley Together 2 towards Waverley Together 3 Areas of concern in sustainability and development of policy and strategy
Vision Focus of concern Potential n ew focus areas for p olicy , strategy and partnership
development Connections within families and between generations can remain unbroken
� Housing affordability � Cost of living
� Maintain and expand affordable housing programs as contributions accrue via voluntary planning agreements.
� Continue to advocate for strong policies in affordable housing in metropolitan land use planning at the state level.
� Ensure the enabling clause for affordable housing in our draft LEP is gazetted to provide a significant improvement to our capacity to deliver affordable housing and, at the very least, continue our current program.
We are inspired and able to renew our physical and spiritual wellbeing
� Access to healthy lifestyle opportunities by the disabled
� Active travel patterns � Access to police
services for those in stressed personal wellbeing
� Social exclusion � Unrestful or crowded
lifestyles associated with high density living
� Engage in service reviews and integrated planning to achieve more effective access to government and community based services by people with disabilities.
� Continue and develop outreach and social inclusion programs and services, particularly targeted to families in crisis, housebound individuals and the disabled.
� Expand police response for families in crisis.
� Expand active travel incentives as outlined in the newly revised Transport Plan.
� Expand both government and community driven support groups, including transport services and home self-sufficiency programs, focussing on those leading isolated lifestyles.
Everyone is welcome to participate positively in community life
� Access and social inclusion opportunities for the disabled, aged and for indigenous people
� Improve the actual knowledge of the services already available for disabled and aged people.
� Maintain and develop indigenous celebration and inclusion programs.
We can express our essential selves through our traditions, our arts, our cultures and our lifestyles
� Arts and entertainment facilities
� Indigenous expression
� Appreciation of local history
� Further develop existing and create multi-function facilities incorporating opportunities for creative, cultural and self expression.

87
Waverley Together 2 towards Waverley Together 3 Areas of concern in sustainability and development of policy and strategy
Vision Focus of concern Potential new focus areas for p olicy , strategy and partnership
development We act together as a compassionate society
� Exclusion of or passive attitudes to those on the margins or in vulnerable circumstances
� Encourage residents and partners to become signatories to the Charter for Compassion (Australia, Inc.) already adopted by Waverley Council and the Federal Government.
� Promote other initiatives such as membership of World Kindness Australia throughout the LGA.
The beauty of our beaches, cliffs and coastal lands endures
� Streetscape appearance
� Cleaning and greening
� Dumped rubbish � Expected sea level
rise � Increasing coastal
erosion
� Continue to increase investment in cleaning and greening.
� Increase investment in education about and efficient collection of dumped rubbish.
� Proactively manage risk and increase investment in climate change adaptation programs.
� Expand civic pride programs and community engagement in street and neighbourhood design and space planning, sharing and maintenance.
The architectural landscape is cared for and developed at a human scale and design is sensitive to the natural, historical and social contexts
� Increasing density and population
� Control of building activity
� Congestion and amenity impacts associated with density
� Balance of benefits of high density living with disadvantages
� Increase the focus on good urban design and preservation of heritage to protect amenity amid increasing urban density.
� Focus on incentives to reduce traffic congestion, problems arising from lack of private parking and refine systems for residential parking.
� Diversify responses to alcohol and anti social behaviour issues and noise complaints.
� In leadership on urban planning, participate actively in emerging debates about the “culture” of local government and urban planning to provide for more strategic planning, increased complying development, and new ways of processing development applications.
Vital services are fully accessible
� Access to services, shops and other facilities by the disabled
� Parking availability for the disabled
� Access to disability support services
� Access to affordable child care services
� Access to family support services
� Minimise misuse of the Mobility Parking Scheme.
� Continue to develop partnerships with and referrals to other agencies in government and the not-for-profit sector in disability support.
� Consolidate child care services and diversify for efficiency (eg., expand family day care services).
� Maintain family support services and networks.

88
Waverley Together 2 towards Waverley Together 3
Areas of concern in sustainability and development of policy and strategy Vision Focus of concern Potential new focus areas for p olicy ,
strategy and partnership development
Scarce resources are conserved and fairly shared
� Excessive demand for and consumption of road and parking resources
� Unfair sharing of limited parking resources
� Shortage of affordable housing
� Waste conservation and resource recovery
� Energy consumption � Water consumption
� Implement adopted policies to equitably distribute access to what will always be a limited supply of on-street parking in both residential and commercial areas.
� Assess changes to schemes and procedures for parking provision against Council’s adopted QBL framework of 14 criteria and 5 principles for achieving sustainable parking resources.
� Pursue alternative transport options such as car share and other incentives to utilise sustainable transport and active travel options.
� Reverse trend of increasing private vehicle registrations, especially 4-wheel drives, and reverse decline in public transport use by implementing Council’s recently revised Transport Plan and maintaining other sustainable policies.
� Maintain and expand affordable housing supply as developer contributions permit.
� Significantly improve the rate of recovery of recyclables, green waste and food waste from the domestic and commercial waste streams.
� Lead and participate with seven other SSROC councils in development of an Advanced Waste Treatment facility (AWT).
� Implement policies and partnerships outlined in Council’s Environmental Action Plan 2 (EAP2) to reverse the trend of water and energy consumption over the next decade.
� Pursue buy-in from government, business and the community itself particularly in energy conservation and creation of renewable supply.
� Reverse the trend of growing water consumption by Council by continuing investment in local water harvesting projects.

89
Waverley Together 2 towards Waverley Together 3
Areas of concern in sustainability and development of policy and strategy Vision Focus of concern Potential new focus areas for p olicy ,
strategy and partnership development
Local economic prosperity provides opportunity for all
� Capacity to realise the economic potential of newly adopted LEPs
� The narrowness of our services-based local economy
� Proactively drive implementation of the newly adopted LEP to ensure appropriately paced take-up of the released development and employment potential in commercial areas.
� Explore diversification of the local services economy by establishing a basis for a more creative economy.
� Ensure continuing access to higher education to build human capital suitable for expansion of the services economy.
� Intensify our economic planning capacity within Council.
� Develop Council’s next property investment strategy to maximise shared benefits of and returns on Council investments.
� Develop viable business futures for Waverley Cemetery and its contribution to QBL sustainability.
As a local community we have the courage to take a leading place in achieving the environmental aims of a global society
� Energy consumption � Water consumption � Modes of travel � Environmental
leadership and partnerships
� Show leadership on long range planning for environmental sustainability in use of CCAP to isolate the best investments in win-win projects for the environment.
� Actively partner with local business in such things as urban environmental investment on cogeneration.
� Map and explore ways of actively partnering with the community to increase use of renewable energy.
� Continue to invest in water harvesting.
� Implement the newly revised Waverley Transport Plan.
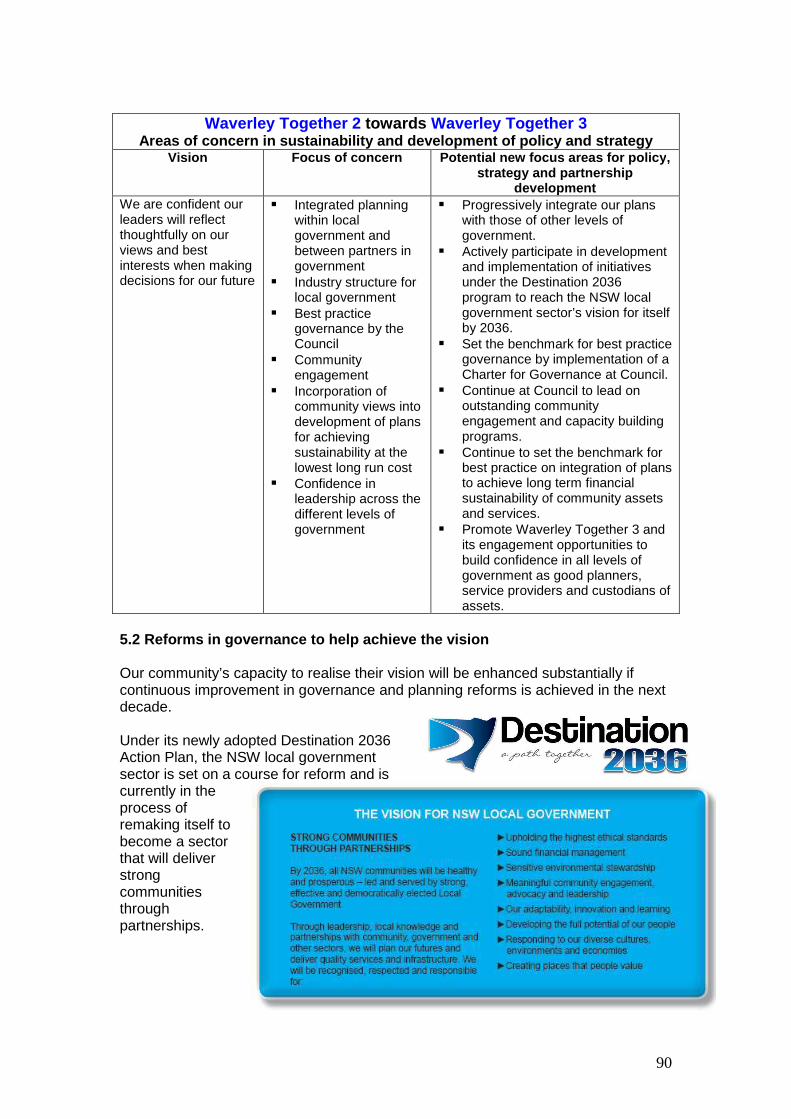
90
Waverley Together 2 towards Waverley Together 3
Areas of concern in sustainability and development of policy and strategy Vision Focus o f concern Potential new focus areas for p olicy ,
strategy and partnership development
We are confident our leaders will reflect thoughtfully on our views and best interests when making decisions for our future
� Integrated planning within local government and between partners in government
� Industry structure for local government
� Best practice governance by the Council
� Community engagement
� Incorporation of community views into development of plans for achieving sustainability at the lowest long run cost
� Confidence in leadership across the different levels of government
� Progressively integrate our plans with those of other levels of government.
� Actively participate in development and implementation of initiatives under the Destination 2036 program to reach the NSW local government sector’s vision for itself by 2036.
� Set the benchmark for best practice governance by implementation of a Charter for Governance at Council.
� Continue at Council to lead on outstanding community engagement and capacity building programs.
� Continue to set the benchmark for best practice on integration of plans to achieve long term financial sustainability of community assets and services.
� Promote Waverley Together 3 and its engagement opportunities to build confidence in all levels of government as good planners, service providers and custodians of assets.
5.2 Reforms in governance to help achieve the visio n Our community’s capacity to realise their vision will be enhanced substantially if continuous improvement in governance and planning reforms is achieved in the next decade. Under its newly adopted Destination 2036 Action Plan, the NSW local government sector is set on a course for reform and is currently in the process of remaking itself to become a sector that will deliver strong communities through partnerships.
91
This program of sector reform lines up well with Waverley’s initiatives in finding efficiencies and achieving service and financial sustainability through great Integrated Planning & Reporting. Waverley Council is a leader in IP&R and has been using it, as stated above, to refine understanding of desired service levels for assets in consultation with the community. This has led to significant rationalisation and reduction of required investment in assets. The Council will now be attempting to use IP&R to do as much for services, particularly to identify how to increase QBL outputs while reducing input costs. In other words we will be attempting to use IP&R to shed light on how we can establish and achieve “QBL productivity”. Initiatives of this kind, if they work, should reform the sector’s capacity over the next decade to become more efficient and attract funding support from other levels of government. Council’s excellent long term financial planning and workforce planning will also help to position the Council to make the maximum contribution to the community’s chances of achieving their vision for Waverley. And integration of our IP&R with delivery of the development potential in new LEPs should boost our area’s contribution to GDP, social capital and economic sustainability overall. Lastly, continuous improvement in governance, organisational strategy, communication and great community engagement will be vital to securing the future. Waverley Council is already accredited with awards in this area, such as the International Association of Public Participation’s 2011 NSW Core Values Award. We will continue to take the lead in engagement for integrated planning and seek to influence the future of the sector as a whole and as an equal and efficient partner with other levels of government, business and the community. Strategic plans for each of these items will be set out in the forthcoming suite of plans supporting Waverley Together 3.

92
Appendix 1: Map of Council’s services towards the v ision How Waverley Council has organised its services to deliver the most effective
contribution to achievement oft the Vision of Waverley Together 2 There is a very strong connection between continuation and enhancement of Waverley Council’s services – full Service Plus – and achievement of the vision of the Waverley community’s adopted Community Strategic Plan, Waverley Together 2. Conversely there is also a very strong connection between discontinuation of services and/or failure to enhance services and – partial implementation of Service Plus – and failure to achieve the Vision of Waverley Together 2. This connection is mapped throughout our integrated plans and communications materials and is summarised as follows: Step 1: Delivery of all s ervices in Service Plus, including service
enhancements contributes directly to implementation of 33 Directions/Strategies in Waverley Together 2 as follows:
Services in Service Plus … … contribute to achievement of
Waverley Together 2 Directions/ Strategies …
1. Asset Management Services G6 2. Beach Services, Maintenance & Safety C5, L3 3. Cemetery Services C1, C2, G6 4. Child Care Services C4 5. Community Services C4, C5 6. Corporate Support Services G5, G7, G8, G9 7. Cultural Services C1, C2, C5, C6, L1, L2 8. Customer Services & Communication G1, G2, G3, G8 9. Development, Building & Health Services L4, L5 10. Emergency Management Services C5 11. Environmental Services E1, E2, E3, E4, E5, E6, E7, E8 12. Governance, Integrated Planning & Community
Engagement C2, G1, G2, G3, G4, G5, G6, G7, G8
13. Library Services C1, C2, C4 14. Parking Services C2, C5, L1, L2, L6, L7, L8, L9 15. Parks Services & Maintenance C7, E1, E6, L3, L4 16. Place Management C2, C5, C6, C7, L1, L2, L3, L4, E3,
G2, G6 17. Recreation Services C6, C7 18. Regulatory Services C5, E7, E5, L2, L3 19. Social & Affordable Housing C3, C4, C5
20. Traffic & Transport Services C2, C5, L1, L2, L6, L7, L8, L9
21. Urban Open Space Maintenance & Accessibility L3 22. Waste Services E3, L3
Then
����

93
Step 2: Implementation of all 33 Directions/Strategies in Waverley Together 2 enhances the community’s capacity to achieve the 60 Targets for or Indicators of quadruple bottom line sustainability as follows:
Directions/ Strategies for a Sustainable Community help the community achieve …
… Waverley Together 2 Targets /Indicators …
C1 Waverley’s cultural heritage and diversity is recognised, protected and respected.
1. The proportion of residents who agree that there is a sense of community in Waverley is steady or increasing.
2. The proportion of residents who volunteer to help in the community is increasing.
C2 The community is welcoming and inclusive and people feel that they are connected and belong.
C3 Housing options are available to enable long term residents and those with a connection to the community to remain in Waverley.
3. The proportion of residents experiencing housing stress is not increasing.
4. The number of units of social and affordable housing in Council’s portfolio is maintained.
C4 Community support services continue to be targeted to and accessible by those who need them most, including children and young people, older people and people with a disability.
5. The level of disadvantage in our area is not significantly increasing.
6. Satisfaction with Council's community facilities and services for a range of people is increasing.
7. Referrals by Council to services by other agencies (target in development as baseline data are yet to be collected).
8. The proportion of residents who think that childcare services are adequate is steady or increasing.
9. The proportion of residents who think there is a good range of community groups and support networks is steady or increasing.
C5 People feel safe in all parts of Waverley. 10. The proportion of people who feel safe in our community is steady or increasing.
11. The number of vehicle accidents and pedestrian accidents per annum is equal to or less than the number in 2005.
C6 Arts and cultural activities foster an involved community and a creative environment.
12. Satisfaction with Council's arts, entertainment and cultural events and facilities is increasing.
C7 Health and quality of life are improved through a range of recreation and leisure opportunities.
13. The proportion of residents who agree there is a good range of leisure and recreation opportunities is steady or increasing.
14. The proportion of residents who agree that sporting facilities in the area meet their needs is steady or increasing.
15. Satisfaction with sporting and recreation facilities, and parks and playgrounds, is increasing.
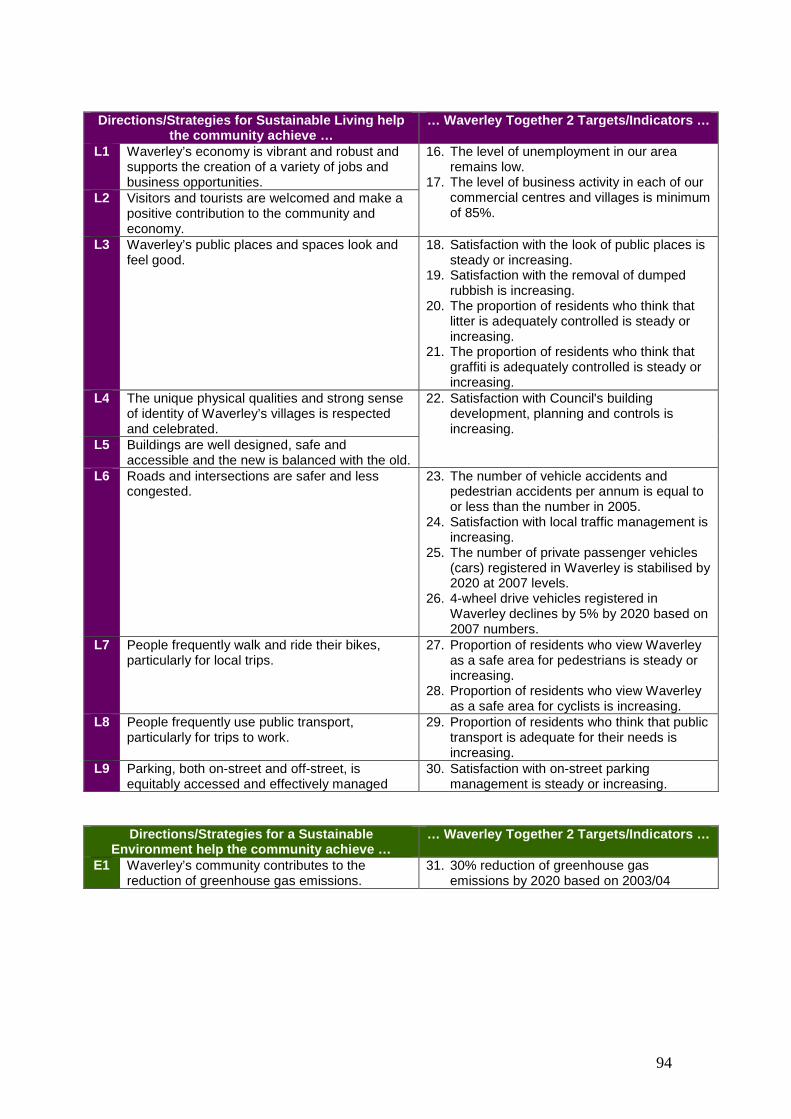
94
Directions/ Strategies for Sustainable Living help
the community achieve … … Waverley Together 2 Targets /Indicators …
L1 Waverley’s economy is vibrant and robust and supports the creation of a variety of jobs and business opportunities.
16. The level of unemployment in our area remains low.
17. The level of business activity in each of our commercial centres and villages is minimum of 85%.
L2 Visitors and tourists are welcomed and make a positive contribution to the community and economy.
L3 Waverley’s public places and spaces look and feel good.
18. Satisfaction with the look of public places is steady or increasing.
19. Satisfaction with the removal of dumped rubbish is increasing.
20. The proportion of residents who think that litter is adequately controlled is steady or increasing.
21. The proportion of residents who think that graffiti is adequately controlled is steady or increasing.
L4 The unique physical qualities and strong sense of identity of Waverley’s villages is respected and celebrated.
22. Satisfaction with Council's building development, planning and controls is increasing.
L5 Buildings are well designed, safe and accessible and the new is balanced with the old.
L6 Roads and intersections are safer and less congested.
23. The number of vehicle accidents and pedestrian accidents per annum is equal to or less than the number in 2005.
24. Satisfaction with local traffic management is increasing.
25. The number of private passenger vehicles (cars) registered in Waverley is stabilised by 2020 at 2007 levels.
26. 4-wheel drive vehicles registered in Waverley declines by 5% by 2020 based on 2007 numbers.
L7 People frequently walk and ride their bikes, particularly for local trips.
27. Proportion of residents who view Waverley as a safe area for pedestrians is steady or increasing.
28. Proportion of residents who view Waverley as a safe area for cyclists is increasing.
L8 People frequently use public transport, particularly for trips to work.
29. Proportion of residents who think that public transport is adequate for their needs is increasing.
L9 Parking, both on-street and off-street, is equitably accessed and effectively managed
30. Satisfaction with on-street parking management is steady or increasing.
Directions/ Strategies for a Sustainable Environment help the community achieve …
… Waverley Together 2 Targets /Indicators …
E1 Waverley’s community contributes to the reduction of greenhouse gas emissions.
31. 30% reduction of greenhouse gas emissions by 2020 based on 2003/04
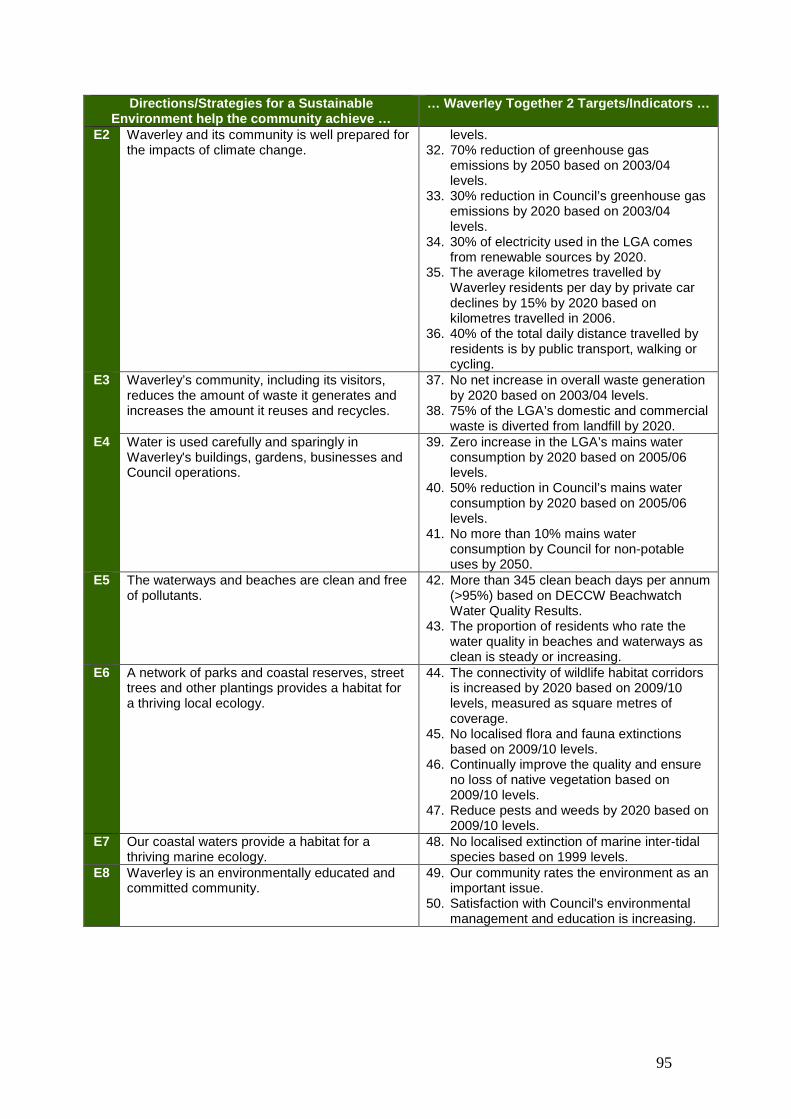
95
Directions/ Strategies for a Sustainable Environment help the community achieve …
… Waverley Together 2 Targets /Indicators …
E2 Waverley and its community is well prepared for the impacts of climate change.
levels. 32. 70% reduction of greenhouse gas
emissions by 2050 based on 2003/04 levels.
33. 30% reduction in Council’s greenhouse gas emissions by 2020 based on 2003/04 levels.
34. 30% of electricity used in the LGA comes from renewable sources by 2020.
35. The average kilometres travelled by Waverley residents per day by private car declines by 15% by 2020 based on kilometres travelled in 2006.
36. 40% of the total daily distance travelled by residents is by public transport, walking or cycling.
E3 Waverley’s community, including its visitors, reduces the amount of waste it generates and increases the amount it reuses and recycles.
37. No net increase in overall waste generation by 2020 based on 2003/04 levels.
38. 75% of the LGA’s domestic and commercial waste is diverted from landfill by 2020.
E4 Water is used carefully and sparingly in Waverley's buildings, gardens, businesses and Council operations.
39. Zero increase in the LGA’s mains water consumption by 2020 based on 2005/06 levels.
40. 50% reduction in Council’s mains water consumption by 2020 based on 2005/06 levels.
41. No more than 10% mains water consumption by Council for non-potable uses by 2050.
E5 The waterways and beaches are clean and free of pollutants.
42. More than 345 clean beach days per annum (>95%) based on DECCW Beachwatch Water Quality Results.
43. The proportion of residents who rate the water quality in beaches and waterways as clean is steady or increasing.
E6 A network of parks and coastal reserves, street trees and other plantings provides a habitat for a thriving local ecology.
44. The connectivity of wildlife habitat corridors is increased by 2020 based on 2009/10 levels, measured as square metres of coverage.
45. No localised flora and fauna extinctions based on 2009/10 levels.
46. Continually improve the quality and ensure no loss of native vegetation based on 2009/10 levels.
47. Reduce pests and weeds by 2020 based on 2009/10 levels.
E7 Our coastal waters provide a habitat for a thriving marine ecology.
48. No localised extinction of marine inter-tidal species based on 1999 levels.
E8 Waverley is an environmentally educated and committed community.
49. Our community rates the environment as an important issue.
50. Satisfaction with Council's environmental management and education is increasing.

96
Directions/ Strategies for Sustainable Governance
help the community achieve … … Waverley Together 2 Targets /Indicators …
G1 Council’s decision making processes are open, transparent, corruption resistant and based on sound integrated planning.
51. The proportion of residents who believe Council acts in an open and honest way is increasing.
G2 Our community is consulted about Council decisions and informed about Council services and activities.
52. The proportion of residents who believe they have the opportunity to have a say in what Council does is increasing.
53. Satisfaction with being informed about Council activities is increasing.
G3 Services to customers are provided in a professional, friendly and timely manner.
54. Satisfaction with Council's customer service is steady or increasing.
G4 Council’s operations are efficient, effective and provide value for money.
55. The proportion of residents who believe that Council's operations are efficient, effective and provide value for money is increasing.
G5 Council is a financially sustainable organisation. 56. Council is declared financially sound annually.
G6 Council assets are well maintained for their current purpose and for future generations.
57. Council assets are capable of delivering the desired levels of service as measured by achieving specified asset condition ratings on an annual basis. (For specified ratings per asset category see full text of Waverley Together 2.)
58. Satisfaction with maintenance of Council assets is increasing.
G7 Council maintains sound safety and risk management practices to protect the community and our employees.
59. Lost Time Injuries that occur in Council are reduced by 57% by 2020, based on 2005/06 levels.
G8 Council manages information and knowledge in an integrated and accessible way.
60. 75% of Council staff agree that the organisation is operating effectively within the Business Excellence Framework by 2013.
G9 Council is an attractive, performance-focused employer governed by great leadership and supported by a committed and adaptable workforce.
Then
����

97
Step 3: Achievement of all 60 Targets/Indicators will mean the community
has realised all 14 elements of the Vision of Waverley Together 2 as follows:
Directions/Strategies help achieve
…Targets/Indicators which realise …
… the Waverley Together 2 Vision elements of …
C5 L3 L5 L6 G7
10, 11 18, 19, 20, 21
22 23, 24, 25, 26
59
We are safe
C1 C6
1, 2 12
We are reconciled with and value our indigenous past
C2 C3 C4 L1
1, 2 3, 4
5, 6, 7, 8, 9 16, 17
Connections within families and between generations can remain unbroken
C1 C2 C4 C6 C7 L3 L4 L5 L7 L8
1, 2 1, 2
5, 6, 7, 8, 9 12
13, 14, 15 18, 19, 20, 21
22 22
27,28 29
We are inspired and able to renew our physical and spiritual wellbeing
C1 C2 C6 L1 L2 L3 L6 L7 L8
1, 2 1, 2 12
16, 17 16, 17
18, 19, 20, 21 23, 24, 25, 26
27, 28 29
Everyone is welcome to participate positively in community life
C1 C2 C6 C7
1, 2 1, 2 12
13, 14, 15
We can express our essential selves through our traditions, our arts, our cultures,
and our lifestyles
C1 C2 C4 G2
1, 2 1, 2
5, 6, 7, 8, 9 52, 53
We act together as a compassionate society
L3 L4 E5 E6 E7
18, 19, 20, 21 22
42, 43 44, 45, 46, 47
48
The beauty of our beaches, cliffs and coastal lands endures
L3 L4 L5
18, 19, 20, 21 22 22
The architectural landscape is cared for and developed at a human scale and design is
sensitive to the natural, historical and social contexts

98
Directions/Strategies help
achieve … … Target/Indicators which
realise … … the Waverley Together 2 Vision elements
of … C3 C4 C7 L6 L7 L8 L9 G3 G4 G6 G7
3, 4 5, 6, 7, 8, ,9 13, 14, 15
23, 24, 25, 26 27, 28
29 30 54 55
57, 58 59
Vital services are fully accessible
L1 L2 L3 L6 L7 L8 L9 G5 G6
16, 17 16, 17
18,19,20,21 23, 24, 25, 26
27, 28 28 30 56
57, 58
Scarce resources are conserved and fairly shared
L1 L2 L3 L4 L5 L6 L7 L8 L9
16, 17 16, 17
18, 19, 20, 21 22 22
23, 24, 25, 26 27, 28
29 30
Local economic prosperity provides opportunity for all
E1 E2 E3 E4 E5 E6 E7 E8 L6 L7 L8 L9
31, 32, 33, 34, 35, 36 31, 32, 33, 34, 35, 36
37, 38 39, 40, 41
42, 43 44, 45, 46, 47
48 49, 50
23, 24, 25, 26 27,28
29 30
As a local community we have the courage to take a leading place in achieving the environmental aims of a global society
G1 G2 G3 G4 G5 G6 G7 G8 G9
51 52, 53
54 55 56
57, 58 59 60 60
We are confident our leaders will reflect thoughtfully on our views and best interests
when making decisions for our future

99
Appendix 2: Full list of services in Service Plus Waverley Council runs a very wide array of services – 22 Services and 150different sub-services. This is called Service Plus. We are soon to run two more as we are currently building our 4th Child Care Centre and a new sport and active recreation facility at Waverley Pavilion. Services Sub-services
Asset management services 1. Asset management planning 2. Asset design services 3. Capital works program planning 4. Road works & maintenance 5. Footpath works & maintenance 6. Kerb & gutter works & maintenance 7. Drainage works & maintenance 8. Building works & maintenance 9. Urban open spaces & malls works & maintenance 10. Coastal & retaining infrastructure works & maintenance 11. Parks infrastructure works & maintenance 12. Parking infrastructure works & maintenance 13. Other infrastructure works & maintenance 14. Property management 15. Facilities management 16. Fleet management 17. Depot & stores
Beach services, maintenance & safety
18. Lifeguard services 19. Beach cleaning & maintenance 20. Support to surf life saving clubs 21. Administration & customer services
Cemetery services 22. Waverley Cemetery services 23. South Head Cemetery services
Child care services 24. Waverley Child Care Centre services 25. Bronte Child Care Centre services 26. Gardiner Child Care Centre services 27. Mill Hill Early Learning & Care Centre 28. Family Day Care services 29. Family support services
Community services 30. Community planning 31. Services for older people 32. Services for young people 33. Services for people with a disability 34. Services for indigenous people 35. Multicultural services 36. Community safety 37. Community support & grants
Corporate support services 38. Administration 39. Financial management 40. Human resources 41. IT & telecommunications 42. Purchasing 43. Risk & insurance management 44. Executive support & strategic projects

100
Services Sub-services
Cultural services 45. Cultural services planning 46. Arts programs 47. Music rooms & programs 48. Theatres and theatre programs 49. Literary programs 50. Cultural festivals & events 51. Bondi Pavilion programs 52. Other cultural programs 53. Administration & customer services
Customer services & communication
54. Customer & Call Centre 55. Media & communications
Development, building & health services
56. Urban planning 57. Heritage conservation 58. Land information mapping services 59. Development assessments & approvals 60. Environmental health 61. Food hygiene & regulation 62. Building & fire safety regulation 63. Administration & customer services
Emergency management services
64. Local & state emergency management
Environmental services 65. Environmental sustainability planning 66. Environmental education programs 67. Energy management programs 68. Water management programs 69. Waste management planning 70. Air quality management 71. Biodiversity management programs 72. Bush care programs 73. Pollution control programs
Governance, integrated planning & community engagement
74. Long term integrated planning & consultation 75. Governance 76. Councillor support 77. Citizenship services 78. Precinct Committee facilitation services 79. Records & public information services 80. Civic pride programs 81. Volunteering programs 82. Advisory committees and forums 83. Internal audit
Library services 84. Library services 85. Community information 86. Local studies
Parking services 87. Parking system planning & management 88. On-street parking services 89. Off-street parking services 90. Road & parking safety programs
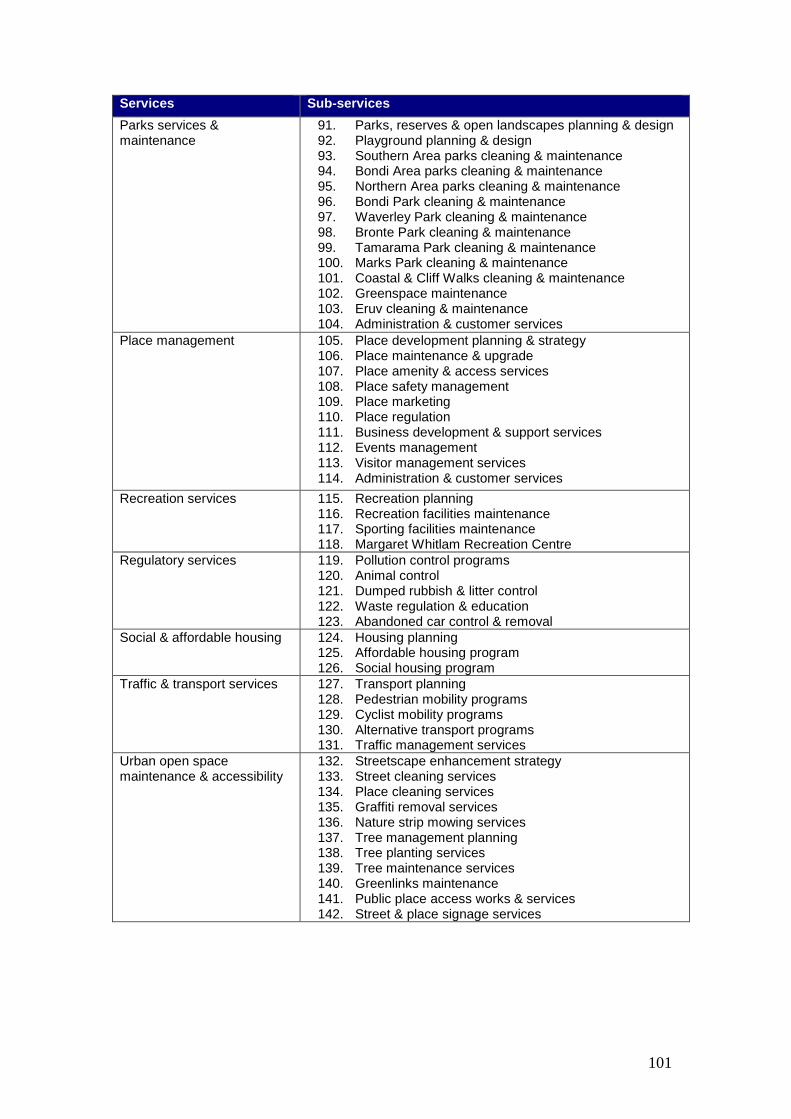
101
Services Sub-services
Parks services & maintenance
91. Parks, reserves & open landscapes planning & design 92. Playground planning & design 93. Southern Area parks cleaning & maintenance 94. Bondi Area parks cleaning & maintenance 95. Northern Area parks cleaning & maintenance 96. Bondi Park cleaning & maintenance 97. Waverley Park cleaning & maintenance 98. Bronte Park cleaning & maintenance 99. Tamarama Park cleaning & maintenance 100. Marks Park cleaning & maintenance 101. Coastal & Cliff Walks cleaning & maintenance 102. Greenspace maintenance 103. Eruv cleaning & maintenance 104. Administration & customer services
Place management 105. Place development planning & strategy 106. Place maintenance & upgrade 107. Place amenity & access services 108. Place safety management 109. Place marketing 110. Place regulation 111. Business development & support services 112. Events management 113. Visitor management services 114. Administration & customer services
Recreation services 115. Recreation planning 116. Recreation facilities maintenance 117. Sporting facilities maintenance 118. Margaret Whitlam Recreation Centre
Regulatory services 119. Pollution control programs 120. Animal control 121. Dumped rubbish & litter control 122. Waste regulation & education 123. Abandoned car control & removal
Social & affordable housing 124. Housing planning 125. Affordable housing program 126. Social housing program
Traffic & transport services 127. Transport planning 128. Pedestrian mobility programs 129. Cyclist mobility programs 130. Alternative transport programs 131. Traffic management services
Urban open space maintenance & accessibility
132. Streetscape enhancement strategy 133. Street cleaning services 134. Place cleaning services 135. Graffiti removal services 136. Nature strip mowing services 137. Tree management planning 138. Tree planting services 139. Tree maintenance services 140. Greenlinks maintenance 141. Public place access works & services 142. Street & place signage services
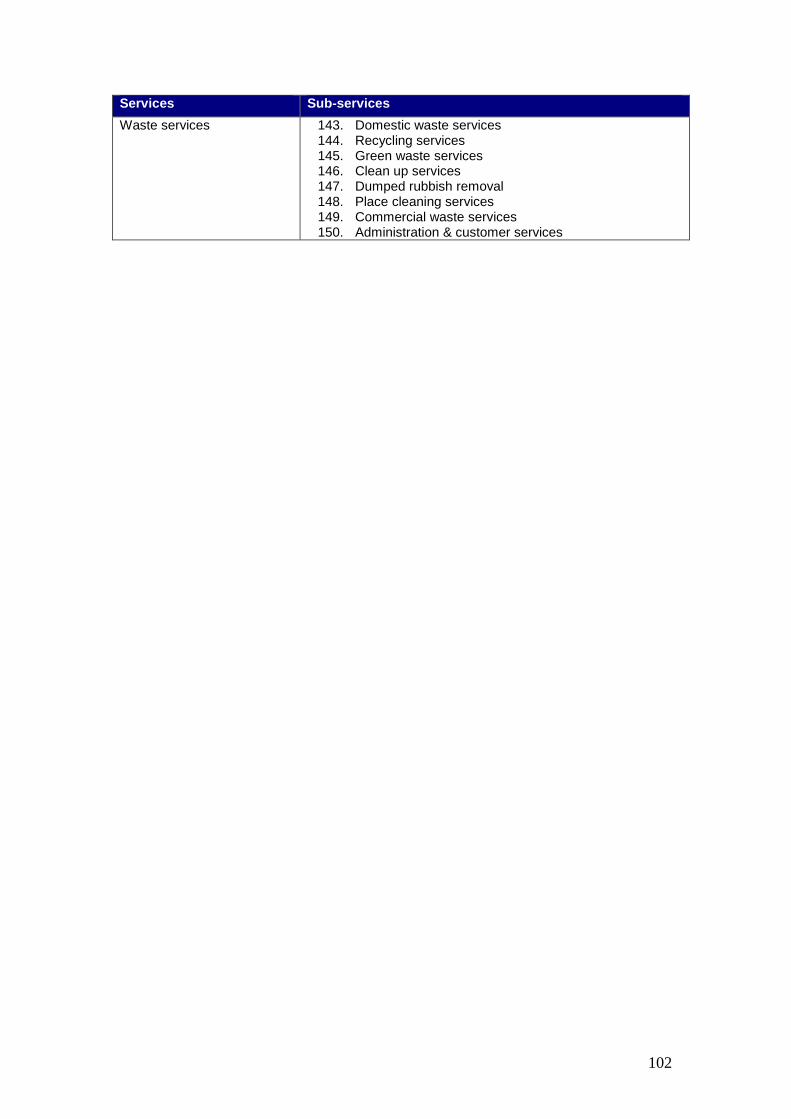
102
Services Sub-services
Waste services 143. Domestic waste services 144. Recycling services 145. Green waste services 146. Clean up services 147. Dumped rubbish removal 148. Place cleaning services 149. Commercial waste services 150. Administration & customer services
103
References Sources of data in the report are generally accessible via Waverley Council’s web site at: http://www.waverley.nsw.gov.au/your_council/planning_for_waverley_future Documents available in full at this site include: � 2009 Hunter Valley Research Foundation Survey of Waverley Residents by
Robin Mcdonald BCom (Hons1) (Newcastle) MEc (Monash) and Russ Redford BSc DipCompSc (New England)
� 2010 Hunter Valley Research Foundation Survey of Survey of Residents and
Ratepayers on Funding Options for Waverley Together 2 by Jenny Williams BSc (Hons) (Sydney) MComm (UNSW) MSW (Hawaii) and Russ Redford BSc DipCompSc (New England)
� 2012 Hunter Valley Research Foundation Survey of Residents’ Views on
Services and Progress Towards the Vision of the Waverley community’s strategic plan, Waverley Together 2 by Jenny Williams BSc (Hons) (Sydney) MComm (UNSW) NSW (Hawaii) and Russ Redford BSc DipCompSc (New England)
Other references: � NSW Bureau of Crime Statistics – NSW Recorded Crime Statistics � NSW Health – NSW Health Statistics � Australian Bureau of Statistics 2006 Census Data � Roads and Maritime Services vehicle registration and accident statistics � NSW Transport Data Centre Statistics � Waverley Council Business Activity Reports � Waverley Council CCAP environmental model � Waverley Council Annual Financial Statements � Waverley Council Long Term Financial Plan 3.1 (LTFP3.1) � Waverley Council Strategic Asset Management Plan 3 (SAMP3)

Environmental Action PlAn 2Progress Report SePtember 2012

contents Waverley together 2 Directions: council’s strategic targets 2
our targets 3
Waverley lGA: council and the wider community 3
Waverley council operations 3
reducing our greenhouse gas emissions – Waverley council 4
reducing our greenhouse gas emissions – Waverley lGA 6
recycling and recovery of resources 8
reducing our water use – Waverley lGA 11
reducing our water use – Waverley council operations 12
Keeping the water clean 13
conserving biodiversity 14
Additional activities 17
Directions: council’s strategic targetse1 Waverley’s community contributes to the reduction of
greenhouse gas emissionse2 Waverley and its community is well prepared for the
impacts of climate change
e3 Waverley’s community, including its visitors, reduces the amount of waste it generates and increases the amount it reuses and recycles
e4 Water is used carefully and sparingly in Waverley’s buildings, gardens, businesses and council operations
e5 the waterways and beaches are clean and free of pollutants
e6 A network of parks and coastal reserves, street trees and other plantings provides a habitat for a thriving local ecology
e7 our coastal waters provide a habitat for a thriving marine ecology
e8 Waverley is an environmentally educated and committed community
l7 People frequently walk and ride their bikes, particularly for local trips.
l8 People frequently use public transport, particularly for trips to work.
Waverley Together2
Waverley council’s environmental Action Plan 2 (eAP 2) was completed in 2009 as part of an integrated process to develop council’s strategic plan, Waverley together 2 (Wt2). this report outlines progress against eAP2 and Wt2 environmental targets in the areas of waste, water, biodiversity and greenhouse (across the local government area (lGA) and council operations) as well as an update of actions achieved in each of these areas. this replaces council’s annual State of environment report.
2 WAverley council Environmental Action Plan 2 ProGreSS rePort SePtember 2012
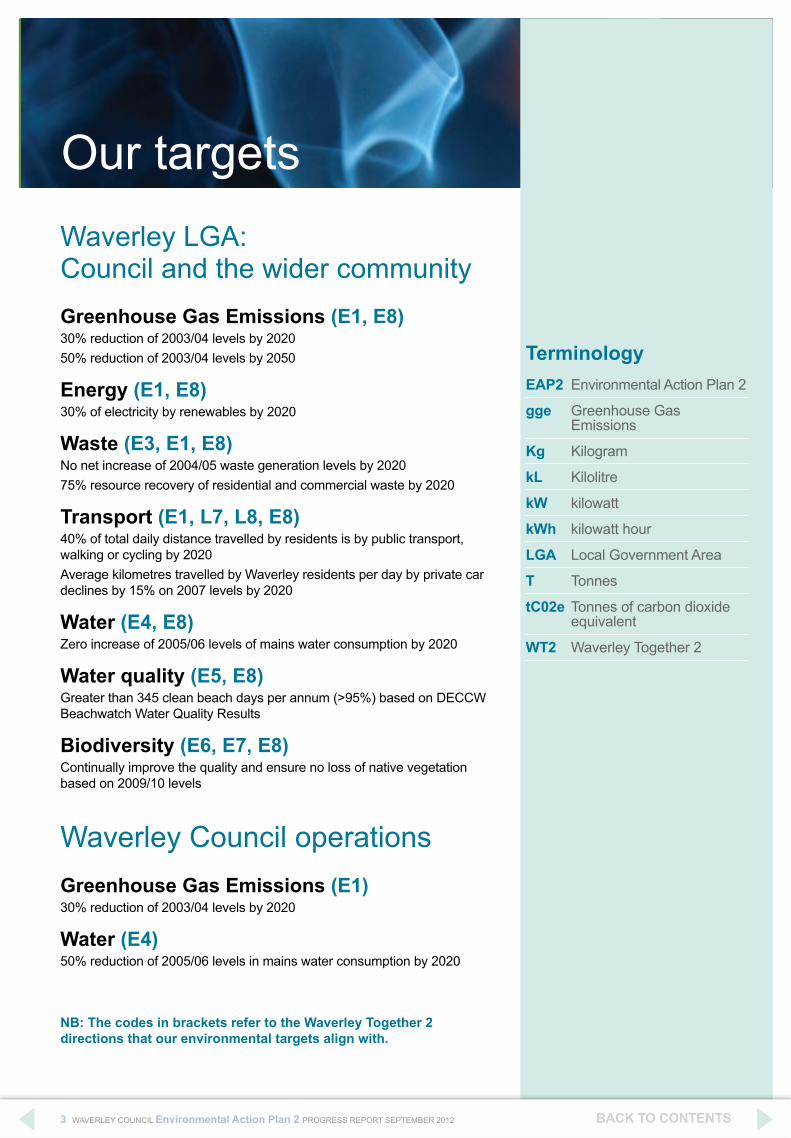
Waverley lGA: council and the wider communityGreenhouse Gas Emissions (E1, E8)30% reduction of 2003/04 levels by 202050% reduction of 2003/04 levels by 2050
Energy (E1, E8)30% of electricity by renewables by 2020
Waste (E3, E1, E8)no net increase of 2004/05 waste generation levels by 202075% resource recovery of residential and commercial waste by 2020
Transport (E1, L7, L8, E8)40% of total daily distance travelled by residents is by public transport, walking or cycling by 2020Average kilometres travelled by Waverley residents per day by private car declines by 15% on 2007 levels by 2020
Water (E4, E8)Zero increase of 2005/06 levels of mains water consumption by 2020
Water quality (E5, E8)Greater than 345 clean beach days per annum (>95%) based on DeccW beachwatch Water Quality results
Biodiversity (E6, E7, E8)continually improve the quality and ensure no loss of native vegetation based on 2009/10 levels
Waverley council operationsGreenhouse Gas Emissions (E1)30% reduction of 2003/04 levels by 2020
Water (E4)50% reduction of 2005/06 levels in mains water consumption by 2020
our targets
TerminologyEAP2 environmental Action Plan 2
gge Greenhouse Gas emissions
Kg Kilogram
kL Kilolitre
kW kilowatt
kWh kilowatt hour
LGA local Government Area
T tonnes
tC02e tonnes of carbon dioxide equivalent
WT2 Waverley together 2
NB: The codes in brackets refer to the Waverley Together 2 directions that our environmental targets align with.
3 WAverley council Environmental Action Plan 2 ProGreSS rePort SePtember 2012

reducing our greenhouse gas emissions – Waverley councilTarget: 30% reduction in Council greenhouse gas emissions by 2020 based on 2003/04 levels
4 WAverley council Environmental Action Plan 2 ProGreSS rePort SePtember 2012

Waverley council has reduced its greenhouse gas emissions by 6% on the base year. Further reductions are anticipated as a result of energy saving projects implemented in 2011/12.
Key activities: ■ the bondi Junction Greenhouse Gas review is complete and as a result, council is investigating district tri-generation as part of redevelopment of council sites in bondi Junction.
■ Waverley council purchases 100% GreenPower for one quarter of the electricity used at the Waverley library, eastgate carpark, council chambers, Zetland Depot and bondi Pavilion. this amounted to 820,110 kWh in 2011/12, avoiding 722 tonnes of greenhouse gas emissions annually.
■ the Waverley energy management Plan 2011 was completed along with the subsequent tender process. Energy efficient lighting, lighting sensors and timers, hot water boiler timers, appliance timers as well as heating, ventilation and air conditioning efficiencies are currently being implemented. Saving council $173,000 in energy costs and maintenance each year, the projects will pay for themselves in 4.4 years.
■ Waverley library has already received its new energy efficient air conditioning chiller which will save $13,000 in electricity costs each year.
■ combined, the energy saving retrofit and chiller replacement will achieve a 15% reduction in council greenhouse gas emissions.
■ 131 park and outdoor lights are receiving energy efficient upgrades as part of the aforementioned project. Further opportunities for energy efficiency upgrades to public lighting will be explored as part of eAP3.
■ council continues to work with AusGrid and the Southern Sydney regional organisation of councils (SSroc) Street lighting improvement Program to improve the energy efficiency of AusGrid owned street lighting in Waverley. Energy efficient compact fluorescent; high pressure sodium; and, light emitting diode (leD) street lights are being installed and/or trialled throughout the lGA.
■ the bondi lifeguards now shower with solar heated hot water due to the three new systems installed on bondi Pavilion.
■ Solar power systems installed on council buildings have increased from a generation capacity of 4kW in 2011/12 to 31 kW in 2012/13. this will result in an estimated output of 38,000 kWh of solar generated electricity at bondi Pavilion, margaret Whitlam recreation centre (Waverley Pavilion), bronte childcare centre and the new bondi Junction early learning & care centre.
■ the Waverley council Sustainable Fleet Action Plan was developed and the subsequent review of Council’s fleet and plant policy was completed. As a result, council is seeking to improve the fuel efficiency of its heavy vehicle fleet such as garbage compactors and recycling trucks.
■ council added an electric bike to their fleet for use by staff and shower facilities have been improved for staff based at council chambers.
5 WAverley council Environmental Action Plan 2 ProGreSS rePort SePtember 2012
the capacity of solar power systems installed in Waverley increased by 225% between 2010 and 2011 and it is anticipated that the majority of these systems contribute towards the 6% of energy from renewable sources in the standard electricity supply.
6% of nSW’s total standard electricity usage is currently provided from renewable energy sources and this is anticipated to rise to 20% by 2020 in response to the Australian Government’s renewable energy target. therefore, all electricity users in Waverley are using a portion of renewable electricity.
Key activities: ■ Accredited GreenPower is also used in some households and businesses in Waverley however GreenPower usage data is not available by lGA.
■ 87 solar power and solar hot water systems were installed across Waverley, Woollahra and randwick council areas as part of the Go Solar program, resulting in abatement of 300 tonnes of co2e per year for next 25 years.
■ installed solar power capacity in the Waverley lGA increased from 259 kW in September 2010 to 844 kW in December 2011. An estimated 963,000 kWh of solar generated electricity was produced in october to December 2011.
■ council commissioned the institute of Sustainable Futures to complete a wind feasibility study in 2010. this found that lGA limitations in terms of disturbance from buildings, trees and power lines meant that return on investment was likely to be relatively low.
Target: 30% reduction of 2003/04 levels of Waverley LGA Greenhouse Gas Emissions
Waverley lGA gge have increased 17% on the base year. it is anticipated that increases in commercial and residential building floor areas have contributed to this.
Key activities: ■ the bondi Junction Greenhouse Gas review was completed in 2011. As a result tri-generation and/or other low carbon technologies are being investigated as part of re-development of council sites and discussed with Westfield Bondi Junction. Planning instruments are also being reviewed to encourage energy efficient design and technologies, use of trigeneration and on-site renewable energy technologies, especially in new mixed development.
■ An engagement program targeting medium to high energy using buildings will also be developed and delivered as part of eAP3.
Target: 30% of electricity used in the LGA is to come from renewable sources by 2020
reducing our greenhouse gas emissions – Waverley lGA
6 WAverley council Environmental Action Plan 2 ProGreSS rePort SePtember 2012

Target: 40% of total daily distance travelled by residents is by public transport, walking or cycling
40%
30%
25%
0%
5%
10%
15%
20%
25%
30%
35%
40%
45%
2007 2009/10 2020 Target
Perc
enta
ge o
f dai
ly d
ista
nce
trav
elle
d
Bus
Train
Walk only
Walk linked (e)
Other modes incl cycling
Target: Average kilometres travelled by Waverley residents per day by private car declines by 15% on 2007 levels by 2020the nSW Government’s transport Data centre survey results suggest that the distance driven by Waverley lGA residents per day is steady (10.7 km) but the proportion of daily distance travelled by sustainable transport has decreased. caution must be taken in interpreting this data due to the small sample size and the methodology; car passengers are not included in the daily distance travelled by car and other modes includes motorcycles as well as cycling.
Key activities: ■ the Waverley transport Plan was completed in 2011. this provides a framework for addressing key focus areas including bondi Junction, bondi Junction to bondi beach corridor, land use and parking, public transport, schools, bike network and facilities, pedestrians, access and mobility.
■ Studies are currently being completed for light rail and/or improvement of public transport options along oxford St and from bondi Junction to bondi beach. Public consultation on the options is due to take place in 2013.
■ 155 residents attended cycling skills and bicycle maintenance workshops in 2011/12. 100 cyclists attended the ride to Work Day breakfast in bondi Junction mall and 65 cyclists participated in bike Safety in the mall activities.
■ Work is underway on a new Waverley bike Plan, due for completion in early 2013.
■ 61car share car park spaces are currently available in the Waverley lGA, providing residents and businesses access to a car for when they need it and reducing the number of vehicles on our streets.
■ local schools participated in Walk to School Day. council provided a fruit breakfast and presenters including buzzy bee for Waverley Public School, St charles Primary School, clovelly Public School, bondi Public School, bondi beach Public School and bronte Public School.
■ Green links walking routes linking key recreational facilities and transport nodes are now clearly marked throughout the lGA with stencilling and signage.
7 WAverley council Environmental Action Plan 2 ProGreSS rePort SePtember 2012

recycling and recovery of resourcesTarget: No net increase on 2004/05 levels of waste generation by 2020 (residential and public place waste)
2004
/05
2005
/06
2006
/07
2007
/08
2008
/09
2009
/10
2010
/11
2011
/12
2020
Target
26,877
26,703
25,840
24,000
24,500
25,000
25,500
26,000
26,500
27,000
27,500
28,000
28,500
29,000
Tota
l res
iden
tial a
nd
publ
ic p
lace
cle
ansi
ng w
aste
(Ton
nes)
the overall amount of waste collected from Waverley residents and public place cleansing has been decreasing in recent years. A further 4 % reduction is required to achieve the target.
Key activities: ■ All Waverley households are provided with container (yellow), paper (blue), green garden waste (green) and general waste (red) bins and collection services.
■ Households are also provided with three free clean up services per year: one scheduled clean up and two your call collections, scheduled upon request.
■ Public place recycling is provided at bondi and bronte beachside parks.
8 WAverley council Environmental Action Plan 2 ProGreSS rePort SePtember 2012
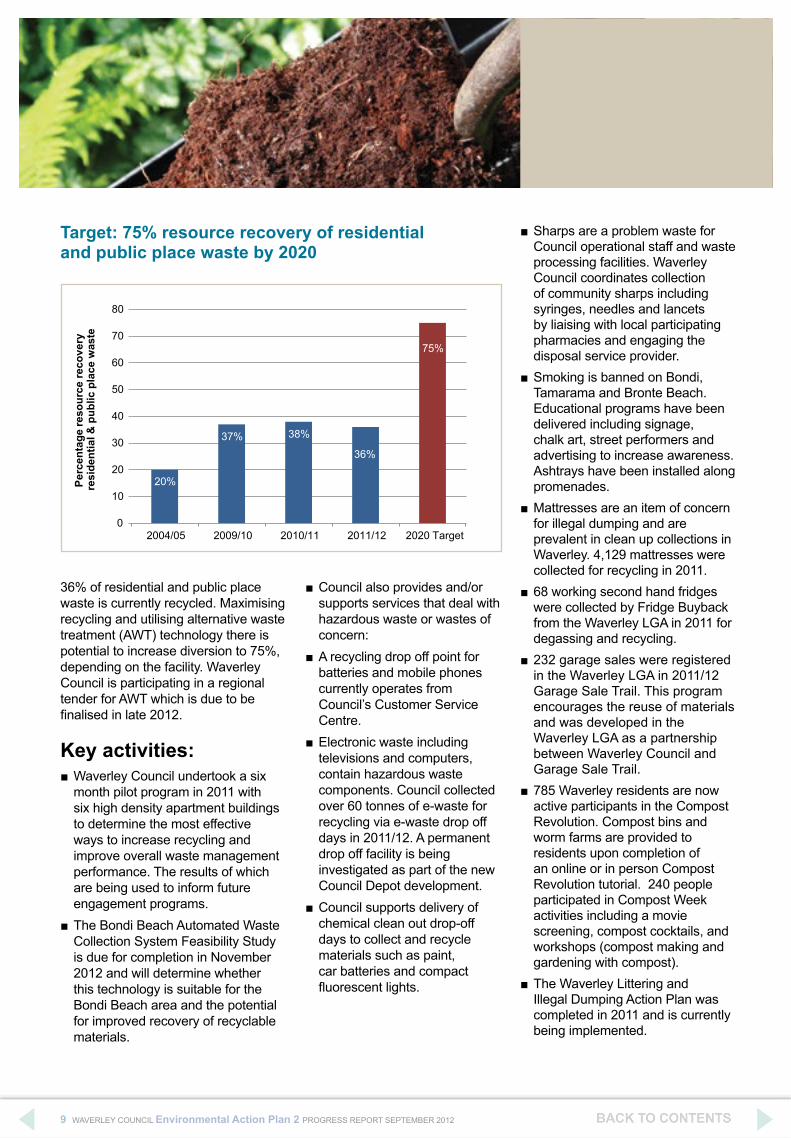
Target: 75% resource recovery of residential and public place waste by 2020
20%
37% 38%
36%
75%
0
10
20
30
40
50
60
70
80
2004/05 2009/10 2010/11 2011/12 2020 Target
Perc
enta
ge re
sour
ce re
cove
ryre
side
ntia
l & p
ublic
pla
ce w
aste
36% of residential and public place waste is currently recycled. maximising recycling and utilising alternative waste treatment (AWt) technology there is potential to increase diversion to 75%, depending on the facility. Waverley council is participating in a regional tender for AWt which is due to be finalised in late 2012.
Key activities: ■ Waverley council undertook a six month pilot program in 2011 with six high density apartment buildings to determine the most effective ways to increase recycling and improve overall waste management performance. the results of which are being used to inform future engagement programs.
■ the bondi beach Automated Waste collection System Feasibility Study is due for completion in november 2012 and will determine whether this technology is suitable for the bondi beach area and the potential for improved recovery of recyclable materials.
■ council also provides and/or supports services that deal with hazardous waste or wastes of concern:
■ A recycling drop off point for batteries and mobile phones currently operates from council’s customer Service centre.
■ electronic waste including televisions and computers, contain hazardous waste components. council collected over 60 tonnes of e-waste for recycling via e-waste drop off days in 2011/12. A permanent drop off facility is being investigated as part of the new council Depot development.
■ council supports delivery of chemical clean out drop-off days to collect and recycle materials such as paint, car batteries and compact fluorescent lights.
■ Sharps are a problem waste for council operational staff and waste processing facilities. Waverley council coordinates collection of community sharps including syringes, needles and lancets by liaising with local participating pharmacies and engaging the disposal service provider.
■ Smoking is banned on bondi, tamarama and bronte beach. educational programs have been delivered including signage, chalk art, street performers and advertising to increase awareness. Ashtrays have been installed along promenades.
■ mattresses are an item of concern for illegal dumping and are prevalent in clean up collections in Waverley. 4,129 mattresses were collected for recycling in 2011.
■ 68 working second hand fridges were collected by Fridge buyback from the Waverley lGA in 2011 for degassing and recycling.
■ 232 garage sales were registered in the Waverley lGA in 2011/12 Garage Sale trail. this program encourages the reuse of materials and was developed in the Waverley lGA as a partnership between Waverley council and Garage Sale trail.
■ 785 Waverley residents are now active participants in the compost revolution. compost bins and worm farms are provided to residents upon completion of an online or in person compost revolution tutorial. 240 people participated in compost Week activities including a movie screening, compost cocktails, and workshops (compost making and gardening with compost).
■ the Waverley littering and illegal Dumping Action Plan was completed in 2011 and is currently being implemented.
9 WAverley council Environmental Action Plan 2 ProGreSS rePort SePtember 2012
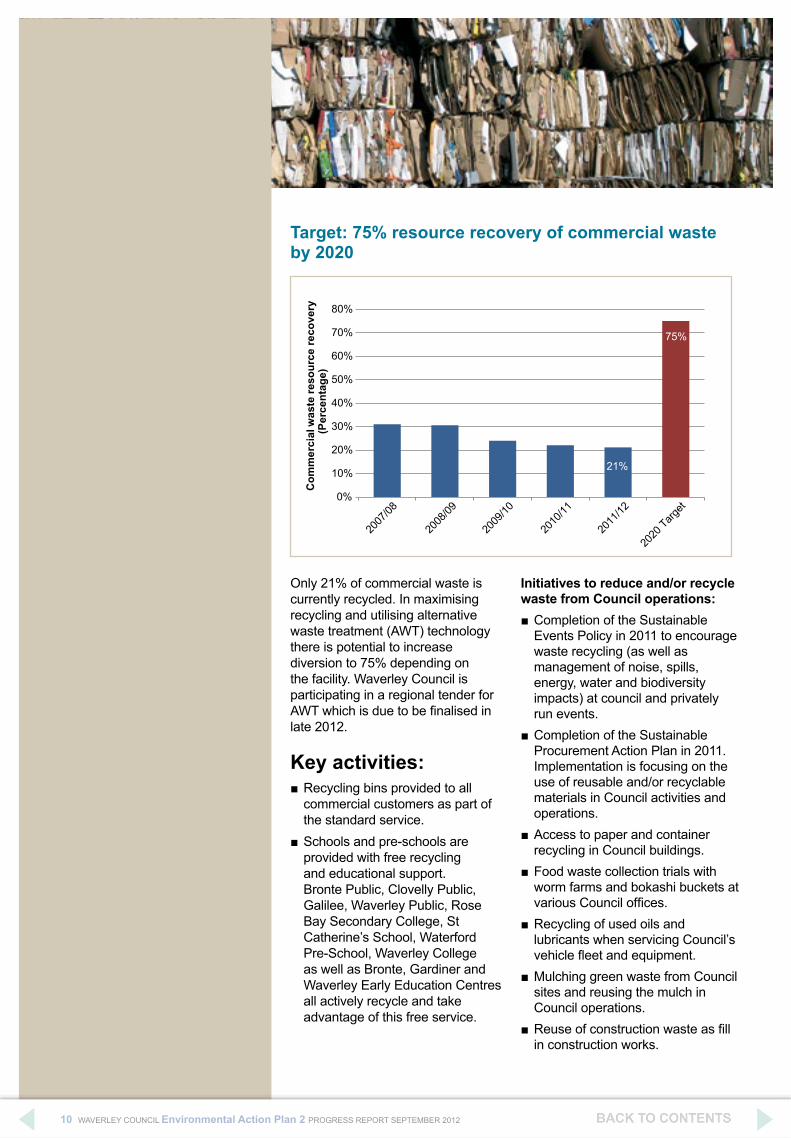
Target: 75% resource recovery of commercial waste by 2020
2007
/08
2008
/09
2009
/10
2010
/11
2011
/12
2020
Target
21%
75%
0%
10%
20%
30%
40%
50%
60%
70%
80%C
omm
erci
al w
aste
reso
urce
reco
very
(P
erce
ntag
e)
only 21% of commercial waste is currently recycled. in maximising recycling and utilising alternative waste treatment (AWt) technology there is potential to increase diversion to 75% depending on the facility. Waverley council is participating in a regional tender for AWT which is due to be finalised in late 2012.
Key activities: ■ recycling bins provided to all commercial customers as part of the standard service.
■ Schools and pre-schools are provided with free recycling and educational support. bronte Public, clovelly Public, Galilee, Waverley Public, rose bay Secondary college, St catherine’s School, Waterford Pre-School, Waverley college as well as bronte, Gardiner and Waverley early education centres all actively recycle and take advantage of this free service.
Initiatives to reduce and/or recycle waste from Council operations:
■ completion of the Sustainable events Policy in 2011 to encourage waste recycling (as well as management of noise, spills, energy, water and biodiversity impacts) at council and privately run events.
■ completion of the Sustainable Procurement Action Plan in 2011. implementation is focusing on the use of reusable and/or recyclable materials in council activities and operations.
■ Access to paper and container recycling in council buildings.
■ Food waste collection trials with worm farms and bokashi buckets at various Council offices.
■ recycling of used oils and lubricants when servicing council’s vehicle fleet and equipment.
■ mulching green waste from council sites and reusing the mulch in council operations.
■ Reuse of construction waste as fill in construction works.
10 WAverley council Environmental Action Plan 2 ProGreSS rePort SePtember 2012

reducing our water use – Waverley lGATarget: Zero increase in Waverley LGA’s 2005/06 levels of mains water consumption by 2020
<1% increase on base year
0
200
400
600
800
1,000
1,200
1,400
1,600
5,200,000
5,400,000
5,600,000
5,800,000
6,000,000
6,200,000
6,400,000
6,600,000
6,800,000
7,000,000
7,200,000
Ann
ual r
ainf
all (
mm
)
Wav
erle
y LG
A W
ater
Con
sum
ptio
n (k
ilolit
res)
Level 3 restrictions June 2005 - June 2009
2004
/05
2003
/04
2002
/03
2005
/06 B
ase Y
ear
2006
/07
2007
/08
2008
/09
2009
/10
2010
/11
2020
Target
Waverley lGA is on track to achieve its mains water target with a further reduction in consumption of less than 1% needed.
Key activities: ■ in recent years, Waverley residents and businesses have adjusted their water use in accordance with Sydney Water restrictions (level 3) and rainfall patterns.
■ 13,342 Waverley residents and organisations received Sydney Water rebates (for water efficient washing machines & rainwater tanks) and subsidised programs (to fix water leaks and/or receive water efficient showerheads, flow restrictors and dual flush toilets) between 2000 and 2011, when these programs ceased.
■ the eastern Suburbs Sustainable business Program continues to be delivered in partnership
with Sydney Water, Woollahra and randwick council’s and has assisted organisations in Waverley to save 1,777 kl of water each year.
■ educational workshops (including sustainable apartments) and resources (including free shower timers) were also provided by council to assist residents and owners corporations to reduce their water use.
11 WAverley council Environmental Action Plan 2 ProGreSS rePort SePtember 2012

reducing our water use – Waverley council operationsTarget: 50% reduction in Council’s mains water consumption from 2005/06 levels by 2020
0
200
400
600
800
1,000
1,200
1,400
1,600
0
20,000
40,000
60,000
80,000
100,000
120,000
140,000
160,000
Rai
nfal
l (m
m)
Mai
ns w
ater
con
sum
ptio
n (k
L)
Level 3 restrictions June 2005 - June 2009
2011
/12
2004
/05
2003
/04
2005
/06 B
ase Y
ear
2006
/07
2007
/08
2008
/09
2009
/10
2010
/11
2020
Target
council mains water use is currently 50% higher than the base year (set during level 3 water restrictions). reductions are anticipated for 2012/13 as a result of recycled water and efficiency projects implemented at bondi and Waverley Park in 2011/12.
Key activities: ■ Since September 2008 the bronte stormwater reuse system has provided 16 ml of recycled water each year for irrigation, toilet flushing, pool cleaning and bush regeneration. beach water quality is also improved.
■ bondi Park stormwater reuse system came online in march 2012 and will provide 50 ml of recycled water each year for irrigation and toilet flushing. Beach water quality is also improved.
■ Waverley Park stormwater reuse system was commissioned in September 2011 and will provide an estimated 35 ml of recycled water each year for irrigation of Waverley Oval, sports fields and ornamental gardens as well as toilet flushing.
■ An average of 12 ml of groundwater is used for irrigation at barracluff Park, north bondi each year.
■ rainwater tanks at bondi School of the Arts, mill Hill childcare centre and marks Park supply rainwater for toilet flushing and/or garden irrigation.
■ Savings of approximately 51,438 kl of mains water each year are anticipated as a result of efficiencies implemented in 2011/12 as part of council’s participation in the Sydney Water irrigation and landscape Efficiency Program (ILEP).
■ The Waverley Water Efficiency Plan 2011 was completed and water saving actions identified at council’s top water using sites. Water leaks were identified as an issue of concern and as a result, an automated leakage detection system is being sought in order to more quickly identify and fix water leaks.
12 WAverley council Environmental Action Plan 2 ProGreSS rePort SePtember 2012
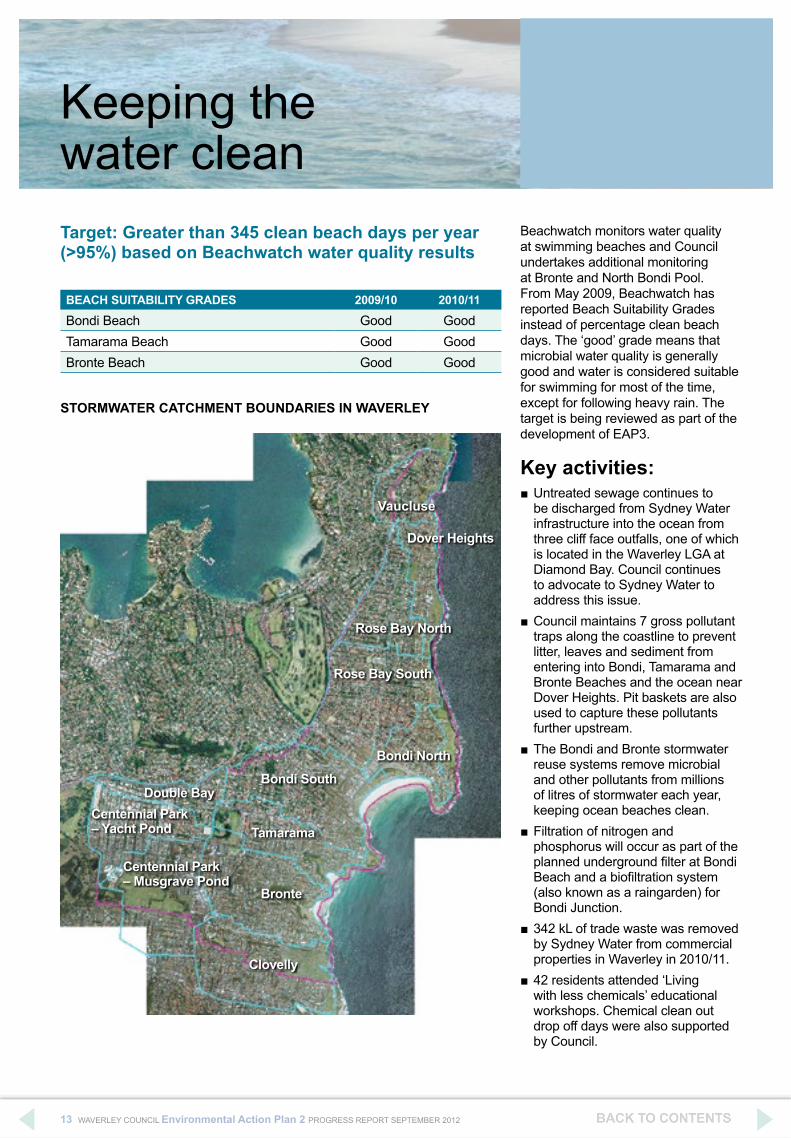
Keeping the water cleanTarget: Greater than 345 clean beach days per year (>95%) based on Beachwatch water quality results
beachwatch monitors water quality at swimming beaches and council undertakes additional monitoring at bronte and north bondi Pool. From may 2009, beachwatch has reported beach Suitability Grades instead of percentage clean beach days. the ‘good’ grade means that microbial water quality is generally good and water is considered suitable for swimming for most of the time, except for following heavy rain. the target is being reviewed as part of the development of eAP3.
Key activities: ■ untreated sewage continues to be discharged from Sydney Water infrastructure into the ocean from three cliff face outfalls, one of which is located in the Waverley lGA at Diamond bay. council continues to advocate to Sydney Water to address this issue.
■ council maintains 7 gross pollutant traps along the coastline to prevent litter, leaves and sediment from entering into bondi, tamarama and bronte beaches and the ocean near Dover Heights. Pit baskets are also used to capture these pollutants further upstream.
■ the bondi and bronte stormwater reuse systems remove microbial and other pollutants from millions of litres of stormwater each year, keeping ocean beaches clean.
■ Filtration of nitrogen and phosphorus will occur as part of the planned underground filter at Bondi Beach and a biofiltration system (also known as a raingarden) for bondi Junction.
■ 342 kl of trade waste was removed by Sydney Water from commercial properties in Waverley in 2010/11.
■ 42 residents attended ‘living with less chemicals’ educational workshops. chemical clean out drop off days were also supported by council.
BEACh SuITABILITy GRAdES 2009/10 2010/11
bondi beach Good Goodtamarama beach Good Goodbronte beach Good Good
SToRmWATER CATChmENT BouNdARIES IN WAvERLEy
vaucluse
dover heights
Rose Bay North
Rose Bay South
Bondi NorthBondi South
Bronte
Clovelly
Tamarama
double BayCentennial Park – yacht Pond
Centennial Park – musgrave Pond
13 WAverley council Environmental Action Plan 2 ProGreSS rePort SePtember 2012

conserving biodiversityTarget: Ensure no loss from 2009/10 levels of remnant vegetation
Target: Continually improve the quality from 2009/10 levels of remnant vegetation
LoCATIoN of REmNANT vEGETATIoN 2010 AREA (m2)
Diamond bay reserve, vaucluse 7,800eastern reserve, Dover Heights 4,800caffyn Park, Dover Heights 1,100raleigh reserve, Dover Heights 1,600loombah road cliffs, Dover Heights/north bondi 1,036Hugh bamford reserve, Dover Heights/north bondi 4,500tamarama Park, tamarama 3,500Waverley cemetery cliffs, bronte 3,100york road bushland, Queens Park (council road verge & centennial and moore Park trust land) 11,000
REmNANT vEGETATIoN CoNdITIoN
ZoNING
ToTAL AREA of CoNdITIoN
ZoNE (hA)
ToTAL AREA of CoNdITIoN
ZoNE (%)
NumBER of INdIvIduAL AREAS
of CoNdITIoN ZoNE
Good 0.2726 4.6 9Fair 1.2046 20.3 16Poor 0.5428 9.1 23
very poor 3.9147 66.0 88
14 WAverley council Environmental Action Plan 2 ProGreSS rePort SePtember 2012
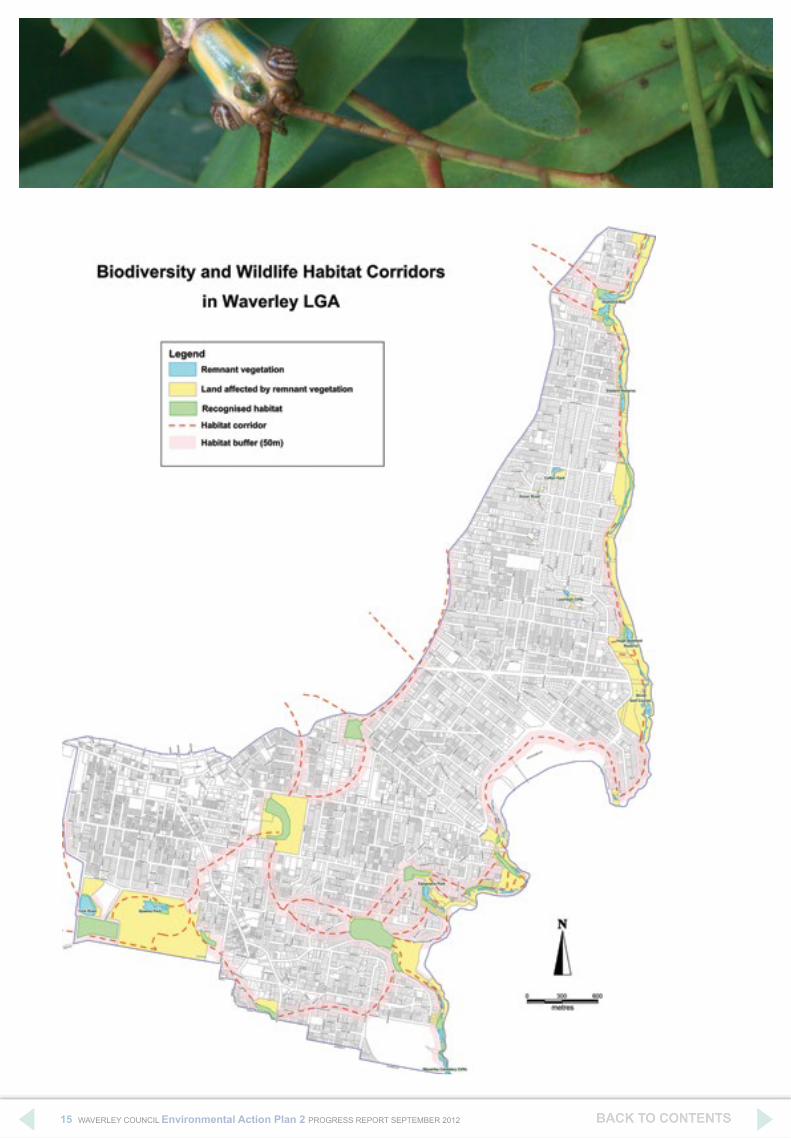
15 WAverley council Environmental Action Plan 2 ProGreSS rePort SePtember 2012
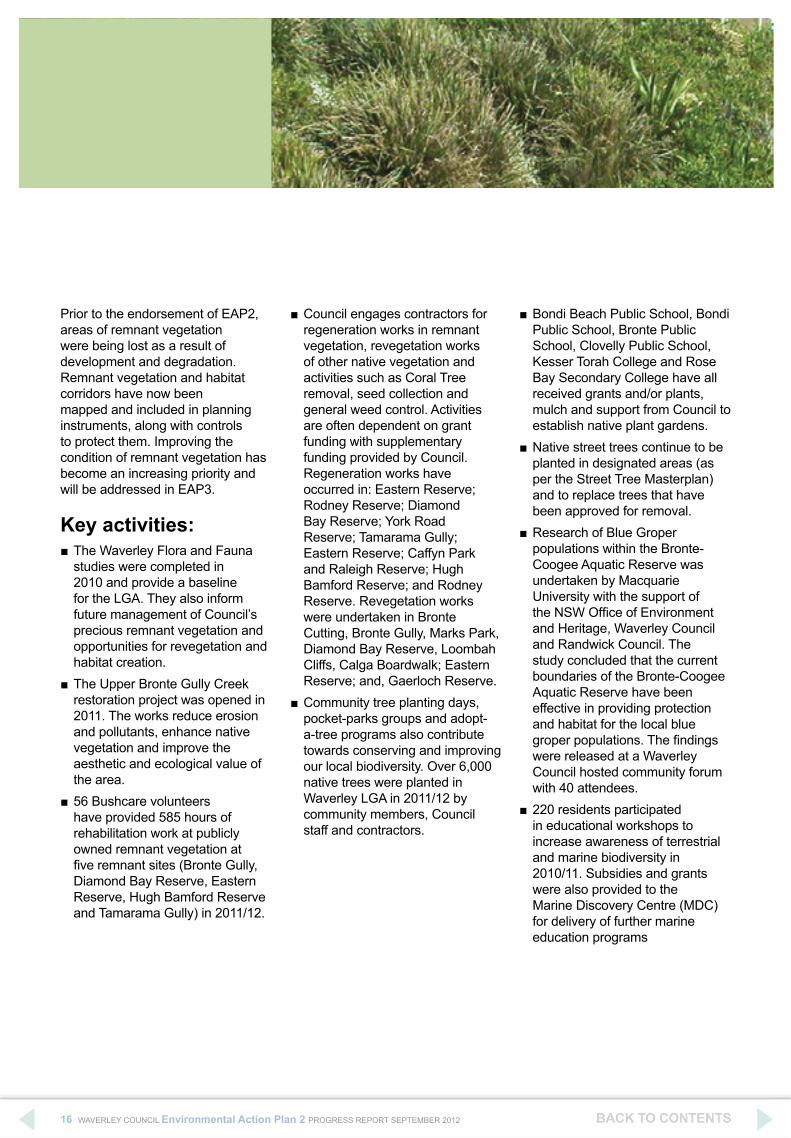
Prior to the endorsement of eAP2, areas of remnant vegetation were being lost as a result of development and degradation. remnant vegetation and habitat corridors have now been mapped and included in planning instruments, along with controls to protect them. improving the condition of remnant vegetation has become an increasing priority and will be addressed in eAP3.
Key activities: ■ the Waverley Flora and Fauna studies were completed in 2010 and provide a baseline for the lGA. they also inform future management of council’s precious remnant vegetation and opportunities for revegetation and habitat creation.
■ the upper bronte Gully creek restoration project was opened in 2011. the works reduce erosion and pollutants, enhance native vegetation and improve the aesthetic and ecological value of the area.
■ 56 bushcare volunteers have provided 585 hours of rehabilitation work at publicly owned remnant vegetation at five remnant sites (Bronte Gully, Diamond bay reserve, eastern reserve, Hugh bamford reserve and tamarama Gully) in 2011/12.
■ council engages contractors for regeneration works in remnant vegetation, revegetation works of other native vegetation and activities such as coral tree removal, seed collection and general weed control. Activities are often dependent on grant funding with supplementary funding provided by council. regeneration works have occurred in: Eastern Reserve; Rodney Reserve; Diamond Bay Reserve; York Road Reserve; Tamarama Gully; Eastern Reserve; Caffyn Park and Raleigh Reserve; Hugh Bamford Reserve; and Rodney reserve. revegetation works were undertaken in bronte cutting, bronte Gully, marks Park, Diamond bay reserve, loombah Cliffs, Calga Boardwalk; Eastern Reserve; and, Gaerloch Reserve.
■ community tree planting days, pocket-parks groups and adopt-a-tree programs also contribute towards conserving and improving our local biodiversity. over 6,000 native trees were planted in Waverley lGA in 2011/12 by community members, council staff and contractors.
■ bondi beach Public School, bondi Public School, bronte Public School, clovelly Public School, Kesser torah college and rose bay Secondary college have all received grants and/or plants, mulch and support from council to establish native plant gardens.
■ native street trees continue to be planted in designated areas (as per the Street tree masterplan) and to replace trees that have been approved for removal.
■ research of blue Groper populations within the bronte-coogee Aquatic reserve was undertaken by macquarie university with the support of the NSW Office of Environment and Heritage, Waverley council and randwick council. the study concluded that the current boundaries of the bronte-coogee Aquatic reserve have been effective in providing protection and habitat for the local blue groper populations. The findings were released at a Waverley council hosted community forum with 40 attendees.
■ 220 residents participated in educational workshops to increase awareness of terrestrial and marine biodiversity in 2010/11. Subsidies and grants were also provided to the marine Discovery centre (mDc) for delivery of further marine education programs
16 WAverley council Environmental Action Plan 2 ProGreSS rePort SePtember 2012

Waverley council continues to further research the local impacts and management of coastal and climate change risks. Activities include:
■ the Waverley coastal Zone risk and Hazards vulnerability Assessment was completed in 2011 and is now publicly available. Planning instruments are currently being updated to reflect the study findings and identify properties subject to geotechnical and/or coastal inundation risks.
■ A climate change risk assessment of council operations was completed in 2012 in accordance with nSW Government requirements.
council also delivers a range of programs to engage and collaborate with local residents, community groups and organisations to improve environmental outcomes. these include:
■ 388 participants enjoyed environmental themed trivia, comedy and other activities as part of the 2011/12 Green brains series.
■ overall, Waverley council environmental events and workshops attracted 4,233 participants in 2011/12.
Additional activities ■ the annual bondi the beautiful festival continues to deliver thousands of residents with a range of environmentally themed activities, entertainment and the opportunity to meet local environmental community group members.
■ Grow it local was successfully delivered for the first time in 2012 to encourage residents and businesses to grow their own food. Grow it local is another high profile program, originating in Waverley, and delivered by council in conjunction with Garage Sale trail and republic of everyone. 123 residents also attended balcony & Kitchen Gardening workshops in 2011/12.
■ 17 schools and 199 educators and parents participate in the eastern Suburbs Sustainable Schools network. Waverley council partner with Woollahra council to facilitate the exchange of ideas, knowledge and resource through quarterly meetings of the network.
Approximately $12,000 in council funded environmental grants are awarded to community groups and schools each year. Grant funded projects implemented in recent years include:
■ bondi beach Public’s children’s garden and environment learning program; and, chook run; Bondi beach Playgroup native habitat garden and family educational day; Sustainability Street Group Waverley communal vegie garden in Waverley Park; Clovelly Public School native gardens and outdoor learning circles; and, excursion to the marine Discovery Centre; Transition bondi Group’s delivery of an aquaponics workshop; Waverley Public School’s Kind Kids program; Bronte Public School’s garden regeneration and water efficient irrigation system; Our big Kitchen’s permaculture food production program; Rose Bay Secondary college’s Gadigal Gardens; St Clare’s College’s water fountains and no bottled water program; WAYS POEM School’s Smart choices Program; Kesser torah college’s courtyard greening; and, Wairoa Special School’s wheelchair accessible garden.
17 WAverley council Environmental Action Plan 2 ProGreSS rePort SePtember 2012

Waverley Council
Annual Financial Statements for the fi nancial year ending 30 June 2012
Incorporating: ■ GENERAL PURPOSE FINANCIAL STATEMENTS
■ SPECIAL PURPOSE FINANCIAL STATEMENTS
■ SPECIAL SCHEDULES

Waverley Council GENERAL PURPOSE FINANCIAL STATEMENTS for the year ended 30 June 2012
"We are united by a common passion for our beautiful home between the city and the sea."

Financial Statements 2012
Waverley Council
General Purpose Financial Statements for the financial year ended 30 June 2012
Contents
1. Understanding Council's Financial Statements
2. Statement by Councillors & Management
3. Primary Financial Statements:
- Income Statement- Statement of Comprehensive Income- Balance Sheet- Statement of Changes in Equity- Statement of Cash Flows
4. Notes to the Financial Statements
5. Independent Auditor's Reports:
- On the Financial Statements (Sect 417 [2]) - On the Conduct of the Audit (Sect 417 [3])
Overview
(i) These financial statements are General Purpose Financial Statements and cover the consolidated operationsfor Waverley Council.
(ii) Waverley Council is a body politic of NSW, Australia - being constituted as a Local Government areaby proclamation and is duly empowered by the Local Government Act (LGA) 1993 of NSW.
Council's Statutory Charter is specified in Paragraph 8 of the LGA and includes;
carrying out activities and providing goods, services & facilities appropriate to the current & futureneeds of the Local community and of the wider public
responsibility for administering regulatory requirements under the LGA and other applicable legislation, &
a role in the management, improvement and development of the resources of the local government area.
A description of the nature of Council's operations and its principal activities are provided in Note 2(b).
(iii) All figures presented in these financial statements are presented in Australian Currency.
(iv) These financial statements were authorised for issue by the Council on 17/10/12.Council has the power to amend and reissue the financial statements.
8
9
7779
Page
4
67
5
2
3
page 1

Financial Statements 2012_
Waverley Council General Purpose Financial Statements for the financial year ended 30 June 2012 Understanding Council's Financial Statements
page 2
Introduction Each year, individual Local Governments across NSW are required to present a set of audited Financial Statements to their Council & Community. What you will find in the Statements The Financial Statements set out the financial performance, financial position & cash flows of Council for the financial year ended 30 June 2012. The format of the Financial Statements is standard across all NSW Councils and complies with both the accounting & reporting requirements of Australian Accounting Standards and requirements as set down by the NSW Division of Local Government. About the Councillor/Management Statement The Financial Statements must be certified by Senior staff as "presenting fairly" the Council's financial results for the year, and are required to be adopted by Council - ensuring both responsibility for & ownership of the Financial Statements. About the Primary Financial Statements The Financial Statements incorporate 5 "primary" financial statements: 1. An Income Statement
A summary of Council's financial performance for the year, listing all income & expenses. This Statement also displays Council's original adopted budget to provide a comparison between what was projected and what actually occurred. 2. A Statement of Comprehensive Income
Primarily records changes in the fair values of Council's Infrastructure, Property, Plant & Equip. 3. A Balance Sheet
A 30 June snapshot of Council's Financial Position including its Assets & Liabilities. 4. A Statement of Changes in Equity
The overall change for the year (in dollars) of Council's "net wealth".
5. A Statement of Cash Flows
Indicates where Council's cash came from and where it was spent. This Statement also displays Council's original adopted budget to provide a comparison between what was projected and what actually occurred.
About the Notes to the Financial Statements The Notes to the Financial Statements provide greater detail and additional information on the 5 Primary Financial Statements. About the Auditor's Reports Council's Financial Statements are required to be audited by external accountants (that generally specialize in Local Government). In NSW, the Auditor provides 2 audit reports: 1. An opinion on whether the Financial Statements
present fairly the Council's financial performance & position, &
2. Their observations on the conduct of the Audit
including the Council's financial performance & financial position.
Who uses the Financial Statements ? The Financial Statements are publicly available documents & must be presented at a Council meeting between 7 days & 5 weeks after the date of the Audit Report. Submissions from the public can be made to Council up to 7 days subsequent to the public presentation of the Financial Statements. Council is required to forward an audited set of Financial Statements to the Division of Local Government. More information A review of Council's financial performance and position for the last 5 financial years can be found at Note 27 of the Financial Statements.

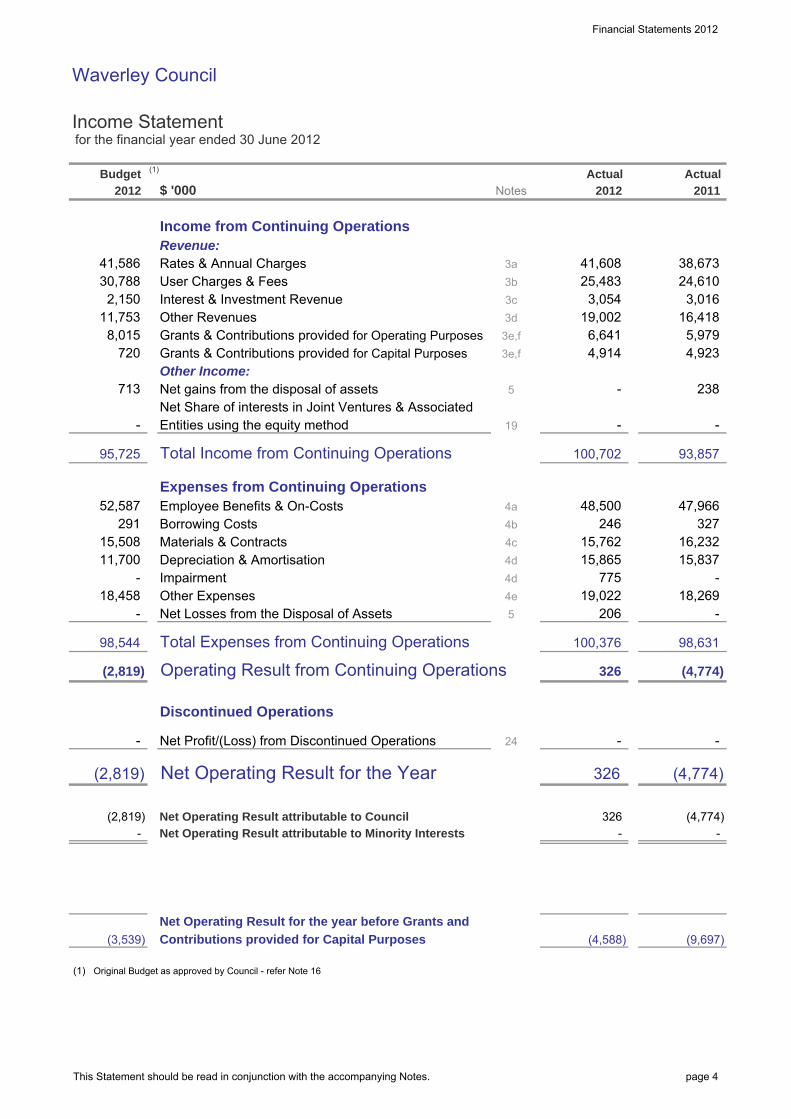
Financial Statements 2012
Waverley Council
Income Statement for the financial year ended 30 June 2012
$ '000
Income from Continuing OperationsRevenue:Rates & Annual ChargesUser Charges & FeesInterest & Investment RevenueOther RevenuesGrants & Contributions provided for Operating PurposesGrants & Contributions provided for Capital PurposesOther Income:Net gains from the disposal of assetsNet Share of interests in Joint Ventures & AssociatedEntities using the equity method
Total Income from Continuing Operations
Expenses from Continuing OperationsEmployee Benefits & On-CostsBorrowing CostsMaterials & ContractsDepreciation & AmortisationImpairmentOther ExpensesNet Losses from the Disposal of Assets
Total Expenses from Continuing Operations
Operating Result from Continuing Operations
Discontinued Operations
Net Profit/(Loss) from Discontinued Operations
Net Operating Result for the Year
Net Operating Result attributable to CouncilNet Operating Result attributable to Minority Interests
Net Operating Result for the year before Grants and
Contributions provided for Capital Purposes
Original Budget as approved by Council - refer Note 16
775
15,762
Actual 2012
246
4,914
-
(4,588)
Actual 2011
-
(9,697)
98,631
(4,774)
(4,774)
- 18,458
713
(1)
(2,819)
-
(3,539)
(2,819)
291 15,508
-
-
98,544
(2,819)
-
95,725
52,587
11,700
41,586
2012
2,150
720
30,788
11,753 8,015
3b
Notes
3a 41,608 25,483
38,673 24,610
3e,f
4d
5
4b
3,016 16,418
5,979
3,054 19,002
48,500
-
100,702
15,865
6,641
19
4a
24
326
Budget (1)
-
-
4c
3d3c
19,022 5 206
-
100,376
4d
3e,f 4,923
238
-
93,857
47,966
-
327 16,232 15,837
18,269
(4,774)
-
4e
326
326
This Statement should be read in conjunction with the accompanying Notes. page 4
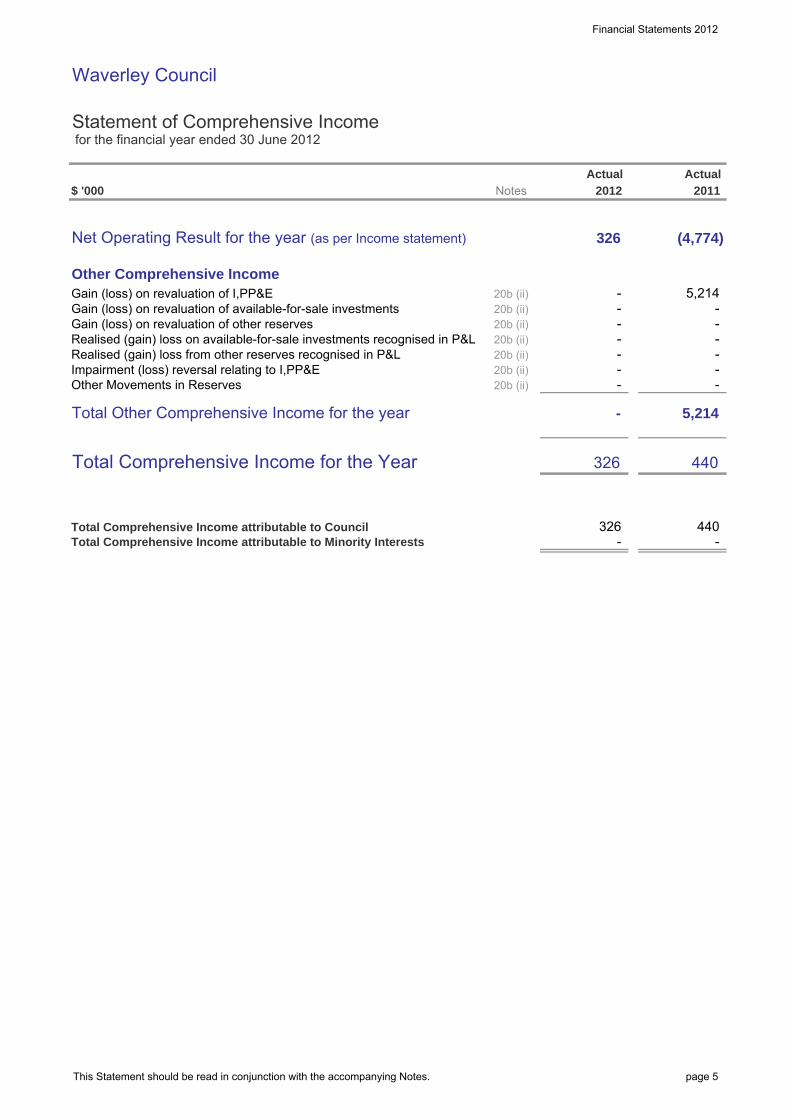
Financial Statements 2012
Waverley Council
Statement of Comprehensive Income for the financial year ended 30 June 2012
$ '000
Net Operating Result for the year (as per Income statement)
Other Comprehensive IncomeGain (loss) on revaluation of I,PP&EGain (loss) on revaluation of available-for-sale investmentsGain (loss) on revaluation of other reservesRealised (gain) loss on available-for-sale investments recognised in P&LRealised (gain) loss from other reserves recognised in P&LImpairment (loss) reversal relating to I,PP&EOther Movements in Reserves (FV reserve reversal relating to disposed I,PP&E)
Total Other Comprehensive Income for the year
Total Comprehensive Income for the Year
Total Comprehensive Income attributable to CouncilTotal Comprehensive Income attributable to Minority Interests
326
Actual 2012
440
440
5,214
-
Actual
-
2011
-
(4,774)
-
-
-
-
-
-
326
-
-
-
20b (ii)
20b (ii)
Notes
20b (ii)
20b (ii)
20b (ii)20b (ii)
326
- 20b (ii)
-
5,214
-
-
This Statement should be read in conjunction with the accompanying Notes. page 5

Financial Statements 2012
Waverley Council
Balance Sheet as at 30 June 2012
$ '000
ASSETSCurrent AssetsCash & Cash EquivalentsInvestmentsReceivablesInventoriesOtherNon-current assets classified as 'held for sale'Total Current Assets
Non-Current AssetsInvestmentsReceivablesInfrastructure, Property, Plant & EquipmentInvestments accounted for using the equity methodInvestment PropertyIntangible AssetsNon-current assets classified as 'held for sale'Total Non-Current Assets
TOTAL ASSETS
LIABILITIESCurrent LiabilitiesPayablesBorrowingsProvisionsTotal Current Liabilities
Non-Current LiabilitiesBorrowingsProvisionsTotal Non-Current Liabilities
TOTAL LIABILITIES
Net Assets
EQUITYRetained EarningsRevaluation ReservesCouncil Equity InterestMinority Equity Interest
Total Equity
35,128
817,338
817,338
576,727 240,611 817,338
5,015 644
852,466
809,851 44,955
4,371
115,639 -
9,517 1,346
19,250 30,113
-
Actual 2010
12,534 22,887
-
12,799
633,792
42,615
6,504 164
2,666
6,861
700
11,514
- 526
Actual
8,842 25,000
2012
20,824
Actual 2011
19,344
160
2,124 638,450
10
10
32,254
41,563
3,202
114,827
853,221
44,955
117,823 -
812,948 787,092 26,715
-
- 637,430
- 19
10
14
1,289 19,926
9
10
2522
11,039
Notes
3,000
78822 18,240
66,129
7,085
518 118
6a6b
6b7
10
818,258
20 572,433
818,584
818,584
34,637
3,842
572,875 20
32,411
655
854,511
10,770
20,456 1,185
-
245,825 245,709
36,253
818,258 -
818,258 818,584
485 1,898
2,383
3,187
This Statement should be read in conjunction with the accompanying Notes. page 6

Financial Statements 2012
Waverley Council
Statement of Changes in Equity for the financial year ended 30 June 2012
$ '000
Opening Balance (as per Last Year's Audited Accounts)
a. Correction of Prior Period Errorsb. Changes in Accounting Policies (prior year effects)
Revised Opening Balance (as at 1/7/11)
c. Net Operating Result for the Year
d. Other Comprehensive Income- Revaluations : IPP&E Asset Revaluation Rsve- Revaluations: Other Reserves- Transfers to Income Statement- Impairment (loss) reversal relating to I,PP&E- Other Movements
Other Comprehensive Income
Total Comprehensive Income (c&d)
e. Distributions to/(Contributions from) Minority Interests
f. Transfers between Equity
Equity - Balance at end of the reporting period
$ '000
Opening Balance (as per Last Year's Audited Accounts)
a. Correction of Prior Period Errorsb. Changes in Accounting Policies (prior year effects)
Revised Opening Balance (as at 1/7/10)
c. Net Operating Result for the Year
d. Other Comprehensive Income- Revaluations : IPP&E Asset Revaluation Rsve- Revaluations: Other Reserves- Transfers to Income Statement- Impairment (loss) reversal relating to I,PP&E- Other Movements (enter details here)
Other Comprehensive Income
Total Comprehensive Income (c&d)
e. Distributions to/(Contributions from) Minority Interests
f. Transfers between Equity
Equity - Balance at end of the reporting period
-
817,778
818,258
Total
245,709
-
-
326
818,584
7,707
-
-
-
-
817,778
480
Reserves
Interest
-
-
-
Total
-
-
Equity
-
5,214
-
440 440 -
- -
(116)
-
-
572,433 245,825 - 818,258
-
- -
818,258
245,825
-
-
5,214
(4,774)
Minority
326
-
1,351,664
818,584
Council
326
-
-
-
817,818
(541,553) - -
Interest
-
-
- -
-
-
-
-
-
-
-
Equity
817,818
(541,553)
7,707
-
-
326
(4,774)
5,214
-
Interest
480
-
-
-
818,258
-
- - -
(Refer 20b)
-
577,207
20 (c) 7,707
- 116
20b (ii)
Earnings
-
1,111,053
20 (d)
572,875
Notes
5,214 -
20b (ii)
20b (ii)
(4,774)
20b (ii) - 20b (ii)
-
20b (ii)
-
-
326
20b (ii)
20b (ii) -
- -
-
(541,553)
2011
-
-
- 240,611
-
240,611
(Refer 20b)
5,214
-
(4,774)
- -
-
-
Retained
5,214
2012
- 20b (ii)
20b (ii)
480 20 (c)
572,433
- 20 (d)
-
ReservesEarnings
MinorityNotes
Retained
-
- -
326 -
571,953 -
-
- -
-
1,351,664
-
-
-
-
-
-
-
-
-
Interest
-
245,825
Council
- 5,214
This Statement should be read in conjunction with the accompanying Notes. page 7
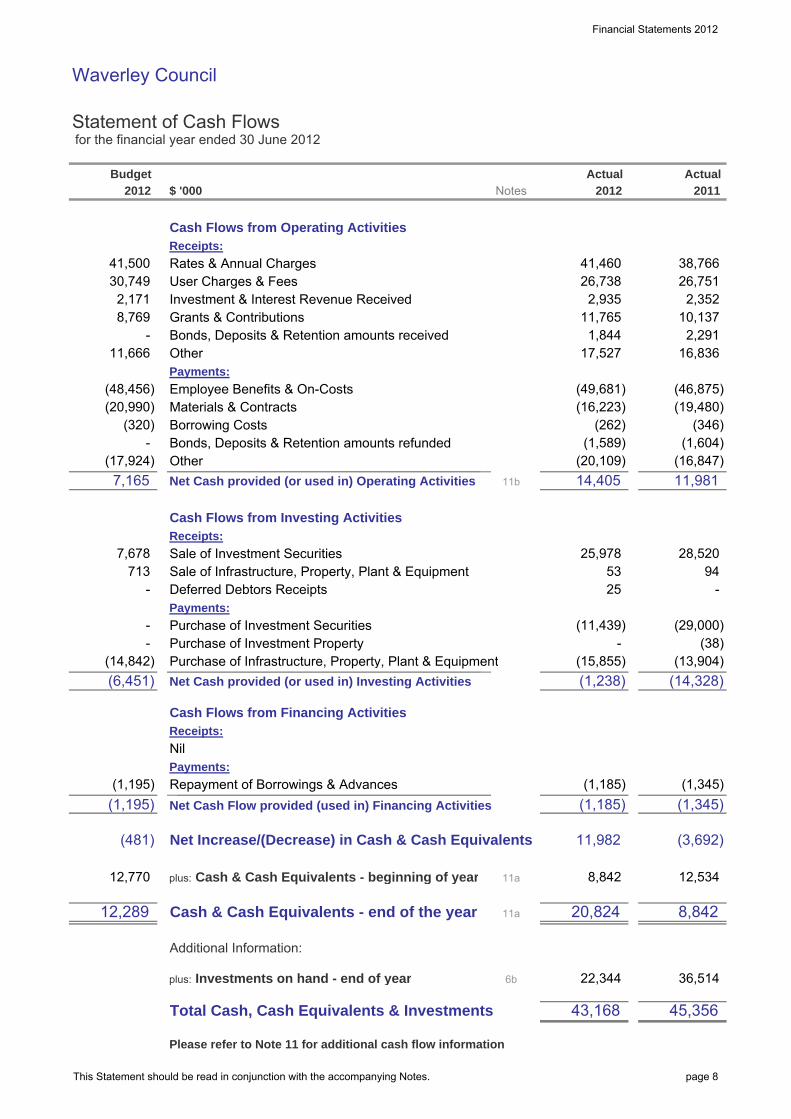
Financial Statements 2012
Waverley Council
Statement of Cash Flows for the financial year ended 30 June 2012
$ '000
Cash Flows from Operating ActivitiesReceipts:
Rates & Annual ChargesUser Charges & FeesInvestment & Interest Revenue ReceivedGrants & ContributionsBonds, Deposits & Retention amounts receivedOtherPayments:
Employee Benefits & On-CostsMaterials & ContractsBorrowing CostsBonds, Deposits & Retention amounts refundedOtherNet Cash provided (or used in) Operating Activities
Cash Flows from Investing ActivitiesReceipts:
Sale of Investment SecuritiesSale of Infrastructure, Property, Plant & EquipmentDeferred Debtors ReceiptsPayments:
Purchase of Investment SecuritiesPurchase of Investment PropertyPurchase of Infrastructure, Property, Plant & EquipmentNet Cash provided (or used in) Investing Activities
Cash Flows from Financing ActivitiesReceipts:
NilPayments:
Repayment of Borrowings & AdvancesNet Cash Flow provided (used in) Financing Activities
Net Increase/(Decrease) in Cash & Cash Equivalents
plus: Cash & Cash Equivalents - beginning of year
Cash & Cash Equivalents - end of the year
Additional Information:
plus: Investments on hand - end of year
Total Cash, Cash Equivalents & Investments
Please refer to Note 11 for additional cash flow information
(19,480) (346) (262)
(16,223) (49,681)
17,527
41,460
2012Notes 2011Actual
(16,847) (1,589)
11b
16,836
14,405 (20,109)
(46,875)
1,844 2,291 10,137 11,765
(6,451)
(1,195)
(14,328)
713
-
-
- (14,842)
12,289
(481)
(1,195)
12,770 11a
(48,456)
11,666
Budget
41,500
- 8,769
2012
30,749 2,171
(320) -
7,678
7,165 (17,924)
(20,990)
36,514
45,356
8,842
(1,345)
12,534
(1,345)
(3,692)
43,168
22,344
(1,238)
20,824 11a
(1,185) (1,185)
8,842
11,982
6b
53 25
94
(1,604)
11,981
28,520 25,978
2,935 26,751
2,352
Actual
26,738 38,766
-
(15,855)
(11,439)
(13,904) - (38)
(29,000)
This Statement should be read in conjunction with the accompanying Notes. page 8

Financial Statements 2012
Waverley Council
Notes to the Financial Statements for the financial year ended 30 June 2012
Contents of the Notes accompanying the Financial Statements
Details
Summary of Significant Accounting PoliciesCouncil Functions / Activities - Financial InformationCouncil Functions / Activities - Component DescriptionsIncome from Continuing OperationsExpenses from Continuing OperationsGains or Losses from the Disposal of AssetsCash & Cash Equivalent AssetsInvestment SecuritiesRestricted Cash, Cash Equivalents & Investments - DetailsReceivablesInventories & Other AssetsInfrastructure, Property, Plant & EquipmentExternally Restricted Infrastructure, Property, Plant & EquipmentInfrastructure, Property, Plant & Equipment - Current Year ImpairmentsPayables, Borrowings & ProvisionsDescription of (& movements in) ProvisionsStatement of Cash Flows - Additional InformationCommitments for ExpenditureStatements of Performance Measures: (i) Local Government Industry Indicators (Consolidated) (ii) Local Government Industry Graphs (Consolidated)Investment PropertiesFinancial Risk ManagementMaterial Budget VariationsStatement of Developer ContributionsContingencies and Other Liabilities/Assets not recognisedControlled Entities, Associated Entities & Interests in Joint VenturesEquity - Retained Earnings and Revaluation Reserves
Financial Result & Financial Position by Fund"Held for Sale" Non Current Assets & Disposal GroupsEvents occurring after Balance Sheet DateDiscontinued OperationsIntangible AssetsReinstatement, Rehabilitation & Restoration Liabilities
Additional Council Disclosures
Financial Commentary & ReviewCouncil Information & Contact Details
n/a - not applicable
70 n/a
64
74
67
73 n/a
70
68
76
74 n/a
74 n/a
75
73
74 n/a
7
8
9(a)
9(b)
28
24
16
20
21
27
23
26
25
59
56
55
5758
9(c)
11
4 38
43
53
49
50
48
52
50
5
6(a)
51
22
14
10(a)
10(b)
17
18
12
13a
19
15
Page
1
47
42
4345
10283033
2(a)
3
2(b)
6(b)
Note
6(c)
page 9

Financial Statements 2012_
Waverley Council Notes to the Financial Statements for the financial year ended 30 June 2012 Note 1. Summary of Significant Accounting Policies
page 10
The principal accounting policies adopted by Council in the preparation of these consolidated financial statements are set out below in order to assist in its general understanding. Under Australian Accounting Standards (AASB's), accounting policies are defined as those specific principles, bases, conventions, rules and practices applied by a reporting entity (in this case Council) in preparing and presenting its financial statements. (a) Basis of preparation (i) Background These financial statements are general purpose financial statements which have been prepared in accordance with; Australian Accounting Standards and
Interpretations issued by the Australian Accounting Standards Board,
the Local Government Act (1993) & Regulation,
and the Local Government Code of Accounting
Practice and Financial Reporting. For the purpose of preparing these financial statements, Council has been deemed to be a not-for-profit entity. (ii) Compliance with International Financial Reporting Standards (IFRSs) Because Australian Accounting Standards (AASB's) are sector neutral, some standards either:
(a) have local Australian content and prescription that is specific to the Not-For-Profit sector (including Local Government) which are not in compliance with IFRS’s, or
(b) specifically exclude application by Not for Profit entities.
Accordingly in preparing these financial statements and accompanying notes, Council has been unable to comply fully with International Accounting Standards, but has complied fully with Australian Accounting Standards.
Under the Local Government Act (LGA), Regulations and Local Government Code of Accounting Practice & Financial Reporting, it should be noted that Councils in NSW only have a requirement to comply with Australian Accounting Standards. (iii) New and amended standards adopted by Council None of the new standards and amendments to standards that are mandatory for the first time for the financial year beginning 1 July 2011 affected any of the amounts recognised in the current period or any prior period and are not likely to affect future periods. (iv) Early adoption of Accounting Standards Council has not elected to apply any pronouncements before their operative date in the annual reporting period beginning 1 July 2011. Refer further to paragraph (ab) relating to a summary of the effects of Standards with future operative dates.. (v) Basis of Accounting These financial statements have been prepared under the historical cost convention except for: (i) financial assets and liabilities at fair value
through profit or loss, available-for-sale financial assets and investment properties which are all valued at fair value,
(ii) the write down of any Asset on the basis of Impairment (if warranted) and
(iii) certain classes of Infrastructure, property, plant
& equipment that are accounted for at fair valuation.
The accrual basis of accounting has also been applied in their preparation. (vi) Changes in Accounting Policies Council’s accounting policies have been consistently applied to all the years presented, unless otherwise stated. There have also been no changes in accounting policies when compared with previous financial statements unless otherwise stated [refer Note 20(d)].

Financial Statements 2012_
Waverley Council Notes to the Financial Statements for the financial year ended 30 June 2012 Note 1. Summary of Significant Accounting Policies (continued)
page 11
(vii) Critical Accounting Estimates The preparation of financial statements requires the use of certain critical accounting estimates (in conformity with AASB's). Accordingly this requires management to exercise its judgement in the process of applying the Council's accounting policies. Estimates and judgements are continually evaluated and are based on historical experience and other factors, including expectations of future events that may have a financial impact on the entity and that are believed to be reasonable under the circumstances. Critical accounting estimates and assumptions Council makes estimates and assumptions concerning the future. The resulting accounting estimates will, by definition, seldom equal the related actual results. The estimates and assumptions that have a significant risk of causing a material adjustment to the carrying amounts of assets and liabilities within the next financial year are set out below. (i) Estimated fair values of investment properties
(ii) Estimated fair values of infrastructure, property,
plant and equipment.
(iii) Estimated tip remediation provisions.
Critical judgements in applying the entity's accounting policies (i) Impairment of Receivables - Council has made
a significant judgement about the impairment of a number of its receivables in Note 7.
(ii) Projected Section 94 Commitments - Council
has used significant judgement in determining future Section 94 income and expenditure in Note 17.
(b) Revenue recognition Council recognises revenue when the amount of revenue can be reliably measured, it is probable that
future economic benefits will flow to the entity and specific criteria have been met for each of the Council’s activities as described below. Council bases any estimates on historical results, taking into consideration the type of customer, the type of transaction and the specifics of each arrangement. Revenue is measured at the fair value of the consideration received or receivable. Revenue is measured on major income categories as follows: Rates, Annual Charges, Grants and Contributions Rates, annual charges, grants and contributions (including developer contributions) are recognised as revenues when the Council obtains control over the assets comprising these receipts. Control over assets acquired from rates and annual charges is obtained at the commencement of the rating year as it is an enforceable debt linked to the rateable property or, where earlier, upon receipt of the rates. A provision for the impairment on rates receivables has not been established as unpaid rates represent a charge against the rateable property that will be recovered when the property is next sold. Control over granted assets is normally obtained upon their receipt (or acquittal) or upon earlier notification that a grant has been secured, and is valued at their fair value at the date of transfer. Revenue from Contributions is recognised when the Council either obtains control of the contribution or the right to receive it, (i) it is probable that the economic benefits comprising the contribution will flow to the Council and (ii) the amount of the contribution can be measured reliably. Where grants or contributions recognised as revenues during the financial year were obtained on condition that they be expended in a particular manner or used over a particular period and those conditions were undischarged at balance date, the unused grant or contribution is disclosed in Note 3(g).

Financial Statements 2012_
Waverley Council Notes to the Financial Statements for the financial year ended 30 June 2012 Note 1. Summary of Significant Accounting Policies (continued)
page 12
Note 3(g) also discloses the amount of unused grant or contribution from prior years that was expended on Council’s operations during the current year. The Council has obligations to provide facilities from contribution revenues levied on developers under the provisions of S94 of the EPA Act 1979. Whilst Council generally incorporates these amounts as part of a Development Consents Order, such developer contributions are only recognised as income upon their physical receipt by Council, due to the possibility that individual Development Consents may not be acted upon by the applicant and accordingly would not be payable to Council. Developer contributions may only be expended for the purposes for which the contributions were required but the Council may apply contributions according to the priorities established in work schedules. A detailed Note relating to developer contributions can be found at Note 17. User Charges, Fees and Other Income User charges, fees and other income (including parking fees and fines) are recognised as revenue when the service has been provided, the payment is received, or when the penalty has been applied, whichever first occurs. A provision for the impairment of these receivables is recognised when collection in full is no longer probable. A liability is recognised in respect of revenue that is reciprocal in nature to the extent that the requisite service has not been provided as at balance date. Sale of Infrastructure, Property, Plant and Equipment The profit or loss on sale of an asset is determined when control of the asset has irrevocably passed to the buyer. Interest and Rents Rents are recognised as revenue on a proportional basis when the payment is due, the value of the payment is notified, or the payment is received, whichever first occurs.
Interest Income from Cash & Investments is accounted for using the Effective Interest method in accordance with AASB 139. (c) Principles of Consolidation These financial statements incorporate (i) the assets and liabilities of Council and any Entities (or operations) that it controls (as at 30/6/12) and (ii) all the related operating results (for the financial year ended the 30th June 2012). The financial statements also include Council’s share of the assets, liabilities, income and expenses of any Jointly Controlled Operations under the appropriate headings. In the process of reporting on Council’s activities as a single unit, all inter-entity year end balances and reporting period transactions have been eliminated in full between Council and its controlled entities. (i) The Consolidated Fund In accordance with the provisions of Section 409(1) of the LGA 1993, all money and property received by Council is held in the Council’s Consolidated Fund unless it is required to be held in the Council’s Trust Fund. The Consolidated Fund and other entities through which the Council controls resources to carry on its functions have been included in the financial statements forming part of this report. The following entities have been included as part of the Consolidated Fund: General Purpose Operations (ii) The Trust Fund In accordance with the provisions of Section 411 of the Local Government Act 1993 (as amended), a separate and distinct Trust Fund is maintained to account for all money and property received by the Council in trust which must be applied only for the purposes of or in accordance with the trusts relating to those monies. Trust monies and property subject to Council’s control have been included in these statements.

Financial Statements 2012_
Waverley Council Notes to the Financial Statements for the financial year ended 30 June 2012 Note 1. Summary of Significant Accounting Policies (continued)
page 13
Trust monies and property held by Council but not subject to the control of Council, have been excluded from these statements. A separate statement of monies held in the Trust Fund is available for inspection at the Council office by any person free of charge. (iii) Joint Ventures Council has no interest in any Joint Venture Entities, Assets or Operations. (iv) Associated Entities Where Council has the power to participate in the financial and operating decisions (of another entity), ie. where Council is deemed to have “significant influence” over the other entities operations but neither controls nor jointly controls the entity, then Council accounts for such interests using the equity method of accounting – in a similar fashion to Joint Venture Entities & Partnerships. Such entities are usually termed Associates. (v) County Councils Council is not a member of any County Councils. (vi) Additional Information Note 19 provides more information in relation to Joint Venture Entities, Associated Entities and Joint Venture Operations where applicable. (d) Leases All Leases entered into by Council are reviewed and classified on inception date as either a Finance Lease or an Operating Lease. Finance Leases Leases of property, plant and equipment where the Council has substantially all the risks and rewards of ownership are classified as finance leases. Finance leases are capitalised at the lease’s inception at the lower of the fair value of the leased property and the present value of the minimum lease payments.
The corresponding rental obligations, net of finance charges, are included in borrowings. Each lease payment is allocated between the liability outstanding and the recognition of a finance charge. The interest element of the finance charge is costed to the income statement over the lease period so as to produce a constant periodic rate of interest on the remaining balance of the liability for each period. Property, plant and equipment acquired under finance leases is depreciated over the shorter of each leased asset’s useful life and the lease term. Operating Leases Leases in which a significant portion of the risks and rewards of ownership are retained by the lessor are classified as operating leases. Payments made under operating leases (net of any incentives received from the lessor) are charged to the income statement on a straight-line basis over the period of the lease. Lease income from operating leases is recognised in income on a straight-line basis over the lease term. (e) Cash and Cash Equivalents Cash and cash equivalents includes; cash on hand, deposits held at call with financial institutions, other short-term, highly liquid investments with
original maturities of three months or less that are readily convertible to known amounts of cash and which are subject to an insignificant risk of changes in value, and
bank overdrafts. Bank overdrafts are shown within borrowings in current liabilities on the balance sheet but are incorporated into Cash & Cash Equivalents for presentation of the Cash Flow Statement.
Financial Statements 2012_
Waverley Council Notes to the Financial Statements for the financial year ended 30 June 2012 Note 1. Summary of Significant Accounting Policies (continued)
page 14
(f) Investments and Other Financial Assets Council (in accordance with AASB 139) classifies each of its investments into one of the following categories for measurement purposes: financial assets at fair value through profit or
loss, loans and receivables, held-to-maturity investments, and available-for-sale financial assets. Each classification depends on the purpose/intention for which the investment was acquired & at the time it was acquired. Management determines each Investment classification at the time of initial recognition and re-evaluates this designation at each reporting date. (i) Financial assets at fair value through profit or loss Financial assets at fair value through profit or loss include financial assets that are “held for trading”. A financial asset is classified in the “held for trading” category if it is acquired principally for the purpose of selling in the short term. Assets in this category are primarily classified as current assets as they are primarily held for trading &/or are expected to be realised within 12 months of the balance sheet date. (ii) Loans and receivables Loans and receivables are non derivative financial assets with fixed or determinable payments that are not quoted in an active market. They arise when the Council provides money, goods or services directly to a debtor with no intention (or in some cases ability) of selling the resulting receivable. They are included in current assets, except for those with maturities greater than 12 months after the balance sheet date which are classified as non-current assets.
(iii) Held-to-maturity investments Held-to-maturity investments are non-derivative financial assets with fixed or determinable payments and fixed maturities that the Council’s management has the positive intention and ability to hold to maturity. In contrast to the “Loans & Receivables” classification, these investments are generally quoted in an active market. Held-to-maturity financial assets are included in non-current assets, except for those with maturities less than 12 months from the reporting date, which are classified as current assets. (iv) Available-for-sale financial assets Available-for-sale financial assets are non-derivatives that are either designated in this category or not classified in any of the other categories. Investments must be designated as available-for-sale if they do not have fixed maturities and fixed or determinable payments and management intends to hold them for the medium to long term. Accordingly, this classification principally comprises marketable equity securities, but can include all types of financial assets that could otherwise be classified in one of the other investment categories. They are generally included in non-current assets unless management intends to dispose of the investment within 12 months of the balance sheet date or the term to maturity from the reporting date is less than 12 months. Financial Assets – Reclassification Council may choose to reclassify a non-derivative trading financial asset out of the held-for-trading category if the financial asset is no longer held for the purpose of selling it in the near term. Financial assets other than loans and receivables are permitted to be reclassified out of the held-for-trading category only in rare circumstances arising from a single event that is unusual and highly unlikely to recur in the near term. Council may also choose to reclassify financial assets that would meet the definition of loans and

Financial Statements 2012_
Waverley Council Notes to the Financial Statements for the financial year ended 30 June 2012 Note 1. Summary of Significant Accounting Policies (continued)
page 15
receivables out of the held-for-trading or available-for-sale categories if it has the intention and ability to hold these financial assets for the foreseeable future or until maturity at the date of reclassification. Reclassifications are made at fair value as of the reclassification date. Fair value becomes the new cost or amortised cost as applicable, and no reversals of fair value gains or losses recorded before reclassification date are subsequently made. Effective interest rates for financial assets reclassified to loans and receivables and held-to-maturity categories are determined at the reclassification date. Further increases in estimates of cash flows adjust effective interest rates prospectively. General Accounting & Measurement of Financial Instruments: (i) Initial Recognition Investments are initially recognised (and measured) at fair value, plus in the case of investments not at “fair value through profit or loss”, directly attributable transactions costs Purchases and sales of investments are recognised on trade-date - the date on which the Council commits to purchase or sell the asset. Financial assets are derecognised when the rights to receive cash flows from the financial assets have expired or have been transferred and the Council has transferred substantially all the risks and rewards of ownership. (ii) Subsequent Measurement Available-for-sale financial assets and financial assets at fair value through profit and loss are subsequently carried at fair value. Loans and receivables and held-to-maturity investments are carried at amortised cost using the effective interest method. Realised and unrealised gains and losses arising from changes in the fair value of the financial assets classified as “fair value through profit or loss” category are included in the income statement in the period in which they arise.
Unrealised gains and losses arising from changes in the fair value of non monetary securities classified as "available-for-sale" are recognised in equity in the available-for-sale investments revaluation reserve. When securities classified as "available-for-sale" are sold or impaired, the accumulated fair value adjustments are included in the income statement as gains and losses from investment securities. Impairment Council assesses at each balance date whether there is objective evidence that a financial asset or group of financial assets is impaired. A financial asset or a group of financial assets is impaired and impairment losses are incurred only if there is objective evidence of impairment as a result of one or more events that occurred after the initial recognition of the asset (a ‘loss event’) and that loss event (or events) has an impact on the estimated future cash flows of the financial asset or group of financial assets that can be reliably estimated. In the case of equity securities classified as available-for-sale, a significant or prolonged decline in the fair value of a security below its cost is considered in determining whether the security is impaired. If any such evidence exists for available-for-sale financial assets, the cumulative loss - measured as the difference between the acquisition cost and the current fair value, less any impairment loss on that financial asset previously recognised in profit and loss - is removed from equity and recognised in the income statement. Impairment losses recognised in the income statement on equity instruments are not reversed through the income statement. If there is evidence of impairment for any of Council’s financial assets carried at amortised cost (eg. loans and receivables), the amount of the loss is measured as the difference between the asset’s carrying amount and the present value of estimated future cash flows (excluding future credit losses that have not been incurred) discounted at the financial asset’s original effective interest rate. The carrying amount of the asset is reduced and the amount of the loss is recognised in profit or loss. If a

Financial Statements 2012_
Waverley Council Notes to the Financial Statements for the financial year ended 30 June 2012 Note 1. Summary of Significant Accounting Policies (continued)
page 16
loan or held-to-maturity investment has a variable interest rate, the discount rate for measuring any impairment loss is the current effective interest rate determined under the contract. As a practical expedient, the group may measure impairment on the basis of an instrument’s fair value using an observable market price. (iii) Types of Investments Council has an approved Investment Policy in order to undertake its investment of money in accordance with (and to comply with) Section 625 of the Local Government Act and S212 of the LG (General) Regulation 2005. Investments are placed and managed in accordance with the Policy and having particular regard to authorised investments prescribed under the Ministerial Local Government Investment Order. Council maintains its investment Policy in compliance with the Act and ensures that it or its representatives exercise care, diligence and skill that a prudent person would exercise in investing Council funds. Council amended its policy following revisions to the Ministerial Local Government Investment Order arising from the Cole Inquiry recommendations. Certain investments that Council holds are no longer prescribed (eg. managed funds, CDOs, and equity linked notes), however they have been retained under grandfathering provisions of the Order. These will be disposed of when most financially advantageous to Council. (g) Fair value estimation The fair value of financial assets and financial liabilities must be estimated for recognition and measurement or for disclosure purposes. The fair value of financial instruments traded in active markets is based on quoted market prices at the balance sheet date. The fair value of financial instruments that are not traded in an active market is determined using valuation techniques.
Council uses a variety of methods and makes assumptions that are based on market conditions existing at each balance date. Quoted market prices or dealer quotes for similar instruments are used for long-term debt instruments held. If the market for a financial asset is not active (and for unlisted securities), the Council establishes fair value by using valuation techniques. These include reference to the fair values of recent arm’s length transactions, involving the same instruments or other instruments that are substantially the same, discounted cash flow analysis, and option pricing models refined to reflect the issuer’s specific circumstances. The nominal value less estimated credit adjustments of trade receivables and payables are assumed to approximate their fair values. The fair value of financial liabilities for disclosure purposes is estimated by discounting the future contractual cash flows at the current market interest rate that is available to the Council for similar financial instruments. (h) Receivables Receivables are initially recognised at fair value and subsequently measured at amortised cost, less any provision for impairment. Receivables (excluding Rates & Annual Charges) are generally due for settlement no more than 30 days from the date of recognition. The collectibility of receivables is reviewed on an ongoing basis. Debts which are known to be uncollectible are written off in accordance with Council’s policy. A provision for impairment (ie. an allowance account) relating to receivables is established when there is objective evidence that the Council will not be able to collect all amounts due according to the original terms of each receivable.
Financial Statements 2012_
Waverley Council Notes to the Financial Statements for the financial year ended 30 June 2012 Note 1. Summary of Significant Accounting Policies (continued)
page 17
The amount of the provision is the difference between the asset’s carrying amount and the present value of estimated future cash flows, discounted at the effective interest rate. Impairment losses are recognised in the Income Statement within other expenses. When a receivable for which an impairment allowance had been recognised becomes uncollectible in a subsequent period, it is written off against the allowance account. Subsequent recoveries of amounts previously written off are credited against other expenses in the income statement. (i) Inventories Raw Materials and Stores, Work in Progress and Finished Goods Raw materials and stores, work in progress and finished goods in respect of business undertakings are all stated at the lower of cost and net realisable value. Cost comprises direct materials, direct labour and an appropriate proportion of variable and fixed overhead expenditure, the latter being allocated on the basis of normal operating capacity. Costs are assigned to individual items of inventory on the basis of weighted average costs. Net realisable value is the estimated selling price in the ordinary course of business less the estimated costs of completion and the estimated costs necessary to make the sale. Inventories held in respect of non-business undertakings have been valued at cost subject to adjustment for loss of service potential. Land Held for Resale/Capitalisation of Borrowing Costs Land held for resale is stated at the lower of cost and net realisable value. Cost is assigned by specific identification and includes the cost of acquisition, and development and borrowing costs during development.
When development is completed borrowing costs and other holding charges are expensed as incurred. Borrowing costs included in the cost of land held for resale are those costs that would have been avoided if the expenditure on the acquisition and development of the land had not been made. Borrowing costs incurred while active development is interrupted for extended periods are recognised as expenses. (j) Infrastructure, Property, Plant and Equipment (I,PP&E) Acquisition of assets Council’s non current assets have been progressively revalued to fair value in accordance with a staged implementation as advised by the Division of Local Government. At balance date, the following classes of I,PP&E were stated at their Fair Value; - Investment Properties – refer Note 1(p), - Water and Sewerage Networks
(Internal Valuation)
- Operational Land (Internal Valuation)
- Buildings – Specialised/Non Specialised (Internal Valuation)
- Plant and Equipment
(as approximated by depreciated historical cost)
- Roads Assets incl. roads, bridges & footpaths (Internal Valuation)
- Drainage Assets (Internal Valuation) - Bulk Earthworks (Internal Valuation)
- Community Land (Internal Valuation)
- Land Improvements
(as approximated by depreciated historical cost)
- Other Structures (as approximated by depreciated historical cost)
- Other Assets (as approximated by depreciated historical cost)
Financial Statements 2012_
Waverley Council Notes to the Financial Statements for the financial year ended 30 June 2012 Note 1. Summary of Significant Accounting Policies (continued)
page 18
Initial Recognition On initial recognition, an assets cost is measured at its fair value, plus all expenditure that is directly attributable to the acquisition. Where settlement of any part of an asset’s cash consideration is deferred, the amounts payable in the future are discounted to their present value as at the date of recognition (ie. date of exchange) of the asset to arrive at fair value. The discount rate used is the Council’s incremental borrowing rate, being the rate at which a similar borrowing could be obtained from an independent financier under comparable terms and conditions. Where infrastructure, property, plant and equipment assets are acquired for no cost or for an amount other than cost, the assets are recognised in the financial statements at their fair value at acquisition date - being the amount that the asset could have been exchanged between knowledgeable willing parties in an arm’s length transaction. Subsequent costs Subsequent costs are included in the asset’s carrying amount or recognised as a separate asset, as appropriate, only when it is probable that future economic benefits associated with the item will flow to Council and the cost of the item can be measured reliably. All other repairs and maintenance are charged to the income statement during the financial period in which they are incurred. Asset Revaluations (including Indexation) In accounting for Asset Revaluations relating to Infrastructure, Property, Plant & Equipment: Increases in the carrying amounts arising on
revaluation are credited to the asset revaluation reserve.
To the extent that the increase reverses a
decrease previously recognised via the profit or loss, then increase is first recognised in profit or loss.
Decreases that reverse previous increases of the
same asset are first charged against revaluation reserves directly in equity to the extent of the
remaining reserve attributable to the asset, with all other decreases charged to the Income statement.
Water and sewerage network assets are indexed annually between full revaluations in accordance with the latest indices provided in the NSW Office of Water - Rates Reference Manual. For all other assets, Council assesses at each reporting date whether there is any indication that a revalued asset’s carrying amount may differ materially from that which would be determined if the asset were revalued at the reporting date. If any such indication exists, Council determines the asset’s fair value and revalues the asset to that amount. Full revaluations are undertaken for all assets on a 5 year cycle. Capitalisation Thresholds Items of infrastructure, property, plant and equipment are not capitalised unless their cost of acquisition exceeds the following; Land - council land 100% Capitalised - open space 100% Capitalised - land under roads (purchases after 30/6/08) 100% Capitalised Plant & Equipment Office Furniture > $2,000 Office Equipment > $2,000 Other Plant &Equipment > $2,000 Buildings & Land Improvements Park Furniture & Equipment > $20,000 Building - construction/extensions 100% Capitalised - renovations > $50,000 Other Structures > $20,000 Stormwater Assets Drains & Culverts > $20,000 Other > $20,000 Transport Assets Road construction & reconstruction > $20,000

Financial Statements 2012_
Waverley Council Notes to the Financial Statements for the financial year ended 30 June 2012 Note 1. Summary of Significant Accounting Policies (continued)
page 19
Reseal/Re-sheet & major repairs: > $20,000 Bridge construction & reconstruction > $20,000 Depreciation Depreciation on Council's infrastructure, property, plant and equipment assets is calculated using the straight line method in order to allocate an assets cost (net of residual values) over its estimated useful life. Land is not depreciated. Estimated useful lives for Council's I,PP&E include: Plant & Equipment - Office Equipment 5 to 10 years - Office furniture 10 to 20 years - Computer Equipment 4 years - Vehicles & /Road Making equip. 5 to 8 years - Other plant and equipment 5 to 15 years Other Equipment - Playground equipment 5 to 15 years - Benches, seats etc 10 to 20 years Buildings - Buildings : Masonry 50 to 100 years - Buildings : Other 20 to 40 years Stormwater Drainage - Drains 80 to 100 years - Culverts 50 to 80 years Transportation Assets - Sealed Roads : Surface 20 years - Sealed Roads : Structure 50 years - Unsealed roads 20 years - Bridge : Concrete 100 years - Bridge : Other 20 to 75 years - Road Pavements 60 years - Kerb, Gutter & Paths 40 years Other Infrastructure Assets - Bulk earthworks Infinite All asset residual values and useful lives are reviewed and adjusted (where appropriate), at each balance sheet date.
An asset’s carrying amount is written down immediately to its recoverable amount if the asset’s carrying amount is greater than its estimated recoverable amount – refer Note 1(s) on Asset Impairment. Disposal and De-recognition An item of property, plant and equipment is derecognised upon disposal or when no further future economic benefits are expected from its use or disposal. Any gain or loss arising on derecognition of the asset (calculated as the difference between the net disposal proceeds and the carrying amount of the asset) is included in Council’s Income Statement in the year the asset is derecognised. (k) Land Land (other than Land under Roads) is in accordance with Part 2 of Chapter 6 of the Local Government Act (1993) classified as either Operational or Community. This classification of Land is disclosed in Note 9(a). (l) Land under roads Land under roads is land under roadways and road reserves including land under footpaths, nature strips and median strips. Council has elected not to recognise land under roads acquired before 1 July 2008 in accordance with AASB 1051. Land under roads acquired after 1 July 2008 is recognised in accordance with AASB 116 – Property, Plant and Equipment. (m) Intangible Assets IT Development and Software Costs incurred in developing products or systems and costs incurred in acquiring software and licenses that will contribute to future period financial benefits
Financial Statements 2012_
Waverley Council Notes to the Financial Statements for the financial year ended 30 June 2012 Note 1. Summary of Significant Accounting Policies (continued)
page 20
through revenue generation and/or cost reduction are capitalised to software and systems. Costs capitalised include external direct costs of materials and service, direct payroll and payroll related costs of employees’ time spent on the project. Amortisation is calculated on a straight line bases over periods generally ranging from 3 to 5 years. IT development costs include only those costs directly attributable to the development phase and are only recognised following completion of technical feasibility and where Council has an intention and ability to use the asset. (n) Crown Reserves Crown Reserves under Council’s care and control are recognised as assets of the Council. While ownership of the reserves remains with the Crown, Council retains operational control of the reserves and is responsible for their maintenance and use in accordance with the specific purposes to which the reserves are dedicated. Improvements on Crown Reserves are also recorded as assets, while maintenance costs incurred by Council and revenues relating the reserves are recognised within Council’s Income Statement. Representations are currently being sought across State and Local Government to develop a consistent accounting treatment for Crown Reserves across both tiers of government. (o) Investment property Investment property comprises land &/or buildings that are principally held for long-term rental yields, capital gains or both that is not occupied by Council. Investment property is carried at fair value, representing an open-market value determined annually by external valuers. Annual changes in the fair value of Investment Properties are recorded in the Income Statement as part of “Other Income”.
Full revaluations are carried out every three years with an appropriate index utilised each year in between the full revaluations. The last full revaluation for Council’s Investment Properties was dated 30 June 2012. (p) Provisions for close down, restoration and for environmental clean up costs – including Tips and Quarries Close down, Restoration and Remediation costs include the dismantling and demolition of infrastructure, the removal of residual materials and the remediation of disturbed areas. Estimated close down and restoration costs are provided for in the accounting period when the obligation arising from the related disturbance occurs, whether this occurs during the development or during the operation phase, based on the net present value of estimated future costs. Provisions for close down and restoration costs do not include any additional obligations which are expected to arise from future disturbance. Costs are estimated on the basis of a closure plan. The cost estimates are calculated annually during the life of the operation to reflect known developments, eg updated cost estimates and revisions to the estimated lives of operations, and are subject to formal review at regular intervals. Close down, Restoration and Remediation costs are a normal consequence of tip and quarry operations, and the majority of close down and restoration expenditure is incurred at the end of the life of the operations. Although the ultimate cost to be incurred is uncertain, Council estimates the respective costs based on feasibility and engineering studies using current restoration standards and techniques. The amortisation or ‘unwinding’ of the discount applied in establishing the net present value of provisions is charged to the income statement in each accounting period.

Financial Statements 2012_
Waverley Council Notes to the Financial Statements for the financial year ended 30 June 2012 Note 1. Summary of Significant Accounting Policies (continued)
page 21
This amortisation of the discount is disclosed as a borrowing cost in Note 4(b). Other movements in the provisions for Close down, Restoration and Remediation costs including those resulting from new disturbance, updated cost estimates, changes to the estimated lives of operations and revisions to discount rates are capitalised within property, plant and equipment. These costs are then depreciated over the lives of the assets to which they relate. Where rehabilitation is conducted systematically over the life of the operation, rather than at the time of closure, provision is made for the estimated outstanding continuous rehabilitation work at each balance sheet date and the cost is charged to the income statement. Provision is made for the estimated present value of the costs of environmental clean up obligations outstanding at the balance sheet date. These costs are charged to the income statement. Movements in the environmental clean up provisions are presented as an operating cost, except for the unwind of the discount which is shown as a borrowing cost. Remediation procedures generally commence soon after the time the damage, remediation process and estimated remediation costs become known, but may continue for many years depending on the nature of the disturbance and the remediation techniques. As noted above, the ultimate cost of environmental remediation is uncertain and cost estimates can vary in response to many factors including changes to the relevant legal requirements, the emergence of new restoration techniques or experience at other locations. The expected timing of expenditure can also change, for example in response to changes in quarry reserves or production rates. As a result there could be significant adjustments to the provision for close down and restoration and environmental clean up, which would affect future financial results.
Specific Information relating to Council's provisions relating to Close down, Restoration and Remediation costs can be found at Note 26. (q) Non-Current Assets (or Disposal Groups) “Held for Sale” & Discontinued Operations Non-current assets (or disposal groups) are classified as held for sale and stated at the lower of either (i) their carrying amount and (ii) fair value less costs to sell, if their carrying amount will be recovered principally through a sale transaction rather than through continuing use. The exception to this is plant and motor vehicles which are turned over on a regular basis. Plant and motor vehicles are retained in Non Current Assets under the classification of Infrastructure, Property, Plant and Equipment - unless the assets are to be traded in after 30 June and the replacement assets were already purchased and accounted for as at 30 June. For any assets or disposal groups classified as Non-Current Assets “held for sale”, an impairment loss is recognised at any time when the assets carrying value is greater than its fair value less costs to sell. Non-current assets “held for sale” are not depreciated or amortised while they are classified as “held for sale”. Non-current assets classified as “held for sale” are presented separately from the other assets in the balance sheet. A Discontinued Operation is a component of the entity that has been disposed of or is classified as “held for sale” and that represents a separate major line of business or geographical area of operations, is part of a single co-ordinated plan to dispose of such a line of business or area of operations, or is a subsidiary acquired exclusively with a view to resale. The results of discontinued operations are presented separately on the face of the income statement.
Financial Statements 2012_
Waverley Council Notes to the Financial Statements for the financial year ended 30 June 2012 Note 1. Summary of Significant Accounting Policies (continued)
page 22
(r) Impairment of assets All Council's I,PP&E is subject to an annual assessment of impairment. Assets that are subject to amortisation are reviewed for impairment whenever events or changes in circumstances indicate that the carrying amount may not be recoverable. An impairment loss is recognised for the amount by which the asset’s carrying amount exceeds its recoverable amount. The recoverable amount is the higher of an asset’s fair value less costs to sell and value in use. For non-cash generating assets of Council such as roads, drains, public buildings etc - value in use is represented by the “deprival value” of the asset which is approximated as its written down replacement cost. Other assets are tested for impairment whenever events or changes in circumstances indicate that the carrying amount may not be recoverable. Goodwill & other Intangible Assets that have an indefinite useful life and are not subject to amortisation are tested annually for impairment. (s) Payables These amounts represent liabilities and include goods and services provided to the Council prior to the end of financial year which are unpaid. The amounts for goods and services are unsecured and are usually paid within 30 days of recognition. (t) Borrowings Borrowings are initially recognised at fair value, net of transaction costs incurred. Borrowings are subsequently measured at amortised cost. Amortisation results in any difference between the proceeds (net of transaction costs) and the redemption amount being recognised in the Income
Statement over the period of the borrowings using the effective interest method. Borrowings are removed from the balance sheet when the obligation specified in the contract is discharged, cancelled or expired. Borrowings are classified as current liabilities unless the Council has an unconditional right to defer settlement of the liability for at least 12 months after the balance sheet date. (u) Borrowing costs Borrowing costs are expensed. Borrowing costs incurred for the construction of any qualifying asset are capitalised during the period of time that is required to complete and prepare the asset for its intended use or sale. (v) Provisions Provisions for legal claims, service warranties and other like liabilities are recognised when: Council has a present legal or constructive
obligation as a result of past events; it is more likely than not that an outflow of
resources will be required to settle the obligation; and
the amount has been reliably estimated. Provisions are not recognised for future operating losses. Where there are a number of similar obligations, the likelihood that an outflow will be required in settlement is determined by considering the class of obligations as a whole. A provision is recognised even if the likelihood of an outflow with respect to any one item included in the same class of obligations may be small. Provisions are measured at the present value of management’s best estimate of the expenditure required to settle the present obligation at the reporting date.
Financial Statements 2012_
Waverley Council Notes to the Financial Statements for the financial year ended 30 June 2012 Note 1. Summary of Significant Accounting Policies (continued)
page 23
The discount rate used to determine the present value reflects current market assessments of the time value of money and the risks specific to the liability. The increase in the provision due to the passage of time is recognised as interest expense. (w) Employee benefits (i) Short Term Obligations Short term employee benefit obligations include liabilities for wages and salaries (including non-monetary benefits), annual leave and vesting sick leave expected to be settled within the 12 months after the reporting period. Leave liabilities are recognised in the provision for employee benefits in respect of employees’ services up to the reporting date with other short term employee benefit obligations disclosed under payables.. These provisions are measured at the amounts expected to be paid when the liabilities are settled. Liabilities for non vesting sick leave are recognised at the time when the leave is taken and measured at the rates paid or payable, and accordingly no Liability has been recognised in these reports. Wages & salaries, annual leave and vesting sick leave are all classified as Current Liabilities. (ii) Other Long Term Obligations The liability for all long service and annual leave in respect of services provided by employees up to the reporting date (which is not expected to be settled within the 12 months after the reporting period) are recognised in the provision for employee benefits. These liabilities are measured at the present value of the expected future payments to be made using the projected unit credit method. Consideration is given to expected future wage and salary levels, experience of employee departures and periods of service. Expected future payments are then discounted using market yields at the reporting date based on national
government bonds with terms to maturity and currency that match as closely as possible the estimated future cash outflows. Due to the nature of when and how Long Service Leave can be taken, all Long Service Leave for employees with 4 or more years of service has been classified as Current, as it has been deemed that Council does not have the unconditional right to defer settlement beyond 12 months – even though it is not anticipated that all employees with more than 4 years service (as at reporting date) will apply for and take their leave entitlements in the next 12 months. (iii) Retirement benefit obligations All employees of the Council are entitled to benefits on retirement, disability or death. Council contributes to various defined benefit plans and defined contribution plans on behalf of its employees. Defined Benefit Plans A liability or asset in respect of defined benefit superannuation plans would ordinarily be recognised in the balance sheet, and measured as the present value of the defined benefit obligation at the reporting date plus unrecognised actuarial gains (less unrecognised actuarial losses) less the fair value of the superannuation fund’s assets at that date and any unrecognised past service cost. The present value of the defined benefit obligation is based on expected future payments which arise from membership of the fund to the reporting date, calculated annually by independent actuaries using the projected unit credit method. Consideration is given to expected future wage and salary levels, experience of employee departures and periods of service. However, when this information is not reliably available, Council can account for its obligations to defined benefit plans on the same basis as its obligations to defined contribution plans – i.e. as an expense when they become payable. Council is party to an Industry Defined Benefit Plan under the Local Government Superannuation Scheme, named the “Local Government Superannuation Scheme – Pool B”

Financial Statements 2012_
Waverley Council Notes to the Financial Statements for the financial year ended 30 June 2012 Note 1. Summary of Significant Accounting Policies (continued)
page 24
This Scheme has been deemed to be a “multi employer fund” for the purposes of AASB 119. Sufficient information is not available to account for the Scheme as a defined benefit plan (in accordance with AASB 119) because the assets to the scheme are pooled together for all Councils. Accordingly, Council’s contributions to the scheme for the current reporting year have been recognised as an expense and disclosed as part of Superannuation Expenses at Note 4(a). The Local Government Superannuation Scheme has advised member councils that, as a result of the global financial crisis, it has a significant deficiency of assets over liabilities amounting to around $4,407,837 at 30 June 2012. As a result, they have asked for significant increases in future contributions to recover that deficiency. Council’s share of that deficiency cannot be accurately calculated as the Scheme is a mutual arrangement where assets and liabilities are pooled together for all member councils. For this reason, no liability for the deficiency has been recognised in these financial statements. Council has, however, disclosed a contingent liability in note 18 to reflect the possible obligation that may arise should the Scheme require immediate payment to correct the deficiency. Defined Contribution Plans Contributions to Defined Contribution Plans are recognised as an expense as they become payable. Prepaid contributions are recognised as an asset to the extent that a cash refund or a reduction in the future payments is available. (iv) Employee Benefit On-Costs Council has recognised at year end the aggregate on-cost liabilities arising from employee benefits, and in particular those on-cost liabilities that will arise when payment of current employee benefits is made in future periods. These amounts include Superannuation and Workers Compensation expenses which will be
payable upon the future payment of certain Leave Liabilities accrued as at 30/6/12. (x) Self insurance Council does not self insure. (y) Allocation between current and non-current assets & liabilities In the determination of whether an asset or liability is classified as current or non-current, consideration is given to the time when each asset or liability is expected to be settled. The asset or liability is classified as current if it is expected to be settled within the next 12 months, being the Council’s operational cycle. Exceptions In the case of liabilities where Council does not have the unconditional right to defer settlement beyond 12 months (such as vested long service leave), the liability is classified as current even if not expected to be settled within the next 12 months. In the case of inventories that are “held for trading”, these are also classified as current even if not expected to be realised in the next 12 months. (z) Taxes The Council is exempt from both Commonwealth Income Tax and Capital Gains Tax. Council does however have to comply with both Fringe Benefits Tax and Goods and Services Tax (GST). Goods & Services Tax (GST) Income, expenses and assets are all recognised net of the amount of GST, except where the amount of GST incurred is not recoverable from the Australian Tax Office (ATO). In these circumstances the GST is recognised as part of the cost of acquisition of the asset or as part of the revenue / expense.

Financial Statements 2012_
Waverley Council Notes to the Financial Statements for the financial year ended 30 June 2012 Note 1. Summary of Significant Accounting Policies (continued)
page 25
Receivables and payables within the Balance Sheet are stated inclusive of any applicable GST. The net amount of GST recoverable from or payable to the ATO is included as a current asset or current liability in the Balance Sheet. Operating cash flows within the Cash Flow Statement are on a gross basis, ie. they are inclusive of GST where applicable. Investing and Financing cash flows are treated on a net basis (where recoverable form the ATO), ie. they are exclusive of GST. Instead, the GST component of investing and financing activity cash flows which are recoverable from or payable to the ATO are classified as operating cash flows. Commitments and contingencies are disclosed net of the amount of GST recoverable from (or payable to) the ATO. (aa) New accounting standards and UIG interpretations Certain new (or amended) accounting standards and interpretations have been published that are not mandatory for reporting periods ending 30 June 2012. Council has not adopted any of these standards early. Council’s assessment of the impact of these new standards and interpretations is set out below. Applicable to Local Government with implications: AASB 9 Financial Instruments, AASB 2009 11 Amendments to Australian Accounting Standards arising from AASB 9 and AASB 2010-7 Amendments to Australian Accounting Standards arising from AASB 9 (December 2010) (effective from 1 January 2013) AASB 9 Financial Instruments addresses the classification, measurement and derecognition of financial assets and financial liabilities. The standard is not applicable until 1 January 2013 but is available for early adoption.
When adopted, the standard will affect in particular the Council’s accounting for its available-for-sale financial assets, since AASB 9 only permits the recognition of fair value gains and losses in other comprehensive income if they relate to equity investments that are not held for trading. Fair value gains and losses on available-for-sale debt investments, for example, will therefore have to be recognised directly in profit or loss. There will be no impact on Council’s accounting for financial liabilities, as the new requirements only affect the accounting for financial liabilities that are designated at fair value through profit or loss and Council does not have any such liabilities. The derecognition rules have been transferred from AASB 139 Financial Instruments: Recognition and Measurement and have not been changed AASB 10 - Consolidated Financial Statements, AASB 11 - Joint Arrangements, AASB 12 - Disclosure of Interests in Other Entities, revised AASB 127 - Separate Financial Statements and AASB 128 - Investments in Associates and Joint Ventures and AASB 2011-7 Amendments to Australian Accounting Standards arising from the Consolidation and Joint Arrangements Standards (effective 1 January 2013) In August 2011, the AASB issued a suite of five new and amended standards which address the accounting for joint arrangements, consolidated financial statements and associated disclosures. AASB 10 replaces all of the guidance on control and consolidation in AASB 127 Consolidated and Separate Financial Statements, and Interpretation 12 Consolidation – Special Purpose Entities. The core principle that a consolidated entity presents a parent and its subsidiaries as if they are a single economic entity remains unchanged, as do the mechanics of consolidation. However, the standard introduces a single definition of control that applies to all entities. It focuses on the need to have both power and rights or exposure to variable returns. Power is the current ability to direct the activities that significantly influence returns. Returns must vary and
Financial Statements 2012_
Waverley Council Notes to the Financial Statements for the financial year ended 30 June 2012 Note 1. Summary of Significant Accounting Policies (continued)
page 26
can be positive, negative or both. Control exists when the investor can use its power to affect the amount of its returns. There is also new guidance on participating and protective rights and on agent/principal relationships. Council does not expect the new standard to have a significant impact on its composition. AASB 11 introduces a principles based approach to accounting for joint arrangements. The focus is no longer on the legal structure of joint arrangements, but rather on how rights and obligations are shared by the parties to the joint arrangement. Based on the assessment of rights and obligations, a joint arrangement will be classified as either a joint operation or a joint venture. Joint ventures are accounted for using the equity method, and the choice to proportionately consolidate will no longer be permitted. Parties to a joint operation will account their share of revenues, expenses, assets and liabilities in much the same way as under the previous standard. AASB 11 also provides guidance for parties that participate in joint arrangements but do not share joint control. Council's investment in the joint venture partnership will be classified as a joint venture under the new rules. As Council already applies the equity method in accounting for this investment, AASB 11 will not have any impact on the amounts recognised in its financial statements. AASB 12 sets out the required disclosures for entities reporting under the two new standards, AASB 10 and AASB 11, and replaces the disclosure requirements currently found in AASB 127 and AASB 128. Application of this standard by Council will not affect any of the amounts recognised in the financial statements, but will impact the type of information disclosed in relation to Council's investments. Amendments to AASB 128 provide clarification that an entity continues to apply the equity method and
does not remeasure its retained interest as part of ownership changes where a joint venture becomes an associate, and vice versa. The amendments also introduce a “partial disposal” concept. Council is still assessing the impact of these amendments. Council does not expect to adopt the new standards before their operative date. They would therefore be first applied in the financial statements for the annual reporting period ending 30 June 2014. AASB 13 Fair Value Measurement and AASB 2011-8 Amendments to Australian Accounting Standards arising from AASB 13 (effective 1 January 2013) AASB 13 was released in September 2011. It explains how to measure fair value and aims to enhance fair value disclosures. Council has yet to determine which, if any, of its current measurement techniques will have to change as a result of the new guidance. It is therefore not possible to state the impact, if any, of the new rules on any of the amounts recognised in the financial statements. However, application of the new standard will impact the type of information disclosed in the notes to the financial statements. Council does not intend to adopt the new standard before its operative date, which means that it would be first applied in the annual reporting period ending 30 June 2014. Applicable to Local Government but no implications for Council; None Applicable to Local Government but not relevant to Council at this stage; Revised AASB 119 Employee Benefits, AASB 2011-10 Amendments to Australian Accounting Standards arising from AASB 119 (September 2011) and AASB 2011-11 Amendments to AASB 119 (September 2011) arising from Reduced Disclosure Requirements (effective 1 January 2013)

Financial Statements 2012_
Waverley Council Notes to the Financial Statements for the financial year ended 30 June 2012 Note 1. Summary of Significant Accounting Policies (continued)
page 27
In September 2011, the AASB released a revised standard on accounting for employee benefits. It requires the recognition of all remeasurements of defined benefit liabilities/assets immediately in other comprehensive income (removal of the so-called 'corridor' method) and the calculation of a net interest expense or income by applying the discount rate to the net defined benefit liability or asset. This replaces the expected return on plan assets that is currently included in profit or loss. The standard also introduces a number of additional disclosures for defined benefit liabilities/assets and could affect the timing of the recognition of termination benefits. The amendments will have to be implemented retrospectively. Council does not recognise defined benefit assets and liabilities for the reasons set out in note 1 (s)(iii) and so these changes will not have an impact on its reported results. Not applicable to Local Government per se; None There are no other standards that are not yet effective and that are expected to have a material impact on the entity in the current or future reporting periods and on foreseeable future transactions. (ab) Rounding of amounts Unless otherwise indicated, amounts in the financial statements have been rounded off to the nearest thousand dollars. (ac) Comparative Figures To ensure comparability with the current reporting period’s figures, some comparative period line items and amounts may have been reclassified or individually reported for the first time within these financial statements and/or the notes.
(ad) Disclaimer Nothing contained within these statements may be taken to be an admission of any liability to any person under any circumstance.

Waverley Council
Notes to the Financial Statements for the financial year ended 30 June 2012
Note 2(a). Council Functions / Activities - Financial Information
page 28
Financial Statem
ents 2012
Cemetery Services 1,194 1,284 1,321 1,122 1,047 1,183 72 237 138 - - 24,041 23,858
6,176 (5,162)
4,310 (4,221)
96,078 Place Management 964 1,124 1,157 (411) (107) (198) 24 21 - - Parks Services & Maintenance 135 995 224 5,297 6,712
2,058
(1,070) (1,165) 1,871 8,988 28,877 23,997
1,230 1,078 (1,061)
5,016
10,810 (2,165)
8,254 32,985 781
(5,717)
18,621 Parking Services 24,547 22,166 22,623 10,827 10,180 9,493 13,720 11,986 13,130 - 8 9,812 11,083 Library Services 252 264
Actual
2011Actual
2011 2012
(137)
(2,553) 2,006 (13,521) (9,933) 20,192
Actual
Operating Result from Continuing Operations
(4,087)
Original
Actual Actual Budget
2012
(1,053) (2,604)
(1,208)
(1,106) 25,701
5 3
2,435 82
-
(6,184)
2012 2011
$ '000 Income, Expenses and Assets have been directly attributed to the following Functions / Activities.
Details of these Functions/Activities are provided in Note 2(b).
Income from Continuing Operations
Expenses from Continuing Operations
Total Assets held (Current &
Non-current) Functions/Activities
20122011Budget
Original
Actual
2012
Actual
Original
Actual 2012
Grants included in Income from Continuing Operations
16,708 Asset Management Services 6,847 10,524
Actual Budget
Beach Services, Maintenance & Safety 2,945
3,850 4,205 4,249
2012
2,929
1,851 1,869
604 6,671 16,780
2,912 359
Cultural Services 418 37,131 Corporate Support Services 36,511
Child Care ServicesCommunity Services 706 763
2,861
4,112 4,378
469
8,273
2,583 17 22 1,070
4,778 7,684
3,045 441 490
4,283
135
61 523 4,473 4,351
959 1,375 1,231
Emergency Management Services -
17 Development, Building & Health Services 3,592 4,618
42 35 125
Customer Services & Communication
Environmental Services -
4,412 70
1,284 Governance, Integrated Planning & Community Engagement 71
171 1,084 1,134
- 4,218
(4,092) (125) (100)
(1,113) 40 89
1,480 (1,134)
(4,341) (4,222) (4,148)
7,993
(3,787) 175 206 17,541
(5,952) 828 64 92,855
25 486
8,078 9,051 17 836
(3,215) -
107
127 -
133
624,480 623,574
Actual
2012 2011
- 34
-
16,024
33
2,229 27,512
-
(3,655)
- -
(47) (396)
(2,257)
2,072 (355) 1,427
1,930 (2,439)
609 644 (638)
(2,476) 141
29,832 4,151
8,777 - 39
-
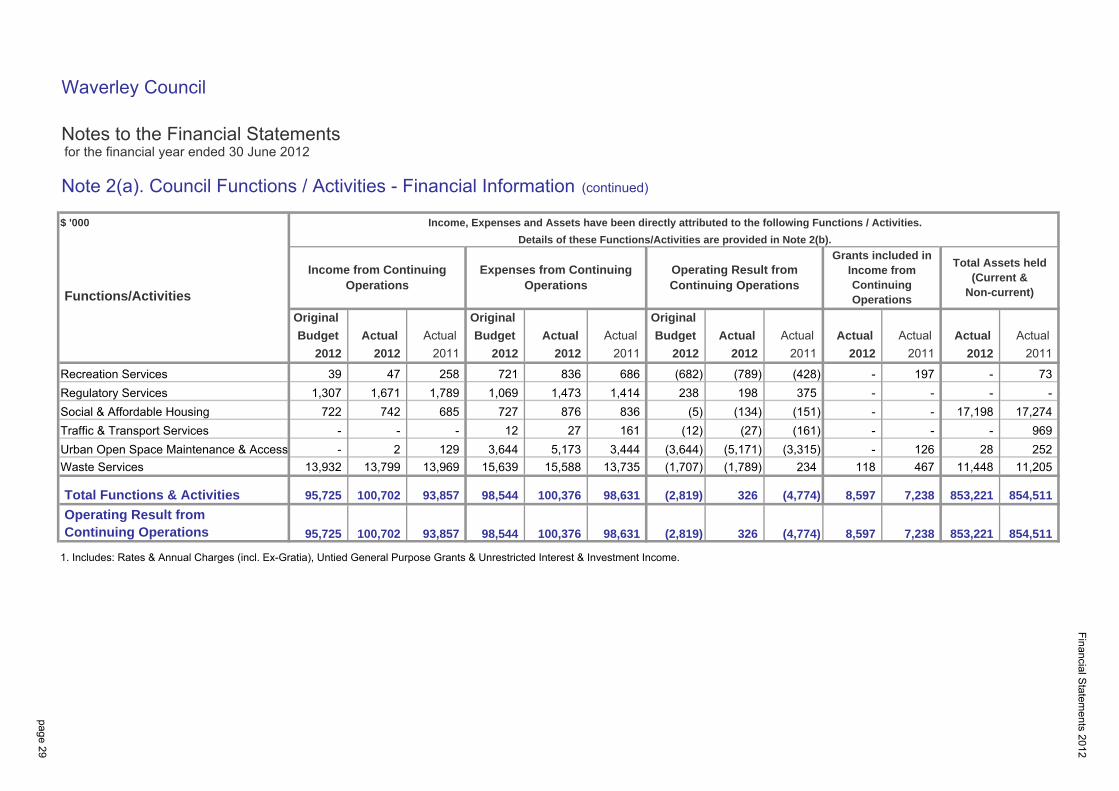
Waverley Council
Notes to the Financial Statements for the financial year ended 30 June 2012
Note 2(a). Council Functions / Activities - Financial Information (continued)
1. Includes: Rates & Annual Charges (incl. Ex-Gratia), Untied General Purpose Grants & Unrestricted Interest & Investment Income.
2012 2012 2011Budget Actual Actual Budget Actual Actual Budget Actual Actual Actual Actual Actual Actual
2012 2011 2012 20112012 2012
- 969
$ '000 Income, Expenses and Assets have been directly attributed to the following Functions / Activities.
Functions/Activities
Details of these Functions/Activities are provided in Note 2(b).
Income from Continuing Operations
Expenses from Continuing Operations
Operating Result from Continuing Operations
Grants included in Income from Continuing Operations
Total Assets held (Current &
Non-current)
Original Original Original
2012 2011
(789) 1,473
686 (682)
Traffic & Transport Services - - - 12 27 161 (12)
- 73
Social & Affordable Housing 722 742 685 727 876 836 (5) (134) (151) - - 17,198 17,274
Recreation Services 39 1,069 1,671
2011 2012
47 258 721 836
3,644
198
(5,171) 129 5,173
1,414 1,789
3,444 Urban Open Space Maintenance & Accessi -
Regulatory Services 1,307
2 (3,644)
- 238 -
(3,315) (1,707)
(2,819)
375
126 - 118 234
(27) - -
(428) - 197
(161)
- -
28
Financial Statem
ents 2012
7,238 854,511
467
853,221
11,205 11,448
854,511 853,221 7,238
252 13,735 (1,789)
98,631
15,639 15,588
8,597 100,376 98,544 (2,819) (4,774) 326 98,631
100,376 8,597 (4,774) 326
13,799 Waste Services
95,725 Total Functions & Activities
13,932 13,969
93,857 98,544
page 29
100,702
Continuing Operations Operating Result from
100,702 95,725 93,857

Financial Statements 2012
Waverley Council
Notes to the Financial Statements for the financial year ended 30 June 2012
Note 2(b). Council Functions / Activities - Component Descriptions
Asset Management Services
Beach Services, Maintenance & Safety
Cemetery Services
Childcare Services
Community Services
Corporate Support Services
Cultural Services
Customer Services & Communication
Development, Building & Health Services
Waverley Council runs a very wide array of services - 22 services and 148 different sub-services. A brief summary of the services which are reported in Note 2(a) are detailed below:
Council provides a range of community services within Waverley in addition to supporting a broad range ofcommunity organisations. Our services and support for other groups and agencies ensure that the communityhas access to relevant, accessible and affordable facilities, spaces, programs and activities.
This service includes planning for renewal of assets, financial management and project delivery of works onvital infrastructure. The Service contributes to every aspect of Council's operations, to our ability to deliver ourservices cost effectively and to the community's social, environmental and economic well being.
This service includes beach safety, beach maintenance and cleaning and also supports voluntary surflifesaving clubs.
This service currently includes interment of ashes and remains at two sites, Waverley and South Head.Waverley Cemetery is a fully operational Cemetery with sales in excess of $1million per annum.
Providing quality, affordable long day care and family day care for children aged 0-5 as well as parentingprograms and counselling for families.
This service includes a range of professional support services for financial planning and management,workforce planning, organisational development and performance management, business systemsimprovement, risk management and insurance, procurement, telecommunications and IT and special projectsto support the Executive in customer service and organisational review.
Council provides and supports a range of activities that celebrate and strengthen an appreciation or ourcultural heritage and diversity.
This area is responsible for ensuring that customer service is provided in a professional, friendly and timelyway, and that our community is informed about Council's plans, initiatives, services and activities.
This service involves preparing new Local Environmental Plans, Development Control Plans and PlanningStrategies relating to future land use planning and heritage conservation.
It also assesses and determines development applications in accordance with the EP&A Act and providesCouncil with a digital mapping service.
page 30
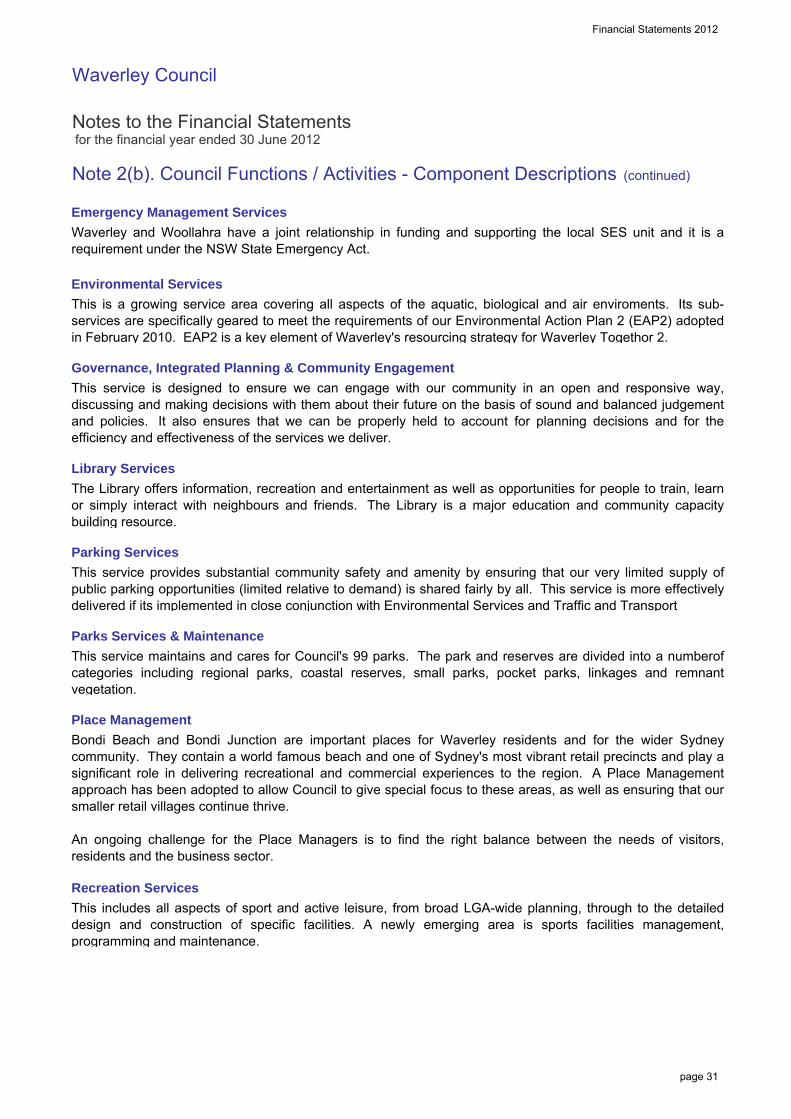
Financial Statements 2012
Waverley Council
Notes to the Financial Statements for the financial year ended 30 June 2012
Note 2(b). Council Functions / Activities - Component Descriptions (continued)
Emergency Management Services
Environmental Services
Governance, Integrated Planning & Community Engagement
Library Services
Parking Services
Parks Services & Maintenance
Place Management
Recreation Services
This includes all aspects of sport and active leisure, from broad LGA-wide planning, through to the detaileddesign and construction of specific facilities. A newly emerging area is sports facilities management,programming and maintenance.
This service provides substantial community safety and amenity by ensuring that our very limited supply ofpublic parking opportunities (limited relative to demand) is shared fairly by all. This service is more effectivelydelivered if its implemented in close conjunction with Environmental Services and Traffic and Transport
This service maintains and cares for Council's 99 parks. The park and reserves are divided into a numberofcategories including regional parks, coastal reserves, small parks, pocket parks, linkages and remnantvegetation.
Bondi Beach and Bondi Junction are important places for Waverley residents and for the wider Sydneycommunity. They contain a world famous beach and one of Sydney's most vibrant retail precincts and play asignificant role in delivering recreational and commercial experiences to the region. A Place Managementapproach has been adopted to allow Council to give special focus to these areas, as well as ensuring that oursmaller retail villages continue thrive.
An ongoing challenge for the Place Managers is to find the right balance between the needs of visitors,residents and the business sector.
This is a growing service area covering all aspects of the aquatic, biological and air enviroments. Its sub-services are specifically geared to meet the requirements of our Environmental Action Plan 2 (EAP2) adoptedin February 2010. EAP2 is a key element of Waverley's resourcing strategy for Waverley Togethor 2.
This service is designed to ensure we can engage with our community in an open and responsive way,discussing and making decisions with them about their future on the basis of sound and balanced judgementand policies. It also ensures that we can be properly held to account for planning decisions and for theefficiency and effectiveness of the services we deliver.
The Library offers information, recreation and entertainment as well as opportunities for people to train, learnor simply interact with neighbours and friends. The Library is a major education and community capacitybuilding resource.
Waverley and Woollahra have a joint relationship in funding and supporting the local SES unit and it is arequirement under the NSW State Emergency Act.
page 31
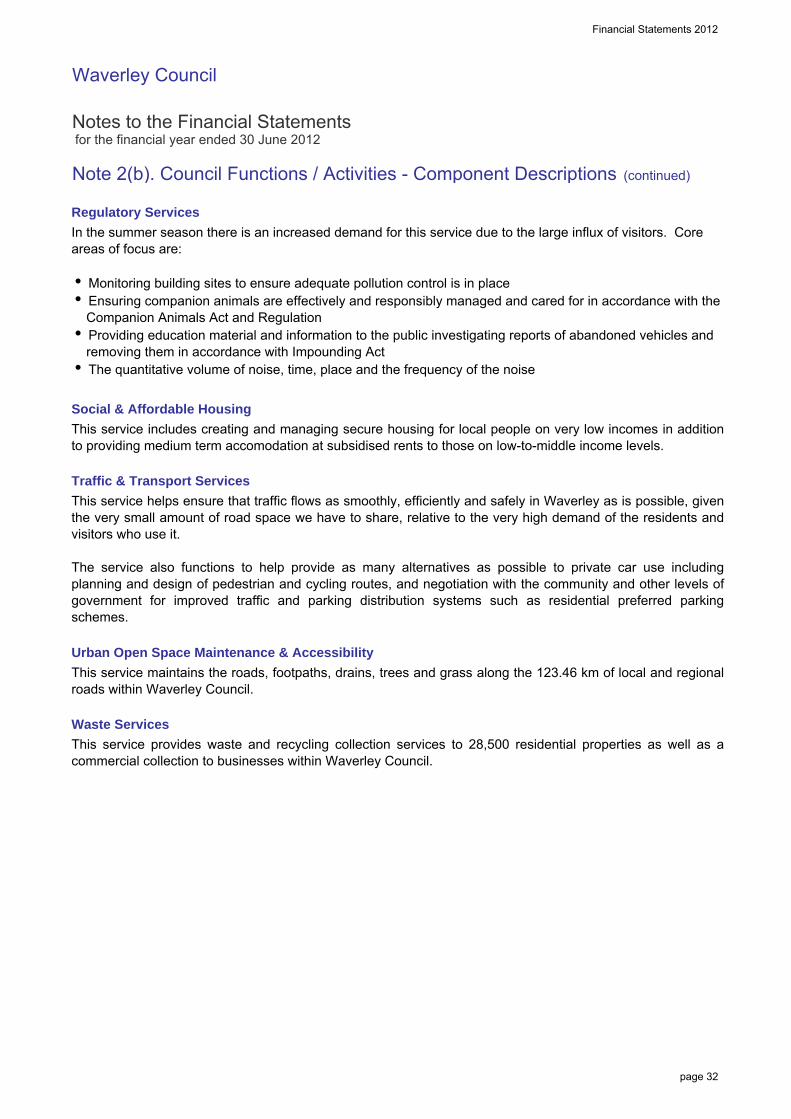
Financial Statements 2012
Waverley Council
Notes to the Financial Statements for the financial year ended 30 June 2012
Note 2(b). Council Functions / Activities - Component Descriptions (continued)
Regulatory Services
Social & Affordable Housing
Traffic & Transport Services
Urban Open Space Maintenance & Accessibility
Waste Services
This service maintains the roads, footpaths, drains, trees and grass along the 123.46 km of local and regionalroads within Waverley Council.
This service helps ensure that traffic flows as smoothly, efficiently and safely in Waverley as is possible, giventhe very small amount of road space we have to share, relative to the very high demand of the residents andvisitors who use it.
The service also functions to help provide as many alternatives as possible to private car use includingplanning and design of pedestrian and cycling routes, and negotiation with the community and other levels ofgovernment for improved traffic and parking distribution systems such as residential preferred parkingschemes.
In the summer season there is an increased demand for this service due to the large influx of visitors. Core areas of focus are:
Monitoring building sites to ensure adequate pollution control is in place Ensuring companion animals are effectively and responsibly managed and cared for in accordance with the Companion Animals Act and Regulation Providing education material and information to the public investigating reports of abandoned vehicles and removing them in accordance with Impounding Act The quantitative volume of noise, time, place and the frequency of the noise
This service includes creating and managing secure housing for local people on very low incomes in additionto providing medium term accomodation at subsidised rents to those on low-to-middle income levels.
This service provides waste and recycling collection services to 28,500 residential properties as well as acommercial collection to businesses within Waverley Council.
page 32

Financial Statements 2012
Waverley Council
Notes to the Financial Statements for the financial year ended 30 June 2012
Note 3. Income from Continuing Operations
$ '000
(a). Rates & Annual Charges
Ordinary RatesResidentialBusinessTotal Ordinary Rates
Special RatesEnvironmentalTotal Special Rates
Annual Charges (pursuant to s.496, s.496A, s.496B, s.501 & s.611)Domestic Waste Management ServicesSection 611 ChargesTotal Annual Charges
TOTAL RATES & ANNUAL CHARGES
Council has used 1/7/2009 year valuations provided by the NSW Valuer General in calculating its rates.
30,367
-
39 11,202
11,241
41,608
11,140
945 945
-
Notes 2012
7,425
Actual
22,033 8,334
Actual 2011
19,163
26,588
37
38,673
11,103
page 33

Financial Statements 2012
Waverley Council
Notes to the Financial Statements for the financial year ended 30 June 2012
Note 3. Income from Continuing Operations (continued)
$ '000
(b). User Charges & Fees
Specific User Charges (per s.502 - Specific "actual use" charges)
Waste Management Services (non-domestic)Total User Charges
Other User Charges & Fees(i) Fees & Charges - Statutory & Regulatory Functions (per s.608)
Hoarding/Crane PermitsPlanning & Building RegulationSection 149 Certificates (EPA Act)Section 603 CertificatesTotal Fees & Charges - Statutory/Regulatory
(ii) Fees & Charges - Other (incl. General User Charges (per s.608)
Admission & Service FeesBus Shelter FeesCar Parking FeesCar Parking Meter IncomeCemeteriesChild CareLeaseback Fees - Council VehiclesPark RentsRestoration ChargesRoad Opening PermitsTemporary Truck Zone PermitOtherTotal Fees & Charges - Other
TOTAL USER CHARGES & FEES
154 139 1,209 1,163 5,628 5,522 6,795 6,800
2,862
227
1,208
1,627
98 160
2,301
627
2,463 141
820
2,866
20,607
557
Notes
1,908
2012Actual Actual
2011
102
927 1,618
2,010
206
2,010
920
1,908
972
396
101
1,178
383
25,483 24,610
19,840
915 134
684
page 34

Financial Statements 2012
Waverley Council
Notes to the Financial Statements for the financial year ended 30 June 2012
Note 3. Income from Continuing Operations (continued)
$ '000
(c). Interest & Investment Revenue (incl. losses)
Interest & Dividends - Interest on Overdue Rates & Annual Charges - Interest earned on Investments (interest & coupon payment income)Fair Value Adjustments - Fair Valuation movements in Investments (at FV or Held for Trading)TOTAL INTEREST & INVESTMENT REVENUE
Interest Revenue is attributable to:
Unrestricted Investments/Financial Assets:Overdue Rates & Annual Charges (General Fund)
General Council Cash & InvestmentsRestricted Investments/Funds - External:Development Contributions - Section 94Domestic Waste Management operationsRestricted Investments/Funds - Internal:Internally Restricted AssetsTotal Interest & Investment Revenue Recognised
(d). Other Revenues
Fair Value Adjustments - Investment PropertiesRental Income - Investment PropertiesRental Income - Other Council PropertiesEx Gratia RatesFinesFines - ParkingLegal Fees Recovery - Rates & Charges (Extra Charges)
Legal Fees Recovery - OtherInsurance Claim RecoveriesRecycling Income (non domestic)Sale of Abandoned VehiclesSales - GeneralOtherTOTAL OTHER REVENUE 16,418
241
55
9,404
127 123 277
14
2,104
35
104
2012
14
8
Notes
2,838 2,581
3,390
108
- 2,033
17
2,996 14
Actual
79
106
104
361
123 3,016
Actual
369 99
2011
2,390 2,318
3,054
390
19,002 498
3,264
22 47
10,043
20 232
4
348
3,016 3,054
75
10
124
79
page 35
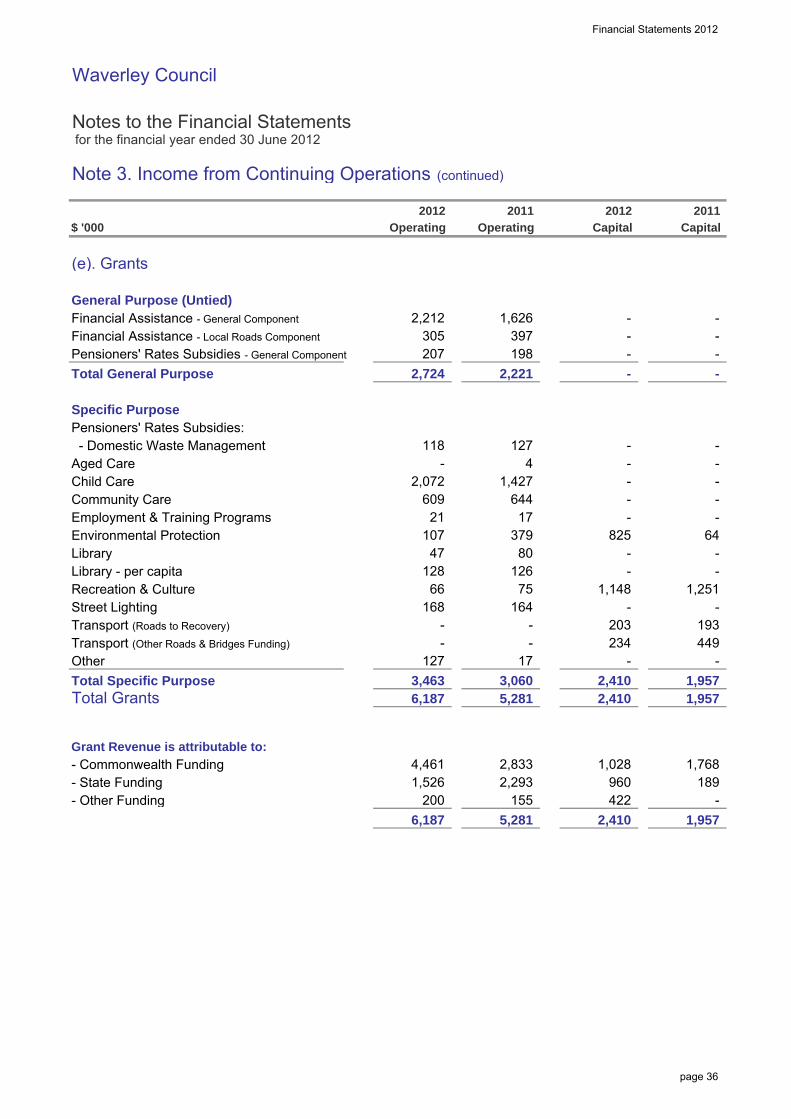
Financial Statements 2012
Waverley Council
Notes to the Financial Statements for the financial year ended 30 June 2012
Note 3. Income from Continuing Operations (continued)
$ '000
(e). Grants
General Purpose (Untied)Financial Assistance - General Component
Financial Assistance - Local Roads Component
Pensioners' Rates Subsidies - General Component
Total General Purpose
Specific PurposePensioners' Rates Subsidies: - Domestic Waste ManagementAged CareChild CareCommunity CareEmployment & Training ProgramsEnvironmental ProtectionLibraryLibrary - per capitaRecreation & CultureStreet LightingTransport (Roads to Recovery)
Transport (Other Roads & Bridges Funding)
OtherTotal Specific PurposeTotal Grants
Grant Revenue is attributable to:
- Commonwealth Funding- State Funding- Other Funding
-
17 21 - 825
4,461
75
2,833
3,060
- 1,427
379 80
126 47
128
- 118
-
Capital
-
- -
- - -
397 1,626
127 - 4 -
198 2,221
644
2,293
207
-
6,187
609
200
20112012Operating
5,281
127
305 2,212
107
2,724
2,072
1,526
6,187
-
155
3,463
- -
5,281
17
164 66
168
1,768
- 1,957
-
1,957
-
-
1,957
-
-
Operating
-
-
20112012Capital
-
449
-
1,251
193
1,148
234
-
2,410
-
203
1,028
-
2,410 2,410
189
-
-
64
422 960
page 36
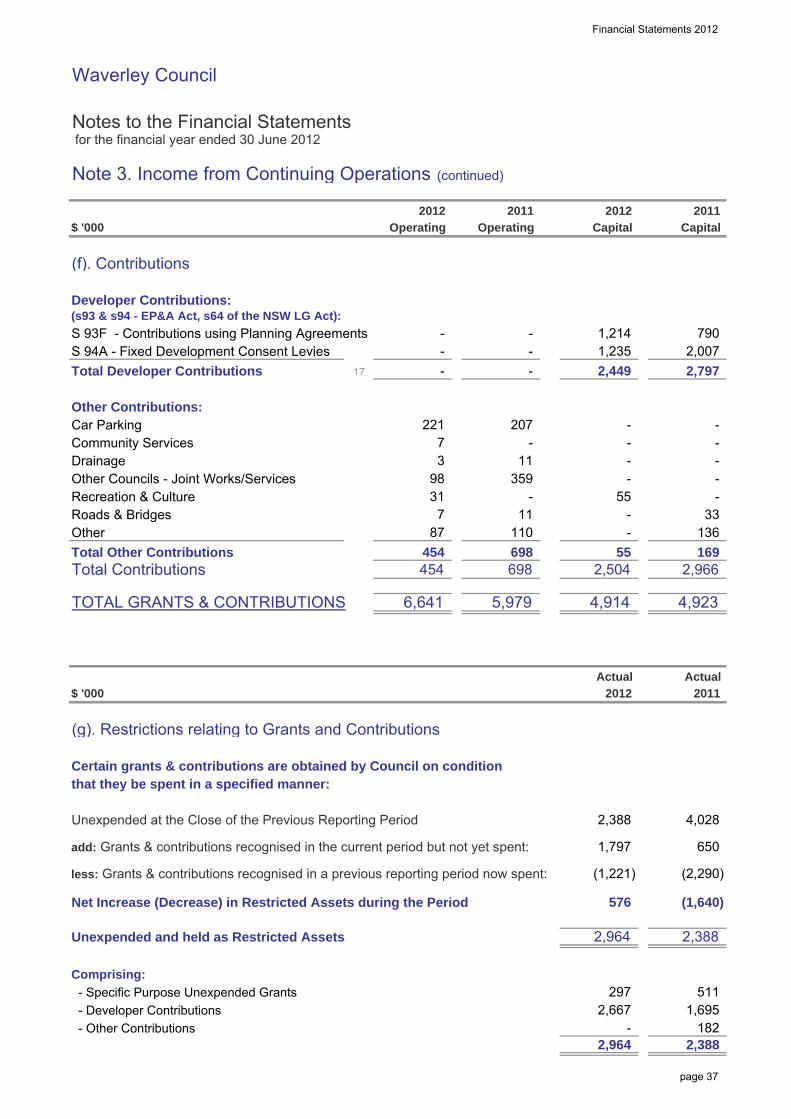
Financial Statements 2012
Waverley Council
Notes to the Financial Statements for the financial year ended 30 June 2012
Note 3. Income from Continuing Operations (continued)
$ '000
(f). Contributions
Developer Contributions:(s93 & s94 - EP&A Act, s64 of the NSW LG Act):
S 93F - Contributions using Planning AgreementsS 94A - Fixed Development Consent LeviesTotal Developer Contributions
Other Contributions:Car ParkingCommunity ServicesDrainageOther Councils - Joint Works/ServicesRecreation & CultureRoads & BridgesOtherTotal Other ContributionsTotal Contributions
TOTAL GRANTS & CONTRIBUTIONS
$ '000
(g). Restrictions relating to Grants and Contributions
Certain grants & contributions are obtained by Council on conditionthat they be spent in a specified manner:
Unexpended at the Close of the Previous Reporting Period
add: Grants & contributions recognised in the current period but not yet spent:
less: Grants & contributions recognised in a previous reporting period now spent:
Net Increase (Decrease) in Restricted Assets during the Period
Unexpended and held as Restricted Assets
Comprising:
- Specific Purpose Unexpended Grants - Developer Contributions - Other Contributions
2,964
2,388
2012
5,979
55 2,504
110
- -
454 698
6,641
454
87
359
17 -
2012Operating Operating
7
98
11
2011
- -
7 3
4,914
-
2,966
Actual
221
- - 55 31
-
207 -
11 -
2,797
- -
2,007
4,028
2,449
1,214
Capital
-
Actual 2011
2,388
650
790
-
136 33
169
-
(1,640)
182
-
(1,221)
511
2,388
(2,290)
2,964
1,695
1,797
297
1,235
4,923
20112012Capital
698
-
-
576
2,667 -
page 37
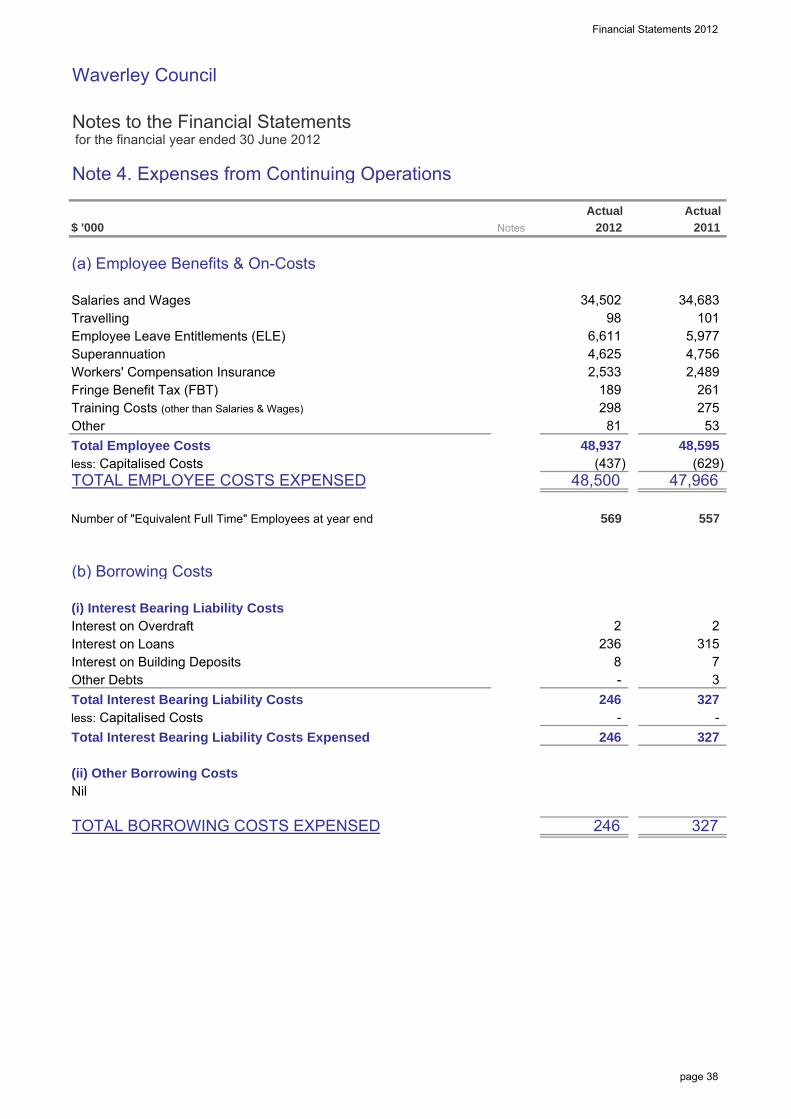
Financial Statements 2012
Waverley Council
Notes to the Financial Statements for the financial year ended 30 June 2012
Note 4. Expenses from Continuing Operations
$ '000
(a) Employee Benefits & On-Costs
Salaries and WagesTravellingEmployee Leave Entitlements (ELE)SuperannuationWorkers' Compensation InsuranceFringe Benefit Tax (FBT)Training Costs (other than Salaries & Wages)
OtherTotal Employee Costsless: Capitalised CostsTOTAL EMPLOYEE COSTS EXPENSED
Number of "Equivalent Full Time" Employees at year end
(b) Borrowing Costs
(i) Interest Bearing Liability CostsInterest on OverdraftInterest on LoansInterest on Building DepositsOther DebtsTotal Interest Bearing Liability Costsless: Capitalised CostsTotal Interest Bearing Liability Costs Expensed
(ii) Other Borrowing CostsNil
TOTAL BORROWING COSTS EXPENSED
48,937
81 298
2,533 261
48,500
2
6,611
-
-
34,502
8 236
246
246
53
47,966
Actual
34,683
4,756
- 327
2 315
48,595
101
7
2011
557
2,489
3
275
5,977
(629)
246 327
4,625
(437)
569
Notes
189
2012Actual
98
327
page 38

Financial Statements 2012
Waverley Council
Notes to the Financial Statements for the financial year ended 30 June 2012
Note 4. Expenses from Continuing Operations (continued)
$ '000
(c) Materials & Contracts
Raw Materials & ConsumablesContractor & Consultancy CostsContractor & Consultancy Costs (Temporary Staff)
Auditors Remuneration (1)
Fuel & GasInfringement Notice Contract Costs (SEINS)Legal Expenses: - Legal Expenses: Planning & Development - Legal Expenses: OtherOperating Leases: - Operating Lease Rentals: Minimum Lease Payments (2)
Total Materials & Contractsless: Capitalised CostsTOTAL MATERIALS & CONTRACTS
1. Auditor Remuneration
During the year, the following fees were incurred for services provided by the Council's Auditor (& the Auditors of other Consolidated Entities):
(i) Audit and Other Assurance Services
- Audit & review of financial statements: Council's AuditorRemuneration for audit and other assurance servicesTotal Auditor Remuneration
2. Operating Lease Payments are attributable to:
BuildingsComputersMotor Vehicles
53
14,635
Notes
1,272 15,551
(14,552)
53
717
1,399 53
15,762
692
1,479
1,479
30,314 29,441
1,584
8,426
995
50
7,774
314 741 876
2011
1,593
2012Actual
694
53
50
573
283
1,320
434
50
948
424
Actual
1,593
(13,209) 16,232
50
page 39

Financial Statements 2012
Waverley Council
Notes to the Financial Statements for the financial year ended 30 June 2012
Note 4. Expenses from Continuing Operations (continued)
$ '000
(d) Depreciation, Amortisation & Impairment
Plant and EquipmentOffice EquipmentBuildings - Non SpecialisedBuildings - SpecialisedOther StructuresInfrastructure: - Roads, Bridges & Footpaths - Stormwater DrainageOther Assets - Library Books - OtherTotal Depreciation & Impairment Costsless: Capitalised Costsless: Impairments (to)/from ARR [Equity]
TOTAL DEPRECIATION &IMPAIRMENT COSTS EXPENSED
- -
15,837
2,803
6,995
127
745
1,108
- -
-
-
-
775
-
-
9a
-
-
- -
2012
- -
- 775
-
-
775
Notes
-
-
-
Actual
Depreciation/Amortisation
Actual
-
199
1,111
2,815
6,980
702
2,211
2011
-
-
15,865
- 15,865
2,167 405
Impairment Costs
2012 2011
208
1,271 413
-
Actual
15,837
-
Actual
129
1,313
page 40

Financial Statements 2012
Waverley Council
Notes to the Financial Statements for the financial year ended 30 June 2012
Note 4. Expenses from Continuing Operations (continued)
$ '000
(e) Other Expenses
Other Expenses for the year include the following:
AdvertisingAbandonment of Fines by Office of State Debt RecoveryBad & Doubtful DebtsBank ChargesCar Park LevyCleaningComputer Software ChargesContributions/Levies to Other Levels of Government - Department of Planning Levy - Emergency Services Levy - NSW Fire Brigade LevyCouncillor Expenses - Mayoral FeeCouncillor Expenses - Councillors' FeesCouncillors' Expenses (incl. Mayor) - Other (excluding fees above)Donations, Contributions & Assistance to other organisations (Section 356)
Electricity & HeatingFamily Day Care SubsidyInsuranceLand Tax - Crown LandPostagePrinting & StationeryRevaluation Decrements (Fair Valuation of Investment Properties)Street LightingSubscriptions & PublicationsTelephone & CommunicationsWaste Disposal ChargesWater Rates & ChargesOtherTotal Other Expensesless: Capitalised CostsTOTAL OTHER EXPENSES
1,252
813
235
2011
36
66
323
697
858
1,426
273
550
1,504
14
200
Notes
200
(95)
1,028
741
709
290
77
985
998
110
709
581
578
-
204
847
866
784
Actual
749
19,022
2012
18,424
1,082
189 121
35
(155) 18,269
234
850
1,090
155
438
235
1,429 336
514
261
19,117
Actual
32
644
311
164
76
885
61
334 304 4,727 4,345
page 41

Financial Statements 2012
Waverley Council
Notes to the Financial Statements for the financial year ended 30 June 2012
Note 5. Gains or Losses from the Disposal of Assets
$ '000
Property (excl. Investment Property)Proceeds from Disposal - Propertyless: Carrying Amount of Property Assets Sold / Written OffNet Gain/(Loss) on Disposal
Plant & EquipmentProceeds from Disposal - Plant & Equipmentless: Carrying Amount of P&E Assets Sold / Written OffNet Gain/(Loss) on Disposal
InfrastructureProceeds from Disposal - Infrastructureless: Carrying Amount of Infrastructure Assets Sold / Written OffNet Gain/(Loss) on Disposal
Financial Assets*Proceeds from Disposal / Redemptions / Maturities - Financial Assetsless: Carrying Amount of Financial Assets Sold / Redeemed / MaturedNet Gain/(Loss) on Disposal
NET GAIN/(LOSS) ON DISPOSAL OF ASSETS
* Financial Assets disposals / redemptions include:- Net Gain/(Loss) from Financial Instruments "At Fair Value through profit & loss"Net Gain/(Loss) on Disposal of Financial Instruments
47 19
(225)
-
-
(25,978)
-
25,978
(206)
(47)
-
Actual
-
249
238
2012
(225)
-
249
249
28,520
53
(28,271)
-
94
-
Actual
(58)
2011
-
(34)
-
(58)
Notes
-
page 42

Financial Statements 2012
Waverley Council
Notes to the Financial Statements for the financial year ended 30 June 2012
Note 6a. - Cash Assets and Note 6b. - Investment Securities
$ '000
Cash & Cash Equivalents (Note 6a)Cash on Hand and at BankCash-Equivalent Assets1
- Deposits at Call- Short Term Deposits
Total Cash & Cash Equivalents
Investment Securities (Note 6b)- Long Term Deposits- Growth Securities- NCD's, FRN's (with Maturities > 3 months)
Total Investment SecuritiesTOTAL CASH ASSETS, CASHEQUIVALENTS & INVESTMENTS
1 Those Investments where time to maturity (from date of purchase) is < 3 mths.
Cash, Cash Equivalents & Investments wereclassified at year end in accordance withAASB 139 as follows:
Cash & Cash Equivalentsa. "At Fair Value through the Profit & Loss"
Investmentsa. "At Fair Value through the Profit & Loss"- "Held for Trading"b. "Held to Maturity"c. "Loans & Receivables"d. "Available for Sale"Investments
-
25,000
Notes
2012Actual
Current
-
-
2011
3,000 25,000 -
2011
1,325
3,000
3,000
1,000
8,842
Current Actual
4,017
- 19,344
4,566
6(b-iv)
6(b-ii)
6(b-iii)
40,168
- 20,824 8,842
- 3,000
3,000
12,000 -
19,344
-
33,842
6(b-i)
20,824
3,500
24,000
-
2012Actual
14,000
12,000
5,311
7,344
11,514
-
-
Non Current
-
-
-
-
11,514
Non Current Actual
25,000
1,513
-
- -
-
2,514
2,778 - - 2,514
9,000
-
9,000
-
11,514
page 43
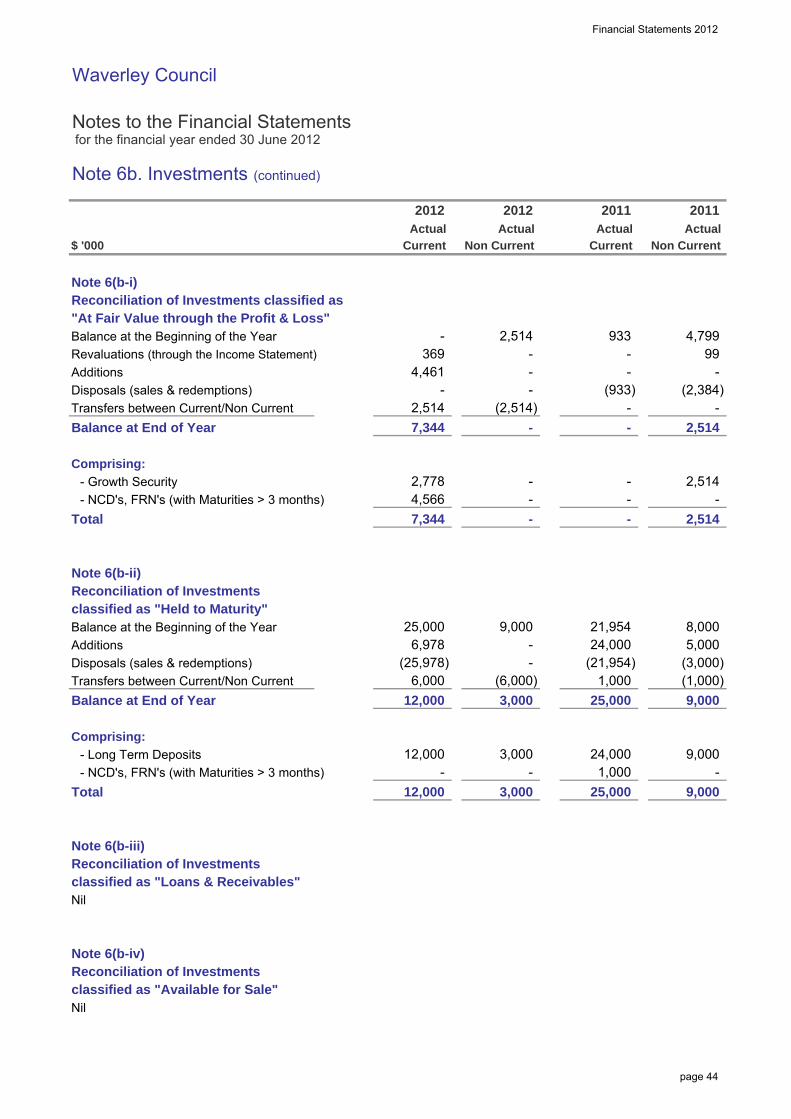
Financial Statements 2012
Waverley Council
Notes to the Financial Statements for the financial year ended 30 June 2012
Note 6b. Investments (continued)
$ '000
Note 6(b-i)Reconciliation of Investments classified as"At Fair Value through the Profit & Loss"Balance at the Beginning of the YearRevaluations (through the Income Statement)AdditionsDisposals (sales & redemptions)Transfers between Current/Non CurrentBalance at End of Year
Comprising:
- Growth Security- NCD's, FRN's (with Maturities > 3 months)
Total
Note 6(b-ii)Reconciliation of Investmentsclassified as "Held to Maturity"Balance at the Beginning of the YearAdditionsDisposals (sales & redemptions)Transfers between Current/Non CurrentBalance at End of Year
Comprising:
- Long Term Deposits- NCD's, FRN's (with Maturities > 3 months)
Total
Note 6(b-iii)Reconciliation of Investmentsclassified as "Loans & Receivables"Nil
Note 6(b-iv)Reconciliation of Investmentsclassified as "Available for Sale"Nil
(1,000)
9,000
24,000
-
-
3,000
3,000
3,000
-
(21,954)
25,000
21,954 24,000
25,000
1,000
-
1,000
-
Non Current
2011
9,000
-
- 933
- (2,514)
2,514
12,000
(25,978) 6,978
369
12,000
Actual
2012Actual
2012
9,000
- 4,461
2,514
(3,000)
12,000
5,000 8,000
(933) -
-
-
-
Current Actual
2,514
99 -
- (2,384)
-
4,566
Current
(6,000) -
-
7,344
-
-
9,000
-
6,000
7,344
- - 2,514
25,000
2,514
4,799
-
2011
2,778
Non Current Actual
page 44
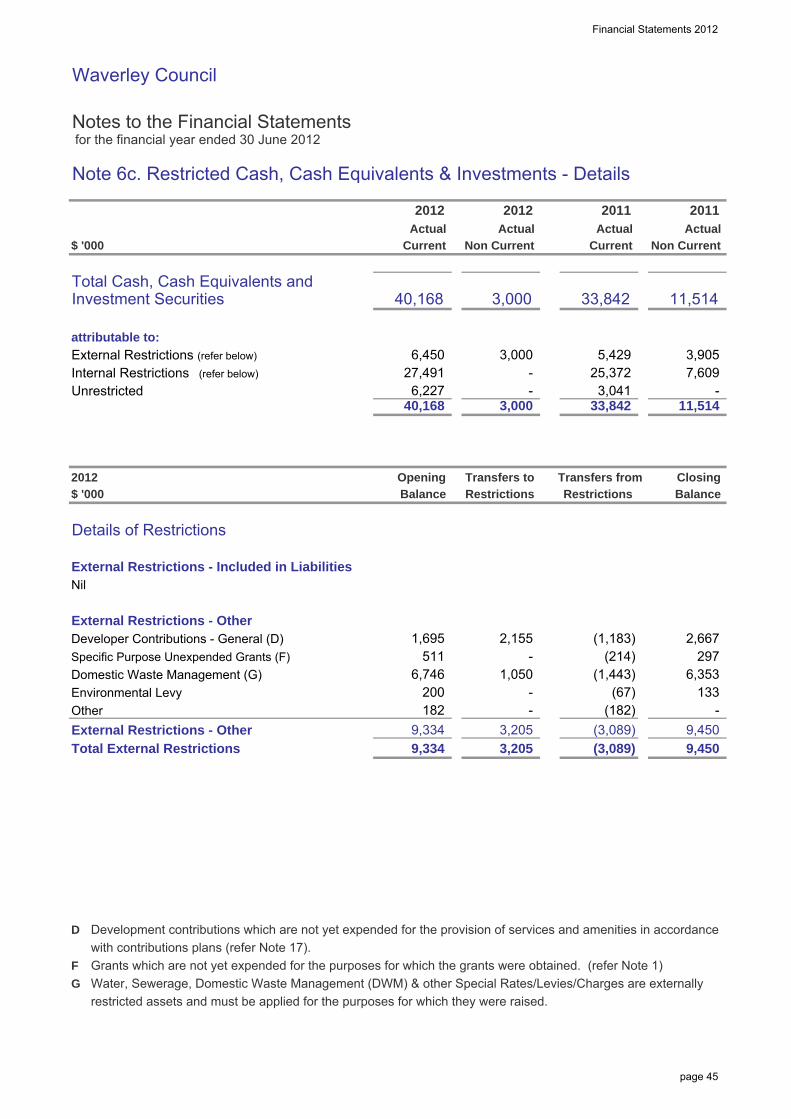
Financial Statements 2012
Waverley Council
Notes to the Financial Statements for the financial year ended 30 June 2012
Note 6c. Restricted Cash, Cash Equivalents & Investments - Details
$ '000
Total Cash, Cash Equivalents andInvestment Securities
attributable to:
External Restrictions (refer below)
Internal Restrictions (refer below)
Unrestricted
$ '000
Details of Restrictions
External Restrictions - Included in LiabilitiesNil
External Restrictions - OtherDeveloper Contributions - General (D)Specific Purpose Unexpended Grants (F)Domestic Waste Management (G)Environmental LevyOtherExternal Restrictions - OtherTotal External Restrictions
D Development contributions which are not yet expended for the provision of services and amenities in accordancewith contributions plans (refer Note 17).
F Grants which are not yet expended for the purposes for which the grants were obtained. (refer Note 1) G Water, Sewerage, Domestic Waste Management (DWM) & other Special Rates/Levies/Charges are externally
restricted assets and must be applied for the purposes for which they were raised.
(3,089) (182)
3,205
- 182 (67)
1,050 6,746
Restrictions
(1,443)
Restrictions
3,041
9,334 9,334
2012
6,227 40,168
Actual
Transfers to
- 3,000
-
Actual
3,000
Non Current
2012
6,450
1,695
- 200
- 2,155
Current
Balance
3,000
511
Opening
40,168
3,205 (3,089)
9,450 9,450
133
(214)
-
6,353
(1,183) 297
2,667
Balance
11,514 -
Non Current
2011
2012 Closing Transfers from
7,609 27,491
33,842
25,372
Actual
3,905
Current
11,514
5,429
33,842
2011Actual
page 45

Financial Statements 2012
Waverley Council
Notes to the Financial Statements for the financial year ended 30 June 2012
Note 6c. Restricted Cash, Cash Equivalents & Investments - Details (continued)
$ '000
Internal RestrictionsPlant & Vehicle ReplacementEmployees Leave EntitlementCarry Over WorksDeposits, Retentions & BondsOffice EquipmentSale of PropertiesInsurance ClaimsParking MetersParking - Off-StreetStreet Tree (Sewer) Aerial BuildingAffordable HousingSocial HousingFuture Capital WorksUnexpended LoansCemetery FundsInvestment StrategyOtherTotal Internal Restrictions
TOTAL RESTRICTIONS
Transfers from
252
1,220 3,547
7,901
894
1,690
255 16
Transfers to Balance
1,444
-
-
111 120 897
2,459
6,383
200
568
4,222
36,941
1,960
42,315
188
1,739
Opening Restrictions
(2,408)
927
150
46 - (5,317)
(62)
(14,077)
384 -
(10,988) 32,981 5,498
1,139 1,500 (1,279)
2012
384
8,703
- 281
-
62
639
-
265 4,312 1,550
Closing
-
(390)
-
(837) (524)
-
(14)
-
(157) 6,638
200 -
27,491
795
2,459
166
252 1,030
4,028
-
- 1,008
1,501 188 -
Restrictions Balance
page 46
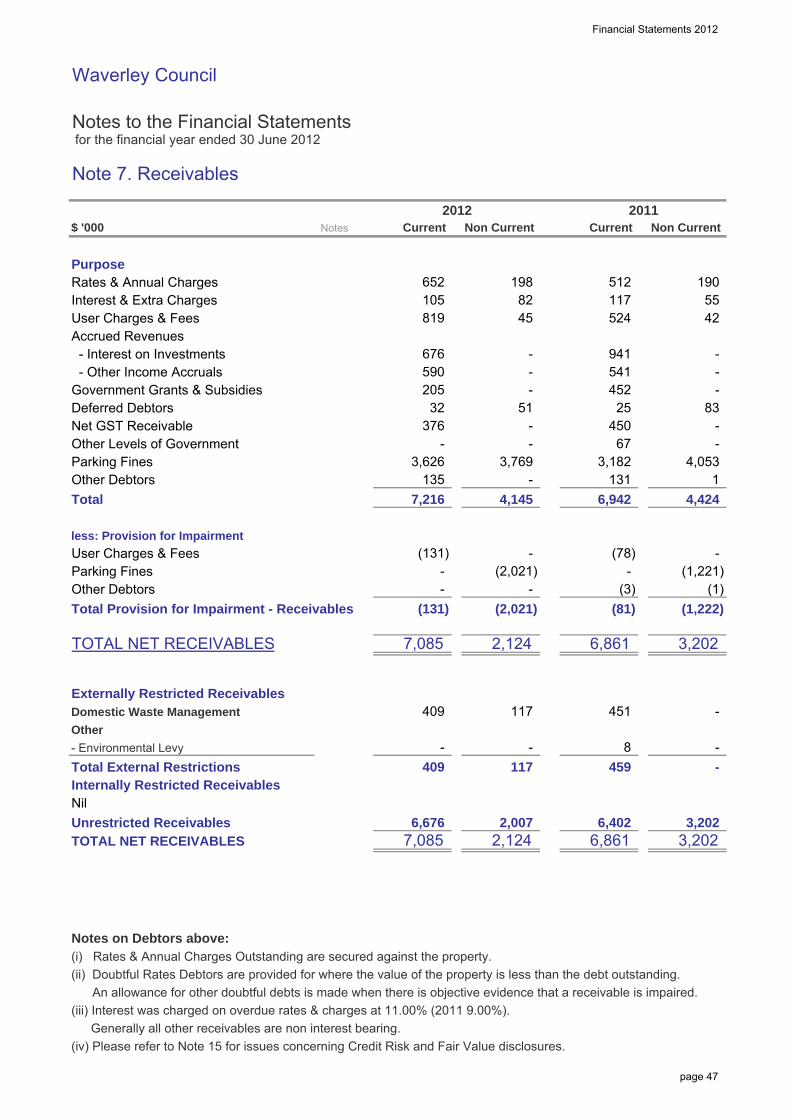
Financial Statements 2012
Waverley Council
Notes to the Financial Statements for the financial year ended 30 June 2012
Note 7. Receivables
$ '000
PurposeRates & Annual ChargesInterest & Extra ChargesUser Charges & FeesAccrued Revenues - Interest on Investments - Other Income AccrualsGovernment Grants & SubsidiesDeferred DebtorsNet GST ReceivableOther Levels of GovernmentParking FinesOther DebtorsTotal
less: Provision for Impairment
User Charges & FeesParking FinesOther DebtorsTotal Provision for Impairment - Receivables
TOTAL NET RECEIVABLES
Externally Restricted ReceivablesDomestic Waste Management
Other
- Environmental LevyTotal External RestrictionsInternally Restricted ReceivablesNilUnrestricted ReceivablesTOTAL NET RECEIVABLES
Notes on Debtors above:(i) Rates & Annual Charges Outstanding are secured against the property.(ii) Doubtful Rates Debtors are provided for where the value of the property is less than the debt outstanding. An allowance for other doubtful debts is made when there is objective evidence that a receivable is impaired.(iii) Interest was charged on overdue rates & charges at 11.00% (2011 9.00%).
Generally all other receivables are non interest bearing.(iv) Please refer to Note 15 for issues concerning Credit Risk and Fair Value disclosures.
-
6,861
(81)
-
(1,222)
3,202
4,424
131
- 451
(78)
1 6,942
(1)
8 - - 409
-
(3) (131)
(131)
459
-
Notes
590 676
205
376 -
- 4,145
82
2012
32
135
-
6,676 2,124
3,202 2,007 6,402 3,202 6,861
51
45
Current
- 25
-
-
- 450
524
-
2,124
409
7,085
-
(2,021)
117
42
190
2011
541
83
-
Non Current
452
-
117
7,216
-
7,085
3,626
652
- 941
Current
819 105
198 117 512
55
Non Current
67 - 3,769 3,182 4,053
- (2,021) - (1,221)
page 47

Financial Statements 2012
Waverley Council
Notes to the Financial Statements for the financial year ended 30 June 2012
Note 8. Inventories & Other Assets
$ '000
InventoriesStores & MaterialsTotal Inventories
Other AssetsPrepaymentsTotal Other Assets
TOTAL INVENTORIES / OTHER ASSETS
Externally Restricted AssetsThere are no restrictions applicable to the above assets.
-
-
-
-
860
700 -
-
118
Notes Current
118
-
Non Current
-
Current
2011Non Current
160 -
160
700 518 518
636
-
2012
page 48
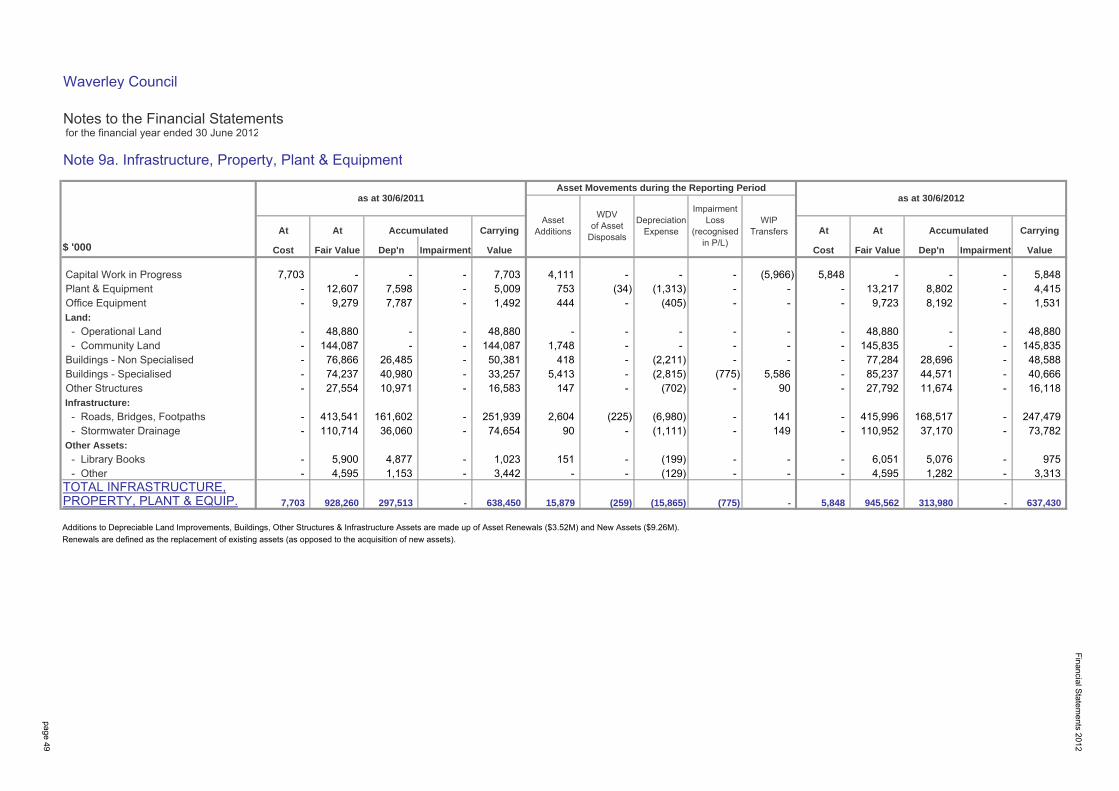
Waverley Council
Notes to the Financial Statements for the financial year ended 30 June 2012
Note 9a. Infrastructure, Property, Plant & Equipment
At At Carrying At At Carrying
$ '000 Cost Fair Value Dep'n Impairment Value Cost Fair Value Dep'n Impairment Value
Capital Work in Progress 7,703 - - - 7,703 4,111 - - - (5,966) 5,848 - - - 5,848 Plant & Equipment - 12,607 7,598 - 5,009 753 (34) (1,313) - - - 13,217 8,802 - 4,415 Office Equipment - 9,279 7,787 - 1,492 444 - (405) - - - 9,723 8,192 - 1,531 Land:
- Operational Land - 48,880 - - 48,880 - - - - - - 48,880 - - 48,880 - Community Land - 144,087 - - 144,087 1,748 - - - - - 145,835 - - 145,835 Buildings - Non Specialised - 76,866 26,485 - 50,381 418 - (2,211) - - - 77,284 28,696 - 48,588 Buildings - Specialised - 74,237 40,980 - 33,257 5,413 - (2,815) (775) 5,586 - 85,237 44,571 - 40,666 Other Structures - 27,554 10,971 - 16,583 147 - (702) - 90 - 27,792 11,674 - 16,118 Infrastructure:
- Roads, Bridges, Footpaths - 413,541 161,602 - 251,939 2,604 (225) (6,980) - 141 - 415,996 168,517 - 247,479 - Stormwater Drainage - 110,714 36,060 - 74,654 90 - (1,111) - 149 - 110,952 37,170 - 73,782 Other Assets:
- Library Books - 5,900 4,877 - 1,023 151 - (199) - - - 6,051 5,076 - 975 - Other - 4,595 1,153 - 3,442 - - (129) - - - 4,595 1,282 - 3,313 TOTAL INFRASTRUCTURE,PROPERTY, PLANT & EQUIP.
Additions to Depreciable Land Improvements, Buildings, Other Structures & Infrastructure Assets are made up of Asset Renewals ($3.52M) and New Assets ($9.26M).Renewals are defined as the replacement of existing assets (as opposed to the acquisition of new assets).
5,848 945,562 313,980 -
Accumulated
637,430 -
Accumulated
7,703 928,260 297,513 - 638,450 15,879 (259) (15,865) (775)
WIPTransfers
as at 30/6/2011Asset Movements during the Reporting Period
page 49
Financial Statements 2012
as at 30/6/2012
Asset Additions
WDVof Asset
Disposals
Depreciation Expense
Impairment Loss
(recognisedin P/L)

Financial Statements 2012
Waverley Council
Notes to the Financial Statements for the financial year ended 30 June 2012
Note 9b. Externally Restricted Infrastructure, Property, Plant & Equipment
Note 9c. Infrastructure, Property, Plant & Equipment - Current Year Impairments
$ '000
Impairment Losses recognised in the Income Statement include: include:Boot Factory building is not fit for purpose & in poor structural condition.Total Impairment Losses
IMPAIRMENT of ASSETS - GAINS/(LOSSES) in P/L
7,567 2,282
TOTAL RESTRICTED I,PP&E
(775)
Notes
2,282 7,567 - -
Domestic Waste Management
$ '000
Class of Asset
5,285 Plant & Equipment Total DWM -
-
3,035 7,394
20112012
(775)
Actual
- 4(d)
7,394
- 3,035 3,035
-
Actual
4,359 7,394 7,567 2,282
5,285
5,285
4,359
Actual
At A/Dep &At
2012
Impairm'tFair Value Fair ValueCost
Carrying Value
At
Actual2011
A/Dep & Carrying ValueCost
At
Impairm't
- (775)
- 4,359
page 50
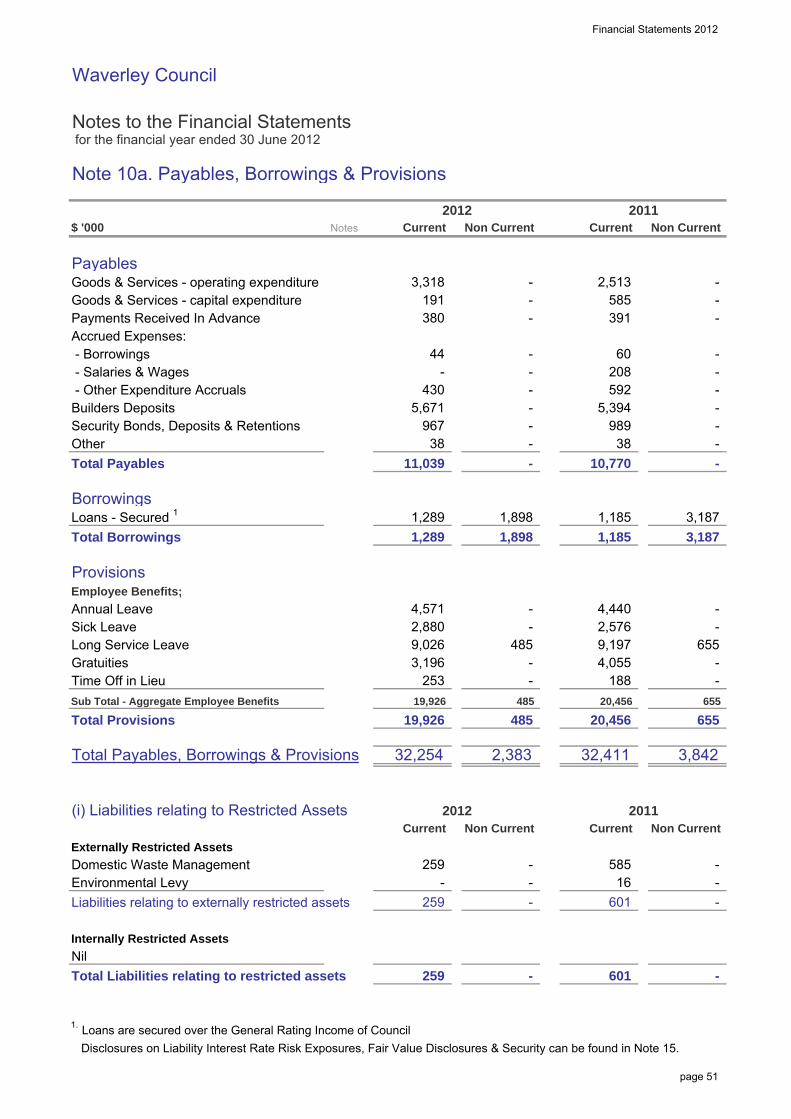
Financial Statements 2012
Waverley Council
Notes to the Financial Statements for the financial year ended 30 June 2012
Note 10a. Payables, Borrowings & Provisions
$ '000
PayablesGoods & Services - operating expenditureGoods & Services - capital expenditurePayments Received In AdvanceAccrued Expenses: - Borrowings - Salaries & Wages - Other Expenditure AccrualsBuilders DepositsSecurity Bonds, Deposits & RetentionsOtherTotal Payables
BorrowingsLoans - Secured 1
Total Borrowings
ProvisionsEmployee Benefits;
Annual LeaveSick LeaveLong Service LeaveGratuitiesTime Off in LieuSub Total - Aggregate Employee Benefits
Total Provisions
Total Payables, Borrowings & Provisions
(i) Liabilities relating to Restricted Assets
Externally Restricted Assets
Domestic Waste ManagementEnvironmental LevyLiabilities relating to externally restricted assets
Internally Restricted Assets
NilTotal Liabilities relating to restricted assets
1. Loans are secured over the General Rating Income of Council Disclosures on Liability Interest Rate Risk Exposures, Fair Value Disclosures & Security can be found in Note 15.
Notes
2012
-
-
-
1,289 1,898
430
- 967
-
1,898
391
1,185
-
592
585
-
2,513
1,289
38
-
3,842
3,187
655
Non Current
-
- 11,039
-
-
-
-
655
259
4,440 2,880
32,254
485 -
19,926
-
4,571
20,456
-
2,576 9,026
253 -
-
20,456
4,055
259
32,411
- 585
485
9,197
1,185
Current
3,187
5,394 -
Non Current Current
-
- 208
Non Current
- -
2011
60
38
- -
-
-
- 655
2011
5,671 -
19,926 485
191
44
380
Current
188
- -
Non Current Current
10,770
3,318
2012
989
-
-
3,196
2,383
259 601 - 16
- 601 -
page 51

Financial Statements 2012
Waverley Council
Notes to the Financial Statements for the financial year ended 30 June 2012
Note 10a. Payables, Borrowings & Provisions (continued)
$ '000
(ii) Current Liabilities not anticipated to be settled within the next 12 months
The following Liabilities, even though classified as current, are not expectedto be settled in the next 12 months.
Provisions - Employees BenefitsPayables - Security Bonds, Deposits & Retentions
Note 10b. Description of and movements in Provisions
a. Employees Leave Entitlements & On-Costs represents those benefits accrued and payable and an estimate of those that will become payable in the future as a result of past service.
20,411 -
-
(7,311)
-
2011
-
9,511
253 3,196
-
Remeasurement effects due to
Discounting
-
2012
ClosingBalance
as at 30/6/12
-
6,611
-
-
- -
18,105
2,880 2,885
(2,049)
65 - (1,094) -
4,571
2011
2012
4,367 13,998
18,365
OpeningBalance
as at 1/7/11
Additional Provisions
Decrease due to Payments
Unused amounts reversed
188 235
1,708
4,440 2,576
Class of Provision
13,956 4,149
TOTAL 21,111 Other Leave
Annual Leave(1,414)
4,055
(2,754)
Long Service Leave 9,852 Gratuities
Sick Leave 1,718
page 52

Financial Statements 2012
Waverley Council
Notes to the Financial Statements for the financial year ended 30 June 2012
Note 11. Statement of Cash Flows - Additional Information
$ '000
(a) Reconciliation of Cash AssetsTotal Cash & Cash Equivalent AssetsLess Bank OverdraftBALANCE as per the STATEMENT of CASH FLOWS
(b) Reconciliation of Net Operating Result to Cash provided from Operating Activities
Net Operating Result from Income StatementAdjust for non cash items:
Depreciation & AmortisationNet Losses/(Gains) on Disposal of AssetsNon Cash Capital Grants and ContributionsImpairment Losses Recognition - I,PP&ELosses/(Gains) recognised on Fair Value Re-measurements through the P&L: - Investments classified as "At Fair Value" or "Held for Trading" - Investment Properties
+/- Movement in Operating Assets and Liabilities & Other Cash Items:
Decrease/(Increase) in ReceivablesIncrease/(Decrease) in Provision for Doubtful DebtsDecrease/(Increase) in InventoriesDecrease/(Increase) in Other AssetsIncrease/(Decrease) in PayablesIncrease/(Decrease) in accrued Interest PayableIncrease/(Decrease) in other accrued Expenses PayableIncrease/(Decrease) in Other LiabilitiesIncrease/(Decrease) in Employee Leave EntitlementsNET CASH PROVIDED FROM/(USED IN)OPERATING ACTIVITIES from the STATEMENT of CASH FLOWS
206
326
(369)
(418)
15,865
182
8,842 -
(2,996)
- (770)
6a
Notes 2012Actual
20,824 -
(4,774)
(238)
244
805
42
(20)
8,842
(99)
10
20,824
775
849
850
Actual 2011
15,837
(910)
401
(700)
(16)
17
(370) (149)
1,217
14,405 11,981
4 (174)
(19)
788
page 53
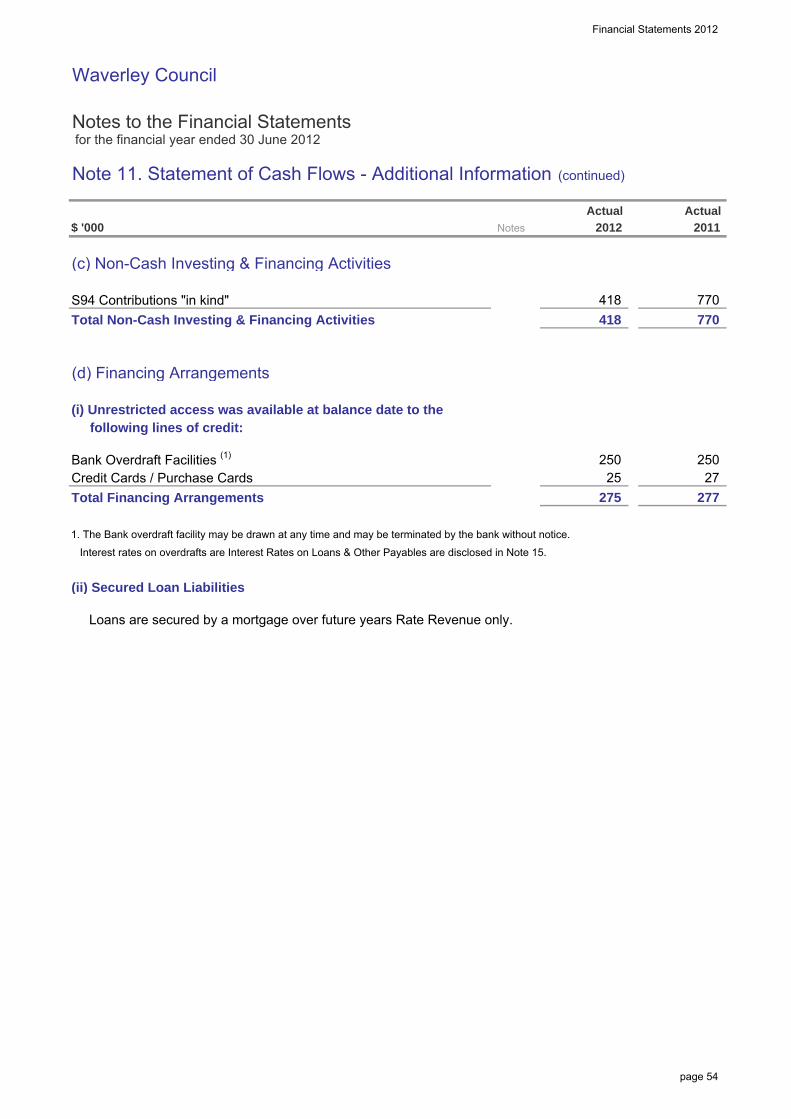
Financial Statements 2012
Waverley Council
Notes to the Financial Statements for the financial year ended 30 June 2012
Note 11. Statement of Cash Flows - Additional Information (continued)
$ '000
(c) Non-Cash Investing & Financing Activities
S94 Contributions "in kind"Total Non-Cash Investing & Financing Activities
(d) Financing Arrangements
(i) Unrestricted access was available at balance date to the following lines of credit:
Bank Overdraft Facilities (1)
Credit Cards / Purchase CardsTotal Financing Arrangements
1. The Bank overdraft facility may be drawn at any time and may be terminated by the bank without notice.
Interest rates on overdrafts are Interest Rates on Loans & Other Payables are disclosed in Note 15.
(ii) Secured Loan Liabilities
Loans are secured by a mortgage over future years Rate Revenue only.
250
275 277
Actual Actual
770
Notes
27
2011
25
418
418 770
250
2012
page 54
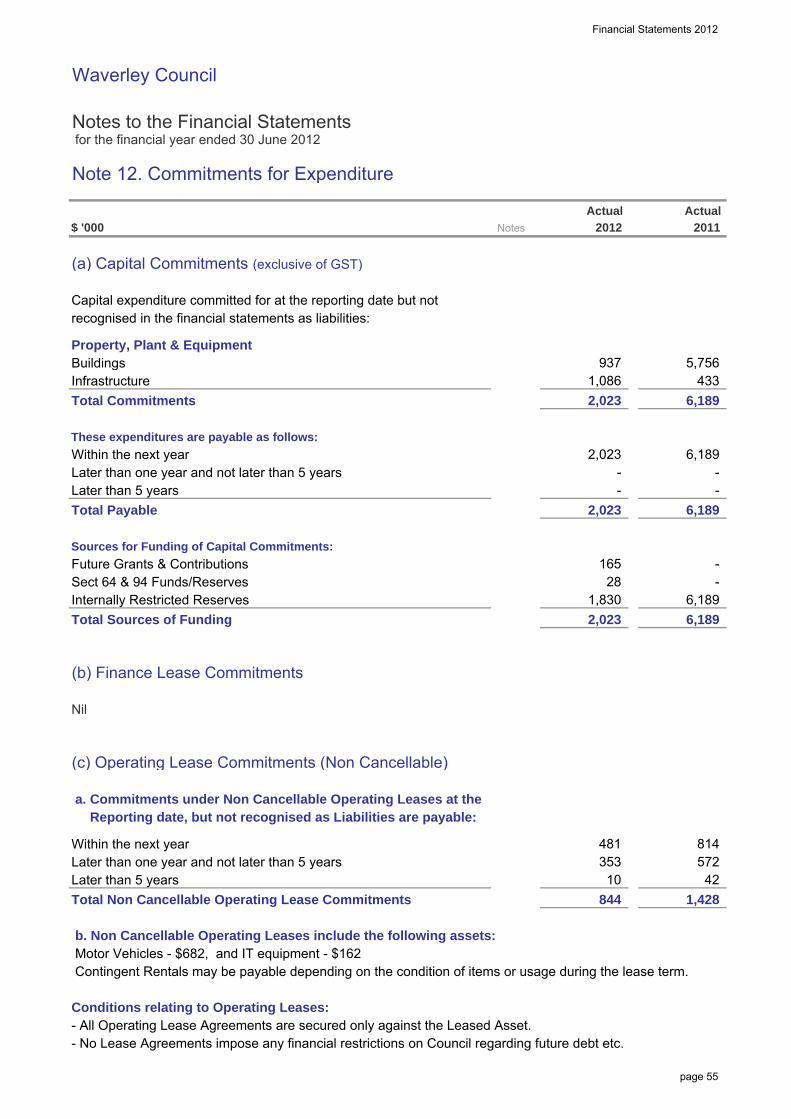
Financial Statements 2012
Waverley Council
Notes to the Financial Statements for the financial year ended 30 June 2012
Note 12. Commitments for Expenditure
$ '000
(a) Capital Commitments (exclusive of GST)
Capital expenditure committed for at the reporting date but notrecognised in the financial statements as liabilities:
Property, Plant & EquipmentBuildingsInfrastructureTotal Commitments
These expenditures are payable as follows:
Within the next yearLater than one year and not later than 5 yearsLater than 5 yearsTotal Payable
Sources for Funding of Capital Commitments:
Future Grants & ContributionsSect 64 & 94 Funds/ReservesInternally Restricted ReservesTotal Sources of Funding
(b) Finance Lease Commitments
Nil
(c) Operating Lease Commitments (Non Cancellable)
a. Commitments under Non Cancellable Operating Leases at the Reporting date, but not recognised as Liabilities are payable:
Within the next yearLater than one year and not later than 5 yearsLater than 5 yearsTotal Non Cancellable Operating Lease Commitments
b. Non Cancellable Operating Leases include the following assets: Motor Vehicles - $682, and IT equipment - $162 Contingent Rentals may be payable depending on the condition of items or usage during the lease term.
Conditions relating to Operating Leases:- All Operating Lease Agreements are secured only against the Leased Asset.- No Lease Agreements impose any financial restrictions on Council regarding future debt etc.
1,428
353 572 10
6,189
2,023
5,756
844
2,023 6,189
-
6,189
-
6,189
433
2,023
-
6,189
Actual 2011
42
814
28
-
2,023
1,086
NotesActual
-
937
1,830 -
2012
481
165
page 55

Financial Statements 2012
Waverley Council
Notes to the Financial Statements for the financial year ended 30 June 2012
Note 13a(i). Statement of Performance Measurement - Indicators (Consolidated)
$ '000
Local Government Industry Indicators
1. Unrestricted Current RatioCurrent Assets less all External Restrictions (1)
Current Liabilities less Specific Purpose Liabilities (2,3)
2. Debt Service RatioDebt Service CostIncome from Continuing Operationsexcluding Capital Items & SpecificPurpose Grants/Contributions
3. Rates & Annual Charges Coverage RatioRates & Annual ChargesIncome from Continuing Operations
4. Rates, Annual Charges, Interest & Extra Charges Outstanding PercentageRates, Annual & Extra Charges OutstandingRates, Annual & Extra Charges Collectible
5. Building & Infrastructure Renewals RatioAsset Renewals(4)
Depreciation, Amortisation & Impairment
Notes
(1) Refer Notes 6-8 inclusive. Also excludes any Real Estate & Land for resale not expected to be sold in the next 12 months(2) Refer to Note 10(a).(3) Refer to Note 10(a)(ii) - excludes all payables & provisions not expected to be paid in the next 12 months (incl. ELE).(4) Asset Renewals represent the replacement &/or refurbishment of existing assets to an equivalent capacity/performance
as opposed to the acquisition of new assets (or the refurbishment of old assets) that increases capacity/performance.
Asset Renewals include building and infrastructure assets only.
2012
4.35 : 1
2.09%1.55%
59,270
2.20%
25.35%3,522 40.04%
2.87
1,037
13,892
2.60
68.75%
42,621
100,702
91,871
2.54%
1,423
39.74%41.20%
Prior Periods2010
41.32%
2011Amounts
13,630
2012
1.95%
2.43%
41,608
Indicator
page 56

Financial Statements 2012
Waverley Council
Notes to the Financial Statements for the financial year ended 30 June 2012
Note 13a(ii). Statement of Performance Measurement - Graphs (Consolidated)
Commentary on 2011/12 Result
Council Building & Infrastructure renewals ratio is 25.35%, this ratio does not taking into account of expenditure spent on a
replacement of existing asset that increase capacity/performance, where Council has
spent $8.8m on in 2011/12.
2011/12 Ratio 2.43%
This ratio shows that the majority of Waverley Council's revenue is from non-rates sources. The 2009/10 avereage for
NSW Councils was 47.3%.
This measure at 2.43% reflects that Waverley Council continues to maintain its excellent collection of rates based debt and
compares favourable with the 2009/10 NSW Council average of 5.31%
Commentary on 2011/12 Result
Commentary on Result
2011/12 Ratio 41.32%
To assess the rate at which these assets are being renewed
relative to the rate at which they are depreciating.
Purpose of Rates & Annual Charges
Outstanding Ratio
To assess the impact of loan principal &
interest repayments on the discretionary revenue of council.
2011/12 Ratio 1.55%
A ratio of 1.55% indicates that Waverley Council has a relatively small portion of revenue committed to the repayment of debt. The 2009/10 average for NSW
Councils was 5%.
Purpose of Unrestricted Current
Ratio
Purpose of Debt Service Ratio
To assess the impact of uncollected rates and annual charges on Council's liquidity and the adequacy of
recovery efforts.
To assess the degree of Council's
dependence upon revenue from rates and annual charges and to assess the
security of Council's income.
2011/12 Ratio 4.35 : 1
2011/12 Ratio 25.35%
Purpose of Asset Renewals Ratio
Commentary on 2011/12 Result
Purpose of Rates & Annual Charges Coverage Ratio
A ratio of 4.32:1 indicates that Waverley Council has sufficient liquid assets on hand to meet its current liabilities as they fall due,
favourably compares with the 2009/10 NSW Council average of 2.71 :1.
To assess the adequacy of working capital and its ability to satisfy obligations in the short term for
the unrestricted activities of Council.
Commentary on 2011/12 Result
3.01 2.87 2.60
4.35
0.0
1.0
2.0
3.0
4.0
5.0
6.0
2009 2010 2011 2012
Rat
io :
1
1. Unrestricted Current Ratio
2.60%2.09% 1.95%
1.55%
0%
1%
2%
3%
4%
2009 2010 2011 2012
Rat
io %
2. Debt Service Ratio
44.20%
39.74%41.20% 41.32%
35%37%39%41%43%45%47%49%
2009 2010 2011 2012
Rat
io %
3. Rates & Annual Charges Coverage Ratio
2.68% 2.54%2.20% 2.43%
0%
1%
2%
3%
4%
2009 2010 2011 2012
Rat
io %
4. Rates, Annual Charges, Interest & Extra Charges Outstanding Percentage
77.08%68.75%
40.04%25.35%
0%
20%
40%
60%
80%
100%
120%
2009 2010 2011 2012
Rat
io %
5. Building & Infrastructure Renewals Ratio
page 57

Financial Statements 2012
Waverley Council
Notes to the Financial Statements for the financial year ended 30 June 2012
Note 14. Investment Properties
$ '000
(a) Investment Properties at Fair value
Investment Properties on Hand
Reconciliation of Annual Movement:Opening Balance
- Capitalised Expenditure - this year- Net Gain/(Loss) from Fair Value Adjustments- Transfers from/(to) Owner Occupied (Note 9)CLOSING BALANCE - INVESTMENT PROPERTIES
(b) Valuation Basis
The basis of valuation of Investment Properties is Fair Value, being the amounts for which the properties couldbe exchanged between willing parties in arms length transaction, based on current prices in an active marketfor similar properties in the same location and condition and subject to similar leases.
The 2012 revaluations were based on Independent Assessments made by:Scott Fullarton Valuations Pty Ltd (ACN 003 683 878)
(c) Contractual Obligations at Reporting Date
Refer to Note 12 for disclosures relating to any Capital and Service obligations that have been contracted.
(d) Leasing Arrangements
Details of leased Investment Properties are as follows;
Future Minimum Lease Payments receivable undernon-cancellable Investment Property Operating Leasesnot recognised in the Financial Statements are due:Within 1 yearLater than 1 year but less than 5 yearsLater than 5 yearsTotal Minimum Lease Payments Receivable
(e) Investment Property Income & Expenditure - summary
Rental Income from Investment Properties:
- Minimum Lease Payments- Other IncomeDirect Operating Expenses on Investment Properties:
- that generated rental income- that did not generate rental incomeNet Revenue Contribution from Investment Propertiesplus:Fair Value Movement for year
Total Income attributable to Investment Properties
2,985
6,077
114,827
(203)
2,033
13
(1,712)
5,494
25
Actual
-
20112012
2,394
- (850)
(1,609)
2,996
2,796 2,104
-
117,823
3,244
(850)
2,996
114,827
NotesActual
3,220
4,161
114,827
115,639
(400)
5,981
117,823
7,745 389
1,916 1,862
page 58
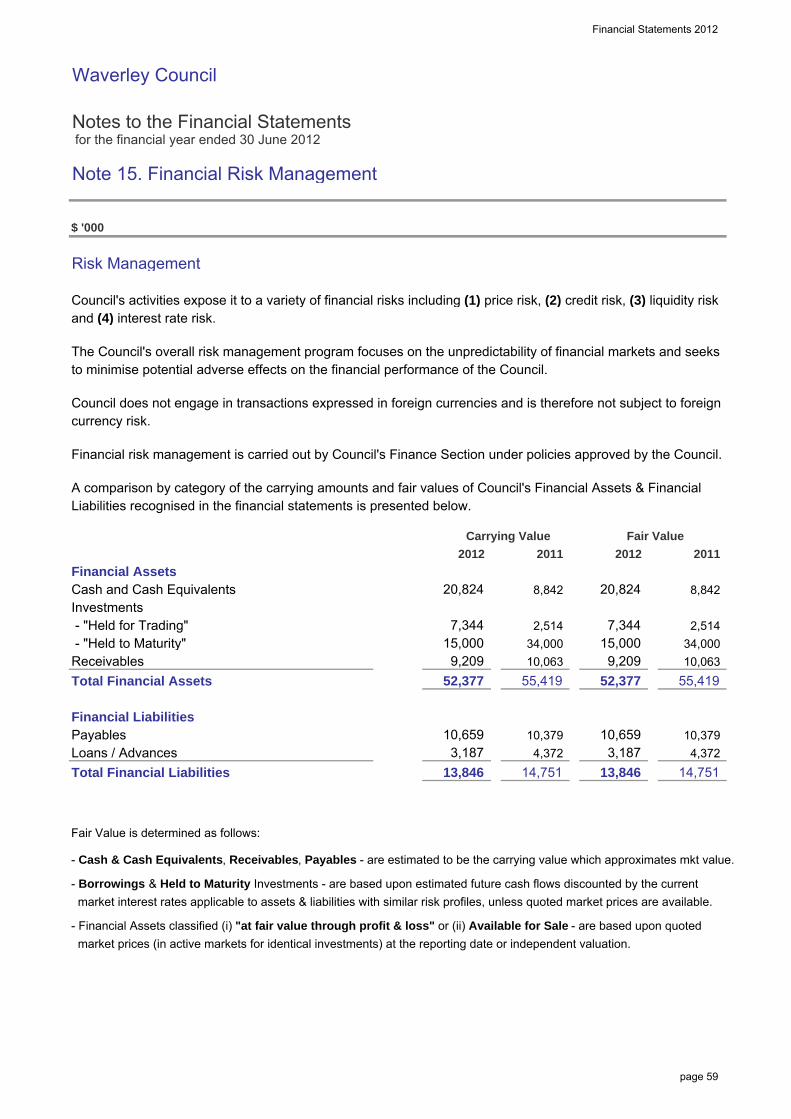
Financial Statements 2012
Waverley Council
Notes to the Financial Statements for the financial year ended 30 June 2012
Note 15. Financial Risk Management
$ '000
Risk Management
Council's activities expose it to a variety of financial risks including (1) price risk, (2) credit risk, (3) liquidity riskand (4) interest rate risk.
The Council's overall risk management program focuses on the unpredictability of financial markets and seeksto minimise potential adverse effects on the financial performance of the Council.
Council does not engage in transactions expressed in foreign currencies and is therefore not subject to foreigncurrency risk.
Financial risk management is carried out by Council's Finance Section under policies approved by the Council.
A comparison by category of the carrying amounts and fair values of Council's Financial Assets & FinancialLiabilities recognised in the financial statements is presented below.
Financial AssetsCash and Cash EquivalentsInvestments - "Held for Trading" - "Held to Maturity"ReceivablesTotal Financial Assets
Financial LiabilitiesPayablesLoans / AdvancesTotal Financial Liabilities
Fair Value is determined as follows:
- Cash & Cash Equivalents, Receivables, Payables - are estimated to be the carrying value which approximates mkt value.
- Borrowings & Held to Maturity Investments - are based upon estimated future cash flows discounted by the current market interest rates applicable to assets & liabilities with similar risk profiles, unless quoted market prices are available.
- Financial Assets classified (i) "at fair value through profit & loss" or (ii) Available for Sale - are based upon quoted market prices (in active markets for identical investments) at the reporting date or independent valuation.
34,000
55,419 10,063
34,000 7,344
15,000 2,514
15,000 7,344
20,824 8,842 20,824 8,842
14,751 3,187
13,846
3,187
52,377
10,063
13,846
2011
14,751
10,379
9,209 52,377
10,659
2,514
4,372 10,379 4,372
9,209
10,659
Carrying Value
55,419
2011
Fair Value
20122012
page 59
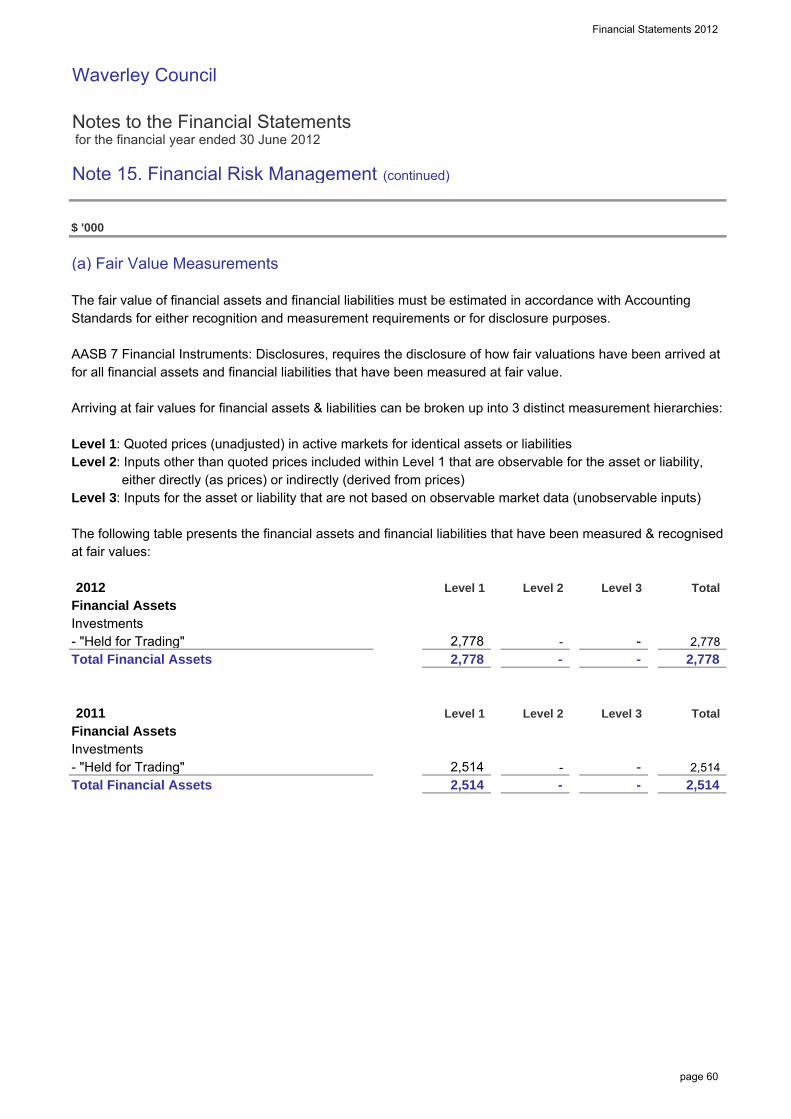
Financial Statements 2012
Waverley Council
Notes to the Financial Statements for the financial year ended 30 June 2012
Note 15. Financial Risk Management (continued)
$ '000
(a) Fair Value Measurements
The fair value of financial assets and financial liabilities must be estimated in accordance with AccountingStandards for either recognition and measurement requirements or for disclosure purposes.
AASB 7 Financial Instruments: Disclosures, requires the disclosure of how fair valuations have been arrived atfor all financial assets and financial liabilities that have been measured at fair value.
Arriving at fair values for financial assets & liabilities can be broken up into 3 distinct measurement hierarchies:
Level 1: Quoted prices (unadjusted) in active markets for identical assets or liabilitiesLevel 2: Inputs other than quoted prices included within Level 1 that are observable for the asset or liability, either directly (as prices) or indirectly (derived from prices) Level 3: Inputs for the asset or liability that are not based on observable market data (unobservable inputs)
The following table presents the financial assets and financial liabilities that have been measured & recognisedat fair values:
2012Financial AssetsInvestments- "Held for Trading"Total Financial Assets
2011Financial AssetsInvestments- "Held for Trading"Total Financial Assets
Total
2,778
Total
-
2,514
Level 1
-
2,514
Level 2
- 2,514 -
2,778
Level 1
-
Level 3
2,778 -
Level 2 Level 3
-
-
2,778
2,514
page 60
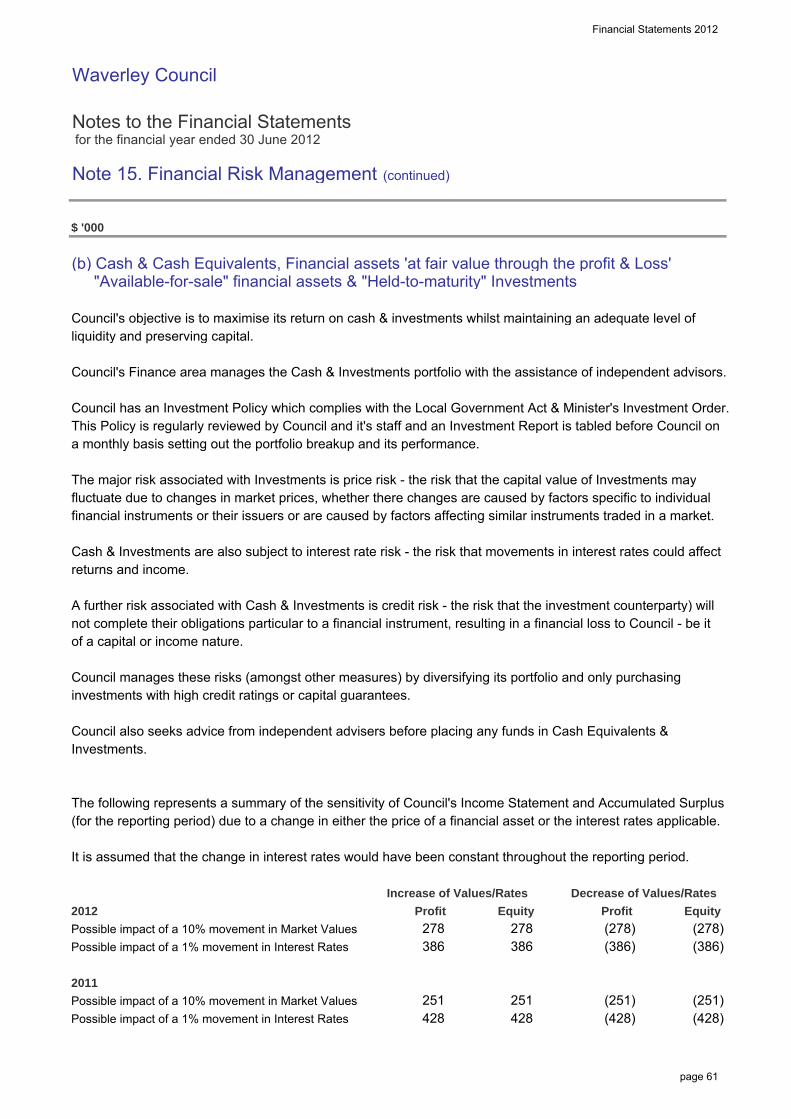
Financial Statements 2012
Waverley Council
Notes to the Financial Statements for the financial year ended 30 June 2012
Note 15. Financial Risk Management (continued)
$ '000
(b) Cash & Cash Equivalents, Financial assets 'at fair value through the profit & Loss' "Available-for-sale" financial assets & "Held-to-maturity" Investments
Council's objective is to maximise its return on cash & investments whilst maintaining an adequate level ofliquidity and preserving capital.
Council's Finance area manages the Cash & Investments portfolio with the assistance of independent advisors.
Council has an Investment Policy which complies with the Local Government Act & Minister's Investment Order.This Policy is regularly reviewed by Council and it's staff and an Investment Report is tabled before Council ona monthly basis setting out the portfolio breakup and its performance.
The major risk associated with Investments is price risk - the risk that the capital value of Investments mayfluctuate due to changes in market prices, whether there changes are caused by factors specific to individualfinancial instruments or their issuers or are caused by factors affecting similar instruments traded in a market.
Cash & Investments are also subject to interest rate risk - the risk that movements in interest rates could affectreturns and income.
A further risk associated with Cash & Investments is credit risk - the risk that the investment counterparty) willnot complete their obligations particular to a financial instrument, resulting in a financial loss to Council - be itof a capital or income nature.
Council manages these risks (amongst other measures) by diversifying its portfolio and only purchasinginvestments with high credit ratings or capital guarantees.
Council also seeks advice from independent advisers before placing any funds in Cash Equivalents &Investments.
The following represents a summary of the sensitivity of Council's Income Statement and Accumulated Surplus(for the reporting period) due to a change in either the price of a financial asset or the interest rates applicable.
It is assumed that the change in interest rates would have been constant throughout the reporting period.
2012
Possible impact of a 10% movement in Market ValuesPossible impact of a 1% movement in Interest Rates
2011
Possible impact of a 10% movement in Market ValuesPossible impact of a 1% movement in Interest Rates
(386) 386
Profit Equity
(428)
(386) 278
251
278
(251)
(278) Profit
428 251
Equity
(278)
(428) 428
386
Increase of Values/Rates Decrease of Values/Rates
(251)
page 61
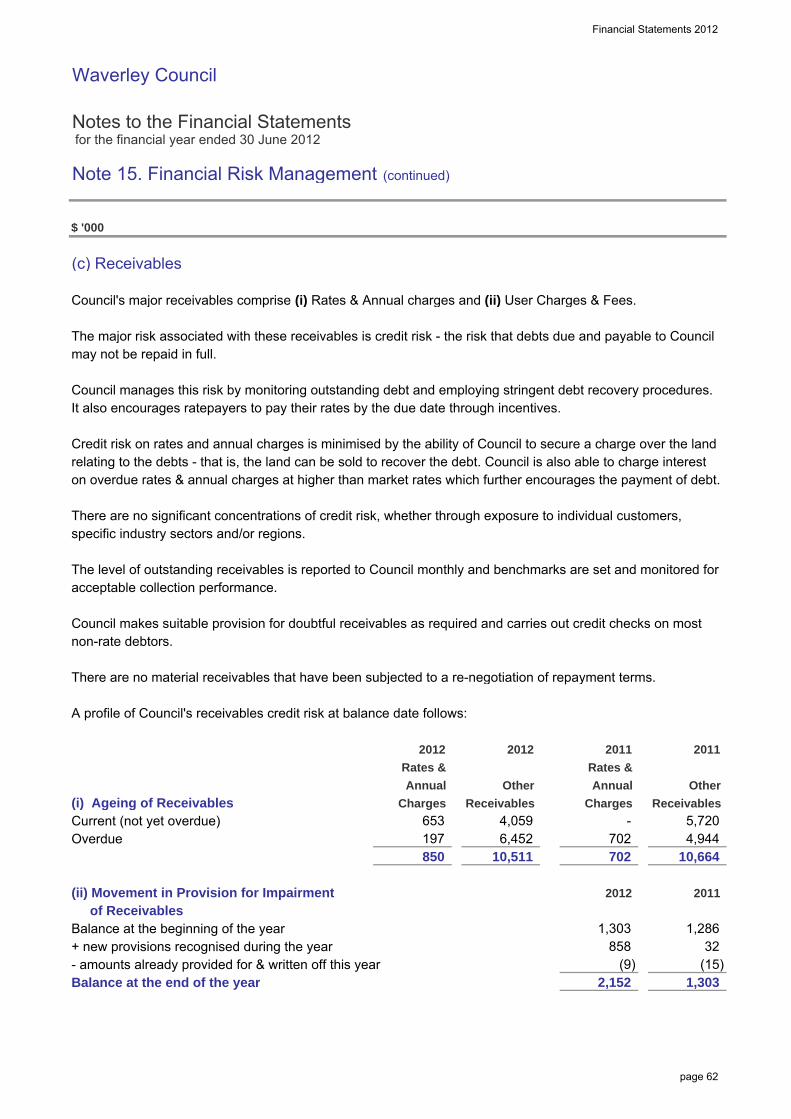
Financial Statements 2012
Waverley Council
Notes to the Financial Statements for the financial year ended 30 June 2012
Note 15. Financial Risk Management (continued)
$ '000
(c) Receivables
Council's major receivables comprise (i) Rates & Annual charges and (ii) User Charges & Fees.
The major risk associated with these receivables is credit risk - the risk that debts due and payable to Councilmay not be repaid in full.
Council manages this risk by monitoring outstanding debt and employing stringent debt recovery procedures.It also encourages ratepayers to pay their rates by the due date through incentives.
Credit risk on rates and annual charges is minimised by the ability of Council to secure a charge over the landrelating to the debts - that is, the land can be sold to recover the debt. Council is also able to charge intereston overdue rates & annual charges at higher than market rates which further encourages the payment of debt.
There are no significant concentrations of credit risk, whether through exposure to individual customers,specific industry sectors and/or regions.
The level of outstanding receivables is reported to Council monthly and benchmarks are set and monitored foracceptable collection performance.
Council makes suitable provision for doubtful receivables as required and carries out credit checks on mostnon-rate debtors.
There are no material receivables that have been subjected to a re-negotiation of repayment terms.
A profile of Council's receivables credit risk at balance date follows:
(i) Ageing of ReceivablesCurrent (not yet overdue)Overdue
(ii) Movement in Provision for Impairment of ReceivablesBalance at the beginning of the year+ new provisions recognised during the year- amounts already provided for & written off this yearBalance at the end of the year
5,720
2,152
2011
850
(9) (15)
- Receivables
4,059
Annual
Charges
20112012
1,303
197
Other
Rates &
653
Rates &
Receivables
Annual
Charges
10,511 6,452 702
2012
Other
2012
4,944 10,664
32
2011
1,303
858 1,286
702
page 62

Financial Statements 2012
Waverley Council
Notes to the Financial Statements for the financial year ended 30 June 2012
Note 15. Financial Risk Management (continued)
$ '000
(d) Payables & Borrowings
Payables & Borrowings are both subject to liquidity risk - the risk that insufficient funds may be on hand to meetpayment obligations as and when they fall due.
Council manages this risk by monitoring its cash flow requirements and liquidity levels and maintaining anadequate cash buffer.
Payment terms can (in extenuating circumstances) also be extended & overdraft facilities utilised as required.
The contractual undiscounted cash outflows (ie. principal and interest) of Council's Payables & Borrowings areset out in the Liquidity Table below:
$ '000
Trade/Other PayablesLoans & AdvancesTotal Financial Liabilities
Trade/Other PayablesLoans & AdvancesTotal Financial Liabilities
Borrowings are also subject to interest rate risk - the risk that movements in interest rates could adverselyaffect funding costs & debt servicing requirements. Council manages this risk through the diversification ofborrowing types, maturities & interest rate structures.
The following interest rates were applicableto Council's Borrowings at balance date:
Trade/Other PayablesLoans & Advances - Fixed Interest Rate 6.0%
10,659 Interest Rate
Carrying
141
10,379
0.0%
Value
Average
138 -
897 694
2012
694 354
354 4,988
Interest Rate
4,372
14,751
Value
2011
Carrying
15,367
-
13,846
-
138
3,187
141 6,383 5,432 1,466
1,466 1,436
- -
794 635 331 6,638 5,310
897
- 4,021
6,383
635 331
- - 6,638
-
- 3,996
1,289 794 -
Cash
2-3 Yrs 3-4 Yrs
Total
1-2 Yrs 4-5 Yrs
- -
Outflows> 5 Yrs
payable in:
≤ 1 Year
Carrying
2011
2012
Subject
maturity
to no
10,659
Average
13,846
3,187
Values
Actual
10,379
10,659
6.0%4,372 3,187 13,846
10,379
-
14,751
0.0%
page 63
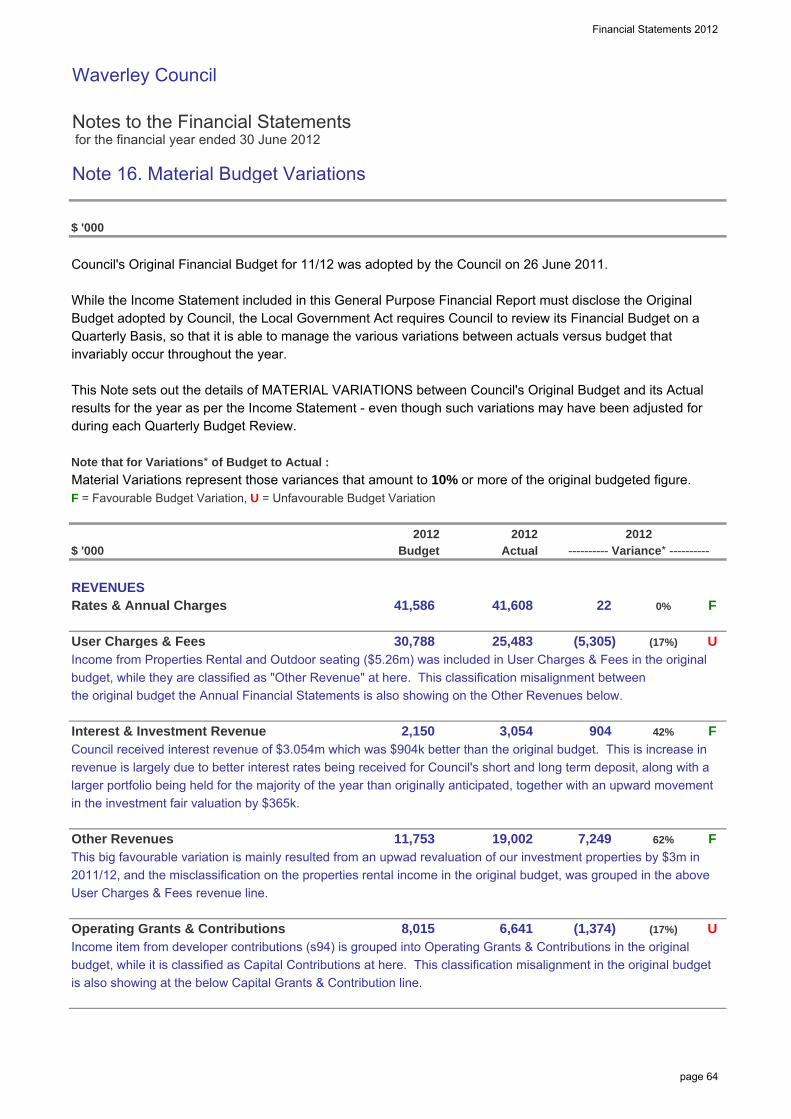
Financial Statements 2012
Waverley Council
Notes to the Financial Statements for the financial year ended 30 June 2012
Note 16. Material Budget Variations
$ '000
Council's Original Financial Budget for 11/12 was adopted by the Council on 26 June 2011.
While the Income Statement included in this General Purpose Financial Report must disclose the OriginalBudget adopted by Council, the Local Government Act requires Council to review its Financial Budget on aQuarterly Basis, so that it is able to manage the various variations between actuals versus budget thatinvariably occur throughout the year.
This Note sets out the details of MATERIAL VARIATIONS between Council's Original Budget and its Actualresults for the year as per the Income Statement - even though such variations may have been adjusted forduring each Quarterly Budget Review.
Note that for Variations* of Budget to Actual :
Material Variations represent those variances that amount to 10% or more of the original budgeted figure.F = Favourable Budget Variation, U = Unfavourable Budget Variation
$ '000
REVENUESRates & Annual Charges
User Charges & FeesIncome from Properties Rental and Outdoor seating ($5.26m) was included in User Charges & Fees in the originalbudget, while they are classified as "Other Revenue" at here. This classification misalignment between the original budget the Annual Financial Statements is also showing on the Other Revenues below.
Interest & Investment RevenueCouncil received interest revenue of $3.054m which was $904k better than the original budget. This is increase in revenue is largely due to better interest rates being received for Council's short and long term deposit, along with alarger portfolio being held for the majority of the year than originally anticipated, together with an upward movement in the investment fair valuation by $365k.
Other RevenuesThis big favourable variation is mainly resulted from an upwad revaluation of our investment properties by $3m in 2011/12, and the misclassification on the properties rental income in the original budget, was grouped in the aboveUser Charges & Fees revenue line.
Operating Grants & ContributionsIncome item from developer contributions (s94) is grouped into Operating Grants & Contributions in the original budget, while it is classified as Capital Contributions at here. This classification misalignment in the original budget is also showing at the below Capital Grants & Contribution line.
904 42%
8,015
41,586
30,788
2,150
11,753
Actual
41,608
6,641
19,002
25,483
U(17%)(1,374)
62%
(5,305)
---------- Variance* ----------
3,054
2012
U
0%
Budget2012
7,249
22
(17%)
F
F
F
2012
page 64
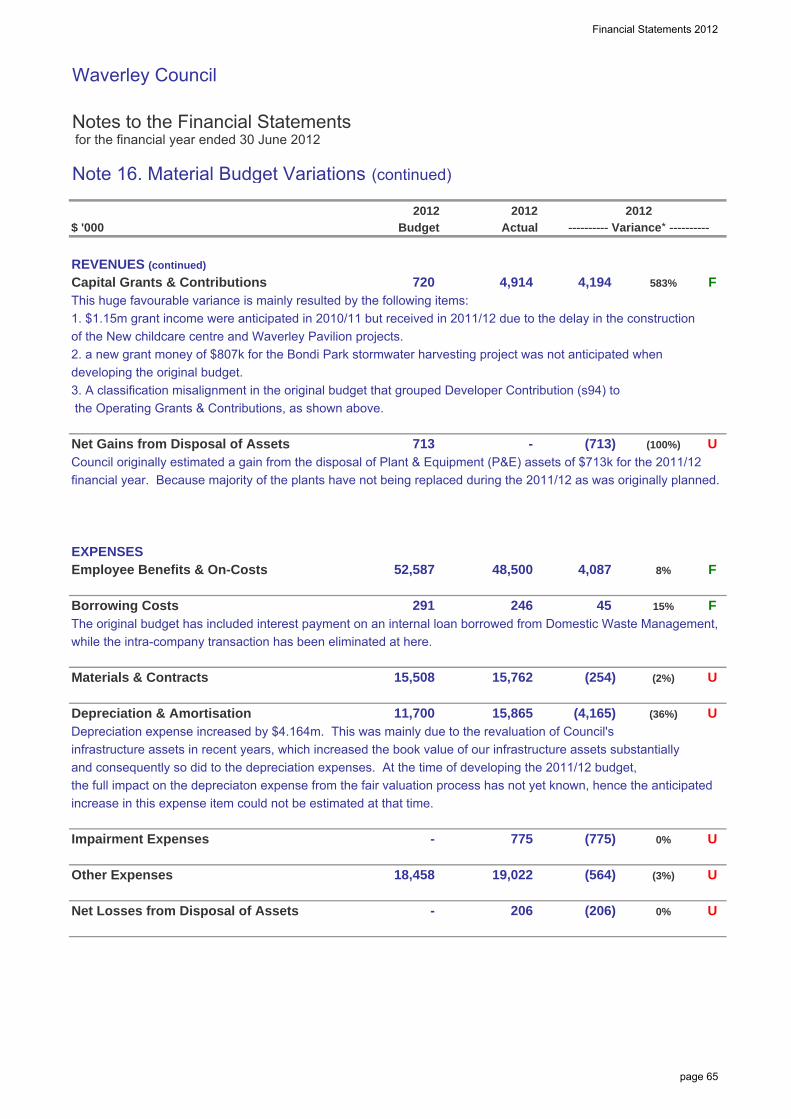
Financial Statements 2012
Waverley Council
Notes to the Financial Statements for the financial year ended 30 June 2012
Note 16. Material Budget Variations (continued)
$ '000
REVENUES (continued)
Capital Grants & ContributionsThis huge favourable variance is mainly resulted by the following items:1. $1.15m grant income were anticipated in 2010/11 but received in 2011/12 due to the delay in the construction of the New childcare centre and Waverley Pavilion projects. 2. a new grant money of $807k for the Bondi Park stormwater harvesting project was not anticipated whendeveloping the original budget.3. A classification misalignment in the original budget that grouped Developer Contribution (s94) to the Operating Grants & Contributions, as shown above.
Net Gains from Disposal of AssetsCouncil originally estimated a gain from the disposal of Plant & Equipment (P&E) assets of $713k for the 2011/12 financial year. Because majority of the plants have not being replaced during the 2011/12 as was originally planned.
EXPENSESEmployee Benefits & On-Costs
Borrowing CostsThe original budget has included interest payment on an internal loan borrowed from Domestic Waste Management, while the intra-company transaction has been eliminated at here.
Materials & Contracts
Depreciation & AmortisationDepreciation expense increased by $4.164m. This was mainly due to the revaluation of Council'sinfrastructure assets in recent years, which increased the book value of our infrastructure assets substantiallyand consequently so did to the depreciation expenses. At the time of developing the 2011/12 budget, the full impact on the depreciaton expense from the fair valuation process has not yet known, hence the anticipated increase in this expense item could not be estimated at that time.
Impairment Expenses
Other Expenses
Net Losses from Disposal of Assets
Budget Actual ---------- Variance* ----------2012 2012 2012
4,087 8%52,587
720
-
15,508
291
U
0%
U
U
15%
U206
18,458
11,700
775
19,022
-
-
0%(206)
(564) (3%)
246
15,865
45
15,762 (254)
(4,165)
713
F4,914
(2%) U
U
(36%)
F
(775)
F
4,194
(100%)(713)
48,500
583%
page 65
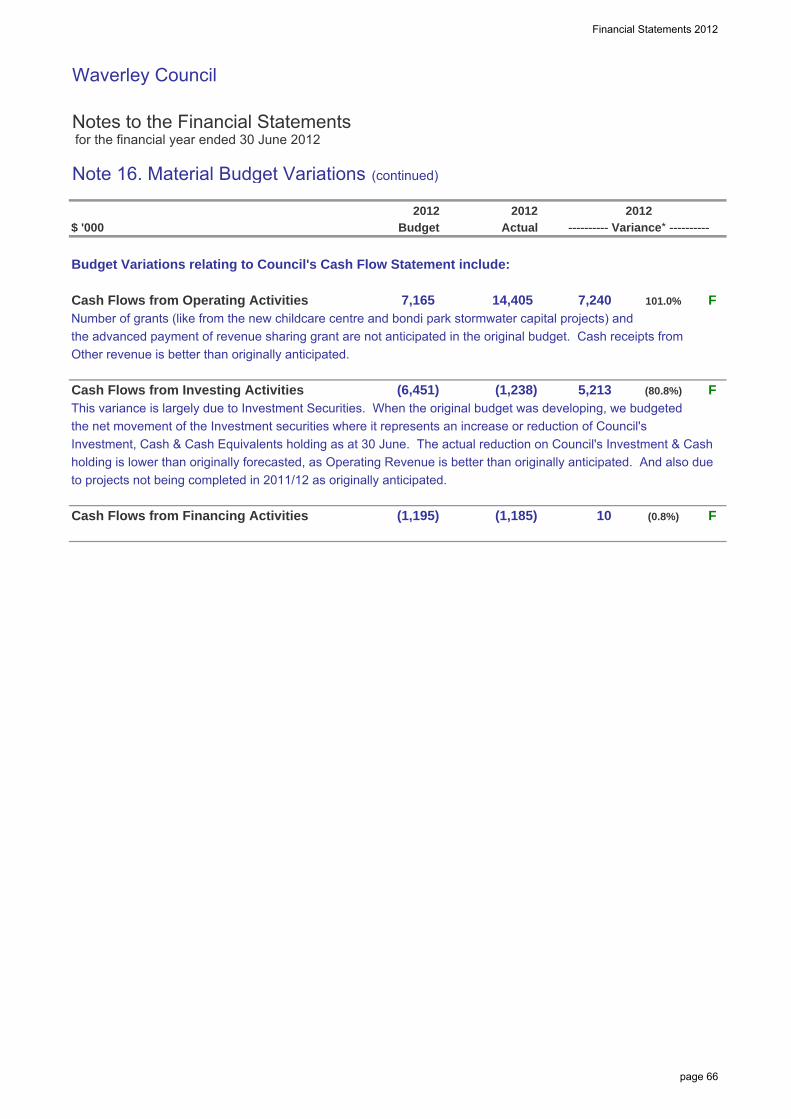
Financial Statements 2012
Waverley Council
Notes to the Financial Statements for the financial year ended 30 June 2012
Note 16. Material Budget Variations (continued)
$ '000
Budget Variations relating to Council's Cash Flow Statement include:
Cash Flows from Operating ActivitiesNumber of grants (like from the new childcare centre and bondi park stormwater capital projects) and the advanced payment of revenue sharing grant are not anticipated in the original budget. Cash receipts from Other revenue is better than originally anticipated.
Cash Flows from Investing ActivitiesThis variance is largely due to Investment Securities. When the original budget was developing, we budgeted the net movement of the Investment securities where it represents an increase or reduction of Council's Investment, Cash & Cash Equivalents holding as at 30 June. The actual reduction on Council's Investment & Cash holding is lower than originally forecasted, as Operating Revenue is better than originally anticipated. And also due to projects not being completed in 2011/12 as originally anticipated.
Cash Flows from Financing Activities
F101.0%7,165 14,405
Budget Actual20122012
F(1,195)
F(1,238)
10 (0.8%)
(80.8%)
(1,185)
(6,451) 5,213
---------- Variance* ----------
7,240
2012
page 66

Waverley Council
Notes to the Financial Statements for the financial year ended 30 June 2012
Note 17. Statement of Developer Contributions
$ '000
Council recovers contributions, raises levies & enters into planning agreements on development works that are subject to a development consent issued by Council.All contributions must be spent/utilised for the specific purpose they were levied and any interest applicable to unspent funds must be attributed to remaining funds.
The following tables detail the receipt, interest and use of the above contributions & levies and the value of all remaining funds which are "restricted" in their future use.
SUMMARY OF CONTRIBUTIONS & LEVIES
S94A LEVIES - UNDER A PLAN
Roads
page 67
Financial Statem
ents 2012
CumulativeProjections
Exp
still
InternalOver or
outstandingBorrowings(under)
due/(payable)FundingBorrowing FutureRestricted
(to)/from
404 -
- -
4,205
-
-
incomeAsset
(76,110)
2,604
-
(80,315)
-
-
-
467
2,667
-
2,031 -
- 1,695
-
Borrowingsdue/(payable)
still
Cumulative
124 Non CashCash
received during the Year
Internal
- in Year
Internal
Borrowing
(892) 467
Exp
Total S94 Revenue Under Plans
Total Contributions
S94A Levies - under a Plan
S93F Planning Agreements
-
S94 Contributions - under a Plan
418 796
1,235
1,695
- -
1,235
-
-
income(under)
Over or
Funding
- outstanding
-
Projections
Future
-
Contributions
-
- - 1,235 1,235
Internal Held asInterest Expenditure
earned during
OpeningPURPOSE
-
-
-
-
-
Yearin Year
-
418
467
2,200
(1,183)
(892)
(291)
PURPOSE Opening
Balance
Contributions
Non Cash
received during the Year
Cash
-
-
(892)
-
124
124
-
124
Interest Expenditure
Restricted
Held as
(to)/from
467
AssetYear
(892) - - Total
Balance
124
earned during

Financial Statements 2012
Waverley Council
Notes to the Financial Statements for the financial year ended 30 June 2012
Note 18. Contingencies & Other Assets/Liabilities Not Recognised
$ '000
The following assets and liabilities do not qualify for (ii) StateCover Limitedrecognition in the Balance Sheet, but their knowledge& disclosure is considered relevant to the users of Council is a member of StateCover Mutual LimitedCouncil's Financial Report. and holds a partly paid share in the entity.
StateCover is a company providing workersLIABILITIES NOT RECOGNISED: compensation insurance cover to the NSW Local
Government Industry and specifically Council.1. Guarantees
Council has a contingent liability to contribute further(i) Defined Benefit Superannuation equity in the event of the erosion of the Company's Contribution Plans capital base as a result of the company's past
performance and/or claims experience or as a resultCouncil participates in an employer sponsored of any increased prudential requirements from APRA.Defined Benefit Superannuation Scheme, and makescontributions as determined by the Superannuation These future equity contributions would be requiredScheme's Trustees. to maintain the company’s minimum level of Net
Assets in accordance with its Licence Requirements.Member Councils bear responsibility of ensuring thereare sufficient funds available to pay out the required (iii) Other Guaranteesbenefits as they fall due.
Council has provided no other Guarantees other thanThe Schemes most recent full actuarial review those listed above.indicated that the Net Assets of the Scheme werenot sufficient to meet the accrued benefits of theSchemes Defined Benefit member category with 2. Other Liabilitiesmember Councils required to make significantlyhigher contributions in future years. (i) Third Party Claims
The Local Government Superannuation Scheme The Council is involved from time to time in varioushowever is unable to provide Council with an accurate claims incidental to the ordinary course of businessestimate of its share of the net deficit and accordingly including claims for damages relating to its services.Council has not recorded any net liability from it'sDefined Benefit Scheme obligations in accordance Council believes that it is appropriately coveredwith AASB 119. for all claims through its Insurance Coverage and
does not expect any material liabilities to eventuate.Future contributions made to the defined benefitscheme to rectify the net deficit position will berecognised as an expense when they becomepayable - similar to the accounting for DefinedContributions Plans.
page 68
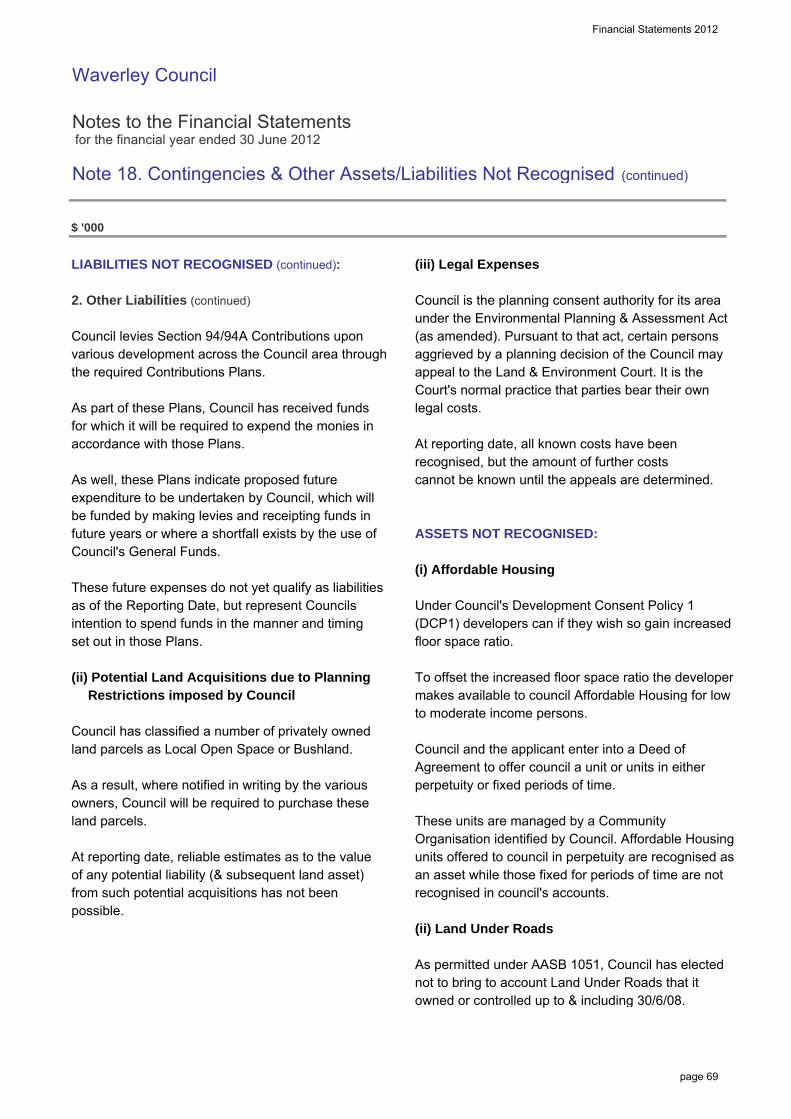
Financial Statements 2012
Waverley Council
Notes to the Financial Statements for the financial year ended 30 June 2012
Note 18. Contingencies & Other Assets/Liabilities Not Recognised (continued)
$ '000
LIABILITIES NOT RECOGNISED (continued): (iii) Legal Expenses
2. Other Liabilities (continued) Council is the planning consent authority for its areaunder the Environmental Planning & Assessment Act
Council levies Section 94/94A Contributions upon (as amended). Pursuant to that act, certain persons various development across the Council area through aggrieved by a planning decision of the Council maythe required Contributions Plans. appeal to the Land & Environment Court. It is the
Court's normal practice that parties bear their ownAs part of these Plans, Council has received funds legal costs. for which it will be required to expend the monies inaccordance with those Plans. At reporting date, all known costs have been
recognised, but the amount of further costsAs well, these Plans indicate proposed future cannot be known until the appeals are determined.expenditure to be undertaken by Council, which willbe funded by making levies and receipting funds infuture years or where a shortfall exists by the use of ASSETS NOT RECOGNISED:Council's General Funds.
(i) Affordable HousingThese future expenses do not yet qualify as liabilitiesas of the Reporting Date, but represent Councils Under Council's Development Consent Policy 1intention to spend funds in the manner and timing (DCP1) developers can if they wish so gain increasedset out in those Plans. floor space ratio.
(ii) Potential Land Acquisitions due to Planning To offset the increased floor space ratio the developer Restrictions imposed by Council makes available to council Affordable Housing for low
to moderate income persons.Council has classified a number of privately ownedland parcels as Local Open Space or Bushland. Council and the applicant enter into a Deed of
Agreement to offer council a unit or units in eitherAs a result, where notified in writing by the various perpetuity or fixed periods of time.owners, Council will be required to purchase theseland parcels. These units are managed by a Community
Organisation identified by Council. Affordable HousingAt reporting date, reliable estimates as to the value units offered to council in perpetuity are recognised asof any potential liability (& subsequent land asset) an asset while those fixed for periods of time are notfrom such potential acquisitions has not been recognised in council's accounts.possible.
(ii) Land Under Roads
As permitted under AASB 1051, Council has electednot to bring to account Land Under Roads that itowned or controlled up to & including 30/6/08.
page 69

Financial Statements 2012
Waverley Council
Notes to the Financial Statements for the financial year ended 30 June 2012
Note 19. Controlled Entities, Associated Entities & Interests in Joint Ventures
Council has no interest in any Controlled Entities, Associated Entities or Joint Ventures.
Note 20. Equity - Retained Earnings and Revaluation Reserves
$ '000
a. Retained Earnings
Movements in Retained Earnings were as follows:Balance at beginning of Year (from previous years audited accounts)
a. Correction of Prior Period Errorsb. Changes in Accounting Policies (prior period effects)c. Other Comprehensive Income (excl. direct to Reserves transactions)d. Net Operating Result for the Yeare. Distributions to/(Contributions from) Minority Interestsf. Transfers between EquityBalance at End of the Reporting Period
b. Reserves
(i) Reserves are represented by:
- Infrastructure, Property, Plant & Equipment Revaluation ReserveTotal
(ii). Reconciliation of movements in Reserves:
Infrastructure, Property, Plant & Equipment Revaluation Reserve- Opening Balance- Revaluations for the year- Transfer to Retained Earnings for Asset disposals- Balance at End of Year
TOTAL VALUE OF RESERVES
(iii). Nature & Purpose of Reserves
Infrastructure, Property, Plant & Equipment Revaluation Reserve
- The Infrastructure, Property, Plant & Equipment Revaluation Reserve is used to record increments/decrements of Non Current Asset values due to their revaluation.
245,825 245,709
(116)
572,433 572,875
- 9(a)
Notes
20 (c)
20 (d)
Actual
240,611
(541,553) 7,707
2011
- -
245,709
245,825
480
Actual 2012
245,709
(4,774)
571,953 1,111,053
116 -
326 -
245,825
5,214
245,709
245,825 -
- -
245,825
page 70

Financial Statements 2012
Waverley Council
Notes to the Financial Statements for the financial year ended 30 June 2012
Note 20. Equity - Retained Earnings and Revaluation Reserves (continued)
$ '000
c. Correction of Error/s relating to a Previous Reporting Period
Correction of errors disclosed in this year's financial statements:
Council identified one residential unit from s94 dedication had not berecognised as being owned by Council. This resulted in the carrying value for the Building-Non-Specialised asset class being under stated. To correct this error the opening balance for the Infrastructure, Property,Plant & Equipment (IPP&E) has been increased. This adjustment has resulted in an increase to the opening 1 July 2010 Retained Earnings Balance.
Correction of errors as disclosed in last year's financial statements:
As part of the revaluation of the Community Land asset class, Council identified a small number of land parcels that had been incorrectly recognised as being owned by Council. This resulted in the carrying value for the Community Land asset class being over stated. To correct this error the opening balance for theInfrastructure, Property, Plant & Equipment (IPP&E) asset class Community Land has been decreased. This adjustment has resulted in a decrease to the opening 1 July 2009 Retained Earnings balance.
- Decrease 1 July 2009 Opening Balance. - Retained Earnings - IPP&E (Community Land)
Council has adjusted the accumulated depreciation forthe following asset classes as at 30/6/10 to reflect the correct valueof accumulated depreciation;
- Other Structures decrease to accumulated depreciation
This adjustment resulted in a net increase / (decrease) in Council'sAccumulated Surplus as at 30/6/11.
In accordance with AASB 108 - Accounting Policies, Changes inAccounting Estimates and Errors, the above Prior Period Errorshave been recognised retrospectively.
These amounted to the following Equity Adjustments:
- Adjustments to Opening Equity - 1/7/10 (relating to adjustments for the 30/6/10 reporting year end and prior periods)
Total Prior Period Adjustments - Prior Period Errors
8,274
2012Actual Actual
7,227
7,227
480
Notes
480
(1,047)
2011
480
page 71

Financial Statements 2012
Waverley Council
Notes to the Financial Statements for the financial year ended 30 June 2012
Note 20. Equity - Retained Earnings and Revaluation Reserves (continued)
$ '000
d. Voluntary Changes in Accounting Policies
Adjustments as disclosed in last year's financial statements:
As part of the transition to Fair Value for Infrastructure, Property, Plant & Equipment (IPP&E), in the 2010/11 Financial Year Council revalued it’s Community Land assets to Fair Value based on the Valuer-Generals land values in accordance with the Local Government Code of Accounting Practice and Financial Reporting Update no. 19.
Council’s Community Land assets had previously been valued and recognised in the Financial Accounts in 1996/97. The basis for this initial valuation was market value. The initial valuation undertaken in 1996/97 resulted in a considerable increase in the value of Community Land assets being recognised in the financial accounts. This valuation was recorded in the balance sheet as a credit (increase) to Council’s Equity via Retained Earnings/Accumulated Surplus.
In 2010/11 Council changed it’s accounting policy with regard to the methodology applied in recognising the value of it’s Community Land assets in the financial accounts. This change in methodology resulted in the carrying value of the Community Land Assets being significantly reduced by $541,553 million.
To reflect this change in accounting policy, the 1 July 2009 opening Retained Earnings balance has been decreased by $541,553 million and the opening balance for IPP&E (Community Land) has also been adjusted down by the same amount in the 2010/11 financial accounts.
- Decrease 1 July 2009 Opening Balance. - Retained Earnings - IPP&E (Community Land)
In accordance with AASB 108 - Accounting Policies, Changes inAccounting Estimates and Errors, the above changes inAccounting Policy have been recognised retrospectively.
These amounted to the following Equity Adjustments:
- Adjustments to Opening Equity - 1/7/10 (relating to adjustments for the 30/6/10 reporting year end and prior periods)
Total Prior Period Adjustments - Accounting Policy Changes
(541,553)
Actual Notes 2012
-
(541,553)
(541,553)
-
Actual 2011
page 72

Financial Statements 2012
Waverley Council
Notes to the Financial Statements for the financial year ended 30 June 2012
Note 21. Financial Result & Financial Position by Fund
Income Statement by Fund$ '000
Council utilises only a General Fund for its operations.
Note 22. "Held for Sale" Non Current Assets & Disposal Groups
$ '000
(i) Non Current Assets & Disposal Group Assets
Non Current Assets "Held for Sale"LandBuildingsTotal Non Current Assets "Held for Sale"
Disposal Group Assets "Held for Sale"None
TOTAL NON CURRENT ASSETSCLASSIFIED AS "HELD FOR SALE"
Note:
Proceeds from above asset sale are internally restricted to capital works projects including new/replacementCouncil Depot.
$ '000
(ii) Reconciliation of Non Current Assets "Held for Sale" & Disposal Groups - i.e. Discontinued Operations
Opening Balance
less: Carrying Value of Assets/Operations Sold
Balance still unsold after 12 months:
Closing Balance of "Held for Sale"
Non Current Assets & Operations
Actual 20122012 2012
Actual Actual
- - 44,955
2012
18,240 -
Assets "Held for Sale"
-
44,955
44,955
- 44,955 -
44,955
Disposal Groups
18,240
44,955
2011
- -
44,955
2011
- -
-
-
- 26,715
2012
Actual 2012
26,715
Non CurrentCurrent
5,235 5,235 21,480
- 18,240
39,720
Non Current
-
Current
44,955
2012 2012 2011 2011
page 73
Financial Statements 2012
Waverley Council
Notes to the Financial Statements for the financial year ended 30 June 2012
Note 23. Events occurring after Balance Sheet Date
$ '000
Events that occur after the reporting date of 30 June 2012, up to and including the date when the financialstatements are "authorised for issue" have been taken into account in preparing these statements.
Council has adopted the date of receipt of the Auditors' Report as the appropriate "authorised for issue" daterelating to these General Purpose Financial Statements.
Accordingly, the "authorised for issue" date is 17/10/12.
Events that occur after the Reporting Date represent one of two types:
(i) Events that have provided evidence of conditions that existed at the Reporting Date
These financial statements (and the figures therein) incorporate all "adjusting events" that provided evidence ofconditions that existed at 30 June 2012.
(ii) Events that have provided evidence of conditions that arose after the Reporting Date
These financial statements (& figures therein) do not incorporate any "non adjusting events" that have occurredafter 30 June 2012 and which are only indicative of conditions that arose after 30 June 2012.
Council is unaware of any material or significant "non adjusting events" that should be disclosed.
Note 24. Discontinued Operations
Council has not classified any of its Operations as "Discontinued".
Note 25. Intangible Assets
Intangible Assets represent identifiable non-monetary asset without physical substance.
Council is unaware of any control over Intangible Assets that warrant recognition in the Financial Statements,including either internally generated and developed assets or purchased assets.
Note 26. Reinstatement, Rehabilitation & Restoration Liabilities
Council has no outstanding obligations to make, restore, rehabilitate or reinstate any of its assets/operations.
Actual Actual
page 74

Financial Statements 2012
Waverley Council
Notes to the Financial Statements for the financial year ended 30 June 2012
Note 27. Financial Review
$ '000
Key Financial Figures of Council over the past 5 years (consolidated)
Financial Performance Figures
Inflows:Rates & Annual Charges RevenueUser Charges RevenueInterest & Investment Revenue (Losses)Grants Income - Operating & CapitalTotal Income from Continuing Operations
Sale Proceeds from I,PP&ENew Loan Borrowings & Advances
Outflows:Employee Benefits & On-cost ExpensesBorrowing CostsMaterials & Contracts ExpensesTotal Expenses from Continuing Operations
Total Cash purchases of I,PP&ETotal Loan Repayments (incl. Finance Leases)
Operating Surplus/(Deficit) (excl. Capital Income)
Financial Position Figures
Current AssetsCurrent LiabilitiesNet Current Assets
Available Working Capital(Unrestricted Net Current Assets)
Cash & Investments - UnrestrictedCash & Investments - Internal RestrictionsCash & Investments - Total
Total Borrowings Outstanding(Loans, Advances & Finance Leases)
Total Value of I,PP&E (excl. Land & Earthworks)
Total Accumulated DepreciationIndicative Remaining Useful Life (as a % of GBV)
Source: Published audited financial statements of Council (current year & prior year)
42,615 42,865
2010
511,909
1,421
4,174 4,211
48,220
8,515
27,491 32,981 35,629 43,168 45,356
2008
1,377
28,550 28,430
512,946 722,347 279,719 207,793
4,372 5,717
313,980 297,513
3,187 7,094
61%200,254
742,996 756,695
59% 60% 61% 59%
48,186
2,063
19,572 14,315
1,045 39,234 49,773
36,245 300
9,152 32,254
26,638 5,503
3,041 6,227
48,002
2009
3,667
15,762 16,232 19,188 489
12,502
98,631 91,542 100,376
10,529 15,855 13,904
(4,588)
1,185 1,345
2012 2011
66,129 41,563
(9,697) (3,101) (11,181)
32,411 30,113 33,875
246 327 401
8,597 6,238 7,238 93,857 92,437
48,500
- 53
100,702
- 94
47,966
24,610
36,769
577
-
12,808
79,030 17,866
39,985 46,949
87,798
-
43,416
11,777
18,911
1,467
-
6,457 80,889
7,807
26
119,993
807 1,783
(103)
2009 2012
2,368
35,715 25,035 21,979
3,054 3,016
38,673 34,817
2008
36,737 25,483 23,657
2011 2010
41,608
2,274
page 75

Financial Statements 2012
Waverley Council
Notes to the Financial Statements for the financial year ended 30 June 2012
Note 28. Council Information & Contact Details
Principal Place of Business:Cnr. Paul St and Bondi RdBondi Junction NSW 2022
Contact DetailsMailing Address: Opening Hours:PO Box 9 Customer Service CentreBondi Junction NSW 1355 55 Spring Street, Bondi Junction
Monday to Friday 8:30am to 5:00pm
Telephone: 02 9369 8000 Internet: www.waverley.nsw.gov.auFacsimile: 02 9387 1820 Email: [email protected]
Officers Elected MembersGENERAL MANAGER MAYORAnthony Reed Clr Sally Betts
RESPONSIBLE ACCOUNTING OFFICER COUNCILLORSIan Mead Clr Leon Goltsman
Clr Miriam Guttman-JonesPUBLIC OFFICER Clr Joy ClaytonBronwyn Kelly Clr Dominic Wy Kanak
Clr John WakefieldAUDITORS Clr Angela BurrillHill Rogers Spencer Steer, Chartered Accountants Clr Andrew Cusack
Clr Paula MasselosClr Tony KayClr Bill MouroukasClr Ingrid Strewe
Other InformationABN: 12 502 583 608
page 76
¦J-a
WAVEKLEY COUMC1L
GENERAL PURPOSE FSNAMCIAL STATEMESMTS
INDEPENDENT AUDITORS' REPORT
Report on the Financial statements
We have audited the accompanying general purpose financial statements of WaverleyCouncil, which comprises the Balance Sheet as at 30 June 2012, Income Statement,Statement of Comprehensive Income, Statement of Changes in Equity and Statement of CashFlows for the year ended on that date, a summary of significant accounting policies and otherexplanatory notes and the Statement by Councillors and Management. The financialstatements include the consolidated financial statements of the economic entity and theentities it controlled at year end or from time to time during the year.
Responsibility of Council for the Financial Statements
The Council is responsible for the preparation and fair presentation of the financialstatements in accordance with Australian Accounting Standards (including the AustralianAccounting Interpretations) and the Local Government Act 1993. This responsibility includesthe maintenance of adequate accounting records and internal controls designed to preventand detect fraud and error; designing, implementing and maintaining internal controlsrelevant to the preparation and fair presentation of the financial statements that are freefrom material misstatement, whether due to fraud or error; selecting and applyingappropriate accounting policies; and making accounting estimates that are reasonable in thecircumstances.
Auditors' Responsibility
Our responsibility is to express an opinion on the financial statements based on our audit.We conducted our audit in accordance with Australian Auditing Standards. These AuditingStandards require that we comply with relevant ethical requirements relating to auditengagements and plan and perform the audit to obtain reasonable assurance whether thefinancial statements are free from material misstatement. Our audit responsibility does notextend to the original budget information disclosed in the Income Statement, Statement ofCash Flows, and Note 2(a) or the budget variation explanations disclosed in Note 16. Nordoes our responsibility extend to the projected future developer contributions and costsdisclosed in Note 17 or the additional disclosures in Notes I3a(i) & 27. Accordingly, noopinion is expressed on these matters.
Assurance Partners
T. +61 2 9232 5111F. +61 2 9233 7950
Level 5, I Chifley SquareGPO Box 7066www.hr-ss.com.au Practising as Hill Rogers Spencer ABN 56 435 338 966Sydney NSW 2000 Australia Sydney NSW [email protected] Steer Assurance Partners
Member of KS International, an association of global independent accounting firms
Liability limited by a scheme approved under Professional Standards Legislationpage 77

disclosures in the financial statements. The procedures selected depend on the auditor'sjudgement, including the assessment of the risks of material misstatement of the financialstatements, whether due to fraud or error. In making those risk assessments, the auditorconsiders internal control relevant to the entity's preparation and fair presentation of thefinancial statements in order to design audit procedures that are appropriate in thecircumstances, but not for the purpose of expressing an opinion on the effectiveness of theCouncil's internal control. An audit also includes evaluating the appropriateness ofaccounting policies used and the reasonableness of accounting estimates made by theCouncil, as well as evaluating the overall presentation of the financial statements.
Our audit did not involve an analysis of the prudence of business decisions made by Councilor management.
We believe that the audit evidence we have obtained is sufficient and appropriate to providea basis for our audit opinion.
Independence
In conducting our audit, we followed applicable independence requirements of Australianprofessional ethical pronouncements.
Auditor's Opinion
In our opinion,
(a)the Council's accounting records have been kept in accordance with the requirements ofthe Local Government Act 1993, Chapter 13 part 3 Division 2; and
(b)the financial statements:(i)have been presented in accordance with the requirements of this Division;(ii)are consistent with the Council's accounting records;(iii)present fairly the Council's financial position, the results of its operations and
its cash flows; and(iv)are in accordance with applicable Accounting Standards and other mandatory
professional reporting requirements in Australia.
(c)all information relevant to the conduct of the audit has been obtained; and
(d)there are no material deficiencies in the accounting records or financial statements thatwe have become aware of during the course of the audit.
HILL ROGERS SPENCER STEER
Partner
Dated at Sydney this 18th day of October 2012
Waverley CouncilGeneral Purpose Financial StatementsIndependent Auditors' Report Page 2
page 78

18 October 2012
The MayorWaverley CouncilPO Box 9BONDI JUNCTION NSW 2022
Mayor,
Audit Report - Year Ended 30 June 2012
We are pleased to advise completion of the audit of Council's books and records for theyear ended 30 June 2012 and that all information required by us was readily available. Wehave signed our reports as required under Section 417(1) of the Local Government Act,1993 and the Local Government Code of Accounting Practice and Financial Reporting to theGeneral and Special Purpose Financial Statements.
Our audit has been conducted in accordance with Australian Auditing Standards so as toexpress an opinion on both the General and Special Purpose Financial Statements of theCouncil. We have ensured that the accounts have been prepared in accordance withAustralian equivalents to International Financial Reporting Standards (AIFRS) and the LocalGovernment Code of Accounting Practice and Financial Reporting.
This report on the conduct of the audit is also issued under Section 417(1) and we nowoffer the following comments on the financial statements and the audit;
1. RESULTS FOR THE YEAR
1,1 Operating Result
The operating result for the year was a surplus of $326,000 as compared with a deficit of$4,774 million in the previous year.
Assurance Partners
T. +61 2 9232 5111 Level 5, I Chifiey Square GPO Box 7066www.hr-ss.com.au Practising as Hill Rogers Spencer ABN 56 435 338 966F. +61 2 9233 7950 Sydney NSW 2000 Australia Sydney NSW [email protected] Steer Assurance Partners
Member of KS International, an association of global independent accounting firmsLiability limited by a scheme approved under Professional Standards Legislation
page 79

''JTJJU y^jn\c-r-s^ J v
The following table sets out the results for the year and the extent (%) that each category ofrevenue and expenses contributed to the total.
%Gf %of Increase2012
Toby2011
Total (Decrease)$000 $000 $000
Revenues before capital items
Bates & annual charges 41,608 43% 38,673 43% 2,935
Lber charges, fees & other re/enues 44,485 46% 41,266 46% 3,219
Grants & contributions prcvided for
operating purposes 6,641 7% 5,979 7% 662Interest & investment revenue 3,054 3% 3,016 3% 38
95,788 100% 88,934 100% 6,854
ExpensesErrployee benefits & costs 48,500 48% 47,966 49% 534h'kteriaJs, contracts & other expenses 34,990 35% 34,501 35% 489
Ctepreciation, amortisation & IrrpairmaTt 16640 17% 15,837 16% 803Bcmcwng costs 246 0% 327 0% (81)
100,376 100% 98,631 100% 1,745
SurpluB/(Ofeficit) before capital items (4,588) (9,697) 5,109
Grants & contributions prcvided for capital
purposes 4,914 4,923 (9)Net Si*plus/(Dfeficit) for the year 326 (4,774) 5,100
The table above shows an overall increase over the previous year of $5,100 million and canlargely be attributed to the increase in the value of investment properties of $2,996 millioncompared to a decrease of $850,000 in the previous year. Rates income increased by $2,935million, or 7.6%, from the previous year.
1.2 Funding Result
The operating result does not take into account all revenues and all expenditures and inreviewing the overall financial performance of Council it is useful to take into account thetotal source of revenues and where they were spent during the year which is illustrated inthe table below.
The Mayor, Waverley CouncilAudit Report for the year ended 30 June 2012 Page 2
page 80
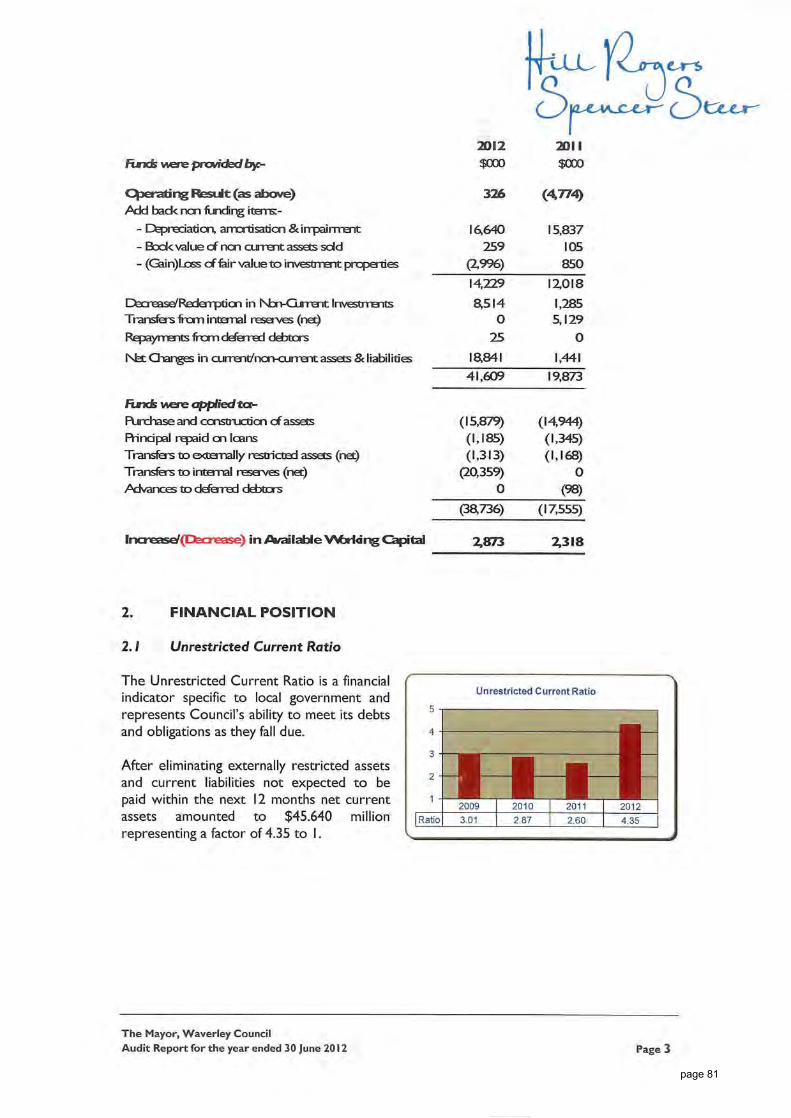
-tuu e^rs
5r2012 2011
Fuids were presided bys- $000 $000
C^acrating ResiJt (as above) 326 (4,774)Add back ncn funding items;-
- Cfepreciation, amortisation ScirrpairrrEnt 16,640 15,837- Book value of ncn current assets sold 259 105- (Gain)Less of fair value to investment properties (2,996) 850
14,229 12018Decnaase'Rederrption in Nbn-CLment Investments 8,514 1,285Transfers from internal reserves (net) 0 5,129Repayments from ddemed debtors 25 0ISfet Changes in current/non-cument assets & liabilities 18,841 1,441
41,609 19,873
Rwids were applied ta-Rjrchase and ccnstruction cf assets (15,879) (14,944)Principal repaid on leans (M85) (1,345)Transfers to externally restricted assets (net) (1,313) (1,168)Transfers to internal reserves (net) (20,359) 0Advances to deferred debtors 0 (98)
(38,736) (17,555)
Increased(Decrease) in Available Wtjrldng Capital 2,873 2,318
2. FINANCIAL POSITION
2.1 Unrestricted Current Ratio
The Unrestricted Current Ratio is a financialindicator specific to local government andrepresents Council's ability to meet its debtsand obligations as they fall due.
After eliminating externally restricted assetsand current liabilities not expected to bepaid within the next 12 months net currentassets amounted to $45,640 millionrepresenting a factor of 4.35 to I.
The Mayor, Waverley CouncilAudit Report for the year ended 30 June 2012 Page 3
page 81
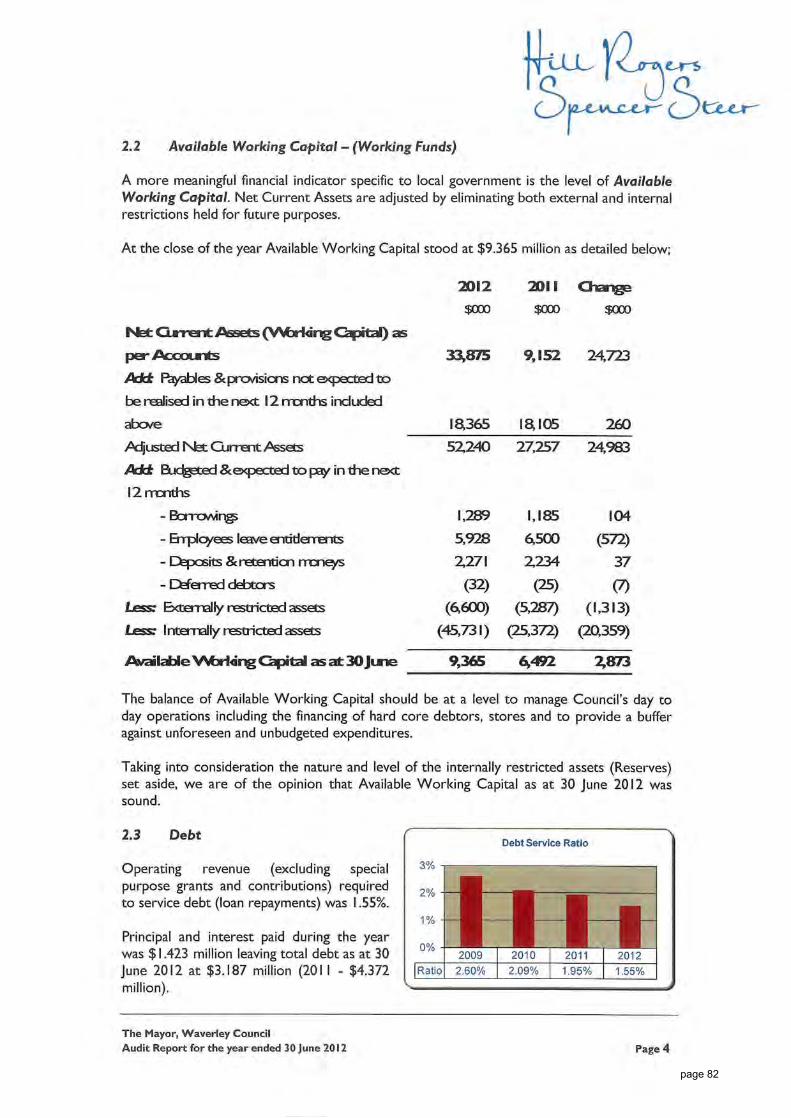
'"jxUU V^cttx e,r-s
2.2 Available Working Capital - (Working Funds)
A more meaningful financial indicator specific to local government is the level of AvailableWorking Capital. Net Current Assets are adjusted by eliminating both external and internalrestrictions held for future purposes.
At the close of the year Available Working Capital stood at $9,365 million as detailed below;
2012 2011 Ot^ge$000$000$000
Net CL»-rent /Assets (WaHdng Capital) as
per Accourts
AJdt Payables & previsions not expected to
be realised in the next 12 months included
abeve
Adjusted Net Current Assets
Addt BudgstEd&expectedtopay in thenext
12 months
-Borro/vin^
-Errplcyees leave entitlements
-Cfepcsits Scretention rrcn^s
-Deferred debtors
less: Externally restricted assets
Less; Internally restricted assets
Available WfcHdng Capital asat30Jine
33,875 9,152 24,723
ia365 18105 26052240 27,257 24,983
1,289 1,185 1045,928 6500 (572)2,27! 2,234 37
(32) (25) (7)(6,600) (5,287) (1,313)
(45,731) (25,372) (20,359)
9,365 6,492 2,873
The balance of Available Working Capital should be at a level to manage Council's day today operations including the financing of hard core debtors, stores and to provide a bufferagainst unforeseen and unbudgeted expenditures.
Taking into consideration the nature and level of the internally restricted assets (Reserves)set aside, we are of the opinion that Available Working Capital as at 30 June 2012 wassound.
2.3 Debt
Operating revenue (excluding specialpurpose grants and contributions) requiredto service debt (loan repayments) was 1.55%.
Principal and interest paid during the yearwas $1,423 million leaving total debt as at 30June 2012 at $3,187 million (201 1 - $4,372million).
Debt Service Ratio
2009Ratio 2.60%
20102.09%
20111.95%
20121.55%
The Mayor, Waverley CouncilAudit Report for the year ended 30 June 2012 Page 4
page 82
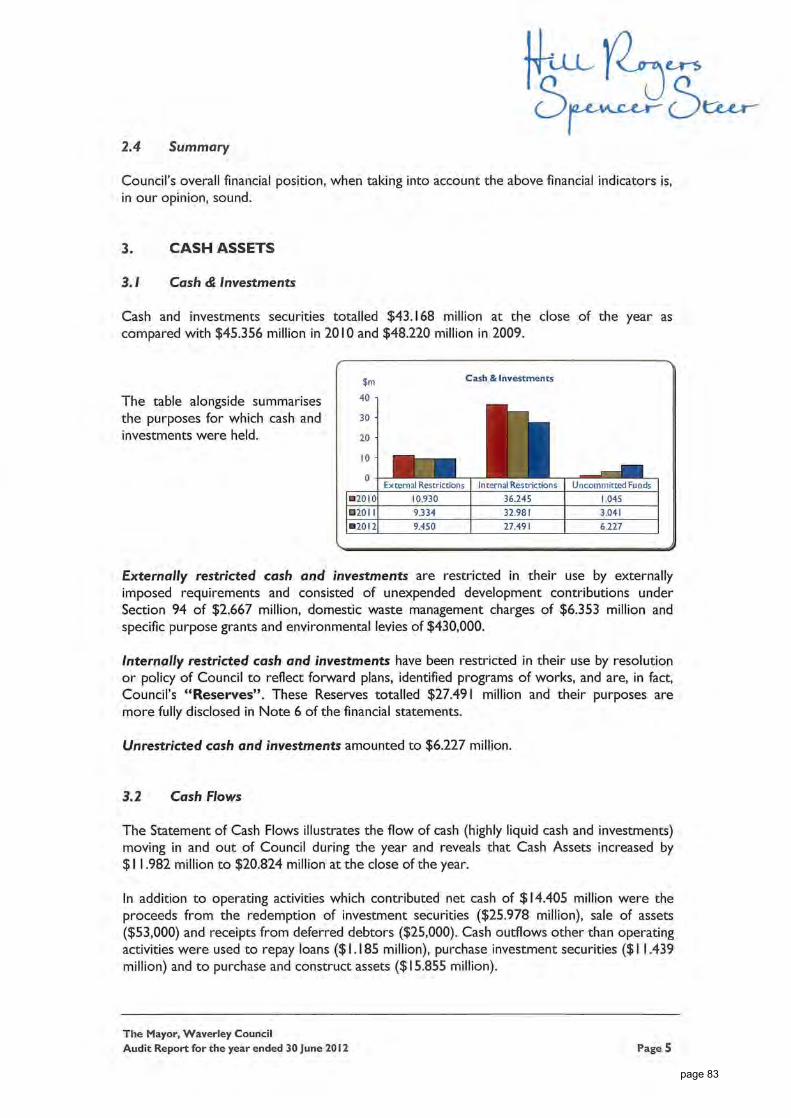
2.4 Summary
Council's overall financial position, when taking into account the above financial indicators is,in our opinion, sound.
3. CASH ASSETS
3.1 Cash & Investments
Cash and investments securities totalled $43,168 million at the close of the year ascompared with $45,356 million in 2010 and $48,220 million in 2009.
The table alongside summarisesthe purposes for which cash andinvestments were held.
$m
40 n
30
20 -
10 ¦
Cash & Investments
External Restrictions Internal Restrictions Uncommitted Funds
2010 10.930 36.245 1.045
201 1 9.334 32.981 3.041
2012 9.450 27.491 6.227
Externally restricted cash and investments are restricted in their use by externallyimposed requirements and consisted of unexpended development contributions underSection 94 of $2,667 million, domestic waste management charges of $6,353 million andspecific purpose grants and environmental levies of $430,000.
Internally restricted cash and investments have been restricted in their use by resolutionor policy of Council to reflect forward plans, identified programs of works, and are, in fact,Council's "Reserves". These Reserves totalled $27.49! million and their purposes aremore fully disclosed in Note 6 of the financial statements.
Unrestricted cash and investments amounted to $6,227 million.
3.2 Cash Flows
The Statement of Cash Flows illustrates the flow of cash (highly liquid cash and investments)moving in and out of Council during the year and reveals that Cash Assets increased by$ I 1.982 million to $20,824 million at the close of the year.
In addition to operating activities which contributed net cash of $14,405 million were theproceeds from the redemption of investment securities ($25,978 million), sale of assets($53,000) and receipts from deferred debtors ($25,000). Cash outflows other than operatingactivities were used to repay loans ($1,185 million), purchase investment securities ($1 1.439million) and to purchase and construct assets ($15,855 million).
The Mayor, Waverley CouncilAudit Report for the year ended 30 June 2012 Page 5
page 83
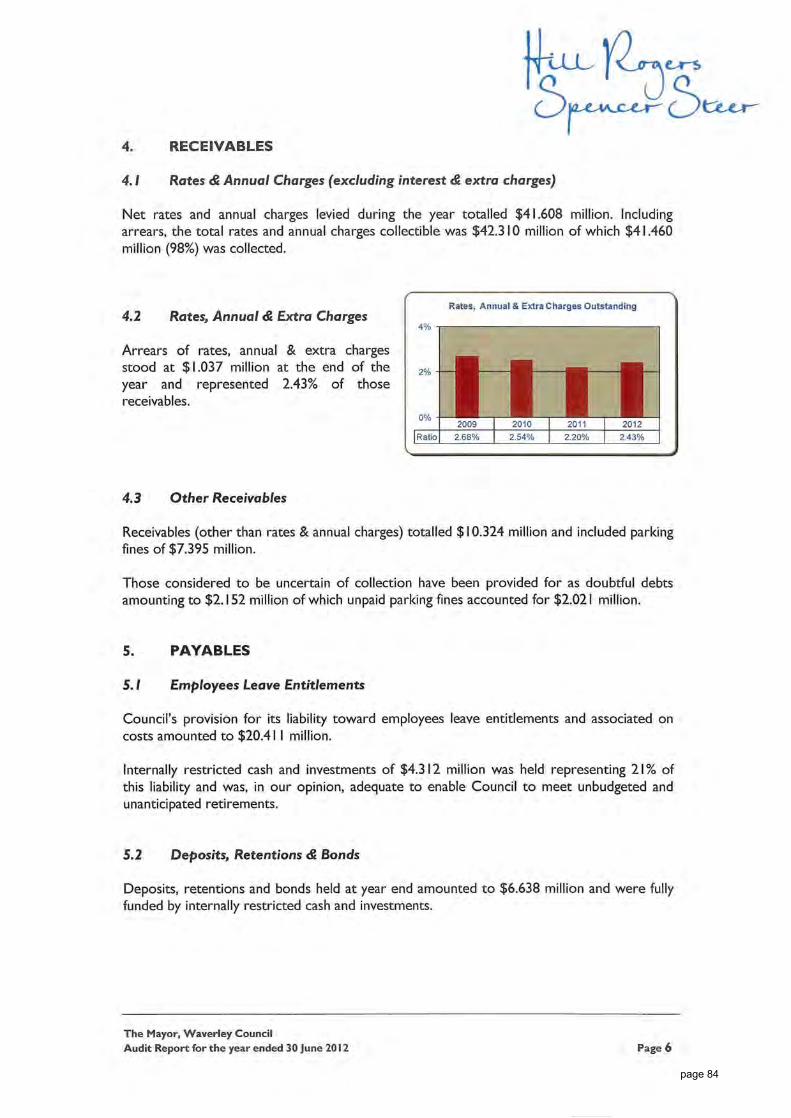
4. RECEIVABLES
4. / Rates <£ Annual Charges (excluding interest £ extra charges)
Net rates and annual charges levied during the year totalled $41,608 million. Includingarrears, the total rates and annual charges collectible was $42,310 million of which $41,460million (98%) was collected.
4.2 Rates, Annual £ Extra Charges
Arrears of rates, annual & extra chargesstood at $1,037 million at the end of theyear and represented 2.43% of thosereceivables.
4.3 Other Receivables
Receivables (other than rates & annual charges) totalled $10,324 million and included parkingfines of $7,395 million.
Those considered to be uncertain of collection have been provided for as doubtful debtsamounting to $2.152 million of which unpaid parking fines accounted for $2.021 million.
5. PAYABLES
5.1 Employees Leave Entitlements
Council's provision for its liability toward employees leave entitlements and associated oncosts amounted to $20.41 I million.
Internally restricted cash and investments of $4,312 million was held representing 21% ofthis liability and was, in our opinion, adequate to enable Council to meet unbudgeted andunanticipated retirements.
5.2 Deposits, Retentions £ Bonds
Deposits, retentions and bonds held at year end amounted to $6,638 million and were fullyfunded by internally restricted cash and investments.
The Mayor, Waverley CouncilAudit Report for the year ended 30 June 2012 Page 6
page 84

6.MANAGEMENT LETTER
An audit management letter addressing the findings from our interim audit was issued on 14March 2012 and this included our recommendations on possible ways to strengthen and/orimprove procedures.
7.CONCLUSION
We wish to record our appreciation to your General Manager and his staff for their readyco-operation and the courtesies extended to us during the conduct of the audit.
Yours faithfully,HILL ROGERS SPENCER STEER
BRPartner
The Mayor, Waverley CouncilAudit Report for the year ended 30 June 2012 Page 7
page 85

Waverley Council SPECIAL PURPOSE FINANCIAL STATEMENTS for the year ended 30 June 2012
"We are united by a common passion for our beautiful home between the city and the sea."

SPFS 2012
Waverley Council
Special Purpose Financial Statements for the financial year ended 30 June 2012
Contents
1. Statement by Councillors & Management
2. Special Purpose Financial Statements:
- Income Statement of Water Supply Business Activity- Income Statement of Sewerage Business Activity- Income Statement of Other Business Activities
- Balance Sheet of Water Supply Business Activity- Balance Sheet of Sewerage Business Activity- Balance Sheet of Other Business Activities
3. Notes to the Special Purpose Financial Statements
4. Auditor's Report
Background
These Special Purpose Financial Statements have been prepared for the use by both Council and the Division ofLocal Government in fulfilling their requirements under National Competition Policy.
The principle of competitive neutrality is based on the concept of a "level playing field" between persons/entitiescompeting in a market place, particularly between private and public sector competitors.
Essentially, the principle is that government businesses, whether Commonwealth, State or Local, should operatewithout net competitive advantages over other businesses as a result of their public ownership.
For Council, the principle of competitive neutrality & public reporting applies only to declared business activities.
These include (a) those activities classified by the Australian Bureau of Statistics as business activities beingwater supply, sewerage services, abattoirs, gas production and reticulation and (b) those activities with a turnoverof over $2 million that Council has formally declared as a Business Activity (defined as Category 1 activities).
In preparing these financial statements for Council's self classified Category 1 businesses and ABS definedactivities, councils must (a) adopt a corporatisation model and (b) apply full cost attribution including tax equivalentregime payments & debt guarantee fees (where the business benefits from councils borrowing position bycomparison with commercial rates).
(iv)
7
5n/a
(i)
(ii)
11
(iii)
n/a
Page
n/an/a3
2
page 1


SPFS 2012
Waverley Council
Income Statement of Council's Other Business Activities for the financial year ended 30 June 2012
$ '000
Income from continuing operationsAccess chargesUser chargesFeesInterestGrants and contributions provided for non capital purposesProfit from the sale of assetsOther incomeTotal income from continuing operations
Expenses from continuing operationsEmployee benefits and on-costsBorrowing costsMaterials and contractsDepreciation and impairmentLoss on sale of assetsCalculated taxation equivalentsDebt guarantee fee (if applicable)Other expensesTotal expenses from continuing operationsSurplus (deficit) from Continuing Operations before capital amounts
Grants and contributions provided for capital purposesSurplus (deficit) from Continuing Operations after capital amounts
Surplus (deficit) from discontinued operationsSurplus (deficit) from ALL Operations before tax
less: Corporate Taxation Equivalent (30%) [based on result before capital]
SURPLUS (DEFICIT) AFTER TAX
plus Opening Retained Profitsplus/less: Prior Period Adjustmentsplus Adjustments for amounts unpaid:- Taxation equivalent payments- Debt guarantee fees- Corporate taxation equivalentadd:- Subsidy Paid/Contribution To Operationsless:- TER dividend paid- Dividend paidClosing Retained Profits
Return on Capital %Subsidy from Council
Category 1 Category 1
- -
(41)
138
(145) (110)
- 41
-
849
-
- -
-
(347) (18) 111,440
1,982 144
-
146.8%
77
247.0%-
(18)
-
97
336
1,051
3,504
- 3,504
-
3,504 -
110,349
-
-
-
-
-
62 - - - -
-
2,453
(1,051)
2,461 849
-
(62) 2,831 (849)
- - -
- -
54 -
860 43 13
-
- 931
3
2,992 1,460
2,831
-
2,004
2,831
-
-
- -
-
110 - 2,012
-
915
2
205 138
- - - -
-
Actual
1,902
2012 Actual
2011 Actual Actual
2011 2012
-
-
205 -
1,874 947 838
138
1,799
-
205
- -
618
-
54
- - - - -
627
-
- 5,965
5,965
912
5,823
- 2,004
-
- 5,823
- -
-
Property Commercial Waste
-
-
(3,922) (663) 113,190
-
-
110,349
2550.5%3337.1%
page 3
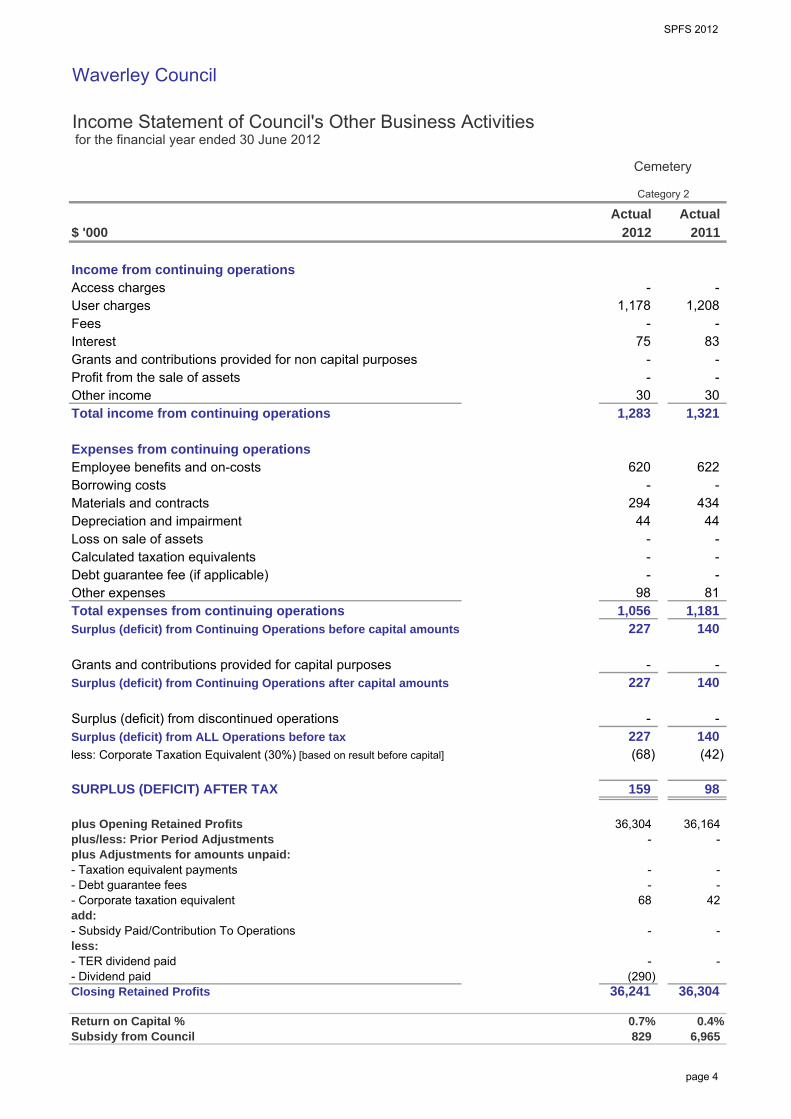
SPFS 2012
Waverley Council
Income Statement of Council's Other Business Activities for the financial year ended 30 June 2012
$ '000
Income from continuing operationsAccess chargesUser chargesFeesInterestGrants and contributions provided for non capital purposesProfit from the sale of assetsOther incomeTotal income from continuing operations
Expenses from continuing operationsEmployee benefits and on-costsBorrowing costsMaterials and contractsDepreciation and impairmentLoss on sale of assetsCalculated taxation equivalentsDebt guarantee fee (if applicable)Other expensesTotal expenses from continuing operationsSurplus (deficit) from Continuing Operations before capital amounts
Grants and contributions provided for capital purposesSurplus (deficit) from Continuing Operations after capital amounts
Surplus (deficit) from discontinued operationsSurplus (deficit) from ALL Operations before tax
less: Corporate Taxation Equivalent (30%) [based on result before capital]
SURPLUS (DEFICIT) AFTER TAX
plus Opening Retained Profitsplus/less: Prior Period Adjustmentsplus Adjustments for amounts unpaid:- Taxation equivalent payments- Debt guarantee fees- Corporate taxation equivalentadd:- Subsidy Paid/Contribution To Operationsless:- TER dividend paid- Dividend paidClosing Retained Profits
Return on Capital %Subsidy from Council
0 Category 2
6,965 0.7%
227
- - 42
36,304(290)
68
-
36,241
159
-
36,304
(42) (68)
83
44
622 -
-
- - -
- 294 434
140 1,181 1,056
1,208
2011 Actual Actual
- 1,178
2012
-
75
620
1,283
-
1,321 30 30
- -
-
- -
Cemetery
44 -
81
227 140
- - 140 227
-
98
- -
98
36,164
- -
0.4%
-
-
829
-
-
page 4

SPFS 2012
Waverley Council
Balance Sheet of Council's Other Business Activities as at 30 June 2012
$ '000
ASSETSCurrent AssetsCash and cash equivalentsInvestmentsReceivablesInventoriesOtherNon-current assets classified as held for saleTotal Current Assets
Non-Current AssetsInvestmentsReceivablesInventoriesInfrastructure, property, plant and equipmentInvestments accounted for using equity methodInvestment propertyOtherTotal Non-Current AssetsTOTAL ASSETS
LIABILITIESCurrent LiabilitiesBank OverdraftPayablesInterest bearing liabilitiesProvisionsTotal Current Liabilities
Non-Current LiabilitiesPayablesInterest bearing liabilitiesProvisionsOther LiabilitiesTotal Non-Current LiabilitiesTOTAL LIABILITIESNET ASSETS
EQUITYRetained earningsRevaluation reservesCouncil equity interestMinority equity interestTOTAL EQUITY
344
76
-
(18) 77
-
86
-
146
- -
(18) 110,426
223
113,190
113,267-
77
-
113,267 110,426 -
-
77 -
-
-
-
344
-
174
-
77
-
77
-
Property
-
-
174
-
-
Category 1
-
Actual
- 45
Commercial Waste
Category 1
-
2012
-
2011
140
Actual 2011
(18)
- -
146
110,349
-
110,426113,267
60
-
94
-
-
-
- -
-
105
83
-
-
110,599
-
113,291
111
110,770
- - -
-
83 - -
77
-
217 (18)
-
60
- - - -
217
199
-
Actual
60 -
-
157
-
94
105
-
- 74
110,710 113,396 113,441
-
268
-
-
-
-
- 105
-
-
-
45 -
-
- -
Actual 2012
- -
140
-
- -
60
100
-
-
page 5

SPFS 2012
Waverley Council
Balance Sheet of Council's Other Business Activities as at 30 June 2012
$ '000
ASSETSCurrent AssetsCash and cash equivalentsInvestmentsReceivablesInventoriesOtherNon-current assets classified as held for saleTotal Current Assets
Non-Current AssetsInvestmentsReceivablesInventoriesInfrastructure, property, plant and equipmentInvestments accounted for using equity methodInvestment propertyOtherTotal Non-Current AssetsTOTAL ASSETS
LIABILITIESCurrent LiabilitiesBank OverdraftPayablesInterest bearing liabilitiesProvisionsTotal Current Liabilities
Non-Current LiabilitiesPayablesInterest bearing liabilitiesProvisionsOther LiabilitiesTotal Non-Current LiabilitiesTOTAL LIABILITIESNET ASSETS
EQUITYRetained earningsRevaluation reservesCouncil equity interestMinority equity interestTOTAL EQUITY
- -
36,304 36,241
- - 286 260
36,241
36,241
- 36,241
- -
16 16
- -
- - -
- - -
286
- - 244 270 260
34,843
Category 2
27
- - -
- -
2012
- 34,843
1,658
35,348
1,242
- -
22
2011
35,348
- - -
-
-
1,631
Cemetery
- - 1,220
Actual Actual
-
-
36,590
-
-
36,304
36,304 -
36,304
-
36,501
page 6
SPFS 2012
Waverley Council
Special Purpose Financial Statements for the financial year ended 30 June 2012
Contents of the Notes accompanying the Financial Statements
Details
Summary of Significant Accounting Policies
Water Supply Business Best Practice Management disclosure requirements
Sewerage Business Best Practice Management disclosure requirements n/a3
Note Page
1
2
8
n/a
page 7
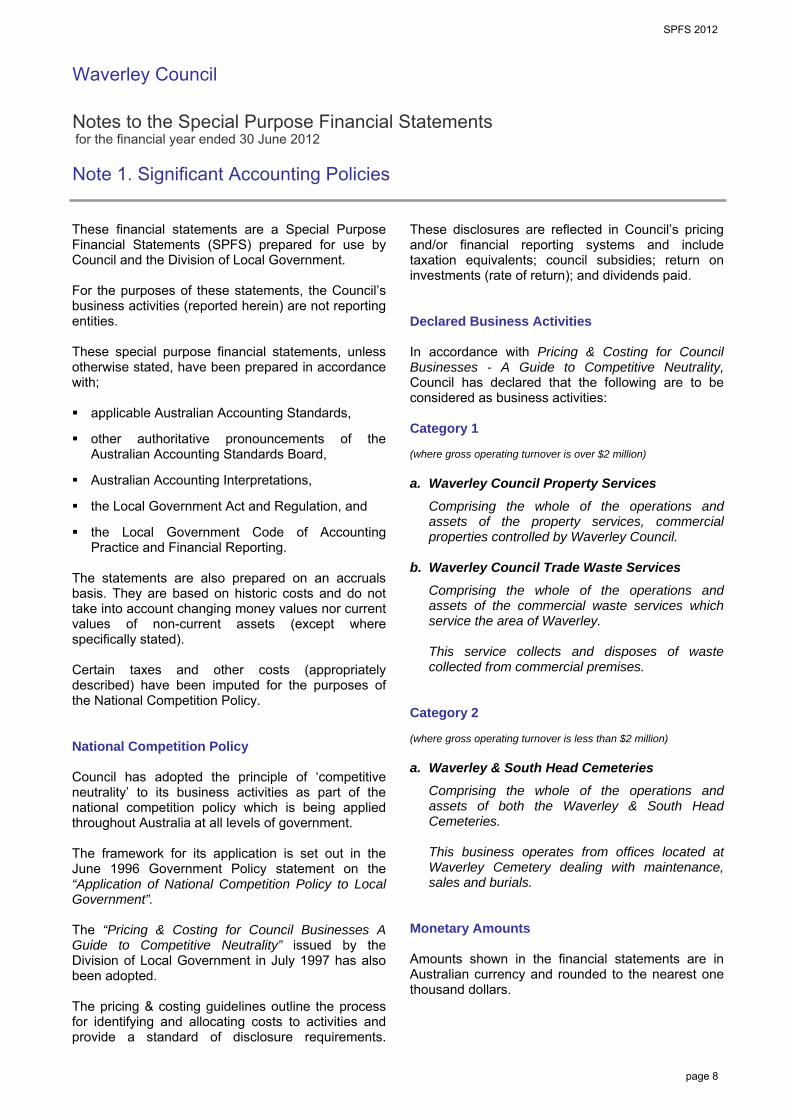
SPFS 2012_ Waverley Council Notes to the Special Purpose Financial Statements for the financial year ended 30 June 2012 Note 1. Significant Accounting Policies
page 8
These financial statements are a Special Purpose Financial Statements (SPFS) prepared for use by Council and the Division of Local Government. For the purposes of these statements, the Council’s business activities (reported herein) are not reporting entities. These special purpose financial statements, unless otherwise stated, have been prepared in accordance with; applicable Australian Accounting Standards,
other authoritative pronouncements of the
Australian Accounting Standards Board, Australian Accounting Interpretations, the Local Government Act and Regulation, and the Local Government Code of Accounting
Practice and Financial Reporting. The statements are also prepared on an accruals basis. They are based on historic costs and do not take into account changing money values nor current values of non-current assets (except where specifically stated). Certain taxes and other costs (appropriately described) have been imputed for the purposes of the National Competition Policy. National Competition Policy Council has adopted the principle of ‘competitive neutrality’ to its business activities as part of the national competition policy which is being applied throughout Australia at all levels of government. The framework for its application is set out in the June 1996 Government Policy statement on the “Application of National Competition Policy to Local Government”. The “Pricing & Costing for Council Businesses A Guide to Competitive Neutrality” issued by the Division of Local Government in July 1997 has also been adopted. The pricing & costing guidelines outline the process for identifying and allocating costs to activities and provide a standard of disclosure requirements.
These disclosures are reflected in Council’s pricing and/or financial reporting systems and include taxation equivalents; council subsidies; return on investments (rate of return); and dividends paid. Declared Business Activities In accordance with Pricing & Costing for Council Businesses - A Guide to Competitive Neutrality, Council has declared that the following are to be considered as business activities: Category 1 (where gross operating turnover is over $2 million) a. Waverley Council Property Services
Comprising the whole of the operations and assets of the property services, commercial properties controlled by Waverley Council.
b. Waverley Council Trade Waste Services
Comprising the whole of the operations and assets of the commercial waste services which service the area of Waverley. This service collects and disposes of waste collected from commercial premises.
Category 2 (where gross operating turnover is less than $2 million) a. Waverley & South Head Cemeteries
Comprising the whole of the operations and assets of both the Waverley & South Head Cemeteries. This business operates from offices located at Waverley Cemetery dealing with maintenance, sales and burials.
Monetary Amounts Amounts shown in the financial statements are in Australian currency and rounded to the nearest one thousand dollars.
SPFS 2012_ Waverley Council Notes to the Special Purpose Financial Statements for the financial year ended 30 June 2012 Note 1. Significant Accounting Policies (continued)
page 9
(i) Taxation Equivalent Charges Council is liable to pay various taxes and financial duties in undertaking its business activities. Where this is the case, they are disclosed in these statements as a cost of operations just like all other costs. However, where Council is exempt from paying taxes which are generally paid by private sector businesses (such as income tax), equivalent tax payments have been applied to all Council nominated business activities and are reflected in these financial statements. For the purposes of disclosing comparative information relevant to the private sector equivalent, the following taxation equivalents have been applied to all council nominated business activities (this does not include council’s non-business activities): Notional Rate Applied % Corporate Income Tax Rate – 30% Land Tax – The first $396,000 of combined land values attracts 0%. From $396,001 to $2,421,000 the rate is 1.6% + $100. For the remaining combined land value that exceeds $2,421,000, a premium marginal rate of 2.0% applies. Payroll Tax – 5.45% on the value of taxable salaries and wages in excess of $678,000. Income Tax An income tax equivalent has been applied on the profits of the business. Whilst income tax is not a specific cost for the purpose of pricing a good or service, it needs to be taken into account of in terms of assessing the rate of return required on capital invested. Accordingly, the return on capital invested is set at a pre-tax level (gain/(loss) from ordinary activities before capital amounts) as would be applied by a private sector competitor – that is, it should include a provision equivalent to the corporate income tax rate, currently 30%. Income Tax is only applied where a positive gain/(loss) from ordinary activities before capital amounts has been achieved.
Since this taxation equivalent is notional - that is, it is payable to the “Council” as the owner of business operations, it represents an internal payment and has no effect on the operations of the council. Accordingly, there is no need for disclosure of internal charges in Council's GPFS. The rate applied of 30% is the equivalent company tax rate prevalent as at balance date. No adjustments have been made for variations that have occurred during the year. Local Government Rates & Charges A calculation of the equivalent rates and charges payable on all Category 1 businesses has been applied to all land assets owned or exclusively used by the business activity. Loan & Debt Guarantee Fees The debt guarantee fee is designed to ensure that council business activities face “true” commercial borrowing costs in line with private sector competitors. In order to calculate a debt guarantee fee, council has determined what the differential borrowing rate would have been between the commercial rate and the council’s borrowing rate for its business activities. (ii) Subsidies Government policy requires that subsidies provided to customers and the funding of those subsidies must be explicitly disclosed. Subsidies occur where council provides services on a less than cost recovery basis. This option is exercised on a range of services in order for council to meet its community service obligations. Accordingly, Subsidies disclosed (in relation to National Competition Policy) represents the difference between revenue generated from ‘rate of return’ pricing and revenue generated from prices set by the council in any given financial year. The overall effect of subsidies is contained within the Income Statement of Business Activities.
SPFS 2012_ Waverley Council Notes to the Special Purpose Financial Statements for the financial year ended 30 June 2012 Note 1. Significant Accounting Policies (continued)
page 10
(iii) Return on Investments (Rate of Return) The Policy statement requires that councils with Category 1 businesses “would be expected to generate a return on capital funds employed that is comparable to rates of return for private businesses operating in a similar field”. Such funds are subsequently available for meeting commitments or financing future investment strategies. The Rate of Return on Capital is calculated as follows: Operating Result before Capital Income + Interest Expense
Written Down Value of I,PP&E as at 30 June As a minimum, business activities should generate a return equal to the Commonwealth 10 year bond rate which is 3.03% at 30/6/12. The actual rate of return achieved by each business activity is disclosed at the foot of each respective Income Statement. (iv) Dividends Council is not required to pay dividends to either itself as owner of a range of businesses or to any external entities.

c^r-s
WAVERLEY COUMCIL
SPECIAL PURPOSE FINANCIAL STATEMENTS
INDEPENDENT AUDITORS' REPORT
Report on the Financial statements
We have audited the accompanying special purpose financial statements of WaverleyCouncil, which comprises the Balance Sheet as at 30 June 2012, Income Statement for theyear ended on that date, a summary of significant accounting policies and other explanatorynotes and the Statement by Councillors and Management.
Responsibility of Council for the Financial Statements
The Council is responsible for the preparation and fair presentation of the financialstatements in accordance with the Local Government Act 1993 and have determined thatthe accounting policies described in Note I to the financial statements, which form part ofthe financial statements, are appropriate to meet the financial reporting requirements of theDivision of Local Government. This responsibility includes the maintenance of adequateaccounting records and internal controls designed to prevent and detect fraud and error;designing, implementing and maintaining internal controls relevant to the preparation and fairpresentation of the financial statements that are free from material misstatement, whetherdue to fraud or error; selecting and applying appropriate accounting policies; and makingaccounting estimates that are reasonable in the circumstances.
Auditors' Responsibility
Our responsibility is to express an opinion on the financial statements based on our audit.We conducted our audit in accordance with Australian Auditing Standards. These AuditingStandards require that we comply with relevant ethical requirements relating to auditengagements and plan and perform the audit to obtain reasonable assurance whether thefinancial statements are free from material misstatement.
An audit involves performing procedures to obtain audit evidence about the amounts anddisclosures in the financial statements. The procedures selected depend on the auditor'sjudgement, including the assessment of the risks of material misstatement of the financialstatements, whether due to fraud or error. In making those risk assessments, the auditorconsiders internal control relevant to the entity's preparation and fair presentation of thefinancial statements in order to design audit procedures that are appropriate in thecircumstances, but not for the purpose of expressing an opinion on the effectiveness of theCouncil's internal control. An audit also includes evaluating the appropriateness ofaccounting policies used and the reasonableness of accounting estimates made by theCouncil, as well as evaluating the overall presentation of the financial statements.
Assurance Partners
T. +61 2 9232 5111Level 5, I Chifley SquareGPO Box 7066www.hr-ss.com.au Practising as Hill Rogers Spencer ABN 56 435 338 966F. +61 2 9233 7950 Sydney NSW 2000 Australia Sydney NSW [email protected] Steer Assurance Partners
Member of KS International, an association of global independent accounting firmsLiability limited by a scheme approved under Professional Standards Legislation page 11

Our audit did not involve an analysis of the prudence of business decisions made by Councilor management.
We believe that the audit evidence we have obtained is sufficient and appropriate to providea basis for our audit opinion.
Independence
In conducting our audit, we followed applicable independence requirements of Australianprofessional ethical pronouncements.
Auditor's Opinion
In our opinion, the special purpose financial statements of the Council are presented fairly inaccordance with the requirements of those applicable Accounting Standards detailed in NoteI and the Local Government Code of Accounting Practice and Financial Reporting.
Basis of Accounting
Without modifying our opinion, we draw attention to Note I to the financial statements,which describes the basis of accounting. The financial statements have been prepared for thepurpose of fulfilling the financial reporting requirements of the Division of LocalGovernment. As a result, the financial statements may not be suitable for another purpose.
HILL ROGERS SPENCER STEER
BRiPartner
Dated at Sydney this 18th day of October 2012
Waverley CouncilSpecial Purpose Financial StatementsIndependent Auditors' Report Page 2
page 12

Waverley Council SPECIAL SCHEDULES for the year ended 30 June 2012
"We are united by a common passion for our beautiful home between the city and the sea."

Special Schedules 2012
Waverley Council
Special Schedules for the financial year ended 30 June 2012
Contents
Special Schedules1
Net Cost of Services
Statement of Long Term Debt (all purposes)
Statement of Internal Loans (Sect. 410(3) LGA 1993)
Water Supply - Income StatementWater Supply - Balance Sheet
Sewerage Service - Income StatementSewerage Service - Balance Sheet
- Notes to Special Schedules No. 3 & 5
Condition of Public Works
Financial Projections
1 Special Purpose Schedules are not audited.
Background
These Special Schedules have been designed to meet the requirements of special purpose users such as;
the NSW Grants Commissionthe Australian Bureau of Statistics (ABS),the NSW Office of Water,the Department of Environment, Climate Change and Water, andthe Division of Local Government (DLG).
The financial data is collected for various uses including;
the allocation of Financial Assistance Grants,the incorporation of Local Government financial figures in national statistics,the monitoring of loan approvals,the allocation of borrowing rights, andthe monitoring of the financial activities of specific services.
- Special Schedule No. 5 n/a
Page
2
4
n/a
- Special Schedule No. 1
- Special Schedule No. 2(a)5
- Special Schedule No. 4
- Special Schedule No. 2(b)
- Special Schedule No. 3n/a
- Special Schedule No. 8
(i)
- Special Schedule No. 6
8
6- Special Schedule No. 7
n/a
n/a
(ii)
page 1

Special Schedules 2012
Waverley Council
Special Schedule No. 1 - Net Cost of Services for the financial year ended 30 June 2012
$'000
Governance
Administration
Public Order and Safety
Beach ControlEnforcement of Local Govt. RegulationsAnimal ControlOtherTotal Public Order & Safety
Health
EnvironmentNoxious Plants and Insect/Vermin ControlOther Environmental ProtectionSolid Waste ManagementStreet CleaningDrainageStormwater ManagementTotal Environment
Community Services and EducationAdministration & EducationSocial Protection (Welfare)Aged Persons and DisabledChildren's ServicesTotal Community Services & Education
Housing and Community AmenitiesPublic CemeteriesPublic ConveniencesStreet LightingTown PlanningOther Community AmenitiesTotal Housing and Community Amenities
Water Supplies
Sewerage Services
-
1,753 -
-
- (1,114)
(3,951)
-
-
(1,884) (870)
-
(661)
44
-
(800)
(3,034)
872 1,928
-
825
-
825
-
825 -
3,952 1,482
12,046
18,752 -
2,449
1,655
9,389
74
994 825
-
2,449 -
6,692
1,046
Net Cost.of Services.
228 (2,777) (1,585)
(654)
(3,966) -
- - - -
(162) - -
(14,700)
-
27
-
Function or Activity
14
Fire Service Levy, Fire Protection, Emergency Services
2,791
4,934
1,031 4,539
19,887
1,753
5,187
- - (4,296)
- (1,488)
-
1,725
189 -
6,135
2
1,209
3,443
-
-
-
(2)
163 (74)
(24) (863)
381
-
-
- 2
-
2,066
5,530 4,490
-
168
- -
Expenses from. Continuing. Operations. Non Capital.
1,402
1
- 3
Capital.
Income fromcontinuing operations
1,630
237
158 -
13,799
1,839
13,961
1,272
168 -
-
page 2

Special Schedules 2012
Waverley Council
Special Schedule No. 1 - Net Cost of Services (continued) for the financial year ended 30 June 2012
$'000
Recreation and CulturePublic LibrariesMuseumsArt GalleriesCommunity Centres and HallsPerforming Arts VenuesOther Performing ArtsOther Cultural ServicesSporting Grounds and VenuesSwimming PoolsParks & Gardens (Lakes)Other Sport and RecreationTotal Recreation and Culture
Fuel & Energy
Agriculture
Mining, Manufacturing and Construction
Building ControlOther Mining, Manufacturing & ConstructionTotal Mining, Manufacturing and Const.
Transport and CommunicationUrban Roads (UR) - LocalUrban Roads - RegionalSealed Rural Roads (SRR) - LocalSealed Rural Roads (SRR) - RegionalUnsealed Rural Roads (URR) - LocalUnsealed Rural Roads (URR) - RegionalBridges on UR - LocalBridges on SRR - LocalBridges on URR - LocalBridges on Regional RoadsParking AreasFootpathsAerodromesOther Transport & CommunicationTotal Transport and Communication
Economic AffairsCamping Areas & Caravan ParksOther Economic AffairsTotal Economic Affairs
Totals – Functions
General Purpose Revenues(2)
Share of interests - joint ventures &associates using the equity method
NET OPERATING RESULT (1)
(1) As reported in the Income Statement | (2) Includes: Rates & Annual Charges (incl. Ex Gratia, excl. Water & Sewer), Non Capital General
Purpose Grants & Interest on Investments (excl. Ext. Restricted Assets)
-
-
(498)
(131)
-
-
Net Cost.of Services.
-
(498)
-
-
(5,934)
-
-
(484) (5,021)
4,922 -
-
(4,626) -
-
35,576
4,914
- - - -
326
-
(35,250)
2,633
-
4,555 1,201
2,633
-
11,958
-
-
- (2,670)
(138)
- (3,256)
-
(13,656)
- 606
-
Capital.
-
-
-
-
- - -
- -
- -
7,142 771
-
253
6
-
-
751
751
- - - -
-
-
Non Capital.
-
Expenses from. Continuing. Operations.
5,627
515 138
4,073
-
817 -
-
-
-
-
-
-
-
-
- -
-
378 15,874 599 115
1,840
- -
Function or Activity
253
-
-
437
-
- -
-
-
378
- -
4,914
-
22,204
-
1 -
-
- 1,215
10,246
14 -
2,671 -
-
-
- -
437
100,376
-
20,073 24,191
1,098 1,098
95,788
3,731
- -
35,576
100,376
3,731
-
60,212
-
296
-
Income fromcontinuing operations
- - -
page 3

Waverley Council
Special Schedule No. 2(a) - Statement of Long Term Debt (all purpose) for the financial year ended 30 June 2012
$'000
Notes: Excludes (i) Internal Loans & (ii) Principal Inflows/Outflows relating to Loan Re-Financing.
This Schedule is prepared using the face value of debt obligations, rather than fair value (which are reported in the GPFS).
Loans (by Source)Commonwealth Government
Current
- - - - - - -
Principal outstanding New Loans raised during
the year
at beginning of the year
Classification of DebtCurrent
Non Current
Total
-
- - -
- - -
Debt redemption during the year
From Revenue
Sinking Funds
-
1,289 - 18
236 -
236 -
1,898 18
-
-
-
-
Special S
chedules 2012
Transfers to Sinking
Funds
Principal outstandingInterest
applicable for Year Total
Non Current
at the end of the year
-
-
- - -
-
- - - -
3,187
- -
1,289 1,880 3,169 -
- - - Other State Government - - -
- - -
- - - -
Treasury Corporation-
-
4 14
Public Subscription - -
- - - - -
-
Financial Institutions 1,181 3,173 4,354 - -
- -
-
-
- 1,185 - - -
1,185
1,185 3,187 Total Loans18
4,372 Other
- - - Other Long Term DebtRatepayers Advances - - -
- Government Advances - Finance Leases -
- - - - -
- -
- - - -
- - -
1,289
- - -
3,187
- - -
1,898
-
236 -
-
-
- Deferred Payments
- -
1,185
-
3,187
- - - -
page 4
Total Long Term Debt - -
Total Debt
-
4,372
-
- 1,185
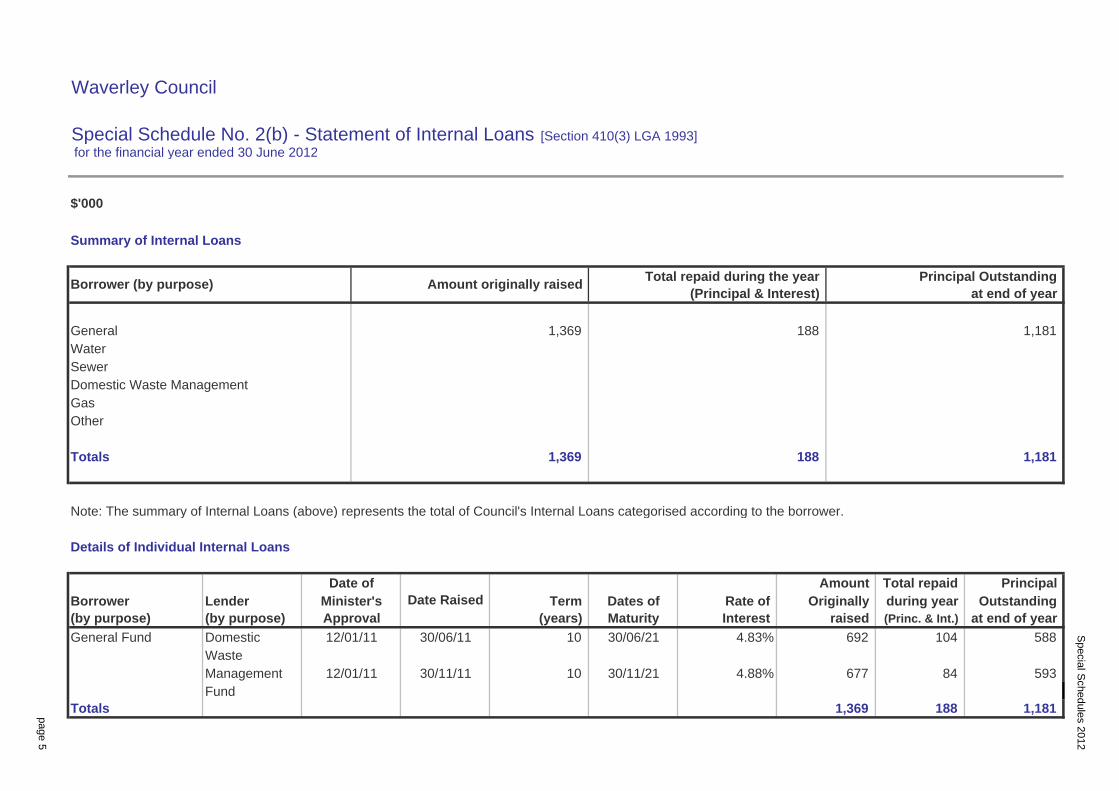
Waverley Council
Special Schedule No. 2(b) - Statement of Internal Loans [Section 410(3) LGA 1993] for the financial year ended 30 June 2012
$'000
Note: The summary of Internal Loans (above) represents the total of Council's Internal Loans categorised according to the borrower.
TotalsFund
4.83%
4.88%
30/06/21
30/11/21
General Fund Domestic 12/01/11
10
10
30/11/11
30/06/11
Management 12/01/11Waste
104 692
677
1,181
84 593
1,369
Gas
Outstanding at end of year
Date ofBorrower Lender Dates of
(Princ. & Int.)
Total repaid during year
Maturity Interest raised Rate of Originally
(by purpose) (by purpose) Approval (years) Date RaisedMinister's
Totals 1,369 188 1,181
Special S
chedules 2012
1,369 188 1,181
Amount Principal Term
188
588
page 5
Summary of Internal Loans
Details of Individual Internal Loans
Principal Outstanding (Principal & Interest) at end of year
Sewer
Total repaid during the year Amount originally raised
Other
Borrower (by purpose)
GeneralWater
Domestic Waste Management

Waverley Council
Special Schedule No. 7 - Condition of Public Works as at 30 June 2012
$'000
Special S
chedules 20
Other Structures Assets not included in Buildings16,118 11,674
4.35% 702 27,792 16,143 4,743 4,535
- 6,980
830
1.67%
1.30%
5,026
2.40%
1,129 1,166
27,792
2,122
702 -
730 2
1.67%
ASSET CLASS
Buildings
Sealed RoadsPublic Roads
sub total
sub total
3,606
Sealed Roads Structure
Council Houses
1.67%
Expense
Asset Category
Amenities/Toilets
Council Offices
1.67%
Commercial
Council Halls
LibraryChildcare Centre(s)
per Note 1
(%)Valuation
RateDep'n.
1.67%
Council Works Depot
1.67%
1.67%
1.67%
18,141 527
162,520
satisfactory
Cost
Accum.DepreciationAmortisation
& Impairment
Dep'n
588
-
9,944 8,197
1 16,261
453
834 180
per Note 4
62,477
($)
14
bring up to a
Condition#.condition / Maintenance
Asset
cost to
- - 457
106 421
3,123 800
10,953
87
Annual Annual Amount (WDV)
33,277
Current(3)
Maintenance
<<<<<<<<<<<< per Note 9 >>>>>>>>>>>>
Required(2)
Estimated
Carrying
sub total
1.04%
1,733 1.64%
Footpaths
Road FurnitureKerb and Gutter
68,008
16.10% 45,434 32,972 25,681 53,610
78,406
141,443 2
68,514 72,929 1,757
79,291 48,847 14,906 33,941
22,028 -
45,980 2 2
11,674 2 16,118
5,547
16,143
89,254 73,266 280 737
14,897 443 14
773 2,180
6,620 8,277
25,731 5,829 2,706
4 3
211 23,228
9,470 34,181
29,200 4 487
3,190
319 1 76 159
226 127 4
standard (1)
283 432 125 267 1,452
142 116
- 1,588
31 414
4,535
1,560
2
1,350
86
4,743
-
1,350
- -
2,348
- -
-
1,490 1,180 866
3,570 3,837
730 -
247,479 415,995 168,516
page 6

Waverley Council
Special Schedule No. 7 - Condition of Public Works (continued) as at 30 June 2012
$'000
Notes:(1). Satisfactory refers to estimated cost to bring the asset to a satisfactory condition as deemed by Council. It does not include any planned enhancements to the existing asset.
(2). Required Annual Maintenance is what should be spent to maintain assets in a satisfactory standard.
(3). Current Annual Maintenance is what has been spent in the current year to maintain assets.
# Asset Condition "Key" - as per the DLG Integrated Planning & Reporting Manual
Excellent - No work required (normal maintenance)
Good - Only minor maintenance work required
Average - Maintenance work required
Poor - Renewal required
Very Poor - Urgent renewal/upgrading required
Annual
Maintenance
10,225
standard (1)
Current(3)
Special S
chedules 2012
1,650
Condition#.Maintenance
29,030 290,626 426,633 717,259 TOTAL - ALL ASSETS
-
4
2
13,819 -
1
73,782 sub total 1,111 37,170 110,952
3
Inlet and Junction Pits 1.02% 17,762 85 2 2 2,528
250 411 1,400
975 180 931
5,371 12,391 Stormwater Conduits 1.00% 93,190 61,391
condition /
per Note 4 <<<<<<<<<<<< per Note 9 >>>>>>>>>>>>
31,799 Drainage Works
Required(2)bring up to a
per Note 1
Cost Valuation (WDV) (%) Annual Asset satisfactory
Asset Category
($) Rate
Amount Expense Carrying
Accum.DepreciationAmortisation
& Impairment
Dep'n. Dep'n cost to
Estimated
496
page 7
ASSET CLASS
12,311
5
3,503

Special Schedules 2012
Waverley Council
Special Schedule No. 8 - Financial Projections as at 30 June 2012
(1)
$'000
(i) OPERATING BUDGETIncome from continuing operationsExpenses from continuing operations
Operating Result from Continuing Operations
(ii) CAPITAL BUDGETNew Capital Works (2)
Replacement/Refurbishment of Existing AssetsTotal Capital Budget
Funded by:– Loans– Asset sales– Reserves– Grants/Contributions– Recurrent revenue– Other
Notes:
(1) From 11/12 Income Statement.
(2) New Capital Works are major non-recurrent projects, eg new Leisure Centre, new Library, new Swimming pool etc.
(3) If Council has only adopted 3 years of projections then only show 3 years.
(4) Financial Projections should be in accordance with Council's Integrated Planning & Reporting framework.
15/16
Forecast(3)Forecast(3)
14/15
113,489
Actual
11/12
Forecast
13/14 12/13
Forecast
5,289 11,407 15,319
100,376 106,354
326 (764)
10,589 22,513 - 200
100,702 147,678
110,719
6,307
41,324 (2,705)
120,803
(2,889)
109,955 118,098
116,378
15,878 33,920 21,626
- 2,500 108
3,906 53 22,040 210 125
16,874 17,327
-
17,527
-
16,874
1,740 2,550
13,027 3,288 2,428
5,249 9,335
3,202 840 2,363
7,335 9,012
6,177 2,488
7,849
17,527 15,878 33,920 -
21,626 16,874 - - - -
page 8

Waverley Council Cnr Paul Street & Bondi RoadBondi Junction
PO Box 9Bondi Junction 1355
DX 12006 Bondi Junction
Email [email protected]
Web www.waverley.nsw.gov.au
Telephone EnquiriesGeneral business 9369 8000
General fax 9387 1820
TTY for hearing impaired 9389 9827
After hours emergencies 9369 8000
Your call will be directed to the appropriate area.