Preliminary Report on Poverty, Extreme Poverty, and Human ...
Upload
khangminh22Category
view
5download
0
o


2019 Annual Poverty
Indicators Survey
(2019 APIS)
Philippine Statistics Authority PSA Complex, East Avenue, Quezon City 110 Philippines

REPUBLIC OF THE PHILIPPINES
HIS EXCELLENCY PRESIDENT RODRIGO ROA DUTERTE
PHILIPPINE STATISTICS AUTHORITY
DENNIS S. MAPA, Ph. D. Undersecretary
National Statistician and Civil Registrar General
Copyright © 2020 by Philippine Statistics Authority PSA Complex, East Avenue, Quezon City
110 Philippines

TERMS OF USE OF PSA PUBLICATIONS The Philippine Statistics Authority (PSA) reserves exclusive right to reproduce all its publications in whatever form. Any part of this publication should not be reproduced, recopied, lent or repackaged for other parties for any commercial purposes without written permission from PSA. Any part of this publication may only be reproduced for internal use of the recipient/customer company. Should any portion of the data in this publication are to be included in a report/article, the source of the data, the title of the publication and PSA as publisher should always be cited. Any information derived from the manipulation of data contained in the publication will no longer be the responsibility of PSA.
ISSN 0119-7851
Published by the Philippine Statistics Authority, PSA Complex, East Avenue, Quezon City, 1101 Philippines
August 2020 The 2019 Annual Poverty Indicators Survey (2019 APIS) is the thirteenth in a series of poverty indicators surveys implemented nationwide. The survey gathers data that can be used to generate non-income based poverty indicators for monitoring the poverty situation in the country, and as basis in the formulation of policies and programs to improve the living conditions of the population. The indicators derived from the survey will be used as inputs to the development of Multi-Dimensional Poverty Index (MPI), and the indicators from Water, Sanitation, and Hygiene (WaSH) module serve as basis for monitoring Sustainable Development Goal (SDG) 6 - Ensure availability and sustainable management of water and sanitation for all. Additional information about the 2019 APIS may be obtained from the Philippine Statistics Authority, PSA Complex, East Avenue, Diliman, Quezon City; telephone: (+632) 8462-6600; email: [email protected]; internet: psa.gov.ph. For technical inquiries, please direct calls at (+632) 8376-1995.


FOREWORD The Philippine Statistics Authority (PSA) is pleased to present the final report of the 2019 Annual Poverty Indicators Survey (2019 APIS). It is primarily meant to provide non-income poverty indicators in assessing Filipino family’s living conditions. The 2019 APIS final report provides information on the demographic, education, economic, and housing characteristics as well as access to safe water supply and sanitation, expenditure and income of the families, and other information that can be used to assess and monitor the poverty situation in the country. The module on Water, Sanitation, and Hygiene (WaSH) was included as a commitment to the Sustainable Development Goals (SDG) 6 in promoting people’s access to drinking water and sanitation. This report aims to provide statistics to the planners and policy makers as inputs to planning, assessment, and evaluation of the various programs designed to reduce poverty incidence in the country. The APIS offers data for the general public, researchers, or institutions which may be used for studies related to poverty and its correlates like education; and water, sanitation, and housing characteristics. Moreover, these data have been generated in accordance with principles, standards, classifications set by international recommendations, and guidelines adapted in local conditions. The PSA extends its sincerest gratitude to the individuals and organizations who contributed to the successful completion of the 2019 APIS, which made this publication possible. Above all, we thank the thousands of households who liberally shared their time, effort, and information during the data collection. DENNIS S. MAPA Ph.D. Undersecretary National Statistician and Civil Registrar General Quezon City, Philippines September 2020


Philippine Statistics Authority | 2019 Annual Poverty Indicators Survey ix
TABLE OF CONTENTS
Page
TITLE PAGE i COPYRIGHT PAGE iii TERMS OF USE OF PSA PUBLICATIONS v FOREWORD vii TABLE OF CONTENTS ix LIST OF TABLES xi LIST OF FIGURES xiv MAP OF THE PHILIPPINES xvii CHAPTER 1 BACKGROUND 1
1.1 Objectives of the Survey 1 1.2 Sampling Design 1 1.3 Response Rate 2 1.4 Limitations of the Data 2 1.5 Survey Questionnaire 3 1.6 Concepts and Definitions 5
CHAPTER 2 HIGHLIGHT OF THE 2019 APIS RESULTS 8
A FAMILY SIZE AND CHARACTERISTICS OF FAMILY HEAD 8 A.1 Average Family Size 8 A.2 Age and Sex of Family Head 8 A.3 Educational Attainment of Family Head 9 A.4 Employment of Family Head 10
B HOUSING CHARACTERISTICS 10 B.1 Tenure Status of Housing Unit and Lot 11 B.2 Floor Area of Housing Unit 12 B.3 Type of Building/House 13 B.4 Construction Materials of the Roof and Outer Walls 14 B.5 Electricity 14 B.6 Main Source of Water Supply and Drinking Water 15 B.7 Sanitation and Handwashing Facility 17 B.8 Household Conveniences 19

x Philippine Statistics Authority | 2019 Annual Poverty Indicators Survey
Page
C EDUCATION 21
C.1 Highest Grade Completed of Population 5 Years and Over 21 C.2 Attendance in School of Persons 3 to 24 Years Old 22 C.3 Reasons for not Attending School 23 C.4 Children in Grade 1 to Grade 6 24 C.5 Children in Junior High School (Grade 7 to Grade 10) 24
D ECONOMIC CHARACTERISTICS 25 D.1 Families with Working Members 18 Years Old and Over 25 D.2 Families with Working Children 5-17 Years Old 26
E HEALTH STATUS 27 F FINANCIAL ACCOUNT 28 G EDUCATIONAL ASSISTANCE 29 H SOCIAL PROTECTION PROGRAMS 30
H.1 Social Insurance 31 H.2 Social Assistance 31 H.3 Labor Market Interventions 33 H.4 PhilHealth 33 H.5 Disaster Preparedness Kit 35
I OTHER RELEVANT INFORMATION 36 I.1 Availment of Loan and Its Sources 36 I.2 Internet Usage and Online Transactions 37 I.3 Feeling Safe Walking Alone 38
CHAPTER 3 APPENDICES
Appendix A. STATISTICAL TABLES 39
Appendix B. SURVEY QUESTIONNAIRE 117

Philippine Statistics Authority | 2019 Annual Poverty Indicators Survey xi
LIST OF TABLES
Page Table 1a. Average Family Size by Region and Residence, Philippines
2019 39 Table 1b. Families by Selected Background Characteristics of the Family
Head by Region, Residence and Sex, Philippines 2019 40 Table 2. Families by Tenure Status of the Housing Unit and Lot They
Occupy by Region and Residence, Philippines 2019 50 Table 3. Families by Floor Area of Housing Unit They Occupy by Region
and Residence, Philippines 2019 51 Table 4. Families by Type of Building/House They Reside in by Region
and Residence, Philippines 2019 52 Table 5. Families by Type of Construction Materials of the Roof of Building
They Occupy by Region and Residence, Philippines 2019 53 Table 6. Families by Type of Construction Materials of the Outer Walls of
Building They Occupy by Region and Residence, Philippines 2019 54
Table 7.1. Families with Electricity in House/Building They Reside in, Main Source of Water Supply by Region and Residence, Philippines 2019 55
Table 7.2. Families Main Source of Drinking Water by Region and Residence: Philippines 2019 56
Table 7.3. Families Who Did Treatment of Drinking Water and their Means of Treatment by Region and Residence, Philippines 2019 58
Table 7.4. Families' Main Reason for Unable to Access Sufficient Water by Region and Residence, Philippines 2019 59
Table 7.5. Percentage of Families and Population by Service Level of Drinking Water, According to their Region and Residence, Philippines 2019 60
Table 8. Families by Type of Sanitation Facility They Use by Region and Residence, Philippines 2019 61
Table 8.2. Percentage of Families and Population by Service Level of Sanitation Facilities, According to their Region and Residence, Philippines 2019 63

xii Philippine Statistics Authority | 2019 Annual Poverty Indicators Survey
Page
Table 8.3. Percentage of Families and Population by Service Level in which Handwashing Facility was Observed, According to their Region and Residence, Philippines 2019 64
Table 9. Families Owning Household Conveniences by Region and Residence, Philippines 2019 65
Table 10. Population Aged 5 Years or Over by Sex, Highest Grade/Year Completed and Region and Residence, Philippines 2019 67
Table 11. Population Aged 3 to 24 Years by Schooling Status by Sex, Age Group and Region and Residence, Philippines 2019 74
Table 12. Population Aged 3 to 24 Years Who Were Attending School by Grade/Year Level Attending, Region and Residence and Sex, Philippines 2019 78
Table 13. Population Aged 6 to 24 Years Who Were Not Attending School by Reason for Not Attending School by Region and Residence and Sex, Philippines 2019 83
Table 14. Families with Children Aged 6 to 11 Years in Grade 1 to 6 by Region and Residence, Philippines 2019 88
Table 15. Families with Children Aged 12 to 15 Years in Junior High School Education (Grade 7 to 10) by Region and Residence, Philippines 2019 88
Table 16. Families with Members Aged 18 Years or Over Who are Gainfully Employed by Region and Residence, Philippines 2019 89
Table 17. Families with Members aged 5 to 17 Years Who are Gainfully Employed by Region and Residence, Philippines 2019 89
Table 18. Population by Frequency of Illness/Sickness/Injury during the Past Month by Sex, Region and Residence, Philippines 2019 90
Table 19. Population 5 Years Old and Over Who Experienced Illness/Sickness/Injury and been a Reason for Their Absence From Work or School or For Not Being Able to Perform Daily Activities in the Past Month by Sex, Region and Residence, Philippines 2019 93
Table 20. Population 5 Years Old and Over Who Experienced Illness/Sickness/Injury and Number of Day/s that Not Able to Go To Work or School, or Perform Daily Activities because of Their Illness/Sickness/Injury During the Past Month by Sex, Region and Residence, Philippines 2019 95
Philippine Statistics Authority | 2019 Annual Poverty Indicators Survey xiii
Page
Table 21. Population 15 Years Old With/Without Account at Bank or Another Type of Financial Institution or With Mobile-Money-Service Provided by Sex, Region and Residence, Philippines 2019 98
Table 22. Population 15 to 24 Years Old Who Availed Senior High School Voucher Program during Academic Years 2016 to 2019 by Sex, Region and Residence, Philippines 2019 100
Table 23. Population 15 to 24 Years Old Who Availed Tertiary Education Subsidy/Assistance during Academic Years 2017 to 2019 by Sex, Region and Residence, Philippines 2019 102
Table 24. Families Who Had a Member or Beneficiary of Social Protection Program by Region, Philippines, 2019 104
Table 25. Families Who Received Assistance as Members or Beneficiary of Selected Social Protection Program by Region, Philippines 2019 107
Table 26. Families with Paying Members and Non-Paying Members of PhilHealth by Region and Residence, Philippines 2019 110
Table 27. Families with Members of PhilHealth Who Received Assistance by Region and Residence, Philippines 2019 110
Table 28. Families Who Received Assistance from Different PhilHealth Services by Region and Residence, Philippines 2019 111
Table 29. Families Who Had Disaster Preparedness Kit and the Content of Disaster Preparedness Kit by Region, Philippines 2019 112
Table 30. Families Who Availed of Loan from January to June 2019 by Region and Residence, Philippines 2019 113
Table 31. Families Who Availed of Loan from January to June 2019 by Source of Loan and Region and Residence, Philippines 2019 114
Table 32. Families Who Used Internet and Made Online Transactions in the Last 6 Months by Region and Residence, Philippines 2019 115
Table 33. Respondents' Perception on How Safe Walking Alone in the Community at Night, Region and Residence, Philippines 2019 116
xiv Philippine Statistics Authority | 2019 Annual Poverty Indicators Survey
LIST OF FIGURES
Page A FAMILY SIZE AND CHARACTERISTICS OF FAMILY HEAD 8
FIGURE A1. Average Family Size, Philippines 2019 APIS 8 FIGURE A2. Percentage of Family Heads by Age and Sex, Philippines
2019 APIS 9 FIGURE A3. Percentage of Family Head by Highest Grade Completed,
Philippines 2019 APIS 9 FIGURE A4. Proportion of Family Head who are Employed by Sex,
Philippines 2019 APIS 10
B HOUSING CHARACTERISTICS 10
FIGURE B1.a. Families by Tenure Status of the Housing Unit and Lot They Occupy, Philippines 2019 APIS 11
FIGURE B1.b. Percentage of Families by Tenure Status of the Housing Unit and Lot They Occupy by Region, Philippines 2019 APIS 12
FIGURE B2. Percentage of Families by Floor Area of their Housing Unit, Philippines 2019 APIS 13
FIGURE B3. Percentage of Families by Type of Building/House they Reside, Philippines 2019 APIS 13
FIGURE B4. Families by Type of Construction Materials of the Roof and Outer Walls of the Building they Occupy, Philippines 2019 APIS 14
FIGURE B5. Percentage of Families with Electricity in House/Building They Reside, Philippines 2019 APIS 15
FIGURE B6. Percent Distribution of Families by Service Level of Drinking Water by Region, Philippines 2019 APIS 16
FIGURE B7.a. Percent Distribution of Families by Service Level of Sanitation Facility, Philippines 2019 APIS 18
FIGURE B7.b. Percent Distribution of Families by Service Level of Handwashing Facility by Region, Philippines 2019 APIS 19
FIGURE B8. Percentage of Families Owning Household Conveniences, Philippines 2019 APIS 20
Philippine Statistics Authority | 2019 Annual Poverty Indicators Survey xv
Page C EDUCATION 21
FIGURE C1. Percentage of Population Age 5 Years and Over by Highest
Grade Completed, Philippines 2019 APIS 21 FIGURE C2. Percentage of Population Aged 3 to 24 Years by Schooling
Status and Region, Philippines 2019 APIS 22 FIGURE C3. Percentage of Population Aged 6 to 24 Years Who Were Not
Attending School by Reason for Not Attending School, Philippines 2019 APIS 23
FIGURE C4. Proportion of Families with Children Aged 6 to 11 Years in Grade 1 to 6 by Residence, Philippines 2019 APIS 24
FIGURE C5. Families with Children Aged 12 to 15 Years in Junior High School (Grade 7 to 10) by Residence, Philippines 2019 APIS 25
D ECONOMIC CHARACTERISTICS 25
FIGURE D1. Percentage of Families with Members Aged 18 Years or Over Who are Gainfully Employed, Philippines 2019 APIS 26
FIGURE D2. Percentage of Families with Members Aged 5 to 17 Years Who are Gainfully Employed, Philippines 2019 APIS 26
E HEALTH STATUS 27
FIGURE E1. Percentage of Population by Health Status during the Reference Period, Philippines 2019 APIS 27
FIGURE E2. Percentage of population 5 years old and over citing illness/sickness/injury as a reason for absence from work or school or for not being able to perform daily activities in the past month, Philippines 2019 APIS 27
FIGURE E3. Percentage on the number of day/s that a family member was not able to go to work or school or perform daily activities due to illness/sickness/injury during the past month, Philippines
2019 APIS 28

xvi Philippine Statistics Authority | 2019 Annual Poverty Indicators Survey
Page F FINANCIAL ACCOUNT 28 FIGURE F1. Population 15 Years Old and Over With/Without Account at
Bank or Another Type of Financial Institution or With Mobile-Money-Service Provider by Sex, Philippines 2019 APIS 29
G EDUCATIONAL ASSISTANCE 29
FIGURE G1.
Proportion of Population 15 to 24 Years Old Who Availed
Senior High School Voucher Program With or Without Additional Fees during Academic Years 2016 to 2019, Philippines 2019 APIS 29
FIGURE G2. Population 15 to 24 Years Old Who Availed SUC/LUC Free Tuition Fee During Academic Years 2017 to 2019 by Sex, Philippines 2019 APIS 30
H SOCIAL PROTECTION PROGRAMS 30
FIGURE H1.
Percentage of Families who have a Member or Beneficiary
of Social Protection Program: January to June 2019, Philippines 2019 APIS 31
FIGURE H2.a. Percentage of Filipino families with a member/beneficiary of Regular Conditional Cash Transfer - Pantawid Pamilyang Pilipino Programs (4Ps), Philippines 2019 APIS 32
FIGURE H2.b. Regions with Highest and Lowest Proportion of Families who Received Assistance/Benefits from Regular Conditional Cash Transfer - 4Ps, Philippines 2019 APIS 32
FIGURE H4.a. Percentage of Families with Paying Members and Non-Paying Members, Philippines 2019 APIS 34
FIGURE H4.b. Percentage of Families with Members of PhilHealth who Received Assistance by Region, Philippines 2019 APIS 34
FIGURE H4.c. Percentage of Families who Received Assistance from Different PhilHealth Services, Philippines 2019 APIS 35
FIGURE H5. Families Who Had Disaster Preparedness Kit and the Content of Disaster Preparedness Kit, Philippines 2019 APIS 36
I OTHER RELEVANT INFORMATION
36
FIGURE I1.
Families Who Availed of Loan from January to June 2019
by Region, Philippines 2019 APIS 37 FIGURE I2. Families Who Used Internet from January to June 2019
by Region, Philippines 2019 APIS 38

Philippine Statistics Authority | 2019 Annual Poverty Indicators Survey xvii
MAP OF THE PHILIPPINES


Chapter 1 - Background | Final Report
Philippine Statistics Authority | 2019 Annual Poverty Indicators Survey 1
Chapter 1 - BACKGROUND The 2019 Annual Poverty Indicators Survey (2019 APIS) is the 13th in a series of poverty indicators surveys conducted nationwide since 1998. The survey gathers data that can be used to generate non-income poverty indicators in order to assess and monitor poverty situations in the country. It also includes questions about access to drinking water, sanitation, and hygiene as commitment to the Sustainable Development Goal (SDG) 6 to monitor people’s access to drinking water, sanitation, and hygiene. Moreover, data from this survey will serve as input in the development of the Multi-dimensional Poverty Index (MPI).
1.1 Objectives of the Survey The survey gathers data on the socio-economic profile of families and other information that are related to their living conditions. Specifically, it generates indicators that are correlated with poverty in order to determine the percent distribution of families in relation to the following indicators:
a. children 6-11 years old enrolled in primary education programs or elementary; b. children 12-17 years old enrolled in junior high school; c. with members 18 years old and over who are gainfully employed and with
working children 5-17 years old; d. who received and availed selected social protection programs; e. access to government services; f. owner-like possession of house and lot and the types of the materials of the
roofs, walls of their housing units and floor materials; g. access to improved drinking water source, sanitation or type of toilet facility and
handwashing facility they use in their homes; and h. who avail of loan/s and its sources.
1.2 Sampling Design The 2013 Master Sample (2013 MS) is utilized for 2019 APIS and other household-based surveys conducted by PSA. The 2013 MS is designed to produce reliable quarterly estimates of selected indicators at the national and regional levels. The design can also provide reliable provincial estimates after completing the four quarterly rounds of about 45,000 samples for each round or a total of 180,000 sample housing units.
Chapter 1- Background | Final Report
2 Philippine Statistics Authority | 2019 Annual Poverty Indicators Survey
In the 2013 MS, each sampling domain (i.e., province/HUC) is subdivided into numbers of exhaustive and non-overlapping area segments known as Primary Sampling Units (PSUs). Each PSU is formed to consist of about 100 to 400 households. A single PSU can be a barangay/Enumeration Area (EA) or a portion of a large barangay or two or more adjacent small barangays/EAs. For the whole country, about 81 thousand PSUs are formed from more than 42,000 barangays. From the ordered list of PSUs, all possible systematic samples of six (6) PSUs were drawn to form a replicate for most of the province domain or 75 out of 81 provinces. On the other hand, for majority of highly urbanized cities, all possible systematic samples of eight (8) PSUs will be drawn to form a replicate. The 2019 APIS used four replicates of the quarterly sample of the MS or about 45,000 sample households deemed sufficient for regional estimates.
1.3 Response Rate Of the 40,307 eligible sample households for the 2019 APIS, about 39,315 were successfully interviewed. This translates to a response rate of 97.5 percent at the national level. The response rate is the ratio of the total households who were completely interviewed to the total eligible households. Eligible households consisted of households who were completely interviewed, refused to be interviewed, temporarily away, not at home or on vacation, and those located in critical or flooded areas during the survey period.
1.4 Limitations of the Data Data gathered from APIS are results of a sample survey and are therefore subject to sampling variations, that is, sampling errors are expected since the data are not obtained through complete enumeration or census. The survey covered a national sample of households deemed sufficient to provide estimates about the population at the regional level. Hence, tabulations and cross-tabulations of variables at lower geographic levels are not generated since these may not be statistically reliable. Like other surveys which seek financial information from individuals/households, estimates from this survey may also be affected by non-sampling errors such as deliberate under or over reporting of income, expenditures, or unwillingness on the part of the respondents to reveal their true levels of income/expenditures.

Chapter 1 - Background | Final Report
Philippine Statistics Authority | 2019 Annual Poverty Indicators Survey 3
Furthermore, data users attempting to match the APIS and the Family Income and Expenditures Survey (FIES) should take note of the differences in the reference period. The FIES is conducted in two visits covering the periods January to June and July to December while the APIS covers only the average monthly income of the family.
1.5 Survey Questionnaire APIS Form 1 is the survey questionnaire that contains questions on the following topics:
● GEOGRAPHIC IDENTIFICATION AND OTHER INFORMATION - region, province, city/municipality, barangay, address, result of visit and code, names of household head and respondent, and the certification portion.
● DEMOGRAPHIC CHARACTERISTICS OF ALL FAMILY MEMBERS - obtain
information of all family members such as name of family head, relationship to the head, sex, age, and marital status.
● SCHOOL ATTENDANCE AND HIGHEST GRADE COMPLETED - determines
whether a family member aged 3 to 24 years is currently attending formal school and, if so, the grade or year the member is currently attending. If not attending, then the reason for not attending school is asked. It also determines if the family members aged 3 to 5 years old are attending/have attended early education or learning system in order to assess their ‘school readiness’. It further determines the educational attainment of the family members 5 years old and over.
● ECONOMIC CHARACTERISTICS - obtains information on the job or business
of each family member 5 years old and over had during the past six months. It also includes questions on occupation and business the family member engaged in.
● HEALTH STATUS - determines the extent or prevalence of illnesses or injuries
of family members. ● FINANCIAL ACCOUNT - collects information which will help to measure
financial inclusion of the family members, and to measure accessibility of financial services.

Chapter 1- Background | Final Report
4 Philippine Statistics Authority | 2019 Annual Poverty Indicators Survey
● EDUCATIONAL ASSISTANCE - determines the availment of educational assistance by the family member 15 to 24 years old, particularly on the voucher program for Senior High School and free tuition fee, tertiary education subsidy, and student loan programs under the Universal Access to Quality Tertiary Education (UAQTE).
● SOCIAL PROTECTION - obtains information about selected social protection
programs that the families availed during the past 6 months prior to this survey. Social protection is defined as consisting of policies and programs that seek to reduce poverty and vulnerability to risks, and enhance the social status and rights of the marginalized by promoting and protecting their livelihood and employment, protecting them against hazards and sudden interruptions, loss of income, and improving people’s capacity to manage risks.¹ There are four main components of social protection – social insurance, social assistance, labor market interventions, and social safety nets.1
● ACCESS TO GOVERNMENT SERVICES - aimed to further enhance the
established empirical baseline on the extent or pervasiveness of corruption in the country.
● HOUSING, WATER, SANITATION, AND HYGIENE - obtains information about
the family’s housing characteristics and conveniences/amenities owned by the family including the main source of water supply and kind of toilet and handwashing facility they used.
● OTHER RELEVANT INFORMATION - to determine whether or not the family
makes use of any form of credit in financing the family’s needs, and determines the source of the loan. It also determines if a family member experienced hunger because he or she did not have food to eat.
● DRUG AWARENESS AND PREVENTION - aims to evaluate the extent to
which households are reached by information on drug prevention and/or control programs and activities implemented in their community.
● PHILIPPINE NATIONAL IDENTIFICATION AWARENESS - determines the Filipinos’ level of awareness of and willingness to participate to the PhilSys and its registration activities that is set to start by the fourth quarter of 2020. Insights from the responses are expected to provide a basis for the direction of the overall PhilSys communication strategy.
1 This is based on the official definition from SDC Resolution No. 1 Series of 2007 which was adopted in the Philippine Social Protection Operational Framework and Strategy by the Department of Social Welfare and Development and NEDA-SDC-Subcommittee on Social Protection (SC-SP) version February 2019.
Chapter 1 - Background | Final Report
Philippine Statistics Authority | 2019 Annual Poverty Indicators Survey 5
1.6 Concepts and Definitions ● RESPONDENT - Is the head of the family or his/her spouse or any responsible
adult family member who can provide accurate answers to all or most of the questions in the survey.
● FAMILY - Aggregate of persons bound by ties of kinship, who live together
under the same roof and eat together or share in common the family food. ● FAMILY HEAD - An adult member of the family who is responsible for the care
and organization of the family or who is regarded as such by the members of the family.
● HIGHEST EDUCATIONAL ATTAINMENT - The highest grade or year
completed in school, college, or university. ● WORK - Any activity a person does for pay, profit, or without pay on family farm
or enterprise, or an activity done by a farm operator or member of his family on another’s farm on “exchange labor” arrangement. In addition, any activity that a person does during the reference period in relation to minor activities such as home gardening, raising of crops or fruit bearing trees, raising hogs/poultry, and fishing for home consumption, and manufacturing for home use are also considered as work.
● FLOOR AREA - The area enclosed by the exterior walls of the housing unit. In
case of several floors, the area of the housing unit is the sum of areas of all floors.
● FAMILY EXPENDITURES - The average weekly food consumption of the
family. Food consumption covers only the actual food consumption of the family excluding the food consumed by domestic helper as well as person employed by the family, boarder and other person not related to the family. Also, food consumed by the family and its guests on special occasion during the reference period are not included.
● FAMILY INCOME - The average monthly income of the family. Family incomes
includes primary income (earnings) and receipts from the other sources received by all family members as participants in any economic activities, either laborer, proprietor, capitalist or entrepreneur, or as recipients of transfers, pensions, grants and others.

Chapter 1- Background | Final Report
6 Philippine Statistics Authority | 2019 Annual Poverty Indicators Survey
● PROPORTION OF FAMILIES WITH OWNED OR OWNER-LIKE POSSESSION OF HOUSING UNITS - The ratio of the number of families with housing unit owned or amortized to the total number of families.
● PROPORTION OF FAMILIES WITH HOUSES MADE OF STRONG
MATERIALS - The ratio of the number of families with houses having roofs and outer walls made of strong materials such as galvanized iron/aluminum, tile, concrete, bricks stone and asbestos to the total number of families.
● PROPORTION OF FAMILIES WITH ELECTRICITY IN THE
HOUSE/BUILDING THEY RESIDE IN AND ACCESS TO IMPROVED WATER SUPPLY - The ratio of the number of families who access water from community water system (piped into their dwelling, yard/plot or public tap) and protected wells to the total number of families with electricity in the house they reside in.
● PROPORTION OF FAMILIES OWNING HOUSEHOLD CONVENIENCES -
The ratio of the number of families owning household conveniences such as car/jeep/van, motorcycle/tricycle, motorized boat/banca, tractor, washing machine, gas range/stove with oven, induction stove, refrigerator/freezer, personal computer/desktop/laptop/netbook/, aircon, cellular phone telephone/ landline, videoke/magic sing, television, cable, radio, broadband internet/fiber internet/dsl and draft animals (cow/carabao/horse) .
● PROPORTION OF FAMILIES WITH SANITATION FACILITY – The ratio of the
number of families with improved toilet/sanitation facility. ● PROPORTION OF FAMILIES WITH GAINFULLY EMPLOYED FAMILY HEAD
- The ratio of the number of families with a family head who is gainfully employed to the total number of families.
● PROPORTION OF FAMILIES WITH GAINFULLY EMPLOYED MEMBERS
18 YEARS OLD AND OVER - The ratio of the number of families with employed members 18 years old and over to the total number of families with members 18 years old and over.
● PROPORTION OF FAMILIES WITH CHILDREN 6 - 11 YEARS OLD IN
GRADE 1 TO GRADE 6 - The ratio of the number of families with children 6-11 years old attending Grade 1 to Grade 6 to the total number of families with children 6-11 years old.
Chapter 1 - Background | Final Report
Philippine Statistics Authority | 2019 Annual Poverty Indicators Survey 7
● PROPORTION OF FAMILIES WITH CHILDREN 12 - 15 YEARS OLD IN JUNIOR HIGH SCHOOL (GRADE 7 TO GRADE 10) - The ratio of the number of families with children 12-15 years old attending Junior High School to the total number of families with children 12-15 years old.
● PROPORTION OF FAMILIES WITH MEMBERS 5 - 17 YEARS OLD WHO ARE
WORKING - The ratio of the number of families with children 5-17 years old who are working to the total number of families with children 5-17 years old.

Chapter 2 – Highlights of the 2019 APIS Results | Final Report
8 Philippine Statistics Authority | 2019 Annual Poverty Indicators Survey
Chapter 2 - HIGHLIGHTS OF THE 2019 APIS RESULTS
This chapter presents the demographic, economic, education assistance, financial, health, housing characteristics, and other relevant information related to the living conditions of families based on the results of 2019 APIS.
A. FAMILY SIZE AND CHARACTERISTICS OF FAMILY HEAD
Information on the family size and characteristics of the family head can provide information about the economic status of a family.
A.1 Average Family Size As of July 2019, the estimated number of families is 25.3 million with an average family size of 4.2 persons. Among regions, Bangsamoro Autonomous Region in Muslim Mindanao (BARMM) registered the highest average family size with 6.1 family members, followed by Region V- Bicol with 4.7 family members. Region IX-Davao and National Capital Region (NCR) had the lowest average family size with 3.9 and 4.0, respectively. (Table 1a)
A.2 Age and Sex of Family Head
In the Philippines, there were more families headed by males than females. The survey showed that 75.7 percent of the total families were headed by males and the remaining 24.3 percent were headed by females. Across age groups, female family heads were generally older than their male counterparts. More than half (55.1%) of female family heads were aged 55 years or over compared with 33.6 percent among male family heads. Meanwhile, two-thirds (64.6%) in the younger age-groups 25 to 54 years old were male family heads higher than female family heads with 43.1 percent. (Figure A2)
FIGURE A1. Average Family Size, Philippines 2019 APIS

Chapter 2 – Highlights of the 2019 APIS Results | Final Report
Philippine Statistics Authority | 2019 Annual Poverty Indicators Survey 9
FIGURE A2. Percentage of Family Heads by Age and Sex, Philippines 2019 APIS
A.3 Educational Attainment of Family Head One in every four family heads (25.8%) at most completed junior high school education. Meanwhile, about 20.9 percent attended elementary education but did not finish it, and 13.0 percent completed college or higher levels of education. The survey showed that a higher proportion of female heads (26.0%) had at least reached college and graduated college level or higher compared with male heads (17.9%).
FIGURE A3. Percentage of Family Head by Highest Grade Completed, Philippines 2019 APIS

Chapter 2 – Highlights of the 2019 APIS Results | Final Report
10 Philippine Statistics Authority | 2019 Annual Poverty Indicators Survey
Across regions, NCR (20.2%), Cordillera Administrative Region (CAR) (15.9%), and Region IVA-CALABARZON (15.7%) posted the highest percentage of family heads with college degree or higher level of education. On the contrary, BARMM (4.8%), Region IX-Davao (9.4%), and Region II-Cagayan Valley (9.4%) had a lowest percentage of family heads with college degree or higher. (Table 1b) A.4 Employment of Family Head In 2019, almost four in every five (78.8%) family heads were employed or had a job or business at any time from January 1 to June 30, 2019. Male heads who were employed comprised 85.8 percent. The corresponding proportion among female heads was lower at 56.9 percent. (Figure A4)
FIGURE A4. Family Head who are Employed by Sex, Philippines 2019 APIS
By region, BARMM (92.8%) registered the highest proportion of family heads with a job or business while NCR posted the lowest proportion with 73.4 percent of family heads with a job or business. (Table 1b)
B. HOUSEHOLD CHARACTERISTICS The data on family’s housing characteristics can indicate the health and economic well-being of families. In the 2019 APIS, the tenure status of housing unit and lot, the floor area of housing unit, type of building or house, and the construction materials of the roof and outer walls of the building were asked. Questions on the presence of electricity, main source of water supply, and type of toilet facility used by the family were also included.
Chapter 2 – Highlights of the 2019 APIS Results | Final Report
Philippine Statistics Authority | 2019 Annual Poverty Indicators Survey 11
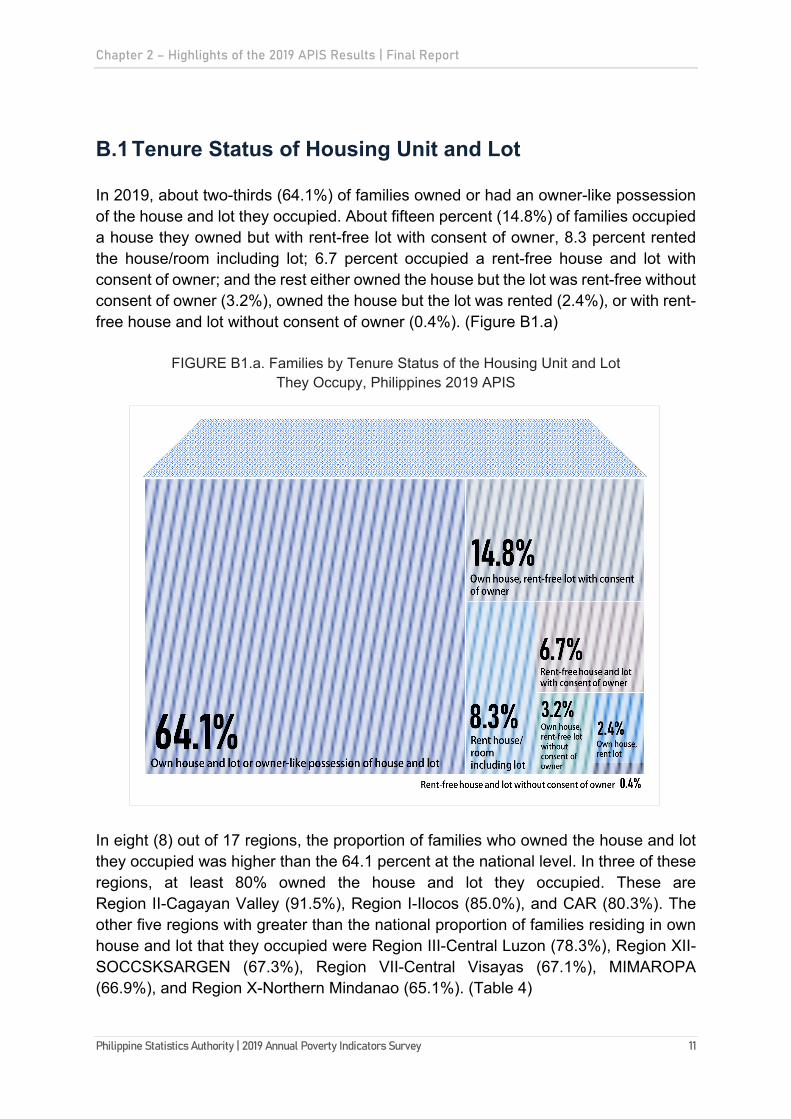
B.1 Tenure Status of Housing Unit and Lot In 2019, about two-thirds (64.1%) of families owned or had an owner-like possession of the house and lot they occupied. About fifteen percent (14.8%) of families occupied a house they owned but with rent-free lot with consent of owner, 8.3 percent rented the house/room including lot; 6.7 percent occupied a rent-free house and lot with consent of owner; and the rest either owned the house but the lot was rent-free without consent of owner (3.2%), owned the house but the lot was rented (2.4%), or with rent-free house and lot without consent of owner (0.4%). (Figure B1.a)
FIGURE B1.a. Families by Tenure Status of the Housing Unit and Lot They Occupy, Philippines 2019 APIS
In eight (8) out of 17 regions, the proportion of families who owned the house and lot they occupied was higher than the 64.1 percent at the national level. In three of these regions, at least 80% owned the house and lot they occupied. These are Region II-Cagayan Valley (91.5%), Region I-Ilocos (85.0%), and CAR (80.3%). The other five regions with greater than the national proportion of families residing in own house and lot that they occupied were Region III-Central Luzon (78.3%), Region XII-SOCCSKSARGEN (67.3%), Region VII-Central Visayas (67.1%), MIMAROPA (66.9%), and Region X-Northern Mindanao (65.1%). (Table 4)

Chapter 2 – Highlights of the 2019 APIS Results | Final Report
12 Philippine Statistics Authority | 2019 Annual Poverty Indicators Survey
FIGURE B1.b. Families who Own or Has Owner-like Possession of House and Lot as Tenure Status by Region, Philippines 2019 APIS
B.2 Floor Area of Housing Unit About sixty-one percent (61.4%) of families were residing in a housing unit with a floor area of less than 50 square meters (sq. m.). Families residing in housing units with floor area of less than 10 sq. m. comprised less than one percent.

Chapter 2 – Highlights of the 2019 APIS Results | Final Report
Philippine Statistics Authority | 2019 Annual Poverty Indicators Survey 13
FIGURE B2. Families by Floor Area of their Housing Unit, Philippines 2019 APIS
Families in CAR (6.0%), Caraga (4.2%), and Region VI-Western Visayas (4.1%) lived in housing units with floor area of at least 200 sq. m. (Table 3)
B.3 Type of Building/House Nine out of ten (92.7%) Filipino families were residing in single houses. The rest dwelt in apartment/accessoria/rowhouse (4.5%), duplex houses (2.2%), and other multi-unit residential/building or commercial/industrial/agricultural building/house, including condominium/condotel (0.6%).
In the National Capital Region (NCR), about 80.9% of families were living in single houses, 12.6 percent resided in apartment/accessoria/rowhouse, 3.2 percent in duplex, while the rest lived in other types of housing units. (Table 4)
FIGURE B3. Families by Type of Building/House they Reside, Philippines, 2019 APIS

Chapter 2 – Highlights of the 2019 APIS Results | Final Report
14 Philippine Statistics Authority | 2019 Annual Poverty Indicators Survey
B.4 Construction Materials of the Roof and Outer Walls Majority of Filipino houses had roofs and outer walls made of strong materials. Nine in every ten (91.1%) families reported that their housing unit was made of strong materials for the roof, and about three in every four (73.5%) families reported with strong materials for the outer walls. Strong materials refer to galvanized iron or aluminum, tile, concrete, and brick stone, while light materials refer to cogon, nipa, or anahaw. Across regions, CALABARZON recorded the highest proportion of families living in houses with strong materials for the roofs (97.5%), while Central Luzon (90.1%) had the highest proportion with strong materials for the outer walls. On the other hand, Bicol (74.5%) and Davao (47.5%) regions have the lowest proportions of families living in houses with strong materials for their roofs and outer walls, respectively. (Tables 5 and 6)
FIGURE B4. Families by Type of Construction Materials of the Roof and Outer Walls of the Building they Occupy, Philippines 2019 APIS
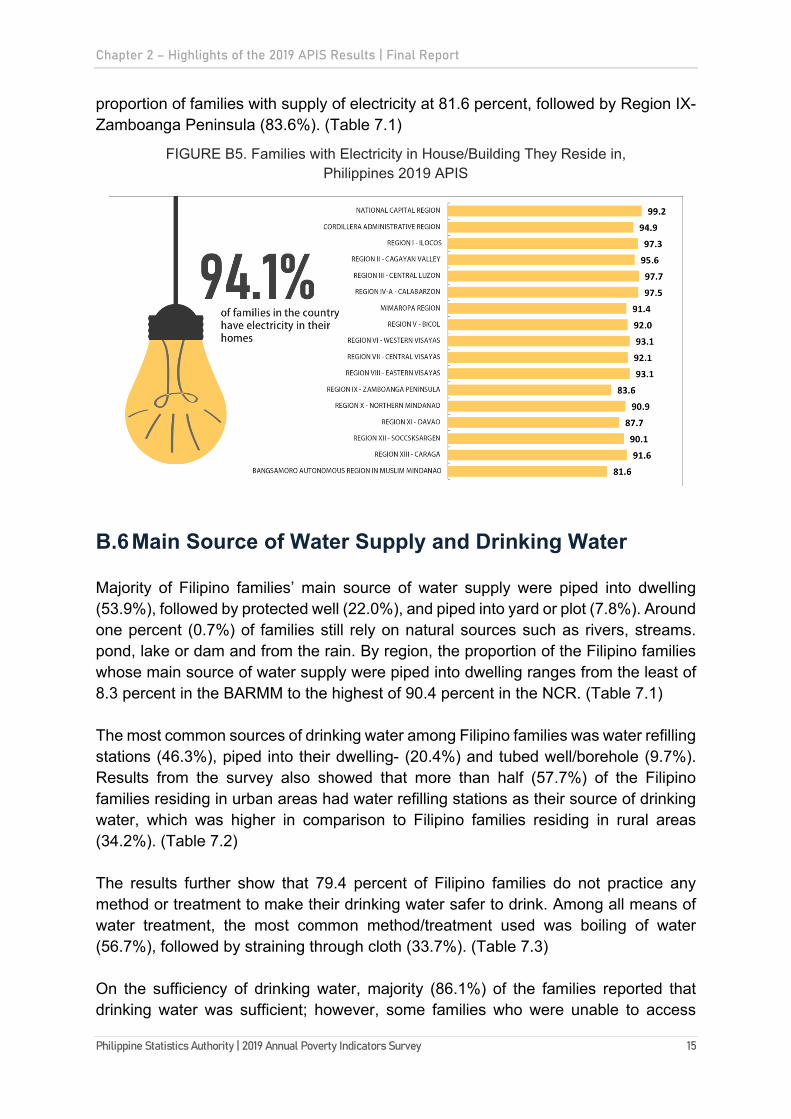
B.5 Electricity About 94.1 percent of families in the country had electricity in their homes. Moreover, NCR residents recorded the highest proportion of families with electricity in their homes (99.2%). This was followed by families residing in Central Luzon (97.7%) and in CALABARZON (97.5%). On the other hand, BARMM registered the lowest
Chapter 2 – Highlights of the 2019 APIS Results | Final Report
Philippine Statistics Authority | 2019 Annual Poverty Indicators Survey 15
proportion of families with supply of electricity at 81.6 percent, followed by Region IX-Zamboanga Peninsula (83.6%). (Table 7.1)
FIGURE B5. Families with Electricity in House/Building They Reside in, Philippines 2019 APIS
B.6 Main Source of Water Supply and Drinking Water Majority of Filipino families’ main source of water supply were piped into dwelling (53.9%), followed by protected well (22.0%), and piped into yard or plot (7.8%). Around one percent (0.7%) of families still rely on natural sources such as rivers, streams. pond, lake or dam and from the rain. By region, the proportion of the Filipino families whose main source of water supply were piped into dwelling ranges from the least of 8.3 percent in the BARMM to the highest of 90.4 percent in the NCR. (Table 7.1) The most common sources of drinking water among Filipino families was water refilling stations (46.3%), piped into their dwelling- (20.4%) and tubed well/borehole (9.7%). Results from the survey also showed that more than half (57.7%) of the Filipino families residing in urban areas had water refilling stations as their source of drinking water, which was higher in comparison to Filipino families residing in rural areas (34.2%). (Table 7.2) The results further show that 79.4 percent of Filipino families do not practice any method or treatment to make their drinking water safer to drink. Among all means of water treatment, the most common method/treatment used was boiling of water (56.7%), followed by straining through cloth (33.7%). (Table 7.3) On the sufficiency of drinking water, majority (86.1%) of the families reported that drinking water was sufficient; however, some families who were unable to access
Chapter 2 – Highlights of the 2019 APIS Results | Final Report
16 Philippine Statistics Authority | 2019 Annual Poverty Indicators Survey
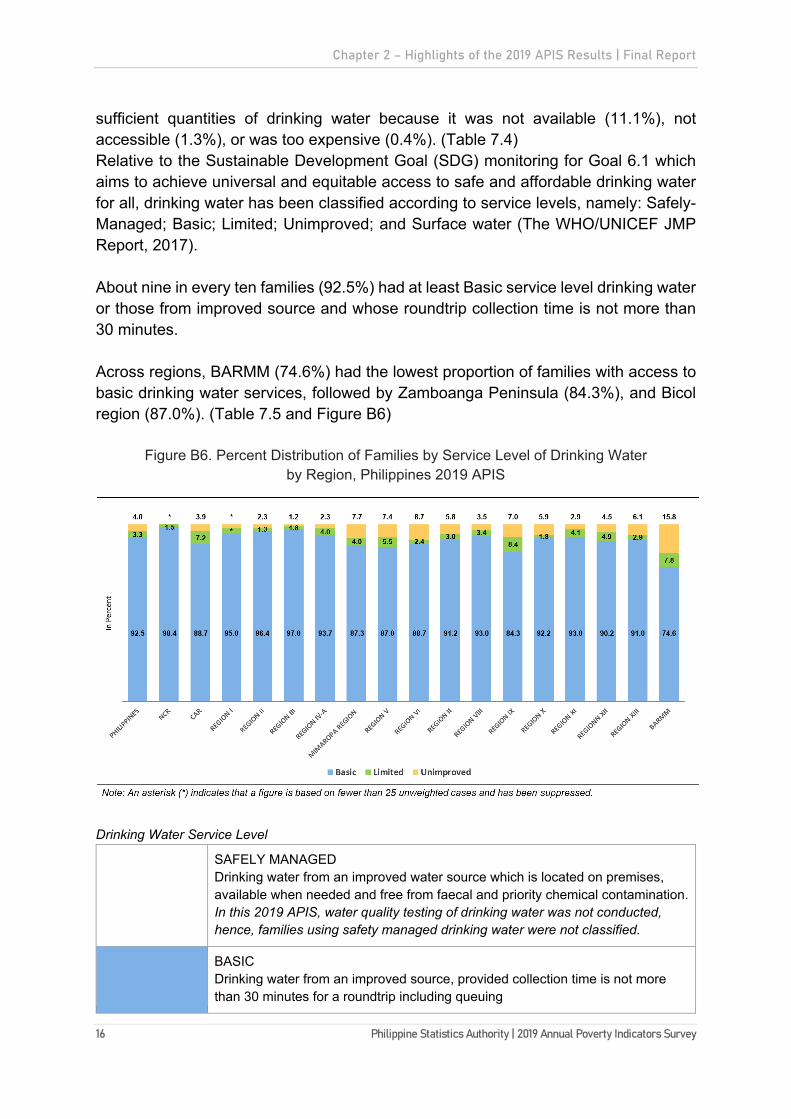
sufficient quantities of drinking water because it was not available (11.1%), not accessible (1.3%), or was too expensive (0.4%). (Table 7.4) Relative to the Sustainable Development Goal (SDG) monitoring for Goal 6.1 which aims to achieve universal and equitable access to safe and affordable drinking water for all, drinking water has been classified according to service levels, namely: Safely-Managed; Basic; Limited; Unimproved; and Surface water (The WHO/UNICEF JMP Report, 2017). About nine in every ten families (92.5%) had at least Basic service level drinking water or those from improved source and whose roundtrip collection time is not more than 30 minutes. Across regions, BARMM (74.6%) had the lowest proportion of families with access to basic drinking water services, followed by Zamboanga Peninsula (84.3%), and Bicol region (87.0%). (Table 7.5 and Figure B6)
Figure B6. Percent Distribution of Families by Service Level of Drinking Water by Region, Philippines 2019 APIS
Drinking Water Service Level
SAFELY MANAGED Drinking water from an improved water source which is located on premises, available when needed and free from faecal and priority chemical contamination. In this 2019 APIS, water quality testing of drinking water was not conducted, hence, families using safety managed drinking water were not classified.
BASIC Drinking water from an improved source, provided collection time is not more than 30 minutes for a roundtrip including queuing
Chapter 2 – Highlights of the 2019 APIS Results | Final Report
Philippine Statistics Authority | 2019 Annual Poverty Indicators Survey 17
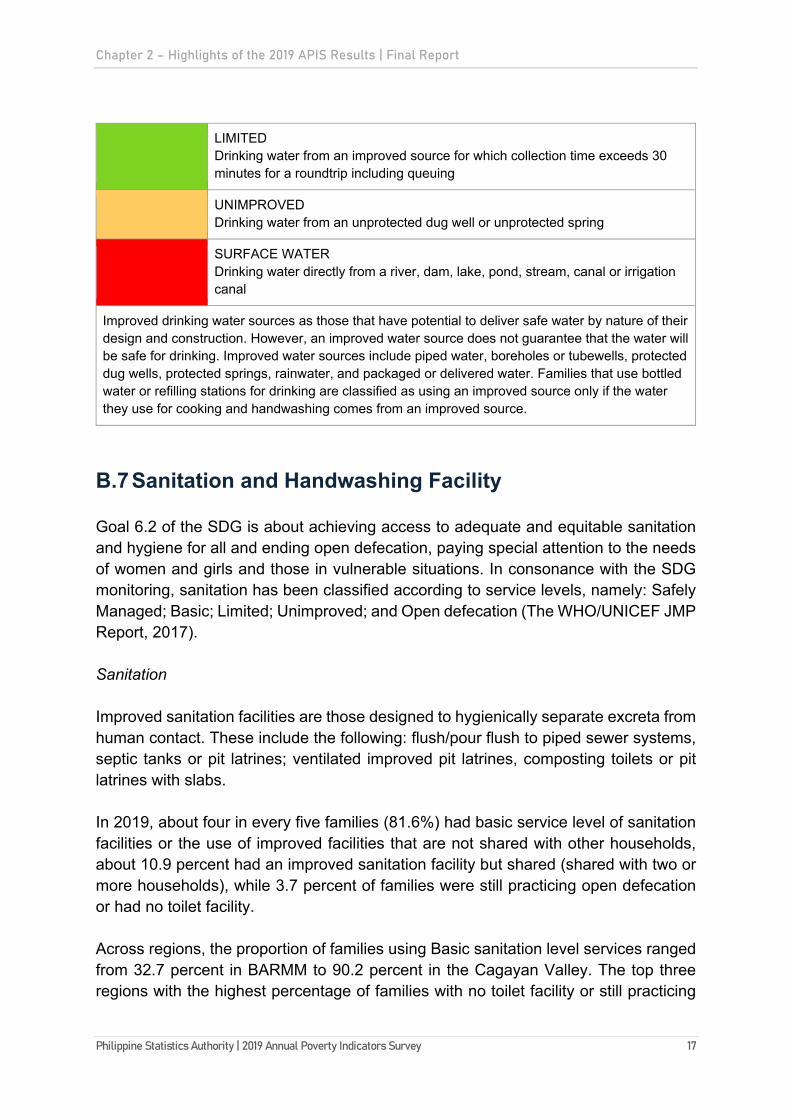
LIMITED Drinking water from an improved source for which collection time exceeds 30 minutes for a roundtrip including queuing
UNIMPROVED Drinking water from an unprotected dug well or unprotected spring
SURFACE WATER Drinking water directly from a river, dam, lake, pond, stream, canal or irrigation canal
Improved drinking water sources as those that have potential to deliver safe water by nature of their design and construction. However, an improved water source does not guarantee that the water will be safe for drinking. Improved water sources include piped water, boreholes or tubewells, protected dug wells, protected springs, rainwater, and packaged or delivered water. Families that use bottled water or refilling stations for drinking are classified as using an improved source only if the water they use for cooking and handwashing comes from an improved source.
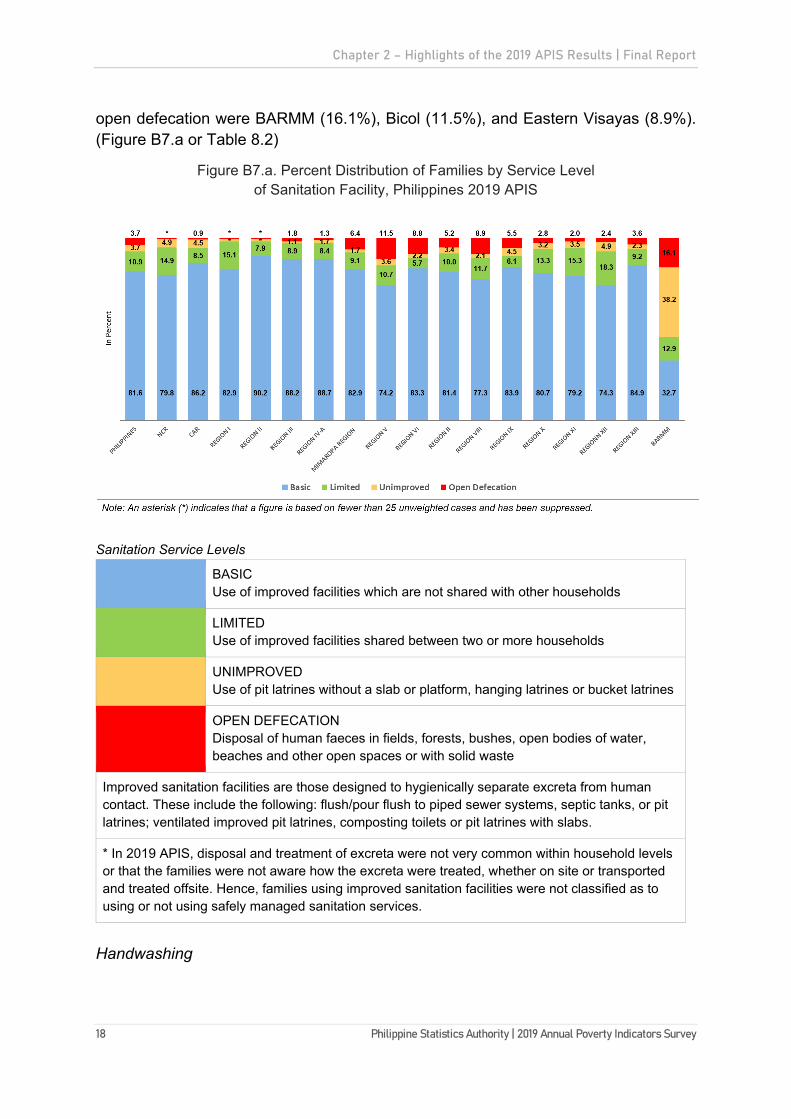
B.7 Sanitation and Handwashing Facility Goal 6.2 of the SDG is about achieving access to adequate and equitable sanitation and hygiene for all and ending open defecation, paying special attention to the needs of women and girls and those in vulnerable situations. In consonance with the SDG monitoring, sanitation has been classified according to service levels, namely: Safely Managed; Basic; Limited; Unimproved; and Open defecation (The WHO/UNICEF JMP Report, 2017). Sanitation Improved sanitation facilities are those designed to hygienically separate excreta from human contact. These include the following: flush/pour flush to piped sewer systems, septic tanks or pit latrines; ventilated improved pit latrines, composting toilets or pit latrines with slabs. In 2019, about four in every five families (81.6%) had basic service level of sanitation facilities or the use of improved facilities that are not shared with other households, about 10.9 percent had an improved sanitation facility but shared (shared with two or more households), while 3.7 percent of families were still practicing open defecation or had no toilet facility. Across regions, the proportion of families using Basic sanitation level services ranged from 32.7 percent in BARMM to 90.2 percent in the Cagayan Valley. The top three regions with the highest percentage of families with no toilet facility or still practicing
Chapter 2 – Highlights of the 2019 APIS Results | Final Report
18 Philippine Statistics Authority | 2019 Annual Poverty Indicators Survey
open defecation were BARMM (16.1%), Bicol (11.5%), and Eastern Visayas (8.9%). (Figure B7.a or Table 8.2)
Figure B7.a. Percent Distribution of Families by Service Level of Sanitation Facility, Philippines 2019 APIS
Sanitation Service Levels
BASIC Use of improved facilities which are not shared with other households
LIMITED Use of improved facilities shared between two or more households
UNIMPROVED Use of pit latrines without a slab or platform, hanging latrines or bucket latrines
OPEN DEFECATION Disposal of human faeces in fields, forests, bushes, open bodies of water, beaches and other open spaces or with solid waste
Improved sanitation facilities are those designed to hygienically separate excreta from human contact. These include the following: flush/pour flush to piped sewer systems, septic tanks, or pit latrines; ventilated improved pit latrines, composting toilets or pit latrines with slabs.
* In 2019 APIS, disposal and treatment of excreta were not very common within household levels or that the families were not aware how the excreta were treated, whether on site or transported and treated offsite. Hence, families using improved sanitation facilities were not classified as to using or not using safely managed sanitation services.
Handwashing

Chapter 2 – Highlights of the 2019 APIS Results | Final Report
Philippine Statistics Authority | 2019 Annual Poverty Indicators Survey 19
Most families (92.9%) had access to Basic service level handwashing facilities or handwashing facilities on premises with soap and water. Urban areas had a higher proportion (93.9%) of families with access to Basic handwashing facility compared to rural areas (91.8%). Across regions, families in BARMM had the highest share of handwashing facility with limited service (15.1%), and without hand washing facility (14.1%). (Table 8.3 and Figure B7.b)
Figure B7.b. Percent Distribution of Families by Service Level of Handwashing Facility by Region, Philippines APIS 2019
Handwashing Service Levels
BASIC Availability of a handwashing facility on premises with soap and water
LIMITED Availability of a handwashing facility on premises without soap and water
NO FACILITY No handwashing facility on premises
B.8 Household Conveniences
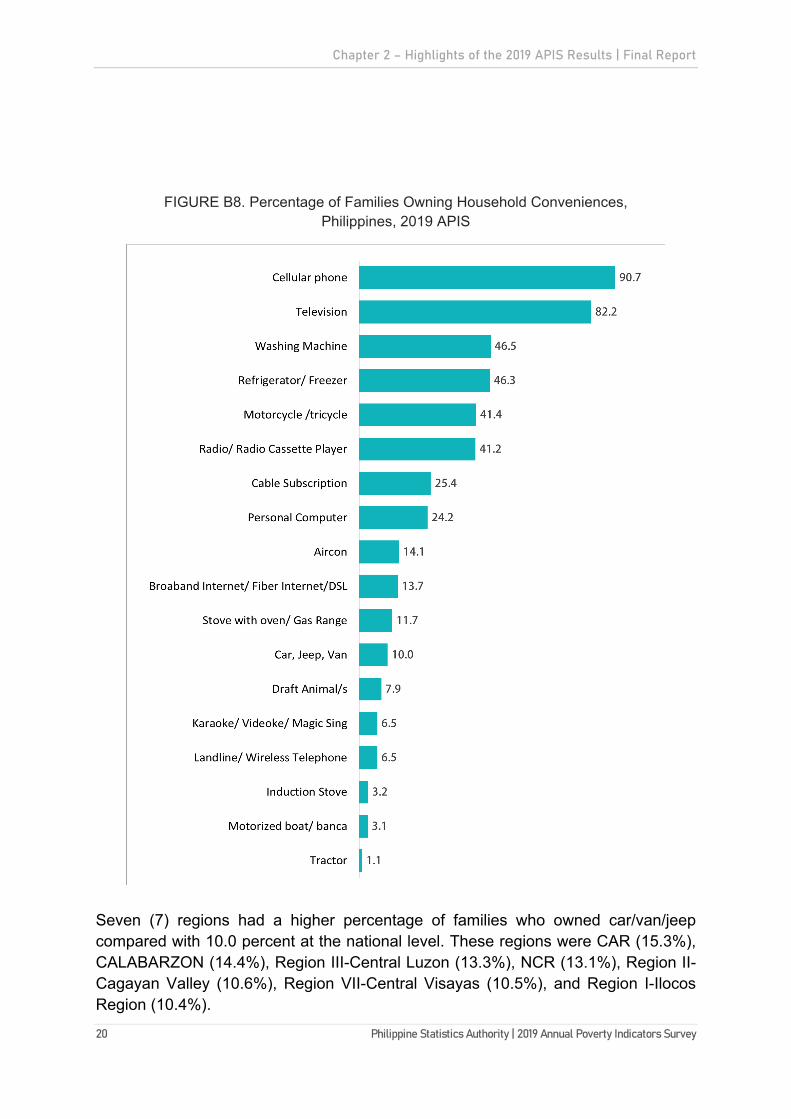
Data on ownership of family conveniences provide proxy indicators of the economic status of the family. Cellular phone (90.7%) was the most common household convenience/device, followed by television set (82.2%), washing machine (46.5%), refrigerator/freezer (46.3%), and motorcycle/tricycle (41.4%).
Chapter 2 – Highlights of the 2019 APIS Results | Final Report
20 Philippine Statistics Authority | 2019 Annual Poverty Indicators Survey
FIGURE B8. Percentage of Families Owning Household Conveniences, Philippines, 2019 APIS
Seven (7) regions had a higher percentage of families who owned car/van/jeep compared with 10.0 percent at the national level. These regions were CAR (15.3%), CALABARZON (14.4%), Region III-Central Luzon (13.3%), NCR (13.1%), Region II-Cagayan Valley (10.6%), Region VII-Central Visayas (10.5%), and Region I-Ilocos Region (10.4%).

Chapter 2 – Highlights of the 2019 APIS Results | Final Report
Philippine Statistics Authority | 2019 Annual Poverty Indicators Survey 21
C. EDUCATION This section presents the highest grade completed, school attendance, and reason for not attending school. Also included in this section are the proportion of those who were currently attending Grade 1 to Grade 6 and Junior High School level. Ages 3-5 years old were included to capture early childhood educational learning.
C.1 Highest Grade Completed of Population 5 Years Old and Over
In 2019, about 12.0 percent of the population aged 5 years old and over had a college degree or higher, with higher percentage among females (14.3%) than males (9.7%). Moreover, this percentage was higher in urban areas (14.8%) as compared in rural areas (9.0%). Further, 19.3 percent finished junior high school, 23.3 percent were elementary undergraduate, and 2.3 percent had no formal education or no grade completed. (Table 10) In addition, the proportion of women who have completed secondary school or higher is greater in urban areas than rural area.
FIGURE C1. Percentage of Population Age 5 Years Old and Over by Highest Grade Completed, Philippines, 2019 APIS

Chapter 2 – Highlights of the 2019 APIS Results | Final Report
22 Philippine Statistics Authority | 2019 Annual Poverty Indicators Survey
C.2 Attendance in School of Persons 3 to 24 Years Old
School refers to formal schools, including vocational/technical schools offering post-secondary courses to obtain formal education. Information on attendance in school for children, 3 to 5 years old was included to capture early childhood educational learning in schools like nursery, kindergarten and preparatory schools. Seven (7) out of ten (10) (71.5%) of the population 3 to 24 years old were enrolled or attending school in 2019. The top regions with higher proportion of school attendance than the national level were Caraga (76.6%), Bicol (75.5%), and MIMAROPA (75.2%). On the contrary, BARMM (63.4%), Region III-Central Luzon (68.4%), and CALABARZON (68.9%) posted the lowest proportion of school attendance. Of the total number of persons 3 to 24 years old who were attending school, 11.6 percent were aged 3 to 5 years old, 26.4 percent were 6 to 9 years old, and 19.1 percent were 10 to 12 years old. (Table 11) About 27.4 percent of those attending school were enrolled in junior high school or Grades 7 to 10, 21.3 percent in Grades 1 to 3, 11.0 percent in senior high school or Grades 11 to 12 and 10.8 percent in pre-school (preparatory/kindergarten/nursery). By urbanity, persons of school age in urban area (9.8%) had higher percentage of those who were attending college and higher education than those in rural areas (7.2%). By region, CAR had the highest percentage of those who were attending college with 11.1 percent, while Caraga region (13.4%) recorded the highest percentage of attending pre-school. (Table 12)
FIGURE C2. Percentage of Population Aged 3 to 24 Years by Schooling Status and Region, Philippines, 2019 APIS

Chapter 2 – Highlights of the 2019 APIS Results | Final Report
Philippine Statistics Authority | 2019 Annual Poverty Indicators Survey 23
C.3 Reasons for Not Attending School More than 10 million persons aged 6 to 24 years old were not attending school in 2019. The top reasons for not attending school were employment (32.8%), marriage or family matters (19.1%), finished schooling (13.6%), and lack of personal interest (13.2%). Among the male population aged 6 to 24 years, employment (38%), and lack of personal interest (19.3%) were the top two reasons they were not attending school. However, among females in the same age group, marriage or family matters (30.7%) and employment (27.2%) were the main reasons. Across regions, NCR had the highest proportion for not attending school due to employment with 43.7 percent, followed by Region III-Central Luzon (40.2%) and Region VII-Central Visayas (39.7%). Not attending school due to lack of personal interest (27.7%) and high cost of education or financial concerns (26.9%) were highest in BARMM. (Table 13)
FIGURE C3. Percentage of Population Aged 6 to 24 Years Who Were Not Attending School by Reason, Philippines 2019 APIS

Chapter 2 – Highlights of the 2019 APIS Results | Final Report
24 Philippine Statistics Authority | 2019 Annual Poverty Indicators Survey
C.4 Children in Grade 1 to Grade 6 A total of 10.1 million families with children aged 6 to 11 years were recorded in the survey. Of this number, 95.5 percent had children who were enrolled in Grades 1 to 6. Across regions, MIMAROPA had the highest proportion with 96.9 percent of families with children in Grades 1 to 6 while BARMM observed the lowest proportion with 90.3 percent. The proportion of families with children aged 6 to 11 years who were enrolled in Grades 1 to 6 was nearly similar among families in urban and rural areas with 95.6 percent and 95.4 percent, respectively. (Table 14)
FIGURE C4. Proportion of Families with Children Aged 6 to 11 Years in Grades 1 to 6 by Residence, Philippines 2019 APIS

Chapter 2 – Highlights of the 2019 APIS Results | Final Report
Philippine Statistics Authority | 2019 Annual Poverty Indicators Survey 25
C.5 Children in Junior High School (Grade 7 to Grade 10) Of the 7.5 million families with children aged 12 to 15 years old, about 87.6 percent were reported having children in this age bracket who were in Junior High School (Grades 7 to 10). Region I-Ilocos reported the highest percentage with children 12 to 15 years old who were attending junior high school at 92.8 percent while BARMM recorded the lowest percentage at 71.7 percent. Among families with children aged 12 to 15 years residing in urban areas, 87.9 percent were enrolled in junior high school; the corresponding percentage in rural area was 87.2 percent. (Table 15)
FIGURE C5. Families with Children Aged 12 to 15 Years Old in Junior High School
(Grades 7 to 10) by Residence, Philippines 2019 APIS

Chapter 2 – Highlights of the 2019 APIS Results | Final Report
26 Philippine Statistics Authority | 2019 Annual Poverty Indicators Survey
D. ECONOMIC CHARACTERISTICS This section presents the economic activities of family members aged 5 years old and over, specifically whether the family member had work or job or business and his/her class of worker. D.1 Families with Working Members 18 Years Old and Over A family member was considered employed if he or she had worked or had a job or business at any time during the reference period, that is, from January 01 to June 30 2019. A work is defined as any economic activity that a person does for pay, profit or without pay on family farm or enterprise, or an activity done by a farm operator or member of his/her family on another’s farm on “exchange labor” arrangement. Of the 25 million families, about 91.3 percent of families had at least one member aged 18 years and over who were employed during the reference period. Proportion of families with members 18 years and over who were gainfully employed across regions ranged from 87.9 percent in Region I-Ilocos to 97.7 percent in BARMM. (Table 16)
FIGURE D1. Percentage of Families with Members Aged 18 Years or Over Who are Gainfully Employed, Philippines 2019 APIS
D.2 Families with Working Children 5-17 Years Old

Chapter 2 – Highlights of the 2019 APIS Results | Final Report
Philippine Statistics Authority | 2019 Annual Poverty Indicators Survey 27
The Labor Code of the Philippines specifies that no child below 18 years old shall be employed except when he/she works directly under the sole responsibility of his parents/guardian and his/her employment does not in any way interfere with his/her schooling. Of the 15.6 million families with members aged 5 to 17 years old, about 7.6 percent of the total families had working children. Across regions, Region X-Northern Mindanao (23.3%), Region V-Bicol (15.4%), Region VIII-Eastern Visayas (13.5%), and Caraga (12.2%) had the highest proportion of families with working children. As to residence status, rural areas (9.5%) had higher percentage of families with working children compared to urban areas (5.7%). (Table 17)
FIGURE D2. Percentage of Families with Members Aged 5 to 17 Years Old Who are Gainfully Employed, Philippines 2019 APIS
E. HEALTH STATUS
This section presents the extent or prevalence of illnesses or injuries which affected any of the family members in the past month prior to the survey.
Majority (81.7%) of family members reported that they were not ill/sick/injured during the reference period (that is one month before the date of the interview). In contrast, 14.8 percent said that they got sick only once during the reference period. (Table 18)
FIGURE E1. Percentage of Population by Health Status during the Reference Period, Philippines 2019 APIS

Chapter 2 – Highlights of the 2019 APIS Results | Final Report
28 Philippine Statistics Authority | 2019 Annual Poverty Indicators Survey
Of the total family members who had illness/sickness/injury, about 46.4 percent were not able to get to work or school or not able to perform daily activities in the past month due to illness/sickness/injury. Higher proportion of those who were not able to go to work or school or were not able to perform daily activities due to illness/sickness/injury were reported in Region XI-Davao (58.9%), Zamboanga Peninsula (58.5%), Region V-Bicol (57.9%), and MIMAROPA (57.8%). (Table 19)
FIGURE E2. Percentage of population 5 years old and over citing illness/sickness/injury
as a reason for absence from work or school or for not being able to perform daily activities in the past month, Philippines 2019 APIS
As to the number of days that they were not able to go to work or school or perform daily activities due to illness/sickness/injury, three-fifths (59.7%) had been absent for one to three days while 13.8 percent were ill/sick/injured for more than seven days. Across regions, those who were unable to go to work or school or perform daily activities for almost a month (26 to 30 days), was recorded highest in Region I-Ilocos (11.4%), followed by Region IX-Zamboanga Peninsula (10.3%), and CALABARZON (9.9%). (Table 20) FIGURE E3. Percentage on the number of day/s that a family member was not able to go to
work or school or perform daily activities due to illness/sickness/injury during the past month, Philippines 2019 APIS

Chapter 2 – Highlights of the 2019 APIS Results | Final Report
Philippine Statistics Authority | 2019 Annual Poverty Indicators Survey 29
F. FINANCIAL ACCOUNT In 2019 APIS, members of the family were asked if they had an account at a bank or another type of financial institution or with a mobile-money-service provider. Financial accounts include banks, credit unions, microfinance institutions, cooperative and other financial institutions. It also includes mobile banking (e.g., Landbank mobile banking, Smart Money and Smart Padala, GCash, BDO mobile banking). An account can be used to save money, to make or receive payments, or to receive wages or financial help. Of the total population 15 years old and over in 2019, 26.3 percent had an account at a bank or another type of financial institution or with a mobile-money-service provider. Also, at the national level, there were more females (29.4%) than males (23.2%) who had financial accounts. Across regions, NCR (42.7%), CALABARZON (35.6%), and Region VII-Central Visayas (28.7%) had the highest proportion of having financial account. On the contrary, BARMM (3.8%), Region IX-Zamboanga Peninsula (14.8%) and Region X-Northern Mindanao (17.9%) had the lowest proportion of having financial accounts. (Table 21)
FIGURE F1. Population 15 Years Old and Over With/Without Account at Bank or Another Type of Financial Institution or With Mobile-Money-Service Provider by Sex,
Philippines 2019 APIS
Chapter 2 – Highlights of the 2019 APIS Results | Final Report
30 Philippine Statistics Authority | 2019 Annual Poverty Indicators Survey
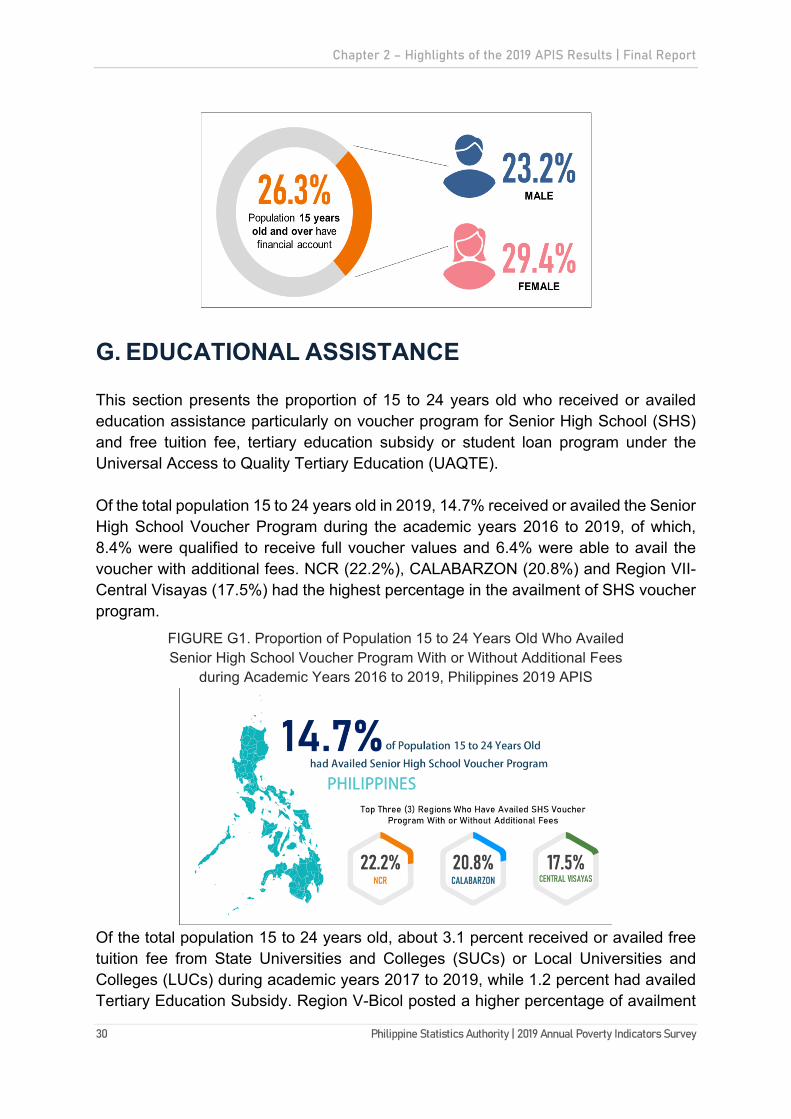
G. EDUCATIONAL ASSISTANCE This section presents the proportion of 15 to 24 years old who received or availed education assistance particularly on voucher program for Senior High School (SHS) and free tuition fee, tertiary education subsidy or student loan program under the Universal Access to Quality Tertiary Education (UAQTE). Of the total population 15 to 24 years old in 2019, 14.7% received or availed the Senior High School Voucher Program during the academic years 2016 to 2019, of which, 8.4% were qualified to receive full voucher values and 6.4% were able to avail the voucher with additional fees. NCR (22.2%), CALABARZON (20.8%) and Region VII-Central Visayas (17.5%) had the highest percentage in the availment of SHS voucher program.
FIGURE G1. Proportion of Population 15 to 24 Years Old Who Availed Senior High School Voucher Program With or Without Additional Fees
during Academic Years 2016 to 2019, Philippines 2019 APIS
Of the total population 15 to 24 years old, about 3.1 percent received or availed free tuition fee from State Universities and Colleges (SUCs) or Local Universities and Colleges (LUCs) during academic years 2017 to 2019, while 1.2 percent had availed Tertiary Education Subsidy. Region V-Bicol posted a higher percentage of availment

Chapter 2 – Highlights of the 2019 APIS Results | Final Report
Philippine Statistics Authority | 2019 Annual Poverty Indicators Survey 31
of SUC/LUC free tuition fee with 6.1 percent. While, Tertiary Education Subsidy was higher in Region VII-Central Visayas with 2.8 percent. Availment of SUC/LUC free tuition fee were higher in rural area (3.6%) compared with urban area (2.6%) (Table 23).
FIGURE G2. Population 15 to 24 Years Old Who Availed SUC/LUC Free Tuition Fee During Academic Years 2017 to 2019 by Sex, Philippines 2019 APIS
H. SOCIAL PROTECTION PROGRAMS 2019 APIS included questions related to selected social protection programs. Social protection is defined as consisting of policies, and programs that seek to reduce poverty, and vulnerability to risks and enhance the social status and rights of the marginalized by promoting, and protecting their livelihood and employment, protecting them against hazards and sudden interruptions, loss of income, and improving people’s capacity to manage risks2.
H.1 Social Insurance About one in every two (52.4%) families had a member/dependent/beneficiary of the Social Security System (SSS). This was followed by membership to Health/Medical
2 This is based on the official definition from SDC Resolution No. 1 Series of 2007 which was adopted in the Philippine Social Protection Operational Framework and Strategy by the Department of Social Welfare and Development and NEDA-SDC-Subcommittee on Social Protection (SC-SP) version February 2019.

Chapter 2 – Highlights of the 2019 APIS Results | Final Report
32 Philippine Statistics Authority | 2019 Annual Poverty Indicators Survey
Insurance other than PhilHealth (22.0%), Life Insurance/Pre-need Insurance (13.5%), and Government Service Insurance System (GSIS) (8.8%). (Table 24)
FIGURE H1. Percentage of Families who have a Member or Beneficiary of Social Protection Program: January to June 2019, Philippines 2019 APIS
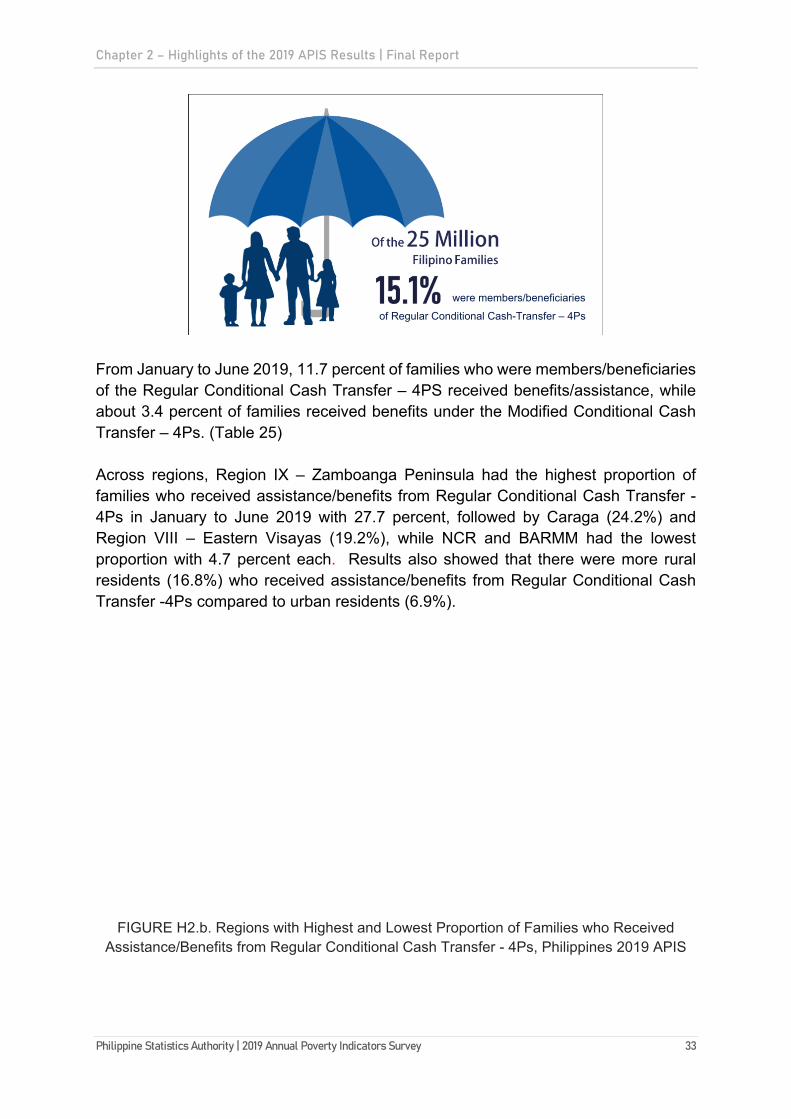
About four out of every five families (79.5%) in the NCR had a member/dependent/ beneficiary of SSS. Meanwhile, CAR had the highest proportion of families with a GSIS member/beneficiary at 12.0 percent. On the other hand, BARMM registered the lowest proportion of families with member or dependent or beneficiary in SSS (9.0%) and GSIS (3.5%). (Table 24) On Filipino families who availed/received assistance/benefits/payments from social insurances in the last six months (January to June 2019), about seven percent (7.1%) availed in the SSS, 3.4 percent from private HMOs, 2.1 percent in GSIS, and less than one percent (0.8%) on life insurance/pre-need insurance. By region, the family who availed/received assistance/benefits in SSS ranges from 2.3 percent in BARMM to 10.1 percent in NCR. (Table 25) H.2 Social Assistance Of the 25 million Filipino families, about 15.1 percent had a member/beneficiary of Regular Conditional Cash Transfer - Pantawid Pamilyang Pilipino Programs (4Ps) while 4.3 percent were under Modified Conditional Cash Transfer – 4Ps, the most common government program that provides conditional cash grants to the poorest of the poor in the country. (Table 24)
FIGURE H2.a. Percentage of Filipino families with a member/beneficiary of Regular Conditional Cash Transfer - Pantawid Pamilyang Pilipino Programs (4Ps),
Philippines 2019 APIS
Chapter 2 – Highlights of the 2019 APIS Results | Final Report
Philippine Statistics Authority | 2019 Annual Poverty Indicators Survey 33
From January to June 2019, 11.7 percent of families who were members/beneficiaries of the Regular Conditional Cash Transfer – 4PS received benefits/assistance, while about 3.4 percent of families received benefits under the Modified Conditional Cash Transfer – 4Ps. (Table 25) Across regions, Region IX – Zamboanga Peninsula had the highest proportion of families who received assistance/benefits from Regular Conditional Cash Transfer -4Ps in January to June 2019 with 27.7 percent, followed by Caraga (24.2%) and Region VIII – Eastern Visayas (19.2%), while NCR and BARMM had the lowest proportion with 4.7 percent each. Results also showed that there were more rural residents (16.8%) who received assistance/benefits from Regular Conditional Cash Transfer -4Ps compared to urban residents (6.9%).
FIGURE H2.b. Regions with Highest and Lowest Proportion of Families who Received Assistance/Benefits from Regular Conditional Cash Transfer - 4Ps, Philippines 2019 APIS
were members/beneficiaries
of Regular Conditional Cash-Transfer – 4Ps

Chapter 2 – Highlights of the 2019 APIS Results | Final Report
34 Philippine Statistics Authority | 2019 Annual Poverty Indicators Survey
Also, of the 25.3 million Filipino families, 13.4 percent of families had members/beneficiaries of Indigent Senior Citizen's Social Pension. Meanwhile, 10.4 percent were under the Unconditional Cash Transfer (UCT) under Tax Reform Program. Among regions, Caraga had the highest proportion of families with member/beneficiary under Indigent Senior Citizen's Social Pension (25.2%), these families also had the most proportion of members who availed assistance from Indigent Senior Citizen's Social Pension (SPISC or SocPen). H.3 Labor Market Intervention Labor Market Intervention are programs that support the development of job relevant skills and workers' retraining, particularly the low-skilled and marginalized.3 In 2019, only one percent of families in the country was a member/beneficiary of Seed Capital Fund/Sea-K and Cash for Work, both under Sustainable Livelihood Program (SLP). Moreover, MIMAROPA region had the highest proportion (2.5%) of those who availed/received assistance from the Seed Capital Fund/Sea-K, while Caraga region had the highest proportion of those who availed/received assistance from the Cash for Work program (2.3%). (Tables 24 and 25)
H.4 PhilHealth
3 Philippine Social Protection Operational Framework and Strategy (PSPOFS), page 12

Chapter 2 – Highlights of the 2019 APIS Results | Final Report
Philippine Statistics Authority | 2019 Annual Poverty Indicators Survey 35
PhilHealth is a national program which aims to provide all Filipinos financial access to quality, affordable, acceptable, available, and accessible health care services with priority to the marginalized and indigent sectors. The program is administered by the Philippine Health Insurance Corporation (PHIC or PhilHealth). Results revealed that 83.9 percent of the total families had at least one member in the family as member of PhilHealth. Three out of seven (43.3%) had families with PhilHealth paying member. These PhilHealth paying members include those members that were categorized under formal economy, informal economy, lifetime member and dependent of paying member. On the other hand, two out of five (40.6%) had families with PhilHealth non-paying members. Non-paying member includes those indigent, sponsored member, senior citizen or elderly, and dependent of non-paying member. (Table 26 and Figure H4)
FIGURE H4.a. Percentage of Families with Paying Members and Non-Paying Members, Philippines 2019 APIS
Among regions, the highest proportion of families with PhilHealth paying members were living in NCR (69.5%), CALABARZON (61.6%), and Region III-Central Luzon (47.8%). Meanwhile, regions with highest proportion of families with PhilHealth non-paying members were in Caraga (65.0%), Region IX-Zamboanga Peninsula (63.0%), and MIMAROPA (62.2%). As to area of residence, the proportion of Philhealth paying members residing in urban areas (56.8%) is higher than in rural areas (28.9%). Of the families with PhilHealth members (whether paying or non-paying), there were about seven percent (6.9%) families who had availed/received assistance from PhilHealth during January to June 2019. Across regions, SOCCSKSARGEN (10.1%), Caraga (9.8%), and Region VIII-Eastern Visayas (9.5%) recorded the top three regions with the highest proportion of families who availed/received assistance from PhilHealth during the reference period. (Table 26)
FIGURE H4.b. Percentage of Families with Members of PhilHealth who Received Assistance by Region, Philippines 2019 APIS

Chapter 2 – Highlights of the 2019 APIS Results | Final Report
36 Philippine Statistics Authority | 2019 Annual Poverty Indicators Survey
The most common type of medical services availed or received by the family was Non-Communicable Disease Services (45.6%). Some examples of a non-communicable diseases are diabetes, Alzheimer's, cancer, osteoporosis, stroke, and heart disease. Other types of assistance availed/received were Infectious Disease Services (24.8%) and Maternal Services (20.2%).
FIGURE H4.c. Percentage of Families who Received Assistance from Different PhilHealth Services, Philippines 2019 APIS
Moreover, families who availed/received Non-Communicable Disease Service ranges from the highest of 53.7 percent in Region XII-SOCCSKSARGEN to the lowest of 32.5 percent in NCR. On the other hand, Region IX-Zamboanga Peninsula had the highest proportion of families who availed Infectious Disease Services with 46.0 percent. NCR (28.8%) had the highest proportion of families who availed/received maternal services. The highest proportion who availed/received Infectious Disease Services were families in Region IX-Zamboanga Peninsula (46.0%). (Table 28)
H.5 Disaster Preparedness Kit
Chapter 2 – Highlights of the 2019 APIS Results | Final Report
Philippine Statistics Authority | 2019 Annual Poverty Indicators Survey 37
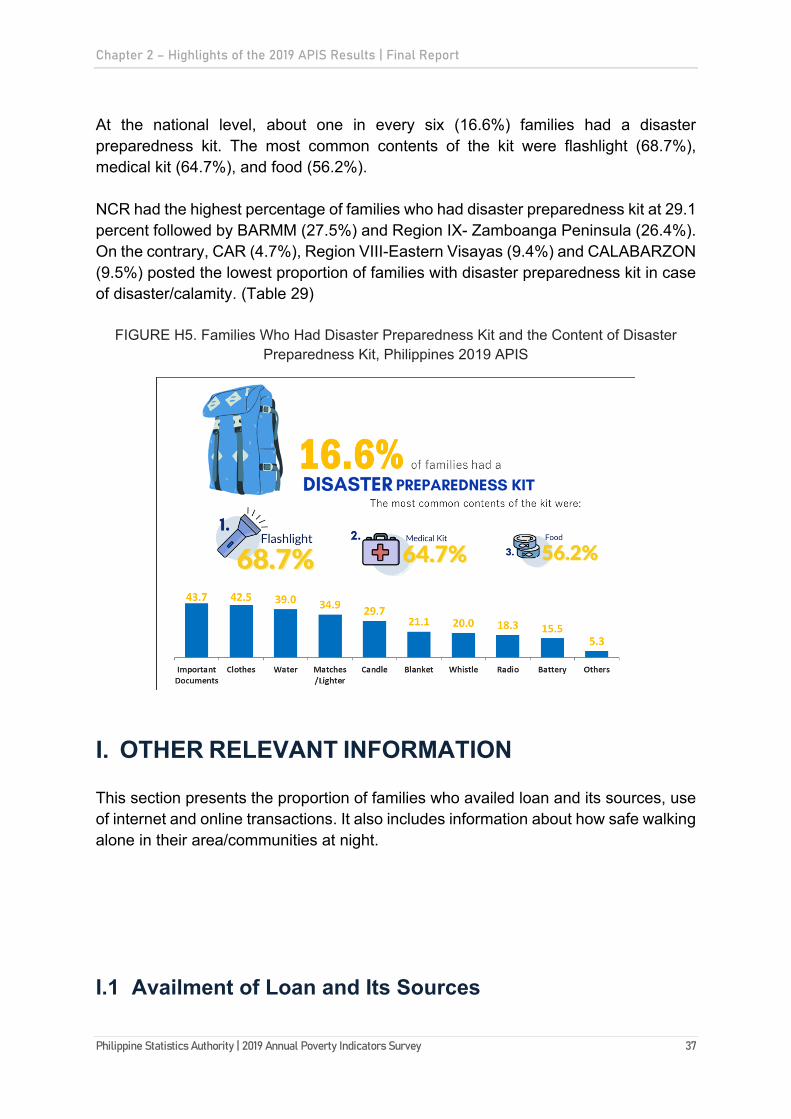
At the national level, about one in every six (16.6%) families had a disaster preparedness kit. The most common contents of the kit were flashlight (68.7%), medical kit (64.7%), and food (56.2%). NCR had the highest percentage of families who had disaster preparedness kit at 29.1 percent followed by BARMM (27.5%) and Region IX- Zamboanga Peninsula (26.4%). On the contrary, CAR (4.7%), Region VIII-Eastern Visayas (9.4%) and CALABARZON (9.5%) posted the lowest proportion of families with disaster preparedness kit in case of disaster/calamity. (Table 29)
FIGURE H5. Families Who Had Disaster Preparedness Kit and the Content of Disaster Preparedness Kit, Philippines 2019 APIS
I. OTHER RELEVANT INFORMATION This section presents the proportion of families who availed loan and its sources, use of internet and online transactions. It also includes information about how safe walking alone in their area/communities at night.
I.1 Availment of Loan and Its Sources

Chapter 2 – Highlights of the 2019 APIS Results | Final Report
38 Philippine Statistics Authority | 2019 Annual Poverty Indicators Survey
Of the total number of families, about 27.5 percent of families availed of loans in January to June 2019. Across regions, Region VIII-Eastern Visayas (44.9%), BARMM (43.2%), and Region V-Bicol (40.0%) had the highest proportion of families who availed loan during the reference period. (Table 30)
Figure I1. Families Who Availed of Loan from January to June 2019
by Region, Philippines 2019 APIS
The most common sources of loan were from microfinance institutions (38.8%), relative or friend (38.4%) and informal lenders (14.9%). Availment of loan in microfinance institutions was higher in rural areas (45.8%) than in urban (31.3%). (Table 31)
I.2 Internet Usage and Online Transactions Almost two in every five families (41.2%) used the internet in the last six months (January to June 2019). NCR had the highest percentage of families who used the internet with 70.8 percent, followed by CALABARZON (51.8%), while Region II-Cagayan Valley posted the lowest percentage with 12.9 percent. More than half (52.2%) of families who lived in urban areas used the internet in the last 6 months, while only three out of 10 (29.4%) of those in rural areas did. Nationwide, buying is the most common online transaction made using the internet by families with 32.6 percent, followed by banking (9.0%), and selling (6.7%). (Table 32)
Figure I2. Families Who Used Internet from January to June 2019 by Region, Philippines 2019 APIS

Chapter 2 – Highlights of the 2019 APIS Results | Final Report
Philippine Statistics Authority | 2019 Annual Poverty Indicators Survey 39
I.3 Feeling Safe Walking Alone Of the total families nationwide, about 82.9 percent of families based on respondent’s perception said that they felt safe walking alone in their area/community at night, 12.1 percent felt somewhat safe, 2.6 percent felt somewhat unsafe, 1.6 percent felt unsafe and less than one percent (0.5%) were afraid to be alone. Perception on safety varies on location ranging from 96.2 percent in Region I-Ilocos to 71.6 percent in NCR. Higher proportion of those in rural areas (88.5%) said that they feel safe walking alone at night as compared to those in urban areas (77.6%). (Table 33)


Appendix A – Statistical Tables I Final Report
Philippine Statistics Authority | 2019 Annual Poverty Indicators Survey 39
Appendix A - STATISTICAL TABLES
Table 1a. Average Family Size by Region and Residence, Philippines 2019
PHILIPPINES 25,310 4.2NATIONAL CAPITAL REGION 3,385 4.0CORDILLERA ADMINISTRATIVE REGION 431 4.2REGION I - ILOCOS 1,232 4.2REGION II - CAGAYAN VALLEY 868 4.2REGION III - CENTRAL LUZON 2,853 4.2REGION IV-A - CALABARZON 3,876 4.1MIMAROPA REGION 754 4.2REGION V - BICOL 1,300 4.7REGION VI - WESTERN VISAYAS 1,870 4.2REGION VII - CENTRAL VISAYAS 1,883 4.2REGION VIII - EASTERN VISAYAS 1,083 4.3REGION IX - ZAMBOANGA PENINSULA 851 4.4REGION X - NORTHERN MINDANAO 1,144 4.3REGION XI - DAVAO 1,320 3.9REGION XII - SOCCSKSARGEN 1,156 4.2REGION XIII - CARAGA 634 4.3BANGSAMORO AUTONOMOUS REGION IN MUSLIM MINDANAO 670 6.1
ResidenceUrban 13,041 4.2Rural 12,269 4.3
Source: Philippine Statistics Authority, 2019 Annual Poverty Indicators Survey
Region/ Residence Number of Families (Total, in thousands) Average Family Size

Appendix A – Statistical Tables I Final Report
40 Philippine Statistics Authority | 2019 Annual Poverty Indicators Survey
Selected Background Characteristics Both Sexes Male Female
PhilippinesNumber of Families (Total, in thousands) 25,310 19,161 6,149Household Head Age Group
Total 100 100 10013 - 14 * * *15 - 24 1.9 1.9 1.925 - 34 13.7 15.1 9.235 - 44 22.3 24.9 14.345 - 54 23.3 24.6 19.655 - 64 20.5 19.7 23.265 and over 18.3 13.9 31.9
Highest Grade CompletedTotal 100 100 100No Grade Completed 1.8 1.7 2.0Pre-school (Kinder/Prep/Nursery) * * *Elementary Undergraduate 20.9 21.5 19.0Elementary Graduate 13.2 13.1 13.5Junior High School Undergraduate 13.3 14.1 10.5Junior High School Graduate 25.8 26.8 22.9Senior High School Undergraduate 0.1 0.1 *Senior High School Graduate * * *Post Secondary Non-Tertiary Undergraduate 0.6 0.6 0.6Post Secondary Non-Tertiary Graduate 1.4 1.4 1.4Post Secondary Short Cycle Tertiary Undergraduat 0.7 0.6 1.0Post Secondary Short Cycle Tertiary Graduate 2.4 2.2 3.0College Undergraduate 6.8 6.8 6.9College Graduate or Higher 13.0 11.1 19.0IPED/SPED/Madrasah * * *
Employment StatusTotal 100 100 100Employed 78.8 85.8 56.9Unemployed 21.2 14.2 43.1
NATIONAL CAPITAL REGIONNumber of Families (Total, in thousands) 3,385 2,370 1,015Household Head Age Group
Total 100 100 10015 - 24 2.8 3.0 2.425 - 34 16.2 17.6 12.935 - 44 23.4 27.3 14.245 - 54 21.1 22.0 19.155 - 64 18.9 17.2 22.765 and over 17.7 12.9 28.8
Highest Grade CompletedTotal 100 100 100No Grade Completed * * *Pre-school (Kinder/Prep/Nursery) * * *Elementary Undergraduate 7.4 6.6 9.2Elementary Graduate 6.4 5.6 8.3Junior High School Undergraduate 10.4 10.6 10.0Junior High School Graduate 36.5 39.5 29.7Senior High School Undergraduate * * *Senior High School Graduate * * *Post Secondary Non-Tertiary Undergraduate 1.3 1.4 *Post Secondary Non-Tertiary Graduate 1.8 1.8 1.7Post Secondary Short Cycle Tertiary Undergraduat 0.9 0.8 *Post Secondary Short Cycle Tertiary Graduate 2.9 2.5 3.6College Undergraduate 12.2 12.7 10.9College Graduate or Higher 20.2 18.4 24.3IPED/SPED/Madrasah * * *
Employment StatusTotal 100 100 100Employed 73.4 82.1 53.2Unemployed 26.6 17.9 46.8
Note: " * " An asterisk indicates that a figure is based on fewer than 25 unweighted cases and has been suppressed.Source: Philippine Statistics Authority, 2019 Annual Poverty Indicators Survey
Table 1b. Families by Selected Background Characteristics of the Family Head by Region, Residence and Sex, Philippines 2019

Appendix A – Statistical Tables I Final Report
Philippine Statistics Authority | 2019 Annual Poverty Indicators Survey 41
Selected Background Characteristics Both Sexes Male Female
CORDILLERA ADMINISTRATIVE REGIONNumber of Families (Total, in thousands) 431 334 97Household Head Age Group
Total 100 100 10015 - 24 3 * *25 - 34 12.1 13.1 8.335 - 44 22.3 25.5 11.545 - 54 23.7 25.5 17.555 - 64 20.5 19.6 23.765 and over 18.9 14.9 32.7
Highest Grade CompletedTotal 100 100 100No Grade Completed 2.6 2.0 4.6Pre-school (Kinder/Prep/Nursery) * * *Elementary Undergraduate 21.3 21.1 22.0Elementary Graduate 11.5 12.0 9.6Junior High School Undergraduate 11.4 12.5 7.4Junior High School Graduate 25.3 27.0 19.6Senior High School Undergraduate * * *Senior High School Graduate * * *Post Secondary Non-Tertiary Undergraduate * * *Post Secondary Non-Tertiary Graduate * * *Post Secondary Short Cycle Tertiary Undergraduate * * *Post Secondary Short Cycle Tertiary Graduate 1.9 1.9 *College Undergraduate 7.8 7.7 8.4College Graduate or Higher 15.9 13.4 24.5IPED/SPED/Madrasah * * *
Employment StatusTotal 100 100 100Employed 80.0 86.1 58.8Unemployed 20.0 13.9 41.2
REGION I - ILOCOS Number of Families (Total, in thousands) 1,232 954 278Household Head Age Group
Total 100 100 10015 - 24 * * *25 - 34 10.0 11.7 *35 - 44 20.1 22.0 13.645 - 54 22.6 24.5 16.355 - 64 24.0 23.8 24.565 and over 22.4 17.1 40.7
Highest Grade CompletedTotal 100 100 100No Grade Completed * * *Pre-school (Kinder/Prep/Nursery) * * *Elementary Undergraduate 13.2 13.1 13.4Elementary Graduate 15.4 14.6 18.2Junior High School Undergraduate 11.1 12.6 *Junior High School Graduate 34.6 36.1 29.3Senior High School Undergraduate * * *Senior High School Graduate * * *Post Secondary Non-Tertiary Undergraduate * * *Post Secondary Non-Tertiary Graduate 2.7 3.0 *Post Secondary Short Cycle Tertiary Undergraduate * * *Post Secondary Short Cycle Tertiary Graduate 2.0 * *College Undergraduate 6.0 6.2 *College Graduate or Higher 13.8 11.9 20.3IPED/SPED/Madrasah * * *
Employment StatusTotal 100 100 100Employed 76.0 83.9 48.8Unemployed 24.0 16.1 51.2
Note: " * " An asterisk indicates that a figure is based on fewer than 25 unweighted cases and has been suppressed.Source: Philippine Statistics Authority, 2019 Annual Poverty Indicators Survey
Table 1b. Families by Selected Background Characteristics of the Family Head by Region, Residence and Sex, Philippines 2019

Appendix A – Statistical Tables I Final Report
42 Philippine Statistics Authority | 2019 Annual Poverty Indicators Survey
Selected Background Characteristics Both Sexes Male Female
REGION II - CAGAYAN VALLEYNumber of Families (Total, in thousands) 868 732 136Household Head Age Group
Total 100 100 10015 - 24 * * *25 - 34 10.5 11.8 *35 - 44 22.6 24.1 14.645 - 54 23.5 25.4 13.755 - 64 24.0 23.9 24.465 and over 18.5 14.0 43.1
Highest Grade CompletedTotal 100 100 100No Grade Completed 1.3 * *Pre-school (Kinder/Prep/Nursery) * * *Elementary Undergraduate 24.9 23.7 31.9Elementary Graduate 21.7 21.7 21.6Junior High School Undergraduate 11.7 13.1 *Junior High School Graduate 24.1 25.6 15.9Senior High School Undergraduate * * *Senior High School Graduate * * *Post Secondary Non-Tertiary Undergraduate * * *Post Secondary Non-Tertiary Graduate 0.9 1.1 *Post Secondary Short Cycle Tertiary Undergraduate * * *Post Secondary Short Cycle Tertiary Graduate * * *College Undergraduate 4.7 5.2 *College Graduate or Higher 9.4 7.6 19.0IPED/SPED/Madrasah * * *
Employment StatusTotal 100 100 100Employed 85.7 90.9 57.7Unemployed 14.3 9.1 42.3
REGION III - CENTRAL LUZONNumber of Families (Total, in thousands) 2,853 2,172 681Household Head Age Group
Total 100 100 10015 - 24 1.2 1.3 *25 - 34 13.4 14.5 10.035 - 44 20.8 23.5 12.045 - 54 24.0 25.3 19.755 - 64 21.1 20.4 23.265 and over 19.5 14.9 34.3
Highest Grade CompletedTotal 100 100 100No Grade Completed * * *Pre-school (Kinder/Prep/Nursery) * * *Elementary Undergraduate 17.2 16.7 18.8Elementary Graduate 15.2 14.7 17.1Junior High School Undergraduate 14.8 15.8 11.6Junior High School Graduate 30.7 31.5 28.1Senior High School Undergraduate * * *Senior High School Graduate * * *Post Secondary Non-Tertiary Undergraduate * * *Post Secondary Non-Tertiary Graduate 1.0 0.9 *Post Secondary Short Cycle Tertiary Undergraduate * * *Post Secondary Short Cycle Tertiary Graduate 2.2 2.0 2.6College Undergraduate 7.2 7.2 7.3College Graduate or Higher 10.7 10.5 11.5IPED/SPED/Madrasah * * *
Employment StatusTotal 100 100 100Employed 75.6 83.9 49.0Unemployed 24.4 16.1 51.0
Note: " * " An asterisk indicates that a figure is based on fewer than 25 unweighted cases and has been suppressed.Source: Philippine Statistics Authority, 2019 Annual Poverty Indicators Survey
Table 1b. Families by Selected Background Characteristics of the Family Head by Region, Residence and Sex, Philippines 2019

Appendix A – Statistical Tables I Final Report
Philippine Statistics Authority | 2019 Annual Poverty Indicators Survey 43
Selected Background Characteristics Both Sexes Male Female
REGION IV-A - CALABARZONNumber of Families (Total, in thousands) 3,876 2,821 1,056Household Head Age Group
Total 100 100 10013 - 14 * * *15 - 24 1.9 2.0 *25 - 34 12.7 13.6 10.235 - 44 24.0 27.3 15.245 - 54 24.9 25.5 23.355 - 64 21.3 20.4 24.065 and over 15.1 11.2 25.6
Highest Grade CompletedTotal 100 100 100No Grade Completed * * *Pre-school (Kinder/Prep/Nursery) * * *Elementary Undergraduate 11.6 11.2 12.7Elementary Graduate 14.2 14.1 14.4Junior High School Undergraduate 11.8 13.0 8.8Junior High School Graduate 30.7 33.3 23.8Senior High School Undergraduate * * *Senior High School Graduate * * *Post Secondary Non-Tertiary Undergraduate * * *Post Secondary Non-Tertiary Graduate 1.3 * *Post Secondary Short Cycle Tertiary Undergraduate * * *Post Secondary Short Cycle Tertiary Graduate 5.0 4.9 *College Undergraduate 8.2 8.0 8.5College Graduate or Higher 15.7 12.9 23.3IPED/SPED/Madrasah * * *
Employment StatusTotal 100 100 100Employed 78.7 84.5 63.3Unemployed 21.3 15.5 36.7
MIMAROPA REGIONNumber of Families (Total, in thousands) 754 592 162Household Head Age Group
Total 100 100 10015 - 24 1.6 1.6 *25 - 34 14.4 16.3 7.435 - 44 22.8 25.4 13.445 - 54 24.5 26.0 18.755 - 64 18.9 17.2 25.465 and over 17.8 13.5 33.3
Highest Grade CompletedTotal 100 100 100No Grade Completed 2.3 * *Pre-school (Kinder/Prep/Nursery) * * *Elementary Undergraduate 27.9 28.8 24.6Elementary Graduate 13.1 13.1 13.1Junior High School Undergraduate 14.7 16.1 9.8Junior High School Graduate 21.7 21.4 23.1Senior High School Undergraduate * * *Senior High School Graduate * * *Post Secondary Non-Tertiary Undergraduate * * *Post Secondary Non-Tertiary Graduate 1.8 1.6 *Post Secondary Short Cycle Tertiary Undergraduate * * *Post Secondary Short Cycle Tertiary Graduate 1.9 1.7 *College Undergraduate 4.8 4.8 5.0College Graduate or Higher 9.9 8.6 14.6IPED/SPED/Madrasah * * *
Employment StatusTotal 100 100 100Employed 83.9 89.0 65.5Unemployed 16.1 11.0 34.5
Note: " * " An asterisk indicates that a figure is based on fewer than 25 unweighted cases and has been suppressed.Source: Philippine Statistics Authority, 2019 Annual Poverty Indicators Survey
Table 1b. Families by Selected Background Characteristics of the Family Head by Region, Residence and Sex, Philippines 2019

Appendix A – Statistical Tables I Final Report
44 Philippine Statistics Authority | 2019 Annual Poverty Indicators Survey
Selected Background Characteristics Both Sexes Male Female
REGION V - BICOLNumber of Families (Total, in thousands) 1,300 974 326Household Head Age Group
Total 100 100 10013 - 14 * * *15 - 24 1.3 * *25 - 34 12.8 14.6 7.535 - 44 21.2 23.7 13.645 - 54 23.1 25.1 16.955 - 64 19.2 18.6 21.165 and over 22.5 17.0 38.7
Highest Grade CompletedTotal 100 100 100No Grade Completed * * *Pre-school (Kinder/Prep/Nursery) * * *Elementary Undergraduate 22.8 22.8 22.8Elementary Graduate 22.6 23.3 20.5Junior High School Undergraduate 14.8 14.9 14.6Junior High School Graduate 19.3 20.5 15.8Senior High School Undergraduate * * *Senior High School Graduate * * *Post Secondary Non-Tertiary Undergraduate * * *Post Secondary Non-Tertiary Graduate 1.6 * *Post Secondary Short Cycle Tertiary Undergraduate * * *Post Secondary Short Cycle Tertiary Graduate * * *College Undergraduate 6.0 6.4 4.7College Graduate or Higher 9.8 7.5 16.8IPED/SPED/Madrasah * * *
Employment StatusTotal 100 100 100Employed 79.3 87.8 54.2Unemployed 20.7 12.2 45.8
REGION VI - WESTERN VISAYASNumber of Families (Total, in thousands) 1,870 1,400 470Household Head Age Group
Total 100 100 10015 - 24 1.4 1.4 *25 - 34 11.0 12.2 7.535 - 44 20.2 22.3 13.745 - 54 22.1 24.1 16.155 - 64 22.2 22.4 21.565 and over 23.1 17.5 39.8
Highest Grade CompletedTotal 100 100 100No Grade Completed 1.8 2.1 *Pre-school (Kinder/Prep/Nursery) * * *Elementary Undergraduate 24.0 24.5 22.6Elementary Graduate 13.3 12.9 14.3Junior High School Undergraduate 13.0 14.0 9.9Junior High School Graduate 23.4 24.3 20.6Senior High School Undergraduate * * *Senior High School Graduate * * *Post Secondary Non-Tertiary Undergraduate * * *Post Secondary Non-Tertiary Graduate 1.7 1.8 *Post Secondary Short Cycle Tertiary Undergraduate 1.1 * *Post Secondary Short Cycle Tertiary Graduate 2.9 2.9 3.1College Undergraduate 4.4 5.0 *College Graduate or Higher 13.6 10.8 21.7IPED/SPED/Madrasah * * *
Employment StatusTotal 100 100 100Employed 76.3 82.8 56.7Unemployed 23.7 17.2 43.3
Note: " * " An asterisk indicates that a figure is based on fewer than 25 unweighted cases and has been suppressed.Source: Philippine Statistics Authority, 2019 Annual Poverty Indicators Survey
Table 1b. Families by Selected Background Characteristics of the Family Head by Region, Residence and Sex, Philippines 2019

Appendix A – Statistical Tables I Final Report
Philippine Statistics Authority | 2019 Annual Poverty Indicators Survey 45
Selected Background Characteristics Both Sexes Male Female
REGION VII - CENTRAL VISAYASNumber of Families (Total, in thousands) 1,883 1,336 547Household Head Age Group
Total 100 100 10015 - 24 1 * *25 - 34 11.1 11.6 10.135 - 44 23.4 25.7 17.945 - 54 24.0 25.4 20.555 - 64 21.2 20.7 22.565 and over 19.2 15.7 27.8
Highest Grade CompletedTotal 100 100 100No Grade Completed * * *Pre-school (Kinder/Prep/Nursery) * * *Elementary Undergraduate 31.3 31.8 30.1Elementary Graduate 13.5 14.0 12.2Junior High School Undergraduate 14.3 16.0 10.0Junior High School Graduate 17.1 17.0 17.2Senior High School Undergraduate * * *Senior High School Graduate * * *Post Secondary Non-Tertiary Undergraduate 0.7 * *Post Secondary Non-Tertiary Graduate * * *Post Secondary Short Cycle Tertiary Undergraduate 1.7 * *Post Secondary Short Cycle Tertiary Graduate 1.6 * *College Undergraduate 4.5 3.9 5.7College Graduate or Higher 13.0 11.4 16.9IPED/SPED/Madrasah * * *
Employment StatusTotal 100 100 100Employed 75.3 82.9 56.7Unemployed 24.8 17.1 43.3
REGION VIII - EASTERN VISAYASNumber of Families (Total, in thousands) 1,083 839 244Household Head Age Group
Total 100 100 10015 - 24 1.7 1.9 *25 - 34 11.5 12.8 7.235 - 44 21.4 23.5 14.145 - 54 24.7 26.9 17.055 - 64 19.6 18.7 22.665 and over 21.2 16.3 38.0
Highest Grade CompletedTotal 100 100 100No Grade Completed 2.4 1.9 *Pre-school (Kinder/Prep/Nursery) * * *Elementary Undergraduate 37.5 40.9 25.9Elementary Graduate 12.5 12.0 14.1Junior High School Undergraduate 14.1 15.3 10.1Junior High School Graduate 14.1 13.1 17.5Senior High School Undergraduate * * *Senior High School Graduate * * *Post Secondary Non-Tertiary Undergraduate * * *Post Secondary Non-Tertiary Graduate * * *Post Secondary Short Cycle Tertiary Undergraduate * * *Post Secondary Short Cycle Tertiary Graduate 1.5 * *College Undergraduate 4.2 4.4 3.6College Graduate or Higher 11.9 9.1 21.5IPED/SPED/Madrasah * * *
Employment StatusTotal 100 100 100Employed 81.2 88.1 57.6Unemployed 18.8 11.9 42.4
Note: " * " An asterisk indicates that a figure is based on fewer than 25 unweighted cases and has been suppressed.Source: Philippine Statistics Authority, 2019 Annual Poverty Indicators Survey
Table 1b. Families by Selected Background Characteristics of the Family Head by Region, Residence and Sex, Philippines 2019
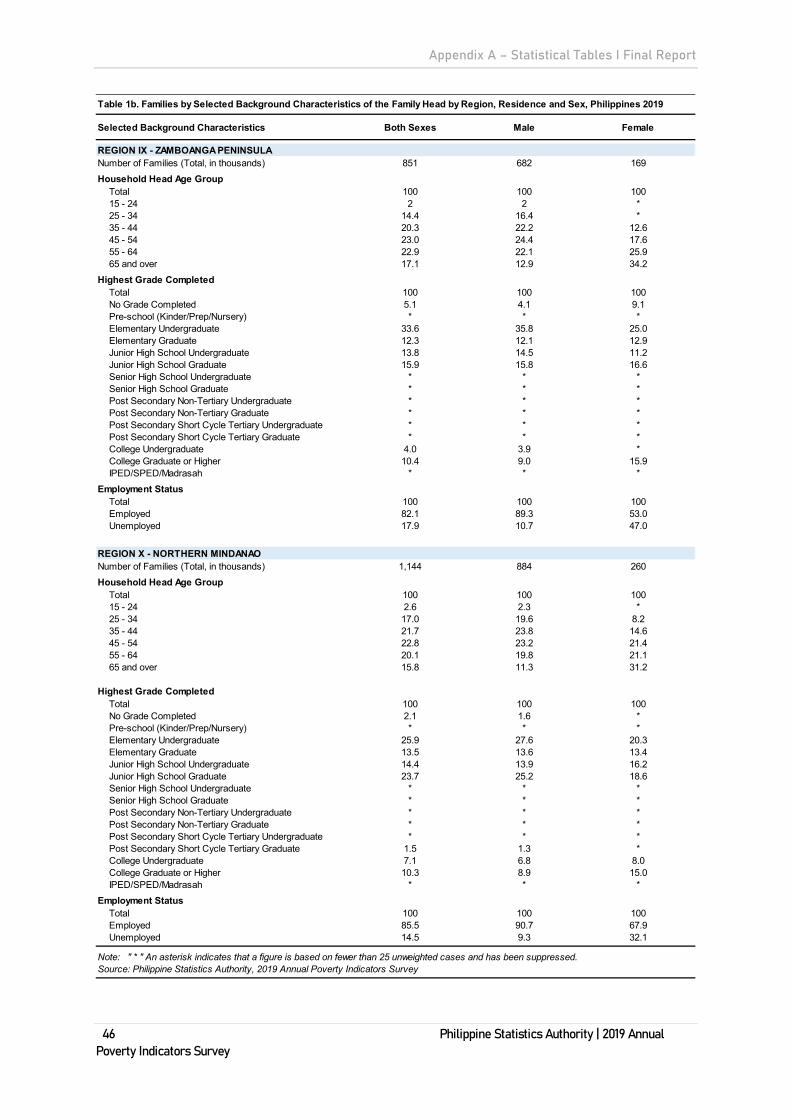
Appendix A – Statistical Tables I Final Report
46 Philippine Statistics Authority | 2019 Annual Poverty Indicators Survey
Selected Background Characteristics Both Sexes Male Female
REGION IX - ZAMBOANGA PENINSULANumber of Families (Total, in thousands) 851 682 169Household Head Age Group
Total 100 100 10015 - 24 2 2 *25 - 34 14.4 16.4 *35 - 44 20.3 22.2 12.645 - 54 23.0 24.4 17.655 - 64 22.9 22.1 25.965 and over 17.1 12.9 34.2
Highest Grade CompletedTotal 100 100 100No Grade Completed 5.1 4.1 9.1Pre-school (Kinder/Prep/Nursery) * * *Elementary Undergraduate 33.6 35.8 25.0Elementary Graduate 12.3 12.1 12.9Junior High School Undergraduate 13.8 14.5 11.2Junior High School Graduate 15.9 15.8 16.6Senior High School Undergraduate * * *Senior High School Graduate * * *Post Secondary Non-Tertiary Undergraduate * * *Post Secondary Non-Tertiary Graduate * * *Post Secondary Short Cycle Tertiary Undergraduate * * *Post Secondary Short Cycle Tertiary Graduate * * *College Undergraduate 4.0 3.9 *College Graduate or Higher 10.4 9.0 15.9IPED/SPED/Madrasah * * *
Employment StatusTotal 100 100 100Employed 82.1 89.3 53.0Unemployed 17.9 10.7 47.0
REGION X - NORTHERN MINDANAONumber of Families (Total, in thousands) 1,144 884 260Household Head Age Group
Total 100 100 10015 - 24 2.6 2.3 *25 - 34 17.0 19.6 8.235 - 44 21.7 23.8 14.645 - 54 22.8 23.2 21.455 - 64 20.1 19.8 21.165 and over 15.8 11.3 31.2
Highest Grade CompletedTotal 100 100 100No Grade Completed 2.1 1.6 *Pre-school (Kinder/Prep/Nursery) * * *Elementary Undergraduate 25.9 27.6 20.3Elementary Graduate 13.5 13.6 13.4Junior High School Undergraduate 14.4 13.9 16.2Junior High School Graduate 23.7 25.2 18.6Senior High School Undergraduate * * *Senior High School Graduate * * *Post Secondary Non-Tertiary Undergraduate * * *Post Secondary Non-Tertiary Graduate * * *Post Secondary Short Cycle Tertiary Undergraduate * * *Post Secondary Short Cycle Tertiary Graduate 1.5 1.3 *College Undergraduate 7.1 6.8 8.0College Graduate or Higher 10.3 8.9 15.0IPED/SPED/Madrasah * * *
Employment StatusTotal 100 100 100Employed 85.5 90.7 67.9Unemployed 14.5 9.3 32.1
Note: " * " An asterisk indicates that a figure is based on fewer than 25 unweighted cases and has been suppressed.Source: Philippine Statistics Authority, 2019 Annual Poverty Indicators Survey
Table 1b. Families by Selected Background Characteristics of the Family Head by Region, Residence and Sex, Philippines 2019

Appendix A – Statistical Tables I Final Report
Philippine Statistics Authority | 2019 Annual Poverty Indicators Survey 47
Selected Background Characteristics Both Sexes Male Female
REGION XI - DAVAONumber of Families (Total, in thousands) 1,320 1,042 278Household Head Age Group
Total 100 100 10015 - 24 3 3 *25 - 34 15.8 17.6 9.035 - 44 22.8 25.4 12.745 - 54 23.9 24.8 20.755 - 64 18.4 16.9 24.165 and over 16.1 12.7 28.9
Highest Grade CompletedTotal 100 100 100No Grade Completed 2.2 2.0 *Pre-school (Kinder/Prep/Nursery) * * *Elementary Undergraduate 21.2 22.4 16.7Elementary Graduate 15.8 16.8 12.0Junior High School Undergraduate 16.3 16.7 14.9Junior High School Graduate 23.6 23.3 24.6Senior High School Undergraduate * * *Senior High School Graduate * * *Post Secondary Non-Tertiary Undergraduate * * *Post Secondary Non-Tertiary Graduate 1.7 1.7 *Post Secondary Short Cycle Tertiary Undergraduate * * *Post Secondary Short Cycle Tertiary Graduate * * *College Undergraduate 6.6 6.1 8.5College Graduate or Higher 9.4 8.2 13.7IPED/SPED/Madrasah * * *
Employment StatusTotal 100 100 100Employed 80.8 88.2 53.1Unemployed 19.2 11.8 46.9
REGION XII - SOCCSKSARGENNumber of Families (Total, in thousands) 1,156 940 216Household Head Age Group
Total 100 100 10015 - 24 2.7 2.7 *25 - 34 17.5 19.6 8.635 - 44 23.5 25.5 14.645 - 54 22.9 23.7 19.155 - 64 18.0 16.8 23.465 and over 15.3 11.7 31.3
Highest Grade CompletedTotal 100 100 100No Grade Completed 5.2 4.9 6.5Pre-school (Kinder/Prep/Nursery) * * *Elementary Undergraduate 26.5 27.9 20.3Elementary Graduate 10.0 9.8 10.8Junior High School Undergraduate 14.7 15.4 11.3Junior High School Graduate 23.4 24.0 20.8Senior High School Undergraduate * * *Senior High School Graduate * * *Post Secondary Non-Tertiary Undergraduate * * *Post Secondary Non-Tertiary Graduate 2.5 2.2 *Post Secondary Short Cycle Tertiary Undergraduate * * *Post Secondary Short Cycle Tertiary Graduate 1.8 * *College Undergraduate 4.0 3.5 *College Graduate or Higher 9.6 8.4 15.1IPED/SPED/Madrasah * * *
Employment StatusTotal 100 100 100Employed 83.4 88.6 60.8Unemployed 16.6 11.4 39.2
Note: " * " An asterisk indicates that a figure is based on fewer than 25 unweighted cases and has been suppressed.Source: Philippine Statistics Authority, 2019 Annual Poverty Indicators Survey
Table 1b. Families by Selected Background Characteristics of the Family Head by Region, Residence and Sex, Philippines 2019

Appendix A – Statistical Tables I Final Report
48 Philippine Statistics Authority | 2019 Annual Poverty Indicators Survey
Selected Background Characteristics Both Sexes Male Female
REGION XIII - CARAGANumber of Families (Total, in thousands) 634 500 134Household Head Age Group
Total 100 100 10015 - 24 2 2 *25 - 34 14.3 16.3 7.135 - 44 19.9 21.6 13.845 - 54 23.6 24.7 19.355 - 64 20.8 19.8 24.365 and over 19.5 15.5 34.7
Highest Grade CompletedTotal 100 100 100No Grade Completed 1.6 * *Pre-school (Kinder/Prep/Nursery) * * *Elementary Undergraduate 33.7 34.4 31.3Elementary Graduate 8.9 9.0 8.7Junior High School Undergraduate 19.3 20.0 16.9Junior High School Graduate 14.9 14.7 15.2Senior High School Undergraduate * * *Senior High School Graduate * * *Post Secondary Non-Tertiary Undergraduate * * *Post Secondary Non-Tertiary Graduate * * *Post Secondary Short Cycle Tertiary Undergraduate * * *Post Secondary Short Cycle Tertiary Graduate 1.7 1.9 *College Undergraduate 6.3 6.2 6.9College Graduate or Higher 12.0 10.7 17.0IPED/SPED/Madrasah * * *
Employment StatusTotal 100 100 100Employed 80.4 86.0 59.6Unemployed 19.6 14.0 40.4
BANGSAMORO BANGSAMORO AUTONOMOUS REGION IN MUSLIM MINDANAONumber of Families (Total, in thousands) 670 590 79Household Head Age Group
Total 100 100 10015 - 24 2.6 2.9 *25 - 34 19.7 21.5 *35 - 44 27.5 28.8 17.645 - 54 23.6 22.6 31.055 - 64 16.0 14.8 24.765 and over 10.6 9.3 20.3
Highest Grade CompletedTotal 100 100 100No Grade Completed 16.2 15.2 24.1Pre-school (Kinder/Prep/Nursery) * * *Elementary Undergraduate 44.2 44.6 41.4Elementary Graduate 5.0 4.9 *Junior High School Undergraduate 11.5 12.3 *Junior High School Graduate 11.9 12.3 *Senior High School Undergraduate * * *Senior High School Graduate * * *Post Secondary Non-Tertiary Undergraduate * * *Post Secondary Non-Tertiary Graduate * * *Post Secondary Short Cycle Tertiary Undergraduate * * *Post Secondary Short Cycle Tertiary Graduate * * *College Undergraduate 4.4 4.8 *College Graduate or Higher 4.8 4.2 9.4IPED/SPED/Madrasah * * *
Employment StatusTotal 100 100 100Employed 92.8 94.7 78.2Unemployed 7.2 5.3 21.8
Note: " * " An asterisk indicates that a figure is based on fewer than 25 unweighted cases and has been suppressed.Source: Philippine Statistics Authority, 2019 Annual Poverty Indicators Survey
Table 1b. Families by Selected Background Characteristics of the Family Head by Region, Residence and Sex, Philippines 2019

Appendix A – Statistical Tables I Final Report
Philippine Statistics Authority | 2019 Annual Poverty Indicators Survey 49
Selected Background Characteristics Both Sexes Male Female
URBANNumber of Families (Total, in thousands) 13,041 9,512 3,529Household Head Household Head Age Group
Total 100 100 10013 - 14 * * *15 - 24 2.4 2.4 2.625 - 34 14.5 15.8 10.835 - 44 23.2 26.3 14.845 - 54 23.5 24.4 21.155 - 64 19.5 18.3 22.865 and over 16.8 12.8 27.9
Highest Grade CompletedTotal 100 100 100No Grade Completed 1.0 0.9 1.1Pre-school (Kinder/Prep/Nursery) * * *Elementary Undergraduate 14.3 14.6 13.3Elementary Graduate 10.1 9.7 11.0Junior High School Undergraduate 12.5 13.1 10.9Junior High School Graduate 29.4 31.0 25.2Senior High School Undergraduate 0.1 0.1 *Senior High School Graduate * * *Post Secondary Non-Tertiary Undergraduate 0.7 0.7 0.7Post Secondary Non-Tertiary Graduate 1.4 1.4 1.5Post Secondary Short Cycle Tertiary Undergraduate 0.9 0.8 1.1Post Secondary Short Cycle Tertiary Graduate 3.0 2.8 3.4College Undergraduate 9.1 9.1 9.1College Graduate or Higher 17.4 15.6 22.4IPED/SPED/Madrasah * * *
Employment StatusTotal 100 100 100Employed 76.7 83.9 57.3Unemployed 23.3 16.1 42.7
RURALNumber of Families (Total, in thousands) 12,269 9,650 2,620Household Head Household Head Age Group
Total 100 100 10013 - 14 * * *15 - 24 1.3 1.3 1.025 - 34 12.8 14.4 7.035 - 44 21.4 23.6 13.545 - 54 23.1 24.7 17.555 - 64 21.6 21.0 23.665 and over 19.8 15.0 37.4
Highest Grade CompletedTotal 100.0 100.0 100.0No Grade Completed 2.6 2.4 3.2Pre-school (Kinder/Prep/Nursery) * * *Elementary Undergraduate 28.0 28.4 26.6Elementary Graduate 16.5 16.4 16.8Junior High School Undergraduate 14.1 15.2 10.0Junior High School Graduate 22.0 22.6 19.7Senior High School Undergraduate 0.1 * *Senior High School Graduate * * *Post Secondary Non-Tertiary Undergraduate 0.4 0.4 0.5Post Secondary Non-Tertiary Graduate 1.3 1.4 1.3Post Secondary Short Cycle Tertiary Undergraduate 0.6 0.5 0.9Post Secondary Short Cycle Tertiary Graduate 1.7 1.5 2.4College Undergraduate 4.4 4.5 4.0College Graduate or Higher 8.4 6.7 14.5IPED/SPED/Madrasah * * *
Employment StatusTotal 100 100 100Employed 81.0 87.7 56.4Unemployed 19.0 12.3 43.6
Note: " * " An asterisk indicates that a figure is based on fewer than 25 unweighted cases and has been suppressed.Source: Philippine Statistics Authority, 2019 Annual Poverty Indicators Survey
Table 1b. Families by Selected Background Characteristics of the Family Head by Region, Residence and Sex, Philippines 2019

Appendix A – Statistical Tables I Final Report
50 Philippine Statistics Authority | 2019 Annual Poverty Indicators Survey
Tabl
e 2.
Fam
ilies
by
Tenu
re S
tatu
s of
the
Hous
ing
Unit
and
Lot T
hey
Occ
upy
by R
egio
n an
d Re
side
nce,
Phi
lippi
nes
2019
Tota
l
Ow
n ho
use
and
lot o
r ow
ner-l
ike
poss
essi
on o
f ho
use
and
lot
Rent
hou
se/
room
incl
udin
g lo
t
Ow
n ho
use,
rent
lot
Ow
n ho
use,
re
nt-fr
ee lo
t w
ith c
onse
nt
of o
wne
r
Ow
n ho
use,
re
nt-fr
ee lo
t w
ithou
t co
nsen
t of
owne
r
Rent
-free
ho
use
and
lot w
ith
cons
ent o
f ow
ner
Rent
-free
ho
use
and
lot w
ithou
t co
nsen
t of
owne
r
PHIL
IPPI
NES
25,3
10
10
064
.18.
32.
414
.83.
26.
70.
4N
ATI
ON
AL
CA
PIT
AL
RE
GIO
N
3,38
5
100
55.4
24.9
1.3
4.8
3.0
10.0
0.6
CO
RD
ILLE
RA
AD
MIN
ISTR
ATI
VE
RE
GIO
N
431
100
80.3
8.9
*2.
9*
6.5
*R
EG
ION
I - I
LOC
OS
1,23
2
100
85.0
*1.
15.
9*
5.6
*R
EG
ION
II -
CA
GA
YA
N V
ALL
EY
86
8
10
091
.51.
6*
2.3
*4.
2*
RE
GIO
N II
I - C
EN
TRA
L LU
ZON
2,
853
10
078
.36.
92.
65.
52.
34.
1*
RE
GIO
N IV
-A -
CA
LAB
AR
ZON
3,
876
10
062
.314
.41.
98.
93.
98.
4*
MIM
AR
OP
A R
EG
ION
75
4
10
066
.93.
7*
20.9
1.7
6.3
*R
EG
ION
V -
BIC
OL
1,30
0
100
52.9
2.5
2.5
32.2
3.5
6.2
*R
EG
ION
VI -
WE
STE
RN
VIS
AY
AS
1,
870
10
048
.91.
43.
438
.53.
83.
9*
RE
GIO
N V
II - C
EN
TRA
L V
ISA
YA
S
1,88
3
100
67.1
5.8
3.5
13.6
3.9
4.5
*R
EG
ION
VIII
- E
AS
TER
N V
ISA
YA
S
1,08
3
100
57.1
1.6
6.0
24.4
3.9
5.4
1.6
RE
GIO
N IX
- ZA
MB
OA
NG
A P
EN
INS
ULA
85
1
10
052
.12.
24.
529
.34.
57.
3*
RE
GIO
N X
- N
OR
THE
RN
MIN
DA
NA
O
1,14
4
100
65.1
4.4
1.7
18.9
1.9
7.7
*R
EG
ION
XI -
DA
VA
O
1,32
0
100
63.6
6.7
2.0
14.0
3.4
9.4
*R
EG
ION
XII
- SO
CC
SK
SA
RG
EN
1,
156
10
067
.33.
51.
114
.94.
88.
3*
RE
GIO
N X
III -
CA
RA
GA
63
4
10
053
.53.
18.
625
.43.
26.
0*
BA
NG
SA
MO
RO
AU
TON
OM
OU
S R
EG
ION
IN
MU
SLI
M M
IND
AN
AO
670
100
57.8
*3.
926
.95.
45.
6*
Resi
denc
eU
rban
13,0
41
10
060
.214
.42.
610
.93.
67.
8*
Rur
al12
,269
100
68.3
1.8
2.2
19.0
2.7
5.6
*
Not
e: "
* "
An
aste
risk
indi
cate
s th
at a
figu
re is
bas
ed o
n fe
wer t
han
25 u
nwei
ghte
d ca
ses
and
has
been
sup
pres
sed.
Sou
rce:
Phi
lippi
ne S
tatis
tics
Aut
horit
y, 2
019
Ann
ual P
over
ty In
dica
tors
Sur
vey
Regi
on/ R
esid
ence
Num
ber o
f Fa
mili
es
(Tot
al,
in th
ousa
nds)
Tenu
re S
tatu
s of
the
Hous
ing
Unit
and
Lot (
Perc
ent D
istri
butio
n)
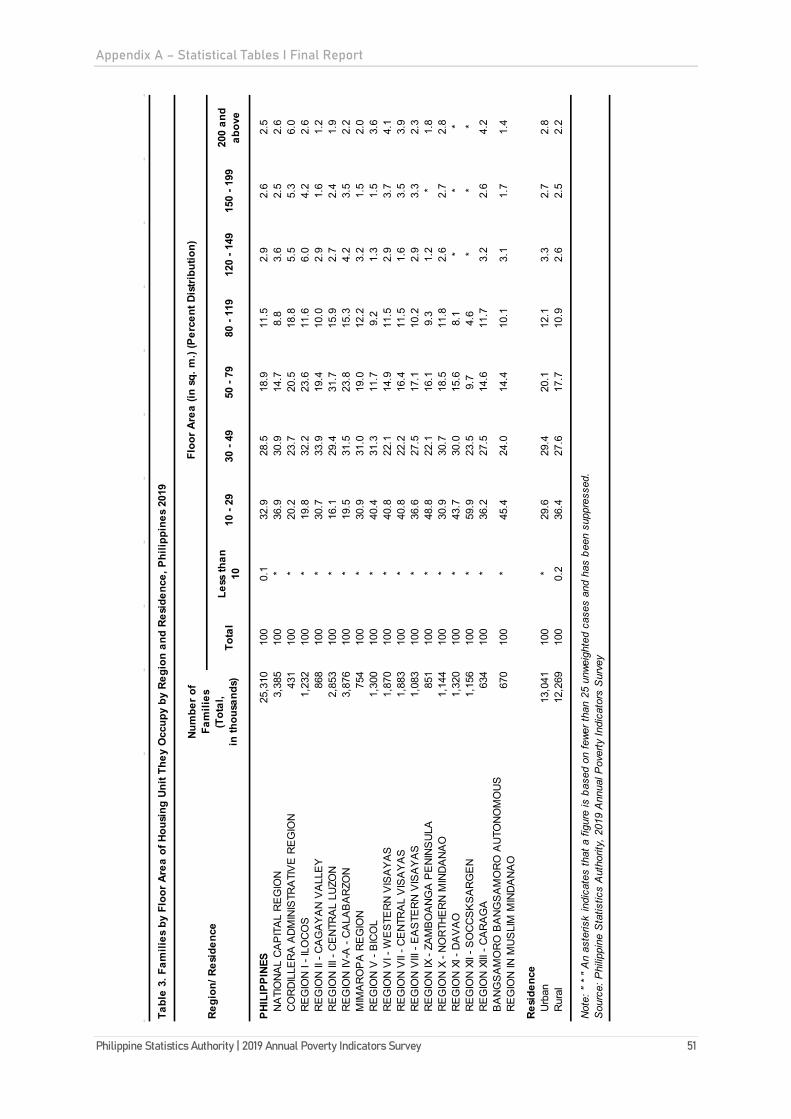
Appendix A – Statistical Tables I Final Report
Philippine Statistics Authority | 2019 Annual Poverty Indicators Survey 51
Tabl
e 3.
Fam
ilies
by
Floo
r Are
a of
Hou
sing
Uni
t The
y O
ccup
y by
Reg
ion
and
Resi
denc
e, P
hilip
pine
s 20
19
Tota
lLe
ss th
an
1010
- 29
30 -
4950
- 79
80 -
119
120
- 149
150
- 199
200
and
abov
e
PHIL
IPPI
NES
25,3
1010
00.
132
.928
.518
.911
.52.
92.
62.
5N
ATI
ON
AL
CA
PIT
AL
RE
GIO
N
3,38
510
0*
36.9
30.9
14.7
8.8
3.6
2.5
2.6
CO
RD
ILLE
RA
AD
MIN
ISTR
ATI
VE
RE
GIO
N
431
100
*20
.223
.720
.518
.85.
55.
36.
0R
EG
ION
I - I
LOC
OS
1,23
210
0*
19.8
32.2
23.6
11.6
6.0
4.2
2.6
RE
GIO
N II
- C
AG
AY
AN
VA
LLE
Y
868
100
*30
.733
.919
.410
.02.
91.
61.
2R
EG
ION
III -
CE
NTR
AL
LUZO
N
2,85
310
0*
16.1
29.4
31.7
15.9
2.7
2.4
1.9
RE
GIO
N IV
-A -
CA
LAB
AR
ZON
3,
876
100
*19
.531
.523
.815
.34.
23.
52.
2M
IMA
RO
PA
RE
GIO
N
754
100
*30
.931
.019
.012
.23.
21.
52.
0R
EG
ION
V -
BIC
OL
1,30
010
0*
40.4
31.3
11.7
9.2
1.3
1.5
3.6
RE
GIO
N V
I - W
ES
TER
N V
ISA
YA
S
1,87
010
0*
40.8
22.1
14.9
11.5
2.9
3.7
4.1
RE
GIO
N V
II - C
EN
TRA
L V
ISA
YA
S
1,88
310
0*
40.8
22.2
16.4
11.5
1.6
3.5
3.9
RE
GIO
N V
III -
EA
STE
RN
VIS
AY
AS
1,
083
100
*36
.627
.517
.110
.22.
93.
32.
3R
EG
ION
IX -
ZAM
BO
AN
GA
PE
NIN
SU
LA
851
100
*48
.822
.116
.19.
31.
2*
1.8
RE
GIO
N X
- N
OR
THE
RN
MIN
DA
NA
O
1,14
410
0*
30.9
30.7
18.5
11.8
2.6
2.7
2.8
RE
GIO
N X
I - D
AV
AO
1,
320
100
*43
.730
.015
.68.
1*
**
RE
GIO
N X
II - S
OC
CS
KS
AR
GE
N
1,15
610
0*
59.9
23.5
9.7
4.6
**
*R
EG
ION
XIII
- C
AR
AG
A
634
100
*36
.227
.514
.611
.73.
22.
64.
2B
AN
GS
AM
OR
O B
AN
GS
AM
OR
O A
UTO
NO
MO
US
R
EG
ION
IN M
US
LIM
MIN
DA
NA
O67
010
0*
45.4
24.0
14.4
10.1
3.1
1.7
1.4
Resi
denc
eU
rban
13,0
4110
0*
29.6
29.4
20.1
12.1
3.3
2.7
2.8
Rur
al12
,269
100
0.2
36.4
27.6
17.7
10.9
2.6
2.5
2.2
Not
e: "
* "
An
aste
risk
indi
cate
s th
at a
figu
re is
bas
ed o
n fe
wer t
han
25 u
nwei
ghte
d ca
ses
and
has
been
sup
pres
sed.
Sou
rce:
Phi
lippi
ne S
tatis
tics
Aut
horit
y, 2
019
Ann
ual P
over
ty In
dica
tors
Sur
vey
Regi
on/ R
esid
ence
Num
ber o
f Fa
mili
es
(Tot
al,
in th
ousa
nds)
Floo
r Are
a (in
sq.
m.)
(Per
cent
Dis
tribu
tion)
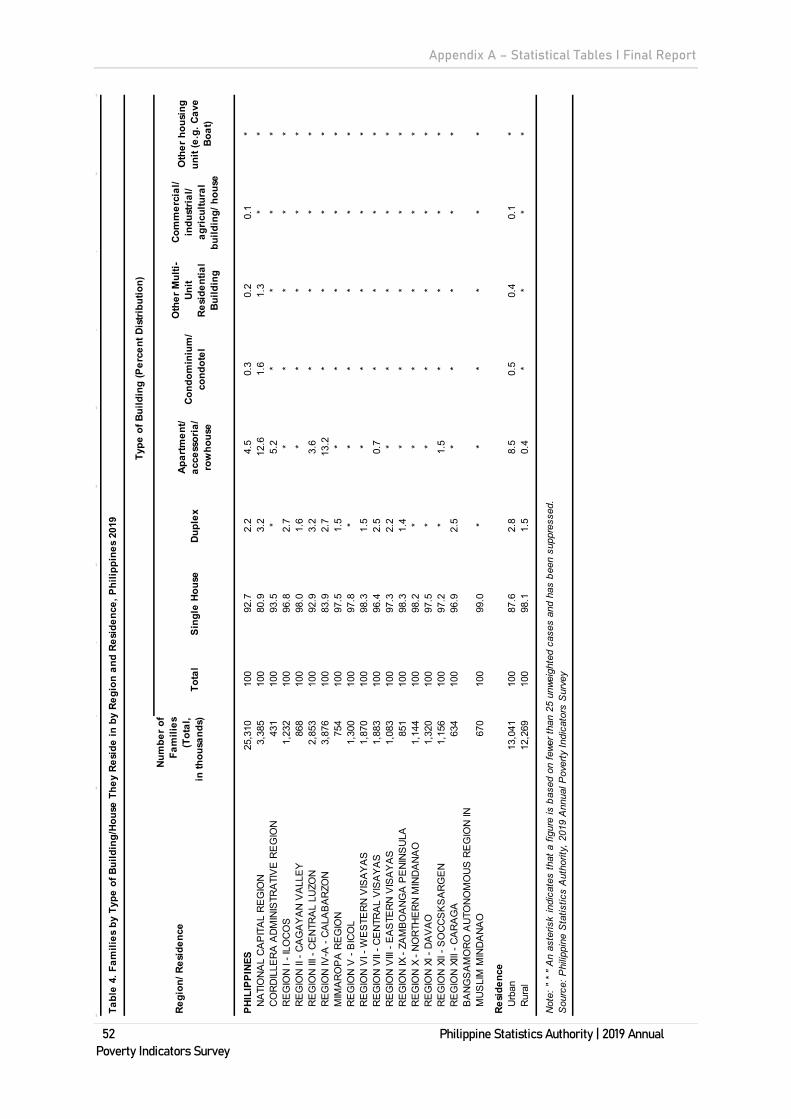
Appendix A – Statistical Tables I Final Report
52 Philippine Statistics Authority | 2019 Annual Poverty Indicators Survey
Tabl
e 4.
Fam
ilies
by
Type
of B
uild
ing/
Hous
e Th
ey R
esid
e in
by
Regi
on a
nd R
esid
ence
, Phi
lippi
nes
2019
Tota
lSi
ngle
Hou
seDu
plex
Apar
tmen
t/ ac
cess
oria
/ ro
who
use
Cond
omin
ium
/ co
ndot
el
Oth
er M
ulti-
Unit
Resi
dent
ial
Build
ing
Com
mer
cial
/ in
dust
rial/
agric
ultu
ral
build
ing/
hou
se
Oth
er h
ousi
ng
unit
(e.g
. Cav
e Bo
at)
PHIL
IPPI
NES
25,3
10
10
092
.72.
24.
50.
30.
20.
1*
NA
TIO
NA
L C
AP
ITA
L R
EG
ION
3,
385
10
080
.93.
212
.61.
61.
3*
*C
OR
DIL
LER
A A
DM
INIS
TRA
TIV
E R
EG
ION
43
1
10
093
.5*
5.2
**
**
RE
GIO
N I
- ILO
CO
S1,
232
10
096
.82.
7*
**
**
RE
GIO
N II
- C
AG
AY
AN
VA
LLE
Y
868
100
98.0
1.6
**
**
*R
EG
ION
III -
CE
NTR
AL
LUZO
N
2,85
3
100
92.9
3.2
3.6
**
**
RE
GIO
N IV
-A -
CA
LAB
AR
ZON
3,
876
10
083
.92.
713
.2*
**
*M
IMA
RO
PA
RE
GIO
N
754
100
97.5
1.5
**
**
*R
EG
ION
V -
BIC
OL
1,30
0
100
97.8
**
**
**
RE
GIO
N V
I - W
ES
TER
N V
ISA
YA
S
1,87
0
100
98.3
1.5
**
**
*R
EG
ION
VII
- CE
NTR
AL
VIS
AY
AS
1,
883
10
096
.42.
50.
7*
**
*R
EG
ION
VIII
- E
AS
TER
N V
ISA
YA
S
1,08
3
100
97.3
2.2
**
**
*R
EG
ION
IX -
ZAM
BO
AN
GA
PE
NIN
SU
LA
851
100
98.3
1.4
**
**
*R
EG
ION
X -
NO
RTH
ER
N M
IND
AN
AO
1,
144
10
098
.2*
**
**
*R
EG
ION
XI -
DA
VA
O
1,32
0
100
97.5
**
**
**
RE
GIO
N X
II - S
OC
CS
KS
AR
GE
N
1,15
6
100
97.2
*1.
5*
**
*R
EG
ION
XIII
- C
AR
AG
A
634
100
96.9
2.5
**
**
*B
AN
GS
AM
OR
O A
UTO
NO
MO
US
RE
GIO
N IN
M
US
LIM
MIN
DA
NA
O67
0
10
099
.0*
**
**
*
Resi
denc
eU
rban
13,0
41
10
087
.62.
88.
50.
50.
40.
1*
Rur
al12
,269
100
98.1
1.5
0.4
**
**
Not
e: "
* "
An
aste
risk
indi
cate
s th
at a
figu
re is
bas
ed o
n fe
wer t
han
25 u
nwei
ghte
d ca
ses
and
has
been
sup
pres
sed.
Sou
rce:
Phi
lippi
ne S
tatis
tics
Aut
horit
y, 2
019
Ann
ual P
over
ty In
dica
tors
Sur
vey
Regi
on/ R
esid
ence
Num
ber o
f Fa
mili
es
(Tot
al,
in th
ousa
nds)
Type
of B
uild
ing
(Per
cent
Dis
tribu
tion)

Appendix A – Statistical Tables I Final Report
Philippine Statistics Authority | 2019 Annual Poverty Indicators Survey 53
Tabl
e 5.
Fam
ilies
by
Type
of C
onst
ruct
ion
Mat
eria
ls o
f the
Roo
f of B
uild
ing
They
Occ
upy
by R
egio
n an
d Re
side
nce,
Phi
lippi
nes
2019
Tota
lSt
rong
mat
eria
lsLi
ght
mat
eria
ls
Salv
aged
/ m
akes
hift
mat
eria
ls
Mix
ed b
ut
pred
omin
antly
st
rong
m
ater
ials
Mix
ed b
ut
pred
omin
antly
lig
ht m
ater
ials
Mix
ed b
ut
pred
omin
antly
sa
lvag
ed
mat
eria
ls
Not a
pplic
able
PHIL
IPPI
NES
25,3
10
100
91.1
5.7
0.5
1.7
0.7
0.1
0.2
NA
TIO
NA
L C
AP
ITA
L R
EG
ION
3,
385
100
93.7
0.4
0.7
3.1
0.7
*1.
3C
OR
DIL
LER
A A
DM
INIS
TRA
TIV
E R
EG
ION
43
1
100
94.4
1.8
*3.
2*
**
RE
GIO
N I
- ILO
CO
S1,
232
100
94.9
4.1
**
**
*R
EG
ION
II -
CA
GA
YA
N V
ALL
EY
86
8
100
94.9
2.7
*2.
0*
**
RE
GIO
N II
I - C
EN
TRA
L LU
ZON
2,
853
100
96.1
2.5
*0.
7*
**
RE
GIO
N IV
-A -
CA
LAB
AR
ZON
3,
876
100
97.5
1.4
**
**
*M
IMA
RO
PA
RE
GIO
N
754
10
079
.416
.5*
2.3
**
*R
EG
ION
V -
BIC
OL
1,30
0
10
074
.520
.1*
3.3
**
*R
EG
ION
VI -
WE
STE
RN
VIS
AY
AS
1,
870
100
90.8
6.0
*1.
8*
**
RE
GIO
N V
II - C
EN
TRA
L V
ISA
YA
S
1,88
3
10
089
.95.
40.
91.
42.
1*
*R
EG
ION
VIII
- E
AS
TER
N V
ISA
YA
S
1,08
3
10
090
.47.
2*
1.3
0.8
**
RE
GIO
N IX
- ZA
MB
OA
NG
A P
EN
INS
ULA
85
1
100
79.7
16.2
*2.
3*
**
RE
GIO
N X
- N
OR
THE
RN
MIN
DA
NA
O
1,14
4
10
090
.86.
9*
1.5
**
*R
EG
ION
XI -
DA
VA
O
1,32
0
10
086
.66.
0*
4.2
**
*R
EG
ION
XII
- SO
CC
SK
SA
RG
EN
1,
156
100
93.4
5.4
**
**
*R
EG
ION
XIII
- C
AR
AG
A
634
10
081
.117
.8*
**
**
BA
NG
SA
MO
RO
AU
TON
OM
OU
S R
EG
ION
IN
MU
SLI
M M
IND
AN
AO
670
10
088
.110
.4*
1.0
**
*
Resi
denc
eU
rban
13,0
41
100
93.3
2.7
0.6
2.0
0.9
*0.
4R
ural
12,2
69
100
88.9
8.9
0.3
1.5
0.4
**
Not
e: "
* "
An
aste
risk
indi
cate
s th
at a
figu
re is
bas
ed o
n fe
wer t
han
25 u
nwei
ghte
d ca
ses
and
has
been
sup
pres
sed.
Sou
rce:
Phi
lippi
ne S
tatis
tics
Aut
horit
y, 2
019
Ann
ual P
over
ty In
dica
tors
Sur
vey
Regi
on/ R
esid
ence
Num
ber o
f Fa
mili
es
(Tot
al,
in th
ousa
nds)
Cons
truct
ion
Mat
eria
ls o
f the
Roo
f (Pe
rcen
t Dis
tribu
tion)

Appendix A – Statistical Tables I Final Report
54 Philippine Statistics Authority | 2019 Annual Poverty Indicators Survey
Tabl
e 6.
Fam
ilies
by
Type
of C
onst
ruct
ion
Mat
eria
ls o
f the
Out
er W
alls
of B
uild
ing
They
Occ
upy
by R
egio
n an
d Re
side
nce,
Phi
lippi
nes
2019
Tota
lSt
rong
m
ater
ials
Ligh
tm
ater
ials
Salv
aged
/ m
akes
hift
mat
eria
ls
Mix
ed b
ut
pred
omin
antly
st
rong
m
ater
ials
Mix
ed b
ut
pred
omin
antly
lig
ht m
ater
ials
Mix
ed b
ut
pred
omin
antly
sa
lvag
ed
mat
eria
ls
Not a
pplic
able
PHIL
IPPI
NES
25,3
10
100
73.5
16.2
0.9
5.7
3.3
0.2
0.3
NA
TIO
NA
L C
AP
ITA
L R
EG
ION
3,
385
100
87.5
0.6
0.5
8.0
2.1
*1.
3C
OR
DIL
LER
A A
DM
INIS
TRA
TIV
E R
EG
ION
43
1
100
88.2
4.9
1.0
4.3
1.3
**
RE
GIO
N I
- ILO
CO
S1,
232
100
79.3
13.6
*4.
3*
**
RE
GIO
N II
- C
AG
AY
AN
VA
LLE
Y
868
10
085
.35.
7*
7.6
**
*R
EG
ION
III -
CE
NTR
AL
LUZO
N
2,85
3
10
090
.16.
00.
72.
20.
7*
*R
EG
ION
IV-A
- C
ALA
BA
RZO
N
3,87
6
10
086
.16.
3*
4.6
2.0
**
MIM
AR
OP
A R
EG
ION
75
4
100
54.3
35.2
1.5
4.4
4.4
**
RE
GIO
N V
- B
ICO
L 1,
300
100
69.3
18.1
*6.
54.
5*
*R
EG
ION
VI -
WE
STE
RN
VIS
AY
AS
1,
870
100
54.9
31.1
1.9
6.2
4.9
**
RE
GIO
N V
II - C
EN
TRA
L V
ISA
YA
S
1,88
3
10
066
.023
.51.
13.
85.
3*
*R
EG
ION
VIII
- E
AS
TER
N V
ISA
YA
S
1,08
3
10
063
.523
.61.
74.
75.
8*
*R
EG
ION
IX -
ZAM
BO
AN
GA
PE
NIN
SU
LA
851
10
054
.735
.31.
43.
64.
7*
*R
EG
ION
X -
NO
RTH
ER
N M
IND
AN
AO
1,
144
100
68.4
22.2
*6.
12.
7*
*R
EG
ION
XI -
DA
VA
O
1,32
0
10
047
.526
.3*
12.6
12.2
**
RE
GIO
N X
II - S
OC
CS
KS
AR
GE
N
1,15
6
10
048
.236
.6*
11.7
3.0
**
RE
GIO
N X
III -
CA
RA
GA
63
4
100
74.2
21.7
*1.
51.
6*
*B
AN
GS
AM
OR
O A
UTO
NO
MO
US
RE
GIO
N IN
M
US
LIM
MIN
DA
NA
O67
0
100
68.1
25.9
*3.
31.
5*
*
Resi
denc
eU
rban
13,0
41
100
79.3
9.7
1.0
5.9
3.5
0.2
0.4
Rur
al12
,269
10
0.0
67.2
23.1
0.8
5.5
3.2
0.2
*
Not
e: "
* "
An
aste
risk
indi
cate
s th
at a
figu
re is
bas
ed o
n fe
wer t
han
25 u
nwei
ghte
d ca
ses
and
has
been
sup
pres
sed.
Sou
rce:
Phi
lippi
ne S
tatis
tics
Aut
horit
y, 2
019
Ann
ual P
over
ty In
dica
tors
Sur
vey
Regi
on/ R
esid
ence
Num
ber o
f Fa
mili
es
(Tot
al,
in th
ousa
nds)
Cons
truct
ion
Mat
eria
ls o
f the
Out
er W
alls
(Per
cent
Dis
tribu
tion)

Appendix A – Statistical Tables I Final Report
Philippine Statistics Authority | 2019 Annual Poverty Indicators Survey 55
Tabl
e 7.
1 Fa
mili
es w
ith E
lect
ricity
in H
ouse
/Bui
ldin
g Th
ey R
esid
e in
, Mai
n So
urce
of W
ater
Sup
ply
by R
egio
n an
d Re
side
nce,
Phi
lippi
nes
2019
With
El
ectri
city
Tota
l D
wel
ling
Yar
d/
Plot
P
ublic
Ta
p Pr
otec
ted
Wel
lUn
prot
ecte
d W
ell
Deve
lope
d Sp
ring
Unde
velo
ped
Spr
ing
Rive
rs/
Stre
am/
Pond
/ La
ke/
Dam
Rain
W
ater
Tank
er
Truc
k/
Pedd
ler/
Neig
hbor
PHIL
IPPI
NES
25,3
10
94
.1
100
53.9
7.8
4.9
22.0
3.8
3.0
1.6
0.5
0.3
2.3
NA
TIO
NA
L C
AP
ITA
L R
EG
ION
3,
385
99.2
10
090
.45.
51.
4*
**
**
*2.
4C
OR
DIL
LER
A A
DM
INIS
TRA
TIV
E R
EG
ION
43
1
94.9
10
046
.611
.02.
313
.01.
318
.64.
0*
*2.
4R
EG
ION
I - I
LOC
OS
1,23
2
97
.3
100
34.4
4.5
*52
.53.
93.
1*
**
*R
EG
ION
II -
CA
GA
YA
N V
ALL
EY
86
8
95.6
10
022
.24.
5*
57.4
2.8
3.1
2.2
**
7.2
RE
GIO
N II
I - C
EN
TRA
L LU
ZON
2,
853
97.7
10
066
.32.
70.
828
.0*
0.3
0.8
**
*R
EG
ION
IV-A
- C
ALA
BA
RZO
N
3,87
6
97
.5
100
69.3
2.6
1.2
19.2
1.4
**
**
4.5
MIM
AR
OP
A R
EG
ION
75
4
91.4
10
037
.812
.85.
329
.38.
62.
8*
1.4
**
RE
GIO
N V
- B
ICO
L 1,
300
92.0
10
033
.67.
412
.431
.26.
44.
02.
9*
*1.
5R
EG
ION
VI -
WE
STE
RN
VIS
AY
AS
1,
870
93.1
10
033
.94.
15.
838
.39.
72.
72.
0*
*3.
2R
EG
ION
VII
- CE
NTR
AL
VIS
AY
AS
1,
883
92.1
10
059
.715
.04.
38.
65.
52.
42.
6*
*1.
3R
EG
ION
VIII
- E
AS
TER
N V
ISA
YA
S
1,08
3
93
.1
100
36.7
11.4
21.9
19.3
5.3
1.5
1.3
**
2.0
RE
GIO
N IX
- ZA
MB
OA
NG
A P
EN
INS
ULA
85
1
83.6
10
037
.813
.312
.215
.46.
58.
32.
42.
1*
1.7
RE
GIO
N X
- N
OR
THE
RN
MIN
DA
NA
O
1,14
4
90
.9
100
46.4
19.4
9.4
14.7
1.9
3.3
3.7
**
*R
EG
ION
XI -
DA
VA
O
1,32
0
87
.7
100
49.4
14.1
5.0
13.9
4.3
10.1
0.8
**
*R
EG
ION
XII
- SO
CC
SK
SA
RG
EN
1,
156
90.1
10
037
.911
.95.
229
.64.
46.
72.
5*
*1.
0R
EG
ION
XIII
- C
AR
AG
A
634
91
.6
100
50.1
9.8
11.8
14.2
6.6
2.3
1.8
**
1.4
BA
NG
SA
MO
RO
BA
NG
SA
MO
RO
AU
TON
OM
OU
S
RE
GIO
N IN
MU
SLI
M M
IND
AN
AO
670
81
.6
100
8.3
7.9
7.8
27.2
15.8
11.7
6.0
5.4
5.5
4.4
Resi
denc
eU
rban
13,0
41
96
.5
100
71.7
6.2
2.5
13.0
1.9
1.3
0.7
*0.
12.
6R
ural
12,2
69
91
.4
100
35.0
9.4
7.4
31.6
5.8
4.9
2.6
0.9
0.5
1.9
--
--
--
--
--
Not
e: "
* "
An
aste
risk
indi
cate
s th
at a
figu
re is
bas
ed o
n fe
wer t
han
25 u
nwei
ghte
d ca
ses
and
has
been
sup
pres
sed.
Sou
rce:
Phi
lippi
ne S
tatis
tics
Aut
horit
y, 2
019
Ann
ual P
over
ty In
dica
tors
Sur
vey
Regi
on/ R
esid
ence
Num
ber o
f Fa
mili
es
(Tot
al,
in th
ousa
nds)
Elec
trici
ty/M
ain
Sour
ce o
f Wat
er S
uppl
y (P
erce
ntag
e)M
ain
Sour
ce o
f Wat
er S
uppl
y (P
erce
ntag
e)
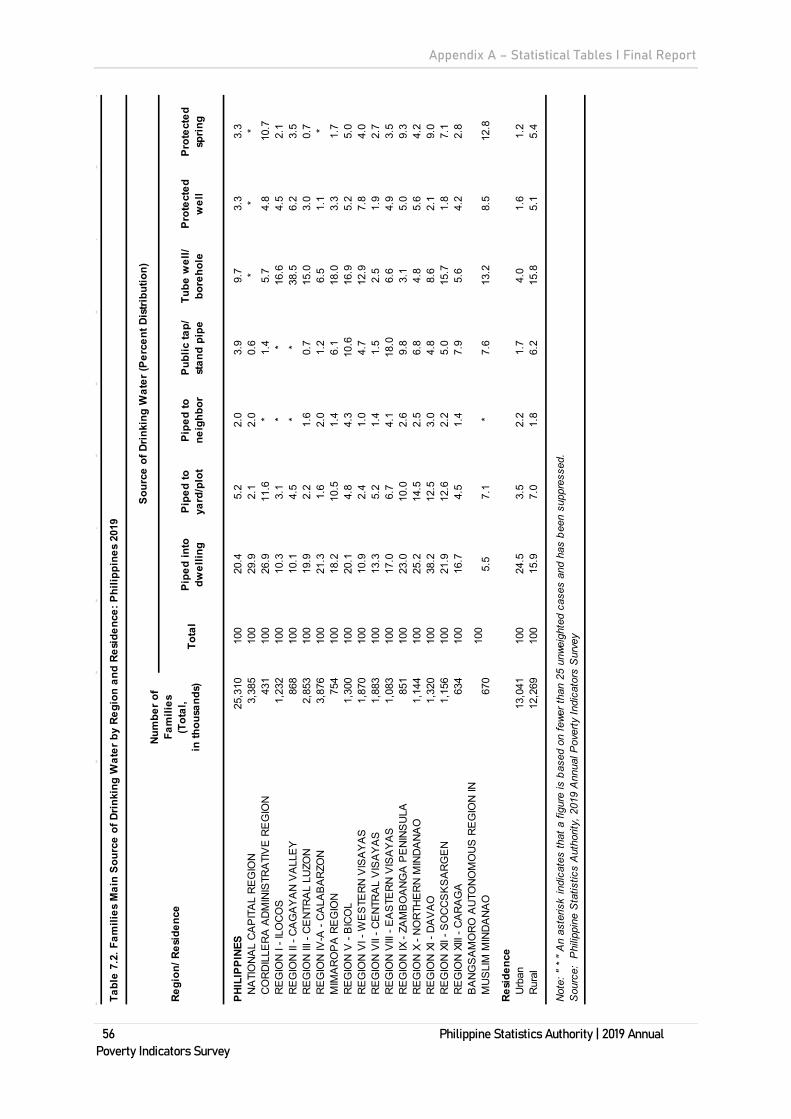
Appendix A – Statistical Tables I Final Report
56 Philippine Statistics Authority | 2019 Annual Poverty Indicators Survey
Tabl
e 7.
2. F
amili
es M
ain
Sour
ce o
f Drin
king
Wat
er b
y Re
gion
and
Res
iden
ce: P
hilip
pine
s 20
19
Tota
lPi
ped
into
dw
ellin
gPi
ped
to
yard
/plo
tPi
ped
to
neig
hbor
Publ
ic ta
p/
stan
d pi
peTu
be w
ell/
bore
hole
Prot
ecte
d w
ell
Prot
ecte
d sp
ring
PHIL
IPPI
NES
25,3
10
100
20.4
5.2
2.0
3.9
9.7
3.3
3.3
NA
TIO
NA
L C
AP
ITA
L R
EG
ION
3,
385
100
29.9
2.1
2.0
0.6
**
*C
OR
DIL
LER
A A
DM
INIS
TRA
TIV
E R
EG
ION
43
1
100
26.9
11.6
*1.
45.
74.
810
.7R
EG
ION
I - I
LOC
OS
1,23
2
10
010
.33.
1*
*16
.64.
52.
1R
EG
ION
II -
CA
GA
YA
N V
ALL
EY
86
8
100
10.1
4.5
**
38.5
6.2
3.5
RE
GIO
N II
I - C
EN
TRA
L LU
ZON
2,
853
100
19.9
2.2
1.6
0.7
15.0
3.0
0.7
RE
GIO
N IV
-A -
CA
LAB
AR
ZON
3,
876
100
21.3
1.6
2.0
1.2
6.5
1.1
*M
IMA
RO
PA
RE
GIO
N
754
10
018
.210
.51.
46.
118
.03.
31.
7R
EG
ION
V -
BIC
OL
1,30
0
10
020
.14.
84.
310
.616
.95.
25.
0R
EG
ION
VI -
WE
STE
RN
VIS
AY
AS
1,
870
100
10.9
2.4
1.0
4.7
12.9
7.8
4.0
RE
GIO
N V
II - C
EN
TRA
L V
ISA
YA
S
1,88
3
10
013
.35.
21.
41.
52.
51.
92.
7R
EG
ION
VIII
- E
AS
TER
N V
ISA
YA
S
1,08
3
10
017
.06.
74.
118
.06.
64.
93.
5R
EG
ION
IX -
ZAM
BO
AN
GA
PE
NIN
SU
LA
851
10
023
.010
.02.
69.
83.
15.
09.
3R
EG
ION
X -
NO
RTH
ER
N M
IND
AN
AO
1,
144
100
25.2
14.5
2.5
6.8
4.8
5.6
4.2
RE
GIO
N X
I - D
AV
AO
1,
320
100
38.2
12.5
3.0
4.8
8.6
2.1
9.0
RE
GIO
N X
II - S
OC
CS
KS
AR
GE
N
1,15
6
10
021
.912
.62.
25.
015
.71.
87.
1R
EG
ION
XIII
- C
AR
AG
A
634
10
016
.74.
51.
47.
95.
64.
22.
8B
AN
GS
AM
OR
O A
UTO
NO
MO
US
RE
GIO
N IN
M
US
LIM
MIN
DA
NA
O67
0
100
5.5
7.1
*7.
613
.28.
512
.8
Resi
denc
eU
rban
13,0
41
100
24.5
3.5
2.2
1.7
4.0
1.6
1.2
Rur
al12
,269
10
015
.97.
01.
86.
215
.85.
15.
4
Not
e: "
* "
An
aste
risk
indi
cate
s th
at a
figu
re is
bas
ed o
n fe
wer t
han
25 u
nwei
ghte
d ca
ses
and
has
been
sup
pres
sed.
Sou
rce:
Phi
lippi
ne S
tatis
tics
Aut
horit
y, 2
019
Ann
ual P
over
ty In
dica
tors
Sur
vey
Regi
on/ R
esid
ence
Num
ber o
f Fa
mili
es
(Tot
al,
in th
ousa
nds)
Sour
ce o
f Drin
king
Wat
er (P
erce
nt D
istri
butio
n)
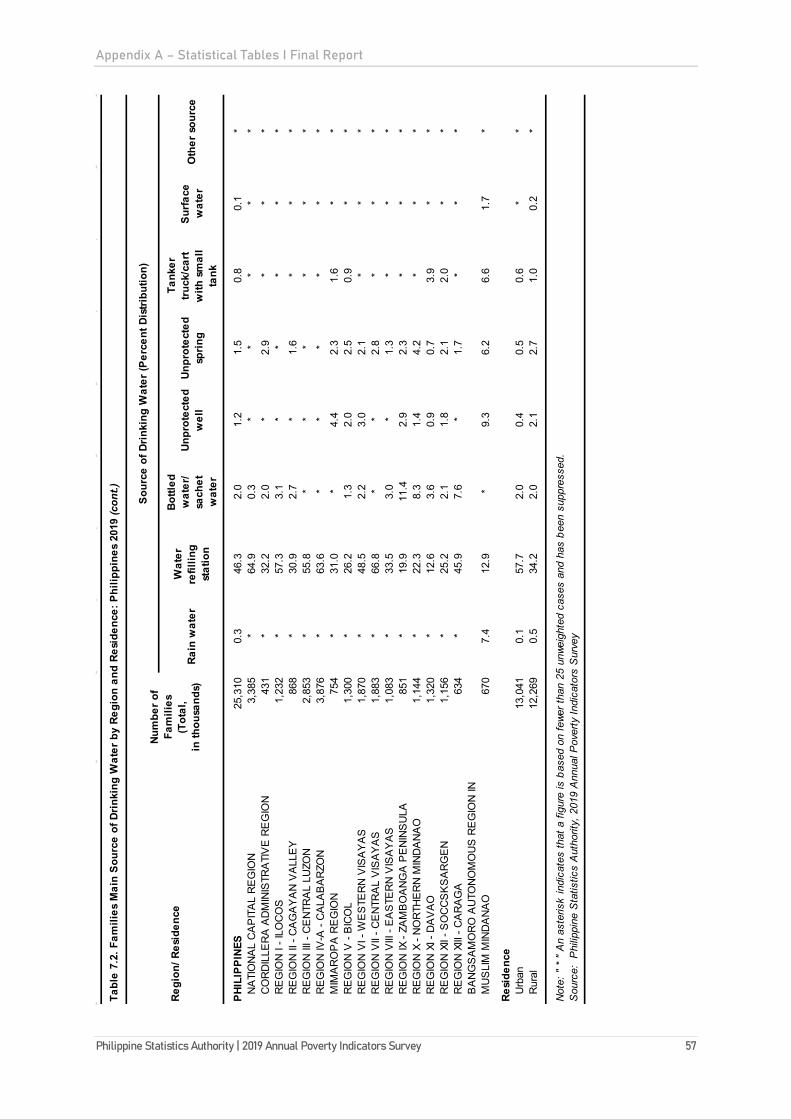
Appendix A – Statistical Tables I Final Report
Philippine Statistics Authority | 2019 Annual Poverty Indicators Survey 57
Tabl
e 7.
2. F
amili
es M
ain
Sour
ce o
f Drin
king
Wat
er b
y Re
gion
and
Res
iden
ce: P
hilip
pine
s 20
19 (c
ont.)
Rain
wat
erW
ater
re
fillin
g st
atio
n
Bottl
ed
wat
er/
sach
et
wat
er
Unpr
otec
ted
wel
lUn
prot
ecte
d sp
ring
Tank
er
truck
/car
t w
ith s
mal
l ta
nk
Surfa
ce
wat
erO
ther
sou
rce
PHIL
IPPI
NES
25,3
10
0.3
46.3
2.0
1.2
1.5
0.8
0.1
*N
ATI
ON
AL
CA
PIT
AL
RE
GIO
N
3,38
5
*
64.9
0.3
**
**
*C
OR
DIL
LER
A A
DM
INIS
TRA
TIV
E R
EG
ION
43
1
*32
.22.
0*
2.9
**
*R
EG
ION
I - I
LOC
OS
1,23
2
*
57.3
3.1
**
**
*R
EG
ION
II -
CA
GA
YA
N V
ALL
EY
86
8
*30
.92.
7*
1.6
**
*R
EG
ION
III -
CE
NTR
AL
LUZO
N
2,85
3
*
55.8
**
**
**
RE
GIO
N IV
-A -
CA
LAB
AR
ZON
3,
876
*63
.6*
**
**
*M
IMA
RO
PA
RE
GIO
N
754
*
31.0
*4.
42.
31.
6*
*R
EG
ION
V -
BIC
OL
1,30
0
*
26.2
1.3
2.0
2.5
0.9
**
RE
GIO
N V
I - W
ES
TER
N V
ISA
YA
S
1,87
0
*
48.5
2.2
3.0
2.1
**
*R
EG
ION
VII
- CE
NTR
AL
VIS
AY
AS
1,
883
*66
.8*
*2.
8*
**
RE
GIO
N V
III -
EA
STE
RN
VIS
AY
AS
1,
083
*33
.53.
0*
1.3
**
*R
EG
ION
IX -
ZAM
BO
AN
GA
PE
NIN
SU
LA
851
*
19.9
11.4
2.9
2.3
**
*R
EG
ION
X -
NO
RTH
ER
N M
IND
AN
AO
1,
144
*22
.38.
31.
44.
2*
**
RE
GIO
N X
I - D
AV
AO
1,
320
*12
.63.
60.
90.
73.
9*
*R
EG
ION
XII
- SO
CC
SK
SA
RG
EN
1,
156
*25
.22.
11.
82.
12.
0*
*R
EG
ION
XIII
- C
AR
AG
A
634
*
45.9
7.6
*1.
7*
**
BA
NG
SA
MO
RO
AU
TON
OM
OU
S R
EG
ION
IN
MU
SLI
M M
IND
AN
AO
670
7.
412
.9*
9.3
6.2
6.6
1.7
*
Resi
denc
eU
rban
13,0
41
0.1
57.7
2.0
0.4
0.5
0.6
**
Rur
al12
,269
0.
534
.22.
02.
12.
71.
00.
2*
Not
e: "
* "
An
aste
risk
indi
cate
s th
at a
figu
re is
bas
ed o
n fe
wer t
han
25 u
nwei
ghte
d ca
ses
and
has
been
sup
pres
sed.
Sou
rce:
Phi
lippi
ne S
tatis
tics
Aut
horit
y, 2
019
Ann
ual P
over
ty In
dica
tors
Sur
vey
Regi
on/ R
esid
ence
Num
ber o
f Fa
mili
es
(Tot
al,
in th
ousa
nds)
Sour
ce o
f Drin
king
Wat
er (P
erce
nt D
istri
butio
n)

Appendix A – Statistical Tables I Final Report
58 Philippine Statistics Authority | 2019 Annual Poverty Indicators Survey
Tabl
e 7.
3 Fa
mili
es W
ho D
id T
reat
men
t of D
rinki
ng W
ater
and
thei
r Mea
ns o
f Tre
atem
ent
by R
egio
n an
d Re
side
nce,
Phi
lippi
nes
2019
Boile
dBl
each
/chl
orin
e ad
ded
Stra
ined
th
roug
h cl
oth
Cera
mic
, sa
nd,
com
psite
or
othe
r filt
er
Let i
t sta
nd
and
settl
eSo
lar
disi
nfec
tion
Oth
erDo
n’t k
now
No
Trea
tmen
t
PHIL
IPPI
NES
25,3
10
5,21
4
56.7
3.9
33.7
13.9
11.8
0.5
3.2
1.7
79.4
NA
TIO
NA
L C
AP
ITA
L R
EG
ION
3,
385
1,
036
65
.83.
319
.027
.610
.2*
2.5
*69
.4C
OR
DIL
LER
A A
DM
INIS
TRA
TIV
E R
EG
ION
43
1
14
5
72
.0*
40.7
8.3
9.0
**
*66
.4R
EG
ION
I - I
LOC
OS
1,23
2
179
77.5
16.2
**
**
**
85.5
RE
GIO
N II
- C
AG
AY
AN
VA
LLE
Y
868
79
66.6
*25
.67.
212
.8*
**
90.9
RE
GIO
N II
I - C
EN
TRA
L LU
ZON
2,
853
39
1
47
.6*
9.8
10.6
1.3
*23
.5*
86.3
RE
GIO
N IV
-A -
CA
LAB
AR
ZON
3,
876
55
3
32
.3*
29.9
35.0
12.2
**
*85
.7M
IMA
RO
PA
RE
GIO
N
754
172
60.2
*50
.1*
10.1
5.5
**
77.2
RE
GIO
N V
- B
ICO
L 1,
300
48
4
56
.67.
348
.74.
313
.6*
**
62.7
RE
GIO
N V
I - W
ES
TER
N V
ISA
YA
S
1,87
0
422
36.7
*65
.07.
723
.4*
**
77.4
RE
GIO
N V
II - C
EN
TRA
L V
ISA
YA
S
1,88
3
326
72.4
*29
.9*
**
**
82.7
RE
GIO
N V
III -
EA
STE
RN
VIS
AY
AS
1,
083
27
0
58
.96.
230
.55.
010
.2*
**
75.1
RE
GIO
N IX
- ZA
MB
OA
NG
A P
EN
INS
ULA
85
1
20
2
66
.7*
37.7
*7.
2*
**
76.2
RE
GIO
N X
- N
OR
THE
RN
MIN
DA
NA
O
1,14
4
188
57.6
*51
.69.
218
.6*
**
83.6
RE
GIO
N X
I - D
AV
AO
1,
320
19
2
58
.825
.926
.411
.627
.3*
**
85.5
RE
GIO
N X
II - S
OC
CS
KS
AR
GE
N
1,15
6
122
42.9
*39
.818
.5*
**
*89
.5R
EG
ION
XIII
- C
AR
AG
A
634
116
47.1
*52
.86.
413
.1*
**
81.7
BA
NG
SA
MO
RO
AU
TON
OM
OU
S R
EG
ION
IN
MU
SLI
M M
IND
AN
AO
670
336
67.1
3.0
42.7
*17
.6*
**
49.8
Resi
denc
eU
rban
13,0
41
2,48
6
57.4
3.5
25.2
21.7
0.4
9.3
5.4
1.6
80.9
Rur
al12
,269
2,
727
56
.14.
341
.46.
80.
614
.01.
21.
877
.8
Sou
rce:
Phi
lippi
ne S
tatis
tics
Aut
horit
y, 2
019
Ann
ual P
over
ty In
dica
tors
Sur
vey
Regi
on/ R
esid
ence
Num
ber o
f Fa
mili
es
(Tot
al,
in th
ousa
nds)
Fam
ilies
Who
Di
d Tr
eatm
ent
of D
rinki
ng
Wat
er (T
otal
, in
thou
sand
s)
Trea
tmen
t of D
rinki
ng W
ater
(Per
cent
age)
Not
e: "
* "
An
aste
risk
indi
cate
s th
at a
figu
re is
bas
ed o
n fe
wer t
han
25 u
nwei
ghte
d ca
ses
and
has
been
sup
pres
sed.
Fam
ilies
may
repo
rt m
ultip
le tr
eatm
ent m
etho
ds s
o th
e su
m o
f tre
atm
ent m
ay e
xcee
d 10
0
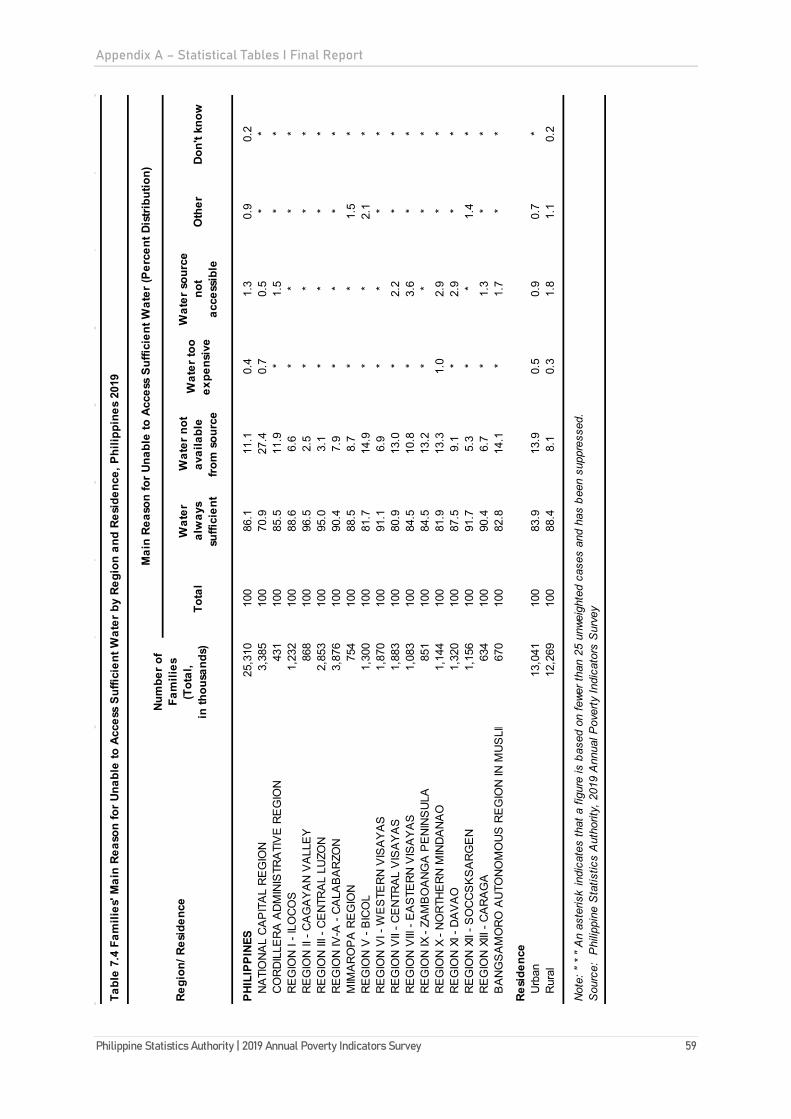
Appendix A – Statistical Tables I Final Report
Philippine Statistics Authority | 2019 Annual Poverty Indicators Survey 59
Tabl
e 7.
4 Fa
mili
es' M
ain
Reas
on fo
r Una
ble
to A
cces
s Su
ffici
ent W
ater
by
Regi
on a
nd R
esid
ence
, Phi
lippi
nes
2019
Tota
lW
ater
al
way
s su
ffici
ent
Wat
er n
ot
avai
labl
e fro
m s
ourc
e
Wat
er to
o ex
pens
ive
Wat
er s
ourc
e no
t ac
cess
ible
Oth
erDo
n't k
now
PHIL
IPPI
NES
25,3
10
100
86.1
11.1
0.4
1.3
0.9
0.2
NA
TIO
NA
L C
AP
ITA
L R
EG
ION
3,
385
10
070
.927
.40.
70.
5*
*C
OR
DIL
LER
A A
DM
INIS
TRA
TIV
E R
EG
ION
43
1
10
085
.511
.9*
1.5
**
RE
GIO
N I
- ILO
CO
S1,
232
10
088
.66.
6*
**
*R
EG
ION
II -
CA
GA
YA
N V
ALL
EY
86
8
10
096
.52.
5*
**
*R
EG
ION
III -
CE
NTR
AL
LUZO
N
2,85
3
100
95.0
3.1
**
**
RE
GIO
N IV
-A -
CA
LAB
AR
ZON
3,
876
10
090
.47.
9*
**
*M
IMA
RO
PA
RE
GIO
N
754
100
88.5
8.7
**
1.5
*R
EG
ION
V -
BIC
OL
1,30
0
100
81.7
14.9
**
2.1
*R
EG
ION
VI -
WE
STE
RN
VIS
AY
AS
1,
870
10
091
.16.
9*
**
*R
EG
ION
VII
- CE
NTR
AL
VIS
AY
AS
1,
883
10
080
.913
.0*
2.2
**
RE
GIO
N V
III -
EA
STE
RN
VIS
AY
AS
1,
083
10
084
.510
.8*
3.6
**
RE
GIO
N IX
- ZA
MB
OA
NG
A P
EN
INS
ULA
85
1
10
084
.513
.2*
**
*R
EG
ION
X -
NO
RTH
ER
N M
IND
AN
AO
1,
144
10
081
.913
.31.
02.
9*
*R
EG
ION
XI -
DA
VA
O
1,32
0
100
87.5
9.1
*2.
9*
*R
EG
ION
XII
- SO
CC
SK
SA
RG
EN
1,
156
10
091
.75.
3*
*1.
4*
RE
GIO
N X
III -
CA
RA
GA
63
4
10
090
.46.
7*
1.3
**
BA
NG
SA
MO
RO
AU
TON
OM
OU
S R
EG
ION
IN M
US
LIM
67
0
10
082
.814
.1*
1.7
**
Resi
denc
eU
rban
13,0
41
100
83.9
13.9
0.5
0.9
0.7
*R
ural
12,2
69
100
88.4
8.1
0.3
1.8
1.1
0.2
Not
e: "
* "
An
aste
risk
indi
cate
s th
at a
figu
re is
bas
ed o
n fe
wer t
han
25 u
nwei
ghte
d ca
ses
and
has
been
sup
pres
sed.
Sou
rce:
Phi
lippi
ne S
tatis
tics
Aut
horit
y, 2
019
Ann
ual P
over
ty In
dica
tors
Sur
vey
Regi
on/ R
esid
ence
Num
ber o
f Fa
mili
es
(Tot
al,
in th
ousa
nds)
Mai
n Re
ason
for U
nabl
e to
Acc
ess
Suffi
cien
t Wat
er (P
erce
nt D
istri
butio
n)
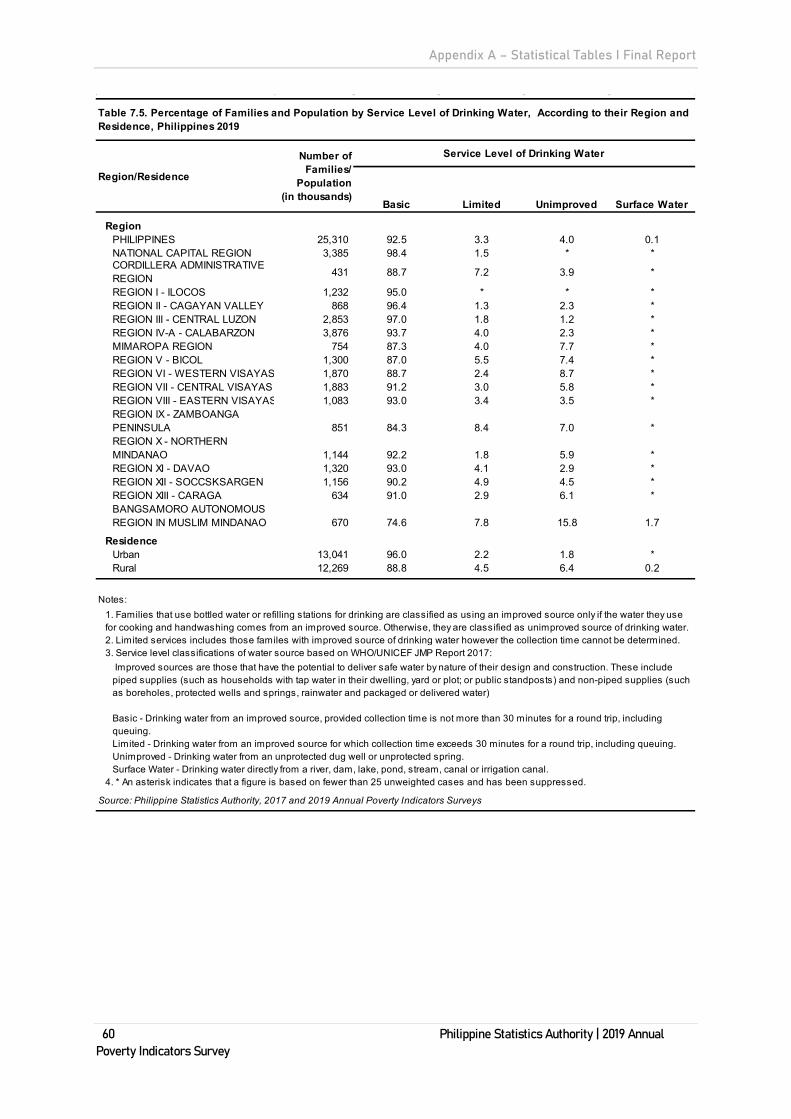
Appendix A – Statistical Tables I Final Report
60 Philippine Statistics Authority | 2019 Annual Poverty Indicators Survey
Basic Limited Unimproved Surface Water
RegionPHILIPPINES 25,310 92.5 3.3 4.0 0.1NATIONAL CAPITAL REGION 3,385 98.4 1.5 * *CORDILLERA ADMINISTRATIVE REGION 431 88.7 7.2 3.9 *
REGION I - ILOCOS 1,232 95.0 * * *REGION II - CAGAYAN VALLEY 868 96.4 1.3 2.3 *REGION III - CENTRAL LUZON 2,853 97.0 1.8 1.2 *REGION IV-A - CALABARZON 3,876 93.7 4.0 2.3 *MIMAROPA REGION 754 87.3 4.0 7.7 *REGION V - BICOL 1,300 87.0 5.5 7.4 *REGION VI - WESTERN VISAYAS 1,870 88.7 2.4 8.7 *REGION VII - CENTRAL VISAYAS 1,883 91.2 3.0 5.8 *REGION VIII - EASTERN VISAYAS 1,083 93.0 3.4 3.5 *REGION IX - ZAMBOANGA PENINSULA 851 84.3 8.4 7.0 *REGION X - NORTHERN MINDANAO 1,144 92.2 1.8 5.9 *REGION XI - DAVAO 1,320 93.0 4.1 2.9 *REGION XII - SOCCSKSARGEN 1,156 90.2 4.9 4.5 *REGION XIII - CARAGA 634 91.0 2.9 6.1 *BANGSAMORO AUTONOMOUS REGION IN MUSLIM MINDANAO 670 74.6 7.8 15.8 1.7
ResidenceUrban 13,041 96.0 2.2 1.8 *Rural 12,269 88.8 4.5 6.4 0.2
Notes:
Source: Philippine Statistics Authority, 2017 and 2019 Annual Poverty Indicators Surveys
Improved sources are those that have the potential to deliver safe water by nature of their design and construction. These include piped supplies (such as households with tap water in their dwelling, yard or plot; or public standposts) and non-piped supplies (such as boreholes, protected wells and springs, rainwater and packaged or delivered water)
Basic - Drinking water from an improved source, provided collection time is not more than 30 minutes for a round trip, including queuing.Limited - Drinking water from an improved source for which collection time exceeds 30 minutes for a round trip, including queuing.Unimproved - Drinking water from an unprotected dug well or unprotected spring.Surface Water - Drinking water directly from a river, dam, lake, pond, stream, canal or irrigation canal.
4. * An asterisk indicates that a figure is based on fewer than 25 unweighted cases and has been suppressed.
Number of Families/
Population (in thousands)
Service Level of Drinking Water
Table 7.5. Percentage of Families and Population by Service Level of Drinking Water, According to their Region and Residence, Philippines 2019
1. Families that use bottled water or refilling stations for drinking are classified as using an improved source only if the water they use for cooking and handwashing comes from an improved source. Otherwise, they are classified as unimproved source of drinking water.2. Limited services includes those familes with improved source of drinking water however the collection time cannot be determined. 3. Service level classifications of water source based on WHO/UNICEF JMP Report 2017:
Region/Residence

Appendix A – Statistical Tables I Final Report
Philippine Statistics Authority | 2019 Annual Poverty Indicators Survey 61
Tabl
e 8.
1 Fa
mili
es b
y Ty
pe o
f San
itatio
n Fa
cilit
y Th
ey U
se b
y Re
gion
and
Res
iden
ce, P
hilip
pine
s 20
19
Tota
lFl
ush
to
pipe
/ sew
er
syst
em
Flus
h to
se
ptic
tank
Flus
h to
pit
latri
neFl
ush
to
open
dra
inFl
ush
to D
K w
here
Vent
ilate
d la
trine
Pit l
atrin
e w
ith s
lab
Pit l
atrin
e w
ithou
t sla
b/
open
pit
PHIL
IPPI
NES
25,3
10
100
11.0
62.7
16.2
1.3
0.6
1.1
1.3
0.4
NA
TIO
NA
L C
AP
ITA
L R
EG
ION
3,
385
100
22.0
66.0
6.6
1.0
3.5
**
*C
OR
DIL
LER
A A
DM
INIS
TRA
TIV
E R
EG
ION
43
1
100
14.8
57.3
17.5
**
*4.
92.
7R
EG
ION
I - I
LOC
OS
1,23
2
10
04.
957
.734
.7*
**
**
RE
GIO
N II
- C
AG
AY
AN
VA
LLE
Y
868
10
07.
366
.017
.1*
*3.
24.
2*
RE
GIO
N II
I - C
EN
TRA
L LU
ZON
2,
853
100
9.2
79.3
8.3
**
**
*R
EG
ION
IV-A
- C
ALA
BA
RZO
N
3,87
6
10
010
.278
.58.
2*
**
**
MIM
AR
OP
A R
EG
ION
75
4
100
3.7
65.5
18.4
**
2.4
2.0
*R
EG
ION
V -
BIC
OL
1,30
0
10
03.
065
.112
.2*
*2.
91.
6*
RE
GIO
N V
I - W
ES
TER
N V
ISA
YA
S
1,87
0
10
05.
564
.215
.80.
8*
1.4
2.0
*R
EG
ION
VII
- CE
NTR
AL
VIS
AY
AS
1,
883
100
22.6
32.3
34.6
**
**
*R
EG
ION
VIII
- E
AS
TER
N V
ISA
YA
S
1,08
3
10
07.
871
.26.
71.
2*
2.7
**
RE
GIO
N IX
- ZA
MB
OA
NG
A P
EN
INS
ULA
85
1
100
10.8
27.5
41.2
**
9.1
**
RE
GIO
N X
- N
OR
THE
RN
MIN
DA
NA
O
1,14
4
10
013
.860
.816
.71.
5*
*2.
4*
RE
GIO
N X
I - D
AV
AO
1,
320
100
9.4
67.7
12.8
2.0
*1.
42.
0*
RE
GIO
N X
II - S
OC
CS
KS
AR
GE
N
1,15
6
10
06.
557
.620
.82.
1*
*6.
4*
RE
GIO
N X
III -
CA
RA
GA
63
4
100
2.6
35.1
54.3
**
*1.
7*
BA
NG
SA
MO
RO
AU
TON
OM
OU
S R
EG
ION
IN M
US
L
670
10
06.
926
.210
.212
.2*
*2.
14.
4
Resi
denc
eU
rban
13,0
41
100
15.4
69.3
9.2
0.7
1.0
0.4
0.6
*R
ural
12,2
69
100
6.3
55.8
23.7
1.9
0.1
1.7
2.2
0.8
Not
e: "
* "
An
aste
risk
indi
cate
s th
at a
figu
re is
bas
ed o
n fe
wer t
han
25 u
nwei
ghte
d ca
ses
and
has
been
sup
pres
sed.
Sou
rce:
Phi
lippi
ne S
tatis
tics
Aut
horit
y, 2
019
Ann
ual P
over
ty In
dica
tors
Sur
vey
Regi
on/ R
esid
ence
Num
ber o
f Fa
mili
es
(Tot
al,
in th
ousa
nds)
Type
of S
anita
tion
Faci
lity
(Per
cent
Dis
tribu
tion)
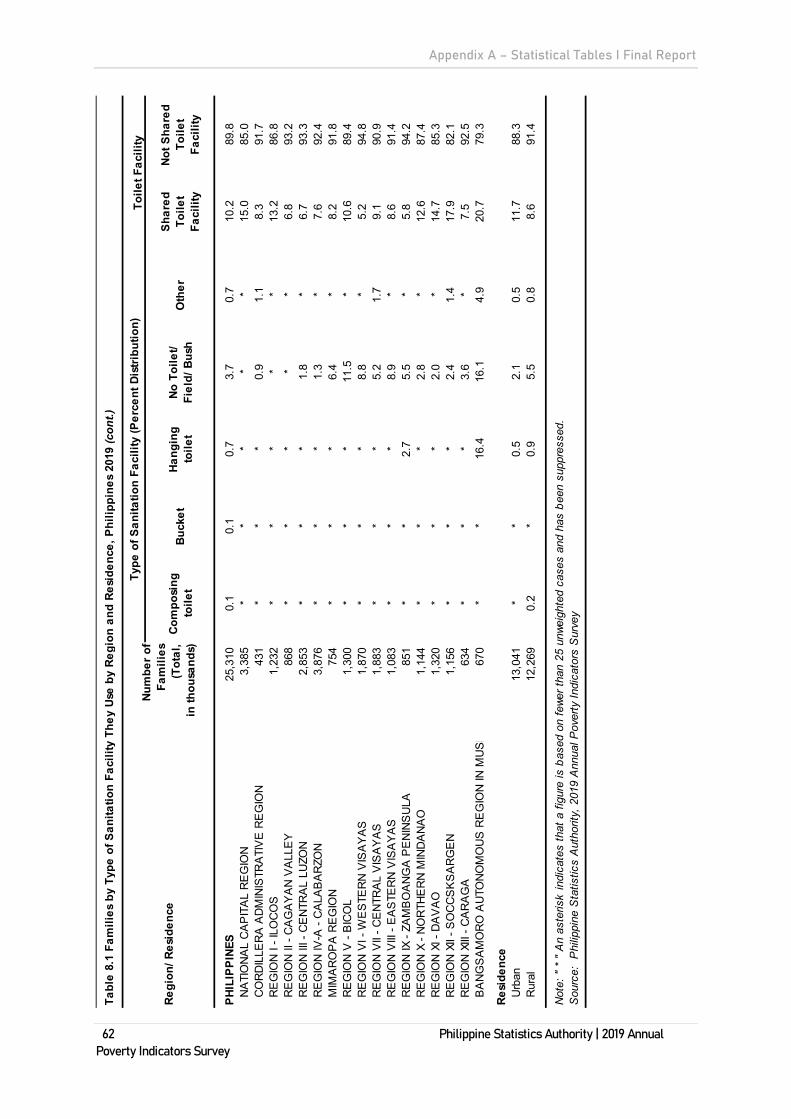
Appendix A – Statistical Tables I Final Report
62 Philippine Statistics Authority | 2019 Annual Poverty Indicators Survey
Tabl
e 8.
1 Fa
mili
es b
y Ty
pe o
f San
itatio
n Fa
cilit
y Th
ey U
se b
y Re
gion
and
Res
iden
ce, P
hilip
pine
s 20
19 (c
ont.)
Com
posi
ng
toile
tBu
cket
Hang
ing
toile
tNo
Toi
let/
Fiel
d/ B
ush
Oth
erSh
ared
To
ilet
Faci
lity
Not S
hare
d To
ilet
Faci
lity
PHIL
IPPI
NES
25,3
10
0.
10.
10.
73.
70.
710
.289
.8N
ATI
ON
AL
CA
PIT
AL
RE
GIO
N
3,38
5
*
**
**
15.0
85.0
CO
RD
ILLE
RA
AD
MIN
ISTR
ATI
VE
RE
GIO
N
431
*
**
0.9
1.1
8.3
91.7
RE
GIO
N I
- ILO
CO
S1,
232
**
**
*13
.286
.8R
EG
ION
II -
CA
GA
YA
N V
ALL
EY
86
8
**
**
*6.
893
.2R
EG
ION
III -
CE
NTR
AL
LUZO
N
2,85
3
*
**
1.8
*6.
793
.3R
EG
ION
IV-A
- C
ALA
BA
RZO
N
3,87
6
*
**
1.3
*7.
692
.4M
IMA
RO
PA
RE
GIO
N
754
*
**
6.4
*8.
291
.8R
EG
ION
V -
BIC
OL
1,30
0
*
**
11.5
*10
.689
.4R
EG
ION
VI -
WE
STE
RN
VIS
AY
AS
1,
870
**
*8.
8*
5.2
94.8
RE
GIO
N V
II - C
EN
TRA
L V
ISA
YA
S
1,88
3
*
**
5.2
1.7
9.1
90.9
RE
GIO
N V
III -
EA
STE
RN
VIS
AY
AS
1,
083
**
*8.
9*
8.6
91.4
RE
GIO
N IX
- ZA
MB
OA
NG
A P
EN
INS
ULA
85
1
**
2.7
5.5
*5.
894
.2R
EG
ION
X -
NO
RTH
ER
N M
IND
AN
AO
1,
144
**
*2.
8*
12.6
87.4
RE
GIO
N X
I - D
AV
AO
1,
320
**
*2.
0*
14.7
85.3
RE
GIO
N X
II - S
OC
CS
KS
AR
GE
N
1,15
6
*
**
2.4
1.4
17.9
82.1
RE
GIO
N X
III -
CA
RA
GA
63
4
**
*3.
6*
7.5
92.5
BA
NG
SA
MO
RO
AU
TON
OM
OU
S R
EG
ION
IN M
US
L
670
*
*16
.416
.14.
920
.779
.3
Resi
denc
eU
rban
13,0
41
*
*0.
52.
10.
511
.788
.3R
ural
12,2
69
0.
2*
0.9
5.5
0.8
8.6
91.4
Not
e: "
* "
An
aste
risk
indi
cate
s th
at a
figu
re is
bas
ed o
n fe
wer t
han
25 u
nwei
ghte
d ca
ses
and
has
been
sup
pres
sed.
Sou
rce:
Phi
lippi
ne S
tatis
tics
Aut
horit
y, 2
019
Ann
ual P
over
ty In
dica
tors
Sur
vey
Regi
on/ R
esid
ence
Num
ber o
f Fa
mili
es
(Tot
al,
in th
ousa
nds)
Toile
t Fac
ility
Type
of S
anita
tion
Faci
lity
(Per
cent
Dis
tribu
tion)
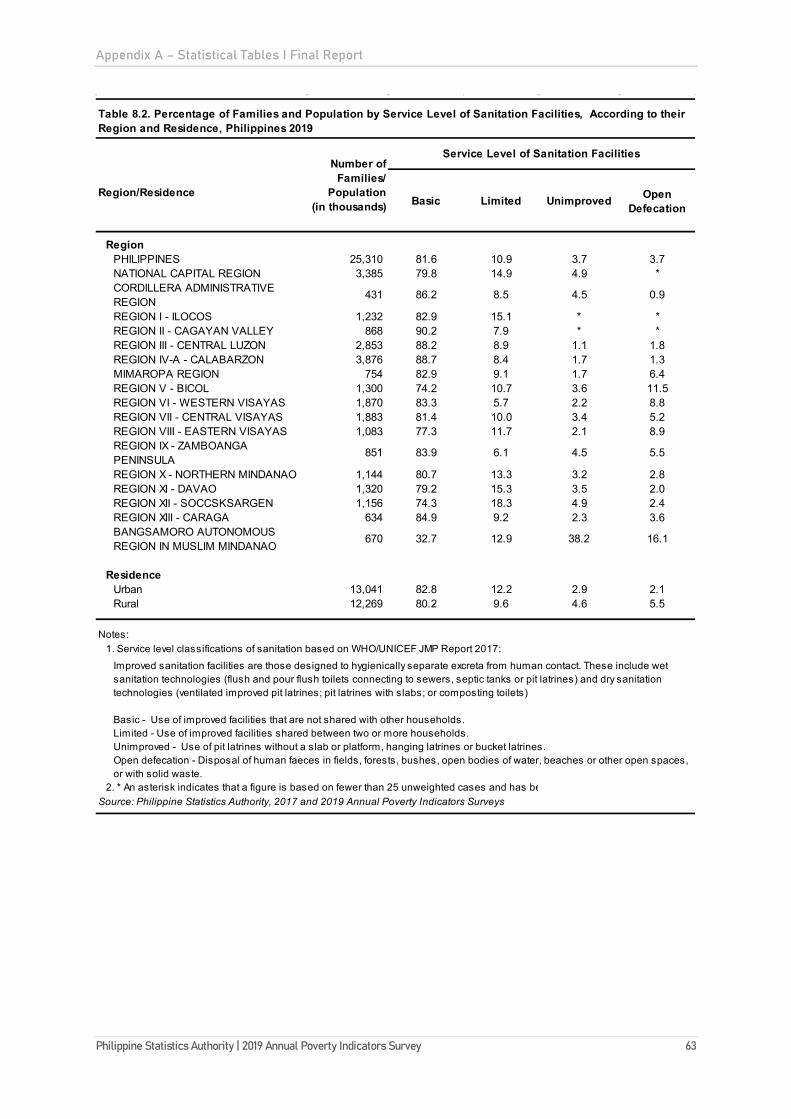
Appendix A – Statistical Tables I Final Report
Philippine Statistics Authority | 2019 Annual Poverty Indicators Survey 63
Basic Limited Unimproved Open Defecation
RegionPHILIPPINES 25,310 81.6 10.9 3.7 3.7NATIONAL CAPITAL REGION 3,385 79.8 14.9 4.9 *CORDILLERA ADMINISTRATIVE REGION
431 86.2 8.5 4.5 0.9
REGION I - ILOCOS 1,232 82.9 15.1 * *REGION II - CAGAYAN VALLEY 868 90.2 7.9 * *REGION III - CENTRAL LUZON 2,853 88.2 8.9 1.1 1.8REGION IV-A - CALABARZON 3,876 88.7 8.4 1.7 1.3MIMAROPA REGION 754 82.9 9.1 1.7 6.4REGION V - BICOL 1,300 74.2 10.7 3.6 11.5REGION VI - WESTERN VISAYAS 1,870 83.3 5.7 2.2 8.8REGION VII - CENTRAL VISAYAS 1,883 81.4 10.0 3.4 5.2REGION VIII - EASTERN VISAYAS 1,083 77.3 11.7 2.1 8.9REGION IX - ZAMBOANGA PENINSULA
851 83.9 6.1 4.5 5.5
REGION X - NORTHERN MINDANAO 1,144 80.7 13.3 3.2 2.8REGION XI - DAVAO 1,320 79.2 15.3 3.5 2.0REGION XII - SOCCSKSARGEN 1,156 74.3 18.3 4.9 2.4REGION XIII - CARAGA 634 84.9 9.2 2.3 3.6BANGSAMORO AUTONOMOUS REGION IN MUSLIM MINDANAO
670 32.7 12.9 38.2 16.1
ResidenceUrban 13,041 82.8 12.2 2.9 2.1Rural 12,269 80.2 9.6 4.6 5.5
Notes:1. Service level classifications of sanitation based on WHO/UNICEF JMP Report 2017:
Source: Philippine Statistics Authority, 2017 and 2019 Annual Poverty Indicators Surveys
Table 8.2. Percentage of Families and Population by Service Level of Sanitation Facilities, According to their Region and Residence, Philippines 2019
Region/Residence
Improved sanitation facilities are those designed to hygienically separate excreta from human contact. These include wet sanitation technologies (flush and pour flush toilets connecting to sewers, septic tanks or pit latrines) and dry sanitation technologies (ventilated improved pit latrines; pit latrines with slabs; or composting toilets)
Basic - Use of improved facilities that are not shared with other households.Limited - Use of improved facilities shared between two or more households.Unimproved - Use of pit latrines without a slab or platform, hanging latrines or bucket latrines.Open defecation - Disposal of human faeces in fields, forests, bushes, open bodies of water, beaches or other open spaces, or with solid waste.
2. * An asterisk indicates that a figure is based on fewer than 25 unweighted cases and has be
Number of Families/
Population (in thousands)
Service Level of Sanitation Facilities
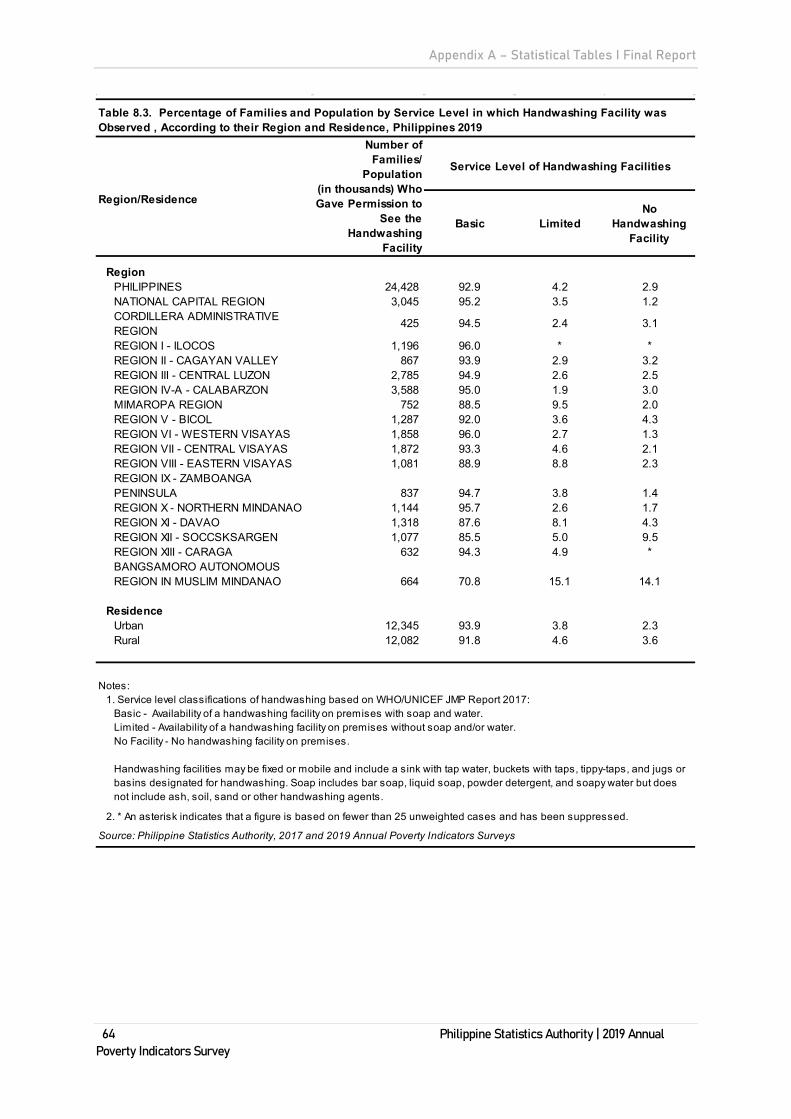
Appendix A – Statistical Tables I Final Report
64 Philippine Statistics Authority | 2019 Annual Poverty Indicators Survey
Basic LimitedNo
Handwashing Facility
RegionPHILIPPINES 24,428 92.9 4.2 2.9NATIONAL CAPITAL REGION 3,045 95.2 3.5 1.2CORDILLERA ADMINISTRATIVE REGION
425 94.5 2.4 3.1
REGION I - ILOCOS 1,196 96.0 * *REGION II - CAGAYAN VALLEY 867 93.9 2.9 3.2REGION III - CENTRAL LUZON 2,785 94.9 2.6 2.5REGION IV-A - CALABARZON 3,588 95.0 1.9 3.0MIMAROPA REGION 752 88.5 9.5 2.0REGION V - BICOL 1,287 92.0 3.6 4.3REGION VI - WESTERN VISAYAS 1,858 96.0 2.7 1.3REGION VII - CENTRAL VISAYAS 1,872 93.3 4.6 2.1REGION VIII - EASTERN VISAYAS 1,081 88.9 8.8 2.3REGION IX - ZAMBOANGA PENINSULA 837 94.7 3.8 1.4REGION X - NORTHERN MINDANAO 1,144 95.7 2.6 1.7REGION XI - DAVAO 1,318 87.6 8.1 4.3REGION XII - SOCCSKSARGEN 1,077 85.5 5.0 9.5REGION XIII - CARAGA 632 94.3 4.9 *BANGSAMORO AUTONOMOUS REGION IN MUSLIM MINDANAO 664 70.8 15.1 14.1
ResidenceUrban 12,345 93.9 3.8 2.3Rural 12,082 91.8 4.6 3.6
Notes:1. Service level classifications of handwashing based on WHO/UNICEF JMP Report 2017:
2. * An asterisk indicates that a figure is based on fewer than 25 unweighted cases and has been suppressed.
Source: Philippine Statistics Authority, 2017 and 2019 Annual Poverty Indicators Surveys
Table 8.3. Percentage of Families and Population by Service Level in which Handwashing Facility was Observed , According to their Region and Residence, Philippines 2019
Region/Residence
Service Level of Handwashing Facilities
Basic - Availability of a handwashing facility on premises with soap and water. Limited - Availability of a handwashing facility on premises without soap and/or water.No Facility - No handwashing facility on premises.
Handwashing facilities may be fixed or mobile and include a sink with tap water, buckets with taps, tippy-taps, and jugs or basins designated for handwashing. Soap includes bar soap, liquid soap, powder detergent, and soapy water but does not include ash, soil, sand or other handwashing agents.
Number of Families/
Population (in thousands) Who Gave Permission to
See the Handwashing
Facility
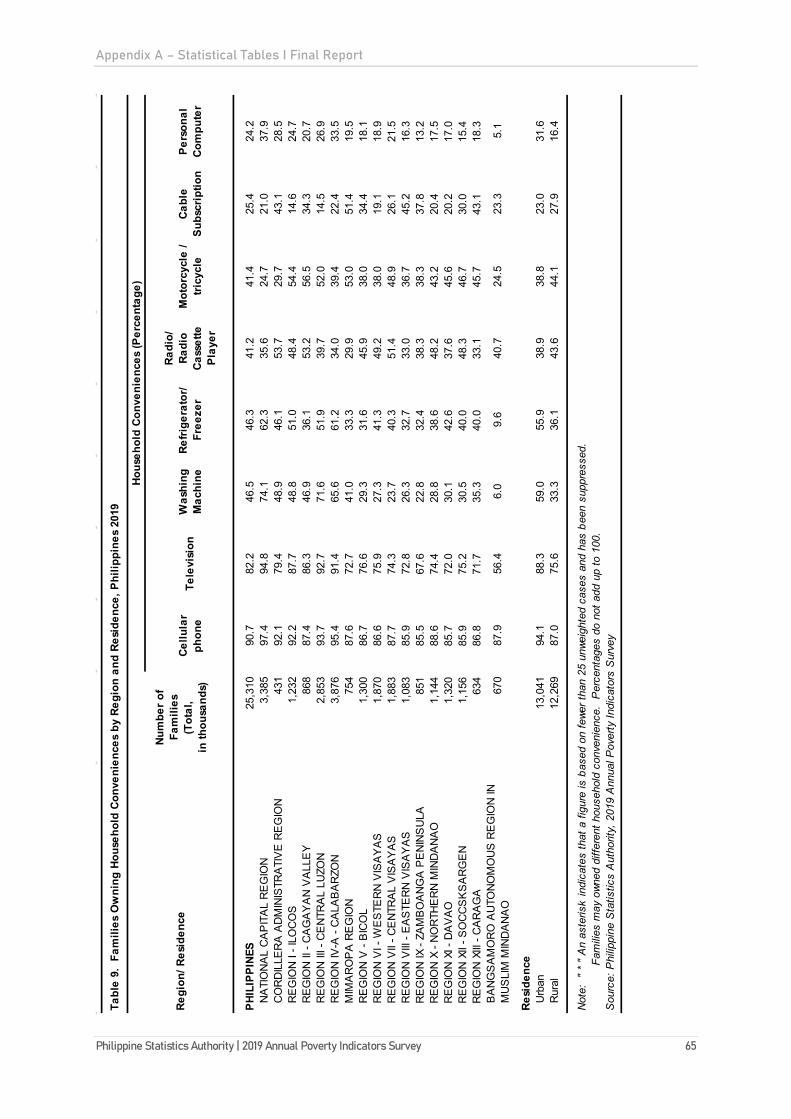
Appendix A – Statistical Tables I Final Report
Philippine Statistics Authority | 2019 Annual Poverty Indicators Survey 65
Tabl
e 9.
Fam
ilies
Ow
ning
Hou
seho
ld C
onve
nien
ces
by R
egio
n an
d Re
side
nce,
Phi
lippi
nes
2019
Cellu
lar
phon
eTe
levi
sion
Was
hing
M
achi
neRe
frige
rato
r/ Fr
eeze
r
Radi
o/
Radi
o Ca
sset
te
Play
er
Mot
orcy
cle
/ tri
cycl
eCa
ble
Subs
crip
tion
Pers
onal
Co
mpu
ter
PHIL
IPPI
NES
25,3
10
90.7
82.2
46.5
46.3
41.2
41.4
25.4
24.2
NA
TIO
NA
L C
AP
ITA
L R
EG
ION
3,
385
97.4
94.8
74.1
62.3
35.6
24.7
21.0
37.9
CO
RD
ILLE
RA
AD
MIN
ISTR
ATI
VE
RE
GIO
N
431
92
.179
.448
.946
.153
.729
.743
.128
.5R
EG
ION
I - I
LOC
OS
1,23
2
92
.287
.748
.851
.048
.454
.414
.624
.7R
EG
ION
II -
CA
GA
YA
N V
ALL
EY
86
8
87.4
86.3
46.9
36.1
53.2
56.5
34.3
20.7
RE
GIO
N II
I - C
EN
TRA
L LU
ZON
2,
853
93.7
92.7
71.6
51.9
39.7
52.0
14.5
26.9
RE
GIO
N IV
-A -
CA
LAB
AR
ZON
3,
876
95.4
91.4
65.6
61.2
34.0
39.4
22.4
33.5
MIM
AR
OP
A R
EG
ION
75
4
87.6
72.7
41.0
33.3
29.9
53.0
51.4
19.5
RE
GIO
N V
- B
ICO
L 1,
300
86.7
76.6
29.3
31.6
45.9
38.0
34.4
18.1
RE
GIO
N V
I - W
ES
TER
N V
ISA
YA
S
1,87
0
86
.675
.927
.341
.349
.238
.019
.118
.9R
EG
ION
VII
- CE
NTR
AL
VIS
AY
AS
1,
883
87.7
74.3
23.7
40.3
51.4
48.9
26.1
21.5
RE
GIO
N V
III -
EA
STE
RN
VIS
AY
AS
1,
083
85.9
72.8
26.3
32.7
33.0
36.7
45.2
16.3
RE
GIO
N IX
- ZA
MB
OA
NG
A P
EN
INS
ULA
85
1
85.5
67.6
22.8
32.4
38.3
38.3
37.8
13.2
RE
GIO
N X
- N
OR
THE
RN
MIN
DA
NA
O
1,14
4
88
.674
.428
.838
.648
.243
.220
.417
.5R
EG
ION
XI -
DA
VA
O
1,32
0
85
.772
.030
.142
.637
.645
.620
.217
.0R
EG
ION
XII
- SO
CC
SK
SA
RG
EN
1,
156
85.9
75.2
30.5
40.0
48.3
46.7
30.0
15.4
RE
GIO
N X
III -
CA
RA
GA
63
4
86.8
71.7
35.3
40.0
33.1
45.7
43.1
18.3
BA
NG
SA
MO
RO
AU
TON
OM
OU
S R
EG
ION
IN
MU
SLI
M M
IND
AN
AO
670
87
.956
.46.
09.
640
.724
.523
.35.
1
Resi
denc
eU
rban
13,0
41
94.1
88.3
59.0
55.9
38.9
38.8
23.0
31.6
Rur
al12
,269
87
.075
.633
.336
.143
.644
.127
.916
.4
Not
e: "
* "
An
aste
risk
indi
cate
s th
at a
figu
re is
bas
ed o
n fe
wer t
han
25 u
nwei
ghte
d ca
ses
and
has
been
sup
pres
sed.
Fa
mili
es m
ay o
wned
diff
eren
t hou
seho
ld c
onve
nien
ce.
Per
cent
ages
do
not a
dd u
p to
100
. S
ourc
e: P
hilip
pine
Sta
tistic
s A
utho
rity,
201
9 A
nnua
l Pov
erty
Indi
cato
rs S
urve
y
Regi
on/ R
esid
ence
Num
ber o
f Fa
mili
es
(Tot
al,
in th
ousa
nds)
Hous
ehol
d Co
nven
ienc
es (P
erce
ntag
e)

Appendix A – Statistical Tables I Final Report
66 Philippine Statistics Authority | 2019 Annual Poverty Indicators Survey
Tabl
e 9.
Fam
ilies
Ow
ning
Hou
seho
ld C
onve
nien
ces
by R
egio
n an
d Re
side
nce,
Phi
lippi
nes
2019
(con
t.)
Airc
onBr
oadb
and
Inte
rnet
/Fib
er
Inte
rnet
/DSL
Stov
e w
ith
oven
/ Gas
Ra
nge
Car,
Jeep
, Va
nDr
aft
Anim
al/s
Kara
oke/
Vi
deok
e/
Mag
ic S
ing
Land
line/
W
irele
ss
Tele
phon
e
Indu
ctio
n St
ove
Mot
oriz
ed
boat
/ ban
caTr
acto
r
PHIL
IPPI
NES
25,3
10
14.1
13.7
11.7
10.0
7.9
6.5
6.5
3.2
3.1
1.1
NA
TIO
NA
L C
AP
ITA
L R
EG
ION
3,
385
26.2
25.5
13.7
13.1
0.3
13.1
15.6
6.3
**
CO
RD
ILLE
RA
AD
MIN
ISTR
ATI
VE
RE
GIO
N
431
1.
58.
714
.515
.311
.21.
94.
69.
1*
3.1
RE
GIO
N I
- ILO
CO
S1,
232
13.4
11.4
6.8
10.4
12.7
2.6
4.8
3.1
*2.
8R
EG
ION
II -
CA
GA
YA
N V
ALL
EY
86
8
5.4
5.3
3.4
10.6
19.9
2.1
*0.
8*
2.3
RE
GIO
N II
I - C
EN
TRA
L LU
ZON
2,
853
22.3
14.2
13.1
13.3
2.4
4.8
5.0
3.1
2.7
2.0
RE
GIO
N IV
-A -
CA
LAB
AR
ZON
3,
876
20.1
23.9
12.9
14.4
3.8
7.4
11.5
2.4
1.1
*M
IMA
RO
PA
RE
GIO
N
754
6.
17.
25.
96.
217
.64.
11.
02.
19.
73.
0R
EG
ION
V -
BIC
OL
1,30
0
6.
910
.811
.44.
814
.04.
91.
8*
4.9
3.1
RE
GIO
N V
I - W
ES
TER
N V
ISA
YA
S
1,87
0
10
.58.
717
.38.
810
.06.
45.
04.
24.
50.
9R
EG
ION
VII
- CE
NTR
AL
VIS
AY
AS
1,
883
11.2
11.2
12.8
10.5
11.5
8.3
6.7
2.9
4.7
*R
EG
ION
VIII
- E
AS
TER
N V
ISA
YA
S
1,08
3
8.
79.
29.
45.
88.
38.
13.
60.
76.
91.
2R
EG
ION
IX -
ZAM
BO
AN
GA
PE
NIN
SU
LA
851
4.
73.
29.
83.
710
.87.
9*
2.3
6.6
*R
EG
ION
X -
NO
RTH
ER
N M
IND
AN
AO
1,
144
8.4
9.1
12.2
7.7
10.5
4.6
4.1
6.2
1.0
*R
EG
ION
XI -
DA
VA
O
1,32
0
8.
66.
712
.35.
97.
73.
72.
6*
2.5
*R
EG
ION
XII
- SO
CC
SK
SA
RG
EN
1,
156
7.7
8.6
10.6
6.7
12.5
2.5
2.0
1.9
1.0
*R
EG
ION
XIII
- C
AR
AG
A
634
11
.78.
49.
57.
87.
77.
33.
62.
96.
1*
BA
NG
SA
MO
RO
AU
TON
OM
OU
S R
EG
ION
IN
MU
SLI
M M
IND
AN
AO
670
*
*2.
42.
612
.8*
*2.
015
.0*
Resi
denc
eU
rban
13,0
41
20.5
19.4
14.7
13.2
2.6
8.6
10.5
4.4
1.4
0.5
Rur
al12
,269
7.
37.
68.
56.
713
.54.
22.
21.
94.
81.
7
Not
e: "
* "
An
aste
risk
indi
cate
s th
at a
figu
re is
bas
ed o
n fe
wer t
han
25 u
nwei
ghte
d ca
ses
and
has
been
sup
pres
sed.
Fam
ilies
may
own
ed d
iffer
ent h
ouse
hold
con
veni
ence
. P
erce
ntag
es d
o no
t add
up
to 1
00.
Sou
rce:
Phi
lippi
ne S
tatis
tics
Aut
horit
y, 2
019
Ann
ual P
over
ty In
dica
tors
Sur
vey
Regi
on/ R
esid
ence
Num
ber o
f Fa
mili
es
(Tot
al,
in th
ousa
nds)
Hous
ehol
d Co
nven
ienc
es (P
erce
ntag
e)

Appendix A – Statistical Tables I Final Report
Philippine Statistics Authority | 2019 Annual Poverty Indicators Survey 67
Highest Grade/Year Completed and Region Both Sexes Male Female
PhilippinesPopulation aged 5 Years or Over (Total, in thousands) 96,258 48,513 47,745
Highest Grade/Year CompletedTotal 100 100 100No Grade Completed 2.3 2.4 2.2Pre-school (Kinder/Prep/Nursery) 3.7 3.8 3.6Elementary Undergraduate 23.3 25.3 21.3Elementary Graduate 7.9 8.0 7.8Junior High School Undergraduate 16.7 17.4 16.0Junior High School Graduate 19.3 19.1 19.6Senior High School Undergraduate 2.9 2.8 3.0Senior High School Graduate 1.0 0.9 1.1Post Secondary Non-Tertiary Undergraduate 0.5 0.5 0.5Post Secondary Non-Tertiary Graduate 1.0 1.1 1.0Post Secondary Short Cycle Tertiary Undergraduate 0.7 0.7 0.8Post Secondary Short Cycle Tertiary Graduate 1.9 1.8 2.0College Undergraduate 6.6 6.4 6.9College Graduate or Higher 12.0 9.7 14.3IPEd/Madrasah/SPED/ALS 0.1 0.1 -
NATIONAL CAPITAL REGIONPopulation aged 5 Years or Over (Total, in thousands) 12,433 6,114 6,319
Highest Grade/Year CompletedTotal 100 100 100No Grade Completed 1.3 1.5 1.1Pre-school (Kinder/Prep/Nursery) 3.4 3.4 3.3Elementary Undergraduate 15.0 16.2 13.8Elementary Graduate 4.3 4.2 4.5Junior High School Undergraduate 13.5 13.8 13.2Junior High School Graduate 25.5 25.7 25.2Senior High School Undergraduate 2.9 2.7 3.0Senior High School Graduate 0.8 0.8 0.8Post Secondary Non-Tertiary Undergraduate 1.0 1.0 1.0Post Secondary Non-Tertiary Graduate 1.4 1.4 1.4Post Secondary Short Cycle Tertiary Undergraduate 0.8 0.9 0.8Post Secondary Short Cycle Tertiary Graduate 2.3 2.1 2.5College Undergraduate 11.0 11.4 10.6College Graduate or Higher 16.8 14.9 18.6IPEd/Madrasah/SPED/ALS * * *
CORDILLERA ADMINISTRATIVE REGIONPopulation aged 5 Years or Over (Total, in thousands) 1,610 819 791
Highest Grade/Year CompletedTotal 100 100 100No Grade Completed 2.0 1.8 2.2Pre-school (Kinder/Prep/Nursery) 3.6 3.9 3.4Elementary Undergraduate 22.1 24.5 19.6Elementary Graduate 7.3 8.0 6.6Junior High School Undergraduate 15.5 17.3 13.6Junior High School Graduate 18.2 19.0 17.3Senior High School Undergraduate 3.1 2.9 3.4Senior High School Graduate 0.8 0.6 1.1Post Secondary Non-Tertiary Undergraduate 0.6 * *Post Secondary Non-Tertiary Graduate 0.6 * 0.7Post Secondary Short Cycle Tertiary Undergraduate * * *Post Secondary Short Cycle Tertiary Graduate 1.9 1.7 2.0College Undergraduate 8.6 8.0 9.2College Graduate or Higher 15.3 11.0 19.8IPEd/Madrasah/SPED/ALS * * *
Note: " * " An asterisk indicates that a figure is based on fewer than 25 unweighted cases and has been suppressed. "-" denotes less than 0.05 percent
Source: Philippine Statistics Authority, 2019 Annual Poverty Indicators Survey
Table 10. Population Aged 5 Years or Over by Sex, Highest Grade/Year Completed and Region and Residence, Philippines 2019

Appendix A – Statistical Tables I Final Report
68 Philippine Statistics Authority | 2019 Annual Poverty Indicators Survey
Highest Grade/Year Completed and Region Both Sexes Male Female
REGION I - ILOCOS Population aged 5 Years or Over (Total, in thousands) 4,721 2,377 2,344
Highest Grade/Year CompletedTotal 100 100 100No Grade Completed 1.0 1.2 0.8Pre-school (Kinder/Prep/Nursery) 3.6 3.2 4.1Elementary Undergraduate 20.0 21.3 18.7Elementary Graduate 7.9 8.0 7.7Junior High School Undergraduate 14.6 15.7 13.5Junior High School Graduate 25.1 25.6 24.7Senior High School Undergraduate 2.8 2.9 2.7Senior High School Graduate 1.4 1.6 1.2Post Secondary Non-Tertiary Undergraduate * * *Post Secondary Non-Tertiary Graduate 1.4 1.9 0.9Post Secondary Short Cycle Tertiary Undergraduate * * *Post Secondary Short Cycle Tertiary Graduate 1.5 1.2 1.9College Undergraduate 6.7 6.6 6.8College Graduate or Higher 13.4 10.2 16.7IPEd/Madrasah/SPED/ALS * * *
REGION II - CAGAYAN VALLEYPopulation aged 5 Years or Over (Total, in thousands) 3,258 1,655 1,602
Highest Grade/Year CompletedTotal 100 100 100No Grade Completed 1.7 1.7 1.7Pre-school (Kinder/Prep/Nursery) 4.4 4.9 3.9Elementary Undergraduate 23.5 24.8 22.1Elementary Graduate 11.4 11.7 11.2Junior High School Undergraduate 17.3 18.2 16.3Junior High School Graduate 18.0 18.9 17.1Senior High School Undergraduate 2.9 2.7 3.0Senior High School Graduate 0.5 * *Post Secondary Non-Tertiary Undergraduate * * *Post Secondary Non-Tertiary Graduate 0.6 0.7 0.5Post Secondary Short Cycle Tertiary Undergraduate * * *Post Secondary Short Cycle Tertiary Graduate 1.0 * 1.5College Undergraduate 5.9 5.7 6.1College Graduate or Higher 12.4 9.3 15.5IPEd/Madrasah/SPED/ALS * * *
REGION III - CENTRAL LUZONPopulation aged 5 Years or Over (Total, in thousands) 10,975 5,531 5,443
Highest Grade/Year CompletedTotal 100 100 100No Grade Completed 1.6 1.7 1.5Pre-school (Kinder/Prep/Nursery) 3.4 3.3 3.5Elementary Undergraduate 21.3 23.0 19.5Elementary Graduate 8.6 8.2 9.0Junior High School Undergraduate 17.9 18.7 17.2Junior High School Graduate 22.3 22.2 22.4Senior High School Undergraduate 2.8 2.8 2.8Senior High School Graduate 0.8 0.7 0.9Post Secondary Non-Tertiary Undergraduate 0.3 * *Post Secondary Non-Tertiary Graduate 1.1 1.1 1.0Post Secondary Short Cycle Tertiary Undergraduate 0.3 * 0.4Post Secondary Short Cycle Tertiary Graduate 2.0 1.8 2.1College Undergraduate 6.7 7.0 6.3College Graduate or Higher 11.0 9.0 12.9IPEd/Madrasah/SPED/ALS * * *
Note: " * " An asterisk indicates that a figure is based on fewer than 25 unweighted cases and has been suppressed. Source: Philippine Statistics Authority, 2019 Annual Poverty Indicators Survey
Table 10. Population Aged 5 Years or Over by Sex, Highest Grade/Year Completed and Region and Residence, Philippines 2019 (cont.)

Appendix A – Statistical Tables I Final Report
Philippine Statistics Authority | 2019 Annual Poverty Indicators Survey 69
Highest Grade/Year Completed and Region Both Sexes Male Female
REGION IV-A - CALABARZONPopulation aged 5 Years or Over (Total, in thousands) 14,228 7,097 7,131
Highest Grade/Year CompletedTotal 100 100 100No Grade Completed 1.9 2.2 1.7Pre-school (Kinder/Prep/Nursery) 2.9 3.0 2.9Elementary Undergraduate 16.9 17.6 16.3Elementary Graduate 9.2 9.7 8.7Junior High School Undergraduate 14.5 16.1 12.9Junior High School Graduate 22.9 23.2 22.6Senior High School Undergraduate 2.6 2.7 2.5Senior High School Graduate 1.4 1.3 1.6Post Secondary Non-Tertiary Undergraduate 0.2 * *Post Secondary Non-Tertiary Graduate 1.2 1.4 1.0Post Secondary Short Cycle Tertiary Undergraduate 0.6 * *Post Secondary Short Cycle Tertiary Graduate 4.0 4.0 4.1College Undergraduate 7.1 6.7 7.6College Graduate or Higher 14.2 11.3 17.1IPEd/Madrasah/SPED/ALS * * *
MIMAROPA REGIONPopulation aged 5 Years or Over (Total, in thousands) 2,770 1,418 1,352
Highest Grade/Year CompletedTotal 100 100 100No Grade Completed 2.4 2.2 2.6Pre-school (Kinder/Prep/Nursery) 4.3 4.5 4.0Elementary Undergraduate 28.4 31.2 25.5Elementary Graduate 8.0 8.2 7.7Junior High School Undergraduate 18.5 18.7 18.2Junior High School Graduate 16.6 15.7 17.6Senior High School Undergraduate 2.7 2.3 3.1Senior High School Graduate 1.4 1.5 1.3Post Secondary Non-Tertiary Undergraduate 0.5 0.5 *Post Secondary Non-Tertiary Graduate 1.1 1.1 1.0Post Secondary Short Cycle Tertiary Undergraduate 0.5 * *Post Secondary Short Cycle Tertiary Graduate 1.2 1.4 1.0College Undergraduate 5.3 4.7 5.9College Graduate or Higher 9.3 7.3 11.3IPEd/Madrasah/SPED/ALS * * *
REGION V - BICOLPopulation aged 5 Years or Over (Total, in thousands) 5,355 2,722 2,634
Highest Grade/Year CompletedTotal 100 100 100No Grade Completed 1.6 1.8 1.4Pre-school (Kinder/Prep/Nursery) 4.6 4.9 4.3Elementary Undergraduate 25.6 27.8 23.3Elementary Graduate 12.3 12.5 12.1Junior High School Undergraduate 18.8 19.3 18.2Junior High School Graduate 15.3 14.1 16.6Senior High School Undergraduate 2.9 2.8 3.1Senior High School Graduate 1.2 1.1 1.3Post Secondary Non-Tertiary Undergraduate 0.5 * *Post Secondary Non-Tertiary Graduate 1.2 1.3 1.1Post Secondary Short Cycle Tertiary Undergraduate 0.3 * *Post Secondary Short Cycle Tertiary Graduate 0.7 0.6 0.9College Undergraduate 5.5 5.3 5.7College Graduate or Higher 9.3 7.4 11.3IPEd/Madrasah/SPED/ALS * * *
Note: " * " An asterisk indicates that a figure is based on fewer than 25 unweighted cases and has been suppressed. Source: Philippine Statistics Authority, 2019 Annual Poverty Indicators Survey
Table 10. Population Aged 5 Years or Over by Sex, Highest Grade/Year Completed and Region and Residence, Philippines 2019 (cont.)

Appendix A – Statistical Tables I Final Report
70 Philippine Statistics Authority | 2019 Annual Poverty Indicators Survey
Highest Grade/Year Completed and Region Both Sexes Male Female
REGION VI - WESTERN VISAYASPopulation aged 5 Years or Over (Total, in thousands) 7,066 3,581 3,485
Highest Grade/Year CompletedTotal 100 100 100No Grade Completed 1.4 1.7 1.2Pre-school (Kinder/Prep/Nursery) 3.7 4.0 3.4Elementary Undergraduate 24.3 26.1 22.4Elementary Graduate 7.9 8.3 7.5Junior High School Undergraduate 15.5 16.5 14.6Junior High School Graduate 19.5 19.4 19.7Senior High School Undergraduate 2.8 3.0 2.6Senior High School Graduate 1.3 1.0 1.5Post Secondary Non-Tertiary Undergraduate 0.4 * 0.6Post Secondary Non-Tertiary Graduate 1.2 1.5 1.0Post Secondary Short Cycle Tertiary Undergraduate 1.0 1.0 0.9Post Secondary Short Cycle Tertiary Graduate 2.4 2.2 2.5College Undergraduate 5.2 5.2 5.3College Graduate or Higher 13.2 9.8 16.7IPEd/Madrasah/SPED/ALS * * *
REGION VII - CENTRAL VISAYASPopulation aged 5 Years or Over (Total, in thousands) 7,037 3,554 3,483
Highest Grade/Year CompletedTotal 100 100 100No Grade Completed 1.7 1.7 1.8Pre-school (Kinder/Prep/Nursery) 3.6 3.7 3.4Elementary Undergraduate 27.5 30.2 24.8Elementary Graduate 8.3 8.2 8.5Junior High School Undergraduate 18.2 18.7 17.6Junior High School Graduate 15.6 15.0 16.2Senior High School Undergraduate 3.3 3.1 3.6Senior High School Graduate 1.0 0.9 1.0Post Secondary Non-Tertiary Undergraduate 0.9 1.0 0.9Post Secondary Non-Tertiary Graduate 0.6 0.6 0.6Post Secondary Short Cycle Tertiary Undergraduate 1.9 1.6 2.2Post Secondary Short Cycle Tertiary Graduate 1.1 1.0 1.2College Undergraduate 4.6 4.3 5.0College Graduate or Higher 11.5 10.1 13.0IPEd/Madrasah/SPED/ALS * * *
REGION VIII - EASTERN VISAYASPopulation aged 5 Years or Over (Total, in thousands) 4,153 2,133 2,020
Highest Grade/Year CompletedTotal 100 100 100No Grade Completed 3.0 3.5 2.4Pre-school (Kinder/Prep/Nursery) 3.7 3.8 3.6Elementary Undergraduate 31.3 35.1 27.2Elementary Graduate 8.4 8.1 8.7Junior High School Undergraduate 18.8 18.8 18.9Junior High School Graduate 11.9 10.7 13.1Senior High School Undergraduate 3.3 2.9 3.6Senior High School Graduate 1.2 1.2 1.1Post Secondary Non-Tertiary Undergraduate 0.5 0.5 *Post Secondary Non-Tertiary Graduate 0.3 * *Post Secondary Short Cycle Tertiary Undergraduate 0.4 0.5 *Post Secondary Short Cycle Tertiary Graduate 0.9 0.8 1.0College Undergraduate 5.1 4.7 5.5College Graduate or Higher 11.2 9.0 13.5IPEd/Madrasah/SPED/ALS * * *
Note: " * " An asterisk indicates that a figure is based on fewer than 25 unweighted cases and has been suppressed. Source: Philippine Statistics Authority, 2019 Annual Poverty Indicators Survey
Table 10. Population Aged 5 Years or Over by Sex, Highest Grade/Year Completed and Region and Residence, Philippines 2019 (cont.)

Appendix A – Statistical Tables I Final Report
Philippine Statistics Authority | 2019 Annual Poverty Indicators Survey 71
Highest Grade/Year Completed and Region Both Sexes Male Female
REGION IX - ZAMBOANGA PENINSULAPopulation aged 5 Years or Over (Total, in thousands) 3,333 1,694 1,638
Highest Grade/Year CompletedTotal 100 100 100No Grade Completed 4.2 3.9 4.6Pre-school (Kinder/Prep/Nursery) 3.7 3.9 3.5Elementary Undergraduate 31.1 34.0 28.0Elementary Graduate 6.8 7.2 6.4Junior High School Undergraduate 19.5 18.6 20.3Junior High School Graduate 12.2 11.4 12.9Senior High School Undergraduate 3.7 3.5 3.9Senior High School Graduate * * *Post Secondary Non-Tertiary Undergraduate 1.0 1.3 *Post Secondary Non-Tertiary Graduate 1.2 * 1.5Post Secondary Short Cycle Tertiary Undergraduate 2.0 2.1 2.0Post Secondary Short Cycle Tertiary Graduate 0.7 0.7 *College Undergraduate 4.4 4.4 4.5College Graduate or Higher 9.1 7.6 10.7IPEd/Madrasah/SPED/ALS * * *
REGION X - NORTHERN MINDANAOPopulation aged 5 Years or Over (Total, in thousands) 4,417 2,249 2,167
Highest Grade/Year CompletedTotal 100 100 100No Grade Completed 1.9 1.8 1.9Pre-school (Kinder/Prep/Nursery) 4.2 4.2 4.2Elementary Undergraduate 26.1 29.4 22.7Elementary Graduate 8.2 8.2 8.2Junior High School Undergraduate 19.1 19.6 18.6Junior High School Graduate 17.8 18.0 17.7Senior High School Undergraduate 3.2 2.9 3.5Senior High School Graduate 0.6 0.5 0.7Post Secondary Non-Tertiary Undergraduate 0.3 * *Post Secondary Non-Tertiary Graduate 0.5 * 0.7Post Secondary Short Cycle Tertiary Undergraduate * * *Post Secondary Short Cycle Tertiary Graduate 0.9 0.9 0.9College Undergraduate 7.1 6.2 8.1College Graduate or Higher 9.8 7.5 12.2IPEd/Madrasah/SPED/ALS * * *
REGION XI - DAVAOPopulation aged 5 Years or Over (Total, in thousands) 4,658 2,384 2,274
Highest Grade/Year CompletedTotal 100 100 100No Grade Completed 2.5 2.5 2.5Pre-school (Kinder/Prep/Nursery) 4.0 4.1 3.9Elementary Undergraduate 23.9 26.2 21.4Elementary Graduate 10.3 11.3 9.3Junior High School Undergraduate 18.6 18.8 18.3Junior High School Graduate 18.8 17.4 20.3Senior High School Undergraduate 2.2 1.8 2.6Senior High School Graduate 1.1 0.9 1.3Post Secondary Non-Tertiary Undergraduate 0.4 * *Post Secondary Non-Tertiary Graduate 1.2 1.3 1.1Post Secondary Short Cycle Tertiary Undergraduate 1.1 1.0 1.2Post Secondary Short Cycle Tertiary Graduate 1.3 1.5 1.0College Undergraduate 6.5 5.8 7.2College Graduate or Higher 8.3 7.1 9.5IPEd/Madrasah/SPED/ALS * * *
Note: " * " An asterisk indicates that a figure is based on fewer than 25 unweighted cases and has been suppressed. Source: Philippine Statistics Authority, 2019 Annual Poverty Indicators Survey
Table 10. Population Aged 5 Years or Over by Sex, Highest Grade/Year Completed and Region and Residence, Philippines 2019 (cont.)
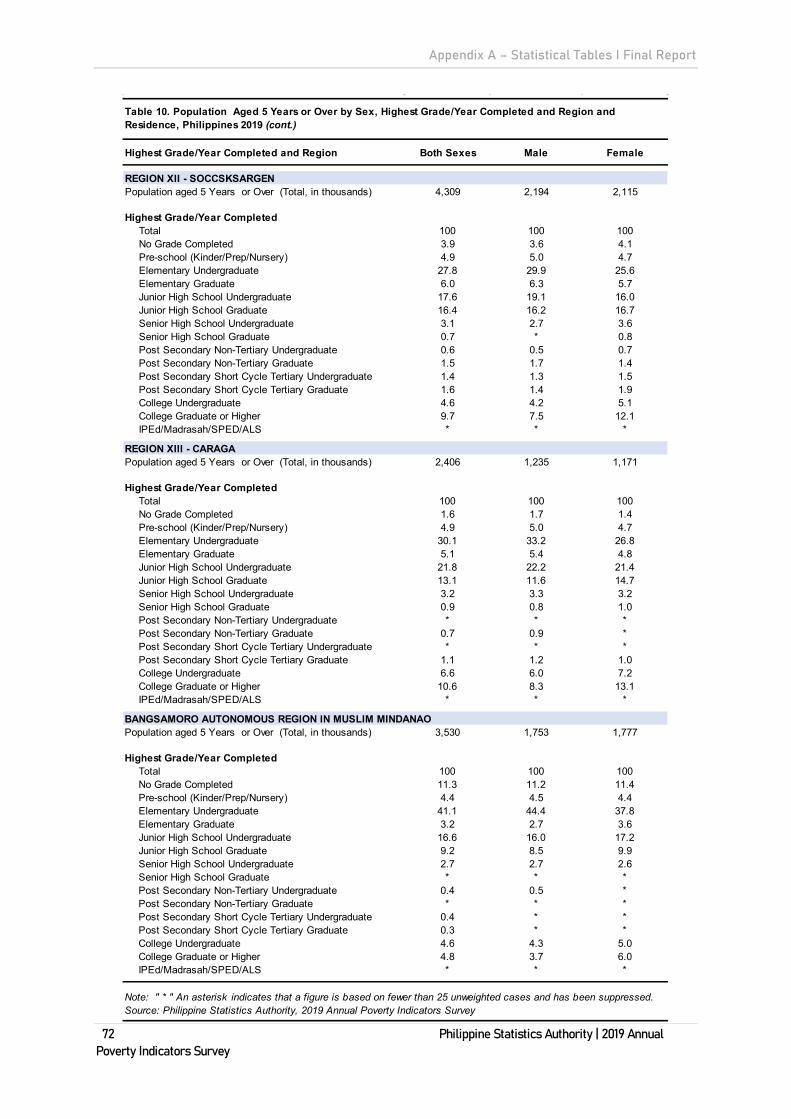
Appendix A – Statistical Tables I Final Report
72 Philippine Statistics Authority | 2019 Annual Poverty Indicators Survey
Highest Grade/Year Completed and Region Both Sexes Male Female
REGION XII - SOCCSKSARGENPopulation aged 5 Years or Over (Total, in thousands) 4,309 2,194 2,115
Highest Grade/Year CompletedTotal 100 100 100No Grade Completed 3.9 3.6 4.1Pre-school (Kinder/Prep/Nursery) 4.9 5.0 4.7Elementary Undergraduate 27.8 29.9 25.6Elementary Graduate 6.0 6.3 5.7Junior High School Undergraduate 17.6 19.1 16.0Junior High School Graduate 16.4 16.2 16.7Senior High School Undergraduate 3.1 2.7 3.6Senior High School Graduate 0.7 * 0.8Post Secondary Non-Tertiary Undergraduate 0.6 0.5 0.7Post Secondary Non-Tertiary Graduate 1.5 1.7 1.4Post Secondary Short Cycle Tertiary Undergraduate 1.4 1.3 1.5Post Secondary Short Cycle Tertiary Graduate 1.6 1.4 1.9College Undergraduate 4.6 4.2 5.1College Graduate or Higher 9.7 7.5 12.1IPEd/Madrasah/SPED/ALS * * *
REGION XIII - CARAGAPopulation aged 5 Years or Over (Total, in thousands) 2,406 1,235 1,171
Highest Grade/Year CompletedTotal 100 100 100No Grade Completed 1.6 1.7 1.4Pre-school (Kinder/Prep/Nursery) 4.9 5.0 4.7Elementary Undergraduate 30.1 33.2 26.8Elementary Graduate 5.1 5.4 4.8Junior High School Undergraduate 21.8 22.2 21.4Junior High School Graduate 13.1 11.6 14.7Senior High School Undergraduate 3.2 3.3 3.2Senior High School Graduate 0.9 0.8 1.0Post Secondary Non-Tertiary Undergraduate * * *Post Secondary Non-Tertiary Graduate 0.7 0.9 *Post Secondary Short Cycle Tertiary Undergraduate * * *Post Secondary Short Cycle Tertiary Graduate 1.1 1.2 1.0College Undergraduate 6.6 6.0 7.2College Graduate or Higher 10.6 8.3 13.1IPEd/Madrasah/SPED/ALS * * *
BANGSAMORO AUTONOMOUS REGION IN MUSLIM MINDANAOPopulation aged 5 Years or Over (Total, in thousands) 3,530 1,753 1,777
Highest Grade/Year CompletedTotal 100 100 100No Grade Completed 11.3 11.2 11.4Pre-school (Kinder/Prep/Nursery) 4.4 4.5 4.4Elementary Undergraduate 41.1 44.4 37.8Elementary Graduate 3.2 2.7 3.6Junior High School Undergraduate 16.6 16.0 17.2Junior High School Graduate 9.2 8.5 9.9Senior High School Undergraduate 2.7 2.7 2.6Senior High School Graduate * * *Post Secondary Non-Tertiary Undergraduate 0.4 0.5 *Post Secondary Non-Tertiary Graduate * * *Post Secondary Short Cycle Tertiary Undergraduate 0.4 * *Post Secondary Short Cycle Tertiary Graduate 0.3 * *College Undergraduate 4.6 4.3 5.0College Graduate or Higher 4.8 3.7 6.0IPEd/Madrasah/SPED/ALS * * *
Note: " * " An asterisk indicates that a figure is based on fewer than 25 unweighted cases and has been suppressed. Source: Philippine Statistics Authority, 2019 Annual Poverty Indicators Survey
Table 10. Population Aged 5 Years or Over by Sex, Highest Grade/Year Completed and Region and Residence, Philippines 2019 (cont.)

Appendix A – Statistical Tables I Final Report
Philippine Statistics Authority | 2019 Annual Poverty Indicators Survey 73
Highest Grade/Year Completed and Region Both Sexes Male Female
ResidenceURBANPopulation aged 5 Years or Over (Total, in thousands) 49,194 24,551 24,643
Highest Grade/Year CompletedTotal 100 100 100No Grade Completed 1.8 1.9 1.7Pre-school (Kinder/Prep/Nursery) 3.5 3.6 3.5Elementary Undergraduate 19.1 20.8 17.5Elementary Graduate 6.4 6.4 6.4Junior High School Undergraduate 15.8 16.6 15.0Junior High School Graduate 21.3 21.2 21.4Senior High School Undergraduate 2.8 2.7 3.0Senior High School Graduate 1.0 0.9 1.1Post Secondary Non-Tertiary Undergraduate 0.6 0.6 0.6Post Secondary Non-Tertiary Graduate 1.1 1.2 1.1Post Secondary Short Cycle Tertiary Undergraduate 0.9 0.8 0.9Post Secondary Short Cycle Tertiary Graduate 2.4 2.3 2.5College Undergraduate 8.4 8.3 8.5College Graduate or Higher 14.8 12.6 17.0IPEd/Madrasah/SPED/ALS 0.1 * *
RURALPopulation aged 5 Years or Over (Total, in thousands) 47,064 23,961 23,103
Highest Grade/Year CompletedTotal 100 100 100
No Grade Completed 2.8 2.9 2.7Pre-school (Kinder/Prep/Nursery) 3.9 4.0 3.8Elementary Undergraduate 27.7 30.0 25.4Elementary Graduate 9.5 9.7 9.2Junior High School Undergraduate 17.7 18.3 17.1Junior High School Graduate 17.3 16.8 17.8Senior High School Undergraduate 3.0 2.9 3.1Senior High School Graduate 1.0 1.0 1.1Post Secondary Non-Tertiary Undergraduate 0.4 0.4 0.4Post Secondary Non-Tertiary Graduate 0.9 1.0 0.8Post Secondary Short Cycle Tertiary Undergraduate 0.6 0.5 0.6Post Secondary Short Cycle Tertiary Graduate 1.3 1.2 1.4College Undergraduate 4.8 4.5 5.1College Graduate or Higher 9.0 6.7 11.4IPEd/Madrasah/SPED/ALS - * *
Note: " * " An asterisk indicates that a figure is based on fewer than 25 unweighted cases and has been suppressed. Source: Philippine Statistics Authority, 2019 Annual Poverty Indicators Survey
Table 10. Population Aged 5 Years or Over by Sex, Highest Grade/Year Completed and Region and Residence, Philippines 2019 (cont.)
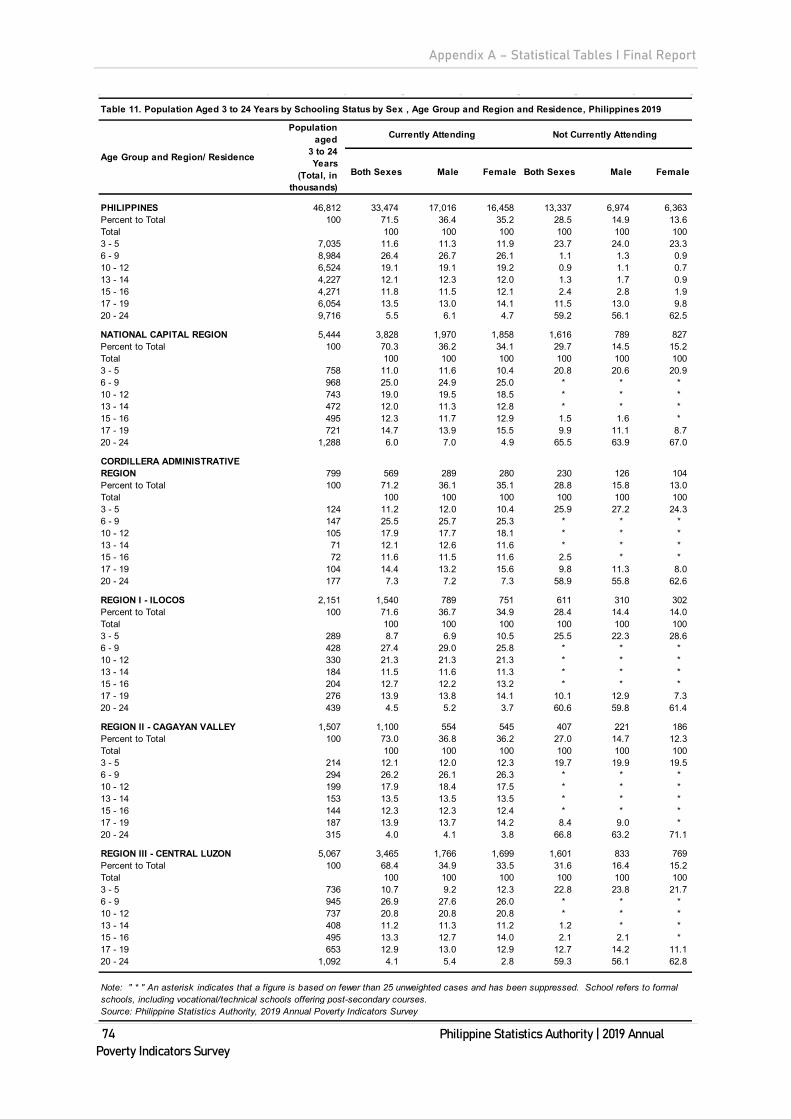
Appendix A – Statistical Tables I Final Report
74 Philippine Statistics Authority | 2019 Annual Poverty Indicators Survey
Table 11. Population Aged 3 to 24 Years by Schooling Status by Sex , Age Group and Region and Residence, Philippines 2019
Both Sexes Male Female Both Sexes Male Female
PHILIPPINES 46,812 33,474 17,016 16,458 13,337 6,974 6,363 Percent to Total 100 71.5 36.4 35.2 28.5 14.9 13.6 Total 100 100 100 100 100 100 3 - 5 7,035 11.6 11.3 11.9 23.7 24.0 23.3 6 - 9 8,984 26.4 26.7 26.1 1.1 1.3 0.9 10 - 12 6,524 19.1 19.1 19.2 0.9 1.1 0.7 13 - 14 4,227 12.1 12.3 12.0 1.3 1.7 0.9 15 - 16 4,271 11.8 11.5 12.1 2.4 2.8 1.9 17 - 19 6,054 13.5 13.0 14.1 11.5 13.0 9.8 20 - 24 9,716 5.5 6.1 4.7 59.2 56.1 62.5
NATIONAL CAPITAL REGION 5,444 3,828 1,970 1,858 1,616 789 827 Percent to Total 100 70.3 36.2 34.1 29.7 14.5 15.2 Total 100 100 100 100 100 100 3 - 5 758 11.0 11.6 10.4 20.8 20.6 20.9 6 - 9 968 25.0 24.9 25.0 * * *10 - 12 743 19.0 19.5 18.5 * * *13 - 14 472 12.0 11.3 12.8 * * *15 - 16 495 12.3 11.7 12.9 1.5 1.6 *17 - 19 721 14.7 13.9 15.5 9.9 11.1 8.7 20 - 24 1,288 6.0 7.0 4.9 65.5 63.9 67.0
CORDILLERA ADMINISTRATIVE REGION 799 569 289 280 230 126 104 Percent to Total 100 71.2 36.1 35.1 28.8 15.8 13.0 Total 100 100 100 100 100 100 3 - 5 124 11.2 12.0 10.4 25.9 27.2 24.3 6 - 9 147 25.5 25.7 25.3 * * *10 - 12 105 17.9 17.7 18.1 * * *13 - 14 71 12.1 12.6 11.6 * * *15 - 16 72 11.6 11.5 11.6 2.5 * *17 - 19 104 14.4 13.2 15.6 9.8 11.3 8.0 20 - 24 177 7.3 7.2 7.3 58.9 55.8 62.6
REGION I - ILOCOS 2,151 1,540 789 751 611 310 302 Percent to Total 100 71.6 36.7 34.9 28.4 14.4 14.0 Total 100 100 100 100 100 100 3 - 5 289 8.7 6.9 10.5 25.5 22.3 28.6 6 - 9 428 27.4 29.0 25.8 * * *10 - 12 330 21.3 21.3 21.3 * * *13 - 14 184 11.5 11.6 11.3 * * *15 - 16 204 12.7 12.2 13.2 * * *17 - 19 276 13.9 13.8 14.1 10.1 12.9 7.3 20 - 24 439 4.5 5.2 3.7 60.6 59.8 61.4
REGION II - CAGAYAN VALLEY 1,507 1,100 554 545 407 221 186 Percent to Total 100 73.0 36.8 36.2 27.0 14.7 12.3 Total 100 100 100 100 100 100 3 - 5 214 12.1 12.0 12.3 19.7 19.9 19.5 6 - 9 294 26.2 26.1 26.3 * * *10 - 12 199 17.9 18.4 17.5 * * *13 - 14 153 13.5 13.5 13.5 * * *15 - 16 144 12.3 12.3 12.4 * * *17 - 19 187 13.9 13.7 14.2 8.4 9.0 *20 - 24 315 4.0 4.1 3.8 66.8 63.2 71.1
REGION III - CENTRAL LUZON 5,067 3,465 1,766 1,699 1,601 833 769 Percent to Total 100 68.4 34.9 33.5 31.6 16.4 15.2 Total 100 100 100 100 100 100 3 - 5 736 10.7 9.2 12.3 22.8 23.8 21.7 6 - 9 945 26.9 27.6 26.0 * * *10 - 12 737 20.8 20.8 20.8 * * *13 - 14 408 11.2 11.3 11.2 1.2 * *15 - 16 495 13.3 12.7 14.0 2.1 2.1 *17 - 19 653 12.9 13.0 12.9 12.7 14.2 11.1 20 - 24 1,092 4.1 5.4 2.8 59.3 56.1 62.8
Source: Philippine Statistics Authority, 2019 Annual Poverty Indicators Survey
Note: " * " An asterisk indicates that a figure is based on fewer than 25 unweighted cases and has been suppressed. School refers to formal schools, including vocational/technical schools offering post-secondary courses.
Age Group and Region/ Residence
Population aged
3 to 24Years
(Total, in thousands)
Currently Attending Not Currently Attending

Appendix A – Statistical Tables I Final Report
Philippine Statistics Authority | 2019 Annual Poverty Indicators Survey 75
Table 11. Population Aged 3 to 24 Years by Schooling Status by Sex , Age Group and Region and Residence, Philippines 2019 (cont.)
Both Sexes Male Female Both Sexes Male Female
REGION IV-A - CALABARZON 6,653 4,581 2,317 2,264 2,072 1,117 955 Percent to Total 100 68.9 34.8 34.0 31.1 16.8 14.4 Total 100 100 100 100 100 100 3 - 5 977 10.6 10.8 10.4 23.8 25.5 21.7 6 - 9 1,236 26.7 27.0 26.5 * * *10 - 12 937 20.4 19.3 21.5 * * *13 - 14 563 11.7 13.1 10.2 * * *15 - 16 555 11.5 11.1 11.8 * * *17 - 19 941 15.2 14.9 15.5 11.8 13.1 10.3 20 - 24 1,443 3.9 3.8 4.0 61.0 57.4 65.3
MIMAROPA REGION 1,469 1,104 564 540 365 194 171 Percent to Total 100 75.2 38.4 36.8 24.8 13.2 11.6 Total 100 100 100 100 100 100 3 - 5 229 12.4 12.0 12.8 25.2 27.5 22.6 6 - 9 306 27.3 27.5 27.2 * * *10 - 12 214 19.0 19.0 18.9 * * *13 - 14 139 12.3 12.4 12.1 * * *15 - 16 134 11.4 11.2 11.6 * * *17 - 19 180 12.6 12.5 12.7 11.3 11.9 10.6 20 - 24 267 5.0 5.3 4.6 58.1 54.8 61.8
REGION V - BICOL 2,872 2,168 1,101 1,067 703 373 330 Percent to Total 100 75.5 38.3 37.2 24.5 13.0 11.5 Total 100 100 100 100 100 100 3 - 5 440 12.5 11.7 13.4 23.9 23.3 24.6 6 - 9 583 26.5 27.1 25.9 * * *10 - 12 404 18.5 18.7 18.2 * * *13 - 14 285 12.9 12.9 12.9 * * *15 - 16 265 11.2 11.0 11.3 3.2 3.4 *17 - 19 362 13.1 12.7 13.6 11.0 13.7 8.0 20 - 24 532 5.3 5.9 4.8 59.2 56.5 62.3
REGION VI - WESTERN VISAYAS 3,339 2,480 1,260 1,220 858 463 396 Percent to Total 100 74.3 37.7 36.5 25.7 13.9 11.9 Total 100 100 100 100 100 100 3 - 5 485 13.3 13.5 13.0 18.1 18.0 18.3 6 - 9 650 26.1 26.3 25.9 * * *10 - 12 453 18.1 17.2 19.0 * * *13 - 14 309 12.0 12.8 11.1 * * *15 - 16 306 11.4 11.1 11.8 2.7 * *17 - 19 441 13.5 12.4 14.7 12.2 15.1 9.0 20 - 24 694 5.7 6.8 4.5 64.5 59.1 70.8
REGION VII - CENTRAL VISAYAS 3,421 2,514 1,278 1,236 906 472 434 Percent to Total 100 73.5 37.4 36.1 26.5 13.8 12.7 Total 100 100 100 100 100 100 3 - 5 517 13.5 12.2 14.9 19.6 20.8 18.2 6 - 9 660 25.9 26.5 25.4 * * *10 - 12 475 18.4 19.8 17.0 * * *13 - 14 313 11.9 11.1 12.8 * * *15 - 16 305 11.2 11.2 11.2 2.6 * *17 - 19 439 13.0 12.2 13.8 12.3 13.6 11.0 20 - 24 711 6.0 6.9 5.0 61.9 58.4 65.7
REGION VIII - EASTERN VISAYAS 2,165 1,591 811 780 574 306 268 Percent to Total 100 73.5 37.5 36.0 26.5 14.1 12.4 Total 100 100 100 100 100 100 3 - 5 334 12.2 12.5 11.9 24.4 23.9 24.9 6 - 9 421 26.1 25.4 26.9 * * *10 - 12 300 18.5 18.1 18.9 * * *13 - 14 207 12.3 12.8 11.7 2.2 * *15 - 16 208 11.9 11.9 11.8 3.3 4.5 *17 - 19 276 12.8 12.1 13.5 12.6 14.1 10.9 20 - 24 418 6.3 7.3 5.2 55.5 51.9 59.5
Source: Philippine Statistics Authority, 2019 Annual Poverty Indicators Survey
Age Group and Region/ Residence
Population aged
3 to 24Years
(Total, in thousands)
Currently Attending Not Currently Attending
Note: " * " An asterisk indicates that a figure is based on fewer than 25 unweighted cases and has been suppressed. School refers to formal schools, including vocational/technical schools offering post-secondary courses.

Appendix A – Statistical Tables I Final Report
76 Philippine Statistics Authority | 2019 Annual Poverty Indicators Survey
Table 11. Population Aged 3 to 24 Years by Schooling Status by Sex , Age Group and Region and Residence, Philippines 2019 (cont.)
Both Sexes Male Female Both Sexes Male Female
REGION IX - ZAMBOANGA PENINSULA 1,742 1,287 658 629 455 240 215 Percent to Total 100 73.9 37.8 36.1 26.1 13.8 12.4 Total 100 100 100 100 100 100 3 - 5 275 11.6 11.9 11.3 27.6 30.0 24.9 6 - 9 339 25.9 25.2 26.6 * * *10 - 12 235 17.8 17.8 17.8 * * *13 - 14 163 12.2 12.1 12.2 * * *15 - 16 173 12.3 12.2 12.4 3.3 * *17 - 19 213 12.9 12.1 13.8 10.3 11.3 9.2 20 - 24 345 7.4 8.8 5.9 54.9 49.3 61.2
REGION X - NORTHERN MINDANAO 2,223 1,618 821 797 605 309 295 Percent to Total 100 72.8 36.9 35.9 27.2 13.9 13.3 Total 100 100 100 100 100 100 3 - 5 335 10.9 10.4 11.4 26.3 24.7 27.9 6 - 9 433 26.5 27.1 26.0 * * *10 - 12 299 18.1 17.9 18.3 * * *13 - 14 208 12.4 12.5 12.3 * * *15 - 16 219 12.8 12.9 12.8 1.9 * *17 - 19 272 13.4 12.6 14.2 9.1 10.4 7.6 20 - 24 456 5.9 6.7 5.1 59.7 59.0 60.5
REGION XI - DAVAO 2,313 1,677 849 827 637 331 306 Percent to Total 100 72.5 36.7 35.8 27.5 14.3 13.2 Total 100 100 100 100 100 100 3 - 5 363 12.7 12.6 12.8 23.5 23.1 24.1 6 - 9 447 26.3 26.4 26.2 * * *10 - 12 318 18.4 18.7 18.1 * * *13 - 14 212 12.3 12.1 12.6 * * *15 - 16 217 11.5 11.5 11.5 3.9 * *17 - 19 282 11.7 11.0 12.3 13.7 13.9 13.4 20 - 24 474 7.1 7.8 6.5 55.6 53.4 58.0
REGION XII - SOCCSKSARGEN 2,216 1,610 812 799 606 322 284 Percent to Total 100 72.7 36.6 36.0 27.3 14.5 12.8 Total 100 100 100 100 100 100 3 - 5 347 13.8 12.9 14.6 20.7 21.8 19.5 6 - 9 421 25.7 26.5 24.8 * * *10 - 12 304 18.5 18.4 18.6 * * *13 - 14 209 12.4 12.5 12.2 * * *15 - 16 190 10.9 11.2 10.7 2.3 * *17 - 19 297 13.3 12.1 14.5 13.7 15.3 12.0 20 - 24 449 5.5 6.4 4.7 59.4 54.8 64.6
REGION XIII - CARAGA 1,257 962 491 471 295 158 136 Percent to Total 100 76.6 39.1 37.5 23.4 12.6 10.9 Total 100 100 100 100 100 100 3 - 5 201 14.1 14.6 13.5 22.1 20.2 24.2 6 - 9 252 26.0 26.2 25.7 * * *10 - 12 169 17.4 17.6 17.2 * * *13 - 14 123 12.5 12.4 12.6 * * *15 - 16 108 10.6 10.1 11.1 * * *17 - 19 158 12.7 12.2 13.3 12.2 15.2 8.6 20 - 24 246 6.7 6.9 6.5 61.7 59.8 63.8
BANGSAMORO AUTONOMOUS REGION IN MUSLIM MINDANAO 2,176 1,379 685 694 797 412 385 Percent to Total 100 63.4 31.5 31.9 36.6 18.9 17.7 Total 100 100 100 100 100 100 3 - 5 411 7.0 7.1 6.9 39.5 39.0 40.0 6 - 9 454 29.9 30.8 29.0 5.3 5.4 5.2 10 - 12 302 20.4 20.4 20.3 2.6 2.9 2.3 13 - 14 208 13.5 13.7 13.4 2.7 3.1 2.3 15 - 16 181 10.3 9.0 11.5 5.0 5.9 4.0 17 - 19 251 12.0 12.2 11.7 10.7 11.2 10.2 20 - 24 369 7.0 6.9 7.1 34.2 32.4 36.1
Source: Philippine Statistics Authority, 2019 Annual Poverty Indicators Survey
Age Group and Region/ Residence
Population aged
3 to 24Years
(Total, in thousands)
Currently Attending Not Currently Attending
Note: " * " An asterisk indicates that a figure is based on fewer than 25 unweighted cases and has been suppressed. School refers to formal schools, including vocational/technical schools offering post-secondary courses.

Appendix A – Statistical Tables I Final Report
Philippine Statistics Authority | 2019 Annual Poverty Indicators Survey 77
Table 11. Population Aged 3 to 24 Years by Schooling Status by Sex , Age Group and Region and Residence, Philippines 2019 (cont.)
Both Sexes Male Female Both Sexes Male Female
ResidenceURBAN 23,201 16,344 8,336 8,008 6,857 3,582 3,275 Percent to Total 100 70.4 35.9 34.5 29.6 15.4 14.1 Total 100.0 100.0 100.0 100.0 100.0 100.0 3 - 5 3,378 11.2 10.9 11.4 22.7 23.7 21.5 6 - 9 4,250 25.6 25.9 25.3 0.9 1.0 0.8 10 - 12 3,153 18.9 18.7 19.1 0.9 1.2 0.5 13 - 14 2,019 11.9 12.0 11.8 1.1 1.5 0.7 15 - 16 2,086 11.9 11.5 12.4 2.0 2.4 1.6 17 - 19 3,066 14.4 13.9 15.0 10.3 11.6 8.9 20 - 24 5,250 6.1 7.1 5.1 62.0 58.5 65.9
RURAL 23,610 17,130 8,680 8,450 6,480 3,393 3,088 Percent to Total 100 72.6 36.8 35.8 27.4 14.4 13.1 Total 100.0 100.0 100.0 100.0 100.0 100.0 3 - 5 3,657 12.0 11.6 12.4 24.8 24.3 25.3 6 - 9 4,734 27.1 27.5 26.8 1.3 1.5 1.1 10 - 12 3,371 19.3 19.4 19.2 0.9 1.0 0.9 13 - 14 2,209 12.3 12.6 12.1 1.4 1.8 1.0 15 - 16 2,186 11.7 11.5 11.9 2.8 3.3 2.2 17 - 19 2,988 12.7 12.1 13.2 12.7 14.4 10.8 20 - 24 4,466 4.8 5.3 4.4 56.1 53.7 58.8
Source: Philippine Statistics Authority, 2019 Annual Poverty Indicators Survey
Age Group and Region/ Residence
Population aged
3 to 24Years
(Total, in thousands)
Currently Attending Not Currently Attending
Note: " * " An asterisk indicates that a figure is based on fewer than 25 unweighted cases and has been suppressed. School refers to formal schools, including vocational/technical schools offering post-secondary courses.
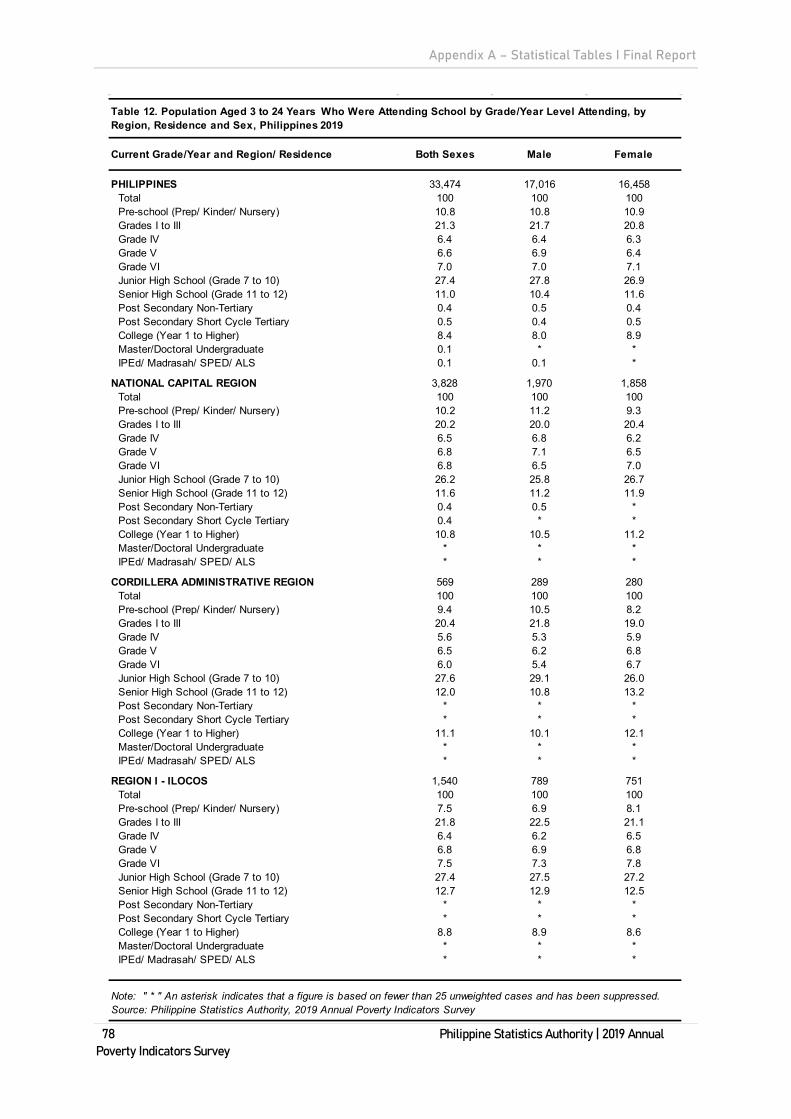
Appendix A – Statistical Tables I Final Report
78 Philippine Statistics Authority | 2019 Annual Poverty Indicators Survey
Current Grade/Year and Region/ Residence Both Sexes Male Female
PHILIPPINES 33,474 17,016 16,458Total 100 100 100Pre-school (Prep/ Kinder/ Nursery) 10.8 10.8 10.9Grades I to III 21.3 21.7 20.8Grade IV 6.4 6.4 6.3Grade V 6.6 6.9 6.4Grade VI 7.0 7.0 7.1Junior High School (Grade 7 to 10) 27.4 27.8 26.9Senior High School (Grade 11 to 12) 11.0 10.4 11.6Post Secondary Non-Tertiary 0.4 0.5 0.4Post Secondary Short Cycle Tertiary 0.5 0.4 0.5College (Year 1 to Higher) 8.4 8.0 8.9Master/Doctoral Undergraduate 0.1 * *IPEd/ Madrasah/ SPED/ ALS 0.1 0.1 *
NATIONAL CAPITAL REGION 3,828 1,970 1,858Total 100 100 100Pre-school (Prep/ Kinder/ Nursery) 10.2 11.2 9.3Grades I to III 20.2 20.0 20.4Grade IV 6.5 6.8 6.2Grade V 6.8 7.1 6.5Grade VI 6.8 6.5 7.0Junior High School (Grade 7 to 10) 26.2 25.8 26.7Senior High School (Grade 11 to 12) 11.6 11.2 11.9Post Secondary Non-Tertiary 0.4 0.5 *Post Secondary Short Cycle Tertiary 0.4 * *College (Year 1 to Higher) 10.8 10.5 11.2Master/Doctoral Undergraduate * * *IPEd/ Madrasah/ SPED/ ALS * * *
CORDILLERA ADMINISTRATIVE REGION 569 289 280Total 100 100 100Pre-school (Prep/ Kinder/ Nursery) 9.4 10.5 8.2Grades I to III 20.4 21.8 19.0Grade IV 5.6 5.3 5.9Grade V 6.5 6.2 6.8Grade VI 6.0 5.4 6.7Junior High School (Grade 7 to 10) 27.6 29.1 26.0Senior High School (Grade 11 to 12) 12.0 10.8 13.2Post Secondary Non-Tertiary * * *Post Secondary Short Cycle Tertiary * * *College (Year 1 to Higher) 11.1 10.1 12.1Master/Doctoral Undergraduate * * *IPEd/ Madrasah/ SPED/ ALS * * *
REGION I - ILOCOS 1,540 789 751Total 100 100 100Pre-school (Prep/ Kinder/ Nursery) 7.5 6.9 8.1Grades I to III 21.8 22.5 21.1Grade IV 6.4 6.2 6.5Grade V 6.8 6.9 6.8Grade VI 7.5 7.3 7.8Junior High School (Grade 7 to 10) 27.4 27.5 27.2Senior High School (Grade 11 to 12) 12.7 12.9 12.5Post Secondary Non-Tertiary * * *Post Secondary Short Cycle Tertiary * * *College (Year 1 to Higher) 8.8 8.9 8.6Master/Doctoral Undergraduate * * *IPEd/ Madrasah/ SPED/ ALS * * *
Note: " * " An asterisk indicates that a figure is based on fewer than 25 unweighted cases and has been suppressed.Source: Philippine Statistics Authority, 2019 Annual Poverty Indicators Survey
Table 12. Population Aged 3 to 24 Years Who Were Attending School by Grade/Year Level Attending, by Region, Residence and Sex, Philippines 2019

Appendix A – Statistical Tables I Final Report
Philippine Statistics Authority | 2019 Annual Poverty Indicators Survey 79
Current Grade/Year and Region/ Residence Both Sexes Male Female
REGION II - CAGAYAN VALLEY 1,100 554 545Total 100 100 100Pre-school (Prep/ Kinder/ Nursery) 10.8 11.1 10.5Grades I to III 20.9 20.9 21.0Grade IV 6.2 6.8 5.6Grade V 7.0 7.3 6.7Grade VI 7.2 6.8 7.5Junior High School (Grade 7 to 10) 26.4 26.6 26.1Senior High School (Grade 11 to 12) 11.6 11.4 11.9Post Secondary Non-Tertiary * * *Post Secondary Short Cycle Tertiary * * *College (Year 1 to Higher) 8.9 8.3 9.6Master/Doctoral Undergraduate * * *IPEd/ Madrasah/ SPED/ ALS * * *
REGION III - CENTRAL LUZON 3,465 1,766 1,699Total 100 100 100Pre-school (Prep/ Kinder/ Nursery) 10.2 9.1 11.4Grades I to III 22.2 23.3 21.0Grade IV 5.0 5.0 4.9Grade V 6.9 6.9 6.9Grade VI 7.5 8.0 7.0Junior High School (Grade 7 to 10) 27.6 26.4 28.8Senior High School (Grade 11 to 12) 11.2 11.0 11.5Post Secondary Non-Tertiary * * *Post Secondary Short Cycle Tertiary * * *College (Year 1 to Higher) 8.8 9.5 8.0Master/Doctoral Undergraduate * * *IPEd/ Madrasah/ SPED/ ALS * * *
REGION IV-A - CALABARZON 4,581 2,317 2,264Total 100 100 100Pre-school (Prep/ Kinder/ Nursery) 9.8 9.9 9.7Grades I to III 21.5 21.6 21.3Grade IV 6.3 6.1 6.4Grade V 6.6 6.0 7.1Grade VI 7.4 6.9 8.0Junior High School (Grade 7 to 10) 26.9 29.1 24.6Senior High School (Grade 11 to 12) 11.7 11.7 11.7Post Secondary Non-Tertiary * * *Post Secondary Short Cycle Tertiary * * *College (Year 1 to Higher) 9.1 8.0 10.2Master/Doctoral Undergraduate * * *IPEd/ Madrasah/ SPED/ ALS * * *
MIMAROPA REGION 1,104 564 540Total 100 100 100Pre-school (Prep/ Kinder/ Nursery) 11.7 11.3 12.1Grades I to III 21.7 22.1 21.2Grade IV 6.9 7.1 6.7Grade V 6.9 7.3 6.5Grade VI 6.9 7.2 6.6Junior High School (Grade 7 to 10) 26.9 26.8 27.0Senior High School (Grade 11 to 12) 10.3 10.2 10.4Post Secondary Non-Tertiary * * *Post Secondary Short Cycle Tertiary * * *College (Year 1 to Higher) 7.6 7.0 8.2Master/Doctoral Undergraduate * * *IPEd/ Madrasah/ SPED/ ALS * * *
Note: " * " An asterisk indicates that a figure is based on fewer than 25 unweighted cases and has been suppressed.Source: Philippine Statistics Authority, 2019 Annual Poverty Indicators Survey
Table 12. Population Aged 3 to 24 Years Who Were Attending School by Grade/Year Level Attending, by Region, Residence and Sex, Philippines 2019 (cont.)

Appendix A – Statistical Tables I Final Report
80 Philippine Statistics Authority | 2019 Annual Poverty Indicators Survey
Current Grade/Year and Region/ Residence Both Sexes Male Female
REGION V - BICOL 2,168 1,101 1,067Total 100 100 100Pre-school (Prep/ Kinder/ Nursery) 12.6 12.2 13.1Grades I to III 20.4 20.4 20.3Grade IV 6.5 7.4 5.5Grade V 6.2 6.2 6.2Grade VI 6.7 7.2 6.2Junior High School (Grade 7 to 10) 29.1 30.0 28.1Senior High School (Grade 11 to 12) 9.5 8.6 10.6Post Secondary Non-Tertiary * * *Post Secondary Short Cycle Tertiary * * *College (Year 1 to Higher) 8.3 7.2 9.3Master/Doctoral Undergraduate * * *IPEd/ Madrasah/ SPED/ ALS * * *
REGION VI - WESTERN VISAYAS 2,480 1,260 1,220Total 100 100 100Pre-school (Prep/ Kinder/ Nursery) 12.8 13.1 12.5Grades I to III 20.8 21.5 20.0Grade IV 6.2 6.1 6.4Grade V 6.0 6.3 5.5Grade VI 7.5 7.1 7.8Junior High School (Grade 7 to 10) 27.0 27.8 26.1Senior High School (Grade 11 to 12) 11.5 10.1 12.9Post Secondary Non-Tertiary * * *Post Secondary Short Cycle Tertiary * * *College (Year 1 to Higher) 7.4 7.0 7.8Master/Doctoral Undergraduate * * *IPEd/ Madrasah/ SPED/ ALS * * *
REGION VII - CENTRAL VISAYAS 2,514 1,278 1,236Total 100 100 100Pre-school (Prep/ Kinder/ Nursery) 12.3 10.9 13.7Grades I to III 19.6 21.0 18.2Grade IV 6.8 6.3 7.2Grade V 7.1 8.8 5.3Grade VI 6.7 6.1 7.4Junior High School (Grade 7 to 10) 27.5 27.3 27.8Senior High School (Grade 11 to 12) 11.0 10.7 11.4Post Secondary Non-Tertiary * * *Post Secondary Short Cycle Tertiary 1.2 * *College (Year 1 to Higher) 7.1 7.2 7.1Master/Doctoral Undergraduate * * *IPEd/ Madrasah/ SPED/ ALS * * *
REGION VIII - EASTERN VISAYAS 1,591 811 780Total 100 100 100Pre-school (Prep/ Kinder/ Nursery) 12.2 12.8 11.6Grades I to III 20.0 19.7 20.2Grade IV 6.9 6.2 7.6Grade V 6.6 7.0 6.2Grade VI 6.8 7.4 6.2Junior High School (Grade 7 to 10) 28.0 29.1 26.8Senior High School (Grade 11 to 12) 10.3 9.1 11.5Post Secondary Non-Tertiary 0.8 * *Post Secondary Short Cycle Tertiary * * *College (Year 1 to Higher) 8.2 7.3 9.1Master/Doctoral Undergraduate * * *IPEd/ Madrasah/ SPED/ ALS * * *
Note: " * " An asterisk indicates that a figure is based on fewer than 25 unweighted cases and has been suppressed.Source: Philippine Statistics Authority, 2019 Annual Poverty Indicators Survey
Table 12. Population Aged 3 to 24 Years Who Were Attending School by Grade/Year Level Attending, by Region, Residence and Sex, Philippines 2019 (cont.)
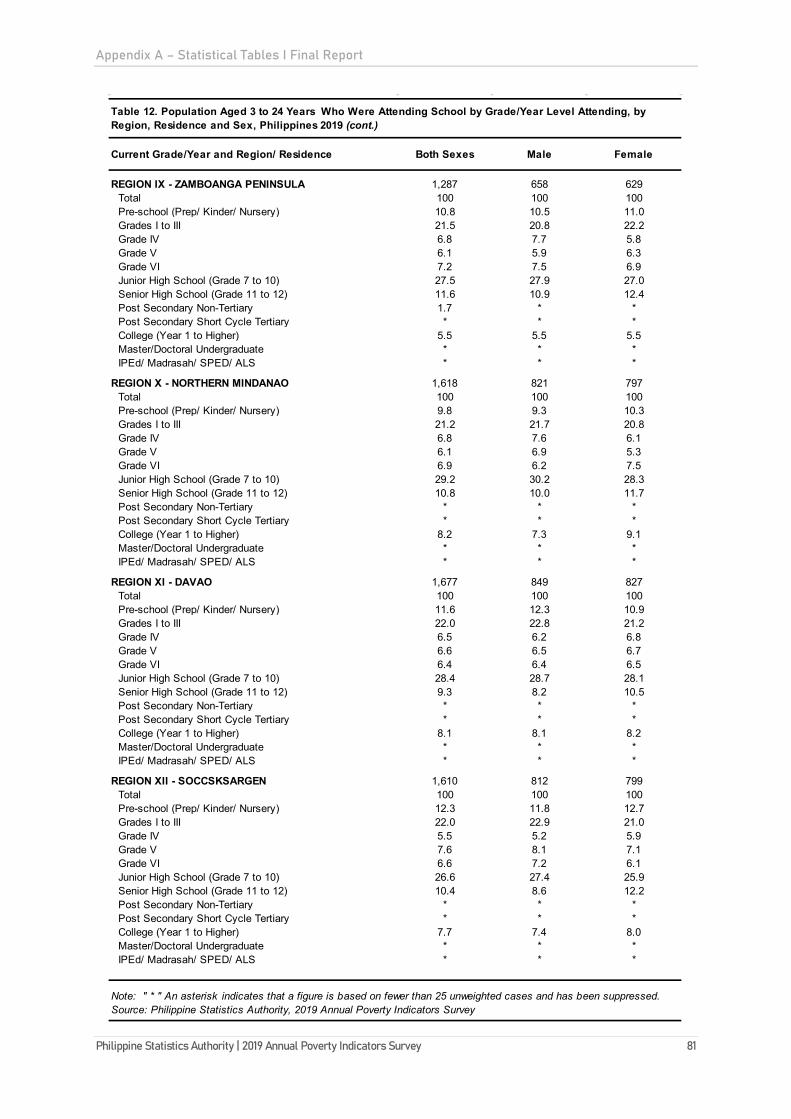
Appendix A – Statistical Tables I Final Report
Philippine Statistics Authority | 2019 Annual Poverty Indicators Survey 81
Current Grade/Year and Region/ Residence Both Sexes Male Female
REGION IX - ZAMBOANGA PENINSULA 1,287 658 629Total 100 100 100Pre-school (Prep/ Kinder/ Nursery) 10.8 10.5 11.0Grades I to III 21.5 20.8 22.2Grade IV 6.8 7.7 5.8Grade V 6.1 5.9 6.3Grade VI 7.2 7.5 6.9Junior High School (Grade 7 to 10) 27.5 27.9 27.0Senior High School (Grade 11 to 12) 11.6 10.9 12.4Post Secondary Non-Tertiary 1.7 * *Post Secondary Short Cycle Tertiary * * *College (Year 1 to Higher) 5.5 5.5 5.5Master/Doctoral Undergraduate * * *IPEd/ Madrasah/ SPED/ ALS * * *
REGION X - NORTHERN MINDANAO 1,618 821 797Total 100 100 100Pre-school (Prep/ Kinder/ Nursery) 9.8 9.3 10.3Grades I to III 21.2 21.7 20.8Grade IV 6.8 7.6 6.1Grade V 6.1 6.9 5.3Grade VI 6.9 6.2 7.5Junior High School (Grade 7 to 10) 29.2 30.2 28.3Senior High School (Grade 11 to 12) 10.8 10.0 11.7Post Secondary Non-Tertiary * * *Post Secondary Short Cycle Tertiary * * *College (Year 1 to Higher) 8.2 7.3 9.1Master/Doctoral Undergraduate * * *IPEd/ Madrasah/ SPED/ ALS * * *
REGION XI - DAVAO 1,677 849 827Total 100 100 100Pre-school (Prep/ Kinder/ Nursery) 11.6 12.3 10.9Grades I to III 22.0 22.8 21.2Grade IV 6.5 6.2 6.8Grade V 6.6 6.5 6.7Grade VI 6.4 6.4 6.5Junior High School (Grade 7 to 10) 28.4 28.7 28.1Senior High School (Grade 11 to 12) 9.3 8.2 10.5Post Secondary Non-Tertiary * * *Post Secondary Short Cycle Tertiary * * *College (Year 1 to Higher) 8.1 8.1 8.2Master/Doctoral Undergraduate * * *IPEd/ Madrasah/ SPED/ ALS * * *
REGION XII - SOCCSKSARGEN 1,610 812 799Total 100 100 100Pre-school (Prep/ Kinder/ Nursery) 12.3 11.8 12.7Grades I to III 22.0 22.9 21.0Grade IV 5.5 5.2 5.9Grade V 7.6 8.1 7.1Grade VI 6.6 7.2 6.1Junior High School (Grade 7 to 10) 26.6 27.4 25.9Senior High School (Grade 11 to 12) 10.4 8.6 12.2Post Secondary Non-Tertiary * * *Post Secondary Short Cycle Tertiary * * *College (Year 1 to Higher) 7.7 7.4 8.0Master/Doctoral Undergraduate * * *IPEd/ Madrasah/ SPED/ ALS * * *
Note: " * " An asterisk indicates that a figure is based on fewer than 25 unweighted cases and has been suppressed.Source: Philippine Statistics Authority, 2019 Annual Poverty Indicators Survey
Table 12. Population Aged 3 to 24 Years Who Were Attending School by Grade/Year Level Attending, by Region, Residence and Sex, Philippines 2019 (cont.)

Appendix A – Statistical Tables I Final Report
82 Philippine Statistics Authority | 2019 Annual Poverty Indicators Survey

Appendix A – Statistical Tables I Final Report
Philippine Statistics Authority | 2019 Annual Poverty Indicators Survey 83
Reason for Not Attending School, Region and Residence Both Sexes Male Female
PHILIPPINES 10,177 5,299 4,878Total 100 100 100Accessibility of school 0.5 0.5 0.4Illness/ disability 3.1 3.6 2.6Marriage/ family matters 19.1 8.4 30.7High cost of education/ financial concern 8.7 9.8 7.6Employment 32.8 38.0 27.2Finished schooling or finished post secondary or college 13.6 10.6 16.9Looking for work 7.9 8.9 6.9Lack of personal interest 13.2 19.3 6.7Problem with school record/ birth certificate 0.3 0.3 *Too young to go to school 0.1 * *Others 0.5 0.5 0.6
NATIONAL CAPITAL REGION 1,281 626 655Total 100 100 100Accessibility of school * * *Illness/ disability 2.5 3.0 *Marriage/ family matters 15.9 6.7 24.7High cost of education/ financial concern 5.8 6.4 5.3Employment 43.7 48.4 39.2Finished schooling or finished post secondary or college 13.9 12.2 15.5Looking for work 9.2 11.6 6.9Lack of personal interest 7.5 9.7 5.5Problem with school record/ birth certificate * * *Too young to go to school * * *Others 1.0 * *
CORDILLERA ADMINISTRATIVE REGION 170 92 79Total 100 100 100Accessibility of school * * *Illness/ disability 3.7 * *Marriage/ family matters 17.7 11.3 25.1High cost of education/ financial concern 5.7 7.8 *Employment 22.1 23.9 20.0Finished schooling or finished post secondary or college 23.7 17.6 30.9Looking for work 7.6 9.1 5.9Lack of personal interest 16.5 24.2 7.4Problem with school record/ birth certificate * * *Too young to go to school * * *Others * * *
REGION I - ILOCOS 456 240 215Total 100 100 100Accessibility of school * * *Illness/ disability 1.4 1.0 1.9Marriage/ family matters 18.0 9.8 27.2High cost of education/ financial concern 8.6 12.3 4.5Employment 31.1 34.6 27.2Finished schooling or finished post secondary or college 15.3 10.6 20.4Looking for work 12.6 13.5 *Lack of personal interest 12.4 17.4 *Problem with school record/ birth certificate * * *Too young to go to school * * *Others * * *
Note: " * " An asterisk indicates that a figure is based on fewer than 25 unweighted cases and has been suppressed.Source: Philippine Statistics Authority, 2019 Annual Poverty Indicators Survey
Table 13. Population Aged 6 to 24 Years Who Were Not Attending School by Reason for Not Attending School by Region, Residence and Sex, Philippines 2019

Appendix A – Statistical Tables I Final Report
84 Philippine Statistics Authority | 2019 Annual Poverty Indicators Survey
Reason for Not Attending School, Region and Residence Both Sexes Male Female
REGION II - CAGAYAN VALLEY 327 177 150Total 100 100 100Accessibility of school * * *Illness/ disability * * *Marriage/ family matters 21.0 * 35.8High cost of education/ financial concern 8.0 10.6 *Employment 25.0 30.8 18.1Finished schooling or finished post secondary or college 16.7 14.3 19.6Looking for work 9.9 * *Lack of personal interest 13.3 18.8 *Problem with school record/ birth certificate * * *Too young to go to school * * *Others * * *
REGION III - CENTRAL LUZON 1,236 634 602Total 100 100 100Accessibility of school * * *Illness/ disability 3.0 3.1 *Marriage/ family matters 17.2 9.0 25.8High cost of education/ financial concern 8.3 8.2 8.5Employment 40.2 47.8 32.2Finished schooling or finished post secondary or college 11.9 7.6 16.5Looking for work 7.7 10.2 5.1Lack of personal interest 10.3 13.0 7.6Problem with school record/ birth certificate * * *Too young to go to school * * *Others * * *
REGION IV-A - CALABARZON 1,580 832 748Total 100 100 100Accessibility of school * * *Illness/ disability * * *Marriage/ family matters 13.8 * 23.7High cost of education/ financial concern 8.1 9.5 6.5Employment 39.0 42.2 35.5Finished schooling or finished post secondary or college 17.1 14.9 19.6Looking for work 6.8 * 7.7Lack of personal interest 11.7 18.8 *Problem with school record/ birth certificate * * *Too young to go to school * * *Others * * *
MIMAROPA REGION 273 140 132Total 100 100 100Accessibility of school * * *Illness/ disability 3.7 * *Marriage/ family matters 25.0 11.3 39.6High cost of education/ financial concern 7.2 8.1 *Employment 27.4 34.2 20.3Finished schooling or finished post secondary or college 10.7 6.0 15.8Looking for work 8.6 11.4 *Lack of personal interest 15.5 23.2 *Problem with school record/ birth certificate * * *Too young to go to school * * *Others * * *
Note: " * " An asterisk indicates that a figure is based on fewer than 25 unweighted cases and has been suppressed.Source: Philippine Statistics Authority, 2019 Annual Poverty Indicators Survey
Table 13. Population Aged 6 to 24 Years Who Were Not Attending School by Reason for Not Attending School by Region, Residence and Sex, Philippines 2019 (cont.)

Appendix A – Statistical Tables I Final Report
Philippine Statistics Authority | 2019 Annual Poverty Indicators Survey 85
Reason for Not Attending School, Region and Residence Both Sexes Male Female
REGION V - BICOL 535 286 249Total 100 100 100Accessibility of school * * *Illness/ disability 4.8 5.9 *Marriage/ family matters 25.3 8.5 44.6High cost of education/ financial concern 5.5 7.0 *Employment 27.6 36.4 17.5Finished schooling or finished post secondary or college 13.3 12.7 14.0Looking for work 7.4 * 9.6Lack of personal interest 15.2 23.2 *Problem with school record/ birth certificate * * *Too young to go to school * * *Others * * *
REGION VI - WESTERN VISAYAS 703 379 324Total 100 100 100Accessibility of school * * *Illness/ disability 3.9 * *Marriage/ family matters 11.8 * 21.0High cost of education/ financial concern 13.8 15.2 12.3Employment 33.3 38.6 27.0Finished schooling or finished post secondary or college 15.3 9.5 22.1Looking for work 10.1 11.2 8.9Lack of personal interest 11.0 16.5 *Problem with school record/ birth certificate * * *Too young to go to school * * *Others * * *
REGION VII - CENTRAL VISAYAS 729 374 355Total 100 100 100Accessibility of school * * *Illness/ disability * * *Marriage/ family matters 17.4 * 29.2High cost of education/ financial concern 3.6 * *Employment 39.7 40.5 38.9Finished schooling or finished post secondary or college 11.9 10.6 13.3Looking for work 9.5 11.8 7.2Lack of personal interest 12.6 19.8 *Problem with school record/ birth certificate * * *Too young to go to school * * *Others * * *
REGION VIII - EASTERN VISAYAS 434 233 201Total 100 100 100Accessibility of school * * *Illness/ disability 4.0 * *Marriage/ family matters 23.5 12.3 36.5High cost of education/ financial concern 12.0 11.9 12.2Employment 28.1 33.6 21.7Finished schooling or finished post secondary or college 11.5 7.6 16.0Looking for work 5.2 7.9 *Lack of personal interest 14.9 21.6 7.2Problem with school record/ birth certificate * * *Too young to go to school * * *Others * * *
Note: " * " An asterisk indicates that a figure is based on fewer than 25 unweighted cases and has been suppressed.Source: Philippine Statistics Authority, 2019 Annual Poverty Indicators Survey
Table 13. Population Aged 6 to 24 Years Who Were Not Attending School by Reason for Not Attending School by Region, Residence and Sex, Philippines 2019 (cont.)

Appendix A – Statistical Tables I Final Report
86 Philippine Statistics Authority | 2019 Annual Poverty Indicators Survey
Reason for Not Attending School, Region and Residence Both Sexes Male Female
REGION IX - ZAMBOANGA PENINSULA 329 168 162Total 100 100 100Accessibility of school * * *Illness/ disability * * *Marriage/ family matters 33.2 17.1 49.9High cost of education/ financial concern 6.2 * *Employment 20.9 27.7 13.9Finished schooling or finished post secondary or college 9.7 * 10.8Looking for work 5.6 * *Lack of personal interest 18.1 26.9 8.9Problem with school record/ birth certificate * * *Too young to go to school * * *Others * * *
REGION X - NORTHERN MINDANAO 446 233 213Total 100 100 100Accessibility of school * * *Illness/ disability * * *Marriage/ family matters 27.2 13.5 42.2High cost of education/ financial concern 6.8 7.7 5.9Employment 21.5 30.5 11.5Finished schooling or finished post secondary or college 20.7 15.1 26.9Looking for work 7.7 9.8 *Lack of personal interest 12.3 19.0 5.0Problem with school record/ birth certificate * * *Too young to go to school * * *Others * * *
REGION XI - DAVAO 487 254 232Total 100 100 100Accessibility of school * * *Illness/ disability 3.7 * *Marriage/ family matters 25.7 8.6 44.5High cost of education/ financial concern 7.7 8.9 *Employment 32.4 42.4 21.3Finished schooling or finished post secondary or college 7.7 * 9.1Looking for work 6.6 5.6 7.7Lack of personal interest 15.2 23.0 6.7Problem with school record/ birth certificate * * *Too young to go to school * * *Others * * *
REGION XII - SOCCSKSARGEN 480 252 228Total 100 100 100Accessibility of school * * *Illness/ disability * * *Marriage/ family matters 24.2 11.0 38.7High cost of education/ financial concern 10.3 13.1 7.1Employment 22.4 26.1 18.3Finished schooling or finished post secondary or college 12.5 7.9 17.5Looking for work 7.1 7.1 7.1Lack of personal interest 18.9 31.1 *Problem with school record/ birth certificate * * *Too young to go to school * * *Others * * *
Note: " * " An asterisk indicates that a figure is based on fewer than 25 unweighted cases and has been suppressed.Source: Philippine Statistics Authority, 2019 Annual Poverty Indicators Survey
Table 13. Population Aged 6 to 24 Years Who Were Not Attending School by Reason for Not Attending School by Region, Residence and Sex, Philippines 2019 (cont.)

Appendix A – Statistical Tables I Final Report
Philippine Statistics Authority | 2019 Annual Poverty Indicators Survey 87
Reason for Not Attending School, Region and Residence Both Sexes Male Female
REGION XIII - CARAGA 230 126 103Total 100 100 100Accessibility of school * * *Illness/ disability 4.0 * *Marriage/ family matters 20.4 * 37.0High cost of education/ financial concern 7.7 8.0 *Employment 28.0 34.4 20.1Finished schooling or finished post secondary or college 13.5 11.3 16.3Looking for work 7.3 8.3 *Lack of personal interest 17.3 25.7 7.0Problem with school record/ birth certificate * * *Too young to go to school * * *Others * * *
BANGSAMORO AUTONOMOUS REGION IN MUSLIM MINDANAO 482 251 231Total 100 100 100Accessibility of school 2.8 * *Illness/ disability 2.0 * *Marriage/ family matters 19.3 11.6 27.7High cost of education/ financial concern 26.9 26.1 27.8Employment 8.4 12.1 *Finished schooling or finished post secondary or college 6.2 * 8.3Looking for work 4.9 6.4 *Lack of personal interest 27.7 31.8 23.2Problem with school record/ birth certificate * * *Too young to go to school * * *Others * * *
ResidenceURBAN 5,302 2,731 2,571Total 100.0 100.0 100.0Accessibility of school * * *Illness/ disability 3.0 3.7 2.4Marriage/ family matters 17.5 7.6 27.9High cost of education/ financial concern 7.9 8.4 7.3Employment 37.0 42.4 31.2Finished schooling or finished post secondary or college 14.6 11.9 17.5Looking for work 8.0 9.0 7.0Lack of personal interest 10.8 16.0 5.3Problem with school record/ birth certificate 0.3 * *Too young to go to school * * *Others 0.6 0.5 0.8
RURAL 4,875 2,567 2,308Total 100 100 100Accessibility of school 0.8 1.0 0.6Illness/ disability 3.2 3.5 2.9Marriage/ family matters 20.9 9.2 33.9High cost of education/ financial concern 9.7 11.3 7.9Employment 28.2 33.3 22.6Finished schooling or finished post secondary or college 12.6 9.3 16.2Looking for work 7.9 8.8 6.9Lack of personal interest 15.9 22.8 8.2Problem with school record/ birth certificate 0.3 * *Too young to go to school * * *Others 0.4 0.4 0.4
Note: " * " An asterisk indicates that a figure is based on fewer than 25 unweighted cases and has been suppressed.Source: Philippine Statistics Authority, 2019 Annual Poverty Indicators Survey
Table 13. Population Aged 6 to 24 Years Who Were Not Attending School by Reason for Not Attending School by Region, Residence and Sex, Philippines 2019 (cont.)

Appendix A – Statistical Tables I Final Report
88 Philippine Statistics Authority | 2019 Annual Poverty Indicators Survey
Number (in thousands) Percent
PHILIPPINES 10,146 9,686 95.5NATIONAL CAPITAL REGION 1,172 1,128 96.3CORDILLERA ADMINISTRATIVE REGION 170 161 94.6REGION I - ILOCOS 466 440 94.4REGION II - CAGAYAN VALLEY 317 301 95.1REGION III - CENTRAL LUZON 1,162 1,123 96.6REGION IV-A - CALABARZON 1,440 1,375 95.5MIMAROPA REGION 323 313 96.9REGION V - BICOL 581 559 96.2REGION VI - WESTERN VISAYAS 766 733 95.7REGION VII - CENTRAL VISAYAS 753 717 95.3REGION VIII - EASTERN VISAYAS 472 447 94.7REGION IX - ZAMBOANGA PENINSULA 381 363 95.3REGION X - NORTHERN MINDANAO 507 487 96.0REGION XI - DAVAO 524 493 94.0REGION XII - SOCCSKSARGEN 483 460 95.4REGION XIII - CARAGA 278 267 96.2BANGSAMORO AUTONOMOUS REGION IN MUSLIM MINDANAO
352 318 90.3
Residence 10,146 9,686 95.5Urban 4,997 4,775 95.6Rural 5,149 4,911 95.4
Source: Philippine Statistics Authority, 2019 Annual Poverty Indicators Survey
Number (in thousands) Percent
PHILIPPINES 7,520 6,586 87.6NATIONAL CAPITAL REGION 836 732 87.6CORDILLERA ADMINISTRATIVE REGION 131 115 88.1REGION I - ILOCOS 363 337 92.8REGION II - CAGAYAN VALLEY 238 204 85.9REGION III - CENTRAL LUZON 850 752 88.5REGION IV-A - CALABARZON 1,028 916 89.2MIMAROPA REGION 244 215 88.0REGION V - BICOL 432 393 91.0REGION VI - WESTERN VISAYAS 550 481 87.4REGION VII - CENTRAL VISAYAS 596 522 87.6REGION VIII - EASTERN VISAYAS 377 327 86.7REGION IX - ZAMBOANGA PENINSULA 269 223 82.8REGION X - NORTHERN MINDANAO 363 322 88.8REGION XI - DAVAO 399 349 87.6REGION XII - SOCCSKSARGEN 365 316 86.4REGION XIII - CARAGA 204 183 89.5BANGSAMORO AUTONOMOUS REGION IN MUSLIM MINDANAO
274 197 71.7
Residence 7,520 6,586 87.6Urban 3,669 3,226 87.9Rural 3,852 3,360 87.2
Source: Philippine Statistics Authority, 2019 Annual Poverty Indicators Survey
Region/ Residence
Families with Children
aged 12-15 Years (in thousands)
Families with Children aged 12-15 Years in Junior High School (Grade 7 to 10)
Table 15. Families with Children Aged 12 to 15 Years in Junior High School Education (Grade 7 to 10) by Region and Residence, Philippines 2019
Table 14. Families with Children Aged 6 to 11 Years in Grade 1 to 6 by Region and Residence, Philippines 2019
Region/ Residence
Families with Children aged 6-11
Years (in thousands)
Families with Children aged 6-11 Yearsin Grade 1 to 6

Appendix A – Statistical Tables I Final Report
Philippine Statistics Authority | 2019 Annual Poverty Indicators Survey 89
Number (in thousands) Percent
PHILIPPINES 25,301 23,097 91.3NATIONAL CAPITAL REGION 3,385 3,085 91.1CORDILLERA ADMINISTRATIVE REGION 431 395 91.8REGION I - ILOCOS 1,232 1,083 87.9REGION II - CAGAYAN VALLEY 868 810 93.3REGION III - CENTRAL LUZON 2,853 2,576 90.3REGION IV-A - CALABARZON 3,874 3,575 92.3MIMAROPA REGION 754 692 91.9REGION V - BICOL 1,300 1,175 90.4REGION VI - WESTERN VISAYAS 1,869 1,650 88.3REGION VII - CENTRAL VISAYAS 1,883 1,713 91.0REGION VIII - EASTERN VISAYAS 1,083 984 90.8REGION IX - ZAMBOANGA PENINSULA 850 780 91.7REGION X - NORTHERN MINDANAO 1,143 1,074 93.9REGION XI - DAVAO 1,319 1,199 90.9REGION XII - SOCCSKSARGEN 1,155 1,068 92.5REGION XIII - CARAGA 634 583 92.0BANGSAMORO AUTONOMOUS REGION IN MUS 669 653 97.7
Residence 25,301 23,097 91.3Urban 13,038 11,887 91.2Rural 12,262 11,210 91.4
Source: Philippine Statistics Authority, 2019 Annual Poverty Indicators Survey
Number (in thousands) Percent
PHILIPPINES 15,641 1,187 7.6NATIONAL CAPITAL REGION 1,845 46 2.5CORDILLERA ADMINISTRATIVE REGION 265 17 6.4REGION I - ILOCOS 760 74 9.8REGION II - CAGAYAN VALLEY 520 33 6.4REGION III - CENTRAL LUZON 1,799 81 4.5REGION IV-A - CALABARZON 2,251 143 6.4MIMAROPA REGION 488 32 6.5REGION V - BICOL 861 133 15.4REGION VI - WESTERN VISAYAS 1,155 72 6.2REGION VII - CENTRAL VISAYAS 1,179 59 5.0REGION VIII - EASTERN VISAYAS 711 96 13.5REGION IX - ZAMBOANGA PENINSULA 565 25 4.4REGION X - NORTHERN MINDANAO 758 177 23.3REGION XI - DAVAO 810 47 5.8REGION XII - SOCCSKSARGEN 763 73 9.6REGION XIII - CARAGA 418 51 12.2BANGSAMORO AUTONOMOUS REGION IN MUS 493 28 5.6
Residence 15,641 1,187 7.6Urban 7,805 442 5.7Rural 7,836 745 9.5
Source: Philippine Statistics Authority, 2019 Annual Poverty Indicators Survey
Table 16. Families with Members Aged 18 Years or Over Who are Gainfully Employed by Region and Residence, Philippines 2019
Region/ Residence
Number of Families with Members
aged 18 Years or Over
(in thousands)
Families with Members aged 18 Years or Over Gainfully Employed
Region/ Residence
Number of Families with Members
aged 5 - 17 Years (in thousands)
Families with Members aged 5 - 17 Years who are Gainfully Employed
Table 17. Families with Members aged 5 to 17 Years Who are Gainfully Employed by Region and Residence,
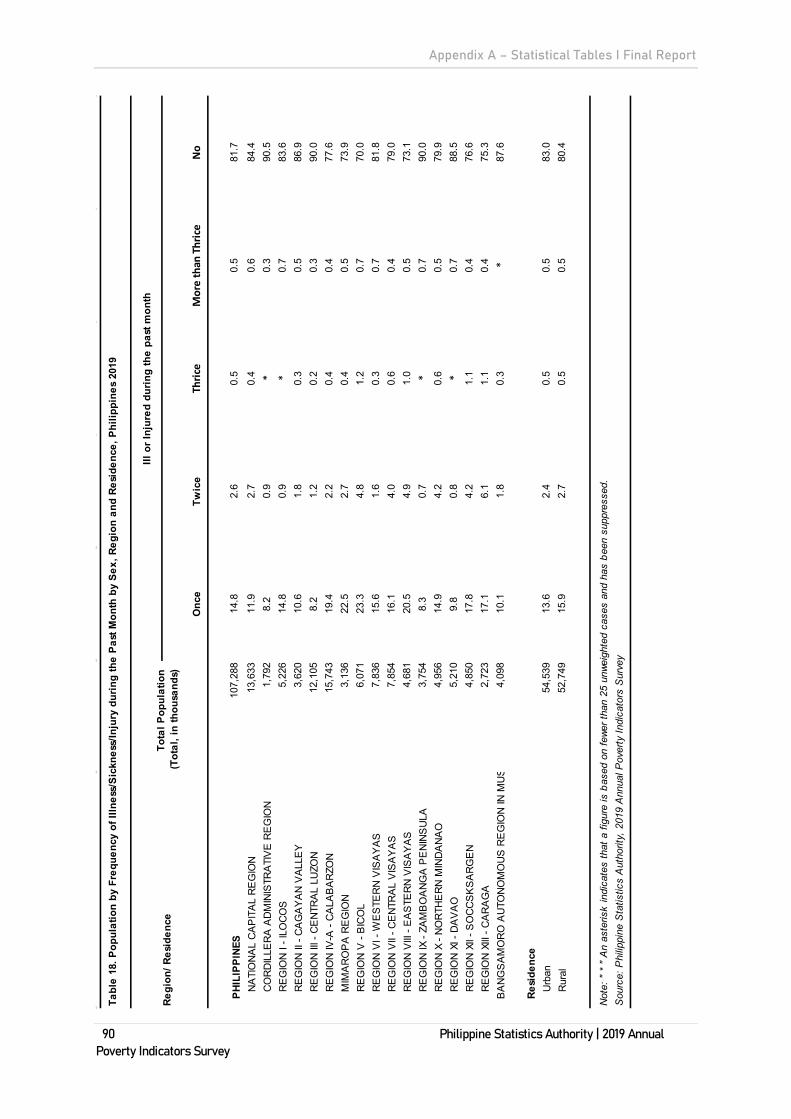
Appendix A – Statistical Tables I Final Report
90 Philippine Statistics Authority | 2019 Annual Poverty Indicators Survey
Onc
eTw
ice
Thric
eM
ore
than
Thr
ice
No
PHIL
IPPI
NES
107,
288
14.8
2.6
0.5
0.5
81.7
NA
TIO
NA
L C
AP
ITA
L R
EG
ION
13
,633
11.9
2.7
0.4
0.6
84.4
CO
RD
ILLE
RA
AD
MIN
ISTR
ATI
VE
RE
GIO
N
1,79
28.
20.
9*
0.3
90.5
RE
GIO
N I
- ILO
CO
S5,
226
14.8
0.9
*0.
783
.6R
EG
ION
II -
CA
GA
YA
N V
ALL
EY
3,
620
10.6
1.8
0.3
0.5
86.9
RE
GIO
N II
I - C
EN
TRA
L LU
ZON
12
,105
8.2
1.2
0.2
0.3
90.0
RE
GIO
N IV
-A -
CA
LAB
AR
ZON
15
,743
19.4
2.2
0.4
0.4
77.6
MIM
AR
OP
A R
EG
ION
3,
136
22.5
2.7
0.4
0.5
73.9
RE
GIO
N V
- B
ICO
L 6,
071
23.3
4.8
1.2
0.7
70.0
RE
GIO
N V
I - W
ES
TER
N V
ISA
YA
S
7,83
615
.61.
60.
30.
781
.8R
EG
ION
VII
- CE
NTR
AL
VIS
AY
AS
7,
854
16.1
4.0
0.6
0.4
79.0
RE
GIO
N V
III -
EA
STE
RN
VIS
AY
AS
4,
681
20.5
4.9
1.0
0.5
73.1
RE
GIO
N IX
- ZA
MB
OA
NG
A P
EN
INS
ULA
3,
754
8.3
0.7
*0.
790
.0R
EG
ION
X -
NO
RTH
ER
N M
IND
AN
AO
4,
956
14.9
4.2
0.6
0.5
79.9
RE
GIO
N X
I - D
AV
AO
5,
210
9.8
0.8
*0.
788
.5R
EG
ION
XII
- SO
CC
SK
SA
RG
EN
4,
850
17.8
4.2
1.1
0.4
76.6
RE
GIO
N X
III -
CA
RA
GA
2,
723
17.1
6.1
1.1
0.4
75.3
BA
NG
SA
MO
RO
AU
TON
OM
OU
S R
EG
ION
IN M
US
4,
098
10.1
1.8
0.3
*87
.6
Resi
denc
eU
rban
54,5
3913
.62.
40.
50.
583
.0R
ural
52,7
4915
.92.
70.
50.
580
.4
Not
e: "
* "
An
aste
risk
indi
cate
s th
at a
figu
re is
bas
ed o
n fe
wer t
han
25 u
nwei
ghte
d ca
ses
and
has
been
sup
pres
sed.
Sou
rce:
Phi
lippi
ne S
tatis
tics
Aut
horit
y, 2
019
Ann
ual P
over
ty In
dica
tors
Sur
vey
Tabl
e 18
. Pop
ulat
ion
by F
requ
ency
of I
llnes
s/Si
ckne
ss/In
jury
dur
ing
the
Past
Mon
th b
y Se
x, R
egio
n an
d Re
side
nce,
Phi
lippi
nes
2019
Regi
on/ R
esid
ence
Tota
l Pop
ulat
ion
(Tot
al, i
n th
ousa
nds)
Ill o
r Inj
ured
dur
ing
the
past
mon
th

Appendix A – Statistical Tables I Final Report
Philippine Statistics Authority | 2019 Annual Poverty Indicators Survey 91
Onc
eTw
ice
Thric
eM
ore
than
Thr
ice
No
MAL
EPH
ILIP
PINE
S54
,201
15.0
2.6
0.5
0.5
81.4
NA
TIO
NA
L C
AP
ITA
L R
EG
ION
6,
734
11
.62.
70.
40.
684
.7C
OR
DIL
LER
A A
DM
INIS
TRA
TIV
E R
EG
ION
91
3
8.5
0.8
**
90.3
RE
GIO
N I
- ILO
CO
S2,
637
15
.41.
0*
*82
.7R
EG
ION
II -
CA
GA
YA
N V
ALL
EY
1,
842
10
.01.
7*
*87
.4R
EG
ION
III -
CE
NTR
AL
LUZO
N
6,11
7
8.6
1.1
*0.
489
.7R
EG
ION
IV-A
- C
ALA
BA
RZO
N
7,87
8
20.2
2.2
**
76.9
MIM
AR
OP
A R
EG
ION
1,
607
23
.22.
6*
*73
.3R
EG
ION
V -
BIC
OL
3,09
2
23.4
4.5
0.9
0.6
70.5
RE
GIO
N V
I - W
ES
TER
N V
ISA
YA
S
3,97
9
16.0
1.7
*1.
081
.1R
EG
ION
VII
- CE
NTR
AL
VIS
AY
AS
3,
976
16
.63.
9*
*78
.5R
EG
ION
VIII
- E
AS
TER
N V
ISA
YA
S
2,40
6
20.8
5.1
1.2
0.5
72.3
RE
GIO
N IX
- ZA
MB
OA
NG
A P
EN
INS
ULA
1,
911
8.
80.
8*
0.7
89.4
RE
GIO
N X
- N
OR
THE
RN
MIN
DA
NA
O
2,52
8
14.8
4.0
0.7
*80
.2R
EG
ION
XI -
DA
VA
O
2,66
8
10.2
0.8
*0.
788
.1R
EG
ION
XII
- SO
CC
SK
SA
RG
EN
2,
473
18
.24.
61.
2*
75.5
RE
GIO
N X
III -
CA
RA
GA
1,
399
17
.55.
81.
1*
75.3
BA
NG
SA
MO
RO
BA
NG
SA
MO
RO
A
UTO
NO
MO
US
RE
GIO
N IN
MU
SLI
M
MIN
DA
NA
O2,
042
9.
42.
1*
*87
.9
Resi
denc
eU
rban
27,3
49
13
.82.
40.
40.
582
.8R
ural
26,8
52
16
.32.
70.
50.
579
.9
Not
e: "
* "
An
aste
risk
indi
cate
s th
at a
figu
re is
bas
ed o
n fe
wer t
han
25 u
nwei
ghte
d ca
ses
and
has
been
sup
pres
sed.
Sou
rce:
Phi
lippi
ne S
tatis
tics
Aut
horit
y, 2
019
Ann
ual P
over
ty In
dica
tors
Sur
vey
Tabl
e 18
. Pop
ulat
ion
by F
requ
ency
of I
llnes
s/Si
ckne
ss/In
jury
dur
ing
the
Past
Mon
th b
y Se
x, R
egio
n an
d Re
side
nce,
Phi
lippi
nes
2019
(con
t.)
Regi
on/ R
esid
ence
Tota
l Pop
ulat
ion
(Tot
al, i
n th
ousa
nds)
Ill o
r Inj
ured
dur
ing
the
past
mon
th

Appendix A – Statistical Tables I Final Report
92 Philippine Statistics Authority | 2019 Annual Poverty Indicators Survey
Onc
eTw
ice
Thric
eM
ore
than
Thr
ice
No
FEM
ALE
PHIL
IPPI
NES
53,0
87
14
.5
2.6
0.5
0.5
82.0
N
ATI
ON
AL
CA
PIT
AL
RE
GIO
N
6,89
9
12.3
2.
6
0.
5
0.
6
84
.1
CO
RD
ILLE
RA
AD
MIN
ISTR
ATI
VE
RE
GIO
N
879
8.
0
1.
0
*
*90
.7
RE
GIO
N I
- ILO
CO
S2,
589
14
.2
**
*84
.5
RE
GIO
N II
- C
AG
AY
AN
VA
LLE
Y
1,77
8
11.1
1.
9
*
*86
.3
RE
GIO
N II
I - C
EN
TRA
L LU
ZON
5,
989
7.
8
1.
2
*
0.3
90.4
R
EG
ION
IV-A
- C
ALA
BA
RZO
N
7,86
5
18.6
2.
3
*
*78
.3
MIM
AR
OP
A R
EG
ION
1,
529
21
.8
2.8
**
74.6
R
EG
ION
V -
BIC
OL
2,97
9
23.2
5.
0
1.
5
0.
8
69
.5
RE
GIO
N V
I - W
ES
TER
N V
ISA
YA
S
3,85
7
15.1
1.
6
*
0.5
82.5
R
EG
ION
VII
- CE
NTR
AL
VIS
AY
AS
3,
878
15
.6
4.0
**
79.4
R
EG
ION
VIII
- E
AS
TER
N V
ISA
YA
S
2,27
5
20.1
4.
8
0.
8
0.
4
73
.9
RE
GIO
N IX
- ZA
MB
OA
NG
A P
EN
INS
ULA
1,
843
7.
8
0.
7
*
0.7
90.7
R
EG
ION
X -
NO
RTH
ER
N M
IND
AN
AO
2,
429
14
.9
4.4
0.6
0.5
79.6
R
EG
ION
XI -
DA
VA
O
2,54
2
9.5
0.8
**
88.9
R
EG
ION
XII
- SO
CC
SK
SA
RG
EN
2,
377
17
.3
3.8
1.0
*77
.7
RE
GIO
N X
III -
CA
RA
GA
1,
324
16
.7
6.4
1.1
*75
.3
BA
NG
SA
MO
RO
BA
NG
SA
MO
RO
A
UTO
NO
MO
US
RE
GIO
N IN
MU
SLI
M
MIN
DA
NA
O2,
056
10
.8
1.6
**
87.2
Resi
denc
eU
rban
27,1
90
13
.5
2.5
0.5
0.4
83.2
R
ural
25,8
97
15
.5
2.7
0.5
0.5
80.8
Not
e: "
* "
An
aste
risk
indi
cate
s th
at a
figu
re is
bas
ed o
n fe
wer t
han
25 u
nwei
ghte
d ca
ses
and
has
been
sup
pres
sed.
Sou
rce:
Phi
lippi
ne S
tatis
tics
Aut
horit
y, 2
019
Ann
ual P
over
ty In
dica
tors
Sur
vey
Tabl
e 18
. Pop
ulat
ion
by F
requ
ency
of I
llnes
s/Si
ckne
ss/In
jury
dur
ing
the
Past
Mon
th b
y Se
x, R
egio
n an
d Re
side
nce,
Phi
lippi
nes
2019
(con
t.)
Regi
on/ R
esid
ence
Tota
l Pop
ulat
ion
(Tot
al, i
n th
ousa
nds)
Ill o
r Inj
ured
dur
ing
the
past
mon
th

Appendix A – Statistical Tables I Final Report
Philippine Statistics Authority | 2019 Annual Poverty Indicators Survey 93
Yes No
BOTH SEXESPHILIPPINES 16,957 46.4 53.6
NATIONAL CAPITAL REGION 1,834 33.2 66.8CORDILLERA ADMINISTRATIVE REGION 150 45.6 54.4REGION I - ILOCOS 744 42.0 58.0REGION II - CAGAYAN VALLEY 379 48.0 52.0REGION III - CENTRAL LUZON 1,061 46.9 53.1REGION IV-A - CALABARZON 3,056 41.5 58.5MIMAROPA REGION 706 57.8 42.2REGION V - BICOL 1,576 57.9 42.1REGION VI - WESTERN VISAYAS 1,244 52.0 48.0REGION VII - CENTRAL VISAYAS 1,440 52.3 47.7REGION VIII - EASTERN VISAYAS 1,080 47.9 52.1REGION IX - ZAMBOANGA PENINSULA 313 58.5 41.5REGION X - NORTHERN MINDANAO 877 41.4 58.6REGION XI - DAVAO 520 58.9 41.1REGION XII - SOCCSKSARGEN 978 47.6 52.4REGION XIII - CARAGA 598 40.3 59.7BANGSAMORO AUTONOMOUS REGION IN MU 401 34.0 66.0
ResidenceUrban 8,013 41.7 58.3Rural 8,944 50.7 49.3
Note: " * " An asterisk indicates that a figure is based on fewer than 25 unweighted cases and has been suppressed.Source: Philippine Statistics Authority, 2019 Annual Poverty Indicators Survey
Table 19. Population 5 Years Old and Over Who Experienced Illness/Sickness/Injury and been a Reason for Their Absence From Work or School or For Not Being Able to Perform Daily Activities in the Past Month by Sex, Region and Residence, Philippines 2019
Region/ Residence
Population aged 5 years old and over who experienced
Ilness/Sickness/Injur during the past month
(Total, in thousands)
Illness/Sickness/Injury been a reason for absence from work or school or for
not being able to perform daily activities in the past month

Appendix A – Statistical Tables I Final Report
94 Philippine Statistics Authority | 2019 Annual Poverty Indicators Survey
Yes No
MALEPHILIPPINES 8,636 51.0 49.0
NATIONAL CAPITAL REGION 881 35.5 64.5CORDILLERA ADMINISTRATIVE REGION 78 52.5 47.5REGION I - ILOCOS 388 46.0 54.0REGION II - CAGAYAN VALLEY 193 53.9 46.1REGION III - CENTRAL LUZON 552 47.6 52.4REGION IV-A - CALABARZON 1,537 47.8 52.2MIMAROPA REGION 372 61.6 38.4REGION V - BICOL 782 64.5 35.5REGION VI - WESTERN VISAYAS 644 56.3 43.7REGION VII - CENTRAL VISAYAS 742 59.6 40.4REGION VIII - EASTERN VISAYAS 563 50.5 49.5REGION IX - ZAMBOANGA PENINSULA 170 62.5 37.5REGION X - NORTHERN MINDANAO 436 43.9 56.1REGION XI - DAVAO 273 61.0 39.0REGION XII - SOCCSKSARGEN 522 51.7 48.3REGION XIII - CARAGA 312 46.1 53.9BANGSAMORO AUTONOMOUS REGION IN MU 191 37.2 62.8
ResidenceUrban 4,018 45.8 54.2Rural 4,618 55.5 44.5
FEMALEPHILIPPINES 8,321 41.7 58.3
NATIONAL CAPITAL REGION 952 31.1 68.9CORDILLERA ADMINISTRATIVE REGION 72 38.1 61.9REGION I - ILOCOS 356 37.6 62.4REGION II - CAGAYAN VALLEY 186 42.0 58.0REGION III - CENTRAL LUZON 510 46.2 53.8REGION IV-A - CALABARZON 1,520 35.2 64.8MIMAROPA REGION 334 53.6 46.4REGION V - BICOL 794 51.4 48.6REGION VI - WESTERN VISAYAS 600 47.5 52.5REGION VII - CENTRAL VISAYAS 698 44.4 55.6REGION VIII - EASTERN VISAYAS 517 45.1 54.9REGION IX - ZAMBOANGA PENINSULA 143 53.8 46.2REGION X - NORTHERN MINDANAO 441 38.9 61.1REGION XI - DAVAO 246 56.5 43.5REGION XII - SOCCSKSARGEN 456 42.9 57.1REGION XIII - CARAGA 286 33.9 66.1BANGSAMORO AUTONOMOUS REGION IN MU 210 31.2 68.8
ResidenceUrban 3,995 37.5 62.5Rural 4,326 45.5 54.5
Note: " * " An asterisk indicates that a figure is based on fewer than 25 unweighted cases and has been suppressed.Source: Philippine Statistics Authority, 2019 Annual Poverty Indicators Survey
Table 19. Population 5 Years Old and Over Who Experienced Illness/Sickness/Injury and been a Reason for Their Absence From Work or School or For Not Being Able to Perform Daily Activities in the Past Month by Sex, Region and Residence, Philippines 2019 (cont.)
Region/ Residence
Population aged 5 years old and over who experienced
Ilness/Sickness/Injur during the past month
(Total, in thousands)
Illness/Sickness/Injury been a reason for absence from work or school or for
not being able to perform daily activities in the past month
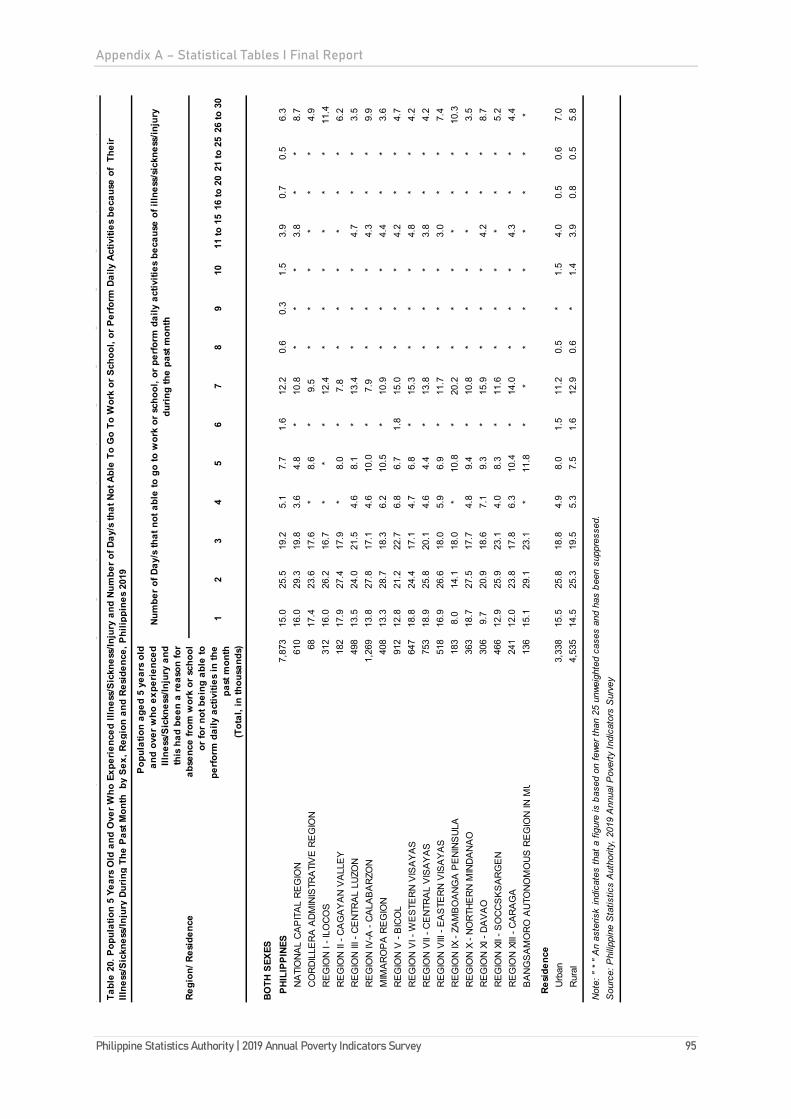
Appendix A – Statistical Tables I Final Report
Philippine Statistics Authority | 2019 Annual Poverty Indicators Survey 95
12
34
56
78
910
11 to
15
16 to
20
21 to
25
26 to
30
BOTH
SEX
ESPH
ILIP
PINE
S7,
873
15.0
25.5
19.2
5.1
7.7
1.6
12.2
0.6
0.3
1.5
3.9
0.7
0.5
6.3
NA
TIO
NA
L C
AP
ITA
L R
EG
ION
61
016
.029
.319
.83.
64.
8*
10.8
**
*3.
8*
*8.
7C
OR
DIL
LER
A A
DM
INIS
TRA
TIV
E R
EG
ION
68
17.4
23.6
17.6
*8.
6*
9.5
**
**
**
4.9
RE
GIO
N I
- ILO
CO
S31
216
.026
.216
.7*
**
12.4
**
**
**
11.4
RE
GIO
N II
- C
AG
AY
AN
VA
LLE
Y
182
17.9
27.4
17.9
*8.
0*
7.8
**
**
**
6.2
RE
GIO
N II
I - C
EN
TRA
L LU
ZON
49
813
.524
.021
.54.
68.
1*
13.4
**
*4.
7*
*3.
5R
EG
ION
IV-A
- C
ALA
BA
RZO
N
1,26
913
.827
.817
.14.
610
.0*
7.9
**
*4.
3*
*9.
9M
IMA
RO
PA
RE
GIO
N
408
13.3
28.7
18.3
6.2
10.5
*10
.9*
**
4.4
**
3.6
RE
GIO
N V
- B
ICO
L 91
212
.821
.222
.76.
86.
71.
815
.0*
**
4.2
**
4.7
RE
GIO
N V
I - W
ES
TER
N V
ISA
YA
S
647
18.8
24.4
17.1
4.7
6.8
*15
.3*
**
4.8
**
4.2
RE
GIO
N V
II - C
EN
TRA
L V
ISA
YA
S
753
18.9
25.8
20.1
4.6
4.4
*13
.8*
**
3.8
**
4.2
RE
GIO
N V
III -
EA
STE
RN
VIS
AY
AS
51
816
.926
.618
.05.
96.
9*
11.7
**
*3.
0*
*7.
4R
EG
ION
IX -
ZAM
BO
AN
GA
PE
NIN
SU
LA
183
8.0
14.1
18.0
*10
.8*
20.2
**
**
**
10.3
RE
GIO
N X
- N
OR
THE
RN
MIN
DA
NA
O
363
18.7
27.5
17.7
4.8
9.4
*10
.8*
**
**
*3.
5R
EG
ION
XI -
DA
VA
O
306
9.7
20.9
18.6
7.1
9.3
*15
.9*
**
4.2
**
8.7
RE
GIO
N X
II - S
OC
CS
KS
AR
GE
N
466
12.9
25.9
23.1
4.0
8.3
*11
.6*
**
**
*5.
2R
EG
ION
XIII
- C
AR
AG
A
241
12.0
23.8
17.8
6.3
10.4
*14
.0*
**
4.3
**
4.4
BA
NG
SA
MO
RO
AU
TON
OM
OU
S R
EG
ION
IN M
U
136
15.1
29.1
23.1
*11
.8*
**
**
**
**
Resi
denc
eU
rban
3,33
815
.525
.818
.84.
98.
01.
511
.20.
5*
1.5
4.0
0.5
0.6
7.0
Rur
al4,
535
14.5
25.3
19.5
5.3
7.5
1.6
12.9
0.6
*1.
43.
90.
80.
55.
8
Not
e: "
* "
An
aste
risk
indi
cate
s th
at a
figu
re is
bas
ed o
n fe
wer t
han
25 u
nwei
ghte
d ca
ses
and
has
been
sup
pres
sed.
Sou
rce:
Phi
lippi
ne S
tatis
tics
Aut
horit
y, 2
019
Ann
ual P
over
ty In
dica
tors
Sur
vey
Tabl
e 20
. Pop
ulat
ion
5 Ye
ars
Old
and
Ove
r Who
Exp
erie
nced
Illn
ess/
Sick
ness
/Inju
ry a
nd N
umbe
r of D
ay/s
that
Not
Abl
e To
Go
To W
ork
or S
choo
l, or
Per
form
Dai
ly A
ctiv
ities
bec
ause
of
Thei
r Ill
ness
/Sic
knes
s/In
jury
Dur
ing
The
Past
Mon
th b
y Se
x, R
egio
n an
d Re
side
nce,
Phi
lippi
nes
2019
Regi
on/ R
esid
ence
Popu
latio
n ag
ed 5
yea
rs o
ld
and
over
who
exp
erie
nced
Ill
ness
/Sic
knes
s/In
jury
and
th
is h
ad b
een
a re
ason
for
abse
nce
from
wor
k or
sch
ool
or fo
r not
bei
ng a
ble
to
perfo
rm d
aily
act
iviti
es in
the
past
mon
th
(Tot
al, i
n th
ousa
nds)
Num
ber o
f Day
/s th
at n
ot a
ble
to g
o to
wor
k or
sch
ool,
or p
erfo
rm d
aily
act
iviti
es b
ecau
se o
f illn
ess/
sick
ness
/inju
ry
durin
g th
e pa
st m
onth

Appendix A – Statistical Tables I Final Report
96 Philippine Statistics Authority | 2019 Annual Poverty Indicators Survey
12
34
56
78
910
11 to
15
16 to
20
21 to
25
26 to
30
MAL
EPH
ILIP
PINE
S4,
406
13.8
24.1
19.3
5.1
7.7
1.7
12.9
0.5
*1.
74.
20.
70.
57.
3N
ATI
ON
AL
CA
PIT
AL
RE
GIO
N
313
18.4
27.8
19.5
4.1
4.1
*10
.7*
**
**
*8.
5C
OR
DIL
LER
A A
DM
INIS
TRA
TIV
E R
EG
ION
41
19.0
22.5
16.8
*11
.1*
**
**
**
**
RE
GIO
N I
- ILO
CO
S17
815
.318
.221
.5*
**
14.0
**
**
**
*R
EG
ION
II -
CA
GA
YA
N V
ALL
EY
10
418
.928
.116
.2*
**
7.9
**
**
**
*R
EG
ION
III -
CE
NTR
AL
LUZO
N
263
12.4
22.7
21.5
*8.
8*
12.3
**
**
**
*R
EG
ION
IV-A
- C
ALA
BA
RZO
N
734
13.5
26.7
15.8
*9.
0*
8.1
**
**
**
12.0
MIM
AR
OP
A R
EG
ION
22
911
.927
.719
.85.
711
.5*
11.0
**
**
**
3.7
RE
GIO
N V
- B
ICO
L 50
411
.621
.023
.46.
85.
7*
15.9
**
*3.
9*
*5.
4R
EG
ION
VI -
WE
STE
RN
VIS
AY
AS
36
317
.822
.915
.85.
08.
0*
17.7
**
*5.
2*
*4.
2R
EG
ION
VII
- CE
NTR
AL
VIS
AY
AS
44
216
.424
.821
.0*
**
14.7
**
**
**
5.9
RE
GIO
N V
III -
EA
STE
RN
VIS
AY
AS
28
412
.624
.418
.65.
67.
6*
12.8
**
*3.
7*
*10
.7R
EG
ION
IX -
ZAM
BO
AN
GA
PE
NIN
SU
LA
106
8.5
13.7
15.1
**
*21
.4*
**
**
*13
.0R
EG
ION
X -
NO
RTH
ER
N M
IND
AN
AO
19
217
.226
.016
.76.
911
.3*
11.0
**
**
**
*R
EG
ION
XI -
DA
VA
O
167
9.2
18.2
17.7
6.1
9.0
*19
.0*
**
**
**
RE
GIO
N X
II - S
OC
CS
KS
AR
GE
N
270
10.6
26.0
24.5
*8.
7*
12.7
**
**
**
6.1
RE
GIO
N X
III -
CA
RA
GA
14
49.
223
.519
.56.
49.
8*
15.1
**
**
**
5.6
BA
NG
SA
MO
RO
AU
TON
OM
OU
S R
EG
ION
IN M
U
71*
27.0
20.5
*15
.2*
**
**
**
**
Resi
denc
eU
rban
1,84
115
.524
.918
.54.
77.
51.
611
.7*
*1.
94.
2*
*7.
6R
ural
2,56
512
.623
.619
.85.
47.
91.
813
.80.
6*
1.5
4.2
0.8
0.5
7.1
Not
e: "
* "
An
aste
risk
indi
cate
s th
at a
figu
re is
bas
ed o
n fe
wer t
han
25 u
nwei
ghte
d ca
ses
and
has
been
sup
pres
sed.
Sou
rce:
Phi
lippi
ne S
tatis
tics
Aut
horit
y, 2
019
Ann
ual P
over
ty In
dica
tors
Sur
vey
Tabl
e 20
. Pop
ulat
ion
5 Ye
ars
Old
and
Ove
r Who
Exp
erie
nced
Illn
ess/
Sick
ness
/Inju
ry a
nd N
umbe
r of D
ay/s
that
Not
Abl
e To
Go
To W
ork
or S
choo
l, or
Per
form
Dai
ly A
ctiv
ities
bec
ause
of
Thei
r Ill
ness
/Sic
knes
s/In
jury
Dur
ing
The
Past
Mon
th b
y Se
x, R
egio
n an
d Re
side
nce,
Phi
lippi
nes
2019
(con
t.)
Regi
on/ R
esid
ence
Popu
latio
n ag
ed 5
yea
rs o
ld
and
over
who
exp
erie
nced
Ill
ness
/Sic
knes
s/In
jury
and
th
is h
ad b
een
a re
ason
for
abse
nce
from
wor
k or
sch
ool
or fo
r not
bei
ng a
ble
to
perfo
rm d
aily
act
iviti
es in
the
past
mon
th
(Tot
al, i
n th
ousa
nds)
Num
ber o
f Day
/s th
at n
ot a
ble
to g
o to
wor
k or
sch
ool,
or p
erfo
rm d
aily
act
iviti
es b
ecau
se o
f illn
ess/
sick
ness
/inju
ry
durin
g th
e pa
st m
onth
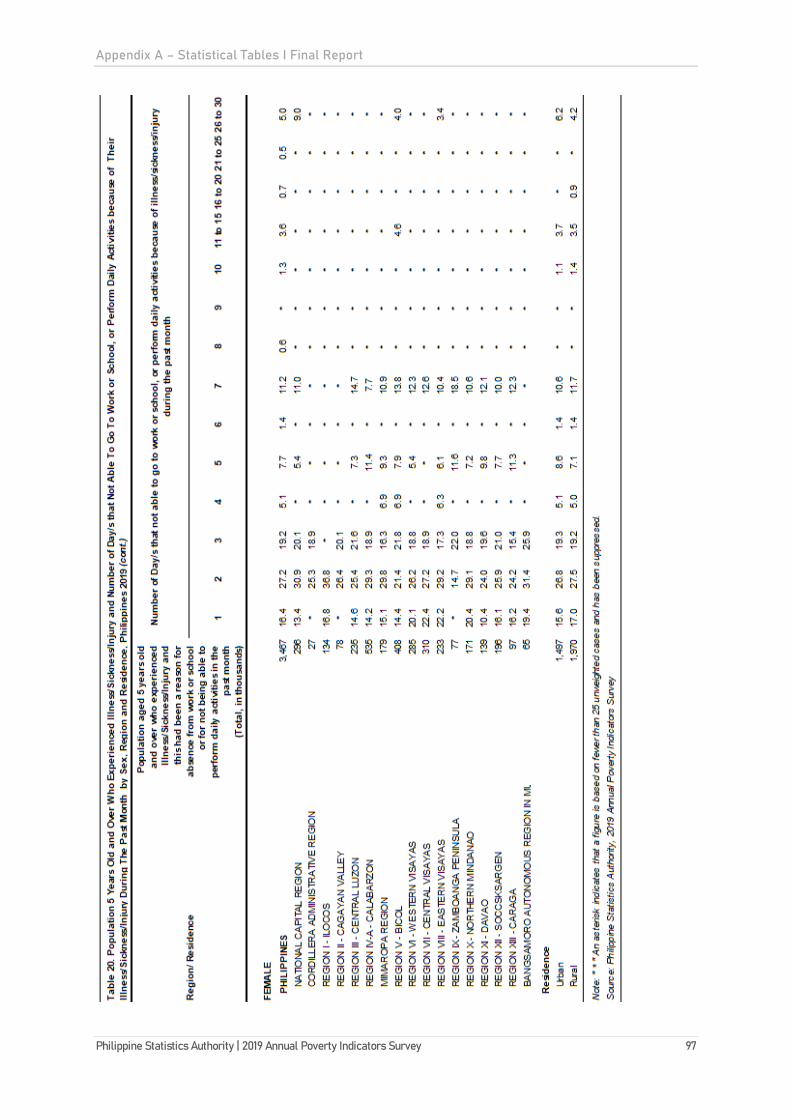
Appendix A – Statistical Tables I Final Report
Philippine Statistics Authority | 2019 Annual Poverty Indicators Survey 97

Appendix A – Statistical Tables I Final Report
98 Philippine Statistics Authority | 2019 Annual Poverty Indicators Survey
Yes No
BOTH SEXESPHILIPPINES 74,453 26.3 73.7
NATIONAL CAPITAL REGION 10,008 42.7 57.3CORDILLERA ADMINISTRATIVE REGION 1,253 26.4 73.6REGION I - ILOCOS 3,689 21.2 78.8REGION II - CAGAYAN VALLEY 2,542 20.3 79.7REGION III - CENTRAL LUZON 8,674 22.0 78.0REGION IV-A - CALABARZON 11,208 35.6 64.4MIMAROPA REGION 2,049 28.1 71.9REGION V - BICOL 3,957 24.3 75.7REGION VI - WESTERN VISAYAS 5,520 19.3 80.7REGION VII - CENTRAL VISAYAS 5,435 28.7 71.3REGION VIII - EASTERN VISAYAS 3,123 19.9 80.1REGION IX - ZAMBOANGA PENINSULA 2,518 14.8 85.2REGION X - NORTHERN MINDANAO 3,377 17.9 82.1REGION XI - DAVAO 3,575 19.5 80.5REGION XII - SOCCSKSARGEN 3,260 25.0 75.0REGION XIII - CARAGA 1,807 22.1 77.9BANGSAMORO AUTONOMOUS REGION IN MUSLIM MINDANAO 2,456 3.8 96.2
ResidenceUrban 38,760 31.8 68.2Rural 35,693 20.3 79.7
Note: " * " An asterisk indicates that a figure is based on fewer than 25 unweighted cases and has been suppressed.Source: Philippine Statistics Authority, 2019 Annual Poverty Indicators Survey
Table 21. Population 15 Years Old With/Without Account at Bank or Another Type of Financial Institution or With Mobile-Money-Service Provided by Sex, Region and Residence, Philippines 2019
Region/ Residence Population 15 Years Old and Over (Total, in thousands)
Have an account at a bank or another type of financial institution or with
mobile-money-service provider
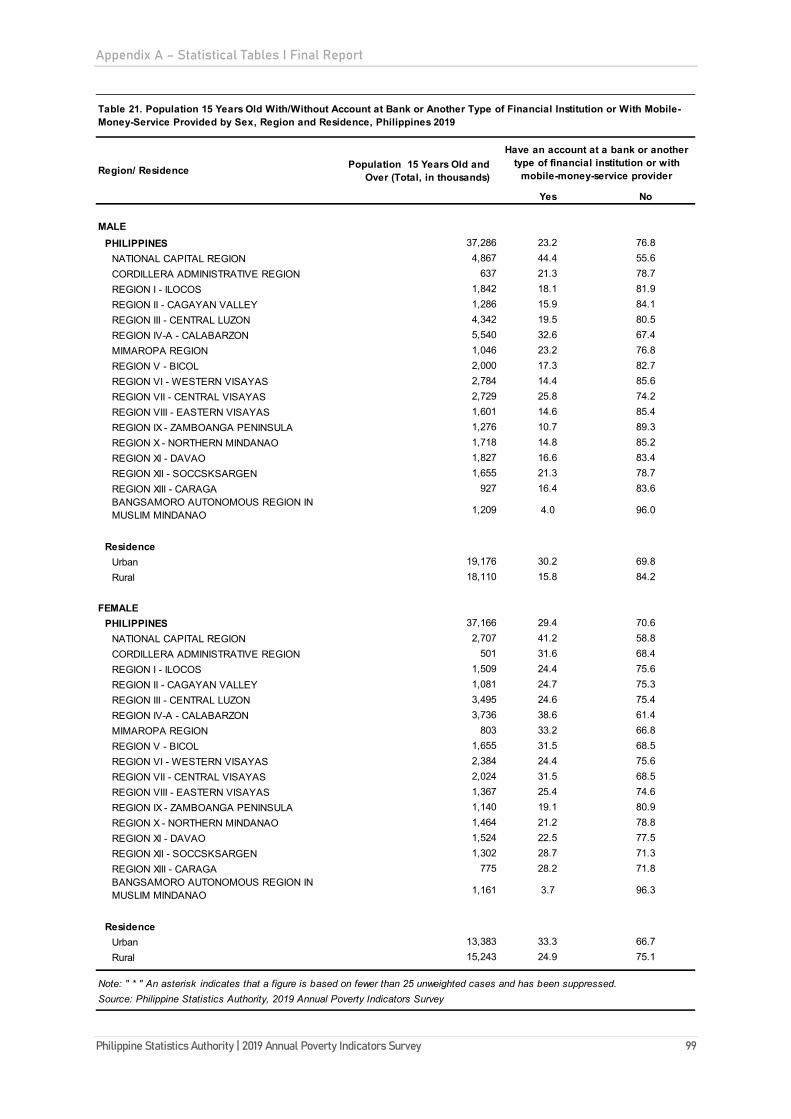
Appendix A – Statistical Tables I Final Report
Philippine Statistics Authority | 2019 Annual Poverty Indicators Survey 99
Yes No
MALEPHILIPPINES 37,286 23.2 76.8
NATIONAL CAPITAL REGION 4,867 44.4 55.6CORDILLERA ADMINISTRATIVE REGION 637 21.3 78.7REGION I - ILOCOS 1,842 18.1 81.9REGION II - CAGAYAN VALLEY 1,286 15.9 84.1REGION III - CENTRAL LUZON 4,342 19.5 80.5REGION IV-A - CALABARZON 5,540 32.6 67.4MIMAROPA REGION 1,046 23.2 76.8REGION V - BICOL 2,000 17.3 82.7REGION VI - WESTERN VISAYAS 2,784 14.4 85.6REGION VII - CENTRAL VISAYAS 2,729 25.8 74.2REGION VIII - EASTERN VISAYAS 1,601 14.6 85.4REGION IX - ZAMBOANGA PENINSULA 1,276 10.7 89.3REGION X - NORTHERN MINDANAO 1,718 14.8 85.2REGION XI - DAVAO 1,827 16.6 83.4REGION XII - SOCCSKSARGEN 1,655 21.3 78.7REGION XIII - CARAGA 927 16.4 83.6BANGSAMORO AUTONOMOUS REGION IN MUSLIM MINDANAO 1,209 4.0 96.0
ResidenceUrban 19,176 30.2 69.8Rural 18,110 15.8 84.2
FEMALEPHILIPPINES 37,166 29.4 70.6
NATIONAL CAPITAL REGION 2,707 41.2 58.8CORDILLERA ADMINISTRATIVE REGION 501 31.6 68.4REGION I - ILOCOS 1,509 24.4 75.6REGION II - CAGAYAN VALLEY 1,081 24.7 75.3REGION III - CENTRAL LUZON 3,495 24.6 75.4REGION IV-A - CALABARZON 3,736 38.6 61.4MIMAROPA REGION 803 33.2 66.8REGION V - BICOL 1,655 31.5 68.5REGION VI - WESTERN VISAYAS 2,384 24.4 75.6REGION VII - CENTRAL VISAYAS 2,024 31.5 68.5REGION VIII - EASTERN VISAYAS 1,367 25.4 74.6REGION IX - ZAMBOANGA PENINSULA 1,140 19.1 80.9REGION X - NORTHERN MINDANAO 1,464 21.2 78.8REGION XI - DAVAO 1,524 22.5 77.5REGION XII - SOCCSKSARGEN 1,302 28.7 71.3REGION XIII - CARAGA 775 28.2 71.8BANGSAMORO AUTONOMOUS REGION IN MUSLIM MINDANAO 1,161 3.7 96.3
ResidenceUrban 13,383 33.3 66.7Rural 15,243 24.9 75.1
Note: " * " An asterisk indicates that a figure is based on fewer than 25 unweighted cases and has been suppressed.Source: Philippine Statistics Authority, 2019 Annual Poverty Indicators Survey
Table 21. Population 15 Years Old With/Without Account at Bank or Another Type of Financial Institution or With Mobile-Money-Service Provided by Sex, Region and Residence, Philippines 2019
Region/ Residence Population 15 Years Old and Over (Total, in thousands)
Have an account at a bank or another type of financial institution or with
mobile-money-service provider
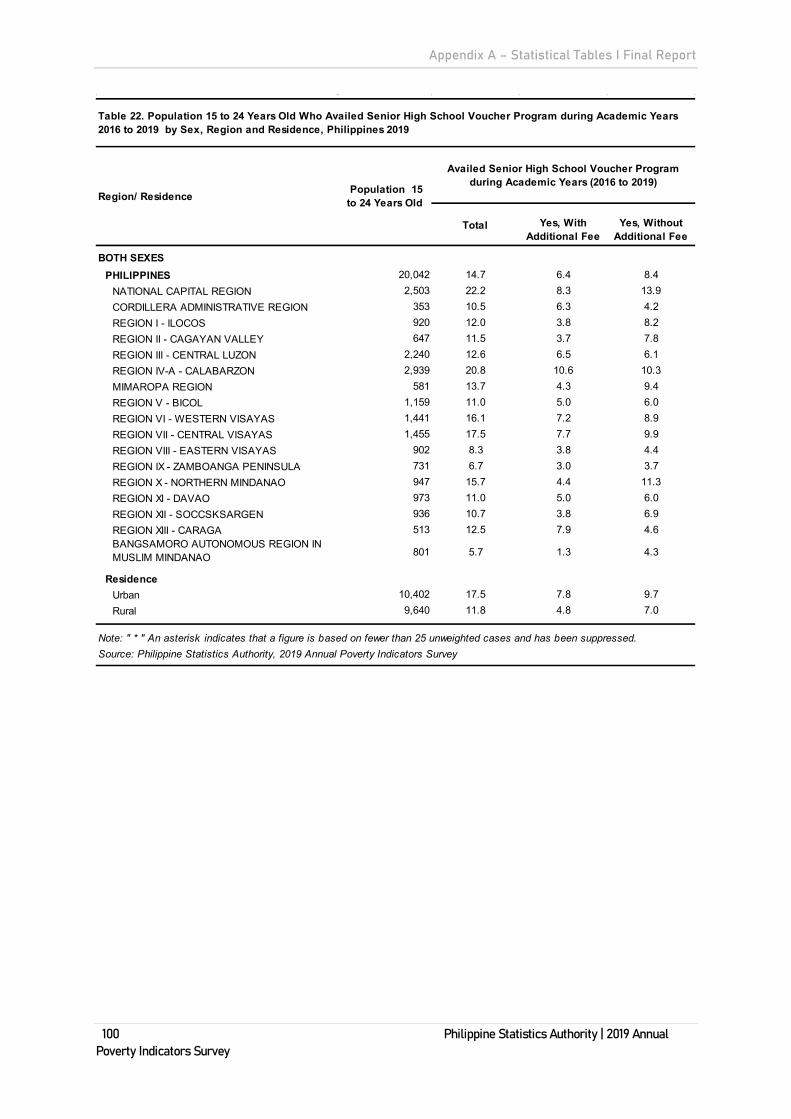
Appendix A – Statistical Tables I Final Report
100 Philippine Statistics Authority | 2019 Annual Poverty Indicators Survey
Total Yes, With Additional Fee
Yes, Without Additional Fee
BOTH SEXESPHILIPPINES 20,042 14.7 6.4 8.4
NATIONAL CAPITAL REGION 2,503 22.2 8.3 13.9CORDILLERA ADMINISTRATIVE REGION 353 10.5 6.3 4.2REGION I - ILOCOS 920 12.0 3.8 8.2REGION II - CAGAYAN VALLEY 647 11.5 3.7 7.8REGION III - CENTRAL LUZON 2,240 12.6 6.5 6.1REGION IV-A - CALABARZON 2,939 20.8 10.6 10.3MIMAROPA REGION 581 13.7 4.3 9.4REGION V - BICOL 1,159 11.0 5.0 6.0REGION VI - WESTERN VISAYAS 1,441 16.1 7.2 8.9REGION VII - CENTRAL VISAYAS 1,455 17.5 7.7 9.9REGION VIII - EASTERN VISAYAS 902 8.3 3.8 4.4REGION IX - ZAMBOANGA PENINSULA 731 6.7 3.0 3.7REGION X - NORTHERN MINDANAO 947 15.7 4.4 11.3REGION XI - DAVAO 973 11.0 5.0 6.0REGION XII - SOCCSKSARGEN 936 10.7 3.8 6.9REGION XIII - CARAGA 513 12.5 7.9 4.6BANGSAMORO AUTONOMOUS REGION IN MUSLIM MINDANAO 801 5.7 1.3 4.3
ResidenceUrban 10,402 17.5 7.8 9.7Rural 9,640 11.8 4.8 7.0
Note: " * " An asterisk indicates that a figure is based on fewer than 25 unweighted cases and has been suppressed.Source: Philippine Statistics Authority, 2019 Annual Poverty Indicators Survey
Table 22. Population 15 to 24 Years Old Who Availed Senior High School Voucher Program during Academic Years 2016 to 2019 by Sex, Region and Residence, Philippines 2019
Region/ Residence Population 15 to 24 Years Old
Availed Senior High School Voucher Program during Academic Years (2016 to 2019)
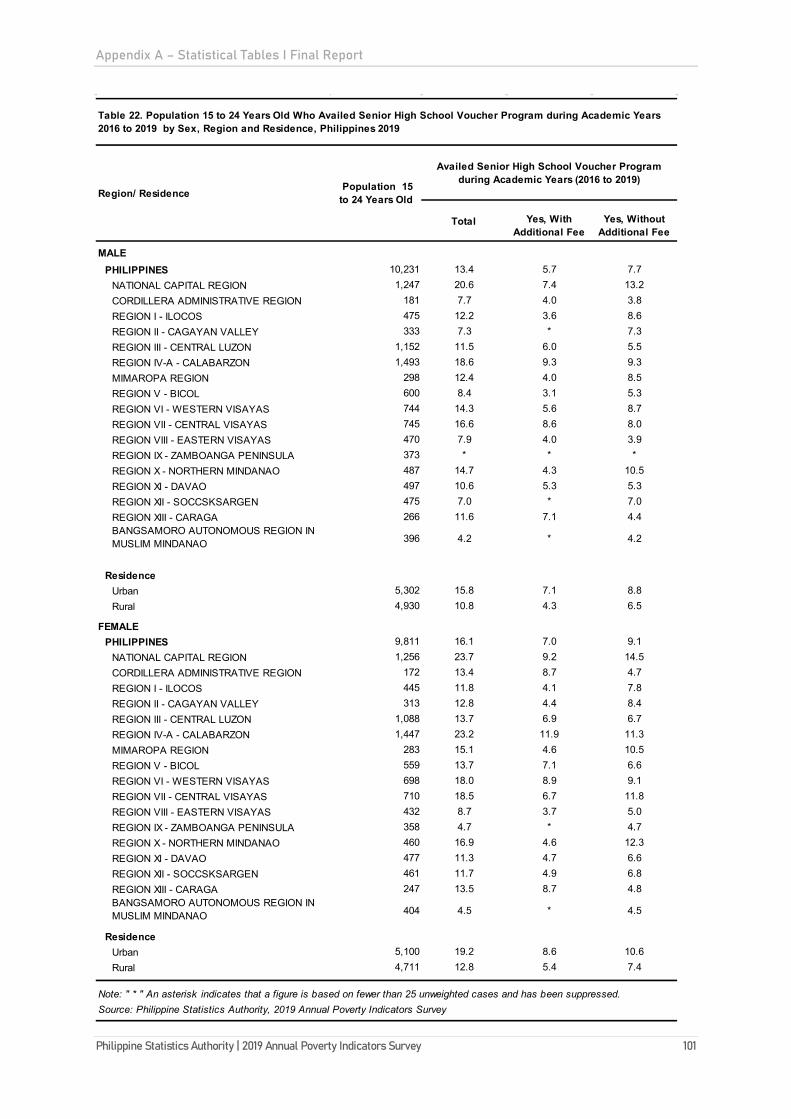
Appendix A – Statistical Tables I Final Report
Philippine Statistics Authority | 2019 Annual Poverty Indicators Survey 101
Total Yes, With Additional Fee
Yes, Without Additional Fee
MALEPHILIPPINES 10,231 13.4 5.7 7.7
NATIONAL CAPITAL REGION 1,247 20.6 7.4 13.2CORDILLERA ADMINISTRATIVE REGION 181 7.7 4.0 3.8REGION I - ILOCOS 475 12.2 3.6 8.6REGION II - CAGAYAN VALLEY 333 7.3 * 7.3REGION III - CENTRAL LUZON 1,152 11.5 6.0 5.5REGION IV-A - CALABARZON 1,493 18.6 9.3 9.3MIMAROPA REGION 298 12.4 4.0 8.5REGION V - BICOL 600 8.4 3.1 5.3REGION VI - WESTERN VISAYAS 744 14.3 5.6 8.7REGION VII - CENTRAL VISAYAS 745 16.6 8.6 8.0REGION VIII - EASTERN VISAYAS 470 7.9 4.0 3.9REGION IX - ZAMBOANGA PENINSULA 373 * * *REGION X - NORTHERN MINDANAO 487 14.7 4.3 10.5REGION XI - DAVAO 497 10.6 5.3 5.3REGION XII - SOCCSKSARGEN 475 7.0 * 7.0REGION XIII - CARAGA 266 11.6 7.1 4.4BANGSAMORO AUTONOMOUS REGION IN MUSLIM MINDANAO 396 4.2 * 4.2
ResidenceUrban 5,302 15.8 7.1 8.8Rural 4,930 10.8 4.3 6.5
FEMALEPHILIPPINES 9,811 16.1 7.0 9.1
NATIONAL CAPITAL REGION 1,256 23.7 9.2 14.5CORDILLERA ADMINISTRATIVE REGION 172 13.4 8.7 4.7REGION I - ILOCOS 445 11.8 4.1 7.8REGION II - CAGAYAN VALLEY 313 12.8 4.4 8.4REGION III - CENTRAL LUZON 1,088 13.7 6.9 6.7REGION IV-A - CALABARZON 1,447 23.2 11.9 11.3MIMAROPA REGION 283 15.1 4.6 10.5REGION V - BICOL 559 13.7 7.1 6.6REGION VI - WESTERN VISAYAS 698 18.0 8.9 9.1REGION VII - CENTRAL VISAYAS 710 18.5 6.7 11.8REGION VIII - EASTERN VISAYAS 432 8.7 3.7 5.0REGION IX - ZAMBOANGA PENINSULA 358 4.7 * 4.7REGION X - NORTHERN MINDANAO 460 16.9 4.6 12.3REGION XI - DAVAO 477 11.3 4.7 6.6REGION XII - SOCCSKSARGEN 461 11.7 4.9 6.8REGION XIII - CARAGA 247 13.5 8.7 4.8BANGSAMORO AUTONOMOUS REGION IN MUSLIM MINDANAO 404 4.5 * 4.5
ResidenceUrban 5,100 19.2 8.6 10.6Rural 4,711 12.8 5.4 7.4
Note: " * " An asterisk indicates that a figure is based on fewer than 25 unweighted cases and has been suppressed.Source: Philippine Statistics Authority, 2019 Annual Poverty Indicators Survey
Table 22. Population 15 to 24 Years Old Who Availed Senior High School Voucher Program during Academic Years 2016 to 2019 by Sex, Region and Residence, Philippines 2019
Region/ Residence Population 15 to 24 Years Old
Availed Senior High School Voucher Program during Academic Years (2016 to 2019)

Appendix A – Statistical Tables I Final Report
102 Philippine Statistics Authority | 2019 Annual Poverty Indicators Survey
SUC/LUC Free Tuition Fee
Tertiary Education Subsidy
BOTH SEXESPHILIPPINES 20,042 3.1 1.2
NATIONAL CAPITAL REGION 2,503 1.5 *CORDILLERA ADMINISTRATIVE REGION 353 3.1 *REGION I - ILOCOS 920 3.4 *REGION II - CAGAYAN VALLEY 647 2.7 *REGION III - CENTRAL LUZON 2,240 3.1 *REGION IV-A - CALABARZON 2,939 3.7 *MIMAROPA REGION 581 4.6 *REGION V - BICOL 1,159 6.1 *REGION VI - WESTERN VISAYAS 1,441 2.9 1.8REGION VII - CENTRAL VISAYAS 1,455 3.8 2.8REGION VIII - EASTERN VISAYAS 902 4.8 1.2REGION IX - ZAMBOANGA PENINSULA 731 3.0 *REGION X - NORTHERN MINDANAO 947 1.5 *REGION XI - DAVAO 973 2.4 *REGION XII - SOCCSKSARGEN 936 * *REGION XIII - CARAGA 513 4.8 2.1BANGSAMORO AUTONOMOUS REGION IN MUSLIM MINDANAO 801 * *
ResidenceUrban 10,402 2.6 1.0Rural 9,640 3.6 1.4
Note: " * " An asterisk indicates that a figure is based on fewer than 25 unweighted cases and has been suppressed.Source: Philippine Statistics Authority, 2019 Annual Poverty Indicators Survey
Table 23. Population 15 to 24 Years Old Who Availed Tertiary Education Subsidy/Assistance during Academic Years 2017 to 2019 by Sex, Region and Residence, Philippines 2019
Region/ Residence Population 15 to 24 Years Old
Availed Tertiary Education Subsidy/Assistance during Academic Years
2017 to 2019
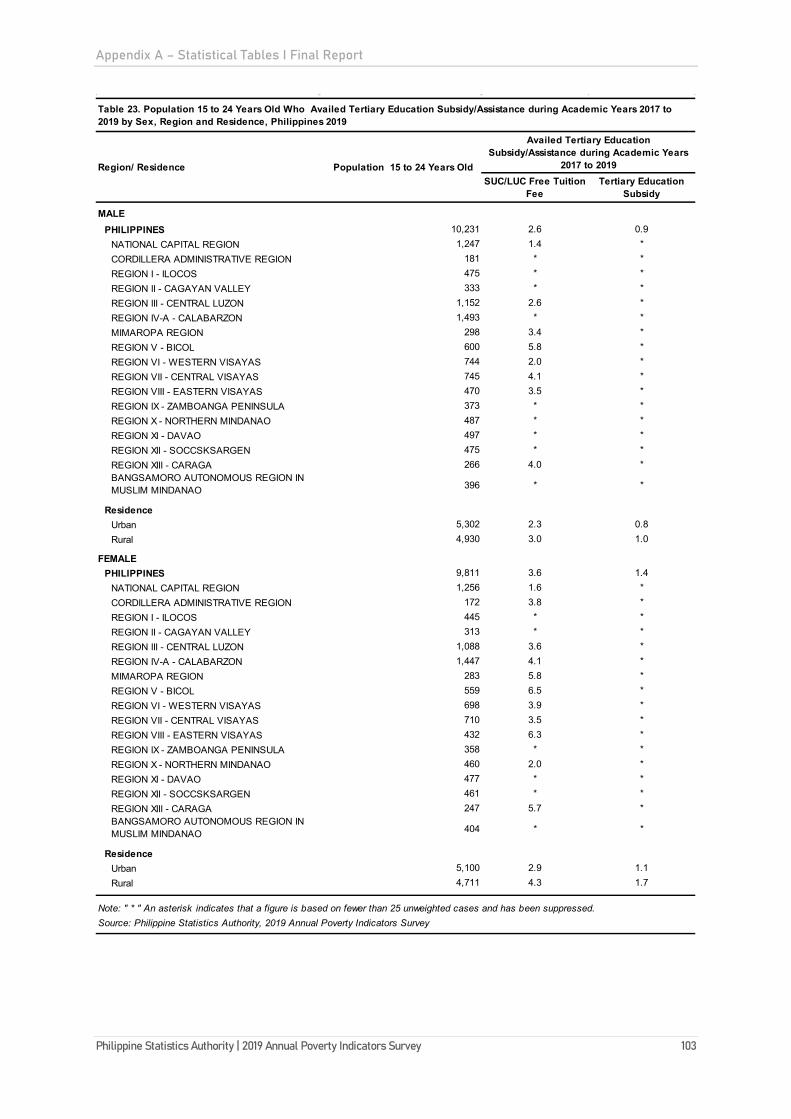
Appendix A – Statistical Tables I Final Report
Philippine Statistics Authority | 2019 Annual Poverty Indicators Survey 103
SUC/LUC Free Tuition Fee
Tertiary Education Subsidy
MALEPHILIPPINES 10,231 2.6 0.9
NATIONAL CAPITAL REGION 1,247 1.4 *CORDILLERA ADMINISTRATIVE REGION 181 * *REGION I - ILOCOS 475 * *REGION II - CAGAYAN VALLEY 333 * *REGION III - CENTRAL LUZON 1,152 2.6 *REGION IV-A - CALABARZON 1,493 * *MIMAROPA REGION 298 3.4 *REGION V - BICOL 600 5.8 *REGION VI - WESTERN VISAYAS 744 2.0 *REGION VII - CENTRAL VISAYAS 745 4.1 *REGION VIII - EASTERN VISAYAS 470 3.5 *REGION IX - ZAMBOANGA PENINSULA 373 * *REGION X - NORTHERN MINDANAO 487 * *REGION XI - DAVAO 497 * *REGION XII - SOCCSKSARGEN 475 * *REGION XIII - CARAGA 266 4.0 *BANGSAMORO AUTONOMOUS REGION IN MUSLIM MINDANAO 396 * *
ResidenceUrban 5,302 2.3 0.8Rural 4,930 3.0 1.0
FEMALEPHILIPPINES 9,811 3.6 1.4
NATIONAL CAPITAL REGION 1,256 1.6 *CORDILLERA ADMINISTRATIVE REGION 172 3.8 *REGION I - ILOCOS 445 * *REGION II - CAGAYAN VALLEY 313 * *REGION III - CENTRAL LUZON 1,088 3.6 *REGION IV-A - CALABARZON 1,447 4.1 *MIMAROPA REGION 283 5.8 *REGION V - BICOL 559 6.5 *REGION VI - WESTERN VISAYAS 698 3.9 *REGION VII - CENTRAL VISAYAS 710 3.5 *REGION VIII - EASTERN VISAYAS 432 6.3 *REGION IX - ZAMBOANGA PENINSULA 358 * *REGION X - NORTHERN MINDANAO 460 2.0 *REGION XI - DAVAO 477 * *REGION XII - SOCCSKSARGEN 461 * *REGION XIII - CARAGA 247 5.7 *BANGSAMORO AUTONOMOUS REGION IN MUSLIM MINDANAO 404 * *
ResidenceUrban 5,100 2.9 1.1Rural 4,711 4.3 1.7
Note: " * " An asterisk indicates that a figure is based on fewer than 25 unweighted cases and has been suppressed.Source: Philippine Statistics Authority, 2019 Annual Poverty Indicators Survey
Table 23. Population 15 to 24 Years Old Who Availed Tertiary Education Subsidy/Assistance during Academic Years 2017 to 2019 by Sex, Region and Residence, Philippines 2019
Region/ Residence Population 15 to 24 Years Old
Availed Tertiary Education Subsidy/Assistance during Academic Years
2017 to 2019
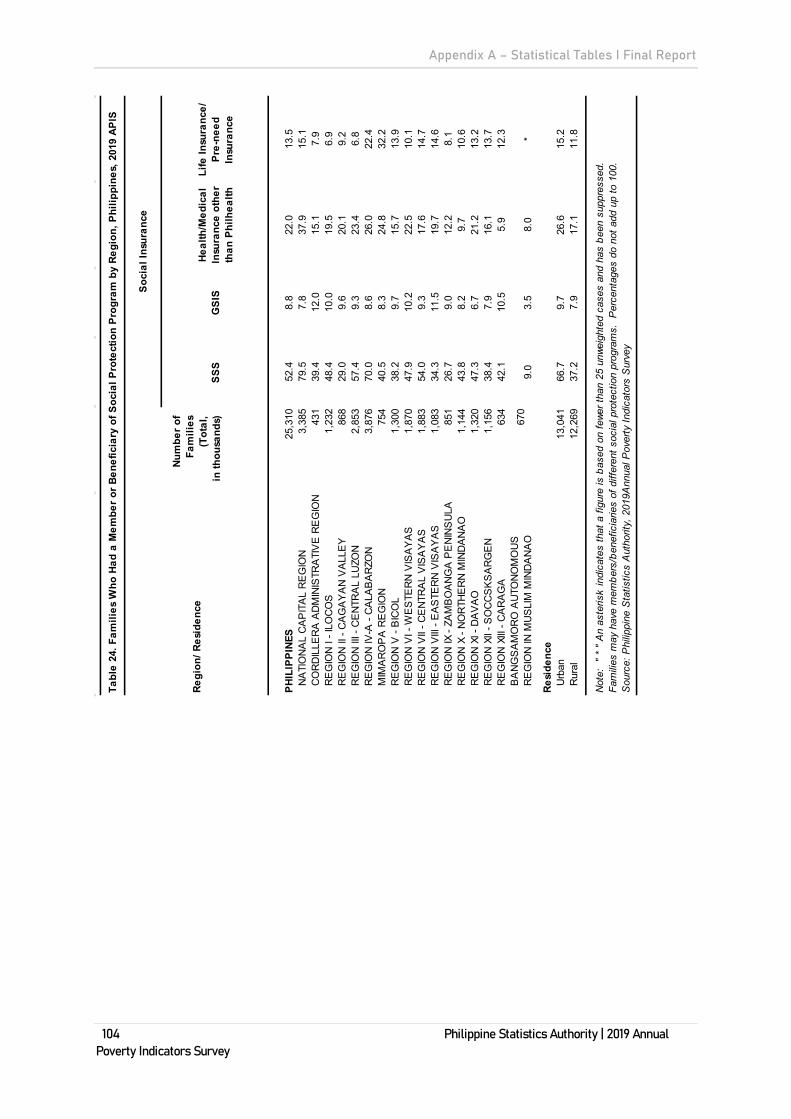
Appendix A – Statistical Tables I Final Report
104 Philippine Statistics Authority | 2019 Annual Poverty Indicators Survey
Tabl
e 24
. Fam
ilies
Who
Had
a M
embe
r or B
enef
icia
ry o
f Soc
ial P
rote
ctio
n Pr
ogra
m b
y Re
gion
, Phi
lippi
nes,
201
9 AP
IS
SSS
GSI
SHe
alth
/Med
ical
In
sura
nce
othe
r th
an P
hilh
ealth
Life
Insu
ranc
e/
Pre-
need
In
sura
nce
PHIL
IPPI
NES
25,3
1052
.48.
822
.013
.5N
ATI
ON
AL
CA
PIT
AL
RE
GIO
N
3,38
579
.57.
837
.915
.1C
OR
DIL
LER
A A
DM
INIS
TRA
TIV
E R
EG
ION
43
139
.412
.015
.17.
9R
EG
ION
I - I
LOC
OS
1,23
248
.410
.019
.56.
9R
EG
ION
II -
CA
GA
YA
N V
ALL
EY
86
829
.09.
620
.19.
2R
EG
ION
III -
CE
NTR
AL
LUZO
N
2,85
357
.49.
323
.46.
8R
EG
ION
IV-A
- C
ALA
BA
RZO
N
3,87
670
.08.
626
.022
.4M
IMA
RO
PA
RE
GIO
N
754
40.5
8.3
24.8
32.2
RE
GIO
N V
- B
ICO
L 1,
300
38.2
9.7
15.7
13.9
RE
GIO
N V
I - W
ES
TER
N V
ISA
YA
S
1,87
047
.910
.222
.510
.1R
EG
ION
VII
- CE
NTR
AL
VIS
AY
AS
1,
883
54.0
9.3
17.6
14.7
RE
GIO
N V
III -
EA
STE
RN
VIS
AY
AS
1,
083
34.3
11.5
19.7
14.6
RE
GIO
N IX
- ZA
MB
OA
NG
A P
EN
INS
ULA
85
126
.79.
012
.28.
1R
EG
ION
X -
NO
RTH
ER
N M
IND
AN
AO
1,
144
43.8
8.2
9.7
10.6
RE
GIO
N X
I - D
AV
AO
1,
320
47.3
6.7
21.2
13.2
RE
GIO
N X
II - S
OC
CS
KS
AR
GE
N
1,15
638
.47.
916
.113
.7R
EG
ION
XIII
- C
AR
AG
A
634
42.1
10.5
5.9
12.3
BA
NG
SA
MO
RO
AU
TON
OM
OU
S
RE
GIO
N IN
MU
SLI
M M
IND
AN
AO
670
9.0
3.5
8.0
*
Resi
denc
eU
rban
13,0
4166
.79.
726
.615
.2R
ural
12,2
6937
.27.
917
.111
.8
Not
e: "
* "
An
aste
risk
indi
cate
s th
at a
figu
re is
bas
ed o
n fe
wer t
han
25 u
nwei
ghte
d ca
ses
and
has
been
sup
pres
sed.
Fa
mili
es m
ay h
ave
mem
bers
/ben
efic
iarie
s of
diff
eren
t soc
ial p
rote
ctio
n pr
ogra
ms.
Per
cent
ages
do
not a
dd u
p to
100
. S
ourc
e: P
hilip
pine
Sta
tistic
s A
utho
rity,
201
9Ann
ual P
over
ty In
dica
tors
Sur
vey
Regi
on/ R
esid
ence
Num
ber o
f Fa
mili
es
(Tot
al,
in th
ousa
nds)
Soci
al In
sura
nce
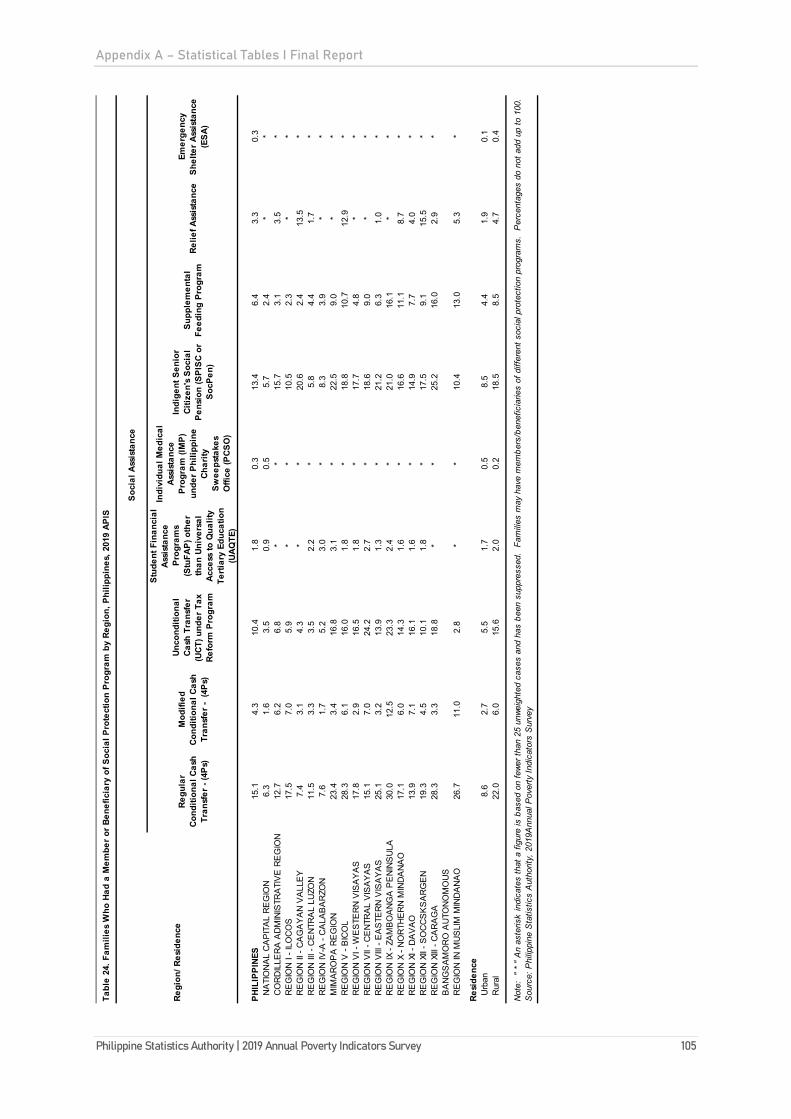
Appendix A – Statistical Tables I Final Report
Philippine Statistics Authority | 2019 Annual Poverty Indicators Survey 105
Tabl
e 24
. Fam
ilies
Who
Had
a M
embe
r or B
enef
icia
ry o
f Soc
ial P
rote
ctio
n Pr
ogra
m b
y Re
gion
, Phi
lippi
nes,
201
9 AP
IS
Regu
lar
Cond
ition
al C
ash
Tran
sfer
- (4
Ps)
Mod
ified
Co
nditi
onal
Cas
h Tr
ansf
er -
(4Ps
)
Unco
nditi
onal
Ca
sh T
rans
fer
(UCT
) und
er T
ax
Refo
rm P
rogr
am
Stud
ent F
inan
cial
As
sist
ance
Pr
ogra
ms
(Stu
FAP)
oth
er
than
Uni
vers
al
Acce
ss to
Qua
lity
Terti
ary
Educ
atio
n (U
AQTE
)
Indi
vidu
al M
edic
al
Assi
stan
ce
Prog
ram
(IM
P)
unde
r Phi
lippi
ne
Char
ity
Swee
psta
kes
Offi
ce (P
CSO
)
Indi
gent
Sen
ior
Citiz
en's
Soci
al
Pens
ion
(SPI
SC o
r So
cPen
)
Supp
lem
enta
l Fe
edin
g Pr
ogra
mRe
lief A
ssis
tanc
eEm
erge
ncy
Shel
ter A
ssis
tanc
e (E
SA)
PHIL
IPPI
NES
15.1
4.3
10.4
1.8
0.3
13.4
6.4
3.3
0.3
NA
TIO
NA
L C
AP
ITA
L R
EG
ION
6.
31.
63.
50.
90.
55.
72.
4*
*C
OR
DIL
LER
A A
DM
INIS
TRA
TIV
E R
EG
ION
12
.76.
26.
8*
*15
.73.
13.
5*
RE
GIO
N I
- ILO
CO
S17
.57.
05.
9*
*10
.52.
3*
*R
EG
ION
II -
CA
GA
YA
N V
ALL
EY
7.
43.
14.
3*
*20
.62.
413
.5*
RE
GIO
N II
I - C
EN
TRA
L LU
ZON
11
.53.
33.
52.
2*
5.8
4.4
1.7
*R
EG
ION
IV-A
- C
ALA
BA
RZO
N
7.6
1.7
5.2
3.0
*8.
33.
9*
*M
IMA
RO
PA
RE
GIO
N
23.4
3.4
16.8
3.1
*22
.59.
0*
*R
EG
ION
V -
BIC
OL
28.3
6.1
16.0
1.8
*18
.810
.712
.9*
RE
GIO
N V
I - W
ES
TER
N V
ISA
YA
S
17.8
2.9
16.5
1.8
*17
.74.
8*
*R
EG
ION
VII
- CE
NTR
AL
VIS
AY
AS
15
.17.
024
.22.
7*
18.6
9.0
**
RE
GIO
N V
III -
EA
STE
RN
VIS
AY
AS
25
.13.
213
.91.
3*
21.2
6.3
1.0
*R
EG
ION
IX -
ZAM
BO
AN
GA
PE
NIN
SU
LA
30.0
12.5
23.3
2.4
*21
.016
.1*
*R
EG
ION
X -
NO
RTH
ER
N M
IND
AN
AO
17
.16.
014
.31.
6*
16.6
11.1
8.7
*R
EG
ION
XI -
DA
VA
O
13.9
7.1
16.1
1.6
*14
.97.
74.
0*
RE
GIO
N X
II - S
OC
CS
KS
AR
GE
N
19.3
4.5
10.1
1.8
*17
.59.
115
.5*
RE
GIO
N X
III -
CA
RA
GA
28
.33.
318
.8*
*25
.216
.02.
9*
BA
NG
SA
MO
RO
AU
TON
OM
OU
S
RE
GIO
N IN
MU
SLI
M M
IND
AN
AO
26.7
11.0
2.8
**
10.4
13.0
5.3
*
Resi
denc
eU
rban
8.6
2.7
5.5
1.7
0.5
8.5
4.4
1.9
0.1
Rur
al22
.06.
015
.62.
00.
218
.58.
54.
70.
4
Not
e: "
* "
An
aste
risk
indi
cate
s th
at a
figu
re is
bas
ed o
n fe
wer t
han
25 u
nwei
ghte
d ca
ses
and
has
been
sup
pres
sed.
Fam
ilies
may
hav
e m
embe
rs/b
enef
icia
ries
of d
iffer
ent s
ocia
l pro
tect
ion
prog
ram
s. P
erce
ntag
es d
o no
t add
up
to 1
00.
Sou
rce:
Phi
lippi
ne S
tatis
tics
Aut
horit
y, 2
019A
nnua
l Pov
erty
Indi
cato
rs S
urve
y
Regi
on/ R
esid
ence
Soci
al A
ssis
tanc
e
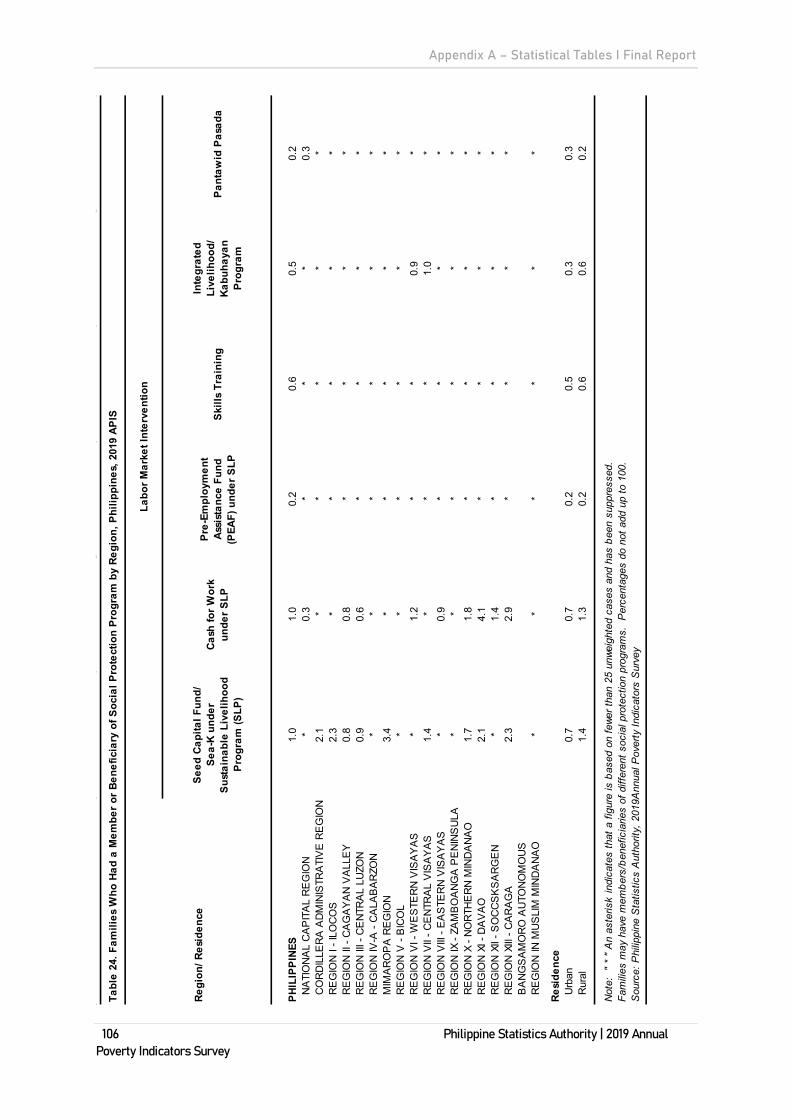
Appendix A – Statistical Tables I Final Report
106 Philippine Statistics Authority | 2019 Annual Poverty Indicators Survey
Tabl
e 24
. Fam
ilies
Who
Had
a M
embe
r or B
enef
icia
ry o
f Soc
ial P
rote
ctio
n Pr
ogra
m b
y Re
gion
, Phi
lippi
nes,
201
9 AP
IS
Seed
Cap
ital F
und/
Sea-
K un
der
Sust
aina
ble
Live
lihoo
d Pr
ogra
m (S
LP)
Cash
for W
ork
unde
r SLP
Pre-
Empl
oym
ent
Assi
stan
ce F
und
(PEA
F) u
nder
SLP
Skill
s Tr
aini
ng
Inte
grat
edLi
velih
ood/
Ka
buha
yan
Prog
ram
Pant
awid
Pas
ada
PHIL
IPPI
NES
1.0
1.0
0.2
0.6
0.5
0.2
NA
TIO
NA
L C
AP
ITA
L R
EG
ION
*
0.3
**
*0.
3C
OR
DIL
LER
A A
DM
INIS
TRA
TIV
E R
EG
ION
2.
1*
**
**
RE
GIO
N I
- ILO
CO
S2.
3*
**
**
RE
GIO
N II
- C
AG
AY
AN
VA
LLE
Y
0.8
0.8
**
**
RE
GIO
N II
I - C
EN
TRA
L LU
ZON
0.
90.
6*
**
*R
EG
ION
IV-A
- C
ALA
BA
RZO
N
**
**
**
MIM
AR
OP
A R
EG
ION
3.
4*
**
**
RE
GIO
N V
- B
ICO
L *
**
**
*R
EG
ION
VI -
WE
STE
RN
VIS
AY
AS
*
1.2
**
0.9
*R
EG
ION
VII
- CE
NTR
AL
VIS
AY
AS
1.
4*
**
1.0
*R
EG
ION
VIII
- E
AS
TER
N V
ISA
YA
S
*0.
9*
**
*R
EG
ION
IX -
ZAM
BO
AN
GA
PE
NIN
SU
LA
**
**
**
RE
GIO
N X
- N
OR
THE
RN
MIN
DA
NA
O
1.7
1.8
**
**
RE
GIO
N X
I - D
AV
AO
2.
14.
1*
**
*R
EG
ION
XII
- SO
CC
SK
SA
RG
EN
*
1.4
**
**
RE
GIO
N X
III -
CA
RA
GA
2.
32.
9*
**
*B
AN
GS
AM
OR
O A
UTO
NO
MO
US
R
EG
ION
IN M
US
LIM
MIN
DA
NA
O*
**
**
*
Resi
denc
eU
rban
0.7
0.7
0.2
0.5
0.3
0.3
Rur
al1.
41.
30.
20.
60.
60.
2
Not
e: "
* "
An
aste
risk
indi
cate
s th
at a
figu
re is
bas
ed o
n fe
wer t
han
25 u
nwei
ghte
d ca
ses
and
has
been
sup
pres
sed.
Fa
mili
es m
ay h
ave
mem
bers
/ben
efic
iarie
s of
diff
eren
t soc
ial p
rote
ctio
n pr
ogra
ms.
Per
cent
ages
do
not a
dd u
p to
100
. S
ourc
e: P
hilip
pine
Sta
tistic
s A
utho
rity,
201
9Ann
ual P
over
ty In
dica
tors
Sur
vey
Regi
on/ R
esid
ence
Labo
r Mar
ket I
nter
vent
ion
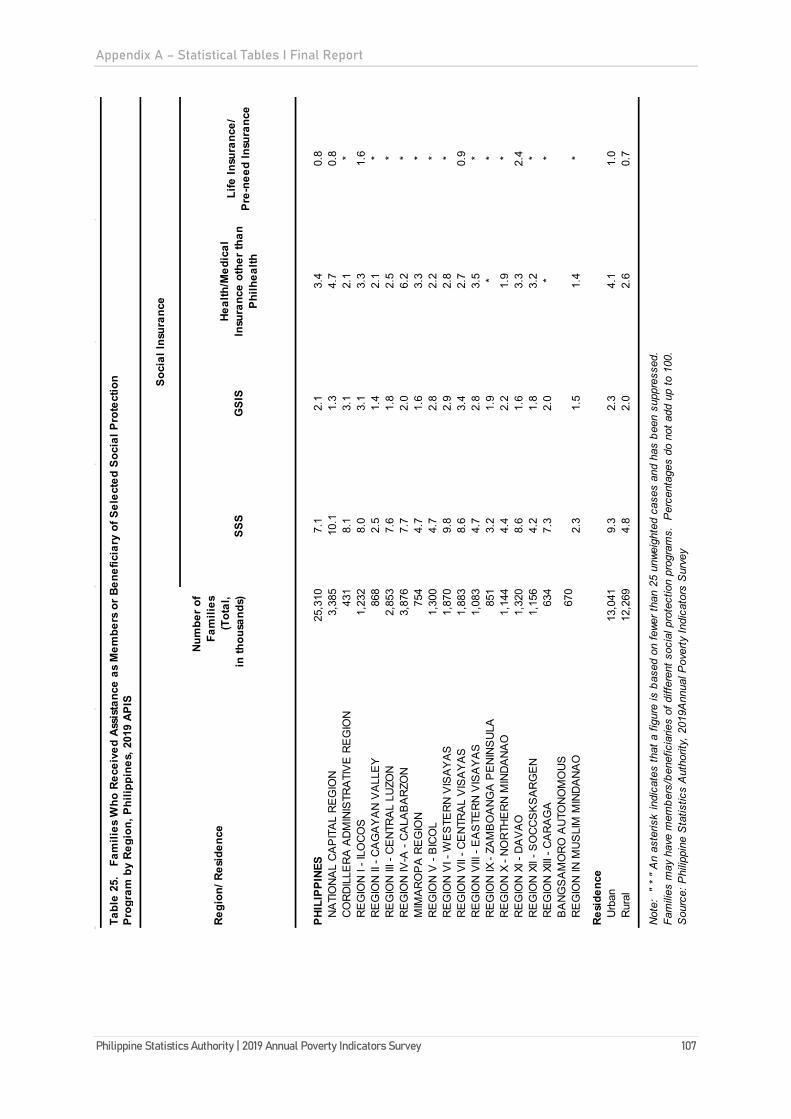
Appendix A – Statistical Tables I Final Report
Philippine Statistics Authority | 2019 Annual Poverty Indicators Survey 107
Tabl
e 25
. F
amili
es W
ho R
ecei
ved
Assi
stan
ce a
s M
embe
rs o
r Ben
efic
iary
of S
elec
ted
Soci
al P
rote
ctio
nPr
ogra
m b
y Re
gion
, Phi
lippi
nes,
201
9 AP
IS
SSS
GSI
SHe
alth
/Med
ical
In
sura
nce
othe
r tha
n Ph
ilhea
lth
Life
Insu
ranc
e/
Pre-
need
Insu
ranc
e
PHIL
IPPI
NES
25,3
107.
12.
13.
40.
8N
ATI
ON
AL
CA
PIT
AL
RE
GIO
N
3,38
510
.11.
34.
70.
8C
OR
DIL
LER
A A
DM
INIS
TRA
TIV
E R
EG
ION
43
18.
13.
12.
1*
RE
GIO
N I
- ILO
CO
S1,
232
8.0
3.1
3.3
1.6
RE
GIO
N II
- C
AG
AY
AN
VA
LLE
Y
868
2.5
1.4
2.1
*R
EG
ION
III -
CE
NTR
AL
LUZO
N
2,85
37.
61.
82.
5*
RE
GIO
N IV
-A -
CA
LAB
AR
ZON
3,
876
7.7
2.0
6.2
*M
IMA
RO
PA
RE
GIO
N
754
4.7
1.6
3.3
*R
EG
ION
V -
BIC
OL
1,30
04.
72.
82.
2*
RE
GIO
N V
I - W
ES
TER
N V
ISA
YA
S
1,87
09.
82.
92.
8*
RE
GIO
N V
II - C
EN
TRA
L V
ISA
YA
S
1,88
38.
63.
42.
70.
9R
EG
ION
VIII
- E
AS
TER
N V
ISA
YA
S
1,08
34.
72.
83.
5*
RE
GIO
N IX
- ZA
MB
OA
NG
A P
EN
INS
ULA
85
13.
21.
9*
*R
EG
ION
X -
NO
RTH
ER
N M
IND
AN
AO
1,
144
4.4
2.2
1.9
*R
EG
ION
XI -
DA
VA
O
1,32
08.
61.
63.
32.
4R
EG
ION
XII
- SO
CC
SK
SA
RG
EN
1,
156
4.2
1.8
3.2
*R
EG
ION
XIII
- C
AR
AG
A
634
7.3
2.0
**
BA
NG
SA
MO
RO
AU
TON
OM
OU
S
RE
GIO
N IN
MU
SLI
M M
IND
AN
AO
670
2.3
1.5
1.4
*
Resi
denc
eU
rban
13,0
419.
32.
34.
11.
0R
ural
12,2
694.
82.
02.
60.
7
Not
e: "
* "
An
aste
risk
indi
cate
s th
at a
figu
re is
bas
ed o
n fe
wer t
han
25 u
nwei
ghte
d ca
ses
and
has
been
sup
pres
sed.
Fa
mili
es m
ay h
ave
mem
bers
/ben
efic
iarie
s of
diff
eren
t soc
ial p
rote
ctio
n pr
ogra
ms.
Per
cent
ages
do
not a
dd u
p to
100
. S
ourc
e: P
hilip
pine
Sta
tistic
s A
utho
rity,
201
9Ann
ual P
over
ty In
dica
tors
Sur
vey
Regi
on/ R
esid
ence
Num
ber o
f Fa
mili
es
(Tot
al,
in th
ousa
nds)
Soci
al In
sura
nce

Appendix A – Statistical Tables I Final Report
108 Philippine Statistics Authority | 2019 Annual Poverty Indicators Survey
Tabl
e 25
. F
amili
es W
ho R
ecei
ved
Assi
stan
ce a
s M
embe
rs o
r Ben
efic
iary
of S
elec
ted
Soci
al P
rote
ctio
n Pr
ogra
m b
y Re
gion
, Phi
lippi
nes,
201
9 AP
IS
Regu
lar C
ondi
tiona
l Ca
sh T
rans
fer -
(4Ps
)M
odifi
ed C
ondi
tiona
l Ca
sh T
rans
fer -
(4P
s)
Unco
nditi
onal
Cas
h Tr
ansf
er (U
CT) u
nder
Ta
x Re
form
Pro
gram
Stud
ent F
inan
cial
As
sist
ance
Pro
gram
s (S
tuFA
P) o
ther
than
Un
iver
sal A
cces
s to
Q
ualit
y Te
rtiar
y Ed
ucat
ion
(UAQ
TE)
Indi
vidu
al M
edic
al
Assi
stan
ce P
rogr
am
(IMP)
und
er
Phili
ppin
e Ch
arity
Sw
eeps
take
s O
ffice
(P
CSO
)
Indi
gent
Sen
ior
Citiz
en's
Soci
al
Pens
ion
(SPI
SC o
r So
cPen
)
Supp
lem
enta
l Fe
edin
g Pr
ogra
mRe
lief A
ssis
tanc
eEm
erge
ncy
Shel
ter
Assi
stan
ce (E
SA)
PHIL
IPPI
NES
11.7
3.4
5.5
1.1
0.2
5.3
5.5
2.9
0.1
NA
TIO
NA
L C
AP
ITA
L R
EG
ION
4.
71.
42.
40.
3*
3.4
2.0
**
CO
RD
ILLE
RA
AD
MIN
ISTR
ATI
VE
RE
GIO
N
11.2
5.5
5.4
**
12.1
1.9
2.1
*R
EG
ION
I - I
LOC
OS
15.3
6.2
4.3
**
2.7
2.1
**
RE
GIO
N II
- C
AG
AY
AN
VA
LLE
Y
6.0
2.3
2.3
**
10.6
1.5
12.9
*R
EG
ION
III -
CE
NTR
AL
LUZO
N
10.0
2.7
2.9
1.4
*3.
23.
91.
1*
RE
GIO
N IV
-A -
CA
LAB
AR
ZON
6.
6*
3.4
2.2
*2.
63.
5*
*M
IMA
RO
PA
RE
GIO
N
9.1
1.5
5.7
1.4
*8.
97.
8*
*R
EG
ION
V -
BIC
OL
16.7
4.1
6.0
1.4
*4.
09.
211
.2*
RE
GIO
N V
I - W
ES
TER
N V
ISA
YA
S
15.6
2.1
6.5
**
3.7
3.8
**
RE
GIO
N V
II - C
EN
TRA
L V
ISA
YA
S
13.2
6.2
11.7
2.0
*8.
18.
2*
*R
EG
ION
VIII
- E
AS
TER
N V
ISA
YA
S
19.9
2.1
8.6
0.8
*4.
65.
30.
9*
RE
GIO
N IX
- ZA
MB
OA
NG
A P
EN
INS
ULA
27
.79.
515
.8*
*13
.713
.6*
*R
EG
ION
X -
NO
RTH
ER
N M
IND
AN
AO
14
.45.
36.
70.
8*
8.1
10.1
8.5
*R
EG
ION
XI -
DA
VA
O
12.6
6.5
8.0
**
6.2
6.5
3.6
*R
EG
ION
XII
- SO
CC
SK
SA
RG
EN
16
.13.
96.
8*
*4.
88.
415
.1*
RE
GIO
N X
III -
CA
RA
GA
24
.22.
48.
6*
*15
.113
.6*
*B
AN
GS
AM
OR
O A
UTO
NO
MO
US
R
EG
ION
IN M
US
LIM
MIN
DA
NA
O4.
74.
1*
**
4.1
9.4
4.9
*
Resi
denc
eU
rban
6.9
2.3
3.1
1.0
0.3
3.8
3.6
1.7
*R
ural
16.8
4.6
8.2
1.3
0.2
6.9
7.4
4.1
0.2
Not
e: "
* "
An
aste
risk
indi
cate
s th
at a
figu
re is
bas
ed o
n fe
wer t
han
25 u
nwei
ghte
d ca
ses
and
has
been
sup
pres
sed.
Fam
ilies
may
hav
e m
embe
rs/b
enef
icia
ries
of d
iffer
ent s
ocia
l pro
tect
ion
prog
ram
s. P
erce
ntag
es d
o no
t add
up
to 1
00.
Sou
rce:
Phi
lippi
ne S
tatis
tics
Aut
horit
y, 2
019A
nnua
l Pov
erty
Indi
cato
rs S
urve
y
Regi
on/ R
esid
ence
Soci
al A
ssis
tanc
e
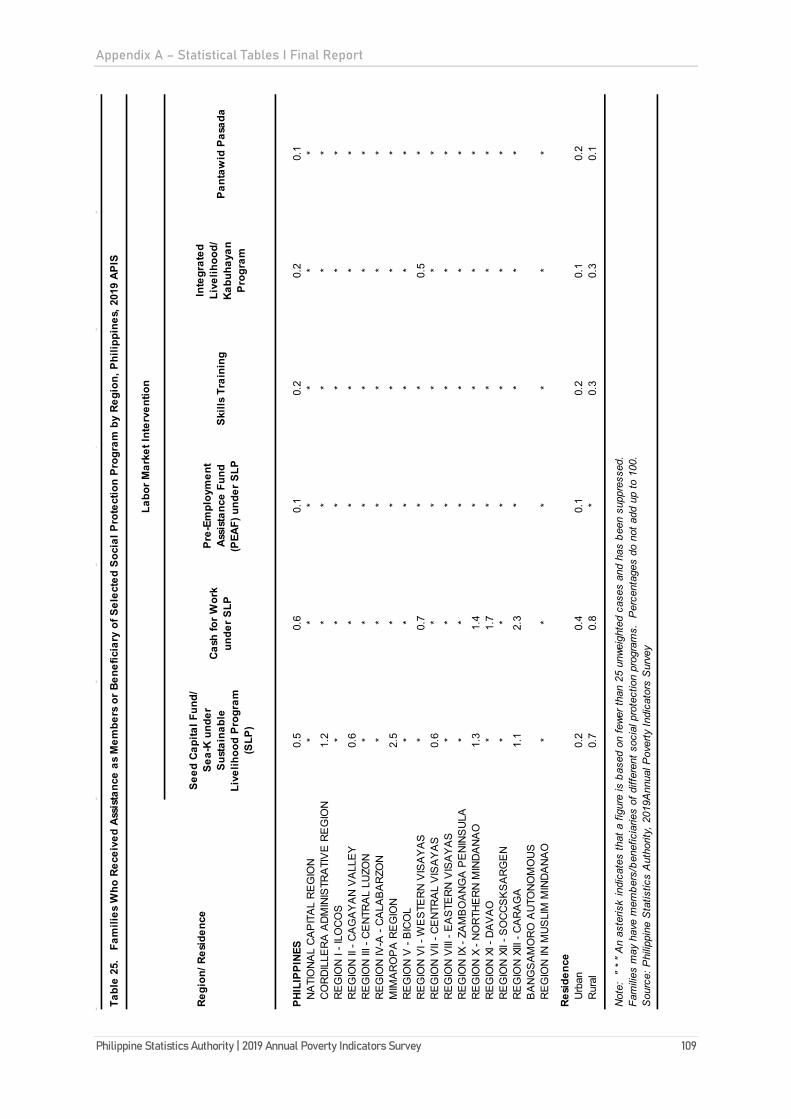
Appendix A – Statistical Tables I Final Report
Philippine Statistics Authority | 2019 Annual Poverty Indicators Survey 109
Tabl
e 25
. F
amili
es W
ho R
ecei
ved
Assi
stan
ce a
s M
embe
rs o
r Ben
efic
iary
of S
elec
ted
Soci
al P
rote
ctio
n Pr
ogra
m b
y Re
gion
, Phi
lippi
nes,
201
9 AP
IS
Seed
Cap
ital F
und/
Sea-
K un
der
Sust
aina
ble
Live
lihoo
d Pr
ogra
m
(SLP
)
Cash
for W
ork
unde
r SLP
Pre-
Empl
oym
ent
Assi
stan
ce F
und
(PEA
F) u
nder
SLP
Skill
s Tr
aini
ng
Inte
grat
edLi
velih
ood/
Ka
buha
yan
Prog
ram
Pant
awid
Pas
ada
PHIL
IPPI
NES
0.5
0.6
0.1
0.2
0.2
0.1
NA
TIO
NA
L C
AP
ITA
L R
EG
ION
*
**
**
*C
OR
DIL
LER
A A
DM
INIS
TRA
TIV
E R
EG
ION
1.
2*
**
**
RE
GIO
N I
- ILO
CO
S*
**
**
*R
EG
ION
II -
CA
GA
YA
N V
ALL
EY
0.
6*
**
**
RE
GIO
N II
I - C
EN
TRA
L LU
ZON
*
**
**
*R
EG
ION
IV-A
- C
ALA
BA
RZO
N
**
**
**
MIM
AR
OP
A R
EG
ION
2.
5*
**
**
RE
GIO
N V
- B
ICO
L *
**
**
*R
EG
ION
VI -
WE
STE
RN
VIS
AY
AS
*
0.7
**
0.5
*R
EG
ION
VII
- CE
NTR
AL
VIS
AY
AS
0.
6*
**
**
RE
GIO
N V
III -
EA
STE
RN
VIS
AY
AS
*
**
**
*R
EG
ION
IX -
ZAM
BO
AN
GA
PE
NIN
SU
LA
**
**
**
RE
GIO
N X
- N
OR
THE
RN
MIN
DA
NA
O
1.3
1.4
**
**
RE
GIO
N X
I - D
AV
AO
*
1.7
**
**
RE
GIO
N X
II - S
OC
CS
KS
AR
GE
N
**
**
**
RE
GIO
N X
III -
CA
RA
GA
1.
12.
3*
**
*B
AN
GS
AM
OR
O A
UTO
NO
MO
US
R
EG
ION
IN M
US
LIM
MIN
DA
NA
O*
**
**
*
Resi
denc
eU
rban
0.2
0.4
0.1
0.2
0.1
0.2
Rur
al0.
70.
8*
0.3
0.3
0.1
Not
e: "
* "
An
aste
risk
indi
cate
s th
at a
figu
re is
bas
ed o
n fe
wer t
han
25 u
nwei
ghte
d ca
ses
and
has
been
sup
pres
sed.
Fa
mili
es m
ay h
ave
mem
bers
/ben
efic
iarie
s of
diff
eren
t soc
ial p
rote
ctio
n pr
ogra
ms.
Per
cent
ages
do
not a
dd u
p to
100
. S
ourc
e: P
hilip
pine
Sta
tistic
s A
utho
rity,
201
9Ann
ual P
over
ty In
dica
tors
Sur
vey
Regi
on/ R
esid
ence
Labo
r Mar
ket I
nter
vent
ion

Appendix A – Statistical Tables I Final Report
110 Philippine Statistics Authority | 2019 Annual Poverty Indicators Survey
Total Paying Member Non-paying member
PHILIPPINES 25,310 83.9 43.3 40.6NATIONAL CAPITAL REGION 3,385 85.9 69.5 16.4CORDILLERA ADMINISTRATIVE REGION 431 86.9 40.8 46.1REGION I - ILOCOS 1,232 84.4 37.9 46.5REGION II - CAGAYAN VALLEY 868 88.8 38.8 50.0REGION III - CENTRAL LUZON 2,853 84.1 47.8 36.3REGION IV-A - CALABARZON 3,876 82.7 61.6 21.1MIMAROPA REGION 754 86.9 24.7 62.2REGION V - BICOL 1,300 82.0 22.8 59.2REGION VI - WESTERN VISAYAS 1,870 86.9 32.4 54.5REGION VII - CENTRAL VISAYAS 1,883 82.6 40.2 42.4REGION VIII - EASTERN VISAYAS 1,083 82.4 25.2 57.2REGION IX - ZAMBOANGA PENINSULA 851 85.1 22.1 63.0REGION X - NORTHERN MINDANAO 1,144 87.7 31.2 56.5REGION XI - DAVAO 1,320 83.9 42.3 41.6REGION XII - SOCCSKSARGEN 1,156 84.7 35.8 48.9REGION XIII - CARAGA 634 91.7 26.7 65.0BANGSAMORO AUTONOMOUS REGION IN MUS 670 51.2 9.9 41.3
ResidenceUrban 13,041 84.3 56.8 27.5Rural 12,269 83.4 28.9 54.5
Source: Philippine Statistics Authority, 2019 Annual Poverty Indicators Survey
Philippines 2019
Number (in thousands) Percent
PHILIPPINES 21,230 1,470 6.9NATIONAL CAPITAL REGION 2,907 145 5.0CORDILLERA ADMINISTRATIVE REGION 374 29 7.9REGION I - ILOCOS 1,041 74 7.2REGION II - CAGAYAN VALLEY 771 50 6.5REGION III - CENTRAL LUZON 2,400 152 6.3REGION IV-A - CALABARZON 3,205 235 7.3MIMAROPA REGION 655 56 8.6REGION V - BICOL 1,066 74 6.9REGION VI - WESTERN VISAYAS 1,625 118 7.3REGION VII - CENTRAL VISAYAS 1,555 93 6.0REGION VIII - EASTERN VISAYAS 893 85 9.5REGION IX - ZAMBOANGA PENINSULA 724 47 6.5REGION X - NORTHERN MINDANAO 1,003 78 7.8REGION XI - DAVAO 1,108 66 6.0REGION XII - SOCCSKSARGEN 979 99 10.1REGION XIII - CARAGA 582 57 9.8BANGSAMORO AUTONOMOUS REGION IN MUS 343 10 2.8
Residence 21,230 1,470 6.9Urban 10,994 708 6.4Rural 10,235 762 7.4
Source: Philippine Statistics Authority, 2019 Annual Poverty Indicators Survey
Table 26. Families with Paying Members and Non-Paying Members of PhilHealth by Region and Residence, Philippines 2019
Region/ Residence Number of Families(Total, in thousands)
Families with PhilHealth
Table 27. Families with Members of PhilHealth Who Received Assistance by Region and Residence,
Region/ Residence
Number of Families with PhilHealth
Members (in thousands)
Families with Members of PhilHealth
who received assistance
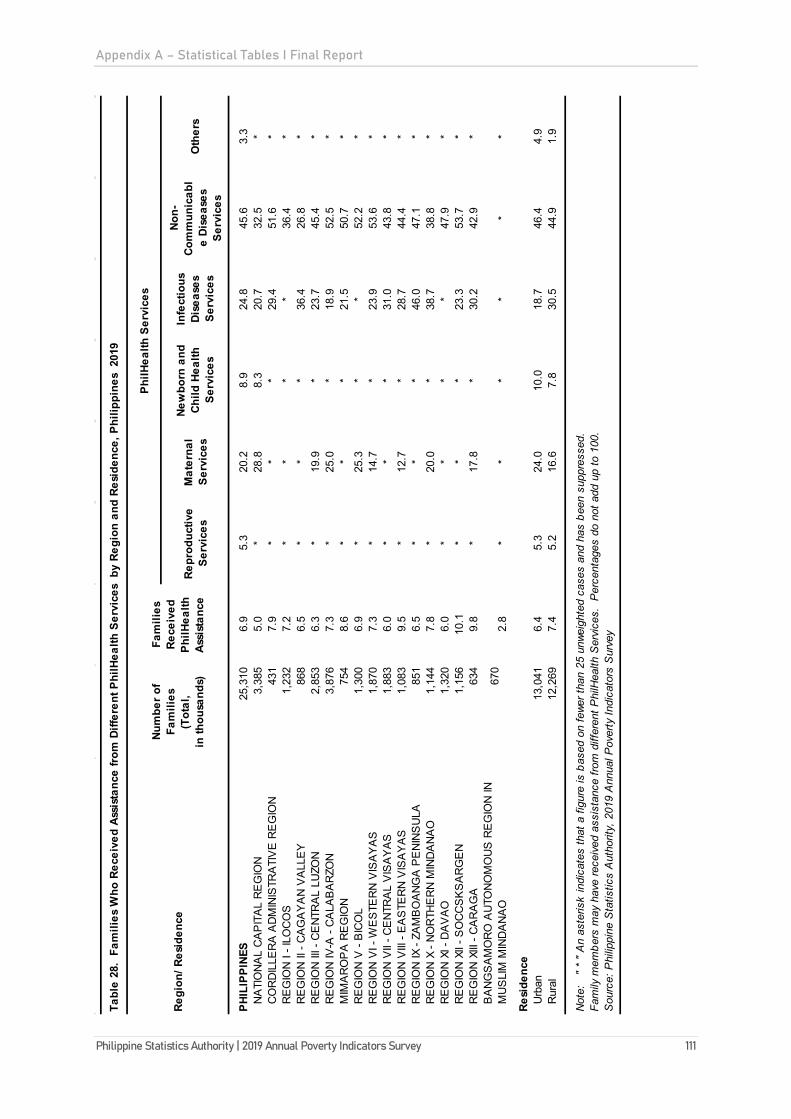
Appendix A – Statistical Tables I Final Report
Philippine Statistics Authority | 2019 Annual Poverty Indicators Survey 111
Tabl
e 28
. Fa
mili
es W
ho R
ecei
ved
Assi
stan
ce fr
om D
iffer
ent P
hilH
ealth
Ser
vice
s b
y Re
gion
and
Res
iden
ce, P
hilip
pine
s 2
019
Repr
oduc
tive
Serv
ices
Mat
erna
l Se
rvic
es
New
born
and
Ch
ild H
ealth
Se
rvic
es
Infe
ctio
us
Dise
ases
Se
rvic
es
Non-
Com
mun
icab
le
Dise
ases
Se
rvic
es
Oth
ers
PHIL
IPPI
NES
25,3
106.
95.
320
.28.
924
.845
.63.
3N
ATI
ON
AL
CA
PIT
AL
RE
GIO
N
3,38
55.
0*
28.8
8.3
20.7
32.5
*C
OR
DIL
LER
A A
DM
INIS
TRA
TIV
E R
EG
ION
43
17.
9*
**
29.4
51.6
*R
EG
ION
I - I
LOC
OS
1,23
27.
2*
**
*36
.4*
RE
GIO
N II
- C
AG
AY
AN
VA
LLE
Y
868
6.5
**
*36
.426
.8*
RE
GIO
N II
I - C
EN
TRA
L LU
ZON
2,
853
6.3
*19
.9*
23.7
45.4
*R
EG
ION
IV-A
- C
ALA
BA
RZO
N
3,87
67.
3*
25.0
*18
.952
.5*
MIM
AR
OP
A R
EG
ION
75
48.
6*
**
21.5
50.7
*R
EG
ION
V -
BIC
OL
1,30
06.
9*
25.3
**
52.2
*R
EG
ION
VI -
WE
STE
RN
VIS
AY
AS
1,
870
7.3
*14
.7*
23.9
53.6
*R
EG
ION
VII
- CE
NTR
AL
VIS
AY
AS
1,
883
6.0
**
*31
.043
.8*
RE
GIO
N V
III -
EA
STE
RN
VIS
AY
AS
1,
083
9.5
*12
.7*
28.7
44.4
*R
EG
ION
IX -
ZAM
BO
AN
GA
PE
NIN
SU
LA
851
6.5
**
*46
.047
.1*
RE
GIO
N X
- N
OR
THE
RN
MIN
DA
NA
O
1,14
47.
8*
20.0
*38
.738
.8*
RE
GIO
N X
I - D
AV
AO
1,
320
6.0
**
**
47.9
*R
EG
ION
XII
- SO
CC
SK
SA
RG
EN
1,
156
10.1
**
*23
.353
.7*
RE
GIO
N X
III -
CA
RA
GA
63
49.
8*
17.8
*30
.242
.9*
BA
NG
SA
MO
RO
AU
TON
OM
OU
S R
EG
ION
IN
MU
SLI
M M
IND
AN
AO
670
2.8
**
**
**
Resi
denc
eU
rban
13,0
416.
45.
324
.010
.018
.746
.44.
9R
ural
12,2
697.
45.
216
.67.
830
.544
.91.
9
Not
e:
" *
" A
n as
teris
k in
dica
tes
that
a fi
gure
is b
ased
on
fewe
r tha
n 25
unw
eigh
ted
case
s an
d ha
s be
en s
uppr
esse
d.
Fam
ily m
embe
rs m
ay h
ave
rece
ived
ass
ista
nce
from
diff
eren
t Phi
lHea
lth S
ervi
ces.
Per
cent
ages
do
not a
dd u
p to
100
. S
ourc
e: P
hilip
pine
Sta
tistic
s A
utho
rity,
201
9 A
nnua
l Pov
erty
Indi
cato
rs S
urve
y
Regi
on/ R
esid
ence
Num
ber o
f Fa
mili
es
(Tot
al,
in th
ousa
nds)
Fam
ilies
Re
ceiv
ed
PhilH
ealth
As
sist
ance
PhilH
ealth
Ser
vice
s
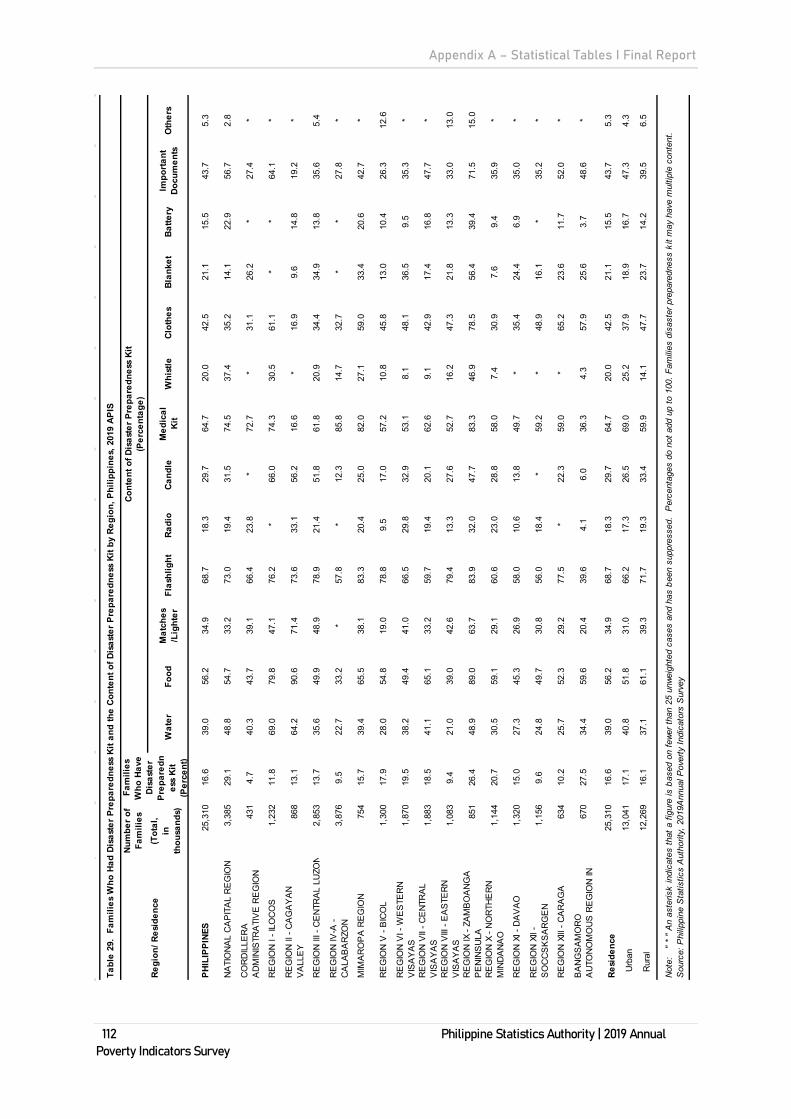
Appendix A – Statistical Tables I Final Report
112 Philippine Statistics Authority | 2019 Annual Poverty Indicators Survey
Tabl
e 29
. Fa
mili
es W
ho H
ad D
isas
ter P
repa
redn
ess
Kit a
nd th
e Co
nten
t of D
isas
ter P
repa
redn
ess
Kit b
y Re
gion
, Phi
lippi
nes,
201
9 AP
IS
Num
ber o
f Fa
mili
es
(Tot
al,
in
thou
sand
s)W
ater
Food
M
atch
es
/Lig
hter
Flas
hlig
htRa
dio
Cand
leM
edic
al
Kit
Whi
stle
Clot
hes
Blan
ket
Batte
ryIm
porta
nt
Docu
men
tsO
ther
s
PHIL
IPPI
NES
25,3
1016
.639
.056
.234
.968
.718
.329
.764
.720
.042
.521
.115
.543
.75.
3
NA
TIO
NA
L C
AP
ITA
L R
EG
ION
3,
385
29.1
48.8
54.7
33.2
73.0
19.4
31.5
74.5
37.4
35.2
14.1
22.9
56.7
2.8
CO
RD
ILLE
RA
A
DM
INIS
TRA
TIV
E R
EG
ION
43
14.
740
.343
.739
.166
.423
.8*
72.7
*31
.126
.2*
27.4
*
RE
GIO
N I
- ILO
CO
S1,
232
11.8
69.0
79.8
47.1
76.2
*66
.074
.330
.561
.1*
*64
.1*
RE
GIO
N II
- C
AG
AY
AN
V
ALL
EY
86
813
.164
.290
.671
.473
.633
.156
.216
.6*
16.9
9.6
14.8
19.2
*
RE
GIO
N II
I - C
EN
TRA
L LU
ZON
2,
853
13.7
35.6
49.9
48.9
78.9
21.4
51.8
61.8
20.9
34.4
34.9
13.8
35.6
5.4
RE
GIO
N IV
-A -
CA
LAB
AR
ZON
3,
876
9.5
22.7
33.2
*57
.8*
12.3
85.8
14.7
32.7
**
27.8
*
MIM
AR
OP
A R
EG
ION
75
415
.739
.465
.538
.183
.320
.425
.082
.027
.159
.033
.420
.642
.7*
RE
GIO
N V
- B
ICO
L 1,
300
17.9
28.0
54.8
19.0
78.8
9.5
17.0
57.2
10.8
45.8
13.0
10.4
26.3
12.6
RE
GIO
N V
I - W
ES
TER
N
VIS
AY
AS
1,
870
19.5
38.2
49.4
41.0
66.5
29.8
32.9
53.1
8.1
48.1
36.5
9.5
35.3
*
RE
GIO
N V
II - C
EN
TRA
L V
ISA
YA
S
1,88
318
.541
.165
.133
.259
.719
.420
.162
.69.
142
.917
.416
.847
.7*
RE
GIO
N V
III -
EA
STE
RN
V
ISA
YA
S
1,08
39.
421
.039
.042
.679
.413
.327
.652
.716
.247
.321
.813
.333
.013
.0
RE
GIO
N IX
- ZA
MB
OA
NG
A
PE
NIN
SU
LA
851
26.4
48.9
89.0
63.7
83.9
32.0
47.7
83.3
46.9
78.5
56.4
39.4
71.5
15.0
RE
GIO
N X
- N
OR
THE
RN
M
IND
AN
AO
1,
144
20.7
30.5
59.1
29.1
60.6
23.0
28.8
58.0
7.4
30.9
7.6
9.4
35.9
*
RE
GIO
N X
I - D
AV
AO
1,
320
15.0
27.3
45.3
26.9
58.0
10.6
13.8
49.7
*35
.424
.46.
935
.0*
RE
GIO
N X
II -
SO
CC
SK
SA
RG
EN
1,
156
9.6
24.8
49.7
30.8
56.0
18.4
*59
.2*
48.9
16.1
*35
.2*
RE
GIO
N X
III -
CA
RA
GA
63
410
.225
.752
.329
.277
.5*
22.3
59.0
*65
.223
.611
.752
.0*
BA
NG
SA
MO
RO
A
UTO
NO
MO
US
RE
GIO
N IN
67
027
.534
.459
.620
.439
.64.
16.
036
.34.
357
.925
.63.
748
.6*
Resi
denc
e25
,310
16.6
39.0
56.2
34.9
68.7
18.3
29.7
64.7
20.0
42.5
21.1
15.5
43.7
5.3
Urb
an13
,041
17.1
40.8
51.8
31.0
66.2
17.3
26.5
69.0
25.2
37.9
18.9
16.7
47.3
4.3
Rur
al12
,269
16.1
37.1
61.1
39.3
71.7
19.3
33.4
59.9
14.1
47.7
23.7
14.2
39.5
6.5
Not
e:
" *
" A
n as
teris
k in
dica
tes
that
a fi
gure
is b
ased
on
fewe
r tha
n 25
unw
eigh
ted
case
s an
d ha
s be
en s
uppr
esse
d. P
erce
ntag
es d
o no
t add
up
to 1
00. F
amili
es d
isas
ter p
repa
redn
ess
kit m
ay h
ave
mul
tiple
con
tent
. S
ourc
e: P
hilip
pine
Sta
tistic
s A
utho
rity,
201
9Ann
ual P
over
ty In
dica
tors
Sur
vey
Regi
on/ R
esid
ence
Fam
ilies
W
ho H
ave
Disa
ster
Pr
epar
edn
ess
Kit
(Per
cent
)
Cont
ent o
f Dis
aste
r Pre
pare
dnes
s Ki
t (P
erce
ntag
e)

Appendix A – Statistical Tables I Final Report
Philippine Statistics Authority | 2019 Annual Poverty Indicators Survey 113
Table 30. Families Who Availed of Loan From January to June 2019 by Region and Residence, Philippines 2019
Region/ ResidenceTotal Number of
Families (in thousands)
Number of FamiliesWho Availed Loan
(in thousands)
Percent of FamiliesWho Availed Loan
PHILIPPINES 25,310 6,972 27.5NATIONAL CAPITAL REGION 3,385 851 25.2CORDILLERA ADMINISTRATIVE REGION 431 69 16.0REGION I - ILOCOS 1,232 271 22.0REGION II - CAGAYAN VALLEY 868 331 38.1REGION III - CENTRAL LUZON 2,853 678 23.8REGION IV-A - CALABARZON 3,876 1,011 26.1MIMAROPA REGION 754 250 33.1REGION V - BICOL 1,300 520 40.0REGION VI - WESTERN VISAYAS 1,870 495 26.5REGION VII - CENTRAL VISAYAS 1,883 408 21.7REGION VIII - EASTERN VISAYAS 1,083 486 44.9REGION IX - ZAMBOANGA PENINSULA 851 215 25.3REGION X - NORTHERN MINDANAO 1,144 279 24.4REGION XI - DAVAO 1,320 318 24.1REGION XII - SOCCSKSARGEN 1,156 305 26.3REGION XIII - CARAGA 634 195 30.7BANGSAMORO AUTONOMOUS REGION IN MUSLIM MINDANAO
670 289 43.2
Residence 25,310 6,972 27.5Urban 13,041 3,349 25.7Rural 12,269 3,623 29.5
Source: Philippine Statistics Authority, 2019 Annual Poverty Indicators Survey

Appendix A – Statistical Tables I Final Report
114 Philippine Statistics Authority | 2019 Annual Poverty Indicators Survey
Tabl
e 31
. Fam
ilies
Who
Ava
iled
of L
oan
From
Jan
uary
to J
une
2019
by
Sour
ce o
f Loa
n an
d Re
gion
and
Res
iden
ce, P
hilip
pine
s 20
19
GSI
SSS
SPa
g-ib
igM
icro
finan
ce
Inst
itutio
nRe
lativ
e/
Frie
ndCr
edit
Unio
nBa
nkIn
form
al
Lend
erPa
wns
hop
Oth
ers
PHIL
IPPI
NES
25,3
104.
45.
02.
938
.838
.44.
04.
114
.91.
24.
0N
ATI
ON
AL
CA
PIT
AL
RE
GIO
N
3,38
5*
8.5
2.2
14.3
60.8
1.7
1.6
36.7
*4.
3C
OR
DIL
LER
A A
DM
INIS
TRA
TIV
E R
EG
IO
431
7.7
**
32.3
24.1
11.5
**
*16
.3R
EG
ION
I - I
LOC
OS
1,23
2*
**
41.7
34.1
**
8.0
**
RE
GIO
N II
- C
AG
AY
AN
VA
LLE
Y
868
5.8
**
22.8
37.1
7.5
5.8
16.3
*14
.9R
EG
ION
III -
CE
NTR
AL
LUZO
N
2,85
3*
4.3
*23
.148
.73.
84.
325
.5*
*R
EG
ION
IV-A
- C
ALA
BA
RZO
N
3,87
64.
56.
4*
44.0
30.9
6.4
4.5
11.3
**
MIM
AR
OP
A R
EG
ION
75
44.
0*
*74
.214
.9*
*4.
2*
*R
EG
ION
V -
BIC
OL
1,30
03.
9*
*53
.835
.7*
6.6
8.1
*7.
7R
EG
ION
VI -
WE
STE
RN
VIS
AY
AS
1,
870
5.3
5.2
5.9
56.5
30.9
3.7
4.6
11.0
**
RE
GIO
N V
II - C
EN
TRA
L V
ISA
YA
S
1,88
37.
34.
9*
54.5
9.5
**
8.5
*13
.8R
EG
ION
VIII
- E
AS
TER
N V
ISA
YA
S
1,08
35.
0*
*51
.338
.76.
03.
110
.6*
3.2
RE
GIO
N IX
- ZA
MB
OA
NG
A P
EN
INS
ULA
85
18.
3*
*48
.830
.3*
*13
.1*
*R
EG
ION
X -
NO
RTH
ER
N M
IND
AN
AO
1,
144
8.5
5.9
4.7
34.0
37.4
4.5
4.4
12.6
**
RE
GIO
N X
I - D
AV
AO
1,
320
*9.
56.
046
.526
.0*
6.6
12.4
**
RE
GIO
N X
II - S
OC
CS
KS
AR
GE
N
1,15
6*
8.0
*31
.344
.8*
*11
.6*
*R
EG
ION
XIII
- C
AR
AG
A
634
4.6
5.6
*56
.622
.211
.17.
113
.5*
*B
AN
GS
AM
OR
O A
UTO
NO
MO
US
R
EG
ION
IN M
US
LIM
MIN
DA
NA
O67
0*
**
*86
.7*
**
19.4
*
Resi
denc
eU
rban
13,0
414.
27.
14.
231
.341
.93.
94.
020
.91.
02.
8R
ural
12,2
694.
53.
21.
745
.835
.24.
14.
39.
41.
45.
0
Not
e: "
* "
An
aste
risk
indi
cate
s th
at a
figu
re is
bas
ed o
n fe
wer t
han
25 u
nwei
ghte
d ca
ses
and
has
been
sup
pres
sed.
Per
cent
ages
do
not a
dd u
p to
100
. A
fam
ily c
an a
vail
loan
from
mor
e th
an o
ne s
ourc
e.
Sou
rce:
Phi
lippi
ne S
tatis
tics
Aut
horit
y, 2
019
Ann
ual P
over
ty In
dica
tors
Sur
vey
Regi
on/ R
esid
ence
Tota
l Num
ber
of F
amili
es
(in th
ousa
nds)
Sour
ce o
f Loa
n (P
erce
ntag
e)

Appendix A – Statistical Tables I Final Report
Philippine Statistics Authority | 2019 Annual Poverty Indicators Survey 115
Tabl
e 32
. Fam
ilies
Who
Use
d In
tern
et a
nd M
ade
Onl
ine
Tran
sact
ions
in th
e La
st 6
Mon
ths
by R
egio
n an
d Re
side
nce,
Phi
lippi
nes
2019
Selli
ngBu
ying
Ban
king
Stud
ying
Sh
ort
Cour
ses
Oth
ers
PHIL
IPPI
NES
25,3
1041
.26.
732
.69.
02.
92.
7N
ATI
ON
AL
CA
PIT
AL
RE
GIO
N
3,38
570
.88.
444
.718
.61.
81.
1C
OR
DIL
LER
A A
DM
INIS
TRA
TIV
E R
EG
ION
43
123
.08.
126
.5*
*16
.4R
EG
ION
I - I
LOC
OS
1,23
240
.0*
28.8
3.9
**
RE
GIO
N II
- C
AG
AY
AN
VA
LLE
Y
868
12.9
*39
.09.
4*
*R
EG
ION
III -
CE
NTR
AL
LUZO
N
2,85
338
.46.
735
.94.
9*
*R
EG
ION
IV-A
- C
ALA
BA
RZO
N
3,87
651
.86.
633
.78.
5*
*M
IMA
RO
PA
RE
GIO
N
754
31.2
7.3
22.7
5.7
4.2
*R
EG
ION
V -
BIC
OL
1,30
035
.44.
215
.63.
64.
0*
RE
GIO
N V
I - W
ES
TER
N V
ISA
YA
S
1,87
038
.29.
424
.24.
34.
0*
RE
GIO
N V
II - C
EN
TRA
L V
ISA
YA
S
1,88
338
.45.
933
.36.
3*
8.8
RE
GIO
N V
III -
EA
STE
RN
VIS
AY
AS
1,
083
40.2
5.7
23.9
4.4
5.4
*R
EG
ION
IX -
ZAM
BO
AN
GA
PE
NIN
SU
LA
851
15.7
*45
.1*
17.5
*R
EG
ION
X -
NO
RTH
ER
N M
IND
AN
AO
1,
144
29.6
8.0
25.2
5.0
10.3
*R
EG
ION
XI -
DA
VA
O
1,32
024
.8*
20.6
8.5
**
RE
GIO
N X
II - S
OC
CS
KS
AR
GE
N
1,15
639
.36.
023
.78.
6*
23.4
RE
GIO
N X
III -
CA
RA
GA
63
436
.9*
22.3
4.8
11.7
*B
AN
GS
AM
OR
O A
UTO
NO
MO
US
RE
GIO
N IN
M
US
LIM
MIN
DA
NA
O67
023
.7*
18.4
**
*
Resi
denc
eU
rban
13,0
4152
.28.
037
.711
.12.
52.
4R
ural
12,2
6929
.44.
323
.15.
23.
63.
3
Not
e: "
* "
An
aste
risk
indi
cate
s th
at a
figu
re is
bas
ed o
n fe
wer t
han
25 u
nwei
ghte
d ca
ses
and
has
been
sup
pres
sed.
P
erce
ntag
es d
o no
t add
up
to 1
00. A
fam
ily c
an m
ake
mor
e th
an o
ne o
nlin
e tra
nsac
tions
. S
ourc
e: P
hilip
pine
Sta
tistic
s A
utho
rity,
201
9 A
nnua
l Pov
erty
Indi
cato
rs S
urve
y
Regi
on/ R
esid
ence
Tota
l Num
ber
of F
amili
es
(in th
ousa
nds)
Fam
ilies
who
us
ed In
tern
et in
th
e la
st 6
m
onth
s (P
erce
nt)
Onl
ine
Tran
sact
ions
(Per
cent
age)

Appendix A – Statistical Tables I Final Report
116 Philippine Statistics Authority | 2019 Annual Poverty Indicators Survey
Tota
lSa
feSo
mew
hat
Safe
Som
ewha
t Un
safe
Unsa
feAf
raid
to b
e Al
one
Don'
t Kno
w
PHIL
IPPI
NES
25,3
1010
082
.912
.12.
61.
60.
50.
3N
ATI
ON
AL
CA
PIT
AL
RE
GIO
N
3,38
510
071
.623
.83.
11.
1*
*C
OR
DIL
LER
A A
DM
INIS
TRA
TIV
E R
EG
IO
431
100
86.4
12.3
**
**
RE
GIO
N I
- ILO
CO
S1,
232
100
96.2
1.9
**
**
RE
GIO
N II
- C
AG
AY
AN
VA
LLE
Y
868
100
95.5
2.3
**
**
RE
GIO
N II
I - C
EN
TRA
L LU
ZON
2,
853
100
84.0
11.1
2.4
1.9
*0.
4R
EG
ION
IV-A
- C
ALA
BA
RZO
N
3,87
610
081
.910
.74.
71.
6*
*M
IMA
RO
PA
RE
GIO
N
754
100
91.3
3.9
1.7
1.8
**
RE
GIO
N V
- B
ICO
L 1,
300
100
82.0
12.5
2.8
*2.
0*
RE
GIO
N V
I - W
ES
TER
N V
ISA
YA
S
1,87
010
088
.99.
7*
**
*R
EG
ION
VII
- CE
NTR
AL
VIS
AY
AS
1,
883
100
82.3
7.7
3.0
6.2
**
RE
GIO
N V
III -
EA
STE
RN
VIS
AY
AS
1,
083
100
87.6
9.6
1.8
**
*R
EG
ION
IX -
ZAM
BO
AN
GA
PE
NIN
SU
LA
851
100
78.3
18.6
1.8
**
*R
EG
ION
X -
NO
RTH
ER
N M
IND
AN
AO
1,
144
100
81.2
13.5
2.1
2.7
**
RE
GIO
N X
I - D
AV
AO
1,
320
100
87.6
10.2
**
**
RE
GIO
N X
II - S
OC
CS
KS
AR
GE
N
1,15
610
072
.019
.84.
73.
0*
*R
EG
ION
XIII
- C
AR
AG
A
634
100
91.3
6.5
*1.
1*
*B
AN
GS
AM
OR
O A
UTO
NO
MO
US
R
EG
ION
IN M
US
LIM
MIN
DA
NA
O67
010
079
.015
.43.
7*
**
Resi
denc
eU
rban
13,0
4110
077
.616
.83.
31.
70.
20.
3R
ural
12,2
6910
088
.57.
21.
71.
50.
70.
3
Not
e: "
* "
An
aste
risk
indi
cate
s th
at a
figu
re is
bas
ed o
n fe
wer t
han
25 u
nwei
ghte
d ca
ses
and
has
been
sup
pres
sed.
Sou
rce:
Phi
lippi
ne S
tatis
tics
Aut
horit
y, 2
019
Ann
ual P
over
ty In
dica
tors
Sur
vey
Regi
on/ R
esid
ence
Tota
l Num
ber
of F
amili
es
(in th
ousa
nds)
How
Saf
e Do
You
Fee
l Wal
king
Alo
ne in
the
Com
mun
ity a
t Nig
ht
Tabl
e 33
. Res
pond
ents
' Per
cept
ion
on H
ow S
afe
Wal
king
Alo
ne in
the
Com
mun
ity a
t Nig
ht, R
egio
n an
d Re
side
nce,
Phi
lippi
nes
2019

Appendix B – Questionnaire
Philippine Statistics Authority | 2019 Annual Poverty Indicators Survey 117
Appendix B - Questionnaire
APIS FORM 1PSA Approval No.: PSA - 1929Expires: 31 May 2020
CONFIDENTIALITY: Sir/Madam:
Very truly yours,
CLAIRE DENNIS S. MAPA, Ph.D.UndersecretaryNational Statistician and Civil Registrar General
GEOGRAPHIC IDENTIFICATION CODES RECORD OF INDIVIDUAL VISIT
REGIONTime:
PROVINCEMUN/CITY
EndedBARANGAYEA . . . . . . . . . . . . . . . . . . . . . . . . . . . . . . . . . . Date:HUSN . . . . . . . . . . . . . . . . . . . . . . . . . . . . . . . . . . . . . . Result:HSN . . . . . . . . . . . . . . . . . . . . . . . . . . . . . . . . . . . . . . . .
Name of Household Head:
Name and Line No of Respondent:Result . . . . . . . . . . . . . . . . . . . . . . . . . . . . . . . . . . . . .
LINE NO. Address:
Number of Visits . . . . . . . . . . . . . . . . . . . . . . . . . . . . .
Number of Household/s in the Housing Unit . . . . . . . . . . . . . . . . .
Total Number of Family Members. . . . . . . . . . . . . . . . . . . . . . . . .
RESULT CODES
1 - Completed Interview 6 - Address Not a Housing Unit2 - Refusal 7 - Housing Unit Not Found3 - Entire Household Absent for Extended Period of T ime 8 - Critical Area, Flooded Area4 - Vacant Housing Unit 9 - Others, specify 5 - Housing Unit Destroyed/Demolished
CERTIFICATION
I hereby certify that the data gathered in this questionnaire were obtained/reviewed by me personally and in accordance with the instructions stated in the Interviewer's Manual.
REPUBLIC OF THE PHILIPPINESPHILIPPINE STATISTICS AUTHORITY
3
CODE FOR FINAL VISIT
Visit 1 2
Began
2019 ANNUAL POVERTY INDICATORS SURVEY
JULY 2019
Signature Over Printed Name of Interviewer Signature Over Printed Name of Reviewer
Date Accomplished Date Reviewed
HOUSEHOLD QUESTIONNAIRE
GEOGRAPHIC IDENTIFICATION AND OTHER INFORMATION
Booklet ____ of ____ Booklets
Section 26 of RA 10625 , stipulates that individual data furnished by a respondent to statistical inquiries, surveys and censuses of the PSA shall be considered privileged communication and such shall be inadmissible as evidence in any proceeding.
Likewise, Section 27 of RA No. 10625 states that a person, including parties within the PSA Board and the PSA, who breach the confidentiality of information, whether by carelessness, improper behavior, behavior with malicious intent, and use of confidential information for profit are considered guilty of an offense and shall be liable to a fine of five thousand pesos (P5,000.00) to not more than ten thousand pesos (P10,000.00) and/or imprisonment of three months but not to exceed one year, subject to the degree of breach of information.
The Philippine Statistics Authority is undertaking the Annual Poverty Indicators Survey for the purpose of gathering data on non-income indicators related to poverty. Your household is one of the 45,000 sample households selected nationwide. The information gathered in this survey would assist our policy makers and program managers in evaluating and designing strageties for improving services and assistance to alleviate poverty, effective planning and policy-decision making.
Please be assured that the data you supply will be STRICTLY CONFIDENTIAL and your report cannot be used for any purposes. Investigation or law enforcement procedure, nor will it be published except in the form of statistical summaries in which no reference to any individual person shall appear.
Your cooperation is earnestly solicited.
A
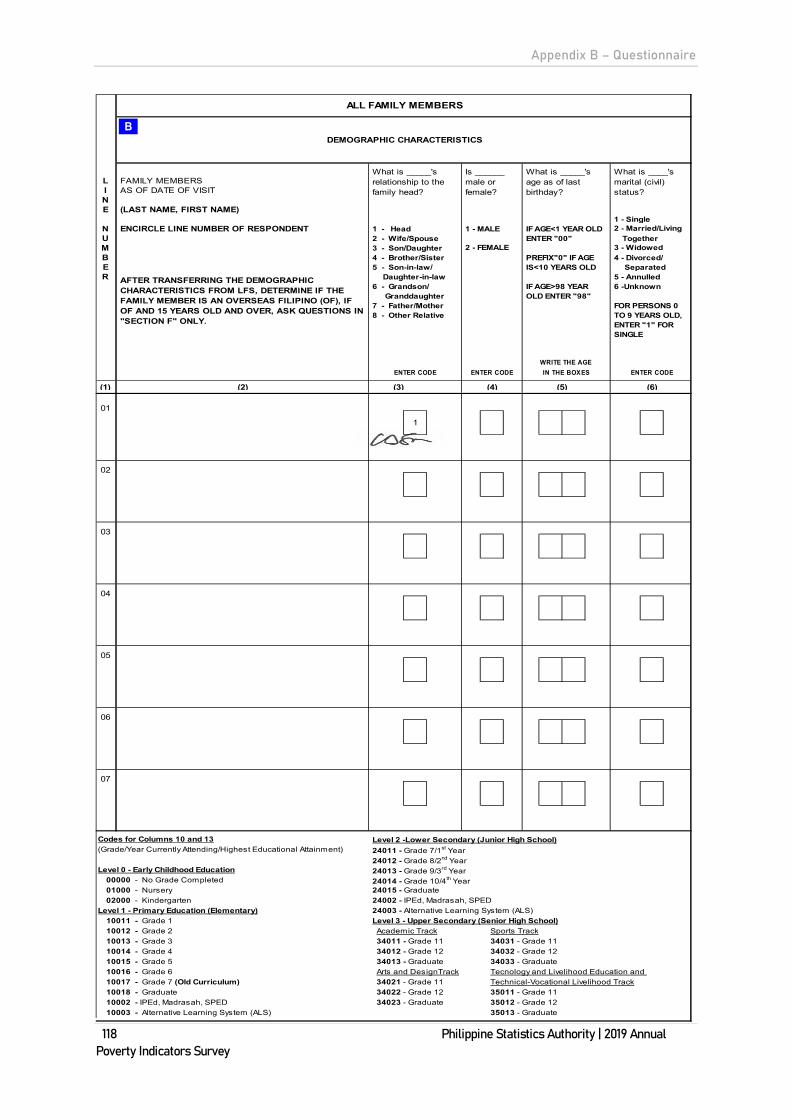
Appendix B – Questionnaire
118 Philippine Statistics Authority | 2019 Annual Poverty Indicators Survey
L FAMILY MEMBERSI AS OF DATE OF VISITNE (LAST NAME, FIRST NAME)
N ENCIRCLE LINE NUMBER OF RESPONDENT 1 - Head 1 - MALEU 2 - Wife/Spouse TogetherM 3 - Son/DaughterB 4 - Brother/Sister 4 - Divorced/E 5 - Son-in-law/ SeparatedR Daughter-in-law 5 - Annulled
6 - Grandson/ 6 -Unknown Granddaughter7 - Father/Mother8 - Other Relative
ENTER CODE
(1) (2) (4)
Codes for Columns 10 and 13 Level 2 -Lower Secondary (Junior High School)(Grade/Year Currently Attending/Highest Educational Attainment) 24011 - Grade 7/1st Year
24012 - Grade 8/2nd YearLevel 0 - Early Childhood Education 24013 - Grade 9/3rd Year
00000 - No Grade Completed 24014 - Grade 10/4th Year01000 - Nursery 24015 - Graduate02000 - Kindergarten 24002 - IPEd, Madrasah, SPED
Level 1 - Primary Education (Elementary) 24003 - Alternative Learning System (ALS)10011 - Grade 1 Level 3 - Upper Secondary (Senior High School)10012 - Grade 2 Academic Track Sports Track10013 - Grade 3 34011 - Grade 11 34031 - Grade 1110014 - Grade 4 34012 - Grade 12 34032 - Grade 12 10015 - Grade 5 34013 - Graduate 34033 - Graduate10016 - Grade 6 Arts and DesignTrack Tecnology and Livelihood Education and 10017 - Grade 7 (Old Curriculum) 34021 - Grade 11 Technical-Vocational Livelihood Track10018 - Graduate 34022 - Grade 12 35011 - Grade 1110002 - IPEd, Madrasah, SPED 34023 - Graduate 35012 - Grade 12 10003 - Alternative Learning System (ALS) 35013 - Graduate
07
06
05
04
03
02
01
(3) (5) (6)
1
What is ____'s marital (civil) status?
2 - FEMALE
IF AGE>98 YEAR OLD ENTER "98"
WRITE THE AGE IN THE BOXESENTER CODE ENTER CODE
ALL FAMILY MEMBERS
DEMOGRAPHIC CHARACTERISTICS
FOR PERSONS 0 TO 9 YEARS OLD, ENTER "1" FOR SINGLE
1 - SingleIF AGE<1 YEAR OLD ENTER "00"
2 - Married/Living
3 - WidowedPREFIX"0" IF AGE IS<10 YEARS OLD
What is _____'s relationship to the family head?
Is ______ male or female?
What is _____'s age as of last birthday?
AFTER TRANSFERRING THE DEMOGRAPHIC CHARACTERISTICS FROM LFS, DETERMINE IF THE FAMILY MEMBER IS AN OVERSEAS FILIPINO (OF), IF OF AND 15 YEARS OLD AND OVER, ASK QUESTIONS IN "SECTION F" ONLY.
B

Appendix B – Questionnaire
Philippine Statistics Authority | 2019 Annual Poverty Indicators Survey 119
Did ________ Is ______ What grade or year Why is ____ What is the highest Did ____ What is ENCIRCLE currently is _______ not attending ENCIRCLE educational attainment _______LINE NO. attending currently school? LINE NO. completed by ___? class of OF ALL school? attending? OF ALL worker?FAMILY FAMILYMEMBERS MEMBERS 3-24 1 - YES, 1 - YES, SEE CODES SEE CODES 5 YRS SEE CODES SEE CODESYRS PUBLIC FOR COLUMN 10 FOR COLUMN 11 OLD AND FOR COLUMN 13OLD BELOW BELOW OVER BELOW BELOW
2 - YES, 2 - YES,PRIVATE PRIVATEINSTITUTION
3 - YES,3 - NO 1 - YES
2 - NO, 4 - NO, GO TO
GO TO COL. 16COL.11
ENTER CODE CODE
(7) (12)
Level 4-Post-Secondary Non-Tertiary Education Level 7-Master Level Education or Equivalent Codes for Column 1540001 -1st Year 70010 - Undergraduate (Class of Worker)40002 -2nd Year IF Graduate, Specify Program 0 - Worked for private household40003 -3rd Year 1 - Worked for private establishmentIF Graduate, Specify Program Level 8- Doctoral Level Education or Equivalent 2 - Worked for government/government corporation
Level 5-Short CycleTertiary Education 80010 - Undergraduate 3 - Self-employed without any paid employee50001 -1st Year IF Graduate, Specify Program 4 - Employer in own family-operated farm or business50002 -2nd Year 5 - Worked with pay in own family-operated farm or business50003 -3rd Year Codes for Column 11 6 - Worked without pay in own family-operated farm or businessIF Graduate, Specify Program (Reason for not attending school)
Level 6-Bachelor Level Education or Equivalent 01 - Accessibility of school60001 - 1st Year 02 - Illness/disability Codes for Column 11 (continuation)60002 - 2nd Year 03 - Marriage/Family matters (Reason for not attending school)60003 - 3rd Year 04 - High cost of education/Financial concern 08 - Lack of personal interest 60004 - 4th Year 05 - Employment 09 - Problem with school record/birth certificate60005 - 5th Year 06 - Finished schooling or 10 - Too young to go to school60006 - 6th Year finished post secondary or college 11 - Others, specify _______IF Graduate, Specify Program 07 - Looking for Work
07 07
SPECIFYSPECIFYGO TO COL. 12
SPECIFY
SPECIFY
06 06
GO TO COL. 12
GO TO COL. 12
SPECIFY
SPECIFY
SPECIFYGO TO COL. 12
05 05
04 04
SPECIFY
SPECIFY
SPECIFY
03 03
SPECIFY
SPECIFYGO TO COL. 12
GO TO COL. 12
SPECIFY
02 02
SPECIFY
01 01
GO TO COL. 12
(13) (14) (15)(11)(8) (9) (10)
work or have job or business at anytime from January to June 2019?
ENTERENTER CODE ENTER CODE ENTER CODE
HOME-SCHOOLED
3 - 24 YEARS OLD
JOB OR BUSINESS
CLASS OF WORKER
attend a pre-primary/ nursery school/center?
LGU/PUBLIC
SCHOOL ATTENDANCE HIGHEST GRADE COMPLETED
ECONOMIC CHARACTERISTICS
5 YEARS OLD AND OVER
ENTER CODE ENTER CODE
C1 DC2

Appendix B – Questionnaire
120 Philippine Statistics Authority | 2019 Annual Poverty Indicators Survey
HEALTH STATUS
Was ____ Did_________ Did__________ENCIRCLE ENCIRCLELINE NO. LINE NO. OF ALL OF ALLFAMILY FAMILYMEMBERS MEMBERS 15 YRS 15 - 24OLD AND YRS OLDOVER
1 - YES, WITHYES, ONCE ADDITIONAL
2- YES, TWICE FEES3- YES, THRICE A - YES, Free Tuition 4- YES, MORE 1 - YES 2 - YES,
THAN 3 B - YES, TES5- NO, GO 2 - NO, C - YES, Student Loan
TO COL. 19 GO TO D - NO, GO TO NEXT MEMBER, COL. 19 1 - YES OR GO TO SECTION H
2 - NO 3 - NO
ENTER CODE ENTER CODE
(17) (19) (21) (22) (23)
06
07 07
06
04 04
03
05 05
03
02 02
01 01
(16) (18) (20)
1-
In the past 12 months did _____ have an account at a bank or another type of financial institution or with a mobile-money-service provider?
How many days was ____ not able to go to work or school, or perform daily activities because of illness/sickness/injury?
ILLNESS/INJURY
15 YEARS OLD AND OVER
ill/sick/injured or with injury during the past month?
IF YES, Ask how many times did __ get ill/sick/injured during the past month.
Was____'s illness/sickness/injury been a reason for his/her absence from work or school or for not being able to perform daily activities in the past month?
An account can be used to save money, to make or receive payments, or to receive wages or financial help.
avail of the voucher program for Senior High School (SHS) anytime during Academic Year
2016 to present?
MULTIPLE RESPONSE
ENTER CODE
15 - 24 YEARS OLD
FINANCIAL EDUCATIONAL ASSISTANCE
SHS VOUCHER PROGRAM
FREE TUITION TERTIARY EDUCATION SUBSIDY (TES)/STUDENT LOAN
FINANCIAL ACCOUNT
receive/avail of the free tuition/Tertiary Education Subsidy (TES)/student loan under the Universal Access to Quality Tertiary Education (UAQTE) at anytime during Academic Year 2017 to present?
ENTER CODEOF DAY/S ENTER CODEENTER NO.
(SUC/LUC)WITHOUT ADDITIONAL FEES
ALL AGES 5 YEARS OLD AND OVER
GE F
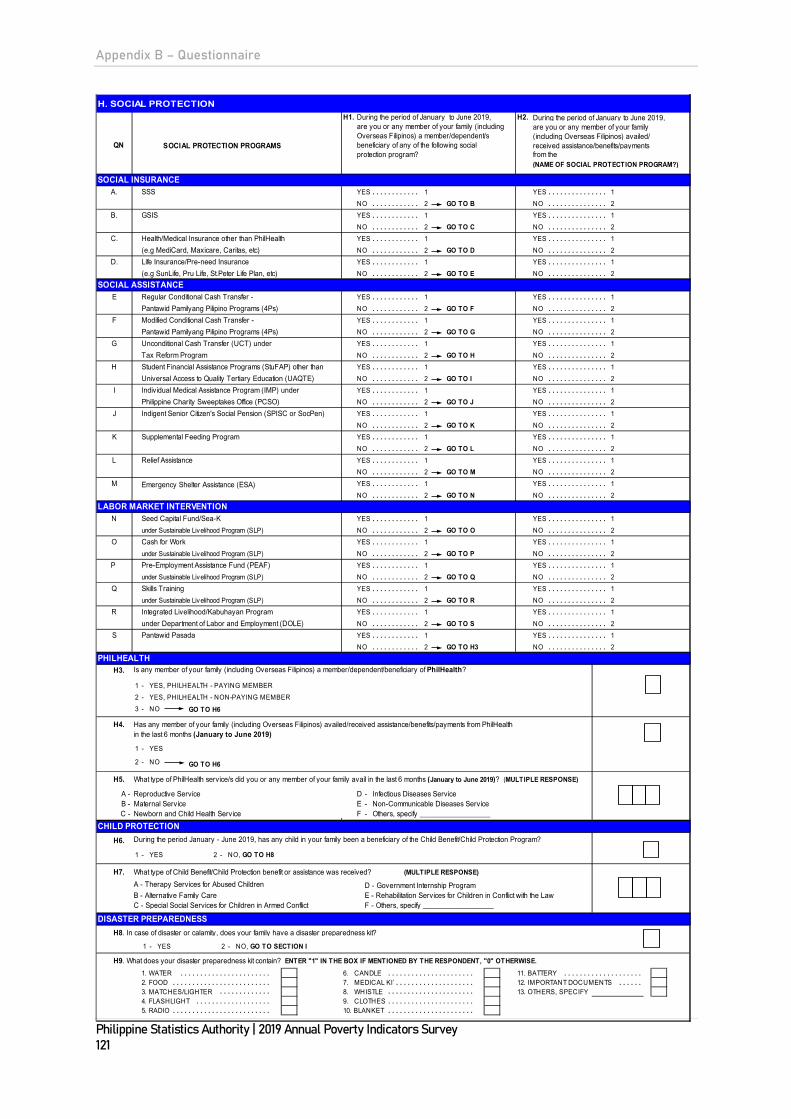
Appendix B – Questionnaire
Philippine Statistics Authority | 2019 Annual Poverty Indicators Survey 121
H1. During the period of January to June 2019, H2. During the period of January to June 2019, are you or any member of your family (including are you or any member of your familyOverseas Filipinos) a member/dependent/s (including Overseas Filipinos) availed/
QN beneficiary of any of the following social received assistance/benefits/payments protection program? from the
(NAME OF SOCIAL PROTECTION PROGRAM?)
SSS YES . . . . . . . . . . . . 1 YES . . . . . . . . . . . . . . . 1NO . . . . . . . . . . . . 2 GO TO B NO . . . . . . . . . . . . . . . 2
GSIS YES . . . . . . . . . . . . 1 YES . . . . . . . . . . . . . . . 1NO . . . . . . . . . . . . 2 GO TO C NO . . . . . . . . . . . . . . . 2
Health/Medical Insurance other than PhilHealth YES . . . . . . . . . . . . 1 YES . . . . . . . . . . . . . . . 1(e.g MediCard, Maxicare, Caritas, etc) NO . . . . . . . . . . . . 2 GO TO D NO . . . . . . . . . . . . . . . 2Life Insurance/Pre-need Insurance YES . . . . . . . . . . . . 1 YES . . . . . . . . . . . . . . . 1(e.g SunLife, Pru Life, St.Peter Life Plan, etc) NO . . . . . . . . . . . . 2 GO TO E NO . . . . . . . . . . . . . . . 2
Regular Conditional Cash Transfer - YES . . . . . . . . . . . . 1 YES . . . . . . . . . . . . . . . 1Pantawid Pamilyang Pilipino Programs (4Ps) NO . . . . . . . . . . . . 2 GO TO F NO . . . . . . . . . . . . . . . 2Modified Conditional Cash Transfer - YES . . . . . . . . . . . . 1 YES . . . . . . . . . . . . . . . 1Pantawid Pamilyang Pilipino Programs (4Ps) NO . . . . . . . . . . . . 2 GO TO G NO . . . . . . . . . . . . . . . 2Unconditional Cash Transfer (UCT) under YES . . . . . . . . . . . . 1 YES . . . . . . . . . . . . . . . 1Tax Reform Program NO . . . . . . . . . . . . 2 GO TO H NO . . . . . . . . . . . . . . . 2Student Financial Assistance Programs (StuFAP) other than YES . . . . . . . . . . . . 1 YES . . . . . . . . . . . . . . . 1Universal Access to Quality Tertiary Education (UAQTE) NO . . . . . . . . . . . . 2 GO TO I NO . . . . . . . . . . . . . . . 2Individual Medical Assistance Program (IMP) under YES . . . . . . . . . . . . 1 YES . . . . . . . . . . . . . . . 1Philippine Charity Sweeptakes Office (PCSO) NO . . . . . . . . . . . . 2 GO TO J NO . . . . . . . . . . . . . . . 2Indigent Senior Citizen's Social Pension (SPISC or SocPen) YES . . . . . . . . . . . . 1 YES . . . . . . . . . . . . . . . 1
NO . . . . . . . . . . . . 2 GO TO K NO . . . . . . . . . . . . . . . 2Supplemental Feeding Program YES . . . . . . . . . . . . 1 YES . . . . . . . . . . . . . . . 1
NO . . . . . . . . . . . . 2 GO TO L NO . . . . . . . . . . . . . . . 2Relief Assistance YES . . . . . . . . . . . . 1 YES . . . . . . . . . . . . . . . 1
NO . . . . . . . . . . . . 2 GO TO M NO . . . . . . . . . . . . . . . 2
Emergency Shelter Assistance (ESA) YES . . . . . . . . . . . . 1 YES . . . . . . . . . . . . . . . 1NO . . . . . . . . . . . . 2 GO TO N NO . . . . . . . . . . . . . . . 2
Seed Capital Fund/Sea-K YES . . . . . . . . . . . . 1 YES . . . . . . . . . . . . . . . 1under Sustainable Livelihood Program (SLP) NO . . . . . . . . . . . . 2 GO TO O NO . . . . . . . . . . . . . . . 2Cash for Work YES . . . . . . . . . . . . 1 YES . . . . . . . . . . . . . . . 1under Sustainable Livelihood Program (SLP) NO . . . . . . . . . . . . 2 GO TO P NO . . . . . . . . . . . . . . . 2Pre-Employment Assistance Fund (PEAF) YES . . . . . . . . . . . . 1 YES . . . . . . . . . . . . . . . 1under Sustainable Livelihood Program (SLP) NO . . . . . . . . . . . . 2 GO TO Q NO . . . . . . . . . . . . . . . 2Skills Training YES . . . . . . . . . . . . 1 YES . . . . . . . . . . . . . . . 1under Sustainable Livelihood Program (SLP) NO . . . . . . . . . . . . 2 GO TO R NO . . . . . . . . . . . . . . . 2Integrated Livelihood/Kabuhayan Program YES . . . . . . . . . . . . 1 YES . . . . . . . . . . . . . . . 1under Department of Labor and Employment (DOLE) NO . . . . . . . . . . . . 2 GO TO S NO . . . . . . . . . . . . . . . 2Pantawid Pasada YES . . . . . . . . . . . . 1 YES . . . . . . . . . . . . . . . 1
NO . . . . . . . . . . . . 2 GO TO H3 NO . . . . . . . . . . . . . . . 2
H3. Is any member of your family (including Overseas Filipinos) a member/dependent/beneficiary of PhilHealth?
1 - YES, PHILHEALTH - PAYING MEMBER2 - YES, PHILHEALTH - NON-PAYING MEMBER3 - NO GO TO H6
H4.
1 - YES
2 - NO GO TO H6
H5. What type of PhilHealth service/s did you or any member of your family avail in the last 6 months (January to June 2019)? (MULTIPLE RESPONSE)
A - Reproductive Service D - Infectious Diseases ServiceB - Maternal Service E - Non-Communicable Diseases ServiceC - Newborn and Child Health Service F - Others, specify __________________
H6. During the period January - June 2019, has any child in your family been a beneficiary of the Child Benefit/Child Protection Program?
1 - YES 2 - NO, GO TO H8
H7. What type of Child Benefit/Child Protection benefit or assistance was received? (MULTIPLE RESPONSE)A - Therapy Services for Abused Children D - Government Internship ProgramB - Alternative Family Care E - Rehabilitation Services for Children in Conflict with the LawC - Special Social Services for Children in Armed Conflict F - Others, specify __________________
H8. In case of disaster or calamity, does your family have a disaster preparedness kit?
1 - YES 2 - NO, GO TO SECTION I
H9. What does your disaster preparedness kit contain? ENTER "1" IN THE BOX IF MENTIONED BY THE RESPONDENT, "0" OTHERWISE.1. WATER . . . . . . . . . . . . . . . . . . . . . . . 6. CANDLE . . . . . . . . . . . . . . . . . . . . . . 11. BATTERY . . . . . . . . . . . . . . . . . . . . 2. FOOD . . . . . . . . . . . . . . . . . . . . . . . . . 7. MEDICAL KIT. . . . . . . . . . . . . . . . . . . . 12. IMPORTANT DOCUMENTS . . . . . . 3. MATCHES/LIGHTER . . . . . . . . . . . . . 8. WHISTLE . . . . . . . . . . . . . . . . . . . . . . 13. OTHERS, SPECIFY4. FLASHLIGHT . . . . . . . . . . . . . . . . . . . 9. CLOTHES . . . . . . . . . . . . . . . . . . . . . . 5. RADIO . . . . . . . . . . . . . . . . . . . . . . . . . 10. BLANKET . . . . . . . . . . . . . . . . . . . . . .
Q
R
S
H. SOCIAL PROTECTION
A.
B.
C.
J
SOCIAL PROTECTION PROGRAMS
H
I
K
L
LABOR MARKET INTERVENTION
CHILD PROTECTION
DISASTER PREPAREDNESS
SOCIAL ASSISTANCE
SOCIAL INSURANCE
M
N
O
P
PHILHEALTH
Has any member of your family (including Overseas Filipinos) availed/received assistance/benefits/payments from PhilHealth in the last 6 months (January to June 2019)
D.
E
F
G
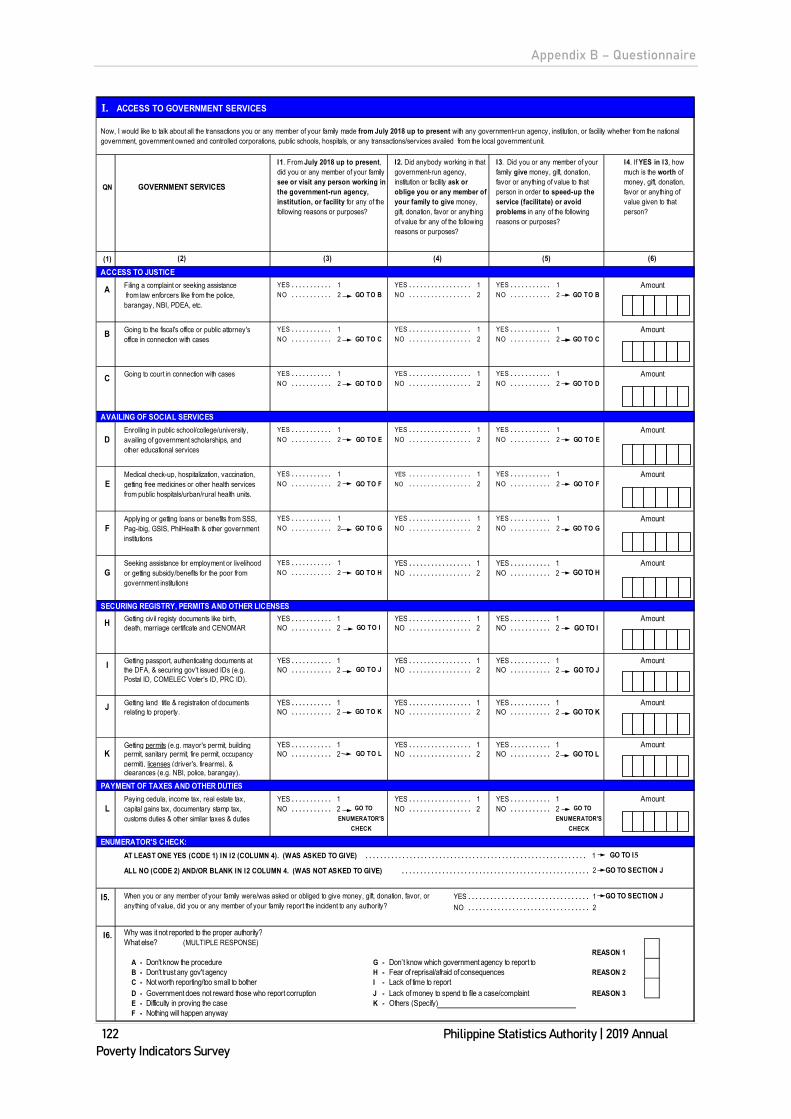
Appendix B – Questionnaire
122 Philippine Statistics Authority | 2019 Annual Poverty Indicators Survey
I. ACCESS TO GOVERNMENT SERVICES
(1)ACCESS TO JUSTICE
Filing a complaint or seeking assistance YES . . . . . . . . . . . 1 YES . . . . . . . . . . . . . . . . . 1 YES . . . . . . . . . . . 1 from law enforcers like from the police, NO . . . . . . . . . . . 2 NO . . . . . . . . . . . . . . . . . 2 NO . . . . . . . . . . . 2barangay, NBI, PDEA, etc.
Going to the fiscal's office or public attorney's YES . . . . . . . . . . . 1 YES . . . . . . . . . . . . . . . . . 1 YES . . . . . . . . . . . 1office in connection with cases NO . . . . . . . . . . . 2 NO . . . . . . . . . . . . . . . . . 2 NO . . . . . . . . . . . 2
Going to court in connection with cases YES . . . . . . . . . . . 1 YES . . . . . . . . . . . . . . . . . 1 YES . . . . . . . . . . . 1NO . . . . . . . . . . . 2 NO . . . . . . . . . . . . . . . . . 2 NO . . . . . . . . . . . 2
AVAILING OF SOCIAL SERVICESEnrolling in public school/college/university, YES . . . . . . . . . . . 1 YES . . . . . . . . . . . . . . . . . 1 YES . . . . . . . . . . . 1availing of government scholarships, and NO . . . . . . . . . . . 2 NO . . . . . . . . . . . . . . . . . 2 NO . . . . . . . . . . . 2other educational services
Medical check-up, hospitalization, vaccination, YES . . . . . . . . . . . 1 YES . . . . . . . . . . . . . . . . . 1 YES . . . . . . . . . . . 1getting free medicines or other health services NO . . . . . . . . . . . 2 NO . . . . . . . . . . . . . . . . . 2 NO . . . . . . . . . . . 2from public hospitals/urban/rural health units.
Applying or getting loans or benefits from SSS, YES . . . . . . . . . . . 1 YES . . . . . . . . . . . . . . . . . 1 YES . . . . . . . . . . . 1Pag-ibig, GSIS, PhilHealth & other government NO . . . . . . . . . . . 2 NO . . . . . . . . . . . . . . . . . 2 NO . . . . . . . . . . . 2institutions
Seeking assistance for employment or livelihood YES . . . . . . . . . . . 1 YES . . . . . . . . . . . . . . . . . 1 YES . . . . . . . . . . . 1or getting subsidy/benefits for the poor from NO . . . . . . . . . . . 2 NO . . . . . . . . . . . . . . . . . 2 NO . . . . . . . . . . . 2government institutions
SECURING REGISTRY, PERMITS AND OTHER LICENSESGetting civil registy documents like birth, YES . . . . . . . . . . . 1 YES . . . . . . . . . . . . . . . . . 1 YES . . . . . . . . . . . 1death, marriage certificate and CENOMAR NO . . . . . . . . . . . 2 NO . . . . . . . . . . . . . . . . . 2 NO . . . . . . . . . . . 2
Getting passport, authenticating documents at YES . . . . . . . . . . . 1 YES . . . . . . . . . . . . . . . . . 1 YES . . . . . . . . . . . 1the DFA, & securing gov't issued IDs (e.g. NO . . . . . . . . . . . 2 NO . . . . . . . . . . . . . . . . . 2 NO . . . . . . . . . . . 2Postal ID, COMELEC Voter's ID, PRC ID).
Getting land title & registration of documents YES . . . . . . . . . . . 1 YES . . . . . . . . . . . . . . . . . 1 YES . . . . . . . . . . . 1relating to property. NO . . . . . . . . . . . 2 NO . . . . . . . . . . . . . . . . . 2 NO . . . . . . . . . . . 2
Getting permits (e.g. mayor's permit, building YES . . . . . . . . . . . 1 YES . . . . . . . . . . . . . . . . . 1 YES . . . . . . . . . . . 1permit, sanitary permit, fire permit, occupancy NO . . . . . . . . . . . 2 NO . . . . . . . . . . . . . . . . . 2 NO . . . . . . . . . . . 2permit), licenses (driver's, firearms), & clearances (e.g. NBI, police, barangay).
PAYMENT OF TAXES AND OTHER DUTIESPaying cedula, income tax, real estate tax, YES . . . . . . . . . . . 1 YES . . . . . . . . . . . . . . . . . 1 YES . . . . . . . . . . . 1capital gains tax, documentary stamp tax, NO . . . . . . . . . . . 2 NO . . . . . . . . . . . . . . . . . 2 NO . . . . . . . . . . . 2customs duties & other similar taxes & duties
ENUMERATOR'S CHECK:AT LEAST ONE YES (CODE 1) IN I2 (COLUMN 4). (WAS ASKED TO GIVE) . . . . . . . . . . . . . . . . . . . . . . . . . . . . . . . . . . . . . . . . . . . . . . . . . . . . . . . . . . . . 1
ALL NO (CODE 2) AND/OR BLANK IN I2 COLUMN 4. (WAS NOT ASKED TO GIVE) . . . . . . . . . . . . . . . . . . . . . . . . . . . . . . . . . . . . . . . . . . . . . . . . . . . 2
YES . . . . . . . . . . . . . . . . . . . . . . . . . . . . . . . . . 1NO . . . . . . . . . . . . . . . . . . . . . . . . . . . . . . . . . 2
Why was it not reported to the proper authority?What else? (MULTIPLE RESPONSE)
REASON 1A - Don't know the procedure G - Don’t know which government agency to report toB - Don't trust any gov't agency H - Fear of reprisal/afraid of consequences REASON 2C - Not worth reporting/too small to bother I - Lack of time to reportD - Government does not reward those who report corruption J - Lack of money to spend to file a case/complaint REASON 3E - Difficulty in proving the case K - Others (Specify)F - Nothing will happen anyway
AmountGO TO B GO TO B
AmountGO TO C GO TO C
AmountGO TO E GO TO E
Amount
GO TO D GO TO DAmount
GO TO L GO TO L
AmountGO TO G GO TO G
I5.
Amount
When you or any member of your family were/was asked or obliged to give money, gift, donation, favor, or anything of value, did you or any member of your family report the incident to any authority?
Amount
AmountGO TO K GO TO K
AmountGO TO J GO TO J
K
LAmount
GO TO GO TO
E
F
AmountGO TO I GO TO I
GO TO H GO TO H
GO TO F GO TO F
(6)
Now, I would like to talk about all the transactions you or any member of your family made from July 2018 up to present with any government-run agency, institution, or facility whether from the national government, government owned and controlled corporations, public schools, hospitals, or any transactions/services availed from the local government unit.
GOVERNMENT SERVICES
I1. From July 2018 up to present, did you or any member of your family see or visit any person working in the government-run agency, institution, or facility for any of the following reasons or purposes?
I2. Did anybody working in that government-run agency, institution or facility ask or oblige you or any member of your family to give money, gift, donation, favor or anything of value for any of the following reasons or purposes?
I3. Did you or any member of your family give money, gift, donation, favor or anything of value to that person in order to speed-up the service (facilitate) or avoid problems in any of the following reasons or purposes?
QN
(2) (3) (4) (5)
I6.
I4. If YES in I3, how much is the worth of money, gift, donation, favor or anything of value given to that person?
G
H
I
J
GO TO I5
GO TO SECTION J
GO TO SECTION J
A
B
C
D
ENUMERATOR'S CHECK
ENUMERATOR'S CHECK

Appendix B – Questionnaire
Philippine Statistics Authority | 2019 Annual Poverty Indicators Survey 123
J. HOUSINGAt the time of visit - SINGLE HOUSE . . . . . . . . . . . . . . . . . . . . . . . . . 1J1. TYPE OF BUILDING/HOUSE DUPLEX . . . . . . . . . . . . . . . . . . . . . . . . . . . . . . . 2
APARTMENT/ACCESSORIA/ROWHOUS. . . . . . . 3CONDOMINIUM/CONDOTEL . . . . . . . . . . . . . . . 4OTHER MULTI-UNIT RESIDENTIAL
BUILDING . . . . . . . . . . . . . . . . . . . . . . . . . . . 5COMMERCIAL/INDUSTRIAL/AGRICULTURAL
BUILDING/HOUSE . . . . . . . . . . . . . . . . . . . . . 6OTHER HOUSING UNIT (E.G. CAVE,
BOAT) (specify) 7
STRONG MATERIALS (GALVANIZED IRON, J2. TYPE OF CONSTRUCTION MATERIALS OF THE ROOF ALUMINUM, TILE, CONCRETE,
BRICK, STONE, ETC.) . . . . . . . . . . . . . . . . . . . 1LIGHT MATERIALS (COGON, NIPA,
ANAHAW) . . . . . . . . . . . . . . . . . . . . . . . . . . . 2SALVAGED/MAKESHIFT MATERIALS . . . . . . . . . 3MIXED BUT PREDOMINANTLY STRONG
MATERIALS . . . . . . . . . . . . . . . . . . . . . . . . . . . 4MIXED BUT PREDOMINANTLY
LIGHT MATERIALS . . . . . . . . . . . . . . . . . . . . . 5MIXED BUT PREDOMINANTLY SALVAGED
MATERIALS . . . . . . . . . . . . . . . . . . . . . . . . . . . 6NOT APPLICABLE . . . . . . . . . . . . . . . . . . . . . . . 7
STRONG MATERIALS (GALVANIZED IRON, J3. TYPE OF CONSTRUCTION MATERIALS OF THE ALUMINUM, TILE, CONCRETE, BRICK,
OUTER WALL STONE,WOOD, PLYWOOD, ETC.. . . . . . . . . . . 1LIGHT MATERIALS (BAMBOO, SAWALI,
COGON, NIPA, ANAHAW) . . . . . . . . . . . . . . . 2SALVAGED/MAKESHIFT MATERIALS . . . . . . . . . 3MIXED BUT PREDOMINANTLY STRONG
MATERIALS . . . . . . . . . . . . . . . . . . . . . . . . . . . 4MIXED BUT PREDOMINANTLY LIGHT
MATERIALS . . . . . . . . . . . . . . . . . . . . . . . . . . . 5MIXED BUT PREDOMINANTLY SALVAGED
MATERIALS . . . . . . . . . . . . . . . . . . . . . . . . . . . 6NOT APPLICABLE . . . . . . . . . . . . . . . . . . . . . . . 7
CONCRETE . . . . . . . . . . . . . . . . . . . . . . . . . . . . . 1J4. TYPE OF CONSTRUCTION MATERIALS OF THE 'FLOOR WOOD PLANK . . . . . . . . . . . . . . . . . . . . . . . . . . . 2
(MAIN MATERIALS)? COCONUT LUMBER. . . . . . . . . . . . . . . . . . . . . . . 3BAMBOO . . . . . . . . . . . . . . . . . . . . . . . . . . . . . . . 4EARTH/SAND/MUD . . . . . . . . . . . . . . . . . . . . . . . 5MAKESHIFT/SALVAGED/IMPROVISED
MATERIALS . . . . . . . . . . . . . . . . . . . . . . . . . . . 6OTHERS, SPECIFY 7
J5. What is the tenure status of the housing unit and lot OWN HOUSE AND LOT OR OWNER-occupied by your family? LIKE POSSESSION OF HOUSE
AND LOT . . . . . . . . . . . . . . . . . . . . . . . . . . . . . 1RENT HOUSE/ROOM INCLUDING LOT . . . . . . . 2OWN HOUSE, RENT LOT . . . . . . . . . . . . . . . . . 3OWN HOUSE, RENT-FREE LOT WITH
CONSENT OF OWNER . . . . . . . . . . . . . . . . . 4OWN HOUSE, RENT-FREE LOT WITHOUT
CONSENT OF OWNER . . . . . . . . . . . . . . . . . 5RENT FREE HOUSE AND LOT WITH
CONSENT OF OWNER . . . . . . . . . . . . . . . . . 6RENT FREE HOUSE AND LOT WITHOUT
CONSENT OF OWNER . . . . . . . . . . . . . . . . . 7NOT APPLICABLE . . . . . . . . . . . . . . . . . . . . . . . 8
J5a. What is the floor area of the housing unit? . . . . . . . . . . . . . . . . . . . . . . . . . . . . . . . . . . . . . . . . .
J6. Is there any electricity in the building/house? YES . . . . . . . . . . . . . . . . . . . . . . . . . . . . . . . . . . . 1NO . . . . . . . . . . . . . . . . . . . . . . . . . . . . . . . . . . . 2
J7. Does your family own any of the following household assets? 1 - YES 2 - NO
CAR, JEEP, VAN . . . . . . . . . . . . . . . . . . . . . . . . a aMOTORCYCLE, TRICYCLE . . . . . . . . . . . . . . . . . b bMOTORIZED BOAT/BANCA . . . . . . . . . . . . . . . . . c cTRACTOR . . . . . . . . . . . . . . . . . . . . . . . . . . . . . d dWASHING MACHIN . . . . . . . . . . . . . . . . . . . . . . . e eGAS RANGE/STOVE WITH OVEN. . . . . . . . . . . . . f fINDUCTION STOVE . . . . . . . . . . . . . . . . . . . . . . . g gREFRIGERATOR/FREEZER . . . . . . . . . . . . . . . . . h hPERSONAL COMPUTER (DESKTOP, LAPTOP,
NETBOOK, IPAD, IPOD, TABLET). . . . . . . . . . . i iAIRCON . . . . . . . . . . . . . . . . . . . . . . . . . . . . . . . j jCELLULAR PHONE . . . . . . . . . . . . . . . . . . . . . . . k kLANDLINE/WIRELESS TELEPHONE. . . . . . . . . . . l lVIDEOKE/MAGIC SING. . . . . . . . . . . . . . . . . . . . . m mTELEVISION . . . . . . . . . . . . . . . . . . . . . . . . . . n nCABLE (e.g SKY cable, Destiny, Cignal, etc) . . . . . o oRADIO . . . . . . . . . . . . . . . . . . . . . . . . . . . . . . . . . p pBROADBAND INTERNET/FIBER INTERNET/DSL . . q qDRAFT ANIMALS (COW/CARABAO/HORSE. . . . . r r
SQ. M

Appendix B – Questionnaire
124 Philippine Statistics Authority | 2019 Annual Poverty Indicators Survey
K. WATER, SANITATION AND HYGIENEK1. What is the family's main source of water supply? COMMUNITY WATER SYSTEM PIPED INTO:
DWELLING . . . . . . . . . . . . . . . . . . . . . . . . . . . 01YARD/PLOT . . . . . . . . . . . . . . . . . . . . . . . . . . . 02PUBLIC TAP. . . . . . . . . . . . . . . . . . . . . . . . . . . 03
POINT SOURCE:PROTECTED WELL/TUBE WELL/
BOREHOLE . . . . . . . . . . . . . . . . . . . . . . . . . 04UNPROTECTED
(OPEN DUG WELL) . . . . . . . . . . . . . . . . . . . 05DEVELOPED SPRING . . . . . . . . . . . . . . . . . . . 06UNDEVELOPED SPRING. . . . . . . . . . . . . . . . . 07RIVER/STREAM/POND/LAKE/DAM . . . . . . . . . 08RAINWATER . . . . . . . . . . . . . . . . . . . . . . . . 09TANKER TRUCK/PEDDLER/NEIGHBOR . . . . . 10
K2. IF ANSWER TO K1 IS ANY OF THE CODES 02 TO 08: How far is this water source from your house? . . . . . . . . . . . . . . . . . . . . . . . . . . . . . . . . . . . . . . . . .
WS1. What is the main source of drinking water used by PIPED WATERmembers of your family? PIPED INTO DWELLING . . . . . . . . . . . . . . . . . 11
PIPED TO YARD/PLOT . . . . . . . . . . . . . . . . . . . 12If unclear, probe to identify the place from which members PIPED TO NEIGHBOR . . . . . . . . . . . . . . . . . . . 13of this family most often collect drinking water PUBLIC TAP/STAND PIP . . . . . . . . . . . . . . . . . 14(collection point)
TUBED WELL/BOREHOLE . . . . . . . . . . . . . . . . . 21
DUG WELLPROTECTED WELL . . . . . . . . . . . . . . . . . . . . . 31UNPROTECTED WELL . . . . . . . . . . . . . . . . . . . 32
SPRINGPROTECTED SPRING . . . . . . . . . . . . . . . . . . . 41UNPROTECTED SPRING. . . . . . . . . . . . . . . . . 42
RAINWATER . . . . . . . . . . . . . . . . . . . . . . . . . . . 51TANKER-TRUCK . . . . . . . . . . . . . . . . . . . . . . . . . 61CART WITH SMALL TANK . . . . . . . . . . . . . . . . . 71WATER REFILLING STATION . . . . . . . . . . . . . . . 72SURFACE WATER (RIVER, DAM,
LAKE, POND, STREAM,CANAL, IRRIGATION CHANNEL . . . . . . . . . . . 81 WS3
PACKAGED WATERBOTTLED WATER . . . . . . . . . . . . . . . . . . . . . 91SACHET WATER . . . . . . . . . . . . . . . . . . . . . . . 92
OTHER (Specify ) 96 WS3
WS2. What is the main source of water used bymembers of your family for other purposes PIPED WATERsuch as cooking and handwashing? PIPED INTO DWELLING . . . . . . . . . . . . . . . . . 11
PIPED TO YARD/PLOT . . . . . . . . . . . . . . . . . . . 12If unclear, probe to identify the place from which PIPED TO NEIGHBOR . . . . . . . . . . . . . . . . . . . 13members of this family most often collect water for PUBLIC TAP/STANDPIPE . . . . . . . . . . . . . . . 14other purposes.
TUBED WELL/BOREHOLE . . . . . . . . . . . . . . . . . 21
DUG WELLPROTECTED WELL . . . . . . . . . . . . . . . . . . . . . 31UNPROTECTED WELL . . . . . . . . . . . . . . . . . . . 32
SPRINGPROTECTED SPRING . . . . . . . . . . . . . . . . . . . 41UNPROTECTED SPRING . . . . . . . . . . . . . . . 42
RAINWATER . . . . . . . . . . . . . . . . . . . . . . . . . . . 51TANKER-TRUCK . . . . . . . . . . . . . . . . . . . . . . . . . 61CART WITH SMALL TANK . . . . . . . . . . . . . . . . . 71WATER REFILLING STATION . . . . . . . . . . . . . . . 72SURFACE WATER (RIVER, DAM,
LAKE, POND, STREAM,CANAL, IRRIGATION CHANNEL . . . . . . . . . . . 81
PACKAGED WATERBOTTLED WATER . . . . . . . . . . . . . . . . . . . . . 91SACHET WATER . . . . . . . . . . . . . . . . . . . . . . . 92
OTHER (Specify ) 96
WS4
WS1
METER
WS1
WS7
WS3
WS4
WS7

Appendix B – Questionnaire
Philippine Statistics Authority | 2019 Annual Poverty Indicators Survey 125
WATER, SANITATION AND HYGIENE WS
WS3. Where is that water source located?IN OWN DWELLING . . . . . . . . . . . . . . . . . . . . . . . 1IN OWN YARD/PLOT. . . . . . . . . . . . . . . . . . . . . . . 2ELSEWHERE . . . . . . . . . . . . . . . . . . . . . . . . . . . 3
WS4. How long does it take for members of your family MEMBERS DO NOT COLLECT . . . . . . . . . . . WS7to go there, get water, and come back? NUMBER OF MINUTES . . . . . . . . . . . . .
DON'T KNOW . . . . . . . . . . . . . . . . . . . . . . . . . 998
WS5. Who usually goes to this source to collect the water for your family? NAME
RECORD THE NAME OF THE PERSON AND COPY THE LINE NUMBER . . . . . . . . . . . . . . . . . . . LINE NUMBER OF THIS PERSON FROM THE LIST OFFAMILY MEMBERS
WS6. Since last__ (DAY OF THE WEEK), how many times hasthis person collected water? NUMBER OF TIMES . . . . . . . . . . . . . . .
DON'T KNOW . . . . . . . . . . . . . . . . . . . . . . . . . . . 98
WS7. In the last month, has there been any time when your familydid not have sufficient quantities of drinking water? YES, AT LEAST ONCE . . . . . . . . . . . . . . . . . . . . . 1
NO, ALWAYS SUFFICIENT . . . . . . . . . . . . . . . . . 2DON'T KNOW . . . . . . . . . . . . . . . . . . . . . . . . . . . 8
WS8. What was the main reason that you were unable to accessdrinking water in sufficient quantities when needed? WATER NOT AVAILABLE FROM SOURCE . . . . . 1
WATER TOO EXPENSIVE . . . . . . . . . . . . . . . . . 2SOURCE NOT ACCESSIBLE . . . . . . . . . . . . . . . 3OTHER (specify ) 6DON'T KNOW . . . . . . . . . . . . . . . . . . . . . . . . . . . 8
WS9. Do you do anything to the water to make it safer to drink?YES . . . . . . . . . . . . . . . . . . . . . . . . . . . . . . . . . . . 1NO . . . . . . . . . . . . . . . . . . . . . . . . . . . . . . . . . . . 2DON'T KNOW . . . . . . . . . . . . . . . . . . . . . . . . . . . 8
WS10. What do you usually do to make the water safer to drink?BOILED IT . . . . . . . . . . . . . . . . . . . . . . . . . . . . . AADD BLEACH/CHLORINE . . . . . . . . . . . . . . . . . B
PROBE: STRAIN IT THROUGH A CLOTH . . . . . . . . . . . . . CAnything else? USE WATER FILTER (CERAMIC, SAND,
COMPOSITE, ETC.) . . . . . . . . . . . . . . . . . . . . . DRECORD ALL METHODS MENTIONED SOLAR DISINFECTION . . . . . . . . . . . . . . . . . E
LET IT STAND AND SETTLE . . . . . . . . . . . . . . . FOTHER (specify) XDON'T KNOW . . . . . . . . . . . . . . . . . . . . . . . . . . . Z
WS11a. What kind of toilet facility do members of your householdusually use? FLUSH/POUR FLUSH
FLUSH TO PIPED SEWER SYSTEM . . . . . . . 11 WS14IF 'FLUSH' OR 'POUR FLUSH', PROBE: FLUSH TO SEPTIC TANK . . . . . . . . . . . . . . . 12Where does it flush to? FLUSH TO PIT LATRINE . . . . . . . . . . . . . . . . . 13
FLUSH TO OPEN DRAIN . . . . . . . . . . . . . . . . . 14IF NOT POSSIBLE TO DETERMINE, ASK FLUSH TO DK WHERE. . . . . . . . . . . . . . . . . . . 15PERMISSION TO OBSERVE FACILITY. PIT LATRINE
VENTILATED IMPROVED LATRINE . . . . . . . . . 21PIT LATRINE WITH SLAB . . . . . . . . . . . . . . . . . 22PIT LATRINE WITHOUT SLAB/
OPEN PIT . . . . . . . . . . . . . . . . . . . . . . . . . 23
COMPOSTING TOILET. . . . . . . . . . . . . . . . . . . . . 31BUCKET . . . . . . . . . . . . . . . . . . . . . . . . . . . . . . . 41HANGING TOILET/HANGING LATRINE . . . . . . . 51NO FACILITY/BUSH/FIELD . . . . . . . . . . . . . . . . . 95PUBLIC TOILET 71OTHER (specify) 96 WS14
WS11b. Where does the outlet of the septic tank go? SEWER LINES . . . . . . . . . . . . . . . . . . . . . . . . . . . 1SOAKAGE PIT . . . . . . . . . . . . . . . . . . . . . . . . . . . 2MUNICIPALITY/CITY DRAINAGE. . . . . . . . . . . . . 3DIRECTLY TO BODY OF WATER-CREEK,RIVER, LAKE, COASTAL WATER . . . . . . . . . . . 4NO OUTLET OR UNDERGROUND . . . . . . . . . . . 5DON’T KNOW . . . . . . . . . . . . . . . . . . . . . . . . . . . 6OTHER (specify) 8
WS12
WS7
WS14
WS9
WS11a
WS14
000
WS12
HW1. . . . . . . . . . . . . . . . . . . . . . . . .

Appendix B – Questionnaire
126 Philippine Statistics Authority | 2019 Annual Poverty Indicators Survey
WATER, SANITATION AND HYGIENE WS
WS12. Has your (ANSWER FROM WS11a) ever been emptied? YES, EMPTIEDWITHIN THE LAST 5 YEARS. . . . . . . . . . . . . . . 1MORE THAN 5 YEARS AGO. . . . . . . . . . . . . . . 2DON'T KNOW WHEN . . . . . . . . . . . . . . . . . . . 3
NO, NEVER EMPTIED . . . . . . . . . . . . . . . . . . . 4NO, NEW TOILET HAS BEEN
CONSTRUCTED . . . . . . . . . . . . . . . . . . . . . 5CLOSED/COVERED AND CONSTRUCTED
A NEW LATRINE/SEPTIC TANK . . . . . . . . . . . 6DON'T KNOW . . . . . . . . . . . . . . . . . . . . . . . . . 8
WS13. The last time it was emptied, where were the contents REMOVED BY SERVICE PROVIDERemptied to? TO A TREATMENT PLANT/REMOVED . . . . . . . . . 1
BURIED IN A COVERED PI . . . . . . . . . . . . . . . . . 2TO DON’T KNOW WHERE . . . . . . . . . . . . . . . . . 3
REMOVED BY HOUSEHOLD/NEIGHBORWas it removed by a service provider? BURIED IN A COVERED PIT . . . . . . . . . . . . . . . 4
TO UNCOVERED PIT, OPEN GROUND,WATER BODY OR ELSEWHERE . . . . . . . . . . . 5
OTHER (specify) 6DON'T KNOW . . . . . . . . . . . . . . . . . . . . . . . . . . . 8
Where is this toilet facility located? IN OWN DWELLING . . . . . . . . . . . . . . . . . . . . . . . 1IN OWN YARD/PLOT . . . . . . . . . . . . . . . . . . . . . 2ELSEWHERE . . . . . . . . . . . . . . . . . . . . . . . . . . . 3 HW1
Do you share this facility with others who are not membersof your household? YES . . . . . . . . . . . . . . . . . . . . . . . . . . . . . . . . . . . 1
NO . . . . . . . . . . . . . . . . . . . . . . . . . . . . . . . . . . . 2 HW1
How many household's in total use this toilet facility, including your own household? NUMBER OF HOUSEHOLDS
(IF LESS THAN 10) . . . . . . . . . . . . . . . . . . . TEN OR MORE HOUSEHOLD . . . . . . . . . . . . . 10
SHARED WITH KNOWN HOUSEHOLDS NOT PUBLIC) . . . . . . . . . . . . . . . . . . . . . . . . . . . 1
SHARED WITH GENERAL PUBLIC . . . . . . . . . . . . . 2
HANDWASHING HW
We would like to learn about where members of this OBSERVEDhousehold wash their hands. FIXED FACILITY OBSERVED (SINK/TAP)
IN DWELLING . . . . . . . . . . . . . . . . . . . . . . . 1Can you please show me where members of your IN YARD/PLOT . . . . . . . . . . . . . . . . . . . . . . . 2household most often wash their hands? MOBILE OBJECT OBSERVED
(BUCKET/JUG/KETTLE) . . . . . . . . . . . . . . . 3
NOT OBSERVEDRECORD RESULT AND OBSERVATION NO HANDWASHING PLACE IN DWELLING/
YARD/PLOT . . . . . . . . . . . . . . . . . . . . . . . . . 4 HW8NO PERMISSION TO SEE . . . . . . . . . . . . . . . 5 HW4OTHER REASON (specify) 6 HW8
OBSERVE PRESENCE OF WATER AT THE PLACE FOR HANDWASHING. WATER IS AVAILABLE . . . . . . . . . . . . . . . . . . . . . 1
VERIFY BY CHECKING THE TAP/PUMP, OR BASIN, BUCKET, WATER IS NOT AVAILABLE . . . . . . . . . . . . . . . . . 2WATER CONTAINER OR SIMILAR OBJECTS FOR PRESENCE OF WATER
IS SOAP OR DETERGENT PRESENT AT THE PLACE FOR HANDWASHING? YES, PRESENT . . . . . . . . . . . . . . . . . . . . . . . . . 1 HW7
NO, NOT PRESENT . . . . . . . . . . . . . . . . . . . . . . . 2 HW5
Where do you or other members of your family most FIXED FACILITY (SINK/TAP)often wash your hands? IN DWELLING . . . . . . . . . . . . . . . . . . . . . . . . . 1
IN YARD/PLOT . . . . . . . . . . . . . . . . . . . . . . . . . 2MOBILE OBJECT
(BUCKET/JUG/KETTLE. . . . . . . . . . . . . . . . . . . 3
NO HANDWASHING PLACE IN DWELLING/YARD/PLOT . . . . . . . . . . . . . . . 4
OTHER (specify ) 6
YES . . . . . . . . . . . . . . . . . . . . . . . . . . . . . . . . . . . 1NO . . . . . . . . . . . . . . . . . . . . . . . . . . . . . . . . . . . 2
Do you have any soap or detergent in your house for washing hands? YES . . . . . . . . . . . . . . . . . . . . . . . . . . . . . . . . . . . 1
NO . . . . . . . . . . . . . . . . . . . . . . . . . . . . . . . . . . . 2
Can you please show it to me? YES, SHOWN . . . . . . . . . . . . . . . . . . . . . . . . . . . 1
NO, NOT SHOWN . . . . . . . . . . . . . . . . . . . . . . . 2
RECORD YOUR OBSERVATION BAR OR LIQUID SOAP . . . . . . . . . . . . . . . . . . . ADETERGENT (POWDER/LIQUID/PASTE) . . . . . . . B
ENCIRCLE ALL THAT APPLY ASH/SOIL/SAND . . . . . . . . . . . . . . . . . . . . . . . . COTHERS, specify D
HW2.
HW3.
WS14.
WS15.
PROBE:
HW4.
HW5.
HW6.
SECTION L
HW7.
HW8. Do you have available water in your house for washing hands?
SECTION L
WS18. Do you share this facility only with members of other households that you know or is the facility open to the use of the general public?
WS17.
HW1.
WS14

Appendix B – Questionnaire
Philippine Statistics Authority | 2019 Annual Poverty Indicators Survey 127
L. OTHER RELEVANT INFORMATIONL1. Did you or any member of your family avail of any loan YES . . . . . . . . . . . . . . . . . . . . . . . . . . . . . . . . . . . 1
during the period January-June 2019? NO . . . . . . . . . . . . . . . . . . . . . . . . . . . . . . . . . . . 2
L2. Where did you or any member of your family GSIS . . . . . . . . . . . . . . . . . . . . . . . . . . . . . . . . . Aavail of this loan? SSS . . . . . . . . . . . . . . . . . . . . . . . . . . . . . . . . . . . B
PAG-IBIG . . . . . . . . . . . . . . . . . . . . . . . . . . . . . . . C(MULTIPLE RESPONSE) MICROFINANCE INSTITUTION . . . . . . . . . . . . . D
RELATIVE/FRIEND . . . . . . . . . . . . . . . . . . . . . E
CREDIT UNION . . . . . . . . . . . . . . . . . . . . . . . . . F
BANK . . . . . . . . . . . . . . . . . . . . . . . . . . . . . . . . . G
INFORMAL LENDER . . . . . . . . . . . . . . . . . . . . . H
PAWNSHOP . . . . . . . . . . . . . . . . . . . . . . . . . I
OTHERS (Specify ) J
L3. Are/were you or any member of your family a member YES . . . . . . . . . . . . . . . . . . . . . . . . . . . . . . . . . . . 1of a cooperative during the period January-June 2019? NO . . . . . . . . . . . . . . . . . . . . . . . . . . . . . . . . . . . 2
Taking into account of all family members who work for a salary or wages, operate business, or received from other sources of income, how much is the average monthly income of your family? . . . . . . . . . . . . . . . . . . . . .
L6. Did you or any of your family members use the internet in YES . . . . . . . . . . . . . . . . . . . . . . . . . . . . . . . . . . . 1 the last 6 months (January to June 2019)? NO . . . . . . . . . . . . . . . . . . . . . . . . . . . . . . . . . . . 2 L8
L7. Did you or any of your family members engage in the following type of online transactions during the past 6 months? SELLING . . . . . . . . . . . . . . . . . . . . . . . . . . . . . . . a a
BUYING . . . . . . . . . . . . . . . . . . . . . . . . . . . . . . . b bBILLS PAYMENT . . . . . . . . . . . . . . . . . . . . . . . . . c cBANKING. . . . . . . . . . . . . . . . . . . . . . . . . . . . . . . d dSTUDYING SHORT COURSES. . . . . . . . . . . . . . . e eOTHERS, specify f f
L8. How safe do you feel walking alone in your area SAFE . . . . . . . . . . . . . . . . . . . . . . . . . . . . . . . . . 1(i.e. neighborhood or village) at night? SOMEWHAT SAFE . . . . . . . . . . . . . . . . . . . . . . . 2
SOMEWHAT UNSAFE . . . . . . . . . . . . . . . . . . . . . 3UNSAFE . . . . . . . . . . . . . . . . . . . . . . . . . . . . . . . 4I'M AFRAID TO BE ALONE . . . . . . . . . . . . . . . . . 5DON'T KNOW . . . . . . . . . . . . . . . . . . . . . . . . . . . 6
M. DRUG AWARENESS AND PREVENTIONM1. In your community (barangay/adjacent barangay), do you YES . . . . . . . . . . . . . . . . . . . . . . . . . . . . . . . . . . . 1
think drug abuse is a problem ? NO . . . . . . . . . . . . . . . . . . . . . . . . . . . . . . . . . . . 2
M2.SERIOUS . . . . . . . . . . . . . . . . . . . . . . . . . . . . . . . 1A LITTLE BIT … . . . . . . . . . . . . . . . . . . . . . . . . . . . 2NO DRUG-RELATED PROBLEM . . . . . . . . . . . . . 3
DRUG CLEARINGS . . . . . . . . . . . . . . . . . . . . . . . a aDRUG ADVOCACY SEMINAR . . . . . . . . . . . . . . . b bDISSEMINATION OR GIVING OF INFORMATION cMATERIALS . . . . . . . . . . . . . . . . . . . . . . . . . . . . . c d
TREATMENT AND REHABILITATION . . . . . . . . . d
ANTI-DRUG ABUSE COUNCIL (ADAC) . . . . . . . a aLAW ENFORCEMENT . . . . . . . . . . . . . . . . . . . . . b bTREATMENT AND REHABILITATION . . . . . . . . . c cSOCIAL WELFARE . . . . . . . . . . . . . . . . . . . . . . . d dSCHOOL-BASED DRUG ABUSE PREVENTION ePROGRAM . . . . . . . . . . . . . . . . . . . . . . . . . . . . . eRANDOM DRUG TESTING IN SCHOOL . . . . . . . f f
1 - YES 2 - NO
Are you aware of the following services offered by the government on drug abuse problem?
M4.
Which of the following activities on drug prevention and/or control are being implemented in your community?
M3.
REFERRALS OF DRUG DEPENDENTS FOR
How would you rate the drug abuse problem in your community?
1 - YES 2 - NO
1 - YES 2 - NO
How much is your family's average weekly food consumption?
L3
L4. . . . . . . . . . . . . . . . . . . . . . . . . . . . . . . . . . . . . . . . . .
L5.


Appendix B – Questionnaire
Philippine Statistics Authority | 2019 Annual Poverty Indicators Survey 129
Copyright © 2022 FDOKUMEN