Survey of surgical emergencies in a rural population in the Northern Areas of Pakistan
Upload
khangminh22Category
view
5download
0
Fishery Management Report No. 12-23
Annual Management Report Yukon and Northern Areas 2010
by
Jeffrey L. Estensen,
Steve Hayes,
Stacey Buckelew,
Dayna Green,
and
Daniel J. Bergstrom
May 2012
Alaska Department of Fish and Game Divisions of Sport Fish and Commercial Fisheries

Symbols and Abbreviations The following symbols and abbreviations, and others approved for the Système International d'Unités (SI), are used without definition in the following reports by the Divisions of Sport Fish and of Commercial Fisheries: Fishery Manuscripts, Fishery Data Series Reports, Fishery Management Reports, and Special Publications. All others, including deviations from definitions listed below, are noted in the text at first mention, as well as in the titles or footnotes of tables, and in figure or figure captions. Weights and measures (metric) centimeter cm deciliter dL gram g hectare ha kilogram kg kilometer km liter L meter m milliliter mL millimeter mm Weights and measures (English) cubic feet per second ft3/s foot ft gallon gal inch in mile mi nautical mile nmi ounce oz pound lb quart qt yard yd Time and temperature day d degrees Celsius °C degrees Fahrenheit °F degrees kelvin K hour h minute min second s Physics and chemistry all atomic symbols alternating current AC ampere A calorie cal direct current DC hertz Hz horsepower hp hydrogen ion activity pH (negative log of) parts per million ppm parts per thousand ppt, ‰ volts V watts W
General Alaska Administrative Code AAC all commonly accepted abbreviations e.g., Mr., Mrs.,
AM, PM, etc. all commonly accepted professional titles e.g., Dr., Ph.D., R.N., etc. at @ compass directions:
east E north N south S west W
copyright corporate suffixes:
Company Co. Corporation Corp. Incorporated Inc. Limited Ltd.
District of Columbia D.C. et alii (and others) et al. et cetera (and so forth) etc. exempli gratia (for example) e.g. Federal Information Code FIC id est (that is) i.e. latitude or longitude lat. or long. monetary symbols (U.S.) $, ¢ months (tables and figures): first three letters Jan,...,Dec registered trademark trademark United States (adjective) U.S. United States of America (noun) USA U.S.C. United States
Code U.S. state use two-letter
abbreviations (e.g., AK, WA)
Mathematics, statistics all standard mathematical signs, symbols and abbreviations alternate hypothesis HA base of natural logarithm e catch per unit effort CPUE coefficient of variation CV common test statistics (F, t, χ2, etc.) confidence interval CI correlation coefficient (multiple) R correlation coefficient (simple) r covariance cov degree (angular ) ° degrees of freedom df expected value E greater than > greater than or equal to ≥ harvest per unit effort HPUE less than < less than or equal to ≤ logarithm (natural) ln logarithm (base 10) log logarithm (specify base) log2, etc. minute (angular) ' not significant NS null hypothesis HO percent % probability P probability of a type I error (rejection of the null hypothesis when true) α probability of a type II error (acceptance of the null hypothesis when false) β second (angular) " standard deviation SD standard error SE variance population Var sample var

FISHERY MANAGEMENT REPORT NO. 12-23
ANNUAL MANAGEMENT REPORT YUKON AND NORTHERN AREAS 2010
by
Jeffrey L. Estensen,
Steve Hayes,
Stacey Buckelew,
Dayna Green,
and
Daniel J. Bergstrom
Alaska Department of Fish and Game, Division of Commercial Fisheries, Anchorage
This investigation was partially funded by Yukon River Salmon U.S./Canada Negotiation Studies Grant Awards No.NA76FP0208-1 from the U.S. Department of Commerce.
Alaska Department of Fish and Game Division of Sport Fish, Research and Technical Services 333 Raspberry Road, Anchorage, Alaska, 99518-1565
May 2012

The Fishery Management Reports series was established in 1989 by the Division of Sport Fish for the publication of an overview of management activities and goals in a specific geographic area, and became a joint divisional series in 2004 with the Division of Commercial Fisheries. Fishery Management Reports are intended for fishery and other technical professionals, as well as lay persons. Fishery Management Reports are available through the Alaska State Library and on the Internet: http://www.adfg.alaska.gov/sf/publications/ This publication has undergone regional peer review.
Jeffrey L. Estensen and Dayna Green Alaska Department of Fish and Game, Division of Commercial Fisheries,
1300 College Road, Fairbanks AK, 99701 USA
and
Steve Hayes, Stacey Buckelew, and Daniel L. Bergstrom Alaska Department of Fish and Game, Division of Commercial Fisheries,
333 Raspberry Road, Anchorage AK, 99518, USA
This document should be cited as: Estensen, J. L., S. Hayes, S. Buckelew, D. Green, and D. J. Bergstrom. 2012. Annual management report for the
Yukon and Northern Areas, 2010. Alaska Department of Fish and Game, Fishery Management Report No. 12-23, Anchorage.
The Alaska Department of Fish and Game (ADF&G) administers all programs and activities free from discrimination based on race, color, national origin, age, sex, religion, marital status, pregnancy, parenthood, or disability. The department administers all programs and activities in compliance with Title VI of the Civil Rights Act of 1964, Section 504 of the Rehabilitation Act of 1973, Title II of the Americans with Disabilities Act (ADA) of 1990, the Age Discrimination Act of 1975, and Title IX of the Education Amendments of 1972.
If you believe you have been discriminated against in any program, activity, or facility please write: ADF&G ADA Coordinator, P.O. Box 115526, Juneau, AK 99811-5526
U.S. Fish and Wildlife Service, 4401 N. Fairfax Drive, MS 2042, Arlington, VA 22203 Office of Equal Opportunity, U.S. Department of the Interior, 1849 C Street NW MS 5230, Washington DC 20240
The department’s ADA Coordinator can be reached via phone at the following numbers: (VOICE) 907-465-6077, (Statewide Telecommunication Device for the Deaf) 1-800-478-3648, (Juneau TDD) 907-465-
3646, or (FAX) 907-465-6078
For information on alternative formats and questions on this publication, please contact: ADF&G Division of Sport Fish, Research and Technical Services, 333 Raspberry Rd, Anchorage AK 99518 (907) 267-2375.

i
TABLE OF CONTENTS Page
LIST OF TABLES........................................................................................................................................................ iv
LIST OF FIGURES ...................................................................................................................................................... iv
LIST OF APPENDICES .............................................................................................................................................. iv
PREFACE...................................................................................................................................................................... x
ABSTRACT .................................................................................................................................................................. 1 YUKON AREA ............................................................................................................................................................. 1
Introduction ................................................................................................................................................................... 1 SALMON FISHERY 2 Description of Area and District Boundaries ................................................................................................................. 2 Fishery Resources .......................................................................................................................................................... 2 Management .................................................................................................................................................................. 3 Alaska Salmon Fisheries Descriptions .......................................................................................................................... 9
Commercial Fishery .................................................................................................................................................. 9 Subsistence Fishery ................................................................................................................................................ 11 Federal Subsistence Management ........................................................................................................................... 14 Commercial-Related Harvests ................................................................................................................................ 14 Personal Use Fishery .............................................................................................................................................. 15 Lower Yukon Area ................................................................................................................................................. 16 Upper Yukon Area .................................................................................................................................................. 18 Sport Fishery ........................................................................................................................................................... 20
Canadian Harvests of Yukon River Salmon ................................................................................................................ 21 U.S./Canada Yukon River Salmon Panel and Treaty Negotiations ........................................................................ 21
R&E Funds .................................................................................................................................................... 22 Upper Yukon River Chinook Salmon ........................................................................................................... 22 Upper Yukon River Fall Chum Salmon ........................................................................................................ 23 Fishing Branch River Fall Chum Salmon...................................................................................................... 24
MARINE FISHERIES INFORMATION .................................................................................................................... 25
Introduction ................................................................................................................................................................. 25 South Alaska Peninsula Salmon Fisheries ................................................................................................................... 25 Salmon Bycatch in the Bering Sea and Gulf of Alaska Groundfish Fisheries ............................................................. 26 Norton Sound ............................................................................................................................................................... 27 Northern Bering Sea Pelagic Trawl Survey ................................................................................................................. 28 Salmon Spawning Escapement .................................................................................................................................... 28
Aerial Survey Escapement Assessment Methods ................................................................................................... 28 Escapement Goals ................................................................................................................................................... 29
AREA SALMON REPORT 2010 ............................................................................................................................... 30
Alaska Board of Fisheries Actions 2010 ..................................................................................................................... 30 Federal Subsistence Management Actions 2010 ......................................................................................................... 31 Total Yukon River Drainage Salmon Harvest 2010 .................................................................................................... 31 Alaska Subsistence Fishery 2010 ................................................................................................................................ 32
Subsistence Harvest Reporting 2010 ...................................................................................................................... 32 Survey Program 2010 ............................................................................................................................................. 32 Subsistence Permit Program 2010 .......................................................................................................................... 32

ii
TABLE OF CONTENTS (Continued) Page
Subsistence Salmon Use from Test Fisheries 2010 ................................................................................................ 33 Alaska Personal Use Fishery 2010 .............................................................................................................................. 33 Yukon Area Chinook and Summer Chum Salmon Fishery Summary 2010................................................................ 33
Chinook Salmon Management Overview 2010 ...................................................................................................... 34 Summer Chum Salmon Management Overview 2010 ............................................................................................ 36 Summer Season Subsistence Fishery 2010 ............................................................................................................. 36
Districts 1, 2, and 3 ........................................................................................................................................ 38 District 4 ........................................................................................................................................................ 38 District 5 ........................................................................................................................................................ 38 District 6 ........................................................................................................................................................ 39 Coastal District, Koyukuk, and Innoko Rivers .............................................................................................. 39
Summer Season Commercial Fishery 2010 ............................................................................................................ 39 Districts 1, 2, and 3 ........................................................................................................................................ 40 Districts 4-6 ................................................................................................................................................... 41
Yukon Area Fall Chum and Coho Salmon Fishery Summary 2010 ............................................................................ 42 Fall Chum Salmon Management Overview 2010 ................................................................................................... 42 Coho Salmon Management Overview 2010 ........................................................................................................... 43 Fall Season Subsistence Fishery 2010 .................................................................................................................... 43 Fall Season Commercial Fishery 2010 ................................................................................................................... 44
Canadian Fisheries 2010 .............................................................................................................................................. 45 Canadian Commercial Fishery 2010 ....................................................................................................................... 45
Chinook Salmon ............................................................................................................................................ 45 Fall Chum and Coho Salmon ........................................................................................................................ 47
Canadian Aboriginal, Domestic, and Recreational Fisheries 2010.............................................................................. 49 Aboriginal Fishery .................................................................................................................................................. 49 Domestic Fishery .................................................................................................................................................... 51 Recreational Fishery ............................................................................................................................................... 51
Escapement 2010 ......................................................................................................................................................... 51 Summer Season Escapement 2010 ......................................................................................................................... 51
Chinook Salmon Escapement ........................................................................................................................ 53 Summer Chum Salmon Escapement ............................................................................................................. 56
Fall Season Escapement 2010 ................................................................................................................................. 57 Fall Chum Salmon Escapement..................................................................................................................... 57 Coho Salmon Escapement ............................................................................................................................. 59
Enforcement 2010........................................................................................................................................................ 60 Outlook for 2011 ......................................................................................................................................................... 60
Chinook Salmon ..................................................................................................................................................... 60 Summer Chum Salmon ........................................................................................................................................... 60 Fall Chum Salmon .................................................................................................................................................. 61 Coho Salmon .......................................................................................................................................................... 62
CAPE ROMANZOF DISTRICT HERRING FISHERY 2010 62 Introduction ................................................................................................................................................................. 62 Commercial Fishery .................................................................................................................................................... 63 Subsistence Fishery ..................................................................................................................................................... 63
Subsistence Fishery 2010........................................................................................................................................ 63 Stock Status ................................................................................................................................................................. 64 Variable Mesh Gillnet Test Fishery ............................................................................................................................. 64

iii
TABLE OF CONTENTS (Continued) Page Herring Outlook for 2011 ............................................................................................................................................ 64 OTHER MARINE AND FRESHWATER FINFISH FISHERIES 2010 65 Subsistence Fishery ..................................................................................................................................................... 65 Commercial Fishery .................................................................................................................................................... 66
Yukon River Whitefish Fishery Summary ............................................................................................................. 66 Harvest Sampling .......................................................................................................................................... 67
SHEEFISH .................................................................................................................................................................. 68 Yukon River Arctic Lamprey Fishery Summary 2010 ................................................................................................ 69
Harvest Sampling .................................................................................................................................................... 70 Assessment ............................................................................................................................................................. 70
NORTHERN AREA 72 Description of Area ..................................................................................................................................................... 72 Subsistence Fisheries ................................................................................................................................................... 72 Commercial Fisheries .................................................................................................................................................. 72
ACKNOWLEDGEMENTS ......................................................................................................................................... 73
REFERENCES CITED ............................................................................................................................................... 74 TABLES AND FIGURES ........................................................................................................................................... 79
APPENDIX A ........................................................................................................................................................... 111
APPENDIX B ............................................................................................................................................................ 199
APPENDIX C ............................................................................................................................................................ 231
APPENDIX D ........................................................................................................................................................... 263
APPENDIX E ............................................................................................................................................................ 279 APPENDIX F ............................................................................................................................................................ 307
APPENDIX G ........................................................................................................................................................... 313
APPENDIX H ........................................................................................................................................................... 321

iv
LIST OF TABLES Table Page 1 Guideline harvest ranges and midpoints for commercial harvest of Chinook, summer chum, and fall
chum salmon, Yukon Area, Alaska, 2010. .................................................................................................... 80 2 Commercial Fisheries Entry Commission salmon gear permits issued by residence, Yukon Area, 2010. ... 81 3 Salmon processors, buyers, catcher-sellers, and associated data, Yukon Area, 2010. .................................. 83 4 Total utilization in numbers of salmon by district and country, Yukon River drainage, 2010. ..................... 84 5 Subsistence and personal use salmon harvest estimates, including commercially related and test fish
harvests provided for subsistence use and related information, Yukon Area, 2010. ..................................... 86 6 Reported subsistence and personal use salmon harvested under the authority of a permit, listed by
permit area, Yukon Area, 2010. .................................................................................................................... 89 7 Chinook and summer chum salmon commercial harvest by district or subdistrict and by period, set and
drift gillnets combined for Districts 1, 2, and 3 and set gillnets and fish wheels combined for Districts 4, 5, and 6, Yukon Area, 2010. ...................................................................................................................... 90
8 Commercial salmon and salmon roe sales by statistical area, Yukon Area, 2010. ........................................ 92 9 Commercial salmon sales and estimated harvest by district and country, Yukon River drainage, 2010....... 94 10 Number of salmon sold from ADF&G test fishing programs, Yukon area, 2010. ........................................ 95 11 Fall chum and coho salmon commercial harvest by district or subdistrict and by period, set and drift
gillnets combined for Districts 1, 2, and 3, and set gillnets and fish wheels combined for Districts 4, 5, and 6, Yukon Area, 2010. .............................................................................................................................. 96
LIST OF FIGURES Figure Page 1 Map of the Yukon River drainage. ................................................................................................................ 98 2 Map of the Alaska portion of the Yukon River drainage showing communities and fishing districts. ......... 99 3 District 1 showing statistical areas, Yukon Area. ........................................................................................ 100 4 District 2 showing statistical areas, Yukon Area. ........................................................................................ 101 5 District 3 showing statistical areas, Yukon Area. ........................................................................................ 102 6 District 4 showing statistical areas, Yukon Area. ........................................................................................ 103 7 District 5 showing statistical areas, Yukon Area. ........................................................................................ 104 8 District 6 showing statistical areas, Yukon Area. ........................................................................................ 105 9 Anvik River management area, Yukon Area. .............................................................................................. 106 10 Fairbanks nonsubsistence area. ................................................................................................................... 107 11 Set Gillnet Only Area of District 1, Lower Yukon Area. ............................................................................ 108 12 Select fall chum salmon monitoring projects, Yukon River drainage. ........................................................ 109 13 The Northern management area. ................................................................................................................. 110
LIST OF APPENDICES Appendix Page A1 List of indigenous fishes found in the Yukon Area. ....................................................................................... 112 A2 Yukon River drainage. ................................................................................................................................ 113 A3 Alaska and Canadian total utilization of Yukon River Chinook, chum, and coho salmon, 1961–2010. ..... 115 A4 Commercial Chinook salmon sales and estimated harvest by area, district, and country, Yukon River
drainage, 1961–2010. .................................................................................................................................. 117 A5 Commercial summer chum salmon sales and estimated harvest by area and district, Yukon River
drainage in Alaska, 1967–2010. .................................................................................................................. 120 A6 Commercial fall chum salmon sales and estimated harvest by area, district, and country, Yukon River
drainage, 1961–2010. .................................................................................................................................. 124

v
LIST OF APPENDICES (Continued) Appendix Page A7 Commercial coho salmon sales and estimated harvest by area and district, Yukon River drainage in
Alaska, 1961–2010. ..................................................................................................................................... 128 A8 Commercial Fisheries Entry Commission (CFEC) salmon permits issued by gear type, Yukon Area,
1976–2010. .................................................................................................................................................. 132 A9 Number of commercial salmon fishing permit holders making at least one delivery by district and
season, Yukon Area, 1971–2010. ................................................................................................................ 133 A10 Commercial salmon pack by species and type of processing, Yukon Area, 1960–2010. ............................ 136 A11 Estimated average prices per pound paid to fishermen, Yukon Area, 1964–2010. ..................................... 138 A12 Value of commercial salmon fishery to Yukon Area fishermen, 1977–2010. ............................................ 139 A13 Average weight of salmon harvests in the commercial fishery, Yukon Area, 1964–2010. ......................... 141 A14 Commercial Chinook salmon quotas or guideline harvest ranges (GHR), Yukon Area, 1974–2010. ........ 142 A15 Commercial summer chum salmon guideline harvest ranges (GHR), Yukon Area, 1990–2010. ............... 143 A16 Commercial fall chum salmon quotas or guideline harvest ranges (GHR), Yukon Area, 1974–2010. ....... 144 A17 Chinook salmon total utilization in numbers of fish by district, area, and country, Yukon River
drainage, 1961–2010. .................................................................................................................................. 146 A18 Summer chum salmon total utilization in numbers of fish by district, area, and country, Yukon River
drainage, 1961–2010. .................................................................................................................................. 154 A19 Fall chum salmon total utilization in numbers of fish by district, area, and country, Yukon River
drainage, 1961–2010. .................................................................................................................................. 160 A20 Coho salmon total utilization in numbers of fish by district, area, and country, Yukon River drainage,
1961–2010. .................................................................................................................................................. 167 A21 Yukon Area pink salmon total utilization in numbers of fish, by district and area, 1980–2010. ................ 174 A22 Percent age composition of combined commercial and subsistence salmon harvest by species, Yukon
River drainage, 1982–2009. ........................................................................................................................ 179 A23 Yukon River Chinook salmon historical harvest percentage by stock group for the United States and
Canada, 1981–2010. .................................................................................................................................... 183 A24 Salmon fishery projects conducted in the Alaska portion of the Yukon River drainage in 2010. ............... 184 A25 Selected environmental and salmon catch information, Yukon River drainage, 1961–2010. ..................... 188 A26 Total catch and estimated catch of Western Alaska (including Canadian Yukon River) Chinook salmon
(in thousands of fish) taken in Japanese high seas salmon gillnet fisheries and total catch of Chinook salmon taken in foreign, joint-venture, and U.S. domestic trawl fisheries, 1964-2010. .............................. 190
A27 List of emergency orders pertaining to the Districts 1-6 Chinook and summer chum salmon fishery, Yukon Area, 2010. ...................................................................................................................................... 192
A28 List of emergency orders pertaining to the Districts 1-6 fall chum and coho salmon fishery, Yukon Area, 2010. .................................................................................................................................................. 196
B1 Commercial catches of Chinook and summer chum salmon by mesh size, Districts 1 and 2, Lower Yukon Area, 1961–2010. ............................................................................................................................ 200
B2 Numbers of commercially caught Chinook salmon (in thousands of fish) by unrestricted mesh size periods, District 1, Lower Yukon Area, 1974–2010. .................................................................................. 202
B3 Numbers of commercially caught Chinook salmon (in thousands of fish) by unrestricted mesh size periods, District 2, Lower Yukon Area, 1978–2010. .................................................................................. 206
B4 Commercial Chinook salmon harvest (in numbers of fish) by statistical area, Lower Yukon Area, 1974–2010. .................................................................................................................................................. 209
B5 Commercial summer chum salmon directed harvest (in numbers of fish) and effort data, Districts 1 and 2, Lower Yukon Area, 1967–2010. ............................................................................................................. 211
B6 Commercial summer chum salmon harvest (in numbers of fish) by statistical area, Lower Yukon Area, 1983–2010. .................................................................................................................................................. 212
B7 Numbers of commercially caught fall chum salmon harvest (in thousands of fish) by period, District 1, Yukon Area, 1978–2010. ............................................................................................................................ 214
B8 Commercial fall chum salmon harvest (in numbers of fish) by statistical area, Lower Yukon Area, 1983–2010. .................................................................................................................................................. 218
B9 Commercial coho salmon harvest (in numbers of fish) by statistical area, Lower Yukon Area, 1983–2010. ............................................................................................................................................................ 220

vi
LIST OF APPENDICES (Continued) Appendix Page B10 Daily and cumulative CPUE for Chinook salmon in the set gillnet test fishery, Lower Yukon River,
2010. ............................................................................................................................................................ 222 B11 Daily and cumulative CPUE for Chinook salmon set gillnet test fishery sites in 2010, compared to
historic and late year average run timing, 1989 to 2008. ............................................................................. 224 B12 Big Eddy and Middle Mouth summer chum salmon daily and cumulative index, cooperative 5.5" mesh
drift gillnet test fishery, Lower Yukon River, 2010. ................................................................................... 225 B13 Fall chum and coho salmon, daily and cumulative catch per unit effort (CPUE), index, cooperative
drift gillnet (6") test fishery, Big Eddy and Middle Mouth sites combined, Lower Yukon River, 2001 to 2009 compared to 2010. .............................................................................................................................. 227
B14 Fall chum salmon daily and cumulative catch per unit effort (CPUE) index, Big Eddy and Middle Mouth sites combined, cooperative drift net test fishery, Lower Yukon River, 2001 to 2009 compared to 2010. ........................................................................................................................................................ 229
B15 Coho salmon daily and cumulative catch per unit effort (CPUE) index, Big Eddy and Middle Mouth sites combined, cooperative drift net test fishery, Lower Yukon River, 2001 to 2009 compared to 2010. . 230
C1 Commercial salmon sales and estimated harvest by statistical area, all gears combined, Upper Yukon Area, 2010. .................................................................................................................................................. 232
C2 Commercial set gillnet salmon sales and estimated harvest by statistical area, Upper Yukon Area, 2010. ............................................................................................................................................................ 233
C3 Commercial fish wheel salmon sales and estimated harvest by statistical area, Upper Yukon Area, 2010. ............................................................................................................................................................ 234
C4 Commercial Chinook sales and estimated harvest by statistical area, Subdistrict 4-A, Upper Cook Inlet, 1974–2010. .................................................................................................................................................. 235
C5 Commercial Chinook salmon sales and estimated harvest by statistical area, Subdistricts 4-B and 4-C, Upper Yukon Area, 1974–2010. ................................................................................................................. 237
C6 Commercial Chinook salmon sales and estimated harvest by statistical area, Subdistricts 5-A, 5-B and 5-C, Upper Yukon Area, 1974–2010. ......................................................................................................... 238
C7 Commercial Chinook salmon sales and estimated harvest by statistical area, Subdistrict 5-D, Upper Yukon Area, 1974–2010. ............................................................................................................................ 239
C8 Commercial Chinook salmon sales and estimated harvest by statistical area, District 6, Upper Yukon Area, 1974–2010. ........................................................................................................................................ 240
C9 Commercial summer chum salmon sales and estimated harvest by statistical area, Subdistrict 4-A, Upper Yukon Area, 1974–2010. .............................................................................................................................. 242
C10 Commercial summer chum salmon sales and estimated harvest by statistical area, Subdistricts 4-B and 4-C, Upper Yukon Area, 1974–2010. ......................................................................................................... 246
C11 Commercial summer chum salmon sales and estimated harvest by statistical area, Subdistricts 5-A, 5-B, and 5-C, Upper Yukon Area, 1974–2010. .............................................................................................. 248
C12 Commercial summer chum salmon sales and estimated harvest by statistical area, Subdistrict 5-D, Upper Yukon Area, 1974–2010. ................................................................................................................. 249
C13 Commercial summer chum salmon sales and estimated harvest by statistical area, District 6, Upper Yukon Area, 1974–2010. ............................................................................................................................ 250
C14 Commercial fall chum salmon sales and estimated harvest by statistical area, District 4, Upper Yukon Area, 1974–2010. ........................................................................................................................................ 252
C15 Commercial fall chum salmon sales and estimated harvest by statistical area, Subdistricts 5-A, 5-B, and 5-C, Upper Yukon Area, 1974–2010. ................................................................................................... 253
C16 Commercial fall chum salmon sales and estimated harvest by statistical area, Subdistricts 5-D, Upper Yukon Area, 1974–2010. ............................................................................................................................ 255
C17 Commercial fall chum salmon sales and estimated harvest by statistical area, District 6, Upper Yukon Area, 1974–2010. ........................................................................................................................................ 256
C18 Commercial coho salmon sales and estimated harvest by statistical area, District 4, Upper Yukon Area, 1974–2010. .................................................................................................................................................. 258
C19 Commercial coho salmon sales and estimated harvest by statistical area, District 6, Upper Yukon Area, 1974–2010. .................................................................................................................................................. 260
C20 Summary of test fish wheel projects conducted in the Upper Yukon Area, 2010. ...................................... 262
vii
LIST OF APPENDICES (Continued) Appendix Page D1 Chinook salmon subsistence harvest totals by fishing district and community of residence, as estimated
from postseason survey, returned permits and Yukon Area, 2000–2010. ................................................... 264 D2 Summer chum salmon subsistence harvest totals by fishing district and community of residence, as
estimated from postseason survey, returned permits and test fish projects, Yukon Area 2000–2010. ........ 266 D3 Fall chum salmon subsistence harvest totals by fishing district and community of residence, as
estimated from postseason survey, returned permits and test fish projects, Yukon Area 2000–2010. ........ 268 D4 Coho salmon subsistence harvest totals by fishing district and community of residence, as estimated
from postseason survey, returned permits and test fish projects, Yukon Area, 2000–2010. ....................... 270 D5 Subsistence salmon harvests taken under authority of a permit in portions of District 5, Yukon Area,
1974–2010. .................................................................................................................................................. 272 D6 Subsistence salmon harvests taken under authority of a permit, Tanana River drainage, 1973–2010. ....... 274 D7 Personal use salmon harvests taken under authority of a permit, Tanana River drainage, 1987–2010. ...... 277 E1 Yukon River drainage salmon spawning escapement goals for selected species and streams, 2007–
2010. ............................................................................................................................................................ 280 E2 Detailed preliminary salmon spawning escapement estimates for the Yukon River drainage, 2010. ......... 281 E3 Pilot Station sonar project estimates, Yukon River drainage, 1995, and 1997–2010. ................................. 285 E4 Chinook salmon aerial survey indices for selected spawning areas in the Alaska portion of the Yukon
River drainage, 1961–2010. ........................................................................................................................ 286 E5 Chinook salmon escapement counts for selected spawning areas in the Alaska portion of the Yukon
River drainage, 1961–2010. ........................................................................................................................ 288 E6 Chinook salmon escapements for selected spawning areas in the Canadian portion of the Yukon River
drainage, 1961–2010. .................................................................................................................................. 290 E7 Summer chum salmon escapements for selected spawning areas in the Alaska portion of the Yukon River
drainage, 1973–2010. ................................................................................................................................... 293 E8 Fall chum salmon abundance estimates or escapement estimates for selected spawning areas in Alaska
portions of the Yukon River drainage, 1971–2010. .................................................................................... 296 E9 Fall chum salmon abundance estimates or escapement estimates for selected spawning areas in
Canadian portions of the Yukon River drainage, 1971–2010. .................................................................... 299 E10 Yukon River fall chum salmon estimated brood year production and return per spawner estimates
1974–2010. .................................................................................................................................................. 302 E11 Coho salmon passage estimates or escapement estimates for selected spawning areas in the Alaska
portion of the Yukon River drainage, 1972–2010. ...................................................................................... 304 F1 Waters open to commercial fishing in the Cape Romanzof District. .......................................................... 308 F2 Commercial Pacific herring fishery data, Cape Romanzof District, 1980–2010. ........................................ 309 F3 Subsistence herring harvest (st) and effort data by community, Cape Romanzof, 1975–2010. .................. 311 F4 Subsistence harvest of herring roe on kelp by community, Cape Romanzof, 1993–2010. ......................... 312 G1 Estimated pink salmon subsistence harvest by residents of surveyed communities, with community and
district totals, Yukon Area, 2000–2010. ...................................................................................................... 314 G2 Reported subsistence and personal use fish harvested under authority of a permit, listed by permit area,
Yukon area, 2010. ....................................................................................................................................... 316 G3 Commercial freshwater finfish harvest, Lower Yukon Area, 1978–2010. .................................................. 317 G4 Commercial freshwater finfish harvest, Upper Yukon Area, 1971–2010. .................................................. 318 G5 Freshwater finfish salmon during the commercial salmon fishing season by district, Upper Yukon
Area, 1988–2010. ........................................................................................................................................ 320 H1 Commercial freshwater finfish harvest and sales, Colville River, Northern Areas, 1964–2010. ................ 322

viii

ix
A select list of acronyms, abbreviations, and symbols, in this report, listed alphabetically, are as follows:
ABWE Alaska Bureau of Wildlife Enforcement ADF&G Alaska Department of Fish and Game Agreement Interim Yukon River Salmon Agreement ASL Age, sex, and length data AVCP Association of Village Council Presidents AYK Arctic-Yukon-Kuskokwim BASIS Bering Arctic Subarctic Integrated Surveys BEG Biological Escapement Goal BLM Bureau of Land Management BOF Alaska Board of Fisheries BSFA Bering Sea Fishermen’s Association CDQ Community Development Quota CFEC Commercial Fisheries Entry Commission CPUE Catch per unit effort DFO Canadian Department of Fisheries and Oceans EEZ U.S. Exclusive Economic Zone EO Emergency Order FWP Division of Fish and Wildlife Protection IFMP Integrated Fisheries Management Plan JTC Joint Technical Committee of the U.S. Canada Panel NMFS National Marine Fisheries Service NOAA National Oceanic and Atmospheric Administration
Panel U.S./Canada Yukon River Panel PST Pacific Salmon Treaty R&E Fund U.S./Canada Restoration and Enhancement Fund SEG Sustainable Escapement Goal TCC Tanana Chiefs Conference, Inc. U.S. United States UFA Comprehensive Land Claim Umbrella Final Agreement USFWS United States Fish and Wildlife Services VHF Very High Frequency YRDFA Yukon River Drainage Fisheries Association YSC Yukon Salmon Committee

x
PREFACE This report summarizes the 2010 season and historical information concerning management of the subsistence, commercial and personal use fisheries of the Yukon–Northern Area of the Arctic-Yukon-Kuskokwim (AYK) Region. Data from selected management and research projects are included in this report. A more complete documentation of project results is presented in separate reports.
Data in this report supersedes information found in previous management reports. An attempt has been made to update information and correct errors in earlier reports.
This report is organized into major sections:
1. Salmon Fishery
2. Cape Romanzof District Herring Fishery
3. Other Marine and Freshwater Finfish Fisheries
4. Northern Area
Yukon Area salmon information is provided in Appendices A, B, C, D, and E, Cape Romanzof herring information is provided in Appendix F. Yukon Area freshwater finfish information is provided in Appendix G, and Northern Area information is provided in Appendix H.

1
ABSTRACT The 2010 Yukon and Northern Area management report summarizes management activities of the Alaska Department of Fish and Game, Division of Commercial Fisheries in the Yukon and Northern Areas of Alaska. The report provides the Yukon Area status of salmon stocks in 2010 with reference to historical data, presents an outlook for the 2011 fishing season, and provides data on the utilization of salmon species by commercial and subsistence (aboriginal) harvests, personal use (domestic), and sport (recreational) fishery. Alaska and Canada fisheries are summarized as the Yukon River is a transboundary river. The report further compiles summaries of selected Yukon River projects (e.g., mark–recapture, sonar, stock identification) and a review of salmon bycatch in the groundfish and pollock fisheries of the Bering Sea and the Gulf of Alaska. Complete documentation of these projects and results may appear in separate reports. Fisheries data in this report supersedes information in previous annual management reports. Some of the data presented are preliminary and may be presented with minor differences in future reports. The Yukon Area report is organized into the following sections: 1) Salmon Fishery: this section presents a description of the area, fishery resources, and fisheries management practices, and a comprehensive report of the 2010 salmon fisheries, by summer and fall season, and makes comparisons with previous years, 2) Cape Romanzof District Herring Fishery: this section presents a description of the area, fishery resources, fisheries and management practices, and summary of the 2010 herring fishery, and 3) Other Marine and Freshwater Finfish Fisheries: this section presents a description of the fishery resources and freshwater finfish fisheries other than salmon and herring and 4) Northern Area, which includes a description of the area and documentation of the Colville River commercial freshwater finfish fishery.
Key words Yukon River, Yukon Area, Yukon River Salmon Agreement, Chinook salmon, Oncorhynchus tshawytscha, chum salmon, Oncorhynchus keta, coho salmon, Oncorhynchus kisutch, Pacific herring, Clupea pallasii, escapement, commercial harvest, subsistence harvest, season outlook, Annual Management Report (AMR).
YUKON AREA INTRODUCTION The Division of Commercial Fisheries of the Alaska Department of Fish and Game (ADF&G) is responsible for the management of state subsistence, personal use, and commercial fisheries in the Yukon Area. This annual management report details the activities of ADF&G in the Yukon Area during 2010.
The Yukon Area includes all waters of the Yukon River drainage in Alaska and all coastal waters of Alaska from Point Romanof southward to the Naskonat Peninsula (Figure 1). Important commercial and subsistence fisheries include salmon and herring. Other marine and freshwater finfish are harvested primarily for subsistence use. A list of indigenous fishes found in the Yukon Area is provided in Appendix A1.

2
SALMON FISHERY
DESCRIPTION OF AREA AND DISTRICT BOUNDARIES The Yukon River is the largest river in Alaska and the fifth largest drainage in North America. The river originates in British Columbia, Canada, within 30 miles of the Gulf of Alaska, and flows over 2,300 miles to its terminus at the Bering Sea. It drains an area of approximately 330,000 square miles and approximately 222,000 square miles of the state. With the possible exception of a few fish taken near the mouth or in the adjacent coastal waters, only salmon of Yukon River origin are harvested in the Yukon Area.
Excluding the greater Fairbanks area (approximately 97,580 residents), there are approximately 21,900 rural residents in the Alaska portion of the drainage (U.S. Census Bureau American Fact Finder http://factfinder2.census.gov/faces/nav/jsf/pages/searchresults.xhtml?refresh=t#none, Accessed May 2011), the majority of whom reside in 43 small communities scattered along the coast and major river systems. Most of these people are dependent to varying degrees on fish and game resources for their livelihood.
Commercial salmon fishing is allowed along the entire 1,200 mile length of the mainstem Yukon River in Alaska, the lower 225 miles of the Tanana River, and lower 12 miles of the Anvik River. The Yukon Area is divided into 7 districts and 10 subdistricts for management and regulatory purposes (Figure 2). The district boundaries were originally established in 1961 and redefined in 1962, 1974, 1978, 1994, and 1996. The Lower Yukon Area (Districts 1, 2, and 3) includes the Yukon River drainage from the mouth to Old Paradise Village at river mile 301. The Coastal District was established in 1994, redefined in 1996, and is open only to subsistence fishing. The Upper Yukon Area (Districts 4, 5, and 6) is that portion of the Yukon River drainage upstream of Old Paradise Village to the border with Canada. The districts and subdistricts are further divided into 28 statistical areas for management and reporting purposes (Figures 3–9). The Yukon River mileages at specific locations are listed in Appendix A2.
In addition to the U.S. fisheries, Aboriginal, commercial, sport, and domestic salmon fisheries occur in the Canadian portion of the Yukon River drainage. The Canadian Department of Fisheries and Oceans (DFO) conducts the corresponding fishery management activities. Details about fisheries management in the Canadian portion of the Yukon River drainage can be found in annual Joint Technical Committee (JTC) of the U.S. Canada Panel reports.
FISHERY RESOURCES Five species of Pacific salmon are found in the Yukon River drainage: Chinook salmon Oncorhynchus tshawytscha, chum salmon O. keta, coho salmon O. kisutch, pink salmon O. gorbuscha, and sockeye salmon O. nerka. Chinook salmon are the largest salmon found in the Yukon River, ranging from 2 to 90 pounds. Spawning populations of Chinook salmon have been documented throughout the Yukon River drainage from the Archuelinguk River, located approximately 80 miles from the mouth, to nearly 2,000 miles upstream at the headwaters of the drainage in Canada. Chinook salmon begin entering the mouth of the Yukon River after ice breakup during late May or early June and continue to migrate upriver through mid-July.

3
The chum salmon return is made up of 2 genetically distinct runs, an early summer chum salmon run and a later fall chum salmon run. Summer chum salmon are characterized by: earlier run timing (early June to mid-July at the river mouth); rapid maturation in freshwater; and smaller body size (average 6 to 7 pounds). Summer chum salmon spawn primarily in run-off streams in the lower 700 miles of the drainage and in the Tanana River drainage. Fall chum salmon are distinguished by: later run timing (mid-July to early September at the mouth); robust body shape; and larger body size (average 7 to 8 pounds). Fall chum salmon primarily spawn in the upper portion of the drainage in streams that are spring fed. Major fall chum salmon spawning areas include the Tanana, Porcupine, and Chandalar river drainages, as well as various streams in Yukon Territory, Canada, including the mainstem Yukon River. Fall chum salmon run size is typically much smaller than that of summer chum salmon.
Coho salmon enter the Yukon River from late July through September. Coho salmon weigh on average approximately 7 pounds. Coho salmon spawn discontinuously throughout the Alaska portion of the drainage, primarily in tributaries in the lower 700 miles of the drainage, and in the Tanana River drainage. Major spawning populations of coho salmon have been documented in tributaries of the Tanana River and in the Andreafsky River.
Pink salmon enter the lower river from late June to late July. Pink salmon weigh on average approximately 2 to 3 pounds. They primarily spawn in the lower portion of the drainage, downstream of the community of Grayling (river mile 336); however, pink salmon have been caught in the mainstem Yukon River upstream as far upriver as Ruby (river mile 601) (ADF&G 1983). In the past decade, pink salmon have exhibited an abundance cycle alternating between high and low every 2 years, with high abundance typically observed during the even numbered years.
Sockeye salmon are uncommon in the Yukon River drainage and only a few fish are caught each year. Sockeye salmon have been reported in the mainstem Yukon River upstream of Rampart (river mile 763). Observations of sockeye salmon have occurred in the Innoko (ADF&G 1986), Kantishna (L. Barton, Fisheries Biologist, ADF&G, Fairbanks, personal communication 1988), Tanana River upstream of confluence with Kantishna River (B. Borba, Commercial Fisheries Biologist, ADF&G, Fairbanks; personal communications 2004), Anvik (M. Erickson, Fisheries Biologist, ADF&G, Anchorage; personal communication 1989), Andreafsky (Tobin and Harper 1995) and Gisasa (Wiswar 1999) river drainages.
MANAGEMENT The policy of ADF&G is to manage salmon runs to the extent possible for maximum sustained yield, unless otherwise directed by State regulation (Policy for the Management of Sustainable Salmon Fisheries (5 AAC 39.222)). ADF&G has managed salmon fisheries in the Yukon Area over the past few decades with the dual goal of maintaining important fisheries while at the same time achieving desired escapements consistent with the Sustainable Salmon Fisheries Policy. Management of the Yukon River salmon fishery is complex due to the inability to determine stock specific abundance and timing, overlapping multispecies salmon runs, increasing efficiency of the fishing fleet, allocation issues, and immense geographic expanse of the Yukon River drainage. The Alaska State Legislature and the Alaska Board of Fisheries (BOF) have designated subsistence use as the highest priority among beneficial uses of the resource. To maintain the subsistence priority and to provide for spawning escapements to ensure sustainable yields, Yukon River salmon fisheries must be managed conservatively.

4
Salmon fisheries within the Yukon River drainage may harvest stocks that are up to several weeks and over a thousand miles from their spawning grounds. Since the Yukon River commercial fishery is a mixed stock fishery, some tributary populations may be under or over exploited in relation to their actual abundance. Based on current knowledge, it is not possible to manage for individual stocks in most areas where commercial fishing occurs. Within the Yukon River drainage, only stocks within the Tanana and Anvik rivers can be managed as terminal harvest areas.
ADF&G uses an adaptive management strategy that evaluates run strength inseason to determine a harvestable surplus above escapement requirements and subsistence uses. Management plans, guideline harvest ranges (GHR) established by the BOF, and emergency order (EO) authority, which is used to implement time and area openings or closures and mesh size restrictions, are the primary tools used by ADF&G to manage the commercial salmon fisheries. Guideline harvest ranges have been established for Chinook, summer chum, and fall chum salmon commercial fisheries throughout the Alaska portion of the drainage (Table 1). ADF&G attempts to manage the commercial salmon fisheries so the harvest in each district or subdistrict is proportional to the respective guideline harvest ranges. Management of commercial fisheries for coho salmon is conditional to the abundance of fall chum salmon. Typically coho salmon harvest is incidental to the fall chum salmon fishery; however, ADF&G now has options to conduct late season coho salmon directed commercial fishing if certain stipulations are met.
During the fishing season, management is based on preseason projections and inseason run assessment. Inseason run assessment includes abundance indices from test fisheries, passage estimates from various sonars, and spawning escapement and harvest data. Since 1995, the main river sonar project at Pilot Station has provided inseason estimates of salmon passage for fisheries management. The level of commercial, subsistence, and personal use harvests can be adjusted through the use of EOs to control time and area of openings and closures. News releases announcing emergency orders are broadcast on local radio stations, VHF radio where available, transmitted by fax, posted on the state web site (http://www.adfg.alaska.gov/index.cfm?adfg=cfnews.main), and emailed to select communities, processors, buyers, and fishermen. Additionally, most processors and buyers are notified of the emergency order by telephone.
In response to the guidelines established in the Sustainable Salmon Fisheries Policy, the BOF classified Yukon River Chinook and fall chum salmon stocks as yield concerns during the September 2000 work session. This determination was based on the inability, despite the use of specific management measures, to maintain expected yields, or harvestable surpluses, above the stock’s escapement needs since 1998 and the anticipated low harvest level in 2001. In addition, the BOF classified Yukon River summer chum salmon and Toklat and Fishing Branch River fall chum salmon stocks as management concerns. This determination was based on the chronic inability to meet existing escapement goals for the summer chum salmon stock since 1998 and for the Toklat and Fishing Branch River’s fall chum salmon stocks since 1997.
During the January 2001 BOF meeting, action plans were developed through public process to guide ADF&G in managing each stock of concern. The action plans contained goals, measurable and implementable objectives, and provisions including fishery management actions needed to achieve rebuilding goals in proportion to each fishery’s use of and hazards posed to a salmon stock. Regulatory actions adopted by the BOF to protect the Yukon River stocks of concern included a 70% reduction of commercial fishing time during the South Peninsula/Area M June

5
fishery, the adoption of the Yukon River King Salmon Management Plan (5 AAC 05.360), changes to the Yukon River summer chum and fall chum salmon management plans, and adoption of a subsistence salmon fishing schedule for the Yukon River. The BOF determined that the subsistence fishing schedule should provide a reasonable opportunity for subsistence users during years of normal to below average salmon run strength. The schedule was enacted to spread the harvest throughout the river, to reduce the impact on a particular stock, and spread subsistence harvest opportunity among users. The goal of the schedule is to provide windows of time during which salmon migrate upriver unexploited. If inseason run strength assessment projects indicate that there is sufficient surplus above escapement and subsistence uses to allow a commercial fishery, the subsistence fishing schedule reverts to the pre-2001 subsistence fishing schedule.
During the January 2007 BOF meeting, Yukon River stocks of concern were re-evaluated. Chinook salmon stock was continued as a yield concern, summer chum salmon stock was discontinued as a management concern, and fall chum salmon stock was discontinued as a stock of concern (Bergstrom et al. 2009; Borba et al. 2009; Howard et al. 2009). Because low yields of Chinook salmon have continued in the Yukon River since 2010 the BOF continued their stock of yield concern status at the 2010 Arctic Yukon Kuskokwim (AYK) meeting.
Conservation management strategies under the management action plan adopted by the BOF allow for successful achievement of escapement goals. The highest management priority is to provide for escapement in both Alaska and Canada. From 2002 to 2005, Chinook salmon management strategies shifted from commercial openings occurring at the first quarter point of the run to the midpoint of the run or later. This strategy provided for conservation of early pulses that are largely comprised of fish bound for Canada before commercial activity started in the lower river. Based on preseason projections and inseason run assessments in 2006 and 2007, commercial fishing was scheduled to commence near the first quarter point of the Chinook salmon run and harvest spread over the midpoint of the run. Beginning in 2008 through 2010, poor Chinook salmon runs did not provide for a Chinook salmon directed commercial fishery, and in 2008 through 2009, management strategies reduced subsistence fishing time.
The Yukon River Chinook salmon run is managed according to the guidelines described in the Yukon River King Salmon Management Plan (5 AAC 05.360). The management plan provides for escapement needs and subsistence users while aiming to reestablish the historic range of harvest levels by other users. Additionally, when the projected commercial harvest is 0–67,350 Chinook salmon, a specific percentage of harvest determined by the BOF should be allocated by district or subdistrict based on the low end of the established guideline harvest ranges. At the 2009 BOF meeting, the management plan was amended by the BOF to allow closure to all salmon fishing in a district or subdistrict if run assessment information indicates an insufficient abundance of Chinook salmon.
The Yukon River summer chum salmon run is managed according to the guidelines described in the Yukon River Summer Chum Salmon Management Plan (5 AAC 05.362). The intent of this plan is to conservatively manage harvests in order to provide for escapement needs and subsistence use priority before other consumptive uses such as commercial, sport, and personal use fishing. Since 2001, this management plan allows for varying levels of harvest opportunity depending on the run size projection. If project run is size is 700,000 to 1,000,000 summer chum salmon and a district, subdistrict, or tributary is projected to meet its escapement goals, then a

6
directed commercial fishery may be opened in the immediate area. When the run size is projected to be greater than 900,000 fish based on Pilot Station sonar project, a directed summer chum salmon commercial fishing may be opened to harvest the available surplus. When the projected commercial harvest range is 0–400,000 summer chum salmon, a specific percentage of harvest determined by the BOF should be allocated by district or subdistrict based on the low end of the established guideline harvest ranges. In 2010, the BOF modified the management plan to allow a commercial harvest up to 50,000 fish if the run size is between 900,000 and 1,000,000 fish, distributed by district or subdistrict in proportion to the guideline harvest levels.
The fall chum salmon run is managed according to the guidelines described in the Yukon River Drainage Fall Chum Salmon Management Plan (5 AAC 01.249). This plan stipulates that directed fall chum salmon commercial fisheries may only be allowed on the projected surplus of the run above 500,000 fall chum salmon for the entire Yukon River drainage. There is an exception to this plan where commercial fishing may be allowed in portions of the drainage where escapement and subsistence needs are projected to be exceeded. Early management actions are based on the preseason outlook derived from the relationship between summer and fall chum salmon. Typically, initiation of commercial fishing does not occur until the quarter to midpoint of the run (first week to middle of August) when information from inseason assessment projects can provide a reasonable projection of run strength. In some cases, commercial fishing is allowed during the transition between summer and fall season (July 16) if there is a large abundance of summer chum salmon in the lower river.
Management of directed coho salmon fishing during the fall season is complicated by an overlapping run of more abundant fall chum salmon stocks. With the coho salmon run is managed according to the guidelines described in the Yukon River Coho Salmon Management Plan (5 AAC 05.369). This plan allows a directed coho salmon commercial fishery when it is judged that there is a surplus of coho salmon available and the fall chum salmon run is above the 500,000 fish threshold necessary to allow a directed fall chum salmon fishery. Thus, commercial harvest of coho salmon is dependent upon the abundance of fall chum salmon and accompanying management strategies used to harvest fall chum salmon. However, modifications to the Yukon River Coho Salmon Management Plan (5 AAC 05.369) were made in 2010 (see section Alaska Board of Fisheries Actions 2010) that provide coho salmon directed commercial opportunity when fall chum salmon directed commercial fishing is not allowed.
Since 1998, below average runs and poor commercial market conditions resulted in limited exploitation of summer and fall chum salmon. In 2007, both the strength of the run and renewed market interest allowed for summer chum salmon directed commercial opportunity. While commercial fishing has occurred, redevelopment of this fishery is hindered by management strategies taken to reduce incidental harvest of co-migrating Chinook salmon. Since 2008, despite the strength of preceding summer chum salmon runs, the fall chum salmon run has not been large enough to provide for commercial opportunity. From 2008 to 2010, management actions have been taken to delay commercial fishing to provide for escapement and subsistence use.

7
Various government and non-government agencies operate projects in the Yukon Area and in Canada to obtain the biological information necessary for management of salmon runs (Appendix A24). These projects include:
1. Catch and Effort Assessment: The harvest and effort of commercial, subsistence, personal use, and sport salmon fisheries were assessed for the Alaska portion of the Yukon River drainage. Commercial salmon fishing was monitored from June through October using fish tickets of commercial sales of salmon. In the majority of the Yukon Area, there is no regulatory requirement for fishermen to report their subsistence salmon harvest. The subsistence salmon harvest from communities is estimated through a voluntary survey program. The program uses a variety of techniques to assess subsistence fishing harvest and effort, including interviews, questionnaires, and catch calendars. In areas of the drainage with road access, fishermen must obtain a subsistence or personal use household permit on which their daily harvest is recorded. The subsistence and personal use fishery harvest is also monitored by these permits. Similarly, sport fishing harvest and effort is estimated using mail-out questionnaires to sport fishing permit holders. Weekly teleconferences were held from May to August by the Yukon River Drainage Fisheries Association (YRDFA) as a forum for fishermen along the Yukon River to interact with state and federal managers and dissemination fisheries information.
2. Test Fishing: ADF&G operates a test fishing project in the lower Yukon River at South, Middle, and North Mouths. The project utilizes set gillnets from June through July 15 to index Chinook salmon runs. Additionally, test fishing that utilizes drift gillnets from June through August provide an index of the Chinook, summer chum, fall chum, and coho salmon runs. Catch rates and species composition from theses test fisheries provide run timing, age composition, and an index of relative abundance for interannual comparisons. Since 2009, an offshore test salmon fishing feasibility study has been operated in Hooper Bay, approximately 30 miles south of the Yukon River mouth. The coastal test fishery assesses run abundance, species composition, and run timing information of salmon bound for the Yukon River in offshore waters to assist with timely management decisions. A test fishery in Mountain Village has been operated by the Asa'carsarmiut Traditional Council to index fall chum and coho salmon run timing and relative abundance using drift gillnets. Additionally, beginning in 2010, a test fishery in Mountain Village was operated by YDFDA to index Chinook salmon run timing and relative abundance using drift gillnets. Test fish wheels equipped with video monitoring systems were used tot index salmon and non-salmon passage based on CPUE at the following locations: 1) on the south (left) bank of the mainstem Yukon River near the community of Tanana (fall season only); 2) in the area known as “Rapids” between the communities of Tanana and Rampart on the mainstem Yukon River; and 3) downstream of the community of Nenana on the Tanana River.
3. Main River Sonar Projects: Hydroacoustic equipment, including both split-beam and DIDSON (Dual frequency IDentification SONar), was operated in the mainstem Yukon River at 2 locations near Pilot Station to obtain inseason salmon passage estimates by species and near Eagle in the mainstem Yukon River bordering Canada to estimate passage of Chinook and chum salmon.

8
4. Tributary Sonar Projects: Hydroacoustic equipment was operated in the Anvik and Sheenjek rivers to estimate summer and fall chum salmon spawning escapements, respectively. Hydroacoustic equipment was also operated in the Chandalar River to estimate fall chum salmon escapement. Age, Sex, and Size Composition: Biological data were collected from salmon harvested in commercial, and subsistence fisheries, as well as test fisheries and escapement projects located throughout the Yukon River drainage. Samples were collected using gillnets, fish wheels, beach seines, weir traps, and carcass surveys. Scales were collected from salmon harvested to determine age composition of the runs. Chum salmon carcass sampling uses vertebra instead of scales for aging because of resorption problems. Sex was determined by examining internal reproductive organs or external characteristics. Length was measured from mideye to fork of tail.
5. Aerial and Ground Surveys of Salmon Spawning Streams: Aerial surveys were flown to monitor spawning escapements in major spawning tributaries throughout the Yukon River drainage. Surveys for Chinook and summer chum salmon were flown in July and August. Fall chum salmon foot surveys were conducted at selected areas in the Tanana River drainage in October and November. Additionally, aerial and ground surveys were conducted in the Nenana River drainage to estimate fall chum and coho salmon escapement in October and November.
6. Tower Projects: Tower counting projects were used on the Chena and Salcha rivers to estimate escapement of Chinook and summer chum salmon from July through August. A tower project was also operated on the Goodpaster River in the Tanana River drainage to estimate Chinook and summer chum salmon escapement during July.
7. Weir Projects: Weirs were operated on the East Fork Andreafsky River, Gisasa River, and Henshaw Creek from June to August in order to estimate Chinook and summer chum salmon escapement.
8. Other Projects: i. The presence of Ichthyophonus in Chinook salmon was monitored in the Lower
Yukon Area at Emmonak and in the Upper Yukon Area at Eagle. ii. Little information is known about the rearing habitat for juvenile Chinook salmon
in non-natal streams in the Yukon River. In July and August, juvenile Chinook salmon were captured to determine whether they rear in tributary streams between the U.S./Canada border and the Tanana River confluence. Additionally, non-natal stream rearing habitat characteristics were described for juvenile Chinook salmon.
Scale pattern analysis, age composition estimates, and geographic distribution has been used by ADF&G on an annual basis from 1981 through 2003 to estimate stock composition of Chinook and chum salmon in Yukon River harvests. In 2004, the feasibility of using genetic analysis in replacement of scale pattern analysis to assess stock composition was first tested (JTC 2011). Since that time, the development of genetic methods and techniques for Chinook and chum salmon stock identification in the Yukon River drainage has been ongoing (Flannery et al. 2010). Salmon stock composition using genetic techniques demonstrates promise as a useful tool for fisheries management on the Yukon River in future years.
In 2010, ADF&G’s Division of Commercial Fisheries permanent full time staff assigned to the Yukon Area included 14 positions: 2 area management biologists (one summer, one fall), 2

9
assistant area management biologists, 9 research biologists, and one field office assistant. In addition, approximately 30 seasonal employees assisted in seasonal management and research projects. ADF&G staff also assisted with the enforcement of regulations in cooperation with the Department of Public Safety, Division of Fish and Wildlife Protection (FWP).
ALASKA SALMON FISHERIES DESCRIPTIONS Commercial Fishery The first recorded commercial salmon harvest in the Alaska portion of the Yukon River drainage occurred in 1918. Relatively large harvests of Chinook, chum, and coho salmon were taken during 1919 to 1921 (ADF&G 1985). The majority of these harvests were taken outside of the river mouth because of restrictions imposed within the river. The early commercial fishery was closed from 1925 to 1931 because of concerns for the large inriver subsistence fishery. Commercial fishing for Chinook salmon was resumed at a reduced level in 1932 and has continued since that time. Commercial harvests of chum and/or coho salmon occurred during 1918 to 1921, 1952 to 1954, 1956, and since 1961. Pink salmon commercial harvests to date within the Yukon River have been very small due to an extremely limited market (Appendix A21).
From 1954 to 1960, a 65,000 Chinook salmon commercial harvest quota was in effect for the Alaska portion of the Yukon River. Of this total, not more than 50,000 fish could be taken below the mouth of the Anuk River (river mile 63), not more than 10,000 fish could be taken in the area between the mouths of the Anuk and Anvik rivers, and not more than 5,000 Chinook salmon could be taken upstream from the confluence of the Anvik River. The current Chinook salmon guideline harvest ranges have been in effect since 1981 (Appendix A14). Chinook salmon commercial harvests began increasing during the late 1970s (Appendix A4), likely due to increased fleet efficiency and the duration of above average run sizes. Concern for possible over-exploitation resulted in more conservative fisheries management; therefore, reduced harvests occurred during the late 1980s into the 1990s. The drastic decline of salmon stocks from 1998 through 2002 significantly changed the character of Yukon River salmon fisheries and, since 2001 the management action plan adopted by the BOF, has been conservative.
Historically, the first commercial opening occurred at the first quarter point of the run. ADF&G uses inseason information from the Emmonak test fishery, subsistence harvest reports, and Pilot Station sonar project passage estimates to assess salmon run timing and strength. As the run progresses upriver, other projects provide additional run assessment information. From 2002 to 2005, management strategies for Chinook salmon shifted from first quarter point commercial openings to openings at the midpoint of the run or later. This interim strategy was designed to pass fish upstream for escapement and provide for cross-border commitments to Canada and subsistence uses during years of poor Chinook salmon run sizes. A drawback to this approach is the concentration of commercial harvest on stocks migrating during the latter half of the run. Therefore, the harvest is not spread out over the entire run and commercial harvest opportunity could be foregone if a strong run materializes. The preferred strategy for managing commercial fisheries is to begin fishing during near the first quarter point and spread the harvest over the midpoint of the run. Additional harvest can occur later in the season, depending on stock assessment information from escapement projects.
Based on preseason projections and inseason run assessments in 2006 and 2007, commercial fishing was scheduled to commence near the first quarter point of the Chinook salmon run and
10
harvest spread over the midpoint of the run. During 2008 to 2010, preseason projects anticipated below average to poor run sizes. Despite a portion of the Chinook salmon surplus that had gone unharvested in 2001, 2003, and 2004, poor run sizes in 2007 to 2010 did not provide for a Chinook salmon directed commercial fishery. In 2010, a conservative preseason management plan was developed to conserve Chinook salmon. The plan maintained providing for escapement goals and treaty obligations as the highest management priority and subsistence fishing as the highest priority use. No directed Chinook salmon commercial fishery was anticipated or eventuated during the season. As opposed to the 2009 summer commercial season, riverwide reductions to the subsistence fishing schedule were not enacted; therefore, the sale of Chinook salmon incidentally caught in the directed summer chum salmon fishery was allowed. This action was different from the 2009 season, when subsistence fishing was reduced beyond the regulatory windowed schedule and the BOF adopted an emergency regulation from July 1 to July 16 restricting the sale of Chinook salmon taken incidentally during the commercial summer chum salmon season in Districts 1–5.
Summer chum salmon commercial harvests increased greatly during the 1980s as a result of regulation changes (e.g., mesh size specifications and earlier openings), greater availability of processing facilities and tendering, higher exvessel prices, development of Japanese markets, and the occurrence of several very large run sizes (Appendix A5). In February 1990, the BOF established a riverwide guideline harvest range of 400,000 to 1,200,000 summer chum salmon (Appendix A15).
Guideline harvest ranges for districts and subdistricts were established by the BOF based on the 1975 to 1989 average harvest shares. Summer chum salmon commercial harvests declined from 1990 through 1993 in response to below average run sizes. Beginning in 1994, declining chum salmon flesh markets limited the harvest, particularly in the lower river. In March 1994, the BOF adopted the Anvik River Chum Salmon Fishery Management Plan (5 AAC 05.368.), which established regulations allowing for a commercial summer chum salmon roe fishery within the Anvik River. Low commercial harvests, related to low summer chum salmon runs and decreasing market interest, continued riverwide through 2003. Additionally, in order to conserve summer chum salmon, inseason management actions were taken to reduce subsistence fishing beyond the regulatory schedule and restrict subsistence gear types. Beginning in 2004, the summer chum salmon run strength began to increase following poor run sizes from 1998 to 2002. However, most of the available surplus went unharvested between 2002 and 2006 due to a lack of market interested. By 2007 the strengthened run size coupled with renewed market interest allowed for directed commercial opportunity in Districts 1 and 2 and, since 2008, in Subdistrict 4-A. Despite harvestable surpluses available in 2007 through 2010, the redevelopment of this fishery is hindered by management strategies taken to reduce incidental harvest of co-migrating Chinook salmon. In response to poor Chinook salmon runs, summer chum salmon directed periods have generally been scheduled to occur when Chinook salmon abundance is expected to be low or after the majority of the run have passed through the lower river. In 2010, while the summer chum salmon run size was anticipated to provide for escapements, support a normal subsistence harvest, and provide a surplus for commercial harvest, commercial harvest activity was delayed early in the season in effort to protect weak Chinook salmon run sizes.
The directed commercial fishery for fall chum salmon began in 1961. Fall chum salmon commercial harvests increased beginning in 1979 (Appendix A6). Low fall chum salmon

11
spawning escapements in the mid-1980s resulted in more conservative management and therefore reduced commercial harvests from 1986 to 1990. Guideline harvest ranges for fall chum salmon were reduced by the BOF in 1986, but the upper end increased to their original levels in 1990 (Appendix A16). The BOF adopted the Yukon River Drainage Fall Chum Salmon Management Plan (5 AAC 01.249) in March 1994. The management plan has been reviewed and modified by the BOF several times since then, the most recent one occurring in 2010 (see section Alaska Board of Fisheries Actions 2010).
Coho salmon runs to the Yukon River are of lesser magnitude than fall chum salmon. Typically, coho salmon were harvested incidentally to the directed fall chum salmon commercial fishery (Appendix A7). Management of directed coho salmon commercial fishing is complicated by their overlapping run timing with fall chum salmon stocks. Prior to 1999, no regulation was in place guiding the commercial harvest of coho salmon. In response, in November of 1998, the BOF adopted the Yukon River Coho Salmon Management Plan (5 AAC 05.369) that provided guidance for directed coho salmon commercial fishing. Since then, this plan has been revised several times. The most recent modifications were adopted by the BOF in January 2010 (see section Alaska Board of Fisheries Actions 2010).
The majority of commercial fishermen are residents of the Yukon River drainage (Table 2). The commercial salmon processors, buyers, and catcher-sellers operating on the Yukon River in 2010 can be referenced in Table 3. The cash income derived from the commercial salmon fishery has assisted many area residents in their subsistence life-style. For example, income earned from commercial fishing is often used to obtain hunting and fishing gear such as nets, boats, and outboard motors, which are utilized in subsistence activities. Most commercial fishermen operate outboard powered skiffs of 18 to 24 feet in length. Very few skiffs utilize gillnet rollers or power reels of any type. Use of larger outboard motors (greater than 100 horsepower), VHF radios, and fish finders have increased the fleet efficiency.
The majority of the Yukon Area salmon harvest is presently processed as a fresh or frozen product in contrast to earlier years when canning and salting was more important (Appendix A10). Currently, most salmon are processed at shore based or floating operations or transported by aircraft outside the area for processing. However, limited “value added” products such as smoked salmon and salmon sausage are now being produced within the Yukon Area.
Subsistence Fishery Yukon Area communities have a long tradition of harvesting salmon for subsistence use. Fishing activities are usually based from a fish camp or a home community. Extended family groups, representing 2 or more households, often work together to harvest, cut, and preserve salmon for subsistence use. Some households from Yukon River tributary communities, such as Shageluk and Venetie, may operate or share in the operation of fish camps along the mainstem Yukon River (Figure 2). The majority of subsistence and personal use harvests are made up of Chinook, chum, and coho salmon.
Subsistence salmon fishing activities in the Yukon Area typically begin in late May and continue through early October with salmon fishing in May and October highly dependent upon river ice conditions. Subsistence salmon harvested for human consumption are commonly dried, smoked, or frozen. There is usually little wastage of fish taken for subsistence purposes, although damp weather may cause some drying fish to spoil and some fish are lost to disease (e.g. Ichthyophonus) or predation (e.g. birds and/or bears).

12
In addition to human consumption, salmon are fed to dogs, which are used for recreation, transportation, and as haul animals. Small (“jacks”), summer chum, fall chum, and coho salmon are primarily harvested to feed dogs in the Upper Yukon Area (Andersen and Scott 2010). Most of the subsistence salmon used for dog food are dried summer chum salmon or “cribbed” (frozen in the open air) fall chum and coho salmon. The practice of keeping sled dogs is more common in the Upper Yukon Area than in the Lower Yukon Area. During the active fishing season all areas feed scraps from salmon processing to dogs. Relatively few whole fresh salmon are fed to dogs in the Lower Yukon Area but due to the larger numbers of dogs in the Upper Yukon Area harvesting salmon for dogs throughout the summer is more common. A gradual reduction in the need for salmon as dog food began around 1930 when airplanes began replacing sled dogs as the primary mail and supply carrier. This decline accelerated in the 1960s with the introduction of snow machines to Interior Alaska (Andersen and Scott 2010). Beginning in the early 1980s, there was a renewed interest in recreational use and racing of sled dogs, thereby increasing the number of subsistence salmon harvested for dog food. From 1991 to present day there has been a decline in the number of households with dog teams (Andersen and Scott 2010). The decline is due in part to poor chum salmon runs from 1998 to 2002 combined with the steep rise in cost of equipment (boat, motor, nets, fuel) needed to harvest fish for dog food.
Subsistence and personal use fishermen in the Yukon Area primarily use drift gillnets, set gillnets, and fish wheels to harvest salmon. Set gillnets are used throughout the Yukon Area, whereas under state regulations, drift gillnets are only allowed from the mouth of the Yukon River to approximately 18 miles below the community of Galena (River Mile 530) to harvest salmon. Drift gillnets are allowed under federal permits in Subdistricts 4-B and 4-C for a portion of the summer during regulatory openings. Although fish wheels are a legal gear type for subsistence fishing throughout the drainage, they are essentially used only in the Upper Yukon Area where water conditions and fishing locations are more suitable. Building materials, such as logs and young spruce trees used for the raft, axle and axle stanchion, lead, and basket construction are also more available in the Upper Yukon Area.
Subsistence salmon fishing in the Yukon Area primarily occurs in nonpermit areas where harvest information is estimated by the annual subsistence survey. Permit areas include the entire Tanana River and portions of the Yukon River that are accessible from the road system. Fishing households are required to obtain a subsistence or personal use permit and submit records of their harvests in these areas (Figure 2). Subsistence permits are used to document harvest data, otherwise much harvest would go unreported because of the transient nature of these fishermen and the fact that most do not reside in a surveyed community.
A personal use fishery was implemented in 1986 and currently takes place in the Fairbanks Nonsubsistence Area (Figure 10). The management area was established in 1992 due to the heavy demand urban fishermen could potentially place on the resource. In this nonsubsistence area, fishermen must possess a personal use household permit and a resident sport fish license. State regulations dictate that personal use fishing has a lower priority than subsistence fishing. Similar to subsistence fishing permits, data collected from personal use permits allow managers to track harvest.
Commercial fishing occurs in portions of the Yukon Area and residents may participate in both commercial and subsistence salmon fishing. Commercially harvested salmon may be retained for subsistence use. In some areas, subsistence fishing is separated from commercial fishing by closures before, during, and after commercial periods, while in other areas subsistence fishing

13
and commercial fishing may occur concurrently. The BOF adopted regulations which separated subsistence and commercial fishing periods beginning in 1993 in Districts 1, 2, and 3 and in 1994 in Subdistrict 4-A. By regulation, once the commercial salmon season is open, subsistence salmon fishing is allowed continuously except for 18 hours immediately before, during, and 12 hours after each District 1, 2, or 3 summer season commercial salmon fishing period. During the fall season in Districts 1, 2, and 3, subsistence salmon fishing may not occur 12 hours immediately before, during, and 12 hours after each commercial fishing period. Separation of fishing times allows for better enforcement of commercial regulations and management of the fisheries. Currently, salmon or their eggs harvested during subsistence openings cannot be legally bought or sold under State of Alaska regulations. During a typical salmon fishing season, substantially more time is allowed for subsistence and personal use salmon fishing than for commercial fishing.
In January 2001, the BOF modified regulations by adopting a subsistence salmon fishing schedule. The BOF judged that this subsistence fishing schedule should provide a reasonable opportunity for subsistence fishermen to obtain an average subsistence harvest during years of normal to below average salmon run strength. The schedule was enacted to spread the harvest throughout the river, to reduce the impact on a particular stock, and spread subsistence harvest opportunity among users. The goal of the schedule is to provide windows of time during which salmon migrate upriver unexploited.
The subsistence salmon schedule is based on current, or past, fishing schedules and is implemented chronologically, consistent with migratory timing, as the salmon run progresses upstream. The commissioner may alter this schedule for conservation by EO if preseason or inseason run indicators show it is necessary. The schedule for subsistence salmon fishing is as follows:
(1) Coastal District, Innoko, Koyukuk, and Kantishna rivers, and Subdistrict 5-D: 7 days per week;
(2) Districts 1, 2, 3: two 36-hour periods a week;
(3) District 4 and Subdistricts 5-B and 5-C: two 48-hour periods a week;
(4) Subdistrict 5-A and District 6: two 42-hour periods a week; and
(5) Old Minto Area: 5 days per week.
If inseason run strength assessment projects indicate that there is sufficient surplus above escapement and subsistence requirements to allow a commercial fishery, the subsistence fishing schedule then reverts to the pre-2001 subsistence fishing schedule.
Prior to 2001, the upper portion of District 4 (Subdistricts 4-B and 4-C) and in Subdistricts 5-B and 5-C, subsistence salmon fishing was allowed 7 days per week until 24 hours prior to and following the commercial salmon fishing season. In these areas, subsistence salmon fishing periods coincide with commercial salmon fishing periods. Additional subsistence-only salmon fishing periods are also allowed during the commercial salmon fishing season. In Subdistrict 5-A, subsistence fishing was allowed 7 days per week until 24 hours prior to the commercial salmon fishing season. In Subdistrict 5-D, subsistence salmon fishing is allowed 7 days per week throughout the fishing season. Subsistence fishing within the lower Tanana River drainage is allowed during two 42-hour periods per week throughout the fishing season unless altered by

14
EO. In the upper Tanana River drainage, subsistence fishing is allowed 7 days per week throughout the fishing season.
Federal Subsistence Management The Alaska National Interest Lands Conservation Act (ANILCA) of 1980 mandates that rural subsistence users have a priority over other users to take wildlife on Federal public lands where recognized customary and traditional use patterns exist and required the creation of Regional Advisory Councils (RAC) to enable rural residents to have a meaningful role in Federal subsistence management. On October 1, 1999, the Secretaries of Interior and Agriculture published regulations to expand Federal management of subsistence fisheries to Alaska rivers, lakes, and limited marine waters within, and adjacent to, Federal public lands. The Secretary of Interior and the Secretary of Agriculture delegated their authority in Alaska to the Federal Subsistence Board (FSB) to manage fish and wildlife resources for subsistence uses on Federal public land, including waters running through or next to these lands. Federal subsistence fishing regulations are adopted by the FSB. The RACs provide recommendations and information to the FSB, review policies and management plans, provide a public forum, and deal with other matters relating to subsistence uses. The FSB or USFWS may close fishing for other uses in these waters and implement a priority for federally qualified rural subsistence users if it is determined that state-managed fishery management is causing subsistence or conservation concerns (Ward and Horn 2003).
Federal subsistence fishing schedules, openings, closures, and fishing methods are established in regulations (Department of Interior 2009). In general, the regulations are the same as those issued for subsistence taking of fish under Alaska Statutes (AS 16.05.060); however, differences in regulations do exist. In some cases, State regulations can be superseded by a Federal Special Action.
Commercial-Related Harvests Distinguishing between subsistence and commercial harvests is more difficult in salmon fisheries where commercial fishermen extract and sell only roe. Stripped carcasses are a byproduct of the commercial roe fishery and are available for fishermen to utilize for consumptive purposes. Subsistence harvests are defined strictly as harvests occurring under subsistence fishing regulations. Neither salmon nor their eggs harvested under subsistence regulations can be legally bought or sold under State of Alaska regulations; however, commercially harvested salmon may be retained by fishermen for consumptive use. Salmon taken during commercial fishing operations that provide fishermen both personal and commercial use are specially assigned to a commercial-related harvest category.
Commercial chum salmon roe fisheries began in 1978 in the Upper Yukon Area. Historically, the commercial-related harvest was a small proportion of the subsistence harvest and was easily absorbed. During this time, ADF&G’s subsistence survey questions were not structured to identify the commercial-related harvests, and it is believed that commercial-related salmon harvests were reported primarily as subsistence harvests. Beginning in 1981 and through most years to 1997, the number of female summer chum salmon carcasses available from the commercial roe fishery, including the incidental harvest of male chum salmon, was greater than the subsistence utilization levels documented prior to commercial roe fisheries in Subdistrict 4-A. In 1984, the Division of Subsistence conducted the first subsistence surveys directly addressing the amount of commercial-related harvests in the communities of Kaltag and Nulato.

15
These surveys attempted to exclude the commercial-related summer chum salmon used from the subsistence harvest. As a result, the subsistence summer chum salmon harvest estimates for Kaltag and Nulato in 1984 were below harvest estimates for previous years. From 1986 to 1989, efforts to identify commercial-related summer chum salmon harvest from the Subdistrict 4-A subsistence harvest estimates were continued (Sandone 1991). Although, during the transition, it is probable that some portion of the commercial-related harvest was still being reported as subsistence harvest. It was not until 1990 that the survey questions and fishermen reports resulted in satisfactory separation into subsistence and commercial-related harvests. From 1998 to 2006, due to a series of poor summer chum salmon runs followed by poor market conditions, no summer chum salmon roe fisheries occurred. Beginning in 2007, following increased market interest and strengthening run sizes, commercial exploitation of summer chum salmon roe was renewed in Subdistrict 4-A at a much smaller scale than before 1998.
All salmon caught by commercial fishermen during a commercial fishing period are required by regulation to be reported on fish tickets, including the number of males and number of female salmon harvested to produce roe sold. Prior to 1990, commercial harvest included the number of fish sold in the round plus the number of females taken to produce the roe sold. Since 1990, by regulation, commercial-related harvests are considered to be the number of female salmon taken to produce the roe sold plus the incidental harvest of male salmon. ADF&G estimates the number of male and female chum salmon harvested during a commercial fishing by using the average pounds of roe per female and the sex ratio calculated during each commercial fishing period.
In 1994, the BOF adopted regulations that allowed a terminal commercial summer chum salmon fishery on the Anvik River. A commercial summer chum salmon roe fishery occurred on the Anvik River from 1994 through 1997. The Anvik River commercial summer chum salmon fishery only involved the sale of roe and resulted in additional chum salmon carcasses becoming available to subsistence users. Commercial-related harvests in the Anvik River fishery are based only on the number of female chum salmon harvested to produce roe. The gear types utilized in this fishery allow for the release of male chum salmon and other non-targeted salmon species.
Personal Use Fishery In 1986, subsistence fishing was limited to rural Alaska residents. The BOF created personal use salmon fisheries in the Yukon Area for nonrural state residents. The regulation directed that fishermen residing within nonrural areas be considered personal use fishermen regardless of where they fished. Correspondingly, fishermen residing in rural areas were considered subsistence fishermen regardless of where they fished. The residents of the greater Fairbanks area were considered non-rural fishermen. Under the statutes and regulations that were in effect from 1988 until July 1, 1990, Alaska residents domiciled in nonrural areas were prohibited from participating in subsistence fisheries. During that time, nonrural residents harvested salmon under personal use fishing regulations wherever they fished. Personal use fishing is a lower priority use of the fish resource than subsistence fishing.
Effective July 1, 1990, the Alaska Supreme Court struck down the rural residency requirement for subsistence participation (McDowell vs. State). In that ruling, the Alaska Constitution prevented the allocation of fish and wildlife resources to people based on the location of their residence. The result was that every Alaska resident became eligible for subsistence fishing. In effect, this decision made the personal use category obsolete in the Yukon Area.

16
During a special session in 1992, the legislature revised the subsistence law to allow the Joint Boards of Fisheries and Game to divide the state into subsistence and nonsubsistence areas. Inside the nonsubsistence areas, personal use fishing could be authorized by BOF, and the regulations, which allowed subsistence fishing, were repealed. The Fairbanks Nonsubsistence Area (Figure 10), the only nonsubsistence area created in the Yukon Area, consists of the Fairbanks North Star Borough and surrounding areas. During the 1993 fishing season, personal use fishery regulations were implemented in this area. In October 1993, the state superior court ruled in the Kenaitze case that the nonsubsistence area provision of the 1992 subsistence law was unconstitutional because it discriminated between different areas of the state. All Alaska residents again qualified as subsistence users during the 1994 fishing season.
On May 9, 1995, the Alaska Supreme Court reversed the superior court’s ruling, upholding the constitutionality of the nonsubsistence areas. Once again, the Joint Boards of Fisheries and Game adopted regulations that reestablished the Fairbanks Nonsubsistence Area. No subsistence fishing is allowed within any nonsubsistence areas; however, personal use fishing regulations are applicable. The nonsubsistence area regulations primarily affect salmon fishermen within Subdistrict 6-C, which is entirely within the boundaries of the Fairbanks Nonsubsistence Area. By regulation, Subdistrict 6-C personal use salmon fishery has a household permit limit of 10 Chinook, 75 summer chum, and 75 fall chum and coho salmon combined. Additionally, the fishery has a harvest limit of 750 Chinook, 5,000 summer chum, and 5,200 fall chum and coho salmon combined.
Lower Yukon Area Since the beginning of the commercial salmon fishery in 1918, the majority of the Yukon River harvest has occurred in Districts 1 and 2. With the advent of the Commercial Fisheries Entry Commission (CFEC) limited entry program in 1976, the number of fishery participants stabilized, while the efficiency of the fleet increased. From 2005 through 2009, an average of 807 CFEC gillnet permits have been issued annually in the Lower Yukon Area (Appendix A8), which is a 13% increase from the previous 5 year average. All Lower Yukon Area permits are designated for gillnet and allow either set or drift gillnets to be operated. With some restrictions, permit holders may transfer fishing effort between Districts 1, 2, and 3 during the season. Drift gillnets are the predominant gear type used within Districts 1, 2, and 3. Set gillnets are more commonly used in coastal areas within the Yukon River delta (during the fall season commercial fishermen must register to operate within the “set gillnet only area” (Figure 11).
In 1960, Chinook salmon harvest quotas were eliminated for Districts 1 and 2. Since 1981, a 60,000 to 120,000 Chinook salmon guideline harvest range has been in effect for Districts 1 and 2 combined (Appendix A14). In District 3, a guideline harvest range of 1,800 to 2,200 Chinook salmon was established in 1979. These guideline harvest ranges are currently still in effect.
From 1961 through 1980, the commercial fishing season was opened by a published regulatory date and fishing regulated by scheduled weekly periods. Commercial fishing periods during the Chinook salmon migration occurred 4 days per week during 1961 to 1967. Fishing time was reduced to 3.5 days per week beginning in 1968, 3 days per week in 1974, and 2.5 days per week in 1977. From 1982 to 1986, 24-hour fishing periods generally occurred twice weekly, and, in 1987, 12-hour periods for Districts 1 and 2 were first used. Since 1989, commercial periods have been generally 6, 9, or 12 hours in duration. Given the poor run salmon run sizes since 1998, fishing restrictions have been necessary. Directed Chinook salmon commercial fishing has only

17
been allowed if run sizes allow for a harvestable surplus above escapement requirements and subsistence needs.
The summer season salmon gillnet fishery currently operates under unrestricted (no mesh size limited) and restricted mesh size fishery openings, depending on the target species. Unrestricted openings are directed at Chinook salmon in the lower Yukon River, although summer chum salmon are also incidentally caught. In years of poor chum salmon abundance, a restricted mesh size of greater than 8 inches may be implemented to target Chinook salmon while reducing the incidental catch of chum salmon. Typically, the restricted commercial openings limits mesh size to a maximum of 6 inches, which targets summer chum salmon. Since 1967, the sale of salmon species caught incidentally during the Chinook salmon directed commercial fishery has been allowed.
Through the late 1960s the incidental catch of summer chum salmon in the Chinook salmon directed commercial fishery was limited by the use of 8 inch minimum stretched mesh gillnets. Beginning in 1970, fishermen could substitute up to 50 fathoms of gillnet of any mesh size in Districts 1 and 2. In 1973, all mesh size restrictions were lifted during the Chinook salmon migration from June 1 through early July. A regulation was adopted in 1973 specifying that gillnets of 6 inch mesh size or less could be fished in Districts 1 and 2 after a specified date in early July to target chum salmon. Prior to the 1976 fishing season, a regulation was adopted which established a flexible range of dates (from June 27 to July 5 in Districts 1 and 2, and from July 5 to 15 in District 3) after which only gillnets of 6 inch maximum mesh size could be used. A regulation was then later adopted prior to the 1985 fishing season that eliminated specific dates and implemented EO authority for establishing restricted mesh size periods (6 inch maximum mesh size) in Districts 1, 2, and 3. Beginning in 2011 a new regulation will take effect to prohibit commercial fishermen from using gillnets with a mesh size larger than 7.5 inches. Recent studies show that larger mesh sizes selectively harvest a greater proportion of older, larger, and predominantly female fish (Howard and Evenson 2010). The goal of the net size reduction is to allow more females and larger size Chinook salmon to reach the spawning grounds.
During the fall season in the lower Yukon River, fall chum salmon are typically the primary species of management focus, with the harvest of coho salmon incidental in the fall fisheries. Historically, approximately 80% of the total area fall chum salmon commercial harvest and 87% of the commercial coho salmon harvest occurs within the Lower Yukon Area (Districts 1, 2, and 3). The vast majority of commercial permit holders fish in the Lower Yukon Area.
In 1961, fall chum salmon directed commercial fishing periods began. Commercial harvests of fall chum salmon in the Lower River Area from 1961 through 1968 averaged about 41,000 fish. During this time, almost all of the commercial harvest was from the Lower Yukon Area. In 1969, commercial harvests in the Lower Yukon Area increased dramatically averaging nearly 145,000 fish through 2009. During this timeframe, approximately 76 % of the areas commercial harvest occurred in the Lower Yukon Area. The increase in harvest observed in 1969 was a result of ADF&G expanding commercial fisheries in the area by liberalizing regulations and encouraging processors to explore and develop new fishing grounds (ADF&G 1969). In 1974, a 200,000 fall chum salmon harvest quota was implemented for the Lower Yukon Area. This action was necessary to stabilize harvests in light of increased fishing effort and to allow commercial harvest in the newly established Upper Yukon River Districts (District 4, 5, and 6) (ADF&G 1985). In 1979, fishing time was reduced to 2 days per week and the quota was replaced by a

18
flexible guideline harvest range of 120,000 to 220,000 fish (ADF&G 1979). Beginning in 1983, a summer season closure date on July 15 was established in the Lower Yukon Area to protect the early portion of the fall chum salmon run and to provide more time to evaluate the fall chum salmon run strength. In addition, two 12-hour periods per week were allowed in Districts 1 and 2, and fishing time in District 3 was reduced from 3 periods per week to 2 periods (Bergstrom et al. 1997).
Since 1990, commercial fishing periods have typically been 12 hours or less in the Set Gillnet Only Area (Figure 11), and 6 or 9 hours in the remaining Lower Yukon Area. In the Coastal Area Only, set gillnets are allowed during commercial fishing periods. More commercial fishing opportunity has been allowed in the coastal Set Gillnet Only Area because of the influence of tides on gear efficiency. Currently, the guideline harvest for fall chum salmon in the Lower Yukon Area is 60,000 to 220,000 fish.
Upper Yukon Area Prior to 1974, the Yukon River drainage above the confluence of the Koyukuk River was designated as a single district (District 4). By regulation, commercial fishing was allowed 7 days per week until the quota of 2,000 Chinook salmon had been harvested. Later in the season the fishery was reopened to harvest fall chum and coho salmon. When the combined quota of 2,000 fall chum and coho salmon was taken, the fishery was closed for the season. These quotas allowed for limited commercial activity in the Upper Yukon Area. Fish wheels and set gillnets are the legal gear types for commercial salmon fishing in the Upper Yukon Area, with fish wheels accounting for roughly 95% of the commercial harvest of summer chum salmon. Fishermen may not transfer fishing activity between districts in the Upper Yukon Area.
In recognition of the burgeoning upriver commercial fishery and increased participation by fishermen, the BOF adopted several major regulation changes prior to the 1974 fishing season. District 4 was divided and reduced in size, and 2 new districts, Districts 5 and 6, were defined. Additionally, the weekly commercial salmon fishing period was reduced from 7 to 5 days per week. Regulations also provided for increased upriver commercial harvest quotas.
Since 1974, the BOF has continued to enact a number of major regulation changes in the Upper Yukon Area. Weekly fishing periods were reduced in all districts (except the upper portion of District 5) from 5 to 4 days per week and split period (two 48-hour periods) fishing schedules were established in 1980. Beginning in 1979, quotas for Chinook salmon and for fall chum and coho salmon combined were replaced with a flexible guideline harvest range, District 4 boundaries were redefined, and new subdistricts were created to allow for stock specific management of fall chum and coho salmon. The designation of District 4 subdistricts has remained static since the regulation change in 1981. District 5 was first divided into 2 sections in 1979 and then further divided in 1981 to 4 subdistricts (Figure 7). Prior to 1993, the guideline harvest range for fall chum and coho salmon was combined for the 2 species in the Upper Yukon Area. In 1993, regulations were changed to exclude coho salmon from this guideline harvest range. Since 1990, the duration of fishing periods has dramatically decreased throughout the Upper Yukon Area, and increasing emphasis has been placed on managing fishing periods using inseason measurements of run timing and strength.
In the spring of 1988, the BOF met in special session to receive testimony on current and proposed salmon management practices on the Tanana River. This special session was a result of large-scale illegal salmon and salmon roe sales documented in 1987 in portions of Districts 5

19
and 6. The BOF adopted regulations for District 6 which included: 1) reducing the commercial and subsistence fishing schedule from two 48-hour periods to two 42-hour periods per week, 2) specifying that no more than one 42-hour commercial fishing period would occur per week during the fall season (repealed to open and close by EO by BOF in 2004), 3) requiring subsistence salmon fishing permits for the entire Tanana River drainage, and 4) establishing subsistence reporting requirements inseason for a portion of Subdistrict 6-B and all of Subdistrict 6-C. In 2007, the BOF removed the commercial fishing time restriction of no more than 42 hours in the Tanana River after August 15 because fishing effort has significantly decreased in recent years and management has shifted to regulating harvest using variable fishing times to achieve escapement goals.
The BOF further instructed ADF&G to manage District 6 on the basis of existing guideline harvest ranges, specifying that these guidelines could be exceeded only if it was determined that doing so would not jeopardize meeting subsistence and escapement requirements. Based on concerns for fall chum salmon spawning escapements in the Toklat River, the BOF in February 1990 reduced the commercial fishing time allowed for Subdistricts 5-A and 6-A to no more than one 24-hour period per week during the fall fishing season. These restrictions were lifted during the 1998 fishing season but were reinstated after that year because escapement objectives were not met. When the BOF integrated the Toklat River Fall Chum Salmon Rebuilding Management Plan into the Yukon River Drainage Fall Chum Salmon Management Plan in 2004, the restriction was removed by default. The openings and closures of commercial fishing periods were then regulated by EO authority, allowing fishery managers the discretion to determine the duration of commercial periods. The fisheries on the Tanana River are considered terminal harvest areas and are managed by emergency order. Indicators of run timing and strength are used inseason to determine harvestable surpluses.
In most of the Upper Yukon Area, summer chum salmon is difficult to market due to high transportation costs and the degradation of flesh caused by freshwater and advancing sexual maturity. In contrast, the quality of summer chum salmon roe is considered excellent by the industry. As a result, the sales of summer chum salmon roe increased from 1980 to 1997. Due to the scale of the summer chum salmon roe fishery in Subdistrict 4-A and difficulty in estimating the associated harvest, the guideline harvest range for Subdistrict 4-A was established in February 1990 as 113,000 to 338,000 summer chum salmon or the equivalent of 61,000 to 183,000 pounds of roe. In addition, regulations were adopted stipulating that no more than 183,000 pounds of summer chum salmon roe from Subdistrict 4-A harvests could be sold annually, and, once the roe cap is reached, fishing effort may continue but sale is limited to chum salmon in the round. Additionally, regulations were adopted that required salmon catch be reported on fish tickets in numbers of fish (both females and incidentally caught males) by CFEC permit holders during commercial fishing periods in Subdistrict 4-A. In 2004 the BOF adopted additional regulations in Subdistrict 4-A designed to conserve chum salmon in years of low abundance. If chum salmon conservation measures are necessary, by EO authority, the commercial fish wheel fishing season may be closed and reopened with the use of set gillnet gear in replacement of wheels.
In March 1994, the BOF adopted the Anvik River Chum Salmon Fishery Management Plan (5 AAC 05.368.). The intent is to allow a harvest of available Anvik River summer chum salmon above spawning escapement goals and to decrease the harvest pressure on non-Anvik River summer chum salmon stocks located in the mainstem Yukon River. Under this plan, the Anvik

20
River may be opened to summer chum salmon commercial fishing if a surplus beyond the escapement goal of 500,000 fish is available. All Chinook salmon taken in the Anvik River during commercial fishing periods must be returned to the water alive.
During the November 1994 BOF meeting, the Anvik River Chum Salmon Fishery Management Plan was amended to allow use of the following gear types: hand operated beach and purse seines, fish wheels with live boxes, and a single set gillnet not to exceed 25 fathoms in length and not larger than 5.25 inch mesh. The management plan also included a provision that gillnets be attended at all times to release Chinook salmon. Beginning in 1994, the lower 12 miles of the Anvik River were opened to commercial fishing (Figure 9). Hand beach seines have been the dominant gear type utilized and only summer chum salmon roe has been sold from the Anvik River fishery. A cap of 100,000 pounds of summer chum salmon roe was established by the BOF in March 1996.
Sport Fishery In general, sport fish salmon harvests in the Yukon Area are minor compared to commercial and subsistence harvests. Sport fishing effort for salmon in the Yukon River drainage is directed primarily at Chinook and coho salmon with little effort directed at chum salmon. In this report, all of the chum salmon harvested in the sport fishery are categorized as summer chum salmon. Although a portion of the genetically distinct fall chum salmon stock may be taken by sport fishermen, most of the sport chum salmon harvest is thought to be made up of summer chum salmon, because: 1) the run is much more abundant in tributaries where the most sport fishing occurs, and 2) the chum salmon harvest is typically incidental to efforts directed at Chinook salmon, which overlap in run timing with summer chum salmon.
Most of the drainage's sport fishing effort occurs in the Tanana River drainage along the road system. From 2005 to 2009 the Tanana River made up 80% of the total Yukon River drainage Chinook salmon harvest, 35% of the summer chum salmon harvest, and 43% of the coho salmon harvest, on average. In the Tanana River, most Chinook and chum salmon are harvested from the Chena, Salcha, and Chatanika rivers, while most coho salmon are harvested from the Delta Clearwater and Nenana river systems. In the Yukon River, most sport fishing effort takes place on the Anvik and Andreafsky rivers.
In 2010, an Emergency Order was issued on July 26 that closed the Chena River to all sport fishing for Chinook salmon (including catch-and-release) effective July 28. On August 17 two Emergency Orders were issues to close all waters of the Yukon and Tanana river drainages to the retention of chum salmon effective August 20. These actions remained in effect throughout the entire 2010 salmon season.
Alaska sport fishing effort and harvests are monitored annually through a statewide sport fishery postal survey. Harvest estimates are typically not available until approximately one calendar year after the fishing season; therefore, the 2010 harvest estimates will not be available in this report. The total 2009 sport harvest of salmon in the Alaska portion of the Yukon River drainage (including the Tanana River) was estimated at 863 Chinook, 174 summer chum, and 964 coho salmon (Appendix A17, A18, and A20). The recent 5 year (2005–2009) average Yukon River drainage sport salmon harvest was estimated at 691 Chinook, 362 summer chum, and 706 coho salmon (Appendix A17, A18, and A20).

21
In 1988, the BOF established a guideline harvest range of 300 to 700 Chinook salmon for the Salcha River sport fishery. In 1990, the BOF established a guideline harvest range of 300 to 600 Chinook salmon for the Chena River sport fishery. In 2001, the BOF eliminated the guideline harvest ranges. Sport fish harvests are now managed to achieve the established escapement goals. Since 2005, all freshwater sport fishing guides and guide businesses operating in Alaska have been required to be licensed. In addition, sport fishing guides and businesses are required to report sport fish harvest and fish released by species in logbooks. From 2006 to 2009, guided sport harvest in the Yukon River drainage (excluding the Tanana River drainage) averaged 97 Chinook and 414 coho salmon (Sigurdsson and Powers 2009).
CANADIAN HARVESTS OF YUKON RIVER SALMON DFO has provided annual harvest data from the Canadian portion of the Yukon River drainage since 1962. The first recorded commercial salmon harvest in the Canadian portion of the Yukon River drainage occurred in 1903, when 70,000 pounds of Chinook and fall chum salmon were taken (ADF&G 1985). Records indicate a Canadian commercial fishery occurred sporadically from 1903 to 1917 and continuously from 1918 to 1947 (Appendix A3). No harvest records are available from 1948 to 1957. Harvest records document the annual salmon harvest by species since 1958 and also by user group since 1961.
The Canadian portion of the Yukon River drainage maintains Aboriginal, domestic, commercial, and sport fisheries for salmon. The Aboriginal and domestic fisheries are in some ways comparable to subsistence and personal use fisheries in Alaska, although the Aboriginal fishery is only open to native people. All of the commercial salmon harvest in Canada occurs on the mainstem Yukon River. Canadian salmon harvests in the Porcupine River drainage consist only of an Aboriginal fishery.
U.S./Canada Yukon River Salmon Panel and Treaty Negotiations Negotiations were initiated in 1985 between the U.S. and Canada regarding a Yukon River salmon treaty, which would enhance the coordination of management for salmon stocks that spawn in the Canadian portion of the Yukon River drainage. Reaching a comprehensive long-term agreement remained a formidable challenge through the mid-1990s. In February 1995, an agreement was formalized and an interim Yukon River Salmon Agreement (Agreement) went into effect. A U.S./Canada Yukon River Panel (Panel) was formed to implement the Agreement. The focus of the Panel was on the salmon stocks that spawn in the Canadian portion of the Yukon River drainage. In December 2002, the United States and Canada signed an agreement that set salmon harvest share target ranges based on a postseason assessment of run strength for Chinook and fall chum salmon into the Canadian mainstem of the Yukon River. Under the Agreement, the Alaska and Canadian fisheries will be managed consistent with stock rebuilding and conservation objectives that have been jointly developed. The Yukon River Panel meets annually during the fall to resume management recommendations. The Panel advises the United States and Canadian Governments on conservation and management of the salmon originating in the Canadian portion of the Yukon River. In recognition of the changing dynamics of the fishery and the spirit of the agreement, interim management objectives are reviewed and agreed upon jointly each spring prior to the salmon returns.
In 1995 a 6 year stabilization plan was completed to prevent further declines in spawning escapement of Canadian Yukon River mainstem Chinook salmon by achieving an escapement of at least 18,000 Chinook salmon annually. In April 1996, the Panel agreed to the first 6 years of a

22
rebuilding plan for recognizing the desirability of rebuilding stocks. In April 1996, in effort to rebuild Canadian mainstem Chinook salmon stocks, the Panel agreed to an interim minimum spawning escapement objective of 28,000 fish for 6 years beginning in 1996. The U.S. obligation was to deliver 44,800 to 47,800 Chinook salmon to the Canadian mainstem Yukon River. The Canadian contribution was to manage the harvest of Chinook salmon in the mainstem Yukon River drainage in Canada by all user groups combined within a guideline harvest range of 16,800 to 19,800 Chinook salmon.
For Canadian Yukon River mainstem fall chum salmon, a 12 year plan was agreed upon to rebuild the stock by achieving a spawning escapement of more than 80,000 fish for all brood years by 2001. The U.S. obligation was to deliver to the Canadian border on the mainstem Yukon River a set number of fall chum salmon agreed to upon the rebuilding schedule. The Canadian contribution was to manage the harvest of fall chum salmon in the mainstem Yukon River drainage in Canada by all user groups combined within a guideline harvest range of 23,600 to 32,600 fall chum salmon.
For the 2010 season, the U.S./Canada panel agreed to one year Canadian interim management escapement goal (IMEG) ranges of 42,500 to 55,000 Chinook salmon and 70,000 to 104,000 fall chum salmon based on the Eagle sonar project. In addition to escapement needs, Alaska is obligated to share harvestable surpluses of the Canadian run component, with Canada receiving 20% to 26% of the available total allowable catch (TAC) for Canadian bound Chinook salmon and 29% to 35% of the available TAC for Canadian bound fall chum salmon. Based on the current projected run size, it is anticipated that approximately 7,000 Chinook and 20,000 fall chum salmon or more, depending on run strength, would fulfill harvest sharing commitments specified in the Agreement. The IMEG range for the Fishing Branch River is 22,000 to 49,000 fall chum salmon based on the Fishing Branch River weir count.
R&E Funds The Panel makes recommendations to the management agencies in Alaska and Canada and also administers the U.S./Canada Restoration and Enhancement Fund (R&E Fund). A key component of the Agreement is administration of the R&E Fund by the Panel to address the restoration and enhancement of Canadian spawned salmon stocks. The U.S. will contribute $1,200,000 per year into the R&E Fund. Monies from the R&E Fund shall be disbursed by the Yukon River Panel according to the following rules:
1. 50% of the annual available funds shall be disbursed on Canadian programs and projects approved by the Canadian section of the Yukon River Panel based on recommendations by the Canadian section of the JTC and found by the Panel as a whole to be consistent with the Principles and Guidelines for Restoration, Conservation and Enhancement Programs and Projects until amended by the parties; and
2. The balance of annual available funds shall be disbursed at the direction of the Panel as a whole based on recommendations by the JTC as a whole.
Upper Yukon River Chinook Salmon Cooperative Canada/U.S. management of Canadian-origin Yukon River Chinook salmon was based on an agreed escapement goal range for rebuilt stocks of 33,000 to 43,000 fish for many years. This goal was developed from, and was subsequently monitored by, a mark–recapture

23
program located just upstream of the international border on the Yukon River. Since 2005, the Parties have developed a new and improved technique, the Eagle sonar project, to assess the abundance of salmon migrating into Canada. Estimates derived from the mark–recapture program were consistently lower than those produced from the sonar project. Based on the disparity between the mark–recapture and sonar project estimates of Canadian border passage, it was inappropriate to continue to apply the longstanding escapement goal based on mark–recapture to escapement estimates derived from the sonar project.
The JTC recommended using the Eagle sonar project in 2008 as the primary assessment tool for the border passage estimate and reviewed the best approach to transition from the mark–recapture based escapement goal to a new goal based on and assessed by the sonar project. Considerable analyses were conducted to construct a new database of stock and recruitment information that was not solely based on mark–recapture estimates. These have included examining the relationships between aerial survey indices (3 scenarios: 3-area index; 4-area index; and a single index) and independent border passage estimates (2 scenarios: Eagle sonar project passage estimates; and passage estimates derived from a radiotelemetry program). A JTC working group reviewed extensive analyses undertaken by Gene Sandone and, after thorough discussion at the March 2008 JTC meeting, made proposals to the JTC as a whole.
The JTC discussed recommendations provided by the Chinook Salmon Escapement Goal working group for a minimum IMEG in 2008. Although working group members could justify IMEG targets ranging from 45,000 to 50,000, consensus was eventually achieved. The JTC recommended that the Yukon River Panel adopt an IMEG of >45,000 Canadian-origin Yukon River Chinook salmon for 2008, to be assessed using information from the Eagle sonar project. This recommendation was established for one year, recognizing that further analysis of a biologically based escapement goal was required and additional factors such as habitat capacity had yet to be incorporated. In 2009, the JTC recommended that the minimum IMEG (>45,000) established for 2008 be used for the second year.
In 2010, the JTC recommended that the IMEG be established as a range to allow for the uncertainty of information from assessment projects. The JTC reached consensus for an upper bound of 55,000 and agreed to adopt the lower bound of 42,500 after discussion with the Yukon River Panel. The Chinook Salmon Escapement Goal working group will continue to examine other data that may be used in recommending a revised escapement goal for future years. Ongoing analysis includes the use of a habitat capacity approach, which may be useful in improving other analyses.
Upper Yukon River Fall Chum Salmon The upper Yukon River escapement goal specified within the Yukon River Salmon Agreement is >80,000 fall chum salmon. This goal was achieved 15 times within the 28 year period from 1982 to 2010. The DFO fall chum salmon mark–recapture program was conducted from 1982 to 2008 while the joint U.S./Canada Eagle sonar project was conducted from 2006 to 2009. The mark–recapture estimates generally agreed with the Eagle sonar project estimates within the 2006 to 2008 period when the 2 programs were conducted concurrently. The JTC recommended using the Eagle sonar project as the primary assessment tool for the Canadian border passage estimate starting in 2008.
The upper Yukon River escapement goal was reviewed in 2001 and after considerable analysis of the available data a recommendation was made for a biological escapement goal (BEG) of

24
60,000 to 129,000 fall chum salmon (Eggers 2001). However, due to concerns over the quality of the data and analytical issues, the BEG recommendation was not accepted during a Pacific Scientific Advice Review Committee (PSARC) review.
For 2010, the JTC recommended that the upper Yukon River fall chum salmon escapement goal be established as a range from 70,000 to 104,000. This range was developed as 0.8 to 1.2 times the estimated spawners at maximum sustained yield (86,600) which was derived from data that included the 2009 returns from the exceptional 2005 spawning escapement of 477,498.
Fishing Branch River Fall Chum Salmon The escapement goal specified within the Yukon River Salmon Agreement is a range of 50,000 to 120,000 fall chum salmon to the Fishing Branch River. This goal has been achieved only 10 times since 1974 and only 5 times since 1985 when the weir program went back into operation. The Fishing Branch escapement goal was reviewed in 2001 and, after considerable analysis of the available data, a recommendation was made for a BEG of 27,000 to 56,000 fall chum salmon (Eggers 2001). However, due to concerns over the quality of the data and analytical issues, the BEG recommendation was not accepted during a PSARC review.
The inability to reach the 50,000 to 120,000 goal, particularly when considering the goal was achieved once over the 2 fall chum salmon 4 year cycles preceding 2008 when escapements to the upper Yukon River in Canada were rebuilding, led the JTC to question whether the lack of success was more related to an unrealistically high goal rather than other factors. As a result, a JTC Escapement Goal Working Group revisited the goal and attempted to address some of the issues raised during the PSARC review of the 2001 recommendation (Eggers 2001) which ultimately led to its rejection. Although there are some approaches that can improve data quality and analysis of a BEG, the working group recommended postponing this analysis until the returns from the recent high escapement of 119,058 fall chum salmon in 2005 were documented.
For the 2008 to 2010 period, the JTC recommended an IMEG range of 22,000 to 49,000 Fishing Branch River fall chum salmon. This recommendation is based on the Bue and Hasbrouck1 method of determining a sustainable escapement goal (SEG) and has been used in Alaska. The Fishing Branch River SEG analyses incorporated weir counts from 1985 to 2007 (22 years; excluding 1990) and the contrast in these escapements, i.e., the ratio of the highest to lowest count (24:1). The escapement goal range reflects the approximated 25 and 75 percentiles of the 22 years of weir counts.
The SEG range encompasses the escapement levels that preliminary analysis of the stock recruitment information indicates will produce maximum returns and maximum sustainable yield, 22,188 and 39,400 respectively. However, while weir counts provide good estimates of spawning escapement, the stock specific harvest data necessary for robust stock recruitment estimates is lacking, lending a high degree of uncertainty to the current estimates.
1 Bue, B. G. and J. J. Hasbrouck. (Unpublished). Escapement goal review of salmon stocks of Upper Cook Inlet, Report to the Alaska Board
of Fisheries, 2001. Alaska Department of Fish and Game, Anchorage.

25
MARINE FISHERIES INFORMATION INTRODUCTION Yukon River salmon migrate into the Bering Sea during the spring and summer after typically spending one winter rearing in fresh water. Information on stock origin from tagging, scale pattern analysis, parasites, and genetic analysis indicate that Yukon River salmon are present throughout the Bering Sea, in regions of the North Pacific Ocean south of the Aleutian chain, and the Gulf of Alaska during their ocean migration (Healey, 1991; Salo 1991). Yukon River salmon have the potential to be captured by fisheries that harvest mixed stocks of salmon, other species of fish (bycatch), and by illegal fishing activities throughout their oceanic distribution.
Several U.S. fisheries are currently managed to limit the interception and bycatch of salmon stocks that include Yukon River salmon. These fisheries include salmon fisheries in the South Alaska Peninsula area and U.S. groundfish trawl fisheries in both the Gulf of Alaska (GOA) and Bering Sea-Aleutian Islands (BSAI) management areas. Information on the South Alaska Peninsula fisheries and salmon bycatch in the Bering Sea and Gulf of Alaska groundfish fisheries are included here along with information on High Seas Driftnet enforcement activities by the United States Coast Guard and National Marine Fisheries Service. Relative abundance estimates of juvenile chum and Chinook salmon in the northern Bering Sea from pelagic trawl surveys by the Alaska Fisheries Science Center, Auke Bay Laboratories are also included as a leading ecosystem indicator of stock status for Yukon River chum and Chinook salmon.
SOUTH ALASKA PENINSULA SALMON FISHERIES The first documented commercial harvests from the South Unimak and Shumagin Islands June fisheries occurred in 1911. During the early to mid-1960s, the South Unimak and Shumagin Islands fisheries were open to commercial salmon fishing 5 days per week. From 1967 to 1970, fishing occurred 7 days per week regardless of the Bristol Bay sockeye salmon run strength. Special regulatory meetings were held annually and resulted in different regulations every year from 1971 to 1974.
In 1975, the BOF implemented an allocation plan in which the South Unimak and Shumagin Islands June fisheries were granted an annual guideline harvest level (GHL) based on the projected Bristol Bay inshore sockeye salmon harvest. Based on historical catch data, 6.8% of the forecasted inshore Bristol Bay harvest was allocated to the South Unimak June fishery and 1.5% was allocated to the Shumagin Islands June fishery. Portions of the GHL were assigned to discrete time periods so the harvest would be spread throughout June. Concerns over large harvests of chum salmon in the early 1980s and a weak fall Yukon River chum salmon run resulted in a chum salmon cap that, if reached, would result in closure of the fishery for the remainder of June. Between 1986 and 2000, the chum salmon cap was as high as 700,000 fish (1992–1997) and as low as 350,000 fish (1998–2000).
In January 2001, the BOF modified the South Unimak and Shumagin Islands June salmon fishery management plan. These modifications were in effect through the 2003 season and included the elimination of the sockeye salmon GHL and the chum salmon cap. Fishing time for any gear group was reduced to a maximum of 16 hours per day. Fishing time by seine and drift gillnet gear was limited to a maximum of 48 hours in a floating 7 day period with no more than two 16 hour periods on consecutive days in any 7 day period. Purse seine and drift gillnet fishing

26
periods through June 24 occurred at the same time in the South Unimak and Shumagin Islands fisheries.
From June 10 through June 24, in 2001 through 2003, set gillnet gear could be operated on consecutive days for 16 hour fishing periods as long as the set gillnet sockeye to chum salmon ratio was above the recent 10 year average in each fishery. If the set gillnet sockeye to chum salmon ratio fell below the recent 10 year average in either of the fisheries (South Unimak or Shumagin Islands), that fishery was closed for one period.
After June 24, in either the South Unimak or Shumagin Islands fisheries, if the ratio of sockeye to chum salmon, for all gear combined, was 2:1 or less on any day, the next fishing period was 6 hours in duration for all gear groups in that fishery. If the ratio of sockeye to chum salmon was 2:1 or less for 2 consecutive fishing periods in either fishery, the season was closed for the remainder of June for all gear groups. If the sockeye to chum salmon ratio was greater than 2:1, a 6 hour fishing period could be extended to a maximum of 16 hours.
Prior to the 2004 fishing season, many of the restrictions in place from 2001 to 2003 were replaced by a set fishing schedule, which is currently in effect. Sockeye salmon harvests from 2004 through 2009 averaged 642,981 in the South Unimak and 649,701 in the Shumagin Islands June fisheries for an average total harvest of 1,292,682. This average total harvest was lower than the 1975–2000 average but above the 2001–2003 average. Chum salmon harvests from 2004 through 2009 for the South Unimak and Shumagin Islands June fisheries average 168,168 and 267,701 fish respectively. The average chum salmon harvest was below the 1975–2000 average total harvest, and above the 2001–2003 average.
SALMON BYCATCH IN THE BERING SEA AND GULF OF ALASKA GROUNDFISH FISHERIES U.S. groundfish fisheries in the BSAI and GOA regions are managed under the Magnuson-Stevens Fisheries Conservation and Management Act by the North Pacific Fishery Management Council (NPFMC) and are regulated by the National Marine Fisheries Service (NMFS) Alaska Regional Office. Annual summaries and inseason information on Pacific salmon bycatch in the Bering Sea and Gulf of Alaska groundfish fisheries are provided by the Alaska Regional Office as part of NMFS catch accounting system (NMFS 2010). Bycatch of Chinook and non-Chinook salmon (principally chum salmon) in the BSAI remained near historic low levels in 2010; however, a large number of Chinook salmon was captured as bycatch in the GOA groundfish fisheries (Appendix 26). Estimated bycatch of Chinook salmon during 2010 was 12,530 in BSAI groundfish fisheries and 54,183 in GOA groundfish fisheries. Estimated bycatch of non-Chinook salmon species during 2010 was 14,977 in BSAI groundfish fisheries and 2,008 in GOA groundfish fisheries.
Pollock directed fisheries in the Bering Sea have been the primary groundfish fishery of concern for salmon bycatch as they account for over 80% of the total Chinook salmon bycatch and over 90% of the non-Chinook salmon bycatch in the BSAI groundfish fisheries. Harvests are managed in the BSAI pollock fishery by setting an annual TAC for pollock and allocating the catch to various sectors of the fishery as specified by the American Fisheries Act in 1998. These allocations are divided into 2 seasons 40% to the winter roe season (January 20 to June 10; A-season) and 60% to summer/fall season (June 10 to November 1; B-season). Chinook salmon

27
bycatch occurs in both the winter season (63%) and the summer/fall season; non-Chinook salmon are caught almost entirely during the summer/fall season (99%).
A variety of regulatory measures have been used to limit salmon bycatch in the GOA and BSAI groundfish fisheries. These measures include: classifying salmon as a prohibited species, salmon savings areas, and a voluntary rolling hotspot system (VRHS). Prohibited species within US groundfish fisheries must be either discarded or donated through the Pacific Salmon Donation Program, which allows for distribution of salmon taken as bycatch to economically disadvantaged individuals by tax exempt organizations. Chinook and Chum Salmon Savings Areas were created in the mid-1990s as part of the BSAI groundfish fisheries. These savings areas enabled cap-and-closure measures to limit salmon bycatch in the Bering Sea pollock fishery. Savings areas are based on locations with historically high spatial and temporal levels of salmon bycatch and were closed to fishing once salmon bycatch levels reached a specified cap. In 2006, fishing vessels participating in the VRHS were exempted from the salmon savings areas. The VRHS is intended to increase the ability of the pollock fishery to minimize salmon bycatch by adaptively defining area closures with inseason bycatch information.
Escalating numbers of Chinook salmon captured as bycatch in the BSAI pollock fishery in 2006 and 2007 prompted a review of alternative management measures used to limit the bycatch of Chinook salmon and an environmental impact assessment of Chinook salmon bycatch in the Bering Sea pollock fishery (NMFS 2009a and 2009b). Following these reviews, the NPFMC recommended amendment 91 (see http://www.fakr.noaa.gov/sustainablefisheries/bycatch/default.htm) be added to the BSAI Groundfish Fisheries Management Plan for the Bering Sea pollock fishery. Amendment 91 has been approved by the Secretary of Commerce and will be implemented by NMFS during the 2011 fishing season. Amendment 91 establishes a bycatch hard-cap of 60,000 Chinook salmon and a performance cap of 47,591 Chinook salmon for vessels participating in an incentive plan agreement (IPA). Chinook salmon bycatch quotas are allocated to each season and sector of the fishery based on bycatch caps, historical Chinook salmon bycatch, and pollock harvest allocations; however, provisions are made in the amendment to transfer unused quotas under the approval of the NMFS Alaska Regional Office. Performance caps establish benchmark performance criteria of incentive plan agreements, the primary tool used to minimize salmon bycatch. Sectors that exceed their proportion of the performance cap more than two times in any 7 year period while participating in an IPA will have their hard cap reduced to their proportion of the performance cap. Salmon still retain their classification of a prohibited species; however, amendment 91 establishes benchmark performance criteria for incentive plan agreements such as the VRHS that have been used or may be used in the future to avoid salmon bycatch in the Bering Sea pollock fishery.
NORTON SOUND A small portion of Yukon River bound Chinook and chum salmon are known to be intercepted in the Norton Sound coastal commercial fisheries (Gaudet and Schaefer 1982). Chinook salmon runs have been weak to the Eastern Norton Sound since 1998; however, runs of chum, coho, and pink salmon have been average to well above average (Menard 2010). The Chinook salmon commercial harvest in 2010 was 120 fish and occurred during the coho salmon commercial fishery which started the last week in July. The Chinook salmon harvest in that time period is believed to be local stocks.

28
In the last 10 years, the subsistence fishery in Norton Sound took from 4,000 to 9,000 Chinook salmon and took place where the majority of Yukon River stocks may be intercepted by Norton Sound residents.
NORTHERN BERING SEA PELAGIC TRAWL SURVEY Pelagic trawl surveys in the northern Bering Sea shelf were initiated in 2002 as part of the Bering Arctic Subarctic Integrated Surveys (BASIS: 2002–2007). BASIS was developed by member nations of the North Pacific Anadromous Fish Commission (NPAFC) (United States, Russia, Japan, Canada, and Korea) to improve our understanding of marine ecology of salmon in the Bering Sea. The United States (Alaska Fisheries Science Center, Auke Bay Laboratories) has continued pelagic trawl surveys in the northern Bering Sea in support of the Bering Sea Integrated Ecosystem Research Project (BSIERP) in 2009 and 2010. Salmon catches during these multi-disciplinary trawl surveys provide a unique opportunity to evaluate the status of salmon stocks during their juvenile life-history stage. A different (smaller) trawl design was used during the first sampling year in the northern Bering Sea and it is unclear what effect this may have had on the relative abundance estimate. Relative abundance estimates from the survey in 2002 are not included in the abundance index. The northern Bering Shelf is the index area for Yukon River salmon based on genetic stock composition of the juvenile population (Murphy et al. 2009; Chris Kondzela, NOAA, Juneau, personal communication, February 2012). Juvenile salmon present in the northern Bering Sea in 2007 and 2008 will be the primary contributors to the 2011 return (Chinook and chum salmon primarily return after 3 to 4 years in the ocean). The increase in juvenile abundance in 2007 supports the expectation that the 6-year-old component of the Chinook salmon run and the 5-year-old component of the chum salmon run will be higher in 2011 than the previous 3 years (Murphy et al., 2009).
SALMON SPAWNING ESCAPEMENT An essential requirement for management of the Yukon River salmon fisheries is documentation of annual salmon spawning escapements. Such documentation provides for:
1. Determination of appropriate escapement levels or goals for selected spawning areas or management units;
2. Evaluation of escapement trends;
3. Evaluation of the effectiveness of the management program, which in turn forms the basis for proposing regulatory changes and management strategies; and
4. Evaluation of stock status for use in projecting subsequent returns.
Aerial Survey Escapement Assessment Methods The Yukon River drainage is too extensive for complete comprehensive escapement coverage of all salmon spawning streams. Consequently, low-level aerial surveys from single-engine, fixed-wing aircraft form an integral component of the escapement assessment program. The greatest advantage of aerial surveys is the cost-effectiveness of obtaining escapement information throughout an extremely vast and remote area. Another advantage to aerial surveillance is that current or potential habitat-related problems arising from natural or man-induced causes can be identified. Among the disadvantages are that results may be highly variable if non-standardized procedures are used.
29
Variability in aerial survey accuracy is dependent upon a number of factors such as weather, water turbidity, timing of surveys with respect to peak spawning, aircraft type, survey altitude, experience of both pilot and observer, and species of salmon being assessed. It is recognized that aerial estimates are lower than actual stream abundance due to these factors. Further, peak abundance measured by aerial survey methods is significantly lower than total spawning abundance due to the die-off of early spawners and arrival of fish after the survey. Aerial estimates in a given stream may demonstrate a wide range in the proportion of fish being estimated from year to year. To the extent that this variability can be controlled, peak aerial counts may serve as indices of relative abundance for examination of annual trends in escapement.
Aerial escapement estimates are obtained from as many spawning streams as possible within the confines of fiscal, personnel, and weather constraints. However, selected spawning streams or "index areas" which represent a larger geographic area have been identified and receive highest priority. Index areas have been designated due to their importance as spawning areas and/or by their geographic location with respect to other unsurveyable salmon spawning streams in the general area.
More comprehensive assessment projects employing such techniques as intensified ground surveys, mark–recapture programs, counting towers, weirs, radiotelemetry, and hydroacoustics are also conducted. These projects tend to provide estimates of total salmon abundance and are often less dependent upon weather and water conditions. Most escapement monitoring projects are located on selected major spawning streams or terminal areas that have escaped beyond fisheries; however, there are some projects used for assessment within the drainage and are technically representing escapement only beyond that point on the river and may not represent terminal areas. Non-terminal projects include projects such as the mainstem Yukon River sonar project operations at Pilot Station and Eagle. There are both advantages and disadvantages related to each type of assessment method. Regardless of the method utilized, the overall objective of escapement assessment in the Yukon Area is to estimate abundance (or provide indices of relative abundance), timing, and distribution of spawning salmon populations throughout the drainage. A summary of projects conducted in the drainage in 2010 that produced estimates of abundance are provided in Appendix E2.
While most of these projects are designed to monitor salmon escapements in selected major spawning streams, 2 projects have been implemented to estimate salmon abundance in the mainstem Yukon River. The ADF&G Pilot Station sonar project estimates total salmon passage by species through the lower Yukon River at river mile 123 near Pilot Station, typically through September 7. Hydroacoustic techniques at the Pilot Station site are used to estimate passage of fish and a comprehensive drift gillnet sampling program is conducted to apportion sonar counts by species. Additionally, ADF&G and DFO cooperatively operate sonar systems annually (below the community of Eagle, Alaska) from July 1 through October 6 since 2005. This project provides estimates of abundance of Chinook and chum salmon entering the Canadian portion of the mainstem Yukon River.
Escapement Goals BEGs have been established for several Yukon River drainage salmon spawning streams or areas (Appendix E1). Escapement goals (EG) for Chinook, summer chum, and fall chum salmon were reviewed for the 2010 BOF cycle (Volk et al. 2009). The EGs developed or modified through

30
this process are primarily presented as ranges. The underlying principle in establishing an EG is that maintenance of average or better spawning escapements should provide for sustained yield consistent with historic levels (Policy for the Management of Sustainable Salmon Fisheries (5 AAC 39.222.) and Policy for Statewide Salmon Escapement Goals (5 AAC 39.223.)). The use of EG ranges should allow for uncertainty associated with measurement techniques, observed variability in the salmon stock measured, changes in climate and oceanographic conditions, and varying abundance within related populations of the salmon stock being measured. BEG means a level of escapement that provides the highest potential to produce maximum sustainable yield. SEG means a level of escapement known to provide for sustainable yield over a 5 to 10 year period.
Most of the EG ranges established within the Yukon River drainage represent the number of desired spawners considered necessary to maintain the historical yield from the stocks and are based upon historical performance, i.e., they are predicated upon some measure of historic averages. Establishment of escapement goals based upon a rigorous analysis of maximum sustained yield is not possible at this time due to the nature of the Yukon River mixed stock fisheries, lack of stock identification data, and consequential inability to reconstruct total inriver stock-specific returns. Consequently, most escapement goals are based upon aerial survey index estimates that do not represent total escapement but are assumed to reflect relative spawner abundance when using standard survey methods under acceptable survey conditions. However, the goals established for Anvik River summer chum salmon (Clark and Sandone 2001), East Fork Andreafsky River summer chum salmon (Fleischman and Evenson 2010) and selected fall chum salmon spawning stocks (Eggers 2001) represent the desired range for total spawning abundance as they are based upon a more comprehensive database. In 2010 the most significant change affecting fall chum salmon EGs included changing the Yukon River drainagewide goal from a BEG to a SEG (Fleischman and Borba 2009). At this time, the analysis did not include the component stocks and they remain listed as BEGs based on Eggers (2001) analysis.
AREA SALMON REPORT 2010 ALASKA BOARD OF FISHERIES ACTIONS 2010 The BOF met in Fairbanks, Alaska, in late January of 2010 and made several changes to the regulations pertaining to Yukon Area fisheries management. The following is a summary of BOF actions at that meeting:
1. Chinook salmon on the Yukon River were continued as a “Stock of Yield Concern” due to variable run sizes, reduced and eliminated commercial harvest since 2001, and subsistence harvests that were steady until 2007 but were restricted in 2008 and 2009.
2. During times of Chinook salmon conservation, the department now has emergency order authority to prohibit the sale of king salmon during chum salmon directed commercial fishing periods.
3. The Yukon River Summer Chum Salmon Management Plan was modified to allow, by emergency order, a commercial harvest up to 50,000 fish if the total run size is between 900,000 and 1,000,000 fish, distributed by district or subdistrict in proportion to the guideline harvest levels.

31
4. The Yukon River Fall Chum Salmon Management Plan was modified by lowering the threshold required to allow a directed fall chum salmon commercial fishery from a run size of 600,000 fall chum salmon to 500,000 fall chum salmon. This modification also changed the threshold in the Yukon River Coho Salmon Management Plan from a run size of 550,000 fall chum salmon to 500,000 fall chum salmon in order to conduct a coho salmon directed commercial fishery.
5. The Yukon River Coho Salmon Management Plan was modified to allow for late season harvest of coho salmon if the department determines there is a harvestable surplus of coho salmon above escapement needs and those necessary for subsistence uses and that a directed coho salmon commercial fishery will not have a significant impact on escapement or allocation of fall chum salmon.
6. The subsistence fishing schedule in Subdistrict 4-A was changed to two 48-hours periods per week, regardless of commercial fishing periods.
7. The Innoko River subsistence fishing schedule was changed to open 7 days per week.
8. The King Salmon Management Plan was amended by adding a new subsection that ADF&G may use emergency order authority to close all salmon fishing in a district or portion of a district if run assessment information indicates an insufficient abundance of Chinook salmon.
9. The subsistence fishing schedule in Subdistricts 4-B and 4-C was modified to open from 6:00 p.m. Sundays until 6:00 p.m. Fridays when commercial fishing closures last longer than 5 days.
10. Effective in 2011, the maximum mesh size for subsistence, commercial, and personal use gillnets in the Yukon River drainage will be 7.5 inches.
FEDERAL SUBSISTENCE MANAGEMENT ACTIONS 2010 The Federal Subsistence Board (FSB) met in January 2011 to review proposals regarding regulation changes to the Code of Federal Regulations under the Federal Subsistence Management Program on Federal public lands within the State of Alaska. The following summary is for informational purposes only and is not intended to detail, reflect, or fully interpret reasons for the FSB’s actions. In total 19 proposals were taken up for review by the FSB, of which 9 were relevant to federal fishery regulations on the Yukon River and 4 were withdrawn and 2 proposals were rejected. The FSB deferred on 2 proposals, one which requested that Federal public waters of Yukon River Subdistrict 5-D be further subdivided into 3 subdistricts to provide managers additional flexibility to more precisely regulate harvest while conserving Chinook salmon run that spawn in the upper Yukon River and another which requested that customary trade in the Yukon River Fisheries Management Area be prohibited in any year when Chinook salmon runs are insufficient to fully satisfy subsistence needs and subsistence fisheries are restricted. Due to deference on the latter proposal, the FSB took no action on one proposal to limit customary trade of Chinook salmon in the Yukon River Management Area and require a customary trade recordkeeping form.
TOTAL YUKON RIVER DRAINAGE SALMON HARVEST 2010 The total 2010 harvest for the Yukon River drainage, including Canada, was 56,656 Chinook, 299,517 summer chum, 80,005 fall chum, and 18,451 coho salmon (Table 4). The 2010 estimated total Yukon River drainage harvests compared to the recent 5 year (2005–2009)

32
averages were as follows: Chinook salmon, 26% below average (Appendix A17); summer chum salmon, 43% above average (Appendix A18); fall chum salmon, 63% below average (Appendix A19); and coho salmon, 71% below average (Appendix A20). The subsistence harvest in the Alaska coastal districts (Scammon Bay and Hooper Bay) of 1,300 Chinook, 22,425 summer chum, 186 fall chum, and 124 coho salmon (Table 5) brought the total Yukon River area harvest to 57,956 Chinook salmon, 321,978 summer chum, 80,191 fall chum, and 18,575 coho salmon (Appendices A17–A20).
ALASKA SUBSISTENCE FISHERY 2010 Subsistence Harvest Reporting 2010 A preliminary total of 44,721 Chinook, 88,692 summer chum, 71,854 fall chum, and 14,107 coho salmon were estimated to have been harvested with 1,504 households estimated to have participated in the Yukon Area subsistence and personal use fisheries in 2010 (Table 5). The Yukon Area includes the Alaska portion of the Yukon River drainage and the communities with the Coastal District. Harvest estimates include salmon given away by test fishing projects (Jallen and Hamazaki 2011).
Historical estimates of the subsistence harvest based on surveys and permit harvest information for salmon species are shown in Appendices D1 through D4. Historical subsistence permit harvest information for fisheries currently in regulation is summarized in Appendices D5 and D6.
Survey Program 2010 The majority of communities within the Yukon Area have no regulatory requirements to report their subsistence salmon harvest. To estimate the harvest of each salmon species from these communities, ADF&G has implemented a voluntary survey program. Household subsistence salmon surveys were conducted in the Lower Yukon Area in September and continued in the Upper Yukon Area through October. The survey program utilizes subsistence catch calendars, postseason household interviews, and postseason household telephone interviews, as well as postcards to collect harvest information.
Stratified random sampling techniques were used to select Yukon Area households to be interviewed during the 2010 postseason survey. Based on survey information collected in 2010, an estimated 1,277 households harvested a preliminary estimate of 36,469 Chinook; 82,206 summer chum; 37,404 fall chum; and 6,741 coho salmon in the survey portion of the Yukon Area, which includes the coastal communities of Hooper Bay and Scammon Bay (Table 5). These totals include salmon retained for subsistence from commercial fishing periods and test fish projects.
Subsistence Permit Program 2010 In some portions of the Yukon Area, subsistence fishermen are required to obtain an annual household permit prior to fishing for salmon and/or non-salmon fish species. These areas include the Tanana River drainage, the Yukon River drainage between the upper end of Garnet Island (below Rampart) and the Dall River (above the Yukon River Bridge) and the upper portion of District 5 between the upstream mouth of Twenty-Two Mile Slough and the U.S./Canada border. In these areas, fishermen are required to document their subsistence salmon harvest on the household permit and return them to ADF&G at the end of the fishing season. A total of 538

33
subsistence permits were issued in 2010, of which, approximately 366 subsistence permits were issued to harvest salmon (Table 6). Subsistence salmon permits issued compares to the 5 year average (2005–2009) of 318 permits and the 10 year average (2000-2009) of 313 permits (Appendices D5 and D6). Additionally, subsistence fishing permits are required annually for the harvest of northern pike Esox lucius in the Tolovana River drainage (designated ST) and for non-salmon fish species in the Upper Tanana River drainage (designated SU).
A total of 229 subsistence permit holders (including Stevens Village) indicated they fished in 2010. The preliminary reported harvest (including Stevens Village) from permits totaled 5,013 Chinook, 1,236 summer chum, 28,425 fall chum, and 5,606 coho salmon, 2,834 whitefish species, 120 sheefish (Stenodus leucichthys), 42 burbot (Lota lota), 250 pike, 104 suckers (Catostomus sp.), and 196 Arctic grayling (Thymallus arcticus) (Table 6 and Appendix G2).
Note that estimates for Stevens Village in Table 5 are a combination of permit and survey data and do not reflect strictly permit totals. Because of its unique location, fishermen in Stevens Village harvested salmon in both the permitted and survey areas. The Stevens Village permit information was used to supplement the postseason survey of the community.
Subsistence Salmon Use from Test Fisheries 2010 In order to monitor and manage the Yukon Area salmon fisheries, ADF&G operates, or oversees, several test fishing projects. The fish harvested during operation of these projects are provided to the local community to supplement their subsistence harvests. In 2010, the test fishery projects throughout the drainage provided a total of 2,959 Chinook, 4,951 summer chum, 2,238 fall chum, and 558 coho salmon to households for subsistence use (Table 5). Residents of the communities of Alakanuk, Emmonak, Hooper Bay, Kotlik, Mountain Village, Pilot Station, and Scammon Bay were the primary recipients of fish from the test fisheries. Salmon caught in the test fisheries were assumed to replace fish that would have been obtained through normal fishing activities; therefore, salmon given away from the test fisheries were added into the subsistence harvest for that community.
ALASKA PERSONAL USE FISHERY 2010 A household permit is required for personal use fishing in the portion of the Tanana River drainage within the Fairbanks Nonsubsistence Area (Figure 10). Fishermen are required to document their personal use harvest on household permits and return them to ADF&G at the end of the season.
In 2010, 67 personal use salmon permits were issued (Table 6; Appendices D7 and G2). This compares to the recent 5 year average (2005–2009) of 59 permits. In addition, 8 personal use whitefish and sucker permits were issued in 2010 to fishermen in the Fairbanks Nonsubsistence Area. Personal use fishermen reported harvest was 162 Chinook, 319 summer chum, 3,208 fall chum, and 1,062 coho salmon. Additionally, 206 whitefish, 1 sheefish, 3 burbot, 7 pike, 66 suckers, and 5 Arctic grayling were reported taken under the personal use fisheries (Appendices D7 and G2).
YUKON AREA CHINOOK AND SUMMER CHUM SALMON FISHERY SUMMARY 2010 In response to the guidelines established in the Sustainable Salmon Fisheries Policy, the BOF classified the Yukon River Chinook salmon stock as a yield concern in its September 2000 work

34
meeting. This determination was based on the inability to maintain expected yields, or harvestable surpluses, above the stock’s escapement needs since 1998 and the anticipated low harvest level in 2001. The classification of yield concern was continued at the BOF meetings in 2004, 2007, and 2009 based on continued low yields of Chinook salmon in the Yukon River (Howard et al. 2009). In addition, the BOF classified the Yukon River summer chum salmon stock as a management concern at its September 2000 work meeting, based on the chronic inability to meet escapement goals since 1998. The classification was maintained at the 2004 BOF meeting. Beginning in 2002, the Yukon River summer chum salmon showed a marked improvement in abundance with the drainagewide optimum escapement goal, and the 2006 run count past the Pilot Station sonar project was the second largest recorded. The improved abundance led to the declassification as stock of concern by the BOF in 2007. Since that time, run abundance has shifted to near average levels and has provided for a harvestable surplus for subsistence and commercial fishing.
The projected run size for Chinook salmon in 2010 was anticipated to be 155,600–226,200 fish, which is a below average to average run size. The 2010 season was entered with the prospect that subsistence conservation measures, much less severe than those used in 2009, may be necessary inseason in an effort to share the available harvest and meet escapement goals. Conservation measures, if required, would include voluntary reductions, shifting harvest to other species, spreading the harvest over the duration of the run, reducing extended sharing, and keeping harvested fish in the local area. It was anticipated that no directed Chinook salmon commercial fishery would occur in 2010. The 2010 summer chum salmon preseason outlook anticipated a run size similar to 2009, with approximately 1.3 million fish. The 2010 run was anticipated to provide for escapements, normal subsistence harvest, and a surplus for commercial harvest. Summer chum salmon runs had provided for a harvestable surplus each year since 2003. If inseason indicators of run strength suggested a sufficient abundance of fish to allow for a commercial fishery, the harvestable surplus for Alaska commercial fishery could range from 250,000 to 500,000 summer chum salmon. The actual commercial harvest of summer chum salmon in 2010 was anticipated to be affected by the potentially poor Chinook salmon run.
Chinook Salmon Management Overview 2010 The drainagewide 2010 run size was projected to be between 155,600 and 226,200 Chinook salmon. Due to poor production since 2007, the upper end of this range was deemed unlikely and Alaska fishery management was based on the lower end of this preseason projection. Thus, the 2010 Yukon River Chinook salmon run size was likely to be below average to average.
Before the 2010 season, ADF&G developed a preseason management strategy with input from USFWS, fishermen, tribal council representatives, and other stakeholders to prepare for the event of a low run. ADF&G and USFWS staff distributed the inseason management approaches as the 2010 Yukon River Salmon Fisheries informational flyer. The resulting preseason strategy was to enter the 2010 season with the prospect that subsistence conservation measures, much less severe than those used in 2009, may be necessary to share the available subsistence harvest and meet escapement goals. Conservation measures if required were to include promoting voluntary reductions, such as encouraging a shift in harvest to other species, spreading harvest out over the duration of the run, reductions in extended sharing, and keeping fish harvested within the village or local area.

35
It was unlikely that there would be a directed Chinook salmon commercial fishery in 2010 on the mainstem Yukon River. However, because the Tanana River is managed independently as a terminal fishery, there may have been opportunity to commercially harvest less than 1,000 Chinook salmon.
YRDFA facilitated weekly teleconferences to provide managers, fishermen, tribal council representatives, and other stakeholders the opportunity to share information, provide input, and discuss inseason management options. During YRDFA inseason weekly teleconferences, ADF&G and USFWS staff provided run assessment and management strategies. Subsistence fishermen provided reports on fishing efforts and were encouraged to provide input on management strategies.
Inseason run strength assessment of Chinook and summer chum salmon was based on the lower river test fisheries at Emmonak/Middle Mouth and Mountain Village, the Pilot Station sonar project, and subsistence fishermen catch reports. In addition, genetic samples collected in the lower river test fisheries and at Pilot Station sonar project were analyzed inseason to determine stock contribution and to project abundance of the Canadian Chinook salmon stocks.
The summer season began with a near average ice breakup in the lower river; however, shorefast sea ice lingering outside the mouth of the river contributed to the late migration of Chinook salmon (Appendix A25). The first pulse of Chinook salmon was observed at the Lower Yukon Test Fishery (LYTF) project on June 16–21, a second pulse on June 23–25, and a third on June 27–28. The first quarter point, midpoint, and third quarter point were June 19 (4 days late), June 25 (5 days late), and July 1 (4 days late), respectively (Appendix B10). The LYTF finished with a cumulative CPUE of 18.67, approximately 15% below the historical average (Appendix B11). The preliminary Pilot Station sonar project estimate was approximately 113,400 Chinook salmon as compared to the 1995–2009 average passage of 142,200 fish (Appendix E3). The first quarter point, midpoint, and third quarter point were on June 22, June 26, and June 30 respectively.
Through the month of June, the Chinook salmon run was assessed to be large enough to provide for escapement and subsistence uses based upon the preseason outlook and late run timing. Most subsistence salmon fishermen delayed their fishing effort due to gas prices and low fish abundance early in the season. The regulatory “windowed” subsistence salmon fishing schedule was initiated on June 7 in District 1 and was implemented chronologically upriver as the run progressed upstream. Persistent wet and cold weather conditions around the Yukon River Delta led many subsistence fishermen to abstain from harvesting the first pulse of Chinook salmon due to the poor processing conditions. Throughout the drainage there were episodes of high water events with heavy debris loads which preempted subsistence fishing.
In Subdistrict 5-D, when it became evident that the Chinook salmon run would fall short of the U.S./Canada Yukon Treaty obligation, fishermen were asked to consider conservation measures such as voluntary harvest reductions, shifting harvest to other species, spreading harvest out over the duration of the run, reducing extended sharing, and keeping fish harvested within the village or local area. It was understood that fishing had been difficult this year due to water conditions and high fuel costs. Imposing fishing restriction at the time would have increased hardships. The hope was to provide fishermen the flexibility to work around their own unique fishing conditions to effectively conserve Chinook salmon where they could.

36
Summer Chum Salmon Management Overview 2010 The strength of the summer chum salmon run in 2010 was dependent on production from the 2006 (age-4 fish) and 2005 (age-5 fish) escapements, as these age classes dominate the run. The total run during 2005 and 2006 was approximately 2.6 and 4.0 million summer chum salmon, respectively, though tributary escapements were highly variable.
Yukon River summer chum salmon generally exhibit strong run size correlations among adjacent years, and it was expected that the total run in the Yukon River would be similar to the 2009 run of approximately 1.3 million fish. The high seas BASIS study indicated a decline in chum salmon in 2004 and 2005 but 2006 and 2007 results showed an increase. Juvenile chum salmon collected in the BASIS study in 2006 and 2007 would correspond to dominant age class returns (age-5 and age-4, respectively) in 2010.
The 2010 summer chum salmon run was anticipated to provide for escapements, support a normal subsistence harvest, and a surplus for commercial harvest. Summer chum salmon runs have provided for a harvestable surplus in each of the last 7 years (2003–2009). If inseason indicators of run strength developed as anticipated, the commercially harvestable surplus in Alaska was expected to range from 250,000 to 500,000 summer chum salmon. The actual commercial harvest of summer chum salmon in 2010 was expected to be affected by a poor Chinook salmon run, as Chinook salmon are incidentally harvested in chum salmon-directed fisheries.
The Yukon River summer chum salmon run was managed according to the guidelines described in the Yukon River Summer Chum Salmon Management Plan (5 AAC 05.362.). The management plan provides for escapement needs and subsistence use priority before other consumptive uses such as commercial, sport, and personal use fishing. The plan allows for varying levels of harvest opportunity depending on the run size projection. ADF&G uses the best available data to assess the run including: preseason run outlooks, Pilot Station sonar project passage estimate, test fishing indices, age and sex composition, subsistence and commercial harvest reports, and information from escapement monitoring projects.
The summer chum salmon run passage at the Pilot Station sonar project was approximately 1.33 million fish (Appendix E3). The first quarter point, midpoint, and third quarter point were on June 23, June 28, and July 1, respectively. Summer chum salmon management decisions were delayed until the third quarter point of the Chinook salmon run at LYTF. At this point, the summer chum salmon run was peaking and a total run size of 1.4 million fish was projected.
The total commercial harvest for Districts 1, 2, 6, and Subdistrict 4-A combined was 232,888 summer chum salmon, which is 195% above the 2000–2009 average harvest of 78,294 fish (Table 4; Appendix A18).
Summer Season Subsistence Fishery 2010 Subsistence fishing occurs throughout most of the Yukon River Area and has the highest priority among all uses of the resource in the State of Alaska. When salmon stocks are abundant and commercial fishing will occur, it is necessary to place some restrictions on the subsistence fishery in order to enforce commercial fishing regulations. For example, subsistence salmon fishing is closed in most areas 24 hours prior to the commercial salmon fishing season to discourage the illegal sale of subsistence caught salmon or salmon roe. Generally, more fishing time is allowed throughout the fishing season for subsistence than for commercial activities.

37
Subsistence fishing for Chinook and summer chum salmon was open 7 days a week prior to commencement of the Yukon River King Salmon Management Plan regulatory schedule on June 7. Breakup timing was near average in the lower river; however persistent shorefast sea ice contributed to the late migration of Chinook salmon. Wet and cold weather in the Yukon River Delta made for poor processing conditions, and many fishermen did not harvest Chinook salmon from the first pulse. The schedules for the Coastal District and the Koyukuk and Innoko rivers (7 days a week) and the Tanana River (two 42-hour periods per week) remained open on their regulatory schedules as these areas have less efficient fishing conditions and/or do not harvest Canadian-bound salmon.
During the 2010 season, Chinook and summer chum salmon run strength assessment was based on the lower river test fisheries (LYTF) at Emmonak (LYTF) and Mountain Village, the Pilot Station sonar project, and subsistence fishermen catch reports. In addition, genetic samples collected in the lower river test fishery and at Pilot Station sonar project were analyzed inseason to determine stock contribution and to project abundance of the Canadian Chinook salmon stocks. The summer season began with a near average ice breakup in the lower river (Appendix A25). However, shorefast sea ice lingering outside the mouth of the river contributed to the late migration of Chinook salmon. The quarter points of the run were 4 to 5 days later than the historic average (Appendix B10), and the LYTF project finished with a cumulative CPUE approximately 15% below the historical average. The preliminary Pilot Station sonar project estimate was approximately 25% below the 10 year average.
Because of the below average to average outlook for Chinook salmon in 2010, the subsistence salmon fishing schedule was planned to be implemented early in the season until the salmon run size was projected to be of sufficient strength to warrant relaxing or additional conservation measures appeared necessary. Subsistence fishing closures were not enacted due to periods of high water and debris coinciding with Chinook salmon pulses. Managers decided to leave the regulatory windows in place and to not force fishermen to take additional risks during openings or fish less efficiently. As the run progressed through Subdistrict 5-D, it became apparent that border passage goals would not be met. Fishermen were asked to consider voluntary harvest restrictions such as spreading harvest over the duration of the run, keeping salmon in their home community, reducing extended sharing, and harvesting other species. Managers understood that water conditions and high fuel costs made fishing difficult in 2010 and did not impose additional hardship on fishermen by reducing the regulatory schedule further. A commercial processor (Kwikpak Fisheries), located in Emmonak, donated 115 Chinook salmon harvested in summer chum salmon directed commercial fisheries to Fort Yukon and Canada (Jack Schultheis, Kwik’pak Fisheries General Manager, Emmonak, personal communication, 2010).
Throughout the summer fishing season, additional subsistence fishing opportunities for non-salmon fish species were available during subsistence salmon period closures. Stipulations for harvesting non-salmon species during closed salmon periods required the use of gillnets with a maximum mesh size of 4 inches and a maximum length of 60 feet as well as the prohibition of fish wheel operation. ADF&G had authority to discontinue these harvest opportunities of non-salmon species if they were found ineffective at adequately reducing salmon harvest.
Subsistence harvest information was gathered during the summer season from fishermen reports to ADF&G’s Emmonak office and an inseason survey program organized by YRDFA. Through these sources, subsistence fishermen in the lower river reported poor catches of Chinook salmon that were insufficient to meet their needs. As the run progressed upriver, subsistence fishermen

38
in the middle river reported a mix of good to below average catches as well as a higher amount of smaller Chinook salmon in their catches compared to the last several years. Subsistence fishermen in the upper river generally reported meeting their subsistence needs but that the run appeared to be weaker than last year’s run. Upriver subsistence fishermen using fish wheels particularly noticed lower catches and an increase in the percentage of smaller fish caught compared to previous years.
Commonly cited reasons for not meeting needs: the fishing schedule conflicted with work opportunities, fishing periods were too short and families could not afford to travel back and forth to fish camps, and fishing took place during poor weather conditions for fish preservation. High water and debris occurred throughout the summer and fall seasons. Fishermen in some communities lost fish wheels or other gear or reduced their fishing time in response to poor conditions. Additional factors contributing to the inability to meet subsistence salmon needs included fuel shortages, high fuel prices, health, elders unable to fish, lack of fishing gear, participating on fire-fighting crews, and mechanical problems.
Districts 1, 2, and 3 Subsistence salmon fishing in the Lower Yukon River districts followed the regulatory subsistence salmon fishing schedule of two 36-hour periods per week beginning June 7 in District 1, June 9 in District 2, and June 13 in District 3. Beginning June 28 in District 1 and July 1 in District 2, commercial salmon fishing opened and subsistence salmon fishing remained open except for 18 hours before, during, and 12 hours following each commercial salmon fishing period. Beginning July 16 and 17 in Districts 1 and 2, respectively, subsistence salmon fishing schedule was allowed 7 days per week until the fall season subsistence schedule began in mid-August.
Commercial salmon fishing did not open in District 3 due to the lack of buyer interest; therefore, subsistence fishing was based on a regulatory schedule allowing two 36-hour periods per week. The regulatory schedule was in effect from June 13 to July 18, after which subsistence fishing was allowed 7 days per week until the fall season subsistence schedule began.
In Districts 1, 2, and 3 from June 1 to July 15 all Chinook salmon taken for subsistence use were required to have both lobes of the tail fin removed.
District 4 Subsistence salmon fishing in District 4 followed the regulatory subsistence salmon fishing schedule of two 48-hour periods per week. The regulatory subsistence schedule began on June 16 in 4-A and on June 23 in Subdistricts 4-B and 4-C. Based on market interest, commercial fishing was allowed in Subdistrict 4-A beginning July 7, and subsistence fishing was not altered by the commercial salmon periods. The regulatory schedule was in effect until July 26, after which subsistence fishing was allowed 5 days per week until the fall subsistence schedule began.
No commercial fishing periods occurred in Subdistricts 4-B and 4-C, accordingly the subsistence salmon fishing remained on a schedule of two 48-hour fishing periods throughout the summer season.
District 5 Subsistence salmon fishing in Subdistricts 5-A, 5-B, and 5-C followed the regulatory subsistence salmon fishing schedule of two 48-hour periods per week beginning June 29. Subdistrict 5-A

39
typically targets salmon bound for the Tanana River and is managed using the Tanana River Salmon Management Plan. Beginning August 4, subsistence salmon fishing was allowed 7 days per week until the fall subsistence schedule began.
Subsistence salmon fishing in Subdistrict 5-D was allowed 7 days per week throughout the summer season. In Subdistrict 5-D when it became evident that the Chinook salmon run would fall short of the U.S./Canada Yukon Treaty obligation to pass adequate numbers into Canadian escapements and provide for harvest sharing, fishermen were asked to consider conservation measures such as voluntary harvest reductions, shifting harvest to other species, spreading harvest out over the duration of the run, reducing extended sharing, and keeping fish harvested within the village or local area.
District 6 Subsistence salmon fishing in District 6, with the exception the Old Minto Area, followed a regulatory subsistence salmon fishing schedule of two 42-hour periods per week throughout the summer season. The Old Minto Area was open to subsistence salmon fishing 5 days per week.
In District 6, five commercial fishing periods were scheduled beginning July 5. Subsistence fishing periods were open concurrently with commercial salmon periods.
Coastal District, Koyukuk, and Innoko Rivers Subsistence salmon fishing in the Coastal District, Koyukuk River, and the Innoko River was allowed 7 days per week throughout the entire summer season.
Summer Season Commercial Fishery 2010 Due to the poor run size, no commercial periods targeting Chinook salmon were allowed in the Yukon River mainstem or in the Tanana River during 2010. The summer chum salmon commercial fishery was managed conservatively by opening the commercial fishing season near the third quarter point of the Chinook salmon run, after the majority of Canadian-origin fish had passed. After the first opening was announced, test fishery information showed an abrupt decline in summer chum salmon entering the river. ADF&G took unprecedented action to cancel the period on short notice to avoid harvesting a significant number Chinook salmon. ADF&G scheduled 8 commercial fishing periods targeting summer chum salmon in District 1 and 7 periods in District 2 (Table 7). No other commercial fishing periods were cancelled in the lower river, as it was anticipated that the delayed opening of the commercial fishery and unseasonably high water would reduce the incidental harvest of Chinook salmon. Additionally, 8 summer chum salmon directed openings were scheduled in Subdistrict 4-A and 5 openings were scheduled in District 6 (Table 7). The commercial harvest of summer chum salmon was below the low end of the guideline harvest range for all districts and subdistricts.
The total commercial harvest for Districts 1, 2, 6, and Subdistrict 4-A combined was 232,888 summer chum salmon, which is 195% above the 2000–2009 average harvest of 78,294 fish (Appendix A5, Tables 8 and 9). The summer chum salmon harvest was the highest since 1968. Incidental to the summer chum salmon directed fishery, 9,897 Chinook salmon were harvested in Districts 1 and 2 (Appendix A4). The Chinook salmon harvest was 59% below the 2000–2009 average harvest of 24,591 Chinook salmon (Appendix A4). The 2010 Chinook salmon harvest was the fifth lowest commercial harvest since statehood.

40
A total of 450 permit holders participated in the summer chum salmon commercial fishery, which was approximately 17% below the 2000–2009 average of 545 permit holders (Appendix A9). The Lower Yukon Area (Districts 1, 2, and 3) and Upper Yukon Area (Districts 4, 5, and 6) are separate Commercial Fisheries Entry Commission (CFEC) permit areas. A total of 440 permit holders fished in the Lower Yukon Area in 2010, which was approximately 16% below the 2000–2009 average of 526. In the Upper Yukon Area, 10 permit holders fished, which was approximately 45% below the 2000–2009 average of 18 (Appendix A9).
Yukon River fishermen in Alaska received an estimated $1.5 million for their Chinook and summer chum salmon harvest in 2010, approximately 16% below the 2005–2009 average of $1.8 million (Appendix A12). Two buyer-processors operated in the Lower Yukon Area. Lower Yukon River fishermen received an estimated average price per pound of $5.00 for incidentally harvested Chinook salmon and $0.70 for summer chum salmon (Appendix A11). The average income for Lower Yukon Area fishermen in 2010 was $3,325. Two buyer-processors operated in the Upper Yukon Area. Upper Yukon Area fishermen received an estimated average price per pound of $0.23 for summer chum salmon (Appendix A11). No Chinook salmon were sold in the Upper Yukon Area. The average income for Upper Yukon Area fishermen that participated in the 2010 fishery was $5,594. No fish from the ADF&G test fish were sold (Table 10).
Districts 1, 2, and 3 No directed Chinook salmon commercial fishery occurred in 2010. However, based on the projected run estimate for summer chum salmon, ADF&G scheduled fifteen summer chum salmon directed commercial periods, restricted to 6 inch maximum mesh size, in the lower river districts, beginning in District 1 on June 28 (Table 7). Additionally, the department attempted to schedule these chum salmon-directed commercial periods when Chinook salmon abundance was low. A short commercial fishing period was announced for June 26 in District 1, with nets restricted to 6 inch maximum mesh size, as a test to determine the chum salmon to Chinook salmon catch ratio. At this late point in the Chinook salmon run, it was expected that incidental harvest of Chinook salmon would be low and any Chinook salmon catches would be small and bound for lower river tributaries; however, test fishery information showed an abrupt drop in the summer chum salmon entering the river, so ADF&G took an unprecedented action, with the cooperation of the primary fish buyer, to cancel the commercial period on short notice to avoid harvesting Chinook salmon. The commercial period was delayed until June 28, which landed a catch of 2,122 Chinook and 30,282 chum salmon (Table 7). Fishing was again delayed until July 1 when the commercial fishery resumed on a more regular schedule for Districts 1 and 2.
A total of 9,897 Chinook salmon were incidentally harvested in Districts 1 and 2 combined (Appendices B1 to B4). The commercial harvest was 57% below the 2000–2009 average harvest in the lower Yukon River of 23,290 fish (Table 4; Appendix A17). The average weight of Chinook salmon in the 2010 commercial harvest was 12.9 pounds, which was 27% below the 2000–2009 average weight of 16.3 pounds (Appendix A13). Chinook salmon age composition from the District 1 restricted (6 inch or smaller mesh) commercial harvest was <1% age-3, 36% age-4, 47% age-5, 16% age-6, and less than 1% age-7 fish; the sex composition of the fish sampled (n=890) was 30% female. Chinook salmon age composition from the District 2 restricted (6 inch or smaller mesh) commercial harvest was <1% age-3, 31% age-4, 52% age-5, 16% age-6, 1% age-7 fish; the sex composition of the fish sampled (n=474) was 34% female (Schumann and Dubois 2011).

41
The actual 2010 Chinook salmon run was much weaker than the preseason projection and early inseason assessment projects indicated. Preliminary Chinook salmon passage at Eagle sonar project was 35,074 fish (JTC 2011), yielding a border passage of approximately 34,500 fish, which was below the 42,500–55,000 escapement goal and did not provide for the Canadian harvest share (Appendix E5). These numbers are preliminary and subject to change.
Summer chum salmon management decisions were delayed until the third quarter point of the Chinook salmon run at LYTF (Appendix B12). At this point, the summer chum salmon run was peaking and a total run size of 1.4 million fish was projected. The cumulative commercial harvest for the lower districts was 183,215 summer chum salmon, which was 65% above the 2000-2009 average harvest in the lower Yukon River of 64,711 fish (Table 4; Appendices A5, B5, B6). The average weight of summer chum salmon in the 2010 commercial harvest was 6.4 pounds, which was consistent with the 2000-2009 average weight of 6.2 pounds (Appendix A13). Summer chum salmon age composition from the District 1 restricted (6 inch or smaller mesh) commercial harvest was 4% age-3, 67% age-4, 28% age-5, and 1% age-6 fish. The sex composition of fish sampled (n=1,259) was 42% female. Summer chum salmon age composition from the District 2 restricted (6 inch or smaller mesh) commercial harvest was 5% age-3, 71% age-4, 23% age-5, and 1% age-6 fish. The sex composition of fish sampled (n=625) in District 2 was 42% (Schumann and Dubois 2011).
There was no commercial harvest of Chinook or summer chum salmon in District 3 (Appendices B4 and B6).
Districts 4-6 Historically, the Subdistrict 4-A fishery targets summer chum salmon with the dominant gear type being fish wheels. Since 1998, limited salmon markets have resulted in lower effort and subsequently lower harvest rates in District 4.
In 2010 a market for summer chum salmon did exist in Subdistrict 4-A. Management of the summer chum salmon commercial fishery was dependent on the available surplus, fishing effort, and buyer input. Based upon preseason contacts with potential buyers in Subdistrict 4-A, directed commercial fishing for summer chum salmon began July 7 and was concurrent with subsistence salmon fishing periods. There were 8 scheduled summer chum salmon directed commercial openings (Table 7). Any Chinook salmon caught incidentally during openings were to be kept for subsistence use or released alive; no Chinook salmon were commercially harvested in Subdistrict 4-A (Appendix C4). The first four 12-hour commercial fishing periods in Subdistrict 4-A were low effort; therefore, commercial fishing was allowed to continue for 21 days until the end of the summer fishing season. A total cumulative harvest of 44,207 summer chum salmon were harvested in Subdistrict 4-A (Table 4; Appendix C9). The summer chum salmon age composition was 22.9% age-3, 70.2% age-4, and 6.9% age-5. The sex composition of summer chum salmon sampled (n=636 fish) was 60.7% female (Schumann and Dubois 2011).
The Anvik River had an escapement of approximately 396,173 summer chum salmon, which was less than 500,000 fish required to allow an inriver commercial fishery (Appendix E6). Thus, the Anvik River Management Area remained closed to commercial fishing in 2010.
There were no buyers interested in purchasing salmon from Subdistricts 4-B and 4-C (Appendices C5 and C10). Additionally, no commercial fishing periods were announced for

42
District 5 in an effort to provide adequate numbers of Canadian-origin Chinook salmon to the spawning grounds (Appendices C6, C7, C11, and C12).
District 6 was managed using inseason assessment information provided by projects operated in the Tanana River drainage. Information from the Nenana test fish wheel and from the Chena and Salcha rivers counting towers escapement estimates were used as indicators of run strength and timing. By July 24, a harvestable surplus of summer chum salmon was identified. Based on the available surplus and market interest, ADF&G scheduled the first commercial fishing period to target chum salmon in District 6 on July 19. ADF&G scheduled 7 commercial fishing periods and the preliminary cumulative harvest was 5,466 summer chum salmon (Table 7, Appendix A18). Approximately 162 Chinook salmon were reported as caught but not sold during commercial periods in District 6. No Chinook salmon were sold commercially in District 6 (Appendix C8).
In the District 6 salmon commercial harvest, 5,466 summer chum salmon were harvested (Appendix C13). Of these 589 fish commercially caught were aged. The summer chum salmon age composition was 25.7% age-3, 66.2% age-4, and 8.1% age-5. Females were 50.6% (Schumann and Dubois 2011).
YUKON AREA FALL CHUM AND COHO SALMON FISHERY SUMMARY 2010 Fall Chum Salmon Management Overview 2010 Management of the Yukon Area fall season commercial salmon fisheries is in accordance with the Policy for the Management of Sustainable Salmon Fisheries (5 ACC 39.222.), the Yukon River Drainage Fall Chum Salmon Management Plan (5 ACC 1.249.), the Yukon River Coho Salmon Management Plan (5 ACC 05.369.), and the Tanana River Salmon Management Plan (5 AAC 05.367.). Both the fall chum and coho salmon management plans were modified at the 2010 Alaska Board of Fisheries Arctic-Yukon-Kuskokwim finfish meeting (see section Alaska Board of Fisheries Actions 2010).
The fall chum salmon plan incorporates U.S./Canada treaty obligations for border passage of fall chum salmon and provides guidelines necessary for escapement and prioritized uses. It directs ADF&G to use the best available information from preseason projections, passage estimates past Pilot Station sonar project, lower river test fisheries, subsistence and commercial fishing reports, and, as the run progresses upriver, information from escapement projects. The plan provides provisions that allow incremental levels of subsistence salmon fishing balanced with requirements to attain escapement objectives during low runs. Commercial fishing is generally allowed only on the surplus above 500,000 fall chum salmon. Adding complexity to the management of the Yukon River fall season is the pulsed entry pattern of fall chum salmon and the run size disparity between fall chum salmon with overlapping coho salmon runs.
Fall season management strategies were formulated in cooperation with the USFWS. Management decisions made early in the fall season are based primarily on the adjusted preseason fall chum salmon outlook. As the fall chum salmon run progressed, management decisions start incorporating relative abundance and run timing information from Pilot Station sonar project and the drift gillnet test fisheries located at Emmonak and Mountain Village. Pilot Station sonar project provides daily passage estimates of fall chum salmon used to derive inseason run size projections. These projections trigger management actions in accordance with the fall chum salmon management plan. Relationships in run timing and run strength from the

43
drift gillnet test fisheries, as well as subsistence fishing reports, are compared for consistency with the Pilot Station sonar project estimates as a method to check that all projects appear to be operating correctly. Individual pulses are tracked as they move upriver and Pilot Station sonar project is used to estimate the abundance of each pulse.
The preseason projection for 2010 was for a run size of 552,000 to 828,000 fall chum salmon. The projection was refined to 600,000 fish based on the 2010 summer chum salmon return and its relationship to past fall chum salmon run sizes. That level of abundance was anticipated to be adequate to meet escapement goals while supporting normal subsistence fishing activities.
Overall, fall chum salmon passage in the Lower Yukon River was about 3 days late (Appendix B13). Four pulses of fall chum salmon were observed entering the mouth of Yukon River between July 16 and September 7. The first pulse passed the LYTF project on August 6 and was about 2 days in duration (Appendix B14). Based on passage estimates at Pilot Station sonar project, the pulse consisted of approximately 24,000 fish. The second pulse passed the LYTF on August 9, was about 2 days in duration, and consisted of approximately 40,000 fish (Appendix B14). The largest pulse passed the LYTF on August 16, was 4 days in duration, and consisted of just over 100,000 fish (Appendix B14). A final pulse lasting 2 days passed the LYTF on August 31 and consisted of approximately 20,000 fish (Appendix B14). As in 2008 and 2009, Pilot Station sonar project operated an additional week into September while Mountain. Village test fishery operated through September 19. No significant pulses of fall chum salmon were detected at either project late in the season.
The preliminary 2010 Yukon River drainagewide total run size estimate of 489,000 fall chum salmon is based on the postseason expanded escapement and estimated harvests. This run size was below both the preseason projection of 552,000 to 828,000 salmon and the projection provided by the summer to fall chum salmon relationship of 600,000 fish (Appendix E9).
Coho Salmon Management Overview 2010 Yukon River coho salmon have a slightly later, but overlapping, run timing with that of fall chum salmon. In managing the coho salmon run, ADF&G follows guidelines adopted by the BOF in the Yukon River Coho Salmon Management Plan (5 AAC 05.369.). In most years, fall chum salmon is the primary species of management concern during the fall season. The coho salmon management plan allows a directed coho salmon commercial fishery only under specific conditions.
The coho salmon outlook for 2010 was for an average run based on a slightly below average parent year escapement and the assumption of average survival to spawning. The 2010 coho salmon run was late and had 3 pulses past Pilot Station sonar project, with the largest occurring on August 30. The cumulative passage estimate of 142,000 coho salmon past Pilot Station sonar project was below the historical average of 151,000 fish (Appendix E10).
Fall Season Subsistence Fishery 2010 The fall season began by regulation on July 16 with subsistence fishing on the pre-2001 schedule: Districts 1, 2, 3, and Subdistrict 5-D were open 7 days per week, 24 hours a day, while District 4 and Subdistricts 5-A, 5-B, and 5-C were on a 5 days per week schedule. Subsistence fishing efforts in Districts 4 and 5 were hindered by high water level and debris early in the fall season. To mitigate for poor fishing conditions, ADF&G liberalized the subsistence fishing

44
schedule in Districts 4 and Subdistricts 5-A, 5-B, and 5-C to 7 days per week, 24 hours per day schedule to provide additional fishing opportunity.
Until approximately mid-August, the historical midpoint of the run past Pilot Station sonar project, fall chum salmon management primarily relied on the preseason outlook. As the run progressed and projections from the inseason assessment projects became more reliable, management decisions were primarily based on information from those projects. At that point, 2 pulses of fall chum salmon had passed Pilot Station sonar project and assessment indicated a weaker than anticipated run, with projections of less than 400,000 fish. At that abundance level, based on the fall chum salmon management plan, commercial fishing was not allowed, and restrictions to subsistence fishing were possible. ADF&G placed the mainstem districts (excluding Subdistrict 5-D) on the regulatory windowed schedule of two 36-hour periods per week in Districts 1, 2, and 3 and two 48-hour periods per week in District 4 and Subdistricts 5-A, 5-B, and 5-C. The third and largest of 4 pulses of fall chum salmon passed Pilot Station sonar project on August 16. Inseason projections continued to show fall chum salmon abundance to be less than 400,000 fish. In addition, ADF&G began to have concerns about fall chum salmon passage at the Canadian border meeting the goal of 80,000 fall chum salmon (70,000 for escapement plus 10,000 for harvest share). In response, ADF&G implemented subsistence restrictions by cancelling one subsistence fishing period in the mainstem districts (no restrictions were imposed in Subdistricts 5-A and 5-D). It became apparent in early September, based on passage information from the Eagle sonar project that the Canadian border passage goal was going to be met. As a result, no subsistence fishing restrictions were imposed in Subdistrict 5-D and the subsistence fishing schedules in the mainstem districts were liberalized. The last, and smallest of the 4 fall chum salmon pulses, passed Pilot Station sonar project on August 31. The subsistence schedules in Districts 2, 3, and 4 were liberalized to 7 days per week on September 5, on September 6 in District 1, and on September 21 in Subdistricts 5-A, 5-B, and 5-C (Subdistrict 5-D was on a 7 day a week subsistence schedule throughout the fall season).
Subsistence and personal use fishing in District 6 were open for two 42-hour per week fishing periods throughout the season and were open concurrent with the late season commercial fishing periods. By October 1, in accordance with the management plans at the close of the commercial fishing season, personal use periods in Subdistrict 6-C remained on the two 42-hour fishing periods per week while subsistence fishing in Subdistricts 6-A and 6-B was relaxed to 7 days a week.
Fall Season Commercial Fishery 2010 A limited late season coho salmon directed commercial fishery was prosecuted in Districts 1 and 2 under the guidelines of the modified Yukon River Coho Salmon Management Plan (5 AAC 05.369.), and a salmon directed commercial fishery was prosecuted in District 6. There were 2 commercial periods in District 1, one period in District 2, and 3 periods in District 6 (Table 11). A total of 2,550 fall chum salmon were harvested commercially in the Alaska portion of the drainage: 815 in the Lower Yukon Area and 1,735 in the Upper Yukon Area (Tables 4 and 11, Appendices A19 and B8). A total of 3,750 coho salmon were harvested in the Alaska portion of the drainage: 2,050 in the Lower Yukon Area and 1,700 in the Upper Yukon Area (Tables 4 and 11, Appendices A20 and B9). Commercial harvests for both species were below their respective most recent 5 and 10 year averages and among the lowest on record (Appendices A19 and A20). All salmon were sold in the round and no salmon roe was sold separately. In District 6, male salmon were selectively purchased.

45
A total of 94 individual permit holders participated in the 2010 fall chum and coho salmon fishery; 90 for Districts 1 and 2 combined, 4 in District 6 (Appendix A9). Overall, fishing effort in 2010 was below the 2003 to 2009 averages.
The average price per pound for fall chum salmon paid to fishermen in the Lower Yukon Area was $1.00 which was above the most recent 5 year average of $0.41/lb (Appendix A11). Fishermen in the Upper Yukon Area were paid $0.23/lb for fall chum salmon which was above the most recent 5 year average of $0.19/lb (Appendix A11). The average price for coho salmon in the lower river was $1.50/lb, while fishermen received $0.26/lb in the upper river (Appendix A11). The exvessel value for the total harvest was $29,166: $8,189 for fall chum salmon and $20,977 for coho salmon (Appendix A12). All exvessel values were below their respective most recent 5 year averages.
CANADIAN FISHERIES 2010 A total of 2,647 Chinook salmon, 5,787 chum salmon, and 12 coho salmon were harvested in the 2010 Canadian fisheries (Table 4; Appendices A17, A19, and A20), including fish harvested in Canadian commercial, sport, domestic and test fisheries (JTC 2011).
Canadian Commercial Fishery 2010 A total of 2,186 chum salmon were harvested in the Canadian Yukon River commercial fishery in 2010 (Table 4; Appendix A19). The catch was No Chinook or coho salmon were commercially harvested. The chum salmon harvest was 43% of the 10 year (2000–2009) average commercial harvest of approximately 5,047 salmon (Appendix A19). Since 1997, poor catches have resulted from below average run sizes of Canadian-origin Yukon River Chinook and chum salmon.
Chinook Salmon The commercial fishery was closed throughout the 2010 Chinook salmon season. The inseason Chinook salmon run status indicated that there would not be a sufficient run to support a commercial fishery. The average commercial Chinook salmon catch for 2000–2009 was 1,910 fish (Appendix A17). Since 1997, there has been a marked decrease in commercial catch of Upper Yukon River Chinook salmon, resulting from a limited market as well as reduced fishing opportunities in some years due to below average run sizes.
In 2010, 16 of 21 eligible Canadian Upper Yukon River commercial fishing licenses were issued. Eighteen commercial licenses were issued in 2008 and 2009, 17 in 2007, 20 in 2005 and 2006, and 21 in 2003 and 2004 (JTC 2011).
The total run of Upper Yukon River Chinook salmon in 2010 was expected to be below average to average. The preseason outlook range was 78,000 to 113,000 Chinook salmon, which included an adjustment to reflect a recent trend where actual runs were lower than the preseason outlooks.
Upper Yukon River Chinook salmon are managed under the umbrella of the Yukon River Salmon Agreement (YRSA). The Yukon River Panel adopted the IMEG range of 42,500–55,000 Upper Yukon River Chinook salmon in 2010. This goal was adopted by DFO and included in the 2010 Integrated Fisheries Management Plan (IFMP) for Yukon River Chinook salmon in Canada. This is the first year that this IMEG has been used. In 2010, the success of achieving this goal was to be assessed using the Eagle sonar project estimate minus catches from fisheries

46
occurring upstream of the sonar project, namely U.S. subsistence catch near the community of Eagle, Alaska and the catch data from Canadian fisheries.
Canadian fishing opportunities in 2010 were dependent upon inseason assessments of run strength. As in previous years, a Chinook salmon decision matrix was developed preseason and was included as part of the IFMP. The decision matrix provided detailed guidance for the management of fisheries linked to specific inseason run abundance levels. The 2010 decision matrix summarized the management reference points, general allocation plans, and anticipated management responses under different run size scenarios (refer to JTC 2011 for inseason fishery management decision matrix for Upper Yukon River Chinook salmon).
It is important to note that the incorporation of an escapement goal range of 42,500–55,000 in 2010 resulted in the following decision thresholds:
i. The commercial and domestic fisheries would not open unless it was expected that the border escapement would be greater than 51,000 Chinook salmon based on the Eagle sonar project. The recreational fishery default regulation is that it is open until closed, therefore, the recreational fishery would be closed at a run <51,000. A border escapement of this magnitude was sufficient to allow for an unrestricted First Nation fishery (Green Zone);
ii. Consideration would be given to restricting First Nation fisheries if the run size to the border was in the 30,000 to 51,000 range. All other fisheries would not be permitted to target Chinook salmon (Yellow Zone); and
iii. Closures in First Nation fisheries would be expected if the run projection was <30,000 (Red Zone).
Management discretion was to be used when the inseason projections were close to the trigger points.
In recent years, the opening of the commercial fishery has frequently been delayed in response to conservation concerns and/or uncertainties concerning the status of the run. Assessment of the 2010 Chinook salmon run was based on information from the Eagle sonar project. The final year the DFO mark–recapture program was implemented was 2008.
Early in the 2010 season, information from the U.S. test fishery at Emmonak and the Pilot Station sonar project on the lower Yukon River suggested that the 2010 Upper Yukon River Chinook salmon run would be lower or at the low end of the adjusted preseason outlook range (78,000 to 113,000 Chinook salmon). Because the run was late entering the river, the early season run size projections, which are very sensitive to the run timing information used, were very uncertain. By the beginning of July, Pilot Station sonar project numbers indicated that the preseason forecast had been optimistic. Further upriver, as the run was migrating into Canada, border escapement run projections were usually produced twice weekly, based on data from the Eagle sonar project estimate, considering timing information from the fish wheel project at Rampart Rapids, and assuming average subsistence Alaska harvest. Border escapement run projections were expanded based on what is considered to be the most likely timing scenario (i.e., early, average, or late timing) given the information at hand. The intent of applying different expansions is to ensure that the projections cover an appropriate range of the potential run timing scenarios.

47
In 2010, the inseason Chinook salmon run projections remained primarily at the low end of the Yellow Zone and at times dipped into the Red Zone. This prompted regular teleconferences with First Nation managers to update them on run projections. Projections were well below the decision threshold that would have triggered a commercial fishery; consequently, the Chinook salmon commercial fishery was closed throughout the 2010 season.
Fall Chum and Coho Salmon Late run timing resulted in limited opportunities for commercial fishery openings during the fall chum salmon season. Only 2,186 fall chum salmon were harvested during 4 commercial fishery openings (Appendix A19). Since 1997, there has been a marked decrease in commercial catches of Upper Yukon River fall chum salmon that have resulted from a limited market as well as reduced fishing opportunities in some years due to below average run sizes.
No coho salmon were recorded in the 2010 commercial fishery. The harvest of coho salmon is negligible within the Upper Yukon River commercial, domestic, recreational, and aboriginal fisheries. This is thought to be related to a combination of low abundance and limited availability of this species based on migration timing.
The preseason outlook for the Upper Yukon River fall chum salmon run in 2010 was a run of 137,000 to 207,000 fish. A run near the lower end of this range would constitute a below average run, whereas, a run near the upper end of this range would constitute an above average run.
Similar to Chinook salmon, Upper Yukon River fall chum salmon are also managed according to provisions of the YRSA. The Yukon River Panel meets annually to recommend the Upper Yukon River fall chum salmon escapement goal. Since the brood year escapements achieved the level defined in the YRSA for a rebuilt Upper Yukon River fall chum salmon stock, the Yukon River Panel maintained the longstanding escapement goal of >80,000 fall chum salmon for 2006 to 2009. For 2010, the Yukon River Panel adopted an escapement goal range of 70,000 to 104,000 fall chum salmon. The range was established to offer more flexibility with respect to uncertainties associated with management. Spawning escapement was to be measured using Eagle sonar project estimates minus catch data from U.S. and Canadian fisheries occurring upstream of the sonar project location.
The decision matrix, adopted by DFO for the management of Upper Yukon River chum salmon and included in the 2010 IFMP, provides detailed guidance for specific inseason decisions. The 2010 matrix takes into account the changeover from the mark–recapture program to the use of the Eagle Sonar project and the escapement goal range therefore differs slightly from the matrix used from 2006 to 2009 (refer to JTC 2011 for inseason fishery management decision matrix for Upper Yukon River fall chum salmon). The Red Zone includes run projections of less than 40,000 fall chum salmon when closures in all fisheries could be expected. The Yellow Zone includes run projections within the 40,000 to 73,000 range; within this zone, commercial, domestic and recreational fisheries would be closed and the First Nation fishery would likely be reduced with restrictions increasingly more severe the closer the run projection was to the lower end of the Yellow Zone. The Green Zone includes run size projections greater than 73,000 fall chum salmon and indicated that First Nation fisheries would be unrestricted and harvest opportunities within the commercial, domestic, and recreational fisheries would be considered, depending on run abundance and international harvest sharing provisions. The difference between the lower end of the escapement goal range (70,000) and the trigger point for the Green Zone is 3,000 fall chum salmon, which is the number of chum salmon needed to allow an

48
unrestricted Canadian aboriginal fishery. Management discretion is used when the inseason projections are close to the trigger points.
Genetic stock identification data were used in conjunction with the Pilot Station sonar project estimates to develop a preliminary index of the Canadian-origin fish run size estimates. These data have been useful in recent years since they provide an early indication of potential Upper Yukon River run strength as the fish move through the lower section of the Yukon River in Alaska. Other data such as the Rampart Rapids Video Test Fish Wheel project results were used to assess run timing for use in projection models. In 2010, projections from the Eagle sonar project were used for the third year for inseason management. Prior to 2008, the Canadian inseason management regime was based primarily on the DFO tagging program.
Inseason decisions on fishery openings/closures for Upper Yukon River fall chum salmon were made in a similar way to those for Chinook salmon. Pilot Station sonar project estimates and historic run timing early in the 2010 fall chum salmon season indicated that the run would be unlikely to perform as well as the preseason forecast. There is much uncertainty associated with the chum salmon early inseason forecasts due to the unpredictable size, timing, and destination of the pulses. Inseason forecasts of the Canadian fall chum salmon run are based on Eagle sonar project estimates and informed by run timing information from downstream indicators (Pilot Station sonar project and Rampart Rapids) as well as genetic estimates of run composition from the Pilot Station test fishery.
As per the decision matrix, a “border escapement” projection of >73,000 was required before fishing opportunities were provided in the commercial fishery. Since it was anticipated, based on harvest in recent years, that the Alaska subsistence fishery upstream of the Eagle sonar project would take about 15,000 chum salmon, a projection of >88,000 at the Eagle sonar project site was required to meet the border escapement objective. The average subsistence catch above the Eagle sonar project from 2006 to 2008 was close to 16,000, with a range from approximately 12,000 to 19,000.
The objective of management actions in 2010 was to ensure that the conservation objective (70,000–104,000 escapement goal range) was achieved. Eagle sonar project guided projections between August 18 and September 19 were in the Yellow Zone, and no commercial fisheries were opened. Projections then entered the Green Zone and continued to improve until the end of the Eagle sonar project on October 6. The commercial and domestic fisheries were opened for 24 hours from September 22–23, which is late in the season for the first opening of these fisheries.
The total 2010 commercial fall chum salmon catch of 2,186 fish was 43% of the 2000 to 2009 average of 5,047 (Table 4; Appendix A19). Within the 2000–2009 period, the commercial fall chum salmon catch ranged from 293 in 2009, when the run was late and the fishery was closed most of season due to conservation concerns, to 11,931 fall chum salmon in 2005 (Appendix A19). The fall chum salmon commercial fishery is somewhat of a misnomer as virtually all of the catch is used for what could be termed personal needs; few fish are sold. This situation could change with the recent development of local value-added products such as smoked fall chum salmon and salmon caviar.

49
CANADIAN ABORIGINAL, DOMESTIC, AND RECREATIONAL FISHERIES 2010 Aboriginal Fishery In 2010, as part of the implementation of the Yukon River Final Agreements (comprehensive land claim agreements), the collection of inseason harvest information for the Upper Yukon River was conducted by First Nations within their respective Traditional Territories. Before the start of the fishing season, locally hired surveyors distributed catch calendars to known fishermen and asked them to voluntarily record catch and effort information on a daily basis. Interviews were then conducted inseason to obtain more detailed catch, effort, gear, and location information at fish camps or in the community, 1 to 3 times weekly. In most cases, weekly summaries were completed by the surveyors and e-mailed to the DFO office in Whitehorse. Late or incomplete information was obtained postseason and reviewed by First Nation staff in conjunction with DFO (JTC 2011).
Based on a preseason outlook for a below average to average run of 78,000 to 113,000 Upper Yukon River Chinook salmon in 2010, the Yukon River Panel was advised that it was prudent to consider that conservation measures would likely be required in Canadian fisheries (i.e. commercial, domestic and recreational fisheries). DFO hosted frequent teleconferences with the First Nations throughout the Chinook salmon run to provide updated information on run timing and abundance, as well as to announce potential changes to fishing plans in other fisheries. DFO recommended that Yukon First Nations develop individual community harvest plans to address conservation concerns for Chinook salmon. Approaches to reductions in harvest varied, but generally the First Nations accepted the need for conservation and implemented harvest monitoring measures in order to stay below what would be considered a normal harvest (JTC 2011).
Given the preseason outlook and the inseason information, it was apparent prior to fishing season that the 2010 border escapement was unlikely to be met and that conservation measures would likely be required in the aboriginal fishery. In response to this information, the majority of fishermen decided not to open their fish camps; the needs of Yukon River aboriginal communities were not met in 2010 (JTC 2011).
In 2010, the Upper Yukon River aboriginal Chinook salmon catch was estimated to be 2,455, including 1,591 reported harvest, and an added adjustment of 864 Chinook salmon to account for underreporting; this was based on recent harvest averages during years of conservation. This estimate was 69% below the 8,000 Chinook salmon considered to be the harvest of a full unrestricted fishery. While intensive surveys of First Nation communities regarding salmon harvest carried out between 1996 to 2001, provided accurate harvest data, recent data has been less robust, indicating the need to incorporate the adjusted harvest numbers. The total harvested (2,455) in the First Nation Fishery was 55% below the recent 10 year average (2000–2009) of 5,421 fish and is the lowest on record since the 1970s (JTC 2011).
The 2010 harvest recorded by Tr'ondëk Hwëch'in in the Dawson area was 525 Chinook salmon, approximately 52% of the recent 10 year average. Ross River Dena Council, fishing on the upper Pelly River, reported a harvest of 54, 81% below their 2000–2009 average. The Selkirk First Nation in the Pelly area and Little Salmon Carmacks First Nation (LSCFN) in the Carmacks area, are normally the 2 largest aboriginal fisheries in the mid-area of the upper Yukon River drainage. The harvest reported by Selkirk First Nation was 488, 64% below the 2000–2009 average of 1,374. Little Salmon Carmacks First Nation did not report a harvest for 2010, but 34

50
Chinook salmon were recorded by the locally hired fish surveyor and a DFO employee during a one day visit of area camps. The 2000–2009 average for LSCFN is 1,365 fish. A harvest of 310 Chinook salmon was reported by the First Nation of Na-Cho Nyäk Dun on the Stewart River; 39% of the 2000–2009 average of 799 fish. The Teslin Tlingit Council (TTC) voluntarily closed fishing completely for the 2010 season. They experienced 98% compliance by community members and reported a total of 41 Chinook salmon harvest, 93% below the 2000–2009 average of 560 fish. The Ta’an Kwach’an Council (TKC), fishing in the vicinity of Lake Laberge near Whitehorse, reported a catch of 139 Chinook salmon, more than three times the recent 10 year average of 38. The increase in harvest from TKC was largely due to the creation of a culture camp (JTC 2011).
For Upper Yukon River fall chum salmon, there was uncertainty concerning the 2010 preseason run projection, but First Nation fishing restrictions were not expected. As inseason information became available it became apparent that the run was late, but would support an unrestricted First Nation fishery. This fishery is managed in a similar fashion to the Chinook salmon fishery using an abundance-based approach (JTC 2011).
The 2010 Upper Yukon River fall chum salmon harvest reported in the aboriginal fishery totaled 1,523 fish. An adjustment of 500 fall chum salmon was added to the reported value of 1,023 to account for underreporting. The chum salmon adjusted value was based on recent average harvests during conservation years (JTC 2011).
The Tr'ondëk Hwëch'in First Nation fishery in the Dawson area reported 1,023 fall chum salmon, 41% lower than the previous 10 year average of 1,738 fall chum salmon. Little Salmon Carmacks First Nation did not report a harvest in 2010, but their 2000–2009 average was 210. The Selkirk First Nation at Pelly Crossing did not report a harvest either; their recent 10 year average was 316. Averages of fall chum salmon derived from a 7 year harvest study conducted by LGL Limited from 1996 to 2002 in the Pelly and Carmacks areas were 433 and 460, respectively. These data from the Yukon River Drainage Basin Harvest Study were used to calculate average catches for Pelly and Carmacks in the absence of complete harvest reports. There is an ongoing effort to finalize the 2010 fall chum salmon catch data (JTC 2011).
Catch estimates of salmon on the Porcupine River near Old Crow are determined from locally conducted interviews using the catch calendar and a voluntary recording system described above. The Vuntut Gwitch’in Government (VGG) also conducted an intensive door to door survey, postseason. There was significant flooding during the 2010 season and many community members were not able to fish, but 191 Chinook salmon were reported harvested. This data was finalized from the results of the survey. The 10 year average is 280 Chinook salmon (JTC 2011).
Preseason run-size forecasts indicated that conservation measures might be required for Porcupine River chum salmon during the 2010 season. There was great uncertainty associated with the preseason forecast and with early inseason forecasts. While early genetics information from the LYTF project indicated that the run might form a larger portion of the run than average, later genetics reports indicated the contrary. High water interfered with some downstream assessment projects (Sheenjek sonar project), and made it difficult to develop better run size estimates until Fishing Branch weir counts and CPUE analysis indicated that the run would be either low in the yellow management zone or in the red zone. High water at this time prevented community members from fishing and therefore, no official restrictions were implemented (JTC 2011).

51
Preliminary data suggests that VGG citizens were not able to fulfill their needs in 2010. Only 2,078 fall chum salmon were harvested in the Old Crow aboriginal fishery, which is 32% below the 2000–2009 average harvest of 3,065 chum salmon. Data was finalized after the postseason survey results (JTC 2011).
Coho salmon were not recorded in the upper Yukon River fisheries (aboriginal, commercial, domestic and recreational) but 12 coho salmon were reportedly harvested in the Porcupine aboriginal fishery. The harvest of coho salmon is usually negligible within the upper Yukon River fisheries. This is thought to be related to a combination of low abundance and limited availability of this species based on late migration timing. Within the Porcupine River drainage there is often some aboriginal fishing for coho salmon that occurs with nets set under the ice (JTC 2011).
Domestic Fishery The domestic fishery was closed during the Chinook salmon season and opened concurrently with the commercial fishery for 4 openings during the fall chum salmon season. In recent years domestic fishermen have targeted Chinook salmon, although historically fall chum salmon were targeted in some years. There was no reported domestic fishing for fall chum salmon in 2010. The average domestic fishery catch of Chinook and fall chum salmon for the 1974 to 2009 period is 393 and 529, respectively; domestic fishery catches were not recorded prior to 1974 (JTC 2011).
Recreational Fishery In 1999, the Yukon Salmon Sub-Committee (SSC) introduced a mandatory Yukon Salmon Conservation Catch Card (YSCCC) in an attempt to improve harvest estimates and to serve as a statistical base to ascertain the importance of salmon to the Yukon River recreational fishery. Anglers are required to report their catch by mail by late fall. The information requested includes the number, species, sex, size, date, and location of all salmon caught and released (JTC 2011).
In 2010, due to conservation concerns, the daily catch and possession limits of Chinook salmon in the recreational fishery were reduced to zero effective at midnight July 9. Chinook salmon had not yet reached the areas where most recreational fishing normally occurs by this date. However, the 2010 recreational catch is one female Chinook salmon caught and retained, and one male Chinook salmon caught and released; both fish are considered illegal/accidental harvest. The average retained Chinook salmon catch within the 2000–2009 period was 306 fish (JTC 2011).
Most recreational fishing occurs on the mainstem Yukon River in close proximity to the Tatchun Creek confluence. Of the 2 salmon caught; one was caught in the Tatchun area and the other in the Mayo River (JTC 2011).
For the 2010 season, the daily catch and possession limits of fall chum salmon in the recreational fishery remained at 2 and 4, respectively. There are no reports of fall chum salmon caught (JTC 2011).
ESCAPEMENT 2010 Summer Season Escapement 2010 ADF&G undertakes a triennial review of salmon escapement goals in conjunction with the BOF meeting cycle. Chinook, summer chum, and fall chum salmon were reviewed for the 2010 BOF

52
cycle. This review is governed by the state’s Policy for the Management of Sustainable Salmon Fisheries (5 AAC 39.222) and Policy for Statewide Salmon Escapement Goals (5 AAC 39.223) adopted in 2001. Under these policies ADF&G determines either a BEG or a SEG (ADF&G 2004; Brannian et al. 2006). A BEG refers to a level of escapement that provides the highest potential to produce maximum sustainable yield. An SEG identifies a level of escapement known to provide for sustainable yield over at least a 5 to 10 year period.
Most AYK Region escapement goals were originally set in the late 1970s or early 1980s. These goals were first documented by Buklis (1993) as required under ADF&G’s original escapement goal policy signed in 1992. Most BEGs were generally established using a simple escapement averaging methodology based on aerial survey counts. Changes to these goals were adopted in 2001 when BEGs were set for Yukon River fall chum salmon (Eggers 2001), Anvik River summer chum salmon (Clark and Sandone 2001), and Andreafsky River summer chum salmon (Clark 2001). These goals are now referred to as SEGs because of precision issues inherent to aerial survey methodology. The SEGs for Chinook salmon were developed using historical aerial survey information.
Beginning in December of 2002, ADF&G undertook the first full review of its escapement goals following the adoption of 2001 policies. An escapement goal review team, consisting of staff from the Divisions of Sport Fish and Commercial Fisheries, met 5 times over a 14 month period. Federal agency biologists and representatives of Tribal and fishing groups were invited to attend and participate in the meetings. The team’s recommendations were presented to the Alaska Board of Fisheries in January 2004 and formally adopted by ADF&G in 2005. During this review, analyses for escapement goals established in 2001 were updated, and most goals were converted from point goals to goal ranges. Given the thoroughness of escapement goal review in 2001 and 2004, no changes were recommended for the February 2007 BOF meeting.
In preparation for the January 2010 BOF meeting, ADF&G completed another review process for escapement goals. Formal meetings, open to agencies and public, were held in October and December of 2008. Draft analyses were distributed to the public for review and comment in March 2009. A final document summarizing the escapement goal review was submitted in December 2009 (Volk et al. 2009). There were 3 escapement goals revised and 2 escapement goals were discontinued in the Yukon Management Area.
Five Chinook salmon aerial survey goals were converted to escapement goal ranges and formally adopted in 2005, using the method devised by Bue and Hasbrouck2 (Appendix E1). In the case of Nulato River, the goals for the 2 forks were combined into a single goal. The escapement goal review team later recommended revision of the Chinook salmon SEG for the East Fork Andreafsky River from an aerial survey-based goal to a weir-based goal in 2010 (Volk et al. 2009). The new SEG is 2,100–4,900 Chinook salmon and was derived using the percentile approach (Bue and Hasbrouck2). The 2010 team recommended elimination of the Gisasa River aerial survey goal for Chinook salmon because, based on comparisons with recent weir counts, aerial surveys do not appear to track true abundance (Volk et al. 2009). All other existing goals continued without revision.
2 Bue, B. G. and J. J. Hasbrouck. (Unpublished). Escapement goal review of salmon stocks of Upper Cook Inlet, Report to the Alaska Board
of Fisheries, 2001. Alaska Department of Fish and Game, Anchorage.

53
In 2009, the escapement goal review team evaluated the type, quality, and amount of data for each summer chum salmon stock to determine appropriate types of escapement goals as defined by the statewide salmon escapement goal policy (Volk et al. 2009). A lower bound SEG replaced the BEG range for the East Fork Andreafsky River stock, primarily because this would be difficult or undesirable to hold escapements below the upper bound of a range through inseason management actions (Fleischman and Evenson 2010; Appendix E1). Because of Andreafsky River’s geographic location, it is unlikely sufficient fishing power could be generated in a timely manner to prevent escapement from exceeding an upper limit, and a lower-bound SEG is most appropriate for this stock. Information garnered from run reconstruction and spawner-recruit analyses suggested that the escapement goal could safely be changed to a lower bound SEG of 40,000. This goal, first implemented in 2010, will improve yield potential and reduce disruptions to the lower Yukon River summer chum salmon fishery.
A number of projects were established between 1993 and 1995 to monitor the escapement of fish into select rivers and tributaries. Escapement monitoring projects were operational on the Yukon River from approximately June to September (Appendix A24). These include: the East Fork and West Fork Andreafsky, Anvik, and Gisasa rivers (Appendices E4 and E5). Ground based escapement projects include: the East Fork Andreafsky and Gisasa River weirs operated by USFWS and Henshaw Creek weir operated by TCC and USFWS-OSM; the Anvik River sonar project operated by ADF&G; the Chena River tower operated by ADF&G; and the Salcha River and Goodpaster River towers operated by BSFA. Maps of these areas are shown in Appendices E11 to E15.
Chinook Salmon Escapement The actual 2010 Chinook salmon run was much weaker than the preseason projection and early inseason assessment projects indicated. Consequently, most escapement results were disappointing. Chinook salmon escapement goals for the East Fork Andreafsky, West Fork Andreafsky, and Salcha rivers were achieved. The Anvik and Chena river escapement goals were not achieved. Escapement objectives into Canada, as dictated by the Yukon River treaty, were also not achieved.
Aerial surveys in the lower Yukon River drainage were conducted under fair or good conditions. Water conditions were generally turbid with high water levels. Five surveys were rated good, 7 surveys were rated fair, and 2 were rated poor. Salmon entering the Yukon River seemed to have a later than average run timing and surveys were adjusted accordingly. Peak spawning was likely missed on some of the systems, particularly those on the lower Koyukuk River. Surveys of the tributaries in the lower and middle Yukon River were conducted during a brief window of fair weather in a relatively rainy season.
A large number of pink salmon were encountered during the Andreafsky surveys, which inhibited accurate counting of Chinook and chum salmon. Surveys of the upper Kantishna including the Bearpaw River were hampered due to poor weather conditions and smoke from wild fires. Escapement on the Chena, Salcha, and Goodpaster rivers was monitored using tower counts. The Salcha River missed 3 full days early in the season and had 3 days of partial counts during peak passage dates. The Goodpaster River experienced a single day of partial counts due to water clarity issues, and the Chena River counting tower was able to count throughout the season.

54
The Chinook salmon escapement counts for selected spawning areas in the Alaska portion of the Yukon River drainage can be found in Appendices E4 and E5.
A weir was operated on the East Fork Andreafsky River by USFWS, and the estimated passage of 2,413 Chinook salmon, which was the third lowest escapement for this system since 2000 (Appendix E4). Age, sex, and length data was collected from Chinook salmon caught in the weir trap. The estimated age composition was 0.3% age-3, 41.4% age-4, 46.8% age-5, 10.5% age-6, and 1.0% age-7 fish. The sex composition of fish sampled (n=624) was 48.6% female and 51.4% male (Schumann and Dubois 2011).
Age, sex, and length data was collected from the Anvik River using a ground-based carcass survey conducted by ADF&G. The estimated age composition was 33.0% age-4, 54.3% age-5, and 12.7% age-6 fish. The sex composition of fish sampled (n=94) was 19.1% female and 80.9% male (Schumann and Dubois 2011).
The Gisasa River weir was operated by USFWS, and the passage estimate was 1,516 Chinook salmon. Age, sex, and length data was collected from fish caught in the weir trap. The estimated age composition from scale samples was 0.3% age-3, 43.7% age-4, 46.8% age-5, 8.7% age-6, and 0.5% age-7 fish. The sex composition of fish sampled (n=492) was 29.0% female and 71.0% male (Schumann and Dubois 2011).
Escapement through the weir operated at Henshaw Creek by TCC and USFWS-OSM was estimated at 793 Chinook salmon. Age, sex, and length data was collected from fish caught in the weir trap. The estimated age composition from scale samples was 0.4% age-3, 21.0% age-4, 57.6% age-5, 19.3% age-6, and 0.5% age-7 fish. The sex composition of fish sampled (n=208) was 49.6% female and 50.4% male (Schumann and Dubois 2011).
BEGs have been established for the Chena and Salcha rivers located on the Tanana River, which are the 2 largest spawning tributaries for Chinook salmon in the Yukon River drainage. The escapement goal was met only for the Salcha River (Appendix E5). Without interpolation for missed counting periods, results from river tower counts indicate the Chinook salmon escapement into the Chena River was approximately 2,301 fish and 5,907 Chinook salmon into Salcha River (Appendix E5). This was the lowest escapement recorded on the Chena River, and third lowest escapement since 2000 on the Salcha River.
Age, sex, and length information was collected from the Chena and Salcha rivers using ground-based carcass surveys conducted by ADF&G. The estimated age composition of Chinook salmon in the Chena River was 22.3% age-4, 51.1% age-5, 24.4% age-6, and 2.2% age-7 fish. The sex composition of fish sampled (n=90) was 33.3% female and 66.7% male. The estimated age composition of the Chinook salmon in the Salcha River was 0.5% age-3, 31.7% age-4, 53.3% age-5, 13.4% age-6, and 1.2% age-7 fish. The sex composition of fish sampled (n=419) was 29.8% female and 70.2% male (Schumann and Dubois 2011).
The Eagle sonar project was used to determine the Canadian Upper Yukon River border passage estimate in 2010. The preliminary border passage estimate for 2010 is 34,465 Chinook salmon based on the Eagle sonar project estimate of 35,074 minus an estimated Alaska subsistence harvest upstream of the sonar project site of 609 fish (Appendix E6). After subtracting the Canadian Upper Yukon River Chinook salmon harvest of 2,455 aboriginal and 0 commercial, domestic, and recreational, a total of 32,010 Chinook salmon is estimated to have reached Canadian spawning areas (Appendix E6). The spawning escapement is approximately 25%

55
below the low end of the IMEG range of 42,500 to 55,000 adopted by the Yukon River Panel in 2010 (Appendix E6).
In addition to operating the sonar project, a drift gillnet project was conducted near Six-Mile Bend to monitor species composition and to collect biological information, including ASL and genetic samples from fish passing the sonar project site. The estimated age composition of Chinook salmon caught in the border fish wheels was 7.4% age-4, 46.2%age-5, 41.7%age-6, and 3.0% age-7 fish. The sex composition of fish sampled (n=338) from the border fish wheels was 40.5% female and 59.5% males (Schumann and Dubois 2011).
Aerial surveys of the Little Salmon, Big Salmon, Wolf, and Nisutlin rivers index areas were conducted by DFO in 2010 (Appendix E2). A single survey was flown for each river system. Peak annual historical counts are documented in Appendix E6.
The Little Salmon aerial survey was flown on August 17. Survey conditions were rated as being poor, due to high winds and some turbidity; surveyors counted 63 Chinook salmon, which was the second lowest count since 2000. This survey count was 7% of the 2000–2009 (10 year) average count of 867 fish (Appendix E2).
The Big Salmon, Nisutlin, and Wolf river index areas were surveyed on August 19 under good to excellent survey conditions. The Big Salmon count of 656 was 60% of the 10 year average 1,094 fish. The Nisutlin River count of 288 was 68% of the 10 year (excluding 2008 when survey was not completed) average count of 427 Chinook salmon. The Wolf River count of 94 was 69% of the 10 year average count of 137 fish (Appendix E2).
Single (or multiple) aerial surveys do not count the entire escapement within an aerial index area as runs are usually protracted with the early spawning fish disappearing before the late ones arrive. Weather and water conditions, the density of spawning fish, as well as observer experience and bias also affect survey accuracy. Index surveys are rated according to survey conditions. Potential ratings include excellent, good, fair, and poor. Survey ratings that rank higher than poor are considered useful for inter-annual comparisons.
J. Wilson and Associates conducted the Blind Creek weir project in 2010, and a total of 270 Chinook salmon were counted between July 19 and August 19 (Appendix E6). This is approximately 42% of the average total count of 646 and is the lowest count recorded in 10 years of operation. Age-sex-length samples were randomly collected from migrating Chinook salmon throughout the period of weir operation. A total of 185 Chinook salmon (68.5% of the run) was sampled, of which 77 (42%) were female and 108 (58%) were male. Jacks (males with a snout to fork length ≤630mm) comprised 10% of the males sampled. The mean fork length of females and males sampled was 855 mm and 765 mm respectively. The DFO scale lab determined ages of 126 of the Chinook salmon sampled. Of these, age-5 and age-6 fish were the predominant age classes, comprising 54% and 32.5% of the sample, respectively. Age-3, age-4, and age-7 represented 0%, 8.7%, and 4.8 %, respectively (JTC 2011).
A total of 672 Chinook salmon ascended the Whitehorse Rapids Fishway between August 3 and September 6, 2010 (Appendix E6). This total was 57% of the 2000–2009 average count of 1,171 fish. The overall sex ratio was 21% female (n=143 fish). Hatchery-produced fish accounted for about 49% of the return (Appendix E6) and consisted of 269 males and 58 females. The non-hatchery count consisted of 345 fish, 260 wild males and 85 wild females. The run midpoint occurred on August 20 and the peak daily count occurred on August 18 when 139 fish were

56
counted. The midpoint of the 2010 run occurred 4 days later than the recent 10 year average (2000–2009) (JTC 2011).
In 2010, fish were not specifically removed from the fishway for coded wire tag sampling; however, several samples were obtained from the brood stock collected. No weirs, i.e. the Wolf or Michie creek weirs, were operated in the drainage upstream of the Whitehorse Rapids Fishway in 2010.
Summer Chum Salmon Escapement Summer chum salmon escapements were variable, but most tributaries experienced good escapements. Summer chum salmon escapements in Gisasa and Henshaw rivers were above expected levels. Anvik and East Fork Andreafsky river escapements successfully met their respective BEGs. On Tanana River, summer chum salmon escapements were near expected counts for Chena River and below expected for Salcha River.
The Pilot Station passage estimate was 1,327,581 summer chum salmon (Appendix E3). Water levels observed near Pilot Station during 2010 exhibited unseasonable fluctuations, with record low water levels recorded during the summer. Therefore, both summer chum and Chinook salmon passage estimates are considered conservative.
The summer chum salmon escapement counts for selected spawning areas in the Alaska portion of the Yukon River drainage can be found in Appendix E7.
The Anvik River sonar project based escapement count of 396,173 summer chum salmon was just below the low end of the BEG range of 400,000 to 800,000 fish (Appendix E7). Age, sex, and length samples were collected in 2010 by beach seine. The estimated age composition was 7.3% age-3, 84.5% age-4, and 8.2% age-5 fish. The sex composition of the fish sampled (n=572) was 52.98% female and 47.3% male (Schumann and Dubois 2011).
The East Fork Andreafsky River weir escapement estimate for chum salmon was 72,839 (Appendix E7). Age, sex, and length data was collected from fish caught in the weir trap. The estimated age composition was 6.2% age-3, 89.3% age-4, 4.2% age-5, and 0.3% age-6 fish. The sex composition of the fish sampled (n=836) was 51.9% female and 48.2% male (Schumann and Dubois 2011).
The escapement estimate of summer chum salmon through the Gisasa River weir was 47,669 fish (Appendix E7). Age, sex, and length data was collected from fish caught in the weir trap. The age composition of samples was 19.2% age-3, 64.7% age-4, 14.7% age-5, and 1.3% age-6 fish. The sex composition of the fish sampled (n=952) was 53.0% female and 47.0% male (Schumann and Dubois 2011).
The escapement estimate of summer chum salmon through the Henshaw Creek weir was 100,670 fish (Appendix E7). Age, sex, and length data was collected from the weir trap. The estimated age composition from scale samples was 8.5% age-3, 64.5% age-4, 27.0% age-5, and 0.1% age-6 fish. The sex composition of fish sampled (n=562) was 52.7% females and 47.3% males (Schumann and Dubois 2011).
The Kaltag Creek, Nulato River, and Tozitna River escapement projects did not operated in 2010.
Age, sex, and length information was collected from the Salcha River using ground-based carcass surveys conducted by ADF&G. The estimated age composition of the Chinook salmon in

57
the Salcha River was 5.0% age-3, 46.9% age-4, 39.4% age-5, 8.1% age-6, and 0.6% age-7 fish. The sex composition of fish sampled (n=160) was 61.3% female and 38.8% male (Schumann and Dubois 2011).
Fall Season Escapement 2010 Fall Chum Salmon Escapement
Historic fall chum salmon escapement information along with the most current 2010 escapement results are presented in Appendix E8 and E9. Major fall chum salmon spawning areas are located in the Tanana, Chandalar, and Porcupine river drainages and within the Canadian portion of the mainstem Yukon River drainage (Figure 12). Historic coho salmon escapement information along with the most current 2010 escapement results are presented in Appendix E11.
The 2010 preseason run projection for Yukon River fall chum salmon ranged from 552,000 to 828,000 fish (Hayes and Estensen 2011). The point projection was 690,000 and the forecast range was based on the upper and lower values of the 80% confidence bounds for the point projection. Confidence bounds were calculated using deviation of point estimates and observed returns from 1987 through 2009. Excessively large escapements typically do not produce well and the primary brood years for the 2010 return both exceeded 870,000 fall chum salmon therefore the run is expected to be closer to the low end of the range.
Initial inseason assessments of fall chum salmon for 2010 were influenced by the performance of summer chum salmon abundance. Determination of summer chum salmon abundance is based on the main river sonar project abundance estimate, Andreafsky River weir counts and estimates of harvest downstream and appeared to be average. The fall chum salmon projection was refined to 600,000 fish based on the 2010 summer chum salmon return and the historical relationship. Management of the fisheries continued with use of inseason monitoring projects located throughout the drainage. Assessment of the run occurred at each project location, and managers looked for alignment from various indicators.
Fall chum salmon pulses take approximately 20 days to reach the confluence of the Tanana River and another 10 days to reach the Canadian Border. In 2010, small pulses arrived at the LYTF project on August 6 and August 10 which indicated late run timing since the mid-point of migration at that location is August 8 (Appendix B13). The third and largest pulse arrived on August 16 but was not sufficient in abundance to improve projections enough to justify commercial fishing .The fourth and final pulse occurred on August 31. In concert, the lower river projects corresponded well for timing information but not as well for relative abundance; however, Lower Yukon River projects provided mixed fall chum salmon assessments of abundance. The LYTF project (based on 9 years of data), Mountain Village (15 years of data), and Pilot Station apportionment test fishery (14 years of data) indicated near average passage. The mainstem sonar project operated at Pilot Station is the main project that provides abundance estimates (14 years of data) and, initially, a considerable amount of weight is placed on this project until upriver monitoring projects can provide data. The assessment of total run reconstruction based on the Pilot Station sonar project and harvests downstream indicated that the run was below average and weaker than anticipated, with projections less than 400,000 fall chum salmon.
As the season progressed, upriver assessment projects provided the distribution of major contributing stocks, and fisheries management actions were adjusted accordingly. The upriver

58
assessment projects typically show a slightly different relationship because the sharp pulses observed down river spread out as the travel speed of the fish begins to dictate passage. Additionally in 2010, the fish traveled through some sustained high water on the mainstem Yukon River further delaying arrival for the bulk of the fish into escapement projects.
Information from Rapids test fish project (14 years of data) indicated the run in 2010 was half of average and up to 7 days later than normal. Escapement information from tributaries came in late because of run timing but it was determined inseason that most of the goals would be achieved with concerns primarily for the weak Porcupine River components (Sheenjek and Fishing Branch rivers).
The Chandalar River sonar project operated from August 8 through September 26, 2010. Flooding occurred during the first week of operations on this system however, they were able to keep at least one sonar operational throughout its detection range. The preliminary escapement estimate was 157,998 upstream fall chum salmon, 17.0% below the 1995-2009 average of 185,000 fish (Appendix E8). Chandalar River sonar project estimates of fall chum salmon range from a low of 65,894 fish in 2000 to 496,484 fish in 2005 (Appendix E8). The 2010 estimate was slightly above the upper end of the biological escapement goal range of 74,000 to 152,000 fall chum salmon.
The Sheenjek River sonar project operated from August 18 through September 24, 2010. The Sheenjek River escapement was monitored by a Dual-Frequency Identification Sonar (DIDSON); however, installation was delayed by high water and the left bank sonar was not deployed because of changes to the cut bank caused by flooding. Both bank operations had occurred from 2005 to 2009. Most of the historical Sheenjek River escapement estimates were only derived from right bank operations with old technology, with counts ranging from 14,000 in 1999 to 247,000 fall chum salmon in 1996, and a high of 562,000 fish observed on both banks combined in 2005. The right bank estimated escapement of approximately 22,000 fish in 2010 was 56% below the lower end of the BEG range of 50,000 to 104,000 fall chum salmon, based on the historical right bank data (Appendix E8).
An IMEG of 22,000 to 49,000 fish was established for the Fishing Branch River weir for the years 2008 through 2010 (JTC 2011). This goal uses percentiles based on weir data only, excluding all years with extrapolations based on other methods of measurement. The average escapement from 1985 to 2009 is 36,000 fall chum salmon ranging from 5,053 in 2000 to 121,413 in 2005. In 2010 the operations of the Fishing Branch River weir began later than normal but the run was late, thus not affecting the count appreciably. The project operated from September 5 to October 12 (typical operations last week of August to as late as October 25), however expansions were added to both ends of the operational periods to approximate the typical run. The 2010 estimated weir passage of approximately 15,773 fish is below the low end of the IMEG (Appendix E9).
The Yukon River mainstem sonar project at Eagle operated into the fall season from August 20 through October 6, and the daily passage of fish was extrapolated through October 18, 2010. The resulting estimate of passage was 132,930 fall chum salmon (JTC 2011). Adjusting for an estimated subsistence harvest of 11,350 between the sonar project site and the U.S./Canada border, the border passage was estimated to be 121,580 fall chum salmon (Appendix E9). Conservative harvests in Canada resulted in an escapement estimate of approximately 117,871 fall chum salmon (Appendix E9). In 2010, a one year IMEG of 70,000 to 104,000 fall chum
59
salmon was established (JTC 2011) and the upper end of the IMEG was exceeded. This level of escapement represents approximately 27% of the return based on escapements to the major spawning grounds.
Inseason monitoring of the Tanana River drainage consisted of monitoring fall chum salmon run timing at the various test fish wheel locations near the villages of Tanana and Nenana, as well as monitoring subsistence and commercial harvest in the fisheries. Based on the historical mark–recapture estimates of fall chum salmon (1995–2007) within the Tanana River, the drainage contributes approximately 30% to the overall run. Genetic mixed stock analysis is used in part to estimate overall abundance of the late running Tanana River stock and resulted in 121,000 chum salmon after July 19 without an adjustment for harvest. An estimated harvest of the Tanana River component of 21,000 fall chum salmon would be expected to result in an escapement of 100,000 fish. The estimated escapement was within the Tanana River BEG range of 61,000 to 136,000 fall chum salmon (Appendix E8).
The Delta River, a tributary and index area in the upper Tanana River drainage, has a BEG range of 6,000 to 13,000 fall chum salmon. Evaluation of the run to the Delta River in 2010 was based on 8 replicate foot surveys conducted between October 5 and December 3. The Delta River escapement was estimated to be 18,000 fall chum salmon based on the area under the curve method (Appendix E8). This level of escapement was 38% above the upper end of the BEG range.
Postseason run size is calculated using the individually monitored spawning escapements including terminal areas such as Chandalar, Sheenjek, and Fishing Branch rivers and passage estimates adjusted for harvest in the mainstem Yukon River at the U.S./Canada border and in the Tanana River.
In 2010, the estimate of 489,000 based on collective projects is approximately 20% higher than the estimate using Pilot Station sonar project. Both methods resulted in estimations below the lower end of the preseason projection based on normal production rates. The 2010 fall chum salmon run could be characterized overall as having a below average even-numbered year run size which started out weak through the first week of August, and the first substantial pulse provided nearly half of the entire run resulting in a below average passage (based on 14 years of data).
Coho Salmon Escapement Assessment of coho salmon spawning escapement is limited in the Yukon River drainage because of funding limitations and marginal survey conditions during periods of peak spawning. The coho salmon passage estimate at Pilot Station sonar project does not represents the total return because the project terminates on September 7, before the end of the run. The preliminary passage estimate of 142,129 coho salmon (SE 7,600) at Pilot Station sonar project was slightly below the average passage of 146,617 fish (Appendix E11). Tributary escapement estimate information was limited to portions of the Tanana River drainage.
Presently, only one escapement goal has been established (in 2004) for coho salmon in the Yukon River drainage. The Delta Clearwater River, in the Tanana River drainage, has an SEG range of 5,200 to 17,000 fish. The Delta Clearwater River spawning count was 5,867 coho salmon and was conducted by boat survey on October 26, 2010. This escapement level is only slightly above the lower end of the escapement goal range and most likely does not represent peak spawning due to the late timing of freeze up and weather precluded conducting additional

60
surveys. Spawning ground surveys were conducted in other areas within the Tanana River drainage, primarily the Nenana (BSFA) and upper Tanana (ADF&G). Coho salmon escapements in the Nenana River were below average overall in 2010. Upper Tanana River aerial surveys were conducted November 10, 2010 and the Richardson Clearwater River had an above average escapement of coho salmon (Appendix E11).
ENFORCEMENT 2010 The primary enforcement authority for violations of Fish and Game regulations is the Fish and Wildlife Protection (FWP) with the Department of Public Safety. State FWP officers worked cooperatively with federal USFWS officers for the purpose of enforcing subsistence, personal use, and commercial fishing regulations within the Yukon Area.
During 2010, 4 FWP officers conducted patrols in the Lower Yukon River, Upper Yukon River, and Kuskokwim River. A total of 339 contacts were made and 37 citations were issued, including violations for improper vessel identification, not possessing a crewmember license, unmarked gear, and fishing during a closed period.
OUTLOOK FOR 2011 Chinook Salmon The total Yukon River Chinook salmon run can be estimated by applying historical average proportions of Canadian-origin fish in the total run to the outlook estimated for the Canadian component of the run. The average proportion of Canadian origin fish in the total run is approximately 50%. Using this method, the expected total Yukon River run size is 216,2003, using the unadjusted model estimate. However, there is a lot of uncertainty associated with this methodology and, due to reductions in productivity in recent years, environmental factors and other phenomena not incorporated into the models, this estimate is unlikely. The drainage-wide run outlook based on the adjusted Canadian-origin model estimate, which attempts to account for low productivity since 2007, is 130,000–178,000 Chinook salmon. Thus, the 2011 Yukon River Chinook salmon run will likely be poor to below average.
Summer Chum Salmon The strength of the summer chum salmon run in 2011 will be dependent on production from the 2007 (age-4 fish) and 2006 (age-5-fish) escapements, as these age classes dominate the run. The total run during 2006 and 2007 were both above average at approximately 4.0 and 2.0 million summer chum salmon respectively, though tributary escapements were highly variable.
Yukon River summer chum salmon generally exhibit strong run size correlations among adjacent years, and it is expected that the total run in the Yukon River will be similar to the 2010 run of approximately 1.6 million fish. In 2010 there was a good showing of age-3 fish from the 2007 brood year which may indicate an upward trend in run size if the age-4 fish returning in 2011 is above average. The high seas BASIS study indicated a decline in chum salmon in 2004 and 2005, but 2006 and 2007 results showed an increase. No BASIS survey was conducted in 2008. Chum salmon collected in the BASIS study in 2007 would correspond to the age-5 returns in
3 Based on the averaged value for both sibling and Ricker models. Values for each model separately are 205,500 and 224,000
for Ricker and sibling models respectively.

61
2011. A collaborative effort between ADF&G and NOAA is in progress to test the applicability of BASIS juvenile salmon indices for run size forecasting.
The 2011 summer chum salmon run will likely be average and is anticipated to provide for escapements, a normal subsistence harvest, and a surplus for commercial harvest. Summer chum salmon runs have provided for a harvestable surplus in each of the last 8 years (2003–2010). The commercially harvestable surplus could range from 300,000 to 600,000 summer chum salmon. The actual commercial harvest of summer chum salmon in 2011 will likely be affected by a potentially poor Chinook salmon run, as Chinook salmon are incidentally harvested in chum salmon directed fisheries.
Fall Chum Salmon The fall chum salmon forecast for 2011 is a point estimate of 737,000 fish with a range of 605,000 fish to 870,000 fish. The forecast range is based on the upper and lower values of the 80% confidence bounds for the point estimate. Confidence bounds were calculated using deviation of point estimates and observed returns from 1987 through 2010. This forecasted run size is below average for odd-numbered year returns.
Yukon River fall chum salmon return primarily as age-4 and age-5 fish, although age-3 and age-6 fish also contribute to the run. The 2011 run will be comprised of parent years 2005 to 2008. Estimates of return per spawner (R/S) based on brood year return were used to estimate production for 2005 and 2006. An auto-regressive Ricker spawner-recruit model was used to predict returns from 2007 and 2008. The 2011 forecast uses the 1984 to the current complete brood year returns applied to the odd/even maturity schedule, because current production is reduced from the pre-1984 level. Contributing parent year escapements from 2005 through 2007 all exceeded the upper end of the drainagewide escapement goal range while 2008 was within the drainagewide escapement goal range of 300,000 to 600,000 fall chum salmon. The 2005 through 2007 parent year’s all contributed less than one return per spawner. The estimated return per spawner of 0.23 for the 2005 brood year was the lowest on record. The 2006 return per spawner was nearly three times that of 2005 but still considered poor. Also, the major contributor to the 2011 fall chum salmon run is anticipated to be age-4 fish returning from 2007 parent year. In 2010 there was a good showing of age-3 fish from the 2007 brood year which may indicate an improved return per spawner and an upward trend in run sizes if the age-4 fish returning in 2011 are also above average.
Brood Year Escapement
Estimated production (R/S)
Estimated Production
Contribution based on age Current Return
2005 1,996,513 0.23 459,198 0.7% 4,814 2006 873,987 0.63 550,612 25.2% 185,871 2007 928,430 0.83 770,612 72,5% 534,093 2008 564,482 1.42 799,421 1.6% 11,857
Total expected run (unadjusted) 736,635 Total 2011 run size expressed as a range based on the forecasted vs. observed returns from 1987 to 2010 (80% CI):
605,000 to 870,000
Another approach to estimate the 2011 fall chum salmon run size examined a time lagged correlation from observed runs (2000–2010, excluding 2005), which resulted in a projection of only 536,000 fall chum salmon with a 95% confidence interval of 300,000 to 700,000 fish. This

62
method effectively reduces the projections by 30%, as the last 3 year’s forecasts have overestimated the run size by approximately that amount. However, a concern with this approach is that it assumes that fall chum stocks are still in decline. With the amount of age-3 fish observed in 2010, the age-4 component would be expected to increase in 2011, and the run size would then be closer to the forecast of 700,000 fall chum salmon. Based on the preseason forecast, it is anticipated that the 2011 fall chum salmon run size will be sufficient for escapement and subsistence uses, and may support a commercial harvest ranging from 50,000 to 300,000 fish.
Coho Salmon Although there is little comprehensive escapement information for Yukon River drainage coho salmon, it is known that coho salmon primarily return as age-4 fish. The major contributor to the 2011 coho salmon run will be the age-4 fish returning from the 2007 parent year. Based on run reconstruction using Pilot Station sonar estimates, the 2007 passage estimate of 173,000 coho salmon was above the historical average of 148,000 fish.
Escapements are mostly monitored in the Tanana River drainage. The Delta Clearwater River is a major producer of coho salmon in the upper Tanana River drainage. The parent year escapement of 15,000 fish in 2007 was near the upper end of the SEG range of 5,200 to 17,000 coho salmon, and coho salmon escapements in the Nenana River complex were nearly average. Assuming average survival, the 2011 coho salmon run is anticipated to be average based on escapements observed in 2007. Depending on whether coho salmon are harvested incidental to fall chum salmon or harvested as a directed fishery late in the season the commercial harvest is anticipated to be 10,000 to 70,000 fish.
CAPE ROMANZOF DISTRICT HERRING FISHERY 2010
INTRODUCTION The Cape Romanzof Herring District consists of all state waters from Dall Point to 62 degrees north latitude (Appendix F1). Pacific herring Clupea harengus pallasii are present in coastal waters of the Yukon Area during May and June. Spawning populations occur primarily in the Cape Romanzof area in Kokechik Bay and Scammon Bay where spawning habitat consists of rocky beaches and rockweed Fucus sp. The arrival of herring on the spawning grounds is influenced by ocean water temperature and ice conditions. Typically, herring appear immediately after ice breakup. Spawning usually occurs between mid-May and mid-June.
Local residents harvest herring in Hooper Bay, Kokechik Bay, and Scammon Bay for subsistence purposes. Additionally, a few fishermen in the Yukon River Delta report harvesting herring along the coast near Black River and Kwiguk Pass for subsistence use. It is speculated that these herring are migrating toward southern Norton Sound. Additionally, some Yukon River Delta residents harvest herring spawn-on-kelp (Fucus sp) north of Stebbins in southern Norton Sound.

63
A commercial herring sac-roe fishery has occurred in the Cape Romanzof District since 1980. Commercial harvests increased steadily after inception of the fishery, reaching a peak harvest of 1,865 tons in 1986 (Appendix F2) Harvests have greatly decreased since then because of declining markets resulting in lower prices paid and lower fishing effort. There has not been a commercial opening since 2006 because of the lack of market interest.
In 1982, the BOF reduced the area open to commercial fishing by closing the waters outside of Kokechik Bay. In 2004, the BOF opened the Cape Romanzof District for commercial herring fishing to the pre-1982 boundaries. Gillnets are the only legal commercial gear type. The use of mechanical shakers has been prohibited since 1988. Limited entry to the fishery began with a moratorium on new entrants in 1988. The fishery is now limited to 101 permits.
COMMERCIAL FISHERY Since the fishery was initiated in 1980, commercial harvests have ranged from 25 st in 2005 to 1,865 st in 1986 (Appendix F2). The exvessel value of the fishery has ranged from $1,000 in 2001–2004 to $1.1 million in 1986. The number of permit holders participating has ranged from 8 in 2006 to 157 in 1987. The commercial fishery saw an increasing trend in effort, harvests, and value from the inception of the fishery in 1980 until its peak in 1986. Declining market value after 1986 through 1990s kept effort, harvest, and exvessel values below early 1980s numbers, eventually leading to record low harvests and effort in the 2000s. There have not been any commercial openings in the district since 2006. In recent years, fishermen in the district have been using larger mesh gillnets to selectively harvest larger (older) herring and a higher percentage of females. This change in the mesh size has increased the harvest quality, but also resulted in lower harvest rates. Harvest of a high percentage of males and partially spawned out herring have historically contributed to low roe recovery rates in the Cape Romanzof fishery.
Historically, short commercial herring fishing openings have been scheduled around high tide events in the Cape Romanzof District. Beginning with the 2004 season, opening and closing the commercial herring fishery based on tide events was modified by opening fishing in the district on a continuous basis. Opening the commercial fishery on a continual basis was justified based on the reduced commercial fishing effort, limited tendering capacity, and decreased processor interest in the area. Conducting commercial fisheries this way allows fishermen the maximum opportunity to explore the district to find marketable quality of sac roe herring and allows the buyer to direct when fishing will occur based on current harvest information.
SUBSISTENCE FISHERY The subsistence harvest and effort figures represent only the harvest which was reported. Therefore, the reported harvest is a minimum estimate since not all fishing families were contacted and not all households who received questionnaires returned them.
Subsistence Fishery 2010 A total of 196 mail-out questionnaires were sent to households in the communities of Hooper Bay, Chevak, and Scammon Bay. A total of 32 (16%) households responded. The subsistence harvest and effort figures represent only the harvest which was reported. The reported harvest is a minimum estimate since not all fishing families were contacted and not all households who received questionnaires returned them. During 2010, an estimated subsistence harvest of 2.1 st of herring was taken by 14 fishing families from Hooper Bay, Chevak, and Scammon Bay

64
(Appendix F3). In addition, 6 households harvested 91 pounds of herring spawn-on-kelp for subsistence purposes (Appendix F4).
STOCK STATUS Because of turbid water in the Cape Romanzof area, it is typically not possible to estimate herring biomass using aerial survey techniques. Herring biomass has been estimated using a combination of information from aerial surveys, test and commercial catches, spawn deposition, and age composition. However, aerial surveys were not flown in 2010. Qualitative spawn deposition surveys were conducted from 1992 through 2003 (Bue et al. 2011). Although these surveys were discontinued in 2004 because of budget limitations, ADF&G has continued to make periodic observations of spawn deposition near the field camp.
VARIABLE MESH GILLNET TEST FISHERY Test fishing with variable mesh gillnets has been conducted since 1978 to determine distribution, timing and relative abundance of spawning herring, and to collect samples for age, sex, size, and relative maturity information. No test fishery has occurred at Cape Romanzof since 2006.
HERRING OUTLOOK FOR 2011 Projections of herring abundance in the upcoming year are made annually. Estimates of survival rates are applied to age-specific estimates of herring escapement to project the number of herring which will survive until the next year. Assumptions of age-specific recruitment rates are used in combination with age-specific abundance to project the number of herring of each age that will recruit to the fishery for the first time (Wepestad 1982). Projections of abundance are converted to units of biomass using data on mean weights at age from the current year. In cases where age-specific abundance or mean weights were not empirically measured, projections from the previous year were applied.
The 2011 projected biomass for the Cape Romanzof District is expected to be 5,538 tons and the minimum biomass threshold is 1,500 tons. Based on the Bering Sea Herring Fishery Management Plan (5 AAC 27.060), the exploitation rate shall not exceed 20% of the estimated biomass. Therefore, the allowable harvest is 1,108 tons.
Since water turbidity in the Cape Romanzof area generally prevents aerial observations of herring, spawn deposition and test and commercial catch rates will be used to determine the timing and duration of commercial fishing periods. Herring ages 6 to 9 are expected to comprise 83% of the returning biomass, 16%, 26%, 23%, and 18%, respectively. Herring age 10 and older, 13%, and ages 4-5 (4%) are expected to comprise the remaining biomass.
Normally it is not possible to determine herring abundance using aerial survey methods in the Cape Romanzof District due to turbid water conditions. Therefore, inseason assessment of stock abundance will be made using information collected from test fishing, commercial harvest rates if available, herring distribution, age composition, and if possible, aerial surveys.
Commercial fishing periods will be determined by the amount of fishing effort present and roe quality. However, no commercial buyers are anticipated to be available in 2011. If a commercial market develops, ADF&G will likely open the fishery on a continuous basis until the quota is landed or there is no longer market interest. Commercial fishing will be opened when it is determined that marketable percentage of sac roe herring and a commercial buyer is present.

65
Fishermen are encouraged to bring more than one mesh size of gillnet if they are available. The quality of roe is dependent on size and maturity of the herring, thus it would benefit fishermen to have some flexibility. It is important that fishermen, buyers, and ADF&G obtain the highest roe recovery possible.
It is likely that gear will initially be restricted to no more than 50 fathoms and one gillnet (one shackle of gear) per vessel. However, because of the lower fishing effort in recent years it is likely that 100 fathoms (2 shackles of gear) per vessel may be permitted in 2011, as was allowed in 2006. Two shackles of gear were allowed for several openings in 2003, 2004, and 2006, but few fishermen took advantage of the opportunity. Fishermen should be prepared and bring 2 nets to the fishing grounds if a market develops.
OTHER MARINE AND FRESHWATER FINFISH FISHERIES 2010
SUBSISTENCE FISHERY Non-salmon species (e.g. pike, sheefish, whitefish, blackfish, etc) are an important subsistence resource for people in most areas throughout the Yukon River drainage (Brown et al. 2005, Andersen et al. 2004). Many subsistence users harvest marine and freshwater finfish other than salmon and herring either as an incidental bycatch while fishing for salmon or by directly targeting those species. Subsistence users particularly rely on non-salmon species when other sources of fish or wildlife are unavailable.
During the annual ADF&G postseason subsistence salmon harvest surveys, non-salmon harvest information is documented; however, this information is gathered ancillary to salmon specific surveys and usually without species distinctions. Recent surveys have only just begun to identify whitefish harvest by species in the Koyukuk River drainage and lower-middle communities of Grayling, Anvik, Shageluk, and Holy Cross (Brown et al. 2005, Andersen et al. 2004). Estimates of non-salmon harvest is poorly understood at a species level throughout the Yukon River drainage, thus a comprehensive assessment of non-salmon harvest and use by species has been identified as a research priority for the Yukon Area (Brown et al. 2011).
Historical estimated and reported subsistence catches of freshwater finfish from subsistence surveys throughout the drainage are presented in Appendix G1. Since 1988, subsistence salmon surveys have included the collection of freshwater finfish harvest data. Prior to 1988, non-salmon subsistence harvest was collected with less consistency during the postseason subsistence salmon surveys. Subsistence catches of freshwater finfish taken under authority of a permit in the Upper Yukon Area are presented in Appendix G2.
A variety of fishing methods are used in the main rivers and coastal marine waters to harvest non-salmon finfish. Beach seines are occasionally used near spawning grounds to capture salmon and other species of schooling fish. In the fall and winter months, various designs of traps and fish weirs are used to capture whitefish, blackfish, and burbot. In the winter and spring months,

66
hand lines are used through the ice to take sheefish, northern pike, char, and "tomcod" (saffron cod). A limited number of sheefish are also harvested during the upriver migration of Chinook salmon. In the spring and early summer, smelt are harvested in the Yukon River Delta area using dip nets. During the fall months, dip nets and “eel sticks” are used to harvest Arctic lamprey in the mainstem Yukon River downstream of Grayling. During the fall months, whitefish and sheefish are also harvested incidentally in fish wheels located in the Upper Yukon and Tanana rivers.
COMMERCIAL FISHERY Regulations adopted by the BOF allow ADF&G to issue permits for the commercial harvest of non-salmon freshwater fish, including whitefish, sheefish, burbot, northern pike, blackfish, and Arctic lamprey, throughout the Yukon and Tanana River drainages. Most of these fisheries are issued as limited or experimental permits and operate in discrete time periods throughout the year. Following the decline in salmon runs a marked increase in non-salmon fisheries emerged on the Yukon River. Despite the strengthening chum salmon returns in recent years, the interest in freshwater fisheries has remained, particularly for Bering cisco and Arctic lamprey.
Yukon River Whitefish Fishery Summary Beginning in 2005 there has been an experimental whitefish commercial fishery in the Lower Yukon River. A Commissioner’s permit has been issued annually allowing for a combined harvest total of 10,000–15,000 pounds of all coregonid (‘whitefish’) species in Districts 1 and 2. Commissioner’s permits are issued for the experimental commercial harvest of species not managed under existing State of Alaska commercial fishing regulations. In response to market preference, commercial permits were targeted to specifically harvest of Bering cisco, and to a lesser extent least cisco, in District 1 beginning in 2009. The catch was sold in the kosher market in New York City. The harvest cap was based on historical commercial harvest information from 1980 to 1990 of sheefish and other whitefish species in the Lower Yukon Area. The exact dates of the fishery have varied each year in response to the seasonal movements of whitefish and the river conditions; however, the commercial harvest has generally occurred in the months of September and October. Gear restrictions were implemented in 2007 to reduce the stretch-mesh size from 6 inches (allowed in 2005 and 2006) to 4 inches in effort to reduce fishing pressure on older-aged fish.
In 2010, two freshwater commercial fishery permits for Bering and least cisco were issued to Kwik’pak Fisheries in the Lower Yukon River. Commercial fishing was prohibited in 2010 in designated areas around the village of Kotlik. Fishing gear was restricted to one set or drift gillnet up to 150 feet in length with a maximum stretch-mesh size of 4 inches or one hand line/hook and line.
The first permit authorized up to 5,000 pound harvest of cisco in District and was valid April 19, 2010 through June 6, 2010. The winter commercial harvest occurred sporadically beneath the ice; however, conditions precluded the successful harvest of whitefish during this time. A second permit was issued for up to 10,000 pounds of cisco in District 1 and was valid from September 15, 2010 to December 31, 2010. The bulk of commercial harvest occurred from September 15 to September 19, 2010, and 11,116 pounds of Bering cisco and 405 pounds of least cisco were harvested. Due to the relatively high rates of fish catch, the total harvest inadvertently exceeded the harvest cap of 10,000 pounds. In October 2010, the permit was extended to allow for an additional harvest of 5,000 pounds, allocated between the south and north river mouths in

67
District 1. The impetus for this authorization was to augment commercial opportunity and collect genetic information for stock identification purposes. The permit was valid from October 14, 2010 through March 15, 2011 or until the 5,000 pound harvest limit was reached. The additional harvest occurred from October 14 to October 20 and 3,619 pounds of Bering and 34 pounds of least cisco were harvested, which was below the 5,000 pound harvest maximum.
A total of 22 fishermen made 68 deliveries to the commercial processor and 15,221 total pounds of whitefish were harvested (Appendix G3). The harvest was 62% above the 5 year (2005 to 2009) average for Bering cisco and 81% below the 5 year (2005 to 2009) average for least cisco. The price per pound was $1.50 and the estimated harvest value to fishermen was $22,836. The average harvest value for each fisherman was approximately $1,200, which was nearly three times the 2009 value. The commercial fishing effort consisted of local residents from the Lower Yukon River communities of Nunam Iqua, Emmonak, Alakanuk, and Kotlik. During September and October, fishermen from Kotlik were responsible for 85% and 66% of the total whitefish harvest during the commercial fishery.
In the Upper Yukon Area, commercial freshwater fisheries targeting whitefish occurred primarily through the late 1970s. Since 1980 there has been sporadic and small quantity commercial harvest of whitefish in the upriver districts. In 2010 no permits were utilized likely due to high operational costs and limited market interest (Appendix G4). Permit authorization is not required for the sale of whitefish species taken incidentally during commercial salmon fishing. In District Y-6 whitefish have been taken incidentally to the salmon harvest since the early 1990s. In 2010, 72 pounds of whitefish were harvested incidentally, which is 59% below the 5 year average (Appendix G5).
Harvest Sampling Fish were identified by species at the processing facility in Emmonak prior to shipment. Age-sex-length (ASL) data were collected by ADF&G staff at a processing facility in Anchorage. A total of 1,040 Bering and 33 least cisco commercially harvested in 2010 were sampled for sex and length. A small incision was made on the ventral side of each specimen to identify reproductive organs. Fork length (tip-of-snout to fork-of-tail) was measured to the nearest millimeter. Otoliths were collected from all fish sampled and will be later analyzed for age classification. Body and organ weights of Bering cisco females were used to index reproductive condition. Gonadosomatic index (GSI) was calculated as gonad weight/total body weight x 100. The weight of the gonads was subtracted from the body weight to minimize the effect of the reproductive cycle on these indices.
Bering cisco were larger than the least cisco sampled (t1,071=3.807, p=0.000). Bering cisco females (χ=348.9±23.4 mm, n=510) were longer than males (χ=331.2±19.2 mm, n=530) sampled (t1,038=13.344, p=0.00), and females harvested in October (χ=354.3±22.8 mm, n=192) were longer than those harvested in September (χ=345.5±23.1 mm, n=318; t508=-4.176, p =0.00). The average female body weight for Bering cisco was 543.9±147.1g (n=145). GSI for females ranged from 0.3 to 4.4%, with an average index of 1.2±0.9%. Female GSI was greater in October (χ=1.5±1.0%, n=89) than September (χ=0.8±0.4%, n=56; t143=-5.142, p=0.00). There was no significant difference in the length of female least cisco (χ=323.4±12.4 mm, n=14) compared to males (χ=325.3±17.6 mm, n=17), or between the length of females harvest in September (χ=332.5±12.9 mm, n=14) compared to October (χ=330.0±7.1 mm, n=2). Approximately 50% of the Bering and least cisco sampled in September and October were female.

68
Age composition information was not available at time of writing for these samples.
Genetic samples were also collected to determine the contribution of stock origin for these species. There is reason to believe that the commercial harvest of Bering cisco at the mouth of the Yukon River is a mix of rearing fish originating from Yukon and Kuskokwim rivers stocks. Results from this analysis will be made available in a later report.
In 2010, no test fishery project was operated in conjunction with the whitefish commercial fishery. Whitefish, however, caught incidentally in the salmon test fisheries located at Mountain Village and above the Pilot Station sonar project during June and July 2010 were sampled for ASL.
SHEEFISH In the last few years there has been burgeoning interest in an improved understanding of non-salmon biology in the Yukon River for management purposes. Currently, the non-salmon fisheries in the Yukon River are largely data deficient, despite their importance as subsistence and, in certain places, a commercial resource. Biological information relating to spawning activity, seasonal migration, demographic composition, and other life history characteristics is generally poorly understood. The majority of the biological knowledge about non-salmon species on the Yukon River has been descriptive or gathered through studies documenting traditional ecological knowledge (TEK). In 1995, research began to focus on identifying migration patterns and spawning locations for certain non-salmon species in the Yukon River drainage, with the contingent goal of defining specific populations and their distributions. More complete information about whitefish population demography is an important cornerstone to effective management strategies. Given the number of species under consideration and their vast geographic extent in the Yukon Area, a working group was formed in 2008 to identify and address issues relating to whitefish. Two meetings were convened in the winter of 2008 to 2009 with the Whitefish Strategic Plan Working Group to discuss biological and social issues relating to whitefish fisheries, identify data gaps in existing information, and consider appropriate methods and data needs for assessment, research, and management. These priority issues guided the development of a strategic plan for research of whitefish species within the Yukon and Kuskokwim rivers.
From Brown et al. 2011 …”More information is currently known about sheefish in the Yukon drainage than whitefish species.”: Several studies have documented spawning areas in the Koyukuk River drainage (Alt 1968, 1969b, 1970, 1974), the upper Yukon Flats, the Sulukna River, a tributary of the Nowitna River (Alt 1985; Gerken 2009), and the Chatanika River (Alt 1969a), a tributary of the Tanana River. Radiotelemetry data indicate that nearly all sheefish in the Yukon River originate in the 6 spawning reaches that have been identified. Additionally, sample evidence suggests that additional spawning populations may occur in the upper Porcupine River drainage (Bryan 1973; Brown et al. 2007) and in the Upper Yukon River drainage in Canada (Walker et al. 1974; Walker 1976).
Sheefish migrate to feeding and spawning areas each summer and fall along the Yukon River during the same time periods when Chinook and chum salmon fisheries take place; therefore, sheefish are vulnerable to the same gear that are set for salmon. Postseason subsistence surveys have estimated the annual harvest of these species for the Yukon River drainage. While multiple populations contribute to these harvests the proportional contributions are unknown.

69
Abundance data has only been available from the Sulukna and Chatanika river populations in the Yukon River drainage and were estimated to be approximately 3,000 and 100 fish respectively. Research suggests that the populations in the Koyukuk and Yukon rivers are larger than those formerly mentioned, but relative abundance information is not available.
YUKON RIVER ARCTIC LAMPREY FISHERY SUMMARY 2010 Beginning in 2003 an experimental commercial Arctic lamprey fishery emerged on the Yukon River. A Commissioner’s permit has been issued annually allowing for a harvest total of 5,000 to 44,080 pounds of Arctic lamprey in District 2 and Subdistrict 4-A. Commissioner’s permits are issued for the experimental commercial harvest of species not managed under existing State of Alaska commercial fishing regulations. The reported historical harvests for the Yukon Area are presented in Appendix G3 and G4. The catch was sold in markets in Asia, as well as pharmaceutical companies. The exact dates of the fishery have varied each year in response to the seasonal movements of lamprey; however, the commercial harvest has generally occurred in the mid- to late-November. Gear is restricted to one hand dip net per commercial permit holder. In 2010, one freshwater commercial fishery permit for Arctic lamprey was issued to Kwik’pak Fisheries allowing a harvest of up to 40,000 pounds of Arctic lamprey. The permit was valid November 15, 2010 through December 15, 2010, or until the harvest limit was reached. A single buying station was located in Subdistrict 4-A at the village of Grayling.
The commercial harvest began on November 20, 2010 in Grayling and ended on November 22, 2010. A total of 22 fishermen delivered a harvest of 30,713 pounds to the commercial processor (Appendix G4), which is the second highest harvest on record since the experimental fishery began in 2003. The estimated number of lamprey harvested in the commercial fishery was approximately 109,000 fish. The buyer paid $1.25 per pound for lamprey, and the estimated commercial value of lamprey was $38,391. The average value per fisherman was $1,745.
The Arctic lamprey fishery was monitored by an ADF&G representative via communications with the commercial processor in Anchorage and with processor representatives located in the Lower Yukon River. Community contacts were also established with local subsistence fishermen in the villages of Alakanuk, Anvik, Emmonak, Grayling, Holy Cross, Marshall, Mountain Village, and Russian Mission. Information was gathered during communications about the commercial and subsistence fishing effort, harvest, local weather conditions, and run timing.
A subsistence fisherman in Alakanuk indicated the first lamprey was caught in the Lower Yukon River in late October. The first run pulse was reported to have passed Mountain Village on approximately November 2, with subsistence fishermen harvesting a small quantity of Arctic lamprey. Few lamprey were caught between St. Mary’s and Russian Mission between November 3 and 7, as fishing effort was limited by unsafe ice conditions. Subsistence fishermen began fishing on November 8 in Russian Mission, and lamprey were caught in Russian Mission between November 9 and 10. The run was considered strong with the average fisherman harvesting between 150 and 300 lamprey. A fisherman from Russian Mission estimated that the total harvest for the village was 6,000–8,000 pounds.
Based on estimated rates of travel, lamprey were expected to pass the village of Holy Cross (RM 279) around November 15. On November 16, no large numbers of Arctic lamprey were observed or harvested, perhaps due to poor ice conditions. On November 20, the first run of lamprey was

70
reported 6 miles south of Anvik and harvest occurred on November 21. One fisherman reported good fishing conditions and harvested 2,000 pounds approximately 9 miles above Anvik.
Fishermen in Grayling (RM 336) used chainsaws and/or manual ice breakers to cut large rectangular holes through nearshore ice at traditional fishing sites. The velocity of the water in the hole was then checked; if the water in the hole was slow moving they disregarded the site, cut a new hole, and continued on with the process until they identified a hole with fast moving water. The fast water is believed to be caused by a channel in the river bottom, which acts as a natural corral to funnel migrating lamprey and facilitate their catch. The fishing holes were monitored (rotating shifts, 24-hours a day) by shining a flashlight through the water to the substrate a few feet below. Fishermen also checked for lamprey by occasionally flicking a stick through the water in the fishing holes. Using these 2 methods fishermen avoided icing their dip nets, which were reserved for the Arctic lamprey migration that passed between November 20 and 22. Despite unseasonably warm temperatures which restricted fishing effort to alongside the river bank, the lamprey were harvested in abundant quantities.
Based on the November 2 report from subsistence fishermen in Mountain Village and the commercial fishery activity which occurred on November 21 in Grayling, the estimated mean lamprey travel speed was 13 miles per day. In coordination with ADF&G, commercial fishermen provided catch logs of their fishing time and catch for postseason evaluation. According to the catch logs fishermen fished an average of 87 minutes ± 101 minutes (sd) with an effort averaging 36 ± 70 net dips per 10 minutes. Fishermen caught an average of 70 ± 60 lamprey per 10 net dips.
In November, ADF&G sent lamprey subsistence harvest surveys to 657 households in Yukon River communities of Anvik, Grayling, Holy Cross, Marshall, Mountain Village, Pilot Station, Pitkas Point, Russian Mission, and St. Mary's. Results from these surveys will be made available in an ADF&G annual subsistence harvest report.
Harvest Sampling Samples were collected by the buyer and shipped to ADF&G in Anchorage in order to collect basic biological information. A total of 250 Arctic lamprey commercially harvested in Grayling were sampled for weight, length, and sex information. Reproductive organs were identified by making a small incision on the ventral side of each specimen. Total length was measured from the tip-of-snout to the tip-of-tail to the nearest millimeter, and weight was measured to the nearest gram. Age composition information was not produced from these samples. At this time, ADF&G has no method for aging adult Arctic lamprey.
The mean length was 430 mm for male and female combined. The mean length was 440 mm for females and 424 mm for males. The average weight was 128 g for male and female combined. The average weight for females was 140 g and for males 122 g. The sample was comprised of 34% female proportion.
Assessment The life history of Arctic lamprey in the Yukon River is sparsely documented. Traditional ecological knowledge provides valuable information regarding harvest sites and run timing in the Lower Yukon River and is readily shared between user groups and local communities. Information on population distribution and exact or relative abundance is generally lacking. In coordination with ADF&G, commercial fishermen provided logs of their fishing time and catch

71
in effort to generate baseline data regarding run timing, harvest, and relative abundance. This methodology has been in the developmental stage since 2003, therefore, provides a limited and unreliable harvest rate index.
While the timing of the lamprey run has been closely monitored by subsistence fishermen, the harvest and use quantities by the subsistence community have been more difficult to estimate; thus there is limited assessment of lamprey harvest abundance from which to gauge exploitation rates. Despite the lacking baseline information, the disposition of ADF&G is that historic levels of harvest have been conservative and are sustainable based on the following factors:
i. Duration of the run compared to the duration of the fishery. ii. Timing of the harvest relative to run. Commercial harvest generally occurs during the
heaviest pulse of the run. This is the preferred timing for harvest in order to reduce potential impact to population structure and distribution. While exact characteristics of the lamprey run are unknown, evidence does suggest that the run follows a normal distribution curve with the run building slowly, peaking, and then slowly diminishing.
iii. Relative inefficiency of the fishing gear and comparison to catch rates. Commercial fishermen use a single manually operated dip net with a variable mesh size. Based on catch rates, such gear is inherently inefficient. Typically a fisherman begins dip netting with no initial success. Catch rate success then increases to 1 to 2 fish per dip, and slowly builds over the course of a couple of hours to 20–30 fish per dip. The total volume of water fished per dip relative to the harvest yield suggests that only small percentage of fish passing through the area is caught.
Recent increases in market interest, along with drastic decreases in commercial salmon harvests on the Yukon River, have prompted buyers to request an augmentation of the allowable commercial lamprey harvest. Such requests have not been met by ADF&G as basic biological and demographic information important to sustainable management are lacking. In response, recent research projects have been geared towards quantifying lamprey abundance in the river. In 2004, ADF&G operated a DIDSON sonar through the ice near Grayling to determine if sonar could be used to observe lamprey migrating under the ice. The results indicated that sonar could be utilized to estimate passage of lamprey, at least during periods of lower passage, which occurred in 2004. However, sonar biologists are unsure how well this technology will work at distinguishing individual fish at high densities or during a high density run (Bruce McIntosh, Commercial Fisheries, Biologist, ADF&G, Fairbanks; personal communication). Additionally, a study was conducted in 2009 to assess the feasibility of tagging lamprey as a pre-requisite to a mark–recapture population estimation (G. Sandone, private consultant, G. Sandone Consulting, LLC, personal communication). While an appropriate lamprey tagging method was identified in this study, low marked sample size hindered the occurrence a recapture study.

72
NORTHERN AREA
DESCRIPTION OF AREA The Northern Area includes all waters of Alaska north of the latitude of the western most tip of Point Hope and west of 141 degrees West longitude, including those waters draining into the Arctic Ocean and the Chukchi Sea (Figure 13).
SUBSISTENCE FISHERIES Many subsistence fishermen operate gillnets in the rivers and coastal marine waters of the Northern Area to harvest marine and freshwater finfish. Small numbers of chum, pink, and Chinook salmon have been reported by subsistence fishermen along the Arctic coast. Traps and fish weirs of various designs are also used, mainly in the fall and winter months, to capture whitefish, blackfish, and burbot. Northern pike, char, and "tomcod" are frequently taken through the ice by hand lines. The extent of the harvest of non-salmon finfish in the Northern Area is inadequately documented. Some fishery harvest studies were undertaken for 2 small Inupiat communities in the Northern Area by ADF&G’s Subsistence Division. It was found that annual community fish catches for Kaktovik consisted of Dolly Varden (Salvelinus malma), Arctic cisco (Coregonus autumnalis), Arctic grayling, Lake trout, salmon, and Arctic cod (Pedersen and Linn 2005). Similarly, community fishermen in Anaktuvuk Pass produced annual catches of “char” (a mix of Arctic char and Dolly Varden), lake trout, Arctic grayling, Arctic cisco, and few burbot (Pedersen and Hugo 2005).
In 2008, a cooperative project was initiated and is ongoing (ADF&G, Divisions of Commercial Fisheries, Habitat and Subsistence and North Slope Borough Department of Wildlife Management and Planning) to assess Pacific salmon resources in the Northern Area. Components of the project include documenting: 1) subsistence salmon fishing patterns such as species targeted, fishing gear and methods, harvest timing, local salmon abundance and run timing, historical knowledge, and observations of spawning locations; 2) conducting aerial surveys to document adult salmon distribution in river systems and determining which rivers could be used as index areas for future monitoring; and 3) acquiring age, sex, length, and genetic samples for salmon.
COMMERCIAL FISHERIES Regulations adopted by BOF allow ADF&G to issue permits for the commercial harvest of freshwater species of fish such as whitefish, sheefish, char, northern pike, blackfish, and Arctic lamprey. However, there are no commercial fisheries for salmon species in the Northern Area. A commercial fishery for freshwater finfish has existed in the Colville River delta (located approximately 60 miles west of Prudhoe Bay) since 1964 (Appendix H1). Historically, commercial fishing generally took place during late June and July for broad and humpback whitefish and October through early December for Arctic and least cisco. However, since 1990 commercial fishing effort has predominately occurred in October and November for Arctic and least cisco. Set gillnets are used as capture gear, and fishing during fall months occurs under the ice. All fish are harvested with the intent to sell commercially and are reported daily on a catch

73
form. However, not all fish reported on permits for this area are sold. Those fish not commercially sold are retained and used for subsistence purposes (Appendix H1).
ACKNOWLEDGEMENTS Employees of the Alaska Department of Fish and Game, U.S. Fish and Wildlife Service, Bering Sea Fishermen Association, Tanana Chiefs Conference, Association of Village Council Presidents, Yukon River Drainage Fisheries Association, Yukon Delta Fisheries Development Association, and other agencies and organizations worked long and irregular hours at various locations throughout the Yukon Area collecting data presented in this report; we gratefully acknowledge their hard work. We also thank the AYK Regional Management Supervisor, Dan Bergstrom, for his guidance and support and review of this report.

74
REFERENCES CITED ADF&G (Alaska Department of Fish and Game). 1969. Annual management report, 1968, Arctic-Yukon-
Kuskokwim region. Alaska Department of Fish and Game, Division of Commercial Fisheries, Annual Management Report, Anchorage.
ADF&G (Alaska Department of Fish and Game). 1979. Annual management report, 1978, Yukon area. Alaska Department of Fish and Game, Division of Commercial Fisheries, Annual Management Report, Anchorage.
ADF&G (Alaska Department of Fish and Game). 1983. Annual management report, 1983, Yukon Area. Alaska Department of Fish and Game, Division of Commercial Fisheries, Anchorage.
ADF&G (Alaska Department of Fish and Game). 1985. Annual management report, 1985, Yukon Area. Alaska Department of Fish and Game, Division of Commercial Fisheries, Anchorage.
ADF&G (Alaska Department of Fish and Game). 1986. Annual management report, 1986, Yukon Area. Alaska Department of Fish and Game, Division of Commercial Fisheries, Anchorage.
ADF&G (Alaska Department of Fish and Game). 2004. Escapement goal review of select AYK region salmon stocks. Alaska Department of Fish and Game, Division of Commercial Fisheries, Regional Information Report 3A04-01, Anchorage.
Alt, K. T. 1968. Sheefish and pike studies in Alaska. Alaska Department of Fish and Game, Federal Aid in Fish Restoration, Volume 9, Juneau.
Alt, K. T. 1969a. Taxonomy and ecology of the Inconnu, Stenodus Leucichthys Nelma, in Alaska. Biological Papers of the University of Alaska, Fairbanks, No. 12.
Alt, K. T. 1969b. Sheefish and whitefish life history studies in Alaska. Alaska Department of Fish and Game, Federal Aid in Fish Restoration, Volume 10, Juneau.
Alt, K. T. 1970. Sheefish and whitefish life history studies in Alaska. Alaska Department of Fish and Game, Federal Aid in Fish Restoration, Volume 11, Juneau.
Alt, K. T. 1974. Sheefish and whitefish life history studies in Alaska. Alaska Department of Fish and Game, Federal Aid in Fish Restoration, Volume 15, Juneau.
Alt, K. T. 1985. Inventory and cataloging of sport fish and sport fish waters of western Alaska. Alaska Department of Fish and Game. Federal Aid in Fish Restoration. Annual Performance Report, 1984-1985, Project F-9-17(26)G-I-P-B, Juneau.
Andersen, D. B., and C. L. Scott. 2010. An update on the use of subsistence-caught fish to feed sled dogs in the Yukon River Drainage, Alaska. Final report to the U.S. Fish and Wildlife Service for Fisheries Resource Monitoring Project 08-250, Anchorage.
Andersen, D. B., C. L. Brown, R. J. Walker, and K. Elkin. 2004. Traditional ecological knowledge and contemporary subsistence harvest of non-salmon Fish in the Koyukuk River drainage, Alaska. Division of Subsistence, Alaska Department of Fish and Game, Technical Paper No. 282, Anchorage.
Bergstrom, D. J., D. F. Evenson, and E. J. Newland. 2009. Yukon River summer chum salmon stock status 2009; a report to the Alaska Board of Fisheries. Alaska Department of Fish and Game, Special Publication No. 09-22, Anchorage.
Bergstrom D. J., K. C. Schultz, B. M. Borba, G. J. Sandone, L. H. Bartoa, D. J. Schneiderhan, J. S. Hayes. 1997. Annual management report Yukon area, 1995. Alaska Department of Fish and Game, Division of Commercial Fisheries, Regional Information Report 3A97-14, Anchorage.
Berkbigler, B.L, and K. Elkin. 2007. Abundance and Run Timing of Adult Salmon in Henshaw Creek, Kanuti National Wildlife Refuge, Alaska, 2006.
Borba, B. M. 2007. Test fish wheel project using video monitoring techniques, Tanana River, 2003. Alaska Department of Fish and Game, Fishery Data Series No. 07-55, Anchorage.

75
REFERENCES CITED (Continued) Borba, B. M., D. J. Bergstrom, and F. J. Bue. 2009. Yukon River fall chum salmon stock status and fall season
salmon fisheries 2009; a report to the Alaska Board of Fisheries. Alaska Department of Fish and Game, Special Publication No. 09-24, Anchorage.
Brannian, L. K., M. J. Evenson, and J. R. Hilsinger. 2006. Escapement goal recommendations for select Arctic-Yukon-Kuskokwim region salmon stocks, 2007. Alaska Department of Fish and Game, Fishery Manuscript No. 06-07, Anchorage.
Brase, A. L. J., and M. Doxey. 2006. Salmon studies in the Chena, Chatanika, Delta Clearwater, and Salcha rivers, 2004 and 2005. Alaska Department of Fish and Game, Fishery Data Series No. 06-61, Anchorage.
Brown, C. L., J. Burr, K. Elkin, and R. J. Walker. 2005. Contemporary subsistence uses and population distribution of non-salmon fish in Grayling, Anvik, Shageluk, and Holy Cross. Federal Subsistence Fishery Monitoring Program, Final Project No. 02-037-2.USFWS Office of Subsistence Management, Fisheries Resource Monitoring Program, Fishery Information Service, Anchorage, Alaska.
Brown, R. J., N. Bickford, and K. Severin. 2007. Otolith trace element chemistry as an indicator of anadromy in Yukon River drainage coreonine fishes. Transactions of the American Fisheries Society 128(3):678-690.
Brown, R. J., C. Brown, N. M. Braem, W. K. Carter III, and N. Legere. 2011. Strategic plan for research of whitefish species in the Yukon and Kuskokwim river drainages in Alaska; summary and recommendations. U.S. Fish and Wildlife Service, Alaska Department of Fish and Game, Fisheries Resource Monitoring Program, Yukon and Kuskokwim Coregonid Strategic Plan Study 08-206, Alaska. http://alaska.fws.gov/asm/pdf/fisheries/reports/08-2062011.pdf (Accessed June 2011).
Bryan, J. E. 1973. The influence of pipeline development on freshwater fishery resources of northern Yukon Territory: aspects of research conducted in 1971 and 1972. Environmental-Social Committee Northern Pipelines, Task Force on Northern Oil Development Report No. 73-6.
Bue, F., S. J. Hayes, E. Newland, D. F. Evenson, K. Clark, B. M. Borba, W. H. Busher and M. Horne-Brine. 2011. Annual management report for the Yukon and Northern Areas, 2006. Alaska Department of Fish and Game, Fishery Management Report No. 11-29 Anchorage.
Buklis, L. S. 1993. Documentation of Arctic-Yukon-Kuskokwim Region salmon escapement goals in effect as of the 1992 fishing season. Alaska Department of Fish and Game, Division of Commercial Fisheries, Regional Information Report 3A93-03, Anchorage.
Carroll, H. C., and B. C. McIntosh. 2008. Sonar estimation of salmon passage in the Yukon River near Pilot Station, 2006. Alaska Department of Fish and Game, Fishery Data Series No. 08-65, Anchorage.
Clark, J. H. 2001. Biological escapement goals for Andreafsky River chum salmon. Alaska Department of Fish and Game, Division of Commercial Fisheries, Regional Information Report 3A01-07, Anchorage.
Clark, J. H., and G. J. Sandone. 2001. Biological escapement goal for Anvik River chum salmon. Alaska Department of Fish and Game, Division of Commercial Fisheries, Regional Information Report 3A01-06, Anchorage.
Cleary, P. M., and T. Hamazaki. 2008. Fall chum salmon mark–recapture abundance estimation on the Tanana and Kantishna rivers, 2007. Alaska Department of Fish and Game, Fishery Data Series No. 08-35, Anchorage.
Crane, A. B., and R. D. Dunbar. 2009. Sonar estimation of Chinook and fall chum salmon passage in the Yukon River near Eagle, Alaska, 2008. Alaska Department of Fish and Game, Fishery Data Series No. 09-30, Anchorage.
Daum, D. W., and B. G. Flannery. 2009. Canadian-origin Chinook salmon rearing in non-natal U.S. tributary streams of the Yukon River, Alaska, 2006-2007. U.S. Fish and Wildlife Service, Fairbanks Fish and Wildlife Field Office, Alaska Fisheries Technical Report Number 102, Fairbanks, Alaska.
Department of Interior. Fish and Wildlife Service. 2009. 50 CFR Part 100. Subsistence Management Regulations for the Harvest of Fish and Shellfish on Federal Public Lands and Waters in Alaska. Subpart C & D, 2005-06.

76
REFERENCES CITED (Continued) Dunbar, R. D. 2010. Sonar estimation of fall chum salmon abundance in the Sheenjek River, 2009. Alaska
Department of Fish and Game, Fishery Data Series No. 10-79, Anchorage.
Eggers, D. M. 2001. Biological escapement goals for Yukon River fall chum salmon. Alaska Department of Fish and Game, Division of Commercial Fisheries, Regional Information Report 3A01-10, Anchorage.
Flannery, B. F., R. R. Holder, G. F. Maschmann, E. J. Kretschmer, and J. K. Wenburg. 2010. Application of mixed-stock analysis for Yukon River fall chum salmon, 2008. U.S. Fish and Wildlife Service, Office of Subsistence Management, Fisheries Resource Monitoring Program, Annual Report for Study 06-205, Anchorage, Alaska.
Fleischman, S. J., and D. F. Evenson. 2010. Run reconstruction, spawner-recruit analysis, and escapement goal recommendation for summer chum salmon in the East Fork of the Andreafsky River. Alaska Department of Fish and Game, Fishery Manuscript No. 10-04, Anchorage.
Fleischman, S. J., and B. M. Borba. 2009. Escapement estimation, spawner-recruit analysis, and escapement goal recommendation for fall chum salmon in the Yukon River drainage. Alaska Department of Fish and Game, Fishery Manuscript Series No. 09-08, Anchorage.
Gaudet, D. M., and G. Schaefer. 1982. Migrations of salmon in Norton Sound, Alaska, determined by tagging in 1978-1979. Alaska Department of Fish and Game, Division of Commercial Fisheries, Informational Leaflet No. 198, Anchorage.
Gerken, J.D. 2008. Yukon River Inseason Salmon Harvest Interviews, 2007. U.S. Fish and Wildlife Service, Fairbanks Fish and Wildlife Field Office, Alaska Fisheries Data Series Number 2008-17, Fairbanks, Alaska.
Gerken, J. D. 2009. Identification and characterization of Inconnu spawning habitat in the Sulukna River, Alaska. Thesis (M.S.), University of Alaska, Fairbanks.
Hayes. S. J., and J. L. Estensen. 2011. 2011 Yukon Area subsistence, personal use, and commercial salmon fisheries outlook and management strategies. Alaska Department of Fish and Game, Regional Information Report 3A11-04 Anchorage.
Healey, M.C. 1991. Life history of Chinook salmon (Onorhynchus tshawytscha). Page 311-394 [In]:: Groot,C., and L. Margolis, editors. Pacific Slmon Life Histories. UBC Press, Vancouver, B.C., Canada.
Hildebrand, H. L., and F. J. Bue. 2009. Fall season cooperative salmon drift gillnet test fishing in the Lower Yukon River, 2008. Alaska Department of Fish and Game, Fishery Data Series No. 09-22, Anchorage.
Horne-Brine, M. H., and L. DuBois. 2010. Salmon age and sex composition and mean lengths for the Yukon River Area, 2008. Alaska Department of Fish and Game, Fishery Data Series No. 10-43, Anchorage.
Howard, K. G., and D. F. Evenson. 2010. Yukon River Chinook salmon comparative mesh size study. Alaska Department of Fish and Game, Fishery Data Series No. 10-92, Anchorage.
Howard, K. G., S. J. Hayes, and D. F. Evenson. 2009. Yukon River Chinook salmon stock status and action plan 2010; a report to the Alaska Board of Fisheries. Alaska Department of Fish and Game, Special Publication No. 09-29, Anchorage.
Jallen, D. M., and T. Hamazaki. 2011. Subsistence and personal use salmon harvests in the Alaska portion of the Yukon River drainage, 2009. Alaska Department of Fish and Game, Division of Commercial Fisheries, Fisheries Data Series No. 11-07, Anchorage.
JTC (Joint Technical Committee of the Yukon River US/Canada Panel). 2011. Yukon River salmon 2010 season summary and 2011 season outlook. Alaska Department of Fish and Game, Division of Commercial Fisheries, Regional Information Report 3A11-01, Anchorage.
Kahler, E., T. Burton, T. Hamazaki, B. M. Borba, J. R. Jasper, and L.-A. Dehn. 2007. Assessment of Ichthyophonus in Chinook salmon within the Yukon River Drainage, 2004. Alaska Department of Fish and Game, Fishery Data Series No. 07-64, Anchorage.

77
REFERENCES CITED (Continued) Maschmann G. F. 2010. Abundance and run timing of adult pacific salmon in the East Fork Andreafsky River,
Yukon Delta National Wildlife Refuge, Alaska, 2009. U.S. Fish and Wildlife Service, Fairbanks Fish and Wildlife Field Office, Alaska Fisheries Data Series Number 2010-5, Fairbanks, Alaska.
McEwen, M. S. 2010. Anvik River sonar chum salmon escapement study, 2009. Alaska Department of Fish and Game, Fishery Data Series No. 10-78, Anchorage.
Melegari, J. L. 2009. Abundance and run timing of adult fall chum salmon in the Chandalar River, Yukon Flats National Wildlife Refuge, Alaska, 2008. U. S. Fish and Wildlife Service, Fairbanks Fishery Resource Office, Alaska Fisheries Data Series Number 2009-8, Fairbanks.
Melegari, J. L. 2010. Abundance and Run Timing of Adult Salmon in the Gisasa River, Koyukuk National Wildlife Refuge, Alaska, 2009. U.S. Fish and Wildlife Service, Fairbanks Fish and Wildlife Field Office, Alaska Fisheries Data Series Number 2010-4, Fairbanks, Alaska.
Moore, P., and D. Daum. 2011. Annual catch-per-unit-effort data collected by the Yukon River Subdistrict Y5-A Test Fish Wheel Project, 2010. Final report to the Yukon River Panel, RM-06-10.
Menard, J. 2010. 2010 Norton Sound salmon fisheries management plan. Alaska Department of Fish and Game, Division of Commercial Fisheries, Regional Information Report 3A10-03, Anchorage.
Murphy, J. M., W. D. Templin, E. V. Farley, Jr., and J. E. Seeb. 2009. Stock-structured distribution of western Alaska and Yukon juvenile Chinook salmon (Onchorhynchus tshawytscha) from United States BASIS surveys, 2002-2007. N. Pac. Anadr. Fish Comm. Bull. 5: 51-59.
NMFS (National Marine Fisheries Service). 2009a. Bering Sea salmon bycatch management Volume I final environmental impact statement. National Marine Fisheries Service Alaska Regional Office. Juneau, AK. December 2009. Available at: http://www.fakr.noaa.gov/Sustainablefisheries/bycatch/salmon/chinook/feis/eis_1209.pdf
NMFS (National Marine Fisheries Service). 2009b. Bering Sea salmon bycatch management Volume II final regulatory impact review. National Marine Fisheries Service Alaska Regional Office. Juneau, AK. December 2009. Available at: http://www.fakr.noaa.gov/Sustainablefisheries/bycatch/salmon/chinook/rir/rir1209.pdf
NMFS (National Marine Fisheries Service). 2010. National Marine Fisheries Service fisheries management catch reports for groundfish, CDQ, and IFQ fisheries. Available at: http://www.fakr.noaa.gov/sustainablefisheries/catchstats.htm.
Pedersen, S. and A. Linn Jr. 2005. North Slope (Kaktovik) subsistence fish harvest assessment. Anchorage, Alaska., USFWS Office of Subsistence Management, Fisheries Resource Monitoring Program, Annual Report No. FIS 01-101.
Pedersen, S. and S. C. Hugo. 2005. North Slope (Anaktuvuk Pass) subsistence fish harvest assessment. Anchorage, Alaska., USFWS Office of Subsistence Management, Fisheries Resource Monitoring Program, Annual Report No. FIS 02-050-3.
Salo, E. O. 1991. Life history of chum salmon, Onchorhynchus keta. In Groot, C. and L. Margolis (Eds), Pacific Salmon Life Histories. UBC Press, Vancouver, B.C., Canada, pp. 231-309.
Sandone, G. J. 1991. An improved procedure to estimate summer chum salmon harvest in District 4 of the Yukon River, Alaska, as applied to the 1989 fishery. Alaska Department of Fish and Game, Division of Commercial Fisheries, Fishery Research Bulletin No. 91-02, Anchorage.
Schumann, K., and L. DuBois. 2011. Salmon age and sex composition and mean lengths for the Yukon River Area, 2010. Alaska Department of Fish and Game, Fishery Data Series No. 11-48, Anchorage.
Sigurdsson, D., and B. Powers. 2009. Participation, effort, and harvest in the sport fish business/guide licensing and logbook reporting programs, 2006-2008. Alaska Department of Fish and Game, Special Publication No. 09-11, Anchorage.
Tobin, J. H., and K. C. Harper. 1995. Abundance and run timing of adult salmon in the East Fork Andreafsky River, Yukon Delta National Wildlife Refuge, Alaska, 1994. U. S. Fish and Wildlife Service, Alaska Fisheries Progress Report No. 95-5, Kenai.

78
REFERENCES CITED (Continued) Volk, E. C., M. J. Evenson, and R. A. Clark. 2009. Escapement goal recommendations for select Arctic-Yukon-
Kuskokwim Region salmon stocks, 2010. Alaska Department of Fish and Game, Fishery Manuscript No. 09-07, Anchorage.
Walker, C. E., R. F. Brown, and D. A. Kato. 1974. Catalogue of fish and stream resources of Carmacks Area. Technical Report Series. Department of the Environment, Fisheries and Marine Services, Pacific Region PAC T/74-8, Vancouver, British Columbia.
Walker, C. E. 1976. Studies on the freshwater and anadromous fishes of the Yukon River within Canada. Department of the Environment, Fisheries and Marine Services, PAC T/76-7, Vancouver, British Columbia.
Ward, T., and N. Horn. 2003. Kuskokwim River salmon management working group support. Alaska Department of Fish and Game, Division of Commercial Fisheries, Regional Information Report 3A03-40, Anchorage.
Wespestad, V. G. 1982. Cohort analysis of catch data on Pacific herring in the eastern Bering Sea. U. S. Dep. Commer., NOAA Tech. Memo. NMFS F/NWC-24, 18 p.
Wiswar, D. W. 1999. Abundance and run timing of adult salmon in the Gisasa River, Koyukuk National Wildlife Refuge, Alaska, 1998. United States Fish and Wildlife Service, Fairbanks Fishery Resources Office, Alaska Fisheries Data Series 99-1, Fairbanks.
Zuray, S. 2010. Rampart Rapids full season video monitoring, 2010 using a fish wheel on the Yukon River, Alaska. Annual report to the Yukon River Panel, Anchorage, Alaska.

79
TABLES AND FIGURES

80
Table 1.–Guideline harvest ranges and midpoints for commercial harvest of Chinook, summer chum, and fall chum salmon, Yukon Area, Alaska, 2010.
Chinook Salmon
Guideline Harvest Range a
District or Lower
Midpoint
Upper Subdistrict Numbers Percent Numbers Percent Numbers Percent
1 and 2 0 to 60,000 89.1
90,000 91.6
120,000 92.9 3 0 to1,800 2.7
2,000 2.0
2,200 1.7
4 0 to 2250 3.3
2,550 2.6
2,850 2.2 5B, C 0 to 2,400 3.6
2,600 2.6
2,800 2.2
5D 0 to 300 0.4
400 0.4
500 0.4 6 0 to 600 0.9
700 0.7
800 0.6
Total 67,350 100.0 98,250 100.0 129,150 100.0 Summer Chum Salmon
Guideline Harvest Range b
District or Lower
Midpoint
Upper Subdistrict Numbers Percent Numbers Percent Numbers Percent
1 and 2 0 to 251,000 62.8
503,000 62.9
755,000 62.9 3 0 to 6,000 1.5
12,500 1.6
19,000 1.6
4A a 0 to 113,000 28.3
225,500 28.2
338,000 28.2 4B, C 0 to 16,000 4.0
31,500 3.9
47,000 3.9
5B, C, D 0 to 1,000 0.3
2,000 0.3
3,000 0.3 6 0 to 13,000 3.3
25,500 3.2
38,000 3.2
Total 400,000 100.0 800,000 100.0 1,200,000 100.0 Anvik River Management Area roe cap of 100,000 pounds. c
Fall Chum Salmon
Guideline Harvest Range d
District or Lower
Midpoint
Upper Subdistrict Numbers Percent
Numbers Percent
Numbers Percent
1, 2, and 3 60,000 82.5
140,000 71.2
220,000 68.6 4 5,000 6.9
22,500 11.4
40,000 12.5
5B, C 4,000 5.5
20,000 10.2
36,000 11.2 5D 1,000 1.4
2,500 1.3
4,000 1.2
6 2,750 3.8
11,625 5.9
20,500 6.4 Total 72,750 100.0 196,625 100.0 320,500 100.0
Subdistrict 5-A range of 0 to 4,000 pounds of roe. e a The Chinook salmon guideline harvest ranges have been in effect since 1981. b Summer chum salmon guideline harvest ranges were established in February 1990 based on the average harvest shares from
1975 to 1989. c The current Anvik River Management Area roe cap was established in March 1996. d The current fall chum salmon guideline harvest ranges were established in 1990. e Subdistrict 5-A was removed from the guideline harvest ranges for Chinook and summer chum and a separate guideline
harvest range of 0 to 4,000 pounds of fall chum salmon roe was established in November 1998.

81
Table 2.–Commercial Fisheries Entry Commission salmon gear permits issued by residence, Yukon Area, 2010.
Gillnet District Residence
Permits
(S04Y) 1, 2, and 3 Alakanuk
87
Anchorage
46
Aniak
1
Bethel
16
Chevak
2
Copper Center
4
Dillingham
1
Eagle River
2
Elim
1
Emmonak
111
Fairbanks
12
Fortuna Ledge
2
Girdwood
2
Glennallen
1
Holy Cross
8
Homer
3
Hooper Bay
3
Kalskag
1
Kenai
1
Kotlik
77
Kotzebue
1
Kwethluk
2
Manley Hot Springs 1
Marshall
46
McGrath
1
Mountain Village 91
Newhalen
1
Newtok
1
Nome
1
Nunam Iqua
12
Palmer
1
Pilot Station
61
Russian Mission 15
Saint Mary's
87
Saint Michael
5
Sand Point
2
Scammon Bay
38
Shageluk
1
Shaktoolik
2
Sheldon Point
4
Sitka
2
Stebbins
10
Tuluksak
1
Unalakleet
1
Wasilla
10
Willow
1
Ocean View, HI 1
Fort Campbell, KY 1
Rock Hill, SC
1
Lakewood, WA
1
Snohomish, WA 2
Wasilla, WA
1
De Pere, WI
1
Total Lower Yukon Area 787 -continued-

82
Table 2.–Page 2 of 2. Gillnet Fish Wheel District Residence
Permits Permits Total
(S04P) (S08P) 4, 5, and 6 Anchorage
4 6 10
Aniak
1 0 1
Anvik
3 7 10
Barrow
0 1 1
Circle City
0 1 1
Delta Junction
0 1 1
Dot Lake
0 1 1
Eagle River
0 1 1
Fairbanks
30 32 62
Fort Wainwright 0 1 1
Fort Yukon
0 1 1
Galena
5 20 25
Girdwood
0 1 1
Grayling
4 7 11
Holy Cross
2 0 2
Huslia
0 1 1
Kaltag
2 12 14
Kenai
0 1 1
Manley Hot Springs 3 6 9
McGrath
1 2 3
Nenana
7 18 25
North Pole
2 3 5
Nulato
0 14 14
Palmer
1 1 2
Rampart
1 0 1
Ruby
1 6 7
Salcha
1 0 1
Stevens Village
1 3 4
Tanana
2 15 17
Valdez
0 2 2
Wasilla
1 2 3
Richmond, CA
0 1 1
Valley Village, CA 1 0 1
St. Augustine, FL 1 0 1
Bemidji, MN
1 0 1
Portland, OR
0 1 1
Anacortes, WA
0 1 1
Comstock, WI
0 1 1
Lusk, WY
1 1 2
Total Upper Yukon Area 76 171 247 Grand Total Yukon Area 863 171 1,034 a
Note: Counts are for initial issues only and do not include transfers. Includes interim entry permits but not interim use or test fish permits.
a Total applies to number of permits.

83
Table 3.–Salmon processors, buyers, catcher-sellers, and associated data, Yukon Area, 2010.
Commercial operation (Processing location/ buying station)
Product District
Kwik’pak Fisheries 1016 West Sixth Avenue Suite 301 Anchorage, AK 99501
Fresh Salmon, Frozen Salmon -Chinook -Chum, Coho Salmon Roe
1 and 2
BB’s Kings HC 60 Box 227 I Copper Center, AK 99573 (St. Mary’s)
Fresh Salmon 2
Boreal Fisheries P.O. Box 89 Graham, WA 98338 (St. Mary’s)
Fresh Salmon -Chinook -Chum, Coho Salmon Roe
1 and 2
David Herbert P.O. Box 287 St. Mary’s, AK 99658
Fresh Salmon
2
Michael D. Irving P.O. Box 1091 Girdwood, AK 99587 (St. Mary’s)
Fresh Salmon
2
Eric Weingarth P.O. Box 74 St. Mary’s, AK 99658
Fresh Salmon
2
Francis C. Beans P.O. Box 325 St. Mary’s, AK 99658
Fresh Salmon
2
Yukon River Gold LLC. PO BOX 4347 Bellingham, WA 98227 (Kaltag)
Fresh Salmon Frozen Salmon Salmon Roe
4
Interior Alaska Fish Processors 2400 Davis Rd. Fairbanks, AK 99709
Fresh Salmon Frozen Salmon Salmon Roe Salted/Brined Salmon Smoked Salmon
5 and 6

84
Table 4.–Total utilization in numbers of salmon by district and country, Yukon River drainage, 2010. Summer Fall District Fishery Chinook a Chum a Chum a Coho a
1 Subsistence b 5,856
25,172
3,202
1,122
Commercial
5,744
102,267
545
1,027
Test Fish Sales
0
0
0
0 Total 11,600 127,439 3,747 2,149
2 Subsistence b 8,676
23,738
1,419
557
Commercial
4,153
80,948
270
1,023
Test Fish Sales
0
0
0
0 Total 12,829 104,686 1,689 1,580
3 Subsistence b 4,299
1,341
1,325
353
Commercial
-
-
-
-
Commercial Related c 0
0
0
0 Total 4,299 1,341 1,325 353
Total Subsistence b 18,831
50,251
5,946
2,032 Lower Commercial
9,897
183,215
815
2,050
Yukon Commercial Related c 0
0
0
0 Area Test Fish Sales
0
0
0
0
Total 28,728 233,466 6,761 4,082 4 Subsistence b 12,888
11,720
6,788
1,730
Commercial -
44,207
-
-
Commercial Related c -
0
-
0
Total 12,888 55,927 6,788 1,730 5 Subsistence b 10,397
3,555
44,334
3,604
Commercial -
-
-
-
Commercial Related c -
-
-
-
Total 10,397 3,555 44,334 3,604 6 Subsistence b 1,143
422
11,391
5,555
Commercial -
5,466
1,735
1,700
Commercial Related c -
0
0
0
Personal use 162
319
3,209
1,062 Total 1,305 6,207 16,335 8,317
Total Subsistence b 24,428
15,697
62,513
10,889 Upper Commercial 0
49,673
1,735
1,700
Yukon Commercial Related c 0
0
0
0 Area Personal use 162
319
3,209
1,062
Total 24,590 65,689 67,457 13,651 Total Subsistence b 43,259
65,948
68,459
12,921
Yukon Commercial 9,897
232,888
2,550
3,750 Area Commercial Related c 0
0
0
0
(Alaska) Personal use 162
319
3,209
1,062
Test Fish sales
0
0
0
0
Sport Fish d 691
362
0
706 Total 54,009 299,517 74,218 18,439
Domestic
0
0
0
0
Total Aboriginal (mainstem) 2,455 e 0
1,523 e 0 Canada Sport Fish
1 f 0
0
0
Test Fish harvest g -
0
0
0
Commercial
-
0
2,186
0
Subtotal
2,456
0
3,709
0
Porcupine Aboriginal
191
0
2,078
12
Total
2,647
0
5,787
12 Grand Total 56,656 299,517 80,005 18,451
-continued-

85
Table 4.–Page 2 of 2. a Commercial harvest includes only fish sold in the round. Does not include subsistence harvest from coastal communities of
Hooper Bay and Scammon Bay. b Data are preliminary. c Commercial related is the estimated harvest of females to produce roe sales. d Preliminary sport fish harvest for the Alaska portion of the Yukon River drainage. Assume majority of chum salmon caught
during summer season. e Number adjusted to account for under reporting. f Sport fishing closed; accidental harvest. g The Canadian test fishery is for management purposes. Chinook salmon that are retained are given to Aboriginal and
Domestic users, but are not reported under those categories. Chum salmon caught in the test fishery are all intended to be released, but any that are retained are reported under the Porcupine Aboriginal harvest.

86
Table 5.–Subsistence and personal use salmon harvest estimates, including commercially related and test fish harvests provided for subsistence use and related information, Yukon Area, 2010.
Number of Number Estimated Harvest Primary Gear Used a
Survey Date, Fishing of Summer Fall Set Drift Fish
Community Permit Area b Households c Dogs d Chinook Chum Chum Coho Gillnet Gillnet Wheels Hooper Bay e 9/15-18
120
325 584 17,020 116 45
106 14 0
Scammon Bay 9/14-16 53 85 716 5,405 70 79 53 0 0 Coastal District Total 173 410 1,300 22,425 186 124 159 14 0
Nunam Iqua f 9/13-14
22
28 404 2,267 143 73
21 1 0 Alakanuk e 9/11-12
86
221 944 7,722 860 449
48 38 0
Emmonak e 9/8-10
91
204 2,194 10,918 1,718 362
18 73 0 Kotlik e 9/11-13 48 142 2,314 4,265 481 238 24 24 0 District 1 Subtotal 247 595 5,856 25,172 3,202 1,122 111 136 0
Mountain Village e 9/20-21
101
165 1,601 7,071 133 127
8 93 0 Pitkas Point 9/21
15
44 580 633 10 116
0 15 0
St. Mary's e 9/22-23
88
66 2,800 7,443 387 92
15 73 0 Pilot Station e 9/24-26
50
74 1,585 6,196 833 189
8 42 0
Marshall 9/27-29 59 145 2,110 2,395 56 33 1 57 0 District 2 Subtotal 313 494 8,676 23,738 1,419 557 32 280 0
Russian Mission 9/29-30
38
130 924 528 104 300
19 19 0 Holy Cross 9/27-28
34
57 3,098 463 21 0
6 28 0
Shageluk 9/25-9/26 11 48 277 350 1,200 53 6 5 0 District 3 Subtotal 83 235 4,299 1,341 1,325 353 31 52 0
Lower Yukon River Total 643 1,324 18,831 50,251 5,946 2,032 174 468 0
Anvik
9/26-27
17
53 1,069 451 169 28
5 12 0 Grayling 9/24-25
39
95 2,122 1,612 202 132
4 35 0
Kaltag
10/10-11
54
101 3,191 102 658 0
0 54 0 Nulato
10/8-9
57
96 2,989 416 1,049 242
9 48 0
Koyukuk 10/7-8
21
81 867 352 792 254
1 19 0 Galena
10/5-7
60
130 1,357 1,702 1,968 549
26 29 5
Ruby 10/16-17 27 69 1,102 1,971 1,026 148 19 0 8 District 4 Yukon River Subtotal 275 625 12,697 6,606 5,864 1,353 64 197 13
Huslia
10/8
16
186 65 1,349 403 289
16 0 0 Hughes 10/9
5
52 63 878 0 0
5 0 0
Allakaket 10/30-31
22
106 63 2,864 521 88
22 0 0 Alatna
11/1
1
9 0 23 0 0
1 0 0
Bettles 10/28-29 0 12 0 0 0 0 0 0 0 Koyukuk River Subtotal 44 365 191 5,114 924 377 44 0 0
District 4 Subtotal 319 990 12,888 11,720 6,788 1,730 108 197 13
-continued-

87
Table 5.–Page 2 of 3.
Number of Number Estimated Harvest Primary Gear Used d
Survey Date, Fishing of Summer Fall Set Drift Fish Community Permit Area a Households b Dogs c Chinook Chum Chum Coho Gillnet Gillnet Wheels Tanana
10/14-16
32
229 3,215 1,856 14,984 2,314
25 0 6
Rampart permits
4
5 262 161 735 24
3 0 1 Fairbanks NSB g permits
52
278 1,670 427 822 2
50 0 2
Stevens Village h 10/12, permits
11
87 469 28 2,706 428
9 0 2 Birch Creek phone
6
9 73 0 0 0
6 0 0
Beaver
10/13
14
42 198 22 37 1
12 0 1 Fort Yukon 10/25-27
61
328 1,683 722 6,006 244
39 0 22
Circle
permits
16
183 324 37 927 164
3 0 13 Central
permits
5
16 90 0 0 0
4 0 1
Eagle e
permits
27
228 867 25 15,008 1
19 0 7 Other District 5 i permits 17 28 779 144 120 0 17 0 0 District 5 Yukon River Subtotal 245 1,433 9,630 3,422 41,345 3,178 187 0 55
Venetie 10/14-15
17
198 767 0 2,989 159
17 0 0 Chalkyitsik 10/27-28 1 17 0 133 0 267 0 0 1 Chandalar and Black Rivers Subtotal 18 215 767 133 2,989 426 17 0 1
District 5 Subtotal 263 1,648 10,397 3,555 44,334 3,604 204 0 56
Manley permits
9
117 337 102 2,696 1,832
7 0 2 Minto
permits
6
84 43 8 70 0
1 0 2
Nenana j permits
18
274 666 85 6,802 2,313
10 0 8 Healy
permits
4
22 2 30 1,068 1,198
3 0 0
Fairbanks NSB k permits
49
122 245 500 3,887 1,274
41 0 8 Other District 6 l permits 20 67 12 16 77 0 16 0 0 District 6 Tanana River Subtotal j,k 106 686 1,305 741 14,600 6,617 78 0 20
Upper Yukon River Total 688 3,324 24,590 16,016 65,722 11,951 390 197 89
Survey Village Subtotal
1,277
3,634 36,469 82,206 37,404 6,741
549 679 45 Subsistence Permit Subtotal m
186
1,423 4,942 1,216 28,425 5,606
138 0 40
Subsistence Test Fish Subtotal n
-
- 2,959 4,951 2,238 558
- - - District 6 Commercial Related o - - 189 0 578 140 - - - Subsistence Harvests Subtotal 1,463 5,057 44,559 88,373 68,645 13,045 687 679 85
Personal Use Permit Subtotals 41 - 162 319 3,209 1,062 36 0 4
Alaska, Yukon River Total p,q 1,331 4,648 43,421 66,267 71,668 13,983 564 665 89
Alaska, Yukon Area Total 1,504 5,058 44,721 88,692 71,854 14,107 723 679 89
AK, Yukon Area Percentages of the Total - - 20% 40% 33% 6% 64% 60% 8%
-continued-

88
Table 5.–Page 3 of 3. a Primary fishing gear used is based on survey information or from subsistence permits issued. Totals for gear and household
may not be equal due to a small number of fishermen using unknown or 'Other' gear types. Primary gear information for surveyed communities was expanded in 2010 for households that were not surveyed. Primary gear is determined by the larger number of salmon harvested by gear types in the household.
b Data collected by Alaska Department of Fish and Game (ADF&G), Division of Commercial Fisheries. Survey data are expanded for number of fishing households, number of dogs, and harvest. Permit data are unexpanded, and are from all permits received as of May 29, 2011.
c Estimated number of households that fished in surveyed communities or number of permit households who reported fishing in permit required areas. Does not include 42 Tolovana River pike permits issued in 2010, except for one pike permit reporting a harvest of one summer chum salmon.
d The number of dogs is based on survey information or from permits issued. e Includes salmon given to communities from test fisheries. f Formerly known as Sheldon or Sheldon’s Point. g Fairbanks North Star Borough (FNSB) households that obtained a permit and indicated they fished in the Yukon River permit
required area. h Permit harvest information from Stevens Village residents was used to complement the information obtained by the survey. i "Other District 5" includes residents of Anchorage, Manley, Minto, Nenana, and Wiseman, and the Upper Tanana River
drainage community of Tok who obtained a household permit and fished in a Yukon River permit required area. j Includes harvest from the personal use permit area and salmon retained from commercial fishing from households that fished
in the Tanana River. k Includes harvest from the personal use permit area in the Tanana River. l "Other District 6" includes residents of the Upper Tanana River drainage communities of Delta Junction, Dot Lake, Northway,
Tanacross, and Tok, and the communities of Anderson and Eagle River who obtained a permit and fished in the Tanana River. m Subsistence permit subtotal does not include Stevens Village permit information or commercially retained salmon from
District 6. n Test fish given away for subsistence use. Residents of Eagle received four Chinook salmon from the Eagle sonar project test
fishery. o District 6 "Commercial Related" included fish caught during commercial fishing and "not sold" but retained for subsistence
use. These salmon are included in the Nenana community harvest. p Does not include Coastal District. q Based on survey estimates, 23 Chinook, 355 summer chum, 16 fall chum, and 6 coho salmon were retained from commercial
harvests in Districts 1 and 2. Commercially retained salmon are included in subsistence harvests from surveyed communities.

89
Table 6.–Reported subsistence and personal use salmon harvested under the authority of a permit, listed by permit area, Yukon Area, 2010.
Number Reported Harvest
of Permits
Permit Fishing Area Permit a Percent Returned
Summer Fall Type b Issued Returned Returned that Fished Chinook Chum Chum Coho
Subsistence Use
Koyukuk Middle SF 1 1 100% 1
0 0 0 0
and South Fork Rivers
Yukon River SR 28 27 96% 22
1,344 304 1,235 24
Rampart Area
Yukon River near SY 85 81 95% 43
1,300 448 422 2
Haul Road Bridge
Yukon River near SE 67 63 94% 36
811 45 4,540 164
Circle and Eagle (below sonar)
Yukon River SEU 26 26 100% 20
604 17 11,415 1
Upper Yukon River (above sonar)
Tanana River SA 22 22 100% 11
360 106 3,094 1,963
Subdistrict 6A
Tanana River SB 93 85 91% 32
583 316 7,625 3,429
Subdistrict 6B
Tanana River SU 41 34 83% 19
10 0 12 0
Upstream of Subdistrict 6C
Kantishna River SK 4 4 100% 3
1 0 82 23
Subdistrict 6A
Tolovana River Pike ST 96 90 94% 42
0 0 0 0
Subdistrict 6B
Subsistence Permit Subtotals 463 433 10 229 5,013 1,236 28,425 5,606 Personal Use
Tanana River Salmon PC 67 67 100% 38
162 319 3,208 1,062
Subdistrict 6C
Tanana River Whitefish/Sucker PW 8 6 75% 3
0 0 1 0
Subdistrict 6C
Personal Use Permit Subtotals 75 73 2 41 162 319 3,209 1,062 Permit Totals 538 506 11 270 c 5,175 1,555 31,634 6,668 Note: Information current as of June 8, 2011. a Includes 46 households that were issued permits for more than one area. b Permit area designation. c Includes 9 households that fished in two different permit areas.

90
Table 7.–Chinook and summer chum salmon commercial harvest by district or subdistrict and by period, set and drift gillnets combined for Districts 1, 2, and 3 and set gillnets and fish wheels combined for Districts 4, 5, and 6, Yukon Area, 2010.
Chinook Salmon
Summer Chum Salmon
Period Starting Start Ending End Mesh Hours Number of
Average
Average Number Time Date Time Date Size Fished Fishermen Numbers Pounds Weight Numbers Pounds Weight
1 6:00 PM 6/28 12:00 AM 6/28 R 6 211 2,122 25,220 11.9
30,282 197,233 6.5 2 8:00 PM 7/1 2:00 AM 7/2 R 6 216 863 11,135 12.9
9,394 60,747 6.5
3 6:00 PM 7/3 12:00 AM 7/3 R 6 210 865 12,038 13.9
9,560 61,635 6.4 4 12:00 PM 7/6 6:00 PM 7/6 R 6 186 688 8,877 12.9
18,408 120,313 6.5
5 6:00 PM 7/8 3:00 AM 7/9 R 9 216 476 7,029 14.8
10,275 67,339 6.6 6 12:00 PM 7/11 9:00 PM 7/11 R 9 171 434 5,776 13.3
13,530 88,843 6.6
7 3:00 PM 7/13 12:00 AM 7/13 R 9 159 228 3,496 15.3
8,688 57,414 6.6 8 3:00 PM 7/15 12:00 AM 7/15 R 9 107 68 985 14.5
2,130 14,008 6.6
No Chinook salmon sold in the fall season.
District 1 Subtotal: 60 264 5,744 74,556 13.7 67,644 667,532 6.5 District 2
Chinook Salmon
Summer Chum Salmon
Period Starting Start Ending End Mesh Hours Number of
Average
Average Number Time Date Time Date Size Fished Fishermen Numbers Pounds Weight Numbers Pounds Weight
1 10:00 AM 7/1 2:00 PM 7/1 R 4 145 1,215 14,183 11.7
18,631 119,658 6.4 2 12:00 PM 7/4 6:00 PM 7/4 R 6 132 794 9,710 12.2
10,002 62,480 6.2
3 12:00 PM 7/7 6:00 PM 7/7 R 6 136 823 10,346 12.6
14,708 93,322 6.3 4 6:00 PM 7/10 12:00 AM 7/10 R 6 144 524 7,062 13.5
13,324 81,328 6.1
5 6:00 PM 7/12 12:00 AM 7/12 R 6 128 299 4,361 14.6
6,653 41,238 6.2 6 6:00 PM 7/14 12:00 AM 7/14 R 6 129 275 4,163 15.1
10,792 69,368 6.4
7 6:00 PM 7/16 3:00 AM 7/17 R 9 105 223 3,465 15.5
6,838 42,170 6.2
No Chinook salmon sold in the fall season.
District 2 Subtotal: 43 181 4,153 53,290 14 80,948 509,564 6.3 Lower Yukon Area, Summer Season,
Districts 1,2 and 3 Subtotal: 103 440 9,897 127,846 12.9 148,592 1,177,096 6.4 -continued-
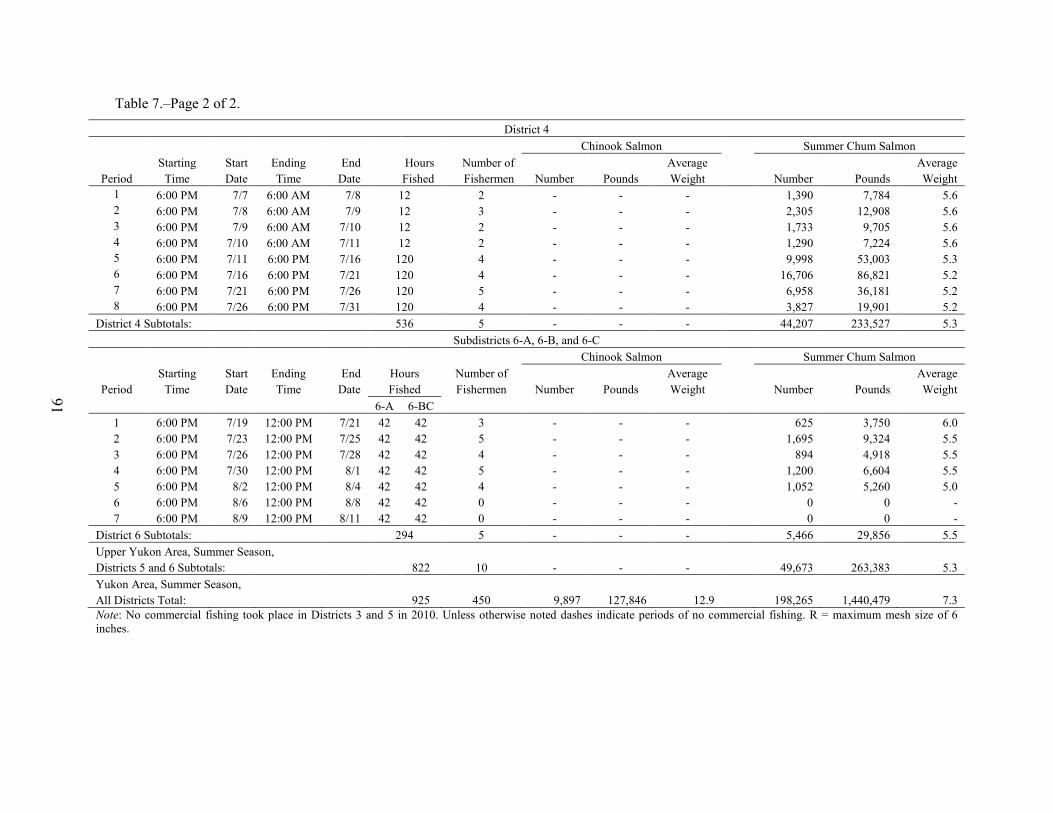
91
Table 7.–Page 2 of 2.
District 4
Chinook Salmon
Summer Chum Salmon
Starting Start Ending End Hours Number of
Average
Average
Period Time Date Time Date Fished Fishermen Number Pounds Weight Number Pounds Weight 1 6:00 PM 7/7 6:00 AM 7/8 12 2 - - -
1,390 7,784 5.6
2 6:00 PM 7/8 6:00 AM 7/9 12 3 - - -
2,305 12,908 5.6 3 6:00 PM 7/9 6:00 AM 7/10 12 2 - - -
1,733 9,705 5.6
4 6:00 PM 7/10 6:00 AM 7/11 12 2 - - -
1,290 7,224 5.6 5 6:00 PM 7/11 6:00 PM 7/16 120 4 - - -
9,998 53,003 5.3
6 6:00 PM 7/16 6:00 PM 7/21 120 4 - - -
16,706 86,821 5.2 7 6:00 PM 7/21 6:00 PM 7/26 120 5 - - -
6,958 36,181 5.2
8 6:00 PM 7/26 6:00 PM 7/31 120 4 - - -
3,827 19,901 5.2 District 4 Subtotals: 536 5 - - - 44,207 233,527 5.3
Subdistricts 6-A, 6-B, and 6-C
Chinook Salmon
Summer Chum Salmon
Starting Start Ending End Hours Number of
Average
Average
Period Time Date Time Date Fished Fishermen Number Pounds Weight
Number Pounds Weight 6-A 6-BC 1 6:00 PM 7/19 12:00 PM 7/21 42 42 3 - - -
625 3,750 6.0
2 6:00 PM 7/23 12:00 PM 7/25 42 42 5 - - -
1,695 9,324 5.5 3 6:00 PM 7/26 12:00 PM 7/28 42 42 4 - - -
894 4,918 5.5
4 6:00 PM 7/30 12:00 PM 8/1 42 42 5 - - -
1,200 6,604 5.5 5 6:00 PM 8/2 12:00 PM 8/4 42 42 4 - - -
1,052 5,260 5.0
6 6:00 PM 8/6 12:00 PM 8/8 42 42 0 - - -
0 0 - 7 6:00 PM 8/9 12:00 PM 8/11 42 42 0 - - -
0 0 -
District 6 Subtotals: 294 5 - - - 5,466 29,856 5.5 Upper Yukon Area, Summer Season,
Districts 5 and 6 Subtotals:
822 10 - - -
49,673 263,383 5.3 Yukon Area, Summer Season, All Districts Total: 925 450 9,897 127,846 12.9 198,265 1,440,479 7.3 Note: No commercial fishing took place in Districts 3 and 5 in 2010. Unless otherwise noted dashes indicate periods of no commercial fishing. R = maximum mesh size of 6 inches.

92
Table 8.–Commercial salmon and salmon roe sales by statistical area, Yukon Area, 2010.
Chinooka Summer Chuma Fall Chuma Cohoa Total Salmon Statistical Number Roe Estimated
Number Roe Estimated
Number Roe Estimated
Number Roe Estimated
Number Roe Estimated
Area Harvest b Harvest b Harvest b Harvest b Harvest b 334-11 252 0 252
3,881 0 3,881
0 0 0
0 0 0
4,133 0 4,133
12 824 0 824
19,138 0 19,138
211 0 211
204 0 204
20,377 0 20,377 13 213 0 213
5,707 0 5,707
0 0 0
5 0 5
5,925 0 5,925
14 358 0 358
12,405 0 12,405
13 0 13
6 0 6
12,782 0 12,782 15 1,266 0 1,266
12,116 0 12,116
83 0 83
142 0 142
13,607 0 13,607
16 985 0 985
9,484 0 9,484
10 0 10
102 0 102
10,581 0 10,581 17 1,570 0 1,570
32,994 0 32,994
167 0 167
445 0 445
35,176 0 35,176
18 276 0 276
6,542 0 6,542
61 0 61
123 0 123
7,002 0 7,002 Subtotal District 1 5,744 0 5,744 102,267 0 102,267 545 0 545 1,027 0 1,027 109,583 0 109,583 334-21 389 0 389
9,575 0 9,575
3 0 3
7 0 7
9,974 0 9,974
22 1,690 0 1,690
23,029 0 23,029
27 0 27
106 0 106
24,852 0 24,852 23 890 0 890
14,474 0 14,474
165 0 165
607 0 607
16,136 0 16,136
24 1,184 0 1,184
33,870 0 33,870
0 0 0
0 0 0
35,054 0 35,054 25 0 0 0
0 0 0
75 0 75
305 0 305
380 0 380
Subtotal District 2 4,153 0 4,153 80,948 0 80,948 270 0 270 1,025 0 1,025 86,396 0 86,396 334-31 - - -
- - -
- - -
32 - - -
- - - NO COMMERCIAL FISHING
- - - Subtotal District 3 - - - - - - - - - - - - - - - Total Lower
Yukon 9,897 0 9,897 183,215 0 183,215 815 0 815 2,052 0 2,052 195,979 0 195,979 -continued-

93
Table 8.–Page 2 of 2.
Chinooka Summer Chuma Fall Chuma Cohoa Total Salmon Statistical Number Roe Estimated
Number Roe Estimated
Number Roe Estimated
Number Roe Estimated
Number Roe Estimated
Area Harvest b Harvest b Harvest b Harvest b Harvest b
334-42 - - - 0 0 0
NO COMMERCIAL FISHING
0 0 0 43 - - - 0 0 0 0 0 0 44 - - - 0 0 0 0 0 0 45 - - - 0 0 0 0 0 0 46 - - - 44,207 0 44,207 44,207 0 44,207 47 - - - 0 0 0 0 0 0 Subtotal District 4 - - - 44,207 0 44,207 - - - - - - 44,207 0 44,207 334-51 - - -
- - -
NO COMMERCIAL FISHING
- - -
52 - - -
- - -
- - - 53 - - -
- - -
- - -
54 - - -
- - -
- - - 55 - - -
- - -
- - -
Subtotal District 5 - - - - - - - - - - - - - - - 334-61 0 0 0
0 0 0
0 0 0
0 0 0
0 0 0
62 0 0 0
5,466 0 5,466
1,735 0 1,735
1,700 0 1,700
8,901 0 8,901 63 0 0 0
0 0 0
0 0 0
0 0 0
0 0 0
Subtotal District 6 0 0 0 5,466 0 5,466 1,735 0 1,735 1,700 0 1,700 8,901 0 8,901 Total Upper
Yukon 0 0 0
49,673 0 49,673
1,735 0 1,735
1,700 0 1,700
53,108 0 53,108 Grand Total Yukon Area 9,897 0 9,897 232,888 0 232,888 2,550 0 2,550 3,752 0 3,752 249,087 0 249,087 Note: Unless otherwise indicated blank cells indicate years in which no information was collected or harvest numbers were insufficient to generate summary information. Dashes
indicate no commercial fishing activity occurred. a Sales reported in numbers of fish sold in the round and pounds of unprocessed roe. Does not include ADF&G test fishery sales. b Estimated harvest includes the estimated number of females to produce the roe sold.

94
Table 9.–Commercial salmon sales and estimated harvest by district and country, Yukon River drainage, 2010.
Chinook
Summer Chum
Fall Chum
Coho
District/ Number of
Sold in Pounds Estimated
Sold in Pounds Estimated
Sold in Pounds Estimated
Sold in Pounds Estimated Subdistrict Fishermen a Round b of Roe Harvest c Round b of Roe Harvest c Round b of Roe Harvest c Round b of Roe Harvest c
1 274
5,744 0 5,744
102,267 0 102,267
545 0 545
1,027 0 1,027 2 183
4,153 0 4,153
80,948 0 80,948
270 0 270
1,025 0 1,025
Subtotal 444 9,897 0 9,897 183,215 0 183,215 815 0 815 2,052 0 2,052 3 0
- - -
- - -
- - -
- - -
Total Lower Yukon 444 9,897 0 9,897 183,215 0 183,215 815 0 815 2,052 0 2,052
Anvik River -
- - -
- - -
- - -
- - - 4-A 5
- - -
44,207 0 44,207
- - -
- - -
4-BC -
- - -
- - -
- - -
- - - Subtotal District 4 5 - - - 44,207 0 44,207 - - - - - -
5-ABC -
- - -
- - -
- - -
- - - 5-D -
- - -
- - -
- - -
- - -
Subtotal District 5 - - - - - - - - - - - - -
6 6
- - -
5,466 0 5,466
1,735 0 1,735
1,700 0 1,700 Total Upper Yukon 11 - - - 49,673 0 49,673 1,735 0 1,735 1,700 0 1,700 Total Alaska 455 9,897 0 9,897 232,888 0 232,888 2,550 0 2,550 3,752 0 3,752 Total Canada 12 0 0 0 0 0 0 2,186 0 2,186 0 0 0 Grand Total 467 9,897 0 9,897 232,888 0 232,888 4,736 0 4,736 3,752 0 3,752
Note: Unless otherwise indicate blank cells indicate years in which no information was collected or harvest numbers were insufficient to generate summary information. Dashes indicate no commercial fishing activity occurred.
a Number of unique permits fished by district, subdistrict or area. Totals by area may not add up due to transfers between districts or subdistricts. b Does not include ADF&G test fishery sales. c Estimated harvest is the number of fish sold, which includes the number of females harvested to produce roe sold.

95
Table 10.–Number of salmon sold from ADF&G test fishing programs, Yukon area, 2010.
Summer
Fall
Year Districts Gear Types Chinook Chum Chum Coho
2010
No fish were sold from the test fishing programs.

96
Table 11.–Fall chum and coho salmon commercial harvest by district or subdistrict and by period, set and drift gillnets combined for Districts 1, 2, and 3, and set gillnets and fish wheels combined for Districts 4, 5, and 6, Yukon Area, 2010.
District 1
Fall Chum Salmon
Coho Salmon
Starting Start Ending End Hours Number of
Average
Average
Percent Period Time Date Time Date Fished Fishermen
Number Pounds Weight
Number Pounds Weight
Coho
Drift Set 1 10:00 AM 9/8 7:00 PM 9/8 9 9 53
331 2,227 6.7
549 3,722 6.8
62.4%
2 10:00 AM 9/10 7:00 PM 9/10 9 9 50
214 1,434 6.7
478 3,150 6.6
69.1% District 1 Subtotal: 18 18 72 545 3,661 6.7 1,027 6,872 6.7 65.3%
Districts 2 and 3
Fall Chum Salmon
Coho Salmon
Period Starting Start Ending End Hours Mesh Number of
Average
Average
Percent Time Date Time Date Fished Fishermen Number Pounds Weight Number Pounds Weight Coho 2 10:00 AM 9/10 7:00 PM 9/10 9 U 18
270 1,767 6.5
1,023 6,818 6.7
79.1%
Districts 2 & 3 Subtotal: 9 18 270 1,767 6.5 1,023 6,818 6.7 79.1% Lower Yukon Area, Fall Season, Districts 1, 2, and 3 Subtotal: 27 18 90 815 5,428 6.7 2,050 13,690 6.7 71.6%
District 4
Fall Chum Salmon
Coho Salmon
Period Starting Start Ending End Hours Number of
Estimated
Estimated
Percent
Time Date Time Date Fished Fishermen
Number Pounds Harvest a
Number Pounds Harvest a
Coho
4-A 4-BC
NO COMMERCIAL FISHING -continued-

97
Table 11.–Page 2 of 2.
District 5
Fall Chum Salmon
Coho Salmon
Period Starting Start Ending End Hours
Number of
Pounds Estimated
Estimated
Percent Time Date Time Date Fished Fishermen Number of Roe Harvest a Number Pounds Harvest a Coho
NO COMMERCIAL FISHING
Subdistricts 6-A, 6-B, and 6-C
Fall Chum Salmon
Coho Salmon
Period Starting Start Ending End Hours
Number of
Estimated
Pounds Estimated
Percent Time Date Time Date Fished Fishermen Number Pounds Harvest a Number of Roe Harvest a Coho 1 6:00 PM 9/20 12:00 PM 9/22 42
3
745 5,215 7
843 5,142 6
53.1%
2 6:00 PM 9/24 12:00 PM 9/26 42
4
599 4,053 7
618 3,708 6
50.8% 3 6:00 PM 9/27 12:00 PM 9/29 42
3
391 2,737 7
239 1,404 6
37.9%
District 6 Subtotal: 126 4 1,735 12,005 7 1,700 10,254 6 46.4% Upper Yukon Area, Fall Season,
Districts 4, 5, and 6 Subtotals: 126 4 1,735 12,005 7 1,700 10,254 6 46.4% Yukon Area, Fall Season,
Districts 1 Through 6 Total: 144 94 2,550 17,433 7 3,750 23,944 6 59.5% Note: U= unrestricted mesh size.

98
Figure 1.–Map of the Yukon River drainage.

99
Figure 2.–Map of the Alaska portion of the Yukon River drainage showing communities and fishing districts.

100
Figure 3.–District 1 showing statistical areas, Yukon Area.

101
Figure 4.–District 2 showing statistical areas, Yukon Area.

102
Figure 5.–District 3 showing statistical areas, Yukon Area.

103
Figure 6.–District 4 showing statistical areas, Yukon Area.

104
Figure 7.–District 5 showing statistical areas, Yukon Area.

105
Figure 8.–District 6 showing statistical areas, Yukon Area.

106
Figure 9.–Anvik River management area, Yukon Area.

107
Figure 10.–Fairbanks nonsubsistence area.

108
Figure 11.–Set Gillnet Only Area of District 1, Lower Yukon Area.

109
Figure 12.–Select fall chum salmon monitoring projects, Yukon River drainage.

110
Figure 13.–The Northern management area.

111
APPENDIX A

112
Appendix A1.–List of indigenous fishes found in the Yukon Area. Species Scientific Name Common Name Code a 601 Lampetra japonica Arctic Lamprey 570 Stenodus leucichthys Inconnu (Sheefish) 588 Coregonus nasus Broad Whitefish 589 Coregonus pidschian Humpback Whitefish 583 Coregonus sardinella Least Cisco 585 Coregonus laurettae Bering Cisco 586 Prosopium cylindraceum Round Whitefish 587 Prosopium coulteri Pygmy Whitefish 610 Thymallus arcticus Arctic Grayling 550 Salvelinus namaycush Lake Trout 520 Salvelinus alpinus Arctic Char 530 Salvelinus malma Dolly Varden 410 Oncorhynchus tshawytscha Chinook Salmon 420 Oncorhynchus nerka Sockeye Salmon 430 Oncorhynchus kisutch Coho Salmon 440 Oncorhynchus gorbuscha Pink Salmon 450 Oncorhynchus keta Chum Salmon 513 Osmerus mordax Rainbow Smelt 514 Hypomesus olidus Pond Smelt 500 Esox lucius Northern Pike 630 Dallia pectoralis Alaska Blackfish 650 Couesius plumbeus Lake Chub 640 Catostomus catostomus Longnose Sucker 670 Percopsis omiscomaycus Trout Perch 590 Lota lota Burbot (lush) 661 Pungitius pungitius Ninespine Stickleback 162 Cottus cognatus Slimy Sculpin ESTUARINE 113 Eleginus gracilis Saffron Cod 122 Liopsetta glacialis Arctic Flounder 127 Limanda aspera Yellowfin Sole 129 Platichthys stellatus Starry Flounder 192 Hexagrammos stelleri Whitespotted Greenling 230 Clupea harengus pallas Pacific Herring 516 Mallotus villosus Capelin NA Megalocottus platycephalus Sculpin Note: Includes fishes found in the Yukon River drainage in Canada. a The species code is a three-digit number that identifies the type of fish caught on harvest fish tickets.

113
Appendix A2.–Yukon River drainage.
Mileage Location from Mouth
Mileage Location from Mouth
NORTH MOUTH (APOON PASS) Kotlik 6 Hamilton 26 MIDDLE MOUTH (KWIKPAK,KAWANAK PASS) Choolunawick 16 Akers Camp 26 New Hamilton 34 SOUTH MOUTH (KWIKLUAK PASS) Mouth, Black River -18 Flat Island 0 Sheldon Point 5 Tin Can Point 8 Alakanuk 17 Emmonak-Kwiguk (Kwiguk Pass) 24 Sunshine Bay 24 Aproka Pass (upstream mouth) 35 Kwikpak Pass (upstream mouth) 44 Head of Passes 48 Fish Village 52 Mouth, Anuk River 63 (District 1/2 Boundary) Patsys Cabin 71 Mountain Village 87 Old Andreafsky 97 Pitkas Point 103 Mouth, Andreafsky River 104 St. Marys 107 Pilot Station 122 Mouth, Atcheulinguk (Chulinak) River 126 Pilot Village 138 Marshall (Fortuna Ledge) 161 Upstream Mouth Owl Slough 163 Ingrihak 170 Ohogamuit 185 Toklik 191 (District 2/3 Boundary) Kakamut 193 Russian Mission 213 Dogfish Villaage 227 Paimuit 251 Mouth, Innoko River 274 (South Slough) Shageluk 328 Holikachuk 383 Holy Cross 279 Mouth, Koserefski River 286 Old Paradise Village 301
(District 3/4 Boundary) Mouth, Bonasila River 306 Anvik 317 Mouth, Anvik River 318 Grayling 336 Mouth, Thompson Creek 349 Blackburn 370 Eagle Slide 402 Mouth, Rodo River 447 Kaltag 450 Mouth, Nulato River 483 Nulato 484 Koyukuk 502 Mouth, Koyukuk River 508 Mouth, Gisasa River 564 Huslia 711 Mouth, Dakli River 755 Mouth, Hogatza River 780 Hughes 881 Mouth, Kanuti River 935 Alatna (Mouth, Alatna R.) 956 Allakaket 956 Mouth, South Fork 986 Mouth, John River 1,117 Bettles 1,121 Middle Fork 1,141 Cold Foot 1,174 Wiseman 1,186 Bishop Rock 514 Prospect Point 519 Galena 530 Whiskey Creek 555 Mouth, Yuki River 562 Ruby 581 Mouth, Melozitna River 583 Horner Hot Springs 605 Kokrines 608 Mouth, Nowitna River 612 Birches 647 Kallands-Mouth of Illinois Creek 664 (District 4/5 Boundary) Mouth, Tozitna River 681 Tanana Village 695 Mouth, Tanana River 695 (District 5/6 Boundary) Manley Hot Springs 765 Mouth, Kantishna River 793 Mouth, Toklat River 838 Mouth, Sushana R. 850 Mouth, Bearpaw River 887 Outlet, L. Minchumina 959 Minto 835

114
Appendix A2.–Page 2 of 2.
Mileage Location from Mouth
Mileage Location from Mouth
Nenana 860 Mouth, Nenana River 860 Mouth, Wood River 894 Rosie Creek Bluffs 912 Mouth, Chena R.(Fairbanks) 920 Mouth, Salcha River 965 Benchmark #735 Slough 991 Mouth, Little Delta R. 1,000 Mouth, Delta Creek 1,014 Mouth, Clear Creek 1,015 (Richardson-Clearwater) Mouth, Shaw Creek 1,021 Mouth, Delta River 1,031 (Big Delta) Delta Junction 1,041 Mouth, Goodpaster River 1,049 Bluff Cabin Slough 1,050 Outlet, Clearwater Lake 1,052 Outlet, Clearwater Crk 1,053 (Delta Clearwater) Mouth, Gerstle River 1,059 Outlet, Healy Lake 1,071 Outlet, Lake George 1,086 Tanacross 1,128 Outlet, Tetlin Lake 1,188 Mouth, Nabesna River 1,210 Northway Junction 1,214 Mouth, Chisana River 1,215 Mouth, Sheep Creek 1,297 Rampart Rapids 731 Rampart 763 Mouth, Hess Creek 789 Mouth, Ray River 817 Highway Bridge - 820 Pipeline Crossing Mouth, Dall River 841 Stevens Village 847
Mouth, Hodzana River 897 Beaver 932 Mouth Hadweenzic River 952 Mouth, Chandalar River (Venetie Landing) 982 Venetie 1,025 Fort Yukon 1,002 Mouth, Porcupine River 1,002 Mouth, Black River 1,026 Chalkyitsik 1,084 Mouth, Salmon Fork R. 1,142 Mouth, Sheenjek River 1,054 Mouth, Coleen River 1,157 Mouth, Salmon Trout R. 1,193 U.S. - Canadian Border 1,219 Old Crow 1,259 Fishing Branch R. 1,600 spawning area Circle 1,061 Woodchopper 1,110 Mouth, Charley River 1,124 Mouth, Kandik River 1,135 Mouth, Nation River 1,166 Mouth, Tatonduk River 1,186 Mouth, Seventymile River 1,194 Eagle 1,213 U.S.-Canadian border 1,224 Mouth, Fortymile River 1,269 Dawson 1,319 Mouth, Klondike River 1,320 Mouth, Sixty Mile River 1,369 Mouth, Stewart River 1,375 McQuesten 1,455

115
Appendix A3.–Alaska and Canadian total utilization of Yukon River Chinook, chum, and coho salmon, 1961–2010. Alaska a,b Canada c Total
Other
Other
Other
Year Chinook Salmon Total Chinook Salmon Total Chinook Salmon Total 1961
141,152 461,597 602,749
13,246
9,076 22,322
154,398 470,673 625,071
1962
105,844 434,663 540,507
13,937
9,436 23,373
119,781 444,099 563,880 1963
141,910 429,396 571,306
10,077
27,696 37,773
151,987 457,092 609,079
1964
109,818 504,420 614,238
7,408
12,187 19,595
117,226 516,607 633,833 1965
134,706 484,587 619,293
5,380
11,789 17,169
140,086 496,376 636,462
1966
104,887 309,502 414,389
4,452
13,192 17,644
109,339 322,694 432,033 1967
146,104 352,397 498,501
5,150
16,961 22,111
151,254 369,358 520,612
1968
118,632 270,818 389,450
5,042
11,633 16,675
123,674 282,451 406,125 1969
105,027 424,399 529,426
2,624
7,776 10,400
107,651 432,175 539,826
1970
93,019 585,760 678,779
4,663
3,711 8,374
97,682 589,471 687,153 1971
136,191 547,448 683,639
6,447
16,911 23,358
142,638 564,359 706,997
1972
113,098 461,617 574,715
5,729
7,532 13,261
118,827 469,149 587,976 1973
99,670 779,158 878,828
4,522
10,135 14,657
104,192 789,293 893,485
1974
118,053 1,229,678 1,347,731
5,631
11,646 17,277
123,684 1,241,324 1,365,008 1975
76,705 1,307,037 1,383,742
6,000
20,600 26,600
82,705 1,327,637 1,410,342
1976
105,582 1,026,908 1,132,490
5,025
5,200 10,225
110,607 1,032,108 1,142,715 1977
114,494 1,090,771 1,205,265
7,527
12,479 20,006
122,021 1,103,250 1,225,271
1978
129,988 1,615,312 1,745,300
5,881
9,566 15,447
135,869 1,624,878 1,760,747 1979
159,232 1,596,133 1,755,365
10,375
22,084 32,459
169,607 1,618,217 1,787,824
1980
197,665 1,730,960 1,928,625
22,846
23,718 d 46,564
220,511 1,754,678 1,975,189 1981
188,477 2,097,871 2,286,348
18,109
22,781 d 40,890
206,586 2,120,652 2,327,238
1982
152,808 1,265,457 1,418,265
17,208
16,091 d 33,299
170,016 1,281,548 1,451,564 1983
198,436 1,678,597 1,877,033
18,952
29,490 d 48,442
217,388 1,708,087 1,925,475
1984
162,683 1,548,101 1,710,784
16,795
29,767 d 46,562
179,478 1,577,868 1,757,346 1985
187,327 1,657,984 1,845,311
19,301
41,515 d 60,816
206,628 1,699,499 1,906,127
1986
146,004 1,758,825 1,904,829
20,364
14,843 d 35,207
166,368 1,773,668 1,940,036 1987
188,386 1,246,012 1,434,398
17,614
44,786 d 62,400
206,000 1,290,798 1,496,798
1988
148,421 2,328,707 2,477,128
21,427
33,915 d 55,342
169,848 2,362,622 2,532,470 1989
157,606 2,289,642 2,447,248
17,944
23,490 d 41,434
175,550 2,313,132 2,488,682
1990
149,433 1,055,515 1,204,948
19,227
34,302 d 53,529
167,114 1,059,943 1,258,477 1991
154,651 1,335,111 1,489,762
20,607
35,653 d 56,260
175,258 1,370,764 1,546,022
1992
168,191 863,575 1,031,766
17,903
21,310 d 39,213
186,094 884,885 1,070,979 1993
160,289 341,593 501,882
16,611
14,150 d 30,761
176,900 355,743 532,643
1994
170,829 551,743 722,572
21,198
38,342 59,540
192,027 590,085 782,112 1995
177,663 1,437,837 1,615,500
20,884
46,109 66,993
198,547 1,483,946 1,682,493
1996
138,562 1,121,181 1,259,743
19,612
24,395 44,007
158,174 1,145,576 1,303,750 1997
174,625 544,879 719,504
16,528
15,880 32,408
191,153 560,759 751,912
1998
99,369 199,735 299,104
5,937 e 8,165 14,102
105,306 207,900 313,206 1999
124,316 236,464 360,780
12,468
19,736 32,204
136,784 256,200 392,984
2000
45,307 106,936 152,243
4,879 f 9,273 14,152
50,186 116,209 166,395 2001
53,738 116,477 170,261
10,144
9,822 19,966
63,882 126,299 190,181
2002
67,888 122,360 190,248
9,257
8,493 17,750
77,145 130,853 207,998 2003
99,150 199,917 299,067
9,616
11,885 21,501
108,766 211,802 320,568
2004
112,332 206,099 318,431
11,238
9,930 21,168
123,570 216,029 339,599 2005
85,521 478,749 564,270
11,371
18,348 29,719
96,892 497,097 593,989
2006 g 95,184 520,258 623,790
9,072
11,907 20,979
104,256 532,165 636,421 2007 g 89,537 532,068 621,605
5,094
14,309 19,403
94,631 546,377 641,008
2008
48,870 481,548 530,277
3,426
9,409 12,835
52,296 490,957 543,253 2009
34,206 355,504 389,002
4,758
2,011 6,769
38,964 357,515 396,479
2010 g 53,952 390,496 441,254 2,647 5,787 8,434 56,599 396,283 452,882 -continued-

116
Appendix A3.–Page 2 of 2. a Includes estimated number of salmon harvested for the commercial production of roe. b Commercial, subsistence, personal use, test fish retained for subsistence, and sport catches combined. Does not include the Coastal District.
communities of Hooper Bay and Scammon Bay. c Aboriginal, Domestic, Commercial, test fishery, and sport catches combined. d Includes the Old Crow Aboriginal fishery harvest of coho salmon. e Catch includes 761 Chinook salmon taken in the mark–recapture test fishery. f Catch includes 737 Chinook salmon taken in the test fishery. g Data are preliminary.

117
Appendix A4.–Commercial Chinook salmon sales and estimated harvest by area, district, and country, Yukon River drainage, 1961–2010.
Upper Yukon Area a
Lower Yukon Area b
District 4
Estimated
Year District 1 District 2 District 3 Subtotal Number Roe Harvest c 1961
84,466
29,026 4,368
117,860
1962
67,099
22,224 4,687
94,010 1963
85,004
24,221 7,020
116,245
1964
67,555
20,246 4,705
92,506 1965
89,268
23,763 3,204
116,235
1966
70,788
16,927 3,612
91,327 1967
104,350
20,239 3,618
128,207
1968
79,465
21,392 4,543
105,400 1969
71,688
14,756 3,595
90,039
1970
56,648
17,141 3,705
77,494 1971
86,042
19,226 3,490
108,758
1972
70,052
17,855 3,841
91,748 1973
56,981
13,859 3,204
74,044
1974 d 71,840
17,948 3,480
93,268
685
0
685 1975
44,585
11,315 4,177
60,077
389
0
389
1976
62,410
16,556 4,148
83,114
409
0
409 1977
69,915
16,722 3,965
90,602
985
0
985
1978
59,006
32,924 2,916
94,846
608
0
608 1979
75,007
41,498 5,018
121,523
1,989
0
1,989
1980
90,382
50,004 5,240
145,626
1,521
0
1,521 1981
99,506
45,781 4,023
149,310
1,347
0
1,347
1982
74,450
39,132 2,609
116,191
1,087
0
1,087 1983
95,457
43,229 4,106
142,792
601
0
601
1984
74,671
36,697 3,039
114,407
961
0
961 1985
90,011
48,365 2,588
140,964
664
0
664
1986
53,035
41,849 901
95,785
502
0
502 1987 e 76,643
47,458 2,039
126,140
1,524
0
1,524
1988
56,120
35,120 1,767
93,007
3,159
0
3,159 1989
61,570 f 33,166 1,645
96,381
2,790
0
2,790
1990
51,199 g 33,061 2,341
86,601
3,536
8
3,538 1991 h 56,332
39,260 2,344
97,936
2,446
2,222
3,582
1992 i 74,212
38,139 1,819
114,170
1,651
2,273
2,394 1993
49,286
37,293 1,501
88,080
1,349
701
1,577
1994
62,241
41,692 1,114
105,047
2,216
564
2,443 1995
76,106
41,458 -
117,564
262
626
499
1996
56,642
30,209 0
86,851
45
202
137 1997
66,384
39,363 -
105,747
1,450
14
1,457
1998
25,413
16,806 0
42,219
-
-
- 1999
37,161
27,133 538
64,832
1,437
0
1,437
2000
4,735
3,783 -
8,518
-
-
- 2001
-
- -
-
-
-
-
2002
11,081 j 11,434 -
22,515
- k - k - 2003
22,709
14,220 -
36,929
562
0
562
2004
28,403
24,145 -
52,548
-
-
- 2005
16,694
13,413 -
30,107
-
-
-
2006
23,748
19,843 315
43,906
-
-
- 2007
18,616
13,306 190
32,112
-
-
-
2008
2,530
2,111 -
4,641
-
-
- 2009
90
226 -
316
-
-
-
2010
5,744
4,153 -
9,897
-
-
- 2000-2009
Average 12,861
10,248 51
23,159
56
0
56 2005-2009
Average 12,336 9,780 101 22,216 - - - -continued-

118
Appendix A4.–Page 2 of 3. Upper Yukon Area a
District 5
District 6
Subtotal Total
Estimated
Estimated
Estimated Estimated Canada Grand
Year Number Roe Harvest c Number Roe Harvest c Number Roe Harvest c Harvest c Total Total 1961
1,804 0 1,804 119,664 3,446 123,110
1962
724 0 724 94,734 4,037 98,771 1963
803 0 803 117,048 2,283 119,331
1964
1,081 0 1,081 93,587 3,208 96,795 1965
1,863 0 1,863 118,098 2,265 120,363
1966
1,988 0 1,988 93,315 1,942 95,257 1967
1,449 0 1,449 129,656 2,187 131,843
1968
1,126 0 1,126 106,526 2,212 108,738 1969
988 0 988 91,027 1,640 92,667
1970
1,651 0 1,651 79,145 2,611 81,756 1971
1,749 0 1,749 110,507 3,178 113,685
1972
1,092 0 1,092 92,840 1,769 94,609 1973
1,309 0 1,309 75,353 2,199 77,552
1974 d 2,663 0 2,663
1,473 0 1,473
4,821 0 4,821 98,089 1,808 99,897 1975
2,872 0 2,872
500 0 500
3,761 0 3,761 63,838 3,000 66,838
1976
3,151 0 3,151
1,102 0 1,102
4,662 0 4,662 87,776 3,500 91,276 1977
4,162 0 4,162
1,008 0 1,008
6,155 0 6,155 96,757 4,720 101,477
1978
3,079 0 3,079
635 0 635
4,322 0 4,322 99,168 2,975 102,143 1979
3,389 0 3,389
772 0 772
6,150 0 6,150 127,673 6,175 133,848
1980
4,891 0 4,891
1,947 0 1,947
8,359 0 8,359 153,985 9,500 163,485 1981
6,374 0 6,374
987 0 987
8,708 0 8,708 158,018 8,593 166,611
1982
5,385 0 5,385
981 0 981
7,453 0 7,453 123,644 8,640 132,284 1983
3,606 0 3,606
911 0 911
5,118 0 5,118 147,910 13,027 160,937
1984
3,669 0 3,669
867 0 867
5,497 0 5,497 119,904 9,885 129,789 1985
3,418 0 3,418
1,142 0 1,142
5,224 0 5,224 146,188 12,573 158,761
1986
2,733 0 2,733
950 0 950
4,185 0 4,185 99,970 10,797 110,767 1987 f 3,758 0 3,758
3,338 0 3,338
8,620 0 8,620 134,760 10,864 145,624
1988
3,436 0 3,436
762 0 762
7,357 0 7,357 100,364 13,217 113,581 1989
3,286 0 3,286
1,741 0 1,741
7,817 0 7,817 104,198 9,789 113,987
1990
3,353 47 3,365
1,757 1,676 2,156
8,646 1,731 9,059 95,660 11,324 106,984 1991 j 3,810 62 3,826
686 1,545 1,072
6,942 3,829 8,480 106,416 10,906 117,322
1992 k 3,852 7 3,855
572 884 753
6,075 3,164 7,002 121,172 10,877 132,049 1993
3,008 0 3,008
1,113 1,313 1,445
5,470 2,014 6,030 94,110 10,350 104,460
1994
3,739 10 3,744
2,135 1,820 2,606
8,090 2,394 8,793 113,840 12,028 125,868 1995
3,242 0 3,242
1,660 4,731 2,747
5,164 5,357 6,488 124,052 11,146 135,198
1996
2,497 518 2,757
278 750 447
2,820 1,470 3,341 90,192 10,164 100,356 1997
3,678 0 3,678
1,966 3,211 2,728
7,094 3,225 7,863 113,610 5,311 118,921
1998
517 0 517
882 260 963
1,399 260 1,480 43,699 390 44,089 1999
2,604 0 2,604
402 1,096 689
4,443 1,096 4,730 69,562 3,160 72,722
2000
- - -
- - -
- - - 8,518 - 8,518 2001
- - -
- - -
- - - - 1,351 1,351
2002
771 0 771
836 896 1,066
1,607 896 1,837 24,352 708 25,060 2003
1,134 0 1,134
1,813 0 1,813
3,509 0 3,509 40,438 2,672 43,110
2004
1,546 0 1,546
2,057 0 2,057
3,603 0 3,603 56,151 3,785 59,936 2005
1,469 0 1,469
453 0 453
1,922 0 1,922 32,029 4,066 36,095
2006
1,839 0 1,839
84 0 84
1,923 0 1,923 45,829 2,332 48,161 2007
1,241 0 1,241
281 0 281
1,522 0 1,522 33,634 - 33,634
2008
- - -
- - -
- - - 4,641 1 4,642 2009
- - -
- - -
- - - 316 364 680
2010
- - -
- - -
- - - 9,897 0 9,897 2000-2009
Average 800 - 800
552 90 575
1,409 90 1,432 24,591 1,528 26,119 2005-2009
Average 910 - 910 164 0 164 1,073 0 1,073 23,290 1,353 24,642 -continued-

119
Appendix A4.–Page 3 of 3. Note: Unless otherwise indicate blank cells indicate years in which no information was collected or harvest numbers were insufficient to
generate summary information. Dashes indicate no commercial fishing activity occurred. a Harvest reported in numbers of fish sold in the round and pounds of roe sold. Since 1990, efforts were made to separate Chinook salmon roe
from summer chum salmon roe. Does not include ADF&G test fish sales. b All fish sold in the round. Includes ADF&G test fish sales prior to 1988. c The estimated harvest is the fish sold in the round plus the estimated number of females to produce the roe sold. d In 1974, District 4 was subdivided to include Districts 5 and 6. f Includes the illegal sales of 653 Chinook salmon in District 5 and 2,136 Chinook salmon in District 6. g Includes the illegal sales of 3,211 Chinook salmon. h Includes the illegal sales of 1,101 Chinook salmon. j Includes the illegal sales of 2,711 Chinook salmon in District 1 and 284 Chinook salmon in District 2. k Includes the illegal sales of 1,218 Chinook salmon in District 1 and 207 Chinook salmon in District 2.

120
Appendix A5.–Commercial summer chum salmon sales and estimated harvest by area and district, Yukon River drainage in Alaska, 1967–2010.
Lower Yukon Area
Year District 1 a District 2 a District 3 Subtotal 1967
9,453
1,425
57
10,935
1968
12,995
1,407
68
14,470 1969
56,886
5,080
-
61,966
1970
117,357
19,649
-
137,006 1971
93,928
6,112
50
100,090
1972
114,234
20,907
527
135,668 1973
221,644
63,402
463
285,509
1974 b 466,004
74,152
1,721
541,877 1975
418,323
99,139
-
517,462
1976
273,204
99,190
9,802
382,196 1977
250,652
105,679
3,412
359,743
1978
393,785
227,548
27,003
648,336 1979
369,934
172,838
40,015
582,787
1980
391,252
308,704
44,782
744,738 1981
507,158
351,878
54,471
913,507
1982
249,516
182,344
4,086
435,946 1983
451,164
248,092
14,600
713,856
1984
292,676
236,931
1,087
530,694 1985
247,486
188,099
1,792
437,377
1986
381,127
288,427
442
669,996 1987
222,898
174,876
3,501
401,275
1988
645,322
424,461
13,965
1,083,748 1989
544,373 c 343,032
7,578
894,983
1990
146,725
131,755
643
279,123 1991
140,470 d 175,149
8,912
324,531
1992 e 177,329
147,129
65
324,523 1993
73,659
19,332
463
93,454
1994
42,332
12,869
35
55,236 1995
142,266
83,817
-
226,083
1996
92,506
30,727
1,534 f 123,233 1997
59,915
18,242
-
78,157
1998
21,270
6,848
-
28,118 1999
16,181
11,702
0
27,883
2000
3,315
3,309
-
6,624 2001
-
-
-
-
2002
6,327
4,027
-
10,354 2003
3,579
2,583
-
6,162
2004
13,993
5,782
-
19,775 2005
23,965
8,313
-
32,278
2006
21,816
25,543
116
47,475 2007
106,790
69,432
1
176,223
2008
67,459
58,139
-
125,598 2009
71,335
86,571
-
157,906
2010
102,267
80,948
-
183,215 2000-2009
Average
35,398
29,300
59
64,711 2005-2009
Average 58,273 49,600 59 107,896 -continued-

121
Appendix A5.–Page 2 of 4. Upper Yukon Area g
District 4
District 5
Estimated
Estimated
Year Number Roe Harvest h Number Roe Harvest h 1967
- - -
- - -
1968
- - -
- - - 1969
- - -
- - -
1970
- - -
- - - 1971
- - -
- - -
1972
- - -
- - - 1973
- - -
- - -
1974 b 27,866 0 27,866
6,831 0 6,831 1975
165,054 0 165,054
12,997 0 12,997
1976
211,307 0 211,307
774 0 774 1977
169,541 0 169,541
1,274 0 1,274
1978
364,184 16,920 381,104
4,892 605 5,497 1979
169,430 35,317 204,747
8,608 1,009 9,617
1980
147,560 135,824 283,384
456 0 456 1981
59,718 187,032 330,445
1,236 49 1,285
1982
3,647 151,281 257,719
213 21 234 1983
6,672 148,125 255,388
42 1,856 1,898
1984
1,009 166,842 278,070
645 47 692 1985
12,007 247,085 427,483
700 0 700
1986
300 269,545 465,535
690 0 690 1987
29,991 121,474 209,800
362 44 406
1988
24,051 254,526 490,074
722 363 1,085 1989
18,554 283,305 510,244
154 373 527
1990
12,364 105,723 222,550
11 594 671 1991
6,381 137,232 309,644
4 28 35
1992
2,659 110,809 211,396
102 295 430 1993
27 22,447 42,957
0 0 0
1994
3,611 89,717 171,607
229 212 464 1995
8,873 281,074 554,587
107 188 316
1996
0 295,190 510,240
0 302 336 1997
2,062 74,231 124,671
137 0 137
1998
- - -
96 13 110 1999
1,267 0 1,267
115 0 115
2000
- - -
- - - 2001
- - -
- - -
2002
- - -
6 0 6 2003
62 0 62
0 0 0
2004
- - -
25 0 25 2005
- - -
0 0 0
2006
- - -
20 0 20 2007
7,304 0 7,304 i 0 0 0
2008
23,746 0 23,746 i - - - 2009
4,589 0 4,589 i - - -
2010
44,207 0 44,207 j - - - 2000-2009 Average
8,925 0 8,925
9 0 9
2005-2009 Average 11,880 0 11,880 7 0 7
-continued-

122
Appendix A5.–Page 3 of 4.
Upper Yukon Area g
District 6
Subtotal
Total
Estimated
Estimated
Estimated
Year Number Roe Harvest h Number Roe Harvest h Number Roe Harvest h 1967
-
- -
-
- -
10,935 - 10,935
1968
-
- -
-
- -
14,470 - 14,470 1969
-
- -
-
- -
61,966 - 61,966
1970
-
- -
-
- -
137,006 - 137,006 1971
-
- -
-
- -
100,090 - 100,090
1972
-
- -
-
- -
135,668 - 135,668 1973
-
- -
-
- -
285,509 - 285,509
1974 b 13,318
0 13,318 d 48,015
0 48,015
589,892 0 589,892 1975
14,782
0 14,782
192,833
0 192,833
710,295 0 710,295
1976
6,617
0 6,617
218,698
0 218,698
600,894 0 600,894 1977
4,317
0 4,317
175,132
0 175,132
534,875 0 534,875
1978
34,814
8,236 43,050
403,890
25,761 429,651
1,052,226 25,761 1,077,987 1979
18,491
3,891 22,382
196,529
40,217 236,746
779,316 40,217 819,533
1980
35,855
3,282 39,137
183,871
139,106 322,977
928,609 139,106 1,067,715 1981
32,477
1,987 34,464
93,431
189,068 366,194
1,006,938 189,068 1,279,701
1982
21,597
1,517 23,114
25,457
152,819 281,067
461,403 152,819 717,013 1983
24,309
18 24,327
31,023
149,999 281,613
744,879 149,999 995,469
1984
56,249
335 56,584
57,903
167,224 335,346
588,597 167,224 866,040 1985
66,913
1,540 68,453
79,620
248,625 496,636
516,997 248,625 934,013
1986
50,483
2,146 52,629
51,473
271,691 518,854
721,469 271,691 1,188,850 1987
10,610
450 11,060
40,963
121,968 221,266
442,238 121,968 622,541
1988
40,129
1,646 41,775
64,902
256,535 532,934
1,148,650 256,535 1,616,682 1989
42,115
4,871 46,986
60,823
288,549 557,757
955,806 288,549 1,452,740
1990
11,127 k 3,059 14,833
23,502
109,376 238,054
302,625 109,376 517,177 1991
18,197
4,716 23,892
24,582
141,976 333,571
349,113 141,976 658,102
1992
5,029
1,892 7,228
7,790
112,996 219,054
332,313 112,996 543,577 1993
3,041
515 3,705
3,068
22,962 46,662
96,522 22,962 140,116
1994
21,208
7,828 31,434
25,048
97,757 203,505
80,284 97,757 258,741 1995
24,711
9,475 37,428
33,691
290,737 592,331
259,774 290,737 818,414
1996
22,360
18,332 46,890
22,360
313,824 557,466
145,593 313,824 680,699 1997
14,886
9,036 25,287
17,085
83,267 150,095
95,242 83,267 228,252
1998
397
140 570
493
153 680
28,611 153 28,798 1999
124
24 148
1,506
24 1,530
29,389 24 29,413
2000
-
- -
-
- -
6,624 - 6,624 2001
-
- -
-
- -
- - -
2002
3,198
16 3,218
3,204
16 3,224
13,558 16 13,578 2003
4,461
0 4,461
4,523
0 4,523
10,685 0 10,685
2004
6,610
0 6,610
6,635
0 6,635
26,410 0 26,410 2005
8,986
0 8,986
8,986
0 8,986
41,264 0 41,264
2006
44,621
0 44,621
44,641
0 44,641
92,116 0 92,116 2007
14,674
0 14,674
21,978
0 21,978
198,201 0 198,201
2008
1,842
0 1,842
25,588
0 25,588
151,186 0 151,186 2009
7,777
0 7,777
12,366
0 12,366
170,272 0 170,272
2010
5,466
0 5,466
49,673
0 49,673
232,888 0 232,888 2000-2009 Average
11,521
2 11,524
15,990
98,222 189,169
78,924 2 78,926
2005-2009 Average 15,580 0 15,580 22,712 13 3,092 130,608 0 130,608
-continued-

123
Appendix A5.–Page 4 of 4. Note: Unless otherwise indicate blank cells indicate years in which no information was collected or harvest numbers were insufficient to generate
summary information. Dashes indicate no commercial fishing activity occurred. a All sales are fish in the round in District 1 and 2. Includes ADF&G test fish sales prior to 1988. b In 1974, District 4 was subdivided to include Districts 5 and 6. c Includes the illegal sales of 150 summer chum salmon in District 1. d Includes the illegal sales of 1,023 summer chum salmon. e Includes the illegal sales of 31 summer chum salmon in District 1 and 91 summer chum salmon in District 2. f Number of males and females harvested to produce 935 pounds of roe. g Harvest reported in numbers of fish sold in the round and pounds of roe. Roe sales may include some pink and Chinook salmon roe. Does
not include ADF&G test fish sales. h From 1967 to 2006, the estimated harvest is the fish sold in the round plus the estimated number of females caught to produce the roe sold. In
addition, the estimated harvest for Districts 3 and 4 includes the estimated number of unsold males. i The number of female fish from which roe were extracted is the number harvested. Males were not purchased and accounted for as caught but
not sold are included in personal use totals. Roe information is included in Zephyr as both numbers of fish and pounds of roe were recorded on fish tickets.
j Both males and females were purchased and are included in the number harvested. k Does not include 1,233 female summer chum salmon sold in Subdistrict 6-C with roe extracted and roe sold separately. These fish are
included in estimated harvest to produce roe sold.

124
Appendix A6.–Commercial fall chum salmon sales and estimated harvest by area, district, and country, Yukon River drainage, 1961–2010.
Lower Yukon Area
Year District 1 a District 2 a District 3 a Subtotal 1961
42,461
-
-
42,461
1962
53,116
-
-
53,116 1963
0
-
-
0
1964
8,347
-
-
8,347 1965
22,936
-
-
22,936
1966
69,836
-
1,209
71,045 1967
36,451
-
1,823
38,274
1968
49,857
-
3,068
52,925 1969
128,866
-
1,722
130,588
1970
200,306
4,858
3,285
208,449 1971
188,533
-
-
188,533
1972
136,711
12,898
1,313
150,922 1973
173,783
45,304
-
219,087
1974 b 176,036
53,540
552
230,128 1975
158,183
51,666
5,590
215,439
1976
105,851
21,212
4,250
131,313 1977
131,758
51,994
15,851
199,603
1978
127,947
51,646
11,527
191,120 1979
109,406
94,042
25,955
229,403
1980
106,829
83,881
13,519
204,229 1981
167,834
154,883
19,043
341,760
1982
97,484
96,581
5,815
199,880 1983
124,371
85,645
10,018
220,034
1984
78,751
70,803
6,429
155,983 1985
129,948
40,490
5,164
175,602
1986
59,352
51,307
2,793
113,452 1987
-
-
-
-
1988
45,317
31,861
2,090
79,268 1989
77,876
97,906
15,332
191,114
1990
27,337
37,173
3,715
68,225 1991
59,724
102,628
9,213
171,565
1992
-
-
- - 1993
-
-
- -
1994
-
-
- - 1995
79,345
90,831
-
170,176
1996
33,629
29,651
-
63,280 1997
27,483
24,326
-
51,809
1998
-
-
-
- 1999
9,987
9,703
-
19,690
2000
-
-
-
- 2001
-
-
-
-
2002
-
-
-
- 2003
5,586
-
-
5,586
2004
660
-
-
660 2005
130,525
-
-
130,525
2006
101,254
39,905
-
141,159 2007
38,852
35,826
-
74,678
2008
67,704
41,270
-
108,974 2009
11,911
12,072
-
23,983
2010
545
270
-
815 2000-2009 Average 35,649 12,907 0 48,557
2005-2009 Average 70,049 25,815 0 95,864
-continued-

125
Appendix A6.–Page 2 of 4. Upper Yukon Area
District 4
District 5
District 6
Estimated
Estimated
Estimated
Year Numbers a Roe c Harvest d Numbers a Roe c Harvest d Numbers a Roe c Harvest d 1961
-
- -
1962
-
- - 1963
-
- -
1964
-
- - 1965
381 e 0 381 e
1966
-
- - 1967
-
- -
1968
-
- - 1969
722 e 0 722 e
1970
1,146 e 0 1,146 e 1971
1,061 e 0 1,061 e
1972
1,254 e 0 1,254 e 1973
13,003 e 0 13,003 e
1974 b 9,213
0 9,213
23,551 0 23,551
26,884 0 26,884 1975
13,666
0 13,666
27,212 0 27,212
18,692 0 18,692
1976
1,742
0 1,742
5,387 0 5,387
17,948 0 17,948 1977
13,980
0 13,980
25,730 0 25,730
18,673 0 18,673
1978
10,988
1,721 12,709
21,016 5,220 26,236
13,259 3,687 16,946 1979
48,899
3,199 52,098
47,459 8,097 55,556
34,185 7,170 41,355
1980
27,978
4,347 32,325
41,771 605 42,376
19,452 68 19,520 1981
12,082
1,311 13,393
86,620 6,955 93,575
25,989 3,019 29,008
1982
3,894
167 4,061
13,593 42 13,635
6,820 596 7,416 1983
4,482
1,963 6,445
43,993 0 43,993
34,089 3,101 37,190
1984
7,625
2,215 9,840
24,060 57 24,117
20,564 56 20,620 1985
24,452
2,525 26,977
25,338 0 25,338
42,352 0 42,352
1986
2,045
0 2,045
22,053 395 22,448
1,892 182 2,074 1987
-
- -
- - -
- - -
1988
15,662
1,421 17,083
16,989 0 16,989
21,844 1,806 23,650 1989
11,776
3,407 15,183
18,215 3,989 22,204
49,090 7,353 56,443
1990
4,989
2,351 8,166
7,778 1,058 8,836
43,182 7,535 50,975 1991
3,737
1,616 6,091
27,355 3,625 30,980
28,195 14,154 44,448
1992
-
- -
- - -
15,721 2,806 19,022 1993
-
- -
- - -
- - -
1994
-
- -
3,630 0 3,630
1 4,368 4,369 1995
2,924
4,126 8,731
9,778 18,816 30,033
67,855 9,560 74,117
1996
2,918
0 2,918
11,878 8,498 20,376
10,266 6,173 17,574 1997
2,458
0 2,458
2,446 1,194 3,640
- - -
1998
-
- -
- - -
- - - 1999
681
0 681
- - -
- - -
2000
-
- -
- - -
- - - 2001
-
- -
- - -
- - -
2002
-
- -
- - -
- - - 2003
1,315
0 1,315
- - -
4,095 0 4,095
2004
-
- -
- - -
3,450 0 3,450 2005
-
- -
- - -
49,637 0 49,637
2006
-
- -
1,667 0 1,667
23,353 0 23,353 2007
-
- -
427 0 427
15,572 0 15,572
2008
-
- -
4,556 0 4,556
5,967 0 5,967 2009
-
- -
- - -
1,893 0 1,893
2010
-
- -
- - -
1,735 0 1,735 2000-2009 Average 132 0 132 665 0 665 10,397 0 10,397
2005-2009 Average 0 0 0 1,330 0 1,330 19,284 0 19,284
-continued-

126
Appendix A6.–Page 3 of 4. Upper Yukon Area
Subtotal
Total
Estimated
Estimated
Canada
Grand Year Numbers a Roe c Harvest d Harvest Total Total 1961
0 0 0
42,461
3,276
45,737
1962
0 0 0
53,116
936
54,052 1963
0 0 0
0
2,196
2,196
1964
0 0 0
8,347
1,929
10,276 1965
381 0 381
23,317
2,071
25,388
1966
0 0 0
71,045
3,157
74,202 1967
0 0 0
38,274
3,343
41,617
1968
0 0 0
52,925
453
53,378 1969
722 0 722
131,310
2,279
133,589
1970
1,146 0 1,146
209,595
2,479
212,074 1971
1,061 0 1,061
189,594
1,761
191,355
1972
1,254 0 1,254
152,176
2,532
154,708 1973
13,003 0 13,003
232,090
2,806
234,896
1974 b 59,648 0 59,648
289,776
2,544
292,320 1975
59,570 0 59,570
275,009
2,500
277,509
1976
25,077 0 25,077
156,390
1,000
157,390 1977
58,383 0 58,383
257,986
3,990
261,976
1978
45,263 10,628 55,891
247,011
3,356
250,367 1979
130,543 18,466 149,009
378,412
9,084
387,496
1980
89,201 5,020 94,221
298,450
9,000
307,450 1981
124,691 11,285 135,976
477,736
15,260
492,996
1982
24,307 805 25,112
224,992
11,312
236,304 1983
82,564 5,064 87,628
307,662
25,990
333,652
1984
52,249 2,328 54,577
210,560
22,932
233,492 1985
92,142 2,525 94,667
270,269
35,746
306,015
1986
25,990 577 26,567
140,019
11,464
151,483 1987
0 0 0
0
40,591
40,591
1988
54,495 3,227 57,722
136,990
30,263
167,253 1989
79,081 14,749 93,830
284,944
17,549
302,493
1990
55,949 10,944 67,977
136,202
27,537
163,739 1991
59,287 19,395 81,519
253,084
31,404
284,488
1992
15,721 2,806 19,022
19,022
18,576
37,598 1993
- - -
-
7,762
7,762
1994
3,631 4,368 7,999
7,999
30,035
38,034 1995
80,557 32,502 112,881
283,057
39,012
322,069
1996
25,062 14,671 40,868
104,148
20,069
124,217 1997
4,904 1,194 6,098
57,907
8,068
65,975
1998
- - -
-
-
- 1999
681 0 681
20,371
10,402
30,773
2000
- - -
-
1,319
1,319 2001
- - -
-
2,198
2,198
2002
- - -
-
3,065
3,065 2003
5,410 0 5,410
10,996
9,030
20,026
2004
3,450 0 3,450
4,110
7,365
11,475 2005
49,637 0 49,637
180,162
11,931
192,093
2006
25,020 0 25,020
166,179
4,096
170,275 2007
15,999 0 15,999
90,677
7,109
97,786
2008
10,523 0 10,523
119,497
4,062
123,559 2009
1,893 0 1,893
25,876
293
26,169
2010
1,735 0 1,735
2,550
2,186
4,736 2000-2009 Average 11,193 0 11,193 59,750 5,047 64,797
2005-2009 Average 20,614 0 20,614 116,478 5,498 121,976
-continued-

127
Appendix A6.–Page 4 of 4. Note: Unless otherwise indicated, blank cells indicate years in which no information was collected or harvest numbers were insufficient to
generate summary information. Dashes indicate no commercial fishing activity occurred. Numbers based on reports generated from the state TIX and Zephyr programs. These numbers supersede any numbers reported in previous Yukon Area annual management reports. Canadian harvest numbers are from Joint Technical Committee of the Yukon River US/Canada Panel. Includes test fish sales prior to 1988.
a Harvest reports in numbers of fish sold in the round. b In 1974, District 4 was subdivided to include Districts 5 and 6. c Sales reported in numbers of fish sold in the round and pounds of unprocessed roe, which may include small amounts of coho salmon roe.
Since 1990, efforts were made to separate coho roe from fall chum roe. d The estimated harvest is the fish sold in the round plus the estimated number of females to produce the roe sold. Prior to 1990, the ratio of
pounds of roe to females to produce roe was assumed to be 1.0 pounds of roe per female. In 1990 an "estimated harvest" column was added to the district-specific tables.
e These numbers were added from original Yukon Area annual management reports January 13, 2006, they are not in the fish ticket programs.

128
Appendix A7.–Commercial coho salmon sales and estimated harvest by area and district, Yukon River drainage in Alaska, 1961–2010.
Lower Yukon Area
Year District 1 a District 2 a District 3 a Subtotal 1961
2,855 - - 2,855
1962
22,926 - - 22,926 1963
5,572 - - 5,572
1964
2,446 - - 2,446 1965
350 - - 350
1966
19,254 - - 19,254 1967
9,925 - 1,122 11,047
1968
13,153 - 150 13,303 1969
13,989 - 1,009 14,998
1970
12,632 - - 12,632 1971
12,165 - - 12,165
1972
21,705 506 - 22,211 1973
34,860 1,781 - 36,641
1974 b 13,713 176 - 13,889 1975
2,288 200 - 2,488
1976
4,064 17 - 4,081 1977
31,720 5,319 538 37,577
1978
16,460 5,835 758 23,053 1979
11,369 2,850 - 14,219
1980
4,829 2,660 - 7,489 1981
13,129 7,848 419 21,396
1982
15,115 14,179 87 29,381 1983
4,595 2,557 - 7,152
1984
29,472 43,064 621 73,157 1985
27,675 17,125 171 44,971
1986
24,824 21,197 793 46,814 1987
- - - -
1988
36,435 34,776 1,419 72,630 1989
24,672 38,522 3,988 67,182
1990
13,354 16,435 918 30,707 1991
54,095 40,898 1,905 96,898
1992
- - - - 1993
- - - -
1994
- - - - 1995
21,625 18,488 - 40,113
1996
27,705 20,974 - 48,679 1997
21,450 13,056 - 34,506
1998
- - - - 1999
855 746 - 1,601
2000
- - - - 2001
- - - -
2002
- - - - 2003
9,757 - - 9,757
2004
1,583 - - 1,583 2005
36,533 - - 36,533
2006
39,323 14,482 - 53,805 2007
21,720 21,487 - 43,207
2008
13,946 19,248 - 33,194 2009
5,992 1,577 - 7,569
2010 1,027 1,023 - 2,050 2000-2009
Average 18,408 14,199 - 26,521 2005-2009
Average 23,503 14,199 - 34,862 -continued-

129
Appendix A7.–Page 2 of 4. Upper Yukon Area
District 4
District 5
District 6
Estimated
Estimated
Estimated
Year Numbers a Roe c Harvest d Numbers a Roe c Harvest d Numbers a Roe c Harvest d 1961
- - -
1962
- - - 1963
- - -
1964
- - - 1965
0 0 0
1966
- - - 1967
- - -
1968
- - - 1969
95 0 95
1970
556 0 556 1971
38 0 38
1972
22 0 22 1973
- - -
1974 b - - -
1,409 0 1,409
1,479 0 1,479 1975
- - -
5 0 5
53 0 53
1976
- - -
- - -
1,103 0 1,103 1977
- - -
2 0 2
1,284 0 1,284
1978
32 0 32
1 0 1
3,066 0 3,066 1979
155 0 155
- - -
2,791 0 2,791
1980
30 0 30
- - -
1,226 0 1,226 1981
- - -
- - -
2,284 0 2,284
1982
15 0 15
- - -
7,780 0 7,780 1983
- - -
- - -
6,168 0 6,168
1984
1,095 0 1,095
- - -
7,688 0 7,688 1985
938 0 938
- - -
11,762 0 11,762
1986
0 0 0
- - -
441 0 441 1987
- - -
- - -
- - -
1988
2 0 2
8 0 8
13,972 0 13,972 1989
3 0 3
84 0 84
16,084 0 16,084
1990
0 0 0
- - -
11,549 4,042 14,804 1991
14 0 14
- - -
6,268 4,299 9,774
1992
- - -
- - -
6,556 1,680 7,979 1993
- - -
- - -
- - -
1994
- - -
- - -
120 5,588 4,451 1995
- - -
- - -
5,826 2,229 6,900
1996
161 0 161
- - -
3,803 4,829 7,142 1997
814 0 814
- - -
- - -
1998
- - -
- - -
- - - 1999
- - -
- - -
- - -
2000
- - -
- - -
- - - 2001
- - -
- - -
- - -
2002
- - -
- - -
- - - 2003
367 0 367
- - -
15,119 0 15,119
2004
- - -
0 0 0
18,649 0 18,649 2005
- - -
- - -
21,778 0 21,778
2006
- - -
- - -
11,137 0 11,137 2007
- - -
- - -
1,368 0 1,368
2008
- - -
91 0 91
2,408 0 2,408 2009
- - -
- - -
742 0 742
2010 - - - - - - 1,700 0 1,700 2000-2009
Average 367 0 367 46 0 46 9,113 0 10,172 2005-2009
Average - - - 91 0 91 7,487 0 7,487 -continued-

130
Appendix A7.–Page 3 of 4.
Subtotal
Alaska
Estimated
Total
Year Numbers a Roe c Harvest d Harvest 1961
- - -
2,855
1962
- - -
22,926 1963
- - -
5,572
1964
- - -
2,446 1965
- - -
350
1966
- - -
19,254 1967
- - -
11,047
1968
- - -
13,303 1969
95 - 95
15,093
1970
556 - 556
13,188 1971
38 - 38
12,203
1972
22 - 22
22,233 1973
- - -
36,641
1974 b 2,888 - 2,888
16,777 1975
58 - 58
2,546
1976
1,103 - 1,103
5,184 1977
1,286 - 1,286
38,863
1978
3,099 - 3,099
26,152 1979
2,946 - 2,946
17,165
1980
1,256 - 1,256
8,745 1981
2,284 - 2,284
23,680
1982
7,795 - 7,795
37,176 1983
6,168 - 6,168
13,320
1984
8,783 - 8,783
81,940 1985
12,700 - 12,700
57,671
1986
441 - 441
47,255 1987
0 - 0
0
1988
13,982 - 13,982
86,612 1989
16,171 - 16,171
83,353
1990
11,549 4,042 14,804
45,511 1991
6,282 4,299 9,788
106,686
1992
6,556 1,680 7,979
7,979 1993
0 0 0
0
1994
120 5,588 4,451
4,451 1995
5,826 2,229 6,900
47,013
1996
3,964 4,829 7,303
55,982 1997
814 0 814
35,320
1998
- - -
0 1999
- - -
1,601
2000
- - -
0 2001
- - -
0
2002
- - -
0 2003
15,486 0 15,486
25,243
2004
18,649 0 18,649
20,232 2005
21,778 0 21,778
58,311
2006
11,137 0 11,137
64,942 2007
1,368 0 1,368
44,575
2008
2,499 0 2,499
35,693 2009
742 0 742
8,311
2010 1,700 0 1,700 3,750 2000-2009
Average 10,237 0 10,237 25,731 2005-2009
Average 7,505 0 7,505 42,366 -continued-

131
Appendix A7.–Page 4 of 4. Note: Unless otherwise indicated, blank cells indicate years in which no information was collected or harvest numbers were insufficient to
generate summary information. Dashes indicate no commercial fishing activity occurred. Numbers based on reports generated from the state TIX and Zephyr programs. These numbers supersede any numbers reported in previous Yukon Area annual management reports. Canadian harvest numbers are from Joint Technical Committee of the Yukon River US/Canada Panel. Does not include test fish sales.
a Harvest reports in numbers of fish sold in the round. b Pounds of salmon roe sold. Since 1990, efforts were made to separate coho salmon roe from the fall chum salmon roe sold. c Estimated harvest is the number of fish sold in the round plus the estimated number of females to produce the roe sold. Prior to 1990, the ratio
of pounds of roe to females to produce roe was calculated at 1:1. In 1990 an "estimated harvest" column was added to the district-specific tables.
d In 1974, District 4 was subdivided into Districts 5 and 6.

132
Appendix A8.–Commercial Fisheries Entry Commission (CFEC) salmon permits issued by gear type, Yukon Area, 1976–2010.
Lower Yukon Area Upper Yukon Area Upper Yukon Area
Set or Drift Gillnet
Set Gillnet
Fish wheel
Total
Permits
Permits
Permits
Permits
Permits
Permits
Permits
Permits
Year Issued Fished Issued Fished Issued Fished Issued Fished
1976 678
118
169
1977 700
609
69
44
160
130
929
783
1978 699
650
71
47
158
137
928
834
1979 708
661
70
50
165
129
943
840
1980 709
654
71
52
163
128
943
834
1981 711
666
80
45
163
125
954
836
1982 710
664
76
45
166
111
952
820
1983 708
655
73
40
164
115
945
810
1984 708
674
73
39
159
99
940
812
1985 708
664
71
40
159
113
938
817
1986 707
670
71
30
162
101
940
801
1987 706
656
71
33
161
108
938
797
1988 707
677
71
43
160
124
938
844
1989 707
682
70
42
160
127
937
851
1990 708
675
71
35
157
116
936
826
1991 708
680 72
36 155
110 935 826
1992 707
678 71
32 179
111 957
821
1993 708
682 72
35 166
88 946 805
1994 707
659
72
30
165
73
944
762
1995 707
663
73
36
166
106
946
805
1996 707
627
72
28
165
107
944
762
1997 705
640
72
22
163
63
940
725
1998 704
643 72
6 162
22 938 671
1999 704
632 72
13 162
25 938 670
2000 704
561 72
0 162
0 938 561
2001 700
0 72
0 156
0 928 0
2002 702
540 72
12 156
12 930 564
2003 703
557 72
7 157
20 932 584
2004 692
551 67
9 137
14 896 574
2005 690
581 67
6 135
15 892 602
2006 863
574 77
10 175
26 1,115 610
2007 846
566 76
6 175
24 1,097 596
2008 829
474 79
2 176
20 1,084 496
2009 807
391 77
2 166
10 1,050 403
2010 787
444 76
0 171
11 1,034 455
2005-2009
Average 807 517 75 5 165 19 1,048 541 Note: Unless otherwise indicate blank cells indicate years in which no information was collected or harvest numbers were insufficient to generate summary information. Dashes indicate no commercial fishing activity occurred.

133
Appendix A9.–Number of commercial salmon fishing permit holders making at least one delivery by district and season, Yukon Area, 1971–2010.
Chinook and Summer Chum Salmon Season
Lower Yukon Area
Upper Yukon Area Yukon
Area
Year District 1 District 2 District 3 Subtotal a District 4 District 5 District 6 Subtotal Total 1971
405 154 33 592
- - - - 592
1972
426 153 35 614
- - - - 614 1973
438 167 38 643
- - - - 643
1974
396 154 42 592
27 31 20 78 670 1975
441 149 37 627
93 52 36 181 808
1976
453 189 42 684
80 46 29 155 839 1977
392 188 46 626
87 41 18 146 772
1978
429 204 22 655
80 45 35 160 815 1979
425 210 22 657
87 34 30 151 808
1980
407 229 21 657
79 35 33 147 804 1981
448 225 23 696
80 43 26 149 845
1982
450 225 21 696
74 44 20 138 834 1983
455 225 20 700
77 34 25 136 836
1984
444 217 20 613
54 31 27 112 725 1985
425 223 18 666
74 32 27 133 799
1986
441 239 7 672
75 21 27 123 795 1987
440 239 13 659
87 30 24 141 800
1988
456 250 22 678
95 28 33 156 834 1989
445 243 16 687
98 32 29 159 846
1990
453 242 15 679
92 27 23 142 821 1991
489 253 27 678
85 32 22 139 817
1992
438 263 19 679
90 28 19 137 816 1993
448 238 6 682
75 30 18 123 805
1994
414 250 7 659
55 28 20 103 762 1995
439 233 0 661
87 28 21 136 797
1996
448 189 9 627
87 23 15 125 752 1997
457 188 0 639
39 29 15 83 722
1998
434 231 0 643
0 18 10 28 671 1999
412 217 5 631
5 26 6 37 668
2000
350 214 0 562
0 0 0 0 562 2001
- - - -
- - - - -
2002
322 223 0 540
0 18 6 24 564 2003
351 217 0 556
3 16 7 26 582
2004
396 212 0 549
0 14 6 20 569 2005
370 228 0 578
0 12 5 17 595
2006
379 214 6 569
0 15 10 25 594 2007
359 220 3 564
5 12 10 27 591
2008
266 181 0 444
8 0 5 13 457 2009
213 166 0 376
6 0 5 11 387
2010
264 181 0 440
5 0 5 10 450 2000-2009 Average 334 208 1 526 2 10 6 18 545
-continued-

134
Appendix A9.–Page 2 of 3. Fall Chum and Coho Salmon Season
Lower Yukon Area
Upper Yukon Area Yukon
Area
Year District 1 District 2 District 3 Subtotal a District 4 District 5 District 6 Subtotal Total 1971
352 - - 352
- - - - 352
1972
353 75 3 431
- - - - 431 1973
445 183
628
- - - - 628
1974
322 121 6 449
17 23 22 62 511 1975
428 185 12 625
44 33 33 110 735
1976
422 194 28 644
18 36 44 98 742 1977
337 172 37 546
28 34 32 94 640
1978
429 204 28 661
24 43 30 97 758 1979
458 220 32 710
31 44 37 112 822
1980
395 232 23 650
33 43 26 102 752 1981
462 240 21 723
30 50 30 110 833
1982
445 218 15 678
15 24 25 64 742 1983
312 224 18 554
13 29 23 65 619
1984
327 216 12 536
18 39 26 83 619 1985
345 222 13 559
22 39 25 86 645
1986
282 231 14 510
1 21 16 38 548 1987
0 0 0 0
0 0 0 0 0
1988
328 233 13 563
20 20 32 72 635 1989
332 229 22 550
20 24 28 72 622
1990
301 227 19 529
11 11 27 49 578 1991
319 238 19 540
8 21 25 54 594
1992
0 0 0 0
0 0 22 22 22 1993
0 0 0 0
0 0 0 0 0
1994
0 0 0 0
0 1 11 12 12 1995
189 172 0 357
4 12 20 36 393
1996
158 109 0 263
1 17 17 35 298 1997
176 130 0 304
3 8 0 11 315
1998
0 0 0 0
0 0 0 0 0 1999
146 110 0 254
4 0 0 4 258
2000
0 0 0 0
0 0 0 0 0 2001 c - - - -
- - - - -
2002
0 0 0 0
0 0 0 0 0 2003
75 0 0 75
2 0 5 7 82
2004
26 0 0 26
0 0 6 6 32 2005
177 0 0 177
0 0 7 7 184
2006
219 71 0 286
0 4 11 15 301 2007
181 122 0 300
0 2 8 10 310
2008
251 177 0 428
0 3 8 11 439 2009
165 130 0 292
0 0 2 2 294
2010
72 18 0 90
0 0 4 4 94 2000-2009 Average 122 56 0 176 0 1 5 6 182
-continued-

135
Appendix A9.–Page 3 of 3. Combined Season b
Lower Yukon Area
Upper Yukon Area Yukon
Area
Year District 1 District 2 District 3 Subtotal a District 4 District 5 District 6 Subtotal Total 1971
473 154 33 660
- - - 27 687
1972
476 153 35 664
- - - - 664 1973
529 205 38 772
- - - 47 819
1974
485 190 42 717
28 43 27 98 815 1975
491 197 39 727
95 57 46 198 925
1976
482 220 44 746
96 62 56 214 960 1977
402 208 54 609
96 53 39 188 797
1978
472 221 29 650
82 53 38 173 823 1979
461 230 33 661
90 49 40 179 840
1980
432 247 27 654
88 51 38 177 831 1981
507 257 26 666
94 56 31 181 847
1982
455 244 22 664
76 53 27 156 820 1983
458 235 26 655
79 47 31 157 812
1984
453 236 26 676
58 45 33 136 812 1985
434 247 24 666
76 48 33 157 823
1986
444 259 18 672
75 30 27 132 804 1987
440 239 13 659
87 30 24 141 800
1988
460 260 24 683
97 35 38 170 853 1989
452 257 23 687
99 38 32 169 856
1990
459 258 22 679
92 31 30 153 832 1991
497 272 29 680
85 33 28 146 826
1992
438 263 19 679
90 28 25 143 822 1993
448 238 6 682
75 30 18 123 805
1994
414 250 7 659
55 28 20 103 762 1995
446 254 0 664
87 31 24 142 806
1996
455 217 9 628
87 29 19 135 763 1997
463 221 0 640
39 31 15 85 725
1998
434 231 0 643
0 18 10 28 671 1999
422 238 5 632
6 26 6 38 670
2000
349 214 0 561
0 0 0 0 561 2001
- - - -
- - - - -
2002
322 223 0 540
0 18 6 24 564 2003
358 217 0 557
3 16 8 27 584
2004
399 212 0 551
0 14 9 23 574 2005
392 228 0 581
0 12 9 21 602
2006
396 224 6 574
0 20 16 36 610 2007
366 236 3 566
5 13 12 30 596
2008
297 208 0 474
8 3 11 22 496 2009
226 172 0 391
6 0 6 12 403
2010
274 183 0 444
5 0 6 11 455 2000-2009 Average 345 215 1 533 2 11 9 22 554
a Combined seasons numbers will differ as the data represent the total number of unique permits fished during the entire season. b Since 1984 the subtotal for the Lower Yukon Area was the unique number of permits fished. Prior to 1984, the subtotals are additive for
Districts 1, 2, and 3. Some individual fishermen in the Lower Yukon Area may have operated in more than one district during the year.

136
Appendix A10.–Commercial salmon pack by species and type of processing, Yukon Area, 1960–2010.
Fresh-Frozen
Cases (48#)
(round wt. in lbs.)
Cured Chinook
Cured Chum
Half
Half
Salmon
Year Chinook Coho Chum Chinook Coho Chum Tierces Tierces Tierces Tierces Roe (lbs.) 1960
13,000 0 0
- a - a - a
250
180
0 0
0
1961
19,474 0 0
- a - a - a
504
146
0 0
0 1962
15,959 512 1,760
- a - a - a
464
280
0 0
0
1963
16,400 1,190 0
- a - a - a
- a - a 0 0
0 1964
12,041 0 0
- a 17,000
66,770
537
499
0 0
0
1965
18,149 0 0
275,000
2,500
160,500
670
67
0 0
0 1966
14,026 836 2,812
414,000
61,355
301,240
398
60
0 0
0
1967
21,503 0 126
475,900
66,400
366,496
627
96
0 0
1,755 1968
19,499 0 816
561,690
93,154
454,409
351
170
0 0
21,000
1969
9,560 1,104 4,499
423,597
26,973 a 829,586 a
647
95
15 0
29,000 1970
6,431 1,002 6,413
716,600
12,900
1,725,000
447
191
51 0
26,300
1971
6,500 502 3,213
1,058,034
45,836
1,432,455
659
229
139 0
55,177 1972
7,418 1,005 6,249
1,002,395
83,960
1,495,922
497
147
0 0
85,278
1973
5,227 1,008 9,902
1,339,317
181,928
2,929,532
61
133
0 72
137,594 1974
6,660 603 21,074
1,062,666
58,816
3,879,300
381
56
57 0
208,842
1975
5,297 40 14,226
781,902
13,299
4,751,941
80
53
45 119
201,404 1976
3,921 80 11,375
1,398,779
29,778
4,256,679
93
92
72 10
226,893
1977
4,642 415 9,428
1,513,484
270,241
4,877,918
180
237
26 0
210,568 1978
5,711 74 9,340
1,473,354
168,241
8,639,156
222
117
7 75
261,422
1979
6,277 22 7,854
2,014,156
108,011
8,098,075
112
91
0 2
410,540 1980
8,764 130 15,783
3,341,262
56,295
8,781,062
29
18
0 37
579,927
1981
1,107 378 11,573
3,686,238
130,097
11,398,680
25
13
9 28
507,550 1982
0 7 751
2,790,456
246,500
4,992,877
0
19
0 1
584,053
1983
0 198 1,181
3,000,843
72,447
10,637,613
5
39
0 7
426,220 1984
0 5 1,768
2,426,205
590,526
5,516,532
0
36
0 16
468,244
1985
0 0 0
2,953,199
409,725
5,462,462
0
9
0 20 b 476,024 1986
0 0 0
2,012,324
299,054
5,960,857
0
15
0 28 c 502,952
1987
0 0 0
2,830,312
0
3,013,889
0
36
0 286,099
1988 d 0 0 0
1,970,879
624,734
9,111,943
0
10
0 22 e 577,748 1989 d 0 0 0
2,005,949
585,216
8,864,714
0
6
0 16 303,298
1990 d 0 0 0
1,846,081
283,504
3,166,199
0
3
0 1,368 f 261,016 1991 g 0 0 0
2,047,188
708,902
3,978,482
0
0
0 2,547 f 350,174
1992
0 0 0
2,537,833
40,685
2,398,093
0
0
0 0
260,590 1993
0 0 0
1,905,414
0
634,931
0
0
0 0
97,630
1994
0 0 0
2,260,301
744
528,666
0
0
0 0
183,873 1995
0 0 0
2,635,972
317,357
3,524,754
0
0
0 0
498,925
1996
0 0 0
1,836,242
400,960
1,733,129
0
0
0 0
443,939 1997
0 0 0
2,324,306
255,228
1,089,678
0
0
0 0
190,359
1998
0 0 0
779,936
9
191,692
0
0
0 0
28,919 1999
0 0 0
1,368,658
10,342
352,970
0
0
0 0
50,696
2000
0 0 0
158,636
0
50,782
0
0
0 0
6,286 2001
- - -
-
-
-
-
-
- -
-
2002
0 0 0
472,625
-
93,416
0
0
0 0
931 2003
0 0 0
841,748
165,757
144,942
0
0
0 0
0
2004
0 0 0
1,142,053
117,295
165,587
0
0
0 0
0 2005
0 0 0
597,192
410,398
1,637,483
0
0
0 0
273
2006
0 0 0
857,552
390,502
1,844,981
0
0
0 0
0 2007
0 0 0
594,003
331,412
1,890,820
0
0
0 0
5,939
2008
0 0 0
65,558
243,030
1,877,346
0
0
0 0
29,094 2009
0 0 0
4,194
55,722
1,261,342
0
0
0 0
4,709
2010 0 0 0 127,846 23,986 1,457,912 0 0 0 0 0 -continued-

137
Appendix A10.–Page 2 of 2. Note: Unless otherwise indicate blank cells indicate years in which no information was collected or harvest numbers were insufficient to generate
summary information. Dashes indicate no commercial fishing activity occurred. Pack represents type of processing when fish were shipped out of districts; roe includes unprocessed roe sold by fishermen and estimated production of roe from in the round purchases.
a Includes approximately 11,600 and 110,500 (round weight) of coho and chum salmon respectively, as salted fish for Japanese market. b Additionally 13 half tierces of coho salmon were packed. c Additionally 2 half tierces of coho salmon were packed. d Does not include District 6 test fish sales. e Additionally 1 half tierce of coho salmon was packed. f Chum salmon are represented in pounds of salted fillets. g Beginning in 1991, no ADF&G test fish sales are included.

138
Appendix A11.–Estimated average prices per pound paid to fishermen, Yukon Area, 1964–2010.
Lower Yukon Area
Upper Yukon Area
Summer
Fall
Summer Fall
Chinook Summer Chum Fall Chum
Coho Year Chinook Chum Chum Coho Chinook Roe Chum Roe Chum Roe Coho Roe
1964 0.17
0.03
1965 0.20
1966 0.20
1967 0.19 0.05 0.05 0.07
1968 0.18 0.06 0.06
1969 0.19 0.08 0.08 0.08
1970 0.22 0.09 0.09 0.12
1971 0.24 0.10 0.10 0.12
1972 0.24 0.11 0.11 0.13
1973 0.30 0.16 0.16 0.18
1974 0.38 0.21 0.21 0.25
0.50
0.15
0.13
0.15
1975 0.42 0.20 0.20 0.21
0.92
0.17
0.14
0.17
1976 0.51 0.24 0.24 0.27
0.74
0.19
0.16
0.19
1977 0.85 0.40 0.45 0.50
1.37
0.27 2.66 0.22
0.27
1978 0.90 0.45 0.47 0.60
0.87
0.24 0.25
0.24
1979 1.09 0.52 0.68 0.80
1.00
0.25 3.00 0.29
0.25
1980 1.04 0.20 0.28 0.36
0.85
0.23 2.50 0.27
0.29
1981 1.20 0.40 0.55 0.60
1.00
0.20 3.00 0.35
0.35
1982 1.41 0.40 0.55 0.69
1.02
0.18 2.75 0.28
0.37
1983 1.40 0.34 0.34 0.35
1.08
0.16 1.66 0.19
0.31
1984 1.50 0.26 0.32 0.50
0.95
0.23 1.78 0.26
0.24
1985 1.50 0.35 0.47 0.53
0.86
0.23 1.94 0.25
0.33
1986 1.63 0.38 0.49 0.71
0.89
0.22 2.08 0.14
0.21
1987 1.98 0.49 - -
0.79
0.19 2.22 -
-
1988 2.97 0.66 1.01 1.38
1.04
0.23 4.33 0.32
0.37
1989 2.77 0.34 0.50 0.66
0.84
0.24 4.41 0.28
0.35
1990 2.84 0.24 0.45 0.66
0.72
0.11 4.41 0.29
0.34
1991 3.70 0.36 0.34 0.44
0.70 2.92 0.18 4.21 0.23 3.56 0.30 2.50
1992 4.12 0.27 - -
0.91 2.82 0.30 4.53 0.39 4.50 0.39 2.18
1993 2.70 0.38 - -
1.06 5.52 0.35 8.53 - - - -
1994 2.07 0.21 - -
0.92 3.11 0.20 3.77 0.16 1.50 0.48 1.50
1995 2.09 0.16 0.15 0.29
0.77 2.64 0.13 3.57 0.13 2.96 0.14 2.51
1996 1.95 0.09 0.10 0.26
0.95 2.57 0.07 3.05 0.13 1.71 0.09 2.16
1997 2.46 0.10 0.22 0.32
0.97 1.62 0.07 1.08 0.17 1.75 0.20 -
1998 2.51 0.14 - -
0.91 2.00 0.18 1.90 - - - -
1999 3.80 0.10 0.25 0.35
1.10 2.11 0.18 2.25 0.20 - - -
2000 4.57 0.17 - -
- - - - - - - -
2001 - - - -
- - - - - - - -
2002 3.77 0.06 - -
0.75 1.75 0.32 2.25 - - - -
2003 2.37 0.05 0.15 0.10
0.80 - 0.27 - 0.10 - 0.05 -
2004 2.80 0.05 0.25 0.05
0.77 - 0.27 - 0.05 - 0.06 -
2005 3.43 0.05 0.32 0.32
0.87 - 0.25 - 0.14 - 0.12 -
2006 3.94 0.05 0.20 0.20
1.30 - 0.16 - 0.14 - 0.19 -
2007 3.73 0.19 0.27 0.39
1.33 - 0.25 2.36 0.20 - 0.20 -
2008 4.64 0.40 0.55 0.97
- - 0.25 3.00 0.27 - 0.20 -
2009 5.00 0.50 0.70 1.00
- - 0.26 3.00 0.19 - 0.15 -
2010 5.00 0.70 1.00 1.50
- - 0.23 - 0.23 - 0.26 -
2005-2009 Average a 4.15 0.24 0.41 0.58 0.70 0.00 0.23 1.67 0.19 0.00 0.17 0.00
Note: Unless otherwise indicate blank cells indicate years in which no information was collected or harvest numbers were insufficient to generate summary information. Dashes indicate no commercial fishing activity occurred.
a Average does not include years with no data.

139
Appendix A12.–Value of commercial salmon fishery to Yukon Area fishermen, 1977–2010.
Summer Season
Chinook
Summer Chum
Lower Yukon Upper Yukon
Lower Yukon Upper Yukon Total
Year Value Value Subtotal Value Value Subtotal Season
1977 1,841,033 148,766 1,989,799
1,007,280 306,481 1,313,761 3,303,560 1978 2,048,674 66,472 2,115,146
2,071,434 655,738 2,727,172 4,842,318
1979 2,763,433 124,230 2,887,663
2,242,564 444,924 2,687,488 5,575,151 1980 3,409,105 113,662 3,522,767
1,027,738 627,249 1,654,987 5,177,754
1981 4,420,669 206,380 4,627,049
2,741,178 699,876 3,441,054 8,068,103 1982 3,768,107 162,699 3,930,806
1,237,735 452,837 1,690,572 5,621,378
1983 4,093,562 105,584 4,199,146
1,734,270 281,883 2,016,153 6,215,299 1984 3,510,923 102,354 3,613,277
926,922 382,776 1,309,698 4,922,975
1985 4,294,432 82,644 4,377,076
1,032,700 593,801 1,626,501 6,003,577 1986 3,165,078 73,363 3,238,441
1,746,455 634,091 2,380,546 5,618,987
1987 5,428,933 136,196 5,565,129
1,313,618 323,611 1,637,229 7,202,358 1988 5,463,800 142,284 5,606,084
5,001,100 1,213,991 6,215,091 11,821,175
1989 5,181,700 108,178 5,289,878
2,217,700 1,377,117 3,594,817 8,884,695 1990 4,820,859 105,295 4,926,154
497,571 506,611 1,004,182 5,930,336
1991 7,128,300 97,140 7,225,440
782,300 627,177 1,409,477 8,634,917 1992 9,957,002 168,999 10,126,001
606,976 525,204 1,132,180 11,258,181
1993 4,884,044 113,217 4,997,261
226,772 203,762 430,534 5,427,795 1994 4,169,270 124,270 4,293,540
79,206 396,685 475,891 4,769,431
1995 5,317,508 87,059 5,404,567
241,598 1,060,322 1,301,920 6,706,487 1996 3,491,582 47,282 3,538,864
89,020 966,277 1,055,297 4,594,161
1997 5,450,433 110,713 5,561,146
56,535 96,806 153,341 5,714,487 1998 1,911,370 17,285 1,928,655
26,415 821 27,236 1,955,891
1999 4,950,522 74,475 5,024,997
19,687 1,720 21,407 5,046,404 2000 725,606 - 725,606
8,633 - 8,633 734,239
2001 - - -
- - - - 2002 1,691,105 20,744 1,711,849
4,342 6,176 10,518 1,722,367
2003 1,871,202 40,957 1,912,159
1,585 6,879 8,464 1,920,623 2004 3,063,667 38,290 3,101,957
8,884 9,645 18,529 3,120,486
2005 1,952,109 24,415 1,976,524
11,004 13,479 24,483 2,001,007 2006 3,290,367 32,631 3,322,998
23,862 42,988 66,850 3,389,848
2007 1,939,114 27,190 1,966,304
220,715 34,421 255,136 2,221,440 2008 325,470 - 325,470
326,930 65,840 392,770 718,240
2009 20,970 - 20,970
514,856 20,430 535,286 556,256 2010 639,230 - 639,230
823,967 61,534 885,501 1,524,731
2005-2009 Average 1,505,606 28,079 1,522,453
219,473 35,432 254,905 1,777,358
-continued-

140
Appendix A12.–Page 2 of 2.
Fall Season
Fall Chum
Coho
Lower Yukon Upper Yukon
Lower Yukon Upper Yukon Total
Total
Year Value Value Subtotal Value Value Subtotal Season Value
1977 718,571 102,170 820,741
140,914 2,251 143,165 963,906
4,267,466 1978 691,854 103,091 794,945
96,823 6,105 102,928 897,873
5,740,191
1979 1,158,485 347,814 1,506,299
83,466 6,599 90,065 1,596,364
7,171,515 1980 394,162 198,088 592,250
17,374 2,374 19,748 611,998
5,789,752
1981 1,503,744 356,805 1,860,549
87,385 4,568 91,953 1,952,502
10,020,605 1982 846,492 53,258 899,750
135,828 18,786 154,614 1,054,364
6,675,742
1983 591,011 128,950 719,961
17,497 11,472 28,969 748,930
6,964,229 1984 374,359 103,417 477,776
256,050 12,823 268,873 746,649
5,669,624
1985 634,616 178,125 812,741
176,254 26,797 203,051 1,015,792
7,019,369 1986 399,321 30,309 429,630
211,942 556 212,498 642,128
6,261,115
1987 - - -
- - - -
7,202,358 1988 638,700 151,300 790,000
734,400 34,116 768,516 1,558,516
13,379,691
1989 713,400 223,996 937,396
323,300 33,959 357,259 1,294,655
10,179,350 1990 238,165 174,965 413,130
137,302 37,026 174,328 587,458
6,517,794
1991 438,310 157,831 596,141
300,182 21,556 321,738 917,879
9,552,796 1992 0 54,161 54,161
0 19,529 19,529 73,690
11,331,871
1993 0 0 0
0 0 0 0
5,427,795 1994 0 8,517 8,517
0 8,739 8,739 17,256
4,786,687
1995 185,036 167,571 352,607
80,019 11,292 91,311 443,918
7,150,405 1996 48,579 45,438 94,017
96,795 13,020 109,815 203,832
4,797,993
1997 86,526 7,252 93,778
79,973 1,062 81,035 174,813
5,889,300 1998 - - -
- - - -
1,955,891
1999 35,639 876 36,515
3,620 0 3,620 40,135
5,086,539 2000 - - -
- - - -
734,239
2001 - - -
- - - -
- 2002 - - -
- - - -
1,722,367
2003 5,993 3,398 9,391
18,168 5,095 23,263 32,654
1,953,277 2004 1,126 848 1,974
2,774 6,372 9,146 11,120
3,131,606
2005 316,698 48,159 364,857
83,793 19,182 102,975 467,832
2,468,839 2006 202,637 33,806 236,443
50,299 11,137 61,436 297,879
3,687,727
2007 144,256 16,907 161,163
127,869 1,368 129,237 290,400
2,511,840 2008 428,969 22,089 451,058
216,777 3,717 220,494 671,552
1,389,792
2009 108,778 1,286 110,064
52,176 457 52,633 162,697
718,953 2010 5,428 2,761 8,189
20,535 442 20,977 29,166
1,553,897
2005-2009 Average 240,268 24,449 264,717
106,183 7,172 113,355 378,072
2,155,430
Note: Unless otherwise indicate blank cells indicate years in which no information was collected or harvest numbers were insufficient to generate summary information. Dashes indicate no commercial fishing activity occurred.
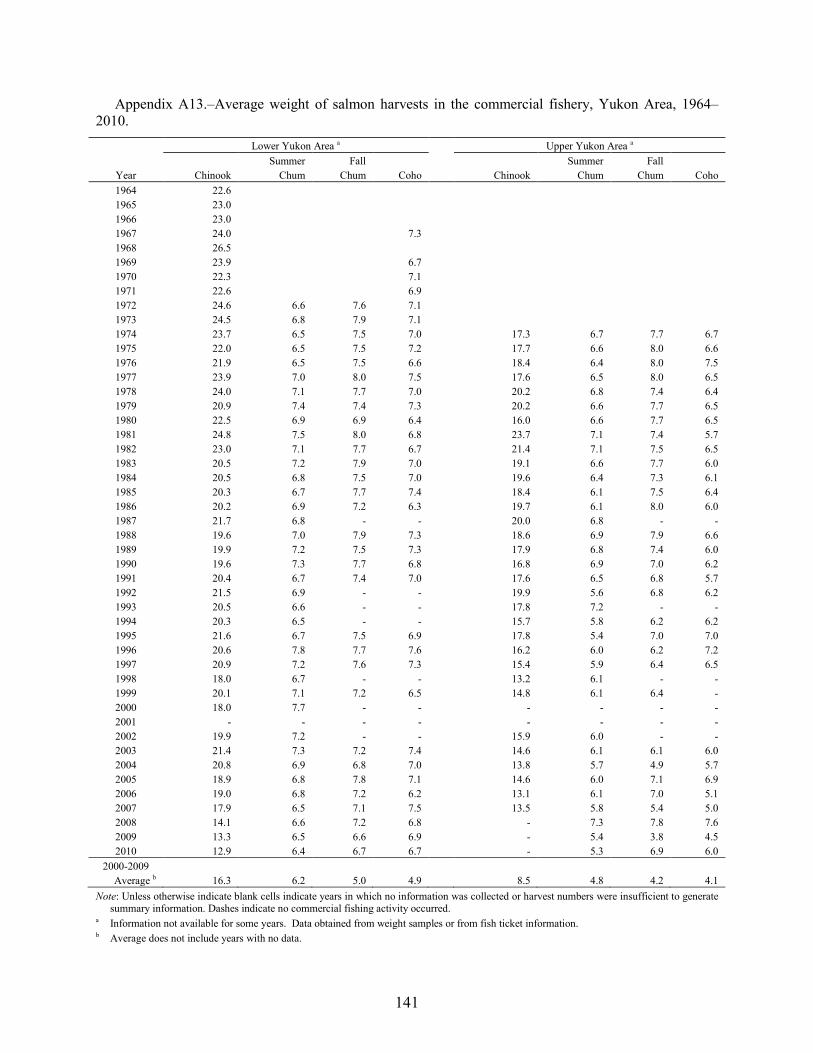
141
Appendix A13.–Average weight of salmon harvests in the commercial fishery, Yukon Area, 1964–2010.
Lower Yukon Area a
Upper Yukon Area a
Summer Fall
Summer Fall
Year Chinook Chum Chum Coho Chinook Chum Chum Coho 1964 22.6
1965 23.0 1966 23.0 1967 24.0
7.3 1968 26.5
1969 23.9
6.7 1970 22.3
7.1
1971 22.6
6.9 1972 24.6 6.6 7.6 7.1 1973 24.5 6.8 7.9 7.1 1974 23.7 6.5 7.5 7.0
17.3 6.7 7.7 6.7 1975 22.0 6.5 7.5 7.2
17.7 6.6 8.0 6.6
1976 21.9 6.5 7.5 6.6
18.4 6.4 8.0 7.5 1977 23.9 7.0 8.0 7.5
17.6 6.5 8.0 6.5
1978 24.0 7.1 7.7 7.0
20.2 6.8 7.4 6.4 1979 20.9 7.4 7.4 7.3
20.2 6.6 7.7 6.5
1980 22.5 6.9 6.9 6.4
16.0 6.6 7.7 6.5 1981 24.8 7.5 8.0 6.8
23.7 7.1 7.4 5.7
1982 23.0 7.1 7.7 6.7
21.4 7.1 7.5 6.5 1983 20.5 7.2 7.9 7.0
19.1 6.6 7.7 6.0
1984 20.5 6.8 7.5 7.0
19.6 6.4 7.3 6.1 1985 20.3 6.7 7.7 7.4
18.4 6.1 7.5 6.4
1986 20.2 6.9 7.2 6.3
19.7 6.1 8.0 6.0 1987 21.7 6.8 - -
20.0 6.8 - -
1988 19.6 7.0 7.9 7.3
18.6 6.9 7.9 6.6 1989 19.9 7.2 7.5 7.3
17.9 6.8 7.4 6.0
1990 19.6 7.3 7.7 6.8
16.8 6.9 7.0 6.2 1991 20.4 6.7 7.4 7.0
17.6 6.5 6.8 5.7
1992 21.5 6.9 - -
19.9 5.6 6.8 6.2 1993 20.5 6.6 - -
17.8 7.2 - -
1994 20.3 6.5 - -
15.7 5.8 6.2 6.2 1995 21.6 6.7 7.5 6.9
17.8 5.4 7.0 7.0
1996 20.6 7.8 7.7 7.6
16.2 6.0 6.2 7.2 1997 20.9 7.2 7.6 7.3
15.4 5.9 6.4 6.5
1998 18.0 6.7 - -
13.2 6.1 - - 1999 20.1 7.1 7.2 6.5
14.8 6.1 6.4 -
2000 18.0 7.7 - -
- - - - 2001 - - - -
- - - -
2002 19.9 7.2 - -
15.9 6.0 - - 2003 21.4 7.3 7.2 7.4
14.6 6.1 6.1 6.0
2004 20.8 6.9 6.8 7.0
13.8 5.7 4.9 5.7 2005 18.9 6.8 7.8 7.1
14.6 6.0 7.1 6.9
2006 19.0 6.8 7.2 6.2
13.1 6.1 7.0 5.1 2007 17.9 6.5 7.1 7.5
13.5 5.8 5.4 5.0
2008 14.1 6.6 7.2 6.8
- 7.3 7.8 7.6 2009 13.3 6.5 6.6 6.9
- 5.4 3.8 4.5
2010 12.9 6.4 6.7 6.7
- 5.3 6.9 6.0 2000-2009
Average b 16.3 6.2 5.0 4.9 8.5 4.8 4.2 4.1 Note: Unless otherwise indicate blank cells indicate years in which no information was collected or harvest numbers were insufficient to generate
summary information. Dashes indicate no commercial fishing activity occurred. a Information not available for some years. Data obtained from weight samples or from fish ticket information. b Average does not include years with no data.

142
Appendix A14.–Commercial Chinook salmon quotas or guideline harvest ranges (GHR), Yukon Area, 1974–2010.
Districts 1 and 2
District 3
District 4
Subdistricts 5-ABC
Subdistricts 5-D
District 6
Year GHR Quota/GHR Quota/GHR Quota/GHR Quota/GHR Quota/GHR 1974
3,000
1,000
3,000 a
1,000
1975
3,000
1,000
3,000 a
1,000 1976
3,000
1,000
3,000 a
1,000
1977
3,000
1,000
3,000 a
1,000 1978
2,000
1,000
3,000 a
1,000
1979 b
1,800-2,200
900-1,100
2,700-3,300
900-1,100 1980
1,800-2,200
900-1,100
2,700-3,300
900-1,100
1981
60,000-120,000
1,800-2,200
2,250-2,850
2,400-2,800
300-500
600-800 1982
60,000-120,000
1,800-2,200
2,250-2,850
2,400-2,800
300-500
600-800
1983
60,000-120,000
1,800-2,200
2,250-2,850
2,400-2,800
300-500
600-800 1984
60,000-120,000
1,800-2,200
2,250-2,850
2,400-2,800
300-500
600-800
1985
60,000-120,000
1,800-2,200
2,250-2,850
2,400-2,800
300-500
600-800 1986
60,000-120,000
1,800-2,200
2,250-2,850
2,400-2,800
300-500
600-800
1987
60,000-120,000
1,800-2,200
2,250-2,850
2,400-2,800
300-500
600-800 1988
60,000-120,000
1,800-2,200
2,250-2,850
2,400-2,800
300-500
600-800
1989
60,000-120,000
1,800-2,200
2,250-2,850
2,400-2,800
300-500
600-800 1990
60,000-120,000
1,800-2,200
2,250-2,850
2,400-2,800
300-500
600-800
1991
60,000-120,000
1,800-2,200
2,250-2,850
2,400-2,800
300-500
600-800 1992
60,000-120,000
1,800-2,200
2,250-2,850
2,400-2,800
300-500
600-800
1993
60,000-120,000
1,800-2,200
2,250-2,850
2,400-2,800
300-500
600-800 1994
60,000-120,000
1,800-2,200
2,250-2,850
2,400-2,800
300-500
600-800
1995
60,000-120,000
1,800-2,200
2,250-2,850
2,400-2,800
300-500
600-800 1996
60,000-120,000
1,800-2,200
2,250-2,850
2,400-2,800
300-500
600-800
1997
60,000-120,000
1,800-2,200
2,250-2,850
2,400-2,800
300-500
600-800 1998
60,000-120,000
1,800-2,200
2,250-2,850
2,400-2,800
300-500
600-800
1999
60,000-120,000
1,800-2,200
2,250-2,850
2,400-2,800 c
300-500
600-800 2000
60,000-120,000
1,800-2,200
2,250-2,850
2,400-2,800 c
300-500
600-800
2001
60,000-120,000
1,800-2,200
2,250-2,850
2,400-2,800 c
300-500
600-800 2002
60,000-120,000
1,800-2,200
2,250-2,850
2,400-2,800 c
300-500
600-800
2003
60,000-120,000
1,800-2,200
2,250-2,850
2,400-2,800 c
300-500
600-800 2004
60,000-120,000
1,800-2,200
2,250-2,850
2,400-2,800 c
300-500
600-800
2005
60,000-120,000
1,800-2,200
2,250-2,850
2,400-2,800 c
300-500
600-800 2006
60,000-120,000
1,800-2,200
2,250-2,850
2,400-2,800 c
300-500
600-800
2007
60,000-120,000
1,800-2,200
2,250-2,850
2,400-2,800 c
300-500
600-800 2008
60,000-120,000
1,800-2,200
2,250-2,850
2,400-2,800 c
300-500
600-800
2009
60,000-120,000
1,800-2,200
2,250-2,850
2,400-2,800 c
300-500
600-800 2010 60,000-120,000 1,800-2,200 2,250-2,850 2,400-2,800 c 300-500 600-800
a Quota or guideline harvest range for all of District 5. b Beginning in 1979, quotas were replaced by guideline harvest ranges. c Subdistrict 5-A was removed from the guideline harvest ranges for Chinook and summer chum salmon and a separate guideline harvest range
of 0 to 4,000 pounds of fall chum salmon roe was established in November 1998.

143
Appendix A15.–Commercial summer chum salmon guideline harvest ranges (GHR), Yukon Area, 1990–2010.
Districts 1 and 2
District 3
Subdistrict 4-A
Anvik River
Subdistrict 4-BC
District 5
District 6
GHR
Year GHR GHR Pounds of Roe a Numbers of Fish Roe Cap GHR GHR GHR
1990
251,000-755,000
6,000-19,000 61,000-183,000 113,000-338,000
16,000-47,000
1,000-3,000
13,000-38,000 1991
251,000-755,000
6,000-19,000 61,000-183,000 113,000-338,000
16,000-47,000
1,000-3,000
13,000-38,000
1992
251,000-755,000
6,000-19,000 61,000-183,000 113,000-338,000
16,000-47,000
1,000-3,000
13,000-38,000 1993
251,000-755,000
6,000-19,000 61,000-183,000 113,000-338,000
16,000-47,000
1,000-3,000
13,000-38,000 1994
251,000-755,000
6,000-19,000 61,000-183,000 113,000-338,000
b 16,000-47,000
1,000-3,000
13,000-38,000
1995
251,000-755,000
6,000-19,000 61,000-183,000 113,000-338,000
50,000
16,000-47,000
1,000-3,000
13,000-38,000 1996
251,000-755,000
6,000-19,000 61,000-183,000 113,000-338,000
100,000
16,000-47,000
1,000-3,000
13,000-38,000
1997
251,000-755,000
6,000-19,000 61,000-183,000 113,000-338,000
100,000
16,000-47,000
1,000-3,000
13,000-38,000 1998
251,000-755,000
6,000-19,000 61,000-183,000 113,000-338,000
100,000
16,000-47,000
1,000-3,000
13,000-38,000
1999
251,000-755,000
6,000-19,000 61,000-183,000 113,000-338,000
100,000
16,000-47,000
1,000-3,000 c 13,000-38,000 2000
251,000-755,000
6,000-19,000 61,000-183,000 113,000-338,000
100,000
16,000-47,000
1,000-3,000 c 13,000-38,000
2001
251,000-755,000
6,000-19,000 61,000-183,000 113,000-338,000
100,000
16,000-47,000
1,000-3,000
13,000-38,000 2002
251,000-755,000
6,000-19,000 61,000-183,000 113,000-338,000
100,000
16,000-47,000
1,000-3,000
13,000-38,000
2003
251,000-755,000
6,000-19,000 61,000-183,000 113,000-338,000
100,000
16,000-47,000
1,000-3,000
13,000-38,000 2004
251,000-755,000
6,000-19,000 61,000-183,000 113,000-338,000
100,000
16,000-47,000
1,000-3,000
13,000-38,000
2005
251,000-755,000
6,000-19,000 61,000-183,000 113,000-338,000
100,000
16,000-47,000
1,000-3,000
13,000-38,000 2006
251,000-755,000
6,000-19,000 61,000-183,000 113,000-338,000
100,000
16,000-47,000
1,000-3,000
13,000-38,000
2007
251,000-755,000
6,000-19,000 61,000-183,000 113,000-338,000
100,000
16,000-47,000
1,000-3,000
13,000-38,000 2008
251,000-755,000
6,000-19,000 61,000-183,000 113,000-338,000
100,000
16,000-47,000
1,000-3,000
13,000-38,000
2009
251,000-755,000
6,000-19,000 61,000-183,000 113,000-338,000
100,000
16,000-47,000
1,000-3,000
13,000-38,000 2010 251,000-755,000 6,000-19,000 61,000-183,000 113,000-338,000 100,000 16,000-47,000 1,000-3,000 13,000-38,000
a Summer chum salmon roe cap of 183,000 pounds. b No summer chum salmon roe cap established for Anvik River management area in 1994. c Subdistrict 5-A was removed from the guideline harvest ranges for Chinook and summer chum salmon and a separate guideline harvest range of 0 to 4,000 pounds of fall chum salmon roe was
established in November 1998.

144
Appendix A16.–Commercial fall chum salmon quotas or guideline harvest ranges (GHR), Yukon Area, 1974–2010.
Districts 1, 2, and 3
District 4
Subdistricts 4-BC
District 5
Subdistricts 5-ABC
Subdistrict 5-D
District 6
Year Quota/GHR Quota/GHR GHR Quota/GHR GHR GHR Quota/GHR 1974
200,000
10,000
25,000
15,000
1975
200,000
10,000
25,000
15,000 1976
200,000
10,000
25,000
15,000
1977
200,000
10,000
25,000
15,000 1978
200,000
10,000
25,000
15,000
1979 a 120,000-220,000
10,000-40,000
10,000-40,000
7,500-22,500 1980
120,000-220,000
10,000-40,000
10,000-40,000
7,500-22,500
1981
120,000-220,000
10,000-40,000
8,000-36,000
2,000-4,000
5,500-20,500 1982
120,000-220,000
10,000-40,000
8,000-36,000
2,000-4,000
5,500-20,500
1983
120,000-220,000
10,000-40,000
8,000-36,000
2,000-4,000
5,500-20,500 1984
120,000-220,000
10,000-40,000
8,000-36,000
2,000-4,000
5,500-20,500
1985
120,000-220,000
10,000-40,000
8,000-36,000
2,000-4,000
5,500-20,500 1986
0-110,000
0-20,000
0-18,000
0-2,000
0-10,250
1987
0-110,000
0-20,000
0-18,000
0-2,000
0-10,250 1988
0-110,000
0-20,000
0-18,000
0-2,000
0-10,250
1989
0-110,000
0-20,000
0-18,000
0-2,000
0-10,250 1990
60,000-220,000
5,000-40,000
4,000-36,000
1,000-4,000
2,750-20,500
1991
60,000-220,000
5,000-40,000
4,000-36,000
1,000-4,000
2,750-20,500 1992
60,000-220,000
5,000-40,000
4,000-36,000
1,000-4,000
2,750-20,500
1993
60,000-220,000
5,000-40,000
4,000-36,000
1,000-4,000
2,750-20,500 1994
60,000-220,000
5,000-40,000
4,000-36,000
1,000-4,000
2,750-20,500
1995
60,000-220,000
5,000-40,000
4,000-36,000
1,000-4,000
2,750-20,500 1996
60,000-220,000
5,000-40,000
4,000-36,000
1,000-4,000
2,750-20,500
1997
60,000-220,000
5,000-40,000
4,000-36,000
1,000-4,000
2,750-20,500 1998
60,000-220,000
5,000-40,000
4,000-36,000
1,000-4,000
2,750-20,500
1999
60,000-220,000
5,000-40,000
4,000-36,000 b 1,000-4,000
2,750-20,500 2000
60,000-220,000
5,000-40,000
4,000-36,000 b 1,000-4,000
2,750-20,500
2001
60,000-220,000
5,000-40,000 c
4,000-36,000 b 1,000-4,000
2,750-20,500 2002
60,000-220,000
5,000-40,000
4,000-36,000 b 1,000-4,000
2,750-20,500
2003
60,000-220,000
5,000-40,000
4,000-36,000 b 1,000-4,000
2,750-20,500 2004
60,000-220,000
5,000-40,000
4,000-36,000 b 1,000-4,000
2,750-20,500
2005
60,000-220,000
5,000-40,000
4,000-36,000 b 1,000-4,000
2,750-20,500 2006
60,000-220,000
5,000-40,000
4,000-36,000 b 1,000-4,000
2,750-20,500
2007
60,000-220,000
5,000-40,000
4,000-36,000 b 1,000-4,000
2,750-20,500 2008
60,000-220,000
5,000-40,000
4,000-36,000 b 1,000-4,000
2,750-20,500
2009
60,000-220,000
5,000-40,000
4,000-36,000 b 1,000-4,000
2,750-20,500 2010 60,000-220,000 5,000-40,000 4,000-36,000 b 1,000-4,000 2,750-20,500
-continued-

145
Appendix A16.–Page 2 of 2. Note: Fall chum and coho salmon combined quota or guideline harvest range for Upper Yukon Area (1974–1992). Beginning in 1993, regulations were changed to exclude coho salmon. a In 1979, quotas were replaced by guideline harvest ranges. b The GHR 4,000 to 36,000 fall chum salmon applies only to Subdistricts 5-B and 5-C. Subdistrict 5-A was removed from the guideline harvest ranges for Chinook and summer chum salmon and a
separate guideline harvest range of 0 to 4,000 pounds of fall chum salmon roe was established in November 1998. c In 2001, the GHR for Subdistrict 4-B and 4-C was changed to include Subdistrict 4-A.

146
Appendix A17.–Chinook salmon total utilization in numbers of fish by district, area, and country, Yukon River drainage, 1961–2010.
District 1
District 2
Personal Test Fish
Test Fish
Year Subsistencea,b Commercial c Use d Sales Total Subsistence Commercial c Sales Total 1961
84,466
84,466
29,026
29,026
1962
67,099
67,099
22,224
22,224 1963
85,004
85,004
24,221
24,221
1964
67,555
67,555
20,246
20,246 1965
89,268
89,268
23,763
23,763
1966
70,788
70,788
16,927
16,927 1967
104,350
104,350
20,239
20,239
1968
79,465
79,465
21,392
21,392 1969
71,688
71,688
14,756
14,756
1970
56,648
56,648
17,141
17,141 1971
86,042
86,042
19,226
19,226
1972
70,052
70,052
17,855
17,855 1973
56,981
56,981
13,859
13,859
1974
71,840
71,840
17,948
17,948 1975
44,585
44,585
11,315
11,315
1976
62,410
62,410
16,556
16,556 1977
69,915
69,915
16,722
16,722
1978 5,246
59,006
64,252
3,964
32,924
36,888 1979 2,879
75,007
77,886
4,268
41,498
45,766
1980 3,669
90,382
94,051
3,674
50,004
53,678 1981 2,282
99,506
101,788
3,580
45,781
49,361
1982 2,311
74,450
76,761
2,109
39,132
41,241 1983 6,263
95,457
101,720
9,065
43,229
52,294
1984 4,624
74,671
79,295
7,172
36,697
43,869 1985 3,071
90,011
93,082
3,468
48,365
51,833
1986 5,275
53,035
58,310
6,483
41,849
48,332 1987 7,278
76,643 0
83,921
9,866
47,458
57,324
1988 3,938
56,120 67 989 61,114
3,823
35,120 68 39,011 1989 4,565
61,570 286 794 67,215
7,147
33,166 59 40,372
1990 6,619
51,199 450 1,063 59,331
9,546
33,061 152 42,759 1991 5,925
56,332
485 62,742
7,617
39,260 113 46,990
1992 5,141
74,212
930 80,283
7,074
38,139 0 45,213 1993 10,408
49,286
1,408 61,102
11,513
37,293 164 48,970
1994 6,540
62,241
1,561 70,342
8,956
41,692 70 50,718 1995 5,960
76,106
2,078 84,144
9,037
41,458 74 50,569
1996 3,646
56,642
1,698 61,986
7,780
30,209 0 37,989 1997 7,550
66,384
2,791 76,725
9,350
39,363 20 48,733
1998 7,242
25,413
878 33,533
9,455
16,806 48 26,309 1999 6,848
37,161
1,049 45,058
10,439
27,133 156 37,728
2000 5,891
4,735
275 10,901
9,935
3,783 322 14,040 2001 7,089
0
0 7,089
13,442
0 0 13,442
2002 5,603
11,087
494 17,184
8,954
11,434 34 20,422 2003 6,332
22,709
619 29,660
9,668
14,220 61 23,949
2004 5,880
28,403
722 35,005
9,724
24,145 70 33,939 2005 5,058
16,694
310 22,062
9,156
13,413 0 22,569
2006 5,122 e 23,748
817 29,687
8,039 e 19,843 0 27,882 2007 6,059 e 18,616
792 25,467
10,553 e 13,306 57 23,916
2008 6,163
2,530
0 8,693
8,826
2,111 0 10,937 2009 4,125
90
0 4,215
6,135
226 0 6,361
2010 5,856 e 5,744
0 11,600
8,676 e 4,153 0 12,829 2005-2009 Avg 5,305
12,336
384 18,025
8,542
9,780 11 18,333
2000-2009 Avg 5,732 12,861 403 18,996 9,443 10,248 54 19,746 -continued-

147
Appendix A17.–Page 2 of 8.
District 3
Lower Yukon Area Subtotals
Personal Test Fish
Year Subsistence Commercial Total Subsistence Commercial Use d Sales Total 1961
4,368 4,368
117,860
117,860
1962
4,687 4,687
94,010
94,010 1963
7,020 7,020
116,245
116,245
1964
4,705 4,705
92,506
92,506 1965
3,204 3,204
116,235
116,235
1966
3,612 3,612
91,327
91,327 1967
3,618 3,618
128,207
128,207
1968
4,543 4,543
105,400
105,400 1969
3,595 3,595
90,039
90,039
1970
3,705 3,705
77,494
77,494 1971
3,490 3,490
108,758
108,758
1972
3,841 3,841
91,748
91,748 1973
3,204 3,204
74,044
74,044
1974
3,480 3,480
93,268
93,268 1975
4,177 4,177
60,077
60,077
1976
4,148 4,148
83,114
83,114 1977
3,965 3,965
90,602
90,602
1978 3,902
2,916 6,818
13,112 94,846
107,958 1979 3,325
5,018 8,343
10,472 121,523
131,995
1980 4,818
5,240 10,058
12,161 145,626
157,787 1981 4,011
4,023 8,034
9,873 149,310
159,183
1982 3,359
2,609 5,968
7,779 116,191
123,970 1983 4,910
4,106 9,016
20,238 142,792
163,030
1984 4,394
3,039 7,433
16,190 114,407
130,597 1985 3,342
2,588 5,930
9,881 140,964
150,845
1986 4,305
901 5,206
16,063 95,785
111,848 1987 4,708
2,039 6,747
21,852 126,140 0
147,992
1988 4,547
1,767 6,314
12,308 93,007 67 1,057 106,439 1989 4,778
1,645 6,423
16,490 96,381 286 853 114,010
1990 4,093
2,341 6,434
20,258 86,601 450 1,215 108,524 1991 3,187
2,344 5,531
16,729 97,936
598 115,263
1992 4,991
1,819 6,810
17,206 114,170
930 132,306 1993 6,592
1,501 8,093
28,513 88,080
1,572 118,165
1994 6,124
1,114 7,238
21,620 105,047
1,631 128,298 1995 5,419
- 5,419
20,416 117,564
2,152 140,132
1996 6,783
0 6,783
18,209 86,851
1,698 106,758 1997 6,311
- 6,311
23,211 105,747
2,811 131,769
1998 4,514
0 4,514
21,211 42,219
926 64,356 1999 7,715
538 8,253
25,002 64,832
1,205 91,039
2000 3,914
- 3,914
19,740 8,518
597 28,855 2001 6,361
- 6,361
26,892 0
0 26,892
2002 4,139
- 4,139
18,696 22,521
528 41,745 2003 5,002
- 5,002
21,002 36,929
680 58,611
2004 4,748
- 4,748
20,352 52,548
792 73,692 2005 5,131
- 5,131
19,345 30,107
310 49,762
2006 5,374 e 315 5,689
18,535 43,906
817 63,258 2007 4,651 e 190 4,841
21,263 32,112
849 54,224
2008 5,855
- 5,855
20,844 4,641
0 25,485 2009 2,924
- 2,924
13,184 316
0 13,500
2010 4,299 e - 4,299
18,831 9,897
0 28,728 2005-2009 Average 4,787
253 4,888
18,634 22,216
395 41,246
2000-2009 Average 4,810 253 4,860 19,985 23,160 457 43,602
-continued-

148
Appendix A17.–Page 3 of 8.
District 4
District 5
Commercial
Commercial Personal
Year Subsistence Commercial Related f Total Subsistence Commercial c Related f Use d Total 1961
1962 1963 1964 1965 1966 1967 1968 1969 1970 1971 1972 1973 1974
685 0 685
2,663 0
2,663 1975
389 0 389
2,872 0
2,872
1976
409 0 409
3,151 0
3,151 1977
985 0 985
4,162 0
4,162
1978 5,549
608 0 6,157
10,405
3,079 0
13,484 1979 7,203
1,989 0 9,192
11,997
3,389 0
15,386
1980 11,053
1,521 0 12,574
17,684
4,891 0
22,575 1981 4,432
1,347 0 5,779
13,300
6,374 0
19,674
1982 5,077
1,087 0 6,164
12,859
5,385 0
18,244 1983 9,754
601 0 10,355
16,780
3,606 0
20,386
1984 7,650
961 0 8,611
14,989
3,669 0
18,658 1985 7,425
664 0 8,089
15,090
3,418 0
18,508
1986 9,530
502 0 10,032
15,944
2,733 0
18,677 1987 7,914
1,524 0 9,438
17,556
3,758 0 1,706 23,020
1988 9,515
3,159 0 12,674
17,200
3,436 0 1,435 22,071 1989 9,074
2,790 0 11,864
20,336
3,286 0 1,877 25,499
1990 11,122
3,536 2 14,660
14,589
3,353 12 1,693 19,647 1991 11,100
2,446 1,136 14,682
16,429
3,810 16
20,255
1992 8,291
1,651 743 10,685
17,691
3,852 3
21,546 1993 10,936
1,349 228 12,513
21,365
3,008 0
24,373
1994 10,327
2,216 227 12,770
18,760
3,739 5
22,504 1995 9,474
262 237 9,973
16,866
3,242 0
20,108
1996 8,193
45 92 8,330
15,727
2,497 260
18,484 1997 12,006
1,450 7 13,463
18,049
3,678 0
21,727
1998 15,801
- - 15,801
14,802
517 0
15,319 1999 11,238
1,437 0 12,675
14,330
2,604 0
16,934
2000 6,264
- - 6,264
8,854
- -
8,854 2001 10,152
- - 10,152
13,566
- -
13,566
2002 9,456
- - 9,456
13,401
771 0
14,172 2003 12,771
562 0 13,333
19,191
1,134 0
20,325
2004 16,269
0 - 16,269
15,666
1,546 0
17,212 2005 13,964
0 - 13,964
17,424
1,469 0
18,893
2006 12,022 e - - 12,022
15,924 e 1,839 0
17,763 2007 11,831 e - - 11,831
19,147 e 1,241 0
20,388
2008 10,619
- - 10,619
11,626
- -
11,626 2009 9,514
- - 9,514
8,917
- -
8,917
2010 12,888 e - - 12,888
10,397 e - -
10,397 2005-2009 Average 11,590
0 - 11,590
14,608
1,516 0
15,517
2000-2009 Average 11,286 187 0 11,342 14,372 1,333 0 15,172
-continued-
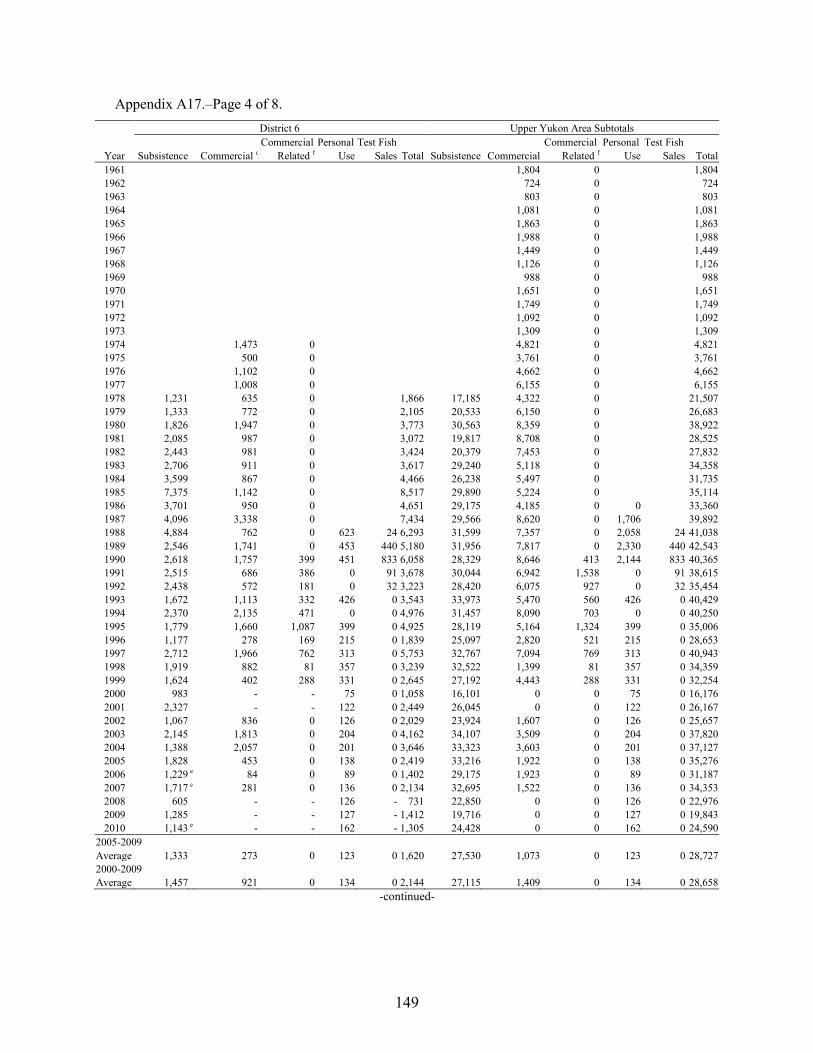
149
Appendix A17.–Page 4 of 8.
District 6 Upper Yukon Area Subtotals
Commercial Personal Test Fish
Commercial Personal Test Fish
Year Subsistence Commercial c Related f Use Sales Total Subsistence Commercial Related f Use Sales Total 1961
1,804 0
1,804
1962
724 0
724 1963
803 0
803
1964
1,081 0
1,081 1965
1,863 0
1,863
1966
1,988 0
1,988 1967
1,449 0
1,449
1968
1,126 0
1,126 1969
988 0
988
1970
1,651 0
1,651 1971
1,749 0
1,749
1972
1,092 0
1,092 1973
1,309 0
1,309
1974
1,473 0
4,821 0
4,821 1975
500 0
3,761 0
3,761
1976
1,102 0
4,662 0
4,662 1977
1,008 0
6,155 0
6,155
1978 1,231
635 0
1,866 17,185 4,322 0
21,507 1979 1,333
772 0
2,105 20,533 6,150 0
26,683
1980 1,826
1,947 0
3,773 30,563 8,359 0
38,922 1981 2,085
987 0
3,072 19,817 8,708 0
28,525
1982 2,443
981 0
3,424 20,379 7,453 0
27,832 1983 2,706
911 0
3,617 29,240 5,118 0
34,358
1984 3,599
867 0
4,466 26,238 5,497 0
31,735 1985 7,375
1,142 0
8,517 29,890 5,224 0
35,114
1986 3,701
950 0
4,651 29,175 4,185 0 0
33,360 1987 4,096
3,338 0
7,434 29,566 8,620 0 1,706
39,892
1988 4,884
762 0 623 24 6,293 31,599 7,357 0 2,058 24 41,038 1989 2,546
1,741 0 453 440 5,180 31,956 7,817 0 2,330 440 42,543
1990 2,618
1,757 399 451 833 6,058 28,329 8,646 413 2,144 833 40,365 1991 2,515
686 386 0 91 3,678 30,044 6,942 1,538 0 91 38,615
1992 2,438
572 181 0 32 3,223 28,420 6,075 927 0 32 35,454 1993 1,672
1,113 332 426 0 3,543 33,973 5,470 560 426 0 40,429
1994 2,370
2,135 471 0 0 4,976 31,457 8,090 703 0 0 40,250 1995 1,779
1,660 1,087 399 0 4,925 28,119 5,164 1,324 399 0 35,006
1996 1,177
278 169 215 0 1,839 25,097 2,820 521 215 0 28,653 1997 2,712
1,966 762 313 0 5,753 32,767 7,094 769 313 0 40,943
1998 1,919
882 81 357 0 3,239 32,522 1,399 81 357 0 34,359 1999 1,624
402 288 331 0 2,645 27,192 4,443 288 331 0 32,254
2000 983
- - 75 0 1,058 16,101 0 0 75 0 16,176 2001 2,327
- - 122 0 2,449 26,045 0 0 122 0 26,167
2002 1,067
836 0 126 0 2,029 23,924 1,607 0 126 0 25,657 2003 2,145
1,813 0 204 0 4,162 34,107 3,509 0 204 0 37,820
2004 1,388
2,057 0 201 0 3,646 33,323 3,603 0 201 0 37,127 2005 1,828
453 0 138 0 2,419 33,216 1,922 0 138 0 35,276
2006 1,229 e 84 0 89 0 1,402 29,175 1,923 0 89 0 31,187 2007 1,717 e 281 0 136 0 2,134 32,695 1,522 0 136 0 34,353 2008 605
- - 126 - 731 22,850 0 0 126 0 22,976
2009 1,285
- - 127 - 1,412 19,716 0 0 127 0 19,843 2010 1,143 e - - 162 - 1,305 24,428 0 0 162 0 24,590
2005-2009 Average 1,333
273 0 123 0 1,620 27,530 1,073 0 123 0 28,727
2000-2009 Average 1,457 921 0 134 0 2,144 27,115 1,409 0 134 0 28,658
-continued-

150
Appendix A17.–Page 5 of 8.
Alaska Yukon River Totals
Commercial Personal Test Fish Sport
Year Subsistence Commercial Related f Use Sales Fish g Total 1961 21,488 119,664 0
141,152
1962 11,110 94,734 0
105,844 1963 24,862 117,048 0
141,910
1964 16,231 93,587 0
109,818 1965 16,608 118,098 0
134,706
1966 11,572 93,315 0
104,887 1967 16,448 129,656 0
146,104
1968 12,106 106,526 0
118,632 1969 14,000 91,027 0
105,027
1970 13,874 79,145 0
93,019 1971 25,684 110,507 0
136,191
1972 20,258 92,840 0
113,098 1973 24,317 75,353 0
99,670
1974 19,964 98,089 0
118,053 1975 12,867 63,838 0
76,705
1976 17,806 87,776 0
105,582 1977 17,581 96,757 0
156
114,494
1978 30,297 99,168 0
523
129,988 1979 31,005 127,673 0
554
159,232
1980 42,724 153,985 0
956
197,665 1981 29,690 158,018 0
769
188,477
1982 28,158 123,644 0
1,006
152,808 1983 49,478 147,910 0
1,048
198,436
1984 42,428 119,904 0
351
162,683 1985 39,771 146,188 0
1,368
187,327
1986 45,238 99,970 0
796
146,004 1987 51,418 134,760 0 1,706
502
188,386
1988 43,907 100,364 0 2,125 1,081 944
148,421 1989 48,446 104,198 0 2,616 1,293 1,063
157,616
1990 48,587 95,247 413 2,594 2,048 544
149,433 1991 46,773 104,878 1,538 0 689 773
154,651
1992 45,626 120,245 927 0 962 431
168,191 1993 62,486 93,550 560 426 1,572 1,695
160,289
1994 53,077 113,137 703 0 1,631 2,281
170,829 1995 48,535 122,728 1,324 399 2,152 2,525
177,663
1996 43,306 89,671 521 215 1,698 3,873
139,284 1997 55,978 112,841 769 313 2,811 2,174
174,886
1998 53,733 43,618 81 357 926 654
99,369 1999 52,194 69,275 288 331 1,205 1,023
124,316
2000 35,841 8,518 0 75 597 276
45,307 2001 52,937 0 0 122 0 679
53,738
2002 42,620 24,128 0 126 528 486
67,888 2003 55,109 40,438 0 204 680 2,719
99,150
2004 53,675 56,151 0 201 792 1,513
112,332 2005 52,561 32,029 0 138 310 483
85,521
2006 47,710 45,829 0 89 817 739
95,184 2007 53,958 33,634 0 136 849 960
89,537
2008 43,694 4,641 0 126 0 409
48,870 2009 32,900 316 0 127 0 863
34,206
2010 43,259 9,897 0 162 0 474
53,792 2005-2009 Average 46,165 23,290 0 123 395 691
70,664
2000-2009 Average 47,101 24,568 0 134 457 913 73,173
-continued-

151
Appendix A17.–Page 6 of 8. Canada: Yukon Territories Totals Mainstem Yukon
Non-Commercial
Porcupine Total
Year Domestic Aboriginal Sport h Test fish i Commercial Subtotal Aboriginal Canadian 1961
9,300
3,446 12,746 500 13,246
1962
9,300
4,037 13,337 600 13,937 1963
7,750
2,283 10,033 44 10,077
1964
4,124
3,208 7,332 76 7,408 1965
3,021
2,265 5,286 94 5,380
1966
2,445
1,942 4,387 65 4,452 1967
2,920
2,187 5,107 43 5,150
1968
2,800
2,212 5,012 30 5,042 1969
957
1,640 2,597 27 2,624
1970
2,044
2,611 4,655 8 4,663 1971
3,260
3,178 6,438 9 6,447
1972
3,960
1,769 5,729
5,729 1973
2,319
2,199 4,518 4 4,522
1974 406 3,342
1,808 5,556 75 5,631 1975 400 2,500
3,000 5,900 100 6,000
1976 500 1,000
3,500 5,000 25 5,025 1977 531 2,247
4,720 7,498 29 7,527
1978 421 2,485
2,975 5,881
5,881 1979 1,200 3,000
6,175 10,375
10,375
1980 3,500 7,546 300
9,500 20,846 2,000 22,846 1981 237 8,879 300
8,593 18,009 100 18,109
1982 435 7,433 300
8,640 16,808 400 17,208 1983 400 5,025 300
13,027 18,752 200 18,952
1984 260 5,850 300
9,885 16,295 500 16,795 1985 478 5,800 300
12,573 19,151 150 19,301
1986 342 8,625 300
10,797 20,064 300 20,364 1987 330 6,069 300
10,864 17,563 51 17,614
1988 282 7,178 650
13,217 21,327 100 21,427 1989 400 6,930 300
9,789 17,419 525 17,944
1990 247 7,109 300
11,324 18,980 247 19,227 1991 227 9,011 300
10,906 20,444 163 20,607
1992 277 6,349 300
10,877 17,803 100 17,903 1993 243 5,576 300
10,350 16,469 142 16,611
1994 373 8,069 300
12,028 20,770 428 21,198 1995 300 7,942 700
11,146 20,088 796 20,884
1996 141 8,451 790
10,164 19,546 66 19,612 1997 288 8,888 1,230
5,311 15,717 811 16,528
1998 24 4,687 - 737 390 5,838 99 5,937 1999 213 8,804 177 - 3,160 12,354 114 12,468 2000 - 4,068 - 761 - 4,829 50 4,879 2001 89 7,421 146 767 1,351 9,774 370 10,144 2002 59 7,138 128 1,036 708 9,069 188 9,257 2003 115 6,121 275 263 2,672 9,446 173 9,619 2004 88 6,483 423 167 3,785 10,946 292 11,238 2005 99 6,376 436 - 4,066 10,977 394 11,371 2006 63 5,757 606 - 2,332 8,758 314 9,072 2007 - 4,175 2 617 - 4,794 300 5,094 2008 - 2,885 - 513 1 3,399 27 3,426 2009 17 3,791 125 - 364 4,297 461 4,758 2010 - 2,455 1 - - 2,456 191 2,647
2005-2009 Average 60 4,597 292 565 1,691 6,445 299 6,744 2000-2009
Average 76 5,422 268 589 1,910 7,629 257 7,886 -continued-

152
Appendix A17.–Page 7 of 8. Yukon River Drainage (Alaska/Canada) Totals a Total Alaska Yukon Area
Commercial Personal Alaska Sport
Coastal
Alaska Yukon Area
Year Subsistence j Commercial Related f Use Test Fish Fish Total
District Total Total 1961 31,288 123,110
154,398
141,152 154,398
1962 21,010 98,771
119,781
105,844 119,781 1963 32,656 119,331
151,987
141,910 151,987
1964 20,431 96,795
117,226
109,818 117,226 1965 19,723 120,363
140,086
134,706 140,086
1966 14,082 95,257
109,339
104,887 109,339 1967 19,411 131,843
151,254
146,104 151,254
1968 14,936 108,738
123,674
118,632 123,674 1969 14,984 92,667
107,651
105,027 107,651
1970 15,926 81,756
97,682
93,019 97,682 1971 28,953 113,685
142,638
136,191 142,638
1972 24,218 94,609
118,827
113,098 118,827 1973 26,640 77,552
104,192
99,670 104,192
1974 23,787 99,897
123,684
118,053 123,684 1975 15,867 66,838
82,705
76,705 82,705
1976 19,331 91,276
110,607
105,582 110,607 1977 20,388 101,477
156 122,021
114,494 122,021
1978 33,203 102,143
523 135,869
488
129,988 136,357 1979 35,205 133,848
554 169,607
159,232 169,607
1980 55,770 163,485
1,256 220,511
197,665 220,511 1981 38,906 166,611
1,069 206,586
188,477 206,586
1982 36,426 132,284
1,306 170,016
152,808 170,016 1983 55,103 160,937
1,348 217,388
198,436 217,388
1984 49,038 129,789
651 179,478
162,683 179,478 1985 46,199 158,761
1,668 206,628
187,327 206,628
1986 54,505 110,767
1,096 166,368
146,004 166,368 1987 57,868 145,624
1,706
802 206,000
3,621
188,386 209,621
1988 51,467 113,581
2,125 1,081 1,594 169,848
1,588
148,421 171,436 1989 56,301 113,987
2,616 1,293 1,363 175,560
16
157,616 175,576
1990 56,190 106,571 413 2,594 2,048 844 168,660
149,433 168,660 1991 56,174 115,784 1,538 0 689 1,073 175,258
154,651 175,258
1992 52,352 131,122 927 0 962 731 186,094
1,451
168,191 187,545 1993 68,447 103,900 560 426 1,572 1,995 176,900
1,429
160,289 178,329
1994 61,947 125,165 703 0 1,631 2,581 192,027
825
170,829 192,852 1995 57,573 133,874 1,324 399 2,152 3,225 198,547
2,085
177,663 200,632
1996 51,964 99,835 521 215 1,698 4,663 158,896
2,365
139,284 161,261 1997 65,965 118,152 769 313 2,811 3,404 191,414
1,139
174,886 192,553
1998 59,280 44,008 81 357 926 654 105,306
391
99,369 105,697 1999 61,325 72,435 288 331 1,205 1,200 136,784
1,111
124,316 137,895
2000 40,720 8,518 0 75 597 276 50,186
563
45,307 50,749 2001 61,584 1,351 0 122 0 825 63,882
2,882
53,738 66,764
2002 51,041 24,836 0 126 528 614 77,145
1,122
67,888 78,267 2003 61,781 43,110 0 204 680 2,994 108,769
1,850
99,150 110,619
2004 60,705 59,936 0 201 792 1,936 123,570
2,038
112,332 125,608 2005 59,430 36,095 0 138 310 919 96,892
848
85,521 97,740
2006 53,844 48,161 0 89 817 1,345 104,256
883 e 95,184 105,139 2007 59,050 33,634 0 136 849 962 94,631
1,198 e 89,537 95,829
2008 47,119 4,642 0 126 0 409 52,296
1,492
48,870 53,788 2009 37,169 680 0 127 0 988 38,964
905
34,206 39,869
2010 45,905 9,897 0 162 0 475 56,439
1,300 e 53,792 57,739 2005-2009 Avg 51,322 24,642 0 123 395 925 77,408
1,065
70,664 78,473
2000-2009 Avg 53,244 26,096 0 134 457 1,127 81,059 1,378 73,173 82,437 -continued-

153
Appendix A17.–Page 8 of 8. Note: Unless otherwise indicate blank cells indicate years in which no information was collected or harvest numbers were insufficient to generate
summary information. Dashes indicate no commercial fishing activity occurred. a Subsistence harvest estimates not available by district until 1978. b Does not include coastal subsistence harvest in Hooper Bay and Scammon Bay. c Includes ADF&G test fish sales prior to 1988 and estimates of illegal sales. d Prior to 1987 and in 1991, 1992, and 1994, personal use was considered part of subsistence. Between 1987 and 1990, personal use fishing
was defined by the fisherman's location of residence versus fishing location. In 1992, the Fairbanks nonsubsistence area was created as the only personal use area in the Yukon River drainage.
e Preliminary. f Commercial related refers to the estimated harvest of female Chinook salmon to produce roe sold. g Estimated sport fish harvest for Alaska portion of the Yukon River drainage. The majority of sport fish harvest occurs in the Tanana River
drainage (District 6). h Canadian sport fish harvest unknown prior to 1980. i Canadian Chinook test fishery is conducted for management purposes, the fish harvested are retained and given to Aboriginal or domestic
users, but are not reported under those categories. j Includes Alaska subsistence harvest and Canadian domestic, test fish and Aboriginal harvests.
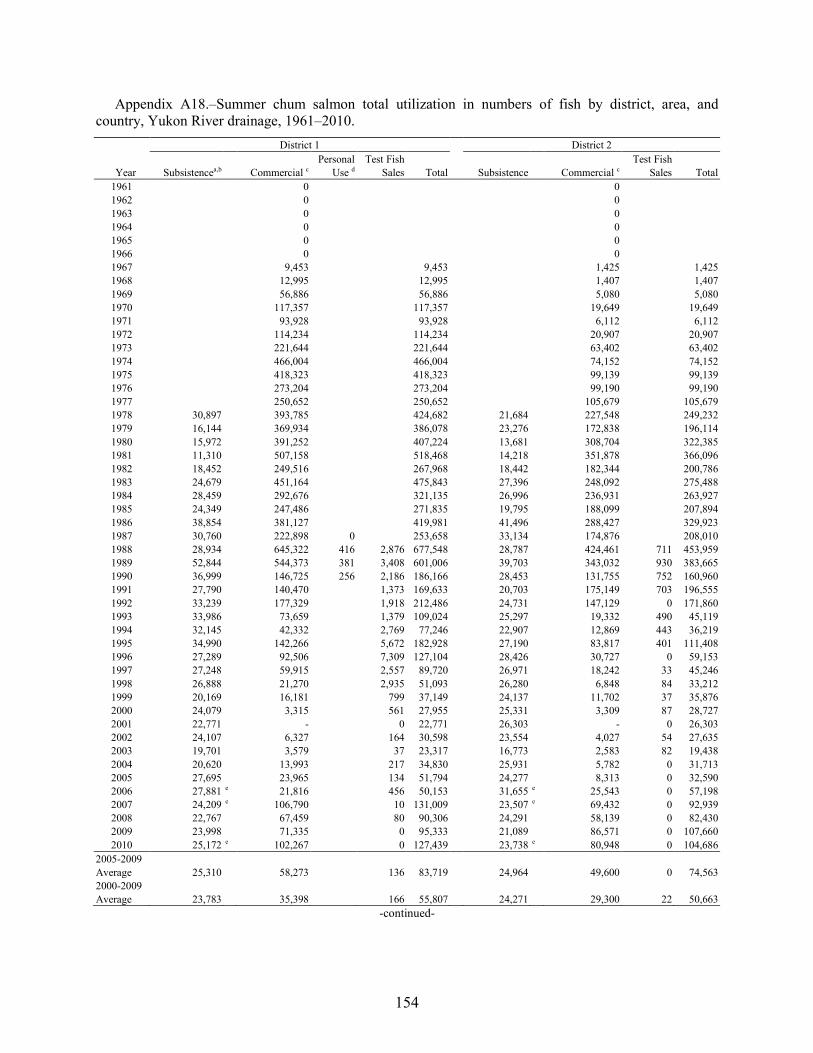
154
Appendix A18.–Summer chum salmon total utilization in numbers of fish by district, area, and country, Yukon River drainage, 1961–2010. District 1 District 2
Personal Test Fish
Test Fish
Year Subsistencea,b Commercial c Use d Sales Total Subsistence Commercial c Sales Total 1961
0
0
1962
0
0 1963
0
0
1964
0
0 1965
0
0
1966
0
0 1967
9,453
9,453
1,425
1,425
1968
12,995
12,995
1,407
1,407 1969
56,886
56,886
5,080
5,080
1970
117,357
117,357
19,649
19,649 1971
93,928
93,928
6,112
6,112
1972
114,234
114,234
20,907
20,907 1973
221,644
221,644
63,402
63,402
1974
466,004
466,004
74,152
74,152 1975
418,323
418,323
99,139
99,139
1976
273,204
273,204
99,190
99,190 1977
250,652
250,652
105,679
105,679
1978 30,897
393,785
424,682
21,684
227,548
249,232 1979 16,144
369,934
386,078
23,276
172,838
196,114
1980 15,972
391,252
407,224
13,681
308,704
322,385 1981 11,310
507,158
518,468
14,218
351,878
366,096
1982 18,452
249,516
267,968
18,442
182,344
200,786 1983 24,679
451,164
475,843
27,396
248,092
275,488
1984 28,459
292,676
321,135
26,996
236,931
263,927 1985 24,349
247,486
271,835
19,795
188,099
207,894
1986 38,854
381,127
419,981
41,496
288,427
329,923 1987 30,760
222,898 0
253,658
33,134
174,876
208,010
1988 28,934
645,322 416 2,876 677,548
28,787
424,461 711 453,959 1989 52,844
544,373 381 3,408 601,006
39,703
343,032 930 383,665
1990 36,999
146,725 256 2,186 186,166
28,453
131,755 752 160,960 1991 27,790
140,470
1,373 169,633
20,703
175,149 703 196,555
1992 33,239
177,329
1,918 212,486
24,731
147,129 0 171,860 1993 33,986
73,659
1,379 109,024
25,297
19,332 490 45,119
1994 32,145
42,332
2,769 77,246
22,907
12,869 443 36,219 1995 34,990
142,266
5,672 182,928
27,190
83,817 401 111,408
1996 27,289
92,506
7,309 127,104
28,426
30,727 0 59,153 1997 27,248
59,915
2,557 89,720
26,971
18,242 33 45,246
1998 26,888
21,270
2,935 51,093
26,280
6,848 84 33,212 1999 20,169
16,181
799 37,149
24,137
11,702 37 35,876
2000 24,079
3,315
561 27,955
25,331
3,309 87 28,727 2001 22,771
-
0 22,771
26,303
- 0 26,303
2002 24,107
6,327
164 30,598
23,554
4,027 54 27,635 2003 19,701
3,579
37 23,317
16,773
2,583 82 19,438
2004 20,620
13,993
217 34,830
25,931
5,782 0 31,713 2005 27,695
23,965
134 51,794
24,277
8,313 0 32,590
2006 27,881 e 21,816
456 50,153
31,655 e 25,543 0 57,198 2007 24,209 e 106,790
10 131,009
23,507 e 69,432 0 92,939
2008 22,767
67,459
80 90,306
24,291
58,139 0 82,430 2009 23,998
71,335
0 95,333
21,089
86,571 0 107,660
2010 25,172 e 102,267
0 127,439
23,738 e 80,948 0 104,686 2005-2009 Average 25,310
58,273
136 83,719
24,964
49,600 0 74,563
2000-2009 Average 23,783 35,398 166 55,807 24,271 29,300 22 50,663
-continued-

155
Appendix A18.–Page 2 of 6. District 3 Lower Yukon Area Subtotals
Personal Test Fish
Year Subsistence Commercial Total Subsistence Commercial c Use d Sales Total 1961
0
0
1962
0
0 1963
0
0
1964
0
0 1965
0
0
1966
0
0 1967
57 57
10,935
10,935
1968
68 68
14,470
14,470 1969
0 0
61,966
61,966
1970
0 0
137,006
137,006 1971
50 50
100,090
100,090
1972
527 527
135,668
135,668 1973
463 463
285,509
285,509
1974
1,721 1,721
541,877
541,877 1975
0 0
517,462
517,462
1976
9,802 9,802
382,196
382,196 1977
3,412 3,412
359,743
359,743
1978 1,706
27,003 28,709
54,287 648,336
702,623 1979 9,531
40,015 49,546
48,951 582,787
631,738
1980 5,727
44,782 50,509
35,380 744,738
780,118 1981 7,430
54,471 61,901
32,958 913,507
946,465
1982 5,840
4,086 9,926
42,734 435,946
478,680 1983 4,609
14,600 19,209
56,684 713,856
770,540
1984 7,351
1,087 8,438
62,806 530,694
593,500 1985 3,687
1,792 5,479
47,831 437,377
485,208
1986 12,238
442 12,680
92,588 669,996
762,584 1987 12,176
3,501 15,677
76,070 401,275 0
477,345
1988 14,609
13,965 28,574
72,330 1,083,748 416 3,587 1,160,081 1989 12,824
7,578 20,402
105,371 894,983 381 4,338 1,005,073
1990 9,521
643 10,164
74,973 279,123 256 2,938 357,290 1991 5,545
8,912 14,457
54,038 324,531
2,076 380,645
1992 9,599
65 9,664
67,569 324,523
1,918 394,010 1993 7,538
463 8,001
66,821 93,454
1,869 162,144
1994 8,492
35 8,527
63,544 55,236
3,212 121,992 1995 12,143
0 12,143
74,323 226,083
6,073 306,479
1996 11,368
1,534 12,902
67,083 124,767
7,309 199,159 1997 10,316
0 10,316
64,535 78,157
2,590 145,282
1998 6,472
0 6,472
59,640 28,118
3,019 90,777 1999 5,748
0 5,748
50,054 27,883
836 78,773
2000 3,687
0 3,687
53,097 6,624
648 60,369 2001 1,309
- 1,309
50,383 -
0 50,383
2002 2,506
0 2,506
50,167 10,354
218 60,739 2003 5,858
0 5,858
42,332 6,162
119 48,613
2004 2,958
0 2,958
49,509 19,775
217 69,501 2005 5,766
0 5,766
57,738 32,278
134 90,150
2006 3,534 e 116 3,650
63,070 47,475
456 111,001 2007 2,056 e 1 2,057
49,772 176,223
10 226,005
2008 2,971
- 2,971
50,029 125,598
80 175,707 2009 1,146
- 1,146
46,233 157,906
0 204,139
2010 1,341 e - 1,341
50,251 183,215
0 233,466 2005-2009 Average 3,095
39 3,118
53,368 107,896
136 161,400
2000-2009 Average 3,179 17 3,191 51,233 64,711 188 109,661
-continued-

156
Appendix A18.–Page 3 of 6. District 4 District 5
Commercial Anvik
Commercial Personal
Year Subsistence f Commercial Related g River h Total Subsistence f Commercial Related g Use d Total 1961
0 0
0 0
1962
0 0
0 0 1963
0 0
0 0
1964
0 0
0 0 1965
0 0
0 0
1966
0 0
0 0 1967
0 0
0 0
1968
0 0
0 0 1969
0 0
0 0
1970
0 0
0 0 1971
0 0
0 0
1972
0 0
0 0 1973
0 0
0 0
1974
27,866 0
27,866
6,831 0
6,831 1975
165,054 0
165,054
12,997 0
12,997
1976
211,307 0
211,307
774 0
774 1977
169,541 0
169,541
1,274 0
1,274
1978 93,139
364,184 16,920
474,243
20,423
4,892 605
25,920 1979 81,838
169,430 35,317
286,585
22,869
8,608 1,009
32,486
1980 117,305
147,560 135,824
400,689
8,594
456 0
9,050 1981 48,452
59,718 270,727
378,897
27,259
1,236 49
28,544
1982 57,967
3,647 254,072
315,686
9,770
213 21
10,004 1983 46,713
6,672 248,716
302,101
22,087
42 1,856
23,985
1984 49,230
1,009 277,061
327,300
31,488
645 47
32,180 1985 59,839
12,007 415,476
487,322
26,996
700 0
27,696
1986 53,020
300 465,235
518,555
21,833
690 0 0 22,523 1987 48,911
29,991 179,809
258,711
20,544
362 44 4,262 25,212
1988 86,623
24,051 466,023
576,697
28,960
722 363 567 30,612 1989 40,935
18,554 491,690
551,179
12,981
154 373 295 13,803
1990 26,534
12,364 210,186
249,084
9,817
11 660 641 11,129 1991 35,269
6,381 303,263
344,913
24,164
4 31
24,199
1992 35,812
2,659 208,737
247,208
12,612
102 328
13,042 1993 20,076
27 42,930
63,033
11,086
0 0
11,086
1994 27,504
3,611 145,423 22,573 199,111
11,830
229 235
12,294 1995 25,084
8,873 490,970 54,744 579,671
7,655
107 209
7,971
1996 16,425
0 425,607 84,633 526,665
11,509
0 336
11,845 1997 24,230
2,062 109,061 13,548 148,901
4,520
137 0
4,657
1998 18,046
0 0 0 18,046
2,314
96 14
2,424 1999 15,339
1,267 0 0 16,606
2,276
115 0
2,391
2000 7,046
0 0 0 7,046
3,641
0 0
3,641 2001 4,588
- 0 0 4,588
2,856
- 0
2,856
2002 15,971
0 0 0 15,971
5,610
6 0
5,616 2003 17,513
62 0 0 17,575
5,545
0 0
5,545
2004 14,959
0 0 0 14,959
3,411
25 0
3,436 2005 12,350
0 0 0 12,350
6,800
0 0
6,800
2006 14,997 e - - - -
11,845 e 20 0
11,865 2007 16,256 e 7,304 0 0 23,560
8,846 e 0 0
8,846
2008 13,517
23,746 0 0 37,263
3,537
- -
3,537 2009 14,958
4,589 0 0 19,547
5,298
- -
5,298
2010 11,720 e 44,207 0 0 55,927
3,555 e - -
3,555 2005-2009 Average 14,416
8,910 0 0 23,180
7,265
7 0
7,269
2000-2009 Average 13,216 4,463 0 0 16,984 5,739 7 0 5,744
-continued-

157
Appendix A18.–Page 4 of 6. District 6 Upper Yukon Area Subtotals
Commercial Personal Test Fish
Commercial Personal Test Fish
Year Subsistence f Commercial Related g Use Sales Total Subsistence Commercial Related Use d Sales Total 1961
0 0
0 0
1962
0 0
0 0 1963
0 0
0 0
1964
0 0
0 0 1965
0 0
0 0
1966
0 0
0 0 1967
0 0
0 0
1968
0 0
0 0 1969
0 0
0 0
1970
0 0
0 0 1971
0 0
0 0
1972
0 0
0 0
0 1973
0 0
0 0
0
1974
13,318 0
13,318
48,015 0
48,015 1975
14,782 0
14,782
192,833 0
192,833
1976
6,617 0
6,617
218,698 0
218,698 1977
4,317 0
4,317
175,132 0
175,132
1978 3,534
34,814 8,236
46,584
117,096 403,890 25,761
546,747 1979 2,312
18,491 3,891
24,694
107,019 196,529 40,217
343,765
1980 6,426
35,855 3,282
45,563
132,325 183,871 139,106
455,302 1981 8,960
32,477 1,987
43,424
84,671 93,431 272,763
450,865
1982 6,942
21,597 1,517
30,056
74,679 25,457 255,610
355,746 1983 23,696
24,309 18
48,023
92,496 31,023 250,590
374,109
1984 23,106
56,249 335
79,690
103,824 57,903 277,443
439,170 1985 23,078
66,913 1,540
91,531
109,913 79,620 417,016
606,549
1986 14,896
50,483 2,146
67,525
89,749 51,473 467,381
608,603 1987 25,153
10,610 450
36,213
94,608 40,963 180,303 4,262
320,136
1988 8,686
40,129 1,646 1,242 0 51,703
124,269 64,902 468,032 1,809 659,012
1989 7,868
42,115 4,871 1,215 6,267 62,336
61,784 60,823 496,934 1,510 6,267 627,318 1990 4,285
11,127 3,706 930 5,325 25,373
40,636 23,502 214,552 1,571 5,325 285,586
1991 5,069
18,197 5,695 - 1,858 30,819
64,502 24,582 308,989 0 1,858 399,931 1992 9,504
5,029 2,199 - 49 16,781
57,928 7,790 211,264 0 49 277,031
1993 6,793
3,041 664 674 0 11,172
37,955 3,068 43,594 674 0 85,291 1994 7,026
21,208 10,226 - 0 38,460
46,360 25,048 178,457 0 0 249,865
1995 11,661
24,711 12,717 780 0 49,869
44,400 33,691 558,640 780 0 637,511 1996 7,486
22,360 24,530 905 0 55,281
35,420 22,360 535,106 905 0 593,791
1997 3,824
14,886 10,401 391 0 29,502
32,574 17,085 133,010 391 0 183,060 1998 6,004
397 173 84 0 6,658
26,364 493 187 84 0 27,128
1999 2,654
124 24 382 0 3,184
20,269 1,506 24 382 0 22,181 2000 1,111
0 0 30 0 1,141
11,798 0 0 30 0 11,828
2001 412
- 0 146 0 558
7,856 - 0 146 0 8,002 2002 512
3,198 19 175 0 3,904
22,093 3,204 19 175 0 25,491
2003 2,914
4,461 0 148 0 7,523
25,972 4,523 0 148 0 30,643 2004 1,793
6,610 0 231 0 8,634
20,163 6,635 0 231 0 27,029
2005 2,014
8,986 0 152 0 11,152
21,164 8,986 0 152 0 30,302 2006 1,010 e 44,621 0 262 0 45,893
27,852 44,641 0 262 0 57,758
2007 1,896 e 14,674 0 184 0 16,754
26,998 21,978 0 184 0 49,160 2008 1,311
1,842 0 138 0 3,291
18,365 25,588 0 138 0 44,091
2009 1,253
7,777 0 308 0 9,338
21,509 12,366 0 308 0 34,183 2010 422 e 5,466 0 319 0 6,207
15,697 49,673 0 319 0 65,689
2005-2009 Average 1,497
15,580 0 209 0 17,286
23,178 22,712 0 209 0 43,099
2000-2009 Average 1,423 10,241 2 177 0 10,819 20,377 14,213 2 177 0 31,849
-continued-

158
Appendix A18.–Page 5 of 6. Alaska Yukon River Totals Total Alaska Yukon Area
Commercial Personal Alaska Sport
Coastal
Yukon Area
Year Subsistence Commercial Related Use Test Fish Fish i Total District Total 1961 305,317
0 0
305,317
305,317
1962 261,856
0 0
261,856
261,856 1963 297,094
0 0
297,094
297,094
1964 361,080
0 0
361,080
361,080 1965 336,848
0 0
336,848
336,848
1966 154,508
0 0
154,508
154,508 1967 206,233
10,935 0
217,168
217,168
1968 133,880
14,470 0
148,350
148,350 1969 156,191
61,966 0
218,157
218,157
1970 166,504
137,006 0
303,510
303,510 1971 171,487
100,090 0
271,577
271,577
1972 108,006
135,668 0
243,674
243,674 1973 161,012
285,509 0
446,521
446,521
1974 227,811
589,892 0
817,703
817,703 1975 211,888
710,295 0
922,183
922,183
1976 186,872
600,894 0
787,766
787,766 1977 159,502
534,875 0
316
694,693
694,693
1978 171,383
1,052,226 25,761
451
1,249,821
16,809
1,266,630 1979 155,970
779,316 40,217
328
975,831
975,831
1980 167,705
928,609 139,106
483
1,235,903
1,235,903 1981 117,629
1,006,938 272,763
612
1,397,942
1,397,942
1982 117,413
461,403 255,610
780
835,206
835,206 1983 149,180
744,879 250,590
998
1,145,647
1,145,647
1984 166,630
588,597 277,443
585
1,033,255
1,033,255 1985 157,744
516,997 417,016
1,267
1,093,024
1,093,024
1986 182,337
721,469 467,381 0
895
1,372,082
1,372,082 1987 170,678
442,238 180,303 4,262
846
798,327
29,668
827,995
1988 196,599
1,148,650 468,032 2,225 3,587 1,037
1,820,130
31,230
1,851,360 1989 167,155
955,806 496,934 1,891 10,605 2,132
1,634,523
2,341
1,636,864
1990 115,609
302,625 214,552 1,827 8,263 472
643,348
643,348 1991 118,540
349,113 308,989 0 3,934 1,037
781,613
781,613
1992 125,497
332,313 211,264 0 1,967 1,308
672,349
16,695
689,044 1993 104,776
96,522 43,594 674 1,869 564
247,999
20,798
268,797
1994 109,904
80,284 178,457 0 3,212 350
372,207
14,903
387,110 1995 118,723
259,774 558,640 780 6,073 1,174
945,164
17,360
962,524
1996 102,503
147,127 535,106 905 7,309 1,946
794,896
22,235
817,131 1997 97,109
95,242 133,010 391 2,590 662
329,004
15,711
344,715
1998 86,004
28,611 187 84 3,019 421
118,326
1,362
119,688 1999 70,323
29,389 24 382 836 555
101,509
13,461
114,970
2000 64,895
6,624 0 30 648 161
72,358
13,177
85,535 2001 58,239
- 0 146 0 82
58,467
13,916
72,383
2002 72,260
13,558 19 175 218 384
86,614
14,796
101,410 2003 68,304
10,685 0 148 119 1,638
80,894
13,968
94,862
2004 69,672
26,410 0 231 217 203
96,733
8,262
104,995 2005 78,902
41,264 0 152 134 435
120,887
14,357
135,244
2006 90,922 e 92,116 0 262 456 583
184,339
24,171 e 208,510 2007 76,770 e 198,201 0 184 10 245
275,410
16,121 e 291,531
2008 68,394
151,186 0 138 80 371
220,169
18,120
238,289 2009 67,742
170,272 0 308 0 174
238,496
12,797
251,293
2010 65,948 e 232,888 0 355 0 1,183
300,374
22,425 e 322,799 2005-2009 Average 76,546
130,608 0 209 136 362
207,860
17,113
224,973
2000-2009 Average 71,610 78,924 2 177 188 428 143,437 14,969 158,405
-continued-

159
Appendix A18.–Page 6 of 6. Note: Unless otherwise indicate blank cells indicate years in which no information was collected or harvest numbers were insufficient to generate
summary information. Dashes indicate no commercial fishing activity occurred. a Subsistence harvest estimates not available by district until 1978. Harvests prior to 1977 were estimated because catches of salmon other than
Chinook salmon were not differentiated by species. b Does not include coastal subsistence harvest in Hooper Bay and Scammon Bay. c Includes ADF&G test fish sales prior to 1988 and estimates of illegal sales. d Prior to 1987 and in 1991, 1992, and 1994, personal use was considered part of subsistence. Between 1987 and 1990, personal use fishing
was defined by the fisherman's location of residence versus fishing location. In 1992, the Fairbanks nonsubsistence area was created as the only personal use area in the Yukon River drainage.
e Preliminary f In 1978 and 1979, the commercial related harvest was subtracted from the subsistence harvest because it was assumed this harvest was
included in the reported subsistence harvest. From 1980 through 1987, the District 4 subsistence harvest was also reduced to account for commercial related harvests being reported in the subsistence harvest. It was calculated that 80.2% of the reported subsistence harvest (excluding Innoko and Koyukuk River catches) was commercial related. Beginning in 1989, subsistence surveys attempted to document subsistence only fishing catches and commercial related use separately.
g In District 4, excluding the Anvik River, commercial related refers to the estimated number of females and incidental males harvested to produce roe sold. Beginning in 2006, the numbers of females harvested are included in the total commercial harvest.
h Only roe has been sold in the Anvik River commercial fishery. The commercial related harvest shown is the estimated number of females harvested to produce roe sold.
i Estimated sport fish harvest for all chum salmon (assumes majority of chum salmon caught during summer season) in Alaska portion of the drainage. A majority of the sport fish harvest occurs in the Tanana River drainage (District 6).

160
Appendix A19.–Fall chum salmon total utilization in numbers of fish by district, area, and country, Yukon River drainage, 1961–2010. District 1 District 2
Personal Test Fish Test Fish Year Subsistence a,b Commercial c Use d Sales e Total Subsistence a Commercial c Sales e Total 1961
42,461
42,461
1962
53,116
53,116 1963
1964
8,347
8,347 1965
22,936
22,936
1966
69,836
69,836 1967
36,451
36,451
1968
49,857
49,857 1969
128,866
128,866
1970
200,306
200,306
4,858
4,858 1971
188,533
188,533
1972
136,711
136,711
12,898
12,898 1973
173,783
173,783
45,304
45,304
1974
176,036
176,036
53,540
53,540 1975
158,183
158,183
51,666
51,666
1976
105,851
105,851
21,212
21,212 1977
131,758
131,758
51,994
51,994
1978 390
127,947
128,337
1,297
51,646
52,943 1979 15,788
109,406
125,194
14,662
94,042
108,704
1980 7,433
106,829
114,262
12,435
83,881
96,316 1981 15,540
167,834
183,374
11,770
154,883
166,653
1982 10,016
97,484
107,500
9,511
96,581
106,092 1983 8,238
124,371
132,609
10,341
85,645
95,986
1984 8,885
78,751
87,636
11,394
70,803
82,197 1985 13,275
129,948
143,223
11,544
40,490
52,034
1986 9,000
59,352
68,352
13,483
51,307
64,790 1987 18,467
- 0 - 18,467
13,454
- - 13,454
1988 5,475
45,317 5 639 51,436
8,600
31,861 16 40,477 1989 4,914
77,876 18 3,641 86,449
10,015
97,906 348 108,269
1990 5,335
27,337 60 2,068 34,800
6,187
37,173 96 43,456 1991 3,935
59,724
2,455 66,114
5,628
102,628 96 108,352
1992 5,216
-
- 5,216
7,382
- - 7,382 1993 7,770
-
- 7,770
3,094
- - 3,094
1994 4,887
-
- 4,887
4,151
- - 4,151 1995 4,698
79,345
1,121 85,164
3,317
90,831 0 94,148
1996 4,147
33,629
1,717 39,493
5,287
29,651 0 34,938 1997 3,132
27,483
867 31,482
4,680
24,326 0 29,006
1998 3,163
-
- 3,163
4,482
- - 4,482 1999 6,502
9,987
1,149 17,638
4,594
9,703 22 14,319
2000 5,294
-
- 5,294
1,425
- - 1,425 2001 3,437
-
- 3,437
3,256
- - 3,256
2002 1,881
-
- 1,881
1,618
- - 1,618 2003 2,139
5,586
0 7,725
2,901
- - 2,901
2004 2,067
660
0 2,727
2,421
- - 2,421 2005 2,889
130,525
87 133,501
3,257
- - 3,257
2006 3,902 f 101,254
0 105,156
4,015 f 39,905 0 43,920 2007 4,390 f 38,852
0 43,242
3,472 f 35,826 0 39,298
2008 2,823
67,704
0 70,527
3,522
41,270 0 44,792 2009 1,917
11,911
0 13,828
1,563
12,072 0 13,635
2010 3,202 f 545
0 3,747
1,419 f 270 0 1,689 2005-2009 Average 3,184
70,049
17 73,251
3,166
32,268 0 28,980
2000-2009 Average 3,074 50,927 12 38,732 2,745 32,268 0 15,652
-continued-

161
Appendix A19.–Page 2 of 7. District 3 Lower Yukon Area Subtotals
Personal Test Fish Year Subsistence a Commercial Total Subsistence a Commercial c Use d Sales e Total 1961
42,461
42,461
1962
53,116
53,116 1963
1964
8,347
8,347 1965
22,936
22,936
1966
1,209 1,209
71,045
71,045 1967
1,823 1,823
38,274
38,274
1968
3,068 3,068
52,925
52,925 1969
1,722 1,722
130,588
130,588
1970
3,285 3,285
208,449
208,449 1971
188,533
188,533
1972
1,313 1,313
150,922
150,922 1973
219,087
219,087
1974
552 552
230,128
230,128 1975
5,590 5,590
215,439
215,439
1976
4,250 4,250
131,313
131,313 1977
15,851 15,851
199,603
199,603
1978 266
11,527 11,793
1,953
191,120
193,073 1979 2,443
25,955 28,398
32,893
229,403
262,296
1980 2,320
13,519 15,839
22,188
204,229
226,417 1981 3,043
19,043 22,086
30,353
341,760
372,113
1982 1,659
5,815 7,474
21,186
199,880
221,066 1983 2,863
10,018 12,881
21,442
220,034
241,476
1984 2,233
6,429 8,662
22,512
155,983
178,495 1985 2,290
5,164 7,454
27,109
175,602
202,711
1986 2,155
2,793 4,948
24,638
113,452
138,090 1987 3,287
0 3,287
35,208
- 0 - 35,208
1988 1,747
2,090 3,837
15,822
79,268 5 655 95,750 1989 1,023
15,332 16,355
15,952
191,114 18 3,989 211,073
1990 2,056
3,715 5,771
13,578
68,225 60 2,164 84,027 1991 615
9,213 9,828
10,178
171,565
2,551 184,294
1992 2,358
- 2,358
14,956
-
- 14,956 1993 1,449
- 1,449
12,313
-
- 12,313
1994 862
- 862
9,900
-
- 9,900 1995 1,672
- 1,672
9,687
170,176
1,121 180,984
1996 2,706
- 2,706
12,140
63,280
1,717 77,137 1997 787
- 787
8,599
51,809
867 61,275
1998 1,561
- 1,561
9,206
-
- 9,206 1999 415
- 415
11,511
19,690
1,171 32,372
2000 598
- 598
7,317
-
- 7,317 2001 700
- 700
7,393
-
- 7,393
2002 164
- 164
3,663
-
- 3,663 2003 738
- 738
5,778
5,586
0 11,364
2004 298
- 298
4,786
660
0 5,446 2005 1,304
- 1,304
7,450
130,525
87 138,062
2006 480 f - 480
8,397 f 141,159
0 149,556 2007 925 f - 925
8,787 f 74,678
0 83,465
2008 1,821
- 1,821
8,166
108,974
0 117,140 2009 937
- 937
4,417
23,983
0 28,400
2010 1,325 f - 1,325
5,946 f 815
0 6,761 2005-2009 Average 1,093
- 1,093
7,443
95,864
17 103,325
2000-2009 Average 797 - 797 6,615 69,366 12 55,181
-continued-

162
Appendix A19.–Page 3 of 7. District 4 District 5
Commercial Commercial Personal Year Subsistence a,g Commercial Related h Total Subsistence a,g Commercial Related h Use d Total 1961
0 i
0
1962
0 i
0 1963
0 i
0
1964
0 i
0 1965
381 i
381
1966
0 i
0 1967
0 i
0
1968
0 i
0 1969
722 i
722
1970
1,146 i
1,146 1971
1,061 i
1,061
1972
1,254 i
1,254 1973
13,003 i
13,003
1974
9,213
0 9,213
23,551 0
23,551 1975
13,666
0 13,666
27,212 0
27,212
1976
1,742
0 1,742
5,387 0
5,387 1977
13,980
0 13,980
25,730 0
25,730
1978 8,931
10,988
1,721 21,640
46,485
21,016 5,220
72,721 1979 34,697
48,899
3,199 86,795
102,695
47,459 8,097
158,251
1980 18,923
27,978
4,752 51,653
75,861
41,771 605
118,237 1981 17,120
12,082
2,853 32,055
104,612
87,856 5,719
198,187
1982 20,152
3,894
167 24,213
71,786
13,593 42
85,421 1983 32,246
4,482
1,963 38,691
105,103
43,993 0
149,096
1984 28,937
7,625
2,215 38,777
98,376
24,060 57
122,493 1985 22,750
24,452
2,525 49,727
117,125
25,338 0
142,463
1986 26,126
2,045
0 28,171
87,729
22,053 395
110,177 1987 41,467
-
- 41,467
141,335 j - - 15,750 157,085
1988 16,958
15,662
1,421 34,041
84,209
16,989 0 1,762 102,960 1989 24,540
11,776
3,407 39,723
112,001
18,215 3,989 3,294 137,499
1990 19,241
4,989
3,177 27,407
90,513
7,778 1,198 3,723 103,212 1991 20,875
3,737
2,354 26,966
74,002
27,355 4,759
106,116
1992 21,232
-
- 21,232
45,701
- -
45,701 1993 10,832
-
- 10,832
43,764
- -
43,764
1994 13,325
-
- 13,325
66,396
3,630 0
70,026 1995 14,057
2,924
5,807 22,788
57,594
9,778 20,255
87,627
1996 16,786
2,918
0 19,704
63,473
11,878 9,980
85,331 1997 11,734
2,458
0 14,192
55,258
2,446 1,474
59,178
1998 7,898
-
- 7,898
31,393
- -
31,393 1999 9,174
681
0 9,855
53,580
- -
53,580
2000 1,759
-
- 1,759
9,920
- -
9,920 2001 3,352
-
- 3,352
20,873
- -
20,873
2002 1,549
-
- 1,549
10,976
- -
10,976 2003 9,750
1,315
0 11,065
28,270
- -
28,270
2004 7,797
-
- 7,797
40,670
- -
40,670 2005 9,405
-
- 9,405
51,663
- -
51,663
2006 6,335 f -
- 6,335
52,158 f 1,667 0
53,825 2007 8,576 f -
- 8,576
53,731 f 427 0
54,158
2008 7,412
-
- 7,412
57,258
4,556 0
61,814 2009 7,382
-
- 7,382
38,083
- -
38,083
2010 6,788 f -
- 6,788
44,334 f - -
44,334 2005-2009 Average 7,822
-
- 7,822
50,579
2,217 0
51,909
2000-2009 Average 6,332 1,315 0 6,463 36,360 2,217 0 37,025
-continued-

163
Appendix A19.–Page 4 of 7. District 6 Upper Yukon Area Subtotals
Commercial Personal Test Fish Commercial Personal Test Fish Year Subsistence a,d Commercial Related h Use d Sales e Total Subsistence a,d,g Commercial Related h Use d Sales e Total 1961
0 0
0
1962
0 0
0 1963
0 0
0
1964
0 0
0 1965
381 0
381
1966
0 0
0 1967
0 0
0
1968
0 0
0 1969
722 0
722
1970
1,146 0
1,146 1971
1,061 0
1,061
1972
1,254 0
1,254 1973
13,003 0
13,003
1974
26,884 0
26,884
59,648 0
59,648 1975
18,692 0
18,692
59,570 0
59,570
1976
17,948 0
17,948
25,077 0
25,077 1977
18,673 0
18,673
58,383 0
58,383
1978 26,870
13,259 3,687
43,816
82,286
45,263 10,628
138,177 1979 44,596
34,185 7,170
85,951
181,988
130,543 18,466
330,997
1980 50,261
19,452 67
69,780
145,045
89,201 5,424
239,670 1981 23,013
25,989 3,619
52,621
144,745
125,927 12,191
282,863
1982 19,014
6,820 550
26,384
110,952
24,307 759
136,018 1983 31,069
34,089 1,105
66,263
168,418
82,564 3,068
254,050
1984 22,670
20,564 56
43,290
149,983
52,249 2,328
204,560 1985 36,963
42,352 0
79,315
176,838
92,142 2,525
271,505
1986 24,973
1,892 182
27,047
138,828
25,990 577
165,395 1987 124,587 k - - 3,316
127,903
307,389
- - 19,066
326,455
1988 34,597
21,844 1,806 2,114
27,008 87,369
135,764
54,495 3,227 3,876
27,008 224,370 1989 58,654
49,090 7,353 1,770
16,984 133,851
195,195
79,081 14,749 5,064
16,984 311,073
1990 44,568
43,182 7,793 1,393
7,060 103,996
154,322
55,949 12,168 5,116
7,060 234,615 1991 40,469
28,195 16,253 0
1,385 86,302
135,346
59,287 23,366 0
1,385 219,384
1992 25,713
15,721 3,301 0
1,407 46,142
92,646
15,721 3,301 0
1,407 113,075 1993 9,853
- - 163
10,016
64,449
- - 163
64,612
1994 33,597
1 4,368 0
37,966
113,318
3,631 4,368 0
121,317 1995 49,168
67,855 6,262 863
124,148
120,819
80,557 32,324 863
234,563
1996 36,467
10,266 7,308 356
54,397
116,726
25,062 17,288 356
159,432 1997 19,550
- - 284
19,834
86,542
4,904 1,474 284
93,204
1998 14,370
- - 2
14,372
53,661
- - 2
53,663 1999 15,471
- - 261
15,732
78,225
681 0 261
79,167
2000 310
- - 1
311
11,989
- - 1
11,990 2001 3,526
- - 10
3,536
27,751
- - 10
27,761
2002 3,202
- - 3
3,205
15,727
- - 3
15,730 2003 12,986
4,095 0 394
17,475
51,006
5,410 0 394
56,810
2004 8,953
3,450 0 230
12,633
57,420
3,450 0 230
61,100 2005 22,946
49,637 0 133
72,716
84,014
49,637 0 133
133,784
2006 16,925 f 23,353 0 333 f
40,611
75,418 f 25,020 0 333 f 100,771
2007 29,893 f 15,572 0 173 f
45,638
92,200 f 15,999 0 173 f 108,372
2008 16,135
5,967 0 181
22,283
80,805
10,523 0 181
91,509 2009 15,099
1,893 0 78
17,070
60,564
1,893 0 78
62,535
2010 11,391 f 1,735 0 3,209 f
16,335
62,513 f 1,735 0 3,209 f
67,457 2005-2009 Average 20,200
19,284 0 180
39,664
78,600
20,614 0 180
99,394
2000-2009 Average 12,998 14,852 0 154 23,548 55,689 15,990 0 154 67,036
-continued-

164
Appendix A19.–Page 5 of 7. 2 Alaska Yukon River Totals Canada: Yukon Area Totals
Commercial Personal Test Fish Mainstem Yukon River Porcupine Year Subsistence a,d,g,l Commercial c Related h Use d Sales e Total Domestic Aboriginal Commercial Subtotal Aboriginal Total 1961 101,772
42,461 0
144,233
3,800 3,276 7,076 2,000 9,076
1962 87,285
53,116 0
140,401
6,500 936 7,436 2,000 9,436 1963 99,031
0 0
99,031
5,500 2,196 7,696 20,000 27,696
1964 120,360
8,347 0
128,707
4,200 1,929 6,129 6,058 12,187 1965 112,283
23,317 0
135,600
2,183 2,071 4,254 7,535 11,789
1966 51,503
71,045 0
122,548
1,430 3,157 4,587 8,605 13,192 1967 68,744
38,274 0
107,018
1,850 3,343 5,193 11,768 16,961
1968 44,627
52,925 0
97,552
1,180 453 1,633 10,000 11,633 1969 52,063
131,310 0
183,373
2,120 2,279 4,399 3,377 7,776
1970 55,501
209,595 0
265,096
612 2,479 3,091 620 3,711 1971 57,162
189,594 0
246,756
150 1,761 1,911 15,000 16,911
1972 36,002
152,176 0
188,178
0 2,532 2,532 5,000 7,532 1973 53,670
232,090 0
285,760
1,129 2,806 3,935 6,200 10,135
1974 93,776
289,776 0
383,552
466 1,636 2,544 4,646 7,000 11,646 1975 86,591
275,009 0
361,600
4,600 2,500 2,500 9,600 11,000 20,600
1976 72,327
156,390 0
228,717
1,000 100 1,000 2,100 3,100 5,200 1977 82,771
257,986 0
340,757
1,499 1,430 3,990 6,919 5,560 12,479
1978 84,239
236,383 10,628
331,250
728 482 3,356 4,566 5,000 9,566 1979 214,881
359,946 18,466
593,293
2,000 11,000 9,084 22,084
22,084
1980 167,233
293,430 5,424
466,087
4,000 3,218 9,000 16,218 6,000 22,218 1981 175,098
467,687 12,191
654,976
1,611 2,410 15,260 19,281 3,000 22,281
1982 132,138
224,187 759
357,084
683 3,096 11,312 15,091 1,000 16,091 1983 189,860
302,598 3,068
495,526
300 1,200 25,990 27,490 2,000 29,490
1984 172,495
208,232 2,328
383,055
535 1,800 22,932 25,267 4,000 29,267 1985 203,947
267,744 2,525
474,216
279 1,740 35,746 37,765 3,500 41,265
1986 163,466
139,442 577
303,485
222 2,200 11,464 13,886 657 14,543 1987 342,597
- - 19,066
361,663
132 3,622 40,591 44,345 135 44,480
1988 151,586
133,763 3,227 3,881
27,663 320,120
349 1,882 30,263 32,494 1,071 33,565 1989 211,147
270,195 14,749 5,082
20,973 522,146
100 2,462 17,549 20,111 2,909 23,020
1990 167,900
124,174 12,168 5,176
9,224 318,642
0 3,675 27,537 31,212 2,410 33,622 1991 145,524
230,852 23,366 0
3,936 403,678
0 2,438 31,404 33,842 1,576 35,418
1992 107,602
15,721 3,301 0
1,407 128,031
0 304 18,576 18,880 1,935 20,815 1993 76,762
- - 163
- 76,925
0 4,660 7,762 12,422 1,668 14,090
1994 123,218
3,631 4,368 0
0 131,217
0 5,319 30,035 35,354 2,654 38,008 1995 130,506
250,733 32,324 863
1,121 415,547
0 1,099 39,012 40,111 5,489 45,600
1996 128,866
88,342 17,288 356
1,717 236,569
0 1,260 20,069 21,329 3,025 24,354 1997 95,141
56,713 1,474 284
867 154,479
0 1,218 8,068 9,286 6,294 15,580
1998 62,867
- - 2
- 62,869
0 1,745 0 1,745 6,159 7,904 1999 89,736
20,371 0 261
1,171 111,539
0 3,234 10,402 13,636 6,000 19,636
2000 19,306
- - 1
- 19,307
0 2,927 1,319 4,246 5,000 9,246 2001 35,144
- - 10
- 35,154
3 3,077 2,198 5,278 4,594 9,872
2002 19,390
- - 3
- 19,393
0 3,109 3,065 6,174 1,860 8,034 2003 56,784
10,996 0 394
0 68,174
0 1,943 9,030 10,973 382 11,355
2004 62,206
4,110 0 230
0 66,546
0 2,180 7,365 9,545 205 9,750 2005 91,464
180,162 0 133
87 271,846
13 2,035 11,931 13,979 4,593 18,572
2006 83,815 f 166,179 0 333 f 0 250,327
0 2,521 4,096 6,617 5,179 11,796 2007 100,987 f 90,677 0 173 f 0 191,837
0 2,221 7,109 9,330 4,500 13,830
2008 88,971
119,497 0 181
0 208,649
0 2,068 4,062 6,130 3,436 9,566 2009 64,981
25,876 0 78
0 90,935
0 820 293 1,113 898 2,011
2010 68,459 f 2,550 0 3,209 f 0 74,218
0 1,523 2,186 3,709 2,078 5,787 2005-2009 Average 86,044
116,478 0 180
17 202,719
3 1,933 5,498 7,434 3,721 11,155
2000-2009 Average 62,305 85,357 0 154 12 122,217 2 2,290 5,047 7,339 3,065 10,403
-continued-

165
Appendix A19.–Page 6 of 7. Yukon River Drainage (Alaska/Canada) Totals Total Alaska Yukon Area
Commercial Personal Alaska Coastal
Alaska Yukon Area
Year Subsistence m Commercial Related h Use d Test Fish Total District Total Total 1961 107,572 45,737 0
153,309
0
144,233 144,233
1962 95,785 54,052 0
149,837
0
140,401 140,401 1963 124,531 2,196 0
126,727
0
99,031 99,031
1964 130,618 10,276 0
140,894
0
128,707 128,707 1965 122,001 25,388 0
147,389
0
135,600 135,600
1966 61,538 74,202 0
135,740
0
122,548 122,548 1967 82,362 41,617 0
123,979
0
107,018 107,018
1968 55,807 53,378 0
109,185
0
97,552 97,552 1969 57,560 133,589 0
191,149
0
183,373 183,373
1970 56,733 212,074 0
268,807
0
265,096 265,096 1971 72,312 191,355 0
263,667
0
246,756 246,756
1972 41,002 154,708 0
195,710
0
188,178 188,178 1973 60,999 234,896 0
295,895
0
285,760 285,760
1974 102,878 292,320 0
395,198
0
383,552 383,552 1975 104,691 277,509 0
382,200
0
361,600 361,600
1976 76,527 157,390 0
233,917
0
228,717 228,717 1977 91,260 261,976 0
353,236
0
340,757 340,757
1978 90,449 239,739 10,628
340,816
665
331,250 331,915 1979 227,881 369,030 18,466
615,377
0
593,293 593,293
1980 180,451 302,430 5,424
488,305
0
466,087 466,087 1981 182,119 482,947 12,191
677,257
0
654,976 654,976
1982 136,917 235,499 759
373,175
0
357,084 357,084 1983 193,360 328,588 3,068
525,016
0
495,526 495,526
1984 178,830 231,164 2,328
412,322
0
383,055 383,055 1985 209,466 303,490 2,525
515,481
0
474,216 474,216
1986 166,545 150,906 577
318,028
0
303,485 303,485 1987 346,486 40,591 0 19,066
406,143
0
361,663 361,663
1988 154,888 164,026 3,227 3,881 27,663 353,685
5,489
320,120 325,609 1989 216,618 287,744 14,749 5,082 20,973 545,166
156
522,146 522,302
1990 173,985 151,711 12,168 5,176 9,224 352,264
0
318,642 318,642 1991 149,538 262,256 23,366 0 3,936 439,096
0
403,678 403,678
1992 109,841 34,297 3,301 0 1,407 148,846
206
128,031 128,237 1993 83,090 7,762 0 163 - 91,015
120
76,925 77,045
1994 131,191 33,666 4,368 0 0 169,225
347
131,217 131,564 1995 137,094 289,745 32,324 863 1,121 461,147
354
415,547 415,901
1996 133,151 108,411 17,288 356 1,717 260,923
392
236,569 236,961 1997 102,653 64,781 1,474 284 867 170,059
0
154,479 154,479
1998 70,771 0 0 2 - 70,773
34
62,869 62,903 1999 98,970 30,773 0 261 1,171 131,175
204
111,539 111,743
2000 27,233 1,319 0 1 - 28,553
89
19,307 19,396 2001 42,818 2,198 0 10 - 45,026
559
35,154 35,713
2002 24,359 3,065 0 3 - 27,427
284
19,393 19,677 2003 59,109 20,026 0 394 0 79,529
146
68,174 68,320
2004 64,591 11,475 0 230 0 76,296
320
66,546 66,866 2005 98,105 192,093 0 133 87 290,418
70
271,846 271,916
2006 91,515 170,275 0 333 0 262,123
187 f 250,327 250,514 2007 107,708 97,786 0 173 0 205,667
234 f 191,837 192,071
2008 94,475 123,559 0 181 0 218,215
386
208,649 209,035 2009 66,699 26,169 0 78 0 92,946
158
90,935 91,093
2010 72,060 4,736 0 3,209 0 80,005
186 f 74,218 74,404 2005-2009 Average 91,700 121,976 0 180 17 213,874
207
202,719 202,926
2000-2009
Average 67,661 64,797 0 154 12 132,620 243 122,217 122,460 -continued-

166
Appendix A19.–Page 7 of 7. Note: Unless otherwise indicated, blank cells indicate years in which no information was collected or harvest numbers were insufficient to
generate summary information. Dashes indicate no commercial fishing activity occurred, includes commercial related or test fish sales. a Subsistence harvest estimates not available by district until 1978. b Does not include coastal subsistence harvest in Hooper Bay and Scammon Bay. c Includes ADF&G test fish sales prior to 1988. d Prior to 1987 and in 1991, 1992, and 1994, personal use was considered part of subsistence. Between 1987 and 1990, personal use fishing
was defined by the fisherman's location of residence versus fishing location. In 1992, the Fairbanks nonsubsistence area was created as the only personal use area in the Yukon River drainage.
e The number of salmon sold by ADF&G test fisheries. f Preliminary. g From 1978 through 1988, the commercial related harvest was subtracted from the subsistence harvest in Districts 4, 5 and 6 because it was
assumed that this harvest was included in the reported subsistence harvest during that time period. Beginning in 1989, subsistence surveys attempted to document subsistence only fishing catches and commercial related use separately.
h Estimated number of females harvested to produce roe sold. i These numbers were added from original Yukon Area annual management reports January 13, 2006; however, they are not in the fish ticket
programs. j Includes an estimated 95,768 fall chum salmon illegally sold in District 5. k Includes an estimated 119,168 fall chum salmon illegally sold in District 6. l Minimum estimates from 1961 to 1978 because subsistence surveys were conducted prior to the end of the fishing season and catches of fish
other than Chinook salmon were not differentiated by species. m Includes Alaska Yukon River subsistence and Canadian domestic and Aboriginal harvests.
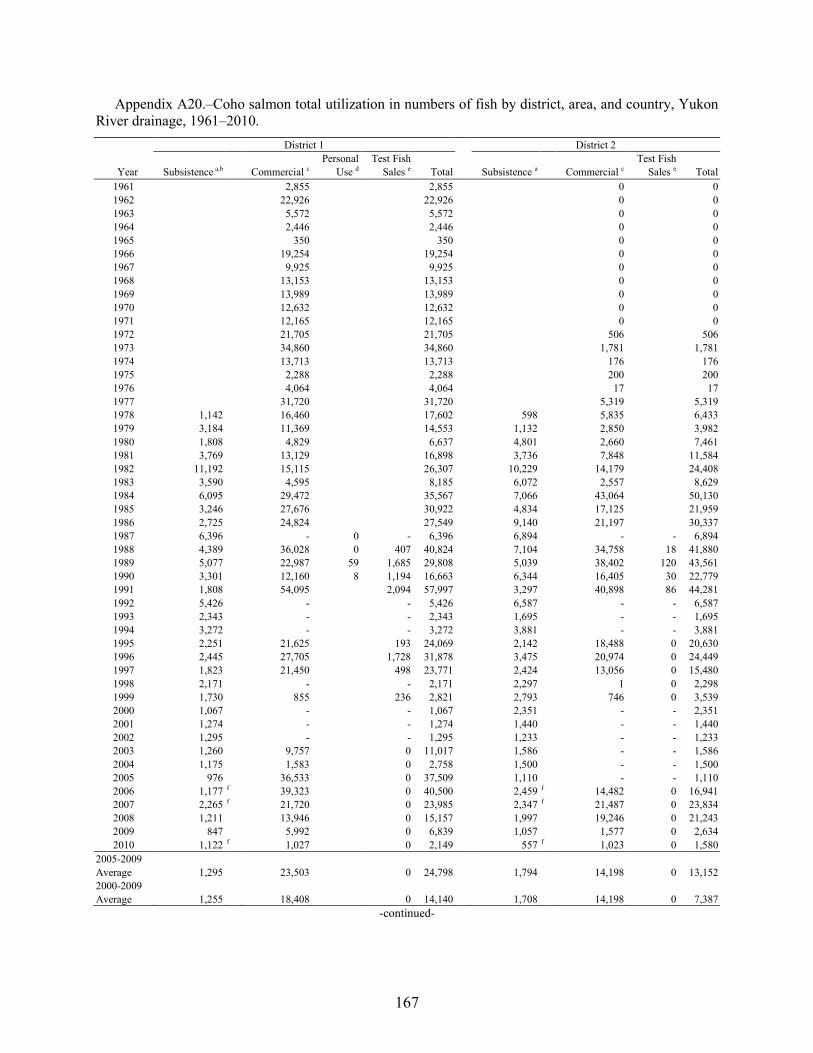
167
Appendix A20.–Coho salmon total utilization in numbers of fish by district, area, and country, Yukon River drainage, 1961–2010. District 1 District 2
Personal Test Fish Test Fish Year Subsistence a,b Commercial c Use d Sales e Total Subsistence a Commercial c Sales e Total 1961
2,855
2,855
0
0
1962
22,926
22,926
0
0 1963
5,572
5,572
0
0
1964
2,446
2,446
0
0 1965
350
350
0
0
1966
19,254
19,254
0
0 1967
9,925
9,925
0
0
1968
13,153
13,153
0
0 1969
13,989
13,989
0
0
1970
12,632
12,632
0
0 1971
12,165
12,165
0
0
1972
21,705
21,705
506
506 1973
34,860
34,860
1,781
1,781
1974
13,713
13,713
176
176 1975
2,288
2,288
200
200
1976
4,064
4,064
17
17 1977
31,720
31,720
5,319
5,319
1978 1,142
16,460
17,602
598
5,835
6,433 1979 3,184
11,369
14,553
1,132
2,850
3,982
1980 1,808
4,829
6,637
4,801
2,660
7,461 1981 3,769
13,129
16,898
3,736
7,848
11,584
1982 11,192
15,115
26,307
10,229
14,179
24,408 1983 3,590
4,595
8,185
6,072
2,557
8,629
1984 6,095
29,472
35,567
7,066
43,064
50,130 1985 3,246
27,676
30,922
4,834
17,125
21,959
1986 2,725
24,824
27,549
9,140
21,197
30,337 1987 6,396
- 0 - 6,396
6,894
- - 6,894
1988 4,389
36,028 0 407 40,824
7,104
34,758 18 41,880 1989 5,077
22,987 59 1,685 29,808
5,039
38,402 120 43,561
1990 3,301
12,160 8 1,194 16,663
6,344
16,405 30 22,779 1991 1,808
54,095
2,094 57,997
3,297
40,898 86 44,281
1992 5,426
-
- 5,426
6,587
- - 6,587 1993 2,343
-
- 2,343
1,695
- - 1,695
1994 3,272
-
- 3,272
3,881
- - 3,881 1995 2,251
21,625
193 24,069
2,142
18,488 0 20,630
1996 2,445
27,705
1,728 31,878
3,475
20,974 0 24,449 1997 1,823
21,450
498 23,771
2,424
13,056 0 15,480
1998 2,171
-
- 2,171
2,297
1 0 2,298 1999 1,730
855
236 2,821
2,793
746 0 3,539
2000 1,067
-
- 1,067
2,351
- - 2,351 2001 1,274
-
- 1,274
1,440
- - 1,440
2002 1,295
-
- 1,295
1,233
- - 1,233 2003 1,260
9,757
0 11,017
1,586
- - 1,586
2004 1,175
1,583
0 2,758
1,500
- - 1,500 2005 976
36,533
0 37,509
1,110
- - 1,110
2006 1,177 f 39,323
0 40,500
2,459 f 14,482 0 16,941 2007 2,265 f 21,720
0 23,985
2,347 f 21,487 0 23,834
2008 1,211
13,946
0 15,157
1,997
19,246 0 21,243 2009 847
5,992
0 6,839
1,057
1,577 0 2,634
2010 1,122 f 1,027
0 2,149
557 f 1,023 0 1,580 2005-2009 Average 1,295
23,503
0 24,798
1,794
14,198 0 13,152
2000-2009 Average 1,255 18,408 0 14,140 1,708 14,198 0 7,387
-continued-

168
Appendix A20.–Page 2 of 7. District 3 Lower Yukon Area Subtotals
Personal Test Fish Year Subsistence a Commercial Total Subsistence a,b Commercial c Use d Sales e Total 1961
0 0
2,855
2,855
1962
0 0
22,926
22,926 1963
0 0
5,572
5,572
1964
0 0
2,446
2,446 1965
0 0
350
350
1966
0 0
19,254
19,254 1967
1,122 1,122
11,047
11,047
1968
150 150
13,303
13,303 1969
1,009 1,009
14,998
14,998
1970
0 0
12,632
12,632 1971
0 0
12,165
12,165
1972
0 0
22,211
22,211 1973
0 0
36,641
36,641
1974
0 0
13,889
13,889 1975
0 0
2,488
2,488
1976
0 0
4,081
4,081 1977
538 538
37,577
37,577
1978 223
758 981
1,963
23,053
25,016 1979 74
0 74
4,390
14,219
18,609
1980 91
0 91
6,700
7,489
14,189 1981 510
419 929
8,015
21,396
29,411
1982 675
87 762
22,096
29,381
51,477 1983 917
0 917
10,579
7,152
17,731
1984 740
621 1,361
13,901
73,157
87,058 1985 376
171 547
8,456
44,972
53,428
1986 954
793 1,747
12,819
46,814
59,633 1987 754
- 754
14,044
- 0 - 14,044
1988 1,667
1,419 3,086
13,160
72,205 0 425 85,790 1989 537
3,988 4,525
10,653
65,377 59 1,805 77,894
1990 1,026
918 1,944
10,671
29,483 8 1,224 41,386 1991 1,340
1,905 3,245
6,445
96,898 0 2,180 105,523
1992 1,549
- 1,549
13,562
-
- 13,562 1993 279
- 279
4,317
-
- 4,317
1994 363
- 363
7,516
-
- 7,516 1995 891
- 891
5,284
40,113
193 45,590
1996 444
- 444
6,364
48,679
1,728 56,771 1997 766
- 766
5,013
34,506
498 40,017
1998 400
- 400
4,868
1
0 4,869 1999 610
- 610
5,133
1,601
236 6,970
2000 94
- 94
3,512
-
- 3,512 2001 0
- 0
2,714
-
- 2,714
2002 115
- 115
2,643
-
- 2,643 2003 711
- 711
3,557
9,757
0 13,314
2004 284
- 284
2,959
1,583
0 4,542 2005 217
- 217
2,303
36,533
0 38,836
2006 83 f - 83
3,719 f 53,805
0 57,524 2007 739 f - 739
5,351 f 43,207
0 48,558
2008 410
- 410
3,618
33,192
0 36,810 2009 321
- 321
2,225
7,569
0 9,794
2010 353 f - 353
2,032 f 2,050
0 4,082 2005-2009 Average 354
- 354
3,443
34,861
0 38,304
2000-2009 Average 297 - 297 3,260 26,521 0 21,825
-continued-

169
Appendix A20.–Page 3 of 7. District 4 District 5
Commercial Commercial Personal Year Subsistence a Commercial Related g Total Subsistence a Commercial Related g Use d Total 1961
1962 1963 1964 1965 1966 1967 1968 1969 1970 1971 1972 1973 1974
1,409 0
1,409 1975
5 0
5
1976
- -
0 1977
2 0
2
1978 145
32 0 177
970
1 0
971 1979 197
155 0 352
595
- -
595
1980 7,734
30 0 7,764
561
- -
561 1981 2,239
- - 2,239
1,713
- -
1,713
1982 2,952
15 0 2,967
3,428
- -
3,428 1983 3,946
- - 3,946
2,448
- -
2,448
1984 2,867
1,095 0 3,962
17,467
- -
17,467 1985 3,949
938 0 4,887
8,098
- -
8,098
1986 2,458
- - 2,458
5,870
- -
5,870 1987 3,479
- - 3,479
11,842 h - - 58 11,900
1988 4,714
2 0 4,716
19,755
8 0 103 19,866 1989 4,030
3 0 4,033
7,187
84 0 82 7,353
1990 3,614
- - 3,614
11,562
- - 18 11,580 1991 4,451
14 0 4,465
4,931
- -
4,931
1992 8,429
- - 8,429
12,376
- -
12,376 1993 1,167
- - 1,167
5,984
- -
5,984
1994 3,515
- - 3,515
4,174
- -
4,174 1995 1,934
- - 1,934
2,205
- -
2,205
1996 2,467
161 0 2,628
6,588
- -
6,588 1997 3,754
814 0 4,568
3,583
- -
3,583
1998 2,593
- - 2,593
2,839
- -
2,839 1999 2,049
- - 2,049
4,241
- -
4,241
2000 1,068
- - 1,068
4,987
- -
4,987 2001 2,266
- - 2,266
7,674
- -
7,674
2002 1,023
- - 1,023
2,076
- -
2,076 2003 5,773
367 0 6,140
3,887
- -
3,887
2004 4,766
- - 4,766
1,423
- -
1,423 2005 2,971
- - 2,971
2,159
- -
2,159
2006 1,302 f - - 1,302
3,779 f - -
3,779 2007 2,952 f - - 2,952
3,366 f - -
3,366
2008 1,490
- - 1,490
3,203
- -
3,203 2009 3,986
- - 3,986
2,498
- -
2,498
2010 1,730 f - - 1,730
3,604 f - -
3,604 2005-2009 Average 2,540
- - 2,540
3,001
- -
3,001
2000-2009 Average 2,760 367 0 2,796 3,505 - - 3,505
-continued-

170
Appendix A20.–Page 4 of 7. District 6 Upper Yukon Area Subtotals
Commercial Personal Test Fish Commercial Personal Test Fish Year Subsistence a Commercial Related g Use d Sales e Total Subsistence a Commercial Related g Use d Sales e Total 1961
1962 1963 1964 1965 1966 1967 1968 1969
95 0
95 1970
556 0
556
1971
38 0
38 1972
22 0
22
1973
0 0
0 1974
1,479 0
1,479
2,888 0
2,888
1975
53 0
53
58 0
58 1976
1,103 0
1,103
1,103 0
1,103
1977
1,284 0
1,284
1,286 0
1,286 1978 4,709
3,066 0
7,775
5,824
3,099 0
8,923
1979 4,612
2,791 0
7,403
5,404
2,946 0
8,350 1980 5,163
1,226 0
6,389
13,458
1,256 0
14,714
1981 9,261
2,284 0
11,545
13,213
2,284 0
15,497 1982 7,418
7,780 0
15,198
13,798
7,795 0
21,593
1983 6,932
6,168 0
13,100
13,326
6,168 0
19,494 1984 14,785
7,688 0
22,473
35,119
8,783 0
43,902
1985 11,761
11,762 0
23,523
23,808
12,700 0
36,508 1986 13,321
441 0
13,762
21,649
441 0
22,090
1987 53,006 i - - 2,465
55,471
68,327
- - 2,523
70,850 1988 30,201
13,972 0 1,147
13,295
58,615
54,670
13,982 0 1,250
13,295 83,197
1989 18,841
16,084 0 731
2,140 37,796
30,058
16,171 0 813
2,140 49,182
1990 17,613
11,549 3,255 1,155
1,426 34,998
32,789
11,549 3,255 1,173
1,426 50,192
1991 21,561
6,268 3,506 -
791 32,126
30,943
6,282 3,506 -
791 41,522
1992 17,554
6,556 1,423 -
1,629 27,162
38,359
6,556 1,423 -
1,629 47,967
1993 4,304
- - 0
4,304
11,455
- - 0
11,455 1994 26,489
120 4,331 -
30,940
34,178
120 4,331 -
38,629
1995 18,802
5,826 1,074 417
26,119
22,941
5,826 1,074 417
30,258 1996 14,893
3,803 3,339 198
22,233
23,948
3,964 3,339 198
31,449
1997 11,595
- - 350
11,945
18,932
814 0 350
20,096 1998 7,472
- - 9
7,481
12,904
- - 9
12,913
1999 9,394
- - 147
9,541
15,684
- - 147
15,831 2000 5,150
- - 0
5,150
11,205
- - 0
11,205
2001 8,966
- - 34
9,000
18,906
- - 34
18,940 2002 9,499
- - 20
9,519
12,598
- - 20
12,618
2003 10,363
15,119 0 549
26,031
20,023
15,486 0 549
36,058 2004 11,584
18,649 0 233
30,466
17,773
18,649 0 233
36,655
2005 19,538
21,778 0 107
41,423
24,668
21,778 0 107
46,553 2006 10,571 f 11,137 0 279 f
21,987
15,652 f 11,137 0 279 f
27,068
2007 7,845 f 1,368 0 135 f
9,348
14,163 f 1,368 0 135 f 15,666
2008 8,428
2,408 0 50
10,886
13,121
2,408 0 50
15,579 2009 7,051
742 0 70
7,863
13,535
742 0 70
14,347
2010 5,555 f 1,700 0 1,062 f
8,317
10,889 f 1,700 0 1,062 f
13,651 2005-2009 Average 10,687
7,487 0 128
18,301
16,228
7,487 0 128
23,843
2000-2009 Average 9,900 10,172 0 148 17,167 16,164 10,224 0 148 23,469
-continued-

171
Appendix A20.–Page 5 of 7. Alaska Yukon River Totals Canada: Yukon Territories Totals
Commercial Personal Test Fish Sport Mainstem Porcupine Year Subsistence a,b,j Commercial a,c Related g Use d Sales e Fish k Total Yukon River l Aborginal Total 1961 9,192
2,855 0
12,047 1962 9,480
22,926 0
32,406
1963 27,699
5,572 0
33,271 1964 12,187
2,446 0
14,633
1965 11,789
350 0
12,139 1966 13,192
19,254 0
32,446
1967 17,164
11,047 0
28,211 1968 11,613
13,303 0
24,916
1969 7,776
15,093 0
22,869 1970 3,966
13,188 0
17,154
1971 16,912
12,203 0
29,115 1972 7,532
22,233 0
29,765
1973 10,236
36,641 0
46,877 1974 11,646
16,777 0
28,423
1975 20,708
2,546 0
23,254 1976 5,241
5,184 0
10,425
1977 16,333
38,863 0
125
55,321 1978 7,787
26,152 0
302
34,241
1979 9,794
17,165 0
50
27,009 1980 20,158
8,745 0
67
28,970
0
1,500 1,500 1981 21,228
23,680 0
45
44,953
0
500 500 1982 35,894
37,176 0
191
73,261
0
0 1983 23,905
13,320 0
199
37,424
0
0 1984 49,020
81,940 0
831
131,791
0
500 500 1985 32,264
57,672 0
808
90,744
0
250 250 1986 34,468
47,255 0
1,535
83,258
0
300 300 1987 82,371
0 0 2,523
1,292
86,186
0
306 306 1988 67,830
86,187 0 1,250
13,720 2,420
171,407
0
350 350 1989 40,711
81,548 0 872
3,945 1,811
128,887
0
470 470 1990 43,460
41,032 3,255 1,181
2,650 1,947
93,525
0
680 680 1991 37,388
103,180 3,506 0
2,971 2,775
149,820
0
235 235 1992 51,921
6,556 1,423 0
1,629 1,666
63,195
0
495 495 1993 15,772
- - 0
- 897
16,669
0
60 60 1994 41,694
120 4,331 0
0 2,174
48,319
2
332 334 1995 28,225
45,939 1,074 417
193 1,278
77,126
0
509 509 1996 30,312
52,643 3,339 198
1,728 1,588
89,808
0
41 41 1997 23,945
35,320 0 350
498 1,470
61,583
2
298 300 1998 17,772
1 0 9
0 758
18,540
0
214 214 1999 20,817
1,601 0 147
236 609
23,410
0
100 100 2000 14,717
- - 0
- 554
15,271
0
37 37 2001 21,620
- - 34
- 1,202
22,856
0
0 0 2002 15,241
- - 20
- 1,092
16,353
26
449 475 2003 23,580
25,243 0 549
0 1,477
50,849
7
523 530 2004 20,732
20,232 0 233
0 1,623
42,820
5
175 180 2005 26,971
58,311 0 107
0 627
86,016
0
11 11 2006 19,371 f 64,942 0 279 f 0 1,000
85,592
1
111 112 2007 19,514 f 44,575 0 135 f 0 597
64,821
2
500 502 2008 16,739
35,600 0 50
0 341
52,730
0
200 200 2009 15,760
8,311 0 70
0 964
25,105
0
0 0 2010 12,921 f 3,750 0 1,062 f 0 944
18,677
0
12 12 2005-2009 Average 19,671
42,348 0 128
0 706
62,853
1
164 165 2000-2009
Average 19,425 36,745 0 148 0 948 46,241 4 201 205 -continued-

172
Appendix A20.–Page 6 of 7. Yukon River Drainage (Alaska/Canada) Totals Total Alaska Yukon Area
Commercial Personal Alaska Sport Coastal Alaska Yukon Area Year Subsistence a,b,j,m Commercial Related g Use d Test Fish e Fish Total District Total Total 1961 9,192
2,855 0
12,047
0
12,047 12,047
1962 9,480
22,926 0
32,406
0
32,406 32,406 1963 27,699
5,572 0
33,271
0
33,271 33,271
1964 12,187
2,446 0
14,633
0
14,633 14,633 1965 11,789
350 0
12,139
0
12,139 12,139
1966 13,192
19,254 0
32,446
0
32,446 32,446 1967 17,164
11,047 0
28,211
0
28,211 28,211
1968 11,613
13,303 0
24,916
0
24,916 24,916 1969 7,776
15,093 0
22,869
0
22,869 22,869
1970 3,966
13,188 0
17,154
0
17,154 17,154 1971 16,912
12,203 0
29,115
0
29,115 29,115
1972 7,532
22,233 0
29,765
0
29,765 29,765 1973 10,236
36,641 0
46,877
0
46,877 46,877
1974 11,646
16,777 0
28,423
0
28,423 28,423 1975 20,708
2,546 0
23,254
0
23,254 23,254
1976 5,241
5,184 0
10,425
0
10,425 10,425 1977 16,333
38,863 0
125
55,321
0
55,321 55,321
1978 7,787
26,152 0
302
34,241
89
34,241 34,330 1979 9,794
17,165 0
50
27,009
0
27,009 27,009
1980 21,658
8,745 0
67
30,470
0
28,970 28,970 1981 21,728
23,680 0
45
45,453
0
44,953 44,953
1982 35,894
37,176 0
191
73,261
0
73,261 73,261 1983 23,905
13,320 0
199
37,424
0
37,424 37,424
1984 49,520
81,940 0
831
132,291
0
131,791 131,791 1985 32,514
57,672 0
808
90,994
0
90,744 90,744
1986 34,768
47,255 0
1,535
83,558
0
83,258 83,258 1987 82,677
0 0 2,523
1,292
86,492
191
86,186 86,377
1988 68,180
86,187 0 1,250
13,720 2,420
171,757
15,672
171,407 187,079 1989 41,181
81,548 0 872
3,945 1,811
129,357
4,299
128,887 133,186
1990 44,140
41,032 3,255 1,181
2,650 1,947
94,205
0
93,525 93,525 1991 37,623
103,180 3,506 0
2,971 2,775
150,055
0
149,820 149,820
1992 52,416
6,556 1,423 0
1,629 1,666
63,690
59
63,195 63,254 1993 15,832
0 0 0
0 897
16,729
40
16,669 16,709
1994 42,026
122 4,331 0
0 2,174
48,653
81
48,319 48,400 1995 28,734
45,939 1,074 417
193 1,278
77,635
152
77,126 77,278
1996 30,353
52,643 3,339 198
1,728 1,588
89,849
92
89,808 89,900 1997 24,243
35,322 0 350
498 1,470
61,883
0
61,583 61,583
1998 17,986
1 0 9
0 758
18,754
349
18,540 18,889 1999 20,917
1,601 0 147
236 609
23,510
74
23,410 23,484
2000 14,754
0 0 0
0 554
15,308
222
15,271 15,493 2001 21,620
0 0 34
0 1,202
22,856
548
22,856 23,404
2002 15,690
17 0 20
0 1,101
16,828
248
16,353 16,601 2003 24,103
25,243 0 549
0 1,484
51,379
292
50,849 51,141
2004 20,907
20,236 0 233
0 1,624
43,000
63
42,820 42,883 2005 26,982
58,311 0 107
0 627
86,027
279
86,016 86,295
2006 19,482 f 64,942 0 279 f 0 1,001
85,704
335 f 85,592 85,927 2007 20,014 f 44,575 0 135 f 0 599
65,323
110 f 64,821 64,931
2008 16,939
35,600 0 50
0 341
52,930
116
52,730 52,846 2009 15,760
8,311 0 70
0 964
25,105
246
25,105 25,351
2010 12,933 f 3,750 0 1,062 f 0 944 f 18,689
124 f 18,677 18,801 2005-2009 Average 19,835
42,348 0 128
0 706
63,018
217
62,853 63,070
2000-2009 Average 19,625 25,724 0 148 0 950 46,446 246 46,241 46,487
-continued-

173
Appendix A20.–Page 7 of 7. Note: Unless otherwise indicated, blank cells indicate years in which no information was collected or harvest numbers were insufficient to
generate summary information. Dashes indicate no commercial fishing activity occurred, includes commercial related and test fish sales. a Subsistence harvest estimates not available by district until 1978. b Does not include coastal subsistence harvest in Hooper Bay and Scammon Bay. c Includes ADF&G test fish sales prior to 1988. d Prior to 1987 and in 1991, 1992, and 1994, personal use was considered part of subsistence. Between 1987 and 1990, personal use fishing
was defined by the fisherman's location of residence versus fishing location. In 1992, the Fairbanks nonsubsistence area was created as the only personal use area in the Yukon River drainage.
e The number of fish sold by ADF&G test fisheries. f Preliminary. g Estimated number of females harvested to produce roe sold. h Includes an estimated 5,015 coho salmon illegally sold in District 5. i Includes an estimated 31,276 coho salmon illegally sold in District 6. j Minimum estimates from 1961-1978 because subsistence surveys were conducted prior to the end of the fishing season and catches of fish
other than Chinook salmon were not differentiated by species. k Estimated sport fish harvest for Alaska portion of the Yukon River drainage. A majority of the sport fish harvest occurs in the Tanana River
drainage, District 6. l Includes domestic, commercial, test, sport, and Aboriginal harvest from the mainstem Yukon River. m Includes Alaska Yukon River subsistence harvest and Canadian Aboriginal harvest.

174
Appendix A21.–Yukon Area pink salmon total utilization in numbers of fish, by district and area, 1980–2010.
Coastal District District 1 District 2
Year Subsist a Comm Total Subsist a Comm Total Subsist a Comm Total 1980
0 0
0 0
1981
0 0
0 0 1982
0 0
0 0
1983
0 0
0 0 1984
0 0
0 0
1985
0 0
0 0 1986
0 0
0 0
1987
0 0
0 0 1988
1,001 1,001
56 56
1989
17 17
0 0 1990
418 418
324 324
1991
0 0
0 0 1992
19 b 0 19
0 0
1993
0 0
0 0 1994 2,053
0 2,053
4,233
0 4,233
2,731
0 2,731
1995 385
0 385
132
0 132
15
0 15 1996 3,517
0 3,517
443
0 443
933
0 933
1997 265
0 265
69
0 69
115
0 115 1998 3,732
0 3,732
1,590
0 1,590
1,550
0 1,550
1999 626
0 626
32
0 32
21
0 21 2000 998
0 998
301
0 301
235
0 235
2001 394
0 394
9
0 9
0
0 0 2002 5,892
0 5,892
1,028
0 1,028
1,282
0 1,282
2003 1,470
0 1,470
207
0 207
117
0 117 2004 7,926
0 7,926
615
0 615
1,138
0 1,138
2005 2,505
0 2,505
390
0 390
230
0 230 2006 2,814
0 2,814
1,114
0 1,114
900
0 900
2007 1,548
0 1,548
382
0 382
185
0 185 2008 3,779
0 3,779
3,053
5 3,058
942
2 944
2009 2,143
0 2,143
132
0 132
14
0 14 2010 2,464 c 0 2,464
787 c 0 787
946 c 0 946
2005-2009 Average 2,558
0 2,558
1,014
1 1,015
454
0 455
2000-2009 Average 2,947 0 2,947 723 1 724 504 0 505
-continued-
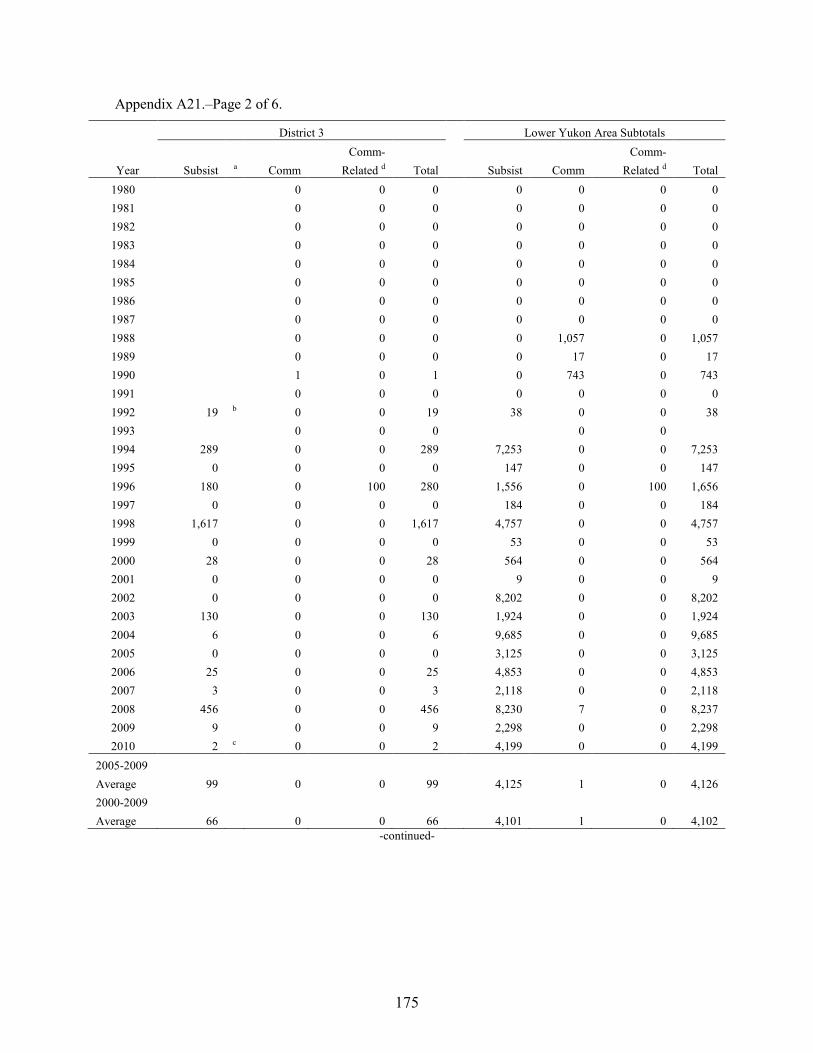
175
Appendix A21.–Page 2 of 6.
District 3 Lower Yukon Area Subtotals
Comm-
Comm-
Year Subsist a Comm Related d Total Subsist Comm Related d Total 1980
0 0 0
0 0 0 0
1981
0 0 0
0 0 0 0 1982
0 0 0
0 0 0 0
1983
0 0 0
0 0 0 0 1984
0 0 0
0 0 0 0
1985
0 0 0
0 0 0 0 1986
0 0 0
0 0 0 0
1987
0 0 0
0 0 0 0 1988
0 0 0
0 1,057 0 1,057
1989
0 0 0
0 17 0 17 1990
1 0 1
0 743 0 743
1991
0 0 0
0 0 0 0 1992 19 b 0 0 19
38 0 0 38
1993
0 0 0
0 0 1994 289
0 0 289
7,253 0 0 7,253
1995 0
0 0 0
147 0 0 147 1996 180
0 100 280
1,556 0 100 1,656
1997 0
0 0 0
184 0 0 184 1998 1,617
0 0 1,617
4,757 0 0 4,757
1999 0
0 0 0
53 0 0 53 2000 28
0 0 28
564 0 0 564
2001 0
0 0 0
9 0 0 9 2002 0
0 0 0
8,202 0 0 8,202
2003 130
0 0 130
1,924 0 0 1,924 2004 6
0 0 6
9,685 0 0 9,685
2005 0
0 0 0
3,125 0 0 3,125 2006 25
0 0 25
4,853 0 0 4,853
2007 3
0 0 3
2,118 0 0 2,118 2008 456
0 0 456
8,230 7 0 8,237
2009 9
0 0 9
2,298 0 0 2,298 2010 2 c 0 0 2
4,199 0 0 4,199
2005-2009 Average 99
0 0 99
4,125 1 0 4,126
2000-2009 Average 66 0 0 66 4,101 1 0 4,102
-continued-

176
Appendix A21.–Page 3 of 6.
District 4 District 5
Comm-
Comm-
Year Subsist a Comm Related d Total Subsist a Comm Related d Total 1980
0 0 0
0 0 0
1981
0 0 0
0 0 0 1982
0 0 0
0 0 0
1983
0 0 0
0 0 0 1984 500
0 0 500
0 0 0
1985
0 0 0
0 0 0 1986
0 0 0
0 0 0
1987
0 0 0
0 0 0 1988
0 0 0
0 0 0
1989
0 0 0
0 0 0 1990
0 0 0
0 0 0
1991
0 0 0
0 0 0 1992 5 b 0 0 5
0 0 0
1993
0 0 0
0 0 0 1994 995
0 66 1,061
0
0 0 0
1995 0
0 0 0
0
0 0 0 1996 59
0 0 59
0
0 0 0
1997 34
0 0 34
0
0 0 0 1998 700
0 0 700
0
0 0 0
1999 2
0 0 2
0
0 0 0 2000 31
0 0 31
0
0 0 0
2001 0
0 0 0
0
0 0 0 2002 221
0 0 221
0
0 0 0
2003 243
0 0 243
0
0 0 0 2004 12
0 0 12
0
0 0 0
2005 7
0 0 7
0
0 0 0 2006 1
0 0 1
0
0 0 0
2007 0
0 0 0
0
0 0 0 2008 1,023
0 0 1,023
276
0 0 0
2009 2
0 0 2
0
0 0 0 2010 0 c 0 0 0
0 c 0 0 0
2005-2009 Average 207
0 0 207
55
0 0 0
2000-2009 Average 154 0 0 154 28 0 0 0
-continued-

177
Appendix A21.–Page 4 of 6.
District 6 Upper Yukon Area Subtotals
Comm-
Comm-
Year Subsist Comm Related d Total Subsist Comm Related d Total 1980
0 0 0
0 0 0 0
1981
0 0 0
0 0 0 0 1982
0 0 0
0 0 0 0
1983
0 0 0
0 0 0 0 1984
0 0 0
500 0 0 500
1985
0 0 0
0 0 0 0 1986
0 0 0
0 0 0 0
1987
0 0 0
0 0 0 0 1988
0 0 0
0 0 0 0
1989
0 0 0
0 0 0 0 1990
0 0 0
0 0 0 0
1991
0 0 0
0 0 0 0 1992
0 0 0
5 0 0 5
1993
0 0 0
0 0 0 0 1994 0 0 0 0
995 0 66 1,061
1995 0 0 0 0
0 0 0 0 1996 0 0 0 0
59 0 0 59
1997 0 0 0 0
34 0 0 34 1998 0 0 0 0
700 0 0 700
1999 0 0 0 0
2 0 0 2 2000 0 0 0 0
31 0 0 31
2001 0 0 0 0
0 0 0 0 2002 0 0 0 0
221 0 0 221
2003 0 0 0 0
243 0 0 243 2004 0 0 0 0
12 0 0 12
2005 0 0 0 0
7 0 0 7 2006 0 0 0 0
1 0 0 1
2007 0 0 0 0
0 0 0 0 2008 0 0 0 0
1,299 0 0 1,299
2009 0 0 0 0
2 0 0 2 2010 0 0 0 0
0 0 0 0
2005-2009 Average 0 0 0 0
262 0 0 262
2000-2009 Average 0 0 0 0 182 0 0 182
-continued-

178
Appendix A21.–Page 6 of 6.
Alaska Yukon Area Totals
Comm- Sport
Year Subsist Comm Related d Fish e Total 1980
0 0 0
0
1981
0 0 0
0 1982
0 0 0
0
1983
0 0 0
0 1984
500 0 0
500
1985
0 0 0
0 1986
0 0 0
0
1987
0 0 0
0 1988
0 1,057 0
1,057
1989
0 17 0
17 1990
0 743 0
743
1991
0 0 0
0 1992
43 0 0
43
1993
0 0 0
0 1994
8,248 0 66
8,314
1995
147 0 0
147 1996
1,615 0 100
1,715
1997
218 0 0
218 1998
5,457 0 0
5,457
1999
55 0 0
55 2000
595 0 0
595
2001
9 0 0
9 2002
8,423 0 0
8,423
2003
2,167 0 0
2,167 2004
9,697 0 0
9,697
2005
3,132 0 0
3,132 2006
4,854 0 0
4,854
2007
2,118 0 0
2,118 2008
9,529 7 0
9,536
2009
2,300 0 0
2,300 2010
4,199 0 0
4,199
2005-2009 Average 4,387 1 0
4,388
2000-2009 Average 4,282 1 0 4,283
a Subsistence harvest estimates not available until 1994. Subsistence harvests of chum salmon below Kaltag prior to 1995 may include some pink salmon.
b Reported as caught but not sold on fish tickets. c Preliminary. d In Districts 3–6, commercial related refers to the estimated number of females and males harvested to produce roe sold. e Estimated sport fish harvest for Alaska portion of the Yukon River drainage.

179
Appendix A22.–Percent age composition of combined commercial and subsistence salmon harvest by species, Yukon River drainage, 1982–2009.
Sample Age In Years (Percent) Species / Run Year Size 3 4 5 6 7 8 Total a
Chinook 1982
3,795 0.2 6.8 18.5 58.3 15.9 0.3 100.0 Salmon 1983
3,801 0.0 6.6 21.0 62.9 9.4 0.0 100.0
1984
3,700 0.0 3.7 27.0 56.0 13.1 0.1 100.0
1985
4,567 0.1 5.7 13.2 69.4 11.3 0.3 100.0
1986
5,785 0.3 3.9 27.2 42.8 25.1 0.6 100.0
1987
5,300 0.0 4.2 8.4 72.5 14.5 0.3 100.0
1988
5,108 0.1 14.8 22.8 31.5 29.4 1.4 100.0
1989
3,901 0.5 7.2 30.3 51.1 10.2 0.6 99.9
1990
3,416 0.0 17.2 26.9 49.4 6.3 0.2 100.0
1991
3,879 0.0 5.8 45.1 42.6 6.4 0.1 100.0
1992
3,772 0.1 8.1 20.1 68.6 3.1 0.0 100.0
1993
4,034 0.2 15.8 25.4 50.5 8.0 0.0 99.9
1994
3,692 0.3 4.1 47.2 44.5 3.8 0.0 99.9
1995
5,559 0.0 7.8 13.7 74.7 3.6 0.2 100.0
1996
5,861 0.0 2.4 44.0 35.6 17.9 0.2 100.1
1997
5,134 0.0 7.5 17.8 70.5 4.2 0.1 100.1
1998
3,122 0.7 5.2 55.1 31.4 7.6 0.0 100.0
1999
4,285 0.1 3.8 17.7 76.7 1.7 0.0 100.0
2000
1,201 0.0 1.0 29.9 60.5 8.6 0.0 100.0
2001 b 1,182 0.1 9.0 27.2 57.6 6.1 0.0 100.0
2002
3,580 0.0 8.2 27.0 53.9 10.9 0.0 100.0
2003
3,850 0.1 3.4 32.3 56.5 7.7 0.0 100.0
2004
6,556 0.0 9.9 23.3 63.1 3.6 0.0 100.0
2005
4,515 0.0 5.8 43.0 48.5 2.6 0.0 100.0
2006
4,470 0.0 4.2 53.6 40.7 1.5 0.0 100.0
2007
7,095 0.0 11.0 26.8 60.0 2.1 0.0 100.0
2008
4,431 0.1 5.6 60.9 30.9 2.5 0.0 100.0
2009
5,232 0.1 14.8 20.2 63.8 1.1 0.0 100.0
2005-2009 Average 5,149 0.1 8.3 40.9 48.8 2.0 0.0 100.0
-continued-

180
Appendix A22.–Page 2 of 4.
Sample Age In Years (Percent) Species / Run Year Size 3 4 5 6 7 Total a
Chum 1982
3,419 5.3 0.0 88.6 6.1 0.0
100.0 Salmon/ 1983
4,110 1.0 53.8 44.4 0.8 0.0
100.0
Summer 1984
2,722 2.0 73.7 23.9 0.5 0.0
100.0
1985
2,472 1.4 68.6 29.2 0.8 0.0
100.0
1986
3,473 0.1 29.1 69.8 1.0 0.0
100.0
1987
2,184 0.4 60.8 31.8 6.9 0.0
100.0
1988
5,112 0.0 70.1 29.1 0.8 0.0
100.0
1989
3,778 0.4 38.7 60.5 0.4 0.0
100.0
1990
3,155 0.4 38.3 58.9 2.4 0.0
100.0
1991
5,015 1.3 48.0 49.8 0.9 0.0
100.0
1992
4,303 0.2 31.0 65.0 3.8 0.0
100.0
1993
2,011 0.4 47.5 47.7 4.5 0.0
100.1
1994
3,820 0.1 51.3 46.6 2.0 0.0
100.0
1995
4,740 0.6 51.9 45.3 2.1 0.0
99.9
1996
3,863 0.4 46.2 48.8 4.5 0.1
100.0
1997
3,195 0.2 29.0 67.2 3.6 0.0
100.0
1998
1,147 0.3 62.8 34.2 2.7 0.0
100.0
1999
1,627 0.2 40.7 58.2 0.9 0.0
100.0
2000
442 0.0 44.2 53.4 2.4 0.0
100.0
2001 b 586 0.0 15.4 81.9 2.7 0.0
100.0
2002
1,103 0.1 52.9 44.4 2.6 0.0
100.0
2003
1,144 0.3 55.4 39.2 5.1 0.0
100.0
2004
2,742 1.3 37.2 60.4 1.0 0.1
100.0
2005
2,381 0.2 83.2 15.2 1.5 0.0
100.0
2006
2,799 0.1 18.6 81.1 0.2 0.0
100.0
2007
4,356 0.0 34.5 50.5 14.9 0.1
100.0
2008
2,292 0.1 35.0 58.6 6.1 0.2
100.0
2009 4,087 1.3 49.0 47.5 2.1 0.2 100.0
2005-2009
Average 3,183 0.3 44.1 50.6 5.0 0.1 100.0 -continued-

181
Appendix A22.–Page 3 of 4.
Sample Age in Years (Percent) Species / Run Year Size 3 4 5 6 Total a Chum 1982
2,918 6.5 58.6 34.5 0.3
100.0
Salmon/ 1983
1,735 0.7 91.4 8.0 0.0
100.0 Fall 1984
1,902 6.6 55.6 37.5 0.4
100.0
1985
2,801 5.2 83.4 11.0 0.4
100.0
1986
1,715 7.4 89.6 2.5 0.5
100.0
1987
1,513 5.0 77.1 17.5 0.4
100.0
1988
4,030 4.1 45.7 46.6 3.5
99.9
1989
4,939 1.0 87.0 11.8 0.2
100.0
1990
2,351 2.8 74.9 21.7 0.6
100.0
1991
5,314 2.7 75.4 21.7 0.2
100.0
1992
3,069 1.2 45.9 51.8 1.1
100.0
1993
1,616 0.1 62.8 35.2 1.8
99.9
1994
1,295 2.4 66.4 31.1 0.1
100.0
1995
1,731 0.8 59.2 37.4 2.6
100.0
1996
1,391 0.3 52.3 43.9 3.5
100.0
1997
1,245 0.3 57.2 41.6 0.9
100.0
1998 c 0 - - - -
-
1999
371 0.0 79.2 20.5 0.3
100.0
2000 c 0 - - - -
-
2001 b 295 0.0 54.2 45.4 0.3
99.9
2002 b 0 - - - -
-
2003
1,596 0.1 79.6 19.4 0.9
100.0
2004
1,449 19.6 54.7 25.7 0.0
100.0
2005
4,754 0.0 97.6 2.1 0.3
100.0
2006
2,340 1.4 43.1 55.4 0.1
100.0
2007
3,064 0.7 75.4 22.2 1.8
100.0
2008
1,557 0.6 45.5 51.9 2.1
100.0
2009 1,901 2.5 71.6 23.5 2.3 100.0
2005-2009
Average 2,723 1.0 66.6 31.0 1.3 100.0 -continued-

182
Appendix A22.–Page 4 of 4.
Sample Age in Years (Percent)
Species / Run Year Size 3 4 5 Total a Coho 1982
320 4.1 87.3 8.6
100.0
Salmon 1983
121 4.1 91.7 4.1
100.0
1984
619 12.9 73.7 13.4
100.0
1985
462 14.1 76.3 9.6
100.0
1986
491 2.2 88.6 9.2
100.0
1987
0 - - -
-
1988
1,091 12.2 85.5 2.3
100.0
1989
749 20.0 74.5 5.5
100.0
1990
428 28.9 67.1 3.9
99.9
1991
615 8.3 91.6 0.1
100.0
1992
920 24.1 74.4 1.6
100.1
1993
522 15.5 83.5 1.0
100.0
1994
752 22.9 76.2 0.9
100.0
1995
664 41.7 58.0 0.3
100.0
1996
944 10.4 87.2 2.4
100.0
1997
516 6.1 92.0 2.0
100.1
1998 c 0 - - -
-
1999
40 7.5 85.0 7.5
100.0
2000 c 0 - - -
-
2001 b 18 22.2 77.8 0.0
100.0
2002 c 0 - - -
-
2003
753 25.1 69.8 5.1
100.0
2004
590 22.3 75.0 2.7
100.0
2005
1,921 8.3 84.8 6.8
100.0
2006
1,231 14.7 80.7 4.6
100.0
2007
1,234 11.6 85.6 2.8
100.0
2008
978 14.4 75.3 10.3
100.0
2009 430 9.3 81.9 8.8 100.0
2005-2009
Average 1,159 11.7 81.7 6.7 100.0 Note: Ages were estimated from samples collected from each gear type, by district and fishery, or from adjacent fisheries with
similar gear. Fisheries for which no appropriate samples were available were not included. a Total may not equal 100% due to rounding. b No commercial fishing, samples were from subsistence harvests. c No commercial fishing occurred and subsistence harvests for fall chum and coho salmon were not sampled.

183
Appendix A23.–Yukon River Chinook salmon historical harvest percentage by stock group for the United States and Canada, 1981–2010.
Lower Middle
Upper
Year U.S. Canada Total
1981 5.4 54.5
31.3 8.8 40.1 1982 13.9 24.7
51.3 10.1 61.4
1983 12.9 33.7
44.6 8.7 53.3 1984 25.3 40.2
25.1 9.4 34.5
1985 27.6 22.3
40.9 9.2 50.1 1986 19.5 9.6
58.7 12.2 70.9
1987 15.9 19.6
56.0 8.6 64.5 1988 21.8 15.8
49.8 12.6 62.5
1989 24.4 15.9
49.4 10.2 59.7 1990 20.2 25.2
43.3 11.4 54.7
1991 28.0 25.3
34.9 11.8 46.7 1992 16.3 21.8
52.3 9.6 61.9
1993 21.5 25.4
43.9 9.2 53.1 1994 18.2 21.4
49.4 11.0 60.4
1995 17.9 22.4
49.2 10.5 59.7 1996 21.0 10.4
56.2 12.4 68.6
1997 26.4 16.8
48.2 8.6 56.9 1998 32.7 17.4
44.2 5.6 49.8
1999 40.1 6.3
44.5 9.1 53.6 2000 33.9 12.3
44.1 9.7 53.8
2001 31.6 16.0
36.5 15.9 52.4 2002 19.4 29.2
39.3 12.1 51.4
2003 6.8 28.9
55.4 8.9 64.3 2004 15.3 28.8
46.8 9.1 55.9
2005 20.7 21.4
46.4 11.5 57.9 2006 17.6 27.6
46.1 8.7 54.9
2007 13.0 30.6
51.1 5.4 56.4 2008 17.0 28.0
48.4 6.6 55.0
2009 11.1 31.4
45.3 12.2 57.5 2010 a
1981-2009 Average 20.5 23.5 46.0 10.0 55.9
2000-2009 Average 18.6 25.4 45.9 10.0 56.0
2005-2009 Average 15.9 27.8 47.5 8.9 56.3
a Data not available.

184
Appendix A24.–Salmon fishery projects conducted in the Alaska portion of the Yukon River drainage in 2010.
Project Name Location Primary Objective(s)/Last Published Project Report (citation) Duration Agency Responsibility
Commercial Catch and Effort Assessment
Alaska portion of the Yukon River drainage
-Document and estimate the catch and associated effort of the Alaska Yukon River and -Commercial salmon fishery via receipts (fish tickets) of commercial sales of salmon.
June - Oct. ADF&G All aspects
Commercial Catch Sampling and Monitoring
Alaska portion of the Yukon River drainage
-Determine age, sex, and size of Chinook, chum and coho salmon harvested in Alaska Yukon River commercial fisheries and -Monitor Alaska commercial fishery openings and closures. (Horne-Brine and DuBois 2010)
June - Oct. ADF&G ADPS
All aspects enforcement
Subsistence and Personal Use Catch and Effort Assessment
Alaska portion of the Yukon River drainage
-Document and estimate the catch and associated effort of the Alaska Yukon River subsistence salmon fishery via interviews, catch calendars, mail-out questionnaires, telephone interviews, and subsistence fishing permits, and of the personal use fishery based on fishery permits.
Ongoing ADF&G All aspects
Sport Catch, Harvest and Effort Assessment
Alaska portion of the Yukon River drainage
-Document and estimate the catch, harvest, and associated effort of the Alaska Yukon River sport fishery via post-season mail-out questionnaires. Postseason ADF&G All aspects
YRDFA Weekly Teleconference Yukon River drainage -Acts as a forum for fishers along the Yukon River to interact with state and federal
managers for the collection and dissemination of fisheries information. May - Sept. YRDFA All aspects R&M funding
Lower Yukon River Set Gillnet Test Fishing
South, Middle, and North mouths of the Yukon River Delta, RM 20
-Index Chinook salmon run timing and abundance using set gillnets and -Sample captured salmon for age, sex, size composition information. (Horne-Brine and DuBois 2010)
June - Aug.
ADF&G All aspects
Hooper Bay Dall Point Offshore Test Fishing
Coastal Bering Sea south of Yukon River outlets
-Assess run abundance, species composition, and run timing information of salmon bound for the Yukon River in offshore waters to assist with timely management decisions.
June - July ADF&G All aspects
Lower Yukon River Drift Test Fishing
South, Middle, and North mouths of the Yukon River delta, RM 20
-Index Chinook, summer and fall chum, and coho salmon run timing and abundance using drift gillnets and -Sample captured salmon for age, sex, size composition information. Fall Season Drift (Hildebrand and Bue 2009) Salmon ASL from all projects (Horne-Brine and DuBois 2010)
June - Aug. ADF&G All aspects
Mountain Village Drift Gillnet Test Fishing
Mainstem Yukon River, RM 87
-Index fall chum and coho salmon run timing and relative abundance using drift gillnets and -Sample captured salmon for age, sex, and size composition information. (Horne-Brine and DuBois 2010)
July - Sept. Asa'carsarmiut Trad. Council
BSFA
All aspects R&M funding
-continued-

185
Appendix A24.–Page 2 of 4.
Project Name Location Primary Objective(s) Duration Agency Responsibility
East Fork Weir, Andreafsky River
Mile 20 East Fork RM 124
-Estimate daily escapement, with age, sex and size composition, of Chinook and summer chum salmon into the East Fork of the Andreafsky River. (Maschmann 2010)
June - Aug. USFWS All aspects OSM funding
Yukon River Sonar Pilot Station, RM 123 -Estimate Chinook and summer and fall chum salmon passage in the mainstem Yukon River. Apportionment of species including coho salmon and other finfish. (Carroll and McIntosh 2008)
June - Aug. ADF&G All aspects YDFDA and R&M funded- extended
operations
Anvik River Sonar Mile 40 Anvik River, RM 358
-Estimate daily escapement of summer chum salmon to the Anvik River and -Estimate age, sex, and size composition of the summer chum salmon escapement. (McEwen 2010) and (Horne-Brine and DuBois 2010)
June - July ADF&G All aspects
Chandalar River Sonar RM 14 Chandalar River, RM 43 Chandalar River RM 996 Yukon River
-Estimate fall chum salmon passage using DIDSON sonar in the Chandalar River, -Estimate sex and size composition of fall chum salmon escapement, and -Collect ASL data including vertebrae. (Melegari 2009)
Aug. - Sept. USFWS All aspects TI Funding R&M funding-ASL
Gisasa River Weir Mile 3 Gisasa River, Koyukuk River drainage, RM 567
-Estimate daily escapement of Chinook and summer chum salmon into the Gisasa River and -Estimate age, sex, and size composition of the Chinook and summer chum salmon escapements. (Melegari 2010) and (Horne-Brine and DuBois 2010)
June - Aug. USFWS All aspects OSM funding
Henshaw Creek Weir Mile 1 Henshaw Creek, RM 976
-Estimate daily escapement of Chinook and summer chum salmon into Henshaw Creek and -Estimate age, sex, and size composition of the Chinook and summer chum salmon escapements. (Berkbigler and Elkin 2007; Horne-Brine and DuBois 2010)
June - Aug. TCC
USFWS-OSM
All aspects oversight & funding report write-up
Y5A Test Fish Wheel Mainstem Yukon River RM 695
-Index the timing of fall chum and coho salmon on the south bank of the Yukon River bound for the Tanana River drainage, using test fish wheel equipped with video monitoring system. (Moore and Daum 2011)
Aug. - Oct. ADF&G USFWS
R&M funded contract R&E funded tech support
Sheenjek River Sonar Mile 6 Sheenjek River Porcupine River drainage, RM 1,060
-Estimate daily escapement of fall chum salmon into the Sheenjek River using DIDSON sonar and counted both left and right banks and -Estimate age, sex, and size composition of the fall chum salmon escapement. (Dunbar 2010; Horne-Brine and DuBois 2010)
Aug. - Sept. ADF&G All aspects
Eagle Sonar Mainstem Yukon River Eagle, RM 1,213
-Estimate daily passage of Chinook and chum salmon in the mainstem Yukon River using both split-beam and DIDSON and -Estimate age, sex, and size composition of salmon captured in the test nets. (Crane and Dunbar 2009; Horne-Brine and DuBois 2010)
July - Oct. ADF&G DFO
All aspects, technical support, TI Funding, R&E
Funding
-continued-

186
Appendix A24.–Page 3 of 4.
Project Name Location Primary Objective(s) Duration Agency Responsibility
Middle Yukon River Chinook Sampling Project
Mainstem Yukon River Kaltag, RM 451
-Estimate age, sex, and size composition of Chinook salmon harvested in middle Yukon River subsistence fisheries. (Horne-Brine and DuBois 2010)
June – July
City of Kaltag
USFWS-OSM
All aspects
Nenana River Escapement Surveys
Nenana River drainage, above RM 860
-Aerial and ground surveys for numbers and distribution of coho and chum salmon in 10 tributaries of the Nenana below Healy Creek. Sept. - Oct. BSFA
ADF&G Field aspects Database
Rapids Test Fish Wheel Mainstem Yukon River RM 730
-Index run timing of Chinook and fall chum salmon runs as well as non-salmon species using video monitoring techniques and -Characterize the sex, weight, and girth composition of Chinook salmon. (Zuray 2010)
June - Sept. Zuray USFWS
All aspects R&E funding
Nenana Test Fish Wheel mainstem Tanana River Nenana, RM 860
-index the timing of Chinook, summer chum, fall chum, and coho salmon runs using a test fish wheel oufitted with video monitoring equipment. (Borba 2007; Cleary and Hamazaki 2008)
June - Sept. ADF&G USFWS
All aspects R&E funded tech support
Toklat River Escapement Sampling
Toklat River, between RM 848 and 860.
-Evaluate fall chum and coho salmon spawning distribution in Toklat River and -Sample fall chum salmon carcasses for age, sex, and size composition information.
Oct. TCC ADF&G
Survey Aging
Biological Sampling of Yukon River Salmon
Middle Yukon (RM279-581) and Fort Yukon
Collect age, sex, and length information from subsistence caught Chinook salmon. (New project reporting to AYKSSI)
July - Aug. TCC All aspects R&E funded
Delta River Ground Surveys Tanana River drainage, RM 1,031
-Estimate fall chum salmon spawning escapement in Delta River and -Sample fall chum salmon carcasses for age, sex, and size composition information. (Horne-Brine and DuBois 2010)
Oct. - Dec. ADF&G All aspects
Chena River Tower Chena River, Tanana River drainage, RM 921
-Estimate daily escapement of Chinook and summer chum salmon into the Chena River. (Brase and Doxey 2006)
July - Aug. ADF&G All aspects AKSSF funding
Salcha River Tower Salcha River, Tanana River drainage, RM 967
-Estimate daily escapement of Chinook and summer chum salmon into the Salcha River. (Brase and Doxey 2006)
July - Aug. BSFA All aspects R&M funding
Goodpaster River Tower Goodpaster River, Tanana River drainage, RM 1,049
-Estimate daily escapement of Chinook and summer chum salmon into the Goodpaster River. July TCC All aspects Pogo Mine
funding
Ichthyophonus Sampling Emmonak, RM 20, Eagle RM 1,213
-Determine prevalence of Ichthyophonus in Chinook salmon in the lower Yukon at Emmonak and in the upperYukon at Eagle. (Kahler et al. 2007)
May - July UAF
ADF&G TCC
All aspects, TI funding, R&E funding
Yukon River Inseason Salmon Harvest Interviews
Emmonak, Holy Cross, Nulato, Huslia, Galena, and Beaver Primary
-Collect qualitative inseason subsistence salmon harvest information through weekly interviews. (Gerken 2008)
June - Sept USFWS YRDFA
All aspects OSM funding
-continued-

187
Appendix A24.–Page 4 of 4.
Project Name Location Primary Objective(s) Duration Agency Responsibility
Juvenile Chinook Rearing in non-natal streams
Yukon River down stream of the Canadian border
-Capture juvenile Chinook salmon in non-natal Yukon River tributary streams, -Determine whether Canadian-origin juvenile Chinook salmon rear in Yukon River tributary streams of the United States using genetic techniques, and -Describe non-natal stream rearing habitat characteristics for habitat characteristics for Yukon River Chinook salmon. (Daum and Flannery 2009)
July - Aug. USFWS All aspects AKSSF Funding
Agency Acronyms: ADF&G = Alaska Department of Fish and Game ADPS = Alaska Department of Public Safety AVCP = Association of Village Council Presidents, Inc. BSFA = Bering Sea Fishermen's Association DFO = Department of Fisheries and Oceans (Canada) NPS = National Park Service TCC = Tanana Chiefs Conference, Inc. UAF = University of Alaska Fairbanks USFWS = United States Fish and Wildlife Service USFWS-OSM = United States Fish and Wildlife Service, Office of Subsistence Management YRDFA = Yukon River Drainage Fisheries Association

188
Appendix A25.–Selected environmental and salmon catch information, Yukon River drainage, 1961–2010.
Average Nome April
Tanana R. Nenana
Iceout Yukon
First Chinook Caught
First Summer
Chum Caught
First District 1 Year Air Temp ( oF) Ice Breakup Delta Area Yukon Delta Area a Yukon Delta Area a Commercial Period 1961 18
5/05
- b 6/5
- b 6/5
1962 18
5/12
6/10
6/7 c - b 6/11 1963 18
5/05
5/29
- b - b 6/3
1964 13
5/20
>6/12
- b - b 6/15 1965 20
5/07
6/01
6/6
- b 6/7
1966 15
5/08
6/06
6/9
- b 6/10 1967 23
5/04
- b 5/20
5/30
6/2
1968 14
5/08
- b - b 6/5
6/3 1969 22
4/28
5/25
5/26
6/2
6/2
1970 15
5/04
late May
6/6
6/5
6/6 1971 13
5/08
6/05
6/11
6/15
6/11
1972 12
5/10
6/03
6/9
6/11
6/9 1973 18
5/04
6/01
5/30 d 6/5
6/5
1974 21
5/06
late May
5/27
6/1
6/3 1975 13
5/10
6/01
6/1
6/13
6/9
1976 10
5/02
6/01
6/12
6/13
6/14 1977 9
5/06
6/01
6/9
6/11
6/11
1978 25
4/30
5/20
5/26
5/26
6/8 1979 26
4/30
5/20
5/24
5/28
6/4
1980 24
4/29
5/19
5/27 e 5/31
6/9 1981 24
4/30
5/18
5/25
5/28
6/5
1982 12
5/10
6/02
6/6
6/6
6/14 1983 25
4/29
5/21
5/25
5/30
6/9
1984 12
5/09
6/01
6/2 f 6/8
6/18 1985 1
5/11
6/05
6/14
6/16
6/24
1986 12
5/08
6/01
6/6
6/7
6/14 1987 19
5/05
5/31
5/31
6/4
6/15
1988 23
4/27
5/20
5/27
5/27
6/9 1989 25
5/01
5/31
5/29 h 6/3
6/13
1990 26
4/24
5/28
5/29
5/31
6/14 1991 25
5/01
5/24
5/29
5/29
6/13
1992 22 i 5/14
5/30 j 6/13
6/13
6/20 1993 28
4/23
5/19
5/26
5/28
6/14
1994 20
4/29
5/22
5/24
5/28
6/13 1995 26
4/26
5/18
5/24
5/26
6/12
1996 21
5/05
5/19
5/24
5/24
6/10 1997 27 k 4/30
5/15
5/22
5/25
6/11
1998 26
4/20
5/22
5/28
5/25
6/15 1999 17
4/29 l 5/29
6/6
6/13
6/22
2000 21
5/01
5/29
6/3
6/5
6/24 2001 22
5/08
6/05
6/7
6/9
N/A
2002 20
5/07
5/24
5/31
5/30
6/20 2003 26
4/29
5/17
5/22
5/30
6/16
2004 29
4/24
5/08
5/18
5/27
6/17 2005 15
4/28
5/17
5/25
6/1
6/24
2006 12 m 5/2
5/29
6/6
6/7
6/19 2007 27 m 4/27
5/18
6/3
6/12
6/18
2008 15 m 5/5
5/24
6/3
6/16
7/2 2009 17 m 5/1
5/26
6/5
6/10
6/20
2010 20 m 4/29 5/22 n 6/9 6/10 6/28 -continued-

189
Appendix A25.–Page 2 of 2. a Subsistence or test fishery. b Information not available. c Caught June 9 Mt. Village, back calculated arrival date to mouth. d Caught June 3 Pilot Station, back calculated arrival date to mouth. e Caught May 23 Marshall, back calculated arrival date to mouth. f Caught June 5 Pitkas Point, back calculated arrival date to mouth. g Special 6-inch maximum mesh size fishing period. h Average May air temperature was 8.2oF below normal. i Caught June 1 St. Marys, back calculated arrival date to mouth. j The mainstem Yukon River was ice free, but ice remained along the coast until June 10. k Average April air temperature was 9oF above normal. l The Nenana Ice Classic tripod moved on April 29, but the ice did not move out for several more days. m Source: http://climate.gi.alaska.edu/AKCityClimo/AK_Climate_Sum.html n Though breakup on the Lower River occurred May 22, shore-fast sea ice persisted until later than usual in the season.

190
Appendix A26.–Total catch and estimated catch of Western Alaska (including Canadian Yukon River) Chinook salmon (in thousands of fish) taken in Japanese high seas salmon gillnet fisheries and total catch of Chinook salmon taken in foreign, joint-venture, and U.S. domestic trawl fisheries, 1964-2010.
Japanese
Japanese
Japanese
Bering Sea-Aleutian Area Gulf of Alaska
Mothership Gillnet
Landbased Driftnet
Total Gillnet
Trawl
Trawl
Western
Western
Western
Joint
Joint
Alaska
Alaska
Alaska
Venture
U.S.
Venture/U.S. Year Origin Total Origin Total Origin Total Foreign Groundfish a Domestic Total Foreign Groundfish b Total
1964
179
410
40
208
219
618 1965
106
185
20
102
126
287
1966
108
208
22
118
130
326 1967
71
128
22
115
93
243
1968
244
362
18
97
262
459 1969
367
554
17
88
384
642
1970
312
437
28
148
340
585 1971
132
206
27
139
159
345
1972
189
261
20
107
209
368 1973
56
119
31
165
87
284
1974
208
361
36
188
244
549 1975
108
162
20
137
128
299
1976
117
285
42
201
159
486 1977
55
93
31
146
86
239
4.8
4.8
1978
36
105
63
210
99
315
39.1
39.1
c 1979
69
126
45
162
114
286
100.4
100.4
16.9
1.0
17.9
1980
416
704
22
160
438
864
113.1 1.9
115.0
31.6
0.2
31.8 1981
30
88
55
190
85
278
35.9 0.3
36.2
28.6
0.0
28.6
1982
45
107
41
165
86
272
13.9 1.7
15.6
4.7
1.2
5.9 1983
31
87
44
178
75
265
9.8 0.5
10.3
5.9
3.6
9.5
1984
36
82
21
92
57
174
9.5 1.7
11.2
11.1
63.2
74.3 1985
25
66
22
100
47
167
7.1 2.5
1.5 11.1
0.3
13.6
13.9
1986
24
60
20
76
44
137
1.0 4.8
3.4 9.2
0.0
20.8
20.8 1987
20
39
d 74
d 116
1.0 8.4
12.8 22.2
0.8
0.8
1988
23
26
d 47
d 73
5.6
24.7 30.3
0.1
0.1 1989
d 16
d 51
d 67
8.6
31.8 40.4
6.7
6.7
1990
-
-
-
-
d 23 e
14.0 14.0
16.9
16.9 1991
-
-
-
-
d 45 e
48.9 48.9
38.9
38.9
1992 f
42.0 42.0
16.8
16.8 1993
46.0 46.0
24.5
24.5
1994
43.8 43.8
13.6
13.6 1995
23.4 23.4
14.6
14.6
1996
63.2 63.2
15.8
15.8 1997
50.5 50.5
15.1
15.1
-continued-

191
Appendix A26.–Page 2 of 2.
Japanese
Japanese
Japanese
Bering Sea-Aleutian Area Gulf of Alaska
Mothership Gillnet
Landbased Driftnet
Total Gillnet
Trawl
Trawl
Western
Western
Western
Joint
Joint
Alaska
Alaska
Alaska
Venture
U.S.
Venture/U.S. Year Origin Total Origin Total Origin Total Foreign Groundfish a Domestic Total Foreign Groundfish b Total
1998
55.4 55.4
17.0
16.9 1999
14.6 14.6
30.6
30.6
2000
8.2 8.2
26.7
26.7 2001
40.5 40.5
15.1
15.1
2002
39.7 39.7
12.9
12.9 2003
54.8 54.8
15.9
15.6
2004
63.1 63.1
18.1
17.8 2005
75.0 75.0
31.6
31.6
2006
87.8 87.8
19.2
19.2 2007
129.5 129.5
39.8
39.8
2008
18.8 18.8
13.3
13.3 2009
14.0 14.0
7.9
7.9
2010 12.5 12.5 54.2 54.2 a Joint-venture harvest reported through 1989 (fishery ended in 1990). b Joint-venture harvest reported through 1988 when fishery ended. U.S. ground fish fishery harvest reported beginning in 1989. c Species composition unknown. d Information not available. e Japanese mothership fishery converted to "nontraditional land-based salmon fishery". f U.S. fishery entirely replaced directed foreign and joint-venture groundfish harvests.

192
Appendix A27.–List of emergency orders pertaining to the Districts 1-6 Chinook and summer chum salmon fishery, Yukon Area, 2010.
EO Number: 3-S-LY-01-10 Effective Date: June 7, 2010
Implements the subsistence salmon fishing schedule in District 1.
EO Number: 3-S-LY-02-10 Effective Date: June 9, 2010
Implements the subsistence salmon fishing schedule in District 2.
EO Number: 3-S-LY-03-10 Effective Date: June 13, 2010
Implements the subsistence salmon fishing schedule in District 3.
EO Number: 3-S-LY-04-10 Effective Date: June 26, 2010
Opens the commercial salmon fishing season in District 1.
EO Number: 3-S-LY-04-10 Effective Date: June 7, 2010
Specifies gillnet mesh size and length during salmon closures for non-salmon species to a maximum of 4 inch mesh and 60 feet in length.
EO Number: 3-S-LY-05-10 Effective Date: June 26, 2010
Establishes a 4-hour commercial fishing period with gillnets restricted to 6-inch maximum mesh size in District 1.
EO Number: 3-S-LY-06-10 Effective Date: June 26, 2010
Cancels the commercial fishing period announced for 6:00 p.m. Saturday, June 26, 2010, until 10:00 p.m. Saturday, June 26, 2010, in District 1.
EO Number: 3-S-LY-07-10 Effective Date: June 28, 2010
Establishes a 6-hour commercial fishing period with gillnets restricted to 6-inch maximum mesh size in District 1.
EO Number: 3-S-LY-08-10 Effective Date: July 1, 2010
Opens the commercial salmon fishing season in District 2.
EO Number: 3-S-LY-09-10 Effective Date: July 1, 2010
Establishes a 4-hour commercial fishing period with gillnets restricted to 6-inch maximum mesh size in District 2.
-continued-

193
Appendix A27.–Page 2 of 4.
EO Number: 3-S-LY-10-10 Effective Date: June 30, 2010
Reduces the amount of time subsistence fishing is closed associated with the commercial fishing period in District 2 announced in emergency order 3-S-LY-09-10 to 18 hours before, during, and 6 hours after the commercial fishing period.
EO Number: 3-S-LY-11-10 Effective Date: July 1, 2010
Establishes a 6-hour commercial fishing period with gillnets restricted to 6-inch maximum mesh size in District 1.
EO Number: 3-S-LY-12-10 Effective Date: July 3, 2010
Established a 6-hour commercial fishing period with gillnets restricted to 6-inch maximum mesh size in District 1.
EO Number: 3-S-LY-13-10 Effective Date: July 4, 2010
Establishes a 6-hour commercial fishing period with gillnets restricted to 6-inch maximum mesh size in District 2.
EO Number: 3-S-LY-14-10 Effective Date: July 6, 2010
Establishes a 6-hour commercial fishing period with gillnets restricted to 6-inch maximum mesh size in District 1.
EO Number: 3-S-LY-15-10 Effective Date: July 7, 2010
Establishes a 6-hour commercial fishing period with gillnets restricted to 6-inch maximum mesh size in District 2.
EO Number: 3-S-LY-16-10 Effective Date: July 8, 2010
Establishes a 9-hour commercial fishing period with gillnets restricted to 6-inch maximum mesh size in District 1.
EO Number: 3-S-LY-17-10 Effective Date: July 10, 2010
Establishes a 6-hour commercial fishing period with gillnets restricted to 6-inch maximum mesh size in District 2.
EO Number: 3-S-LY-18-10 Effective Date: July 11, 2010
Establishes a 9-hour commercial fishing period with gillnets restricted to 6-inch maximum mesh size in
EO Number: 3-S-LY-19-10 Effective Date: July 10, 2010
Reduces the amount of time subsistence fishing is closed in District 1 associated with the commercial fishing period announced in emergency order 3-S-LY-18-10 to 12 hours before, during, and 12 hours after the commercial fishing period.
-continued-

194
Appendix A27.–Page 3 of 4.
EO Number: 3-S-LY-20-10 Effective Date: July 12, 2010
Establishes a 6-hour commercial fishing period with gillnets restricted to 6-inch maximum mesh size in District 2.
EO Number: 3-S-LY-21-10 Effective Date: July 13, 2010
Establishes a 9-hour commercial fishing period with gillnets restricted to 6-inch maximum mesh size in District 1.
EO Number: 3-S-LY-22-10 Effective Date: July 14, 2010
Establishes a 6-hour commercial fishing period with gillnets restricted to 6-inch maximum mesh size in District 2.
EO Number: 3-S-LY-23-10 Effective Date: July 15, 2010
Establishes a 9-hour commercial fishing period with gillnets restricted to 6-inch maximum mesh size in District 1.
EO Number: 3-S-LY-24-10 Effective Date: July 16, 2010
Establishes a 9-hour commercial fishing period with gillnets restricted to 6-inch maximum mesh size in District 2.
EO Number: 3-S-UY-01-10 Effective Date: June 16, 2010
Implements subsistence fishing schedule in Subdistrict Y4-A of two 48-hour periods per week.
EO Number: 3-S-UY-02-10 Effective Date: June 23, 2010
Implements subsistence fishing schedule in Subdistrict Y4-B and Y4-C of two 48-hour periods per week.
EO Number: 3-S-UY-03-10 Effective Date: June 29, 2010
Implements subsistence fishing schedule in Subdistricts Y5-A, Y5-B and Y5-C of two 48-hour periods per week.
EO Number: 3-S-UY-04-10 Effective Date: July 7, 2010
Opens commercial fishing in Subdistricts Y4-A, Y4-B, and Y4-C. Schedules 5 12-hour periods in Subdistrict Y4-A from July 7-12.
EO Number: 3-S-UY-05-10 Effective Date:July 11, 2010
Extends commercial period in Y4-A from 12 hours July 11-12 to 48 hours July 11-13.
EO Number: 3-S-UY-06-10 Effective Date: July 13, 2010
Extends commercial period in Y4-A from 48 hours July 11-13 to 120 hours July 11-16.
-continued-

195
Appendix A27.–Page 4 of 4.
EO Number: 3-S-UY-07-10 Effective Date: July 16, 2010
Establishes one 120-hour commercial salmon fishing period in Subdistrict 4-A.
EO Number: 3-S-UY-08-10 Effective Date: July 19, 2010
Establishes a 42-hour commercial fishing period in District 6 from 6:00 p.m. July 19 to 12:00 noon July 21.
EO Number: 3-S-UY-09-10 Effective Date: July 21, 2010
Establishes a 120 hour commercial fishing period in Subdistrict 4-A from 6:00 p.m. July 21 to 6:00 p.m. July 26.
EO Number: 3-S-UY-10-10 Effective Date: July 23, 2010
Establishes a 42 hour commercial fishing period in District 6 from 6:00 p.m. July 23 to 12:00 noon July 25.
EO Number: 3-S-UY-11-10 Effective Date: July 30, 2010
Closes personal use salmon fishing in the Tanana River within ½ mile of the mouth of the Chena River.
EO Number: 3-S-UY-12-10 Effective Date: July 25, 2010
Establishes 5 days per week subsistence fishing schedule for Subdistricts 4-A, 4-B, and 4-C.
EO Number: 3-S-UY-13-10 Effective Date: July 26, 2010
Establishes one 120-hour commercial fishing period in Subdistrict 4-A from 6:00 p.m. July 26 to 6:00 p.m. July 31.
EO Number: 3-S-UY-14-10 Effective Date: July 26, 2010
Establishes one 42-hour commercial fishing period in District 6 from 6:00 p.m. July 26 to 12:00 noon July 28.
EO Number: 3-S-UY-15-10 Effective Date: July 30, 2010
Establishes one 42-hour commercial fishing period in District 6 from 6:00 p.m. July 30 to 12:00 noon August 1.
EO Number: 3-S-UY-16-10 Effective Date: Aug. 2, 2010
Establishes one 42-hour commercial fishing period in District 6 from 6:00 p.m. August 2 to 12:00 noon August 4.
EO Number: 3-S-UY-17-10 Effective Date: Aug. 6, 2010
Establishes one 42-hour commercial fishing period in District 6 from 6:00 p.m. August 6 to 12:00 noon August 8.
EO Number: 3-S-UY-18-10 Effective Date: Aug. 9, 2010
Establishes one 42-hour commercial fishing period in District 6 from 6:00 p.m. August 9 to 12:00 noon August 11.

196
Appendix A28.–List of emergency orders pertaining to the Districts 1-6 fall chum and coho salmon fishery, Yukon Area, 2010.
EO Number: 3-S-FY-01-10 Effective Date: August 3, 2010
Opens District 4 subsistence fishing to 7 days per week.
EO Number: 3-S-FY-02-10 Effective Date: August 3, 2010
Opens Subdistricts 5-A, 5-B, and 5-C subsistence fishing to 7 days per week.
EO Number: 3-S-FY-03-10 Effective Date: August 18, 2010
Closes subsistence fishing in District 1 8am August 18 and reopens 8pm August 19 on schedule of two 36-hour periods per week.
EO Number: 3-S-FY-04-10 Effective date: August 20, 2010
Closes subsistence fishing in Districts 2 and 3 8am August 20 and reopens 8pm August 22 on schedule of two 36-hour periods per week.
EO Number: 3-S-FY-05-10 Effective Date: August 20, 2010
Closes subsistence fishing in District 4 8pm August 20 and reopens 6pm August 22 on schedule of two 48-hour periods per week.
EO Number: 3-S-FY-06-10 Effective Date: August 22, 2010
Closes subsistence fishing in Subdistricts 5-A, 5-B, and 5-C 6pm August 22 and reopens 6pm August 24 on schedule of two 48-hour periods per week.
EO Number: 3-S-FY-07-10 Effective Date: August 23, 2010
Cancels subsistence period in District 1 scheduled 8pm August 23 until 8am August 25.
EO Number: 3-S-FY-08-10 Effective Date: August 25, 2010
Cancels subsistence period in Districts 2 and 3 scheduled 8pm August 25 until 8am August 27.
EO Number: 3-S-FY-09-10 Effective Date: August 29, 2010
Cancels subsistence period in District 4 scheduled 6pm August 29 until 6pm August 31.
EO Number: 3-S-FY-10-10 Effective Date: September 5, 2010
Cancels subsistence period in Subdistricts 5-B and 5-C scheduled 6pm September 3 until 6pm September 5.
-continued-
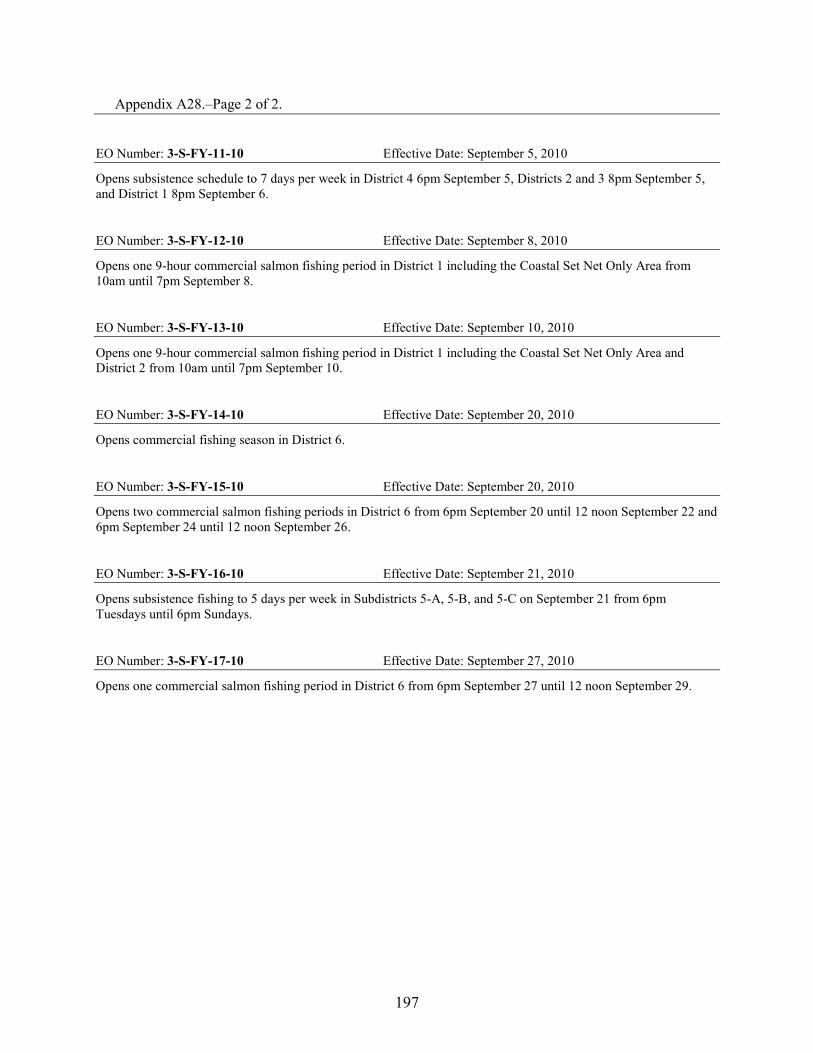
197
Appendix A28.–Page 2 of 2.
EO Number: 3-S-FY-11-10 Effective Date: September 5, 2010
Opens subsistence schedule to 7 days per week in District 4 6pm September 5, Districts 2 and 3 8pm September 5, and District 1 8pm September 6.
EO Number: 3-S-FY-12-10 Effective Date: September 8, 2010
Opens one 9-hour commercial salmon fishing period in District 1 including the Coastal Set Net Only Area from 10am until 7pm September 8.
EO Number: 3-S-FY-13-10 Effective Date: September 10, 2010
Opens one 9-hour commercial salmon fishing period in District 1 including the Coastal Set Net Only Area and District 2 from 10am until 7pm September 10.
EO Number: 3-S-FY-14-10 Effective Date: September 20, 2010
Opens commercial fishing season in District 6.
EO Number: 3-S-FY-15-10 Effective Date: September 20, 2010
Opens two commercial salmon fishing periods in District 6 from 6pm September 20 until 12 noon September 22 and 6pm September 24 until 12 noon September 26.
EO Number: 3-S-FY-16-10 Effective Date: September 21, 2010
Opens subsistence fishing to 5 days per week in Subdistricts 5-A, 5-B, and 5-C on September 21 from 6pm Tuesdays until 6pm Sundays.
EO Number: 3-S-FY-17-10 Effective Date: September 27, 2010
Opens one commercial salmon fishing period in District 6 from 6pm September 27 until 12 noon September 29.

198

199
APPENDIX B

200
Appendix B1.–Commercial catches of Chinook and summer chum salmon by mesh size, Districts 1 and 2, Lower Yukon Area, 1961–2010.
Unrestricted Mesh Size a,b 6 inch Maximum Mesh Size a,c
Chinook
Summer Chum
Chinook Summer Chum
Year d District 1 District 2 Total Districts 1 and 2 Districts 1 and 2 Districts 1 and 2 1961
84,466 29,026 113,492
-
- -
1962
67,099 22,224 89,323
-
- - 1963
85,004 24,221 109,225
-
- -
1964
67,555 20,246 87,801
-
- - 1965
89,268 23,763 113,031
-
- -
1966
70,788 16,927 87,715
-
- - 1967
104,350 20,239 124,589
10,919
- -
1968
79,465 21,392 100,857
14,402
- - 1969
70,588 14,756 85,344
41,418
97 15,437
1970
56,469 17,141 73,610
104,705
57 16,623 1971
84,397 19,226 103,623
42,189
1,176 57,851
1972
68,059 17,317 85,376
78,698
1,991 37,881 1973 e 52,790 12,479 65,269
89,841
5,168 196,540
1974
69,457 17,464 86,921
349,758
1,631 227,507 1975
41,550 9,064 50,614
148,919
4,162 345,472
1976
56,392 15,296 71,688
267,075
7,631 128,431 1977
65,745 15,328 81,073
157,909
4,720 205,634
1978
53,198 28,872 82,070
275,512
7,737 354,603 1979
61,790 33,347 95,137
136,973
22,136 434,188
1980
78,157 42,755 120,912
95,876
19,474 605,679 1981
88,038 37,660 125,698
163,979
18,648 758,767
1982
70,743 35,656 106,399
225,106
6,887 217,563 1983
76,280 30,798 107,078
121,927
31,002 590,329
1984
65,101 29,355 94,456
242,076
16,394 287,531 1985 f 76,106 38,194 114,300
170,345
22,445 265,240
1986
42,922 36,603 79,525
231,372
15,307 438,182 1987
62,147 40,127 102,274
128,017
21,827 269,757
1988
32,792 20,009 52,801
225,049
39,469 848,321 1989 g 32,180 21,494 53,674
126,360
38,548 765,233
1990 g 42,092 24,000 66,092
99,588
18,147 281,418 1991 g 52,074 36,290 88,364
108,986
4,145 205,610
1992 g 54,569 28,679 83,248
81,458
27,678 242,878 1993
47,084 37,293 84,377
47,488
2,202 45,503
1994 h 61,633 41,692 103,325
39,832
608 15,369 1995
74,827 39,607 114,434
113,860
3,098 112,223
1996
56,642 30,209 86,851
123,233
0 0 1997
63,062 39,052 102,114
49,953
3,611 28,204
1998
24,202 16,806 41,008
20,314
1,211 7,804 1999
37,145 27,119 64,264
27,883
0 0
-continued-

201
Appendix B1.–Page 2 of 2.
Unrestricted Mesh Size a,b 6 inch Maximum Mesh Size a,c
Chinook
Summer Chum
Chinook Summer Chum
Year d District 1 District 2 Total Districts 1 and 2 Districts 1 and 2 Districts 1 and 2 2000
4,735 3,783 8,518
6,624
0 0
2001
- - -
-
- - 2002
11,087 11,434 22,521
10,354
0 0
2003
22,708 14,220 36,928
6,162
0 0 2004
28,401 24,145 52,546
19,775
0 0
2005
16,619 13,413 30,032
32,278
0 0 2006
23,728 19,356 43,084
35,574
478 11,785
2007
13,558 9,238 22,796
11,311
9,121 164,911 2008
0 0 0
0
4,401 125,598
2009
0 0 0
0
188 157,906 2010 0 0 0 0 9,897 183,215
2005-2009 Average
10,781 8,401 19,182
15,833
2,838 92,040 2000-2009
Average 13,426 10,621 24,047 13,564 1,576 51,133 Note: Unless otherwise indicate blank cells indicate years in which no information was collected or harvest numbers were
insufficient to generate summary information. Dashes indicate no commercial fishing activity occurred. a Does not include Chinook caught during the fall season fishery. b Primarily 8 to 8-1/2 inch mesh size used during early June to early July. c Catch through July 15–20, relatively few Chinook and summer chum salmon taken after these dates. d ADF&G test fishery sales included, 1961–1990. ADF&G test fishery sales not included, 1991–2005. e Six inch maximum mesh size regulation beginning late June to early July became effective in 1973. f Six inch maximum mesh size regulation by emergency order during commercial fishing season became effective in 1985. g Only includes information from fish ticket database; does not include salmon purchased illegally. h Eight inch or greater mesh size restriction was in effect until June 27 and fishermen were requested to take chum salmon home
for subsistence use until June 22 in order to reduce the harvest of chum salmon.

202
Appendix B2.–Numbers of commercially caught Chinook salmon (in thousands of fish) by unrestricted mesh size periods, District 1, Lower Yukon Area, 1974–2010. Date 1974 1975 1976 1977 1978 1979 1980 1981 1982 1983 1984 1985 1986 06/01
06/02 06/03 06/04 06/05 3.5 (3.5)
6.1 (6.1)
06/06 06/07
11.1 (11.1) 06/08 7.5 (11.0)
4.9 (11.0)
06/09
2.5 (2.5)
15.6 (26.7) 06/10
6.8 (6.8)
22.3 (22.3)
06/11
0.2 (0.2) 06/12 14.7 (25.7)
19.5 (30.5)
14.5 (41.2)
06/13
5.8 (8.3) 06/14
0.4 (0.6)
0.04 (0.04)
26.1 (32.9)
12.7 (35.0)
06/15 11.1 (36.8)
5.6 (5.6) 06/16
0.1 (0.1)
9.3 (39.8)
18.3 (59.5)
06/17
17.6 (25.9)
14.6 (47.5)
28.6 (63.6) 06/18
1.1 (1.7)
2.6 (2.6)
12.4 (18.0)
06/19 18.8 (55.6)
3.2 (3.3)
16.7 (56.5)
28.5 (88.0)
13.7 (13.7) 06/20
7.5 (33.4)
21.7 (21.7)
06/21
5.7 (7.4)
10.4 (13.0)
26.2 (73.7)
12.7 (76.3) 06/22 2.9 (58.5)
5.3 (61.8)
20.0 (38.0)
18.8 (32.5)
06/23
9.6 (12.9)
4.5 (78.2) 06/24
14.4 (47.8)
10.2 (31.9)
06/25
17.1 (24.5)
26.3 (39.3)
7.1 (45.1)
23.6 (23.6) 06/26 7.2 (65.7)
15.4 (28.3)
16.1 (48.6)
06/27
9.8 (34.3)
5.4 (53.2) 06/28
17.7 (57.0)
33.7 (57.3)
06/29 3.8 (69.5)
18.1 (63.2)
16.5 (65.1) 06/30
13.8 (42.1)
5.6 (37.5)
07/01
7.3 (41.6)
8.7 (65.7) 07/02
14.3 (56.4)
7.5 (70.7)
18.8 (76.1)
07/03 07/04
5.4 (42.9) 07/05
07/06 07/07 07/08
-continued-

203
Appendix B2.–Page 2 of 4. Date 1987 1988 1989 a 1990 b 1991 c 1992 d 1993 1994 1995 1996 1997 1998 1999 06/01 06/02
06/03 06/04 06/05 06/06 06/07 06/08 06/09 06/10
14.0 (14.0) 06/11
11.4 (11.4)
06/12
18.4 (18.4) 06/13
13.5 (13.5)
6.8 (20.8)
06/14
5.9 (5.9)
17.1 (17.1) 06/15
19.0 (19.0)
9.1 (9.1)
17.5 (35.9)
1.8 (1.8)
06/16 13.0 (13.0)
18.9 (18.9)
23.0 (36.5)
11.2 (22.5) 06/17
16.0 (21.9)
6.7 (27.5)
06/18
15.1 (32.2)
23.0 (32.1) 06/19 22.5 (35.5)
6.5 (42.4)
20.1 (42.7)
06/20
10.8 (29.7)
11.5 (11.5)
11.3 (38.8) 06/21
10.9 (32.8)
4.7 (36.9)
10.4 (42.5)
06/22
2.5 (32.2) 15.0 (34.0)
22.1 (33.6)
13.8 (50.3) 21.0 (64.0)
11.2 (11.2) 06/23 15.0 (50.5)
7.4 (50.1) 11.8 (13.6)
06/24
10.9 (49.7) 06/25
9.3 (46.2)
06/26 11.6 (62.1)
10.0 (43.6)
11.0 (75.0)
13.0 (63.1)
9.8 (21.0) 06/27
11.2 (61.5)
6.9 (56.6)
7.2 (20.8)
06/28
2.9 (45.4) 06/29
6.5 (40.4)
06/30
7.5 (28.5) 07/01
1.6 (47.0)
07/02
5.9 (52.1) 11.0 (54.6) 07/03
1.7 (42.1)
6.3 (34.8)
07/04 07/05 07/06 07/07
3.4 (24.2) 07/08
2.3 (37.1)
-continued-

204
Appendix B2.–Page 3 of 4 Date 2000 2001 e 2002 2003 2004 2005 2006 2007 2008 f 2009 f 2010 f 06/01
06/02 06/03 06/04 06/05 06/06 06/07 06/08 06/09 06/10 06/11 06/12 06/13 06/14 06/15 06/16
10.7 (10.7) 06/17
3.1 (3.1)
06/18 06/19
4.7 (4.7) 4.3 (4.3) 06/20
4.9 (4.9)
06/21
7.3 (18.0) 8.0 (11.1)
5.9 (10.2) 06/22
06/23 06/24
4.6 (9.5)
10.2 (21.2) 5.0 (5.0) 06/25 2.6 (2.6)
3.4 (13.6)
06/26
2.6 (20.6)
7.2 (11.9) 06/27
1.6 (11.1)
7.6 (12.7)
06/28
2.7 (23.9) 06/29
7.6 (19.6)
06/30 2.2 (4.7)
1.6 (25.6) 2.9 (15.6) 07/01
07/02
1.6 (22.3) 1.5 (27.1) 07/03
3.1 (22.7)
07/04 07/05
1.0 (28.1) 1.0 (16.6) 07/06
1.0 (23.7)
07/07
0.4 (22.7) 07/08
07/09 0.3 (28.4) -continued-

205
Appendix B2.–Page 4 of 4.
Note: Cumulative catch during unrestricted mesh size fishing periods, in thousands of fish, are located in the brackets ( ). a Does not include 3,211 Chinook salmon sold illegally. b Does not include 1,101 Chinook salmon sold illegally. c Does not include 2,711 Chinook salmon sold illegally. d Does not include 1,218 Chinook salmon sold illegally. e No commercial fishing periods. f No unrestricted mesh size fishing periods.

206
Appendix B3.–Numbers of commercially caught Chinook salmon (in thousands of fish) by unrestricted mesh size periods, District 2, Lower Yukon Area, 1978–2010.
Date 1978 1979 1980 1981 1982 1983 1984 1985 1986 1987 1988 06/01
06/02 06/03 06/04
1.6 (1.6) 06/05
06/06 06/07
1.4 (3.0) 06/08
7.6 (7.6)
06/09 4.8 (4.8)
3.9 (3.9) 06/10
06/11
5.1 (8.1)
11.4 (19.0) 06/12 3.2 (8.0)
7.8 (11.7)
06/13
6.0 (6.0) 06/14
06/15
14.2 (22.3)
10.5 (29.5) 06/16 4.3 (12.3)
10.9 (22.6)
7.3 (13.3)
2.7 (2.7)
06/17
4.0 (4.0) 06/18
3.9 (26.2)
8.2 (37.7)
9.5 (9.5)
06/19 7.8 (20.1) 06/20
8.1 (30.7)
10.6 (23.9)
9.0 (11.7)
06/21
7.2 (33.4)
7.8 (11.8)
5.6 (5.6) 06/22
12.2 (21.7)
06/23 4.1 (24.2)
12.0 (42.7)
6.9 (30.8)
14.5 (14.5)
8.3 (20.0) 06/24
11.9 (23.7)
06/25
14.4 (20.0)
10.9 (32.5) 06/26 4.7 (28.9)
06/27
7.0 (7.0) 12.3 (26.8) 06/28
3.4 (27.1)
9.4 (29.4)
06/29
7.6 (40.1) 06/30
07/01
8.6 (35.7)
18.3 (25.3) 07/02
7.4 (34.2)
07/03 07/04
12.9 (38.2) 07/05
07/06 07/07
2.4 (36.6) 07/08
-continued-

207
Appendix B3.–Page 2 of 3. Date 1989 1990 1991 a 1992 b 1993 1994 1995 1996 1997 1998 1999 06/01
06/02 06/03 06/04 06/05 06/06 06/07 06/08 06/09
7.5 (7.5) 06/10
06/11
1.2 (1.2) 06/12
10.0 (17.5)
06/13 06/14
9.2 (10.4) 06/15
8.2 (8.2)
7.3 (7.3)
06/16
4.9 (22.4) 06/17
11.5 (11.5)
10.6 (10.6)
06/18
10.3 (10.3)
9.8 (20.2)
9.6 (16.8) 06/19 11.0 (11.0)
3.3 (25.7)
06/20
9.6 (21.1)
18.2 (26.4) 06/21
14.1 (24.7)
8.4 (28.6)
06/22 7.5 (18.5)
5.5 (5.5)
15.2 (32.1) 06/23
3.3 (29.0)
06/24
7.7 (18.0) 6.7 (27.8) 13.0 (18.5) 06/25 3.0 (21.5)
6.8 (31.5) 11.2 (37.6)
7.0 (39.1)
8.1 (8.1)
06/26
4.1 (31.9)
6.6 (6.6) 06/27
3.2 (33.7)
06/28
7.4 (25.9) 06/29
7.8 (15.8)
06/30
2.6 (36.0) 07/01
1.2 (30.2)
07/02
4.5 (22.4)
7.4 (14.0) 7.0 (22.9) 07/03
4.1 (41.7)
07/04
4.4 (36.3) 07/05
1.6 (24.0)
4.3 (27.1)
07/06 07/07 07/08 2.8 (28.7) 2.8 (16.8)
-continued-

208
Appendix B3.–Page 3 of 3. Date 2000 2001 c 2002 2003 2004 2005 2006 2007 2008 d 2009 d 2010 d 06/01
06/02 06/03 06/04 06/05 06/06 06/07 06/08 06/09 06/10 06/11 06/12 06/13 06/14 06/15
8.9 (8.9)
2.1 (2.1) 06/16
0.9 (0.9)
06/17 06/18
7.5 (7.5) 06/19
5.2 (5.2)
06/20
4.0 (13.0)
3.9 (6.0) 06/21
06/22 06/23
7.3 (20.2) 6.4 (6.4) 06/24
5.9 (6.8) 3.2 (9.2)
06/25
5.2 (12.7) 06/26
4.1 (9.4)
4.9 (11.3)
06/27 3.8 (3.8)
3.9 (24.1)
7.1 (13.9) 06/28
06/29 06/30
2.1 (11.4) 07/01
07/02
0.7 (13.4)
2.1 (13.4) 3.9 (17.8) 07/03
07/04 07/05 07/06
1.5 (19.3) 07/07
0.8 (14.2)
Note: Cumulative catch during unrestricted mesh size fishing periods, in thousands of fish, are located in the brackets ( ). a Does not include 284 Chinook salmon sold illegally. b Does not include 207 Chinook salmon sold illegally. c No commercial fishing periods. d No unrestricted mesh size fishing periods.

209
Appendix B4.–Commercial Chinook salmon harvest (in numbers of fish) by statistical area, Lower Yukon Area, 1974–2010.
District 1 Year a 334-11 334-12 334-13 334-14 334-15 334-16 334-17 334-18 Total 1974
2,935 30,174 6,984 3,987 12,721 2,048
6,826 6,165 71,840
1975
6,396 15,844 8,763 314 1,720 606
6,879 4,063 44,585 1976
8,333 27,937 7,507 851 5,101 1,415
6,164 5,102 62,410
1977
11,278 16,787 8,866 1,216 15,214 1,550
7,109 7,895 69,915 1978
886 12,237 4,135 4,388 22,019 3,738
7,533 4,070 59,006
1979
1,017 13,152 4,149 5,782 12,839 10,960
18,976 8,202 75,077 1980
464 12,832 3,235 9,224 30,737 12,333
13,654 7,903 90,382
1981
6,639 12,875 2,975 8,976 19,730 15,158
22,251 10,902 99,506 1982
3,439 11,268 2,842 9,038 9,331 7,295
18,185 13,052 74,450
1983
7,919 23,523 8,161 14,961 9,416 5,297
19,172 7,008 95,457 1984
14,385 15,320 2,598 6,297 11,123 1,434
19,089 4,425 74,671
1985
4,233 22,696 12,160 2,492 12,806 3,955
25,144 6,525 90,011 1986
4,187 7,954 3,494 5,430 10,258 1,422
15,948 4,342 53,035
1987
14,656 12,056 8,703 3,533 6,780 3,250
18,573 9,092 76,643 1988
6,780 11,154 6,023 4,274 14,123 618
8,703 5,434 57,109
1989 a 2,213 5,703 4,794 3,999 12,682 7,303
18,037 4,422 59,153 1990 b 1,473 7,315 4,478 4,257 12,486 2,794
14,619 3,739 51,161
1991 c 1,689 4,244 1,624 3,451 12,664 6,251
18,243 5,455 53,621 1992 d 11,302 12,601 9,001 6,313 5,880 2,285
18,233 7,379 72,994
1993
3,642 7,368 4,342 3,324 11,407 2,346
9,380 7,477 49,286 1994
4,176 6,723 5,037 3,888 14,580 1,686
17,575 8,576 62,241
1995
3,719 6,939 6,181 5,430 22,357 3,790
18,980 8,710 76,106 1996
6,079 6,858 3,791 3,297 8,850 4,478
16,789 6,500 56,642
1997
4,570 5,865 2,844 6,648 12,460 4,703
21,443 7,851 66,384 1998
226 1,741 654 1,591 7,264 1,934
7,822 4,181 25,413
1999
1,454 2,604 3,112 3,798 4,057 935
13,130 8,071 37,161 2000
78 1,057 144 389 640 85
1,259 1,083 4,735
2001
- - - - - -
- - - 2002
1,001 1,271 449 742 2,993 69
2,338 2,224 11,087
2003
1,601 4,714 1,089 1,514 4,756 437
3,518 5,080 22,709 2004
975 2,505 1,965 1,502 4,285 1,783
9,270 6,118 28,403
2005
2,137 1,531 944 592 2,580 1,650
3,926 3,334 16,694 2006
2,252 2,106 1,558 928 3,507 2,476
6,201 4,720 23,748
2007
1,116 1,419 1,555 855 4,890 1,168
5,828 1,785 18,616 2008
50 440 209 263 372 226
628 342 2,530
2009
1 16 4 3 36 17
10 3 90 2010
252 824 213 358 1,266 985
1,570 276 5,744
2005-2009 Average 1,111 1,102 854 528 2,277 1,107 3,319 2,037 12,336
-continued-

210
Appendix B4.–Page 2 of 2.
District 2
District 3 Year 334-21 334-22 334-23 334-24 334-25 Total 334-31 334-32 Total 1974
6,344 5,611 2,624 3,369 - 17,948
1,423 2,057 3,480
1975
3,282 3,045 2,785 2,203 - 11,315
2,791 1,386 4,177 1976
5,083 4,490 3,031 3,952 - 16,556
1,827 2,321 4,148
1977
6,577 4,584 2,110 3,451 - 16,722
1,617 2,348 3,965 1978
9,004 7,953 5,248 8,499 2,220 32,924
746 2,170 2,916
1979
10,698 11,214 6,733 7,573 5,280 41,498
2,195 2,823 5,018 1980
11,544 12,903 8,259 9,591 7,707 50,004
2,039 3,201 5,240
1981
12,341 13,275 7,024 5,950 7,191 45,781
1,241 2,782 4,023 1982
10,567 9,236 5,262 8,932 5,135 39,132
896 1,713 2,609
1983
12,433 10,424 7,779 6,260 6,333 43,229
1,335 2,771 4,106 1984
9,179 11,573 4,668 5,752 5,525 36,697
900 2,139 3,039
1985
11,843 18,584 4,877 4,613 8,448 48,365
854 1,734 2,588 1986
11,138 15,326 3,450 4,336 7,599 41,849
606 295 901
1987
14,195 9,672 5,663 6,376 11,552 47,458
1,698 341 2,039 1988
6,191 11,605 4,721 6,784 5,887 35,188
1,387 380 1,767
1989
5,257 12,380 4,647 4,411 6,530 33,225
1,623 22 1,645 1990
5,592 10,675 3,741 8,514 4,691 33,213
2,128 213 2,341
1991 e 9,330 10,423 5,332 6,552 7,339 38,976
1,214 1,130 2,344 1992 f 9,014 11,647 4,135 11,311 1,825 37,932
1,160 659 1,819
1993
8,641 9,223 6,118 6,085 7,226 37,293
1,478 23 1,501 1994
9,223 14,350 4,514 8,734 4,871 41,692
1,114 0 1,114
1995
7,832 14,041 4,841 5,887 8,857 41,458
0 0 0 1996
8,265 9,134 2,749 3,626 6,435 30,209
0 0 0
1997
13,939 13,344 2,280 6,104 3,696 39,363
0 0 0 1998
2,203 6,081 2,245 4,613 1,664 16,806
0 0 0
1999
4,666 8,565 2,623 6,923 4,356 27,133
0 538 538 2000
1,434 966 415 457 511 3,783
0 0 0
2001
- - - - - -
- - - 2002
2,140 3,044 1,992 2,712 1,546 11,434
- - -
2003
2,965 5,454 993 2,104 2,704 14,220
- - - 2004
5,879 8,326 3,459 3,819 2,662 24,145
- - -
2005
3,292 5,905 1,397 347 2,472 13,413
- - - 2006
3,750 8,457 2,700 3,425 1,511 19,843
315 0 0
2007
2,818 5,509 2,458 1,375 1,146 13,306
190 0 0 2008
420 654 670 252 115 2,111
- - -
2009
39 106 56 2 23 226
- - - 2010
389 1,690 890 1,184 0 4,153
- - -
2005-2009 Average 2,064 4,126 1,456 1,080 1,053 9,780 253 0 0 Note: Unless otherwise indicate blank cells indicate years in which no information was collected or harvest numbers were
insufficient to generate summary information. Dashes indicate no commercial fishing activity occurred. Includes fish caught in fall commercial fishing season; sales from test fishery and fish sold as roe not included.
a Does not include 3,211 Chinook salmon sold illegally. b Does not include 1,101 Chinook salmon sold illegally. c Does not include 2,711 Chinook salmon sold illegally. d Does not include 1,218 Chinook salmon sold illegally. e Does not include 284 Chinook salmon sold illegally. f Does not include 207 Chinook salmon sold illegally.

211
Appendix B5.–Commercial summer chum salmon directed harvest (in numbers of fish) and effort data, Districts 1 and 2, Lower Yukon Area, 1967–2010.
District 1
District 2
Days
Days
Year Duration Fished Catch Duration Fished Catch 1967
6/08-6/27 11.0 9,494
- - -
1968
6/06-7/03 14.0 12,995
6/13-7/02 10.5 1,407 1969
6/02-6/28 12.5 8,840
6/15-7/01 8.0 5,024
1970
6/11-7/03 10.5 87,169
6/14-7/03 9.0 17,536 1971
6/14-7/03 10.5 36,077
6/20-7/05 8.5 6,112
1972
6/08-7/01 12.5 69,658
6/15-7/01 8.5 9,040 1973 a 6/07-7/11 14.5 191,840
6/10-7/14 14.5 56,481
1974
6/03-7/13 16.5 461,025
6/05-7/16 15.5 72,281 1975
6/09-7/16 15.0 394,447
6/11-7/18 10.5 99,139
1976
6/14-7/14 12.0 272,493
6/20-7/16 11.0 99,190 1977
6/13-7/12 12.0 232,427
6/19-7/15 10.0 102,759
1978
6/08-7/15 13.5 393,785
6/08-7/14 13.5 218,196 1979
6/04-7/14 13.5 369,934
6/03-7/13 13.5 172,838
1980
6/09-7/15 12.8 391,252
6/08-7/17 12.5 308,704 1981
6/06-7/14 12.0 507,158
6/07-7/16 12.0 351,458
1982
6/14-7/13 9.5 248,950
6/16-7/16 10.0 180,321 1983
6/09-7/15 11.0 451,164
6/12-7/18 11.0 248,092
1984
6/18-7/13 8.0 292,676
6/20-7/16 8.0 234,677 1985 b 6/24-7/15 6.3 247,486
6/26-7/18 7.3 188,099
1986
6/14-7/15 8.5 381,127
6/15-7/14 7.5 288,427 1987
6/15-7/10 6.0 222,898
6/17-7/09 5.0 174,876
1988
6/09-7/15 6.8 648,198
6/12-7/14 6.8 425,172 1989
6/13-7/14 5.3 547,781 c
6/15-7/13 4.5 343,962
1990
6/14-7/03 2.3 148,911
6/18-7/05 2.4 132,507 1991
6/13-7/05 3.0 140,470 d
6/16-7/07 3.0 175,149
1992
6/20-7/09 2.9 177,329 e
6/22-7/08 2.3 147,129 f 1993
6/14-7/01 2.0 73,659
6/16-6/30 1.8 19,332
1994
6/13-7/05 1.6 42,332
6/15-7/03 1.3 12,869 1995
6/12-7/07 2.6 142,266
6/11-6/22 1.6 83,817
1996
6/10-6/28 2.5 92,506
6/09-7/01 2.4 30,727 1997
6/11-6/30 2.7 59,915
6/15-6/26 1.9 18,242
1998
6/15-7/08 1.5 21,270
6/26-7/09 1.0 6,848 1999
6/22-7/09 1.5 16,181
6/25-7/05 1.1 11,702
2000
6/25-6/30 0.5 3,315
6/27-6/27 0.3 3,309 2001
No Openings 0.0 -
No Openings 0.0 -
2002
6/20-6/28 0.9 6,327
6/19-7/01 0.8 4,027 2003
6/16-7/8 1.3 3,579
6/18-7/08 1.0 2,583
2004
6/18-7/11 2.6 13,993
6/15-6/28 1.0 5,782 2005
6/24-7/06 1.3 23,965
6/23-7/03 0.0 8,313
2006
6/19-7/07 1.5 21,816
6/15-7/07 1.2 25,543 2007
6/18-7/15 3.0 106,790
6/15-7/08 1.9 69,432
2008
7/2-7/14 1.7 67,459
7/04-7/16 1.3 58,139 2009
6/29-7/15 2.2 71,335
6/29-7/16 1.6 86,571
2010 6/28-7/15 2.5 102,267 7/01-7/17 1.8 80,948 Note: Unless otherwise indicate blank cells indicate years in which no information was collected or harvest numbers were
insufficient to generate summary information. Dashes indicate no commercial fishing activity occurred. Summer chum salmon caught after the specified dates are not included. Includes ADF&G test fish sales through 1990.
a Six inch maximum mesh size regulation during late June to early July became effective in 1973. b Six inch maximum mesh size regulation by emergency order during commercial fishing season became effective in 1985. c Includes 150 summer chum salmon sold illegally. d Includes 1,023 summer chum salmon sold illegally. e Includes 31 summer chum salmon sold illegally. f Includes 91 summer chum salmon sold illegally.

212
Appendix B6.–Commercial summer chum salmon harvest (in numbers of fish) by statistical area, Lower Yukon Area, 1983–2010.
District 1
Year 334-11 334-12 334-13 334-14 334-15 334-16 334-17 334-18 Total 1983
42,165 112,074 37,976 64,556 29,841 22,918
96,512 45,122 451,164
1984
42,264 81,295 14,888 38,285 22,485 5,838
64,320 23,301 292,676 1985
13,696 53,540 26,127 10,047 33,133 10,381
73,948 26,614 247,486
1986
39,468 102,887 35,315 52,980 26,732 6,807
85,798 31,140 381,127 1987
34,852 51,350 22,794 15,109 21,646 7,786
45,911 23,450 222,898
1988
72,408 148,578 79,248 60,956 61,752 13,239
129,938 82,070 648,189 1989 a 29,129 89,794 40,036 71,576 118,908 20,468
136,669 41,051 547,631
1990 b 23,453 35,542 15,326 12,369 10,931 1,513
39,575 10,202 148,911 1991 c 13,767 32,621 5,223 11,133 11,560 23,213
34,775 7,155 139,447
1992 d 24,094 39,225 22,293 16,717 12,000 2,500
40,353 20,116 177,298 1993
13,123 17,869 9,745 8,672 2,920 661
9,196 11,473 73,659
1994
11,208 6,340 5,165 2,389 3,602 290
8,693 4,645 42,332 1995
32,084 23,420 15,834 19,154 15,919 3,150
24,349 8,356 142,266
1996
19,432 17,769 6,837 5,611 13,111 2,831
17,864 9,051 92,506 1997
10,764 9,519 6,190 10,374 5,429 1,650
10,719 5,270 59,915
1998
54 2,583 441 2,275 5,115 730
6,601 3,471 21,270 1999
1,128 1,667 1,653 2,979 816 141
3,845 3,952 16,181
2000
146 537 207 650 631 60
546 538 3,315 2001
- - - - - -
- - -
2002
193 1,303 374 1,519 858 4
1,277 799 6,327 2003
90 588 117 292 690 188
566 1,048 3,579
2004
667 885 1,446 904 2,694 870
4,171 2,356 13,993 2005
4,260 2,791 1,658 2,697 3,631 1,985
3,970 2,973 23,965
2006
4,310 3,181 1,915 899 2,315 1,441
4,382 3,373 21,816 2007
3,724 15,690 14,297 10,746 15,816 8,801
25,753 11,963 106,790
2008
1,200 9,216 5,521 9,224 6,219 5,937
17,423 12,719 67,459 2009
730 7,457 9,120 9,569 12,979 4,930
23,532 3,018 71,335
2010 3,881 19,138 5,707 12,405 12,116 9,484 32,994 6,542 102,267 2005-2009
Average 2,845 7,667 6,502 6,627 8,192 4,619 15,012 6,809 58,273 -continued-

213
Appendix B6.–Page 2 of 2. District 2 District 3
334-31
Year
334-21 334-22 334-23 334-24 334-25 Total
Estimated
Number Roe Harvest e
1983
57,740 71,821 56,499 31,027 31,005 248,092
3,106
3,106 1984
46,261 91,790 43,116 36,076 19,688 236,931
447
447
1985
32,911 87,687 24,983 18,911 23,607 188,099
872
872 1986
44,393 129,569 36,304 47,179 30,982 288,427
442
442
1987
48,734 54,459 19,157 22,988 29,538 174,876
3,418
3,418 1988
74,252 140,291 56,302 88,393 65,934 425,172
11,463
11,463
1989
46,224 140,571 48,986 54,542 53,639 343,962
7,548
7,548 1990 b 15,414 37,585 25,132 34,980 19,396 132,507
562
562
1991
46,378 70,188 32,584 14,915 11,084 175,149
3,347
3,347 1992 f 31,399 59,401 22,107 31,085 3,046 147,038
63
63
1993
5,444 3,711 4,445 2,920 2,812 19,332
460
460 1994
4,100 5,314 1,435 1,395 625 12,869
35
35
1995
23,794 38,808 11,541 7,257 2,417 83,817
0
0 1996
9,177 13,056 4,965 2,479 1,050 30,727
0 162 465
1997
7,126 7,938 673 1,667 838 18,242
- - - 1998
710 2,350 1,079 2,351 358 6,848
0 0 0
1999
1,758 3,269 1,457 3,415 1,803 11,702
0 0 0 2000
1,552 961 327 220 249 3,309
- - -
2001
- - - - - -
- - - 2002
1,105 997 862 794 269 4,027
- - -
2003
1,153 855 218 181 176 2,583
- - - 2004
1,724 1,439 1,350 1,061 208 5,782
- - -
2005
2,852 3,978 850 105 528 8,313
- - - 2006
6,325 10,523 2,080 5805 810 25,543
116 0 116
2007
21,356 32,583 9,310 1,740 4,443 69,432
1 0 1 2008
15,326 14,017 16,781 10,145 1,870 58,139
- - -
2009
13,583 48,571 19,717 3,053 1,647 86,571
- - - 2010 9,575 23,029 14,474 33,870 0 80,948 - - -
2005-2009 Average 11,888 21,934 9,748 4,170 1,860 49,600 59 0 59
Note: Unless otherwise indicate blank cells indicate years in which no information was collected or harvest numbers were insufficient to generate summary information. Dashes indicate no commercial fishing activity occurred.
a Does not include 150 summer chum salmon sold illegally. b Includes ADF&G test fish sales through 1990. c Does not include 1,023 summer chum salmon sold illegally. d Does not include 31 summer chum salmon sold illegally. e Estimated harvest includes reported harvest of both males and females harvested to produce roe sold. f Does not include 91 summer chum salmon sold illegally.

214
Appendix B7.–Numbers of commercially caught fall chum salmon harvest (in thousands of fish) by period, District 1, Yukon Area, 1978–2010. Period and (Cumulative) harvest (in thousands of fish)
Date 1978 1979 1980 1981 1982 1983 1984 1985 1986 1987 a 1988 7/17
7/18 6.3 (6.3)
4.2 (4.2)
6.3 (6.3) 7/19
16.1 (16.1)
7/20
6.0 (6.0)
4.3 (4.3) 7/21 5.1 (11.4)
6.0 (6.0)
7/22
6.6 (10.8) 7/23
27.8 (32.1)
7/24
7.2 (13.2)
1.3 (7.3) 7/25 52.8 (64.2)
10.4 (21.2)
7/26 7/27
14.8 (28.0)
4.0 (36.1) 7/28 2.8 (67.0)
57.3 (64.6)
7/29
15.3 (36.5)
3.0 (19.1) 7/30
11.7 (47.8)
7/31
9.7 (37.7) 1.4 (37.9) 23.2 (87.8)
18.3 (18.3) 8/1 14.4 (81.4)
8/2
18.5 (37.6)
2.2 (8.5) 8/3
17.5 (55.2)
17.1 (35.4)
8/4 0.4 (81.8)
7.9 (55.7) 8/5
6.2 (44.1)
23.7 (61.3)
11.4 (11.4)
8/6
1.2 (56.9)
15.2 (23.7) 8/7
37.8 (93.0) 13.5 (57.6)
1.8 (37.2)
8/8 1.4 (83.2)
7.5 (18.9) 8/9
44.0 (105.3)
35.8 (59.5)
32.5 (32.5)
8/10
1.3 (94.3)
13.7 (70.6) 8/11 1.6 (84.8)
5.2 (62.8)
8/12
20.7 (91.3) 19.1 (124.4)
10.5 (29.4) 8/13
43.8 (131.6)
65.3 (124.8)
8/14
7.1 (101.4) 1.8 (64.6)
11.8 (49.0) 8/15 1.4 (86.2)
16.2 (45.6)
8/16 8/17
10.1 (59.1) 8/18 10.2 (96.4)
3.9 (135.5)
8/19
42.2 (106.8)
5.8 (51.4)
0.5 (33.0) 8/20
8/21 8/22 21.9 (118.3)
8.0 (59.4)
8/23
6.9 (39.9) 8/24
8/25 4.4 (122.7) 8/26
4.1 (44.0)
8/27 8/28 8/29 5.2 (127.9)
8/30 1.5 (45.5) -continued-

215
Appendix B7.–Page 2 of 4. Period and (Cumulative) harvest (in thousands of fish)
Date 1989 1990 1991 1992 a 1993 a 1994 a 1995 1996 1997 1998 a 1999 7/17
7/18 7/19 7/20 7/21 7/22 7/23 7/24
1.0 (1.0) 7/25
7/26 7/27
1.8 (2.8) 7/28 4.4 (4.4)
7/29 7/30
15.3 (15.3) 7/31
1.7 (4.5)
0.7 (0.7)
8/1 0.2 (4.5)
5.6 (5.6) 8/2
3.0 (18.3)
0.4 (1.1)
8/3
11.2 (15.7) 8/4 48.8 (53.3)
8/5
12.7 (13.8)
0.7 (6.3) 8/6
7.4 (25.7)
1.8 (1.8) 2.0 (2.0)
8/7
7.5 (23.2)
10.4 (24.2) 8/8 3.8 (57.2)
8/9
9.2 (34.9)
8.1 (32.3) 4.3 (6.1)
0.2 (6.5) 8/10
8/11 2.5 (59.7)
4.5 (36.8)
3.9 (5.9) 8/12
6.2 (12.3)
3.5 (10.0)
8/13
1.4 (36.3)
10.4 (47.2)
6.7 (12.6) 8/14
8/15 14.9 (74.7)
14.8 (62.0) 15.1 (27.4) 8/16
4.1 (40.4)
9.4 (22.0)
8/17 8/18
16.7 (78.7)
5.5 (27.5) 8/19
1.3 (28.8)
8/20
4.1 (27.3) 2.8 (43.2) 8/21
0.7 (79.4)
8/22 2.9 (77.6)
1.3 (30.1) 8/23
14.7 (57.9)
8/24 8/25 0.3 (77.9)
8/26
3.5 (33.6) 8/27
1.8 (59.7)
8/28 8/29 8/30
-continued-

216
Appendix B7.–Page 3 of 4. Period and (Cumulative) harvest (in thousands of fish)
Date 2000 a 2001 a 2002 a 2003 2004 2005 2006 2007 2008 2009 2010 7/17
2.1 (2.1)
7/18
4.0 (4.0) 7/19
7/20 7/21 7/22
6.0 (8.2) 2.8 (6.8) 7/23
7/24 7/25
4.9 (13.1) 7/26
7/27
0.4 (.4)
7/28
7/29
8.2 (8.6)
19.3 (32.4) 1.6 (8.4)
7/30
16.6 (16.6)
7/31
24.3 (32.9)
8/1
6.3 (22.9)
18.3 (50.7)
8/2
8/3
0.7 (33.6) 1.2 (24.1)
8/4
8/5
32.6 (66.2)
2.6 (11.0)
8/6
8/7
7.5 (31.6)
8/8
8/9
4.2 (70.4) 2.9 (34.6)
8/10
1.5 (36.1)
8/11
3.5 (73.9)
8/12
8/13
21.9 (57.9)
8/14
3.2 (77.1)
8.0 (8.0)
8/15
6.5 (64.5)
8/16
0.6 (77.7)
8/17
5.9 (70.4)
8/18
5.6 (83.4)
8/19
2.3 (10.3)
8/20
10.5 (80.9)
8/21
9.7 (93.1) 8/22
4.5 (97.7) 2.0 (82.8)
8/23 8/24
8.4 (106.1) 4.6 (87.4) 17.0 (27.3) 8/25
2.5 (2.5)
4.2 (110.3)
8/26
5.9 (116.3)
5.9 (33.1) 9.8 (60.5) 8/27
0.4 (2.9)
7.4 (94.8)
-continued-

217
Appendix B7.–Page 4 of 4. Period and (Cumulative) harvest (in thousands of fish)
Date 2000 a 2001 a 2002 a 2003 2004 2005 2006 2007 2008 2009 2010 8/28
8/29
0.1 (3.0)
4.4 (120.7) 0.8 (95.6) 8/30
2.9 (123.6)
4.0 (37.2) 0.9 (61.4)
8/31
0.0 (.0) 2.7 (126.3) 5.4 (100.9) 9/1
0.7 (3.7)
1.4 (127.7)
9/2
0.4 (.4) 0.6 (128.3)
1.6 (63.0) 9/3
1.0 (4.8)
0.5 (128.8) 0.2 (101.2) 0.7 (37.9)
9/4
0.1 (.5) 0.4 (129.2) 9/5
0.5 (5.3)
0.3 (129.4) 0.1 (101.3)
2.1 (65.1)
9/6
0.1 (.6) 0.3 (129.7)
0.3 (38.2)
0.1 (11.1) 9/7
0.8 (130.5)
9/8
0.0 (.6)
2.0 (67.1) 0.7 (11.8) 0.3 (.3) 9/9
0.1 (5.4)
0.6 (38.9)
9/10
0.0 (.7)
0.6 (67.7) 0.2 (11.9) 0.2 (.5) 9/11 0.2 (5.6)
a No commercial fishing periods.

218
Appendix B8.–Commercial fall chum salmon harvest (in numbers of fish) by statistical area, Lower Yukon Area, 1983–2010.
District 1 Year a 334-11 334-12 334-13 334-14 334-15 334-16 334-17 334-18 Total 1983 135 10,300 2,224 10,460 35,824 19,985
24,816 20,627 124,371
1984 315 24,914 2,488 16,234 13,536 6,873
9,390 5,001 78,751 1985 594 34,332 6,035 36,885 43,022 1,485
5,898 1,697 129,948
1986 376 9,891 3,032 2,683 21,058 4,091
12,004 6,217 59,352 1987 - - - - - -
- - -
1988 10,217 6,953 2,625 206 6,692 3,905
9,526 5,405 45,317 1989 0 2,929 1,420 5,577 26,611 17,477
15,526 8,336 77,876
1990 255 3,690 501 1,167 7,927 5,618
4,695 3,484 27,337 1991 75 11,976 3,036 5,586 9,968 8,040
11,880 9,163 59,724
1992 - - - - - -
- - - 1993 - - - - - -
- - -
1994 - - - - - -
- - - 1995 1,674 6,766 6,892 11,909 16,450 1,696
23,722 10,236 79,345
1996 0 2,686 2,333 1,243 4,561 9,976
8,504 4,326 33,629 1997 0 2,870 3,452 3,768 3,943 1,596
6,747 5,107 27,483
1998 - - - - - -
- - - 1999 4 1,931 474 1,182 1,934 1,439
1,103 1,920 9,987
2000 - - - - - -
- - - 2001 - - - - - -
- - -
2002 - - - - - -
- - - 2003 0 2,784 177 310 958 0
381 976 5,586
2004 0 509 25 67 0 0
19 40 660 2005 117 16,840 8,735 25,330 8,253 31,864
29,546 9,840 130,525
2006 163 16,212 9,929 9,973 7,538 9,568
32,200 15,671 101,254 2007 0 6,395 8,550 4,951 1,423 2,130
12,562 2,841 38,852
2008 22 16,471 6,018 9,138 5,152 7,090
16,072 7,741 67,704 2009 66 1,355 457 301 4,576 2,118
2,415 623 11,911
2010 0 211 0 13 83 10 167 61 545 2000-2009
Average 53 8,652 4,842 7,153 3,986 7,539 13,314 5,390 50,927 -continued-

219
Appendix B8.–Page 2 of 2.
District 2 District 3 Year a 334-21 334-22 334-23 334-24 334-25 Total 334-31 334-32 Total 1983 17,245 4,673 24,132 22,072 17,523 85,645
4,607 5,411 10,018
1984 10,951 22,942 7,622 19,183 10,105 70,803
6,429 0 6,429 1985 9,131 10,607 3,530 5,859 11,363 40,490
4,173 991 5,164
1986 6,472 16,377 5,212 11,352 11,894 51,307
2,793 0 2,793 1987 - - - - - -
- - -
1988 5,077 13,215 5,385 4,283 3,901 31,861
1,748 342 2,090 1989 12,005 34,268 15,001 19,029 17,603 97,906
15,153 179 15,332
1990 6,311 8,298 5,403 10,147 7,014 37,173
1,863 1,852 3,715 1991 10,584 23,195 14,291 28,306 26,252 102,628
7,209 2,004 9,213
1992 - - - - - -
- - - 1993 - - - - - -
- - -
1994 - - - - - -
- - - 1995 147 54,231 20,018 16,435 0 90,831
- - -
1996 1,960 14,349 4,184 7,634 1,524 29,651
- - - 1997 5,040 9,827 2,316 5,972 1,171 24,326
- - -
1998 - - - - - -
- - - 1999 1,536 2,836 3,254 1,910 167 9,703
- - -
2000 - - - - - -
- - - 2001 - - - - - -
- - -
2002 - - - - - -
- - - 2003 - - - - - -
- - -
2004 - - - - - -
- - - 2005 - - - - - -
- - -
2006 3,362 21,069 11,060 4,414 0 39,905
- - - 2007 8,619 17,068 8,245 1,894 0 35,826
- - -
2008 10,027 11,630 11,507 7,424 682 41,270
- - - 2009 1,107 7,988 1,593 235 1,149 12,072
- - -
2010 3 27 165 0 75 270 - - - 2000-2009
Average 5,779 14,439 8,101 3,492 458 32,268 - - - Note: Unless otherwise indicate blank cells indicate years in which no information was collected or harvest numbers
were insufficient to generate summary information. Dashes indicate no commercial fishing activity occurred. a Includes ADF&G test fish sales in Districts 1 and 2 through 1990.
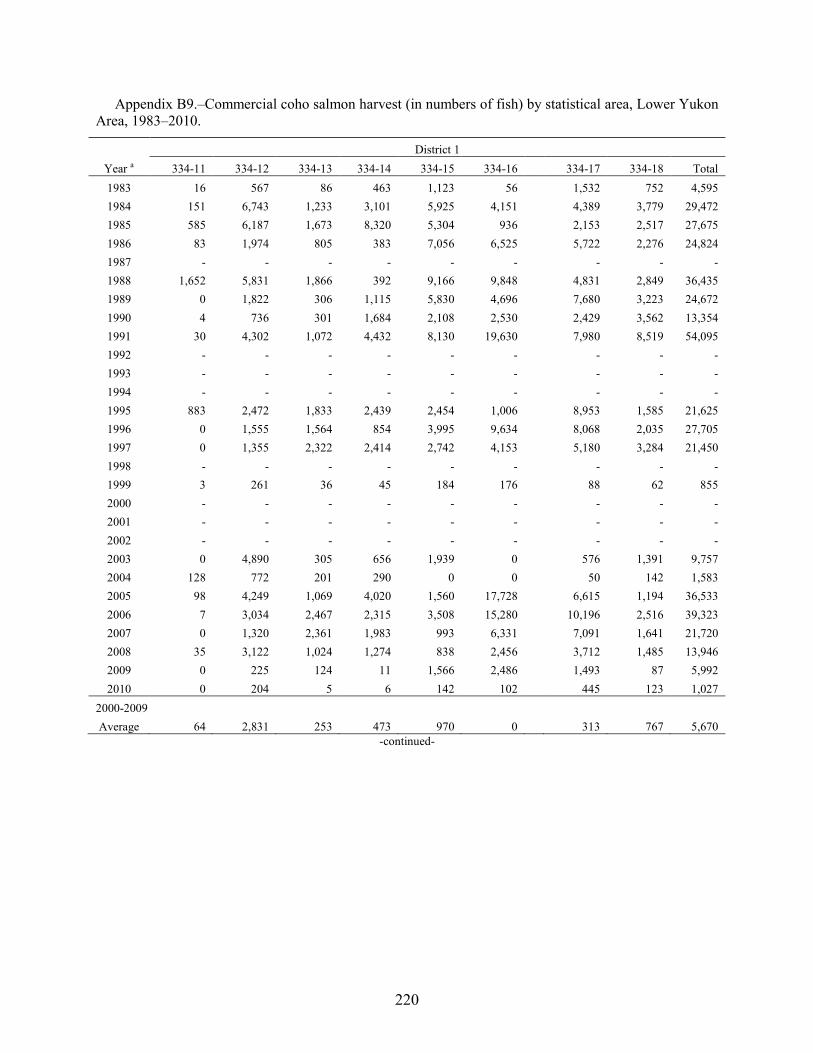
220
Appendix B9.–Commercial coho salmon harvest (in numbers of fish) by statistical area, Lower Yukon Area, 1983–2010.
District 1 Year a 334-11 334-12 334-13 334-14 334-15 334-16 334-17 334-18 Total 1983 16 567 86 463 1,123 56
1,532 752 4,595
1984 151 6,743 1,233 3,101 5,925 4,151
4,389 3,779 29,472 1985 585 6,187 1,673 8,320 5,304 936
2,153 2,517 27,675
1986 83 1,974 805 383 7,056 6,525
5,722 2,276 24,824 1987 - - - - - -
- - -
1988 1,652 5,831 1,866 392 9,166 9,848
4,831 2,849 36,435 1989 0 1,822 306 1,115 5,830 4,696
7,680 3,223 24,672
1990 4 736 301 1,684 2,108 2,530
2,429 3,562 13,354 1991 30 4,302 1,072 4,432 8,130 19,630
7,980 8,519 54,095
1992 - - - - - -
- - - 1993 - - - - - -
- - -
1994 - - - - - -
- - - 1995 883 2,472 1,833 2,439 2,454 1,006
8,953 1,585 21,625
1996 0 1,555 1,564 854 3,995 9,634
8,068 2,035 27,705 1997 0 1,355 2,322 2,414 2,742 4,153
5,180 3,284 21,450
1998 - - - - - -
- - - 1999 3 261 36 45 184 176
88 62 855
2000 - - - - - -
- - - 2001 - - - - - -
- - -
2002 - - - - - -
- - - 2003 0 4,890 305 656 1,939 0
576 1,391 9,757
2004 128 772 201 290 0 0
50 142 1,583 2005 98 4,249 1,069 4,020 1,560 17,728
6,615 1,194 36,533
2006 7 3,034 2,467 2,315 3,508 15,280
10,196 2,516 39,323 2007 0 1,320 2,361 1,983 993 6,331
7,091 1,641 21,720
2008 35 3,122 1,024 1,274 838 2,456
3,712 1,485 13,946 2009 0 225 124 11 1,566 2,486
1,493 87 5,992
2010 0 204 5 6 142 102 445 123 1,027 2000-2009
Average 64 2,831 253 473 970 0 313 767 5,670 -continued-

221
Appendix B9.–Page 2 of 2.
District 2 District 3 Year a 334-21 334-22 334-23 334-24 334-25 Total 334-31 334-32 Total 1983 1,549 140 715 114 39 2,557
0 0 0
1984 4,736 26,506 5,514 4,556 1,752 43,064
621 0 621 1985 3,369 5,052 4,394 1,077 3,233 17,125
171 0 171
1986 3,074 9,317 2,250 4,117 2,439 21,197
793 0 793 1987 - - - - - -
- - -
1988 3,844 12,503 4,891 7,141 6,397 34,776
1,291 128 1,419 1989 6,199 18,427 3,668 4,262 5,966 38,522
3,978 10 3,988
1990 1,226 11,364 962 2,032 851 16,435
752 166 918 1991 8,746 17,939 3,587 6,094 4,532 40,898
1,427 478 1,905
1992 - - - - - -
- - - 1993 - - - - - -
- - -
1994 - - - - - -
- - - 1995 115 12,154 2,951 3,268 0 18,488
- - -
1996 761 12,155 2,755 4,409 894 20,974
- - - 1997 2,197 6,449 1,238 3,025 147 13,056
- - -
1998 - - - - - -
- - - 1999 147 238 248 65 48 746
- - -
2000 - - - - - -
- - - 2001 - - - - - -
- - -
2002 - - - - - -
- - - 2003 - - - - - -
- - -
2004 - - - - - -
- - - 2005 - - - - - -
- - -
2006 2,138 7,250 3,745 1,349 0 14,482
- - - 2007 4,195 12,354 3,253 1,685 0 21,487
- - -
2008 3,275 6,076 4,594 4,680 621 19,246
- - - 2009 368 1,085 97 8 19 1,577
- - -
2010 7 105 606 0 305 1,023 - - - 2000-2009
Average 2,494 6,691 2,922 1,931 160 14,198 - - - Note: Unless otherwise indicate blank cells indicate years in which no information was collected or harvest numbers were
insufficient to generate summary information. Dashes indicate no commercial fishing activity occurred. a Includes ADF&G test fish sales in Districts 1 and 2 through 1990.

222
Appendix B10.–Daily and cumulative CPUE for Chinook salmon in the set gillnet test fishery, Lower Yukon River, 2010.
Chinook Salmon in 8.5" Set Gillnets a
Late Year
Average
2010
1989-2008 b
1989-2008
Daily
Daily
Cumulative Comm/period
Cumulative
Cumulative
Date Catch CPUE CPUE Hrs Fished Proportion CPUE Proportion CPUE 5/26
0.00
0.00
0.00
0.00
5/27
0.00
0.00
0.00
0.03 5/28
0.00
0.00
0.00
0.04
5/29
0.00
0.00
0.00
0.07 5/30
0.00
0.00
0.00
0.12
5/31 0
0.00
0.00
0.00
0.00
0.01
0.18 6/1 0
0.00
0.00
0.00
0.00
0.01
0.24
6/2 0
0.00
0.00
0.00
0.00
0.01
0.35 6/3 0
0.00
0.00
0.00
0.00
0.02
0.50
6/4 0
0.00
0.00
0.00
0.00
0.03
0.69 6/5 0
0.00
0.00
0.00
0.00
0.03
0.87
6/6 0
0.00
0.00
0.00
0.04
0.04
1.14 6/7 0
0.00
0.00
0.00
0.06
0.06
1.45
6/8 0
0.00
0.00
0.01
0.09
0.07
1.83 6/9 1
0.01
0.01
0.02
0.26
0.09
2.44
6/10 15
0.16
0.17
0.02
0.36
0.12
2.96 6/11 2
0.02
0.19
0.03
0.50
0.14
3.52
6/12 15
0.16
0.35
0.04
0.70
0.17
4.21 6/13 29
0.30
0.65
0.06
1.10
0.20
5.00
6/14 71
0.74
1.39
0.09
1.50
0.24
5.74 6/15 45
0.47
1.86
0.12
1.89
0.27
6.50
6/16 72
0.75
2.61
0.14
2.49
0.31
7.43 6/17 87
0.91
3.52
0.17
2.73
0.35
8.31
6/18 76
0.79
4.31
0.21
3.37
0.39
9.20 6/19 73
0.76
5.07
0.23
4.04
0.42
10.07
6/20 69
0.72
5.79
0.24
4.86
0.46
10.82
6/21 89
0.93
6.72
0.27
5.42
0.50
11.75
6/22 61
0.64
7.36
0.32
6.54
0.54
12.74 6/23 62
0.65
8.01
0.39
7.58
0.58
13.68
6/24 91
0.95
8.96
0.44
8.58
0.63
14.76
6/25 93
0.97
9.93
0.52
9.59
0.67
15.66
6/26 69
0.72
10.65
0.59
10.33
0.71
16.56 6/27 100
1.04
11.69
0.65
11.10
0.75
17.32
6/28 120
1.25
12.94 6
0.72
12.39
0.78
18.04 6/29 32
0.33
13.27
0.76
13.36
0.81
18.74
6/30 38
0.40
13.67
0.78
13.88
0.84
19.25 -continued-

223
Appendix B10.–Page 2 of 2.
Chinook Salmon in 8.5" Set Gillnets a
Late Year
Average
2010
1989-2008 b
1989-2008
Daily
Daily
Cumulative Comm/period
Cumulative
Cumulative
Date Catch CPUE CPUE Hrs Fished Proportion CPUE Proportion CPUE 7/1 43
0.45
14.12 6
0.80
14.30
0.86
19.70
7/2 27
0.28
14.40
0.82
14.84
0.88
20.16 7/3 27
0.28
14.68 6
0.84
15.26
0.90
20.56
7/4 58
0.60
15.28
0.87
15.62
0.91
20.89 7/5 56
0.58
15.86
0.90
15.97
0.93
21.22
7/6 73
0.76
16.62 6
0.92
16.23
0.94
21.51 7/7 41
0.43
17.05
0.94
16.55
0.95
21.76
7/8 27
0.28
17.33 9
0.95
16.79
0.96
21.99 7/9 25
0.26
17.59
0.95
17.00
0.97
22.18
7/10 15
0.16
17.75
0.97
17.12
0.98
22.33 7/11 33
0.34
18.09 9
0.97
17.27
0.99
22.44
7/12 28
0.29
18.38
0.98
17.35
0.99
22.53 7/13 16
0.17
18.55 9
0.99
17.38
0.99
22.62
7/14 6
0.06
18.61
0.99
17.41
1.00
22.68 7/15 6
0.06
18.67 9
1.00
17.48
1.00
22.76
Total 1,791 18.67 60 17.48 22.76 Note: Boxes indicate the first to the third quartile and median date of the cumulative catch per unit effort (CPUE). a 2009 not included because high water and debris caused considerable difficulty for the project. b Fifteenth percentile from years 1989 to 2008.

224
Appendix B11.–Daily and cumulative CPUE for Chinook salmon set gillnet test fishery sites in 2010, compared to historic and late year average run timing, 1989 to 2008.
Note: The symbols along the cumulative index lines represent the first to third quartile of the cumulative index. The median date
of the cumulative index is represented by the center symbol.

225
Appendix B12.–Big Eddy and Middle Mouth summer chum salmon daily and cumulative index, cooperative 5.5" mesh drift gillnet test fishery, Lower Yukon River, 2010. Summer Chum Salmon in 5.5" Drift Gillnet
Big Eddy Drift
Middle Mouth Drift
Big Eddy and Middle Mouth Combined
Daily Daily
Cumulative Daily
Daily
Cumulative
Daily Daily
Cumulative
Date Catch Index Proportion Index Catch Index Proportion Index Catch Index Proportion Index 5/26
5/27 5/28 5/29 5/30 5/31 6/1 6/2 6/3 6/4 6/5 6/6 0 0.00
0.00 0.00
0
0.00
0.00 0.00
0 0.00 0.00 0.00
6/7 0 0.00
0.00 0.00
0
0.00
0.00 0.00
0 0.00 0.00 0.00 6/8 0 0.00
0.00 0.00
0
0.00
0.00 0.00
0 0.00 0.00 0.00
6/9 0 0.00
0.00 0.00
0
0.00
0.00 0.00
0 0.00 0.00 0.00 6/10 3 4.29
0.00 4.29
0
0.00
0.00 0.00
3 4.29 0.00 4.29
6/11 0 2.86
0.00 7.15
0
0.00
0.00 0.00
0 2.86 0.00 7.15 6/12 6 9.12
0.00 16.26
0 b 0.00
0.00 0.00
6 9.12 0.00 16.26
6/13 6 9.23
0.01 25.49
0
0.00
0.00 0.00
6 9.23 0.01 25.49 6/14 27 41.50
0.02 66.99
0
0.00
0.00 0.00
27 41.50 0.01 66.99
6/15 73 100.60
0.05 167.59
8
14.81
0.01 14.81
81 115.40 0.04 182.40 6/16 106 129.76
0.09 297.35
13
19.47
0.02 34.28
119 149.23 0.07 331.62
6/17 191 326.36
0.18 623.71
17
47.84
0.05 82.12
208 374.20 0.15 705.82 6/18 80 300.01
0.27 923.72
26
96.00
0.12 178.12
106 396.01 0.23 1,101.84
6/19 63 198.17
0.33 1,121.89
27
72.52
0.17 250.64
90 270.69 0.28 1,372.53 6/20 82 292.33
0.41 1,414.22
9
23.72
0.18 274.35
91 316.05 0.35 1,688.57
6/21 87 243.26
0.48 1,657.48
4
11.19
0.19 285.54
91 254.45 0.40 1,943.02 6/22 42 73.56
0.50 1,731.04
21
28.56
0.21 314.10
42 73.56 0.41 2,016.58
6/23 22 55.24
0.52 1,786.28
20
28.86
0.23 342.96
42 84.10 0.43 2,100.68 6/24 45 153.99
0.57 1,940.27
13
20.73
0.24 363.69
58 174.72 0.47 2,275.40
6/25 13 21.85
0.57 1,962.12
16
23.02
0.26 386.71
29 44.87 0.48 2,320.27 -continued-

226
Appendix B12.–Page 2 of 2. Summer Chum Salmon in 5.5" Drift Gillnet
Big Eddy Drift
Middle Mouth Drift
Big Eddy and Middle Mouth Combined
Daily Daily
Cumulative Daily
Daily
Cumulative
Daily Daily
Cumulative
Date Catch Index Proportion Index Catch Index Proportion Index Catch Index Proportion Index 6/26 102 187.52
0.63 2,149.63
63
110.64
0.33 497.36
165 298.16 0.54 2,618.43
6/27 34 118.50
0.66 2,268.14
80
248.05
0.49 745.40
114 366.55 0.61 2,984.97 6/28 25 52.37 a 0.68 2,320.51
57 a 184.47
0.62 929.87
82 236.84 0.66 3,221.82
6/29 18 33.28
0.69 2,353.78
69
87.32
0.68 1,017.20
87 120.60 0.69 3,342.42 6/30 14 24.23
0.69 2,378.01
13
19.66
0.69 1,036.85
14 43.89 0.70 3,386.30
7/1 8 12.31 b 0.70 2,390.32
11 b 22.46
0.70 1,059.31
19 34.77 0.70 3,421.07 7/2 43 66.15
0.72 2,456.47
16
25.14
0.72 1,084.45
59 91.29 0.72 3,512.37
7/3 18 39.03
0.73 2,495.50
28
37.92
0.75 1,122.37
46 76.95 0.74 3,589.31 7/4 11 42.88 a 0.74 2,538.38
35 a 103.65
0.81 1,226.02
46 103.65 0.76 3,692.96
7/5 92 157.95
0.79 2,696.33
42
67.20
0.86 1,293.22
134 225.15 0.81 3,918.11 7/6 106 332.21
0.88 3,028.53
44
78.46
0.91 1,371.68
106 410.67 0.89 4,328.78
7/7 43 87.81
0.91 3,116.34
26
37.81
0.94 1,409.49
69 125.62 0.92 4,454.40 7/8 43 95.81
0.94 3,212.15
29
39.33
0.96 1,448.82
72 135.14 0.94 4,589.54
7/9 27 60.04
0.95 3,272.20
13
17.67
0.97 1,466.49
40 77.71 0.96 4,667.25 7/10 6 15.89
0.96 3,288.09
17
22.16
0.99 1,488.65
23 38.05 0.97 4,705.30
7/11 5 15.38 a 0.96 3,303.47
6 a,c 17.58
1.00 1,506.23
11 32.97 0.97 4,738.27 7/12 46 112.59
1.00 3,416.06
46 112.59 1.00 4,850.86
7/13 3 9.23
1.00 3,425.29
3 9.23 1.00 4,860.09 7/14 2 3.89 c 1.00 3,429.18
2 3.89 1.00 4,863.98
7/15 - -
- -
- - - - Total 1,492 3,429.18 723 1,506.23 2,137 4,863.98 Note: The box within the column indicates the first to the third quartile and median date of the cumulative index. a Drift schedule was altered, only two drifts were conducted. b Drift schedule was altered, only three drifts were conducted. c Last day of project operation.

227
Appendix B13.–Fall chum and coho salmon, daily and cumulative catch per unit effort (CPUE), index, cooperative drift gillnet (6") test fishery, Big Eddy and Middle Mouth sites combined, Lower Yukon River, 2001 to 2009 compared to 2010. Historical Fall Chum Salmon Historical Coho Salmon
Median 2001 to 2009 Average
2010
Median 2001 to 2009 Average
2010
Cumulative Daily Daily
Cumulative
Daily
Daily
Cumulative
Cumulative Daily Daily
Cumulative
Daily
Daily
Cumulative
Date Percent a Catch Index % Index a Catch Index % Index a Percent a Catch Index % Index a Catch Index % Index a 7/16 0.01 23 15.71 0.01 15.71
18
15.82 0.01 15.82
0.00 1 0.00 0.00 0.00
0
0.00 0.00 0.00
7/17 0.04 33 25.11 0.03 40.82
40
28.41 0.04 44.23
0.00 1 0.07 0.00 0.07
0
0.00 0.00 0.00 7/18 0.06 43 42.72 0.06 83.54
108
84.79 0.10 129.02
0.00 0 0.00 0.00 0.07
0
0.00 0.00 0.00
7/19 0.09 22 20.31 0.07 103.85
58
47.19 0.14 176.21
0.00 0 0.00 0.00 0.07
0
0.00 0.00 0.00 7/20 0.11 6 4.99 0.08 108.83
16
11.76 0.15 187.98
0.00 0 0.00 0.00 0.07
0
0.00 0.00 0.00
7/21 0.13 11 8.33 0.09 117.16
5
3.66 0.15 191.64
0.00 0 0.00 0.00 0.07
0
0.00 0.00 0.00 7/22 0.15 10 7.11 0.09 124.27
2
1.52 0.16 193.16
0.00 0 0.09 0.00 0.16
0
0.00 0.00 0.00
7/23 0.17 8 8.86 0.10 133.13
44
31.87 0.18 225.03
0.00 1 0.26 0.00 0.42
2
1.50 0.00 1.50 7/24 0.19 13 10.10 0.11 143.23
22
16.51 0.19 241.53
0.00 0 0.10 0.00 0.52
0
0.00 0.00 1.50
7/25 0.23 15 11.96 0.12 155.20
16
11.67 0.20 253.20
0.00 0 0.00 0.00 0.52
0
0.00 0.00 1.50 7/26 0.25 5 3.67 0.13 158.86
3
2.27 0.21 255.47
0.00 0 0.25 0.00 0.77
0
0.00 0.00 1.50
7/27 0.30 29 25.32 0.15 184.18
6
4.69 0.21 260.16
0.00 2 1.71 0.01 2.48
0
0.00 0.00 1.50 7/28 0.32 20 22.35 0.17 206.53
37
23.05 0.23 283.21
0.00 1 0.92 0.01 3.40
2
1.02 0.01 2.52
7/29 0.34 34 28.92 0.19 235.45
38
28.04 0.25 311.25
0.00 2 1.75 0.02 5.15
2
1.48 0.01 4.00 7/30 0.35 23 22.04 0.22 257.49
7
5.58 0.26 316.83
0.01 5 2.25 0.02 7.41
0
0.00 0.01 4.00
7/31 0.37 65 77.76 0.27 335.25
7
4.86 0.26 321.69
0.01 5 2.12 0.03 9.53
3
2.20 0.02 6.19 8/1 0.38 50 36.38 0.30 371.63
3
2.36 0.26 324.04
0.01 3 1.69 0.04 11.22
1
0.73 0.02 6.93
8/2 0.39 40 29.05 0.33 400.68
1
0.71 0.26 324.76
0.01 5 3.24 0.05 14.46
0
0.00 0.02 6.93 8/3 0.41 56 41.02 0.37 441.70
29
20.65 0.28 345.41
0.02 15 9.83 0.07 24.29
5
3.55 0.03 10.48
8/4 0.45 36 25.01 0.39 466.70
1
0.71 0.28 346.12
0.02 12 9.05 0.08 33.34
0
0.00 0.03 10.48 8/5 0.49 18 19.14 0.40 485.85
1
0.73 0.28 346.85
0.04 5 4.07 0.09 37.41
2
1.59 0.03 12.07
8/6 0.53 42 56.36 0.44 542.21
163
130.12 0.38 476.97
0.04 7 7.82 0.12 45.23
5
3.40 0.04 15.46 8/7 0.55 70 49.18 0.48 591.39
26
18.71 0.40 495.69
0.06 25 15.45 0.16 60.68
6
4.82 0.05 20.28
8/8 0.58 39 29.00 0.52 620.39
0
0.00 0.40 495.69
0.08 14 10.61 0.19 71.29
1
0.75 0.05 21.03 8/9 0.62 40 28.24 0.56 648.63
94
62.82 0.45 558.51
0.11 20 10.81 0.23 82.10
7
4.70 0.06 25.73
8/10 0.66 24 16.69 0.58 665.32
151
136.27 0.56 694.78
0.13 16 12.70 0.26 94.80
42
36.38 0.15 62.12 8/11 0.69 8 6.84 0.58 672.16
20
14.41 0.57 709.20
0.15 10 8.77 0.29 103.57
38
26.31 0.21 88.42
8/12 0.70 50 46.00 0.63 718.16
6
4.20 0.58 713.39
0.20 22 16.86 0.33 120.43
21
15.17 0.25 103.59 8/13 0.72 57 49.51 0.68 767.67
7
5.11 0.58 718.50
0.23 27 22.25 0.39 142.68
10
7.47 0.27 111.06
8/14 0.74 26 23.14 0.70 790.80
1
0.75 0.58 719.25
0.34 23 19.04 0.44 161.72
2
1.49 0.27 112.55 8/15 0.77 29 41.42 0.74 832.22
0 b 0.00 0.58 719.25
0.39 28 39.24 0.52 200.96
0 b 0.00 0.27 112.55
8/16 0.82 43 42.83 0.79 875.05
176
200.98 0.74 920.23
0.45 20 20.82 0.57 221.78
53
72.56 0.45 185.11 8/17 0.83 15 12.64 0.80 887.69
101
94.76 0.82 1,014.99
0.51 16 13.40 0.61 235.19
47
42.67 0.55 227.77
8/18 0.85 15 13.45 0.81 901.14
78
54.59 0.86 1,069.58
0.58 13 10.79 0.64 245.98
31
23.05 0.61 250.82 8/19 0.87 32 26.37 0.84 927.51
68
46.55 0.90 1,116.13
0.62 25 15.97 0.70 261.95
49
32.38 0.69 283.20
-continued-

228
Appendix B13.–Page 2 of 2. Historical Fall Chum Salmon Historical Coho Salmon
Median 2001 to 2009 Average
2010
Median 2001 to 2009 Average
2010
Cumulative Daily Daily
Cumulative
Daily
Daily
Cumulative
Cumulative Daily Daily
Cumulative
Daily
Daily
Cumulative
Date Percent a Catch Index % Index a Catch Index % Index a Percent a Catch Index % Index a Catch Index % Index a 8/20 0.89 29 25.63 0.87 953.14
11
8.28 0.91 1,124.41
0.68 13 12.66 0.75 274.60
17
13.46 0.72 296.66
8/21 0.91 14 11.54 0.88 964.68
5
3.77 0.91 1,128.18
0.70 11 13.43 0.79 288.03
11
8.26 0.74 304.91 8/22 0.93 21 16.54 0.90 981.22
17
11.62 0.92 1,139.80
0.75 19 14.00 0.83 302.03
32
21.76 0.79 326.68
8/23 0.94 17 23.14 0.91 1,004.36
53
36.64 0.95 1,176.44
0.80 8 7.80 0.85 309.83
37
26.17 0.86 352.84 8/24 0.96 26 22.68 0.93 1,027.04
27
19.87 0.96 1,196.31
0.87 8 8.00 0.88 317.83
15
11.09 0.88 363.93
8/25 0.97 17 18.95 0.95 1,045.99
4
3.06 0.97 1,199.36
0.89 8 9.11 0.91 326.94
7
5.20 0.90 369.13 8/26 0.98 16 14.85 0.97 1,060.83
2
1.58 0.97 1,200.94
0.91 10 8.40 0.94 335.34
2
1.60 0.90 370.73
8/27 0.99 19 14.44 0.99 1,075.27
5
3.75 0.97 1,204.69
0.97 15 10.90 0.98 346.24
4
3.02 0.91 373.74 8/28 1.00 17 11.83 1.00 1,085.79
9
7.00 0.98 1,211.69
1.00 8 6.17 0.99 351.72
4
3.02 0.92 376.76
8/29 1.00 30 33.59 1.00 1,089.52 37 28.46 1.00 1,240.15 1.00 15 17.87 1.00 353.71 45 34.62 1.00 411.38 Total 1,261 1,523 439 503
a Historical percent passage is based on the median from the set net test fishery 1980 to 1993 and 1995 to 2000. The box indicates the first to the third quartile and median date of the cumulative catch per unit effort (CPUE).
b Project did not operate due to inclement weather.

229
Appendix B14.–Fall chum salmon daily and cumulative catch per unit effort (CPUE) index, Big Eddy and Middle Mouth sites combined, cooperative drift net test fishery, Lower Yukon River, 2001 to 2009 compared to 2010.

230
Appendix B15.–Coho salmon daily and cumulative catch per unit effort (CPUE) index, Big Eddy and Middle Mouth sites combined, cooperative drift net test fishery, Lower Yukon River, 2001 to 2009 compared to 2010.

231
APPENDIX C

232
Appendix C1.–Commercial salmon sales and estimated harvest by statistical area, all gears combined, Upper Yukon Area, 2010.
Beach Seine, Purse Seine, Set Gillnet and Fish Wheel Combineda Statistical Number of
Chinook
Summer Chum
Fall Chum
Coho
Area Fishermen b Number
Roe Estimated
Number Roe Estimated
Number Roe Estimated
Number Roe Estimated Harvest Harvest Harvest Harvest
334-42 0
NO COMMERCIAL FISHING
0 0 0 0 0 0 0 0 0 334-43 0 0 0 0 0 0 0 0 0 0 334-44 0 0 0 0 0 0 0 0 0 0 334-45 0 0 0 0 0 0 0 0 0 0 334-46 5 44,207 0 44,207 0 0 0 0 0 0 334-47 0 0 0 0 0 0 0 0 0 0
Subtotal District 4 5 0 0 0 44,207 0 44,207 0 0 0 0 0 0
334-51
NO COMMERCIAL FISHING 334-52 334-53 334-54 334-55
Subtotal District 5 0 0 0 0 0 0 0 0 0 0 0 0 0
334-61 0
0
0 0
0 0 0
0 0 0 0 0 0 334-62 9
0
0 0
5,466 0 5,466
1,735 0 1,735 1,700 0 1,700
334-63 0
0
0 0
0 0 0
0 0 0 0 0 0 Subtotal District 6 9 0 0 0 5,466 0 5,466 1,735 0 1,735 1,700 0 1,700 Total Upper
Yukon Area 14 0 0 0 49,673 0 49,673 1,735 0 1,735 1,700 0 1,700 a The estimated harvest is the number of fish sold in the round plus estimated number of females harvested to produce roe sold. b The number of fishermen is the unique number of permits fished i.e., some fishermen may fish multiple areas, therefore the subtotals will not necessarily add up by district.

233
Appendix C2.–Commercial set gillnet salmon sales and estimated harvest by statistical area, Upper Yukon Area, 2010.
Set Gillneta Statistical Number of
Chinook
Summer Chum
Fall Chum
Coho
Area Fishermen b Number Roe Estimated
Number Roe Estimated
Number Roe Estimated
Number Roe Estimated Harvest Harvest Harvest Harvest
334-42 0
NO COMMERCIAL FISHING
0 0 0 0 0 0 0 0 0 334-43 0 0 0 0 0 0 0 0 0 0 334-44 0 0 0 0 0 0 0 0 0 0 334-45 0 0 0 0 0 0 0 0 0 0 334-46 0 0 0 0 0 0 0 0 0 0 334-47 0 0 0 0 0 0 0 0 0 0
Subtotal District 4 0 0 0 0 0 0 0 0 0 0 0 0 0
334-51
NO COMMERCIAL FISHING 334-52 334-53 334-54 334-55
Subtotal District 5 0 0 0 0 0 0 0 0 0 0 0 0 0
334-61 0
0 0 0
0 0 0
0 0 0
0 0 0 334-62 0
0 0 0
0 0 0
0 0 0
0 0 0
334-63 0
0 0 0
0 0 0
0 0 0
0 0 0 Subtotal District 6 0 0 0 0 0 0 0 0 0 0 0 0 0 Total Upper
Yukon Area 0 0 0 0 0 0 0 0 0 0 0 0 0 a The estimated harvest is the number of fish sold in the round plus estimated number of females harvested to produce roe sold. b The number of fishermen is the unique number of permits fished i.e., some fishermen may fish multiple areas, therefore the subtotals will not necessarily add up by district.

234
Appendix C3.–Commercial fish wheel salmon sales and estimated harvest by statistical area, Upper Yukon Area, 2010.
Fish Wheela Statistical Number of Chinook Summer Chum Fall Chum Coho
Area Fishermen b Number Roe Estimated
Number Roe Estimated
Number Roe Estimated
Number Roe Estimated Harvest Harvest Harvest Harvest
334-42 0
NO COMMERCIAL FISHING
0 0 0 0 0 0 0 0 0 334-43 0 0 0 0 0 0 0 0 0 0 334-44 0 0 0 0 0 0 0 0 0 0 334-45 0 0 0 0 0 0 0 0 0 0 334-46 5 44,207 0 44,207 0 0 0 0 0 0 334-47 0 0 0 0 0 0 0 0 0 0
Subtotal District 4 5 0 0 0 44,207 0 44,207 0 0 0 0 0 0
334-51
NO COMMERCIAL FISHING 334-52 334-53 334-54 334-55
Subtotal District 5 0 0 0 0 0 0 0 0 0 0 0 0 0
334-61 0
0 0 0
0 0 0
0 0 0
0 0 0 334-62 9
0 0 0
5,466 0 5,466
1,735 0 1,735
1,700 0 1,700
334-63 0
0 0 0
0 0 0
0 0 0
0 0 0 Subtotal District 6 9
0 0 0
5,466 0 5,466
1,735 0 1,735
1,700 0 1,700
Total Upper Yukon Area 14 0 0 0 49,673 0 49,673 1,735 0 1,735 1,700 0 1,700 a The estimated harvest is the number of fish sold in the round plus estimated number of females harvested to produce roe sold. b The number of fishermen is the unique number of permits fished i.e., some fishermen may fish multiple areas, therefore the subtotals will not necessarily add up by district.

235
Appendix C4.–Commercial Chinook sales and estimated harvest by statistical area, Subdistrict 4-A, Upper Cook Inlet, 1974–2010.
334-41 334-44 334-45 334-46 Total Year Number a Roe b Harvest c Number a Roe b Harvest c Number a Roe b Harvest c Number a Roe b Harvest c Number a Roe b Harvest c
1974 0 - 0
- - -
- - -
- - -
0 - 0 1975 15 - 15
- - -
- - -
- - -
15 - 15
1976 44 - 44
- - -
- - -
- - -
44 - 44 1977 317 - 317
- - -
- - -
- - -
317 - 317
1978 183 - 183
- - -
- - -
- -
183 - 183 1979 785 - 785
- - -
- - -
- - -
785 - 785
1980 352 - 352
- - -
- - -
- - -
352 - 352 1981 106 - 106
- - -
- - -
- - -
106 - 106
1982 78 - 78
- - -
- - -
- - -
78 - 78 1983 0 - 0
- - -
- - -
- - -
0 - 0
1984 2 - 2
- - -
- - -
- - -
2 - 2 1985 0 - 0
- - -
- - -
- - -
0 - 0
1986 11 - 11
- - -
- - -
- - -
11 - 11 1987 91 - 91
- - -
- - -
- - -
91 - 91
1988 19 - 19
- - -
- - -
- - -
19 - 19 1989 59 - 59
- - -
- - -
- - -
59 - 59
1990 d
0 8 2
0 0 0
52 0 52
52 8 54 1991
0 67 35
0 7 4
69 88 114
69 162 153
1992
0 0 0
0 15 9
0 71 41
0 86 50 1993
0 0 0
0 0 0
0 0 0
0 0 0
1994
0 0 0
0 0 0
0 14 7
0 14 7 1995
0 0 0
0 0 0
0 0 0
0 0 0
1996
0 0 0
0 0 0
0 0 0
0 0 0 1997
- - -
- - -
- - -
- - -
1998
- - -
- - -
- - -
- - - 1999
- - -
- - -
- - -
- - -
2000
- - -
- - -
- - -
- - - -continued-

236
Appendix C4.–Page 2 of 2.
334-41 334-44 334-45 334-46 Total Year Number a Roe b Harvest c Number a Roe b Harvest c Number a Roe b Harvest c Number a Roe b Harvest c Number a Roe b Harvest c 2001
- - -
- - -
- - -
- - -
2002
0 0 0
0 0 0
0 0 0
0 0 0 2003
- - -
- - -
- - -
- - -
2004
- - -
- - -
- - -
- - - 2005
- - -
- - -
- - -
- - -
2006
- - -
- - -
- - -
- - - 2007
0 0 0
0 0 0
0 0 0
0 0 0
2008
0 0 0
0 0 0
0 0 0
0 0 0 2009
0 0 0
0 0 0
0 0 0
0 0 0
2010 0 0 0 0 0 0 0 0 0 0 0 0 2005-2009
Average 0 0 0 0 0 0 0 0 0 0 0 0 Note: Unless otherwise indicate blank cells indicate years in which no information was collected or harvest numbers were insufficient to generate summary information. Dashes
indicate no commercial fishing activity occurred. a Harvest reported in numbers of fish sold in the round. b Pounds of salmon roe sold. Since 1990, efforts were made to separate Chinook salmon roe from the summer chum salmon roe sold. c The estimated harvest is the fish sold in the round plus the estimated number of females to produce the roe sold. Since 1990, the estimated number of females that produce the
roe sold is based on a District 4 sampling program that estimated average roe weight per female by statistical area, by period and gear type. d In 1990, Subdistrict 4-A (Statistical Area 334-41) was subdivided into Statistical Areas 334-44, 334-45 and 334-46.

237
Appendix C5.–Commercial Chinook salmon sales and estimated harvest by statistical area, Subdistricts 4-B and 4-C, Upper Yukon Area, 1974–2010.
334-42
334-43
Total
Year Number a Roe b Harvest c Number a Roe b Harvest c Number a Roe b Harvest c 1974
685 - 685
- - -
685 - 685
1975
374 - 374
- - -
374 - 374 1976
365 - 365
- - -
365 - 365
1977
668 - 668
- - -
668 - 668 1978
425 - 425
- - -
425 - 425
1979 d
370 - 370
834 - 834
1,204 - 1,204 1980
549 - 549
620 - 620
1,169 - 1,169
1981
867 - 867
374 - 374
1,241 - 1,241 1982
497 - 497
512 - 512
1,009 - 1,009
1983
382 - 382
219 - 219
601 - 601 1984
272 - 272
687 - 687
959 - 959
1985
318 - 318
346 - 346
664 - 664 1986
100 - 100
391 - 391
491 - 491
1987
999 - 999
434 - 434
1,433 - 1,433 1988
1,599 - 1,599
1,541 - 1,541
3,140 - 3,140
1989
696 - 696
2,035 - 2,035
2,731 - 2,731 1990
784 0 784
2,700 0 2,700
3,484 0 3,484
1991
916 386 1,113
1,461 1,674 2,316
2,377 2,060 3,429 1992
623 482 818
1,028 1,705 1,526
1,651 2,187 2,344
1993
190 279 269
1,159 422 1,308
1,349 701 1,577 1994
389 374 539
1,827 176 1,897
2,216 550 2,436
1995
262 30 262
0 596 237
262 626 499 1996
11 202 103
34 0 34
45 202 137
1997
326 14 333
1,124 0 1,124
1,450 14 1,457 1998
0 0 0
0 0 0
0 0 0
1999
233 0 233
1,204 0 1,204
1,437 0 1,437 2000
0 0 0
0 0 0
0 0 0
2001
- - -
- - -
- - - 2002
0 0 0
0 0 0
0 0 0
2003
0 0 0
562 0 562
562 0 562 2004
- - -
- - -
- - -
2005
- - -
- - -
- - - 2006
- - -
- - -
- - -
2007
- - -
- - -
- - - 2008
- - -
- - -
- - -
2009
- - -
- - -
- - - 2010 - - - - - - - - - 2005-2009
Average - - - - - - - - - Note: Unless otherwise indicate blank cells indicate years in which no information was collected or harvest numbers were
insufficient to generate summary information. Dashes indicate no commercial fishing activity occurred. a Harvest reported in numbers of fish sold in the round. b Pounds of salmon roe sold. Since 1990, efforts were made to separate Chinook salmon roe from the summer chum salmon roe
sold. c The estimated harvest is the fish sold in the round plus the estimated number of females to produce the roe sold. Since 1990,
the estimated number of females that produce the roe sold is based on a District 4 sampling program that estimated average roe weight per female by statistical area, by period and gear type.
d In 1979, Statistical Area 334-42 was subdivided into Statistical Areas 334-42 and 334-43.

238
Appendix C6.–Commercial Chinook salmon sales and estimated harvest by statistical area, Subdistricts 5-A, 5-B and 5-C, Upper Yukon Area, 1974–2010. 334-51 334-52 334-53 Total
Year Number a Roe b Harvest c Number a Roe b Harvest c Number a Roe b Harvest c Number a Roe b Harvest c 1974
2,284 - 2,284
379 - 379
- - -
2,663 - 2,663
1975
2,602 - 2,602
270 - 270
- - -
2,872 - 2,872 1976
2,843 - 2,843
308 - 308
- - -
3,151 - 3,151
1977
4,013 - 4,013
149 - 149
- - -
4,162 - 4,162 1978
2,838 - 2,838
241 - 241
- - -
3,079 - 3,079
1979
3,389 - 3,389
0 - 0
- - -
3,389 - 3,389 1980
4,554 - 4,554
337 - 337
- - -
4,891 - 4,891
1981 d 97 - 97
3,051 - 3,051
2,477 - 2,477
5,625 - 5,625 1982
61 - 61
2,352 - 2,352
2,277 - 2,277
4,690 - 4,690
1983
0 - 0
632 - 632
2,738 - 2,738
3,370 - 3,370 1984
128 - 128
1,589 - 1,589
1,568 - 1,568
3,285 - 3,285
1985
0 - 0
1,142 - 1,142
1,842 - 1,842
2,984 - 2,984 1986
0 - 0
1,552 - 1,552
875 - 875
2,427 - 2,427
1987
0 - 0
1,183 - 1,183
1,356 - 1,356
2,539 - 2,539 1988
0 - 0
1,498 - 1,498
1,477 - 1,477
2,975 - 2,975
1989
31 - 31
1,411 - 1,411
1,459 - 1,459
2,901 - 2,901 1990
0 0 0
1,630 47 1,642
1,180 0 1,180
2,810 47 2,822
1991
56 0 56
1,724 62 1,740
1,476 0 1,476
3,256 62 3,272 1992
0 0 0
1,276 7 1,279
2,119 0 2,119
3,395 7 3,398
1993
0 0 0
1,124 0 1,124
1,484 0 1,484
2,608 0 2,608 1994
0 0 0
1,648 10 1,653
1,641 0 1,641
3,289 10 3,294
1995
0 0 0
1,519 0 1,519
1,234 0 1,234
2,753 0 2,753 1996
0 0 0
898 455 1,216
1,151 63 1,183
2,049 518 2,399
1997
0 0 0
1,314 0 1,314
1,757 0 1,757
3,071 0 3,071 1998
0 0 0
279 0 279
196 0 196
475 0 475
1999
0 0 0
1,468 0 1,468
721 0 721
2,189 0 2,189 2000
- - -
- - -
- - -
- - -
2001
- - -
- - -
- - -
- - - 2002
0 0 0
307 0 307
257 0 257
564 0 564
2003
0 0 0
711 0 711
197 0 197
908 0 908 2004
0 0 0
1,317 0 1,317
229 0 229
1,546 0 1,546
2005
0 0 0
1,297 0 1,297
172 0 172
1,469 0 1,469 2006
0 0 0
1,358 0 1,358
481 0 481
1,839 0 1,839
2007
0 0 0
1,064 0 1,064
177 0 177
1,241 0 1,241 2008
- - -
- - -
- - -
- - -
2009
- - -
- - -
- - -
- - - 2010 - - - - - - - - - - - -
2005-2009 Average 0 0 0 1,240 0 1,240 277 0 277 1,516 0 1,516
Note: Unless otherwise indicate blank cells indicate years in which no information was collected or harvest numbers were insufficient to generate summary information. Dashes indicate no commercial fishing activity occurred.
a Harvest reported in numbers of fish sold in the round. Does not include estimates of illegal sales in 1987 of 653 Chinook salmon.
b Pounds of salmon roe sold. Since 1990, efforts were made to separate Chinook salmon roe from the summer chum salmon roe sold.
c The estimated harvest is the fish sold in the round plus the estimated number of females to produce the roe sold. Since 1990, the estimated number of females that produce the roe sold is based on a District 5 sampling program that estimated average roe weight per female by period.
d In 1981, Subdistrict 5-A (Statistical Area 334-51) and Subdistrict 5-B (Statistical Area 334-52) were subdivided to include two additional subdistricts, Subdistrict 5-C (Statistical Area 334-53) and Subdistrict 5-D (Statistical Area 334-54).

239
Appendix C7.–Commercial Chinook salmon sales and estimated harvest by statistical area, Subdistrict 5-D, Upper Yukon Area, 1974–2010.
334-54 334-55 Total Year Number a Roe b Harvest c Number a Roe b Harvest c Number a Roe b Harvest c 1974
- - -
- - -
- - -
1975
- - -
- - -
- - - 1976
- - -
- - -
- - -
1977
- - -
- - -
- - - 1978
- - -
- - -
- - -
1979
- - -
- - -
- - - 1980
- - -
- - -
- - -
1981 d 749 - 749
- - -
749 - 749 1982
695 - 695
- - -
695 - 695
1983
236 - 236
- - -
236 - 236 1984
384 - 384
- - -
384 - 384
1985
434 - 434
- - -
434 - 434 1986
306 - 306
- - -
306 - 306
1987
566 - 566
- - -
566 - 566 1988
461 - 461
- - -
461 - 461
1989
385 - 385
- - -
385 - 385 1990 e 194 0 194
349 0 349
543 0 543
1991
192 0 192
362 0 362
554 0 554 1992
0 0 0
457 0 457
457 0 457
1993
0 0 0
400 0 400
400 0 400 1994
0 0 0
450 0 450
450 0 450
1995
0 0 0
489 0 489
489 0 489 1996
58 0 58
390 0 390
448 0 448
1997
262 0 262
345 0 345
607 0 607 1998
11 0 11
31 0 31
42 0 42
1999
81 0 81
334 0 334
415 0 415 2000
- - -
- - -
- - -
2001
- - -
- - -
- - - 2002
0 0 0
207 0 207
207 0 207
2003
0 0 0
226 0 226
226 0 226 2004
- - -
- - -
- - -
2005
- - -
- - -
- - - 2006
- - -
- - -
- - -
2007
- - -
- - -
- - - 2008
- - -
- - -
- - -
2009
- - -
- - -
- - - 2010 - - - - - - - - -
2005-2009 Average - - - - - - - - -
Note: Unless otherwise indicate blank cells indicate years in which no information was collected or harvest numbers were insufficient to generate summary information. Dashes indicate no commercial fishing activity occurred.
a Harvest reported in numbers of fish sold in the round. b Pounds of salmon roe sold. Since 1990, efforts were made to separate Chinook salmon roe from the summer chum salmon roe
sold. c The estimated harvest is the fish sold in the round plus the estimated number of females to produce the roe sold. Since 1990,
the estimated number of females that produce the roe sold is based on a District 5 sampling program that estimated average roe weight per female by period.
d In 1981, Subdistrict 5-A (Statistical Area 334-51) and Subdistrict 5-B (Statistical Area 334-52) was subdivided to include two additional subdistricts, Subdistrict 5-C (Statistical Area 334-53) and Subdistrict 5-D (Statistical Area 334-54).
e In 1990, Subdistrict 5-D (Statistical Area 334-54) was subdivided into two statistical areas, (Statistical Areas 334-54 and 334-55).

240
Appendix C8.–Commercial Chinook salmon sales and estimated harvest by statistical area, District 6, Upper Yukon Area, 1974–2010.
334-61 334-62 334-63 Total Year Number a Roe b Harvest c Number a Roe b Harvest c Number a Roe b Harvest c Number a Roe b Harvest c 1974 111 - 111
1,102 - 1,102
260 - 260
1,473 - 1,473
1975 77 - 77
153 - 153
270 - 270
500 - 500 1976 490 - 490
320 - 320
292 - 292
1,102 - 1,102
1977 405 - 405
365 - 365
238 - 238
1,008 - 1,008 1978 34 - 34
58 - 58
543 - 543
635 - 635
1979 102 - 102
336 - 336
334 - 334
772 - 772 1980 92 - 92
1,588 - 1,588
267 - 267
1,947 - 1,947
1981 438 - 438
366 - 366
183 - 183
987 - 987 1982 414 - 414
309 - 309
258 - 258
981 - 981
1983 249 - 249
364 - 364
298 - 298
911 - 911 1984 0 - 0
375 - 375
492 - 492
867 - 867
1985 15 - 15
560 - 560
567 - 567
1,142 - 1,142 1986 0 - 0
597 - 597
353 - 353
950 - 950
1987 0 - 0
600 - 600
602 - 602
1,202 - 1,202 1988 305 - 305
253 - 253
204 - 204
762 - 762
1989 809 - 809
614 - 614
318 - 318
1,741 - 1,741 1990 326 0 326
1,243 1,354 1,565
188 322 265
1,757 1,676 2,156
1991 117 0 117
450 1,365 791
119 180 164
686 1,545 1,072 1992 39 0 39
371 679 510
162 205 204
572 884 753
1993 57 0 57
810 1,213 1,116
246 100 272
1,113 1,313 1,445 1994 0 0 0
1,941 1,513 2,333
194 307 273
2,135 1,820 2,606
1995 0 110 26
1,418 3,783 2,287
242 838 434
1,660 4,731 2,747 1996 0 0 0
110 645 255
168 105 192
278 750 447
1997 38 0 38
1,662 2,816 2,334
266 395 356
1,966 3,211 2,728 1998 217 0 217
431 208 496
234 52 250
882 260 963
1999 0 0 0
269 734 462
133 362 228
402 1,096 690 2000 - - -
- - -
- - -
- - -
2001 - - -
- - -
- - -
- - - 2002 0 0 0
732 896 962
104 0 104
836 896 1,066
2003 0 0 0
1,445 0 1,445
368 0 368
1,813 0 1,813 -continued-

241
Appendix C8.–Page 2 of 2.
334-61 334-62 334-63 Total Year Number a Roe b Harvest c Number a Roe b Harvest c Number a Roe b Harvest c Number a Roe b Harvest c 2004 0 0 0
1,542 0 1,542
515 0 515
2,057 0 2,057
2005 0 0 0
391 0 391
62 0 62
453 0 453 2006 0 0 0
0 0 0
84 0 84
84 0 84
2007 0 0 0
106 0 106
175 0 175
281 0 281 2008 0 0 0
0 0 0
0 0 0
0 0 0
2009 0 0 0
0 0 0
0 0 0
0 0 0 2010 0 0 0 0 0 0 0 0 0 0 0 0
2005-2009 Average 0 0 0 99 0 99 64 0 64 164 0 164
Note: Unless otherwise indicate blank cells indicate years in which no information was collected or harvest numbers were insufficient to generate summary information. Dashes indicate no commercial fishing activity occurred.
a Harvest reported in numbers of fish sold in the round. Does not include estimates of illegal sales in 1987 of 2,136 Chinook salmon. b Pounds of salmon roe sold. Since 1990, efforts were made to separate Chinook salmon roe from the summer chum salmon roe sold. c The estimated harvest is the fish sold in the round plus the estimated number of females to produce the roe sold. Since 1990, the estimated number of females
that produce the roe sold is based on a District 6 sampling program that estimated average roe weight per female by period.

242
Appendix C9.–Commercial summer chum salmon sales and estimated harvest by statistical area, Subdistrict 4-A, Upper Yukon Area, 1974–2010. 334-41 334-44
Roe Expansion
Roe Expansion
Estimated
Estimated Year
Number a Roe b Males c
Females d
Harvest e
Number a Roe b Males c Females d Harvest e
1974 0 0 0 - - - - - 1975
0 0
0
- - - - -
1976
0 0
0
- - - - - 1977
0 0
0
- - - - -
1978
16,920 0
16,920
- - - - - 1979
35,117 0
35,117
- - - - -
1980
119,957 0
119,957
- - - - - 1981
160,757 123,266 f 160,757
- - - - -
1982
1,032 137,611 95,788
137,611
234,431
- - - - - 1983
3,407 130,013 90,740
130,013
224,160
- - - - -
1984
51 148,519 98,962
148,519
247,532
- - - - - 1985
5,130 222,149 157,062
222,149
384,341
- - - - -
1986
0 236,856 172,222
236,856
409,078
- - - - - 1987
29,314 110,977 51,379
110,977
191,670
- - - - -
1988
19,070 230,276 167,594
256,718 g 443,382
- - - - - 1989
14,397 270,039 170,322
301,383 h 486,102
- - - - -
1990 i
0 27,628 24,484 31,409 55,893 1991
88 39,281 37,164 47,574 84,826
1992
0 20,444 13,192 22,383 35,575 1993
0 6,234 4,308 7,334 11,642
1994 j
0 18,095 12,937 22,606 35,543 1995
0 37,595 37,575 46,084 83,659
1996
0 31,186 26,210 34,592 60,802 1997
0 14,188 10,905 15,118 26,023
1998
- - - - - 1999
- - - - -
2000
- - - - - 2001
- - - - -
2002
- - - - - 2003
- - - - -
2004
- - - - - 2005
- - - - -
2006
- - - - - 2007 k
5,359 -
5,359
2008 k
- - - - - 2009 k
3,890 -
3,890
2010 l - - - - - 2005-2009
Average
4,625
4,625 -continued-

243
Appendix C9.–Page 2 of 4. 334-45 334-46
Roe Expansion
Roe Expansion
Estimated
Estimated Year
Number a Roe b Males c Females d Harvest e
Number a Roe b Males c
Females d
Harvest e
1974 - - - - - - - - - - 1975
- - - - -
- - -
-
-
1976
- - - - -
- - -
-
- 1977
- - - - -
- - -
-
-
1978
- - - - -
- - -
-
- 1979
- - - - -
- - -
-
-
1980
- - - - -
- - -
-
- 1981
- - - - -
- - -
-
-
1982
- - - - -
- - -
-
- 1983
- - - - -
- - -
-
-
1984
- - - - -
- - -
-
- 1985
- - - - -
- - -
-
-
1986
- - - - -
- - -
-
- 1987
- - - - -
- - -
-
-
1988
- - - - -
- - -
-
- 1989
- - - - -
- - -
-
-
1990 i 427 28,181 24,153 32,166 56,746
10,750 39,732 29,490
44,742
84,982 1991
79 43,087 42,445 53,401 95,925
5,122 45,863 47,563
56,819
109,504
1992
0 35,312 26,463 40,142 66,605
0 43,945 32,502
49,489
81,991 1993
0 6,081 4,246 7,230 11,476
0 8,170 5,579
9,499
15,078
1994 j 0 15,091 11,031 19,276 30,307
0 29,615 28,825
37,119
65,944 1995
0 49,577 49,149 56,667 105,816
0 102,080 105,663
124,550
230,213
1996
0 40,692 30,785 45,483 76,268
0 109,172 98,926
120,942
219,868 1997
0 526 342 570 912
0 41,587 29,207
44,247
73,454
1998
- - - - -
- - -
-
- 1999
- - - - -
- - -
-
-
2000
- - - - -
- - -
-
- 2001
- - - - -
- - -
-
-
2002
- - - - -
- - -
-
- 2003
- - - - -
- - -
-
-
2004
- - - - -
- - -
-
- 2005
- - - - -
- - -
-
-
2006
- - - - -
- - -
-
- 2007 k - - - - -
1,945 -
1,945
2008 k - - - - -
23,746 -
23,746 2009 k 699 -
699
- - -
-
-
2010 l - - - - - 44,207 - - - 44,207 2005-2009
Average
699
699
12,846
-
-
12,846 -continued-

244
Appendix C9.–Page 3 of 4. Subtotal 334-41, 44, 45 and 46 334-47 (Anvik River) Total (Subdistrict 4-A and Anvik)
Roe Expansion
Roe Expansion
Roe Expansion
Estimated
Estimated
Estimated Year
Number a Roe b Males c Females d Harvest e
Number a Roe b Females d Harvest e
Number a Roe b Males c
Females d
Harvest e
1974 0 0 0 0 - - - - - 0 0 0 1975
0 0 0 0 -
- - - -
0 0
0
1976
0 0 0 0 -
- - - -
0 0
0 1977
0 0 0 0 -
- - - -
0 0
0
1978
0 16,920 0 16,920 -
- - - -
16,920 0
16,920 1979
0 35,117 0 35,117 -
- - - -
35,117 0
35,117
1980
0 119,957 0 119,957 -
- - - -
119,957 0
119,957 1981
0 160,757 123,266 160,757 -
- - - -
160,757 123,266 f 160,757
1982
1,032 137,611 95,788 137,611 234,431
- - - -
1,032 137,611 95,788
137,611
234,431 1983
3,407 130,013 90,740 130,013 224,160
- - - -
3,407 130,013 90,740
130,013
224,160
1984
51 148,519 98,962 148,519 247,532
- - - -
51 148,519 98,962
148,519
247,532 1985
5,130 222,149 157,062 222,149 384,341
- - - -
5,130 222,149 157,062
222,149
384,341
1986
0 236,856 172,222 236,856 409,078
- - - -
0 236,856 172,222
236,856
409,078 1987
29,314 110,977 51,379 110,977 191,670
- - - -
29,314 110,977 51,379
110,977
191,670
1988
19,070 230,276 167,594 256,718 443,382
- - - -
19,070 230,276 167,594
256,718 g 443,382 1989
14,397 270,039 170,322 301,383 486,102
- - - -
14,397 270,039 170,322
301,383 h 486,102
1990 i 11,177 95,541 78,127 108,317 197,621
- - - -
11,177 95,541 78,127
108,317
197,621 1991
5,289 128,231 127,172 157,794 290,255
- - - -
5,289 128,231 127,172
157,794
290,255
1992
0 99,701 72,158 112,013 184,171
- - - -
0 99,701 72,158
112,013
184,171 1993
0 20,485 14,133 24,063 38,196
- - - -
0 20,485 14,133
24,063
38,196
1994 j 0 62,801 52,794 79,000 131,794
0 19,532 22,574 22,574
0 82,333 52,794
101,574
154,368 1995
0 189,252 192,387 227,301 419,688
0 48,477 54,744 54,744
0 237,729 192,387
282,045
474,432
1996
0 181,050 155,921 201,017 356,938
0 76,318 84,663 84,663
0 257,368 155,921
285,680
441,601 1997
0 56,301 40,454 59,935 100,389
0 13,067 13,548 13,548
0 69,368 40,454
73,483
113,937
1998
- - - - -
- - - -
- - -
-
- 1999
- - - - -
- - - -
- - -
-
-
2000
- - - - -
- - - -
- - -
-
- 2001
- - - - -
- - - -
- - -
-
-
2002
- - - - -
- - - -
- - -
-
- 2003
- - - - -
- - - -
- - -
-
-
2004
- - - - -
- - - -
- - -
-
- 2005
- - - - -
- - - -
- - -
-
-
2006
- - - - -
- - - -
- - -
-
- 2007 k 7,304 -
7,304
- - - -
7,304 -
7,304
2008 k 23,746 -
23,746
- - - -
23,746 -
23,746 2009 k 4,589 -
4,589
- - - -
4,589 -
4,589
2010 l 44,207 - 44,207 - - - - 44,207 44,207 2005-2009
Average
11,880 - - - 11,880
- - - -
11,880 - -
-
11,880 -continued-

245
Appendix C9.–Page 4 of 4.
Note: Unless otherwise indicated, blank cells indicate years in which no information was collected or harvest numbers were insufficient to generate summary information. Dashes indicate no commercial fishing activity occurred.
a Harvest reported in numbers of fish sold in the round. b Pounds of salmon roe sold. Prior to 1990, roe production may include small amounts of Chinook salmon roe. Since 1990, efforts were made to separate Chinook salmon roe
from the summer chum salmon roe sold. c The estimated number of unsold males that were caught and not sold while harvesting the females that produced the roe sold. Prior to 1981, it was assumed that all males were
sold in the round. Since 1981, all fish sold in the round are assumed to be the estimated percentage of males in the harvest was based on percentage of males observed in the department Stink Creek test fish wheel catches (1981 - 0.434; 1982 - 0.413; 1983-0.420; 1984- 0.400; and 1985 - 0.422). For the years 1986 through 1988, was based on the average percentage of males observed in the Stink Creek test fishery for the years 1981 through 1985 (average of 0.421). For the year 1989, the estimated percentage of males in the harvest was .38. Since 1990, the estimated number is based on a District 4 sampling program that estimated average percent males in the harvest by statistical area, by period and gear type.
d The estimated number of females to produce the roe sold. Unless otherwise noted, prior to 1991, the roe expansion assumes 1.0 pound of roe per female. Since 1991, the estimated number of females that produce the roe sold is based on a District 4 sample roe weight per female by statistical area, by period and gear type.
e From 1974 to 2006 the estimated harvest is the number of fish sold in the round plus the estimated number of females and the estimated number of unsold males harvested to produce the roe sold. Beginning in 2007 the actual numbers of female fish from which roe were extracted are included in the total harvest. Males were recorded as caught but not sold, thus are accounted for in personal use totals.
f Assumes no males were sold in the round. g Roe expansion assumes 0.897 pound of roe per female. h Roe expansion assumes 0.896 pound of roe per female. i In 1990, Subdistrict 4-A (Statistical Area 334-41) was subdivided into Statistical Areas 334-44, 334-45 and 334-46. j In 1994, Statistical Area 334-47 was included in Subdistrict 4-A and it represents the Anvik River Management Area. k The number of female fish from which roe were extracted is the number harvested. Males were not purchased and accounted for as caught but not sold are included in personal
use totals. Roe information is included in Zephyr as both numbers of fish and pounds of roe were recorded on fish tickets. l Both males and females were purchased and are included in the number harvested.

246
Appendix C10.–Commercial summer chum salmon sales and estimated harvest by statistical area, Subdistricts 4-B and 4-C, Upper Yukon Area, 1974–2010.
334-42 334-43 Total Roe Expansion Roe Expansion Roe Expansion
Year Number a Roe b Females c Harvest d Number a Roe b Females c Harvest d Number a Roe b Females c Males e Harvest d
1974 0 0 - - - - 0 0 01975 0 0 - - - - 0 0 01976 0 0 - - - - 0 0 01977 0 0 - - - - 0 0 01978 0 0 - - - - 0 0 01979 f 200 200 0 0 g 200 200 1980 14,385 14,385 1,482 1,482 g 15,867 15,867 1981 23,677 23,677 2,598 2,598 g 26,275 26,275 1982 1,059 12,550 12,550 13,609 1,556 1,120 1,120 2,676 2,615 13,670 13,670 7,003 23,288 1983 3,265 17,549 17,549 20,814 0 563 563 563 3,265 18,112 18,112 9,851 31,228 1984 659 15,184 15,184 15,843 299 3,139 3,139 3,438 958 18,323 18,323 11,257 30,538 1985 1,785 19,306 19,306 21,091 5,092 5,630 5,630 10,722 6,877 24,936 24,936 11,329 43,142 1986 241 29,169 29,169 29,410 59 3,520 3,520 3,579 300 32,689 32,689 23,468 56,457 1987 593 9,956 9,956 10,549 84 541 541 625 677 10,497 10,497 6,956 18,130 1988 4,592 21,766 24,265 g 26,358 389 2,484 2,769 g 3,158 4,981 24,250 27,034 g 14,677 46,692 1989 2,940 9,915 11,066 h 12,855 1,217 3,351 3,740 h 4,957 4,157 13,266 14,806 h 5,179 24,142 1990 1,091 6,600 7,799 8,890 96 3,582 4,434 4,530 1,187 10,182 12,233 11,509 24,929 1991 1,092 8,282 8,996 10,088 0 719 781 781 1,092 9,001 9,777 8,520 19,389 1992 1,363 9,010 9,616 10,979 1,296 2,098 2,902 4,198 2,659 11,108 12,518 12,048 27,225 1993 0 1,851 2,134 4,445 27 111 140 316 27 1,962 2,274 2,460 4,761 1994 2,844 6,455 14,803 767 929 2,436 3,611 7,384 17,239 1995 8,873 39,699 73,570 0 3,646 6,585 8,873 43,345 80,155
-continued-

247
Appendix C10.–Page 2 of 2.
334-42 334-43 Total Roe Expansion Roe Expansion Roe Expansion
Year Number a Roe b Females c Harvest d Number a Roe b Females c Harvest d Number a Roe b Females c Males e Harvest d
1996 0 36,927 39,156 67,012 0 895 939 1,627 0 37,822 40,095 28,544 68,639 1997 1,942 4,786 5,199 10,484 120 77 81 250 2,062 4,863 5,280 5,454 12,796 1998 - - - - - - - - - - - - -1999 153 0 0 153 1,114 0 0 1,114 1,267 0 0 0 1,267 2000 - - - - - - - - - - - - -2001 - - - - - - - - - - - - -2002 0 0 0 0 0 0 0 0 0 0 0 0 0 2003 0 0 0 0 62 0 0 62 62 0 0 0 62 2004 - - - - - - - - - - - - -2005 - - - - - - - - - - - - -2006 - - - - - - - - - - - - -2007 - - - - - - - - - - - - -2008 - - - - - - - - - - - - -2009 - - - - - - - - - - - - -2010 - - - - - - - - - - - - -
2005-2009 Average - - - - - - - - - - - - -
Note: Unless otherwise indicated, blank cells indicate years in which no information was collected or harvest numbers were insufficient to generate summary information. Dashes indicate no commercial fishing activity occurred.
a Harvest reported in numbers of fish sold in the round. b Pounds of salmon roe sold. Prior to 1990, roe production may include small amounts of Chinook salmon roe. Since 1990, efforts were made to separate Chinook salmon roe
from the summer chum salmon sold. c The estimated number of females to produce the roe sold. Unless otherwise noted, prior to 1991, the roe expansion assumed 1.0 pound of roe per female. Since 1990, the
estimated number of female that produce the roe sold is based on a District 4 sampling program that estimated average roe weight per female by statistical area, by period and gear type.
d The total estimated harvest is the fish sold in the round plus estimated number of females harvested to produce roe sold plus the estimated number of males caught but not sold. e Estimated number of males caught but not sold. Total males caught but not sold calculated the same as for District 4-A (using sex ratio and sales in the round assumed to be
male chum salmon). f In 1979, Statistical Area 334-42 was subdivided into Statistical Areas 334-42 and 334-43. g Roe expansion assumes 0.897 pound of roe per female. h Roe expansion assumes 0.896 pound of roe per female.

248
Appendix C11.–Commercial summer chum salmon sales and estimated harvest by statistical area, Subdistricts 5-A, 5-B, and 5-C, Upper Yukon Area, 1974–2010. 334-51 334-52 334-53 Total
Year Number a Roe b Harvest c Number a Roe b Harvest c Number a Roe b Harvest c Number a Roe b Harvest c 1974
0
0
- - -
6,831 0 6,831
1975
0
0
- - -
12,997 0 12,997 1976
0
0
- - -
774 0 774
1977
0
0
- - -
1,274 0 1,274 1978
605
0
- - -
4,892 605 5,497
1979
1,009
0
- - -
8,608 1,009 9,617 1980
0
0
- - -
456 0 456
1981 d
0
49
0
1,236 49 1,285 1982
21
0
0
213 21 234
1983
0 242 242
37 269 306
5 1,345 1,350
42 1,856 1,898 1984
50 0 50
578 47 625
12 0 12
640 47 687
1985
0 0 0
700 0 700
0 0 0
700 0 700 1986
0 0 0
682 0 682
8 0 8
690 0 690
1987
0 0 0
362 44 406
0 0 0
362 44 406 1988
0 0 0
717 337 1,054
5 26 31
722 363 1,085
1989
0 0 0
112 204 316
1 169 170
113 373 486 1990
0 0 0
0 225 250
5 350 394
5 575 644
1991
0 0 0
0 28 31
4 0 4
4 28 35 1992
0 0 0
30 295 358
72 0 72
102 295 430
1993
0 0 0
0 0 0
0 0 0
0 0 0 1994
0 0 0
133 212 368
96 0 96
229 212 464
1995
0 0 0
0 188 209
107 0 107
107 188 316 1996
0 0 0
0 0 0
0 188 209
0 188 209
1997
0 0 0
0 0 0
125 0 125
125 0 125 1998
0 0 0
37 13 51
59 0 59
96 13 110
1999
0 0 0
74 0 74
40 0 40
114 0 114 2000
- - -
- - -
- - -
- - -
2001
- - -
- - -
- - -
- - - 2002
- - -
0 0 0
6 0 6
6 0 6
2003
- - -
0 0 0
0 0 0
0 0 0 2004
- - -
3 0 3
22 0 22
25 0 25
2005
- - -
0 0 0
0 0 0
0 0 0 2006
- - -
20 0 0
0 0 0
20 0 0
2007
- - -
0 0 0
0 0 0
0 0 0 2008
- - -
- - -
- - -
- - -
2009
- - -
- - -
- - -
- - - 2010 - - - - - - - - - - - -
2005-2009 Average - - - 7 0 0 0 0 0 7 0 0
Note: Unless otherwise indicated, blank cells indicate years in which no information was collected or harvest numbers were insufficient to generate summary information. Dashes indicate no commercial fishing activity occurred.
a Harvest reported in numbers of fish sold in the round. b Pounds of salmon roe sold. Prior to 1990, roe production may include small amounts of Chinook roe. Since 1990, efforts were
made to separate Chinook roe from the summer chum salmon roe sold. c The estimated harvest is the fish sold in the round plus the estimated number of females to produce the roe sold. Prior to1990,
the roe expansion assumed 1.0 pound of roe per female. Since 1990, the estimated number of females that produced the roe sold is based on a District 5 sampling program that estimated average roe weight per female by period.
d In 1981, Subdistrict 5-A (Statistical Area 334-51) and Subdistrict 5-B (statistical Area 334-52) were subdivided to include two additional subdistricts, Subdistrict 5-C (Statistical Area 334-53) and Subdistrict 5-D (Statistical Area 334-54). In 1990, Subdistrict 5-D (Statistical Area 333-54) was further subdivided into Statistical Areas 334-54 and 334-55.

249
Appendix C12.–Commercial summer chum salmon sales and estimated harvest by statistical area, Subdistrict 5-D, Upper Yukon Area, 1974–2010. 334-54 334-55 Total Year Number a Roe b Harvest c Number a Roe b Harvest c Number a Roe b Harvest c 1974 - - -
- - -
- - -
1975 - - -
- - -
- - - 1976 - - -
- - -
- - -
1977 - - -
- - -
- - - 1978 - - -
- - -
- - -
1979 - - -
- - -
- - - 1980 - - -
- - -
- - -
1981
0
- - -
0 1982 d
0
- - -
0
1983 0 0 0
- - -
0 0 0 1984 5 0 5
- - -
5 0 5
1985 0 0 0
- - -
0 0 0 1986 0 0 0
- - -
0 0 0
1987 0 0 0
- - -
0 0 0 1988 0 0 0
- - -
0 0 0
1989 41 0 41
- - -
41 0 41 1990 d 6 19 27
0 0 0
6 19 27
1991 0 0 0
0 0 0
0 0 0 1992 0 0 0
0 0 0
0 0 0
1993 0 0 0
0 0 0
0 0 0 1994 0 0 0
0 0 0
0 0 0
1995 0 0 0
0 0 0
0 0 0 1996 0 114 127
0 0 0
0 114 127
1997 12 0 12
0 0 0
12 0 12 1998 0 0 0
0 0 0
0 0 0
1999 0 0 0
1 0 1
1 0 1 2000 - - -
- - -
- - -
2001 - - -
- - -
- - - 2002 0 0 0
0 0 0
0 0 0
2003 0 0 0
0 0 0
0 0 0 2004 - - -
- - -
- - -
2005 - - -
- - -
- - - 2006 - - -
- - -
- - -
2007 - - -
- - -
- - - 2008 - - -
- - -
- - -
2009 - - -
- - -
- - - 2010 - - - - - - - - - 2005-2009
Average - - - - - - - - - Note: Unless otherwise indicated, blank cells indicate years in which no information was collected or harvest numbers were
insufficient to generate summary information. Dashes indicate no commercial fishing activity occurred. a Harvest reported in numbers of fish sold in the round. b Pounds of salmon roe sold. Prior to 1990, roe production may include small amounts of Chinook salmon roe. Since 1990,
efforts were made to separate Chinook salmon roe from the summer chum salmon roe sold. c The estimated harvest is the fish sold in the round plus the estimated number of females to produce the roe sold. Prior to 1990,
the roe expansion assumed 1.0 pound of roe per female. Since 1990, the estimated number of females that produce the roe sold is based on a District 5 sampling program that estimated average roe weight per female by period.
d In 1981, Subdistrict 5-A (Statistical Area 334-51) and Subdistrict 5-B (Statistical Area 334-52) were subdivided to include two additional subdistricts, Subdistrict 5-C (Statistical Area 334-53) and Subdistrict 5-D (Statistical Area 334-54).
e In 1990, Subdistrict 5-D (Statistical Area 334-54) was subdivided into two statistical areas, (Statistical Areas 334-54 and 334-55).
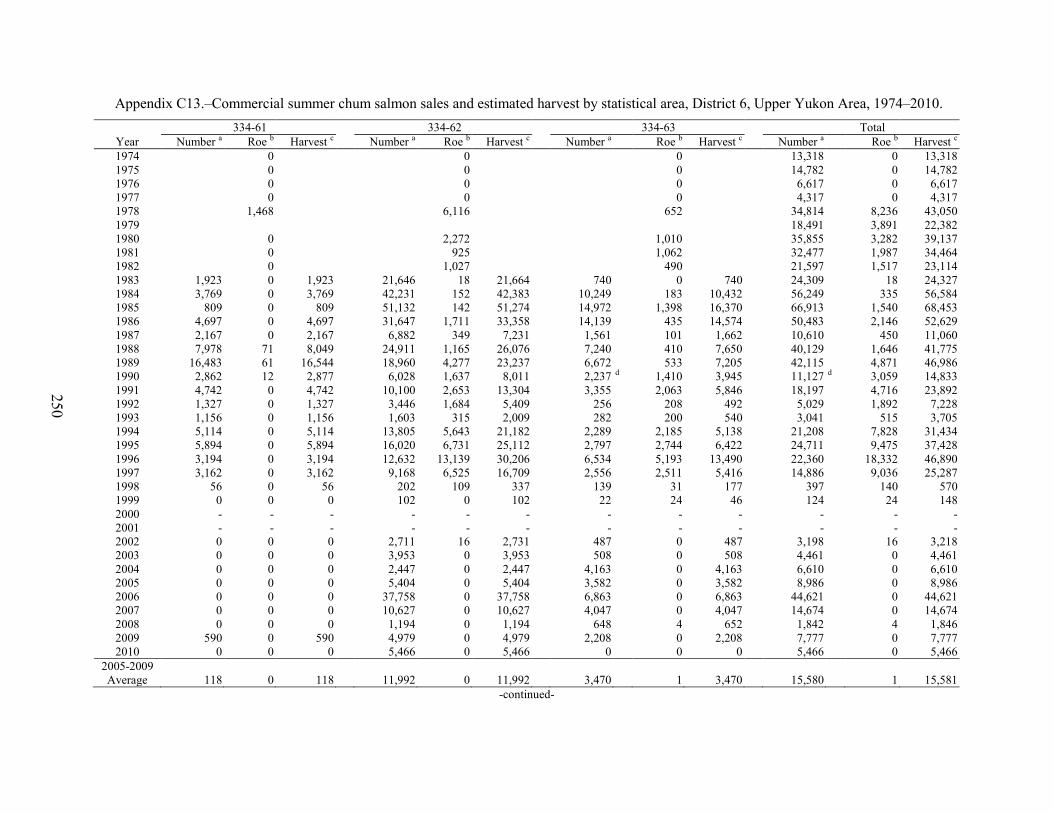
250
Appendix C13.–Commercial summer chum salmon sales and estimated harvest by statistical area, District 6, Upper Yukon Area, 1974–2010. 334-61 334-62 334-63 Total
Year Number a Roe b Harvest c Number a Roe b Harvest c Number a Roe b Harvest c Number a Roe b Harvest c 1974
0
0
0
13,318
0 13,318
1975
0
0
0
14,782
0 14,782 1976
0
0
0
6,617
0 6,617
1977
0
0
0
4,317
0 4,317 1978
1,468
6,116
652
34,814
8,236 43,050
1979
18,491
3,891 22,382 1980
0
2,272
1,010
35,855
3,282 39,137
1981
0
925
1,062
32,477
1,987 34,464 1982
0
1,027
490
21,597
1,517 23,114
1983 1,923 0 1,923
21,646 18 21,664
740
0 740
24,309
18 24,327 1984 3,769 0 3,769
42,231 152 42,383
10,249
183 10,432
56,249
335 56,584
1985 809 0 809
51,132 142 51,274
14,972
1,398 16,370
66,913
1,540 68,453 1986 4,697 0 4,697
31,647 1,711 33,358
14,139
435 14,574
50,483
2,146 52,629
1987 2,167 0 2,167
6,882 349 7,231
1,561
101 1,662
10,610
450 11,060 1988 7,978 71 8,049
24,911 1,165 26,076
7,240
410 7,650
40,129
1,646 41,775
1989 16,483 61 16,544
18,960 4,277 23,237
6,672
533 7,205
42,115
4,871 46,986 1990 2,862 12 2,877
6,028 1,637 8,011
2,237 d 1,410 3,945
11,127 d 3,059 14,833
1991 4,742 0 4,742
10,100 2,653 13,304
3,355
2,063 5,846
18,197
4,716 23,892 1992 1,327 0 1,327
3,446 1,684 5,409
256
208 492
5,029
1,892 7,228
1993 1,156 0 1,156
1,603 315 2,009
282
200 540
3,041
515 3,705 1994 5,114 0 5,114
13,805 5,643 21,182
2,289
2,185 5,138
21,208
7,828 31,434
1995 5,894 0 5,894
16,020 6,731 25,112
2,797
2,744 6,422
24,711
9,475 37,428 1996 3,194 0 3,194
12,632 13,139 30,206
6,534
5,193 13,490
22,360
18,332 46,890
1997 3,162 0 3,162
9,168 6,525 16,709
2,556
2,511 5,416
14,886
9,036 25,287 1998 56 0 56
202 109 337
139
31 177
397
140 570
1999 0 0 0
102 0 102
22
24 46
124
24 148 2000 - - -
- - -
-
- -
-
- -
2001 - - -
- - -
-
- -
-
- - 2002 0 0 0
2,711 16 2,731
487
0 487
3,198
16 3,218
2003 0 0 0
3,953 0 3,953
508
0 508
4,461
0 4,461 2004 0 0 0
2,447 0 2,447
4,163
0 4,163
6,610
0 6,610
2005 0 0 0
5,404 0 5,404
3,582
0 3,582
8,986
0 8,986 2006 0 0 0
37,758 0 37,758
6,863
0 6,863
44,621
0 44,621
2007 0 0 0
10,627 0 10,627
4,047
0 4,047
14,674
0 14,674 2008 0 0 0
1,194 0 1,194
648
4 652
1,842
4 1,846
2009 590 0 590
4,979 0 4,979
2,208
0 2,208
7,777
0 7,777 2010 0 0 0 5,466 0 5,466 0 0 0 5,466 0 5,466
2005-2009 Average 118 0 118 11,992 0 11,992 3,470 1 3,470 15,580 1 15,581
-continued-

251
Appendix C13.–Page 2 of 2.
Note: Unless otherwise indicated, blank cells indicate years in which no information was collected or harvest numbers were insufficient to generate summary information. Dashes indicate no commercial fishing activity occurred.
a Harvest reported in numbers of fish sold in the round. b Pounds of salmon roe sold. Prior to 1990, roe production may include small amounts of Chinook salmon roe. Since 1990, efforts were made to separate Chinook salmon roe
from the summer chum salmon roe sold. c The estimated harvest is the fish sold in the round plus the estimated number of females to produce the roe sold. Prior to 1990, the roe expansion assumed 1.0 pound of roe per
female. Since 1990, the estimated number of females that produce the roe sold is based on a District 6 sampling program that estimated average roe weight per female by period.
d Does not include 1,233 female summer chum salmon sold with roe extracted and roe sold separately. Females are accounted for in the roe expansion.

252
Appendix C14.–Commercial fall chum salmon sales and estimated harvest by statistical area, District 4, Upper Yukon Area, 1974–2010. 334-41 a 334-42 334-43 Total
Year Number b Roe c Harvest d Number b Roe c Harvest d Number b Roe c Harvest d Number b Roe c Harvest d 1974
0 0 0
9,213 0 9,213
9,213 0 9,213
1975 e
13,666 0 13,666 1976
462 0 462
1,280 0 1,280
1,742 0 1,742
1977 e
13,980 0 13,980 1978
1,721
10,988 1,721 12,709
1979 f
3,199
0
48,899 3,199 52,098 1980
1,789
2,558
27,978 4,347 32,325
1981
1,311
0
12,082 1,311 13,393 1982
958 20 978
2,936 147 3,083
3,894 167 4,061
1983
3,681 1,591 5,272
801 372 1,173
4,482 1,963 6,445 1984
2,961 1,222 4,183
4,664 993 5,657
7,625 2,215 9,840
1985
14,468 891 15,359
9,984 1,634 11,618
24,452 2,525 26,977 1986
2,045 0 2,045
0 0 0
2,045 0 2,045
1987
- - -
- - -
- - - 1988
10,157 703 10,860
5,505 718 6,223
15,662 1,421 17,083
1989
9,819 2,023 11,842
1,957 1,384 3,341
11,776 3,407 15,183 1990
3,406 1,680 5,676
1,583 671 2,490
4,989 2,351 8,166
1991
2,998 490 3,718
739 1,126 2,373
3,737 1,616 6,091 1992
- - -
- - -
- - -
1993
- - -
- - -
- - - 1994
- - -
- - -
- - -
1995
2,924 225 3,249
0 3,901 5,482
2,924 4,126 8,731 1996
2,918 0 2,918
0 0 0
2,918 0 2,918
1997
463 0 463
1,995 0 1,995
2,458 0 2,458 1998
- - -
- - -
- - -
1999
104 0 104
577 0 577
681 0 681 2000
- - -
- - -
- - -
2001
- - -
- - -
- - -
- - - 2002
- - -
- - -
- - -
- - -
2003
- - -
- - -
1,315 0 1,315
1,315 0 1,315 2004
- - -
- - -
- - -
- - -
2005
- - -
- - -
- - -
- - - 2006 g 0 0 0
- - -
- - -
- - -
2007
- - -
- - -
- - -
- - - 2008
- - -
- - -
- - -
- - -
2009
- - -
- - -
- - -
- - - 2010 - - - - - - - - - - - -
2000-2009 Average - - - - - - 1,315 0 1,315 1,315 0 1,315
Note: Unless otherwise indicated, blank cells indicate years in which no information was collected or harvest numbers were insufficient to generate summary information. Dashes indicate no commercial fishing activity occurred.
a In Subdistrict 4-A (Statistical Area 334-41), from 1977 to 2001, commercial fishing, by regulation, was not allowed during fall season. Additionally, in 1990, Subdistrict 4-A (Statistical Area 334-41) was subdivided into Statistical Areas 334-44, 334-45 and 334-46. Because this is the same area and because no harvest has occurred in Subdistrict 4-A, all data is recorded under 334-41.
b Harvest reported in numbers of fish sold in the round. c Pounds of salmon roe sold. Prior to 1990, roe production may include small amounts of coho salmon roe. Since 1990, efforts
were made to separate coho salmon roe from the fall chum salmon roe sold. d The estimated harvest is the fish sold in the round plus the estimated number of females to produce the roe sold. Prior to 1990,
the roe expansion assumed 1.0 pound of roe per female. Since 1990, the estimated number of females that produce the roe sold is based on a District 4 sampling program that estimated average roe weight per female by period, by statistical area and gear type.
e Harvest information not available by statistical area. f In 1979, Statistical Area 334-42 was subdivided into Statistical Areas 334-42 and 334-43. g Commercial periods were open in Subdistrict 4-A, however no harvest took place.
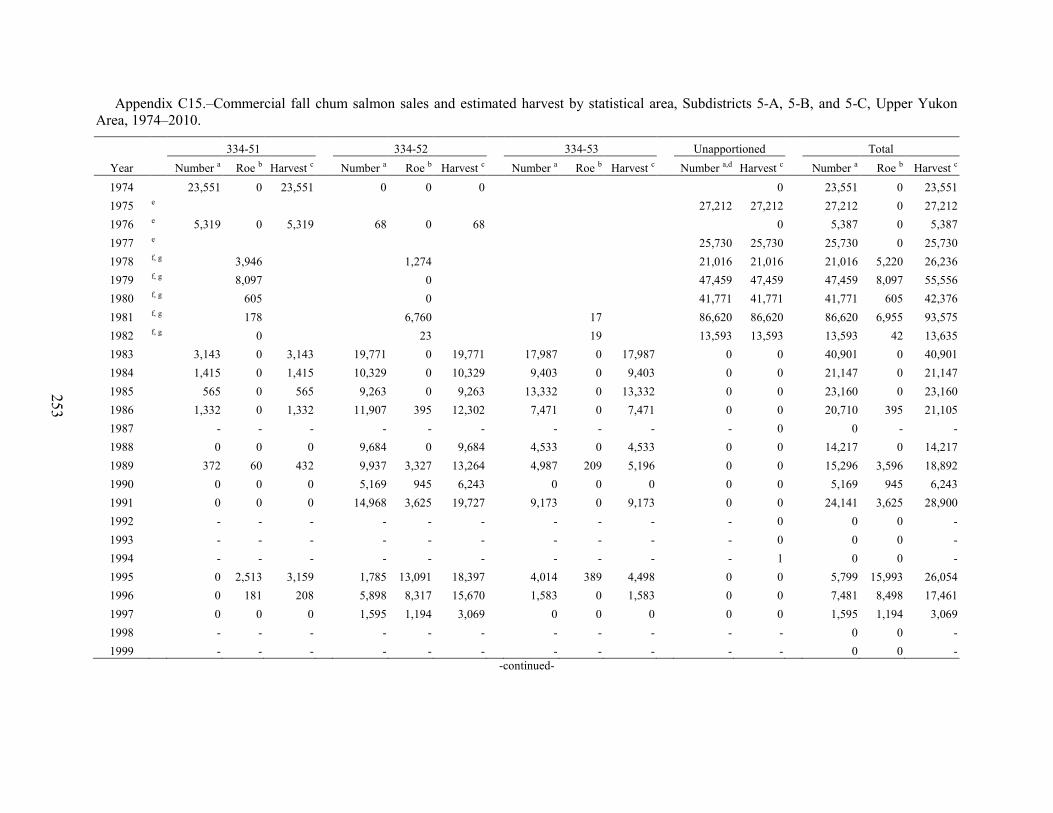
253
Appendix C15.–Commercial fall chum salmon sales and estimated harvest by statistical area, Subdistricts 5-A, 5-B, and 5-C, Upper Yukon Area, 1974–2010.
334-51 334-52 334-53 Unapportioned Total Year Number a Roe b Harvest c Number a Roe b Harvest c Number a Roe b Harvest c Number a,d Harvest c Number a Roe b Harvest c 1974
23,551 0 23,551
0 0 0
0
23,551 0 23,551
1975 e
27,212 27,212
27,212 0 27,212 1976 e 5,319 0 5,319
68 0 68
0
5,387 0 5,387
1977 e
25,730 25,730
25,730 0 25,730 1978 f, g 3,946
1,274
21,016 21,016
21,016 5,220 26,236
1979 f, g 8,097
0
47,459 47,459
47,459 8,097 55,556 1980 f, g 605
0
41,771 41,771
41,771 605 42,376
1981 f, g 178
6,760
17
86,620 86,620
86,620 6,955 93,575 1982 f, g 0
23
19
13,593 13,593
13,593 42 13,635
1983
3,143 0 3,143
19,771 0 19,771
17,987 0 17,987
0 0
40,901 0 40,901 1984
1,415 0 1,415
10,329 0 10,329
9,403 0 9,403
0 0
21,147 0 21,147
1985
565 0 565
9,263 0 9,263
13,332 0 13,332
0 0
23,160 0 23,160 1986
1,332 0 1,332
11,907 395 12,302
7,471 0 7,471
0 0
20,710 395 21,105
1987
- - -
- - -
- - -
- 0
0 - - 1988
0 0 0
9,684 0 9,684
4,533 0 4,533
0 0
14,217 0 14,217
1989
372 60 432
9,937 3,327 13,264
4,987 209 5,196
0 0
15,296 3,596 18,892 1990
0 0 0
5,169 945 6,243
0 0 0
0 0
5,169 945 6,243
1991
0 0 0
14,968 3,625 19,727
9,173 0 9,173
0 0
24,141 3,625 28,900 1992
- - -
- - -
- - -
- 0
0 0 -
1993
- - -
- - -
- - -
- 0
0 0 - 1994
- - -
- - -
- - -
- 1
0 0 -
1995
0 2,513 3,159
1,785 13,091 18,397
4,014 389 4,498
0 0
5,799 15,993 26,054 1996
0 181 208
5,898 8,317 15,670
1,583 0 1,583
0 0
7,481 8,498 17,461
1997
0 0 0
1,595 1,194 3,069
0 0 0
0 0
1,595 1,194 3,069 1998
- - -
- - -
- - -
- -
0 0 -
1999
- - -
- - -
- - -
- -
0 0 - -continued-

254
Appendix C15.–Page 2 of 2.
334-51 334-52 334-53 Unapportioned Total Year Number a Roe b Harvest c Number a Roe b Harvest c Number a Roe b Harvest c Number a,d Harvest c Number a Roe b Harvest c 2000
- - -
- - -
- - -
- -
0 0 -
2001
- - -
- - -
- - -
- -
0 0 - 2002
- - -
- - -
- - -
- -
0 0 -
2003
- - -
- - -
- - -
- -
0 0 - 2004
- - -
- - -
- - -
- -
0 0 -
2005
- - -
- - -
- - -
- -
0 0 - 2006
- - -
- - -
1,667 - 1,667
- -
1,667 0 1,667
2007
- - -
385 - 385
42 - 42
- -
427 0 427 2008
- - -
4,556 - 4,556
- - -
- -
4,556 0 4,556
2009
- - -
- - -
- - -
- -
0 0 - 2010 - - - - - - - - - - - 0 0 -
2000-2009 Average - - - 2,471 - 2,471 855 - 855 - - 665 - 2,217
Note: Unless otherwise indicated, blank cells indicate years in which no information was collected or harvest numbers were insufficient to generate summary information. Dashes indicate no commercial fishing activity occurred.
a Harvest reported in numbers of fish sold in the round. b Pounds of salmon roe sold. Prior to 1990, roe production may include small amounts of coho salmon roe. Since 1990, efforts were made to separate coho salmon roe from the
fall chum salmon roe sold. c The estimated harvest is the fish sold in the round plus the estimated number of females to produce the roe sold. Prior to 1990, expansion assumed 1.0 pound of roe the roe per
female. Since 1990, the estimated number of females that produce the roe sold is based on a District 5 sampling program that estimated average roe weight per female by period.
d Includes harvest in Subdistrict 5-D from 1978 through 1982. e Harvest information not available by statistical area. f Complete harvest information not available by statistical area. g In 1981, Subdistrict 5-A (Statistical Area 334-51) and Subdistrict 5-B (statistical Area 334-52) was subdivided to include two additional subdistricts, Subdistrict 5-C (Statistical
Area 334-53) and Subdistrict 5-D Statistical Area (Statistical Area 334-54) and Subdistrict 5-D (Statistical Area 334-54) was further subdivided into Statistical Areas 334-54 and 334-55.

255
Appendix C16.–Commercial fall chum salmon sales and estimated harvest by statistical area, Subdistricts 5-D, Upper Yukon Area, 1974–2010.
334-54 334-55 Total Year Number a Roe b Harvest c Number a Roe b Harvest c Number a Roe b Harvest c 1981 d
1982 1983
3,092 0 3,092
3,092 0 3,092 1984
2,913 57 2,970
2,913 57 2,970
1985
2,178 0 2,178
2,178 0 2,178 1986
1,343 0 1,343
1,343 0 1,343
1987
- - -
- - - 1988
2,772 0 2,772
2,772 0 2,772
1989
2,919 393 3,312
2,919 393 3,312 1990 e 1,758 113 1,882
851 0 851
2,609 113 2,733
1991
1,846 0 1,846
1,368 0 1,368
3,214 0 3,214 1992
- - -
- - -
- - -
1993
- - -
- - -
- - - 1994
- - -
3,630 0 3,630
3,630 0 3,630
1995 f 0 0 0
3,979 2,823 3,979
3,979 2,823 3,979 1996
890 0 890
3,507 0 3,507
4,397 0 4,397
1997
40 0 40
811 0 811
851 0 851 1998
- - -
- - -
- - -
1999
- - -
- - -
- - - 2000
- - -
- - -
- - -
2001
- - -
- - -
- - - 2002
- - -
- - -
- - -
2003
- - -
- - -
- - - 2004
- - -
- - -
- - -
2005
- - -
- - -
- - - 2006
- - -
- - -
- - -
2007
- - -
- - -
- - - 2008
- - -
- - -
- - -
2009
- - -
- - -
- - - 2010
- - -
- - -
- - -
2000-2009 Average - - - - - - - - -
Note: Unless otherwise indicated, blank cells indicate years in which no information was collected or harvest numbers were insufficient to generate summary information. Dashes indicate no commercial fishing activity occurred.
a Harvest reported in numbers of fish sold in the round. b Pounds of salmon roe sold. Prior to 1990, roe production may include small amounts of coho salmon roe. Since 1990, efforts
were made to separate coho salmon roe from fall chum salmon roe. c The estimated harvest is the fish sold in the round plus the estimated number of females to produce the roe sold. Prior to 1990,
the roe expansion assumed 1.0 pounds of roe per female. Since 1990, the estimated number of females that produce the roe sold is based on a District 5 sampling program that estimated average roe weight per female by period.
d In 1981, Subdistrict 5-A (Statistical Area 334-51) and Subdistrict 5-B (Statistical Area 334-52) was subdivided to include two additional subdistricts, Subdistrict 5-C (Statistical Area 334-53) and Subdistrict 5-D (Statistical Area 334-54).
e In 1990, Subdistrict 5-D (Statistical Area 334-54) was subdivided into two statistical areas, (Statistical Areas 334-54 and 334-55).
f Estimated harvest equals fish sold in round. The roe came from fish sold in the round, therefore, not included in estimated harvest to avoid duplicate counting.

256
Appendix C17.–Commercial fall chum salmon sales and estimated harvest by statistical area, District 6, Upper Yukon Area, 1974–2010.
334-61 334-62 334-63 Total Year Number a Roe b Harvest c Number a Roe b Harvest c Number a Roe b Harvest c Number a Roe b Harvest c 1974 d
26,884 0 26,884
1975 d
18,692 0 18,692 1976 d
17,948 0 17,948
1977 d
18,673 0 18,673 1978
4,704 1,826 6,530
8,036 1,680 9,716
519 181 700
13,259 3,687 16,946
1979 d
34,185 7,170 41,355 1980 e
0
53
15
19,452 68 19,520
1981 e
0
2,784
235
25,989 3,019 29,008 1982
706 0 706
4,586 596 5,182
1,528 0 1,528
6,820 596 7,416
1983
3,526 0 3,526
23,096 3,009 26,105
7,467 92 7,559
34,089 3,101 37,190 1984
5,617 0 5,617
11,809 0 11,809
3,138 56 3,194
20,564 56 20,620
1985
1,462 0 1,462
34,663 0 34,663
6,227 0 6,227
42,352 0 42,352 1986
176 0 176
1,345 182 1,527
371 0 371
1,892 182 2,074
1987
- - -
- - -
- - -
- - - 1988
4,500 0 4,500
13,617 1,035 14,652
3,727 771 4,498
21,844 1,806 23,650
1989
14,870 173 15,043
25,650 7,050 32,700
8,570 130 8,700
49,090 7,353 56,443 1990
9,254 0 9,254
28,932 6,617 35,776
4,996 918 5,945
43,182 7,535 50,975
1991
3,278 0 3,278
21,834 12,253 35,904
3,083 1,901 5,266
28,195 14,154 44,448 1992
- - -
13,713 1,816 15,852
2,008 990 3,170
15,721 2,806 19,022
1993
- - -
- - -
- - -
- - - 1994 - - - 0 4,319 4,319 1 49 50 1 4,368 4,369
-continued-

257
Appendix C17.–Page 2 of 2.
334-61 334-62 334-63 Total Year Number a Roe b Harvest c Number a Roe b Harvest c Number a Roe b Harvest c Number a Roe b Harvest c 1995
6,170 0 6,170
60,466 8,164 65,061
1,219 1,396 2,896
67,855 9,560 74,127
1996
663 236 934
8,491 4,906 14,332
1,112 1,031 2,308
10,266 6,173 17,574 1997
- - -
- - -
- - -
- - -
1998
- - -
- - -
- - -
- - - 1999
- - -
- - -
- - -
- - -
2000
- - -
- - -
- - -
- - - 2001
- - -
- - -
- - -
- - -
2002
- - -
- - -
- - -
- - - 2003
- - -
3,778 0 3,778
317 0 317
4,095 0 4,095
2004
- - -
3,450 0 3,450
- - -
3,450 0 3,450 2005
- - -
49,637 0 49,637
- - -
49,637 0 49,637
2006
- - -
23,353 0 23,353
- - -
23,353 0 23,353 2007
- - -
15,572 0 15,572
- - -
15,572 0 15,572
2008
4,029 0 4,029
1,706 0 1,706
232 0 232
5,967 0 5,967 2009
- - -
1,893 0 1,893
- - -
1,893 0 1,893
2010
- - -
1,735 0 1,735
- - -
1,735 0 1,735 2000-2009
Average 4,029 0 4,029 14,198 0 14,198 275 0 275 14,852 0 14,852 Note: Unless otherwise indicated, blank cells indicate years in which no information was collected or harvest numbers were insufficient to generate summary information. Dashes
indicate no commercial fishing activity occurred. a Harvest reported in numbers of fish sold in the round. b Pounds of salmon roe sold. Prior to 1990, roe production may include small amounts of coho salmon roe. Since 1990, efforts were made to separate coho salmon roe from the
fall chum salmon roe sold. c The estimated harvest is the fish sold in the round plus the estimated number of females to produce the roe sold. Prior to 1990, the roe expansion assumed 1.0 pounds of roe per
female. Since 1990, the estimated number of females that produce the sold is based on a District 6 sampling program that estimated average roe weight per female by period. d Harvest information not available by statistical area. e Complete harvest information not available by statistical area.

258
Appendix C18.–Commercial coho salmon sales and estimated harvest by statistical area, District 4, Upper Yukon Area, 1974–2010.
334-41 334-42 334-43 Total Year Number a Roe b Harvest c Number Roe Harvest Number Roe Harvest Number Roe Harvest 1974 d
1975 d 1976 d 1977 d, e 1978
32 0 32
32 - 32
1979 f
155 0 155
0 - 0
155 - 155 1980 g
30 - 30
1981
- - -
- - -
- - - 1982
0 - 0
15 0 15
15 0 15
1983
- - -
- - -
- - - 1984
412 0 412
683 0 683
1,095 0 1,095
1985
153 0 153
785 0 785
938 0 938 1986
- - -
- - -
- - -
1987
- - -
- - -
- - - 1988
2 0 2
0 - 0
2 0 2
1989
0 0 0
3 0 3
3 0 3 1990
- - -
- - -
- - -
1991
11 0 11
3 0 3
14 0 14 1992
- - -
- - -
- - -
1993
- - -
- - -
- - - 1994
- - -
- - -
- - -
1995
- - -
- - -
- - - 1996
161 0 161
0 0 0
161 0 161
1997
19 0 19
795 0 795
814 0 814 1998
- - -
- - -
- - -
1999
- - -
- - -
- - - 2000
- - -
- - -
- - -
2001
- - -
- - -
- - -
- - - 2002
- - -
- - -
- - -
- - -
-continued-

259
Appendix C18.–Page 2 of 2.
334-41 334-42 334-43 Total Year Number a Roe b Harvest c Number Roe Harvest Number Roe Harvest Number Roe Harvest 2003
- - -
- - -
367 0 367
367 0 367
2004
- - -
- - -
- - -
- - - 2005
- - -
- - -
- - -
- - -
2006 h 0 0 0
- - -
- - -
- - - 2007
- - -
- - -
- - -
- - -
2008
- - -
- - -
- - -
- - - 2009
- - -
- - -
- - -
- - -
2010
- - -
- - -
- - -
- - - 2000-2009 Average - - - - - - 367 0 367 367 0 367
Note: Unless otherwise indicated, blank cells indicate years in which no information was collected or harvest numbers were insufficient to generate summary information. Dashes indicate no commercial fishing activity occurred.
a Harvest reports in numbers of fish sold in the round. b Pounds of salmon roe sold. Since 1990, efforts were made to separate coho salmon roe from the fall chum salmon roe sold. c The estimated harvest is the fish sold in the round plus the estimated number of females to produce the roe sold. Prior to 1990, the roe expansion assumed 1.0 pounds of roe per
female. Since 1990, the estimated number of females that produce for sold is based on a District 4 sampling program that estimated average roe weight per female by period. d Coho salmon harvested as incidental catch, therefore harvest information may be incomplete. e 1977 was the last year Subdistrict 4-A (Statistical Area 334-41) by regulation was allowed a late season. f In 1979, Statistical Area 334-42 was subdivided into Statistical Areas 334-42 and 334-43. g Harvest information not available by statistical area. h Commercial periods were open, however no harvest took place.

260
Appendix C19.–Commercial coho salmon sales and estimated harvest by statistical area, District 6, Upper Yukon Area, 1974–2010.
334-61 334-62 334-63 Total Year Number a Roe b Harvest c Number Roe Harvest Number Roe Harvest Number Roe Harvest 1974 d
-
-
-
1,479 0 1,479
1975
0 0 0
0 0 0
53 0 53
53 0 53 1976 d
-
-
-
1,103 0 1,103
1977
252 - 252
766 - 766
266 - 266
1,284 0 1,284 1978
521 - 521
2,450 - 2,450
95 - 95
3,066 0 3,066
1979
465 - 465
2,059 - 2,059
267 - 267
2,791 0 2,791 1980
423 - 423
632 - 632
171 - 171
1,226 0 1,226
1981
535 - 535
1,335 - 1,335
414 - 414
2,284 0 2,284 1982
1,004 - 1,004
6,449 - 6,449
327 - 327
7,780 0 7,780
1983
745 - 745
5,048 - 5,048
375 - 375
6,168 0 6,168 1984
1,608 - 1,608
5,360 - 5,360
720 - 720
7,688 0 7,688
1985
432 - 432
9,628 - 9,628
1,702 - 1,702
11,762 0 11,762 1986
30 - 30
370 - 370
41 - 41
441 0 441
1987
- - -
- - -
- - -
- - - 1988
1,240 - 1,240
10,372 - 10,372
2,360 - 2,360
13,972 0 13,972
1989
2,818 - 2,818
10,181 - 10,181
3,085 - 3,085
16,084 0 16,084 1990
3,173 0 3,173
7,096 3,559 9,951
1,280 483 1,680
11,549 4,042 14,804
1991
0 0 0
4,572 3,737 7,620
1,696 562 2,154
6,268 4,299 9,774 1992
- - -
5,731 1,267 6,800
825 413 1,179
6,556 1,680 7,979
1993
- - -
- - -
- - -
- - - 1994
- - -
0 5,398 4,184
120 190 267
120 5,588 4,451
1995
1,475 0 1,475
4,209 2,072 5,156
142 157 269
5,826 2,229 6,900 1996
182 0 182
3,403 4,571 6,557
218 258 403
3,803 4,829 7,142
1997
- - -
- - -
- - -
- - - 1998
- - -
- - -
- - -
- - -
1999
- - -
- - -
- - -
- - - 2000
- - -
- - -
- - -
- - -
2001
- - -
- - -
- - -
- - - 2002
- - -
- - -
- - -
- - -
-continued-

261
Appendix C19.–Page 2 of 2.
334-61 334-62 334-63 Total Year Number a Roe b Harvest c Number Roe Harvest Number Roe Harvest Number Roe Harvest 2003
- - -
14,984 0 14,984
135 0 135
15,119 0 15,119
2004
- - -
18,649 0 18,649
0 0 0
18,649 0 18,649 2005
- - -
21,778 0 21,778
0 0 0
21,778 0 21,778
2006
- - -
11,137 0 11,137
- - -
11,137 0 11,137 2007
- - -
1,368 0 1,368
- - -
1,368 0 1,368
2008
2,160 0 2,160
248 0 248
0 0 0
2,408 0 2,408 2009
- - -
742 0 742
- - -
742 0 742
2010
- - -
1,700 0 1,700
- - -
1,700 0 1,700 2000-2009 Average 2,160 0 2,160 9,844 0 9,844 34 0 34 10,172 0 10,172
Note: Unless otherwise indicated, blank cells indicate years in which no information was collected or harvest numbers were insufficient to generate summary information. Dashes indicate no commercial fishing activity occurred.
a Harvest reports in numbers of fish sold in the round. b Pounds of salmon roe sold. Since 1990, efforts were made to separate coho salmon roe from the fall chum salmon roe sold. c The estimated harvest is the fish sold in the round plus the estimated number of females to produce the roe sold. Prior to1990, the roe expansion assumed 1.0
pound of roe per female. Since 1990, the estimated number of females that produce the roe sold is based on a District 6 sampling program that estimated average roe weight per female by period.
d Harvest information not available by statistical area.

262
Appendix C20.–Summary of test fish wheel projects conducted in the Upper Yukon Area, 2010.
Total Estimated Total Salmon Captured a
Test Fish Wheel Contractor/ River
Year
Operational Days of
Summer Fall
Historical Data / Comments
Projects Operator Mile b Dates Operation Chinook Chum Chum Coho
Yukon River
Tanana Village Test Fish Wheel
Left Bank Pat Moore 690 2010 7/1 to 9/30 91 3,494 4,289 9,167 1,433 Wheel uses 24 hour video counts.
Yukon River (Rapids) Test Fish Wheel
Left Bank c Stan Zuray 731 2010 7/29 to 9/14 47 - - 24,042 - Wheel uses 24 hour video counts.
Tanana River
Nenana Test Fish Wheel ADF&G
Right Bank Paul Kleinschmidt 859 2010 7/1 to 8/5 35 1,601 1,074 - - Project started in 1988 for CPUE.
8/16 to 10/4 49 - - 4,063 7,776 Video counts since 2003. a Unless otherwise noted, fish wheel catch are adjusted to estimate total catch per day (i.e., less than or greater than 24 hour catches adjusted to reflect a 24 hour catch). b Estimated river miles from the mouth of the Yukon River. c Estimated summer chum salmon totals include all chum salmon caught through August 4.

263
APPENDIX D

264
Appendix D1.–Chinook salmon subsistence harvest totals by fishing district and community of residence, as estimated from postseason survey, returned permits and Yukon Area, 2000–2010.
2000-2004 2005-2009
Community 2000 2001 2002 2003 2004 2005 2006 2007 2008 2009 2010 Average Average Hooper Bay 114 2,150 282 722 1,042 157 376 430 388 183 584 862 307 Scammon Bay 449 732 840 1,128 996 691 507 768 1,104 722 716 829 758 Coastal District Total 563 2,882 1,122 1,850 2,038 848 883 1,198 1,492 905 1,300 1,691 1,065 Nunam Iqua 684 550 393 925 647 338 371 907 163 200 404 640 396 Alakanuk 1,109 973 1,773 1,707 1,317 860 690 1,257 1,238 634 944 1,376 936 Emmonak 2,205 2,473 1,751 2,763 2,768 1,730 2,311 2,326 2,696 1,634 2,194 2,392 2,139 Kotlik 1,893 3,093 1,686 937 1,148 2,130 1,750 1,569 2,066 1,657 2,314 1,751 1,834 District 1 Subtotal 5,891 7,089 5,603 6,332 5,880 5,058 5,122 6,059 6,163 4,125 5,856 6,159 5,305 Mountain Village 1,715 1,864 1,523 2,174 2,362 2,383 1,659 2,077 1,645 1,482 1,601 1,928 1,849 Pitkas Point 753 651 566 633 609 618 274 320 544 265 580 642 404 St. Mary's 1,810 3,815 2,045 1,916 2,357 2,693 2,233 3,573 1,756 1,929 2,800 2,389 2,437 Pilot Station 2,378 2,614 2,530 2,886 2,406 1,658 1,976 2,028 1,597 1,258 1,585 2,563 1,703 Marshall 3,279 4,498 2,290 2,059 1,990 1,804 1,897 2,555 3,284 1,201 2,110 2,823 2,148 District 2 Subtotal 9,935 13,442 8,954 9,668 9,724 9,156 8,039 10,553 8,826 6,135 8,676 10,345 8,542 Russian Mission 1,860 3,428 1,887 2,057 2,337 1,894 1,851 1,301 2 978 924 2,314 1,205 Holy Cross 1,249 2,711 1,813 2,395 1,993 2,817 3,165 2,902 2,509 1,745 3,098 2,032 2,628 Shageluk 805 222 439 550 418 420 358 448 397 201 277 487 365 District 3 Subtotal 3,914 6,361 4,139 5,002 4,748 5,131 5,374 4,651 5,855 2,924 4,299 4,833 4,787 Lower Yukon River Total 19,740 26,892 18,696 21,002 20,352 19,345 18,535 21,263 20,844 13,184 18,831 21,336 18,634 Anvik 205 608 708 1,286 1,588 1,206 958 1,321 1,433 796 1,069 879 1,143 Grayling 839 1,077 2,249 1,613 1,869 1,878 1,702 1,500 1,761 1,133 2,122 1,529 1,595 Kaltag 1,074 1,506 1,435 1,838 1,656 3,367 2,833 1,456 2,403 1,970 3,191 1,502 2,406 Nulato 1,083 2,127 1,773 2,531 5,199 2,749 2,707 2,431 1,250 1,551 2,989 2,543 2,138 Koyukuk 175 449 323 860 400 396 835 811 513 982 867 441 707 Galena 788 1,755 1,522 3,112 3,296 2,864 2,380 2,511 2,232 1,370 1,357 2,095 2,271 Ruby/Kokrines 1,577 2,033 954 631 1,620 1,193 304 1,594 637 542 1,102 1,363 854 District 4 Subtotal 5,741 9,555 8,964 11,871 15,628 13,653 11,719 11,624 10,229 8,344 12,697 10,352 11,114 Huslia 424 377 222 469 285 207 258 146 255 969 65 355 367 Hughes 50 144 67 113 291 33 8 8 61 101 63 133 42 Allakaket 41 76 200 306 65 68 23 53 58 90 63 138 58 Alatna 8 0 3 12 0 0 14 0 16 10 0 5 8 Bettles 0 0 0 0 0 3 0 0 0 0 0 0 1 Koyukuk River Subtotal 523 597 492 900 641 311 303 207 390 1,170 191 631 476 District 4 Total (Incl. Koyukuk R.) 6,264 10,152 9,456 12,771 16,269 13,964 12,022 11,831 10,619 9,514 12,888 10,982 11,590
-continued-

265
Appendix D1.–Page 2 of 2.
2000-2004 2005-2009
Community 2000 2001 2002 2003 2004 2005 2006 2007 2008 2009 2010 Average Average Tanana 2,895 4,112 2,379 5,332 2,689 3,729 3,794 5,498 3,981 2,950 3,215 3,481 3,990 Rampart a 847 1,857 852 1,411 287 411 429 250 136 528 262 1,051 351 Fairbanks b 1,342 1,125 1,767 1,932 1,997 2,584 2,184 2,492 1,898 1,509 1,670 1,633 2,133 Stevens Village 466 1,111 1,334 1,121 2,394 1,570 1,245 610 753 405 469 1,285 917 Birch Creek 72 0 67 78 82 131 174 113 32 15 73 60 93 Beaver 196 1,368 702 1,156 858 957 830 1,244 546 516 198 856 819 Fort Yukon 988 2,361 2,348 4,004 4,430 3,591 3,144 4,076 1,991 846 1,683 2,826 2,730 Circle 627 447 1,533 895 565 1,283 694 1,057 519 372 324 813 785 Central 26 84 58 144 83 175 130 334 48 167 90 79 171 Eagle 1,087 1,033 1,910 2,081 1,512 2,566 2,303 1,999 1,068 446 867 1,525 1,676 Other c 205 40 348 862 357 315 330 472 362 541 779 362 404 District 5 Subtotal 8,751 13,538 13,298 19,016 15,254 17,312 15,257 18,145 11,334 8,295 9,630 13,971 14,069 (Excluding Chandalar and Black Rivers)
Venetie 103 28 77 125 352 59 667 1,002 292 622 767 137 528 Chalkyitsik 0 0 26 50 60 53 0 0 0 0 0 27 11 Chandalar/Black River 103 28 103 175 412 112 667 1,002 292 622 767 164 539
Subtotal District 5 Total 8,854 13,566 13,401 19,191 15,666 17,424 15,924 19,147 11,626 8,917 10,397 14,136 14,608
Manley 58 534 336 213 239 289 361 333 106 345 337 276 287 Minto 0 197 19 317 35 35 31 82 12 0 43 114 32 Nenana 541 1,405 509 1,193 633 533 712 893 322 458 658 856 584 Fairbanks d 360 191 159 392 449 971 125 409 108 396 91 310 402 Other e 24 0 44 30 32 0 0 0 57 86 14 26 29 District 6 Tanana R. Total 983 2,327 1,067 2,145 1,388 1,828 1,229 1,717 605 1,285 1,143 1,582 1,333 Upper Yukon River Total 16,101 26,045 23,924 34,107 33,323 33,216 29,175 32,695 22,850 19,716 24,428 26,700 27,530 Alaska, Yukon River Total f 35,841 52,937 42,620 55,109 53,675 52,561 47,710 53,958 43,694 32,900 43,259 48,036 46,165 Alaska, Yukon Area Total 36,404 55,819 43,742 56,959 55,713 53,409 48,593 55,156 45,186 33,805 44,559 49,727 47,230 Note: Estimates from 2006 and 2007 are preliminary. Does not include harvest from personal use permits. a Rampart area harvest as reported from subsistence fishing permits established by the Alaska Board of Fisheries (BOF) in 2004. b Harvests by Fairbanks subsistence permit holders who fished in District 5 near the Yukon River bridge crossing. c Other permit holders who fished in District 5 but did not reside in the communities listed. d Harvest by Fairbanks subsistence permit holders who fished in the Tanana River. e Other permit holders who fished in District 6 but did not reside in the communities listed. f Does not include the Coastal District.

266
Appendix D2.–Summer chum salmon subsistence harvest totals by fishing district and community of residence, as estimated from postseason survey, returned permits and test fish projects, Yukon Area 2000–2010.
2000-2004 2005-2009 Community 2000 2001 2002 2003 2004 2005 2006 2007 2008 2009 2010 Average Average Hooper Bay 9,301 12,593 9,780 10,658 3,242 9,771 19,468 12,234 12,007 9,195 17,020 9,115 12,535 Scammon Bay 3,876 1,323 5,016 3,310 5,020 4,586 4,703 3,887 6,113 3,602 5,405 3,709 4,578 Coastal District Total 13,177 13,916 14,796 13,968 8,262 14,357 24,171 16,121 18,120 12,797 22,425 12,824 17,113 Nunam Iqua 3,309 1,942 1,897 2,561 2,698 2,794 2,903 2,325 1,949 2,280 2,267 2,481 2,450 Alakanuk 6,259 5,992 7,637 5,287 6,555 5,687 7,790 7,611 6,881 5,152 7,722 6,346 6,624 Emmonak 8,338 8,242 8,458 7,644 8,618 12,594 11,899 9,256 9,646 9,038 10,918 8,260 10,487 Kotlik 6,173 6,595 6,115 4,209 2,749 6,620 5,289 5,017 4,291 7,528 4,265 5,168 5,749 District 1 Subtotal 24,079 22,771 24,107 19,701 20,620 27,695 27,881 24,209 22,767 23,998 25,172 22,256 25,310 Mountain Village 7,074 8,484 6,657 6,497 10,676 8,861 13,119 8,104 7,559 7,204 7,071 7,878 8,969 Pitkas Point 1,728 862 639 800 717 1,023 680 515 1,246 994 633 949 892 St. Mary's 8,094 10,026 7,284 4,521 6,994 6,877 7,394 8,107 6,451 5,831 7,443 7,384 6,932 Pilot Station 5,223 5,329 6,490 4,163 5,779 4,333 6,070 3,711 6,012 4,888 6,196 5,397 5,003 Marshall 3,212 1,602 2,484 792 1,765 3,183 4,392 3,070 3,023 2,172 2,395 1,971 3,168 District 2 Subtotal 25,331 26,303 23,554 16,773 25,931 24,277 31,655 23,507 24,291 21,089 23,738 23,578 24,964 Russian Mission 1,318 165 395 171 884 925 1,328 759 2,400 849 528 587 1,252 Holy Cross 569 460 155 214 276 760 825 320 441 194 463 335 508 Shageluk 1,800 684 1,956 5,473 1,798 4,081 1,381 977 130 103 350 2,342 1,334 District 3 Subtotal 3,687 1,309 2,506 5,858 2,958 5,766 3,534 2,056 2,971 1,146 1,341 3,264 3,095 Lower Yukon River Total 53,097 50,383 50,167 42,332 49,509 57,738 63,070 49,772 50,029 46,233 50,251 49,098 53,368 Anvik 425 94 1,089 844 248 529 387 5,250 340 277 451 540 1,357 Grayling 474 92 1,311 1,072 1,129 783 644 641 660 1,429 1,612 816 831 Kaltag 169 10 234 1,028 213 680 159 109 916 50 102 331 383 Nulato 377 208 269 180 198 634 838 356 468 133 416 246 486 Koyukuk 204 118 426 1,339 329 537 394 995 1,104 1,378 352 483 882 Galena 820 53 712 289 782 1,013 1,205 571 758 1,718 1,702 531 1,053 Ruby/Kokrines 1,233 1,025 1,406 876 2,010 967 1,714 416 655 603 1,971 1,310 871 District 4 Subtotal 3,702 1,600 5,447 5,628 4,909 5,143 5,341 8,338 4,901 5,588 6,606 4,257 5,862 Huslia 745 833 3,178 6,187 3,844 2,433 1,122 3,243 4,377 2,554 1,349 2,957 2,746 Hughes 1,079 551 1,089 1,265 3,823 2,230 3,254 1,213 944 1,723 878 1,561 1,873 Allakaket 1,520 1,604 6,242 4,383 2,367 2,535 5,170 3,451 3,229 4,924 2,864 3,223 3,862 Alatna 0 0 15 50 16 5 110 11 66 163 23 16 71 Bettles 0 0 0 0 0 4 0 0 0 6 0 0 2 Koyukuk River Subtotal 3,344 2,988 10,524 11,885 10,050 7,207 9,656 7,918 8,616 9,370 5,114 7,758 8,553 District 4 Total(Incl. Koyukuk R) 7,046 4,588 15,971 17,513 14,959 12,350 14,997 16,256 13,517 14,958 11,720 12,015 14,416
-continued-

267
Appendix D2.–Page 2 of 2.
2000-2004 2005-2009 Community 2000 2001 2002 2003 2004 2005 2006 2007 2008 2009 2010 Average Average Tanana 2,848 1,407 3,321 3,075 1,490 4,832 5,474 5,229 2,877 4,665 1,856 2,428 4,615 Rampart a 47 0 14 9 103 315 135 25 27 112 161 35 123 Fairbanks b 275 165 295 89 280 780 1,341 529 119 44 427 221 563 Stevens Village 50 0 12 0 108 442 972 254 163 6 28 34 367 Beaver 7 328 77 7 2 68 117 41 27 22 22 84 55 Fort Yukon 0 289 1,832 2,176 1,187 67 2,165 2,365 230 275 722 1,097 1,020 Circle 109 6 5 85 52 3 58 200 5 0 37 51 53 Central 1 0 0 0 0 5 2 0 0 2 0 0 2 Eagle 121 555 24 104 171 235 974 15 14 0 25 195 248 Other c 51 0 17 0 3 53 117 81 25 29 144 14 61 District 5 Subtotal 3,509 2,750 5,597 5,545 3,396 6,800 11,355 8,739 3,487 5,155 3,422 4,159 7,107 (Excluding Chandalar and Black Rivers)
Venetie 0 106 13 0 15 0 475 107 50 143 0 27 155 Chalkyitsik 132 0 0 0 0 0 0 0 0 0 133 26 0 Chandalar/Black River 132 106 13 0 15 0 475 107 50 143 133 53 155 Subtotal
District 5 Total 3,641 2,856 5,610 5,545 3,411 6,800 11,845 8,846 3,537 5,298 3,555 4,213 7,265 Manley 240 338 93 65 296 163 89 140 144 367 102 206 181 Minto 3 19 10 625 7 21 460 82 9 1 8 133 115 Nenana 775 19 360 2,193 1,171 1,771 388 1,419 753 506 83 904 967 Fairbanks d 90 36 47 31 308 45 73 255 94 372 183 102 168 Other e 3 0 2 0 11 14 0 0 311 7 46 3 66 District 6 Tanana R. Total 1,111 412 512 2,914 1,793 2,014 1,010 1,896 1,311 1,253 422 1,348 1,497
Upper Yukon River Total 11,798 7,856 22,093 25,972 20,163 21,164 27,837 26,998 18,365 21,509 15,697 17,576 23,175 Alaska, Yukon River Total f 64,895 58,239 72,260 68,304 69,672 78,902 90,907 76,770 68,394 67,742 65,948 66,674 76,543 Alaska, Yukon Area Total 78,072 72,155 87,056 82,272 77,934 93,259 115,078 92,891 86,514 80,539 88,373 79,498 93,656 Note: Estimates from 2006 and 2007 are preliminary. Does not include harvest from personal use permits. a Rampart area harvest as reported from subsistence fishing permits established by the Alaska Board of Fisheries (BOF) in 2004. b Harvests by Fairbanks subsistence permit holders who fished in District 5 near the Yukon River bridge crossing. c Other permit holders who fished in District 5 but did not reside in the communities listed. d Fairbanks North Star Borough residents who subsistence fished in the Tanana River. e Other permit holders who fished in District 6 but did not reside in the communities listed. f Does not include the Coastal District.

268
Appendix D3.–Fall chum salmon subsistence harvest totals by fishing district and community of residence, as estimated from postseason survey, returned permits and test fish projects, Yukon Area 2000–2010. 2000-2004 2005-2009 Community 2000 2001 2002 2003 2004 2005 2006 2007 2008 2009 2010 Average Average Hooper Bay 78 364 44 40 264 1 146 64 329 41 116 158 116 Scammon Bay 11 195 240 106 56 69 41 170 57 117 70 122 91 Coastal District Total 89 559 284 146 320 70 187 234 386 158 186 280 207 Nunam Iqua 105 176 284 127 49 310 735 152 59 41 143 148 259 Alakanuk 505 1,032 222 348 953 627 624 1,348 423 116 860 612 628 Emmonak 1,165 1,272 1,261 1,257 785 1,436 2,056 2,360 1,670 1,589 1,718 1,148 1,822 Kotlik 3,519 957 114 407 280 516 487 530 671 171 481 1,055 475 District 1 Subtotal 5,294 3,437 1,881 2,139 2,067 2,889 3,902 4,390 2,823 1,917 3,202 2,964 3,184 Mountain Village 313 470 478 873 918 1,290 2,398 1,073 926 926 133 610 1,323 Pitkas Point 5 34 16 49 0 6 5 44 101 76 10 21 46 St. Mary's 255 227 103 762 104 490 417 825 830 106 387 290 534 Pilot Station 852 1,522 680 823 1,108 838 785 741 917 265 833 997 709 Marshall 0 1,003 341 394 291 633 410 789 748 190 56 406 554 District 2 Subtotal 1,425 3,256 1,618 2,901 2,421 3,257 4,015 3,472 3,522 1,563 1,419 2,324 3,166 Russian Mission 37 76 164 615 172 667 251 530 578 205 104 213 446 Holy Cross 523 624 0 9 76 582 224 248 920 627 21 246 520 Shageluk 38 0 0 114 50 55 5 147 323 105 1,200 40 127 District 3 Subtotal 598 700 164 738 298 1,304 480 925 1,821 937 1,325 500 1,093 Lower Yukon River Total 7,317 7,393 3,663 5,778 4,786 7,450 8,397 8,787 8,166 4,417 5,946 5,787 7,443 Anvik 175 29 401 179 398 497 118 429 317 176 169 236 307 Grayling 284 314 52 441 267 1,009 691 317 1,012 490 202 272 704 Kaltag 190 607 314 725 687 1,089 823 910 620 200 658 505 728 Nulato 0 151 0 1,341 1,246 421 751 1,345 729 552 1,049 548 760 Koyukuk 239 517 255 835 344 803 1,147 927 1,177 578 792 438 926 Galena 564 420 349 1,510 1,587 2,695 1,632 1,471 1,364 4,306 1,968 886 2,294 Ruby/Kokrines 64 581 78 2,331 1,064 559 227 1,959 657 134 1,026 824 707 District 4 Subtotal 1,516 2,619 1,449 7,362 5,593 7,073 5,389 7,358 5,876 6,436 5,864 3,708 6,426 Huslia 35 683 0 1,786 1,139 1,614 313 272 64 86 403 729 470 Hughes 157 0 0 497 97 111 240 0 127 288 0 150 153 Allakaket 36 50 100 105 968 557 393 939 1,345 572 521 252 761 Alatna 15 0 0 0 0 0 0 7 0 0 0 3 1 Bettles 0 0 0 0 0 50 0 0 0 0 0 0 10 Koyukuk River Subtotal 243 733 100 2,388 2,204 2,332 946 1,218 1,536 946 924 1,134 1,396 District 4 Total (Incl. Koyukuk R.) 1,759 3,352 1,549 9,750 7,797 9,405 6,335 8,576 7,412 7,382 6,788 4,841 7,822
-continued-

269
Appendix D3.–Page 2 of 2. 2000-2004 2005-2009 Community 2000 2001 2002 2003 2004 2005 2006 2007 2008 2009 2010 Average Average Tanana 9,384 9,779 6,255 14,308 23,118 20,545 23,167 21,596 17,478 19,595 14,984 12,569 20,476 Rampart a 0 183 0 365 0 358 250 250 1,000 1,000 735 110 572 Fairbanks b 8 0 0 105 43 1,682 5,269 2,126 659 229 822 31 1,993 Stevens Village 10 20 0 857 1,080 246 50 199 643 770 2,706 393 382 Beaver 0 21 1 192 48 179 0 354 13 120 37 52 133 Ft. Yukon 355 2,209 3,523 7,963 7,302 8,088 5,178 8,264 14,252 2,829 6,006 4,270 7,722 Circle 0 2,588 74 499 1,022 918 664 1,286 3,198 110 927 837 1,235 Central 0 0 0 0 0 36 0 0 0 0 0 0 7 Eagle 32 2,714 339 2,871 5,482 17,356 16,801 18,676 15,269 10,941 15,008 2,288 15,809 Other c 1 0 100 0 13 117 44 46 3,183 71 120 23 692 District 5 Subtotal 9,790 17,514 10,292 27,160 38,108 49,525 51,423 52,797 55,695 35,665 41,345 20,573 49,021 (Excluding Chandalar and Black Rivers)
Venetie 130 3,286 680 770 2,083 1,801 520 721 1,563 2,373 2,989 1,390 1,396 Chalkyitsik 0 73 4 340 479 337 215 213 0 45 0 179 162 Chandalar/Black River Subtotal 130 3,359 684 1,110 2,562 2,138 735 934 1,563 2,418 2,989 1,569 1,558 District 5 Total 9,920 20,873 10,976 28,270 40,670 51,663 52,158 53,731 57,258 38,083 44,334 22,142 50,579 Manley 0 1,230 947 1,303 1,504 2,985 3,374 3,419 2,490 4,126 2,696 997 3,279 Minto 2 251 100 675 0 600 242 155 28 0 70 206 205 Nenana 8 999 1,070 7,802 5,367 10,594 10,530 21,863 6,585 7,623 6,802 3,049 11,439 Fairbanks d 0 191 229 1,949 1,024 6,691 1,311 3,325 340 3,460 678 679 3,025 Other e 300 855 856 1,257 1,058 2,076 1,468 1,131 6,692 870 1,145 865 2,447 District 6 Tanana R. Total 310 3,526 3,202 12,986 8,953 22,946 16,925 29,893 16,135 16,079 11,391 5,795 20,396 Upper Yukon River Total 11,989 27,751 15,727 51,006 57,420 84,014 75,418 92,200 80,805 61,544 62,513 32,779 78,796 Alaska, Yukon River Total f 19,306 35,144 19,390 56,784 62,206 91,464 83,815 100,987 88,971 65,961 68,459 38,566 86,240 Alaska, Yukon Area Total 19,395 35,703 19,674 56,930 62,526 91,534 84,002 101,221 89,357 66,119 68,645 38,846 86,447 Note: Estimates from 2006 and 2007 are preliminary. Does not include harvest from personal use permits. a Rampart area harvest as reported from subsistence fishing permits established by the Board of Fisheries (BOF) in 2004. b Harvests by Fairbanks subsistence permit holders who fished in District 5 near the Yukon River bridge crossing. c Other permit holders who fished in District 5 but did not reside in the communities listed. d Harvests by Fairbanks subsistence permit holders who fished in the Tanana River. e Other permits holders who fished in District 6 but did not reside in the communities listed. f Does not include the Coastal District.

270
Appendix D4.–Coho salmon subsistence harvest totals by fishing district and community of residence, as estimated from postseason survey, returned permits and test fish projects, Yukon Area, 2000–2010.
2000-2004 2005-2009 Community 2000 2001 2002 2003 2004 2005 2006 2007 2008 2009 2010 Average Average Hooper Bay 218 439 125 244 9 0 175 26 66 24 45 207 58 Scammon Bay 4 63 123 48 54 279 160 84 50 222 79 58 159 Coastal District Total 222 502 248 292 63 279 335 110 116 246 124 265 217 Nunam Iqua 5 32 56 117 79 241 392 92 24 71 73 58 164 Alakanuk 84 414 183 193 207 322 101 857 157 194 449 216 326 Emmonak 191 342 514 547 296 191 450 1,032 717 401 362 378 558 Kotlik 787 486 542 403 593 222 234 284 313 181 238 562 247 District 1 Subtotal 1,067 1,274 1,295 1,260 1,175 976 1,177 2,265 1,211 847 1,122 1,214 1,295 Mountain Village 376 423 361 745 521 246 1,856 1,027 518 413 127 485 812 Pitkas Point 139 112 47 130 0 30 16 38 130 45 116 86 52 St. Mary's 117 610 209 276 258 252 171 97 591 151 92 294 252 Pilot Station 1,708 222 230 371 296 241 225 263 268 203 189 565 240 Marshall 11 73 386 64 425 341 191 922 490 245 33 192 438 District 2 Subtotal 2,351 1,440 1,233 1,586 1,500 1,110 2,459 2,347 1,997 1,057 557 1,622 1,794 Russian Mission 24 0 115 178 151 133 19 259 372 96 300 94 176 Holy Cross 70 0 0 498 27 84 16 213 38 120 0 119 94 Shageluk 0 0 0 35 106 0 48 267 0 105 53 28 84 District 3 Subtotal 94 0 115 711 284 217 83 739 410 321 353 241 354 Lower Yukon River Total 3,512 2,714 2,643 3,557 2,959 2,303 3,719 5,351 3,618 2,225 2,032 3,077 3,443 Anvik 0 13 0 12 288 406 0 807 40 137 28 63 278 Grayling 372 144 30 559 233 234 224 271 25 318 132 268 214 Kaltag 110 533 212 463 138 307 106 204 45 40 0 291 140 Nulato 60 258 78 928 203 60 214 130 195 171 242 305 154 Koyukuk 138 80 249 1,155 166 37 330 189 84 198 254 358 168 Galena 71 142 169 1,507 1,307 607 137 425 558 2,353 549 639 816 Ruby/Kokrines 173 871 69 648 1,540 361 11 168 291 314 148 660 229 District 4 Subtotal 924 2,041 807 5,272 3,875 2,012 1,022 2,194 1,238 3,531 1,353 2,584 1,999 Huslia 132 83 60 375 764 734 105 592 100 323 289 283 371 Hughes 12 117 100 20 110 20 150 100 0 89 0 72 72 Allakaket 0 25 56 99 17 205 25 66 152 43 88 39 98 Alatna 0 0 0 7 0 0 0 0 0 0 0 1 0 Bettles 0 0 0 0 0 0 0 0 0 0 0 0 0 Koyukuk River Subtotal 144 225 216 501 891 959 280 758 252 455 377 395 541 District 4 Total (Incl. Koyukuk R.) 1,068 2,266 1,023 5,773 4,766 2,971 1,302 2,952 1,490 3,986 1,730 2,979 2,540
-continued-

271
Appendix D4.–Page 2 of 2.
2000-2004 2005-2009 Community 2000 2001 2002 2003 2004 2005 2006 2007 2008 2009 2010 Average Average Tanana 4,826 6,675 2,032 3,480 1,049 1,616 3,619 2,369 1,511 2,373 2,314 3,612 2,298 Rampart a 0 0 0 0 0 10 0 50 0 0 24 0 12 Fairbanks b 2 11 0 120 91 10 79 26 7 13 2 45 27 Stevens Village 0 2 0 0 100 0 0 0 0 90 428 20 18 Beaver 0 0 17 0 0 0 0 354 6 0 1 3 72 Fort Yukon c 129 972 14 0 19 394 35 567 1,618 2 244 227 523 Circle 0 0 0 244 100 100 22 0 0 13 164 69 27 Central 0 0 0 0 0 1 0 0 0 0 0 0 0 Eagle 0 0 1 0 14 15 0 0 0 0 1 3 3 Other c 30 0 0 25 0 13 0 0 61 7 0 11 16 District 5 Subtotal 4,987 7,660 2,064 3,869 1,373 2,159 3,755 3,366 3,203 2,498 3,178 3,991 2,996 (Excluding Chandalar and Black Rivers)
Venetie 0 10 12 11 5 0 24 0 0 0 159 8 5 Chalkyitsik 0 4 0 7 45 0 0 0 0 0 267 11 0 Chandalar/Black River 0 14 12 18 50 0 24 0 0 0 426 19 5 Subtotal
District 5 Total 4,987 7,674 2,076 3,887 1,423 2,159 3,779 3,366 3,203 2,498 3,604 4,009 3,001 Manley 2,180 2,637 1,617 886 1,384 2,510 1,671 1,126 1,901 2,308 1,832 1,741 1,903 Minto 3 0 250 423 5 0 14 155 0 0 0 136 34 Nenana 1,767 4,443 3,574 5,431 6,494 12,395 7,032 4,487 2,775 3,475 2,313 4,342 6,033 Fairbanks d 0 68 1,024 1,049 1,435 3,032 745 609 230 577 212 715 1,039 Other e 1,200 1,818 3,034 2,574 2,266 1,601 1,109 1,468 3,522 691 1,198 2,178 1,678 District 6 Tanana River Total 5,150 8,966 9,499 10,363 11,584 19,538 10,571 7,845 8,428 7,051 5,555 9,112 10,687 Upper Yukon Area Total 11,205 18,906 12,598 20,023 17,773 24,668 15,652 14,163 13,121 13,535 10,889 16,101 16,228 Alaska, Yukon River Total f 14,717 21,620 15,241 23,580 20,732 26,971 19,371 19,514 16,739 15,760 12,921 19,178 19,671 Alaska, Yukon Area Total 14,939 22,122 15,489 23,872 20,795 27,250 19,706 19,624 16,855 16,006 13,045 19,443 19,888 Note: Estimates from 2006 and 2007 are preliminary. Does not include harvest from personal use permits. a Rampart area harvest as reported from subsistence fishing permits established by the Board of Fisheries (BOF) in 2004. b Harvests by Fairbanks subsistence permit holders who fished in District 5 near the Yukon River bridge crossing. c Other permit holders who fished in District 5 but did not reside in the communities listed. d Harvests by Fairbanks subsistence permit holders who fished in the Tanana River. e Other permits holders who fished in District 6 but did not reside in the communities listed. f Does not include the Coastal District.

272
Appendix D5.–Subsistence salmon harvests taken under authority of a permit in portions of District 5, Yukon Area, 1974–2010. Yukon River “Bridge” Area Subsistence Salmon Fisherya
Number Number Number Reported Harvest
of Permits of Permits Reporting
Summer Fall
Year Issued Returned Harvest Chinook Chum b Chum b Coho 1974
29 - -
591 - 1,857 1,271
1975
19 - -
727 - 778 70 1976
28 - 18
531 - 974 -
1977
38 - -
467 - 2,567 - 1978
57 - -
1,333 - 9,735 -
1979
55 - 41
2,194 - 12,374 - 1980
70 - 67
1,350 - 6,488 36
1981
57 - 24
1,095 - 12,034 - 1982
64 - 44
1,935 - 11,328 20
1983
68 - 46
2,672 - 15,059 - 1984
67 - 54
4,676 - 27,869 399
1985
55 - 42
2,618 - 21,832 33 1986
76 - 58
3,827 - 18,690 759
1987
16 - 14
1,818 2,091 7,631 6 1988
24 21 18
1,747 2,097 3,183 606
1989
26 20 13
2,483 574 1,157 309 1990
26 25 16
2,033 3,493 1,109 455
1991
52 46 34
2,529 1,295 3,953 20 1992
45 42 33
2,241 975 2,491 34
1993
49 47 36
3,767 492 2,915 16 1994
50 49 36
3,073 384 2,911 25
1995
59 59 39
3,253 954 2,244 59 1996
47 45 31
1,157 3,475 2,727 42
1997
44 42 28
1,588 683 491 26 1998
48 47 31
1,685 103 156 15
1999
66 64 47
1,653 356 701 2 2000
56 52 33
1,607 324 8 32
2001
65 62 38
1,819 176 0 13 2002
60 58 45
2,285 320 100 0
2003
86 80 62
2,670 89 104 145 2004
69 67 51
2,032 164 43 91
2005
76 72 57
1,847 643 17 9 2006
68 66 53
1,952 1,063 4,855 79
2007
85 79 50
1,689 142 626 26 2008
73 68 44
1,434 130 705 7
2009
68 66 38
1,248 28 996 106 2010 c 85 81 43
1,300 448 422 2
2005-2009 Average
74 70 48
1,634 401 1,440 45
2000-2009 Average 71 67 47 1,858 308 745 51
-continued-

273
Appendix D5.–Page 2 of 2. Yukon River "Rampart Village" Area Subsistence Salmon Fishery d
Number Number Number Reported Harvest
of Permits of Permits Reporting
Summer Fall
Year Issued Returned Harvest Chinook Chum Chum Coho 2004
14 11 9
832 249 0 0
2005
22 19 17
1,721 663 2,023 10 2006
19 19 16
1,083 647 318 0
2007
23 19 15
1,744 495 2,050 50 2008
18 18 15
1,049 43 1,000 0
2009
25 24 20
1,404 159 1,070 4 2010 c 28 27 22
1,344 304 1,235 24
2005-2009 Average
21 20 17
1,400 401 1,292 13
Upper Yukon River "Circle-Eagle" Area Subsistence Salmon Fishery e
1979
75 - 6
4,063 - 30,475 114 1980
48 - 39
3,649 - 18,477 6
1981
71 - 51
4,510 - 38,333 - 1982
60 - 61
3,833 - 15,432 -
1983
53 - 52
2,831 - 23,708 - 1984
58 - 54
2,543 - 21,675 17
1985
59 - 36
2,419 - 19,059 2 1986
40 - 52
4,148 - 20,701 43
1987
51 51 58 f 3,602 2,495 27,369 0 1988
58 57 50
2,783 2,134 9,078 101
1989
59 56 42
1,186 68 7,515 1 1990
81 75 54
3,746 1,629 14,992 206
1991
70 69 48
3,219 658 14,898 5 1992
85 79 54
2,984 409 12,009 57
1993
79 79 49
1,910 118 2,419 95 1994
79 76 51
3,093 145 12,844 30
1995
87 87 53
3,628 129 19,047 1 1996
86 84 51
3,458 528 20,861 1
1997
98 93 60
3,148 393 18,616 212 1998
101 95 54
3,562 55 630 132
1999
119 116 71
3,404 364 14,079 0 2000
121 118 47
1,806 233 33 0
2001
98 93 33
1,688 561 5,322 0 2002
94 87 42
3,877 29 418 1
2003
95 85 58
3,406 189 3,374 0 2004
89 83 50
2,304 223 6,517 114
2005
89 81 55
4,004 241 18,427 130 2006
85 82 59
3,302 1,034 17,866 22
2007
78 71 50
3,548 218 19,985 0 2008
96 87 50
1,808 19 18,496 0
2009
73 70 54
1,092 2 11,051 13 2010 c 93 89 56
1,415 62 15,955 165
2005-2009 Average 84 78 54 2,751 303 17,165 33
2000-2009 Average 92 86 50 2,684 275 10,149 28
Note: Prior to 1988 the reported harvest was expanded for permits not returned. Beginning in 1988, reported harvest was not expanded. a That portion of the Yukon River drainage from Hess Creek to Dall River. b Summer chum and fall chum salmon undifferentiated from 1974 to 1986. c Preliminary. d That portion of the Yukon River drainage from Garnett Island to Hess Creek. 2004 is the first year of permit requirement in
this Yukon River Area. e That portion of the Yukon River drainage from Twenty-Two Mile Slough, located downstream of the village of Circle, to the
United States/Canadian border. f Some fishermen reporting harvests did not have permits.

274
Appendix D6.–Subsistence salmon harvests taken under authority of a permit, Tanana River drainage, 1973–2010.
Subdistrict 6-A Subsistence Salmon Fishery
Number
Number
Number Reported Harvest
of Permits
of Permits
Reporting
Summer
Fall
Year Issued Returned Harvest Chinook Chum Chum Coho
1988 a,b 28
24
18
845
1,389
9,165
3,455
1989 b, c 29
28
24 d 651
1,918
25,266
5,292
1990 c 42
36
26
1,369
2,250
27,957
8,408 1991
45
41
31
420
1,716
17,472
8,486
1992
38
35
26
508
450
5,999
5,028
1993 c 42
41
22
331
784
2,617
1,317
1994 e 37
37
30
576
3,793
18,076
12,449 1995
41
38
29
456
4,898
23,522
11,344
1996
31
29
23
209
1,338
18,931
5,959 1997
33
32
21
887
542
10,621
3,703
1998
31
31
19
512
519
4,726
1,526 1999
24
24
14
137
525
5,712
3,464
2000
24
24
12
80
240
0
2,441 2001
26
24
14
398
327
1,541
3,319
2002
24
23
20
542
101
1,341
2,246 2003
23
21
13
276
65
2,445
2,514
2004
23
23
12
339
308
2,148
2,004 2005
24
22
15
424
168
4,317
2,659
2006
24
24
18
503
114
3,694
2,283 2007
22
22
14
333
144
3,779
2,121
2008
38
35
19
115
241
2,583
2,002 2009
28
27
19
543
422
4,649
2,680
2010 f 26
26
14
361
106
3,176
1,986 2005-2009 Average 27 26 17 384 218 3,804 2,349 2000-2009
Average
26
25
16
355
213
2,650
2,427 -continued-

275
Appendix D6.–Page 2 of 3.
Subdistrict 6-B Subsistence Salmon Fishery
Number
Number
Number Reported Harvest g
of Permits
of Permits
Reporting
Summer
Fall
Year Issued Returned Harvest Chinook Chum Chum Coho
1988 a 75
66
52
3,721
3,167
18,902
18,906
1989 h 60
51
37 d 455
363
18,506
8,453
1990 h 70
58
38
1,234
1,966
16,332
9,155
1991 h 87
78
51
1,796
2,373
21,629
11,971
1992 h 98
89
57
1,587
7,820
18,782
11,409 1993
99
89
38
1,341
5,976
7,166
2,987
1994
102
94
49
1,337
2,035
13,726
12,480 1995
98
98
59
1,322
6,712
25,364
7,458
1996
105
96
59
968
6,138
17,439
8,934 1997
103
95
55
1,825
3,282
8,729
7,892
1998
94
84
46
1,407
5,485
9,573
5,937 1999
83
79
47
1,487
2,129
9,757
5,930
2000
81
79
33
903
869
210
2,709 2001
87
81
44
1,511
74
1,983
5,646
2002
62
60
25
525
711
2,193
8,032 2003
77
72
40
1,839
2,849
10,537
7,849
2004
60
56
30
1,049
1,485
6,805
9,580 2005
70
67
29
1,404
1,846
15,367
9,659
2006
78
76
42
423
885
13,047
7,897 2007
79
184
93
1,139
1,752
12,478
5,160
2008
73
71
35
486
854
7,815
4,009 2009
69
68
37
730
830
9,112
4,064
2010 f 93
85
32
583
316
7,625
3,429 2005-2009 Average 74 93 47 836 1,233 11,564 6,158 2000-2009
Average
74
81
41
1,001
1,216
7,955
6,461 -continued-

276
Appendix D6.–Page 3 of 3.
Upper Tanana River Drainage Subsistence Salmon Fishery Number Number Number Reported Harvest
of Permits
of Permits
Reporting
Summer
Fall
Year Issued Returned Harvest Chinook Chum Chum Coho
1988 a 0
0
0
0
0
0
0 1989
2
2
2
5
0
39
0
1990
1
1
0
0
0
0
0 1991
8
7
6
0
0
288
14
1992
11
11
4
0
0
36
1 1993
10
10
8
0
0
5
0
1994
7
7
3
0
0
202
15 1995
50
46
12
0
0
88
0
1996
42
39
15
0
10
97
0 1997
61
58
26
0
0
200
0
1998
46
46
17
0
0
71
9 1999
29
29
13
0
0
2
0
2000
41
36
16
0
2
100
0 2001
57
50
22
0
0
2
1
2002
32
31
16
0
0
25
0 2003
38
32
17
30
0
4
0
2004
35
30
14
0
0
0
0 2005
29
24
13
0
0
15
0
2006
23
22
17
0
0
10
0 2007
34
33
17
0
0
41
5
2008
58
50
19
0
0
17
6 2009
42
40
17
0
0
84
0
2010 f 41
34
19
10
0
12
0 2005-2009 Average 37 34 17 0 0 33 2 2000-2009
Average 39 35 17 3 0 30 1 a Prior to 1988, salmon harvests were expanded for permits not returned. Beginning in 1988, the reported harvests were not
expanded. Dashes in the table indicate the information is not available. b Many Subdistrict 6-A fishermen did not obtain a permit in 1988 and 1989. c Includes salmon given away as part of the department's test fishing project in Manley. d Includes harvests reported by fishermen who did not have permits. e Beginning in 1994, a separate Kantishna River drainage permit was required. The Subdistrict 6-A harvest totals include those
from the Kantishna River drainage. f Preliminary. g Includes small numbers of salmon harvested and reported on the Tolovana River drainage (Subdistrict 6-B) subsistence pike
permit, established in 1993. h Includes salmon given away as part of the department's test fish project in Nenana.

277
Appendix D7.–Personal use salmon harvests taken under authority of a permit, Tanana River drainage, 1987–2010.
Subdistrict 6-C Personal Use Salmon Fishery
Number
Number
Number
Reported Harvest
of Permits
of Permits
Reporting
Summer
Fall
Year Issued Returned Harvest Chinook Chum Chum Coho
1987
132 a -
60 b
3,316
2,465
1988
208
162
120
317
1,182
2,074
1,125
1989
175
160
112
397
991
1,770
731
1990
152
144
102
442
918
1,353
1,120
1991 c -
-
-
-
-
-
-
1992 c -
-
-
-
-
-
-
1993
133
131
79
426
674
163
0
1994 c -
-
-
-
-
-
-
1995
139
138
91
399
780
863
417
1996
129
125
73
215
905
356
198
1997
112
109
61
313
391
284
350
1998
103
101
52
357
84
2
9
1999 d 103
103
67
331
382
261
147
2000
70
69
16
75
30
1
0
2001
54
51
24
122
146
10
34
2002
57
55
29
126
175
3
20
2003
67
67
32
204
148
394
549
2004
68
66
35
201
231
230
233
2005
63
59
27
138
152
133
107
2006
60
60
35
89
262
333
279
2007
65
63
32
136
184
173
135
2008
51
50
25
126
138
181
50
2009
57
57
22
127
308
71
65
2010 g 67
67
38
162
319
3,208
1,062 2005-2009 Average 59 58 28 123 209 178 127
2000-2009 Average 61 60 28 134 177 153 147
a Includes 60 former subsistence fishermen who were reissued personal use permits to fish for fall chum salmon b Some fishing families used both subsistence and personal use permits. c From July 1, 1990 through 1992, and in 1994, the regulations did not provide for a personal use fishery in this area. d Does not include four whitefish and sucker fishery permit holders, two of which fished, that reported a total harvest of one fall
chum and six coho salmon in 1999. e After 1997 the regulations did not provide for a personal use fishery in these areas. f After July 1, 1991 the regulations did not provide for a personal use salmon fishery in this area. g Data are preliminary. Includes 1 fall chum salmon caught in the PW fishery.

278

279
APPENDIX E

280
Appendix E1.–Yukon River drainage salmon spawning escapement goals for selected species and streams, 2007–2010. 2007 and 2009 Goal 2010 Goal
Chinook Salmon Stock Goal (Type) Year Established Goal (Type) Year Established E. Fork Andreafsky River 960-1700 (SEG) 2005 2,100-4,900 (SEG)a 2010 W. Fork Andreafsky River 640-1,600 (SEG) 2005 No Change Anvik River 1,100–1,700 (SEG) 2005 No Change Gisasa River 420–1,100 (SEG) 2005 Discontinued 2010 Nulato N. and S. combined 940–1,900 (SEG) 2005 No Change North Fork Nulato River Discontinued 2005 No Change South Fork Nulato River Discontinued 2005 No Change Chena River 2,800–5,700 (BEG) 2001 No Change Salcha River 3,300–6,500 (BEG) 2001 No Change Mainstem Yukon River Canada 33,000-43,000 (2007); >45,000
(2008,2009) b 42,500 – 55,000 b
Summer Chum Salmon Stock E. Fork Andreafsky River 65,000– 130,000 (BEG) 2001 > 40,000 (SEG) 2010 E. Fork Andreafsky River Discontinued (aerial) c 2005 No Change W. Fork Andreafsky River Discontinued (aerial) c 2005 No Change W. Fork Andreafsky River Discontinued (aerial) c 2005 No Change Anvik River 350,00 –700,000 (BEG) 2005 No Change
Fall Chum Salmon Stock Yukon Drainage 300,000–600,000 (BEG) 2001 Change to SEG Tanana River 61,000–136,000 (BEG) 2001 No Change Delta River 6,000 –13,000 (BEG) 2001 No Change Toklat River 15,000-33,000 (BEG) 2001 No Change Upper Yukon tributaries 152,000–312,000 (BEG) 2001 No Change Chandalar River 74,000–152,000 (BEG) 2001 No Change Sheenjek River 50,000–104,000 (BEG) 2001 No Change Fishing Branch River (YT, Canada) 50,000–120,000 (2001)d; 22,000-49,000
(2009) 22,000-49,000
Mainstem Yukon River (YT, Canada) >80,000 e 70,000-104,000
Coho Salmon Stock Delta Clearwater 5,200 – 17,000 (SEG) 2004 No Change a Goal was originally aerial survey-based goal, but changed to weir-based goal in 2010 b Escapement goals developed by JTC since 1985. Goals prior to 2008 were based on mark-recapture abundance estimates,
goals since that time are based on Eagle sonar estimates of border passage. Interim Management Escapement Goal (IMEG) established in years 2008–2010.
c Discontinued because of difficulty conducting aerial surveys of summer chum salmon. d Escapement goals developed by JTC in October 1987. Interim goals of 15,000 fall chum salmon for 2003 and 13,000 fall
chum salmon for 2004 were established. e Escapement goals developed by JTC in November 1990. Interim goals of 60,000 fall chum salmon for 2002, and 65,000 fall
chum salmon for 2003 and 2004 were established. Estimated total spawning escapement excluding the Porcupine River (estimated mainstem Yukon River border passage minus Canadian harvests).

281
Appendix E2.–Detailed preliminary salmon spawning escapement estimates for the Yukon River drainage, 2010. Survey Summer Fall Stream (drainage) Date Rating Chinook Chum Chum Coho Agency Andreafsky River
East Fork (weir count)
6/20-7/31 -- 2,413 72,893 -- 10 USFWS East Fork
8/2 Poor (537) (1,982) -- -- ADF&G
West Fork
8/2 Fair 858 24,380 -- -- ADF&G Andreafsky Subtotal 3,271 97,273 -- 10 Pilot Station (Sonar estimate)
(113,410) (1,327,581) (350,981) (142,149) ADF&G
Atchuelinguk (Chulinak)
8/3 Fair 76 1,240 -- -- ADF&G Anvik River (Sonar estimate)
6/22-7/24 -- -- 396,173 -- -- ADF&G
Goblet Creek to Yellow R.
8/3 Fair 150 (2,217) -- -- ADF&G Yellow R. to McDonald Cr. (Chinook index area)a
8/3 Fair 721 (1,654) -- -- ADF&G
Swift River
8/3 Fair 34 (365) -- -- ADF&G Beaver Creek
8/3 Fair 101 (162) -- -- ADF&G
Otter Creek
8/3 Fair 60 (670) -- -- ADF&G Anvik Subtotal 1,066 396,173 -- -- Kaltag River (foot survey)
7/17 Fair 0 1,325 -- -- ADF&G
Nulato River North Forkb
7/30 Fair 356 1,891 -- -- ADF&G South Fork
7/30 Fair 355 1,038 -- -- ADF&G
Total Lower Yukon River (downstream of Koyukuk River) 5,124 498,940 -- 10 Koyukuk River Drainage
Gisasa River (weir project)
6/19-7/31 -- 1,515 47,669 -- -- USFWS Gisasa River (aerial)
7/30 Good (264) (1,096) -- -- ADF&G
Huslia River Billy Hawk Creek
8/1 Poor 0 69 -- -- ADF&G Dakli River
Mainstem Dakli
8/1 Good 0 1,665 -- -- ADF&G Wheeler Creek
8/1 Good 0 1,809 -- -- ADF&G
Hogatza River drainage Clear Creek
8/1 Fair 0 469 -- -- ADF&G Caribou Creek
8/1 Fair 0 371 -- -- ADF&G
Alatna River Malamute Fork
7/31 Good 126 392 -- -- ADF&G Iniakuk River
7/31 Good 19 374 -- -- ADF&G
Henshaw Creek (weir project)
6/23-8/8 -- 793 100,670 -- -- TCC -continued-

282
Appendix E2.–Page 2 of 4. Survey Summer Fall Stream (drainage) Date Rating Chinook Chum Chum Coho Agency
South Fork Koyukuk River Mainstem South Fork
7/31 Good 116 9 -- -- ADF&G Jim River
7/31 Good 104 74 -- -- ADF&G
Wild River
8/1 Good 23 0 -- -- ADF&G
Total Koyukuk River 2,696 153,571 -- -- Melozi Hot Springs Creek
7/31 Good 6 699 -- -- ADF&G
Black Sand Creek
7/31 Fair 3 335 -- -- ADF&G Melozitna Subtotal 9 1,034 -- --
Total Yukon River (downstream of Tanana River) 7,829 653,545 -- 10
Tanana River Drainage Kantishna River Drainage Toklat Springs (helicopter survey) Main Channel and Sloughs
10/31 Good -- -- 3,042 6 ADF&G/TCC Geiger Creek 10/31 Good -- -- 512 85 ADF&G/TCC
Toklat Subtotal -- -- 3,554 91
Total Kantishna River -- -- 3,554 91 Chatanika River
7/28 Good 58 26 -- -- ADF&G
Nenana River Drainage Teklanika River
10/21 Good -- -- -- (280) BSFA Teklanika Springs (helicopter survey)
10/31 Good -- -- 0 341 ADF&G
Seventeen Mile Slough
10/21 Good -- -- -- 720 BSFA Julius Creek
10/21 Good -- -- -- 0 BSFA
Wood Creek
10/21 Good -- -- -- 340 BSFA Clear Creek
10/21 Good -- -- -- 130 BSFA
Glacier Creek
10/21 Good -- -- -- 0 BSFA Lost Slough (western floodplain)
10/21 Good -- -- -- 1,110 BSFA
Lignite Springs (foot survey)
9/23 Good -- -- -- 234 BSFA Nenana Subtotal -- -- 0 2,875 Chena River (counting tower estimate) c
6/28-8/7 -- 2,301 7,580 -- -- ADF&G
Salcha River (counting tower estimate) c
7/1-8/15 -- 5,907 23,863 -- -- BSFA
Richardson Clearwater River
11/10 Fair -- -- 1,850 1,002 ADF&G -continued-

283
Appendix E2.–Page 3 of 4. Survey Summer Fall Stream (drainage) Date Rating Chinook Chum Chum Coho Agency Mainstem Tanana sloughs (helicopter survey)
Benchmark 735 slough
11/10 Good -- -- 598 507 ADF&G Little Delta River mouth vicinity
11/10 Fair -- -- 325 30 ADF&G
Whitestone slough
11/10 Good -- -- 20 100 ADF&G Rika's Roadhouse vicinity
11/10 Fair -- -- 1,265 0 ADF&G
Bluff Cabin Island slough
11/10 Good -- -- 455 2 ADF&G Clearwater Lake Outlet slough
11/10 Good -- -- 1,465 51 ADF&G
Pearse slough and vicinity
11/10 Fair -- -- 1,090 0 ADF&G Goodpaster River (counting tower estimate)
7/7-8/1 -- 1,125 0 -- -- TCC/BSFA
Delta River Foot Survey (peak count)
11/9 Good -- -- (17,013) 99 ADF&G Population Estimate d
-- -- 17,993 -- ADF&G
Blue Creek
11/10 Fair -- -- 560 80 ADF&G Bluff Cabin Slough
11/10 Good -- -- 1,610 1 ADF&G
Bluff Cabin Creek
11/10 Good -- -- 355 110 ADF&G Delta Clearwater River Index Area (boat survey)
10/26 Fair -- -- -- 5,867 ADF&G
Tok Overflow #1 (foot survey)
10/27 -- -- -- -- 1 ADF&G
Total Tanana River 9,391 31,469 31,140 10,816
Chandalar River (Sonar estimate) e
8/8-9/26 -- -- -- 157,998 -- USFWS
Porcupine River Drainage Sheenjek River (Sonar estimate) e,f
8/18-9/24 -- -- -- 22,053 -- ADF&G
Fishing Branch River (weir project) e
9/15-10/12 -- -- -- 15,773 -- DFO
Total Porcupine River
-- -- 37,826 -- Eagle (Sonar estimate)
8/20-10/18
(35,074) -- (132,930) -- ADF&G/DFO
Total Alaska Portion of Drainage Observed Escapements g 17,220 685,014 211,191 10,826 -continued-

284
Appendix E2.–Page 4 of 4. Survey Summer Fall Stream (drainage) Date Rating Chinook Chum Chum Coho Agency
Yukon Territory Streams h Klondike River (sonar estimate)
7/5-8/17 -- 777 -- -- -- DFO i
Blind Creek (weir)
7/19-8/19 -- 270 -- -- -- DFO i
Little Salmon River (Index area)
8/17/10 Poor 63 -- -- -- DFO
Big Salmon River (index area)
8/19/10 Good (656) -- -- -- DFO Big Salmon River (sonar estimate)
7/20-8/26 -- 3,817 -- -- -- DFO i
Teslin River Drainage Nisutlin River
8/19/10 Good 288 -- -- -- DFO Wolf River
8/19/10 Good 94 -- -- -- DFO
Teslin Subtotal
382 -- -- --
Whitehorse Fishway
8/3-9/6 -- 672 -- -- -- DFO i
Subtotal Individual Mainstem Sites 5,981 -- -- --
Canadian Mainstem Yukon River Border Passage Estimate (Eagle sonar minus U.S. harvest)
(34,465) -- (121,580) -- ADF&G/DFO
Canadian Escapement Estimate (Border Passage minus Canada Harvest)
32,010 -- 117,871 -- ADF&G/DFO
Total Yukon Territory j 32,010 -- 133,644 -- DFO
Yukon River Drainage Total Observed Escapements 49,230 685,014 329,062 10,826 Note: Data in parentheses are not included in subtotals or totals. a Anvik River chum salmon index area includes mainstem counts between Goblet Creek and McDonald Creek. b Nulato River mainstem aerial survey counts below the forks are included with the North Fork. c Considered to be a conservative estimate due to the project ending before the completion of the chum salmon run. d Population estimate based upon replicate foot surveys and salmon stream life data. e Counts interpolated during periods of high water. f Sonar counts are for left bank only in 2010. g Total for Alaska portion of drainage does not include Fishing Branch River. Total for Yukon Territory includes Fishing Branch River. h Canadian "border passage" estimate for Yukon Territory streams (excluding the Fishing Branch River). Canadian harvest has not been removed. i Yukon Territory counts provided by DFO but are operated by various contractors mostly funded by Restoration and Enhancement Funds. j Yukon Territory counts include Canadian mainstem Yukon River escapement estimate plus Fishing Branch River.

285
Appendix E3.–Pilot Station sonar project estimates, Yukon River drainage, 1995, and 1997–2010.
Estimated Passage
Species 2010 2009 2008 2007 2006 2005 2004 2003 2002 2001 2000 1999 1998 1997 a 1995
Large Chinook Salmon b 95,913 92,648 106,708 90,184 145,553 142,007 110,236 245,037 92,584 85,511 39,233 127,809 71,177 118,121 130,271
Small Chinook Salmon
17,497 30,342 23,935 35,369 23,850 17,434 46,370 23,500 30,629 13,892 5,195 16,914 16,675 77,526 32,674
Total Chinook Salmon
113,410 122,990 130,643 125,553 169,403 159,441 156,606 268,537 123,213 99,403 44,428 144,723 87,852 195,647 162,945
Summer Chum Salmon
1,327,581 1,285,437 1,665,667 1,726,885 3,767,044 2,439,616 1,357,826 1,168,518 1,088,463 441,450 456,271 973,708 826,385 1,415,641 3,556,445
Fall Chum Salmon
350,981 240,449 615,127 684,011 790,563 1,813,589 594,060 889,778 326,858 376,182 247,935 379,493 372,927 506,621 1,053,245
Total Chum Salmon
1,678,562 1,525,886 2,280,794 2,410,896 4,557,607 4,253,205 1,951,886 2,058,296 1,415,321 817,632 704,206 1,353,201 1,199,312 1,922,262 4,609,690
Coho Salmon c 142,149 205,278 135,570 173,289 131,919 184,718 188,350 269,081 122,566 137,769 175,421 62,521 136,906 104,343 101,806
Other Species d 1,412,928 694,240 1,143,353 1,157,015 991,523 631,180 880,632 507,534 622,670 354,096 396,723 467,316 344,317 624,236 1,036,459
TOTAL 3,347,049 2,548,394 3,690,360 3,866,753 5,850,452 5,228,544 3,177,474 3,103,448 2,283,770 1,408,900 1,320,778 2,027,761 1,768,387 2,846,488 5,910,900 a The Yukon River sonar project operated in training mode in 1996 and there are no passage estimates for that year. b Chinook Salmon >655 mm for 1999–2005, >700mm for 1995–1998. c This estimate may not include the entire run. d Includes pink salmon, cisco, whitefish, sheefish, burbot, suckers, Dolly Varden, sockeye salmon, and northern pike.

286
Appendix E4.–Chinook salmon aerial survey indices for selected spawning areas in the Alaska portion of the Yukon River drainage, 1961–2010.
Andreafsky River Anvik River Nulato River Gisasa River
Year East Fork West Fork Drainagewide Total Index Area a North Fork South Fork Both Forks
1961
1,003
1,226
376 b 167
543
266 b
1962
675 b 762 b 1963
1964
867
705 1965
355 b 650 b
1966
361
303
638 1967
276 b 336 b
1968
380
383
310 b 1969
231 b 231 b 296 b
1970
665
574 b 368 1971
1,904
1,682
1972
798
582 b 1,198 1973
825
788
613
1974
285
471 b
55 b 23 b 78 b 161 1975
993
301
730
123
81
204
385
1976
818
643
1,053
471
177
648
332 1977
2,008
1,499
1,371
286
201
487
255
1978
2,487
1,062
1,324
498
422
920
45 b 1979
1,180
1,134
1,484
1,093
414
1,507
484
1980
958 b 1,500
1,330
1,192
954 b 369 b 1,323 b 951 1981
2,146 b 231 b 807 b 577 b
791
791
1982
1,274
851
421 1983
653 b 376 b 526
480
1,006
572
1984
1,573 b 1,993
641 b 574 b 1985
1,617
2,248
1,051
720
1,600
1,180
2,780
735
1986
1,954
3,158
1,118
918
1,452
1,522
2,974
1,346 1987
1,608
3,281
1,174
879
1,145
493
1,638
731
1988
1,020
1,448
1,805
1,449
1,061
714
1,775
797 1989
1,399
1,089
442 b 212 b
1990
2,503
1,545
2,347
1,595
568 b 430 b 998 b 884 b
1991
1,938
2,544
875 b 625 b 767
1,253
2,020
1,690 1992
1,030 b 2,002 b 1,536
931
348
231
579
910
1993
5,855
2,765
1,720
1,526
1,844
1,181
3,025
1,573 1994
300 b 213 b
913 b 843
952
1,795
2,775
1995
1,635
1,108
1,996
1,147
968
681
1,649
410 1996
624
839
709
100
100
1997
1,140
1,510
3,979
2,690
144 b
1998
1,027
1,249 b 709 b 648 b 507
546
1,053
889 b -continued-

287
Appendix E4.–Page 2 of 2.
Andreafsky River Anvik River Nulato River Gisasa River
Year East Fork West Fork Drainagewide Total Index Area North Fork South Fork Both Forks
1999
b 870 b
b 950 b
b b
b
2000
1,018
427
1,721
1,394
b b
b
2001
1,059
565
1,420
1,177
1,116
768
1,884 c 1,298 b
2002
1,447
917
1,713
1,329
687
897
1,584
506
2003
1,116 b 1,578 b 1,100 b 973 b
b b 2004
2,879
1,317
3,679
3,304
856
465
1,321
731
2005
1,715
1,492
2,421
1,922
323
230
553
958 2006
591 b 824
1,876
1,776 d 1,292
-
1,292
843
2007
1,758
976
1,529
1,497
2,583
-
2,583
593
2008
278 b 262 b 992 b 827 b 922
-
922
487
2009
84 b 1,678
832
590
2,260
-
2,260
515
2010 537 858 974 721 356 355 711 264
SEG e 960-1,900 640-1,600 1,100-1,700 940-1,900 420-1,100
Average All Years
1,319
1,121
1,241
1,168
774
564
1,456
740 2000-2009
1,195
1,004
1,728
1,570
-
-
1,549
741
2005-2009 885 1,046 1,529 1,472 - - 1,520 679 Note: Aerial survey counts are peak counts only. Survey rating was fair or good unless otherwise noted. a Anvik River Index Area includes mainstem counts between Yellow River and McDonald Creek. b Incomplete, poor timing and/or poor survey conditions resulting in minimal or inaccurate counts. c In 2001, the Nulato River escapement goal was established for both forks combined. d Index area includes counts from Beaver Creek to McDonald Creek. e Sustainable escapement goal.

288
Appendix E5.–Chinook salmon escapement counts for selected spawning areas in the Alaska portion of the Yukon River drainage, 1961–2010. Nulato
Andreafsky River
River
Henshaw Creek Gisasa River
Chena River
Salcha River
Tower Weir Weir
Year
No. %
No.
No. % No. %
No.
%
No.
% Fish Fem. Fish Fish Fem. Fish Fem. Fish Fem. a Fish Fem. a
1986
1,530 23.3 b
9,065 c 25.4 1987
2,011 56.1 b
6,404 c 48.2
4,771 c 52.0
1988
1,339 38.7 b
3,346 c 33.9
4,562 c 45.3 1989
13.6
2,666 c 45.3
3,294 c 43.8
1990
41.6
5,603 c 36.3
10,728 c 36.2 1991
33.9
3,025 c 31.5
5,608 c 40.7
1992
21.2
5,230 c 21.6
7,862 c 36.0 1993
29.9
12,241 b 11.7
10,007 b 22.9
1994
7,801 35.5 d,e 1,795 e
2,888
e 11,877 b 32.4
18,399 b 40.4 1995
5,841 43.7 d 1,412
4,023 46.0
9,680 c 51.7
13,643 b 48.4
1996
2,955 41.9 d 756
1,991 19.5
7,153 c 26.8
7,570 b 26.2 1997
3,186 36.8 d 4,766
3,764 26.0
13,390 c 25.6
18,514 b 41.8
1998
4,034 29.0 d 1,536
2,414 16.2
4,745 b 28.4
5,027 b 26.1 1999
3,444 28.6 d 1,932
2,644 26.4
6,485 b 45.6
9,198 b 44.6
2000
1,609 54.3 d 908
244 29.7 2,089 34.4
4,694 c 21.7
4,595 b 34.3 2001
e
e 1,103 36.3 3,052 49.2 e 9,696 b 30.1
13,328 b 32.1
2002
4,123 21.1 d 2,696
649 30.8 2,025 20.7
6,967 c 27.3
9,000 b,f 29.8 2003
4,336 45.3 d 1,716 e 763 38.4 1,901 38.1
11,100 b,g 31.8
15,500 b,f 36.6
2004
8,045 37.3
h 1,248 21.3 1,774 30.1
9,645 b 43.9
15,761 b 54.2 2005
2,239 50.2
h 1,059 41.4 3,111 34.0
b,e 30.6
5,988 b 47.5
2006
6,463 42.6
h
e 3,030 28.2
2,936 b 32.1
10,679 b 38.1 2007
4,504 44.7
h 740 24.9 1,425 39.0
3,806 b 27.3
6,425 b 31.0
2008
4,242 34.8
h 766 27.7 1,735 16.2
3,208 b 29.0
5,415 b,f 33.7 2009
3,004 46.0
h 1,637 49.0 1,955 29.3
5,253 b 40.0
12,774 b 33.9
2010 i 2,413 48.6
h 793 49.6 1,516 29.0
2,301 b 20.6
5,907 b 26.6 BEG j 2,800-5,700 3,300-6,500
Average
All Years
3,928 37.4
1,946
912 34.9
2,489 30.1
6,879
32.4
9,506
37.6
2000-2009
4,285 41.8
1,773
912 34.9
2,210 31.9
6,367
31.4
9,947
37.0 2005-2009 4,090 43.7 - 1,051 35.8 2,251 29.3 3,801 31.8 8,256 36.5
-continued-

289
Appendix E5.–Page 2 of 2. a In years when only carcass surveys were conducted, proportions of males and females were adjusted based on the average of ratios of unbiased estimates from mark–recapture
experiments to estimates from carcass samples over those years when mark–recapture studies were conducted. In years when mark–recapture experiments were conducted, proportions of males and females were estimated as the ratio of the abundance estimate of each gender to the abundance estimate of all fish.
b Tower counts. c Mark–recapture population estimate. d Weir counts. e No estimate due to extreme high water conditions. f Estimate includes an expansion for missed counting days based on average run timing. Minimum documented abundances from successful counting days were 4,644 in 2002,
11,758 in 2003, and 5,415 in 2008. g Estimate includes an expansion for missed counting days based on average run timing. Minimum documented abundance during successful counting days was 8,739 (SE=653)
fish. h Project did not operate. i Data are preliminary j Biological escapement goals (BEG) established by the Alaska Board of Fisheries, January 2001.

290
Appendix E6.–Chinook salmon escapements for selected spawning areas in the Canadian portion of the Yukon River drainage, 1961–2010.
Whitehorse Fishway Canadian Mainstem
Little
Big
Big Klondike Percent Border
Spawning
Tincup
Tatchun
Salmon
Salmon
Nisutlin
Ross
Wolf
Blind Chandindu Salmon River
Hatchery Passage
Escapement Year Creek a Creek b River a River a,c River a,d River a,e River a,f Creek River Sonar Sonar Count Contribution Estimate g Harvest Estimate h
1961
1,068
0 1962
1,500
0
1963
483
0 1964
595
0
1965
903
0 1966
7 i
563
0
1967
533
0 1968
173 i 857 i, c 407 i 104 i
414
0
1969
120
286
105
334
0 1970
100
670 c 615
71 i
625
0
1971
130
275
275 c 650
750 j
856
0 1972
80
126
415
237
13 j
391
0
1973
99
27 i 75 i 36 i
224
0 1974
192
70 i 48 i
273
0
1975
175
153 i 249
40 i
313
0 1976
52
86 i 102
121
0
1977
150
408
316 i 77
277
0 1978
200
330
524
375
725
0
1979
150
489 i 632
713
183 i
1,184
0 1980
222
286 i 1,436
975
377
1,383
0
1981
133
670
2,411
1,626
949
395
1,555
0 1982
73
403
758
578
155
104
473
0 60,346
16,808 43,538
1983
100
264
101 i 540
701
43 i, k 95
905
0 63,227
18,752 44,475 1984
150
153
434
1,044
832
151 i 124
1,042
0 66,300
16,295 50,005
1985
210
190
255
801
409
23 i 110
508
0 59,586
19,151 40,435 1986 228 155 54
i 745 459 l 72
i 109 557 0 61,489 20,064 41,425
-continued-

291
Appendix E6.–Page 2 of 3.
Whitehorse Fishway Canadian Mainstem
Little
Big
Big Klondike Percent Border
Spawning
Tincup Tatchun
Salmon
Salmon
Nisutlin
Ross
Wolf
Blind Chandindu Salmon River
Hatchery Passage
Escapement
Year Creek a Creek b River a River a, c River a, d River a, e River a, f Creek River Sonar Sonar Count Contribution Estimate g Harvest Estimate h 1987 100 159 468 891
183
180
l 35 327
0 58,870
17,563 41,307
1988 204 152 368 765
267
242 66 405
16 61,026
21,327 39,699
1989 88 100 862 1,662
695
433 m 146 549
19
77,718
17,419 60,299 1990 83 643 665 1,806
652
457
l 188 1,407
24 78,192
18,980 59,212
1991
326 1,040
250 201 n 1,266
o 51 o 63,172
20,444 42,728
1992 73 106 494 617
241
423 110 n 758
o 84 o 56,958
17,803 39,155
1993
183 184 572
339
400 168 n 668
o 73 o 52,713
16,469 36,244
1994 101 l 477 726 1,764
389
506 393
n 1,577 o 54
o 77,219
20,770 56,449
1995 121 397 781 1,314
274
253 l 229
n 2,103
57 70,761
20,088 50,673
1996
150 423 1,150 2,565
719
102 l 705
n 2,958
35 93,606
19,546 74,060
1997 193 1,198 1,025 1,345
277
322 n 957
2,084
24
69,538
15,717 53,821
1998 53 405 361 523
145
66
373 132 777
95 41,335
5,838 35,497
1999
252 495 353
330
131
892 239 1,118
74 49,538
12,354 37,184
2000 19 p 276
p 46 113
20
32
4 m 677
69
30,699 4,829 25,870
2001 39 p
1,035 1,020
481
154
129
q 988
36 62,333
9,769 52,564
2002
526 1,149
280
84
n 605
39 51,428
9,069 42,359
q
2003
1,658 3,075
687
292
1,115 185 r 1,443
70
90,037
9,443 80,594 2004
1,140 762
330
226
792
1,989
76
59,415
10,946 48,469
2005
1,519 952
807
363
260
525
5,584 2,632
57 78,962
10,977 67,985
2006
1,381 1,140
601
114
677
7,308 1,720
47 71,388
8,758 62,630
2007
451 601
137
54
304
4,450 427
56 39,698
4,794 34,904
2008
93 303
22
276
1,329 399
54 37,282
3,399 33,883
2009
821 1,827
497
134
716
9,261 4,725 828
47 69,575
4,297 65,278
2010 s
63
i 656 288 94 270 3,817 777
34,465 2,455 32,010 IMEG t
42,500-55,000
t -continued-
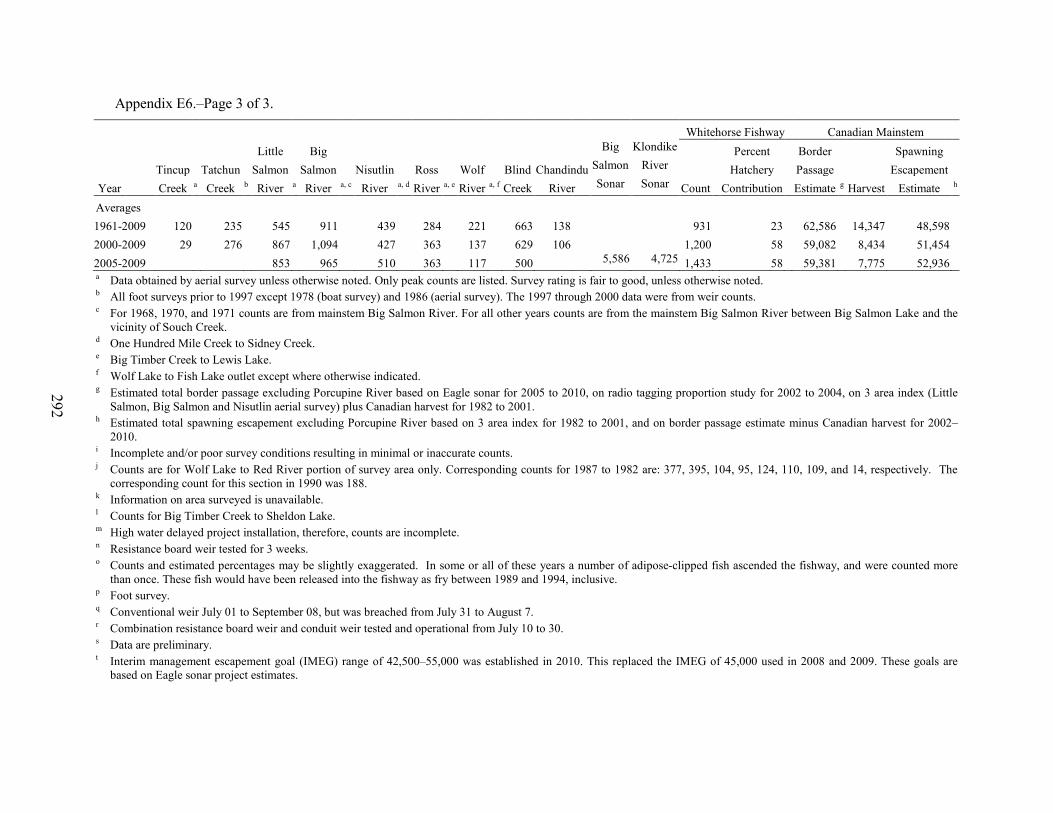
292
Appendix E6.–Page 3 of 3.
Whitehorse Fishway Canadian Mainstem
Little
Big
Big Klondike Percent Border
Spawning
Tincup Tatchun
Salmon
Salmon
Nisutlin
Ross
Wolf
Blind Chandindu Salmon River
Hatchery Passage
Escapement
Year Creek a Creek b River a River a, c River a, d River a, e River a, f Creek River Sonar Sonar Count Contribution Estimate g Harvest Estimate h Averages
1961-2009 120
235
545
911
439
284
221
663 138
931
23
62,586
14,347 48,598
2000-2009 29
276
867
1,094
427
363
137
629 106
1,200
58
59,082
8,434 51,454 2005-2009 853 965 510 363 117 500 5,586 4,725 1,433 58 59,381 7,775 52,936
a Data obtained by aerial survey unless otherwise noted. Only peak counts are listed. Survey rating is fair to good, unless otherwise noted. b All foot surveys prior to 1997 except 1978 (boat survey) and 1986 (aerial survey). The 1997 through 2000 data were from weir counts. c For 1968, 1970, and 1971 counts are from mainstem Big Salmon River. For all other years counts are from the mainstem Big Salmon River between Big Salmon Lake and the
vicinity of Souch Creek. d One Hundred Mile Creek to Sidney Creek. e Big Timber Creek to Lewis Lake. f Wolf Lake to Fish Lake outlet except where otherwise indicated. g Estimated total border passage excluding Porcupine River based on Eagle sonar for 2005 to 2010, on radio tagging proportion study for 2002 to 2004, on 3 area index (Little
Salmon, Big Salmon and Nisutlin aerial survey) plus Canadian harvest for 1982 to 2001. h Estimated total spawning escapement excluding Porcupine River based on 3 area index for 1982 to 2001, and on border passage estimate minus Canadian harvest for 2002–
2010. i Incomplete and/or poor survey conditions resulting in minimal or inaccurate counts. j Counts are for Wolf Lake to Red River portion of survey area only. Corresponding counts for 1987 to 1982 are: 377, 395, 104, 95, 124, 110, 109, and 14, respectively. The
corresponding count for this section in 1990 was 188. k Information on area surveyed is unavailable. l Counts for Big Timber Creek to Sheldon Lake. m High water delayed project installation, therefore, counts are incomplete. n Resistance board weir tested for 3 weeks. o Counts and estimated percentages may be slightly exaggerated. In some or all of these years a number of adipose-clipped fish ascended the fishway, and were counted more
than once. These fish would have been released into the fishway as fry between 1989 and 1994, inclusive. p Foot survey. q Conventional weir July 01 to September 08, but was breached from July 31 to August 7. r Combination resistance board weir and conduit weir tested and operational from July 10 to 30. s Data are preliminary. t Interim management escapement goal (IMEG) range of 42,500–55,000 was established in 2010. This replaced the IMEG of 45,000 used in 2008 and 2009. These goals are
based on Eagle sonar project estimates.

293
Appendix E7.–Summer chum salmon escapements for selected spawning areas in the Alaska portion of the Yukon River drainage, 1973–2010.
Rodo
Kaltag
Andreafsky River
Anvik River
River
Creek
Nulato River
East Fork
West Fork
South Fork
North Fork a
Mainstem
Sonar, Tower, or
Tower & Year Aerial b Weir Counts Aerial b Aerial c Sonar Aerial b Tower Aerial b Aerial b Tower
1973
10,149 d
51,835
249,015 1974
3,215 d
33,578
411,133
16,137
29,016
29,334
1975
223,485
235,954
900,967
25,335
51,215
87,280 1976
105,347
118,420
511,475
38,258
9,230 d 30,771
1977
112,722
63,120
358,771
16,118
11,385
58,275 1978
127,050
57,321
307,270
17,845
12,821
41,659
1979
66,471
43,391
- 277,712
-
1,506
35,598 1980
36,823 d
114,759
- 482,121
-
3,702 d 11,244 d
1981
81,555
147,312 e -
- 1,479,582
-
14,348
- 1982
7,501 d 180,078 e 7,267 d - 444,581
-
-
-
1983
-
110,608 e -
- 362,912
-
1,263 d 19,749 1984
95,200 d 70,125 e 238,565
- 891,028
-
-
-
1985
66,146
-
52,750
- 1,080,243
24,576
10,494
19,344 1986
83,931
167,614 f 99,373
- 1,085,750
-
16,848
47,417
1987
6,687 d 45,221 f 35,535
- 455,876
-
4,094
7,163 1988
43,056
68,937 f 45,432
- 1,125,449
13,872
15,132
26,951
1989
21,460 d -
-
- 636,906
-
-
- 1990
11,519 d -
20,426 d - 403,627
1,941 d
3,196 d,g 1,419 d
1991
31,886
-
46,657
- 847,772
3,977
13,150
12,491 1992
11,308 d -
37,808 d - 775,626
4,465
5,322
12,358
1993
10,935 d -
9,111 d - 517,409
7,867
5,486
7,698 1994
-
200,981 h,i -
- 1,124,689
-
47,295
-
-
148,762 i
1995
-
172,148 h -
- 1,339,418
12,849
77,193
10,875
29,949
236,890 1996
-
108,450 h -
- 933,240
4,380
51,269
8,490 d,h -
129,694
1997
-
51,139 h -
- 605,752
2,775 d 48,018
-
-
157,975 1998
-
67,720 h -
- 487,301
-
8,113
-
-
49,140
1999 j -
32,587 h -
- 437,356
-
5,339
-
-
30,076 2000
2,094 d 24,785 h 18,989 d - 196,349
-
6,727
-
-
24,308
2001
-
2,134 h,i -
- 224,058
-
- k -
-
- l 2002
-
44,194 h -
- 459,058
-
13,583
-
-
72,232
2003
-
22,461 h -
- 256,920
-
3,056
-
-
19,590 i 2004
-
64,883 h -
- 365,353
-
5,247
-
-
- k
2005
-
20,127
-
- 525,391
-
22,093
-
-
- k 2006
3,100 d 102,260
617
- 605,485
-
- k 7,772
11,658
- s
2007
-
69,642
-
- 460,121
-
- k 21,825
15,277
- s 2008
9,300
57,259
25,850
- 374,928
-
- k 12,070
10,715
- s
2009
736
8,770
3,877
- 193,099
621
- k 2,120
567
- s 2010
1,982
72,839
24,380
- 396,173 q -
-
1,891
1,038
-
E. O. >40 m >116 n 350-700 m >53 o -continued-

294
Appendix E7.–Page 2 of 3.
Henshaw
Tozitna
Creek
Gisasa River
Hogatza River
River
Chena River
Salcha River
Clear &
Clear
Caribou Cr.
Creek
Weir and Year Weir Aerial b Weir Aerial b Tower Aerial b Aerial b Tower Aerial b Tower
1973
79 d
290 1974
22,022
1,823
4,349
3,510
1975
56,904
22,355
3,512
1,670
7,573 1976
21,342
20,744
725 d 685
6,484
1977
2,204 d
10,734
761 d 610
677 d 1978
9,280 d
5,102
2,262
1,609
5,405
1979
10,962
14,221
-
1,025 d
3,060 1980
10,388
19,786
580
338
4,140
1981
-
-
-
3,500
8,500 1982
334 d
4,984 d
874
1,509
3,756
1983
2,356 d
28,141
1,604
1,097
716 d 1984
-
184 d
-
1,861
9,810
1985
13,232
22,566
1,030
1,005
3,178 1986
12,114
-
1,778
1,509
8,028
1987
2,123
5,669 d
-
333
3,657 1988
9,284
6,890
2,983
432
2,889 d
1989
-
-
-
714 d
1,574 d 1990
450 d
2,177 d
36
245 d
450 d
1991
7,003
9,947
93
115 d
154 d 1992
9,300
2,986
794
848 d
3,222
1993
1,581
-
970
168
5,400
212
5,809 1994
6,827
51,116 i 8,247 p
-
1,137
9,984
4,916
39,450
1995
6,458
136,886
-
116,735
4,985
185 d 3,519 i 934 d 30,784 1996
-
158,752
27,090 p 100,912
2,310
2,061
12,810 i 9,722
74,827
1997
686 d 31,800
1,821 d 76,454
428 d 594 d 9,439 i 3,968 d 35,741 1998
-
21,142
120 d,q 212 k 7 d 24 d 5,901
370 d 17,289
1999 j
-
10,155
-
11,283
-
520
9,165
150
23,221 2000
27,271
-
11,410
-
19,376
480
105
3,515
228
20,516
2001
35,031
-
17,946
-
3,674
12,527
2
4,773
-
14,900 k 2002
25,249
-
33,481
-
13,150
18,789
-
1,021 i 78
20,837 k
2003
22,556
-
25,999
-
6,159
8,487
-
573 i -
- 2004
86,474
-
37,851
-
15,661
25,003
-
15,162 i -
47,861
2005
237,481
-
172,259
-
26,420
39,700
219
2,928 i 4320
193,085 2006
-
1,000
261,305
-
29,166
22,629
469
35,109 i 152
111,869
2007
44,425
-
46,257
-
6,029 q,s 8,470
-
4,999
4 d 13,069 2008
97,281
20,470
36,938
-
- s 9,133
37
1,300 i 0 d 2,212 i
2009
156,201
1,060
25,904
3,981
- s 8,434
-
16,516
-
31,035 j 2010
100,670 j 1,096
47,669
840
-
-
-
7,560
-
22,185 j
E. O. >17 r >3.5 n -continued-

295
Appendix E7.–Page 3 of 3.
Note: Unless otherwise noted blank cells indicate years prior to the project being operational. Dashes indicate years in which no information was collected.
a Includes mainstem counts below the confluence of the North and South Forks, unless otherwise noted. b Aerial survey counts are peak counts only, survey rating is fair or good unless otherwise noted. c From 1972 to 1979 counting tower operated; escapement estimate listed is the tower counts plus expanded aerial
survey counts below the tower (see Buklis 1982). d Incomplete survey and/or poor survey timing or conditions resulted in minimal or inaccurate count. e Sonar count. f Tower count. g Mainstem counts below the confluence of the North and South Fords of the Nulato River included in the South
Fork counts. h Weir count. i Incomplete count due to late installation and/or early removal of project or high water events. j Data are preliminary. k Project did not operate. l No counts due to incomplete operations. m Biological escapement goals (in thousands of fish) established by the Alaska Board of Fisheries, January 2010. n Interim escapement objective (in thousands of fish). o Interim escapement objective (in thousands of fish) for North Fork Nulato River only. p BLM helicopter survey. q Consists of Clear Creek only. r Consists of Clear and Caribou Creeks interim escapement objectives (in thousands of fish) of 9,000 and 8,000,
respectively.
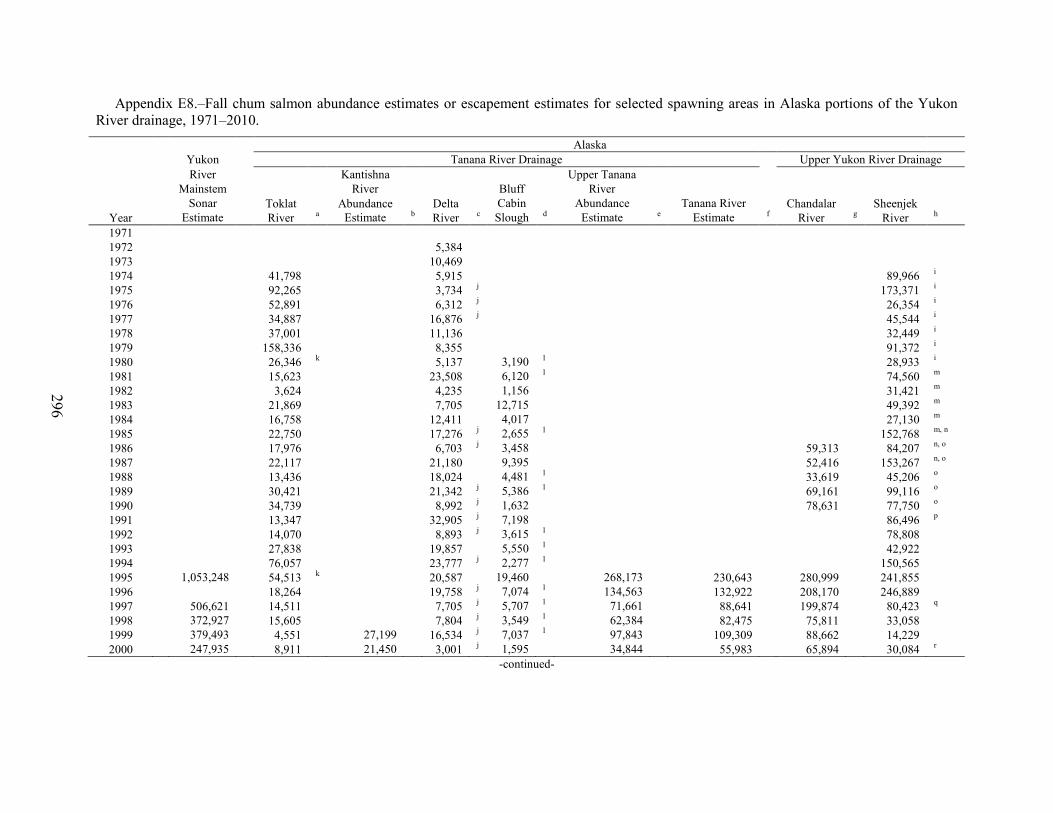
296
Appendix E8.–Fall chum salmon abundance estimates or escapement estimates for selected spawning areas in Alaska portions of the Yukon River drainage, 1971–2010.
Alaska
Yukon Tanana River Drainage Upper Yukon River Drainage
River Kantishna Upper Tanana
Mainstem River Bluff River
Sonar Toklat Abundance Delta Cabin Abundance Tanana River Chandalar Sheenjek Year Estimate River a Estimate b River c Slough d Estimate e Estimate f River g River h 1971 1972 5,384 1973 10,469 1974 41,798 5,915 89,966 i 1975 92,265 3,734 j 173,371 i 1976 52,891 6,312 j 26,354 i 1977 34,887 16,876 j 45,544 i 1978 37,001 11,136 32,449 i 1979 158,336 8,355 91,372 i 1980 26,346 k 5,137 3,190 l 28,933 i 1981 15,623 23,508 6,120 l 74,560 m 1982 3,624 4,235 1,156 31,421 m 1983 21,869 7,705 12,715 49,392 m 1984 16,758 12,411 4,017 27,130 m 1985 22,750 17,276 j 2,655 l 152,768 m, n 1986 17,976 6,703 j 3,458 59,313 84,207 n, o 1987 22,117 21,180 9,395 52,416 153,267 n, o 1988 13,436 18,024 4,481 l 33,619 45,206 o 1989 30,421 21,342 j 5,386 l 69,161 99,116 o 1990 34,739 8,992 j 1,632 78,631 77,750 o 1991 13,347 32,905 j 7,198 86,496 p 1992 14,070 8,893 j 3,615 l 78,808 1993 27,838 19,857 5,550 l 42,922 1994 76,057 23,777 j 2,277 l 150,565 1995 1,053,248 54,513 k 20,587 19,460 268,173 230,643 280,999 241,855 1996 18,264 19,758 j 7,074 l 134,563 132,922 208,170 246,889 1997
506,621
14,511 7,705 j 5,707 l 71,661 88,641 199,874 80,423 q
1998 372,927 15,605 7,804 j 3,549 l 62,384 82,475 75,811 33,058 1999 379,493 4,551 27,199 16,534 j 7,037 l 97,843 109,309 88,662 14,229 2000 247,935 8,911 21,450 3,001 j 1,595 34,844 55,983 65,894 30,084 r -continued-

297
Appendix E8.–Page 2 of 3. Alaska
Tanana River Drainage Upper Yukon River Drainage
Yukon River Kantishna Upper Tanana
Mainstem Sonar River Bluff River
Estimate Toklat Abundance Delta Cabin Abundance Tanana River Chandalar Sheenjek Year River a Estimate b River c Slough d Estimate e Estimate f River g River h 2001 376,182 6,007 s 22,992 8,103 i 1,808 l 96,556 t 116,012 110,971 53,932 2002 326,858 28,519 56,719 11,992 i 3,116 109,970 163,421 89,850 31,642 2003 889,778 21,492 87,359 22,582 j 10,600 l 193,418 263,302 214,416 44,047 u 2004 594,060 35,480 76,163 25,073 j 10,270 l 123,879 187,409 136,706 37,878 2005 1,813,589 17,779 k 107,719 28,132 j 11,964 l 337,755 372,758 496,484 561,863 n, v, w 2006 790,563 71,135 14,055 j 202,669 233,193 245,090 160,178 n, v 2007 684,011 81,843 18,610 j 320,811 357,016 228,056 65,435 n, v 2008 615,127 23,055 j 1,198 l 264,200 178,278 x 50,353 n, v, x 2009 240,449 y
13,492 j 2,900 l 159,828 54,126 n, v, x
2010 350,981 17,933 j 1,610 l 212,660 157,998 22,053 Escapement z 300,000 15,000 aa 6,000 46,000 ab 61,000 74,000 50,000 Objective 600,000 33,000 13,000 103,000 136,000 152,000 104,000
Average 1971-2009 665,415 y, ac 31,243
61,398
14,227
5,683
158,040
187,807
153,284
92,989
2000-2009 704,234 y, ac 19,698
65,673
16,810
5,431
177,488
217,312
196,194
108,954 2005-2009 975,823 y, ac 17,779 86,899 19,469 5,354 287,078 277,399 286,977 178,391
a Expanded total abundance estimates for upper Toklat River index area using stream life curve (SLC) developed with 1987–1993 data. Index area includes Geiger Creek, Sushana River, and mainstem floodplain sloughs from approximately 0.25 mile upstream of roadhouse.
b Fall chum salmon abundance estimate for the Kantishna and Toklat River drainages is based on a mark-recapture program. Tag deployment occurs at a fish wheel located near the mouth of the Kantishna River and recaptures are collected at four fish wheels; two located 8 miles upstream of the mouth of the Toklat River (1999–2005) and one fish wheel on the upper Kantishna River (2000–2002, 2006–2007) and two fish wheels in 2003–2005.
c Estimates are a total spawner abundance, using migratory time density curves and stream life data, unless otherwise indicated. d Foot survey, unless otherwise indicated. e Fall chum salmon abundance estimate for the upper Tanana River drainage is based on a mark–recapture program. Tag deployment occurs from a fish wheel (two fish wheels in
1995) located just upstream of the Kantishna River and recaptures are collected from one fish wheel (two fish wheels in 1995) located downstream from the village of Nenana. f Tanana River abundance estimates prior to 1995 can be found in Eggers (2001) but are based on Upper Tanana plus Toklat River escapement. Estimates from 1995 to 1998 are
based on the relationship of the Upper Tanana to the Kantishna river abundance estimates, and 2008-2011 are based on the relationship of the Tanana estimate (1995–2007) with the Delta River escapements. The harvests from the Tanana River fisheries are removed to estimate escapement.
g Single-beam sonar estimate for 1986 to 1990, split-beam sonar estimate 1995 to 2006. DIDSON in since 2007, project was aborted in 2009. h Single-beam sonar estimate beginning in 1981, split-beam sonar estimate 2002 to 2004, DIDSON since 2005.
-continued-

298
Appendix E8.–Page 3 of 3. i Total escapement estimate using sonar to aerial survey expansion factor of 2.22. j Population estimate generated from replicate foot surveys and stream life data (area under the curve method). k Minimal estimate because of late timing of ground surveys with respect to peak of spawning. l Aerial survey count, unless otherwise indicated. m Project started late, estimated escapements expanded for portion missed using average run timing curves based on Chandalar (1986–1990) and Sheenjek (1991–1993) rivers. n Sonar counts include both banks in 1985–1987, 2005–2009. o Expanded estimates for period approximating second week August through fourth week September, using annual Chandalar River run timing data (1986–1990). p Total abundance estimates are for the period approximating second week August through fourth week of September (1991 to present). Comparative escapement estimates
before 1986 are considered more conservative; approximating the period end of August through September. q Data interpolated due to high water from 29 August until 3 September 1997, during buildup to peak passage. r Project ended early (September 12) because of low water. s Minimal estimate because Sushana River was breached by the main channel and uncountable. t Low numbers of tags deployed and recovered resulted in an estimate with an extremely large confidence interval (95% CI +/- 41,072). u Project ended on peak daily passages due to late run timing, estimate was expanded based on run timing (87%) at Rampart. v In addition to the historical right bank count, the left bank was enumerated with DIDSON (right bank count for 2005–2009 was 266,963, 106,397, 39,548, 35,912, and 28,480, ,
not including expansions by bank). w Project ended while still counting >10,000 fish per day, estimate was expanded based on run timing (73%) at Rampart. x Run timing was late and counts were expanded to represent the remainder of the run after the project was terminated for the season. y Pilot Station sonar project encountered record low water levels during the fall season causing difficulties with species apportionment and catchability. Fall chum salmon
estimate is suspected of being conservative and should not be used in averages or run reconstructions. z Escapement goal (EG) includes individual tributary BEGs and drainagewide SEG from 2010. aa EG discontinued in 2010. ab The BEG for the Tanana River as a whole is 61,000 to 136,000. However it includes the Toklat plus and the Upper Tanana which was broke out for comparison to the upper
Tanana River abundance estimates. ac Does not include 2009.

299
Appendix E9.–Fall chum salmon abundance estimates or escapement estimates for selected spawning areas in Canadian portions of the Yukon River drainage, 1971–2010.
Porcupine Drainage Canadian Mainstem
Fishing
Mainstem
Border
Spawning
Branch
Yukon River
Koidern Kluane
Teslin
Passage
Escapement Year River a Index b River b, c River b, d River b, e Estimate Harvest Estimate f
1971 312,800 g
1972 35,230 h
198 i, j
1973 15,991
383
2,500 1974 31,841
400
1975 353,282
7,671
362 j 1976 36,584 f
20
1977 88,400 f
3,555 1978 40,800 f
0 j
1979 119,898 f
4,640 j 1980 55,268 f
3,150
39,130
16,218 22,912
1981 57,386 k
25,806
66,347
19,281 47,066 l
1982 15,901 f 1,020 m
5,378
47,049
15,091 31,958 1983 27,200 f 7,560
8,578 j
118,365
27,490 90,875
1984 15,150 f 2,800 n 1,300 7,200 200
81,900
25,267 56,633 l
1985 56,223
10,760 1,195 7,538 356
99,775
37,765 62,010 1986
31,810
825 14 16,686 213
101,826
13,886 87,940
1987
49,038
6,115 50 12,000
125,121
44,345 80,776 1988
23,645
1,550 0 6,950 140
69,280
32,494 36,786
1989
44,041
5,320 40 3,050 210 a 55,861
20,111 35,750 1990
35,000 o 3,651 1 4,683 739
82,947
31,212 51,735
1991 37,870
2,426 53 11,675 468
112,303
33,842 78,461 1992 22,539
4,438 4 3,339 450
67,962
18,880 49,082
1993 28,707
2,620 0 4,610 555
42,165
12,422 29,743 1994 65,247
1,429 a 20 a 10,734 209 a 133,712
35,354 98,358
1995 51,971 p 4,701 0 16,456 633
198,203
40,111 158,092 1996 77,302
4,977
14,431 315
143,758
21,329 122,429
-continued-

300
Appendix E9.–Page 2 of 3.
Porcupine Drainage Canadian Mainstem
Fishing
Mainstem
Border
Spawning
Branch
Yukon River
Koidern Kluane
Teslin
Passage
Escapement Year River a Index b River b, c River b, d River b, e Estimate Harvest Estimate f
1997 27,031
2,189
3,350 207
94,725
9,306 85,419 1998 13,687
7,292
7,337 235
48,047
1,795 46,252
1999 12,958
5,136 19 a 72,188 q 13,636 58,552 2000 5,057
933 a
1,442 204
57,978 q 4,246 53,732
2001 21,737
2,453
4,884
5
38,769 q 5,278 33,491 2002 13,600 973
7,147 64 104,853 q 6,174 98,679
2003 29,713
7,982
39,347
390
153,656 q 10,523 143,133 2004 20,417
3,440
18,982
167
163,625 q 9,545 154,080
2005 119,058 16,425 34,600 585 451,477 13,979 437,733
2006 30,954 6,553
18,208
620
218,611 r, s 6,617 211,994 2007 32,150 no survey
263,979 r, s 9,330 254,649
2008
19,086 p no survey
180,379 r, s 6,130 174,267 t
2009
25,828 u no survey
94,739 r 1,115 93,626 v
2010 w 15,773 u
121,580 s 3,709 117,871 EO x 50,000-120,000 >80,000
IMEG 22,000-49,000 y 70,000-104,000 z Average
1971-2009
53,856
4,480
223
8,982
317
117,752
17,628 99,540 2000-2009
31,760
5,537
---
17,801
291
172,807
7,294 165,538
2005-2009 27,005 6,553 --- 18,208 620 189,427 5,798 183,634 a Weir count, unless otherwise indicated. b Aerial survey count, unless otherwise indicated. c Index area includes Tatchun Creek to Fort Selkirk. d Index area includes Duke River to end of spawning sloughs below Swede Johnston Creek. e Index area includes Boswell Creek area (5 km below to 5 km above confluence). f Excludes Fishing Branch River escapement (estimated border passage minus Canadian mainstem harvest). g Total escapement estimated using weir to aerial survey expansion factor of 2.72, unless otherwise indicated.
-continued-

301
Appendix E9.–Page 3 of 3. h Weir installed September 22. Estimate consists of weir count of 17,190 after September 22, and tagging passage estimate of 17,935 before weir installation. i Incomplete and/or poor survey conditions resulting in minimal or inaccurate counts. j Foot survey, unless otherwise indicated. k Initial aerial survey count doubled before applying the weir/aerial expansion factor of 2.72 since only half of the spawning area was surveyed. l Escapement estimate based on mark–recapture program unavailable. Estimate based on assumed average exploitation rate. m Boat survey. n Total index area not surveyed. Survey included the mainstem Yukon River between Yukon Crossing to 30 km below Fort Selkirk. o Weir not operated. Although only 7,541 chum salmon were counted on a single survey flown October 26, a population estimate of approximately 27,000 fish was made through
date of survey, based upon historic average aerial-to-weir expansion of 28%. Actual population of spawners was reported by DFO as between 30,000–40,000 fish considering aerial survey timing.
p Incomplete count caused by late installation and/or early removal of project or high water events. q 1999 to 2004 border passage estimates were revised using a stratified "SPAS" analysis. r 2006 to present border passage estimate is based on sonar minus harvest from Eagle residents upstream of deployment. s Mark–recapture border passage estimates include 217,810, 235,956, and 132,048 from 2006 to 2008 respectively, during transition to sonar. t The 2008 estimate based on a mark-recapture estimate. u Run timing was late and counts were expanded to represent the remainder of the run after the project was terminated for the season. v The 2009 estimate based on the Eagle sonar estimate. w Data are preliminary x Escapement objective (EO) based on US/Canada Treaty Obligations, some years stabilization or rebuilding goals are applied. y Interim management escapement goal (IMEG) established for 2008-2010 based on percentile method. z Interim management escapement goal (IMEG) established for 2010 based on brood table of Canadian origin mainstem stocks (1982 to 2003).

302
Appendix E10.–Yukon River fall chum salmon estimated brood year production and return per spawner estimates 1974–2010.
(P)
Estimated Brood Year Return
(R)
(R/P)
Estimated Annual Totals
Number of Salmon a
Percent
Total
Brood Year
Return/ Year Escapement b Catch Run Age 3 Age 4 Age 5 Age 6 Age 3 Age 4 Age 5 Age 6 Returna Spawner 1974
436,485
478,875 915,360
91,751
497,755
68,693
0
0.139 0.756 0.104 0.000
658,199
1.51
1975
1,465,213
473,062 1,938,275
150,451
1,225,440
61,401
123
0.105 0.853 0.043 0.000
1,437,415
0.98 1976
268,841
339,043 607,884
102,062
587,479
137,039
4,316
0.123 0.707 0.165 0.005
830,895
3.09
1977
514,843
447,918 962,761
102,660
1,075,198
175,688
4,189
0.076 0.792 0.129 0.003
1,357,735
2.64 1978
320,487
434,030 754,517
22,222
332,230
90,580
0
0.050 0.747 0.204 0.000
445,032
1.39
1979
780,818
615,377 1,396,195
41,114
769,496
274,311
3,894
0.038 0.707 0.252 0.004
1,088,814
1.39 1980
263,167
488,373 751,540
8,377
362,199
208,962
3,125
0.014 0.622 0.359 0.005
582,663
2.21
1981
551,192
683,391 1,234,583
45,855
955,725
278,386
8,888
0.036 0.742 0.216 0.007
1,288,853
2.34 1982
179,828
373,519 553,347
11,327
400,323
166,754
679
0.020 0.691 0.288 0.001
579,083
3.22
1983
347,157
525,485 872,642
12,569
875,355
223,468
2,313
0.011 0.786 0.201 0.002
1,113,704
3.21 1984
270,042
412,323 682,365
7,089
408,040
174,207
8,516
0.012 0.683 0.291 0.014
597,852
2.21
1985
664,426
515,481 1,179,907
46,635
874,819
270,984
3,194
0.039 0.732 0.227 0.003
1,195,632
1.80 1986
376,374
318,028 694,402
0
429,749
368,513
4,353
0.000 0.535 0.459 0.005
802,614
2.13
1987
651,943
406,143 1,058,086
12,413
617,519
290,767
7,720
0.013 0.665 0.313 0.008
928,418
1.42 1988
325,137
353,685 678,822
41,003
175,236
152,368
10,894 c 0.108 0.462 0.401 0.029
379,501
1.17
1989
506,173
545,166 1,051,339
2,744
282,905
345,136 c 20,290
0.004 0.435 0.530 0.031
651,075
1.29 1990
369,654
352,007 721,661
710
579,452 c 418,448
30,449
0.001 0.563 0.407 0.030
1,029,059
2.78
1991
591,132
439,096 1,030,228
3,663 c 1,024,800
369,103
12,167
0.003 0.727 0.262 0.009
1,409,733
2.38 1992
324,253
148,846 473,099
6,763
653,648
197,073
3,907
0.008 0.759 0.229 0.005
861,392
2.66
1993
352,688
91,015 443,703
7,745
451,327
102,420
3,235
0.014 0.799 0.181 0.006
564,727
1.60 1994
769,920
169,225 939,145
4,322
225,243
149,527
1,603 c 0.011 0.592 0.393 0.004
380,695
0.49
1995
1,009,155
461,147 1,470,302
2,371
266,955
68,918 c 383
0.007 0.788 0.204 0.001
338,627
0.34 1996
800,022
260,923 1,060,945
420
165,691 c 136,906
8,295
0.001 0.532 0.440 0.027
311,312
0.39
1997
494,831
170,059 664,890
3,087 c 244,801
118,343
3,332
0.008 0.662 0.320 0.009
369,563
0.75 1998
263,121
70,820 333,941
651
269,653
57,962
6,694
0.002 0.805 0.173 0.020
334,960
1.27
1999
288,962
131,175 420,137
29,097
705,152
174,424
13,720
0.032 0.764 0.189 0.015
922,392
3.19 2000 210,756 28,543 239,299 8,446 297,012 115,478 0 0.020 0.706 0.274 0.000 420,937 2.00
-continued-

303
Appendix E10.–Page 2 of 2.
(P) Estimated Brood Year Return (R) (R/P)
Estimated Annual Totals
Number of Salmon a
Percent
Total
Brood Year
Return/ Year Escapement b Catch Run Age 3 Age 4 Age 5 Age 6 Age 3 Age 4 Age 5 Age 6 Returna Spawner 2001
337,765
44,976 382,741
136,038
2,157,498
675,688
33,955
0.045 0.718 0.225 0.011
3,003,179
8.89
2002
397,977
27,411 425,388
0
444,507
239,154
13,067
0.000 0.638 0.343 0.019
696,728
1.75 2003
695,363
79,529 774,892
24,263
858,714
434,639
15,995
0.018 0.644 0.326 0.012
1,333,611
1.92
2004
537,873
76,296 614,169
0
332,454
145,066
1,743
0.000 0.694 0.303 0.004
479,263
0.89 2005
1,996,513
290,183 2,286,696
2,269
369,995
79,298
4,784
0.005 0.811 0.174
456,346 d >0.23
2006
873,987
270,471 1,144,458
24,326
332,924
193,832
551,082 e >0.63 2007
928,430
203,393 1,131,823
70,148
2008
564,482
217,947 782,429 2009
462,063
93,319 555,382
2010
409,353
74,759 484,112 Average-09 560,863 306,563 867,426
495,664 All Brood Years (1974-2004) 29,866 598,270 215,819 7,453 0.0309 0.6872 0.2726 0.0093 851,409 2.04
382,121
Even Brood Years (1974-2004) 19,072
385,042
176,671
6,103
0.0318 0.6557 0.3020 0.0105
586,887
1.82
616,777 Odd Brood Years (1974-2004) 41,380 825,714 257,578 8,893 0.0299 0.7209 0.2412 0.0080 1,133,565 2.28
512,803
All Brood Years (1974-1983) 58,839 708,120
168,528 2,753
0.0611 0.7401 0.1960 0.0027
938,239
2.20
293,762
Even Brood Years (1974-1983) 47,148
435,997
134,406
1,624
0.0692 0.7045 0.2239 0.0023
619,175
2.28
731,845 Odd Brood Years (1974-1983) 70,530 980,243 202,651 3,881 0.0530 0.7757 0.1681 0.0031 1,257,304 2.11
487,503
All Brood Years (1984-2004) 16,069
545,961
238,339
9,691
0.0165 0.6620 0.3091 0.0124
810,061
1.97
422,284
Even Brood Years (1984-2004) 6,309
361,881
195,882
8,138
0.0148 0.6334 0.3376 0.0142
572,210
1.61
559,244 Odd Brood Years (1984-2004) 26,805 748,449 285,042 11,399 0.0183 0.6935 0.2777 0.0105 1,071,696 2.36 a The estimated number of salmon which returned are based upon annual age composition observed in lower Yukon test nets each year, weighted by test fish CPUE. b Contrast in escapement data is 11.10. c Based upon expanded test fish age composition estimates for years in which the test fishery terminated early both in 1994 and 2000. d Brood year return for 3, 4, and 5 year fish, indicate that production (R/P) from brood year 2005 was at least 0.23. Recruits estimated for incomplete brood year. e Brood year return for 3 and 4 year fish, indicate that production (R/P) from brood year 2006 was at least 0.63. Recruits estimated for incomplete brood year.

304
Appendix E11.–Coho salmon passage estimates or escapement estimates for selected spawning areas in the Alaska portion of the Yukon River drainage, 1972–2010.
Yukon Kantishna Upper Tanana River Drainage East River River Nenana River Drainage Delta Fork Mainstem Drainage Seventeen Delta Clearwater Clearwater Richardson
Andreafsky Sonar Geiger Lost Nenana Wood Mile Clearwater River Lake and Clearwater Year River a Estimate b Creek c Slough Mainstem d Creek Slough River e Tributaries f Outlet River g
1972 632 417 454 h
1973 3,322 551 375 1974 1,388 27 3,954 h 560 652 1975 943 956 5,100 1,575 i 4 h
1976 25 g, h 118 281 1,920 1,500 i 80 h
1977 60 524 g 310 c 1,167 4,793 730 i 327 1978 350 300 c 466 4,798 570 i
1979 227 1,987 8,970 1,015 i 372 1980 3 g, h 499 g 1,603 c 592 3,946 1,545 i 611 1981 1,657 g 274 849 a, j 1,005 8,563 k 459 g 550 1982 81 1,436 a, j 8,365 k
1983 42 766 1,042 a 103 8,019 k 253 88 1984 20 g, h 2,677 8,826 a 11,061 1,368 428 1985 42 g, h 1,584 4,470 a 2,081 6,842 750 1986 5 794 1,664 a 218 i 10,857 1,800 146 h
1987 1,175 2,511 2,387 a 3,802 22,300 4,225 i
1988 1,913 l 159 348 2,046 a 21,600 825 i
1989 155 412 a 824 g 12,600 1,600 i 483 1990 211 688 1,308 15 g 8,325 2,375 i
1991 427 564 447 52 23,900 3,150 i
1992 77 372 490 3,963 229 i 500 1993 138 484 419 666 a, m 581 10,875 3,525 i
1994 410 944 1,648 1,317 a, n 2,909 62,675 17,565 3,425 i 5,800 1995 10,901 100,664 142 4,169 2,218 500 a 2,972 g 20,100 6,283 3,625 i
1996 8,037 233 2,040 2,171 201 g, h 3,666 i 14,075 3,300 1,125 h
1997 9,472 105,956 274 1,524 o 1,446 p 1,996 11,525 2,375 2,775 i
1998 7,193 129,076 157 1,360 h 2,771 h p 1,413 q 11,100 2,775 2,775 i
1999 2,963 60,886 29 1,002 h 745 h 370 662 h 10,975 2,805 2000 8,451 169,392 142 55 g, h 68 g, h p 879 g, h 9,225 2,358 1,025 i 2,175 2001 15,896 132,283 578 242 859 699 3,753 46,875 11,982 4,425 i 1,531 2002 3,577 117,908 744 0 328 935 1,910 38,625 9,873 5,900 874 2003 8,231 265,119 973 85 658 3,055 4,535 105,850 27,057 8,800 6,232 2004 11,146 199,884 583 220 450 840 3,370 37,950 9,701 2,925 8,626 2005 5,303 184,071 625 430 325 h 1,030 3,890 34,293 8,766 2,100 2,024 2006 131,919 194 160 h 634 1,916 16,748 4,281 4,375 271
-continued-

305
Appendix E11.–Page 2 of 2. Yukon Kantishna Upper Tanana River Drainage
East River River Nenana River Drainage
Delta Fork Mainstem Drainage Delta Clearwater Clearwater Richardson
Andreafsky Sonar Geiger Lost Nenana Wood Seventeen Clearwater River Lake and ClearwaterYear River a Estimate b Creek c Slough Mainstem d Creek Mile Slough River e Tributaries f Outlet River 2007 173,289 63 520 605 1,733 14,650 3,961 2,075 553 2008 135,570 183 1,342 1,539 578 1,652 7,500 1,917 1,275 265 2009 205,278 s 137 410 470 680 16,850 4,307 5,450 155 2010 r 142,149 1,110 280 340 720 5,867 813 1,002 SEG t 5,200-17,000 t
Average 1972-2009 8,288 146,617 270 859 1,004 1,433 1,593 17,203 7,457 2,253 1,343 Note: Only peak counts presented. Survey rating is fair to good, unless otherwise noted. a Weir count, unless otherwise indicated. b Passage estimates for coho salmon are incomplete. The sonar project is terminated prior to the end of the coho salmon run. c Foot survey, unless otherwise indicated. d Index area includes mainstem Nenana River between confluence's of Lost Slough and Teklanika River. e Boat survey counts of index area (lower 17.5 river miles), unless otherwise indicated. f Helicopter surveys counted tributaries of the Delta Clearwater River, outside of the normal mainstem index area, from 1994 to 1998, after which an expansion factor was used
to estimate the escapement to the areas. g Aerial survey, fixed wing or helicopter. h Poor survey. i Boat Survey. j Weir was operated at the mouth of Clear Creek (Shores Landing). k Expanded estimate based on partial survey counts and historic distribution of spawners from 1977 to 1980. l The West Fork Andreafsky was also surveyed and 830 chum salmon were observed. m Weir project terminated on October 4, 1993. Weir normally operated until mid to late October. n Weir project terminated September 27, 1994. Weir normally operated until mid-October. o Survey of western floodplain only. p No survey of Wood Creek due to obstructions in creek. q Combination foot and boat survey. r Data preliminary. s Pilot Station sonar project encountered record low water levels during the fall season causing difficulties with species apportionment and catchability. Coho salmon are
suspected of being over estimated therefore this value should not be used in averages or run reconstructions. t Sustainable escapement goal (SEG) established January 2004, (replaces BEG of greater than 9,000 fish established March, 1993) based on boat survey counts of coho salmon
in the lower 17.5 river miles during the period October 21 through 27.

306

307
APPENDIX F

308
Appendix F1.–Waters open to commercial fishing in the Cape Romanzof District.

309
Appendix F2.–Commercial Pacific herring fishery data, Cape Romanzof District, 1980–2010.
1980 1981 1982 1983 a 1984 1985 1986 1987 b 1988 1989
1990 1991 1992 1993 1994 Catch (short tons) 611 720 657 816 1,185 1,299 1,865 1,342 1,119 926
329 526 530 371 456
Hours Fished 326 120 180 144 90 60 42 8 11 13
3 5 6 12.5 7 Percent Roe Recovery 9.8 8 9.3 9 8.6 8.3 9.2 8.9 9.1 9.33
8.4 8.8 8 9.6 9.2
Average Weight of Fish (Grams) f 188 189 206 224 239 240 252 294 306 313
304 355 358 373 372 Estimated Value ($ millions) 0.13 0.21 0.22 0.37 0.31 0.55 1.14 1 1.02 0.49
0.15 0.21 0.16 0.11 0.12
Number of Buyers 2 4 2 3 3 2 5 9 6 6
4 2 2 2 2 Number of Fishermen 69 111 75 63 66 73 97 157 113 115
95 80 73 41 55
Number of Boats 54 82 50 57 59 69 90 152 108 110
90 79 73 41 54 Number of Boats with Shakers c 12 11 10 2 1 2 12 22 - -
- - - - -
% Effort by Local Fishermen d 70 81 85 92 99 91 84 53 63 87
76 96 97 95 95 % Harvest by Local Fishermen d 40 60 84 88 100 94 70 33 60 82
77 97 96 91 92
Biomass Estimate e 3,000 4,850 4,850 5,512 6,063 7,000 7,500 7,216 6,600 4,400
4,500 4,500 4,500 4,000 5,000 Exploitation Rate 20.4 14.8 13.5 14.8 19.5 18.6 24.9 18.6 17.0 21.0
7.3 11.7 11.8 9.3 9.1
1995 1996 1997 1998 1999 2000 2001 2002 2003 2004
2005 2006 2007h 2008h 2009h
Catch (short tons) 541 752 879 727 533 500 137 102 81 25
125 92 0.0 0.0 0.0 Hours Fished 15 34 29.5 35 13.5 13.0 13.5 41.5 64.0 148.0
158.0 89.0 0.0 0.0 0.0
Percent Roe Recovery 10.1 10.6 10.2 9.6 9.2 8.1 7.6 9.8 10.9 12.4
10.4 10.3 0.0 0.0 0.0 Average Weight of Fish (Grams) f 367 356 360 369 364 376 378 412 428 359
401 407 0.0 0.0 0.0
Estimated Value ($ millions) 0.33 0.64 0.19 0.13 0.13 0.08 0.01 0.01 0.01 0.01
0.04 0.02 0.0 0.0 0.0 Number of Buyers 2 3 3 1 1 2 1 1 1 1
1 1 0.0 0.0 0.0
Number of Fishermen 49 63 65 41 57 46 23 21 11 10
10 8 0.0 0.0 0.0 Number of Boats 49 63 65 41 57 46 23 21 11 10
10 8 0.0 0.0 0.0
Number of Boats with Shakers c - - - - - - - - - -
% Effort by Local Fishermen d 98 95 95 98 98 98 100 100 100 100
100 100 0.0 0.0 0.0
% Harvest by Local Fishermen d 99 96 95 98 99 98 100 100 100 100
100 100 0.0 0.0 0.0 Biomass Estimate e 5,000 6,000 5,000 4,500 3,800 3,500 2,700 3,600 3,685 3,500 g 3,388 4,813 4,500 5,000 4,800 Exploitation Rate 10.8 12.5 17.6 16.2 14.0 14.3 5.1 2.8 2.2 0.7
3.7 1.9 0.0 0.0 0.0
-continued-

310
Appendix F2.–Page 2 of 2.
2005-2009 2000-2009 1980-2009
2010h Average Average Average
Catch (short tons) 0.0
18 97 300 Hours Fished 0.0
18 48 44
Percent Roe Recovery 0.0
2 6 8
Average Weight of Fish (Grams) f 0.0
81 251 305 Estimated Value ($ millions) 0.0
0 0 0.11
Number of Buyers 0.0
0 1 1 Number of Fishermen 0.0
2 12 27
Number of Boats 0.0
2 12 27
Number of Boats with Shakers c
- - -
% Effort by Local Fishermen d 0.0
20 63 79
% Harvest by Local Fishermen d 0.0
20 63 79
Biomass Estimate e 5,500
4,923 4090 4252 Exploitation Rate 0.0 0 3 7 a Exclusive Use Regulation into effect. b Last year hydraulic shakers were allowed. c Numbers of boats using shakers were estimated. d Local fishermen described as residents of Chevak, Scammon Bay, and Hooper Bay. e Biomass estimate is a qualitative estimate of herring abundance, except for aerial survey biomass estimate in 1987. f Estimated by department from commercial harvest samples. g In 2004 the preseason biomass was estimated as a range of 3000–4000 . h No commercial fishing occurred.

311
Appendix F3.–Subsistence herring harvest (st) and effort data by community, Cape Romanzof, 1975–2010.
Scammon Bay Chevak Hooper Bay Totals
Number of
Number of
Number of
Number of
Year Harvest Fishermen Harvest Fishermen Harvest Fishermen Harvest Fishermen 1975 - -
- -
2.8 34
2.8 34
1976 0.7 4
0.7 9
3.0 28
4.4 41 1977 - -
0.2 2
2.4 28
2.5 30
1978 0.7 1
- -
3.9 29
4.5 30 1979 6.0 21
2.3 21
3.1 42
11.4 84
1980 3.1 18
3.6 20
3.7 23
10.4 61 1981 7.7 16
1.8 9
4.0 20
13.5 45
1982 3.9 15
1.9 10
4.7 18
10.5 43 1983 2.5 14
1.5 5
5.2 18
9.2 37
1984 4.3 16
2.6 7
4.2 24
11.1 47 1985 2.4 11
2.2 13
3.4 20
8.0 44
1986 2.8 17
0.7 4
2.5 19
6.0 40 1987 1.4 8
0.5 5
1.1 10
3.0 23
1988 2.0 7
1.5 6
3.6 19
7.2 32 1989 1.1 7
0.1 1
1.8 16
3.0 24
1990 1.7 5
0.6 3
5.6 24
7.9 32 1991 1.7 7
0.4 3
1.1 8
3.2 18
1992 1.2 10
0.4 4
2.5 16
4.1 30 1993 2.7 17
0.1 1
2.4 24
5.1 42
1994 1.4 9
2.0 16
3.1 23
6.5 48 1995 1.1 11
1.2 9
3.8 22
6.1 42
1996 1.0 10
0.5 4
1.7 15
3.1 29 1997 0.9 10
0.2 3
2.2 21
3.2 34
1998 0.7 7
0.1 2
0.9 7
1.7 16 1999 6.0 24
2.3 12
4.2 31
12.5 67
2000 3.9 26
1.0 10
1.3 14
6.2 50 2001 1.5 8
1.0 10
0.1 5
3.1 24
2002 0.6 7
0.2 3
1.1 10
1.9 20 2003 3.0 13
1.0 8
2.0 13
6.0 34
2004 3.5 14
1.2 8
1.3 12
6.0 34 2005 6.2 9
0.1 2
0.6 2
6.9 13
2006 1.7 9
0.3 3
0.5 2
2.5 14 2007 1.5 8
1.2 6
0.4 4
3.1 18
2008 1.0 7
1.0 2
0.3 3
2.3 12 2009 0.7 6
0.3 3
0.2 3
1.2 12
2010 0.6 6 0.7 3 0.8 5 2.1 14 2005-2009
Average 2.2 7.8 0.6 3.2 0.4 2.8 3.2 13.8 Note: Subsistence survey results are believed to reflect harvest trends, however, reported catches reflect minimum
figures since all fisherman could not be contacted. Data are updated annually as new information is obtained.

312
Appendix F4.–Subsistence harvest of herring roe on kelp by community, Cape Romanzof, 1993–2010.
Scammon Bay Chevak Hooper Bay Total
Number Pounds
Number Pounds
Number Pounds
Number Pounds
Year of
Fishermen Roe-on-
Kelp of
Fishermen Roe-on-
Kelp of
Fishermen Roe-on-
Kelp of
Fishermen Roe-on-
Kelp 1993 9 300
10 213
19 513
1994 7 104
4 135
12 417
23 656 1995 12 298
1 25
13 383
26 706
1996 7 113
2 31
9 480
18 624 1997 6 130
1 25
13 400
20 555
1998 2 420
2 105
3 60
7 585 1999 15 416
5 160
22 549
42 1,125
2000 19 644
3 155
8 220
30 1,019 2001 2 25
3 113
2 50
7 188
2002 2 56
0 0
4 105
6 161 2003 8 185
2 130
7 185
17 500
2004 7 354
1 50
1 5
9 409 2005 5 1,125
0 0
0 0
5 1,125
2006 3 170
1 20
1 30
5 220 2007 2 50
1 10
0 0
3 60
2008 3 28
1 2
0 0
4 30 2009 0 0
1 5
0 0
1 5
2010 3 49 0 0 3 42 6 91 2005-2009
Average 3 275 1 7 0 6 4 288 Note: Subsistence survey results are believed to reflect harvest trends, however, reported catches reflect minimum figures since
all fishermen cannot be contacted. Data are updated annually as new information is obtained.

313
APPENDIX G

314
Appendix G1.–Estimated pink salmon subsistence harvest by residents of surveyed communities, with community and district totals, Yukon Area, 2000–2010.
Estimated Total
Even Years Odd Years All Years
Community 2000 2001 2002 2003 2004 2005 2006 2007 2008 2009 2010 Average Average Average Hooper Bay 902 32 5,475 473 5,418 860 1,433 113 1,013 957 219 2,848 487 1,668 Scammon Bay 96 362 417 997 2,508 1,645 1,381 1,435 2,766 1,186 2,245 1,434 1,125 1,279 Coastal District 998 394 5,892 1,470 7,926 2,505 2,814 1,548 3,779 2,143 2,464 4,282 1,612 2,947 Nunam Iqua 0 0 10 5 32 132 555 170 757 61 306 271 74 172 Alakanuk 38 0 130 0 233 49 115 32 494 24 151 202 21 112 Emmonak 0 9 39 4 32 54 225 51 641 5 206 187 25 106 Kotlik 263 0 849 198 318 155 219 129 1,161 42 124 562 105 333 District 1 301 9 1,028 207 615 390 1,114 382 3,053 132 787 1,222 224 723 Mountain Village 61 0 745 117 891 78 616 87 500 6 217 563 58 310 Pitkas Point 114 0 35 0 0 2 44 66 15 0 143 42 14 28 St. Mary's 54 0 7 0 137 144 236 32 367 5 543 160 36 98 Pilot Station 6 0 22 0 5 0 1 0 34 3 22 14 1 7 Marshall 0 0 473 0 105 6 3 0 26 0 21 121 1 61 District 2 235 0 1,282 117 1,138 230 900 185 942 14 946 899 109 504 Russian Mission 8 0 0 0 6 0 8 3 436 0 2 92 1 46 Holy Cross 20 0 0 0 0 0 17 0 20 0 0 11 0 6 Shageluk 0 0 0 130 0 0 0 0 0 9 0 0 28 14 District 3 28 0 0 130 6 0 25 3 456 9 2 103 28 66 Anvik 30 0 0 240 0 0 0 0 23 2 0 11 48 30 Grayling 0 0 30 3 0 3 0 0 200 0 0 46 1 24 Kaltag 0 0 0 0 10 4 0 0 383 0 0 79 1 40 Nulato 0 0 50 0 0 0 1 0 35 0 0 17 0 9 Koyukuk 0 0 4 0 0 0 0 0 67 0 0 14 0 7 Galena 0 0 50 0 0 0 0 0 31 0 0 16 0 8 Ruby 1 0 87 0 2 0 0 0 184 0 0 55 0 27 Huslia 0 0 0 0 0 0 0 0 100 0 0 20 0 10 Hughes 0 0 0 0 0 0 0 0 0 0 0 0 0 0 Allakaket 0 0 0 0 0 0 0 0 0 0 0 0 0 0 Alatna 0 0 0 0 0 0 0 0 0 0 0 0 0 0 Bettles 0 0 0 0 0 0 0 0 0 0 0 0 0 0 District 4 31 0 221 243 12 7 1 0 1,023 2 0 258 50 154
-continued-

315
Appendix G1.–Page 2 of 2.
Estimated Total
Even Years Odd Years All Years
Community 2000 2001 2002 2003 2004 2005 2006 2007 2008 2009 2010 Average Average Average Tanana 0 0 0 0 0 0 0 0 80 0 0 16 0 8 Stevens Village 0 0 0 0 0 0 0 0 0 0 0 0 0 0 Birch Creek 0 0 0 0 0 0 0 0 0 0 0 0 0 0 Beaver 0 0 0 0 0 0 0 0 0 0 0 0 0 0 Fort Yukon 0 0 0 0 0 0 0 0 196 0 0 39 0 20 Venetie 0 0 0 0 0 0 0 0 0 0 0 0 0 0 Chalkyitsik 0 0 0 0 0 0 0 0 0 0 0 0 0 0 District 5 0 0 0 0 0 0 0 0 276 0 0 55 0 28 Survey Totals 1,593 403 8,423 2,167 9,697 3,132 4,854 2,118 9,529 2,300 4,199 6,819 2,024 4,422 CI (95%) 559 416 4,091 964 2,829 1,521 990 739 1,818 1,184 1,209 - - - Note: Estimates from 2006 and 2007 are preliminary. CI (95%) is the annual confidence interval.

316
Appendix G2.–Reported subsistence and personal use fish harvested under authority of a permit, listed by permit area, Yukon area, 2010.
Number Reported Harvest a
of Permits
Permit Fishing Area Permit Percent Returned
Summer Fall
Longnose Arctic Type Issued b Returned Returned that Fished c Chinook Chum Chum Coho Whitefish Sheefish Burbot Pike Sucker Grayling Subsistence Permit
Yukon River near SY 85 81 95% 43
1,300 448 422 4 65 9 0 12 0 0 Haul Road Bridge
Yukon River near SE 66 62 94% 35
755 45 4,520 149 147 29 7 27 32 144 Circle and Eagle d
Yukon River SEU 27 27 100% 21
610 8 11,350 1 104 25 10 2 8 12 Upper Yukon River (above sonar)
Yukon River SR 28 27 96% 22
1,344 299 1,235 24 158 0 5 20 0 1 Rampart Area
Koyukuk River SF 1 1 100% 1
0 0 0 0 8 0 0 0 0 0 South Fork Koyukuk
Tanana River SA 22 22 100% 11
360 106 3,005 1,950 68 6 0 3 0 0 Subdistrict 6A
Tanana River SB 92 85 92% 31
580 683 7,434 3,168 496 7 6 18 34 1 Subdistrict 6B
Tanana River SU 41 34 83% 19
10 0 12 0 1,542 0 11 13 21 38 Upstream of Subdistrict 6C
Kantishna River SK 4 4 100% 3
1 0 81 23 3 0 3 28 0 0 Subdistrict 6A
Tolovana River Pike ST 96 90 94% 42
0 0 0 0 181 39 0 115 9 0 Subdistrict 6B
Subsistence Permit Subtotals 462 433 94% 228 4,960 1,589 28,059 5,319 2,772 115 42 238 104 196 Personal Use Permit
Tanana River PC 67 67 100% 38
162 355 3,221 1,013 190 0 3 6 9 5 Subdistrict 6C
Tanana River Whitefish PW 8 6 75% 3
0 0 1 0 14 1 0 1 57 0 Upstream of Subdistrict 6C
Personal Use Permit Subtotals 75 73 97% 41 162 355 3,222 1,013 204 1 3 7 66 5 Permit Totals 537 506 94% 269 5,122 1,944 31,281 6,332 2,976 116 45 245 170 201 a Information is preliminary and includes all permits returned as of March 29, 2011. b Includes 46 households that were "issued" permits for more than one area, one household that was issued a duplicate permit for the same area, and 5 permit holders issued an
additional SE or SEU permit to record harvest above and below the Eagle sonar. c Includes 9 households that "fished" in two different permit areas. d Does not include fish distributed to community households from ADF&G Eagle Sonar test fish project (there were no test fish mortalities in 2010).

317
Appendix G3.–Commercial freshwater finfish harvest, Lower Yukon Area, 1978–2010. Sheefish Bering Cisco Other Whitefisha Burbot Pike Lamprey Blackfish
Year Number Pounds Number Pounds Number Pounds Number Pounds Pounds Number Pounds Pounds 1978 0
0
19 87
0 0
0
0
0
0
1979 5
39
23 55
0 0
0
0
0
0 1980 283
2,265
78 250
0 0
0
0
0
293
1981 299
2,812
779 2,875
0 0
9
0
0
0 1982 754
6,161
1,633 6,214
102 482
0
0
0
0
1983 395
2,692
163 648
0 0
0
0
0
0 1984 94
762
794 2,362
0 0
0
0
0
0
1985 358
3,081
1,514 4,586
0 0
0
0
0
0 1986 0
0
1,533 5,845
0 0
0
80
0
1987 0
0
2,144 7,564
0 0
0
0
0
0 1988 0
0
696 2,171
0 0
0
0
0
0
1989 0
0
0 0
0 0
0
0
0
0 1990 0
0
180 260
0 0
0
0
0
0
1991 0
0
0 0
0 0
0
0
0
0 1992 0
0
95 640
0 0
0
0
0
0
1993 -
-
- -
- -
- -
-
-
-
- 1994 0
0
157 471
0 0
0
0
0
0
1995 -
-
- -
- -
- -
-
-
-
- 1996 -
-
- -
- -
- -
-
-
-
- 1997 -
-
- -
- -
- -
-
-
-
- 1998 -
-
- -
- -
- -
-
-
-
- 1999 -
-
- -
- -
- -
-
-
-
- 2000 -
-
- -
- -
- -
-
-
-
- 2001 -
-
- -
- -
- -
-
-
-
- 2002 -
-
- -
- -
- -
-
-
-
- 2003 0
0
0 0
0 0
0
84,665 b 23,960
0
2004 -
-
- -
- -
- -
-
-
-
- 2005 266
1,688
241 362 c 2,669 4,265
0 0
0
0
0
0
2006 472
2,912
4,497 5,519
1,932 2,832
0 0
0
3,149 d 715
0 2007 445 e 3,363
2,451 2,951
1,748 3,145
0 0
0
0
0
0
2008 0
0
8,642 9,380
695 692
0 0
0
0
0
0 2009 0
0
9,066 9,743
750 763
0 0
0
1,520 f 465
0
2010 0 0 13,922 14,784 g 418 437 0 0 0 0 0 0 2005-2009
Average 237 1,593 4,979 5,591 1,559 2,339 0 0 0 934 236 0 2000-2009
Average 197 1,327 4,979 5,591 1,299 1,949 0 0 0 14,889 4,190 0 Note: Unless otherwise indicated a blank cell indicates information is not available. Dashes indicate years in which no
commercial fishing occurred. a Based on Zephyr categorizations other whitefish species include: general whitefish, least cisco, broad whitefish, and
humpback whitefish. b Number of lamprey equals pounds of lamprey divided by the average lamprey weight (0.283). Harvest took place in St.
Mary's area. c In response to market conditions commercial whitefish fishing began to target Bering Cisco, therefore harvest of this species
are separated from other whitefish species. d Number of lamprey equals pounds of lamprey divided by the average lamprey weight (0.227). A few deliveries were made in
Mountain Village and St. Mary's. e Includes 416 sheefish harvested in the whitefish directed commercial fishery and 29 sheefish harvested in the salmon directed
commercial fishery. f Number of lamprey equals pounds of lamprey divided by the average lamprey weight (0.306). A few deliveries were made in
Marshall. g Includes 160 lb Bering Cisco harvested in January 2010 under permit authorized in fall 2009.

318
Appendix G4.–Commercial freshwater finfish harvest, Upper Yukon Area, 1971–2010.
Healy Lake Lake Minchumina Tanana River Yukon River
Whitefish a
Whitefish a
Burbot a Whitefish a
Burbot a Bering Cisco a Other Whitefishb Lamprey
Year Number Pounds Number Pounds
Number Pounds Number Pounds
Number Pounds Number Pounds Number Pounds Number
Pounds
1971
3,277 9,831
0 0 0 0
0 0 0 0 0 0 1972 2,605 3,950
718 2,154
0 0 0 0
0 0
0 0 0
0
1973 2,187 3,915
1,697 5,037
0 0 0 0
0 0
0 0 0
0 1974 1,885 3,390
854 2,562
0 0 0 0
0 0
0 0 0
0
1975 1,357 2,375
0 0
0 0 0 0
0 0
0 0 0
0 1976 1,440 2,625
0 0
0 0 0 0
0 0
0 0 0
0
1977 - -
- -
- - - -
- - - - - - -
- 1978 - -
- -
- - - -
- - - - - - -
-
1979 1,336 2,306
0 0
0 0 0 0
0 0
0 0 0
0 1980 - -
- -
- - - -
- - - - - - -
-
1981 - -
- -
- - - -
- - - - - - -
- 1982 - -
- -
- - - -
- - - - - - -
-
1983 - -
- -
- - - -
- - - - - - -
- 1984 0 0
0 0
0 76 0 0
0 0
0 0 0
0
1985 - -
- -
- - - -
- - - - - - -
- 1986 0 0
0 0
0 0 72 0
0 0
0 0 0
0
1987 - -
- -
- - - -
- - - - - - -
- 1988 0 0
0 0
0 0 837 0
0 0
0 0 0
0
1989 0 0
0 0
0 0 0 0
1 0
0 2,070 0
0 1990 0 0
0 0
1 0 809 0
0 0
985 2,078 0
0
1991 - -
- -
- - - -
- - - - - - -
- 1992 - -
- -
- - - -
- - - - - - -
-
1993 - -
- -
- - - -
- - - - - - -
- 1994 0 0
0 0
0 0 921 1,400
0 0
0 0 0
0
1995 - -
- -
- - - -
- - - - - - -
- 1996 - -
- -
- - - -
- - - - - - -
-
1997 0 0
0 0
0 0 908 1,160
0 0
0 0 0
0 1998 - -
- -
- - - - c - - - - - - -
-
1999 - -
- -
- - - -
- - - - - - -
- -continued-

319
Appendix G4.–Page 2 of 2.
Healy Lake Lake Minchumina Tanana River Yukon River
Whitefish a
Whitefish a
Burbot a Whitefish a
Burbot a Bering Cisco a Other Whitefishb Lamprey
Year Number Pounds Number Pounds
Number Pounds Number Pounds
Number Pounds Number Pounds Number Pounds Number
Pounds
2000 - -
- -
- - - -
- - - - - - -
- 2001 - -
- -
- - - -
- - - - - - -
-
2002 - -
- -
- - - -
- - - - - - -
- 2003 - -
- -
- - - -
- - - - - - 99,988 d 25,697
2004 - -
- -
- - - -
- - - - - - 0
0 2005 - -
- -
- - - -
- - - - - - 0
0
2006 - -
- -
- - - -
- - - - - - 32,943 e 7,481 2007 - -
- -
- - - -
- - - - - - 163 f 42
2008 - -
- -
- - - -
- - - - - - 41,750 g 11,137 2009 - -
- -
- - - -
- - - - - - 48,117 h 14,745
2010 - - - - - - - - - - - - - - 108,838 i 30,713 2005-2009
Average - - - - - - - - - - - - - - 24,595 6,681 2000-2009
Average - - - - - - - - - - - - - - 31,852 8,443 Note: Unless otherwise indicated a blank cell indicates information is not available. Dashes indicate years in which no commercial fishing occurred. a Numbers reflect fish harvested with the intent of commercial sale. b Based on Zephyr categorizations other whitefish species include: general whitefish, least cisco, broad whitefish, and humpback whitefish. c Requests for commercial whitefish fishing permits were denied because of the additional pressure placed on non-salmon species during poor salmon runs. d Number of lamprey equals pounds of lamprey divided by the average lamprey weight (0.257). Harvest took place in Grayling area. e Number of lamprey equals pounds of lamprey divided by the average lamprey weight (0.227). The majority of the harvest took place in the Grayling area. f Number of lamprey equals pounds of lamprey divided by an average lamprey weight (0.258). All of the harvest took place near Grayling and no samples
were collected. An average weight was calculated from samples taken in Grayling in 2003, 2004, and 2006. g Number of lamprey equals pounds of lamprey divided by the average lamprey weight (0.267). Harvest took place in Grayling area. h Number of lamprey equals pounds of lamprey divided by the average lamprey weight (0.306). Harvest took place in Grayling area. i Number of lamprey equals pounds of lamprey divided by the average lamprey weight (0.282). Harvest took place in Grayling area.

320
Appendix G5.–Freshwater finfish salmon during the commercial salmon fishing season by district, Upper Yukon Area, 1988–2010.
District 4
District 5
District 6
Whitefish
Whitefish
Sheefish
Whitefish
Year Number Pounds Number Pounds Number Pounds Number Pounds 1988 170
977
1,432
1,497
94
689
1,055
1,078
1989 403
1,331
687
803
47
381
178
444 1990 0
0
266
266
25
170
2
15
1991 2,600
4,055
0
0
0
0
-
-
1992 2,635
2,455
1,864
1,379 a 0
0
199
499 1993 0
0
59
48
0
0
140
300
1994 1
4
108
215
0
0
209
433 1995 0
0
95
95
0
0
183
387
1996 0
0
22
66
0
0
103
292 1997 0
0
270
301
0
0
4
8
1998 0
0
116
88
0
0
0
0 1999 0
0
0
0
0
0
0
0
2000 -
-
-
-
-
-
-
- 2001 -
-
-
-
-
-
-
-
2002 0
0
0
0
0
0
60
120 2003 40
113
0
0
0
0
129
297
2004 -
-
4
15
0
0
53
112 2005 0
0
0
0
0
0
66
175
2006 -
-
0
0
0
0
99
397 2007 0
0
0
0
0
0
55
152
2008 0
0
276
289
38
338
165 b 507 2009 0
0
-
-
-
-
-
-
2010 0 0 - - - - 18 72 2005-2009
Average 0 0 69 72 10 85 96 308 2000-2009
Average 7 19 40 43 5 48 90 251 Note: Unless otherwise indicated a blank cell indicates information is not available, Dashes indicate years in which no
commercial fishing occurred. a The sale of fish sold did not include number of fish; therefore, number of fish were estimated using average weight (0.74 lbs)
from previous deliveries in 1992. b The sale of fish sold did not include number of fish; therefore, number of fish were estimated using average weight (3.07 lbs)
from 2007 and 2010 in District 6.

321
APPENDIX H

322
Appendix H1.–Commercial freshwater finfish harvest and sales, Colville River, Northern Areas, 1964–2010.
Estimated Commercial Sales
Number of Fish Harvested Intended for Commercial Sale a
Based on Fish Tickets b
Broad
Humpback
Least Cisco Arctic Cisco Total
Year Whitefish Whitefish ("herring") ("kaktok") Harvest Arctic Cisco Whitefish Species c 1964
2,951 d -
9,000 16,000 27,951
-
-
1965
3,000 d -
- 50,000 53,000
-
- 1966
2,500 d -
- 40,000 42,500
-
-
1967
-
-
- - 0
- -
1968
3,130
-
18,180 42,055 63,365
- -
1969
-
-
- - 0
- -
1970
2,080 d -
25,930 19,602 47,612
-
- 1971
3,815
132
22,713 38,016 64,676
-
-
1972
3,850
1,497
13,283 37,333 55,963
-
- 1973
2,161
-
25,188 71,569 98,918
-
-
1974
3,117
2,316
13,813 35,601 54,847
-
- 1975
2,201
1,946
20,778 28,291 53,216
-
-
1976
2,172
1,815
34,620 31,659 70,266
-
- 1977
443
1,431
14,961 31,796 48,631
-
-
1978 e 20
1,102
21,589 17,292 40,003
-
- 1979
0
1,831
24,984 8,684 35,499
-
-
1980
0
4,231
31,459 14,657 50,347
-
- 1981
1,035
469
16,584 38,206 56,294
-
-
1982
1,662
201
25,746 15,067 42,676
-
- 1983
0
408
35,322 18,162 53,892
-
-
1984
789
179
13,076 27,686 41,730
-
- 1985
401
191
17,595 23,679 41,866
-
-
1986
0
18
9,444 29,895 39,357
-
- 1987
5
1,989
10,922 24,769 37,685
-
-
1988
429
6,733
23,910 10,287 41,359
-
- 1989
71
6,575
23,303 17,877 47,826
-
-
1990
0
5,694
21,003 19,374 46,071
12,571 f 14,249 f 1991
0
1,240
5,697 13,805 20,742
1,970 g 3,307 g
1992
126
5,209
6,962 20,939 33,236
-
10,200 h 1993
20
5,339
6,037 31,310 42,706
11,291 g 6,170 g
1994
-
6,056 j 10,176 8,958 25,190
7,434 g 4,121 g 1995
-
33,794 k - - 33,794
13,921
6,000
1996
-
6,425 j 7,796 21,817 36,038
9,076
4,127 1997
-
1,721 j 10,754 9,403 21,878
9,403
4,760
1998
-
4,881 j 9,936 7,019 21,836
5,648
7,105 1999 - 6,875 j 7,430 8,832 23,137 7,095 6,170
-continued-

323
Appendix H1.–Page 2 of 2.
Estimated Commercial Sales
Number of Fish Harvested Intended for Commercial Sale a
Based on Fish Tickets b
Broad
Humpback
Least Cisco Arctic Cisco Total
Year Whitefish Whitefish ("herring") ("kaktok") Harvest Arctic Cisco Whitefish Species c 2000
-
3,706 j 5,758 2,619 12,083
2,809
6,569
2001
-
6,078 j 2,839 1,740 10,657
1,779
7,306 2002
-
4,183 j 5,503 3,935 13,621
899
4,093
2003
-
6,463 j 4,777 5,627 16,867
0
1,292 2004
-
1,145 j 3,061 3,061 7,267
2,412 h 476
2005
-
490 j 2,870 9,343 12,703
2,975 h 2,170 2006
-
1,188 j 4,995 3,293 9,476 1,482 h 3,655
2007
-
462 j 2,265 390 3,117 - i - i 2008
-
-
- - -
-
-
2009
-
-
- - - -
-
2010
-
-
- - - -
-
2005-2009 Average - 428 2,026 2,605 5,059 891 1,165
2000-2009 Average - 2,372 3,207 3,001 8,579 1,236 2,556
a Reported on daily catch form returned to ADF&G. Catch reports were returned to the department following the fishing season. All fish reported on the catch report were harvested with the intent to sell. Dashes indicate information is not available.
b Fish tickets were often not generated at the time of sale. Since 1990, the commercial harvest is based on fish ticket information. Dashes indicate information is not available.
c Whitefish species include mostly humpback whitefish and least cisco, with occasional broad whitefish. d Includes small numbers of Humpback whitefish. e Reported the harvest of 1 Chinook, 2 sockeye, 9 chum, and 118 pink salmon. f Commercial harvest estimate based on one fish ticket average weights of 0.89 pounds (900 Arctic cisco at 800
pounds) and 0.61 pounds (1400 whitefish species at 850 pounds). g Estimated commercial harvest sales based on 1995 to 2001 average weight of .92 pounds for Arctic cisco and .89
pounds for whitefish species (humpback and broad whitefish, and least cisco). h Mixed commercial harvest of mostly Arctic cisco along with humpback and broad whitefish, and least cisco.
Estimated commercial harvest sales based on 1995 to 2001 combined average of $1.07/lb. for whitefish species and Arctic cisco.
j Humpback whitefish harvest includes undetermined amounts of broad whitefish. k Humpback whitefish harvest includes undetermined amounts of broad whitefish, least cisco, and Arctic cisco. i No information is available from fish tickets indicating that harvested fish were sold commercially.
Copyright © 2022 FDOKUMEN