Animated Monte Carlo simulation for teaching power generating system reliability analysis
11
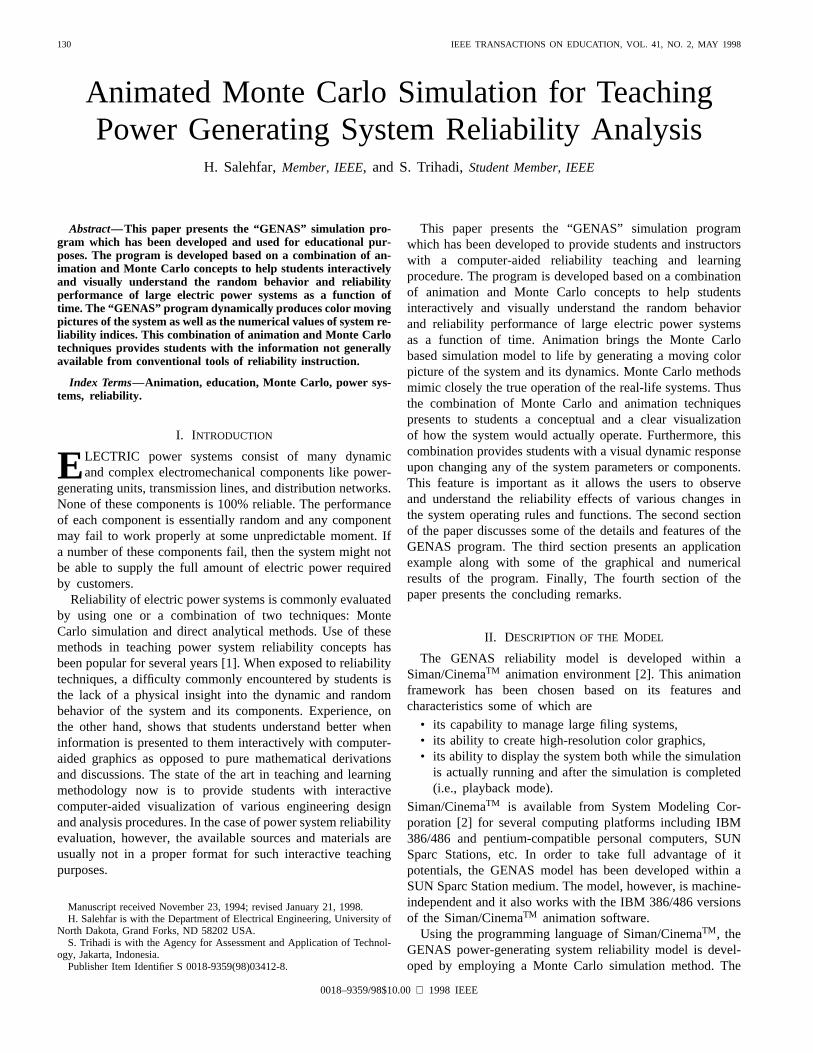
130 IEEE TRANSACTIONS ON EDUCATION, VOL. 41, NO. 2, MAY 1998 Animated Monte Carlo Simulation for Teaching Power Generating System Reliability Analysis H. Salehfar, Member, IEEE, and S. Trihadi, Student Member, IEEE Abstract—This paper presents the “GENAS” simulation pro- gram which has been developed and used for educational pur- poses. The program is developed based on a combination of an- imation and Monte Carlo concepts to help students interactively and visually understand the random behavior and reliability performance of large electric power systems as a function of time. The “GENAS” program dynamically produces color moving pictures of the system as well as the numerical values of system re- liability indices. This combination of animation and Monte Carlo techniques provides students with the information not generally available from conventional tools of reliability instruction. Index Terms—Animation, education, Monte Carlo, power sys- tems, reliability. I. INTRODUCTION E LECTRIC power systems consist of many dynamic and complex electromechanical components like power- generating units, transmission lines, and distribution networks. None of these components is 100% reliable. The performance of each component is essentially random and any component may fail to work properly at some unpredictable moment. If a number of these components fail, then the system might not be able to supply the full amount of electric power required by customers. Reliability of electric power systems is commonly evaluated by using one or a combination of two techniques: Monte Carlo simulation and direct analytical methods. Use of these methods in teaching power system reliability concepts has been popular for several years [1]. When exposed to reliability techniques, a difficulty commonly encountered by students is the lack of a physical insight into the dynamic and random behavior of the system and its components. Experience, on the other hand, shows that students understand better when information is presented to them interactively with computer- aided graphics as opposed to pure mathematical derivations and discussions. The state of the art in teaching and learning methodology now is to provide students with interactive computer-aided visualization of various engineering design and analysis procedures. In the case of power system reliability evaluation, however, the available sources and materials are usually not in a proper format for such interactive teaching purposes. Manuscript received November 23, 1994; revised January 21, 1998. H. Salehfar is with the Department of Electrical Engineering, University of North Dakota, Grand Forks, ND 58202 USA. S. Trihadi is with the Agency for Assessment and Application of Technol- ogy, Jakarta, Indonesia. Publisher Item Identifier S 0018-9359(98)03412-8. This paper presents the “GENAS” simulation program which has been developed to provide students and instructors with a computer-aided reliability teaching and learning procedure. The program is developed based on a combination of animation and Monte Carlo concepts to help students interactively and visually understand the random behavior and reliability performance of large electric power systems as a function of time. Animation brings the Monte Carlo based simulation model to life by generating a moving color picture of the system and its dynamics. Monte Carlo methods mimic closely the true operation of the real-life systems. Thus the combination of Monte Carlo and animation techniques presents to students a conceptual and a clear visualization of how the system would actually operate. Furthermore, this combination provides students with a visual dynamic response upon changing any of the system parameters or components. This feature is important as it allows the users to observe and understand the reliability effects of various changes in the system operating rules and functions. The second section of the paper discusses some of the details and features of the GENAS program. The third section presents an application example along with some of the graphical and numerical results of the program. Finally, The fourth section of the paper presents the concluding remarks. II. DESCRIPTION OF THE MODEL The GENAS reliability model is developed within a Siman/Cinema TM animation environment [2]. This animation framework has been chosen based on its features and characteristics some of which are • its capability to manage large filing systems, • its ability to create high-resolution color graphics, • its ability to display the system both while the simulation is actually running and after the simulation is completed (i.e., playback mode). Siman/Cinema TM is available from System Modeling Cor- poration [2] for several computing platforms including IBM 386/486 and pentium-compatible personal computers, SUN Sparc Stations, etc. In order to take full advantage of it potentials, the GENAS model has been developed within a SUN Sparc Station medium. The model, however, is machine- independent and it also works with the IBM 386/486 versions of the Siman/Cinema TM animation software. Using the programming language of Siman/Cinema TM , the GENAS power-generating system reliability model is devel- oped by employing a Monte Carlo simulation method. The 0018–9359/98$10.00 1998 IEEE
-
Upload
independent -
Category
Documents
-
view
0 -
download
0
Transcript of Animated Monte Carlo simulation for teaching power generating system reliability analysis
130 IEEE TRANSACTIONS ON EDUCATION, VOL. 41, NO. 2, MAY 1998
Animated Monte Carlo Simulation for TeachingPower Generating System Reliability Analysis
H. Salehfar,Member, IEEE, and S. Trihadi,Student Member, IEEE
Abstract—This paper presents the “GENAS” simulation pro-gram which has been developed and used for educational pur-poses. The program is developed based on a combination of an-imation and Monte Carlo concepts to help students interactivelyand visually understand the random behavior and reliabilityperformance of large electric power systems as a function oftime. The “GENAS” program dynamically produces color movingpictures of the system as well as the numerical values of system re-liability indices. This combination of animation and Monte Carlotechniques provides students with the information not generallyavailable from conventional tools of reliability instruction.
Index Terms—Animation, education, Monte Carlo, power sys-tems, reliability.
I. INTRODUCTION
ELECTRIC power systems consist of many dynamicand complex electromechanical components like power-
generating units, transmission lines, and distribution networks.None of these components is 100% reliable. The performanceof each component is essentially random and any componentmay fail to work properly at some unpredictable moment. Ifa number of these components fail, then the system might notbe able to supply the full amount of electric power requiredby customers.
Reliability of electric power systems is commonly evaluatedby using one or a combination of two techniques: MonteCarlo simulation and direct analytical methods. Use of thesemethods in teaching power system reliability concepts hasbeen popular for several years [1]. When exposed to reliabilitytechniques, a difficulty commonly encountered by students isthe lack of a physical insight into the dynamic and randombehavior of the system and its components. Experience, onthe other hand, shows that students understand better wheninformation is presented to them interactively with computer-aided graphics as opposed to pure mathematical derivationsand discussions. The state of the art in teaching and learningmethodology now is to provide students with interactivecomputer-aided visualization of various engineering designand analysis procedures. In the case of power system reliabilityevaluation, however, the available sources and materials areusually not in a proper format for such interactive teachingpurposes.
Manuscript received November 23, 1994; revised January 21, 1998.H. Salehfar is with the Department of Electrical Engineering, University of
North Dakota, Grand Forks, ND 58202 USA.S. Trihadi is with the Agency for Assessment and Application of Technol-
ogy, Jakarta, Indonesia.Publisher Item Identifier S 0018-9359(98)03412-8.
This paper presents the “GENAS” simulation programwhich has been developed to provide students and instructorswith a computer-aided reliability teaching and learningprocedure. The program is developed based on a combinationof animation and Monte Carlo concepts to help studentsinteractively and visually understand the random behaviorand reliability performance of large electric power systemsas a function of time. Animation brings the Monte Carlobased simulation model to life by generating a moving colorpicture of the system and its dynamics. Monte Carlo methodsmimic closely the true operation of the real-life systems. Thusthe combination of Monte Carlo and animation techniquespresents to students a conceptual and a clear visualizationof how the system would actually operate. Furthermore, thiscombination provides students with a visual dynamic responseupon changing any of the system parameters or components.This feature is important as it allows the users to observeand understand the reliability effects of various changes inthe system operating rules and functions. The second sectionof the paper discusses some of the details and features of theGENAS program. The third section presents an applicationexample along with some of the graphical and numericalresults of the program. Finally, The fourth section of thepaper presents the concluding remarks.
II. DESCRIPTION OF THEMODEL
The GENAS reliability model is developed within aSiman/CinemaTM animation environment [2]. This animationframework has been chosen based on its features andcharacteristics some of which are
• its capability to manage large filing systems,• its ability to create high-resolution color graphics,• its ability to display the system both while the simulation
is actually running and after the simulation is completed(i.e., playback mode).
Siman/CinemaTM is available from System Modeling Cor-poration [2] for several computing platforms including IBM386/486 and pentium-compatible personal computers, SUNSparc Stations, etc. In order to take full advantage of itpotentials, the GENAS model has been developed within aSUN Sparc Station medium. The model, however, is machine-independent and it also works with the IBM 386/486 versionsof the Siman/CinemaTM animation software.
Using the programming language of Siman/CinemaTM, theGENAS power-generating system reliability model is devel-oped by employing a Monte Carlo simulation method. The
0018–9359/98$10.00 1998 IEEE
SALEHFAR AND TRIHADI: MONTE CARLO SIMULATION FOR TEACHING SYSTEM RELIABILITY ANALYSIS 131
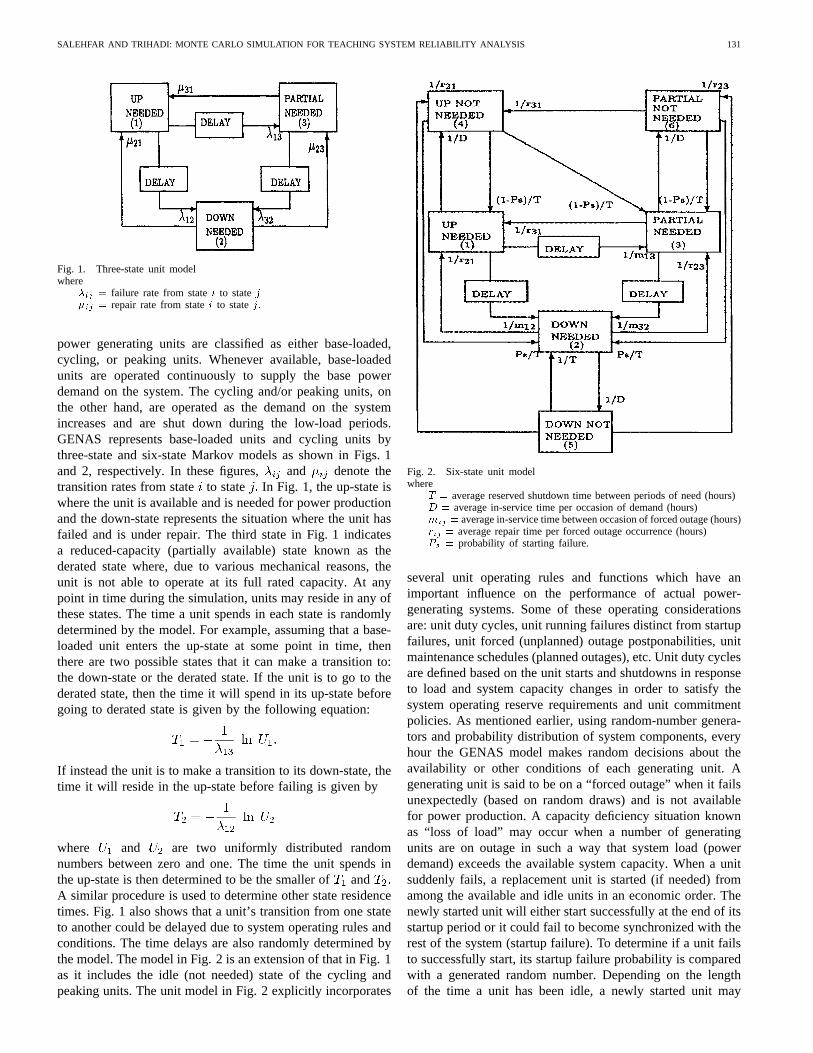
Fig. 1. Three-state unit modelwhere
�ij = failure rate from statei to statej�ij = repair rate from statei to statej.
power generating units are classified as either base-loaded,cycling, or peaking units. Whenever available, base-loadedunits are operated continuously to supply the base powerdemand on the system. The cycling and/or peaking units, onthe other hand, are operated as the demand on the systemincreases and are shut down during the low-load periods.GENAS represents base-loaded units and cycling units bythree-state and six-state Markov models as shown in Figs. 1and 2, respectively. In these figures, and denote thetransition rates from stateto state In Fig. 1, the up-state iswhere the unit is available and is needed for power productionand the down-state represents the situation where the unit hasfailed and is under repair. The third state in Fig. 1 indicatesa reduced-capacity (partially available) state known as thederated state where, due to various mechanical reasons, theunit is not able to operate at its full rated capacity. At anypoint in time during the simulation, units may reside in any ofthese states. The time a unit spends in each state is randomlydetermined by the model. For example, assuming that a base-loaded unit enters the up-state at some point in time, thenthere are two possible states that it can make a transition to:the down-state or the derated state. If the unit is to go to thederated state, then the time it will spend in its up-state beforegoing to derated state is given by the following equation:
If instead the unit is to make a transition to its down-state, thetime it will reside in the up-state before failing is given by
where and are two uniformly distributed randomnumbers between zero and one. The time the unit spends inthe up-state is then determined to be the smaller ofandA similar procedure is used to determine other state residencetimes. Fig. 1 also shows that a unit’s transition from one stateto another could be delayed due to system operating rules andconditions. The time delays are also randomly determined bythe model. The model in Fig. 2 is an extension of that in Fig. 1as it includes the idle (not needed) state of the cycling andpeaking units. The unit model in Fig. 2 explicitly incorporates
Fig. 2. Six-state unit modelwhere
T = average reserved shutdown time between periods of need (hours)D = average in-service time per occasion of demand (hours)mij = average in-service time between occasion of forced outage (hours)rij = average repair time per forced outage occurrence (hours)Ps = probability of starting failure.
several unit operating rules and functions which have animportant influence on the performance of actual power-generating systems. Some of these operating considerationsare: unit duty cycles, unit running failures distinct from startupfailures, unit forced (unplanned) outage postponabilities, unitmaintenance schedules (planned outages), etc. Unit duty cyclesare defined based on the unit starts and shutdowns in responseto load and system capacity changes in order to satisfy thesystem operating reserve requirements and unit commitmentpolicies. As mentioned earlier, using random-number genera-tors and probability distribution of system components, everyhour the GENAS model makes random decisions about theavailability or other conditions of each generating unit. Agenerating unit is said to be on a “forced outage” when it failsunexpectedly (based on random draws) and is not availablefor power production. A capacity deficiency situation knownas “loss of load” may occur when a number of generatingunits are on outage in such a way that system load (powerdemand) exceeds the available system capacity. When a unitsuddenly fails, a replacement unit is started (if needed) fromamong the available and idle units in an economic order. Thenewly started unit will either start successfully at the end of itsstartup period or it could fail to become synchronized with therest of the system (startup failure). To determine if a unit failsto successfully start, its startup failure probability is comparedwith a generated random number. Depending on the lengthof the time a unit has been idle, a newly started unit may
132 IEEE TRANSACTIONS ON EDUCATION, VOL. 41, NO. 2, MAY 1998
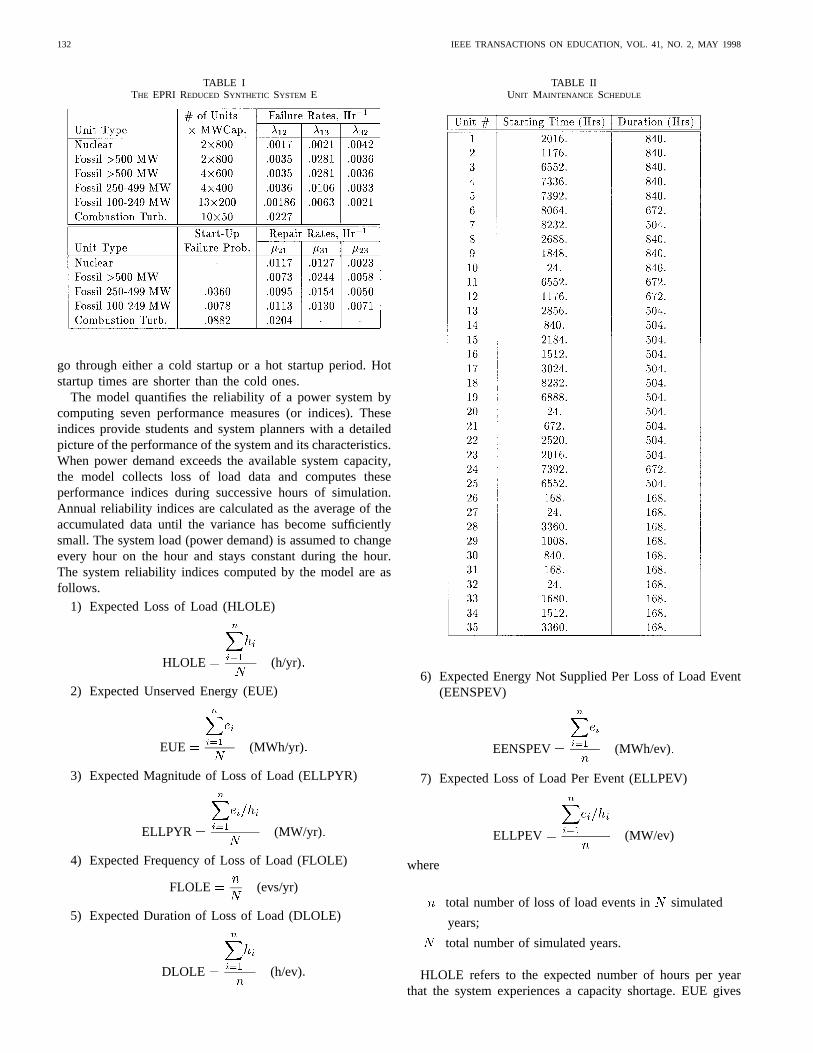
TABLE ITHE EPRI REDUCED SYNTHETIC SYSTEM E
go through either a cold startup or a hot startup period. Hotstartup times are shorter than the cold ones.
The model quantifies the reliability of a power system bycomputing seven performance measures (or indices). Theseindices provide students and system planners with a detailedpicture of the performance of the system and its characteristics.When power demand exceeds the available system capacity,the model collects loss of load data and computes theseperformance indices during successive hours of simulation.Annual reliability indices are calculated as the average of theaccumulated data until the variance has become sufficientlysmall. The system load (power demand) is assumed to changeevery hour on the hour and stays constant during the hour.The system reliability indices computed by the model are asfollows.
1) Expected Loss of Load (HLOLE)
HLOLE (h/yr)
2) Expected Unserved Energy (EUE)
EUE (MWh/yr)
3) Expected Magnitude of Loss of Load (ELLPYR)
ELLPYR (MW/yr)
4) Expected Frequency of Loss of Load (FLOLE)
FLOLE (evs/yr)
5) Expected Duration of Loss of Load (DLOLE)
DLOLE (h/ev)
TABLE IIUNIT MAINTENANCE SCHEDULE
6) Expected Energy Not Supplied Per Loss of Load Event(EENSPEV)
EENSPEV (MWh/ev)
7) Expected Loss of Load Per Event (ELLPEV)
ELLPEV (MW/ev)
where
total number of loss of load events in simulated
years;
total number of simulated years.
HLOLE refers to the expected number of hours per yearthat the system experiences a capacity shortage. EUE gives

SALEHFAR AND TRIHADI: MONTE CARLO SIMULATION FOR TEACHING SYSTEM RELIABILITY ANALYSIS 133
Fig. 3. System overview screen.
the expected amount of energy not supplied by the generatingsystem during a year, due to loss of load occurrences. ELLPYRrepresents the expected magnitude of loss of load conditionsper year. FLOLE denotes the expected number of times peryear that a loss of load situation occurs. DLOLE is equal tothe expected duration of each loss of load event. EENSPEVdefines the expected amount of energy not supplied by thegenerating system during each loss of load event. ELLPEVrepresents the expected magnitude of each loss of load event.
The above computed reliability indices are all averagevalues and provide an insight into the long-term averageperformance of the system. The program also produces theprobability distributions of each of these reliability indices.These distributions are important as they provide engineerswith a complete insight into the temporal and random behaviorof the system. Using these index distributions, planning engi-neers can quantify and compare the uncertain characteristicsof several system alternative plans.
The GENAS model is structured based on three files:the model-file, the experimental-file, and the layout-file. Themodel-file contains the logical flow of system events includingthe events affecting the unit operations and duty cycles. Unitcommitment priority is modeled in the model-file by searchingall the units in their idle states. The searching technique isaccording to either the economic order of the generators, ifinsufficient capacity is on line, or their reverse priority order,if excess capacity exists. The experimental-file contains the
experimental conditions of the system: the simulation length,initial conditions, unit transition rates, maintenance schedules,etc. The student will only need to manipulate the data entries ofthis experimental-file in order to run the program and observethe effects of various decision alternatives on the systemperformance. The layout-file contains the graphical symbolsthat will be viewed during each simulation run. The layout-file is created using a menu-driven program; no programmingis needed. The layout-file contains two types of graphicalobjects: static objects and dynamic objects. The static objectsform the layout background environment and represent theportion of the layout that does not change during a simulationrun. The dynamic objects represent the objects within thesystem that change size, location, shape, and color during eachexecution of the model. The graphical symbols in the layout-file are tied to the expressions specified in the model- andexperimental-file. Therefore, during a simulation run each timethe expressions in the model- and experimental-file change, thecorresponding graphical symbols in the layout-file will alsochange colors or shapes accordingly.
III. EDUCATIONAL APPLICATION
To evaluate the performance of a power-generating system,students should describe their system of interest by manipu-lating or modifying the data entries of the experimental-file.For teaching purposes, several alternative experimental-files
134 IEEE TRANSACTIONS ON EDUCATION, VOL. 41, NO. 2, MAY 1998
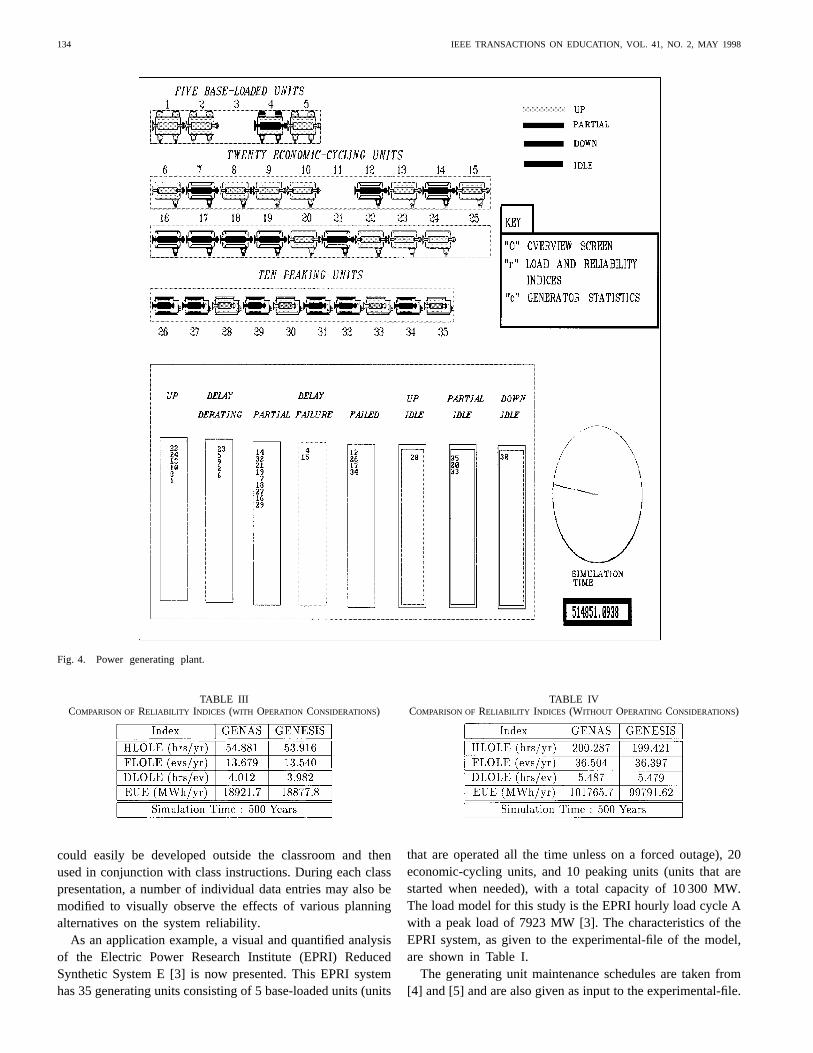
Fig. 4. Power generating plant.
TABLE IIICOMPARISON OFRELIABILITY INDICES (WITH OPERATION CONSIDERATIONS)
could easily be developed outside the classroom and thenused in conjunction with class instructions. During each classpresentation, a number of individual data entries may also bemodified to visually observe the effects of various planningalternatives on the system reliability.
As an application example, a visual and quantified analysisof the Electric Power Research Institute (EPRI) ReducedSynthetic System E [3] is now presented. This EPRI systemhas 35 generating units consisting of 5 base-loaded units (units
TABLE IVCOMPARISON OFRELIABILITY INDICES (WITHOUT OPERATING CONSIDERATIONS)
that are operated all the time unless on a forced outage), 20economic-cycling units, and 10 peaking units (units that arestarted when needed), with a total capacity of 10 300 MW.The load model for this study is the EPRI hourly load cycle Awith a peak load of 7923 MW [3]. The characteristics of theEPRI system, as given to the experimental-file of the model,are shown in Table I.
The generating unit maintenance schedules are taken from[4] and [5] and are also given as input to the experimental-file.
SALEHFAR AND TRIHADI: MONTE CARLO SIMULATION FOR TEACHING SYSTEM RELIABILITY ANALYSIS 135
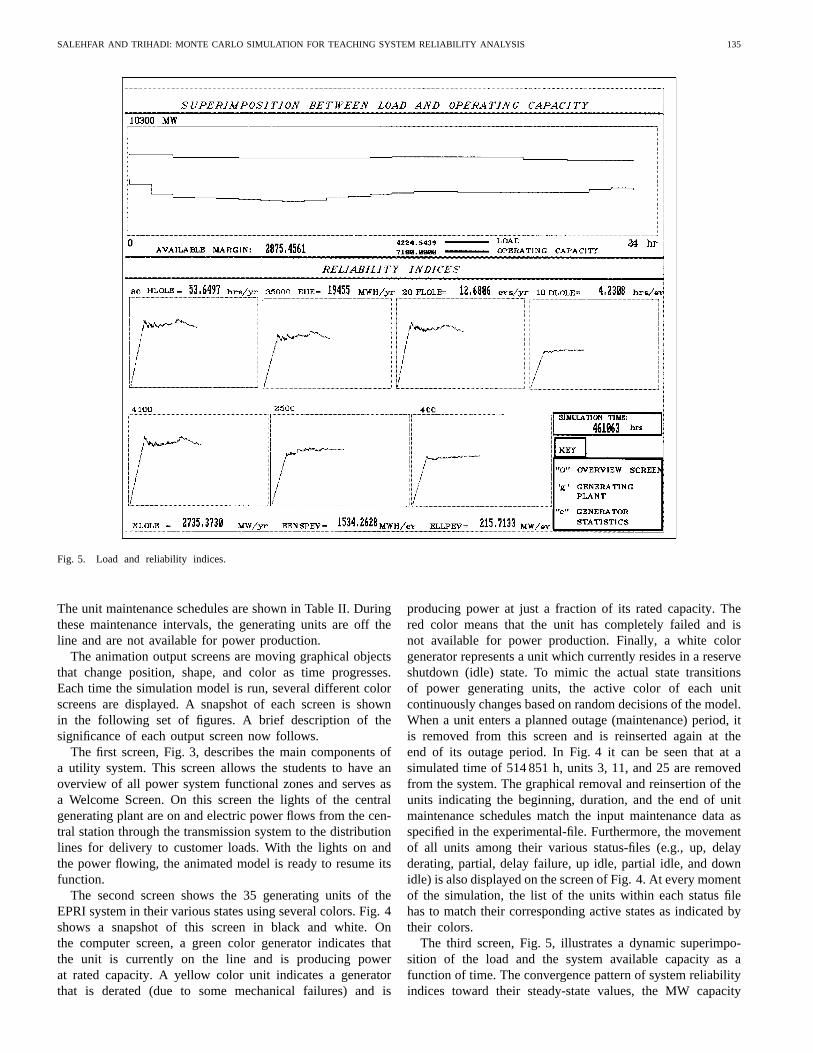
Fig. 5. Load and reliability indices.
The unit maintenance schedules are shown in Table II. Duringthese maintenance intervals, the generating units are off theline and are not available for power production.
The animation output screens are moving graphical objectsthat change position, shape, and color as time progresses.Each time the simulation model is run, several different colorscreens are displayed. A snapshot of each screen is shownin the following set of figures. A brief description of thesignificance of each output screen now follows.
The first screen, Fig. 3, describes the main components ofa utility system. This screen allows the students to have anoverview of all power system functional zones and serves asa Welcome Screen. On this screen the lights of the centralgenerating plant are on and electric power flows from the cen-tral station through the transmission system to the distributionlines for delivery to customer loads. With the lights on andthe power flowing, the animated model is ready to resume itsfunction.
The second screen shows the 35 generating units of theEPRI system in their various states using several colors. Fig. 4shows a snapshot of this screen in black and white. Onthe computer screen, a green color generator indicates thatthe unit is currently on the line and is producing powerat rated capacity. A yellow color unit indicates a generatorthat is derated (due to some mechanical failures) and is
producing power at just a fraction of its rated capacity. Thered color means that the unit has completely failed and isnot available for power production. Finally, a white colorgenerator represents a unit which currently resides in a reserveshutdown (idle) state. To mimic the actual state transitionsof power generating units, the active color of each unitcontinuously changes based on random decisions of the model.When a unit enters a planned outage (maintenance) period, itis removed from this screen and is reinserted again at theend of its outage period. In Fig. 4 it can be seen that at asimulated time of 514 851 h, units 3, 11, and 25 are removedfrom the system. The graphical removal and reinsertion of theunits indicating the beginning, duration, and the end of unitmaintenance schedules match the input maintenance data asspecified in the experimental-file. Furthermore, the movementof all units among their various status-files (e.g., up, delayderating, partial, delay failure, up idle, partial idle, and downidle) is also displayed on the screen of Fig. 4. At every momentof the simulation, the list of the units within each status filehas to match their corresponding active states as indicated bytheir colors.
The third screen, Fig. 5, illustrates a dynamic superimpo-sition of the load and the system available capacity as afunction of time. The convergence pattern of system reliabilityindices toward their steady-state values, the MW capacity
136 IEEE TRANSACTIONS ON EDUCATION, VOL. 41, NO. 2, MAY 1998
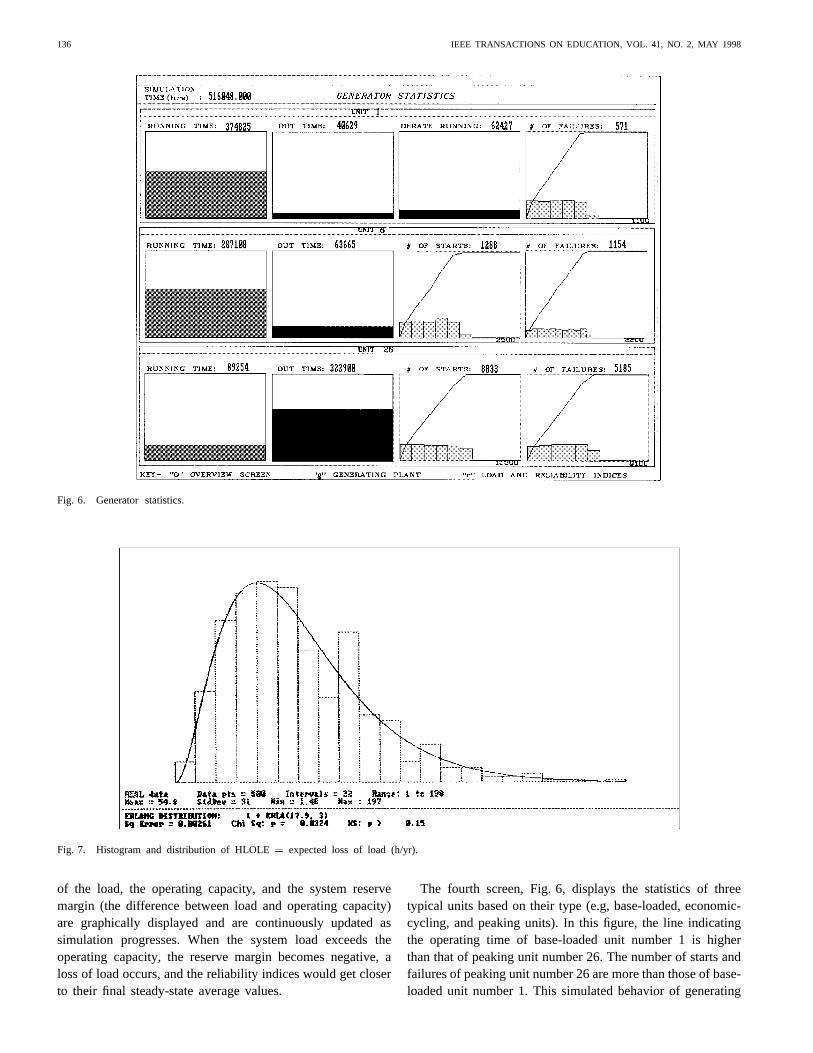
Fig. 6. Generator statistics.
Fig. 7. Histogram and distribution of HLOLE= expected loss of load (h/yr).
of the load, the operating capacity, and the system reservemargin (the difference between load and operating capacity)are graphically displayed and are continuously updated assimulation progresses. When the system load exceeds theoperating capacity, the reserve margin becomes negative, aloss of load occurs, and the reliability indices would get closerto their final steady-state average values.
The fourth screen, Fig. 6, displays the statistics of threetypical units based on their type (e.g, base-loaded, economic-cycling, and peaking units). In this figure, the line indicatingthe operating time of base-loaded unit number 1 is higherthan that of peaking unit number 26. The number of starts andfailures of peaking unit number 26 are more than those of base-loaded unit number 1. This simulated behavior of generating
SALEHFAR AND TRIHADI: MONTE CARLO SIMULATION FOR TEACHING SYSTEM RELIABILITY ANALYSIS 137
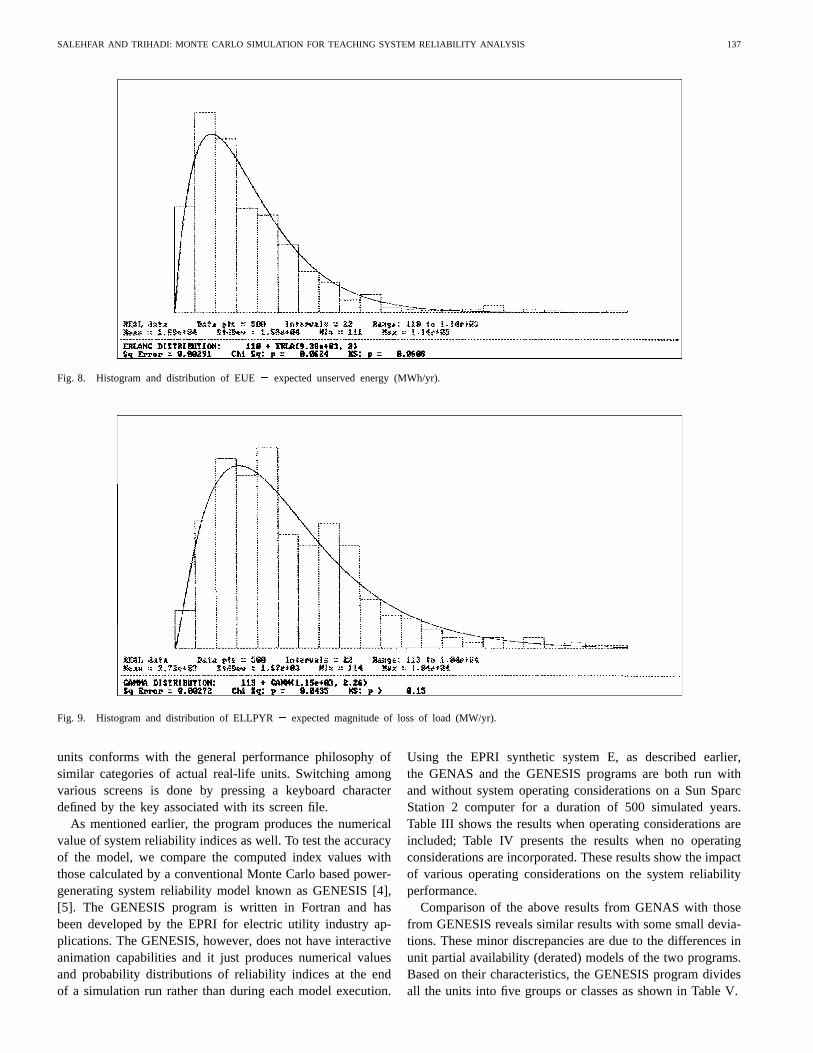
Fig. 8. Histogram and distribution of EUE= expected unserved energy (MWh/yr).
Fig. 9. Histogram and distribution of ELLPYR= expected magnitude of loss of load (MW/yr).
units conforms with the general performance philosophy ofsimilar categories of actual real-life units. Switching amongvarious screens is done by pressing a keyboard characterdefined by the key associated with its screen file.
As mentioned earlier, the program produces the numericalvalue of system reliability indices as well. To test the accuracyof the model, we compare the computed index values withthose calculated by a conventional Monte Carlo based power-generating system reliability model known as GENESIS [4],[5]. The GENESIS program is written in Fortran and hasbeen developed by the EPRI for electric utility industry ap-plications. The GENESIS, however, does not have interactiveanimation capabilities and it just produces numerical valuesand probability distributions of reliability indices at the endof a simulation run rather than during each model execution.
Using the EPRI synthetic system E, as described earlier,the GENAS and the GENESIS programs are both run withand without system operating considerations on a Sun SparcStation 2 computer for a duration of 500 simulated years.Table III shows the results when operating considerations areincluded; Table IV presents the results when no operatingconsiderations are incorporated. These results show the impactof various operating considerations on the system reliabilityperformance.
Comparison of the above results from GENAS with thosefrom GENESIS reveals similar results with some small devia-tions. These minor discrepancies are due to the differences inunit partial availability (derated) models of the two programs.Based on their characteristics, the GENESIS program dividesall the units into five groups or classes as shown in Table V.
138 IEEE TRANSACTIONS ON EDUCATION, VOL. 41, NO. 2, MAY 1998
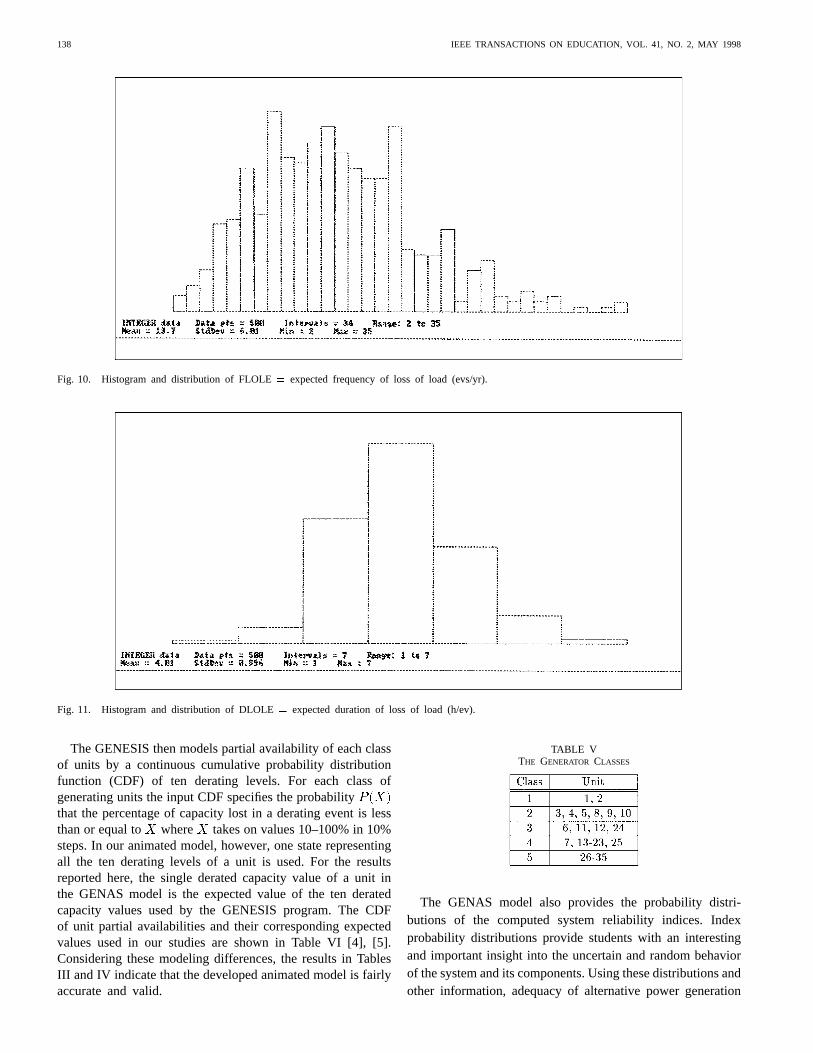
Fig. 10. Histogram and distribution of FLOLE= expected frequency of loss of load (evs/yr).
Fig. 11. Histogram and distribution of DLOLE= expected duration of loss of load (h/ev).
The GENESIS then models partial availability of each classof units by a continuous cumulative probability distributionfunction (CDF) of ten derating levels. For each class ofgenerating units the input CDF specifies the probabilitythat the percentage of capacity lost in a derating event is lessthan or equal to where takes on values 10–100% in 10%steps. In our animated model, however, one state representingall the ten derating levels of a unit is used. For the resultsreported here, the single derated capacity value of a unit inthe GENAS model is the expected value of the ten deratedcapacity values used by the GENESIS program. The CDFof unit partial availabilities and their corresponding expectedvalues used in our studies are shown in Table VI [4], [5].Considering these modeling differences, the results in TablesIII and IV indicate that the developed animated model is fairlyaccurate and valid.
TABLE VTHE GENERATOR CLASSES
The GENAS model also provides the probability distri-butions of the computed system reliability indices. Indexprobability distributions provide students with an interestingand important insight into the uncertain and random behaviorof the system and its components. Using these distributions andother information, adequacy of alternative power generation
SALEHFAR AND TRIHADI: MONTE CARLO SIMULATION FOR TEACHING SYSTEM RELIABILITY ANALYSIS 139
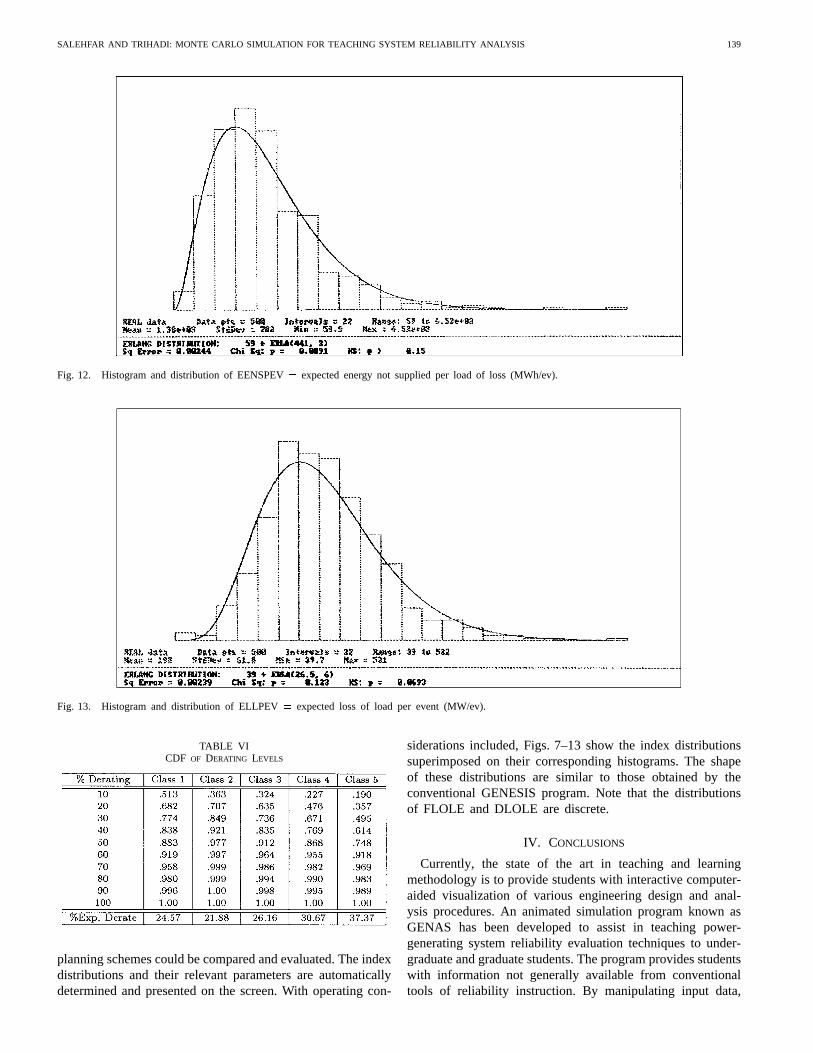
Fig. 12. Histogram and distribution of EENSPEV= expected energy not supplied per load of loss (MWh/ev).
Fig. 13. Histogram and distribution of ELLPEV= expected loss of load per event (MW/ev).
TABLE VICDF OF DERATING LEVELS
planning schemes could be compared and evaluated. The indexdistributions and their relevant parameters are automaticallydetermined and presented on the screen. With operating con-
siderations included, Figs. 7–13 show the index distributionssuperimposed on their corresponding histograms. The shapeof these distributions are similar to those obtained by theconventional GENESIS program. Note that the distributionsof FLOLE and DLOLE are discrete.
IV. CONCLUSIONS
Currently, the state of the art in teaching and learningmethodology is to provide students with interactive computer-aided visualization of various engineering design and anal-ysis procedures. An animated simulation program known asGENAS has been developed to assist in teaching power-generating system reliability evaluation techniques to under-graduate and graduate students. The program provides studentswith information not generally available from conventionaltools of reliability instruction. By manipulating input data,

140 IEEE TRANSACTIONS ON EDUCATION, VOL. 41, NO. 2, MAY 1998
the students can graphically observe the system response tovarious power generation planning alternatives. The programattracts students as it greatly improves their ability to visualizeand understand the uncertain and random behavior of theactual real life systems.
REFERENCES
[1] R. Billinton and L. Gan, “Use of Monte Carlo simulation in teachinggenerating capacity adequacy assessment,”IEEE Trans. Power Syst.,vol. 6, pp. 1571–1577, Nov. 1991.
[2] C. D. Pegden, R. E. Shannon, and R. P. Sadowski,Introduction toSimulation Using Siman. New YorK: McGraw-Hill, 1990.
[3] Electric Power Research Institute, “Synthetic electric utility systems forevaluating advanced technologies,” EPRI EM-285, Project TPS 75-615,Palo Alto, CA., Feb. 1977.
[4] , “Modeling of unit operating considerations in generating capac-ity reliability evaluation. Volume 1: Mathematical models, computingmethods and results,” Rep. EL-2519, Palo Alto, CA, July 1982.
[5] , “Modeling of unit operating considerations in generating capac-ity reliability evaluation. Volume 2: Computer program documentation,”Rep. EL-2519, Palo Alto, CA, July 1982.
H. Salehfar (S’78–M’90) received the B.S. degree in electrical engineeringfrom the University of Texas at Austin, and the M.S. and Ph.D. degrees inelectrical engineering from Texas A&M University, College Station.
He was a Research Assistant with the Electric Power Institute at TexasA&M University during 1985–1990. He was an Assistant Professor of Elec-trical Engineering at Clarkson University, Potsdam, NY, during 1990–1995.Since 1995 he has been with the Department of Electrical Engineering,University of North Dakota, Grand Forks. He was a consultant to the NewYork Power Pool during the Summer of 1993. His research interests currentlyinclude power systems reliability, power systems production costing and loadmanagement, power electronics, neural network and fuzzy logic applicationsto power systems, and dynamic systems simulation.
Dr. Salehfar is a member of the IEEE Power Engineering, Power Elec-tronics, and Reliability Societies, and the American Society for EngineeringEducation.
S. Trihadi (S’93) was born in Indonesia on June 14, 1960. He received theB.S. degree from University of Indonesia in 1984, the M.S. degree from NewJersey Institute of Technology, Hoboken, NJ, in 1990, and the Ph.D. degreefrom Clarkson University, Potsdam, NY, in 1994, all in electrical engineering.
He is currently with the Agency for the Assessment and Application ofTechnology, Jakarta, Indonesia.