ANDHRA PRADESH AT A GLANCE - ecostat.telangana.gov.in
272
HAND BOOK OF STATISTICS ANDHRA PRADESH 2008 ISSUED BY DIRECTORATE OF ECONOMICS AND STATISTICS GOVERNMENT OF ANDHRA PRADESH HYDERABAD-500004
-
Upload
khangminh22 -
Category
Documents
-
view
2 -
download
0
Transcript of ANDHRA PRADESH AT A GLANCE - ecostat.telangana.gov.in

HAND BOOK OF STATISTICS ANDHRA PRADESH
2008
ISSUED BY DIRECTORATE OF ECONOMICS AND STATISTICS
GOVERNMENT OF ANDHRA PRADESH HYDERABAD-500004

P R E F A C E
In the era of information technology, dissemination of
Statistical data has gained its pace. Being a nodal agency of State
Government, Directorate of Economics and Statistics shoulders
the responsibility of disseminating the data collected through
different departments in the form of publication. This publication
“Hand book of Statistics – Andhra Pradesh 2008” is 49th in its
series of publication being published annually.
This publication covers factual information on all the
sectors of economy which will be useful as a handy source of
reference to the data users. This Directorate is grateful to
various Central and State Government Departments for their
co-operation in providing the Statistical data on time.
HYDERABAD Dr.SAROJA RAMA RAO
Date: 08.04.2008 DIRECTOR

i
C O N T E N T S
Table No Description Pages
Andhra Pradesh at a Glance 1. Selected Indicators of Andhra Pradesh at a Glance 2. State Economy:
2.1 Estimates of Gross, State Domestic Product and Per Capita Income at Current and Constant (1999-2000) Prices, 1999-2000 to 2007-08 (A)
3
2.2 Gross State Domestic Product of A.P. by Industry of Origin at Constant (1999-2000) Prices, 1999-2000 to 2007-08 (A)
4-7
3. Area and Population: 3.1 Distribution of Population, Sex Ratio, Growth Rate and Density of
Population, Dist. wise, 2001Census 8&9
3.2 Census Statistics - Summary, 1991 and 2001 10 3.3 Area and Rural Population-District wise, 2001Census 11
3.4(A) Principal Towns and Cities with Population of 50,000 and above, 2001 Census
12-22
3.4(B) District wise Slum Population in Urban areas, 2001Census 23 3.4(C) District wise and Religion wise Population, 2001 Census 24&25 3.4(D) District wise Disabled Population by type of Disability, 2001 Census 26&27
3.5 Distribution of Population by Age Groups-Andhra Pradesh, 2001 Census
28
3.6 Scheduled Castes and Scheduled Tribes Population- District wise, 2001 Census
29
3.7 Scheduled Castes and Scheduled Tribes Rural and Urban Population, 2001 Census
30
3.8 Working Population by Occupational Divisions, 2001 Census 31 3.9 Literate Population, District wise, 2001 Census 32 3.10 Scheduled Caste Literate Population, District wise, 2001 Census 33 3.11 Scheduled Tribe Literate Population, District wise, 2001 Census 34 3.12 District wise Number of Households, 1991 & 2001 Census 35&36 3.13 Projected Population characterstics as on 1st March 2001-2026 37 3.14 Demographic Indicators 2001-2025 38
3.15(A,B&C)
Distribution of House holds by the condition of Census Houses occupied by the residents and S.C./S.T Persons 2001 Census
39&40
4. Climate: 4.1 Temperature at Selected Centres, 2006 and 2007 41 4.2 Rainfall-Region wise and Season wise ,2005-06 to 2007-08 42

ii
Table No Description Pages
5. Agriculture: 5.1 Land Utilization, 2005-06 and 2006-07 43 5.2 Area and Out-turn of Principal Crops, 2005-06 to 2007-08 44 5.3 Average Yield of Principal Crops, 2004-05 to 2006-07 45 5.4 Index Numbers of Agricultural Production, 1998-99 to 2006-07 46-49 5.5 Agricultural Machinery and Implements, 1999 and 2003 50 5.6 Distribution of Chemical Fertilizers, 2005-06 and 2006-07 51 6. Irrigation:
6.1 Net Area Irrigated by Sources, 2005-06 and 2006-07 52 6.2 Percentage of Area Irrigated to Area Sown, Crop wise, 2004-05
to 2006-07 53
7. Livestock and Fisheries: 7.1 Livestock and Poultry, 2003 and 2007 Census 54 7.2 Marine Fish and Prawns (Species wise) production in Andhra Pradesh
2006-07 55&56
7.3 Inland Fish production in Andhra Pradesh, 2006-07 57 7.4 Veterinary Services in Andhra Pradesh, 2005-06 and 2006-07 58 8. Forests:
8.1 Amount Realised on sale of Forest Produce, 2002-03 to 2006-07 59 9. Industries:
9.1 Factories working under the Factories Act and Persons Employed, 2000 to 2006
60
9.2 Factories working under the Factories Act, Industry wise and Persons Employed in Andhra Pradesh, 2005
61&62
9.2(A) Factories working under the Factories Act, Industry wise and Persons Employed in Andhra Pradesh, 2006
63&64
9.3 Working of Factories Registered under Sections 2m (i) and 2m(ii), 2003-04 and 2004-05
65
9.4 Index Numbers of Industrial Production in Andhra Pradesh, 2005-06 to 2007-08
66
10. Mining:
10.1 Production of Selected Principal Minerals in A.P., 2005-06 and 2006-07
67
11. Fuel and Power:
11.1 Installed Capacity, Generation and Consumption of Electricity, 2005-06 and 2006-07
68
11.2 Number of Consumers, Category wise, 2005-06 and 2006-07 69 11.3 Electricity Consumption, Category wise, 2005-06 and 2006-07 70 11.4 Per Capita Consumption of Electricity, 2005-06 and 2006-07 71 11.5 Number of Electric Pumpsets Energised, 2005-06 and 2006-07 72

iii
Table No Description Pages
12. Labour and Employment:
12.1 Distribution of State Public Sector Employees according to Sex and Sectors as on 31-12-2001 and 31-03-2006
73
12.2 Distribution of Employees in State Public Sector according to Sex, District-wise as on 31-12-2001 and 31-03-2006
74
12.3 Distribution of State Public Sector Employees by Sectors and Social Groups as on 31-12-2001 and 31-03-2006
75&76
12.4 Employment in Public and Private Sector Establishments – Industry wise 2005-06& 2006-07
77
12.5(A) Registrations and Placements by Employment Exchanges, 2005 to 2007
78
12.5(B) District wise Registrations and Placements through Employment Exchanges as on 31-12-2006
79&80
12.5(C) Registrations and Placements through Employment Exchanges as on 31-12-2007
81&82
12.6 Employment in Shops and Commercial Establishments, (Covered by Shops and Establishments Act, 1988), 2006 and 2007
83
12.7 Industrial Disputes and Man-days lost in Major Industries, 2003 to 2007 84 12.8 No.of Enterprises and Employment,5th Economic Census 2005 85
12.9 No.of Enterprises and Employment during 4th & 5th Economic Census , 1998 and 2005
86
12.10 No.of Non-Agricultural Enterprises by major activity group, 5th Economic Census-2005
87
12.11 Employment in Non-Agricultural Enterprises by major activity group, 5th Economic Census-2005
88
13. Transport and Communications: 13.1 Number of Registered Motor Vehicles , 2005-06 and 2006-07 89
13.2 Roads Maintained by R & B and Panchyat Raj Departments, 2005-06 and 2006-07
90
13.3 A.P.S.R.T.C. (Operational Statistics), 2006-07 & 2007-08 91 13.4 No. of Railway Stations and Kilometreage in Andhra Pradesh,
2005-06 and 2006-07 92
13.5 Post and Telegraphs, 2005-06 and 2006-07 93 14. Education: 14.1 Recognised Educational Institutions, 2005-06 to 2007-08 94 14.2 Enrolment in Educational Institutions, 2005-06 to 2007-08 95 14.3 Teachers Employed in Educational Institutions, 2005-06 to 2007-08 96-98 14.4 Stage wise Enrolment in Educational Institutions, 2005-06 to 2007-08 99 14.5 Public Examination Results, 2005 to 2007 100 14.6 Enrolment of Scheduled Caste Students in Schools 2005-06 to
2007-08 101& 102

iv
Table No Description Pages
14.7 Enrolment of Scheduled Tribe Students in Schools, 2005-06 to 2007-08
103& 104
14.8 Stage wise Enrolment of Scheduled Caste Students in Educational Institutions, 2005-06 to 2007-08
105
14.9 Stage wise Enrolment of Scheduled Tribe Students in Educational Institutions, 2005-06 to 2007-08
106
14.10 Government Hostels for Scheduled Caste Students – District wise, 2006-07 & 2007-08
107
14.11(A) Government Hostels and Ashram Schools for Scheduled Tribes Students - District wise, 2006-07
108
14.11(B) Government Hostels and Ashram Schools, for Scheduled Tribes Students - District wise, 2007-08
109
14.12 Government B.C.Welfare Hostels,District wise 2007-08 110 14.13 Medical Colleges in Andhra Pradesh 2007 111&112 14.14 Engineering Colleges in Andhra Pradesh 2007-08 113 14.15 Pharmacy Colleges in Andhra Pradesh 2007-08 114 14.16 Poytechnic Colleges in Andhra Pradesh 2007-08 115
15. Medical and Public Health: 15.1 Medical Facilities, 2006-07 116 15.2 Deaths in Govt. Hospitals according to Causes, in A.P., 2004 to 2006 117 15.3 District wise Family Planning Clinics and Achievements, 2005-06
and 2006-07 118&119
16. Public Finance: 16.1 Overall Budget, 2006-07 to 2008-09 120 16.2 Principal Heads of Revenue Receipts 2006-07 to 2008-09 121 16.3 Principal Heads of Expenditure (Revenue Account), 2006-07 to
2008-09 122&123
16.4 Principal Heads of Capital Budget, 2006-07 to 2008-09 124&125 16.5 Income Tax - Number of assesses and Tax-paid, 2005-06 and
2006-07 126
16.6 Small Savings, 2005-06 to 2007-08 127&128 17. Banks and Joint Stock Companies:
17.1 District wise Distribution of Commercial Banks and Average Population per Bank, Deposits, Credits & Credit Deposit Ratio of all Scheduled Commercial Banks, September 2007.
129&130
17.2 Loans Sanctioned by Andhra Pradesh State Financial Corporation - Industry wise, 2005-06 and 2006-07
131
17.3 Working of Joint Stock Companies Limited by Shares in A.P., 2002-03 to 2006-07
132
18. Co-operation: 18. Working of A.P. State Co-operative Bank, 2002-03 to 2006-07. 133

v
Table No Description Pages
19. Local Bodies: 19.1 Gram Panchayats in Andhra Pradesh, 2004-05 and 2005-06 134
19.2(A) Receipts and Expenditure of Zilla Parishads, 2005-06 135 19.2(B) Receipts and Expenditure of Mandal Parishads, 2005-06 136 19.2(C) Receipts and Expenditure of Gram Panchayats, 2005-06 137
19.3 Municipalities in Andhra Pradesh, 2005-06 and 2006-07 138 20. Police and Crime:
20.1 Strength of Civil Police, 2006 and 2007 139 20.2 Cognizable Crimes, 2005 and 2006 140&141 20.3 Non-Cognizable Crimes, 2005 and 2006 142 20.4 Property Stolen and Recovered, 2005 and 2006 143 21. Planning and Community Development:
21.1 Plan Expenditure, 1st plan to 10th Plan upto 2006-07 144 21.2 Plan Expenditure by Heads of Development, 2005-06 and 2006-07 145&146 22. Prices: 22.1 Annual State Average Wholesale Prices of Foodgrains, 2002-03 to 2007-08 147 22.2 Consumer Price Index Numbers for Agricultural Labourers in
A.P, 2001-02 to 2007-08.. 148
22.3(A) Consumer Price Index Numbers for Industrial Working Class at Selected Centres Andhra Pradesh, (Central Series, Base 1982=100) 2003-04 to 2005-06
149
22.3(B) Consumer Price Index Numbers for Industrial Working Class at Selected Centres in Andhra Pradesh, (Central Series, New Base 2001 = 100) 2006 -07 and 2007-08
150
22.4(A) Consumer Price Index Numbers for Industrial Working Class at Selected Centres in Andhra Pradesh, (State Series, Base 1982=100) 2003-04 to 2005-06 (up to Dec’2005)
151
22.4(B) Consumer Price Index Numbers for Industrial Working Class at Selected Centres in Andhra Pradesh, (State Series, New Base 2001 = 100) 2006-07 & 2007-08
152
22.5 Consumer Price Index Numbers for Urban Non-Manual Employees, 2002-03 to 2007-08
153
23. Miscellaneous: 23.1 News Papers, Periodicals and Books Registered, 2003-04 to 2006-07 154 23.2 Number of Agricultural Market Committees & Regulated
Markets in Andhra Pradesh, 2003-04 to 2006-07 155
23.3 Annual Turnover of Principal Agricultural Commodities at Regulated Markets in Andhra Pradesh, 2005-06 and 2006-07
156&157
23.4 Commodity wise Exports and Imports handled by the Intermediate and Minor Ports in A.P., 2005-06 and 2006-07
158&159
23.5 Number of House sites distributed to Scheduled Castes, Scheduled Tribes, Backward Classes and Economically Backward Classes - District wise, 2006-07.
160

vi
Table No Description Pages
24. All India: 24.1 Area and Population – State wise, Census 2001 161-166
24.2 Literacy Rates - State wise Census 2001 167-172
24.3 Percentage Distribution of Population by Age-groups 2001 Census 173
24.4(A) Select Indicators of Human Development for Bigger States - Birth and Death Rates, 2006
174
24.4(B) Select Indicators of Human Development for Bigger States-Death Rate, Infant Mortality Rates and Life expectancy at Birth, 2006
175
24.4( C) Projected levels of expectation of Life at Birth (with out Aids) 2006-2025 (Male)
176
24.4(D) Projected levels of expectation of Life at Birth (with out Aids) 2006-2025 (Female)
177
24.5 Land Utilisation, 2001-02 to 2004-05 178
24.6(A)(i) Area, Production and Yield of Foodgrains - State wise, 2003-04 179
24.6(A)(ii) Area, Production and Yield of Pulses - State wise, 2003-04 180
24.6(A)(iii) Area, Production and Yield of Cereals - State wise, 2003-04 181
24.6(B)(i) Area, Production and Yield of Foodgrains - State wise, 2004-05 182
24.6(B)(ii) Area, Production and Yield of Pulses - State wise, 2004-05 183
24.6(B)(iii) Area, production and Yield of Cereals - State wise 2004-05 184
24.6(C)(i) Area, Production and Yield of Foodgrains - State wise, 2005-06 185
24.6(C)(ii) Area, Production and Yield of Pulses - State wise, 2005-06 186
24.6(C)(iii) Area, production and Yield of Coarse Cereals - State wise 2005-06 187
24.7 Index Numbers of Wholesale Prices by Groups and Sub-Groups 2004-05 to 2007-08
188
24.8 Consumer Price Index Numbers for Industrial Workers, 2004-05 to 2007-08
189
24.9 Number of Villages and Towns Electrified and Irrigation Pumpsets Energised as on 31st March, 2005
190&191
24.10 Category wise Per Capita Consumption of Electricity, 2004-05 192
24.11 Net National Product at Factor Cost at Current and Constant Prices (New Series at 1999-2000 Prices),1999-2000 to 2007-08
193
24.12(A) Tax Revenue and Non-Tax Revenue of Individual States, 2006-07 Revenue Account (Revised Estimates)
194
24.12(B) Tax Revenue and Non-Tax Revenue of Individual States, 2007-08 Revenue Account (Revised Estimates)
195

vii
Table No Description Pages
24.13(A) Developmental and Non-Developmental Expenditure of
Individual States, 2006-07 Revenue Account (Revised Estimates)
196
24.13(B) Developmental and Non-developmental Expenditure of
Individual States, 2007-08 Revenue Account (Budget Estimates)
197
24.14(A) State wise Percentage of Budgeted Expenditure
on Selected Sectors to Total Budgeted Expenditure 2006-07
(Revised Estimates)
198-200
24.14(B) State wise Percentage of Budgeted Expenditure on Selected
Sectors to Total Budgeted Expenditure 2007-08 (Budget
Estimates)
201-203
24.14(C) State wise Per Capita Budgeted Expenditure on Selected Sectors
2006-07 (Revised Estimates)
204-206
24.14(D) State wise Per Capita Budgeted Expenditure on Selected Sectors
2007-08 (Budget Estimates)
207-209
24.15 Factories Registered under sections 2m(i) and 2m(ii) – State wise,
2004-05
210-211
24.16 Medical Facilities-Number of Beds in Government Hospitals 212&213
24.17 Percentage of Population below Poverty Line 1999-2000 and
2004-05
214&215
24.18(A) State wise Railway Route Kilometres per lakh Population & Route
Kms. per 1000 Sq.Kms as on 31.3.2006
216&217
24.18(B) State wise Railway Route Kilometres per lakh Population & Route
Kms. per 1000 Sq.Kms as on 31.3.2007
218&219
24.19 Number of Offices, Deposits, Credits and Credit Deposit Ratio of
All Scheduled Commercial Banks - State wise, September, 2007.
220
24.20(A) State wise Number of Employment Exchanges, Registrations and
Placements - 2005
221-224
24.20(B) State wise and Category wise Number of Employment Exchanges,
Registrations and Placements - 2006
225-228
24.21(A) Per thousand distribution of Persons by Usual Activity status by
States (Rural), 2004-05.
229-230
24.21(B) Per thousand distribution of Persons by Usual Activity status by
States (Urban), 2004-05
231-232
viii
Table No Description Pages
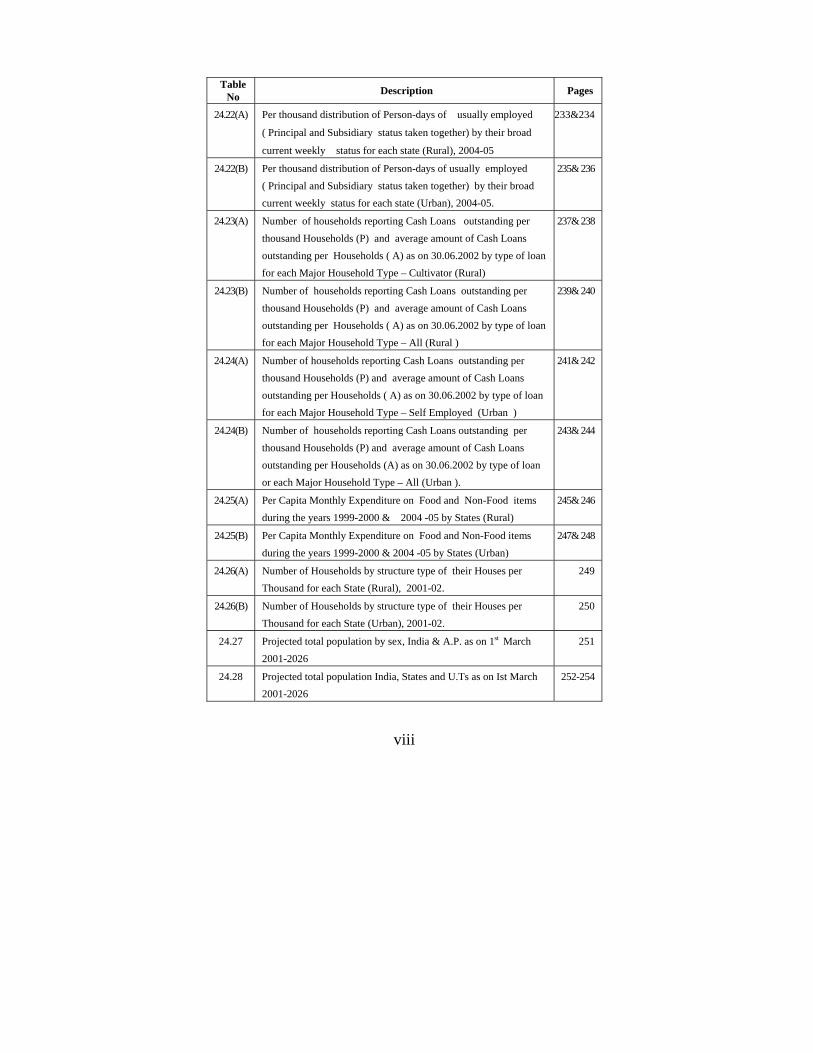
24.22(A) Per thousand distribution of Person-days of usually employed
( Principal and Subsidiary status taken together) by their broad
current weekly status for each state (Rural), 2004-05
233&234
24.22(B) Per thousand distribution of Person-days of usually employed ( Principal and Subsidiary status taken together) by their broad current weekly status for each state (Urban), 2004-05.
235& 236
24.23(A) Number of households reporting Cash Loans outstanding per thousand Households (P) and average amount of Cash Loans outstanding per Households ( A) as on 30.06.2002 by type of loan for each Major Household Type – Cultivator (Rural)
237& 238
24.23(B) Number of households reporting Cash Loans outstanding per thousand Households (P) and average amount of Cash Loans outstanding per Households ( A) as on 30.06.2002 by type of loan for each Major Household Type – All (Rural )
239& 240
24.24(A) Number of households reporting Cash Loans outstanding per thousand Households (P) and average amount of Cash Loans outstanding per Households ( A) as on 30.06.2002 by type of loan for each Major Household Type – Self Employed (Urban )
241& 242
24.24(B) Number of households reporting Cash Loans outstanding per thousand Households (P) and average amount of Cash Loans outstanding per Households (A) as on 30.06.2002 by type of loan or each Major Household Type – All (Urban ).
243& 244
24.25(A) Per Capita Monthly Expenditure on Food and Non-Food items during the years 1999-2000 & 2004 -05 by States (Rural)
245& 246
24.25(B) Per Capita Monthly Expenditure on Food and Non-Food items during the years 1999-2000 & 2004 -05 by States (Urban)
247& 248
24.26(A) Number of Households by structure type of their Houses per Thousand for each State (Rural), 2001-02.
249
24.26(B) Number of Households by structure type of their Houses per Thousand for each State (Urban), 2001-02.
250
24.27 Projected total population by sex, India & A.P. as on 1st March 2001-2026
251
24.28 Projected total population India, States and U.Ts as on Ist March 2001-2026
252-254

1
ANDHRA PRADESH AT A GLANCE
Particulars Unit
Area (Census 2001 ) '000 Sq.Kms. 275.0
Districts (No.) 23
Revenue Divisions " 81
ndals " 1,128
Gram Panchayats " 21,895
Inhabited Villages (Census 2001 ) " 26,613
Towns " " 210@
Population " (Lakhs) 762.10
Males " " 385.27
Females " " 376.83
Rural Population " " 554.01
Urban Population " " 208.09
Literacy " (Percentage) 60.47
Scheduled Caste Population " (Lakhs) 123.39
Scheduled Tribe Population " " 50.24
Members of Parliament:
a. Lok Sabha (No.) 42
b. Rajya Sabha " 18
Members of Legislative Assembly *
" 295
Members of Legislative Counsel
87
State Economy 1999-00 2006-2007(Q) 2007-2008(A)
GSDP at Constant (1999-00) Prices (Rs. Crores)
1,29,403 2,07,904 2,29,461
GSDP at Current Prices (Rs. Crores)
1,29,403 2,69,173 3,11,752
Per Capita Income at Current Prices (Rupees)
15,507 29,582 33,970
* Including one Nominated Anglo Indian Member Q: Quick Estimates A : Advance Estimates @ Some of the census towns of 1991 were declassified Source: i) Census of India, 2001

2
TABLE 1
Sclected Indicators of Andhra Pradesh at a glance
Sl.No Item Unit 2004-05 2005-06 2006-07 (1) (2) (3) (4) (5) (6) 1. Population
(Mid year) (Lakhs) 795.02 803.69 820.49
2. Gross Irrigated Area (Lakh Hectares) 49.87 59.96 60.69
3. Index Numbers of Agriculture Production
(Base:Triennium Ending 1993-94 =100)
105.6 122.66 126.47
4. Production of Foodgrains (Lakh Tonnes) 133.94 169.50 162.29
5. Production of Oil Seeds (Lakh Tonnes) 22.06 20.41 17.22
6. Production of Cotton
('000 Bales of 170 Kgs. lint)
21.90 21.08 21.82
7. Production of Sugarcane (Gur) (Lakh Tonnes) 15.73 18.65 23.68
8. Electricity - Installed Capacity
(Mega Watts) 11,105.71 11,151.00 11,996.00
9. Electricity Generated (Million units) 28,562.15 28,574.00 31,280.00
10. Roads Maintained by P.W.D.(R&B)
('000 K.ms.) 62 64 64
11. Motor Vehicles Registered (on Road)
(000) 5,791 6,137 6,844
12. Enrolment of Children in Primary Classes (I to V)
(Lakhs) 76.92 73.92 73.63
Source : Directorate of Economics & Statistics, Andhra Pradesh.

3
2. STATE ECONOMY
TABLE 2.1
Estimates of Gross, Net State Domestic Product and Per Capita Income at Current and Constant (1999-2000) Prices
GSDP
(Rsin.Crores) NSDP
(Rs.inCrores) Per Capita Income
(Rs.in crores)
Year At Current Prices
At Constant (1999-2000) Prices
At Current Prices
At Constant
(1999-2000) Prices
At Current Prices
At Constant
(1999-2000) Prices
(1) (2) (3) (4) (5) (6) (7)
1999-2000 1,29,403 1,29,403 1,16,966 1,16,966 15,507 15,507
2000-01 1,45,090 1,39,680 1,31,123 1,26,402 17,243 16,622
2001-02 1,57,150 1,45,543 1,42,598 1,32,108 18,630 17,260
2002-03 1,68,143 1,50,281 1,52,066 1,35,881 19,568 17,486
2003-04 1,90,880 1,64,213 1,73,274 1,49,067 22,041 18,961
2004-05 2,10,449 1,75,641 1,88,855 1,57,975 23,755 19,871
2005-06(P) 2,36,034 1,90,957 2,10,772 1,71,462 26,226 21,334
2006-07(Q) 2,69,173 2,07,904 2,40,261 1,85,462 29,582 22,835
2007-08(A) 3,11,752 2,29,461 2,78,717 2,04,869 33,970 24,969
P :- Provisional Q :- Quick Estimates A:- Advanced Estimates

GROSS STATE DOMESTIC PRODUCT OF A.P. CONSTANT PRICES
1999-2000
29%
47%
24%
AGRICULTURESECTORINDUSTRY SECTOR
SERVICES SECTOR
2005-2006 (Provisional Estimates)
26%
50%
24%
AGRICULTURESECTORINDUSTRYSECTORSERVICES

2
2006-2007 (Quick Estimates)25%
24%
51%
AGRICULTURE SECTOR INDUSTRY SECTOR SERVICES SECTOR
2007-2008 (Advance Estimates)
24%
24%
52%
AGRICULTURE SECTOR
INDUSTRY SECTOR
SERVICES SECTOR

3
PERCAPITA INCOME AT CURRENT AND CONSTANT PRICES IN A.P. DURING 1999-2000
TO 2007-2008(A)
0
5000
10000
15000
20000
25000
30000
35000
40000
1999
-200
0
2000
-200
1
2001
-200
2
2002
-200
3
2003
-200
4
2004
-200
5
2005
-200
6(P)
2006
-200
7(Q
)
2007
-200
8 (A
)
YEARS
IN R
UPE
ES
AT CURRENT PRICES AT CONSTANT PRICES

4
2. STATE ECONOMY TABLE 2.2
Gross State Domestic Product of Andhra Pradesh by Industry of Origin at Constant (1999-2000) Prices from 2001-02 to 2007-08
(Rs. in Crores) Sl. No. Industry 1999-
2000 % to
G.S.D.P 2001-
02 % to
G.S.D.P (1) (2) (3) (4) (5) (6)
1 Agriculture, Forestry and Fishing.
1.1(a) Agriculture 24,296 18.78 25,859 17.77 1.1(b) Livestock 8,234 6.36 10,365 7.12
1.2 Forestry and Logging 1,408 1.09 1,394 0.96 1.3 Fishing 3,189 2.46 3,751 2..58
Agriculture Sector 37,126 28.69 41369 28.43 2 Mining and Quarrying 3,592 2.78 4,309 2.96 3 Manufacturing.
3.1 Registered 11,324 8.75 11,868 8.15 3.2 Unregistered 4,810 3.72 5,004 3.44
4 Electricity, Gas and Water Supply 3,827 2.96 3,286 2.26
5 Construction 7,651 5.91 8,853 6.08
Industry Sector Sub-Total (2 to 5) 31,204 24.11 33320 22.89
6 Trade, Hotels and Restaurants 16,885 13.05 19,370 13.31
7 Transport, Storage and Communication
7.1 Railways 2,031 1.57 2,103 1.44
7.2 Transport by Other Means and Storage 5,532 4.27 6,403 4.40
7.3 Communications 1,827 1.41 3,020 2.07
8 Financing, Real Estates and Insurance, Business Services
8.1 Banking and Insurance 5,576 4.31 6,897 4.74
8.2 Ownership of Dwellings, Real Estates and Business Services
10,286 7.95 11,908 8.18
9 Community, Social and Personal Services
9.1 Public Administration 6,439 4.98 7,032 4.83 9.2 Other Services 12,497 9.66 14,122 9.70
Services Sector Sub-Total (6 to 9) 61,073 47.20 70,854 48.68
Gross State Domestic Product 1,29,403 100.00 1,45,543 100.00
Contd..

5
2. STATE ECONOMY TABLE 2.2
Gross State Domestic Product of Andhra Pradesh by Industry of Origin at Constant (1999-2000) Prices from 2001-02 to 2007-08
(Rs. in Crores)
Sl. No. Industry 2002-03 % to
G.S.D.P 2003-
04 % to
G.S.D.P
(1) (2) (7) (8) (9) (10) 1 Agriculture, Forestry and Fishing.
1.1(a) Agriculture 20,545 13.67 25,463 15.51 1.1(b) Livestock 11,694 7.78 12,500 7.61
1.2 Forestry and Logging 1,399 0.93 1,393 0.85 1.3 Fishing 4,520 3.01 4,580 2.79
Agriculture Sector 38158 25.39 43936 26.76 2 Mining and quarrying 4,798 3.19 4,996 3.04 3 Manufacturing.
3.1 Registered 12,956 8.62 13,817 8.41 3.2 Unregistered 5,348 3.56 5,999 3.65
4 Electricity, Gas and Water Supply 4,238 2.82 4,070 2.48
5 Construction 9,468 6.30 10,114 6.16 Induatry Sector Sub-Total
(3 to 5) 36807 24.49 38995 23.74
6 Trade, Hotels and Restaurants 20,062 13.35 22,136 13.48
7 Transport, Storage and Communication 7.1 Railways 2,277 1.52 2,390 1.46
7.2 Transport by Other Means and Storage 6,797 4.52 7,737 4.71
7.3 Communications 3,679 2.45 4,416 2.69 8 Financing, Real Estates andInsurance, Business Services
8.1 Banking and Insurance 7,558 5.03 7,672 4.67
8.2
Ownership of Dwellings, Real Estates and Business Services
12,769 8.50 13,673 8.33
9 Community, Social and Personal Services
9.1 PublicAdministration 7,386 4.91 7,602 4.63 9.2 Other Services 14,787 9.84 15,656 9.53
Services Sector Sub-Total (6 to 9) 75,316 50.12 81,282 49.50
GrossState Domestic Product 1,50,281 100.00 1,64,213 100.0
Contd..

6
2. STATE ECONOMY TABLE 2.2
Gross State Domestic Product of Andhra Pradesh by Industry of Origin at Constant (1999-2000) Prices from 2001-02 to 2007-08
(Rs. in Crores)
Sl. No. Industry 2004-05 (R)
% to G.S.D.P
2005-06 (P)
% to G.S.D.P
(1) (2) (11) (12) (13) (14) 1 Agriculture, Forestry and Fishing.
1.1(a) Agriculture 26,834 15.28 29,529 15.46 1.1(b) Livestock 13,189 7.51 13,958 7.31
1.2 Forestry and Logging 1,417 0.81 1,433 0.75 1.3 Fishing 4,449 2.53 4,610 2.41
Agriculture Sector 45,889 26.13 49,530 25.93
2 Mining and Quarrying 5,291 3.01 5,971 3.13 3 Manufacturing.
3.1 Registered 15,006 8.54 16,319 8.55 3.2 Unregistered 6,344 3.61 6,738 3.53
4 Electricity, Gas and Water Supply 4,269 2.43 4,401 2.30
5 Construction 10,838 6.17 12,022 6.30 Industry Sector Sub-Total (2 to 5) 41,749 23.77 45,450 23.81
6 Trade, Hotels and Restaurants 23,445 13.35 25,567 13.39
7 Transport, Storage and Communication
7.1 Railways 2,563 1.46 2,779 1.45
7.2 Transport by Other Means and Storage 8,397 4.78 9,202 4.82
7.3 Communications 5,446 3.10 6,843 3.58 8 Financing, Real Estates and Insurance, Business Services
8.1 Banking and Insurance 8,331 4.74 9,016 4.72
8.2
Ownership of Dwellings, Real Estates and Business Services
14,747 8.40 15,806 8.28
9 Community, Social and Personal Services
9.1 PublicAdministration 8,110 4.62 8,572 4.49 9.2 Other Services 16,965 9.66 18,192 9.53
Services Sector Sub –Total (6 to 9) 88,003 50.10 95,977 50.26
Gross State Domestic Product 1,75,641 100.00 1,90,957 100.00
Contd..

7
2. STATE ECONOMY TABLE 2.2 (Concld..)
Gross State Domestic Product of Andhra Pradesh by Industry of Origin at Constant(1999-2000) Prices from 2001-02 to 2007-08
(Rs. in Crores)
Sl. No. Industry 2006-07(Q)
% to G.S.D.P
2007-08(A)
% to G.S.D.P.
(1) (2) (15) (16) (17) (18) 1 Agriculture, Forestry and Fishing.
1.1(a) Agriculture 30,573 14.71 33,655 14.67 1.1(b) Livestock 14,576 7.01 15,526 6.76
1.2 Forestry and Logging 1,474 0.71 1,506 0.65 1.3 Fishing 4,854 2.33 5,106 2.23
Agruculture Sector 51,477 24.76 55,793 24.31 2 Mining and Quarrying 7,575 3.64 9,024 3.93 3 Manufacturing.
3.1 Registered 17,801 8.56 18,699 8.15 3.2 Unregistered 7,312 3.52 7,861 3.43
4 Electricity, Gas and Water Supply 4,635 2.23 4,982 2.17
5 Construction 13,586 6.53 15,373 6.70 Industry Sector Sub-Total (2 to 5) 50,910 24.49 55,939 24.38
6 Trade, Hotels and Restaurants 28,087 13.51 31,416 13.69
7 Transport, Storage and Communication
7.1 Railways 3,072 1.48 3,233 1.41
7.2 Transport by Other Means and Storage 10,075 4.85 10,941 4.77
7.3 Communications 8,707 4.19 11,192 4.88 8 Financing, Real Estates and Insurance, Business Services
8.1 Banking and Insurance 9,691 4.66 10,750 4.68
8.2 Ownership of Dwellings, Real Estates and Business Services
17,808 8.56 20,128 8.77
9 Community, Social and Personal Services
9.1 PublicAdministration 8,968 4.31 9,445 4.12 9.2 Other Services 19,110 9.19 20,624 8.99
Services Sector Sub-Total (6 to 9) 1,05,517 50.75 1,17,729 51.31
Gross State Domestic Product 2,07,904 100.00 2,29,461 100.00
P:- Provisional Q:- Quick Estimates A :- Advanced Estimates

8
3. AREA AND POPULATION
TABLE 3.1
Distribution of Population, Sex Ratio, Growth Rate and Density of Population - District wise, 2001 Census
Population 2001 Sl.No District
Persons Male Female (1) (2) (3) (4) (5) 1. Srikakulam 25,37,593 12,60,020 12,77,573
2. Vizianagaram 22,49,254 11,19,541 11,29,713
3. Visakhapatnam 38,32,336 19,30,197 19,02,139
4. East Godavari 49,01,420 24,59,640 24,41,780
5. West Godavari 38,03,517 19,10,038 18,93,479
6. Krishna 41,87,841 21,17,401 20,70,440
7. Guntur 44,65,144 22,50,279 22,14,865
8. Prakasam 30,59,423 15,52,332 15,07,091
9. Nellore 26,68,564 13,44,935 13,23,629
10. Chittoor 37,45,875 18,89,690 18,56,185
11. Kadapa 26,01,797 13,18,093 12,83,704
12. Anantapur 36,40,478 18,59,588 17,80,890
13. Kurnool 35,29,494 17,96,214 17,33,280
14. Mahbubnagar 35,13,934 17,82,340 17,31,594
15. Rangareddy 35,75,064 18,39,227 17,35,837
16. Hyderabad 38,29,753 19,81,173 18,48,580
17. Medak 26,70,097 13,52,446 13,17,651
18. Nizamabad 23,45,685 11,62,905 11,82,780
19. Adilabad 24,88,003 12,50,958 12,37,045
20. Karimnagar 34,91,822 17,47,968 17,43,854
21. Warangal 32,46,004 16,44,895 16,01,109
22. Khammam 25,78,927 13,05,543 12,73,384
23. Nalgonda 32,47,982 16,51,990 15,95,992
ANDHRA PRADESH 7,62,10,007 3,85,27,413 3,76,82,594
Contd..

9
3. AREA AND POPULATION
TABLE 3.1 (Concld.) Distribution of Population, Sex Ratio, Growth Rate and Density of
Population - District wise, 2001 Census SEX-RATIO (FEMALES PER 1000 MALES)
DENSITY OF POPULATION (PER Sq. Km)
DECENNIAL GROWTH RATE
OF POPULATION
Sl.No District
1991 2001 1991 2001 1981-91 1991-01 (1) (2) (6) (7) (8) (9) (10) (11) 1. Srikakulam 1,012 1,014 398 438 18.46 9.33
2. Vizianagaram 1,000 1,009 323 346 17.00 6.55
3. Visakhapatnam 975 985 294 342 27.50 16.66
4. East Godavari 998 993 420 454 22.70 7.93
5. West Godavari 994 991 454 494 22.39 8.13
6. Krishna 969 978 424 481 21.33 13.22
7. Guntur 970 984 360 392 19.57 8.72
8. Prakasam 970 971 156 174 18.44 10.88
9. Nellore 980 984 183 204 18.73 11.55
10. Chittoor 966 982 215 246 19.14 14.86
11. Kadapa 955 974 148 169 17.30 14.73
12. Anantapur 946 958 166 191 24.95 14.34
13. Kurnool 953 965 168 199 23.50 18.72
14. Mahbubnagar 973 972 167 191 25.87 14.20
15. Rangareddy 941 944 340 477 61.31 40.10
16. Hyderabad 933 933 14,499 19,149 39.16 21.74
17. Medak 970 974 234 275 25.60 17.64
18. Nizamabad 1,017 1,017 256 293 21.30 15.12
19. Adilabad 980 989 129 155 27.06 19.47
20. Karimnagar 986 998 257 296 24.68 14.96
21. Warangal 962 973 219 252 22.54 15.15
22. Khammam 961 975 138 161 26.50 16.39
23. Nalgonda 962 966 200 229 25.11 13.88
Andhra Pradesh 972 978 242 277 24.20 14.59 Source : Final Population Totals of Census of India, 2001 issued by Directorate of
Census Operations, Andhra Pradesh

10
3. AREA AND POPULATION
TABLE 3.2
Census Statistics - Summary, 1991 and 2001
Item Unit 1991 2001
Decennial Growth
Rate (Percentage)
(1) (2) (3) (4) (5)
Population Lakhs 665.08 762.10 14.59
Male Lakhs 337.25 385.27 14.24
Female Lakhs 327.83 376.83 14.95
Sex ratio Females per ‘000 Males 972 978 -
Rural Population Lakhs 486.21 554.01 13.94
Urban Population Lakhs 178.87 208.09 16.34
Literates Lakhs 244.88 399.34 63.08
Workers Lakhs 299.64 348.94 16.45
(a) Main workers Lakhs 284.45 290.41 2.10 (b)Marginal workers Lakhs 15.18 58.53 285.57
Non-Workers Lakhs 365.44 413.16 13.06
Density of Pop. Per Sq. Km 242 277 14.46
Scheduled Castes Lakhs 105.92 123.39 16.49
Scheduled Tribes Lakhs 41.99 50.24 19.65 Birth Rate (During the Decade)
Births Per ‘000 Population 26.0 22.9 -
Death Rate (During the Decade)
Deaths Per ‘000 Population 9.7 8.5 -
Source: Directorate of Census Operations, Andhra Pradesh

11
3. AREA AND POPULATION
TABLE 3.3
Area and Rural Population - District wise, 2001 Census
Population (in Lakhs) Sl.
No District Area
(‘000 Sq. Kms) Total Rural
% of Rural
Popula-tion
Density per
Sq.Kms.
(1) (2) (3) (4) (5) (6) (7) 1. Srikakulam 5.8 25.38 22.59 89.01 438
2. Vizianagaram 6.5 22.49 18.37 81.68 346
3. Visakhapatnam 11.2 38.32 23.01 60.05 342
4. East Godavari 10.8 49.01 37.49 76.49 454
5. West Godavari 7.7 38.04 30.53 80.26 494
6. Krishna 8.7 41.88 28.44 67.91 481
7. Guntur 11.4 44.65 31.79 71.20 392
8. Prakasam 17.6 30.59 25.92 84.73 174
9. Nellore 13.1 26.69 20.70 77.56 204
10. Chittoor 15.2 37.46 29.35 78.35 246
11. Kadapa 15.4 26.02 20.14 77.40 169
12. Anantapur 19.1 36.40 27.21 74.75 191
13. Kurnool 17.7 35.29 27.12 76.85 199
14. Mahbubnagar 18.4 35.14 31.43 89.44 191
15. Rangareddy 7.5 35.75 16.37 45.79 477
16. Hyderabad 0.2 38.30 0.00 0.00 19,149
17. Medak 9.7 26.70 22.87 85.65 275
18. Nizamabad 8.0 23.46 19.21 81.88 293
19. Adilabad 16.1 24.88 18.28 73.47 155
20. Karimnagar 11.8 34.92 28.13 80.56 296
21. Warangal 12.9 32.46 26.23 80.81 252
22. Khammam 16.0 25.79 20.68 80.19 161
23. Nalgonda 14.2 32.48 28.15 86.67 229
Andhra Pradesh 275.0 762.10 554.01 72.70 277 Source: Final Population Totals of Census of India, 2001 issued by Directorate of Census Operations, Andhra Pradesh

12
3. AREA AND POPULATION
TABLE 3.4 (A)
Principal Towns and Cities with Population of 50,000 and above 2001 Census
Population Sl. No
Size Class of City/UA/Town Persons Male Female Growth
Rate (1) (2) (3) (4) (5) (6) CLASS I (1,00,000 and above)
1 HYDERABAD U.A. (A+B+C)
57,42,036 29,73,472 27,68,564 32.01
A.Hyderabad U.A (Hyd.Dist.)
38,29,753 19,81,173 18,48,580 21.74
(a) Hyderabad M. C. 36,12,427 18,70,068 17,42,359 21.85 (b) Secunderabad Contonment
(C.B) 2,06,102 1,04,335 1,01,767 20.42
(c) Osmania University (C.T) 11,224 6,770 4,454 10.55 B. Hyderabad U. A
(R.R.Dist) 18,04,832 9,36,447 8,68,385 61.06
(i) Hyderabad M.C portion of R.R.Dist
25,056 12,996 12,060 (-)68.39
(ii) Balapur (O.G) 5,126 2,818 2,308 (-)26.51 (iii) Kothapet (O.G) 10,484 5,746 4,738 191.71 (iv) Hydershakot (O.G) 3,786 1,929 1,857 92.28 (v) Venkatapur (O.G) 987 509 478 8.34 (vi) Mallapur (O.G) 644 350 294 (-)13.90 (a) Kukatpally (M) 2,92,289 1,53,331 1,38,958 56.34 (b) L.B.Nagar (M+O.G) 2,87,781 1,48,493 1,39,288 76.33 (i) L.B.Nagar (M) 2,68,689 1,38,667 1,30,022 72.77 (ii) Kuntloor (O.G.) 3,884 1,976 1,908 74.09 (iii) Injapur (O.G) 1,727 918 809 (-)29.71 (iv) Nadargul Partly (O.G) 1,720 881 839 N.A. (v) Jillellaguda (O.G) 11,761 6,051 5,710 291.38 (c) Meerpet (C.T) 12,935 6,610 6,325 154.18 (d) Malkajgiri (M) 1,93,863 98,972 94,891 52.43 (e) Quthbullapur (M) 2,31,108 1,20,690 1,10,418 116.82 (f) Kapra (M) 1,59,002 82,579 76,423 81.21 (g)Rajendranagar (M+O.G.) 1,63,115 85,099 78,016 63.26 (i.) Rajendranagar (M) 1,43,240 74,889 68,351 69.47 (ii.) Shazadi Begum (O.G) 673 344 329 2,303.57 (iii.) Shamshabad (O.G). 19,202 9,866 9,336 24.96
Contd..

13
3. AREA AND POPULATION
TABLE 3.4 (A)
Principal Towns and Cities with Population of 50,000 and above, 2001Census
Population Sl. No
Size Class of City/UA/Town
Persons Male Female
Growth Rate 1991-
2001 (%) (1) (2) (3) (4) (5) (6) (h) Uppal Kalan(M+O.G) 1,18,085 61,322 56,763 56.07 (i.) Uppal kalan (M) 1,17,217 60,857 56,360 54.96 (ii.) Makta Bibi Sahebguda
(O.G) 868 465 403 5,325.00
(i) Serilingampalli (M) 1,53,364 79,225 74,139 112.06 (j) Alwal (M+O.G) 94,372 48,038 46,334 40.29 (i.) Alwal (M). 93,206 47,436 45,770 40.22 (ii.) Singaipalle (O.G) 1,166 602 564 45.75 (k) Gaddiannaram (C.T) 52,835 27,740 25,095 50.15 (C) Hyderabad U.A.
(Medak Dist.) 1,07,451 55,852 51,599 18.47
(a) Patancheru (C.T.) 40,273 21,316 18,957 49.93 (b) Ramachandrapuram
(C.T.) 52,363 27,019 25,344 13.51
(c)Ramachandrapuram BHEL Township (C.T.)
14,815 7,517 7,298 (-)16.33
2. VISAKHAPATNAM U.A 13,45,938 6,87,985 6,57,953 27.32 (a) Visakhapatnam
(M.C+O.G) 10,42,388 5,32,157 5,10,231 22.38
(i) Visakhapatnam (M.C) 9,82,904 5,01,406 4,81,498 19.24 (ii) Adivivaram (O.G.) 23,070 12,197 10,873 87.01 (iii) Yendada (O.G) 8,164 4,127 4,037 230.53 (iv) Rishikonda (O.G) 2,065 1,027 1,038 43.20 (v) Pothinamallayyapalem
(O.G) 7,911 4,041 3,870 183.75
(vi) Madhuravada (O.G) 18,274 9,359 8,915 117.34 (b) Gajuwaka (M+O.G) 2,76,552 1,42,172 1,34,380 43.45 (i) Gajuwaka (M) 2,59,180 1,33,469 1,25,711 44.16 (ii) Aganampudi (O.G.) 17,372 8,703 8,669 33.64 (c) Vepagunta (C.T) 26,998 13,656 13,342 114.64
Contd..

14
3. AREA AND POPULATION TABLE 3.4(A)
Principal Towns and Cities with Population of 50,000 and above,
2001 Census Population
Sl. No
Size Class of City/UA/Town Persons Male Female
Growh Rate
1991-2001(%)
(1) (2) (3) (4) (5) (6) 3. VIJAYAWADA U.A 10,39,518 5,27,307 5,12,211 N.A. (a) Vijayawada (M.C+O.G) 9,45,530 4,79,141 4,66,389 28.81 (i) Vijayawada (M.C) 8,51,282 4,31,243 4,20,039 21.30 (ii) Prasadampadu (O.G.) 10,501 5,522 4,979 61.83 (iii)Ramavarappadu (O.G.) 12,802 6,543 6,259 52.08 (iv)Yanamalakuduru (O.G.) 25,476 13,020 12,456 47.00 (v) Tadepalli( (O.G.) 41,699 20,945 20,754 44.08 (vi) Undavalli (Partly) (O.G.) 3,770 1,868 1,902 N.A. (b) Kanuru (C.T) 30,639 16,276 14,363 29.84 (c) Mangalagiri (M+OG) 63,349 31,890 31,459 7.10 (i) Mangalagiri(M) 61,981 31,232 30,749 4.78 (ii) Navuluru (Partly) (O.G.) 957 477 480 N.A. (iii )Atmakur (Partly)(O.G.) 411 181 230 N.A.
4. WARANGAL U.A. 5,79,216 2,93,709 2,85,507 N.A. (a) Warangal (MC+OG) 5,79,216 2,93,709 2,85,507 N.A. (i) Warangal (M.C) 5,30,636 2,68,954 2,61,682 18.54 (ii) Gopalpur (O.G.) 3,549 1,825 1,724 26.64 (iii) Madi konda (R) (Partly)
(O.G.) 12,773 6,502 6,271 N.A.
(iv) Gorrekunta (Partly)(O.G.) 4,559 2,311 2,248 N.A. (v) Bheemaram (Partly)(O.G.) 7,870 4,128 3,742 N.A. (vi) Stambampalli (O.G.) 3,334 1,745 1,589 43.51 (vii) Enumamula (O.G.) 8,958 4,460 4,498 113.59 (viii) Kadipi konda (O.G.) 7,537 3,784 3,753 13.69
5. GUNTUR (M.C) 5,14,461 2,57,775 2,56,686 9.22 6. RAJAHMUNDRY U.A. (a+b) 4,13,616 2,07,869 2,05,747 2.88 (a) Rajahmundry (M.C.+O.G.) 3,74,721 1,88,585 1,86,136 2.19 (i) Rajahmundry (M.C) 3,15,251 1,58,454 1,56,797 -2.96 (ii) Katheru (O.G.) 21,624 11,005 10,619 14.29 (iii) Hukumpeta (O.G.) 7,172 3,694 3,478 104.27 (iv) Bommuru (O.G.) 12,997 6,553 6,444 50.24 (v) Morampudi (Partly) (O.G.) 2,498 1,274 1,224 289.70 (vi) Rajahmundry NMA.(O.G) 15,179 7,605 7,574 50.14 (b) Dowleswaram (C.T) 38,895 19,284 19,611 10.02
Contd..

15
3. AREA AND POPULATION TABLE 3.4 (A)
Principal Towns and Cities with Population of 50,000 and above,
2001 Census
Population Sl. No
Size Class of City/UA/Town Persons Male Female
Growh Rate 1991-2001 (%)
(1) (2) (3) (4) (5) (6) 7. NELLORE U.A. 4,04,775 2,03,823 2,00,952 27.85 (a) Nellore (M+O.G) 4,04,775 2,03,823 2,00,952 27.85 (i) Nellore (M) 3,78,428 1,90,522 1,87,906 19.53 (ii) Nellore (Bit-1) (O.G) 14,496 7,259 7,237 N.A. (iii) Allipuram (Partly)(O.G.) 4,869 2,444 2,425 N.A.
(iv) Buja Buja Nellore (Partly) (O.G.)
4,207 2,082 2,125 N.A.
(v) Kallurpalle (Partly)(O.G.) 2,775 1,516 1,259 N.A. 8. KAKINADA U.A. 3,76,861 1,87,064 1,89,797 12.59 (a) Kakinada (M+O.G) 3,35,299 1,66,095 1,69,204 9.85 (i) Kakinada (M) 2,96,329 1,46,476 1,49,853 5.84 (ii) Turangi (R) (O.G.) 18,918 9,504 9,414 31.47 (iii) Chidiga (O.G.) 5,049 2,554 2,495 37.20 (iv) Vakalapudi (O.G.) 15,003 7,561 7,442 108.96 (b) Ramanayyapeta (C.T) 22,337 11,309 11,028 39.06 (c) Suryaraopeta (C.T) 19,225 9,660 9,565 43.17
9. KURNOOL U.A . 3,42,973 1,74,190 1,68,783 24.55 (a) Kurnool (M.C) 2,69,122 1,36,619 1,32,503 13.65 (b) Kallur (C.T) 73,851 37,571 36,280 91.52
10. TIRUPATI U.A. 3,03,521 1,55,468 1,48,053 44.05 (a) Tirupathi (M+O.G.) 2,44,990 1,26,688 1,18,302 33.93 (i) Tirupathi (M) 2,28,202 1,18,187 1,10,015 30.87 (ii) Settipalli (O.G.) 2,448 1,227 1,221 32.90 (iii) Timminaidupalli (O.G.) 2,280 1,162 1,118 12.32 (iv) Avilala (O.G.) 12,060 6,112 5,948 157.36 (b) Tirupathi (N.M.A.)(C.T) 25,702 12,280 13,422 76.83 (c) Akkarampalli (C.T) 20,342 10,321 10,021 289.47 (d) Tiruchanur (C.T) 12,487 6,179 6,308 55.70
11. NIZAMABAD (M) 2,88,722 1,46,198 1,42,524 19.78 Contd..

16
3. AREA AND POPULATION TABLE 3.4 (A)
Principal Towns and Cities with Population of 50,000 and above,
2001 Census
Population Sl. No
Size Class of City/UA/Town
Persons Male Female
Growth Rate
1991-2001 (%)
(1) (2) (3) (4) (5) (6) 12. KADAPA U.A. 2,62,506 1,33,224 1,29,282 21.00
(a) Kadapa (M+O.G.) 1,48,039 74,563 73,476 5.25 (i) Kadapa (M) 1,26,505 63,669 62,836 4.15 (ii) Ukkayapalli (O.G.) 6,646 3,322 3,324 26.04 (iii) Palempalle (O.G.) 3,868 2,006 1,862 10.01 (iv) Ramarajupalli (O.G.) 4,058 2,052 2,006 171.80 (v) Gudur (R) (O.G.) 5,234 2,642 2,592 10.03
(vi) Mamillapalle (Partly) (O.G.)
1,728 872 856 (-)58.44
(b) Akkayapalli (C.T) 18,307 9,361 8,946 40.92 (c) Chemmumiahpet (C.T) 31,431 15,995 15,436 41.91 (d) Chinna Chowk (C.T) 64,729 33,305 31,424 61.56
13. ANANTAPUR U.A. 2,43,143 1,23,713 1,19,430 32.46 (a) Anantapur (M+O.G.) 2,43,143 1,23,713 1,19,430 32.46 (i) Anantapur (M) 2,18,808 1,10,979 1,07,829 25.09 (ii) Narayanapuram (O.G.) 8,568 4,351 4,217 62.06
(iii) Kakkalapalli (R) (Partly) (O.G.)
4,945 2,480 2,465 N.A.
(iv) Anantapur (R) (O.G.) 10,822 5,903 4,919 223.62 14. RAMAGUNDAM U.A. 2,37,686 1,21,250 1,16,436 10.87
(a) Ramagundam (M+O.G) 2,37,686 1,21,250 1,16,436 10.87 (i) Ramagundam (M) 2,36,600 1,20,687 1,15,913 10.36
(ii) Penchikalapeta (Partly) (O.G.)
1,086 563 523 N.A.
15. KARIMNAGAR U.A 2,18,302 1,11,875 1,06,427 41.13 (a) Karimnagar (M+O.G) 2,18,302 1,11,875 1,06,427 41.13 (i) Karimnagar (M) 2,05,653 1,05,336 1,00,317 38.41 (ii) Bommakal (O.G) 7,266 3,694 3,572 35.99 (iii) Arepalli (Partly)
(O.G.) 2,105 1,065 1,040 N.A.
(iv) Sitarampur (O.G.) 1,605 862 743 112.02 (v) Chintakunta (Partly)
(O.G.) 1,673 918 755 N.A.
Contd..

17
3. AREA AND POPULATION TABLE 3.4(A)
Principal Towns and Cities with Population of 50,000 and above, 2001 Census
Population Sl. No Size Class of City/UA/Town
Persons Male Female
Growth Rate
1991-2001 (%)
(1) (2) (3) (4) (5) (6) 16. ELURU U.A 2,15,804 1,05,476 1,10,328 (-)2.93
(a) Eluru (M+O.G) 2,15,804 1,05,476 1,10,328 (-)2.93 (i) Eluru (M) 1,90,062 92,790 97,272 (-)10.71 (ii) Eluru (R) (Partly) (O.G.) 6,208 3,111 3,097 N.A. (iii) Satrampadu (O.G.) 5,225 2,806 2,419 79.61
(iv) Komadavolu (Partly) (O.G.)
543 272 271 N.A.
(v) Gavaravaram (O.G.) 8,324 3,853 4,471 109.57 (vi) Tangellmudi (R) (O.G.) 5,442 2,644 2,798 112.25
17. KHAMMAM U.A. 1,98,620 1,00,930 97,690 33.23 (a) Khammam (M+O.G.) 1,98,620 1,00,930 97,690 33.23 (i) Khammam (M) 1,59,544 80,574 78,970 24.65
(ii) Khanapuram Haveli (Partly) (O.G.)
29,925 15,630 14,295 93.79
(iii) Edulapuram (Partly) O.G. 9,151 4,726 4,425 62.17 18. VIZIANAGARAM U.A. 1,95,801 97,032 98,769 10.61
(a) Vizianagaram (M+O.G.) 1,76,023 87,081 88,942 9.11 (i) Vizianagaram (M) 1,74,651 86,375 88,276 8.91
(ii) Jammunarayanapuram (Partly) (O.G.)
1,372 706 666 41.15
(b) Gajularega (C.T) 13,081 6,536 6,545 13.61 (c) Kanapaka (C.T) 6,697 3,415 3,282 60.33
19. MACHILIPATNAM (M) 1,79,353 89,100 90,253 12.72 20. CHIRALA U.A. 1,66,294 82,954 83,340 16.47
(a) Chirala (M+O.G.) 1,29,242 64,635 64,607 19.15 (i) Chirala (M) 84,970 42,436 42,534 5.08 (ii) Chirala (R) (O.G.) 28,278 14,190 14,088 2.43
(iii) Epurupalem (Partly) (O.G.)
13,119 6,547 6,572 N.A.
(iv) Kothapeta (Partly) (O.G.) 2,875 1,462 1,413 N.A. (b) Vetapalem (C.T) 37,052 18,319 18,733 7.99
21. ADONI U.A. 1,62,458 82,345 80,113 19.29 (a) Adoni (M+O.G.) 1,62,458 82,345 80,113 19.29 (i) Adoni (M) 1,57,305 79,639 77,666 15.51 (ii) Mandagiri (Partly) (O.G.) 5,153 2,706 2,447 N.A.
Contd..

18
3. AREA AND POPULATION TABLE 3.4 (A)
Principal Towns and Cities with Population of 50,000 and above,
2001 Census Population Sl.
No Size Class of City/UA/Town
Persons Male Female
Growth Rate 1991-
2001(%) (1) (2) (3) (4) (5) (6) 22. NANDYAL U.A 1,57,120 79,500 77,620 31.14
(a) Nandyal (M+O.G) 1,57,120 79,500 77,620 31.14 (i) Nandyal (M) 1,52,676 77,273 75,403 27.43
(ii) Noonepalli (R) (Partly) (O.G)
1,369 705 664 N.A.
(iii) Ayyalur (Partly) (O.G.) 3,075 1,522 1,553 N.A. 23. ONGOLE U.A 1,53,829 78,242 75,587 19.57
(a) Ongole (M+O.G) 1,53,829 78,242 75,587 19.57 (i) Ongole (M) 1,50,471 76,511 73,960 16.96 (ii) Pernamitta (Partly) (O.G.) 3,358 1,731 1,627 N.A.
24. TENALI (M) 1,53,756 77,404 76,352 6.98 25. CHITTOOR (M) 1,52,654 76,879 75,775 14.38 26. PRODDATUR (M) 1,50,309 75,372 74,937 12.24 27. BHIMAVARAM U.A 1,42,064 71,929 70,135 17.10
(a) Bhimavaram (M+O.G) 1,42,064 71,929 70,135 17.10 (i) Bhimavaram (M) 1,37,409 69,473 67,936 13.27
(ii) Rayalam (R) (Partly) (O.G.)
2,337 1,199 1,138 N.A.
(iii) Chinameram (Partly) (O.G.)
2,318 1,257 1,061 N.A.
28. MAHBUBNAGAR U.A 1,39,662 71,516 68,146 19.54 (a) Mahbubnagar (M+O.G) 1,39,662 71,516 68,146 19.54 (i) Mahbubnagar (M) 1,30,986 67,007 63,979 12.11
(ii) Mahbubnagar (R) (Partly) (O.G.)
6,071 3,178 2,893 N.A.
(iii) Yenogonda (R) (Partly) (O.G.)
2,566 1,309 1,257 N.A.
(iv) Boyapalli (R) (Partly) (O.G.)
39 22 17 N.A.
(v) Palakonda(Partly)(OG) - - - - 29. ADILABAD U.A 1,29,403 65,501 63,902 37.86
(a) Adilabad (M) 1,09,529 55,641 53,888 30.00 (b) Dasnapur (C.T) 19,874 9,860 10,014 106.83
30. HINDUPUR (M) 1,25,074 64,132 60,942 19.52 Contd..

19
3. AREA AND POPULATION TABLE 3.4 (A)
Principal Towns and Cities with Population of 50,000 and above, 2001 Census
Population Sl. No
Size Class of City/UA/Town Persons Male Female
Growth Rate 1991-
2001(%) (1) (2) (3) (4) (5) (6) 31. MANCHERIAL U.A 1,18,195 60,371 57,824 39.34
(a) Mancherial (M) 70,381 35,710 34,671 33.66 (b) Naspur (C.T.) 33,059 16,971 16,088 67.14 (c) Teegalpahad (C.T.) 14,755 7,690 7,065 19.11
32. GUNTAKAL (M) 1,17,103 59,211 57,892 8.84 33. SRIKAKULAM U.A 1,17,320 58,753 58,567 31.99
(a) Srikakulam (M+O.G.) 1,17,320 58,753 58,567 31.99 (i) Srikakulam (M) 1,09,905 54,926 54,979 23.65 (ii) Balaga(R)(Partly) (O.G.) 3,383 1,735 1,648 N.A.
(iii) Pathrunivalasa (Partly) (O.G.) 226 122 104 N.A.
(iv) Arasavalli (R) (Partly) (O.G.) 1,350 651 699 N.A.
(v) Patha Srikakulam (R) (Partly) (O.G.) 2,456 1,319 1,137 N.A.
34. GUDIVADA (M) 1,13,054 55,867 57,187 11.21 35. NALGONDA U.A 1,11,380 56,848 54,532 31.17
(a) Nalgonda (M+O.G.) 1,11,380 56,848 54,532 31.17 (i) Nalgonda (M) 1,10,286 56,299 53,987 29.89 (ii) Nalgonda (R)(Partly) (O.G.) 281 140 141 N.A.
(iii) Panagallu (R)(Partly) (O.G.) 519 263 256 N.A.
(iv) Gollaguda (R)(Partly) (O.G.) 294 146 148 N.A. 36. MADANAPALLI U.A 1,07,449 54,497 52,952 45.56
(a) Madanapalli (M+O.G) 1,07,449 54,497 52,952 45.56 (i) Madanapalli (M) 99,967 50,686 49,281 35.42 (ii) Kollabailu (Partly) (O.G) 1,451 781 670 N.A.
(iii) Ponnutipalem (Partly) (O.G.) 739 408 331 N.A.
(iv) Basinikonda (Partly) (O.G.) 3,662 1,867 1,795 N.A. (v) Madanapalli(R)(Partly) (O.G.) 1,630 755 875 N.A.
37. KOTHAGUDEM U.A 1,05,266 52,318 52,948 3.06 (a) Kothagudem (M+O.G) 86,306 42,817 43,489 (-)0.74 (i) Kothagudem (M) 79,721 39,461 40,260 (-)0.89 (ii) Garimellapadu (O.G.) 6,585 3,356 3,229 1.14 (b) Chunchupalli (C.T.) 18,960 9,501 9,459 24.85
38. DHARMAVARAM (M) 1,03,357 52,785 50,572 30.90 39. TADEPALLIGUDEM (M) 1,02,622 50,925 51,697 15.46
Contd..

20
3. AREA AND POPULATION
TABLE 3.4(A)
Principal Towns and Cities with Population of 50000 and above, 2001 Census
Population Sl. No Size Class of City/U.A/Town
Persons Male Female
Geowth Rate
1991-2001 (%)
(1) (2) (3) (4) (5) (6) CLASS II (50000-99999)
1. NARSARAOPET U.A 95,349 47,994 47,355 7.46 (a) Narasaraopet (M+O.G) 95,349 47,994 47,355 7.46 i. Narasaraopet (M) 93,321 46,980 46,341 5.18
ii. Lingamguntla Agraharam(Partly) (O.G.)
1,252 623 629 N.A
iii. Narasaraopet (R) (Partly) (O.G)
776 391 385 N.A
2. SURYAPET U.A 94,585 49,221 45,364 56.00 (a) Suryapet (M+O.G) 94,585 49,221 45,364 56.00 i. Suryapet (M) 93,239 48,505 44,734 53.78 ii. Pillalamarri (Partly)(O.G.) 1,346 716 630 N.A
3. CHILAKALURIPET (M) 91,656 45,619 46,037 15.81 4. MIRYALAGUDA U.A 91,359 46,770 44,589 38.68 (a) Miryalaguda (M+O.G) 91,359 46,770 44,589 38.68 i. Miryalaguda (M) 90,886 46,530 44,356 37.96 ii. Nandipahad (Partly)(O.G.) 473 240 233 N.A
5. TADPATRI (M) 86,843 44,047 42,796 22.20 6. (a) KAVALI U.A 85,616 44,237 41,379 29.90 i. Kavali (M+O.G) 85,616 44,237 41,379 29.90 ii. Kavali (M) 79,682 41,242 38,440 20.90 iii. Maddurpadu (Partly) (OG) 2,769 1,395 1,374 N.A iv. Masunuru (Partly)(O.G.) 3,165 1,600 1,565 N.A
7. JAGTIAL(M) 85,521 43,377 42,144 26.53 8. ANAKAPALLI (M) 85,486 42,471 43,015 1.34 9. YEMMIGANUR(M) 76,411 38,692 37,719 17.39 10. PALACOLE U.A. 76,308 37,983 38,325 3.67
(a) Palacole (M+O.G) 76,308 37,983 38,325 3.67 i. Palacole (M) 57,317 28,426 28,891 0.61 ii. Ullamparru (O.G) 5,229 2,619 2,610 14.55 iii. Poolapalli (O.G) 7,799 3,886 3,913 2.97 iv. Palacole(R)(O.G) 5,963 3,052 2,911 32.45
Contd..

21
3. AREA AND POPULATION
TABLE 3.4(A)
Principal Towns and Cities with Population of 50000 and above 2001 Census
Population Sl. No
Size Class of City/U.A/Town Persons Male Female
Geowth Rate 1991-
2001 (%) (1) (2) (3) (4) (5) (6) 11. KADIRI (M) 76,252 38,468 37,784 20.31 12. NIRMAL (M) 75,254 37,794 37,460 30.29 13. GUDUR U.A. 74,046 36,403 37,643 32.26
(a) Gudur (M+O.G) 74,046 36,403 37,643 32.26 i. Gudur (M) 68,782 33,719 35,063 22.86
ii. Gudur (R) (East) (Partly) (O.G.).
633 362 271 N.A
iii. Gudur (R) (West) (Partly)(O.G.)
4,631 2,322 2,309 N.A
iv. Mutyalampadu (Partly) (O.G.)
- - - -
v. Nellaturu (Partly) (O.G.)
- - - -
14. TANUKU U.A. 72,970 36,319 36,651 15.99 (a). Tanuku (M+O.G) 72,970 36,319 36,651 15.99 i. Tanuku (M) 68,585 34,094 34,491 9.02
ii. Mandapaka (Partly) (O.G.)
4,385 2,225 2,160 N.A
15. RAYACHOTI (C.T.) 72,297 37,163 35,134 39.22 16. BODHAN (M) 71,520 36,164 35,356 11.05 17. SRIKALAHASTI (M) 70,854 35,613 35,241 15.06 18.. PALVANCHA(M) 69,088 35,495 33,593 30.10 19. BAPATLA (M) 68,397 34,776 33,621 9.37 20. BELLAMPALLI (M) 66,792 33,812 32,980 0.02 21. MANDAMARRI (M) 66,596 33,950 32,646 0.68 22. SIRCILLA (M) 65,314 32,666 32,648 30.50 23. KAMAREDDY (M) 64,496 32,770 31,726 32.53 24. SIDDIPET (M) 61,809 31,109 30,700 14.27 25. KAGHAZNAGAR (M) 59,734 30,436 29,298 3.82
Contd..

22
3. AREA AND POPULATION
TABLE 3.4(A) (Concld.)
Principal Towns and Cities with Population of 50000 and above 2001 Census
Population Sl. No
Size Class of City/U.A/Town Persons Male Female
Growth Rate
1991-2001 (%)
(1) (2) (3) (4) (5) (6) 26. NARSAPUR(M) 58,604 28,938 29,666 3.98 27. MARKAPUR (M) 58,462 29,743 28,719 28.31 28. TANDUR (M) 57,941 29,584 28,357 27.30 29. PONNUR (M) 57,640 28,914 28,726 6.03 30. SANGAREDDY(M) 57,113 29,021 28,092 13.95 31. RAYADURG (M) 54,125 27,408 26,717 32.51 32. KORATLA (M) 54,012 27,273 26,739 34.76 33. SAMALKOTA (M) 53,602 26,720 26,882 9.93 34. GADWAL U.A. 53,560 27,497 26,063 31.46
(a) Gadwal (M+O.G) 53,560 27,497 26,063 31.46 i. Gadwal (M) 50,941 26,129 24,812 25.03 ii. Gadwal (R) Partly (O.G) 2,619 1,368 1,251 -
35. VINUKONDA (C.T) 52,519 26,942 25,577 51.76 36. AMALAPURAM (M) 51,444 25,782 25,662 11.76 37. SATHENAPALLI (M) 51,404 25,794 25,610 13.12 38. BHONGIR (M) 50,407 25,967 24,440 23.72 39. TUNI (M) 50,368 24,838 25,530 14.72 40. NUZIVID(M) 50,354 25,526 24,828 17.97 41. KANDUKUR (M) 50,326 25,631 24,695 21.75 42. WANAPARTHY (N.P.) 50,114 25,712 24,402 28.95 43. PITHAPURAM (M) 50,103 24,694 25,409 13.71 44. BOBBILI (M) 50,096 25,033 25,063 15.83
U.A. : Urban Agglomeration. C.B. : Contonment Board O.G. : Out Growth. M.C. : Municipal Corporation M : Municipality C.T. : Census Town N.P. : Nagar Panchayat. R. : Rural NMA : Non Municipal Area Source :1. District Census Hand Books 1991 issued by Directorate of Census Operations Andhra Pradesh. 2. Final Population Totals of Census of India 2001 issued by Directorate of
Census operations, Andhra Pradesh.

23
3. AREA AND POPULATION
TABLE 3.4(B)
District wise Slum Population in Urban Areas, 2001 Census
Sl. No. District Total
Population Urban
Population
Slum Population
(p)
% of Slum
Popula-tion(P) to total Popula
-tion
% of Slum
Popula-tion
(P) to Urban Popula-
tion (1) (2) (3) (4) (5) (6) (7) 1. Srikakulam 25,37,593 2,78,659 48,632 1.92 17.45 2. Vizianagaram 22,49,254 4,12,395 67,525 3.00 16.37 3. Visakhapatnam 38,32,336 15,30,899 1,96,990 5.14 12.87
4. East Godavari 49,01,420 11,51,885 1,70,372 3.48 14.79 5. West Godavari 38,03,517 7,50,887 2,67,592 7.04 35.64 6. Krishna 41,87,841 13,43,447 3,99,120 9.53 29.71
7. Guntur 44,65,144 12,85,760 4,06,766 9.11 31.64 8. Prakasam 30,59,423 4,67,368 87,969 2.88 18.82 9. Nellore 26,68,564 5,99,043 1,90,327 7.13 31.77
10. Chittoor 37,45,875 8,11,030 2,08,266 5.56 25.68 11. Kadapa 26,01,797 5,87,753 81,415 3.13 13.85 12. Anantapur 36,40,478 9,19,563 3,43,378 9.43 37.34
13. Kurnool 35,29,494 8,17,464 2,53,341 7.18 30.99 14. Mahbubnagar 35,13,934 3,71,355 51,481 1.47 13.86 15. Rangareddy 35,75,064 19,37,837 5,49,129 15.36 28.34
16. Hyderabad 38,29,753 38,29,753 6,21,295 16.22 16.22 17. Medak 26,70,097 3,83,524 62,622 2.35 16.33 18. Nizamabad 23,45,685 4,24,738 1,98,453 8.46 46.72
19. Adilabad 24,88,003 6,60,017 2,37,460 9.54 35.98 20. Karimnagar 34,91,822 6,78,812 1,90,852 5.47 28.12 21. Warangal 32,46,004 6,23,212 2,30,190 7.09 36.94
22. Khammam 25,78,927 5,10,861 1,79,487 6.96 35.13 23. Nalgonda 32,47,982 4,32,678 1,06,610 3.28 24.64 Andhra Pradesh 7,62,10,007 2,08,08,940 51,49,272 6.76 24.75
Source :1. Final Population Totals of Census of India 2001 issued by Directorate of Census Operations, Andhra Pradesh

24
3. AREA AND POPULATION
TABLE 3.4(C)
District wise and Religion wise Population – 2001 Census
Sl. No District All
Religion Buddhists Christians Hindus
(1) (2) (3) (4) (5) (6)
1. Srikakulam 25,37,593 24 14,199 25,13,087
2. Vizianagaram 22,49,254 26 15,495 22,14,541
3. Visakhapatnam 38,32,336 924 62,227 36,88,280
4. East Godavari 49,01,420 154 70,000 47,52,009
5. West Godavari 38,03,517 169 1,38,363 35,80,207
6. Krishna 41,87,841 172 1,82,614 37,29,204
7. Guntur 44,65,144 181 1,31,713 38,34,204
8. Prakasam 30,59,423 135 32,674 28,25,681
9. Nellore 26,68,564 146 31,593 23,82,701
10. Chittoor 37,45,875 59 28,337 33,68,878
11. Kadapa 26,01,797 73 28,978 21,81,572
12. Anantapur 36,40,478 226 20,770 32,25,156
13. Kurnool 35,29,494 120 40,581 29,10,182
14. Mahbubnagar 35,13,934 32 18,800 31,93,932
15. Rangareddy 35,75,064 1,528 89,893 30,63,118
16. Hyderabad 38,29,753 832 92,915 21,21,963
17. Medak 26,70,097 611 34,651 23,34,169
18. Nizamabad 23,45,685 1,880 16,204 19,83,275
19. Adilabad 24,88,003 24,392 14,751 22,07,843
20. Karimnagar 34,91,822 122 20,576 32,51,834
21. Warangal 32,46,004 69 33,354 30,28,537
22. Khammam 25,78,927 96 30,777 24,06,066
23. Nalgonda 32,47,982 66 32,452 30,40,212
Andhra Pradesh 7,62,10,007 32,037 11,81,917 6,78,36,651
Contd..

25
3. AREA AND POPULATION
TABLE 3.4(C) (Concld.)
District wise and Religion wise Population – 2001 Census
Sl. No District Jains Muslims Sikhs Others
Religion not
Stated (1) (2) (7) (8) (9) (10) (11)
1. Srikakulam 30 7,759 119 38 2,337
2. Vizianagaram 752 15,472 209 30 2,729
3. Visakhapatnam 1,672 71,669 2,776 261 4,527
4. East Godavari 3,698 70,456 500 279 4,324
5. West Godavari 1,356 79,048 251 81 4,042
6. Krishna 4,520 2,65,617 678 197 4,839
7. Guntur 2,841 4,87,839 577 166 7,623
8. Prakasam 26 1,95,637 290 78 4,902
9. Nellore 2,401 2,48,676 301 101 2,645
10. Chittoor 943 3,42,965 560 170 3,963
11. Kadapa 693 3,86,900 303 65 3,213
12. Anantapur 1,110 3,89,201 378 89 3,548
13. Kurnool 1,845 5,72,404 235 131 3,996
14. Mahbubnagar 26 2,96,975 254 84 3,831
15. Rangareddy 1,530 4,08,281 4,512 951 5,251
16. Hyderabad 16,592 15,76,583 10,951 1,278 8,639
17. Medak 283 2,96,486 842 110 2,945
18. Nizamabad 409 3,38,824 1,876 38 3,179
19. Adilabad 426 2,36,844 1,065 137 2,545
20. Karimnagar 81 2,13,811 1,962 312 3,124
21. Warangal 307 1,77,217 1,099 48 5,373
22. Khammam 216 1,37,639 448 82 3,603
23. Nalgonda 89 1,70,553 812 42 3,756
Andhra Pradesh 41,846 69,86,856 30,998 4,768 94,934
Source :1. Final Population Totals of Census of India 2001 issued by Directorate of Census Operations Andhra Pradesh

26
3. AREA AND POPULATION
TABLE 3.4(D)
District wise Disabled Population by type of Disability-2001 Census
Sl. No District Visual Speech Hearing
(1) (2) (3) (4) (5)
1. Srikakulam 22,498 5,249 3,159
2. Vizianagaram 23,057 4,791 3,060
3. Visakhapatnam 32,639 6,965 3,252
4. East Godavari 45,146 9,215 3,793
5. West Godavari 18,143 7,502 3,778
6. Krishna 25,443 8,175 4,059
7. Guntur 30,065 8,665 3,742
8. Prakasam 16,779 6,017 2,687
9. Nellore 17,871 5,639 3,873
10. Chittoor 19,298 7,167 3,965
11. Kadapa 16,570 5,208 3,781
12. Anantapur 21,479 6,801 5,120
13. Kurnool 26,237 6,059 4,497
14. Mahbubnagar 29,632 5,707 3,400
15. Rangareddy 28,756 5,133 2,325
16. Hyderabad 26,361 4,716 1,737
17. Medak 21,695 4,466 2,127
18. Nizamabad 18,224 3,561 1,642
19. Adilabad 13,644 3,815 1,521
20. Karimnagar 29,591 5,887 2,889
21. Warangal 32,312 6,512 2,893
22. Khammam 31,758 5,665 2,708
23. Nalgonda 34,389 6,059 3,365
Andhra Pradesh 5,81,587 1,38,974 73,373
Contd..

27
3. AREA AND POPULATION
TABLE 3.4(D)
District wise Disabled Population by type of Disability-2001 Census
Sl. No District Locomoter Mentally
Retarted Total Disabled
Population (1) (2) (6) (7) (8)
1. Srikakulam 15,234 5,468 51,608
2. Vizianagaram 14,133 4,365 49,406
3. Visakhapatnam 17,454 6,953 67,263
4. East Godavari 25,466 9,060 92,680
5. West Godavari 23,608 8,104 61,135
6. Krishna 24,058 9,421 71,156
7. Guntur 24,183 10,080 76,735
8. Prakasam 17,283 6,165 48,931
9. Nellore 16,104 6,166 49,653
10. Chittoor 19,577 7,527 57,534
11. Kadapa 14,641 5,829 46,029
12. Anantapur 22,465 8,030 63,895
13. Kurnool 21,306 7,162 65,261
14. Mahbubnagar 21,144 6,132 66,015
15. Rangareddy 16,488 6,373 59,075
16. Hyderabad 12,242 7,534 52,590
17. Medak 14,237 4,747 47,272
18. Nizamabad 12,126 4,386 39,939
19. Adilabad 10,615 4,127 33,722
20. Karimnagar 15,255 7,028 60,650
21. Warangal 19,017 6,387 67,121
22. Khammam 16,999 6,565 63,695
23. Nalgonda 22,213 7,590 73,616
Andhra Pradesh 4,15,848 1,55,199 13,64,981 Source :1. Final Population Totals of Census of India 2001 issued by Directorate of Census Operations, Andhra Pradesh

28
3. AREA AND POPULATION
TABLE 3.5 Distribution of Population by Age Groups – Andhra Pradesh,
2001 Census
Age Group (Years)
Rural Urban Total
(1) (2) (3) (4)
All ages 5,54,01,067 2,08,08,940 7,62,10,007
0-4 50,12,932 16,71,429 66,84,361
5-14 1,31,41,553 45,72,211 1,77,13,764
15-19 52,63,858 23,16,106 75,79,964
20-24 47,96,962 21,39,935 69,36,897
25-29 47,79,944 19,82,327 67,62,271
30-34 40,20,132 16,05,373 56,25,505
35-39 40,35,189 16,17,522 56,52,711
40-49 58,97,425 22,61,468 81,58,893
50-59 38,68,354 13,05,759 51,74,113
60-69 28,83,813 8,25,463 37,09,276
70-79 12,35,889 3,38,603 15,74,492
80+ 3,86,032 1,18,278 5,04,310
A.N.S 78,984 54,466 1,33,450
A.N.S. : Age Not stated. Source : Registrar General of India, Ministry of Home Affairs, New Delhi.

29
3. AREA AND POPULATION
TABLE 3.6 Scheduled Caste and Scheduled Tribe Population - District wise,
2001 Census (In lakhs)
Sl. No District Scheduled Castes Scheduled Tribes
(1) (2) (3) (4) 1. Srikakulam 2.30 1.51
2. Vizianagaram 2.38 2.15
3. Visakhapatnam 2.91 5.58
4. East Godavari 8.82 1.91
5. West Godavari 7.29 0.97
6. Krishna 7.47 1.08
7. Guntur 8.18 2.08
8. Prakasam 6.52 1.18
9. Nellore 5.87 2.42
10. Chittoor 7.02 1.28
11. Kadapa 4.09 0.61
12. Anantapur 5.15 1.27
13. Kurnool 6.28 0.70
14. Mahbubnagar 6.01 2.79
15. Rangareddy 5.20 1.46
16. Hyderabad 3.07 0.35
17. Medak 4.70 1.34
18. Nizamabad 3.48 1.66
19. Adilabad 4.61 4.16
20. Karimnagar 6.50 0.90
21. Warangal 5.51 4.58
22. Khammam 4.27 6.83
23. Nalgonda 5.76 3.43
Andhra Pradesh 123.39 50.24 Source : Final Population totals of Census of India 2001 issued by Directorate of Census Operations, Andhra Pradesh.
30
3. AREA AND POPULATION
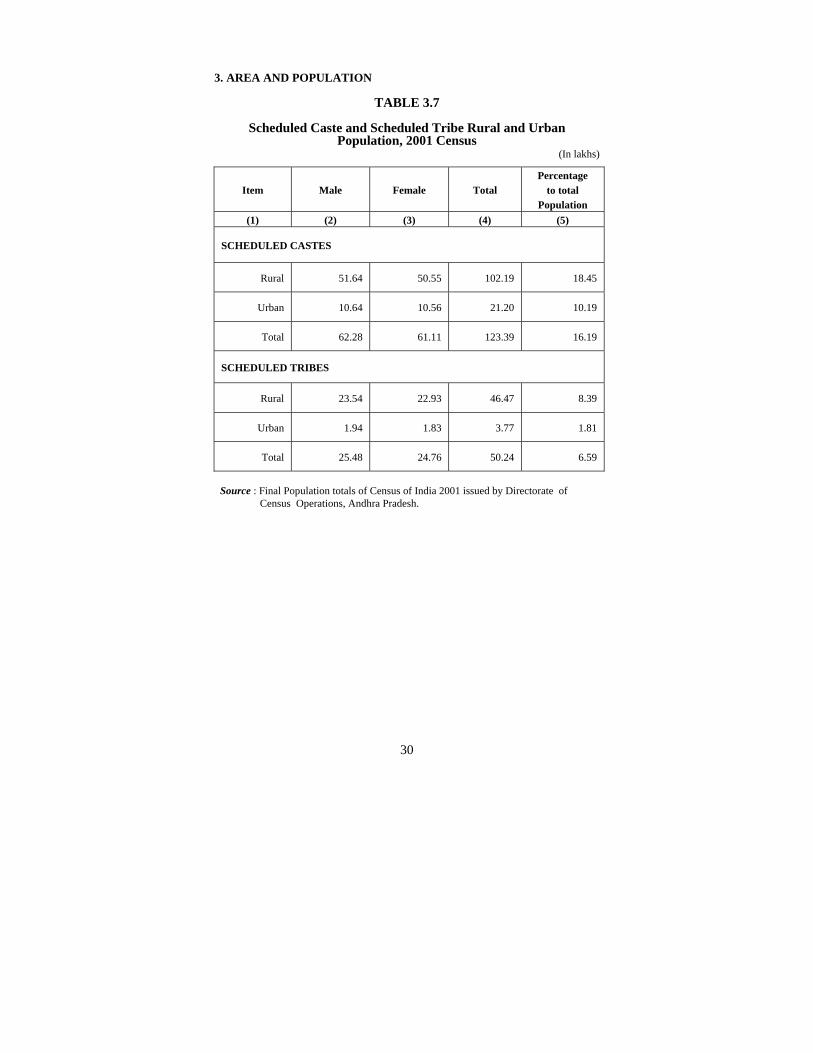
TABLE 3.7
Scheduled Caste and Scheduled Tribe Rural and Urban Population, 2001 Census
(In lakhs)
Source : Final Population totals of Census of India 2001 issued by Directorate of Census Operations, Andhra Pradesh.
Item Male Female Total Percentage
to total Population
(1) (2) (3) (4) (5)
SCHEDULED CASTES
Rural 51.64 50.55 102.19 18.45
Urban 10.64 10.56 21.20 10.19
Total 62.28 61.11 123.39 16.19
SCHEDULED TRIBES
Rural 23.54 22.93 46.47 8.39
Urban 1.94 1.83 3.77 1.81
Total 25.48 24.76 50.24 6.59

31
3. AREA AND POPULATION
TABLE 3.8
Working Population - By Occupational Divisions, 2001 Census
( In lakhs) Working Population among
Sl. No.
Occupational Division
Total Working
Population Scheduled
Castes Scheduled
Tribes
(1) (2) (3) (4) (5)
A. Main Workers:
1. Cultivators 73.98
(25.47) 5.72
(11.59) 8.80
(41.01)
2. Agricultural Labourers 98.23
(33.83) 31.70
(64.21) 8.98
(41.86)
3. Household Industry 13.53 (4.66)
0.91 (1.84)
0.62 (2.87)
4. Other Workers 104.67 (36.04)
11.04 (22.36)
3.06 (14.26)
Total Main Workers 290.41 (100.0)
49.37 (100.00)
21.46 (100.00)
B. Marginal Workers
1. Cultivators 4.62
(7.89) 0.34
(2.70) 0.48
(8.57)
2. Agricultural Labourer 40.09
(68.49) 10.88
(83.95) 4.35
(77.68)
3. Household Industry 2.89
(4.94) 0.26
(2.01) 0.19
(3.39)
4. Other Workers 10.93
(18.68) 1.48
(11.34) 0.58
(10.36)
Total Marginal Workers 58.53
(100.00) 12.96
(100.00) 5.60
(100.00) 1) Figures in parenthesis represent percentage to total main and Marginal workers 2) Percentages calculated on full figures (actuals) Sources :Directorate of Census Operations, Andhra Pradesh.

32
3. AREA AND POPULATION
TABLE - 3.9
Literate Population - District wise, 2001 Census
Number of Literates Literacy Rate Sl. No
District Male Female Total Male Female Total
(1) (2) (3) (4) (5) (6) (7) (8)
1. Srikakulam 7,31,778 4,85,881 12,17,659 67.19 43.68 55.31
2. Vizianagaram 6,05,038 3,92,444 9,97,482 62.37 39.91 51.17
3. Visakhapatnam 11,71,082 8,31,234 20,02,316 69.68 50.12 59.96
4. East Godavari 15,04,676 13,03,052 28,07,728 70.00 60.94 65.48
5. West Godavari 13,08,598 11,50,224 24,58,822 78.05 68.99 73.53
6. Krishna 13,86,261 11,53,713 25,39,974 74.39 63.19 68.85
7. Guntur 14,07,402 10,48,563 24,55,965 71.24 53.74 62.54
8. Prakasam 9,38,482 5,93,644 15,32,126 69.35 45.08 57.38
9. Nellore 8,66,975 6,55,891 15,22,866 73.67 56.38 65.08
10 Chittoor 12,73,940 9,03,050 21,76,990 77.62 55.78 66.77
11. Kadapa 8,67,054 5,53,698 14,20,752 75.83 49.54 62.83
12. Anantapur 11,04,042 6,70,046 17,74,088 68.38 43.34 56.13
13. Kurnool 10,03,659 5,88,513 15,92,172 65.96 40.03 53.22
14. Mahbubnagar 8,50,414 4,67,107 13,17,521 56.63 31.89 44.41
15. Rangareddy 11,92,100 8,42,281 20,34,381 75.26 56.49 66.16
16. Hyderabad 14,49,602 11,85,347 26,34,949 83.74 73.50 78.80
17. Medak 7,38,208 4,32,926 11,71,134 64.33 38.66 51.65
18. Nizamabad 6,42,996 4,01,792 10,44,788 64.91 39.48 52.02
19. Adilabad 6,88,072 4,24,117 11,12,189 64.98 40.30 52.68
20. Karimnagar 10,13,328 6,47,761 16,61,089 67.09 42.75 54.90
21. Warangal 9,73,527 6,22,218 15,95,745 68.86 45.09 57.13
22. Khammam 7,45,679 5,22,265 12,67,944 66.11 47.44 56.89
23. Nalgonda 9,81,875 6,13,768 15,95,643 69.23 44.68 57.15
Andhra Pradesh 2,34,44,788 1,64,89,535 3,99,34,323 70.32 50.43 60.47
Note: Literates exclude children in the age group 0-6 years. Source : Final Population Totals of Census of India 2001 issued by Directorate of Census Operations, Andhra Pradesh.
33
3. AREA AND POPULATION
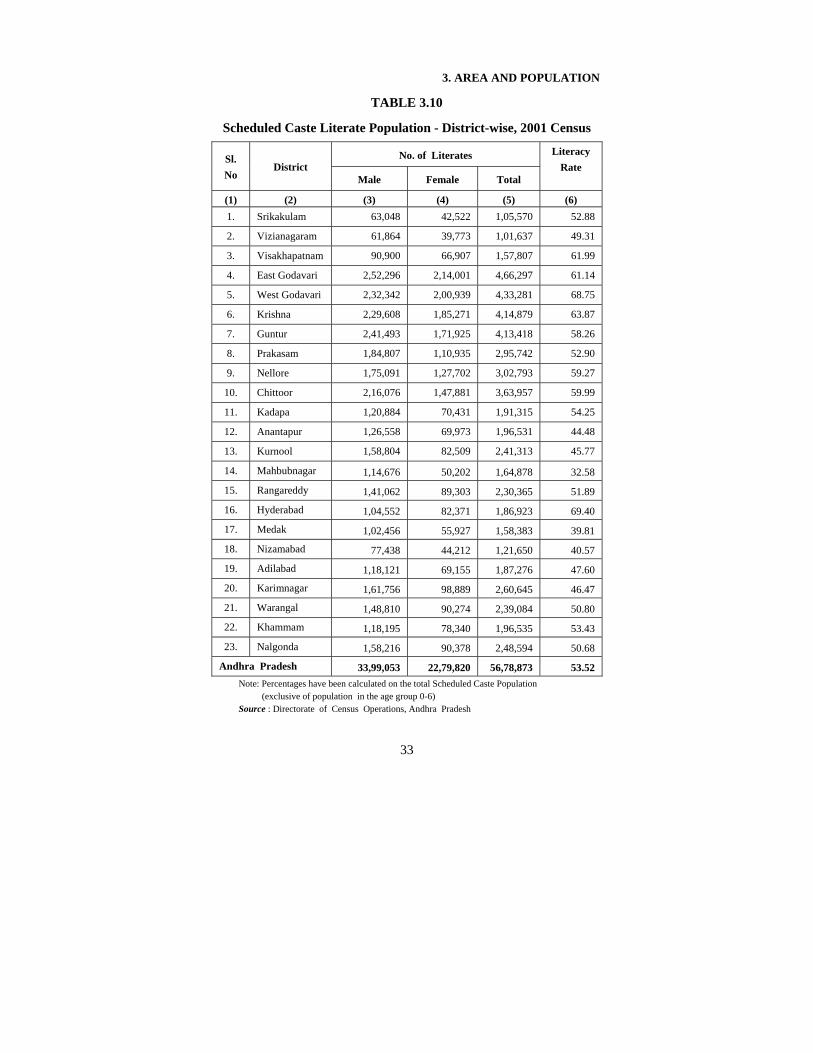
TABLE 3.10
Scheduled Caste Literate Population - District-wise, 2001 Census
Note: Percentages have been calculated on the total Scheduled Caste Population (exclusive of population in the age group 0-6) Source : Directorate of Census Operations, Andhra Pradesh
No. of Literates Sl. No
District Male Female Total
Literacy Rate
(1) (2) (3) (4) (5) (6) 1. Srikakulam 63,048 42,522 1,05,570 52.88
2. Vizianagaram 61,864 39,773 1,01,637 49.31
3. Visakhapatnam 90,900 66,907 1,57,807 61.99
4. East Godavari 2,52,296 2,14,001 4,66,297 61.14
5. West Godavari 2,32,342 2,00,939 4,33,281 68.75
6. Krishna 2,29,608 1,85,271 4,14,879 63.87
7. Guntur 2,41,493 1,71,925 4,13,418 58.26
8. Prakasam 1,84,807 1,10,935 2,95,742 52.90
9. Nellore 1,75,091 1,27,702 3,02,793 59.27
10. Chittoor 2,16,076 1,47,881 3,63,957 59.99
11. Kadapa 1,20,884 70,431 1,91,315 54.25
12. Anantapur 1,26,558 69,973 1,96,531 44.48
13. Kurnool 1,58,804 82,509 2,41,313 45.77
14. Mahbubnagar 1,14,676 50,202 1,64,878 32.58
15. Rangareddy 1,41,062 89,303 2,30,365 51.89
16. Hyderabad 1,04,552 82,371 1,86,923 69.40
17. Medak 1,02,456 55,927 1,58,383 39.81
18. Nizamabad 77,438 44,212 1,21,650 40.57
19. Adilabad 1,18,121 69,155 1,87,276 47.60
20. Karimnagar 1,61,756 98,889 2,60,645 46.47
21. Warangal 1,48,810 90,274 2,39,084 50.80
22. Khammam 1,18,195 78,340 1,96,535 53.43
23. Nalgonda 1,58,216 90,378 2,48,594 50.68
Andhra Pradesh 33,99,053 22,79,820 56,78,873 53.52

34
3. AREA AND POPULATION
TABLE 3.11
Scheduled Tribe Literate Population - District wise, 2001 Census
No. of Literates SL. No
District Male Female Total
Literacy Rate
(1) (2) (3) (4) (5) (6)
1. Srikakulam 34,096 19,742 53,838 41.92
2. Vizianagaram 39,492 23,832 63,324 35.28
3. Visakhapatnam 1,07,248 52,772 1,60,020 34.34
4. East Godavari 40,633 31,771 72,404 44.60
5. West Godavari 22,604 19,049 41,653 50.86
6. Krishna 23,893 15,808 39,701 43.75
7. Guntur 41,539 23,651 65,190 37.28
8. Prakasam 23,785 13,943 37,728 38.15
9. Nellore 43,587 32,833 76,420 37.42
10. Chittoor 28,740 18,880 47,620 44.44
11. Kadapa 13,635 7,501 21,136 41.20
12. Anantapur 32,186 16,209 48,395 44.52
13. Kurnool 16,562 7,909 24,471 42.73
14. Mahbubnagar 42,745 14,411 57,156 25.76
15. Rangareddy 27,813 12,537 40,350 34.53
16. Hyderabad 9,598 6,400 15,998 55.38
17. Medak 22,401 7,301 29,702 28.08
18. Nizamabad 29,779 10,931 40,710 30.71
19. Adilabad 89,169 45,199 1,34,368 39.68
20. Karimnagar 17,408 8,173 25,581 34.23
21. Warangal 89,160 41,300 1,30,460 34.43
22. Khammam 1,38,021 78,042 2,16,063 37.85
23. Nalgonda 71,853 27,136 98,989 35.22
Andhra Pradesh 10,05,947 5,35,330 15,41,277 37.04 Note: Percentages have been calculated on the total Scheduled Tribe population (exclusive of the population in the age group 0-6) Source: Directorate of Census Operations, Andhra Pradesh

35
3. AREA AND POPULATION
TABLE 3.12
District wise Growth of Number of Households during 1991 and 2001 Census
Households 1991 Sl.
No. District Rural Urban Total
(1) (2) (3) (4) (5)
1 Srikakulam 4,47,902 60,867 5,08,769
2 Vizianagaram 3,83,091 77,626 4,60,717
3 Visakhapatnam 4,45,975 2,86,155 7,32,130
4 East Godavari 8,00,666 2,42,211 10,42,877
5 West Godavari 6,41,099 1,63,870 8,04,969
6 Krishna 5,58,503 2,93,152 8,51,655
7 Guntur 6,77,931 261,799 9,39,730
8 Prakasam 4,94,593 99,614 5,94,207
9 Nellore 4,23,493 1,24,673 5,48,166
10 Chittoor 5,56,022 1,36,281 6,92,303
11 Kadapa 3,73,254 1,09,770 4,83,024
12 Ananthapur 4,76,365 1,43,562 6,19,927
13 Kurnool 4,10,169 1,39,971 5,50,140
14 Mahbubnagar 5,01,438 58,664 5,60,102
15 RangaReddy 2,46,634 2,47,930 4,94,564
16 Hyderabad - 5,33,748 5,33,748
17 Medak 3,52,514 60,650 4,13,164
18 Nizamabad 3,20,163 74,829 3,94,992
19 Adilabad 3,27,682 95,382 4,23,064
20 Karimnagar 5,13,854 1,30,002 6,43,856
21 Warangal 4,78,633 1,08,197 5,86,830
22 Khammam 3,79,548 93,865 4,73,413
23 Nalgonda 5,17,433 67,675 5,85,108
Andhra Pradesh 1,03,26,962 36,10,493 1,39,37,455 Contd.

36
3. AREA AND POPULATION
TABLE 3.12(Concld)
District wise Growth of Number of Households during 1991 and 2001 Census
Households 2001 Growth Rate Sl.
No. District Rural Urban Total Rural Urban Total
(1) (2) (6) (7) (8) (9) (10) (11)
1 Srikakulam 5,21,523 60,854 5,82,377 1.53 0.00 1.36
2 Vizianagaram 4,22,971 91,941 5,14,912 1.00 1.71 1.12
3 Visakhapatnam 5,36,287 3,50,716 8,87,003 1.86 2.06 1.94
4 East Godavari 9,30,679 2,71,982 12,02,661 1.52 1.17 1.44
5 West Godavari 7,70,429 1,76,847 9,47,276 1.85 0.77 1.64
6 Krishna 7,08,724 3,03,167 10,11,891 2.41 0.34 1.74
7 Guntur 7,83,685 2,93,618 10,77,303 1.46 1.15 1.38
8 Prakasam 5,95,288 1,07,271 7,02,559 1.87 0.74 1.69
9 Nellore 5,04,132 1,36,810 6,40,942 1.76 0.93 1.58
10 Chittoor 6,70,452 1,78,155 8,48,607 1.89 2.72 2.06
11 Kadapa 4,62,760 1,23,227 5,85,987 2.17 1.16 1.95
12 Ananthapur 5,89,465 1,89,587 7,79,052 2.15 2.82 2.31
13 Kurnool 5,40,822 1,58,369 6,99,191 2.80 1.24 2.43
14 Mahbubnagar 6,20,801 67,411 6,88,212 2.16 1.40 2.08
15 RangaReddy 3,26,274 4,16,316 7,42,590 2.84 5.32 4.15
16 Hyderabad - 6,95,906 6,95,906 - 2.69 2.69
17 Medak 4,44,242 76,776 5,21,018 2.34 2.39 2.35
18 Nizamabad 4,04,834 79,754 4,84,588 2.37 0.64 2.07
19 Adilabad 3,89,854 1,34,795 5,24,649 1.75 3.52 2.18
20 Karimnagar 6,67,824 1,45,973 8,13,797 2.66 1.17 2.37
21 Warangal 5,96,929 1,32,181 7,29,110 2.23 2.02 2.19
22 Khammam 4,86,856 1,14,803 6,01,659 2.52 2.03 2.43
23 Nalgonda 6,32,336 90,679 7,23,015 2.03 2.97 2.14
Andhra Pradesh 1,26,07,167 43,97,138 1,70,04,305 2.02 1.99 2.01 Source: Census of India ‘2001.

37
3. AREA AND POPULATION
TABLE 3.13
Projected Population Characteristics as on 1st March: 2001-2026 - Andhra Pradesh
Indicator 2001 2006 2011 2016 2021 2026
(1) (2) (3) (4) (5) (6) (7)
Population ( 000’)
Total 76,210 80,712 84,735 88,361 91,549 94,073
Male 38,527 40,677 42,611 44,348 45,880 47,061
Female 37,683 40,036 42,124 44,013 46,669 47,012
Sex Ratio 978 984 989 992 995 999 Population density (Sq. km.) 277 293 308 321 333 342
Population by broad age-groups(000’)
18 years and above 47,051 52,753 58,618 63,690 67,712 71,059
0-14 24,441 22,836 21,216 20,318 19,742 19,036
15-59 46,317 51,395 55,827 58,803 60,655 61,641
60+ 5,452 6,481 7,692 9,241 11,152 13,397 Proportion (percent)
0-14 32.1 28.3 25.0 23.0 21.6 20.2
15-59 60.8 63.7 65.9 66.5 66.3 65.5 15-49(Female population 53.5 55.5 56.7 56.2 54.7 52.9
60+ 7.2 8.0 9.1 10.5 12.2 14.2
Median age (years) 24.21 26.04 28.03 30.05 32.32 34.58
Dependency Ratio
Young (0-14) 528 444 380 346 325 309
Old (60+) 118 126 138 157 184 217 Total (Young and Old) 645 570 518 503 509 526
Source: Census of India 2001- Population Projections or India and States 2001-2026. Report of the Technical Group on Population Projections constituted by the National Commission on Population, May 2006. Office of the Registrar General & Census Commissioner, India, New Delhi.

38
3. AREA AND POPULATION
TABLE 3.14
Demographic Indicators: 2001-2025 Andhra Pradesh (Vital Statistics)
Indicator 2001-05 2006 -10 2011-15 2016-20 2021-25
(1) (2) (3) (4) (5) (6) Population growth rate 1.2 1.0 0.8 0.7 0.5
Crude Birth Rate (CBR) 19.2 17.4 16.2 15.1 13.7
Crude Death Rate (CDR) 7.4 7.4 7.5 7.7 8.0
Infant Mortality Rate (IMR) 59.1 53.1 47.9 43.3 39.5
Under-5 mortality rate(q5) 67.6 60.7 54.9 49.7 45.4
Total Fertility Rate (TFR) 2.1 1.9 1.8 1.8 1.8
Life Expectancy of Males 63.4 65.4 66.9 68.4 69.4
Life Expectancy of Females 67.9 69.4 70.9 72.1 73.3
Source: Census of India 2001- Population Projections or India and States 2001-2026. Report of the Technical Group on Population Projections constituted by the National Commission on Population, May 2006. Office of the Registrar General & Census Commissioner, India, New Delhi.

39
3. AREA AND POPULATION
TABLE 3.15(A)
Distribution of Households by the condition of Census Houses occupied by the residents in Andhra Pradesh – 2001 Census.
(in No.) Sl.No. Total Good Livable Dilapidated
(1) (2) (3) (4) (5) (6) 1. A.P 1,68,49,857 99,56,509 62,37,114 6,56,234 2. Rural 1,26,76,218 69,54,920 51,57,199 5,64,099 3. Urban 41,73,639 30,01,589 10,79,915 92,135
Residence Sl.No. Total Good Livable Dilapidated
1. A.P 1,64,26,658 96,87,886 60,92,563 6,46,209 2. Rural 1,23,59,518 67,60,500 50,43,080 5,55,938 3. Urban 40,67,140 28,27,386 10,49,483 90,271
Residence cum other uses Sl.No. Total Good Livable Dilapidated
1. A.P 4,23,199 2,68,623 1,44,551 10,025 2. Rural 3,16,700 1,94,420 1,14,119 8,161 3. Urban 1,06,499 74,203 30,432 1,864
Source: Series-29, Census of India-2001.
TABLE 3.15(B)
Distribution of Households by the condition of Census Houses occupied by Scheduled Caste Persons in Andhra Pradesh-
2001 Census. (in No.)
Sl.No. Total Good Livable Dilapidated (1) (2) (3) (4) (5) (6) 1. A.P 29,69,915 15,42,072 12,60,031 1,67,812 2. Rural 24,63,823 12,24,936 10,90,529 1,48,358 3. Urban 5,06,092 3,17,136 1,69,502 19,454
Residence Sl.No. Total Good Livable Dilapidated
1. A.P 2,94,52,002 15,28,782 12,49,641 1,66,779 2. Rural 24,44,109 12,14,867 10,81,788 1,47,454 3. Urban 5,01,093 3,13,915 1,67,853 19,325
Residence cum other uses Sl.No. Total Good Livable Dilapidated
1. A.P 24,713 13,290 10,390 1,033 2. Rural 19,714 10,069 8,741 904 3. Urban 4,999 3,221 1,649 129
Source: Series-29, Census of India-2001.

40
3. AREA AND POPULATION
TABLE 3.15( C)
Distribution of Households by the condition of Census Houses occupied by Scheduled Tribes persons in Andhra Pradesh
2001 Census. (in No.)
Sl.No. Total Good Livable Dilapidated (1) (2) (3) (4) (5) (6)
1. A.P 12,34,037 5,33,140 6,28,041 72,856
2. Rural 10,93,622 4,52,081 5,76,369 65,172
3. Urban 1,40,415 81,059 51,672 7,684
Residence
Sl.No. Total Good Livable Dilapidated
1. A.P 12,21,577 5,27,378 6,21,858 72,341
2. Rural 10,83,212 4,47,495 5,70,991 64,726
3. Urban 1,38,365 79,883 50,867 7,615
Residence cum other uses
Sl.No. Total Good Livable Dilapidated
1. A.P 12,460 5,762 6,183 515
2. Rural 10,410 4,586 5,378 446
3. Urban 2,050 1,176 805 69 Source: Series-29, Census of India-2001. Note: Since the Local conditions vary from place to place and even in Rural and Urban Areas, it was not considered feasible to give any simple comprehensive defination for the terms used to determine the condition of Census House. The condition of Census houses was recorded as ‘Good’ or livable or dilapidated based on the perception and response of the respondant.

41
4. CLIMATE TABLE 4.1
Temperatures at Selected Centres
(In Celcius degrees) 2006 2007 Sl.
No Station
Maximum Minimum Maximum Minimum
(1) (2) (3) (4) (5) (6) 1. Adilabad 40.0 10.9 NA NA
2. Anantapur 40.0 15.7 39.5 16.5
3. Arogyavaram 36.8 13.0 37.0 12.3
4. Bapatla 36.7 16.7 40.2 16.3
5. Bhadrachalam 38.4 16.5 NA NA
6. Gannavaram 37.6 18.2 42.4 18.4
7. Hanumakonda 40.6 16.4 42.7 23.3
8. Hyderabad 38.4 14.0 40.4 15.9
9 Kadapa 41.6 17.1 41.5 18.8
10. Kakinada 36.5 19.5 38.6 20.3
11. Kalingapatnam 33.0 16.4 34.1 17.5
12. Kavali 37.9 19.8 40.5 19.6
13. Khammam NA NA NA NA
14. Kurnool 39.8 17.2 40.0 17.6
15. Machilipatnam 36.9 19.7 40.2 19.8
16. Mahbubnagar 38.8 16.3 39.4 17.0
17. Medak 42.1 13.0 42.3 14.2
18. Nalgonda 40.3 16.3 41.5 15.8
19. Nandigama 38.5 16.7 42.1 16.1
20. Nandyal 40.0 16.4 40.6 16.6
21 Narsapur 35.0 20.0 37.0 19.8
22. Nellore 38.5 20.7 40.6 20.7
23 Nizamabad 40.7 14.5 42.4 16.1
24. Ongole 38.1 19.8 40.9 19.7
25. Ramagundam 39.5 13.9 42.2 14.9
26. Rentachintala 40.0 15.0 NA NA
27. Nidadavolu NA NA NA NA
28. Tirupathi (Air Port) 39.4 17.5 40.9 17.9
29. Tuni 37.0 18.4 37.6 19.5
30. Visakhapatnam(CWC) 32.7 20.0 33.5 20.3
31. Visakhapatnam(NAS) 35.9 17.9 37.2 18.4 Source : Meteorological Centre, Indian Meteorological Department, Hyderabad.

42
4. CLIMATE
TABLE 4.2
Region wise and Season wise, Rainfall (in mm)
Source : Directorate of Economics and Statistics, Andhra Pradesh.
Monsoon Coastal Andhra
Rayala- Seema
Telan- gana
Andhra Pradesh
(1) (2) (3) (4) (5) South-West Monsoon (June-September) Normal 620 407 715 624 2005-06 665 418 820 690 2006-07 649 307 734 627 2007-08 804 647 737 747 North-East Monsoon (October-December) Normal 324 238 129 224 2005-06 439 432 172 321 2006-07 288 157 64 168 2007-08 250 227 60 163 Winter Period (January-February) Normal 20 6 11 14 2005-06 0 0 0 0 2006-07 8 1 3 5 2007-08 69 24 23 41 Hot Weather Period (March-May) Normal 114 64 51 78 2005-06 147 107 139 136 2006-07 67 81 40 58 2007-08 87 58 106 90 TOTAL: Normal 1,078 715 907 940 2005-06 1,251 957 1,131 1,147 2006-07 1,012 546 841 858 2007-08(upto March’08) 1,210 956 926 1,041

43
5. AGRICULTURE
TABLE 5.1
Land Utilisation (Area In Lakh Hectares)
Source : Directorate of Economics and Statistics, Andhra Pradesh.
Sl. No Category 2005-
06 % to Total
2006-07
% to Total
(1) (2) (3) (4) (5) (6)
1. Forests 61.99 22.6 62.10 22.6
2. Barren and Un-Culturable Land 20.84 7.6 20.98 7.6
3. Land put to Non- Agricultural uses 26.15 9.5 25.91 9.4
4. Culturable Waste 6.92 2.5 6.95 2.5
5. Land under Misc. tree crops and groves not included in the Net Area Sown
2.78 1.0 3.20 1.2
6. Permanent pastures and Other grazing Lands
6.76 2.5 6.02 2.2
7. Current fallows 24.34 8.9 31.66 11.5
8. Other fallow lands 16.23 5.9 15.83 5.8
9. Net Area Sown including fish culture
108.39 39.5 102.39 37.2
10. Total Geographical Area (According to Village Paper)
274.40 100.0 275.04 100.0
11. Gross Cropped Area 133.62 48.7 128.11 46.6
12. Area Sown more than once 26.17 9.5 26.64 9.7

4
LAND UTILISATION IN ANDHRA PRADESH 2006-07
22.6%
7.6%
9.4%
2.5%
1.2%
2.2%
11.5%5.8%
37.2%
ForestsBarren and Un-Culturable LandLand put to Non- Agricultural usesCulturable Waste Land under M isc. tree crops and groves not included in the Net Area SownPermanent pastures and Other grazing Lands Current fallowsOther fallow landsNet Area Sown including fish culture

44
5. AGRICULTURE
TABLE 5.2
Area and Out-turn of Principal Crops
Area (In Lakh Hectares) Production (In Lakh Tonnes) Sl.
No Crop 2005-
06 2006-07
2007-08(P)
2005- 06
2006- 07
2007-08(P)
(1) (2) (3) (4) (5) (6) (7) (8) I. Food Grains
(a) Cereals and Millets 53.86 52.90 52.21 155.75 148.82 171.54
1. Rice 39.82 39.78 39.02 117.04 118.72 129.59 2. Wheat 0.11 0.10 0.09 0.09 0.09 0.07 3. Jowar 4.44 4.23 3.78 5.88 4.11 4.73 4. Bajra 0.81 0.61 0.71 0.82 0.47 0.86 5. Ragi 0.66 0.59 0.55 0.79 0.64 0.62 6. Maize 7.58 7.25 7.70 30.87 24.62 35.32 7. Small Millets 0.44 0.34 0.36 0.26 0.17 0.35
(b) Total Pulses 17.82 19.84 21.01 13.75 13.47 15.44 8. Bengalgram 3.94 6.02 6.37 6.27 6.53 7.32 9. Greengram 3.85 3.94 4.28 1.65 1.44 1.87
10. Redgram 4.94 4.01 4.65 3.01 1.61 3.03 11. Blackgram 4.21 4.98 4.91 2.50 3.50 2.87 12. Horsegram 0.57 0.64 0.52 0.21 0.30 0.27 13. Other Pulses 0.31 0.25 0.28 0.11 0.09 0.08
TOTAL FOOD GRAINS(a+b) 71.68 72.74 73.22 169.50 162.29 186.98
II Total Oil Seeds 30.41 23.61 26.10 20.41 17.22 28.54 14. Groundnut 18.76 13.34 17.65 13.66 7.43 22.86 15. Seasamum 1.16 1.14 1.11 0.29 0.29 0.27 16. Sunflower 4.44 4.46 4.07 2.98 3.29 2.88 17. Soyabean 0.98 1.03 0.87 1.91 1.56 1.39 18. Castor 3.45 2.02 1.97 1.40 0.87 0.97
III. Other Crops 19. Chillies. 1.72 2.14 2.25 5.38 7.66 7.80 20. Turmeric 0.70 0.65 0.63 5.19 4.01 3.76 21. Sugarcane (Gur) 2.30 2.64 2.47 18.65 23.67 202.69 22. Cotton (a) 10.33 9.72 11.33 21.08 21.81 39.99 23. Mesta (b) 0.50 0.62 0.56 4.55 5.44 4.98 24. Tobacco 1.34 1.27 1.08 1.98 1.82 1.51
(a) : Bales of 170 Kgs. Lint (b) : Bales of 180 Kgs. each. Source : Directorate of Economics and Statistics, Andhra Pradesh.

45
5. AGRICULTURE TABLE 5.3
Average Yield of Principal Crops
(In Kgs. per Hectare) Sl. No Crop 2004-05 2005-06 2006-07
(1) (2) (3) (4) (5)
I. Foodgrains
(a) Cereals
1. Rice 3,111 2,939 2,984
2. Wheat 502 800 878
3. Jowar 1,030 1,324 966
4. Bajra 868 1,014 771
5. Ragi 1,267 1,209 1,095
6. Maize 3,142 4,073 3,391
7. Other Small Millets 525 449 537
(b) Pulses
8. Bengalgram 1,012 1,590 1,087
9. Greengram 351 429 364
10. Tuar (Redgram) 456 608 401
11. Blackgram 605 593 703
12. Horsegram 383 371 470
13. Other Pulses 239 189 324
II. Non-Food Crops
14. Groundnut 891 728 557
15. Seasamum 180 249 253
16. Sunflower 610 669 739
17. Soyabean 1,528 1,954 1,524
18. Castor 388 407 430
19. Chillies 3,164 3,136 3,579
20. Turmeric 6,809 7,410 6,214
21. Sugarcane (Gur) 7,506 8,110 8,957
22. Cotton (Lint) 316 347 381
23. Mesta 1,539 1,645 1,581
24. Tobacco (Virginia) 1,208 1,272 1,225
Souce: Directorate of Economics and Statistics-Hyderabad

46
5. AGRICULTURE
TABLE 5.4
Index Numbers of Agricultural Production (Base: Triennium ending 1993-94 = 100)
Sl. No Cmmodity Weight 1998-
99 1999-2000
2000-01
2001-02
(1) (2) (3) (4) (5) (6) (7) 1. Rice 32.13 124.24 111.27 130.31 119.14
2. Wheat 0.05 108.74 152.99 137.20 160.26
3. Jowar 3.09 59.96 61.42 70.97 72.69
4. Bajra 0.42 107.75 88.06 134.19 64.20
5. Maize 2.18 178.17 189.66 203.58 187.60
6. Ragi 0.47 74.76 67.73 73.55 62.97
7. Small Millets 0.18 54.22 39.05 46.31 39.49
Total Cereals & Millets 38.53 128.82 115.61 135.28 123.75
8. Bengalgram 0.42 200.60 146.70 352.87 560.25
9. Redgram 0.92 163.56 148.41 210.07 180.51
10. Greengram 2.04 99.60 96.56 84.39 71.17
11. Blackgram 2.55 108.54 122.43 162.09 158.98
12. Horsegram 0.18 90.20 90.82 51.41 99.29
13. Cowgram 0.05 141.83 112.75 122.21 115.64
14. Other Pulses 0.02 86.30 70.90 96.62 81.16
Total Pulses 6.18 97.56 100.69 122.87 119.45
Total Foodgrains 44.71 128.68 115.54 135.22 123.73
15. Groundnut 20.32 84.66 42.79 84.19 49.12
16. Sesamum (Gingelly) 0.53 95.05 94.89 94.11 67.48
17. Sunflower 0.35 91.20 73.18 77.15 100.86
18. Safflower 0.06 85.07 118.03 100.24 90.26
19. Nigerseed 0.11 85.10 94.55 79.20 105.80
20. Linseed 0.02 45.25 18.62 63.01 81.81
21. Castor 0.56 60.63 77.80 182.47 110.63
22. Rape and Mustard 0.01 97.67 137.46 223.00 168.10
Total Oil Seeds 21.96 97.00 49.14 96.54 56.43
Contd..

47
5. AGRICULTURE
TABLE 5.4
Index Numbers of Agricultural Production
(Base: Triennium ending 1993-94 = 100) Sl. No Cmmodity 2002-
03 2003-
04 2004-
05 2005-
06 2006-
07
(1) (2) (8) (9) (10) (11) (12)
1. Rice 76.64 93.65 100.43 122.42 124.18
2. Wheat 251.69 113.89 77.80 150.21 148.60
3. Jowar 69.64 85.07 59.10 67.41 47.07
4. Bajra 51.95 133.85 73.46 74.25 42.46
5. Maize 191.33 318.95 265.75 397.54 317.08
6. Ragi 47.09 61.98 53.55 48.61 39.51
7. Small Millets 26.28 34.60 27.16 30.89 20.03
Total Cereals & Millets 80.21 98.51 104.90 128.25 129.41
8. Bengalgram 589.05 704.39 532.94 967.39 1,008.31
9. Redgram 144.12 208.86 209.93 288.17 154.17
10. Greengram 54.05 143.13 73.05 75.74 65.79
11. Blackgram 156.10 83.08 107.37 103.79 145.31
12. Horsegram 73.58 98.56 64.62 53.17 75.94
13. Cowgram 102.19 167.70 105.73 147.40 111.83
14. Other Pulses 65.33 90.85 79.03 52.48 67.07
Total Pulses 110.43 113.62 98.12 111.53 118.49
Total Foodgrains 80.35 98.57 104.87 128.17 129.36
15. Groundnut 32.24 38.73 64.40 53.66 29.17
16. Seasamum (Gingely) 45.60 108.11 95.18 73.49 72.64
17. Sunflower 126.97 153.20 133.42 136.78 151.43
18. Safflower 99.55 81.28 126.37 123.41 137.13
19. Nigerseed 75.80 89.65 80.53 80.47 70.40
20. Linseed 71.37 68.78 26.93 82.75 44.81
21. Castor 115.74 175.80 140.57 186.68 115.85
22. Rape and Mustard 157.88 91.92 192.35 546.41 591.54
Total Oil Seeds 37.18 44.73 73.99 61.75 33.74 Contd..

48
5. AGRICULTURE
TABLE 5.4
Index Numbers of Agricultural Production
(Base: Triennium ending 1993-94 = 100) Sl. No. Cmmodity Weight 1998-99 1999-2000 2000-01 2001-02
(1) (2) (3) (4) (5) (6) (7) 23. Cotton (Kapas) 9.11 114.45 119.92 123.76 142.29
24. Mesta 0.20 110.25 126.78 139.74 136.61
Total Fibres 9.32 120.36 126.30 130.48 149.62
25. Coffee 0.04 113.46 165.22 171.32 146.00 Total Plantation Crops 0.04 121.40 176.78 183.31 156.23
26. Chillies 7.24 162.47 153.40 162.70 182.87
27. Turmeric 3.26 80.30 81.18 97.59 64.79
28. Arecanuts 0.08 49.90 49.11 142.79 88.56
29. Coriander 0.28 97.56 44.71 75.65 85.93
30. Ginger 0.05 181.83 117.68 106.72 102.59
31. Garlic 0.01 252.40 318.38 95.99 286.58 Total Condiments and Spices 10.92 156.39 149.73 163.54 165.54
32. Potatoes 0.02 196.00 221.40 255.01 255.62
33. Sweet Potatoes 0.04 58.05 74.34 136.05 137.89
34. Onions 0.63 115.20 125.94 129.25 134.78
35. Tapioca 0.17 94.74 80.13 119.59 105.36
36. Banana 1.94 120.64 105.10 110.65 102.78
37. Cashewnut 0.53 170.28 179.51 148.53 185.11 Total Fruits and Vegetables 3.32 150.76 136.42 143.31 136.20
38. Sugarcane(for Harvest) 5.93 122.48 137.35 131.28 134.18
39. Total Tobacco 3.81 130.88 102.86 46.59 89.62
40. Total Other Crops 9.74 121.52 135.89 129.44 132.67
Total Non-food grains 55.29 114.45 107.14 119.53 109.03
All Crops 100.00 124.23 112.92 130.32 119.13 Contd..

49
5. AGRICULTURE
TABLE 5.4 (Concld.)
Index Numbers of Agricultural Production
(Base: Triennium ending 1993-94 = 100)
Source:- Directorate of Economics and Statistics, Andhra Pradesh.
Sl. No. Cmmodity 2002-
03 2003-
04 2004-
05 2005-
06 2006-
07 (1) (2) (8) (9) (10) (11) (12)
23. Cotton (Kapas) 81.05 143.38 162.85 161.71 164.62
24. Mesta 124.82 95.65 93.25 92.66 110.58
Total Fibres 85.98 150.08 170.20 169.02 172.32
25. Coffee 149.27 233.00 176.05 57.85 123.83 Total Plantation Crops 159.73 249.33 188.39 61.91 132.53
26. Chillies 126.42 246.47 231.46 166.28 236.78
27. Turmeric 73.63 83.28 108.51 134.67 104.13
28. Arecanuts 84.22 43.59 23.87 46.16 34.72
29. Coriander 51.92 60.54 35.25 48.16 38.08
30. Ginger 54.27 91.96 178.64 269.55 168.74
31. Garlic 29.20 37.40 488.91 556.62 596.81 Total Condiments and Spices 126.16 221.30 220.13 181.31 222.39
32. Potatoes 325.81 419.51 480.17 515.70 780.20
33. Sweet Potatoes 71.48 48.78 41.83 46.62 45.99
34. Onions 99.40 125.14 145.36 167.73 139.58
35. Tapioca 57.21 87.98 105.67 90.70 150.57
36. Banana 138.73 69.57 132.35 126.28 165.24
37. Cashewnut 93.89 187.40 160.47 191.94 179.12 Total Fruits and Vegetables 165.40 99.41 168.84 166.76 203.00
38. Sugarcane (for Harvest) 114.19 111.84 116.81 131.04 160.98
39. Total Tobacco 89.15 103.96 88.37 105.30 96.67
40. Total Other Crops 113.01 110.83 115.57 129.71 159.06
Total Non-food grains 87.60 93.11 107.15 110.54 120.14
All Crops 82.62 96.87 105.59 122.66 126.47

50
5.AGRICULTURE
TABLE 5.5
Agricultural Machinery and Implements
Item Unit 1999 2003
% Increase or
decrease(-) in 2003 over
1999
(1) (2) (3) (4) (5)
I. Ploughs
a.Wooden (Lakhs) 25.35 18.74 (-)26.07
b.Iron/Steel (Lakhs) 7.24 7.73 6.77
Total (I) (Lakhs) 32.59 26.47 (-)18.78
II. Sugarcane Crushers
a. Operated by Power ('000) 22.58 15.50 (-)31.36
b. Worked by Bullocks ('000) 18.42 35.65 93.54
Total (II) ('000) 41.00 51.15 24.76
III . Water Lifting devices
Water Lifting devices
(Manual) ('000) 13.85 20.09 45.05
Water Lifting devices (Animal) ('000) 6.75 8.05 19.26
Total (III) ('000) 20.60 28.14 36.60
IV. Water Pumps for Irrigation
Operated by oil Engines ('000) 138.82 151.34 9.02
Operated by Electric Motors ('000) 1,115.45 1,316.22* 18.00
Total (IV) ('000) 1,254.27 1,467.56 17.01
V. Tractors Government and
Private (No.) 90,333 92,384# 2.27
Total (V) (No.) 90,333 92,384 2.27
VI. Oil Ghanies ('000) 4.28 12.58 193.93
Total (VI) ('000) 4.28 12.58 193.93 * : Irrigation Purpose Electric Pumpsets = Electric Pumpsets+ Drip Irrigation sets+ Sprinkler Irrigation set # : Including Crawler Tractors
Source : Director of Animal Husbandry, Andhra Pradesh.

51
5. AGRICULTURE TABLE 5.6
Distribution of Chemical Fertilisers
('000 Tonnes) Sl. No. Item 2005-06 2006-07
(1) (2) (3) (4)
1 Ammonium Sulphate 157 139
2 Urea 2,329 2,229
3. Calcium Ammonium Nitrate 31 28
4. Ammonium Chloride (25% N) 5 2
5. Ammonium Phosphate (20:20) 794 789
6 Ammonium Phosphate (28:28) 226 244
7. Ammonium Phosphate (16:20) 37 32
8. Di-ammonium Phosphate 610 604
9 Single Super Phosphate 216 207
10 Muriate of Potash 411 403
11 Sulphate of Potash 9 10
12 17:17:17 54 16
13 14:28:14 0 0
14 14:35:14 254 259
15 15:15:15 28 26
16 19:19:19 48 35
17 12:32:16 16 16
18 10:26:26 111 128
19 23:23 0 0
Total 5,336 5,167
Source :Commissioner of Agriculture, Andhra Pradesh.

52
6. IRRIGATION
TABLE 6.1
Net Area Irrigated by Sources (In Lakh Hectares)
Sl. No Source 2005-
06 % to Total
2006- 07
% to Total
(1) (2) (3) (4) (5) (6)
1 Canals 15.72 35.8 16.22 36.4
2 Tanks 6.62 15.1 6.02 13.5
3 Tube wells 13.51 30.7 14.20 31.9
4 Dug wells 6.36 14.5 6.53 14.7
5 Other Sources 1.72 3.9 1.55 3.5
Total 43.93 100.0 44.52 100.0
Source : Directorate of Economics and Statistics, Andhra Pradesh.

53
6. IRRIGATION

53
6. IRRIGATION
TABLE 6.2
Percentage of Area Irrigated to Area Sown- Crop wise
Sl. No Crops 2004-05 2005-06 2006-07
(1) (2) (3) (4) (5)
1 Rice 95.2 96.6 96.4
2 Wheat 88.9 72.7 80.0
3 Jowar 8.6 7.9 5.7
4 Bajra 21.3 22.2 26.2
5 Ragi 18.8 18.2 20.3
6 Maize 32.3 34.3 38.2
7 Cereals and Millets 72.5 77.6 78.9
8 Pulses 1.4 1.1 1.3
9 Chillies 69.6 73.8 75.7
10 Sugarcane 92.6 93.5 94.4
11 Groundnut 13.9 14.9 18.6
12 Cotton 17.9 20.1 21.3
13 Tobacco 24.2 24.6 26.0
14 All Crops 39.8 44.9 47.4
Source: Directorate of Economics and Statistics, Andhra Pradesh.

54
7. LIVESTOCK AND FISHERIES
TABLE 7.1
Livestock and Poultry
(In Lakhs)
Sl. No Particulars As per 2003
Census As per 2007 Census(P)
% of increase(+) or Decrease (-) in 2003 over 1999
(1) (2) (3) (4) (5)
A. Cattle 94.24 114.89 21.9
B. Buffaloes 107.68 137.28 27.5
I. Total Bovines (A+B) 201.92 252.17 24.9
II. Total Sheep 210.15 245.85 17.0
III. Total Goats 64.27 97.65 51.9
IV. Horses and Ponies 0.06 0.26 333.3
V. Donkeys 0.31 0.50 61.3
VI. Pigs 5.49 4.35 (-)20.8
VII. Others - - -
Total Livestock (I to VII)
482.20 600.77 24.6
VIII. Rabbits 0.17 0.23 35.3
IX. Total Poultry 1,005.80 1,184.86 17.8
X. Dogs 14.36 10.81 (-)24.7
Source: (1) Director of Animal Husbandry, Andhra Pradesh – Live Strock Census-2007 Provisional.

55
7. LIVESTOCK AND FISHERIES
TABLE 7.2
Marine Fish & Prawns Production (Species- wise) in Andhra Pradesh, 2006-07
(Quantity in Tonnes, Value Rs. in lakhs) Sl. No Name of the Species Quantity Value
(1) (2) (3) (4)
1. Shark 7,061.76 2,543
2. Skates 4,715.52 1,087
3. Rays 4,359.99 1,001
4. Oil Sardine 13,481.30 1,750
5. Other Sardine 7,361.77 1,314
6. Hilsa Shad 2,679.56 509
7. Other Shad 1,560.20 269
8. Thrisocies 5,273.39 1,204
9. Anchovies 3,397.56 949
10. Other Clupeds 4,138.68 711
11. Harpoden neherus 2,419.94 458
12. Chriocentrus 1,206.22 181
13. Polynemids 4,933.19 1,326
14. Chorinemus 1,527.00 304
15. Trichuridae 5,685.05 1,298
16. Carangids 6,069.38 1,137
17. India Markerel 11,908.37 3,368
18. Other Makerel 7,617.82 1,816
19. S.Commorson 1,300.35 809
20. S.Gutatus 1,151.74 531
21. S.Laneoitus 287.20 29
22. Tunnies 1,975.13 581
23. Mugli(Mullets) 7,726.12 2,147
24. Eels 2,762.99 442
25. Cat fishes 7,982.38 1,784
Contd..

56
7. LIVESTOCK AND FISHERIES
TABLE 7.2 (Concld.)
Marine Fish & Prawns Production (Species-wise) in Andhra Pradesh, 2006-07
(Quantity in Tonnes, Value Rs. in lakhs)
Source: Commissioner of Fisheries, Hyderabad, Andhra Pradesh.
Sl.No Name of the Species Quantity Value
(1) (2) (3) (4)
26 Threadfin bream 3,991.33 856
27 Pigface bream 1,014.00 134
28 Other perches 3,502.55 474
29 Sciaenids 5,692.45 1,170
30 Leignathus 2,305.42 434
31 Black pomfret 10,571.46 5,108
32 Silver pomfret 10,616.86 8,988
33 Sole(flat fish) 2,594.86 699
34 P. mondon 10,487.26 31,947
35 P. Indicus 8,456.50 20,653
36 Meta penius 4,788.56 5,861
37 Nonpanaida prawn 9,866.41 8,075
38 Mannecructcens 2,066.45 995
39 Other crustaceans 1,299.06 275
40 Lobsters 242.15 227
41 Mulluses 846.70 293
42 Squids & Cuttle fish 1,593.11 163
43 Miscellaneous fish 41,682.03 6,230
Total 2,40,713.15 1,20,131

57
7. LIVESTOCK AND FISHERIES
TABLE 7.3
Inland Fish & Prawns Production in Andhra Pradesh, 2006-07
(Quantity in Tonnes, Value Rs.in lakhs) Sl. No
Name of Species Quantity Value
(1) (2) (3) (4)
1. Barbus 24,203 5,113
2. Carps 4,77,677 1,90,382
3. Cat fishes 18,723 5,136
4. Murrel 13,743 12,673
5. Mullets 2,380 599
6. Prawns 58,072 1,77,105
7. Hilsa 127 33
8. Miscellaneous 67,459 21,487
Total 6,62,384 4,12,528
Source : Commissioner of Fisheries, Hyderabad, Andhra Pradesh.

58
7. LIVESTOCK AND FISHERIES
TABLE 7.4
Veterinary Services in Andhra Pradesh
Source : Director of Animal Husbandry, Hyderabad, Andhra Pradesh.
Sl. No
Particulars Unit 2005-06 2006-07
(1) (2) (3) (4) (5)
1. Veterinary Poly Clinics ( No.) 22 22
2. Veterinary Hospitals “ 281 281
3. Veterinary Dispensaries “ 1,794 1,813
4. Rural Livestock Units “ 2,916 3,006
5. Number of cases treated
a) In-door ('000) 8 8
b) Out-door “ 61,833 46,707
Total (a + b) “ 61,841 46,715
6. Number of Castrations done “ 1,094 980
7. Number of Vaccinations done “ 83,985 80,094
8. Number of Artificial Inseminations done
a) Exotic “ 1,025 1,065
b) Indigenous “ 158 181
c) Murrah “ 2,225 2,349
Total (a + b + c) “ 3,408 3,595
9. No. of Calves Born
a) Exotic ('000) 411 431
b) Indigenous (") 61 70
c) Murrah (") 843 869
Total (a+b+c) (") 1,315 1,370
10. Number of Artificial Insemination Centres
(No) 4,832 4,946
11. Area brought under improved fodder crops
(‘000 Acres)
1,355 885

59
8. FORESTS
TABLE 8.1
Amount Realised on Sale of Forest Produce (Rs. in lakhs)
Source : Chief Conservator of Forests, Andhra Pradesh.
Sl. No
Species 2002-03 2003-04 2004-05 2005-06 2006-07
(1) (2) (3) (4) (5) (6) (7)
1 Timber 2,102.46 2,662.95 1,732.41 1,755.83 2,656.23
2 Fire-Wood & Charcoal
47.65 44.26 79.67 56.85 33.43
3 Bomboo 1,886.93 1,871.65 2,462.85 1,854.14 1,042.63
4 Beedi Leaves 2,279.44 1,474.81 1,139.16 1,213.43 35.25
5 Other Forest Produce
17.91 1,577.15 16.02 15.92 147.17
6 Miscellaneous 1,982.40 933.08 2,803.57 4,558.78 2,732.65
Total 8,316.79 8,563.90 8,233.68 9,454.95 6,647.36

60
9. INDUSTRIES
TABLE 9.1
Factories working under the Factories Act and persons employed
Year No. of Factories No. of Workers
(1) (2) (3)
2000 28,914 7,07,774
2001 29,203 7,11,276
2002 30,747 7,23,776
2003 27,912 7,09,764
2004 28,001 7,56,797
2005 28,134 7,65,266
2006 28,153 7,82,712
Source: Director of Factories, Andhra Pradesh.

61
9. INDUSTRIES TABLE 9.2
Factories working Under the Factories Act, Industry wise and Persons Employed in Andhra Pradesh 2005
NIC Code No.
Industry
No.of Factories
No.of Workers
(1) (2) (3) (4) 01 Agriculture Hunting and related Service activities 891 34,185 14 Other Mining and Quarrying 457 5,075 15 Manufacture of Food Products and Beverages 12,541 2,22,399 16 Manufacturing of Tobacco Products 223 24,716 17 Manufacture of Textile 408 57,785
18 Manufacture of Wearing apparel Dressing and Dying of fur.
47 4,980
19 Tanning and dressing of Leather manufacture of Luggage Hand bags Saddlery Harness and Footwear
99 2,699
20 Manufacture of Wood and Wood products and cork except furniture manufacturing of articles of straw and plating materials
2,999 16,224
21 Manufacture of Paper and Paper products 410 20,338
22 Publishing Printing and reproduction of recorded media
280 14,535
23 Manufacture of Coke Refined petroleum Products and Nuclear Fuels
97 4,624
24 Manufacture of Chemical and Chemical Products 1,100 58,182 25 Manufacture of Rubber and Plastic products 836 24,391
26 Manufacture of Other Non-metallic Mineral Products
3,557 54,983
27 Manufacture of Basic-metal 678 41,962
28 Manufacture of fabricated Metal products except Machinery equipment
1,230 28,186
29 Manufacture of Machinery and equipment N.E.C 725 37,494
30 Manufacture of Office Accounting and Computing Machine
5 7,996
31 Manufacture of Electrical machinery and apparatus N.E.C
299 15,157
32 Manufature of Radio, Television and Communication equipment and apparatus
123 5,730
33 Manufacture of medical precision and optical instruments watches and clocks
34 1,172
34 Manufacturing of Motor vehicles trailers and semi-trailers
183 10,414
35 Manufacture of other Transport equipment 30 16,081 Contd..

62
9. INDUSTRIES
TABLE 9.2 (Concld.)
Factories working Under the Factories Act, Industry wise and Persons Employed in Andhra Pradesh 2005
NIC Code No.
Industry
No. of Factories
No. of Workers
(1) (2) (3) (4)
36. Manufacture of Furniture Manufacturing N.E.C.
89 4,040
37. Recycling 25 677 40 Electricity Gas Steam and Hot water supply 183 14,728
41 Collection purification and distribution of water
28 1309
45 Construction 5 442
50 Sale maintenance and repair of Motor vehicles and Motor Cycles retail sale of automotive fuel
428 24,687
51 Wholesale trade and Commission except of motor Vehicles and motor cycles
3 70
52 Retail trade except of motor vehicles and motor cycles repair of personal and household goods
3 34
60 Land transport, transport via pipelines 21 1875
63 Supporting and auxiliary transport activities, activities of travel agencies
123 4360
72. Computer and related activities 1 62 74. Other business activities 0 0
75 Public administration and defence compulsory social security
4 2893
90 Sewage and refuse disposal sanitation and Similar activities
3 42
92 Recreational Cultural and Sporting activities 10 604
93 Other Service activities 9 135
Total 28134 765266
Source: Director of Factories, Andhra Pradesh.

63
9. INDUSTRIES
TABLE 9.2(A) Factories working under the Factories Act, Industry wise and
persons employed in Andhra Pradesh 2006
NIC Code No.
Industry
No.of Factories
No.of Workers
(1) (2) (3) (4) 01 Agriculture Hunting and related Service activities 891 32977 14 Other Mining and Quarrying 405 5124 15 Manufacture of Food Products and Beverages 12530 221554 16 Manufacturing of Tobacco Products 225 21491 17 Manufacture of Textile 430 58471
18 Manufacture of Wearing apparel Dressing and Dying of fur. 53 6322
19 Tanning and dressing of Leather manufacture of Luggage Hand bags Saddlery Harness and Footwear 95 3479
20 Manufacture of Wood and Wood products and cork except furniture manufacturing of articles of straw and plating materials
2939 16433
21 Manufacture of Paper and Paper products 447 21144
22 Publishing Printing and reproduction of recorded media 320 15734
23 Manufacture of Coke Refined petroleum Products and Nuclear Fuels 102 4981
24 Manufacture of Chemical and Chemical Products 1221 66480 25 Manufacture of Rubber and Plastic products 890 26940 26 Manufacture of Other Non-metallic MineralProducts 3407 55743 27 Manufacture of Basic-metal 691 46561
28 Manufacture of fabricated Metal products except Machinery equipment 1204 29072
29 Manufacture of Machinery and equipment N.E.C 730 40599
30 Manufacture of Office Accounting and Computing Machine 6 7483
31 Manufacture of Electrical machinery and apparatus N.E.C 311 14964
32 Manufature of Radio, Television and Communication equipment and apparatus 115 5145
33 Manufacture of medical precision and optical instruments watches and clocks 24 1069
34 Manufacturing of Motor vehicles trailers and semi-trailers 163 9711
35 Manufacture of other Transport equipment 30 15605 Contd.,

64
9. INDUSTRIES
TABLE 9.2(A)(concld) Factories working Under the Factories Act, Industry wise and
Persons Employed in Andhra Pradesh 2006
Source: Director of Factories, Andhra Pradesh.
NIC Code No.
Industry
No. of Factories
No. of Workers
(1) (2) (3) (4)
36. Manufacture of Furniture Manufacturing N.E.C. 89 3715
37. Recycling 23 845
40 Electricity Gas Steam and Hot water supply 134 15711
41 Collection purification and distribution of water 28 1471
45 Construction 7 592
50 Sale maintenance and repair of Motor vehicles and Motor Cycles retail sale of automotive fuel
459 24438
51 Wholesale trade and Commission except of motor Vehicles and motor cycles
3 55
52 Retail trade except of motor vehicles and motor cycles repair of personal and household goods
1 14
60 Land transport, transport via pipelines 23 1930
63 Supporting and auxiliary transport activities, activities of travel agencies
121 2751
72. Computer and related activities 2 80
74. Other business activities 2 7
75 Public administration and defence compulsory social security
4 2893
90 Sewage and refuse disposal sanitation and Similar activities
3 48
92 Recreational Cultural and Sporting activities 12 521
93 Other Service activities 9 128
Total 28153 782712

65
9. INDUSTRIES TABLE 9.3
Working of Factories Registered under Sections
2m(i) & 2m(ii) ( As per ASI Report)
Source : Directorate of Economics and Statistics, Andhra Pradesh.
Sl. No Item Unit 2003-04 2004-05
(1) (2) (3) (4) (5)
1. Factories (No.) 14,802 15,568
2. Fixed Capital (Rs in lakhs)
34,21,609 35,26,698
3. Working Capital “ 7,37,874 9,25,898
4. Productive Capital “ 41,59,483 44,52,596
5. Outstanding Loans “ 18,70,161 27,90,505
6. All Workers (No.) 7,22,710 7,84,015
7. All Employees (No.) 8,64,112 9,33,473
8. Wages to Workers (Rs in lakhs)
2,44,226 2,77,696
9. Total Emoluments “ 4,03,134 4,57,531
10. Fuel etc. consumed “ 6,14,979 5,91,095
11. Material consumed “ 50,26,808 63,74,919
12. Total Inputs “ 66,00,381 82,65,800
13. Products “ 72,42,917 88,99,068
14. Total Output “ 82,60,177 1,02,36,470
15. Depreciation “ 3,22,929 3,73,251
16. Net Value Added “ 13,36,867 15,97,419
17. Gross Value Added “ 16,59,796 19,70,670

66
9. INDUSTRIES TABLE 9.4
Index Numbers of Industrial Production in Andhra Pradesh
(Base Year 1993-94=100) Cumulative Index
Ind Code Item/Group Name/Sector Weight 2005-
06** 2006- 07**
2007- 08(P)
# (1) (2) (3) (4) (5) (6) 20-21 Manufacture of Food Products 193.6 121.2 131.7 146.6
22 Manufacture of Beverages Tobacco and allied products 62.7 119.6 137.2 146.2
23 Manufacture of Cotton Textiles 54.5 154.5 169.6 178.4 24 Manufacture of Wool Silk and Man
made Fibre Textiles 13.8 186.5 189.3 218.3
25 Manufacture of Jute and Other Vegetable Fibre Textiles Except Cotton
3.6 75.0 98.2 107.1
26 Manufacture of Textile Products(including Wearing Apparal) 2.8 434.1 441.9 471.9
27 Manufacture of Wood and Wood Products (Furniture and Fixtures) 0.6 129.0 109.8 126.3
28 Manufacture of paper and paper products and Printing Publishing and allied Industries
30.5 200.4 212.2 220.7
29 Manufacture of Leather and product of Leather and Fur products 1.4 51.3 52.4 60.2
30 Manufacture of Basic Chemicals and Chemical products(Except products of Petrolium and coal)
113.6 244.0 273.3 259.4
31 Manufacture of Rubber Plastic Petroleum and Coal Products 62.4 187.4 220.4 229.3
32 Manufacture of Non - metallic Mineral Products 81.5 150.5 165.4 175.0
33 Basic metal & Alloy Industries 102.5 182.0 192.0 198.4
34 Manufacture of Metal Products and parts except Machinery and equipment
11.1 88.1 99.2 114.6
35-36
Manufacture of Machinery and equipment Other than transport equipment
89.6 258.6 287.6 264.8
37 Manufacture of Transport equipment and Parts 14.8 361.4 412.0 447.9
38 Other Manufacturing Industries 3.1 109.1 108.5 91.9 1 Mining & Quarrying* 48.5 353.2 705.8 770.3
2-3 Manufacturing 842.1 178.0 196.4 200.9 4 Electricity 109.4 198.8 218.6 226.6
General Index 1000.0 188.7 223.6 231.3 ** :April-March # : April – February *: The indices of Mining and Quarrying Sector have been revised taking in to account of new items Source: Directorate of Economics and Statistics, Andhra Pradesh.

67
10. MINING TABLE 10
Production of selected Principal Minerals in Andhra Pradesh
(Quantity in Tonnes. Value in Rs. '000)
MCM : Million Cubic Metres Source : Indian Bureau of Mines, Nagpur.
2005-06 2006-07 Sl. No
Mineral Quantity Value Quantity Value
(1) (2) (3) (4) (5) (6) 1 Apatite 3,870 8,177 3,550 7,232 2 Asbestos 663 17,422 359 13,708 3 Ballclay 1,92,539 23,804 2,23,885 42,211 4 Barytes 7,52,554 3,62,310 10,16,134 4,69,799 5 White Clay 1,74,529 11,571 1,90,477 20,855 6 Coal ('000 tonnes) 36,138 3,41,15,118 38,430 3,99,06,320 7 Dolomite 13,50,938 2,08,882 13,73,895 2,98,905 8 Felspar 5,06,174 98,142 5,79,831 1,04,509 9 Fireclay 1,12,111 11,329 83,505 10,332 10 Garnet(abbrassive) 114 46 1,019 448
11 Iron Ore ('000 tonnes)
4,743 4,03,609 5,624 7,29,394
12 China Clay 8,048 534 11,703 1,281 13 Laterite 10,12,858 45,974 14,17,365 95,545 14 Lime Kanker 4,143 1,401 3,061 1,053
15 Limestone ('000 Tonnes)
29,517 25,48,768 34,625 31,34,559
16 Lime shell 8,000 1,600 8,819 1,764 17 Manganese Ore 76,584 67,104 62,209 58,711 18 Mica (Crude) 5,288 1,57,781 7,428 2,15,984 19 Natural Gas (MCM) 1,613 48,40,170 1,506 45,17,298 20 Ochre 1,01,490 4,229 89,254 3,871
21 Petroleum (Crude) ('000 tonnes)
N.A N.A N.A N.A 22 Pyrophyllite 1,164 379 2,921 611 23 Quartz 2,71,671 29,207 3,46,674 39,642 24 Sand (Others) 25,15,580 96,095 17,05,232 57,722 25 Shale 4,02,454 13,716 7,39,626 31,930 26 Silica Sand 8,25,514 42,035 11,75,311 56,944 27 Steatite 91,180 24,171 1,14,859 33,906 28 Vermiculate 4,488 2,207 10,975 4,535 Total - 4,43,54,107 - 5,10,74,386

68
11. FUEL AND POWER
TABLE 11.1
Installed Capacity Generation and Consumption of Electricity
Sl. No Particulars Unit 2005-06 2006-07
(1) (2) (3) (4) (5)
1 Installed Capacity MW 11,151 11,996
2 Power Generated MU 28,574 31,280
3 Power Consumed in Stations
Auxiliaries MU 1,983 20,39.0
4 Power sent out from APGENCO
Power Stations (2-3) MU 26,591 29,241
5 Power received from other
Stations (including wheeling) MU 25,984 28,829
6 Power available for sale
(including wheeling) (4+5) MU 52,575 58,070
6(A) Power purchased from all power
stations MU 51,857 57,464
7 Power sold within the State MU 39,652 44,850
8 Power sent out to other States MU 1,727 713
9 Energy Losses MU 10,478 11,901 MW : Mega Watts MU : Million Units Source : Andhra Pradesh Transco Ltd., Hyderabad.

69
11. FUEL AND POWER
TABLE 11.2
Number of Consumers - Category wise (Including RESCOS)
(As on 31st. March)
RECOS: Rural Electric Supply State Cooperative Society Source: A.P. Transco Ltd., Hyderabad.
Sl. No
Particulars 2005-06 2006-07
(1) (2) (3) (4)
1. Domestic Supply 1,34,79,226 1,43,84,869
2. Non-Domestic Supply 12,81,922 13,38,932
3. Industrial 1,79,426 1,84,394
4. Cottage Industries 23,663 24,368
5. Agricultural 24,40,823 25,27,800
6. Public Lighting/Local
Bodies 1,08,184 1,14,309
7. General Purpose 87,681 90,224
8. Temporary 963 1,034
Total L.T. Services 1,76,01,888 1,86,65,930
Total H.T. Services (including RESCOS) 6,392 7,220
Total L.T. & H.T. Services 1,76,08,280 1,86,73,150

70
11. FUEL AND POWER
TABLE 11.3
Electricity Consumption - Category wise
(In Million Units) Sl. No Particular 2005-06 2006-07
(1) (2) (3) (4)
1. Domestic Supply 8,462 9,178
2. Non-Domestic Supply 2,047 2,298
3. Industrial 2,226 2,387
4. Cottage Industries 43 49
5. Agricultural 13,267 15,538
6. Public Lighting/Local Bodies 1,176 1,182
7. General Purpose 115 124
8. Temporary 9 9
Total L.T 27,345 30,765
Total H.T.(Including RESCOS) 12,307 14,084
Total L.T. and H.T. 39,652 44,850
Source: A.P. Transco Ltd., Hyderabad.

71
11. FUEL AND POWER
TABLE 11.4
Per Capita Consumption of Electricity (Utility only)
(In KWH)
Sl. No District 2005-06 2006-07
(1) (2) (3) (4) 1. Srikakulam 226 253
2. Vizianagaram 350 413
3. Visakhapatnam 477 514
4. East Godavari 323 356
5. West Godavari 485 531
6. Krishna 358 377
7. Guntur 373 409
8. Prakasam 356 393
9. Nellore 513 570
10. Chittoor 510 606
11 Kadapa 511 596
12. Anantapur 488 589
13. Kurnool 341 379
14. Mahbubnagar 558 627
15. Ranga Reddy 911 1,006
16. Hyderabad 749 868
17. Medak 1,009 1,179
18. Nizamabad 569 637
19. Adilabad 385 247
20. Karimnagar 436 330
21. Warangal 442 462
22. Khammam 336 262
23. Nalgonda 870 930
Andhra Pradesh (Including Capitive Genaration)
604 673
Source: A.P. Transco. Ltd., Hyderabad.

72
11. FUEL AND POWER
TABLE 11.5
Number of Electric Pumpsets Energised
(As on 31st March)
Sl. No District 2005-06 2006-07
(1) (2) (3) (4) 1. Srikakulam 21,883 22,596
2. Vizianagaram 26,244 27,168
3. Visakhapatnam 24,958 25,702
4. East Godavari 34,715 35,834
5. West Godavari 65,085 67,474
6. Krishna 55,093 60,000
7. Guntur 51,122 55,909
8. Prakasam 77,440 82,869
9. Nellore 1,07,045 1,11,048
10. Chittoor 2,15,021 2,22,515
11. Kadapa 90,110 92,841
12. Anantapur 1,46,657 1,51,264
13 Kurnool 81,073 83,865
14. Mahbubnagar 1,62,841 1,69,304
15. Ranga Reddy 97,826 98,996
16. Hyderabad 1,003 1,003
17. Medak 1,65,841 1,70,536
18. Nizamabad 1,72,986 1,77,694
19. Adilabad 69,859 73,087
20. Karimnagar 2,56,736 2,65,453
21. Warangal 2,25,595 2,32,008
22. Khammam 74,526 78,602
23. Nalgonda 2,17,164 2,22,032
Andhra Pradesh * 24,40,823 25,27,800 * : Includes pump sets under the control of Rural Electrical Co-operative Societies Source : A.P. Transco. Ltd., Hyderabad.

73
12. LABOUR AND EMPLOYMENT
TABLE 12.1
Distribution of State Public Sector Employees according to Sex & Sectors
No. of Employees as on 31.12.2001
No. of Employees as on 31-03-2006 Sl.
No Sector
Male Female Total Male Female Total (1) (2) (3) (4) (5) (6) (7) (8)
1. State Govt. 4,16,927 1,42,645 5,59,572 4,09,107 2,06,140 6,15,247
2. Judiciary 77 28 105 10,705 2,732 13,437
3. Aided Educational Institutions
25,966 15,567 41,533 14,939 8,042 22,981
4. Zilla Parishads 41,370 13,184 54,554 48,168 23,472 71,640
5. Mandal Parishads
98,411 43,540 1,41,951 1,18,075 55,821 1,73,896
6. Gram Panchayats
16,493 3,005 19,498 33,417 6,298 39,715
7. Municipal Corporations
9,477 5,517 14,994 15,661 7,313 22,974
8. Municipalities 20,828 10,708 31,536 13,840 7,546 21,386
9. Agri.Market Committees
4,312 48 4,360 3,705 788 4,493
10. Zilla Grandhalaya Samsthas
2,222 500 2,722 1,468 310 1,778
11. Urban Development Authority
1,191 214 1,405 1,121 203 1,324
12. State Public Sector undertakings
2,84,591 14,161 2,98,752 2,40,391 13,036 2,53,427
13. Universities 31,205 6,740 37,945 12,324 3,549 15,873
14. Co-operative Institutions
17,852 1,391 19,243 14,998 1,809 16,807
15. Temples - - - 11,458 2,543 14,001
16. Legislat ure - - - 292 94 386,
Total 9,70,922 2,57,248 12,28,170 9,49,669 3,39,696 12,89,365
Source: Directorate of Economics & Statistics, Andhra Pradesh Note: 2006 ,Employees Census figures are provisional

74
12. LABOUR AND EMPLOYMENT
TABLE 12.2
Distribution of Employees in State Public Sector according to Sex District wise
Employees as on 31.12..2001 Employees as on 31..03.2006 Sl No
District Male Female Total Male Female Total
(1) (2) (3) (3) (4) (5) (6) (7) 1. Srikakulam 26,546 8,681 35,227 26,164 11,263 37,427 2. Vizianagaram 24,613 6,413 31,026 25,879 11,053 36,932 3. Visakhapatnam 38,535 11,870 50,405 35,623 15,436 51,059 4. East Godavari 46,934 15,851 62,785 48,435 21,466 69,901 5. West Godavari 32,468 10,588 43,056 34,919 17,313 52,232 6. Krishna 48,232 17,082 65,314 45,703 19,995 65,698 7. Guntur 42,509 13,592 56,101 38,271 19,004 57,275 8. Prakasam 31,402 9,653 41,055 31,069 11,489 42,558 9. Nellore 34,195 10,627 44,822 32,650 14,058 46,708
10. Chittoor 45,541 14,405 59,946 51,179 19,071 70,250 11. Kadapa 34,760 9,491 44,251 33,392 12,178 45,570 12. Anantapur 35,583 10,413 45,996 36,945 14,767 51,712 13. Kurnool 40,582 11,696 52,278 39,085 13,926 53,011 14. Mahbubnagar 35,078 10,894 45,972 33,956 14,319 48,275 15. Rangareddy 24,659 7,120 31,779 39,261 13,731 52,992 16. Hyderabad 1,02,177 26,252 1,28,429 83,279 27,445 1,10,724 17. Medak 26,066 6,699 32,765 29,089 9,493 38,582 18. Nizamabad 29,556 6,803 36,359 31,081 9,611 40,692 19. Adilabad 72,854 8,674 81,528 56,474 9,321 65,795 20. Karimnagar 68,061 9,550 77,611 67,556 13,424 80,980 21. Warangal 42,250 9,917 52,167 46,502 13,354 59,856 22. Khammam 52,559 11,125 63,684 49,088 16,116 65,204 23. Nalgonda 34,751 9,536 44,287 34,069 11,863 45,932
Out Side A.P. 1,011 316 1,327 - - -
Andhra Pradesh 9,70,922 2,57,248 12,28,170 9,49,669 3,39,696 12,89,365 Source: Directorate of Economics and Statistics, Andhra Pradesh
Note: 2006 ,Employees Census figures are provisional

75
12. LABOUR AND EMPLOYMENT
TABLE 12.3
Distribution of State Public Sector Employees by Sectors and
Social Groups as on 31.12.2001and 31.03.2006
Sl.No Sector Scheduled Castes
Scheduled Tribes
Backward Classes
Other Caste Total
(1) (2) (3) (4) (5) (6) (7) 1. State Government: i. 2001 1,21,172 34,129 2,17,893 1,86,378 5,59,572
(21.7) (6.1) (38.9) (33.3) (100.0)
ii. 2006
1,39,038 44,113 2,32,269 1,99,827 6,15,247
(22.6) (7.2) (37.8) (32.5) (100.0)
2. Judiciary
i. 2001 17 - 40 48 105
(16.2) - (38.1) (45.7) (100.0)
ii. 2006
1,691 418 4,833 6,495 13,437
(12.6) (3.1) (36.0) (48.3) (100.0)
3. Aided Educational Institutions
i. 2001 5,123 508 13,551 22,351 41,533
(12.4) (1.2) (32.6) (53.8) (100.0)
ii. 2006 2,730 232 6,947 13,072 22,981 (11.9) (1.0) (30.2) (56.9) (100.0)
4. Local Bodies*
i. 2001 55,847 10,629 96,914 99,143 2,62,533
(21.3) (4.0) (36.9) (37.8) (100.0)
ii. 2006 79,842 17,013 1,16,029 1,16,727 3,29,611
(24.2) (5.2) (35.2) (35.4) (100.0)
5. Others (**)
i. 2001 1,509 286 3,327 3,365 8,487
(17.8) (3.4) (39.2) (39.6) (100.0)
ii. 2006 1,404 306 2,632 3,253 7,595
(18.5) (4.0) (34.7) (42.9) (100.0)
Contd..

76
12. LABOUR AND EMPLOYMENT
TABLE 12.3 (Concld.,) Distribution of State Public Sector Employees by Sectors and
Social Groups on 31.12.2001and 31.03.2006 Sl.No Sector Scheduled
Caste Scheduled
Tribes Backward
Classes Other Caste Total
(1) (2) (3) (4) (5) (6) (7) 6. State Public Sector
i. 2001 55,148 13,110 1,35,863 94,631 2,98,752 (18.4) (4.4) (45.5) (31.7) (100.0) ii. 2006 45,412 10,089 1,11,930 85,996 2,53,427 (17.9) (4.0) (44.2) (33.9) (100.0)
7. Universities
i. 2001 6,423 1,332 13,910 16,280 37,945 (16.9) (3.5) (36.7) (42.9) (100.0) ii. 2006 2,940 483 5,140 7,310 15,873 (18.5) (3.0) (32.4) (46.1) (100.0)
8. Co-operative Institutions i. 2001 2,904 266 7,758 8,315 19,243 (15.1) (1.4) (40.3) (43.2) (100.0) ii. 2006 2,072 473 5,877 8,385 16,807 (12.3) (2.8) (35.0) (49.9) (100.0)
9. Temples i. 2001 - - - - - - - - - - ii. 2006 1,995 618 4,968 6,420 14,001 (14.2) (4.4) (35.5) (45.9) (100.0)
10. Legislature
i. 2001 - - - - - - - - - - ii. 2006 83 13 145 145 386 (21.5) (3.4) (37.6) (37.6) (100.0) Total i. 2001 2,48,143 60,260 4,89,256 4,30,511 12,28,170 (20.2) (4.9) (39.8) (35.1) (100.0) ii. 2006 2,77,207 73,758 4,90,770 4,47,630 12,89,365 (21.5) (5.7) (38.1) (34.7) (100.0)
(*) Includes Z.P.P., M.P.P., G.P., M.Corporations & Muncipalities (**) Includes Urban Dev. Authorities, Agri. Market Committees, Zilla Grandhalaya Samsthas Source :Directorate of Economics and Statistics, Andhra Pradesh.
Note: 2006 ,Employees Census figures are provisional

77
12. LABOUR AND EMPLOYMENT
TABLE 12.4
Employment in Public & Private Sector Establishments - Industry wise (As on 31st March)
(in ‘000)
Note: All Establishments in Public Sector and Non-agricultural Establishments in Private Sector employing 10 or more persons in the State are covered Source: Commissioner of Employment and Training, Andhra Pradesh.
2005-06 2006-07 NIC Code Industry
Public Pri-vate Total Public Pri-
vate Total
(1) (2) (3) (4) (5) (6) (7) (8)
0
Agriculture Hunting Forestry and Fishing
26.9 3.0 29.9 24.8 3.1 27.9
1 Mining and Quarrying 82.1 241.2 323.3 74.3 4.3 78.6
2 & 3 Manufacturing 62.6 147.6 210.2 72.2 377.5 449.7
4 Electricity Gas and Water 92.9 2.7 95.6 44.0 0.9 44.9
5 Construction 10.8 36.8 47.6 50.0 9.6 59.6
6
Wholesale and Retail Trade Restaurants and Hotels
346.3 24.9 371.2 10.4 38.6 49.0
7 Transport Storage and Communications
366.0 42.7 408.7 261.3 8.6 269.9
8
Finance Insurance Real Estate and Business services
372.2 98.1 470.3 103.6 75.8 179.4
9
Community Social and Personal Services
14.9 29.7 44.6 750.6 135.6 886.2
Total 1,374.7 626.7 2,001.4 1391.2 654.0 2045.2

78
12. LABOUR AND EMPLOYMENT
TABLE 12.5 (A)
Registrations and Placements by Employment Exchanges (As on 31st December)
Sl. No. Item Unit 2005 2006 2007
(1) (2) (3) (4) (5) (6)
1. Number of Employment Exchanges in the State (No) 42 42 42
2. Total Number of Candidates on Live Register at the beginning of the year (Cumulative)
('000) 2,424 2,459 2,323
3. Number of Registrations done during the year " 348 262 241
4. Number of applicants employed through the employment exchanges " 2 1.4 1.4
5. Number of applicants who ceased to be on Live Register due to reasons other than placements
" 440 397 315
6. Number of applicants on the Live Register at the end of the year " 2,330 2,323 2,248
Source: Commissioner of Employment and Training, Andhra Pradesh.

79
12. LABOUR AND EMPLOYMENT
TABLE 12.5 (B)
District wise Registrations and Placements through Employment Exchanges
(As on 31st December 2006)
Sl. No District
No. of Employment Exchanges
Total No. of Applicants on Live
Register at the beginning of the
year (Cummulative)
No. of Registrations during the
year
(1) (2) (3) (4) (5) 1. Srikakulam 1 78,775 9,578 2. Vizianagaram 1 67,448 5,429 3. Visakhapatnam 4 1,80,382 18,784 4. East Godavari 2 80,714 9,396 5. West Godavari 2 74,156 9,498 6. Krishna 2 1,06,453 9,063 7. Guntur 1 87,027 11,172 8. Prakasam 2 67,105 7,061 9. Nellore 1 80,113 9,090
10. Chittoor 3 1,36,732 16,768 11. Kadapa 1 89,173 10,428 12. Anantapur 1 1,20,419 15,796 13. Kurnool 1 1,37,447 14,489 14 Mahabubnagar 2 1,21,407 10,504 15 Rangareddy 2 99,587 6,620 16 Hyderabad 6 1,89,593 16,260 17 Medak 1 93,073 10,107 18 Nizamabad 1 55,834 6,449 19 Adilabad 2 1,34,433 19,701 20 Karimnagar 2 1,36,710 13,139 21 Warangal 1 1,57,259 13,156 22 Khammam 2 78,814 11,303 23 Nalgonda 1 86,674 8,597
Total 42 24,59,328 2,62,388
Contd..

80
12. LABOUR AND EMPLOYMENT
TABLE 12.5 (B) (Concld.)
District wise Registrations and Placements through Employment Exchanges
(As on 31st December 2006)
Sl.No District
No. of Applicants employed through
Employment Exchanges
No. of Applicants who ceased
to be on Live Register due
to reasons other than Placements
No. of Applicants on the live Register at the end of the year
No. of Vacancies notified during the the Year
(1) (2) (6) (7) (8) (9)
1. Srikakulam 81 13,527 74,745 366 2. Vizianagaram 31 13,583 59,263 208 3. Visakhapatnam 68 26,526 1,72,572 1,084 4. East Godavari 58 13,478 76,574 235 5. West Godavari 28 8,724 74,902 130 6. Krishna 5 18,454 97,057 156 7. Guntur 37 14,455 83,707 415 8. Prakasam 23 9,692 64,451 476 9. Nellore 4 8,824 80,375 355 10. Chittoor 82 23,542 1,29,876 168 11. Kadapa 44 15,478 84,079 215 12. Anantapur 48 21,828 1,14,339 1,852 13. Kurnool 1 5,124 1,46,811 2,561 14. Mahabubnagar 43 16,056 1,15,812 770 15. Rangareddy 24 17,377 88,806 2,368 16. Hyderabad 294 68,641 1,36,918 3,748 17. Medak 21 10,802 92,357 530 18. Nizamabad 7 8,853 53,423 473 19. Adilabad 12 25,150 1,28,972 36 20. Karimnagar 102 20,770 1,28,977 682 21. Warangal 77 6,431 1,63,907 727 22. Khammam 246 14,562 75,309 683 23. Nalgonda 61 15,271 79,939 232
Total 1,397 3,97,148 23,23,171 18,470 Source: Director of Employment and training, Andhra Pradesh

81
12. LABOUR AND EMPLOYMENT
TABLE 12.5 (C)
District wise Registrations and Placements through Employment Exchanges
(As on 31st December 2007)
Sl. No District No. of
Employment Exchanges
Total No. of Applicants on
Live Register at the beginning of
the year (Cummulative)
No. of Registrations
during the year
(1) (2) (3) (4) (5) 1. Srikakulam 1 74,745 7,746 2. Vizianagaram 1 59,263 5,672 3. Visakhapatnam 4 172,572 17,258 4. East Godavari 2 76,574 8,225 5. West Godavari 2 74,902 7,098 6. Krishna 2 97,057 8,513 7. Guntur 1 83,707 7,779 8. Prakasam 2 64,451 6,528 9. Nellore 1 80,375 7,361
10. Chittoor 3 1,29,876 13,322 11. Kadapa 1 84,079 7,641 12. Anantapur 1 1,14,339 13,461 13. Kurnool 1 1,46,811 10,822 14 Mahabubnagar 2 1,15,812 9,153 15 Rangareddy 2 88,806 6,004 16 Hyderabad 6 1,36,918 30,832 17 Medak 1 92,357 7,918 18 Nizamabad 1 53,423 15,094 19 Adilabad 2 1,28,972 10,149 20 Karimnagar 2 1,28,977 13,816 21 Warangal 1 1,63,907 11,294 22 Khammam 2 75,309 9,524 23 Nalgonda 1 79,939 5,795
Total 42 23,23,171 2,41,005
Contd..

82
12. LABOUR AND EMPLOYMENT
TABLE 12.5 (C) (Concld.)
District wise Registrations and Placements through Employment Exchanges
(As on 31st December 2007)
Sl. No District
No. of Applicants employed through
Employment Exchanges
No. of Applicants who ceased
to be on Live
Register due to reasons other than Placements
No. of Applicants on the live Register at the end of the year
No. of Vacancies notified during the the Year
(1) (2) (6) (7) (8) (9)
1. Srikakulam 43 10,869 71,579 1,071
2. Vizianagaram 24 11,064 53,847 383
3. Visakhapatnam 82 26,126 1,63,622 2,245
4. East Godavari 6 5,142 79,651 2,229
5. West Godavari 91 11,346 70,563 1,006
6. Krishna 19 14,911 90,640 1,443
7. Guntur 52 11,946 79,488 1,603
8. Prakasam 21 7,928 63,030 124
9. Nellore - 5,550 82,186 491
10. Chittoor 72 20,246 1,22,880 324
11. Kadapa 11 14,577 77,132 741
12. Anantapur 142 19,074 1,08,584 884
13. Kurnool - 15,814 1,41,819 240
14. Mahabubnagar 103 22,556 1,02,306 817
15. Rangareddy 109 15,752 78,949 1,581
16. Hyderabad 55 8,774 1,58,921 6,564
17. Medak 54 12,985 87,236 943
18. Nizamabad 16 1,782 66,719 738
19. Adilabad 34 1,101 1,37,986 1,687
20. Karimnagar 127 23,351 1,19,315 461
21. Warangal 121 32,705 1,42,375 372
22. Khammam 180 7,564 77,089 632
23. Nalgonda 50 13,468 72,216 339
Total 1,412 3,14,631 22,48,133 26,918 Source: Commissioner of Employment and Training, Andhra Pradesh

83
12. LABOUR AND EMPLOYMENT
TABLE 12.6
Employment in Shops and Commercial Establishments (Covered by Shops and Establishments Act. 1988)
(As on 31st December)
Sl. No Category Unit 2006 2007 (1) (2) (3) (4) (5)
1. Shops ( No.) 3,32,853 3,58,576
2. Commercial Establishments ( No.) 31,019 39,834
3. Cinema Theaters, Hotels And Restaurants
( No.) 28,814 17,934
4. All Establishments :
a) Number ( No.) 3,92,686 4,16,344
b) No. of Workers ( No.) 5,34,194 8,46,395
Source:- Commissioner of Labour, Andhra Pradesh.

84
12. LABOUR AND EMPLOYMENT
TABLE 12.7
Industrial Disputes and Man-days lost in Major Industries (As on 31st December)
Sl. No
Particulars Unit 2003 2004 2005 2006 2007
(1) (2) (3) (4) (5) (6) (7) (8)
1. Strikes (No) 4 10 7 9 4
2. Lock-outs (No) 3 5 4 2 5
3. Total disputes (No) 7 15 11 11 9
4. Number of workers involved
('000) 15 17 13 16 16
5. Number of Man-days lost
('000) 613 898 684 2,225 338
Source : Commissioner of Labour, Hyderabad, Andhra Pradesh.

85
12. LABOUR AND EMPLOYMENT
TABLE 12.8
Number of Enterprises and Employment 5th Economic Census (Provisional)
(in ‘000) Rural Urban Combined
Type of Enterprises 5th EC
% of growth
5th EC
% of growth
5th EC
% of growth
(1) (2) (3) (4) (5) (6) (7) AGRICULTURAL ACTIVITY 1. All Enterprises 950 100.00 32 100.00 982 100.00 a) Own Account Enterprises 799 84.09 24 74.18 823 83.77 b) Establishments 151 15.91 8 25.82 159 16.23 2. Persons Usually working in Enterprises 1904 100.00 84 100.00 1988 100.00
a) Own Account Enterprises 1202 63.13 37 43.67 1239 62.31 b) Establishments i) Total 702 36.87 47 56.33 749 37.69 ii) Hired 587 30.81 39 46.87 626 31.49 NON - AGRICULTURAL ACTIVITY 1. All Enterprises 1898 100.00 1117 100.00 3015 100.00 a) Own Account Enterprises 1260 66.39 561 50.25 1821 60.41 b) Establishments 638 33.61 556 49.75 1194 39.59 2. Persons Usually working in Enterprises 4938 100.00 4275 100.00 9214 100.00
a) Own Account Enterprises 1764 35.72 728 17.03 2492 27.05 b) Establishments i) Total 3174 64.28 3547 82.97 6722 72.95 ii) Hired 2822 57.15 3079 72.02 5901 64.05 AGRICULTURAL & NON - AGRICULTURAL ACTIVITY 1. All Enterprises 2848 100.00 1149 100.00 3997 100.00 a) Own Account Enterprises 2059 72.29 585 50.92 2644 66.15 b) Establishments 789 27.71 564 49.08 1353 33.85 2. Persons Usually working in Enterprises 6842 100.00 4359 100.00 11202 100.00
a) Own Account Enterprises 2966 43.35 765 17.54 3731 33.31 b) Establishments i) Total 3876 56.65 3595 82.46 7471 66.69 ii) Hired 3409 49.82 3118 71.53 6527 58.27 Source: Directorate of Economics & Statistics-Hyderabad, 5th Economic Census,2005.

86
12. LABOUR AND EMPLOYMENT TABLE 12.9
Number of Enterprises and Employment during 4th and 5th Economic Census(Provisional)
(in ‘000) Rural Urban Combined
Type of Enterprises 4th EC
5th EC (P)
% of growth
over 4th EC
4th EC
5th EC(P)
% of growth over 4th
EC
4th EC
5th EC (P)
% of growth over 4th
EC (1) (2) (3) (4) (5) (6) (7) (8) (9) (10)
AGRICULTURAL ACTIVITY 1. All Enterprises 574 950 65.51 25 32 28.00 600 982 63.67 a) Own Account Enterprises 531 799 50.47 22 24 9.09 553 823 48.83 b) Establishments 44 151 243.18 3 8 166.67 47 159 238.30 2. Persons Usually working in Enterprises 1073 1904 77.45 47 84 78.72 1120 1988 77.50 a) Own Account Enterprises 904 1202 32.97 35 37 5.71 939 1239 31.95 b) Establishments i) Total 169 702 315.39 12 47 291.67 181 749 313.81 ii) Hired 111 587 428.83 8 39 387.50 119 626 426.05
NON - AGRICULTURAL ACTIVITY 1. All Enterprises 1433 1898 32.45 870 1117 28.39 2303 3015 30.92 a) Own Account Enterprises 1107 1260 13.82 569 561 -1.41 1676 1821 8.65 b) Establishments 327 638 95.11 301 556 84.72 627 1194 90.43 2. Persons Usually working in Enterprises 3562 4938 38.63 2830 4275 51.06 6392 9214 44.15 a) Own Account Enterprises 1834 1764 -3.82 1006 728 -27.63 2841 2492 -12.28 b) Establishments i) Total 1728 3174 83.68 1824 3547 94.46 3551 6722 89.30 ii) Hired 1480 2822 90.68 1473 3079 109.03 2953 5901 99.83
AGRICULTURAL & NON - AGRICULTURAL ACTIVITY 1. All Enterprises 2007 2848 41.90 895 1149 28.38 2903 3997 37.69 a) Own Account Enterprises 1637 2059 25.78 591 585 -1.02 2229 2644 18.62 b) Establishments 370 789 113.24 304 564 85.53 674 1353 100.74 2. Persons Usually working in Enterprises 4635 6842 47.62 2877 4359 51.51 7512 11202 49.12 a) Own Account Enterprises 2739 2966 8.29 1041 765 -26.51 3780 3731 -1.30 b) Establishments i) Total 1897 3876 104.32 1835 3595 95.91 3732 7471 100.19 ii) Hired 1591 3409 114.27 1481 3118 110.53 3072 6527 112.47
4th Economic Census:1998 , 5th Economic Census: Source: Directorate of Economics and Statistics-Hyderabad P: Provisional

87
12. LABOUR AND EMPLOYMENT
TABLE 12.10
Number of Non-Agricultural Enterprises by Major Activity groups by type of Enterprise- 5th Economic Census-2005(P)
(in ‘000)
RURAL URBAN COMBINED Major activity Group
OAE Estt., Total OAE Estt., Total OAE Estt., TotalRANK
(1) (2) (3) (4) (5) (6) (7) (8) (9) (10) (11)
Mining & Quarrying 8 5 13 0.872 1 2 9 6 15 15
Manufacturing 348 161 509 106 109 215 454 271 724 2
Electricity, Gas & Water 0.455 2 2 0.175 0.834 1 0.630 3 3 16
Construction 18 7 25 9 6 15 27 13 40 13
Sale, Maint., & Repair M/V & M/C 11 8 19 8 19 28 19 27 46
12
Wholesale Trade 22 9 30 8 14 22 30 22 52 11
Retail Trade 507 146 653 269 215 484 776 362 1137 1
Restaurants & Hotels 58 29 86 21 30 51 79 59 138 4
Transport & Storage 51 18 69 44 21 65 95 39 134 5
Posts & Telecommunications 20 14 34 20 15 35 40 29 69 8
Financial Intermediation 8 6 14 6 9 15 14 16 29 14
Real Estate Banking & Service 23 13 35 17 25 43 40 38 78
7
Pub Admin Defence Social Sec 5 40 45 1 12 14 7 52 59
10
Education 5 95 100 4 24 28 9 119 128 6
Health & Social Work 17 20 37 6 17 23 23 37 60 9
Other Community Personal Service 160 66 225 40 35 76 200 101 301
3
Other Activities 0.003 0.004 0.007 0.004 0.004 0.008 0.007 0.008 0.015 17
NON-AGRICULTURAL ACTIVITIES
1260 638 1898 561 556 1117 1821 1194 3015
P:Provisional Source: Directorate of Economics and Statistic-Hycerabad

88
12. LABOUR AND EMPLOYMENT
TABLE 12.11
Employment in Non-Agricultural Enterprises by major activity groups by type of Enterprise- 5th Economic
Census(Provisional)-2005 (in ‘000)
RURAL URBAN COMBINED Major activity Group
OAE Estt., Total OAE Estt., Total OAE Estt., TotalRANK
(1) (2) (3) (4) (5) (6) (7) (8) (9) (10) (11)
Mining & Quarrying 15 76 91 1 25 27 16 101 117 14
Manufacturing 528 1100 1628 156 655 812 684 1756 2440 2 Electricity, Gas & Water 0.695 15 16 0.317 12 12 1 27 28 16
Construction 22 26 48 10 39 49 32 65 97 15 Sale, Maint. & Repair M/V & M/C 13 34 47 11 100 111 24 135 158 12
Wholesale Trade 29 67 96 11 85 96 40 152 192 10
Retail Trade 674 560 1234 336 1053 1390 1010 1613 2624 1
Restaurants & Hotels 98 125 223 33 187 220 131 312 443 6
Transport & Storage 55 82 137 46 140 187 101 223 324 7 Posts & Telecommunications 24 42 66 23 98 121 47 140 187 11 Financial Intermediation 10 33 43 7 94 101 17 127 144 13 Real Estate Banking & Service 28 45 73 21 184 205 49 229 277 8 Pub Admin Defence Social Sec 9 225 234 2 253 255 11 478 489 5
Education 10 454 464 7 296 303 17 750 768 3
Health & Social Work 20 84 105 8 142 149 28 226 254 9 Other Community Personal Service 229 204 434 56 183 238 285 387 672 4
Other Activities 0.004 0.045 0.049 0.005 0.054 0.059 0.009 0.099 0.108 17 NON-AGRICULTURAL ACTIVITIES 1764 3174 4938 728 3547 4275 2492 6722 9214 Source: Directorate of Economics and Statistic-Hycerabad

89
13. TRANSPORT AND COMMUNICATIONS
TABLE 13.1
Number of Registered Motor Vehicles
Sl. No
Item 2005-06 2006-07
(1) (2) (3) (4)
1. Stage Carriages 21,162 21,378
2. Goods Vehicles 3,66,286 3,94,476
3. Tractors/Trailers (Commercial) 1,68,327 1,86,470
4. Contract Carriages 23,228 52,433
5. Taxi Cabs 1,72,932 1,72,932
6. Auto Rickshaws 3,56,158 4,08,054
7. Four Wheelers (Cars & Jeeps) 6,82,395 4,88,952
8. Two Wheelers 40,61,206 48,14,388
9. Others Vehicles 2,85,576 3,04,922
Total 61,37,270 68,44,005
• Including Heavy Goods Vehicles. Source: 1. Commissioner of Transport, Andhra Pradesh. 2. Managing Director, A.P.S.R.T.C., Hyderabad.

90
13. TRANSPORT AND COMMUNICATIONS
TABLE 13.2
Roads Maintained by Public Works (R&B) and
Panchayat Raj Departments (in Kilometres)
Sl. No Particulars 2005-06 2006-07
(1) (2) (3) (4) 1 National Highways
(a) Cement Concrete 2 10
(b) Blacktop or Asphalt 4,646 4,638
(c) Metal - -
(d) Others (Un-Metalled) 41* 41*
Total 4,648 4,648
2 State Roads (P.W.D)
(a) Cement Concrete 487 612
(b) Blacktop or Asphalt 52,882 54,651
(c) Metal 6,596 5,262
(d) Others (Un-Metalled) 3,674 3,339
Total 63,639 63,864
3 District Roads
(a) Cement Concrete 1,524 1,682
(b) Blacktop or Asphalt 18,291 19,340
(c) Metal 31,516 31,087
(d)Others (Un-Metalled) 68,952 71,171
Total 1,20,283 123,280
Grand Total (1+2+3) 1,88,570 1,91,792 * Missed Link on NH202 and NH16 (not included in total figures) Source : 1. Chief Engineer, National Highways, Andhra Pradesh. 2. Engineer - in – Chief, R & B, Andhra Pradesh.
3. Chief Engineer Panchayatraj Department, Andhra Pradesh.

91
13. TRANSPORT AND COMMUNICATIONS
TABLE 13.3
Andhra Pradesh State Road Transport Corporation
(Operational Statistics) (As on 31 st March)
Sl. No Item 2006-07 2007-08
(1) (2) (3) (4) 1. Number of Routes 7,363 7,551
2. Route Kilometres 9,04,000 N.A.
3. Total Effective Kilometres (in Crores) 244.73 253.47
4. Average Number of Vehicles
a) Held
i) Corporation 17,770 17,944
ii) Hired 1,580 1,719
b) On Road
i) Corporation 17,653 17,841
ii) Hired 1,579 1,717
5. Percentage of Fleet Utilisation 99.32 99.43
6. Effective Vehicle Utilisation (Kms. per day) 347 352
7. Number of Accidents 2,868 3,076 Source : Managing Director , Andhra Pradesh State Road Transport Corporation, Hyderabad.

92
13. TRANSPORT AND COMMUNICATIONS
TABLE 13.4
Number of Railway Stations and Kilometreage in
Andhra Pradesh
(Length in Kms.) Route Kilometreage
Sl. No
Name of the Railway
No. of
Stations Broad Guage
Metre Guage
Narrow Guage Total
(1) (2) (3) (4) (5) (6) (7)
2005-2006:
1. South Central Railway
570 3,952.65 328.96 - 4,281.61
2. Southern Railway
16 121.00 - - 121.00
3. South Eastern Railway*
73 559.64 - ** 36.69 596.33
Total 659 4,633.29 328.96 36.69 4,998.94
2006-2007:
1. South Central Railway
573 4005.24 267.68 - 427,2.92
2. Southern Railway 16 120.85 - - 120.85
3. South Eastern Railway*
73 554.83 - ** 36.69 591.52
Total 662 4,680.92 267.68 36.69 4,985.29
* Pertains to 2003-04 **The Narrow guaze between Naupada in A.P. and Gunupur in Orissa is under gauge
conversion and the line is closed since 24-7-2004 Source : 1. Chief Engineer South Central Railway, Secunderabad 2. General Manager Southern Railway, Chennai. 3. Chief Track Engineer East Coast Railway, Bhuwaneswar.

93
13. TRANSPORT AND COMMUNICATIONS
TABLE 13.5
Posts and Telegraphs
Sl.No Particulars Unit 2005-06® 2006-07
(1) (2) (3) (4) (5)
I. Post Offices
1. Head Offices No 101 98
2. Mukya Dak Ghar " - -
3. Sub-Offices " 2,390 **2,370
4. Branch Offices " 13,686 13,754
Total 16,177 16,222
II. Telephone Exchanges " 3,568 3,677
III. Telephone Connections " 44,11,716 29,31,352
IV. Telegraph Offices " 114 80
V. Public Telephones " 2,81,281 *2,71,327
NR : Not Reported; ** including extra departmental sub-offices * excluding cell phones Source: 1. Chief Post Master General, Andhra Pradesh Circle, Hyderabad. 2. Chief General Manager,Telecommunications, Andhra Pradesh circle, Hyderabad.

94
14. EDUCATION
TABLE 14.1
Recognised Educational Institutions
Sl. No Type of Institution 2005-06 2006-07 2007-08
(1) (2) (3) (4) (5) I. University Education :
(a) Colleges for General Education (Degree Colleges)
357 1,674 1,738
(b)Oriental Colleges 41 37 37 Total 398 1,711 1,775
II. Institutions below Degree level : (a) Junior Colleges 3,712 3,813 4032 (b) Polytechnic Colleges 140 144 149 Total 3,892 3,957 4,181
III Secondary Eduation :
(a) Higher Secondary Schools (Kendriya Vidyalayas and Public Schools)
98 97 99
(b) High Schools 15,437 16,195 16,937 Total 15,535 16,292 17,036
IV Elementary Education : (a) Primary Schools 62,162 62,162 62,464 (b) Upper Primary Schools 17,290 17,823 17,957 Total 79,489 79,985 80,421
*: Government, Pvt aided and Private colleges only ** : Government and Pvt aided colleges only Source : 1. Directorate of School Education, Andhra Pradesh
2. Directorate of Intermediate Education, Andhra Pradesh 3. Directorate of Technical Education, Andhra Pradesh 4. Commissioner of Collegiate Education, Andhra Pradesh

95
14. EDUCATION
TABLE 14.2
Enrolment in Educational Institutions
Sl. No Type of Institution 2005-06 2006-07 2007-08
(1) (2) (3) (4) (5) I University Education :
(a) Colleges for General Education (Government and Aided colleges)
4,22,186 4,23,664 4,10,857
(b) Oriental Colleges 8,024 8002 6,912 Total 4,29,710 4,31,666 4,17,769
II Institutions below Degree level : (a) Junior Colleges 13,77,364 13,91,367 N.A. (b Polytechnic Institutions 19,009 23,537 25,000* Total 13,96,373 14,14,904 25,000
III Secondary Education :
(a) Higher Secondary Schools (Kendriya Vidyalayas & Public Schools)
1,02,538 1,03,188 99,664
(b) High Schools 48,39,243 49,88,791 51,14,442 Total 49,41,781 5,091,979 52,14,106
IV Elementary Education : (a)Primary Schools 53,98,008 55,13,155 53,66,949
(b)Upper Primary Schools 31,72,134 32,46,096 31,10,686
Total 85,70,142 87,59,251 84,77,635 * : Enrolement figures are not avilable, hence Intake capacity is furnished. Source : 1. Directorate of School Education, Andhra Pradesh
2. Directorate of Intermediate Education, Andhra Pradesh. 3. Directorate of Technical Education, Andhra Pradesh
4. Commissioner of Collegiate Education, Andhra Pradesh .

96
14. EDUCATION
TABLE 14.3
Teachers employed in Educational Institutions
2005-06 Sl.
No Type of Institution Men Women Total
(1) (2) (3) (4) (5)
I University Education :
(a) Colleges for General Education
(Degree Colleges) 8,822 4,044 12,866
(b) Oriental Colleges 236 100 336
Total 9,058 4,144 13,202
II Institutions below Degree level :
(a) Junior Colleges 30,859 9,506 40,365
(b) Polytechnic Institutions (Govt.
only) 1,475 354 1,829
Total 32,334 9,860 42,194
III Secondary Education :
(a) Higher Secondary Schools
(Kendriya Vidyalayas and Public
Schools)
1,629 2,329 3,958
(b) High Schools 85,108 57,436 1,42,544
Total 86,737 59,765 1,46,502
IV Elementary Education :
(a) Primary Schools 91,079 75,711 1,66,790
(b) Upper Primary Schools 62,034 44,181 1,06,215
Total 1,53,113 1,19,892 2,73,005
Contd..

97
4. EDUCATION
TABLE 14.3 (Contd.)
Teachers employed in Educational Institutions
2006-07 Sl.
No Type of Institution Men Women Total
(1) (2) (6) (7) (8)
I University Education :
(a) Colleges for General Education
(Degree Colleges) 8,797 4,114 12,911
(b) Oriental Colleges 235 85 320
Total 9,032 4,199 13,231
II Institutions below Degree level :
(a) Junior Colleges 31,179 9,592 40,771
(b) Polytechnic Institutions (Govt.
only) 883 301 1,184
Total 32,062 9,893 41,955
III Secondary Education :
(a) Higher Secondary Schools
(Kendriya Vidyalayas and Public
Schools)
1,621 2,435 4,054
(b) High Schools 92,008 61,980 1,58,042
Total 93,629 64,415 1,62,096
IV Elementary Education :
(a) Primary Schools 89,116 78,607 1,67,723
(b) Upper Primary Schools 64,744 48,244 1,12,388
Total 153,860 1,26,851 2,80,111
Contd.

98
14. EDUCATION
TABLE 14.3 (Concld.)
Teachers employed in Educational Institutions
2007-08 Sl.
No Type of Institution Men Women Total
(1) (2) (9) (10) (11)
I University Education :
(a) Colleges for General Education
(Degree Colleges) 8,502 4,035 12,537
(b) Oriental Colleges 170 67 237
Total 8,672 4,102 12,774
II Institutions below Degree level :
(a) Junior Colleges 31,788 9,771 41,559
(b) Polytechnic Institutions (Govt.
only) N.A. N.A. N.A.
Total
III Secondary Education :
(a) Higher Secondary Schools
(Kendriya Vidyalayas and
Public Schools)
1,696 2,545 4,241
(b) High Schools 93,500 63,387 1,56,887
Total 95,196 65,932 1,61,128
IV Elementary Education :
(a) Primary Schools 87,704 79,355 1,67,059
(b) Upper Primary Schools 62,735 48,214 1,10,949
Total 1,50,439 1,27,569 2,78,008
Source : 1. Directorate of School Education, Andhra Pradesh 2. Directorate of Intermediate Education, Andhra .Pradesh
3. Directorate of Technical Education, Andhra Pradesh 4. Commissioner of Collegiate Education, Andhra Pradesh

99
14. EDUCATION
TABLE 14.4
Stage wise Enrolment in Educational Institutions
2005-06 Sl.
No Stage
Boys Girls Total (1) (2) (3) (4) (5)
1. Pre –Primary 2,66,742 2,11,270 4,78,012
2. Classes (I-V) 37,42,698 36,49,224 73,91,922
3. Classes (VI & VII) 13,73,194 12,70,111 26,43,305
4. Classes (VIII - X) 15,90,723 14,00,439 29,91,162
5. Classes (XI &XII) 4,186 3,336 7,522
Total 69,77,543 65,34,380 1,35,11,923
2006-07 Sl.
No Stage
Boys Girls Total
(1) (2) (6) (7) (8)
1. Pre –Primary 3,88,582 3,20,651 7,09,233
2. Classes (I-V) 37,36,789 36,26,448 73,63,237
3. Classes (VI & VII) 13,76,071 12,90,151 26,66,222
4. Classes (VIII - X) 16,32,733 14,72,556 31,05,289
5. Classes (XI &XII) 4,136 3,113 7,249
Total 71,38,311 67,12,919 1,38,51,230
2007-08 Sl.
No Stage
Boys Girls Total
(1) (2) (3) (4) (5)
1. Pre –Primary 379,410 3,07,631 6,87,041
2. Classes (I-V) 36,40,320 35,33,217 71,73,537
3. Classes (VI & VII) 13,40,274 12,72,608 26,12,882
4. Classes (VIII - X) 16,70,749 15,40,712 32,11,461
5. Classes (XI &XII) 3,690 3,130 6,820
Total 70,34,443 66,57,298 1,36,91,741 Source :Directorate of School Education, Andhra Pradesh

100
14. EDUCATION
TABLE 14.5
Public Examination Results
2005 2006 2007
Sl. No
Exami-nation
Number Appeared
Number Passed
Number Appeared
Number Passed
Number Appeared
Number Passed
(1) (2) (3) (4) (5) (6) (7) (8)
I S.S.C. (March) (Regular candidates only)
(i) Boys 4,37,404 3,19,521 4,73,299 3,46,599 6,92,592 4,23,022
(ii) Girls 3,61,920 2,66,260 4,06,953 2,97,375 5,45,805 4,59,987
Total 7,99,324 5,85,781 8,80,252 6,43,974 12,38,397 8,83,009
II S.S.C. (June)
(i) Boys 1,70,159 46,091 1,81,493 69,115 2,61,047 78,646
(ii) Girls 1,05,368 31,793 1,18,430 51,321 1,80,769 58,881
Total 2,75,527 77,884 2,99,923 1,20,436 4,41,816 1,37,527
III Teacher Training
(i) Men 1,351 1,302 1,620 1,606 1,548 1,505
(ii)Women 1,137 1,093 1,422 1,404 1,634 1,603
Total 2,488 2,395 3,042 3,010 3,182 3,108 Source:- Directorate of Government Examinations, Andhra Pradesh.

101
14. EDUCATION
TABLE 14.6
Enrolment of Scheduled Caste Students in Schools
2005-06 2006-07 Sl.
No Type of
Institution Boys Girls Total Boys Girls Total (1) (2) (3) (4) (5) (6) (7) (8)
I Secondary Education :
a) Higher Secondary Schools (Kendriya Vidyalayas & Public Schools)
5,280 3,622 8,902 555 265 820
b) High Schools 4,84,341 4,23,395 9,07,736 3,07,167 2,69,688 5,76,855
Total 4,89,621 4,27,017 9,16,638 3,07,722 2,69,953 5,77,675
II Elementary Education :
a) Primary Schools 5,47,335 5,38,630 10,85,965 7,15,816 6,99,646 14,15,462
b) Upper Primary Schools
2,87,126 2,63,514 5,50,640 2,62,497 2,41,663 5,04,,160
Total 8,34,461 8,02,144 16,36,605 9,78,313 9,41,309 19,19,622
III Professional and Special Education :
a) Teacher Training Institutions
438 260 698 N.A N.A N.A b) Special
Schools for Physically and Orthopaedically Handicapped
1,521 914 2,435 N.A N.A N.A
c) Oriental Schools 2,356 2,359 4,715 N.A N.A N.A
Total 4,315 3,533 7,848 N.A N.A N.A
Contd.

102
14. EDUCATION
TABLE 14.6(Concld.)
Enrolment of Scheduled Caste Students in Schools
2007-08 Sl. No
Type of Institution Boys Girls Total
(1) (2) (3) (4) (5) I Secondary Education : a) Higher
Secondary Schools (Kendriya Vidyalayas & Public Schools)
460 223 683
b) High Schools 3,12,955 2,85,976 5,98,931 Total 3,13,415 2,86,199 5,99,614
II Elementary Education : a) Primary
Schools 6,89,936 6,75,744 13,65,680
b) Upper Primary Schools 2,50,899 2,36,899 4,87,798
Total 9,40,835 9,12,643 18,53,478
III Professional and Special Education :
a) Teacher Training Institutions
N.A. N.A. N.A.
b) Special Schools for Physically and Orthopaedically Handicapp ed
N.A. N.A. N.A.
c) Oriental Schools N.A. N.A. N.A.
Source : Directorate of School Education, Andhra Pradesh.

103
14. EDUCATION
TABLE 14.7
Enrolment of Scheduled Tribe Students in Schools
2005-06
2006-07
Sl. No
Type of
Institution Boys Girls Total Boys Girls Total (1) (2) (3) (4) (5) (6) (7) (8)
I Secondary Education :
a) Higher Secondary Schools (Kendriya Vidyalayas & Public Schools)
1,851 1,212 3,063 245 104 349
b) High Schools 1,82,726 1,31,862 3,14,588 1,16,417 83,793 2,00,210
Total 1,84,577 1,33,074 3,17,651 116662 83897 200559
II Elementary Education :
a)Primary schools 3,15,519 3,01,719 6,17,238 3,94,884 3,66,888 7,61,772
b) Upper Primary Schools
1,33,665 1,03,814 2,37,479 1,18,123 92,328 2,10,451
Total 4,49,184 4,05,533 8,54,717 5,13,007 4,59,216 9,72,223
III Professional and Special Education :
a)Teacher training Institutions
148 88 236 N.A N.A N.A
b) Special Schools for Physically and Orthopaedically Handicapped
357 221 578 N.A N.A N.A
c)Oriental schools 781 650 1,431 N.A N.A N.A
Total 1,286 959 2,245 N.A N.A N.A
Contd.

104
14. EDUCATION
TABLE 14.7(concld)
Enrolment of Scheduled Tribe Students in Schools
2007-08 Sl.
No Type of
Institution Boys Girls Total (1) (2) (3) (4) (5) I Secondary Education : a) Higher
Secondary Schools (Kendriya Vidyalayas & Public Schools)
203 85 288
b) High Schools 120587 95370 215957 Total 120790 95455 216245
II Elementary Education : a) Primary
Schools 382779 355844 738623
b) Upper Primary Schools
111068 90583 201651
Total 493847 446427 940274
III Professional and Special Education :
a) Teacher Training Institutions
N.A. N.A. N.A.
b) Special Schools for Physically and Orthopaedically Handicapp ed
N.A. N.A. N.A.
c) Oriental Schools N.A. N.A. N.A.
Total N.A. N.A. N.A. Source :Directorate of School Education, Andhra Pradesh.

105
14. EDUCATION
TABLE 14.8
Stage wise Enrolment of Scheduled Caste Students in
Educational Institutions
2005-06 2006-07 Sl. No
Stage Boys Girls Total Boys Girls Total
(1) (2) (3) (4) (5) (6) (7) (8)
1. Pre-primary
27,408 22,284 49,692 49,451 42,330 91,781
2. Classes (I-V)
7,27,571 7,10,036 14,37,607 7,15,816 6,99,646 14,15,462
3. Classes (VI & VII)
2,64,989 2,38,861 5,03,850 2,62.497 2,41,663 5,04,160
4. Classes (VIII –X)
3,03,576 2,57,681 5,61,257 3,07,167 2,69,688 5,76,855
5. Classes (XI & XII)
538 299 837 555 265 820
Total 13,24,082 12,29,161 25,53,243 13,35,486 12,53,592 25,89,078
2007-08 Sl. No
Stage Boys Girls Total
(1) (2) (9) (10) (11)
1. Pre-primary
46,580 39,248 85,828
2. Classes (I-V)
6,89,936 6,75,744 13,65,680
3. Classes (VI & VII)
2,50,899 2,36,899 4,87,798
4. Classes (VIII –X)
3,12,955 2,85,976 5,98,931
5. Classes (XI & XII)
460 223 683
Total 13,00,830 12,38,090 25,38,920 Source : Directorate of School Education, Andhra Pradesh.

106
14. EDUCATION
TABLE 14.9
Stage wise Enrolment of Scheduled Tribe Students in Educational Institutions
2005-06 2006-07 Sl.
No. Stage Boys Girls Total Boys Girls Total
(1) (2) (3) (4) (5) (6) (7) (8)
1. Pre-primary
11,385 8,511 19,896 25,437 21,421 46,858
2. Classes (I-V)
3,98,875 3,69,849 7,68,724 3,94,884 3,66,888 7,61,772
3. Classes (VI& VII)
1,15,669 87,226 2,02,895 1,18,123 92,328 2,10,451
4. Classes (VIII– X)
1,07,594 72,897 1,80,491 1,16,417 83,793 2,00,210
5. Classes (XI & XII)
238 124 362 245 104 349
Total 6,33,761 5,38,607 11,72,368 6,55,106 5,64,534 12,19,640
2007-08 Sl. No. Stage
Boys Girls Total
(1) (2) (3) (4) (5)
1. Pre-primary 20,582 16,752 37,334
2. Classes (I-V)
3,82,779 3,55,844 7,38,623
3. Classes (VI & VII)
1,11,068 90,583 2,01,651
4. Classes (VIII – X)
1,20,587 95,370 2,15,957
5. Classes (XI & XII)
203 85 288
Total 6,35,219 5,58,634 11,93,853 Source : Directorate of School Education, Andhra Pradesh.

107
14. EDUCATION
TABLE 14.10
Government Hostels for Scheduled Caste Students District wise
2006-07 2007-08 Sl.
No District
No Strength No Strength (1) (2) (3) (4) (5) (6)
1. Srikakulam 63 7,031 63 7,300
2. Vizianagaram 58 5,651 62 6,028
3. Visakhapatnam 78 7,799 86 8,445
4. East Godavari 120 13,896 122 13,696
5. West Godavari 148 14,917 154 14,951
6. Krishna 163 12,732 164 14,201
7. Guntur 94 9,597 95 9,864
8. Prakasam 116 11,777 117 12,000
9. Nellore 143 14,715 152 14,328
10. Chittoor 125 11,193 128 12,750
11. Kadapa 149 15,167 148 14,320
12. Anantapur 126 12,164 126 12,219
13. Kurnool 101 13,269 102 14,772
14. Mahbubnagar 102 16,180 102 10,463
15. Ranga Reddy 67 8,080 67 9,044
16. Hyderabad 21 1,986 21 12,182
17. Medak 90 9,389 90 5,758
18. Nizamabad 67 5,704 67 7,204
19. Adilabad 78 8,360 78 9,236
20. Karimnagar 104 9,839 104 2,000
21. Warangal 99 13,350 99 15,923
22. Khammam 84 9,649 84 6,884
23. Nalgonda 125 17,347 125 14,456
Andhra Pradesh 2321 2,49,792 2,356 2,48,024 Source : Commissioner of Social Welfare, Andhra Pradesh.

108
14. EDUCATION
TABLE 14.11 (A)
Government Hostels and Ashram Schools for Scheduled Tribe Students District wise, 2006-07
Hostels Ashram Schools Sl. No.
District No Strength No Strength
(1) (2) (3) (4) (5) (6) 1. Srikakulam 9 1,606 41 12,127 2. Vizianagaram 16 2,265 49 12,221 3. Visakhapatnam 13 2,721 102 29,225 4. East Godavari 19 3,169 59 11,896 5. West Godavari 18 2,529 39 6,752 6. Krishna 19 2,703 1 1 7. Guntur 32 3,867 0 0 8. Prakasam 22 2,644 3 135 9. Nellore 24 2,020 1 102 10. Chittoor 16 1,565 1 157 11. Kadapa 9 1,174 0 0 12. Anantapur 17 2,495 1 138 13. Kurnool 10 1,375 3 104 14. Mahbubnagar 20 4,635 5 1,138 15. Ranga Reddy 12 2,612 4 897 16. Hyderabad 7 807 0 0 17. Medak 16 2,430 4 0 18. Nizamabad 13 2,415 3 625 19. Adilabad 12 2,062 112 26,146 20. Karimnagar 15 1,723 10 1,074 21. Warangal 40 7,434 41 12,214 22. Khammam 45 10,366 74 25,233 23. Nalgonda 36 14,271 11 3,347 24. Srisailam Project 0 0 34 4,986
Andhra Pradesh 440 78,888 598 1,48,518
Source: Commissioner of Tribal Welfare, Andhra Pradesh.

109
14. EDUCATION
TABLE 14.11 (B)
Government Hostels and Ashram Schools for Scheduled Tribe Students District wise, 2007-08
Hostels Ashram Schools Sl.
No. District
No Strength No Strength (1) (2) (3) (4) (5) (6)
1. Srikakulam 9 1,288 41 11,001
2. Vizianagaram 17 2,120 55 12,732
3. Visakhapatnam 13 2,767 102 33,454
4. East Godavari 19 2,780 58 11,874
5. West Godavari 18 2,403 33 3,964
6. Krishna 19 2,372 1 101
7. Guntur 32 6,510 0 0
8. Prakasam 22 2,720 3 221
9. Nellore 24 2,199 1 133
10. Chittoor 16 1,531 1 141
11. Kadapa 10 1,227 1 110
12. Anantapur 17 2,500 1 125
13. Kurnool 10 1,340 3 491
14. Mahbubnagar 21 4,969 5 1,103
15. Ranga Reddy 12 2,467 4 958
16. Hyderabad 7 724 0 0
17. Medak 16 2,148 4 340
18. Nizamabad 13 2,509 3 731
19. Adilabad 11 2,026 112 23,725
20. Karimnagar 15 1,431 11 1,474
21. Warangal 40 11,389 39 9,211
22. Khammam 45 10,226 74 25,541
23. Nalgonda 36 11,956 11 2,913
24. Srisailam Project 0 0 36 4,758
Andhra Pradesh 442 81,602 599 1,45,101
Source: Commissioner of Tribal Welfare, Andhra Pradesh.

110
14. EDUCATION TABLE 14.12
Government B.C.Welfare Hostels
District wise, 2007-08
Number of Hostels Sl. No.
District Boys Girls Total
Sanctioned Strength
(1) (2) (3) (4) (5) (6) 1. Srikakulam 68 14 82 10,433
2. Vizianagaram 46 12 58 7,540
3. Visakhapatnam 51 18 69 8,823
4. East Godavari 42 20 62 7,924
5. West Godavari 43 17 60 6,656
6. Krishna 50 18 68 7,770
7. Guntur 50 12 62 7,349
8. Prakasam 60 17 77 8,949
9. Nellore 68 19 87 8,966
10. Chittoor 47 18 65 7,701
11. Kadapa 49 15 64 8,427
12. Anantapur 60 13 73 10,879
13. Kurnool 76 16 92 14,207
14. Mahbubnagar 47 15 62 9,993
15. Ranga Reddy 39 11 50 5,608
16. Hyderabad 10 4 14 1,250
17. Medak 53 14 67 6,928
18. Nizamabad 33 10 43 4,102
19. Adilabad 41 12 53 4,231
20. Karimnagar 44 9 53 5,529
21. Warangal 40 10 50 6,719
22. Khammam 36 12 48 5,020
23. Nalgonda 51 19 70 7,982
Andhra Pradesh 1,104 325 1,429 1,72,986
Source: Director , Tribal Welfare-Hyderabad

111
14. EDUCATION
TABLE 14.13
Medical Colleges In Andhra Pradesh- 2007
No. of Colleges Intake S. No University
Total Govt Pvt Total Govt Pvt (1) (2) (3) (4) (5) (6) (7) (8) I ANDHRA UNIVERSITY MEDICAL 10 3 7 1,200 450 750 DENTAL 7 1 6 600 40 560 AYURVEDIC 1 1 0 30 30 0 HOMEOPATHY 2 2 0 90 90 0 NATUROPATHY 0 0 0 0 0 0 UNANI 0 0 0 0 0 0 NURSING 55 1 54 2,776 26 2,750 PHYSIOTHERAPY 13 0 13 560 0 560 BSC MLT 15 0 15 560 0 560 Total 103 8 95 5,816 636 5,170 II OSMANIA UNIVERSITY MEDICAL 13 3 10 1,700 500 1,200 DENTAL 9 1 8 700 40 660 AYURVEDIC 3 2 1 130 80 50 HOMEOPATHY 1 1 0 60 60 0 NATUROPATHY 1 1 0 30 30 0 UNANI 1 1 0 50 50 0 NURSING 56 1 55 2,690 30 2,660 PHYSIOTHERAPY 16 0 16 800 0 800 BSCMLT 18 1 17 770 20 750 Total 118 11 107 6,930 810 6,120 III SRI VENKATESWARA MEDICAL 7 4 3 850 550 300 DENTAL 3 0 3 250 0 250 AYURVEDIC 1 0 1(TT.D) 40 0 40 HOMEOPATHY 1 1 0 30 30 0 NATUROPATHY 0 0 0 0 0 0 UNANI 1 0 1 50 - 50 NURSING 50 3 47 2,441 136 2,305 PHYSIOTHERAPY 7 0 7 340 0 340 BSCMLT 11 0 11 450 0 450 Total 81 8 73 4,451 716 3,735
IV Siddhartha Medical College
1 1 0 100 100 0
Contd.

112
14. EDUCATION
TABLE 14.13(Concld)
Medical Colleges In Andhra Pradesh- 2007
No. of Colleges Intake Sl. No University
Total Govt Pvt Total Govt Pvt
(1) (2) (9) (10) (11) (12) (13) (14) 1 MEDICAL 31 11 20 3,850 1,600 2,250
2 DENTAL 19 2 17 1,550 80 1,470
3 AYURVEDIC 5 3 2 200 110 90
4 HOMEOPATHY 4 4 0 180 180 0
5 NATUROPATHY 1 1 0 30 30 0
6 UNANI 2 1 1 100 50 50
7 NURSING 161 5 156 7,907 192 7,715
8 PHYSIOTHERAPY 36 0 36 1,700 0 1,700
9 BSC MLT 44 1 43 1,780 20 1,760
Total 303 28 275 17,297 2,262 15,035
Source:Dr. N.T.R. University of Health Sciences, Vijayawada.

113
14. EDUCATION
TABLE 14.14
Engineering Colleges in Andhra Pradesh-2007-08
No. of Colleges S.No Districts
Government Private Total (1) (2) (3) (4) (5)
1 Srikakulam 0 5 5
2 Vizianagaram 1 5 6
3 Visakhapatnam 1 15 16
4 East Godavari 1 11 12
5 West Godavari 0 12 12
6 Krishna 0 14 14
7 Guntur 0 20 20
8 Prakasam 0 11 11
9 Nellore 0 11 11
10 Chittoor 1 14 15
11 Kadapa 1 7 8
12 Anantapur 2 6 8
13 Kurnool 0 11 11
14 Mahbubnagar 0 5 5
15 Rangareddy 0 79 79
16 Hyderabad 3 27 30
17 Medak 0 13 13
18 Nizamabad 0 7 7
19 Adilabad 0 2 2
20 Karimnagar 1 9 10
21 Warangal 0 10 10
22 Khammam 1 14 15
23 Nalgonda 0 18 18
Andhra Pradesh 12 326 338 Souce:A.P.State Council of Higher Education-Hyderabad.

114
14. EDUCATION
TABLE 14.15 Pharmacy Colleges in Andhra Pradesh-2007-08
No. of Colleges S.No Districts
Government Private Total (1) (2) (3) (4) (5)
1 Srikakulam 0 2 2
2 Vizianagaram 0 6 6
3 Visakhapatnam 2 7 9
4 East Godavari 0 8 8
5 West Godavari 0 8 8
6 Krishna 0 7 7
7 Guntur 0 21 21
8 Prakasam 0 6 6
9 Nellore 0 8 8
10 Chittoor 3 8 11
11 Kadapa 0 5 5
12 Anantapur 0 2 2
13 Kurnool 0 5 5
14 Mahbubnagar 0 3 3
15 Rangareddy 0 41 41
16 Hyderabad 0 20 20
17 Medak 0 6 6
18 Nizamabad 1 0 1
19 Adilabad 0 0 0
20 Karimnagar 0 6 6
21 Warangal 2 29 31
22 Khammam 0 7 7
23 Nalgonda 0 18 18
Andhra Pradesh 8 223 231 Souce:A.P.State Council of Higher Education-Hyderabad.

115
14. EDUCATION
TABLE 14.16
Polytechnic Colleges in Andhra Pradesh-2007-08
No. of Colleges S.No Districts
Government Private Total (1) (2) (3) (4) (5)
1 Srikakulam 2 2 4
2 Vizianagaram 1 3 4
3 Visakhapatnam 5 4 9
4 East Godavari 3 6 9
5 West Godavari 0 5 5
6 Krishna 2 8 10
7 Guntur 4 9 13
8 Prakasam 2 5 7
9 Nellore 4 4 8
10 Chittoor 4 5 9
11 Kadapa 2 5 7
12 Anantapur 2 1 3
13 Kurnool 4 2 6
14 Mahbubnagar 2 1 3
15 Rangareddy 2 5 7
16 Hyderabad 10 3 13
17 Medak 3 0 3
18 Nizamabad 2 0 2
19 Adilabad 2 0 2
20 Karimnagar 2 2 4
21 Warangal 3 7 10
22 Khammam 2 2 4
23 Nalgonda 2 5 7
Andhra Pradesh 65 84 149 Souce: Commissioner of Technical Education-Hyderabad.

116
15. MEDICAL AND PUBLIC HEALTH
TABLE 15.1 Medical Facilities, 2006-07
Sl. No Item
Medi-cal
Educa- tion Dept
A.P. Vaidhya Vidhana Parishad
Dire-ctorate
of Health
Insura- nce
Medi-cal
Servi-ces
Indian Medi- cine &
Homeo-pathy
Total
(1) (2) (3) (4) (5) (6) (7) (8) I ALLOPATHIC : 1.Hospitals 11 232 * 50 10 - 303
2.Hospitals for Special Treatment
25 8 13 - - 46
3.No.of.P.H.C.s (including up- graded PHCs)
10 - 1,570 - - 1,580
4.Dispensaries - 25 105 132 - 262
5.Beds 14,137 16,214 6,324 949 - 37,624 6.Govt. Doctors 3,617 1,282 2,665 432 - 7,996
II. AYURVEDIC 1.Hospitals - - - - 7 7 2.Dispensaries - - - - 557 557 3.Doctors - - - - 451 451
III UNANI 1.Hospitals - - - - 5 5 2.Dispensaries - - - - 196 196
3.Doctors - - - - 259 259 IV. HOMOEOPATHY 1.Hospitals - - - - 6 6
2.Dispensaries - - - - 286 286 3.Doctors - - - - 361 361
* : Community Health Centers Source: 1.Directorate of Medical Education,Andhra Pradesh 2.Commissioner of Andhra Pradesh Vaidya Vidhana Parishad 3.Directorate of Health, Andhra Pradesh 4. Directorate of Insurance and Medical Services, A.P. 5. Commissioner , Indian Medicine and Homeopathy Department, Andhra Pradesh

117
15. MEDICAL AND PUBLIC HEALTH
TABLE 15.2 Deaths in Government Hospitals according to Causes
in Andhra Pradesh
Source: Director of Health,Andhra Pradesh.
Sl. No
Disease 2004
2005
2006
(1) (2) (3) (4) (5) 1.
Acute Diarrhoeal Diseases (Including Gastro enteritis and cholera)
116 248 130
2. Diphtheria 2 9 3
3. Acute Polio Myelitis 0 0 0
4. T.T Other than Neonatal 41 36 23
5. Neonatal Tetanus 12 2 2
6. Whooping cough 0 0 0
7. Measels 2 2 1
8. Acute Respiratory Infection (Including Influenza and excluding Pneumonia)
404 463 446
9. Pneumonia 192 163 133
10 Enteric fever 39 32 11
11. Viral Hepatities 72 39 28
12. Japanies Encephalitis 3 2 15
13. Menigococcal Meningitis 54 36 11
14. Rabies bite (Including Dog Bites) 49 24 48
15. Syphilis 3 0 0
16. Genococcal Infection 0 0 4
17. Pulmonary Tuberculos 1,232 1,543 1,201
18. All Other Deseases 11,863 14,687 10,231
Total 14,084 17,286 12,287

118
15. MEDICAL AND PUBLIC HEALTH
TABLE 15.3
District wise Family Planning Clinics and Achievements
Number of Clinics 2005-06 2006-07
Sl. No
District Rural Urban Rural Urban
(1) (2) (3) (4) (5) (6)
1. Srikakulam 60 5 60 4
2. Vizianagaram 55 14 55 5
3. Visakhapatnam 58 15 58 17
4. East Godavari 68 28 68 9
5. West Godavari 63 23 63 11
6. Krishna 53 18 53 10
7. Guntur 59 34 59 13
8. Prakasam 57 15 57 12
9. Nellore 35 17 35 9
10. Chittoor 50 17 50 12
11. Kadapa 28 11 28 5
12. Anantapur 5 25 5 11
13. Kurnool 16 26 16 12
14. Mahbubnagar 52 12 52 5
15. Ranga Reddy 41 4 23 19
16. Hyderabad - 34 0 54
17. Medak 66 11 46 6
18. Nizamabad 45 17 43 6
19. Adilabad 67 17 46 17
20. Karimnagar 72 18 54 16
21. Warangal 67 18 60 5
22. Khammam 59 14 12 6
23. Nalgonda 72 12 62 15
Andhra Pradesh 1,490 405 1,005 279 Contd..

119
15. MEDICAL AND PUBLIC HEALTH
TABLE 15.3 (Concld..)
District wise Family Planning Clinics and Achievements
Number of Cases Sterilised
Number of Cases of IUD’s inserted Sl.No District
2005-06 2006-07 2005-06 2006-07 (1) (2) (7) (8) (9) (10)
1. Srikakulam 26,014 24,866 15,983 15,906
2. Vizianagaram 22,106 33,294 13,201 18,330
3. Visakhapatnam 35,242 23,130 17,936 13,883
4. East Godavari 47,136 49,624 24,799 26,731
5. West Godavari 41,418 42,084 20,760 22,307
6. Krishna 31,827 31,151 22,422 22,662
7. Guntur 32,477 39,834 21,512 22,134
8. Prakasam 26,123 25,225 18,260 19,036
9. Nellore 24,667 27,696 15,724 16,011
10. Chittoor 39,369 30,656 23,069 15,507
11. Kadapa 29,859 32,769 13,490 19,401
12. Anantapur 37,966 35,150 20,769 21,292
13. Kurnool 26,662 43,065 19,241 23,355
14. Mahbubnagar 27,769 26,839 8,405 16,010
15. Ranga Reddy 42,454 35,157 19,896 21,747
16. Hyderabad 27,599 22,558 12,366 4,269
17. Medak 33,172 34,448 16,605 10,259
18. Nizamabad 29,926 33,172 14,718 10,030
19. Adilabad 24,088 34,769 4,092 16,829
20. Karimnagar 43,282 29,486 21,964 16,892
21. Warangal 36,072 26,577 11,213 14,718
22. Khammam 24,840 45,037 13,894 20,139
23. Nalgonda 34,203 41,006 20,356 14,584
Andhra Pradesh 7,44,271 7,67,593 3,90,675 4,02,032 Source: Commissioner of Family Welfare, Andhra Pradesh.

120
16. PUBLIC FINANCE
TABLE 16.1
Overall Budget (Rs. in Crores)
Source : Finance Department, Government of Andhra Pradesh.
Sl.No Item Accounts (2006-07)
Revised Estimates (2007-08)
Budget Estimates (2008-09)
(1) (2) (3) (4) (5)
I Revenue Account
a) Revenue 44,245.47 56,126.60 70,927.03
b) Expenditure 41,438.39 55,675.81 70,217.72
c) Surplus (+) or Deficit (-)
2,807.08 450.79 709.31
II Capital Account
a) Receipts 94,440.40 44,661.91 53,458.09
b) Disbursements 97.439.41 44,845.90 54,033.19
c) Surplus (+) or Deficit (-)
-2,999.01 -183.99 -575.10
III Overall Surplus (+) or Deficit (-)
-191.93 266.80 134.21

121
16. PUBLIC FINANCE
TABLE 16.2
Principal Heads of Revenue Receipts (Rs.in crores)
Sl. No Item Accounts
(2006-07)
Revised Estimates (2007-08)
Budget Estimates (2008-09)
(1) (2) (3) (4) (5)
I Tax Receipts 32,792.20 41,899.50 50,463.60
i.Share of Central Taxes (Union Excise Duties, Income tax etc.,)
8,866.00 10,497.87 12,597.44
ii.Taxes on Income and Expenditure (Taxes on Professional trade, ceiling and Employment)
312.21 383.00 421.30
iii.Taxes on property 3,004.40 3,929.48 4,722.98
a.Land Revenue 113.50 129.48 130.48
b.Stamps and Registration Fees 2,865.38 3,750.00 4,537.50
c.Taxes on immovable Property (Other than Agricultural Land)
25.52 50.00 55.00
iv.Taxes on Commodities (a+b+c+d+e)
20,609.59 27,089.15 32,721.88
a.State Excise 3,436.63 4,125.00 4,991.25
b.Sales Tax 15,467.08 20,568.00 24,887.28
c.Taxes on Vehicles 1,364.74 1,892.40 2,289.80
d.Taxes and Duties on Electricity 151.05 175.83 192.84
e.Others 190.09 327.92 360.71
II. Non-Tax Receipts(i+ii+iii+iv) 6,487.83 6,872.13 8,872.63
i.Interest Receipts and Dividends 2,278.57 3,669.38 4,434.92
ii.General Services 2,037.00 309.11 1,027.57
iii.Social Services 249.43 248.29 282.53
iv.Economic Services 1,922.83 2,645.35 3,127.61
III. Grant-in-aid and Contributions 4,965.44 7,354.97 11,590.80
IV. Total Revenue Receipts (I+II+III) 44,245.47 56,126.60 70,927.03
Source :- Finance Department, Government of Andhra Pradesh.

122
16. PUBLIC FINANCE
TABLE 16.3
Principal Heads of Expenditure (Revenue Account) (Rs. In crores)
Sl.. No
Item Accounts (2006-07)
Revised Estimates (2007-08)
Budget Estimates (2008-09)
(1) (2) (3) (4) (5) I. Non-Development Expenditure 15,313.97 19,095.29 20,223.71 A.General Services
(I+II+III+IV+V) 15,313.97 19,095.29 20,223.71
i.Organs of State 360.64 392.85 459.90 ii.Fiscal Services (Collection
of taxes) 606.42 711.84 808.19
iii.Interest Payment and Servicing of debts
7,493.78 9,005.74 9,404.46
iv.Administrative Services 2,702.21 4,260.61 4,348.29 v. Pensions and Miscellaneous
General Services 4,150.92 4,724.25 5,202.87
II. Development Expenditure (B+C) 25,879.59 36,316.14 49,624.45 B) Social and Community
Services 15,369.33 20,956.94 29,062.54
1.Education, Sports, Art and Culture
6,035.61 8,603.44 10,520.44
i.General Education 5,649.55 8,161.10 10,053.03 ii.Technical Education 202.28 226.86 224.29 iii.Others 183.78 215.48 243.12 2.Health and Family Welfare 1,853.93 2,429.41 3,125.70 i.Medical and Public Health 1,494.48 2,011.52 2,542.67 ii.Family Welfare 359.45 417.89 583.03 3.Water supply, Sanitation, Housing
and Urban Development 2,637.41 4,017.14 6,453.58
i.Water Supply and Sanitation 1,027.07 1,220.30 1,389.02 ii.Housing 537.54 1,111.09 2,168.28 iii.Urban Development 1,072.80 1,685.75 2,896.28
Contd…

123
16. PUBLIC FINANCE
TABLE 16.3 (Concld..)
Principal Heads of Expenditure (Revenue Account) (Rs. In crores)
Sl. No
Item Accounts (2006-07)
Revised Estimates (2007-08)
Budget Estimates (2008-09)
(1) (2) (3) (4) (5)
4.Welfare of SC, ST & BCs 1,870.96 2,757.64 3,376.13
5. Labour and Labour Welfare 92.56 124.16 277.87
6. Social Welfare and Nutrition 2,878.86 3,025.15 5,308.82
i.Relief on account of natural calamities
710.21 319.23 401.61
ii.Information and Broadcasting & Others
2,168.65 2,705.92 4,907.21
C. Economic Services 10,510.26 15,359.20 20,561.91
i.Agriculture and allied activities
1,438.12 2,036.48 3,430.85
ii.Rural Development 2,445.95 2,551.27 4,203.02
iii.Irrigation and Flood Control 3,176.56 5,484.41 6,956.43
iv.Energy 1,601.12 2,578.41 2,509.97
v.Industries and Minerals 232.10 578.03 675.95
vi.Transport 1,134.25 1,392.98 1,505.98
vii.Science, Technology and Environment
7.23 8.76 10.68
viii.Others 474.93 728.86 1,269.03
III. Grants-in-aid 244.83 264.38 369.56
IV. Total Expenditure (I+II+III) 41,438.39 55,675.81 70,217.72
Source :- Finance Department, Government of Andhra Pradesh.

124
16. PUBLIC FINANCE
TABLE 16.4
Principal Heads of Capital Budget (Rs. in Crores)
Sl. No
Item Accounts (2006-07)
Revised Estimates (2007-08)
Budget Estimates (2008-09)
(1) (2) (3) (4) (5) A. Receipts I+II+III+IV 94,440.40 44,661.91 53,458.09
I. PUBLIC DEBT INCURRED (a+b) 4,550.22 12,638.72 15,668.06
a) Internal Debt of the State Government 4,235.65 11,540.86 13,099.29
b) Loans and Advances fromCentral Government
314.57 1,097.86 2,568.77
II. Loans and Advances repaid to State Government
471.34 275.80 355.66
III. Unfunded Debt. (Small Savings and Provident fund)
5,913.93 3,068.81 3,204.56
IV. Deposits and Advances (including Contingency Fund etc.)
83,504.91 28,678.58 34,229.81
B Disbursements (I+II) 97,439.41 44,845.90 54,033.19
I.Capital Outlay (i+ii+iii) 9,904.00 12,912.34 17,851.84
i .Capital expenditure on General Services 344.22 112.29 210.12
ii. Capital expenditure on Social and Community Services (a to e)
163.82 631.62 1,285.81
a.Education, Sports, Arts and Culture 77.88 141.89 274.32
b.Health and Family Welfare 6.77 58.00 91.50
c.Water Supply, Sanitation, Housing and Urban Development
3.00 60.96 58.96
d.Welfare of SC, ST & BCs. 75.51 327.63 785.51
e.Others 0.66 43.14 75.52 Contd…

125
16. PUBLIC FINANCE
TABLE 16.4 (Concld…)
Principal Heads of Capital Budget (Rs. in Crores)
Sl. No
Item Accounts (2006-07)
Revised Estimates (2007-08)
Budget Estimates (2008-09)
(1) (2) (3) (4) (5)
iii.Capital Expenditure on Economic Services (a to f)
9,395.96 12,168.43 16,355.91
a.Irrigation & Flood control 8,217.71 11,227.05 14,024.95
b.Agriculture and Allied Activities 18.09 30.12 67.65
c.Energy 16.00 0.00 0.00
d. Industries and Minerals 33.22 45.76 49.75
e.Transport 889.70 717.77 1,220.63
f.Others 221.24 147.73 992.93
II. Loans and Advances and Debt. Settlements (i+ii+iii+iv)
87,535.41 31,933.56 36,181.35
i.Public Debt. discharges (a+b) 4,252.72 5,759.42 7,496.20
a.Internal Debt. 3,062.53 4,976.20 6,695.83
b.Loans and Advances including their inter state settlement
1,190.19 783.22 800.37
ii.Repayment of Loans and Advances including Inter-state settlement
906.69 5,251.39 4,870.79
iii.Unfunded debt. Discharges (Small Savings and Provident fund)
1,217.82 1,481.56 1,671.27
iv.Deposits, Advances (including Contingency Fund)
81,158.18 19,441.19 22,143.09
Source: Finance Department, Government of Andhra Pradesh.

126
16. PUBLIC FINANCE
TABLE 16.5
Income Tax - Number of Assessees and Tax paid
Item Unit 2005-06 2006-07
(1) (2) (3) (4)
Number of effective Assesses '000 1,458 1,494
Budget Collections (Rs. in crores) 6,682 10,173
Source:- Chief Commissioner of Income Tax, Hyderabad-1.

127
16. PUBLIC FINANCE
TABLE 16.6
Small Savings (Rs. in Crores)
Sl. No Name of the Security 2005-06 2006-07 2007-08
(1) (2) (3) (4) (5)
1. Post Office Savings Bank A/c.
a.Gross 2,110.67 2,661.26 3,836.56
b.Net 39.66 92.91 0.89
2. Post Office Recurring Deposits A/c
a.Gross 1,874.82 2,064.76 2,104.82
b.Net 690.81 790.29 332.25
3. Post Office Time Deposits (All Types)
a.Gross 1,127.56 1,177.97 776.76
b.Net 1,127.56 74.3 -314.62
4. Post Office Monthly Income Scheme
a.Gross 3,208.23 1,824.58 1,286.13
b.Net 2,261.54 457.71 -290.21
5. National Savings Scheme 1992
a. Gross 1.88 9.85 0.04
b. Net 1.50 1.2 -7.96
6. NationalSavings Certificates VIII Issue
a.Gross 352.78 350.16 241.02
b.Net 93.84 37.93 -13.52
Contd…

128
16. PUBLIC FINANCE
TABLE 16.6
Small Savings(Concld…) (Rs. in Crores)
Sl. No Name of the Security 2005-06 2006-07 2007-08
(1) (2) (5) (6) (7)
7. Deposit Scheme for Retiring Govt./Public sector Employees - - -
a.Gross - - -
b.Net - - -
8. Indira Vikas Patras - - -
a.Gross - - -
b.Net - - -10.07
9. Kisan Vikas Patras
a.Gross 1,299.31 1,178.48 649.26
b.Net 323.16 287.18 -169.08
10. Public Provident Fund Scheme
a.Gross 77.99 120.55 81.51
b.Net 61.25 63.24 -40.2
11. Old Certificates -
a.Gross 12.34 1.23 0.72
b. Net 10.59 -15.25 -28.73
GrandTotal (Gross) 10,065.58 9,388.84 8,976.82
Grand Total (Net) 4,609.91 1,789.51 -541.25
Source: Regional Director, National Savings, Govt. of India, Hyderabad.

129
17. BANKS AND JOINT STOCK COMPANIES
TABLE 17.1
District wise Distribution of Commercial Banks, Average Population per Bank, Deposits, Credits and Credit Deposit Ratio of
All Scheduled Commercial Banks- September, 2007
Offices
Sl. No District
State Bank of India & its asso-ciates
Nation-alised Banks
For-eign Banks
Rea-gional Rural Banks
Other Sched-uled Comm-ercial Banks
All Sched-uled Comm-ercial Banks
(1) (2) (3) (4) (5) (6) (7) (8) 1. Srikakulam 132 48 - 57 4 141 2. Vizianagaram 33 39 - 56 6 134 3. Visakhapatnam 100 139 1 49 37 326 4. East Godavari 89 222 - 16 39 366 5. West Godavari 63 186 - 17 32 298 6. Krishna 94 222 - 29 40 385 7. Guntur 85 180 - 51 31 347 8. Prakasam 52 122 - 52 14 240 9. Nellore 36 100 - 64 15 215
10. Chittoor 49 120 - 70 28 267 11. Kadapa 47 52 - 69 13 181 12. Anantapur 41 80 - 81 25 227 13. Kurnool 54 85 - 66 19 224 14. Mahbubnagar 69 55 - 70 5 199 15. Ranga Reddy 90 124 - 23 31 268 16. Hyderabad 160 375 10 - 107 652 17. Medak 51 46 - 64 6 167 18. Nizamabad 58 73 - 27 12 170 19. Adilabad 46 28 - 70 4 148 20. Karimnagar 54 83 - 45 11 193 21. Warangal 60 78 - 40 23 201 22. Khammam 53 42 - 70 6 171 23. Nalgonda 55 58 - 77 5 195
Andhra Pradesh 1,471 2,557 11 1,163 513 5,715 Contd…

130
17. BANKS AND JOINT STOCK COMPANIES
TABLE 17.1 (Concld…)
District wise Distribution of Commercial Banks, Average Population per Bank, Deposits, Credits and Credit Deposit Ratio of
All Scheduled Commercial Banks- September, 2007
All Scheduled Commercial Banks
(Rs. in Crores) Sl. No
District
Population as on
September ’2007
Average popula-tion per
Bank Office
(in 000) Credits Deposits
Credit Deposit Ratio
(1) (2) (9) (10) (11) (12) (13) 1 Srikakulam 27,66,225 19.62 1,350 1,625 83.07 2 Vizianagaram 23,43,055 17.49 1,074 1,358 79.08 3 Vishakapatnam 44,46,281 13.64 7,755 16,506 46.98 4 East Godavari 51,73,298 14.13 6,066 5,185 106.99 5 West Godavari 40,70,617 13.66 5,425 3,781 143.48 6 Krishna 47,09,394 12.23 7,042 7,075 99.53 7 Guntur 47,71,043 13.75 7,118 5,358 132.84 8 Prakasham 33,42,190 13.93 2,942 2,684 109.61 9 Nellore 29,80,756 13.86 3,361 2,814 119.43 10 Chittoor 41,42,979 15.52 3,774 6,645 56.79 11 Cuddapah 29,56,253 16.33 2,302 2,688 85.63 12 Anantapur 40,09,046 17.66 2,839 4,157 68.29 13 Kurnool 40,86,607 18.24 2,939 2,972 98.88 14 Mahoobnagar 38,43,543 19.31 1,874 2,126 88.14 15 Rangareddy 45,74,981 17.07 5,082 9,537 53.28 16 Hyderabad 43,66,342 6.70 61,438 61,092 100.56 17 Medak 30,00,004 17.96 2,615 2,346 111.46 18 Nizamabad 26,35,406 15.50 1,857 2,055 90.36 19 Adilabad 29,16,491 19.71 1,437 2,095 68.59 20 Karimnagar 39,28,892 20.36 2,235 3,705 60.32 21 Warangal 35,93,590 17.88 2,645 3,395 77.90 22 Khammam 28,76,837 16.82 1,672 2,294 72.88 23 Nalgonda 35,87,255 18.40 1,928 2,058 93.68
Andhra Pradesh
8,51,21,084
14.89
1,36,771 1,53,552 89.07
Source: Quarterly handout September 2006, Reserve Bank of India, Mumbai

131
17. BANKS AND JOINT STOCK COMPANIES
TABLE 17.2
Loans Sanctioned by Andhra Pradesh State Financial Corporation - Industry wise
(Rupees in Lakhs) Sl. No. Industry 2005-06 2006-07
(1) (2) (3) (4)
1. Food Manufacturing 5,963 9,071
2. Textiles (Cotton and allied) 3,665 4,041
3. Tobacco and Tobacco Products 0 107
4. Printing and Publishing 835 1,306
5. Chemical and Chemical Products 10,044 6,435
6. Metallic, Non-metallic and Electrical goods 10,520 18,756
a.Non-Metallic Mineral Products 3,362 8,056
b.Metal Products 805 365
c.Basic Metal Industries 3,823 4,846
d.Manufacture of Machinery (Except Electrical Machinery) 1,264 4,088
e.Manufacture of Electrical Machinery 1,266 1,401
7. Paper and Paper Products 2,766 3,171
8. Miscellaneous 24,807 27,588
Total 58,600 70,475
Source: Andhra Pradesh State Financial Corporation, Hyderabad.

132
17. BANKS AND JOINT STOCK COMPANIES
TABLE 17.3
Working of Joint Stock Companies Limited by Shares in Andhra Pradesh
(Paid up Capital Rs. in Crores)
P: Provisional R=Revised Source: Department of Company affairs, Ministry of law, Justice and Company affairs, Govt. of India, New Delhi.
Sl.No Particulars 2002-03 ( R)
2003-04 ( R)
2004-05 ( R)
2005-06
2006-07 (P)
(1) (2) (3) (4) (5) (6) (7)
I. Public
a.Number of companies 6,339 6,437 6,567 6,756 6,235
b.Paid up Capital 18,624.15 19,741.49 53,896.48 N.A. N.A.
II. Private
a.Number of companies 32,985 35,104 37,763 41,395 43,775
b.Paid up Capital 13,346.03 13,965.99 17,803.34 N.A. N.A.
III. Total
a.Number of companies 39,324 41,541 44,330 48,151 50,010
b.Paid up Capital 31,970.18 33,707.48 71 N.A. N.A.

133
18. CO-OPERATION TABLE 18
The A.P.State Cooperative Bank Ltd.,Hyderabad
(As on 31st March) (Rs.in Lakhs)
Year Member ship
Share Capital
Statutory Reserves Deposits Borrow-
ings Working Capital
(1) (2) (3) (4) (5) (6) (7)
2002-03 23 18,910 62,375 1,35,963 3,35,937 5,28,477
2003-04 23 19,014 64,271 1,67,794 3,21,937 5,73,016
2004-05 23 19,190 1,12,400 1,86,764 3,12,352 6,30,706
2005-06 23 19,193 1,19,555 1,69,715 4,07,473 4,63,095
2006-07 23 19,198 1,24,415 1,77,844 4,19,146 7,40,604
Contd..
Source: Managing Director, A.P State Coperative Bank Ltd., Hyderbad.
L O A N S Year
Advances Recovered Out Standing Over due
Bad and Doubtful
Debts
(1) (8) (9) (10) (11) (12)
2002-03 2,38,583 2,87,099 4,53,237 85,040 1,66,852
2003-04 3,28,670 3,33,547 4,47,982 74,998 1,37,485
2004-05 9,11,807 8,43,942 5,15,847 59,325 76,231
2005-06 9,43,602 8,95,466 5,64,068 63,809 86,801
2006-07 10,92,359 10,49,973 6,06,454 87,849 11,344

134
19. LOCAL BODIES
TABLE 19.1
Gram Panchayats in Andhra Pradesh
Sl. No. Item 2004-05 2005-06
(1) (2) (3) (4)
1. Number of Gram Panchayats 21,900 21,895
2. Total Receipts (Rs. in Lakhs ) 1,12,455 1,89,568
3. Total Expenditure (Rs. in Lakhs) 85,969 1,04,196
4. Projected Rural Population ( in Lakhs) 583.70 591.38
Source : Director, State Audit, Hyderabad.

135
19. LOCAL BODIES
TABLE 19.2(A)
Receipts and Expenditure of Zilla Parishads, 2005-06
Source : Director, State Audit, Andhra Pradesh
Sl . No.
District Receipts
(Rs. in Lakhs) Expenditure (Rs.
in Lakhs) (1) (2) (3) (4) 1. Srikakulam 9,009.70 9,071.17
2. Vizianagaram 5,870.72 4,561.16
3. Visakhapatnam 2,769.61 2,373.76
4. East Godavari 9,907.48 9,985.56
5. West Godavari 12,917.86 11,794.76
6. Krishna 14,032.13 13,033.58
7. Guntur 11,580.97 10,373.55
8. Prakasam 6,,660.35 6,316.82
9. Nellore 4,195.71 3,959.48
10. Chittoor 7,551.46 6,778.71
11. Kadapa 11,161.91 9,183.81
12. Anantapur 5,175.82 3,829.96
13. Kurnool 4,876.38 4,074.38
14. Mahbubnagar 7,379.43 15,263.52
15. Ranga Reddy 10,960.37 16,737.40
16. Hyderabad ,- ,
17. Medak 5,977.21 4,655.74
18. Nizamabad 4,989.46 4,199.49
19. Adilabad 3,172.30 3,258.92
20. Karimnagar 11,710.63 6,976.67
21. Warangal 12,026.29 10,811.89
22. Khammam 17,973.71 17,407.00
23. Nalgonda 10,421.31 9,042.70
Total 1,90,320.81 1,83,690.03

136
19. LOCAL BODIES TABLE 19.2(B)
Receipts and Expenditure of Mandal Parishads, 2005-06
Source : Director, State Audit Andhra Pradesh.
Sl . No.
District Receipts
(Rs. in Lakhs) Expenditure (Rs.
in Lakhs)
(1) (2) (3) (4)
1. Srikakulam 2,102.16 1,899.77
2. Vizianagaram 2,340.28 2,588.31
3. Visakhapatnam 1,195.22 1,196.17
4. East Godavari 4,270.41 3,612.24
5. West Godavari 1,461.48 1,523.90
6. Krishna 2,678.13 2,387.72
7. Guntur 71,237.98 73,990.47
8. Prakasam 1,932.36 1,737.81
9. Nellore 731.60 763.49
10. Chittoor 1,920.94 1,992.19
11. Kadapa 690.58 867.81
12. Anantapur 3,681.46 4,111.14
13. Kurnool 1,986.22 2,041.81
14. Mahbubnagar 937.31 1,026.93
15. Ranga Reddy 2,025.00 1,712.15
16. Hyderabad - -
17. Medak 2,952.15 3,068.63
18. Nizamabad 2,490.46 2,563.81
19. Adilabad 6,488.50 6,038.65
20. Karimnagar 3,571.97 1,947.32
21. Warangal 1,224.15 1,081.44
22. Khammam 3,152.61 3,491.72
23. Nalgonda 8,515.49 8,165.69
Total 1,27,586.46 1,27,809.17

137
19. LOCAL BODIES
TABLE 19.2(C )
Receipts and Expenditure of Gram Panchayats, 2005-06
Source : Director, State Audit Andhra Pradesh.
Sl . No.
District Receipts (Rs. in
Lakhs) Expenditure (Rs.
in Lakhs)
(1) (2) (3) (4)
1. Srikakulam 6,157.44 945.69
2. Vizianagaram 6,615.90 2,608.75
3. Visakhapatnam 7,540.62 6,158.56
4. East Godavari 63,064.44 39,433.23
5. West Godavari 8,049.44 - 36,340.57
6. Krishna 7,109.23 6,586.14
7. Guntur 6,846.72 5,351.52
8. Prakasam 7,009.72 4,284.21
9. Nellore 4,155.02 3,178.29
10. Chittoor 4,756.94 4,279.56
11. Kadapa 4,786.19 3,886.68
12. Anantapur 7,394.44 9,328.67
13. Kurnool 6,902.57 5,049.27
14. Mahbubnagar 16,782.28 12,322.16
15. Ranga Reddy 5,347.18 5,631.52
16. Hyderabad - -
17. Medak 3,369.91 3,360.72
18. Nizamabad 7,022.22 5,342.95
19. Adilabad 788.15 1,399.97
20. Karimnagar 5,197.15 4,813.61
21. Warangal 5,212.43 11,914.20
22. Khammam 1,277.35 1,705.65
23. Nalgonda 4,183.08 2,955.02
Total 1,89,568.42 1,04,195.80

138
19. LOCAL BODIES
TABLE 19.3
Municipalities in Andhra Pradesh
Sl. No. Item Unit 2005-06* 2006-07*
(1) (2) (3) (4) (5)
1. Municipalities No. 120+14
Municipal Corporations
109+15 Municipal
Corporations
2. Population** Lakh 190.81 192.19
3. Members No. 4,473 4,170
4. Receipts (Ordinary and Capital including Govt. grants)
Rs. Crores 2,046.22 1,825.36
5. Expenditure (Ordinary and Capital including Govt. grants)
Rs. Crores 1,696.69 1,585.20
* Data includes Municipal Corporations ** Population as per 2001 Census Source: Director of Municipal Administration, Andhra Pradesh.

139
20. POLICE AND CRIME TABLE 20.1
Strength of Civil Police
(As on 31st December) Sl. No Particulars 2006 2007
(1) (2) (3) (4)
Sanctioned Strength of Police Force:
1 Inspector General and Deputy Inspector General
i.Director General of Police 1 1
ii. Addl D.G.P 20 19
iii. Special I.G.P. 21 23
iv.Deputy I.G.P. 30 26
2 Superintendents, Assistant and Deputy Superintendents
i.Superintendents 75 83
ii.Additional Superintendents of Police 72 75
iii.Commandants 20 23
iv.Additional Commandants 13 19
v.Assistant Commandants (Dy.S.P. Rank) 101 125
vi.Assistant Superintendents of Police and Deputy Superintendents of Police 324 327
3 Inspectors and Sub-Inspectors
i.Police Inspectors including Reserve Inspectors 1,235 1,463
ii.Sub-Inspectors including Reserve Sub- Inspectors 4,107 4,653
4 Head Constables including Assistant Sub-Inspectors/ARSI 17,330 19,959
5 Number of Constables including Armed Reserve 61,814 63,985
Total 85,163 90,781
Source: Director General of Police, Hyderabad, Andhra Pradesh.

140
20. POLICE AND CRIME
TABLE 20.2
Cognizable Crimes (As on 31st December)
Contd…
Number of Cases Sl.No Particulars
2005 2006
(1) (2) (3) (4)
A Classes (I to VI) including Abatement and Criminal Conspiracy:
Investigation Stage :
1. Number of cases pending investigation from previous year 55,135 50,758
2. Number of cases reported during the year 1,57,123 1,73,909
3. Number of cases not investigated or in which investigation was refused 28 27
4. Number of cases declared false/ Mistake of fact of law non-cognizable 16,203 14,979
5. Cases in which charge sheets were laid down during the year 1,25,092 1,24,089
6. Cases in which charge sheets were not laid down but investigation was completed and final reports submitted during the year
20,177 15,797
7. Cases pending investigation at the end of the year 50,758 69,775
Trial Stage :
8. Cases pending trial at court from previous year 2,11,123 2,29,198
9. Cases sent to court for trial during the year 1,25,092 1,24,089
10. Compounded/ with drawn 25,718 23,649
11. Cases withdrawn or otherwise disposed 27 14
12. Cases acquitted 50,658 47,440
13. Cases convicted 30,614 27,712
14. Cases pending trial at court at the end of the year 2,29,198 2,54,472

141
20. POLICE AND CRIME
TABLE 20.2 (Concld.,) Cognizable Crimes (As on 31st December)
Source:- Director General of Police, Andhra Pradesh.
Number of Cases Sl.No Particulars
2005 2006
(1) (2) (3) (4)
B. Part-II Offence under special and local laws
Investigation Stage :
1. Number of cases pending investigation from previous year 8,959 7,217
2 Number of cases reported during the year 5,09,083 6,02,146
3 Number of cases not investigated or in which investigation was refused 10 3
4 Number of cases declared false/ Mistake of fact of law non-cognizable 728 1,777
5 Cases in which charge sheets were laid down during the year 5,09,922 6,00,349
6 Cases in which charge sheets were not laid down but investigation was completed and final report submitted during the year
165 621
7 Cases pending investigation at the end of the year 7,217 6,613
Trail Stage
8 Cases pending trial at court from previous year 25,392 21,941
9 Cases sent to court for trial during the year 5,09,922 6,00,349
10. Compounded/Withdrawn 1,703 721
11. Cases withdrawn or otherwise disposed - -
12. Cases acquitted 7,693 6,925
13. Cases convicted 5,03,977 5,89,159
14. Cases pending trial at court at the end of the year 21,941 25,485

142
20. POLICE AND CRIME
TABLE 20.3
Non - Cognizable Crimes (As on 31st December)
Number of Cases Sl. No Particulars
2005 2006
(1) (2) (3) (4)
A. Classes (I to VI) including Abatement and Criminal Conspiracy
1. Number of cases pending at the beginning of the year 15,809 15,545
2. Cases reported during the year 90,123 1,17,662
3. Total for disposal 1,05,932 1,33,207
4. Number of cases dismissed without trial 731 417
5. Cases in which accused, died, escaped or became insane during trial in which charges were abandoned,compounded or withdrawn
416 609
6. Cases discharged or acquitted 2,984 3,040
7. Cases convicted 85,856 1,19,708
8. Number of cases declared by the court never to have occurred or to be mistaken of facts of law 362 273
9. No. in which the court held that the cognizable offence committed
36 36
10. Cases reversed on appeal or revision 2 6
11. Number of cases pending at the end of the year
15,545 9,118
Source: Director General of Police, Andhra Pradesh.

143
20. POLICE AND CRIME
TABLE 20.4
Property Stolen and Recovered (As on 31st December)
Number of Cases Sl. No
Particulars
2005 2006
(1) (2) (3) (4)
1 Number of Cases in which property was stolen
32,858 32,815
2 Number of cases in which property was recovered
17,962 16,837
3 Percentage of cases in which property was recovered to cases in which property was stolen
54.66% 51.31%
4 Amount of property stolen (Rs. in lakhs)
8,358.04 9,960.25
5 Amount of property recovered (Rs. in lakhs)
3,840.24 4,361.03
6 Percentage of property recovered to value of property stolen
45.95% 43.78%
Source: Director General of Police, Andhra Pradesh.

144
21. PLANNING AND COMMUNITY DEVELOPMENT
TABLE 21.1
Plan Expenditure (Rs. in Crores)
Period Total Plan Expenditure
Central Assistance
% of Central Assistance
to total Expenditure
(1) (2) (3) (4)
Ist Plan (1951-56) 96.78 N.A. --
2nd Plan (1956-61) 188.60 92.73 49
3rd Plan (1961-66) 352.42 220.77 63
1966-67 Annual Plan 93.40 61.99 66
1967-68 Annual Plan 66.30 57.50 87
1968-69 Annual Plan 74.36 42.80 58
4th Plan (1969 to 1974) 448.87 230.31 51
5th Plan (1974 to 1978) 1,004.28 351.08 35
1978-79 Annual Plan 440.44 232.07 53
1979-80 Annual Plan 459.16 253.01 55
6th Plan (1980-85) 3,237.07 1,045.44 32
7th Plan (1985-90) 5,978.88 1,857.34 31
1990-91 Annual Plan 1,465.33 569.41 39
1991-92 Annual Plan 1,561.86 511.77 33
8th Plan (1992-97) 13,606.61 3,549.03 26
9th Plan (1997-2002) 28,572.40 4,509.71 16
10th Plan (2002-2007)
(a) 2002-03 Annual Plan 8,315.09 1,118.65 13
(b) 2003-04 Annual Plan 10,758.80 1,239.04 12
(c) 2004-05 Annual Plan 11,456.54 1,239.04 11
(d) 2005-06 Annual Plan 13,439.41 1,239.04 9
(e) 2006-07 Annual Plan 18,206.98 1,297.09 7 Source: Planning Department, Secretariat, Andhra Pradesh.

145
21. PLANNING AND COMMUNITY DEVELOPMENT
TABLE 21.2
Plan Expenditure by Heads of Development (Rs. In Lakhs)
2005-06 2006-07 Sl. No
Heads of Development Expen-
diture % to Total
Expen-diture
% to Total
(1) (2) (3) (4) (5) (6)
A ECONOMIC SERVICES 9,98,364.61 74.29 13,25,675.78 72.81
I Agriculture and allied Services 47,791.26 3.56 51,579.91 2.83
II Rural Development 97,194.91 7.23 1,45,666.89 8.00
III Special Area development 22,068.74 1.64 42,357.60 2.33
IV Irrigation and flood control 6,67,205.30 49.65 9,12,607.77 50.12
V Energy 5,682.59 0.42 5,892.13 0.32
VI Industry and Minerals 26,879.47 2.00 20,428.93 1.12
VII Transport 1,11,308.24 8.28 1,32,262.06 7.26
VIII Communi- cations - - - -
IX Science, Technology & Environment
112.41 0.01 96.88 0.01
X General Economic Services
20,121.69 1.50 14,783.61 0.81
Contd…

146
21. PLANNING AND COMMUNITY DEVELOPMENT
TABLE 21.2 (Concld.,)
Plan Expenditure by Heads of Development (Rs. In Lakhs)
2005-06 2006-07 Sl. No
Heads of Development Expenditure
% to Total
Expenditure % to Total
(1) (2) (3) (4) (5) (6)
B SOCIAL SERVICES 3,38,778.75 25.21 4,54,864.96 24.98
1.General Education 46,168.74 3.44 53,340.21 2.93
2.Sports & Youth Services 12,461.23 0.93 9,446.79 0.52
3.Technical Education 5,596.18 0.42 8,063.62 0.44
4.Art & Culture 1,135.20 0.08 660.17 0.04
5.Medical & Public Health 33,964.48 2.53 39,466.10 2.17
6.Water Supply & Sanitation 60,189.08 4.48 63,626.64 3.49
7.Housing 40,468.27 3.01 52,415.56 2.88
8.Urban Development 47,275.45 3.52 89,222.38 4.90
9.Information & Publicity 481.62 0.04 484.00 0.03
10.Welfare of S.C., S.T.,B.C., & Minorities
79,442.81 5.91 1,05,755.68 5.81
11.Labour & Employment 1,187.42 0.09 974.19 0.05
12.Social Security & Welfare 3,143.27 0.23 11,556.06 0.63
13.Nutrition ( WD & CW) 7,265.00 0.54 19,853.56 1.09
C GENERAL SERVICES 6,797.97 0.51 40,157.68 2.21
GRAND TOTAL (A+B+C) 13,43,941.33 100.00 18,20,698.42 100.00
Source : Planning Department, Secretariat, Government of A.P.

147
22. PRICES TABLE 22.1
Annual State Average Wholesale Prices of Foodgrains
(As on 31st March) (Price per Quintal in Rs.)
Sl. No
Commodity
2002- 03
2003- 04
2004- 05
2005- 06
2006- 07
2007-08 (Provisio
nal) April 07 to Feb 08
(1) (2) (3) (4) (5) (6) (7) (8)
1.
Paddy (Ist Sort)
824.43 641.13 656.24 747.96 795.41 829.39
2.
Paddy (IInd Sort)
655.43 527.83 565.11 658.36 675.60 716.95
3. Rice
(Ist Sort) 1,582.07 1,473.18 1,344.79 1,423.68 1,636.03 1624.94
4.
Rice (IInd Sort)
1,019.95 925.66 925.34 1,023.77 1,163.81 1204.72
5. Wheat 1,047.64 1,206.67 1,196.49 1,215.35 1,521.48 1500.25
6. Maize 549.61 526.46 539.65 543.59 619.94 715.25
7.
Jowar (White)
673.62 626.89 714.49 702.73 761.18 909.23
8. Bajra 598.46 594.41 594.55 669.75 837.63 855.46
9. Ragi 571.46 599.17 624.42 643.46 766.81 853.20
Source: Directorate of Marketing, Andhra Pradesh
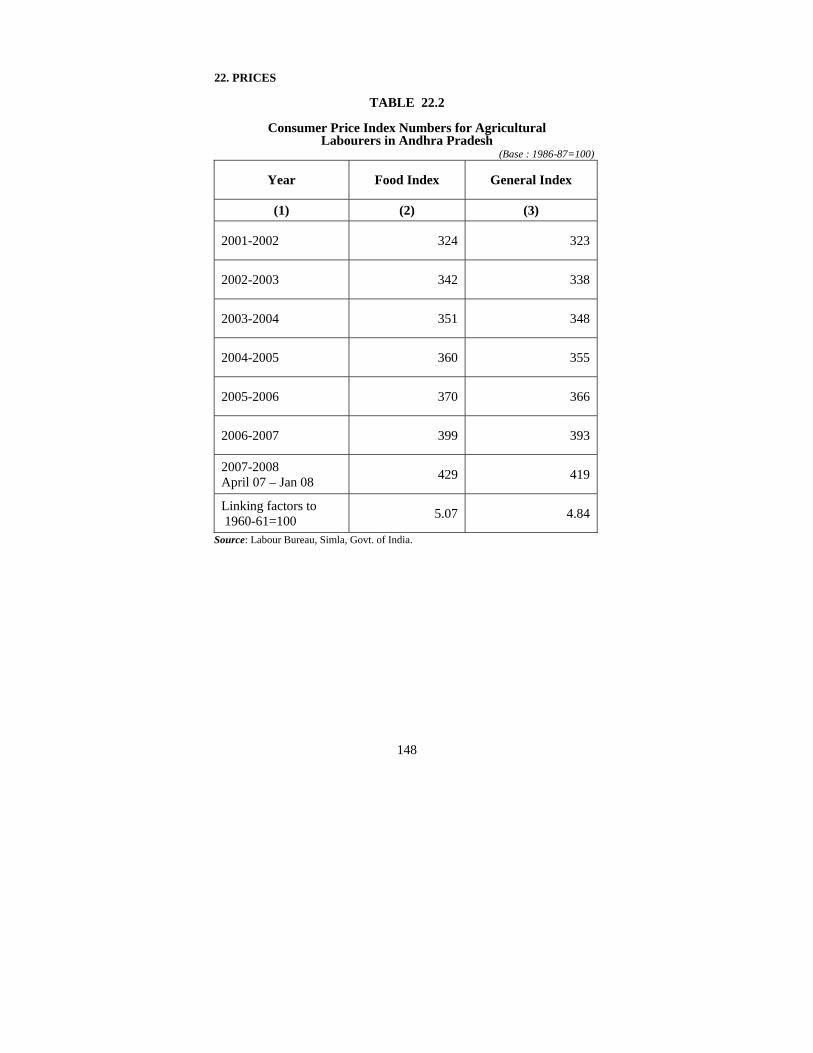
148
22. PRICES
TABLE 22.2
Consumer Price Index Numbers for Agricultural Labourers in Andhra Pradesh
(Base : 1986-87=100)
Year Food Index General Index
(1) (2) (3)
2001-2002 324 323
2002-2003 342 338
2003-2004 351 348
2004-2005 360 355
2005-2006 370 366
2006-2007 399 393
2007-2008 April 07 – Jan 08 429 419
Linking factors to 1960-61=100 5.07 4.84
Source: Labour Bureau, Simla, Govt. of India.

149
22. PRICES
TABLE-22.3(A)
Consumer Price Index Numbers for Industrial Working Class at Selected Centres in Andhra Pradesh
(Central Series) (Base : 1982 = 100)
Annual Average
Sl. No
Centre 2003-04
2004-05
2005-06
Linking Factors
1960=100
(1) (2) (3) (4) (5) (6)
Apl05
to Dec05
Jan06 to
Mar06
1. Hyderabad 501 516 536 113 5.23
2. Guntur 506 510 529 117 5.60
3. Gudur 471 495 504 - 4.33
Vijayawada * - - - 116
4. Visakhapatnam 489 507 528 115 1.87
5. Warangal 525 535 561 118 1.90
6. Kothagudem 504 521 553 - -
Godavarikhani * - - - 121 -
*From January 06 onwards Base 2001=100, Vijayawada & Godavarikhani were selected instead of Gudur & Kothagudem in Central series in the New Base. Source: Labour Bureau, Govt. of India., Simla
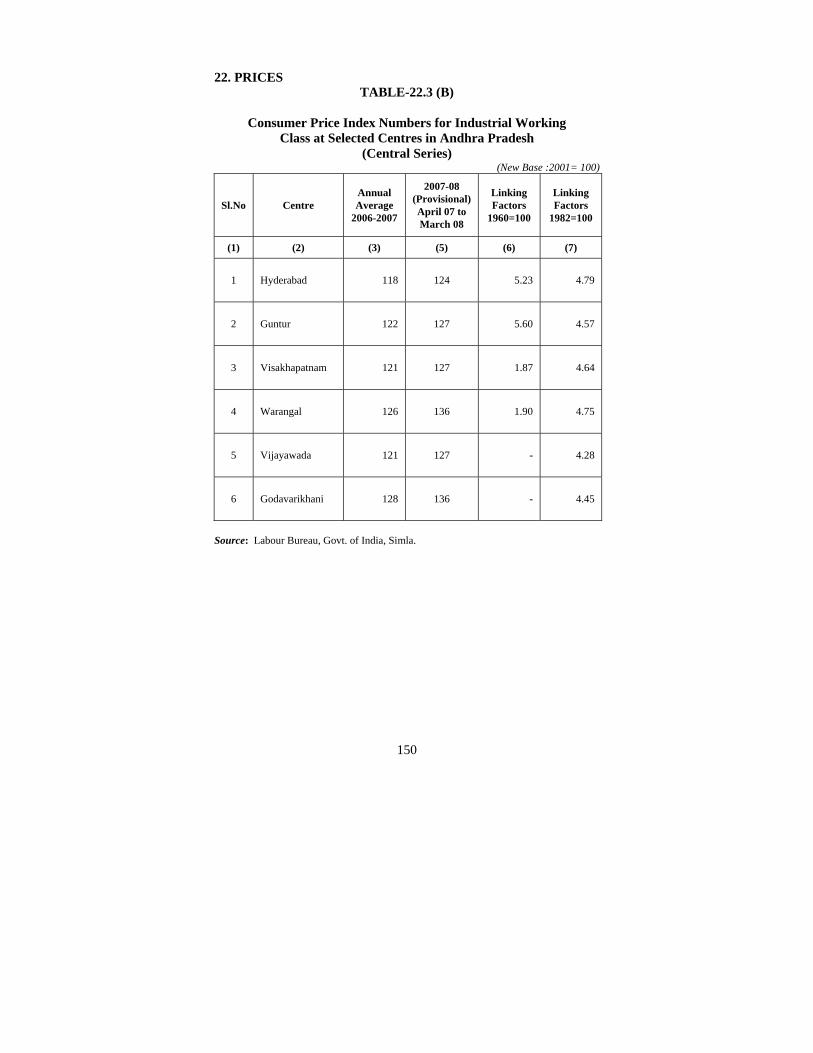
150
22. PRICES TABLE-22.3 (B)
Consumer Price Index Numbers for Industrial Working
Class at Selected Centres in Andhra Pradesh (Central Series)
(New Base :2001= 100)
Sl.No Centre Annual Average
2006-2007
2007-08 (Provisional) April 07 to March 08
Linking Factors
1960=100
Linking Factors
1982=100
(1) (2) (3) (5) (6) (7)
1 Hyderabad 118 124 5.23 4.79
2 Guntur 122 127 5.60 4.57
3 Visakhapatnam 121 127 1.87 4.64
4 Warangal 126 136 1.90 4.75
5 Vijayawada 121 127 - 4.28
6 Godavarikhani 128 136 - 4.45
Source: Labour Bureau, Govt. of India, Simla.

151
22. PRICES
TABLE-22.4(A) Consumer Price Index Numbers for Industrial Working
Class at Selected Centres in Andhra Pradesh (State Series)
(Base : 1982 = 100)
Annual Average Sl. No
Centre 2003-04 2004-05
2005-06( April 05 to Dec 05)
(1) (2) (3) (4) (5)
1. Vizianagaram 432 449 468
2. Rajahmundry 485 500 521
3. Adoni 492 505 521
4. Vijayawada 463 474 490
5. N.S.B. Complex 485 498 516
6. M.G.P. Complex 479 494 512
Source: Directorate of Economics and Statistics, Andhra Pradesh.
CPI NUMBERS FOR INDUSTRIAL WORKING CLASS AT SELECTED CENTRES IN ANDHRA PRADESH
400420440460480500520540
2003-04 2004-05 2005-06( Apil05 to Dec 05)
YEAR
IND
EX N
UM
BER
S
Vizianagaram Rajahmundry AdoniVijayawada N.S.B. Complex M .G.P. Complex

152
22. PRICES
TABLE-22.4(B) Consumer Price Index Numbers for Industrial Working
Class at Selected Centres in Andhra Pradesh (State Series)
(New Base :2001= 100)
Sl. No Centre
Jan 06 to
March 06
Annual Average
2006-2007
2007-08 (Provisional) April 07 to Mar 08
Linking Factors 1960= 100
Linking Factors
1982=100
(1) (2) (3) (4) (5) (6) (7)
1 Vizianagaram & Chittivalsa 120 127 135 - 3.93
2 Rajahmundry & Kakinada 124 131 137 1.81 4.26
3 Jaggaiahpet & Miryalaguda 125 130 137 - -
4 Tirupati & Renigunta 121 126 132 - -
5 Kothagudem & Palwancha 121 126 132 - 4.58
6 Nizamabad & Bodhan 125 132 137 1.89 4.21
Source: Directorate of Economics and Statistics, Andhra Pradesh.

153
22. PRICES
TABLE 22.5 Consumer Price Index Numbers for Urban
Non-Manual Employees
(Base : 1984-85 = 100)
Annual Average Sl. No
Centre 2002-03
2003-04
2004-05
2005- 06
2006-07
2007-08
(Provisional) April 07 to
Feb 08
Linking Factors for the base Year 1960= 100
(1) (2) (3) (4) (5) (6) (7) (8) (9)
1. Hyderabad 427 440 459 488 526 558 5.51
2. Kurnool 416 426 439 456 482 513 5.36
3. Vijayawada 455 477 496 517 539 558 5.86
4. Visakhapatnam 415 429 441 465 493 525 5.18
5. Warangal 428 442 455 479 518 561 -
Source: Central Statistical Organisation, Government of India, New Delhi.

154
23. MISCELLANEOUS
TABLE 23.1 News Papers, Periodicals and Books Registered
(figure in number)
Sl.No Item 2003-04 2004-05 2005-06 2006-07
(1) (2) (3) (4) (5) (6)
1 News Papers and Periodicals
i. Titles 544 491 551 605
ii. Issues 28,586 29,828 36,868 41,150
2 Books Registered
i. Telugu 1,683 2,628 2,755 2,176
ii. Hindi 40 32 14 9
iii. Sanskrit - - 2 17
iv. Tamil - - -
v. Kannada - - -
vi. Marathi - - -
vii. Urdu 67 79 133 96
viii. English & Other European Languages
315 417 185 320
ix. Bilingual - - 2 2
Total ( Item’2’) 2,105 3,158 3,091 2,498
Source: Registrar of Publications, Andhra Pradesh.

155
23. MISCELLANEOUS
TABLE 23.2 Number of Agricultural Market Committees and
Regulated Markets in Andhra Pradesh
Sl. No
Item 2003-
04 2004-
05 2005-
06 2006-
07
(1) (2) (3) (4) (5) (6)
1. Number of Market Committees 299 305 310 316
2. Number of Markets Notified under the jurisdiction of Market Committees
889 889 889 891
3. Total Value of Principal Agrl. Commodities arrived at the Regulated Markets (Rs. in Crores)
20,094 22,580 22,160 25,257
Source: Commissioner and Director of Marketing, Andhra Pradesh..

156
23. MISCELLANEOUS
TABLE 23.3 Annual Turnover of Principal Agricultural Commodities
at Regulated Markets in Andhra Pradesh (Quantity in Lakh Quintals, Value in Crore Rs.)
2005-06 2006-07 Sl.No Name of the Commodity
Quantity Value Quantity Value
(1) (2) (3) (4) (5) (6)
1. Paddy 1,286.84 7,354.08 1,315.72 8,176.98
2. Rice 150.48 1,725.28 189.17 2,438.43
3. Jowar 15.78 116.69 16.45 138.20
4. Wheat 1.39 10.18 1.74 10.94
5. Ragi 4.08 19.20 5.11 23.94
6. Bajra 2.81 12.55 3.10 14.63
7. Maize 81.51 325.78 98.42 551.79
8. Redgram 17.64 236.30 19.34 384.45
9. Blackgram 5.20 74.32 6.18 86.17
10. Greengram 4.87 106.99 5.03 112.78
11. Bengalgram 5.90 73.45 6.10 87.95
12. Horsegram 1.30 14.87 1.87 15.38
13. Other Pulses 5.71 33.72 6.94 49.86
14. Groundnut (Pods) 47.16 588.09 51.32 613.16
15. Groundnut (Kernals) 12.86 194.84 13.16 221.78
16. Til Seed 2.77 76.09 3.40 79.83
17. Castor Seed 4.98 85.76 6.80 104.18
18. Karad Seed - - - -
19. Neem Seed - - - -
20. Sunflower Seed 12.73 225.57 13.08 252.49
Contd…

157
23. MISCELLANEOUS
TABLE 23.3 (Concld…)
Annual Turnover of Principal Agricultural Commodities at Regulated Markets in Andhra Pradesh
(Quantity in Lakh Quintals, Value in Crore Rs.) 2005-06 2006-07 Sl.
No Name of the Commodity Quantity Value Quantity Value
(1) (2) (3) (4) (5) (6)
21. Other Oil Seeds 6.20 37.72 7.12 40.17
22. Chillies 46.83 1,616.86 60.54 1,776.21
23. Turmeric 11.32 175.82 18.41 198.62
24. Onion 23.99 141.30 24.63 176.54
25. Coriander 3.82 27.21 4.20 36.97
26. Tamarind 4.63 78.24 5.79 84.43
27. Ajwan 0.39 1.70 0.47 1.86
28. Garlic 2.95 49.13 3.13 58.18
29. Ginger 1.25 8.31 1.48 8.73
30. Cotton (kapas) 284.95 3,946.92 312.76 4,394.39
31. Jute (Mesta) 1.97 11.77 2.10 12.11
32. Jaggery 77.37 398.61 81.04 399.90
33. Cashewnut 6.36 259.33 6.87 284.61
34. Tobacco 0.03 0.54 0.06 1.01
35. Others 57.16 206.17 40.03 178.32
36. Coconuts - 1,431.56 - 1,529.72
37. Fruits - 1,125.58 - 1,271.61
38. Vegetables - 536.58 - 582.26
39. Betal leaves - - - -
40. Livestock - 28.47 - 31.96
41. Fish & Prawn - 804.01 - 826.47
Total 2,193.23 22,159.59 2,331.56 25,257.01 Source: Directorate of Marketing, Andhra Pradesh.

158
23. MISCELLANEOUS
TABLE 23.4
Commodity wise Exports and Imports handled by the Intermediate and Minor Port at Kakinada in Andhra Pradesh
(Quantity in Tonnes, Value in Lakh Rs.)
2005-06 2006-07 Sl.No Commodity
Quantity Value Quantity Value
(1) (2) (3) (4) (5) (6)
A. EXPORTS
1. Wheat - - 450 52.04
2. Rice 12,61,604 1,28,878.90 19,95,223 2,46,624.68
3. Urea - - - -
4. RBD Pamolein - - - -
5. Sugar - - 2,629 526.23
6. Cement 3,83,888 10,457.19 2,62,493 7,967.14
7. Soya Bean Meal Extraction - - 18,157 1,224.70
8. Spice Turmeric - - - -
9. Sand 7,050 11.53 39,055 85.93
10 SoyaBean Extraction 5,506 448.21 - -
11. Maize 25,060 1,842.73 56,460 4,263.67
12. Castro Seed Oil Extraction - - - -
13. Stone Dust - - 500 1.32
14. Paper - - 4,663 1,640.15
15. Rice bran Extraction 1,04,760 3,350.28 2,37,572 9,625.95
16. Red Chillies - - - -
17. Feldspar 3,200 49.68 - -
18. Yellow Corn - - 12,466 910.19
19. Construction Metal - - 250 1.87
20 Organic Manure 1,500 155.25 2,002 157.96
21 Soyabean Oil 10,000 2,161.06 - -
22 Sourgham 46,760 4,625.61 25,582 2,284.33 Total (A) 18,49,328 1,51,980.44 26,57,502 2,75,366.16
Contd…

159
23. MISCELLANEOUS
TABLE 23.4 (Concld..) Commodity-wise Exports and Imports Handled by the
Intermediate and Minor Port at Kakinada in Andhra Pradesh
(Quantity in Tonnes, Value in Lakh Rs.) 2005-06 2006-07 Sl.
No Commodity Quantity Value Quantity Value
(1) (2) (3) (4) (5) (6) B. IMPORTS
1. Murate of Potash 4,89,056 47,944.79 4,26,365 43,495.39
2. Rock Phosphate 62,055 1,905.94 48,900 1,172.19
3. RBD Polmolein - - - -
4. Industrial Salt 1,43,390 1,967.46 1,16,751 1,863.19
5. D.A.P - - - -
6. RBD Polmolein (Crude) - - - -
7. Soya bean Oil - - - -
8. S.M.A Phosphate - - - -
9. M.A. Phosphate - - - -
10. Soya bean Pellets 11,000 1,372.86 - -
11. Crude Palmolein Oil 8,850 1,473.84 1,000 244.97
12. Peas - - 19,243 3,125.30
13. Ammonium Phosphate - - - -
14. Ammonium Sulphate 18,000 882.11 35,829 1,884.26
15. Urea 2,38,085 19,497.89 4,66,658 38,472.18
16. Potassium Chloride - - - -
17 Sulphate of Potash 10,500 1,324.92 11,000 1,554.65 Total (B) 9,80,936 76,369.81 11,25,746 91,812.13 Total (A+B) 28,30,264 2,28,350.25 37,83,248 3,67,178.29
C Crude Oil 26,65,352 2,40,199.95 26,48,267 2,027.70 Grand Total
(A+B+C) 54,95,616 4,68,550.20 64,31,515 3,69,205.99
Note: Crude Oil is not exported from Ancharage Port. It is exported from “Ravva Joint Venture” directly. These figures were obtained from Port office and furnished. Source : Special Commissioner of Ports, Kakinada Andhra Pradesh.

160
23. MISCELLANEOUS
TABLE 23.5 Number of House Sites Distributed to Scheduled Castes, Scheduled Tribes, Backward Classes and Economically
Backward Classes, District-wise during 2006-07
Sl.No District Extent of Land
Distributed (Acres) Number of
Beneficiaries (1) (2) (3) (4)
1. Srikakulam 235.78 14,142
2. Vizianagaram 27.45 1,075
3. Visakhapatnam 236.13 9,209
4. East Godavari 600.96 30,237
5. West Godavari 657.62 26,783
6. Krishna 1,509.05 51,213
7. Guntur 683.23 27,839
8. Prakasam 450.80 14,208
9. Nellore 832.09 25,326
10. Chittoor 1,198.83 42,101
11. Kadapa 84.94 2,540
12. Anantapur 714.25 27,401
13. Kurnool 460.00 23,335
14. Mahbubnagar 344.29 9,630
15. Ranga Reddy 108.23 3,115
16. Hyderabad 0.00 0
17. Medak 687.20 19,833
18. Nizamabad 608.37 18,305
19. Adilabad 392.33 9,077
20. Karimnagar 130.65 5,375
21. Warangal 739.64 24,980
22. Khammam 1,026.16 22,468
23. Nalgonda 527.58 16,532
Andhra Pradesh 12,255.58 4,24,724 Note: Social group wise House sites distributed is not available Source: Commissioner of Social Welfare, Andhra Pradesh.

161
24. ALL INDIA
TABLE 24.1 Area and Population - State wise, Census 2001
Population Sl.
No State/Union Territory
Area in (‘000
Sq.Kms) Total Male Female
(1) (2) (3) (4) (5) (6)
INDIA 3,287.24 1,02,86,10,328 53,21,56,772 49,64,53,556
States :
1. Andhra Pradesh 275.04 7,62,10,007 3,85,27,413 3,76,82,594
2. Arunachal Pradesh
84.74 10,97,968 5,79,941 5,18,027
3. Assam 78.44 2,66,55,528 1,37,77,037 1,28,78,491
4. Bihar 94.16 8,29,98,509 4,32,43,795 3,97,54,714
5. Chhatisgarh 135.19 2,08,33,803 1,04,74,218 1,03,59,585
6. Goa 3.70 13,47,668 6,87,248 6,60,420
7. Gujarat 196.02 5,06,71,017 2,63,85,577 2,42,85,440
8. Haryana 44.21 2,11,44,564 1,13,63,953 97,80,611
9. Himachal Pradesh 55.67 60,77,900 30,87,940 29,89,960
10. Jammu & Kashmir 222.24 1,01,43,700 53,60,926 47,82,774
11. Jharkhand 79.71 2,69,45,829 1,38,85,037 1,30,60,792
12. Karnataka 191.79 5,28,50,562 2,68,98,918 2,59,51,644
13. Kerala 38.86 3,18,41,374 1,54,68,614 1,63,72,760
14. Madhya Pradesh 308.24 6,03,48,023 3,14,43,652 2,89,04,371
15. Maharashtra 307.71 9,68,78,627 5,04,00,596 4,64,78,031
16. Manipur* 22.33 21,66,788 10,95,634 10,71,154
17. Meghalaya 22.43 23,18,822 11,76,087 11,42,735
18. Mizoram 21.08 8,88,573 4,59,109 4,29,464
19. Nagaland 16.58 19,90,036 10,47,141 9,42,895
20. Orissa 155.71 3,68,04,660 1,86,60,570 1,81,44,090 Contd…

162
24. ALL INDIA
TABLE 24.1 Area and Population - State wise, Census 2001
Population
Sl. No
State/Union Territory
Area in (‘000
Sq.Kms) Total Male Female
(1) (2) (3) (4) (5) (6)
21. Punjab 50.36 2,43,58,999 1,29,85,045 1,13,73,954
22. Rajasthan 342.24 5,65,07,188 2,94,20,011 2,70,87,177
23. Sikkim 7.10 5,40,851 2,88,484 2,52,367
24. Tamilnadu 130.06 6,24,05,679 3,14,00,909 3,10,04,770
25. Tripura 10.49 31,99,203 16,42,225 15,56,978
26. Uttaranchal 53.48 84,89,349 43,25,924 41,63,425
27. Uttar Pradesh 240.93 16,61,97,921 8,75,65,369 7,86,32,552
28. West Bengal 88.75 8,01,76,197 4,14,65,985 3,87,10,212
Union Territories
1. Andaman and Nicobar Islands
8.25 3,56,152 1,92,972 1,63,180
2. Chandigarh 0.11 9,00,635 5,06,938 3,93,697
3. Dadra & Nagar Haveli 0.49 2,20,490 1,21,666 98,824
4. Daman & Diu 0.11 1,58,204 92,512 65,692
5. Delhi 1.48 1,38,50,507 76,07,234 62,43,273
6. Lakshadweep 0.03 60,650 31,131 29,519
7. Pondicherry 0.48 9,74,345 4,86,961 4,87,384
Contd…

163
24. ALL INDIA
TABLE 24.1 Area and Population - State wise, Census 2001
Population SlNo State/Union Territory
Rural Urban
Density per
Sq.Km
(1) (2) (7) (8) (9)
INDIA 74,24,90,639 28,61,19,689 313
States :
1. Andhra Pradesh 5,54,01,067 2,08,08,940 277
2. Arunachal Pradesh 8,70,087 2,27,881 13
3. Assam 2,32,16,288 34,39,240 340
4. Bihar 7,43,16,709 86,81,800 881
5. Chhatisgarh 1,66,48,056 41,85,747 154
6. Goa 6,77,091 6,70,577 364
7. Gujarat 3,17,40,767 1,89,30,250 258
8. Haryana 1,50,29,260 61,15,304 478
9. Himachal Pradesh 54,82,319 5,95,581 109
10. Jammu & Kashmir 76,27,062 25,16,638 46
11. Jharkhand 2,09,52,088 59,93,741 338
12. Karnataka 3,48,89,033 1,79,61,529 276
13. Kerala 2,35,74,449 82,66,925 819
14. Madhya Pradesh 4,43,80,878 1,59,67,145 196
15. Maharashtra 5,57,77,647 4,11,00,980 315
16. Manipur* 15,90,820 5,75,968 97
17. Meghalaya 18,64,711 4,54,111 103
18. Mizoram 4,47,567 4,41,006 42
19. Nagaland 16,47,249 3,42,787 120
20. Orissa 3,12,87,422 55,17,238 236
Contd…

164
24. ALL INDIA
TABLE 24.1 Area and Population - State wise, Census 2001
Population Sl.
No
State/Union Territory
Rural Urban Density Per
Sq.Km
(1) (2) (7) (8) (9)
21. Punjab 1,60,96,488 82,62,511 484
22. Rajasthan 4,32,92,813 1,32,14,375 165
23. Sikkim 4,80,981 59,870 76
24. Tamilnadu 3,49,21,681 2,74,83,998 480
25. Tripura 26,53,453 5,45,750 305
26. Uttaranchal 63,10,275 21,79,074 159
27. Uttar Pradesh 13,16,58,339 3,45,39,582 690
28. West Bengal 5,77,48,946 2,24,27,251 903
Union Territories
1. Andaman and Nicobar Islands
2,39,954
1,16,198 43
2. Chandigarh 92,120 8,08,515 7,900
3. Dadra & Nagar Haveli 1,70,027 50,463 449
4. Daman & Diu 1,00,856 57,348 1,413
5. Delhi 9,44,727 1,29,05,780 9,340
6. Lakshadweep 33,683 26,967 1,895
7. Pondicherry 3,25,726 6,48,619 2,034
Contd…

165
24. ALL INDIA
TABLE 24.1 Area and Population - State-wise, Census 2001
Sl. No State/Union Territory Scheduled Castes Scheduled Tribes
(1) (2) (10) (11)
INDIA 16,66,35,700 84,326,240 States :
1. Andhra Pradesh 1,23,39,496 50,24,104
2. Arunachal Pradesh 6,188 7,05,158
3. Assam 18,25,949 33,08,570
4. Bihar 1,30,48,608 7,58,351
5. Chhatisgarh 24,18,722 66,16,596
6. Goa 23,791 566
7. Gujarat 35,92,715 74,81,160
8. Haryana 40,91,110 0
9. Himachal Pradesh 15,02,170 2,44,587
10. Jammu & Kashmir 7,70,155 11,05,979
11. Jharkhand 31,89,320 70,87,068
12. Karnataka 85,63,930 34,63,986
13. Kerala 31,23,941 3,64,189
14. Madhya Pradesh 91,55,177 1,22,33,474
15. Maharashtra 98,81,656 85,77,276
16. Manipur 60,037 7,41,141
17. Meghalaya 11,139 19,92,862
18. Mizoram 272 8,39,310
19. Nagaland 0 17,74,026
20. Orissa 60,82,063 81,45,081
Contd…

166
24. ALL INDIA
TABLE 24.1 (Concld…) Area and Population - State-wise, Census 2001
Sl.No State/Union Territory Scheduled Castes Scheduled Tribes
(1) (2) (10) (11)
21. Punjab 70,28,723 0
22. Rajasthan 96,94,462 70,97,706
23. Sikkim 27,165 1,11,405
24. Tamilnadu 1,18,57,504 6,51,321
25. Tripura 5,55,724 9,93,426
26. Uttaranchal 15,17,186 2,56,129
27. Uttar Pradesh 3,51,48,377 1,07,963
28. West Bengal 1,84,52,555 44,06,794
Union Territories :
1. Andaman and Nicobar Islands 0 29,469
2. Chandigarh 1,57,597 0
3. Dadra & Nagar Haveli 4,104 1,37,225
4. Daman & Diu 4,838 13,997
5. Delhi 23,43,255 0
6. Lakshadweep 0 57,321
7. Pondicherry 1,57,771 0
* Including the estimated Population of Mao Maram ,Paomata and Purul sub-division of Senapathi district of Manipur. Source: 1. Directorate of Census Operations, Andhra Pradesh 2. Registrar General and Census Commissioner of India, New Delhi.

167
24. ALL INDIA
TABLE 24.2 Literacy Rates - State wise, Census 2001
All
Sl. No State/Union Territories
Male Female Total
(1) (2) (3) (4) (5)
1. Andhra Pradesh 70.32 50.43 60.47
2. Arunachal Pradesh 63.83 43.53 54.34
3. Assam 71.28 54.61 63.25
4. Bihar 59.68 33.12 47.00
5. Chhatisgarh 77.38 51.85 64.66
6. Goa 88.42 75.37 82.01
7. Gujarat 79.66 57.80 69.14
8. Haryana 78.49 55.73 67.91
9. Himachal Pradesh 85.35 67.42 76.48
10. Jammu & Kashmir 66.60 43.00 55.52
11. Jarkhand 67.30 38.87 53.56
12. Karnataka 76.10 56.87 66.64
13. Kerala 94.24 87.72 90.86
14. Madhya Pradesh 76.06 50.29 63.74
15. Maharashtra 85.97 67.03 76.88
16. Manipur 80.33 60.53 70.53
17. Meghalaya 65.43 59.61 62.56
18. Mizoram 90.72 86.75 88.80
19. Nagaland 71.16 61.46 66.59
20. Orissa 75.35 50.51 63.08
Contd…

168
24. ALL INDIA
TABLE 24.2 Literacy rates - State wise, Census 2001
All
Sl. No State/Union Territories Male Female Total
(1) (2) (3) (4) (5)
21. Punjab 75.23 63.36 69.65
22. Rajasthan 75.70 43.85 60.41
23 Sikkim 76.04 60.40 68.81
24. Tamil Nadu 82.42 64.43 73.45
25. Tripura 81.02 64.91 73.19
26. Uttaranchal 83.28 59.63 71.62
27. Uttar Pradesh 68.82 42.22 56.27
28. West Bengal 77.02 59.61 68.64
Union Territories
1. Andaman & Nicobar Islands 86.33 75.24 81.30
2. Chandigarh 86.14 76.47 81.94
3. Dadra and Nagar Haveli 71.18 40.23 57.63
4. Daman and Diu 86.76 65.61 78.18
5. Delhi 87.33 74.71 81.67
6. Lakshadweep 92.53 80.47 86.66
7. Pondicherry 88.62 73.90 81.24
ALL INDIA 75.26 53.67 64.84
Contd…

169
24. ALL INDIA
TABLE 24.2 Literacy Rates - State wise, Census 2001
Scheduled Castes
Sl.No State/Union Territories Male Female Total
(1) (2) (6) (7) (8)
1. Andhra Pradesh 63.51 43.35 53.52
2. Arunachal Pradesh 76.31 54.99 67.64
3. Assam 75.74 57.14 66.78
4. Bihar 40.23 15.58 28.47
5. Chhatisgarh 78.70 49.22 63.96
6. Goa 81.56 62.05 71.92
7. Gujarat 82.56 57.58 70.50
8. Haryana 66.93 42.26 55.45
9. Himachal Pradesh 80.01 60.35 70.31
10. Jammu & Kashmir 69.57 47.46 59.03
11. Jarkhand 51.59 22.55 37.56
12. Karnataka 63.75 41.72 52.87
13. Kerala 88.07 77.56 82.66
14. Madhya Pradesh 72.33 43.28 58.57
15. Maharashtra 83.29 59.98 71.90
16. Manipur 81.78 62.97 72.32
17. Meghalaya 65.86 45.21 56.27
18. Mizoram 88.44 92.16 89.20
19. Nagaland 0.00 0.00 0.00
20. Orissa 70.47 40.33 55.53
Contd…

170
24. ALL INDIA
TABLE 24.2 Literacy Rates - State wise, Census 2001
Scheduled Castes Sl.No State/Union Territories
Male Female Total
(1) (2) (6) (7) (8)
21. Punjab 63.38 48.25 56.22
22. Rajasthan 68.99 33.87 52.24
23 Sikkim 70.15 55.71 63.04
24. Tamil Nadu 73.41 53.01 63.19
25. Tripura 81.85 67.24 74.68
26. Uttaranchal 77.26 48.74 63.40
27. Uttar Pradesh 60.34 30.50 46.27
28. West Bengal 70.54 46.90 59.04
Union Territories
1. Andaman & Nicobar Islands 0.00 0.00 0.00
2. Chandigarh 76.20 57.22 67.66
3. Dadra and Nagar Haveli 88.37 67.05 78.25
4. Daman and Diu 94.03 75.82 85.13
5. Delhi 80.77 59.07 70.85
6. Lakshadweep 0.00 0.00 0.00
7. Pondicherry 78.41 60.05 69.12
ALL INDIA 66.64 41.90 54.69
Contd…

171
24. ALL INDIA
TABLE 24.2 Literacy Rates - State wise, Census 2001
Scheduled Tribes Sl.
No State/Union Territories Male Female Total
(1) (2) (9) (10) (11)
1. Andhra Pradesh 47.66 26.11 37.04
2. Arunachal Pradesh 58.77 40.56 49.62
3. Assam 72.34 52.44 62.52
4. Bihar 39.76 15.54 28.17
5. Chhatisgarh 65.04 39.35 52.09
6. Goa 63.49 47.32 55.88
7. Gujarat 59.18 36.02 47.74
8. Haryana 0.00 0.00 0.00
9. Himachal Pradesh 77.71 53.32 65.50
10. Jammu & Kashmir 48.16 25.51 37.46
11. Jarkhand 53.98 27.21 40.67
12. Karnataka 59.66 36.57 48.27
13. Kerala 70.78 58.11 64.35
14. Madhya Pradesh 53.55 28.44 41.16
15. Maharashtra 67.02 43.08 55.21
16. Manipur 73.16 58.42 65.85
17. Meghalaya 63.49 59.20 61.34
18. Mizoram 91.71 86.95 89.34
19. Nagaland 70.26 61.35 65.95
20. Orissa 51.48 23.37 37.37
Contd…
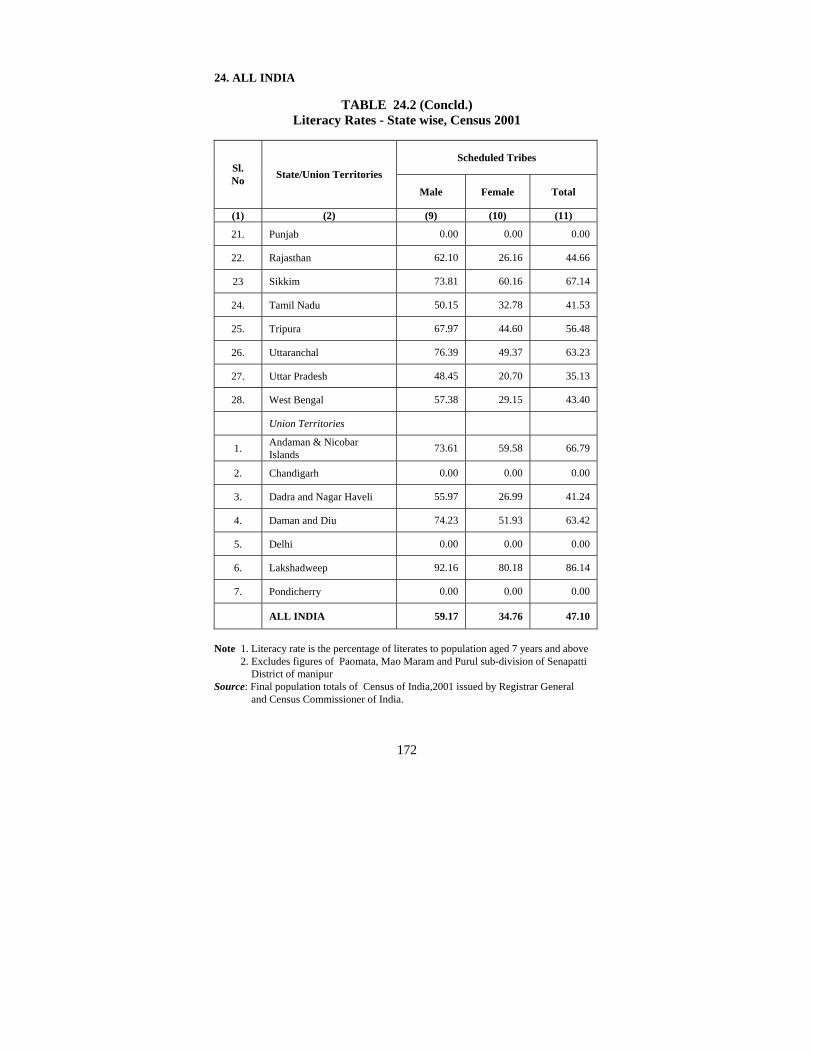
172
24. ALL INDIA
TABLE 24.2 (Concld.) Literacy Rates - State wise, Census 2001
Scheduled Tribes Sl. No State/Union Territories
Male Female Total
(1) (2) (9) (10) (11)
21. Punjab 0.00 0.00 0.00
22. Rajasthan 62.10 26.16 44.66
23 Sikkim 73.81 60.16 67.14
24. Tamil Nadu 50.15 32.78 41.53
25. Tripura 67.97 44.60 56.48
26. Uttaranchal 76.39 49.37 63.23
27. Uttar Pradesh 48.45 20.70 35.13
28. West Bengal 57.38 29.15 43.40
Union Territories
1. Andaman & Nicobar Islands 73.61 59.58 66.79
2. Chandigarh 0.00 0.00 0.00
3. Dadra and Nagar Haveli 55.97 26.99 41.24
4. Daman and Diu 74.23 51.93 63.42
5. Delhi 0.00 0.00 0.00
6. Lakshadweep 92.16 80.18 86.14
7. Pondicherry 0.00 0.00 0.00
ALL INDIA 59.17 34.76 47.10
Note 1. Literacy rate is the percentage of literates to population aged 7 years and above 2. Excludes figures of Paomata, Mao Maram and Purul sub-division of Senapatti District of manipur Source: Final population totals of Census of India,2001 issued by Registrar General and Census Commissioner of India.

173
4. ALL INDIA
TABLE 24.3 Percentage Distribution of Population
by Age-groups, 2001 Census
% of Population under the Age Group Sl.No State
0-14 15-59 60 and above
(1) (2) (3) (4) (5)
1. Andhra Pradesh 32.01 60.22 7.77
2. Assam 37.40 56.63 5.96
3. Bihar 42.02 51.14 6.84
4. Gujarat 32.81 60.19 7.00
5. Haryana 35.85 56.28 7.87
6. Karnataka 31.87 60.34 7.78
7. Kerala 26.06 63.39 10.56
8. Madhya Pradesh 38.53 54.11 7.36
9. Maharashtra 32.10 59.05 8.85
10. Orissa 33.17 58.40 8.43
11. Punjab 31.27 59.34 9.38
12. Rajasthan 39.89 52.85 7.25
13. Tamil Nadu 26.78 63.71 9.51
14. Uttar Pradesh 40.87 51.68 7.45
15. West Bengal 33.23 59.52 7.25
ALL INDIA (Including Union Territories)
35.35 56.93 7.72
Source: Directorate of Census Operations, Andhra Pradesh.

174
24. ALL INDIA
TABLE 24.4(A) Selected Indicators of Human Development for Bigger States
(Birth and Death Rates), 2006
Birth Rate Death Rate Sl. No State
Total Rural Urban Total Rural Urban
(1) (2) (3) (4) (5) (6) (7) (8)
1. Andhra Pradesh 18.9 19.8 16.5 7.3 7.9 5.8
2. Assam 24.6 26.1 15.4 8.7 9.2 5.8
3. Bihar 29.9 30.7 23.0 7.7 7.8 6.3
4. Chhattisgarh 26.9 28.5 19.9 8.1 8.5 6.3
5. Delhi 18.4 19.5 18.2 4.7 5.4 4.6
6. Gujarat 23.5 25.0 21.1 7.3 8.2 5.9
7. Haryana 23.9 25.1 21.1 6.5 6.9 5.6
8. Jammu&Kashmir 18.7 20.0 14.2 5.9 6.1 5.0
9. Jharkhand 26.2 28.0 18.8 7.5 7.9 5.9
10. Karnataka 20.1 21.5 17.7 7.1 8.0 5.5
11. Kerala 14.9 15.0 14.6 6.7 6.8 6.5
12. Madhya Pradesh 29.1 31.2 21.9 8.9 9.6 6.3
13. Maharashtra 18.5 19.2 17.5 6.7 7.4 5.8
14. Orissa 21.9 22.8 16.2 9.3 9.7 6.9
15. Punjab 17.8 18.4 16.8 6.8 7.4 5.8
16. Rajasthan 28.3 29.7 23.9 6.9 7.2 6.1
17. Tamilnadu 16.2 16.5 15.9 7.5 8.3 6.4
18. Uttar Pradesh 30.1 31.0 26.0 8.6 9.1 6.6
19. West Bengal 18.4 20.7 12.3 6.2 6.2 6.3
ALL INDIA 23.5 25.2 18.8 7.5 8.1 6.0 Source: S.R.S. Bulletins of October, 2007– Registrar General of India, New Delhi.

175
24. ALL INDIA
TABLE 24.4(B) Selected Indicators of Human Development for Bigger States
(Death Rate and Infant Mortality Rate), 2006
Death Rate Infant Mortality Rate, Sl.
No State Male Female Total Male Female
(1) (2) (3) (4) (5) (6) (7)
1. Andhra Pradesh 8.5 6.1 56 55 58
2. Assam 9.2 8.1 67 67 68
3. Bihar 7.4 7.9 60 58 63
4. Chhattisgarh 8.1 8.7 61 59 62
5. Delhi 5.0 4.3 37 36 39
6. Gujarat 7.8 6.8 53 52 54
7. Haryana 7.3 5.6 57 57 58
8. Jammu&Kashmir 6.4 5.2 52 51 53
9. Jharkhand 7.0 8.1 49 46 52
10. Karnataka 8.0 6.3 48 46 50
11. Kerala 7.5 5.9 15 14 16
12. Madhya Pradesh 9.1 8.6 74 72 77
13. Maharashtra 7.3 6.1 35 35 36
14. Orissa 9.8 8.8 73 73 74
15. Punjab 7.4 6.1 44 39 50
16. Rajasthan 7.4 6.5 67 65 69
17. Tamilnadu 8.4 6.6 37 36 37
18. Uttar Pradesh 8.8 8.5 71 70 73
19. West Bengal 6.8 5.6 38 37 40 ALL INDIA 8.0 7.0 57 56 59
Source: S.R.S. Bulletin of October,2007, Registrar General of India, New Delhi.

176
24. ALL INDIA TABLE 24.4 (C)
Projected Levels of Expectation of Life at Birth(with out aids) For India and States (Excluding Goa)
2006-2025 (Male)
Sl.No India / State 2006-10 2011-15 2016-20 2021-25
(1) (2) (3) (4) (5) (6)
1 Andhra Pradesh 65.4 66.9 68.4 69.4
2 Assam 61.6 63.6 65.6 67.1
3 Bihar 67.1 68.6 69.6 70.6
4 Chattisgarh 61.0 63.0 65.0 66.5
5 Delhi 71.4 72.2 73.0 73.5
6 Gujarat 67.2 69.2 70.7 71.9
7 Haryana 67.9 68.9 69.9 70.9
8 Himachal Pradesh 69.8 70.8 71.6 72.4
9 Jammu & Kashmir 65.0 66.5 68.0 69.2
10 Jharkhand 66.0 67.5 68.5 69.5
11 Karnataka 66.5 68.0 69.0 70.0
12 Kerala 72.0 73.2 74.2 75.2
13 Madhya Pradesh 62.5 64.5 66.5 68.0
14 Maharashtra 67.9 68.9 69.9 70.9
15 Orissa 62.3 64.3 66.3 67.8
16 Punjab 68.7 69.7 70.7 71.5
17 Rajasthan 66.1 67.6 68.6 69.6
18 Tamilnadu 67.6 68.6 69.6 70.6
19 Uttar Pradesh 64.0 66.0 67.5 68.7
20 Uttaranchal 64.0 66.0 67.5 68.5
21 West Bengal 68.2 69.2 70.2 71.0
22 NE States (Excluding Assam) 68.1 69.1 70.1 70.9
All India 65.8 67.3 68.8 69.8 Source: The Registrar General and Census Commissioner of India

177
24. ALL INDIA TABLE 24.4 (D)
Projected Levels of Expectation of Life at Birth(with out aids) For India and States (Excluding Goa)
2006-2025 (Female)
Sl. No India / State 2006-10 2011-15 2016-20 2021-25
(1) (2) (3) (4) (5) (6)
1 Andhra Pradesh 69.4 70.9 72.1 73.3
2 Assam 62.8 64.8 66.8 68.8
3 Bihar 66.7 68.7 70.2 71.4
4 Chattisgarh 64.0 66.0 68.0 69.5
5 Delhi 74.8 75.8 76.6 77.4
6 Gujarat 71.0 72.5 73.7 74.9
7 Haryana 69.8 71.3 72.5 73.7
8 Himachal Pradesh 73.3 74.3 75.3 76.1
9 Jammu & Kashmir 67.0 69.3 71.3 72.8
10 Jharkhand 64.0 66.0 68.0 69.5
11 Karnataka 71.1 72.3 73.5 74.5
12 Kerala 76.8 77.6 78.1 78.6
13 Madhya Pradesh 63.3 65.3 67.3 69.3
14 Maharashtra 71.3 72.5 73.7 74.7
15 Orissa 64.8 67.3 69.6 71.6
16 Punjab 71.6 72.8 73.8 74.8
17 Rajasthan 69.2 70.7 71.9 73.1
18 Tamilnadu 70.6 71.8 73.0 74.0
19 Uttar Pradesh 64.4 66.9 69.2 71.2
20 Uttaranchal 68.0 69.5 71.0 72.2
21 West Bengal 70.9 72.1 73.3 74.3
22 NE States (Excluding Assam) 71.8 73.0 74.0 75.0
All India 68.1 69.6 71.1 72.3
Source: The Registrar General and Census Commissioner of India

178
24. ALL INDIA
TABLE 24.5 Land Utilisation
(In Lakh Hectares) Sl. No. Particulars 2001-
02 2002-
03 2003-04 (P)
2004-05 (P)
(1) (2) (3) (4) (5) (6) I. Geographical Area 3,287.26 3,287.26 3,287.26 3,287.30
II. Reporting Area for Land Utilisation (1 to5 )
3,048.45 3,048.47 3,058.43 3,052.30
1 Forests 694.87 694.67 697.00 696.70
2 Not available for cultivation (a+b)
417.80 420.36 422.18 423.00
(a) Land put to non-Agri.uses 240.91 242.74 244.85 247.20
(b) Barren and un- culturable land
176.89 177.62 177.33 175.80
3 Other un-culturable land excluding fallow land (a+b+c)
272.68 273.07 270.00 270.00
(a)Permanent pastures and other grazing lands
105.81 104.99 104.55 104.30
(b) Land under Miscellaneous tree crops and groves not included in net area sown
33.35 33.25 33.69 33.80
( c ) Culturable Waste 133.52 134.83 131.76 131.90 4 Fallow lands (a+b) 249.27 332.39 260.43 249.40
(a) Fallow lands other than current fallows
102.54 117.08 112.38 107.20
(b) Current fallows 146.73 215.31 148.05 142.20 5 Net area sown (6-7) 1,413.83 1,327.98 1,408.83 1,413.20 6 Total Cropped area 1,904.88 1,759.88 1,906.44 1,909.10 7 Area sown more than once 491.05 431.90 497.61 495.90
III. Net Irrigated Area 558.53 531.48 551.05 585.40 IV Gross Irrigated Area 783.28 729.66 768.20 795.10
V Net Irrigated Area as % of Net Area Sown
39.50 40.01 39.11 41.42
VI Gross Irrigated Area as % of Gross Area Sown
41.12 41.24 40.30 41.65
Source :- 1) Economic Intelligence service, CMIE, Agriculture (March,2006), Mumbai. 2) Statistical Abstract of A.P-2006 3) Fertilizers Statistics-2005-06 4) Agricultural Statistics at a Glance-2007

179
24. ALL INDIA TABLE 24.6(A)(i)
Area, Production and Yield of Food grains State wise, 2003-04
(Area in ‘000 Hectares, Production in ‘000 Tonnes ,Yield in Kg/Hect) Sl. No State Area Production Yield
(1) (2) (3) (4) (5)
1 Andhra Pradesh 6,807 13,697 2,012 2 Arunachal Pradesh 192 245 1,276
3 Assam 2,743 4,036 1,471 4 Bihar 7,012 11,217 1,600 5 Chhatisgarh 5,068 6,226 1,228
6 Goa 63 181 2,873 7 Gujarat 4,034 6,571 1,629 8 Haryana 4,286 13,224 3,085
9 Himachal Pradesh 807 1,399 1,734 10 Jammu & Kashmir 902 1,375 1,524 11 Jharkhand 1,950 2,905 1,490
12 Karnataka 6,906 6,639 961 13 Kerala 309 636 2,058 14 Madhya Pradesh 12,677 15,872 1,252
15 Maharashtra 12,179 10,930 897 16 Manipur 168 383 2,280 17 Meghalaya 135 234 1,733
18 Mizoram 75 138 1,840 19 Nagaland 233 312 1,339 20 Orissa 5,388 7,225 1,341
21 Punjab 6,294 24,729 3,929 22 Rajasthan 13,964 17,986 1,288 23 Sikkim 72 100 1,389
24 Tamilnadu 2,879 4,459 1,549 25 Tripura 249 529 2,124 26 Uttar Pradesh 20,197 44,247 2,191
27 Uttaranchal 1,031 1,724 1,672 28 West Bengal 6,597 15,979 2,422 All India 1,23,325 2,13,455 1,731
Source: Ministry of Agriculture, Govt. of India, New Delhi.

180
24. ALL INDIA
TABLE 24.6(A)(ii) Area, Production and Yield of Pulses State wise, 2003-04
(Area in ‘000 Hectares, Production in ‘000 Tonnes, Yield in Kg/Hect)
Sl. No State Area Production Yield (1) (2) (3) (4) (5) 1 Andhra Pradesh 2,185 1,239 567
2 Arunachal Pradesh 7 8 1,143
3 Assam 115 63 548
4 Bihar 684 563 823
5 Chhatisgarh 876 479 547
6 Goa 10 9 900
7 Gujarat 833 622 747
8 Haryana 196 145 740
9 Himachal Pradesh 29 9 310
10 Jammu & Kashmir 28 13 464
11 Jharkhand 266 135 508
12 Karnataka 1,863 558 300
13 Kerala 11 8 727
14 Madhya Pradesh 4,620 3,577 774
15 Maharashtra 3,490 2,027 581
16 Manipur 6 3 500
17 Meghalaya 5 4 800
18 Mizoram 5 4 800
19 Nagaland 25 21 840
20 Orissa 715 273 382
21 Punjab 48 39 813
22 Rajasthan 3,861 2,279 590
23 Sikkim 7 7 1,000
24 Tamilnadu 537 201 374
25 Tripura 8 5 625
26 Uttar Pradesh 2,708 2,400 886
27 Uttaranchal 42 29 690
28 West Bengal 252 212 841
All India 23,443 14,940 637 Source: Ministry of Agriculture, Govt. of India, New Delhi.
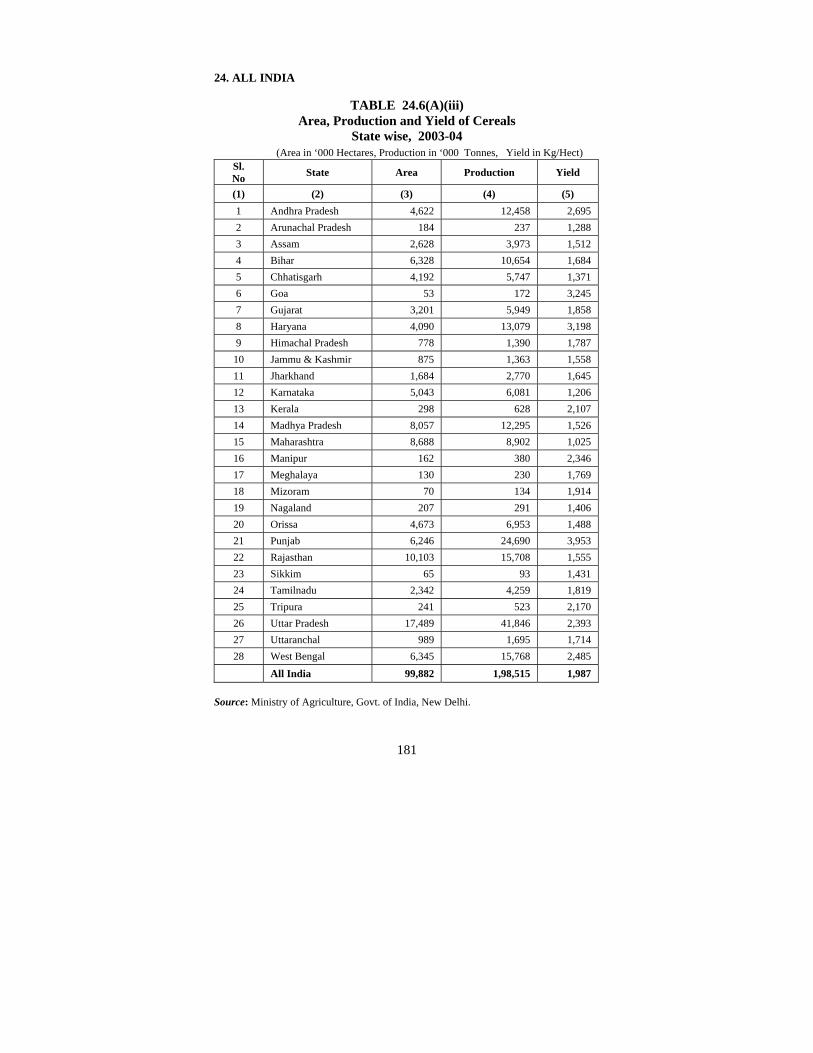
181
24. ALL INDIA
TABLE 24.6(A)(iii) Area, Production and Yield of Cereals
State wise, 2003-04 (Area in ‘000 Hectares, Production in ‘000 Tonnes, Yield in Kg/Hect) Sl. No State Area Production Yield
(1) (2) (3) (4) (5) 1 Andhra Pradesh 4,622 12,458 2,695 2 Arunachal Pradesh 184 237 1,288 3 Assam 2,628 3,973 1,512 4 Bihar 6,328 10,654 1,684 5 Chhatisgarh 4,192 5,747 1,371 6 Goa 53 172 3,245 7 Gujarat 3,201 5,949 1,858 8 Haryana 4,090 13,079 3,198 9 Himachal Pradesh 778 1,390 1,787 10 Jammu & Kashmir 875 1,363 1,558 11 Jharkhand 1,684 2,770 1,645 12 Karnataka 5,043 6,081 1,206 13 Kerala 298 628 2,107 14 Madhya Pradesh 8,057 12,295 1,526 15 Maharashtra 8,688 8,902 1,025 16 Manipur 162 380 2,346 17 Meghalaya 130 230 1,769 18 Mizoram 70 134 1,914 19 Nagaland 207 291 1,406 20 Orissa 4,673 6,953 1,488 21 Punjab 6,246 24,690 3,953 22 Rajasthan 10,103 15,708 1,555 23 Sikkim 65 93 1,431 24 Tamilnadu 2,342 4,259 1,819 25 Tripura 241 523 2,170 26 Uttar Pradesh 17,489 41,846 2,393 27 Uttaranchal 989 1,695 1,714 28 West Bengal 6,345 15,768 2,485 All India 99,882 1,98,515 1,987
Source: Ministry of Agriculture, Govt. of India, New Delhi.

182
24. ALL INDIA TABLE 24.6(B)(i)
Area, Production and Yield of Foodgrains State wise, 2004-05
(Area in ‘000 Hectares, Production in ‘000 Tonnes, Yield in Kg/Hect) Sl. No State Area Production Yield
(1) (2) (3) (4) (5)
1 Andhra Pradesh 6,266.8 13,396.0 2,138 2 Arunachal Pradesh 192.6 226.9 1,178
3 Assam 2,575.5 3,618.2 1,405 4 Bihar 6,463.2 7,704.4 1,192 5 Chhatisgarh 5,129.4 5,023.0 979
6 Goa 63.4 155.7 2,456 7 Gujarat 3,724.3 5,257.5 1,412 8 Haryana 4,240.2 13,109.0 3,092
9 Himachal Pradesh 838.6 1,612.3 1,923 10 Jammu & Kashmir 889.2 1,499.0 1,686 11 Jharkhand 1,872.1 2,311.1 1,234
12 Karnataka 7,563.0 10,495.0 1,388 13 Kerala 294.5 670.9 2,278 14 Madhya Pradesh 12,473.0 14,104.8 1,131
15 Maharashtra 12,605.3 10,540.7 836 16 Manipur 187.4 447.8 2,390 17 Meghalaya 134.5 225.2 1,674
18 Mizoram 66.0 124.6 1,888 19 Nagaland 255.8 403.5 1,577 20 Orissa 5,299.7 6,889.7 1,300
21 Punjab 6,354.3 25,670.7 4,040 22 Rajasthan 12,054.9 12,150.8 1,008 23 Sikkim 73.9 103.9 1,406
24 Tamilnadu 3,295.9 6,175.8 1,874 25 Tripura 255.4 556.4 2,179 26 Uttar Pradesh 19,293.8 37,836.3 1,961
27 Uttaranchal 1,038.0 1,761.0 1,697 28 West Bengal 6,475.7 16,055.4 2,479 All India 1,20,078.0 1,98,362.8 1,652
Source: Ministry of Agriculture, Govt. of India, New Delhi.

183
24. ALL INDIA TABLE 24.6(B)(ii)
Area, Production and Yield of Pulses State wise, 2004-05
(Area in ‘000 Hectares, Production in ‘000 Tonnes, Yield in Kg/Hect)
Sl.No State Area Production Yield (1) (2) (3) (4) (5)
1 Andhra Pradesh 1,803.8 1,019.0 565
2 Arunachal Pradesh 6.5 6.8 1,046
3 Assam 107.6 61.4 571
4 Bihar 657.9 466.9 710
5 Chhatisgarh 932.2 367.8 395
6 Goa 10.4 9.4 904
7 Gujarat 710.2 479.3 675
8 Haryana 184.2 146.0 793
9 Himachal Pradesh 32.3 18.1 560
10 Jammu & Kashmir 30.7 15.1 492
11 Jharkhand 273.0 160.0 586
12 Karnataka 2,106.0 792.0 376
13 Kerala 3.4 2.9 853
14 Madhya Pradesh 4,519.7 3,429.2 759
15 Maharashtra 3,384.0 1,664.0 492
16 Manipur 7.9 3.0 380
17 Meghalaya 2.6 3.6 1,385
18 Mizoram 3.7 4.8 1,297
19 Nagaland 31.6 25.2 797
20 Orissa 642.5 249.6 388
21 Punjab 39.6 31.7 801
22 Rajasthan 3,571.1 1,337.4 375
23 Sikkim 6.9 6.6 957
24 Tamilnadu 599.3 245.6 410
25 Tripura 8.9 5.5 618
26 Uttar Pradesh 2,803.7 2,375.0 847
27 Uttaranchal 45.0 28.0 622
28 West Bengal 225.7 167.1 740 All India 22,763.0 13,129.5 577
Source: Ministry of Agriculture, Govt. of India, New Delhi.
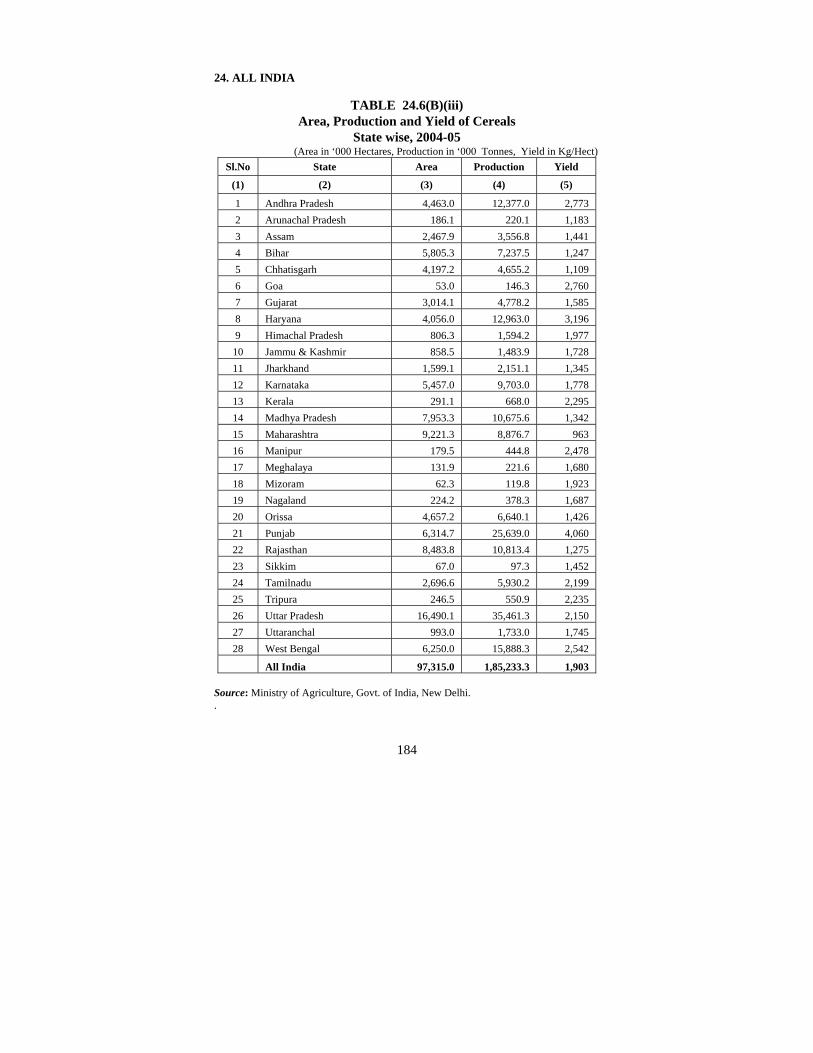
184
24. ALL INDIA
TABLE 24.6(B)(iii) Area, Production and Yield of Cereals
State wise, 2004-05 (Area in ‘000 Hectares, Production in ‘000 Tonnes, Yield in Kg/Hect)
Sl.No State Area Production Yield
(1) (2) (3) (4) (5)
1 Andhra Pradesh 4,463.0 12,377.0 2,773 2 Arunachal Pradesh 186.1 220.1 1,183 3 Assam 2,467.9 3,556.8 1,441 4 Bihar 5,805.3 7,237.5 1,247 5 Chhatisgarh 4,197.2 4,655.2 1,109 6 Goa 53.0 146.3 2,760 7 Gujarat 3,014.1 4,778.2 1,585 8 Haryana 4,056.0 12,963.0 3,196 9 Himachal Pradesh 806.3 1,594.2 1,977 10 Jammu & Kashmir 858.5 1,483.9 1,728 11 Jharkhand 1,599.1 2,151.1 1,345 12 Karnataka 5,457.0 9,703.0 1,778 13 Kerala 291.1 668.0 2,295 14 Madhya Pradesh 7,953.3 10,675.6 1,342 15 Maharashtra 9,221.3 8,876.7 963 16 Manipur 179.5 444.8 2,478 17 Meghalaya 131.9 221.6 1,680 18 Mizoram 62.3 119.8 1,923 19 Nagaland 224.2 378.3 1,687 20 Orissa 4,657.2 6,640.1 1,426 21 Punjab 6,314.7 25,639.0 4,060 22 Rajasthan 8,483.8 10,813.4 1,275 23 Sikkim 67.0 97.3 1,452 24 Tamilnadu 2,696.6 5,930.2 2,199 25 Tripura 246.5 550.9 2,235 26 Uttar Pradesh 16,490.1 35,461.3 2,150 27 Uttaranchal 993.0 1,733.0 1,745 28 West Bengal 6,250.0 15,888.3 2,542 All India 97,315.0 1,85,233.3 1,903
Source: Ministry of Agriculture, Govt. of India, New Delhi. .

185
24. ALL INDIA
TABLE 24.6(C)(i) Area, Production and Yield of Food Grains
State wise, 2005-06 (Area in ‘000 Hectares, Production in ‘000 Tonnes, Yield in Kg/Hect)
Sl.No State Area Production Yield
(1) (2) (3) (4) (5)
1 Andhra Pradesh 7,170 16,950 2,365
2 Assam 2,600 3,680 1,416
3 Bihar 6,550 8,590 1,311
4 Chhatisgarh 5,150 5,710 1,111
5 Gujarat 3,970 6,150 1,551
6 Haryana 4,270 13,000 3,045
7 Jharkhand 1,930 2,070 1,073
8 Karnataka 7,600 13,490 1,776
9 Madhya Pradesh 11,680 13,200 1,130
10 Maharashtra 12,750 12,090 948
11 Orissa 5,460 7,360 1,349
12 Punjab 6,320 25,180 3,986
13 Rajasthan 12,450 11,450 919
14 Tamilnadu 3,320 6,130 1,847
15 Uttar Pradesh 19,640 40,410 2,057
16 Uttaranchal 1,030 1,590 1,548
17 West Bengal 6,440 15,610 2,423
18 Others 3,270 5,940 @
All India 1,21,600 2,08,600 1,715
@ : Since Area/Production is low in individual States, Yield rate is not Worked out.
Source: Ministry of Agriculture, Govt. of India, New Delhi

186
24. ALL INDIA TABLE 24.6(C)(ii)
Area, Production and Yield of Pulses State wise, 2005-06
(Area in ‘000 Hectares, Production in ‘000 Tonnes, Yield in Kg/Hect)
Sl. No State Area Production Yield
(1) (2) (3) (4) (5)
1 Andhra Pradesh 1,780 1,380 772
2 Bihar 600 450 749
3 Chhatisgarh 950 450 477
4 Gujarat 780 550 704
5 Haryana 190 120 622
6 Jharkhand 290 170 592
7 Karnataka 1,980 960 487
8 Madhya Pradesh 4,280 3,230 754
9 Maharashtra 3,430 2,010 584
10 Orissa 810 340 416
11 Rajasthan 3,440 900 261
12 Tamilnadu 530 180 337
13 Uttar Pradesh 2,750 2,230 811
14 West Bengal 220 170 785
15 Others 360 240 @
All India 22,390 13,380 598
@ : Since Area/Production is low in individual States, Yield rate is not Worked out.
Source: Ministry of Agriculture, Govt. of India, New Delhi

187
24. ALL INDIA
TABLE 24.6(C)(iii) Area, Production and Yield of Coarse Cereals
State wise, 2005-06
(Area in ‘000 Hectares, Production in ‘000 Tonnes, Yield in Kg/Hect) Sl.No State Area Production Yield
(1) (2) (3) (4) (5)
1 Andhra Pradesh 1,390 3,860 2,772
2 Bihar 700 1,410 2,021
3 Chhatisgarh 350 160 460
4 Gujarat 1,610 1,840 1,142
5 Haryana 720 810 1,124
6 Himachal Pradesh 330 570 1,715
7 Jammu & Kashmir 350 470 1,344
8 Jharkhand 220 260 1,165
9 Karnataka 3,880 6,560 1,693
10 Madhya Pradesh 2,040 2,350 1,150
11 Maharashtra 6,870 6,090 887
12 Orissa 170 160 968
13 Punjab 180 470 2,697
14 Rajasthan 6,770 4,530 669
15 Tamilnadu 740 730 985
16 Uttar Pradesh 2,150 2,970 1,383
17 Uttaranchal 270 320 1,188
18 West Bengal 70 150 2,132
19 Others 250 360 @
All India 29,060 34,070 1,172 @ : Since Area/Production is low in individual States, Yield rate is not Worked out. Source: Ministry of Agriculture, Govt. of India, New Delhi

188
24. ALL INDIA
TABLE 24.7 Index Numbers of Wholesale Prices by Groups and Sub-Groups
(Base : 1993-94 = 100)
Financial Year Averages
Sl. No. Item
2004-05 2005-06 2006-07
2007-08 (Pro)
April 07 to Jan. 08
(1) (2) (3) (4) (5) (6) All Commodities 187.3 195.6 206.1 214.4 I Primary Articles - 193.6 208.6 223.0
(A) Food Articles 186.3 195.3 210.3 221.6
(a) Food Grains (Cereals + Pulses) 177.5 186.9 205.9 214.5
(a1) Cereals 177.9 185.8 199.3 210.5 (a2) Pulses 174.4 194.6 253.8 244.1
(b) Fruits & Vegetables 204.2 219.3 227.9 238.1 (c) Milk 183.6 184.3 195.8 211.2 (d) Eggs, Fish & Meat 194.0 217.2 226.9 238.3 (e) Condiments and Spices 188.1 176.9 227.9 238.8 (f) Other Food Articles 124.1 129.9 154.3 154.3 (B) Non- Food Articles 187.6 179.1 188.2 209.6 (C) Minerals 255.1 322.8 413.2 437.6
II Fuel, Power, Light & Lubricants 280.2 306.8 324.9 324.8
III Manufactured Products 166.3 171.5 179.0 186.8 (A) Food Products 174.9 176.9 182.5 188.4
(B) Beverages, Tobacco and Tobacco Products 216.2 226.8 243.5 267.1
(C) Textiles 135.7 129.5 132.3 131.5 (D) Wood & Wood Products 179.5 194.6 206.4 215.9 (E) Paper and Paper Products 174.6 178.4 190.7 194.0
(F) Leather and Leather Products 155.7 166.8 159.4 166.5
(G) Rubber & Rubber Products 134.5 139.1 148.2 158.0
(H) Chemical & Chemical Products 181.7 188.3 193.9 203.7
(I) Non Metallic Mineral Products 157.7 170.0 191.8 207.9
(J) Basic Metals, Alloys and Metal Products 203.3 218.7 233.3 245.9
(K) Machinery and Machine Tools 140.2 147.5 155.6 166.3
(L) Transport Equipment & Parts 154.3 159.9 162.4 166.0
Source: 1. Economic Advisor, Ministry of Commerce and Industries, GOI, New Delhi. 2. Reserve Bank of India Bulletin, August 2006.

189
24. ALL INDIA TABLE 24.8
Consumer Price Index Numbers for Industrial Workers (General Index)
(Base 1982= 100 upto December 2005 and 2001= 100 for data from January 2006 onwards)
Financial year Average
SI. No. Centre 2004-05
2005-06
@ 2006-07
2007-08 (Pro)
(April 07 to Feb 08)
(1) (2) (3) (4) (5) (6) ALL INDIA 520 540 125 132
1. Ahmedabad 510 522 123 130 2. Alwaye (Ernakulam) 523 545 127 133 3. Asansol 493 515 128 141 4. Bangalore 508 538 128 138 5. Bhavanagar 529 540 122 131 6. Bhopal 540 566 130 135 7. Chandigarh - 620 127 132 8. Chennai 555 567 119 126 9. Coimbatore 501 508 121 128 10. Delhi 611 652 124 129 11. Guwahati 520 541 117 120 12. Howrah 595 627 124 132 13. Hyderabad 516 536 118 124 14. Jaipur 473 498 130 136 15. Jamshedpur 484 514 128 134 16. Kolkatta 568 593 123 134 17. Ludhiana 479 508 131 135 18. Madurai 500 512 117 122 19. Monghyr-Jamalpur* 483 516 128 136 20. Mumbai 610 608 128 136 21. Mundakayam 504 516 126 132 22. Nagapur 533 556 134 141
23. Saharanpur * (Kanpur) 479 510 127 132
24. Sholapur 532 540 127 141 25. Srinagar 606 634 120 126
@ : Represents average for Nine months (April – December 2005.) * : Data for Saharanpur has been replaced by data for Kanpur from January 2006 onwards. Note: New series of Consumer Price Index for Industrial Workers with base 2001=100 was released in January 2006 by Labour Bureau, Shimla, Source: Reserve Bank of India Bulletin , August 2006.

190
24. ALL INDIA
TABLE 24.9 Number of Villages and Towns Electrified and Irrigation
Pumpset Energised (As on 31st March, 2005)
Sl. No
State
Total Number
of Villages (2001
Census)
No.of Villages Electrified
% of Villages covered
No.of Towns Electri-fied
Irri-gation
pumpset Ener-gised
(1) (2) (3) (4) (5) (6) (7)
1 Andhra Pradesh 26,613 26,565 99.8 210 23,74,365
2 Arunachal Pradesh 3,863 1,867 48.3 17 0
3 Assam 25,124 19,342 77.0 125 3,675
4 Bihar 39,015 20,006 51.3 130 2,70,392
5 Chattisgarh 19,744 15,119 76.6 97 1,06,749
6 Goa 347 347 100.0 44 7,485
7 Gujarat 18,066 17,823 98.7 242 8,07,681
8 Harayana 6,764 6,764 100.0 106 4,62,635
9. Himachal Pradesh 17,495 11,950 68.3 57 9,196
10 .Jammu & Kashmir 6,417 6,304 98.2 75 9,714
11 Jharkhand 29,354 9,239 31.5 152 8,735
12 Karnataka 27,481 26,971 98.1 270 14,34,060
13 Kerala 1,364 1,364 100.0 159 4,46,366
14 Madhya Pradesh 52,117 50,213 96.3 394 13,29,388
15 Maharashtra 41,095 35,541 86.5 378 25,72,815
16 Manipur 2,315 1,903 82.2 33 45
17 Meghalaya 5,782 3,328 57.6 16 65
Contd…

191
24. ALL INDIA
TABLE 24.9 (Concld…) Number of Villages and Towns Electrified and Irrigation
(As on 31st March, 2005)
Sl. No
State
Total Number
of Villages
(2001 Census)
No.of Villages
Electrified
% of Villages covered
No.of Towns Electri-
fied
Irrigation pumpset
Energised
(1) (2) (3) (4) (5) (6) (7)
18. Mizoram 707 570 80.6 22 0
19. Nagaland 1,278 855 66.9 9 194
20. Orissa 47,529 26,235 55.2 138 74,625
21. Punjab 12,278 12,278 100.0 157 9,12,889
22. Rajasthan 39,753 25,385 63.9 222 7,41,124
23. Sikkim 450 425 94.4 9 0
24. Tamilnadu 15,400 14,621 94.9 832 18,54,471
25. Tripura 858 491 57.2 23 3,095
26. Uttar Pradesh 97,942 56,977 58.2 704 8,44,964
27. Uttaranchal 15,761 14,534 92.2 86 17,719
28. West Bengal 37,945 32,190 84.8 375 1,13,563
29. Union Territories 875 593 67.8 79 39,004
All India 5,93,732 4,39,800 74.1 5,161 1,44,45,014
Source: General Review, 2006 on Electricity issued by Central Electricity Authority, New Delhi

192
24. ALL INDIA TABLE 24.10
Category-wise Per Capita Consumption of Electricity, 2004-05 (Utilities and Non - Utilities)
(In K.W.H.) Industrial
Sl. No
State
Dome-
stic
Comm-ercial
Low & Medium Voltage
High Vol-tage
Agri-
culture
All Cate-gories
(1) (2) (3) (4) (5) (6) (7) (8)
1. Andhra Pradesh 99.61 23.59 31.53 115.21 179.02 543.14
2. Arunachal Pradesh 56.52 11.74 3.91 0.00 0.00 144.78
3. Assam 25.49 8.03 3.02 17.84 0.51 85.27 4. Bihar 13.64 3.40 1.58 7.66 11.96 44.56 5. Chhattisgarh 62.25 10.88 14.74 179.03 47.06 535.15 6. Goa 206.56 80.67 43.24 649.88 10.84 1,318.34 7. Gujarat 101.25 37.93 110.60 185.05 224.62 908.12 8. Haryana 126.25 33.56 42.12 112.45 252.44 658.00
9. Himachal Pradesh 127.93 38.61 22.81 212.87 3.99 484.04
10 Jammu & Kashmir 137.19 41.84 69.38 0.00 11.47 348.74
11. Jarkhand 29.43 5.63 4.05 219.71 2.12 402.14 12. Karnataka 89.18 34.88 26.24 90.96 168.88 504.69 13. Kerala 129.79 39.64 21.20 69.78 6.06 296.07
14. Madhya Pradesh 58.97 12.55 10.60 61.91 90.00 308.40
15. Maharashtra 124.02 52.44 47.19 174.95 105.13 585.35 16. Manipur 45.01 4.88 2.82 0.37 0.09 70.47 17. Meghalaya 70.61 15.86 2.17 199.81 0.38 352.21 18. Mizoram 90.13 6.95 2.05 0.00 0.00 133.69 19. Nagaland 57.15 8.71 1.74 0.00 0.00 87.23 20. Orissa 69.34 13.92 7.05 86.28 4.77 394.89 21. Punjab 198.33 50.62 73.59 267.94 253.36 907.30 22. Rajasthan 55.53 17.91 24.42 61.15 87.54 328.09 23. Sikkim 172.81 98.25 47.37 0.00 0.00 397.72 24. Tamilnadu 172.12 58.53 70.07 149.18 151.67 713.26 25. Tripura 44.19 9.74 14.93 0.00 21.13 113.10
26. Uttar Pradesh 57.75 11.71 13.34 23.34 27.21 202.03
27. Utaranchal 112.14 63.61 10.31 88.34 54.16 393.47
28. West Bengal 66.71 24.81 20.53 81.58 9.90 247.54
All India (+) 87.77 28.79 30.49 95.75 81.25 411.04 (+) : Includes Union Territories. Source: General Review, 2006 on Electricity issued by Central Electricity Authority, New Delhi.

193
24. ALL INDIA
TABLE 24.11 Net National Product at Factor Cost at Current and Constant
Prices (New Series at 1999-2000 Prices)
Net National Product ( Rs. in Crores)
Per-capita Net National Product (in Rupees)
Year Current Prices
Constant (1999-2000)
Prices
Current Prices
Constant (1999-2000)
Prices (1) (2) (3) (4) (5)
1999-2000 15,85,501 15,85,501 15,839 15,839
2000-2001 16,96,388 16,43,997 16,648 16,133
2001-2002 18,47,667 17,39,876 17,800 16,762
2002-2003 19,93,846 18,01,430 18,899 17,075
2003-2004 22,46,465 19,59,599 20,936 18,263
2004-2005 (R.E) 25,01,067 21,03,350 22,946 19,297
2005-2006 (P.E) 28,70,750 23,06,894 25,956 20,858
2006-2007 (Q.E) 33,25,817 25,30,495 29,642 22,553
2007-2008 (A.E) 37,70,302 27,60,325 33,131 24,256
R.E.: Revised Estimates P.E : Provisional Estimates Q.E : Quick Estimates A.E : Advanced Estimates Source: New Series of National Accounts Statistics, Central Statistical Organisation, GOI, New Delhi

194
24. ALL INDIA
TABLE 24.12(A) Tax Revenue and Non-tax Revenue of individual States, 2006-07
Revenue Account (Revised Estimates)
(Rs. in crores)
Sl. No State Tax
Revenue Non-Tax Revenue
Total Revenue
% of the Tax-
Revenue to Total Revenue
(1) (2) (3) (4) (5) (6) 1. Andhra Pradesh 33,611.47 11,534.51 45,145.98 74.45 2. Arunachal
Pradesh 416.94 1,975.70 23,92.64 17.43 3. Assam 7,240.57 8,776.98 16,017.55 45.20 4. Bihar 17,048.66 5,711.67 22,760.32 74.91 5. Chattisgarh 8,346.03 3,580.26 11,926.29 69.98 6. Goa 1,480.29 1,053.51 2,533.80 58.42 7. Gujarat 22,496.60 7,963.32 30,459.92 73.86 8. Haryana 11,769.71 4,148.41 15,918.12 73.94 9. Himachal
Pradesh 2,109.55 4,836.47 6,946.03 30.37 10. Jammu &
Kashmir 3,390.98 8,589.62 11,980.60 28.30 11. Jharkhand 6,946.13 3,198.34 10,144.47 68.47 12. Karnataka 28,897.57 9,098.23 37,995.80 76.05 13. Kerala 15,197.55 3,769.49 18,967.04 80.13 14. Madhya
Pradesh 17,790.15 7,069.70 24,859.86 71.56 15. Maharashtra 46,347.19 13,920.18 60,267.37 76.90 16. Manipur 522.19 2,466.50 2,988.69 17.47 17. Meghalaya 689.80 1,767.98 2,457.78 28.07 18. Mizoram 334.60 1,658.79 1,993.39 16.79 19. Nagaland 417.58 2,325.32 2,742.91 15.22 20. Orissa 11,965.28 5,683.23 17,648.52 67.80 21. Punjab 11,331.73 8,543.24 19,874.97 57.02 22. Rajasthan 18,074.61 7,358.95 25,433.56 71.07 23. Sikkim 338.62 2,078.05 2,416.66 14.01 24. Tamilnadu 34,436.09 6,024.56 40,460.66 85.11 25. Tripura 833.23 2,348.44 3,181.67 26.19 26. Uttaranchal 3,482.30 3,361.04 6,843.34 50.89 27. Uttar Pradesh 46,261.71 13,768.46 60,030.15 77.06 28. West Bengal 21,039.71 6,001.06 27,040.77 77.81
All States 3,72,816.83 1,58,612.00 53,1,428.85 70.15
1. National Capital Territory of Delhi
10,075.75 2,231.11 123,06.86 81.87
2. Pondicherry 537.00 1,265.42 1,802.42 29.79 Source: State Finances A study of Budgets of 2007-08 issued by Reserve Bank of India, Mumbai.

195
24 . ALL INDIA TABLE 24.12(B)
Tax Revenue and Non-tax Revenue of individual States, 2007-08 Revenue Account (Budget Estimates)
(Rs. in Crores)
Sl. No. State Tax
Revenue Non-Tax Revenue
Total Revenue
% of the Tax-
Revenue to Total Revenue
(1) (2) (3) (4) (5) (6) 1. Andhra Pradesh 40,589.88 14,359.70 54,949.59 73.87 2. Arunachal
Pradesh 490.25 1,841.02 2,331.27 21.03 3. Assam 8,267.87 8,720.36 16,988.23 48.67 4. Bihar 20,001.16 7,439.87 27,441.03 72.89 5. Chattisgarh 9,343.38 4,123.57 13,466.96 69.38 6. Goa 1,556.92 1,825.07 3,381.99 46.04 7. Gujarat 25,154.92 7,809.30 32,964.22 76.31 8. Haryana 13,594.10 4,323.25 17,917.35 75.87 9. Himachal
Pradesh 2,603.11 4,702.35 7,305.46 35.63 10. Jammu &
Kashmir 3,670.11 9,734.79 13,404.90 27.38 11. Jharkhand 8,345.49 3,266.58 11,612.07 71.87 12. Karnataka 32,991.17 7,770.92 40,762.09 80.94 13. Kerala 17,591.27 3,854.47 21,445.75 82.03 14. Madhya Pradesh 20,101.59 7,894.25 27,995.84 71.80 15. Maharashtra 53,002.11 15,296.76 68,298.87 77.60 16. Manipur 643.95 2,118.21 2,762.16 23.31 17. Meghalaya 861.17 2,380.60 3,241.77 26.56 18. Mizoram 409.02 1,527.34 1,936.36 21.12 19. Nagaland 470.68 2,589.13 3,059.82 15.38 20. Orissa 13,406.31 6,060.89 19,467.20 68.87 21. Punjab 12,729.11 10,020.43 22,749.54 55.95 22. Rajasthan 20,914.30 7,685.19 28,599.49 73.13 23. Sikkim 406.36 2,358.06 2,764.41 14.70 24. Tamilnadu 38,555.43 5,976.85 44,532.28 86.58 25. Tripura 928.84 2,734.11 3,662.95 25.36 26. Uttaranchal 3,990.52 5,025.98 9,016.50 44.26 27. Uttar Pradesh 55,281.40 18,736.30 74,017.69 74.69 28. West Bengal 24,321.29 6,336.02 30,657.31 79.33
ALL STATES 4,30,221.71 17,65,11.37 6,06,733.09 70.91
1. National Capital Territory of Delhi
12,125.03 3,157.12 15,282.15 79.34
2. Pondicherry 586.00 1,373.80 1,959.80 29.90 Source: State Finances A study of Budgets of 2007-08 issued by Reserve Bank of India, Mumbai.

196
24. ALL INDIA TABLE 24.13(A)
Development & Non-Development Expenditure of individual States, 2006-07 Revenue Account (Revised Estimates)
(Rs. in Crores)
Sl No State
Develop-ment
Expen-diture
Non-Develop-
ment Expen-diture
Compen-sation
Assigment to Local bodies and PR Institu-
tions
Total Expen-diture
% of Develop-mental Expen-diture
(1) (2) (3) (4) (5) (6) (7) 1. Andhra
Pradesh 29,051.56 15,887.87 260.10 45,199.53 64.27
2. Arunachal Pradesh 1,391.02 581.14 0.00 1,972.16 70.53
3. Assam 10,,225.62 6,406.03 16.00 16,647.65 61.42 4. Bihar 13,383.35 10,125.02 4.37 23,512.74 56.92 5. Chattisgarh 6,760.48 3,027.94 459.54 10,,247.96 65.97 6. Goa 1,734.20 834.48 0.00 2,568.68 67.51 7. Gujarat 16,612.20 11,890.71 154.15 28,657.06 57.97 8. Haryana 11,441.66 4,853.68 275.91 16,571.25 69.05 9. Himachal
Pradesh 3,880.12 3,117.02 2.87 7,000.01 55.43
10 Jammu & Kashmir 5,931.72 4,135.11 0.00 10,066.84 58.92
11 Jharkhand 7,716.44 3,515.23 2.66 11,234.33 68.69 12 Karnataka 21,395.33 12,238.64 1,530.29 35,164.26 60.84 13 Kerala 11,735.87 11,236.60 1,911.04 24,883.51 47.16 14 Madhya
Pradesh 13,005.97 8,824.81 1,265.70 23,096.48 56.31 15 Maharashtra 35,864.90 26,648.94 946.05 63,459.89 56.52 16 Manipur 1,386.84 825.35 0.00 2,212.19 62.69 17 Meghalaya 1,432.09 685.67 0.00 2,117.76 67.62 18 Mizoram 1,160.39 656.61 0.00 1,817.01 63.86 19 Nagaland 1,288.32 1,047.87 0.00 2,336.19 55.15 20 Orissa 8,720.46 7,902.92 277.42 16,900.79 51.60 21 Punjab. 9,265.06 12,391.15 409.34 22,065.56 41.99 22 Rajasthan 14,746.35 10,583.18 7.58 25,337.11 58.20 23 Sikkim 705.65 1,262.03 0.00 1,967.68 35.86 24 Tamilnadu 22,868.61 15,367.77 2,470.87 40,707.25 56.18 25 Tripura 1,373.07 1,209.71 51.10 2,633.89 52.13 26 Uttaranchal 3,791.01 2,397.53 296.75 6,485.29 58.46 27 Uttar Pradesh 29,870.45 24,107.21 2,693.52 56,671.18 52.71 28 West Bengal 17,194.80 17,948.37 317.22 35,460.39 48.49
ALL INDIA 3,03,933.53 2,19,708.6 1 12,406.44 5,36,994.6 3 56.60
1. National Capital Territory of Delhi
4,630.79 2,877.95 531.84 8,040.58 57.59
2. Pondicherry 1,468.62 464.75 3.79 1,937.17 75.81 Source: State Finances A Study of Budgets of 2007-08 issued by Reserve Bank of India, Mumbai..

197
24. ALL INDIA TABLE 24.13(B)
Development & Non-Development Expenditure of individual States, 2007-08 Revenue Account (Budget Estimates)
(Rs. in Crores)
Sl No State
Develop-ment
Expen-diture
Non-Develop-
ment Expen-diture
Compen-sation
Assigment to Local bodies and PR Institu-
tions
Total Expen-diture
% of Develop-mental Expen-diture
(1) (2) (3) (4) (5) (6) (7) 1. Andhra
Pradesh 35,857.21 18,848.04 280.79 54,986.04 65.21
2. Arunachal Pradesh 1,597.88 570.64 0 2,168.53 73.68
3. Assam 9,921.51 6,030.99 138.31 16,090.81 61.66 4. Bihar 13,667.09 10,290.67 0 23,957.76 57.05 5. Chattisgarh 7,557.20 3,711.91 396.50 11,665.62 64.78 6. Goa 1,766.97 1,622.94 0 3,389.91 52.12 7. Gujarat 17,511.07 13,701.91 100.36 31,313.35 55.92 8. Haryana 11,194.59 5,241.87 332.09 16,768.55 66.76 9. Himachal
Pradesh 4,225.71 3,326.73 3.16 7,555.60 55.93
10 Jammu & Kashmir 6,115.25 4,500.60 0 1,0615.86 57.60
11 Jharkhand 7,692.00 4,426.79 0.16 12,118.94 63.47 12 Karnataka 25,458.89 11,772.16 1,904.39 39,135.44 65.05 13 Kerala 12,318.89 12,275.89 2,102.13 26,696.90 46.14 14 Madhya
Pradesh 14,527.63 10,078.40 1,383.08 25,989.11 55.90 15 Maharashtra 36,981.55 29,870.74 935.90 67,788.2 54.55 16 Manipur 1,514.67 843.48 0 2,358.15 64.23 17 Meghalaya 1,960.10 771.99 0 2,732.09 71.74 18 Mizoram 1,133.16 640.35 0 1,773.51 63.89 19 Nagaland 1,332.13 1,122.22 0 2,454.35 54.28 20 Orissa 9,952.52 8,148.06 320.89 1,8421.47 54.03 21 Punjab. 10,563.22 13,460.29 565.47 24,588.97 42.96 22 Rajasthan 16,703.88 11,663.77 17.08 28,384.73 58.85 23 Sikkim 783.11 1,596.91 0 2,380.02 32.90 24 Tamilnadu 25,092.39 16,448.12 3,093.16 4,4633.67 56.22 25 Tripura 1,510.97 1,449.22 63.15 3,023.35 49.98 26 Uttaranchal 4,934.92 2,814.11 323.55 8,072.58 61.13 27 Uttar Pradesh 37,753.69 26,491.28 3,,626.41 67,871.38 55.63 28 West Bengal 18,623.09 18,865.15 336.82 37,825.06 49.23
ALL STATES 3,38,251.30 2,40,585.23 15,923.42 594759.95 56.87
1. National Capital Territory of Delhi
5,889.04 3,410.67 666.94 9,966.64 59.09
2. Pondicherry 1,653.30 492.53 4.03 2,149.86 76.90 Source: State Finances A Study of Budgets of 2007-08 issued by RBI, Mumbai.

198
24. ALL INDIA TABLE 24.14(A)
State wise Percentage of Budgeted Expenditure on Selected Sectors to Total Budgeted Expenditure, 2006-07 (Revised Estimates)
Sl. No State
Education, Sports, Art and Culture
Medical and Public
Health
Agriculture and Allied Activities
Rural Develop-
ment
(1) (2) (3) (4) (5) (6) 1 Andhra Pradesh 15.60 3.64 3.66 5.84 2 Arunachal Pradesh 12.72 4.15 11.80 2.40 3 Assam 23.12 4.88 5.06 5.38 4 Bihar 22.54 4.40 2.67 6.55 5 Chhattisgarh 16.21 3.55 10.05 7.19 6 Goa 16.20 5.22 2.92 1.82 7 Gujarat 15.64 3.25 3.60 3.80 8 Haryana 14.16 2.64 3.75 1.97 9 Himachal Pradesh 18.09 4.59 6.91 1.98 10 Jammu & Kashmir 11.97 5.35 5.92 1.18 11 Jharkhand 18.85 6.12 6.00 10.37 12 Karnataka 16.80 3.45 8.12 2.79 13 Kerala 19.78 5.08 5.11 1.66 14 Madhya Pradesh 15.51 4.16 7.81 7.32 15 Maharashtra 19.75 3.42 5.19 4.87 16 Manipur 16.92 3.11 7.05 2.25 17 Meghalaya 18.35 4.40 10.14 4.65 18 Mizoram 17.56 4.34 9.96 2.45 19 Nagaland 14.35 4.04 8.45 4.31 20 Orissa 15.12 3.28 4.12 3.72 21 Punjab 12.15 3.26 2.46 0.69 22 Rajasthan 19.19 4.30 3.29 4.08 23 Sikkim 11.06 2.66 5.98 1.90 24 Tamilnadu 16.88 3.78 4.83 1.88 25 Tripura 20.16 4.17 7.42 3.52 26 Uttaranchal 21.55 3.81 9.48 4.26 27 Uttar Pradesh 19.12 4.69 3.06 4.11 28 West Bengal 18.50 4.39 2.60 4.58
ALL STATES 17.66 4.00 4.74 4.13
1. National Capital Territory of Delhi 22.90 12.03 0.65 0.06
2. Pondicherry 11.40 8.43 5.27 1.21 Contd..

199
24. ALL INDIA TABLE 24.14(A)
State wise Percentage of Budgeted Expenditure on Selected Sectors to Total Budgeted Expenditure, 2006-07
(Revised Estimates)
Sl. No State
Irrigation and Flood
control Energy
Industry and
Minerals
Transport and
Commu-nications
(1) (2) (7) (8) (9) (10) 1 Andhra Pradesh 10.00 3.01 0.83 2.38 2 Arunachal Pradesh 3.14 6.12 0.90 5.35 3 Assam 1.91 1.83 1.06 3.14 4 Bihar 3.22 4.61 0.31 1.99 5 Chhattisgarh 1.02 1.82 1.30 3.28 6 Goa 1.08 20.72 1.23 4.51 7 Gujarat 1.81 7.08 1.00 4.23 8 Haryana 4.47 22.82 1.05 6.10 9 Himachal Pradesh 1.83 2.86 0.48 6.45 10 Jammu & Kashmir 2.08 18.42 1.20 0.37 11 Jharkhand 1.64 3.82 1.66 2.98 12 Karnataka 0.79 7.00 1.15 4.36 13 Kerala 1.10 0.22 0.99 3.25 14 Madhya Pradesh 1.23 2.98 0.74 1.90 15 Maharashtra 2.23 3.65 0.81 1.00 16 Manipur 2.30 10.90 1.77 3.75 17 Meghalaya 0.64 7.18 2.32 3.62 18 Mizoram 0.14 7.59 1.96 3.74 19 Nagaland 1.93 4.90 1.85 3.92 20 Orissa 1.67 0.79 0.70 3.59 21 Punjab 2.77 8.85 0.65 2.17 22 Rajasthan 3.93 6.91 0.40 3.24 23 Sikkim 0.93 1.94 1.17 2.98 24 Tamilnadu 1.15 2.91 1.23 2.12 25 Tripura 1.05 0.05 1.22 2.85 26 Uttaranchal 2.46 0.62 0.45 2.54 27 Uttar Pradesh 3.72 2.88 0.37 2.60 28 West Bengal 1.86 0.05 1.11 2.39
ALL STATES 2.84 4.62 0.87 2.75
1. National Capital Territory of Delhi 0.64 1.21 0.27 4.02
2. Pondicherry 0.99 25.22 1.16 2.27 Contd…

200
24. ALL INDIA TABLE 24.14(A) (Concld.,)
State wise Percentage of Budgeted Expenditure on Selected Sectors to Total Budgeted Expenditure, 2006-07
(Revised Estimates)
Sl. No State
Science, Technology& Environment
General Economic Services
Others Total
Expen-diture
(1) (2) (11) (12) (13) (14) 1 Andhra Pradesh 0.01 1.27 53.77 100.00 2 Arunachal Pradesh 0.58 5.09 47.75 100.00 3 Assam 0.01 2.79 50.80 100.00 4 Bihar - 0.55 53.17 100.00 5 Chhattisgarh 0.08 0.30 55.20 100.00 6 Goa 0.14 1.47 44.66 100.00 7 Gujarat 0.15 1.13 58.32 100.00 8 Haryana 0.05 0.23 42.75 100.00 9 Himachal Pradesh 0.03 1.35 55.44 100.00 10 Jammu & Kashmir 0.08 0.69 52.75 100.00 11 Jharkhand - 0.92 47.64 100.00 12 Karnataka 0.12 1.22 54.21 100.00 13 Kerala 0.25 0.87 61.69 100.00 14 Madhya Pradesh 0.04 0.22 58.11 100.00 15 Maharashtra 0.04 0.51 58.54 100.00 16 Manipur 0.47 1.64 49.85 100.00 17 Meghalaya 0.01 2.12 46.56 100.00 18 Mizoram 0.09 1.51 50.66 100.00 19 Nagaland 0.48 2.72 53.05 100.00 20 Orissa 0.11 2.93 63.95 100.00 21 Punjab 0.00 3.02 63.98 100.00 22 Rajasthan 0.02 1.17 53.47 100.00 23 Sikkim 0.12 0.79 70.45 100.00 24 Tamilnadu 0.03 5.39 59.81 100.00 25 Tripura 0.03 0.53 59.00 100.00 26 Uttaranchal 0.21 1.17 53.46 100.00 27 Uttar Pradesh 0.17 0.21 59.07 100.00 28 West Bengal 0.03 0.28 64.21 100.00
ALL STATES 0.08 1.33 56.99 100.00
1. National Capital Territory of Delhi 0.09 0.50 57.63 100.00
2. Pondicherry 0.07 1.56 42.45 100.00 Source: State Finances A Study of Budgets of 2007-08 issued by Reserve Bank of India, Mumbai.

201
24. ALL INDIA TABLE 24.14(B)
State-wise Percentage of Budgeted Expenditure on Selected Sectors to Total Budgeted Expenditure, 2007-08 (Budget Estimates)
Sl. No State
Education, Sports, Art and Culture
Medical and Public
Health
Agriculture and Allied Activities
Rural Develop-
ment
(1) (2) (3) (4) (5) (6) 1 Andhra Pradesh 14.66 3.79 3.65 4.58 2 Arunachal Pradesh 9.96 3.67 8.39 2.10 3 Assam 23.08 6.20 5.23 5.02 4 Bihar 22.48 4.17 2.69 7.98 5 Chhattisgarh 16.48 4.34 9.38 6.77 6 Goa 11.36 4.07 2.36 1.41 7 Gujarat 15.27 3.28 4.04 3.40 8 Haryana 17.37 2.90 4.55 2.42 9 Himachal Pradesh 19.71 4.70 6.22 2.23 10 Jammu & Kashmir 12.16 5.32 5.76 1.27 11 Jharkhand 19.21 4.11 6.68 6.35 12 Karnataka 17.76 3.67 9.54 2.92 13 Kerala 20.79 4.66 4.43 0.96 14 Madhya Pradesh 15.75 3.81 6.75 7.77 15 Maharashtra 18.17 3.47 4.51 5.39 16 Manipur 15.81 3.25 5.98 2.76 17 Meghalaya 18.57 4.26 11.29 6.02 18 Mizoram 16.50 4.81 7.99 2.80 19 Nagaland 14.29 4.28 7.78 3.82 20 Orissa 16.43 3.81 5.30 5.60 21 Punjab 11.88 3.08 3.55 1.52 22 Rajasthan 18.47 4.36 3.11 4.12 23 Sikkim 10.03 2.79 5.37 1.66 24 Tamilnadu 18.47 4.03 4.48 1.43 25 Tripura 19.41 4.14 7.50 3.06 26 Uttaranchal 20.51 4.22 8.37 4.64 27 Uttar Pradesh 17.98 4.36 3.85 4.47 28 West Bengal 18.07 4.40 2.54 4.70
ALL STATES 17.46 4.00 4.81 4.14 1. National Capital
Territory of Delhi 22.58 12.27 0.54 0.81 2. Pondicherry 10.84 8.38 4.03 0.87
Contd…

202
24. ALL INDIA TABLE 24.14(B)
State-wise Percentage of Budgeted Expenditure on Selected Sectors to Total Budgeted Expenditure, 2007-08 (Budget Estimates)
Sl. No State
Irrigation and Flood
control Energy
Industry and
Minerals
Transport & Commu-
nications (1) (2) (7) (8) (9) (10) 1 Andhra Pradesh 10.09 4.69 1.03 2.54 2 Arunachal Pradesh 3.77 5.72 0.65 4.83 3 Assam 2.18 0.21 1.02 3.18 4 Bihar 2.42 3.04 0.56 2.35 5 Chhattisgarh 0.88 1.83 1.30 2.92 6 Goa 0.98 15.10 1.22 3.04 7 Gujarat 1.51 7.25 1.44 4.65 8 Haryana 4.85 13.79 0.47 6.74 9 Himachal Pradesh 1.74 2.57 0.54 6.35 10 Jammu & Kashmir 2.27 19.35 1.21 0.35 11 Jharkhand 1.25 5.72 1.53 2.88 12 Karnataka 0.67 5.57 1.60 3.72 13 Kerala 1.18 0.22 0.73 2.87 14 Madhya Pradesh 1.17 2.84 0.82 1.86 15 Maharashtra 2.54 3.46 0.90 1.03 16 Manipur 2.15 8.60 1.66 3.60 17 Meghalaya 0.70 7.81 2.34 2.91 18 Mizoram 0.37 7.96 1.65 3.89 19 Nagaland 2.38 4.01 2.73 3.95 20 Orissa 2.00 0.62 0.80 4.27 21 Punjab 2.72 8.15 0.53 1.99 22 Rajasthan 3.65 4.54 0.37 2.51 23 Sikkim 0.54 1.75 1.11 2.63 24 Tamilnadu 1.24 2.58 0.97 1.98 25 Tripura 1.02 0.06 1.06 2.74 26 Uttaranchal 2.31 0.25 0.46 2.69 27 Uttar Pradesh 3.71 2.40 1.06 2.20 28 West Bengal 1.63 0.10 0.79 2.32
ALL STATES 2.90 4.03 0.96 2.66 1. National Capital
Territory of Delhi 0.52 0.07 0.31 4.54 2. Pondicherry 0.96 23.87 1.28 1.40
Contd…

203
24. ALL INDIA
TABLE 24.14(B) (Concld.,) State-wise Percentage of Budgeted Expenditure on Selected
Sectors to Total Budgeted Expenditure, 2007-08 (Budget Estimates)
Sl. No State
Science, Technology& Environment
General Economic Services
Others Total
Expend-iture
(1) (2) (11) (12) (13) (14) 1 Andhra Pradesh 0.02 1.36 53.59 100.00 2 Arunachal Pradesh 0.47 27.62 32.83 100.00 3 Assam 0.03 2.45 51.40 100.00 4 Bihar 0.53 53.78 100.00 5 Chhattisgarh 0.07 0.28 55.76 100.00 6 Goa 0.11 1.03 59.32 100.00 7 Gujarat 0.10 1.12 57.94 100.00 8 Haryana 0.05 0.73 46.12 100.00 9 Himachal Pradesh 0.02 1.25 54.67 100.00
10 Jammu & Kashmir 0.09 1.16 51.06 100.00 11 Jharkhand - 0.84 51.43 100.00 12 Karnataka 0.09 2.22 52.24 100.00 13 Kerala 0.24 0.85 63.07 100.00 14 Madhya Pradesh 0.11 0.21 58.91 100.00 15 Maharashtra 0.04 0.49 60.02 100.00 16 Manipur 0.47 8.97 46.75 100.00 17 Meghalaya 0.01 3.80 42.28 100.00 18 Mizoram 0.14 3.11 50.77 100.00 19 Nagaland 0.32 3.05 53.40 100.00 20 Orissa 0.19 2.42 58.56 100.00 21 Punjab 0.08 4.27 62.22 100.00 22 Rajasthan 0.02 5.84 53.03 100.00 23 Sikkim 0.15 1.52 72.46 100.00 24 Tamilnadu 0.04 4.74 60.06 100.00 25 Tripura 0.08 0.59 60.36 100.00 26 Uttaranchal 0.15 1.18 55.22 100.00 27 Uttar Pradesh 0.18 0.22 59.58 100.00 28 West Bengal 0.06 0.29 65.10 100.00
ALL STATES 0.08 1.74 57.21 100.00
1. National Capital Territory of Delhi 0.21 0.61 57.54 100.00
2. Pondicherry 0.06 2.27 46.03 100.00 Source: State Finances A Study of Budgets of 2007-08 issued by Reserve Bank of India, Mumbai.

204
24. ALL INDIA TABLE 24.14(C)
State wise Per Capita Budgeted Expenditure on Selected Sectors 2006-07 (Revised Estimates)
( In Rupees)
Sl No State
Education, Sports, Art and Culture
Medical and
Public Health
Agriculture and Allied Activities
Rural Develop-
ment
(1) (2) (3) (4) (5) (6) 1 Andhra Pradesh 864.36 201.50 202.85 323.63 2 Arunachal Pradesh 2,118.07 690.88 1,965.71 399.32 3 Assam 1,324.99 279.49 290.04 308.52 4 Bihar 574.68 112.27 68.02 166.99 5 Chhattisgarh 724.53 158.46 449.08 321.23 6 Goa 2,702.79 870.97 487.27 303.96 7 Gujarat 803.36 166.65 185.09 195.11 8 Haryana 988.08 184.13 262.00 137.46 9 Himachal Pradesh 1,940.24 492.29 741.69 212.15 10 Jammu & Kashmir 1,085.31 485.34 536.80 106.65 11 Jharkhand 712.02 231.03 226.68 391.76 12 Karnataka 1,038.26 213.09 501.69 172.39 13 Kerala 1,467.70 377.19 379.32 123.47 14 Madhya Pradesh 530.00 142.08 266.90 250.11 15 Maharashtra 1,178.07 203.75 309.87 290.44 16 Manipur 1,602.70 294.22 667.21 212.97 17 Meghalaya 1,554.64 372.56 858.84 393.92 18 Mizoram 3,329.65 823.38 1,889.46 464.93 19 Nagaland 1,562.56 440.33 920.51 468.95 20 Orissa 650.66 141.01 177.45 160.26 21 Punjab 1,015.63 272.66 205.26 57.87 22 Rajasthan 766.68 171.97 131.58 163.15 23 Sikkim 3,733.10 898.80 2,019.55 642.54 24 Tamilnadu 1,047.03 234.47 299.85 116.52 25 Tripura 1,539.66 318.76 566.40 269.03 26 Uttaranchal 1,492.17 263.52 656.68 294.79 27 Uttar Pradesh 580.14 142.36 92.79 124.80 28 West Bengal 761.71 180.92 107.20 188.71
ALL STATES 855.19 193.50 229.75 199.83 1. National Capital
Territory of Delhi 1117.07 586.82 31.82 2.97 2. Pondicherry 1926.61 1,424.35 890.23 204.10
Contd…

205
24. ALL INDIA
TABLE 24.14(C) State wise Per Capita Budgeted Expenditure on Selected Sectors
2006-07 (Revised Estimates) (in Rupees)
Sl. No State
Irrigation and Flood
control Energy
Industry and
Minerals
Transport & Communi-
cations (1) (2) (7) (8) (9) (10) 1 Andhra Pradesh 554.06 166.85 45.74 131.87 2 Arunachal Pradesh 523.73 1,019.59 149.49 890.79 3 Assam 109.68 105.14 60.85 179.96 4 Bihar 82.09 117.57 7.88 50.62 5 Chhattisgarh 45.69 81.53 58.26 146.43 6 Goa 180.58 3,455.84 205.97 752.73 7 Gujarat 92.85 363.32 51.58 217.11 8 Haryana 311.82 1,592.83 73.25 425.93 9 Himachal Pradesh 196.28 307.23 51.01 691.45
10 Jammu & Kashmir 188.78 1,670.90 108.43 33.26 11 Jharkhand 61.90 144.25 62.53 112.71 12 Karnataka 48.95 432.35 71.13 269.23 13 Kerala 81.62 16.25 73.76 240.97 14 Madhya Pradesh 42.01 101.88 25.18 64.90 15 Maharashtra 132.95 217.83 48.07 59.76 16 Manipur 218.11 1,031.89 167.38 354.97 17 Meghalaya 54.32 608.60 196.44 306.92 18 Mizoram 26.93 1,439.46 372.03 708.98 19 Nagaland 209.98 533.75 201.72 426.99 20 Orissa 72.05 34.04 30.14 154.65 21 Punjab 231.38 739.63 54.70 181.67 22 Rajasthan 157.09 276.03 16.01 129.30 23 Sikkim 312.69 656.43 395.54 1,006.69 24 Tamilnadu 71.33 180.21 76.21 131.32 25 Tripura 79.88 3.65 92.87 217.40 26 Uttaranchal 170.52 43.12 31.11 175.60 27 Uttar Pradesh 112.78 87.37 11.13 78.82 28 West Bengal 76.49 1.98 45.71 98.21 ALL STATES 137.64 223.66 42.01 133.37
1. National Capital Territory of Delhi 31.03 58.79 13.22 196.21
2. Pondicherry 166.67 4,262.30 195.55 383.42 Contd..

206
24. ALL INDIA TABLE 24.14(C) (Concld.,)
State Wise Per Capita Budgeted Expenditure on Selected Sectors 2006-07 (Revised Estimates)
(in Rupees.)
Sl. No State
Science, Technology &Environ-
ment
General Economic Services
Others Total
Expen-diture
(1) (2) (11) (12) (13) (14) 1 Andhra Pradesh 0.68 70.38 2,980.36 5,542.28 2 Arunachal Pradesh 97.30 848.48 7,953.38 16,656.76 3 Assam 0.78 159.85 2,910.80 5,730.10 4 Bihar 14.09 1,355.75 2,549.97 5 Chhattisgarh 3.47 13.41 2,466.37 4,468.46 6 Goa 24.03 245.97 7,449.61 16,679.74 7 Gujarat 7.58 57.77 2,994.51 5,134.94 8 Haryana 3.59 16.37 2,983.97 6,979.43 9 Himachal Pradesh 3.00 144.58 5,946.41 10,726.34
10 Jammu & Kashmir 7.55 62.63 4,784.39 9,070.04 11 Jharkhand - 34.65 1,799.34 3,776.88 12 Karnataka 7.31 75.19 3,349.45 6,179.03 13 Kerala 18.20 64.43 4,577.25 7,420.16 14 Madhya Pradesh 1.45 7.46 1,986.25 3,418.21 15 Maharashtra 2.31 30.35 3,491.67 5,965.06 16 Manipur 44.22 155.44 4,720.89 9,469.99 17 Meghalaya 1.12 179.40 3,944.28 8,471.04 18 Mizoram 17.75 286.01 9,608.14 18,966.70 19 Nagaland 52.68 296.41 5,777.44 10,891.33 20 Orissa 4.94 125.91 2,751.97 4,303.08 21 Punjab 0.40 252.81 5,349.00 8,361.02 22 Rajasthan 0.79 46.64 2,136.63 3,995.89 23 Sikkim 39.79 266.90 23,778.90 33,750.94 24 Tamilnadu 1.81 334.28 3,709.60 6,202.63 25 Tripura 2.61 40.56 4,505.86 7,636.68 26 Uttaranchal 14.32 80.77 3,702.43 6,925.03 27 Uttar Pradesh 5.30 6.51 1,792.53 3,034.52 28 West Bengal 1.11 11.73 2,643.55 4,117.32 ALL STATES 3.74 64.35 2,760.37 4,843.41
1. National Capital Territory of Delhi 4.48 24.56 2,810.84 4,877.81
2. Pondicherry 11.43 263.26 7,175.83 16,903.75 Note: Projected Population for the year 2007 is taken for Per Capita calculation. Source:State Finances A Study of Budgets of 2007-08 issued by Reserve Bank of India, Mumbai.

207
24. ALL INDIA TABLE 24.14(D)
State wise Per Capita Budgeted Expenditure on Selected Sectors 2007-08 (Budget Estimates)
( In Rupees)
Sl No State
Education, Sports, Art and Culture
Medical and
Public Health
Agriculture and Allied Activities
Rural Develop- ment
(1) (2) (3) (4) (5) (6) 1 Andhra Pradesh 978.41 252.78 243.79 305.48 2 Arunachal Pradesh 1,802.84 663.61 1,519.53 379.38 3 Assam 1,261.85 338.70 285.97 274.41 4 Bihar 575.08 106.74 68.79 204.17 5 Chhattisgarh 825.99 217.65 470.23 339.65 6 Goa 2,412.16 864.47 500.25 299.75 7 Gujarat 844.68 181.53 223.42 187.86 8 Haryana 1,204.74 201.32 315.94 168.16 9 Himachal Pradesh 2,258.57 538.50 712.77 254.97 10 Jammu & Kashmir 1,146.91 501.33 543.52 119.89 11 Jharkhand 771.22 164.91 268.30 254.96 12 Karnataka 1,207.69 249.31 648.70 198.40 13 Kerala 1,642.04 368.26 350.18 76.00 14 Madhya Pradesh 595.51 144.06 255.21 293.77 15 Maharashtra 1,140.54 217.62 282.95 338.28 16 Manipur 1,576.65 324.66 596.28 275.47 17 Meghalaya 2,005.85 460.08 1,219.41 650.12 18 Mizoram 3,016.91 878.76 1,461.75 511.86 19 Nagaland 1,615.34 483.42 879.92 432.38 20 Orissa 763.33 176.94 246.36 260.32 21 Punjab 1,093.25 283.28 327.00 140.07 22 Rajasthan 812.40 191.78 136.67 181.28 23 Sikkim 4,037.39 1,124.70 2,162.27 667.01 24 Tamilnadu 1,246.84 272.31 302.54 96.29 25 Tripura 1,680.72 358.95 649.30 264.97 26 Uttaranchal 1,740.88 357.80 710.51 393.61 27 Uttar Pradesh 641.34 155.66 137.34 159.43 28 West Bengal 785.85 191.34 110.39 204.36
ALL STATES 923.87 211.62 254.52 219.13
1. National Capital Territory of Delhi 1,327.35 721.30 31.60 47.63
2. Pondicherry 1,934.97 1,495.93 720.10 156.15 Contd…

208
24. ALL INDIA
TABLE 24.14(D) (Contd.,) State wise Per Capita Budgeted Expenditure on Selected Sectors
2007-08 (Budget Estimates) (in Rupees)
Sl. No State
Irrigation and
Flood control
Energy Industry
and Minerals
Transport &
Communi-cations
(1) (2) (7) (8) (9) (10) 1 Andhra Pradesh 673.63 313.34 68.59 169.82 2 Arunachal Pradesh 682.14 1,035.81 116.86 874.79 3 Assam 119.22 11.36 55.90 173.69 4 Bihar 61.83 77.87 14.42 60.08 5 Chhattisgarh 43.90 91.92 65.03 146.62 6 Goa 207.71 3,208.02 259.84 644.99 7 Gujarat 83.52 400.78 79.59 256.94 8 Haryana 336.63 956.47 32.65 467.77 9 Himachal Pradesh 199.15 293.92 61.32 727.49 10 Jammu & Kashmir 213.99 1,824.66 114.04 32.84 11 Jharkhand 50.32 229.66 61.32 115.84 12 Karnataka 45.87 378.45 109.11 252.67 13 Kerala 92.89 17.72 57.41 226.49 14 Madhya Pradesh 44.35 107.49 30.82 70.41 15 Maharashtra 159.46 217.45 56.36 64.84 16 Manipur 214.30 858.08 165.27 359.31 17 Meghalaya 75.06 843.87 252.73 314.15 18 Mizoram 68.04 1,454.74 302.47 712.06 19 Nagaland 268.91 453.85 308.11 446.06 20 Orissa 92.88 28.58 37.07 198.27 21 Punjab 250.11 750.02 48.84 183.22 22 Rajasthan 160.32 199.60 16.11 110.29 23 Sikkim 216.92 703.21 447.72 1,060.07 24 Tamilnadu 83.74 174.11 65.50 133.42 25 Tripura 88.20 4.98 91.46 237.38 26 Uttaranchal 196.06 20.88 39.17 227.97 27 Uttar Pradesh 132.18 85.49 37.83 78.44 28 West Bengal 70.99 4.32 34.18 100.76
ALL STATES 153.28 213.29 50.91 140.61
1. National Capital Territory of Delhi 30.68 4.28 18.27 266.97
2. Pondicherry 172.09 4,262.46 228.57 250.66 Contd..

209
24. ALL INDIA TABLE 24.14(D) (Concld.,)
State Wise Per Capita Budgeted Expenditure on Selected Sectors 2007-08 (Budget Estimates) (in Rs.)
Sl. No State
Science, Technology &Environ-
ment
General Economic Services
Others Total
Expen-diture
(1) (2) (11) (12) (13) (14) 1 Andhra Pradesh 1.06 90.90 3,577.28 6,675.09 2 Arunachal Pradesh 85.81 4,998.66 5,941.82 18,101.25 3 Assam 1.62 134.00 2,809.86 5,466.56 4 Bihar - 13.61 1,376.09 2,558.69 5 Chhattisgarh 3.30 13.80 2,795.28 5,013.37 6 Goa 23.81 218.42 12,600.63 21,240.04 7 Gujarat 5.54 62.17 3,203.82 5,529.85 8 Haryana 3.45 50.51 3,199.83 6,937.47 9 Himachal Pradesh 2.77 143.65 6,263.44 11,456.56 10 Jammu & Kashmir 8.60 109.73 4,814.94 9,430.45 11 Jharkhand - 33.84 2,065.04 4,015.42 12 Karnataka 6.31 151.01 3,552.74 6,800.25 13 Kerala 19.05 66.86 4,981.13 7,898.02 14 Madhya Pradesh 3.98 7.91 2,227.42 3,780.95 15 Maharashtra 2.36 30.49 3,767.96 6,278.31 16 Manipur 46.70 894.75 4,663.79 9,975.25 17 Meghalaya 1.11 410.36 4,566.05 10,798.77 18 Mizoram 25.67 569.07 9,282.27 18,283.61 19 Nagaland 35.70 344.40 6,037.08 11,305.16 20 Orissa 8.64 112.53 2,720.53 4,645.43 21 Punjab 7.16 393.15 5,725.67 9,201.77 22 Rajasthan 0.86 256.82 2,332.30 4,398.41 23 Sikkim 59.39 613.54 29,178.85 40,271.07 24 Tamilnadu 2.43 319.75 4,054.93 6,751.83 25 Tripura 6.53 50.87 5,227.04 8,660.41 26 Uttaranchal 13.02 100.54 4,687.20 8,487.62 27 Uttar Pradesh 6.58 7.72 2,125.40 3,567.41 28 West Bengal 2.46 12.60 2,830.70 4,347.96
ALL STATES 4.46 91.87 3,026.54 5,290.09
1. National Capital Territory of Delhi 12.08 35.94 3,382.19 5,878.29
2. Pondicherry 10.30 405.90 8,218.85 17,855.98 Note: Projected Population for the year 2008 is taken for Per Capita calculation. Source State Finances A Study of Budgets of 2007-08 issued by Reserve Bank of India, Mumbai.

210
24. ALL INDIA
TABLE 24.15 Factories Registered under Section 2m (i) and 2m (ii)
State wise, 2004-05
Sl.No State No.of
Factories No.of
Employees Fixed Capital (Rs in Lakhs)
(1) (2) (3) (4) (5)
1 Andhra Pradesh 15,568 9,33,473 35,26,698
2 Assam 1,710 1,19,548 7,02,998
3 Bihar 1,674 61,775 2,96,767
4 Chattisgarh 1,343 1,06,409 12,27,351
5 Gujarat 13,603 8,08,618 87,11,140
6 Haryana 4,339 3,54,861 16,62,464
7 Himachal Pradesh 653 44,287 5,94,781
8 Jammu & Kashmir 424 31,090 78,445
9 Jharkhand 1,607 1,52,530 16,20,522
10 Karnataka 7,596 5,53,457 38,36,252
11 Kerala 5,493 3,17,834 7,39,885
12 Madhya Pradesh 3,028 2,16,563 17,46,384
13 Maharashtra 18,912 11,62,346 96,16,976
14 Orissa 1,749 1,45,747 16,04,281
15 Punjab 7,575 3,91,081 10,71,349
16 Rajasthan 5,740 2,68,437 14,76,796
17 Tamil Nadu 21,053 12,68,335 51,01,608
18 Uttaranchal 752 51,762 2,87,679
19 Uttar Pradesh 9,582 5,87,702 31,52,999
20 West Bengal 6,105 5,17,939 24,56,223
21 Other States and Union Territories 3,156 1,21,128 2,35,621
ALL INDIA 1,31,662 82,14,922 4,97,47,219
Contd…

211
24. ALL INDIA TABLE 24.15 (Concld…)
Factories Registered under Section 2m(i) and 2m(ii), State-wise-2004-05
Sl. No
State
Working Capital (Rs in Lakhs)
Invested Capital (Rs in Lakhs)
Value of outpt (Rs in
Lakhs)
Net Value added (Rs in Lakhs)
(1) (2) (6) (7) (8) (9)
1 Andhra Pradesh 9,25,898 44,52,596 1,02,36,470 15,97,419
2 Assam 2,04,272 9,07,270 22,05,002 3,72,082
3 Bihar 2,28,187 5,24,954 12,22,169 91,016
4 Chattisgarh 3,17,968 15,45,319 27,80,028 8,70,540
5 Gujarat 21,90,887 1,09,02,027 2,60,74,860 36,01,558
6 Haryana 6,37,597 23,00,061 75,71,944 11,69,560
7 Himachal Pradesh 1,81,350 7,76,131 9,17,408 2,18,516
8 Jammu & Kashmir 44,673 1,23,118 3,96,342 57,597
9 Jharkhand 7,93,368 24,13,890 37,58,194 16,77,796
10 Karnataka 8,48,190 46,84,442 1,08,84,648 20,53,182
11 Kerala 3,39,462 10,79,347 36,11,959 4,06,601
12 Madhya Pradesh 6,51,640 23,98,024 46,96,851 5,55,351
13 Maharashtra 24,21,230 1,20,38,206 3,58,87,957 51,30,921
14 Orissa 1,26,231 17,30,512 23,29,400 6,04,542
15 Punjab 6,90,148 17,61,497 53,04,591 5,80,741
16 Rajasthan 5,61,815 20,38,611 44,88,205 6,58,264
17 Tamil Nadu 13,60,073 64,61,681 1,59,50,703 21,56,743
18 Uttaranchal 1,18,035 4,05,714 10,07,348 1,94,801
19 Uttar Pradesh 12,04,511 43,57,510 1,09,13,874 14,29,776
20 West Bengal 6,51,443 31,07,666 72,42,287 10,54,892
21 Other States and Union Territories
2,91,035 5,26,656 17,51,199 2,43,083
ALL INDIA 1,47,88,013 6,45,35,232 15,92,31,439 2,47,24,981 Source: Results of Annual Survey of Industries, 2003-04 released by Central Statistical Orgnisation, Govt.of India, New Delhi.

212
24. ALL INDIA
TABLE 24.16 Medical Facilities - Number of Beds in Government Hospitals
Sl. No State
Total Number of
Government Hospitals
Number of Beds
Reference Period
(1) (2) (3) (4) (6)
1. Andhra Pradesh 521 35,021 01.01.2006
2. Arunachal Pradesh 45 2,166 01-09-2004
3. Assam * 100 3,000 01-09-2004
4. Bihar * 101 3,030 01-09-2004
5. Chattisgarh 138 5,565 01.01.2004
6. Goa 20 2,639 01.01.2005
7. Gujarat 503 35,056 01.01.2004
8. Haryana 133 7,118 01.01.2005
9. Himachal Pradesh 141 7,786 01.01.2005
10. Jammu Division 36 1,700 01.01.2000
Kasmir Division 40 1,595 01.01.2004
11. Jharkhand 47 1,410 01-09-2004
12. Karnataka 723 41,304 01-09-2005
13. Kerala 189 25,839 01.01.2006
14. Madhya Pradesh 324 17,702 01.04.2001
15. Maharashtra 1,170 76,447 01-09-2004
16. Manipur 28 670 01-09-2006
17. Meghalaya 30 2,157 01-09-2004
18. Mizoram 20 1,169 01.01.2005
19. Nagaland 48 2,060 01.01.2005
20. Orissa 406 13,146 01.01.2006
Contd…

213
24. ALL INDIA
TABLE 24.16 (Concld…) Medical Facilities - Number of Beds in Government Hospitals
Sl. No State
Total Number of Government
Hospitals.
Numbeof Beds
Reference Period
(1) (2) (3) (4) (6)
21. Punjab 160 8,973 01.01.2004
22. Rajasthan 510 32,080 01.01.2005
23. Sikkim 7 730 01.01.2006
24. Tamilnadu 424 43,567 01.01.2006
25. Tripura 26 2,231 01.01.2005
26. Uttar Pradesh * 294 8,820 01.09.2004
27. Uttaranchal 36 1,080 01-09-2004
28. West Bengal 642 58,516 01.01.2005
Union Territories
1. Nicobar Islands 8 897 01.01.2005
2. Chandigarh 7 2,200 01.01.2004
3. Dadra & Nagar Haveli 2 105 01.01.2005
4. Daman & Diu 4 192 01.01.2004
5. Delhi 105 20,368 01.01.2004
6. Lakshadweep 5 160 01.01.2005
7. Pondicherry 15 3,173 01.01.2005
ALL INDIA 7,008 4,69,672 * : Figure show only CHCs as per Rural Health Bulletin March, 2005 and relates
01.09.2004. Note: Figures of number of beds (all types) relate to Allopathic establishments –
Hospitals, dispensaries, CHCs, PHCs and Sub Centresm Sanatorium and TB Clinics and other health establishments.
Source: Director of Health Services of States/Union Territories.

214
24. ALL INDIA
TABLE 24.17 Percentage of Population Below Poverty line
1999-00 2004-05 Sl. No
States/Union Territories Rural Urban Total Rural Urban Total
(1) (2) (3) (4) (5) (6) (7) (8)
1. Andhra Pradesh 11.05 26.63 15.77 11.2 28.0 15.8
2. Arunachal Pradesh
40.04 7.47 33.47 22.3 3.3 17.6
3. Assam 40.04 7.47 36.09 22.3 3.3 19.7
4. Bihar 44.30 32.91 42.60 42.1 34.6 41.4
5. Jarkhand - - - 46.3 20.2 40.3
6. Goa 1.35 7.52 4.40 5.4 21.3 13.8
7. Gujarat 13.17 15.59 14.07 19.1 13.0 16.8
8. Haryana 8.27 9.99 8.74 13.6 15.1 14.0
9. Himachal Pradesh
7.94 4.63 7.63 10.7 3.4 10.0
10. Jammu & Kashmir
3.97 1.98 3.48 4.6 7.9 5.4
11. Karnataka 17.38 25.25 20.04 20.8 32.6 25.0
12. Kerala 9.38 20.27 12.72 13.2 20.2 15.0
13. Madhya Pradesh
37.06 38.44 37.43 26.9 42.1 38.3
14. Maharashtra 23.72 26.81 25.02 29.6 32.2 30.7
15. Manipur 40.04 7.47 28.54 22.3 3.3 17.3
16. Meghalaya 40.04 7.47 33.87 22.3 3.3 18.5
17. Mizoram 40.04 7.47 19.47 22.3 3.3 12.6
Contd…

215
24. ALL INDIA
TABLE 24.17 (Concld…) Percentage of Population Below Poverty line
1999-00 2004-05 Sl.
No States/Union Territories Rural Urban Total Rural Urban Total
(1) (2) (3) (4) (5) (6) (7) (8)
18. Nagaland 40.04 7.47 32.67 22.3 3.3 19.0
19. Orissa 48.01 42.83 47.15 46.8 44.3 46.4
20. Punjab 6.35 5.75 6.16 9.1 7.1 8.1
21. Rajasthan 13.74 19.85 15.28 18.7 32.9 22.1
22. Sikkim 40.04 7.47 36.55 22.3 3.3 20.1
23. Tamil Nadu 20.55 22.11 21.12 22.8 22.2 22.5
24. Tripura 40.04 7.47 34.44 22.3 3.3 18.9
25. Uttar Pradesh 31.22 30.89 31.15 33.4 30.6 32.8
26. West Bengal 31.85 14.86 27.02 28.6 14.8 24.7
27. Andaman & Nicobar Island
20.55 22.11 20.99 22.9 22.2 22.6
28. Chandigarh 5.75 5.75 5.75 7.1 7.1 7.1
29 Chattisgarh - - - 40.8 41.2 40.9
30. Dadra & Nagar Haveli
17.57 13.52 17.14 39.8 19.1 33.2
31. Delhi 0.40 9.42 8.23 6.9 15.2 14.7
32. Lakshadweep 9.38 20.27 15.60 13.3 20.2 16.0
33. Pondicherry 20.55 22.11 21.67 22.9 22.2 22.4 34 Damand & Diu - - - 5.4 21.2 10.5 35 Uttar Khand - - - 40.8 36.5 39.6 All India 27.09 23.62 26.10 28.3 25.7 27.5
Note : Poverty line of Himachal Pradesh and expenditure of J&K are used to estimate Poverty Ratio of J&K. Source: Tenth Five Year Plan 2002-2007, Vol III, Issued by Planning Commission, New Delhi.

216
24. ALL INDIA TABLE 24.18(A)
State wise Railway Route Kms per lakh of Population and Route Kms per 1000 Sq.Kms as on 31-3-2006
Sl.No State
Area in Sq. Kms. ( Census
2001)
Route in K.Ms
Route Kms
Per lakh popula-
tion
Route Kms per
1000 sq. Kms
(1) (2) (3) (4) (5) (6)
1. Andhra Pradesh 2,75,045 5,185.10 6.42 18.85
2. Arunachal Pradesh 83,743 1.26 0.11 0.02
3. Assam 78,438 2,284.28 7.97 29.12
4. Bihar 94,163 3,330.41 3.67 35.37
5. Chhattisgarh 1,35,191 1,186.10 5.25 8.77
6. Goa 3,702 69.00 4.62 18.64
7. Gujarat 1,96,024 5,282.87 9.61 26.95
8. Haryana 44,212 1,595.00 6.84 36.08
9. Himachal Pradesh 55,673 285.01 4.42 5.12
10. Jammu & Kashmir 2,22,236 137.77 1.26 0.62
11. Jharkhand 79,714 1,954.83 6.67 24.52
12. Karnataka 1,91,791 3,002.28 5.34 15.65
13. Kerala 38,863 1,050.20 3.16 27.02
14. Madhya Pradesh 3,08,245 4,903.16 7.39 15.91
15. Maharashtra 3,07,713 5,527.98 5.27 17.96
16. Manipur 22,327 1.35 0.06 0.06
17. Meghalaya 22,429 0.00 0.00 0.00
18. Mizoram 21,081 1.50 0.16 0.07
19. Nagaland 16,579 12.85 0.61 0.78
20. Orissa 1,55,707 2,281.47 5.87 14.65
Contd…

217
24. ALL INDIA TABLE 24.18(A) (Concld.,)
State-wise Railway Route Kms per lakh of Population and Route Kms per 1000 Sq.Kms as on 31-3-2006
Sl. No State
Area in Sq. Kms. ( Census
2001)
Route in K.Ms
Route Kms
Per lakh popula-
tion
Route Kms per
1000 sq. Kms
(1) (2) (3) (4) (5) (6)
21. Punjab 50,362 2,133.41 8.19 42.36
22. Rajasthan 3,42,239 5,837.99 9.37 17.06
23. Sikkim 7,096 0.00 0.00 0.00
24. Tamilnadu 1,30,058 4,170.86 6.40 32.07
25. Tripura 10,486 64.42 1.89 6.14
26. Uttaranchal 53,483 344.92 3.74 6.45
27. Uttar Pradesh 2,40,928 8,546.36 4.66 35.47
28. West Bengal 88,752 3,910.73 4.59 44.06
Union Territories
1. Andamam & Nicobar Islands 8,249 0.00 0.00 0.00
2. Chandigarh 114 15.70 1.42 137.72
3. Dadra & Nagar Haveli 491 0.00 0.00 0.00
4. Daman & Diu 112 0.00 0.00 0.00
5. Delhi 1,483 204.22 1.27 137.71
6. Lakshadweep 32 0.00 0.00 0.00
7. Pondicherry 479 11.10 1.01 23.17
All India 32,87,240 63,332.13 5.69 19.26
Note : Projected population particulars are adopted for the year 2006 Source: Ministry of Railways, Govt. of India, New Delhi.

218
24. ALL INDIA TABLE 24.18(B)
State wise Railway Route Kms per lakh of Population and Route Kms per 1000 Sq.Kms as on 31-3-2007
Sl. No State
Area in Sq. Kms. ( Census
2001)
Route in K.Ms
Route Kms
Per lakh popula-
tion
Route Kms per
1000 sq. Kms
(1) (2) (3) (4) (5) (6)
1. Andhra Pradesh 2,75,045 5,171.60 6.34 18.80
2. Arunachal Pradesh 83,743 1.26 0.11 0.02
3. Assam 78,438 2,283.71 7.86 29.11
4. Bihar 94,163 3,410.99 3.70 36.22
5. Chhattisgarh 1,35,191 1,185.47 5.17 8.77
6. Goa 3,702 69.00 4.48 18.64
7. Gujarat 1,96,024 5,308.58 9.51 27.08
8. Haryana 44,212 1,540.38 6.49 34.84
9. Himachal Pradesh 55,673 285.01 4.37 5.12
10. Jammu & Kashmir 2,22,236 137.77 1.24 0.62
11. Jharkhand 79,714 1,941.33 6.53 24.35
12. Karnataka 1,91,791 3,005.83 5.28 15.67
13. Kerala 38,863 1,050.20 3.13 27.02
14. Madhya Pradesh 3,08,245 4,883.90 7.23 15.84
15. Maharashtra 3,07,713 5,519.28 5.19 17.94
16. Manipur 22,327 1.35 0.06 0.06
17. Meghalaya 22,429 0.00 0.00 0.00
18. Mizoram 21,081 1.50 0.16 0.07
19. Nagaland 16,579 12.85 0.60 0.78
20. Orissa 1,55,707 2,246.92 5.72 14.43
Contd…

219
24. ALL INDIA TABLE 24.18(B) (Concld.,)
State-wise Railway Route Kms per lakh of Population and Route Kms per 1000 Sq.Kms as on 31-3-2007
Sl. No State
Area in Sq. Kms. ( Census
2001)
Route in K.Ms
Route Kms
Per lakh popula-
tion
Route Kms per
1000 sq. Kms
(1) (2) (3) (4) (5) (6)
21. Punjab 50,362 2,133.41 8.08 42.36
22. Rajasthan 3,42,239 5,911.09 9.32 17.27
23. Sikkim 7,096 0.00 0.00 0.00
24. Tamilnadu 1,30,058 4,121.09 6.28 31.69
25. Tripura 10,486 64.42 1.87 6.14
26. Uttaranchal 53,483 344.91 3.68 6.45
27. Uttar Pradesh 2,40,928 8,574.83 4.59 35.59
28. West Bengal 88,752 3,910.73 4.54 44.06
Union Territories
1. Andamam & Nicobar Islands 8,249 0.00 0.00 0.00
2. Chandigarh 114 15.70 1.35 137.72
3. Dadra & Nagar Haveli 491 0.00 0.00 0.00
4. Daman & Diu 112 0.00 0.00 0.00
5. Delhi 1,483 182.48 1.11 123.05
6. Lakshadweep 32 0.00 0.00 0.00
7. Pondicherry 479 11.10 0.97 23.17
All India 32,87,240 63,326.69 5.61 19.26
Note : Projected population particulars are adopted for the year 2007 Source: Ministry of Railways, Govt. of India, New Delhi.

220
24. ALL INDIA TABLE 24.19
Number of Offices, Deposits, Credits and Credit Deposit Ratio of All Scheduled Commercial Banks – State wise, September, 2007
Sl. No
States
Offices
Deposits (Rs in
Crores)
Credits (Rs in
Crores)
Credit Deposit
Ratio (%) (1) (2) (3) (4) (5) (6) 1 Andhra Pradesh 5,715 1,53,552 1,36,771 89.07 2 Arunachal Pradesh 72 2,072 615 29.68 3 Assam 1,282 27,328 11,979 43.83 4 Bihar 3,634 59,723 18,061 30.24 5 Chhattisgarh 1,093 26,120 12,592 48.21 6 Goa 369 18,930 4,754 25.11 7 Gujarat. 3,926 1,33,938 80,786 60.32 8 Haryana. 1,882 64,677 35,596 55.04 9 Himachal Pradesh. 869 17,432 6,960 39.93 10 Jammu & Kashmir. 889 22,615 11,415 50.48 11 Jharkhand 1,559 38,685 12,979 33.55 12 Karnataka 5,246 1,86,142 1,41,728 76.14 13 Kerala 3,739 1,00,013 63,697 63.69 14 Madhya Pradesh 3,592 71,253 41,825 58.70 15 Maharashtra 6,797 7,31,830 6,69,861 91.53 16 Manipur 76 1,285 803 62.49 17 Meghalaya 189 4,183 1,332 31.84 18 Mizoram 84 1,228 718 58.47 19 Nagaland 78 2,164 754 34.84 20 Orissa 2,413 45,641 26,605 58.29 21 Punjab 2,941 90,352 56,650 62.70 22 Rajasthan 3,595 64,381 52,350 81.31 23 Sikkim 63 1620 864 53.33 24 Tamilnadu 5,205 1,76,986 1,94,302 109.78 25 Tripura 188 4,219 1,483 35.15 26 Uttar Pradesh 8,,695 1,91,440 82,910 43.31 27 Uttarannchal 938 32,410 8,857 27.33 28 West Bengal 4,722 1,66,767 98,998 59.36 29 Union Territories 2,266 4,16,839 2,,64,663 63.49 All India 72,117 28,53,825 20,40,907 71.51
Source: Quarterly Handout September 2007, released by R.B.I Mumbai.

221
24. ALL INDIA
TABLE 24.20(A) State wise and Category wise Number of Employment
Exchanges, Registrations and Placements - 2005
Registrations ('000) Placements ('000) Sl. No
State/Union Territories
Employ- ment
Exchan-ges /
UEIGB/$SC ST OBC SC ST OBC
(1) (2) (3) (4) (5) (6) (7) (8) (9)
1 Andhra Pradesh 31 70.5 13.0 110.6 0.2 @ 0.2
2 Arunachal Pradesh 10 @ 2.3 0.1 @ @ @
3 Assam 52 18.5 22.7 30.0 0.3 @ @
4 Bihar 37 11.3 3.4 31.4 @ @ @
5 Chhastisgarh 18 19.7 31.1 33.5 @ 0.2 0.2
6 Delhi 14 20.1 2.0 6.9 @ @ 0.2
7 Goa 1 0.4 1.1 1.1 @ @ @
8 Gujarat 42 21.7 21.2 1.1 6.0 6.7 0.7
9 Haryana 61 29.9 0.1 5.4 0.1 - @
10 Himachal Pradesh 15 25.9 5.5 10.6 0.2 0.1 0.1
11 Jammu & Kashmir 14 1.1 0.3 0.1 - - -
12 Jarkhand 33 12.5 12.2 22.2 @ @ 0.1
13 Karnataka 40 15.3 5.5 2.9 0.3 0.1 0.1
14 Kerala 86 31.4 2.7 145.9 1.2 0.1 3.2
15 Madhya Pradesh 58 59.9 46.7 78.3 0.2 0.5 0.2
16 Maharashtra 46 76.5 18.4 111.3 1.7 0.7 2.1
17 Manipur 11 0.7 18.5 @ @ @ -
18 Meghalaya 11 @ 7.2 @ @ @ @
19 Mizoram 3 - 1.3 - - - -
20 Nagaland 7 0.1 8.9 - - @ -
Contd…

222
24. ALL INDIA
TABLE 24.20(A) (Contd.,) State wise and Category wise Number of Employment
Exchanges, Registrations and Placements - 2005
Registrations ('000) Placements ('000) Sl. No
State/Union Territories
Employ-ment Exchan-ges / UEIGB/$ SC ST OBC SC ST OBC
(1) (2) (3) (4) (5) (6) (7) (8) (9)
21 Orissa 40 17.1 10.0 16.4 0.2 0.2 0.1
22 Punjab 46 22.7 - 1.6 0.2 - @
23 Rajasthan 42 27.6 24.0 49.1 1.1 0.7 1.5
24 Sikkim *
25 Tamilnadu 34 88.6 1.5 205.5 3.1 0.1 4.5
26 Tripura 5 3.9 5.0 2.1 0.1 @ @
27 Uttaranchal 23 18.3 2.0 7.8 0.4 @ 0.2
28 Uttar Pradesh 84 66.0 0.9 58.9 0.4 @ 0.3
29 West Bengal 75 28.8 5.7 8.8 1.2 0.3 0.4
Union
Territories
1
Andaman &
Nicobar
Islands
1 - - - - - -
2 Chandigarh 2 1.2 @ 0.3 0.1 @ @
3 Dadra and
Nagar Haveli 1 - - - - - -
4 Daman and
Diu 2 - - - - - -
6 Lakshadweep 1 - - - - - -
7 Pondicherry 1 0.6 @ 0.6 0.1 - 0.2
ALL INDIA 947 689.9 273.4 942.5 17.1 10.0 14.3 Contd.,

223
24. ALL INDIA
TABLE 24.20(A) (Contd.,) State wise and Category wise Number of Employment
Exchanges, Registrations and Placements - 2005
Live Register $ ('000) % of Placements to Registrations Sl.
No State/Union Territories
SC ST OBC SC ST OBC
(1) (2) (10) (11) (12) (13) (14) (15)
1 Andhra Pradesh 592.7 140.9 968.0 0.3 0.0 0.2
2 Arunachal Pradesh 0.9 9.7 0.3 0.0 0.0 0.0
3 Assam 113.2 203.9 257.4 1.6 0.0 0.0
4 Bihar 188.9 17.9 440.8 0.0 0.0 0.0
5 Chhastisgarh 111.7 192.3 143.2 0.0 0.6 0.6
6 Delhi 98.2 9.8 22.0 0.0 0.0 2.9
7 Goa 2.8 2.1 9.1 0.0 0.0 0.0
8 Gujarat 169.5 113.5 9.2 27.6 31.6 63.6
9 Haryana 173.2 0.5 24.8 0.3 0.0 0.0
10 Himachal Pradesh 186.5 27.9 48.1 0.8 1.8 0.9
11 Jammu & Kashmir 6.2 2.2 1.3 0.0 0.0 0.0
12 Jarkhand 143.7 207.4 289.0 0.0 0.0 0.5
13 Karnataka 236.4 50.9 43.7 2.0 1.8 3.4
14 Kerala 528.9 30.4 1,684.4 3.8 3.7 2.2
15 Madhya Pradesh 326.4 305.3 296.0 0.3 1.1 0.3
16 Maharashtra 686.4 168.8 797.5 2.2 3.8 1.9
17 Manipur 7.3 153.0 0.4 0.0 0.0 0.0
18 Meghalaya 0.1 30.1 0.2 0.0 0.0 0.0
19 Mizoram - 40.1 - 0.0 0.0 0.0
20 Nagaland 0.3 42.7 - 0.0 0.0 0.0
Contd…

224
24. ALL INDIA
TABLE 24.20(A) (Concld.,) State wise and Category wise Number of Employment
Exchanges, Registrations and Placements - 2005
Live Register $ ('000) % of Placements to Registrations Sl.
No State/Union Territories
SC ST OBC SC ST OBC
(1) (2) (10) (11) (12) (13) (14) (15)
21 Orissa 166.3 111.7 75.0 1.2 2.0 0.6
22 Punjab 143.9 - 6.3 0.9 0.0 0.0
23 Rajasthan 141.8 96.6 180.1 4.0 2.9 3.1
24 Sikkim *
25 Tamilnadu 955.3 13.0 2,010.7 3.5 6.7 2.2
26 Tripura 66.9 70.0 13.9 2.6 0.0 0.0
27 Uttaranchal 59.1 9.8 25.2 2.2 0.0 2.6
28 Uttar Pradesh 377.6 4.6 343.7 0.6 0.0 0.5
29 West Bengal 838.8 165.3 192.7 4.2 5.3 4.5
Union Territories
1 Andaman & Nicobar Islands - 0.7 1.0 0.0 0.0 0.0
2 Chandigarh 12.9 0.1 1.2 8.3 0.0 0.0
3 Dadra and Nagar Haveli 0.2 0.9 - 0.0 0.0 0.0
4 Daman and Diu 0.2 @ - 0.0 0.0 0.0
6 Lakshadweep - 6.4 - 0.0 0.0 0.0
7 Pondicherry 16.7 0.1 25.9 16.7 0.0 0.0
ALL INDIA 6,352.8 2,228.6 7,910.6 2.5 3.7 1.5
*: No Employment Exchange is functioning in this State. @: Figures less than 50 $: At the end of the year. UEIGB : University Employment Information & Guidance Bureau. Source: Directorate General of Employment and Training, Ministry of Labour & Employment, GOI, New Delhi.

225
24. ALL INDIA
TABLE 24.20(B) State wise and Category wise Number of Employment
Exchanges, Registrations and Placements - 2006
Registrations ('000) Placements ('000)
Sl. No
State/Union Territories
Employ-ment
Exchan-ges /
UEIGB/$ Total Women Total Women
(1) (2) (3) (4) (5) (6) (7)
1 Andhra Pradesh 31 347.6 104.7 0.9 0.3
2 Arunachal Pradesh 10 7.3 2.2 @ @
3 Assam 52 147.8 41.7 1.1 0.2
4 Bihar 37 479.9 121.7 0.1 -
5 Chhastisgarh 18 167.9 48.5 2.5 0.6
6 Delhi 14 77.3 21.1 0.2 0.1
7 Goa 1 10.2 6.2 0.6 0.2
8 Gujarat 42 239.4 53.9 99.0 7.8
9 Haryana 61 161.6 30.9 3.1 0.3
10 Himachal Pradesh 15 136.5 53.9 1.8 0.4
11 Jammu & Kashmir 14 13.1 2.9 - -
12 Jarkhand 33 144.8 15.6 1.6 0.2
13 Karnataka 40 104.8 48.8 2.3 0.6
14 Kerala 86 521.2 277.8 10.0 5.3
15 Madhya Pradesh 58 370.1 91.7 1.9 0.1
16 Maharashtra 46 586.3 175.7 13.9 3.0
17 Manipur 11 43.8 16.8 0.1 0.1
18 Meghalaya 11 6.5 2.4 @ @
19 Mizoram 3 21.0 7.2 @ @
20 Nagaland 7 9.1 5.4 @ @
Contd…

226
24. ALL INDIA
TABLE 24.20(B) (Contd.,) State wise and Category wise Number of Employment
Exchanges, Registrations and Placements - 2006
Registrations ('000) Placements ('000)
Sl. No
State/Union Territories
Employ-ment
Exchan-ges /
UEIGB/$ Total Women Total Women
(1) (2) (3) (4) (5) (6) (7)
21 Orissa 40 182.6 48.6 1.0 0.2
22 Punjab 46 83.6 27.5 3.3 0.6
23 Rajasthan 42 194.9 92.4 4.1 0.5
24 Sikkim*
25 Tamilnadu 34 991.4 429.1 9.7 4.8
26 Tripura 5 34.8 21.2 0.4 0.1
27 Uttaranchal 23 141.3 69.4 3.1 0.4
28 Uttar Pradesh 84 1,535.2 539.0 1.7 0.1
29 West Bengal 75 498.8 166.8 13.1 4.6
Union Territories
1 Andaman &
Nicobar Islands 1 3.7 0.9 0.3 0.1
2 Chandigarh 2 3.4 1.4 0.3 0.1
3 Dadra and Nagar
Haveli 1 - @ - -
4 Daman and Diu 2 0.4 0.1 @ -
6 Lakshadweep 1 - 0.8 - -
7 Pondicherry 1 23.3 10.9 0.7 0.4
ALL INDIA 947 7,289.5 2,537.4 177.0 31.3
Contd…

227
24. ALL INDIA
TABLE 24.20(B) (Contd.,) State wise and Category wise Number of Employment
Exchanges, Registrations and Placements - 2006
Live Register $ ('000) % of Placements to Registrations Sl.
No State/Union Territories
Total Women Total Women
(1) (2) (8) (9) (10) (11)
1 Andhra Pradesh 2,418.6 622.4 0.3 0.3
2 Arunachal Pradesh 30.2 9.3 - -
3 Assam 1,843.2 423.1 0.7 0.5
4 Bihar 1,747.1 210.3 N -
5 Chhastisgarh 1,050.9 208.8 1.5 1.2
6 Delhi 556.9 182.9 0.3 0.5
7 Goa 101.8 33.0 5.9 3.2
8 Gujarat 801.5 174.4 41.4 14.5
9 Haryana 1,120.4 222.2 1.9 1.0
10 Himachal Pradesh 766.0 260.2 1.3 0.7
11 Jammu & Kashmir 105.6 16.5 - -
12 Jarkhand 1,254.2 131.9 1.1 1.3
13 Karnataka 1,143.5 280.1 2.2 1.2
14 Kerala 3,777.3 2,191.5 1.9 1.9
15 Madhya Pradesh 2,006.1 382.6 0.5 0.1
16 Maharashtra 3,652.2 772.1 2.4 1.7
17 Manipur 579.9 160.1 0.2 0.6
18 Meghalaya 32.1 12.9 - -
19 Mizoram 44.9 16.8 - -
20 Nagaland 42.6 11.6 - -
Contd…

228
24. ALL INDIA
TABLE 24.20(B) (Concld.,) State wise and Category wise Number of Employment
Exchanges, Registrations and Placements - 2006
Live Register $ ('000) % of Placements to Registrations Sl.
No State/Union Territories Total Women Total Women
(1) (2) (8) (9) (10) (11)
21 Orissa 891.3 212.9 0.5 0.4
22 Punjab 454.3 133.7 3.9 2.2
23 Rajasthan 779.6 106.4 2.1 0.5
24 Sikkim*
25 Tamilnadu 4,258.8 1,848.6 1.0 1.1
26 Tripura 427.2 157.1 1.1 0.5
27 Uttaranchal 464.1 89.2 2.2 0.6
28 Uttar Pradesh 3,110.6 696.6 0.1 0.0
29 West Bengal 7,702.3 2,099.4 2.6 2.8
Union Territories
1 Andaman & Nicobar Islands 40.0 13.0 8.1 11.1
2 Chandigarh 52.0 12.8 8.8 7.1
3 Dadra and Nagar Haveli 6.5 1.9 - -
4 Daman and Diu 10.9 2.9 - -
5 Lakshadweep 11.2 3.5 - -
6 Pondicherry 182.2 80.4 3.0 3.7
ALL INDIA 41,466.0 11,781.0 2.4 1.2
N : Negligeble *: No Employment Exchage is functioning in this state. @: Figures less than 50 $: At the end of the year. UEIGB : University Employment Information & Guidance Bureau. Source: Directorate General of Employment and Training, Ministry of Labour & Employment, GOI, New Delhi.

229
24. ALL INDIA
TABLE 24.21 (A) Per Thousand Distribution of Persons by Usual Activity Status
by States -2004-05
(Rural)
Working (Principal Status) Sl. No States Self
Employed
Regular Wages/ Salaried
Casual Labour All
(1) (2) (3) (4) (5) (6)
1 Andhra Pradesh 469 73 457 1,000
2 Assam 674 105 221 1,000
3 Bihar 601 29 370 1,000
4 Gujarat 501 81 418 1,000
5 Haryana 614 178 208 1,000
6 Himachal Pradesh 732 138 129 1,000
7 Jammu & Kashmir 701 166 133 1,000
8 Karnataka 474 51 475 1,000
9 Kerala 408 181 411 1,000
10 Madhya Pradesh 603 53 344 1,000
11 Maharashtra 498 84 418 1,000
12 Orissa 549 64 387 1,000
13 Punjab 478 185 336 1,000
14 Rajasthan 758 64 178 1,000
15 Tamilnadu 421 105 474 1,000
16 Uttar Pradesh 728 65 207 1,000
17 West Bengal 522 83 395 1,000
ALL INDIA 573 78 350 1,000
Source: NSSO Report No. 515 (61/10/1) of 61st Round (page No.130) Contd…

230
24. ALL INDIA TABLE 24.21(A) (Concld…)
Per Thousand Distribution of Persons by Usual Activity Status by States-2004-05
(Rural)
Working (Principal Status+Subsidiary Status) Sl. No States Self
Employed
Regular Wages/ Salaried
Casual Labour All
(1) (2) (7) (8) (9) (10)
1 Andhra Pradesh 479 72 450 1,000
2 Assam 710 91 199 1,000
3 Bihar 602 27 371 1,000
4 Gujarat 536 71 393 1,000
5 Haryana 676 137 187 1,000
6 Himachal Pradesh 767 119 115 1,000
7 Jammu & Kashmir 774 125 101 1,000
8 Karnataka 493 50 457 1,000
9 Kerala 454 164 381 1,000
10 Madhya Pradesh 605 52 343 1,000
11 Maharashtra 511 79 409 1,000
12 Orissa 584 56 360 1,000
13 Punjab 631 129 240 1,000
14 Rajasthan 774 54 172 1,000
15 Tamilnadu 427 104 470 1,000
16 Uttar Pradesh 764 54 182 1,000
17 West Bengal 552 75 373 1,000
ALL INDIA 602 71 328 1,000
Source: NSSO Report No. 515 (61/10/1) of 61st Round (page No.130)

231
24. ALL INDIA
TABLE 24.21(B) Per Thousand Distribution of Persons by Usual Activity Status
by States-2004-05
(Urban)
Working (Principal Status) Sl. No States Self
Employed
Regular Wages/ Salaried
Casual Labour All
(1) (2) (3) (4) (5) (6)
1 Andhra Pradesh 441 365 194 1,000
2 Assam 406 474 120 1,000
3 Bihar 594 230 176 1,000
4 Gujarat 407 464 129 1,000
5 Haryana 464 460 76 1,000
6 Himachal Pradesh 315 388 297 1,000
7 Jammu & Kashmir 558 335 107 1,000
8 Karnataka 414 391 195 1,000
9 Kerala 374 311 316 1,000
10 Madhya Pradesh 491 360 149 1,000
11 Maharashtra 369 476 155 1,000
12 Orissa 438 370 192 1,000
13 Punjab 451 468 82 1,000
14 Rajasthan 528 357 114 1,000
15 Tamilnadu 391 446 162 1,000
16 Uttar Pradesh 576 312 112 1,000
17 West Bengal 438 393 168 1,000
ALL INDIA 438 411 151 1,000
Contd…

232
24. ALL INDIA
TABLE 24.21(B) (Concld…) Per Thousand Distribution of Persons by Usual Activity Status
by States-2004-05 (Urban)
Working (Principal Status+Subsidiary Status) Sl. No States Self
Employed
Regular Wages/ Salaried
Casual Labour All
(1) (2) (7) (8) (9) (10)
1 Andhra Pradesh 445 361 194 1,000
2 Assam 423 451 126 1,000
3 Bihar 598 223 179 1,000
4 Gujarat 417 449 135 1,000
5 Haryana 497 425 78 1,000
6 Himachal Pradesh 341 375 283 1,000
7 Jammu & Kashmir 586 314 100 1,000
8 Karnataka 421 386 193 1,000
9 Kerala 411 287 301 1,000
10 Madhya Pradesh 498 348 154 1,000
11 Maharashtra 381 465 155 1,000
12 Orissa 444 356 200 1,000
13 Punjab 478 443 79 1,000
14 Rajasthan 560 326 114 1,000
15 Tamilnadu 398 441 161 1,000
16 Uttar Pradesh 599 290 111 1,000
17 West Bengal 462 372 166 1,000
ALL INDIA 454 395 150 1,000
Source: NSSO Report No. 515 (61/10/1) of 61st Round (page No.133)

233
24. ALL INDIA
TABLE 24.22 (A) Per 1000 Distribution of Person-Days of usually Employed
( Principal and Subsidiary Status taken together) by their broad current weekly Status for each State-2004-05
(Rural)
Male Sl. No States
Employed Un- employed
Not in Labour Force
All
(1) (2) (3) (4) (5) (6)
1 Andhra Pradesh 960 22 17 1,000
2 Assam 970 12 18 1,000
3 Bihar 978 15 7 1,000
4 Gujarat 978 10 12 1,000
5 Haryana 964 27 9 1,000
6 Himachal Pradesh 927 27 46 1,000
7 Jammu & Kashmir 943 29 27 1,000
8 Karnataka 974 10 16 1,000
9 Kerala 914 47 38 1,000
10 Madhya Pradesh 953 23 24 1,000
11 Maharashtra 950 28 22 1,000
12 Orissa 927 29 44 1,000
13 Punjab 979 14 8 1,000
14 Rajasthan 961 24 15 1,000
15 Tamilnadu 975 16 9 1,000
16 Uttar Pradesh 957 14 30 1,000
17 West Bengal 954 30 16 1,000
ALL INDIA 958 22 21 1,000
Contd…

234
24. ALL INDIA
TABLE 24.22 (A) (Concld…) Per 1000 Distribution of Person-Days of usually Employed
( Principal and Subsidiary Status taken together) by their broad current weekly Status for each State-2004-05
(Rural)
Female Sl. No States
Employed Un-employed
Not in Labour Force
All
(1) (2) (7) (8) (9) (10)
1 Andhra Pradesh 864 36 100 1,000
2 Assam 710 12 278 1,000
3 Bihar 830 19 152 1,000
4 Gujarat 913 8 79 1,000
5 Haryana 864 6 130 1,000
6 Himachal Pradesh 850 13 137 1,000
7 Jammu & Kashmir 735 8 257 1,000
8 Karnataka 884 12 104 1,000
9 Kerala 814 61 125 1,000
10 Madhya Pradesh 768 15 216 1,000
11 Maharashtra 852 36 112 1,000
12 Orissa 696 24 280 1,000
13 Punjab 967 5 28 1,000
14 Rajasthan 824 18 158 1,000
15 Tamilnadu 938 18 45 1,000
16 Uttar Pradesh 801 4 195 1,000
17 West Bengal 821 23 156 1,000
ALL INDIA 833 20 147 1,000
Source : NSSO Report No. 515(61/10/1) of 61 st Round ( Page No. 187)

235
24. ALL INDIA
TABLE 24.22 (B) Per 1000 Distribution of Person-Days of usually Employed
( Principal and Subsidiary Status taken together) by their broad current weekly status for each State -2004-05
(Urban) Male
Sl. No States
Employed Un- employed
Not in Labour Force
All
(1) (2) (3) (4) (5) (6)
1 Andhra Pradesh 976 14 10 1,000
2 Assam 984 6 10 1,000
3 Bihar 976 19 4 1,000
4 Gujarat 983 11 6 1,000
5 Haryana 986 11 3 1,000
6 Himachal Pradesh 985 2 13 1,000
7 Jammu & Kashmir 989 4 8 1,000
8 Karnataka 991 6 3 1,000
9 Kerala 929 32 38 1,000
10 Madhya Pradesh 972 15 13 1,000
11 Maharashtra 968 24 7 1,000
12 Orissa 951 16 33 1,000
13 Punjab 986 13 1 1,000
14 Rajasthan 976 14 11 1,000
15 Tamilnadu 980 11 9 1,000
16 Uttar Pradesh 976 15 8 1,000
17 West Bengal 982 12 6 1,000
ALL INDIA 977 14 9 1,000
Contd…

236
24. ALL INDIA
TABLE 24.22 (B) (Concld…) Per 1000 Distribution of Person-Days of usually Employed
( Principal and Subsidiary Status taken together) by their broad current weekly status for each State-2004-05
(Urban) Female
Sl. No States
Employed Un-employed
Not in Labour Force
All
(1) (2) (7) (8) (9) (10)
1 Andhra Pradesh 938 12 51 1,000
2 Assam 893 14 93 1,000
3 Bihar 920 13 67 1,000
4 Gujarat 936 14 50 1,000
5 Haryana 926 12 62 1,000
6 Himachal Pradesh 920 - 80 1,000
7 Jammu & Kashmir 877 7 116 1,000
8 Karnataka 939 11 50 1,000
9 Kerala 822 34 145 1,000
10 Madhya Pradesh 841 9 150 1,000
11 Maharashtra 904 29 67 1,000
12 Orissa 813 31 156 1,000
13 Punjab 970 7 23 1,000
14 Rajasthan 871 8 121 1,000
15 Tamilnadu 965 14 21 1,000
16 Uttar Pradesh 877 10 112 1,000
17 West Bengal 942 7 51 1,000
ALL INDIA 914 15 71 1,000
Source : NSSO Report No. 515(61/10/1) of 61 st Round ( Page No. 188)

237
24. ALL INDIA TABLE 24.23 (A)
Number of Households reporting Cash Loans outstanding Per thousand Households ( P ) and average amount of Cash Loans outstanding Per Households ( A ) as on 30.06.2002 by type of
loan for Each Major Household Type Major Household Type : Cultivator.
(Rural) Type of loan
Sl.No
State Type of estimate
Short term
pledged
Short term Non-
pledged
Short term (col. ( 3) &
(4) Combined)
(1) (2) (3) (4) (5) (6) 1 Andhra Pradesh P 62 127 184 A 1,159 2,465 3,624 2 Assam P 6 18 25 A 21 99 119 3 Bihar P 25 39 64 A 243 351 594 4 Gujarat P 42 71 110 A 1,438 1,964 3,403 5 Haryana P 16 124 137 A 726 5,014 5,739 6 Himachal Pradesh P 9 27 36 A 166 388 554 7 Jammu &Kashmir P 2 2 4 A 26 20 46 8 Karnataka P 39 72 110 A 1,397 1,472 2,869 9 Kerala P 107 81 173 A 3,806 2,388 6,193
10 Madhya Pradesh P 42 72 109 A 864 1,271 2,135
11 Maharashtra P 108 75 175 A 3,063 1,181 4,244
12 Orissa P 44 113 156 A 476 1,041 1,517
13 Punjab P 33 48 81 A 3,230 1,905 5,135
14 Rajasthan P 30 78 106 A 1,214 1,884 3,098
15 Tamilnadu P 63 116 165 A 931 2,078 3,008
16 Uttar Pradesh P 30 44 71 A 515 555 1,070
17 West Bengal P 18 34 51 A 126 268 394 ALL INDIA P 40 65 101 A 943 1,139 2,082
Contd..

238
24. ALL INDIA TABLE 24.23 (A) (Concld…)
Number of Households reporting Cash Loans outstanding Per thousand Households ( P ) and average amount of Cash Loans outstanding Per Households ( A ) as on 30.06.2002 by type of
loan for Each Major Household Type Major Household Type : Cultivator.
(Rural) Type of loan
Sl. No
State Type
of Esti-mate
Medium term
Long term All
Estd. Hhs(00)/
Amount of Cash Loan ( Rs.00000)
(1) (2) (3) (7) (8) (9) (10) 1 Andhra Pradesh P 218 201 540 61,186 A 6,186 6,342 16,154 9,88,376
2 Assam P 32 12 67 26,132 A 189 333 641 16,750
3 Bihar P 91 76 225 70,639 A 1,523 1,219 3,336 2,35,652
4 Gujarat P 124 130 339 35,252 A 3,514 6,042 12,958 4,56,815
5 Haryana P 93 110 317 18,532 A 4,634 6,949 17,340 3,21,346
6 Himachal Pradesh P 93 59 179 9,007 A 2,497 2,791 5,843 52,624
7 Jammu &Kashmir P 14 19 38 9,230 A 284 868 1,198 11,057
8 Karnataka P 209 100 391 40,147 A 5,803 4,750 13,422 5,38,861
9 Kerala P 149 180 429 24,771 A 7,462 13,986 27,641 6,84,690
10 Madhya Pradesh P 145 102 317 62,164 A 4,232 5,879 12,246 7,61,257
11 Maharashtra P 131 109 378 64,989 A 3,761 6,263 14,268 9,27,228
12 Orissa P 111 58 313 42,698 A 1,351 1,105 3,976 1,69,778
13 Punjab P 101 124 285 16,040 A 7,079 12,996 25,211 4,04,370
14 Rajasthan P 122 159 367 52,393 A 4,196 5,967 13,261 6,94,767
15 Tamilnadu P 164 111 403 38,381 A 5,885 5,930 14,823 5,68,914
16 Uttar Pradesh P 84 96 241 1,65,973 A 1,546 2,740 5,363 8,90,035
17 West Bengal P 80 132 247 68,836 A 800 2,624 3,820 2,62,943 ALL INDIA P 114 104 297 8,82,296 A 3,008 4,169 9,261 81,70,868
Source : NSSO Report No. 501(59/18.2/2) of 59th Round (Page No. A-481)

239
24. ALL INDIA TABLE 24.23 (B)
Number of Households reporting Cash Loans outstanding Per thousand Households ( P ) and average amount of Cash Loans outstanding Per Households ( A ) as on 30.06.2002 by type of
loan for Each Major Household Type Major Household Type : All
(Rural) Type of loan
Sl. No
State Type of estimate
Short term
pledged
Short term Non-
pledged
Short term (col. ( 3)
&(4) Combined)
(1) (2) (3) (4) (5) (6) 1 Andhra Pradesh P 34 84 115 A 572 1,425 1,997
2 Assam P 8 16 24 A 25 73 98
3 Bihar P 23 38 60 A 185 307 492
4 Gujarat P 25 46 70 A 845 1,181 2,025
5 Haryana P 12 103 112 A 512 3,619 4,131
6 Himachal Pradesh P 8 23 30 A 129 325 453
7 Jammu & Kashmir P 2 2 4 A 23 20 43
8 Karnataka P 26 57 82 A 851 957 1,808
9 Kerala P 86 80 155 A 2,438 2,052 4,490
10 Madhya Pradesh P 31 55 83 A 594 903 1,497
11 Maharashtra P 67 57 120 A 1,904 978 2,882
12 Orissa P 36 100 134 A 408 848 1,256
13 Punjab P 23 42 65 A 1,867 1,255 3,122
14 Rajasthan P 27 77 102 A 984 1,952 2,936
15 Tamilnadu P 49 84 126 A 729 1,261 1,990
16 Uttar Pradesh P 28 43 69 A 435 532 967
17 West Bengal P 13 31 44 A 83 264 347 ALL INDIA P 31 56 85 A 668 915 1,583
Contd..

240
24. ALL INDIA TABLE 24.23 (B) (Concld…)
Number of Households reporting Cash Loans outstanding Per thousand Households ( P ) and average amount of Cash Loans outstanding Per Households ( A ) as on 30.06.2002 by type of
loan for Each Major Household Type Major Household Type : All
(Rural) Type of loan
Sl. No
State Type
of Esti-mate
Medium term
Long term All
Estd. Hhs(00)/
Amount of Cash Loan (Rs.00000)
(1) (2) (3) (7) (8) (9) (10) 1 Andhra Pradesh P 182 170 423 1,42,450 A 4,087 4,505 10,590 15,08,580
2 Assam P 41 11 75 41,595 A 270 276 643 26,752
3 Bihar P 88 74 218 1,16,853 A 1,414 1,087 2,992 3,49,668
4 Gujarat P 111 118 281 62,504 A 3,140 6,628 11,794 7,37,169
5 Haryana P 91 89 273 31,472 A 3,541 4,677 12,359 3,88,950
6 Himachal Pradesh P 81 50 153 11,960 A 2,416 2,327 5,196 62,146
7 Jammu & Kashmir P 13 18 36 10,420 A 262 809 1,114 11,610
8 Karnataka P 168 81 313 69,908 A 4,194 3,191 9,193 6,42,696
9 Kerala P 141 153 394 49,945 A 5,277 9,897 19,663 9,82,080
10 Madhya Pradesh P 112 93 261 94,044 A 3,033 4,502 9,031 8,49,341
11 Maharashtra P 93 85 275 1,18,183 A 2,686 4,823 1,0391 12,28,015
12 Orissa P 88 51 264 66,199 A 1,278 1,073 3,609 2,38,919
13 Punjab P 89 118 257 29,847 A 4,633 8,748 16,502 4,92,554
14 Rajasthan P 117 137 338 70,199 A 3,922 5,172 12,031 8,44,574
15 Tamilnadu P 138 79 313 1,10,182 A 3,688 3,626 9,304 10,25,128
16 Uttar Pradesh P 83 93 234 2,21,460 A 1,517 2,554 5,059 11,20,263
17 West Bengal P 71 114 218 1,21,614 A 656 2,187 3,194 3,88,445 ALL INDIA P 105 94 265 14,78,529 A 2,480 3,472 7,539 1,11,46,778
Source : NSSO Report No. 501(59/18.2/2) of 59th Round (Page No. A-483)

241
24. ALL INDIA TABLE 24.24 (A)
Number of Households reporting Cash Loans outstanding Per thousand Households ( P ) and average amount of Cash Loans outstanding Per Households ( A ) as on 30.06.2002 by type of
loan for Each Major Household Type Major Household Type : Self Employed
(Urban) Type of loan Sl.
No
State Type of estimate
Short term
pledged
Short term Non-
pledged
Short term (col. ( 3) & (4) Combined)
(1) (2) (3) (4) (5) (6) 1 Andhra Pradesh P 22 39 58 A 1,060 1,947 3,008 2 Assam P 9 8 17 A 82 167 249 3 Bihar P 17 28 45 A 184 298 482 4 Gujarat P 12 10 22 A 145 243 387 5 Haryana P 9 30 35 A 1,553 1,678 3,231 6 Himachal Pradesh P 2 6 8 A 46 372 418 7 Jammu &Kashmir P - 4 4 A 17 35 52 8 Karnataka P 13 44 55 A 551 915 1,466 9 Kerala P 44 72 116 A 2,573 2,569 5,142
10 Madhya Pradesh P 17 23 41 A 468 1,127 1,595
11 Maharashtra P 17 36 54 A 1,247 1,023 2,270
12 Orissa P 13 59 72 A 121 1,349 1,470
13 Punjab P 5 20 25 A 266 569 835
14 Rajasthan P 12 35 45 A 363 2,201 2,563
15 Tamilnadu P 50 67 114 A 879 2,137 3,016
16 Uttar Pradesh P 10 22 31 A 172 497 669
17 West Bengal P 9 27 35 A 441 300 741 ALL INDIA P 16 31 47
A 601 981 1,582 Contd..

242
24. ALL INDIA TABLE 24.24 (A) (Concld…)
Number of Households reporting Cash Loans outstanding Per thousand Households ( P ) and average amount of Cash Loans outstanding Per Households ( A ) as on 30.06.2002 by type of
loan for Each Major Household Type Major Household Type : Self Employed
(Urban) Type of loan
Sl. No
State Type
of Esti-mate
Medium term
Long term All
Estd. Hhs(00)/
Amount of Cash Loan (Rs.00000)
(1) (2) (3) (7) (8) (9) (10) 1 Andhra Pradesh P 120 151 308 17,240 A 5,335 13,444 21,787 3,75,622 2 Assam P 29 10 53 2,417 A 522 385 1,156 2,793 3 Bihar P 30 21 95 7,256 A 906 663 2,051 14,878 4 Gujarat P 75 133 218 13,151 A 2,576 11,893 14,856 1,95,374 5 Haryana P 77 69 176 4,893 A 4,531 9,950 17,712 86,655 6 Himachal Pradesh P 70 42 116 454 A 10,223 19,147 29,788 13,523 7 Jammu & Kashmir P 32 10 46 1,612 A 1,102 651 1,806 2,911 8 Karnataka P 87 61 198 10,596 A 3,499 7,581 12,546 1,32,937 9 Kerala P 147 227 411 5,763 A 8,098 22,109 35,349 2,03,717
10 Madhya Pradesh P 46 64 149 10,535 A 2,039 5,051 8,685 91,499
11 Maharashtra P 48 57 152 25,429 A 4,319 12,574 19,170 4,87,484
12 Orissa P 37 83 190 3,536 A 1,028 11,991 14,488 51,228
13 Punjab P 41 52 116 7,254 A 3,870 7,467 12,181 88,365
14 Rajasthan P 57 78 171 8,189 A 2,243 5,417 10,223 83,712
15 Tamilnadu P 118 91 300 16,956 A 5,752 6,001 14,769 2,50,420
16 Uttar Pradesh P 48 66 141 31,283 A 1,147 2,706 4,522 1,41,450
17 West Bengal P 37 88 156 16,595 A 1,068 4,388 6,197 1,02,844 ALL INDIA P 64 79 179 2,00,597 A 3,019 7,532 12,134 24,34,071
Source : NSSO Report No. 501(59/18.2/2) of59th Round (Ppage No. A-484)

243
24. ALL INDIA TABLE 24.24 (B)
Number of Households reporting Cash Loans outstanding Per thousand Households ( P ) and average amount of Cash Loans outstanding Per Households ( A ) as on 30.06.2002 by type of
loan for Each Major Household Type Major Household Type : All
(Urban) Type of loan Sl.
No
State Type of estimate
Short term
pledged
Short term Non-
pledged
Short term (col. ( 3) &(4) Combined)
(1) (2) (3) (4) (5) (6) 1 Andhra Pradesh P 13 37 49
A 522 1,234 1,756 2 Assam P 8 13 21
A 73 149 222 3 Bihar P 14 28 42
A 192 344 535 4 Gujarat P 7 12 19
A 103 161 264 5 Haryana P 6 33 37
A 672 999 1,671 6 Himachal Pradesh P 2 4 6
A 39 131 170 7 Jammu &Kashmir P 6 3 9
A 323 43 366 8 Karnataka P 9 33 41
A 241 520 761 9 Kerala P 49 62 108
A 1,974 2,036 4,010 10 Madhya Pradesh P 9 23 32 A 327 862 1,189 11 Maharashtra P 16 24 39 A 783 910 1,693 12 Orissa P 10 60 70 A 93 1,498 1,591 13 Punjab P 4 22 25 A 141 431 571 14 Rajasthan P 11 35 45 A 515 1,297 1,812 15 Tamilnadu P 39 59 94 A 625 1,556 2,181 16 Uttar Pradesh P 9 19 27 A 227 415 642 17 West Bengal P 8 21 29 A 275 360 635 ALL INDIA P 14 29 41 A 440 783 1,223
Contd..

244
24. ALL INDIA TABLE 24.24 (B) (Concld…)
Number of Households reporting Cash Loans outstanding Per thousand Households ( P ) and average amount of Cash Loans outstanding Per Households ( A ) as on 30.06.2002 by type of
loan for Each Major Household Type Major Household Type : All
(Urban) Type of loan
Sl. No
State Type
of Esti-mate
Medium term
Long term All
Estd. Hhs(00)/
Amount of Cash Loan (Rs.00000)
(1) (2) (3) (7) (8) (9) (10) 1 Andhra Pradesh P 113 155 298 50,677 A 4,214 13,931 19,901 10,08,513 2 Assam P 30 11 60 5,175 A 1,147 757 2,126 11,001 3 Bihar P 28 26 95 14,411 A 752 1,328 2,616 37,699 4 Gujarat P 62 144 214 35,332 A 1,865 13,587 15,715 5,55,244 5 Haryana P 64 67 160 12,139 A 3,241 8,017 12,929 1,56,940 6 Himachal Pradesh P 50 42 101 1,535 A 6,034 19,105 25,951 39,829 7 Jammu &Kashmir P 23 19 50 3,217 A 1,541 2,532 4,438 14,278 8 Karnataka P 82 67 186 34,771 A 2,460 7,322 10,544 3,66,614 9 Kerala P 129 187 373 17,452 A 6,607 17,819 28,446 4,96,445
10 Madhya Pradesh P 53 98 177 30,125 A 1,776 12,064 15,029 4,52,747
11 Maharashtra P 55 69 155 89,306 A 3,493 9,980 15,192 13,56,783
12 Orissa P 44 82 192 10,435 A 1,331 10,484 13,406 1,39,895
13 Punjab P 44 65 131 16,335 A 2,402 7,319 10,297 1,68,191
14 Rajasthan P 49 77 165 21,917 A 1,863 5,442 9,130 2,00,105
15 Tamilnadu P 103 79 255 54,595 A 3,793 5,962 11,936 6,51,631
16 Uttar Pradesh P 43 64 130 62,667 A 1,064 2,568 4,275 2,67,923
17 West Bengal P 43 103 171 41,460 A 1,044 6,390 8,071 3,34,613 ALL INDIA P 62 84 178 5,54,976 A 2,504 8,037 11,771 65,32,656
Source : NSSO Report No. 501(59/18.2/2) of 59th Round (Page No. A-486)

245
24. ALL INDIA
TABLE 24.25 (A) Per Capita Monthly Expenditure on Food and Non- Food items
During the Years 1999-2000 & 2004-05 by States. RURAL
Average Household Size All Food Items (In Rs.)
Sl. No. States
1999-2000 2004-2005 1999-2000 2004-2005
(1) (2) (3) (4) (5) (6)
1 Andhra Pradesh 4.1 3.9 274.45 323.15
2 Assam 5.5 5.0 288.20 358.44
3 Bihar 5.3 5.1 255.99 270.26
4 Gujarat 5.0 4.8 329.81 345.46
5 Haryana 5.6 5.1 396.55 419.34
6 Jammu & Kashmir 5.2 NA 423.92 NA
7 Karnataka 4.9 4.6 295.25 283.04
8 Kerala 4.6 4.2 411.19 455.64
9 Madhya Pradesh 5.3 5.2 233.23 232.17
10 Maharashtra 4.7 4.6 271.78 293.29
11 Orissa 4.6 4.7 239.25 245.58
12 Punjab 5.4 5.2 388.27 416.45
13 Rajasthan 5.7 5.4 326.60 323.97
14 Tamilnadu 4.0 3.7 301.91 315.49
15 Uttar Pradesh 5.7 5.6 267.94 345.88
16 West Bengal 5.1 4.7 299.53 329.93
ALL INDIA 5.0 4.8 288.80 307.60
Contd..

246
24. ALL INDIA
TABLE 24.25 (A) (Concld…) Per Capita Monthly Expenditure on Food and Non- Food items
During the Years 1999-2000 & 2004-05 by States.
RURAL
Non-Foods Items (In Rs.)
Total Monthly Per-Capita Consumer
Expenditure (In Rs.)
Sl. No. States
1999-2000 2004-2005 1999-2000 2004-2005
(1) (2) (7) (8) (9) (10)
1 Andhra Pradesh 179.16 262.40 453.61 585.55
2 Assam 137.93 184.74 426.13 543.18
3 Bihar 129.10 146.85 385.10 417.11
4 Gujarat 221.52 250.63 551.33 596.09
5 Haryana 317.83 443.55 714.38 862.89
6 Jammu &Kashmir 253.68 NA 677.60 NA
7 Karnataka 204.53 225.42 499.78 508.46
8 Kerala 354.51 557.52 765.71 1013.15
9 Madhya Pradesh 168.27 206.89 401.50 439.06
10 Maharashtra 224.99 274.46 496.77 567.76
11 Orissa 133.92 153.31 373.17 398.89
12 Punjab 354.55 430.30 742.82 846.75
13 Rajasthan 222.28 266.86 548.88 590.83
14 Tamilnadu 212.16 286.68 514.07 602.17
15 Uttar Pradesh 198.70 301.27 466.63 647.15
16 West Bengal 155.27 232.18 454.80 562.11
ALL INDIA 197.36 251.19 486.16 558.78 Source: 1 .NSSO Report No.457of 55th Round . 2. NSSO Report No. 515(61/10/1) of 61st Round 3. NSSO Report No. 508(61/1.0/1) of 61st Round

247
24. ALL INDIA TABLE 24.25 (B)
Per Capita Monthly Expenditure on Food and Non- Food items During the Years 1999-2000 & 2004-05 by States
URBAN
Average Household Size All Food Items (in Rs.)
Sl. No. States
1999-2000 2004-2005 1999-2000 2004-2005
(1) (2) (3) (4) (5) (6)
1 Andhra Pradesh 4.2 3.9 366.95 423.24
2 Assam 4.1 3.9 450.82 523.68
3 Bihar 5.1 4.7 344.54 356.01
4 Gujarat 4.5 4.4 442.06 500.39
5 Haryana 4.7 4.5 418.37 472.65
6 Jammu & Kashmir 5.2 NA 528.88 NA
7 Karnataka 4.5 4.2 421.94 446.48
8 Kerala 4.4 4.1 457.35 516.02
9 Madhya Pradesh 5.1 5 330.12 351.56
10 Maharashtra 4.5 4.3 440.99 464.27
11 Orissa 4.4 4.3 352.23 378.13
12 Punjab 4.3 4.4 423.54 499.03
13 Rajasthan 5.1 5.1 404.64 401.17
14 Tamilnadu 3.9 3.6 443.17 460.85
15 Uttar Pradesh 5.1 5.1 348.54 461.08
16 West Bengal 4.1 4.1 453.01 487.61
ALL INDIA 4.5 4.3 410.84 447.41
Contd…

248
24. ALL INDIA TABLE 24.25 (B) (Concld…)
Per Capita Monthly Expenditure on Food and Non- Food items During the Years 1999-2000 & 2004-05 by States.
URBAN
Non-Foods Items (In Rs.)
Total Monthly Per-capita Consumer Expenditure
(In Rs.)
Sl. No. States
1999-2000
2004-2005 1999-2000 2004-2005
(1) (2) (7) (8) (9) (10)
1 Andhra Pradesh 406.57 595.31 773.52 1018.55
2 Assam 363.30 534.30 814.12 1057.99
3 Bihar 257.36 340.26 601.90 696.27
4 Gujarat 449.62 614.81 891.68 1115.20
5 Haryana 493.70 669.70 912.08 1142.35
6 Jammu & Kashmir 423.97 NA 952.84 NA
7 Karnataka 489.06 586.73 910.99 1033.21
8 Kerala 475.26 774.87 932.62 1290.89
9 Madhya Pradesh 363.44 552.13 693.56 903.68
10 Maharashtra 532.34 684.00 973.33 1148.27
11 Orissa 266.25 379.18 618.49 757.31
12 Punjab 475.28 827.05 898.82 1326.09
13 Rajasthan 391.17 562.85 795.81 964.02
14 Tamilnadu 528.46 618.80 971.63 1079.65
15 Uttar Pradesh 341.79 517.18 690.33 978.26
16 West Bengal 413.58 636.01 866.59 1123.61
ALL INDIA 444.08 604.95 854.92 1052.36 Source: 1 .NSSO Report No.457of 55th Round . 2. NSSO Report No. 515(61/10/1) of 61st Round 3. NSSO Report No. 508(61/1.0/1) of 61st Round

249
24. ALL INDIA TABLE 24.26 (A)
Number of Households by Structure type of their Houses per Thousand for each State-2001-2002
(Rural)
Structure type of Houses Sl. No. States
Pucca Semi Pucca
Serviceable katcha
Un Serviceable
No House
(1) (2) (3) (4) (5) (6) (7)
1 Andhra Pradesh 456 327 161 55 1
2 Assam 147 300 162 391 0
3 Bihar 274 345 99 280 2
4 Gujarat 351 573 70 6 0
5 Haryana 834 130 35 1 0
6 Himachal Pradesh 402 585 11 2 1
7 Jammu & Kashmir 579 211 205 3 2
8 Karnataka 207 687 90 16 0
9 Kerala 357 562 56 23 2
10 Madhya Pradesh 194 722 73 9 2
11 Maharashtra 368 573 36 22 0
12 Orissa 183 286 474 56 1
13 Punjab 708 245 43 4 0
14 Rajasthan 541 230 201 27 1
15 Tamilnadu 264 463 236 37 0
16 Uttar Pradesh 513 255 189 41 2
17 West Bengal 211 528 203 57 1
ALL INDIA (Including union Territories0
358 428 149 64 1
Source: NSSO Report No. 489 of 58th Round.

250
24. ALL INDIA
TABLE 24.26 (B) Number of Households by Structure type of their Houses
per Thousand for each State-2001-2002
(Urban)
Structure type of Houses Sl. No States
Pucca Semi Pucca
Serviceable katcha
Un Serviceable
No House
(1) (2) (3) (4) (5) (6) (7)
1 Andhra Pradesh 797 146 42 13 2
2 Assam 649 257 14 81 0
3 Bihar 698 195 37 67 2
4 Gujarat 905 86 8 0 1
5 Haryana 898 98 3 0 0
6 Himachal Pradesh 857 137 6 0 0
7 Jammu & Kashmir 902 65 34 0 0
8 Karnataka 635 333 28 3 2
9 Kerala 534 436 19 11 0
10 Madhya Pradesh 661 316 23 0 0
11 Maharashtra 832 161 4 3 1
12 Orissa 677 213 104 6 1
13 Punjab 851 136 9 4 0
14 Rajasthan 873 81 43 1 2
15 Tamilnadu 625 299 54 20 2
16 Uttar Pradesh 888 86 16 8 2
17 West Bengal 651 327 18 3 1
ALL INDIA (Including union Territories)
768 199 24 9 1
Source: NSSO Report No. 489 of 58th Round.

251
24. ALL INDIA TABLE 24.27
Projected Total Population by Sex as on 1st March – 2001-2026 India and Andhra Pradesh
(‘000)
INDIA ANDHRA PRADESH Year Persons Males Females Persons Males Females (1) (2) (3) (4) (5) (6) (7)
2001 10,28,610 5,32,157 4,96,454 76,210 38,527 37,683
2002 10,45,547 5,40,936 5,04,611 77,154 38,976 38,179
2003 10,62,388 5,49,671 5,12,716 78,074 39,414 38,660
2004 10,79,117 5,58,354 5,20,763 78,973 39,844 39,129
2005 10,95,722 5,66,976 5,28,746 79,852 40,264 39,587
2006 11,12,186 5,75,529 5,36,657 80,712 40,677 40,036
2007 11,28,521 5,84,019 5,44,501 81,554 41,080 40,474
2008 11,44,734 5,92,451 5,52,283 82,375 41,475 40,900
2009 11,60,813 6,00,816 5,59,997 83,178 41,862 41,316
2010 11,76,742 6,09,107 5,67,634 83,964 42,240 41,724
2011 11,92,506 6,17,316 5,75,191 84,735 42,611 42,124
2012 12,08,116 6,25,446 5,82,670 85,491 42,974 42,517
2013 12,23,581 6,33,505 5,90,076 86,229 43,329 42,901
2014 12,38,887 6,41,484 5,97,403 86,952 43,676 43,277
2015 12,54,019 6,49,374 6,04,644 87,662 44,015 43,647
2016 12,68,961 6,57,168 6,11,793 88,361 44,348 44,013
2017 12,83,600 6,64,802 6,18,799 89,035 44,671 44,363
2018 12,98,041 6,72,334 6,25,707 89,691 44,986 44,705
2019 13,12,240 6,79,741 6,32,500 90,330 45,293 45,037
2020 13,26,155 6,86,998 6,39,157 90,949 45,591 45,359
2021 13,39,741 6,94,080 6,45,660 91,549 45,880 45,669
2022 13,52,695 7,00,811 6,51,884 92,111 46,147 45,964
2023 13,65,302 7,07,355 6,57,947 92,649 46,401 46,248
2024 13,77,442 7,13,643 6,63,799 93,160 46,641 46,518
2025 13,88,994 7,19,606 6,69,388 93,636 46,862 46,774
2026 13,99,838 7,25,176 6,74,663 94,073 47,061 47,012 Source: Census of India 2001- Population Projections for India and States 2001-2026. Report of the Technical Group on Population Projections constituted by the National Commission on Population, May 2006. Office of the Registrar General & Census Commissioner, India, New Delhi.

252
24. ALL INDIA
TABLE 24.28 Projected Total Population as on 1st March – 2001-2026
India, States and Union Territories (‘000)
2001 2006 Sl. No.
State/Union terrotory Persons Males Females Persons Males Females
(1) (2) (3) (4) (5) (6) (7) (8) 1 Andhra Pradesh 76,210 38,527 37,683 80,712 40,677 40,036 2 Arunachal Pradesh 1,098 580 518 1,169 617 553 3 Assam 26,656 13,777 12,878 28,665 14,763 13,902 4 Bihar 82,999 43,244 39,755 90,752 47,165 43,586 5 Chattisgarh 20,834 10,474 10,360 22,594 11,345 11,249 6 Goa 1,348 687 660 1492 776 716 7 Gujarat 50,671 26,386 24,285 54,979 28,760 26,220 8 Haryana 21,145 11,364 9,781 23,314 12,568 10,746 9 Himachal Pradesh 6,078 3,088 2,990 6,455 2,289 3,166
10 Jammu & Kashmir 10,144 5,361 4,783 10,941 5,756 5,185 11 Jharkhand 26,946 13,885 13,061 29,299 15,088 14,211 12 Karnataka 52,851 26,899 25,952 56,258 28,573 27,684 13 Kerala 31,841 15,469 16,373 33,265 16,191 17,074 14 Madhya Pradesh 60,348 31,444 28,904 66,390 34,617 31,773 15 Maharashtra 96,879 50,401 46,478 1,04,804 54,623 50,181 16 Manipur 2,167 1,096 1,071 2,308 1,165 1,143 17 Meghalaya 2,319 1,176 1,143 2,470 1,251 1,219 18 Mizoram 889 459 429 946 488 458 19 Nagaland 1,990 1,047 943 2,119 1,113 1,006 20 Orissa 36,805 18,661 18,144 38,887 19,692 19,196 21 Punjab 24,359 12,985 11,374 26,059 13,956 12,104 22 Rajasthan 56,507 29,420 27,087 62,276 32,466 29,811 23 Sikkim 541 288 252 576 307 269 24 Tamilnadu 62,406 31,401 31,005 65,135 32,730 32,404 25 Tripura 3,199 1,642 1,557 3,407 1,746 1,661 26 Uttaranchal 8,489 4,326 4,163 9,219 4,699 4,520 27 Uttar Pradesh 1,66,198 87,565 78,633 1,83,282 96,589 86,693 28 West Bengal 80,176 41,466 38,710 85,216 43,947 41,268 29 Andaman &
Nicobar 356 193 163 419 231 188
30 Chandigrah 901 507 394 1103 632 471 31 Dadra & Nagar
Havali 220 122 99 266 157 109
32 Daman & Diu 158 93 66 216 131 85 33 Delhi 13,851 7,607 6,243 16,021 8,835 7,186 34 Lakshadweep 61 31 30 72 36 36 35 Pondicherry 974 487 487 1098 551 547
ALL INDIA 10,28,610 5,32,157 4,96,454 11,12,186 5,75,529 5,36,657

253
24. ALL INDIA TABLE 24.28 (Contd.,)
Projected Total Population as on 1st March – 2001-2026 India, States and Union Territories
(‘000) 2011 2016 Sl.
No. State/Union
terrotory Persons Males Females Persons Males Females (1) (2) (3) (4) (5) (6) (7) (8) 1 Andhra Pradesh 84,735 42,611 42,124 88,361 44,348 44,013 2 Arunachal Pradesh 1,241 654 587 1,313 691 622 3 Assam 30,568 15,698 14,870 32,449 16,625 15,825 4 Bihar 97,720 50,640 47,080 1,03,908 53,676 50,231 5 Chattisgarh 24,258 12,177 12,081 25,879 12,989 12,890 6 Goa 1,767 926 841 1,977 1,063 914 7 Gujarat 59,020 31,005 28,016 62,825 33,140 29,685 8 Haryana 25,439 13,754 11,685 27,477 14,892 12,586 9 Himachal Pradesh 6,793 3,471 3,322 7,095 3,635 3,460 10 Jammu & Kashmir 11,718 6,139 5,579 12,419 6,479 5,940 11 Jharkhand 31,472 16,198 15,274 33,652 17,303 16,349 12 Karnataka 59,419 30,140 29,278 62,374 31,613 30,761 13 Kerala 34,563 16,859 17,704 35,677 17,440 18,236 14 Madhya Pradesh 72,200 37,673 34,527 77,875 40,661 37,213 15 Maharashtra 1,12,660 58,844 53,816 1,20,076 62,849 57,226 16 Manipur 2,449 1,235 1,214 2,592 1,305 1,287 17 Meghalaya 2,621 1,325 1,296 2,773 1,400 1,373 18 Mizoram 1,004 517 487 1,063 547 516 19 Nagaland 2,249 1,180 1,069 2,380 1,247 1,133 20 Orissa 40,750 20,602 20,148 42,479 21,438 21,041 21 Punjab 27,678 14,886 12,792 29,112 15,718 13,394 22 Rajasthan 67,830 35,394 32,436 72,948 38,090 34,858 23 Sikkim 612 325 287 647 344 303 24 Tamilnadu 67,444 33,852 33,592 69,396 34,790 34,605 25 Tripura 3,616 1,851 1,765 3,826 1,955 1,871 26 Uttaranchal 9,943 5,072 4,871 10,632 5,431 5,201 27 Uttar Pradesh 2,00,764 1,05,798 94,966 2,18,088 1,14,903 1,03,185 28 West Bengal 89,499 46,045 43,454 93,550 48,012 45,538 29 Andaman &
Nicobar 494 261 233 551 283 268
30 Chandigrah 1,438 832 606 1,780 1,056 724 31 Dadra & Nagar
Havali 354 194 160 422 228 194
32 Daman & Diu 270 175 95 330 221 109 33 Delhi 18,451 10,215 8,235 21,285 11,827 9,458 34 Lakshadweep 76 38 38 81 39 42 35 Pondicherry 1391 730 661 1669 929 740
ALL INDIA 11,925,06 6,17,316 5,75,191 12,68,961 6,57,168 6,11,793
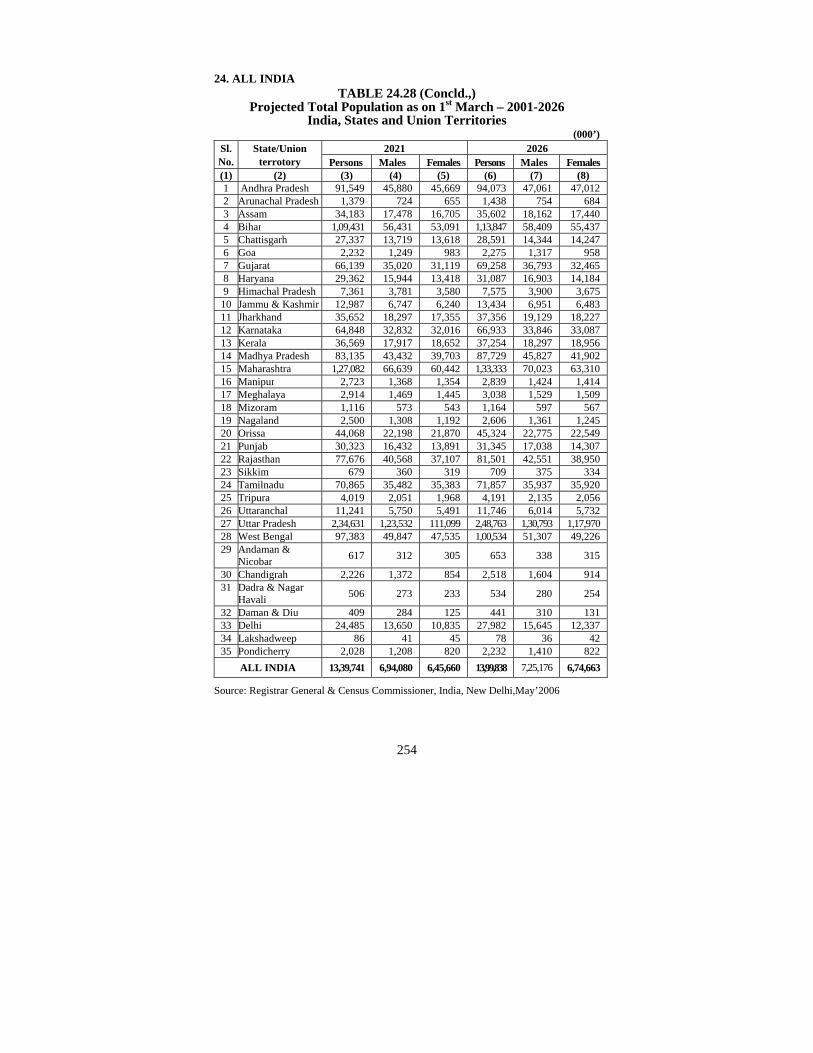
254
24. ALL INDIA TABLE 24.28 (Concld.,)
Projected Total Population as on 1st March – 2001-2026 India, States and Union Territories
(000’) 2021 2026 Sl.
No. State/Union
terrotory Persons Males Females Persons Males Females (1) (2) (3) (4) (5) (6) (7) (8) 1 Andhra Pradesh 91,549 45,880 45,669 94,073 47,061 47,012 2 Arunachal Pradesh 1,379 724 655 1,438 754 684 3 Assam 34,183 17,478 16,705 35,602 18,162 17,440 4 Bihar 1,09,431 56,431 53,091 1,13,847 58,409 55,437 5 Chattisgarh 27,337 13,719 13,618 28,591 14,344 14,247 6 Goa 2,232 1,249 983 2,275 1,317 958 7 Gujarat 66,139 35,020 31,119 69,258 36,793 32,465 8 Haryana 29,362 15,944 13,418 31,087 16,903 14,184 9 Himachal Pradesh 7,361 3,781 3,580 7,575 3,900 3,675 10 Jammu & Kashmir 12,987 6,747 6,240 13,434 6,951 6,483 11 Jharkhand 35,652 18,297 17,355 37,356 19,129 18,227 12 Karnataka 64,848 32,832 32,016 66,933 33,846 33,087 13 Kerala 36,569 17,917 18,652 37,254 18,297 18,956 14 Madhya Pradesh 83,135 43,432 39,703 87,729 45,827 41,902 15 Maharashtra 1,27,082 66,639 60,442 1,33,333 70,023 63,310 16 Manipur 2,723 1,368 1,354 2,839 1,424 1,414 17 Meghalaya 2,914 1,469 1,445 3,038 1,529 1,509 18 Mizoram 1,116 573 543 1,164 597 567 19 Nagaland 2,500 1,308 1,192 2,606 1,361 1,245 20 Orissa 44,068 22,198 21,870 45,324 22,775 22,549 21 Punjab 30,323 16,432 13,891 31,345 17,038 14,307 22 Rajasthan 77,676 40,568 37,107 81,501 42,551 38,950 23 Sikkim 679 360 319 709 375 334 24 Tamilnadu 70,865 35,482 35,383 71,857 35,937 35,920 25 Tripura 4,019 2,051 1,968 4,191 2,135 2,056 26 Uttaranchal 11,241 5,750 5,491 11,746 6,014 5,732 27 Uttar Pradesh 2,34,631 1,23,532 111,099 2,48,763 1,30,793 1,17,970 28 West Bengal 97,383 49,847 47,535 1,00,534 51,307 49,226 29 Andaman &
Nicobar 617 312 305 653 338 315
30 Chandigrah 2,226 1,372 854 2,518 1,604 914 31 Dadra & Nagar
Havali 506 273 233 534 280 254
32 Daman & Diu 409 284 125 441 310 131 33 Delhi 24,485 13,650 10,835 27,982 15,645 12,337 34 Lakshadweep 86 41 45 78 36 42 35 Pondicherry 2,028 1,208 820 2,232 1,410 822
ALL INDIA 13,39,741 6,94,080 6,45,660 13,99,838 7,25,176 6,74,663 Source: Registrar General & Census Commissioner, India, New Delhi,May’2006

255
CONVERSION CO-EFFICIENT
(For Changing British units of weight,
Length and capacity into Metric Units)
I. STANDARDS OF WEIGHTS
I Ounce = 28.3495 Grams
1 Gram = 0.035274 Ounce
= 0.09 Tola
1 Pound = 0.45359 Kilogram
1 Kilogram = 2.20462 Pounds
1 Tonne = 0.98420 Ton
(Metric Ton) = 1000 Kilograms
= 10 Quintals
1 Ton = 1.01605 Metric Tons
= 2240 Pounds
1 Maund = 0.037324 Metric Tons
= 82.2857 Pounds
= 0.3732 Quintal
1 CWT = 0.508 Quintal
1 Seer = 0.9331 Kilogram
1 Bale of Cotton Lint = 0.1778 Metric Ton
(392 1bs.)
1 Bale of Jute (400 lbs.) = 0.181436 Metric Ton
1 Metric ton = 5.624 Bales
1 Metric ton = 5.5166 Bales of Jute

256
II. STANDARDS OF AREA
1 Hectare = 2.47105 Acres
1 Acre = 0.404686 Hectare
= 4840 Sq. yards
(43,560 sq. ft.)
1 Sq. mile = 640 Acres
= 2.59 Sq. Kilometres
1 Sq. Kilometre = 0.3861 Sq. Mile
= 100 Hectares
1. Sq. Yard = 0.8361 Sq. metre
1 Sq. metre = 1.1960 Sq. yards
III. STANDARDS OF LENGTH AND CAPACITY
1 Kilometre = 0.6214 Mile
1 Metre = 1.0936 Yards
1 Yard = 0.9144 Metre
= 91.44 Centimetres
1 Inch = 25.4 Millimetres
1 Millimetre = 0.04 Inch
1 Gallon = 4.546 Litres
1 Litre = 0.2199 Gallon

ABBREVIATIONS USED
Sq. Kms. - Square kilometres
% - Percentage
Tonne - Metric Ton
Kg. - Kilogram
N.A. - Not available
Kwh. - Kilowatt hours
Accts. - Accounts
Q.E. - Quick estimates
A.E. - Advance estimates
R.E. - Revised estimates
B.E. - Budget estimates
K.W. - Kilowatts
Km. - Kilometre
Hect. - Hectare