
ancient architecture in virtual reality does immersion really aid ...
394
ANCIENT ARCHITECTURE IN VIRTUAL REALITY DOES IMMERSION REALLY AID LEARNING? by Jeffrey Jacobson BA, Computer Science, University of Texas, 1986 MS, Information Science, University of Pittsburgh, 1997 Submitted to the Graduate Faculty of Information Sciences in partial fulfillment of the requirements for the degree of Doctor of Philosophy University of Pittsburgh 2008
-
Upload
khangminh22 -
Category
Documents
-
view
0 -
download
0
Transcript of ancient architecture in virtual reality does immersion really aid ...

ANCIENT ARCHITECTURE IN VIRTUAL REALITY
DOES IMMERSION REALLY AID LEARNING?
by
Jeffrey Jacobson
BA, Computer Science, University of Texas, 1986
MS, Information Science, University of Pittsburgh, 1997
Submitted to the Graduate Faculty of
Information Sciences in partial fulfillment
of the requirements for the degree of
Doctor of Philosophy
University of Pittsburgh
2008
ii
UNIVERSITY OF PITTSBURGH
Department of Information Sciences
This dissertation was presented
by
Jeffrey Jacobson
It was defended on
January 29th, 2008
and approved by
Dr. Peter Brusilovsky, Associate Professor, School of Information Sciences, PITT
Dean Lowry Burgess, Professor, Fine Arts, Carnegie Mellon University
Dr. Stephen C. Hirtle, Professor, School of Information Sciences, PITT
Dr. Kurt VanLenh, Professor, Computer Science, PITT
Thesis Director/Dissertation Advisor: Dr. Michael Lewis, Professor,
School of Information Sciences, PITT

iii
Copyright © by Jeffrey Jacobson
2008
ANCIENT ARCHITECTURE IN VIRTUAL REALITY
DOES IMMERSTION REALLY AID LEARNING
Jeffrey Jacobson, PhD
University of Pittsburgh, 2008
iv
This study explored whether students benefited from an immersive panoramic display while
studying subject matter that is visually complex and information-rich. Specifically, middle-
school students learned about ancient Egyptian art and society using an educational learning
game, Gates of Horus, which is based on a simplified three dimensional computer model of an
Egyptian temple. First, we demonstrated that the game is an effective learning tool by comparing
written post-test results from students who played the game and students in a no-treatment
control group. Next, we compared the learning results of two groups of students who used the
same mechanical controls to navigate through the computer model of the temple and to interact
with its features. One of the groups saw the temple on a standard computer desktop monitor
while the other-saw it in a visually immersive display (a partial dome) The major difference in
the test results between the two groups appeared when the students gave a verbal show-and-tell
presentation about the Temple and the facts and concepts related to it. During that exercise, the
students had no cognitive scaffolding other than the Virtual Egyptian Temple which was
projected on a wall. The student navigated through the temple and described its major features.
Students who had used the visually immersive display volunteered notably more than those who
had used a computer monitor. The other major tests were questionnaires, which by their nature
provide a great deal of scaffolding for the task of recalling the required information. For these
tests we believe that this scaffolding aided students‘ recall to the point where it overwhelmed the
differences produced by any difference in the display. We conclude that the immersive display
provides better supports for the student's learning activities for this material. To our knowledge,
this is the first formal study to show concrete evidence that visual immersion can improve
learning for a non-science topic.

v
TABLE OF CONTENTS
PREFACE ................................................................................................................................. XVI
1.0 INTRODUCTION ........................................................................................................ 1
2.0 BACKGROUND .......................................................................................................... 3
2.1 WHAT IS VIRTUAL REALITY? ..................................................................... 4
2.1.1 Our Working Definition of VR ....................................................................... 4
2.1.1.1 A Three-dimensional Space: .............................................................. 5
2.1.1.2 Autonomy: The virtual environment (VE) persists .......................... 5
2.1.1.3 Interaction The user interacts with the virtual environment ........... 5
2.1.1.4 (Thematic) Presence The interface informs the senses ...................... 6
2.1.1.5 (Sensory) Presence This is the feeling of being there .......................... 6
2.1.2 The VR Research Community’s Definition of VR ....................................... 7
2.1.3 Educators’ Descriptions of VR ....................................................................... 8
2.1.4 Augmented Reality .......................................................................................... 9
2.2 VR IS EXPRESSIVE ......................................................................................... 11
2.2.1 Dimensions of Information ........................................................................... 12
2.2.2 Dimensions of Expression ............................................................................. 13
2.2.3 One Dimensional Formats: ........................................................................... 14
2.2.4 Two Dimensional Formats:........................................................................... 14
2.2.5 Three Dimensional Formats ......................................................................... 15
2.2.6 Four Dimensional Formats ........................................................................... 16
2.2.6.1 Five Dimensional Formats .................................................................. 16
2.3 VR TECHNOLOGY ......................................................................................... 17
2.3.1 Informative 3D Models ................................................................................. 17
2.3.2 Advancing Graphics Technology ................................................................. 19

vi
2.3.3 Flight Simulators ........................................................................................... 21
2.3.4 Head-Mounted Displays ................................................................................ 22
2.3.5 Flat-Screen Projection-Based Immersive Displays .................................... 23
2.3.6 Digital Dome Displays ................................................................................... 25
2.3.7 Direct Retinal Imagers .................................................................................. 26
2.3.8 Interaction Devices ........................................................................................ 26
2.3.9 Online Communities ...................................................................................... 29
2.3.10 Augmented Reality ....................................................................................... 31
2.4 ADAPTIVE HYPERMEDIA ............................................................................ 32
2.4.1 User Modeling ................................................................................................ 33
2.4.2 Methods of Adaptation .................................................................................. 34
2.4.3 Some Applications ......................................................................................... 36
2.4.4 Augmenting Virtual Space with Adaptive Behaviors ................................ 37
2.4.5 Augmenting Physical Space with Adaptive Behaviors ............................... 38
2.4.6 Learning Games ............................................................................................. 38
2.5 LEARNING THEORY AND VR ..................................................................... 41
2.5.1 Constructivism ............................................................................................... 42
2.5.2 Direct Interaction with Information ............................................................ 45
2.5.3 Presence and Engagement ............................................................................ 47
2.5.4 Information Delivery in VR .......................................................................... 48
2.5.5 Mayer’s Multimedia Design Principles ....................................................... 49
2.5.6 Mayer's (Cognitive) Theory of Multimedia Learning ................................ 51
2.5.7 Distributed Cognition and Internal Representation .................................. 53
2.5.8 Conceptual Change........................................................................................ 55
2.5.9 Learner Differences ....................................................................................... 57
2.5.10 Measurement and Evaluation ..................................................................... 59
2.5.11 Winn’s Synthesis ........................................................................................... 60
2.6 EMPIRICAL STUDIES OF LEARNING WITH IMMERSIVE VR ........... 62
2.6.1 Introduction ................................................................................................... 62
2.6.2 Advantages ..................................................................................................... 64
2.6.3 Problems ......................................................................................................... 65

vii
2.6.4 Summary of Previous Experiments ............................................................. 66
2.6.5 Moreno’s Research ........................................................................................ 68
2.6.6 Research at the University of Washington .................................................. 69
2.6.6.1 The Effect of Student Construction Of Virtual Environments....... 70
2.6.6.2 Learning Science in an Immersive Virtual Environment. .............. 70
2.6.6.3 Constructivism in Practice: The Case for Meaning-Making ......... 71
2.6.6.4 Collaboration and Learning Within Tele-Immersive ...................... 71
2.6.6.5 Water on Tap: The Use of Virtual Reality as an Educational ....... 71
2.6.6.6 Design And Construction Of A Virtual Environment. .................... 72
2.6.7 The Science Space Experiments ................................................................... 73
2.6.7.1 Using VR's Frames of Reference in Mastering. ............................... 73
2.6.7.2 Multisensory Immersion as a Modeling Environment .................... 74
2.6.7.3 A Model for Understanding How Virtual Reality ............................ 74
2.6.8 The NICE Projects......................................................................................... 74
2.6.9 The Virtual Gorilla Exhibit .......................................................................... 75
2.7 VIRTUAL HERITAGE .................................................................................... 76
2.7.1 History of VH ................................................................................................. 76
2.7.2 Advantages ..................................................................................................... 78
2.7.3 Problems ......................................................................................................... 80
2.7.4 Building a VH Environment ......................................................................... 81
2.7.5 Lifelike Pedagogical Agents .......................................................................... 85
2.7.6 Current Activity in Virtual Heritage ........................................................... 89
3.0 EXPERIMENT ........................................................................................................... 92
3.1 INTRODUCTION ............................................................................................. 93
3.2 RATIONALE ..................................................................................................... 96
3.3 GATES OF HORUS .......................................................................................... 98
3.3.1 Interface .......................................................................................................... 99
3.3.2 Training Phase ............................................................................................. 104
3.3.3 Game Logic .................................................................................................. 106
3.3.3.1 Definitions. ......................................................................................... 107
3.3.3.2 Actions .............................................................................................. 108

viii
3.3.4 Statements and Questions ........................................................................... 109
3.3.4.1 Pylon ................................................................................................... 110
3.3.4.2 Courtyard .......................................................................................... 112
3.3.4.3 Hypostyle Hall. .................................................................................. 114
3.3.4.4 Sanctuary ........................................................................................... 116
3.4 HYPOTHESES ................................................................................................ 119
3.5 TEST POPULATION AND PILOT STUDY ................................................ 121
3.6 TESTING SEQUENCE................................................................................... 122
3.7 DATA GATHERING ...................................................................................... 125
3.7.1 Online Evaluation Forms ............................................................................ 125
3.7.2 Multiple Evaluators ..................................................................................... 128
3.7.3 Access to the Forms ..................................................................................... 130
3.7.4 Data Management........................................................................................ 131
3.8 THREATS TO VALIDITY ............................................................................ 133
3.8.1 Immersive VR is Engaging Because It Is New. ......................................... 133
3.8.2 Motion Sickness ........................................................................................... 133
3.8.3 Application & Interaction Design .............................................................. 134
3.8.4 Limited Quantity of Content ...................................................................... 134
3.8.5 Fixed Learning Time ................................................................................... 135
3.8.6 Fatigue .......................................................................................................... 135
4.0 POST TEST RESULTS (ACCEPTANCE AND EFFECTIVENESS) ................ 136
4.1 ACCEPTANCE................................................................................................ 137
4.2 QUESTIONS IN THE POST TEST .............................................................. 139
4.3 GRADING THE OPEN-ENDED QUESTIONS ........................................... 142
4.4 INTERRATER RELIABILITY ANALYSIS ................................................ 144
4.5 HYPOTHESIS TESTS .................................................................................... 148
4.6 COMPARE WITH RPM RESULTS ............................................................. 152
5.0 VIDEO TEST RESULTS (IMMERSION HELPS) .............................................. 154
5.1 DESCRIPTION................................................................................................ 155
5.2 GRADING ........................................................................................................ 158
5.3 INTERRATER RELIABILITY ANALYSIS ................................................ 163

ix
5.3.1 Our Data is Ordinal and Not Normally Distributed ................................ 166
5.3.2 Calculating Interrater Reliability .............................................................. 167
5.3.3 Grader Agreement ....................................................................................... 168
5.4 RESULTS, FACTUAL KNOWLEDGE ........................................................ 172
5.5 RESULTS, CONCEPTUAL KNOWLEDGE ............................................... 179
5.6 RPM INTERACTS WITH IMMERSION .................................................... 188
5.7 DISCUSSION ................................................................................................... 196
6.0 OTHER MEASURES .............................................................................................. 197
6.1 PRETEST ......................................................................................................... 198
6.2 GAME LOGS ................................................................................................... 200
6.3 PRESENCE AND COMFORT TEST ........................................................... 204
6.4 DRAWN MAP .................................................................................................. 208
6.5 MAGNET MAP ............................................................................................... 215
6.6 FOLLOW-UP TEST ....................................................................................... 221
6.6.1 Description ................................................................................................... 221
6.6.2 Grading ......................................................................................................... 226
6.6.3 Results ........................................................................................................... 228
6.6.4 Other Questions ........................................................................................... 234
7.0 SUMMARY AND CONCLUSION ......................................................................... 236
7.1 BACKGROUND .............................................................................................. 238
7.1.1 What is Virtual Reality? ............................................................................. 238
7.1.2 VR Is Expressive .......................................................................................... 240
7.1.3 VR Can Accommodate the Learner ........................................................... 240
7.1.4 Sensory Presence Is Not Enough ................................................................ 242
7.1.5 Immersion Must Support the Learning Activity ...................................... 243
7.1.6 Virtual Heritage ........................................................................................... 244
7.1.7 Learning Games ........................................................................................... 244
7.2 EXPERIMENT ................................................................................................ 246
7.2.1 Rationale ....................................................................................................... 246
7.2.2 Gates of Horus ............................................................................................. 247
7.2.3 Hypotheses .................................................................................................... 249
x
7.2.4 Protocol ......................................................................................................... 250
7.3 RESULTS ......................................................................................................... 251
7.3.1 Acceptance .................................................................................................... 251
7.3.2 Effectiveness ................................................................................................. 252
7.3.3 Immersion..................................................................................................... 253
7.3.4 Other Measures............................................................................................ 254
7.3.5 Visual Reasoning Skill ................................................................................. 254
7.4 DISCUSSION ................................................................................................... 256
APPENDIX A; ONLINE QUESTIONNAIRES .................................................................... 259
PRETEST .......................................................................................................................... 260
PRESENCE AND COMFORT TEST ............................................................................ 263
DRAWN MAP GRADING FORM ................................................................................. 264
MAGNET MAP GRADING FORM .............................................................................. 268
VIDEOTEST GRADING FORM ................................................................................... 272
POST TEST ...................................................................................................................... 287
POST TEST GRADING FORM ..................................................................................... 292
FOLLOW-UP TEST ........................................................................................................ 297
FOLLOW-UP TEST GRADING FORM ....................................................................... 303
APPENDIX B; TESTING PACKET ..................................................................................... 307
APPENDIX C; EGYPT BOOKLET ...................................................................................... 321
APPENDIX D; OTHER MATERIALS ................................................................................. 345
PERMISSION FORM ...................................................................................................... 346
EGYPT FOLLOW-UP LETTER ................................................................................... 351
GIFT CERTIFICATE LETTER .................................................................................... 352
GIVING VIDEO LETTER .............................................................................................. 353
RECRUITING FLIER ..................................................................................................... 354
HINT CARDS ................................................................................................................... 355
BIBLIOGRAPHY ..................................................................................................................... 357
xi
LIST OF TABLES
Table 1. Previous Experiments with Immersive VR .................................................................... 67
Table 2. Virtual Heritage Projects ................................................................................................ 89
Table 3: Affective Questions and Raw Results .......................................................................... 137
Table 4. Affective Questions ...................................................................................................... 138
Table 5. Questions from the Post Test ........................................................................................ 140
Table 6: Grader's form for scoring open-ended questions .......................................................... 143
Table 7. Short-Answer Questions Interrater Reliabilty for the Post Test ................................... 145
Table 8. Comparison of Learning from the Post Test Short Answer Questions......................... 149
Table 9. Hypothesis Results from the Post Test ......................................................................... 151
Table 10. Post Test H1 Comparison Crossed with RPM Results. .............................................. 153
Table 11. Video Grading Form Questions .................................................................................. 159
Table 12. Sample Data for One Fact ........................................................................................... 164
Table 13. Interrater Reliability Analysis of the Video Data ....................................................... 169
Table 14. Sample Data Converted To Numbers ......................................................................... 172
Table 15. Sample Portion of Hypothesis Test Tables ................................................................. 174
Table 16: Factual Recall, Theater Group versus All Others ....................................................... 176
Table 17. Conceptual Understanding, Theater Group versus All Others ................................... 182
xii
Table 18. Connections Between Factual Recall and Conceptual Understanding ....................... 184
Table 19. Results from RPM Test, Question sets C & D. .......................................................... 189
Table 20: RPM Scores Crossed With Factual Learning Differences ......................................... 191
Table 21: RPM Scores Crossed With Conceptual Learning ....................................................... 194
Table 22: Pretest Results ............................................................................................................. 199
Table 23. Results from the Game Logs ...................................................................................... 201
Table 24: Results from the Presence and Comfort Test ............................................................. 206
Table 25: Drawn Map Grading Form Questions. ....................................................................... 210
Table 26: Results for Student Drawn Maps ................................................................................ 213
Table 27: Magnet Map Grading Form Questions. ...................................................................... 217
Table 28: Results of the Magnet Map Test ................................................................................. 219
Table 29: Follow-Up Test Questions .......................................................................................... 222
Table 30: Follow-Up Grading Form ........................................................................................... 226
Table 31: Interrater Reliability for Short-Answer Question on the Follow-Up Test ................. 229
Table 32: Follow-Up Test Grader Reports Hypothesis Test ...................................................... 232
Table 33: Multiple Choice Questions Hypothesis Test .............................................................. 233
Table 34: Results of Affective Measures in the Follow-Up Test ............................................... 235
Table 35. Summary of RPM Effect ............................................................................................ 255

xiii
LIST OF FIGURES
Figure 1. The Virtual Egyptian Temple in the Earth Theater ......................................................... 1
Figure 2. Schematic of the Great Pyramyd (Kufu, 2004) ............................................................. 17
Figure 3. An Ancient Roman Kitchen (Capasso 2004). ............................................................... 18
Figure 4. Advent's Children (RopeOfSilicon 2004) ..................................................................... 20
Figure 5. UT2007 (EpicGames 2007) ........................................................................................... 20
Figure 6. Exterior (left) and interior (right) of a flight simulator (Simlabs 2006) ........................ 21
Figure 7. Two HMDs (left) from Cybermind (2006) and (right) from Virtual Realities (2006) .. 22
Figure 8. User in the SAS-Cube, exploring a virtual nightclub (ALTERNE 2005). .................... 23
Figure 9. The Virtual Theater (Jacobson 2005c) .......................................................................... 24
Figure 10. Dome display at Digital Life (2006) courtesy of the Elumenati (2008) ...................... 25
Figure 11. IS-900 MiniTrax Wand Tracker (Intersense 2006) ..................................................... 27
Figure 12. CyberGlove (Metamotion 2006). ................................................................................ 28
Figure 13. An avatar in Second Life conversing with the user. .................................................... 29
Figure 14. Player avatars in World of Warcraft, a popular MMORPG ........................................ 30
Figure 15. Mayer's Learning Model ............................................................................................. 52
Figure 16. The Cyclorama at Gettysburg, USA ............................................................................ 77
Figure 17. Example of shape vs. texture to produce detail (Papiaoannou 2003). ......................... 82

xiv
Figure 18. The Sanctuary of the Virtual Egyptian Temple displaying in the Earth Theater. ....... 93
Figure 19. Temple of Horus and the high priest ........................................................................... 98
Figure 20. The Gyromouse ......................................................................................................... 100
Figure 21. Hawk statue and object selection cursor. .................................................................. 101
Figure 22. ―Moving‖ through the Virtual Egyptian Temple in the Earth Theater. ..................... 102
Figure 23. Overhead Diagram of the Earth Theater Main Screen .............................................. 103
Figure 24. Side View Diagram of the Earth Theater .................................................................. 103
Figure 25. Training Area............................................................................................................. 105
Figure 26. The Pylon................................................................................................................... 110
Figure 27. The Courtyard ............................................................................................................ 112
Figure 28. Hypostyle Hall ........................................................................................................... 114
Figure 29: The Sanctuary ........................................................................................................... 116
Figure 30. Gates of Horus Trigger Volumes in the Temple ....................................................... 118
Figure 31. Sample page from the online Post Test ..................................................................... 126
Figure 32. Sample page from the online Grading Form for the Post Test .................................. 127
Figure 33. Sample Index of Online Grading Forms ................................................................... 130
Figure 34. The Grading Matrix ................................................................................................... 131
Figure 35. Key Affective Results................................................................................................ 138
Figure 36. Video Test Setup ....................................................................................................... 155
Figure 37. Student (shown in silhouette) giving a tour of the temple......................................... 156
Figure 38. Sample Page From the Video Grading Form ............................................................ 158
Figure 39. Conceptual Grading Form. ........................................................................................ 180
Figure 40. Sample Question from the RPM Test ........................................................................ 189

xv
Figure 41. Presence and Comfort Test ........................................................................................ 205
Figure 42. Sample Drawn Temple Map (left) and a sample Drawn Room Map (right). ............ 209
Figure 43. Blank Map of the Temple .......................................................................................... 215
Figure 44. Magnetic Cutouts....................................................................................................... 216
Figure 45. Did paying the game, Gates of Horus make you any more interested in learning about Egypt? ....... 234
Figure 46. Virtual Egyptian Temple and the High Priest ........................................................... 236
Figure 47. Map of the Virtual Egyptian Temple......................................................................... 247
Figure 48. The Temple in the Earth Theater ............................................................................... 248
Figure 49. Key Affective Results................................................................................................ 251
Figure 50. Post Test Sequence and Results. ............................................................................... 252
Figure 51. Video Test Sequence and Results.............................................................................. 253

xvi
PREFACE
I dedicate this dissertation to the late Dr. William Winn of the Department of Education at the
University of Washington. During his time on my PhD committee, Dr. Winn's guidance was
central to my experimental design and background research. A wise scholar and a gentle man,
his work in the area of Virtual Reality for children's education was an inspiration to me and to
many others.
I express further thanks and deep appreciation to these individuals (in alphabetical order):
Dr. Michael Lewis, my advisor, who worked especially closely with me over the years,
showing great wisdom and patience.
Kerry Handron, my co-investigator for the actual learning experiments. She participated
in every level of the implementation, recruited all of the test subjects and managed
resources at the Earth Theater in the Carnegie Museum of Natural History of Pittsburgh,
where we conducted the experiments.
Dean Lowry Burgess, who worked especially closely with me over the years on matters
of content and dramaturgy. His insights on how to engage human nature were crucial to
the design and success of this study.
Lynn Holden, Egyptologist and co-Author of the Gates of Horus learning game. My
thanks to him for providing the educational content for my learning experiment and for
valuable insights.
Dr. Anne Faye, in the Office of Technology in Education at Carnegie Mellon University
for her important early help with navigating the educational research questions.
Dr. Roy D. Harris for being a friend, mentor and advisor through the whole process.
Dr. Mack C. Shelley for crucially important help in selecting the appropriate statistical
methods I used to analyze the results.
xvii
Gordon Orris and Jane Vadnal for their excellent (and merciless) editing. To Jane, again
for other help in production of materials for the experiments.
To Kathy Bruckner, Adrienne Baker, Benjamin Getkin, Jane Vadnal and Lynn Holden
for their excellent work in evaluating the students' performance in the posttests.
To Mary Smith for helping us recruit so many test subjects, and for her early advice on
how to structure the post-treatment quizzes.
Richard Graefe, Gordon Orris, and Jane Vadnal for their excellent (and merciless)
editing. To Jane, again for other help in production of materials for the experiments.
To Kathy Bruckner, Adrienne Baker, Benjamin Getkin, Jane Vadnal and Lynn Holden
for their excellent work in evaluating the students' performance in the post-tests.
To Mary Smith for helping us recruit so many test subjects and for her early advice on
how to structure the post-tests.
The following institutions also deserve appreciation and acknowledgement.
The School of Information Sciences at the University of Pittsburgh for providing a
supportive and resourceful environment for me to do this work.
The Carnegie Museum of Natural History of Pittsburgh for supporting this research by
making the Earth Theater and its resources available for the study.
PublicVR for creating and distributing the open-source software (CaveUT, VRGL and
Gates of Horus) we relied upon to conduct the study.
EpicGames for their general support for academic research using the game Unreal
Tournament 2004 and its software core, the Unreal Engine.
Last, but far from least, I thank my very patient husband Christopher Graefe, for putting up with
me during the whole crazed process.
The best way to read this document is to start with “Summary and Conclusion” (section 7.0
p236).

1
1.0 INTRODUCTION
This study explored whether students benefit from an immersive panoramic display while
studying subject matter which is visually complex and information-rich. Specifically, middle-
school students learned about ancient Egyptian art and society using an educational learning
game, Gates of Horus (section 3.3, p247), which is based on a simplified virtual model of an
Egyptian temple. First, we demonstrated that the game is an effective learning tool by comparing
written post-test results from students who played the game from and student in a no-treatment
control group.
Figure 1. The Virtual Egyptian Temple in the Earth Theater
Next, we compared the learning results of two groups of students who used the same
controls to navigate through the temple and interact with its features. One group saw the temple
on a standard desktop computer monitor while the other saw it in a visually immersive display (a
partial dome). The difference appeared when each student gave a verbal show-and-tell
presentation of the temple and the concepts and facts related to it. During the student‘s
presentation, she had no cognitive scaffolding other than the virtual temple, on a small wall
2
projection, which the student navigated during the presentation. The other major tests were
questionnaires, which by their nature provide a great deal of scaffolding for the task of recalling
the required information. For these tests we believe that this scaffolding aided students‘ recall to
the point where it overwhelmed the differences produced by any difference in the display.
We conclude that the immersive display provides better supports for the student's
learning activities for this material. To our knowledge, this is the first formal study to show
concrete evidence that visual immersion can improve learning for a non-science topic.
The best introduction to this study is to first read “Summary and Conclusion”
(section 7.0 p236).
3
2.0 BACKGROUND
In this chapter, we will introduce the existing theory and practice upon which we based our
study. It begins with an exploration of the concepts and practices which comprise Virtual Reality
and our own working definition of the term. Next, we survey existing VR technology. Then we
discuss how applications can be made responsive to individual users and their changing needs in
the Adaptive Hypermedia section. Games are special case of adaptive media. After that, we will
go into some detail to explain the important educational theories which inform the productive use
of virtual reality and learning applications. This provides the context for the next section, in
which we address directly the advantages and disadvantages of using Immersive Virtual Reality
for education. There, we survey and discuss previous studies and the implications of their
findings. Finally, we will survey the field called Virtual Heritage, the applications and practice of
using VR to recreate historical artifacts as they are or as they might have been. Our learning
game, Gates of Horus, is an adaptive application which employs a pedagogical agent. The temple
served as the centerpiece of our learning experiments with Immersive VR. This major section
will give us the context we need to situate and implement our study.
4
2.1 WHAT IS VIRTUAL REALITY?
Virtual Reality has existed in various forms for some time, but the term did not gain wide use
until it was popularized by William Gibson (1984). There is still no final agreement on its
precise meaning, in part because VR is being developed and employed by several distinct
research communities, each with different goals, methods, theories and vocabularies. As VR
technology continues to advance and its cost continues to decline, more communities are
developing VR-based applications. This study will focus of two of these groups, educators and
the traditional VR-research community. This section will describe, (1) the features of VR, which
are generally agreed upon, (2) what VR means to the traditional VR-research community, and (3)
what VR means to the educational research community. Later sections of this survey will refer to
VR as the educators do and will reference the taxonomy and the core principles of VR described
here. The term Immersive VR will be used unambiguously to refer to VR applications which
produce sensory immersion.
2.1.1 Our Working Definition of VR
This section discusses the key aspects of virtual reality which are shared among most users and
researchers, despite cross-disciplinary differences in terminology and approach.
A ―Virtual Environment‖ (VE) is an artificial space, an imaginary or illusory world,
created and maintained by appropriate computer applications. The user interacts with the VE and
may also interact with objects, agents or representations of other users found in the VE. For
example, a flight simulator presents an illusory landscape over which the user appears to fly
over. The act of navigating the imaginary aircraft through the VE is a way of interacting with it.
The VE may have other virtual aircraft within it, piloted by other users or by software agents.
Another example of a Virtual Environment is the online shared VR applications which support
virtual environments accessible via the Internet. Each user is represented by an avatar, a

5
representation (usually humanoid), with which they interact with the VE and with the other users
there (SecondLife, 2004; There, 2004; Dede, 2004).
The term, Virtual Reality, (VR) generally refers to using a computer to interact with a
virtual environment. The Encyclopedia Britannica (2004) says VR is, ―The use of computer
modeling and simulation to enable a person to interact with an artificial three-dimensional visual
or other sensory environment.‖ More specific definitions of VR all depend upon David Zeltzer's
often cited definition, which maintains that a VR application must have or provide ―autonomy,
interaction and presence‖ (Zeltzer, 1992). However, the meaning of the term ―Virtual Reality‖
continues to evolve and differentiate, as disparate research communities find new ways to use it.
We present our own working definition for VR, which we state as criteria:
2.1.1.1 A Three-dimensional Space: The user perceives an illusory three-dimensional ―space‖
known as the Virtual Environment (VE). The VE is an illusion is composed of information
rendered into a form the user can perceive. Usually, the representation is visual, although many
VR applications use sound, touch, proprioception, and other senses
2.1.1.2 Autonomy: The virtual environment (VE) persists and changes with or without a user
present. Part of this illusion of temporal coherence is caused by the way in which virtual objects
and actors respond to the user; they develop in a manner consistent with their purpose and with
the overall theme of the environment. For example, the NICE project (Roussos 1999) is based on
a shared children's ―virtual garden‖ where, for example, the carrots continue to grow whether any
children are ‖present‖ or not. Each time a child ―visits‖ the garden through some VR interface,
s/he will ―see‖ the carrots in some state resulting from when the carrots were originally
―planted,‖ the (virtual) growing conditions and what the other children may have been doing in
the garden.
2.1.1.3 Interaction The user interacts with the virtual environment in a meaningful way (Zeltzer,
1992). In many VR applications, the central interaction is the ability of the user to navigate
though the VE, thus appearing to travel in the virtual space. A higher degree of interaction gives
the user some means of influencing the elements in the VE, whether it is simply moving objects
or interacting with an intelligent computer-generated agent or with another user ―in‖ the VE.
6
Central to interaction is the relationship between objects in the VE and the user's viewpoint. In a
first person view, the user is embodied in the viewpoint, as it moves though the environment. In a
third-person view, the user is represented or embodied by an avatar, usually a humanoid figure.
The user navigates by moving the avatar while the viewpoint tracks it some algorithm (Sheridan
1992). In a ―world-in-miniature view, everything in the VE appears within the user's view, and
the user manipulates the VE, usually by rotating it, while the viewpoint (apparently) remains
stationary. Many variations on these themes exist, as well as entirely different navigation
schema.
2.1.1.4 (Thematic) Presence The interface informs the senses so that the user ―feels‖ as if s/he
is in a particular location within the virtual environment (Zeltzer 1992). Perspective correction
and other aspects of a visual display define the user‘s egocenter, which is the user‘s location in
the virtual environment (Psotka 1996). The display must produce at least a very wide view for
the user, such as those provided by a digital partial-dome theater (e.g. a Planetarium) or a Head
Mounted Display (HMD). See section 2.3, p17, for examples.
2.1.1.5 (Sensory) Presence This is the feeling of being there in the virtual world (VE), the sense
that the VE is your environment, rather than the real world or perhaps in addition to it. When
Zeltzer (1992) first published his three requirements, he emphasized the sense of presence that
comes from sensory immersion. Sensory immersion depends on physically creating the illusion
of a virtual space with a combination of sensory effects, most commonly based on imagery. The
use of sound is also common, and there are established technologies for adding physical motion
cues, haptic feedback and even olfactory input (Stanney, 2002). Presence is typically measured
with introspective questions for the user (Witmer, 1998b; Lessiter, 2001; Slater, 1999; Pausch,
1997; Darken, 1999b).
In the following discussion, we will call applications satisfying all five criteria,
Immersive Virtual Reality (Immersive VR) and those which satisfy only the first four criteria,
Desktop Virtual Reality (Desktop VR). We retain Virtual Reality (VR) as a general term
referring to both.
7
2.1.2 The VR Research Community’s Definition of VR
Members of the mainstream VR research community usually adheres closely to Zeltzer‘s (1992)
definition of VR, ―autonomy, interaction, and (sensory) presence‖ described above. They
implicitly add that any respectable VR display must be capable of stereographic imaging.
Most researchers in this community are concerned with VR technology and its
applications. Most are computer scientists and many of the rest are electrical engineers,
interaction designers or experts in ergonomics. There are also a few researchers from disciplines
representing current or intended user communities for VR applications. It is very common for
members of this community to combine expertise from several of these fields Researchers in this
group receive much of their funding directly or indirectly from the American military; their most
common use of VR remains training and simulation for pilots, navigators and soldiers. Other
funding comes from medical applications, education, geology, entertainment, archeology,
geographic information systems and human-computer interaction. In Europe, there is significant
funding for applications in cultural heritage and historical preservation (section 2.7, p76).
The core of the traditional VR research community is primarily concerned with the
physical interfaces for VR and their psychological and ergonomic effects. This leads them to
stress the immersive aspects of VR and the fidelity and cohesiveness of the VE. A good example
is Kay Stanney‘s Handbook of Virtual Environments (2002). In her book bulk of the
introductory chapter and most of the other chapters are devoted to topics directly related to
building functional Immersive VR interfaces and using them properly. Applications are also
explored, but not in the same depth.
For the foreseeable future, the research agenda of this community will remain important,
useful and in many ways central. However, they appear to have lost control of the meaning of the
term ―VR‖, because they are greatly outnumbered by user communities who employ a broader
definition of VR.

8
2.1.3 Educators’ Descriptions of VR
Educators and other user communities regard VR as any application which maintains a persistent
virtual environment (autonomy) and within which users interact with each other, or objects, or
independent agents These communities place much less emphasis on the nature of the interface.
For example, text-only MUD systems are regarded as a form of VR, as well as many desktop VR
applications
Because a wider range of applications are included, the educators‘ definition of VR
requires modifying Zeltzer‘s (1992) definition of presence. Rather than pure sensory immersion,
the engagement of attention is emphasized in a way that centers on a single reference point in the
virtual environment, the user's egocenter (Psotka, 1996). All of the user's spatial interactions
with and within the VE are relative to the user‘s egocenter.
Presence then becomes a special case of engagement, which describes the degree to
which the user devotes his or her attentional resources to some activity within a VR environment.
Many argue that the more engaged s/he is with some task ―in‖ the VE, the greater the degree of
presence—certainly, introspective questions of presence will yield higher scores in this case.
Conversely, it may be that an increased sense of presence, perhaps from sensory immersion, will
enhance the user's sense of engagement in the task(s) central to a particular VR application. To
avoid a circular definition, let us say that presence is a particular type of engagement. Our
definition of presence then becomes psychological presence which requires that the VR
application has a defined egocenter for the user and that it successfully engages the user's
attention.
Under educators‘ broader definition of VR, most educational applications fall into one of
three groups:
Text-Only The MUD (Multi-User Dungeon) support text-only interaction with the
virtual environment and between the users. MUDs have existed for nearly twenty years,
before the term VR was coined, but researchers who use MUDs now regularly refer to
them as virtual worlds and to the MUDs as a form of virtual reality. Few are solitary,
most support very large communities of users (Bruckman, 2002a).

9
Desktop With Desktop VR, the user interacts with a persistent autonomous virtual
environment using a standard computer monitor, keyboard and mouse. Applications can
be solitary or support a large community of users (SecondLife, 2004; There, 2004; Dede,
2004; Cobb, 2002; Raiha, 1997). See section 2.3.9, p29, for more detail.
Immersive These applications attempt to enlarge a VR environment beyond the scale of
a computer monitor to more fully engage the users‘ senses, especially by improving the
visual interface. Immersive VR applications usually use a Head Mounted Display (HMD)
or a CAVE-like display in which several screens are used to simulate 3 dimensions.
(Winn, 2003b; Jackson, 2000). Some of them also attempt to engage such other human
capacities as hearing and the viewer‘s tactile sense.
This expanded definition appears to be stable and does not hinder educators who wish to
experiment with Immersive VR. However, it raises questions about how the traditional VR
research community, for whom the only VR is Immersive, references these other applications.
They often rely heavily on the term ―Virtual Environment.‖ An example is the title of Kay
Stanney's book, Handbook of Virtual Environments (Stanney, 2002). The book itself gives the
best overview of VR research up to that time. To achieve its breadth, the book includes articles
about important non-immersive VR applications. Accordingly, the title of the book uses ―Virtual
Environments‖ not ―Virtual Reality,‖ which covers these non-immersive applications. Stanney
stretches the term ―Virtual Environment,‖ because many of the articles are about interfaces, not
environments. We see no harm in this extension of the definition of VE, especially if the authors
define the term within their context.
2.1.4 Augmented Reality
Also worthy of mention is VR's close cousin, Augmented Reality (AR), which is the practice of
using VR techniques to enhance a physical space (Papagiannakis, 2004a, 2004b; Ruiz, 2002;
Sinclair, 2001; Addison, 2002). For example, AR Quake (Piekarski, 2002), users observe the real
world through special glasses. Animated autonomous agents are added to the user's view by
having the computer ―paint‖ the appropriate imagery onto the surface of the glasses. The agents
interact with each other, the terrain and with the user. With ―Hippie‖ and related applications

10
(Oppermann, 1999; Baber, 2001), the user hears a topical narrative when s/he nears a point of
interest in a museum. The narratives change adaptively, depending on who the user is and what
s/he has seen previously. It could be said that there is a continuum of possible applications
between pure reality and a true virtual environment, with the term Augmented Reality including
everything in between.
11
2.2 VR IS EXPRESSIVE
Virtual Reality provides the educator with new ways to represent many objects and systems more
effectively than with other media. For example, the VR user can interact with simulations of
objects that cannot be perceived in the real world (Roussos, 1999) because they are too small, too
big, dangerous, far away, no longer exist, do not exist yet, or are simply inconvenient. Students
can make mistakes in a virtual environment safely and cheaply, which allows for learning
activities not possible in the real world. A virtual environment can also simulate dynamic
systems such as ocean currents, planetary motions, changes in electrostatic fields, or social
behavior in a troop of gorillas. These simulations become especially powerful teaching tools
when the student can participate in them, giving the student an inside view (egocentric) and the
ability to experiment with the system (Winn, 1999; Bowman, 1999; Dede, 1999)
VR theorists often use the concept of dimensions or dimensionality to describe or define
virtual environments and user interaction with them (Benedikt 1991, Wexelblat 1991, Bowman
2002). The most helpful dimensional taxonomies depend on the context for their intended use.
Accordingly, the following taxonomy supports later discussion (in this study) of how different
VR applications represent information and receive and respond to user input. The purpose of this
section is to help the reader understand and classify educational applications based on VR by
providing paradigms to describe:
1. The available dimensions in a VR interface: width, height, depth, time, sound, touch,
proprioception, and taste/smell.
2. Dimensions to classify information: one-dimensional, two-dimensional, three-
dimensional, multi-dimensional, temporal, tree and network. This is adapted from
Schneiderman's (1996) Task by Type Taxonomy.
3. Ways to map the information to the display, with examples of common usage.
This taxonomy emphasizes how the user receives information from the display. For a detailed
taxonomy on interaction, see Bowman (2002).
12
2.2.1 Dimensions of Information
In Schneiderman's (1996) Task by Type Taxonomy, he lists a series of ―data types,‖ each
ostensibly representing a type of information. Each data type is described along with its most
appropriate vehicle. For example, two-dimensional information includes maps and images. The
following is a somewhat modified list of Schneiderman's data types.
One Dimensional: Text, including font, color, and meta-information like author or date.
Anything that comes in a linear order, such as a list of names or clothes on a rack
organized by size. At this level of abstraction, sound can be considered one dimensional.
In reality, sound contains many dimensions within it, just as color does, but this overview
will not address that level of detail.
Two Dimensional: Planar or map data include geographic maps, floor plans, images, or
newspaper layouts.
Three-dimensional: Molecules, architecture, the human body, machine inner workings,
etc.
Temporal: Timelines, project schedules, fictional or historical narratives, etc. Users
often query the temporal ordering and grouping of things.
Multi-Dimensional: N-dimensional data, usually stored in a relational database.
Tree: Hierarchical information.
Network: There are many types of networks, primarily acyclic, lattice, rooted, unrooted,
and entity-relationship diagrams. Visualizing this type of information is useful for
determining relationships, identifying cycles and finding short paths between points in
the network.

13
2.2.2 Dimensions of Expression
These dimensions refer to the way in which the user experiences the virtual environment, which
is why the first four and the remaining items can appear on the same list. The level of granularity
in this list is arbitrary, formulated to suit the level of this discussion. For a much more detailed
taxonomy of the senses, see Spring (1992).
1. Width: Horizontal length with respect to the user's view.
2. Height: Vertical length.
3. Depth: Distance away from the user's viewpoint.
4. Color: The color(s) of objects within the environment.
5. Time: The temporal aspect of a user's interaction with some person, place or thing in the
virtual environment.
6. Sound: This can range from monophonic sound from a computer speaker to fully
spatialized sound.
7. Touch: Also known as ―haptic feedback,‖ or ―force feedback.‖ The simulated ability to
touch a virtual object. The user manipulates some physical device, such as a special glove
or stylus, which creates the sensation of touch when the device's analog in the virtual
environment encounters an object.
8. Proprioception: The sense of orientation or movement sensed through the vestibular
system, visual system and sense of touch.
9. Taste: We are not aware of any VR displays which employ this sense.
10. Smell: Some VR displays to release odors as directed by the VR software.
In this section, we will present ways in which information can be mapped to aspects of the
computer display. We categorize these aspects by the number and type of dimensions by which
they can convey or represent information. The most important dimensions readily visible in any
14
each sensory mode are called ―dominant,‖ an arbitrary distinction based on how the user is
expected to experience or think about the display. The discussion is also weighed towards
display rather than interaction. For a detailed taxonomy interaction, we recommend Bowman
(2002). While the discussion is intended for VR displays, others are included for context.
2.2.3 One Dimensional Formats:
There is no immersive, one dimensional display but static text is the nearest approximation;
narrative fiction, for example. Static text requires that either height or width be dominant (height
for Asian languages and width for most others) and but allows some contribution from other
dimensions—just enough to allow the letters and characters to be readable. Color, font, point-
size, and so on, are all subordinate to height or width in this case. In reality, the typical page of
text is a two dimensional presentation and its layout can have an important influence on the
viewer. Nevertheless, the user's attention primarily moves along one dimension, from one word
to the next.
2.2.4 Two Dimensional Formats:
Most applications of the familiar print and electronic media are two-dimensional.
1. One of the most common applications of the two dimensional display includes maps,
images, static web pages, maps, floor plans, newspaper layouts, etc. This would include
many forms of Schneiderman's ―Temporal‖ data—a graphed schedule (PERT chart,
GANT chart, etc.) for example. The dominant dimensions are height and width.
2. Sound-only presentations belong to this category as well, because they have two
dominant dimensions, time and sound.
3. A popular two dimensional display is the text-only ―chat‖ interface, which allows the
user to interact in real time with other users by reading and typing text. Here, the two
dominant dimensions are width and time. If Asian characters are used in a vertical
display, those would be height and time.

15
4. All MUDs use a text-based ―chat‖ interface and maintain persistent virtual environments
and social interactions. The virtual environment and the actions of the actors within it are
―displayed‖ as textual description. However, some scholars maintain that a MUD maps
many dimensions into the one dimensional text-most often arguing that MUDs exist in
width and time.
5. Static three-dimensional images can be projected onto the two dimensional surface, as
with a photograph, painting or drawing. In these cases, depth has to be included as a
subordinate dimension, indicated by perspective, occlusion and shading effects. There is
actually a spectrum of displays between two and three dimensions, so a good photograph
may well be considered a 2.5 dimensional display. Though height and width are
dominant with these representations, depth can be suggested and color can be indicated,
though rarely faithfully reproduced.
2.2.5 Three Dimensional Formats
1. Static images of molecules, architecture, the human body, machine inner workings, etc.,
when shown with a volumetric display. Most volumetric displays use stereopsis to
display depth information.
2. A three-dimensional display can be mimicked in a dynamic two-dimensional display,
such as a computer monitor by introducing factors such as user viewpoint motion, the
motion of objects in the environment or both. Fred Brooks (2004) states that the recovery
of form from motion is stronger than stereopsis. A way to get depth-from-motion is to
add head-tracked perspective correction, so the viewer's own motion contributes. These
displays provide indications of height, width and depth.
3. Interactive silent applications which employ a two-dimensional interface but show
change over time. Examples include a large variety of games (i.e. Pac Man) and some
virtual communities (i.e. Randy Farmer's ―Habitat,‖) These applications employ height,
width, and time.

16
4. A silent movie. Height, width, and time are predominant, though depth can be implied as
a minor dimension.
2.2.6 Four Dimensional Formats
1. Interactive multimedia applications where the dominant dimensions are height, width,
time and sound.
2. Silent, interactive VR applications using a three-dimensional display. Height, width,
depth and time.
2.2.6.1 Five Dimensional Formats
1. Interactive VR with spatialized sound, or a typical movie. Height, width, depth, time and
sound.
From the forgoing examples, it is clear that the basic idea of mapping the dimensions of the data
to dimensions of the display is fairly straightforward. However, the science of it (data
visualization) and the art of it (information design) is very complex and beyond the scope of this
study. This is especially true for data which has a many dimensions or which cannot be defined
in terms of dimensions (i.e. tree or network), but can only be displayed using a limited number of
dimensions.

17
2.3 VR TECHNOLOGY
Recent trends in the technologies which can be used for VR applications have opened up many
new possibilities. The following sections provide an overview of these possibilities.
2.3.1 Informative 3D Models
Scientists, engineers, archaeologists, and many other professionals increasingly use three-
dimensional models to represent information and interact with it. While the majority of
applications which employ 3D models do not qualify as DesktopVR, many do (section 2.1, p4).
They range from simple and elegant, to rich in complexity and information. A model may be
created by human artists as an original work or as a virtualization of something that already
exists in the physical world. Some 3-D models could also be a visualization of some stream of
data, such as the fluid dynamics of a cloud front, an abstract representation of the stock market,
or the result of a CAT scan. Figure 2, below, is a good example of a useful model.
Figure 2. Schematic of the Great Pyramid (Kufu, 2004)
Most of the simple 3D models are written in the old VRML programming language, it‘s
probable successor X3D (Web3D, 2006) or one of many lesser-known alternatives. Models of

18
this type are easy to produce and can be made part of a web-based application. For example, an
object in a VRML-based virtual world can have a standard hyperlink associated with it, so that
clicking on the object in a virtual world might display a web page in another frame on the same
page (Jacobson, 1998h). More complex models are usually built with advanced commercial tools
such as Maya or 3D-Studio Maxx (Autodesk, 2006).
Figure 3. An Ancient Roman Kitchen (Capasso 2004).
VRML and X3D support simple animations which can be compelling in the hands of an
imaginative designer. On the other hand, tools such as Maxx and Maya support very complex
animations which can provide greater levels of detail and subtlety. The most sophisticated
examples include computer-animated movies such as Final Fantasy (FinalFantasy, 2001) and
interactive video games, such as Doom (Id_Software, 2004) or Unreal Tournament (EpicGames,
2007).
Finally, authoring tools are available for content-creation in the more advanced video
games, and they take input from the professional authoring tools. Some of them, like Unreal
Tournament 2004, are partially open-source, allowing for extensive reprogramming of existing

19
games and creation of new content by members of the public (EpicGames, 2004; Id_Software,
2004).
2.3.2 Advancing Graphics Technology
Detailed three-dimensional computer graphics require a great deal of computing power,
especially if they are dynamic or interactive. Typically, the application must produce thirty
visual frames per second to produce convincing movement through the virtual space. As recently
as the late 1990s, high quality computer graphics required computers which were powerful,
specialized, and very expensive.
Today, advanced graphics hardware is available to the mass market through new video
cards (nVidia 2007; ATI 2007; Lewis 2002) for standard home computers and special-purpose
game computers, called playstations (i.e., Xbox, PS2 and others). Because of this, the game
industry has grown larger than the movie industry by every measure and shows no sign of
slowing down its drive towards ever-faster home-computer graphics. Nearly everyone involved
in computer graphics has taken advantage of the game industry spinoff technologies.
The efficiency of a highly optimized game engine can be ten to one hundred times greater
than general-purpose graphics software. However, high-performance graphics engines (game
engines) are always highly optimized and often quite specialized. For any particular game
engine, some features are trivially easy to employ in a VR application, while other features can
be harnessed by with specialized knowledge and good programming support. Still others are
simply unavailable. The key for VR application development using these graphics engines is
careful advance study to choose the right one and a willingness to expend the effort to learn the
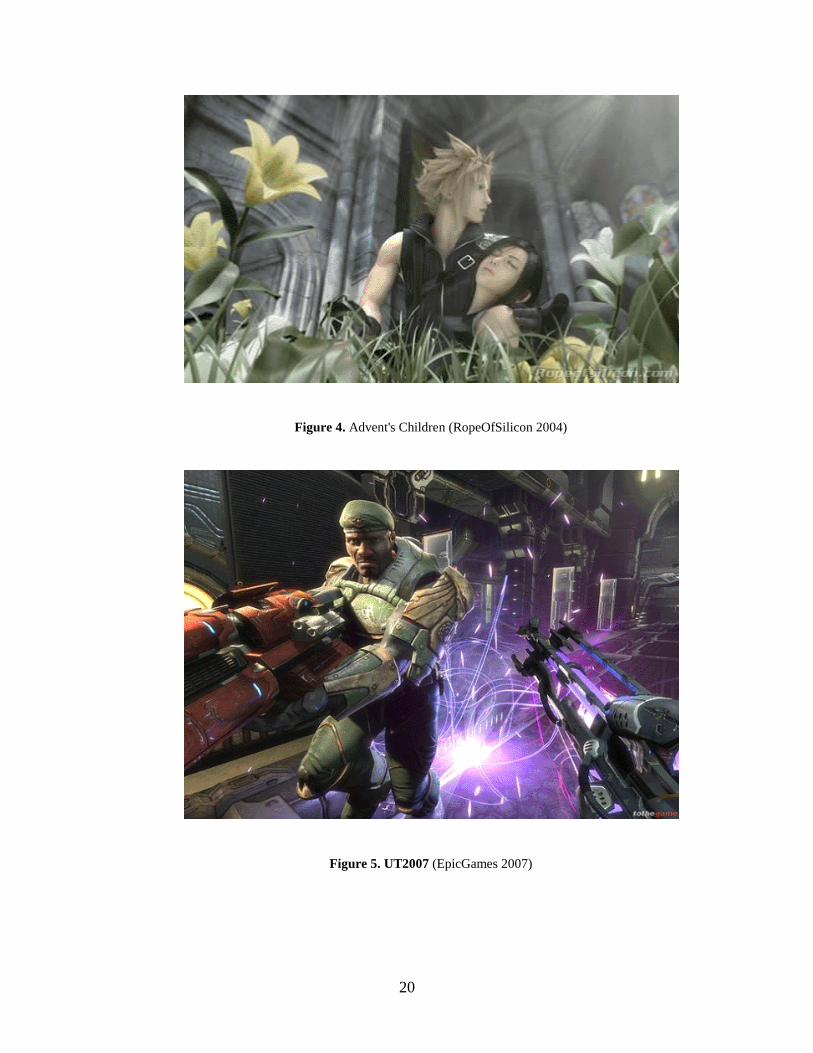
chosen engine well. Figure 4, below, shows a movie rendered using the latest graphic
technology. Figure 5, below, shows a scene from one of the most advanced computer games.
20
Figure 4. Advent's Children (RopeOfSilicon 2004)
Figure 5. UT2007 (EpicGames 2007)

21
Because of the technical challenges, many authors of Virtual Reality applications still use
traditional VR authoring packages (Virtools, 2007; VR-Juggler, 2007) or write everything from
scratch. These approaches provide complete flexibility for the author/programmer, but require a
great deal of time and effort to achieve basic effects. Furthermore, the resulting graphics are
significantly inferior to those generated by the game engines. Accordingly, a small but growing
number of VR authors are using game engines for their applications (Lewis 2002).
2.3.3 Flight Simulators
The modern history of Virtual Reality began in the 1960‘s with the flight simulator, an artificial
aircraft cockpit with video screens instead of windows. The pilot ―flies‖ over a computer-
generated landscape using controls which simulate the action of real controls (Ellis 1991). Many
simulators are mounted on mechanized platforms which tilt and roll to simulate the motion of a
real aircraft cockpit. The experience is real enough to justify these devices‘ long history and wide
use for pilot training. Recently, simulators have been used in such disparate fields as truck
driving, tug-boat piloting, and mining equipment operation to provide basic training on the use of
heavy equipment.
Figure 6. Exterior (left) and interior (right) of a flight simulator (Simlabs 2006)

22
2.3.4 Head-Mounted Displays
In real life, the left eye sees a slightly different view of the world than the right eye, simply
because they are separated by a few inches. The brain exploits this difference to produce a strong
visual cue for depth at near distances, an effect called stereopsis. A Head Mounted Display
(HMD) can simulate it for a virtual world by holding a small video screen in front of each eye.
Each screen shows a similar view of the virtual world, but the viewpoint for each screen is offset
a small distance in the virtual environment, creating stereopsis for the user.
In the HMD, both images change based on where the viewer is looking. Coordinated with
a device for tracking the viewer's head movements, the software driving the displays on the
HMD's screens determines the direction and location of each of the viewer's eyes in the virtual
environment. For example, if the application begins by showing the viewer a scene, and the
viewer turns his or her head slowly to the left, the scene the viewer sees in the HMD changes in
just the same way a real one would. With proper calibration, the HMD creates the illusion that
the user is entirely within the virtual world, and can see different views of that world by looking
in different directions.
Figure 7. Two HMDs (left) from Cybermind (2006) and (right) from Virtual Realities (2006)
Generally, HMDs are the least expensive of the classic stereoscopic displays, popular
among VR users. However, the HMD rarely offers a wide field of view, usually showing less
than thirty degrees in the horizontal dimension. The user can turn his or her head to see more, but
effectively has tunnel-vision in the virtual world. While this is less restrictive than it may sound,

23
it is a real limitation. Another disadvantage of the HMD is that it cuts the viewer off from
everything not mediated by the computer and makes direct visual person-to-person social
interaction impossible. We mistrust devices which subtract from the human experience so
sharply. Perhaps that is why Figure 7, above, is disturbing. The man on the left looks as if some
boneless sea creature is gripping his face, and the man on the right looks like his is a menacing
cyborg.
2.3.5 Flat-Screen Projection-Based Immersive Displays
Around 1991 at the University of Chicago, Sandin and DeFanti developed the "CAVE,‖ an
immersive electronic display, which operates on the same general principle as the cyclorama
(Cruz-Niera 1993). A single viewer stands in the center of a partial cube, where each wall is a
rear-projected screen, effectively a very large computer monitor. The image on each screen is
part of a larger panorama. If the image on each screen has the proper perspective correction, all
the images together appear to the viewer as a single contiguous landscape. In the VR research
community, the acronym "CAVE" has evolved into the general term, cave, in the VR community
to refer to any multiscreen enclosure with similar properties
Figure 8. User in the SAS-Cube, exploring a virtual nightclub (ALTERNE 2005).

24
The CAVE supports a stereographic view for the user by projecting both the right- and
left-eye views onto the screens at the same time. The viewer wears special glasses, which filter
the images so that each eye receives only the image it should. The lens over the left eye blocks
the image intended for the right eye but lets the left-eye image through. The right-eye lens does
the opposite, and the final result is a single stereographic view. Furthermore, an electronic
tracking device makes the computer aware of where the user's head is located, so that it can
adjust the perspective on all screens as the user moves. This preserves the illusion while allowing
the viewer to look around and walk around in the CAVE.
Figure 9. The Virtual Theater (Jacobson 2005c)
While stereoscopic caves remain expensive, those which produce a monoscopic (normal)
video image have become much cheaper recently (Pape, 2002; Jacobson, 2001, 2005i; Blake,
2003; PublicVR 2008). Though they do not present the optimal display, nonetheless they can be
very useful and cost-effective (PublicVR 2008), especially for applications where the objects of
interest are some (virtual) distance from the user. In real life, the stereographic effect diminishes
with distance.

25
2.3.6 Digital Dome Displays
Digital dome displays evolved from conventional planetaria and offer an impressive degree of
visual immersion, without stereo, head-tracking or any other special equipment. The curved
screen eliminates seams and minimizes perspective distortions as the user moves his or her
viewpoint. Most installations are large, allowing many viewers at one time. Recently, there has
been an effort in the technical community to provide interactive content for these displays
(Elumens, 2001; Elumenati, 2008). The cost of building these displays has decreased, and
software makers are providing an ever-widening range of content-generation tools which can be
used in them (Softimage, 2001; Multigen, 2001; Web3D, 2004; DomeUT 2006).
Figure 10. Dome display at Digital Life (2006) courtesy of the Elumenati (2008)
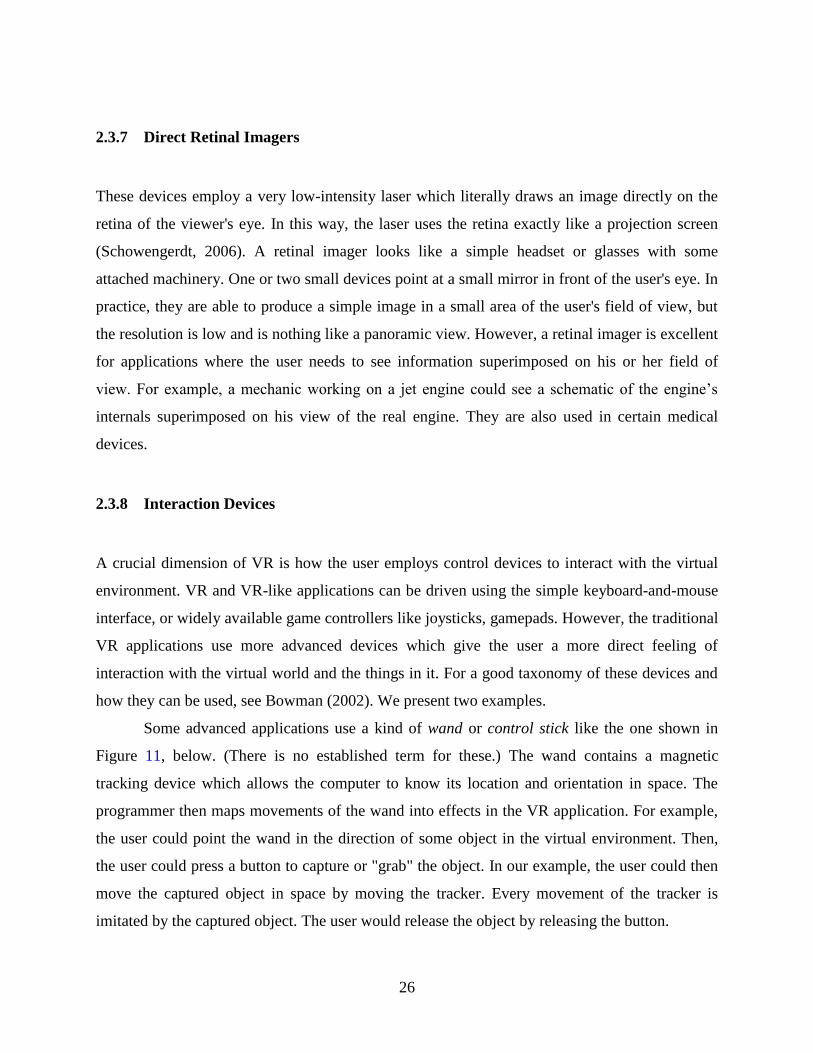
26
2.3.7 Direct Retinal Imagers
These devices employ a very low-intensity laser which literally draws an image directly on the
retina of the viewer's eye. In this way, the laser uses the retina exactly like a projection screen
(Schowengerdt, 2006). A retinal imager looks like a simple headset or glasses with some
attached machinery. One or two small devices point at a small mirror in front of the user's eye. In
practice, they are able to produce a simple image in a small area of the user's field of view, but
the resolution is low and is nothing like a panoramic view. However, a retinal imager is excellent
for applications where the user needs to see information superimposed on his or her field of
view. For example, a mechanic working on a jet engine could see a schematic of the engine‘s
internals superimposed on his view of the real engine. They are also used in certain medical
devices.
2.3.8 Interaction Devices
A crucial dimension of VR is how the user employs control devices to interact with the virtual
environment. VR and VR-like applications can be driven using the simple keyboard-and-mouse
interface, or widely available game controllers like joysticks, gamepads. However, the traditional
VR applications use more advanced devices which give the user a more direct feeling of
interaction with the virtual world and the things in it. For a good taxonomy of these devices and
how they can be used, see Bowman (2002). We present two examples.
Some advanced applications use a kind of wand or control stick like the one shown in
Figure 11, below. (There is no established term for these.) The wand contains a magnetic
tracking device which allows the computer to know its location and orientation in space. The
programmer then maps movements of the wand into effects in the VR application. For example,
the user could point the wand in the direction of some object in the virtual environment. Then,
the user could press a button to capture or "grab" the object. In our example, the user could then
move the captured object in space by moving the tracker. Every movement of the tracker is
imitated by the captured object. The user would release the object by releasing the button.

27
Figure 11. IS-900 MiniTrax Wand Tracker (Intersense 2006)
Another classic VR interface device is a special glove which not only has a location and
orientation tracker, but can read the posture of each finger on the user's hand Figure 12, below. In
some applications, a computer graphic image of a hand in the virtual environment shadows all of
the motions of the real user's hand. The virtual hand can touch an object, grab it and move it
around. In some gloves, actuators in the inside of the glove squeeze the inside of the user's
fingers, gently, in the places where the virtual hand is touching the virtual object. The effect is
the illusion of feeling the virtual object. Importantly, the glove also enables the user to give
commands to the computer by making specific gestures.
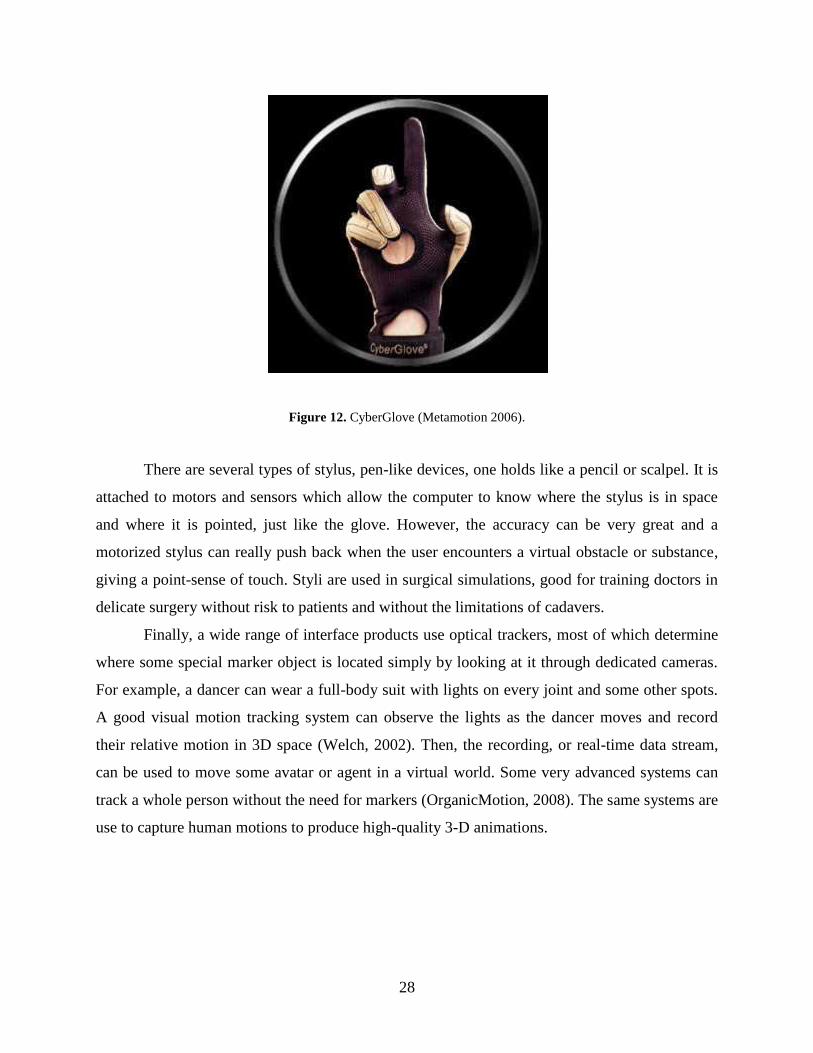
28
Figure 12. CyberGlove (Metamotion 2006).
There are several types of stylus, pen-like devices, one holds like a pencil or scalpel. It is
attached to motors and sensors which allow the computer to know where the stylus is in space
and where it is pointed, just like the glove. However, the accuracy can be very great and a
motorized stylus can really push back when the user encounters a virtual obstacle or substance,
giving a point-sense of touch. Styli are used in surgical simulations, good for training doctors in
delicate surgery without risk to patients and without the limitations of cadavers.
Finally, a wide range of interface products use optical trackers, most of which determine
where some special marker object is located simply by looking at it through dedicated cameras.
For example, a dancer can wear a full-body suit with lights on every joint and some other spots.
A good visual motion tracking system can observe the lights as the dancer moves and record
their relative motion in 3D space (Welch, 2002). Then, the recording, or real-time data stream,
can be used to move some avatar or agent in a virtual world. Some very advanced systems can
track a whole person without the need for markers (OrganicMotion, 2008). The same systems are
use to capture human motions to produce high-quality 3-D animations.

29
2.3.9 Online Communities
Massively multiple online communities (MMOs) are becoming increasingly important in
education (Dede, 2004). In an MMO, a large number of participants use DesktopVR on their
home computers to join a shared virtual environment, a 3D computer graphic world they access
over the Internet. Each person controls a 3-D model or avatar, usually humanoid, which
represents the player in virtual world. A window on the user‘s desktop (or the full screen) shows
that avatar‘s view, and is the player‘s main viewpoint to the virtual environment
Figure 13. An avatar in Second Life conversing with the user.
Figure 13, above, shows a view that the user might see when conversing with a
female avatar in the foreground. Actual conversation in MMOs can be typed text (online
chat) or voice, enhanced by the visual context. Context includes the appearance of the
environment and the interaction rules which govern it, as well as the locations of the avatars
and objects within it. Combined with body language, facial expressions, social motion, and
location in a complex space, participants in the MMO can have a rich way to communicate.

30
In recent years, general purpose MMOs, such as Second Life (2008) and There
(200?), have attracted great attention from the general public and the mainstream media.
Major corporations are setting up ―areas‖ for themselves within Second Life, and important
organizations are having virtual meetings there. Advertising in Second Life is becoming
ubiquitous. All of these changes have been difficult for the Second Life community to
digest, leading to some conflict. That conflict and the difficulty of upgrading to more
current computer graphics software pose a significant challenge to the survival of this
particular enterprise. Nevertheless, this paradigm of interaction will continue to evolve and
become increasingly important in human social communication.
Figure 14. Player avatars in World of Warcraft, a popular MMORPG
The technology for online virtual communities began as games, and the best technology
and the majority of the users continue to employ the technology for game-play. MMORPG is an
acronym for "Massively Multiple Online Roleplaying Game‖ where a fictional theme imposed
upon the players and the environment, such as medieval European folklore or Star Trek. See
Figure 14, above. The avatars come into the environment with particular traits appropriate to the

31
milieu and are usually called characters. Game goals vary, but usually involve gathering treasure
and power, fighting wars or solving mysteries. MMORPGs have reached a wide mainstream
audience, becoming a very large business. There are actually real people making real money by
playing these games to build up characters to a desirable level of ability, which they then sell to
new players. Other users are crafters, players who make objects for other players to enjoy at a
real and/or virtual price.
We predict that visual and sensory display will become more important in MMORPGs
and their successors. Soon, immersive virtual reality and the massively multiple online games
will merge, giving users a wide range of displays from which to choose.
2.3.10 Augmented Reality
A close cousin to VR, Augmented Reality (AR) is the practice of using VR techniques to
enhance a real, physical, space (Papagiannakis, 2004a, 2004b; Ruiz, 2002; Sinclair, 2001;
Addison, 2002). For example, AR Quake (Piekarski, 2002) has the user look at the world
through special glasses. Animated autonomous agents are added to the user's view by having the
computer ―paint‖ the appropriate imagery onto the surface of the glasses. The agents interact
with each other, the terrain and the user. With ―Hippie‖ and related applications (Oppermann,
1999; Baber, 2001) the user hears a topical narrative when approaching a point of interest in a
museum. The narratives change, adaptively, depending on who the user is and what the user has
seen before. It could be said that there is a continuum of possible applications from pure reality
to a fully virtual environment, with the term ―Augmented Reality‖ including most things in
between.

32
2.4 ADAPTIVE HYPERMEDIA
An interactive device is said to be adaptive if it automatically changes its appearance and/or
behavior to better suit the user's needs and goals. A great deal of research has been devoted to
adaptive hypermedia, (Brusilovsky, 2001, 2004). Hypermedia applications are widespread and
important (e.g. the World Wide Web). Many hypermedia applications are used by people who
differ in ways that have an effect on the application's usefulness. This is especially true for
educational applications, because student demographics can vary widely and a students' prior
knowledge has a decisive effect on any learning activity (Bloom, 1956).
Most of the Virtual Heritage applications described in section 2.7, p76, are part of some
larger web-based hypermedia application. Unfortunately, few of them have any capability to
adapt to the user's particular actions or needs (Kameas, 2000). Even so, adaptive methods have
been applied successfully to other educational media. The addition of adaptivity to Virtual
Heritage applications is an important and useful step for VH developers. Techniques from
adaptive hypermedia (AH) have been proven to be effective, and are therefore not difficult to
implement.
A significant portion of the adaptive hypermedia research is aimed at educational
applications (Brusilovsky, 2003c; Cristea, 2004; Garzotto, 2004). Many of these applications use
a Desktop VR interface, make adaptive changes to the 3D virtual environment itself (Chittaro,
2003, 2004) or influence user navigation (Hughes, 2002). Finally, there are hypermedia
applications which use adaptive narratives to augment a real, physical space, (Oppermann, 1999;
Specht, 1999b; Not, 1998a, 1998b; Sinclair, 2001) which is a form of augmented reality (Baber,
2001).

33
2.4.1 User Modeling
The behavior of an adaptive device is usually governed by some implicit or explicit model of the
user. Researchers in Artificial Intelligence (AI) developed many of the formal methods for user
modeling and information accessing tasks, such as dialog systems (Chin, 1989; Johansson, 2002)
and web-navigation systems (Levy, 2000; Weber, 2001). The user model is developed from
information about the user which the program is able to gather or infer (Brusilovsky, 2001, 2004;
Torre, 2001; Bra, 2000). There are several ways to gather and/or infer that information.
The simplest is for the instructor or operator to provide information about the user to the
program before startup or for the program to ask the user for the information it needs. In a formal
educational setting, a questionnaire may be appropriate. However, many users outside of the
classroom will only tolerate a few questions.
A more sophisticated method is to observe the past behavior of a particular user. The
program can record usage behavior as an important clue to the user's goals and preferences. For
example, many automated online retailers make buying recommendations to the user-based on
his or her previous purchases. Alternatively, applications can keep a history of the points of
interest (physical or virtual) that the user has visited and adjust its behavior to match. The
application can also incorporate information about the tasks the user must perform to achieve his
or her goals. Then, the application can attempt to assist the user by adapting in ways that make
the user's tasks easier (Garlatti, 1999).
Based on the information gathered, a hypermedia application can infer a great deal about
the user by matching that information with a pre-existing database of user stereotypes (Rich,
1989). For adaptive hypermedia, a stereotype is a set of facts about a hypothetical user who
belongs to some demographic group. Key facts identify a user as probably matching some
stereotype. For example, a forty-year-old college educated person is likely to ask for a different
explanation of what a giraffe is, than the typical six-year old. Information gathered during the
use of the software can refine the stereotype, either generally or with respect to the current user.
Several studies feature learner stereotypes based on different learning styles (Danielson,
1997; Mammar, 2002; Kim K, 1999; Bruen, 2002; Carver, 1999). With stereotyping, a great deal
of information can be inferred quickly. However, none of it is certain, so it is best for the
application to keep track of inferred facts and change some measure of each one's validity based
34
on supporting or counter-evidence. A practical example is SETA, an application which helps
retailers to tailor their online stores to specific user stereotypes (Ardissono, 1999).
Another way to gather information about the user is through collaborative
recommendation (Balabanovic, 1997). Actual users of the application are grouped by stereotype,
behavior, or in some other way. They are then asked for recommendations which are evaluated
partially on the basis of stated or observed preferences of individual members of that group.
Though stereotyping has proved to be useful, it is never completely accurate and can
sometimes be misleading. Also, the stereotype groups can overlap considerably making the rules
of determining which is appropriate for a particular user quite complex
2.4.2 Methods of Adaptation
The term ―hypermedia‖ usually refers to computer applications in which an information space is
rendered into discrete portions; the user navigates this divided space by ―moving‖ from a view of
one portion to another though some built-in mechanism. The most common of these is the
hyperlink, (e.g. a URL on the Web) although more advanced mechanisms are common,
including search-by-query, map-based navigation, and the traversal of some three-dimensional
visualization. Regardless of the mechanism, the underlying principle is that the user is navigating
through a predefined information space. In the Adaptive Hypermedia literature, the value of
adaptation is generally regarded as positive. It is seen as a method of guiding the user in
navigating the information space by changing, helping or hindering the user to navigate in some
informational directions and not others.
One of the simplest ways to make hypertext adaptive is to change the links. Since
hypertext is connected by links, changing links redefines navigation in the information space.
This should only be done with great care, because the user is likely to have already built at least a
partial mental map of the information space based on the defined ―modules‖ of information s/he
has encountered when first entering a particular VR application. If it is decided that the linking
structure can be altered within an application, it is generally more acceptable to users to add links
rather than to remove them. For example, an adaptive labeling application, like ILEX (Cox,
1999), will simply display more of an information module to the user if it deduces that s/he is
ready for more detailed levels of information.

35
Another adaptation is to change the appearance of the display. The change can emphasize
some information and/or links and deemphasize others. The adaptive mechanism can be simple,
like reordering menus or highlighting certain items within a list. More advanced applications
have also been developed. . For example, KnowledgeSea (Brusilovsky, 2002) has a large number
of links attached to an abstract map a selected subject area. Regions within this area can change
color, depending on the number of visitors and other factors. Another example, is Gates of Horus
(section 3.3, p98) our own learning game. When the cursor is over an active object, it changes
color, indicating that the student can select it to trigger an action.
Advanced hypermedia may use more sophisticated adaptation methods, such as complex
rules to determine the appearance and behavior of the interface (Bra, 1999; Brusilovsky, 2004).
The adaptive media application may also change its rules to accommodate the user either before
or during a particular (usually user initiated) operation.
Recently, there has been interest in meta-adaptation, where higher-order rules determine
which more specific and ―lower level‖ adaptive rules are invoked to assist the user. Brusilovsky
(2003a) did a post-hoc analysis of three previous AH experiments, which showed unmistakably
that different students needed different kinds of support in learning media. He found that
students new to some material needed a great deal of guidance, preferring to stay on some
predetermined path which navigated through the subject matter presented within the application.
Other students, who possessed significant prior knowledge, tended to ―jump around‖ in the
information space a lot more, interrogating the interface for specific pieces of knowledge.
Brusilovsky (2003a) and Assis (2004) emphasize the importance of this problem and suggest
certain meta-rules which can be used to design an application‘s navigation and display strategies
depending on measures which attempt to assess the level of the students' prior knowledge. Torre
(2001) describes a framework for user modeling which could be used in dynamic modeling.
In the strategies described above, the user is not directly notified that changes are made to
a particular application‘s interface. Indeed, in some designs, the user may not realize that
changes have occurred at all. However, there are other strategies which depend on the user being
aware that adaptations occur while the user is engaged with the application. For example, the
adaptivity in an AH application may be embodied in one or more autonomous agents, as in
broker and advocate agents in recommendations system which offer advice or suggest
opportunities to the user (Manouselis, 2002). For example, friendly agents may give advice to

36
the user about which path to take or may even ―bring‖ information directly to the user (Rhodes,
2000). An autonomous helper or tutor agent may even embody adaptive behaviors which serve
to assist the student (section 2.7.5, p82).
Most adaptive navigation applications present the user with a finite information space.
However, researchers have recently begun to experiment not just with adapting the method in
which the user navigates the information space, but also adjusting the size and nature of the
information space through which they navigate. Brusilovsky (2001) points out that most of the
existing hypermedia applications provide the user with a static information space which allows
the designer to build all the links and rules ahead of time to take advantage of the particular
―geography‖ of the information space and of the goals of the potential users. Alternatively, the
rules of adaptation can themselves be changed in real-time, a kind of meta-adaptation
(Brusilovsky, 2003a). Applications based on a changeable information base are more difficult,
especially with the World Wide Web (Carver, 1999b). Users must be given some explanation of
the overall structure and meaning of the subject matter they are navigating. This is much more
difficult than it may initially appear. Many initial attempts were not successful, although some
success has been reported.
2.4.3 Some Applications
Most existing adaptive applications use text, imagery, animations and other visual strategies,
though all of these displays are limited to two spatial dimensions. For example, a virtual museum
is similar to a traditional hypertext museum guide with adaptation added, providing the kind of
information one usually finds in a physical museum‘s catalogue (Bertoletti, 1999, 2001; Cox,
1999; Oberlander, 1998; Milosavljevic, 1998).
Some adaptive applications seek to lead the viewer along a single path through the
information space, but tailor the path based on the viewer's knowledge and interests. For
example, students may work their way through a curriculum which adaptively changes to suit
their needs, based on predetermined rules set by and instructor and presumably under the
instructor's supervision (Brusilovsky, 2003b; Tan, 1997; Specht, 1997; Nykanen, 1998).
Virtual museums and adaptive course-ware are special cases of such expert systems, in
that they give the user information at least partially based on what the tutoring system determines

37
s/he knows. The static precursor to this is a simple list of instructions, where each instruction
assumes the ones before it have been followed. An adaptive system will have much more
complex ways of responding to the user and guiding him or her towards some knowledge goal.
While it is possible to embody the tutoring system in a static hyperlinked structure, such as the
primitive expert systems, it is far more effective (and far more difficult) to use techniques
developed in Artificial Intelligence research to determine the knowledge space and the
informational paths through it.
2.4.4 Augmenting Virtual Space with Adaptive Behaviors
An information space embodied in an adaptive application can often be expressed as a three-
dimensional virtual environment. The user can query this 3D interface in a variety of ways. In
some cases, part or the whole of the environment can change depending on the user‘s perceived
needs. For example, a virtual or physical space can be augmented with audio clips of information
(Oppermann, 1999; Sinclair, 2001; Not, 1998b). The content of these clips may change
depending on which user model the user is determined to belong to and where s/he has been in
the VE, (Petrelli, 1999). This technique is particularly useful for museum-like environments. A
more advanced approach is to generate automatically different versions of the virtual
environment based on the user's current perceived need (Chittaro, 2003, 2004).
An entirely different adaptive strategy is to change the way in which the user navigates
within the virtual environment in a dynamical fashion. For example, going around a corner to see
what is there is can be regarded as a kind of spatial query. There are a number of feasible
methods to constrain or deflect the user's movement through the virtual space, so that s/he is
either encouraged or required to notice certain things or to emphasize certain trajectories
(Brusilovsky, 2004). One way to do this is to use ―guide agents‖ who recommend the direction
of gaze or movement (Hughes S, 2002a). Examples include a moving spotlight, a floating arrow
that stays in front of the user, points which serve as a compass (Hughes S, 2002a) and a lifelike
guide agent who leads the user in particular direction or indicates points of interest (Chittaro,
2003, 2004).
In yet another level of adaptation, the ―guide agents‖ themselves may be programmed to
change their strategy depending on the perceived needs or interests of the user and based on the

38
overarching narrative structure of the application. This is especially common in games, where
agents often populate a virtual landscape or social environment. They can change their behavior
depending on who the user is supposed to be or on events that occurred before the user's avatars
encounters the agent.
2.4.5 Augmenting Physical Space with Adaptive Behaviors
A variety of methods exist to guide the user though physical spaces using recorded or generated
narratives. The narratives can be heard on speakers, in mobile tape recorders, read on location-
sensitive PDAs, or delivered by other means. Using HyperAudio, for example, the user can hear
a narrative explanation of some object when s/he nears it (Oppermann, 1999; Specht, 1999b; Not
1998a, 1998b; Sinclair, 2001). These narratives can be made adaptive, changing according to the
users' prior interaction within the environment, learning goals and other factors. For very large
physical spaces, adaptive applications are typically implemented with some kind of Personal
Digital Assistant (PDA) for the user and some means of determining the user's location. This
allows the application to make travel recommendations, give instructions for physical navigation,
reveal historical information, and so on (Sendin, 2002; Cheverst, 2000). All such strategies can
be modeled in virtual environments or employed for use in VE-based applications.
Adaptive educational applications (immersive or not) can be more learner-centered than
static educational software. This is also true for pedagogical agents, who are more lifelike and
functionally helpful if some kind of adaptive intelligence can drive their behavior.
2.4.6 Learning Games
The game paradigm is an excellent way to center interaction on the user in a flexible virtual
environment. Since the nineteen-eighties, educational researchers have studied how the
structures and methods used in extremely popular computer games could be harnessed to
promote learning in a variety of fields. Today such efforts are attracting even more interest and
resources (Squire 2003, 2007; Kirriemuir 2004; Repenning, 2005). Games usually are based on a

39
microworld of some sort and almost invariably use goal-seeking activities to motivate the user to
explore this ―world‘ (Champion, 2004b; DeLeon, 2000). Similarly, immersive VR interfaces
often use goal-seeking strategies to shape interaction with many types of virtual environments,
especially those with a high level of visual fidelity.
Today, computer games are a very common part of popular culture, with millions of
people playing them. Through video games and other electronic media, many users have
developed a high degree of video literacy, comfort and competence with fast, information-dense
input. Also, the game industry has developed powerful, flexible software that can be adapted for
educational use–indeed, much of it has already been adapted to Immersive VR (Squire, 2002;
Kirriemuir, 2004; Jacobson, 2005). These developments put many types of educational virtual
reality within reach of educators and their institutions (Lewis, 2002; Dondlinger, 2007). The key
advantages of game-based learning are:
1. the student/player's intense investment in reaching a goal defined by the educator
designer.
2. continual feedback for the student as s/he interacts with the system,
3. a high degree of student involvement and investment in the activity itself
We believe that educational games are a special case adaptive media (Brusilovsky 2008) and are
well suited to both Constructivist learning activities (section 2.5.1, p42) and to Virtual Reality.
The key is to make the goals of the game serve the students learning goals and the
broader curriculum. The student would benefit little if an educational game is designed to be
some kind of a wrapper around the information s/he is expected to learn. In these cases, the
student might play the game for its own sake and quickly forget the subject matter. It would be
easy to design a game n which the student gains points for solving riddles or remembering facts.
However, it would be much more effective if the goal of the game was to accomplish something
within the context of the subject matter. Winn (2001) provides an excellent example of a good
conceptual design; in his study, students adjust environmental factors in a simulated part of the
world to find an optimal solution to global warming. This activity is definitely a game, although
Winn does not describe it as such, neither in the instructions given to his subjects nor in the
paper describing his experiment. The students simply enjoyed and learned.

40
In our study, we structured the student learning experience as a game.

41
2.5 LEARNING THEORY AND VR
In the following discussion we will explore how the educational theories that were developed in
the field of Artificial Intelligence now inform the development and use of immersive VR in
education. Other studies have addressed this topic, and they are usually they are shaped by
educational theory of Constructivism, in which students learn best through an active self-directed
curriculum. Most investigators believe that the expressiveness and flexibility inherent in all types
of VR (not just immersive) supports this style of instruction.
Further, many of these scholarly works endorse the idea that sensory immersion produces
a feeling of presence which enhances engagement and therefore learning; we believe the truth is
more complex (section 2.5.3, p47). Another major justification for using Immersive VR in
teaching is the idea that VR is a powerful means of expression, encoding a great deal of
information with which the user can interact directly. Most arguments for this are based on the
Ecological (Gibson, 1979) approach to understanding the mind, however others are firmly
Cognitivist. As will be discussed below, some of the literature on this topic uses the concept of
Distributed Cognition, which begins to combine the Cognitivist and the ecological approaches.
The goal of all of these approaches is to give students enough flexibility to support their own
learning, but to do so in a way that can be measured objectively. At the end of this section, we
will present Dr. William Winn‘s synthesis which we have expanded and modified to produce the
core of our own investigational theory.

42
2.5.1 Constructivism
Constructivism has been central to the way most researchers approach educational VR,
particularly in 1990's (Fallman, 1999; Dalgarno, 2001b, 2002a, 2002b), while more recent theory
and work (Winn, 2003a; Moreno, 2002b; Mayer, 2001) combine Cognitivist approaches with
Constructivist concepts. Unfortunately, much substandard work has claimed a Constructivist
underpinning (Jonassen, 2000a; Land, 2000). For example, many 2D multimedia learning
applications developed during the 90's claimed to be Constructivist, but do not give the student
enough autonomy to direct their own learning (Land, 2000). Efforts to use VR and Immersive
VR have a similar range of quality. As with all media, the technology does not solve problems so
much as it creates opportunities. This section describes constructivism as it is presented in the
educational VR literature and in Jonassen (2000a).
One of the central tenets of Constructivism is that the learner defines the learning
environment. Individuals respond not to some fundamental reality, but to their own context or
―Umwelt,‖ the environment as the user perceives it (Winn, 2003b). For example, people from
warm climates imagine snow to be a uniform material, while the Inuit peoples regard it as an
extremely varied phenomenon which they describe using many different words (Jonassen,
2000a; Land, 2000). Part of this context is the body of information that the student already
knows. If education is to be successful and relevant), the learner must actively connect the new
knowledge presented in the learning experience to the knowledge into their own preexisting
knowledge context (Bloom, 1956). This process requires both self-knowledge and knowledge of
the environment. For example, a business student must understand how to apply his or her
unique advantages in the cultural-economic setting where s/he expects to be successful.
Constructivism not only stresses the student's ―Umwelt,‖ but it also sees knowledge
acquisition as part of a larger social process of discovery and negotiation whose outcomes are
encoded in cultural artifacts (Land, 2000; Vygotsky, 1978; Furness, 1997; Winn, 1999b; Osberg,
1997a; Jackson, 2000). This is how language, religion, culture, technology and science all came
into being, and they necessarily form much of the learner's environment. To paraphrase (Jackson
2000):

43
In Constructivist theory, learning is rooted in specific situations and their cultural
artifacts. Ideally, instruction should be centered in a community of learners who
collaborate to create their own curriculum (Brown and Champion, 1994; Driver, 1995).
In McLellan's (1996) view of ―situated learning,‖ knowledge is encoded into the
environment and developed by the activity, context and culture of the students.
For example, when students work on group assignments, they must come to a common
understanding of what relevant material forms the underpinning of the task at hand and also of
the strategies and tools that can be used to accomplish it.. When students study together for
assignments, they negotiate the meaning of the relevant material as a way of pooling their
intelligence to better approximate what they believe the teacher wants them to know. In Activity
Theory, this is called the ―co-construction of shared knowledge‖ (Vygotsky 1978, Jonassen
2000b, Jackson 2000). Hay (2000) calls it ―investigation-based learning.‖
Constructivism is not simply a theory about the personal and social nature of knowledge
and understanding; it also provides the underpinning for learning strategies. A major goal of the
Constructivist approach is to teach students how to learn. However, proponents of the
Constructivist approach also admit that instructors cannot fully know their students‘ minds and
students often learn without specific instruction. Students must develop personal strategies for
learning, and it is generally agreed that students learn better if they feel they have some
ownership of the learning process (Furness, 1997). A Constructivist educator helps the students
during the discovery and meaning-making processes. An effective instructor provides learning
tools and initial information, sets overall goals, monitors students' progress, provides additional
materials when necessary and resolves problems. The students themselves frame the intermediate
problems, set their short-terms goals, and develop the skills they need to achieve the larger goal.
According to Constructivist theory, these skills can often be developed within the framework of
some assigned group learning project. The intent is to teach goal-making, planning, evaluation,
and especially self-evaluation techniques, all skills which are necessary for the students to be
successful in later learning.
Constructivist learning can be seen in terms of the student's Zone of Proximal
Development, (Vygostky, 1978; Jackson, 2000) which includes learning activities which the
student can do, but only with assistance from an instructor. The student can perform the simpler
learning activities ―below‖ the zone without help, while activities ―above‖ the zone are too
complex for him or her, even with instructor assistance. When the student is performing tasks in

44
his or her ―proximal zone‖, s/he exercises abilities that are still forming, which is when learning
is most effective (Vygotsky, 1978; Jackson 2000).
Similarly, the Bi-Directional Zone of development (Forman, 1989; Jackson, 2000)
describes those activities which students can perform, but only by working together with other
students, and thereby scaffolding each other's learning. Collaborative learning is especially
useful, because teamwork itself is a critical workplace skill (Vygotsky, 1978; Roussou, 1999;
Jackson, 2000).
Project-based learning is an important part of the Constructivist approach. Instructors
often facilitate learning by assigning group projects to their students, project-based learning.
Papert calls this approach Constructionism (Hay, 2000). Project-based learning supports ―multi-
level engagement/activity, challenge and structure,‖ and that student engagement is stronger
when the students have authorship in the goals of the project and the final product itself (Furness,
1997; Roussou, 1999).
Finally, Constructivist practice places great value on the necessity of choosing the level
of ―authenticity‖ that is appropriate to the learning task at hand. Concurrently, the wider
literature about Immersive VR places great importance on the medium's ability to create virtual
environments which faithfully represent aspects of the real world. Researchers in educational
Immersive VR are particularly interested in learning environments which are ―authentic‖,
―naturalistic‖ or even "realistic", because, if these types of ―worlds‖ can be created, students can
be placed in an environmental context which is familiar to them and which can be made relevant
to their learning goals (Furness, 1997). On one hand, such environments must be information-
rich, containing enough of the right detail to be realistic (with respect to the learning goals). On
the other, they must be as free as possible of irrelevant features. Jackson (2000) calls such
applications ―selectively realistic.‖ However, Jonassen (2000a) warns of ―reductive bias‖, which
leads learning exercises to be excessively or inappropriately simplified.
It is worth noting that roughly half of the empirical educational Immersive VR
experiments in this survey explored the teaching of children in public schools. The majority
teach science subject matter, such as physics, geology or astronomy, which present significant
educational challenges.
They all claim to employ Constructivist learning principles to achieve "Conceptual Change"
(p53) in the student. Their success in providing a truly Constructivist learning experience varies,

45
however, as shown in section 2.6.4 (p66) Also, equal numbers of the Constructivist learning
experiences in the experiments were constructionist (learning by making something) or
experiencing (primarily exploration and inquiry). Two experiments (Winn, 1997; Roussou,
1999) were both—students built small virtual worlds and other students experienced them.
2.5.2 Direct Interaction with Information
According to much of the VR literature, the user interacts directly with information, with no
intermediary, bypassing symbol systems. It is often said that the VR interface ―disappears,‖
freeing the user to concentrate on the subject matter (Bricken 1990, 1992; Winn 1997b, 1999a,
2001, 2003b). This view is inspired partly from the Ecological Cognition model and its heirs
which posit that users are directly aware of their environment, indistinguishable from it (Gibson
1979). This model assumes that information embodied or embedded in the environment is
directly accessible to a person's mind—it can be viewed as the external component of a larger
cognitive process (Gibson, 1979). Proponents of this view argue that a VR-based environment
can embody information that is encoded in a form directly available to the user's sensorium-in
effect making the information directly accessible to the user‘s cognitive processes. In this sense,
there ceases to be any interface between the user and the information.
Dr. Winn often stated that, with Immersive VR, the interface effectively disappears, thus
freeing the student to concentrate on the subject matter (Winn 1997a, 1997b, 1999, 2001,
2003b). In Winn (1999) he specifically states that VEs allow direct construction of knowledge,
―bypassing symbol systems.‖ The VR-as-direct-information view is widely held by authors in
the general VR literature, a good example of this is Merideth Bricken's often cited article
―Virtual Reality; No Interface to Design‖ (Bricken, 1990).
Unfortunately, this model does not address the gap between the information the designer
means to convey and the way it is expressed in (or as) a virtual environment (VE). For the user to
―directly perceive‖ the basic information that the educational VE is intended to convey, a perfect
conversion of the information into some sensorially accessible form would be required. Such a
conversion is impossible. The only information that the user can access directly in the Ecological
sense, is a representation of that information; and that representation is created by some person
or some process defined by the author of the virtual environment.

46
The correspondence between the data and the representation may be very close in some
cases, for example in a visualization of a storm front from atmospheric data. Even there,
however, design issues have a vital effect on the way the user perceives the information because
the design of the representation is not intrinsic to the information itself. In our example, the
colors assigned to different regions of air pressure could have a significant effect on how the user
reads the visualization.
At the other extreme there some information can only be represented with some arbitrary
symbol system, for example the text on the road signs in some virtual village. Many successful
future VEs will be some mixture of representation, symbol, iconography and metaphor. The use
of representations to construct an environment or artificial reality raises important ontological
issues (Heim, 1993; Koepsell, 2000).
Nevertheless, authors in the literature are well aware that the expression of information in
a VE must be tailored to its purpose, to the limitations of the technology and to the demands of
the human sensory and intellectual system. For example, Furness (1997) says that the design of
the VE influences how the user interacts with the information which in turn influences the way
s/he interprets it. Winn (2003b) reports that students using VR to learn about global climate
change learned more than control group about ocean currents, but learned no more about salinity
levels. He attributes this to the design of the representations used in the learning application.
Furness (1997) states that VR can be used as a medium for a wide range of symbol systems,
which is useful because different symbol systems activate different mental models in memory.
He also states that ―..some less 'abstract' symbol systems allow more direct construction of
conceptual and propositional knowledge." (Furness, 1997). Among VR theorists and
practitioners, there seems to be agreement that varying interpretations about such issues of
representation are unavoidable.
We believe that (1) everything in a VE is some kind of representation, (2) the user
perceives those representations as part of his or her environment, and (3) that VR derives its
expressive power from the wide range of possible representations and the ability to combine
large numbers of them into a single coherent presentation.

47
2.5.3 Presence and Engagement
The sense of presence is a critical component of VR (Zeltzer, 1992) and without it, an immersive
learning application cannot be successful (Winn, 2003a). The users would learn nothing, because
they could not understand the information presented by the application‘s interface. Accordingly,
nearly all experiments with educational VR test for presence, using a variety of measures.
In the existing VR literature, a key argument for using sensory immersion in an
educational application is that this would produce a significant increase in student engagement
with the subject matter (Furness, 1997; Dede, 1999; Osberg, 1997a; Jackson, 2000; Winn,
2003a). In many studies, the degree of sensory presence (section 2.1.1.5, p6) was positively
correlated with student learning and enjoyment (Dede, 1999; Salzman, 1998; Winn, 1997a,
2001). However, there are many other ways to enhance student engagement with the learning
activity, with interaction being the dominant factor. Non-Immersive VR can also enhance
engagement (Cobb, 2002; Dede, 2004; SecondLife, 2004; There, 2004) chiefly by raising
thematic presence (section 2.1.1.4, p6).
A stronger reason for using Immersive VR in education is that it allows the student to
interact with the information in a way that is both meaningful and not otherwise available. As
with other media, a VR application is successful to the extent that the particular advantages of
the medium are an explicit part of the information design. For example, Salzman (1998)
performed a successful learning experiment where students manipulated a model of an electric
field in an immersive display. In that study, students who could switch between egocentric and
exocentric views of the field learned best because each vantage point was superior for invoking
certain types of inference.
Several experiments attempting to demonstrate a causal link between general sensory
immersion and quality of learning were not successful (Moreno, 2002b; Byrne, 1996; Rose,
1996; Roussou, 1999; Salzman, 1999). In all of these experiments, sensory immersion was not
relevant to the subject matter and students could have conducted the same learning activities with
a non-immersive display. The best examples of the successful use of immersive VR are the
experiments designed and conducted by Salzman (1998) and Dede (1999). In these cases, the
learning task specifically required the user's sense of being present in a particular location within
the virtual environment (Maxwell World) to best perceive certain facts visible within the

48
environment. Students learned better in the immersive condition because the immersion was part
of the information delivery design.
We may conclude that (1) presence is a necessary but not sufficient, condition for the
success of any instructional VR application, and (2) learning outcomes are not predicted by the
degree of presence unless it is an explicit part of the VR application's instructional design.
However, this raises the question of how learning outcomes can be meaningfully measured.
2.5.4 Information Delivery in VR
In several papers Winn (1999a, 2001, 2003b) and Furness (1997) praise the expressive powers of
the VR paradigm as a useful tool for education. Winn states that VR makes more and better
interactions and metaphors possible, such as spatial metaphors for information which provide
qualitative insights (Winn, 2001).
Dede (1999) cites several advantages of multi-sensory presentation. Besides being
engaging, multi-sensory presentations can provide more ways for the user to interact with the
information, rather than just absorbing it passively. Multisensory presentation can be efficient
because different sensory channels can be used to present different information, while deliberate
redundancy across sensory channels can emphasize or reinforce certain information. However
multi-sensory presentations must be designed with care, because different sensory channels have
distinct comparative advantages and disadvantages. Particular representations of knowledge may
elicit idiosyncratic biases in the listener.
Educational VR supports student interaction with highly complex information and allows
the educator to situate learning in meaningful, familiar, motivating contexts, many of which
cannot be represented in other media (Winn, 1999b, 2003b; Jackson, 2000). It also allows
educators to present complex topics with less need to simplify the subject matter (Furness, 1997).
Oversimplifying lessons to fit the teaching method or medium can lead to learner
misconceptions, a problem Winn (2003b) calls ―Reduction Bias.‖ Loftin (1993) and Dede (1999)
agree with these conclusions but frame them in a more information-theoretical structure.
The theories advanced by Winn found a rigorous test in the work of Mayer (2001)
(section 2.5.5, p49) and Moreno (2000, 2002b) (section 2.6.5, p68). Both researchers combine
Constructivist and Cognitive approaches. Though Mayer (2001) mainly studied multimedia

49
designs, Moreno (2000, 2002b) described how the theories they both explore could apply to VR
applications. She also studied how using information delivery methods in VR can create
successful learning experiences.
2.5.5 Mayer’s Multimedia Design Principles
In the late 1980‘s, Richard E. Mayer developed his ―Cognitive Theory of Multimedia Learning‖
(Mayer 1987) which drew on dual coding theory, cognitive load theory and Constructivist
learning theory (Moreno, 2000b). He modeled the process of perception and learning based on
contemporary research into such bio-cognitive processes as sensory memory, auditory buffers,
short-term memory, and others. His model described the final step to learning the point at which
the student combines new information with existing knowledge to construct a new knowledge
structure. Moreno used Mayer's theory to shape her inquiries into using information delivery
methods in VR to create successful learning experiences.
According to Mayer, multimedia can enrich the learning experience by making better use
of auditory and visual channels, which often play only a minor role in contemporary educational
strategies. Both sensory channels encode a range of perceptible phenomena, though, as with
other sensory channels such as smell, some phenomena convey more specific types of
information than others over a given period of time. A simple example is that a color image
could be used to convey more information than a monochrome image of the same resolution.
This idea can be extended to predict that a CAVE-like display or an HMD with a very wide field
of view can provide peripheral visual cues, which can be helpful to the perception of self-motion
and self-location as well as the maintenance of a coherent mental image of the environment.
Spatialized sound also provides positional information on sound sources and self-location cues.
Assuming a skillful design and appropriate use, these capabilities should allow a greater
information flow into working memory.
In tandem with better use of specific sensory channels, the VR designer has the
opportunity to employ several sensory channels simultaneously. For example, many VR
applications for medicine use the sense of touch to provide ―haptic‖ feedback for training
surgeons (Westwood, 2004; Satava, 2002). A scalpel or other implement is represented by an

50
object which is shaped like a stylus. The user grips one end of this device but the other end is
attached to a motorized apparatus. While immersed in the VR application, the user can
manipulate a virtual object with a virtual tool controlled by this physical stylus. When the virtual
tool touches some virtual object, the physical stylus pushes back in the user's physical hand.
Depending on the fidelity of the display, the user can feel the shape and even the texture of
virtual object. Other applications such as flight simulators employ vestibular input as a sensory
channel (Stanney, 2002). Some applications employ smell (Stanney, 2002b) and others employ
other senses such as the ability to sense temperature. Again, if the application is appropriate and
the design is good, a greater number of sensory channels can be used to allow a greater
information flow into working memory.
VR affords the possibility of the use of new paradigms for perceptual integration.
Possibly the most often cited new capability of VR applications is to present information in a
form which leverages the mechanisms that the user employs to understand the natural world
(Wickens, 1995). For example, a building can be presented as a three-dimensional object which
the user can explore in an immersive display. By being ―inside‖ the architectural space, the
learner does not have to imagine what it would look like to an observer inside the real space. As
another example, a process in the natural world, like the progression of global warming, could be
depicted in a time-lapsed model of some landscape (Winn 2003b, Jackson, 2000).
Finally, VR can support new paradigms for human-computer interaction. If learning is to
be an active process, the learner must also be able to interact with the information efficiently.
Along with the rich ways in which VR applications can present information, they also can
provide more naturalistic ways for the learner to interact with it. For example, use of a hand-
tracking glove (Bowman, 2002) with an appropriate VR application would allow the user to
move an object in 3D space by simply reaching out, grasping it and moving the object to where
s/he wants it to be. Assuming an effective software and hardware implementation, this is much
easier than moving the object with some mouse, joystick or other indirect interface device. Such
a more naturalistic mode of interaction would reduce the cognitive load for the user and also
would support certain interaction metaphors which would otherwise be prohibitively complex.
Ellis (1991) provides an example of this from the training literature, where an astronaut was to
learn how to rendezvous with a spinning space capsule. The task is made easier by changing the

51
user's perceptual orientation so that the capsule is the ―ground‖ and the astronaut is flying
―above‖ it, trying to ―land on‖ it.
These principles may inform the design of educational VR applications and, more
importantly, the way in which they are used. However, the success of any instructional
technology depends on its ability to satisfy the particular needs of the learner Some of the
characteristics that may contribute to the effectiveness of a VR application are distributed among
potential learners in a systematic way.
2.5.6 Mayer's (Cognitive) Theory of Multimedia Learning
According to Mayer (2001c), Learning is an active process, and in practice the curriculum must
support the individual student's active inquiry into a problem—a learner centered approach.
Mayer built his theory on the following assumptions which have been verified by subsequent
research.
Multiple Cognitive Channels: Humans posses separate cognitive channels for
processing different types of information, such as textual, visual and auditory information
(Mayer, 2001c; Beacham, 2002).
Limited Capacity: Humans can only process a limited amount of information in a
particular information channel at the same time.
Active Processing: Humans engage in active learning by attending to relevant incoming
information, organizing selected information into coherent mental representations and
integrating these mental representations with other knowledge they possess.
This figure shown below is drawn from an article by Mayer (2001c). It illustrates the presents
process he proposes, with most of the boxes representing functional components of the mind and
the arrows representing the flow of information.

52
Figure 15. Mayer's Learning Model
It is important to understand that the flow of information is continuous, with higher-level
thinking strongly influencing lower level perception and selection. (Barsalou 1992) In other
words, the stepwise processing occurs at all levels in parallel, as the learner absorbs information.
It is not a naive ―program‖ by which the learner's mind starts with a lesson at the beginning and
end up with a parcel of learning at the end. In the graph above:
Multimedia presents differing combinations of text and pictures to the user.
The words and pictures are initially stored in the student's sensory memory, which, for a
brief period, records almost everything that s/he perceives. Written words are seen with
the eyes and spoken or recorded words are heard with the ears. They are then
―understood‖ through a complicated and subtle process.
The sounds and images to which the student is receptive move into working memory
shortly after they are experienced. Working memory is not a ―place‖ where memories
reside, but rather is a process which attempts to integrate new memories with the older,
more organized, memories. These memories are not organized into discrete categories.
For example, sounds may evoke images from memory and images may evoke sounds, as
when the student reads written words and ―hears‖ in his or her mind the sound of those
words. This process is partially shown by the arrows between the ―Sounds‖ and ―Images‖
boxes in the Working Memory section of the diagram shown above.
In the next ―step,‖ the words and images are integrated by the processes inherent in
working memory that is related to verbal and pictorial model.

53
The final step in the process of comprehension is that the student uses both the current the
verbal and pictorial input and the structure that has been developed to organize prior
knowledge to create new knowledge. This part of Mayer's model represents a process that
is much more complex than the prior steps in his explanation.
The limited capacity of the visual and verbal channels that serve as input into ‖working memory‖
is very important. Mayer (2001c) cites a series of experiments that show that presenting audio
narratives or explanations along with pictures results in better learning than when presenting the
same information as text with pictures. This is because written words and pictures compete for
the limited capacity of the mind‘s visual channel into working memory, while the information
presented by way of sounds is processed in a different ―part‖ of working memory. If an
educational VR application is well designed , a simultaneous presentation of sound and imagery
can allow the student to absorb more information more quickly without overloading. Mayer also
reports that this effect is stable with animations as well as with static images.
2.5.7 Distributed Cognition and Internal Representation
In the Distributed Cognition model, ―trajectories of information‖ (Hollan 2000) flow through the
physical environment, through the minds of the people in them and through the social systems
people comprise. The movement and transformation of information in an individual's mind is
more commonly known as thinking. The movement and transformation of information in a social
system or a culture is often referred to as social discourse, culture, politics, and above all,
teamwork. Social information is mediated through the use of language and other communication
channels. One may use of physical props which have been integrated into the iconography of the
culture-for example, certain ―evocative‖ words or images such as the American flag. On a more
fundamental level, the physical world encodes information about itself within itself. (Gibson
1979, Norman 1988) The Distributed Cognition approach attempts to build models which bring
all of this together into a single theoretical framework within an individual‘s consciousness and
organized memories. This approach borrows heavily from systems theory.
An example of this approach is Hutchins' (1995b) model of an airplane cockpit, which
included all of the equipment, the operating procedures and the crew itself. He analyzed it as an

54
integrated cognitive system, using conceptual models derived from cognitive science and from
systems theory. He described how decisions are made and how information is stored, with each
component doing its part in the memory (saving state) and problem solving. He treats the crew
members as components, thereby creating a detailed account of what is expected of them and of
their immediate environment. He speculates that he could very well have included internal
models of the pilots' minds, but he felt that level of granularity was not needed for the analysis he
wanted to do.
Hollan (2000) argues that the computer and elements of its interface should be perceived
as part of the user's active cognitive environment. They should be full participants in distributed
cognitive processes, in much the same way that features of Hutchins' (1995b) cockpit could be
combined into an integrated cognitive environment.
If cognition is distributed, what does it mean to introduce a student to some task or to a
body of information within a particular environment? With the assistance of the educator the
learner must adapt to both the environment and to the expected task. Where appropriate, the
educator scaffolds the learning process using appropriate explanations, representative learning
tasks, and an environment which approximates the target environment as closely as possible.
This holds whether the student, himself, regards the learning task as a separate entirety within
the cognition/action system (i.e. learning to sing.) or as part of a much larger system. (i.e.
learning how to be a member of a bridge crew.) Hutchins (1995a) goes into great deal of detail
about how cognition (and therefore learning) takes place in the real world, while Hollan (2000)
extends these principles to human-computer interaction.
For educational applications, Distributed Cognition provides a unified way to model the
learner, the learning environment and the learning activities. Bell (2000) goes further, stating that
a Distributed Cognition approach can be used to understand the material that the students are
expected to learn. He gives the example of cultural artifacts which derive their meaning from
their original context. That context can be described as representative Distributed Cognitions,
and learning activities can be understood to parallel them in a way that encourages the student to
learn something about the original artifact. That, in turn, requires the educator to build learning
activities which deliberately distribute cognitive activities. Doing so reinforces learning through
relevant activities, rather than merely through simple comprehension.

55
It must be recognized, however, that there is a critical difference between the theory of
Distributed Cognition and theories which are based entirely on external models of thought and
action. (For example, Ecological Cognition, Activity Theory, Constructionism, and some forms
of Situated Cognition) As described above, Distributed Cognition models ―trajectories of
information,‖ attempting to understand the possible permutations of specific information as it
moves through the cognitive environment, is incorporated into memory, and becomes a factor
which guides an individual‘s future behavior in and attitudes toward parts of his or her
environment. While trajectories can be analyzed at a high enough level of abstraction by treating
a person's mind as a black box, more detailed analysis requires modeling the many structures
internal to the mind. So, ideas about the nature of the internal structures in the mind are not just
compatible with Distributed Cognition but could become a useful components for formulating
new educational theories and strategies.
2.5.8 Conceptual Change
―Conceptual change,‖ which is described below, is not directly related to Immersive VR, but is
important to the understanding of many of the educational Immersive VR experiments presented
in this study (Dede, 1999; Mohr, 1999; Winn, 2001; Windshitl, 2000; Jackson, 2000; Johnson,
1999a).
Learning new information and/or skills is an active process, where the student must first
make sense of the new information by connecting it to what s/he already knows. The student
must resolve conflicts between prior conceptions and the new information, and, finally, s/he must
draw new conclusions from his or her new knowledge base (Gagne, 1987; Jackson, 2000).
―Conceptual change‖ refers to a process in which the learner may often have to abandon a prior
conception when confronted with both counter-evidence and with an alternative model of the
relevant topic. Many of the educational Immersive VR experiments have employed applications
for teaching basic science and are specifically geared to create conceptual change, albeit under
slightly different names. Grouped by application, these experiments include:
In the ―Global Change World‖ Experiments (Winn, 2001, 2003a, 2003b; Windshitl,
2000; Jackson, 1999; Jackson, 2000 p10), the authors refer to paradigm conflict, a

56
synonym for Conceptual Change. This is where the student begins with an oversimplified
or incorrect cognitive model to explain some physical phenomena in the natural world.
Confronted with evidence that their paradigm is incorrect, the student often becomes
confused and seek out a new explanation. If that explanation is readily available,
logically correct, and reinforced by a great deal of scientific scholarship, the users will
often listen to it and accept its validity.
In the ―Science Space‖ Experiments, the authors discuss the necessary transformation
from students' incorrect conceptions to correct knowledge (Loftin, 1993; Salzman, 1998,
1999; Dede, 1999). Often, new knowledge becomes distorted when the student tries to fit
it into a defective schema. This transformational account assumes that old knowledge is
transformed through operations. Scholars have produced many theories about why this
phenomenon occurs but as yet there is no widely accepted description of this
transformational mechanism (Moher, 1999).
In the ―Round Earth‖ experiments (Moher, 1999; Johnson, 1999b), the authors propose
a displacement account of learning. According to this theory, the learner establishes an
alternative cognitive starting point when he or she is presented with information within
an artificial environment. The alternative model is established outside of the learner's
existing domain knowledge. When the student forms this alternative informational model,
it will (hopefully) replace the student's earlier defective model. This conclusion appears
very similar to the ideas posited in the Conceptual Change theory.
Many authors discuss how difficult it is to change students' misconceptions on scientific topics
and how alternative, artificially-generated environments can be used to induce the mental
dissonance that can challenge their erroneous beliefs. Preconceived notions can certainly be a
problem for the Virtual Heritage applications which are described below, especially those that
concern politically sensitive topics. Theories about conceptual change may present productive
ways of approaching such problems.

57
2.5.9 Learner Differences
It is generally accepted that some learner differences can be measured in ways that divide
students into categories which are useful for instructional design (Mayer, 1987). Common
measures are:
1. Prior Knowledge: Students are constantly tested, ranked, and grouped according to their
measured skills and knowledge, mainly to ascertain what they are ready to learn next
(Bloom, 1956).
2. Motivation: The student's desire to learn something about a particular topic. This can
either exist already, to be created in the student by the instructor curriculum. The
instructor must also make sure the student connects that motivation to the required
learning activities (Mayer, 1987).
3. Learning Ability: This is often measured in standardized achievement tests and IQ tests,
which do predict performance in a typical educational setting (Mayer, 1987). However,
Gardner (1999) declares that both the IQ/achievement tests and standard curricula are
strongly biased toward verbal and mathematical ability. If so, then this correlation is a
narrow one and may not hold for more broadly-based learning curricula.
4. Demographics: Basic measures such as age, education level, profession, and other
standard measures can predict some factors that influence learning,- including levels of
prior knowledge, communication preferences, cultural requirements and other social and
intellectual forces which shape the learning experience of a particular student. Adaptive
media applications can use such factors to impute a user ―stereotype‖, which can give it a
strong start in building its user model (Chin, 1989; Garlatti, 1999; Rich, 1989).
The learner differences described above are addressed in the Immersive VR in education
literature. However, there are other important systematic learner differences which it does not
address.
Cognitive Aptitudes include spatial, verbal and mathematical abilities, which have a long
history in educational testing. If these differences are the results of experience (nurture), then any
student can be trained to comprehend any type of information. However, if the differences are
innate (nature) then each student will always do better with a curriculum tailored to his or her

58
abilities. Gardener's controversial theory (1983, 1999) argues that there is no single measure of
intelligence, but that each person has some mixture of seven intelligences: Linguistic, Logical-
Mathematical, body-kinesthetic, spatial, musical, interpersonal, and intrapersonal skills.
However, it is not always clear how measuring prospective students' cognitive abilities
and other aptitudes can be used to develop curricula. Gardner himself criticizes many of his
devotees for using his theory to create naive pedagogical formulas (Gardner, 1999). He argues
that the most common mistake is to build a comprehensive lesson plan around some single
aptitude. For example, one might infer that students with high visual aptitude would benefit most
from learning with a highly visual interface. However, students with low visual ability may gain
more in such environments (Bricken, 1990) because they can use the incorporated visualizations
to reduce their cognitive load. Gardner states that cognitive aptitudes contribute crucially to
determining the ways in which a student may learn best, but the two are not the same.
―Learning style‖ refers to the way a student may best absorb new information. For
example, some students may learn more by first investigating the relevant theories about a
particular phenomena and then see examples of it in action, while others may prefer to study the
examples first and then generalize from them to investigate and validate relevant theories. There
is no consensus within the educational community on what the measurable learning styles are or
should be, and conclusive evidence has been elusive so far (Mayer 1987).
Nevertheless, several well-known taxonomies (Carver, 1999a; Larkin-Hein, 2001;
Danielson, 1997; Chen, 2002) have attracted significant study and there is some empirical
evidence which confirms their validity. Again, the question of nature versus nurture is important.
If a person's learning style is determined only by a lifetime of experiences, than any student can
eventually be trained to learn in any way. However, if learning style is even partially innate, then
the student will always benefit more from some educational strategies rather than others Mayer
(1987). Cognitive aptitudes are most likely the result of a complex mixture of genetic potentials
and learned experience. Learning style is probably a second-order effect based on cognitive
aptitudes, aesthetic preferences, acquired learning skills and cumulative knowledge.
Another practical question is: to what extent can a flexible, learner-centered, learner-
controlled curriculum address student differences without the intervention of an experienced
educator. To some extent, students may be able to satisfy their own needs simply by exercising
the options available to them. Perhaps flexible learning environments and supporting curricula
59
can be designed which divide the task of managing student differences between the student, the
instructor and the environment itself.
VR can provide unique learning and teaching tools, which may be especially helpful to
learners who are under-served by current methods. Theories of learning style may provide some
answers about how to accomplish this. However, most of the educational Immersive VR
literature does not seriously address the research in learning styles or cognitive aptitudes,
although some scholars, such as Bell (1996) mention that these issues are important. Currently,
theories of learning styles vary widely and are controversial in the educational research
community. So far, educational VR researchers have not been willing to address the double
challenge of experimenting with VR as a teaching tool while targeting the needs of certain
learners.
2.5.10 Measurement and Evaluation
Constructivist theory also has implications for another aspect of educational research, that of
measurement and evaluation. Bloom (1956) refers to six levels of learning, as summarized by
Clark (1999):
Knowledge: Recalls data.
Comprehension: Understands the meaning, translation, interpolation, and interpretation
of instructions and problems. States a problem in one's own words.
Application: Uses a concept in a new situation or unprompted use of an abstraction.
Applies what was learned in the classroom to novel situations in the ―real world‖.
Analysis: Separates material or concepts into components so that its organizational
structure may be understood. Distinguishes between facts and inferences.
Synthesis: Builds a structure or pattern from diverse elements. Put parts together to form
a whole, with emphasis on creating a new meaning or structure.
Evaluation: Makes judgments about the value of new ideas or materials.

60
Many educational studies measure learning outcomes with explicit measurements for different
levels of learning, often using a taxonomy similar to the one described above though , usually
simpler. For example, Land (2000) refers to a level of learning called ―transfer,‖ roughly
analogous to Bloom's "Application.‖ However, few studies actually test for all levels of learning
for philosophical or practical reasons. For example, factual knowledge, comprehension, and
application (transfer) can be measured with written exams uncontroversially, but Constructivists
argue that the higher forms of learning often cannot be tested this way. The student has to design,
build and debug very large logical structures, a process which simply takes too long for any
timed evaluation in a classroom, and is too interactive to be adequately measured in a written
test.
In Constructivism, project evaluation is the primary measurement tool, not only looking
at the final product, but at the student‘s conduct during the learning process. Many
Constructivists go further to say that it is useless to measure learning in anything other than the
student's own context. However, this leads to a paradox. For a student to achieve ―transfer‖ s/he
has to be able to apply that lesson elsewhere. Furthermore, there has to be some way to evaluate
students' knowledge and skills with respect to social standards. Therefore, attempts to both train
and test students in ―authentic‖ or ecologically rich environments can lead to too little difference
between the training and the test itself. When this happens, only rote learning can be measured
clearly. It is acceptable to use the same environment, but test on a different task (transfer) or do
the same task in a different environment (Land, 2000). Exploring these issues further is beyond
the scope of this study.
2.5.11 Winn’s Synthesis
Dr. William Winn of the University of Washington and his colleagues have produced roughly
half of the formal experimental studies in Immersive VR for education (section 2.6.6, p69). His
theories began with a mixed Cognitivist and Constructivist approach, rejecting the popular belief
that two were incompatible (Winn, 1993). More recently, he developed his own approach, which
he calls ―Embodiment, Embeddedness and Dynamic Adaptation‖ (Winn, 2003a) which embraces
ideas from Constructivism, Distributed Cognition and cognitive science. In this approach,
optimal learning requires:

61
Embeddedness: in the environment. The mental and physical tasks a person performs
cannot be defined without some reference to the environment. This does not imply that
the environment defines cognition, but that some reference to the environment is required
to describe cognition.
Embodiment: The learner/actor's physical body is an essential part of the process,
because everything we perceive must be mediated through our limited senses. We
directly use our bodies to accomplish most tasks and the brain must be regarded as an
organ of the body.
Dynamic Adaptation: In a changing environment, we must continually adapt to the
changing circumstances. It is also true that the environment changes in response to the
person's actions. In this way the individual and his or her environment are evolving
together, responding to each other.
While Winn avoids the term Distributed Cognition, preferring to say that Cognitive Science has
evolved to include issues of context, his theories have significant similarity to those advanced by
Hollan (2000) and Hutchins (1995a). Winn's theory is also compatible with what Jonassen
describes as a recent consensus between most education theorists, where cognitive and
Constructivist principles support unified models of learning (Jonassen, 2000a).

62
2.6 EMPIRICAL STUDIES OF LEARNING WITH IMMERSIVE VR
Most VR technologies were originally developed for training purposes, most commonly by the
military. More recently, Immersive VR has been used as a tool for education in a variety of fields
such as mathematics, physical science, geography, architecture, engineering and others. There
have been many efforts to use VR to teach declarative knowledge and related cognitive skills,
but only a relatively small number of them have been conducted as formal studies (Hay, 2000).
Because of this, the educational use of Immersive VR is still not well understood (Salzman,
1999; Winn, 2001). This section will summarize the existing educational studies which have
employed Immersive VR, the theories supporting them and areas in which further studies are
needed.
2.6.1 Introduction
There are still only a small number of empirical learning experiments with Immersive VR
reported in the educational and VR-research literatures (Salzman, 1999; Winn, 2001; Moreno,
2002b; Winn, 2001; Jackson, 2000). Only twelve formal experimental studies are readily
apparent in the literature (section 2.6.4, p66). There are probably another fifty informal studies
(such as pilot studies, surveys, ethnographic studies and formative evaluations) and
approximately four hundred papers reporting those studies and discussing supporting theory,
along with reports in the popular press. These numbers are difficult to estimate, first because
each discipline which uses VR has only a limited number of educators who are interested in
teaching with VR applications. Also, the results of their efforts are usually reported in the
literature for that discipline, but not cross-referenced with other studies using educational VR.
Almost all of the experiments reported in this survey were conducted in 1999 or before,
apparently for economic reasons. Most of the researchers who conducted the pre-1999
experiments cite a sharp decrease in US-Government funding for educational VR experiments as
reason for the lack of recent research (Roussos, 2004; Bowman, 2004; Loftin, 2004; Moher,

63
2004). The exception is work by Moreno's work (section 2.6.5, p68), Maria Roussou (2006,
2008), and this study.
Fortunately, all kinds of VR applications have become much less costly because of the
adoption of technologies developed by the game industry (Lewis, 2002; Dalgarno, 2002a;
Young, 2000; Pivec, 2003b; Bruckman, 2002a; DeLeon, 2000; Tougaw, 2003; Stang, 2003;
Jacobson, 2002a, 2004a). This may lead to renewed interest, but in the short term it may be a
deterrent to further research. Researchers and educators may be reluctant to expend a great deal
of time and effort in a technology that they think will soon be obsolete. Another reason may be
competition from the online collaborative virtual worlds and other desktop VR applications.
These provide significant opportunities for interesting and important educational research at
much lower cost than Immersive VR (SecondLife, 2004; There, 2004; Dede, 2004; Andrews,
2002).
An entirely different problem is that VR may still be too poorly defined to support
meaningful comparisons between it and traditional teaching methods (Hughes, 2001; Jackson,
2000; Youngblut, 1998). For example, too little is known about collaborative learning in VR to
make meaningful comparisons with other computer-mediated or open classroom collaborative
activities (Moshell, 2002; Youngblut, 1998). Mayer (2001) goes further to say that direct media-
to-media comparisons of all types are rarely meaningful. Not only do different media lend
themselves to different teaching methods, but also the method and the medium cannot be
separated in any practical approach.
Mayer (2001) recounts the history of new media in education, specifically film, radio,
television, computers, and the Internet. Each time a new technology was introduced, there were
high hopes that it would transform education. Most of the technologies have found some use in
schools, but none have become dominant or even displaced the book. All of these researchers
agree that efforts should concentrate first on discovering the educational properties of VR before
it can or should be distributed widely or compared to other media.
Nevertheless, many educational Immersive VR studies report successful learning (Byrne,
1996; Winn, 1997c; Osberg, 1997a; Jackson, 2000; Winn, 2001; Dede, 1999; Salzman, 1998).
Students in those experiments may have learned the material just as well using some other
teaching method, (Winn, 1999b) but the experiments do show that Immersive VR can be used
successfully for teaching. As with most other forms of media, it is most likely that Immersive
64
VR is best used as part of a larger curriculum, rather than a general replacement for other forms
of instruction (Bowman, 1999; Wickens, 1992; Hay, 2000).
2.6.2 Advantages
VR allows the user to interact with models of things they could not touch in the real world
(Roussos, 1999). Certain places or things may be otherwise inaccessible because of microscopic
or macroscopic scale such as molecules, galaxies or weather systems. They may be physically
inaccessible, such as the surface of the moon, or inaccessible to students with special needs.
They may be no longer extant, such as the Temple of Isis at Pompeii. They may even be
imagined or proposed, such as a colony on Mars. They may be dangerous or too expensive to be
used in a classroom. They may even be theoretical or abstract (Winn, 2003b; Jackson, 2000;
Youngblut, 1998). For example, Global Change World (Winn, 2001, 2003a) allows the learner to
manipulate major environmental factors in a model of Puget Sound (Washington, USA) and to
travel through virtual time to see the results.
VR can also illustrate subjects and processes that are difficult to express using other
media. For example, topics with a strong spatial component, such as architecture, are better
expressed in three-dimensional media, rather than two dimensional media such as a blackboard
or a printed page. For architecture, Immersive VR has the added advantage of letting the viewer
see the inside of a virtual structure. Also, VR is a good way to interface with simulations of
dynamic systems. System examples include ocean currents, planetary motion, changes in
electrostatic fields, movement of nutrients in a food web and the social behavior in a troop of
gorillas. The behavior of such systems is often nonlinear, being an emergent property of an entire
system of factors, mutually influencing each other, that change unpredictably over time (Winn,
2003b). Simulations are particularly useful for modeling natural systems.
There is a consensus in the literature that the sense of ―presence‖ afforded by VR-based
learning application can enhance learning (section 2.5.3, p47). Finally, VR and particularly
Immersive VR are popular and tend to be well received by educators and students (Antonietti,
2000).
65
2.6.3 Problems
The interface and control technology for VR is still cumbersome, exhibits poor fidelity and is
generally primitive (Dede, 1999), which is a particular problem for educators (Roussos, 1999).
Developing effective learning tools with VR requires considerable time, technical expertise and
design skills (Winn, 1997). Furthermore, many important applications also require considerable
artistic skill, particularly with archaeological reconstructions. Fortunately, advances in mass-
market graphics hardware and display technology have greatly driven down the cost of hardware
and high-performance graphics software (Lewis, 2002; Dalgarno, 2002a; Young, 2000; Pivec,
2003b; Bruckman, 2002a; DeLeon, 2000; Tougaw, 2003; Stang, 2003; Jacobson, 2002a, 2004a).
However, developing for VR applications still requires technical expertise and a considerable
artistic effort. Productivity tools for rapid development (Igarashi, 1999; Jung, 2002) tend to
improve the quality of the final product rather than reduce the workload of the developer.
There are other, more intrinsic problems as well. Students show wide variation in their
ability to deal with the VR interface, which affects their ability to navigate—many students feel
lost in the VE (Dede, 1999). Some students never become proficient with navigation in a VE
application; usually because they have distance/depth estimation problems (Winn, 2003b).
Problems with navigation and control are reported in many of the educational experiments using
Immersive VR. Even when a student is able to perform navigation maneuvers comfortably, s/he
must still be able to traverse the virtual space without getting lost and without experiencing an
excessive cognitive load irrelevant to the learning exercise. Fortunately, VR navigation has been
the subject of considerable research and much progress (Darken, 2001). Bowman (2002)
developed an excellent taxonomy and set of principles for interaction design in VR applications.
However the act of navigation itself may result in motion sickness caused by the sensory
conflict in immersive displays—a well documented problem (Harris 1998, 1999; Kennedy, 1992,
1995; Kolanski, 1995; Lin, 2002; Prothero, 1999; Kuno, 1999; Owen, 1998; Howarth, 1998).
Most educational experiments using Immersive VR report that some test subjects had significant
problems with motion sickness induced by the display (Jackson, 2000). Also, the long-term side
effects of exposure to Immersive VR, if any, are not known (Winn, 2003b). It is interesting that
large audiences regularly attend immersive dome displays (e.g. an Omnimax theater) and

66
audience members often experience motion sickness. To my knowledge, however, there has been
no public outcry about the dangers, the attractions remain popular and no special safely protocols
have been enacted.
Finally, the degree to which VR is engaging, just because it is novel and perhaps
fashionable, could confound experimental results. This would be a kind of Hawthorne Effect
(Campbell, 1963), which could probably be mitigated by giving students enough time to get used
to VR. It should not interfere with learning experiments which compare different VR conditions,
as long as students' enthusiasm does not lead to a ceiling effect.
2.6.4 Summary of Previous Experiments
Table 1, below, lists the previous educational experiments by theoretical approach, quality of
design and nominal success.
In a constructionist learning experiment, the students learn something by building a
virtual environment or part of one. In an experiencing experiment, students interact with some
ready-made VE. Note that a constructionist learning task is always Constructivist, while an
experiencing task may or may not be part of a Constructivist learning experience.
A study will be marked as strong if the experimental design is sound and complete and
the implementation is sufficient. A study is labeled as weak if it was intended to be an
experimental inquiry, but there is a significant flaw either in the experimental design or in the
implementation. Sometimes, however, an experiment can have a major flaw in its design, but
still produce a believable result. Usually this occurs when secondary measures or other
circumstances support the conclusion.
A study is classified as Successful if it proved its hypothesis or produced some closely
related discovery, otherwise, it is marked as Inconclusive. Some of the best designed and
implemented studies fail, especially in educational testing, which as many inherent difficulties.
Nevertheless, inconclusive studies may produce much useful material.
Finally, the dominant display device used in the VR application in each study will be
listed. A CAVE is an enclosure made of rear projection screens, which surround the user with a
stereoscopic view of a computer generated landscape (Cruz-Neira, 1993). An HMD is a device
worn on the head, which drives two small displays, each one directly in front of one of the

67
viewer‘s eyes, to produce the experience of total visual immersion in the virtual environment. A
deliberately introduced difference between the left and right eye views creates a stereoscopic
effect enhancing the illusion of depth. "Desktop" refers to a basic computer monitor, keyboard,
and mouse.
Table 1. Previous Experiments with Immersive VR
Reference Section Quality Success Experiencing / Constructionist
Interface(s)
(Moreno, 2002a) 2.6.5 Strong Successful Constructionist HMD vs Desktop
(Winn, 2001) 2.6.6.2 Weak Successful Experiencing HMD
(Jackson, 2000) 2.6.6.4 Strong Inconclusive Experiencing HMD
(Bowman, 1999) 0 Weak Inconclusive Experiencing HMD
(Dede, 1999) 2.6.7.2 Strong Successful Experiencing HMD vs Desktop
(Roussos, 1999) 2.6.8 Weak Inconclusive Constructionist CAVE
(Salzman, 1999) 2.6.7.3 Weak Inconclusive Experiencing HMD
(Salzman 1998) 2.6.7.1 Strong Successful Experiencing HMD
(Osberg, 1997a) 2.6.6.3 Strong Successful Both HMD
(Winn, 1997) 0 Strong Successful Both HMD
(Byrne, 1996) 2.6.6.5 Strong Successful Experiencing HMD vs Desktop
(Rose, 1996) 2.6.6.6 Weak Inconclusive Experiencing HMD
Only formal experimental designs have been listed, those which use a classic
experimental design or a quasi-experimental design, when laboratory conditions are not practical
(Campbell, 1963). I do not wish to imply that non-experimental studies are valueless. They
include usability studies, focus groups, formative evaluations, ethnomethodological studies and
other forms of structured inquiry. These methods can resolve obvious problems quickly, refine
the application, refine testing methods, generate testable hypotheses, gather anecdotal
information and examine problems where formal methods are not usable. A good example is a
study by Roussos (2006, 2008) which uses Activity Theory to analyze student activity during an

68
ImmersiveVR experiment. Non-experimental studies are not a direct concern of this review,
although some will be referenced.
None of the experimental studies listed in Table 1 contained any significant pre-
experiment analysis of the physical controllers used and how they might affect user interaction
and the experiment. Many of them suffered significant problems with user navigation, sometimes
so severe that they cause the failure of the experiment (Jackson 2000). More attention to
interface design is needed. For example, Bowman (1999, 2002) describes a task and design
strategy for VR interaction design which is quite helpful for interaction design and analysis.
2.6.5 Moreno’s Research
Moreno (2002c) and Mayer examined the learning effects of sensory immersion using VR and
whether certain design principles from multimedia apply to VR-based learning environments.
The results of two formal studies reported in Moreno (2002c) are summarized below.
Learning activities and materials for both experiments were based on the learning game,
―Design-A-Plant.‖ In the game, the student is given series of alien worlds with known
environmental conditions, and the student has to design plants which can survive in those
environments. S/he is assisted by a pedagogic agent who gives personalized advice, feedback
and encouragement.
The first experiment has a two-factor design, with three levels for each factor. The first
factor is immersion, where the student uses either Desktop VR while remaining seated or wore
an HMD and able to walk around. The second factor is the delivery method of the pedagogical
agent's narrative—either text, or audio or both. The working hypothesis of the experiment
appears to have been that (1) greater immersion produces a greater sense of presence (2)
immersion affects learning and (3) delivery method of the narrative affects learning. Results
showed that students did have a greater sense of presence with greater immersion and learned
more when the narrative was delivered in an auditory form. No learning effect for degree of
immersion was found, nor was any interaction effect found.
The second study had the same protocols as the first, except that the walking-and-HMD
condition was eliminated. The other major difference is that the third a priori hypothesis is
different: that students learn more deeply if the narrative is delivered as both text and audio. The

69
results of the second experiment agree with the first in that the students reported that greater
presence with greater immersion and that the degree of immersion had no effect on learning.
They also found that auditory narrative was the best method of delivering the material. Students
with both narrative and text learned no better than students with narrative alone and, students in
the text-only condition did considerably worse than student who received only narrative. No
interaction effects were reported.
2.6.6 Research at the University of Washington
The mission of the HIT Lab at the University of Washington is to use VR as a tool for the
advancement of education. Dr. William Winn and his students have led most of the empirical
studies (Winn 1997, 2001, 2002; Jackson, 2000; Osberg 1997a) which are based in the
Department of Education at the same university. Studies based in other departments were
conducted by Bryne (1993, 1996), a student of Tom Furness and Merideth Bricken, and Rose
(1996) a student of Furness and Winn. Also, Dr. Winn has written extensively on educational
theories relevant to the use of Virtual Reality for education. (Winn, 1993, 2002, 2003) Given the
difficulty of empirical educational testing in general, and with new technologies in particular,
this group did well. Of the empirical studies listed,
1. Two were strong and successful (Winn, 1997; Osberg, 1997a).
2. Two were weak but successful anyway (Winn, 2001; Byrne, 1996).
3. One had a strong design but was inconclusive (Jackson, 2000).
4. One was weak and inconclusive (Rose, 1996).
This group's research efforts are not well reported or referenced in the mainstream Immersive
VR literature in journals such as Presence, Cyberpsychology and Behavior and at conferences
such as Virtual Reality, SIGGAPH, and Medicine Meets Virtual Reality. This probably because
Dr. Winn's publications appear in the educational literature, which receives only limited attention
from the mainstream VR researchers who are mostly computer scientists. Papers reporting
experiments by Dr. Winn and his group take a primarily Constructivist approach, but they also
reference the concepts and literature from cognitive science (Jackson 2000, Winn 1997, Winn
70
2001). In an early paper, Winn (1993) argues that Constructivism and cognitive science are
compatible. Ten years later (Winn 2003b) described his unified approach. Experiments
performed by this group are summarized here by the papers in which they were reported.
2.6.6.1 The Effect of Student Construction Of Virtual Environments on the Performance
of High and Low Ability Students (Winn, 1997): Elementary students worked in small
groups, to produce a small Virtual Environment intended to help the user learn about certain
topic materials specified by the teacher. Each student helped to build one educational VE then
experienced one produced by a different group. All students received a pretest and a posttest for
the subject matter for both virtual environments s/he had contact with. Results were analyzed
with a two-way ANOVA, where the first factor was whether the student had constructed the
environment or experienced it. The second factor was the student's ―ability‖ as measured by the
Raven Progressive Squares test (CPS, 2004). The main hypothesis was that higher ability will
lead to better learning performance, and that constructing the VE will produce better learning
than experiencing it.
No main effects were found, but there was a strong interaction effect: students with high
Raven scores did well regardless of constructing or experiencing the VE, but students with low
raven scores did much better in the constructionist condition (p < 0.01). The experimenters
concluded the students with low ability were aided more by the constructing experience. An
alternative explanation is that the students with low Raven scores were simply an under-served
population in the school system, whose intelligence is not evidenced well in written tests and
who learn better by doing rather than experiencing. The experiment was successful because it
revealed the interaction effect.
2.6.6.2 Learning Science in an Immersive Virtual Environment (Winn, 2001): Students
were immersed in a virtual environment, which visualized the action of the tides, current flows
and salinity levels in a simulation of Puget Sound in Washington State, USA. They were able to
investigate the dynamics of that system by "flying" though the simulation, adjusting the time
scale and introducing certain changes to the environment to observe the result. Students received
a pretest of the topic materials, participated in learning exercises, and then completed a Post Test.
The hypothesis was that students would learn from the experience, and pretest-Post Test

71
comparisons implied this, however there was no Control Group, making the study weak.
Nevertheless, they did record a positive result-students did learn from the simulation.
2.6.6.3 Constructivism in Practice: The Case for Meaning-Making in the Virtual World
(Osberg, 1997a) Students produced a small Virtual Environment (VE) which illustrates a natural
cycle (water, carbon, nitrogen or energy). Each student helped to build one educational VE then
experienced one produced by a different group. All students received a pretest and a Post Test
for the topic materials for both virtual environments s/he had contact with. Pretest-Post Test
learning differences were compared between: (1) materials learned by constructing a VE, (2)
materials learned by experiencing a VE, (3) traditional instruction, and (4) no instruction. The
constructionist learning group learned significantly more than the no-instruction Control Group,
but there were no other significant differences found between the groups. Her study failed to
prove its main hypothesis, but did demonstrate successful learning during the constructionist
activities.
2.6.6.4 Collaboration and Learning Within Tele-Immersive Virtual Environments
(Jackson, 2000) Students learned about global climate change using Global Change World, an
immersive simulation of weather and climate conditions in the Puget Sound area. Students
change (virtual) factors such as CO2 level, rainfall, and vegetation and observe the effects of
(simulated) global warming. There were three treatment groups: (1) students working alone, (2)
students working in collaborative pairs, ―seeing‖ each other in the virtual environment, and (3)
students receiving significant guidance from the instructor. The central hypothesis was that
students would learn better with either type of collaboration. Because of significant testing
problems, Jackson judged the data to be too unstable to produce any conclusive results.
2.6.6.5 Water on Tap: The Use of Virtual Reality as an Educational Tool (Byrne, 1996)
Students used Virtual Chemistry World (VCW) to build molecules from atoms. There were two
primary factors in the experimental design: immersion versus interactivity. The high-immersion,
high-interactivity condition was the VR version of VCW. The low-immersion, low-interactivity
condition was a two-dimensional version of VCW. The low interaction, low immersion condition
was a video. There was no high-immersion, low-interactivity condition. The main hypothesis

72
was that both immersion and interaction would improve learning. No significant learning
difference was shown between students who used the immersive VCW versus those who used
the two-dimensional version. This is probably because the VE in the immersive condition
conveyed no more information than the one in the two-dimensional condition and did not have
any better interaction options. However, students in both interactive conditions learned better
than those in the non-interactive (video) condition.
2.6.6.6 Design And Construction Of A Virtual Environment For Japanese Language
Instruction (Rose, 1996) This study compared students' success at learning how to construct
Japanese prepositions using (1) standard text-only learning exercises, (2) learning exercises
which include moving physical props to illustrate the meaning of each proposition, and (3)
learning exercises similar to those in the second condition, conducted in an immersive virtual
environment. The main hypothesis was that learning outcomes for students in the second and
third groups would be similar and that both would be superior to those for treatment one. Results
were inconclusive, with no significant differences in learning between any of the groups. This
was attributed to an insufficient number of test subjects. This experiment attempted to compare
learning across different media and different teaching methods, which is very difficult (Mayer,
2001; Moreno, 2002b).

73
2.6.7 The Science Space Experiments
―Science Space‖ is a set of immersive educational projects produced by Chris Dede at George
Mason University R. Bowen Loftin at the University of Houston, and Dede's doctoral student,
Marilyn C. Salzman (Dede, 1996). They conducted at least two formative evaluations of
ScienceSpace applications, one survey and three formal experiments. Of those experiments,
1. One was both strong and successful (Salzman, 1998).
2. One had a weak design, but was successful anyway (Dede, 1999).
3. One was weak and inconclusive (Salzman, 1999).
2.6.7.1 Using VR's Frames of Reference in Mastering Abstract Information (Salzman,
1998) This study used Maxwell World, which places the student in a VE featuring a visible
model of a hypothetical magnetic field. The student can manipulate the shape of the model by
moving a (virtual) magnetic charge in or near the field. The method of viewing can be (1)
exocentric, where the user sees the entire field and the charge appears as a movable object, (2)
egocentric, where the user's view is co-located with the charge, as though s/he were the charge
itself, (3) both, where the student can switch from an egocentric to an exocentric view at will.
The hypothesis was that the exocentric and egocentric views would each provide unique
advantages for learning different aspects of magnetic fields, and that having both modes
available would be best of all.
Results from the egocentric-only and the exocentric-only groups indicated strengths in
the expected (different) areas of the knowledge Post Test, but the results were not conclusive.
Students able to switch between both viewing modes produced the best learning results. This
experiment was strong and successful, because (1) it used Immersive VR for its particular
strengths, (2) it asked an important and useful question, (3) the experimental design was sound,
(4) previous formative evaluations had improved the design and stability of Maxwell World, and
(5) the subject matter was compatible with the low-resolution graphics available to the
experimenters.

74
2.6.7.2 Multisensory Immersion as a Modeling Environment for Learning Complex
Scientific Concepts (Dede, 1999): Students in one group used EM Field, a respected learning
application which uses two dimensional representations of electromagnetic fields. Students in the
other group used Maxwell World, which was restricted to provide the student with only an
exocentric view of a three-dimensional model of an electromagnetic field. In both applications,
the student learned about magnetic fields by moving a virtual magnetic charge in or near the
field. The hypothesis was that students in the VR condition would give better answers to certain
questions which require an understanding of the spatial aspects of the material, which is what the
experimenters found, at (p < 0.05). If this experiment had been conducted in isolation, I would
classify it as ―weak,‖ because the number of test subjects (fourteen) was small for an educational
experiment. However, the context of Salzman's (1998) study and the large number of formative
studies conducted by this group (at least three are reported) make the results convincing.
2.6.7.3 A Model for Understanding How Virtual Reality Aids Complex Conceptual
Learning (Salzman, 1999): The experiment used Newton World, an Immersive VR application
for teaching kinematics and dynamics. The student throws a ball against a wall, where the
student can change the properties of the environment such as friction and the elasticity of the
ball. Potential energy, kinetic energy, and other information are visualized through use of color,
object size and so on. There were three treatment groups with varying degrees of sensory
immersion: (1) Visual only. (2) Visual and auditory. The user can hear the ball bouncing. (3)
Visual, Auditory and Tactile. The user can feel the ball. The hypothesis was that the greater the
degree of sensory immersion, the better students' learning outcomes would be. No significant
differences were found.
2.6.8 The NICE Projects
Research in collaborative learning with children in Immersive VR was conducted at the
Electronic Visualization Laboratory at the University of Chicago (Johnson, 1998a, 1998b, 2002,
2003; Roussos, 1997a, 1997b, 1999; Moher, 1999). The core of the group is Dr. Moher and his

75
two students, Johnson and Roussos. Their studies used HMDs, but this group used the CAVE
which they networked to a big-wall workstation and the Web. At the time that the studies were
conducted, the technology used was the most advanced, and their experiments were the most
ambitious in combining many different factors in their learning experiments. They produced two
pilot studies and one weak experimental study (Roussos, 1999) which were all inconclusive, and
which showed only anecdotal evidence of learning.
2.6.9 The Virtual Gorilla Exhibit
A set of Immersive VRED experiments was centered on the Virtual Gorilla exhibit at the Atlanta
Zoo. The first effort was a formative evaluation (Allison, 1997) followed by one weak and
inconclusive experiment (Bowman, 1999). Later, Hay (2000) conducted a constructionist
learning programme, an ethnographic study, based on the virtual gorilla application.

76
2.7 VIRTUAL HERITAGE
Virtual heritage (VH) is the use of electronic media to recreate, or interpret, culture and cultural
artifacts as they are today or as they might have been in the past (Moltenbrey, 2001; Roehl,
1997). By definition, VH applications employ some kind of three-dimensional representation and
the means used to display it range from still photos to Immersive VR. We are interested in the
VH applications which are also VR applications. This section will detail the history of VH, and
advantages and problems specific to educational VH applications, with particular emphasis on
pedagogic agents and educational Immersive VR. General issues around adaptive pedagogic
agents are explained in section 2.7.5, p85, and the use of Immersive VR for educational
experiments is explained in section 2.5, p41. Techniques for implementing VH applications are
described here.
2.7.1 History of VH
Humans have always described their perceived cultural past with whatever communication
media that are available. These have included single dimension narrative texts, two-dimensional
paintings and drawings, three-dimensional models and four-dimensional reenactments (height,
width, depth, time). Since antiquity, many cultures have used statuary of the dead, ritual
enactments of legends and history, and physical scale-models to represent people, places and
events. Since the 18th century, museums and private collections have used dioramas, scale
models depicting (for example) people from the past or distant cultures engaged in daily
activities.

77
The late 17th century saw the development of the cyclorama, a ―large composite picture
placed on the interior walls of a cylindrical room so as to appear in natural perspective to a
spectator standing in the center of the room‖ (Houghton-Mifflin, 2000). Cycloramas were
especially popular in the 19th century, and some are still in use today (Maloney, 1997). Also in
the late 19th and early 20th centuries, physical VR-like attractions used props and actors to
create an otherworldly experience for visitors. In one such installation, visitors boarded a mock
rocket-ship and ―flew‖ to the moon. They then walked through a series of artificial caverns
staffed with costumed actors, all contrived to represent a fanciful lunar civilization (Maloney,
1997).
Today, ―living museums‖ recreate historic sites complete with actors who reenact daily
life and important events. For example, Fort Snelling in Minnesota, USA, is an actual Civil-War
fort, now staffed by actors who interact with tourists. This tradition continues in most forms of
electronic media, with film documentaries often presenting historical dramas and multimedia
Figure 16. The Cyclorama at Gettysburg, USA

78
applications presenting animations and images depicting historical facts. Since the 1980's,
mainframe computers, capable of advanced graphics, have been used to build detailed virtual
models of existing and reconstructed artifacts (Jacobson, 2004c; Capasso 2004). Today, many
Virtual Heritage applications use a desktop VR interface, while very few use Immersive VR.
2.7.2 Advantages
By definition, Virtual Heritage applications always feature a three-dimensional model of some
cultural artifact or architectural space. These models, and the process of making them, have
several advantages for both researchers and educators.
For the researcher, high-quality 3D renderings of existing artifacts can make them
accessible to a wider audience while preserving the often fragile originals. (e.g. A Neolithic cave
painting.) Three-dimensional renderings are also an efficient tool for collaborative work, because
archaeologists around the world can share them easily. If the artifact itself no longer exists, the
act of reconstructing it forces the archaeologist to confront gaps in the evidence and
contradictions or weaknesses in existing theories (Frischer, 2003; Levy, 2004; Champion, 2001).
The value of 3D modeling is so well recognized, that architects have been constructing 3D
models of planned buildings since ancient times, and CAD software is now a required tool for
most architectural projects.
For educators, a spatial model can be an efficient means of communicating a large
amount of visual information. One detailed 3D model can contain as much visual information as
a large number of still images, and it leverages the user's natural spatial perception abilities. This
is especially important with architectural spaces that are ―well-integrated‖ in the sense that
information is encoded in the way the space looks to an observer. An Egyptian Temple is an
extreme example of this, because the hieroglyphics, the larger painted images, and the conduct of
ceremonies are all tightly integrated, with the physical space itself being the main semantic
organizing principle. Such an artifact is best viewed with the space intact, from the vantage
points from which it was meant to be seen. In addition, users find 3D renderings compelling, and
a good rendering of a beautiful monument is also beautiful. This helps users accept the
technology and engage in the experience. If a 3D model appears to beautiful, it is likely to
79
possess an added degree of perceptual coherence, which in turn can make it a more effective
vehicle for information.
Most VH applications present the user with an unchanging landscape to navigate or a
static object to examine. As important and useful as this is, VR technology supports many more
options than simply modeling.
1. Autonomous agents can represent ancient peoples conducting their business or interacting
with the user (Economou, 2001; Ulicny, 2002).
2. The VR interface can engage the other senses, using sound, touch, proprioception (sense of
balance), and even smell. By engaging the other senses, they can convey more information,
provide a more complete simulation, and create a stronger sense of realism (of the object) or
presence (of the user in the virtual space). Examples include a virtual statue of a bull which
the user can ―touch,‖ (Nord, 2003) and a virtual mosque complete with virtual actors filling
the space with liturgical song (Karabiber, 2002). The ―acoustical heritage‖ of cultures is
important and usually overlooked in VH applications.
3. Networked multiuser environments (ActiveWorlds 2004) allow distant students and
educators to ―meet‖ in a shared virtual environment, which can be constructed for Virtual
Heritage (Raalte, 2003; Santos, 2002).
4. Interaction and activity dominate engagement and are central to learning (p33). Goal-seeking
activities are especially effective, and can be cast in the form of a game (Champion, 2004;
DeLeon, 2000).
As VR technology becomes more widely available, it will be employed in Virtual
Heritage applications in novel ways. Nevertheless, all VH applications depend on good
interaction design and sufficient artistic quality.

80
2.7.3 Problems
An archaeological reconstruction is necessarily pieced together from existing evidence which is
often incomplete and which requires many judgments during construction. Depending on the
level of conjecture tolerated by the reconstruction project, the builders may produce a
reconstruction based on one of several competing theories of what the artifact really looked like.
However, the final appearance of a static model is emphatic in the way it presents the model as
the way the artifact must have looked. Uninformed viewers are likely to accept the model as
authoritative (Champion, 2004a; Frischer, 2003). A static visual solution, like coding features
with colors or with opacity would seriously degrade the appearance and the effectiveness of the
model. Temporal solutions, like toggling certain features on and off, are probably best, but they
complicate interaction design and are more difficult to implement.
Another problem is that archaeological evidence of any site reflects its entire history, not
some snapshot in time. For example, ancient monuments with a long history may have features
from more than one time period. Deciding what to put into the virtual reconstruction requires
considerable judgment and sensitivity from the authors. The Venice Charter (VeniceCharter,
2004) on physical restorations and reconstructions recommends that all time periods represented
in an artifact should be respected. Guidelines from the Charter and agreements like it can be
helpful to VH designers.
Determining historically accurate simulations of ancient peoples and their activities is
especially difficult (Weis, 2004). Most of the evidence of how they looked and what they did is
indirect, inferred mostly from ancient artwork, writings, and funerary arrangements.
Nevertheless, this work is important, because the ultimate goal of archeology is to infer what
ancient cultures were like by examining their artifacts.
Unfortunately, Virtual Heritage is widely abused to produce misleading reconstructions
of archaeological treasures, usually for entertainment purposes (Moltenbrey, 2001). While there
is nothing wrong with ―borrowing‖ material from the real world for works of fiction, many
fictional recreations of the past mislead the audience for no purpose. For example, the 2001 film,
―The Mummy Returns,‖ shows a scene in ancient Egypt where two women are sparring with
Korean weapons (Sai) that won't be invented for millennia. One way to reduce the problem may

81
be for genuine archeology to become more accessible to the public. VR may be a good medium
for doing this, just as television has been through documentary programming (AIA, 2004).
Finally, low resolution virtual models have been inexpensive and relatively easy to
construct ever since the early 1990‘s, when VRML become popular. Low-cost game related
technologies are now driving software and hardware costs down even more. However, high-
quality imagery and interactivity still require significant time and expertise to produce, primarily
because of the demands of the artwork.
2.7.4 Building a VH Environment
This section describes some of the methods used for building three-dimensional models,
especially architectural models , since they are ubiquitous in VH applications.
The first decision that must be made is whether the VH objects should be automatically
generated or constructed ―by hand.‖ A branch of scientific visualization employs visual
recognition algorithms to build 3D models of buildings and objects using photographs or direct
sensor scans of the object's surface (Moltenbrey, 2001; Han, 2000; Kanade, 1997). For example,
Duran (2004) used GIS data to auto-generate a simplified model of the historical section of
Istanbul, which his team is ―filling in‖ with more detailed hand-built models. Other applications
take 3D scans of museum artifacts and make them available on the web (Zheng, 2000). Still
others feature highly detailed models of existing monuments (Ledermann, 2003). Human faces
can be reconstructed using volumetric data (Attardi, 1999; Spice, 2004). The models are
generated automatically and embody a very high level of detail.
This approach is superior for many applications, especially those requiring virtual
simulations of physical objects. However, the models produced tend to have a high internal
complexity, using unnecessarily complex geometry to produce the visual model. This makes the
models difficult to change, as must often done when the object is to be placed in some context,
when the virtual object is used as a starting point for a model of the artifact restored to some
earlier appearance, or when the model is intended for use in some larger model, composited from
scanned components. Building a larger composite model from scanned components requires
modifying (usually trimming) the machine-generated scans of its parts, which requires some

82
effort and judgment. Finally, the overly-complex models use a larger portion of the computer's
rendering capacity than models which are constructed ―by hand."
Figure 17 illustrates the advantages of hand-made models for relatively simple objects. It
contains two versions of a decorative block of masonry, The model made with 34000 triangles
(on the left) was produced by a highly-accurate 3D scan. The model on the right contains 21
triangles are mostly in the image maps applied to a hand-made 3D model. The images maps were
probably made from photographs of the original block. In most modern graphics cards for PCs,
performance is determined by the total number of triangles in the virtual scene. Texture maps
also require memory, but as long as the total amount of dedicated texture memory on the
graphics card is not exceeded, the effect on performance is usually much less than the savings
gained from using fewer polygons.
Once the designer has decided whether to generate the material automatically or
manually (or some combination of the two), a long, complex process is required to produce the
virtual objects or environment. Using archaeological evidence, VE designers can create models
and simulations of lost or damaged architecture, artifacts and peoples. As an example, we will
look at the manual reconstruction of an architectural space.
Figure 17. Example of shape vs. texture to produce detail (Papiaoannou 2003).

83
The first step is to recreate a geometric model, usually based on drawings and
photographs of ancient ruins, depictions and descriptions of the space (if any) in ancient artwork
and reconstructions (usually drawings or paintings) produced by earlier scholars. Once the model
is in place, digital ―textures‖ are applied to it. A texture is usually a modified photograph
showing the surface of an object or a material. Textures range in complexity from a simple
material (e.g. stone) to complex artwork (e.g. a fresco or mural). The artist then applies the
textures to the geometric forms, in software, one at a time by ―mapping‖ each texture onto a
portion of the model. For example, an image of a human face may be mapped onto mannequin-
like head shape to create a 3D virtual statue. Finally, the artist specifies light sources, such as a
(virtual) sun or fires or candles.
The reconstruction process is time consuming and meticulous, and the artist's skill makes
a significant difference in the quality of the final result. The artist and the archaeologist/historian
work together closely, rebuilding the artifact or space by stages. Often the archaeologist will
have to make changes to the reconstruction plan as the process itself leads to new insights
(Frischer, 2003; Levey, 2004). The degree of effort is greatly influenced by how much of the
architecture must be reconstructed from indirect evidence. For example, the Temple of Isis in the
Pompeii project (Jacobson, 2004c) had to have all of its walls in place and properly decorated.
However, the artworks in the upper portions of the temple are completely missing, so it had to be
replaced in with wall-art from other monuments. To leave the walls blank would have made the
reconstruction's overall appearance highly inaccurate.
Creating ―virtual people‖ (agents) is a far more complex process, one that only few VH
applications have attempted (Economou, 2001; Ulicny, 2002; Jacobson, 2005c; Champion,
2004a; Raalte, 2003; Santos, 2002; Karabiber, 2002). High-quality models of virtual humans
must be sculpted using advanced animation tools, with joints fully specified. Then, their
individual motions (e.g. flex an elbow, bend at knee) and more complex motions (e.g. walk, run,
sit) must either be individually crafted by the artist or driven by advanced software. For simpler
animations, usually based on VRML, the behavior of the human figures can be programmed
directly, but high quality movement cannot be achieved without very great expense.
The most popular tools for advanced modeling and animation are applications like Maya
and 3D Studio Maxx. Mid-level tools include UnrealEd (EpicGames, 2004) and Lightwave.
There are also many tools for VRML modeling and animation which allow authors to create
84
Virtual Heritage applications and to integrate them with web-based applications inexpensively.
Newer VRML editors support rapid 3D design with sketching tools (Igarashi, 1999; Jung, 2002).
VRML does not support high levels of visual detail and provides only minimal support for
animation. However, VRML is free and open source, has a very large user community (Web3D,
2004), is simple to program and integrates well with web-based applications.
Finally, spatialized audio can be a compelling addition to a virtual space (Karabiber,
2002) and there is an entire industry which provides software and hardware for it. Even simple
sounds which activate and deactivate when the user comes near to some trigger location can be
crafted to make the virtual environment much more believable.

85
2.7.5 Lifelike Pedagogical Agents
For educational multimedia and VR applications, a pedagogical agent is commonly defined as an
application which pro-actively supports learning The agent operates within or as part of a larger
application and functions as an actor who supports the application's instructional design. The
agent may interact explicitly with the student or may act quietly in the background as with many
adaptive hypermedia applications (section 2.4, p32). An overt agent may communicate with the
user via pre-recorded text or audio segments, generated text or speech and/or presented imagery
(Chittaro, 2003, 2004). Agents may also be embodied with a visual representation, usually an
icon, a face, or a complete body. Additionally, visible agents may use facial expressions and
body language to convey information.
Lifelike embodied pedagogical agents can help educational software provide active
support for the learner (Kim M, 2003; Moreno, 2000a). They may be particularly useful in
Virtual Heritage applications, because agents can be a fully integrated into the virtual space and
into the subject matter itself. Furthermore, the agents can be programmed to interact with the
student and to adjust to the user‘s level of knowledge and to the persona that the user assumes
within the application. Generally, this approach helps the student feel embedded and embodied
in the virtual environment (section 2.5.11, p60). It also supports a more believable and functional
social interaction between the software and the student, which in turn constructively (or do you
meant Constructivist? If not, used ―effectively, since ―Constructivist‖ and ―constructively‖ are
very similar) supports learning.
There has been little research featuring lifelike agents in Virtual Heritage applications
and apparently only one with a pedagogical agent (Economou, 2001) although agents are likely
to have the same benefits as with other educational media applications. This section will briefly
summarize the history, background, advantages and challenges of conducting educational
research with pedagogical agents.
In the 1970's, researchers experimented with intelligent tutoring systems (ITS), which are
educational software packages that use AI techniques to guide the student through a learning
curriculum (Boulay, 2001). At minimum, these applications would guide the student through a
specific subject area using a set of interaction rules driving program behavior. Later, researchers

86
recognized the limitations of the automated tutoring systems of the time, so they developed more
varied roles for programmed instructional intelligence. Today, the ITS databases contain large
amounts of subject matter and the interaction rules have become very complex as well. This is
especially true since recent advances in natural language processing (NLP) have made make
human-computer interaction increasingly naturalistic. The more advanced systems continually
model the student and respond according to the student's needs in light of the current learning
goals. The general trend is toward helping the student to act independently and to have more
control over his or her learning experience while at the same time supporting social and
cooperative learning (Cho, 2003; Dalgarno, 2001a, 2002b; Boulay, 2001; Hongpaisanwiwat,
2002).
Many desktop-VR applications employ agents. Some pedagogical agents are used for
educational experiments in MUDs and MOOs, (Bruckman, 2002b; Dede, 2004) while others are
used in stand-alone applications (Chittaro 2003, 2004; Megazina, 2002; Jiman, 2002). However,
no Virtual Heritage application has yet implemented a lifelike pedagogical agent. Though many
Virtual Heritage applications have simulated ancient peoples with programmed humanoid agents
(Gauthier, 2003; Jacobson, 2005c; ACID, 2004; Karabiber, 2002; Ulicny, 2002), few of these
agents are intelligent and none are programmed to guide the user though a learning process. The
only Virtual Heritage application I know of which uses any kind of pedagogical agent is SENET
which employs a desktop VR style window surrounded by a frame. The agent is in the frame
(Economou, 2001). Finally, I am not aware of any educational experiments with Immersive VR
which have employed a pedagogical agent.
The technology for building lifelike pedagogical agents in Immersive VR is now
available and more research in this area is needed.
A lifelike agent can convey a great deal of information through its facial expressions,
body language and motion, all of which can leverage on the agent's narrative and the context
provided by the virtual environment. Most importantly, a lifelike agent can employ the rich
semantics of gesture and expression which support verbal communication. For example, the
sentence, ―He put that over there.‖ is only intelligible in a visual context where the speaker
points to an object (that) and some location (there). Having an agent convey information
employs dedicated capacity in the human sensorium, which supports rapid recognition of
emotional states, social cues and language.
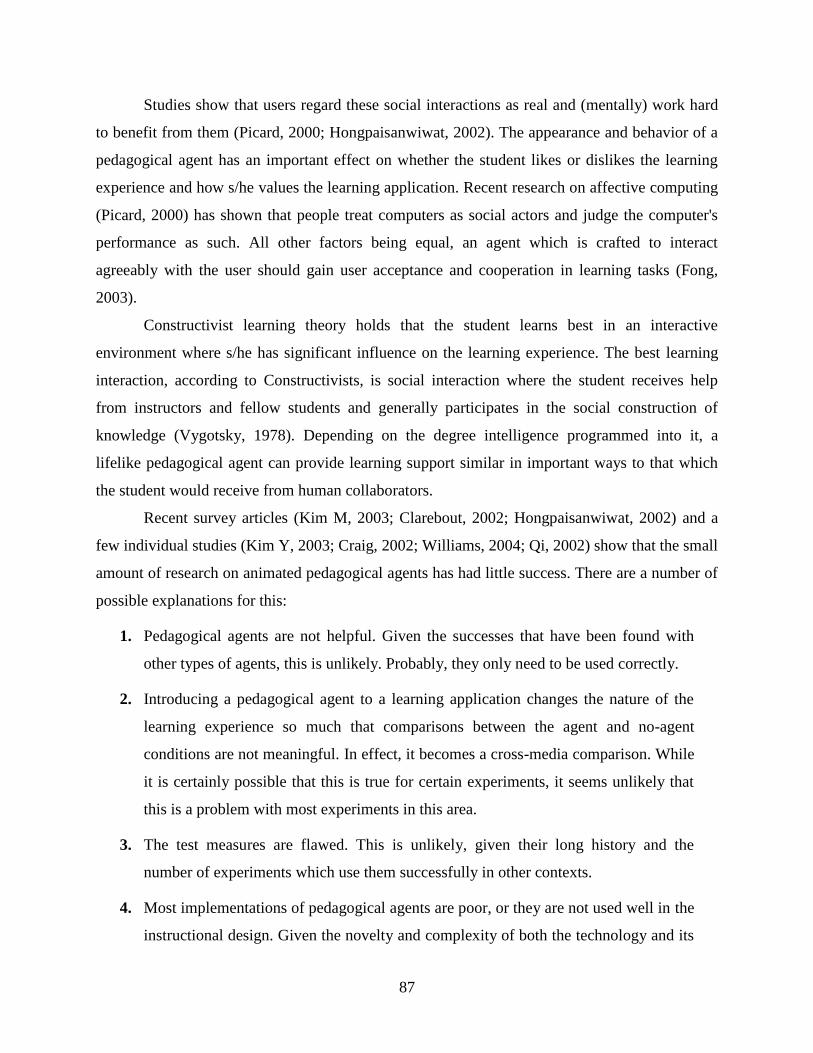
87
Studies show that users regard these social interactions as real and (mentally) work hard
to benefit from them (Picard, 2000; Hongpaisanwiwat, 2002). The appearance and behavior of a
pedagogical agent has an important effect on whether the student likes or dislikes the learning
experience and how s/he values the learning application. Recent research on affective computing
(Picard, 2000) has shown that people treat computers as social actors and judge the computer's
performance as such. All other factors being equal, an agent which is crafted to interact
agreeably with the user should gain user acceptance and cooperation in learning tasks (Fong,
2003).
Constructivist learning theory holds that the student learns best in an interactive
environment where s/he has significant influence on the learning experience. The best learning
interaction, according to Constructivists, is social interaction where the student receives help
from instructors and fellow students and generally participates in the social construction of
knowledge (Vygotsky, 1978). Depending on the degree intelligence programmed into it, a
lifelike pedagogical agent can provide learning support similar in important ways to that which
the student would receive from human collaborators.
Recent survey articles (Kim M, 2003; Clarebout, 2002; Hongpaisanwiwat, 2002) and a
few individual studies (Kim Y, 2003; Craig, 2002; Williams, 2004; Qi, 2002) show that the small
amount of research on animated pedagogical agents has had little success. There are a number of
possible explanations for this:
1. Pedagogical agents are not helpful. Given the successes that have been found with
other types of agents, this is unlikely. Probably, they only need to be used correctly.
2. Introducing a pedagogical agent to a learning application changes the nature of the
learning experience so much that comparisons between the agent and no-agent
conditions are not meaningful. In effect, it becomes a cross-media comparison. While
it is certainly possible that this is true for certain experiments, it seems unlikely that
this is a problem with most experiments in this area.
3. The test measures are flawed. This is unlikely, given their long history and the
number of experiments which use them successfully in other contexts.
4. Most implementations of pedagogical agents are poor, or they are not used well in the
instructional design. Given the novelty and complexity of both the technology and its

88
educational use and the fact that the agent can affect the student in many ways, there
are more opportunities for confusion and mishap. Also, the technology for animating
visual agents can become very complex and difficult to implement successfully.
5. Pedagogical agents do facilitate learning, but not in ways captured by the outcomes
measures, because the tool (the agent) may not be appropriate for the pedagogic goals
of the test. I believe that this is the most likely explanation. The goals of
Constructivist learning focus on higher levels of learning (i.e. transfer, learning how
to learn and learning how to collaborate). These types of learning are not measured in
many standardized knowledge tests which tend to emphasize factual and conceptual
knowledge. While the experiment itself may not have been conceived as a
Constructivist exercise, pedagogical agents appear to be best suited to that approach.
More research is needed to determine the best way to employ lifelike pedagogical agents,
especially for Virtual Heritage applications. Of particular interest is discovering how to employ
agents in ways that are uniquely advantageous, probably though student-and-agent role playing.
Another important research direction is the development of more advanced displays which would
allow students and educators to see more of the reconstructed environment(s) and interact with it
in novel ways. The effective educational use of immersive displays is a primary concern for this
review, and requires a careful examination of the existing research.

89
2.7.6 Current Activity in Virtual Heritage
Virtual Heritage is an active area of research, especially in the last seven years (Michell 2000,
Champion, 2004a, 2004b, 2004c; Addison, 2000; Moshell, 2002; Roehl, 1997; Stone, 2002;
Levy, 2004). This is due to the ubiquity of VRML, the rapidly declining cost of computer
hardware and the growth of the World Wide Web. Now, a general trend in VR applications
towards the use of computer game technology is making real-time animation and high detail
affordable (Lewis, 2002; Dalgarno, 2002a; Young, 2000; Pivec, 2003b; Bruckman, 2002a;
DeLeon, 2000; Tougaw, 2003; Stang, 2003; Jacobson, 2002a, 2004), and VH researchers are
taking advantage of it.
Table 2 lists activity in the field along with the appropriate references.
Table 2. Virtual Heritage Projects
Dedicated conferences VAST, 2005
Conferences which devote significant time to VH VSMM, 2004; Eurographics, 2004; iGrid, 2000
Dedicated research labs, companies and
organizations
Frischer, 2000, 2003; DWI, 2004; MIRALab,
2004; IAA, 2004; CVRLab, 2004; LearningSites,
2004; VHN, 2004; OnlineArchaeology, 2004;
VirtualHeritage, 2004; VWAI, 2004
Individual projects 3Dweb, 2004; ACID, 2004; Arabesk, 2004; BBC,
2004a; BBC, 2004b; Beacham, 2004; Burgess,
1999; Dudley, 2004; Duran, 2004; Economou,
2001; Gauthier, 2003; Grajetzki, 2003; Holloway,
2000; Hughes C, 2001; Karabiber, 2002; Kufu,
2004; Kwon, 2003; Ledermann, 2003; Lehner,
2003; Levy, 2004; Hughes 2001; Nord, 2003;
Oliverio, 2003; OsmosisInc, 2000; 2004; Park,
2003; Tam, 2004; Tennant, 2003; TimeRef, 2004;
TrajanForum, 1999; TroiaVR, 2003; TutTomb,
2001; Udine3D, 2004; Ulicny, 2002; Valzano,
2004; ViHAP3D, 2004; VirtualArcheology, 2004;
Zheng, 2000; Jacobson, 2004a

90
VH applications which employ computer game
technology.
Stone, 2002; Economou 2001; Schulman, 1999;
Champion, 2003, 2004b; OsmosisInc, 2000
Projects centered on reconstructions of
architectural spaces. These virtual environments
can be navigated, but are otherwise empty and not
interactive. They are almost always part of some
larger application or instructional design. Quality
ranges from very simple to moderately complex,
and all are useful.
Hughes C, 2001; Holloway, 2000; Frischer, 2000,
2003; Freudenberg, 2001; Beacham, 2004; Kufu,
2004; Learning Sites, 2004; Ledermann, 2003;
Lehner, 2003; Levy, 2004; Oliverio, 2003;
OsmosisInc, 2004; Ruiz, 2002; TimeRef, 2004;
TrajanForum, 1999; TroiaVR, 2003; Valzano,
2004; Zara, 2003; Grajetzki, 2003; BBC, 2004a;
Jacobson, 2004a
Virtual reconstructions of certain artifacts by
optical scan.
Tam, 2004; Zheng, 2000
VE applications which use architectural
reconstructions as their base environment, but are
also responsive to the user in some way.
Udine3D, 2004; Arabesk, 2004; TutTomb, 2001;
Jacobson, 1998
Architectural reconstructions which have
autonomous agents populating the virtual space.
The agents simulate the activities of ancient
peoples performing daily living activities or
religious rituals.
MIRALab, 2004; Ulicny, 2002; Gauthier, 2003;
ACID, 2004; Karabiber, 2002; Papagiannakis,
2003, 2004b; Jacobson, 2004c
VH applications which have some degree of
networking, allowing more than one user to enter
the virtual environment.
Oliverio, 2003; Pape, 2000; Park, 2003; Jacobson,
2004a
Networked VR applications. Raalte, 2003; Santos, 2002
Networked VR applications which resemble online
communities.
SecondLife, 2004; There, 2004; MUVEES, 2004
Applications which use their multi-user capability
to allow instructor/operators to control avatars to
help create the experience for the user.
Hughes, 2001; Economou, 2001
VH applications where the most important
information is convey through sound.
Karabiber, 2002
VH applications where the most important
information is convey through touch.
Nord, 2003
VH applications which provide visual immersion
for the user. Quality, capability and method vary
widely.
iGrid, 2000; Pape, 2000; Park, 2003, Jacobson,
2004c, 2004d
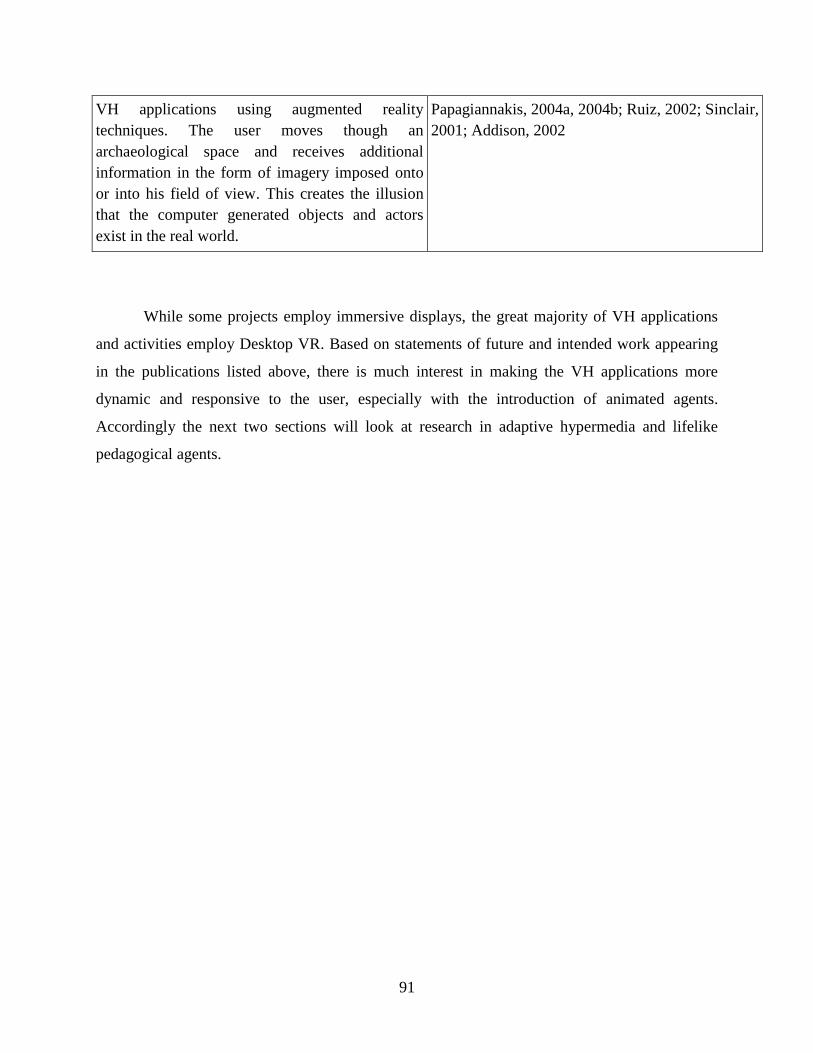
91
VH applications using augmented reality
techniques. The user moves though an
archaeological space and receives additional
information in the form of imagery imposed onto
or into his field of view. This creates the illusion
that the computer generated objects and actors
exist in the real world.
Papagiannakis, 2004a, 2004b; Ruiz, 2002; Sinclair,
2001; Addison, 2002
While some projects employ immersive displays, the great majority of VH applications
and activities employ Desktop VR. Based on statements of future and intended work appearing
in the publications listed above, there is much interest in making the VH applications more
dynamic and responsive to the user, especially with the introduction of animated agents.
Accordingly the next two sections will look at research in adaptive hypermedia and lifelike
pedagogical agents.

92
3.0 EXPERIMENT
In this chapter, we will describe the experiment at the heart of our study. After a brief
introduction, we will discuss the contribution we hope to make the literature. Next, we will
describe the learning game, Gates of Horus, which all students played and immersive and non-
immersive interfaces which are the basis for our main experimental comparison. We formally
state our hypotheses and describe in detail exactly who we were testing and what we can do.
Next, we describe how we gather the data, and finally we list potential threats to validity of our
expected results. We will detail and analyze the actual results in following chapters, but we can
say we are pleased with the outcome.

93
3.1 INTRODUCTION
We hope to demonstrate that an immersive visual display is superior to a standard computer
monitor for learning certain kinds of information which contain important spatial and visual
elements. Specifically, we will investigate how well middle-school students learn Egyptian
religious architecture using an interactive computer game. We will compare results achieved by
students using a standard desktop computer monitor versus those using an immersive display
Figure 18. The Sanctuary of the Virtual Egyptian Temple displaying in the Earth Theater.
Students interacted with the material, by playing a learning game of our own design,
called Gates of Horus, a single-student mystery-solving game. It features a simplified model of a
classic late period Egyptian temple, which is designed to embody all the key features of such
temples with a minimum of clutter. We chose this topic, because Egypt appears in most middle-
school curricula, and the temple was the center of Egyptian public life. For each area of the
temple, a pedagogical agent, the high priest, explains features of the temple when prompted by
the student. To complete the game, the student must answer the priest's questions to open doors
to progressively more secret and important areas of the temple. The student "wins" when s/he
answers the final questions so that the god, Horus, will open a divine gateway and let the
blessings of heaven flow to the land.

94
We conducted all testing at the Earth Theater of the Carnegie Museum of Pittsburgh,
which features a partial dome display providing visual immersion for up to sixty people. From
area schools, civic organizations, and individual families, we recruited eighty-five middle school
students (grades 6-8) to come to the Earth Theater and play Gates of Horus. As each student
came in, we randomly assigned each student to one of three groups. Each student in the Theater
Group played Gates of Horus using the immersive dome display. Each student in the Desktop
Group played the game on a standard desktop computer in an area adjoining the main theater.
Members of the Control Group also played the game on a standard desktop but took the test for
basic knowledge of the temple before playing the learning game. The Control Group‘s scores on
the Post Test take the place of a knowledge pretest for the other two groups. This is necessary
because any question-and-answer pretest given to the Theater and Desktop Groups would reveal
too much information about the temple itself, and distort or ruin our test results.
We expected students playing the game with the visually immersive display to learn more
information, retain it longer, and like it better. We also expected that students‘ scores on a visual
reasoning test, Raven‘s progressive matrices (RPM), would be correlated with their test
outcomes, in some way. Either students with low RPM scores will have more to gain from the
immersive view or those with the high scores will (Bricken 1991; Winn 1997).
Here, we summarize the experimental protocols (section 0. p121), in the order the student
experiences them:
1. Pretest: Take a pretest for general information such as their attitude towards VR and
Egypt.
2. RPM: Complete a visual intelligence test, Raven‘s Progressive Matrices (RPM) (Shiply
1949; Gregory 1999). If in the Control Group, take a written Post Test, a fairly typical
multiple-choice and short answer quiz. Then, proceed with the following tests.
3. Game Logs: Play the learning game, Gates of Horus, to completion. The software logs
all activity for later analysis.
4. Drawn Map: Draw a map of the temple.
5. Magnet Map: Place small magnets representing features of the temple on a correct map
of the temple.

95
6. Video: Give a guided tour of the temple, navigating the model of the temple on the
computer, explaining its purpose and features. The tour is videotaped and later scored by
evaluators.
7. Post Test: If not in the Control Group, take the written Post Test, the same one member
of the Control Group take before playing.
8. Follow-Up: One to two months later, the student completes an online quiz which
measures knowledge of the temple.
We gathered results for the Pretest and the RPM test for comparative analysis with our
primary measures of relative student performance. The other tests and the game itself provide
measures which we used to directly compare average performance of students in the three
groups. In this section we will describe our experimental design in more detail and how we
instrument the protocols.

96
3.2 RATIONALE
The goal of our study was to determine whether a visually immersive display can have a
provable advantage over a non-immersive display for topics in cultural heritage.
We chose the Egyptian Temple as the sample topic for our learning study, because the
temple was absolutely central to their life and culture, and because is appropriate for the virtual
reality medium. The temple itself, the hieroglyphics, the painted images, and the conduct of
ceremonies are all tightly integrated. The physical space itself is the main semantic organizing
principle. The temple is best viewed with the space intact from the vantage points from which it
was meant to be seen. Visual Immersion takes this one step further, providing an egocentric
view, which allows the observer to view the temple from the inside, as it was meant to be viewed
in real life. To our knowledge, ours is the first formal experimental study in the use of Immersive
VR for virtual heritage.
We chose the game metaphor for the advantages described in section 2.4.6, p38. With the
temple, we saw a design opportunity in the information structure of the temple and supporting
materials. We were able to structure the learning goals and activities in a way that is inextricable
from the topic matter itself. See section 3.3, p98, for details. To our knowledge, only Winn
(2001) structured an Immersive VR learning experiment as a game. Our study would be the
second.
The most difficult and important goal of our study was to demonstrate how an immersive
display could have more utility than a cheaper desktop monitor in a realistic situation. Several
previous studies failed to do this (Moreno, 2002b; Byrne, 1996; Rose, 1996; Salzman, 1999) and
only one succeeded (Salzman, 1998). Guided by Salzman‘s experiment, we structured our
experiment in terms of the effectiveness of an egocentric view versus exocentric view, and their
appropriateness for this particular topic matter. We also thought it important to test for the
difference between short and long-term retention, and the interaction between students‘ level of
visual skill and the display type.

97
We are pleased to report our study was successful in its major goals, which we will
discuss in our conclusion section 7.0 p236, First, we will describe the learning game, our
experimental design, and our basic results.

98
3.3 GATES OF HORUS
Gates of Horus is an educational game based on a Virtual Egyptian Temple (Jacobson, 2005e,
2004a), which provides both the content and the structure for our learning experiments. The
temple has no real-world analog, although it is constructed mostly from elements of the Temples
of Horus at Edfu (Arnold, 1999) and at Medinet Habu (Chicago, 1930). Its purpose is to embody
the key features of the typical New Kingdom period Egyptian temple in a way that an untrained
audience can handle. The temple consists of four major areas, the exterior (Pylon), the
Courtyard, the Hypostyle Hall, and the inner Sanctuary, arranged in that order and separated by
gateways.
Compared to a real temple, the virtual Egyptian Temple model is simple, having only
enough detail to represent the key features required (Figure 19). For example, there is only one
of each of the four types of areas, while an actual temple might have had several Courtyards and
Hypostyle Halls. Similarly, the hieroglyphics are larger than they would be in an actual temple to
make them more legible. There is a copy of the high priest in each of the major areas,
functioning as a pedagogical agent. In this way, it is similar to the Virtual Notre Dame Cathedral
(DeLeon 1999). Nevertheless, the scale and proportions of the spaces are correct, hieroglyphics
make the appropriate statements, murals and statuary are in their proper locations, and so on.
Figure 19. Temple of Horus and the high priest

99
In the game, the student navigates the temple in a ―first-person‖ view, where the view
screen is made to look like a window onto the virtual world. The student is able to use the cursor
to click on individual features of the Temple, which prompts the priest in that particular area to
explain that feature‘s meaning. To progress from one area of the Temple to the next, the student
must answer all of the priest‘s questions for that area. The questions are based entirely on what
the priest has to say about that area‘s active features. When the student correctly answers all of
these questions, the Gateway to the next area the Temple opens which the student explores and
learns about in the same way. The student wins the game when s/he answers all of the questions
from the priest in the inner Sanctuary. Metaphorically, this makes the divine image of the God
speak, and bring the blessings of heaven to the land of Egypt.
Gates of Horus uses CaveUT‘s built-in logging functions to record everything that
happens in the game. We make use of this in our experiments (section 6.2, p200).
3.3.1 Interface
Gates of Horus is based on the two freeware packages, CaveUT and VRGL (Jacobson, 2005)
and a commercial game, UT2004 (EpicGames, 2004). The student navigates and interacts using
a mouse. In our experiments, students used a special type of cordless mouse, the Gyromouse
(Figure 20, below) as a reasonably effective device for navigation and selection (Duncan, 2006;
Herpers, 2005; Olwal, 2002; Patel, 2001; Hafner, 2000; Winograd, 2000). All of the test subjects
played Gates of Horus using the Gyromouse, regardless of whether they were using a desktop
computer or the immersive display.

100
Figure 20. The Gyromouse
To the operating system, the Gyromouse appears as a standard two-button-with-wheel
mouse, but in practice it is somewhat difficult to use. By holding a trigger on the underside of the
mouse, one could activate the ability to turn, which is then done by moving the mouse in the
direction the student want to turn or look. The student can also move forwards and backwards by
pressing the left and right mouse buttons. Finally, to exit navigation mode and to go into cursor
mode the student presses the mouse wheel.
In cursor mode, the student can select an object by moving the cursor ―over‖ it, treating
the composite screen like a very large image map on a flat web page. However, the targeting is
three-dimensional, allowing the student to select the same object from many directions. For
example, Figure 21, below, shows a hawk statue in front of the temple with the targeting cursor
over it. The cursor also indicates when it is over an active object by turning green (not shown).
Down on the little mouse wheel changes the interface back to navigation mode.

101
Figure 21. Hawk statue and object selection cursor.
In the Desktop and Control conditions, each computer was equipped with a monitor, a
keyboard (which went unused during game-play), the Gyromouse, and two headphones
connected to the single sound port on the computer via a Y-splitter adaptor. During play, the
student would hear the voice of the priest on one pair of headphones. During the training phase, a
tester would wear the other headphones to hear the priest, also. In the Theater condition we used
wireless headphones.
In the Theater condition, Gates of Horus uses CaveUT to display on the main screen of
the Earth Theater, a multi-projector partial dome, shown here in Figure 22, Figure 23, Figure 24.
The Gyromouse-based control of the cursor and general interaction with the game are exactly the
same as with the desktop condition. However, using immersive display has a large practical
effect in the way the student perceives the virtual space, navigates through it, and selects objects.
For example, students with an immersive view often learn to (virtually) move less and physically
look more, taking advantage of the wide view.
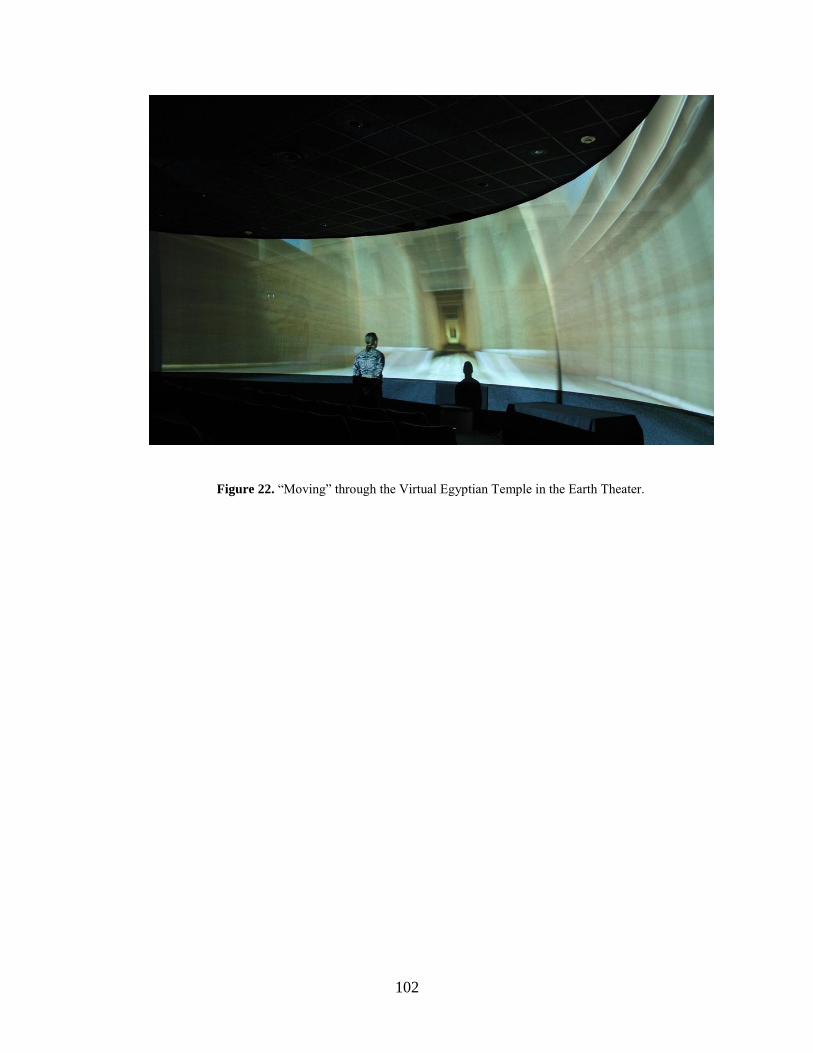
102
Figure 22. ―Moving‖ through the Virtual Egyptian Temple in the Earth Theater.

103
Figure 23. Overhead Diagram of the Earth Theater Main Screen
Figure 24. Side View Diagram of the Earth Theater

104
For the purpose of illustration, the person in Figure 22 is standing too close to the screen.
In our experiment the student was located where Figure 23 and Figure 24 indicate, slightly
forward of the center of the sphere defined by the curve of the main screen. We allowed the
student to sit or stand, according to their wishes.
Interestingly, students who have played first person shooter games tend to waste the
advantage of the immersive display by over-focusing on the center of the screen, navigating as
they usually so in their desktop-centric games. Students, who have not played games of this type,
tend to have a harder time learning to navigate, but develop better search strategies. Our
(anecdotal) observation is that both types of students appear to do equally well.
3.3.2 Training Phase
The student begins the game facing the side of the Temple, in the ―Training Area.‖ The student
will interact with the experimenter and with the software to learn how to play the game.
1. The training session begins with the student (virtually) facing the part of the temple
shown in Figure 25, below. The experimenter demonstrates the proper use of the
Gyromouse, and lets the student navigate around the exterior of the Temple, until s/he
appears to be comfortable with it.
2. The experimenter then demonstrates object selection, again using the Gyromouse. The
experimenter supervises the student as s/he selects random features of the temple, until
the student appears to be proficient.
3. The experimenter asks the student to navigate back to where s/he began, to see the view
in Figure 25, below.

105
Figure 25. Training Area
4. The experimenter directs to student to click on the priest, which triggers a voice
recording, "Before you begin the game, we will show you how to play using this small
example. You are looking at the Egyptian priest and side of the temple, which is behind
him. On the wall, you can see that two human-like images are highlighted. Notice how
they are facing each other and the things around them. Please click on each highlighted
feature to find out what it is.‖
5. When the student clicks on the figure on the left, s/he hears a recording, ―This is Pharaoh
offering something good to the Ram-Headed god, Khnum.‖ When s/he clicks the figure
on the right, s/he hears ―This is the Ram-Headed god, Khnum, receiving a gift from
Pharaoh.‖
6. After having clicked on both figures and heard the recordings, the student hears, ―Notice
how the cursor changes color when it is over either one of the figures. Pay attention to the
color of the cursor, because there are interesting things in the temple that you will want to
click on, but they are not spotlighted. Next, you will have to answer a question. To
answer 'yes' click the right mouse once. To answer 'no', click the right mouse button
twice, quickly. This is sometimes called a 'double-click'. Please try it now."
7. From this point, on, each time the student single-clicks the priest, the recorded voice says,
―Please try again. Click the right mouse button twice, as fast as you can."

106
8. When the student double-clicks, the priest said, "Good! Now make a 'yes' answer by
clicking the mouse, once." Every time the student double-clicks, the priest says, "Please
try again to make a 'yes' by clicking the right mouse button only once."
9. When the student produces a single-click, using the proper button, the priest says, "Good!
Now, click on the priest, and answer his question with a 'yes' or a 'no'. When clicked
upon, the priest asks: "In the mural in front of you, is Khnum reaching out for Pharaoh's
present?"
10. Each time the student/student indicated, "Yes,‖ the priest would reply, "Your answer is
incorrect, please try again. Is Khnum reaching out for the present from Pharaoh??
11. When the student answered ―no,‖ the priest said: "Correct. You are now ready to play
the game. Please go to the front of the temple."
12. The experimenter directs the student to move to the front of the temple and moves the
view to approximate the scene in Figure 19.
13. The experimenter gives the student four ―hint‖ cards (Appendix D, p355) to help the
student find the most difficult clues in each area. We had discovered the need for these
during pilot testing.
14. The experimenter stays with the student, ready to answer questions, while the student
works through the Pylon stage of the game. We collect and analyze data, while the
student is working with the pylon, but we are careful about drawing any conclusions from
it, because this is still a part of the training phase.
15. When the student has finished with the pylon, and the main gate of the temple opens, the
tester leaves the student to complete the game.
3.3.3 Game Logic
The following is a description of the logic which supports the student‘s dialogue with the game.
Because these are generic instructions on how to play the game, we use the present tense.

107
3.3.3.1 Definitions We use the following terms in all further discussion of the Temple and the
experiment.
1. Area: There are four areas associated with the temple, the Pylon, Courtyard, Hypostyle
Hall and Sanctuary. The interaction logic for each area is the same, except where noted.
2. Priest: Each Area also has a priest standing near the closed gate to the next area.
3. Goal: Each Area has a goal, which is a concept or idea. The goal has two or more
questions associated with it.
4. Clue: A clue is one of the short voice recordings which explain something. For example,
when the student clicks on the hawks on the ceiling, the recording it triggers is called the
Ceiling clue. Each goal has two or more questions associated with it.
5. Feature: Each clue is associated with a temple feature, which can be anything. Some
features are spotlighted. When the cursor is over any active Feature, the cursor changes to
the ―active‖ color.
6. Activate: When the student clicks on a temple Feature, s/he activates the clue associated
with it. Until that clue is Complete, it is activated.
7. Introduction: Each Area has a clue called Introduction, and its Feature is a particular
patch of ground. For the Pylon, it is the Area in front of the temple, large enough to find
easily and with some ―empty‖ space between it and the temple itself. For the Courtyard it
is the Area just inside the door from the outside. For the Hypostyle Hall, it is the Area
near the door to the Courtyard, and for the Shrine it is the Area near the door to the
Hypostyle Hall. Of the last three, each on is positioned so that the student will (virtually)
enter it the first time s/he enters the Area. The intro Area is indicated with a ring-of-
smoke effect just over ground. In all other ways, each Introduction is functionally the
same as all the other clues.
8. Each clue has several Questions associated with it. The questions are always in yes/no
form, and always asked by the priest in the room.

108
9. Each clue also has a View associated with it, which is the ideal (virtual) location and
orientation for the student to see the corresponding feature of the temple.
10. When the student has correctly answered enough of the questions associated with a view,
we say that the clue is Complete. Similarly, a Goal is completed when all of its questions
are answered correctly.
11. Until all of the clues have been Completed, there is always one and only one clue that is
called the Current Clue. It is always (1) Activated (2) not Complete and (3) the clue most
recently clicked. There could be two or more clues that the student has heard, but which
are not complete. The Priest keeps track of which clues are currently Active and the
student‘s most recent answer to each question already posed to the student.
3.3.3.2 Actions Here, we characterize the basic rules of the game.
1. The student may trigger an Introduction audio recording, only once, by (virtually)
walking onto the area associated with it. Entering the area again will not trigger the
introduction recording. However, the student may trigger the introductory recording at
any time by clicking on the floor just inside the door to the area. That part is indicated by
the smoke ring effect.
2. Each time the student clicks on the priest agent, s/he will hear questions associated with
features in the area or goal questions about the area as a whole. The student answers with
a Yes or No, using the buttons on the mouse. If the student immediately clicks on the
priest, again, the priest will repeat the question.
3. Once a student has answered a question correctly, the priest will never ask it again.
4. If a student has answered a question incorrectly, the priest will ask some other question
associated with the same clue. Only if no other questions remain will the priest ask the
incorrectly answered question immediately again.
5. If the student‘s answer is his or her second wrong answer for that clue since the time that
clue’s recording played, the student‘s view will automatically move to that clue‘s view
and the student will hear the clue‘s recording play again.

109
6. The student may click on an active feature at any time, eliciting the clue‘s recording. If
that clue is not Complete, it will become the Current Clue, regardless of whether one or
more clues are currently active.
7. When the Current Clue is completed, a previous clue that the student has heard, but has
not completed, will become the new Current Clue. If no clues are active, but there are
still clues the student has not yet heard, the priest will instruct the student to go hunt for
more clues.
8. When all clues in an area are complete, the priest will ask questions related to the goal.
When the goal is complete, the priest will congratulate the user and the gate to the next
area will open.
9. When the student successfully answers all questions for the sanctuary, the ―god‖ will
speak, congratulating the student on winning the game.
3.3.4 Statements and Questions
This section gives the full text for each clue in the Temple, the questions associated with each
clue, and the goal questions associated with each area. The name of each clue indicates the
feature to which it is attached. Each clue is preceded by its name and a description of how to
activate it. Each question is followed by its correct answer in parentheses. Because this is generic
information about the game, we use present tense.

110
3.3.4.1 Pylon Here, we describe each clue associated with the pylon (front) of the Temple, and
all the questions associated with each clue. In each description, the first sentence describes the
action the user must take to Activate the Clue. The second sentence gives the text of the Clue as
the student hears it. Each question is followed by its correct answer.
Figure 26. The Pylon
1. Intro: To hear this clue, the student enters a white circle on the (virtual) ground, which
marks a touch-trigger volume in the front of the temple. "The very large front of the temple is
called the 'Pylon'. It is gigantic, impressive, and colorfully decorated, but the colors have
faded away over time. The massive east and west halves represent the mountains on either
side of the Nile. The Pylon is a symbol of what Egypt could be." To hear the introduction,
again, the student can either go back to the starting position (in the circle) or click the circle.
Q1. Is the whole temple as massive as the Pylon? (no)
Q2. Was there originally more color in the decorations on the Pylon? (yes)
Q3. Just from what you see of the Pylon, does the temple seem well ordered and
designed? (yes)

111
2. King: Click on the very large scene spotlighted on the left part of the temple. "Pharaoh is
depicted on a grand scale, shown defeating the enemies of Egypt. The god grants Pharaoh the
power and authority, represented by a sword. The Egyptians believed that this was the way
things were supposed to be."
Q1. In the battle scene, is Pharaoh winning? (yes)
Q2. In the battle scene, is the god also beating Egypt's enemies? (no)
Q3. Do the gods give Pharaoh the authority to defeat the enemies of Egypt? (yes)
3. Hawk: Click on either hawk statue flanking the Main entrance. "I am Horus, the god of
Kingship. The hawk is my symbol and this is my temple. The image of Pharaoh beneath the
hawk's breast shows that I protect him, for Pharaoh and the gods are united for the good of
the world. I represent all gods, and Pharaoh is the link between the people and the gods."
Q1. Is there disunity between the gods and Pharaoh? (no)
Q2. Does the hawk show that this is the temple of Horus? (yes)
Q3. Is it important that the hawk statue protects a little king statue? (yes)
4. Disk: Click on the winged disk over the main gate. "The winged disk is a symbol of unity
and protection, helping to guide you through the temple. It represents the divine life-force
which flows from heaven and into all things. The disk is a symbol of the world according to
the Egyptians, representing creation, life and especially protection. "
Q1. Does the winged disk represent unity? (yes)
Q2. Does the winged disk guide you through the temple? (yes)
Q3. Does the winged disk represent war? (no)
5. Pylon Goal Questions: The Priest asks these, when the student has answered all of the other
questions about the Pylon.
Q1. Did the Egyptians think the world was orderly? (yes)
Q2. Does the scene where Pharaoh is beating the enemies of Egypt show what the
Egyptians wanted? (yes)
If the student's answers to these questions are satisfactory, the gates to the Hypostyle Hall will
open.

112
3.3.4.2 Courtyard Here, we describe each clue associated with the Courtyard of the Temple, in
the same way we did for the Pylon.
Figure 27. The Courtyard
1. Intro: Enter the Courtyard. "The Courtyard is an open and undivided space, made for large
religious celebrations and rituals. Everyone comes to these events dressed in the same simple
garments. They do this to show how all people are equal and humble before the gods."
Q1. Does Pharaoh come to the Courtyard, sometimes? (yes)
Q2. Can ordinary people go to the Courtyard? (yes)
2. Floor: Click on the floor. The floor‘s trigger-volume was centered on the courtyard, filling
about two-thirds of the space. It stops short of the columns and the ramp into the Hypostyle
Hall. To hear the introduction, again, go back under the courtyard gate to leave the trigger
volume, or click on the area under the door. "The Courtyard was a wide open space, without
subdivisions. It held large religious celebrations and rituals. Everyone dressed in simple
garments to show that they are humble before the gods."
Q1. Is the Courtyard divided into different areas for different people? (no)
Q2. Do rich people wear fancy cloths during the celebrations here? (no)

113
3. Sky: Click the sky above the Courtyard. ―The open sky over the Courtyard reminds us of the
connection between heaven and earth. All Egypt is united under the sun, which embodies the
creator god, Amon.‖
Q1. Does the sun embody the god, Amon? (Yes)
Q2. Was there a purpose to having no roof over the Courtyard? (yes)
4. Festival Scene: Click on either wall, behind the columns on the long sides of the space. The
trigger volumes should approximately run the length of each wall, except for a blank spot
behind the spotlighted column. "The celebrations here are joyous events showing the peoples'
gratitude to the gods. It is a sacred duty, a serious business, but also an enjoyable one.
Everyone brings the best things they have to give, as further offerings of gratitude."
Q1. Do people come to the Courtyard to complain to the gods? (no)
Q2. Do the people give their worst things to the temple? (no)
5. Offering Scene: Click on the spotlighted offering scene to the right of the gateway to the
Hypostyle Hall. "On behalf of all Egyptians, the King gives thanks by offering ‗every good
thing‘ to the god, who is their creator. In return, he blesses the King, the land of Egypt and its
entire people with life and prosperity forever."
Q1. Does Pharaoh represent the people's interest before the gods? (yes)
Q2. Do the gods give the King something in return for his offerings? (yes)
6. Columns: Click on the spotlighted column. "The king and god embrace, representing
humanity and divinity coming together in a public way. The King represents all Egyptians,
while Horus represents both the gods and the natural world."
Q1. Do the king and Horus spend all their time in the Courtyard? (no)
Q2. During the celebrations, were the god and Pharaoh symbolically there? (yes)
7. Courtyard Goal Questions: The Priest will ask these, when the student has answered all of
the questions, above.
Q1. Did the people give thanks to the gods as a community? (yes)
Q2. Did the people bring gifts with them to the festival? (yes)
If the student's answers to these questions are satisfactory, the gates to the Hypostyle Hall will
open.

114
3.3.4.3 Hypostyle Hall Here, we describe each clue associated with the Hypostyle Hall of the
Temple, in the same way we did for the Pylon.
Figure 28. Hypostyle Hall
1. Intro: Enter the hall to trigger the recording. To hear the recording again, go back under
gate from the Courtyard to leave the trigger volume, then enter it again, or click on the area
under the gate ―Unlike the Courtyard, the Hypostyle Hall was a quiet and private place. Only
the literate people, the upper class, ever came here. They conducted small private ceremonies
to honor their ancestors. This is another way for the people to connect with heaven.‖
Q1. Do people revere their ancestors here? (yes)
Q2. Can anyone come to the Hypostyle Hall? (no)
Q3. Do worshippers in the hall connect with heaven though their ancestors? (yes)
Q4. Is the Hypostyle Hall a public space, like the Courtyard? (no)
2. Lamps: Click any one of the lamps. ―The Egyptians remember and revere their ancestors by
making offerings and prayers to them. These offerings are placed before statues and images
of their ancestors, which are kept in homes and workplaces. Those who make great gifts to

115
the temple may have family offering places inside the Hypostyle Hall, a place of great
honor.‖
Q1. If you make a big donation to the temple, can you put a statue of your ancestors in
the hall? (yes)
Q2. Could anyone have a statue or offering table in the Hypostyle Hall? (no)
Q3. Can a poor Egyptian still have an ancestor statue or offering table at home or at
work? (yes)
3. Columns: Click the highlighted column. ―The Hypostyle Hall is filled with plant-form
columns which represent the primeval marsh. This marsh surrounded the first mound of land,
which rose from the waters at the beginning of time. It is built on a grand scale to let you
know that you are in a sacred space.‖
Q1. Do the plant-form columns represent broccoli? (no)
Q2. Do the columns have a special meaning? (yes)
Q3. Do the columns represent the primeval marsh at the beginning of time? (yes)
4. Ceiling Hawks: Click on the center strip of the ceiling, the part with the hawks printed on it.
―The hawks on the ceiling are spirit guides leading into the temple, showing the connection
between heaven and earth.‖
Q1. Do the spirit guides on the ceiling show the connection between heaven and
Earth? (yes)
Q2. Do the birds on the ceiling lead you out of the temple? (no)
5. Hypostyle Hall Goal Questions: The Priest will ask these when he decides that the student
has answered enough of the questions, above.
Q1. Is the Hypostyle Hall an intimate space? (yes)
Q2. Does the hall support a private connection to the divine? (yes)
If the student‘s answers to these questions are satisfactory, the gates to the Hypostyle Hall will
open.
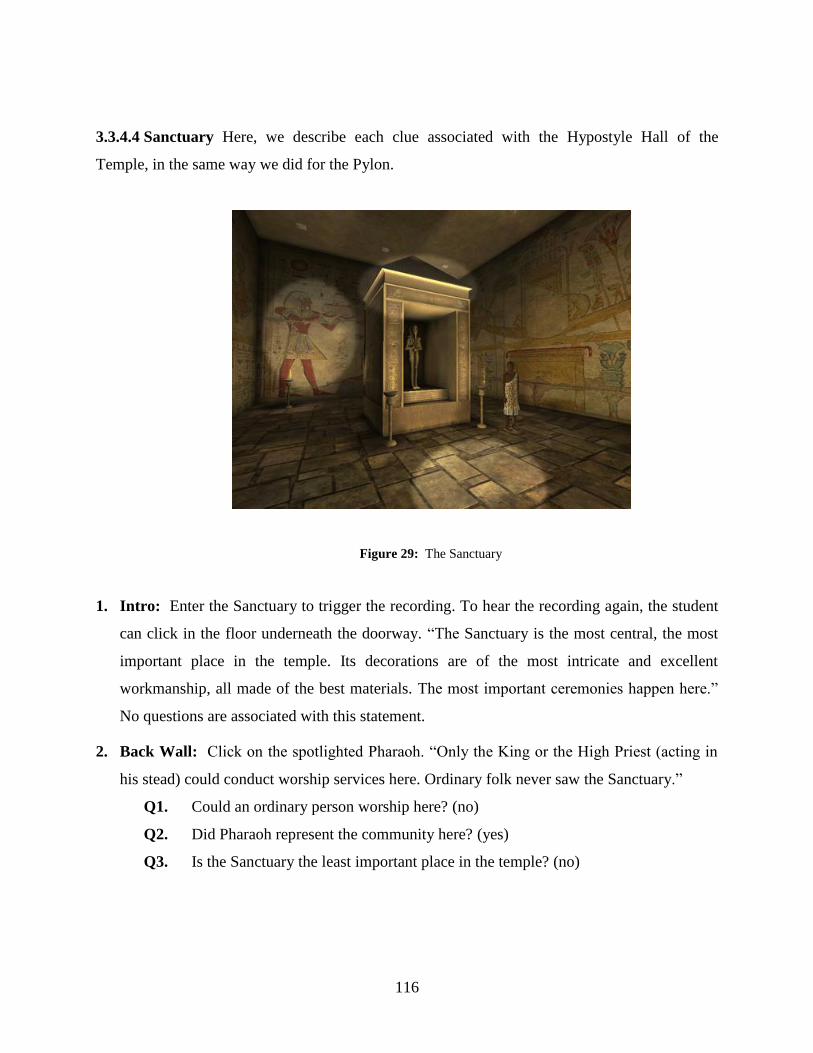
116
3.3.4.4 Sanctuary Here, we describe each clue associated with the Hypostyle Hall of the
Temple, in the same way we did for the Pylon.
Figure 29: The Sanctuary
1. Intro: Enter the Sanctuary to trigger the recording. To hear the recording again, the student
can click in the floor underneath the doorway. ―The Sanctuary is the most central, the most
important place in the temple. Its decorations are of the most intricate and excellent
workmanship, all made of the best materials. The most important ceremonies happen here.‖
No questions are associated with this statement.
2. Back Wall: Click on the spotlighted Pharaoh. ―Only the King or the High Priest (acting in
his stead) could conduct worship services here. Ordinary folk never saw the Sanctuary.‖
Q1. Could an ordinary person worship here? (no)
Q2. Did Pharaoh represent the community here? (yes)
Q3. Is the Sanctuary the least important place in the temple? (no)

117
3. Floor: Click on the spotlighted spot on the floor. ―The ground under the Sanctuary is the
primordial mound, the very first place in both space and time. People in every town in Egypt
think that the world began under their local temple.‖
Q1. Did the local Egyptians believe that the world began on the ground where their
temple is built? (yes)
Q2. When the world was created, was the ground under the Sanctuary created last?
(no)
Q3. Did the local Egyptians think that time began where their temple is built? (yes)
4. Shrine: Click on the top of the shrine. ―The Shrine was the gateway between heaven and
earth, from which the blessings of heaven would flow, but only if proper ceremonies were
conducted correctly. It is the god who opens this magical gate.‖
Q1. Is it important for the Pharaoh or the High Priest to do the ceremonies correctly?
(yes)
Q2. Do the blessings of heaven come out from the shrine? (yes)
Q3. If asked correctly, would the gods help the people? (yes)
5. Divine Image: Click on the figurine in the shrine. ―Standing in the shrine, the divine image
of Horus represents all gods. At times, it is inhabited by the spirit of the god, who influences
events for the benefit of the community. For example, if the gods were pleased, they might
bring a good harvest to the land.‖
Q1. Is the statue of the god just a statue to the Egyptians? (no)
6. Sanctuary Goal Questions: The Priest will ask these when he decides that the student has
answered enough of the questions, above.
Q1. Does Pharaoh communicate with the gods here? (yes)
Q2. Is there anything more important than what happened in the Sanctuary? (no)
Q3. In this temple, does Horus represent all gods? (yes)
When the student has answered these questions satisfactorily, the following recording plays:
―Congratulations young one! You have unlocked the secrets of my temple. When you are King,
you will come here to make the offerings, so that the gods will bless the people and land of
Egypt, forever. This is your power, your right and your duty.‖
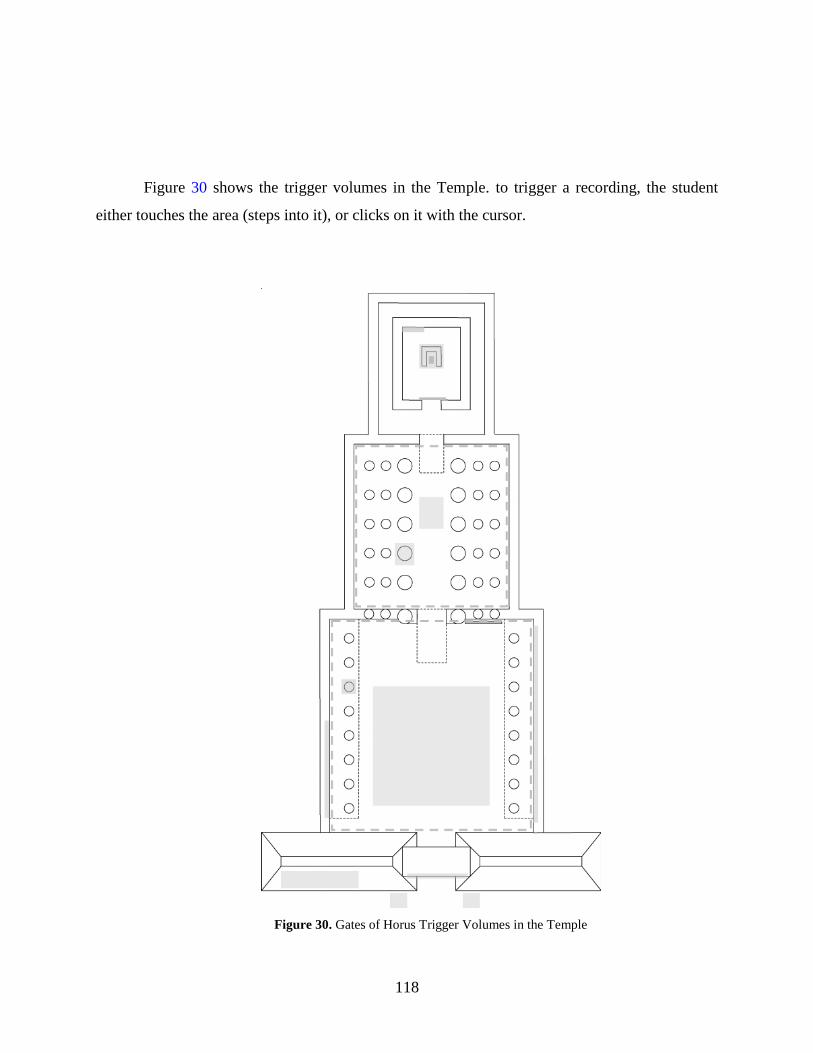
118
Figure 30 shows the trigger volumes in the Temple. to trigger a recording, the student
either touches the area (steps into it), or clicks on it with the cursor.
Figure 30. Gates of Horus Trigger Volumes in the Temple

119
3.4 HYPOTHESES
Two hypotheses H2 and H3, embody the primary goals of the study. H1 plays a supporting role
while H4, H5 and H6 refine the possible results found in H2 and H3. Many other comparisons
are possible using additional measures (e.g., age, gender, computer literacy) which we gathered
for their anecdotal value. However, such comparisons would not fall within the a priori goals of
the study, making the occasionally significant result suspect.
(H1) Students who play Gates of Horus (section 3.3, p98) to completion learn more of
the facts and concepts of the Virtual Egyptian Temple than those who have not. This
would be proved if Post Test scores for students in the Control Group were significantly
worse than scores for all students in the other two groups taken together. Failure to find a
significant difference would indicate a failure of either the learning experience itself or
the testing procedures.
(H2) Students in the Theater Group learn more facts and concepts than the others. This
would be proved if students in the Theater Group generally scored higher on the Post
Test or the Video Test than those in the Desktop Group. It would also be proved if
students in the Theater Group scored higher than all students in the other two groups
taken together. While this conveys the statistical advantage of comparing larger groups, it
gives the aggregate non-Theater Group an unfair advantage in the Video Test. Students in
the Control Group had more exposure to the material because they took the Posttest first.
If there is no significant difference, the positive effects of using the Theater would have
to be stronger.
(H3) One or two months after playing Gates of Horus, students in the Theater Group will
remember more conceptual and spatial knowledge than those in the Desktop Group. This
will be reported in the Follow-Up test.
(H4) Students in the Theater Group will learn more of the (spatial) structure and features
of the temple than those in the other two groups, taken together. The literature on spatial
navigation training in VR indicates this is a very likely result.

120
(H5) One or two months after playing Gates of Horus (section 3.3, p98), students in the
Theater Group report more motivation to learn about Egypt and a more positive view of
their experience. This is reported in the Follow-Up test. The Educational VR literature
indicates that this is a very likely result.
(H6) We expect students‘ scores on the Raven's Progressive Matrices (RPM) to interact
with the experimental results for the Post Test, video test, or Follow-Up test. The
immersive view conveys more advantage either to students who score high on RPM or
those who score low.
Our most important goal is to prove H2 or H3 to show that visual immersion helps children learn
more about Egypt, a common topic in middle-school curricula. However, we must prove H1
first, because the game has to be shown to be effective for learning before we can use it for
student-interface comparisons. Good computer learning games are difficult to produce, many VR
applications fail (section 2.6.4, p66), and Gates of Horus is both. We investigated H4 because
superior spatial learning is widely reported in the VR training literature (Darken, 2001). We
investigated H5, because enjoyment of VR interfaces is widely reported in VR literature.
We included H6, because Raven‘s Progressive Matrices (RPM) (Shiply, 1949; Gregory,
1999) measures students' basic spatial and spatial-analogical reasoning ability without the use of
language. One might expect those who score highly on Progressive Matrices to do better in the
Post Test results because of their higher spatial ability. The reverse may occur, however, with the
students of lower spatial ability benefiting more from having the temple visualized for them by
the software (Merideth Bricken, 1991). There is some indication in a study by Winn (1997) that
low-achieving students had more to gain, on average, from Winn‘s VR learning application.
121
3.5 TEST POPULATION AND PILOT STUDY
For this study, we recruited middle school students in grades six through eight, ages 11 through
14, from Pittsburgh area schools, civic organizations, and patron-members of the Carnegie
Museums of Pittsburgh. (Appendix D, p354) We believe that Gates of Horus (section 3.3, p98) is
appropriate for this age group, and relevant to most primary school curricula. The students are
old enough to handle the material and the test instruments but young enough to be enthusiastic
about planned-learning activities. The interactive game-like quality of the experimental learning
exercise is often familiar to them from the video games they may already play. Also, middle-
school students may remember activity-oriented learning experiences from elementary school.
Finally, Egypt is popular with the children of the museum-going public. At the Carnegie
Museum of Natural History, attendance in the 5th
floor Egyptian exhibition is second only to that
of the dinosaur exhibits.
Each student interested in the study and his or her parents or guardian were granted free
admission to the Carnegie Museum of Natural History for the day of the test regardless of
whether the student agreed to participate in the study. Upon completion of testing in the Earth
Theater, students received an informational booklet which gave more information about our
virtual Temple and Egyptian temples generally. Upon completion of the Follow-Up Test (section
6.6, p221) students received by mail a DVD containing a copy of the tour of the temple they
produced during the Video Test. They also received a $5 gift certificate to the Carnegie Museum
Store.
Kerry Handron, the director of the Carnegie Museum‘s Earth Theater, and Jeffrey
Jacobson, the principal investigator of this study, served as ―testers‖ supervising the testing and
management of the student, with occasional help from Ms. Handron‘s assistants. All testing was
individual to each student, but we employed Earth Theater facilities to handle up to six students
at any one time.
The first seventeen students we recruited became pilot testers; we used their comments
and learning outcomes to refine the testing procedures. We also used lessons learned from the
pilot study to refine our experimental design, primarily to mitigate threats to validity (section 3.8,
p133). We saved the data gathered from the pilot study for its anecdotal value, but we did not use
it in any formal analysis.

122
We had 17 pilot testers, 21 in the Control Group, 20 in the Desktop Group, and 27 in the
Theater Group, for a total of 85 subjects. (The pilot test is a dry run of the entire test protocol
intended to eliminate bugs in the procedure, the software, or even the design. Data gathered in
the pilot tests are not used in any of the analysis.) To improve the validity of our study, we
successfully recruited students from a range of economic strata and geographic areas, including
students from disadvantaged groups.
3.6 TESTING SEQUENCE
This section describes the full sequence of student and tester actions during an individual
student‘s testing session.
1. Upon arrival, the student had to have a consent form signed by a parent or guardian
(Appendix D, p346).
2. The tester explained to the student what the study entailed and obtained the student‘s
written assent. The student was free to withdraw from the study at any time for any
reason or no reason. Few did.
3. The tester asked each student who agreed to be in the study to invent a code name for him
or herself. This code was used to identify the student‘s test results and related records to
protect his or her privacy. The tester wrote the code on the student‘s parental permission
form and stored the forms in a locked filing cabinet in Kerry Handron‘s office. The
student or the tester tagged every test the student took with his or her code name; it was
also put on the game logs.
4. The tester randomly assigned the student to an experimental group (Control, Desktop, or
Theater) and wrote the date, the group, and the student's code name on the front page of a
blank testing packet (Appendix B, p307). The packet contained instructions for the tester
and some of the actual tests the student took. Throughout the experiment, the packet had
to either stay with the student or be carefully associated with him/her in some way. The
tester took the student to a desk with a standard desktop computer, monitor, keyboard and
mouse. Desks were located in quiet side rooms adjoining the Earth Theater.

123
5. Student completed the Pretest (section 6.1, p198) on the computer.
6. Student completed the Raven‘s Progressive Matrices test (section 5.6, p188).
7. If the student was in the Control Group, the tester launched the Post Test (section 4.0
p136) which the student completed. The student then continued with the next step, like
the other students.
8. If the student was in the Theater Group, the tester took him/her to the proper
viewing/control location in the Earth Theater. In effect, the student used the Earth
Theater‘s server computer as s/he would use a desktop, except for the difference in the
display. The student stayed at the desktop computer if s/he was in the Control Group or
Desktop Group.
9. The tester worked with the student to complete the training phase of the Gates of Horus
game (section 3.3, p98).
10. The student completed the first part of the game, centered on the Pylon. During this phase
of the game, the tester coached the student on navigation, selection and game play as
needed. Before the student (virtually) entered the Courtyard, the tester gave him/her Hint
Cards (Appendix D, p355) to help find the most difficult clues. We added the Hint Cards,
because pilot testing revealed that the game was too difficult for students to complete
within the desired time limit.
11. The student completed the Gates of Horus learning game (section 3.3, p98), usually in 45
to 60 minutes.
12. Student completed the Presence and Comfort test (section 6.3, p204) which is quite brief.
13. The tester took the student to a desk in the testing room, usually the one where the
student started.
14. Student completed the Drawn Map Test 6.4, p208)
15. Student completed the Magnet Map Test (section 6.5, p215).
16. The tester led the student to a separate room where s/he completed the Video Test
(section 5.0 p154).
124
17. If the student was in the Theater or Desktop Group, the tester conducted the student to a
desktop computer where the student completed the Post Test (section 4.0 p136).
18. The tester asked the student to log in to a special website, one month later, to complete
the Follow-Up Test (section 6.6, p221).
19. The tester conducted a short Exit Interview, asking the student for his or her impressions
and opinions of the testing process. During the interview, the tester gave the student a
booklet with more information on Egyptian temples and culture with references to online
resources for Egyptian history. The tester also informed the student of the Egypt Hall
exhibit on the Fifth Floor of the Carnegie Museum.
20. Four weeks after the VR experiment, we wrote to the student‘s parents to remind them of
the Follow-Up Test (section 6.6, p221), the student‘s personal code, and the payment the
student will receive for completing the test (Appendix D, p352).
21. The student took the Follow-Up Test (section 6.6, p221) via the internet, using any
computer with a web browser. The student was expected to use a computer at home or
school or at the public library.
22. To each student who completed the Follow-Up test, we sent a recording of his or her
video on a CD-ROM, a $5 gift certificate for the museum store (Appendix D, p352), and
our thanks section (Appendix D, p353)
Inevitably, the testing itself was part of the student's experience, and order effects were
probably significant. Each knowledge test gave the student a chance to elaborate and
organize what s/he knew, as well as providing additional information on the material. Rather
than attempting to control for ordering effects, we employed them as part of the learning
curricula, testing all students in all groups in the same order.

125
3.7 DATA GATHERING
This section describes the observation methods and test instruments we will employ to evaluate
students' learning.
3.7.1 Online Evaluation Forms
All student data and all evaluation forms are made available to the graders online, with only two
exceptions. We sent the videos on television-format DVDs and Dr. Holden's evaluation forms
were written. This allowed the graders to conduct their evaluations regardless of physical
location, and eliminated the need to manually enter their grades to the database. Figure 31 shows
a small example, the first part of the Post Test (section 4.0 p136).
The Post Test was accessible through a specific URL on this survey monkey site, in the
"area" designated for our study. We can log in with a password to edit the questionnaires,
download data, and perform other functions. While the survey is marked "open," anyone on the
Internet can access it, enter data, and send in answers. In practice, the URL is so cryptic that
there is no way anyone could find it unless we provide it. We stored the link in the shortcut on
the desktop of each one of the testing machines, so the tester only needed to double-click the
shortcut to call up the Post Test.
Many of the questions in the Post Test were automatically scored, being multiple-choice
questions of some type. However other questions were short-answer, which requires human
interpretation. We wanted each required to be able to assign-certain number of points to each
student's response to each question. Given certain limitations in survey monkey at the time, we
chose to make an individual grading form for every student who took the Post Test. Figure 32,
p127, shows a sample page.

126
Figure 31. Sample page from the online Post Test

127
Figure 32. Sample page from the online Grading Form for the Post Test

128
As you can probably see in the instructions on the sample form (Figure 32, above), the
original question is shown in italics after an asterisk, while the student answers are shown in
plain text. The number of each question is the number as it appears on the original test. For
question two in Figure 32, above, the grader has three choices for assigning data, none, half-
credit, or full-credit.
This is equivalent to a three-level Likert scale. While five level Likert scales are common
and easy to work with in data analysis, we felt that five levels would convey no more true
information. In the case of question number two, what would one quarter credit or three quarters
credit really mean? As it is, a half credit answer means that the student indicated something very
similar to the winged disk or alluded to it.
3.7.2 Multiple Evaluators
We will employ four outside experts to evaluate test results:
1. Two middle and high school teachers, Kathy Bruckner and Adrienne Baker.
2. Jane Vadnal, an expert art historian, but not an Egyptologist.
3. Benjamin Getkin, tour guide for the Virtual Egyptian Temple at the Museum. Gates of
Horus was built on the educational materials surrounding the virtual Egyptian Temple.
All four of them evaluated the open-ended student responses in the Post Test and Follow-Up test,
and then evaluated (student-made) Drawn Maps, Magnet Maps and Videos. Additionally, Dr.
Lynn Holden performed a special valuation of the Videos. Dr. Holden is the Egyptologist who
provided the content and advising for Gates of Horus (section 3.3, p98).
We had multiple evaluators, so we could merge their results to produce a more stable
evaluation. While having two graders is minimal, we really wanted three, so we engaged four.
As it happened, we were fortunate to receive full feedback from all four on almost all the tests.
The one exception was the video test, where we had three graders, which is acceptable.
Most of the tests and all of the evaluations are conducted online, primarily using a web-
based survey hosting service, Survey Monkey (2007). The service has an online survey builder,
simple data management, and hosting for as many surveys we needed. It worked reasonably

129
well, and saved us a great deal of time programming our own online forms and database.
However, it was never intended for research of this type, which led to some quirky limitations.
Chiefly, we found ourselves having to create a large number of special purpose surveys, many of
them referring to a single student for a single test. This will become clearer as we present the
tests in this section.
Both the Pretest and Post Test resembled a kind of quiz that one would take in a
classroom, and were implemented standard online surveys. As with the typical survey, each test
was accessible through the internet via a URL. When the student indicated that s/he was done
with the test, Survey Monkey would store the information. At any time, we could download all
of the student answers to a single spreadsheet, from anywhere on the Internet. Student
confidentiality was protected by the password access to survey monkey and our use of code
names. Both the Pretest and Post Test were accessible through shortcuts on the desktop for each
of the testing computers, except for the Earth Theater‘s server. When it was time for student to
take one of these tests, the tester would simply double-click on the shortcut to launch the online
quiz.
The Follow-Up test is an online quiz, like the Pretest and Post Test. The student took it at
home or the library or wherever else s/he had access to a computer. For practical reasons the
student took the RPM test, the Presence and Comfort test, and the Drawn Maps, on paper. We
copied all of the RPM test scores on to a spreadsheet, but found it more convenient to use a
Survey Monkey form to enter all of the presence and comfort test data. We photographed
students‘ Magnet Maps and filmed their Video presentations.
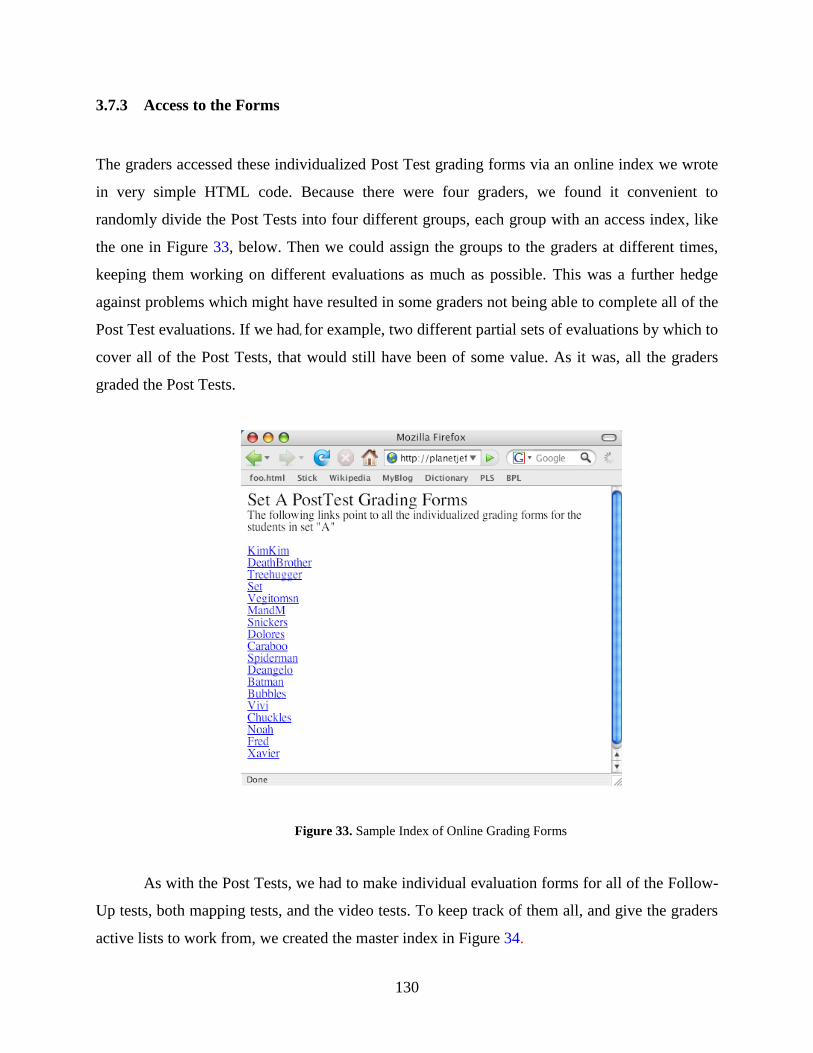
130
3.7.3 Access to the Forms
The graders accessed these individualized Post Test grading forms via an online index we wrote
in very simple HTML code. Because there were four graders, we found it convenient to
randomly divide the Post Tests into four different groups, each group with an access index, like
the one in Figure 33, below. Then we could assign the groups to the graders at different times,
keeping them working on different evaluations as much as possible. This was a further hedge
against problems which might have resulted in some graders not being able to complete all of the
Post Test evaluations. If we had, for example, two different partial sets of evaluations by which to
cover all of the Post Tests, that would still have been of some value. As it was, all the graders
graded the Post Tests.
Figure 33. Sample Index of Online Grading Forms
As with the Post Tests, we had to make individual evaluation forms for all of the Follow-
Up tests, both mapping tests, and the video tests. To keep track of them all, and give the graders
active lists to work from, we created the master index in Figure 34.

131
Figure 34. The Grading Matrix
As it appears, each cell of the table is an active link to an index of individualized tests,
the Grading Matrix. The due dates on the left changed with current circumstances. The ones you
see in this example are simply the due dates from the final role update.
Each grader worked through his or her personal list of individualized forms. Note that the
forms were individualized by student, but not to the graders as well. For example, Survey
Monkey recorded input from all four graders for student ―KimKim‖ in a single spreadsheet. Data
analysis required merging the spreadsheets.
3.7.4 Data Management
We stored and manipulated all data in Microsoft Excel, which we also used for much of
the data analysis. We used SPSS for some of the more advanced statistical analysis. We stored
absolutely all files for everything related to this dissertation in SVN, a configuration
management and file versioning tool. This allowed us to make incremental changes, save those

132
versions, and attach specific comments to each incremental change. All files, including the raw,
unprocessed data files, are available upon request, as well as the change log files and
intermediate versions.
All files pertaining to this dissertation are maintained in a directory tree under SVN
management. We refer to files by their full path from the directory root through the actual file
name. For example, ―/Analysis/Videos/HypothesisTest.xls‖ refers to the (statistical) hypothesis
test performed on data gathered from the ―Video‖ testing (section 5.0 p154). In all files
everywhere, each student‘s data is referred to by that student‘s code name. Some of them are
whimsical, but all protect the students‘ privacy.

133
3.8 THREATS TO VALIDITY
This section describes confounding or interfering factors that may pose a risk to a statistically
significant outcome or the relevance of the result. We believe that we have mitigated the most
likely threats, which are described here, taking care to make the game playable, the user interface
usable, the test protocol comfortable, and all three as bug-free as possible. We structured the
game itself to naturally resolve (usually) within time limits. We hoped that a field trip to the
Museum and playing an Egypt-themed computer game were exciting enough, so the added
excitement of using virtual reality would not make much difference in the final results. The
design of the Earth Theater mitigated motion sickness. Finally, we mitigated fatigue by allowing
students to take a short break at any time and moving them from one activity to another
frequently. During pilot testing we eliminated or minimized all of these negative factors.
3.8.1 Immersive VR is Engaging Because It Is New.
At present, Immersive VR applications are rare and usually praised by users as thrilling, fun and
exciting. This alone may result in a high level of user engagement, which theoretically could
provide a transitory advantage for students in the Theater Group. However, computer games,
Egypt, and field trips to the museum are all very popular with this age group. We expected that
all of the test subjects would be so excited that the added thrill of visual immersion would not
make a measurable difference.
3.8.2 Motion Sickness
Unlike Head Mounted Displays, CAVEs and similar devices provide optic flow in the student's
peripheral vision, which may cause motion sickness in some of the subjects (Harris, 1998, 1999;
Kennedy, 1992, 1995; Kolanski, 1995; Lin, 2002; Prothero, 1999; Kuno, 1999; Owen, 1998;
Howarth, 1998). The most effective way to reduce this problem was to discourage students from
moving and turning in the virtual environment any more than necessary.

134
The panoramic view available in the Earth Theater and the user‘s ability to control the
selection/activation cursor independently reduced the student's need to navigate to see and select
objects Also, the navigation speed in Earth Theater was much slower than in the typical video
games to reduce confusion and motion sickness and to convey a sense of the temple's grand
scale. Most importantly, audiences see immersive movies in the Earth Theater on a regular basis
with very few complaints of motion sickness. While the projection screen in the Earth Theater
provides a 210° horizontal field of view, it only provides 30° vertical, which helps the audience
feel more physically grounded. During testing, students reported little or no symptoms of motion
sickness.
3.8.3 Application & Interaction Design
Success of any VR application depends on the quality of its interaction design. Navigation has to
be easy and comfortable, selection straightforward and performance crisp. Many Immersive VR
experiments have had major problems as a result of poor interaction design or inadequate
technology (Jackson, 2000). Fortunately, the technology has advanced considerably from the
time most of those studies were conducted. Also, interaction design for VR applications has
continued to improve, yielding some clear design principles (Bowman, 2002). We improved the
interface for Gates of Horus during pilot testing to what we hoped was an acceptable level of
quality.
3.8.4 Limited Quantity of Content
The content of the learning game (Gates of Horus, section 3.3, p98) must be finite for practical
reasons. However, if there is too little to learn, it could result in a ceiling effect for learning
outcomes, where all students in all treatment groups learn everything. The Pilot Study (section
3.5, p121) showed this unlikely to be a problem.

135
3.8.5 Fixed Learning Time
For practical reasons, students must have a fixed period of time to explore the temple and learn
the associated materials. This runs the risk of forcing a student to stop when s/he is engaged in
and learning or to be forced to continue when they wish to stop. That is why, we structured the
game, Gates of Horus (section 3.3, p98) to complete in a limited period of time. Most students
completed the game in approximately 40-80 minutes, which was acceptable for the study,
3.8.6 Fatigue
Testing and treatment took approximately two hours for each subject, which could be tiring.
Fortunately, students revealed a remarkable degree of energy and interest from the kids, with
none of them asking for a break. We surmise that the variety of activities kept it interesting.

136
4.0 POST TEST RESULTS (ACCEPTANCE AND EFFECTIVENESS)
Results from the Post Test strongly support H0 (section 3.4, p119), showing that students found
the game, Gates of Horus (section 3.4, p98) enjoyable and useful. Results also supported H1,
showing that students in the Theater Group and the Desktop Group scored far better on the Post
Test than those in the Control Group. This shows the stability and effectiveness of the learning
game and of the VR interface. The result also gives us a basis for further comparisons of
immersive and non-immersive interfaces using the game.
In this chapter, we will first present data for the affective questions (H0) on the Post Test
and the results. Then, we will list the questions asked on the Post Test and show which questions
produced results on which our graders could agree well enough for further analysis. Finally, we
compare the learning results among the experimental groups (H1) to demonstrate that students
who play the game really learned something.
However, comparing the Desktop and the Theater Groups produced no significant
differences we can trust (for H2). We believe this is because our Post Test is not sensitive to
deeper learning, instead resembling a standard quiz for factual knowledge. Students are very
experienced with tests of this type and make good use of the scaffolding questions they provide.
That said, it might be possible to detect the learning result this way, if our population size were
larger. While it was important that we have a test of this kind to maintain consistency with
common practice, the Video Test proved more fruitful (section 5.0 p154).

137
4.1 ACCEPTANCE
The first part of the Post Test questionnaire asks the student to rate their satisfaction with the
learning game. Student acceptance is very important to any learning activity, being a crucial
determinant of engagement. One of the main justifications for educational gaming is the hope
that students will accept it with at least some of the enthusiasm they show for games of similar
complexity (section 2.4.6, p38). Fortunately, the students in our study reported that they found
Gates of Horus (section 3.3, p98) enjoyable and useful. Table 3 and Figure 35 summarize the
raw results. This satisfies experimental hypothesis H0 (section 3.4, p119).
Table 3: Affective Questions and Raw Results
Yes, Totally! Yes Maybe No
Absolutely Not!
Did you have fun playing the game? 12 26 3 0 1
Would you recommend Gates of Horus to your friends? 8 18 14 2 0
Did you learn something? 19 23 1 0 0
Are you glad you learned what you did learn? 14 25 4 1 0
Are you glad you played the game? 19 17 3 2 1
Would you like to play another game like it? 18 19 5 0 1
Do you want to learn more about ancient Egypt? 13 18 10 1 0

138
Figure 35. Key Affective Results
As impressive as these reports are, the most important indicator of student acceptance is
that nearly all students played the game from beginning to end, 45 minutes to one hour, without
even asking for a break.
However, comparing affective results from the Desktop and Theater Groups showed no
significant difference. In this case, we were able to use the T-TEST, two-tailed, uneven samples
to produce the P-values in Table 4, below. This was possible, because the students provided their
answers on a five-level Likert scale and the results were sufficiently close to a normal
distribution for a parametric test (Jaccard, 1996). We believe the lack of a clear difference
between the two groups‘ affective scores is a result of our efforts to reduce the effect of the raw
novelty of VR (3.8.1, p133). With the excitement of a day at the Museum, playing a learning
game, and the popularity of Egypt, we had hoped to stimulate students in both groups to
experience as similar an excitement level as possible. It is possible that we have succeeded, but
our experiments are not structured to assess that.
Table 4. Affective Questions
Question Short Name D v T Did you have fun playing the game? fun 0.1028 +
Would you recommend Gates of Horus to your friends? commend 0.3456 +
Did you learn something? learn 0.2325 +
Are you glad you learned what you did learn? gladlearn 0.1171 +
Are you glad you played the game? gladplay 0.2625 +
Would you like to play another game like it? another 0.4055 +
Do you want to learn more about ancient Egypt? learnmore 0.1966 +
Affect Average aave 0.0904 +

139
4.2 QUESTIONS IN THE POST TEST
The Post Test measures at the factual level of learning (Bloom 1957). Factual questions (usually
multiple-choice formats) quiz the student on the most basic physical features of the temple itself.
Examples include ―How many gates does the temple have?‖ and ―Where were the big hawk
statues?‖ Conceptual questions often repeat the questions asked by the priests by the gateways,
but in a different form. For example, two or three yes/no questions may be condensed into a
single multiple-choice question or a question may be reworded. Conceptual questions are those
which were not asked by the priest, but which follow the same criteria. Some are corollary to the
priests' questions, but others are not. Some questions require written answers, with just one or
two sentences needed and not more than a paragraph allowed.
Table 5, below, lists all questions in the Post Test. Multiple-choice questions, such as
Q11 and Q15 have the answer options listed to their right. Open-ended questions are indicated as
such in the second column. Question 2 presents the student with a matrix where s/he gives one of
five responses to each of the sub-questions. See (Appendix A, p287) for a reproduction of the
test.

140
Table 5. Questions from the Post Test
Q1. What is your code name? (open ended)
Q2. For each of the following questions, please check the box which best matches your answer. (Absolutely not, no, maybe, yes, yes Totally!) Did you have fun
playing the game?
Would you recommend Gates of Horus to your friends?
Did you learn something?
Are you glad you learned what you did learn?
Are you glad you played the game?
Would you like to play another game like it?
Do you want to learn more about ancient Egypt?
Q3. What was the important symbol above all of the doorways in the temple? (choose one) Son of the Sun Hawk God Winged Disk
Double Crown of Egypt
Q4. The great, big, front of the temple was called the (choose one) Horus Gate Pylon Mountains
Q5. Like many of the real temple ruins in Egypt, most of our temple does not have much color. Why? (choose one)
It's supposed to be that way
Over the centuries, the colors were worn away.
Somebody in the 20th century spray-painted all the ruins with the sandy/gold color you see.
Q6. What was the important symbol above all of the doorways in the temple?_______________. (open ended)
Q7. Who or what gives Pharaoh the authority to defeat the enemies of Egypt, according to the ancient Egyptians? (choose one) The people of Egypt The rich nobility
The Egyptian army The Gods
Q8. When Pharaoh went before the gods with his offerings, who was he representing? Whose interests was he looking out for? (choose one) The Egyptian people himself the nobility
Q9. Very important festivals took place in the Courtyard of the temple. Who went to these festivals? (choose one)
the workers and the lower classes everybody the nobility
pharaoh and the priests
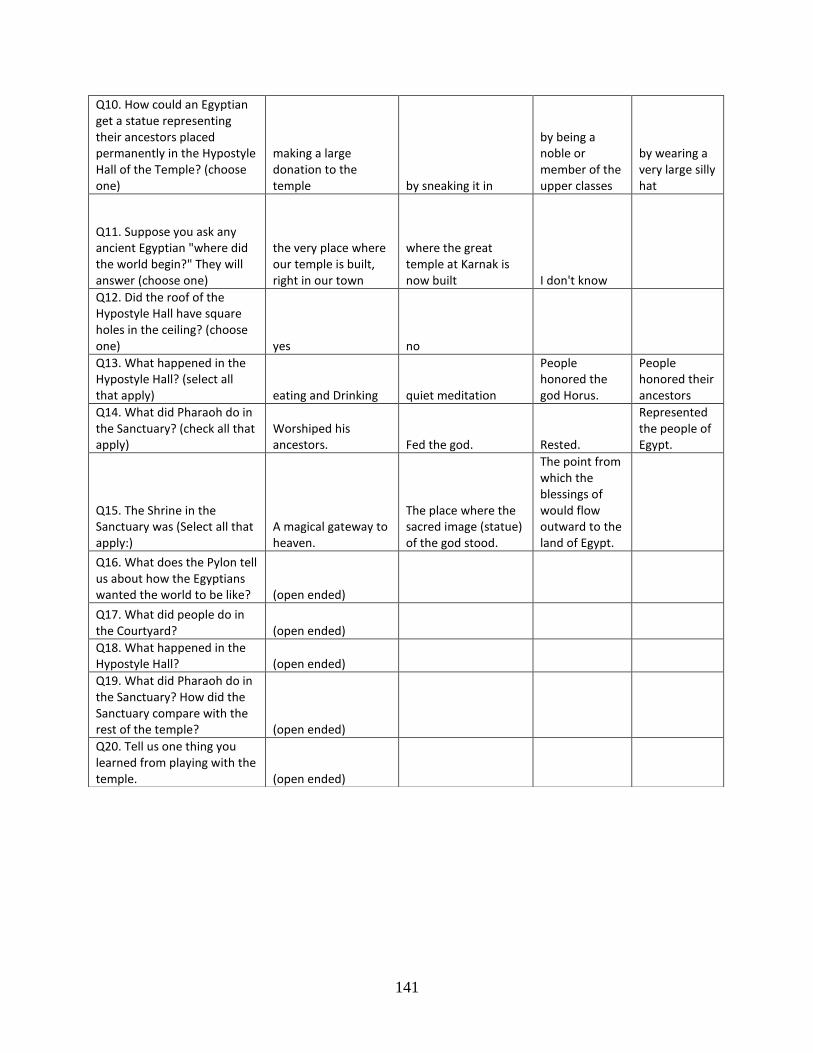
141
Q10. How could an Egyptian get a statue representing their ancestors placed permanently in the Hypostyle Hall of the Temple? (choose one)
making a large donation to the temple by sneaking it in
by being a noble or member of the upper classes
by wearing a very large silly hat
Q11. Suppose you ask any ancient Egyptian "where did the world begin?" They will answer (choose one)
the very place where our temple is built, right in our town
where the great temple at Karnak is now built I don't know
Q12. Did the roof of the Hypostyle Hall have square holes in the ceiling? (choose one) yes no
Q13. What happened in the Hypostyle Hall? (select all that apply) eating and Drinking quiet meditation
People honored the god Horus.
People honored their ancestors
Q14. What did Pharaoh do in the Sanctuary? (check all that apply)
Worshiped his ancestors. Fed the god. Rested.
Represented the people of Egypt.
Q15. The Shrine in the Sanctuary was (Select all that apply:)
A magical gateway to heaven.
The place where the sacred image (statue) of the god stood.
The point from which the blessings of would flow outward to the land of Egypt.
Q16. What does the Pylon tell us about how the Egyptians wanted the world to be like? (open ended)
Q17. What did people do in the Courtyard? (open ended)
Q18. What happened in the Hypostyle Hall? (open ended)
Q19. What did Pharaoh do in the Sanctuary? How did the Sanctuary compare with the rest of the temple? (open ended)
Q20. Tell us one thing you learned from playing with the temple. (open ended)

142
4.3 GRADING THE OPEN-ENDED QUESTIONS
While multiple-choice questions can be scored automatically, the short answer questions require
human judgment. To report his or her judgment on a student's short-answer questions, the grader
filled out the online Post Test Grading Form for that student. Table 6, p143, lists the questions on
that form. Note that most questions have a series of facts following, for each of which the grader
assigns a rating. The available ratings for a question are listed after the question itself in the same
cell.
Many of the questions have "Other1" and "Other2" listed as options. Each one is a
wildcard for the grader to use to give a point score for some fact that is relevant to the question but
did not appear as a choice. The grader does not indicate what that fact is. While this information
from the grading of the wildcard is interesting, the way the Post Test Grading Form asks for it
has proven to be problematic in data analysis. See Appendix D, p345, for a reproduction of the
Post-Test Grading Form.

143
Table 6: Grader's form for scoring open-ended questions
Grader Name
Q2. What was the important symbol above all of the doorways in the temple?_______________. (none, half, full)
Q3. What does the Pylon tell us about how the Egyptians wanted the world to be like? (none, half, full)
Orderly Ruled by Egypt Pharaoh rules Egypt
Pharaoh has the support of the gods Other1 Other2
Q4. What did people do in the Courtyard? (none, half, full)
Had great public festivals for everyone
Dressed simply to show their humility before the gods
Brought their best things as offerings
Gave thanks to the gods as a community
Saw the god and pharaoh (symbolically) embrace in a public way
Saw the connection between heaven and earth symbolized by the open sky of the Courtyard
Saw how Pharaoh made offerings to the gods on behalf of the people. Other1 Other2
Q5. What happened in the Hypostyle Hall? (none, half, full)
People made a private connection with the divine.
People honored their ancestors.
People saw the connection to the beginning times through the planet-form columns. Other1 Other2
Q6. What did Pharaoh do in the Sanctuary? How did the Sanctuary compare with the rest of the temple? (none, half, full)
Communicates with the gods.
Makes offerings to the gods.
Entreats the god to let the blessings of heaven flow to the land of Egypt.
Represents the community.
Stands on the ground with the world began Other1 Other2
Q7. Tell us one thing you learned from playing with the temple. (low, average, high, N/A) importance relevance generality
Q8. Please rate these aspects of The student's performance (strongly disagree, disagree, neutral, agree, strongly agree) strongly disagree disagree neutral agree
strongly agree
Q9. Please add any additional comments you have regarding student’s answers to these questions. Are there any additional concepts that the student entered? Is there a pattern to the student’s answers which are not captured by the grading scheme above?

144
4.4 INTERRATER RELIABILITY ANALYSIS
Four different graders (Baker, Bruckner, Getkin, and Vadnal) evaluated students‘ answers to the
short-answer questions in the Post Test. This gives us four ratings for each fact the student was
supposed to master, and our goal is to average all four into a single rating for further analysis.
For each grade, this average gives us a more stable measure, less influenced by who the graders
are. However, we cannot simply accept a simple average because we could create a reasonable
looking average from wildly disparate (and therefore meaningless) grader scores. To determine
whether there is sufficient agreement for an average to be valid, we use the same method of
Interrater Reliability Analysis (IRR) we employ for the Video Test. See section 5.3, p163.
Part of this process is to recode the grader responses into numbers, because it is more
convenient. In the Post Test, we made the following substitutions:
Simple, factual questions: none 0, half 0.5, full 1.0
"Tell us one thing you learned from playing with the Temple.": N/A 0, low 0.33,
average 0.66, high 1
The four questions under: ―Please rate these aspects of the student's performance‖: N/A
0, strongly disagree 0, disagree 0.25, neutral 0.05, agree
0.75, strongly agree 1.
Table 7, shows results of the IRR analysis on grades for the short-answer questions in the Post
Test. The first column shows the individual questions. The second column shows all of the facts
associated with each question. The third column shows the short name or codename for each

145
concept. For each student and for each fact, each grader assigns a score depending on how well
the grader thought the student showed knowledge of the fact in his or her answer to the open-
ended question. The fourth column shows the IRR calculation‘s P-values for graders‘ agreement
on each fact. If P > 0.05 for any fact, there is significant disagreement among the graders, so we
will exclude data for that fact from further analysis. Finally, the fifth column shows the total
number of points awarded by all graders to all answers for each fact.
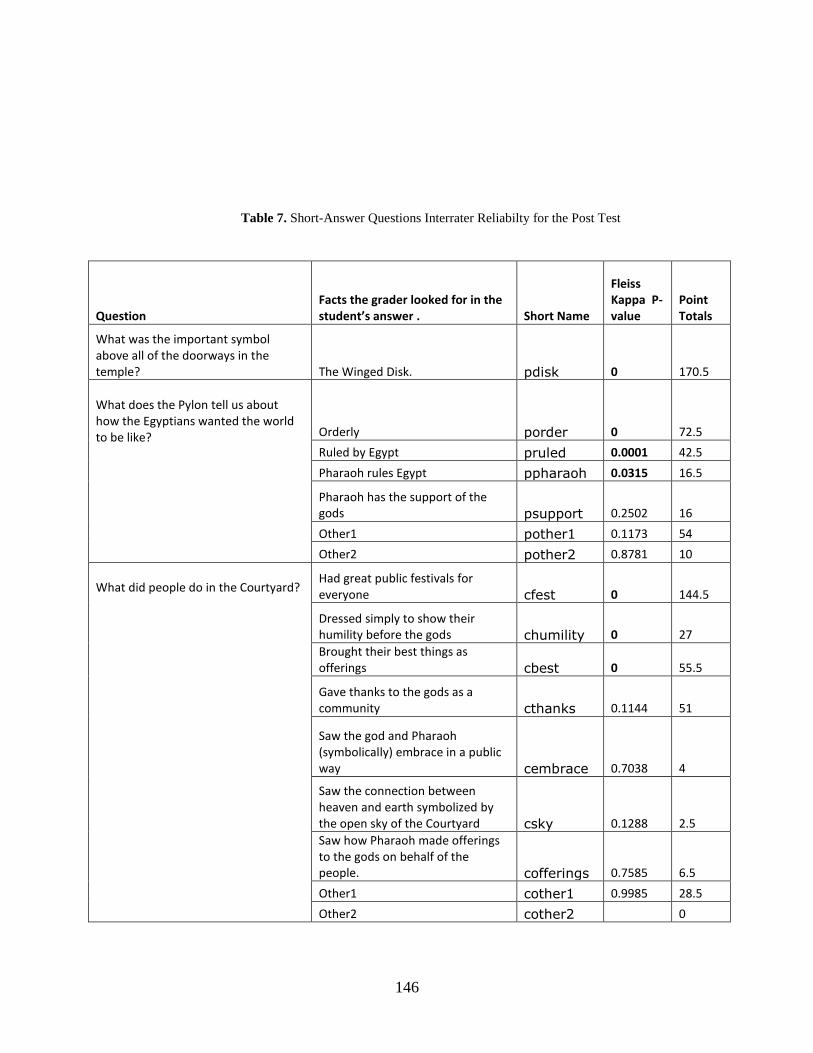
146
Table 7. Short-Answer Questions Interrater Reliabilty for the Post Test
Question Facts the grader looked for in the student’s answer . Short Name
Fleiss Kappa P-value
Point Totals
What was the important symbol above all of the doorways in the temple? The Winged Disk. pdisk 0 170.5
What does the Pylon tell us about how the Egyptians wanted the world to be like? Orderly porder 0 72.5
Ruled by Egypt pruled 0.0001 42.5
Pharaoh rules Egypt ppharaoh 0.0315 16.5
Pharaoh has the support of the gods psupport 0.2502 16
Other1 pother1 0.1173 54
Other2 pother2 0.8781 10
What did people do in the Courtyard?
Had great public festivals for everyone cfest 0 144.5
Dressed simply to show their humility before the gods chumility 0 27
Brought their best things as offerings cbest 0 55.5
Gave thanks to the gods as a community cthanks 0.1144 51
Saw the god and Pharaoh (symbolically) embrace in a public way cembrace 0.7038 4
Saw the connection between heaven and earth symbolized by the open sky of the Courtyard csky 0.1288 2.5
Saw how Pharaoh made offerings to the gods on behalf of the people. cofferings 0.7585 6.5
Other1 cother1 0.9985 28.5
Other2 cother2
0

147
Question Facts the grader looked for in the student’s answer . Short Name
Fleiss Kappa P-value
Point Totals
What happened in the Hypostyle Hall?
People made a private connection with the divine. hdivine 0 78.5
People honored their ancestors. hancestors 0 165.5
people saw the connection to the beginning times through the planet-form columns. hcolumns 0.904 3.5
Other1 hother1 0 71
Other2 hother2 0.922 7.5
What did Pharaoh do in the Sanctuary? How did the Sanctuary compare with the rest of the temple? Communicates with the gods. sgods 0 130
Makes offerings to the gods. sofferings 0 89
Entreats the god to let the blessings of heaven flow to the land of Egypt. sblessings 0.0001 55
Represents the community. srepresent 0.0007 46.5
Stands on the ground where the world began sground 0.0095 10.5
Other1 sother1 0 97.5
Other2 sother2 0.548 15
Tell us one thing you learned from playing with the temple.
importance limport 0 135.76
relevance lrelevant 0 129.7
generality lgeneral 0 132.84
Please rate these aspects of The student's performance
Student is integrating knowledge from school or elsewhere into his or her answers. integrate 0.5732 73.75
Student is making interesting connections between facts showing a higher level learning. connection 0.001 103
Student is doing a good job of reciting the facts of the temple. roterecall 0 128.5
Student has made references to the way that temple, or parts of it, actually look. references 0.091 64.5

148
Table 7, above, shows that data for a fairly large number of ratings had to be eliminated
from consideration. However, they account for only 13.07% of total points awarded. We also
eliminated the three ―other‖ columns from further analysis, because that data is problematic
(section 4.3, p142).

149
4.5 HYPOTHESIS TESTS
Table 8, below, shows the results of comparing student performance among the three treatment
groups. We refer to each rated fact by its short name in the first column. In column ―C vs D,‖
each number refers to the error P-value of the Mann-Whitney comparison between grades for
students in the Control Group versus grades for students in the Desktop Group, for the
corresponding fact.
Each P-value represents the probability that the observed difference between the
compared groups of grades resulted from random chance. The third column shows the polarity or
direction of the comparison. For example, the ―+‖ in row ―pdisk‖ under column ―C vs D‖
indicates that the average grade for students in the Desktop Group for this fact is higher than the
average grade for students in the Control Group for this fact. Notice how the polarity for all
comparisons where the P-value is less than 0.1 always positive. P-values less than 0.1 are shown
in boldface type.
Column ―C vs T‖ compares the Control Group with a Theater Group, and column ―D vs
T‖ compares results from the Desktop Group versus the Theater Group. The last column shows
the total number of points awarded by all graders to all students for each rating. Facts are
clustered, with an overall comparison for the whole cluster appearing at the bottom of the cluster.
This is not a simple average of the utilities in the cluster. Instead, each cluster P-value is based
on an average of the original data for all ratings in the row. ―grandave‖ below all 4 clusters is
based on an average of all ratings that appear in the table above it.

150
Table 8. Comparison of Learning from the Post Test Short Answer Questions
Shortname C vs D
C vs T
D vs T
Total Points
pdisk 0.0056 + 0.0022 + 0.7100 + 170.5
porder 0.4098 + 0.0158 + 0.5226 + 72.5
pruled 0.0392 + 0.0100 + 0.5752 + 42.5
ppharaoh 0.2739 + 0.3047 + 0.7369 - 16.5
pave 0.0025 + 0.0002 + 0.2995 +
cfest 0.7175 + 0.1162 + 0.6162 + 144.5
chumility 0.2308 + 0.0596 + 0.8189 + 27.0
cbest 0.0064 + 0.0125 + 0.0528 + 55.5
cave 0.0326 + 0.0005 + 0.3967 +
hdivine 0.5417 - 0.3589 + 0.7136 + 78.5
hancestors 0.0137 + 0.0001 + 0.0421 + 165.5
have 0.0090 + 0.0002 + 0.4428 +
sgods 0.5226 + 0.0930 + 0.4258 + 130.0
sofferings 0.9941 - 0.1247 + 0.6407 + 89.0
sblessings 0.1478 + 0.1118 + 0.9628 + 55.0
srepresent 0.7429 + 0.0490 + 0.5979 + 46.5
sground 0.4872 + 0.2468 + 0.0485 + 10.5
save 0.1946 + 0.0068 + 0.5029 +
grandave 0.0064 + 0.0000 + 0.6712 +
limport 0.0000 + 0.0000 + 0.4582 + 135.8
lrelevant 0.0000 + 0.0000 + 0.9116 + 129.7
lgeneral 0.0000 + 0.0000 + 0.1759 - 132.8
lave 0.0000 + 0.0000 + 0.8388 +
connection 0.0011 + 0.0002 + 0.9581 + 103.0
roterecall 0.0003 + 0.0000 + 0.6865 + 128.5

151
You will notice that the large number of P-values under ―C vs. D‖ and ―C vs. T‖ show
the Control Group performing considerably worse than the other groups. This is what we would
expect because members of the Control Group simply took the pretest before any exposure to the
educational materials. They had to depend upon previous knowledge and test-taking techniques.
We compare results for Desktop and Theater Groups separately, to make sure that the VR
interface for the Theater Group is not a problem. Finally, it is important that when we asked the
graders to produce more general judgments of student performance, shown in the rows below
―grandave‖ in Table 8, the P-values became very low.
When we compare the results in the two columns, it looks like the Theater Group gained
a wider lead over the Control Group than did the Desktop Group. However, the direct
comparison between the Theater and Desktop Groups in column ―D vs. T‖ does not show a
convincing difference in performance. Only three facts have values below 0.1, and none of the
aggregate scores do.
Similar to Table 8, results for the multiple-choice questions in
Table 9, show (1) the Theater Group had a clear advantage over the Control Group, (2) the
Desktop Group had a weaker but still-visible advantage over the Control Group, and (3) the
results were inconclusive for the Desktop versus Theater Group comparison. In all three
columns, the comparison score for the averaged data in row ―grandave‖ show a solidly
significant difference. This appears paradoxical in the ―D vs. T‖ column—a clear example of
why an average or total, by itself, cannot be trusted. The other two averages are believable,
because enough of the component data shows significant or nearly significant difference. This
satisfies experimental hypothesis H1 (section 3.4, p119).
Given how high all of the other P-values are it is not clear that testing a larger group of
students would make much difference. We believe that asking students factual questions about
the Temple is not the appropriate method to measure the learning effects of visual immersion
with this material (Dede, 2007).

152
Table 9. Hypothesis Results from the Post Test
(Multiple-Choice Questions)
Question C vs D
C vs. T
D vs. T
overdoor 0.0036 + 0.0010 + 1.0000
bigfront 0.0536 + 0.0337 + 1.0000
color 0.1818 + 0.0741 + 1.0000
authority 1.0000
1.0000
1.0000
represent 0.2733 + 0.0146 + 0.3087 +
festivals 0.0001 + 0.0001 + 1.0000
statues 0.0038 + 0.0001 + 0.7095 +
genesis 0.5145 + 0.0188 + 0.2604 +
square 0.3416 + 0.0325 + 0.4444 +
eating 1.0000
0.6423 + 1.0000
meditating 0.1110 - 0.7551 + 0.0169 +
honorhorus 0.3203 - 1.0000
0.2047 +
ancestors 0.6614 + 0.3830 + 1.0000
worship 1.0000
0.5503 - 0.3666 -
feedhorus 0.5145 - 0.5370 - 1.0000
rested 0.0436 + 0.0567 + 1.0000
thepeople 0.2003 + 0.0032 + 0.2604 +
heaven 0.5145 + 0.0010 + 0.0271 +
image 1.0000
1.0000
1.0000
blessings 0.5006 - 1.0000
0.3357 +
grandave 0.0000 + 0.0020 + 0.0290 +

153
4.6 COMPARE WITH RPM RESULTS
Comparisons that involve students‘ scores on Raven‘s Progressive Matrices (section 5.6, p188)
essentially showed nothing. In
Table 10, below, only two (Mann-Whitney error) P-values were below 0.1, which is probably a
random result. In hindsight, we surmise that because Raven‘s Progressive Matrices is a measure
of each student‘s visual reasoning ability, it would have only a secondary effect on factual recall.
If RPM scores are correlated with better performance, and there is no guarantee of that, our
sample size is much too small to detect it.

154
Table 10. Post Test H1 Comparison Crossed with RPM Results.
LowRPM( D vs. T ) HighRPM( D vs. T ) LowRPM vs. HighRPM in D&T
0.9029 0.9303 1.0000
0.1895 0.2127 0.7841
0.5920 1.0000 0.5072
0.7925 0.7214 1.0000
0.4911 0.4328 0.5194
0.1092 0.5193 0.1081
0.7926 1.0000 0.5217
0.9338 0.9100 0.0139
0.1649 0.4679 0.7413
0.5810 0.8079 0.9233
0.0213 0.3067 0.0843
0.0533 0.8161 0.4643
0.1995 0.3590 0.8088
0.1308 0.6513 0.8475
0.9076 0.2698 0.3718
0.1339 0.3034 0.7741
0.8212 0.4737 0.2174
0.1395 0.2695 0.9661
0.1167 0.7524 0.9886
0.7122 0.1469 0.7220
0.6128 0.4896 0.6576
0.2303 0.7527 0.1184
0.6878 0.5408 0.4504
0.3231 0.9843 0.8540
0.3523 0.7831 0.4999
155
5.0 VIDEO TEST RESULTS (IMMERSION HELPS)
Each student produced a documentary video. First, three human graders evaluated the video for
factual knowledge, and their judgments were combined to produce a final score. Our most
important result was a significant difference between the Video Test results from the Theater
Group and results for the other two groups combined. Figure 51 shows the stages of our testing
sequence relevant to the Video Test and its main results. We included the Video Test scores from
the Control Group, after they had played the game, because we did not think that the order of the
Post Test and the game would make a substantial difference in their overall learning.
Next, our Egyptologist, Dr. Lynn Holden, evaluated each student‘s video for the student‘s
mastery of factual knowledge about the temple. Here, the difference in learning with visual
immersion versus non-immersion was statistically much stronger. Not only were the main results
for the conceptual and factual measures in accord, but they also tended to parallel each other in
the individual measures. For every concept where the Theater Group statistically did better than
the others, there was at least one fact related to that concept where the Theater Group also did
better. We are confident that this data satisfies H2.
Finally, we found some evidence that students with low visual reasoning skills, as
measured by Raven‘s Progressive Matrices test section 5.6, p188, had more to gain from using
visual immersion than those with better visual skills. This supports H6, and is worth comparing
to Winn‘s (1997) findings.
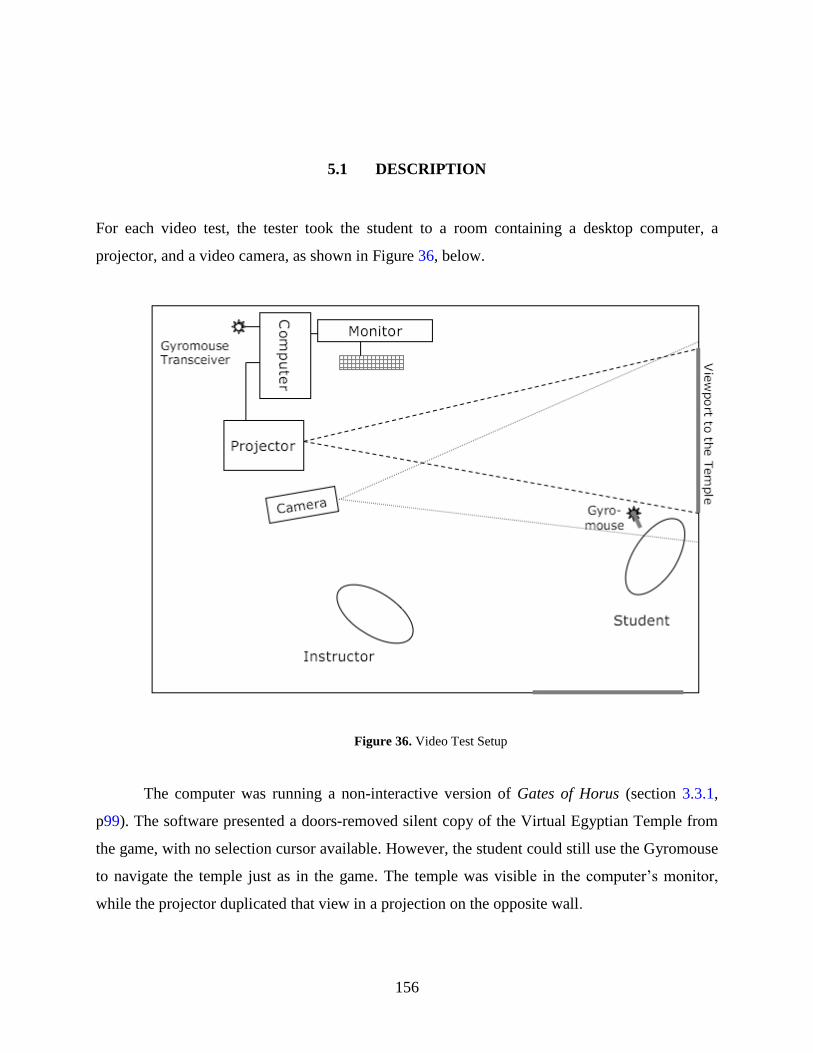
156
5.1 DESCRIPTION
For each video test, the tester took the student to a room containing a desktop computer, a
projector, and a video camera, as shown in Figure 36, below.
Figure 36. Video Test Setup
The computer was running a non-interactive version of Gates of Horus (section 3.3.1,
p99). The software presented a doors-removed silent copy of the Virtual Egyptian Temple from
the game, with no selection cursor available. However, the student could still use the Gyromouse
to navigate the temple just as in the game. The temple was visible in the computer‘s monitor,
while the projector duplicated that view in a projection on the opposite wall.

157
The tester restarted everything and positioned the user view to show the front of the
temple, similar to where the student started in the Pylon section of the game (Figure 26, p110).
Next, the tester instructed the student to produce a guided tour of the Temple, saying in effect
“Tell us everything you know about the Temple, and show us as you tell us.” The student was
informed that his or her guided tour would be recorded, with one copy to stay in confidence with
the testers. We also informed each student that s/he would receive a personal copy (a DVD) of
the recording, if s/he completed the Follow-Up tests. When the student was ready, the tester
would begin recording both the student and the computer screen with a digital video camera
while the students made the presentation. See Figure 37.
Figure 37. Student (shown in silhouette) giving a tour of the temple.

158
A tour took approximately 15 minutes to produce, which we had discovered during pilot
testing. The student used the Gyromouse to navigate and could choose a variety of methods to
indicate features of the Temple. The student could point with his or her free hand, or with the
hand holding the Gyromouse, or with a laser pointer. Also, the student could face the screen, or
face the camera most of the time, sometimes using the monitor on desktop to help with
navigation. While some presentation styles may have been more demanding than others, the
distribution of presentation strategies was essentially random with respect to our experimental
conditions. We believe that letting each student use whatever presentation style s/he was most
comfortable with was the best way to elicit that student’s knowledge with minimum interference
from the testing process. In their ―tours‖ the students revealed:
factual knowledge of the temple
knowledge of concepts related to the temple and Egyptian culture
ways of thinking about of the temple
other related ideas and knowledge they may have learned from other sources
attitudes and preferences toward the temple
An advantage of this test was the lack of interference from written test questions. Obviously, this
favored students who were extroverted, verbal, or both. For this reason, the video test makes a
good companion to the more traditional written tests, which favor students who write well and
which do not require social contact by the student during the testing process..
Furthermore, the game itself is also purely visual and verbal, and students performed the
video test after the game with no intervening written test. This approach has the potential to
provide insight into the abilities and preferences of students who have trouble with written
media. Unlike some proponents of using VR for education, we do not believe that VR is
inherently superior to word-based media for learning, but that it is merely a different tool.

159
5.2 GRADING
To evaluate a student‘s video, the grader viewed it at least once and answered questions on the
Video Grading Form via Survey Monkey. The form asked whether and how well the student
grasped a large number of specific ideas, concepts, and facts. The grading form was separated by
area to reduce the grader's workload. The grader was free to go forward and backward through
the video while making grading decisions.
Figure 38. Sample Page From the Video Grading Form

160
Table 11, below, lists all questions which the grader answered after or during seeing a
student video. Questions 3, 4, 9, 8, 13, 14, 18, and 19 each contains a list of statements; the
grader checks a box indicating how much credit the grader wants to give the student for knowing
a particular fact. For a reproduction of the grading form, see (Appendix A, p272).
Table 11. Video Grading Form Questions
Q1. Grader Name (open ended)
Q2. Is the sound quality too poor to grade this video? (checkbox)
PYLON
Q3. REMEMBERING FACTS: Evaluate the extent to which the student repeats or paraphrases what the priest told him/her as well as facts which should be apparent from the appearance of certain features of the temple. Indicate for each fact. (none, half, full)
The temple is will ordered
the Pylon is a symbol of what Egypt could be
the Pylon is the most massive part of the temple.
the Pylon was colorful.
the colors of the Pylon had been worn away over time.
the Pylon represents the mountains on either side of the Nile.
Pharaoh is shown defeating the enemies of Egypt
the god grants Pharaoh his authority
a sword represents the authority that the god gives to Pharaoh
This temple is dedicated to the god Horus
the hawk statues represent Horus
Horus protects Pharaoh
the statue of Pharaoh beneath the hawk's breast shows that the god protects him.
Horus represents all gods
Pharaoh is the link between the people and the gods
Pharaoh and the gods are united for the good of the world
Horus is the god of Kingship
the hawk is the symbol of Horus
The winged disk is a symbol of unity and protection
the winged disk represents the divine life-force
the winged disk is a symbol of the world
the winged disk represents creation
the winged disk represents life
and a script resents protection
Q4. GOAL CONCEPT(s): The student is expected to infer these ideas from the facts. (none, half, full)
The Egyptians thought that the world was orderly.
The Egyptians thought the world was centered on Egypt and its gods.
Q5. EXTRA: Did the students make any TRUE statements about the Pylon which do NOT appear in the previous two questions? Please list. (open ended)

161
Q6. MISTAKES: How many incorrect or glaringly false statements did the student make? (one, two, three)
Q7. COMMENTS: please add anything you want to say about the student’s performance in this area of the temple. (open ended)
COURTYARD
Q8. REMEMBERING FACTS: Evaluate the extent to which the student repeats or paraphrase what the priest told him/her as well as facts which should be apparent from the appearance of certain features of the temple? Indicate for each fact. (none, half, full)
The Courtyard holds several hundred.
Everybody could come there, from farmer to Pharaoh
Open and undivided.
made for large religious celebrations.
The celebrations were joyous.
The joy of the celebrations showed people's gratitude to the gods.
everyone offered their best things at the celebrations
Everyone came wearing simple garments to show their humility before the gods.
The open sky indicates the connection between heaven and earth.
The sun represents the creator god, Amon.
All Egypt was (supposed to be) united under the sun.
The offering scene mural shows Pharaoh giving “every good thing” to the god
The offering scene mural shows the god blessing the King and Egypt with life and prosperity.
On the pillar, the Pharaoh and Horus embrace.
On the pillar, Horus represents the gods and the natural world
On the pillar, Horus and Pharaoh embracing represents the gods and humanity coming together
Q9. GOAL CONCEPT(s): The student is expected to infer these ideas from the facts. (none, half, high)
The people gave thanks to the gods as a community.
Q10. EXTRA: Did the students make any TRUE statements about the Pylon which do NOT appear in the previous two questions? Please list. (open ended)
Q11. MISTAKES: How many incorrect or glaringly false statements did the student make? (one, two, three, four, five+)
Q12. COMMENTS: please add anything you want to say about the students' performance in this area of the temple. (open ended)
HYPOSTYLE HALL
Q13. REMEMBERING FACTS: Evaluate the extent to which the student repeats or paraphrase what the priest told him/her as well as facts which should be apparent from the appearance of certain features of the temple? Indicate for each fact. (none, half, full)
the hall is a quiet and private place
the hall is built on a grand scale to let you know it is sacred
only the literate class could come here
they honored their ancestors here
by honoring their ancestors they connected with heaven
They made offerings to their ancestors
the offerings were placed before statues of their ancestors

162
anyone could have an ancestor statue at work or at home
if you made a big donation to the temple you could have an ancestor statue tonight the hall.
the columns represent the primeval marsh.
the marsh surrounded the first mound of land
the first land rose from the waters at the beginning of time
The hawks on the ceiling are spirit guides
the hawks guide you deeper into the temple
the hawks show the connection between heaven and earth
Q14. GOAL CONCEPT(s): The student is expected to infer these ideas from the facts. (none, half, high)
The Hypostyle Hall is an intimate space.
The Hypostyle Hall provides the worshiper a private connection to the divine.
Q15. EXTRA: Did the students make any TRUE statements about the Pylon which do NOT appear in the previous two questions? Please list. (open ended)
Q16. MISTAKES: How many incorrect or glaringly false statements did the student make? (one, two, three, four, five+)
Q17. COMMENTS: please add anything you want to say about the students' performance in this area of the temple. (open ended)
SANCTUARY
Q18. REMEMBERING FACTS: Evaluate the extent to which the student repeats or paraphrase what the priest told him/her as well as facts which should be apparent from the appearance of certain features of the temple? Indicate for each fact. (none, half, full)
the Sanctuary is the most important part of the temple
the Sanctuary has the best decorations
everything there is made of the best materials
the most important ceremonies happened there
the ground under the Sanctuary was the very first part of the world.
Time began here.
Every Egyptian town from the world again under their particular temple.
The divine image of Horus stands in the shrine.
Horus represents all gods.
At times, the spirit of the God inhabits the divine image.
If the god was pleased, he would make good things happen for the community, such as a good harvest.
The shrine was the gateway to heaven.
The blessings of heaven flow from the shrine, through the temple, and on to Egypt.
Pharaoh makes the blessings of heaven flow, by conducting the proper ceremonies correctly.
The high priest could act in Pharaoh's place.
Q19. GOAL CONCEPT(s): The student is expected to infer these ideas from the facts. (none, half, full)
Pharaoh communicates with the gods
here, Pharaoh brings down the blessings of heaven by honoring the gods
Q20. EXTRA: Did the students make any TRUE statements about the Pylon which do NOT appear in the previous two questions? Please list. (open ended)
Q21. MISTAKES: How many incorrect or glaringly false statements did the student make? (one, two, three, four,

163
five+)
Q22. COMMENTS: please add anything you want to say about the students' performance in this area of the temple. (open ended)
FINAL QUESTION
Q23. Is there anything else you want to say about the students' performance in their video? Did they seem to understand what they were talking about? Did they make interesting connections between facts? Did they display knowledge of this league learn from other sources besides the learning-game? (open-ended).
164
5.3 INTERRATER RELIABILITY ANALYSIS
Three graders evaluated the student-made videos using the Video Grading Form (Appendix A,
p272). A great deal of research in the social sciences depends upon having multiple raters
(graders in our case) evaluate the same phenomena, each one assigning it a score or number. The
next step is to aggregate the grader scores into a single rating (grade) which is more stable and
accurate than judgments by any one person. We had three raters, Getkin, Bruckner, and Vadnal,
assign point values to specific elements of the video. On the grading form, the grader assigned a
point score to indicate the degree to which the student evidenced knowledge of a particular fact.
Points were awarded on the three-level Likert scale for each fact, with three choices: ―none,‖
―half‖ and ―full.‖ Resulting data for a single fact looked like Table 12, below.
However, combining graders‘ assessments must be done with care. Otherwise the final
score may be uninformative or (worse) misleading. Interrater Reliability Analysis is a significant
problem that has attracted a great deal of research (Ubersax, 2007; Garson, 2007; Lombard,
2005). Choosing the correct procedure to aggregate the grader scores depends critically on the
type of data with which one starts —not just what the numbers or rankings look like, but what
they represent.
Table 12, below, shows simple data (grades) for one of the facts the graders were looking
for in the student videos. The context of the statement ―Pharaoh is shown defeating the enemies
of Egypt.‖ tells the grader that the statement refers to the artwork on the Pylon, the front of the
Temple.

165
Table 12. Sample Data for One Fact
Pharaoh is shown defeating the enemies of Egypt.
Code Name Getkin Vadnal Bruckner
Ace half full full
ALG none half half On the left is sample video rating data for a particular fact. The students, themselves, chose their own codenames. The three columns on the right contain the scores given by each grader indicating how well that grader thought each student evidenced knowledge of that fact/idea in the student’s video (section 5.1, p155)
Anna none none none
Bam82 full full full
Batman none none none
Beaver32 none none none
Bubbles none none none
Butterbean none none half
Caraboo half full full
Champ full full full
Chuckles none none none
Claire full full half
Commando none none none
Deangelo none none none
DeathBrother half half half
Dolores full full full
FibMaster none none none
Fred none none none
Grechen full full full
Gumball none none none
HarpsichordDude none none none
Icarus13 none none none
Jen full full half
JSS full full full
Kimiko full full full
KimKim full full full
Lulu none none half
Magma1000 none none none
MandM none none none
Mara full full none
Margarita none none none
Milky full full half
MoneyBags none none none
MrBeans none none none
Natalie half none none
Nellie none none none

166
Pharaoh is shown defeating the enemies of Egypt.
Code Name Getkin Vadnal Bruckner
NicelyNicely none none none
Noah none none none
Pinky none none none
PinkySprinkles none none none
Pumpkin none none none
Renee none none none
Shadow none none none
Skizzy half full half
Snickers none none none
Sparkey none none none
Spicy44 none none none
Spiderman none none none
StarFire none none none
Superman full full half
The none none none
TRCB full full full
TreeHugger full full full
Twister22 half half half
Vegitomsn full full full
Vivi none none none
Whatever none none none
Xavier none none none
Zulu1138 half half half

167
5.3.1 Our Data is Ordinal and Not Normally Distributed
Because the graders were evaluating simple facts and ideas already presented in Gates of Horus,
we used three-level Likert scales (―none,‖ ―half,‖ ―full‖), despite the fact that five-level scales
are much more commonly used in social science research. Adding more levels (e.g., ―none,
―some,‖ half, ―a lot,‖ ―full‖) would have created false granularity to the results and burdened the
graders unnecessarily. Five-level Likert scales are convenient, because one can often convert the
ratings into numbers and analyze the results using parametric methods (Garson, 2007), which are
more sensitive than non-parametric methods.
Converting Likert scale ratings to absolute numbers assumes a fixed distance between the
levels of the ratings, a distance that is the same for all pairs of adjacent levels. This would not be
a problem if, for example, one asked the raters to determine whether a glass of water is empty,
half full, or completely full. For topics that are much more subjective or theoretical, such as the
beauty of the day or the relevance of a political theory, one cannot assume a fixed distance or
difference between levels. In practice, however, one can usually treat five or more levels of most
judgments, as if the differences were fixed and use parametric methods in reasonable safety
(Jaccard, 1996).
However, we use only three-level Likert scales, and it would make no sense to assign an
absolute distance between ―none‖ and ―half‖ or ―half‖ and ―full‖ on our scale. The data is not
continuous, but it does have defined ordering in the values, making it ordinal (Wikipedia,
2007a). We cannot use parametric methods on this data, because three levels is insufficient to
reliably define a normal curve.
The other reason we do not want to use a parametric method is that our data is heavily
weighted towards ―none‖ grades, making the data‘s distribution strongly non-normal. Because
there are so many facts in the temple, the students could not be expected to remember them all
and describe them in the video test. This gave our measurement depth, but it prevented our data
from being normally distributed because of the high level of ―none‖ values. Converting all the
data points to Z-scores, which are normally distributed by definition, does not work either. It is
very hard to impute a believable normal curve using only three data points, regardless of how
those points are distributed.
168
5.3.2 Calculating Interrater Reliability
Before we chose our method for judging interrater reliability, we had to define exactly what type
of agreement we were measuring. In our experiment, we were primarily interested in whether
students in one experimental condition were more than students in a different condition. We
were less interested in whether one grader was consistently more generous than another—we
were more interested in whether the graders agreed on which students did relatively well and
which did relatively poorly. However, using a test that is sensitive to grader bias protected us in
cases where one or more graders‘ scores associated with a fact diverged sharply. There do not
appear to have been many cases where this happened but the added protection was still an
advantage. Therefore, we were primarily interested in whether the graders‘ scores varied in
tandem (correlation), but we also have a lesser interest in measures of grader bias.
A measure of correlation would satisfy of our needs, because such measures compare
variations in grading and we could use separate tests for grader bias, as needed. However, our
data is non-continuous, so we could not use the typical measure of correlation (i.e. Pearson‘s-R).
We then considered using Spearman‘s-R, a common non-parametric alternative test, ―…which is
simply Pearson‘s-R computed on the ranks and average ranks [of the data]‖ (Connover, 1999,
p314-315). However, the non-normal distribution of our data made this test unworkable. Using
either correlation measure would be overly conservative, reporting lower levels of agreement
than were actually present (type-2 error).
We chose Fleiss Kappa (Fleiss, 1981; Shrout, 1979; Siegel, 1988, p284), which has been
used productively for nonparametric interrater reliability analysis for a long time (Ubersax, 2007;
King, 2004). It is sensitive to grader bias, but not overly so. Most importantly, it is designed to
handle ratings with very few levels (i.e., True/False, high/medium/low, etc.) and to handle any
number of raters. To compute Fleiss Kappa, we found it most convenient to use the code in the
spreadsheet produced by King (2004).
The final result was a probability score (approximate standard error from Fleiss, 1979)
for each question indicating whether the graders were substantially in agreement on the quality
of all students‘ performance with regard to the fact being graded. If the standard approximate

169
error was P < 0.05, there is a 95% chance that all three graders are truly in agreement on all
students‘ performance (taken together) with regard to that fact, despite a small amount of random
fluctuation.
Students‘ membership in an experimental treatment group was not a factor. We were
concerned only with whether the graders were in agreement for each student.
5.3.3 Grader Agreement
Overall, grades for students‘ explanation of 47 out of the 77 (64%) facts show acceptable levels
of rater agreement (p < 0.5). Although only 64% of the facts led to useable data, they accounted
for 89.38% of all points awarded. This is because students earned very few points from the
graders in most of the rejected cases. This is logical, because when the graders award very few
points for students‘ sparse mention of a fact, small and perhaps random variations can produce
what looks like a large lack of agreement.
To verify this, we wanted to create a total value for each fact showing how many points
all of the graders assigned to all of the students for their performance with regard to each fact. To
do this, we created an alternate version of the data where ―none‖ was converted to 0, ―half‖
became 0.5, and ―full‖ was scored as 1. This allowed us to simply add all the ratings together to
get the total to produce a reasonable measure of how frequently all student presented the fact and
in a way the graders could understand. We are careful not to use the grades-as-numbers for any
parametric test (section 5.3, p163).
Table 13, below, shows which sets of data (per fact) are acceptable for further analysis.
We reject those where Fliess Kappa ‘s error value (P) is greater than 0.05. Also, the last column
shows the total number of points assigned by all graders to all students for each given fact. We
also reject data sets where no graders assigned any credit to any students. In these cases we have
no data to use for any further analysis, and the Kappa statistic is undefined. We copied all the
data with acceptable Kappa P-values into HypothesisText.xls for comparative analysis.

170
Table 13. Interrater Reliability Analysis of the Video Data
Category Question Kappa P-value
p < 0.05?
Point Total
PYLON FACTS The temple is well ordered 0.7845
2
the Pylon is a symbol of what Egypt could be 0.9753
1.5
the Pylon is the most massive part of the temple. 0.0017 Yes 14.5
the Pylon was colorful. 0.0383 Yes 10.5
the colors of the Pylon had been worn away over time. 0.0017 Yes 13
the Pylon represents the mountains on either side of the Nile. 0.0190 Yes 7
pharaoh is shown defeating the enemies of Egypt 0.0000 Yes 56
The God grants pharoh his authority 0.0013 Yes 19
a sword represents the authority that the god gives to pharaoh 0.0018 Yes 12
This temple is dedicated to the god Horus 0.0000 Yes 35.5
the hawk statues represent Horus 0.0000 Yes 62
horus protects pharaoh 0.0029 Yes 45.5
the statue of pharaoh beneath the hawk's breast shows that the god protects him. 0.0000 Yes 76
Horus represents all gods 0.0136 Yes 9.5
pharaoh is the link between the people and the gods 0.0154 Yes 9
pharaoh and the gods are united for the good of the world 0.5680
2.5
horus is the god of Kingship
0
the hawk is the symbol of Horus 0.6825
12.5
The winged disk is a symbol of unity and protection 0.0001 Yes 24.5
the winged desk represents the divine life-force
0
to winged disk is a symbol of the world 0.9954
0.5
0
the winged disk represents life 0.9867
1
0
PYLON GOAL The Egyptians thought that the world was orderly. 0.9546
3
The Egyptians thought the world was centered on Egypt and it's gods. 0.6786
3
COURTYARD FACTS The Courtyard holds several hundred. 0.7284
3
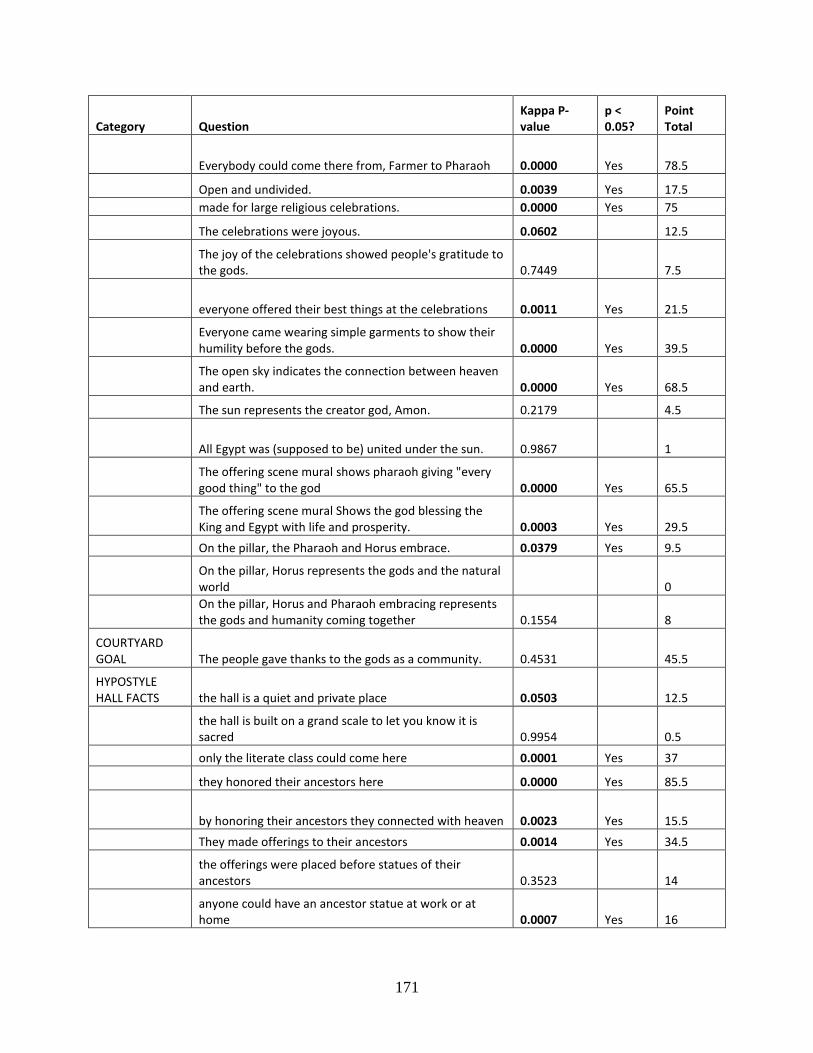
171
Category Question Kappa P-value
p < 0.05?
Point Total
Everybody could come there from, Farmer to Pharaoh 0.0000 Yes 78.5
Open and undivided. 0.0039 Yes 17.5
made for large religious celebrations. 0.0000 Yes 75
The celebrations were joyous. 0.0602
12.5
The joy of the celebrations showed people's gratitude to the gods. 0.7449
7.5
everyone offered their best things at the celebrations 0.0011 Yes 21.5
Everyone came wearing simple garments to show their humility before the gods. 0.0000 Yes 39.5
The open sky indicates the connection between heaven and earth. 0.0000 Yes 68.5
The sun represents the creator god, Amon. 0.2179
4.5
All Egypt was (supposed to be) united under the sun. 0.9867
1
The offering scene mural shows pharaoh giving "every good thing" to the god 0.0000 Yes 65.5
The offering scene mural Shows the god blessing the King and Egypt with life and prosperity. 0.0003 Yes 29.5
On the pillar, the Pharaoh and Horus embrace. 0.0379 Yes 9.5
On the pillar, Horus represents the gods and the natural world
0
On the pillar, Horus and Pharaoh embracing represents the gods and humanity coming together 0.1554
8
COURTYARD GOAL The people gave thanks to the gods as a community. 0.4531
45.5
HYPOSTYLE HALL FACTS the hall is a quiet and private place 0.0503
12.5
the hall is built on a grand scale to let you know it is sacred 0.9954
0.5
only the literate class could come here 0.0001 Yes 37
they honored their ancestors here 0.0000 Yes 85.5
by honoring their ancestors they connected with heaven 0.0023 Yes 15.5
They made offerings to their ancestors 0.0014 Yes 34.5
the offerings were placed before statues of their ancestors 0.3523
14
anyone could have an ancestor statue at work or at home 0.0007 Yes 16
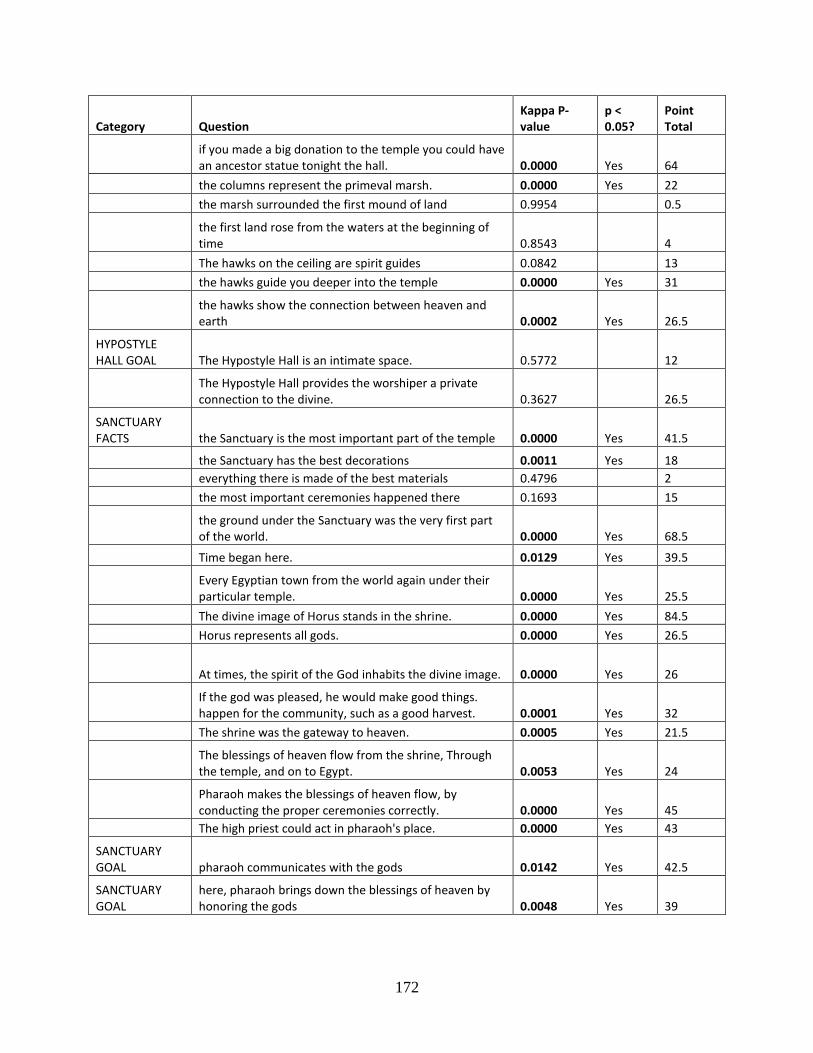
172
Category Question Kappa P-value
p < 0.05?
Point Total
if you made a big donation to the temple you could have an ancestor statue tonight the hall. 0.0000 Yes 64
the columns represent the primeval marsh. 0.0000 Yes 22
the marsh surrounded the first mound of land 0.9954
0.5
the first land rose from the waters at the beginning of time 0.8543
4
The hawks on the ceiling are spirit guides 0.0842
13
the hawks guide you deeper into the temple 0.0000 Yes 31
the hawks show the connection between heaven and earth 0.0002 Yes 26.5
HYPOSTYLE HALL GOAL The Hypostyle Hall is an intimate space. 0.5772
12
The Hypostyle Hall provides the worshiper a private connection to the divine. 0.3627
26.5
SANCTUARY FACTS the Sanctuary is the most important part of the temple 0.0000 Yes 41.5
the Sanctuary has the best decorations 0.0011 Yes 18
everything there is made of the best materials 0.4796
2
the most important ceremonies happened there 0.1693
15
the ground under the Sanctuary was the very first part of the world. 0.0000 Yes 68.5
Time began here. 0.0129 Yes 39.5
Every Egyptian town from the world again under their particular temple. 0.0000 Yes 25.5
The divine image of Horus stands in the shrine. 0.0000 Yes 84.5
Horus represents all gods. 0.0000 Yes 26.5
At times, the spirit of the God inhabits the divine image. 0.0000 Yes 26
If the god was pleased, he would make good things. happen for the community, such as a good harvest. 0.0001 Yes 32
The shrine was the gateway to heaven. 0.0005 Yes 21.5
The blessings of heaven flow from the shrine, Through the temple, and on to Egypt. 0.0053 Yes 24
Pharaoh makes the blessings of heaven flow, by conducting the proper ceremonies correctly. 0.0000 Yes 45
The high priest could act in pharaoh's place. 0.0000 Yes 43
SANCTUARY GOAL pharaoh communicates with the gods 0.0142 Yes 42.5
SANCTUARY GOAL
here, pharaoh brings down the blessings of heaven by honoring the gods 0.0048 Yes 39

173
5.4 RESULTS, FACTUAL KNOWLEDGE
Data from the video tests is suitable for evaluating Hypothesis 2 (H2, section 3.2, p96) by
comparing grades of the Theater Group to (1) grades of the Desktop Group and (2) grades of the
Desktop and Control Groups, taken together. While the second comparison conveys the
statistical advantage of comparing larger groups, it gives the aggregate non-Theater Group an
unfair advantage. Students in the Control Group had more exposure to the material because they
took the Post Test before playing the Game of Horus. To find a significant difference, the
positive effects of using the theater would have to be strong enough to overcome this slight
advantage.
We made these comparisons on each set of rater-produced data associated with each fact.
However, we had to first find a way to aggregate the data from all three raters, so that there was a
single rating for each fact for each student. Therefore, we converted all the data into numbers
where, ―none‖ = 0, ―half‖=0.5 and ―full‖= 1, as shown with the sample data in Table 14, below.
Table 14. Sample Data Converted To Numbers
Pharaoh is shown defeating the enemies of Egypt.
Code Name Getkin Vadnal Bruckner AVERAGE
Ace 0.5 1 1 0.8333
ALG 0 0.5 0.5 0.3333
Anna 0 0 0 0
… … … … …
Xavier 0 0 0 0
Zulu1138 0.5 0.5 0.5 0.5
Had the data for this fact not passed our interrater reliability analysis (section 5.3, p163),
simply averaging the student-by-fact grades would have been inappropriate. For example, two
graders might disagree strongly and give opposite results when deciding what grades should be
awarded for student performance around some fact. An average or a total of their scores could
cancel the effect of two widely divergent scores, leaving the third rater with disproportionate

174
influence. In cases where the data had passed our interrater reliability analysis, all three raters
were in substantial agreement, so the average is a valid measure to use for analysis. Therefore,
we were able to produce a single spreadsheet based on these average values. Table 15, below,
shows part of it.

175
Table 15. Sample Portion of Hypothesis Test Tables
Area ->
COURT YARD
ALL
Fact ->
…
Everybody could come there from, Farmer to Pharaoh …
everyone offered their best things at the celebrations …
Courtyard Average …
Grand Average
Fact (short name) ->
… ceverybody … cbest … caverage … GrandAve
Student Name Anna C … 0 … 0 … 0.2963 … 0.2741
Bam82 C … 1 … 0 … 0.1852 … 0.0593
Batman C … 0 … 0 … 0.0185 … 0.1185
… … … … … … … … … …
MoneyBags D … 0 … 0 … 0.0000 … 0.0148
Noah D … 0.5 … 0.3333 … 0.1481 … 0.1370
Spiderman D … 0 … 0 … 0.0185 … 0.1370
… … … … … … … … … …
TreeHugger T … 1 … 0.3333 … 0.5556 … 0.4630
Vegitomsn T … 1 … 0 … 0.6111 … 0.3630
Zulu1138 T … 0 … 0 … 0.3333 … 0.2556
Mann-Witney,
0.6327
0.0303
0.0649
0.0330
Polarity (aveT - aveCD)
+
+
+
Total Points
26.17
7.17
15
12.0481
In Table 15, above, the left column shows students‘ short names, and all data in each row
belongs to the student named. Similarly, each column represents all of the data associated with a
fact stated in the column heading. Students‘ data are sorted into three groups as indicated by the
second column, Control (C), Desktop (D), and Theater (T). Data for facts are grouped by major
area of the Temple (e.g., ―Courtyard‖). The columns, ―ceverybody‖ and ―cbest‖ contain
examples of data associated with basic facts. Remember that these numbers are the average
scores given by all three raters when they were asked to look for evidence of the fact named at
the top of the column in each student‘s video.
The data in each cell of column ―Courtyard Average‖ is a simple arithmetic average of all
the (average) scores for a particular student for facts regarding the Courtyard of the Temple.

176
Similarly, the Grand Average is the arithmetic average of all facts in all areas – it is not an
average of the averages. This means that some areas will contribute more weight to the final
result than others, either because more of the area‘s component grades survived interrater
reliability analysis, or because the point totals were higher for student performance for the area‘s
facts.
In the Grand Average and in the Sanctuary Average we excluded data for the two ―Goal
Questions‖ associated with the Sanctuary. These Two Goal Questions were intended to be a
different measure from simple factual questions, measuring a deeper level of learning. To answer
the goal questions, the students (we believe) had to infer facts from the information all of the
other ―Clues‖ and questions provided for that area of the temple. However, for the Sanctuary
area, only the Goal Questions survived Interrater Reliability Analysis (section 5.3, p163).
Combining those scores with the Sanctuary average would make it incomparable to averages in
the other areas. Given how unstable IRR analysis showed the Goal Questions measure was, we
do not wish to combine the Sanctuary goal data with the grand average. It is better that the grand
average remain a purer measure of low-level factual learning than a suspect measure of broader
learning.
Next, we chose a measure to compare data among the different treatment groups. In this,
we encountered similar issues we confronted when choosing a measure for interrater reliability.
Because our original data is fundamentally ordinal, we could not safely use a parametric test,
even on these averages, which appear to have a reasonable number of levels. The averages are
expressed as numbers which are continuous, but the underlying data is not continuous. Also, the
data is not distributed normally, which further disqualified parametric tests.
Therefore, we used the Mann-Whitney test, a nonparametric alternative to the T-Test that
works with ranks of the data values rather than the data values themselves. To compare data
among three groups, we used the Kruskal-Wallace test, a nonparametric replacement for the
ANOVA test. The Kruskalenclave,-Wallace test is identical to the Mann-Whitney test when
applied to data from only two groups, just as a two-group comparison with ANOVA is
equivalent to the T-Test. In practice we find both ANOVA and Kruskal-Wallace to be of limited
use. All they could tell us is that among three or more groups there is some sort of difference, not
where the difference actually lies.

177
Table 16. Factual Recall, Theater Group versus All Others
Fact Short Name
Point Totals P-value
PYLON paverage 28.14 0.0962
a sword represents the authority that the god gives to pharaoh psword 12 0.0172
pharaoh is the link between the people and the gods plink 9 0.0499
Horus represents all gods prepresents 9.5 0.1887
the hawks statues represent Horus phawks 62 0.1891
This temple is dedicated to the god Horus pdedicated 35.5 0.2063
The winged disk is a symbol of unity and protection psymbol 24.5 0.2224
the Pylon represents the mountains on either side of the Nile. pmountain 7 0.2813
The god grants pharoh his authority pgrants 19 0.3128
pharaoh is shown defeating the enemies of Egypt pdefeating 56 0.3315
the Pylon is the most massive part of the temple. pmassive 14.5 0.3400
the Pylon was colorful. pcolorful 10.5 0.3580
horus protects pharaoh pprotects 45.5 0.8838
the statue of pharaoh beneath the hawk's breast shows that the god protects him. pstatue 76 0.9553
the colors of the Pylon had been worn away over time. pcolorworn 13 0.9640
COURTYARD caverage 45.00 0.0649
Everyone came wearing simple garments to show their humility before the gods. csimple 39.5 0.0017
everyone offered their best things at the celebrations cbest 21.5 0.0303
On the pillar, the Pharaoh and Horus embrace. cembrace 9.5 0.0962
The offering scene mural Shows the god blessing the King and Egypt with life and prosperity. cblessing 29.5 0.2042
made for large religious celebrations. ccelebrate 75 0.3209
The offering scene mural shows pharaoh giving "every good thing" to the god cgiving 65.5 0.3348
Open and undivided. copen 17.5 0.6103
Everybody could come there from, Farmer to Pharaoh ceverybody 78.5 0.6327
The open sky indicates the connection between heaven and earth. cconnect 68.5 0.9858
HYPOSTYLE HALL haverage 36.89 0.0865
if you made a big donation to the temple you could have an ancestor statue tonight the hall. hdonation 64 0.0035
They made offerings to their ancestors hancestors 34.5 0.0995
only the literate class could come here hliterate 37 0.1986

178
they honored their ancestors here hhonored 85.5 0.2969
the columns represent the primeval marsh. hmarsh 22 0.3062
anyone could have an ancestor statue at work or at home cworkhome 16 0.4037
by honoring their ancestors they connected with heaven hheaven 15.5 0.5328
the hawks guide you deeper into the temple chawks 31 0.5959
the hawks show the connection between heaven and earth cshow 26.5 0.6407
SANCTUARY saverage 38.13 0.0359
At times, the spirit of the God inhabits the divine image. sinhabit 26 0.0001
The divine image of Horus stands in the shrine. sdivine 84.5 0.0300
If the god was pleased, he would make good things. happen for the community, such as a good harvest. sgood 32 0.0512
the Sanctuary has the best decorations sdeocor 18 0.0541
Every Egyptian town from the world again under their particular temple. sbegan 25.5 0.0594
Time began here. stime 39.5 0.0785
Horus represents all gods. sallgods 26.5 0.0922
the ground under the Sanctuary was the very first part of the world. sfirst 68.5 0.2052
The shrine was the gateway to heaven. sgateway 21.5 0.3244
the Sanctuary is the most important part of the temple simportant 41.5 0.5130
Pharaoh makes the blessings of heaven flow, by conducting the proper ceremonies correctly. sproper 45 0.7169
The high priest could act in pharaoh's place. spriest 43 0.8173
The blessings of heaven flow from the shrine, Through the temple, and on to Egypt. sflow 13 24 1.0000
GRAND TOTAL grandtotal 36.15 0.0458
SANCTUARY GOAL QUESTIONS
pharaoh communicates with the gods sgconverse 42.5 0.3986
here, pharaoh brings down the blessings of heaven by honoring the gods sgbring 39 0.1266

179
Table 16, above, summarizes the results from our evaluation of the video test data
produced by Bruckner, Getkin and Vadnal grading the student videos for the presence of certain
facts. In the table, each fact has a row of data under the area of the temple to which it applies.
The first column shows the full text describing the fact. The second column carries the fact‘s
short name.
The third column, "Point Totals," represents the sum of all points awarded by all graders
for the fact in the first column for that row. It shows the main effect across all groups for learning
that fact, which is instructive in understanding the learning game the Gates of Horus (add link).
Also, it shows the reader how much each fact contributed to the area average. For example, fact
"psword" received 12 total points, which is less than half the average points received for facts in
the Pylon area, which is 28.14 points. The grand average is shown above lines referring to Goal
Questions, because those questions are not included in the grand average.
The fourth column is the most important. It shows P-values produced by the Mann-
Whitney test comparing the grades awarded to the Theater Group and those awarded to students
in the other two groups. For example, if P = 0.05, it means that there is only a 5% chance that the
observed difference is a random event, and therefore it is probably real. For each fact where the
difference is P < 0.10, the polarity of that difference is always in favor of the Theater Group, so
we do not report any of the comparison polarities here. P-values less than 0.1 are shown in
boldface type. For each area, all facts are sorted according to the P-value produced by the Mann-
Whitney test, in the last column.
It is important to understand that the P-value for each major area (e.g., P = 0.0649 for the
Courtyard) is NOT a simple average of the P-values for the facts in that area. For each student,
we computed the average number of points s/he received for all facts in each major area. The P-
value for an area is computed by comparing the group averages for points for all facts in that
area. That is why the P-value for a major area can be lower than most of the P-values for the
facts in it. However, we cannot simply look at the area averages, because there are ways for any
average to look valid while its component data is contradictory.
The P-values for the overall Grand Totals is an excellent P = 0.0458, showing that there
is a very likely real difference in results between the Theater Group and the other students.
Furthermore, the overall P-value for the Sanctuary (P = 0.0359) is even better—not just because
it is the lowest for the four areas, but also because the P-values for seven of its 13 facts

180
individually are favorable P-values, less than 0.01. The Sanctuary is the most important area in
the temple, where all of the themes in the temple come together. The overall results for the
sanctuary can reasonably be used as the primary result of this test.
We also did a separate comparison between the Theater Group and the Desktop Group.
None of the P-values were below 0.1. Had results from the two comparisons pointed in different
directions, the premise of aggregating the Control Group and Desktop Group scores (H2, section
3.4 above) might have been in doubt. As it stands, the failure of the Desktop versus Theater
Group comparison was probably did not involve enough students. (N was too small.) Given the
rationale for H2, we saw no reason to look more closely at this.
Nevertheless, these results are very encouraging. They show that students using the
immersive display appeared to learn more than those using only a desktop monitor
5.5 RESULTS, CONCEPTUAL KNOWLEDGE
We desired a deeper measure of learning, so we constructed a grading questionnaire intended for
an expert on Egypt, generally, and in our Virtual Temple, specifically. At the time, the only
expert available was Dr. Lynn Holden, our content expert. While he was fully aware of the study
goals and structure, he did not know any student‘s test group membership when he was grading
their videos. At the time, he lived in a different city and was not involved in any of the day-to-
day operations of the experiment. We constructed a questionnaire focusing on whether the
student in a video seemed to have a grasp of certain concepts. Dr. Holden watched each video
and circled the appropriate answers for each question. We later transcribed his answers into a
spreadsheet via a form in Survey Monkey. We have reproduced the questionnaire in Figure 39,
below.

181
Figure 39. Conceptual Grading Form.

182
The results showed a strong difference between ratings Dr. Holden gave to students in the
Theater Group and the ratings he gave to all other students. Importantly, Dr. Holden‘s
conceptual-level grades parallel grades given by the other three evaluators for more factual
questions. The narrower comparison of results from the Theater Group and from the Desktop
Group showed a very similar pattern, and many of the results were significant and paralleled the
Theater-verses-all-others comparison. We will report the details of the latter comparison.
We computed these results in exactly the same way as we did for the factual data, except
that there was no need for interrater reliability analysis. Table 17 reports the key values
computed from the Mann-Whitney test for each concept, and the point totals. P-values less than
0.1 are shown in boldface type. All of the averages (except ―cave‖) show P-values less than 0.1,
and each one has his significant percentage of its component concepts also have low P-values.

183
Table 17. Conceptual Understanding, Theater Group versus All Others
Theme Short Name P-value Total Points
Does the student seem to know the facts that s/he is talking about? overall1 0.0001 30.5
Does the student discuss the most important concepts about the temple learned from the game? Pylon Form 0.7246 9
Balance 1.0000 2
Royal Power 0.0634 26
Pylon Average pave 0.0602 12.33
Does the student discuss the most important concepts about the temple learned from the game? Courtyard Public 0.7812 19
Festival 0.7812 19
Equality 0.0703 15
Courtyard Average cave 0.2123 17.67
Does the student discuss the most important concepts about the temple learned from the game? Hypostyle Hall Privacy 0.3626 14
Ancestors 0.0362 30
Offerings/Sacrifice 1.0000 24
Hypostyle Hall Average have 0.0637 22.67
Does the student discuss the most important concepts about the temple learned from the game? Sanctuary Secret 1.0000 11
Divine Presence 0.0179 34
Original Place 0.1684 21
Sanctuary Average save 0.0184 22
Does the student appear to be integrating knowledge, ideas, etc. from other sources, besides the game (other books, museum, online resources, etc.) outside 0.8438 3.75
When in one space, does the student refer to objects in the other spaces? spaceobj 1.0000 2.75
Is the student doing a good job integrating the visual and verbal knowledge they got from the game. visverb 0.0001 29.75
Is the student drawing connections between the different spaces. space to space 0.1053 5
Is the student connecting the facts with the visuals? factviz 0.0002 30
Is the student making connections between the different elements of the temple. elements 0.3460 6

184
Theme Short Name P-value Total Points
Did the student demonstrate understanding of concepts other than the five. concepts 0.7589 0.75
Components Average Includes the area averages (e.g. Courtyard Average) and all the Likert question values. compave 0.0040 11.14
What is your overall impression of the student’s performance. Overall2 0.0004 31.75
The first question, ―overall1,‖ asks the rater to give a general impression of how
competent the student appears to be at the beginning of the video. The last question, ―overall2‖
asks for the rate, after he has seen the entire video. The Mann-Whitney comparison shows a clear
advantage for the Theater Group in both questions, with P(overall1) = 0.0001 and P(overall2) =
0.0004, which are nearly equal. The data for both of those questions are also very strongly
correlated, with Pearson‘s R=0.9305, indicating that they vary in tandem.
Furthermore, ―compave‖ shows the result of a Mann-Whitney comparison on all the
other data, averaged into a single column. The result is also very strong, P = 0.004, in favor of
the Theater Group having genuinely learned more than the others. There is some correlation
between the ―compave‖ data and the data for ―overall1,‖ R = 0.7616, and ―overall2,‖ R = 0.7796.
Essentially, we asked for a general assessment of each student‘s performance in three different
ways, and all three answers correlate, which speaks well for the stability of the results.
Results from the other requested judgments, below the Sanctuary Average, are also
interesting. The Theater Group students received higher marks for integrating visual and verbal
information (―factviz,‖‖visverb‖ and ―space to space‖), which we would expect (see section 3.2,
p96). We believe that our visually immersive display was a much better vehicle for
communicating the way the Egyptians expressed information in their religious architecture. We
remind the reader that the Egyptians were very skilled at visual communication, which is why we
chose this subject matter. Results of the other general questions, ―concepts,‖ ―elements,‖
―spaceobj‖ and ―outside,‖ showed little or no difference between the groups. This is almost
certainly because they had very low point totals, which generally causes Mann-Whitney test to
produce a higher P-value to reflect the uncertainty of making conclusions based on a small
number of data points.

185
Table 18. Connections Between Factual Recall and Conceptual Understanding
P-value Themes Connection Concepts P-value
pmassive 0.3400
pcolorful 0.3580
pcolorworn 0.9640
pmountain 0.2813
0.7246 Form
pdefeating 0.3315
pgrants 0.3128
1.0000 Balance
psword 0.0172
pdedicated 0.2063
0.0634 Royal Power
phawks 0.1891
pprotects 0.8838
0.0601927 pave
pstatue 0.9553
prepresents 0.1887
plink 0.0499
psymbol 0.2224
paverage 0.0962
0.7812 Public
ceverybody 0.6327
copen 0.6103
0.7812 Festival
ccelebrate 0.3209
cbest 0.0303
0.0703 Equality
csimple 0.0017
cconnect 0.9858
0.2123 cave
cgiving 0.3348
cblessing 0.2042
cembrace 0.0962
caverage 0.0649
hliterate 0.1986
hhonored 0.2969
hheaven 0.5328
0.3626 Privacy
hancestors 0.0995
cworkhome 0.4037
0.0362 Ancestors
hdonation 0.0035
hmarsh 0.3062

186
P-value Themes Connection Concepts P-value
1.0000 Offerings/ Sacrifice
chawks 0.5959
cshow 0.6407
0.0637 have
haverage 0.0865
simportant 0.5130
sdeocor 0.0541
sfirst 0.2052
stime 0.0785
1.0000 Secret
sbegan 0.0594
sdivine 0.0300
0.1684 Original Place
sallgods 0.0922
sinhabit 0.0001
0.0179 Divine Presence
sgood 0.0512
sgateway 0.3244
0.0184 save
sflow 1.0000
sproper 0.7169
spriest 0.8173
saverage 0.0359
0.0001 overall1
GrandAve 0.0330

187
Table 18, above, shows several important connections between the high-level learning
reported by Dr. Holden and the factual grading by the other raters. The results show a strong
difference between ratings given to students in the Theater Group and ratings given to all other
students. Most importantly, Dr. Holden's conceptual-level grades parallel grades given by the
other three evaluators for more factual questions. The narrower comparison of results for the
Theater Group and those for the Desktop Group showed a very similar pattern, and many of the
results were significant and paralleled the Theater-verses-all-others comparison. We will report
the details of the latter comparison.
We computed these results in exactly the same way as we did for the factual data, except
that there was no need for interrater reliability analysis. Table 18 reports the key values
computed from the Mann-Whitney test for each concept, and the point totals. P-values less than
0.1 are shown in boldface type. All of the averages (except "cave") show P-values less than 0.1,
and each average also has significant percentage of its component concepts with low P-values.
The arrows connect concepts with related facts. Notice how every concept where the Theater
Group did significantly better is connected to at least one related fact where the Theater Group
also did better. This is why we say that the conceptual learning results parallel the factual
learning results.
In the area of Pylon facts, Theater Group students were significantly better at
remembering that Pharaoh‘s sword represents his authority (psword) and that he is the link
between the people and the gods (plink). The Theater students also scored significantly higher in
understanding the theme of royal power (rpower), which is strongly connected to the two facts.
Comparisons for the fact, ―Pharaoh defeats the enemies of Egypt,‖ do not show a
significant difference between test groups; this is probably due to a ―ceiling effect.‖ Total points
awarded for all students on this fact by all three graders equal 56 points which is very high. It is
most likely that this fact is so obvious that all students did well with it regardless of interface.
Similarly, students in the Theater Group did better with the concept ―Group,‖ and they
also had superior recall for the fact that everyone wore the same simple garments when they
gathered in the Courtyard for festivals (csimple).
Students in the Theater Group were better at remembering that the Egyptians honored
their ancestors in the Hypostyle Hall (hancestors), and they also showed better understanding of
the larger concepts around ancestor worship in the Hypostyle Hall (ancestors).

188
Students in the Theater condition showed a better understanding of the theme regarding
the divine presence in the Sanctuary and how it works (divine presence). This is strongly
connected to the fact/idea that the divine image of Horus stands within the shrine (sdivine) and
that the spirit of the god inhabits the divine image (sinhabit).
Finally, another positive result is less important, but quite interesting. Students in the
immersive condition showed a significantly positive learning result for a particular theme, the
idea of the divine presence of the god (Horus) in the temple Sanctuary. This appears in two
factual questions in the Post Test, as well as one fact and one concept in the Video Test. We
speculate that immersion creates a much more dramatic sense of presence for the student with
regard to the human-sized figure of Horus stepping out from the Shrine, a sense of visual drama
Egyptian temple-builders took great care to create. By feeling embodied, the student is able to
experience some fraction of what a real Egyptian of that period would have, causing better recall
for the most closely related ideas. Also, there is a particular question in the Post Test (about
parties in the Courtyard) where the immersive condition produced a stronger than for other
questions, again, most likely because make the situation feel more real, and therefore more
memorable.

189
5.6 RPM INTERACTS WITH IMMERSION
All students completed the standard version of Raven's Progressive Matrices Test (Raven, 1957),
which measures abstract reasoning ability through a series of non-verbal puzzles. Each puzzle is
presented as a 3 x 3 grid of geometric shapes with the last one (lower right) missing. The subject
must complete the grid using one of eight alternatives figures, only one of which is correct.
Determining which alternative answer is correct requires the test taker to infer the logical
progressions from the existing members of the grid. We used a variation of the test that takes
most normal adults approximately twenty minutes to complete, and we imposed a forty-minute
time limit. In effect, the test was not timed, making it more of a measure of mental capacity
rather than mental efficiency (Westby, 1953).
RPM has a long history (Shiply, 1949), is very stable (Gregory, 1999) and is easy to
administer. However, we must carefully define what it measures in the context of this
experiment. Researchers often use Raven's Progressive Matrices (RPM) as a test for native
intelligence, rather than for the effective intelligence one develops through knowledge and
training. RPM is valued because most other types of intelligence test are sensitive, at least to
some degree, to effective intelligence as well as to native intelligence (Gregory, 1999). But RPM
is also important for another reason: it requires visual skills such as the ability to estimate
relative size and shape, which may not be directly related to verbal ability. Bortner (1965)
contends that the visual reasoning measured by RPM is not the same thing as general
intelligence.

190
Table 19. Results from RPM Test, Question sets C & D.
9 12 13 14 14 14
15 15 16
17 17 17 17 17 17 18 18 18 18 18 18 18 18 18 18 18 18 18 18
19 19 19 19 19 19 19 19 19 20 20 20 20 20 20 20 20 20 20 20 20
21 21 21 21 21 21 22 22 22 22 22 23 23 23
24
Figure 40. Sample Question from the RPM Test

191
We used RPM to measure students' reasoning ability in a way that is not affected either by verbal
ability or by the student‘s history in the education system. This allowed us to make some
interesting comparisons, because Gates of Horus (section 3.3, p98) is an entirely visual and
auditory experience. As we describe in Hypothesis Six (H6, section 3.4, p119) we could see
whether the students with lower ability could handle visually-mediated information benefit more
from visual immersion, as Winn (1999) found. This is particularly important because it is
possible that modern students' exposure to complex visual stimuli elsewhere could influence
their performance (Westby, 1953). Verbal ability rather than written literacy is needed to
comprehend and integrate the clues in the audio clips contained in Gates of Horus.
Figure 40, above, shows a sample question from the RPM test, and Table 19, above,
summarizes the results. We combined the RPM scores from the Raven‘s progressive matrices
test with other results to see if low ability students had more to gain from the immersive
condition (Winn 1997). Perhaps the advantage would go to the high-scorers, or neither. Table 20,
below, shows results from comparing student grades by RPM score, and by RPM score crossed
with group membership, for the factual data. The results appear to show interesting trends, but
nothing conclusive

192
.
Table 20. RPM Scores Crossed With Factual Learning Differences
LowRPM T vs. C&D
HighRPM T vs. C&D
LowRPM vs. HighRPM
pmassive 0.3478 + 0.7350 + 0.0766 +
pcolorful 0.5257 - 0.8972 - 0.3463 +
pcolorworn 1.0000 + 1.0000 + 0.8039 +
pmountain 1.0000 - 0.5257 - 0.4889 +
pdefeating 0.6524 + 0.9449 - 0.8728 -
pgrants 0.5257 + 0.7945 - 0.7489 +
psword 0.1107 + 1.0000 - 0.4889 -
pdedicated 0.3123 + 0.2418 + 0.0174 +
phawks 0.7912 - 0.2305 + 0.0457 +
pprotects 0.4178 - 0.6701 + 0.8391 +
pstatue 0.7806 - 0.7697 + 0.3597 -
prepresents 1.0000 - 0.5257 - 1.0000 +
plink 0.7628 + 1.0000 - 1.0000 -
psymbol 1.0000 - 0.0329 + 0.3488 +
paverage 0.2708 + 0.5355 + 0.3912 +
ceverybody 0.4651 + 0.8588 + 0.2687 +
copen 0.1107 + 0.5657 - 0.0625 +
ccelebrate 0.3818 + 0.4708 + 0.2269 +
cbest 0.0017 + 0.8500 - 1.0000 -
csimple 0.1028 + 0.0017 + 0.4217 +
cconnect 0.3366 - 0.5150 - 0.9819 -
cgiving 0.3692 + 0.6401 + 0.9300 -
cblessing 0.1114 + 0.5278 + 0.9051 +
cembrace 0.3478 + 0.3123 + 0.1680 +
caverage 0.1032 + 0.1631 + 0.3557 +
hliterate 0.5707 + 0.9362 + 0.1458 +
hhonored 0.4299 + 0.6853 + 0.0752 +
hheaven 1.0000 - 1.0000 - 0.2274 +
hancestors 0.0120 + 0.6509 + 0.3718 +
cworkhome 0.6917 + 0.5257 - 0.2825 -
hdonation 0.0593 + 0.2802 + 0.6259 +
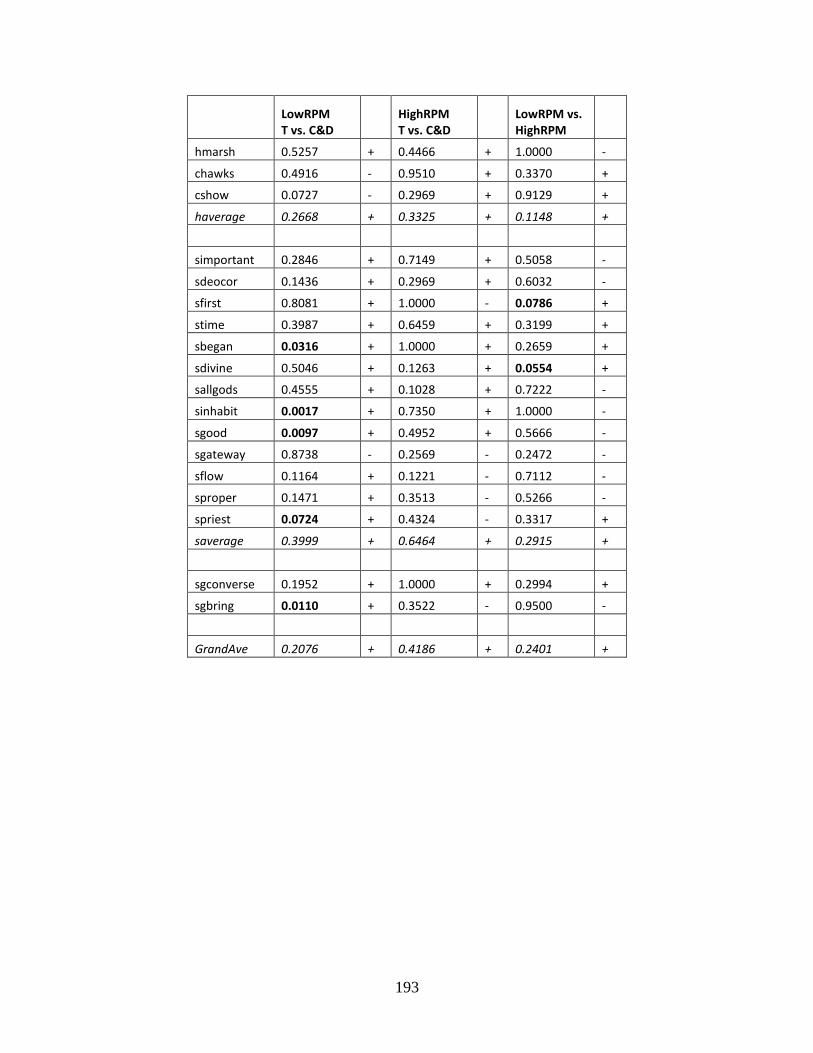
193
LowRPM T vs. C&D
HighRPM T vs. C&D
LowRPM vs. HighRPM
hmarsh 0.5257 + 0.4466 + 1.0000 -
chawks 0.4916 - 0.9510 + 0.3370 +
cshow 0.0727 - 0.2969 + 0.9129 +
haverage 0.2668 + 0.3325 + 0.1148 +
simportant 0.2846 + 0.7149 + 0.5058 -
sdeocor 0.1436 + 0.2969 + 0.6032 -
sfirst 0.8081 + 1.0000 - 0.0786 +
stime 0.3987 + 0.6459 + 0.3199 +
sbegan 0.0316 + 1.0000 + 0.2659 +
sdivine 0.5046 + 0.1263 + 0.0554 +
sallgods 0.4555 + 0.1028 + 0.7222 -
sinhabit 0.0017 + 0.7350 + 1.0000 -
sgood 0.0097 + 0.4952 + 0.5666 -
sgateway 0.8738 - 0.2569 - 0.2472 -
sflow 0.1164 + 0.1221 - 0.7112 -
sproper 0.1471 + 0.3513 - 0.5266 -
spriest 0.0724 + 0.4324 - 0.3317 +
saverage 0.3999 + 0.6464 + 0.2915 +
sgconverse 0.1952 + 1.0000 + 0.2994 +
sgbring 0.0110 + 0.3522 - 0.9500 -
GrandAve 0.2076 + 0.4186 + 0.2401 +

194
In Table 20, above, the first column identifies temple facts by their short names (from
Table 16, p176). The second column, ―LowRPM T vs. C&D‖ shows the learning differences
between low-RPM-scoring students in the Theater Group versus the low-RPM-score students in
the other two groups. The numbers in that column are P-Scores produced by the Mann-Whitney
test. P-Scores less than 0.1 are shown in boldface type. Although none of the area averages have
a significant P-Score, there is a total of seven individual facts with P-Scores less than 0.1. One of
them, ―cshow‖ has a negative polarity, meaning that students in the Theater Group actually
scored lower than students in the other groups. However, at P=0.0727, the result is weak.
It is especially interesting that the same comparison for High-RPM-scoring students
(column 4) showed significant differences for only two facts. These differences are most likely
random events, because they are so few. We can look at this as anecdotal evidence, a hint, that
low RPM scoring students have more to gain from using the immersive interface than the high-
scorers.
In Table 21, below, column labeled ―LowRPM vs HighRPM‖ shows the main effect of
Raven‘s Progressive Matrices scores on students‘ final scores. The premise of the comparison is
that students with high RPM score do better, and this is supported by the six significant
differences (P < 0.1) and their positive polarity. If it is true that students who score high on
Raven‘s progressive matrices do better with the game than those who score low on RPM, that
does not necessarily conflict with the idea that low-scoring students have more to gain from
visual immersion. Winn (1997) discovered that otherwise low-achieving students became almost
as proficient as the high-achieving students in his experiment, but only with the immersive
interface. High-achieving students achieved high scores, regardless of the interface.
We must stress that while the data is provocative, it is not conclusive. There are not
enough low P-values in one place to say that we have definitely found an effect, even though the
trends were worth discussing. The next step was to cross the RPM scores with the conceptual
learning comparisons.

195
Table 21. RPM Scores Crossed With Conceptual Learning
LowRPM C&D vs. T
HighRPM C&D vs. T
LowRPM vs. HighRPM
Form 0.5331 + 1.0000 + 0.4635 +
Balance 1.0000 - 1.0000 - 0.4898 -
Royal Power 0.6687 - 0.0168 - 0.3772 +
pave 1.0000 - 0.1151 - 0.3027 +
Public 1.0000 - 0.2077 - 0.0255 +
Festival 0.6570 + 0.0571 + 0.5380 -
Equality 0.0474 + 0.3548 + 0.7416 +
cave 0.2484 + 0.2351 + 0.1983 +
Privacy 0.6146 - 0.3548 - 0.7416 +
Ancestors 0.1782 + 0.4013 + 0.0465 +
Offerings/Sacrifice 1.0000 - 0.2077 - 0.5607 +
have 0.5812 + 0.8375 + 0.0393 +
Secret 1.0000 + 1.0000 + 0.2467 +
Divine Presence 0.4225 + 0.2077 + 1.0000 +
Original Place 0.3564 + 0.4013 + 0.7624 +
save 0.2065 + 0.7671 + 0.3825 +
outside 1.0000 - 0.2800 - 0.3541 +
spaceobj 1.0000 - 1.0000 - 0.2347 +
visverb 0.0064 + 0.0337 + 0.1425 +
spacespace 1.0000 - 0.8862 - 0.1160 +
factviz 0.0504 + 0.0233 + 0.0991 +
elements 0.2589 - 0.2912 - 0.1146 +
concepts 0.7554 + 1.0000 + 0.2347 -
Compave 0.2311 + 0.2812 + 0.0236 +
Overall1 0.0030 + 0.0430 + 0.0370 +
Overall2 0.0149 + 0.0922 + 0.0515 +

196
From the results in Table 21 and Table 20, we suspect that students with higher RPM
scores generally do better with Gates of Horus (section 3.3, p98), but we did not test enough
students to say that we have produced conclusive evidence of the effect. The ―LowRPM vs.
HighRPM‖ in Table 20 (p191) add weak evidence to our belief by having seven individual
comparisons statistically significant. The strongest evidence is the fact that the P-values for
Compave, Overall1, and Overall2 in Table 21, above, strongly indicate a significant difference.
However, their case is weakened by a lack of significant differences in the individual concept
and theme questions.
Furthermore, there is probably an interaction effect between the experimental treatment
and students‘ RPM score. Both Table 20, p191, and Table 21, p194 above, show more individual
facts/themes/concepts where the students in the Theater Group did significantly better than all
the other students. Also, the values in row ―Overall1‖ in Table 20 shows a lower ―P‖ value for
low RPM students than for high RPM students, and so does Overall2. In Table 21, the averages
for the low-RPM students show lower P-values than those for higher-RPM students. In short, we
believe that the low-RPM score students do in fact have more to gain from the immersive visual
condition but that we did not test enough of them to prove it.
When we look at the treatment effect for the lower-RPM-scoring half of the students, we
have only approximately seven students in the Theater Group and 15 students in the aggregate
Control Group. The same is true when we test the high-RPM scoring students. For higher P-
values, there are few students on either side of a comparison which results in more erratic
behavior among the P values. There are ways to adjust the P-values to account for this, but we
believe we do not have enough data to make these manipulations worthwhile. We regard our
findings from the Raven‘s Progressive Matrices data crossed with the results from the video data
as informative and interesting, but anecdotal.

197
5.7 DISCUSSION
By design, the Sanctuary is the smallest and most intimate space of the Virtual Egyptian
Temple, but it is also the most complex, unifying all of the major themes of the temple. The
smallness and visual complexity of the space also requires the student to search for features
(―clues‖ in the game) in many directions as well as behind the shrine. This conveys a mechanical
advantage to students in the immersive condition because they have to spend less time
navigating and less time rotating the view. Finally, by the time students reach the Sanctuary,
they have had the most time (compared to when they entered other areas) to learn the game and
become familiar with the interface. This would tend to decrease the statistical ―static‖ caused by
variations in learning speed (of the interface and the game), and allow the main effect of the
experimental treatments to come to the fore. Finally, many of the ideas presented in the
Sanctuary were directly supported by features in other areas of the Temple. The most important
example of this is the idea of Pharaoh and the gods exchanging gifts of bounty and power. It is
in fact, the central idea of the Temple as a whole, which is literally designed to focus attention
on the divine image in this study.
Evidence suggests, but does not prove, that students who score higher on the RPM tests
do better with Gates of Horus (section 3.3, p98) , because all students in this study had no more
than an hour to both learn and play the game. Students who are more visually oriented were able
to figure out the interface and the game itself more quickly and find important features more
easily. The same evidence suggests that students with less visual ability shown greater
improvement when using the immersive interface. This would be in line with the results found
by Winn (1999). Unfortunately, this evidence must be considered anecdotal, because we do not
have enough data to produce a statistically conclusive result. This would be an excellent topic
for further research.

198
6.0 OTHER MEASURES
In this section we present measures which did not describe statistically useful results, but are
instructive nonetheless. Refer to section 3.6, p122, to see all of the tests in this study and the
order in which we conducted them.
In data from both the Drawn Map Test for H4 and the Magnet Map Test for H5, we saw
no significant differences in performance for the Theater Group versus the other groups, not even
a trend in one direction or the other. This is at odds with the virtual reality training literature,
which has established that Immersive VR is a good way to teach survey and route knowledge of
an area. We conclude that the Temple was too small and too simple for immersion to produce a
genuine difference in students‘ knowledge which could be detected with a mapping test.
We also compared results for the Follow-Up Test, one or two months later, and
comparing responses from students in the Theater Group to all the others. Unfortunately, we saw
no statistically significant differences, and there were not enough differences in individual scores
to be convincing. The Follow-Up Test was very similar to the Post Test, except that students
gave much less informative answers on the short-answer questions. We conclude that if there are
any lasting comparative benefits to visual immersion over a standard desktop monitor, a standard
quiz such as a Follow-Up Test is not sensitive enough to detect it.
This leaves H3, H4 and H5 unproven.
199
6.1 PRETEST
The pretest queries students on basic demographic information, computer literacy, game literacy,
attitudes towards computers, exposure to computer games, and attitudes about Egypt.
Unfortunately, a knowledge pretest which asks specific questions about the Virtual
Egyptian Temple is not possible because it would reveal too much information about the temple,
giving any student who took it an artificial advantage in any posttest. While all of the
comparison groups would have equal advantage, it would still distort the results. It would most
likely lead to a ceiling effect, where all students scored so well that there would be little
difference between their learning outcomes. A true knowledge pretest for the temple might also
cause the students to ―over-fit-the-data‖ attempting to study to the test and only the test, which
would hurt the external validity of any results of the experiment.
Therefore we added the Control Group to the experiment. They took the same Post Test
(section 4.0 p136) the other groups, but filled it out before playing the game. This gave us a
measure of how well the average student can use prior knowledge and clever guessing based on
the structure of the test itself. In effect, the Control Group‘s scores on our Post Test took the
place of a knowledge pretest for the other two groups. Instead, the Pretest focuses on
demographic and attitudinal questions, which may the useful for later analysis. Table 22, below,
summarizes the questions, options, and results. For an exact reproduction of the Pretest, see
section Appendix A, p259.

200
How old are you? 11 25
12 28
13 19
14 5
What grade are you in at school?
6th 32
7th 28
8th 17
Are you a boy or a girl?
boy 39
girl 38
How many hours a day do you use a computer?
none 2
0-1 27
1-3 39
3-6 8
7 or more 1
Do you play computer games?
yes 71
no 6
On average how many hours a day do you play computer games?
none 7
0-1 37
1-2 28
2-3 3
4 or more 2
Do you play some computer games that have a three dimensional world?
yes 50
no 27
Table 22. Pretest Results
Do you play some computer games that have a three dimensional world?
yes 50
no 27
How do you feel about computers?
Very bad 0
. 1
. 9
. 26
Very good 41
How interested are you in Ancient Egypt?
Not Very 3
. 11
. 31
. 21
Very 11
How many times have you visited an Egyptian collection in a museum?
none 13
one or two 46
three to ten 12
more than ten 6
Have you ever visited the Egypt Hall at Carnegie Museum of Natural History?
yes 51
no 26
How many books about Ancient Egypt have you looked at?
none 6
one or two 40
three to five 19
more than five 12
When do you know you are experiencing Virtual Reality? Select all that apply:
Using a computer 30
Interacting with a three dimensional world 49
Dreaming 23
Seeing the computer animated world all in big wide view sometimes all around you
46
Playing a game 33
Have you ever played a virtual reality game?
yes 50
no 27
Did you ever play with a virtual reality game or ride at an amusement park or arcade?
yes 49
no 28
Which of the following do you know something about?
The Nile River 67
Ramses 26
The Valley of the Kings 25
The Sphinx 44
Scarab Beetles 25
201
6.2 GAME LOGS
Gates of Horus records every event in the game for later analysis. To summarize:
1. Every location in the virtual space occupied by the player every fifth of a second. This
gave a clear record of where the student is during the time s/he played the game.
2. The length of time the student took to:
a. Complete the entire game, from triggering the first recording (―clue‖) speech for
the Pylon to triggering the final God-Speech declaring the student victorious.
b. Complete each Area of the temple, from triggering the first recording to the time
the priest opens the gate to the next Area.
c. Move from Area to Area, from leaving one Area to triggering the first recording
in the next Area. There are three such transitions, Pylon-Courtyard, Courtyard-
Hypostyle Hall, and Hypostyle Hall-Sanctuary.
3. For each Area of the temple, the average time the student spent per question.‖
4. The number of times the student answered a question incorrectly.
5. The number of times the student listened to a recording.
This record of events was very useful during the pilot testing. For the main study, Table
23, below, shows the results for the measures we were interested in.
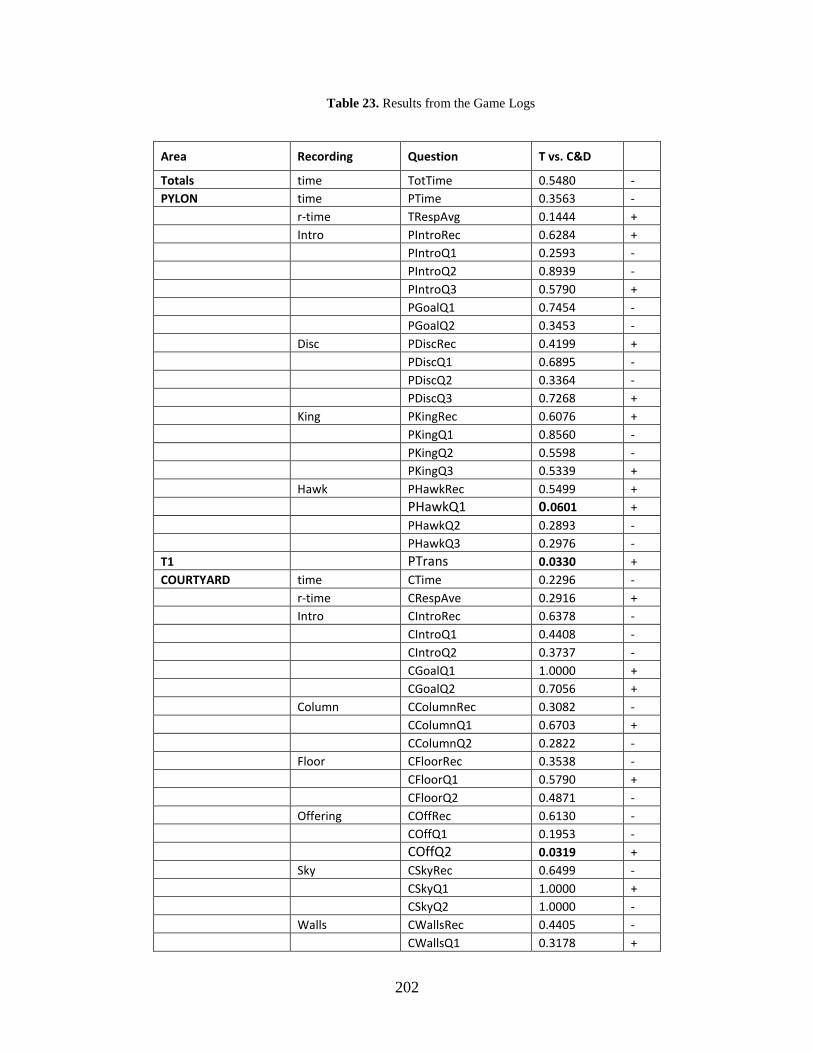
202
Table 23. Results from the Game Logs
Area Recording Question T vs. C&D
Totals time TotTime 0.5480 -
PYLON time PTime 0.3563 -
r-time TRespAvg 0.1444 +
Intro PIntroRec 0.6284 +
PIntroQ1 0.2593 -
PIntroQ2 0.8939 -
PIntroQ3 0.5790 +
PGoalQ1 0.7454 -
PGoalQ2 0.3453 -
Disc PDiscRec 0.4199 +
PDiscQ1 0.6895 -
PDiscQ2 0.3364 -
PDiscQ3 0.7268 +
King PKingRec 0.6076 +
PKingQ1 0.8560 -
PKingQ2 0.5598 -
PKingQ3 0.5339 +
Hawk PHawkRec 0.5499 +
PHawkQ1 0.0601 +
PHawkQ2 0.2893 -
PHawkQ3 0.2976 -
T1
PTrans 0.0330 +
COURTYARD time CTime 0.2296 -
r-time CRespAve 0.2916 +
Intro CIntroRec 0.6378 -
CIntroQ1 0.4408 -
CIntroQ2 0.3737 -
CGoalQ1 1.0000 +
CGoalQ2 0.7056 +
Column CColumnRec 0.3082 -
CColumnQ1 0.6703 +
CColumnQ2 0.2822 -
Floor CFloorRec 0.3538 -
CFloorQ1 0.5790 +
CFloorQ2 0.4871 -
Offering COffRec 0.6130 -
COffQ1 0.1953 -
COffQ2 0.0319 +
Sky CSkyRec 0.6499 -
CSkyQ1 1.0000 +
CSkyQ2 1.0000 -
Walls CWallsRec 0.4405 -
CWallsQ1 0.3178 +

203
Area Recording Question T vs. C&D
CWallsQ2 0.2974 -
T2
CHTrans 0.0005 +
HYPOSTYLE time HTime 0.3525 -
r-time HRespTime 0.9333 +
Intro HIntroRec 0.2958 +
HIntroQ1 0.0266 -
HIntroQ2 0.0369 +
HIntroQ3 1.0000 +
HIntroQ4 0.4841 -
HGoalQ1 1.0000 +
HGoalQ2 0.2966 -
Column HColRec 0.3082 -
HColQ1 0.0130 +
HColQ2 1.0000 -
HColQ3 0.6771 -
Ceiling HCeilingRec 0.7731 -
HCeilingQ1 0.0165 -
HCeilingQ2 0.1363 -
Lamp HLampRec 0.6950 +
HLampQ1 1.0000 +
HLampQ2 0.6463 +
HLampQ3 0.0321 -
T3 HSTrans 0.0020 +
SANCTUARY time STime 0.2657 -
r-time SRespAve 0.3484 +
Intro SIntroRec 0.0392 -
SGoalQ1 1.0000 -
SGoalQ2 0.7430 +
SGoalQ3 0.7140 +
Idol SIdolRec 0.6339 +
SIdolQ1 1.0000 -
Floor SFloorRec 0.2609 +
SFloorQ1 1.0000 +
SFloorQ2 1.0000 +
SFloorQ3 0.6399 +
Shrine SShrineRec 0.2623 -
SShrineQ1 1.0000 -
SShrineQ2 0.3964 -
SShrineQ3 0.5624 +
Wall SWallRec 0.2755 -
SWallQ1 0.2058 +
SWallQ2 0.6817 +
SWallQ3 0.8189 +

204
Table 23, above, the first column indicates the Area of the Temple to which the measures for all
the rows until the next Area apply. For example, the priest for the Pylon area asked the question
―PKingQ1.‖ There are also three transition periods, T1, T2 and T3, from the time the Gates to an
area open, to the time the student triggers the introductory recording in that Area. In rows where
the second column shows ―time,‖ it refers to a comparison between how long it look students in
the Theater Group to complete the area/transition compared to the time for all other students.
Where there is the name of a recording in column 2, the value in that row refers to the number of
times Theater Group students listened to that recording, compared to the number of times all
other students listened to it. Finally, in any row with column 2 blank, the value in that row refers
to a comparison between the number of times students in the Theater Group got a particular
question (named in column three) wrong before getting it right and the number of times all other
students got the question wrong before getting it right before they finally got it right.
Column 3 has the actual names of the areas, transitions, recordings and questions.
The fourth column shows the Mann-Whitney test P-value of a comparison between
performance by students in the Theater Group versus students in the other two groups on each
question or recording. Values less than 0.1 are indicated with boldface type, because they have
some measure of statistical significance. The fifth column shows (indirectly) which group did
better.
For example, in a row with a question, the performance measure is the average of how
many times all students in a comparison group answered a question incorrectly with low being
good, obviously. So, for question ―COffQ2,‖ the fifth column shows a ―+‖ sign, meaning that the
Theater Group did better, on average, than the combined Controls and Desktop Group. The P
value is 0.0319, which means that there is only a 3.19% chance that the difference in average
number of wrong answers is just a random event. For time measures the P-value is based on
which comparison group finishes the area or transition more quickly, on average. For the
recordings, we compare on the average number of times the student hears the recording.
As you can see, not many of the P-Values are even mildly significant (P < 0.1) and those
that are, tend to cancel each other out because they have opposite polarity. The only clear pattern
that emerges is that the transition times are slower for students in the immersive condition. This
is probably due to differences in the way the action of the controller (the Gyromouse) relates to
the display (section 3.3.1, p99). We make no other conclusions from this data.

205
6.3 PRESENCE AND COMFORT TEST
The Presence and Comfort test was a short written questionnaire we gave to the Theater Group
students, immediately after they played the learning game. Most of the questions on it are from
Kennedy‘s questionnaire for motion sickness (Kennedy, 1992). Also, the first question measured
the student's degree of presence (section 2.5.3, p47) in the virtual temple using an adaptation of
Hunter Hoffman's questionnaire for Presence (Hoffman, 1999). Figure 41 is a condensed image
of the test form.
Table 24, below, shows the full results of the test. We tested for a difference in students‘
self-reported sense of Presence (third column) between students in the Theater Group (T) and
students in the other two groups (C & D). A two-tailed uneven-samples T-Test yielded P =
0.6087, which indicates no evidence of any difference between students in the two conditions. It
could be that the test is not sensitive enough, but we think that it more likely that students in the
two conditions really did have similar levels of presence. The Earth Theater does not have the
same degree of sensory immersion found in a Stereoscopic CAVE or an HMD used in
conducting most Immersive VR experiments. Also, a single rating of presence confounds the
effects of sensory and thematic presence. We draw no conclusion from the presence data.
The responses to questions from the Kennedy (1992) questionnaire showed very little
self-reported motion sickness—not enough to have had much of an effect. Given the lack of
complaints over the long history of the Earth Theater‘s operation, we expected this, but we had
to test for it. We surmise that this is a result of the narrow vertical field of view, the relatively
low light intensity of the display, and the availability of a floor-attached seat to the user.

206
Figure 41. Presence and Comfort Test
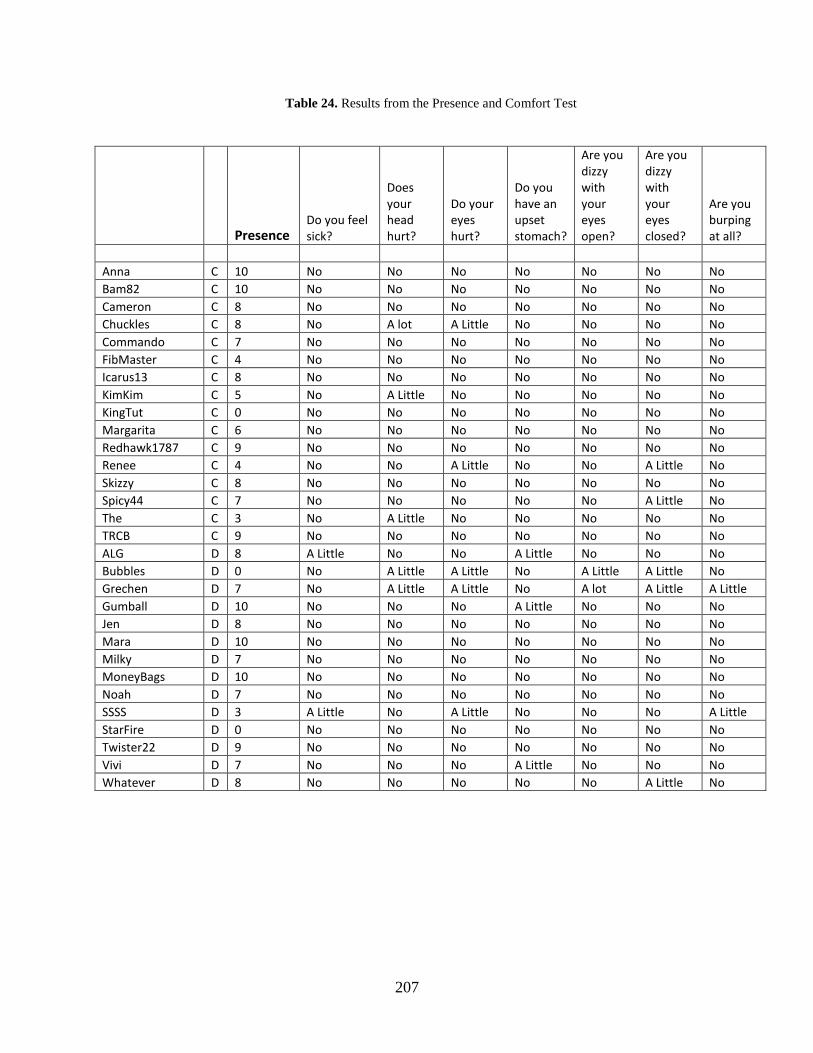
207
Table 24. Results from the Presence and Comfort Test
Presence Do you feel sick?
Does your head hurt?
Do your eyes hurt?
Do you have an upset stomach?
Are you dizzy with your eyes open?
Are you dizzy with your eyes closed?
Are you burping at all?
Anna C 10 No No No No No No No
Bam82 C 10 No No No No No No No
Cameron C 8 No No No No No No No
Chuckles C 8 No A lot A Little No No No No
Commando C 7 No No No No No No No
FibMaster C 4 No No No No No No No
Icarus13 C 8 No No No No No No No
KimKim C 5 No A Little No No No No No
KingTut C 0 No No No No No No No
Margarita C 6 No No No No No No No
Redhawk1787 C 9 No No No No No No No
Renee C 4 No No A Little No No A Little No
Skizzy C 8 No No No No No No No
Spicy44 C 7 No No No No No A Little No
The C 3 No A Little No No No No No
TRCB C 9 No No No No No No No
ALG D 8 A Little No No A Little No No No
Bubbles D 0 No A Little A Little No A Little A Little No
Grechen D 7 No A Little A Little No A lot A Little A Little
Gumball D 10 No No No A Little No No No
Jen D 8 No No No No No No No
Mara D 10 No No No No No No No
Milky D 7 No No No No No No No
MoneyBags D 10 No No No No No No No
Noah D 7 No No No No No No No
SSSS D 3 A Little No A Little No No No A Little
StarFire D 0 No No No No No No No
Twister22 D 9 No No No No No No No
Vivi D 7 No No No A Little No No No
Whatever D 8 No No No No No A Little No

208
Presence Do you feel sick?
Does your head hurt?
Do your eyes hurt?
Do you have an upset stomach?
Are you dizzy with your eyes open?
Are you dizzy with your eyes closed?
Are you burping at all?
Ace T 4 No A Little A Little No A Little No No
Beaver32 T 10 No No No No No No No
Bman T 1 No No No No No No No
Champ T 9 A Little A Little No A Little A Little No No
Claire T 10 No No No No A Little No No
HarpsichordDude T 9 No A Little No No No A Little No
JSS T 10 A Little No No A Little A Little No No
Kimiko T 10 No A Little No No No No No
Magma1000 T 8 No No No No No No No
Morgan T 7 No No No No No No No
MrBeans T 3 No No No No No No No
Natalie T 8 No A Little No No No No No
Nellie T 0 A Little A Little No A Little No No No
NicelyNicely T 6 A Little A Little No No No No No
Paris T 8 No No No No No No No
PinkySprinkles T 0 A Little A Little A Little No No A Little No
Pumpkin T 8 No No No No No No No
Set T 2 No No No No No No No
Shadow T 8 No No No No No No No
Sparky T 7 No No No No No No No
Superman T 8 A Little A Little A Little No No No No
TreeHugger T 7 No No No No No No No
Vegitomsn T 6 No No A Little No No No No
Zulu1138 T 0 No A Little No No No No No

209
6.4 DRAWN MAP
During the game, students learned the structure and appearance of the Temple by navigating
through it and interacting with the spotlighted (Figure 26, p110) features and the priest. While
developing a good cognitive map (Johns, 2002; Darken, 2001) of the temple was valuable in
itself, it was also crucial as the organizing structure for the facts the student needed to learn and
as a cognitive tool for understanding the required concepts. For this, the student requires survey
knowledge of the temple, with the acquisition of route knowledge useful primarily as an
intermediate step (Koh, 1999). Virtual environments are an effective means to teach students
how to recognize and navigate (analog) real spaces (Darken, 2001; Durlach, 2000). Therefore we
believe our use of a virtual environment to describe the temple was effective.
Each student drew at least two maps in his or her testing booklet using provided pencils
with erasers. The first map represented the actual room the student was in, the table or desk
where s/he was sitting and the door into the room. The second map was a map of the temple: a
simple floor plan showing the major objects located within the temple. This is a very common
method of testing students' survey knowledge of navigable spaces and is widely used in VR
studies (Johns, 2002; Goerger, 1998; Gabrielli, 2000; Miller, 2002; Arthur, 2001). However,
mapping is a skill that some children are never taught. If the test subjects did not know how to
draw a map, this test was a poor indicator of their spatial knowledge of the Temple. Having each
student draw the room in which s/he was sitting was intended to indicate whether that student
had any mapping skill.
We photographed all the maps for later analysis. Figure 42, below, shows a sample
temple map and a sample room map.
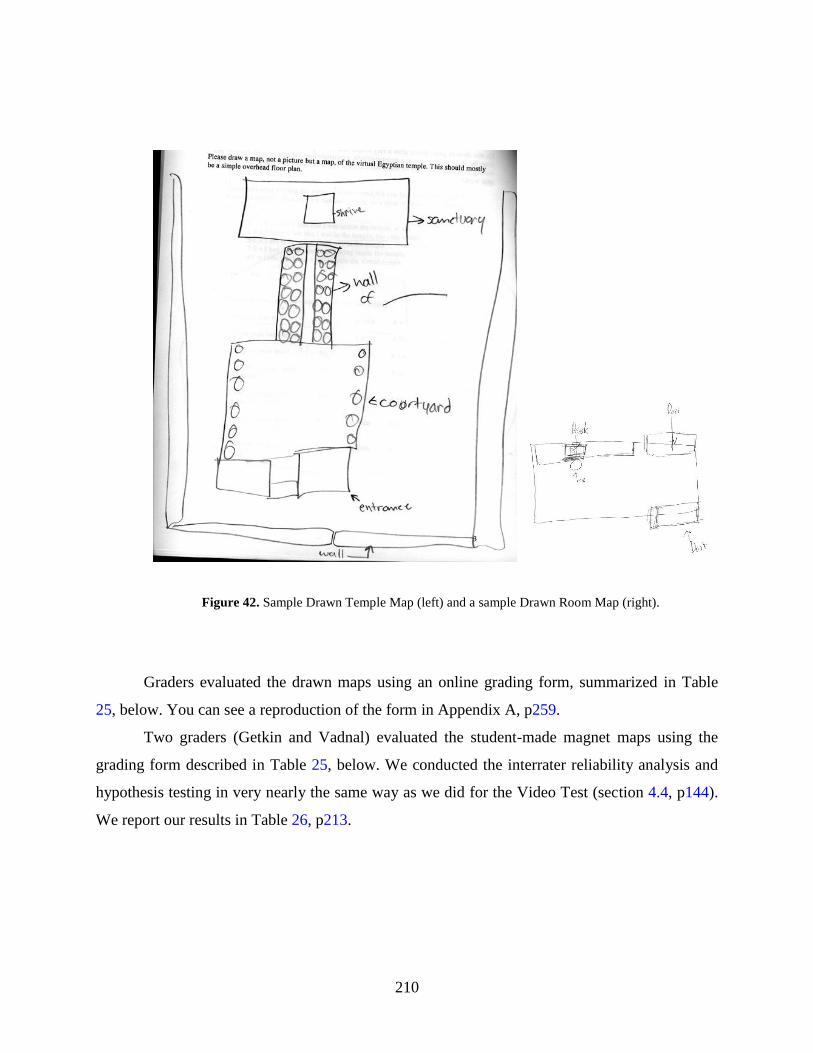
210
Figure 42. Sample Drawn Temple Map (left) and a sample Drawn Room Map (right).
Graders evaluated the drawn maps using an online grading form, summarized in Table
25, below. You can see a reproduction of the form in Appendix A, p259.
Two graders (Getkin and Vadnal) evaluated the student-made magnet maps using the
grading form described in Table 25, below. We conducted the interrater reliability analysis and
hypothesis testing in very nearly the same way as we did for the Video Test (section 4.4, p144).
We report our results in Table 26, p213.
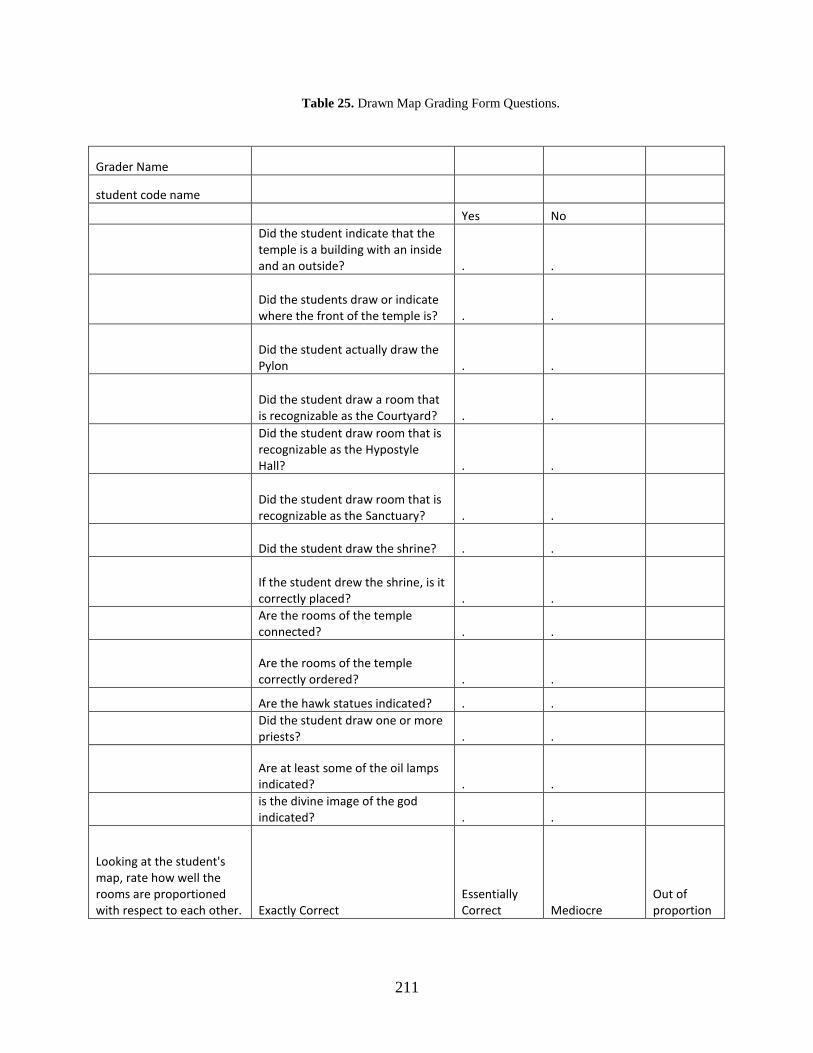
211
Table 25. Drawn Map Grading Form Questions.
Grader Name
student code name
Yes No
Did the student indicate that the temple is a building with an inside and an outside? . .
Did the students draw or indicate where the front of the temple is? . .
Did the student actually draw the Pylon . .
Did the student draw a room that is recognizable as the Courtyard? . .
Did the student draw room that is recognizable as the Hypostyle Hall? . .
Did the student draw room that is recognizable as the Sanctuary? . .
Did the student draw the shrine? . .
If the student drew the shrine, is it correctly placed? . .
Are the rooms of the temple connected? . .
Are the rooms of the temple correctly ordered? . .
Are the hawk statues indicated? . .
Did the student draw one or more priests? . .
Are at least some of the oil lamps indicated? . .
is the divine image of the god indicated? . .
Looking at the student's map, rate how well the rooms are proportioned with respect to each other. Exactly Correct
Essentially Correct Mediocre
Out of proportion

212
The Courtyard
The Hypostyle Hall
The Sanctuary
Describe the columns as the student drew them. Check all that apply. The student drew...
the correct number of columns - The Courtyard . . .
the correct number of columns - The Hypostyle Hall . . .
the correct number of columns - The Sanctuary . . .
the correct number of rows of columns - The Courtyard . . .
the correct number of rows of columns - The Hypostyle Hall . . .
the correct number of rows of columns - The Sanctuary . . .
some rows of columns are in the correct location - The Courtyard . . .
some rows of columns are in the correct location - The Hypostyle Hall . . .
some rows of columns are in the correct location - The Sanctuary . . .
some rows of columns are in the wrong location - The Courtyard . . .
some rows of columns are in the wrong location - The Hypostyle Hall . . .
some rows of columns are in the wrong location - The Sanctuary . . .
opposing ranks of columns are different in number - The Courtyard . . .
opposing ranks of columns are different in number - The Hypostyle Hall . . .
opposing ranks of columns are different in number - The Sanctuary . . .

213
Comparing the number of columns in the Hypostyle Hall versus the Courtyard.
The Hypostyle Hall is shown with more columns than the Courtyard.
Both rooms are shown with the same number of columns.
Both rooms have NO columns at all.
the Courtyard is shown with more columns than the Hypostyle Hall.
How many features of the temple are correctly labeled? (open ended)
How many features of the temple are correctly described in a general way? for example of students may use "statue" to describe the divine image of the god in the shrine. (open ended)
how many features of the temple are Mislabeled? (open ended)
Do you wish to say anything else anything else about theism student's drawing of the temple? (open ended)

214
Table 26. Results for Student Drawn Maps
Question Short Name
Fleiss Kappa error
P-values
Did the student indicate that the temple is a building with an inside and an outside? inout 0.0000 0.9103
Did the students draw or indicate where the front of the temple is? front 0.0000 0.8137
Did the student actually draw the Pylon Pylon 0.0000 0.3884
Did the student draw a room that is recognizable as the Courtyard? court 0.0004 0.5284
Did the student draw room that is recognizable as the Hypostyle Hall? hypo 0.0069 0.8364
Did the student draw room that is recognizable as the Sanctuary? Sanctuary 0.0041 0.1251
Did the student draw the shrine? shrine 0.0000 0.2981
If the student drew the shrine, is it correctly placed? shrineplace 0.0000 0.0382
Are the hawk statues indicated? hawks 0.0000 0.5362
Did the student draw one or more priests? priests 0.0000 0.9416
Are at least some of the oil lamps indicated? lamps 0.0000 0.5582
is the divine image of the god indicated? divineimage 0.0000 0.4610
Looking at the student's map, rate how well the rooms are proportioned with respect to each other. proportions 0.0001 0.1252
Describe the columns as the student drew them. Check all that apply. The student drew... courtcolnum 0.0041 0.5442
the correct number of columns - The Courtyard
the correct number of columns - The Hypostyle Hall hypocolnum 0.0041 0.1008
the correct number of rows of columns - The Courtyard courtcolrows 0.0004 0.4568
the correct number of rows of columns - The Hypostyle Hall hypocolrows 0.0000 0.8790
some rows of columns are in the correct location - The Hypostyle Hall hypocolloc 0.0000 0.3477
some rows of columns are in the wrong location - The Courtyard courtcolloc 0.0024 0.1598
some rows of columns are in the wrong location - The Hypostyle Hall hypowrong 0.0001 0.0495
some rows of columns are in the wrong location - The Sanctuary sancwrong 0.0000 0.8542
opposing ranks of columns are different in number - The Courtyard courtwrong 0.0000 0.7774
opposing ranks of columns are different in number - The Hypostyle Hall hypowrong 0.0000 0.5194
How many features of the temple are correctly labeled? labels 0.7900

215
The fourth column in Table 26, above, shows that grader responses were in substantial
agreement for all evaluated aspects of the map, except for ―labels‖ in the last row. The P-value is
greater than 0.1, which is unacceptable, but all of the other aspects passed, so we could apply the
hypothesis test Among those that passed, only two of the Mann-Whitney P-Values reported in
the last column of Table 26 were less than 0.1, ―hypowrong‖ and ―shrineplace.‖ This is probably
a random event, given that all of the others are greater than 0.1, indicating no evidence of a
significant difference. Therefore, we can conclude nothing from this data.
Also, we had intended to use the room maps (Figure 42, p209) as an additional test for
the validity of the main drawn maps data. However, most of the room maps appeared to us to be
correct, with very few being dysfunctional. We did not believe it would be worthwhile to
evaluate them in detail.
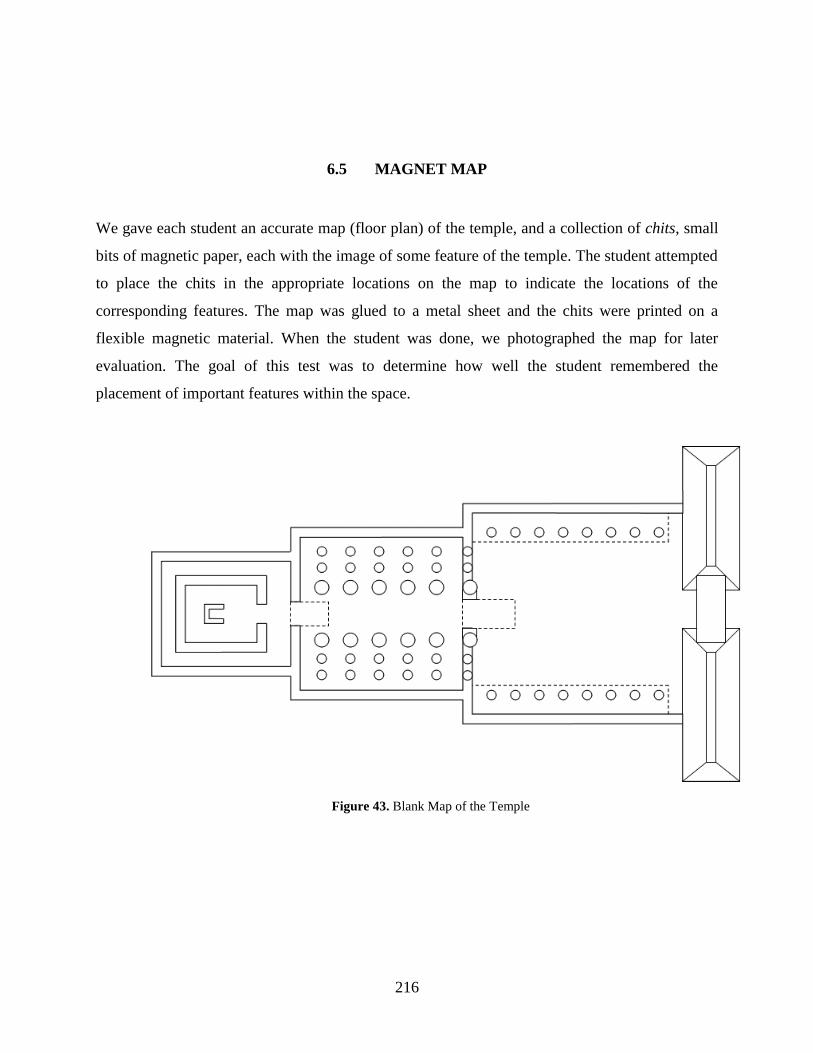
216
6.5 MAGNET MAP
We gave each student an accurate map (floor plan) of the temple, and a collection of chits, small
bits of magnetic paper, each with the image of some feature of the temple. The student attempted
to place the chits in the appropriate locations on the map to indicate the locations of the
corresponding features. The map was glued to a metal sheet and the chits were printed on a
flexible magnetic material. When the student was done, we photographed the map for later
evaluation. The goal of this test was to determine how well the student remembered the
placement of important features within the space.
Figure 43. Blank Map of the Temple

217
Figure 44. Magnetic Cutouts
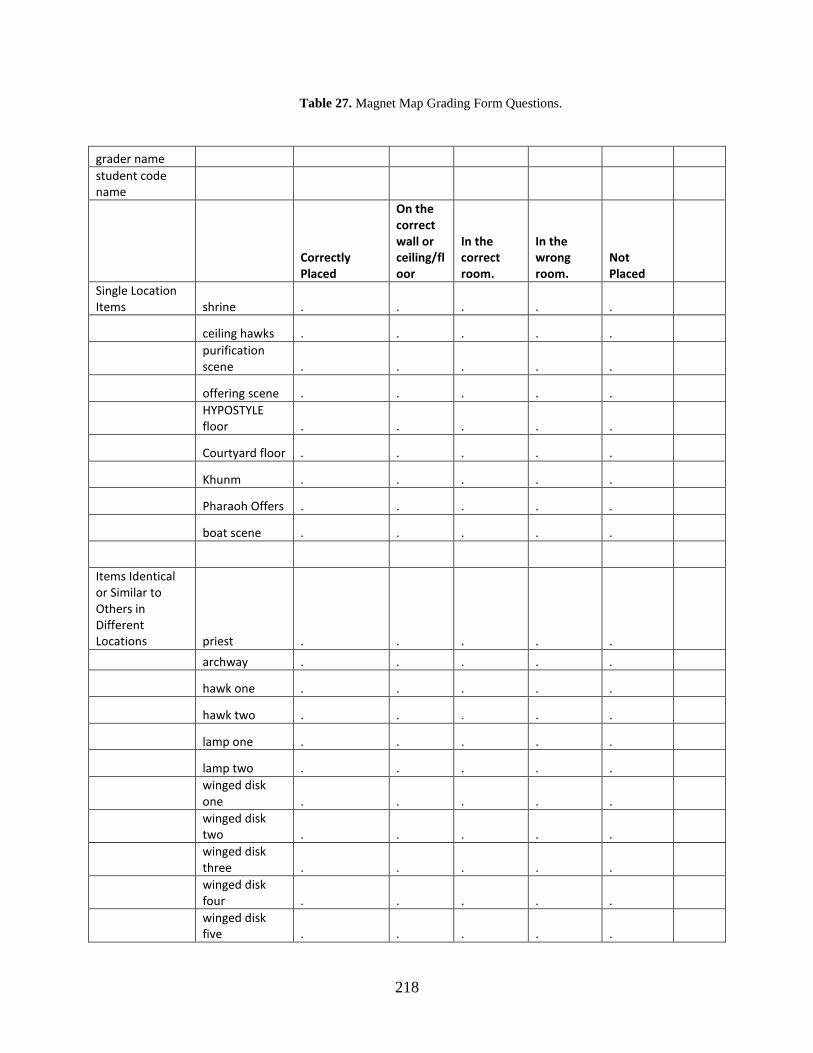
218
Table 27. Magnet Map Grading Form Questions.
grader name student code
name
Correctly Placed
On the correct wall or ceiling/floor
In the correct room.
In the wrong room.
Not Placed
Single Location Items shrine . . . . .
ceiling hawks . . . . .
purification scene . . . . .
offering scene . . . . .
HYPOSTYLE floor . . . . .
Courtyard floor . . . . .
Khunm . . . . .
Pharaoh Offers . . . . .
boat scene . . . . .
Items Identical or Similar to Others in Different Locations priest . . . . .
archway . . . . .
hawk one . . . . .
hawk two . . . . .
lamp one . . . . .
lamp two . . . . .
winged disk one . . . . .
winged disk two . . . . .
winged disk three . . . . .
winged disk four . . . . .
winged disk five . . . . .
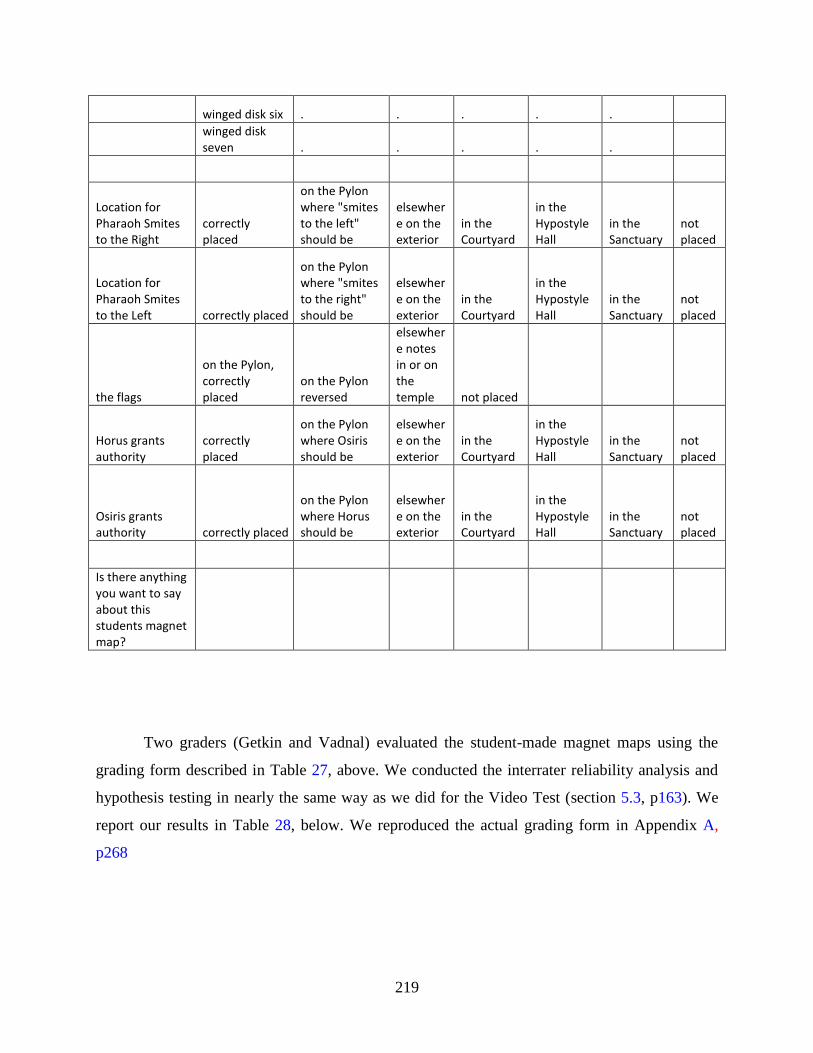
219
winged disk six . . . . .
winged disk seven . . . . .
Location for Pharaoh Smites to the Right
correctly placed
on the Pylon where "smites to the left" should be
elsewhere on the exterior
in the Courtyard
in the Hypostyle Hall
in the Sanctuary
not placed
Location for Pharaoh Smites to the Left
correctly placed
on the Pylon where "smites to the right" should be
elsewhere on the exterior
in the Courtyard
in the Hypostyle Hall
in the Sanctuary
not placed
the flags
on the Pylon, correctly placed
on the Pylon reversed
elsewhere notes in or on the temple not placed
Horus grants authority
correctly placed
on the Pylon where Osiris should be
elsewhere on the exterior
in the Courtyard
in the Hypostyle Hall
in the Sanctuary
not placed
Osiris grants authority
correctly placed
on the Pylon where Horus should be
elsewhere on the exterior
in the Courtyard
in the Hypostyle Hall
in the Sanctuary
not placed
Is there anything you want to say about this students magnet map?
Two graders (Getkin and Vadnal) evaluated the student-made magnet maps using the
grading form described in Table 27, above. We conducted the interrater reliability analysis and
hypothesis testing in nearly the same way as we did for the Video Test (section 5.3, p163). We
report our results in Table 28, below. We reproduced the actual grading form in Appendix A,
p268

220
Table 28. Results of the Magnet Map Test
Name IRR P or R Value T vs. C&D
shrine 0.0000 0.5387
ceiling hawks 0.0000 0.0794
purification scene 0.0227 0.6354
offering scene 0.0001 0.4291
HYPOSTYLE floor 0.0021 0.1701
Courtyard floor 0.0000 0.2766
Khunm 0.0000 0.4349
Pharaoh Offers 0.0018 0.8330
boat scene 0.0000 0.8909
priest 0.0000 0.8680
archway 0.0000 0.8903
hawk one 0.0000 0.5599
hawk two 0.0000 0.2805
winged disk two 0.0000 0.4995
winged disk three 0.0000 0.9758
winged disk four 0.0005 0.7814
winged disk five 0.0001 0.4789
winged disk six 0.0000 0.9949
winged disk seven 0.0000 0.3292
Location for Pharaoh Smites to the Right 0.8963 0.0185
Location for Pharaoh Smites to the Left 0.8924 0.0383
the flags 0.0000 0.3055
Horus grants authority 0.8837 0.6491
Osiris grants authority 0.7606 0.4467
221
In Table 28, for each feature, the second column contains the output of a test for interrater
reliability between the graders. Grader evaluation for four of the features required answering a
seven-level Likert scale. We recoded the data into numbers, the resulting scores produced by
each grader had seven levels and were reasonably close to normally distributed. Therefore, we
used Pearson‘s-R, a parametric test, to produce the ―R-value‖ in column ―IRR P or R Value.‖
Given that we have 52 students, we needed an R-value of 0.273 for there to be a 95% chance that
the two sets of data (Vadnal‘s Grades and Getkin‘s grades) are truly correlated (Hall, 1998).
With the lowest R value (for ―Osiris grants authority‖) being 0.7606, all four passed the
interrater reliability test. We performed all other interrater reliability calculations Fleiss Kappa
(King, 2004), and reported the error P-Value in the same column. All are less than 0.1, so all
passed, meaning we considered the data for their associated temple features in the hypothesis
test.
The third column contains the output of the hypothesis test for each feature. For the four
features graded on the second level Likert scale, the t-test (two-tailed, uneven sample sizes) was
most appropriate. We evaluated the data for all of the other features using the Mann-Whitney
test. Both tests produce a P-value, which one can interpret in the same way. Data analysis for all
features showed only three cases where students in the Theater Group did better than students in
the Control and Desktop Groups, taken together. The significant difference found for the two
―Pharaoh smites…‖ scenes may be due to the students in the immersive condition tending to
keep their viewpoint closer to the front of the Temple. The other semi-significant difference
found (―ceiling hawks‖) is most likely a random event, because it is so isolated.
We concluded nothing from this data.
222
6.6 FOLLOW-UP TEST
6.6.1 Description
When a student completed the testing at the earth theater, we gave the student a booklet,
(Appendix C, p321) which contains more information that elaborates on Egyptian and
contextualizes the temple. It also contains links to relevant external resources. One to two
months later, we tested the student again for his or her knowledge of the Temple and some of
what s/he may have learned from the booklet or elsewhere.
Questions on the Follow-Up test are in three general categories (1) those which are
questions from the Post Test but are often rephrased (2) questions and require knowledge from
the booklet and (3) questions requiring knowledge from both. Our goal was to test retention,
outside learning, and synthesis. Questions required responses that varied from simple, factual
answers to slightly more complex and conceptual answers.
Question Q5 (see Table 29, below) appears on the test as a matrix, where the student
chooses among pre-defined answers to rate the frequency of his or her recent involvement in
Egypt-related activities. See Appendix A, p259 for a reproduction of the actual test.

223
Table 29. Follow-Up Test Questions
Question Short Name
Q1. What is your secret name? name
Q2. Do you remember playing a learning game (Gates of Horus) on the computer with an ancient Egyptian temple? Select one: tell
Yes
Maybe
No
Q3. How many people did you tell about Gates of Horus? Select one: Thebook
Nobody
1-3
4-10
more than 10
Q4. Just before you left the museum, we gave you a little book about the Temple (the one in the game). Did you read it? Select one: abook
No.
I looked at the pictures
Yes, I read it.
I read it carefully and more than once.
Q5. In the past month, did you see or play with anything else about ancient Egypt? Please select all that apply, if any. (Once, Two or Three Times, Lots) movie
Read part of a book about Egypt. abook
Saw a movie about Egypt. movie
Saw a show on TV about Egypt TV
Went to the library to look at Egypt books library
Talked to somebody who knows Egypt. talked
Saw a website about Egypt. website
Played a game about Egypt. game
Made something about Egypt made
Q6. Did you become interested in any of the activities, above, from playing Gates of Horus? Select one: Interest1
No, not at all.
I would have done these things, anyway. Playing the game didn’t make any difference.
I did some or all of these activities, because I became more interested in Egypt when I played Gates of Horus.
Q7. Did playing the game, Gates of Horus make you any more interested in learning about Egypt? Select one: Interest2
No, and I’m not interested in ancient Egypt.
I’m already interested in ancient Egypt and the game didn’t make any difference.
I am more interested in ancient Egypt, now, because of the game.
Q8. Did you actually made something Egyptian or about Egypt? Please tell us what it was. (open

224
ended)
Q9. What were the four main areas or pieces of the temple? Check all that apply.
Pylon Pylon
Nylon nylon
Forecastle forecastle
Sanctuary Sanctuary
Dining Hall dining
Hypostyle Hall hypo
Courtyard Courtyard
Dome dome
Q10. There were “spirit forms” of Hawks on the ceiling of the Hypostyle Hall. Where did they lead? Select One: Hawks
Into the temple.
Out of the temple.
To the restroom.
Q11. In Egyptian belief, what would cause the gods to bless Egypt with good fortune? Select ALL that apply:
The devotion of the people. popdevo
Offerings from Pharaoh to the gods. pharaoh
Ceremonies performed by Pharaoh or the High Priest ceremonies
Nothing. The gods blessed Egypt, regardless nothing
Q12. What symbol represented creation, life and especially protection? Select one: symbol
The Hawk statues.
The Winged disk above most door.
The flagpoles.
The lamps.
Q13. Did the roof of the Hypostyle Hall have square holes in the ceiling? Select one: roof
Yes
No
Q14. Like many of the real temple ruins in Egypt, most of the temple does not have much color. Why? Select one: nocolor
It's supposed to be that way.
Over the centuries, the colors were worn away.
The Egyptian government spray-painted all the ruins with the sandy/gold color you see.
Q15. When Pharaoh went before the gods with his offerings and so on, who was he representing? Whose interests was he looking out for? Select one: represent
The Egyptian people.
Himself
People who were devoted enough to worship in the Hypostyle Hall
Q16. What was the important symbol above all of the doorways in the temple? (open ended)
Q17. The Shrine in the Sanctuary was. Select ALL that apply:
A magical gateway to heaven. gateway

225
The place where the sacred image (statue) of the god stood. stood
The point from which the blessings of would flow outward to the land of Egypt. blessings
Adorned with all the sacred symbols in the other rooms. adorned
Q18. Some of the main areas of the temple are open and sunny (outdoor) while others are dark and mysterious (indoor). For each major area named on the left, select the box which applies. (Outdoor, Indoor)
Pylon pout, pin
Courtyard cout, cin
Hypostyle Hall bout, bin
Sanctuary sout, sin
Q19. What does the Pylon tell us about how the Egyptians wanted the world to be like? (open ended)
Q20. What was the Courtyard for? What did people do here? (open ended)
Q21. In the Hypostyle Hall, what do the columns represent and why? (open ended)
Q22. How did the Sanctuary compare with the rest of the temple? (open ended)
Q23. The temple in our game, Gates of Horus, did not actually exist in Egypt. We made it from parts of which real temple or temples? Select all that apply: parts
The mortuary temple of Medinet Habu
The temple at Abu Symbel.
The cult temple of Horus in the town of Edfu.
The palace of the Scorpion King
Q24. The Egyptians recognized three seasons. What were they? Select ALL that apply: season
Spring, Summer and Fall
Flood, Growth and Drought
Earth, Wind and Fire
Planting, Harvest, Fallow
Q25. Where is Egypt? Select ALL that apply:
Northern Africa, nafrica
bordering the Mediterranean Sea med
between Libya and the Gaza Strip libgaza
and the Red Sea north of Sudan redsudan
Q26. Why was the temple the only building to be made of stone in a town? Select One: stone
The Egyptians built everything from stone.
So it would be eternal and last forever.
The Egyptians believed that stone was the flesh of the gods.
Q27. What did Egyptians do in the daily lives that helped unify them as a people. Select ALL that apply:
Connecting with the gods/goddesses where they lived. gods
Remembering to honor their ancestors. ancestors
Reading the Egyptian Bible every day. bible
Celebrating good fortune and harvests. celebrate

226
Drinking beer. beer
Honoring the King and the great nobles of their cities. honoring

227
6.6.2 Grading
While multiple-choice questions can be scored automatically, the short answer questions require
human judgment. To report his or her judgment on each student's short answer questions, the
grader filled out the Post Test Grading form (online) for that student.
Multiple-choice questions, such as Q7, show the original question on the next line, the
student‘s response (remember that the grading forms are individualized) and the grader‘s
available options listed to the right. Open-ended questions, where the student writes the short
answer are indicated as such in the second column. See Appendix A, p303, for a reproduction of
what the test actually looks like.
Table 30. Follow-Up Grading Form
Q1. Grader Name (open ended)
Q2. Did you actually make something Egyptian or about Egypt? Please tell us what it was. (open ended)
<student answer> (strongly disagree, disagree, neutral, agree, strongly agree)
Did the student make something relevant to Egypt?
Was it somehow related to the virtual temple in our game?
that it sound like a worthwhile activity?
Q3. What was the important symbol above all of the doorways in the temple?
<student answer> none, half, full
Q4. What does the Pylon tell us about how the Egyptians wanted the world to be like?
<Student Response> (none, half, full)
Orderly Ruled by Egypt Pharaoh rules Egypt
Pharaoh has the support of the gods Other1 Other2

228
Q5. What was the Courtyard for? What did people do here?
<Student Response> (none, half, full)
Had great public festivals for everyone
Dressed simply to show their humility before the gods
Brought their best things as offerings
Gave thanks to the gods as a community
Saw the god and pharaoh (symbolically) embrace in a public way
Saw the connection between heaven and earth symbolized by the open sky of the Courtyard
Saw how Pharaoh made offerings to the gods on behalf of the people. Other1 Other2
Q6. In the Hypostyle Hall, what do the columns represent and why?
<Student Response> (none, half, full)
The primeval marsh at the beginning of time.
The environment when the gods lived on the earth.
The reed houses the Egyptians lived in during the predynastic times.
Other1 Other2
Q7. How did the Sanctuary compare with the rest of the temple?
<Student Response> (none, half, full) most sacred. most important. most exclusive.
the blessings of heaven originate in the shrine and flow outward through the temple. the highest ground other-1
other-2
Q8. Please add any additional comments you have regarding student's answers to these questions. Are there any additional concepts that the student entered? Is there a pattern to the student's answers which is not captured by the grading scheme above? (open ended)

229
6.6.3 Results
We had hoped that students who learned with the immersive condition would remember more
facts and concepts than the others. Unfortunately, our comparisons between all outcomes for the
Theater Group versus all outcomes for the Desktop and Control Groups showed no significant
differences. As with the Post Test, we surmise that asking questions about simple facts and
concepts is not sensitive to the theorized learning advantage provided by immersive condition.
We analyzed the Follow-Up test data in very nearly the same way we analyzed data for
the Post Test (section 4.0 p136). We present the results in the following tables with some
commentary.

230
Table 31. Interrater Reliability for Short-Answer Question on the Follow-Up Test
Original Question Concepts the Grader Was Looking For Short Name IRR P-value
Did you actually make something Egyptian or about Egypt? Please tell us what it was.
Did the student make something relevant to Egypt? relevant 0.0000
Was it somehow related to the virtual temple in our game? related 0.1101
that it sound like a worthwhile activity? worthwhile 0.0000
What was the important symbol above all of the doorways in the temple?_______________. The winged disk. disk 0.0000
What does the Pylon tell us about how the Egyptians wanted the world to be like?
Orderly porderly 0.0000
Ruled by Egypt pruled 0.0000
Pharaoh rules Egypt ppharaoh 0.1820
Pharaoh has the support of the gods psupport 0.0000
Other1 pother1 0.0001
Other2 pother2 0.6637
What was the Courtyard for? What did people do here?
Had great public festivals for everyone cfest 0.0000
Dressed simply to show their humility before the gods csimple 0.0000
Brought their best things as offerings cbest 0.0000
Gave thanks to the gods as a community cthanks 0.0000
Saw the god and pharaoh (symbolically) embrace in a public way cembrace 0.0126
Saw the connection between heaven and earth symbolized by the open sky of the Courtyard csky 0.8567
Saw how Pharaoh made offerings to the gods on behalf of the people. cofferings 0.0394
Other1 cother1 0.5862
Other2 cother2 0.9284
In the Hypostyle Hall, what do the columns represent and why?
The primeval marsh at the beginning of time. hmarsh 0.0000
The environment when the gods lived on the earth. hearth 0.3145
The reed houses the Egyptians lived in during the predynastic times. hhouses 0.0266

231
Original Question Concepts the Grader Was Looking For Short Name IRR P-value
Other1 hother1 0.0000
Other2 hother2 0.3811
How did the Sanctuary compare with the rest of the temple?
most sacred. ssacred 0.0000
most important. simportant 0.0000
most exclusive. sexclusive 0.0000
the blessings of heaven originate in the shrine and flow outward through the temple. sblessings 0.0000
the highest ground shighest 0.9284
other-1 sother1 0.0000
other-2 sother2 0.0000

232
Similarly to the Post Test results, most of the Follow-Up test results survived interrater
reliability analysis, as shown in the table above. Unacceptable Fleiss Kappa scores are shown in
boldface type in Table 31, above. The only difference being that the most of the ―other‖ columns
survived, so we included them in.
Table 32, below, shows the results of using the Mann-Whitney test to compare Theater
Group students‘ grades with the grades for students in the other two groups taken together. The
comparison shows only two individual concepts where the Theater Group appeared to do better
than the others. These are probably random events, because all the other comparisons are non-
significant, including the averages. Also, students earned very few total points for these two
concepts, which suggests that the apparent significant difference is really a random event. We
conclude nothing from this data.

233
Table 32. Follow-Up Test Grader Reports Hypothesis Test
Short Name C&D vs. T
Total Points
relevant 0.6863
20.94
worthwhile 0.8519
19.38
pdisk 0.1475
34.75
porderly 0.0340 + 8.88
pruled 0.9959
6.75
psupport 0.2424
1.00
pave 0.2310
10.40
cfest 0.3490
32.25
csimple 0.8087
2.25
cbest 0.9822
7.63
cthanks 0.5556
8.63
cembrace 0.4669
0.50
cofferings 0.7475
0.50
cave 0.1760
8.63
hmarsh 0.5595
3.00
hhouses 0.0347 + 1.38
have 0.1050
2.19
ssacred 0.3032
11.88
simportant 0.7356
9.25
sexclusive 0.7913
18.13
sblessings 0.6159
2.38
save 0.4192
10.71
grandave 0.1201
9.94
pother1 0.9430 cother1 0.7340 hother1 0.0290 sother1 0.2340 sother2 0.9360 otherave 0.2690
Short Name P-value
Total Points
tell 0.3833 - 19.83
thebook 0.2350 + 13.88
abook 0.1812 - 17.21
movie 0.0178 - 8.92
TV 0.9038 + 7.59
library 0.1961 - 7.92
talked 0.5682 - 12.94
website 0.3530 - 10.25
game 0.8418 + 9.59
made 0.3145 - 11.6
interest1 0.3750
0
interest2 0.1490
0
pylon 0.3258 - 35
nylon 0.6780 + 41
forecastle 1.0000 + 44
sanctuary 1.0000 + 46
dining 1.0000 - 43
hypo 0.2044 + 41
courtyard 1.0000 - 47
dome 1.0000 + 44
hawks 0.3064 - 37
popdevo 0.7738 - 26
pharaoh 0.6780 + 41
ceremonies 1.0000 + 11
nothing 1.0000 + 46
symbol 1.0000 + 28
roof 0.3623 + 42
nocolor 0.4468 - 46

234
Similarly, Table 33, below, shows no apparent difference in Theater Group students‘
grades on the multiple-choice questions versus grades earned by the other students. The only two
concepts showing a significant difference have opposite polarity, while many P-values for the
other comparisons are high, and there are nearly as many with negative polarity. A comparison
result with negative polarity tells us the opposite of what we were expecting – but only if its P-
value is less than 0.05. We conclude nothing from this data.
Table 33. Multiple Choice Questions Hypothesis Test
Short Name P-value
Total Points
represents 1.0000 + 40
gateway 0.3742 + 27
stood 0.1794 + 35
blessings 0.5624 + 29
adorned 0.7438 - 35
pout 0.5047 + 35
pin 0.7310 + 36
cout 1.0000 + 46
cin 1.0000 - 45
hout 1.0000 - 47
hin 1.0000 + 46
sout 1.0000 - 47
sin 1.0000 + 46
parts 1.0000 + 40
seasons 0.7339 - 37
nafrica 1.0000 + 37
med 0.3896 - 28
libgaza 0.3419 + 14
redsudan 1.0000 + 22
stone 0.5047 + 35
gods 0.2690 + 39
ancestors 0.4878 + 38
bible 1.0000 - 39
celebrate 0.7583 + 32
beer 0.4468 - 46
honoring 0.0796 + 29

235
6.6.4 Other Questions
Finally, the online Follow-Up test also asked the student whether playing the game influenced
him or her. The affective results shown in Figure 45, are similar to some results from the Post
Test (section 4.1, p137).
Figure 45. Did paying the game, Gates of Horus make you any more interested in
learning about Egypt?
Also, as we saw in the Post Test, section 4.5, p148, there was no overall significant
difference between students in the Theater Group and all other students. (We used the Mann-
Whitney test to compare these results.) Only on P-value is less than 0.05, on question ―movie,‖
and only one other, for ―website‖, is less than 0.10 These are probably random events, because
all the other P-values vary so much.
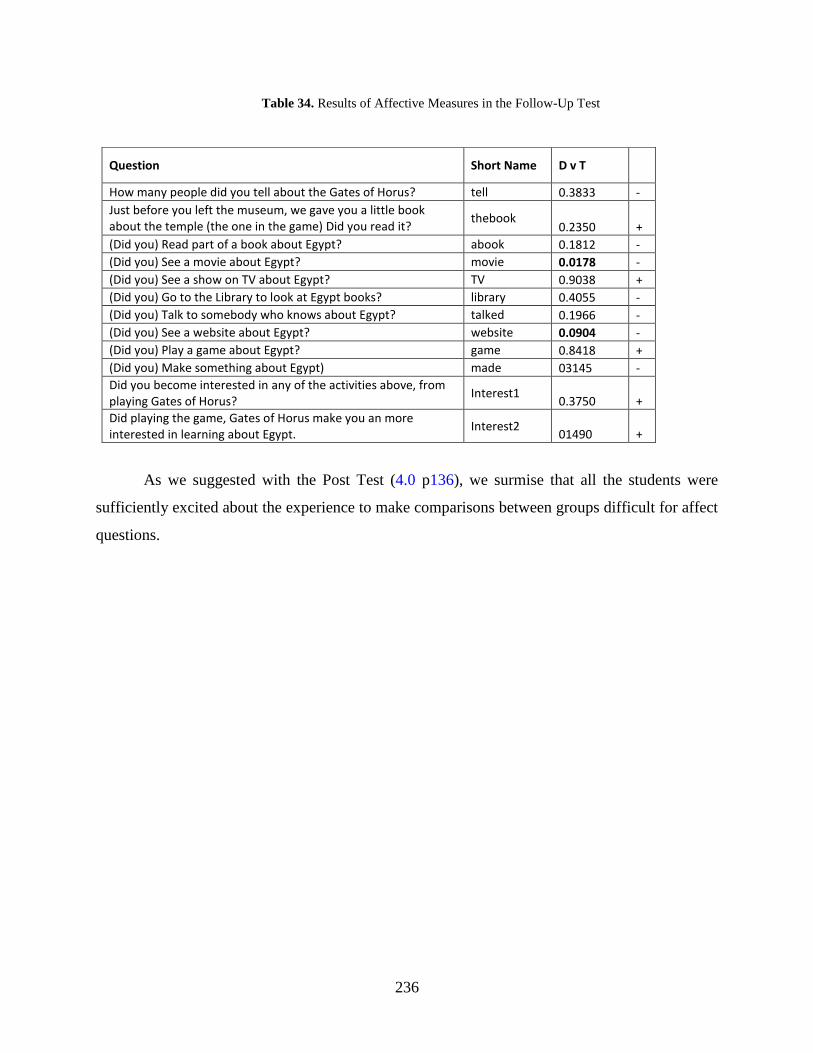
236
Table 34. Results of Affective Measures in the Follow-Up Test
As we suggested with the Post Test (4.0 p136), we surmise that all the students were
sufficiently excited about the experience to make comparisons between groups difficult for affect
questions.
Question Short Name D v T
How many people did you tell about the Gates of Horus? tell 0.3833 -
Just before you left the museum, we gave you a little book about the temple (the one in the game) Did you read it?
thebook 0.2350 +
(Did you) Read part of a book about Egypt? abook 0.1812 -
(Did you) See a movie about Egypt? movie 0.0178 -
(Did you) See a show on TV about Egypt? TV 0.9038 +
(Did you) Go to the Library to look at Egypt books? library 0.4055 -
(Did you) Talk to somebody who knows about Egypt? talked 0.1966 -
(Did you) See a website about Egypt? website 0.0904 -
(Did you) Play a game about Egypt? game 0.8418 +
(Did you) Make something about Egypt) made 03145 -
Did you become interested in any of the activities above, from playing Gates of Horus?
Interest1 0.3750 +
Did playing the game, Gates of Horus make you an more interested in learning about Egypt.
Interest2 01490 +

237
7.0 SUMMARY AND CONCLUSION
This study explored whether students benefit from an immersive panoramic display while
studying subject matter which is visually complex and information-rich. Specifically, middle-
school students learned about ancient Egyptian art and society using an educational learning
game, Gates of Horus, which is based on a simplified virtual model of an Egyptian temple. First,
we demonstrated that the game is an effective learning tool by comparing written post-test results
from students who played the game and from students in a no-treatment control group.
Figure 46. Virtual Egyptian Temple and the High Priest
Next, we compared learning results of two groups of students who had the same
mechanical controls, but one group saw the temple in a visually immersive display (a partial
dome) while the others saw it on a standard desktop monitor. The difference appeared when each
student gave a verbal show-and-tell presentation of the Temple and the concepts and facts related
to it. During that exercise, the student had no cognitive scaffolding other than the virtual temple,

238
on a small wall projection, which the student navigated during the presentation. The other major
tests were questionnaires, which by their nature provide a great deal of scaffolding for the task of
recalling the required information. For these tests we believe that this scaffolding aided students‘
recall to the point where it overwhelmed the differences produced by any difference in the
display.
We conclude that the immersive display provides better supports for the student's
learning activities for this material. To our knowledge, this is the first formal study to show
concrete evidence that visual immersion can improve learning for a non-science topic.
This section summarizes the entire dissertation and contains many links to the main body
of the text. We recommend that the reader understand this summary first, and refer to other areas
of the dissertation for more detail.

239
7.1 BACKGROUND
Section 2.6, p62 catalogs previous educational research in Immersive Virtual Reality and
presents its theoretical underpinnings. Here, we summarize what we learned from that survey
and what we set out to accomplish.
Looking for previous studies in the educational use of Immersive Virtual Reality, we find
only twelve (Rose, 1996; Byrne, 1996; Winn, 1997; Osberg, 1997a; Salzman 1998; Salzman,
1999; Roussos, 1999; Bowman, 1999; Dede, 1999; Jackson, 2000; Winn, 2001; Moreno, 2002a)
which used a formal experimental design (Campbell, 1963), and not many more studies which
use other formal methods (Roussou, 2006, 2008). We attribute this small number to the
historically high cost of the necessary technology, which limited most development in the 1990s
to the computer scientists and most applications to the military. Nevertheless, there is still much
interest in VR in the educational community, as evidenced by the very large number of Desktop
VR applications and learning experiments (Cobb, 2002). Fortunately, the cost of ImmersiveVR
is decreasing (Lewis, 2002; Dalgarno, 2002a; Young, 2000; Pivec, 2003b; Bruckman, 2002a;
DeLeon, 2000; Tougaw, 2003; Stang, 2003; Jacobson 2005i; CaveUT, 2008), which enabled us
to do our study. We believe that this decrease in cost is already leading to more educational
research in immersive virtual reality.
7.1.1 What is Virtual Reality?
The meaning of the term ―Virtual Reality‖ (VR) continues to evolve and differentiate, as
disparate research communities find new ways to use it. We present our own working definition,
which we state as criteria:
A Three-dimensional Space: The user perceives an illusory three-dimensional ―space‖
defined by the (computer graphic) objects within it and known as the Virtual
Environment (VE). This illusion is composed of information rendered into a form the
user can perceive—usually through computer graphics artwork.
240
Interaction: The user must be able to interact with the virtual environment in a
meaningful way (Zeltzer, 1992). Virtual objects and actors respond to the user in a
manner consistent with their purpose and the overall theme of the environment. For
example, a virtual cat in an Egyptian temple might come near the user, but avoid being
―touched.‖
Autonomy: Many objects or processes in the virtual environment will (appear to)
continue to operate without input from the user (Zeltzer, 1992). For example, a virtual
dog digging holes in a virtual garden would continue to produce more holes, whether or
not the user was nearby.
(Thematic) Presence: The user must have some imaginary location and identity within
the virtual environment. An actual virtual body and a co-located viewpoint may be
clearly represented or merely implied. The important thing is that the user has a location
in the virtual space and a role in the narrative.
For practitioners in the education and virtual heritage communities, these criteria are enough for
an application to be considered Virtual Reality. We will call them examples of Desktop VR,
because they nearly always use a standard computer monitor and keyboard and mouse. However,
traditional VR researchers and computer scientists have a further requirement:
(Sensory) Presence: The interface informs the senses so that the user sensorially feels
like s/he is at a particular location in the virtual environment (Zeltzer, 1992). Perspective
correction and other aspects of a visual display define the user‘s egocenter, which is the
user‘s location in the virtual environment (Psotka, 1996). At a bare minimum, the display
must produce a very wide view for the user, as with a digital partial-dome theater (e.g. a
Planetarium) or a Head Mounted Display (HMD). See section 2.3, p17, for examples.
In the following discussion, we will call applications satisfying all five criteria, Immersive
Virtual Reality (Immersive VR) and those which satisfy only the first four criteria, Desktop
Virtual Reality (Desktop VR). We retain Virtual Reality (VR) as a general term referring to
both.
241
7.1.2 VR Is Expressive
Virtual Reality provides the educator with new ways to represent objects and systems more
effectively than with other media. In VR, the user can interact with simulations of things that
could be perceived in the real world (Roussos, 1999), because they are too small, too big, no
longer exist, do not exist yet, dangerous, far away, or simply inconvenient. Students can make
mistakes in a virtual environment safely and cheaply, which allows for learning activities not
possible in the real world. A virtual environment could simulate dynamic systems such as ocean
currents planetary motions, changes in electrostatic fields, or social behavior in a troop of
gorillas. These simulations become especially powerful teaching tools when the student can
participate in them, giving the student an inside view (egocentric) and the ability to experiment
with the system (Winn, 1999; Bowman, 1999; Dede, 1999)
VR is also a powerful means of communication. Students and educators can collaborate
over great distances using a networked virtual environment as a collaborative space (Cobb, 2002;
Dede, 2004; Bruckman, 2002a; Andrews, 2002; Räihä, 1997; Raalte, 2003; Santos, 2002). The
multisensory interface and potential methods of interaction allow VR applications to
communicate a lot of information to and from the user (Bowman, 2002; Mayer 2001c). VR
creates significant opportunities for non-written and even non-verbal communication, which can
be very useful for certain situations and students. Autonomous agents can represent people
conducting their business or interacting with the user (Ulicny, 2002). Pedagogical agents in the
environment can guide and facilitate learning (Economou, 2001).
Nevertheless, virtual reality is still just one more form of media with comparative
advantages and appropriate uses. VR should not be used as a general replacement for anything,
but instead as part of a larger curriculum (Bowman, 1999; Wickens, 1992; Hay, 2000).
7.1.3 VR Can Accommodate the Learner
The theoretical underpinnings of almost all educational experiments in Immersive VR, as stated
by the authors, center on the idea of learning as active, self-directed, and context-dependent. The
student does or makes something, alone or in a group to gain new knowledge. The student must
construct new personal knowledge by understanding the lesson in terms of his or her prior

242
knowledge (Bloom, 1956) and perception of the world (Winn, 2003b). The instructor helps the
students learn how to learn, facilitating and focusing the students‘ own process of exploration.
This model of learning is called Constructivism (Jonassen, 2000c). In Activity Theory, this
is called the ―co-construction of shared knowledge‖ (Vygotsky, 1978; Jonassen, 2000b; Jackson
2000). Hay (2000) calls it ―investigation-based learning.‖ Many of the Immersive VR learning
studies specifically claim a Constructivist basis (Fallman, 1999; Dalgarno, 2001b, 2002a,
2002b). The basic idea is that VR gives the instructor many ways to produce (and control)
instructional situations for the students to work through. These special-purpose virtual
environments can be rich in meaning and complexity or elegant and focused, as needed.
A very important part of this process is Conceptual Change (Gagne, 1987). This is the
moment when students must abandon some misconception when confronted with both counter-
evidence and a better explanation of what they thought they knew. Many Immersive VR learning
studies were designed to produce this effect (Dede, 1999; Moher, 1999; Winn, 2001; Windshitl,
2000; Jackson, 2000; Johnson, 1999a). Conceptual Change is especially helpful in teaching
science topics, where students often have misconceptions of natural processes.
Other researchers sought to more clearly define the learning process, adding approaches
from Cognitive Theory (Winn, 2003a; Moreno, 2002b; Mayer, 2000b). We prefer Winn‘s
(2003a) conditions for optimal learning with VR. The student must be embedded in the virtual
world, meaning that learning tasks and overall experience are defined in whole or in part by the
virtual reality application. The student must also be embodied, in that the learner‘s physical
body is an essential part of the process. This could be as simple as requiring the student to
perform physical actions, or as subtle as engaging the student‘s senses in a particular way.
Finally, the student must engage in dynamic adaptation, always adjusting to changing
circumstances. The individual and his or her environment evolve together, responding to each
other. We use a fourth aspect, Connectedness, where the learner is connected to information,
virtual entities or processes, other students, instructors, or other users. In our own research, we
strive to develop learning experiences which have these properties to the extent possible.
We restate that researchers in educational Virtual Reality believe learning is an active and
individual process, which good curriculum supports. Virtual Reality can support complex and
meaningful interaction using metaphors which are naturalistic and easy to understand. The

243
virtual environment can respond to a student based on where that student is in the learning
process.
7.1.4 Sensory Presence Is Not Enough
We believe that sensory presence is one of many desirable forms of engagement. For example,
an interesting conversation with an artificially intelligent character (an agent) may fascinate the
student (Charles, 2007). Perhaps the student is very interested in the topic or intent on winning a
VR-based learning game. Having a central place in the narrative (thematic presence) is certainly
engaging. We believe that different types of engagement are mutually reinforcing and tend to
have common causes, such as good application design.
Almost everyone involved in Educational Virtual Reality believes that sensory presence
enhances student engagement and therefore facilitates learning. Nearly every article on the
subject clearly states or strongly implies this, e.g., Furness (1997). Surveying the literature, we
see that a sense of presence self-reported by the students is definitely correlated with learning in
VR. However, correlation does not imply causation.
No experiment which relied solely on sensory presence to enhance learning was
successful in showing any advantage for immersion (Moreno, 2002b; Byrne, 1996; Rose, 1996;
Salzman, 1999). In these studies, sensory immersion was not relevant to the learning activities—
their students could have done those activities equally well with a non-immersive display. In
each experiment, there was no significant difference in learning between students who had an
immersive display and those who did not. By contrast, all of the studies which did not show an
advantage for immersion (Dede, 1999; Salzman, 1998; Winn, 2001) had the student perform
learning tasks which depended on that student ―being‖ in a particular location within the virtual
environment. This allowed the student to perceive information and interact with the environment
in a particular way.
We conclude that the value of an immersive display is not determined by the sensory
presence it elicits, but by its functional support for the learning activity.

244
7.1.5 Immersion Must Support the Learning Activity
We are interested in when and how Immersive Virtual Reality can be helpful for learning. To be
effective, an Immersive VR learning application must (1) be reliable, stable and useful, (2)
support clearly defined learning activities, (3) employ some of the capabilities of VR, and (4) use
the visual immersion to functionally support learning activities. The first two criteria are basic to
any learning software. The third criterion is that the learning activities require some of the
capabilities of VR to support a learning experience which other media could not do as well.
Generally, one would ask this of any proposal to use a particular interactive medium for a
particular learning activity. Similarly, one must use sensory immersion (Immersive VR) only if it
is an integral part of a desirable learning activity which is not otherwise available.
Generally speaking, immersive virtual reality is appropriate when learning activity
requires interaction between the student and something that is difficult or impossible to simulate
or encounter in real life. Immersive VR will be more advantageous the more complex, context-
dependent, and physical the task is. This is why pilots start learning to fly with flight simulators,
historically, the first examples of Immersive VR technology.
Learning to operate a plane is usually described as training, while education is usually
thought of as classroom learning. The distinction is vague, and we mention it only because there
is much literature on using virtual reality for training in a variety of fields. The value of
immersive virtual reality for training is not in doubt. We are interested in seeing how effective it
can be as a tool for the major subjects taught in schools.
Salzman (1998), Dede (1999), and Winn (1997, 2001) have had success with topics in
science, where the student works with an interactive representation of some otherwise invisible
process. Many lessons in science are cognitively difficult to absorb, but lend themselves to
helpful representations in virtual reality. We believe this is a fruitful area of research and look
forward to further developments.

245
7.1.6 Virtual Heritage
Virtual heritage (VH) is the use of electronic media to recreate or interpret culture and cultural
artifacts as they are today or as they might have been in the past (Moltenbrey 2001; Roehl,
1997). We believe this is an excellent topic for VR learning research, given the centrality of
visual artifacts and places, and the importance of history in real life and the classroom.
By definition, VH applications employ a three-dimensional representation of something
and the means used to display it, from still photos to immersive virtual reality. This is a very
active area of research and development, (Michell, 2000; Champion, 2004b; Champion, 2004c;
Addison, 2000; Roehl, 1997; Stone, 2002; Levy, 2004) and most of it is intended for educational
use. The majority of VH applications are architectural reconstructions, centered on reconstructed
buildings or monuments, and most of them use VRML technology. A handful of VH applications
illustrate topics on ancient Egypt (Kufu, 2004; Economou, 2001; Lehner, 2003; Michell, 2000;
TutTomb, 2001).
These three-dimensional objects are ―well-integrated‖ in the sense that much cultural
information is encoded in the way the space looks to an observer. Therefore, applications in
virtual heritage have much to gain by using virtual reality. While most VH applications are
limited to the desktop (Kameas, 2000), some employ Immersive VR (iGrid, 2000; Pape, 2000;
Park, 2003; PublicVR, 2008) some make excellent use of augmented reality (Papagiannakis,
2004a, 2004b). In our study, students interact with the Virtual Egyptian Temple (Jacobson,
2005e) using Immersive VR.
7.1.7 Learning Games
The game paradigm is an excellent way to center interaction on the user in a flexible virtual
environment. Educational researchers have been interested in harnessing games as a vehicle for
learning for a long time (Avedon, 1972), and today such efforts have attracted significant interest
and resources (Squire 2003, 2007; Kirriemuir 2004). Goal-seeking activities are especially
effective and can be cast in the form of a game (Champion 2004b; DeLeon, 2000). Every game

246
is based on a microworld of some type, and IVR interfaces are optimal for interacting with many
useful types of virtual environments, especially those with a high level of visual fidelity.
Today, computer games are a central activity in popular culture, with millions of children
now playing them. Through video games and other electronic media, many students have
developed a high degree of video literacy, comfort and competence with fast, information-dense
input. Also, the game industry has developed a large quantity of powerful, flexible software that
can be adapted for educational use, and much of it has already been adapted to IVR (Squire
2002, Kirriemuir 2004, and Jacobson 2005i). These new developments put many types of
educational virtual reality within reach of educators and their institutions (Lewis, 2002). The key
advantages of a game-based learning are:
1. The student's intense investment toward reaching a goal defined by the educator or
designer.
2. Continual feedback for the student while interacting with the system.
3. A high degree of student involvement or investment in the activity itself.
4. The potential for intense student concentration on the learning task.
We believe that educational games are a special case of adaptive media and are well-suited to
Constructivist learning activities and to Virtual Reality (Brusilovsky, 2003c).
The key is to make the goals of the game serve the student’s learning goals and the
broader curriculum. The student benefits little if the game is designed as some kind of a
wrapper around the information he or she is expected to learn, because the student might play the
game for its own sake and quickly forget the topic matter. For example, it would be easy to
design a game in which the student gains points for solving riddles or remembering facts.
However, it would be much more effective if the goal of the game was to accomplish something
within the context of the topic matter. Winn (2001) provides an excellent example of good
conceptual design. In his study, students adjust environmental factors in a simulated part of the
world to find an optimal solution to global warming. The activity is definitely a game, although
Winn does not describe it as such in his paper or to his subjects. The student simply enjoyed and
learned. In our study, we structured the student learning experience as a game.
247
7.2 EXPERIMENT
7.2.1 Rationale
The goal of our study was to determine whether a visually immersive display can have a
provable advantage over a non-immersive display for topics in cultural heritage.
We chose the Egyptian temple as the sample topic for our learning study, because the
temple was absolutely central to Egyptian life and culture, and because it is appropriate for the
virtual reality medium. The temple itself, the hieroglyphics, the painted images, and the conduct
of ceremonies are all tightly integrated. The physical space itself is the main semantic organizing
principle. Visual Immersion provides an egocentric view, which allows the observer to view the
temple from the inside, as it was meant to be viewed in real life. To our knowledge, ours is the
first formal experimental study in the use of immersive virtual reality for virtual heritage.
We chose the game metaphor for the advantages described in section 2.4.6, p38. With the
temple, we saw a design opportunity in the information structure of the temple and supporting
materials. We were able to structure the learning goals and activities in a way that is inextricable
from the topic matter itself. See 3.3, p98, for details. To our knowledge, only Winn (2001)
structured an Immersive VR learning experiment as a game in a formal learning experiment
with. Our study would be the second.
The most difficult and important goal of our study was to demonstrate how an immersive
display could have more utility than a cheaper desktop monitor in a realistic situation. Several
previous studies failed to do this (Moreno, 2002b; Byrne, 1996; Rose, 1996; Salzman, 1999) and
only one succeeded (Salzman, 1998). Guided by Salzman‘s experiment, we structured our
experiment in terms of the effectiveness of an egocentric view verses an exocentric view, instead
of their appropriateness for this particular topic matter. We also thought it important to test for
the difference between short-term and long-term retention, and the interaction between students‘
level of visual skill and the display type.

248
7.2.2 Gates of Horus
In our study, eighty-five middle-school students (grades 6-8) learned about ancient Egyptian art,
religion, and society by playing an educational learning game, Gates of Horus. The game is
based on a Virtual Egyptian Temple (Jacobson, 2005e, 2004a), which has no real-world analog.
Instead, it embodies only the key features of the typical New Kingdom period Egyptian temple in
a way that an untrained audience can handle. The temple has four major areas, and each one has
a copy of the High Priest, a pedagogical agent.
Figure 47. Map of the Virtual Egyptian Temple
Ordinarily, the student navigates the temple in Desktop VR (standard desktop PC) and
selects spotlighted features of the Temple. Each time the student selects a feature, the priest will
explain what it is and what it does. When the student clicks on the priest, the priest asks the
student a question about one of the features the student selected earlier. When the student
correctly answers all of the questions for a particular area, the gateway to the next area opens.
The goal of the game is to reach the innermost area, the Sanctuary which contains the divine
image of the God, Horus. When the student answers all the priest‘s questions for the Sanctuary,
the divine image will speak and bring the blessings of heaven to the land of Egypt.
The software for Gates of Horus is based on a commercial game, UT2004 (EpicGames,
2008), and two freeware packages, CaveUT and VRGL (PublicVR, 2008). The freeware enables
the game to operate in a variety of immersive displays. In our study, some students saw the
temple on a standard desktop monitor while others used the Earth Theater at the Carnegie

249
Museum of Natural History in Pittsburgh (Figure 48). Otherwise, all students interacted with the
game in the same way, one at a time and with a Gyromouse. In our study, students navigate
through the temple and select items using the Gyromouse, a cordless hand-held device used in
some VR applications (Duncan, 2006; Herpers, 2005; Olwal, 2002; Patel, 2001; Hafner, 2000;
Winograd, 2000).
Figure 48. The Temple in the Earth Theater

250
7.2.3 Hypotheses
We randomly assigned each student to one of three groups. Each student in the Theater Group
played Gates of Horus using the immersive dome display. Each student in the Desktop Group
played the game on a standard desktop computer in an area adjoining the main theater. Members
of the Control Group also played the game on a standard desktop but took the Post Test for basic
knowledge before playing the learning game. The Control Group‘s scores on the Post Test take
the place of a knowledge pretest for the other two groups. This is necessary, because any
question-and-answer pretest given to the Theater and Desktop Groups would reveal too much
information about the temple itself.
Our first a priori experimental hypothesis is that (H0) students will enjoy playing Gates of
Horus and engage with it fully during the experiment. The second is that (H1) students who play
Gates of Horus will learn something. A positive result in both hypotheses would show that we
made an effective learning tool that students will actually use. Both are prerequisite for our core
hypotheses, (H2). Students who play the game with Immersive VR will learn more and retain
more than those who play it using Desktop VR, as measured immediately after testing and (H3)
one or two months later. We specifically designed the experiment to test these hypotheses.
However, we added three other measures to test hypotheses which were not primary, but
worth investigating. They are (H4) Students who played the game with ImmersiveVR will have
better spatial knowledge of the temple than those who used Desktop VR, (H5) One or two
months after playing Gates of Horus, students using ImmersiveVR will report more motivation
to learn about Egypt, and (H6) students with low visual reasoning ability will benefit more from
visual immersion or the opposite will be true (Bricken 1990). Regardless, we expect visual
reasoning ability to matter.

251
7.2.4 Protocol
Upon arrival, each student was randomly assigned to an experimental group, Control, Desktop,
or Theater. The following sequence describes the important tasks each student performed during
the study.
1. All students completed Raven‘s Progressive Matrices test, which measures current visual
reasoning ability (Raven, 1957; Shiply, 1949; Gregory, 1999).
2. Each student in the Desktop Group played Gates of Horus on a desktop computer.
3. Each student in the Theater Group played Gates of Horus in the Earth Theater.
4. Each student in the Control Group took the Post Test before playing Gates of Horus.
5. Post Test questions are standard multiple-choice or short-answer.
6. Gates of Horus records everything during play.
7. Each student in the Desktop or Theater Group took the Post Test.
8. Each student in the Control Group played Gates of Horus on a desktop computer.
9. Each student drew a map of the temple to test his or her knowledge of its layout (Drawn
Map Test).
10. Each student placed magnets representing features of the temple onto a provided map of
the Temple (Magnet Map Test).
11. Each student produced a video tour of the virtual temple. The student stood in front of a
projection of the virtual Egyptian temple, and navigated using the Gyromouse. The
student conducted a show-and-tell tour of the virtual temple, which we recorded as a
simple documentary video.
12. One or two months later, the student completed the Follow-Up test via the Internet using
any computer with a Web browser. This test is also a standard quiz, with multiple-choice
and short-answer questions.
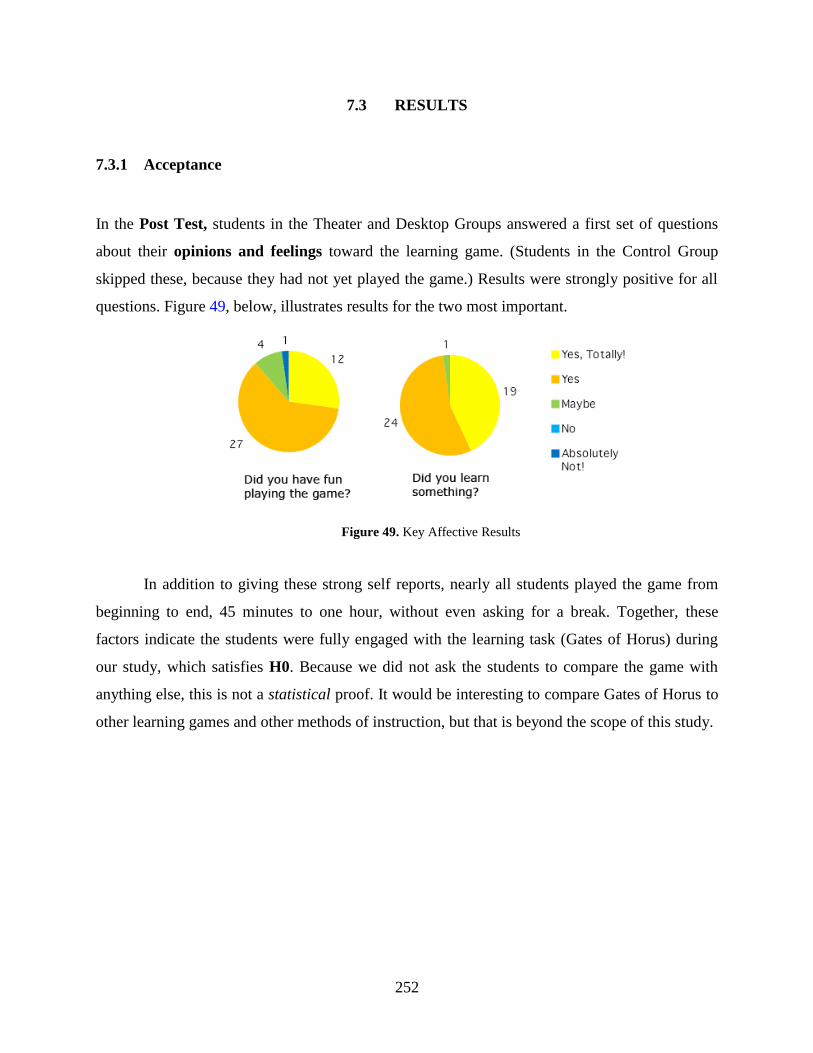
252
7.3 RESULTS
7.3.1 Acceptance
In the Post Test, students in the Theater and Desktop Groups answered a first set of questions
about their opinions and feelings toward the learning game. (Students in the Control Group
skipped these, because they had not yet played the game.) Results were strongly positive for all
questions. Figure 49, below, illustrates results for the two most important.
Figure 49. Key Affective Results
In addition to giving these strong self reports, nearly all students played the game from
beginning to end, 45 minutes to one hour, without even asking for a break. Together, these
factors indicate the students were fully engaged with the learning task (Gates of Horus) during
our study, which satisfies H0. Because we did not ask the students to compare the game with
anything else, this is not a statistical proof. It would be interesting to compare Gates of Horus to
other learning games and other methods of instruction, but that is beyond the scope of this study.

253
7.3.2 Effectiveness
The remaining bulk of the Post Test quizzed students on their knowledge of the temple. We
gave the test to the Control Group before they played the game to determine how well students
could guess their way using prior knowledge and employing test-taking techniques. All other
students played Gates of Horus first, and we compared their Post Test results with those of the
Control Group.
Figure 50. Post Test Sequence and Results.
Figure 50 shows the portion of our testing sequence which pertains to the Post Test. Each
student earned a total score awarded by four graders (section 4.4, p144). The Post Test scores
produced by students who played the game showed a high probability of being different from the
scores of those who did not (P < 0.001) when analyzed with the Mann-Whitney statistical test.
Furthermore, students who played the game did (statistically) significantly better (P < 0.05) in 22
out of the 45 relevant items on the Post Test. This is strong evidence that Gates of Horus is an
effective learning tool, which satisfies H1. It allows us to meaningfully make further
comparisons on the effectiveness of different versions of the game.
Next, we compared Post Test scores for the Theater Group versus Post Test scores for the
Desktop Group (H2). The Theater group seemed to do better, but the difference was not

254
statistically significant. We believe that a quiz of this type is not sufficiently sensitive to measure
the conceptual learning advantage that we expect from visual immersion.
7.3.3 Immersion
Each student produced a documentary video. First, three human graders evaluated the video for
factual knowledge, and their judgments were combined to produce a final score. Our most
important result was a significant difference between the Video Test results from the Theater
Group with results for the other two groups combined. Figure 51 shows the stages of our testing
sequence relevant to the Video Test and its main results. We included the Video Test scores from
the Control Group, after they had played the game, because we did not think that the order of the
Post Test and the game would make a substantial difference in their overall learning.
Figure 51. Video Test Sequence and Results.
Statistically, students in the Theater Group did significantly better than students in the
other two groups (Mann-Whitney test, P < 0.05). Looking at the individual facts that the students
were expected to master, the Theater Group did significantly better in 9 out of 45 at the P < 0.05
level and we found that 14 out of 45 at the P < 0.10 level. Taken together, these results support
H2.

255
Next, our Egyptologist, Dr. Lynn Holden, evaluated each student‘s video for the student‘s
mastery of conceptual knowledge about the temple. Here, the difference was statistically much
stronger, and a respectable number of individual measures also showed results significantly
different (in 6 of 19, P < 0.05). Dr. Holden also assigned an overall impression of the student‘s
mastery of the information, which provided the strongest difference of all, P < 0.001. Not only
were the main results for the conceptual and factual measures in accord, but they also tended to
parallel each other in the individual measures. For every concept where the Theater Group
statistically did better than the others, there was at least one fact related to that concept where the
Theater Group also did better. We are confident that this data satisfies H2.
7.3.4 Other Measures
We also compared results for the Follow-Up Test, one or two months later, and
comparing responses from students in the Theater Group to all the others. Unfortunately, we saw
no statistically significant differences, and there were not enough differences in individual scores
to be convincing. The Follow-Up Test was very similar to the Post Test, except that students
gave much less informative answers on the short-answer questions. We conclude that if there are
any lasting comparative benefits to visual immersion over a standard desktop monitor, a standard
quiz such as a Follow-Up Test is not sensitive enough to detect it. This leaves H3 unproven.
In data from both the Drawn Map Test for H4 and the Magnet Map Test for H5, we saw
no significant differences in performance for the Theater Group versus the other groups, not even
a trend in one direction or the other. This is at odds with the virtual reality training literature,
which has established that Immersive VR is a good way to teach survey and route knowledge of
an area. We conclude that the temple was too small and too simple for immersion to produce a
genuine difference in students‘ knowledge which could be detected with a mapping test.
7.3.5 Visual Reasoning Skill
We did see an interesting interaction between students‘ visual reasoning ability and their overall
rating in the conceptual video data. As expected, we found that students with higher RPM scores
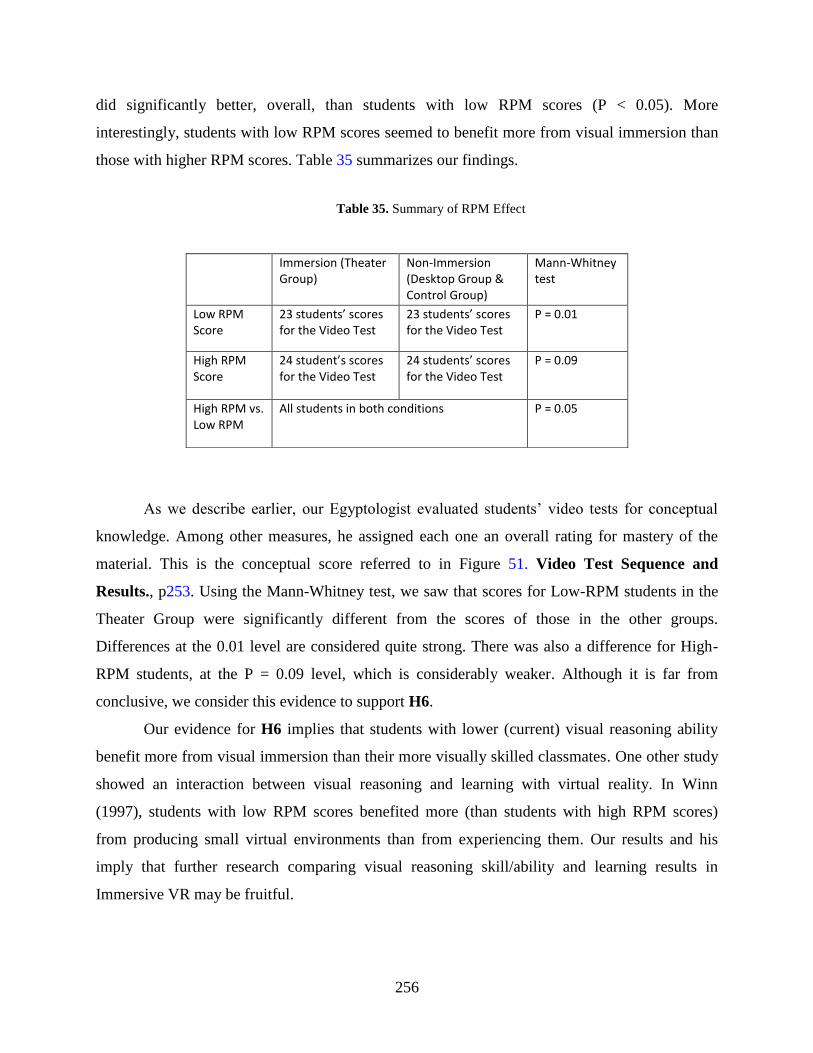
256
did significantly better, overall, than students with low RPM scores (P < 0.05). More
interestingly, students with low RPM scores seemed to benefit more from visual immersion than
those with higher RPM scores. Table 35 summarizes our findings.
Table 35. Summary of RPM Effect
As we describe earlier, our Egyptologist evaluated students‘ video tests for conceptual
knowledge. Among other measures, he assigned each one an overall rating for mastery of the
material. This is the conceptual score referred to in Figure 51. Video Test Sequence and
Results., p253. Using the Mann-Whitney test, we saw that scores for Low-RPM students in the
Theater Group were significantly different from the scores of those in the other groups.
Differences at the 0.01 level are considered quite strong. There was also a difference for High-
RPM students, at the P = 0.09 level, which is considerably weaker. Although it is far from
conclusive, we consider this evidence to support H6.
Our evidence for H6 implies that students with lower (current) visual reasoning ability
benefit more from visual immersion than their more visually skilled classmates. One other study
showed an interaction between visual reasoning and learning with virtual reality. In Winn
(1997), students with low RPM scores benefited more (than students with high RPM scores)
from producing small virtual environments than from experiencing them. Our results and his
imply that further research comparing visual reasoning skill/ability and learning results in
Immersive VR may be fruitful.
Immersion (Theater Group)
Non-Immersion (Desktop Group & Control Group)
Mann-Whitney test
Low RPM Score
23 students’ scores for the Video Test
23 students’ scores for the Video Test
P = 0.01
High RPM Score
24 student’s scores for the Video Test
24 students’ scores for the Video Test
P = 0.09
High RPM vs. Low RPM
All students in both conditions P = 0.05

257
7.4 DISCUSSION
Our study directly demonstrates that a visually immersive display is more effective than a
standard computer monitor for a reasonable learning activity in an important topic area (H2).
The immediate implication is that Immersive Virtual Reality is the optimal interface for learning
declarative and conceptual knowledge, if:
1. Some visual artifact effect or process provides the central organizing theme for the
material.
2. The immersive interface allows the student to interact with the information in some way
not otherwise available or efficient.
3. Almost every way in which the student interacts with the virtual environment is relevant
to the learning task.
In our study, a very wide egocentric view of the Virtual Egyptian Temple allowed students to (1)
navigate less and think more and (2) see the interior of the temple as a whole, rather than as a
collection of features. Generally, if the objective is for the student to understand some artifact
system or phenomenon as a whole, have the student work with it as a whole.
In some topics, Immersive VR is the best medium for this. Salzman (1998) produced the
only other study to clearly demonstrate an educational advantage of adding Immersive VR‘s
capabilities to what a non-immersive display can provide. Her experiment centered on
understanding magnetic fields and science topics which can be presented in a similar way. By
achieving a similar result in the area of cultural heritage, we have identified another large
intellectual territory where Immersive VR has practical use. We hope that future studies will
provide more such working examples to add to the existing literature. For example, someone
could conduct an experiment in which students learn to ―read‖ an urban neighborhood to
determine its planning needs.
Our data showed that the immersed students learned better than those with only a
monitor, but it did not tell us why. Perhaps the immersed students (a) had a mechanical
advantage to access information encoded in the environment, (b) developed a deeper
understanding of the topic materials, because the immersive view presents the information in a
more coherent manner (c) experienced a deeper sense of presence in the virtual environment or
(d) benefited from some mixture of all three factors. We can safely discount presence as a

258
significant factor because self-reported presence was only slightly different between students
who used Immersive VR and those who use desktop VR. Furthermore, previous studies which
isolated presence in ImmersiveVR as a potential influence on learning showed no effect
(Moreno, 2002b; Byrne, 1996; Rose, 1996; Salzman, 1999). Separating the other two factors
would not be so simple.
We could certainly restructure the study to isolate the benefits of the Immersive view
from the benefits of the physical interaction. That would require a difficult and interesting set of
experiments concerned with understanding how the computer and the human work together.
Alternatively, we could try a ―brute force‖ approach, where we repeat the experiment with better
evaluation tools, a larger sample size, a longer exposure time (perhaps as part of a larger
curriculum) and a larger and more meaningful lesson. If successful, this would further verify our
results and allow us to make fine-grained comparisons of factors such as the effect of RPM
score, gender, or video game experience.
We are particularly interested in our data which implies that students with lower visual
reasoning skills (as measured by RPM score) benefited more from visual immersion in our
experiment (H6). It would be fairly straightforward to conduct follow up experiments to see if
this is really happening. If the finding is corroborated, perhaps Immersive VR could be used to
improve visual reasoning skills among the students who need it most. In the meantime, it could
help them keep up with their more skilled peers in certain topics.
We could deepen the study by adding more interaction possibilities for the student. We
are particularly interested in adding people to the Virtual Egyptian Temple (or some other space)
to provide a social context. These people could be a mixture of automatons, educators, and other
students, re-creating aspects of the ancient society. As a teaching tool, adding virtual people
should be very effective, and for the archeologist it would be a means of testing hypotheses on
what ancient cultures were like.
We are pleased to see that the students liked the game, Gates of Horus, which was our
central learning activity for all conditions and experiment (H0). The fact that students did learn
from the game, regardless of interface, is also important and useful (H1). Without these results,
data comparing learning with or without immersion (H3) would have been meaningless.
Our ultimate goal is to inform the educator on when and how to employ Immersive
Virtual Reality. We see it as a new learning tool which the educator and student can combine

259
with existing approaches to solve real problems for real people. With that in mind, we look at
these trends:
1. Educational research applications and practice using Desktop VR have exploded in recent
years, with the bulk of the growth in shared online communities. Students‘ comfort with
technology and continuing advances in personal electronics and telecommunications
make Desktop VR increasingly practical.
2. The sophistication of projection hardware is increasing as its cost is decreasing, which
has made visually immersive displays affordable for schools, museums and small
institutions. A very important part of this trend is the fact that planetaria and dome
displays are increasingly all-digital. Eventually, personal visual immersive displays will
become affordable for individuals in schools.
3. The gaming metaphor is becoming increasingly influential in education, as educators
exploit the opportunities it affords. Students‘ high acceptance and intense concentration
on current video games is irresistible to educators. It will become more important, as new
teachers who played video games as children grow up to be teachers.
4. A wide range of industries and academic disciplines are increasingly adopting computer
graphics of all types. Within almost every professional literature, one can find a small but
persistent subset concerned with the use of virtual reality to address their topic.
5. Museums, especially science museums, continue to innovate with interactive displays of
all types. Unlike the schools, they must make their exhibits and educational programs
interesting to continue to attract patrons.
We believe these trends are converging toward a wider use of interactive immersive
media, especially in museum education and educational gaming. We believe that our study was
well-positioned to explore questions relevant to this near future, and we look forward to building
on the results.

260
APPENDIX A
[ONLINE QUESTIONNAIRES]
In this appendix we will show examples of all the online questionnaires used in this study. We
present them exactly as they appeared to the test subjects (students) and the graders. We show
the Pretest, Presence and Comfort Test, Post Test and Follow Up Test questionnaires in their
entirety. All of the grading forms are individualized, one for each student for each type. For
example, there is an individual Post Test Grading Form for every student in the study. We show
one example for each grading form.

261
PRETEST
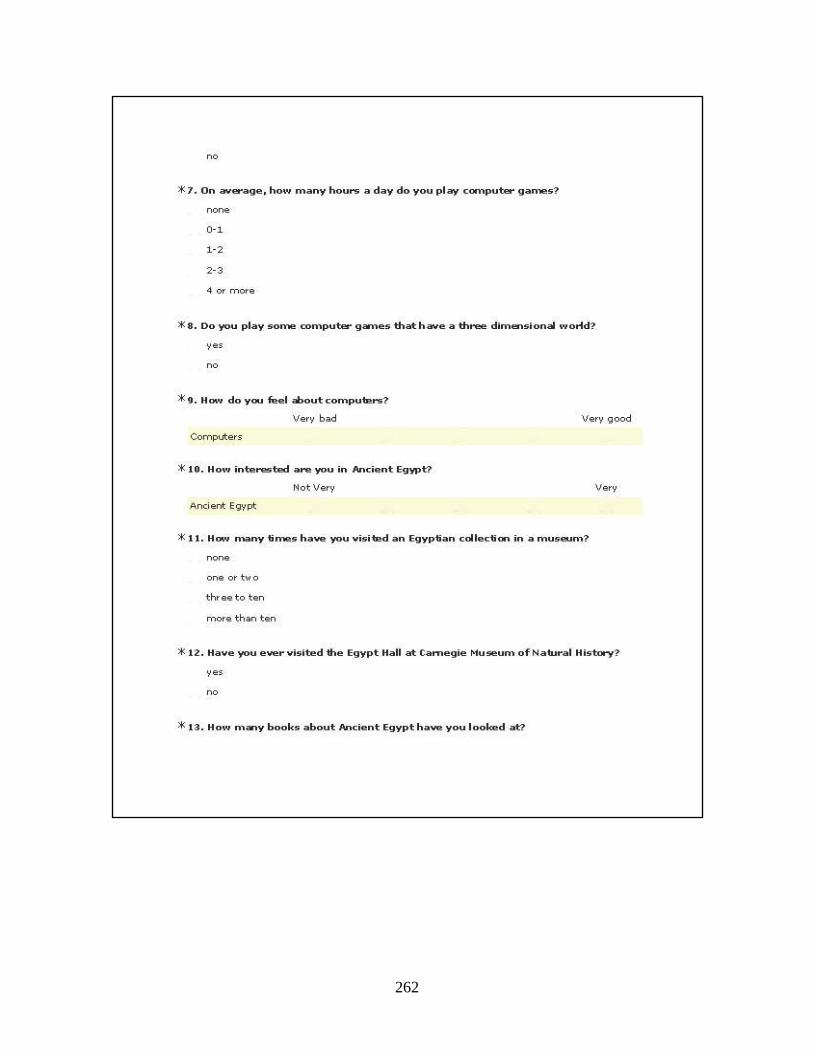
262

263

264
PRESENCE AND COMFORT TEST

265
DRAWN MAP GRADING FORM

266
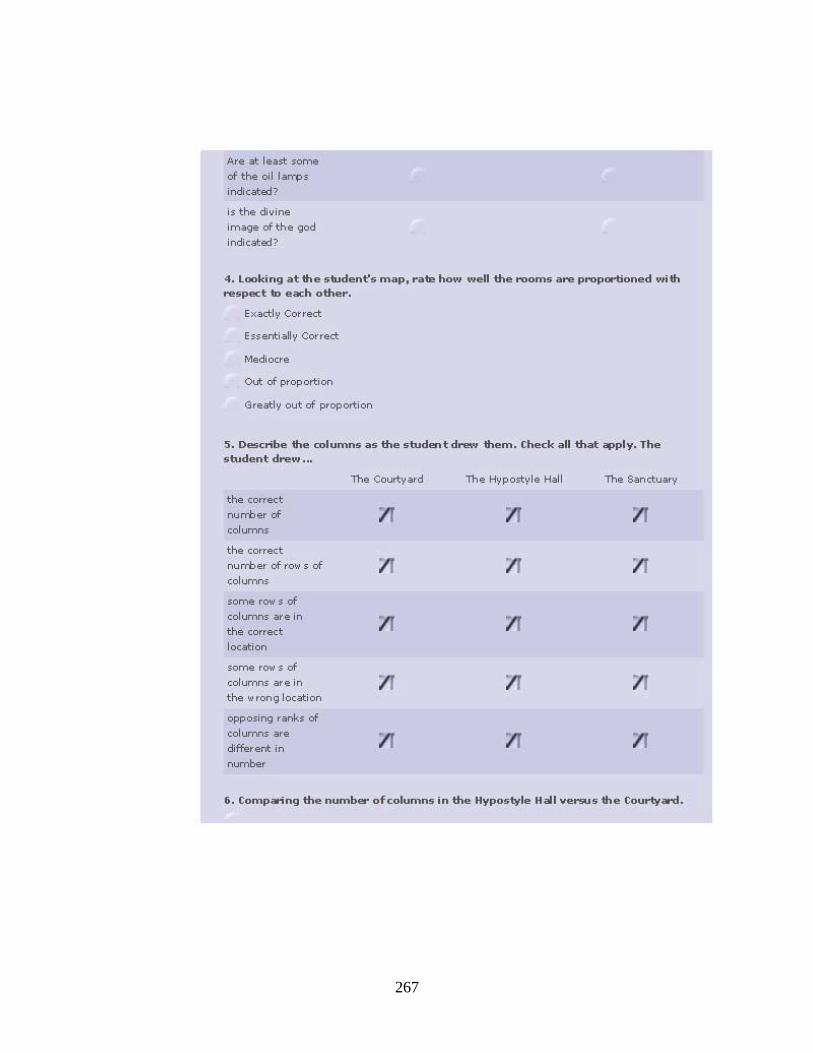
267

268

269
MAGNET MAP GRADING FORM

270

271
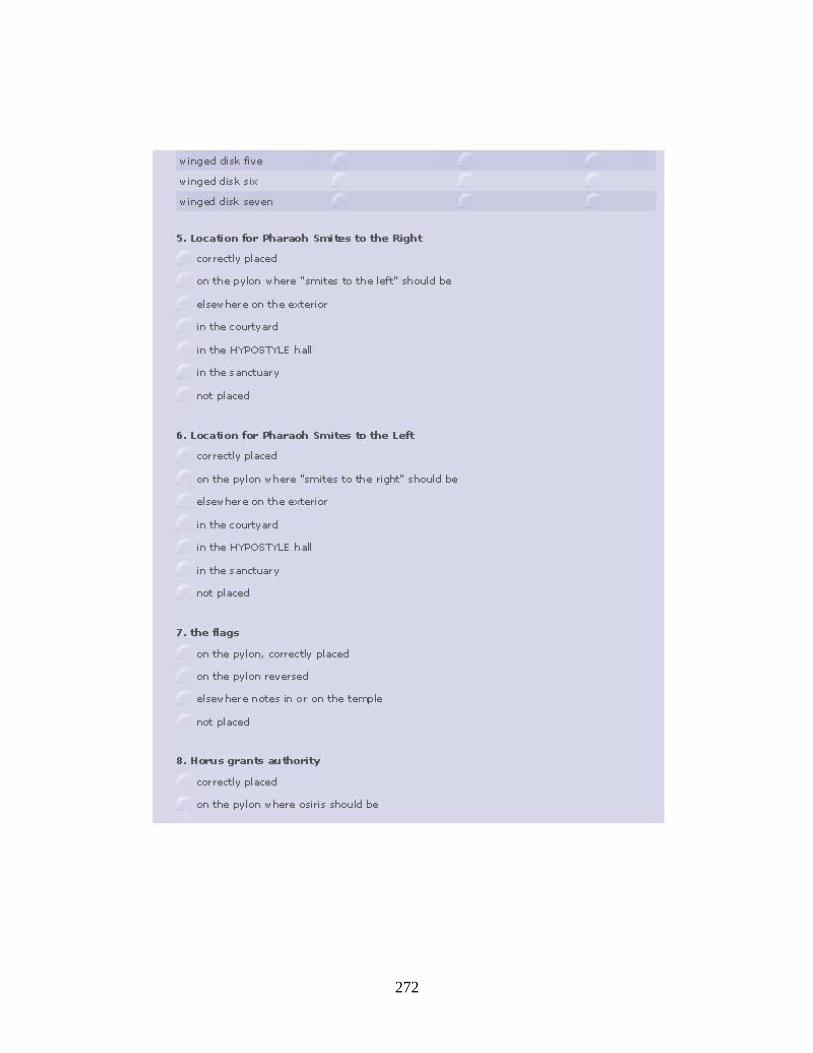
272

273
VIDEOTEST GRADING FORM

274
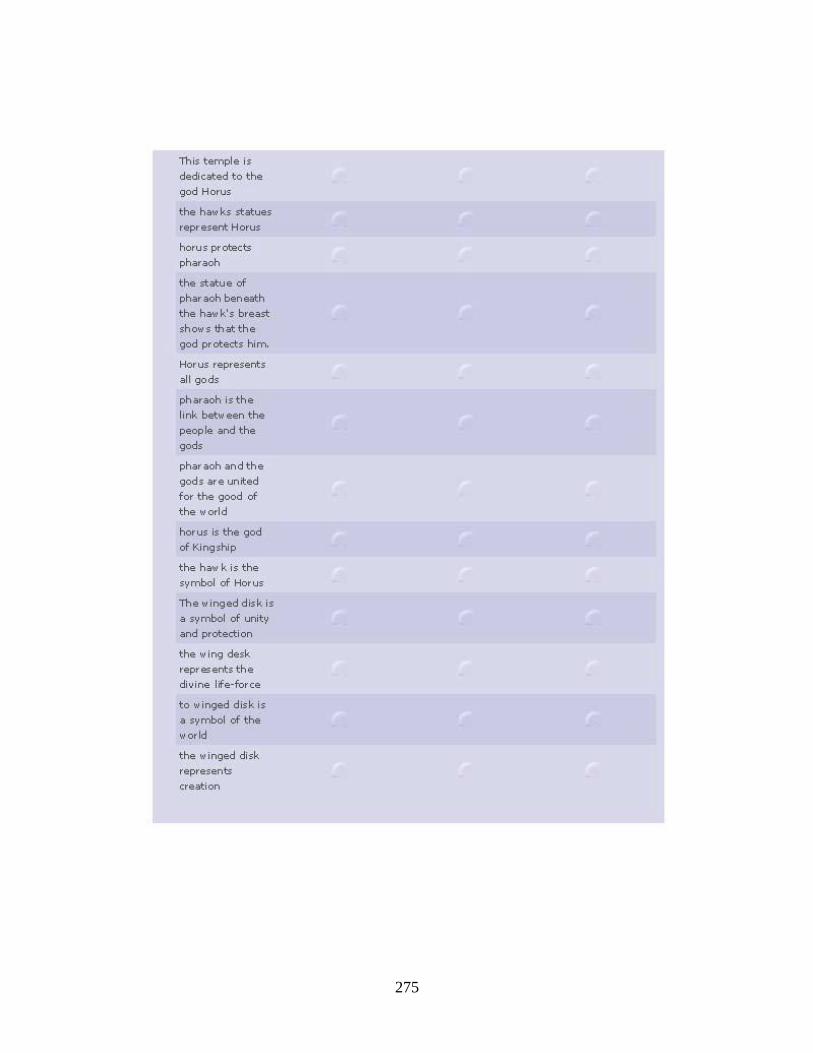
275

276

277

278

279

280
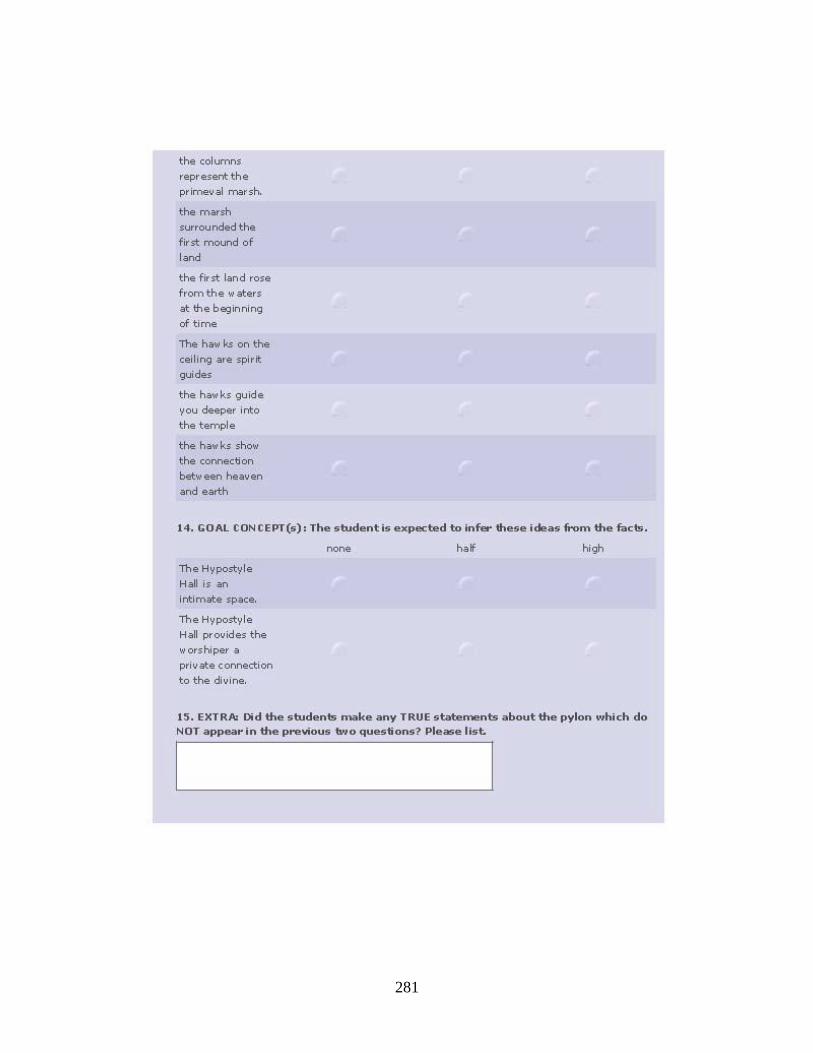
281

282

283

284

285
286

287
kj
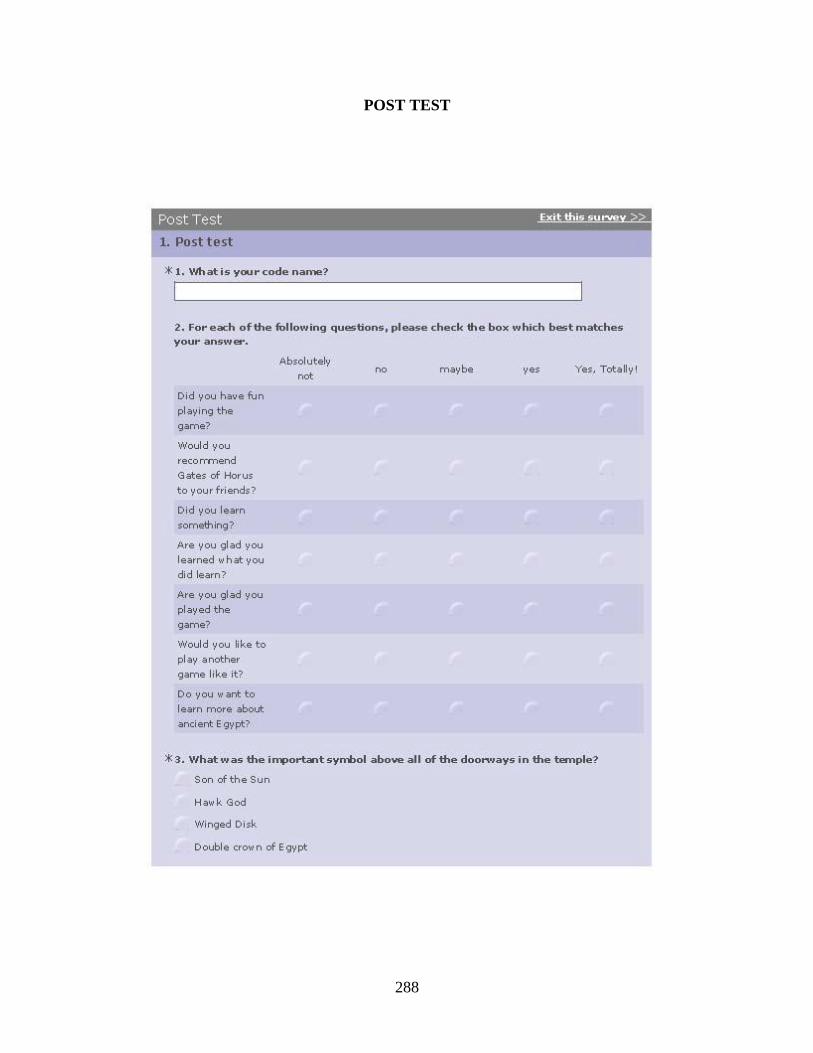
288
POST TEST

289

290

291

292
k

293
POST TEST GRADING FORM

294

295

296

297

298
FOLLOW-UP TEST

299
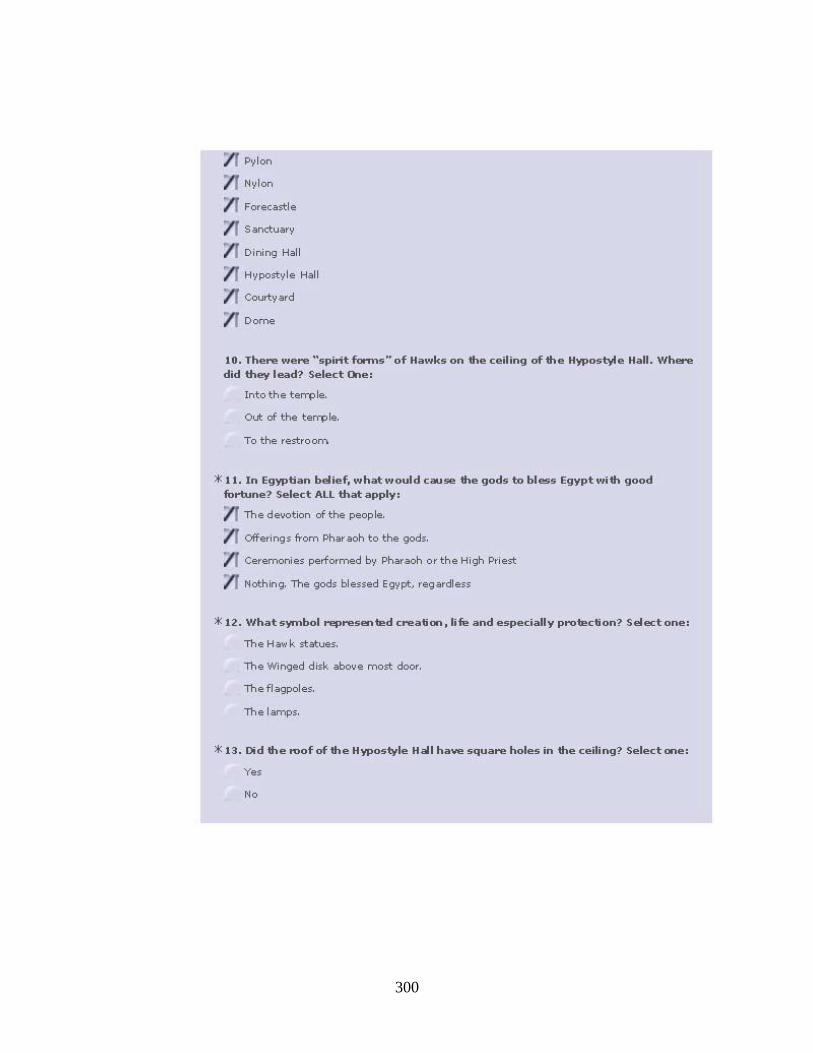
300
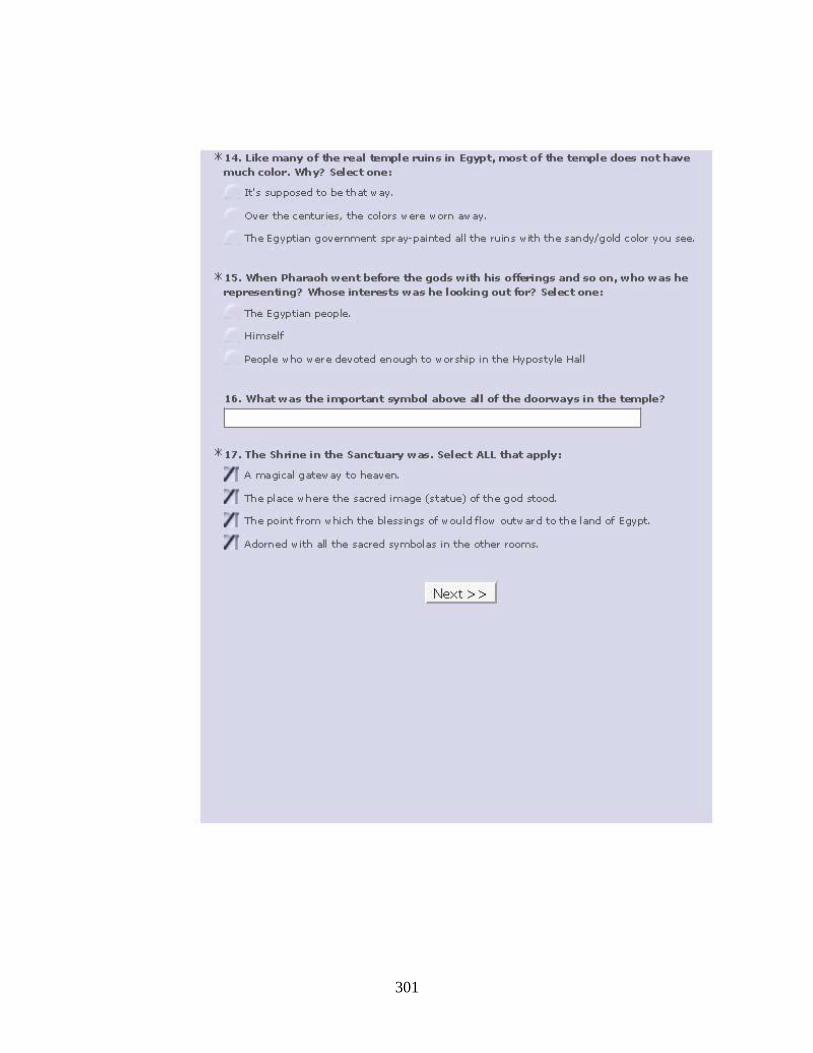
301

302

303

304
FOLLOW-UP TEST GRADING FORM

305

306

307

308
APPENDIX B
[TESTING PACKET]

309

310

311

312

313
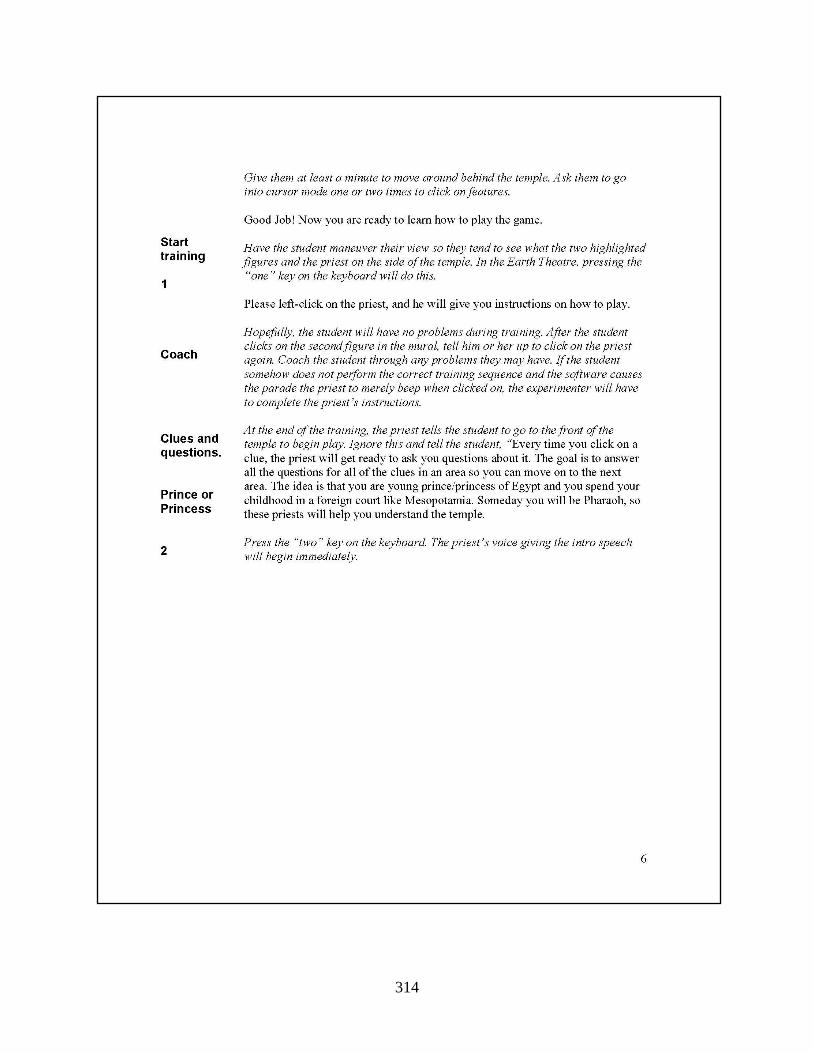
314
315

316

317

318
319

320

321

322
APPENDIX C
[TEMPLE BOOK]
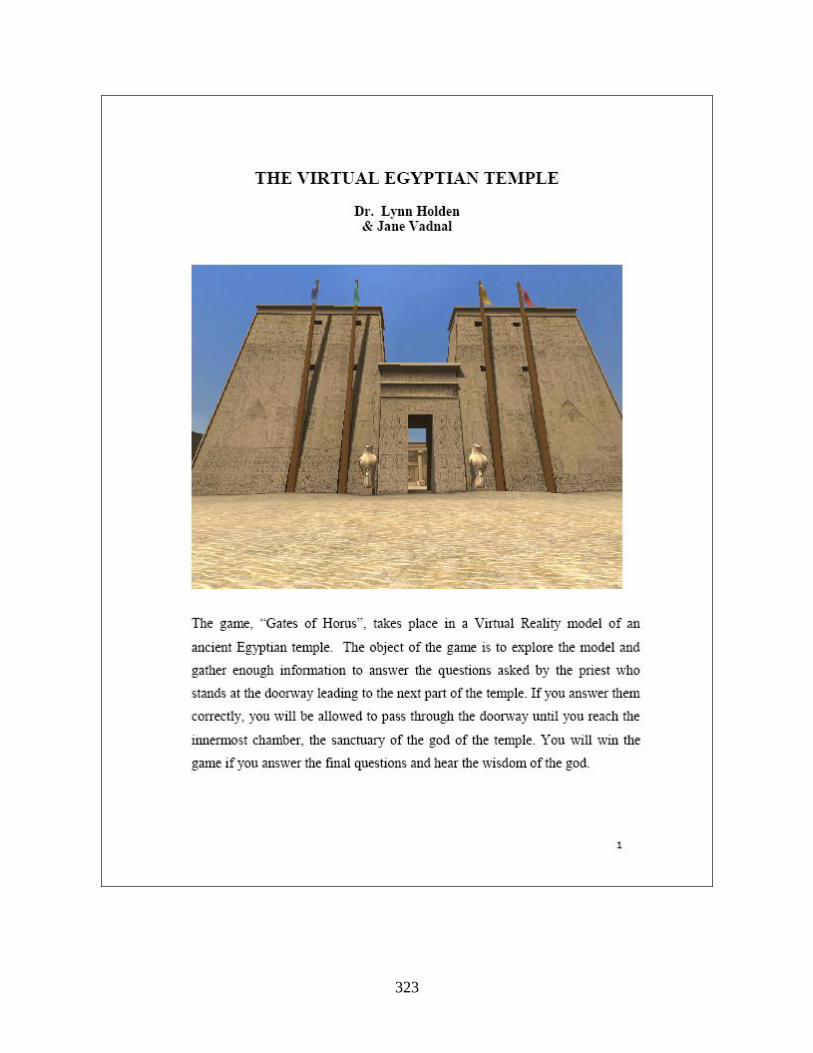
323
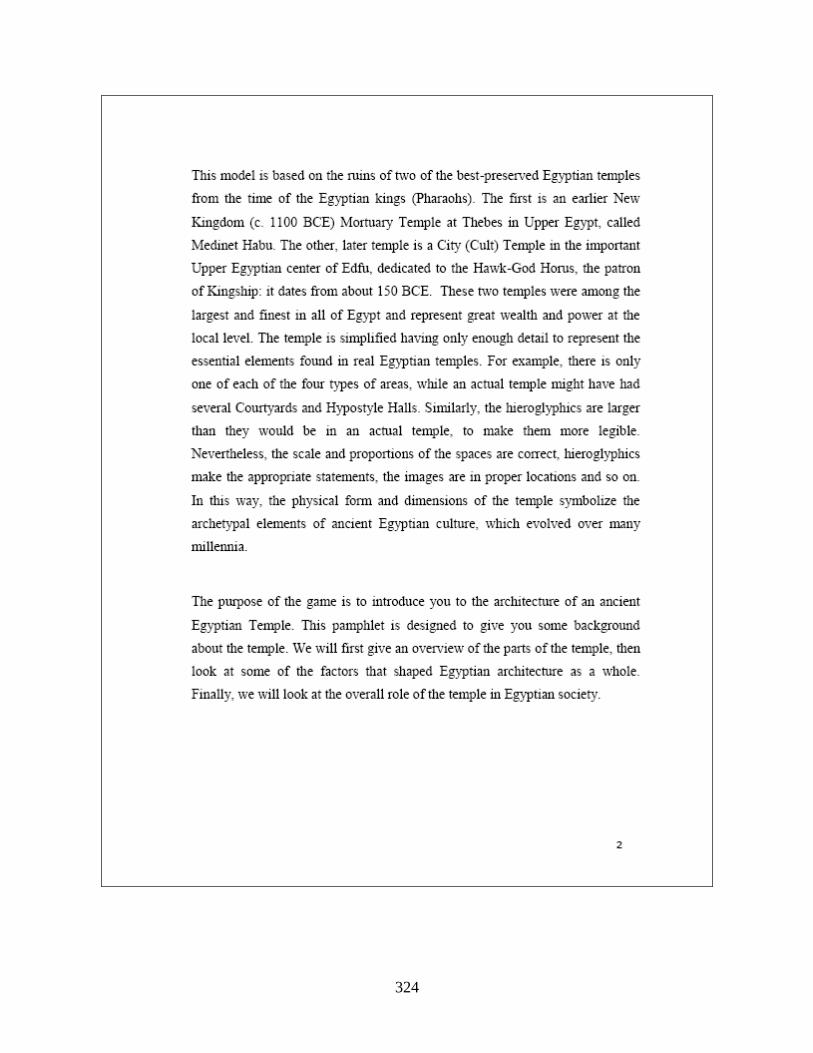
324

325

326

327

328
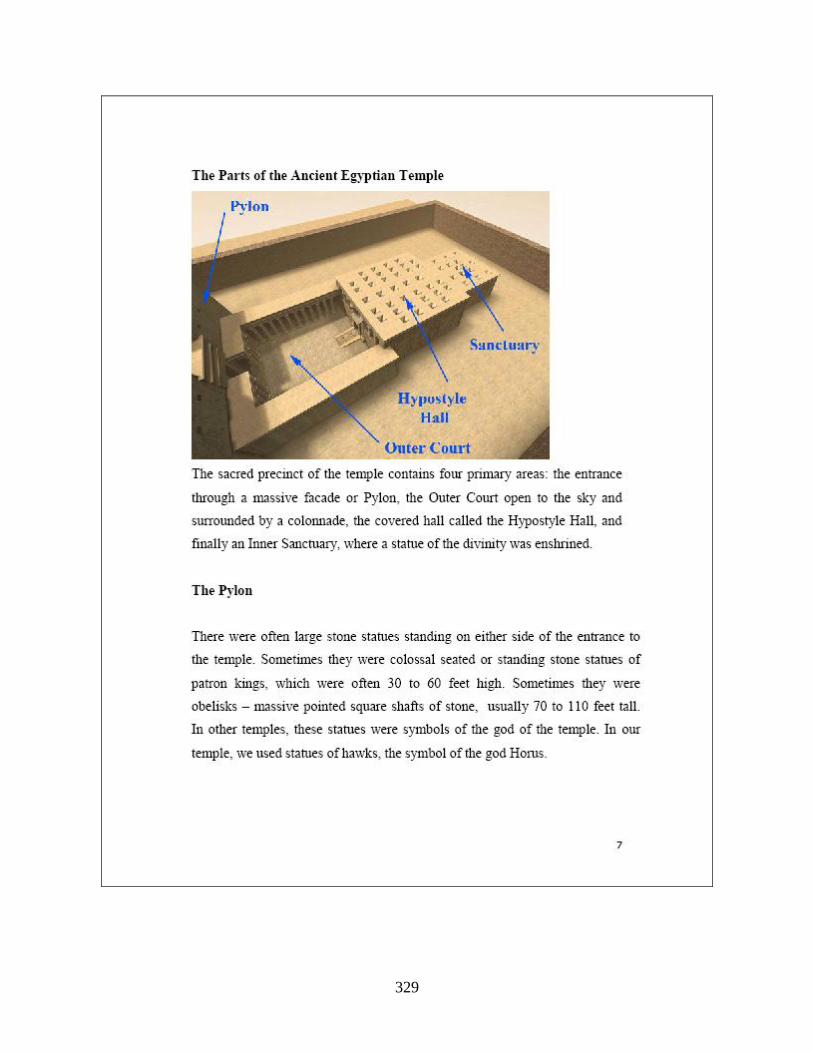
329
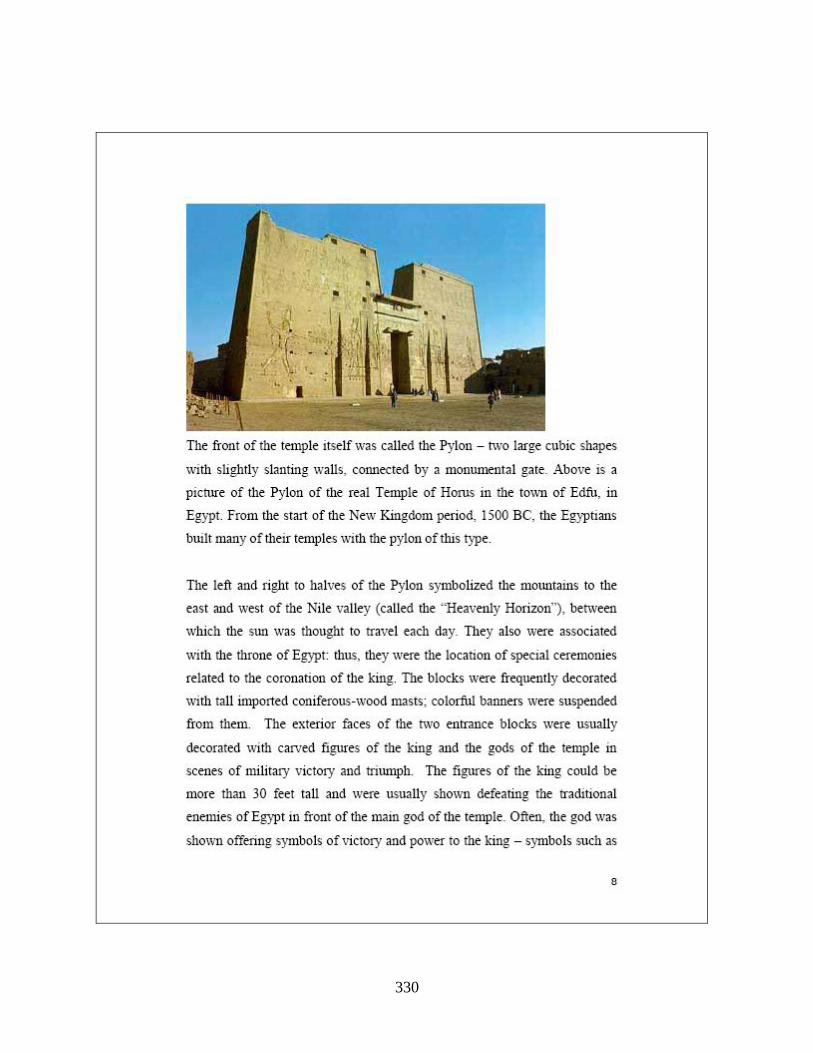
330

331

332

333

334

335

336
337

338
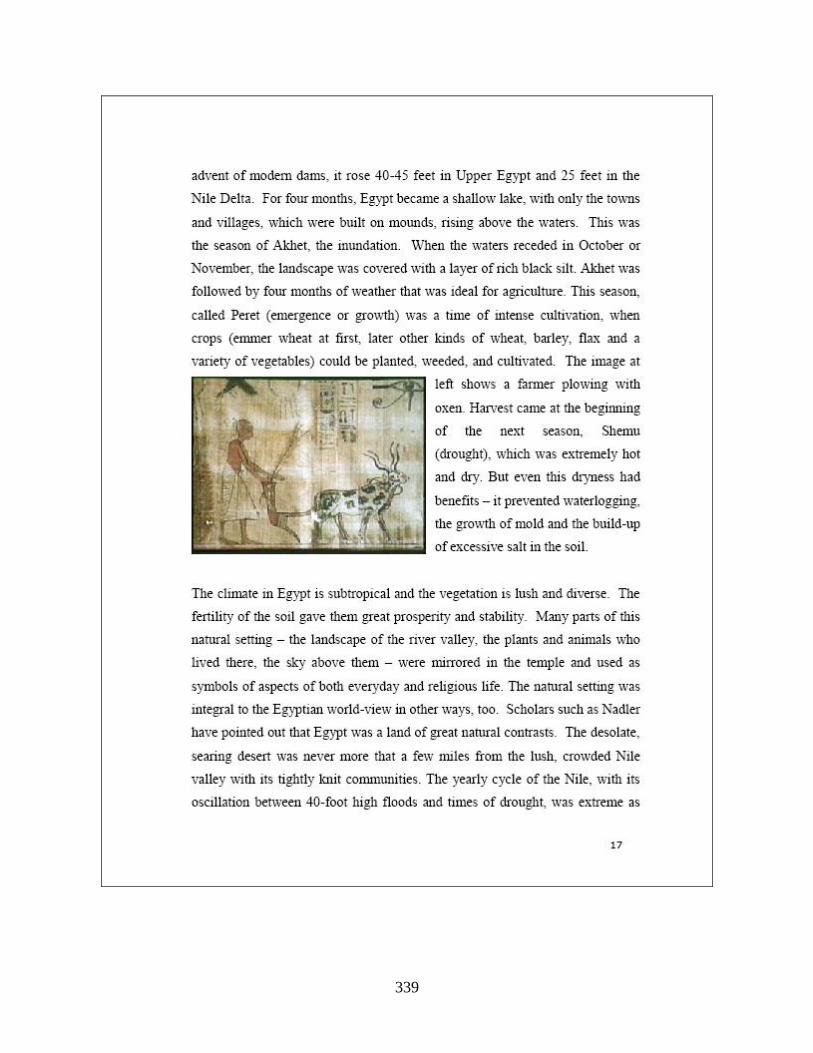
339

340

341

342

343

344

345

346
APPENDIX D
[OTHER MATERIALS]

347
PERMISSION FORM

348

349

350

351

352
EGYPT FOLLOW-UP LETTER

353
GIFT CERTIFICATE LETTER

354
GIVING VIDEO LETTER

355
RECRUITING FLIER
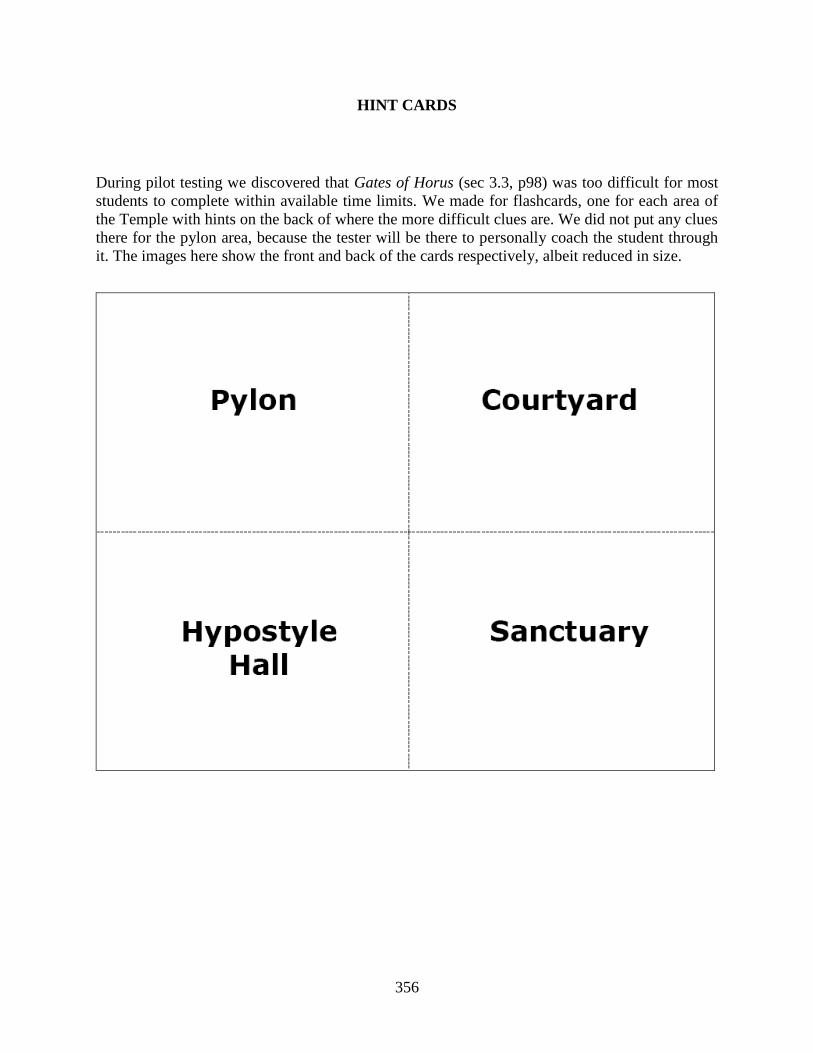
356
HINT CARDS
During pilot testing we discovered that Gates of Horus (sec 3.3, p98) was too difficult for most
students to complete within available time limits. We made for flashcards, one for each area of
the Temple with hints on the back of where the more difficult clues are. We did not put any clues
there for the pylon area, because the tester will be there to personally coach the student through
it. The images here show the front and back of the cards respectively, albeit reduced in size.
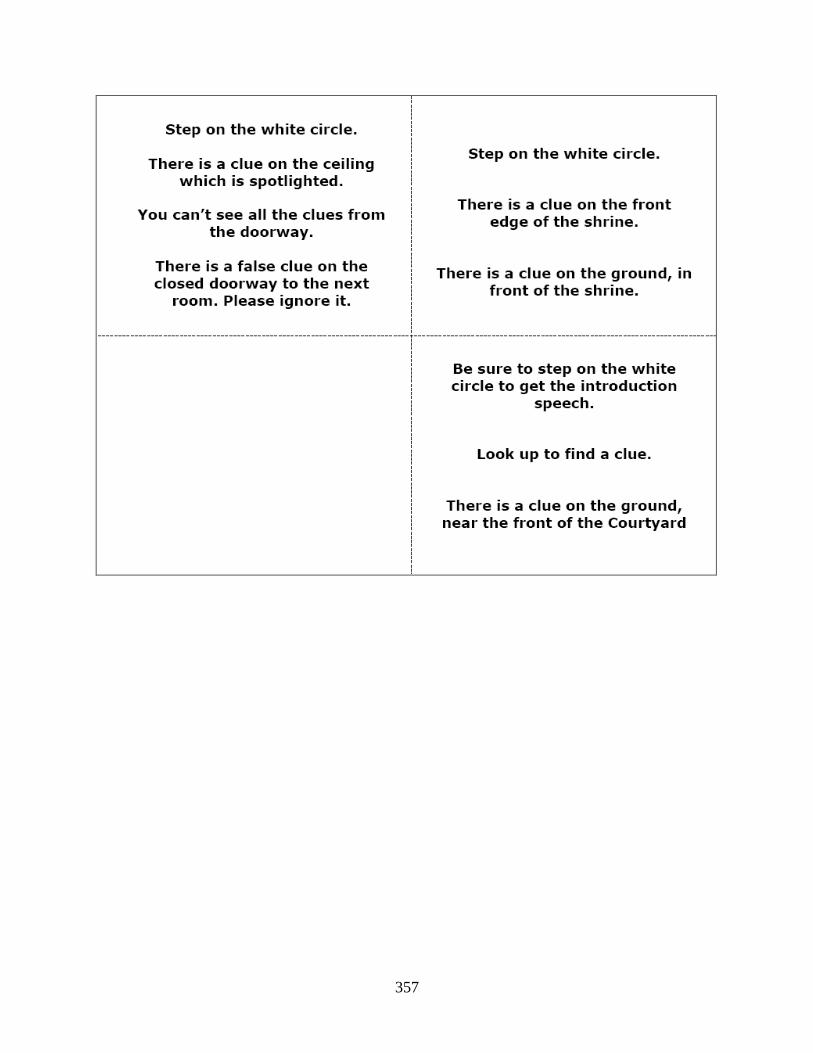
357

358
BIBLIOGRAPHY
3Dweb. (2004). 3D Web, http://3dweb.netera.ca/about_project.html
ACID. (2004). Digital Songlines, http://songlines.interactiondesign.com.au/
ActiveWorlds. (2004). ActiveWorlds, http://www.activeworlds.com/edu/index.asp
Addison, A. C. (2000). Emerging Trends in Virtual Heritage. Multimedia, IEEE, 7(2), 22-25.
AIA. (2004). Archaeological Institute of America, http://www.archaeological.org
Allison, D., Wills, B., Bowman, D., Wineman, J., Hodges, L. (1997). The Virtual Reality Gorilla Exhibit.
IEEE Computer Graphics and Applications, 17(6).
Andrews, D. C. (2002). Audience-Specific Online Community Design. Communications of the ACM, 45.
Antonietti, A., Rasi, C., Imperio E., Sacco, M. (2000). The Representation of Virtual Reality in
Education. Education and Information Technologies, 5(4), 317-327.
Arabesk. (2004). Virtual Arabic Museum, http://www.museumarabesk.nl/
Ardissono, L., Goy, A. (1999). Tailoring the Interaction With Users in Electronic Shops. 7th Conference
on User Modeling (UM'99), Banff, Canada.
Arnold, D. (1999). Temples of the Last Pharaohs. Oxford, Oxford Press.
Arthur, E. J., Hancock, P. A. (2001). "Navigation Training in Virtual Environments." International
Journal of Ergonomics, 5(4): 387–400Assis, P. S., Schwabe, D., Barbosa, S. D. J. (2004). Meta-
models for Adaptive Hypermedia Applications and Meta-adaptation. ED-MEDIA 2004
Attardi, G., Betro, M., Forte, M., Gori, R., Guidazzoli, A., Imboden, S., Mallegni, F. (1999). 3D facial
Reconstruction and Visualization of Ancient Egyptian Mummies Using Spiral CT Data Soft
Tissues Reconstruction and Textures Application. SIGGRAPH 1999
Avedon, E. M., Sutton-Smith, B. (1972) The Study of Games, John Wiley, New York
Baber, C., Bristow, H., Cheng, S. L., Hedly, A., Kuriyama, Y., Lien, M., Pollard, J., Sorrell, P. (2001).
Augmenting Museums and Art Galleries. Human-Computer Interaction, INTERACT '01
Balabanovic, B., Shoham, Y. (1997). Fab: Content-Based, Collaborative Recommendation.
Communications of the ACM, 40, 66-72.

359
Barfield, W., Weghorst, S. (1993). The sense of presence within virtual environments: A conceptual
framework. In Human-computer Interaction: Applications and Case Studies (pp. 699-704).
Amsterdam: Elsevier
Barsalou, L. W. (1992). Cognitive Psychology. Hillsdale, NJ: Lawrence Erlbaum Associates, Inc. 0-
8058-0691-1 (hard) 0-8058-0691-0 (pbk)
BBC. (2004a). Virtual Tours (History), http://www.bbc.co.uk/history/multimedia_zone/virtual_tours/
<broken>
BBC. (2004b). World War One Trench, http://www.bbc.co.uk/history/3d/trench.shtml <broken>
Beacham, N. A., Elliott, A.C., Alty, J. L., Al-Sharrah, A. (2002). Media Combinations and Learning
Styles: A Dual Coding Approach. World Conference on Educational Multimedia, Hypermedia
and Telecommunications
Beacham, R. (2004). The Theatron Project, http://www.theatron.org/
Bell, J. T., Folger, S. (1996). Vicher: A Virtual Reality Based Educational Module for Chemical Reaction
Engineering. Computer Applications in Engineering Education, 4(4).
Benedikt, A. (1991). Cyberspace: Some Proposals. In M. Benedikt (Ed.), Cyberspace: First Steps (pp.
255-271). Cambridge, MA: MIT Press. I0262-52177-6
Bertoletti, A. C. (1999). SAGRES - A Virtual Museum. Museums and the Web 1999
Bertoletti, A. C. (2001). Providing Personal Assistance in the SAGRES Virtual Museum. Museums and
the Web 2001, Seattle
Beier, K. P., Et. Al.. (2004). The Great Pyramid of Khufu, http://www-
vrl.umich.edu/project/pyramid/index.html
Blake, E., Fang, K. C., Feng, F. Y., Wai, K. M. (2003). Low-Cost Virtual Reality System - PC Driven
System (No. CS03-17-00). Cape Town: Department of Computer Science, University of Cape
Town.
Bloom, B. S. (1956). Taxonomy of Educational Objectives; Book 1 Cognitive Domain. New York:
Longman Inc. 0-582-28010-9
Bortner, M. (1965). Progressive Matrices. The Sixth Mental Measurements Yearbook. O. K. Buros.
Highland Park, NJ, Gryphon Press: 762-465.
Boulay. (2001). Modeling Human Teaching Tactics and Strategies for Tutoring Systems. International
Journal of Artificial Intelligence in Education(12), 235-256.
Bowman, D. A., Hodges L. F., Allison, D., Wineman, J. (1999). The Educational Value of an
Information-Rich Virtual Environment. Presence Teleoperators and Virtual Environments, 8(3),
317-331.
Bowman, D. A. (2002). Principles for the Design of Performance-oriented Interaction Techniques. In K.
M. Stanney (Ed.), Handbook of Virtual Environments (p 277). Mahwah, New Jersey: Lawrence
Erlbaum Associates, Inc., Publishers. 0-8058-3270-X
Bowman, D. A. (2004). Personal Communication.
360
Bra, P., Aerts, A., Houben, G., Wu, H. (2000). Making General-Purpose Adaptive Hypermedia Work.
World Conference on the WWW and Internet (WEBNETC)
Bricken, M. (1990). Virtual Worlds: No Interface to Design. In M. Benedikt (Ed.), Cyberspace: First
Steps (pp. 363-382). Cambridge, MA: MIT Press. 0-262-02327-X (hb) 0-262-52177-6 (pb)
Bricken, M., Bryne, C. M. (1992). Summer Students in Virtual Reality: A Pilot Study on Educational
Applications of Virtual Reality Technology. In Wexelblat (Ed.), Virtual Reality, Applications and
Explorations. Cambridge, MA: Academic Press Professional.
Britannica. (2004). Encyclopedia Britannica Online, http://www.britannica.com
Brooks, F. (2004). Personal communication.
Brown, A. L., Champione, J. C. (1994). Guided discovery in a community of learners. In K. McGilly
(Ed.), Classroom Lessons: Integrating Cognitive Theory and Classroom Practice, Cambridge,
MA: MIT Press, MA
Bruckman, A. (2002a, April). The Future of E-Learning Communities. Communications of the ACM, 45,
60-63.
Bruckman, A. (2002b). No Magic Bullet: 3D Video Games in Education. Proceedings of ICLS 2002,
Seattle, Washington
Bruen, C. (2002). A Development Framework for Re-usable Learning Resources for Different Learning
Styles and Requirements. World Conference on E-Learning in Corp., Govt., Health & Higher Ed.
( ELEARN )
Brusilovs.ky, P. (2001). Adaptive hypermedia. User Modeling and User Adapted Interaction, Ten Year
Anniversary Issue (Alfred Kobsa, ed.) 11 (1/2), 87-110.
Brusilovsky, P.J., Henze, nicola, Millan, E. (2002). Adaptive Systems for Web-Based Education.
WASWBE 2002. 84-699-8192-7
Brusilovsky, P. (2003a). Adaptive Navigation Support in Educational Hypermedia: the Role of Student
Knowledge Level and the Case for Meta-Adaptation. British Journal of Educational Technology,
34(4), 487-497.
Brusilovsky, P., Vassileva, J. (2003b). Course Sequencing Techniques for Large-scale Web-based
Education. International Journal of Continuing. Engineering Education and Lifelong Learning,,
13(1/2), 75.
Brusilovsky, P., Peylo, C. (2003c). Adaptive and Intelligent Web-based Educational Systems.
International Journal of Artificial Intelligence in Education, 13, 156–169.
Brusilovsky, P. (2004). Adaptive Navigation Support: From Adaptive Hypermedia to the Adaptive Web
and Beyond. PsychNology Journal, 2(1), 7 - 23.
Bungert, C. (1998). Stereoscopic 3D-Quake, http://www.stereo3d.com/quake.htm
Burgess, e. a. (1999). Virtual Ancient Egypt Course, http://artscool.cfa.cmu.edu:16080/~hemef/egypt/

361
Byrne, C. (1996). Water on Tap: The Use of Virtual Reality as an Educational Tool. Unpublished PhD
Dissertation, University of Washington, Seattle, Washington. URL:
http://www.hitl.washington.edu/publications/dissertations/Byrne/
Campbell, C. T., Stanley, J. C. (1963). Experimental and Quasi-Experimental Designs for Research:
Houghton Mifflin Company. 0-395-30787-2
Capasso, G. (2004). Journey to Pompeii. Naples: Capware, Ottaviano: Tel.815288505
Carver, C. A., Howard, R. A., Lane, W. D. (1999a). Enhancing Student Learning Through Hypermedia
Courseware and Incorporation of Student Learning Styles. IEEE Transactions on Education,
42(1).
Carver, C. A., Hill, J. M. D., Pooch, U. W. (1999b). Third Generation Adaptive Hypermedia Systems.
World Conference on the WWW and Internet (WEBNETC)
Champion, E. (2001). Travels through the imagination: Future visions of VR & related technologies.
YVR2001. http://www.arbld.unimelb.edu.au/~erikc/papers/papers.html
Champion, E. (2003). Applying Game Design Theory to Virtual Heritage Environments. Proceedings of
the 1st International Conference on Computer Graphics and Interactive Techniques in Australasia
and South East Asia, Melbourne, Australia. 1-58113-578-5
http://www.arbld.unimelb.edu.au/~erikc/papers/papers.html
Champion, E. (2004a). The Limits of Realism in Architectural Visualization. 21st Annual Conference of
the Society of Architectural Historians Australia and New Zealand, Melbourne, Australia.
http://www.arbld.unimelb.edu.au/~erikc/papers/papers.html
Champion, E. (2004b, February 13). Heritage Role Playing—History as an Interactive Digital Game.
Australian Workshop on Interactive Entertainment, Sydney.
http://www.arbld.unimelb.edu.au/~erikc/papers/papers.html
Champion, E. (2004c, 17-19 November). Hermeneutic Richness from the Inside Out: Evaluation and
Virtual Heritage Environments. VSMM 2004 Hybrid Realities, Digital Partners Ogaki City,
Japan. http://www.arbld.unimelb.edu.au/~erikc/papers/papers.html
Chen, Y., Macredie, R. D. (2002). Cognitive Styles and Hypermedia Navigation: Development of a
Learning Model. Journal of the American Society for Information Science and Technology,
53(1), 3-15.
Charles F., Lemercier S., Vogt T., Bee N., Mancini M., Urbain J., Price M., André E., Pélachaud C., and
Cavazza M., Demo paper for Virtual Storytelling 2007 (ICVS 2007), France, December 5-7,
2007. http://ive.scm.tees.ac.uk/content/1191631935/icvs07_CharlesCavazza_Demo.pdf
Cheverst, K., Davies, N., Mitchell, K., Friday, A., Efstratiou, C. (2000). Developing a Context-aware
Electronic Tourist Guide: Some Issues and Experiences. CHI 2000 / Chi Letters
Chicago, O. I. (1930-1969). Medinet Habu. Chicago, The University of Chicago Oriental Institute
Publications.
Chin, D. N. (1989). KNOME: Modeling What the User Knows in UC. In A. Kobsa and W. Wahlster
(eds.) User Models in Dialog Systems, (pp. 74-107): Springer-Verlag

362
Chittaro, L., Ranon, R., Leronutti. (2003, November 4). Navigating 3D Worlds by Following Virtual
Guides: Helping both Users and Developers of 3D Web Sites. HCITALY 2003, Torino, Italy
Chittaro, L., Leronutti, L., Ranon, R. (2004). Navigating 3D Virtual Environments by Following
Embodied Agents: a Proposal and its Informal Evaluation on a Virtual Museum Application.
PsychNology Journal, 2(1), 24 - 42.
Cho, Y., Moher, T., Johnson, A. (2003). Scaffolding Children's Scientific Data Collection in a Virtual
Field. VSMM 2003
Chromium. (2004). Chromimum http://chromium.sourceforge.net/
Clarebout, G., Elen, J., Johnson, W. (2002). Animated pedagogical agents: Where do we stand? World
Conference on Educational Multimedia, Hypermedia and Telecommunications.
Clark, D. (1999). Learning Domains or Bloom's Taxonomy,
http://www.nwlink.com/~donclark/hrd/bloom.html
Cobb, S., Helen, N., Crosier, J., Wilson, J. R. (2002). Development and Evaluation of Virtual
Environments for Education. In K. M. Stanney (Ed.), Handbook of Virtual Environments; Design,
Implementation, and Applications. Mahwah, NJ & London: Lawrence Erlbaum Associates
Cox, R., Donnell, M. O., Oberlander, J. (1999). Dynamic versus static hypermedia in museum education:
an evaluation of ILEX, the intelligent labeling explorer. Artificial Intelligence in Education, Le
Mans
Craig, S., Gholson, B. (2002). Does an agent matter? The Effects of Animated Pedagogical Agents on
Multimedia Environments. World Conference on Educational Multimedia, Hypermedia and
Telecommunications (ED-MEDIA)
Cristea, A., Garzotto, F. (2004). Designing patterns for adaptive or adaptable educational hypermedia: a
taxonomy. World Conference on Educational Multimedia, Hypermedia and Telecommunications
(ED-MEDIA)
Cruz-Neira, C., Sandin, D., DeFanti, T. A. (1993). Surround-Screen Projection-Based Virtual Reality:
The Design and Implementation of the CAVE. SIGGRAPH '93
CVRLab. (2004). Cultural VR Lab, http://www.cvrlab.org/
Dalgarno, B., Hedberg, J. (2001a). 3D Learning Environments in Tertiary Education. ASCILITE,
Melbourne. http://www.ascilite.org.au/conferences/melbourne01/pdf/papers/dalgarnob.pdf
Dalgarno, B. (2001b). Interpretations of Constructivism and Consequences for Computer Assisted
Learning. British Journal of Educational Technology, 32(2).
Dalgarno, B., Hedberg, J., Harper, B. (2002a). The Contribution of 3D Environments to Conceptual
Understanding. European Conference on AI in Education
Dalgarno, B. (2002b). The Potential of 3D Virtual Learning Environments: A Constructivist Analysis. E-
Journal of Instructional Science and Technology, 5(2).
Danielson, R. L. (1997). Work in Progress: Learning Styles, Media Preferences, and Adaptive
Education. Adaptive Systems and User Modeling on the World Wide Web, Chia Laguna,
Sardinia. http://www.contrib.andrew.cmu.edu/~plb/UM97_workshop/Danielson.html
363
Darken, R. P., Bernatovich, D., Lawson, J., and Peterson, B. (1999b). Quantitative Measures of Presence
in Virtual Environments: The Roles of Attention and Spatial Comprehension. Cyberpsychology
and Behavior, 2(4), 337-347.
Darken, R. P., Peterson, B. (2001). Spatial Orientation, Wayfinding, and Representation. In K. M.
Stanney, Kennedy, R. S. (Ed.), Handbook of Virtual Environment Technology
Dede, C., Salzman, M. C., Loftin, R. B. (1996). ScienceSpace: Virtual realities for learning complex and
abstract scientific concepts. IEEE Virtual Reality Annual International Symposium, New York
Dede, C., Salzman, M. C., Loftin, R. B., Sprague, D. (1999). Multisensory Immersion as a Modeling
Environment for Learning Complex Scientific Concepts. In Computer Modeling and Simulation
in Science Education: Springer-Verlag
Dede, C. (2004). Multi-User Virtual Environment Experiential Simulator,
http://muve.gse.harvard.edu/muvees2003/index.html
DeLeon, V. J., Berry, R., Jr. (2000). Bringing VR to the desktop: are you game? Multimedia, IEEE, 7(2),
68-72.
DeLeon, V. J. (1999). VRND: Notre-Dame Cathedral: A Globally Accessible Multi-User Real-Time
Virtual Reconstruction. Proceedings, Virtual Systems and Multimedia (VSMM) 1999.
Driver, R. (1995). Constructivist Approaches to Science Teaching. In Steffe, L. P., Gale, J. E. (Ed.),
Constructivism in Education. Hillsdale, NJ: Lawrence Erlbaum Assoc.
Dudley. (2004). Dudley Castle 'Virtual Tours', http://www.imint.freeserve.co.uk/historic.htm
Duncan, M., Kelley, M., Jacobson, J. (2006) High School Graduate Refines Gyromouse Interface For
Virtual Reality; Preteens Play Crucial Role. Computer Graphics Quarterly, Vol. 40, No. 2, ACM
SIGGRAPH (publisher), August 2006.
Duran, Z., Dogru, A. G., Toz, G. (2004). Web-Based Multimedia GIS for Historical Sites. 20th ISPRS
Congress, Istanbul, Turkey
Durlach, N., Darken, R. P., Allen, G., Loomis, J., Templeman, J. (2000). Virtual Environments and the
Enhancement of Spatial Behavior: Toward a Comprehensive Research Agenda. Presence:
Teleoperators and Virtual Environments. 9(6): 593 - 615.
DWI. (2004). Digital Worlds Institute, http://www.digitalworlds.ufl.edu/
Economou, D., Mitchell, W., Pettifer, S., Cook, J., Marsh, J. (2001). User Centered Virtual Actor
Technology. Conference of Virtual Reality, Archeology, and Cultural Heritage. 1-58113-447-
92001
Ellis, S. R. E. (1991). Pictorial Communication in Virtual and Real Environments (2nd ed.). London:
Taylor and Francis
Elumens. (2001). Elumens Corporation Announces SPI-API For Multigen-Paradigm Vega Customers,
http://www.multigen.com/news/pr/0812_01_2.shtml
Eluminati. (2008). Eluminati http://www.elumenati.com.
EpicGames. (2004). Unreal Tournament http://www.unrealtournament.com.

364
Eurographics. (2004). European Association for Computer Graphics, http://www.eg.org/
Fallman, D. (1999, February 18-19). VR in Education: An Introduction to Multisensory Constructivist
Learning Environments. Conference on University Pedagogy, Umea University, Sweden.
http://daniel.fallman.org/resources/papers/Fallman_VRIE.pdf
Fong, T., Nourbakhsh, I., Dautenhahn, K. (2003). A Survey of Socially Interactive Robots. Robotics and
Autonomous Systems(42), 143-166.
Forman, E. A. (1989). The role of peer interaction in the social construction of mathematical knowledge.
International Journal of Educational Research(13), 55-70.
Fleiss, J. L., Levin, B., Cho, M.(1981) Statistical Methods for Rates and Proportions. ISBN: 0-471-52629-0
Fleiss, J. L., Nee, J. C. M., Landis, J. R. (1979) Large sample variance of kappa in the case of different
sets of raters. Psychological Bulliten.
Freudenberg, B., Masuch, M., Rober, N., Strothotte, T. (2001). The Computer-Visualistik-Raum:
Veritable and Inexpensive Presentation of a Virtual Reconstruction. VAST2001: Virtual Reality,
Archeology, and Cultural Heritage
Frischer, B., Favro, D., Liverani, P., De Blaauw, S., Abernathy, D. (2000). Virtual Reality and Ancient
Rome: The UCLA Cultural VR Lab's Santa Maria Maggiore Project. In J. A. Barcelo, Forte, M.,
Sanders, D. H. (Ed.), Virtual Reality in Archeology, British Archaeological Reports, International
Series S 843 (pp. 155-162). Oxford: ArcheoPress
Frischer. (2003). Mission and Recent Projects of the UCLA Cultural Virtual Reality Laboratory. Virtual
Retrospect 2003 or Virtual Concept 2003(November), 5-7 http://www.cvrlab.org/.
Furness, T. A., Winn, W., Yu, R. (1997). The Impact of Three Dimensional Immersive Virtual
Environments on Modern Pedagogy. http://www.hitl.washington.edu/publications/r-97-32/.
Gabrielli, S., Rogers, Y., Saife, M. (2000). Young Children's Spatial Representations Developed Through
Exploration of a Desktop Virtual Reality Scene. Education and Information Technologies 5(4):
251-262.
Gagne, R. M. (1987). Instructional technology: Foundations. Hillsdale, NJ.um: Lawrence Erlbaum
Associates
Gardner, H. (1983). Frames of Mind: Basic Books. 0-465-02508-0 0-465-02509-9 0-465-02510-2
Gardner, H. (1999). Intelligence Reframed. New York: Basic Books. 0-465-02611-7
Garlatti, S., Iksal, S., Kervella, P. (1999). Adaptive On-Line Information System by Means of a Task
Model and Spatial Views. 2nd Workshop on Adaptive Systems and User Modeling on the WWW
Garzotto, F., Cristea, A. (2004). ADAPT Major Design Dimensions for Educational Adaptive
Hypermedia. World Conference on Educational Multimedia, Hypermedia and
Telecommunications (ED-MEDIA)
Gauthier, J. M. (2003). Virtual Archeology at Aphrodisias, http://www.tinkering.net/aphro.htm
Gibson, J. J. (1979). The Ecological Approach to Visual Perception. Boston: Houghton Mifflin

365
Gibson, W. (1984). Neuromancer. N.Y., N.Y.: Penguin Putnam, Inc. 0-441-56959-5
Goerger, S., Darken, R., Boyd, M., Gagnon, T., Liles, S., Sullivan, J., & Lawson, J. (1998). Spatial
Knowledge Acquisition from Maps and Virtual Environments in Complex Architectural Spaces.
Proceedings of the 16th Applied Behavioral Sciences Symposium, U.S. Air Force Academy,
Colorado Springs, CO.
Grajetzki, W., Quirke, S., Shide, N. (2003). Digital Egypt for Universities,
http://www.digitalegypt.ucl.ac.uk//Welcome.html
Gregory, R. J. (1999). Foundations of Intellectual Assessment. Needham Heights, MA, Allyn & Bacon.
Hafner, U., Matthias, B., Magg, R. (2000). Wireless Interaction in Cost-Effective Display Environments.
Immersive Projection Technology Workshop (IPT2000).
Hall, R. (1998), ―R Significance/Probability Table,‖ Psychology World (publisher‘s website)
http://web.umr.edu/~psyworld/rcalculator.htm#1
Han, M., Kanade, T. (2000, December). Creating 3D Models with Uncalibrated Cameras. IEEE
Computer Society Workshop on the Application of Computer Vision (WACV2000)
Harris, L. J., M., Zikovitz, D.C. (1998). Vestibular Cues and Virtual Environments. Virtual Reality
Annual International Symposium, 1998
Harris, L. J., M., Zikovitz, D.C. (1999, 13-17 March). Vestibular cues and virtual environments:
choosing the magnitude of the vestibular cue. Virtual Reality, 1999
Hay, K., Crozier, J., Barnett, M., Allison, D., Bashaw, M., Hoos, B., & Perkins, L. (2000). Virtual Gorilla
Modeling Project: Middle School Students Constructing Virtual Models for Learning. In
Fishman, B. J., O‘Connor S. F. (Ed.), International Conference of the Learning Sciences (pp.
212-214): Mahwah, NJ: Erlbaum. http://www.umich.edu/~icls/
Heim, M. (1993). The Metaphysics of Virtual Reality. Oxford: Oxford University Press. 0-195-09258-9
Herpers, R., Hetmann, F., Hau, A., Heiden, W. (2005). Immersion Square - A Mobile Platform for
Immersive Visualizations. Proc. Virtual Environment on a PC Cluster Workshop, Protvino,
Russia, 2002. http://viswiz.gmd.de/VEonPC/2002/proceedings/03-1.pdf
Hoffman, H.G., Prothero, J., Wells, M. and Groen, J. (1998). Virtual Chess: Meaning enhances users'
sense of presence in virtual environments. International Journal of Human-Computer Interaction,
10(3), 251-263.
Hollan, J., Hutchins, E., Kirsh, D. (2000). Distributed Cognition: Toward a new Foundation for Human-
Computer Interaction Research. 2000 ACM Transactions on Human-Computer Interaction, 7(2),
174-196.
Holloway, D. R. (2000). Native American Virtual Reality Archeology: An Architect's Perspective. In
Virtual Reality in Archeology. London: Archeo Press
Honpaisanwiwat, C. (2002). The Influence of Animated Character on Comprehension and Attention
Performance in Multimedia Presentation. Unpublished Doctoral Dissertation, Dept. of
Information Science and Telecommunications, University of Pittsburgh.

366
Houghton-Mifflin. (2000). The American Heritage® Dictionary of the English Language, Fourth Edition,
Boston
Howarth, P. A. (1998). Oculomotor Changes Within Virtual Environments. Applied Ergonomics, 30, 59-
67.
Hullfish, K. C. (1996). Virtual Reality Monitoring. Unpublished Master's Thesis, University of
Washington, http://www.hitl.washington.edu/publications/hullfish/.
Hutchins, E. (1995a). Cognition in the Wild: MIT Press. 0-262-58146-9
Hutchins, E. (1995b). How a Cockpit Remembers Its Speeds. Cognitive Science, 19, 265-288.
IAA. (2004). The Institute of Archeology and Antiquity, http://www.arch-
ant.bham.ac.uk/Computing/HP_VISTA/HPindex.htm
Id_Software. (2004). Doom III http://www.doom3.com/.
Igarashi, T., Matsuoka, S., Tanaka, H. (1999). Teddy: a sketching interface for 3D freeform design.
International Conference on Computer Graphics and Interactive Techniques. 0-201-48560-5
iGrid. (2000). Cultural Heritage in Virtual Reality,
http://www.startap.net/startap/igrid2000/cultHeritVR00.html
Jaccard, James and Choi K. Wan (1996). LISREL approaches to interaction effects in multiple regression.
Thousand Oaks, CA: Sage Publications.
Jackson, R. L., Winn, W. (1999, Dec. 12-15). Collaboration and Learning in Immersive Virtual
Environments. Proceedings of the Computer Support for Collaborative Learning (CSCL) 1999
Conference, Stanford University, Palo Alto, California
Jackson, R. L. (2000). Collaboration and Learning Within Tele-Immersive Virtual Environments,
unpublished doctoral dissertation, University of Washington, Seattle, Washington.
Jacobson, J., Vadnal, J. (1998). Learning in a Highly Interactive, Low-Resolution Virtual Environment:
The Tomb of Lady Hao. IEEE International Conference on Systems, Man, and Cybernetics.
http://planetjeff.net/IndexDownloads/hao-smc98.pdf
Jacobson, J., Redfern, M. S., Furman, J. M., Whiney, L. W., Sparto, P. J., Wilson, J. B., Hodges, L. F.
(2001, November). Balance NAVE; A Virtual Reality Facility for Research and Rehabilitation of
Balance Disorders. Virtual Reality Software and Technology Meeting, Banff, Canada.
http://planetjeff.net/IndexDownloads/VRST-2001.pdf
Jacobson, J., Hwang, Z. (2002a, January). Unreal Tournament for Immersive Interactive Theater.
Communications of the ACM, 45, 39-42.
Jacobson, J. (2004a). Planet Jeff, http://planetjeff.net
Jacobson, J. (2004b). CaveUT, http://planetjeff.net/ut/CaveUT.html
Jacobson, J., et al. (2004c). The Pompeii Project, http://artscool.cfa.cmu.edu/~hemef/pompeii or
http://publicvr.org/#Pompeii

367
Jacobson, J., Holden, L. (2005e). The Virtual Egyptian Temple. World Conference on Educational
Media, Hypermedia & Telecommunications (ED-MEDIA), Montreal, Canada.
Jacobson, J., Lewis, L. (2005i). Game Engine Virtual Reality With CaveUT. IEEE Computer, 38, 79-82.
Jiman, J. (2002). Virtual Reality: The Future of Animated Virtual Instructor, The Technology and Its
Emergence to a Productive E-Learning Environment. World Conference on E-Learning in Corp.,
Govt., Health., & Higher Ed., 2002
Johansson, P. (2002). User Modeling in Dialog Systems.
http://www.ida.liu.se/~ponjo/downloads/papers/johansson_sar2002.pdf
Johns, C. (2002). The Spatial Learning Method: Facilitation of Learning Through the Use of Cognitive
Mapping in Virtual Environments. Computer Science. Cape Town, University of Cape Town.
Johnson, A., Roussos, M., Leigh, J., Vasilakis, C., Barnes, C., Moher, T. (1998a). The NICE Project:
Learning Together in a Virtual World. VRAIS '98.
http://www.evl.uic.edu/aej/vrais98/vrais98.2.html
Johnson, A., Leigh, J., Costigan, J. (1998b). Multiway Tele-Immersion at Supercomputing 97;
Or, Why We Used $6,000,000 Worth of VR Equipment to do the Hokey Pokey. IEEE Computer
Graphics and Applications, 18(4), 2-5.
Johnson, A., Moher, T., Ohlsson, S., Leigh, J. (1999a, March). Exploring Multiple Representations in
Elementary School Science Education. Virtual Reality 2001, Yokohama, Japan
Johnson, A., Moher, T., Cho, Y.J., Lin, Y.J., Haas, D., Kim, J. (2002). Augmenting elementary school
education with VR. Computer Graphics and Applications, IEEE, 22(3).
Johnson, A., Moher, T., Cho, Y.J., Edelson, D., Russell. (2003). ‘Field’ Work. SIGGRAPH 2003
Educators Program, San Diego, CA
Jonassen, D. H. (1995). Constructivism and computer-mediated communication in distance education.
American Journal of Distance Education, 9(2), 7-26.
Jonassen, D. H., Land, S. M. (2000a). Theoretical Foundations of Learning Environments. Mahwah, New
Jersey: Lawrence Erlbaum Associates. 0-8058-3215-7 hardback, 0-8058-3216-5 paperback
Jonassen, D. H., Land, S. M. (2000b). Preface. In Theoretical Foundations of Learning Environments.
Mahwah, New Jersey. 0-8058-3215-7 hardback, 0-8058-3216-5 paperback
Jonassen, D. H. (2000c). Revisiting Activity Theory as a Framework for Designing Student-Centered
Learning Environments. In Theoretical Foundations of Learning Environments. Mahwah, New
Jersey. 0-8058-3215-7 hardback, 0-8058-3216-5 paperback
Jung, T., Gross, M. D., Yi-Luen Do, E. (2002). Annotating and sketching on 3D web models.
International Conference on Intelligent User Interfaces, San Francisco, California, USA. 1-58113-
459-2
Kameas, A., Pintelas, P., Mikropoulos, T. A., Katsikis, A., Emvalotis, A. (2000). EIKON: Teaching a
high-school technology course with the aid of virtual reality. Education and Information
Technologies, 5(4), 305-315.

368
Kanade, T., Rander, P., Narayanan, P. J. (1997). Virtualized Reality: Constructing Virtual Worlds from
Real Scenes. IEEE Multimedia.
Karabiber, Z. (2002). The Conservation of Acoustical Heritage. First International Workshop on 3D
Virtual Heritage, Geneva, Switzerland
Kennedy, R. S., Fowl. (1992). Use of a motion sickness history questionnaire for prediction of simulator
sickness. Aviation, Space, & Environmental Medicine, 63(7), 588-593.
Kennedy, R. S. L. (1995, 11-15 March 1995). Implications of balance disturbances following exposure to
virtual reality systems. Virtual Reality Annual International Symposium, 1995
Kim, K. (1999). Effects of Problem Solving Style on Information-Seeking Behavior. ED-MEDIA
Kim, M., & Ryu, J. (2003). Meta-Analysis of the Effectiveness of Pedagogical Agent. World Conference
on Educational Multimedia, Hypermedia and Telecommunications.
Kim, Y., Baylor, A., & Reed, G. (2003). The Impact of Image and Voice with Pedagogical Agents. World
Conference on E-Learning in Corp., Govt., Health., & Higher Ed.
King, J. E. (2007) http://www.ccitonline.org/jking/homepage/kappa.xls
Kirriemuir, J., McFarlane, A. (2004). Literature Review in Games and Learning, NESTA FUTURELAB.
http://www.nestafuturelab.org/research/reviews/08_01.htm
Koepsell, D. R. (2000). The Ontology of Cyberspace: Philosophy, Law, and the Future of Intellectual
Property. Peru, Illinois: Open Court Publishing
Koh, G., von Wiengand, T. E., Garnett, R. L., Durlach, N. I. (1999). "Use of Virtual Environments for
Acquiring Configurational Knowledge About Specific Real-World Spaces." Presence 8(6): 632-
656.
Kolasinski, E. M. (1995). Simulator Sickness in Virtual Environments; Technical Report 1027: Simulator
Systems Research Unit, Training Systems Research Division, U.S. Army Research Institute for
the Behavioral and Social Sciences.
Kufu. (2004). The Great Pyramid of Khufu, http://www-vrl.umich.edu/project/pyramid/index.html
Kuno, S., Kawakita, T., Kawakami, O., Miyake, Y., Wantanabe, S. (1999). Postural Adjustment Response
to Depth Direction Moving Patterns Produced by Virtual Reality Graphics. Japanese Journal of
Psychology, 49, 417-424.
Kwon, Y. M., Hwang, J. E., Lee, T. S., Jeong, M., Suhl, J. K., Ryu, S. W. (2003). Toward the
Synchronized Experiences between Real and Virtual Museum. APAN, Fukuoka
Land, S. M., Hannafin, M. J. (2000). Student-Centered Learning Environments. In Theoretical
Foundations of Learning Environments. Mahwah, New Jersey. 0-8058-3215-7 hardback, 0-8058-
3216-5 paperback
Lange, K. A. H. (1961). Egypt: Architecture, Sculpture and Painting in Three Thousand Years. London:
Phaidon Press, London
Larkin-Hein, T., Budny, D. D. (2001). Research on Learning Style: Applications in the Physics and
Engineering Classrooms. IEEE Transactions on Education, 44(3).
369
LearningSites. (2004). Learning Sites Inc., http://www.learningsites.com/Frame_layout01.htm
Ledermann, F., Schmalstieg, D. (2003). Presenting an Archaeological Site in the Virtual Showcase. 4th
International Symposium on Virtual Reality, Archeology and Intelligent Cultural Heritage, VAST
2003
Lehner. (2003). Virtual Giza, http://oi.uchicago.edu/OI/PROJ/GIZ/Giza.html
Lessiter, J., Freeman, J., Keogh, E., Davidoff, J. (2001). A Cross-Media Presence Questionnaire: The
ITC-Sense of Presence Inventory. Presence Teleoperators and Virtual Environments, 10(3).
Levy, A. Y., Weld, D. S. (2000). Intelligent Internet Systems. Artificial Intelligence, 118, 1-14.
Levy, R. M., Dawson, P. C., Arnold, C. (2004). Reconstructing traditional Inuit house forms using Three-
dimensional interactive computer modeling. Visual Studies, 19(1).
Lewis, M., Jacobson, J. (2002). Game Engines In Scientific Research. Communications of the ACM, 45,
27-31.
Lin, J. J. W., Duh, B. L., Parker, D. E., Abi-Rached, H., Furness, T. A. (2002). Effects of Field of View on
Presence, Enjoyment, Memory, and Simulator Sickness in a Virtual Environment. IEEE Virtual
Reality Conference 2002. 0-7695-1492-8
Loftin, R. B., Engleberg, M., Benedetti, R. (1993). Virtual Controls in Interactive Environments: A
Virtual Physics Laboratory. Society for Information Display International Symposium Digest of
Technical Papers.
Loftin, R. B. (2004). Personal communication at the conference, "Virtual Reality 2004".
Maloney, J. (1997). Fly Me to the Moon: A Survey of American Historical and Contemporary Simulation
Entertainments. Presence: Teleoperators and Virtual Environments, 6(5), 565 - 580.
Mammar, H. H., Bernard, F. T. (2002). Cognitive User Profiles for Adapting Multimedia Interfaces.
World Conference on Educational Multimedia, Hypermedia and Telecommunications 2002
Manouselis, N., Sampson, D. (2002). Dynamic Educational E-Content Selection using Multiple Criteria
Analysis in Web-based Personalized Learning Environments. The 14th World Conference on
Educational Multimedia, Hypermedia and Telecommunications (ED-MEDIA 2002), Denver,
Colorado, USA.
http://www.ask.iti.gr/Uploads/Files/Publications/Gr_Pubs/ManSamEDMEDIA02_draft.pdf
Mayer, R. E. (1987). Educational Psychology; A Cognitive Approach. Boston: Little, Brown and
Company. 0-316-55151-1
Mayer, R. E. (2001c). Multimedia Learning: Cambridge University Press. 0-521-7839-2, 0-521-7839-1
Megazina. (2002). Pompeii: An adventure during the last days of Pompeii,
http://hem.passagen.se/zinana/pomprot/sidor/uk2-1.html
Michell, W. L., Economou, D. (2000). The Internet and Virtual Environments in Heritage Education:
More Than Just a Technical Problem. In Barcelo, J. A., Forte, M., Sanders, D. H. (Ed.), Virtual
Reality in Archeology (pp. 149-154). 1-84171-047-4

370
Milosavljevic, M., Dale, R., Green, S. J., Paris, C., Williams, S. (1998). Virtual Museums on the
Information Superhighway: Prospects and Potholes. Annual Conference of the International
Committee for Documentation of the International Council of Museums, CIDOC'98
MIRALab. (2004). MIRALab, Virtual Life in Pompeii, http://www.miralab.unige.ch/
Moher, T., Johnson, A. (1999). Bridging Strategies for VR-Based Learning. Computer Human Interaction
(CHI), Pittsburgh, Pennsylvania, USA
Moher, T. (2004). Personal Communication.
Moltenbrey, K. (2001, September). Preserving the Past. Computer Graphics World.
Moreno, R., Mayer, R. E., Lester, J. C. (2000a). Life-Like Pedagogical Agents in Constructivist
Multimedia Environments: Cognitive Consequences of their Interaction. ED-MEDIA 2000
Moreno, R., Mayer, R. E. (2000b). Meaningful Design for Meaningful Learning: Applying Cognitive
Theory to Multimedia Explanations. ED-MEDIA 2000
Moreno, R., Mayer, R. E., Spires, H. A., Lester, J. C. (2001a). The Case for Social Agency in Computer-
Based Teaching: Do Students Learn More Deeply When They Interact With Animated
Pedagogical Agents? Cognition and Instruction, 19(2), 177-213.
Moreno, R., Mayer, R. E. (2001b). Virtual Reality and Learning: Cognitive and Motivational Effects of
Students' Sense of Presence. WebNet 2001, Charlottesville, VA
Moreno, R. (2002b). Pedagogical Agents in Virtual Reality Environments: Do Multimedia Principles
Still Apply? World Conference on Educational Multimedia, Hypermedia and
Telecommunications (ED-MEDIA), Charlottesville, VA
Hughes, C. E., Moshell, J. M., Reed, D. Chase, D. Z., Chase, A. F. (2001). The Caracol Time Travel
Project. Journal of Visual Computer Animation, 12, 203-214.
Moshell, J. M., and Hughes, Charles E. (2002). Virtual Environments as a Tool for Academic Learning.
In K. M. Stanney (Ed.), Handbook of Virtual Environments; Design, Implementation, and
Applications (pp. 893-910). Mahwah, NJ & London: Lawrence Erlbaum Associates
Multigen. (2004). Multigen, http://www.multigen.com/
Nord, B., Colbengtson, T. C. (2003). Virtual Vouni, The Museum of the Future. VR for Public
Consumption (Workshop at VR2003), Chicago
Norman, D. A. (1988). The Design of Everyday Things. New York: Basic Books. 0-465-06710-7
Not, E., Zancanaro, M. (1998a, June 20-24, 1998). Content Adaptation for Audio-based Hypertexts in
Physical Environments. 2nd Workshop on Adaptive Hypertext and Hypermedia,
HYPERTEXT'98, Pittsburgh
Not, E., Petrelli, D., Sarini, M., Stock, O., Strapparava, C., Zancanaro, M. (1998b). Hypernavigation in
the physical space: adapting presentations to the user and to the situational context (Technical
Note). The New Review of Hypermedia and Multimedia, 4, 33-34.
Nykanen, O., Ala-Rantala, M. (1998). A Design for a Hypermedia-based Learning Environment.
Education and Information Technologies(3, 1998), 277-290.

371
Oberlander, J., O'Donnel, M., Mellish, C., Knott, A. (1998). Conversation in the museum: experiments in
dynamic hypermedia with the intelligent labeling explorer. The New Review of Hypermedia and
Multimedia, 4, 11 - 32.
Octaga. (2004) Octaga. www.octaga.com
Oliverio, J., Sompura, R. (2003). Extending Virtual Heritage Beyond the Local Site: Creating An
International Digital Network. Virtual Systems and Multimedia, Montreal, Canada
Olwal, A. (2002). Unit – A Modular Framework for Interaction Technique Design, Development and
Implementation. Master‘s Thesis: Dept. of Numerical Analysis and Computer Science at the
Royal Institute of Technology (KTH), Stockholm, Sweden, executed in the Computer Graphics
and User Interfaces Laboratory at the Dept. of Computer Science at Columbia University (CU),
New York, USA. http://www.nada.kth.se/~alx/text/thesis.pdf
OnlineArchaeology. (2004). Online Archeology, http://www.online-archaeology.co.uk/
Oppermann, R., Specht, M. (1999). A Nomadic Information System for Adaptive Exhibition Guidance.
International Cultural Heritage Informatics (CHIM), Washington, DC, USA
Osberg, K. M. (1997a). Constructivism in Practice: The Case for Meaning-Making in the Virtual World.
Unpublished doctoral dissertation, University of Washington, Seattle, Washington.
OsmosisInc. (2000). Virtual Olympia, http://www.osmosis.com.au/visualize/olympia_01.htm
OsmosisInc. (2004). Virtual Ayutthaya, http://www.osmosis.com.au/animate/ayutthaya_01.htm
Owen, N., Leadbetter, A. G., Yardley, L. (1998). Relationship Between Postural Control and Motion
Sickness in Healthy Subjects. Brain Research Bulletin, 47(5), 471-474.
Örnberg, T. (2003). Why Computers? Constructivist Language Learning on the Internet. Unpublished
master's thesis, Umeå University, http://www2.humlab.umu.se/therese/exjobb.pdf.
Pair, J., Gotz, D., Wilson, J., Hodges, L., Jensen, C., Flores, J. Arias, J. (2000). NAVE: Low Cost
Spatially Immersive Display System, http://mysite.verizon.net/jarrell.pair/NAVE/navejarrell.htm
Papagiannakis, G., Foni, A., Magnenat-Thalmann, N. (2003). Real-Time recreated ceremonies in VR
reconstituted cultural heritage sites. CIPA 19th International Symposium
Papagiannakis, S., S., Ponder, M., Arevalo, M., Magnenat-Thalmann, N. (2004a, 15-16 March 2004).
Real-Time Virtual Humans in AR Sites, London, UK
Papagiannakis, G., Schertenleib, S., O'Kennedy, B., Poizat, M. (2004b). Mixing Virtual and Real scenes
in the site of ancient Pompeii. Journal of Computer Animation and Virtual Worlds, 16(1), 11-24.
Papiaoannou, G., Gaitatzes, A., Christopoulos, D. (2003). Enhancing Virtual Reality Walkthroughs of
Archaeological Sites. 4th International Symposium on Virtual Reality, Archaeology and
Intelligent Cultural Heritage
Pape, D., Anstey, J., Carter, B., Leigh, J., Roussou, M., Portlock, T. (2000). Virtual Heritage at iGrid
2000. iGrid 2000
Pape, D., Anstey, J., Dawe G., (2002). A Low-Cost Projection Based Virtual Reality Display. SPIE
Electronic Imaging: Science and Technology 2002, San Jose.

372
Patel, H., et al. (2001). VIEW of the future, Information Society Technologies (IST), Technical Report:
IST-2000-26089 www.view.iao.fraunhofer.de/pdf/D3_2.pdf
Park, C., Ko, H., Kim, T. (2003). NAVER: Networked and Augmented Virtual Environment Architecture;
Design and Implementation of VR Framework for Gyeongju VR Theater. Computers & Graphics,
223–230.
Pausch, R., Proffitt, D., Williams, G. (1997). Quantifying Immersion in Virtual Reality. ACM
SIGGRAPH 1997
Petrelli, D., De Angeli, A., Convertino, G. (1999). A User-Centered Approach to User Modeling.
Proceedings of the Seventh International Conference of User Modeling.
Picard, R. W. (2000). Affective Computing. Boston, MA: MIT Press. 0-262-66115-2
Piekarski, W., Thomas, B. (2002). ARQuake: The Outdoor Augmented Reality Gaming System.
Communications of the ACM, 45, 36-38.
Pivec, M. (2003b, December). UniGame: Game-based Learning in Universities and Lifelong Learning.
Internationale Konferenz für technologish gestützte Aus- und Weiterbildung
Pizzi, D. and Cavazza, M., AAAI Fall Symposium on Intelligent Narrative Technologies, Arlington,
Virginia, November 2007. http://ive.scm.tees.ac.uk/content/uploads/PDF/FS06PizziA.pdf
Prothero, J. D., Draper, M. H., Furness, T. A., Parker, D. E., Wells, M., J. (1999). The Use of an
Independent Visual Background to Reduce Simulator Side-Effects. Aviation, Space, and
Environmental Medicine, 70(3).
Psokta, J. (1996). Factors Affecting the Location of Virtual Egocenters; From The Renaissance to
Cyberspace. (No. ATTN: PERI-IIC, 5001 Eisenhower Ave. Alexandria, VA 22333-5600): US
Army Research Institute.
PublicVR (2008). http://publicvr.org
Qi, H., & Gilbert, J.,Brewer, J. (2002). Using Animated Pedagogical Agents to Teach Entomology. World
Conference on E-Learning in Corp., Govt., Health., & Higher Ed.
Raalte, S. V., Kallman, R., Wikstrom, T. (2003). A Cultural Heritage Dialogue; IT Support for
Reflections on the Present and the Future. Computer Applications and Quantitative Methods in
Archaeology, Vienna
Radjlich, P. (2004). Vizbox, Inc., http://www.visbox.com/
Räihä, K. J. (1997). Review of Virtual Communities, http://www.cs.uta.fi/~kjr/ACHCI/tang.html
Rich, E. (1989). Stereotypes and User Modeling. In Wahlster, A. K. A. W. (Ed.), User Models in Dialog
Systems (pp. 35-51): Springer Verlag
Roehl, D. B. (1997). Virtual archeology. Bring new life to ancient worlds. Innovation, 28 - 35.
Rose, H. (1996). Design and Construction of a Virtual Environment for Japanese Language Instruction.
Unpublished Master‘s, University of Washington.
373
Roussos, M., Johnson, A. Moher, T., Leigh, J., Vasilakis C., Barnes, C. (1997a). The NICE project:
Narrative, Immersive, Constructionist/Collaborative Environments for Learning in Virtual
Reality. ED-MEDIA/ED-TELECOM 1997
Roussos, M. (1997b). Issues in the Design and Evaluation of a Virtual Reality Learning Environment.
Unpublished Master‘s thesis, University of Illinois, Chicago.
Roussos, M. (2004). Personal Communication.
Roussos, M., Johnson, A. Moher, T., Leigh, J., Vasilakis C., Barnes, C. (1999). Learning and Building
Together in an Immersive Virtual World. Presence, 8(3), 247-263.
Roussou, M. (2000). Immersive Interactive Virtual Reality and Informal Education. ICS-FORTH
Roussou, M., Oliver, M., & Slater, M. (2006). The Virtual Playground: an Educational Virtual Reality
Environment for Evaluating Interactivity and Conceptual Learning. Journal of Virtual Reality
10(3-4), Springer, pp. 227-240.
Roussou, M., Oliver, M., & Slater, M. (2007) Exploring Activity Theory as a Tool for Evaluating
Interactivity and Learning in Virtual Environments for Children. Journal of Cognition,
Technology & Work, Springer, ISSN: 1435-5558 (Print) 1435-5566
Ruiz, R., Weghorst, S., Savage, J., Oppenheimer, P., Furness, T.A., Dozal, Y. (2002). Virtual Reality for
Archaeological Maya Cities. UNESCO World Heritage Conference, Mexico City
Salzman, M. C., Dede, C., Loftin, R. B., Ash, K. (1998). Using VR's Frames of Reference in Mastering
Abstract Information. Third International Conference on Learning Sciences, Charlottesville, VA
Salzman, M. C., Dede, C., Loftin, R. B., Chen, J. (1999). A Model for Understanding How Virtual Reality
Aids Complex Conceptual Learning. Presence: Teleoperators and Virtual Environments, 8(3),
293 - 316.
Santos, S. R. D., Fraga, L. S.,. (2002). Using a Multi User Desktop Based Virtual Reality System to
Recreate the São Miguel das Missões Ruins. CyberPsychology & Behaviour, 5(5), 471-479.
Satava, R., M., Jones, S. B. (2002). Medical Applications of Virtual Environments. In K. M. Stanney
(Ed.), Handbook of Virtual Environments: Lawrence Erlbaum Associates, Inc. 0-8058-3270-X
Schowengerdt, B.T, Seibel, E.J. (2006). True 3D scanned voxel displays using single and multiple light
sources. Journal of the Society for Information Display, 14(2), 135-143.
http://www.hitl.washington.edu/publications//r-2006-34/r-2006-34.pdf
Schulman, S. (1999). Virtual Reality Goes to School. Computer Graphics World, 22(3).
SecondLife. (2008). SecondLife http://millisecond's/, http://secondlife.com/
Sendin, M., Lores, J., Sola, J. (2002). Making our multi-device architecture applied to the Montsec area
heritage adaptive and anticipating. Workshop Mobile Tourism Support, Pisa
Sheridan, T. B. (1992). Telerobotics, Automation, and Human Supervisory Control. Cambridge, MA:
MIT Press. 0262193167
Siegel, S. (1988). Nonparametric Statistics, McGraw-Hill Inc. ISBN 0-07-057357-3

374
Shiply, W. C. (1949). Progressive Matrices: A Perceptual Test of Intelligence. The Third Mental
Measurements Yearbook. O. K. Buros. New Brunswick, Rutgers University Press: 257-259.
Shneiderman, B. (1996). The Eyes Have It: A Task by Data Type Taxonomy for Information
Visualizations. IEEE Conference on Visual Languages, Boulder, CO
Sinclair, P., Martinez, K. (2001, August). Adaptive Hypermedia in Augmented Reality. Third Workshop
on Hypertext and Hypermedia at the Twelfth ACM Conference on Hypertext and Hypermedia,
Aarhus, Denmark
Shrout, P. E., Fleiss, J. L. (1979) Intraclass Correlations: Uses in Assessing Rater Reliability. 86(2),
p420-428.
Slater, M. (1999). Measuring Presence: A Response to the Witmer and Singer Presence Questionnaire.
Presence: Teleoperators and Virtual Environments, 8(5), pp 560-565.
Softimage. (2001). Softimage Enhances Runtime Technology With Support For Elumens' Display,
http://www.softimage.com/Corporate/Press/PressReleases/010322_elumens.htm
Specht, M., Weber G., Heitmeyer, S., Schoch, V. (1997). AST: Adaptive WWW-Courseware for
Statistics. Adaptive Systems and User Modeling on the World Wide Web, Sixth International
Conference on User Modeling, Chia Laguna, Sardinia
Specht, M., Oppermann, R. (1999b, September 27 - October 1, 1999). User Modeling and Adaptivity in
Nomadic Information Systems. Proceedings of the 7.GI-Workshop Adaptivität und
Benutzermodellierung in Interaktiven Softwaresystemen (ABIS99), Universität Magdeburg
Spice, B. (2004, Sunday, Dec. 19). Computer modeling lets scientists make virtual re-creations of ancient
people, things. Pittsburgh Post Gazette.
Spring, M. (1992). Virtual Reality and Abstract Data: Virtualizing Information. Virtual Reality World,
1(1).
Srinivasa, G. R. (2003). FPS VR, http://www.cfar.umd.edu/~gsrao/FPSVR.html
Squire, K. (2002). "Video Games in Education." International Journal of Intelligent Simulations and
Gaming 2(1).
Stang, B. (2003). Game Engines features and Possibilities: Institute of Informatics and Mathematical
Modeling @ The Technical University of Denmark
http://www.garagegames.com/uploaded/GameEngines2.pdf.
Stanney, K. M. (2002). Handbook of Virtual Environments. Mahwah, New Jersey: Lawrence Erlbaum
Associates, Inc., Publishers. 0-8058-3270-X
Stanney, K. M., Zyda, M. (2002b). Virtual Environments in the 20th Century. In Handbook of Virtual
Environments. Mahwah, New Jersey: Lawrence Erlbaum Associates, Inc., Publishers. 0-8058-
3270-X
Squire, K. D., Jenkins, H. (2003). Harnessing the Power of Games in Education, Insight, (3)5
Stone, R., Ojika, T. (2002). Virtual Heritage: What Next? IEEE Multimedia, 73-74.
Squire, K. D. (2007). Games, Learning and Society: Building a Field, Educational Technology

375
Tam, S. (2004). The 3D Bible Project, http://www3.telus.net/public/kstam/en/default.htm
Tan, S., Tan, L. (1997). CHEMMAT: Adaptive Multimedia Courseware for Chemistry. Journal of
Science Education and Technology, 6(1).
Tennant, S., Kock, C., Palakal, M., Rogers, J., Baker, M. P. (2003, October). Negotiating Virtual and
Physical Museum Space. Virtual Systems and MultiMedia, Montreal
There. (2008). There http://www.there.com
TimeRef. (2004). TimeRef http://www.timeref.com/
TombRaider (2008). http://en.wikipedia.org/wiki/Tomb_Raider
Torre, I. (2001). Goals, Tasks and Application Domains as the Guidelines for Defining a Framework for
User Modeling. In User Modeling 2001, Lecture Notes in Computer Science (pp. 260-262):
Springer Verlag
Tougaw, D., Will, J. (2003). Visualizing the Future of Virtual Reality. Computing in Science &
Engineering, 5(4 ), 8-11.
TrajanForum. (1999). The Forum of Trajan in Rome,
http://www.getty.edu/artsednet/Exhibitions/Trajan/index.html
TroiaVR. (2003). TroiaVR, http://www.uni-tuebingen.de/troia/vr/vr0103_en.html
TutTomb. (2001). Take a virtual tour of the Tomb of Tutankhamun,
http://www.civilization.ca/civil/egypt/egqtvr1e.html
Ubersax (2007) http://ourworld.compuserve.com/homepages/jsuebersax/agree.htm
Udine3D. (2004). Udine 3D, http://udine3d.uniud.it/en/index.html
Ulicny, B., Thalmann, D. (2002). Crowd Simulation for Virtual Heritage. First International Workshop
on 3D Virtual Heritage, Geneva
Valzano, V., Bandiera, A., Beraldin, J. A., Picard, M., El-Hakim, S. F., Godin, G. (2004). Virtual
Heritage: the Cases of the Byzantine Crypt of Santa Cristina and Temple C of Selinunte. IX
Convegno della Associazione Italiana Intelligenza Artificiale, Perugia
VAST. (2005). The 5th International Symposium on Virtual Reality, Archaeology and Cultural Heritage.
http://www.eg.org/EG/DL/WS/VAST/VAST04
VeniceCharter. (2004). The Venice Charter; International Charter for the Conservation and Restoration
of Monuments and sites, http://www.international.icomos.org/e_venice.htm
VHN. (2004). Virtual Heritage Network, http://www.virtualheritage.net/
ViHAP3D. (2004). Virtual Heritage: High Quality Acquisition and Presentation,
http://www.vihap3d.org/project.html
VirtualArcheology. (2004). Virtual Archeology, http://www.mnsu.edu/emuseum/archaeology/virtual/
Viz-Tek. (2004). Virtual WallsTM
, http://www.viz-tek.com/PCWall.html

376
VRheritage. (2004). VR Heritage, http://vrheritage.org
VSMM. (2004). International Society of Virtual Systems and MultiMedia, http://www.vsmm.org/
VWAI. (2004). Virtual Worlds in Archeology, http://www.learningsites.com/VWinAI/VWAI_home.htm
Vygotsky, L. S. (1978). Mind in Society: The Development of Higher Psychological Processes.
Cambridge, MA: Cambridge University Press
Web3D (2004). XJ3D, http://www.web3d.org/x3d/applications/xj3d/index.html.
Weber, G., Brusilovsky, P. (2001). ELM-ART: An Adaptive Versatile System for Web-based
Instruction. International Journal of Artificial Intelligence in Education, 12, 351-384.
Weis, A. (2004). Personal Communication.
Welch, G., Foxlin, E. (2002) Motion Tracking: No Silver Bullet, but a Respectable Arsenal, IEEE
Computer Graphics and Applications, November/December 2002.
Westby, G. (1953). Progressive Matrices. The Fourth Mental Measurements Yearbook. O. K. Buros.
Highland Park, NJ, Gryphon Press: 418-422.
Westwood, J. D., Haluck, R. S., Hoffman, H. M. et al. (2004). Medicine Meets Virtual Reality
12:.Building a Better You: The Next Tools for Medical Education, Diagnosis, and Care: IOS
Press. 1-586-03404-9
Wexelblat, A. (1991). Giving Meaning to Place: Semantic Spaces. In M. Benedikt (Ed.), Cyberspace:
First Steps (pp. 255-271). Cambridge, MA: MIT Press. ISBN 0262-02327-X (hb) 0262-52177-6
(pb)
Wickens, C. D. (1992). Virtual Reality and Education. IEEE International Conference on Systems, Man
and Cybernetics
Wickens, C. D., Baker, P. (1995). Cognitive issues in virtual reality. In Barfield, I. W., Furness, T. A.
(Ed.), Virtual Environments and Advanced Interface Design (pp. 514-541). New York: Oxford
University Press
Williams, M., Gilbert, J., & Madsen, N. (2004). Nel: An Interactive Physics Tutor. World Conference on
E-Learning in Corp., Govt., Health, & Higher Ed.
Windschitl, M., Winn, B. (2000). A Virtual Environment Designed To Help Students Understand Science.
Fourth International Conference of the Learning Sciences.
Winograd, T. (2000) Interaction Spaces for 21st Century Computing, in John Carroll, Ed., HCI in the New
Millennium, Addison Wesley, http://hci.stanford.edu/~winograd/papers/21st/
Winn, W. (1993). A Conceptual Basis for Educational Applications of Virtual Reality (R-93-9). Seattle:
University of Washington, Human Interface Technology Laboratory,
http://www.hitl.washington.edu/publications/r-93-9/
Winn, W. (1997). The Impact of Three-Dimensional Immersive Virtual Environments on Modern
Pedagogy (Technical Report R-97-15). Seattle: Human Interface Technology Lab,
http://www.hitl.washington.edu/publications/r-97-15/

377
Winn, W. (1997c, May 19-21, 1997). Learning in Hyperspace. The Potential of the Web: A Professional
Development Workshop for Educators, College Park, MD
Winn, W. J., R. (1999a). Fourteen propositions about educational uses of virtual reality. Educational
Technology, 39(4 July/August 1999).
Winn, W., Windschitl, M., Thomson-Bulldis, A. (1999b). Learning Science in Virtual Environments: A
Theoretical Framework and Research Agenda. Educational Media International, 36(4), 217-279.
Winn, W., Windschitl, M., Hedly, N., Postner, L. (2001). Learning Science in an Immersive Virtual
Environment. Presented at the Annual Meeting of the American Educational Research
Association, Seattle, WA
Winn, W., (2002, May). What Can Students Learn in Artificial Environments That They Cannot Learn in
Class? First International Symposium, Open Education Faculty, Anadolu University, Turkey,
Winn, W., Windschitl, M., Fruland, R., Lee, Y. (2003a). Features of Virtual Environments that
Contribute to Learners' Understanding of Earth Science. Annual Meeting of the National
Association for Research in Science Teaching, New Orleans
Winn, W. (2003b). Learning in Artificial Environments: Embodiment, Embeddedness and Dynamic
Adaptation. Tech., Inst., Cognition and Learning, 1, 87-114.
Witmer, B., Singer, M. (1998b). Measuring Presence in Virtual Environments: A Presence
Questionnaire. Presence Teleoperators and Virtual Environments, 7(3), 225-240.
Young, J. R. (2000, October, 6). Virtual Reality on a Desktop Hailed as New Tool in Distance Education.
Chronicle of Higher Education, http://chronicle.com/free/v47/i06/06a04301.htm.
Youngblut, C. (1998). Educational Uses of Virtual Reality (No. IDA Document Report Number D-2128,
Log: H 98-000105): Alexandria, VA: Institute for Defense Analysis.
Zara, J., Slavik, P. (2003). Cultural Heritage Presentation in Virtual Environment: Czech Experience.
From Proceedings of the Fourteenth International Workshop on Database and Expert Systems
Applications.. Prague. 0-7695-1993-8
Zeltzer, D. (1992). Autonomy, Interaction and Presence. Presence: Teleoperators & Virtual
Environments, 1(1), p 127-232.
Zhang, J. (2001). External representations in complex information processing tasks. In. Williams, A. K. J.
G. (Ed.), Encyclopedia of Microcomputers. New York: Marcel Dekker, Inc.
Zheng, J. Y. (2000). Virtual Recovery and Exhibition of Heritage. IEEE Multimedia.