ANC, BNC and mobilization of Cr from polluted sediments in function of pH changes
17
HUB RESEARCH PAPER ANC, BNC and mobilization of Cr From polluted sediments in Function of PH changes A. Shtiza, R. Swennen, V. Cappuyns and A. Tashko Centrum voor Duurzaam Ondernemen (CEDON) HUB RESEARCH PAPER 2008/26. JULI 2008 Hogeschool-Universiteit Brussel University College Brussels Stormstraat 2, 1000 Brussel, Belgium T: +32 2 608 14 41 T: +32 2 210 12 11 F: + 32 2 217 64 64
-
Upload
trismegistos -
Category
Documents
-
view
2 -
download
0
Transcript of ANC, BNC and mobilization of Cr from polluted sediments in function of pH changes

HUB RESEARCH PAPER
ANC, BNC and mobilization of Cr From polluted sediments in Function of PH changes A. Shtiza, R. Swennen, V. Cappuyns and A. Tashko Centrum voor Duurzaam Ondernemen (CEDON) HUB RESEARCH PAPER 2008/26. JULI 2008
Hogeschool-Universiteit Brussel University College Brussels Stormstraat 2, 1000 Brussel, Belgium T: +32 2 608 14 41 T: +32 2 210 12 11 F: + 32 2 217 64 64

ORIGINAL ARTICLE
ANC, BNC and mobilization of Cr from polluted sedimentsin function of pH changes
A. Shtiza Æ R. Swennen Æ V. Cappuyns ÆA. Tashko
Received: 5 December 2007 / Accepted: 24 February 2008
� Springer-Verlag 2008
Abstract During the manufacturing of chromate salts
(1972–1992) large quantities of Chromite Ore Processing
Residue (COPR) were released into a decantation pond east
of the former chemical plant of Porto-Romano (Durres,
Albania), giving rise to yellow colored pond sediments.
These Cr(VI) bearing sediments were deposited upon
Quaternary silty-clay lagoonal sediments rich in iron oxi-
des and organic matter. The pH values in these lagoonal
sediments vary around 6.6, while in the pond sediments, it
is mainly acidic (due to the presence of the sulfur stock
piles in the area and the release of the H2SO4 from the
activity of the former chemical plant), varying between 1.4
and 3.8. Continuous leaching of the COPR waste resulted
in yellow-colored surface water runoff. The prediction of
pH changes in the different types of sediments based upon
acid/base neutralizing capacity (ANC/BNC) jointly with
the quantitative data on release of heavy metals and
especially Cr is considered an important advantage of the
pHstat leaching test if compared to conventional leaching
procedures. Thus, factors controlling the leaching of
Cr(VI), Cr(III), Ca, Al, Fe, Mg from the COPR were
investigated by means of pHstat batch leaching tests and
mineralogical analysis. Moreover, mathematical and geo-
chemical modeling complemented the study. The COPR in
the area contain very high concentrations of chromium
24,409 mg/kg, which mainly occurs as Cr(III) (75–90%) as
well as Cr(VI) (25–10%). The leaching of Cr(VI) occurs in
all the range (2–10) of the tested pH values, however, it
decreases under acidic conditions. Beside some reduction
of Cr(VI) to Cr(III), the Cr(VI) content of the leachtes
remains relatively high in the acidic environment, while the
limning of Cr(VI) pond sediments will increase the release
of the latter specie. The leaching of the Cr(III) occurs
strictly under acidic conditions, whereby limning of these
sediments will give rise to the lower solubility of Cr(III).
The key mineral phases responsible for the fast release of
the Cr(VI) are: the chromate salts (i.e. sodium chromate
and sodium dichromate), while sparingly soluble chroma-
tite (CaCrO4) and hashemite (BaCrO4) release Cr(VI) very
slowly. Thus, pH and mineral solubility have been identi-
fied as key factors in the retention and the release of the
hexavalent CrO42- and Cr2O7
- from the COPR-rich pond
sediments.
Keywords COPR � Cr speciation � Cr(VI) � Cr(III) �pHstat � ANC � BNC � Leaching � Solubility
Introduction
Cr in Albania: occurrences and uses
Albania was ranked (until 1991) among the most important
producers (the third) of chromium ore in the world (Perron
1995), due to the major podiform chromite deposits
occurring mainly in the eastern part of the country, in the
so-called ophiolite complex in the geological zone of
Mirdita (Robertson and Shallo 2000). The mining of large
amounts of chromium ores was expanded with additional
industrial sectors that widely used Cr as raw material.
Production of ferrochromium occurred in smelters near the
A. Shtiza (&) � R. Swennen � V. Cappuyns
Geology Department, Faculty of Sciences,
Katholieke Universiteit Leuven, Celestijnenlaan 200E,
3001 Heverlee, Belgium
e-mail: [email protected]
A. Tashko
Faculty of Geology and Mining, Geochemistry Department,
Polytechnic University Tirana, Rruga Elbasanit, Tirana, Albania
123
Environ Geol
DOI 10.1007/s00254-008-1263-7

cities of Elbasan and Burrel (from 1979 to date) while
production of the sodium (di)chromate took place in the
former chemical plant of Porto-Romano (which was active
in the period 1972–1992). In Albania, due to absence of
any environmental legislation until 1990 as well as due to
economical restrictions with respect to waste storage, the
areas around the mining and industrial sites became
severely contaminated. In order to study the degree of
contamination, different investigations were undertaken by
Shallari et al. (1998), Dhimo et al. (1999), Sallaku et al.
(1999) and Shtiza et al. (2005a, b, 2008) especially in
Albanian sites related to the treatment of chromium ores.
Cr chemistry
Speciation of an element according to Templeton et al.
(2000) and Hursthouse (2001) is defined as ‘‘the distribu-
tion of an element amongst defined species in a system’’
e.g. Cr(III) and Cr(VI).
Cr(III) of geogenic (natural) origin in soils and rocks
mostly occurs as the mineral chromite (Cr2O3) which is
extremely insoluble (Bartlett and James 1988; Becquer
et al. 2003), while Cr(VI) rarely occurs under natural
conditions (Bartlett and Kimble 1976), apart from the rare
mineral crocoite (PbCrO4) as reported in Zayed and Terry
(2003). Moreover, Cr(III) is considered to be an essential
trace element for the functioning of living organisms
(known as glucose tolerance factor (CrGTF)), while Cr(VI)
is toxic to humans via inhalation (James 1994, 1996;
Whalley et al. 1999) and skin contact can induce allergies
(Yassi and Niober 1988). Cr(VI) is estimated to be about
100 times more toxic and soluble than Cr(III) (Cheung and
Gu 2003). As reported by Turner and Rust (1971) con-
centrations of Cr(VI), as low as 0.5 mg/kg in solution and
5 mg/kg in soils can be toxic to plants.
An increase in the solubility of Cr(III) is observed in
acid conditions especially at pH B 4 according to Fendorf
(1995). Chromate salts (i.e. rich in variable amounts of
Cr(VI)) are mainly of anthropogenic (man-made) origin
and are easily soluble at all the pH ranges predominantly
forming (hydro)oxyanions including hydrogenchromate
(HCrO4-), dichromate (Cr2O7
2-) and chromate (CrO42-)
(Fendorf 1995; McLeod 2001). Moreover, chromate is
weakly sorbed at high pH values and reducing hexavalent
Cr to the less mobile and less toxic trivalent state is also
very difficult at alkaline environments (Deakin et al. 2001).
This reduction might occur due to the presence of the iron
oxides, organic matter as well as reduced sulfur, while the
only known reaction which might oxidize Cr (III) to Cr(VI)
occurs in the presence of manganese oxides (Bartlett and
James 1979; Palmer and Wittbrodt 1991; Fendorf and
Zasoski 1992; Buerge and Hug 1997; Bolan et al. 2003).
Therefore, it is important to know the redox reactions
occurring in a site, since they control the valence state and
the mobility of Cr.
Knowledge of these soil chemical transformations
allows predicting the mobility of Cr in the soil/sediment-
water systems and assisting in the decision to remediate
Cr(VI) enriched soils/sediments via reduction processes.
Therefore, besides, total element concentrations and spe-
ciation, some general sediment features such as grain size,
pH, organic matter and CEC were determined since they
reflect key physico-chemical properties like governing the
distribution, speciation, mobility and availability of chro-
mium and chromates in the study area. Mineralogical
analyses were conducted to provide direct information on
solid-phase speciation of heavy metals and especially of
chromium.
Overall industrial setting and sampling
The so-called high lime process responsible for the gener-
ation of the chromite ore processing residue (COPR) waste
was largely abandoned in the Western World in the late
1960s, but it is still being used in countries such as China,
Russia, India, Pakistan (Geelhoed et al. 2003) and Porto-
Romano (Albania) from 1972 to 1992 (Zelfo 1987). The
industrial COPR waste generated by the manufacturing of
chromate salts (Deakin et al. 2001) contains variable
amounts of Cr(III) and Cr(VI) due to the incomplete
leaching of Cr(VI). In the world millions of tons of COPR
have been deposited in the past in urban areas [Hudson
County, New Jersey (USA) and Glasgow (Scotland)] and
continue to leach Cr(VI) at very high concentrations (Burke
et al. 1991; Farmer et al. 1999; Geelhoed et al. 2003).
This study focuses on the Porto-Romano site (Longi-
tude: E 19.42754; Latitude: N 41.36968) where the sodium
chromate and dichromate salts were intensively produced
during a period of 20 years. During this period more than
100 tonnes of COPR wastes were released as suspended
particles in waste waters or as dissolved species (Zelfo
1987), in the nearby decantation pond, east of the Porto-
Romano chemical plant. The majority of chromium in
COPR is present as Cr(III), partly as unreacted chromite
ore, but 10 to 25% occurs as Cr(VI) as reported for pond
sediments of Porto-Romano in Shtiza et al. (2008). More-
over, yellow crystals (known as chromate blooms, Burke
et al. 1991) could be easily observed on the site especially
after the rainy season. Due, to the high solubility of the
COPR-constituents, a yellow color marks the surface
waters and concentrations up to 168 mg/L could be mea-
sured (Shtiza et al. 2008) which are 3,000 times higher than
Environmental Quality Standards. Similar values have also
been reported from Farmer et al. (2002) for the COPR
wastes occurring in Glasgow.
Environ Geol
123

The subsurface of the polluted site is composed of
quaternary lagoonal swamps rich in silty-clays, which
forms a nearly impermeable layer for the further infiltration
of pollutants in depth. These sediments are rich in iron
oxides and organic matter, while the COPR-rich pond
sediments are mainly sand dominated and poor in iron
oxides and organic matter. The pH of the silty-clays is
neutral to slight alkaline while the COPR-sandy sediments
often are acidic. In Porto-Romano, due to the complexity of
the pollutants (i.e. sodium (di)chromate salts and presence
of sulfur) the acidic and slight alkaline conditions are
dominating in the polluted COPR-pond sediments (Shtiza
et al. 2008), while in other sites (i.e. Glasgow) the pH of
COPR-wastes is rather alkaline (pH [ 11) as reported in
Geelhoed et al. (2002) and Farmer et al. (1999, 2006).
The aim of this study is to understand the factors which
control speciation and solubility of different chromium
species with regard to pH changes based on the investi-
gation of COPR polluted pond sediments and lagoonal
sediments (from Porto-Romano). For this purpose, one
lagoonal sediment and three COPR-pond sediment samples
with different general physical–chemical, Cr-speciation,
geochemical, mineralogical signatures as well as the dif-
ferent acid/base buffering behavior were selected for the
pHstat tests. The lagoonal sediment (sample B1) was
selected since natural attenuation conditions were reported
to occur and no forms of soluble Cr were detected. From
the pond sediment samples, one posses a high solubility of
Cr(VI) (sample B3), and two others are characterized by a
high solubility of Cr(III) (samples F3 and F4).
Methodology
General sample characteristics
In order to differentiate between the pond and the lagoonal
sediments a detailed description was based on field
observations and laboratory measurements.
Determination of the sediment colors was made with the
Munsell (1997) catalog under laboratory conditions, while
granulometry (Gee and Bauder 1986) was determined by
laser diffraction (Malvern Mastersizer S long bed; Malvern,
Worcestershire, UK). Soil-pH (after standard calibration at
pH 4 and 7 of the instrument) was measured in a suspension
solution of 10 g of sediment in 25 mL water, after magnetic
stirring for 30 min and 5 min sediment settling. The pH was
measured in the sediment suspension with TitroWico
Multititrator� (Wittefield and Cornelius, Germany). The
organic matter was determined according to the Walkley-
Black method (Allison 1965). Cation exchange capacity
(CEC) was measured applying the ‘‘silver thiourea method’’
(van Reeuwijk 1992). In Table 1, the general characteristics
of the selected samples are summarized.
Geochemistry
The bulk samples collected for the pHstat batch tests
weighted about 3 kg. The sediments were dried, disag-
gregated gently in an agate mortar, homogenized, sieved,
and the\2 mm fraction subdivided in four parts and one of
them was crushed to fine powder. After homogenization,
finally 0.1 g was digested; 4-acid digestion was applied
(2.5 mL HNO3conc, 5 mL HFconc, 1.5 mL HClO4conc,
2.5 mL HClconc) for total digestion of the pond samples
(Shtiza et al. 2005a). The term total concentrations will be
used for the geochemical results obtained from the 4-acid
digestion. Total concentrations of Cr, Ni, Co, Zn, Cu, Mn,
Fe, Ca, Mg, K and Al were measured with an Flame
Atomic Absorption Spectrophotometry (FAAS) Varian
AA6 and Varian AA-1475. The detection limit for most of
the elements varied around 1 mg/kg. All used reagents
were of analytical grade. The results of total concentrations
of the selected sediments are summarized in Table 2.
International soil standards (i.e. SO-1 Regosolic and
GBW07411) were added to series analyzed with the 4-acid
method. Values for three replicates of the SO-1 standard (at
95% confidence level) were (in mg/kg) for Cr 159 ± 12.5
(certified 160 ± 15); Cu 63 ± 7.5 (certified 61 ± 2.9); Ni
89.2 ± 10.2 (certified 87 ± 6); Zn 147 ± 6 (certified
146 ± 5). In two replicates of the GBW07411 soil stan-
dard, the concentrations were (in mg/kg): Cr 57.2 ± 3
(certified 59.6 ± 5.0); Co 9.5 ± 3 (certified 11.6 ± 1.4);
Cu 63 ± 4.1 (certified 65.4 ± 4.7); Ni 23.6 ± 2.5
(certified 24.2 ± 2.1) and Zn 3,700 ± 100 (certified
3,800 ± 100).
Table 1 General characteristics of the selected pond and lagoonal sediments from the former chemical plant of Porto-Romano (Durres, Albania)
Bulk samples Depth (cm) Sediment type Munsell classification color Clay % Silt % Sand % Org. C % pH H2O CEC (cmol/kg)
B1 45–105 Lagoonal sediment 5Y 5/3 Grayish Olive 15 83 2 1.8 6.6 34
B3 0–30 Pond sediment 5Y 6/3 Olive Yellow 9 55 36 0.3 3.8 11
F3 3–17 Pond sediment 10YR 4/4 Brown 15 73 12 1.9 3.3 29
F4 0–3 Pond sediment 5Y 6/3 Olive Yellow 9 63 28 2.6 1.4 6
Environ Geol
123

Cascade leaching test (CLT)
A test designed to assess the maximum leachable amount
of metals, which becomes available for leaching under
normal conditions was adopted from NEN 7349 (1995).
Sample material with a grain size \2 mm is used for the
cascade leaching test (CLT). A measure of 1.5 g of sedi-
ment was suspended in a 30 mL of deionized water
(pH = 4) in an acid-rinsed extraction tube and shaked
using a mechanical shaker for 12 h. After centrifugation
(10 min, 3,000 rpm), the eluate was filtered through a
\0.45 lm Millipore filter. The leaching procedure is
subsequently repeated five times resulting in (L/S) ratios of
20, 40, 60, 80 and 100 L/kg dry material. The water in final
leached eluate had a transparent color, in contrast to the
first eluates which were yellow colored, due to the disso-
lution of chromate salts. The results presented in Table 3
show the total amounts of the phases, which become sol-
ubilized in the five subsequent extractions.
The residue remaining after the five steps of the CLT
was analyzed with X-ray powder diffraction (XRD), which
proved that within the detection limit of the XRD no
Cr(VI) phases were present any more, which suggested that
the remaining Cr was occurring as insoluble.
pHstat batch leaching tests
pHstat leaching experiments are batch leaching tests in
which automatic titrators are used to keep pre-defined pH
values constant over time. Such experiments can be
efficient to assess the long-term effects of pH variation
with regard to the leaching characteristics of the heavy
metals (Forstner and Hasse 1998). Different pre-defined
values (acid or alkaline) can be used during the leaching
experiment in order to study the potential release of the
heavy metals under these conditions. The quantity of acid
or base added during the pHstat experiment to keep the pre-
defined pH value constant during the experiment is known
as acid neutralizing capacity (ANC) or base neutralizing
capacity (BNC), respectively. It should be stressed that
obvious differences exist between the pHstat leaching tests
and the ‘‘in situ’’ pore water situation (van Herreweghe
et al. 2002). These differences relate to the natural leaching
conditions, temperature, acid rain precipitations as well as
the biological activity. Since the main investigation will
focus on the effect of the pH in Cr solubility and specia-
tion, the other factors are considered as of minor impact.
pHstat batch experiments (Fig. 1) were carried out with
an automatic multi-titration system (Titro-Wico Multiti-
trator�, Wittefield and Cornelius, Bochum, Germany). An
amount of 80 g (\2 mm) fraction was put in each Erlen-
meyer flask with 800 mL of distilled water and placed on a
horizontal-shaking device. A pH-electrode and an auto-
matic titration dispenser were attached to each flask. From
earlier experiments performed by Paschke et al. (1999),
24 h pHstat tests were insufficient to determine accurately
the heavy metal release, as well as the buffering capacity
of the system. Batch tests carried out by Deakin et al.
(2001) on samples rich in COPR have shown that the Cr
release occurs rapidly in the first hours, but after 96 h no
Table 2 Summary of the total concentrations in the selected samples
Bulk samples Ca
(g/kg)
K
(g/kg)
Mg
(g/kg)
Al
(g/kg)
Na
(g/kg)
Fe
(g/kg)
Ni
(mg/kg)
Zn
(mg/kg)
Cu
(mg/kg)
Co
(mg/kg)
Mn
(mg/kg)
Cr
(mg/kg)
B1 1.81 2.97 2.39 6.42 7.84 6.04 319 169 71 72 460 1,710
B3 5.27 0.09 1.72 4.49 9.02 1.66 153 45 36 53 201 3,452
F3 4.16 1.92 1.95 6.45 0.60 4.75 230 155 110 41 237 24,409
F4 11.38 0.52 0.39 1.09 0.39 1.16 34 19 73 45 146 2,814
The differences between the lagoonal sediment (B1) and the pond sediments (B3, F3 and F4) are clear if major elements (i.e. Ca, K, Mg, Na and
Fe), and Cr are compared
Table 3 Summary of the cumulative soluble concentrations of the selected samples after five consequent steps of cascade leaching test (CLT)
Bulk
samples
Ca
(g/kg)
K
(mg/kg)
Mg
(mg/kg)
Al
(mg/kg)
Na
(g/kg)
Fe
(mg/kg)
Ni
(mg/kg)
Zn
(mg/kg)
Cu
(mg/kg)
Co
(mg/kg)
Mn
(mg/kg)
Cr(VI)
(mg/kg)
Cr(III)
(mg/kg)
SO42-
(g/kg)
B1 0.46 835 956 D.L. 0.25 D.L. D.L. D.L. D.L. D.L. N.A. \0.1 \0.1 3.27
B3 1.77 13 295 D.L. 0.42 D.L. D.L. D.L. D.L. D.L. N.A. 422 504 8.63
F3 2.77 299 1,901 258 0.18 D.L. D.L. D.L. D.L. D.L. 9 \0.1 88 8.34
F4 5.03 235 1,724 685 0.21 679 D.L. D.L. D.L. D.L. 10 \0.1 574 12.42
D.L. Below detection limit; N.A. Not analyzed
Environ Geol
123

further chromium is released in solution, thus, Cr con-
centrations are likely to remain constant towards the end of
the experiment. Hence, 96 h pHstat batch tests appear to
give a good representation of the release of the heavy
metals as well as data with regard to ANC and BNC
evolution for the selected samples. The suspensions were
first shaken for 30 min without the addition of any
chemicals. Previous experiments performed in our labo-
ratory (van Herreweghe et al. 2002; Cappuyns et al. 2004)
demonstrated that the rapid addition of the acid/base to the
sediment suspension could lead to the over passing of the
pre-defined pH. Therefore, the concentration of the titra-
tion solution was adapted to the set-point pH as
summarized in Table 4. The choice for the concentration
of the titration was based on the preliminary tests. Thus,
the interval of pH acquisition was set to 200 s. By doing
so, after adding acid/base to the suspension the system has
enough time to react and eventually neutralize the acid/
base before more acid or base is added. At regular time
intervals (0, 0.5, 1, 3, 6, 12, 24, 48, 72 and 96 h) a sample
of the suspension was taken over a filter (0.45 lm Acro-
disc, Pall; East Hills, NY) by means of a syringe attached
to a flexible tube (Fig. 1).
For a better understanding of the reactions responsible
for pH buffering, slow potentiometric titrations were car-
ried out on the four samples (B1, B3, F3 and F4). During
the pHstat experiments, different buffers were added to the
respective sediment/water suspensions in order to maintain
constant the pH values. The pH was continuously moni-
tored along all the duration of the experiment. Moreover,
ANC/BNC and the leaching behavior of the Cr species (i.e.
III and VI) and other elements are investigated. The results
from the pHstat tests allow inferring the mobility of the
contaminants, simulating changes that might occur in the
natural environment with respect to pH. Moreover, a blank
pHstat test (in which no acid or base was added) was carried
out for 96 h on each of the samples to investigate the
behavior of the pH as well as the solubility of the different
elements under natural conditions.
Immediately after sampling, the electrical conductivity,
redox potential as well as Cr(VI) (see below), sulfate
(Vogel 1961) and chlorite (Vogel 1968) concentrations
were measured. Moreover, some samples were analyzed
for total organic carbon (TOC) content with a Therm-
aloxTM TOC (Analytical Sciences Ltd, England). Finally,
the samples were acidified with a drop of concentrated
HNO3 (ultra pure) to bring the pH to *2. Subsequently,
the sample was kept in refrigerator prior to additional
analysis. Concentrations of Ca, Mg, Al, Fe, K, Na, Mn, Ni,
Cr, Zn, Cu, Co, Pb and Ba were measured by FAAS for the
major elements and inductively coupled plasma-mass
spectroscopy (ICP-MS Hewlett Packard 4500 series; Palo
Alto, CA) for the trace elements.
Geochemical modeling
The quantities of soluble species measured by the pHstat
leaching procedure and the respective pH values (Table 5),
were used as input data to calculate the main species dis-
tribution by means of the Visual MINTEQ version 2.40
(Gustafsson 2006) thermodynamic geochemical speciation
model. The database from Visual MINTEQ version 2.40
was used to assess the species distribution.
Moreover, the data derived from the XRD analysis were
combined with the data derived from the geochemical
modeling in order to compare the main mineralogical find-
ings and estimate the solid state sources which contributed to
the main solubilized species. Due to the rather low detection
limit of the XRD analysis and the difficulty to trace minor
mineralogical phases, the combination of the geochemical
modeling was considered important in order to be able to
confirm even the presence of these mineralogical phases.
Mathematical modeling
ANC and leaching of metals as a function of time was
described mathematically based on the acquired pHstat data
by the use of MATLAB (The mathworks; Natick, MA) and
Fig. 1 Schematic layout of the pHstat batch system. a Erlenmeyer, bhorizontal shaker, c soil suspension, d pH electrode connected with a
computer for continuous pH registration, e automatic computer
controlled titration dispenser, f flexible tube, g filter, h syringe to
sample the eluate from the suspension
Environ Geol
123

EXCEL (Microsoft; Redmont, WA) softwares. ANC and
BNC curves obtained by the pHstat tests with a continuous
set-point titration were described according to Schwartz
et al. (1999). The proton buffering capacity (BC) of soils
during the pHstat experiments can be described as the sum
of two independent first-order reactions:
Hb tð Þ ¼ BC1 1� exp �kitð Þð Þ þ BC2 1� exp �kitð Þð Þ ð1Þ
Hb(t) (mmol/kg), corresponds to the buffered protons at a
time t; BC1 (mmol/kg) is the buffering capacity of the
system 1, ki (per h) is the rate coefficient of the buffer
system i and t (h) is the time after starting the titration. The
BC is defined as the total amount of H+ that can be neu-
tralized by a buffer system, while buffered protons are those
which are neutralized from reactions with the soil matrix.
In analogy with the earlier reaction, the release capacity
of an element (m) at a time (t) can be described by the
following reaction:
RLm ¼ RC1 1� exp �r1tð Þð Þ þ RC2 1� exp �r2tð Þð Þ ð2Þ
RC1 is the release capacity of buffer system 1 (mg/kg), r1 is
the rate coefficient of the system 1 (per h), and t is the time
after starting the titration (h). The release capacities of the
two buffer systems (RC1 and RC2) can be considered as two
dominant sinks for heavy metals from which the elements
are released with different rates. Important to be stressed is
the fact that the release capacities and the rate coefficients
of this empirical fit can not be assigned to well-defined
buffer substances (Schwarz et al. 1999), thus the selection
of only ‘two buffer systems’ or ‘pools’ is operationally
defined. In theory, it is possible to consider more than just
two components since it is known that soils consist of dif-
ferent components like clays, organic matter and Fe, Mn, Al
hydroxides, etc. To make an accurate description of the
mechanisms, much more complex reaction descriptions are
needed, however, making the understanding of the reaction
mechanisms complex and difficult.
Cr speciation
Speciation analysis is a term used to identify and/or mea-
sure the quantities of one or more individual species in a
sample (Templeton et al. 2000). The determination of
Cr(VI) in the eluates (e.g. CLT and pHstat) and water
samples was carried out applying the colorimetric diphe-
nylcarbazide (DCB) method (USEPA 1995) versus
calibration standards in the range 0.5–2.0 lg/L. In order to
achieve accurate results with regard to the chromium spe-
ciation, analysis were carried out within the day the eluates
were collected.
In presence of Cr(VI), the reaction with DCB gives a
red-violet color to the solution. After 5 min reaction, the
absorbance of the sample is measured with an UV–VIS
Spectrophotometer 635, at a wavelength of 540 nm. To
check the accuracy of the Cr(VI) colorimetric method, the
eluate samples were also measured for soluble Cr by AAS.
If no red-violet color is formed in presence of DCB, but Cr
is measurable by AAS, this was considered to be Cr(III).
Mineralogy
Quantitative analysis by XRD is a difficult task, especially
when the samples contain complex mixtures of phases, as
is often the case with samples from highly contaminated
sites, or from waste materials (Hillier et al. 2003). The
complexity of many such mixtures and the resulting XRD
patterns mean that quantitative methods based on the
measurement of single/several resolved peaks are often not
feasible. However, a combination of geochemistry and
XRD were applied to deduce the main mineralogical
composition of the different solid sampling media (i.e.
insoluble residue after 4-acid digestion as well as in sedi-
ments from the CLT and pHstat).
XRD analysis were carried out using a Philips� powder
diffractometer with Co radiation tube, (k-1.7902 A). The
samples were scanned from 5-75� 2h, in steps of 0.02� at
1 s/step. All mineralogical determinations were carried out
in duplicates.
Results
Major and trace element mobility during
the pHstat batch tests
The results for the final eluates of the pHstat tests are given
in Table 5. During the pHstat leaching test of the selected
Table 4 Summary of the operational parameters for the pHstat
leaching test
Operational parameters pHstat leaching
test
Blank pHstat leaching
test
Solid/liquid ratio 1:10 1:10
pH Pre-defined Natural
Concentration of
HNO3 solution (M) 2 2.5
4 1
6 0.25
NaOH solution (M) 6 0.25
8 1
10 2.5
Titration speed Variable (pH dependent)
Shaking frequency (per min) 175 175
PH measurement interval (s) 200 200
Duration (h) 96 96
Environ Geol
123

Ta
ble
5T
he
resu
lts
fro
mth
ep
Hst
at
leac
hin
gte
sts
for
the
fou
rse
lect
edsa
mp
les
mg
/kg
dry
wei
gh
t
Sam
ple
pH
Fin
al
AN
C/B
NC
(mm
ol/
kg
)
Eh
(mV
)
DO
C
(mg
/L)
EC
(mS
/cm
)
Ca
Mg
Al
Fe
SO
42-
Cl-
KN
aM
nN
iC
r(II
I)C
r(V
I)Z
nC
uC
oP
bB
a
B1
28
18
15
8N
.A.
N.A
.9
,35
52
83
1,1
66
1,2
90
5,0
42
N.A
.7
51
54
77
12
25
2\
0,1
85
30
1,0
07
B1
42
50
31
D.L
.N
.A.
5,2
73
16
8\
1\
11
4,7
41
21
74
41
50
\0
.1\
0.1
\0
.7\
0.1
\0
.1\
0.1
\0
.1N
.A.
33
8
B1
61
31
-9
.52
8.7
N.A
.4
,05
6N
.A.
\1
\1
12
,27
12
,26
8N
.A.
37
6\
0.1
\0
.1\
0.1
\0
.1\
0.1
\0
.1\
0.1
N.A
.N
.A.
B1
n7
.7–
N.A
.N
.A.
N.A
.3
,49
3N
.A.
14
61
21
6,7
88
N.A
.4
72
,23
5\
0.1
\0
.1\
0.1
\0
.1\
0.1
22
\0
.01
N.A
.
B1
81
27
-8
0N
.A.
N.A
.3
,48
06
92
97
26
8,0
32
N.A
.3
1N
.A.
\0
.1\
0.1
\0
.1\
0.1
\0
.1\
0.1
\0
.1\
0.0
12
35
B1
10
–-
64
N.A
.N
.A.
17
50
84
9N
.A.
9,0
25
N.A
.1
8N
.A.
\0
.11
2\
0.1
93
1\
0.1
N.A
.
B3
23
99
36
8N
.A.
N.A
.8
,31
9N
.A.
1,3
66
N.A
.1
7,9
89
N.A
.N
.A.
N.A
.0
\0
.13
83
91
10
23
\0
.1N
.A.
B3
n4
.2–
N.A
.N
.A.
N.A
.6
,27
8N
.A.
\1
21
34
,22
1N
.A.
53
,37
3\
0.1
30
18
53
31
\0
.1N
.A.
B3
61
27
40
3D
.L.
12
.76
,99
23
40
\1
16
92
9,8
60
2,0
77
23
3N
.A.
\0
.1\
0.1
02
75
34
\0
.1\
0.1
17
2
B3
82
62
41
2D
.L.
11
.87
,00
62
35
\1
16
73
5,5
92
2,1
20
27
8N
.A.
\0
.1\
0.1
05
02
46
\0
.1\
0.1
10
2
B3
10
83
04
05
D.L
.1
4.5
7,0
85
\1
\1
18
48
6,9
28
2,2
34
22
9N
.A.
\0
.1\
0.1
56
61
53
3\
0.1
\0
.12
33
F3
n4
.0–
38
0N
.A.
2.5
29
,58
91
,58
81
51
\1
35
,48
7N
.A.
15
51
,54
89
\0
.15
0\
0.1
7\
0.1
\0
.1\
0.1
N.A
.
F3
64
40
N.A
.D
.L.
8.0
24
,96
41
,31
92
94
93
7,5
53
1,3
33
99
N.A
.1
\0
.1\
0.1
\0
.1\
0.1
0\
0.1
\0
.13
82
F3
88
28
N.A
.D
.L.
8.7
44
,71
78
96
11
43
51
,52
21
,21
09
1N
.A.
0\
11
\0
.10
0\
0.1
\0
.13
03
F4
n2
.7–
49
0N
.A.
3.2
29
,28
71
,66
46
39
67
94
2,3
63
N.A
.1
81
1,9
10
10
\0
.15
38
\0
.18
21
\0
.1\
0.1
N.A
.
F4
62
72
N.A
.5
0.8
7.4
25
,16
91
,47
63
52
03
4,7
13
53
81
24
N.A
.6
2\
0.1
\0
.10
0\
0.1
\0
.14
27
F4
84
45
N.A
.6
8.2
6.6
55
,13
41
,31
81
2\
14
0,0
64
54
61
57
N.A
.0
01
\0
.1\
0.1
1\
0.1
\0
.11
,18
3
Th
efi
nal
pH
,ac
ido
rb
ase
neu
tral
izin
gca
pac
ity
(AN
C,
BN
C),
red
ox
-po
ten
tial
(Eh
),d
isso
lved
org
anic
carb
on
(DO
C),
elec
tric
alco
nd
uct
ivit
y(E
C),
asw
ell
asth
ele
ach
ing
of
the
maj
or
elem
ents
and
hea
vy
met
als,
SO
42-
,C
l-in
acid
ican
dal
kal
ine
env
iro
nm
ents
are
giv
en
nle
ach
ing
inn
atu
ral
con
dit
ion
sw
ith
wat
er(s
edim
ent/
liq
uid
rati
ois
1/1
0).
N.
A.
no
tan
aly
zed
,D
.L.
bel
ow
det
ecti
on
lim
it
Environ Geol
123
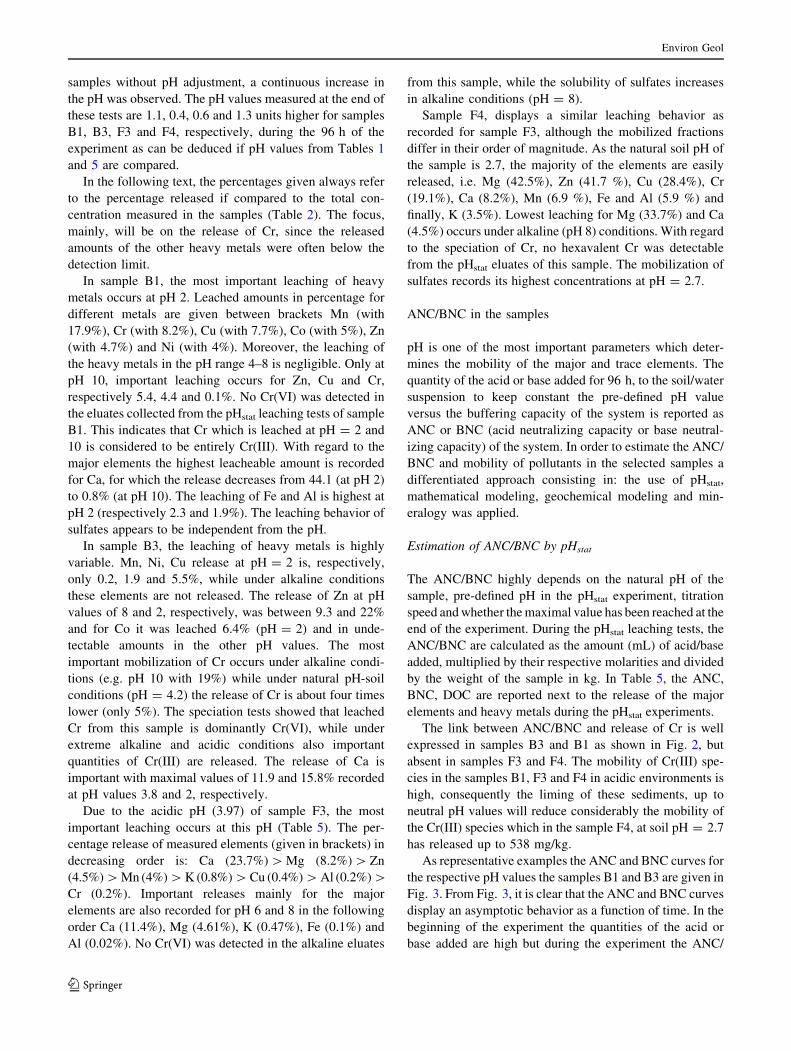
samples without pH adjustment, a continuous increase in
the pH was observed. The pH values measured at the end of
these tests are 1.1, 0.4, 0.6 and 1.3 units higher for samples
B1, B3, F3 and F4, respectively, during the 96 h of the
experiment as can be deduced if pH values from Tables 1
and 5 are compared.
In the following text, the percentages given always refer
to the percentage released if compared to the total con-
centration measured in the samples (Table 2). The focus,
mainly, will be on the release of Cr, since the released
amounts of the other heavy metals were often below the
detection limit.
In sample B1, the most important leaching of heavy
metals occurs at pH 2. Leached amounts in percentage for
different metals are given between brackets Mn (with
17.9%), Cr (with 8.2%), Cu (with 7.7%), Co (with 5%), Zn
(with 4.7%) and Ni (with 4%). Moreover, the leaching of
the heavy metals in the pH range 4–8 is negligible. Only at
pH 10, important leaching occurs for Zn, Cu and Cr,
respectively 5.4, 4.4 and 0.1%. No Cr(VI) was detected in
the eluates collected from the pHstat leaching tests of sample
B1. This indicates that Cr which is leached at pH = 2 and
10 is considered to be entirely Cr(III). With regard to the
major elements the highest leacheable amount is recorded
for Ca, for which the release decreases from 44.1 (at pH 2)
to 0.8% (at pH 10). The leaching of Fe and Al is highest at
pH 2 (respectively 2.3 and 1.9%). The leaching behavior of
sulfates appears to be independent from the pH.
In sample B3, the leaching of heavy metals is highly
variable. Mn, Ni, Cu release at pH = 2 is, respectively,
only 0.2, 1.9 and 5.5%, while under alkaline conditions
these elements are not released. The release of Zn at pH
values of 8 and 2, respectively, was between 9.3 and 22%
and for Co it was leached 6.4% (pH = 2) and in unde-
tectable amounts in the other pH values. The most
important mobilization of Cr occurs under alkaline condi-
tions (e.g. pH 10 with 19%) while under natural pH-soil
conditions (pH = 4.2) the release of Cr is about four times
lower (only 5%). The speciation tests showed that leached
Cr from this sample is dominantly Cr(VI), while under
extreme alkaline and acidic conditions also important
quantities of Cr(III) are released. The release of Ca is
important with maximal values of 11.9 and 15.8% recorded
at pH values 3.8 and 2, respectively.
Due to the acidic pH (3.97) of sample F3, the most
important leaching occurs at this pH (Table 5). The per-
centage release of measured elements (given in brackets) in
decreasing order is: Ca (23.7%) [ Mg (8.2%) [ Zn
(4.5%)[ Mn (4%)[ K (0.8%) [ Cu (0.4%) [ Al (0.2%)[Cr (0.2%). Important releases mainly for the major
elements are also recorded for pH 6 and 8 in the following
order Ca (11.4%), Mg (4.61%), K (0.47%), Fe (0.1%) and
Al (0.02%). No Cr(VI) was detected in the alkaline eluates
from this sample, while the solubility of sulfates increases
in alkaline conditions (pH = 8).
Sample F4, displays a similar leaching behavior as
recorded for sample F3, although the mobilized fractions
differ in their order of magnitude. As the natural soil pH of
the sample is 2.7, the majority of the elements are easily
released, i.e. Mg (42.5%), Zn (41.7 %), Cu (28.4%), Cr
(19.1%), Ca (8.2%), Mn (6.9 %), Fe and Al (5.9 %) and
finally, K (3.5%). Lowest leaching for Mg (33.7%) and Ca
(4.5%) occurs under alkaline (pH 8) conditions. With regard
to the speciation of Cr, no hexavalent Cr was detectable
from the pHstat eluates of this sample. The mobilization of
sulfates records its highest concentrations at pH = 2.7.
ANC/BNC in the samples
pH is one of the most important parameters which deter-
mines the mobility of the major and trace elements. The
quantity of the acid or base added for 96 h, to the soil/water
suspension to keep constant the pre-defined pH value
versus the buffering capacity of the system is reported as
ANC or BNC (acid neutralizing capacity or base neutral-
izing capacity) of the system. In order to estimate the ANC/
BNC and mobility of pollutants in the selected samples a
differentiated approach consisting in: the use of pHstat,
mathematical modeling, geochemical modeling and min-
eralogy was applied.
Estimation of ANC/BNC by pHstat
The ANC/BNC highly depends on the natural pH of the
sample, pre-defined pH in the pHstat experiment, titration
speed and whether the maximal value has been reached at the
end of the experiment. During the pHstat leaching tests, the
ANC/BNC are calculated as the amount (mL) of acid/base
added, multiplied by their respective molarities and divided
by the weight of the sample in kg. In Table 5, the ANC,
BNC, DOC are reported next to the release of the major
elements and heavy metals during the pHstat experiments.
The link between ANC/BNC and release of Cr is well
expressed in samples B3 and B1 as shown in Fig. 2, but
absent in samples F3 and F4. The mobility of Cr(III) spe-
cies in the samples B1, F3 and F4 in acidic environments is
high, consequently the liming of these sediments, up to
neutral pH values will reduce considerably the mobility of
the Cr(III) species which in the sample F4, at soil pH = 2.7
has released up to 538 mg/kg.
As representative examples the ANC and BNC curves for
the respective pH values the samples B1 and B3 are given in
Fig. 3. From Fig. 3, it is clear that the ANC and BNC curves
display an asymptotic behavior as a function of time. In the
beginning of the experiment the quantities of the acid or
base added are high but during the experiment the ANC/
Environ Geol
123

BNC curves gradually become saturated and towards the
end of the experiment an almost horizontal pattern is
observed. However, as can be seen in the pattern at pH 10
for sample B3 the plateau level of the BNC is not entirely
reached even after 96 h of the pHstat experiment. Moreover,
it is noteworthy to stress the fact that the high ANC
(pH = 2) of the lagoonal clays (sample B1; 818.2 mmol/
kg) contrasts with the lower ANC value of the pond sedi-
ments (sample B3; 398.5 mmol/kg; Fig. 3). The contrasting
ANC values illustrate the capacity of the lagoonal sediments
(B1) in neutralizing large amounts of the acid effluents.
The release pattern of Cr in samples B1 and B3 at pH 2
is selected due to the important mobilization of Cr under
acidic conditions. In sample B1 (Fig. 4a), trivalent Cr is
released starting from 0.5 h after the starting of the pHstat
experiment (12 mg/L) while towards the end of the
experiment the Cr(III) increases gradually until reaching
252 mg/L as shown at 96 h. In sample B3, Cr(VI) was the
only species released during the first 24 h, but latter on
until towards the end of the experiment (24–96 h), also
Cr(III) species were contributing to the total amount of Cr
released (Fig. 4b). This contribution can be assessed from
the difference between total chromium and Cr(VI). The
amount of Cr(III) varies between 1 mg/L at 24 h, 21 mg/L
at 48 h and up to 38 mg/L at 96 h of the pHstat experiment.
Mathematical modeling of ANC/BNC
In an attempt to infer whether ANC/BNC were fully
exhausted after the entire duration of the experiment, i.e.
96 h, the ANClong term and BNClong term were calculated as
the sum of their buffering capacities.
ANC=BNClong term ¼ BC1 þ BC2: ð3Þ
The estimation for the long term ANC and BNC was made
based on the modeling of the measured ANC and BNC
Fig. 2 Release of Cr in the four
selected samples in association
with the ANC and BNC values
in the respective samples. In
sample B3, the released Cr
species were Cr(VI) and Cr(III),
while from the other samples
only Cr(III) was released,
mainly under extreme acid
conditions (pH 2). The
rectangle indicates the leaching
of the Cr during the blank pHstat
Fig. 3 Example of ANC and BNC at different pH values of the pHstat in the samples B3 and B1, respectively
Environ Geol
123

(Cappuyns et al. 2004). Buffering capacities (BC), rate
coefficients (k), and measured and modeled ANC/BNC values
are given in Table 6. Measured and modeled values of ANC
and BNC of all the samples display relatively good fitting
(Table 6) and asymptotic behavior as a function of time.
The ANC and BNC at the respective pH values of 2 and
8 for sample B1 are nearly completely exhausted with
about 97.8 and 97.9%, respectively, to be consumed after
96 h according to the modeling (Table 6).
With respect to sample B3, the modeling suggests that
99.9% of the ANC at pH = 2 is exhausted by the end of the
experiment (96 h). As the set-point pH increases gradually
from 6 to 10 the contribution of the rapid buffer (BC1) to
the BNC increases from 64 mmol/kg (pH 6) up to
535 mmol/kg (pH 10). An illustration of the BNC curve
and the rapid and slow buffer constants (respectively, BC1
and BC2) versus time is shown in Fig. 5 for the sample B3
at pH 10. The constant (BC2) related to the slow buffer
appears to play an important role especially towards the
end of the experiment in this sample.
The exhaustion constants for sample F3, as calculated
from the BNC values for the 96 h pHstat are overestimated
from the model (103 and 108% at the respective pH values
6 and 8). This is due to the higher BNC values calculated
from the model (453 and 893 mmol/kg at pH values 6 and
8, respectively) if compared to the measured values (440
and 829 mmol/kg).
The BNC in sample F4 at pH 6 and 8 is not exhausted
since the modeling indicates that only 92 and 97%,
respectively, are consumed after 96 h. During the modeling
of the BNC in this sample, the contribution of the slow
buffer (BC2) at pH 6 and 8 (i.e. 200 and 252 mmol/kg,
respectively) appears to play an important role in such a
BNC pattern (Table 6).
The release of the major elements like Ca, Fe and Al
might give an idea with respect to the buffering mecha-
nisms taking place during the release of the heavy metals.
The amount of these elements released at pH 2 after 96 h is
given in Table 5. These data indicate that at pH = 2 dis-
solution of Fe- and Al-phases hardly contributes to the
ANC, with respective values below 2.1 and 1.8% of their
total concentrations, compared to up to 52% of the total Ca
concentration.
Mathematical modeling of the Cr release
In order to infer the contribution of the different Cr-bearing
mineralogical phases in the soluble forms, the release of
trivalent and/or hexavalent Cr was mathematically mod-
eled for the samples B1 and B3 (Table 7). However, notice
that the mathematical model overestimates the Cr(III)
released (135%) at pH 2 for sample B1.
For sample B3 at pH = 2, the release of total Cr is
estimated to be 94%, from which 98% corresponds to
Fig. 4 a, b Leaching of Cr-
species from samples B1 and B3
at pH 2 as a function of time in
comparison with the measured
ANC
Table 6 Buffer capacities (BC)
and rate coefficients (k)
calculated in MATLAB by
fitting the ANC/BNC curves
according to Eq. 1
The percentage of the
(calculated) ANC/BNC which
was exhausted after the 96 h of
the pHstat is expressed as
BCex% = (BC1 + BC2)/ANC
or BNC 9 100
Sample pHstat
values
BC1
(mmol/kg)
BC2
(mmol/kg)
k1
(per h)
k2
(per h)
R ANC/BNC BCex %
Modeled
(mmol/kg)
Measured
(mmol/kg)
B1 pH 2 222 579 0.70 0.06 0.996 801 819 97.8
pH 8 67 43 0.71 0.05 0.990 111 113 97.9
B3 pH 2 83 315 15.91 0.04 0.994 398 398 99.9
pH 6 64 82 0.62 0.01 0.997 146 127 115.5
pH 8 153 138 0.29 0.02 0.998 290 262 110.9
pH 10 535 380 0.08 0.01 0.997 916 830 110.3
F3 pH 6 163 290 0.80 0.04 0.997 453 440 103.0
pH 8 277 616 0.41 0.02 0.999 893 829 107.7
F4 pH 6 51 200 697.66 0.06 0.975 252 272 92.4
pH 8 179 252 32.53 0.07 0.984 432 445 96.9
Environ Geol
123

Cr(VI). In the other pH values, there is a trend towards the
increase of the BNC towards the end of the experiment,
while the release of Cr(VI) (in pH 6 and 8) contributes with
89.6 and 77% in the respective pH values. At pH 10, the
release of Cr corresponds to 71.8% of the total Cr, of which
67.4% corresponds to hexavalent Cr (Table 7). To be
noticed in Table 7, is the impact of the slow release
capacity (RC2) of Cr in the presence of both Cr species,
while when only Cr(VI) is present (i.e. B3, pH 6 and 8) the
rapid release capacity (RC1) appears to be of primary
importance.
Since in samples F3 and F4, Cr(III) was released only in
the natural acidic pH conditions but not during the pHstat,
the Cr release in the latter samples was not modeled.
Sediment acidification
Data from the pHstat leaching tests jointly with data from
acid deposition, allow to predict (in long term) the time
required for sediment acidification. To estimate the time
period (years) over which the ANC and BNC (data from
Table 5) might become exhausted the following equation is
used:
Time ðyearsÞ ¼ ANC96h or BNC96h mmol=kgð Þ3000 mmol acid=ha=yearð Þ�2 hað Þ
mass kg=hað Þð4Þ
The calculation was carried out for the upper surface
(20 cm) of an area of 2 ha (study area of Porto-Romano).
Knowing that changes in the buffering capacity due to
acidification normally occur in the uppermost layers, the
selection of 20 cm thickness is of relevance, however, the
depth of the sediments can be extended further if needed.
With respect to the bulk density, a value of 1.4 ton/m3 was
used. In 1989, the deposition of the total acid in Albania
was estimated to be around 3000 mmol/ha/year (EDACS
1995).
It is clear from the data in Table 8 that it would take
between 40 and 310 years to have substantial changes in
the pH of the studied sediments. If the ANC of the lagoonal
or pond sediments is high, (Table 8) more than 306 and
149 years, respectively are needed in order to have sub-
stantial changes to reach, i.e. pH = 2 in the lagoonal (B1)
Table 7 Release capacities
(RC) and rate coefficients (k)
calculated in MATLAB by
fitting the Cr total and Cr(VI)
concentrations according to
Eq. 2
The percentage of the
(calculated) ANC/BNC which
was exhausted after the 96 h of
the pHstat is expressed as
BCex% = (BC1 + BC2)/
Cr 9 100
Sample pHstat
values
Cr
released
RC1
(mmol/kg)
RC2
(mmol/kg)
K1
(per h)
K2
(per h)
R Cr RCex
(%)Modeled
(mg/kg)
Measured
(mg/kg)
B1 pH 2 Cr (III) 99 241 0.10 0.01 0.999 341 252 135.2
B3 pH 2 Cr total 131 295 3.14 0.07 0.979 426 453 94.0
Cr (VI) 106 277 51.15 0.10 0.981 383 391 97.8
pH 6 Cr (VI) 208 39 75.69 0.04 0.934 246 275 89.6
pH 8 Cr (VI) 234 152 1.60 0.03 0.969 387 502 77.0
pH 10 Cr total 69 413 42.88 0.09 0.991 482 671 71.8
Cr (VI) 74 341 52.66 0.11 0.986 415 615 67.4
Fig. 5 Example of the measured and mathematical modeled BNC
and buffering capacities in the sample B3 at pH 10, calculated
according to Eq. 1
Table 8 Estimation of time (years) to predict the effect of acidifi-
cation in the behaviour of these sediments (for more explanation see
text)
Sample pHstat values ANC/BNC measured
(mmol/kg)
Time calculated
(years)
B1 2 819 306
8 113 42
B3 2 398 149
4 230 86
6 127 47
8 262 98
10 830 310
F3 6 440 164
8 829 310
F4 6 272 102
8 445 166
Environ Geol
123

and pond (B3) sediments. However, pH changes and time
frame for possible changes highly depend on the natural pH
of the samples and the sewage of pollutants occurring in
the area. Moreover, important to be stressed is the fact that
the result in years should be used as an order of magnitude
rather than exact years (van Herreweghe et al. 2002).
Mineralogical phases and modeling
The characterization of the soluble phases was assessed by
a combination of the XRD and geochemical modeling
Visual MINTEQ 2.40 (Gustafsson 2006) jointly with the
respective pH values. The database from Visual MINTEQ
2.40 was used. The solubility of Cr from lagoonal sediment
B1 is rather low under normal conditions (pH 6 and 8) as
observed from the pHstat leaching test results (Table 5).
Under acidic (pH 2, 4) conditions Cr occurs mainly as Cr+3
(84%) and CrSO4+ (62%) while in the alkaline (pH 10) the
Cr occurs as soluble hydroxide chromium (i.e. Cr(OH)3(aq))
(Table 9). The XRD pattern of the lagoonal sediment B1
indicated that at different pH values the content of specific
phases changed due to pH changes in solution. The most
important dissolution taking place in this sample is the
partial dissolution of clays (especially clinochlore) along
all the pH range investigated and the formation of chromite
ore in the pH 8 and 10. The signature of gypsum in this
sample is rather low due to the dominant signature of
quartz, which is weakly dissolved (Fig. 6a).
In sample B3, the pH changes during the pHstat batch
tests are also reflected in the mineralogical composition
changes through the dissolution and formation of secondary
precipitates. In this sample, the partial dissolution of gyp-
sum occurs in the complete range of the studied pH values
as indicated in Fig. 6b, however, most distinctive dissolu-
tion occurs in the alkaline environment as shown also by
Visual MINTEQ 2.40 (Table 9). The dissolved sulfates
occur predominantly as SO42- (i.e. 20% at pH 2 until up to
80% at pH 10), or as CaSO4(aq) predominantly in the acidic
(pH 2; 42%) and almost neutral environments (pH 6; 40%).
From the mineralogical data it is clear that the Cr(VI)
occurs associated mainly with sodium (sodium chromate
and sodium dichromate). However, the dominant soluble
species differ depending on the pH. In acidic environments
(pH = 3.8), the hydrogenchromate (HCrO4-) is the pre-
dominant soluble specie accounting for up to 82% of the
total soluble hexavalent Cr, while in the alkaline environ-
ments the chromate anion (CrO42-) is the dominant form
increasing from 23?38?61% if the pH is increasing
from 6?8?10, respectively. The soluble chromatite
(CaCrO4(aq)) appears to play an important role in the alka-
line environment accounting for 39% (pH 10) and up to
62% (pH 8). Barium solubility depends on the presence of
Table 9 The content (in %) of the main species based on the geochemical modeling with Visual MINTEQ 2.40 of the different soluble phases
leached during the pHstat experiments
Components Species name Sample
B1 B3 F3 F4
pH 2 4 6 7.7 8 10 2 3.8 6 8 10 3.9 6 8 2.7 6 8
Cr(III) Cr3+ 83.8 23.0 47.1 16.3 16.5
Cr(OH)3 (aq) 95.3 95.7 96.0
Cr(OH)4- 4.6 5.1
CrOH2+ 0.4 9.8 0.2 6.1
CrSO4+ 15.9 61.4 52.7 72.3 82.9
CrOHSO4 (aq) 4.8
Cr2(OH)24+ 94.8
Cr(VI) CrO42- 0.4 22.8 37.8 61.0
HCrO4- 71.0 82.4 28.7 0.5
Cr2O72- 22.9 15.9 2.9
CaCrO4 (aq) 0.6 45.5 61.5 38.7
CrO3SO42- 5.9 0.7
Sulfates SO42- 9.8 49.6 54.3 59.3 50.3 96.9 19.5 64.7 54.8 60.4 80.2 37.3 62.4 73.7 33.8 58.3 62.8
CaSO4 (aq) 36.9 49.5 44.4 31.8 49.0 3.0 41.6 34.9 40.7 36.4 18.8 45.0 2.5 19.6 37.6 27.8 25.2
MgSO4 (aq) 11.4 10.7 6.0 10.4 12.4 10.2
AlSO4+ 38.7
Barite Ba+2 36.5 29.8 3.6 28.1 16.0 31.6 26.3
BaSO4 (aq) 63.0 69.7 96.3 71.9 83.9 68.4 73.7
Environ Geol
123

barite (BaSO4) and hashemite (BaCrO4) in the analyzed
sample and the isomorphic substitution of the SO42- for
CrO42- as well as on the dissolution/recrystallization cycles
of these mineralogical phases. From Visual MINTEQ 2.40
calculations (Table 9), the solubility of Cr(III) appears to be
important at (pH 2) occurring mainly as Cr+3 (47%) or as
CrSO4+ (53%). The source of Cr(III) in solution appears to
be related to the presence of chromite ores.
In acidic environments, the samples F3 and F4, Cr is
mainly (up to 83%) occurring as CrSO4+, while in alkaline
environments the dominant specie is Cr(OH)3(aq). The
solubility of sulfates differs in the pre-selected samples by
dissolving maximum quantities in the alkaline (sample F3)
and acidic (sample F4) environments (Table 9). The clays
appear to be unaffected by the different pH values, while
the content of anhydrite is likely to be affected by the pH.
Its peaks increase their intensity at pH values 6 and 8 in
sample F4 and only in pH 6 in sample F3 (Fig. 6c,d).
However, due to the low detection limit of the XRD
analysis (Fig. 6) and the low content of the chromium, the
solubility of the main Cr-species is difficult to be observed.
Thus, the use of the Visual MINTEQ 2.40 highlights the
mineralogical sources, which occur even in small quantities
as well as on the speciation of the soluble phases.
Implications for the on-site leaching
Worldwide there are a wide range of methods (especially
leaching tests) addressing the same question: how much
does a waste material leach under normal or simulated
conditions? For a better understanding of the leaching
behavior, the information on the behavior of the major
elements (like Fe, Al, Ca, etc.) is crucial as they dictate the
leaching environment for the trace contaminants (van der
Sloot et al. 2006). Thus, the use of a differentiated
approach to study the sites highly contaminated with
COPR-wastes has shown how combination of geochemical
analysis, leaching tests, mineralogical characterization,
mathematical and geochemical modeling can provide
valuable insights into the processes occurring on-site or
under simulated pH conditions. The modeling of the sol-
uble species in combination with the mineralogical
determinations have been used to provide a qualitative
assessment of the mineral phases present and the deter-
mination of the different contributors with respect to
dissolution and precipitation in the complex materials such
as COPR.
Mineral solubility and pH have been identified as key
factors in the retention and the release of the Cr(VI)O42-
Fig. 6 XRD patterns of the samples B1 (a), B3 (b), F3 (c) and F4 (d) before and after the pHstat tests with the respective pH values as indicated.
The XRD patterns from the pHstat tests are off set for clarity
Environ Geol
123

and Cr(VI)2O7- from the COPR-rich sediments. The
release of elements (except Cr(VI)), increases by
decreasing the pH. The key mineral phases responsible
for the fast release of the Cr are the chromate salts (i.e.
sodium chromate and sodium dichromate), while the
long-term retention and comparatively slow but still
considerable release of Cr(VI) are chromatite (CaCrO4)
and hashemite (BaCrO4). In the case of Cr(VI), the
decrease in the Cr(VI) concentration in the equilibrium
solution may be possibly due to both direct adsorption of
Cr(VI) on soil/sediment particles and the reduction of the
Cr(VI) to Cr(III) and its subsequent adsorption as shown
in Bolan et al. (2003). Since there was no evidence for
the adsorption of Cr(VI) by the soil, the decrease in the
concentration of Cr(VI) (sample B3) in the acidic envi-
ronments during the pHstat batch experiment was
attributed mainly to the reduction of Cr(VI) to Cr(III) and
its subsequent adsorption into sediment particles. This is
expressed by rather similar total concentrations of Cr
(Table 2) recorded in the lagoonal and pond sediments
(samples B1 and B3, respectively).
The solubility of Cr in solution is highly susceptible
to changes in pH. There is a higher release of Cr(III) in
the pH value 2, but there is almost no release of Cr(III)
in the alkaline environments. The low Cr(III) concen-
trations occurring in the natural to slight alkaline
environments were attributed mainly to the adsorption–
precipitation of Cr(III) because there was no evidence for
the oxidation of Cr(III) to Cr(VI). The oxidation of
Cr(III) to Cr(VI) has been reported to occur in soils and
the presence of the high valence Mn oxides is a pre-
requisite, to act as an electron acceptor for the reaction
to occur (Bartlett and James 1979; Fendorf and Zasoski
1992). Since the sediments in this study contained very
small amounts of Mn oxides, the oxidation of Cr(III) is
unlikely to occur.
The strongly buffered lagoonal clays (sample B1)
appear to be a significant natural barrier for the further
migration of the COPR-pollutants in depth. Moreover, due
to the high buffering capacity of the COPR-rich sediments,
considerable changes of the pH are, on a time scale of
decades, unlikely to occur under the existing field
conditions.
Conclusions
Based on the investigated lagoonal and pond sediments, the
use of pHstat leaching tests, the characterization of solid-
state by means of XRD and soluble-state by means of
geochemical modeling is possible to depict the following
conclusions:
– In general, the solubility of heavy metals is highly
susceptible to changes in pH (increase by decreasing
pH). Apart from pH, for Cr also speciation plays a
significant role in its solubility.
– The strongly buffered lagoonal clays (sample B1) are a
strong natural barrier for the further migration of the
pollutants (i.e. pond sediments and COPR-wastes) in
depth due to their low permeability. Moreover, due to
the high buffering capacity of these lagoonal sediments,
considerable changes of the pH are, on a time scale of
decades, unlikely to occur under the existing field
conditions as shown by the results from the sediment
acidification.
– However, if extreme acidic conditions (pH = 2) occur
in the lagoonal sediments (sample B1) at pH \ 4 will
enhance the leaching of only mainly Cr(III) species.
The release of Cr(III) in acidic conditions corresponds
to some extend to the dissolution of the iron oxides and
clays (Fe, Al, Ca and K), which are known to play an
important role in the adsorption of Cr precipitates
especially in the form of Cr(III) hydroxides.
– The release of the Cr(VI), Cr(III), SO42-, Ca, Mg, Fe
and other elements under natural or pre-defined pH
conditions, strongly depends on the dissolution of solid
phases from COPR-wastes.
– The limning of the Cr(VI)-rich pond sediments (sample
B3) will result in a higher concentrations of the Cr(VI)
soluble species, while their acidification will minimize
the solubility of the Cr(VI) species by four times. The
results from the pHstat batch leaching tests and
geochemical modeling suggest that leaching of Cr(VI)
can be increased by unsuitable treatments (such as
uncontrolled liming of the pond sediments).
– On contrary, the limning of the Cr(III)-rich pond
sediments (samples F3 and F4) will result in immobi-
lization of Cr(III) species in solution for all the duration
of the pHstat experiment.
– Mineral solubility has been identified as key factor in
the retention and release of the different Cr species
from the pond and lagoonal sediments. However, due
to the low detection limit of the XRD analysis the
solubility of different Cr containing species is diffi-
cult to be recorded accurately, thus the use of the
Visual MINTEQ 2.40 appears to help in the inves-
tigation of species partition, which occur even in
small quantities.
– The site-specific conditions of Porto-Romano play an
important role in the speciation/fractionation of dis-
solved different Cr-species. Thus, the mobility of the
different Cr species (i.e. Cr(VI), Cr(III)) and pH shall
be taken into account in the decision to remediate or
isolate this site.
Environ Geol
123

– Moreover, the findings reported here along with a
comprehensive presentation of Cr speciation and other
relevant data for these COPR-contaminated sites, may
also be significant with respect to the Cr behaviour and
the remediation of Cr-contaminated sites elsewhere in
the world.
Thus, improving the knowledge with respect to processes
controlling the release of Cr, the chemical speciation can
be addressed even in the most complex and heterogeneous
waste materials as is the case for COPR.
Acknowledgments This research is realized with the financial
support of the Katholieke Universiteit of Leuven, East European
Initiatives Project 3E000659.
References
Allison LE (1965) Organic carbon, Walkley–Black method. In: Black
CA (ed) Methods of soil analysis, part 2. American Society of
Agronomy. Madison, pp 1367–1378
Bartlett RJ, James BR (1979) Behaviour of chromium in soils: III
Oxidation. J Environ Qual 8/1:173–176
Bartlett RJ, James BR 1988. Mobility and availability of chromium in
soils. In: Nriagu JO, Nieboer E (eds) Chromium in natural and
human environments. Wiley, New York, pp 267–304
Bartlett RJ, Kimble JM (1976) Behavior of chromium in soils. II.
Hexavalent forms. J Environ Qual 5/4:383–386
Becquer T, Quantin C, Sciot M Boudot JP (2003) Chromium
availability in ultramafic soils from New Caledonia. Sci Tot
Environ 301:251–261
Bolan NS, Adriano DC, Natesan R, Koo BJ (2003) Effects of organic
amendments on the reduction and phytoavailability of chromate
in mineral soil. J Environ Qual 32:120–128
Buerge IJ, Hug SJ (1997) Kinetics and pH dependence of chro-
mium(VI) reduction by Fe(II). Environ Sci Technol 31/5:1426–
1432
Burke Th, Fagliano J, Goldoft M, Hazen RE, Iglewicz R, McKee Th
(1991) Chromite ore processing residue in Hudson Country, New
Jersey. Environ Health Perspect 92:131–137
Cappuyns V, Swennen R, Verhulst J (2004) Assessment of acid
neutralizing capacity and potential mobilization of trace metals
from land-disposed dredged sediments. Sci Tot Environ
333:233–247
Cheng KH, Gu J-D (2003) Reduction of chromate (CrO42-) by an
enrichment consortium and an isolate of marine sulfate-reducing
bacteria. Chemosphere 52:1523–1529
Deakin D, West LJ, Stewart DI, Yardley BWD (2001) The leaching
characteristics of chromite ore processing residue. Environ
Geochem Health 23:201–206
Dhimo LL, Haxhimarka A, Xhule M, Cara F, Pluger WL, Lausmann
M (1999) Albanian–German collaboration project. Geological
Survey of Albania (in Albanian)
EDACS (1995) EDACS: (European Deposition Maps of Acidifying
Components on a Small Scale). Model description and primary
results. National Institute of Public Health and Environmental
Protection, Bilthoven, The Netherlands. Report 722401005,
pp 21
Farmer JG, Graham MC, Thomas RP, Licona-Manzur C, Paterson E,
Campbell CD, Geelhoed JS, Lumsdon DG, Meeussen JCL, Roe
MJ, Conner A, Fallick AE, Bewley RJF (1999) Assessment and
modeling of the environmental chemistry and potential for
remediative treatment of chromium contaminated land. Environ
Geochem Health 21:331–337
Farmer JG, Paterson E, Begley RJF, Geelhoed JS, Hillier S, Meeussen
JCL, Lumsdon DJ, Thomas RP, Graham MC (2006) The
implications of integrated assessment and modeling studies for
the future remediation of chromite ore processing residue
disposal sites. Sci Tot Environ 360: 90–97
Farmer JG, Thomas RP, Graham MC, Geelhoed JS, Lumsdon DG,
Paterson E (2002) Chromium speciation and fractionation in
ground and surface waters in the vicinity of chromite ore
processing residue disposal sites. J Environ Monit 4:235–243
Fendorf SE (1995) Surface reactions of chromium in soils and waters.
Geoderma 67:55–71
Fendorf SE, Zasoski RJ (1992) Cr(III) oxidation by b-MnO2.
Characterization. Environ Sci Technol 26:79–85
Forstner U, Hasse I (1998) Geochemical immobilization of metallic
pollutants in solid waste—implications for arsenic in water
sludge. J Geochem Explor 58:185–194
Gee GW, Bauder JM (1986) Particle size analysis. In: Klute A (ed)
Methods of soils analysis. Part 1. Physical and mineralogical
methods. American Society of Agronomy and Soil Science
Society, Madison, pp 383–411
Geelhoed JS, Meeussen JCL, Hillier S, Lumsdon DG, Thomas RP,
Farmer JG, Paterson E (2002). Identification and geochemical
modeling of processes controlling leaching of Cr(VI) and other
major elements from chromite ore processing residue. Geochim
Cosmo Acta 66/22:3927–3942
Geelhoed JS, Meeussen JCL, Roe MJ, Hillier S, Thomas RP, Farmer
JG, Paterson E (2003) Chromium remediation or release? Effect
of iron(II) sulfate addition on chromium(VI) leaching from
columns of chromite ore processing residue. Environ Sci
Technol 37/14:3206–3213
Gustafsson JP (2006) VisualMINTEQ version 2.40. A chemical
equilibrium model for the calculation of metal speciation,
solubility equilibrium etc. for environmental systems. http://www.
lwr.kth.se/English/OurSoftware/vMINTEQ/index.htm
Hillier S, Roe MJ, Geelhoed JS, Fraser AR, Farmer JG, Paterson E
(2003) Role of quantitative mineralogical analysis in the
investigation of sites highly contaminated by chromite ore
processing residue. Sci Tot Environ 308:195–210
Hursthouse AS (2001) The relevance of speciation in the remediation
of the soils and sediments contaminated by metallic elements—
an overview and examples from Central Scotland, UK. J Environ
Monit 3/1:49–60
James BR (1994) Hexavalent chromium solubility and reduction in
alkaline soils enriched with chromite ore processing residue.
J Environ Qual 23:227–233
James BR (1996) The challenge of remediating chromium contam-
inated soil. Environ Sci Technol 30/6:248–251
McLeod N (2001) Chemical immobilization of chromium wastes
using modified smectite clays (e-clays). Environ Geochem
Health 23:273–279
Munsell (1997) Revised standard soil color charts. Eijkelkamp
Agriresearch Equipment
NEN 7349 (1995) Leaching characteristics of solid earthy and stoney
building and waste materials. Leaching tests. Determination of
the inorganic components from granular materials with the
cascade test, 1st edn. Nederland Normalisatie-Instituut (NEN)
February 1995, Delft, p 11
Palmer CD, Wittbrodt PR (1991) Processes affecting the remediation
of Chromium-contaminated sites. Environ Health Pros 92:25–
40
Paschke A, Wennrich R, Morgenstern P (1999) Comparison of the
24 h and long-term pHstat leaching tests for heavy metal
mobilization from solid matrices. Acta Hydrochim Hydrobiol
27:223–229
Environ Geol
123

Perron L (1995) Chromium. Canadian minerals yearbook. http://
www.nrcan;gc.ca/mms/cmy/content/1995/19.pdf
Robertson A, Shallo M (2000) Mesozoic-tertiary tectonic evolution of
Albania in its regional Eastern Mediterranean context. Techton-
ophysics 316:197–254
Sallaku F, Shallari S, Wegener HR, Henningsen PF (1999) Heavy
metals in industrial area of Elbasani. Bulg Agric Sci 3:85–92
Schwarz A, Wilcke W, Styk J, Zech W (1999) Heavy metal release
from soils in batch pHstat experiments. J Soil Sci Soc Am 63/
2:290–296
Shallari S, Schwartz C, Hasko A, Morel JL (1998) Heavy metals in
soils and plants of serpentine and industrial sites of Albania. Sci
Tot Environ 209:133–142
Shtiza A, Swennen R, Tashko A (2005a) Chromium and heavy metal
distribution in soil, dust, active river and overbank sediments
around the Burrel Chromium smelters (Albania). J Geochem
Explor 87:92–108
Shtiza A, Swennen R, Tashko A (2005b) Cr(VI) pollution of soils and
pond sediments at a former chemical industrial site in Porto-
Romano (Albania). In: Proceedings in Contaminated Soils
(ConSoil) International Congress, Bordeaux, France, pp 1309–
1318, 3–7 October 2005
Shtiza A, Swennen R, Tashko A (2008) Chromium speciation and
existing natural attenuation conditions in lagoonal and pond
sediments in the former chemical plant of Porto-Romano
(Albania). Environ Geol 53/3:1107–1128
Templeton DM, Ariese F, Cornelis R, Danielsson L-D, Muntau H,
van Leeuwen HP, Lobinski R (2000) Guidelines for terms
related to chemical speciation and fractionation of elements.
Definitions, structural aspects and methodological approaches.
Pure Appl Chem 72/8:1453–1470
Turner MA, Rust RH (1971) Effects of chromium on growth and
mineral nutrition of soyabeans. Am J Soil Sci Soc 35:755–758
USEPA (1995) Chromium hexavalent (Colorimetric). In: SW 846,
3rd edn. U.S. Environmental Protection Agency, Washington
DC
van der Sloot HA, Meeussen JCL, van Zomeren A, Kosson DS (2006)
Developments in the characterization of waste materials for
environmental impact assessment purposes. J Geochem Explor
88:72–76
van Herreweghe S, Swennen R, Cappuyns V, Vandecasteele C (2002)
Chemical associations of heavy metals and metalloids in
contaminated soils near former ore treatment plants: a differen-
tiated approach with emphasis on pHstat-leaching. J Geochem
Expl 76:113–138
van Reeuwijk LP (1992) Procedures for soil analysis, 3rd edn. ISRIC,
Wageningen
Vogel AI (1961) Nephelometric determination of sulfates. In: A text
book of quantitative inorganic analysis, 3rd edn. Longmans,
London, pp 850–851
Vogel AI (1968) Determination of chlorites in water samples by
colorimetry. In: A textbook of quantitative inorganic analysis,
1st edn. Longmans, London, p 809
Whalley C, Hursthouse A, Rowlat S, Iqbal-Zahid P, Vaughan H,
Durant R (1999) Chromium speciation in natural waters draining
contaminated land, Glasgow, U.K. Water Air Soil Pollut
112:389–405
Yassi A, Niober E (1988) Carcinogenity of chromium compounds. In:
Nriagu JO, Nieboer E (eds) Chromium in the natural and human
environments, vol 20. Wiley, New York, pp 514–530
Zayed AM, Terry N (2003) Chromium in the environment: factors
affecting biological remediation. Plant Soil 249:139–156
Zelfo L (1987) Determination of the pollution levels in the chemical
plant Durres and ways to reduce them. Institute of Studies and
Projection of Technological Chemistry (ISPTK), pp 16–25 (in
Albanian)
Environ Geol
123