analyzing school reform efforts in low-performing, high
186
THE TIPPING POINT OF TRANSFORMATION: ANALYZING SCHOOL REFORM EFFORTS IN LOW-PERFORMING, HIGH-POVERTY SCHOOLS Melissa A. Rasberry A dissertation submitted to the faculty of the University of North Carolina at Chapel Hill in partial fulfillment of the requirements for the degree of Doctorate of Education in the School of Education. Chapel Hill 2007 Approved by: Dr. Kathleen M. Brown, Committee Chair Dr. Fenwick English, Committee Member Dr. Diana Montgomery, Committee Member
-
Upload
khangminh22 -
Category
Documents
-
view
1 -
download
0
Transcript of analyzing school reform efforts in low-performing, high
THE TIPPING POINT OF TRANSFORMATION: ANALYZING SCHOOL REFORM EFFORTS IN LOW-PERFORMING,
HIGH-POVERTY SCHOOLS
Melissa A. Rasberry
A dissertation submitted to the faculty of the University of North Carolina at Chapel Hill in partial fulfillment of the requirements for the degree of Doctorate of Education in the School of Education.
Chapel Hill 2007
Approved by: Dr. Kathleen M. Brown, Committee Chair Dr. Fenwick English, Committee Member Dr. Diana Montgomery, Committee Member

ii
© 2007 Melissa A. Rasberry
ALL RIGHTS RESERVED
iii
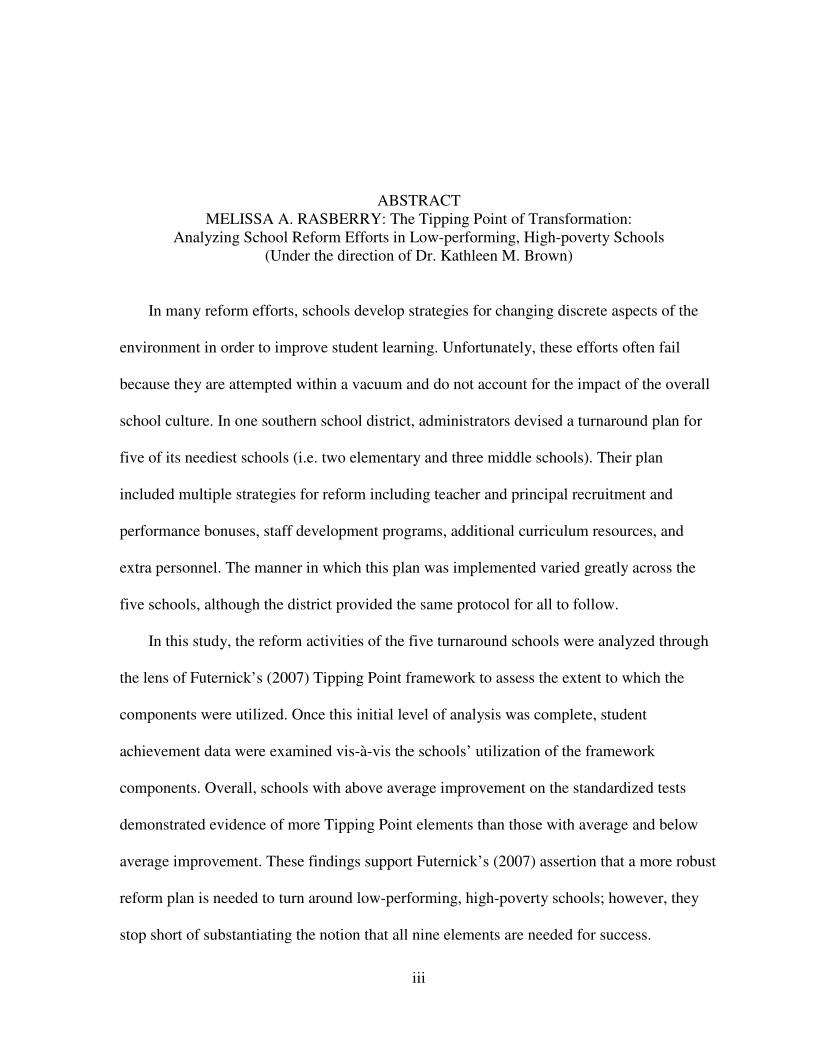
ABSTRACT MELISSA A. RASBERRY: The Tipping Point of Transformation:
Analyzing School Reform Efforts in Low-performing, High-poverty Schools (Under the direction of Dr. Kathleen M. Brown)
In many reform efforts, schools develop strategies for changing discrete aspects of the
environment in order to improve student learning. Unfortunately, these efforts often fail
because they are attempted within a vacuum and do not account for the impact of the overall
school culture. In one southern school district, administrators devised a turnaround plan for
five of its neediest schools (i.e. two elementary and three middle schools). Their plan
included multiple strategies for reform including teacher and principal recruitment and
performance bonuses, staff development programs, additional curriculum resources, and
extra personnel. The manner in which this plan was implemented varied greatly across the
five schools, although the district provided the same protocol for all to follow.
In this study, the reform activities of the five turnaround schools were analyzed through
the lens of Futernick’s (2007) Tipping Point framework to assess the extent to which the
components were utilized. Once this initial level of analysis was complete, student
achievement data were examined vis-à-vis the schools’ utilization of the framework
components. Overall, schools with above average improvement on the standardized tests
demonstrated evidence of more Tipping Point elements than those with average and below
average improvement. These findings support Futernick’s (2007) assertion that a more robust
reform plan is needed to turn around low-performing, high-poverty schools; however, they
stop short of substantiating the notion that all nine elements are needed for success.
iv
To my family, I cannot say enough how much your words of encouragement and praise
helped me through this educational journey. Ma, you are my biggest cheerleader and I will be
forever grateful for your love and patience. I know that Daddy is looking down on both of us
and feeling very proud of this accomplishment. Heather and Hailey, thank you for your
laughs, your emails, and your kindness. I am very appreciative that you could be there for me
on my special day.
To my TBD family (Adrian, Maya, Chris, Meagan, Melisha, and Kristal), thank you for
keeping me sane and making sure that I had fun along the way. I know that my friendships
with all of you will last a lifetime.
To my Reconciliation family, especially the Bakers and the Johnsons, thank you for your
prayers and support. You lifted my spirit and kept me fed (both physically and spiritually). I
praise God for finding such a wonderful church family to call my own.
And finally to my CTQ family (both past and present), thank you for helping me to learn
and grow as a professional. I am so very appreciative of the opportunities that I have been
afforded and the friends that I have gained in the process.
So to all of my families, I say once more … thank you! I close with these words from
gospel singer Marvin Sapp:
I would have lost it all … But now I see how you were there for me and I can say … I'm stronger, I'm wiser, I'm better … Much better. When I look back over all you brought me through … I can see that you were the one that I held on to … And I never … Never would have made it … Oh I never could have made it … Never could have made it without you.
v
ACKNOWLEDGMENTS
Many thanks are extended to Dr. Kathleen M. Brown for her outstanding mentorship and
guidance throughout my graduate studies. Kathleen, you are a true beacon of light as a
woman, as an educator, and as a scholar. Thank you for your undeniable patience and
understanding. Special gratitude is also extended to Dr. Fenwick English and Dr. Diana
Montgomery, who served as excellent committee members. The diversity of experience and
perspective that the two of you brought to the table provided an excellent balance for debate
and critique of my dissertation. Thanks so much for your support in this endeavor.
vi
TABLE OF CONTENTS
Page LIST OF TABLES................................................................................................................. xiii Chapter
I. INTRODUCTION .............................................................................................1
Statement of the Problem.......................................................................1
Purpose of the Study ..............................................................................4
Theoretical Framework..............................................................5
Research Questions....................................................................7
Definitions..................................................................................8
School Reform ...............................................................8
High-poverty Schools ....................................................9
Low-performing Schools ...............................................9
Tipping Point ...............................................................10
Delimitations and Limitations..................................................11
Significance of the Study.........................................................13
II. LITERATURE REVIEW & THEORETICAL FRAMEWORK.....................15
Introduction..........................................................................................15
Challenges Facing High-poverty Schools............................................16
Inadequate School Facilities ....................................................16
Adverse Community Conditions..............................................17
vii
Poor Teaching Quality .............................................................18
Low Student Achievement.......................................................19
High-poverty, High-performing Schools .....................20
School Reform .....................................................................................24
Futernick’s (2007) Perspective on Reform ..............................27
Gladwell’s (2002) The Tipping Point ..........................28
Theoretical Framework: Futernick’s (2007) Tipping Point Strategy .........................................................................33
Teams.......................................................................................34
Time .........................................................................................38
Physical Environment ..............................................................41
Class-size Reduction................................................................44
Autonomy and Shared Governance .........................................46
Leadership................................................................................49
A Well-rounded Curriculum....................................................52
External Support ......................................................................54
Parent/Community Involvement..............................................56
Summary..............................................................................................58
III. METHODOLOGY ..........................................................................................60
Introduction..........................................................................................60
Assumptions and Rationale for Mixed-Methods Design.....................60
The Role of the Researcher..................................................................62
Data Collection Procedures..................................................................64

viii
Research Design.......................................................................64
Research Questions..................................................................66
Sites and Sample ......................................................................67
Sites..............................................................................67
Sample..........................................................................70
Research Procedures ................................................................71
Semi-structured Interviews ..........................................71
Focus Groups ...............................................................73
Surveys.........................................................................75
Document Archival Review.........................................76
Data Analysis Procedures ........................................................76
Qualitative Data ...........................................................77
Quantitative Data .........................................................80
Methods of Verification...........................................................81
Qualitative Trustworthiness .........................................81
Quantitative Reliability and Validity ...........................82
Outcome of the Study and Its Relation to Theory and Literature ...........................................................................83
IV. DATA ANALYSIS..........................................................................................84
Introduction..........................................................................................84
Utilization of the Framework Components..........................................85
Utilization Subquestions ..........................................................89
Common Components .................................................89

ix
Components in High Utilization Schools ....................91
Framework Components and Student Achievement............................92
Student Achievement Subquestions.........................................97
Components in Above Average Improvement Schools ..................................................97
Components in Below Average Improvement Schools ..................................................99
Complete School Profiles ..................................................................100
School A.................................................................................100
Teams.........................................................................101
Time ...........................................................................102
Physical Environment ................................................103
Class-size Reduction..................................................104
Autonomy and Shared Governance ...........................104
Leadership..................................................................105
A Well-rounded Curriculum......................................106
External Support ........................................................107
Parent/Community Involvement................................107
School B.................................................................................109
Teams.........................................................................109
Time ...........................................................................110
Physical Environment ................................................111
Class-size Reduction..................................................113
Autonomy and Shared Governance ...........................113
x
Leadership..................................................................114
A Well-rounded Curriculum......................................116
External Support ........................................................116
Parent/Community Involvement................................117
School C.................................................................................118
Teams.........................................................................118
Time ...........................................................................120
Physical Environment ................................................120
Class-size Reduction..................................................120
Autonomy and Shared Governance ...........................121
Leadership..................................................................121
A Well-rounded Curriculum......................................122
External Support ........................................................123
Parent/Community Involvement................................123
School D.................................................................................124
Teams.........................................................................124
Time ...........................................................................125
Physical Environment ................................................126
Class-size Reduction..................................................126
Autonomy and Shared Governance ...........................127
Leadership..................................................................128
A Well-rounded Curriculum......................................129
External Support ........................................................130
xi
Parent/Community Involvement................................130
School E .................................................................................131
Teams.........................................................................131
Time ...........................................................................132
Physical Environment ................................................133
Class-size Reduction..................................................134
Autonomy and Shared Governance ...........................135
Leadership..................................................................136
A Well-rounded Curriculum......................................137
External Support ........................................................138
Parent/Community Involvement................................138
Conclusion .........................................................................................139
V. TESTING THE TIPPING POINT.................................................................141
Introduction........................................................................................141
Critique of the Framework.................................................................144
Recommendations for Further Study.................................................151
Additional Ideas for Study at the Five Identified Sites..........151
Opportunities for Exploration in Other Schools ....................152
Suggestions for Framework Development and Refinement ......................................................................152
Conclusion .........................................................................................153
APPENDICES ...............................................................................................154
A: School Profiles ..........................................................................................154
xii
B: Principal Interview Questions ...................................................................157
C: Teacher Focus Group Questions ...............................................................158
D: Online Survey Questions ..........................................................................159
E: Alignment of Futernick’s (2007) Tipping Point Framework with Extant Data .........................................................................161
F: IRB Application.........................................................................................162
REFERENCES ..............................................................................................167
LIST OF TABLES
Table Page
1. Utilization of Futernick’s (2007) Framework Components.................................................87
2. Evidence of Futernick’s (2007) Framework Components...................................................88
3. Improvement on Student Achievement Tests from 2003-04 to 2004-05 ............................94
4. Point Growth on Student Achievement Tests......................................................................95
5. Futernick’s (2007) Framework Components and Student Achievement.............................96
CHAPTER 1
INTRODUCTION
Statement of the Problem
In today’s world, students must be prepared to tackle complex problems by collaborating
with diverse colleagues, utilizing higher-order thinking skills, and embracing change to
create innovative solutions. The traditional 3 R’s of “reading, ‘riting, and ‘rithmetic” have
been replaced in the new millennium by “rigor, relevance, and relationships” (Bill & Melinda
Gates Foundation, 2007). Modern schools are responsible for ensuring that their students
receive a rigorous curriculum based upon lessons and activities that are relevant to their lives
through a network of genuine relationships with their teachers, administrators, and peers.
According to the United States Department of Education’s Office of the Secretary (2006),
twenty-first century schools must:
… help students develop the skills they will need to compete and succeed in higher education and the workforce, which are increasingly connected in this changed world. They must develop a pool of technically adept and numerically literate Americans to ensure a continual supply of highly trained mathematicians, scientists and engineers (p.9). The No Child Left Behind (NCLB) Act of 2001 put measures in place to guarantee that
all children, regardless of their zip code, receive the same high-quality education. Using a
high-stakes accountability model, NCLB now requires schools to demonstrate adequate
yearly progress on standardized tests in reading and mathematics for all student subgroups,
including the learning disabled, ethnic minority groups, English language learners, and
2
economically disadvantaged youth (United States Department of Education, Office of the
Secretary, 2006). Educators can no longer ignore pockets of their student population who
historically have lagged behind their White, middle class, English-speaking peers (McCall,
Hauser, Cronin, Kingsbury & Houser, 2006).
Unfortunately, from the rural Mississippi Delta to the inner city streets of Los Angeles,
schools with large populations of high-poverty students continue to struggle under the
pressures of high-stakes accountability (Alliance for Excellent Education, 2007; Doherty &
Abernathy, 1998). Student achievement is typically only one among numerous challenges
that these schools face, however (Kozol, 1991). Many suffer from antiquated buildings,
outdated materials, and insufficient learning tools (Peterson, 1994). Their students may lack
adequate health care and nutrition, manifesting in medical or dental problems such as asthma
and toothaches that can interfere with their performance (Rothstein, 2004). Their
communities may be ravaged by high rates of violence, crime, and unemployment (Kozol,
1991). Parents in these neighborhoods may also not take an active role in their children’s
education due to being addicted to drugs, working multiple low-wage jobs, or feeling
unwelcome in the school environment.
Labeled as failures, high-poverty schools turn to a variety of reform initiatives to
transform their learning environments and thereby, increase student achievement. With a
plethora of choices for reform, many school leaders feel overwhelmed and uncertain about
which models would work best for their particular context. Some adopt new literacy
strategies or begin tutoring programs, while others create professional learning teams. Still
more restructure the school schedule or institute shared governance and decision-making.
3
Rarely, however, do schools undergo comprehensive turnaround plans to revamp their entire
culture (Youngs & King, 2002).
After observing the efforts of high-poverty, low-performing schools in California, Ken
Futernick (2007) realized something had to change. In school after school, he witnessed
firsthand that even the most dedicated principals and teachers could not turn things around if
they followed a piecemeal approach. The introduction of a new curricular model or
instructional practice would only address one part of the problem. Futernick (2007) surmised:
If we look at the vast number of high-poverty schools that continue to fail decade after decade, we must admit that the remedies we’ve tried are capable of producing only limited results in most cases. No strategy that teachers, administrators, and educational reformers have tried suggests that we know how to produce dramatic and lasting change in the vast majority of these schools. What we haven’t tried, it seems, is a full-on, holistic approach that creates a context, all at once, for teachers and their students to succeed. If it really were possible to trigger social epidemics among teachers, and if we were willing to create highly supportive and professional environments for them to work in, then maybe it was possible to accomplish what many of us in California still believe is possible: a systematic (and systemic) turnaround of our low-performing schools into the thriving, high-performing learning environments we wish they could be (p.3).
As a basis for his new theory, Futernick (2007) extracted wisdom from the work of
Gladwell (2002). Inspired by the concepts of social epidemics in Gladwell’s (2002) seminal
book, The Tipping Point: How Little Things Can Make a Big Difference, Futernick (2007)
devised a Tipping Point plan for school reform that enveloped nine components of the school
community. The researcher pondered:
Could we really initiate social epidemics by motivating clusters of highly qualified teachers to transfer to struggling schools? If that were possible and if we offered them the right kind of administrative, community, and collegial support, couldn’t we jumpstart a process that would transform these schools into healthy and thriving higher performers? (Futernick, 2007, p.3-4).
4
Purpose of the Study
The purpose of this study was to examine the actions taken by high-poverty schools to
transform from low-performing learning environments to high-performing school cultures
(see Appendix A: School Profiles). Does change actually occur? If so, what contributes to a
school’s success or failure? Do schools vary in their progress, even if they are following the
same protocol for reform? To what can this variance be attributed? An extant data set
containing interviews and surveys from a sample of administrators and principals at five
turnaround schools in one southern school district was utilized for this multiple-case study.
Their responses to specific semi-structured interview and online survey questions were
analyzed according to a theoretical framework based on Futernick’s (2007) Tipping Point
strategy for reform.
Given the concrete nature of the turnaround plan used at these five sites, the researcher
hoped that an investigation into its effectiveness would shed light on the elements needed to
convert high-poverty schools into high-functioning cultures for teachers and students. In the
past, school leaders have simply been told to emulate successful schools without much
explanation as to how or why they became so effective. As Futernick (2007) notes:
We urge people in failing schools to imitate “outlier” schools—the few schools that succeed despite their demographics and what appears to be their fated story—but that advice has been of little help because it hasn’t provided the means for becoming an outlier. Some attempt bottom-up school redesigns that have shown promising results, but such initiatives have been difficult to sustain and even harder to replicate (p.3).
Futernick (2007) has attempted to rectify this situation by presenting nine components
that he believes are necessary to create a Tipping Point phenomenon in high-poverty schools.
What his model lacks, however, is clear explication of how these elements would actually be
5
organized in a real reform plan. The researcher admitted that his framework “lacks specificity
and local perspective;” therefore, “a more comprehensive plan should be constructed by local
stakeholders who understand the unique challenges that must be overcome in order to
achieve success” (Futernick, 2007, p.34). The turnaround plan developed by the targeted
district in this study represents one possible solution that has been tailored to meet the unique
contextual challenges of a large school system in the southern part of the United States. By
examining the actions taken by the five sites under the direction of this turnaround plan,
Futernick’s (2007) Tipping Point model was evaluated for its relevance and effectiveness in
creating high-poverty, high-performing schools.
Theoretical Framework
The nine components of Futernick’s (2007) Tipping Point for school reform provided
the theoretical framework for this study. Teams, time, physical environment, class-size
reduction, autonomy and shared governance, leadership, a well-rounded curriculum, external
support, and parent/community involvement must all be addressed, according to the
researcher, if high-poverty schools want to surmount the traditional challenges of inadequate
school facilities (Peterson, 1994), adverse community conditions (Kozol, 1991; Rothstein,
2004), poor teaching quality (Claycomb, 2000; Johnson & Birkeland, 2003; Ladson-Billings,
2001), and low student achievement (Alliance for Excellent Education, 2007; Johnson,
Kardos, Kauffman, Liu & Donaldson, 2004; McCall, Hauser, Cronin, Kingsbury & Houser,
2006). Just as “Gladwell illustrate[d] how situations in our everyday world can change
rapidly and unexpectedly under the right conditions,” Futernick (2007) aimed to delineate
how these same conditions for social epidemics could be replicated in schools in need of
massive reform (p.2). Part of the problem, he admitted, was that many educators and
6
members of the public at large have failed to realize that high-poverty schools can, in fact,
succeed. He provided this explanation:
Maybe the reason so few of these [high-poverty] schools are able to escape from a cycle of failure is our failure to recognize that a tipping point exists for them. Maybe after seeing so many reforms fail and so much money wasted, educators and the public alike have come to believe there really isn’t a way to overcome the economic realities preventing so many impoverished schools from succeeding (Futernick, 2007, p.3).
So why this discussion of comprehensive school reform? Districts across the country are
clamoring for answers about how to transform their high-poverty schools. The pressures of
NCLB have forced these school systems to look for solutions, in the form of plans and/or
models that can be adopted or adapted to meet the needs of their impoverished populations.
For example, the Clover Park School District outside Tacoma, Washington began a reform
initiative in 1995 to improve student achievement across the system, particularly in its Title I
schools. Armed with the belief that all children can learn at high levels (regardless of their
socioeconomic backgrounds), schools within Clover Park “embarked on a year-long study of
their status and research-based options” for improvement (Davis, Sagmiller & Hagans, 2001,
n.p.). After this intensive year of self-study and examination, several schools adopted popular
school reform models, such as Accelerated Schools, Paideia, and Success for All. The
leadership of Clover Park soon discovered, however, that these “models are tools to assist
schools [in] implement[ing] a comprehensive approach, and are not comprehensive on their
own” (Davis, Sagmiller & Hagans, 2001, n.p.). Thus, more work had to be done--from
scheduling to governance to budgeting--to ensure that successful change occurred.
Futernick’s (2007) Tipping Point model helps schools districts, such as Clover Park, by
providing extensive insight into the various elements of the school environment that must be
7
addressed to ensure true reform (see Chapter Two, Literature Review, for an in-depth
presentation of the Tipping Point framework and its nine essential components as the
theoretical perspective that will frame this study).
Research Questions
In this study of transforming high-poverty schools, two extant data sets were utilized.
The qualitative results of semi-structured administrator interviews and teacher focus groups
were described and analyzed, along with a quantitative data set of responses from an online
survey of educators’ perceptions of their working conditions. In addition, document archival
review was conducted to research the schools’ improvement on standardized achievement
tests (see Chapter Three, Methodology). Using Futernick’s (2007) Tipping Point framework
for school reform as the theoretical lens (see Chapter Two, Literature Review), the major
empirical questions addressed by this research deal with the implementation and
effectiveness of a turnaround plan to transform high-poverty schools. Two research questions
were examined: (1) To what extent did the schools utilize Futernick’s Tipping Point
framework components? (2) Were the schools that utilized a greater number of the Tipping
Point framework components more successful in improving student achievement on
standardized tests? Four subquestions were also addressed: (1a) Which components were
common across all schools? (1b) Which components were only present in schools with high
utilization? (2a) Which components were common only across schools with above average
improvement? (2b) Which components did schools with below average improvement lack?
Qualitative and quantitative data were aligned to the nine components of Futernick’s
(2007) Tipping Point design: teams, time, physical environment, class-size reduction,
autonomy and shared governance, leadership, a well-rounded curriculum, external support,
8
and parent/community involvement. The researcher examined all data for these distinctive
elements in order to assess each school’s utilization of the Tipping Point model. Afterwards,
the schools’ improvement on standardized tests was compared to their utilization levels.
Definitions
The words of everyday language are rich in multiple meanings. Like other symbols, their power comes from the combination of meaning in a specific setting…. Scientific language ostensibly strips this multiplicity of meaning from words in the interest of precision. This is the reason common terms are given “technical meanings” for scientific purposes (Firestone, 1987, p.17).
To reduce miscommunication from multiple meanings and to insure reader clarity, the
following four key terms are defined: school reform, high-poverty schools, low-performing
schools, and Tipping Point. Since these terms are utilized multiple times throughout this
study, it is imperative that their meanings be clear and concise to ease understanding and
facilitate comprehension.
School Reform
School reform encompasses a variety of strategies, models, and approaches promoted by
educators, researchers, and policymakers to improve schools. More succinctly, Tyack and
Cuban (1995) define it as “planned efforts to change schools in order to correct perceived
social and educational problems” (p.4). Prescribed frameworks, such as Core Knowledge or
Coalition of Essential Schools, are often adopted by schools to create massive change. On the
other hand, many schools and/or districts devise home-grown, organic reform models to
better meet their unique contexts. Regardless of the approach, “to varying degrees all [sound
school reform plans] are based on research, provide schools with a common vision, and deal
in some way with the critical areas of professional development, school organization, and
curriculum and instruction” (Northwest Regional Educational Laboratory, 2005, n.p.).
9
High-poverty Schools
High-poverty schools may be identified with varying proportions of children from low-
income homes relative to the overall context. In some places where the economy is sound,
high-poverty schools may only mean one quarter of the student population, whereas in other
locations with low rates of employment and weak tax bases, high-poverty may equate to
third-quarters or more of pupils. “Standard practice in the education literature [is to] …
measure poverty at the school level by the percentage of students who apply for and were
found eligible for the federally sponsored free lunch program (those with incomes below 130
percent of the poverty line)” (Clotfelter, Ladd, Vigdor & Wheeler, 2006, p.5). The federal
government further recognizes high-poverty schools by the number of Title I dollars
allocated. The largest share of resources are designated for school-wide Title I programs.
“Schools enrolling at least 40 percent of students from poor families are eligible to use Title I
funds for school-wide programs that serve all children in the school” (United States
Department of Education, Office of Communications and Outreach, 2006). For the purposes
of this study, the federal government’s minimum of 40 percent was used to demarcate the
lower threshold for designating high-poverty schools.
Low-performing Schools
School performance may be measured through a large number of educational outcomes,
ranging from graduation rates to SAT scores to standardized tests (Alliance for Excellent
Education, 2007). In today’s high-stakes world of No Child Left Behind, many people
identify schools as high- or low-performing simply by their ability to meet standards of
adequate yearly progress as determined by the federal government. In this particular study,
selection of low-performing schools was based on student performance on the Stanford
10
Achievement Test (SAT-10), a local and state requirement for testing and accountability for
the targeted sites. Regardless of the method for identification, low-performing schools
typically share several common challenges, including: being located in impoverished
communities where crime, violence, and distress are prevalent; lacking adequate financial,
human, and programmatic resources to support high-quality teaching and learning; dealing
with cultures of chaos and disorganization, which impede improvement; and having high
rates of student truancy and dropout (Doherty & Abernathy, 1998).
Tipping Point
In The Tipping Point: How Little Things Can Make a Big Difference, Gladwell (2002)
presented a detailed account of how social epidemics, such as fashion trends, crime waves,
and sexually transmitted diseases, spread their products and messages in a similar manner as
viruses proliferate the human body. Many people believe that change typically occurs one
incremental step at a time; however, Gladwell (2002) contended that more frequently,
unanticipated moments create a “tipping point” of change to make a lasting difference. The
author further elucidated his ideas by outlining the impact of three major elements: the Law
of the Few (that is, the people who help to initiate and sustain social epidemics); the
Stickiness Factor (the content and delivery of the message to be spread); and the Power of
Context (the outside factors which impede or facilitate the success of an epidemic). Upon
reading Gladwell’s (2002) seminal work, educational researcher Ken Futernick (2007)
applied the Tipping Point framework to the notion of transforming high-poverty schools and
identified nine components for inclusion in his model: teams, time, physical environment,
class-size reduction, autonomy and shared governance, leadership, a well-rounded
curriculum, external support, and parent/community involvement.
11
Delimitations and Limitations
Delimitations and limitations provide two parameters by which a research study
establishes the boundaries, exceptions, reservations, and qualifications inherent within its
design (Castetter & Heisler, 1977). More specifically, delimitations narrow the scope of a
study, whereas limitations identify potential weaknesses (Creswell, 2003). In order to
properly delineate these parameters, several delimitations and limitations must be addressed
in this proposal.
While many high-poverty schools across the country have attempted to convert their
learning environments from low-performing to high-performing cultures, this study only
examined a set of schools which underwent a comprehensive turnaround plan designed by
their large district in the southern region of the United States. The focus on these five sites,
two of which housed elementary-aged students (grades kindergarten through five) and three
of which served middle schoolers (grades six through eight), may cause the findings to be
irrelevant at the high school level (grades nine through twelve). Similarly, schools found in
smaller, less financially advantaged systems may find difficulty in relating to the results, due
to the massive amount of resources (i.e. physical and fiscal) poured into the turnaround plan.
The small sample population of educators interviewed further narrowed this study’s
scope. All administrators participated in one-on-one interviews to gather their thoughts,
opinions, and perceptions. On the other hand, teachers only had the opportunity to discuss
their ideas and concerns in a focus group setting. In two of the five locations, only three
teachers participated in these interviews. This limited the insights gained from these
particular sites. Additionally, the failure of one school’s teachers to participate in the online
survey further reduced the availability of information upon which to base this investigation,
12
as did the overall lack of relevant survey questions for certain framework components (i.e.
teams, a well-rounded curriculum, external support, and parent/ community involvement).
Data for this study were collected after only one year of implementation, another
limitation of the research. Some might argue that little improvement would be evident after
just one year of reform; however, the current culture of high-stakes accountability requires
schools to make rapid transformations. If schools are unable to produce immediate results,
they may lose funding and/or support for reform. Therefore, while this may be classified as a
limitation, it is also a reality for today’s educators.
Because this mixed-methods design included qualitative research, critics may identify
the study’s transferability or generalizability as a weakness or limitation. Some could argue,
for instance, that the findings may be open to other interpretations, rather than the ones to be
generated for this study. This may be true; however, it is important to remember that the
researcher drew conclusions only by using Futernick’s (2007) Tipping Point model for
school reform as the theoretical framework. No other lens was applied or analyzed within
this research design.
To counterbalance this limitation of transferability, the researcher utilized mixed-
methods strategies for within-case and multiple-case sampling to triangulate the results.
Qualitative interview and focus group data were supplemented by quantitative survey results
to provide a “more complete, holistic, and contextual portrayal of the unit(s) under study”
(Jick, 1979, p.603). The multisite design strengthened the ability to generalize by providing
various settings in which to test Futernick’s (2007) Tipping Point framework. By addressing
the same research questions in a number of settings using similar data collection and analysis
13
procedures, the researcher built a strong case for utilizing and applying the results across
diverse venues.
Significance of the Study
If students of poverty are ever to achieve at rates commensurate with their more
advantaged peers, schools across America must find a way to meet their social, emotional,
and academic needs. Educators have a moral imperative to ensure that all students succeed,
regardless of their socioeconomic backgrounds (Fullan, 2003). This study’s focus on one
district’s efforts to transform five historically underachieving schools helps to shed light on
the necessary steps to undergo massive reform. The results are important for several reasons.
First, school systems, like the one in this investigation, are desperately searching for
“silver bullets” to transform their schools of poverty from low-performing learning
environments to high-performing cultures. Unfortunately, the answers on how to get from
point A to point B are not always obvious:
Though there is an impressive body of literature that describes how these so-called ‘outlier’ schools operate, simply telling (or expecting) struggling schools to act like them does little good. The problem is that policy makers and educators do not know how to jump-start the process of turning failing schools into outliers (Futernick, 2007, p.11).
By clearly elucidating the multi-layered approach followed by the five schools in this study
and its relationship to Futernick’s (2007) Tipping Point framework, the researcher provides
districts with a better understanding of the complexities inherent within the reform process.
While the intent of this particular study was not to provide a “how to” guide for school
reform, the findings may help school leaders to initiate their own plans for turnaround.
Second, this study also provides a blueprint for policymakers to reference in creating
policies conducive for reform. While schools and districts may be able to independently
14
make progress, their efforts will be in vain if the overall policy context within which they
operate does not support and sustain change. Local, state, and national policymakers can
identify roadblocks to reform and implement strategies to alleviate these obstacles through
the examination of Futernick’s (2007) nine Tipping Point components. It is critical that
policymakers take action to thwart these challenges because schools will inadvertently revert
back to the status quo if supportive policies are not in place. Futernick (2007) warns, “unless
[failing schools] can be improved to a point of stability, most will eventually return to their
prior state of dysfunction. In fact, they may be worse off than before…. Offering some help
may be the equivalent of offering no help” (p.10). Policymakers can learn more about what
and how to help high-poverty schools through the conclusions drawn from this study’s
questions and subquestions:
(1) To what extent did the schools utilize Futernick’s Tipping Point framework
components?
(1a) Which components were common across all schools?
(1b) Which components were only present in schools with high utilization?
(2) Were the schools that utilized a greater number of the Tipping Point framework
components more successful in improving student achievement on standardized tests?
(2a) Which components were common only across schools with above average
improvement?
(2b) Which components did schools with below average improvement lack?
CHAPTER 2
LITERATURE REVIEW AND THEORETICAL FRAMEWORK
Introduction
Nearly twenty-five years ago, the National Commission on Excellence in Education
(1983) released A Nation at Risk: The Imperative for Education Reform. Since that time,
Americans from all walks of life, including politics, business, education, and the general
public, have relentlessly fought for better schools and quality teaching by demanding that
federal, state, and local governments support the improvement of public education through
increased funding and higher accountability standards (The Teaching Commission, 2004;
National Education Commission on Time and Learning, 2005). Numerous programs and
initiatives, such as the ABC’s of Public Education in North Carolina and the federal
government’s No Child Left Behind (NCLB) Act, have been introduced during the past two
decades to solve this crisis.
While great strides have been made in the twenty years that these programs have been in
place, some students continue to face harsh challenges, simply because of their home zip
code and the school to which they are assigned. Schools with large populations of high-
poverty students face the brunt of these challenges; consequently, educators in these
impoverished communities constantly search to find proactive solutions to meet the needs of
their students. In this chapter, the literature related to school reform will be reviewed,
including its inherent challenges and its potential solutions. The reader will be presented with

16
a detailed description of the status of high-poverty schools in America, as well as an
overview of the approaches proposed for transforming impoverished, low-performing
schools. The last portion of the chapter will be devoted to explicating Futernick’s (2007)
Tipping Point strategy for school reform in high-poverty schools, the theoretical framework
for which the data in this study will be reviewed and analyzed.
Challenges Facing High-poverty Students
Pockets of impoverished children, mostly situated in large urban or remote rural areas,
attend schools which perpetually rank low in student achievement (Doherty & Abernathy,
1998). These low-income schools, such as the ones targeted for this study, face a variety of
obstacles in meeting the diverse needs of their students, such as inadequate school facilities,
adverse community conditions, poor teaching quality, and low student achievement. In the
sections that follow, the reader will better understand these distinct challenges and their
impact on school reform efforts.
Inadequate School Facilities
For inner city schools in urban areas, the larger district structure presents many barriers.
“Often, [these high-poverty schools] are part of a large, centralized bureaucracy that may be
slow to respond to the needs of schools. Resources are scarce, and many buildings are in
disrepair” (Peterson, 1994, p.1). Walls may be in need of fresh paint, windows may be
inadequately insulated, and heating/air conditioning systems may function poorly (if at all).
Teachers may lack the physical resources they need for instruction, such as lab tables,
science equipment, and up-to-date books. Students may be forced to sit in uncomfortable, old
furniture and to utilize unkempt, rusty bathroom facilities. Overall, the facilities pale in
comparison to those available in suburban communities.
17
Kozol (1991) has spent decades visiting schools with similar conditions. For instance, in
East St. Louis, the staff and students at Martin Luther King Junior High School had to
contend with the aftermath of a sewage backup three times in one year. Raw waste flowed
into the basement, through the floor, and then into the school cafeteria, causing the building
to be closed. At Public School 261 in District 10 of the New York City Public Schools, over
1300 pupils attended school in a former roller-skating rink. The windowless building was
located on a crowded street, hidden by the traffic and an elevated public transit line.
“Textbooks are scarce and children have to share their social studies books … the carpets are
patched and sometimes taped together to conceal an open space” (Kozol, 1991, p.86).
Because of these inadequate school facilities, high-poverty students are often ill-equipped in
meeting state and federal standards for success.
Adverse Community Conditions
A significant portion of the student population in impoverished schools lives in
communities where drug use, gang activity, and crime run rampant--a second challenge to
school reform. Some children choose to stay inside, rather than play in the streets for fear of
random gunshots. Others get pulled into the illegal activities. As one teacher told Kozol
(1991), “At eight years old, some of the boys are running drugs and holding money for the
dealers. By 28, they’re going to be dead” (p.182).
If students manage to escape the crime of their neighborhoods, many are crippled by the
other decrepit conditions of living below middle class standards. “Students come to school
carrying the burdens of poverty, hunger, and poor housing” (Peterson, 1994, p.1). They fight
daily with medical problems stemming from inadequate prenatal and pediatric health care
(Rothstein, 2004). “I have seen children in New York,” says Kozol (1991), “with teeth that
18
look like brownish, broken sticks. I have also seen teenagers who were missing half their
teeth” (p.21). In addition to dental woes, many children of poverty suffer from other medical
problems, including asthma, diabetes, and lead poisoning. A school nurse in New Jersey
explained, “Many kids have chronic and untreated illnesses. I had a child in here yesterday
with diabetes. Her blood-sugar level was over 700 … close to coma level” (Kozol, 1991,
p.138).
One major reason for the omnipresent health problems in low-income communities is
the lack of adequate medical care. With fewer doctors available than in the suburbs, children
face longer recovery periods for even the most common ailments. More days of school are
missed as a consequence. According to Rothstein (2004):
There are fewer primary-care physicians in low-income communities, where the physician-to-population ratio is less than a third the rate in middle-class communities. For that reason, disadvantaged children--even those with health insurance--are more likely to miss school for relatively minor problems, such as common ear infections, for which middle-class children are treated promptly (p.20).
Without a supportive community infrastructure, children of poverty have a difficult time
reaching the same levels of success as their more advantaged peers. Although schools cannot
control the home environments of their pupils, they must find ways to meet their academic,
as well as social, emotional, and physical needs.
Poor Teaching Quality
Unfortunately, the troubles do not end there for students in high-poverty schools.
Another obstacle to school reform is the substandard teaching quality found in these
buildings. While the federal government pushes districts to ensure “highly qualified teachers”
for all students, school leaders in impoverished areas must often settle for a warm body in the
classroom (Claycomb, 2000). Data indicate that youngsters in these schools are more likely
19
to be taught by inexperienced and underprepared teachers (Berry, 2004). In fact, a recent
analysis of federal statistics revealed that poor high school students were twice as likely as
their more advantaged classmates to be taught key subjects by teachers not certified in those
fields (Schouten & Bivens, 2002).
Many teachers enter the school doors in low-income communities lacking formal
preparation with emergency teaching certificates, while others are licensed, yet assigned to
classrooms for which they are not qualified to teach. Even those with a degree in education
are rarely prepared to work with such diverse, high-poverty populations (Ladson-Billings,
2001). It should come as no surprise that a large number of teachers in low-income schools
struggle to understand the complexities of their pupils’ lives outside of school and the
ramifications that their impoverished environments have on their learning. As a result, one in
five new teachers leave the classroom within the first three years of employment,
perpetuating the cycle of teacher turnover in these underserved contexts (Johnson &
Birkeland, 2003). Because of this constant revolving door, high-poverty schools struggle to
provide their students with high-quality instruction from caring, competent teachers.
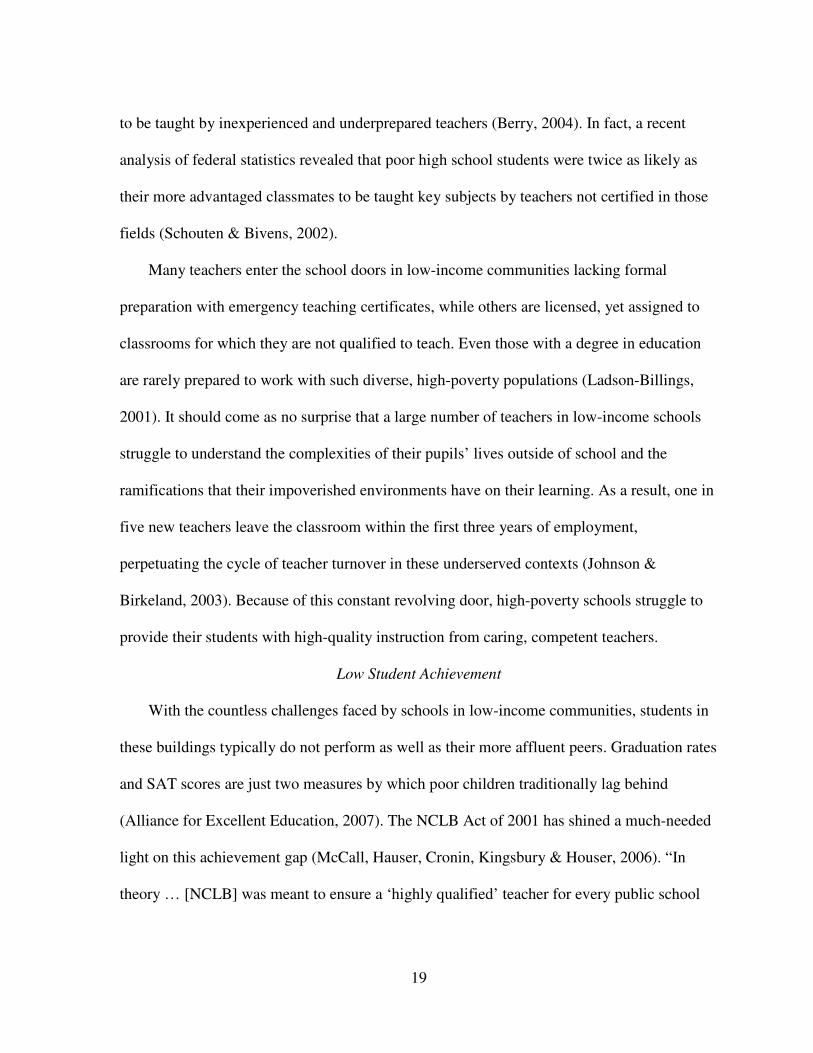
Low Student Achievement
With the countless challenges faced by schools in low-income communities, students in
these buildings typically do not perform as well as their more affluent peers. Graduation rates
and SAT scores are just two measures by which poor children traditionally lag behind
(Alliance for Excellent Education, 2007). The NCLB Act of 2001 has shined a much-needed
light on this achievement gap (McCall, Hauser, Cronin, Kingsbury & Houser, 2006). “In
theory … [NCLB] was meant to ensure a ‘highly qualified’ teacher for every public school
20
student, regardless of that student’s socioeconomic status” (Johnson, Kardos, Kauffman, Liu
& Donaldson, 2004).
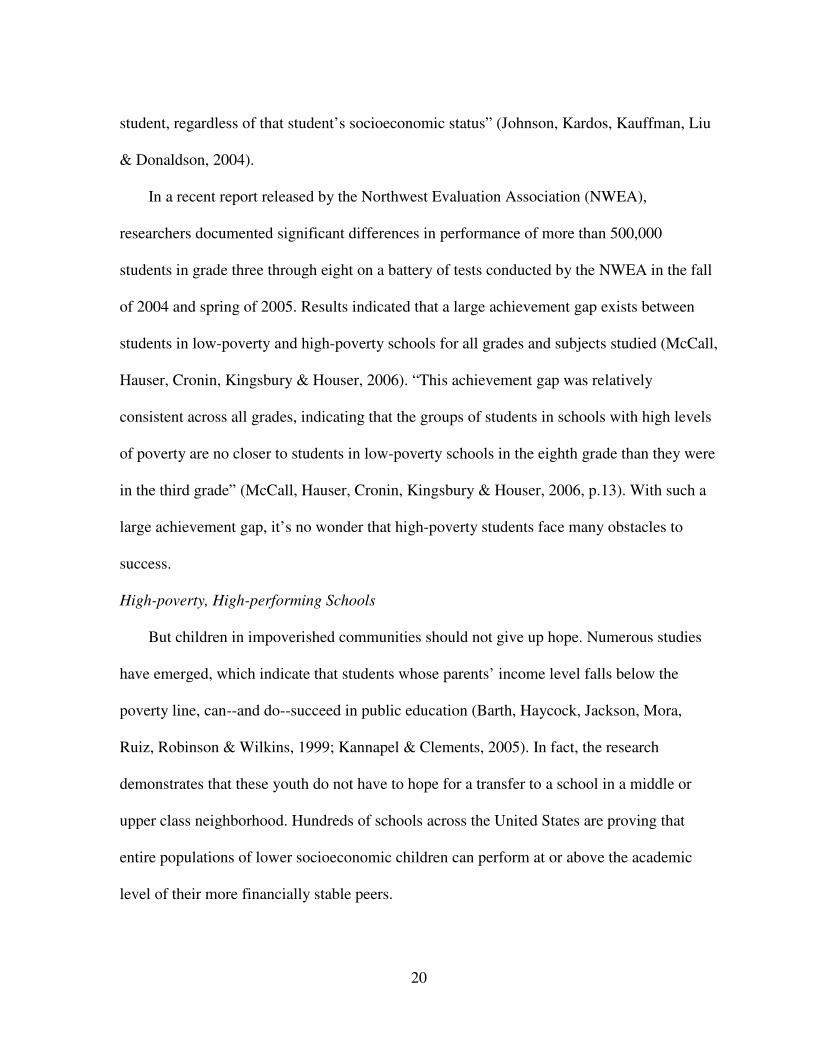
In a recent report released by the Northwest Evaluation Association (NWEA),
researchers documented significant differences in performance of more than 500,000
students in grade three through eight on a battery of tests conducted by the NWEA in the fall
of 2004 and spring of 2005. Results indicated that a large achievement gap exists between
students in low-poverty and high-poverty schools for all grades and subjects studied (McCall,
Hauser, Cronin, Kingsbury & Houser, 2006). “This achievement gap was relatively
consistent across all grades, indicating that the groups of students in schools with high levels
of poverty are no closer to students in low-poverty schools in the eighth grade than they were
in the third grade” (McCall, Hauser, Cronin, Kingsbury & Houser, 2006, p.13). With such a
large achievement gap, it’s no wonder that high-poverty students face many obstacles to
success.
High-poverty, High-performing Schools
But children in impoverished communities should not give up hope. Numerous studies
have emerged, which indicate that students whose parents’ income level falls below the
poverty line, can--and do--succeed in public education (Barth, Haycock, Jackson, Mora,
Ruiz, Robinson & Wilkins, 1999; Kannapel & Clements, 2005). In fact, the research
demonstrates that these youth do not have to hope for a transfer to a school in a middle or
upper class neighborhood. Hundreds of schools across the United States are proving that
entire populations of lower socioeconomic children can perform at or above the academic
level of their more financially stable peers.
21
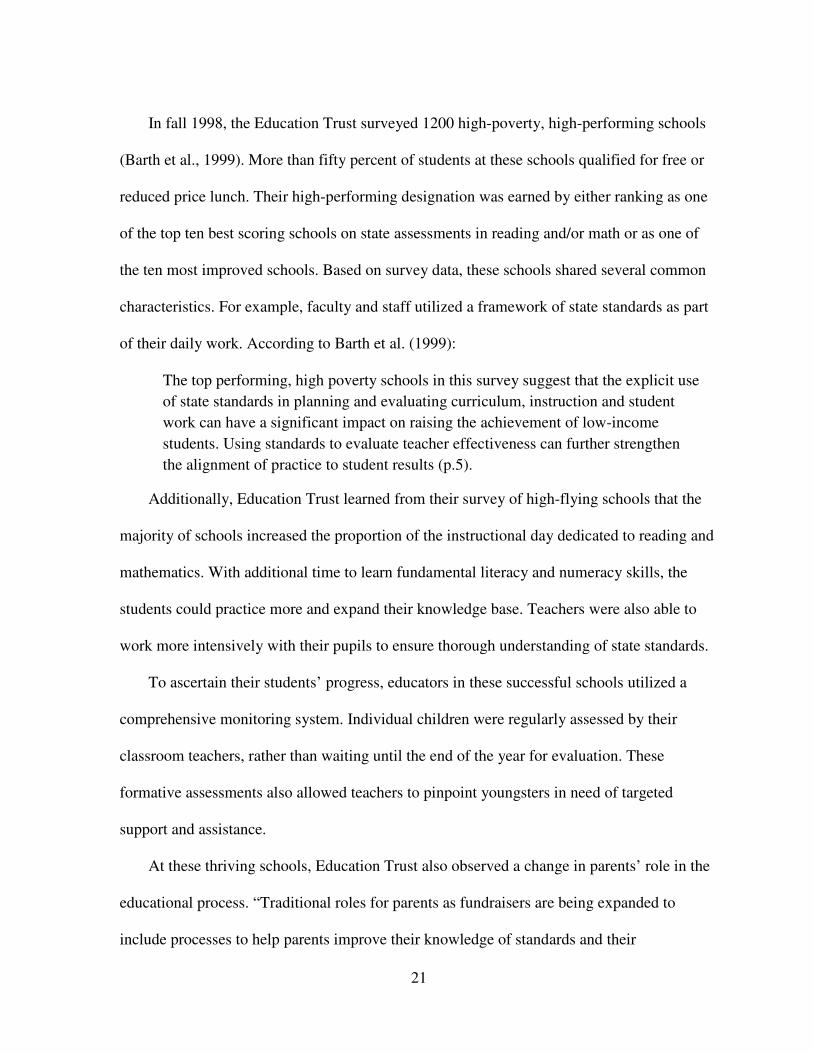
In fall 1998, the Education Trust surveyed 1200 high-poverty, high-performing schools
(Barth et al., 1999). More than fifty percent of students at these schools qualified for free or
reduced price lunch. Their high-performing designation was earned by either ranking as one
of the top ten best scoring schools on state assessments in reading and/or math or as one of
the ten most improved schools. Based on survey data, these schools shared several common
characteristics. For example, faculty and staff utilized a framework of state standards as part
of their daily work. According to Barth et al. (1999):
The top performing, high poverty schools in this survey suggest that the explicit use
of state standards in planning and evaluating curriculum, instruction and student
work can have a significant impact on raising the achievement of low-income
students. Using standards to evaluate teacher effectiveness can further strengthen
the alignment of practice to student results (p.5).
Additionally, Education Trust learned from their survey of high-flying schools that the
majority of schools increased the proportion of the instructional day dedicated to reading and
mathematics. With additional time to learn fundamental literacy and numeracy skills, the
students could practice more and expand their knowledge base. Teachers were also able to
work more intensively with their pupils to ensure thorough understanding of state standards.
To ascertain their students’ progress, educators in these successful schools utilized a
comprehensive monitoring system. Individual children were regularly assessed by their
classroom teachers, rather than waiting until the end of the year for evaluation. These
formative assessments also allowed teachers to pinpoint youngsters in need of targeted
support and assistance.
At these thriving schools, Education Trust also observed a change in parents’ role in the
educational process. “Traditional roles for parents as fundraisers are being expanded to
include processes to help parents improve their knowledge of standards and their
22
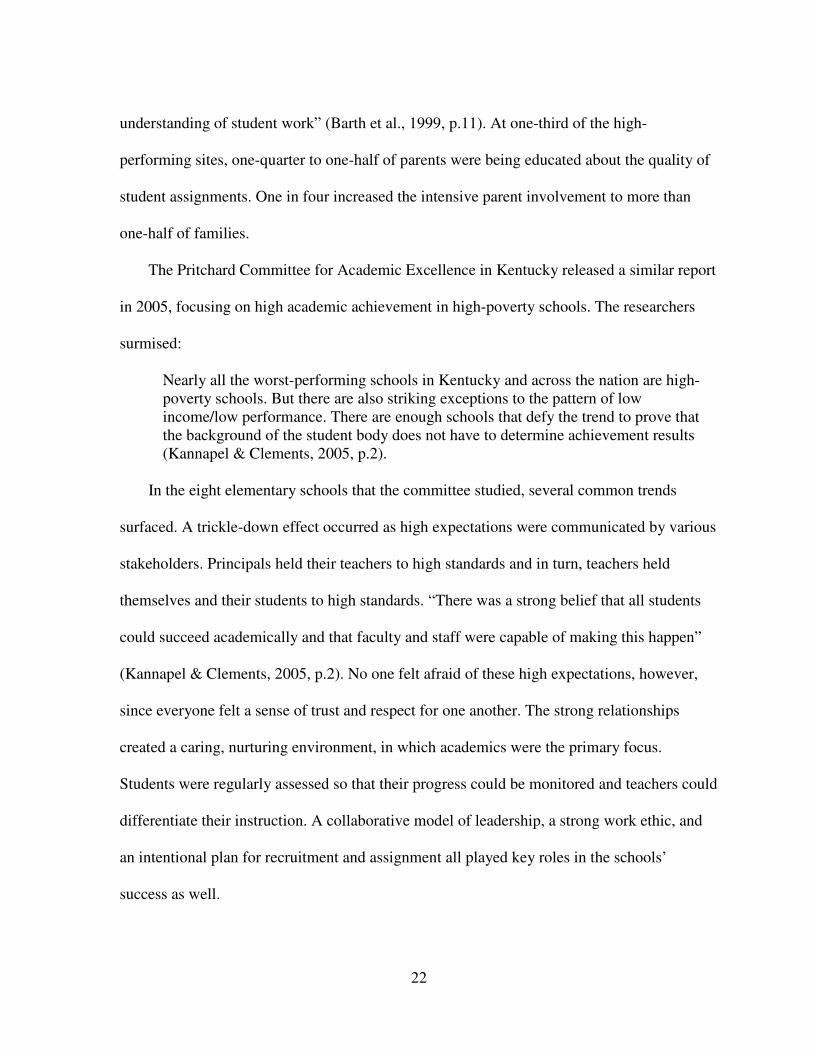
understanding of student work” (Barth et al., 1999, p.11). At one-third of the high-
performing sites, one-quarter to one-half of parents were being educated about the quality of
student assignments. One in four increased the intensive parent involvement to more than
one-half of families.
The Pritchard Committee for Academic Excellence in Kentucky released a similar report
in 2005, focusing on high academic achievement in high-poverty schools. The researchers
surmised:
Nearly all the worst-performing schools in Kentucky and across the nation are high- poverty schools. But there are also striking exceptions to the pattern of low income/low performance. There are enough schools that defy the trend to prove that the background of the student body does not have to determine achievement results (Kannapel & Clements, 2005, p.2).
In the eight elementary schools that the committee studied, several common trends
surfaced. A trickle-down effect occurred as high expectations were communicated by various
stakeholders. Principals held their teachers to high standards and in turn, teachers held
themselves and their students to high standards. “There was a strong belief that all students
could succeed academically and that faculty and staff were capable of making this happen”
(Kannapel & Clements, 2005, p.2). No one felt afraid of these high expectations, however,
since everyone felt a sense of trust and respect for one another. The strong relationships
created a caring, nurturing environment, in which academics were the primary focus.
Students were regularly assessed so that their progress could be monitored and teachers could
differentiate their instruction. A collaborative model of leadership, a strong work ethic, and
an intentional plan for recruitment and assignment all played key roles in the schools’
success as well.
23
Kannapel and Clements (2005) observed another important characteristic of high-
poverty, high-performing schools. “Faculty did not make an issue of the fact that many of
their students were ‘in poverty.’ Disadvantaged students appeared to be treated in
fundamentally similar ways as advantaged students” (Kannapel & Clements, 2005, p.4). This
finding is particularly revealing since a recent study conducted by the Public Education
Network (2003) cited poverty as having more of an effect on teacher performance and
student learning than racial or cultural diversity.
Delpit (1995) shared similar sentiments, based on her experiences in working with
teachers of various ethnic backgrounds across the country. Through her research, she found
that teachers were not always able to work effectively with students of their same race who
came from different socioeconomic backgrounds. “The middle-class African-American
teachers who do not identify with the poor African-American students they teach may hold
similarly damaging stereotypes” (Delpit, 1995, p.xiv). Unlike the teachers at the Pritchard
schools, the majority of teachers Delpit (1995) observed simply did not know how to reach
poor children. Unfortunately, “despite their good intentions, many teachers who work with
students of backgrounds different from their own have limited experience in teaching them
and become frustrated and angry at the conditions in which they work” (Nieto, 2003, p.15).
These studies of high-poverty, high-performing schools provide hope to students,
teachers, and administrators who all strive to find ways to improve student achievement in
impoverished communities. While the data presented in this section offer evidence of what
these schools can--and do--achieve, they provide only a cursory overview of how other
schools can replicate their success. In the section that follows, school reform will be
examined in more detail, along with examples of comprehensive school reform programs

24
supported by the federal government. This information will help to set the stage for the final
portion of this literature review, which is a full examination of Futernick’s (2007) multi-
layered approach to transforming high-poverty schools.
School Reform
School reform is a generic term used by educators and policymakers when describing a
host of strategies, approaches, and models for improving schools. Tyack and Cuban (1995)
defined it in this way:
When we speak of educational reforms, we mean planned efforts to change schools in order to correct perceived social and educational problems … whatever the reform, it usually entail[s] a long and complex set of steps discovering problems, devising remedies, adopting new policies, and bringing about institutional change (p.4).
In 1957 when Sputnik sent education into the American spotlight, school reform became
the method of choice in regaining our nation’s number one spot in the global economy.
Although many progressives of the 1950’s believed that “good ideas would travel of their
own volition” into schools and classrooms (Elmore, 1996, p.18), researchers found that few
initiatives made impacts wider than within isolated school buildings. The federal government
responded by launching a large-scale series of national curriculum reform initiatives during
the late 1950’s and throughout the 1960’s. Fullan (2000) coined this time period the
“adoption era” because:
The goal was to get innovations out there, as if flooding the system with external ideas would bring about desired improvements. Huge sums of money were poured into major curriculum reforms like PSSC Physics, BSCC Biology, and MACOS Social Sciences, and organizational innovations such as open plan schools, flexible scheduling, and team teaching (Fullan, 2000, p.6).
Despite these wide-reaching plans, little progress was made in moving reform from
isolated improvement to large-scale institutionalization by the early 1970’s. “The term

25
‘implementation’ (or more accurately, ‘failed implementation’) came into the vocabulary of
reform” and researchers soon discovered that “putting ideas into practice was a far more
complex process than people realized” (Fullan, 2000, p.6).
After witnessing the continual failure of these reform movements in public education,
Goodlad (1975) decided to initiate a five-year research and development project aimed at
examining the struggle for institutional change. He discovered that the conventional model
for studying educational change attempted “to manipulate certain instructional interventions
(such as class size or teaching method) and to look for changes in pupil outcomes;” however,
this model did not always prove sufficient (Owens, 2001, p.213). The intermediary factors of
regular school practices, sustained by expectations, approval, and rewards, also had an effect
on school change.
According to Goodlad (1975), individual teachers cannot confront these rituals without
the support of the entire school culture; thus, the overarching school culture surfaced as the
unit of study. “We see everything constituting the culture of the school--its operational
curriculum, written and unwritten rules, verbal and nonverbal communication, physical
properties, pedagogical regularities, principal’s leadership behavior and so on” (Goodlad,
1975 as cited in Owens, 2001, p.213). A new model for research design emerged with the
school’s culture serving as the independent variable and both the behavior of the teacher and
the pupil outcomes as dependent variables of school culture. At the same time, pupil
outcomes also served as a dependent variable of teacher behavior.
Goodlad’s (1975) malleable framework more accurately reflected the reality of
education in the mid- to late-1970’s (Owens, 2001). Prior to his research, schools tried to
reform certain elements of their environment, without considering the bigger picture.
26
“Student and staff learning can be weakened by organizational fragmentation when schools
implement programs that are unrelated to each other, that address only limited numbers of
students and staff, or that are ended after short periods of time” (Youngs & King, 2002,
p.646). From Goodlad’s (1975) research, schools learned that reform efforts must address the
entire school culture, rather than just discrete parts; otherwise, the status quo will soon return.
As Donahoe (1993) so aptly stated:
As long as the responses only bend, rather than break, the traditional model, any changes brought about in a school are living on borrowed time. It is easier to go back than to go forward because the system that envelops the school was created to support the traditional model and is thoroughly inhospitable to any other form (n.p). About two decades later in 1997, the United States Congress passed legislation
promoting inclusive models of school reform. “The Comprehensive School Reform
Demonstration program, or CSRD, provided funding for schools to implement reform
programs that met nine components of comprehensiveness described in the law” (Northwest
Regional Educational Laboratory, 2005, n.p.). These nine guidelines incorporated: effective,
research-based methods and strategies; comprehensive design with aligned components;
ongoing, high quality professional development; measurable goals and benchmarks for
student achievement; support from within the school; parental and community involvement;
external technical support and assistance; evaluation strategies; and coordination of
resources. Four years later, the authorization of the No Child Left Behind Act of 2001
continued the program and added two more components of comprehensiveness, including a
prerequisite of scientifically based research to back the plans. Rather than advocate
individual reform strategies, this federal program was “designed to foster coherent
schoolwide improvements that cover virtually all aspects of a school’s operations, rather than
27
piecemeal, fragmented approaches to reform.… These reforms must help all children to meet
challenging state academic content and achievement standards” (United States Department of
Education, 2007).
The Comprehensive School Reform (CSR) program supports various popular reform
initiatives found in many schools across America. Over 2,500 schools participated in CSR in
the first two years of implementation (Davis, Sagmiller & Hagans, 2001). Accelerated
Schools, Different Ways of Knowing, Core Knowledge, and Roots and Wings are just a few
of the federally-supported programs selected by these schools. While these models vary in
approach and scope, all aim to improve student achievement. The Northwest Regional
Educational Laboratory (2005) warned:
It is important to remember, however, that comprehensive school reform involves more than simply adopting a model and expecting student achievement to improve as a result. Very few models fully address all 11 CSR components, so schools seeking CSR funds have to fill in the gaps with site-based initiatives. What’s more, reform in general requires continuous planning, focusing, monitoring, adjusting, and working together to address implementation issues and new problems as they arise (n.p.).
Futernick’s (2007) Perspective on Reform
Futernick (2007) agreed that schools must change the entire school environment in order
to initiate--and sustain--true educational improvement. The research professor from
California pointed out:
Unless [failing schools] can be improved to a point of stability, most will eventually return to their prior state of dysfunction. In fact, they may worse off than before. Just like the patient who builds up resistance to antibiotics when too little is taken, the school builds up its own resistance when too little is done to turn it around (Futernick, 2007, p.10). Futernick (2007) was highly influenced after reading Malcolm Gladwell’s (2002) The
Tipping Point: How Little Things Can Make a Big Difference. Using the Tipping Point
28
elements as a frame of reference, the researcher developed a comprehensive plan for school
reform. His study of low-performing schools in California that proved unsuccessful in
improving also contributed to the plan. “Implementing just a few of the improvements--no
matter how sound any of them might be--was not enough to counteract the habits and myriad
forces that resist change so effectively in these schools” (Futernick, 2007, p.5).
Consequently, Futernick (2007) decided to “define the set of interlinking, essential supports a
failing school would need to turn itself around” (p.5).
In devising the framework, he first met with teachers, administrators, parents, and other
educational stakeholders to present his ideas and incorporate their feedback. In 2001, he
attempted to pilot a study of its implementation in three targeted schools in Oakland.
Unfortunately, district bureaucracy slowed his progress and the school system was taken over
by the state before it could be initiated. While he gained support from educators in other parts
of California for his plan, he had yet to implement and evaluate its full impact at the time of
this study. He felt confident, however, that it could prove to be an effective means of reform
for low-performing, high-poverty schools.
Before Futernick’s (2007) framework is described in full detail, an overview of
Gladwell’s (2002) concepts is first illuminated so that the reader can gain a better
understanding of how and why Futernick (2007) made his case for education reform.
Gladwell’s (2002) The Tipping Point
Gladwell’s (2002) book presented a detailed explanation of how certain ideas garner
support to take flight and become a widespread phenomenon. From fashion trends to crime
waves to sexually transmitted diseases, Tipping Point explicated how “ideas and products
and messages and behaviors spread just like viruses do” (Gladwell, 2002, p.7). While many

29
people believe that change typically occurs one incremental step at a time, Gladwell (2002)
argued that more often social epidemics result from unexpected moments which make a
lasting difference. According to the author:
Epidemics are a function of the people who transmit infectious agents, the infectious agent itself, and the environment in which the agent is operating. And when an epidemic tips, when it is jolted out of equilibrium, it tips because something has happened, some change has occurred in one (or two or three) of those areas (Gladwell, 2002, p.18-19).
There are three main elements to better understand these social epidemics: the Law of
the Few, the Stickiness Factor, and the Power of Context. The first agent of change, the Law
of the Few, describes the impact that certain individuals can have on the thoughts, opinions,
and actions of others. “Economists often talk about the 80/20 Principle, which is the idea that
in any situation roughly 80 percent of the ‘work’ will be done by 20 percent of the
participants” (Gladwell, 2002, p.19). In the same way, a select few “do the work” of
spreading social epidemics. One famous example is Paul Revere. The popularity and
connectedness of Revere helped to ensure that his cautionary message was received across
the Boston countryside. “The success of any kind of social epidemic is heavily dependent on
the involvement of people with a particular and rare set of social gifts” (Gladwell, 2002,
p.33).
According to Gladwell (2002), there are three types of socially influential people:
Connectors, Mavens, and Salesmen. Connectors possess a wide and diverse circle of family,
friends, colleagues, and acquaintances. These individuals proactively network to make new
connections at every possible opportunity. “[Connectors] manage to occupy many different
worlds and subcultures and niches … their ability to span many different worlds is a function

30
of something intrinsic to their personality, some combination of curiosity, self-confidence,
sociability, and energy” (Gladwell, 2002, p.48-49).
Mavens, on the other hand, specialize in information, not people. These special few
accumulate a plethora of data about a variety of subjects and passionately spread their
expertise with others. “Mavens have the knowledge and the social skills to start word-of-
mouth epidemics. What sets Mavens apart, though, is not so much what they know but how
they pass it along” (Gladwell, 2002, p.62). Their desire to help others with decision-making
helps to gain the attention of many.
While Mavens will not adamantly persuade their family and friends, Salesmen fill the
void with determination and eloquence. These social masterminds are critical to spreading
epidemics. The energy, charm, and likeability of Salesmen make their pitch quite easy.
People cannot help but buy their ideas, due to their contagious enthusiasm, subtle signals,
and non-verbal cues. Altogether, Connectors, Mavens, and Salesmen help to initiate and
sustain social epidemics, or in the case of Futernick’s (2007) framework, school reform
efforts.
The second agent of change proposed by Gladwell (2002) is the Stickiness Factor.
“Stickiness” can be described as the “specific quality that a message needs to be successful”
(Gladwell, 2002, p.92). In other words, it is the characteristic or quality that makes the idea
unique and spreadable. Its memorable nature helps Connectors, Mavens, and Salesmen to do
their jobs.
Columbia Record Club used the Stickiness Factor as part of a successful advertising
campaign. Consumers were advised to look for a small gold box in their issues of several
weekly periodicals. Once they found the treasure box, they could write in for a free record.
31
“The gold box … was a kind of trigger. It gave viewers a reason to look for the ads in the TV
Guide and Parade. It created a connection between the Columbia message viewers saw on
television and the message they read in a magazine” (Gladwell, 2002, p.95).
Just as this example demonstrates, the Stickiness Factor does not always require
elaborate schemes; rather, the sticky trigger can be “as small and as seemingly trivial as …
[a] gold box” (Gladwell, 2002, p.96). Those interested in capturing the attention of the
masses may simply have to tinker with their presentation style in order to obtain mass appeal.
That is just what the creators of Sesame Street, the children’s show, did. Television
researchers at the University of Massachusetts conducted a series of experiments testing
youngsters’ attention spans. The producers of Sesame Street originally believed that kids
would simply sit and stare at the screen, eventually zoning out. But the University of
Massachusetts research indicated that was not the case:
[Children] could divide their attention between a couple of different activities. And they weren’t being random. There were predictable influences on what made them look back at the screen, and these were not trivial things, not just flash and dash (Gladwell, 2002, p.100-101).
So the writers and producers of Sesame Street implemented significant changes to the format
of the show, making it one of the most successful children’s series of all time. In the same
fashion, Futernick (2007) believed that the presentation of school reform initiatives could be
tinkered with to effectively make the message “stick” for various stakeholders and help bring
about broad-scale change.
The third agent of change, the Power of Context, is a bit more complicated. “Epidemics
are sensitive to the conditions and circumstances of the times and places in which they
occur” (Gladwell, 2002, p.139). For example, a syphilis outbreak in Baltimore spreads far

32
more substantially in the months of June and July as opposed to January and February. So
what is the cause? The warm weather of the summer means that people venture out and move
around more than in the cold, snowy months of the winter. The sexually transmitted disease,
therefore, has wider reaching effect during that time and is more likely to create a health
epidemic.
Crime outbreaks can also be attributed to the Power of Context. Criminologists James Q.
Wilson and George Kelling spawned the notion of Broken Windows to support this theory.
According to these two:
Crime is the inevitable result of disorder. If a window is broken and left unrepaired, people walking by will conclude that no one cares and no one is in charge. Soon, more windows will be broken, and the sense of anarchy will spread from the building to the street on which it faces, sending a signal that anything goes (Gladwell, 2002, p.141). Kelling put this theory to the test when he was hired in the mid-1980s by the New York
Transit Authority as a consultant to reduce crime. The Transit Authority followed his advice
and began cleaning graffiti off the train cars. While others thought the focus was ludicrous
and the emphasis should be on reducing crime and increasing subway reliability, Kelling was
persistent. The graffiti campaign transitioned into a crackdown on fare-beating and before
long, the subway system was under control.
The Power of Context is just as effective in dealing with positive subjects as negative
ones. For instance, Gladwell (2002) outlined the impact of context on book sales. The widely
popular novel, Divine Secrets of the Ya-Ya Sisterhood, did not immediately rise to the top of
the bestseller lists. Its early sales, in fact, were pretty gradual until it became a staple read for
book clubs. Female customers started creating their own Ya-Ya Sisterhood groups “and
bringing Wells (the author) pictures of their group for her to sign. The lesson of Ya-Ya … is

33
that small, close-knit groups have the power to magnify the epidemic potential of a message
or idea” (Gladwell, 2002, p.174). Members of a community context, therefore, are much
more likely to spread an idea than those isolated as individuals; thus, Futernick (2007)
proposed using contextual influences to effectively move school reform strategies forward. In
the next section, the nine components of his Tipping Point framework are detailed one
element at a time.
Theoretical Framework: Futernick’s (2007) Tipping Point Strategy
As previously mentioned, Futernick (2007) combined the elements of Gladwell’s (2002)
Tipping Point model to develop a comprehensive plan for school reform. The educational
researcher proposed:
From a “tipping point” perspective, each chronically failing school cannot be helped with a slow, gradualist approach to reform even if the effort is led by a dedicated and competent principal. Something more radical and immediate is needed to break the cycle of failure, something that enables a school to reach a tipping point—a point where it begins performing like an outlier (Futernick, 2007, p.46). To achieve this goal, Futernick (2007) surmised that schools must address nine key
components for reform: teams, time, physical environment, class-size reduction, autonomy
and shared governance, leadership, a well-rounded curriculum, external support, and
parent/community involvement. Taken in isolation, many of these components have been
observed in common reform efforts across the United States. Futernick’s (2007) framework
differed from most, however, in that it called for a massive overhaul of the entire school
environment. Rather than simply introduce a new reading program or hire more teachers to
lower class size, a school should think about the interplay of all elements and how they
impact the ultimate goal of improved student achievement.
34
Each of the nine components will be examined in detail in the sections that follow.
Futernick’s (2007) perspective on these components will be explicated, along with their
current status in schools. Research-based best practices will also be delineated, where
appropriate.
Teams
The first component of Futernick’s (2007) framework involved the use of teams. In
schools across the country, teachers work primarily in isolation, responsible for a set group of
children for one or more subjects with little to no input from their colleagues (Lortie, 1975;
Goodlad, 1984; Rosenholtz, 1989). Even when teachers are grouped by grade level or subject
area, the configurations rarely function as true teams (Leonard & Leonard, 2003). For
instance, when they come together for scheduled grade level or departmental meetings,
discussion typically centers on superficial issues, such as field trips and testing dates. Even
worse, this time may be spent merely disseminating school-wide information that could have
just as easily been distributed via email. Rarely do educators engage in deeper conversations
about curricular concerns, pedagogical practices, and student progress; and unfortunately,
there does not seem to be much motivation for teachers “to change their practices in their
daily work routines” (Elmore, 1996, p.15).
As a result of these superficial teams, many educators may feel alone in their struggles,
without the comfort of having colleagues to turn to for advice and support. Teachers in low-
income, low-performing schools may face particularly difficult isolation. According to
Futernick (2007):
[It] can be an especially lonely experience. Parents seldom volunteer their time in the classroom. Each teacher is segregated in his or her own classroom for the bulk of the school day. The daily challenges that accompany teaching students who live in
35
poverty—e.g., serving as a “surrogate” parent, providing snacks to those who are hungry, keeping students safe from violence while at school, making sure they have a safe place to go to after school—further limit the time teachers have to plan, evaluate, and problem-solve together (p.16-17). “Building organizational capacity through collegial interaction in schools has become
prominent in much of the literature on education reform and school improvement” (Leonard
& Leonard, 2003, n.p). Thus, districts have started to take the initiative to establish
collaborative cultures to enhance teachers’ knowledge, skills, and dispositions, using
professional development activities as the impetus for change (Youngs & King, 2002, p.647).
For example, in 2003, the Monroe Township Public Schools in New Jersey devised several
strategies to encourage their teachers to utilize their collective brainpower to improve
instruction (Tienken & Stonaker, 2007). Like their peers in many other districts across the
United States, teachers in Monroe Township attended a couple days of “sit and get”
workshops throughout the year, with little to no follow-up once they returned to their
classrooms. District administrators met with members of the professional development
committee to devise a plan to convert “from one-shot ‘topics’ to a system based on NSDC’s
Standards for Staff Development” (Tienken & Stonaker, 2007, p.25).
The committee then surveyed staff across the district, talked with a variety of teachers
from their buildings, and researched best practices in adult learning. Upon doing so, they
developed a comprehensive reform plan for professional development. “Leaders reallocated
money that had been spent to hire consultants from outside the district and used it to develop
a core of knowledgeable teacher leaders who would work with their peers during the
scheduled days” (Tienken & Stonaker, 2007, p.25). Realizing that this time was not enough,
the district also created a teacher exchange program, wherein educators could request to visit

36
a colleague’s classroom for observation or conversely, ask a peer to provide coaching in their
own room. A total of sixty days of substitute teaching was allocated to facilitate this
exchange.
Because collaborative cultures are different from the norm in most school buildings,
clear expectations must be established from the onset about why teams are formed and what
they should accomplish. Johnston, Knight, and Miller (2007) explained:
Collaboration is a departure from the traditional school culture of isolation, and teachers had to learn how to develop a purpose for the meeting and show results, such as discernible changes in their instructional strategies, interventions with students, examination of common assessments, and curriculum plans (p.16). Without a clear purpose and goals, teams may flounder and revert back to the superficial
topics of most group meetings.
In 2002-03, the Papillion-La Vista Public Schools in Nebraska sought to increase the
collaboration of its teachers and enhance their assessment literacy (Johnston, Knight &
Miller, 2007). Before beginning this initiative, central office staff devised a series of concrete
steps to meet their goals:
District leaders planned and created classroom goals teams in 2002-03 to help teachers develop strategies to evaluate student assessments and target their instruction based on the results. Currently, every teacher and specialist serves on one of these teams that meet monthly on the professional learning days (Johnston, Knight & Miller, 2007, p.16). By dividing the staff up into set units, educators began to feel a sense of camaraderie as they
collectively tackled specific goals. “By being part of a consistent team all year, teachers built
peer relationships and held one another accountable for taking active steps toward reaching
individual classroom goals” (Johnston, Knight & Miller, 2007, p.16). Meeting time was
37
facilitated by drilling down to three key questions: How did students perform well? How do
students need to improve? Did your assessment match your instructional strategy?
To supplement these goals teams, the district developed a second set of collaborative
groups to work together during the school day on curriculum planning and student
interventions. In these weekly or biweekly meetings:
[T]eachers preview a future summative assessment and discuss what students should understand at the end of the corresponding unit. They identify and discuss how students will demonstrate learning and collaborate on assessments and lesson plans. Lastly, teachers document the progress and effectiveness of the instructional activities (Johnston, Knight & Miller, 2007, p.18). Both teams together helped teachers to improve their instruction and better meet the needs of
their students.
Teams must not always focus on long-term, sustained goals, however. The Maine-
Endwell Central School District in New York developed a roll-through program to allow its
teachers to collaborate on short, targeted professional development activities. “A roll-through
brings specific groups of staff together for identified learning, followed by individualized
coaching in the classroom” (Sever & Bowgren, 2007, p.22). Substitute teachers covered one
grade level or department at a time, while the targeted teachers participated in a learning
session. Once these teachers completed the short course, the subs moved on to the next grade
level or department until all were trained. “Teachers then decide how much time they need to
practice a new skill and for classroom coaching before they come back together for the next
roll-through” (Sever & Bowgren, 2007, p.22). Instructional coaches support classroom
teachers by scheduling demonstration lessons. Afterwards, they debrief to share successes
and challenges. “Maine-Endwell teachers have discovered the power of collaboration and

38
reflection. They feel energized with the immediacy of bringing new ideas from staff
development directly to the classroom” (Sever & Bowgren, 2007, p.23).
It is evident that working collaboratively as teams can reap huge results for student
success. As Johnson (1990) explained:
A lone teacher can impart phonics, fractions, the pluperfect tense, or the periodic table, but only through teachers’ collective efforts will schools produce educated graduates who can read and compute; apply scientific principles; comprehend the lessons of history; value others’ cultures and speak their languages; and conduct themselves responsibly as citizens. Such accomplishments are the product of a corporate venture (p.149).
In today’s twenty-first century world, these higher-order thinking skills are no longer a
luxury--but a necessity--for competing in our global economy (National Education
Commission on Time and Learning, 2005). Thus, Futernick (2007) proposed using teams to
support this type of teaching and learning in his Tipping Point framework for school reform
initiatives.
Time
A major obstacle to teacher collaboration is the inherent lack of time in the daily school
schedule, Futernick’s (2007) second component for school reform (Leonard & Leonard,
2003). “It is not enough simply to assign people to teams. If they do not have ample time to
work with one another and have a sense of shared mission, they will be mere collections of
individuals—not true teams” (Futernick, 2007, p.19). Schools across the United States
grapple with the issue of finding time for teachers to collaborate to meet the needs of their
students. “Finding time for teams to work … is both a necessity and a responsibility. If
educators [want] to improve student learning, leaders must take responsibility for providing
39
team time … and a structure in which they are able to work collaboratively” (Johnston,
Knight & Miller, 2007, p.15).
Since 1999, the staff members at Garfield Elementary School in Livonia, Michigan have
used creative thinking to find precious time during the school day, a minimum of at least
sixty and sometimes as much as ninety minutes. “That is long enough to accomplish critical
tasks and still hold team members’ attention,” said Garfield Principal William Green
(Khorsheed, 2007, p.44).
The elementary teachers at Green’s school utilize four distinct strategies to reallocate
time for teacher collaboration. For starters, they use specials or enrichment classes to give
core teachers planning periods:
Once special teachers have fulfilled their meeting time with each class, there may be another class time available in their schedules that principals traditionally might have used to assign these teachers other tasks or to allow a class an extra music period (Khorsheed, 2007, p.44).
In addition, recess time is scheduled immediately before or after the extra arts period to
extend the collaboration for teachers. Additional staff members are hired using Title I funds
to supervise the students. “One year, Garfield’s principal used Title I funds to hire two part-
time teachers. The two managed two classes, providing additional literacy instruction and
enabling two regular classroom teachers to collaborate” (Khorsheed, 2007, p.44). Classes are
joined together for certain time periods as well so that fewer teachers oversee larger groups:
At Garfield, for example, three first grade classes of 20 were reconfigured into two groups of 30 students for their music and gym periods, followed by a recess, without exceeding the contractual maximum. In this way, three classes were covered by two specialist teachers, and three classroom teachers were able to collaborate for at least an hour (Khorsheed, 2007, p.44).
40
In other school districts, administrators have experimented with a variety of different
techniques to find time for teachers during the day. Sparks (1999), former executive director
of the National Staff Development Council, presented the following innovative ideas:
Promising and productive approaches include using substitutes to free teachers, focusing faculty meetings on teacher learning, adjusting the master schedule, and lengthening the school day for a few minutes four days per week. Schools also are implementing an early release on the fifth day to provide an extended period of time for professional development, engaging students one morning per week in alternative activities such as community service, and providing commonly scheduled lunch or planning periods for teachers working on joint projects (Sparks, 1999, n.p.). Even when teachers do have pockets of time during the work day without students,
however, myriad other responsibilities may pull them away from teamwork. With limited
minutes away from children, teachers are forced to take care of personal concerns (e.g.,
bathroom breaks) and other important tasks, including phone calls to parents, special
education meetings, and lesson preparation. One elementary teacher in a study conducted by
researchers Leonard and Leonard (2003) explained:
It’s hard to find extra time to devote to collaboration. Extra time is spent on developing lesson plans, helping children who were absent with make-up work, running papers, gathering materials for lessons and school committee work. I teach fourth grade and average about forty conferences a year. This takes a lot of our time also (n.p.).
Scheduling time for meetings, therefore, must be balanced with providing time for
teachers to complete their other required tasks. The Pacific Telesis Foundation found similar
conclusions after funding three elementary schools in California to undergo a comprehensive
restructuring project. Although money was available to buy time for the school staff
members, the efforts proved unsuccessful. An evaluator of the project sites revealed this
important insight:

41
It wasn’t just a matter of finding time for meetings; there had to be time for all the additional interaction, assignments, and emotional energy that stitch an organization--a culture--together. For those teachers who thought a lot about what they did, we were crowding the time they would otherwise have spent thinking about their children and their classrooms by giving them the additional responsibility of thinking about the whole school (Donahoe, 1993, n.p.). Studies of educational systems throughout the world indicate that teachers in other
countries typically have more time for independent and collective planning than their
American counterparts (National Education Commission on Time and Learning, 2005). In
particular, research by Stevenson and his colleagues have found that students and teachers in
the countries of China, Taiwan, and Japan have a much different looking day than their peers
in America. In these Asian nations, “an eight-hour school day is structured so that teachers
are in charge of classes only 60% of the time they are at school, and teaching itself is a group
endeavor” (Donahoe, 1993, n.p.). The remaining time is spent planning lessons, analyzing
student assessments, and coordinating projects with their peers. If schools truly want to
effectively succeed in transforming their cultures, they must adopt some of these strategies
for time, as Futernick (2007) proposed.
Physical Environment
Futernick’s (2007) third element of school reform centers on the physical environment.
Schools’ physical atmosphere can vary greatly across buildings within and between districts.
While state-of-the-art technology and modern resources may exist in newly constructed or
renovated schools, many older facilities lack the basic of necessities. Old, dingy paint may
adorn walls. Wrinkled, soiled carpet may cover floors. Restrooms may have an unpleasant
odor or even be out of order and unusable. Few books may exist or if they are present, may
be out of date and tattered.
42
Overall, the physical environment in some schools may present an unwelcoming,
uncomfortable climate for students. At Lathrop Elementary School in Chicago Public
Schools, students face a bleak building each day. “There are no hoops on the basketball court
and no swings in the playground … for 21 years, according to the Chicago Tribune, the
school has been without a library” (Kozol, 1991, p.53). Books are not taken home by the
pupils; instead, they lay moldy, tattered, and dusty on a large table in the cafeteria. Oyler
Elementary School in Cincinnati, Ohio is also pretty barren. In a fifth grade science class at
the school:
[T]he children were studying plant biology … but not with lab equipment. There was none. There was a single sink that may have worked but was not being used, a couple of test tubes locked up in a cupboard, and a skeleton also locked behind glass windows. The nearly total blankness of the walls was interrupted only by a fire safety poster. The window shades were badly worn. The only textbook … [found] had been published by Addison-Wesley in 1973. A chart of “The Elements” on the wall behind the teacher listed no elements discovered in the past four decades (Kozol, 1991, p.230- 231).
In Williams v. California, the American Civil Liberties Union (ACLU) filed a complaint
against the state of California based on the conditions of school facilities (Futernick, 2007).
According to the ACLU, buildings, which housed a majority of students of color, suffered
from a variety of decrepit conditions. For example, many schools lacked working water
fountains, clean toilets, and normal functioning heat/air conditioning units. Roofs were leaky
and rodent infestations were common. In August 2004, the state of California and the ACLU
settled the case that “led to legislation which allocated close to one billion dollars to correct
these conditions” (Futernick, 2007, p.21).
43
Just as the Broken Windows theory impacted the subway system in New York City
(Gladwell, 2002), the notion also applies to the physical environment of modern schools.
According to Futernick (2007):
It seems quite plausible that if one were to walk into a school and see broken windows, graffiti, leaky roofs, dirty classrooms and bathrooms in disrepair, one would conclude that no one cares, that no one is in charge and anything goes. If students (or, by referral, their parents) draw these conclusions, how can they be expected to take their education seriously, much less succeed academically? If teachers draw these conclusions, how can they be expected to stay at these schools, much less succeed in teaching their students? (p.20-21). Researchers from Boston College and SUNY-Stony Brook found that the quality of the
physical environment was an important predictor of teachers’ decision to stay or leave their
current position in the District of Columbia’s public schools. Since the average school
building in the United States is over forty years old (Buckley, Schneider & Shang, 2005), it
can be expected that many facilities are not up to present standards. Several factors were
examined to determine the quality of the school building and consequently, teacher
satisfaction and student achievement.
For starters, air quality was investigated. In nearly two-thirds of the public schools in the
District of Columbia, teachers reported poor circulation as a problem (Buckley, Schneider &
Shang, 2005). As a result, the “sick building syndrome” impacted students and teachers alike,
who suffered from asthma and other respiratory problems. Thermal comfort and classroom
lighting were two other factors that were examined as well. Many teachers believed that
regulation of heating and air impacted student learning (Lackney, 1999). In addition, over
fifteen studies have shown that adequate lighting can improve student performance and
reduce behavior problems (Jago & Tanner, 1999). Taken together, all of these elements can
also impact teacher retention.

44
While the researchers found that a variety of other factors (especially teacher pay)
influenced educators’ decisions to stay or leave their current positions, school facilities
indeed ranked as important. “As the perceived quality of the school facility improves, ceteris
paribus, the probability of retention increases” (Buckley, Schneider & Shang, 2005, p.1115).
Improving a school’s physical environment can therefore prove to be a cost-effective strategy
to retaining teachers. “A major facilities improvement is likely to be a one-time expense, last
for many years, and have supplemental sources of state or federal funding available”
(Buckley, Schneider & Shang, 2005, p.1119). For years to come, the district will then reap
the benefits through improved teacher satisfaction. Futernick (2007) agreed that the physical
environment can have advantageous effects on school reform; therefore, he included it in his
Tipping Point framework for improving high-poverty schools.
Class-size Reduction
Class-size reduction marks Futernick’s (2007) fourth component in his framework for
school reform. According to the researcher, in order to meet individual student needs, a
teacher must be able to interact with his or her pupils frequently. Due to myriad reasons,
teachers in today’s schools may find this difficult because of large class sizes. Poor
recruitment and retention strategies, decreased funding, and federal mandates for “highly
qualified teacher” status may all contribute to teachers’ exorbitant class rosters.
The more students in a class, the more difficult it becomes for teachers to differentiate
instruction. Particularly in high schools, teachers struggle to plan and implement student-
centered lessons as thirty-plus pupils rotate in and out of their rooms for five to six periods
per day. One-on-one contact between teacher and student is nearly impossible in these
settings.
45
With larger class size also comes increased behavior management concerns. Since most
classrooms were not constructed to support desks and chairs for more than thirty students, the
physical area grows cramped. Students have less personal space in which to work and less
room to move around. Consequently, teachers are less likely to vary instruction as hands-on
and group activities present cumbersome challenges.
In a recent teacher retention study, Futernick (2007) interviewed one elementary teacher
in a high-poverty school that indicated class size was an important factor in her decision to
stay at her present school. The teacher reflected:
Smaller class sizes allow much more one-on-one time with children--more time to meet their individual needs. It’s a total management issue. It’s not nearly as stressful having a smaller class size, especially in preparation, in delivery, in planning, in talking and meeting with parents. When you have fewer students, you have more time to do all those things (Futernick, 2007, p.22). Not all class size reduction plans have proven successful, however. In the mid-1990s,
California adopted a program for grades kindergarten through third, which capped class sizes
at twenty (Futernick, 2007). Unfortunately, because the program was implemented in such a
quick manner, some disturbing results followed as Bohrnstedt and Stecher (2002) described:
The overnight need for approximately 18,000 new classrooms in a facility-challenged state led to expedient, but compromised solutions--conversion of libraries, labs, and assembly stages into classrooms; switches to year-round calendars--some of which remain problematic. The already-existing problem of teacher shortages, quality, and distribution took on crisis proportions. The hiring of many new teachers taxed schools’ capacity to support and mentor teachers. Particularly troubling was the proliferation of emergency-permit teachers in high poverty areas, which raised early concerns about equity. Would low-income and minority students, who stood to gain the most from CSR, be least likely to benefit? (p.4). To counteract these challenges, associates at the Public Policy Institute of California
recommended several changes to the program (Futernick, 2007). First, they suggested that
the initiative be integrated and aligned with other reforms. As is often the case in education,
46
multiple reforms may be introduced simultaneously, presenting conflicting priorities. Rather
than forcing schools to pick and choose reform strategies, the Public Policy Institute
recommended streamlining the class size program so that it worked well with other
initiatives.
The Institute also suggested the development of pilot sites with even lower class sizes to
“further test [its] potential to improve the achievement of low-income/minority students”
(Futernick, 2007, p.23). In similar studies, Glass and Smith (1978) found that class sizes
below twenty led to large achievement advantages, when compared to control groups of
larger sizes. Likewise, Tennessee’s Project STAR, a large-scale longitudinal study, revealed
two important findings: students in small classes “performed better at all K-3 grade levels
than students in larger classes. And minority and inner-city children gained more from class
size reduction than their White and non-urban school peers; indeed, the effects were two to
three times as great” (Bohrnstedt & Stecher, 2002, p.5). Finn (2002) discovered that small
classes affected educators as well. The teachers in the small classes of Project STAR had
higher morale and spent more time on direct instruction and less on classroom management
than in larger classes. Indeed, best practices for small class instruction should be included in
any school reform, as Futernick (2007) recommended in his Tipping Point framework.
Autonomy and Shared Governance
Futernick (2007) also believed that autonomy and shared governance should be
addressed in any school reform effort. Teachers have historically been divorced from the
major decision-making responsibilities in schools. While they make the majority of day-to-
day choices within their classrooms, rarely do they find a place at the table when dealing
with larger school or district policy decisions. For instance, issues of budgeting, hiring, and
47
scheduling are traditionally under the purview of their principal and/or superintendent.
Teachers become even more distanced from decision-making at the state and federal levels.
Curriculum changes, licensure qualifications, and standardized testing timelines are handled
by the “experts” at their state departments of education or on Capitol Hill.
More recently, however, teachers are being invited to take on greater leadership
responsibility, particularly in school reform (Doherty & Abernathy, 1998; Institute for
Educational Leadership, 2001). Models of shared decision-making are becoming increasingly
popular in schools across the United States (Leonard & Leonard, 2003). Many aspiring
administrators are now learning--as part of their preparation programs--how to tap into the
knowledge and skills of accomplished teachers. Through pre-service and professional
development programs, current and future teachers are building their leadership skills and
learning the ins and outs of collaborative decision-making.
Shared governance structures are most commonly found in the form of school leadership
or site-based decision-making teams. “Many experts correctly believe that democratically run
schools are positively associated with higher job satisfaction, stronger professional
commitment, better teacher retention rates, increased parent involvement, and increased
academic achievement” (Futernick, 2007, p.24). But just as teachers must learn how to work
in teams with one another, so, too, do teachers and administrators need to understand how to
establish relationships as collaborative partners. Teachers are accustomed to autonomy in
their classrooms. Principals have traditionally been autonomous as school leaders. As these
two groups begin working more closely together, the relationships become strained.
“Resistance is evident among teachers who prefer the status quo and see no reason for
change--particularly from those who doubt that their ideas for improvement will be taken
48
seriously” (Futernick, 2007, p.25). School governance is also a skill area which is new to
most teachers so the tasks may seem complicated. “Teachers often struggle because most
have little training and experience with such matters. Then poor decisions get made and
participants begin questioning their collective ability to make sound decisions” (Futernick,
2007, p.25).
Collaborative decision-making requires the efforts and abilities of all stakeholders to
truly be successful. Teachers are not the only group that should be pinpointed for inclusion,
as Donahoe (1993) explained:
In order for schools to outgrow their dependency on the principal, every member of the administrative, teaching, and classified staff--as well as some parents--must have an active role in the formal organization. Schools are small enough to function as a form of direct, rather than representative, democracy (n.p.).
Mechanisms must be in place to solicit the ideas and concerns of all so that certain
individuals or groups are not simply glorified as the inner circle. “When a school practices
shared influence, it does not mean that decisions--and therefore power--are simply delegated
to, or even vested in, an individual or a committee … everyone in the school community has
at least an opportunity to influence outcomes” (Donahoe, 1993, n.p.). To achieve this
equitable culture, some schools send home periodic surveys to parents to get a pulse on their
satisfaction and learn ways they might volunteer. Others organize community nights, where
neighboring business and civic organizations are invited along with the parents to learn more
about the school’s programs. Working collaboratively, the entire school family experiences
success:
In a shared-influence setting, teachers have less individual autonomy because the pressure to do things differently comes from a source that they need to respond to-- their peers. The loss of individual autonomy is offset, however, by the collective
49
ability to do things on behalf of student learning that the teachers was not able to do in isolation (Donahoe, 1993, n.p.).
Thus, as Futernick (2007) contended, autonomy and shared governance are key components
in transforming any high-poverty school.
Leadership
Leadership is yet another crucial element in Futernick’s (2007) Tipping Point framework
for school reform. In most of today’s schools, principals harbor primary responsibility for
leadership. At sites undertaking whole-school reform, strong leadership becomes even more
important (Datnow & Castellano, 2001). In the course of any given day, administrators must
provide guidance to their teachers, build trusting relationships with parents, and serve as
ambassadors to the community, all while managing the daily tasks of running a school.
Administrators must ensure that their staff has adequate facilities and resources, collaborative
planning time, and ongoing professional development. Research has shown that effective
leaders:
… are visible in the school and interested in instruction. They have high expectations for all students and are focused on learning goals. These leaders believe that part of their job is to eliminate distractions and competing programs that may interfere with reaching the district’s learning goals (Shannon & Bylsma, 2004, p.3). Because a principal’s job is so difficult, it behooves him or her to reach out to staff for
help. Individuals should be tapped to assist in leading, based on the strengths and weaknesses
of the overall team. Investing time in developing the leadership of others may seem
unfeasible for the busy administrator; however, it can reap huge benefits in the end. As more
staff, parents, and community members feel comfortable in leading, the principal can more
effectively complete his or her tasks at hand. Not all school leaders possess these skills
though. While ISLLC Standard Two states that they should all strive to create such an
50
environment, only the best and brightest leaders usually succeed (Council of Chief State
School Officers, 1996). Research on successful leaders discovered that:
An effective administrator develops capacity for success within the school and the community, not just through his or her intrinsic skills and talents. He or she must have genuine confidence that teachers, staff and parents are capable of constructing a coherent vision for the school, managing change, and serving as competent leaders themselves (Futernick, 2007, p.26-27).
In high-poverty schools, administrators face even more challenges than the average
principal. Older facilities, a revolving door of teacher turnover, and increased student needs
are just a few of the impediments that they must overcome. “One thing common to almost
every successful urban school is a strong and competent principal. Unfortunately, the
conditions principals face in these schools are often so demanding and stressful that many—
even the successful ones—do not stay long” (Futernick, 2007, p.26).
As a consequence, districts must constantly seek and support quality candidates to fill
positions at low-income schools:
The fact that so many urban schools have such a difficult time attracting good principals is surely due to the perception, even if it is not the reality, that they must perform heroically. But not only are principals-as-heroes hard to come by, they are not as effective as we might think. This is because they leave untapped the wealth of skill, expertise, and leadership potential of many teachers and parents (Futernick, 2007, p.26). Principals cannot expect others to lead immediately. Some transition time may be
necessary to provide these individuals with the training and practice needed for shared
decision-making:
[T]he leadership skills of the principal are critical, at least in the early years, to the success of an effort to create a formal environment of shared influence. Teachers who have just emerged from their individual boxes are not yet ready to assume leadership roles in a shared-influence setting. Schools are trapped by a leadership dilemma: they require skilled, effective principals in order to outgrow their utter dependency on those principals (Donahoe, 1993, n.p.).
51
In order to be an effective leader in today’s society, leaders must learn to negotiate the
dynamics of change. “The more complex society gets, the more sophisticated leadership must
become. Complexity means change, but specifically it means rapidly occurring,
unpredictable, nonlinear change … How do you lead in a culture such as ours, which seems
to specialize in pell-mell innovation?” (Fullan, 2001, p.ix). Fullan (2001) offered a solution
to this difficult dilemma. His framework for leadership combined five essential components
that work independently, yet mutually, together to bring about positive change.
According to Fullan (2001), today’s leaders must operate with a moral purpose as their
driving force. That is, they must act “with the intent of making a positive difference in the
lives of their employees, customers, and society as a whole” (Fullan, 2001, p.3). Once a
leader has established a moral purpose, they must be prepared to confront the complexities of
the change process. Leaders cannot rely on simply having the best ideas. They must be
willing to sell their plans to others and work collaboratively with various stakeholders. They
must network with others within and outside of their organization to promote their pursuits
and interests. In communicating with these stakeholders, they should be prepared to interact
with a variety of individuals from diverse backgrounds and schools of thought. Leaders must
also commit themselves to constantly generating and increasing knowledge inside and
outside of their organization (Fullan, 2001). Because the change process can produce both
positive and negative outcomes, these individuals must learn to live with its ambiguity. At
times, change brings about frustration and resistance from stakeholders. In other instances, it
sparks innovation as dissenters present diverse opinions. Consequently, leaders must be
tolerant enough to deal with this duality of messiness in order to keep the innovative juices
52
flowing. They must also be willing, at times, to challenge the status quo and shake things up
a bit.
Regardless of the model adopted by school leaders, it is critical for high-poverty schools
to have effective leadership in place in order to turn themselves around. Futernick (2007)
strongly supported the development strong leaders for reform.
A Well-rounded Curriculum
While leadership provides a critical component in transforming high-poverty schools,
Futernick (2007) contended that a well-rounded curriculum is also needed. In today’s test-
crazed world, however, critics argue that school curriculum has been narrowed to only those
subjects that are assessed through standardized measures. In many states, that means students
receive a huge dose of reading and math instruction, with little to no time dedicated to
studying other subjects, such as science, social studies, and the arts. Life in the twenty-first
century, however, requires much more than the rudimentary three R’s of reading, ‘riting, and
‘rithmetic. “Since an estimated 85 percent of current jobs and almost 90 percent of the
fastest-growing and best-paying jobs now require some postsecondary education, a high
school diploma and the skills to succeed in college and the workplace are essential” (Alliance
for Excellent Education, 2007, p.1).
A well-rounded curriculum is essential for successful workers in the new millennium.
This is not the norm for most impoverished students:
The typical curriculum for the urban poor treats students as passive, empty vessels to be “filled up” with knowledge … many educators who work with the urban poor believe that such learning will produce equity, with students more literate and better able to advance to college and to compete for jobs (Lee, 2003, p.449-450).
53
The deficit view of learning fails to achieve this equitable conclusion, however. Students’
prior knowledge is not respected and little effort is made to connect the curriculum to their
culture (Kozol, 2005). Feeling unattached to school, these youngsters mentally “check out”
and become disengaged with their education.
Professional organizations, such as the National Council of Teachers of Mathematics,
have developed standards which support student-centered pedagogy. With a focus on
students’ talents, skills, and interests, teachers can more effectively help their pupils succeed.
According to Lee (2003):
When students engage in challenging and authentic learning activities in which purposeful intellectual work is connected to the real world of problem solving and creative projects and in which a critically supportive audience responds to work in progress, students’ motivation and commitment to meet high expectations increase dramatically … It is only when students care about their own work that they begin to care about meeting standards (p.453). Unfortunately, impoverished schools, particularly in inner city areas, still fail to implement
the student-centered model (Lee, 2003). Instead, Haberman (1991) calls these schools’
practices the “pedagogy of poverty,” wherein schoolwork “consists primarily of control
techniques that include giving directions, making assignments, and monitoring seatwork”
(Lee, 2003, p.450). Proponents of this approach contend:
[I]f students do not know how to read, they cannot possibly learn about science and social studies. Those who are far behind academically, the argument goes, cannot afford to take time for non-essential subjects. How can they be expected to gain an understanding of the world or to think critically if they cannot read, write, and compute (Futernick, 2007, p.28)? Yet, while more assistance may be necessary to ensure success with the rudimentary
elements, lack of exposure to a rich curriculum may, in fact, hinder ultimate achievement.
Standardized tests, particularly in reading, draw upon essays, articles, and stories on diverse
subject matter. Students in schools that emphasize “the basics” may be able to pronounce the

54
words on the page; however, their comprehension skills may be lagging. Balanced exposure to
both phonics and critical thinking is the better alternative:
Students in low-performing schools do not need more exposure to highly-scripted, teacher-proof reading programs; they need well-prepared teachers who know how to teach reading and who will present a balanced and stimulating curriculum--the same things most students in wealthier schools get (Futernick, 2007, p.29). Indeed, developing a well-rounded curriculum is yet another element of Futernick’s (2007)
Tipping Point plan for transforming high-poverty schools that cannot be ignored.
External Support
Principals and teachers share extremely long “to do” lists each day; therefore, Futernick
(2007) recommended finding sources of external support to facilitate the school reform
process. Between monitoring students, participating in professional development, and
communicating with parents, staff at low-income, low-performing schools must also navigate
the challenges of implementing reform initiatives. The constant barrage of competing
priorities can make reflecting on the progress and pitfalls of reform nearly impossible.
Steeped in the day-to-day work, teachers and administrators may need others outside of the
organization to serve as a sounding board and motivator.
“Schools need an external change agent to help them through the traumas of change …
just as for individuals, the help of a change agent eases organizational change and, like rebar
in concrete, keeps the process from cracking and crumbling” (Donahoe, 1993, n.p.).
Individuals providing external support bring several positive elements to the reform process.
For starters, they serve as advocates for the future, counteracting the present demands of
teaching and schooling:
[I]t is hard to refer constantly or sometimes even at all to the school’s reform vision and values, and even harder to devote time on a sustained basis to planned reform initiatives … external partners can prompt meetings on key reform initiatives and
55
otherwise keep the reform process alive in people’s minds and actions (Futernick, 2007, p.30). Maintaining a consistent focus and eye toward the end result is critical for ultimate success.
External supporters also offer an insider-outsider perspective. With clear knowledge
about the school, these individuals can have a better understanding than most about the
complexities internal to the school. At the same time, they still reside outside of the daily
grind, providing a more objective viewpoint. This insider-outsider perspective is particularly
important for the reform process:
Because schools must be dynamic organizations, identifying and adapting to changing circumstances and improved teaching methods and curriculum, they need someone who stands outside and looks at their culture and effectiveness with a cold eye and a warm heart, who would not be tempted to let difficult circumstances limit what the school believes it can achieve, who will not allow the school ever again to be a static organization, who cannot be co-opted by either the district or the school (Donahoe, 1993, n.p.). As “mirror and thought partner,” the external reform agent allows busy school leaders to
think, process, and reflect (Futernick, 2007). In Clover Park School District outside Tacoma,
Washington, members of the district office team served as these critical friends for principals
and teachers undergoing massive efforts of school reform. During a year-long self-study by
the targeted schools, district officials made frequent visits, attended faculty meetings,
facilitated group discussions, and interpreted data. “In a real sense, the district-level staff
became staff to the schools, which marked a real shift in the critical relationship between
building and district, and a truly collaborative district/building relationship developed”
(Davis, Sagmiller & Hagans, 2001, n.p.).
External support may also add skills and perspectives that are new to a school’s faculty
during the reform process:

56
Whatever the organizational development agenda of a particular ‘tipping point’ school, it is much more likely to establish effective new ways of working—different from those that its staff members have experienced in the past—if it has an external partner with expertise in building the kind of organization that the school aspires to become (Futernick, 2007, p.31). For example, these partners may be able to assist the teachers and administrators in collecting
and analyzing data, organizing and running efficient school operations, or designing and
implementing continuous improvement strategies. All of these skills help to sustain forward
movement in reform efforts. In Clover Park School District, as previously mentioned,
members of the central office staff provided much needed assistance to principals and
teachers at selected reform sites. For example, “district staff began to meet weekly with the
principals of the schoolwide eligible schools to assist them with the process of conducting a
comprehensive needs assessment of their schools” (Davis, Sagmiller & Hagans, 2001, n.p.).
At these weekly meetings, they taught the school-based administrators about the complexities
of facilitating change, consensus-building strategies, and other critical communications skills.
As the research demonstrates, external support offers tremendous benefits to schools
attempting to transform their cultures for success. Futernick (2007) acknowledged this when
he added this eighth element to the list of critical components for his Tipping Point
framework for reform.
Parent/Community Involvement
Effective schools use their internal collaborative strength to seek out relationships with the community. They see parents more as part of the solution than as part of the problem. They pursue programs and activities that are based on two-way capacity building in order to mobilize the resources of both the community and the school in the service of learning (Fullan, 2000, n.p.).
Futernick (2007) recognized the challenges that teachers in many impoverished
neighborhoods face in building effective bridges between the school, home, and community.
57
In some cases, engaging family members can be difficult because the parents may still recall
their own struggles in education. For instance, they may have encountered learning
disabilities or behavior problems, causing school to be viewed as a necessary evil rather than
a joyful place. Teachers may have been seen as enemies, rather than advocates.
Consequently, school staff must create warm, welcoming environments that encourage
parents to visit and take active roles in their children’s education without fear of criticism or
ridicule.
In other situations, parents may want to participate with their children in school but be
strapped for time as they juggle multiple jobs to support their families. Parents in low-income
areas are typically paid hourly wages; therefore, if they miss work, they do not earn money.
Thus, teachers and administrators must get creative when scheduling parent conferences and
other important meetings (Epstein, 1995). Early morning or late evening times should be
made available to accommodate parents’ schedules. Babysitting services and free meals can
provide added incentives for attendance.
The work required of today’s schools cannot be accomplished in isolation. While
teachers and administrators may be extremely dedicated to helping their students, the
children’s needs may necessitate additional support from outside agencies. Social workers
may be required to ensure a safe, orderly home life. Community volunteers may be needed to
provide one-on-one or small group tutoring. Medical and dental attention may be called for
to meet the children’s physical needs. District central offices may assist in the oversight of
new programs. State agencies may offer professional development. Together, these sources
of external support prove critical to the success of school reform (Shannon & Bylsma, 2004).
58
Creating inclusive school cultures is not an overnight venture. A great deal of time and
effort must be dedicated to this component. Futernick (2007) explained:
Developing support from parents and the community does not come easily or without a concerted effort from the school. When parents and members of the community learn that their dysfunctional school is about to undergo significant reform, some will undoubtedly react with skepticism or resistance, especially if they have seen reforms come and go without making a lasting difference (p.33). Teachers and administrators must consistently reach out to their constituents to build their
trust and confidence. This may take months--even years--to establish but will be well worth
the effort in the end.
“The model of school, family, and community partnerships locates the student at the
center” (Epstein, 1995). Regardless of how much teachers and administrators commit
themselves, schools cannot create successful students on their own. Even with extra support
and guidance from families and community members, children’s success is still not
guaranteed. “Students are the main actors in their education, development, and success in
school…. Partnership activities may be designed to engage, guide, energize, and motivate
students to produce their own successes” (Epstein, 1995, p.702). Thus, improving
family/community involvement cannot be ignored in high-poverty schools, as Futernick
(2007) explained in his Tipping Point model for school reform.
Summary
It is clear that in order to effectively turn around high-poverty schools, a comprehensive
approach to reform is necessary. Piecemeal strategies may provide temporary relief;
however, full-scale sustainable reform requires tactics for improving the overall school
environment. To help support this argument, the researcher began this chapter by painting a
vivid picture of the myriad challenges facing high-poverty schools in today’s high-stakes
59
world, such as inadequate school facilities, decrepit community conditions, substandard
teaching quality, and low student achievement. An historical overview of school reform was
then presented, including an introduction to the federal government’s comprehensive school
reform program, to help situate the reader in the past and present perspectives towards
transforming schools. A detailed outline of Futernick’s (2007) nine components in the
Tipping Point strategy followed to provide insights into the theoretical framework for this
study. In the next chapter, methods for conducting this mixed-methods research design have
been delineated.
CHAPTER THREE
METHODOLOGY
Introduction
Across America, many schools with large concentrations of high-poverty students
struggle to reach pre-determined measures of success, as defined by the high-stakes
accountability model of No Child Left Behind (Doherty & Abernathy, 1998). Futernick
(2007) argued that these “failing” schools require a comprehensive turnaround plan that
encompasses all elements of the school environment. In this mixed-methods study, the
researcher applied Futernick’s (2007) framework to extant qualitative and quantitative data
sets from five reconstituted schools in a large southern school district.
Assumptions and Rationale for Mixed-Methods Design
“Paradigms are frameworks that function as maps or guides for scientific communities”
(Usher, 1996, p.15). Thus, selecting the appropriate research paradigm helps to delineate the
primary function and purpose of the research proposal. Because the researcher desired a rich,
thick examination of the practices utilized by the schools to transform their cultures for
school improvement, a mixed-methods design was employed.
Mixed-methods research can be defined as “the class of research where the researcher
mixes or combines quantitative and qualitative research techniques, methods, approaches,
concepts, or language into a single study” (Johnson & Onwuegbuzie, 2004, p.17). The origin
of mixed-methods design dates back to studies of psychological traits conducted by
61
Campbell and Fiske in 1959 (Creswell, 2003). In publicizing their results, these trailblazers
encouraged their colleagues to combine multiple methods, such as qualitative observations
and quantitative surveys, to gain a richer, more complex set of results. As more and more
researchers attempted this novel strategy, they soon realized the benefits of mixed-methods
design. “Recognizing that all methods have limitations, researchers felt that biases inherent in
any single method could neutralize or cancel the biases of other methods” (Creswell, 2003,
p.15).
Combining methodologies to study the same subject became known as triangulation
(Denzin, 1978). Taken from navigation and military strategy, the geometric principles of
triangulation helped social science researchers to understand how they could “improve the
accuracy of their judgments by collecting different kinds of data bearing on the same
phenomenon” (Jick, 1979, p.602). When evidence from multiple research strategies converge
and generate similar results, researchers can create more compelling conclusions than could
be produced from any single method (Jick, 1979; Yin, 2006). In addition to greater
confidence in results, triangulation offers enriched explanations of the problem through
deviant data points and synthesis of competing theories. These benefits of triangulating data
led researchers to start touting the promise and potential of mixed-methods design, calling it
the “research paradigm whose time has come” (Johnson & Onwuegbuzie, 2004, p.14).
Because the researcher in this study desired rich results, a “between (or across) methods”
mixed-methods design was utilized (Denzin, 1978). Extant data from three distinct methods
(i.e. semi-structured interviews, focus groups, and surveys) were examined fully to better
understand the practices taken by high-poverty schools to improve instruction and ultimately,
to increase student achievement (a fourth data set). By studying these diverse data through
62
the theoretical lens of Futernick’s (2007) Tipping Point framework, the researcher hoped to
gain critical information about how schools can transform their cultures from low-performing
to high-performing environments.
A mixed-methods design was most appropriate for this investigation since, as
Onwuegbuzie and Johnson (2006) explained, multiple purposes could be served. According
to these researchers, “in a single [mixed-methods] study practical questions can be addressed,
different perspectives can be examined, and if well documented, practitioners can obtain
some sense of what might be useful in their local situations” (Onwuegbuzie & Johnson,
2006, p.48-49). The end goal--a “more complete, holistic, and contextual portrayal of the
unit(s) under study” (Jick, 1979, p.603)--can then be obtained by combining the data from
qualitative semi-structured interviews and focus groups with quantitative survey results.
The Role of the Researcher
The role of the researcher in qualitative research is “situationally determined, depending
on the context, the identities of others, and your own personality and values” (Glesne, 1999,
p.41). Because this mixed-methods study involved qualitative techniques, the investigator
“enters into the lives of the participants” (Marshall & Rossman, 1999, p.79); therefore, she
had to be mindful of her past experiences and proactively divulge any circumstances which
could have created subjective interpretation of the data gathered. “With these concerns in
mind, inquirers [must] explicitly identify their biases, values, and personal interests about
their research topic and process” (Creswell, 2003, p.184).
In this mixed-methods study, the investigator had to “unself” herself on several levels in
order to effectively conduct the research (Glesne, 1999). For starters, in the fall of 2005 when
the qualitative data were collected, the researcher worked at the educational research and
63
policy non-profit, which was hired to conduct an evaluation of the large southern school
district’s turnaround plan. As an employee at the non-profit, the researcher was asked to
participate in the site visit and conduct the semi-structured interviews with the administrators
at the five reconstituted schools (see Appendix B: Principal Interview Questions). Assistance
from the researcher was provided to a senior research associate, who maintained primary
responsibility for developing the interview protocols, drafting the consent letters, and
coordinating the focus groups for teachers (see Appendix C: Teacher Focus Group
Questions). At the site visit, the researcher had no interaction with the 27 teachers who
participated in the focus groups. Data from the semi-structured interviews and focus groups
were transcribed by a policy assistant and coded by schools to protect the anonymity of the
teachers and administrators, before they were given back to the researcher for use as an
extant data set.
The survey data used in this study were collected in the winter of 2005 through another
project at the non-profit (see Appendix D: Online Survey Questions). The researcher was
aware that the survey was being implemented in the same district as the five targeted schools;
however, she played a minimal role in survey development or implementation. Data were
aggregated at the school level and coded using the same system as the qualitative interviews
and focus groups in order to allow for comparison in this study.
Working at the same organization in which the data were gathered was not the only
obstacle that the researcher had to surmount to fully “unself” herself for this study.
According to Dillard (1995), “our interests originate as much out of our own personal
biographical situations and previous and current life circumstances as out of a sense of what
we are working to bring into being” (p.543). Thus, the researcher’s decision to study high-
64
poverty schools was a natural extension of her past experiences in high-needs schools. As a
student, the researcher attended elementary and high schools in economically disadvantaged
neighborhoods. Although she came from a middle-class home herself, most of her friends
lived in the surrounding impoverished neighborhoods so she became quite intimate with the
culture of poverty. Later, as an elementary teacher and administrator, the researcher worked
in similar communities. With a majority of students receiving free or reduced lunches, these
schools suffered from analogous challenges as the ones profiled in this existing data set.
Having prior experiences as a student, teacher, and administrator in high-poverty
schools, the researcher could relate fairly easily to the subjects involved. As previously
mentioned, these past experiences highly influenced the researcher’s decision to study the
turnaround schools. As a result, a higher level of self-consciousness, which attended to the
researcher’s behavior and its consequences, had to be developed to ensure that these past
experiences and present interests did not interfere with data analysis (Glesne, 1999).
Data Collection Procedures
Research Design
Research design can be described as “an action plan for getting from here to there” (Yin,
1994, p.19). Simply put, it “deals with answering who, what, when, where, how, and why
questions” (Anfara, Brown & Mangione, 2002, p.31). Because the researcher valued the
richness of qualitative data along with the breadth and consistency of quantitative data, a
mixed-methods design was selected for this study. Qualitative and quantitative techniques
were viewed as “complementary rather than as rival camps” (Jick, 1979, p.602). Thus, this
mixed-methods study allowed the strengths of each technique to be illuminated and the
inherent weaknesses minimized.
65
According to Creswell (2003), a mixed-methods approach can be described as:
… [O]ne which the researcher tends to base knowledge claims on pragmatic grounds (e.g., consequence-oriented, problem-centered, and pluralistic). It employs strategies of inquiry that involve collecting data either simultaneously or sequentially to best understand research problems. The data collection also involves gathering both numeric information (e.g., on instruments) as well as text information (e.g., on interviews) so that the final database represents both quantitative and qualitative information (p.18, 20).
In this specific mixed-methods study, the strategies of qualitative interviews (i.e. semi-
structured interviews and focus groups) and quantitative data analysis of population surveys
were utilized to meet the goals of “goodness” criteria that Zelditch (1962) outlined.
Informational adequacy, or completeness of data, was facilitated by research at multiple sites
involving multiple stakeholder groups. Efficiency of time and effort was achieved by
analyzing only the portions of extant data that were most pertinent to the research questions
of this study.
Qualitative data played a primary role in the design, contrary to what many critics of
mixed-methods believe. “The assumption that qualitative research in mixed methods inquiry
is always given secondary or auxiliary status” is false (Creswell, Shope, Plano Clark &
Green, 2006, p.2). In this study, the data from qualitative interviews did not simply serve to
“supplement, validate, explain, illuminate, or reinterpret quantitative data gathered from the
same setting” (Miles & Huberman, 1994, p.10). Instead, it “made context explicit in
explanations” of the quantitative results to paint a fuller, more holistic picture (Creswell,
Shope, Plano Clark, & Green, 2006, p.2). Without qualitative data, this study would lack the
critical elements to understanding how high-poverty schools transform into high-functioning
communities for all students.
66
Numerous strategies exist for designing mixed-methods research studies. Of the six
major models that Creswell (2003) delineated, the concurrent nesting strategy is most similar
to the design for this particular study. While the data sets were not collected at the same time,
one method (i.e. qualitative) predominated over the other, nested method (i.e. quantitative).
As Creswell (2003) explained, “the embedded method addresses a different question than the
dominant method … [and] the data collected from the two methods are mixed during the
analysis phase of the project” (p.218). In this study, the quantitative survey indeed examined
a different set of questions (i.e. inquiries about recruitment incentives and teacher working
conditions), than the qualitative interviews and focus groups. However, the portion of the
survey dedicated to teacher working conditions offered insights into educators’ perceptions
about various elements of Futernick’s (2007) Tipping Point framework, which could not be
ascertained directly from the face-to-face interviews and focus groups. Using the concurrent
nesting strategy was advantageous because the “researcher can gain broader perspectives as a
result of using the different methods as opposed to using the predominant method alone”
(Creswell, 2003, p.218).
Research Questions
A single study no doubt starts with a single set of research questions. A frequent practice in allegedly carrying out mixed methods research is to split the original set of questions, so that different methods address different questions. In education evaluations, a typical split is for qualitative methods to address “process” questions and for quantitative methods to address “outcome” questions (Yin, 2006, p.42-43). In this mixed-methods study, the process and outcome questions were addressed
concomitantly by qualitative and quantitative methods, rather than separately as Yin (2006)
described. The following two major research questions were answered by examining the
extant data sets of semi-structured interview and focus group transcripts and population
67
survey results, along with the archived student achievement data: (1) To what extent did the
schools utilize Futernick’s Tipping Point framework components? (2) Were the schools that
utilized a greater number of the Tipping Point framework components more successful in
improving student achievement on standardized tests? Four subquestions were also
addressed: (1a) Which components were common across all schools? (1b) Which
components were only present in schools with high utilization? (2a) Which components were
common only across schools with above average improvement? (2b) Which components did
schools with below average improvement lack?
The elements of Futernick’s (2007) Tipping Point model were used as a framework to
examine the qualitative and quantitative data sets. Questions from the semi-structured
interviews with administrators, from the focus groups with teachers, and from the population
survey were assigned to Futernick’s (2007) nine key components of reform: teams, time,
physical environment, class-size reduction, autonomy and shared governance, leadership, a
well-rounded curriculum, external support, and parent/community involvement [see
Appendix E: Alignment of Futernick’s (2007) Tipping Point Framework with Extant Data].
Responses to the respective questions, whether derived through qualitative or quantitative
techniques, helped to determine the schools’ level of utilization of the Tipping Point
framework.
Sites and Sample
Sites
Data for this study were collected from five high-poverty, low-performing schools in a
large school district in the southern region of the United States (see Appendix A: School
Profiles). In the fall of 2004, the district launched a bold new effort to transform these
68
underachieving schools. These two elementary and three middle schools, which suffered
from the traditional challenges of high teacher turnover, inadequate funding, and under-
qualified and ineffective faculty, ranked much lower than their more advantaged peers on
various student achievement assessments, including the Stanford Achievement Test (the
same test used in this study to determine the schools’ level of improvement). To turn these
high-poverty, low-performing schools around, the district developed and implemented a
comprehensive turnaround plan.
At the five targeted sites, turnaround strategies of school reconstitution, recruitment and
performance incentives, intensive professional development, and increased resources and
support were employed to attract high-quality teachers committed to improving their
professional practice and their students’ learning through innovative approaches. For starters,
school reconstitution required all faculty and staff members at the schools (including the
principals) to re-apply in order to keep their present positions. Only two principals were
selected by district administrators to retain their helms, while one transferred from another
school and two more came from other systems in the state to transform the low-performing
schools. These five school leaders varied in their perspectives towards reconstitution. Some
selected a majority of the current teachers and support staff to remain in their positions;
others kept only a handful. Regardless of their previous work history at the schools, all
turnaround faculty members were asked to commit to five years of continued service to
reduce the risk of turnover and to create a stable environment.
Recruitment and performance incentives were offered to teachers and administrators at
the turnaround schools to attract and retain high-quality professionals. The monetary
supplements were intended to not only recognize the challenges of working in hard-to-staff
69
schools but also reward teachers and school leaders for their students’ academic progress.
Teachers could receive up to $8,000 in incentives (i.e., a $4,000 signing bonus and up to
$4,000 for student performance on standardized tests), while principals and their assistant
administrators could earn up to a total of $12,000 and $9,000 respectively.
Intensive professional development was provided to enhance the alignment of
curriculum, instruction, and assessment at the turnaround schools. In addition to site-based
in-services throughout the year, all faculty members attended an intensive summer program
that focused on understanding the students’ background, creating a positive school climate
and culture, implementing differentiated and standards-based instruction, and utilizing data-
driven decision-making.
Schools also received a variety of increased resources and support through the
turnaround plan. For example, each school hired an achievement specialist and an academic
coach to provide support to classroom teachers in content, student motivation, and classroom
management. Social workers, counselors, and school nurses were hired to enhance mental
health support for students, and efforts were made to reduce class size. Additionally, plans
were initiated for building a data warehouse to enhance accessibility and use of data.
The targeted schools of the turnaround plan were all nested within the larger quantitative
survey population. As Yin (2006) described, “fieldwork samples may be nested within
survey samples, as in the by now routine situation where case studies are conducted on a
small set of schools that are part of a much larger survey sample of schools” (p.44). In the
case of this research initiative, however, the qualitative data were all collected months before
leaders of the non-profit organization were approached by a regional laboratory to conduct a
population survey of licensed educators in one southern state about the incentives necessary
70
to recruit and retain teachers to high-needs schools. Perceptual questions about teacher
working conditions were also contained within the study. Since the educational lab allowed
the non-profit to help select the three school systems to be investigated, the non-profit’s
leaders successfully advocated for including the same district in which the turnaround
schools were located. Unfortunately, one of the five reconstituted schools studied chose not
to participate in the online survey; therefore, no quantitative data were available for this site.
Sample
“The logic and power of purposeful sampling lies in selecting information-rich cases for
study in depth. Information-rich cases are those from which one can learn a great deal about
issues of central importance to the purpose of the research” (Patton, 1990, p.169). Since the
original intent of collecting the qualitative data was to gather perceptions of the district’s
turnaround plan, purposeful sampling dictated that various members of the school
communities needed to be studied. For this qualitative data collection, both within-case and
multiple-case strategies were employed. Within-case sampling required administrators and
teachers to be interviewed to gain a full picture of stakeholder perspectives. In addition,
multiple-case sampling necessitated that all five sites be visited to “strengthen the precision,
the validity, and the stability of the findings” (Miles & Huberman, 1994, p.29). Applying
both strategies of purposeful sampling created a robust data set of information from which to
draw the research team’s findings.
With the two groups at the five sites identified, the non-profit researchers had to
determine how the information would be gathered from them. As Miles and Huberman
(1994) explained, “questions of practicality also face us. There is a finite amount of time,
with variable access to different actors and events, and an abundance of logistical problems”

71
(p.31). Indeed, practicality was an issue for the original research team. With only three days
to complete site visits at five schools, a well-organized model for sampling had to be
developed. To achieve Zelditch’s (1962) “goodness” criterion of efficiency, the researchers
decided to conduct one-on-one, semi-structured interviews with administrators, while focus
groups were organized to reach a broader range of teachers. A minimum of one administrator
and three teachers were interviewed at each of the five schools. All interviews lasted
approximately one hour. Participating subjects were questioned regarding their perspectives
on the design and implementation of the turnaround plan at their school.
The quantitative data were originally collected using an online survey of all licensed
educators in three diverse school districts in the same southern state. Since the researchers
had access to all names and email addresses in the overall survey population, a single-stage
sampling design was utilized, rather than a multistage, clustering procedure (Creswell, 2003).
An adequate portion of teachers (i.e. more than 40 percent) at four of the study sites
completed the survey. One school chose not to participate in the survey.
Research Procedures
Semi-structured Interviews
Researchers ask questions in the context of purposes generally known fully only to themselves. Respondents, the possessors of information, answer questions in the context of dispositions (motives, values, concerns, needs) that researchers need to unravel in order to make sense out of the words that their questions generate. The questions, typically created by the researchers, may be fully established before interviewing begins and remain unchanged throughout the interview. Questions may emerge in the course of interviewing and may be added to or replace the preestablished ones (Glesne, 1999, p.68).
Glesne’s (1999) depiction of inquiry provides quite an illustrative introduction to the art
and science of interviewing. When researchers interview others, they aim to gather behavior,
feelings, or interpretations of the world that cannot be observed simply by watching others
72
(Merriam, 1988). These qualitative data can then serve as a “source of well-grounded, rich
descriptions and explanations of processes in identifiable local contexts” (Miles &
Huberman, 1994, p.1). “The opportunity to learn about what you cannot see and to explore
alternative explanations of what you do see is the special strength of interviewing in
qualitative inquiry” (Glesne, 1999, p. 69).
Semi-structured interviewing combines the formalized, orderly framework of structured
interviewing with the naturalistic quality of ethnographic research. An interview schedule (or
protocol) of questions may be developed by the researcher in advance of the interview;
however, follow-up probes for clarification and deeper understanding may also be interjected
(Glesne, 1999). “The participant’s perspective on the phenomenon of interest should unfold
as the participant views it, not as the researcher views it” (Marshall & Rossman, 1999,
p.108). Thus, in semi-structured interviews, the researcher does not miss out on important
opportunities to follow a respondent’s train of thought; instead, he or she seizes the moment
to dig deeper and gain a fuller understanding of the subject in study. Careful consideration is
taken, however, to move the questioning back to the interview schedule to ensure consistency
across case sites.
For this particular study, semi-structured interviews with the administrators at the
targeted schools offered multiple benefits (see Appendix B: Principal Interview Questions).
For starters, narrative content derived from the interviews helped to paint a more detailed
picture of the school contexts in which the turnaround plan was implemented. The district
administrators and community organizers desired a rich, robust understanding that
quantitative data alone could not provide. “Words, especially organized into incidents or
stories, have a concrete, vivid, meaningful flavor that often proves far more convincing to a
73
reader–another researcher, a policymaker, a practitioner–than pages of summarized numbers”
(Miles & Huberman, 1994, p.1). The semi-structured interviews also allowed for deeper
personal interactions with the administrators to be fostered by the research team member, as
she met with them in their natural settings (i.e. their schools), thus creating a more relaxed
interview environment for them to speak openly and honestly.
Because the researchers were solely interested in collecting data regarding the educators’
perspectives about the design and implementation of the turnaround plan, a topical
interviewing approach was employed. “Topical interviewing … focuses more on a program,
issue, or process than on people’s lives” (Glesne, 1999, p.69). Consequently, more time was
spent learning about the administrators’ perspectives on the plan, rather than their life
histories. Basic demographic information was collected in a minimal amount (e.g., number of
years in education, number of years at that particular site, etc.).
To facilitate the interview process, a tape recorder was used with participants’
permission. According to Glesne (1999), recording “provides a nearly complete record of
what has been said and permits easy attention to the course of the interview” (p.78). The
researcher wrote minimal field notes during the interviews to ensure that the communication
flowed. Full transcripts of the recordings were completed following the site visits by a policy
assistant at the non-profit.
Focus Groups
Focus group interviewing was the second method of data collection utilized for this
study (see Appendix C: Teacher Focus Group Questions). Just as with semi-structured
interviews, this qualitative technique can help researchers to “preserve chronological flow,
see precisely which events led to which consequences, and derive fruitful explanations”
74
(Miles & Huberman, 1994, p.1). In addition, this distinctive interviewing approach can “play
an especially prominent role by eliciting data and suggesting conclusions to which other
methods would be blind. Elements of the context are illuminated” (Jick, 1979, p.603).
Although they both represent qualitative data collection strategies, focus groups differ
slightly from semi-structured interviews. “When more than one person participates (e.g.,
focus group interviews), the interview process gathers a wide variety of information across a
larger number of subjects than if there were fewer participants--the familiar trade-off
between breadth and depth” (Marshall & Rossman, 1999, p.110). As significant amounts of
data are obtained quickly from a myriad of participants, the overall data set becomes
enriched. The data gained through focus groups may be different, however, than what would
have been garnered via individual interviews since participants in focus groups may
sometimes feed off the social nature of the group and alter their responses after hearing
others’ opinions and perspectives (Marshall & Rossman, 1999).
In this study, focus groups were utilized as an efficient strategy to collect data from a
wide spectrum of teachers at the five turnaround schools. With limited time and staff
available, this technique offered a valuable alternative to one-on-one conversations. “The
interviewer create[d] a supportive environment, asking focused questions, to encourage
discussion and the expression of differing opinions and points of view” (Marshall &
Rossman, 1999, p.114). The use of a tape recorder, with the permission of the participants,
helped to capture the insightful comments and allow conversation to flow more naturally as
the researchers did not need to focus on writing (Glesne, 1999). The recorded focus group
conversations were then also transcribed by the non-profit’s policy assistant at the
completion of the site visits.
75
Surveys
According to Creswell (2003), “a quantitative approach [to research] is one in which the
investigator primarily uses postpositivist claims for developing knowledge … , employs
strategies of inquiry such as experiments and surveys, and collects data on predetermined
instruments that yield statistical data” (p.18). More specifically, a survey design “provides a
quantitative or numeric description of trends, attitudes, or opinions of a population by
studying a sample of that population” (Creswell, 2003, p.153). Through analyzing items on a
survey, researchers can make “inferences about a large group of people from data drawn on a
relatively small number of individuals from that group” (Marshall & Rossman, 1999, p.130).
While qualitative research may be characterized as in-depth, time-intensive work,
quantitative surveys are often viewed as an efficient means to compile massive quantities of
information. The “economy of the design and rapid turnaround in data collection” make this
research strategy useful for studies of large-scale (Creswell, 2003, p.154). In addition to
convenience, surveys also offer the benefit of accuracy in measurement, which is “enhanced
by quantification, replicability, and control over observer effects” (Marshall & Rossman,
1999, p.130). Ease of administration, management, and analysis should also be noted as
advantages.
Yet, surveys have “little value for examining complex social relationships or intricate
patterns of interaction” (Marshall & Rossman, 1999, p.131). For example, many surveys
simply ask respondents to select one answer from among multiple choices, with no option to
explain why or how the decision was made. Researchers can then only make assumptions
about the factors that contributed to the participants’ judgments.

76
Because the researcher in this study sought a robust data set, quantitative survey data
from teachers at the turnaround schools supplemented the qualitative interview data collected
at all sites (see Appendix D: Online Survey Questions). The survey, which was distributed
online through an email link, contained working conditions questions in four distinct
domains: (1) organization and management; (2) facilities and resources; (3) leadership; and
(4) professional development. Questions from these domains overlapped with elements found
in Futernick’s (2007) Tipping Point framework for school reform, except for the components
of teams, a well-rounded curriculum, external support, and parent/community involvement.
Responses from teachers at four of the five turnaround schools (one school chose not to
participate) were analyzed through the lens of the related Tipping Point components.
Document Archival Review
The use of archival documents offers an unobtrusive means to collect data without
disrupting sites (Marshall & Rossman, 1999). Extensive document review was required for
this study in order to determine the schools’ level of improvement on standardized tests. The
state board of education’s report cards provided the requisite data, including scores for the
Stanford Achievement Test (SAT-10) from the 2003-04 and 2004-05 school years. In
addition, the report cards offered background information for the targeted sites, which has
been included in the school profiles found in Appendix A.
Data Analysis Procedures
Data analysis in mixed methods relates to the type of research strategy chosen for the procedures … analysis occurs both within the quantitative (descriptive and inferential numeric analysis) approach and the qualitative (description and thematic text or image analysis) approach, and often between the two approaches (Creswell, 2003, p.220).
“Transforming data into research results is called analysis,” (LeCompte, 2000, p.146). In
this study, data analysis occurred within and between the qualitative and quantitative
77
approaches, as Creswell (2003) elucidated. The purpose of analyzing the data sets separately
and collectively was to examine the multiple levels of information collected through this
concurrent nested model in order to ascertain a full understanding of the schools’
implementation of the turnaround plan and their relationship to Futernick’s (2007) reform
model [see Appendix E: Alignment of Futernick’s (2007) Tipping Point Framework with
Extant Data]. As these processes unfolded, the researcher sought to answer the two
overarching research questions for this study: (1) To what extent did the schools utilize
Futernick’s Tipping Point framework components? (2) Were the schools that utilized a
greater number of the Tipping Point framework components more successful in improving
student achievement on standardized tests? Four subquestions were also addressed: (1a)
Which components were common across all schools? (1b) Which components were only
present in schools with high utilization? (2a) Which components were common only across
schools with above average improvement? (2b) Which components did schools with below
average improvement lack?
Qualitative Data
Data analysis is the process of bringing order, structure, and meaning to volumes of
collected data (Marshall & Rossman, 1999). For qualitative research, this process can be
particularly time-consuming as pages upon pages of text are compiled through interviews and
focus groups. “Confronted with a mountain of impressions, documents, transcribed
interviews, and field notes, the qualitative researchers faces the difficult task of making sense
of what has been learned” (Anfara, Brown & Mangione, 2002, p.31). In this study, the six
common phases of analytic procedures were followed to facilitate the researcher’s journey
through the qualitative data. These six phases include: “(a) organizing the data; (b)
78
generating categories, themes, and patterns; (c) coding the data; (d) testing the emergent
understandings; (e) searching for alternative explanations; and (f) writing the report”
(Marshall & Rossman, 1999, p.152).
To organize the data, information from the written transcripts of the interviews and focus
groups was recorded in an Excel spreadsheet, with each school having its own worksheet.
The researcher muddled through the “code mines” (Glesne, 1999) by “divid[ing] text into
segments or chunks, attach[ing] codes to the chunks, and find[ing] and display[ing] all
instances of coded chunks (or combinations of coded chunks)” (Miles & Huberman, 1994, p.
12). The tough task of generating coding schemas for important concepts and terms was
simplified, as the nine categories were already identified [i.e. the key components of
Futernick’s (2007) Tipping Point framework]. The related literature was reviewed, however,
in order to create the building blocks for coding system development, which correlated to
these categories (Glesne, 1999).
The process of data reduction was interwoven into data analysis. “Data reduction refers
to the process of selecting, focusing, simplifying, abstracting, and transforming the data that
appear in written-up field notes of transcriptions” (Miles & Huberman, 1994, p.10). Given
the large volume of interview information, this task required a great deal of effort and
patience, as the researcher determined “which data chunks to code and which to pull out,
which patterns best summarize a number of chunks, which evolving story to tell” (Miles &
Huberman, 1994, p.11). Through data reduction, emerging understandings were tested and
alternative explanations sought out by the researcher. These phases of analysis required the
data to be sifted “by repeated readings through field notes, interviews, and text to identify
items relevant to the research questions. Concentrating these items in data involves
79
systematic processes of looking for frequency, omission, and declaration” (LeCompte, 2000,
p.148). In essence, finding out how often participants mentioned certain topics or whether
they avoided them altogether was critical in the data analysis, as was discerning their
perceived statements of affirmation and absence of the relevant framework components.
After careful analysis and reflection upon Futernick’s (2007) tenets of reform, levels of
utilization were demarcated. A high bar was set for utilization strength, since Futernick
(2007) argued that successful reform required all nine framework components. Consequently,
schools with eight or nine elements were considered “high utilization,” schools with six or
seven were deemed “moderate utilization,” and schools with five or less framework
components were labeled as “low utilization.”
The final phase of analysis included writing the dissertation chapter on research results.
As Marshall and Rossman (1999) explain, the writing process plays an integral role in the
data analysis framework:
Writing about qualitative data cannot be separated from the analytic processes. In fact, it is central to that process, for in the choice of particular words to summarize and reflect the complexity of the data, the researcher is engaging in the interpretive act, lending shape and form--meaning--to massive amounts of raw data (p.157-158).
A “realist tale” with a clear separation between the researcher and the researched was
developed for the dissertation (Van Maanen, 1988). While some view this genre as boring
and drab, others see it as the “tradition [that] set the standards and criteria for credibility,
quality, and respectability in qualitative work” (Marshall & Rossman, 1999, p.158). The
practices of turnaround schools were linked to the theory of Futernick’s (2007) Tipping Point
strategy to analyze its effectiveness in school reform.
80
Quantitative Data
Quantitative data analysis occurred simultaneously with the qualitative data analysis.
First, items on the population survey were coded using the same characteristics as the
interviews and focus groups to determine their relationship to the nine components of
Futernick’s (2007) Tipping Point model [see Appendix E: Alignment of Futernick’s (2007)
Tipping Point Framework with Extant Data]. Once the pertinent survey data were identified
by code mapping (Glesne, 1999), means for each relevant question were calculated for each
school using descriptive statistics (Howell, 2002). The average scores for each question were
then rank ordered by educational level (i.e. elementary, middle, high) to determine how a
school was evaluated in comparison to its peers in the district. This information helped the
researcher to determine how well the school utilized Futernick’s (2007) Tipping Point
strategies. In doing so, the goal was to draw conclusions about the reform model’s
effectiveness in transforming high-poverty schools to high-functioning cultures. That is, “we
want to infer something about the characteristics of the population (parameters) from what
we know about the characteristics of the sample (statistics)” (Howell, 2002, p.5).
Additional quantitative data analysis was required in order to determine the schools’
level of improvement on the Stanford Achievement Test (SAT-10). To begin, the progress
for each grade level from 2003-04 to 2004-05 was calculated for both the reading and math
tests. These grade level growth scores were then averaged to produce an overall mean for
school improvement. The means were compared to the district average for reading and math.
If schools matched the district average, they received a rating of “0,” if they exceeded it, they
were ranked as “+1,” and if they fell short, they were identified as “-1.” The two scores for
reading and math were combined to determine a school’s final improvement rating. Three
81
levels delineated student progress on the SAT-10: above average improvement (a final rating
of 1 or more), average improvement (a final rating equal to 0), and below average
improvement (a final rating of less than 0).
Methods of Verification
The “validity” issue, at least as we use the term, is not about singular truths, and it certainly is not limited to quantitative measurement; rather, by validity we mean that a research study, its parts, the conclusions drawn, and the applications based on it can be of high or low quality, or somewhere in between (Onwuegbuzie & Johnson, 2006, p.48). Creating meaningful results involves validity, or whether or not research findings seem accurate or reasonable to the people who were studied. It also refers to whether or not results obtained in one study can be applied to other studies with similar or identical people or situations (LeCompte, 2000, p.152).
Qualitative Trustworthiness
“Too frequently, qualitative research is evaluated against the positivist criteria of validity
and reliability and found to be lacking or ‘soft’” (Anfara, Brown & Mangione, 2002, p.28).
To counteract these attacks against trustworthiness (the preferred qualitative term for
validity), several strategies were employed in this research study. For starters, the researcher
demonstrated researcher reflexivity (i.e. self-disclosed her assumptions, beliefs, and biases).
According to Creswell and Miller (2000), “it is particularly important for researchers to
acknowledge and describe their entering beliefs and biases early in the research process to
allow readers to understand their positions, and then to bracket or suspend those researcher
biases as the study proceeds” (p.127). Although this validity procedure was already
demonstrated in the section of this proposal entitled, “The Role of the Researcher,”
additional information was inserted as new insights were gained throughout the data analysis
process. Any unearthed experiences, values, and beliefs of the researcher, which interfered
with the research study, have been fully disclosed in the final dissertation.

82
Triangulation of data sources offered another strategy to ensure qualitative
trustworthiness (Glesne, 1999; Creswell, 2003). “Triangulation is a validity procedure where
researchers search for convergence among multiple and different sources of information to
form themes or categories in a study” (Creswell & Miller, 2000, p.126). In this study, within-
case and between-case sampling techniques provided a myriad of data from two separate
stakeholder groups in five different schools. These “in-depth interviews with multiple
informants at each site will … allow [the researcher] to triangulate findings across sources
and test issues of reliability and validity” (Marshall & Rossman, 1999, p.60). In other words,
the data from the semi-structured interviews helped to triangulate the information from the
focus groups. In turn, these qualitative data were also triangulated by the secondary analysis
of the quantitative survey results. Glesne (1999) said it well: “The more sources tapped for
understanding, the richer the data and the more believable the findings” (p.31).
The robust, detailed nature of qualitative research provided evidence of trustworthiness
as well. As Creswell (2003) suggested, “rich, thick description” of the schools’
implementation of the turnaround plan and its related adherence to Futernick’s (2007)
Tipping Point framework were used “… to convey the findings. This may transport readers
to the setting and give the discussion an element of shared experiences” (p.196). As readers
gain a better understanding of the school contexts, they will be able to process the research
findings much easier.
Quantitative Reliability and Validity
“There are several threats to validity that will raise potential issues about an
experimenter’s ability to conclude that the intervention affects an outcome” (Creswell, 2003,
p.171). In this research study, the quantitative internal validity threat was subverted because

83
one standard survey instrument was utilized for all qualitative case sites. Inadequate
procedures (e.g., changing the instrument during the experiment), therefore, did not interfere
with the analysis of the data.
An external validity threat, known as population validity, could arise if readers believe
that the data derived from the turnaround schools are unlikely to be generalized to a larger
population of high-poverty schools (Onwuegbuzie & Johnson, 2006). These targeted sites
were unique in that their respective school district allocated a huge amount of financial
resources and support to transform the school environments. External validity might not be
achieved if readers view this uniqueness as a hindrance to greater generalization of results.
Outcome of the Study and Its Relation to Theory and Literature
Despite an expansive amount of literature on high-poverty schools and various school
reform initiatives proposed to “save” them, few researchers have systematically probed
administrators and teachers about the ability to completely transform entire school
environments from low-achieving to high-functioning cultures. The purpose of this study was
to determine whether Futernick’s (2007) Tipping Point framework for comprehensive school
reform will indeed turn schools around and create cultures of success for all students. The
results may prove crucial for the high-poverty schools across the nation that so desperately
want to increase student learning.
CHAPTER FOUR
DATA ANALYSIS
Introduction
The purpose of analysis is to define, structure, and order data in a research study
(LeCompte, 2000). Interpretation requires an eye for detail, focus, and openness to subtlety
(Marshall & Rossman, 1999). This becomes particularly important for the mixed methods
researcher who must not only delve into quantitative statistics, but also dig out of the mounds
of amassed qualitative data. Van Maanen (1988) described this process as telling the “tales of
the field” by translating what has been learned into a body of textual information that
communicates understandings to the reader.
Chapter Four strives to tell the “tale” of turnaround schools by answering the research
questions posed at the onset of this mixed methods study. There were two main questions for
investigation: (1) To what extent did the schools utilize Futernick’s Tipping Point framework
components? (2) Were the schools that utilized a greater number of the Tipping Point
framework components more successful in improving student achievement on standardized
tests? The first question, which focused on the utilization of Futernick’s framework,
contained two subquestions: (1a) Which components were common across all schools? (1b)
Which components were only present in schools with high utilization? The second question,
which addressed the influence of the framework components on improvement in student
achievement, included two additional subquestions: (2a) Which components were common
85
only across schools with above average improvement? (2b) Which components did schools
with below average improvement lack? Through the voices of the principal and teacher
interviewees as well as the survey responses, Chapter Four attempts to illustrate the
turnaround schools’ efforts for reform and their subsequent student achievement results.
Utilization of the Framework Components
Futernick’s (2007) Tipping Point framework provided a nine-point plan for school
reform in low-performing, high-poverty schools. Data from the five schools under study were
examined closely to answer the following question about utilization: (1) To what extent did
the schools utilize Futernick’s Tipping Point framework components? Two subquestions
were also addressed: (1a) Which components were common across all schools? (1b) Which
components were only present in schools with high utilization?
Because Futernick (2007) contended that successful reform required all nine components
of reform, a high bar was set for delineations of utilization strength. Schools with eight or
nine elements were considered “high utilization,” while schools with six or seven were
deemed “moderate utilization.” Schools with five or less framework components were
labeled as “low utilization.”
After careful analysis of the qualitative and quantitative data that was compiled for this
study, it was found that School B utilized nine out of nine components for reform (high
utilization), while Schools A and C both exemplified six (moderate utilization). School D
ranked next with five elements (low utilization) and School E came in last with evidence of
just four elements (low utilization). For a complete overview of the turnaround schools and
their utilization of the reform components, see Table 1. Supplemental information about how
these components were supported by the data may be found in Table 2. For example, if the

86
data surfaced positive affirmation of the framework component, a “+” has been noted; on the
other hand, negative comments resulted in a “-.” If no data were available for the element, a
“/” has been used, while a “0” denotes mixed information (findings that are both positive and
negative). These compiled data produced final ratings found in Table 1. Schools needed at
least two “+” marks to indicate the presence of a reform component, with the only exception
being cases where evidence was lacking for two of the three data sources and one “+” mark
was found in the remaining area. A complete profile of the schools and their resulting
evidence can be found at the end of this chapter.

87
Table 1 Utilization of Futernick’s (2007) Framework Components
___________________________________________________________________________ Schools ____________________________________________________________ Components School B School A School C School D School E
Teams x x x x x Time x x x Physical Environment x x Class-size Reduction x x x Autonomy and Shared x Governance Leadership x x x A Well-rounded x x x x x Curriculum External Support x x x Parent/Community x x x x x Involvement
Utilization High Moderate Moderate Low Low
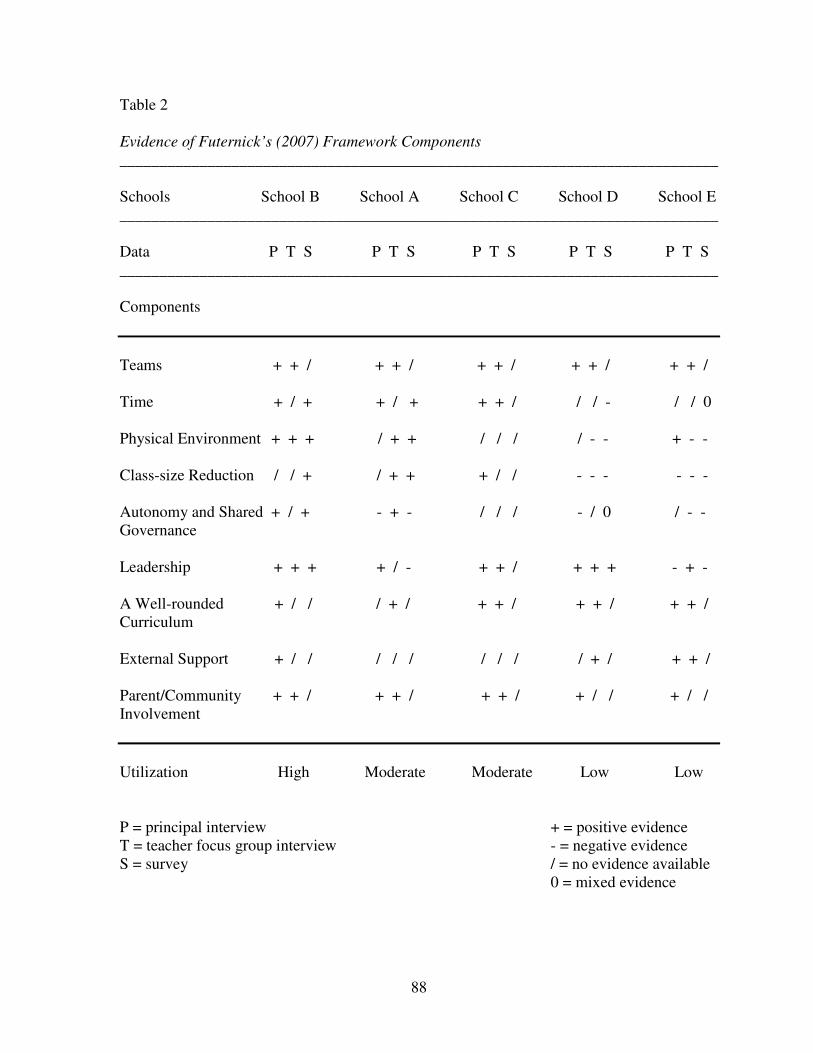
88
Table 2 Evidence of Futernick’s (2007) Framework Components
___________________________________________________________________________ Schools School B School A School C School D School E ___________________________________________________________________________ Data P T S P T S P T S P T S P T S ___________________________________________________________________________ Components
Teams + + / + + / + + / + + / + + / Time + / + + / + + + / / / - / / 0 Physical Environment + + + / + + / / / / - - + - - Class-size Reduction / / + / + + + / / - - - - - - Autonomy and Shared + / + - + - / / / - / 0 / - - Governance Leadership + + + + / - + + / + + + - + - A Well-rounded + / / / + / + + / + + / + + / Curriculum External Support + / / / / / / / / / + / + + / Parent/Community + + / + + / + + / + / / + / / Involvement
Utilization High Moderate Moderate Low Low P = principal interview + = positive evidence T = teacher focus group interview - = negative evidence S = survey / = no evidence available 0 = mixed evidence

89
Utilization Subquestions
Data analysis presented in the previous sections delineated the extent to which the
turnaround schools utilized Futernick’s Tipping Point framework components in their school
reform efforts. School B, deemed a high utilization site, had evidence of nine framework
components. Schools A and C demonstrated moderate utilization with six elements each.
Schools D and E recorded five and four components respectively, qualifying as low
utilization sites. With this information in hand, two subquestions remained: (1a) Which
components were common across all schools? (1b) Which components were only present in
schools with high utilization?
Common Components
Across all five turnaround schools, there were three common elements: teams, a well-
rounded curriculum, and parent/community involvement. Given the nature of the turnaround
plan, it seems logical that these particular components would be found in all schools. The
district devised the reform plan with an underlying philosophy that educators within the
school system would unite together to ensure student success in these particular buildings.
Principals were hired with a teamwork mentality to “rally the troops” and build a collective
vision for high student achievement. In addition, a tremendous amount of resources were
pumped into these schools to ensure that students received a well-rounded curriculum.
Teachers attended extensive professional development workshops during the summer and
throughout the school year to enhance their skills as instructional leaders. District
administrators pushed the turnaround teachers to utilize differentiation strategies to meet the
needs of their unique learners. From the beginning, the community played an important role
in devising the reform plan. Parents, business leaders, and other citizens were asked to offer
90
their input on how to support and staff these high-needs schools. Consequently, efforts to
continue their engagement flowed naturally from this inclusive starting point.
Evidence of teams was prevalent throughout the interview data from principals and
teachers. Phrases, such as “we share a similar vision” and “we’re in this together,” could be
found in reviewing the transcripts at several schools. The educators talked candidly about
everyone in the building playing a part in turning the school around. “We don’t just mean
teachers as family,” said one teacher at School B. “We mean all people--even custodians.” A
colleague at School D added, “As a faculty, we work together in unity.” Collaborative
coaching, lesson modeling, and resource sharing provided a strong foundation upon which
these teams could be built. In addition, teachers came together on a regular basis at every
school to design assessments, examine data, and tailor instruction in order to meet their
students’ needs better. “We were able to spot check other teachers and provide support for
them,” a teacher at School A explained.
The presence of a well-rounded curriculum surfaced in the data for all five turnaround
schools. The principals were particularly pleased by their teachers’ efforts to improve their
instructional practice. For example, the administrator at School B applauded the effects of the
district’s math initiative, while the principal at School C acknowledged the “twinkle in the
students’ eyes” after they formed new attitudes about learning. From the teachers’
perspectives, the use of hands-on manipulatives emerged as a common theme. A science
teacher at School E relayed how successful her students had been on the district assessment
since she started using group work and authentic lab activities. In addition, a math teacher at
School D explained how she transformed her instruction from teacher-led to child-centered
so that her students now discovered the formulas for themselves.
91
Interview data offered insights into the effective strategies utilized by all five schools to
enhance parent and community involvement. Teachers at School A talked a great deal about
building strong lines of communication from the start of the school year. The administrator at
School D shared information about that school’s efforts to go out into the neighborhoods to
conduct school meetings in order to reach parents on neutral ground. School C distributed
plus/delta surveys to their students’ guardians to get an honest view of the school’s strengths
and weaknesses. The larger community was engaged at Schools B and E in order to fill the
void for maintenance and resource needs. These partners in education, along with the
renewed parental support, have helped these schools to greatly improve their images in the
community. “Their sense of self-pride has increased,” remarked the principal at School D.
“Everyone is proud of what these schools have become.”
Components in High Utilization Schools
Data analysis revealed School B as the sole qualifier as a high utilization school, with
evidence of all nine framework components present in the data collected. When examined in
juxtaposition to the elements present at the four other turnaround schools, autonomy and
shared governance stood out as the distinctive component at School B; no other school in the
study provided sufficient information to indicate its inclusion in reform efforts. Survey data
ranked this school in the top tier of all elementary schools in the district for autonomy and
shared governance. In the eight questions addressing this element, no less than 82.6% of
respondents either agreed or strongly agreed with all statements. More specifically, a full
100% of teachers who completed the survey agreed that “The faculty has an effective process
for making group decisions and solving problems” (resulting in a second place ranking for all
elementary schools in the district for this item). Similarly, 93.5% of surveyed educators
92
agreed that they are “recognized as an educational expert and … trusted to make sound
professional decisions about instruction.”
Data from the administrator interview confirmed the quantitative statistics. In that in-
depth conversation, the principal described her leadership philosophy in this way, “I must
treat my staff as professionals…. let everyone have a say and a voice.” Indeed, there was an
atmosphere of autonomy and shared governance at School B, unlike any other school in the
research study.
Framework Components and Student Achievement
Futernick (2007) developed the Tipping Point framework for reform in order to improve
student achievement at low-performing, high-poverty schools. He contended that the
application of his robust turnaround plan would result in gains on standardized assessments.
In order to test this assumption, data from the five researched schools were analyzed to
address the following question: (2) Were the schools that utilized a greater number of the
Tipping Point framework components more successful in improving student achievement on
standardized tests? Two subquestions were also examined: (2a) Which components were
common only across schools with above average improvement? (2b) Which components did
schools with below average improvement lack?
Student data from the Stanford Achievement Test (SAT-10) were utilized to determine
the schools’ level of improvement. To start, the growth for each grade level from 2003-04 to
2004-05 was calculated for both the reading and math tests. These grade level growth scores
were then averaged to produce an overall mean for school improvement in reading and math.
The means were compared to the district average for these two subject areas. Schools
received a rating of “0” if they matched the district average, “+1” if they exceeded it, and “-
93
1” if they fell short. The two subject area scores were added together to determine a school’s
final rating.
Three levels demarcated student growth on the SAT-10: above average improvement (a
final rating of 1 or more), average improvement (a final rating equal to 0), and below average
improvement (a final rating of less than 0). After careful analysis of the SAT-10 scores for
each grade level, three schools--School A, B, and C--qualified for above average
improvement with final ratings of +2. School E recorded a final rating of 0 for average
improvement, while School D’s final rating of -1 was marked as below average
improvement. Tables 3 and 4 provide a detailed numerical illustration of how these ratings
were determined.
Were the schools that utilized a greater number of the Tipping Point framework
components in fact more successful in improving student achievement on standardized tests?
To answer the major research question for this section, the results from Table 1 were
compared to the findings in Table 4. School B, with nine out of nine elements from
Futernick’s framework, was classified as an above average improvement school.
Furthermore, Schools A and C (both with six out of nine components) also ranked as above
average improvement sites. On the other hand, average improvement on the SAT-10 was
demonstrated at School E, which provided evidence for only four components. School D
received a below average improvement rating, while substantiating the presence of just five
framework elements. See Table 5 for further details.
Based on these improvement ratings, it can be ascertained that schools in this study
averaged higher rates of improvement on the SAT-10 when more framework components
were included in their efforts for reform. All three schools receiving a designation as above
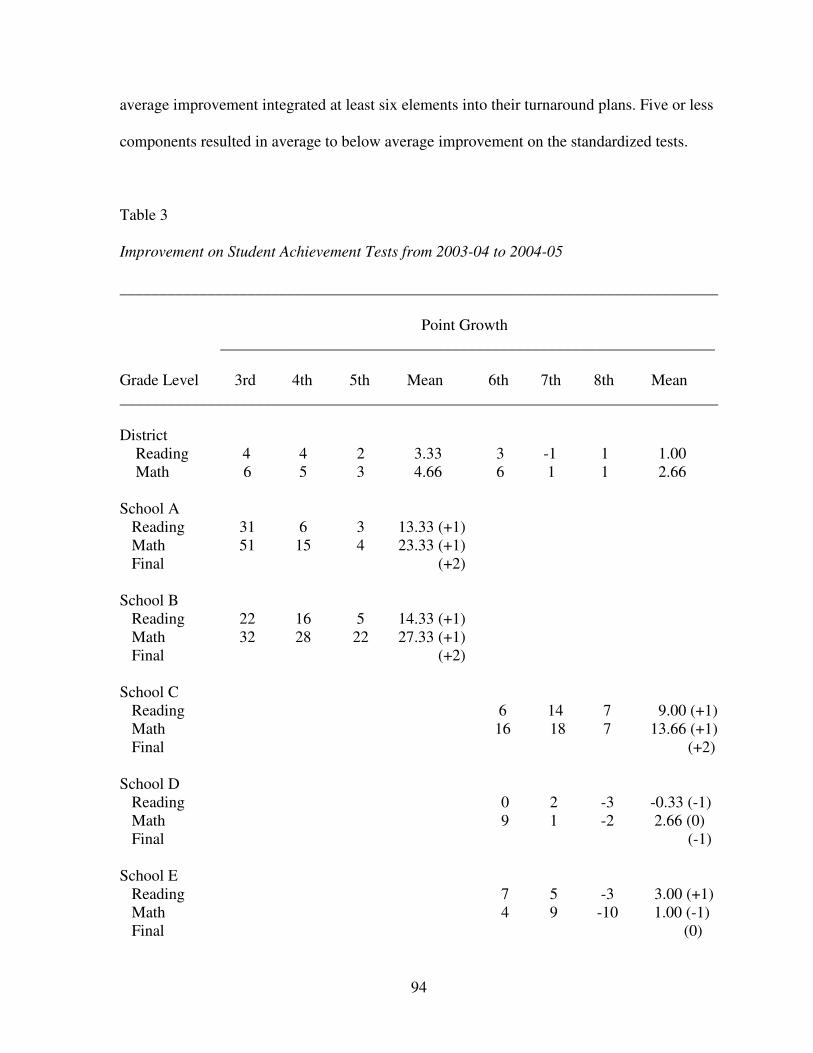
94
average improvement integrated at least six elements into their turnaround plans. Five or less
components resulted in average to below average improvement on the standardized tests.
Table 3
Improvement on Student Achievement Tests from 2003-04 to 2004-05
___________________________________________________________________________
Point Growth ______________________________________________________________ Grade Level 3rd 4th 5th Mean 6th 7th 8th Mean ___________________________________________________________________________ District Reading 4 4 2 3.33 3 -1 1 1.00 Math 6 5 3 4.66 6 1 1 2.66 School A Reading 31 6 3 13.33 (+1) Math 51 15 4 23.33 (+1) Final (+2) School B Reading 22 16 5 14.33 (+1) Math 32 28 22 27.33 (+1) Final (+2) School C Reading 6 14 7 9.00 (+1) Math 16 18 7 13.66 (+1) Final (+2) School D Reading 0 2 -3 -0.33 (-1) Math 9 1 -2 2.66 (0) Final (-1) School E Reading 7 5 -3 3.00 (+1) Math 4 9 -10 1.00 (-1) Final (0)
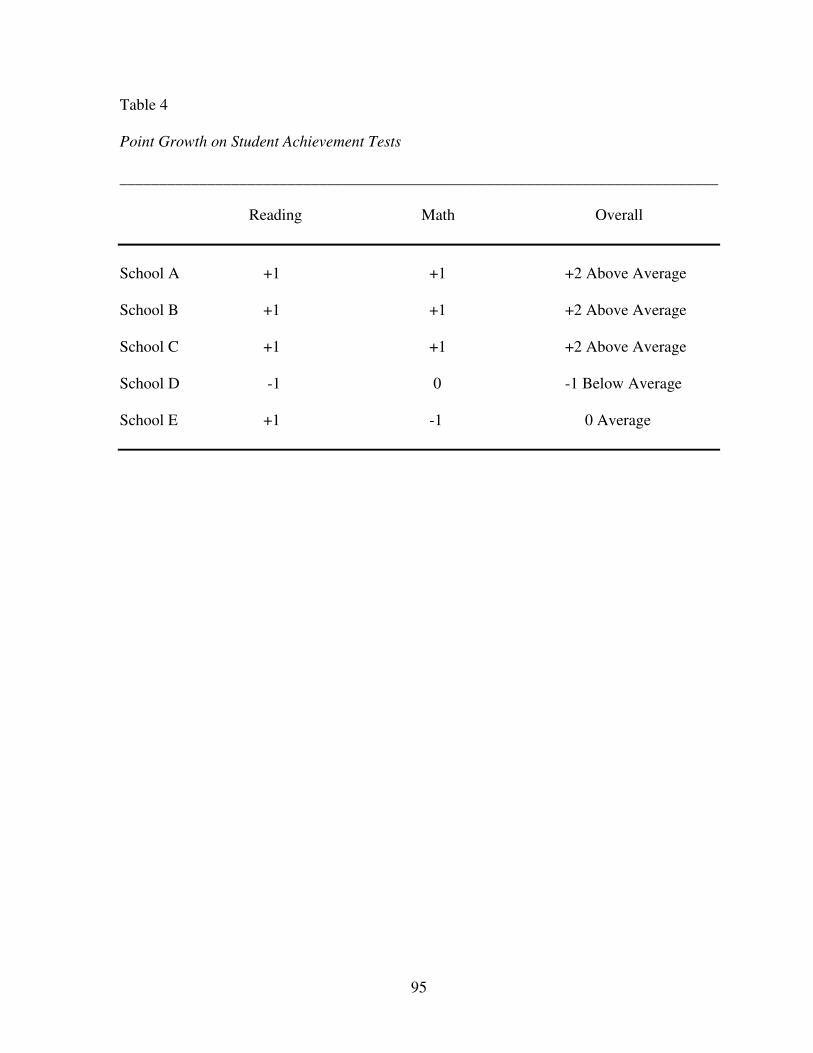
95
Table 4
Point Growth on Student Achievement Tests
___________________________________________________________________________ Reading Math Overall
School A +1 +1 +2 Above Average School B +1 +1 +2 Above Average School C +1 +1 +2 Above Average School D -1 0 -1 Below Average School E +1 -1 0 Average
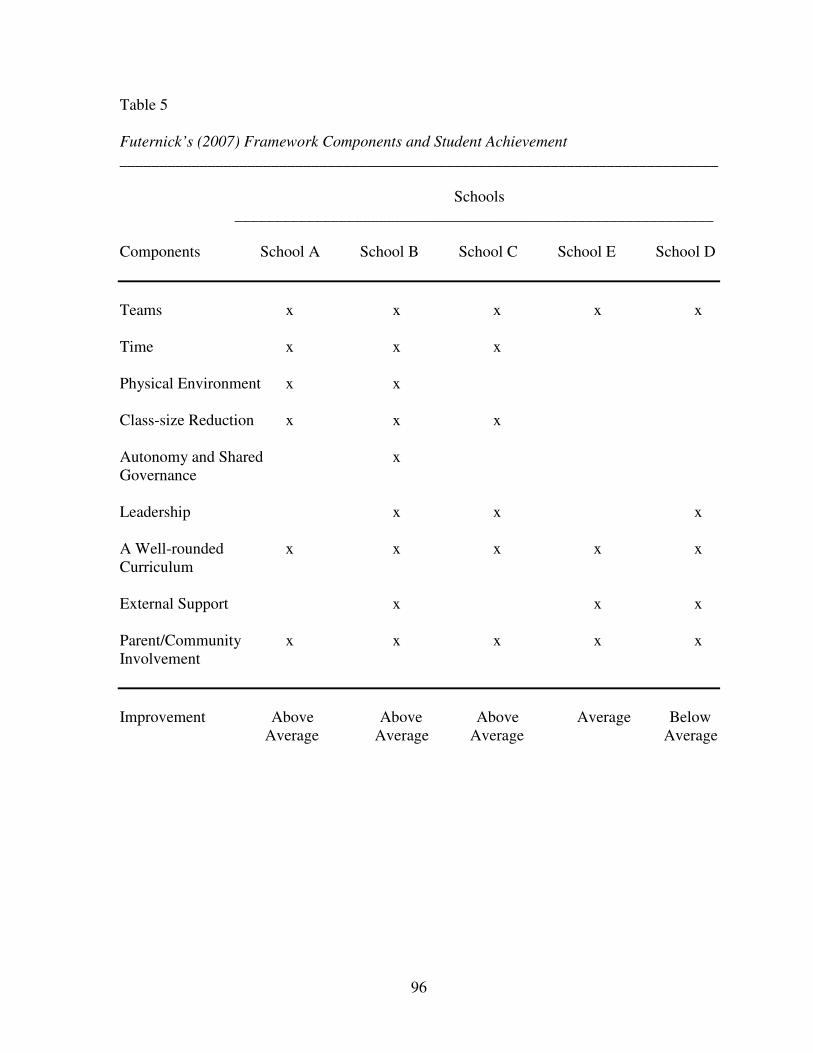
96
Table 5
Futernick’s (2007) Framework Components and Student Achievement
___________________________________________________________________________ Schools ____________________________________________________________ Components School A School B School C School E School D
Teams x x x x x Time x x x Physical Environment x x Class-size Reduction x x x Autonomy and Shared x Governance Leadership x x x A Well-rounded x x x x x Curriculum External Support x x x Parent/Community x x x x x Involvement
Improvement Above Above Above Average Below Average Average Average Average
97
Student Achievement Subquestions
Data analysis from the preceding section described the relationship between the number
of Tipping Point framework components utilized at each school and the subsequent
improvement in student achievement scores on the Stanford Achievement Test (SAT-10).
Further examination of these findings helped to address the following two subquestions that
were raised: (2a) Which components were common only across schools with above average
improvement? (2b) Which components did schools with below average improvement lack?
Components in Above Average Improvement Schools
Schools A, B, and C all received ratings of above average improvement, upon evaluation
of their respective grade level scores in reading and math on the SAT-10. Comparing these
schools side-by-side, it became clear that they had several components in common. As
previously noted, evidence of teams, a well-rounded curriculum, and parent/community
involvement were found at all five sites (for further discussion of these universal elements,
see the subsection labeled Common Components). Schools A, B, and C were distinctive,
however, in sharing two additional components. At these above average improvement
schools, time and class-size reduction were evident, yet Schools D and E lacked them.
Teachers and administrators shared myriad ideas on how time was effectively utilized at
the above average improvement schools. At School A, the principal pushed back when
district officials condemned her for not following protocol with a common schedule. The
central office administrators wanted all teachers in the building to provide reading instruction
at the same time during the daily schedule. The leader at School A rejected that idea by
stating, “One teacher cannot observe another if everybody is doing reading at the same time.”
She held her ground and eventually the district office realized how important this flexible
98
time for modeling lessons and coaching peers could be for teacher growth and development.
A minimum 45 minutes of collaborative planning time was also built into the schedule each
day for teachers at School A, with the block expanding to 75 minutes in year two of reform.
School B’s administrator ensured teacher collaboration time--in addition to the regularly
scheduled team meetings--by allocating half-days each month for group planning. Students
stayed longer with their enrichment teachers, while their regular classroom teachers
collectively developed lesson units, evaluated student assessments, and planned other
activities. School C demonstrated effective use of time by extending the periods at the middle
school to 90 minutes. These larger blocks provided teachers with more time to explore
deeper lessons with their students and also offered them more opportunity to collaborate. One
teacher at the school noted, “The longer blocks allow us to analyze test scores, plan units,
and work together more often. It’s pretty cool.”
Quantitative data for Schools A and B supplemented the qualitative data at these above
average improvement schools (School C’s teachers did not participate in the survey;
therefore, no quantitative data were available for this school). When teachers were asked if
they agreed with the statement, “Time in school is used efficiently to maximize student
learning,” more than three-fourths of respondents at Schools A (76.7%) and B (82.6%) either
agreed or strongly agreed. The second statement regarding time (i.e. “The non-instructional
time provided to me is sufficient to improve my teaching practices”) garnered lower
responses overall across the district. Thus, while only 56.7% and 54.3% of School A and
School B’s survey respondents agreed respectively, both schools still ranked in the top tier of
all elementary schools for this question.

99
The Tipping Point framework component of class-size reduction was shared across the
three above average improvement schools as well. During the teacher focus group at School
A, one educator elucidated the importance of small class size on student learning. She
remarked, “With a small class, you can reach every child. There were lots of resources and
my struggling students soared. I haven’t always had that. With large classes, you reach who
you can reach and some are left behind.” At School C, teachers in grades seven and eight saw
a dramatic decrease in their roster size during the first year of reform. Their classes averaged
21 students or less.
The quantitative survey data bolstered the qualitative evidence of class-size reduction for
Schools A and B (no surveys were completed at School C). No less than 71.7% of teachers at
the two schools agreed with the following statements:
• The student composition in my classes is reasonable to allow me to meet the
educational needs of all students (73.3% for School A and 71.7% for School B).
• I have reasonable class sizes, affording me the time to meet the educational needs of
all students (80.0% for School A and 76.1% for School B).
These high levels of agreement for survey respondents at the two above average
improvement schools led to top tier rankings for all elementary schools for both class-size
reduction questions.
Components in Below Average Improvement Schools
Only one school out of five turnaround schools--School D--was assessed as having
below average improvement on the SAT-10 standardized test. School D’s quantitative and
qualitative data provided evidence of just five elements (see section labeled School D for a
more detailed description of this school’s framework results). The four components that this

100
school lacked include: time, physical environment, class-size reduction, and autonomy and
shared governance. Survey responses from teachers at School D ranked the school in the
bottom tier of all middle schools in the district for questions related to time, physical
environment, and class-size reduction. Questions of autonomy and shared governance
received mixed responses. For example, only 44.4% of teachers surveyed at School D agreed
that “There is an atmosphere of trust and mutual respect in my school.” Conversely, a much
larger percentage (79.6%) agreed with the statement, “Useful information is readily available
to me so I can make informed decisions.” The principal’s explanation of required lesson
plans and committee reports submittal negated the more positive survey findings, resulting in
an overall lack of consistent utilization for the framework component of autonomy and
shared governance.
Complete School Profiles
Information for each of the five turnaround schools has been included in the following
section to fully explain the results found in this study. These profiles delineate the extent to
which the reform components were utilized in each school, as addressed in the first research
question.
School A
School A is an elementary school located in the large southern school district under
investigation. The head administrator and her assistant principal were interviewed, along
with ten teachers at the school. Thirty out of thirty-five teachers completed the online survey
for a response rate of 85.7%. The following six framework components were found present at
School A, resulting in a rating of moderate utilization: teams, time, physical environment,
class-size reduction, a well-rounded curriculum, and parent/ community involvement.
101
Teams
Data analysis of principal and teacher interviews revealed a strong presence of teams at
School A. The head administrator and her assistant discussed various collaborative
configurations instituted during the first year of reform. For example, school-wide book
studies led to collegial discussions in grade level groups. “Everyone started doing book
studies together and have grown by reading and seeing their work in the books,” said the
principal. She went on to add, “Veterans are continuing to learn as well [as novices]. It has
been a reciprocal relationship.” Other grade level activities conducted during the weekly
meetings have further solidified the teamwork mentality. As one teacher noted, “we now
have true collaboration on our grade level. [In our meetings], we are able to spot-check other
teachers and provide support for their concerns.”
This teamwork was also evident in the principal’s explanation of substitute procedures.
After long discussions about ways to improve student achievement, grade levels decided to
create a management tool called a split list. Each teacher divided his or her students up into
small groups to be assigned to another teacher on grade level when the regular teacher was
out, due to illness, vacation, or other commitments. The administrator explained in her
interview:
During reading and math instruction, the children automatically shift to the split list teacher to which they have been assigned, even if a sub is in place. In this way, we are committed to providing reading and math instruction every single day by a certified teacher. The sub just assists in one of the other rooms where he or she might be needed to provide extra support.
Teachers quickly bought into this idea and felt a greater sense of camaraderie in sharing their
students. They especially appreciated the extra pair of hands provided by the substitute
teacher when they carried a larger class load during certain class periods.
102
Subs have been utilized to allow teachers time to work together as well. For instance,
accomplished teachers at School A were offered sub coverage to visit struggling teachers’
classes and vice versa. With this added assistance, the expert educators could observe, co-
teach, and/or model activities with their needy peers. “It was not intimidating,” the principal
stated. “Everyone worked together. My fourth grade teachers even went to visit the pre-K
room to watch the teacher instruct the students on place value and working with bundles [in
math].” Overall, the teachers in School A developed bonds as teammates and viewed the
success of the school as their primary mission.
While there were no survey questions that addressed the presence of teams, the data
from principal and teacher interviews supported a strong presence of teamwork.
Time
During the principal interview, the school leader talked vividly about her commitment to
finding time for teacher collaboration. She shared this story:
The central office reps were upset when they first came to visit my school. They felt that we were not doing Open Court [a reading program] properly and wanted me to hire a consultant to assist the teachers…. They wanted me to have a common reading schedule for everyone in the building, but I did not agree. One teacher cannot observe another if everybody is doing reading at the same time.
While the principal had to defend her decision to operate on a different daily schedule than
other schools throughout the district, central office administrators finally relented and
eventually conceded to her plan. “Now, I sit in meetings and hear other folks talk about
building in time for collaboration, as I suggested,” admitted the administrator.
On the survey, teachers responded with their perceptions about the availability of time at
School A. Three-quarters (76.7%) indicated agreement with the statement, “Time in school is
used efficiently to maximize student learning.” This relatively high percentage supported the

103
interview reflections of time spent on working collaboratively to ensure student success. On
the other hand, only 56.7% of teachers agreed or strongly agreed that “The non-instructional
time provided to me is sufficient to improve my teaching practices.” While this percentage is
much lower than the three-quarters in agreement on the previous statement, School A ranked
relatively well in comparison to its elementary school peers for that question (11 out of 60).
Overall, these survey data combine with the interviews to result in a positive presence of the
element of time in School A’s efforts for school reform.
Physical Environment
Teacher interviews at School A elicited strong emotions about the physical environment.
During June and July prior to the first year of turnaround, the teachers at the school put in
long hours to radically change the look of the school building. “We were here from sun up to
sun down, seven days a week,” recalled one educator. They knocked out bookshelves,
painted walls, and decorated their rooms to prepare for students’ arrival in the fall. “[District
officials] were going to renovate this place for us, but they were going to do it in their time,”
a teacher commented. “We wanted people to see change … from the beginning, when they
walked in.” According to those interviewed, the physical makeover made a tremendous
difference. One teacher explained, “Parents came in and said they’ve seen their children have
new attitudes about coming into this new environment. They came in with a positive
attitude.” Her colleague added, “Look good, feel good, do good….The school was given
money to make it look good [in order] to help our students be successful. And that’s what has
happened.”
Surveys revealed that most teachers at the school (not just those interviewed) were
pleased with the physical transformation of the building. Four-fifths agreed that they had
104
“sufficient access to instructional materials and resources” (80.8%), their “school building is
clean and well-maintained” (80.0%), and it is a “safe and secure place to teach and learn”
(83.3%). These high marks, in conjunction with the positive interview data, offered strong
evidence of efforts to transform the physical environment, as one component of reform.
Class-size Reduction
Interviews with teachers and the school administrator did not elicit much conversation
about class-size reduction at School A. The only comment recorded came from a teacher who
reflected on the small class lists, in comparison to what she had experienced in years past.
She noted, “With a small class, you can reach every child. There were lots of resources and
my struggling students soared. I haven’t always had that. With large classes, you reach who
you can reach and some are left behind.”
Survey data indicated a significant portion of the teachers surveyed were satisfied with
the efforts for class-size reduction. For example, when asked whether the “student
composition in my classes is reasonable to allow me to meet the educational needs of all
students,” 73.3% agreed. Approximately seven percent more teachers (80.0%) either agreed
or strongly agreed with the statement, “I have reasonable class sizes, affording me the time to
meet the educational needs of all students.” Both of these questions ranked School A in the
top tier for all elementary schools. These positive statistics, along with the sentiments shared
in the teacher interview, indicated that attention was paid to class-size reduction in the
transformation plan at School A.
Autonomy and Shared Governance
The interview data revealed limited information about autonomy and shared governance
at this elementary school. One teacher shared that it is “good to be on the same accord with
105
administration as a master teacher” and to have “permission to reach out there [to help the
children].” On the other hand, the principal offered a different side of autonomy. The school
leader reflected that “some teachers had been allowed so much latitude in the past that they
did not know how to follow.” She felt that there was “a lot of shared governance at [the
school], but someone has to lead.” Accordingly, she demonstrated her authority by requiring
teachers to submit weekly lesson plans and committee reports.
Teachers who completed the online survey recorded relatively low marks for autonomy
and shared governance at School A. For instance, only 30.0% of respondents agreed that
“There is an atmosphere of trust and mutual respect in my school.” Only slightly more
teachers (36.7%) shared that they “feel comfortable raising issues and concerns that are
important to me.” Furthermore, a scant 43.3% agreed with the statement, “In my school,
teachers are centrally involved in decision making about important educational issues” and
just one-half (50.0%) reported being “recognized as an educational expert and … trusted to
make sound professional decisions about instruction.” When compared to their elementary
peers, School A ranked in the bottom tier for all questions in this area of the survey,
corroborating a lack of solid evidence from the interviews that autonomy and shared
governance were present during the school reform process.
Leadership
The principal interview provided information about the leadership efforts at School A.
For example, the administrator talked about her background in organizational leadership and
the skills she gathered through her studies. She spoke about the importance of understanding
the change process and its different dynamics, as well as the necessity of establishing a
learning culture to “manage the knowledge.” According to the school leader:

106
CEOs of Fortune 500 companies “manage the knowledge” by identifying the information that cannot be found in manuals or handbooks. That is, they determine the implicit knowledge that makes some people more efficient or effective and then catalogue it for others to learn from.
To gather this knowledge, the principal “tries hard to be in classrooms 90% of her day, as the
district expects. I need to know information about all projects [at the school], although I may
not be directly in charge of them.”
Survey data indicated less than satisfactory agreement with the principal’s leadership
skills, however. On two of the leadership questions, School A ranked second to last out of all
elementary schools. That is, one-half or less respondents agreed with the statements, “My
school leadership consistently supports me when I need it” (50%) and “Overall, the
leadership in my school is effective” (46.7%). Slightly more teachers (56.7%) supported the
notion that “School leaders are proficient in establishing positive learning environments and
efficient operations,” but that still placed the school in the lowest tier for all elementary
schools (52 out of 60). These negative data heavily outweighed the principal’s interview
remarks, revealing a lack of positive evidence for leadership reform at School A.
A Well-rounded Curriculum
The teachers in this transformed elementary school spent a great deal of time relaying
information about curriculum in their interviews. Reading instruction, differentiated
interventions, and learning styles were their main areas of discussion. After being prompted
about what caused a change in their reading program, one teacher shared the influence of
having a reading coach on staff at the school. “If there was a problem, it was remediated
immediately. We called in the reading coach and used her resources” to rectify the situation.
This teacher went on to say, “Our delivery of instruction has been consistent, explicit, and
direct. The kids know what we expect from them.” A colleague at School A added:
107
We no longer teach to just smart or high kids. If we identify a child who is struggling, we are able to write a prescription for him [or her]. We don’t leave anybody out. We have intervention programs, like Open Court and Voyager…. We set time aside each day to help children who are struggling. Nobody is left behind. If teachers don’t know something, we knew where to go now [to get help or assistance].
This dedication to meeting student needs was echoed by other teachers at the elementary
school. “I know where they are coming from so they won’t be left behind,” commented one
educator. “I approach them in a holistic style to deal with their needs and use resources here
that are available, such as counselors, social workers, and nurses.” The well-roundedness of
the curriculum allowed teachers to “reach every child on an individual level with a package
that is distinctively designed for that child,” as one teacher eloquently explained. She further
elucidated how a focus on critical thinking raised the bar for success: “We have really
concentrated on higher-order thinking, not just one word answers. We expected more out of
our children, took them a step higher. It took a lot of planning and implementation … but it
was worth the work.”
Although there were no survey questions that addressed the presence of a well-rounded
curriculum at School A, the interview data alone supported strong attention to this reform
component.
External Support
There were no interview data or survey questions that illustrated the presence of external
support or outside change agents for School A.
Parent/Community Involvement
Teachers and administrators at School A reflected on the changes in parent and
community involvement through their interviews and survey responses. During the first year
of reform, tremendous changes were observed in the receptiveness of families served by the

108
school. “They perceived us as coming because of the extra money [provided as a recruitment
incentive],” explained the principal. “But they soon realized our commitment.” This was
particularly important to the staff, as the school leader elucidated, because many of the
parents and grandparents attended the school as children. “We didn’t want to be looked at as
outsiders so we worked diligently to build relationships. Now, folks come in and take
pictures of bulletin boards and displays with student achievement,” the principal stated.
Teachers also reflected on the historical impact of the school’s transformation. “Grandparents
remember the way [the school] was … before it started going down. The community is happy
we transformed it physically. We received support from local churches to help make
transformation possible,” noted one educator. Her colleague added, “People came before
school started and said they loved what we were doing.”
School staff members emphasized that one of the biggest challenges to reform was
changing the attitudes of those who assumed that families were not concerned with their
children’s success. “Contrary to rumor, they [parents] were very interested in their kid’s
education,” relayed one focus group participant. “A lot of time, they just don’t know how to
help or what to do. They were very helpful to offer their services once I contacted them.”
Teachers at School A reached out to parents and grandparents at the start of school to build
strong bridges for communication. “I set the foundation at the beginning of the year for
parents. I noticed a big change in their attitudes, by communicating what I expected from
them. They wanted to work with me even more then,” one teacher shared. “Despite the fact
that they might not have school supplies,” remarked a teaching peer, “[these parents] deserve
respect.”
109
While there were no survey questions that addressed parent and community involvement
in the schools, the interview data presented sufficient support for this element of the
framework.
School B
School B is an elementary school situated in this study’s large southern school system.
The principal and her assistant were interviewed, along with six teachers at the school. All
forty-six certified educators at School B completed the online survey for a response rate of
100%. The following nine framework components were found present at School B, resulting
in a rating of high utilization: teams, time, physical environment, class-size reduction,
autonomy and shared governance, leadership, a well-rounded curriculum, external support,
and parent/ community involvement.
Teams
At School B, the principal and teacher interviews revealed a strong presence of teams at
the elementary school. From the start, a teamwork philosophy permeated the turnaround
efforts. The administrators looked for candidates’ willingness to work with others during
initial interviews. Once the staff members were all selected, the school leaders initiated
activities to bring the diverse group together. This was particularly important since a
significant number of teachers came with the two administrators from another school in the
district. As a result, the school leaders worked tirelessly to ensure that everyone felt part of
the team. Their initial efforts paid off. The assistant principal reflected, “This school is
envied by others in the district because of our closeness and professionalism. At last
summer’s in-service when all other schools left for lunch, we ate together at potlucks.”
110
This camaraderie intensified during weekly team meetings throughout the year. “We
plan as a team together and examine test scores each week on Data Fridays,” noted the
principal. Everyone at School B--from the administration to the support staff--has bought
into the vision for student success. “We don’t just mean teachers as family,” one teacher
explained. “All people--even custodians--work hard to help the children.” A colleague
concurred, “The school staff really values and respects each other.” This collective
responsibility and mutual respect have established a strong foundation upon which the staff
has gelled as a cohesive unit.
While there were no survey questions that addressed teams, the interview data provided
ample evidence of a collaborative teamwork mentality at School B.
Time
During the principal interview, the administrators shared information about how time
has been spent at the transformed elementary school during the first year of reform. The
principal and her assistant realized how difficult it was for their teachers to allocate time
during the day for collaboration, so they designated half-days each month for group work.
Creative scheduling allowed students to spend more time with their enrichment teachers,
while their regular classroom teachers planned units together and organized upcoming grade
level activities. Time was also allotted for the school leaders to work in their teachers’ rooms.
“[The administrators] do interventions with small groups in the classrooms from 2:00pm-
2:50pm,” the principal explained. This time assisted children in meeting their individual
needs, and also instilled a sense of trust and understanding as the teachers witnessed their
leaders taking an active role in their students’ instruction.

111
Survey data from the staff resulted in fairly positive findings about time. More than four-
fifths of respondents (82.6%) agreed or strongly agreed with the statement, “Time in school
is used efficiently to maximize student learning.” On the other hand, just over one-half of
teachers (54.3%) surveyed affirmed the statement, “The non-instructional time provided to
me is sufficient to improve my teaching practices.” Although this percentage of agreement
was much less than for the previous question, teachers at other elementary schools in the
district also recorded much lower agreement for this question. Consequently, the school still
ranked in the top tier of all elementary schools (13 out of 60).These survey data, in
conjunction with the findings from the principal interview at School B, offered adequate
substantiation of the appropriate use of time at this elementary school during the first year of
reform implementation.
Physical Environment
The administrators and teachers at School B talked a great deal in their interviews about
aesthetic changes made during reform. All interviewees noted how grave the environment
had been when they first started at the school. “The classrooms were light blue and prison
gray,” explained a teacher. “Can you imagine passing from each grade and the only change is
your teacher’s face?” The principal added, “When I first visited this building, I noticed a
strong stench in the air…. It was a mixture of mold, urine, and stale air. We had to make a
change to create an inviting atmosphere for our students and their parents.”
Unfortunately, the staff faced obstacles in transforming the physical environment.
According to the assistant principal, “We asked downtown [central services] for numerous
maintenance repairs, but they took too long to respond. We knew if we waited for them,
things would not be ready by the start of school … so we took matters into our own hands.”

112
The school leaders called on local businesses to landscape the school grounds and build a
new entrance sign. Teachers also stepped in to improve the facilities. “We cleaned and gutted
the building,” the principal commented. They painted the walls with the school mascot,
created beautiful bulletin board displays, and spruced up the front lobby with plants and
pictures. “When you look good, you feel good … and when you feel good, you strive to do
better,” concluded one teacher.
The most striking physical transformation at School B came at the end of October during
year one of reform. “For the first time ever, kids at this school were able to check out books.
In the past, they had not been trusted to take them home,” stated the principal. She added,
“The media center had been horrible … full of old books, lots of puzzles and games.” The
staff pulled together to sift through the antiquated materials, salvage usable resources, and
order new books. The principal reflected on their success, “Over the course of the past year,
we circulated 25,000 books through the media center and only 35 were lost or not returned. It
was truly amazing to see.”
The positive turnaround of the physical environment was also reflected in the survey
results. Repeatedly, School B ranked in the top tier of all elementary schools for the
questions addressing facilities and resources. An astounding 95.7% of all respondents agreed
with the statements, “I have sufficient access to instructional materials and resources” and
“My school is a safe and secure place to teach and learn.” A full 100% of teachers who
completed the survey affirmed that their “school building is clean and well-maintained.”
These high marks, coupled with the strong interview data, validated a focus on the physical
environment in School B’s reform efforts.
113
Class-size Reduction
There were no interview data that referenced class-size reduction, yet the survey
questions offered insight into this framework component. For both questions dealing with
classes, School B ranked in the top tier for all elementary schools. For instance, when queried
about whether class composition was reasonable for meeting students’ needs, just under
three-fourths of survey respondents (71.7%) agreed, for a ranking of 19 out of 60 elementary
schools. Similarly, 76.1% of teachers either agreed or strongly agreed with the statement, “I
have reasonable class sizes, affording me the time to meet the educational needs of all
students” (17 out of 60). Although the data for this framework element were minimal, the
available information supported the idea that School B adequately addressed class-size
reduction as part of their reform plan.
Autonomy and Shared Governance
Evidence of autonomy and shared governance was found in both interview and survey
data. During the administrator interview, the principal spoke candidly about the importance
of trusting her teachers. She communicated:
I must treat my staff as professionals. We give them a lot of responsibility and let everyone have a say and a voice. We show people that we trust them. And of course, we see where the staff stands before making a decision.
Survey data supported this culture of autonomy and shared governance, as expressed by
the lead administrator. No less than four-fifths of teachers who completed the survey agreed
with the following statements:
• I feel comfortable raising issues and concerns that are important to me (82.6%).
• In my school, teachers are centrally involved in decision making about important
educational issues (87.0%).
114
• There is an atmosphere of trust and mutual respect in my school (87.0%).
• I am recognized as an educational expert and am trusted to make sound professional
decisions about instruction (93.5%).
• In my school we take steps to solve problems, we don’t just talk about them (95.7%).
• The staff is committed to “whatever it takes” to help every student learn (95.7%).
• Useful information is readily available to me so I can make informed decisions
(97.8%).
• The faculty has an effective process for making group decisions and solving problems
(100.0%).
Through these survey data and the interview findings, it became evident that autonomy and
shared governance were key elements of School B’s reform efforts.
Leadership
Interviews with principals and teachers provided strong support for leadership. The
assistant principal at School B started the conversation by describing her confidence in the
leadership skills of the principal. “This school has always been the stepchild of the system,”
the assistant administrator explained. “[Our principal] was not going to take it anymore and
she refused to take ‘no’ for an answer. She is the only principal who won’t take it. She makes
waves.” Numerous teachers interviewed shared this same trust in the principal’s leadership.
“I knew there would be strong leadership [at this school] so I was really motivated about
being part of this team,” one teacher commented. Her co-worker--a teacher who came with
administration from another school in the district--noted, “Our principal is very strong. I
knew what kind of person and leader she was. I didn’t feel uncomfortable about coming to
115
[School B] at all because I knew she would be here. That was the main factor in deciding [to
move].”
During the teacher focus group, further evidence of strong leadership pervaded the
discussion. “[The principal] has the same expectations for every teacher on this faculty. She
has high expectations of us and we have high expectations for our students. Everyone meets
or exceeds those expectations or they don’t stay around,” one teacher remarked. Another
teacher made sure to mention, however, that the administration upheld the same expectations
for themselves as they asked of their staff members. She elucidated, “We don’t have low jobs
or high jobs … just jobs that we all must complete to ensure student success. It’s not unusual
to see [the principal] picking up trash around the building. She wants 100% from us and she
gives 150%.” Her colleague added similar comments about the assistant principal, “We were
both going around the school and tightening table legs. We knew it needed to be done and
[the assistant principal] helped me to make that happen.”
The results from the online survey questions substantiated this strong evidence of
leadership. A full 100% of all respondents agreed with the statement, “My school leadership
communicates clear expectations to students, teachers and parents.” A slightly lower
percentage of teachers (97.8%) who completed the survey affirmed that school leaders
established positive learning environments and efficient operations and also consistently
supported the teachers when needed. Similarly, 97.8% either strongly agreed or agreed with
the statement, “Overall, the leadership in my school is effective.” Indeed, the complementary
data from interviews and surveys confirmed the presence of strong leadership in the reform
efforts at School B.
116
A Well-rounded Curriculum
During the principal interview, the administrators touched on the importance of creating
a well-rounded curriculum. As part of their turnaround efforts, all teachers participated in
district-based professional development for approximately six to seven weeks throughout the
school year. A widely respected math initiative helped staff to understand diverse ways to
tailor instruction to meet their students’ needs. A literacy coach demonstrated model lessons
on integrating reading and writing skills across the curriculum. In addition, teachers designed
their own assessments to track student growth and progress in all subject areas.
Extracurricular activities were organized by staff to engage children in non-academic
interests, such as music and art.
While there were no survey questions that addressed curricular issues, the interview data
from the administrators provided weak but sufficient evidence of efforts to create a well-
rounded curriculum at School B.
External Support
The administrators shared both positive and negative experiences with external support
during their interview with researchers. Overall, they felt little support from the district.
“We’re constantly jumping through hoops,” the assistant principal explained. “No matter
what, you get different stories from people downtown in central office. [The principal] was
asked to be here, so let her do her job.” The principal further elaborated, “The school is now
the bright spot in the community, although central office hasn’t been very helpful. They will
not paint, landscape, or fulfill other maintenance needs for us.” The school leaders have been
persistent, however, in finding external supporters. “[The director of elementary education]
has been awesome. She is the only good one downtown,” the assistant principal commented.
117
“[The director of the local education fund] has been great as well,” added the principal. “She
gave our school PE equipment and has provided us with great feedback.” She went on to say,
“I’m going to fight for the building and gather support from these people. We need partners
in education--people who keep us grounded and focused on our goals.”
There were no survey questions to support the qualitative data, yet the interview data
provided sufficient evidence of efforts made to garner external support at School B.
Parent/Community Involvement
Throughout the principal and teacher interviews, the staff at School B communicated the
importance of establishing strong parent and community relations. From quarterly
conferences (“Every teacher met face-to-face with every parent in their room during the first
quarter,” shared the principal) to home visits (“We do home visits nearly every day, so much
so that the people know our cars in the neighborhoods,” the assistant principal explained), the
staff was committed to maintaining regular communication with parents. Establishing these
collaborative relationships was not easy, however. One teacher revealed:
Before we got here [to this school], parents thought we held sole responsibility for helping their kids. We taught them that it’s a joint effort. Now, the children know that the whole community wants them to do well--from the parents to the teachers to the principals.
A colleague added, “There was a lot of fear because parents didn’t know what would happen
to their children [at the turnaround school]. We faced a lot of opposition.” Through their
continued commitment and care for the children, the educators won the naysayers over. The
teacher further explicated, “We have changed the climate of this entire community. There is
pride now. We gave parents and their children the opportunity to be proud of themselves.”
Teachers reached out to the community in other ways as well. For example, at departure
time, they noticed how disruptive the children became as soon as they exited the school’s
118
doors. Their docile, obedient youngsters turned into rambunctious troublemakers as they
headed home. To mollify this situation, the teachers decided to walk their students home.
With no bus riders, this meant that every child in the building would be safely escorted to
their front doors. The teachers divided the students by streets and organized a schedule for
these afternoon duties. A byproduct of these walks was improved relations with the older
members of the surrounding community. Children were no longer running through their
lawns, fighting in the streets, or yelling loudly as they passed by. The neighbors appreciated
these changes and often expressed their gratitude to the staff. As one teacher reflected, “A
community member told me that we had really changed things. He was glad that his yard
wasn’t getting messed up anymore.”
These strong data from the interviews offered ample evidence, in the absence of
supporting survey data, that School B effectively implemented efforts to build strong parent
and community involvement.
School C
School C is one of nineteen middle schools in the large southern school district under
investigation for this study. The principal was interviewed, along with three teachers from
the school. The educators at School C opted not to participate in the online survey; therefore,
no quantitative data is available for analysis. The following six framework components were
found present at School C, resulting in a rating of moderate utilization: teams, time, class-
size reduction, leadership, a well-rounded curriculum, and parent/community involvement.
Teams
At School C, interviews revealed the presence of teams among administrators, teachers,
and students in the building. For example, on two days per week (i.e. Data Mondays for
119
departments and Data Thursdays for the entire school), teachers collaborated to examine data
and design lessons to meet their children’s needs. “We get together to recognize ‘the good,
the bad, and the ugly’ of test data and help one another determine the prescription,”
explained the principal.
From the start, it was important to the school leader to have individuals on board who
preferred teamwork to isolation. Consequently, she shared that sentiment repeatedly during
interviews. “I don’t like cliques at all,” the principal noted. “I prefer people to work
holistically.” At School C, this vision was carried out by coaches who joined team meetings
to model and plan lessons with teachers. Colleagues also shared resource materials, such as
class libraries, lab equipment, and graphic organizers, and delegated common tasks to share
the workload. This collective sense of responsibility was instilled by the school leader, as this
teacher described: “[The principal] makes sure that the janitorial staff up to herself plays a
part in a child’s life.”
Evidence of teams has been observed in students as well. During the teacher focus group
interview, this insightful story was shared:
We grouped our children in a certain way…. We separated the boys from the girls. I had lower achievers--all boys--and they kind of knew it. [In gender separate classes], they decided to achieve. The students policed each other, worked together. I had one case, where one little boy came in … I teach science, but the social studies teacher on my team gave him a project to do and we had completed a test. The other boys had begun to work on their project after the test and that particular boy didn’t pull anything out. The other boys questioned him about his project and encouraged him to do his work and helped him with it…. They made sure he had what he needed so their class wouldn’t look bad. That meant a whole lot to me. They were teaching each other.
While School C chose not to participate in the survey, the interview data offered
sufficient evidence to support the presence of teams at the middle school.
120
Time
At School C, the principal and teacher interviews offered important information about
the use of time at the middle school. According to one teacher, periods have extended to 90
minutes. This additional time with students allows teachers to “do quite a few more lessons.”
The instructor went on to say, “I can teach, test, and determine what they grasped, all within
one class period.” This extended time also provided teachers with more opportunity to
collaborate. “The longer blocks allow us to analyze test scores, plan units, and work together
more often. It’s pretty cool,” added a colleague. The school has formally organized group
meetings on Mondays and Thursdays, as previously mentioned in the Teams section, to
examine data. Allocating this time ensured that staff members understood “how to interpret
the assessment scores and how to drive instruction to meet student needs,” noted the
principal.
No survey data for questions of time were available for analysis as School C selected to
not participate in the survey, yet the interview data substantiated the effective use of this
element.
Physical Environment
There were no data available for physical environment since School C opted not to
complete the survey. The teachers and administrators did not discuss it during their
qualitative interviews either.
Class-size Reduction
The principal interview provided insights into efforts to institute class-size reduction at
School C. According to the head administrator, seventh and eighth grade classes averaged 21
students. On the other hand, sixth grade numbers looked much more challenging. “We have
121
186 students in sixth grade with only four teachers. That means each class will have 45 kids,”
the school leader explained. “We’re currently trying to hire more teachers. Those numbers
just won’t do.” While sixth grade still suffered, two out of three grade levels reaped the
benefits of her efforts.
For School C, no survey data were available for questions of class-size reduction as
teachers at the school chose not to answer the survey; however, evidence in the administrator
interview of proactive efforts to further reduce class sizes demonstrated the principal’s
commitment to reform, and class-size reductions had occurred in two of three grade levels.
Autonomy and Shared Governance
No data were accessible for School C in this area, as autonomy and shared governance
were not addressed in interviews and school survey data were not available.
Leadership
The principal spoke a great deal about leadership in her individual interview. The School
C leader reported that her biggest success during the first year of reform had been earning the
“trust, respect, and support of her school family.” As a newcomer to the district, she worked
diligently to build strong relationships with her students, teachers, and parents. “No one
respects an individual who is simply ‘visible’ because he or she does not have any sense
about the data, about children’s backgrounds, or how to collaborate with them to work
toward success,” the principal noted. To be “effectively visible,” the administrator made
daily efforts to interact with her students and staff. “I walked the halls, stopped children to
talk to them, and asked how they were doing in class,” remarked the turnaround principal. “I
knew that data inside and out so I could call them out if they weren’t telling me the truth.
Because they knew I was aware of what was going on, they began to reach out to me more.”
122
In turn, the school leader gained her teachers’ trust and respect. “They liked that I wasn’t
afraid to ‘get down and dirty’ and help out with instruction,” the principal said. “I have a
rolling easel that I use to help kids learn what they need. I even put on funny costumes to
visit classrooms as the weird math teacher.” The teachers also appreciated her efforts to
increase time on task. A teacher shared, “[The principal] was very good at making sure
students were in class when they needed to be, so that learning could take place. That played
an important part of success.”
Although teachers did not complete the survey at School C, the interview data for both
principal and teachers revealed sufficient affirmation of leadership’s effectiveness in reform.
A Well-rounded Curriculum
A well-rounded curriculum surfaced in both principal and teacher interviews at School
C. It was a big issue for the educators. To begin, the principal talked proudly of the students’
change in attitude toward learning. “They are now energized about their work and really
believe in themselves…. They have a twinkle in their eyes.” Teachers attributed this
transformation to their varied classroom instruction. One educator noted:
We are now teaching out of the box. We’re not always using paper and pencil. My children love to sing, rap, beat, and tap. So, okay, we’re going to rap about science. I did a lot of things that other teachers didn’t want to do. I saw that a child could learn if I adapted my lesson to meet his needs…. From class to class, you have different types of learners. I’m a visual learner. I have to see it. But I repeat myself over and over for auditory learners or do hands-on activities for kinesthetic learners. You must adapt to the different learning styles of your students.
The principal recognized the increase in her staff’s ability to differentiate instruction, as this
teacher described. “In the beginning, only 13% knew how to teach to the needs of their
learners. Now, we’re at 50%. The leadership team and coaches did lots of hands-on work to
assist, supervise, and coach their colleagues in this area.”
123
The teachers and administrator at School C also talked strongly about the infusion of
literacy and math throughout the curriculum. While these two areas were stressed more than
others, the educators ensured that the tasks assigned were authentic and engaging to the
students so that their curriculum was robust, rather than limited. “In the mornings, we
provided them with real-life math problems to solve in the cafeteria while they were eating
breakfast. They worked individually or with classmates to complete these problems,” the
principal expressed. “They became competitive with one another to get finished quickly.”
Once they ate their meals, they moved to the gymnasium to sit and read. “Many of these
students do not have a quiet environment at home to enjoy a book. Although they didn’t have
to be at school that early, over 80% came in to read with us,” continued the school leader.
There were no survey questions that addressed curricular issues. Additionally, School C
opted not to participate in the survey. On the other hand, the principal and teacher interview
data validated the presence of a well-rounded curriculum at the school.
External Support
There were no survey questions that addressed the presence of external support or
outside change agents. Moreover, School C selected not to participate in the survey and the
interview data did not include information about this component.
Parent/Community Involvement
The principal and teacher interviews at School C revealed valuable data about
parent/community involvement. The head administrator discussed ways that churches and
government agencies were engaged at the school. Volunteers from these organizations read
with students in the mornings, helped in classrooms, and donated resources, such as books,
school supplies, and clothing for needy children. Parents were provided with opportunities to
124
express their opinions with staff through periodic plus/delta forms. They were asked both
strengths and weaknesses of the school, along with recommendations for improvement.
During their focus group interview, the teachers also recognized the value of parent and
community engagement and their pride in its increase during the first year; however, they
also admitted their hope for continued progress in this area. “I think we need more,” stated
one teacher. “We need more and it should be radically different.”
There were no survey questions that addressed strong parent and community
involvement. School C decided not to participate in the survey. Interview data, however,
offered sufficient evidence of reform for this component.
School D
School D is a middle school found in this study’s large southern school system. The
principal and two assistant administrators were interviewed, along with three teachers at the
school. Fifty-four out of fifty-seven certified educators completed the online survey for a
response rate of 94.7%. The following five framework components were found present at
School D, resulting in a rating of low utilization: teams, leadership, a well-rounded
curriculum, external support, and parent/community involvement.
Teams
From the principal and teacher interviews, it was evident that the development of teams
was incorporated into the school reform efforts at School D. The principal acknowledged that
the staff “shared a similar vision … whether it was in spirit or based on performance.” With a
large contingent of faculty members present at the school since before the turnaround plan,
the administrator relied upon the old teachers to bring the new ones on board with the
initiative. According to the principal, the veterans “helped new folks to build a collaborative
125
community. I made sure that the old teachers mixed with the new to serve as leaders and
familiarize them with the student population and the surrounding community.”
The teachers confirmed this culture of teamwork in their interviews. “As a faculty, we
work together in unity,” stated one. A colleague added, “We’re supportive of each other.
When one makes a mistake, another corrects it so we all improve.” The curriculum meetings
have helped the faculty mix with one another and coalesce around student learning. Through
discussions of content and assessment, the teachers have developed common language and
recognized the importance of teamwork. The educators even noted that their students were
eager to learn due to the collaborative efforts of their teachers.
There were no survey questions that addressed the presence of teams in the schools;
however, the interview data revealed a strong teamwork mentality at School D.
Time
Very little interview data were collected that referenced the effective use of time in
School D. While teachers talked about giving up their planning time for tutoring and parent
conferences (“One conference takes up the whole planning time because we show the
student’s progress and all the documentation”), they did not mention having the opportunity
during the school day to collaborate with their peers, as the time component entails. Survey
data, however, revealed a lack of adequate time for teachers. Less than one-quarter of
respondents (24.1%) indicated agreement with the statement, “The non-instructional time
provided to me is sufficient to improve my teaching practices,” resulting in a ranking of 18
out of 19 middle schools. Only slightly more than one-half (51.9%) agreed that “Time in
school is used efficiently to maximize student learning,” earning School D another spot in the
126
bottom third of middle schools. Together, these low rankings negate the presence of time in
School D’s reform plan.
Physical Environment
The physical environment left much to be desired at School D, as indicated by interview
and survey data. The teachers made a point to mention the poor conditions of the school
during their interview. “Make sure they write in the report that [our school] needs a bigger,
better facility. This school has been here since 1900 with no renovations,” reported one
classroom instructor. “We have 984 kids right now and they predict we’ll get over 1000
soon,” added a colleague. “But we have one bathroom on the entire hall. That’s a time issue,
with just one bathroom for the whole hall.”
Survey data substantiated the teachers’ concerns. Less than two-thirds of staff (64.8%
and 61.1% respectively) responded with agreement to the statements, “I have sufficient
access to instructional materials and resources” and “My school building is clean and well-
maintained.” These percentages were low relative to the other middle schools in the district,
resulting in School D’s ranking in the bottom third of schools at their level. The interview
and survey data both reflected the negative assessments of the physical environment at
School D.
Class-size Reduction
Data from interviews and surveys revealed concerns with class-size reduction at School
D. Both the principal and teachers expressed their frustration with the large class rosters. The
school leader indicated that the big class size stood in the way of continued progress at the
school. Teachers agreed. “The school is overflowing with children. We’re talking 48 children
in a class this year,” noted one. Administrators proposed hiring more teachers to carry these

127
larger class loads. Unfortunately, the teachers did not believe the rooms could accommodate
that many youngsters at once. “To be honest,” a teacher admitted, “as big as my room is, I
don’t think I can have 48 desks. If I do, they’re not going to be set up in the way I want them
to be set up.”
Survey data triangulated the interview remarks from the principal and teachers at School
D. When probed for their agreement with the statement, “The student composition in my
classes is reasonable to allow me to meet the educational needs of all students,” only 16.7%
of respondents agreed or strongly agreed (for a ranking of 18 out of 19). The middle school
teachers ranked their school last in the district on the second statement referencing class-size
reduction, “I have reasonable class sizes, affording me the time to meet the educational needs
of all students,” with only 11.1% agreeing. These data substantiated the need for
improvement in the area of class-size reduction at School D.
Autonomy and Shared Governance
At School D, there was little evidence of autonomy and shared governance based upon
analysis of the interview and survey data. While the principal talked about garnering teacher
input for professional development, the suggestion was for the future, rather than an
indication of the present condition. Other comments revealed a tight control over teachers
and their decision-making. Course syllabi and class rules were developed collaboratively by
teachers; however, the administrators had to approve them before they were used in the
classrooms.
Survey data indicated mixed results for teachers’ autonomy and administrators’ control.
A mere 44.4% of respondents agreed with the statement, “There is an atmosphere of trust and
mutual respect in my school.” On the other hand, nearly four-fifths (79.6%) of teachers
128
surveyed felt that “Useful information is readily available to me so I can make informed
decisions.” Slightly less (72.2%) either agreed or strongly agreed that they were recognized
as educational experts and trusted to make sound instructional decisions. When compared
with its middle school peers, School D ranked low (14 out of 19 schools) when teachers were
asked if school took steps to solve problems or simply talked about them. Neither these
mixed survey results nor the negative interview findings could substantiate the presence of
autonomy and shared governance at School D.
Leadership
Insight into leadership at School D was surfaced through the interview and survey data.
During the focus group interview, one teacher readily admitted that she was drawn to the
middle school because of the supportive administration. The principal, in turn, looked for
“new teachers who had taught in similar situations.” He told them exactly how it was at the
school so they would know what to expect, including the fact that discipline was an issue.
When teachers showed difficulty in meeting these expectations, he worked with them to
build their confidence. “The only way you’re going to improve student learning is via
teachers,” said the school leader. He recommended:
You must model for them because the principal sets the tone. You must implement what you’ve learned at conferences and through your own professional development. And you must speak of high expectations … that is, model for them and practice what you preach. Teachers at School D confirmed their confidence in their principal’s leadership skills
through their survey responses. More than four-fifths (85.2%) agreed or strongly agreed that
their “school leadership communicates clear expectations to students, teachers, and parents.”
Approximately three-quarters of respondents felt “Overall, the leadership in my school is
effective” (75.9%) and “My school leadership consistently supports me when I need it”
129
(72.2%). Together, these survey results and interview data affirmed the presence of effective
leadership at School D.
A Well-rounded Curriculum
Administrators and teachers alike talked about significant changes in curriculum at the
middle school, following the implementation of the turnaround plan. “More hands-on
manipulatives were utilized in the classrooms,” raved the principal. One social studies
teacher described how she used newspapers and magazines to share current events with her
classes. A math instructor also explicated:
What I’ve done [in the past] was usually teacher-led. I did everything. Now, I let them do most of the work … let them discover the formulas … do what needs to be done. Before, I didn’t have the opportunity to go into the computer lab. Now we have computers in the classrooms, so once we’ve gone over the concept, they can go and reinforce it with the Accelerated Math program.
A colleague talked about the impact of having students work in small groups to discover
learning. “They get in groups to solve problems. If one doesn’t know, they ask the next
person in the group. After they’ve asked each other, then they can ask me [if they still cannot
figure out the solution].” Implementing cooperative learning in her classroom has resulted in
changes in student thinking. Her children have expressed their appreciation for listening to
others’ ideas. “They tell me all the time, ‘I never thought about it like that’ and ‘if I look at it
this way, I didn’t know I could….’ They wouldn’t have discovered these new modes for
learning without working in teams.” Several teachers in the focus group admitted that using
these innovative teaching strategies in a balanced curriculum required confidence and risk-
taking. “You have to be willing to change,” said one participant. “You cannot be set in your
own ways.”

130
While there were no survey questions that addressed curricular issues, the strong data
found in the teacher interviews supported the presence of a well-rounded curriculum at
School D.
External Support
Although external support was not discussed in great detail during the interviews, there
was some evidence of its presence at School D. For example, teachers shared how resources
from the district--particularly human resources--played a key role in turning the school
around. “We have a reading coach at the school,” shared one participant. “But we also have
support from our literacy specialist downtown. She’s there for support. I can call her anytime
if I have questions.” Other sources of external support included local church members who
volunteered their time as tutors, district math coordinators, and outside professional
development experts who facilitated summer workshops.
There were no survey questions that addressed external support from outside change
agents. Yet, the interview data substantiated its presence, albeit only minimally, at School D.
Parent/Community Involvement
Numerous activities to enhance parent and community involvement during the first year
of reform were shared in the administrator interview. For starters, the principal noted, “We
bonded with the community by bringing meetings into their neighborhoods.” Rather than
having parents come to the school, the staff went out to local community centers to facilitate
discussions about student progress and school activities. “This resulted in greater
collaboration among stakeholders,” observed the school leader. In addition, it created a
stronger sense of pride in the success of School D’s students. The principal reflected:
Parents are very proud of their children and many now attend meetings…. Band and chorus performances have been combined with free dinners to entice parents to the
131
school. When they come, the staff provides them with the information they need about their child’s learning. A true partnership has been formed.
While there were no survey questions that addressed the presence of strong parent and
community involvement in the schools, interview data confirmed the presence of this
component.
School E
School E is a middle school located in the large southern school district under
investigation. The principal was interviewed, along with five teachers at the school. Fourteen
out of thirty-five teachers completed the online survey for a response rate of 40.0%, the
minimum standard accepted for data analysis in this study. The following four framework
components were found present at School E, resulting in a rating of low utilization: teams, a
well-rounded curriculum, external support, and parent/community involvement.
Teams
At School E, evidence of the importance of teams was found in both the principal and
teacher interviews. According to the principal interview, the school faculty began to
collaborate as a “community of learners” following the launch of the turnaround plan.
“Everyone takes responsibility for all kids’ learning,” said the administrator and through a
shared vision for success, everyone works together to transform the school. The deep
connections developed with the children created reciprocal relationships of respect between
staff and students. “Give kids the love and care they need and they will give you the results,”
stated the principal. Teachers echoed their administrators’ sentiments by stating that their
commitment to working as teams was firmly planted in their desire to see all children
succeed. “Kids need someone to help them, stick with them, show them the reason why
they’re doing [the work], so they can improve and be somebody,” explained one teacher
132
during the focus group interview. Consequently, the teachers relied upon one another to find
proactive solutions to meet their students’ needs.
There were no survey questions that addressed the presence of teams or a collaborative
teamwork mentality in the schools; however, the interview data offered sufficient evidence of
this reform element.
Time
Upon examining the principal and teacher interviews, there was no evidence found,
which indicated that School E used the framework component of time in their transformation
efforts. No discussion of providing ample planning and collaboration time was mentioned
during either set of interviews.
According to the survey data collected, there were mixed results with regard to time.
Survey respondents were asked to indicate their level of agreement with the statement, “Time
in school is used efficiently to maximize student learning.” Only 57.1% of teachers who
completed the survey agreed or strongly agreed with this statement. This percentage
comparatively ranked the middle school in the bottom third of all middle schools in the
district (13 of 19 middle schools). Additionally, exactly one-half (50%) of teacher
respondents agreed or strongly agreed with the statement, “The non-instructional time
provided to me is sufficient to improve my teaching practices.” While the percentage of
teachers agreeing with this statement was less than those agreeing in the previous question,
district teachers in the survey overall felt more negatively about this statement, resulting in
School E’s ranking of 6 out of 19 middle schools (top third of survey results for middle
schools). Even still, these findings failed to provide strong evidence that administrators and

133
teachers at this school embraced the importance of finding adequate time within the school
day to plan and collaborate with peers.
Physical Environment
The interview and survey data for School E revealed only minimal efforts to improve the
physical environment at that school. During the administrator interview, the principal
revealed that the school had been the “stepchild of the district” prior to transformation, with
poor resources and antiquated facilities. Efforts had been initiated, however, to create a “safe
environment that was conducive to learning” with the purchase of new resources, such as the
Read 180 program and other computer hardware and software. Lockers were also removed,
hallways painted, and classrooms decorated to improve the aesthetic appeal of the building.
On the other hand, teachers were not as impressed by the level of improvement. “We have a
computer lab,” noted one instructor, “but the most disgraceful thing to me is that the eighth
grade computer lab doesn’t hold an entire classroom. We have to take half of them to test at a
time.” Another teacher added that while she knew more funding was provided to the school
as a result of the reform plan, she did not see the investments in action. “As far as classroom
size and resources for the teacher to actually use, I have not seen that…. That has not
happened,” said the educator.
Survey results supported the teachers’ perceptions. For example, when asked their level
of support for the statement, “I have sufficient access to instructional materials and
resources,” only 50% of respondents indicated agreement, ranking the middle school dead
last in the district for middle schools. Similarly, School E ranked in the bottom third of all
middle schools (16 out of 19) for the statement, “My school building is clean and well-
maintained,” with only 57.1% of teachers surveyed stating that they agreed or strongly
134
agreed. Neither the interview data nor the survey results found strong support for the notion
that the physical environment was greatly transformed as part of School E’s reform efforts.
Class-size Reduction
Although class-size reduction was a major component of the district’s turnaround plan,
insufficient teacher recruitment efforts resulted in large classes in some of the schools.
School E was one of those negatively impacted by the failure of recruitment incentives. The
principal admitted that he would have “preferred to hire more teachers to reduce class size;”
however, it was difficult to find enough applicants to fill the requisite positions, much less
additional ones. Thus, class sizes could not be lowered. One teacher shared that rosters
reached 30 to 32 for at least the first part of the school year. While this was phased out by
January, classes were still larger than most teachers could handle. “Class size needs to be
small to really do differentiated instruction to meet the needs of all students,” she added.
Upon further analysis, the survey data substantiated the concerns of both the principal
and teachers. A mere 21.4% of teachers queried at School E agreed or strongly agreed with
the statement, “The student composition in my classes is reasonable to allow me to meet the
educational needs of all students.” This low percentage resulted in the school falling to the
bottom tier of middle schools (16 out of 19). On the surface, it might appear that results for
the statement, “I have reasonable class sizes, affording me the time to meet the educational
needs of all students,” indicated a more positive situation for class size at School E. The
school ranked 7 out of 19 middle schools on this question, yet only 35.7% of their teachers
either agreed or strongly agreed with the statement. These low levels of agreement on the
survey questions, coupled with mixed findings from the principal and teacher interviews,
resulted in a lack of evidence that class-size reduction was implemented at School E.
135
Autonomy and Shared Governance
Autonomy and shared governance (or lack thereof) were addressed in both interview and
survey questions. For example, one teacher at School E talked about the importance of
allowing teachers to have input in professional development choices. “We need something
practical we can use. It’s okay to stay abreast of research, but we don’t need a lot of theory
week after week,” stated the teacher. She went on to say that teachers should have more
opportunity to work together and collaborate on their practice. “I need to hear from other
science teachers about what they consider success,” she added, rather than listening to
outside experts brought in by the district.
This lack of input in school decisions was supported by survey results. School E ranked
in the bottom third of middle schools on six out of eight questions, which addressed
autonomy and shared governance. For instance, only 42.9% of teachers who completed the
survey agreed with the statement, “The faculty has an effective process for making group
decisions and solving problems.” Slightly more than half (57.1%) of respondents either
agreed or strongly agreed with the statements, “I am recognized as an educational expert and
am trusted to make sound professional decisions about instruction,” “There is an atmosphere
of trust and mutual respect in my school,” and “I feel comfortable raising issues and concerns
that are important to me.” Slightly better, 64.3% of teachers surveyed agreed that “In my
school, teachers are centrally involved in decision making about important educational
issues.” Nevertheless, these low survey results, along with the negative responses from
teacher interviews, substantiated the lack of a concerted effort to establish an atmosphere of
autonomy and shared governance at School E.
136
Leadership
Similar concerns about leadership could be found in the interview and survey data for
School E. While the principal shared his commitment for the children and ensuring success
for all (“I’ve always been ‘for the underdog’ and believed in community”), he also admitted
his own weaknesses in leadership. During the one-on-one interview, the school leader noted:
There are things that I need in terms of professional development as a principal, but I’m not getting them because I’m required to attend teacher sessions. I understand the importance of being present at the teachers’ workshops so that I can understand what they are being taught and what they should be implementing. However, I need assistance in technology, financial planning, and budgeting … how to deal with teachers who do not understand the [turnaround] philosophy and how to get professional staff to understand their roles. One teacher admitted that the principal’s reputation as an administrator led her to apply
to the school; however, overall it was difficult to recruit teachers to School E. Many
educators were “too scared” to take up the cause and accept the call to work in a turnaround
school. Thus, the principal had to lower his desired qualities for candidates. Nevertheless,
“with the choices that were available, I feel like I did a good job,” he reflected. As his earlier
comments indicated, the administrator struggled to deal with those who did decide to work
there. The roles for coaches, for example, were “not fully defined and no training was
provided to them before starting in their positions, nor did I get trained on how to evaluate
them.” Mixed messages were being sent to the coaches by the district administrators, making
his job as principal difficult.
Survey questions further supported the administrator’s reflections on his weak leadership
skills. When his teachers were asked their level of agreement with the statement, “School
leaders are proficient in establishing positive learning environments and efficient
operations,” only 57.1% agreed or strongly agreed, resulting in a ranking in the bottom third
137
of middle schools (14 out of 19). Responses to the statements, “My school leadership
communicates clear expectations to students, teachers and parents” and “Overall, the
leadership in my school is effective” were only slightly higher, with 64.3% of teachers
surveyed indicating their agreement (which ranked the school in the bottom tier of all middle
schools for both questions). These data, in conjunction with the interview findings, indicated
a lack of effective leadership for school reform.
A Well-rounded Curriculum
At School E, a presence of a well-rounded curriculum was supported by the interviews
with the school principal and his teachers. Numerous curricular strategies were implemented
during the first year of reform, including gender classes and differentiated learning styles.
“My kids were very successful,” praised one teacher who was interviewed. “They had the
highest scores in science for sixth grade in all schools in the district. I believe in a lot of
grouping and hands-on work, which has been very successful for my students.” A math
teacher acknowledged the importance of hands-on learning in her classroom as well. “We
don’t use the book at all in class. They use it as home for practice. We use a lot of
manipulatives,” she explained. The principal admitted that he looked for teachers who
understood and utilized these varied instructional strategies. In particular, he looked for
people “who talked about kinesthetic activities because the kids at this school enjoy them.”
There were no survey questions that addressed the presence of a well-rounded
curriculum or other curricular issues; however, the interview data were strong enough to
support its emphasis in the reform effort at School E.
138
External Support
The job of transforming School E required the support and assistance of external change
agents, as evidenced by the principal and teacher interviews. To meet this arduous task, the
administrator “called on friends from throughout his career to come help turn the school
around.” Through a powerful network of peers and colleagues, he used his connections to
recruit teachers. He also reached out to local organizations to provide services for his
students. The local education fund and a tutoring company were called in by the school
leader to work with approximately 200 out of 400 students three days per week for
personalized tutoring. These organizations helped to offer supplemental support to the
students who needed the most help in meeting their academic goals. Although
communication between these tutors and the regular classroom teachers could have been
improved, the school leader was pleased with their commitment. Healthy snacks and
transportation were provided, along with the human resources. Support for teachers came
from various sources as well. One teacher commented about the tremendous help given by
the district math coordinators. “Our math supervisor did an awesome workshop. She nailed
inclusion,” the teacher shared. This curricular support, combined with the tutoring services
for students, helped teachers to feel more successful.
There were no survey questions that addressed external support; however, interview data
sufficed for this reform element.
Parent/Community Involvement
Parent and community involvement at School E were discussed widely throughout the
principal interview. From the start, the administrator loved the idea of turning schools around
because of his investment in the community. “I worked in the neighborhood around the
139
school as a pool manager and developed a kinship with the people here. It has been a labor of
love to serve as principal at this school,” stated the school leader. His connections in the
community have facilitated his efforts to build better relationships with businesses and civic
leaders. He has been able to network politically around the city and has built good rapport
with the city council, county commissioners, state representatives, and senators. These
politicians have visited the school and made donations to support school resources.
The principal looked for this same commitment to the community in his interviews with
teachers. He asked them to bring evidence of family support from their classrooms (e.g.,
newsletters and volunteer activities) and involvement with the surrounding community. He
did not want to hire teachers who were “afraid of going into their homes or in their
community.”
Even though there were no survey questions that addressed parent and community
involvement, the principal interview data provided adequate support for this element.
Conclusion
Mixed methods data analysis for this study revealed insight into the utilization and
effectiveness of Futernick’s (2007) Tipping Point framework for school reform. After careful
investigation, it was found that School B (high utilization) used all nine elements in their
turnaround efforts, while Schools A and C (moderate utilization) provided evidence of six.
Schools D and E (low utilization) utilized just five and four components respectively. These
findings were then examined in light of the schools’ level of improvement on the SAT-10
achievement test. The moderate to high utilization schools--A, B, and C--produced above
average improvement on the standardized assessment. School E, a low utilization school,
demonstrated average improvement and School D, also a low utilization site, exhibited below
140
average improvement. These findings support Futernick’s (2007) assertion that a more robust
reform plan is needed to turn around low-performing, high-poverty schools; however, they
stop short of substantiating the notion that all nine elements are needed for success. A
critique of the assumptions underlying his plan, as well as ideas for further study, will be
explored in Chapter Five.
CHAPTER FIVE
TESTING THE TIPPING POINT
Introduction
In today’s culture of high-stakes accountability, schools must tackle the tremendous
challenge of reaching the 2014 deadline of 100% proficiency for all subgroups on state tests
in reading and math (United States Department of Education, Office of the Secretary, 2006).
This NCLB requirement has created a particularly strong urgency in high-poverty schools
across this country, which have traditionally lagged behind their more advantaged peers in
rankings of standardized test scores (Alliance for Excellent Education, 2007; Doherty &
Abernathy, 1998). Scrambling for answers, many high-poverty schools have turned to the
popular “reform du jour” to solve their academic accountability woes.
“Certainly most Americans would agree … that students who attend high-poverty
schools have been sold short. And they would also agree that at least part of the remedy for
this situation is to raise our expectations and to direct all available resources toward helping
students fulfill them,” says Lee (2003). But how exactly should the resources be utilized?
Concurrence of educators, policymakers, and other interested stakeholders on this issue
diverges when it comes to identifying the proper strategy for reform. “Poor kids need to
focus on the basics of reading, writing, and math,” argue a few. “We need to pay more
attention to getting their parents involved,” others counter. Still more contend, “What about
142
renovating their dilapidated buildings and giving them new books, lab equipment, and other
resources?”
Indeed, the modus operandi for reform is vast and diverse. Various reform programs tout
particular “silver bullets” for turning low-performing, high-poverty schools around.
According to Futernick (2007), “We invest modestly in one reform measure and another and
celebrate even the smallest gains” (p.3). Yet, unfortunately, these one-size-fits-all approaches
frequently leave the schools worse off than when they started. Teachers, in particular, face
the brunt of the challenges. Many grow weary of following one reform initiative after
another. Feeling frustrated, these educators often migrate toward teaching assignments in less
impoverished areas. As a result, administrators at high-poverty schools are then forced to
scrounge to fill their classroom positions, frequently resorting to hiring uncertified,
unqualified candidates simply to have a warm body in front of the students (Berry, 2004;
Clotfelter, Ladd, Vigdor & Wheeler, 2006).
Meanwhile, students at these low-performing, high-poverty schools must still be
prepared for life in a twenty-first century world. According to the United States Department
of Education’s Office of the Secretary (2006), “A high school diploma, once desirable, is
now essential--and, increasingly, insufficient. About 90 percent of the fastest-growing jobs of
the future will require some postsecondary education” (p.5). Employment in the new
millennium involves flat worlds and global markets. It requires using technology efficiently,
thinking critically, communicating effectively, and brainstorming collectively. It also entails
creativity, innovation, and flexibility.
Thus, in 2007, it is not only a legal requirement (per the guidelines of NCLB) but also a
moral imperative to prepare all students--especially high-poverty children--to meet the
143
demands of a twenty-first century education (Fullan, 2003). Indeed, schools must find a way
to overcome the barriers of low socioeconomic status to ensure academic achievement for
every child. Some schools have already managed to do so; however, these isolated pockets of
success have not yet led to large-scale reform (Futernick, 2007; Snipes, Doolittle, & Herlihy,
2002).
“If we look at the vast number of high-poverty schools that continue to fail decade after
decade, we must admit that the remedies we’ve tried are capable of producing only limited
results in most cases” (Futernick, 2007, p.3). Futernick (2007), therefore, responded to the
call for transforming low-performing, high-poverty schools by outlining a robust plan for
reform. His nine-point framework attempts to systematize the various components necessary
to create a Tipping Point for change in these struggling buildings. According to the
researcher, reform initiatives must address the elements of teams, time, physical
environment, class-size reduction, autonomy and shared governance, leadership, a well-
rounded curriculum, external support, and parent/community involvement. If schools design
plans which encompass all of these “interlinking, essential supports,” then their chances for
success would dramatically improve (Futernick, 2007, p.5).
In this study, the reform activities of five reconstituted schools in one large southern
school district were analyzed through the lens of Futernick’s (2007) Tipping Point
framework to assess the extent to which the components were utilized. Once this initial level
of analysis was complete, student achievement data were evaluated vis-à-vis the schools’
utilization of the framework components. Overall, schools with above average improvement
on the standardized tests (Schools A, B, and C) demonstrated evidence of more Tipping Point
elements than those with average and below average improvement (Schools E and D
144
respectively). What do these results really mean? The researcher begins by offering a critique
of Futernick’s (2007) framework, followed by recommendations for further study.
Critique of the Framework
In Futernick’s (2007) paper, Excellence Loves Company, the professor at California
State University laid out a nine-point plan for reform. Just like many other researchers who
focus on low-performing, high-poverty schools, he presented a compelling case for why
change is necessary in these historically failing schools. The nine components of reform that
he advocated are quite simply a common sense approach to transformation. It would be quite
difficult to argue that any of the nine elements could not help a school turn itself around. But
what is more complicated are the underlying assumptions implied by his plan. These four
main assumptions include the following ideas: (1) The Tipping Point framework allows
reformers to de-contextualize the condition of schools when designing turnaround plans; (2)
All nine of Futernick’s (2007) components are needed for school success; (3) Each element
should be viewed as equally important; and (4) Everyone understands the defining principles
of the nine components. In the remainder of this section, the researcher will carefully
examine and critique each of these assumptions, based on the findings from this mixed
methods study.
The first assumption underlying Futernick’s (2007) framework is that the components
inherent within the plan allow reformers to de-contextualize the circumstances surrounding
impoverished schools so that attention is solely paid to the nine components brainstormed by
the researcher. That is, a school’s unique context is less important than the adoption and
implementation of the components themselves. In essence, the context does not matter, since
145
Futernick (2007) contends that all low-performing, high-poverty schools should follow the
same plan. This study revealed, however, that context does matter.
Just as educators should recognize the fallacy of adopting quick, simplistic silver bullets
for success, they should also realize that reform efforts do not operate within a vacuum.
Throughout this mixed methods study, variance in implementation of the nine framework
components of teams, time, physical environment, class-size reduction, autonomy and shared
governance, leadership, a well-rounded curriculum, external support, and parent/community
involvement was observed across schools. All five schools were provided with the same
turnaround plan for reform, yet the elements played out differently depending upon their
uniquely different contexts.
Take, for instance, the case of class-size reduction. Although equal access to funding
was offered to participating schools in order to reduce their class loads, the outcomes differed
quite a bit across contexts. At one elementary school in the study, numerous candidates
applied for jobs at the turnaround school because they wanted to work with the strong
principal who had been recruited to lead the initiative. As a result, this administrator had no
problem filling the extra positions needed to reduce class sizes. On the other hand, at a
middle school across the district, hiring was not as fruitful. Recruitment incentives were
offered to entice interested teachers to work there, but few took the bait. Consequently, class
rosters in one grade level reached as high as 48 students per room. Even if more teachers had
been hired though, the building lacked the space to accommodate them. The physical
environment was simply inadequate.
These two exemplar schools demonstrate well the importance of context. The current
conditions of low-performing, high-poverty schools must be considered when designing
146
implementation plans, rather than simply adopting a blanket framework of nine components.
Futernick (2007) readily admits that his theory “lacks specificity and local perspective”
(p.34); however, he fails to clearly recognize the degree to which schools’ implementation of
the framework may vary depending upon the context. Stakeholders with history and
experience at the school must be able to utilize their knowledge of the unique culture and
climate to make these key decisions. Reform simply cannot be de-contextualized.
A second assumption of Futernick’s (2007) Tipping Point theory is that the entire
package of components is needed to garner success. But are all nine really needed for reform,
as Futernick (2007) contends? Is it possible to improve student achievement if you lack
attention to teams, time, physical environment, class-size reduction, autonomy and shared
governance, leadership, a well-rounded curriculum, external support, or parent/community
involvement?
According to the results of this mixed methods study, it is possible! While one school
produced evidence of utilizing all nine components for reform, two others demonstrated the
presence of just six elements and still resulted in above average improvement on the SAT-10
standardized tests. Furthermore, one school used only four and managed to receive an
average improvement rating (a higher designation than a school, which utilized five
elements). How could this be possible, if all nine components are needed for transformation?
And what does this mean for Futernick’s (2007) nine-pronged assertion?
For starters, the findings from this study support the researcher’s notion that true reform
cannot concentrate on just one or two elements of a school’s culture and climate, as most
turnaround plans currently do. A tipping point for reform must be leveraged in order to truly
transform a school from an environment of low performance to an atmosphere of high
147
expectations for success. Coordinated efforts for massive turnaround should be designed and
implemented to disrupt the old ways of schooling and establish new strategies for teaching
and learning. What is less clear is how many areas of reform must be addressed in order to
spark school improvement.
According to the limited results of this study, utilization of a minimum of six
components led to above average improvement on standardized tests. So does that mean that
Futernick’s (2007) framework should be reduced to six? Not necessarily, since the same six
elements were not used across all successful schools. What should be changed, however, is
the identification of any number as the magic number for reform. The benefit of Futernick’s
(2007) plan, as it is currently configured, is that it presents a robust, comprehensive look at
school reform. The drawback is that it focuses too much on requiring all nine elements, when
in fact, all nine may not need to be addressed (at least, not in the beginning). Schools and
districts might be overwhelmed by the “all or nothing” mentality of Futernick’s (2007)
Tipping Point plan. Instead of turning these schools away, his framework should serve as a
guidebook for transformation, mapping out the various elements of a school that should be
considered (not automatically adopted) when devising a reform initiative.
What’s more, Futernick’s (2007) declaration of nine discrete components fails to
account for the fact that there might be other areas of reform in need of attention. For
example, the five schools under investigation in this study all utilized reconstitution as part of
their turnaround plans. Where would that strategy fall in Futernick’s (2007) framework? It
appears unclear at this point. And what about professional development? While it is
tangentially related to a few of the present elements, it does not have its own discrete place in
the framework although many schools need strong professional development plans to

148
continually develop their teachers’ knowledge and skills. Mentoring and induction for
novices and student discipline are just a few of the other areas that also lack an appropriate
place in the current reform plan.
A third assumption purported by Futernick (2007) is that the framework components all
require equal attention. In his article, Excellence Loves Company, there is no discussion from
Futernick (2007) about differentiating between high-priority versus low-priority areas of
reform. Each of the nine elements is viewed as critical as the next. Is it feasible to believe
that schools can change all nine components at once? What about schools and/or districts
without the funding to do so? Is there ever any hope for schools in this predicament?
The research findings from this mixed methods study support a resounding answer of
“yes;” there is hope. School E, with just four components, still managed to produce average
improvement gains in reading and math, as compared to its middle school counterparts, after
just one year of reform. While this school may not be viewed as successful as Schools A, B,
and C (all with above average improvement), it should not go unnoticed that the turnaround
school did improve significantly. Success was possible, even with just four of Futernick’s
(2007) nine components. Consequently, this finding negates the third assumption that all
elements should receive the same attention. Again, in this case, evidence indicated that just
four components were addressed and average success resulted. By adding just two more
areas of reform [not the remaining five as Futernick (2007) would have you believe], Schools
A and C reached above average improvement.
If schools want to improve, their goal may be to implement a comprehensive plan of all
nine components; however, their reality may cause them to focus on just a few. The priority
of these elements (i.e. which ones must be “fixed” first), the pace of reform (i.e. how quickly
149
things can change), and the relative weight of importance (i.e. how much time and effort is
comparatively expended on the various elements) cannot be dictated from the district, state,
or federal levels.
At School B, for example, a great deal of attention was paid to creating a culture of
autonomy and shared governance. Interestingly, this component stood out as the sole
framework element to be found in only one school--the same school which also happened to
utilize all nine components. So what makes autonomy and shared governance so important
for educators? According to Futernick (2007):
Democratically run schools are often more successful not just because parents and teachers acquire a sense of ownership and commitment; they are also more successful because critical decisions about the mission of the school, the way it is organized, what is taught and how, are better informed.
As the principal and her assistant at School B demonstrated, tapping into your resources (i.e.
the knowledge, skills, and dispositions of teachers and community members, in particular)
allows school leaders to distribute leadership, rather than harboring all roles and
responsibilities on their shoulders. A more inclusive, welcoming environment is therefore
created, causing all stakeholders to feel a part of the change process.
Administrators in similar low-performing, high-poverty schools should find ways to tap
into their own resources by surveying their staff for talented leaders and unleashing their
potential to lead reform efforts. Parents should also be viewed as resources for
transformation; that is, schools should unearth caregivers’ talents and interests to partner with
teachers and administrators for supporting school improvement. Further up the chain of
command, district officials should tap into the school-based administrators as well as local
teachers to brainstorm ideas and develop plans of actions. And of course, policymakers
150
should look to all of these stakeholder groups for feedback and guidance when crafting
policies and procedures which will impact classrooms on a daily basis.
To improve Futernick’s (2007) Tipping Point framework, the researcher recommends
that more studies be conducted to ascertain whether reform components should be added or
deleted. Once these findings are compiled, the resulting framework should be presented as a
menu--rather than a recipe--for transformation to interested stakeholders. Schools could then
pick and choose the areas they most need to address, based upon their respective needs and
contexts, from a robust list of reform elements. Otherwise, Futernick’s (2007) plan simply
becomes a nine-pack of silver bullets.
A fourth and final assumption of Futernick’s (2007) framework that should be examined
is the idea that everyone views the nine components in the same manner. In Excellence Loves
Company, the researcher fails to provide a clear set of operational definitions for teams, time,
physical environment, class-size reduction, autonomy and shared governance, leadership, a
well-rounded curriculum, external support, and parent/community involvement. Brief
sections within the document provide supporting evidence for the rationale to include the
element; however, little information is included, which delineates what this component truly
means when implementing school reform. Consequently, educators, policymakers, and other
interested stakeholders are left to their own interpretations.
For this mixed methods study, an extensive literature review resulted in guiding
principles and characteristics for identifying the nine elements in quantitative and qualitative
data analysis. With no clearly defined set of terms from Futernick (2007), however, another
researcher might end up with a slightly different analytical frame. How can Futernick (2007)
expect schools to successfully implement reform plans when the possibility of
151
misinterpretation exists? Definitions must be fully developed and administrators trained on
how to best address them in low-performing, high-poverty schools, in order for this plan to
have longevity.
Recommendations for Further Study
While this mixed methods study questioned four key assumptions inherent within
Futernick’s (2007) framework, there are numerous recommendations for further study that
would deepen the knowledge base of understanding for this reform plan. These
recommendations can be divided into three main categories: (1) additional ideas for study at
the five identified sites; (2) opportunities for exploration in other schools; and (3) suggestions
for framework development and refinement.
Additional Ideas for Study at the Five Identified Sites
In Chapter Three, the limitations and delimitations of this study were outlined for the
reader to understand the parameters within which the study was designed and implemented.
Given there was only limited data available--both qualitative and quantitative--ideas for
additional study at the five identified sites are extensive. For example, researchers could go
back to these buildings now that several years of reform have transpired to take another look
at the progress and improvement of these low-performing, high-poverty schools. Their
current conditions may differ greatly than the interview and survey data revealed after just
one year of implementation. In addition, interview protocols and survey questions tailored to
the Futernick (2007) framework could be designed to specifically address the nine
components. Teachers and administrators could also be asked to complete self-assessments
of the presence of the reform elements, with supportive evidence provided in the form of
artifacts contained within a school-wide portfolio.
152
Opportunities for Exploration in Other Schools
To increase the generalizability of Futernick’s (2007) plan, exploration of reform
activities in other schools in different contexts should be organized. The large southern
school district in this study is certainly not the only district which has developed and
implemented turnaround plans for their struggling schools. Therefore, it would be interesting
to study the efforts of school leaders across a variety of contexts, from expansive urban
school systems (e.g., New York City or Los Angeles) to small rural districts (e.g., those
found in the Mississippi Delta or in the flatlands of Kansas). Additionally, it would be
enlightening to compare the success of schools which had reform initiatives dictated to them
versus those that developed a grassroots plan on their own. Are reform efforts more
successful when generated by and for teachers and administrators? Can district-led efforts
receive sufficient buy-in and support to create change? In all of these studies, both qualitative
and quantitative data should be captured, using a variety of tools that directly address the
components of the Tipping Point framework for reform.
Suggestions for Framework Development and Refinement
An assumption of this study has been that Futernick’s (2007) nine components are
indeed valid and important for turning low-performing, high-poverty schools around.
Perhaps, however, this idea should be explored further in order to more fully develop and
refine Futernick’s (2007) framework. Are the nine components indeed necessary for
improving all struggling schools? Do some have more weight than others in their importance
and potential for impact? What role does the school context play in making choices about
where to focus efforts? Are there other key factors that have been excluded? To answer these
questions, successful high-poverty schools could be identified across the country, based on

153
comparative analysis of socioeconomic status and student achievement. Once these sites are
pinpointed, investigators could then conduct case study visits to evaluate whether the nine
elements of reform were, in fact, present in these schools. This cross-school examination
would help to validate and further explain the relative importance--and necessity--of teams,
time, physical environment, class-size reduction, autonomy and shared governance,
leadership, a well-rounded curriculum, external support, and parent/community involvement,
as well as other possible areas for reform.
Conclusion
…[I]f dysfunctional schools are bi-modal and prone to regress unless they reach a threshold of stability, then this gradualist approach to reform is misguided. The theory presented in this Tipping Point proposal, by contrast, suggests that whatever is done for these schools, it must be sufficient to ensure they reach a threshold where change can be sustained. And it suggests that offering some help may be the equivalent of offering no help. In fact, more harm than good may be done if all that is provided to dysfunctional schools is the equivalent of two days’ worth of antibiotics (Futernick, 2007, p.10).
Education in America stands at a crossroads. While we espouse that no child should be
left behind, we continue to act as if these students can make it on their own by failing to
provide them with the necessary tools, resources, and human capital to prepare them for a
twenty-first century world. If we truly believe that every child can--and should--receive a
robust, well-rounded education, then we must be willing to invest time and energy into
reforming the schools which need the most help. Across this country, high-poverty schools
continue to lack quality teachers, adequate facilities and resources, strong leadership, and
external support to bring about change. Rather than offer them “two days’ worth of
antibiotics” (Futernick, 2007, p.10) through silver bullet-like reform initiatives, we should
instead ensure they have a long-term prescription for care. The children are depending on us.
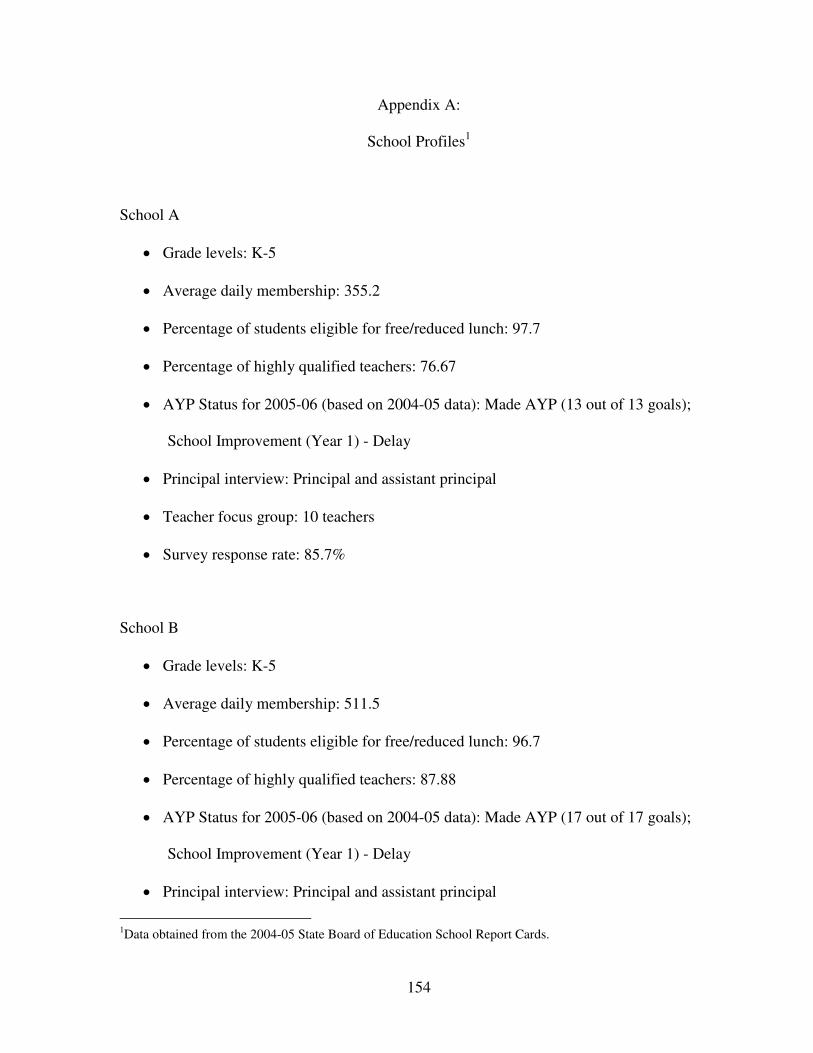
154
Appendix A:
School Profiles1
School A
• Grade levels: K-5
• Average daily membership: 355.2
• Percentage of students eligible for free/reduced lunch: 97.7
• Percentage of highly qualified teachers: 76.67
• AYP Status for 2005-06 (based on 2004-05 data): Made AYP (13 out of 13 goals);
School Improvement (Year 1) - Delay
• Principal interview: Principal and assistant principal
• Teacher focus group: 10 teachers
• Survey response rate: 85.7%
School B
• Grade levels: K-5
• Average daily membership: 511.5
• Percentage of students eligible for free/reduced lunch: 96.7
• Percentage of highly qualified teachers: 87.88
• AYP Status for 2005-06 (based on 2004-05 data): Made AYP (17 out of 17 goals);
School Improvement (Year 1) - Delay
• Principal interview: Principal and assistant principal
1Data obtained from the 2004-05 State Board of Education School Report Cards.
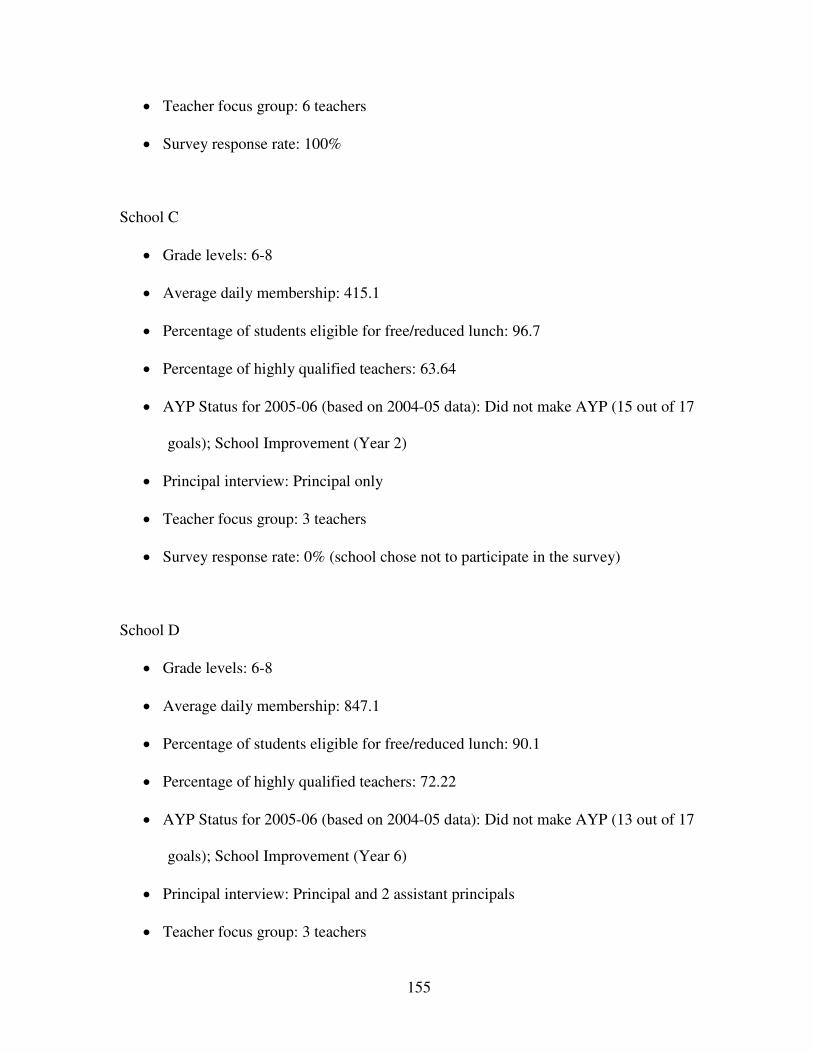
155
• Teacher focus group: 6 teachers
• Survey response rate: 100%
School C
• Grade levels: 6-8
• Average daily membership: 415.1
• Percentage of students eligible for free/reduced lunch: 96.7
• Percentage of highly qualified teachers: 63.64
• AYP Status for 2005-06 (based on 2004-05 data): Did not make AYP (15 out of 17
goals); School Improvement (Year 2)
• Principal interview: Principal only
• Teacher focus group: 3 teachers
• Survey response rate: 0% (school chose not to participate in the survey)
School D
• Grade levels: 6-8
• Average daily membership: 847.1
• Percentage of students eligible for free/reduced lunch: 90.1
• Percentage of highly qualified teachers: 72.22
• AYP Status for 2005-06 (based on 2004-05 data): Did not make AYP (13 out of 17
goals); School Improvement (Year 6)
• Principal interview: Principal and 2 assistant principals
• Teacher focus group: 3 teachers
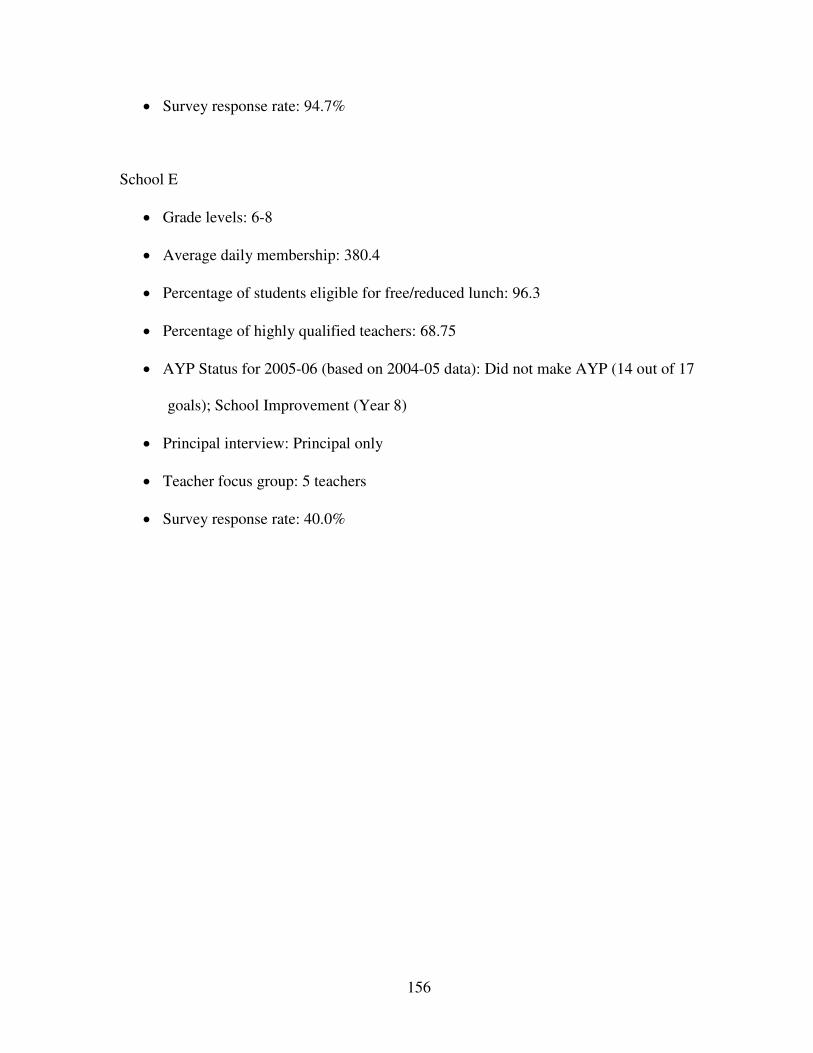
156
• Survey response rate: 94.7%
School E
• Grade levels: 6-8
• Average daily membership: 380.4
• Percentage of students eligible for free/reduced lunch: 96.3
• Percentage of highly qualified teachers: 68.75
• AYP Status for 2005-06 (based on 2004-05 data): Did not make AYP (14 out of 17
goals); School Improvement (Year 8)
• Principal interview: Principal only
• Teacher focus group: 5 teachers
• Survey response rate: 40.0%

157
Appendix B:
Principal Interview Questions
1. Tell me a little about yourself. What influenced your decision to come work here?
2. What was it that most influenced your decision to be the principal at this school?
3. What kinds of improvements or successes have you experienced at this school in the past
year?
4. What is it that has prompted the successes you have experienced in your school?
5. How important was it to be able to hire new teachers for this school?
6. Let’s talk next about your greatest needs for continuing to improve the quality of
instruction for students in your school. What are the two things that would make the most
difference for improving students’ learning in this school?
7. If you could remove one barrier to improve teaching and student learning in your school,
what would it be?
8. In closing, you’ve stepped onto an elevator and met a principal from another school who
asks your advice about what you have learned that could be applied to helping to improve
student learning in his/her school. What would you say to him/her about how to begin in
the coming year to turn his/her school around with regard to student learning?

158
Appendix C:
Teacher Focus Group Questions
1. Tell me a little about yourself. What do you teach? How long have you taught here at this
school? In this district?
2. What was it that most influenced your decision to teach here?
3. What kinds of improvements or successes have you experienced at this school in the past
year?
4. What is it that has prompted the successes you have experienced in your school?
5. Let’s shift focus to your own classroom. What has prompted successes you have
experienced in your classroom teaching?
6. What is your greatest need for continuing to improve the quality of your instruction for
your students?
7. In closing, you’ve stepped onto an elevator and met a teacher from another school who you
know is a great teacher. This friend shares with you that he/she is considering a move to a
turnaround school and would like your advice about this decision. What would you say to
this teacher in the thirty seconds that you have about what it would take to teach the
students in your school?

159
Appendix D:
Online Survey Questions
Q3a. The student composition in my classes is reasonable to allow me to meet the
educational needs of all students.
Q3b. I have reasonable class sizes, affording me the time to meet the educational needs of all
students.
Q3c. Time in school is used efficiently to maximize student learning.
Q3d. The non-instructional time provided to me is sufficient to improve my teaching
practices.
Q3f. The staff is committed to “whatever it takes” to help every student learn.
Q4a. I have sufficient access to instructional materials and resources.
Q4c. My school building is clean and well-maintained.
Q4d. My school is a safe and secure place to teach and learn.
Q5a. In my school, teachers are centrally involved in decision making about important
educational issues.
Q5b. I am recognized as an educational expert and am trusted to make sound professional
decisions about instruction.
Q5c. Useful information is readily available to me so I can make informed decisions.
Q5d. In my school we take steps to solve problems, we don’t just talk about them.
Q5e. The faculty has an effective process for making group decisions and solving problems.
Q5f. There is an atmosphere of trust and mutual respect in my school.
Q5g. I feel comfortable raising issues and concerns that are important to me.

160
Q5h. School leaders are proficient in establishing positive learning environments and
efficient operations.
Q5i. My school leadership consistently supports me when I need it.
Q5j. My school leadership communicates clear expectations to students, teachers and parents.
Q5k. Overall, the leadership in my school is effective.
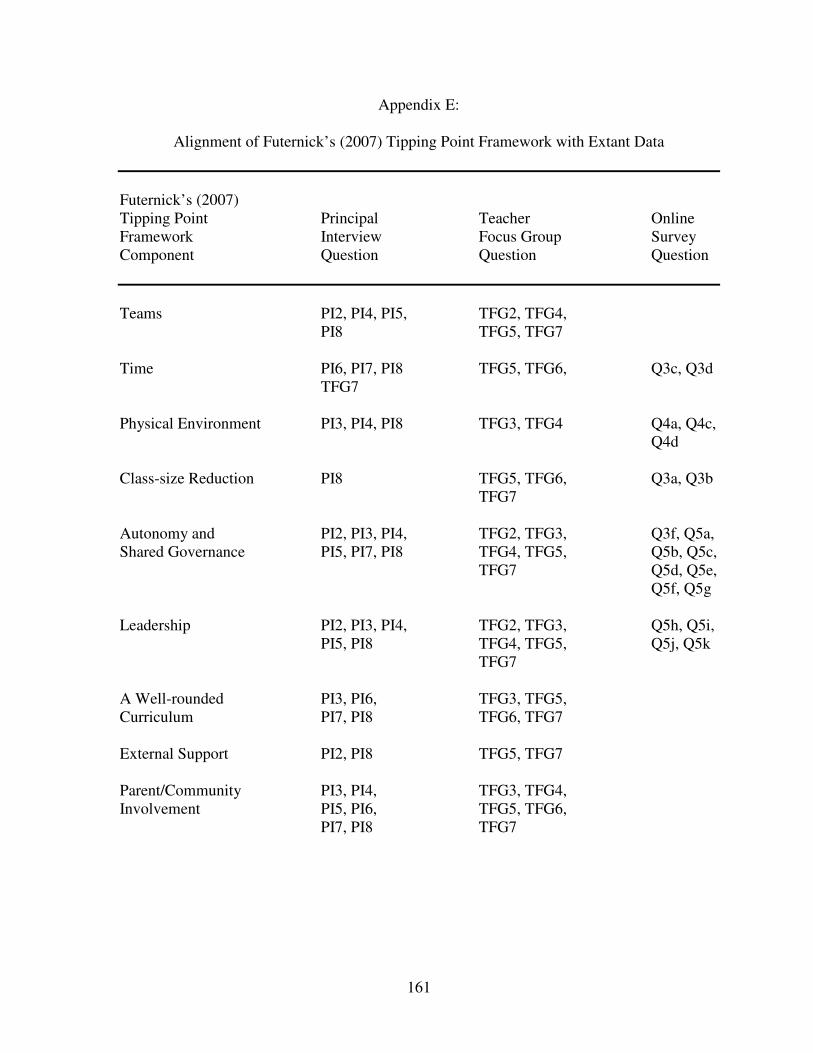
161
Appendix E:
Alignment of Futernick’s (2007) Tipping Point Framework with Extant Data
Futernick’s (2007) Tipping Point Principal Teacher Online Framework Interview Focus Group Survey Component Question Question Question
Teams PI2, PI4, PI5, TFG2, TFG4, PI8 TFG5, TFG7 Time PI6, PI7, PI8 TFG5, TFG6, Q3c, Q3d TFG7 Physical Environment PI3, PI4, PI8 TFG3, TFG4 Q4a, Q4c, Q4d Class-size Reduction PI8 TFG5, TFG6, Q3a, Q3b TFG7 Autonomy and PI2, PI3, PI4, TFG2, TFG3, Q3f, Q5a, Shared Governance PI5, PI7, PI8 TFG4, TFG5, Q5b, Q5c, TFG7 Q5d, Q5e, Q5f, Q5g Leadership PI2, PI3, PI4, TFG2, TFG3, Q5h, Q5i, PI5, PI8 TFG4, TFG5, Q5j, Q5k TFG7 A Well-rounded PI3, PI6, TFG3, TFG5, Curriculum PI7, PI8 TFG6, TFG7 External Support PI2, PI8 TFG5, TFG7 Parent/Community PI3, PI4, TFG3, TFG4, Involvement PI5, PI6, TFG5, TFG6, PI7, PI8 TFG7
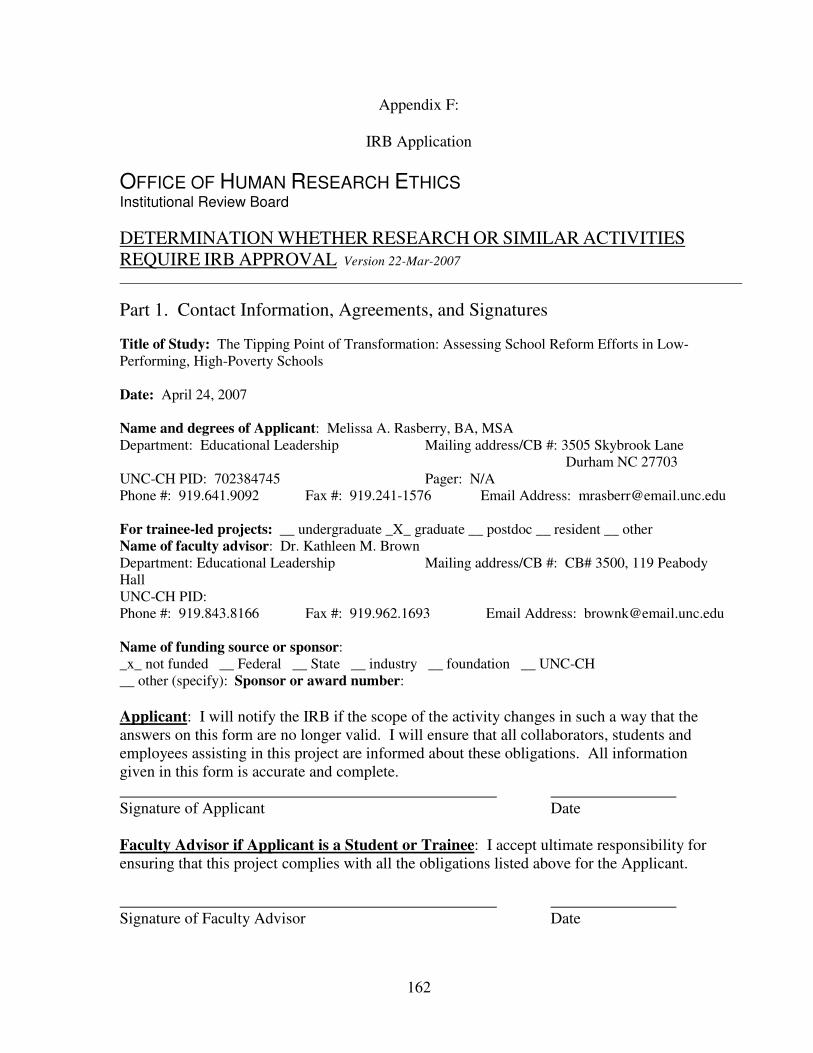
162
Appendix F:
IRB Application
OFFICE OF HUMAN RESEARCH ETHICS Institutional Review Board
DETERMINATION WHETHER RESEARCH OR SIMILAR ACTIVITIES
REQUIRE IRB APPROVAL Version 22-Mar-2007
Part 1. Contact Information, Agreements, and Signatures
Title of Study: The Tipping Point of Transformation: Assessing School Reform Efforts in Low-Performing, High-Poverty Schools
Date: April 24, 2007 Name and degrees of Applicant: Melissa A. Rasberry, BA, MSA Department: Educational Leadership Mailing address/CB #: 3505 Skybrook Lane Durham NC 27703 UNC-CH PID: 702384745 Pager: N/A Phone #: 919.641.9092 Fax #: 919.241-1576 Email Address: [email protected] For trainee-led projects: __ undergraduate _X_ graduate __ postdoc __ resident __ other Name of faculty advisor: Dr. Kathleen M. Brown Department: Educational Leadership Mailing address/CB #: CB# 3500, 119 Peabody Hall UNC-CH PID: Phone #: 919.843.8166 Fax #: 919.962.1693 Email Address: [email protected] Name of funding source or sponsor: _x_ not funded __ Federal __ State __ industry __ foundation __ UNC-CH __ other (specify): Sponsor or award number:
Applicant: I will notify the IRB if the scope of the activity changes in such a way that the answers on this form are no longer valid. I will ensure that all collaborators, students and employees assisting in this project are informed about these obligations. All information given in this form is accurate and complete. Signature of Applicant Date Faculty Advisor if Applicant is a Student or Trainee: I accept ultimate responsibility for ensuring that this project complies with all the obligations listed above for the Applicant. Signature of Faculty Advisor Date
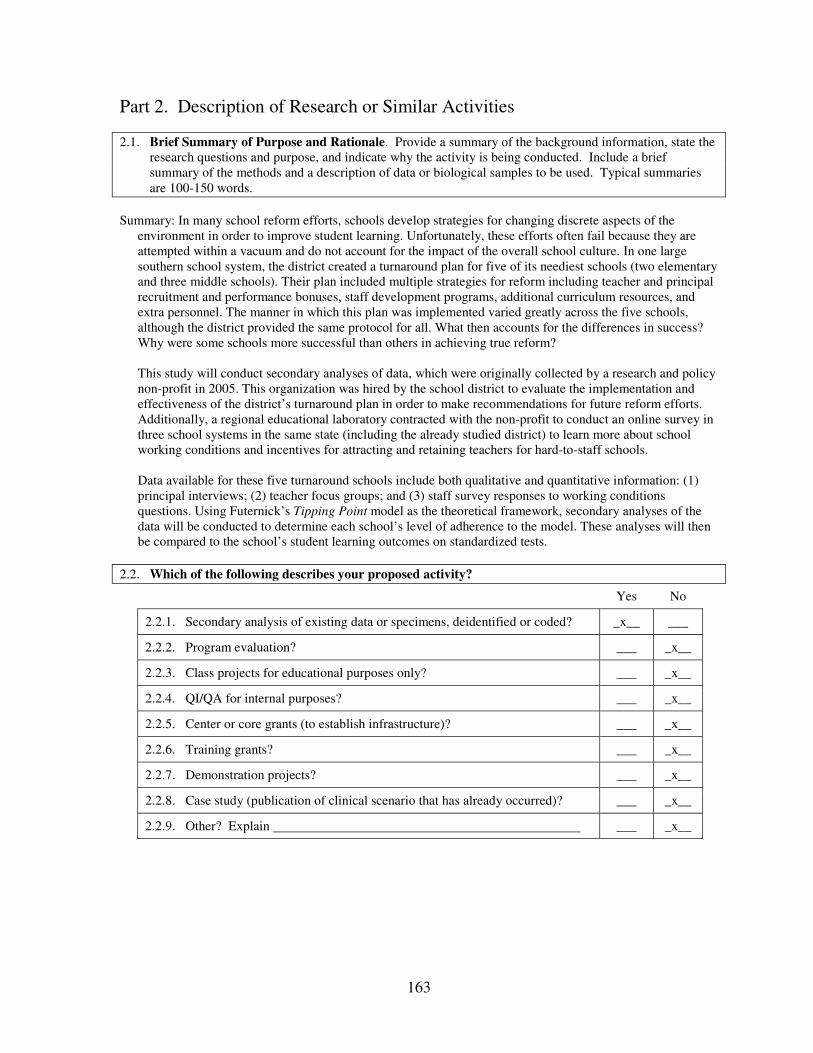
163
Part 2. Description of Research or Similar Activities
2.1. Brief Summary of Purpose and Rationale. Provide a summary of the background information, state the research questions and purpose, and indicate why the activity is being conducted. Include a brief summary of the methods and a description of data or biological samples to be used. Typical summaries are 100-150 words.
Summary: In many school reform efforts, schools develop strategies for changing discrete aspects of the
environment in order to improve student learning. Unfortunately, these efforts often fail because they are attempted within a vacuum and do not account for the impact of the overall school culture. In one large southern school system, the district created a turnaround plan for five of its neediest schools (two elementary and three middle schools). Their plan included multiple strategies for reform including teacher and principal recruitment and performance bonuses, staff development programs, additional curriculum resources, and extra personnel. The manner in which this plan was implemented varied greatly across the five schools, although the district provided the same protocol for all. What then accounts for the differences in success? Why were some schools more successful than others in achieving true reform?
This study will conduct secondary analyses of data, which were originally collected by a research and policy
non-profit in 2005. This organization was hired by the school district to evaluate the implementation and effectiveness of the district’s turnaround plan in order to make recommendations for future reform efforts. Additionally, a regional educational laboratory contracted with the non-profit to conduct an online survey in three school systems in the same state (including the already studied district) to learn more about school working conditions and incentives for attracting and retaining teachers for hard-to-staff schools.
Data available for these five turnaround schools include both qualitative and quantitative information: (1)
principal interviews; (2) teacher focus groups; and (3) staff survey responses to working conditions questions. Using Futernick’s Tipping Point model as the theoretical framework, secondary analyses of the data will be conducted to determine each school’s level of adherence to the model. These analyses will then be compared to the school’s student learning outcomes on standardized tests.
2.2. Which of the following describes your proposed activity?
Yes No
2.2.1. Secondary analysis of existing data or specimens, deidentified or coded? _x__ ___
2.2.2. Program evaluation? ___ _x__
2.2.3. Class projects for educational purposes only? ___ _x__
2.2.4. QI/QA for internal purposes? ___ _x__
2.2.5. Center or core grants (to establish infrastructure)? ___ _x__
2.2.6. Training grants? ___ _x__
2.2.7. Demonstration projects? ___ _x__
2.2.8. Case study (publication of clinical scenario that has already occurred)? ___ _x__
2.2.9. Other? Explain ___ _x__
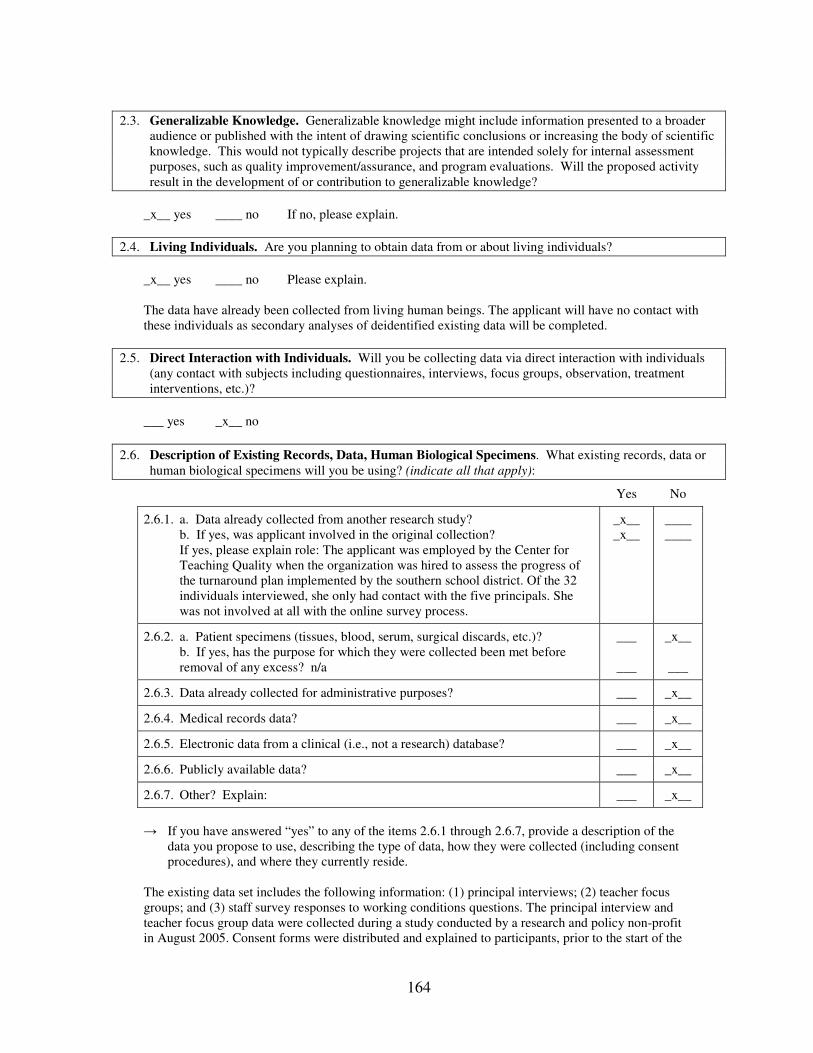
164
2.3. Generalizable Knowledge. Generalizable knowledge might include information presented to a broader audience or published with the intent of drawing scientific conclusions or increasing the body of scientific knowledge. This would not typically describe projects that are intended solely for internal assessment purposes, such as quality improvement/assurance, and program evaluations. Will the proposed activity result in the development of or contribution to generalizable knowledge?
_x__ yes ____ no If no, please explain.
2.4. Living Individuals. Are you planning to obtain data from or about living individuals?
_x__ yes ____ no Please explain. The data have already been collected from living human beings. The applicant will have no contact with
these individuals as secondary analyses of deidentified existing data will be completed.
2.5. Direct Interaction with Individuals. Will you be collecting data via direct interaction with individuals (any contact with subjects including questionnaires, interviews, focus groups, observation, treatment interventions, etc.)?
___ yes _x__ no
2.6. Description of Existing Records, Data, Human Biological Specimens. What existing records, data or human biological specimens will you be using? (indicate all that apply):
Yes No
2.6.1. a. Data already collected from another research study? b. If yes, was applicant involved in the original collection?
If yes, please explain role: The applicant was employed by the Center for Teaching Quality when the organization was hired to assess the progress of the turnaround plan implemented by the southern school district. Of the 32 individuals interviewed, she only had contact with the five principals. She was not involved at all with the online survey process.
_x__ _x__
____ ____
2.6.2. a. Patient specimens (tissues, blood, serum, surgical discards, etc.)? b. If yes, has the purpose for which they were collected been met before
removal of any excess? n/a
___
___
_x__
___
2.6.3. Data already collected for administrative purposes? ___ _x__
2.6.4. Medical records data? ___ _x__
2.6.5. Electronic data from a clinical (i.e., not a research) database? ___ _x__
2.6.6. Publicly available data? ___ _x__
2.6.7. Other? Explain: ___ _x__
→ If you have answered “yes” to any of the items 2.6.1 through 2.6.7, provide a description of the
data you propose to use, describing the type of data, how they were collected (including consent procedures), and where they currently reside.
The existing data set includes the following information: (1) principal interviews; (2) teacher focus groups; and (3) staff survey responses to working conditions questions. The principal interview and teacher focus group data were collected during a study conducted by a research and policy non-profit in August 2005. Consent forms were distributed and explained to participants, prior to the start of the

165
interview and focus group sessions. All individuals were promised anonymity and confidentiality. The staff survey responses to working conditions questions were compiled during the administration of an online survey in December 2005 by the same organization. Individuals were asked to provide select demographic information; however, all identifiers have been removed except the name of the school in which the participants teach.
2.7. Private Information. Private information includes information about behavior that occurs in a context that an individual can reasonably expect will not be made public (e.g., a medical or school record). Public information might include information that is publicly available or from observation of public behavior (e.g., seatbelt use, use of bicycle lanes, etc.). Are the data for your project private?
_x__ yes ___ no If no, explain:
2.8. HIPAA. Do any of these data come directly from a health plan, health care clearinghouse, or health care provider? (See http://www.unc.edu/hipaa/index.htm for more about HIPAA.)
___ yes _x__ no
2.9. Identifiers in Existing Data. Do the data you will receive have any of the following identifiers?
_x_ No __ Yes If yes, check all that apply:
a. __ Names b. __ Telephone numbers c. __ Any elements of dates (other than
year) for dates directly related to an individual, including birth date, admission date, discharge date, date of death. For ages over 89: all elements of dates (including year) indicative of such age, except that such ages and elements may be aggregated into a single category of age 90 and older
d. __ Any geographic subdivisions smaller than a State, including street address, city, county, precinct, zip code and their equivalent geocodes, except for the initial three digits of a zip code
e. __ Fax numbers f. __ Electronic mail addresses g. __ Social security numbers h. __ Medical record numbers i. __ Health plan beneficiary numbers j. __ Account numbers k. __ Certificate/license numbers l. __ Vehicle identifiers and serial numbers
(VIN), including license plate numbers m. __ Device identifiers and serial numbers
(e.g., implanted medical device) n. __ Web universal resource locators (URLs) o. __ Internet protocol (IP) address numbers p. __ Biometric identifiers, including finger
and voice prints
q. __ Full face photographic images and any comparable images
r. __ Any other unique identifying number, characteristic or code, other than dummy identifiers that are not derived from actual identifiers and for which the re-identification key is maintained by the health care provider and not disclosed to the researcher
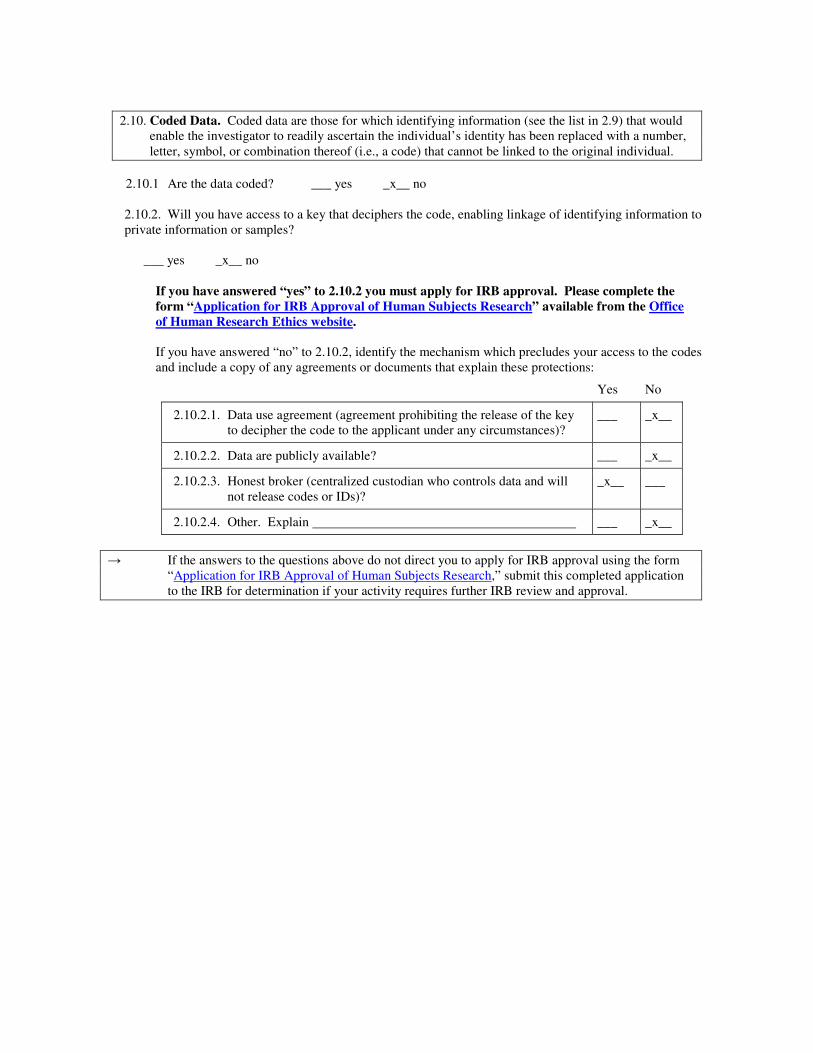
2.10. Coded Data. Coded data are those for which identifying information (see the list in 2.9) that would enable the investigator to readily ascertain the individual’s identity has been replaced with a number, letter, symbol, or combination thereof (i.e., a code) that cannot be linked to the original individual.
2.10.1 Are the data coded? ___ yes _x__ no 2.10.2. Will you have access to a key that deciphers the code, enabling linkage of identifying information to private information or samples?
___ yes _x__ no
If you have answered “yes” to 2.10.2 you must apply for IRB approval. Please complete the
form “Application for IRB Approval of Human Subjects Research” available from the Office
of Human Research Ethics website.
If you have answered “no” to 2.10.2, identify the mechanism which precludes your access to the codes and include a copy of any agreements or documents that explain these protections:
Yes No
2.10.2.1. Data use agreement (agreement prohibiting the release of the key to decipher the code to the applicant under any circumstances)?
___ _x__
2.10.2.2. Data are publicly available? ___ _x__
2.10.2.3. Honest broker (centralized custodian who controls data and will not release codes or IDs)?
_x__ ___
2.10.2.4. Other. Explain ___ _x__
→ If the answers to the questions above do not direct you to apply for IRB approval using the form “Application for IRB Approval of Human Subjects Research,” submit this completed application to the IRB for determination if your activity requires further IRB review and approval.

167
REFERENCES
Anfara, V.A., Brown, K.M. & Mangione, T.L. (2002, October). Qualitative analysis on stage: Making the research process more public. Educational Researcher, 31(7), 28-38.
Alliance for Excellent Education (2007). Understanding high school graduation rates. Washington, DC: Author. Barth, P., Haycock, K., Jackson, H., Mora, K., Ruiz, P., Robinson, S. & Wilkins, A.
(1999). Dispelling the myth: High poverty schools exceeding expectations. Washington, DC: Education Trust.
Berry, B. (2004). Recruiting and retaining "Highly Qualified Teachers" for hard-to-staff schools. NASSP Bulletin, 88(638), 5-27. Bill & Melinda Gates Foundation (2007). The 3Rs solution. Seattle, WA: Author.
Retrieved on August 3, 2007 from http://www.gatesfoundation.org/UnitedStates/ Education/RelatedInfo/3Rs_Solution.htm
Bohrnstedt, G.W. & Stecher, B.M. (2002). What we have learned about class size
reduction in California. California Department of Education: CSR Research Consortium.
Buckley, J., Schneider, M. & Shang, Y. (2005, May). Fix it and they might stay: School
facility quality and teacher retention in Washington, DC. Teachers College
Record, 107(5), 1107-1123. Castetter, W.B. & Heisler, R.S. (1977). Developing and defending a dissertation
proposal. Philadelphia: Center for Field Studies, Graduate School of Education, University of Pennsylvania.
Claycomb, C. (2000). High-quality urban school teachers. The State Education Standard,
1(1), 17-20. Clotfelter, C., Ladd, H.F., Vigdor, J. & Wheeler, J. (2006). High-poverty schools and the
distribution of teachers and principals. Durham, NC: Terry Sanford Institute of Public Policy, Duke University.
Council of Chief State School Officers (1996). Interstate school leaders licensure
consortium (ISLLC) standards for school leaders. Washington, DC: Author. Retrieved on May 5, 2007 from: http://www.ccsso.org/content/pdfs/isllcstd.pdf
Creswell, J.W. (2003). Research design: Qualitative, quantitative, and mixed methods
approaches (2nd
ed.). Thousand Oaks, CA: Sage Publications.
168
Creswell, J.W. & Miller, D.L. (2000, Summer). Determining validity in qualitative inquiry. Theory into Practice, 39(3), 12-130.
Creswell, J.W., Shope, R., Plano Clark, V.L., & Green, D.O. (2006, Spring). How
interpretive qualitative research extends mixed methods research. Research in the
Schools, 13(1), 1-11. Datnow, A. & Castellano, M.E. (2001, April). Managing and guiding school reform:
Leadership in success for all schools. Educational Administration Quarterly,
37(2), 219-249. Davis, D., Sagmiller, K. & Hagans, R. (2001). Implementing school reform models:
The Clover Park experience. Portland, OR: Northwest Regional Educational Laboratory.
Delpit, L. (1995). Other people's children: Cultural conflict in the classroom. New York:
New Press. Denzin, N.K. (1978). The research act (2
nd ed.). New York: McGraw-Hill.
Dillard, C.B. (1995). Leading with her life: An African-American feminist
(re)interpretation of leadership for an urban high school principal. Educational
Administration Quarterly, 31(4), 539-563. Doherty, K. & Abernathy, S. (1998). Turning around low-performing schools: A guide
for state and local leaders. Washington, DC: United States Department of Education.
Donahoe, T. (1993). Finding the way: Structure, time, and culture in school
improvement. Phi Delta Kappan, 75(4), 298-306. Elmore, R. (1996). Getting to scale with good educational practice. Harvard Educational
Review, 66(1), 1-26. Epstein, J.L. (1995, May). School/family/community partnerships: Caring for the
children we share. Phi Delta Kappan, 76(9), 701-712. Finn, J.D. (2002). Class-size reduction in grades K-3. In A. Molnar (Ed.). School reform
proposals: The research evidence. Tempe, AZ: Education Policy Research Unit, Arizona State University, 15-24.
Firestone, W.A. (1987). Meaning in method: The rhetoric of quantitative and qualitative
research. Educational Researcher, 16(7), 16-21. Fullan, M. (2000). The return of large-scale reform. Journal of Educational Change,
1(1), 5-28.
169
Fullan, M. (2001). Leading in a culture of change. San Francisco: Jossey-Bass. Fullan, M. (2003). The moral imperative of school leadership. Thousand Oaks, CA:
Corwin Press.
Futernick (2007). Excellence loves company: A tipping point turnaround strategy for
California’s low-performing schools. San Francisco: WestEd. Gladwell, M. (2002). The tipping point: How little things can make a big difference. New
York: Little, Brown and Company. Glass, G.V. & Smith, M.L. (1978). Meta-analysis of research on the relationship of
class size and achievement. San Francisco: Far West Laboratory of Educational Research and Development.
Glesne, C. (1999). Becoming qualitative researchers: An introduction. New York: Addison Wesley Longman. Goodlad, J.I. (1975). The uses of alternative theories of educational change.
Bloomington, IN: Phi Delta Kappa International. Goodlad, J.I. (1984). A place called school: Prospects for the future. New York:
McGraw-Hill. Haberman, M. (1991). The pedagogy of poverty versus good teaching. Phi Delta
Kappan, 73, 290-295. Howell, D.C. (2002). Statistical methods for psychology (5
th ed.). Pacific Grove, CA:
Duxbury. Institute for Educational Leadership (2001, April). Leadership for student learning:
Redefining the teacher as leader. Washington, DC: Author. Jago, E. & Tanner, K. (1999). Influence of the school facility on student achievement:
Athens, Ga.: Department of Educational Leadership, University of Georgia. Retrieved on July 2, 2007 from http://www.coe.uga.edu/sdpl/researchabstracts/ visual.html
Jick, T.D. (1979, December). Mixing qualitative and quantitative methods: Triangulation
in action. Administrative Science Quarterly, 24(4), 602-611. Johnson, R.B. & Onwuegbuzie, A.J. (2004). Mixed methods research: A research
paradigm whose time has come. Educational Researcher, 33(7), 14-26. Johnson, S.M. (1990). Teachers at work. New York: Basic Books.
170
Johnson, S.M. & Birkeland, S.E. (2003). Pursuing a “sense of success”: New teachers explain their career decisions. American Educational Research Journal, 40(3), 581-617.
Johnson, S.M., Kardos, S.M., Kauffman, D., Liu, E. & Donaldson, M.L. (2004, October 29). The support gap: New teachers’ early experiences in high-income and low- income schools. Education Policy Analysis Archives, 12(61). Retrieved January 4, 2005 from http://epaa.asu.edu/epaa/v12n61/ Johnston, J., Knight, M. & Miller, L. (2007, Spring). Finding time for teams. Journal of
Staff Development, 28(2), 14-18. Kannapel, P.J. & Clements, S.K. (2005, February). Inside the black box of high-
performing high-poverty schools. Lexington, Kentucky: Pritchard Committee for Academic Excellence.
Khorsheed, K. (2007, Spring). Four places to dig deep to find more time for teacher
collaboration. Journal of Staff Development, 28(2), 43-45. Kozol, J. (1991). Savage inequalities: Children in America's schools. New York: Crown. Kozol, J. (2005). Confections of apartheid: A stick-and-carrot pedagogy for the children
of our inner-city poor. Phi Delta Kappan, 87(4), 264-275. Lackney, J.A. (1999). Assessing school facilities for learning/assessing the impact of the
physical environment on the educational process. Mississippi State, MS: Educational Design Institute (ERIC Document Reproduction Service No. ED441330).
Ladson-Billings, G. (2001). Crossing over to Canaan. San Francisco: Jossey-Bass. LeCompte, M.D. (2000, Summer). Analyzing qualitative data. Theory into Practice,
39(3), 146-154. Lee, J.O. (2003, February). Implementing high standards in urban schools: Problems and
solutions. Phi Delta Kappan, 84(6), 449-455. Leonard, L. & Leonard, P. (2003, September 17). The continuing trouble with
collaboration: Teachers talk. Current Issues in Education [Online], 6(15). Retrieved on June 7, 2007 from http://cie.ed.asu.edu/volume6/number15/
Lortie, D.C. (1975). Schoolteacher. Chicago: University of Chicago Press. Marshall, C. & Rossman, G.B. (1999). Designing qualitative research (3
rd ed.).
Thousand Oaks, CA: Sage Publications.
171
McCall, M.S., Hauser, C., Cronin, J., Kingsbury, G.G., & Houser, R. (2006). Achievement gaps: An examination of differences in student achievement and
growth. Lake Oswego, OR: Northwest Evaluation Association. Merriam, S. (1988). Case study research in education: A qualitative approach. San
Francisco, CA: Jossey-Bass Publishers. Miles, M.B. & Huberman, A.M. (1994). Qualitative data analysis (2
nd ed.). Thousand
Oaks, CA: Sage Publications. National Commission on Excellence in Education (1983). A nation at risk: The
imperative for educational reform. Washington, DC: Government Printing Office. National Education Commission on Time and Learning (2005). Prisoners of time.
Denver: Education Commission of the States. Nieto, S. (2003). What keeps teachers going? Educational Leadership, 60(8), 14-18. Northwest Regional Educational Laboratory (2005). Catalog of school reform models.
Portland, OR: Author. Retrieved on August 1, 2007 from http://www.nwrel.org/scpd/catalog/index.shtml
Onwuegbuzie, A.J. & Johnson, R.B. (2006, Spring). The validity issue in mixed research.
Research in the Schools, 13(1), 48-63. Owens, R.G. (2001). Organizational behavior in education (7
th ed.). Boston: Allyn and
Bacon. Patton, M. (1990). Qualitative evaluation and research methods (2
nd ed). Newbury Park,
CA: Sage Publications. Peterson, K. D. (1994). Building collaborative cultures: Seeking ways to reshape urban
schools. Naperville, IL: North Central Regional Educational Laboratory. Retrieved January 8, 2005 from http://www.ncrel.org/sdrs/areas/issues/educatrs/ leadrshp/le0pet.htm/
Public Education Network (2003). The voice of the new teacher. Washington, DC:
Public Education Network. Rosenholtz, S. (1989). Teachers' workplace: The social organization of schools. New
York: Longmans. Rothstein, R. (2004). Class and the classroom. American School Board Journal, 191(10),
16-21.
172
Schouten & Bivens (2002, December 23). A substitute for an education: Least-qualified teachers often teach poor, minority kids. USA Today, 6D. Sever, K. & Bowgren, L. (2007, Spring). Shaping the workday. Journal of Staff
Development, 28(2), 20-23. Shannon, G.S. & Bylsma, P. (2004). Characteristics of improved school districts:
Themes from research. Olympia, WA: Office of Superintendent of Public Instruction. Retrieved October 2, 2006 from http://www.k12.wa.us/research/ pubdocs/DistrictImprovementReport.pdf
Snipes, J., Doolittle, F. & Herlihy, C. (2002). Foundations for success: Case studies of
how urban school systems improve student achievement. New York: MDRC. Sparks, D. (1999, March). How can schools make time for teacher learning? Results.
Retrieved on May 10, 2007 from http://www.nsdc.org/library/publications/ results/res3-99learning.cfm
The Teaching Commission (2004). Teaching at risk: A call to action. New York:
Reinventing America’s Schools. Tienken, C.H. & Stonaker, L. (2007, Spring). When every day is professional
development day. Journal of Staff Development, 28(2), 24-29. Tyack, D. & Cuban, L. (1995). Tinkering toward utopia: A century of public school
reform. Cambridge, MA: Harvard University Press. United States Department of Education (2007). Comprehensive school reform program.
Washington, DC: Author. Retrieved on August 2, 2007 from http://www.ed.gov/programs/compreform/2pager.html
United States Department of Education, Office of Communications and Outreach (2006).
Guide to U.S. Department of Education programs. Washington, DC: Author. Retrieved on August 5, 2007 from http://www.ed.gov/programs/gtep/gtep.pdf
United States Department of Education, Office of the Secretary (2006). Answering the
challenge of a changing world: Strengthening education for the 21st century.
Washington, DC: Author. Retrieved on August 4, 2007 from http://www.ed.gov/about/inits/ed/competitiveness/strengthening/strengthening.pdf
Usher, R. (1996). “A critique of the neglected epistemological assumptions of educational research.” In Understanding educational research, edited by D. Scott and R. Usher, 9-32. New York: Routledge.
Van Maanen, J. (1988). Tales of the field: On writing ethnography. Chicago: University
of Chicago Press.
173
Yin, R.K. (1994). Case study research: Design and methods (2nd
ed.). Thousand Oaks, CA: Sage Publications.
Yin, R.K. (2006, Spring). Mixed methods research: Are the methods genuinely integrated
or merely parallel? Research in the Schools, 13(1), 41-47. Youngs, P. & King, M.B. (2002). Principal leadership for professional development to
build school capacity. Educational Administration Quarterly, 38(5), 643-670. Zelditch, M. Jr. (1962). Some methodological problems of field studies. American
Journal of Sociology, 67, 5-19.