Analysis & Reporting using Minitab, Prolink Charting, & Excel ...
145
Analysis & Reporting using Minitab, Prolink Charting, & Excel SPC Office Buddy ® Training Manual & Workbook Version 3.4.49
-
Upload
khangminh22 -
Category
Documents
-
view
0 -
download
0
Transcript of Analysis & Reporting using Minitab, Prolink Charting, & Excel ...
Analysis & Reporting using
Minitab, Prolink Charting, &
Excel
SPC Office Buddy®
Training
Manual & Workbook Version 3.4.49

Notices
This document was produced by Prolink Corporation, 148 Eastern Blvd, Glastonbury, CT 06033. Telephone: 860-659-5928 Fax: 860-633-7309 E-mail: [email protected]
Internet: http:// www.SPCOfficeBuddy.com
Warranty
Prolink, Inc. warrants that the software will operate according to the specifications
described in the software reference manual and be free from known defects in materials
or workmanship for a period of one year from the date of shipment. During this warranty
period, Prolink will, at its option, repair, replace or provide a work-around solution to any
items that prove to be defective. In order to qualify for such warranty service, a complete
description of the problem, with appropriate documentation (such as results, program
listing, sample part and program) should be forwarded to Prolink for our inspection. Such
items will be returned to the customer if requested. Prolink does not warrant that the
operation of the software will be uninterrupted or error-free. The information in this
manual is subject to change without notice.
THESE WARRANTIES AND PROLINK’S LIABILITY HEREUNDER, ARE THE SOLE AND EXCLUSIVE WARRANTIES AND ARE EXPRESSLY IN LIEU OF ALL OTHER WARRANTIES, EXPRESSED OR IMPLIED, INCLUDING THE IMPLIED WARRANTIES OF MERCHANTABILITY AND FITNESS FOR A PARTICULAR PURPOSE. IN NO EVENT SHALL PROLINK BE LIABLE FOR ANY DIRECT, INDIRECT, SPECIAL, CONSEQUENTIAL, INCIDENTAL OR OTHER DAMAGES INCLUDING, AND NOT BY WAY OF LIMITATION, LOSS OF PROFITS, AND WITHOUT REGARD TO THE FORM OF THE ACTION OR THE NATURE OF THE CLAIM WHICH IS MADE.
The information contained herein is based on the experience and knowledge relating to the subject matter
gained by Prolink, Inc. prior to publication.
No patent license is granted or implied by this information.
Prolink, Inc. reserves the right to change this information without notice and makes no warranty, express or
implied, with respect to this information. Prolink shall not be liable for any loss or damage, including
consequential or special damages, resulting from the use of this information, even if loss or damage is
caused by negligence or other fault on the part of Prolink, Inc.
Due to the nature of this material, a number of hardware and software products may be mentioned by name.
In most cases the companies that manufacture the products claim these product names as trademarks. It is
not our intent to claim these names or trademarks as our own.

Table of Contents
1. INTRODUCTION .................................................................................................................................... 1
1.1 THE SPC OFFICE BUDDY ...................................................................................................................... 1
1.2 WHAT IS THE DATA SOURCE ................................................................................................................. 1
1.3 HOW IS THE DATA ORGANIZED ............................................................................................................. 1
1.4 WHAT IF I DON’T HAVE A NETWORK ................................................................................................... 2
1.5 NETWORK CONFIGURATION .................................................................................................................. 2
2. SETUP ....................................................................................................................................................... 2
2.1 HOW DO I GET A COPY OF QC-CALC .................................................................................................. 2
3. THE BASICS ............................................................................................................................................ 3
3.1 THE DATA GRID .................................................................................................................................... 4
3.2 THE NOMINALS & TOLERANCES HEADER ............................................................................................. 4
4. RUNNING CHARTS ............................................................................................................................... 5
4.1 SUBGROUP SELECTION .......................................................................................................................... 6
4.1.1 Select a Subgroup Size .................................................................................................................. 6
4.1.2 Use Size from QCC File ................................................................................................................ 6
4.1.3 Subgroup Across Rows ................................................................................................................. 6
4.1.4 Stacked Columns ........................................................................................................................... 6
4.2 MINITAB NON-NORMAL DATA - VERSION 14 ......................................................................................... 7
4.2.1 Single-Sided Data is Non-Normal ................................................................................................ 7
4.2.2 Single-Sided Data is Normal ........................................................................................................ 7
4.2.3 Other SPC Charts ......................................................................................................................... 7
4.3 MINITAB NON-NORMAL DATA VERSION 16 OR HIGHER ......................................................................... 8
4.3.1 Single-Sided Data is Non-Normal ................................................................................................ 8
4.3.2 Identify the Fit ............................................................................................................................... 8
4.3.3 Run your Chart ............................................................................................................................. 8
4.3.4 Non-Normal Charts with Buddy ................................................................................................... 9
4.3.5 SPC Office Buddy Non-Normal Steps ......................................................................................... 10
5. FILTERING DATA ............................................................................................................................... 12
5.1 INTRODUCTION ................................................................................................................................... 12
5.2 DIMENSION FILTER ............................................................................................................................. 12
5.2.1 Introduction ................................................................................................................................ 12
5.2.2 Dimension Filter Explained ........................................................................................................ 12
5.3 RECORD FILTER .................................................................................................................................. 16
5.3.1 Introduction ................................................................................................................................ 16
5.3.2 Record Filter Details .................................................................................................................. 16
5.4 APPLYING BOTH DIMENSION AND RECORD FILTERS ........................................................................... 18
6. EXCEL JOBS ......................................................................................................................................... 20
6.1 INTRODUCTION ................................................................................................................................... 20
6.1.1 No Charts .................................................................................................................................... 20
6.1.2 Using Minitab Charts ................................................................................................................. 21
6.1.3 Using Prolink Charting .............................................................................................................. 21
6.2 LET’S GET STARTED ........................................................................................................................... 22
6.3 THE EXCEL JOB CONTROL PANEL ....................................................................................................... 22
6.4 SETUP THE EXCEL JOB ........................................................................................................................ 22
6.5 GETTING STARTED .............................................................................................................................. 23
6.6 ADD NEW JOB ..................................................................................................................................... 24
6.6.1 Step #1 ........................................................................................................................................ 24
6.6.2 Step #2 ........................................................................................................................................ 24
6.6.3 Step #3 ........................................................................................................................................ 26
6.6.4 Step #4 ........................................................................................................................................ 26
6.6.5 Step #5 ........................................................................................................................................ 29
6.6.6 Step #6 ........................................................................................................................................ 29
6.6.7 Run Job ....................................................................................................................................... 30

Table of Contents
6.7 SHOW ADVANCED ............................................................................................................................... 31
6.7.1 Locking Worksheets .................................................................................................................... 32
6.7.2 Running Macros .......................................................................................................................... 32
6.7.3 Macros with Parameters ............................................................................................................. 34
6.7.4 Dynamic Parameters .................................................................................................................. 34
6.7.5 Macros Tips ................................................................................................................................ 34
6.7.6 Using with QC-CALC ................................................................................................................. 34
6.8 UNDERSTANDING TAGS ...................................................................................................................... 34
6.9 REPORT ITEMS .................................................................................................................................... 36
6.9.1 Introduction ................................................................................................................................ 36
6.9.2 Report Item Categories ............................................................................................................... 36
6.9.3 Part Data .................................................................................................................................... 39
6.9.4 Auto Match Tag Names – Part Data ........................................................................................... 44
6.9.5 Numeric and Text Factors .......................................................................................................... 45
6.9.6 Auto Match Tag Names – Factors .............................................................................................. 48
6.9.7 Statistics ...................................................................................................................................... 49
6.9.8 Auto Match Tag Names – Statistics ............................................................................................ 50
6.10 UNDERSTANDING TAGS WITH PICTURES ........................................................................................... 52
6.10.1 Special {Column} Tag Variable ................................................................................................ 53
6.10.2 The {Row:x} Command ............................................................................................................. 54
6.10.3 Resizing Pictures Using Tags ................................................................................................... 55
6.10.4 Auto Match Tag Names – Charts .............................................................................................. 55
6.11 CONTROLLING DATA PLACEMENT .................................................................................................... 55
6.11.1 Special {Skip} Command .......................................................................................................... 55
6.11.2 The {Hop} Command ................................................................................................................ 56
6.11.3 The {Jump} Command .............................................................................................................. 58
6.11.4 The {Hop_Continue} Command ............................................................................................... 60
6.11.5 The {Jump_Continue} Command .............................................................................................. 63
6.11.6 The {Next} Command ............................................................................................................... 66
6.11.7 The {Current} Command .......................................................................................................... 66
6.11.8 The {Stop} Command ................................................................................................................ 67
6.11.9 Page Break Tag ........................................................................................................................ 67
6.12 GENERAL TIPS FOR EXCEL JOB ......................................................................................................... 72
6.13 WORKBOOK AND SHEET CONSIDERATIONS ....................................................................................... 72
7. BATCH JOBS ......................................................................................................................................... 74
7.1 INTRODUCTION ................................................................................................................................... 74
7.2 BATCH JOB CONCEPT .......................................................................................................................... 74
7.3 RUNNING MULTI-JOB EXAMPLE ......................................................................................................... 75
7.3.1 The Master Template – Make the Template ................................................................................ 75
7.3.2 The Second Template .................................................................................................................. 76
7.3.3 The Related Excel Job ................................................................................................................. 77
7.3.4 The Final Report ......................................................................................................................... 78
7.3.5 The Related Excel Job ................................................................................................................. 79
7.4 CREATE THE BATCH JOB ..................................................................................................................... 80
7.4.1 Ask Parameters ........................................................................................................................... 83
7.4.2 Batch Job Options ....................................................................................................................... 84
7.5 RUN THE BATCH JOB ........................................................................................................................... 85
8. RUNNING JOBS FROM WINDOWS ................................................................................................. 86
8.1 RUNNING BATCH JOBS FROM WINDOWS ............................................................................................. 86
8.1.1 Introduction ................................................................................................................................ 86
8.1.2 Command Line Structure ............................................................................................................ 86
8.1.3 Make the Batch File .................................................................................................................... 86
8.1.4 Run the File ................................................................................................................................. 86
8.2 RUNNING EXCEL JOBS FROM WINDOWS ............................................................................................. 87
8.2.1 Introduction ................................................................................................................................ 87
8.2.2 Command Line Structure ............................................................................................................ 87
8.2.3 Make the Batch File .................................................................................................................... 88

Table of Contents
8.2.4 Run the File ................................................................................................................................. 88
8.2.5 Dynamic Filtering with Ask Filters ............................................................................................. 88
8.2.6 Scheduled Tasks .......................................................................................................................... 89
8.2.7 Tips and Troubleshooting ........................................................................................................... 90
9. ADVANCED TOPICS ........................................................................................................................... 91
9.1 EXPORTING & IMPORTING EXCEL JOBS ............................................................................................... 91
9.1.1 Exporting Excel Jobs .................................................................................................................. 91
9.1.2 Importing Excel Jobs .................................................................................................................. 91
9.2 ADVANCED RECORD FILTER ............................................................................................................... 93
9.2.1 Criteria Field Explained ............................................................................................................. 93
9.2.2 “Filter On” Explained ................................................................................................................ 93
9.2.3 Filter Examples: ......................................................................................................................... 95
10. FILE MENU ......................................................................................................................................... 97
10.1 OPEN QC-CALC DATABASE ............................................................................................................ 97
10.2 EXIT .................................................................................................................................................. 97
11. VIEW MENU ........................................................................................................................................ 97
11.1 INTRODUCTION ................................................................................................................................. 97
11.2 BATCH JOBS ...................................................................................................................................... 97
11.3 EXCEL JOBS ...................................................................................................................................... 98
11.4 RECORD FILTER ................................................................................................................................ 98
11.5 DIMENSION FILTER ........................................................................................................................... 98
11.6 TOOLBAR .......................................................................................................................................... 98
11.7 STATUS BAR ..................................................................................................................................... 99
11.8 SHOW TOLERANCES .......................................................................................................................... 99
11.9 SHOW SPECIFICATIONS ..................................................................................................................... 99
11.10 AUTO REFRESH ............................................................................................................................... 99
11.11 REFRESH ......................................................................................................................................... 99
12. STATS MENU .....................................................................................................................................100
12.1 MINITAB CHARTS .............................................................................................................................100
12.2 PROLINK CHARTING OPTION ............................................................................................................100
12.3 BASIC STATISTICS ............................................................................................................................101
12.3.1 One Sample T ...........................................................................................................................101
12.3.2 Two Sample T ..........................................................................................................................101
12.4 VARIABLE CHARTS FOR SUBGROUPS ...............................................................................................102
12.4.1 Making Minitab Equivalent to Prolink Charting .....................................................................102
12.4.2 Xbar-R .....................................................................................................................................103
12.4.3 Xbar-S ......................................................................................................................................104
12.4.4 I-MR-R/S (Between/Within) .....................................................................................................105
12.4.5 Individuals chart: .....................................................................................................................106
12.4.6 Moving range chart: ................................................................................................................106
12.4.7 R chart or S chart: ...................................................................................................................106
12.4.8 Xbar .........................................................................................................................................107
12.4.9 Range .......................................................................................................................................108
12.4.10 Sigma .....................................................................................................................................109
12.4.11 Zone .......................................................................................................................................110
12.5 VARIABLE CHARTS FOR INDIVIDUALS ..............................................................................................111
12.5.1 I-MR .........................................................................................................................................112
12.5.2 Individuals ...............................................................................................................................113
12.5.3 Moving Range ..........................................................................................................................114
12.6 QUALITY TOOLS...............................................................................................................................115
12.6.1 Individual Distribution Identification ......................................................................................116
12.6.2 Run Chart.................................................................................................................................117
12.6.3 Capability Analysis (normal) ...................................................................................................118
12.6.4 Capability Analysis (non-normal) ............................................................................................119
12.6.5 Capability Sixpack ...................................................................................................................120

Table of Contents
12.6.6 Raw Data (True Position) Charts (2D) ....................................................................................121
12.6.7 True Position Charts (3D) .......................................................................................................122
12.6.8 Gage R&R Study ......................................................................................................................123
12.7 GAGE R&R USING EXCEL JOBS - MINITAB ......................................................................................124
12.8 GAGE R&R USING EXCEL JOBS – PROLINK CHARTING ....................................................................125
13. EXPORT MENU .................................................................................................................................126
13.1 QUICK EXPORT ................................................................................................................................126
13.2 EXPORT TO .. ....................................................................................................................................126
13.2.1 Export Type ..............................................................................................................................126
13.2.2 Records ....................................................................................................................................127
13.2.3 Dimensions ..............................................................................................................................127
13.2.4 Options .....................................................................................................................................127
14. TOOLS – OPTIONS MENU ..............................................................................................................128
14.1 CHART SETTINGS .............................................................................................................................128
14.1.1 Chart Tool ................................................................................................................................128
14.1.2 Install Path...............................................................................................................................128
14.1.3 Show True Position for Raw Data Chart .................................................................................128
14.1.4 Deleted Data Options ..............................................................................................................129
14.1.5 Data Options ............................................................................................................................129
14.1.6 Process Capability/Sixpack Options ........................................................................................130
14.1.7 Gage R&R (Nested) Options ....................................................................................................130
14.1.8 1 & 2 Sample T Options ...........................................................................................................131
14.2 NON-NORMAL DATA .......................................................................................................................131
14.3 EMAIL ..............................................................................................................................................132
14.3.1 Using Prolink Mail Server .......................................................................................................132
14.3.2 Sender Name ............................................................................................................................132
14.3.3 Sender E-Mail ..........................................................................................................................132
14.3.4 Using Your Mail Server ...........................................................................................................132
14.4 EXCEL JOBS .....................................................................................................................................132
14.4.1 Excel Jobs Folder ....................................................................................................................133
14.4.2 Default Template Folder ..........................................................................................................133
14.4.3 Default Report Folder ..............................................................................................................133
14.4.4 Other Options ..........................................................................................................................134
14.5 GLOBAL SETTINGS ...........................................................................................................................135
14.5.1 Language .................................................................................................................................135
14.5.2 Application Themes..................................................................................................................135
14.5.3 Assignable Cause/Corrective Action Paths .............................................................................135
14.5.4 Filter Settings ...........................................................................................................................135
14.6 UPDATE ............................................................................................................................................136
14.6.1 Specify when to look for and run new updates .........................................................................136
14.6.2 Update Patch Location ............................................................................................................136
14.6.3 Run Update without User Interaction ......................................................................................137
15. HELP MENU .......................................................................................................................................138
15.1 RUN UPDATE ....................................................................................................................................138
15.2 LICENSE CONFIGURATION ................................................................................................................138
15.2.1 Computer ID ............................................................................................................................138
15.2.2 Activation Code .......................................................................................................................139
15.2.1 Use PLS ...................................................................................................................................139
15.2.2 Kill License ..............................................................................................................................139

Introduction
SPC Office Buddy Page 1
1. Introduction
1.1 The SPC Office Buddy SPC Office Buddy (referred to as Buddy throughout the remainder of this document) is a Windows software program that provides a fast and easy method of moving CMM and gage inspection results directly into Minitab
®, JMP
®, and
Prolink Charting Statistical Software. In addition, data can be exported directly into Excel 97, Excel 2003, Excel 2007 & Excel 2010. Buddy displays your data as a grid of numbers that you filter by both rows (records) and columns (dimensions). After you reduce the raw data to the items you want to analyze, Buddy can export the data to Minitab and/or directly run selected Minitab reports for you. Likewise, the JMP export can be automated using any valid JSL (JMP Scripting Language) commands. This saves an enormous amount of typing since all nominal and tolerance data is automatically sent to the report. If you do not own these software products you can use our built-in graphing package called Prolink Charting.
1.2 What is the Data Source Currently, the source of inspection data is QC-CALC Real-Time. QC-CALC was written to read data directly from CMMs, Vision CMMs, and gages. QC-CALC Real-Time runs in your CMM and saves all inspection results to one common format known as .QCC files. For purposes of discussion, we will use the word CMM to imply the source of all inspection results.
1.3 How is the Data Organized Buddy was written to run in the same computer as your Minitab, JMP, or Excel software. This is usually located in your office, hence the name SPC Office Buddy. This combination of running QC-CALC Real-Time in your CMM and Buddy in your office PC creates a complete solution. You are able to obtain and analyze inspection results in Minitab without having to type any numbers. This speeds up the analysis process to near real-time.
If you are a current user of QC-CALC Real-Time and Minitab, JMP, or Excel you will immediately gain from this valuable program. The installation of software contains a sample QCC file for you to practice with and is referenced throughout this document.

Introduction
SPC Office Buddy Page 2
1.4 What If I Don’t Have a Network If your CMM is not connected to a network you will have to copy the QC-CALC files to a memory stick or floppy disk. This is sometimes referred to as a “Sneaker Net” since you must move the data manually which involves walking. This is still a much better solution than retyping raw data into Excel and importing it into Minitab. Simply copy the QC-CALC files of interest. All QC-CALC files have a file extension of .QCC.
1.5 Network Configuration Since CMMs are usually located in an inspection room the inspection results are not readily available unless you are saving your results to a shared network server. By default, QC-CALC Real-Time saves data on the C: drive of the CMM PC as parts are measured. Since the shop floor can be a dangerous place, it is usually recommended that you save QC-CALC data on a network drive. This way, data is collected on the shop floor but is saved to a company file server on the network that is backed up nightly and can be recovered in the event of hardware failure. Also, following this suggestion makes the data available for other network applications such as QC-CALC SPC or SPC Office Buddy.
2. Setup SPC Office Buddy is distributed via the Internet and must be installed in your Windows PC using the standard SETUP.EXE program. Perform the following steps:
1. Install SPC Office Buddy. 2. The following screen is displayed on the first run.
3. If you purchased the software, click the Activate Software button otherwise, click the Begin Evaluation button. NOTE: You may activate your software at any time.
4. SAMPLE.QCC is loaded for you and displayed in the grid. 5. You are now ready to begin a quick demonstration of the Buddy software
using the sample file. If you already own QC-CALC you can begin exporting your own data to Excel and/or Minitab immediately.
2.1 How Do I Get a Copy of QC-CALC If you do not own a copy of QC-CALC you can download a copy for free and try it for 30-days. Visit the Downloads page of our website at:
www.ProlinkSoftware.com
If you have a Prolink account you must login to download. If you do not have an account, you can create one instantly by entering an email address and password. Don’t forget to download the CMM manual so you can obtain the simple QC-CALC instructions to ensure successfully data collection with your particular CMM or Gage.

The Basics
SPC Office Buddy Page 3
3. The Basics Before getting into the details about this software product, let’s quickly cover the basics. Double click the SPC Office Buddy icon on your desktop to start the program. On first launch the SAMPLE.QCC data file is opened for you so you have some data to use for this simple demonstration. A screen similar to the one shown below contains several areas of interest.
• The Data Grid pg. 4
• The Nominals & Tolerances Header pg. 4
• Excel Jobs pg. 20
• Batch Jobs pg. 74
• Record Filter pg. 16
• Dimension Filter pg. 12
• File Menu pg. 97
• Toolbar pg. 98

The Basics
SPC Office Buddy Page 4
3.1 The Data Grid This grid contains the data of the QC-CALC file you opened. In this example, we opened our demonstration file called SAMPLE.QCC as shown in the title bar at the top of the screen. The amount of data displayed can be too much and should be filtered to a reasonable amount. The filters are discussed in detail in the Record Filter (page 16) and Dimension Filter (page 12) sections.
3.2 The Nominals & Tolerances Header Should you need to reference the nominals & tolerances of the dimensions, they can be shown above each column. QC-CALC Real-Time automatically obtained the nominal and tolerance information from your part program and Buddy displays the values in a multi-line header. Remember, a row of data is one part and a column is one dimension (feature).
Columns with Tolerances
Columns with Specifications
Columns with Tolerances and Specs
When you perform any of the Minitab analysis reports, Buddy sends the nominal and tolerance information directly to the Minitab report you choose. To select what is displayed in this header, choose the View – Tolerances menu and/or the View – Specifications menu. The grid header can contain:
• Dimension Labels, Nominals, and Specifications
• Dimension Labels, Nominals, and Tolerances
• Dimension Labels, Nominals, Tolerances, and Specifications
• Just Dimension Labels If both are chosen you see 5 lines of values. Tolerances and Specification Limits are displayed above each column to save you the time of looking up and entry during Minitab analyses.

Running Charts
SPC Office Buddy Page 5
4. Running Charts Now that you’ve learned how to open QC-CALC files and the general layout of the software you are ready to create some SPC charts. 1. Start by selecting data using the
mouse. Here we selected 18-rows and 3-columns in the data area that we wish to send to Minitab. It is required that Minitab be installed in this PC in order to launch and send the necessary commands and data to it. If you do not wish to use Minitab, you can always select “Prolink Charting” as the Chart Tool in the Chart Settings area of the Tools – Options menu.
2. Once you have the data you want
plotted, simply select the Stats – Capability Composite Chart (or Capability Sixpack) menu as shown. Note: This menu text changes to Capability Sixpack if you are using Minitab. This is the same for any other chart but for this demonstration we’ll use the Sixpack Chart.
Note: The True Position chart is only available using Prolink Charts. Likewise for the 3D True Position chart. Please see Raw Data (True Position) Charts (2D) and True Position Charts on page 121 & 122 for a full description.
3. Next the Data Range box is displayed asking you to verify your data selection before the charts are run in Minitab or Prolink Charting. When you click OK Buddy sends the data and commands to the charting package and executes your desired charts. Sort Dimensions gives you the ability to control the order the dimensions appear in in your reports. Ascending order will always be used, but you can choose different items to sort on in the list. Stack Columns allows you to join columns together into one set of numbers having the same magnitude. See Stacked Columns on page 6 for

Running Charts
SPC Office Buddy Page 6
more details. Removing outliers rids the data of any numbers exceeding 3-sigma. This processes in successive rounds until no more outliers are found and is only available when using Prolink Charting.
You will see your charting package launch, the data inserted, and the charts plotted. Once the charts are complete your charting package is left onscreen.
4.1 Subgroup Selection If you select a chart requiring a Subgroup Size, you have several options available. You can manually select a subgroup from 1 to 15, use QC-CALC’s current Subgroup Size, or subgroup across rows.
4.1.1 Select a Subgroup Size
You can manual select the subgroup size before the report is printed by choosing from a list of 1 through 15.
4.1.2 Use Size from QCC File
Each QC-CALC file has a Subgroup Size setting within the file. Choosing this option simply passes the QC-CALC value through to your charting package. There are 2 Subgroup Sizes for each QC-CALC file.
• Real-Time – used during data collection
• SPC – used during analysis in SPC
This option uses the SPC Subgroup Size and the Real-Time Subgroup Size is ignored.
4.1.3 Subgroup Across Rows
This option allows you to subgroup across columns such as Minitab C1, C2, & C3. You must select a matching set of columns for the Subgroup Size. For example, if your Subgroup Size is 3, highlight the 3 columns and the appropriate number of rows and your single chart is generated. In this example our subgroup size is 3 because we selected 3 columns of 12 rows and then chose Subgroup Across Rows. Each number in row 1, column 1, 2, & 3 is
subgrouped before moving to row 2. This yields a total of 12 subgroups of 3. It should be clear that the Subgroup Size is driven by the number of columns selected.
4.1.4 Stacked Columns
If you have several features that have the same nominal and tolerances and wish to join them together instead of subgrouping across rows, you can check the Stack Columns box. This same option in QC-CALC is known as Group Dimensions. Performing an I-MR chart on the above diagram would yield 36 points on one chart (rather than 3 charts with 12 points each). To picture it, picture the columns literally being stacked on top of each other forming one column. This checkbox is not remembered to ensure you do not accidentally forget to turn it off between runs.

Running Charts
SPC Office Buddy Page 7
4.2 Minitab Non-normal data - version 14
4.2.1 Single-Sided Data is Non-Normal
When Buddy commands Minitab to create a process capability or Sixpack chart, it adds additional information when a feature has a single-sided tolerance. This occurs with items such as True Position, Flatness, Perpendicularity, etc. In most cases single-sided data is considered non-normal so Buddy commands Minitab to apply a Johnson Transformation before charting. Since you normally set a boundary when all data falls on one side of nominal, Buddy also commands Minitab to set the boundary for you. For more details see Process Capability/Sixpack Options on page 130. Note: As of Minitab 16 the method of transforming your data has changed. Please see Minitab non-normal data version 16 or Higher on page 8 for an explanation.
The resultant chart has text added indicating the data has been transformed so the numbers will appear different than the raw data you might expect to see.
4.2.2 Single-Sided Data is Normal
Occasionally, single-sided data appears normally distributed. When this occurs, Minitab shows a warning notice that the transformation will not be performed in its Session window as shown below. Just be aware that Buddy attempted to enforce a transform but Minitab overrode this command.
At this writing, Buddy only supports the Johnson Transform.
4.2.3 Other SPC Charts
All other charts found in the Stats menu operate the same as the Sixpack but have differing output results.

Running Charts
SPC Office Buddy Page 8
4.3 Minitab non-normal data version 16 or Higher
4.3.1 Single-Sided Data is Non-Normal
When Buddy commands Minitab to create a non-Normal Process Capability or Sixpack chart, it needs to know which transform to use. Typically, you identify the distribution to use and then command Minitab to perform non-normal Sixpack and select your transform. This action is shown below where we selected Weibull and entered the appropriate details.
4.3.2 Identify the Fit
The problem we face is identifying the distribution to use. Fortunately, Minitab provides a quick method to identify the distribution by selecting the Stats – Quality Tools – Individual Distribution Identification. The results of the Goodness of Fit Test are found in Minitab’s Session window similar to the list shown below. You typically use the transform with the highest P value. In this example, the Box Cox Transform would be used.
Goodness of Fit Test Distribution AD P LRT P Normal 0.455 0.240 Box-Cox Transformation 0.320 0.509 Lognormal 0.431 0.277 3-Parameter Lognormal 0.469 * 0.991 Exponential 1.235 0.058 2-Parameter Exponential 0.453 >0.250 0.006 Weibull 0.323 >0.250 3-Parameter Weibull 0.330 >0.500 0.326 Smallest Extreme Value 0.721 0.051 Largest Extreme Value 0.418 >0.250 Gamma 0.356 >0.250 3-Parameter Gamma 0.356 * 1.000 Logistic 0.463 0.203 Loglogistic 0.452 0.216 3-Parameter Loglogistic 0.523 * 0.716
4.3.3 Run your Chart
Now that Minitab has helped you identify the best fit, you re-run your non-normal SixPack but this time select the correct (best) fit. It should be obvious this is a two-step process and can be time consuming if many dimensions are being analyzed. The next paragraph explains how to automate these two steps.

Running Charts
SPC Office Buddy Page 9
4.3.4 Non-Normal Charts with Buddy
SPC Office Buddy was designed to save you time so dealing with non-normal data should be no exception. The two step process just discussed can be performed quickly using Buddy but more discussion is needed. There are four possible normality situations for Buddy to handle based on the feature tolerance type and data’s normality:
Tolerance Type Normality Action to Take
Bilateral Data Is already normal Run the process chart
Bilateral Data is NOT normal Check for best fit, run chart
Single Side Data is already normal Run the process chart
Single Side Data is NOT normal Check for best fit, run chart
Buddy knows everything about each QC-CALC feature including the tolerance type and automatically runs the Minitab Goodness-of-Fit test for you. Based on your selection Buddy will choose the transform with the highest P-value for you and run the chart. However, you can override Buddy’s choice by adjusting the options in the Tools – Options – Non-Normal Data area.
Check bilateral dimensions and use rules below
Typically the transformation of non-normal data applies to single-sided dimensions, but with this option non-normal dimensions that are bilateral can follow the same rules set up for the single-sided dimensions.
Ignore normality results when using Prolink Charting
With this option, the capability calculations (like Cpk) will be calculated by Prolink Charting even if the data is determined to be non-normal.
• If you choose Run with a normal distribution a normal Sixpack will be run regardless of the normality of the data being used.
• If you choose the Run a Johnson Transform option Buddy will run the same as it did in Minitab version 14. In other words if the data needs to be transformed, Minitab will do it for you otherwise it won’t. This is the default setting.
• If you choose Fit to a Distribution Buddy will command Minitab to test each dimension against all selected transforms. It will record all of the P-

Running Charts
SPC Office Buddy Page 10
value results from Minitab and prepare the chart for you using the highest P-value transform. Buddy will Choose the Correct Distribution if you select Automatically By Taking The Highest P-Value. Uncheck the transforms that do not apply to your company’s SPC standards.
• You can slow the process down a bit and choose a transform for each dimension if you select “By presenting me with a list of available choices”. Buddy will stop and ask you which transform to use for each dimension requiring you to review the P-values manually.
• The default setting for Buddy is to assume the data of bilateral features is normally distributed. This is the quickest method of running Minitab charts. However, it may be wrong. By selecting Check bilateral dimensions and use rules below, Buddy will check the normality of each bilateral dimension before running the process chart. If the data is found to be normal, Minitab is commanded to run the Normal Process chart. Otherwise, it is command to run the Non-Normal chart with the added transform.
A checkbox in the Chart Settings screen is used to treat bilateral dimensions as single sided if the USL or LSL is zero. If Omit specs for SSL/SSU or when zero is checked then Buddy omits the zero (when one of the spec limits = 0) which should calculate a higher Cpk.
All single sided dimensions are checked for normality now (even single sided dimensions that are assumed to be non-normal). If the data is normally distributed, then it runs the Capability Analysis or Sixpack using the normal chart. In conclusion if you turn on distributions, Buddy checks all single sided for normality and runs the best fit distribution for those that are non-normal. If you also check the "bilateral checkbox", it will check all dimensions for normality. Any dimension found to be non-normal causes the best fit distribution to be run. The ones that are normal run normally.
4.3.5 SPC Office Buddy Non-Normal Steps
• Select Tools – Options – Non-Normal Data and decide how you want Buddy to act on all single-sided dimensions. Remember to “de-select” the transforms you do not want to use.

Running Charts
SPC Office Buddy Page 11
• Select which dimensions you wish to analyze. This screen shows 6 true position dimensions selected.
• Next, choose the chart you desire such as the Six Pack or Capability Analysis report. The chart is run.
• Note: you’ll see Minitab flash twice; once for the transform analysis and once for running the charts. After the first Minitab run Buddy records the best fit for each dimension. Buddy uses the best fit on the second run by commanding Minitab to use what it found.
• Notice how the Weibull Distribution Model was chosen and listed and the top of the page.
HINT: There was an additional Stats menu added to Buddy labeled Individual Distribution Identification which exists in Minitab as well. You can use this option to test your data without going to Minitab. Buddy will do it for you. When Minitab is complete, just scroll through Minitab’s Session window to see the P-Test results.

Filtering – Dimensions
SPC Office Buddy Page 12
5. Filtering Data
5.1 Introduction Buddy can reduce the amount of data you send to your charting package by removing rows (parts) or removing columns (dimensions) or both. Collectively this is known as filtering the data. Reducing the number of dimensions is useful to show only the critical or important dimensions thereby creating less confusion. By reducing the number of records (parts) you can separate parts made by the same machine, cavity, operator, etc. This session discusses the methods of reducing data so you can quickly identify the source of any problems..
5.2 Dimension Filter
5.2.1 Introduction
The Dimension filter is used to reduce the number of columns shown in the grid. When you request a report each column displayed will create a separate chart. Be sure you reduce the columns to just the dimensions of interest. In our example we will create a filter where the labels of each column contain an X. This reduces the columns to three.
Before getting into the fine details, let’s generate some success by sending our data to Minitab with minimal details. You will begin to understand the software operation by these simple examples.
Dimension Filter Example
Using the SAMPLE file shipped with Buddy, create a Minitab Capability Analysis report for all dimensions whose label contains the letter x. Use all data found in the rows.
1. Be sure both the Record Filter and Dimension Filter areas are both showing by selecting View – Record Filter and View – Dimension Filter.
2. In the Dimension Filter area, click on the words (Containing Text) and type the letter X (either upper or lower case). Click OK.
3. Now give the filter a name of All My X’s. 4. Your new filter is saved and displayed in the list. 5. Click on your All My X’s filter to select it. In this case it is already
selected because you just created the filter. 6. The columns are reduced to 3 columns of numbers since only 3 of the 20
columns contain the letter x in their label. 7. Now select Stats – Capability Analysis. 8. The final step before data is sent to Minitab is to decide on a range of
your data. A form appears to allow you a final choice. 9. Minitab is loaded, the data is transferred, and the charts are displayed.
5.2.2 Dimension Filter Explained
To reduce the number of dimensions shown in the grid Buddy uses the concept of a dimension filter. This is a manual operation where a list of your dimensions is displayed and you highlight the ones you want to see. When you are inspecting parts on your CMM QC-CALC Real-Time automatically saves your data with all dimensions selected by default. Buddy uses this same filter so there may be more dimensions listed than you want.
Filtering – Dimensions
SPC Office Buddy Page 13
There are two types of dimension filters to choose from. They are:
• Containing Text Filter
• List Filter
The List filter is a static list of dimensions to choose from while the Containing Text filter is dynamic. The difference between the two is the static list of dimensions is selected by you and does not change across files while the Containing Text filter changes each time you open a different file. In other words, if you want Buddy to display all dimension labels that contain the letters TP no matter where they are positioned in the list, use the Containing Text.
Using the Containing Text Filter
This special filter allows you to select the dimensions where the label contains a particular set of text characters. For example, let’s assume your dimension labels for all true position dimensions always end with the letters “TP“ or maybe you use “PC” for all process critical dimensions. If this is the case, you can quickly create global dimension filters for all parts using the Containing Text option.
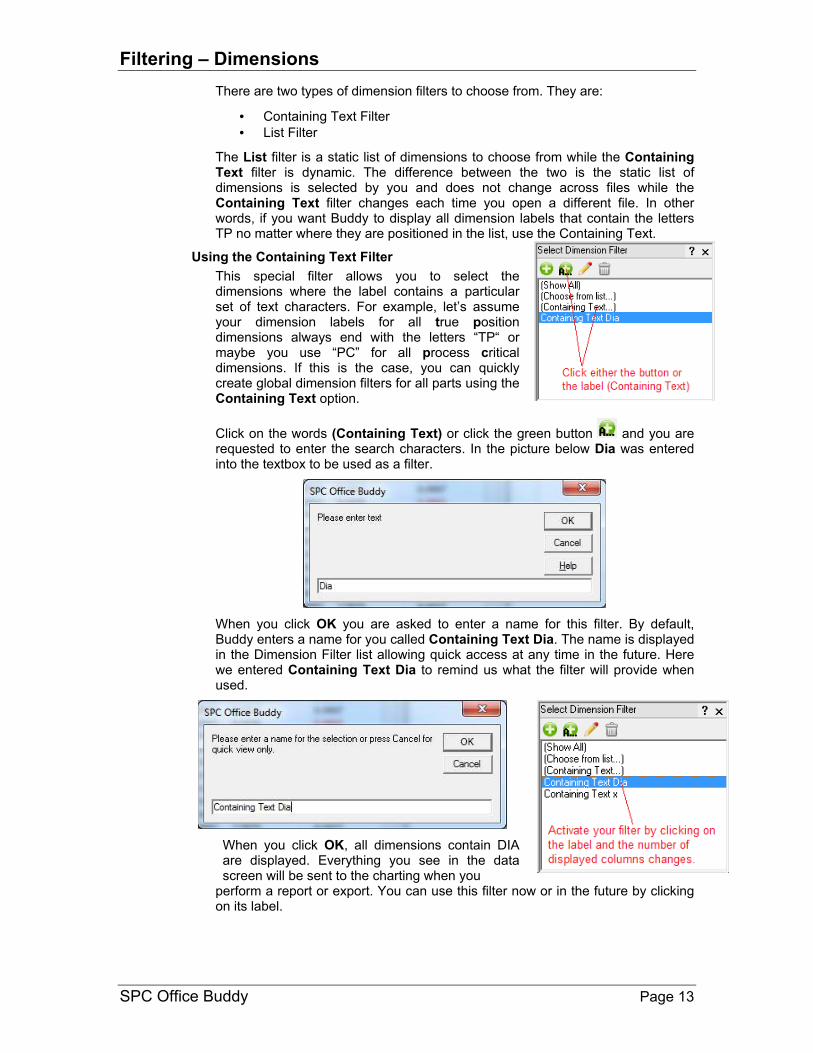
Click on the words (Containing Text) or click the green button and you are requested to enter the search characters. In the picture below Dia was entered into the textbox to be used as a filter.
When you click OK you are asked to enter a name for this filter. By default, Buddy enters a name for you called Containing Text Dia. The name is displayed in the Dimension Filter list allowing quick access at any time in the future. Here we entered Containing Text Dia to remind us what the filter will provide when used.
When you click OK, all dimensions contain DIA are displayed. Everything you see in the data screen will be sent to the charting when you
perform a report or export. You can use this filter now or in the future by clicking on its label.

Filtering – Dimensions
SPC Office Buddy Page 14
The List Filter
To create a List Filter for dimension selection we must first display the Dimension Filter window by clicking the View – Dimension Filter menu. The dimension filter is now shown on the left side of the Buddy window. Click on (Choose From List)
or click the green and dimension selector is displayed. The diagram below / left show all 20 dimensions selected while the same list on the right diagram shows only 3 of the 20 selected. Clicking OK immediately reduces the visible columns thereby “deselecting” the unwanted dimensions.
All Dimension Selected Selected Dimensions
Save Custom Selection by Name
After selecting which dimensions you wish to view, the selection can be saved by name. First select your dimensions then click the Save As button. You are then asked for a name for this selection and clicking OK saves your name in the list of Dimension Filters. In the future you can recall any selection quickly by choosing the name from the list.
In this example we chose a name of Critical Dimensions so at any time we can view just the important dimensions. You could make a list called My Diameters if you wanted to reduce the screen to all hole diameters on the part, etc.

Filtering – Dimensions
SPC Office Buddy Page 15
Advanced Selection
There are times you have too many dimensions to filter and need tools to make the job easier. Pressing the Advanced button on the Dimension Selector window provides a search capability to speed up the process.
For example, suppose you have 200 dimensions in a QC-CALC file and you want to quickly find all dimensions that have an X in the label. Using the Advanced Dimension Selection screen, type your text in the Find window and the list in the left panel highlights the matching dimensions. Here we typed an X and just the dimension labels containing an X are highlighted. The large right arrow is enabled allowing you to move your selection to the Selected Dimensions area.
Now you can start over with a new search for dimensions in the left panel and add new results to your list. Click OK when you are done and optionally give your selection a name. TIP: You can move dimensions back and forth by highlighting items in both sides and click the appropriate arrow. You can press and hold the CTRL key to highlight / un-highlight selected dimensions by clicking the mouse on the dimensions of interest.

Filtering Data
SPC Office Buddy Page 16
5.3 Record Filter
5.3.1 Introduction
The record filter is used to reduce the number of rows shown in the grid. When a report is requested, all numbers in the grid are sent to the charting package. Be sure to filter out the records you do not want analyzed. You can filter on date / time / record numbers / trace fields, etc. The record filter is completely described in the next section. For this example we will use all available data by selecting Show All (100 records).
The top of the list contains any predefined filters that are not editable. These predefined filters will be shown in parentheses to show they are not editable. The Show All selection removes any active filter.
5.3.2 Record Filter Details
When you click the Add New button the record filter editor is displayed. To create a new filter enter a name in the Add New Filter Name area shown in the upper left corner and click the Add >> button.
Entering Maximum Number of Records
Once you have a filter name you can change the Maximum Number of Records to Return. This number applies only when this specific filter is in used and can be no larger than the maximum number of records allowed in the database (2,000,000). If you know your subgroup is 3 and you want the latest 100 subgroups analyzed, set this number to 300. If you uncheck the Max records to return option, the filtering will return all records found. In addition, you can use the default set on the Tools – Options – Global screen by clicking the Global Default button.
Entering Criteria
In the middle of the filter editor is the Criteria frame where your filter is created and edited. The choices you make for the items in this frame affect the data you see and any reports you run. The Filter On list contains all the possible types of information Buddy uses as a filter. From the Select Filter to Edit list pick the filter name you want to edit. Clicking
the button adds new criteria to the end of the filter and the button

Filtering Data
SPC Office Buddy Page 17
removes the currently selected criteria from the list. You can use the and buttons to move a criteria up and down respectively to change the selection process of the filter.
Filter Criteria
The design of the filter criteria is setup to create a “man readable” sentence as the filter. As you select the fields in this row think about what the sentence is saying and the filter technique should be clear. For example, it should be obvious what you are trying to obtain when the filter reads:
Lot is between 22 and 23 Date only is = TODAY Cavity is = 3 Operator is Not = Bruce
Save the Filter
Once your filter(s) are complete, click the OK button and the filter is saved and displayed in the list. Click on the filter and it immediately reduces the data to only the data that matches your criteria.
Edit an Existing Filter
To edit an existing filter, select the filter’s name from the Select Filter to Edit area and edit the filter contents in the Criteria frame. Once you have modified your filter, click OK and your changes are saved.
Deleting a Filter
Just to the right of the Select Filter to Edit list is the Delete Filter button. Clicking this button removes the currently selected filter from the list. A dialog box is displayed asking you to verify your choice. The record filters are very capable and the detailed operation must be discussed. The Advanced Record Filter section on page 93 details the use of these filters.

Filtering Data
SPC Office Buddy Page 18
5.4 Applying Both Dimension and Record Filters The next three diagrams show the progressive reduction of data to just the details we want. Diagram 1 shows all data which in this example is 100 records of 20 dimensions.
Next, we clicked on the Cavity 1 filter and the number of rows is reduced to just seven. Many records are not included as depicted by the missing record numbers in column 1.

Filtering Data
SPC Office Buddy Page 19
Lastly, we click on the dimension filter labeled Containing Text x which reduces the columns to three. This is the data we want to send to Minitab.
Excel Jobs
SPC Office Buddy Page 20
6. Excel Jobs
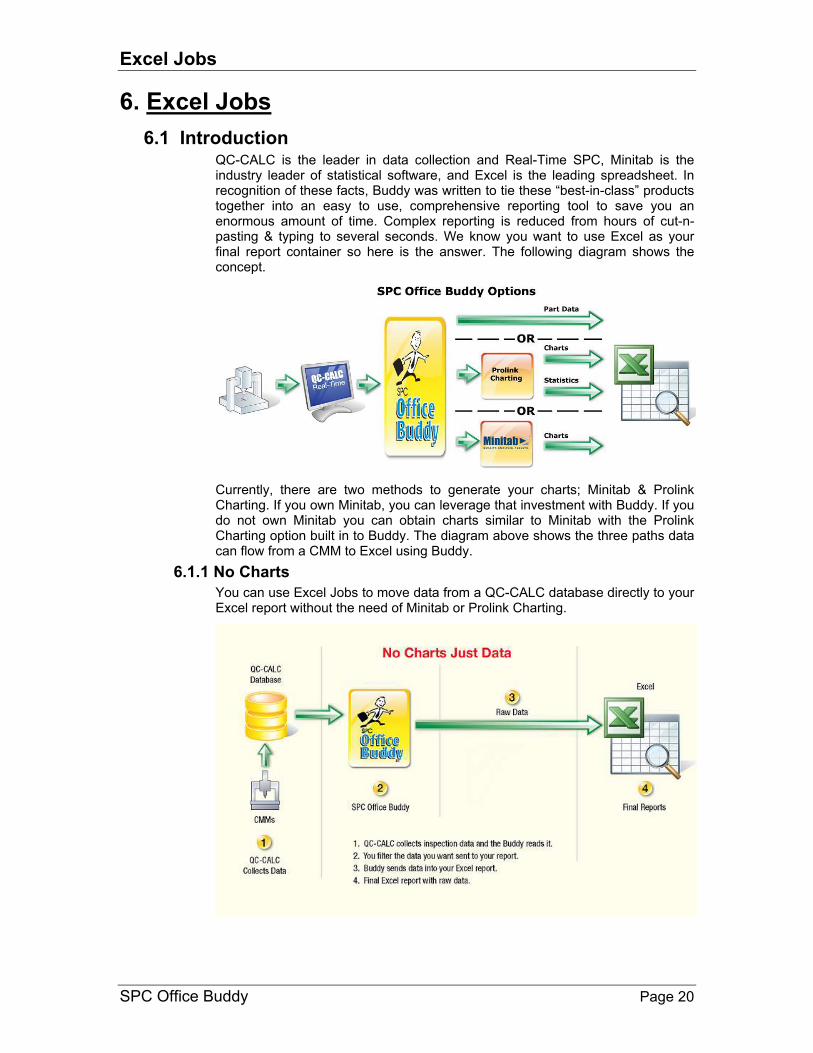
6.1 Introduction QC-CALC is the leader in data collection and Real-Time SPC, Minitab is the industry leader of statistical software, and Excel is the leading spreadsheet. In recognition of these facts, Buddy was written to tie these “best-in-class” products together into an easy to use, comprehensive reporting tool to save you an enormous amount of time. Complex reporting is reduced from hours of cut-n-pasting & typing to several seconds. We know you want to use Excel as your final report container so here is the answer. The following diagram shows the concept.
Currently, there are two methods to generate your charts; Minitab & Prolink Charting. If you own Minitab, you can leverage that investment with Buddy. If you do not own Minitab you can obtain charts similar to Minitab with the Prolink Charting option built in to Buddy. The diagram above shows the three paths data can flow from a CMM to Excel using Buddy.
6.1.1 No Charts
You can use Excel Jobs to move data from a QC-CALC database directly to your Excel report without the need of Minitab or Prolink Charting.
Excel Jobs
SPC Office Buddy Page 21
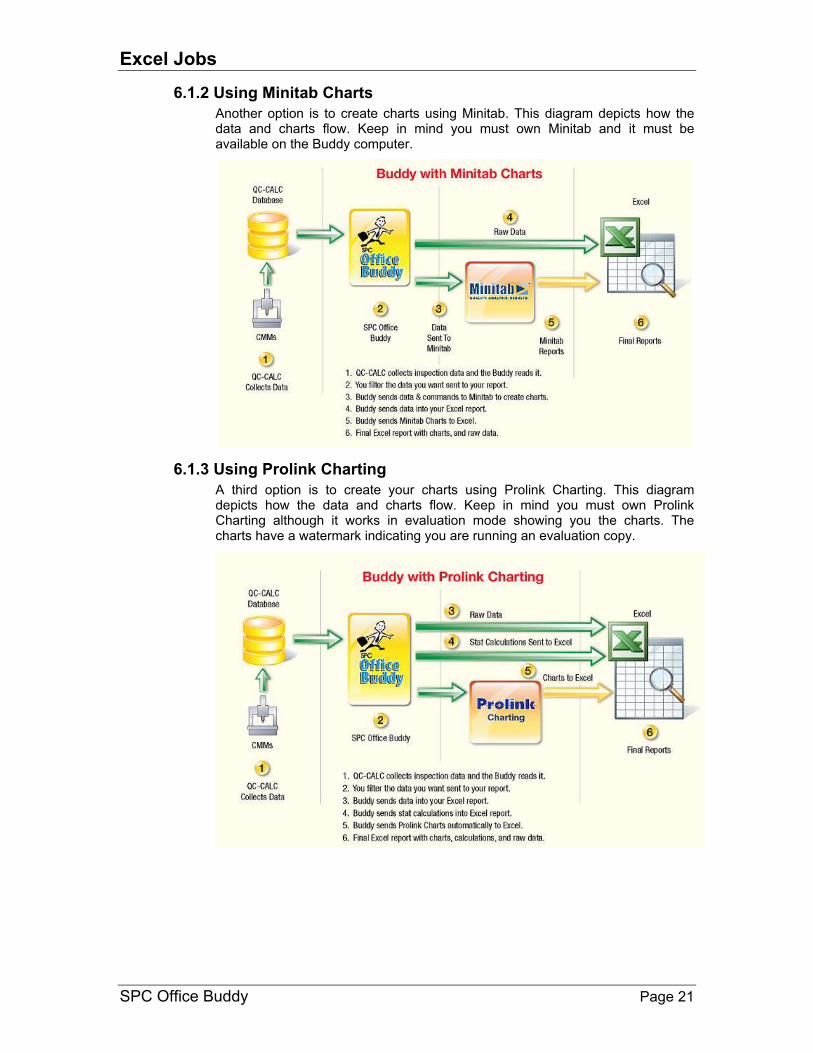
6.1.2 Using Minitab Charts
Another option is to create charts using Minitab. This diagram depicts how the data and charts flow. Keep in mind you must own Minitab and it must be available on the Buddy computer.
6.1.3 Using Prolink Charting
A third option is to create your charts using Prolink Charting. This diagram depicts how the data and charts flow. Keep in mind you must own Prolink Charting although it works in evaluation mode showing you the charts. The charts have a watermark indicating you are running an evaluation copy.

Excel Jobs
SPC Office Buddy Page 22
6.2 Let’s Get Started Before you can create your final Excel report using Minitab or Prolink Charts, you must write what is called an Excel Job. Writing, Editing, and Deleting of Excel Jobs is controlled from the Excel Job Panel. This section walks you through the various steps of creating and editing these jobs. The first job you write might take a little while but after that, you’ll be writing them in a couple of minutes.
6.3 The Excel Job Control Panel The buttons that control the Excel Job operation are:
• You press the Add button to create a new Excel job. You are lead through the Excel Report Job Setup Wizard which asks questions about your job. Your job is saved in the list for future, repeated use.
• Click on any job in the list and the Edit button becomes available. Use the Edit button to change an existing Excel job. This launches the Excel Report Job Setup Wizard.
• You can remove any unwanted jobs by pressing the Delete button. You are asked if you are sure before the job is permanently removed from the list.
• Likewise, clicking on the Copy button after highlighting a job makes a copy of the highlighted job. When you edit the job, rename it.
• Highlight a job in the list and press the Run button to start the job. Optionally, you can double click any job in the list.
• Press the Export button to send someone else one or more of your Excel jobs. The Export file contains the Excel spreadsheet template and the Excel job file for each job selected. For details on the Export operation please see Exporting Excel Jobs on page 91.
• The Import button is used to read Excel jobs from other users into your SPC Office Buddy. The file type is .ZIP which contains the Excel spreadsheet and the Excel Job. For details on the Import operation please see Importing Excel Jobs on page 91.
6.4 Setup the Excel Job In this section we discuss how to setup your Excel reports so you can send QC-CALC data, stat calculations, charts, and place these results where you want them in your spreadsheet report. An overview includes:
1. Using Excel create a report template used to create your final report.
• Place Tags indicating where the data to be placed.
• Place Tags indicating where you want Minitab or Prolink charts. 2. Add a new Excel Job in Buddy. 3. Optionally filter the data for the report. 4. Run the Excel Job.

Excel Jobs
SPC Office Buddy Page 23
6.5 Getting Started Before starting a new Excel job, let’s take a look at the final report we want to create in Excel. Here you see a column of 12 numbers on the left and a Minitab Sixpack chart on the right. Using this final report, we will create the needed Excel template shown below the report. We realize your reports are more complex but for demonstration purposes we’ll use this simple example.
As you can see, the Excel template contains very little data but instead contains Tags telling Buddy where to place the data and which chart to create in the final report. Tags are words in square brackets [ ]. Please see Understanding Tags on page 34 for more details explaining their use. With these two pictures in mind, let’s create an Excel Job in Buddy and tie it all together.

Excel Jobs
SPC Office Buddy Page 24
6.6 Add New Job
6.6.1 Step #1
To begin your Excel Job, press the Add New Excel Job button to start the Excel Report Job Setup Wizard. Enter a Name in the box. Here we entered Customer Test. The name lets you re-run or Edit this job at any time by selecting it from the list instead of using this wizard again.
6.6.2 Step #2
Press the Next >> button to move to the File Options screen. In the Template Path area, choose the Excel spreadsheet to use as the template. Now enter the Output Path and File Name for the report. We selected AS9102Template.xls as the template and AS9102.xls as the output report as shown below. File extensions of .xls, .xlsx, and .xlsm are supported. Buddy will automatically produce a spreadsheet of the same type as set in the template. Therefore, if the template is a macro enabled (.xlsm) spreadsheet, the report output will create the same. TIP: Please see Tools – Options – Excel Jobs on page 132 for a discussion on default paths.

Excel Jobs
SPC Office Buddy Page 25
Custom Name
The File Name entered is the name of the .XLS file that will be created. There are times when you may want the File Name to be variable, based on a Factor Value, the Date and Time, or typed in text. The Custom Name button allows you to select what the final File Name will be at export time. Clicking the Custom Name button brings you to the Custom File Name Editor.
• Use Part Name, Date, and Time
• Date of Inspection
• Time of Inspection
• QCC File Name
• Any Text Factor value
• Any Numeric Factor value
Simply select the item from the list and click the Add button. If you know what you want, you can manually type the text into the lower box. When the Excel Job runs, all items are joined together and the name that is formed is used for the Excel file name.
Use report as template on subsequent batch runs
This feature allows you to use the report file name for subsequent runs in batch mode. Batch mode refers to three situations; when running in a batch command file, when running as part of a batch job in Buddy, and when running an export that runs the same Excel Job multiple times from the Enterprise Report Scheduler (ERS). In the latter two instances, both Buddy and ERS pass a job number along with the commands when running the Excel Job multiple times. The job number is simply a counter telling the Buddy which step is being run. For instance, if a batch job runs the Excel Job 5 times, it will pass 1, 2, 3, 4, and 5 for each time it runs the job. If this checkbox is checked in the Excel Job, then a special behavior happens. If the number is 1, then the normal template path set in the Excel Job is used. If the number is greater than 1, the report path set in the Excel Job is used. This way, the template is used on the first iteration and the report output is updated on subsequent iterations allowing you to save the template for later use. Limitations:
1. Buddy does not track whether the same Excel Job is being run multiple times or multiple jobs are being run. Therefore, if a batch job is created that runs one MyReport1 twice and then MyReport2 once, MyReport2 will be sent a job number of 3 even though it is the first time it is being run. This could cause unintended consequences and this checkbox should not be used in this situation.
2. Buddy does not take custom report naming into account when using the report name. Therefore, if the report is set up to use a date/time stamp in the output filename, it will find a different report file name each time it runs since the time will have changed. Again, unintended consequences will occur and this option should be avoided.
Show Excel during job
With this option enabled, Excel is visible while the job is running and you see your data and charts being substituted for Tags as the job runs. This is useful for troubleshooting your Excel Job but it slows the job down a bit due to the constant screen repainting.
Excel Jobs
SPC Office Buddy Page 26
Show charting during job
With this option enabled Minitab or Prolink Charting is shown during the job processing as it is generated. After the charting package closes, you will see the Tag substituted with the charts if Show Excel during job is checked.
Show Excel after job
With this option enabled Excel stays on screen and your final report is available to view. In either case, Buddy saves your final Excel report to disk at the conclusion of the job.
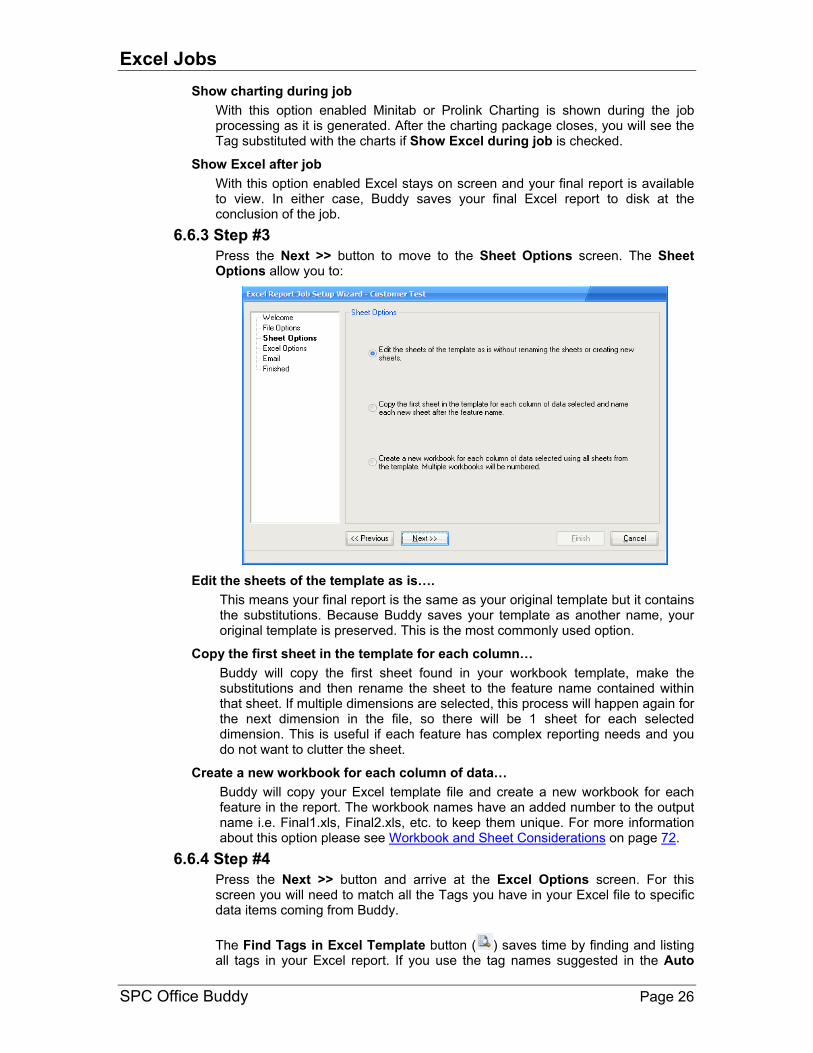
6.6.3 Step #3
Press the Next >> button to move to the Sheet Options screen. The Sheet Options allow you to:
Edit the sheets of the template as is….
This means your final report is the same as your original template but it contains the substitutions. Because Buddy saves your template as another name, your original template is preserved. This is the most commonly used option.
Copy the first sheet in the template for each column…
Buddy will copy the first sheet found in your workbook template, make the substitutions and then rename the sheet to the feature name contained within that sheet. If multiple dimensions are selected, this process will happen again for the next dimension in the file, so there will be 1 sheet for each selected dimension. This is useful if each feature has complex reporting needs and you do not want to clutter the sheet.
Create a new workbook for each column of data…
Buddy will copy your Excel template file and create a new workbook for each feature in the report. The workbook names have an added number to the output name i.e. Final1.xls, Final2.xls, etc. to keep them unique. For more information about this option please see Workbook and Sheet Considerations on page 72.
6.6.4 Step #4
Press the Next >> button and arrive at the Excel Options screen. For this screen you will need to match all the Tags you have in your Excel file to specific data items coming from Buddy.
The Find Tags in Excel Template button ( ) saves time by finding and listing all tags in your Excel report. If you use the tag names suggested in the Auto

Excel Jobs
SPC Office Buddy Page 27
Match Tag Names areas, Buddy will automatically list and match them to the replacement item. Please see:
• Auto Match Tag Names – Part Data pg. 44
• Auto Match Tag Names – Factors pg. 48
• Auto Match Tag Names – Statistics pg. 50
• Auto Match Tag Names – Charts pg. 55
In the screen below the Find Tags in Excel Template button was pressed and the entire Excel spreadsheet was read. The tags were extracted and the results displayed here. The [Label] tag was automatically matched (mapped) to {Feature Label}. Any item listed as {Blank} means you need to edit the link and connect your tag with a replacement item.

Excel Jobs
SPC Office Buddy Page 28
Use the Delete Replacement ( ) and Copy Replacement ( ) buttons as required.
Show Advanced
Checking the Show Advanced option enables a new step in the Wizard that is used to turn on Password protection in the Excel file or run macros before or after processing. See Show Advanced on page 31 for details.
Excel Job Replacement Setup
Select the sheet name from the list and enter the tag name (in square brackets [ ]) you wish to assign (link) to a replacement item. In our continuing example, the sheet name was filled in for us as Sheet1 and [Label] is the tag found in that sheet.
Edit Report Type
Double click any item in the list to edit the Replacement item or press the Edit Replacement button. Use the Report Type Category list to select the type of item to link to your tag. There are five categories to choose from:
Charts Various SPC plots and charts to include in your report.
Numeric Factors Trace information in numeric form such as cavity numbers.
Text Factors Trace information in text form such as name, lot num, etc.
Part Data Actuals, nominals, tolerances, data source, etc.
Statistics Calculations such as Avg, Range, Min, Max, Cpk, Sigma, etc.
The items found in the Report Item list change as you select a different Report Type category. Select the exact item from the Report Item list you wish matched with your [data] tag and click OK. This example tells Buddy to write the current column of data to the spreadsheet. Buddy looks for a tag called [data] and replaces it with the corresponding actual values for
the dimension being processed. Buddy stops filling data if it finds an End Tag [/data]. See Understanding Tags on page 34 for details on tags. The Composite chart is placed in the Excel report by typing [Composite] in the Search Tag area, selecting Charts for the Report Type, and Capability Composite Chart from the Report Item list. While viewing our template (Getting Started section) on page 23, notice how the tags are set on a diagonal forming

Excel Jobs
SPC Office Buddy Page 29
the size and placement of the Composite chart. Remember, the size of the chart is set by the location of the replacement tags.
Sync record numbers with page break tag
Please see the Page Break Tag section on page 67 for an explanation of this feature.
6.6.5 Step #5
Press the Next >> button to arrive at the optional email screen. You can email your generated Excel report as an attachment to anyone you wish. Check the Send As Email Attachment checkbox and fill-in the usual email details. Use semicolons (;) to separate the addresses. When the job is complete you’ll briefly see the email screen sending your email.
6.6.6 Step #6
Click the Next >> button. You have completed the Excel job and can Run the Job Now by checking the checkbox. For now, just click Finish and we will run the job manually in the next step.

Excel Jobs
SPC Office Buddy Page 30
Clean up unused {column} tags after replacements are finished
This option will remove any extra tags that remain with different dimension numbers referenced. See Special {Column} Tag Variable on page 53 for details.
Clean up all unused tags after replacements are finished
This option will remove all extra tags from the Excel file after processing has finished.
6.6.7 Run Job
Using the mouse, we selected the 12 data points we want to report and we are now ready to run the job.
Double-click your newly created Excel job (Customer Test) from the list in the control panel and the job begins to run. You can use the Run button instead of double clicking if you prefer. Verify the Data Range is correct. In our example we used the mouse to select one column with 12 values so use Selected Records and Selected Dimensions.

Excel Jobs
SPC Office Buddy Page 31
Clicking OK starts the sequence of launching Minitab or Prolink Charting, loading the data, running the selected charts, and moving the actual data and charts into Excel. If you checked the Show Excel after Job option, your final report is presented in Excel where you can modify it if required. The report was saved using the name and location you entered in Step #2 on page 24.
6.7 Show Advanced The previous Step 4 shows an option on the screen we did not discuss. Checking this option causes the Advanced step to be inserted into the Wizard. This screen is used to control more advanced functionality which includes locking worksheets with passwords and running macros before or after the Excel Job.

Excel Jobs
SPC Office Buddy Page 32
6.7.1 Locking Worksheets
The purpose of this option is to lock the worksheet to ensure no one changes the report after it finishes. You will have to enter the password twice to ensure you entered the password correctly.
At the conclusion of the run, the saved worksheet is viewable but not editable.
6.7.2 Running Macros
You can run Excel macros before or after the tag replacements within an Excel Job run. Buddy was designed so you do not require macros but power users can expand on the capability of Buddy by using this option. There are many reasons you might want to use macros but we’ll show you one simple example of adding new tags to a worksheet after Buddy finishes.
Macro Example
Let’s say you inspect five features on a part and at the conclusion of the CMM program you run an Excel Job. The Excel Job simply writes the five values in the next available row in the spreadsheet. Here you can see we have one tag labeled [Data] with a matching end tag of [/data].

Excel Jobs
SPC Office Buddy Page 33
As the job runs the tags are replaced with data (row 7) as normal. Without going into the details of macro writing, our macro finds the last written row and rewrites the same tags in that row, column 2 and 6. Because this macro finds the last written row and then writes a new set of tags in row 8, the final report is actually a new Excel template but with the first run of data inserted. Now the template can be reused as an input template because new tags are available. After Run 2 the data is written into row 8 and the macro adds new tags in row 9 etc.
Remember, every time an Excel job runs, the tags are replaced with the corresponding data so the normal final Excel report cannot be reused (no tags to find). The solution we chose in this example is to write and run the following macro after the job runs. The example below shows the macro “WriteFiveDims” in Excel and we added the macro name in the Run Macro After box so Buddy will automatically run that macro when the Excel Job has finished.

Excel Jobs
SPC Office Buddy Page 34
If we chose to Run Macro Before the Excel Job, the tags would have been written to the template and replaced so quickly you may not even see the tags. When you run this macro Before the job runs no extra tags are left in your final report. You would not have to delete the very last set of tags on the last part when the report is complete.
6.7.3 Macros with Parameters
Parameters can be passed into macros by enclosing them in parentheses just after the name of the macro in the text field. Parameters are separated from each other by commas and Buddy currently supports up to 10 parameters per macro. Examples:
MyMacro(param1, param2) DoSomething(1, 2)
6.7.4 Dynamic Parameters
Dynamic parameters can also be passed to the macros. When the macro is run, these dynamic parameters are automatically replaced with the numbers they represent at run-time. Please keep in mind that the text for these parameter names is not case sensitive. Buddy currently supports the following dynamic parameters: {Number of Features} – The number of dimensions being sent to the Excel Job. {Number of Records} – The number of records being sent to the Excel Job. {Subgroup Size} – The subgroup size chosen when the Excel Job was run.
Example: Assuming the job is run with 10 dimensions and 15 records, the following dynamic parameters would be replaced as shown.
DoSomething({Number of records}, {Number of features})
At run-time becomes…
DoSomething(15, 10)
6.7.5 Macros Tips
• Any macro you write must be in the Excel spreadsheet you use.
• Buddy was written so you do not have to use complex macros. Please keep in mind these advanced features are not normally required.
6.7.6 Using with QC-CALC
Normally, Buddy runs separately in your office PC using shared QC-CALC data found on your file server. We added the ability to QC-CALC to directly trigger an automatic Buddy when your inspection is complete. The QC-CALC Real-Time training manual explains how to run this type of report.
6.8 Understanding Tags Since it is difficult to determine where to place data and charts in an Excel report, Buddy works on the concept of TAG substitution. Tags are any words you type into your Excel template between square brackets [ ]. You map a Report Item to each tag which is replaced with the value of each item when you run the Excel Job. You can have a single tag or matched pair. Matched pairs of tags have the same text but the “End Tag” is preceded with a forward slash. i.e. [Data] … [/Data].

Excel Jobs
SPC Office Buddy Page 35
Matched pair tags are used to block out the area of the spreadsheet you want the data to use. In the case of a column of numbers, you may want Buddy to stop early to ensure portions of your report are not accidentally overwritten. In the case of a chart, you use the matched pair to define the size and location of the chart. i.e. [Composite] is the upper left corner and [/Composite] is the lower right corner.
As shown above, you map your custom tag names to a Report Item in the Excel Job Replacement Setup screen. Here we show an area in Sheet 1 of the Excel workbook mapped to {Actuals Current Column}. Likewise, we have mapped an area using [Composite] & [/Composite] to contain a Capability Composite chart. You can use a tag to start a column or row of data without an End Tag. Be careful as this can get out of control when large amounts of data are saved since the data continues filling the column until all data is exhausted. Using an End Tag guarantees the flow of data will stop when the tag is reached.

Excel Jobs
SPC Office Buddy Page 36
6.9 Report Items
6.9.1 Introduction
Report Items are items that replace your tags when the Excel job runs. Buddy needs to know what sheet to look on, what tag you want replaced, and what Report Item to use in place of that tag.
Report Items are surrounded by curly brackets and you choose them from the list. Your typed tags are replaced with the value of the Report Item selected. Due to the large number of items in the list, the Report Items are grouped into 5 different categories:
• Part Data
• Factors (text)
• Factors (numeric)
• Statistics
• Charts See the Report Item Categories section on page 36 for a more thorough explanation of the different categories available.
6.9.2 Report Item Categories
While there is an ever expanding list of report items you can use to replace tags in your templates, they all fit into 4 main categories with predictable behaviors. Once you understand the different categories, you can use them in different ways to create the desired effect in your spreadsheets. These categories are listed below with descriptions and examples to help you understand the different concepts.
Single Values
Single values are literally single values that can be placed in your template. They do not support end tags because there is only one value that will be replaced. They tend to be used with the second and third worksheet options (Copy worksheet or Copy Workbook) because they apply to a single feature.

Excel Jobs
SPC Office Buddy Page 37
Notice in the image below that the Feature Label, Nominal, and Tolerances are replaced by the individual values for the feature in question.
Examples: {Part Name} {Cpk} {Nominal}
List Types
List types are lists that typically span features or records. They support the end tag which allows you both limit the data and to flow the data either vertically or horizontally. List types automatically snake until they hit the end tag without truncation. They almost always begin with the word “All” to indicate multiple values will be replacing your tag. The only exception to this is {Actuals Current Column}. Notice how the data starts in cell A1 below and then snakes its way as columns until stopping in cell C5.
Examples: {Actuals Current Column} {All Cpks} {All Nominals}
Block Types
Block types are two dimensional lists that span both features and records. They support the end tag and flow either as columns or as rows. All block report items begin with the word “All” and end with either “As Columns” or “As Rows”. When Buddy reaches an end tag boundary, it truncates the remaining values of that particular row or column and starts over on the next row or column of the spreadsheet.

Excel Jobs
SPC Office Buddy Page 38
Below is an example of a block type flowing “as columns”. Notice how the data flows downward from A1 until hitting the end tag boundary at A5. Any data after A5 is truncated and the next feature’s data starts in B1. This differs from the snaking nature of the list type. In the example below, the first column’s values are all approximately 1.00 while the second column is clearly a different feature since its values are all approximately 2.00.
Below is an example of a block type flowing “as rows”. Notice how, similar to “as columns”, it flows in rows from left to right until hitting the end tag boundary. The remaining data is then truncated and the next row starts with data from the next feature.
Examples: {All Actuals as Columns} {All Actuals as Rows} {All Deviations as Columns} {All Notes as Columns}
Charts
Charts are literal pictures that are created from a charting tool (either Minitab or the built-in Prolink Charting). The charting tool saves the images as JPG, EMF, or PNG files and Buddy places them in the exact location of the begin tag. End tags are supported to allow you to size the image. The image is always positioned to line up with the top left corner of the cell in which the tag is placed. The image is then sized to line up with the lower right corner of the cell in which the end tag is found. If no end tag is specified, the image is displayed at 100% of size.
Examples: Capability Analysis Capability Sixpack Box Plot

Excel Jobs
SPC Office Buddy Page 39
6.9.3 Part Data
{Actuals Current Column}
The Current Column refers to the feature being reported at the moment. As Buddy cycles through each column it replaces a single column of numbers for the current feature being reported. This is useful if you ask Buddy to create separate sheets for each of the 3 features. It will create 3 separate sheets and write the actual of each feature on each separate sheet. You will not see the other feature data since it is on another sheet.
You can create a template containing a tag and an End Tag with an offset to force your single column of numbers into a grid. For example, if we start our tag in A1 and end in C5 the data is placed in multiple columns. In this example, we sent 11 values so Buddy squeezed the data by going down column A until the max was reached, then started over in B1.
{All Actuals as Columns}
All Actuals as Columns allows you to place an entire grid of numbers in one location within the Excel report. If you have 3 features of 20 numbers and you want the 3 columns to appear next to one another, you must specify {All Actuals as Columns}. The final report shows as many columns as your template tags allow. Each column is placed next to one another. NOTE: Be sure to enter your tags on a diagonal and leave enough room for all data.
In the above example we selected 3 columns of 11 numbers in Buddy data grid. Did you notice how each column has a different set of numbers but they are trimmed at row 5? This happened because we set our End Tag at C5 causing 6 numbers in each column to be discarded.

Excel Jobs
SPC Office Buddy Page 40
{All Actuals as Rows}
This is the same as {All Actuals as Columns} but it allows you to save your data in rows instead of columns. This is similar to a pivot table in Excel except Buddy rotates your data for you.
We selected 3 columns of 11 numbers in Buddy data grid. Did you notice how each row has a different set of numbers (magnitude) but they are trimmed at column 3? This happened because we set our End Tag at C5 causing 8 numbers in each row to be discarded. There is one special case to consider. Since Buddy rotates your data 90 degrees when you use {All Actuals as Rows} you can place a selected row of data in columns by using {All Actuals as Rows}. Below we selected 1 row of 5 values yet we set up our template as columns. We used {All Actuals as Rows} giving the effect of taking your selected data and placing it where you wanted it. This works for multiple rows as well.
{Actual}
This is a single value from within the set of actuals being sent to the Excel Job. The key to this single value is that Buddy must be told which row and column within the data should be placed into the Excel sheet. As such, this is not commonly used and should only be used when no other option will work for the report. The format of the tag is normal, but must contain a “{rowcol:x,y}” command within the square brackets of the tag. The RowCol section must appear in curly brackets, followed by a colon, and the row and column numbers separated by a comma. The keywords “First” and “Last” are also available to use in both the row and column positions.

Excel Jobs
SPC Office Buddy Page 41
NOTE: The row and column specified are relative to the data being sent to the Excel Job and are NOT the positions within the QCC file. Therefore, row 2 is not necessarily the 2
nd record in the QCC file, but is instead the 2
nd record in the data
set being sent to the Excel Job. NOTE: If you choose to sort the dimensions when you run the job, your dimensions may re-order. In this case, the column specified will be after the sort was applied and may not be in the same position as it is shown in the main Buddy grid. Examples: [mytag{rowcol:2,4}] – places the value from the 2
nd row and the 4
th column.
[mytag{rowcol:First,Last}] – places the value from first row (1) and last column based on the data that is sent to the job when it runs.
[mytag{rowcol:Last,Last}] – places the value from last row and column based on the data that is sent to the job when it runs.
Due to the specificity, the replacement in the Excel Job should match the tag in the template. No wildcards are accepted. This allows you to have multiple “actual” tags throughout the document. The image below shows the tag in the cell, the replacement screen from the Excel Job Wizard, the data being sent to the job during running, and the final report.
{Part Name}
This is a single variable value containing the QC-CALC file name. This is a convenient method of identifying the origin of the report’s data. If you use multiple QC-CALC files with the same template, using this Report Item helps you identify the report.
{Current Time}
This is the system time at the time the Excel Job is run. Using this variable is an easy way to mark the date and time your report was created.
{Inspect Time}
This is the inspection time of the one part you are reporting. Remember, each part in the QC-CALC database has an inspection time associated with the entire part. If a multiple sheet report is created across many sheets, you may want this time printed on each sheet for each feature. If you send multiple parts to Excel, the first part’s inspection time is used.

Excel Jobs
SPC Office Buddy Page 42
{All Inspect Times}
When multiple features with multiple values are used there is a time associated with each part. Here we created an Excel template with data and time and used both {All Actuals as Columns} and {All Inspect Times} to print the date and time of each row (part).
{Feature Label}
The Feature Label applies to the current feature being reported. There is only one value returned for this Report Item.
{All Feature Labels}
This item has many labels and is used when you want a grid of labels in one row or one column. This Report Item requires that you place a tag and an End Tag in the template to tell Buddy which direction to travel. i.e. Top – Bottom or Left – Right. Remember, the default direction of fill is top – bottom so if we hadn’t placed the [/label] at the end of the row, the labels would have overwritten some of our data (go down).
{All Record Numbers}
This will display a list of the actual Record Numbers used on the Excel sheet.

Excel Jobs
SPC Office Buddy Page 43
{Upper Spec} {Plus Tol} {Nominal} {Minus Tol} {Lower Spec}
These five items should be self-explanatory; however, we will use them in an example for clarity. Each Report Item contains one value for the current reported feature. All items operate the same and they do not require an End Tag for direction flow since there is only one value.
{All Upper Specs} {All Plus Tols} {All Nominals} {All Minus Tols} {All Lower Specs}
These Report Items each have many values (one for each reported feature) and are used when you need to display their values in a row or column. They all operate the same and they require an End Tag to ensure proper direction flow in a row.
{Feature Number}
This will display the current Feature Number being used.
{All Feature Numbers}
This will display a list of the Feature Numbers displayed in the Excel sheet.

Excel Jobs
SPC Office Buddy Page 44
6.9.4 Auto Match Tag Names – Part Data
To improve the speed of mapping your tags to the Report items, use standard tag words and Buddy will do the work for you. When you press the Find Tags button it not only finds your tags but it ties the tags together with the built-in Report replacement items within Buddy.
Report Type Item Your Tag for Part Data {All Actuals As Columns} [ACTCOL], [DATA], [ACTCOLS]
{All Deviations As Columns}
[DEVCOL], [DEVCOLS]
{All Actuals As Rows} [ACTROW], [ACTROWS]
{All Deviations As Rows} [DEVROW], [DEVROWS]
{All Feature Labels} [LABELS], [ALLLABELS], [ALL LABELS], [ALL FEATURE LABELS]
{All Feature Sources} [FEATURE_SOURCES], [FEATURE SOURCES], [SOURCES], [ALL SOURCES]
{All Feature Extra Info} [ALL FEATURE INFO], [ALL EXTRA INFO], [ALL DIM INFO]
{All Feature Numbers} [ALL FEATURE NUMBERS], [DIM NUMBERS], [FEATURE NUMBERS], [ALL DIM NUMBERS], [ALL DIM NUMS]
{All Inspect Time} [ALLDATES], [ALL DATES], [DATES], [TIMES]
{All Lower Specs} [LSLS], [ALL LSLS]
{All Minus Tols} [ALLMINUS], [MINUSTOLS]
{All Nominals} [ALLNOMS], [ALLNOMINALS], [NOMS], [ALL NOMINALS]
{All Plus Tols} [ALLPLUS], [PLUSTOLS]
{All Upper Specs} [USLS], [ALL USLS]
{All Record Numbers} [RECORD NUMBERS], [RECNUMS], [REC NUMS], [ALL RECORD NUMS], [ALL REC NUMS], [ALL RECORD NUMBERS]
{All Notes As Columns} [NOTESCOL], [NOTES AS COLS]
{All Notes As Rows} [NOTESROW], [NOTES AS ROWS]
{All Assignable Cause # Descriptions}
[ALL AC#S], [ALL AC#], [AC#]
{All Corrective Action # Descriptions}
[ALL CA#S], [ALL CA#], [CA#]
{Actuals Current Column} [ACTUALS], [ACT]
{Deviations Current Column}
[DEVIATIONS], [DEV], [DEVS]
{Feature Label} [LABEL], [FEATURE LABEL], [FEATURELABEL]
{Feature_Source} [FEATURE_SOURCE], [FEATURE SOURCE], [DIM SOURCE], [SOURCE]
{Feature Extra Info } [EXTRA_INFO], [FEATURE INFO], [DIM INFO], [INFO]
{Feature Number} [FEATURENUMBER], [FEATURE NUMBER], [DIM NUMBER], [DIMNUMBER], [DIM NUM]
{Current Time} [CURRENTDATE], [CURRENT DATE], [CURRENTTIME], [CURRENT TIME]
{Inspect Time} [DATE], [TIME]
{Lower Spec} [LSL], [LOWER SPEC], [LOWER]
{Minus Tol} [MINUS], [MINUSTOL], [MINUS TOL]
{Nominal} [NOM], [NOMINAL]
{Part Name} [PART], [PART NAME], [PARTNAME]
{Plus Tol} [PLUS], [PLUSTOL], [PLUS TOL]

Excel Jobs
SPC Office Buddy Page 45
{Upper Spec} [USL], [UPPER SPEC], [UPPER]
{Notes Current Column} [NOTES]
6.9.5 Numeric and Text Factors
{Numeric Factor 1} {Text Factor 1}
QC-CALC has 30 Numeric Factors and 30 Text Factors that are used to track a part’s origin or other non-measurement data i.e. {Numeric Factor 1} thru {Numeric Factor 30}. You save items like Lot Number, Cavity, Fixture, Operator, Machine, etc. in the QC-CALC factors and then use Buddy to save them into your Excel spreadsheet. The value of {Numeric Factor 1} is singular for the current part being reported. Therefore, you use these Report Items when reporting into a separate spreadsheet or workbook. Should you select multiple rows when running your Excel Job, Buddy uses the value of the first row. Remember, each part is stored in a row in QC-CALC and Buddy. In this example, we linked {Numeric Factor 1} and {Text Factor 1} to [NFac1] and [TFac1] to show the value at the bottom of the column of raw data.
{Numeric Factor Named} {Text Factor Named}
These two options allow you to specify the factor by name rather than by ordinal position. This can be very useful if you want to run your Excel Job with multiple QCC files and the factors are not always in the same order. For instance, in one QCC file, Operator may be the 1st text factor while in another it is the 5th text factor. If you call the factor by name, Buddy will automatically find the factor in the QCC file. If the factor is found, it will replace the tag with your value. If it is not found, it will be skipped.

Excel Jobs
SPC Office Buddy Page 46
When you choose this option from the list on the Tag Replacement screen, the Factor Name field becomes enabled and you can type the name of the factor you want to search on. In the picture above, the name of the factor is “Cavity”. Please keep in mind that the factor name is not case sensitive. Therefore, Buddy will find the factor even if the actual casing is “cavity”, “Cavity”, or “cAvItY”. In addition, if you know the factor is named differently based on the QCC file, you can enter multiple spellings of the factor name separated by commas into the Factor Name field and Buddy will search for all of them. For instance, in one QCC file, the factor is called “Cavity”, but it’s named “Cav #” in another QCC file and “Cav Num” in a third. You can enter all three spellings separated by commas and Buddy will use the first one it finds in the QCC file. Example: Cavity, Cav #, Cav Num
{All Numeric Factors 1s} {All Text Factor 1s}
These are the same Factor values just discussed. The value of {All Numeric Factor 1s} is plural meaning each part has a value to report so if many parts are selected, Buddy has many factors to report. If you select multiple rows when running your Excel Job, Buddy will use the value for each part (row). This means if you have a column of 15 numbers you might want to display a column of Numeric Factor 1 values in a column next to it. Each record shown in the Buddy grid contains many factor values all found in {All Numeric Factor 1s} or {All Text Factor 1s}. You can see what is available by scrolling the grid to the extreme right side. You use these Report Items when you report multiple items in a single spreadsheet.
{All Numeric Factors Named} {All Text Factor Named}
These are the same Factor values just discussed. The value of {All Numeric Factors Named} is plural, meaning each part has a value to report so if many parts are selected, Buddy has many factors to report. If you select multiple rows when running your Excel Job, Buddy will use the value for each part (row). This means if you have a column of 15 numbers, you might want to display a column of factor values in a column next to it. Just like above with the named factor, this uses a name rather than an ordinal position (i.e. All Text Factor 2s). The casing and multiple value rules discussed above in the named factor tags are the same for these list tags.

Excel Jobs
SPC Office Buddy Page 47
In this example we made room for 3 data columns and placed the factor values to the right side. We linked the [NFac1] tag to {All Numeric Factor 1s} and [TFac1] to {All Text Factor 1s}.
NOTE: We formatted the cells in the template as numbers with 4 decimal points on the right side. This is not noticeable until the final report is complete. Format your cells in the template to ensure your final report is exactly the way you want it without having to make changes after Buddy is finished. Also note the blue label format.
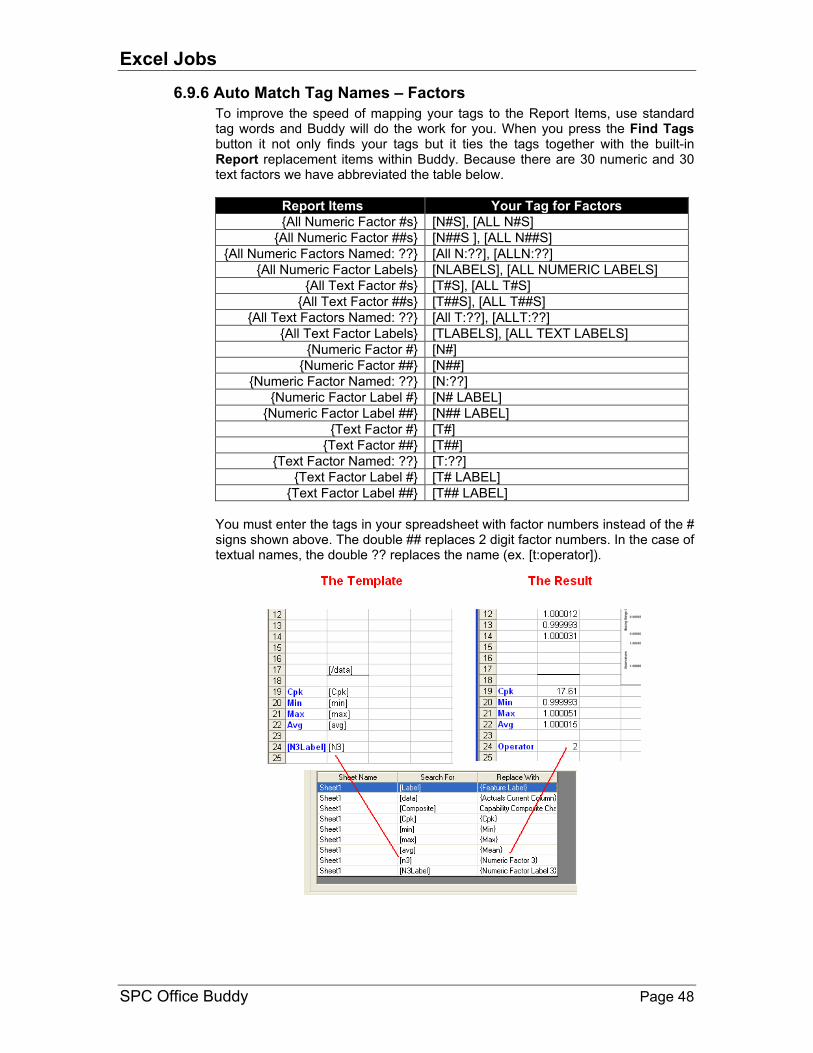
Excel Jobs
SPC Office Buddy Page 48
6.9.6 Auto Match Tag Names – Factors
To improve the speed of mapping your tags to the Report Items, use standard tag words and Buddy will do the work for you. When you press the Find Tags button it not only finds your tags but it ties the tags together with the built-in Report replacement items within Buddy. Because there are 30 numeric and 30 text factors we have abbreviated the table below.
Report Items Your Tag for Factors
{All Numeric Factor #s} [N#S], [ALL N#S]
{All Numeric Factor ##s} [N##S ], [ALL N##S]
{All Numeric Factors Named: ??} [All N:??], [ALLN:??]
{All Numeric Factor Labels} [NLABELS], [ALL NUMERIC LABELS]
{All Text Factor #s} [T#S], [ALL T#S]
{All Text Factor ##s} [T##S], [ALL T##S]
{All Text Factors Named: ??} [All T:??], [ALLT:??]
{All Text Factor Labels} [TLABELS], [ALL TEXT LABELS]
{Numeric Factor #} [N#]
{Numeric Factor ##} [N##]
{Numeric Factor Named: ??} [N:??]
{Numeric Factor Label #} [N# LABEL]
{Numeric Factor Label ##} [N## LABEL]
{Text Factor #} [T#]
{Text Factor ##} [T##]
{Text Factor Named: ??} [T:??]
{Text Factor Label #} [T# LABEL]
{Text Factor Label ##} [T## LABEL]
You must enter the tags in your spreadsheet with factor numbers instead of the # signs shown above. The double ## replaces 2 digit factor numbers. In the case of textual names, the double ?? replaces the name (ex. [t:operator]).

Excel Jobs
SPC Office Buddy Page 49
6.9.7 Statistics
There are many statistical calculations built into Buddy that are only available when Prolink Charting is enabled. Here we added four of the many available statistical items to our continuing example. A few of the available Statistics are explained below. For a complete list of calculations, see Auto Match Tag Names – Statistics on page 50.
{Cp} {Cpk}
The Cp and Cpk values are calculated based on the Sigma by Range value (Rbar/D2). If you need the Process Capability that was calculated based on the square root of the variance (the summation equation for Sigma), you should use the Pp or Ppk items.
{All Lower Control Limits} {All Means} {All RBars} {All Upper Control Limits} {etc…}
These Report Items each have many values (one for each reported feature) and are used when you need to display their values in a row or column. These items are calculated based on the specific data being used at the time the Excel Job runs and these are only available if Prolink Charting is enabled.
{Lower Control Limit} {Mean} {RBar} {Upper Control Limit} {etc…}
Each Report Item contains one value for the current reported feature. All items operate the same and they do not require an End Tag for direction flow since there is only one value. These items are calculated based on the specific data being used at the time the Excel Job runs and these are only available if Prolink Charting is enabled.

Excel Jobs
SPC Office Buddy Page 50
{All QCC Lower Control Limits} {All QCC Means} {All QCC Range Means} {All QCC Upper Control Limits} {etc…}
All items with a QCC in their name are taken directly from the QCC file. These values were saved in the QCC file at some point in the past and are NOT calculated based on the data currently being used. These Report Items each have many values (one for each reported feature) and are used when you need to display their values in a row or column.
{QCC Lower Control Limit} {QCC Mean} {QCC Range Mean} {QCC Upper Control Limit} {etc…}
All items with a QCC in their name are taken directly from the QCC file. These values were saved in the QCC file at some point in the past and are NOT calculated based on the data currently being used. Each Report Item contains one value for the current reported feature. All items operate the same and they do not require an End Tag for direction flow since there is only one value.
6.9.8 Auto Match Tag Names – Statistics
To improve the speed of mapping your tags to the Report Items, use standard tag words and Buddy will do the work for you. When you press the Find Tags button it not only finds your tags but it ties the tags together with the built-in Report replacement items within Buddy.
Report Item Your Tag for Statistics
{All Cps}* [CPS], [ALL CPS]
{All Cpks}* [CPKS], [ALL CPKS]
{All CpkLs}* [ALL CPKLS], [CPKLS]
{All CpkUs}* [ALL CPKUS], [CPKUS]
{All Cpms}* [ALL CPMS], [CPMS]
{All Crs}* [ALL CRS], [CRS]
{All Lower Control Limits}* [LCLS], [ALL LCLS]
{All Upper Control Limits}* [UCLS], [ALL UCLS]
{All Maxes}* [MAXES], [ALL MAXES]
{All Means}* [MEANS], [ALL MEANS]
{All Medians}* [MEDIANS], [ALL MEDIANS]
{All Mins}* [MINS], [ALL MINS]
{All Record Counts}* [COUNTS], [ALL RECORD COUNTS], [RECORD COUNTS], [ALL COUNTS]
{All Pps}* [PPS], [ALL PPS]
{All Ppks}* [PPKS], [ALL PPKS]
{All PpkLs}* [ALL PPKLS], [PPKLS]
{All PpkUs}* [ALL PPKUS], [PPKUS]
{All ZLowers}* [Z LOWERS], [ALL Z LOWERS]
{All ZUppers}* [Z UPPERS], [ALL Z UPPERS]
{All QCC Lower Control Limits} [QCCLCLS], [QCC LCLS]
{All QCC Means} [QCCMEANS], [QCC MEANS]
{All QCC Range Lower Control Limits} [QCCRLCLS], [QCC RLCLS]
{All QCC Range Means} [QCCRMEANS], [QCC RMEANS]
{All QCC Sigma Lower Control Limits} [QCCSLCLS], [QCC SLCLS]
{All QCC Sigma Means} [QCCSMEANS], [QCC SMEANS]
{All QCC Upper Control Limits} [QCCUCLS], [QCC UCLS]
{All QCC Range Upper Control Limits} [QCCRUCLS], [QCC RUCLS]
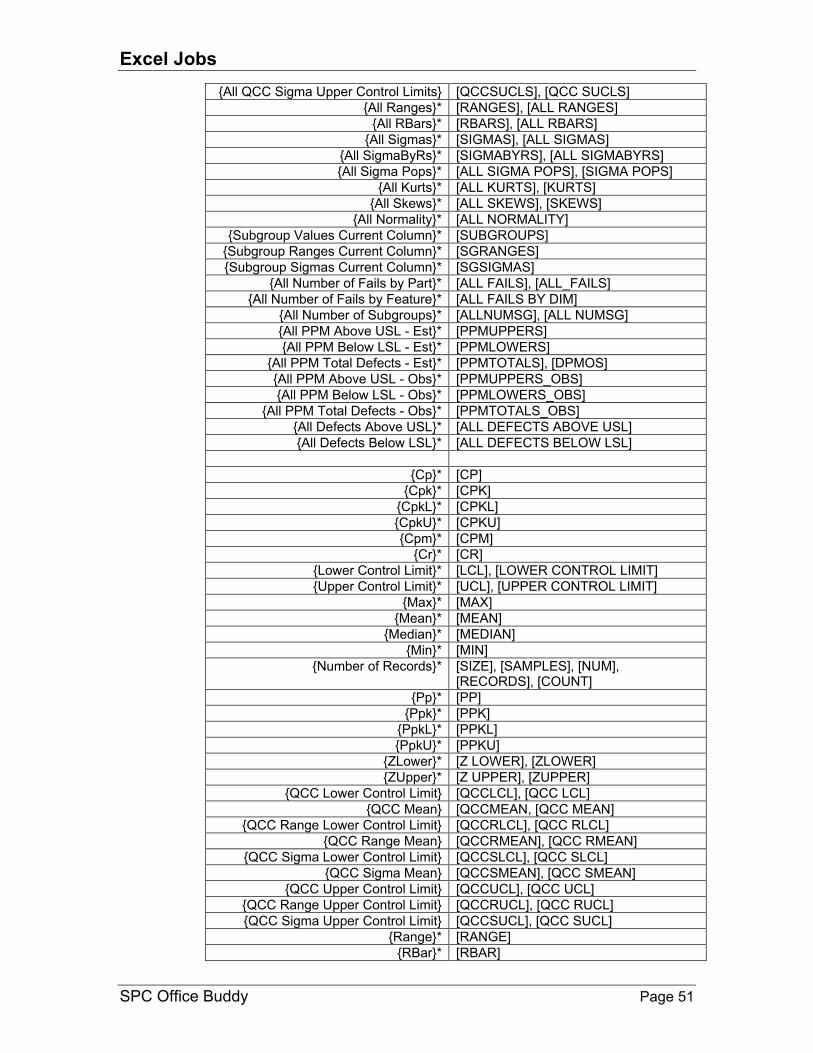
Excel Jobs
SPC Office Buddy Page 51
{All QCC Sigma Upper Control Limits} [QCCSUCLS], [QCC SUCLS]
{All Ranges}* [RANGES], [ALL RANGES]
{All RBars}* [RBARS], [ALL RBARS]
{All Sigmas}* [SIGMAS], [ALL SIGMAS]
{All SigmaByRs}* [SIGMABYRS], [ALL SIGMABYRS]
{All Sigma Pops}* [ALL SIGMA POPS], [SIGMA POPS]
{All Kurts}* [ALL KURTS], [KURTS]
{All Skews}* [ALL SKEWS], [SKEWS]
{All Normality}* [ALL NORMALITY]
{Subgroup Values Current Column}* [SUBGROUPS]
{Subgroup Ranges Current Column}* [SGRANGES]
{Subgroup Sigmas Current Column}* [SGSIGMAS]
{All Number of Fails by Part}* [ALL FAILS], [ALL_FAILS]
{All Number of Fails by Feature}* [ALL FAILS BY DIM]
{All Number of Subgroups}* [ALLNUMSG], [ALL NUMSG]
{All PPM Above USL - Est}* [PPMUPPERS]
{All PPM Below LSL - Est}* [PPMLOWERS]
{All PPM Total Defects - Est}* [PPMTOTALS], [DPMOS]
{All PPM Above USL - Obs}* [PPMUPPERS_OBS]
{All PPM Below LSL - Obs}* [PPMLOWERS_OBS]
{All PPM Total Defects - Obs}* [PPMTOTALS_OBS]
{All Defects Above USL}* [ALL DEFECTS ABOVE USL]
{All Defects Below LSL}* [ALL DEFECTS BELOW LSL]
{Cp}* [CP]
{Cpk}* [CPK]
{CpkL}* [CPKL]
{CpkU}* [CPKU]
{Cpm}* [CPM]
{Cr}* [CR]
{Lower Control Limit}* [LCL], [LOWER CONTROL LIMIT]
{Upper Control Limit}* [UCL], [UPPER CONTROL LIMIT]
{Max}* [MAX]
{Mean}* [MEAN]
{Median}* [MEDIAN]
{Min}* [MIN]
{Number of Records}* [SIZE], [SAMPLES], [NUM], [RECORDS], [COUNT]
{Pp}* [PP]
{Ppk}* [PPK]
{PpkL}* [PPKL]
{PpkU}* [PPKU]
{ZLower}* [Z LOWER], [ZLOWER]
{ZUpper}* [Z UPPER], [ZUPPER]
{QCC Lower Control Limit} [QCCLCL], [QCC LCL]
{QCC Mean} [QCCMEAN, [QCC MEAN]
{QCC Range Lower Control Limit} [QCCRLCL], [QCC RLCL]
{QCC Range Mean} [QCCRMEAN], [QCC RMEAN]
{QCC Sigma Lower Control Limit} [QCCSLCL], [QCC SLCL]
{QCC Sigma Mean} [QCCSMEAN], [QCC SMEAN]
{QCC Upper Control Limit} [QCCUCL], [QCC UCL]
{QCC Range Upper Control Limit} [QCCRUCL], [QCC RUCL]
{QCC Sigma Upper Control Limit} [QCCSUCL], [QCC SUCL]
{Range}* [RANGE]
{RBar}* [RBAR]

Excel Jobs
SPC Office Buddy Page 52
{Sigma}* [SIGMA]
{SigmaByR}* [SIGMABYR]
{Sigma Pop}* [SIGMA POP]
{Kurt}* [KURT]
{Skew}* [SKEW]
{Normality}* [NORMALITY]
{Subgroup Size} [SUBGROUP]
{Number of Fails by Part}* [NUM FAILS], [NUM_FAILS], [FAILS]
{Number of Fails by Feature}* [FAILS BY DIM]
{Number of Subgroups}* [NUMSG]
{PPM Above USL – Est}* [PPMUPPER]
{PPM Below LSL - Est}* [PPMLOWER]
{PPM Total Defects - Est}* [PPMTOTAL], [DPMO]
{PPM Above USL - Obs}* [PPMUPPER_OBS]
{PPM Below LSL - Obs}* [PPMLOWER_OBS]
{PPM Total Defects - Obs}* [PPMOBSERVED], [PPMSOBSERVED], [PPMTOTAL_OBS]
{Defects Above USL}* [DEFECTS ABOVE USL]
{Defects Below LSL}* [DEFECTS BELOW LSL]
{Gage R&R - Total}† [TOTAL], [GRRTOTAL]
{Gage R&R - Repeatability}† [REPEAT], [GRRREPEAT]
{Gage R&R - Reproducibility}† [REPROD], [GRRREPROD]
{Gage R&R - Part Variation}† [PARTVAR], [GRRPARTVAR]
* Only available with the Prolink Charting option enabled † Either Minitab or Prolink Charting needed
6.10 Understanding Tags with Pictures By now you should understand how to place a Minitab or Prolink chart in your Excel report. But how would you include multiple Minitab charts in the same Excel sheet? We need a method to describe which column of actuals represents the chart being generated. Suppose you have a sheet named Capability and you want to place 3 Minitab capability charts in the sheet (one for each column of data). You must use the {column} tag variable.

Excel Jobs
SPC Office Buddy Page 53
6.10.1 Special {Column} Tag Variable
When Buddy is sending data to Excel, it does so 1 column at a time. The current column (dimension) number is a simple count from 1 to x columns. If you place the tag variable {column} in your tag, the word {column} is replaced with a count that represents the current column being added to your Excel report. This creates an internal list of labels to look for such as [Lab1], [Lab2], [Lab3] etc. By adding these labels into your template, Buddy knows where to place this Report Item. This example explains the use of multiple labels and multiple charts.

Excel Jobs
SPC Office Buddy Page 54
6.10.2 The {Row:x} Command
Similar to the column command, there is a row command which is useful in row-based individual value tags. Most replacements are column-based (ex: {Nominal}, {Cpk}, {Max}), but there are a few row-based replacements. When a tag replacement is set up for a row-based replacement and the replacement is an individual value replacement (such as {Inspect Time} or {Text Factor 1}), Buddy always uses the first value from the list of records passed to the Excel Job. If the value of a different row of data is desired, the {Row:x} command can be used in the tag itself to specify the row from which to pull the data. The two images below illustrate the use of the {Row:X} command in a report. This report has 4 features and subgroups of 5 parts. In order to show the appropriate inspection date for the subgroup, the [date] tag is augmented to show [date{Row:1}], [date{Row:6}], and [date{Row:11}]. This way, the correct inspection date lines up with the data rows being shown.
Before Row Replacement
After Row Replacement
The {Row:x} command can accept either a number or the keywords “First” or “Last” to automatically pull the first or last value. If the number specified is greater than the number of records available, Buddy will automatically return the last row of the dataset. Examples:
[TextFactor1{Row:5}] – Returns the 5th row’s Text Factor 1 value.
[TextFactor1{Row:Last}] – Returns the last row’s Text Factor 1 value. The following tag replacements support the {Row:x} command:
{Inspect Time} {Number of Fails by Part} {Numeric Factor 1} – {Numeric Factor 30} {Text Factor 1} – {Text Factor 30}
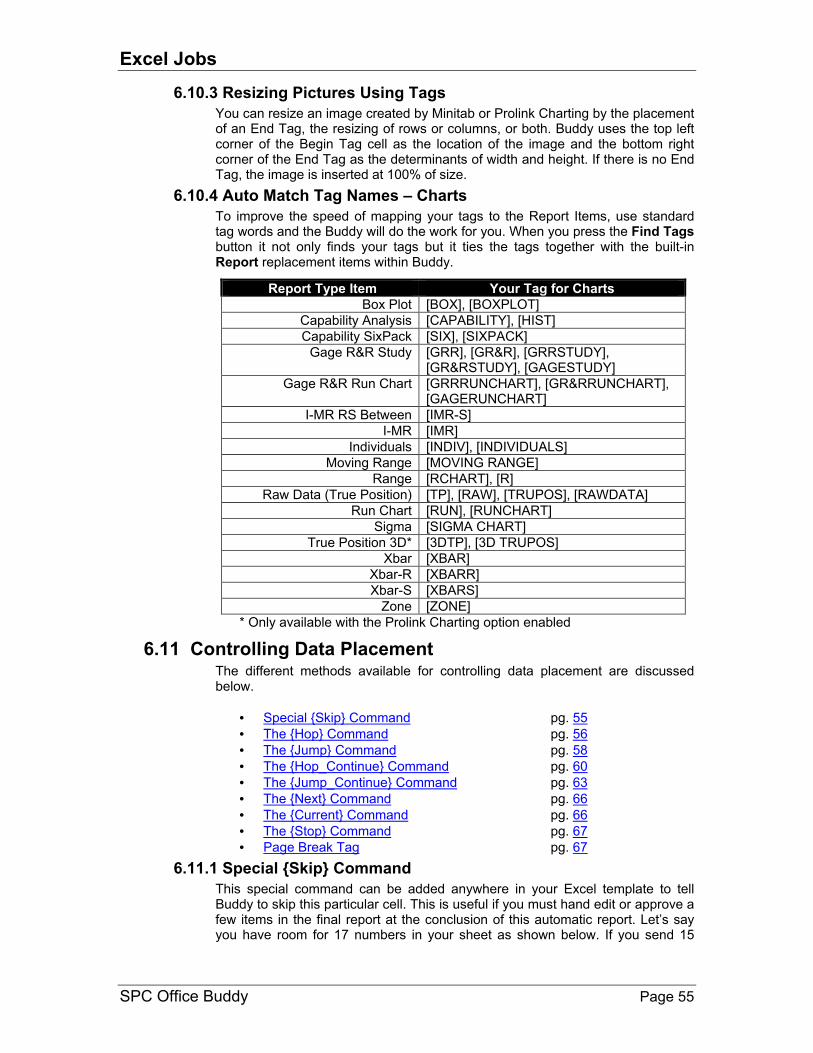
Excel Jobs
SPC Office Buddy Page 55
6.10.3 Resizing Pictures Using Tags
You can resize an image created by Minitab or Prolink Charting by the placement of an End Tag, the resizing of rows or columns, or both. Buddy uses the top left corner of the Begin Tag cell as the location of the image and the bottom right corner of the End Tag as the determinants of width and height. If there is no End Tag, the image is inserted at 100% of size.
6.10.4 Auto Match Tag Names – Charts
To improve the speed of mapping your tags to the Report Items, use standard tag words and the Buddy will do the work for you. When you press the Find Tags button it not only finds your tags but it ties the tags together with the built-in Report replacement items within Buddy.
Report Type Item Your Tag for Charts
Box Plot [BOX], [BOXPLOT]
Capability Analysis [CAPABILITY], [HIST]
Capability SixPack [SIX], [SIXPACK]
Gage R&R Study [GRR], [GR&R], [GRRSTUDY], [GR&RSTUDY], [GAGESTUDY]
Gage R&R Run Chart [GRRRUNCHART], [GR&RRUNCHART], [GAGERUNCHART]
I-MR RS Between [IMR-S]
I-MR [IMR]
Individuals [INDIV], [INDIVIDUALS]
Moving Range [MOVING RANGE]
Range [RCHART], [R]
Raw Data (True Position) [TP], [RAW], [TRUPOS], [RAWDATA]
Run Chart [RUN], [RUNCHART]
Sigma [SIGMA CHART]
True Position 3D* [3DTP], [3D TRUPOS]
Xbar [XBAR]
Xbar-R [XBARR]
Xbar-S [XBARS]
Zone [ZONE]
* Only available with the Prolink Charting option enabled
6.11 Controlling Data Placement The different methods available for controlling data placement are discussed below.
• Special {Skip} Command pg. 55
• The {Hop} Command pg. 56
• The {Jump} Command pg. 58
• The {Hop_Continue} Command pg. 60
• The {Jump_Continue} Command pg. 63
• The {Next} Command pg. 66
• The {Current} Command pg. 66
• The {Stop} Command pg. 67
• Page Break Tag pg. 67
6.11.1 Special {Skip} Command
This special command can be added anywhere in your Excel template to tell Buddy to skip this particular cell. This is useful if you must hand edit or approve a few items in the final report at the conclusion of this automatic report. Let’s say you have room for 17 numbers in your sheet as shown below. If you send 15
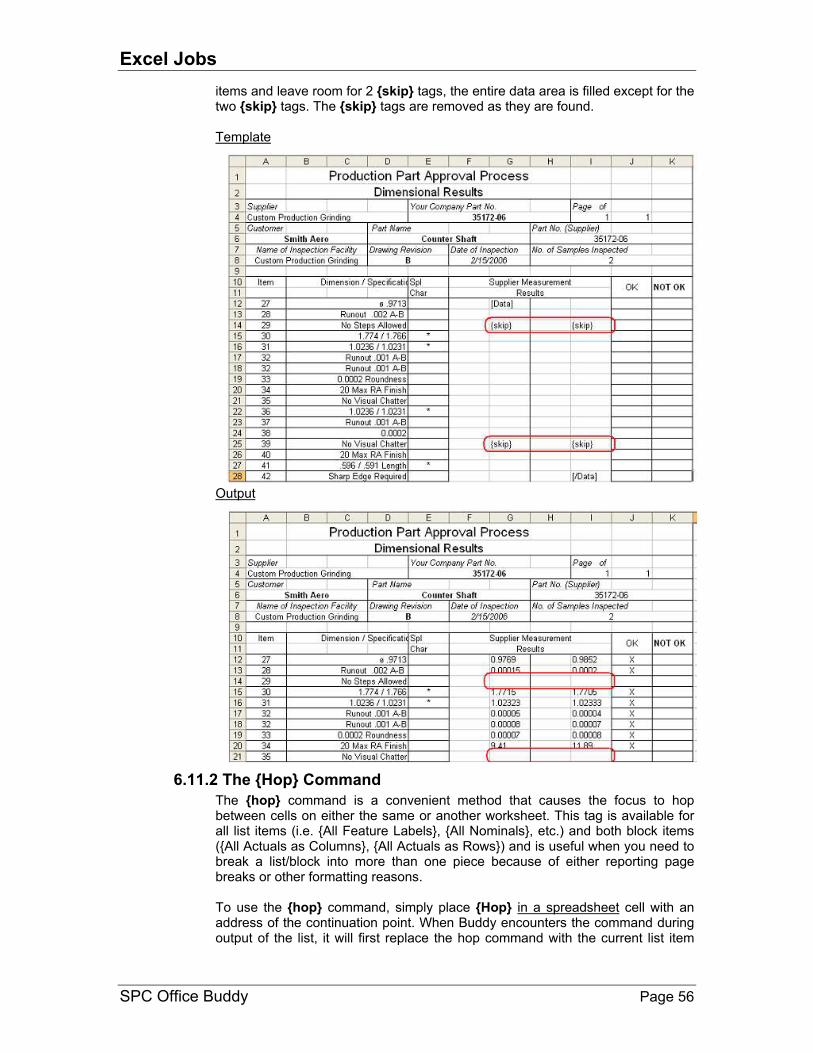
Excel Jobs
SPC Office Buddy Page 56
items and leave room for 2 {skip} tags, the entire data area is filled except for the two {skip} tags. The {skip} tags are removed as they are found. Template
Output
6.11.2 The {Hop} Command
The {hop} command is a convenient method that causes the focus to hop between cells on either the same or another worksheet. This tag is available for all list items (i.e. {All Feature Labels}, {All Nominals}, etc.) and both block items ({All Actuals as Columns}, {All Actuals as Rows}) and is useful when you need to break a list/block into more than one piece because of either reporting page breaks or other formatting reasons. To use the {hop} command, simply place {Hop} in a spreadsheet cell with an address of the continuation point. When Buddy encounters the command during output of the list, it will first replace the hop command with the current list item

Excel Jobs
SPC Office Buddy Page 57
and then jump to the new location and continue with the list until either a new end tag is found or the list ends. Template
The {hop} tag is formatted as follows: {hop:[sheet name]![cell address]} Sheet Name – This should be the name of the sheet as seen at the bottom of the Excel window. If the sheet name contains spaces, it should be enclosed in single quotes. This is a standard Excel practice for addressing.
(i.e. {hop:‘this is a sheet’!A5}).
Cell Address – This is the standard Excel addressing style of letter + number indicating the column letter and row number.
Examples: {hop:Sheet1!J6} – will cause the next item to be placed in J6 on Sheet1.
The template shown on the previous page shows the data starting a B6 flowing down to B17 then hopping to J6 and finally ending at J17 where our end tag is waiting. Here is what the final report might look like. Output

Excel Jobs
SPC Office Buddy Page 58
Hop Commands with End Tags
What’s important to understand about Buddy is that list type items always flow in the direction of the end tag (i.e. [/tag]). When Buddy encounters a {hop} command and jumps to another location, it searches for a new end tag. If it doesn’t find one, the list will continue on flowing downward (the default direction). If an end tag is found, the list will continue and flow in the direction of the new end tag. In this way, you could have a list that flows downward on one page, then hops to a new page and flows to the right. NOTE: You can place end tags on your sheets to effect flow direction regardless as to whether or not you will ever actually reach the end tag. This is because the end tag is always removed as soon as it is found and its location is remembered by Buddy during the sending of the data.
Hop Commands with Blocks
An important thing to remember about blocks is that the rows or columns do not loop back. They always run in one direction until either an end tag is reached or the data runs out. To stay consistent with this style, a {hop} command will cause the focus to jump to another cell, but the list will not be continued or loopback. Instead, the next row or column in the list will be started. This is to keep orphan items from being displayed in the wrong place. If you want looping to occur, use a series of {Actuals Current Column} lists and flow them either as columns or rows as necessary. Since {Actuals Current Column} is a list type, it will follow the normal list rules. Also see the hop_continue command.
6.11.3 The {Jump} Command
The {jump} command is similar to the {hop} command in that it causes the focus to jump between cells on either the same or another worksheet. The main difference is the {jump} command performs the jump before placing the value into the cell that contained the command. In other words, the {hop} command replaces the command with data first and then hops while the {jump} command jumps first and then puts the next data point in the destination cell before continuing. This tag is available for all list items (i.e. {All Feature Labels}, {All Nominals}, etc.) and both block items ({All Actuals as Columns}, {All Actuals as Rows}) and is useful when you need to break a list/block into more than one piece because of either reporting page breaks or other formatting reasons. To use the {jump} command, simply place {jump} in a spreadsheet cell with an address of the continuation point. When Buddy encounters the command during output of the list, it will jump to the new location and continue with the list until either a new end tag is found or the list ends.

Excel Jobs
SPC Office Buddy Page 59
Template
The {jump} tag is formatted as follows: {jump:[sheet name]![cell address]} Sheet Name – This should be the name of the sheet as seen at the bottom of the Excel window. If the sheet name contains spaces, it should be enclosed in single quotes. This is a standard Excel practice for addressing. (i.e. {jump:‘this is a sheet’!A5}). Cell Address – This is the standard Excel addressing style of letter + number indicating the column letter and row number.
Examples: {jump:Sheet1!J6} – will cause the next item to be placed in J6 on Sheet1.
The template above shows the data starting a B6 flowing down to B17 then jumping to J6 and finally ending at J19 where our end tag is waiting. Notice that the jump occurs before the data is placed into cell B17 which causes it to be blank. This is probably not a typical example, but was used to illustrate the difference between the {hop} and {jump} commands. Here is what the final report might look like.

Excel Jobs
SPC Office Buddy Page 60
Output
Jump Commands with End Tags
What’s important to understand about Buddy is that list type items always flow in the direction of the end tag (i.e. [/tag]). When Buddy encounters a {jump} command and jumps to another location, it searches for a new end tag. If it doesn’t find one, the list will continue on flowing downward (the default direction). If an end tag is found, the list will continue and flow in the direction of the new end tag. In this way, you could have a list that flows downward on one page, then jumps to a new page and flows to the right. NOTE: You can place end tags on your sheets to effect flow direction regardless as to whether or not you will ever actually reach the end tag. This is because the end tag is always removed as soon as it is found and its location is remembered by Buddy during the sending of the data.
Jump Commands with Blocks
An important thing to remember about blocks is that the rows or columns do not loop back. They always run in one direction until either an end tag is reached or the data runs out. To stay consistent with this style, a {jump} command will cause the focus to jump to another cell, but the list will not be continued or loopback. Instead, the next row or column in the list will be started. This is to keep orphan items from being displayed in the wrong place. If you want looping to occur, use a series of {Actuals Current Column} lists and flow them either as columns or rows as necessary. Since {Actuals Current Column} is a list type, it will follow the normal list rules. Also see the jump_continue command.
6.11.4 The {Hop_Continue} Command
The {hop continue} command is very similar to the hop command. In fact, if you are using it in list types (such as {All Nominals} or {All Labels}), it behaves identically to the {hop} command. The difference happens when using it within a
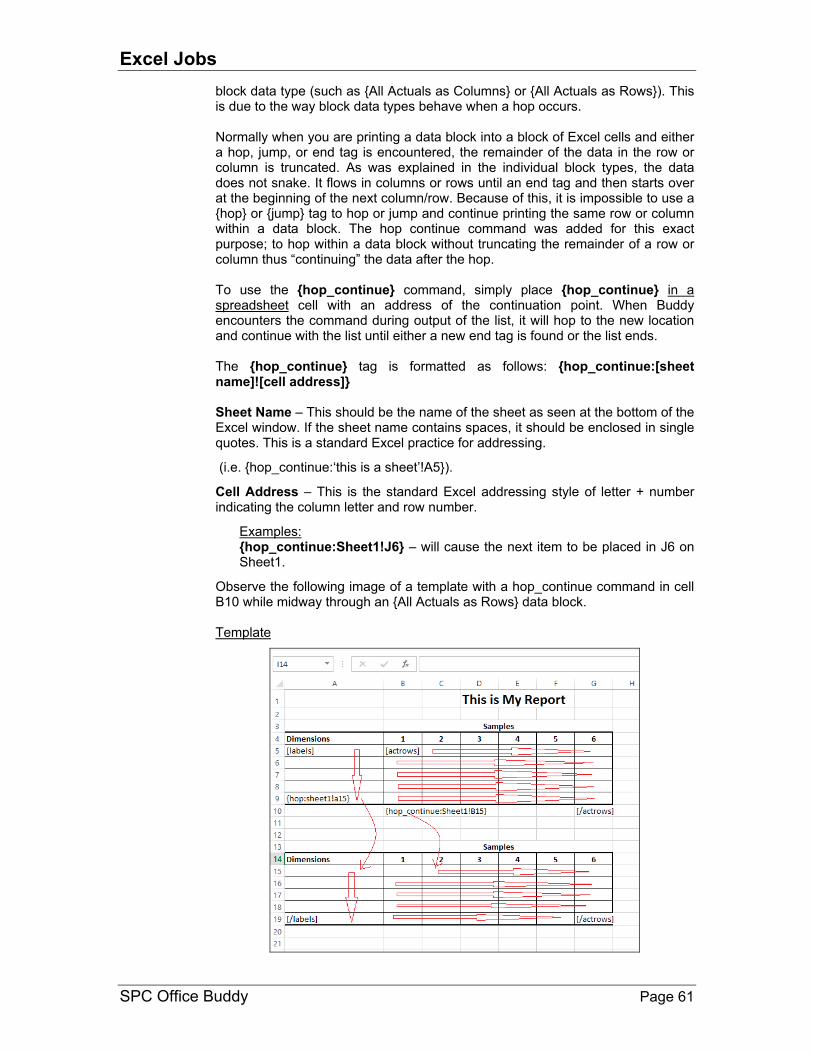
Excel Jobs
SPC Office Buddy Page 61
block data type (such as {All Actuals as Columns} or {All Actuals as Rows}). This is due to the way block data types behave when a hop occurs. Normally when you are printing a data block into a block of Excel cells and either a hop, jump, or end tag is encountered, the remainder of the data in the row or column is truncated. As was explained in the individual block types, the data does not snake. It flows in columns or rows until an end tag and then starts over at the beginning of the next column/row. Because of this, it is impossible to use a {hop} or {jump} tag to hop or jump and continue printing the same row or column within a data block. The hop continue command was added for this exact purpose; to hop within a data block without truncating the remainder of a row or column thus “continuing” the data after the hop. To use the {hop_continue} command, simply place {hop_continue} in a spreadsheet cell with an address of the continuation point. When Buddy encounters the command during output of the list, it will hop to the new location and continue with the list until either a new end tag is found or the list ends. The {hop_continue} tag is formatted as follows: {hop_continue:[sheet name]![cell address]} Sheet Name – This should be the name of the sheet as seen at the bottom of the Excel window. If the sheet name contains spaces, it should be enclosed in single quotes. This is a standard Excel practice for addressing.
(i.e. {hop_continue:‘this is a sheet’!A5}).
Cell Address – This is the standard Excel addressing style of letter + number indicating the column letter and row number.
Examples: {hop_continue:Sheet1!J6} – will cause the next item to be placed in J6 on Sheet1.
Observe the following image of a template with a hop_continue command in cell B10 while midway through an {All Actuals as Rows} data block. Template
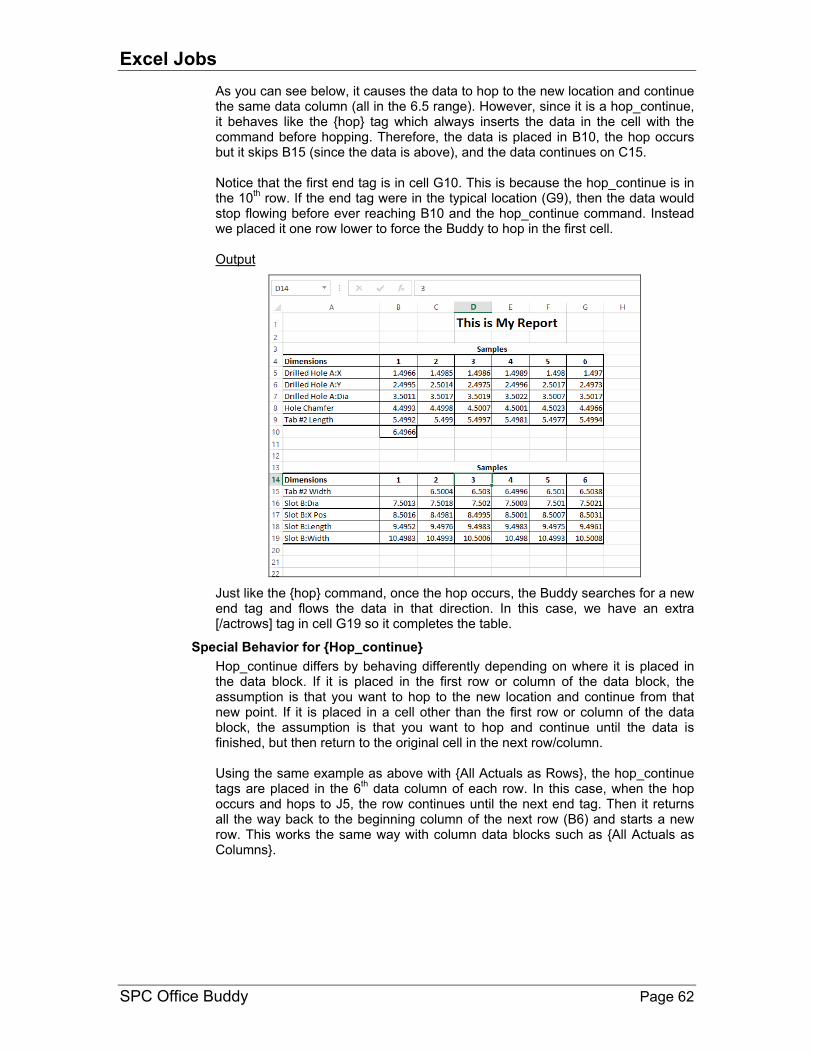
Excel Jobs
SPC Office Buddy Page 62
As you can see below, it causes the data to hop to the new location and continue the same data column (all in the 6.5 range). However, since it is a hop_continue, it behaves like the {hop} tag which always inserts the data in the cell with the command before hopping. Therefore, the data is placed in B10, the hop occurs but it skips B15 (since the data is above), and the data continues on C15. Notice that the first end tag is in cell G10. This is because the hop_continue is in the 10
th row. If the end tag were in the typical location (G9), then the data would
stop flowing before ever reaching B10 and the hop_continue command. Instead we placed it one row lower to force the Buddy to hop in the first cell. Output
Just like the {hop} command, once the hop occurs, the Buddy searches for a new end tag and flows the data in that direction. In this case, we have an extra [/actrows] tag in cell G19 so it completes the table.
Special Behavior for {Hop_continue}
Hop_continue differs by behaving differently depending on where it is placed in the data block. If it is placed in the first row or column of the data block, the assumption is that you want to hop to the new location and continue from that new point. If it is placed in a cell other than the first row or column of the data block, the assumption is that you want to hop and continue until the data is finished, but then return to the original cell in the next row/column. Using the same example as above with {All Actuals as Rows}, the hop_continue tags are placed in the 6
th data column of each row. In this case, when the hop
occurs and hops to J5, the row continues until the next end tag. Then it returns all the way back to the beginning column of the next row (B6) and starts a new row. This works the same way with column data blocks such as {All Actuals as Columns}.

Excel Jobs
SPC Office Buddy Page 63
Template
In the example above there are multiple [/actrows] end tags on the right side in cells O10-O14 because each hop_continue searches for an end tag and flows toward it if found. In addition, each hop_continue also removes the end tag when found making it necessary to add 4 end tags to match the 4 hop_continue commands. Output
In cell B10, there is a jump_continue command which introduces our next topic.
6.11.5 The {Jump_Continue} Command
The {jump_continue} command behaves the same as the hop_continue command except it jumps before the data is placed in the cell. This mirrors the behavior of the {hop} and {jump} commands respectively. Like the {hop_continue} command, if you are using it in list types (such as {All Nominals} or {All Labels}), it behaves identically to the {jump} command. The difference happens when using it within a block data type (such as {All Actuals as Columns} or {All Actuals as Rows}). To use the {jump_continue} command, simply place {jump_continue} in a spreadsheet cell with an address of the continuation point. When Buddy encounters the command during output of the list, it will jump to the new location and continue with the list until either a new end tag is found or the list ends. The {jump_continue} tag is formatted as follows:
{jump_continue:[sheet name]![cell address]}

Excel Jobs
SPC Office Buddy Page 64
Sheet Name – This should be the name of the sheet as seen at the bottom of the Excel window. If the sheet name contains spaces, it should be enclosed in single quotes. This is a standard Excel practice for addressing. (i.e. {jump_continue:‘this is a sheet’!A5}). Cell Address – This is the standard Excel addressing style of letter + number indicating the column letter and row number.
Examples: {jump_continue:Sheet1!J6} – will cause the next item to be placed in J6 on Sheet1.
Observe the following image of a template with a jump_continue command in cell B10 while midway through an {All Actuals as Rows} data block: Template
Like the {jump} command, it jumps (before inserting the data into B10) and then continues inserting rows until running out in G19. Just like the hop, jump, and hop_continue commands, it searches for a new end tag after the jump and flows in the direction of G19.

Excel Jobs
SPC Office Buddy Page 65
Output
Special Behavior of {jump_continue}
Like the hop_continue command, jump_continue differs by behaving differently depending on where it is placed in the data block. If it is placed in the first row or column of the data block, the assumption is that you want to jump to the new location and continue from that new point. If it is placed in a cell other than the first row or column of the data block, the assumption is that you want to jump and continue until the data is finished, but then return to the original cell in the next row/column.
Template
In the example above there are multiple [/actrows] end tags on the right side in cells O10-O14 because each jump_continue searches for an end tag and flows toward it if found. In addition, each jump_continue also removes the end tag

Excel Jobs
SPC Office Buddy Page 66
when found making it necessary to add 4 end tags to match the 4 jump_continue commands.
Output
Using the same example as above with {All Actuals as Rows}, the jump_continue tags are placed in the 6
th data column of each row. In this case, when the jump
occurs and jumps to J5, the row continues until the next end tag. Then it returns all the way back to the beginning column of the next row (B6) and starts a new row. However, since we are using a {jump_continue}, it jumps before placing the value into the cell where the jump_continue is found. This leaves the 6
th data
column empty and is similar to the {jump} command since it jumps first. This works the same way with column data blocks such as {All Actuals as Columns}. As you can see from the examples throughout the {hop}, {jump}, {hop_continue} and {jump_continue}, there are different scenarios where each of these commands are well and not so well suited. Using a combination of the commands should be able to help you flow the data in the direction you need and give you the ability to hop or jump across pages.
6.11.6 The {Next} Command
When using the {hop}, {hop_continue}, {jump}, or {jump_continue} commands, you can use the {next} command in place of the sheet name to substitute the name of the next sheet. This can be especially useful when using a Page Break tag because Buddy will be creating worksheets dynamically and you may not know the name of the sheet until it is created. The {next} command will automatically move to the next sheet (if found) and continue.
Example: {jump_continue:Sheet1!J6} – will cause the next item to be placed in J6 on Sheet1.
{jump_continue:{Next}!J6} – will cause the next item to be placed in J6 on the next worksheet.
6.11.7 The {Current} Command
When using the {hop}, {hop_continue}, {jump}, or {jump_continue} commands, you can use the {current} command in place of the sheet name to substitute the name of the current sheet. This is a very useful command when you are using the second worksheet option (copy first worksheet for each dimension) because the worksheets are created/named dynamically based on the dimensions sent to

Excel Jobs
SPC Office Buddy Page 67
the report. The {current} command allows you to hop/jump around within each individual sheet without having to worry about the name.
6.11.8 The {Stop} Command
As the name implies, when the {stop} command is encountered all block and list type replacements stop in that cell. Please note that the cell containing the {stop} command is replaced with the value before the stop actually occurs. This can be a convenient command to use in addition to/in place of an end tag. Normally Buddy replaces end tags as soon as they are found. When you hop or jump, Buddy looks for a new end tag and flows the data toward that end tag until the end tag’s cell is hit (or another hop/jump command is encountered along the way). When found, the end tag is removed from the cell (cell’s value is set to “”) as soon as it is found. Therefore, if you have several hop commands in the same sheet, you’ll also need several end tags since each is removed when found. The {stop} command is never removed until it is encountered. This allows you to use the end tag to control the flow, but the {stop} command to issue a hard stop.
6.11.9 Page Break Tag
In your report, you may want to allow the report to flow onto multiple pages if you send more data than you have room for on a single worksheet. When you are setting up your Excel Job in the wizard, you have the opportunity to declare a Page break tag. This tag can be any valid block type tag on any of the sheets in your report. When you declare the Page Break tag, you are telling Buddy to look at the data that is being sent to the Excel Job and create as many worksheets as necessary to display all of the data. As a simple example, let’s say you have a template that will display your data as columns and you have laid it out so you have 5 columns and 10 rows. If you declare a Page Break tag on your {All Actuals as Columns} tag and you have highlighted 5 columns and 30 rows Buddy will automatically copy the worksheet twice to account for the extra 20 rows of data and will populate all three worksheets until it has run out of data. All other tags on the copied worksheets will also be replaced to match the first sheet. Rules for Page Break tags:
1. Page Break tags can only be used in Excel Jobs using the first worksheet option (Edit the sheets of the template as is…).
2. Only one Page Break tag is allowed per Excel Job. 3. Only block type tags can be used as the Page Break tag. 4. The worksheet with the Page Break tag can be any worksheet in the
workbook. All copied worksheets will be placed to the right of the worksheet containing the Page Break tag.
Worksheet Numbering
Worksheet numbering is generally a two number system (dimensions and records) that always begins with the page number as it relates to dimensions and ending with the page number as it relates to records. This is explained better with the example below.

Excel Jobs
SPC Office Buddy Page 68
Let’s say you have a Worksheet called “Report” that has a tag space for {All Actuals as Columns} spanning 5 columns and 10 rows. When you run the Excel Job, you highlight 7 features and 30 rows.
When Buddy copies the worksheet, it realizes that you need extra space for both features and records so it first copies the worksheet twice for the features (1-5 and 6-7) and then three times for the extra records. The result will be the following six worksheets:
Report 1~1 – Features 1-5 and records 1-10 Report 1~2 – Features 6-7 and records 1-10 Report 2~1 – Features 1-5 and records 11-20 Report 2~2 – Features 6-7 and records 11-20 Report 3~1 – Features 1-5 and records 21-30 Report 3~2 – Features 6-7 and records 21-30
The first two pages have been displayed below.
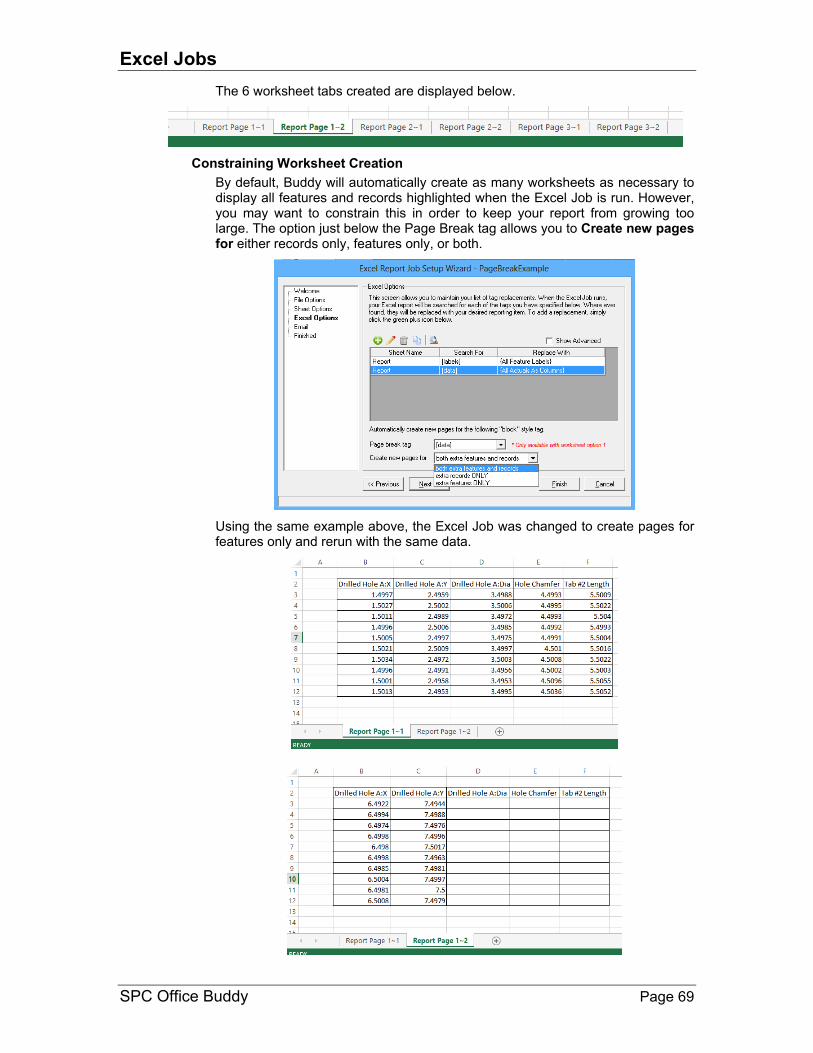
Excel Jobs
SPC Office Buddy Page 69
The 6 worksheet tabs created are displayed below.
Constraining Worksheet Creation
By default, Buddy will automatically create as many worksheets as necessary to display all features and records highlighted when the Excel Job is run. However, you may want to constrain this in order to keep your report from growing too large. The option just below the Page Break tag allows you to Create new pages for either records only, features only, or both.
Using the same example above, the Excel Job was changed to create pages for features only and rerun with the same data.

Excel Jobs
SPC Office Buddy Page 70
As you can see, only two worksheets were created this time and the remaining records (11-30) were truncated. One issue you’ll notice about this report is that the Feature Labels are repeated on the second page and do not match the data that is beneath them. There are times when you will want to repeat the same labels on subsequent worksheets (for instance, when you are printing records 11-30), but this is not one of them. To solve this issue, we’ll modify our template slightly.
Use of {hop} with Page Break Tags
We made two changes to our template. The first change was to move the [/labels] tag to the right by one cell. This is so the feature labels will still flow in a row. However, this end tag will never be hit due to the second change.
The second change is the {hop} command (highlighted above in the formula line). On its way to the [/labels] end tag, Buddy will encounter the {hop} command and hop to cell B2 in the “next” worksheet. Notice the use of the {next} keyword. The {next} command is explained earlier in this manual, but it essentially tells Buddy to hop to the next worksheet regardless of its name. Since the worksheets will be created when the Excel Job is run, we don’t know the name of each worksheet when the template is created. The {next} command ensures the correct worksheet will be found dynamically. Furthermore, cell B2 on the next worksheet just happens to be the [labels] tag since all tags are copied to the new worksheets. As such, the Feature Label list will flow from B2 to F2, hop to B2 on the next worksheet, and continue until they run out or hit another {hop} command.

Excel Jobs
SPC Office Buddy Page 71
The result is below and is now correct.
Please keep in mind that the example above uses the {hop} command, but the {hop_continue}, {jump}, and {jump_continue} commands are all supported.
Synchronizing Records across Page Break
As stated above, the worksheets are copied for dimensions first and then records. Using the above scenario, it’s easy to see how you might want to save record related data into your spreadsheet (record numbers, trace information at the part level, etc). Since we don’t know how many pages will be created from the dimension, this creates a problem. For example, if we send 7 dimensions, then it will create two pages for each set of records (total: 6 pages). However, if we sent 12 dimensions, then it will create three pages for each set of records (total: 9 pages). This means the {next} keyword will not work for records. Instead, there is a special checkbox that can be set when setting up the tag replacements in the Excel Job itself. On the Excel Job Replacement Setup screen, check the Sync record numbers with page break tag. When this is checked and a page break occurs, the records automatically stay synchronized across pages regardless as to how many dimension pages are created due to the page breaks. This checkbox is only available if a page break tag has been selected and a

Excel Jobs
SPC Office Buddy Page 72
record level replacement is chosen (such as factor lists, record numbers, actuals current column, etc).
6.12 General Tips for Excel Job 1. The default assumption for placing data in the sheet is to insert columns
of numbers from top to bottom and then left to right. To force Buddy to place the next value in a row, you must place an End Tag to the right of the tag.
2. When using End Tags, you must place the End Tag in a larger cell than the beginning tag. In other words, it must be to the right or lower in the sheet, or both. Buddy does not support reverse lookups.
3. Each feature in the QC-CALC database has only one nominal yet it has many actual values. For this reason, you’ll notice the Report Item names are written as singular - {Feature Label} or plural {Actuals Current Column}.
4. You should format the cells in your Excel template the way you want the final report. This way you will not have to reformat each report after Buddy creates it. So if you want certain text colors or numeric formatting, or conditional formatting, put everything in the template and your final report will be exactly what you want when Buddy finishes.
5. Excel offers Conditional Formatting where you have the sheet test for out of specification. If the value is larger than the Upper Spec Limit or lower than the Lower Spec Limit, you can make the text red in color to catch your eye. Of course you must send the nominals and tolerances to your report so they can be used in the Conditional Formatting.
6. The order in which the Report Items are placed in your Excel report is based on the list you generated in your Excel job. The job is run top to bottom one after another. So if you overlap tag pairs you may overlap some of the data in the report. Be careful!
6.13 Workbook and Sheet Considerations The Sheet Option discussed earlier may require some extra description to ensure you understand all options available to you. You can simply use a single sheet template to hold all features or create new sheets or new workbooks as described in the Excel Report Job Setup Wizard. Let’s take a closer look at our options.
Edit the sheets of the template as is without renaming the sheets or creating new sheets.
Most users will choose to have Buddy place all of the results onto an Excel sheet that contains the framework of their original report. In other words, replace the data from the report they used to do by hand with [tags] which creates a template that can be reused over and over again by Buddy. This requires a method of

Excel Jobs
SPC Office Buddy Page 73
identifying and separating the data by using the {column} tag variable discussed in Special {Column} Tag Variable on page 53.
Copy the first sheet in the template for each column of data selected and name each new sheet after the feature name.
There may be times when your report is so complex you want each reported feature to be separated into different sheets and each sheet to be renamed to the feature name. This option is used to create such a report. The setup is simple. Create the template you want on the first sheet in the workbook and Buddy will copy that sheet, fill it with the data and charts, and rename it to that particular reported feature. It will do this over and over until all features have been processed. Your final Excel workbook report contains the same number of sheets as reported features, each separated by name. In the worksheet method, Buddy always copies the first worksheet and only replaces tags on that worksheet and its copies. As such, you’ll notice that the Sheet list is disabled on the Excel Options screen of the Excel Report Job Setup Wizard. Furthermore, as you add replacements, “Sheet1” is always added to the grid below. It is not necessary for the sheet to actually be named “sheet1” as Buddy uses the first sheet it finds.
Create a new workbook for each column of data selected using all sheets from the template.
You may want to raise the option beyond the sheet level to the workbook level. The concept is the same as the previous option but instead of copying sheets and renaming them, Buddy copies the entire workbook and names it the same name as your original but adds a number 1, 2, 3 etc. One benefit of this option over the worksheet method is that Buddy can replace tags on multiple sheets for the same column of data. Therefore, you could have tags on Sheet1, other tags on Sheet2, and others on Sheet3. When you build the Excel Job, you specify which sheet to search when you create your replacements just as you would when using the first option.

Batch Jobs
SPC Office Buddy Page 74
7. Batch Jobs
7.1 Introduction Batch Jobs were added to version 3.3 of Buddy to simplify the process of running multiple Excel Jobs to merge data from different QC-CALC files. Say you have 2 different inspection results files from different gages that you wish to summarize in one Excel report. It is normal to join data from OP10 and OP20 and so on.
7.2 Batch Job Concept This concept involves creating one master template with several sections, each being filled in by a different Excel Job. You’ll start with a master template that contains the entire report template and run the first Excel Job. This Excel Job creates a second Excel file (template) which is partially filled in. You then open a another QC-CALC file; select the second set of data, and run a second Excel Job using the spreadsheet from the first job as the template. You can continue performing this leap frog sequence as many times as needed. Graphically it looks something like:
This type of sequence may seem difficult but it allows for extreme flexibility. In the following example, we will write two separate Excel Jobs and use two separate QC-CALC databases and run them both to create our final report. The sequence is as follows:
1. Open a QC-CALC database with record and dimension filters 2. Run Excel Job #1 called BigBatch using Master.xls as the template. 3. The output is saved as Final.xls as the next template 4. Open the second QC-CALC database with record and dimension filters 5. Run Excel Job #2 called Final_Report using Final.xls 6. The final report is completed, saved, and left on screen.
Keep in mind you can use Batch Jobs to run totally unrelated Excel jobs to speed up the task of running periodic reports. Use the tool that saves you the most time.

Batch Jobs
SPC Office Buddy Page 75
7.3 Running Multi-Job Example
7.3.1 The Master Template – Make the Template
This is the beginning template called Master.xls or whatever you desire. We use this as the first template and will run our BigBatch Excel Job to create Final.xls. The newly created Excel file is used in the last step of this example. Everything in the left side of this template is filled in by the first Excel Job and saved as Final.xls. The right hand side will be filled in using the second Excel Job. Step 1: We opened the L4 64676.QCC Step 2: Using the Dimension selector we chose Dims 1, 2, & 3 Step 3: We saved the selection as My First 3 Dims Step 4: Using the Record Filter we chose (Show All) Step 5: We ran the BigBatch Excel Job and the following Excel file was created

Batch Jobs
SPC Office Buddy Page 76
7.3.2 The Second Template
This is a new template just created and is called Final.xls. We use this template (half filled in) in our next job and will finish populating the right side with data from a second QC-CALC database.

Batch Jobs
SPC Office Buddy Page 77
7.3.3 The Related Excel Job
Here are the basic settings that match the Excel template above. The Template Path (input) along with the Output Path and File Name are specified in the second step of the Excel Job wizard.
The screen below shows how we linked the tags found in the Excel template to the SPC Office Buddy replacements items.

Batch Jobs
SPC Office Buddy Page 78
7.3.4 The Final Report
This report is the final report we wanted to create. The first 3 dimensions on the left are from one QC-CALC database after running the first Excel Job and the second two on the right are from running the second Excel Job. This Excel file is called Final.xls. Step 1: We opened a QC-CALC file called A-CMM-Report.QCC Step 2: We chose Dim 13 (4TP) and Dim 23 (4Diameter) Step 3: We saved the dimension selection as TP & Diameter Step 4: Using the Record Filter we chose (Show All) Step 5: We ran the Final_Report Excel Job creating the following Excel file

Batch Jobs
SPC Office Buddy Page 79
7.3.5 The Related Excel Job
Here are the basic settings that match the Excel template above. The Template Path (input) along with the Output Path and File Name are specified. Notice how in this step the template and output file name are the same? This is so we save over the existing file. It is not recommended you do this in the first Excel Job because you would have to recreate the template next time. However, in subsequent steps, you can safely save the report over the existing template as you slowly build out your full report.
The screen below shows how we linked the tags found in the template to Buddy’s replacements items.

Batch Jobs
SPC Office Buddy Page 80
7.4 Create the Batch Job Now that we created and ran the two individual Excel Jobs along with their Excel templates we want to run both jobs as one large job to speed up the process. This step-by-step explanation shows you how to automate the two Excel Jobs into this one Batch Job which is perfect for repetitive tasks. 1. Select the View menu and choose Batch Job List. If this menu is already
checked press ESC otherwise, check it. This ensures you can see and use the Batch Job panel.
2. In the Select Batch Job panel click the green plus button (Add New Batch Job). The following wizard screen appears:
3. Enter a name such as First Try and Click the Next >> button. 4. On the Excel Jobs screen, click the green plus button to Add an Excel Job
to the process.

Batch Jobs
SPC Office Buddy Page 81
5. Answer all the questions on the Batch Job Setup screen and click OK. These are the same details we chose while making our First Excel Job (The Master Template – Make the Template section) on page 75.
6. Next, click the Add New Task button on the Batch Job Setup Wizard screen again.
7. Answer the questions on the Batch Job Setup screen for the next stage of your Batch Job. These are the same details we chose while making our second Excel Job (The Second Template section) on page 76.

Batch Jobs
SPC Office Buddy Page 82
8. Click OK and the Batch Job should look something like this:
9. Click the Next >> button followed by the Finish button to complete the Batch Job.

Batch Jobs
SPC Office Buddy Page 83
7.4.1 Ask Parameters
When filling out the tasks, you fill out the Excel Job to run, QCC file to use as the data source, and the Dimension and Record Filters. When choosing a Record Filter, if the record filter is the type that has “ASK” parameters, you can specify them as a comma delimited list in the Ask Parameters field just below the Record Filter list.
For instance, let us assume you need to create a report to group the data across 2 lots and 5 cavities to see how each is performing. This will create 10 combinations/groupings for your report. Rather than creating 10 separate record filters to capture each combination, build a filter that includes two ASK filters as shown below so the values can be supplied when the report runs.
When you are setting up the Batch Job, you supply the values for your ASK filters in the parameter list just below the Record Filter list separated by commas. For instance, if you wanted to query Lot 2 and Cavity 4, you would specify 2,4 in your list for that Excel Job step. In the example above, you would likely have 10 identical tasks (steps) in your Batch Job with the exception of the parameters for the record filter (i.e. 1,1 1,2 1,3 1,4 1,5 2,1…).

Batch Jobs
SPC Office Buddy Page 84
7.4.2 Batch Job Options
Most batch jobs assume they are starting with a blank template and then executing several Excel Jobs until the template is full. Each Excel Job fills in a section or worksheet in your final report until it is complete. However, in certain cases, you may want to run multiple Batch Jobs to create different sections on the same overall report. Much like the Use report as template on subsequent batch runs checkbox allows you to re-use the same template rather than having two separate Excel Jobs in order to run batch jobs, there is an option to allow Batch Jobs to operate on the same Excel spreadsheet as well. On the Finish screen is a list of options that can be chosen. No continuation (default) – This option operates normally. It passes the step number normally to the Excel Job in each step. If the Excel Job was setup using the Use report as template… checkbox, it will use the template spreadsheet on the first step and the report spreadsheet on subsequent steps until the report is built. Automatically continue with a previous batch – This option still passes in the step number to each Excel Job. However, for the first step, it also passes in an override flag that tells the Excel Job to use the report as the template even though it is the first step. This allows one Batch Job to lead to another and operate on the same final report without restarting. Prompt user for selection – This option will allow you to choose either option at run time when you launch the Batch Job. This option can be useful if you have a few Batch Jobs that will create your report but you do not always run them in the same order. If this option is set, then when you run the Batch Jobs, Buddy will ask you whether you want to continue with an existing report as the template (continue with a previous batch) or start with a clean template. Choosing Yes continues with a previous batch and No starts with a clean template.

Batch Jobs
SPC Office Buddy Page 85
7.5 Run the Batch Job Running a Batch Job is extremely easy since it contains all of the selections and requires no further choices. Simply highlight the Batch Job in the list and press the green Play button. Hint: you can double click the Batch Job and it will run. During the running of a Batch Job you will see a lot of screen flashing as the data is moved between software products until all jobs are complete. Speed Issue: Be sure the Excel template file is in Normal view and NOT in Page Layout. Page Layout view makes the job very slow!

Running Jobs from Windows
SPC Office Buddy Page 86
8. Running Jobs from Windows
8.1 Running Batch Jobs from Windows
8.1.1 Introduction
Now that you have created a Batch Job to produce one large report across multiple files, you might want to trigger this batch job using Windows Task Scheduler found under the Administrator Tools. This section describes how to write and periodically run command files using Windows Scheduled Tasks.
8.1.2 Command Line Structure
The command line structure is very simple and an example follows. The command line contains the keyword “/batch;” followed by one item that tells Buddy which batch job to run. The command line item is not case sensitive.
“C:\Prolink\SPC Office Buddy 3.4\SpcOfficeBuddy.exe” /batch;batchjob=first try.sjo
Using Windows 7 Task Scheduler we chose Buddy as the Program/script and added the batch job to run in the Add arguments area.
8.1.3 Make the Batch File
If you wish, you can create a Windows batch command file (.BAT) using Notepad or a similar text editor. Using Notepad, create a file and save it on your desktop and give it a name like Buddy.bat. A quick way to get started is to copy the example above and paste it into your Notepad file, then simply change the parameter values to suit your particular needs. If you would like to run multiple Batch Jobs together, copy the example multiple times specifying different Batch Jobs in each step. When you run the batch file, Buddy will appear more than once as each step in the batch is run. Remember, you can run a simple one line batch file any time you want to run Batch Jobs. This means you can create a batch file and have it run automatically using Windows Scheduled Tasks even though you are not joining multiple files.
8.1.4 Run the File
Run your newly created batch file by double clicking the file name you just finished. If you saved the batch file on your desktop, simply double click it and you’ll see the Buddy splash screen and eventually the Excel spreadsheet containing your results. While running, you’ll also see a black DOS screen. This will disappear when the batch file has finished.
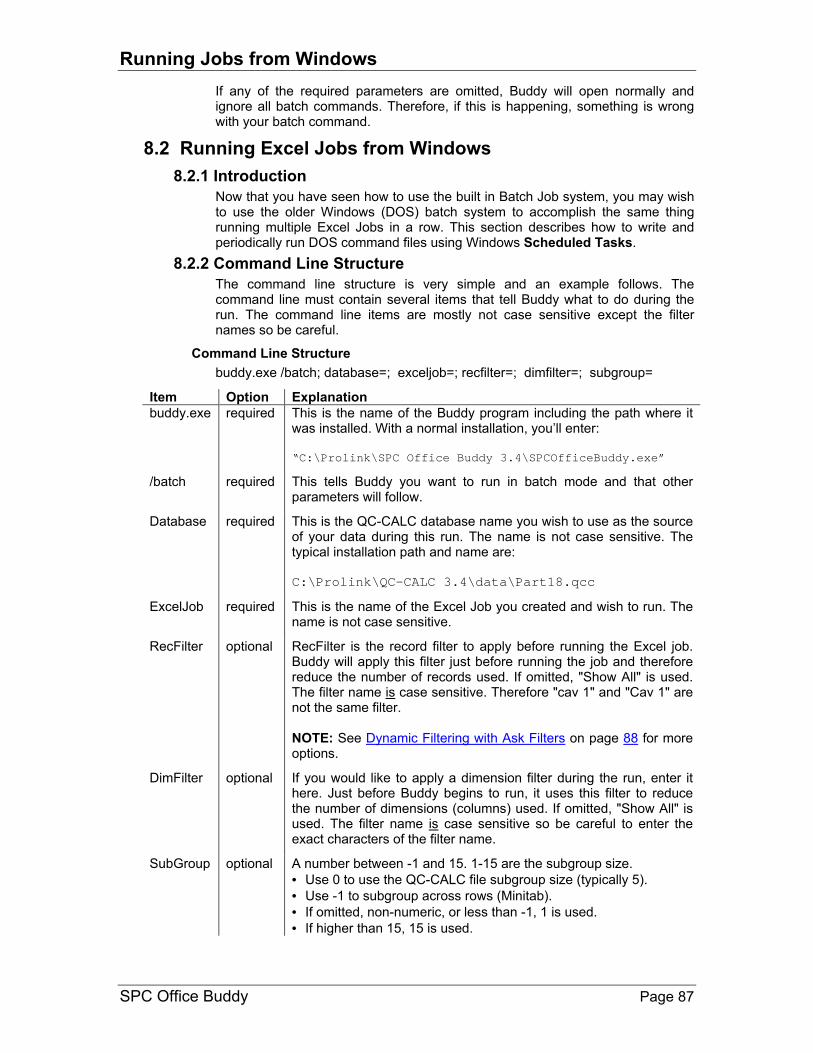
Running Jobs from Windows
SPC Office Buddy Page 87
If any of the required parameters are omitted, Buddy will open normally and ignore all batch commands. Therefore, if this is happening, something is wrong with your batch command.
8.2 Running Excel Jobs from Windows
8.2.1 Introduction
Now that you have seen how to use the built in Batch Job system, you may wish to use the older Windows (DOS) batch system to accomplish the same thing running multiple Excel Jobs in a row. This section describes how to write and periodically run DOS command files using Windows Scheduled Tasks.
8.2.2 Command Line Structure
The command line structure is very simple and an example follows. The command line must contain several items that tell Buddy what to do during the run. The command line items are mostly not case sensitive except the filter names so be careful.
Command Line Structure
buddy.exe /batch; database=; exceljob=; recfilter=; dimfilter=; subgroup=
Item Option Explanation
buddy.exe required This is the name of the Buddy program including the path where it was installed. With a normal installation, you’ll enter: “C:\Prolink\SPC Office Buddy 3.4\SPCOfficeBuddy.exe”
/batch required This tells Buddy you want to run in batch mode and that other parameters will follow.
Database required This is the QC-CALC database name you wish to use as the source of your data during this run. The name is not case sensitive. The typical installation path and name are: C:\Prolink\QC-CALC 3.4\data\Part18.qcc
ExcelJob required This is the name of the Excel Job you created and wish to run. The name is not case sensitive.
RecFilter optional RecFilter is the record filter to apply before running the Excel job. Buddy will apply this filter just before running the job and therefore reduce the number of records used. If omitted, "Show All" is used. The filter name is case sensitive. Therefore "cav 1" and "Cav 1" are not the same filter. NOTE: See Dynamic Filtering with Ask Filters on page 88 for more options.
DimFilter optional If you would like to apply a dimension filter during the run, enter it here. Just before Buddy begins to run, it uses this filter to reduce the number of dimensions (columns) used. If omitted, "Show All" is used. The filter name is case sensitive so be careful to enter the exact characters of the filter name.
SubGroup optional A number between -1 and 15. 1-15 are the subgroup size.
• Use 0 to use the QC-CALC file subgroup size (typically 5).
• Use -1 to subgroup across rows (Minitab).
• If omitted, non-numeric, or less than -1, 1 is used.
• If higher than 15, 15 is used.

Running Jobs from Windows
SPC Office Buddy Page 88
Each parameter is entered as a name=value pair separated by semicolons. e.g. "C:\Prolink\SPC Office Buddy 3.4\SPCOfficeBuddy.exe " /batch; database=C:\Prolink\QC-CALC 3.4\data\MyPart .qcc; exceljob=cmm batch; recfilter=MyRecs; dimfilter=MyD ims Notes:
• Double quotes were added around the Buddy’s file path and name. This is required since the DOS portion of Windows has difficulty with long file names and <space> characters in the name.
• Be sure you insert a <space> before the /batch parameter.
• The command line shown above is actually one long line, but it is shown as three separate lines because of line wrapping (display only).
8.2.3 Make the Batch File
You must create a Windows batch command file (.BAT) using Notepad or a similar text editor. Using Notepad, create a file and save it on your desktop and give it a name like Buddy.bat. Be sure Notepad doesn't name it "Buddy.bat.txt" as this will not work. You can ensure no .TXT is added by selecting “All Files” in the Save as type area when you save the file. A quick way to get started is to copy the example above and paste it into Notepad. Then simply change the parameter values to suit your particular needs. If you would like to run multiple Excel Jobs together, simply copy the example multiple times specifying different QCC files, filters, and/or Excel Jobs in each step. When you run the batch file, Buddy will appear more than once as each step in the batch is run. Remember, you can run a simple one line batch file any time you want to run jobs without having to remember the parameters. This means you can create a batch file and have it run automatically using Windows Scheduled Tasks even though you are not joining multiple files.
8.2.4 Run the File
Run your newly created batch file by double clicking the file name you just finished. If you saved the batch file on your desktop, simply double click it and you’ll see the Buddy splash screen and eventually the Excel spreadsheet containing your results. While running, you’ll also see a black DOS screen. This will disappear when the batch file has finished. If any of the required parameters are omitted, Buddy will open normally and ignore all batch commands. Therefore, if this is happening, something is wrong with your batch command.
8.2.5 Dynamic Filtering with Ask Filters
Normally, you specify the optional record filter to use in your batch by adding the “RecFilter=xyz” parameter to the batch script. However, in certain cases, you may be running several filters of the same type. For example, if you have a 16 cavity mold, you may want to filter on each of the 16 cavities and run 16 different jobs to create a large report on all your grouped data. To do this manually in Buddy, you typically create one filter called “Cavity Ask Me” and tell the filter to ask you the cavity on which to filter. When you click the filter in Buddy, it immediately pops up and asks you which cavity to filter, you type a number, click OK, and the data is filtered. For more information on using Ask filters, please see “Filter On” Explained on page 93.

Running Jobs from Windows
SPC Office Buddy Page 89
This is very convenient as it saves you from having to create 16 different filters (cavity = 1, cavity = 2, cavity = 3, etc). However, in batch mode you are not interacting with the Buddy screens and therefore cannot specify the cavity number via the popup dialog box that would normally appear. To solve this issue and allow you to use Ask filters, the batch parameter allows you to specify the answers to your Ask filters through the command line interface. This is done by adding parentheses after the filter name and entering the value that would have been entered in the box in Buddy. Using the example above, you could specify: RecFilter=Cavity Ask Me(5) This example would filter on cavity 5 and then run the Excel Job in the batch. If you ran several jobs in a row for each cavity, it may look like the following:
Buddy.exe /batch; database=C:\MyPart.qcc; exceljob= batch1; recfilter=Cavity Ask Me(1) Buddy.exe /batch; database=C:\MyPart.qcc; exceljob= batch2; recfilter=Cavity Ask Me(2) Buddy.exe /batch; database=C:\MyPart.qcc; exceljob= batch3; recfilter=Cavity Ask Me(3)
If you have a filter that has more than one ask value, simply separate the values with commas. For example, your filter criteria may be:
Cavity = Ask-Value AND Employee = Ask-Value In this case, simply add the second value to the list: RecFilter=Cavity Ask Me(5,Joe) This would filter on both Cavity = 5 and Employee = Joe before running the Excel Job.
8.2.6 Scheduled Tasks
Your batch file can be run automatically by using Scheduled Tasks found in the Control Panel. Simply select your .BAT file to run and set the day and time to run it. The procedure is:
1. Press the Start button and select Control Panel from the Start menu 2. Double click the Scheduled Tasks option 3. Click Add Scheduled Task 4. Use the Browse button to find your batch file 5. Give your task a name and select the day, week, month to run 6. Select the time on the next panel 7. Enter your user name and password 8. Click the Finish button
Your batch file will now run as set without you having to remember to run it.

Running Jobs from Windows
SPC Office Buddy Page 90
8.2.7 Tips and Troubleshooting
1. If you double click your batch file and the black DOS screen flashes quickly, (and nothing productive appears to happen) it may mean that the path to Buddy is spelled incorrectly. Make sure you have double quotes around the path to Buddy if it contains <space> characters.
2. Double quotes are only required around the initial path to the SPCOfficeBuddy.exe file. All parameters after the “/batch;” command can contain <space> characters without the need for quotes.
3. When running multiple jobs in a batch that update the same Excel spreadsheet, make sure only the last job has the option to Show Excel after job checked. Otherwise earlier jobs will leave the spreadsheet open causing any jobs that follow to fail when they try to save the spreadsheet (since it is Read Only when already open).
4. Test your batch file before adding it to the Scheduled Tasks. This will ensure
you are getting the desired results under normal circumstances. If it works when you double click it, there is no reason it will not work in the Scheduled Tasks.
5. When creating an Excel Job, it is possible to specify the same file path and
name for both the template and the output report. In this case, Buddy will automatically save the new report over the existing template file. This is not desirable in most cases since you are overwriting the template and will need to recreate it the next time you wish to run the job. However, in the case of multiple steps, it is often much easier to do it this way.
As an example, start with the master “template.xls” that contains all the tags. The first job in the batch saves it as “report.xls” so the original template remains intact. However, each successive job opens “report.xls” as the template and saves it as “report.xls”. This is safe to do since you are simply updating the same spreadsheet with new data.

Advanced Topics – Exporting & Importing Excel Jobs
SPC Office Buddy Page 91
9. Advanced Topics
9.1 Exporting & Importing Excel Jobs There are times when you will want to share Excel jobs and Excel templates with friends and customers. This brief section describes how to export and import the jobs.
9.1.1 Exporting Excel Jobs
Click the Export button ( ) when you want to give a copy of one or more Excel Jobs to a colleague. Since each Excel job is made up of an Excel file (template) and the job itself, Buddy includes both files in the transfer file for each Excel job you export and saves all of it to a zip file. When the receiver imports the job, he has everything he needs. On the screen that appears, choose the Excel Job(s) you wish to Export and click the Export button. Hint: You can choose multiple jobs by holding down either the SHIFT or CTRL keys while clicking in the list per the Windows standard.
9.1.2 Importing Excel Jobs
Pressing the Import button ( ) provides a method for adding an Excel job to your local machine. Browse to the zip file given to you and click the Open button. The list of Excel Jobs found within the zip file will be displayed. Choose which Excel Jobs you wish to import and click the Import button. Hint: You can choose multiple jobs by holding down either the SHIFT or CTRL keys while clicking in the list per the Windows standard. The Excel Jobs Folder described on page 133 is used during the importing of Excel Jobs. There are 3 folders involved with each job:
• The Excel Jobs Folder where your jobs are located
• The Default Template Folder where you keep your Excel templates
• The Default Report Folder where the final report is saved When someone Exports an Excel Job and gives the file to you, there is a good chance their file locations will not match your folder structure. Buddy attempts to convert the folder locations of the imported job to match your file folders as best as it can. Here is how it works:
Excel Jobs
For every *.job file found in the .zip file, Buddy tests to see if the job name exists in your Excel Job folder. If it finds a duplicate name you are asked if you wish to rename or overwrite the job. The job is written to the folder found in your Tools – Options – Excel Jobs – Excel Jobs Folder setting.
Excel Templates
The Excel template associated with the Excel job found in the .zip file has a drive and folder path added to it. If the drive letter is a: b: c: d: e: or f:, Buddy assumes this is a local drive and copies the Excel template to your local hard drive. If the drive letter is higher than f: Buddy tells you that it appears to be a network path and asks if you would like to use the copy on your network (assuming it exists). If yes, Buddy does not copy the template and instead uses the one found on your network. If no, Buddy first looks to see if the folder specified in the Excel
Advanced Topics – Exporting & Importing Excel Jobs
SPC Office Buddy Page 92
Job exists on your local PC. If so, it copies the template to this folder. If not, it copies the template to your Default Template Folder.
Report Folder
The report folder found in the transfer files is tested to see if it exists. If so, it is used to store your reports. If not, you will be asked if you want Buddy to create it. If yes, it will attempt to create the folder assuming you have permission to do so. If no, it will redirect the report output to your local default report directory. NOTE: All updates to the file folders are updated in your Excel jobs to ensure the job works immediately.
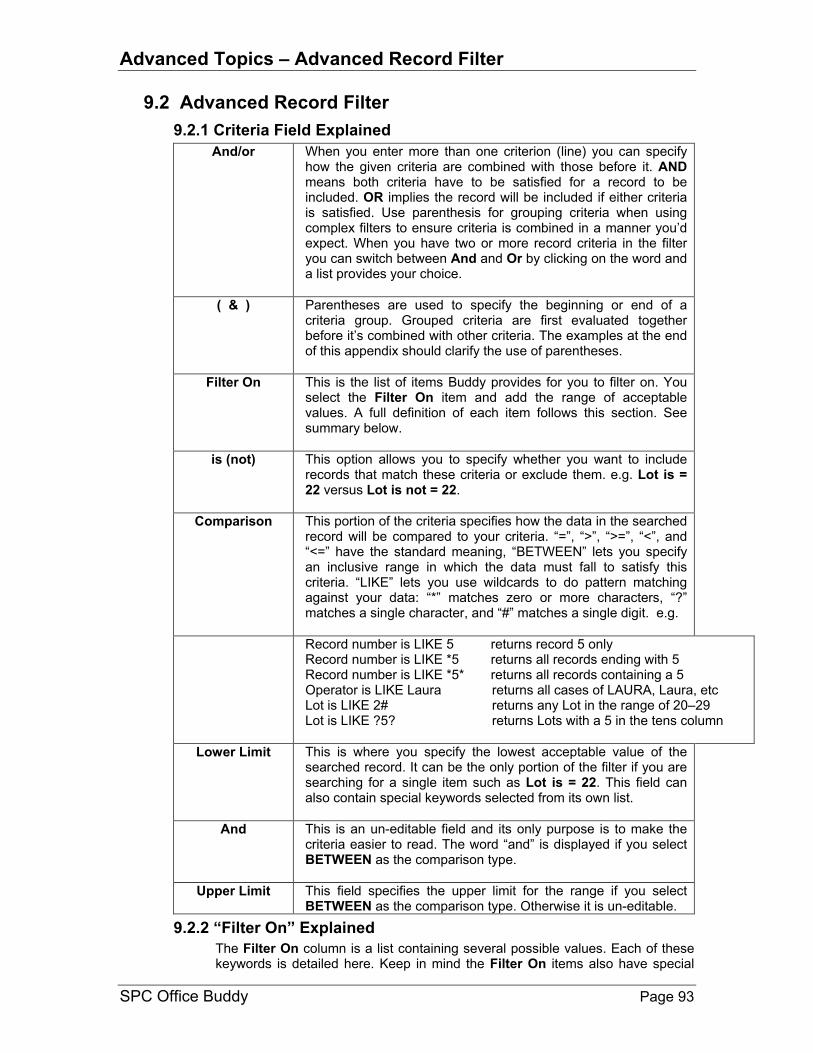
Advanced Topics – Advanced Record Filter
SPC Office Buddy Page 93
9.2 Advanced Record Filter
9.2.1 Criteria Field Explained
And/or When you enter more than one criterion (line) you can specify how the given criteria are combined with those before it. AND means both criteria have to be satisfied for a record to be included. OR implies the record will be included if either criteria is satisfied. Use parenthesis for grouping criteria when using complex filters to ensure criteria is combined in a manner you’d expect. When you have two or more record criteria in the filter you can switch between And and Or by clicking on the word and a list provides your choice.
( & ) Parentheses are used to specify the beginning or end of a criteria group. Grouped criteria are first evaluated together before it’s combined with other criteria. The examples at the end of this appendix should clarify the use of parentheses.
Filter On This is the list of items Buddy provides for you to filter on. You select the Filter On item and add the range of acceptable values. A full definition of each item follows this section. See summary below.
is (not) This option allows you to specify whether you want to include records that match these criteria or exclude them. e.g. Lot is = 22 versus Lot is not = 22.
Comparison This portion of the criteria specifies how the data in the searched record will be compared to your criteria. “=”, “>”, “>=”, “<”, and “<=” have the standard meaning, “BETWEEN” lets you specify an inclusive range in which the data must fall to satisfy this criteria. “LIKE” lets you use wildcards to do pattern matching against your data: “*” matches zero or more characters, “?” matches a single character, and “#” matches a single digit. e.g.
Record number is LIKE 5 returns record 5 only Record number is LIKE *5 returns all records ending with 5 Record number is LIKE *5* returns all records containing a 5 Operator is LIKE Laura returns all cases of LAURA, Laura, etc Lot is LIKE 2# returns any Lot in the range of 20–29 Lot is LIKE ?5? returns Lots with a 5 in the tens column
Lower Limit This is where you specify the lowest acceptable value of the searched record. It can be the only portion of the filter if you are searching for a single item such as Lot is = 22. This field can also contain special keywords selected from its own list.
And This is an un-editable field and its only purpose is to make the criteria easier to read. The word “and” is displayed if you select BETWEEN as the comparison type.
Upper Limit This field specifies the upper limit for the range if you select BETWEEN as the comparison type. Otherwise it is un-editable.
9.2.2 “Filter On” Explained
The Filter On column is a list containing several possible values. Each of these keywords is detailed here. Keep in mind the Filter On items also have special

Advanced Topics – Advanced Record Filter
SPC Office Buddy Page 94
keywords you can use instead of filtering on a number or text. These values are summarized in the table below with details following.
Filter On Enter or Special Key Words
Record Number number LAST N RECORDS Date Only number TODAY, LAST_WEEK, etc Time Only number Date & Time number Number of Fails number Day of the Week MONDAY, TUESDAY, etc Assignable Cause or TRUE or FALSE only Corrective Action TRUE or FALSE only Numeric Factors number LAST_VALUE or ASK_VALUE Text Factors number/text LAST_VALUE or ASK_VALUE Dimensions number
Filter on Details
Record Number Using this keyword lets you filter based on the record numbers. You can specify the range of records by entering a Lower and Upper Limit. You can also select the LAST-N-RECS in the Lower Limit column where this word has been added. Use this keyword as a variable whenever you wish the newest X records to always be returned from the end of the database. You will be prompted for the value of N.
Date Only Using this keyword allows you to ignore the time portion associated with a date. It also lets you specify special keywords such as TODAY, YESTERDAY, THIS-WEEK, THIS-MONTH, THIS-YEAR, LAST-WEEK, LAST-MONTH, and LAST-YEAR. These special keywords let you create a filter that is timeless so when you create your reports for last week’s work you can always use the same filter without having to know the actual dates of that week.
Time Only Using this keyword lets you specify the time of day the part was received. There are no keywords associated with time.
Date and Time This keyword lets you specify both the date and the time the part was received.
Number of Fails Each part stored in the database has a fails count saved with it. This keyword allows you to filter on the number of failed dimensions within a part. For example, you can build a filter that only reports the parts containing bad dimensions. The filter would read:
Number of Fails is > 0
Day of Week This keyword allows you to specify the day of the week the part was received. The possible values are SUNDAY – SATURDAY. These values are supplied in the list and cannot be entered by you.
Assignable Cause or
Corrective Action
This keyword allows you to specify whether the part has an Assignable Cause or a Corrective Action associated with it. The only possible values are TRUE or FALSE. You can filter all parts that have Causes or Actions assigned to them.
Numeric Factor Each part saved in the database has Factors saved with it. This keyword lets you specify the value a Numeric Factor must equal to satisfy the criteria. There are two special keywords to

Advanced Topics – Advanced Record Filter
SPC Office Buddy Page 95
discuss for the Numeric Factor and they are: LATEST-VALUE – only parts having the same Numeric Factor as the most recently received part satisfy these criteria. This filter keyword is very important since it allows for dynamic filtering. For example, let’s say you are inspecting plastic parts made in a 16 cavity mold and you want to filter on the part just inspected. Normally you would create 16 different filters labeled Cavity 1 through Cavity 16. To filter on each cavity you would click on each filter and instantly see the parts made in Cavity 1. This can be tedious because it is a manual task that humans must perform. The LATEST-VALUE keyword allows Buddy to filter on the part just received from the inspection equipment. What this means is you can request Buddy to automatically filter on the current cavity without touching the filters. This is a very useful tool when full automation is in use. When a problem occurs you know immediately which the offending cavity is. To see the usefulness, turn on the Auto Refresh in the Tools menu and then active a filter with a LATEST-VALUE filter criteria in it. As parts are inspected your active filter shows you all the parts made in Cavity 1 or 2 or 3, etc. Your screen dynamically is changing before your eyes. ASK-VALUE – this keyword is preloaded into the Lower Limit field to assist you with quick lookups. When you click a filter containing this keyword, Buddy asks you to supply the filter value. For example, let’s say you have a 64-cavity mold and you do not want to create 64 separate filters. You can create a filter containing a value of ASK-VALUE. The filter might read: Cavity is = ASK-VALUE To activate the filter, click on the filter name and a dialog box asks for the Cavity number and your data is filtered using that value.
Text Factor The Text Factors are the same as the Numeric Factors but they allow you to enter text as a value. Everything just discussed in the Numeric Factors above applies to the Text Factors.
Dimension You can specify the value of any dimension in the database by selecting the dimension number. You then specify the allowable range for the dimension. You might use this to find all parts within the last 100 inspected parts with a dimension exceeding a particular value.
9.2.3 Filter Examples:
The following set of examples is supplied to increase your understanding of the filter use.
Example #1
Show only the last 20 records:

Advanced Topics – Advanced Record Filter
SPC Office Buddy Page 96
Example #2
Show only records received yesterday:
Example #3
Assuming Text Factor 5 holds the operator’s name, show parts measured by all operators whose names are between “B” and “G” alphabetically:
Example #4
Show only records with odd record numbers (ending in 1, 3, 5, 7, or 9):
Example #5
Assuming you have multiple machines collecting data to the same file and storing the Machine ID in Numeric Factor 2, show only parts collected from the machine that sent the last part.
Example #6
Show parts from this week that had at least one dimension out of spec.
Example #7
Assuming Text Factor 5 contains the operator’s name and Numeric Factor 2 contains Machine, show parts measured last month, on the 2nd shift (between 3pm and 10pm), on machines 1 or 3, measured by BOB or JOHN.
Example #8
Assuming Text Factor 5 holds the operator’s name, show parts measured by operators other than Bob, which had at least 1 dimension out of spec and did not have an Assignable Cause or Corrective Action assigned to them:

File & View Menus
SPC Office Buddy Page 97
10. File Menu
10.1 Open QC-CALC Database
QC-CALC Real-Time is the source of data used for Buddy. QC-CALC Real-Time was written to read data directly from CMMs, Vision CMMs, and gages. QC-CALC runs in your CMM and saves all inspection results to one common format known as .QCC files. In order to run reports you must open the .QCC file containing your data.
10.2 Exit
This operation will close the Buddy program, but will not close any reports you have open in your charting package.
11. View Menu
11.1 Introduction The View menu has many items to discuss as shown in the picture to the right. We will discuss the purpose of each menu in this section. Each viewable item was made optional to reduce the on-screen clutter.
11.2 Batch Jobs
This menu shows the Batch Jobs panel allowing you to run a sequence of Excel Jobs. You can Add, Change, Delete, Copy, & Run Batch Jobs from here. There are no menu controls for these jobs and therefore, you must “show” this panel to use this functionality. See Batch Jobs on page 74 for details.

File & View Menus
SPC Office Buddy Page 98
11.3 Excel Jobs
This menu shows the Excel Jobs window allowing you to run a sequence of data movement to and from Minitab and Excel. You can Add, Change, Delete, Copy, & Run jobs as well as Import and Export jobs from other users. There are no menu controls for these jobs and therefore, you must “show” this panel to use this functionality. See Excel Jobs on page 20 for details.
11.4 Record Filter
This menu shows the Select Record Filter window to the left of the grid. The record filter is used to reduce the number of records (rows) shown in the grid. When a report is requested, all numbers in the grid are sent to your charting package, so be sure you filter out the records you do not want analyzed. You can filter on date / time / record numbers / trace fields, etc. See Record Filter on page 16 for more details.
11.5 Dimension Filter
This menu shows the Select Dimension Filter window to the left of the data grid. This window is used to control the dimensions (columns) that are displayed. When you are inspecting parts on your CMM QC-CALC Real-Time automatically saves your data with all dimensions selected by default. Buddy uses this same setting for the columns to show in the grid. When you request a Minitab report each column displayed will create a separate Minitab chart. Be sure you reduce the columns to just the dimensions of interest. See Dimension Filter on page 12 for more details.
11.6 Toolbar This menu controls the visibility of the Toolbar. The buttons on the Toolbar are shortcuts to the most commonly used items.
File – Open
Quick Chart – This button runs the last report you ran from the Stats menu using the data that is currently selected. If any filters are applied and data is also highlighted in the grid, the highlighted data will be used for the report. If no filters are applied and nothing is highlighted in the grid, all available data in the .qcc file will be used.
View – Batch Jobs
View – Excel Jobs

File & View Menus
SPC Office Buddy Page 99
View – Dimension Filter
View – Record Filter
Tools – Options – This menu provides a single location to change all of the SPC Office Buddy’s settings. See the Tools – Options section starting on page 128 for details.
File – Exit
11.7 Status Bar This menu controls the visibility of the Status area at the bottom of the Buddy screen. The information shown in this area tells you about the total number of records in the file and any filters that are turned on.
11.8 Show Tolerances This menu controls if the Nominals and Tolerances are shown at the top of the grid. See The Nominals & Tolerances Header on page 4 for more details.
11.9 Show Specifications This View menu controls if the Nominals and Specification Limits are shown at the top of the grid. See The Nominals & Tolerances Header on page 4 for more details.
11.10 Auto Refresh With this option enabled the data shown will automatically refresh as more data is added to the .qcc file from QC-CALC Real-Time.
11.11 Refresh This menu will find out if there has been any new data added to the .qcc file and will bring any new values into the grid. Use the View – Auto Refresh menu if you would like this to happen automatically all the time.

The Stats Menu
SPC Office Buddy Page 100
12. Stats Menu
12.1 Minitab Charts The list of supported Minitab charts is shown in the Stats menu to the right. Most of the supported Minitab charts are found in Minitab’s Stat – Control Charts menu as depicted in the diagrams below.
12.2 Prolink Charting Option Optionally, you can purchase a separate charting package from Prolink thereby eliminating the need to run Minitab. Throughout this section each Minitab example is followed by a Prolink Charting equivalent.
• Basic Statistics pg. 101
• Variable Charts for Subgroups pg. 102
• Variable Charts for Individuals pg. 111
• Quality Tools pg. 115
• Gage R&R using Excel Jobs - Minitab pg. 124
• Gage R&R using Excel Jobs – Prolink Charting pg. 125

The Stats Menu
SPC Office Buddy Page 101
12.3 Basic Statistics The following basic statistics are supported in Buddy and more may be added from in the future based on customer demand:
• One Sample T
• Two Sample T
12.3.1 One Sample T
The One Sample T test predicts the probability that all samples in the same column are from the same population.
12.3.2 Two Sample T
The Two Sample T test predicts the probability that all samples between two columns are from the same population. Since this test is performed on two columns, Buddy uses all combinations of column pairs when more than two columns are sent to Minitab. For example, if you highlight 3 columns, Buddy will run the test 3 times; once for columns 1 & 2, once for columns 2 & 3, and once for columns 3 & 1.

The Stats Menu
SPC Office Buddy Page 102
12.4 Variable Charts for Subgroups Variables control charts for subgroups plot statistics from measurement data, such as length or pressure, for subgroup data. Variables control charts for
individuals, time-weighted charts, and multivariate charts also plot measurement data. Attributes control charts plot count data, such as the number of defects or defective units.
• Xbar-R pg. 103
• Xbar-S pg. 104
• I-MR-R/S (Between/Within) pg. 105
• Xbar pg. 107
• Range pg. 108
• Sigma pg. 109
• Zone pg. 110
12.4.1 Making Minitab Equivalent to Prolink Charting
Buddy and QC-CALC estimate Sigma using the settings shown in the picture below. Please set Minitab’s default settings by choosing Tools – Options – Control Charts and Quality Tools – Estimating Standard Deviation.

The Stats Menu
SPC Office Buddy Page 103
12.4.2 Xbar-R
The Xbar-R chart displays a control chart for Subgroup Means (an Xbar chart) and a control chart for Subgroup Ranges (an R chart) in the same graph window. The Xbar chart is drawn in the upper half of the screen; the R chart in the lower half. Seeing both charts together allows you to track both the process level and process variation at the same time, as well as detect the presence of special causes. Xbar-R charts are typically used to track the process level and process variation for samples of size 8 or less, while Xbar and S charts are used for larger samples. By default, Minitab's Xbar-R chart bases the estimate of the process variation, s, on the average of the subgroup ranges. Please see the Making Minitab Equivalent to Prolink Charting section on page 102 for more details. Minitab
Prolink Charting
With either charting package, the Subgroup Size is determined by your selection just before you clicked OK

The Stats Menu
SPC Office Buddy Page 104
12.4.3 Xbar-S
The Xbar-S charts displays a control chart for Subgroup Means (an Xbar chart) and a control chart for Subgroup Standard Deviations (an S chart) in the same graph window. The Xbar chart is drawn in the upper half of the screen; the S chart in the lower half. Seeing both charts together allows you to track both the process level and process variation at the same time, as well as detect the presence of special causes. Xbar and S charts are typically used to track process variation for samples of nine or more, while Xbar and R charts are used for smaller samples. By default, Minitab's Xbar and S Chart bases the estimate of the process variation, s, on the average of the subgroup standard deviations. This matches what Prolink Charting does, but you can also use a pooled standard deviation, or enter a historical value for s in Minitab. Minitab
Prolink Charting

The Stats Menu
SPC Office Buddy Page 105
12.4.4 I-MR-R/S (Between/Within)
The I-MR-R/S (Between/Within) Chart produces a three-way control chart using both between-subgroup and within-subgroup variations. An I-MR-R/S chart consists of:
• An individuals chart of Mean
• A moving range chart
• An R chart or S chart
Minitab
Prolink Charting
When collecting data in subgroups, random error may not be the only source of variation. For example, if you sample five parts in close succession every hour, the only differences should be due to random error. Over time, the process could shift or drift, so the next sample of five parts may be different from the previous sample. Under these conditions, the overall process variation is due to both between-sample variation and random error. Variation within each sample also contributes to overall process variation. Suppose you sample one part every hour, and measure five locations across the

The Stats Menu
SPC Office Buddy Page 106
part. While the parts can vary hour to hour, the measurements taken at the five locations can also be consistently different in all parts. Perhaps one location almost always produces the largest measurement, or is consistently smaller. This variation due to location is not accounted for, and the within-sample standard deviation no longer estimates random error, but actually estimates both random error and the location effect. This results in a standard deviation that is too large causing control limits that are too wide, with most points on the control chart placed very close to the centerline. This process appears to be too good, and it probably is. You can solve this problem by using I-MR-R/S (Between/Within) to create three separate evaluations of process variation:
12.4.5 Individuals chart:
The Individual Chart charts the mean from each sample on an individuals control chart, rather than on an Xbar chart. This chart uses a moving range between consecutive means to determine the control limits. Since the distribution of the sample means is related to the random error, using a moving range to estimate the standard deviation of the distribution of sample means is similar to estimating just the random error component. This eliminates the within-sample component of variation in the control limits.
12.4.6 Moving range chart:
Charts the subgroup means using a moving range to remove the within-sample variation. Use this chart, along with the Individuals chart, to track both process location and process variation, using the between-sample component of variation.
12.4.7 R chart or S chart:
Charts process variation using the within-sample component of variation. Whether Minitab displays an R chart or an S chart depends on the chosen estimation method and the size of the subgroup. If you base estimates on the average of subgroup ranges, then an R chart will be displayed. If you base estimates on the average of subgroup standard deviations, then an S chart will be displayed. If you base estimates on the pooled standard deviation and your subgroup size is less than nine, an R chart will be displayed. If you base estimates on the pooled standard deviation and your subgroup size is nine or greater, an S chart will be displayed. If you specify historical groups, the display of an R or S chart is based on the minimum of the mode sample size for all historical groups. If you base estimates on the pooled standard deviation and the minimum of the mode sample sizes is less than ten, an R chart is displayed. Otherwise, Minitab displays an S chart if you estimate using pooled standard deviation or an R chart if you estimate using Rbar. Thus, the combination of the three charts provides a method of assessing the stability of process location, the between-sample component of variation, and the within-sample component of variation.

The Stats Menu
SPC Office Buddy Page 107
12.4.8 Xbar
A control chart of subgroup means. You can use X charts to track the process level and detect the presence of special causes. By default, Minitab's X chart estimates the process variation, s, using a pooled standard deviation. You can also base the estimate on the average of the subgroup ranges or standard deviations, or enter a historical value for s. Minitab
Prolink Charting

The Stats Menu
SPC Office Buddy Page 108
12.4.9 Range
A control chart of subgroup ranges. You can use R charts to track process variation and detect the presence of special causes. R charts are typically used to track process variation for samples of size 8 or less, while S charts are used for larger samples. By default, an R chart bases the estimate of the process variation, s, on the average of the subgroup ranges. You can also use a pooled standard deviation, or enter a historical value for s. Minitab
Prolink Charting

The Stats Menu
SPC Office Buddy Page 109
12.4.10 Sigma
A control chart of subgroup standard deviations. You can use S charts to track the process variation and detect the presence of special causes. S charts are typically used to track process variation for samples of 9 or more, while R charts are used for smaller samples. By default, Minitab's S Chart command bases the estimate of the process variation, s, on the average of the subgroup standard deviations. You can also use a pooled standard deviation, or enter a historical value for s. Minitab
Prolink Charting

The Stats Menu
SPC Office Buddy Page 110
12.4.11 Zone
As a hybrid between an Xbar (or individuals) chart and a CUSUM chart, a Zone chart plots a cumulative score based on "zones" at 1, 2, and 3 standard deviations from the center line. Zone charts are usually preferred over Xbar or individuals charts because of their utter simplicity: a point is out of control simply, by default, if its score is greater than or equal to 8. Thus, you do not need to recognize the patterns associated with non-random behavior as on a Shewhart chart. This method is equivalent to four of the standard tests for special causes in an Xbar or Individuals chart. Minitab
Prolink Charting
You can modify the zone chart weighting scheme to provide the sensitivity needed for a specific process. For example, you may want one set of weights during the initial SPC phase for detecting special causes. Then you may want to change the weights when the process is in control and it is more important to detect drift. You can display a chart based on subgroup means or individual observations. With data in subgroups, the mean of the observations in each subgroup is

The Stats Menu
SPC Office Buddy Page 111
calculated, and then plotted on the chart. When subgroup sizes are unequal, Minitab generates a standardized zone chart. By default, the process standard deviation, s, is estimated using a pooled standard deviation. You can also base the estimate on the average of subgroup ranges or subgroup standard deviations, or enter a historical value for s. With individual observations, a point is plotted for each observation. By default, s is estimated using MR / d2, the average of the moving range divided by an unbiasing constant. Moving ranges are artificial subgroups created from the individual measurements. The moving range is of length 2, since consecutive values have the greatest chance of being alike. You can also estimate s using the median of the moving range, change the length of the moving range, or enter a historical value for s.
12.5 Variable Charts for Individuals Variables control charts for individuals plot statistics from measurement data, such as length or pressure, for individuals data. Variables control charts for subgroups, time-weighted charts, and multivariate charts also plot measurement data. Attributes control charts plot count data, such as the number of defects or defective units.
• I-MR pg. 112
• Individuals pg. 113
• Moving Range pg. 114
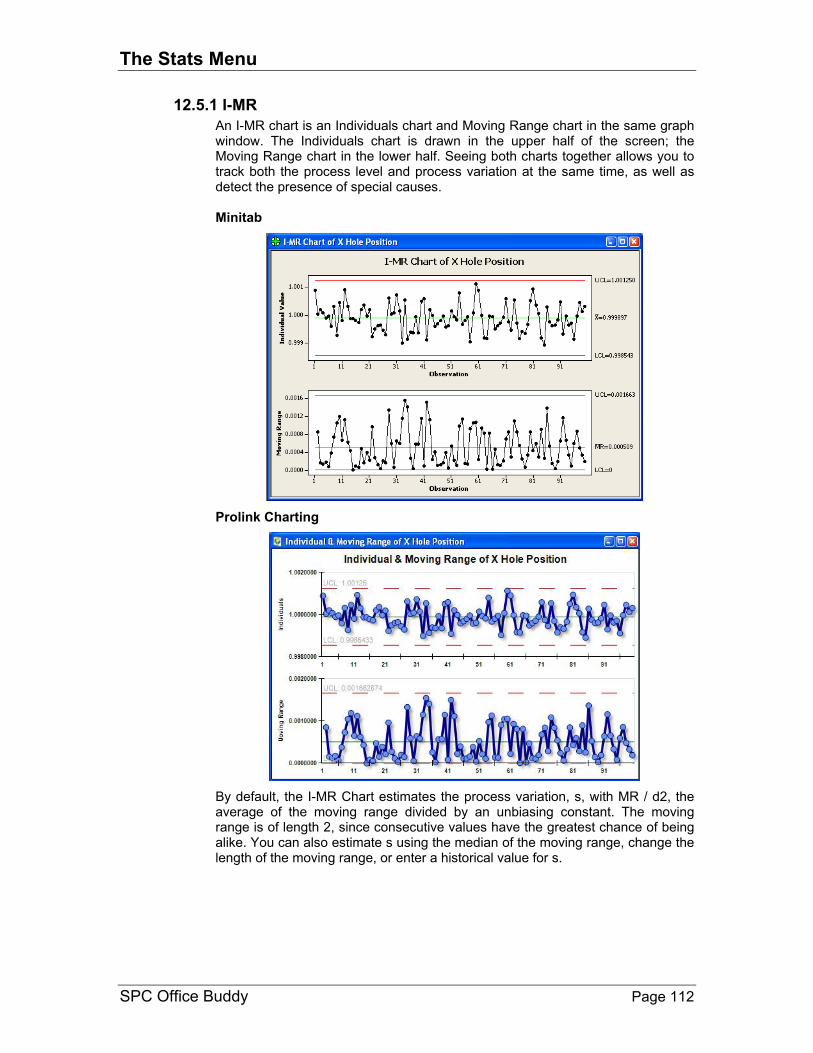
The Stats Menu
SPC Office Buddy Page 112
12.5.1 I-MR
An I-MR chart is an Individuals chart and Moving Range chart in the same graph window. The Individuals chart is drawn in the upper half of the screen; the Moving Range chart in the lower half. Seeing both charts together allows you to track both the process level and process variation at the same time, as well as detect the presence of special causes. Minitab
Prolink Charting
By default, the I-MR Chart estimates the process variation, s, with MR / d2, the average of the moving range divided by an unbiasing constant. The moving range is of length 2, since consecutive values have the greatest chance of being alike. You can also estimate s using the median of the moving range, change the length of the moving range, or enter a historical value for s.

The Stats Menu
SPC Office Buddy Page 113
12.5.2 Individuals
An Individuals chart is a control chart of individual observations. You can use individual charts to track the process level and detect the presence of special causes when the sample size is 1. By default, individuals chart estimates the process variation, s, with MR / d2, the average of the moving range divided by an unbiasing constant. Moving ranges are artificial subgroups created from the individual measurements. By default, the moving range is of length 2, since consecutive values have the greatest chance of being alike. You can also estimate s using the median of the moving range, change the length of the moving range, or enter historical values of s. Minitab
Prolink Charting
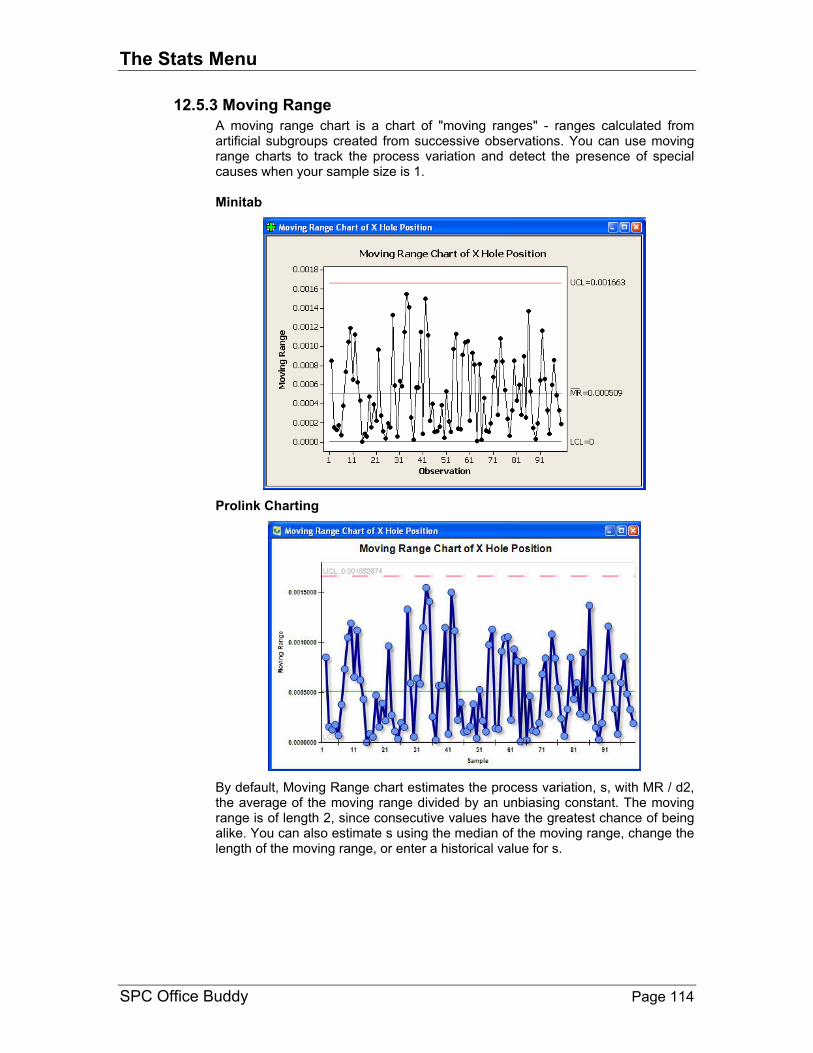
The Stats Menu
SPC Office Buddy Page 114
12.5.3 Moving Range
A moving range chart is a chart of "moving ranges" - ranges calculated from artificial subgroups created from successive observations. You can use moving range charts to track the process variation and detect the presence of special causes when your sample size is 1. Minitab
Prolink Charting
By default, Moving Range chart estimates the process variation, s, with MR / d2, the average of the moving range divided by an unbiasing constant. The moving range is of length 2, since consecutive values have the greatest chance of being alike. You can also estimate s using the median of the moving range, change the length of the moving range, or enter a historical value for s.

The Stats Menu
SPC Office Buddy Page 115
12.6 Quality Tools Minitab offers several graphical tools to help you explore and detect quality problems and improve your process:
• Run charts detect patterns in your process data, and perform two tests for non-random behavior.
• Multi-vari charts present analysis of variance data in graphical form to give you a "look" at your data.
• Individual Distribution Identification pg. 116
• Run Chart pg. 117
• Capability Analysis (normal) pg. 118
• Capability Analysis (non-normal) pg. 119
• Capability Sixpack pg. 120
• Raw Data (True Position) Charts (2D) pg. 121
• True Position Charts (3D) pg. 122
• Gage R&R Study pg. 123

The Stats Menu
SPC Office Buddy Page 116
12.6.1 Individual Distribution Identification
This will run a goodness of fit test to try and identify the best distribution fit for your data. If the data is non-normal, this is a helpful way to determine how to treat it when trying to get statistical charts such as a Sixpack or Capability Analysis. The result of this test is a set of charts and a Goodness of Fit test in the Minitab Session window. If the P value for Normal is above 0.05, then the data is considered normal as is the case below. Goodness of Fit Test Distribution AD P LRT P Normal 0.449 0.233 Lognormal 0.446 0.236 3-Parameter Lognormal 0.151 * 0.066 Exponential 5.945 <0.003 Weibull 0.937 0.015 If the data is considered to be non-normal, most customers take the largest P value from the list and use that distribution when running a non-normal Sixpack or Capability Analysis report. Fortunately, you can tell Buddy to do this for you automatically. When doing so, Buddy will first run Minitab and create the Goodness of Fit test. It will then read the results, choose the best P-value (or optionally present you with a list from which to choose), and run your Sixpack or Capability Analysis with the correct distribution. This fully automatic feature is explained more in the section called Minitab (non-normal data) version 16 or Higher.

The Stats Menu
SPC Office Buddy Page 117
12.6.2 Run Chart
Use Run Chart to look for evidence of patterns in your process data, and perform two tests for non-random behavior. Run Chart plots all of the individual observations versus the subgroup number, and draws a horizontal reference line at the median. When the subgroup size is greater than one, Run Chart also plots the subgroup means or medians and connects them with a line. Minitab
Prolink Charting
The two tests for non-random behavior detect trends, oscillation, mixtures, and clustering in your data. Such patterns suggest that the variation observed is due to special causes - causes arising from outside the system that can be corrected. Common cause variation is variation that is inherent or a natural part of the process. A process is in control when only common causes affect the process output.

The Stats Menu
SPC Office Buddy Page 118
12.6.3 Capability Analysis (normal)
Use Capability Analysis (Normal) to produce a process capability report when your data are from a normal distribution or to transform the data to follow normal distribution using Box-Cox transformation. The report includes a capability histogram overlaid with two normal curves, and a complete table of overall and within capability statistics. The two normal curves are generated using the process mean and within standard deviation and the process mean and overall standard deviation. Minitab
Prolink Charting
The report also includes statistics of the process data, such as the process mean, the target (if you enter one), the within and overall standard deviation, and the process specifications; the observed performance; and the expected within and overall performance. So the report can be used to visually assess whether the data are normally distributed, whether the process is centered on the target, and whether it is capable of consistently meeting the process specifications.

The Stats Menu
SPC Office Buddy Page 119
12.6.4 Capability Analysis (non-normal)
Capability Analysis (non-normal) is used to produce a process capability chart when your data has a single-sided tolerance. Normally, you would set a boundary when all of the data falls on one side of nominal. Below we show an example of running a Minitab report with the lower boundary set. See Minitab Non-normal data on page 7 for details when non-normal data is analyzed. Also read Process Capability/Sixpack Options on page 130.
QC-CALC automatically checks the lower boundary checkbox on all positive single-sided dimensions and checks the upper boundary for all negative single-sided dimensions. The Minitab report includes a capability histogram overlaid with one normal curve. A typical chart is shown below.

The Stats Menu
SPC Office Buddy Page 120
12.6.5 Capability Sixpack
Use to produce process capability report when your data follows a normal distribution. See Minitab Non-normal data on page 7 for details when non-normal is analyzed. Minitab
Prolink Charting Capability Composite Chart
To confirm process stability, the report includes:
• An Xbar chart (or Individuals chart for individual observations)
• An R chart or S chart (for subgroups size greater than 8)
• A run chart of the last 25 subgroups (or last 25 observations) To confirm normality, the report includes:
• A histogram of the process data
• A normal probability plot (also Anderson-Darling and P values) To assess capability, the report includes:
• A process capability plot

The Stats Menu
SPC Office Buddy Page 121
• within and overall capability statistics; Cp, Cpk, Cpm (if you specify a target), Pp, and Ppk
12.6.6 Raw Data (True Position) Charts (2D)
QC-CALC Real-Time version 3.3 and above has a special plot type called True Position. The goal of True Position MMC is to relax the positional tolerance of a feature by adding unused size tolerance (bonus) to the position tolerance. Although this method cleverly saves parts from the scrap heap when the position of a hole is “out of spec” in X or Y, it has added a great deal of confusion. When SPC is applied to many true position measurements even more confusion results. The relationship of a measured feature such as a hole involves joining several characteristics of the feature; namely the hole size, X, Y, and the TP. This relationship is discussed in the QC-CALC Real-Time Training Manual available from Prolink. If you are unfamiliar with QC-CALC’s operation you should consult your local QC-CALC user who is generating the data you’re using here in Buddy.
These two charts show the condition of the hole position both in time and in 2D space. Normally, the RFS tolerance ring is round but since you can stretch the plot in any direction, all points are scaled correctly.

The Stats Menu
SPC Office Buddy Page 122
12.6.7 True Position Charts (3D)
The 3D True Position chart is a combination of the time and position charts discussed on the previous page. This plot is sizable and rotatable (using your mouse) so you can see the relationship between time and position. Time is displayed from bottom to top (most recent part).
• Any point inside the true position cylinder (pink) is within its specified RFS tolerance.
• If the point is outside the cylinder but has a bonus ring large enough to intersect the RFS cylinder, the part is good. The bonus ring is displayed as a green disk around the point and the part is said to be “bought on bonus”.
• If the point is outside the RFS ring and the bonus is not large enough to “buy” the part, it is displayed as a red dot (out of spec).
The goal is to give you a visual representation of the true position location of many parts over time. The math provides a larger Cpk because the bonus tolerance is included in the calculation. The centroid calculation provides a simple offset adjustment based on the average position of many parts.

The Stats Menu
SPC Office Buddy Page 123
12.6.8 Gage R&R Study
A Gage Repeatability and Reproducibility Study (GR&R) is a method of determining the suitability of a gage or gauging system for measuring a particular process. Every measurement taken has some error associated with it, and if this error is large compared to the tolerance band, the measuring device will frequently accept bad parts and reject good ones. A Gage Repeatability and Reproducibility Study convey 6 basic pieces of information. They are:
• Part Variation • Repeatability and Reproducibility (R&R)
• Repeatability • Percent of Total Variation
• Reproducibility • Percent of Tolerance Minitab GR&R
Prolink Charting GR&R

The Stats Menu
SPC Office Buddy Page 124
12.7 Gage R&R using Excel Jobs - Minitab You can run an Excel Job to automate the GR&R report across many dimensions as shown in this example. The Minitab Gage R&R Study and the Gage R&R Run Chart are generated by the Excel Job and placed in this simple workbook with each sheet (tab) being dedicated to one dimension. The calculations were removed from Minitab’s session window and placed here for your convenience.
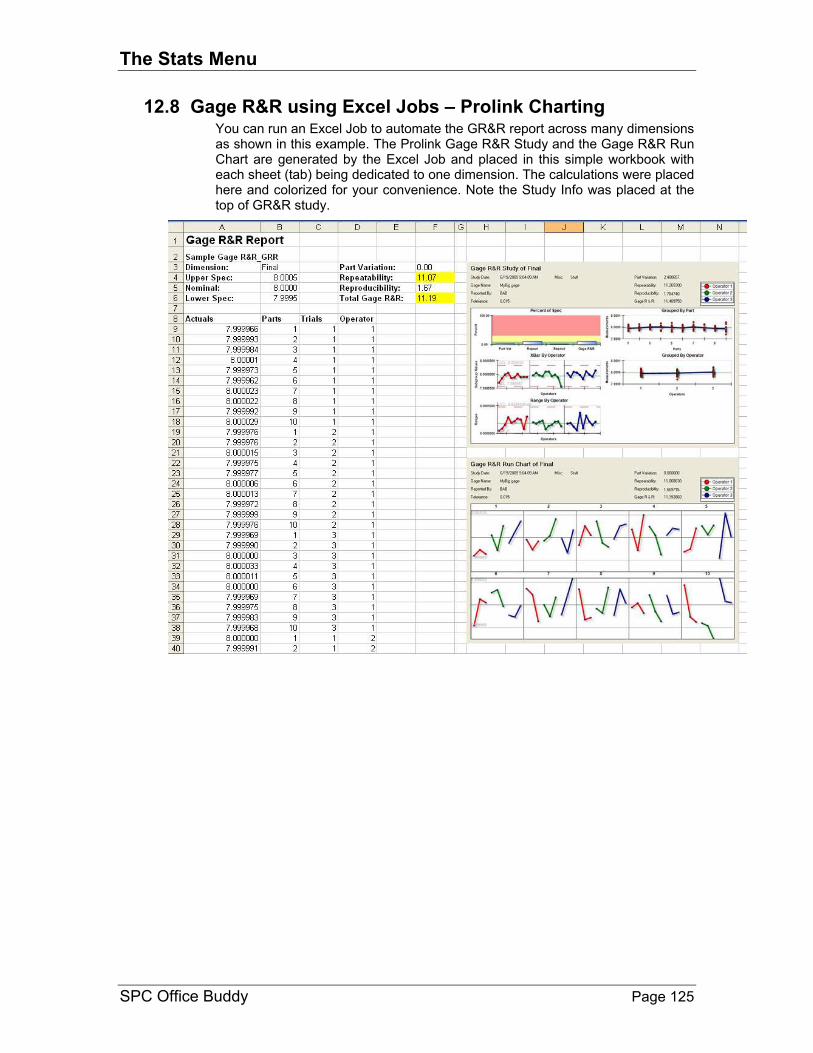
The Stats Menu
SPC Office Buddy Page 125
12.8 Gage R&R using Excel Jobs – Prolink Charting You can run an Excel Job to automate the GR&R report across many dimensions as shown in this example. The Prolink Gage R&R Study and the Gage R&R Run Chart are generated by the Excel Job and placed in this simple workbook with each sheet (tab) being dedicated to one dimension. The calculations were placed here and colorized for your convenience. Note the Study Info was placed at the top of GR&R study.

The Export Menu
SPC Office Buddy Page 126
13. Export Menu
13.1 Quick Export This menu is used to repeat the last export no matter what it was. This saves you time by not showing the configuration screen if no settings have changed.
13.2 Export to .. Using this menu choice displays a window where you choose where you want the data to be sent.
13.2.1 Export Type
Minitab Export
This option exports the data directly into Minitab, but will not run the Stat reports automatically. Buddy will create a .txt file of whatever name you choose, then open Minitab with that file as a Worksheet. This is an easy way to get your filtered data into Minitab so you can run any of the Stats Buddy does not support.
JMP Export
This option exports the data directly into JMP, but will not run any Stats automatically. When JMP is chosen, the Configure button is enabled allowing you to control the operation of JMP and the data.
The JMP export can execute a script before and after the export. This script can be any valid JSL (JMP Scripting Language) commands you wish to run. This is very convenient if you have a Journal or other setup you like to run and wish to

The Export Menu
SPC Office Buddy Page 127
run it with varying sets of data. Simply paste the script from your JMP window into the JMP Export Configuration window. When you export your data, JMP will run the script as entered into this screen. The sample script shown first closes all report windows, then exports the data, and finally runs a few control charts on the exported data.
Excel Export
This option exports the data directly into Excel. When Excel is chosen, the Configure button is enabled allowing you to control the operation of the export.
The Excel export is controlled by filling out this window. You can tell Buddy what Sheet Name to use, where the Start Cell is located, and possibly to clear the Worksheet before sending the data. You can also send the Nominals, Tolerances, and Feature Labels if you wish.
13.2.2 Records
The amount of data exported is based on the current filter you have set. For example, if you have a record filter enabled, the Filtered Records option is active instead of All Records.
13.2.3 Dimensions
Likewise, if a dimension filter is active, the Filtered Dimensions option is enabled by default instead of All Dimensions.
13.2.4 Options
Open in Default Application
This option will automatically launch the corresponding application for the Export Type you chose and show you the data that was exported.
Append To File
This option will either append the data at the end of any data currently in the file, or delete the data that is there and start the file over. This option is not available for Minitab.

Tools – Options Menu
SPC Office Buddy Page 128
14. Tools – Options Menu
This menu provides a single location to change all of the SPC Office Buddy’s settings. Each menu is discussed in the following order:
• Chart Settings pg. 128
• Non-Normal Data pg. 131
• Email pg. 132
• Excel Jobs pg. 132
• Global Settings pg. 135
• Update pg. 136
14.1 Chart Settings There are a few settings that pertain to the charting options. You will receive the same charts but might see slight differences between the calculations.
14.1.1 Chart Tool
Currently, there are two options for charting; Minitab and Prolink Charting. If you do not own Minitab, select Prolink Charting from the list.
14.1.2 Install Path
If for some reason Buddy cannot detect the installation of Minitab, you can use this option to locate the Minitab executable. Prolink Charting should be auto-detected in Buddy’s installation path.
14.1.3 Show True Position for Raw Data Chart
(Prolink Charting option only) Data can be viewed in 2D or 3D true position charts. The source of the data is a QC-CALC file where you must join the dimensions together yielding a complex TP chart. The 2D true position chart shows the data in a time based chart (1D) with an added 2D position chart

Tools – Options Menu
SPC Office Buddy Page 129
beneath it. When you attempt to run the Raw Data (True Position) chart, it will only show a 2D True Position chart if the dimension chosen is a True Position dimension (set up in QC-CALC Real-Time). Otherwise, Buddy will default to a raw data plot. This checkbox allows you to run the Raw Data plot regardless of the dimension(s) you have chosen. It effectively overrides Buddy from running a True Position chart if you happen to have chosen a True Position dimension. To force Buddy to always run Raw Data reports, uncheck this option. Otherwise, it will run the 2D True Position chart when possible. Please review your QC-CALC Real-Time user manual for creating the true position relationship. Also see the Raw Data (True Position) Charts (2D) and True Position Charts sections on page 121 & 122 for a discussion of these charts.
14.1.4 Deleted Data Options
QC-CALC allows you to delete records (parts) or individual points. They are seen in Buddy as gold colored values. You need to tell Buddy how to deal with these values in your charting package. There are three choices for both Deleted Records and Deleted Points: Always Send – This option will send the data value to the charting package and there will not be any way to tell from within the charting package that the value should be ignored.
Original To Stats Export
1.234 1.234 1.234
1.325 1.325 1.325
1.425 1.425 1.425
1.253 1.253 1.253
1.266 1.266 1.266
Never Send – This option will skip any deleted records or points and send nothing for those values. This is pretty straight forward for Deleted Records (an entire row will not be sent to the charting package), but for a Deleted Point the Stats menu will end up with 1 dimension containing less data than the others.
Original To Stats Export
1.234 1.234 1.234
1.325 1.325 1.325
1.425 1.253
1.253 1.266 1.253
1.266 1.266
Send as “*” – This option replaces any deleted values with an “*”. If an entire record is deleted, then the entire row in the charting package is filled with “*”. When a Deleted Point is sent, the value is replaced with an asterisk (*).
Original To Stats Export
1.234 1.234 1.234
1.325 1.325 1.325
1.425 * *
1.253 1.253 1.253
1.266 1.266 1.266
14.1.5 Data Options
Precision
You can choose to view a particular number of digits (precision) in QC-CALC. The precision value is saved in the QC-CALC database and Buddy uses it. Normally, the number of digits displayed is sent to the charting software. If you

Tools – Options Menu
SPC Office Buddy Page 130
need full precision sent (recommended), select Full Precision instead of the stored QCC file precision.
Subgroup Direction
(Prolink Charting option only) This option is only available when using Prolink Charting.
14.1.6 Process Capability/Sixpack Options
Send Boundary Flag for Process Capability
(Minitab option only) When using Minitab for charting Buddy automatically sends the upper and lower specification limits to Minitab. When a Process Capability chart is run in Minitab with a single-sided dimension, the “Boundary” flags are generally checked. If you want Buddy not to check this option, simply uncheck the Boundary Flag checkbox on this screen. When you define upper and lower specification limits as boundaries, Minitab sets the expected percentage of values that are out of specifications to * for a boundary.
Run in Minitab 16 Compatibility Mode
(Minitab option only) With version 16 of Minitab, support was removed for some commands that Buddy used when running reports, so commands need to be sent differently for those reports when Minitab version 16 is in use. This option tells Buddy to send the commands specific for version 16 of Minitab.
Show Histogram if data fails validation
(Minitab option only) When running a Capability Analysis, Minitab does not handle the Upper Spec Limit being less than or equal to the Lower Spec Limit very well. If that case happens and this option is enabled Buddy will run a normal Histogram instead of the full Capability Analysis.
Omit specs for SSL/SSU or when zero
(Capability Sixpack only) Normally Buddy sends over the data, USL, and LSL and Minitab runs the Sixpack accordingly. If one of the specification limits (not Tolerances) is zero and it is not sent (instead of sending the zero), it is treated differently. With this option checked one or both of the specification limits is omitted in the command file if either of them are zero.
Omit target for single sided dimensions
With this option the nominal value will not be included in the command file sent to Minitab.
14.1.7 Gage R&R (Nested) Options

Tools – Options Menu
SPC Office Buddy Page 131
Use XBar Method or Use ANOVA Method
When performing Gage R&R studies you can choose between the Xbar or ANOVA method.
Gage R&R Info
This information is used to populate the final report to help you identify the study and conditions while performing the study. You should fill out this info before running the study but should you forget, fill it out and rerun the report since it only takes a few seconds to recreate the report.
Use Minitab for GR&R Statistics
This option controls if Prolink Charting or Minitab’s GR&R statistics will be used in the Excel Job. Minitab does not return any other statistical values, so this ONLY applies to the GR&R values that are calculated.
14.1.8 1 & 2 Sample T Options
Confidence Level
When calculating the 1 and 2 Sample T probabilities the Confidence Level is used to set the area under the bell curve that should be taken into account.
Run Histogram
With this option checked a Histogram chart will be run as the probability prediction for the data is run.
Run Individuals
With this option checked an Individuals chart will be run as the probability prediction for the data is run.
Run Boxplot
With this option checked a Boxplot chart will be run as the probability prediction for the data is run.
14.2 Non-Normal Data Please see Non-Normal Charts with Buddy on page 9 for a full explanation of this option.
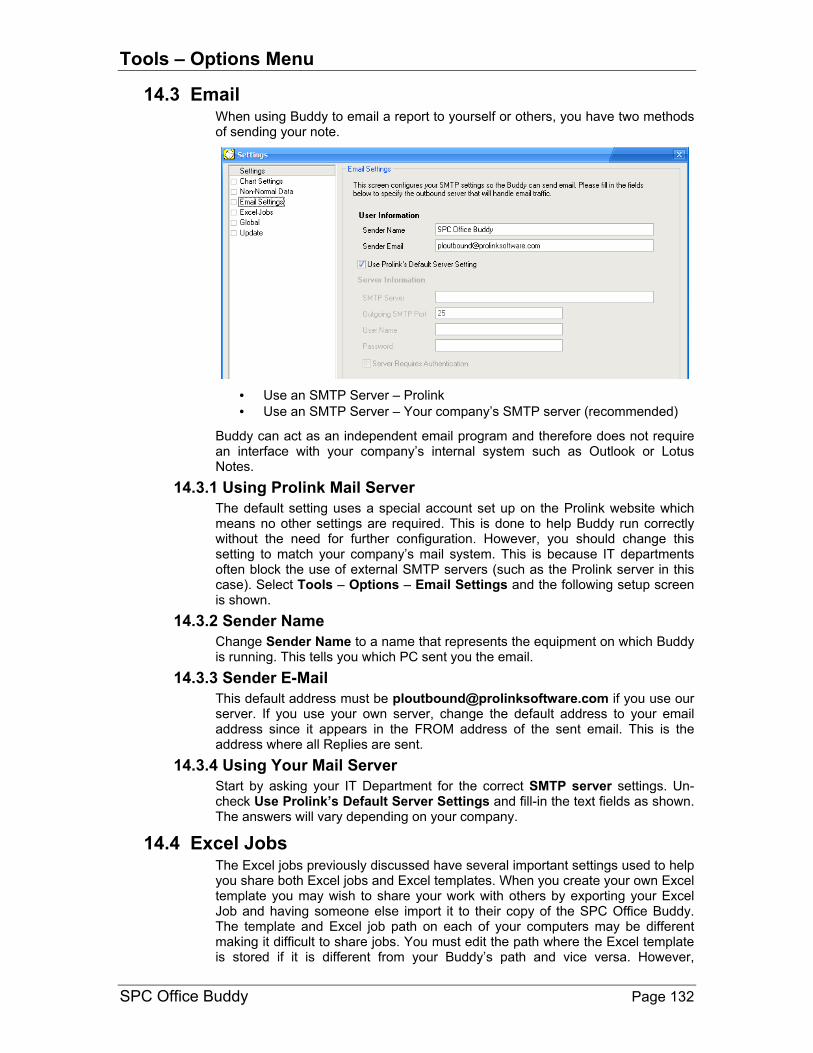
Tools – Options Menu
SPC Office Buddy Page 132
14.3 Email When using Buddy to email a report to yourself or others, you have two methods of sending your note.
• Use an SMTP Server – Prolink
• Use an SMTP Server – Your company’s SMTP server (recommended)
Buddy can act as an independent email program and therefore does not require an interface with your company’s internal system such as Outlook or Lotus Notes.
14.3.1 Using Prolink Mail Server
The default setting uses a special account set up on the Prolink website which means no other settings are required. This is done to help Buddy run correctly without the need for further configuration. However, you should change this setting to match your company’s mail system. This is because IT departments often block the use of external SMTP servers (such as the Prolink server in this case). Select Tools – Options – Email Settings and the following setup screen is shown.
14.3.2 Sender Name
Change Sender Name to a name that represents the equipment on which Buddy is running. This tells you which PC sent you the email.
14.3.3 Sender E-Mail
This default address must be [email protected] if you use our server. If you use your own server, change the default address to your email address since it appears in the FROM address of the sent email. This is the address where all Replies are sent.
14.3.4 Using Your Mail Server
Start by asking your IT Department for the correct SMTP server settings. Un-check Use Prolink’s Default Server Settings and fill-in the text fields as shown. The answers will vary depending on your company.
14.4 Excel Jobs The Excel jobs previously discussed have several important settings used to help you share both Excel jobs and Excel templates. When you create your own Excel template you may wish to share your work with others by exporting your Excel Job and having someone else import it to their copy of the SPC Office Buddy. The template and Excel job path on each of your computers may be different making it difficult to share jobs. You must edit the path where the Excel template is stored if it is different from your Buddy’s path and vice versa. However,

Tools – Options Menu
SPC Office Buddy Page 133
Importing Excel Jobs on page 91 describes Buddy’s attempt to streamline this process.
14.4.1 Excel Jobs Folder
Setting the default path to a shared network path makes sharing jobs between computers much easier. In the previous screen we store our Jobs and Templates on our shared S: drive making them available to others. The final report is saved on the local computer in a folder called Reports located in the SPC Office Buddy install area.
14.4.2 Default Template Folder
The Default Template Folder option is used in the File Options screen of the Excel Report Job Wizard. This value is available as a variable within your Excel Jobs called [default_template]. Entering this variable in the Template Path area (or Output Path if needed) as shown in the picture below tells Buddy to use the path from the Tools – Options – File Options area in place of the variable when the Excel Job runs. If you need to change the path at a later date you will not have to change all of your Excel Jobs as you would if the specific paths were used instead of the variable. Just change this single setting and all Excel Jobs using the [default_template] variable will automatically adapt to the new path.
14.4.3 Default Report Folder
The Default Report Folder option is used in the File Options screen of the Excel Report Job Wizard. This value is available as a variable within your Excel Jobs called [default_report]. Entering this variable in the Output Path area (or Template Path if needed) as shown in the picture above tells Buddy to use the

Tools – Options Menu
SPC Office Buddy Page 134
path from the Tools – Options – File Options area in place of the variable when the Excel Job runs. If you need to change the path at a later date you will not have to change all of your Excel Jobs as you would if the specific paths were used instead of the variable. Just change this single setting and all Excel Jobs using the [default_report] variable will automatically adapt to the new path.
14.4.4 Other Options
Chart image format
You can choose the type of image to be created and used in your Excel Job. The choices are JPEG, EMF, or PNGH.
Display Boundary Tolerances/Specs for Single-sided Dimensions
Normally Buddy will leave boundary tolerances or specification limits blank when filling in the cells of an Excel Job. Therefore, if you are running an Excel Job and the job calls for an upper spec limit, the value will be left blank if the dimension in question is a single-sided lower dimension since the upper spec limit is equal to the nominal and is usually zero. However, if you want to display values like the above regardless (to avoid “holes” in the spreadsheet) check this box and Buddy will fill them in appropriately. Upper and Lower Spec limits will be filled in as Nominal. Plus and Minus Tolerances will be filled in as zero.
Display Tolerances/Specs for dimensions that are a part of True Positions
When defining a True Position relationship in QC-CALC, the X, Y, and Diameter dimensions are typically assigned along with a TP dimension to form the True Position grouping. During this process, the X and Y dimensions’ tolerance types are changed to “non-toleranced” for statistical reasons. However, the original plus and minus tolerance numbers are preserved. By default, (unchecked) Buddy will not show the values for upper spec, lower spec, plus tolerance, and minus tolerance since the dimension is considered to be not tolerance. However, if you check this option, you can choose to have Buddy print the actual tolerances or spec limits to the Excel report (thus ignoring the non-toleranced status).

Tools – Options Menu
SPC Office Buddy Page 135
14.5 Global Settings The Global area is used to choose the Language Buddy displays in the menus and messages and to change the Filter Path used with your record filters.
14.5.1 Language
Choose the language you would like to use when running SPC Office Buddy from the list on the right. You will be prompted to restart Buddy after clicking OK so the new language can be loaded.
14.5.2 Application Themes
You can change the look and feel of the screens within SPC Office Buddy with this option. Choosing “None” will remove any theme and the current Windows style will be used.
14.5.3 Assignable Cause/Corrective Action Paths
In order for the Assignable Cause and Corrective Action tags to work within the Excel Jobs the location of the Assignable Cause and Corrective Action files that QC-CALC used during the entry of these values must be specified.
14.5.4 Filter Settings
Filter File
The record filters created and used in Buddy are unique to each copy of Buddy on your local hard drive. However, you may wish to use your QC-CALC record filters in Buddy. Here we chose to Browse to our installation of QC-CALC 3.4 and use the default filters we create in QC-CALC. This simply means you do not have to create the same filters twice; once in QC-CALC and again in the SPC Office Buddy. You can also share filters with others across a network.
Start of Week
With this option you can choose which day of the week starts your week. For example, if you choose a filter for “Last week” and the Start of Week is set to Monday, you would get all the data in that file for the previous Monday to the present Monday. The Start of Week will be set to Sunday by default.

Tools – Options Menu
SPC Office Buddy Page 136
Default maximum records to return
This option is the maximum number of records to return after running the filter. This number applies only when a filter is in effect and cannot be larger than the maximum number of records allowed in the database (2,000,000).
Enable search limiting
Once this option is enabled you can limit how many records will be searched for results that match the filter criteria by entering the Maximum records to search in the box. If this setting is not used then all records in the .qcc file will be searched regardless of how long this search may take.
14.6 Update
Buddy has the ability to automatically check for updates to the latest version. There are two ways of getting an update: from the Prolink Website (www.ProlinkSoftware.com) or from a Local File Server.
14.6.1 Specify when to look for and run new updates
You have the option of having Buddy automatically check to see if updates are available. If you do not want Buddy to check for updates automatically, then set the frequency to Manual. With the setting at Manual, the Help – Run Update menu will be the only way to perform the update operation. The choices to check for updates are:
• Manual
• Every Time Program Starts
• Once Every Day
• Once Every Week
• Once Every Month.
14.6.2 Update Patch Location
Buddy can be configured to look in multiple locations for the update patch. By default it will look at the Prolink website to see if a new patch is available, but you can also point it to an installation of Prolink License Server or choose a location on your local network.
Local File Server
If you want to update individual copies using a central location (meaning you control when the updates are downloaded and installed), then you need to visit the Prolink website then download the update to a location where it will be accessible to everyone. After the update has been downloaded, configure all Buddies to check for available updates from that location by setting the Update Patch Location to the path where the update has been stored.

Tools – Options Menu
SPC Office Buddy Page 137
Prolink Website or Prolink License Server
When using the Prolink website or Prolink License Server option, Buddy will continually check to see if a new update is available based on the frequency specified at the top. When a new revision is detected the Enable on-screen update link option will cause a link to appear in the lower right corner of the main Buddy screen.
Clicking on this link shows the Software update available screen and lists the Release Notes between the revision you are running and the revision available to download. Click the Download Now button to download and run the update.
14.6.3 Run Update without User Interaction
Using the Silent Run option along with the automatic updating will keep Buddy up to date without the operators having to do anything at all. If a needed update was detected when the program started, the update will be downloaded and installed, then the program will start automatically when the updating process is finished.

Help Menu
SPC Office Buddy Page 138
15. Help Menu
15.1 Run Update This menu option will locate and run the update patch to update your current version of Buddy, if a newer revision is available. See the Update section on page 136 for a description of the Update settings. When this menu is used the following screen will appear so you can monitor the update process:
15.2 License Configuration Most of this window is self-explanatory but various aspects are detailed here.
The top of the license screen displays the status of your license. If you are running an evaluation copy it tells you how many days are left until the evaluation period expires. If it is a full purchased copy that has been activated it reads, “SOFTWARE ACTIVATED”. Your serial number is printed on the second line. From time to time you will supply the serial number to Prolink during phone support or identifying your software on the website. This serial number is also available from the Help – About SPC Office Buddy menu.
15.2.1 Computer ID
The number that appears in this area is generated by Buddy and is considered your PC’s identification number. This helps you identify which copy of Buddy you

Help Menu
SPC Office Buddy Page 139
are working with and it is the origin of the Activation Code. If you have purchased multiple copies of Buddy, it makes it easier to identify which copy you are discussing with our support staff or the website.
15.2.2 Activation Code
If the Activation Code is blank it means you have not activated the software and you are still running an evaluation copy. Your Activation Code is issued by our website or by Prolink personnel. The Activation Code contains 6 groups of 4 and 1 single character at the end which totals to a 25 character code. This code consists of numbers 0 - 9 and letters A – F. (i.e. 0103 EEF4 ADDD 603B AB2A 9CE9 4). After entering an Activation Code and clicking the OK button, the Activation Code disappears and is replaced by “NO KEY NECESSARY” in order to avoid any confusion. The current software status is displayed at the top of the window.
15.2.1 Use PLS
This link is used to license the software by connecting to a Prolink License Server installation. PLS will connect to the website to validate any license changes and will automatically enter the Activation Code for you. See the Prolink website (www.prolinksoftware.com) for more details about PLS.
15.2.2 Kill License
This option is used to remove the Buddy license on a particular machine. We use this option to transfer a license from one computer to another. You are asked if you are sure before the license is removed. When successful a dialog box is displayed verifying your action.
You will read this number to a Prolink support staff member to allow you to move the license to a different machine. But in most case this is not required.
- End of Manual -