Analysis of settlement data, Wappapello Dam, Missouri / by ...
62
TA .W34 no.3-398 tC
-
Upload
khangminh22 -
Category
Documents
-
view
0 -
download
0
Transcript of Analysis of settlement data, Wappapello Dam, Missouri / by ...

TA
.W34no.3-398
tC

CORPS OF ENGINEERS. U. S. ARMY
ANALYSIS OF SETTLEMENT DATA
WAPPAPELLO DAM, MISSOURI
CWI ITEM NO. 505
PROTOTYPE ANALYSIS (SOILS)
nICI lil
li00~ 0 011
TECHNICAL MEMORANDUM NO. 3-398
PREPARED FOR
OFFICE OF THE CHIEF OF ENGINEERS
BY
WATERWAYS EXPERIMENT STATION
VICKSBURG, MISSISSIPPI
ARMY-MRC VICKSBURG. MISS.
FEBRUARY 1955
_ -- -

i
PREFACE
The Waterways Experiment Station was authorized to undertake the
analysis presented in this report by 1st Ind, dated 14 September 1950,
from the Office, Chief of Engineers, to letter from the Waterways
Experiment Station, dated 7 July 1950, subject "Minutes of Conference
Held 27-28 June 1950." Settlement studies at Wappapello Dam were
approved as a part of the Office, Chief of Engineers, Civil Works
Investigation Program Item 903-B, which was subsequently changed to
Item 505, "Prototype Testing and Analysis, Soils."
The program of prototype tests to study the performance of earth
dams and foundations originally was divided into 14 categories. Of these,
four were selected for initial analytical study: (a) relief well systems,
(b) compaction, (c) pressures in and under dams, and (d) settlement under
dams. Certain test facilities were installed in a number of structures
to provide data on these four items from the behavior during and after
construction of the structures. Considerable data on various phases of
their performance have been obtained.*
One of the structures for which performance data have been obtained
is the Wappapello Dam, Missouri. These data were obtained through the
cooperation of the Memphis District, CE. The Wappapello Dam project was
constructed under the inmediate direction of the District Engineer,
Memphis District, CE, Memphis, Tennessee, and the supervision of the
* A series of reports, entitled "Analysis of Piezometer and Relief-WellData," presenting data obtained under this phase of the prototype testprogram, was initiated with the publication in February 1954 of TM3-:79, Report No. 1, "Data from Sardis Dam, Missiasippi."

t
Prei~et, Missisipit River Co lission, C, ViOcksburg, Missistpp, ean
the ie of egns, U. S. Ar, washits D. C.
1raat of ti Sols Di vision o tn as es aere Station
actively onnected with studB y erw s besrs. V. J. Turnbull, W. 0.
Sbookley, A. A. Uexltl, J. L. McCal, G. V. Leens, a) a rs. Marile M.
Leaster. hs repofl was prepared by Mr. KcCafl.

iii
CONTENTS
PREFACE . . . . . . . . . . . . 9 . . . . . . . . . . . . . .
PART I: INVESTIGATIONS OF PERFORMAICE OF EARTH DAM
Objective . . . . . . . . . . . . . . . . .Selection of Wappapello Dam for Analysis . . .
PART II: DESCRIPTION OF PROJECT . . . . . . . .
General Features . . . . . . . . . . . . . . .
Prototype Test Facilities . . . . . . . . .
PART III PREDICTED AND ACTUAL SETTLEMENTS. . . .
Prototype Test Facilities Used in Analysis . .Methods of Computation . . . . . . . . . .
Comparison of Predicted and Actual Settlement
PART IV: ANALYSIS OF PROTOTYPE DATA . . . . . .
Ultimate Settlement . . . . . . . . . . . . .Time Rate of Settlement.. . . . . . . . .
PART V: DISCUSSIO. . . .... .........
PART VI: CONCLUSIONS AND RECO{EDATIOS . . . . .
Conclusions . . . . . . . . . . . . . .. . .Recommendations . . .. .. . . . .. .
ASSOCIATED REPORTS
TABLES 12-4
PLATES 1-22
S
Is 9 0 9 . 9
. . 9 . 9 9 .
" " " "
" " " " "
" " s "
iv
I
12
3
37
9
91012
15
1521
25
28
2828

iv
SU *ARY
Data obtained from observations of settlement plates at Wappappapello
Dam, Missouri, are analyzed in this report in furtherance of a Corps of
Engineers program to study the performance of earth dams and foundations.
The data derived from these studies are to be used to assist in solution
of problems encountered in the design of future, similar structures.
Review is made of assumptions and the method of computation used
in the original settlement predictions together with new assumptions and
methods of computations of settlement. The results of the various compu-
tations are then compared with measured settlement of the foundation. It
was found that the agreement between theoretical and measured settlements
was measurably improved when consideration was given to certain factors
affecting settlement at the site that had not originally been considered.

ANALYSIS OF SETI 4AENT DATA
DATA FROM WAPFAPPAPELLO DAMt MISSOURI
PART I: INVESTIGATIONS OF PERFORMANCE OF EARTH DAMS
Objective
1. A large number of dams built by the Corps of Engineers during
recent years consist wholly or partly of earthen materials and rest on
soil foundations. The design of such structures is based on soil
mechanics theories which in many cases are complex and their application
to specific problems is not always fully understood. Furthermore, soil
conditions at the sites are often very complicated and impractical to
explore in detail. Therefore, certain simplifying assumptions are made
so that generalized soil conditions may be established which will permit
the application of the theories of soil mechanics in the design analysis.
2. Because of these uncertainties in the design of earth structures
and foundations, the Office, Chief of Engineers, has inaugurated a program
of investigations to provide information on the performance of such
structures in operation. This information is intended to assist in the
design of future, similar projects. Specifically, data on the actual
behavior of engineering structures built of earthen materials and on soil
foundations, and which have been in operation long enough to permit a
reasonable evaluation of their performance, are compared with the design
requirements. Valuable information as to the prototype behavior of
structures of this type is thus made available for future use.

2
Selection of Wapapello Dam for Analysis
3. Wappapello Dam was selected for study of foundation settlements
because the foundation of the dam is composed of compressible soils and
the dam is of sufficient height to impose enough load on these soils to
result in substantial settlements. In addition, design data and a com-
plete record of prototype settlement data for the dam were available.

PART II: DESCRIPTION OF PROJECT
General Features
4. Wappapello Dam, built for flood-control purposes, is located
on the St. Francis River at the edge of the Ozark foothills. It is about
one-quarter mile southwest of the town of Wappapello, which is located
in. southeast Missouri. The project consists of a rolled earth dam,
approximately 2700 ft in length, across the river valley; three small
auxiliary dikes north of the dam site; an outlet structure located in
the right abutment, and an outlet channel; a spillway also located in
the right abutment, and a spillway outlet channel. The main embankment
has a crown width of 30 ft at elev 420 mG1 and symmetrical upstream and
downstream composite slopes, as shown on the typical cross section,
plate 1. The maximum section is between sta 19+00 and 19+50, where the
dam crosses the St. Francis River bed, and has a height of approximately
110 ft above the stream bed. The stream bed was filled with compacted
earth for 500 ft upstream and downstream from the axis of the dam.
Topography
5. The main embankment is constructed across the valley of the
St. Francis River at a point where the flanking hills converge to narrow
the valley to approximately 2400 ft at elev 350 mrG1. The flanking hills,
which form the right and left abutments to the dam, rise on an average
slope of I on 2.2 to slightly above crown elevation and then flatten to
gentler slopes. The valley floor was traversed by the St. Francis River,
located nearly in the center of the valley, and by two small streams,

4
Redman Creek and Peoples Creek. Redman Creek was located adjacent to
the south abutment at sta 6+00 and emptied into the St. Francis River
approximately 2000 ft downstream from the axis of the dam. Peoples Creek
was located on the valley floor near the north abutment and crossed
obliquely under the dam in a meandering pattern, emptying into the St.
Francis River about midway between the axis and downstream toe of the
dam (see plate 2).
Subsurface explorations
6. Soil conditions existing in the foundation for the main embank-
ment were explored during the latter part of 1935. Explorations were
extended by means of 34 auger, 29 core, and 5 undisturbed sample borings
as the design of the various component parts of the structure progressed.
The soils data obtained from the borings were further supplemented by
data obtained by excavating 10 test pits, numbered TP U-14 to TP U-23,
inclusive, and two test trenches, numbered 6 and 7. The auger borings,
test pits and trenches were limited in depth to ground-water level,
except for a few test pits in which the ground-water level was lowered
by pumping. Ground water was encountered 10 to 25 ft below the ground
surface. The core borings were carried well into the underlying bedrock.
The undisturbed sample borings varied from 44 to 70 ft in depth. Locations
of subsurface explorations, except auger borings, are shown on plate 2.
Foundation conditions
7. A log of borings along the center line of the dam is shown on

5
plate 3.* It may be noted that the foundation of the dam consists of
alluvial soils of variable thickness which are underlain by limestone
bedrock. The soil types vary considerably, both horizontally and
vertically along the axis of the dam. Fine-grained top stratum soils
averaging approximately 50 ft in thickness are encountered adjacent to
the right and left abutments of the dam and extend from the right abutment
to sta 11+00 and from the left bank of the St. Francis River (sta 20+00)
to the left abutment of the dam. These fine-grained soils are underlain
by strata of sandy soils, some of which contain gravel. Generally sandy
soils averaging 100 ft in thickness extend from sta 11+00 to the right
bank of the St. Francis River and from natural ground to the limestone.
These soils also contain strata of gravelly sandy soils.
8. A deep stratum of silty clay extends from approximately sta
8+00 across the valley to the left abutment (see plate 3). A weathered
zone approximately 10 ft deep tops the underlying limestone, The lime-
stone rises sharply under both abutments and is covered with a soil
mantle which generally contains broken stone, boulders, gravel, and
strata of weather porous limestone. A generalized soil profile * is
shown in the upper part of plate 3.
Sanpling and testing
9. Samples taken from the foundation beneath the main embankment
were subjected to tests according to their types and the purposes for
* The upper portion of plate 3 is a reproduction of plate 97, and thelower portion is a reproduction of plate 65 of St. Francis River Proj-ect, "Wappapello Dam, Analysis of Design, Appendix II, Report on SoilInvestigations," Memphis District, CE.

6
which they were obtained. Samples taken by auger, drive tube, and cores
were subjected to water content and mechanical analysis tests. Samples
recovered from the 6 undisturbed sample holes were tested for shear
strength and Atterberg limits in addition to the above-mentioned tests.
The samples recovered from test pits TP U-14 and TP U-23, inclusive, were
tested for consolidation characteristics, shear strength, Atterberg
limits, and specific gravity,
Design of embankment
10. The selection of rolled-fill construction for the embankment
of the dam was based on investigations that indicated that the materials
to be excavated for the appurtenant structures were suitable for compacted
fill. The design of the embankment section was based on a thorough in-
vestigation of the stability of the foundation, which contained strata
of plastic materials of considerable thickness in some areas as may be
noted from plate 3. The crest elevation initially selected was 416 ft
mraG1 and was subsequently changed to 420 ft mGl.
Construction
11. Construction work was started in August 1938 with clearing and
stripping of unsuitable top stratum materials in the foundation. The
amount of stripping found necessary varied from 1 to 4 ft. The stripped
foundation was thoroughly scarified prior to fill placement. The toe
drain was completed and rolled fill placed to elev 390 ft mCG1 on both
sides of the river, with only a few interruptions occasioned by inclement
weather. Upstream and downstream cofferdams were then constructed across

the St. Francis River and the river bed was dewatered and stripped of
unsuitable materials prior to construction of the closure section. The
toe drain across the river bed was of similar design to that placed
elsewhere, except that a rocky fill was placed in the old channel up to
elev 336 ft mGl. The entire embankment was completed to project grade
of 420 ft mG1 by May 1941.
Prototype Test Facilities
Settlement plates
12. Eighteen settlement plates, located as shown on plate 2, were
placed in the foundation in order to observe the amount and rate of
settlement. The location and original elevation of the plates are
tabulated below:
Plate ElevationNo. Station Location ft, mGl
1 6+37 Center line 327.492 8+06 250 ft upstream 348.393 7+53 Center line 349.124 10+50 Center line 345.495 8+98 250 ft downstream 347.666 15+25 Center line 346.077 25+68 200 ft downstream 348.498 283+05 250 ft upstream 342.669 25+65 Center line 343.78
10 22+55 Center line 348.7411 21+05 250 ft downstream 339.6112 18+00 250 ft downstream 315.6813 19+00 Center line 312.7014 16+03 480 ft downstream 308.9915 19+50 250 ft upstream 312.3516 19+50 480 ft upstream 313.8317 21+55 250 ft upstream 350.2118 15+07 250 ft downstream - 345.68

The settlement plates were made of 3/4-in.thick steel plate, 3 ft by
3 ft square, and were placed on the first or second layer of compacted
fill. A vertical l-t/2-in, steel riser pipe was welded to the center
of each plate and lengthened in 5-ft sections as the height of the
embankment increased. These vertical riser pipes were not cased.
Present engineering practice usually provides for casing such riser
pipes in order to eliminate friction between the pipe and the
surrounding compacted fill and provide freedom of movement as the plates
settle.
Hydrostatic pressure gages
13. Twenty-eight hydrostatic pressure gages of the Goldbeck,
Foxboro, and Wilson types were installed at various locations and
depths in the foundation for the purpose of observing the pore-water
pressure resulting from construction of the embankment and the progress
of consolidation of the compressible material.

PART III: PREDICTED AND ACTUAL SETTLMBENTS
Protot ye Test Facilities Used in Analysis
14. The highly stratified nature of the foundation is apparent
from a study of plate 3. The continuity between borings of the various
strata was generally indeterminate. In many cases, samples of fine-
grained soils contained silt and sand partings and samples of sandy
soils contained clay lumps.
15. Settlement predictions were made, for inclusion in the analysis
of design, at 11 locations based on the results of consolidation tests
of samples from 10 test pits, TP U-14 to TP U-23, inclusive, and on
an embankment height extending to elev 416 mGl. Of the 11 locations
selected for settlement computations, only 7 were close enough to
settlement plates to warrant comparisons of the predicted and measured
settlement in this report. Thus, predicted and measured settlements
are compared by means of data obtained from
Settlement plate 3 and TP U-20
Settlement plate 4 and TP U-20
Settlement plate 6 and TP U-16
Settlement plate 10 and TP U-22
Settlement plate 9 and TP U-23
Settlement plate 13 and TP U-17
Settlement plate 18 and TP U-19
the following:
32
265
10
10
10
95
50
Settlement plate 4, located at eta 10+50, was compared with test pit TP
U-20 because the original estimate of settlement at this location was
based on soil conditions encountered in test pit TP U-20 even though
ft
ft
ft
ft
ft
ft
ft
apart
apart
apart
apart
apart
apart
apart

10
test pit TP U-21 was located at a distance of only 125 ft from the
settlement plate.
Methods of Conputation
Ultimate settlement
16. The amount of consolidation of a given stratum in the
foundation was determined from the pressure-void ratio diagram for
a sample representative of that stratum. The ultimate settlement, S,
was determined from the following expression:
el - e$ l+e 1 h ,
where in:
el = void ratio corresponding to overburden pressure,
e 2 = void ratio corresponding to total pressure afterconstruction of embankment, and
h = thickness of stratum.
The total settlement is equal to the summation of ultimate settlement S
for each stratum encountered under the settlement plate. An average
overburden load of 110 lb per cu ft, based on laboratory test data, was
used. A submerged unit weight of 64 lb per cu ft was used for strata
below the water table. The added load due to the embankment was taken
simply as the weight of the embankment above the point in question, using
a unit weight of 130 lb per cu ft. Void ratios el and e2 corresponding
to the pressures before and after the addition of load were taken
directly from the laboratory pressure-void ratio curve for a sample
representative of the stratum under consideration.

11
Settlement during construction
17. Settlements that would occur during the construction period
were computed, using Terzaghi' s method, based on the assumption that the
settlement at the end of construction would be the same as that which
would have occurred in one-half the construction time had the entire load
been acting. A construction period of 9 months was used in the settlement
predictions and the loading during the construction period was presumed
to be accomplished at a uniform rate.
Depth of foundation considered
18. Consolidation tests were made only on samples taken from the
10 test pits, and settlement predictions were not made for strata
located below the bottom of the test pits. Depths of the test pits
(TP U-14 through TP U-23) are listed in table 1. It thus appears that
settlement was assumed to be the result of compression in the soil
strata above the bottom of the test pits, although no statement to this
effect has been found in the available reports.
19. There is one exception to the above implied assumption. The
"Analysis of Design Report, Appendix II," paragraph 7-08, states in
part: "A greater thickness, 90 feet of compressible material was found
along the center line in the vicinity of sta 27+50.* Assuming identical
conditions (with test pit TP U-20), the maximum settlement will occur at
this point and will equal approximately 5 feet of which approximately
50 per cent will occur during the construction period."
* Stationing has changed since publication of report so that oldstation 27+50 is now station 10+50.

12
Comparison of Predicted and Actual Settlement
Predicted ultimate settlement
20. A study of the computations for the original settlement
predictions showed that the loads were computed from the top of the
fill down to the stripping line and from the original ground surface
downward, thereby introducing a small error in that the weight of the
soil between natural ground surface and the stripping line entered the
computations twice. This error was generally small and its magnitude
of occurrence depended on the depth of stripping at the location of
the settlement prediction. In order to provide a basis for comparison,
the original computations have been corrected in this report to eliminate
the overlap in weight of the soil between the original ground surface and
the stripping line. In making-the correction, the computations are based
on a net embankment load and assume that the net effect of the rebound and
recompression of the foundation because of stripping is negligible.
21. The settlement was then recomputed to take into account the
change in project grade from elev 416 to 420 mG1 using the same assump-
tions and methods as were employed in the original computations. The
originally predicted settlement and the corrected originally predicted
settlement for project grade at elev 416 ft mGL, and the recomputed
originally predicted settlement for project grade at elev 420 ft mG1
are summarized in table 1. The latter values will be used in this report
for "predicted settlement."
22. The per cent of settlement occurring at the end of the construc-
tion period, as originally predicted, was assumed not to be affected by

13
the computations described abve so that settlement at the end of the
construction period was determined in each case frox the ultimate
settlement on a percentage basis. Table I shovs that it was predicted
that the ultimate settlements would take place during the construction
period at stations betveen eta 11+60 and 18+05 where the compressible
strata were relatively thin. At the ends of the dam, where the compres*
sible strata were relatively thicker, only about 50 to 60 per cent of
the ultimate settlement ase predicted to occur during construction.
Actual settlement
23. The amount and rate of actual settlement ocurring within the
foundation were obtained by running precise levels at given periods of
time on the settlement plate riser pipes. The periods of time varied
from daily during construction to semiannually sometime after completion
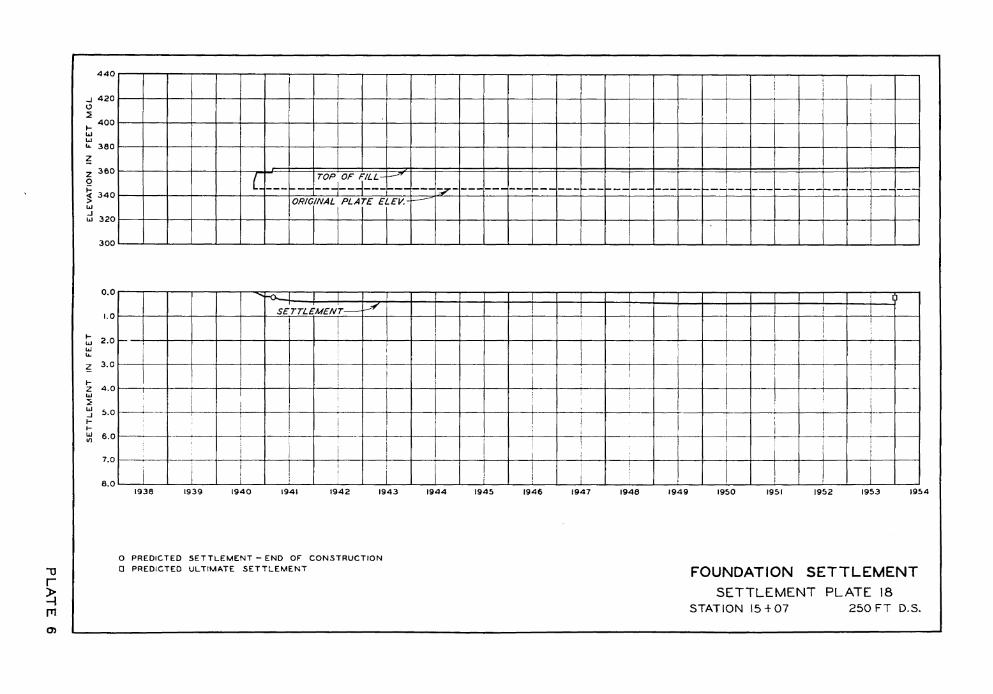
of the structure. The measured settlement taking place to 30 June 1953
at the settlement plates listed in paragraph 15, together with predicted
ultimate settlements and settlement at end of construction, is plotted
on plates 4 through 10. The progress of embankment construction also is
shown on these plates. Reference to these plates shows that practically
all settlement had taken place at every location by 30 June 1953 and that
only a small amount of additional settlement may be expected. The actual
settlement that had occurred by 30 June 1953 is presented on table 2
together with the predicted ultimate settlement for the 420-ft mC1 proj-
ect grade., Plate 1U shovs the measured settlement along the center line
of the Asm on 30 June 1953 compared with ultimate gpredicted settlement for
projceot grade of 420 ft mC. Plate 12 shows a cross section of the dam
at approximately sta 22+00, the predicted settlement on the center line

14
at sta 22+45, and the settlement measured by settlement plates 10, 11,
and 17 at the end of construction and on 30 June 1953. It may be noted
on plate 12 that the measured settlement at the center line had exceeded
the ultimate predicted settlement by the end of the construction period.
A comparison between the per cent predicted settlement and the per cent
measured settlem ent at the end of the construction period is shown in
table 2.

15
PART IV ANALYSIS OF PROTOTYPE DATA
Ultimate Settlement
24. Comparison of measured versus predicted settlements after
adjustments were made for stripping and actual height of dam showed that
good agreement obtained only in the case of settlement plate 3. Other
settlement plates showed measured settlements considerably in excess of
the predicted values. It is the purpose of this portion of the analysis
to determine the reason for these differences. Settlements at plates 4
and 13 were eliminated from further analysis because the distances
between the settlement plates and the nearest test pits were considered
too great to permit a reliable comparison between computed and measured
settlements.
Depth of compressible material
25. Apparently the predicted settlement was computed on the basis
of compression of the soil strata above the bottom of the test pits, as
stated in paragraph 18. Plate 3 shows that compressible soil strata are
also encountered between the bottom of the test pits and the underlying
bedrock. A computation of settlement based on the full depth of conpres-
sible material, but otherwise using the same assumptions as were used in
the original computations, was made and the results are listed in
table 3 under Case I.
26. Available consolidation test data were limited to test pit
samples. In lieu of actual consolidation test data for the compressible
soil strata below the bottom of the test pits, correlated data obtained
from a study of all soil data were used in the analysis. A chart was

prepared (see plate 13) on which the soil profiles were plotted together
with available soils data for the five test pits and settlement plates
under consideration. Soil conditions below the depth of the test pits
were taken from the nearest borings. The soil profiles were then divided
into strata and the available data for each strata were recorded on the
chart. Silty material encountered immediately below the bottoms of test
pits TP 22 and U-22 and TU-23 was assumed to be essentially the samn as that
sampled near the bottom of each of these two test pits. Accordingly,
consolidation characteristics of the silty material at the bottom of
each test pit were assigned to similar strata immediately beneath it in
each case. Consolidation test data obtained for sample 47, test pit TP
U-20, recovered at a depth of 48 ft, were assumed to be representative of
the lower clay strata in this test pit. Since this stratum was the
deepest actually tested, the data were also assumed to be representative
of all the clay strata encountered below the bottom of the test pits.
Properties of sandy soils were assumed on the basis of an initial void
ratio of 0.550, a compression index (Cc) of 0.40, and a saturated condi-
tion. These properties of sandy material are fairly typical of similar
materials encountered in the alluvial valley of the Mississippi River.
27. Settlement values obtained for Case I conditions again compared
favorably with measured settlement for settlement plate 3, and reasonably
well with the measured value at settlement plate 18 (see table 3). The
settlement values obtained for other settlement plates were larger than
the measured settlement but showed better agreement at settlement plates
9 and 10 than did the predicted settlement.
16

17
Other factors affectingsettlement computations
28. Other factors which may affect settlement computations for this
site aret the method of determination of vertical stress, the effect of
preconsolidation of the soil strata, the use of an assumed embankment
density vwhich was not obtained in the field, and variations in ground-
water elevation. These factors and their effects on the settlement
ccputations will be considered in subsequent zaragraphs.
29. Vertical stress determination. Vertical stresses for the
canputation of predicted settlement were determined as the weight of the
embankment directly over the point in question, using a density of 130 lb
per on ft. Vertical stresses may also be computed by the elastic method.
In the theory of elasticity, the vertical stress distribution imposed on
a foundation by the construction of an embankment is dependent on the
size and shape of the embankment section in addition to the unit weight
of the embankment material. The accuracy of the stress computations is
limited to a certain extent by the fact the soils do not behave as per-
fectly elastic bodies, Vertical stresses, based on the elastic theory
method, were computed by means of a chart based on the Carothers-Terzaghi
formula* for strip loads of infinite length, Computations were made for
vertical stresses at depths corresponding to the mid-height of the vari-
ous strata encountered under each of the five settlement plates con-
sidered. An egbankment density of 130 lb per cu ft was used, as in the
computations for predicted settlement. The depth-vertical stress
* Leo Jurgenson, The Aplication of Theories of Elasticity andPlasticity to Foundation Problems, 8$S, 1934.

18
variation under the five settlement plates caused by the embankment
surcharge load is shown on plate 14. It may be noted on this plate that
considerable reduction of vertical stress is indicated as the depth in-
creases at settlement plates located under the axis of the dam, and a
slight increase in vertical stress is shomw as depth increases at settle-
ment plate 18 which is located 250 ft downstream from the axis. This
effect is to be expected because, according to the elastic theory, the
stres intensity under areas subjected to triangular loading is dissipated
in an outward direction from the center as the depth increases. Thus,
vertical stresses below the surface near the outer edge of the loaded area
may equal or slightly exceed the stress caused by imposed load directly
above. The ultimate settlements computed on the basis of the entire depth
of compressible material and using vertical stresses determined by the
elastic theory method are tabulated in table 3 under Case II.
30. Settlement values obtained for Case II conditions generally
compared slightly more favorably with the measured settlement than those
obtained originally or for Case I conditions; however, the differences
were numerically quite small between Cases I and II. Settlement values
for all settlement plates except plate 18 were lover than those obtained
for Case I conditions.
31. Effect of preconsolidation. The concept of preconsolidation of
soil strata and its relationship to settlement problems was not generally
considered when the settlement analysis, cu ~:bich the predicted settle-
meants were based, was made. A study of the pressure-void ratio curves
obtained from consolidation tests showed that the soils at this site have

19
been preconsolidated to varying pressures in excess of the overburden
pressure at the beginning of construction. A number of methods for
adjusting the pressure-void ratio curves to take preconsolidation into
account have been proposed and are in current use. In this analysis the
adjustments were made in accordance with the method proposed by
Terzaghi*,: which is illustrated on plate 15.
32. Eb~_bankment density. In the laboratory compaction test when
gravelly soils are being tested it is standard practice to remove the
material retained on the 3/4-in. sieve. The wasted material is then
replaced on a parcentage basis with material retained on the No. 4
(0.18-n.) sieve. In placing the embankment, however, stones up to 6 in.
in diamoter were allotced in the fill. Under these conditions it is dif-
ficult to obtain field compacte densities that agree closely with the
laboratory values. The overa-ll compacted density obtained for the
embankmnt on this da amounted to approximately 88 per cent of that
obtained in the laboratory. Actual average densities of the erbnlkment
material ere determined from available field control data, and are
included in table 3.
33. Vaiations in roundr-xater elevtion. A factor which has
coniderable bearing on settlement comrutations is the determination of
a reliable average ground-ater elevation for any particular point. A
review of the exploratory data showled that ground-wter elevations
determined in the test pits varied only3 4 ft in the 10 test pits, with
an average elevation of 325 ft rl. However, 11 core borings showing an
* K. Terzaghi, ' Relation of Undisturbed Sampling to Laboratory T'sting."Discussion, Proc ASCE, JUne 1943.

20
extreme variation of 16 ft in water elevation gave an average ground-water
elevation of 335 ft mGi, which is 10 ft higher than that shown by the
test pits. It was decided to use the ground-water elevation from the core
borings as shown on the lower part of plate 3, because the plotted ground-
water table conformed more nearly to natural conditions and therefore
appeared to be more reasonable.
34. Overburden weight. The overburden weights were computed for
each test pit from the available laboratory and correlated soils data
(see plate 13) using the relationships
S 7
m 1 t"e
wherein ym = unit moist weight
o'm = unit submerged weight
7w = unit weight of water
S = 6specific gravity
a = void ratio
w = water content
The overburden load-depth diagrams for the five test pit locations are
show on plate 16.
35. A computation of settlement was made based op the full depth
of cozressible material, vertical stresses computed by the elastic
method, and considering factors described in the preceding paragraph
(31 to 34). Results of the computations are shown in table 3 under
Case III. Settlement values obtained for Case III conditions compare

2
very favorably with the measured values for the five settlement plates
under consideration.
Time Rate of Settlement
Method of Computation
36. Tie-settlement rates were recomputed for instantaneous loading
conditions based on ultimate settlement computations for Case III. The
following relationships were used:
t90OL
and
-T---t t
wherein
tg F = time for 90 per cent consolidation in field stratum
t90L = time for 90 per cent consolidation in laboratory specimen
= height of longest drainage path in field specimen
=L = one-half height of laboratory specimen
tuF = time for u per cent consolidation in field stratum
T = time factor for corresponding u per cent consolidation
(Case I as tabulated by Tersaghi and Frbhlich*)
Values of t w0L vere obtained for the portion of the compressible soils
above the bottom of the test pitse and for silty soil imuediately below
the bottom of the test pits by averaging values of tg90 L, for all
* Theorie der Setzung von Tonschickten, Vienna: Deutische, 1936.
22
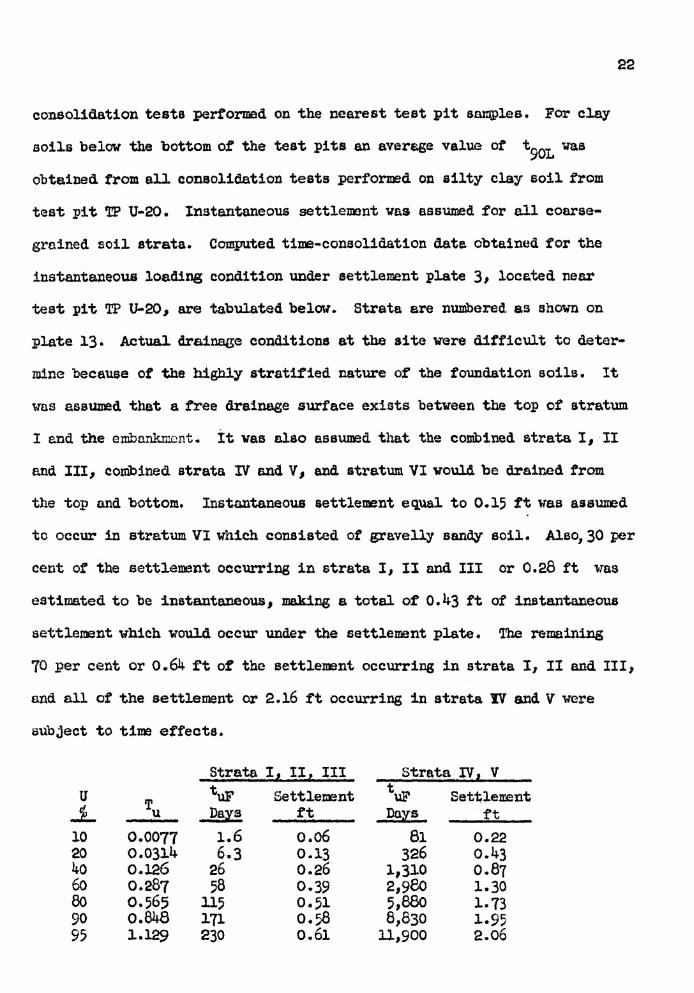
consolidation tests performed on the nearest test pit samples. For clay
soils below the bottom of the test pits an average value of t90L Vas
obtained from all consolidation tests performed on silty clay soil from
test pit TP O-20. Instantaneous settlement was assumed for all coarse-
grained soil strata. Computed time-consolidation data obtained for the
instantaneous loading condition under settlement plate 3, located near
test pit TP U-20, are tabulated below. Strata are numbered as shown on
plate 13. Actual drainage conditions at the site were difficult to deter-
mine because of the highly stratified nature of the foundation soils. It
was assumed that a free drainage surface exists between the top of stratum
I and the embankmnnt. It was also assumed that the combined strata I, II
and III, combined strata IV and V, and stratum VI would be drained from
the top and bottom. Instantaneous settlement equal to 0.15 ft was assumed
to occur in stratum VI which consisted of gravelly sandy soil. Also, 30 per
cent of the settlement occurring in strata I, II and III or 0.28 ft was
estimated to be instantaneous, making a total of 0.43 ft of instantaneous
settlement which would occur under the settlement plate. The remaining
70 per cent or 0.64 ft of the settlement occurring in strata I, II and III,
and all of the settlement or 2.16 ft occurring in strata IV and V were
subject to time effects.
Strata I, II, III Strata I , V
StuF Settlement F SettlementT Days ft Days ft
10 0.0077 1.6 0.06 81 0.22o20 0.031 6.3 0.13 326 0.4340 0.l426 26 0.26 1,310 0.8760 0.287 58 0.39 2,980 1.3080 0.565 115 0.51 5,880 1.7390 0.848 171 0.58 8,830 1.9595 1.129 230 0.61 11,900 2.06

23
Time-settlement curves forconstruction rate of loadi
37. Data similar to those tabulated above were utilized to construct
the tipe-settlement curves for the construction rate of loading which are
shown on plates 17 through 21 for the five settlement plates (3, 18, 6,
10, and 9) under consideration. The time rate of construction was divided
into stages which conformed as nearly as practicable to the actual con-
struction rate. Computations for the time-settlement for the construction
rate of loading were made on the basis of conditions for Case III as
described in table 3.
38. The method used to determine the adjusted time-settlement curve
is described in paragraph 4 04, part CXIXJ chapter 4 of the "Engineering
Manual for Civil Works Construction.. The following is an application of
this method to the specific case The theoretical and measured time-
settlement curves for the construction rate of loading at settlement plate
3 are shown on plate 17. It may be noted that the rate of construction was
divided into two stages which conform fairly well with the actual construc-
tion rate. Stage I represents a period of uniform loading for 379 days dur-
ing which time 79 per cent of the total embankent load was applied.
Stage 2 represents a period of uniform loading for 161 days during which
time 21 per cent of the total embankment load was applied. There vas also
a period of 320 days between stages 1 and 2 when no embankment load was
applied.
39. in order to obtain the theoretical time-settlement curve for
eonstruction loading, plate 17, the settlements obtained for instantaneous,
canbined strata I, IIU, and III, and ccmbined strata IV and V vere propor-
tioned on a percentage basis vith 79 per cent allotted to stage 1 and

24
21 per cent allotted to stage 2. For stae , the instantaneous settle..
meat as applied uniformly over the construction period. The settlements
subject to time effects (strata I, fI, and II, and strata I1 and V)
vere applied starting at the halt-time for stage I period. Thus, three
settlement urves for assumedt. instan s loading conditions were drMawn
instantaneous settlements for all strata cbined, time settlements for
strata I, U, and I and time settlements for strata V and VI. The
toretical settlement urve for construction loading, stage 1I was ob-
tasned by adding the ordlnates for the three curves. In a similar man.
nero settlements for stage 2 constructton were applied to the theoretical
cIrve obtained for stage 1 construction. The theoretical settlement
curves were developed in a similar manner for the other settlement plates
as shoa on plates 18 through 21.
40. A cazparmison between the actual and reocpted settlaemnts at
the end of the construction period ts shon on table 4. The individual
settlemet curves for instantaneous loaditn coditions that were used to
obtain the theoretial tie-stleent curves are not shown on plates 17

25
PART V: DISCUSSION
41. The predicted settlement and settlement computed on the basis
of Cases I and II as given in table 3 did not compare favorably with the
measured settlement except at settlement plate 3. Settlement computed on
the basis of Case III conditions as given in table 3 compared favorably
with the measured settlement. Computations for Case III conditions had
the advantage of the use of actual average embankment densities and the
refinement of adjusted pressure-void ratio curves to take preconsolidation
into account, factors which were not available for the original
computations.
42. Discrepancies between the originally predicted and measured
settlements can be attributed largely to the fact that the compressible
soil strata below the bottom of the test pits was not considered. The
close agreement between predicted and measured settlement at settlesettlement
plate 3 supports this statement, because the depth of test pit TP U-20,
on which the computations were based, was closest of all the test pits
considered to the actual bedrock. However, when the full depth of the
compressible soil strata is considered, Case I computations result in
settlement values which somewhat exceed the measured values. Case II
computations, which utilize vertical stresses determined by the elastic
method, result in settlement values that agree more favorably with the
measured values and thus demonstrate the advantage of the elastic method
for vertical stress determination when compressible soil strata extend
to considerable depths as at this site.

43. Consideration was given to the various factors affecting settle-
ment described in paragraphs 31 to 34 in the Case III computations. The
effect of the individual factors on the computations was not separately
demonstrated. The combined effect of considering these factors is shown
by the close agreement obtained between the coputed and measured settle-
eint values. It is believed that the factor effecting the major improve-
ment in the results was use of the actual embankment densities, although
consideration of the other factors may have materially contributed.
44. Some of the discrepancy between the theoretical and measured
settlements may be attributed to the fact that settlement plates were
usually located at some distance from the test pits. Soil conditions at
the site were heterogeneous, as previously stated, so that computation of
settlement at the test pit may not be valid for couparison with measured
settlement at the nearest settlement plate. These circumstances are
inescapable when test pits are employed for obtaining samples for con-
solidazion tests and subsequent settlement analysis, because the settle-
ment plate ast be located at a sufficient distance from the test pit to
avoid disturbed soil conditions attendant to excavation and backfilling
of the test pit.
45. The recomputed theoretical time-settlement curves for construc-
tion loading based on conditions for Case III comared very favorably
with the measured settlements at settlement plate 18 (plate 18) and fairly
well with the measured settlements at settlement plate 6 (plate 19). The
comparison at other settlement plates was not good. Several factors may
have influenced the results of these computations. They are: sample
disturbance, selection of a representative value of t9oL , and the

27
occurrence of thin strata or lenses of fine sand or silt in the founda-
tion soil. It is believed that the largest error in the time-settlement
computations for this site was introduced by the lenticular nature of
the fourndaton soila which contained innumerable fine sand and silt
lenses. These lenses, if continuous or interconnected, provide drainage
paths for pore water dissipation and thus introduce additional drainage
boundaries which may greatly speed up the rate of consolidation over that
predicted on the assumption of a homogeneous stratum. A careful examina-
tion of the undisturbed samples in conjunction with a study of the boring
logs may provide a basis for establishing mr e realistic drainage condi-
tions than is apparent from an inspection of the boring logs alone.

28
PART VI COIUSIONS AND RECIOWIATIONS
Conclusions
6E. On the basis of the preceding analysis, the following conclu-
sions are believed warranted,
a. A reasonable estimate of ultimate settlement for a struc-ture of this type may be made, as evidenced by results ofCase III cmputations, if factors influencing settlementat the site are carefully evaluated.
b. Reliable time-settlement predictions are difficult to makeVhen lnticular ecapressible soil strata are encounteredin the foundation, as at this site. Under these conditions,predicted settlement values at the end of construction areusually less than measured values. A careful examinationof undisturbed samples and boring logs is required to revealdraage conditions in such foundations that may in turnresult in more favorable time.settlement predictions.
Recommendations
47. The following procedures are reomsded for use in explorations
and settlement analyses, and in installation of prototype test facilities
in connection with future studies of this type.
a. Foundation explorations for the purpose of settlementanalyses should be made by means of borings of a type anddiameter suitable for the recovery of undisturbed samplesfor consolidation tests. The required depth of borings forsettlement analyses should be detemined on the basis of afew deep preiminary borings. If soils subject to consider-able consolidation are encountered in the preliminaryborings, the borings for settlement analyses should eitherpenetrate the compressible strata or extend to such depththat the stress increase for still deeper strata is reducedto values so small that the corresponding consolidation ofthese strata will not materially influence the settlement ofthe proposed structure. Plate 22 shows a diagram of a pro-posed method for determining the required depth of boringsfor settlement analyses .*
* M. Jul v-orsle, Subsurface.: Exploration and S-mplirq- of Soils forCivil Engineerinjg Purposes. iES, lovember 198, age 18.

29
b. Consolidation test data should be examined to determinewhether the soils are preconsolidated. If preconsolida-tion is indicated, the pressure-void ratio curves shouldbe adjusted as described in paragraph 31, or by othermethods, before use.
. A preliminary computation of vertical stresses should bemade by the elastic theory method. If compressible soilstrata extend to depths below bich the vertical stressestend to decrease with depth, the settlement analyses shouldbe based on vertical stresses determined by the elastictheory method. The preliminary computations will alsoserve as a guide to determining the required depth of boringsas described in a above.
d. Bettlement plates installed for the purpose of comparingpredicted settlement with measured settlement should belocated within a few feet of the boring on which thesettlement prediction is based.

ASSOCIATED REPORTS
St. Francis River Project - The Wappapello Dam, Analysis of Design,Appendix II, Report on Soil Investigations.
St. Francis River Project - The Wappapello Dam, Plans for Constructionof Dam and Appurtenant Structures.
St. Francis River Project - The Wappapello Dam, Completion Report(unpublished).

Test PitDepth
Station Location No. ft
7+85
10+50*
11+60
11+75
15+15
15+35
15+35
18+05
18+05
22+45
25+55
Centerline
Centerline
300 ftDS
Centerline
300 ftDS
225 ftUS
Centerline
225 ftUS
Centerline
Centerline
Centerline
TP U-20
TP U-20
TP U-18
TP U-21
TP U-19
TP U-14
TP U-16
TP U-15
TP U-17
TP U-22
TP U-23
68.5
68.5
24.3
24.4
26.2
28.0
26.2
24.3
20.5
43.3
42.4
Table 1
SUMMARY OF PREDICTED SETTLEMENT
Predicted SettlementOriginal Project Grade, Corrected Original Project
416 ft mGl Grade, 416 ft mGlAt End
Ultimate Constructionft ft Per Cent
3.29
5.00
0.19
0.96
0.32
0.23
1.17
0.45
1.84
1.70
2.78
1.71
2.50
0.19
0.91
0.32
0.23
1.17
0.45
1.84
1.04
1.53
52
50
100
95
100
100
100
100
100
61
55
At EndUltimate Construction
ft ft Per Cent
3.04
5.00
0.14
0.96
0.21
0.20
1.15
0.38
1.84
1.67
2.78
1.57
2.50
0.14
0.91
0.21
0.20
1.15
0.38
1.84
1.02
1.53
52
50
100
95
100
100
100
100
61
55
Recomputed Original ProjectGrade, 420 ft mG1
At EndUltimate Construction
ft ft Per Cent
3.24
5.00
0.14
1.01
0.21
0.20
1.20
0.38
2.02
1.76
2.91
1.68
2.50
0.14
0.96
0.21
0.20
1.20
0.38
2.02
1.07
1.60
52
50
100
95
100
100
100
100
100
61
55
* Estimate based on 90 ft of compressible material. Refinement not considered warranted.

Table 2
COMPARISON OF PREDICTED AND MEASURED SETTLEMENT
Predicted*At
Ultimate
3.24
5.00
0.21
1.20
2.02
1.76
2.91
EndCon-
struc-tion
1.68
2.50
0.21
1.20
2.02
1.07
1.60
Settlement in Feet
PerCent
52
50
100
100
100
61
55
Ultimateas of30 June1953
3.35
3.76
0.50
2.09
1.58
5.14
5.79
Measured
AtEndCon-
struc -tion
2.50
3.03
0.25
1.60
1.00
3.25
4.13
Settlements computed on basis of** Settlement recomputed for 250 ft
*** Estimate
420-ft mGl project grade and 9-monthsDS, while prediction was computed for
construction period.
300 ft DS,
Settle-mentPlate
3
4
18*
6
13
10
9
Station
7+53
10+50***
15+07
15+25
19+00
22+55
25+65
Loca -tion
CL
CL
250 ftDS
CL
CL
CL
CL
TestPitNo.
TP U-20
TP U-20
TP U-19
TP U-16
TP U-17
TP U-22
TP U-23
OriginalElev ofPlateft mGl
349.12
345.49
345.68
346.07
312.70
348.74
343.78
Con-struc-tion
Periodin
Months
26
25
5
25
9
19
19
PerCent
75
81
50
76
63
63
71

Table 3
MEASURED AND COMPUTED SETTLEMENTS
Project Grade, 420 ft mGl
Measured
30 JuneStation Location 1953
SettLement in FeetRecomputed
DesignPredicted Case I Case II Case III
Assumed Depth ofCompressible MaterialGround Surface in FeetPredicted Recomputed
Density ofEmbankmentCase IIIlb/cu ft
7+53 Centerline
18 15+07 250 ftDS
6 15+25 Centerline
10 22+55 Centerline
9 25+65 Centerline
3.35
0.50
2.09
5.14
5.79
3.24
0.21
1.20
1.76
2.91
3.38 3.26
0.63 0.80
3.14 2.65
6.64 6.26
7.37 6.60
Case I: Full depth of compressibledirectly above.
Case II: Full depth of compressibleCase III: Full depth of compressible
consolidation of foundationutilized.
material with vertical stresses equal to the weight of embankment
material with vertical stresses determined by the elastic method.material, vertical stresses determined by the elastic method, pre-materials considered and the actual coverage embankment densities
LSette -mentPlateNo.
3.24
0.44
2.19
5.31
5.77
68. 4
24.5
38.0
29.3
42.3
82
125
122
122
126.2
119.7
121.0
120.5
121.0
i r rr - r r r i -
lAl _ _ 1.7 i '7 t T
--
- -- ~~ ~-~~-~-~ -~-

TABLE 4
COEARISON F COF C'UTED AND MEASURED SETIIENETEND OF CCNSTRUC~ TIN PERIOD
SettlementPlate
3
6
10
9
Station
7+53
15+07
15+25
25+65
Location
CL
250 ft DS
CL
CL
CL
Settlement in ft atEnd of Construction
PeriodMeasured Recomuted
2.50 i.66
0.25 0.27
1.6o 1.73
3.25 2.10
4.13 2.26
Error
Feet Per Cent
0,84 34
0.02 8
0.13 8
1.15 35
1.87 45
- UL IL - - --
J - -U - L-L-L i . L ..-
.___~~~_~______ _~______ _ _~ __~ _ ~_ _ _____~ __~~____~ _~~~~_~___~ ~~__ _~~_______ _~__~__ _~_ ______~

UPSTREAM
3'- O"DUMPED 4SLOPE O/V 5S_ EL 378.
CROWN OF ROAD EL 420.0'
SLOPE /ON 2 SLOPE ON 2
SLOPE ON 4 EL 405S.0 ..3' " EL 405.O SLOPE / ON 4 DOWNSTREAM
/PRAP ':MA" T'E . < .: 3'-O" DUMPED RIPRAP
5IS" .' COMPACTED • "EL_378.75 SLOPE I ON 5S- IMPERVIOUS MATERIAL - 3787 EL 3670
/&6"SAND & GRAVEL ! r I'- O"SAND GRAVEL " .C.,
APPROX ORIGINAL GROUND AVERAGE DEPTH OF STRIPPING APPROX STRIPPING LI
APPROX 3'- 0"
SCALE IN FEET
50 0 50 100
13I
rTYPICAL CROSS SECTION
.. '"

v .0
LEGEND
O SP SETTLEMENT PLATE
® U UNDISTURBED BORING
* CORE BORINGo TP TEST PITIL- TRENCH LOCATIONS OF EXPLORATIONS
AND SETTLEMENT PLATES
T3r
*1rn
N
I

LEGEND
CLAY
L SILT
SAND OR
SAND AND GRAVEL
TEST PIT
CENTER LINE PROFILESTATIONING ALONG CENTER LINE OF DAM
270 , 0 GENERALIZED SOIL250 -250 PROFILE AND BORINGS230. -230 ALONG CENTER LINE210 o210 OF DAM
PROFILE ALONG CENTER LINE
STATIONING ALONG CENTER LINE OF DAM
3600
- 340
Z 320
300
W 2a0
260
!-or
rriCo

J
U
wHLLz
z
7
0H
w
w
w
UL
z
Li
H
Li
2w
wU,
1938 1939 1940 1941 1942 1943 1944 1945 1946 1947 1948 1949 1950 1951 1952 1953 1954
O PREDICTED SETTLEMENT - END OF CONSTRUCTION0 PREDICTED ULTIMATE SETTLEMENT FOUNDATION SETTLEMENT
SETTLEMENT PLATE 3STATION 7+53 CENTER LINE
420 - --
TOP OF FILL!400
380
360 --
ORIGINAL PLATE ELEV
320
300
0.0
1.0
2.0
SETTLEMENT--------
4.0
5.0
6.0
7.0
r-
H-
e w

420i ==..=.TOP OF FILL -
400
380
360
340ORIGINAL PLATE ELEV.
320
300
1938 1939 1940 1941 1942 1943 1944 1945 1946 1947 1948 1949 1950 1951 1952 1953 1954
O PREDICTED SETTLEMENT - END OF CONSTRUCTIONO PREDICTED ULTIMATE SETTLEMENT FOUNDATION SETTLEMENT
SETTLEMENT PLATE 4STATION 10+50 CENTER LINE
Jl
WLLU-
z
z0
w
J
w
F-
Ut-I
z
F-
w
2U
F-HH
VI)
-Ur
440 l- IT I I -- i
J 421C,
420
401W
w
a
L 38
z
36
w 32
30
0.
6.
w 2.
zL
Z 3.1
Z 4.1
w
I
w .
u} 6
7.
8.1938 1939 1940 1941 1942 1943 1944 1945 1946 1947 1948 1949 1950 1951 1952 1953 195
0
0
0
STOP O F FL
ORIGINAL PLATE ELEV
0
0 SE T TL EMEN T
I I
0 I
0
I I
0 i_ _ i I i IL i _ _ 1
O PREDICTED SETTLEMENT - END OF CONSTRUCTION0 PREDICTED ULTIMATE SETTLEMENT FOUNDATION SETTLEMENT
SETTLEMENT PLATE 18STATION 15+07 250 FT D.S.
54
'Dr
rn0)

J 420C,
2400
Hw
w
L 380
z
z 360360
OS340
w 320
0.0 T T [ 1 - T - T I
I.
2.
n I -i - I TS . .. ___ L 4 _ _ - 4 1 4 £4I 1 ; T 1 1 4 1 1 4 I--- 4-
01 -I I I- rzrftt-r'r-rA Li ISET TL EMi
I I I[ IFIT I4.0 11
7.0
7.0-
a.0
1938 1939 1940 1941 1942 1943 1944 1945 1946 1947 1948 1949 J950 1951 1952 1953 1954
O PREDICTED SETTLEMENT - END OF CONSTRUCTIONO PREDICTED ULTIMATE SETTLEMENT FOUNDATION SETTLEMENT
SETTLEMENT PLATE 6STATION 15+25 CENTER LINE
ENT---wWL-
z
Hzi2w
JF-H-Liu}
I-
-m
vu
v.v

440
420
I-2 TOP OF FILL-
400wL 3 C80
z
360
340
ORIGINAL PLATE ELEV.
O PREDICTED SETTLEMENT - END OF CONSTRUCTIONO PREDICTED ULTIMATE SETTLEMENT FOUNDATION SETTLEMENT
SETTLEMENT PLATE 13STATION 19+00 CENTER LINECDI
Ir1
cx,

J
HwWUL-
z
z2HUI-
w
w
w
w
F-
w
U I7.0 zi8.0
1938 1939 1940 1941 1942 1943 1944 1945 1946 1947 1948 1949 1950 1951 1952 1953 1954
O PREDICTED SETTLEMENT - END OF CONSTRUCTION
0 PREDICTED ULTIMATE SETTLEMENT FOUNDATION SETTLEMENTSETTLEMENT PLATE 10
STATION 22+55 CENTER LINE
4404
420
TOP OF FILL
400
380-------------------- - - _ - --
360
0.0
3. -
4.0
SE T TL EMENT -
- ---
T1
-uJ"O
r
co
_ -

F-WIUU
z
zz0
J
w
U
zH
z
J
F-w
Hul
O PREDICTED SETTLEMENT - END OF CONSTRUCTION
O PREDICTED ULTIMATE SETTLEMENT FOUNDATION SETTLEMENT
SETTLEMENT PLATE 9STATION 25+65 CENTER LINE
-4rP__0

0
w
zI-
tR3
J
5
60+00
LEGEND
0 PREDICTED SETTLEMENT AT
0 MEASURED SETTLEMENT ATJUNE 30,1953
* ESTIMATED
10+00 20+00CENTER LINE STATIONING
30+00
UNDATION SETTLEMENT
)NG CENTER LINE OF DAM
-r-
m

DISTANCE IN FEET DOWNSTREAM
0 160
DISTANCE IN FEET UPSTREAM
160 241
LO
w 2.0
z
r-Z 3.0w
-J
4.0u
5.0
6.0
DATE EMBANKMENT WAS COMPLETE TOPROJECT GRADE OVER SETTLEMENTPLATE.
wwLzI -zw
Lii
LIn
FOUNDATION SETTLEMENTAPPROX STATION 22 +00
r
r
I
a_

PLATE 3F TP U-20
cy 0N
l
So _ c--
°~ .d -
II my oa -- N
.. N
-Oqflnc
0 jenc P2 F.
0a:
0
20
40
I-
Ls 60L
.la
100
PLATE 18TP U-19
250 03
oo 00
1 0o0
Iv
Vl -IO, nI N
o 00
I o I -
• 0I 0 0 IVIII co -t
v
0
PLATE 6TP U- 16
, o lo u ,-Evieo12r=
F
Il-
iv
V
VI
&-
I
PLATE 10TP U-22
Su
N r o -
l0I O N l
SF -,F -o
1 01 i I0
VIIl j 144vP I
VII1
SX
LEGEND
SETTLEMENT PLATE POSITIONGROUND WATER DEPTHWATER CONTENTCOMPRESSION INDEXSWELLING INDEXEXISTING OVERBURDEN PRESSUREPRECONSOLIDATION PRESSUREINITIAL VOID RATIO AT EAISTING OVERBURDEN PRESSUREHEIGHT OF STRATA IN FEET
UNDERSCORED FIGURES ARE ASSIGNED VALUES BASEDON TEST RESULTS ON TEST PIT SAMPLES
IO
F
cr
:,
IV
Y
VI
VII
VIII
Li X
PLATE 9TP U-23
o
o c, o a u r
•ONNf -noi 'N0
.NI OJ -
Im l l o
o1 r
nI
tooI
I
III
1
I
cI
0
20
40
I--60 w
z
I
80 w
120
140
GENERALIZED DATA FOR FIVE
SETTLEMENT PLATES
oI'I onI - NNI° ..
1I 1
i t I -
NO 'q.
1 pj CMNO O
120
140
F
I-a
w
F
u
z
U.ODm '
2w
CcCtPoPceoH
-u,r
-1mrN
- ----- --- ------- -- ----------- --- -- --- ------------ ------ - --- --
4
F
I i

0
20
wwF-iI-
z 40
hJ
F-J
C-n
- 601-4LUWz
w
hi
ED3:80I-0WQ
100
120
AP IN TONS PER SQ FT
VERTICAL STRESSES DETERMINEDBY ELASTIC METHODEMBANKMENT LOADING
CURVE LOCATION DENSITY SETTLEMENTCURVE LOCATION LB/CU FT PLATE
I _ 13 3,6,9 & 10 /2 k 126 33 C121 9&10
4 120 6
- -- 5 250' DS 130 18-6 250o' DS 120 18
-ur
-rli

N d n co -03- N m3 1 o a I- 0 - N at
I I I I l
eo " B I. DRAW HORIZONTAL LINE AB THROUGH
POINT OF INITIAL VOID RATIO , .
2. DETERMINE P AND PC.
AF - LABORATORY CONSOLI- 3. DRAW VERTICAL LINES THROUGH P AND
DATION CURVE Pc INTERSECTING AB AT C AND DCG - CONSTRUCTED CONSOLI- RESPECTIVELY.
DATION CURVE
Po - EXISTING OVERBURDENPRESSURE 4. DRAW LINE DG PARALLEL TO EF (STRAIGHT
P - PRECONSOLIDATION - - - - - - - - - LINE PORTION OF LABORATORY CURVE)
PRESSURE THROUGH D.
5. STARTING AT C. SKETCH A PRESSURE-
VOID RATIO CURVE OF SIMILAR TREND
AND CURVATURE TO LABORATORY CURVE
AND TANGENT TO DG.
Po PCLOG OF PRESSURE
METHOD OF ADJUSTINGPRESSURE-VOID RATIO CURVE
PRECONSOLIDATED SOILS
0
Ia
-Dr
-Imn
_ ~ _~___~
F G

OVERBURDEN CURVES20 -- WAPPAPELLO DAM
TP U-20TP U-19
"--- T P U-2 2
40 ------ TP U-23
-- TP U-16
60
80
20
LI I I [ i - 1 [1 1 [ l J -1 II I I I I IAII I i -J-I Ili I.i - I-2 3
Po - OVERBURDEN PRESSURE IN TONS PER SQ FT4
VERTICAL STRESSES FOREXISTING OVERBURDEN LOAD
I-UwLL-
z
I
a-UWO=
0
I
-I
0)
I

- I 4Il I I -
____ - _ _ - --i-- -I--
0 -
--. THEORETICAL SETTLEMENT FOR1.5 CONSTRUCTION LOADING
25 - MEASURED SETTLEMENT
3.0 4 - -0 16uuTIME IN DAYS
TIME IN DAYS
SETTLEMENT-TIME FORCONSTRUCTION LOADING
SETTLEMENT PLATE 3
-0hozJ
J 50
L0
t.,0
-0
I-rn-IiT
00
100I1 1 / j i
r' 1 i 1 I 1 I I ! i I 1 _
I u IW%600 10U00 [200o200 400

IL0<NLO
zJ
w.-hi
0
800TIME IN DAYSTIME IN DAYS
1000 1200 1400 1600
SETTLEMENT-TIME FORCONSTRUCTION LOADING
SETTLEMENT PLATE 18
02
0.3
-- I M EASURED SE r TL EMEN --
THEORETICAL SETTLEMENT FOR.- CONS TRUC TION LOADING
0.6 2400 200AAA
nA IAA n .w
-wN
W
i
hiZ
hI2W
W-JF-I-hiCI}
>t
m
v LV~ 44,UU00
=

Ud
0<-0
I-
U.
z
I-
z
U
z
I
JI-I-U
U)
600 TIE N DAYSTIME IN DAYS
1000
SETTLEMENT-TIME FORCONSTRUCTION LOADING
SETTLEMENT PLATE 6
100
0.4THEORETICAL SETTLEMENT FOR
CONSTRUCTION LOADING
0.0
1.2
MEASURED SETTLEMENT
2.0
0~ 9 rt/- dA e., ,., ............... ...
_Q[-r-t
rV 400 1200 1400 1600I -

LL a0<
F-Oz-Ju0
aJ-
r
w0
z
I-WW
zw
z
HZW
J
HHi
400 600 800
TIME IN DAYS
1000 1200 1400
SETTLEMENT-TIME FORCONSTRUCTION LOADING
SETTLEMENT PLATE 10
100
THEORETICAL SETTLEMENT FOR
cONsRUCTION LOADING
1
S- _ - MEASURED SETTLEMENT
6 ~ ~~~ _ _ _ j__ _ __
~_00 500
r-I
to
1600
_~__~_~~_
20 0

- i
w ----- k----.-0-
w\
U
-- - ........ _ THEORETICAL SET TLEMEN T FOR3-- CONSTRUCT/ON LOADING
1--w J -_-
MEASURED SETTLEMENT
TIME IN DAYS
SETTLEMENT-TIME FORr
CONSTRUCTION LOADINGSSETTLE . SETTLEMENT PLATE 9
0 F 0 00')t0 20 4010

VERTICAL STRESSGROUND LEVEL
z0
O_C '
SQ I
w /NNCREASE IN VERTICAL SOIL STRESS
O CAUSED BY PROPOSED STRUCTURE
I C:-J
w
owC
rIO 10/o OF ORIGINAL VERTICALI- STRESS IN SOIL
0,
STRESS DISTRIBUTION DIAGRAMS
METHOD FOR DETERMININGr
SREQUIRED DEPTH OF-I
fl BORING
N