ANALYSIS OF PERCEIVED EASE OF USE, ATTITUDE, AND ...
103
ANALYSIS OF PERCEIVED EASE OF USE, ATTITUDE, AND PERCEIVED RISK AS FACTORS INFLUENCING E-FILING USE A THESIS Presented as a Partial Fulfillment of the Requirements to Obtain the Bachelor Degree in Accounting Department By: AULIA FATIMA Student Number: 13312007 INTERNATIONAL PROGRAM FACULTY OF ECONOMICS UNIVERSITAS ISLAM INDONESIA YOGYAKARTA 2017
-
Upload
khangminh22 -
Category
Documents
-
view
1 -
download
0
Transcript of ANALYSIS OF PERCEIVED EASE OF USE, ATTITUDE, AND ...

ANALYSIS OF PERCEIVED EASE OF USE, ATTITUDE, AND
PERCEIVED RISK AS FACTORS INFLUENCING E-FILING USE
A THESIS
Presented as a Partial Fulfillment of the Requirements to Obtain the Bachelor
Degree in Accounting Department
By:
AULIA FATIMA
Student Number: 13312007
INTERNATIONAL PROGRAM
FACULTY OF ECONOMICS
UNIVERSITAS ISLAM INDONESIA
YOGYAKARTA
2017

i
ANALYSIS OF PERCEIVED EASE OF USE, ATTITUDE, AND
PERCEIVED RISK AS FACTORS INFLUENCING E-FILING USE
A THESIS
Presented as a Partial Fulfillment of the Requirements to Obtain the Bachelor
Degree in Accounting Department
By:
AULIA FATIMA
Student Number: 13312007
INTERNATIONAL PROGRAM
FACULTY OF ECONOMICS
UNIVERSITAS ISLAM INDONESIA
YOGYAKARTA
2017

ii
ANALYSIS OF PERCEIVED EASE OF USE, ATTITUDE, AND
PERCEIVED RISK AS FACTORS INFLUENCING E-FILING USE
A THESIS
Presented as a Partial Fulfillment of the Requirements to Obtain the Bachelor
Degree in Accounting Department
By:
AULIA FATIMA
Student Number: 13312007
INTERNATIONAL PROGRAM
FACULTY OF ECONOMICS
UNIVERSITAS ISLAM INDONESIA
YOGYAKARTA
2017

iii
ANALYSIS OF PERCEIVED EASE OF USE, ATTITUDE, AND PERCEIVED
RISK AS FACTORS INFLUENCING E-FILING USE
Presented By:
AULIA FATIMA
Student Number: 13312007
Approved By:
Content Advisor,
Hadri Kusuma, Prof., Dr., MBA. January, 8th
, 2018
Language Advisor,
Willy Prasetya, S.Pd., M.A. January, 8th
, 2017
iv
ANALYSIS OF PERCEIVED EASE OF USE, ATTITUDE, AND
PERCEIVED RISK AS FACTORS INFLUENCING E-FILING USE
A BACHELOR DEGREE THESIS
By:
AULIA FATIMA
Student Number: 13312007
Defended before the Board of Examiners
On February 13th, 2018, and Declare Acceptable
Board of Examiners
Examiner I
Hadri Kusuma, Prof., Dr., MBA. February 13th, 2018
Examiner II
Johan Arifin, S.E., M.Si., Ph.D. February 13th, 2018
Yogyakarta, February 13th, 2018
International Program
Faculty of Economics
Universitas Islam Indonesia
Dean,
Dr. Drs. Dwipraptono Agus Harjito, M.Si.

v
DECLARATION OF AUTHENTICITY
Hereby I declare the originality of the thesis; I have not presented someone
else’s work to obtain my university degree, not I have presented someone else’s
words, ideas or expressions without any of the acknowledgements. All quotations
are cited and listed in the bibliography of the thesis. If in the future this statement
is proven to be false, I am willing to accept any sanction complying with the
determined regulation or its consequence.
Yogyakarta, January 3rd
, 2018
Aulia Fatima

vi
“For indeed, with hardship [will be] ease.”
― Ash-Sharh [94]:5
“You can, you should, and if you’re brave enough to start, you will.”
― Stephen King
“Be the change that you wish to see in the world.”
― Mahatma Gandhi
“Twenty years from now you will be more disappointed by the things that you
didn't do than by the ones you did do. So throw off the bowlines. Sail away from
the safe harbor. Catch the trade winds in your sails. Explore. Dream. Discover.”
― H. Jackson Brown Jr.
“At the end of the day, we can endure much more than we think we can.”
― Frida Kahlo
vii
Earnest gratitude,
This thesis is dedicated to my parents and families who have loved and stood
behind me from the start and also my friends who have supported me during the
process of this thesis writing.
viii
ACKNOWLEDGEMENTS
Assalamu’alaikum Warahmatullahi Wabarakatuh.
All perfect praise is due to Allah , the Lord of the Worlds. I bear
witness than none is worthy of worship but Allah , alone with no partners.
And I bear witness that Muhammad is His Messenger, may Allah exalt
his mention.
Alhamdulillahirabbil’alamin, the thesis which entitled “Analysis of
Perceived of Use, Attitude, and Perceived Risk as Factors Influencing E-
Filing Use” as partial requirements to obtain the bachelor degree in Accounting
Department, International Program, Faculty of Economics, Universitas Islam
Indonesia is finally finished.
I would like to thank everyone who have participated in the process of
making this thesis. Hopefully, this thesis can be useful in the future. Through this
occasion, I would like to address my appreciation and gratitude to:
1. My beloved mother, Diana Wijayanti, for every hard work and efforts to
support me. My beloved father, Wahyu Widiarto, for constantly reminding
me to pursue my dreams. They will be forever my best teacher in
understanding the meaning of life and how to live as a person. My two
younger brothers, Muhammad Reza Faletehan and Afrizal Hasbi Azizy,
who is currently working hard on their study, who is also my companies at

ix
home. For all of them, thank you for standing by me from the start, for the
unconditional love and endless support. Hopefully Allah SWT will always
give His blessings to them and help us to be a stronger and better person in
the future.
2. Nandang Sutrisno, SH., LLM., M.Hum., Ph.D. as a rector, Wiryono
Rahardjo, Ir., M.Arch., Ph.D. as a Director of International Program, and
Dwipraptono Agus Harjito, Dr., Drs., M.Si. as a dean of Faculty of
Economics Universitas Islam Indonesia.
3. Hadri Kusuma, Prof., Dr., MBA as my thesis advisor who always helped
me in the process of making this thesis into whole. Thank you for your
understanding and patience during my time of guidance.
4. Willy Prasetya, S.Pd., M.A. who has given me lexical advice on this
thesis.
5. Anas Hidayat, Drs., M.Bus., Ph.D and Rokhedi Priyo Santoso, S.E.,
MIDEc as the Head and Deputy Head of Business and Economics
Department IP UII for facilitating and accommodating me in IP UII. Also,
special gratitude for Pak Ahmad and Mba Alfi who always assisted me
during my time in university, Mas Kandri, Pak Kus, Pak Irwan, and others
for the warm welcome and friendliness during my time in IP UII.
6. All lecturers at Faculty of Economics UII, who had taught me in learning
accounting and helped me surviving in this field of study.
7. All International Program students who had welcomed me warmly and
letting me to become a part of the family, may Allah SWT leads us to the

x
way of success. Good luck and see you guys on top!
8. All IP Accounting 2013 classmates, Delia, Bhayu, Kiki, Rachma, Sari,
Diana, Putri, Lita, Fanny, Nauval, Adun, Khresna, Bagas, Nauval, Intan,
Nadia, Bagas, Faruq, Ardi, Rezha,
9. My beloved friends, Tisa Rachma Andreina, Rahma Maulida, Fella Shofa,
Lina, and Nisa for being good friends of mine during my time in university
who also took a quite huge part on my thesis-making process, I’m looking
forward to our bright future. Wish you guys all a very good luck.
10. My special friend, Azel Aditya, who constantly made my days in
university become so colorful. Thank you for the unconditional love and
the endless support when I feel like I can’t stand on my own feet. May
Allah SWT showers you with His blessings and guidance. Wish you a
very good luck for the upcoming days of your life.
11. All parties whom I could not mention one by one for the support, love, and
motivation.
We ask Allah SWT to grant us sincerity and accept all of our works, and to
enable us to perform all that pleases Him.
Wassalamualaikum Warahmatullahi Wabarakatuh.
Yogyakarta, January 3th
, 2018
Aulia Fatima
xi
TABLE OF CONTENTS
COVER PAGE ......................................................................................................... i
PAGE TITLE .......................................................................................................... ii
LEGALIZATION PAGE ....................................................................................... iii
APPROVAL PAGE ............................................................................................... iv
DECLARATION OF AUTHENTICITY ................................................................ v
MOTTO. ................................................................................................................ vi
ACKNOWLEDGEMENTS ................................................................................. viii
TABLE OF CONTENTS ....................................................................................... xi
LIST OF TABLES ............................................................................................... xiv
LIST OF FIGURES .............................................................................................. xv
LIST OF APPENDICES ...................................................................................... xvi
ABSTRACT ........................................................................................................ xvii
ABSTRAK ......................................................................................................... xviii
CHAPTER I
INTRODUCTION ................................................................................................. 1
1.1. BACKGROUND OF THE STUDY ............................................................ 1
1.2. PROBLEM FORMULATION ..................................................................... 6
1.3. RESEARCH OBJECTIVES ........................................................................ 7
1.4. RESEARCH CONTRIBUTIONS ................................................................ 7
1.5. SYSTEMATICS OF WRITING .................................................................. 8

xii
CHAPTER II
REVIEW OF RELATED LITERATURE .......................................................... 9
2.1. LITERATURE REVIEW ............................................................................ 9
2.1.1. INTRODUCTION ................................................................................ 9
2.1.2. FACTORS INFLUENCING THE USAGE OF E-FILING ................ 13
2.1.2.1 THEORY OF TECHNOLOGY ACCEPTANCE MODEL (TAM)
VARIABLES ................................................................................................ 19
2.1.2.2 OTHER VARIABLE .................................................................. 18
2.1.3. SUMMARY AND IMPLICATIONS ................................................. 19
2.2. THEORETICAL FRAMEWORK ............................................................. 21
2.3. HYPOTHESIS DEVELOPMENT ............................................................. 24
2.3.1. PERCEIVED EASE OF USE (PEOU) AND E-FILING ................... 24
2.3.2. ATTITUDE AND E-FILING ............................................................. 24
2.3.3. PERCEIVED RISK (PR) AND E-FILING ........................................ 25
CHAPTER III
RESEARCH METHOD ..................................................................................... 27
3.1. TYPE OF STUDY ..................................................................................... 27
3.2. POPULATION AND SAMPLE ................................................................ 27
3.3. SOURCES AND DATA COLLECTION METHOD ................................ 27
3.4. RESEARCH VARIABLES ....................................................................... 28
3.4.1. DEPENDENT VARIABLE ................................................................ 28
3.4.2. INDEPENDENT VARIABLES.......................................................... 29
3.4.3. CONTROL VARIABLE ..................................................................... 32
3.5. METHOD OF ANALYSIS ........................................................................ 33
3.5.1. STRUCTURAL EQUATION MODEL – PARTIAL LEAST
SQUARES .................................................................................................... 33
3.5.1.1 MEASUREMENT MODEL (OUTER MODEL) ....................... 34

xiii
3.5.1.2 STUCTUAL MODEL (INNER MODEL)........................................ 37
3.6. HYPOTHESIS TESTING .......................................................................... 37
3.6.1. PERCEIVED EASE OF USE (PEOU) ............................................... 38
3.6.2. ATTITUDE ......................................................................................... 38
3.6.3. PERCEIVED RISK (PR) .................................................................... 38
CHAPTER IV
DATA ANALYSIS AND DISCUSSIONS ......................................................... 39
4.1. GENERAL EXPLANATION OF RESEARCH OBJECTS ...................... 39
4.2. OUTER MODEL EVALUATION RESULT ............................................ 41
4.2.1. CONVERGENT VALIDITY TEST ................................................... 41
4.2.2. DISCRIMINANT VALIDITY TEST ................................................. 43
4.2.3. RELIABILITY TEST ......................................................................... 43
4.3. INNER MODEL EVALUATION RESULT ............................................. 45
4.4. HYPOTHESIS TESTING .......................................................................... 46
4.5. DISCUSSIONS .......................................................................................... 47
4.2.3. RELIABILITY TEST ......................................................................... 43
4.2.3. RELIABILITY TEST ......................................................................... 43
4.2.3. RELIABILITY TEST ......................................................................... 43
CHAPTER V
CONCLUSIONS AND RECOMMENDATIONS ............................................ 53
5.1. CONCLUSIONS ........................................................................................ 53
5.2. RESEARCH IMPLICATIONS .................................................................. 54
5.3. RESEARCH LIMITATIONS .................................................................... 57
5.4. RECOMMENDATIONS ........................................................................... 57
REFRENCES ........................................................................................................ 58
APPENDICES....................................................................................................... 62
xiv
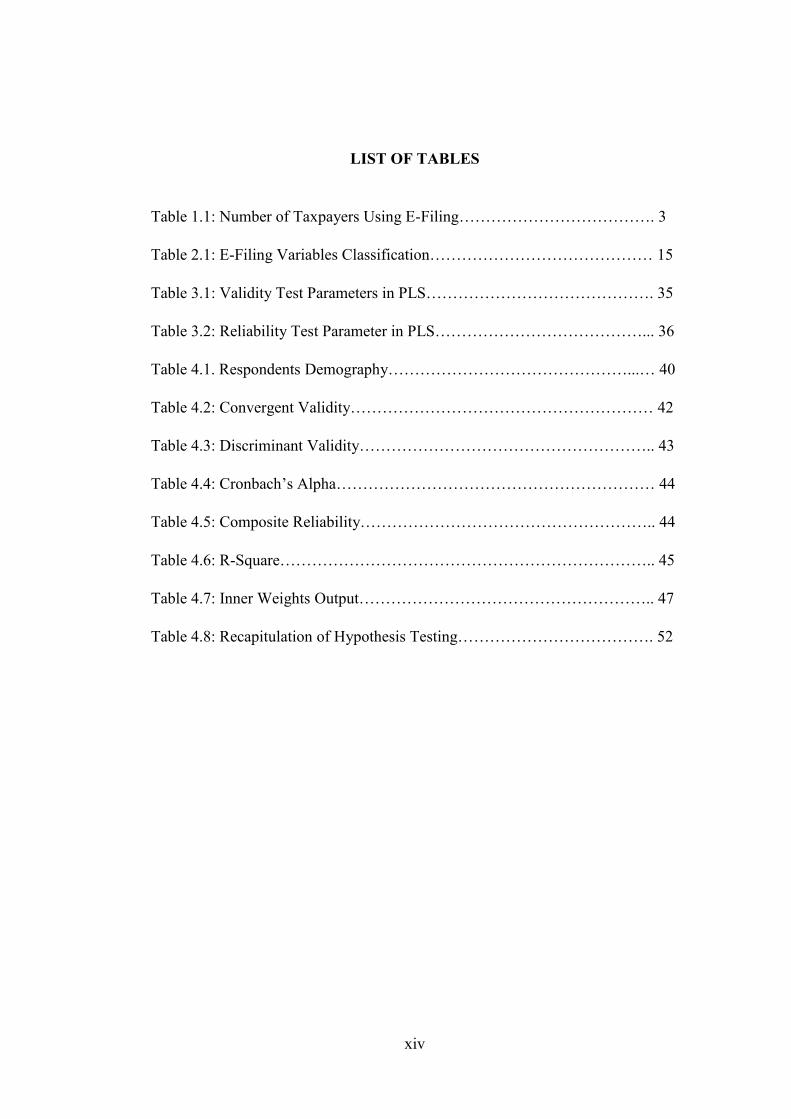
LIST OF TABLES
Table 1.1: Number of Taxpayers Using E-Filing………………………………. 3
Table 2.1: E-Filing Variables Classification…………………………………… 15
Table 3.1: Validity Test Parameters in PLS……………………………………. 35
Table 3.2: Reliability Test Parameter in PLS…………………………………... 36
Table 4.1. Respondents Demography………………………………………...… 40
Table 4.2: Convergent Validity………………………………………………… 42
Table 4.3: Discriminant Validity……………………………………………….. 43
Table 4.4: Cronbach’s Alpha…………………………………………………… 44
Table 4.5: Composite Reliability……………………………………………….. 44
Table 4.6: R-Square…………………………………………………………….. 45
Table 4.7: Inner Weights Output……………………………………………….. 47
Table 4.8: Recapitulation of Hypothesis Testing………………………………. 52

xv
LIST OF FIGURES
Figure 2.1: Research Model…………………………………………………….. 20

xvi
LIST OF APPENDICES
Appendix 1: Questionnaire…………………………………………………… 81
Appendix 2: Data Tabulation………………………………………………… 86

xvii
ABSTRACT
Governments worldwide are moving towards utilizing the power of information,
communication and technology (ICT) to make public service more effective and
efficient. E-filing, is a system of tax returns submission electronically which is
conducted through the online system in real time. In Indonesia, this system is also
known as e-SPT. According to Directorate General of Taxation verdict No. Kep-
88/pj/2004 on tax return submission electronically, taxpayers can submit their tax
returns electronically by downloading an application through an application
service provider chosen by the Directorate General of Taxation (DGT) with 24/7
access. This study analyzes the factors influencing e-filing use. Based on the
sample of 155 respondents in Yogyakarta with convenience sampling method
used, path analysis results show that Perceived Ease of Use (PEOU) and Attitude
have a positive and significant impact on e-filing use. On the contrary, Perceived
Risk (PR) has negative impact on e-filing use. This study is significant for
scholars in understanding the factors that affect e-filing use. Moreover, for DGT,
this study contributes to the input of the e-filing system revitalization and
development for a better e-government service in Indonesia.
Keywords: e-filing, perceived ease of use, attitude, perceived risk, TAM theory,
tax, e-government, Indonesia

xviii
ABSTRAK
Seiring dengan berkembang nya e-government pada dekade ini, banyak cara yang
dapat dilakukan untuk membuat pelayanan publik menjadi lebih efektif dan
efisien. Pemerintah di seluru dunia bergerak lebih maju menuju pemanfaatan
kekuatan informasi, komunikasi, dan teknologi informasi (TIK) dengan memasuki
dimensi baru melalui e-filing. E-filing, atau yang lebih dikenal dengan sebutan e-
SPT di Indonesia, merupakan sebuah sistem pelaporan pajak yang dilakukan
melalui sistem online secara real time. Berdasarkan Keputusan Direktorat
Jenderal Pajal No. Kep-88/pj/2004 perihal pelaporan pajak secara elektronik,
wajib pajak dapat melakukan pelaporan pajak sacara elektronik dengan cara
mengunduh sebuah aplikasi melalu penyedia pelayanan aplikasi yang telah
ditentukan oleh Direktorat Jenderal Pajak yang dapat diakses 24 jam. Penelitian
ini menganalisis factor-faktor yang mempengaruhi penggunaan e-filing.
Berdasarkan sampel yang berjumlah 155 responden di Yogyakarta, menggunakan
metode convenience sampling, hasil dari path analysis menunjukkan bahwa
persepsi kemudahan dan sikap berpengaruh positif-signifikan terhadap
penggunaan e-filing. Akan tetapi, hasil analisis menunjukkan bahwa persepsi
resiko berpengaruh negative terhadap penggunaan e-filing. Penelitian ini
berpengaruh signifikan kepada akademisi dalam memahami lebih dalam
mengenai factor-faktor yang berhubungan dengan penggunaan e-filing. Selain
itu, penelitian ini juga dapat memberikan kontribusi kepada Direktorat Jenderal
Pajak (DJP) sebagai input untuk merevitalisasi dan mengembangkan sistem e-
filing untuk memajukan pelayanan e-government di Indonesia.
Kata kunci: e-filing, persepsi kemudahan, sikap, persepsi resiko, teori TAM,
pajak, e-government, Indonesia

1
CHAPTER I
INTRODUCTION
1.1. BACKGROUND OF THE STUDY
In today's era of globalization, several changes have been made in various
aspects of human life. A very visible and contrast changes are the development in
the field of technology that experienced rapid development from year to year,
especially in the field of electronics that bring ease in performing archival tasks.
One of the influence of technological progress is e-government. As mentioned by
Abdurrohman, Domai, & Shobaruddin (2015), e-government is an interaction
mechanism between people and governments using information technology with
the purpose of increasing effectiveness and efficiency of public services.
The Ministry of Finance of Indonesia have developed electronic tax
reporting called e-SPT. Based on Article 1 of Law Number 28 Year 2007 SPT
(annual notice letter) itself is a letter that is used to report the calculation and
payment of taxes, tax objects and or non taxable objects and/or assets and
liabilities (Chandra, 2016). Fundamental changes made by the government related
to the modernization of taxes occurred in 2004 where the DGT sought to fulfill
taxpayers’ aspirations by simplifying the procedures for reporting tax returns. It
was marked with the issuance of Decision of the Director General of Tax No.
KEP-88/PJ/2004 dated May 14, 2004 on the delivery of SPT electronically. After

2
the success of e-SPT program on January 24, 2005, the President of the Republic
of Indonesia together with DGT launched the e-filing system (Laihad, 2013).
e-SPT is a system of tax returns submission electronically conducted
through the online system in real time, first established on January, 24 2011
following Directorate General of Taxation verdict Kep-88/PJ/2004 on May, 14,
2004. The goal of e-filing establishment is to help taxpayers in reporting tax
returns in paperless form with less administrative costs (Laihad, 2013). Beside
that, as mentioned by Ilias, Abd Razak, & Yasoa' (2014), the important thing
about e-filing usage is that it is safe and secure for archiving tax returns.
According to Directorate General of Taxation verdict No. Kep-88/pj/2004 on tax
return submission electronically, taxpayers can submit their tax returns
electronically by downloading an application through an application service
provider chosen by the Directorate General of Taxation (DGT) with 24/7 access.
However, as mentioned by Laihad (2013), in this meantime, there are not
so many taxpayers implementing e-filing on tax returns submission because of
less socialization from Direktorat Jenderal Pajak. In addition, most taxpayers still
can’t effectively use new technologies. They assume that the usage of e-filing will
be more complex rather than the old tax return submission method. Claudia
(2016) stated that there are still a lot of taxpayers tend to choose manual tax return
submission instead of using e-filing with several reasons such as the fear of
network error and inflexible access that will possibly end up in data loss and
insecurities.
In the report of Annual Income Tax Returns, the Directorate General of

3
Tax actually provides various facilities for the public in reporting its obligations
through post office, e-SPT, and even reporting to the tax service office. Amianti
(2017), reported that the number of taxpayers who report electronically signifies
the success of national tax authorities in developing tax reporting because the
awareness of the community on e-filing usage has increased since the tax
amnesty. Moreover, e-filing avoids taxpayers from long-lines in tax service office.
Table 1.1. Number of Taxpayers Using e-SPT
Source: Annual report of Directorate General of Taxation, 2015
As recorded by DGT, the total of taxpayers in Indonesia is around 29
million. However, by 2016, as reported in annual report of DGT, it is found that
only 6 millions of them have reported the tax return (Kusuma, 2017). Table 1.1.
shows that approximately 5 millions taxpayers have used e-SPT. It can be
concluded that the usage of e-SPT in Indonesia needs to be increased because
there are still 1 million taxpayers that have not used e-SPT.
Due to the significant role of e-SPT usage and its acceptance in tax return
process, there have been several studies conducted regarding the factors that will
affect the effectiveness and efficiency of e-filing usage. In Indonesia, studies

4
conducted by Laihad (2013), Wowor, Morasa, & Elim (2014), Jimantoro &
Tjondro (2014), Nurhasanah, Firmansyah, & Novrida (2015), Claudia (2016), and
Chandra (2016) show that Perceived Usefulness (PU), Perceived Ease of Use
(PEOU), attitude, experience, safety and security, payment speed, users’
satisfaction, subjective norms, perceived behavioral control, and computer self
efficacy have an impact on the usage of e-filing.
Furthermore, other studies conducted by Ambali (2009), Illias, Abd
Razak, & Yasoa' (2009), Ojha, Sahu, & Gupta (2009), Azmi & Bee (2010), Lu,
Huang, & Lo (2010), Azmi & Kamarulzaman (2012), Ibrahim & Chandra (2015),
Chittoo & Dhotah (2016), and Sondakh (2017) found that there are several factors
that affect e-filing, such as technology readiness level, Perceived Risk (PR),
Perceived Usefulness (PU), Perceived Ease of Use (PEOU), trust, perceived
system quality, experience, education background, information system quality,
information quality, perceived credibility, satisfaction, safety, problems, social
and moral norms, tax equity, personal innovativeness in information technology,
relative advantage, compatibility, and performance.
However, several variables are found to be inconsistent, such as Perceived
Ease of Use (PEOU), Attitude, and Perceived Risk (PR). Azmi & Kamarulzaman
(2012) stated that Perceived Ease of Use (PEOU) does not significantly affect the
e-filing adoption, whereas Ojha, Sahu, & Gupta (2009), Noviandini (2012),
Laihad (2013), Perkasa & Rustam (2016), and Claudia (2016) found that PEOU
have a significant influence on e-filing usage. Attitude is also found inconsistent.
Laihad (2013) found that attitude is significant to the e-filing usage, in contrast,

5
Sondakh (2017) stated that attitude toward e-filing usage is not significantly
giving an impact. In addititon, Perceived Risk (PR) also found to be inconsistent.
According to Chittoo & Dhotah’s (2016) study, PR is found to be insignificant to
the e-filing usage while Schaupp & Carter (2010) stated that PR is significant to e-
filing usage. As different results for several variables are inconsistent to the usage
of e-filing, researcher found that the cause of this difference is that the
measurements used in the previous studies were particularly different from one
another.
Among those mentioned studies above, several authors found some
limitations and recommendations for future research regarding to the usage of e-
filing and its acceptance factors. It is found in each previous study that the
dimension used to measure the variables by the authors were particularly
different, therefore, it caused insignificancy to the results of the studies. As an
addition, Azmi & Kamarulzaman (2012), regarding to the PR, expressed that
companies, that engage in complex transactions, may focus on different risk facets
than individual taxpayers, when e-filing tax returns. Also, Sondakh (2017)
mentioned that the survey concentrates on a specific area and does not represent
the whole of Indonesia. Hence, caution needs to be taken when generalizing this
study to the whole of Indonesia.
On the other hand, Agustin (2014) recommended future research to add
unused indicators of e-filing such as attitude toward behavior and to use different
unit of analysis, population, and sample to provide supporting findings and to
strengthen previous theories. Additional reserach is also needed to determine
6
whether the results of this study can be replicated in other population and e-
government services. To add, Claudia (2016) suggests to use Perceived Ease of
Use (PEOU) as a reference for future research.
Therefore, this study endavours to decrease the gap arise in the previous
studies to give comprehensive results on the factors that will affect the usage of e-
filing. For that reason mentioned above, this study will focus on Perceived Ease of
Use (PEOU), attitude toward behavior, and Perceived Risk (PR) as the
determinants to e-filing adoption due to the suggestions and inconsistent results
found on previous research.
1.2. PROBLEM FORMULATION
The objects of this study is to solve following problems:
1. Does Perceived Ease of Use (PEOU) influence the e-filing acceptance and its
usage?
2. Does Attitude influence the e-filing acceptance and its usage?
3. Does Perceived Risk (PR) influence the e-filing acceptance and its usage?
1.3. RESEARCH OBJECTIVES
The purposes of this study are to:
1. Analyze the influence of Perceived Ease of Use (PEOU) on the e-filing
acceptance and its usage.
2. Analyze the influence of Attitude on the e-filing acceptance and its usage.

7
3. Analyze the influence of Perceived Risk (PR) on the e-filing acceptance and
its usage.
1.4. RESEARCH CONTRIBUTIONS
This study is made with the intention to give benefits and knowledge for
the following interested users:
1. The Field of Accounting
This study is hopefully will give deeper understanding regarding e-
filing acceptance and its usage and expected to be useful in future research as
a reference for developing studies about e-filing usage.
2. The Directorate General of Taxation
This study is aimed to give relevant and reliable information to the
Directorate General of Taxation in Indonesia to develop e-filing usage in
Indonesia.

8
1.5. SYSTEMATICS OF WRITING
Systematics of writing consists of the outline of the study that will help
readers to understand this study easily. This study consists of:
CHAPTER I : INTRODUCTION
This chapter gives general study background, problem
formulation, research objective, research contribution, and
systematics of writing
CHAPTER II : REVIEW OF RELATED LITERATURE
The second chapter of this study, gives pictures about literature
used in this study. This includes literature review, theoretical
review, research model, and hypothesis development.
CHAPTER III: RESEARCH METHOD
This third part of the study explains about the variables used in
this study, population and sampling method, tools used to analysis
the data, and data collection method and its analysis.
CHAPTER IV: DATA ANALYSIS AND DISCUSSIONS
This chapter of this study focus on the results and findings of the
data analysis.
CHAPTER V : CONCLUISONS AND RECOMMENDATIONS
The last chapter of this study encompasses conclusion regarding
the research as a whole and as a closing part of this study. This
part also contains recommendations and suggestions for future
studies.

9
CHAPTER II
REVIEW OF RELATED LITERATURE
2.1. LITERATURE REVIEW
2.1.1. INTRODUCTION
As mentioned by Abdurrohman, Domai, & Shobaruddin (2015), e-
government is an interaction mechanism between people and a government using
information technology with purpose to increase effectivity and efficiency of
public services. Schneider & Bowen, and Dawes (as cited in Dombrowski,
Hayes, & Mazmanian, 2014), defined e-government as the study of technology
used to support internal government operations in order to engage citizens and
enhance access to government services. According to Carter & Belanger (2005),
e-government increases the convenience and accessibility of government services
and information to citizens. Islam et al. (as cited in Mohd, 2003), mentioned that
the increasing development of e-government caused by “the potential benefits
where e-government can enhance the way that a government interacts with
citizens and businesses”. According to United Nation e-Government Readiness
Index (2016), there has been high numbers of countries that are starting e-
government service to provide online services through online platforms that help
people to access public services. Referring to the research done by United Nation
e-Government Readiness Index on 2016, Indonesia ranked 116 of 193 with
0.4478 e-government development index. It is also found that Indonesia’s rank on
e-government development falling down continously since 2005.
10
Carter & Belanger (2005) stated that despite the advantages of e-
government to expand government responsibility to subjects, greater public access
to information and a more efficient and cost-effective government, the success
and acceptance of e-government initiatives are contingent upon citizens’
willingness to adopt this innovation. According to Dombrowski et al. (as cited in
Dombrowski, Hayes, & Mazmanian, 2014), government services does not happen
without substantial invisible work by intermediaries, the individuals who assist
others in gaining access to and use of these services. They divided challenges in e-
government adoption into four aspects.
First is awareness or how familiar or conscious an individual is of a
particular service or e-government initiative, including how familiar one is with
the benefits that a particular service might provide. Awoleye et al. (as cited in
Dombrowski, Hayes, & Mazmanian, 2014), found that awareness has been
identified as the challenge for e-government, because it is a necessary precussor to
the use of a system.
Second is usefulness that defined by Nam and Sagoyo (as cited in
Dombrowski, Hayes, & Mazmanian, 2014) as users’ belief that there would be a
personal benefit from using an e-government system. However, Pearson (1977),
Lucas (1981), and Turner (1982) found that generally, users of new information
systems are pessismistic about the benefit generated from the information systems
itself. These statements are also supported by Dombrowski, Hayes, & Mazmanian
(2014) who found that these government programs are often thought to be harmful
and/or risky by potential clients.

11
The third aspect of new system acceptance is users’ trust. Trust, according
to Bélanger et al. (as cited in Dombrowski, Hayes, & Mazmanian, 2014), is said
to exist when a person is confident in the reliability and integrity of another party.
Dombrowski, Hayes, & Mazmanian (2014) argued that if trust tends to be low in
any party, they are unlikely to engage with these systems. Common trust-related
concerns include a diminished sense of privacy; the potential for the misuse of
personal data; and the reluctance to disclose personal, intimate information
(General Accounting Office (GAO) and McClure (2001), Bélanger et al. (2002),
GAO and McClure (2001), Carter and Weerakkody (as cited in Dombrowski,
Hayes, & Mazmanian, 2014).
The last challenge for new system adoption is digital divide. According to
Riggins & Dewan, and Bélanger & Carter (as cited in Dombrowski, Hayes, &
Mazmanian, 2014), what is fundamental to digital divide is the capacity or the
lack access to technology, whether information and communication technologies
or their underlying infrastructure. The usage of information systems are often
misunderstood as contradictive to its purposeto improve decision making and
increase organizational effectiveness and efficiencyby its users (Lyytinen,
1987). New users of a certain system usually do not understand deeply about the
systems they are about to use and the amount of the output they can gain (Lucas,
1975). Lyytinen (1987) mentioned that three most common problems could
possibly happen when establishing new information system include complexity,
concept, and people’s reactions.
Dorasamy, Marimuthu, Raman, & Kaliannan (2012) stated that tax filing

12
whether done manually or via digital means is an important phenomenon for most
income earners and business entities. Governments worldwide are moving
towards utilizing the power of information, communication and technology (ICT)
by embarking into e-filing. According to Trauner (2007), Davis (1989), and Joppe
(as cited in Asianzu & Maiga, 2012), e-taxation is a specific usage of e-
government. E-filing refers to trans-organizational processes with data transfer
between the IT systems of the professionals and those of the tax authorities. The
benefits from the use of the e-tax systems are many, it includes enjoying cost-free
preparation and lodgment of tax returns, safety and security, all time availability
and time saving, and tax returns can be completed on any computer anywhere.
These benefits of e-taxation are linked to the adoption and usage of the e-tax
services.
e-SPT is a system of tax returns submission electronically conducted
through the online system in real time, first established on January, 24 2011
following Directorate General of Taxation verdict Kep-88/PJ/2004 on May, 14,
2004. The goal of e-filing establishment is to help taxpayers in reporting tax
returns in paperless form with less administrative costs (Laihad, 2013). Beside
that, as mentioned by Ilias, Abd Razak, & Yasoa' (2014), the important thing
about e-filing usage is that it is safe and secure for archiving tax returns.
According to Directorate General of Taxation verdict No. Kep-88/pj/2004 on tax
return submission electronically, taxpayers can submit their tax returns
electronically by downloading an application through an application service
provider chosen by the Directorate General of Taxation (DGT) with 24/7 access.

13
However, as mentioned by Laihad (2013), in this meantime, there are not
so many taxpayers implementing e-filing on tax returns submission because of
less socialization from Direktorat Jenderal Pajak. In addition, most taxpayers still
can’t effectively use new technologies. They assume that the usage of e-filing will
be more complex rather than the old tax return submission method. Claudia
(2016) stated that there are still a lot of taxpayers tend to choose manual tax return
submission instead of using e-filing with several reasons such as the fear of
network error and inflexible access that will possibly end up in data loss and
insecurities.
2.1.2. FACTORS INFLUENCING THE USAGE OF E-FILING
According to the theory of Technology Acceptance Model (TAM), there
are six variables that determine the usage of a system.
a. Attitude
b. Perceived Usefulness (PU)
c. Perceived Ease of Use (PEOU)
d. Information System Quality
e. Information Quality
f. Perceived Credibility
In relation with online tax return submission, there are previous studies
found several factors that affect the usage of e-filing. Ojha, Sahu, & Gupta, 2009;
Noviandini, 2012; Laihad, 2013; Perkasa & Rustam, 2016; Claudia, 2016; and

14
Kumar & Gupta, 2017, found that Perceived Usefulness (PU) have an impact on
e-filing adoption. Beside that, Perceived Ease of Use (PEOU) (Ojha, Sahu, &
Gupta, 2009; Noviandini, 2012; Schaupp & Carter, 2010; Laihad, 2013; Claudia,
2016; and Chandra, 2016), and Perceived Risk (PR) (Schaupp & Carter, 2010;
Chittoo & Dhotah, 2016) also found to be determinants that affect the usage of e-
filing.
15
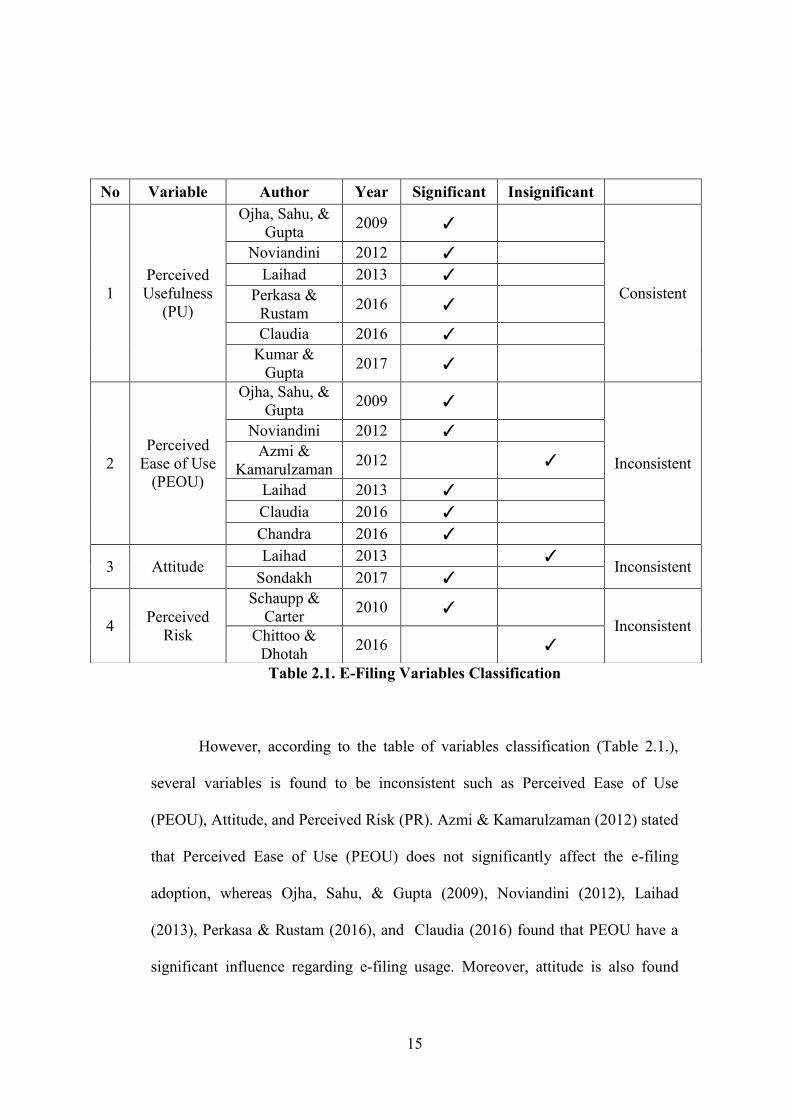
Table 2.1. E-Filing Variables Classification
However, according to the table of variables classification (Table 2.1.),
several variables is found to be inconsistent such as Perceived Ease of Use
(PEOU), Attitude, and Perceived Risk (PR). Azmi & Kamarulzaman (2012) stated
that Perceived Ease of Use (PEOU) does not significantly affect the e-filing
adoption, whereas Ojha, Sahu, & Gupta (2009), Noviandini (2012), Laihad
(2013), Perkasa & Rustam (2016), and Claudia (2016) found that PEOU have a
significant influence regarding e-filing usage. Moreover, attitude is also found
No Variable Author Year Significant Insignificant
1
Perceived
Usefulness
(PU)
Ojha, Sahu, &
Gupta 2009 ✓
Consistent
Noviandini 2012 ✓
Laihad 2013 ✓
Perkasa &
Rustam 2016 ✓
Claudia 2016 ✓
Kumar &
Gupta 2017 ✓
2
Perceived
Ease of Use
(PEOU)
Ojha, Sahu, &
Gupta 2009 ✓
Inconsistent
Noviandini 2012 ✓
Azmi &
Kamarulzaman 2012
✓
Laihad 2013 ✓
Claudia 2016 ✓
Chandra 2016 ✓
3 Attitude Laihad 2013
✓
Inconsistent Sondakh 2017 ✓
4 Perceived
Risk
Schaupp &
Carter 2010 ✓
Inconsistent
Chittoo &
Dhotah 2016
✓

16
inconsistent. (Sondakh, 2017) found that attitude is significant to the e-filing
usage, but, in contrary, (Laihad, 2013) stated that attitude toward e-filing usage is
not significantly giving an impact. In addititon, Perceived Risk (PR) also found to
be inconsistent. According to Chittoo & Dhotah’s (2016) study, PR is found to be
insignificant to the e-filing usage while Schaupp & Carter (2010) stated that PR is
significant to e-filing usage. As different results for several variables are
inconsistent to the usage of e-filing, researcher found that the cause of this
difference is that the measurements used in the previous studies were particularly
different from one another.
2.1.2.1. THEORY OF TECHNOLOGY ACCEPTANCE MODEL (TAM)
VARIABLES
1. Perceived Usefulness (PU)
According to Davis (1989), Perceived Usefulness (PU) is a degree of a
particular technology usage that will improve the user’s work performance.
According to Adamson and Shine (as cited in Perkasa & Rustam, 2016), PU is
defined as what constructs one's belief that the use of a particular technology will
improve their performance. It can be concluded that PU is inter-related to the
system’s productivity and effectivity of its usage as a whole to increase the
performance of the system’s users (Perkasa & Rustam, 2016). It is found that PU
have a strong impact on people’s intention and attitude over the usage of a system
or a behavior (Davis, 1989; Chang. et al., 2005). In relation with perceived
usefulness, if the usage of e-filing is considered beneficial to the users, they will

17
definitely use the system. Otherwise, if the users feel that the system of e-filing
doesn’t benefit them, they will doubt the establishment of e-filing (Laihad, 2013).
Noviandini (2012), Laihad (2013), and Perkasa & Rustam (2016) found
that PU is consistently significant to the usage of e-filing.
2. Perceived Ease of Use (PEOU)
Perceived Ease of Use (PEOU) can be defined as the degree to which the
prospective user expects the target system to be free of effort that relevant in
computer use behaviors (Davis F. D., 1989). In other words, according to Davis
(as cited in Kim, Chun, & Song, 2009) systems that are easy to use, and have
easy, simple interfaces, should be systems that are also useful for people in their
jobs. Restated, ease of use can be considered a pre-requisite for useful systems.
Morris & Dillion (as cited in Kim, Chun, & Song, 2009), revealed that if an
individual perceives a system to be easy to use, he/she is more likely to perceive
the system to be useful also.
Azmi & Kamarulzaman (2012) stated that Perceived Ease of Use (PEOU)
does not significantly affect the e-filing use, while Ojha, Sahu, & Gupta (2009),
Noviandini (2012), Laihad (2013), Perkasa & Rustam (2016), and Claudia (2016)
found that PEOU has a significant impact in e-filing use.
3. Attitude
According to Davis (1989) and supported by Chang et al. (2005), attitude
is personal interest towards a system or behavior. Looking at the Technology

18
Acceptance Model (TAM), an attitude toward behaviour is an output of users’
beliefs which are Perceived Usefulness (PU) and Perceived Ease of Use (PEOU)
and an input to Behavioural Intention (BI) to use certain system. It is found by
Davis (1989) that attitude toward system’s usage is indirectly affect actual system
use. The attitude to use is concerned with the user’s evaluation of the desirability
of employing a particular information system application (Surendran, 2012).
According to Fazio (as cited in Kim, Chun, & Song, 2009), an attitude affects an
individual’s behaviors by filtering information and shaping the individual’s
perception of the world. In addition, they stated that a user who strongly holds a
favorable attitude toward using a certain technology may adopt and continuously
use the technology; but a user who weakly holds a favorable attitude toward using
a technology may be easily persuaded to change his or her favorable attitude,
preventing adoption or continued use of the technology.
Laihad (2013) found that attitude toward behavior does not affect the use
of e-filing, but, in contrary, Sondakh (2017) proved that attitude shows significant
impact on e-filing adoption.
2.1.2.2. OTHER VARIABLE
1. Perceived Risk
Perceived Risk (PR) is defined as taxpayers’ perception on the reliability
of the system’s usefulness/functionality and the control of their personal data
information in an online environment (Azmi & Bee, 2010). According to

19
Warkentin et al. (2002) and Pavlou (2003), Perceived Risk (PR) is defined as the
citizen’s subjective expectation of suffering a loss in pursuit of a desired outcome.
It is composed of behavioral and environmental uncertainty. Behavioral
uncertainty exists because online service providers may behave in an
opportunistic manner by taking advantage of the impersonal nature of the
electronic environment, while environmental uncertainty arises due to the
unpredictable nature of internet-based technology that is beyond the control of the
consumer.
Chittoo & Dhotah’s (2016) stated that PR is insignificant to the e-filing
usage while Schaupp & Carter (2010) stated that PR is significant to e-filing
usage.
2.1.3. SUMMARY AND IMPLICATIONS
Among those mentioned studies above, several authors found some
limitations and recommendations for future research regarding to the usage of e-
filing and its acceptance factors.
It is found in previous studies that the dimension used to measure the
variables was particularly different. In the end, it caused insignificancy to the
results of the studies. In addition, Azmi & Kamarulzaman (2012), regarding to the
PR, expressed that companies, that engage in complex transactions, may focus on
different risk facets than individual taxpayers, when e-filing tax returns. Also,
Sondakh (2017) mentioned that the survey concentrates on a specific area and

20
does not represent the whole of Indonesia. Hence, caution needs to be taken when
generalizing this study to the whole of Indonesia.
Moreover, Agustin (2014) recommends future research to add unused
indicators of e-filing such as attitude toward behavior and to use different unit of
analysis, population, and sample to provide supporting findings and to strengthen
previous theories. Additional reserach is also needed to determine whether the
results of this study can be replicated in other population and e-government
services. To add, Claudia (2016) suggests to use Perceived Ease of Use (PEOU)
as a reference for future research.
Therefore, this study endavours to decrease the gap arise in the previous
studies to give comprehensive results on the factors that will affect the usage of e-
filing. For that reason mentioned above, this study will focus on Perceived Ease of
Use (PEOU), attitude toward behavior, and Perceived Risk (PR) as the
determinants to e-filing adoption due to the suggestions and inconsistent results
found on previous research.
Figure 2.1. Research Model
Perceived
Usefulness (PU)
Perceived Ease
of Use (PEOU) E-Filing
Usage Attitude
Perceived Risk
(PR)
+
-
+

21

22
2.2. THEORETICAL FRAMEWORK
Theory of Technology Acceptance Model (TAM)
Technology Acceptance Model (TAM), introduced by Davis (1986), is an
adaptation of Theory of Reasoned Action (TRA) specifically tailored for
modeling user acceptance of information systems. The goal of TAM itself is to
provide an explanation of the determinants of computer acceptance that is general,
capable of explaining user behavior across a broad range of end-user computing
technologies and user populations. A key purpose of TAM, therefore, is to
provide a basis for tracing the impact of external factors on internal beliefs,
attitudes, and intentions. In accordance to the results of some empirical studies by
Liu & Arnett, Gefen et al., Pavlou, and Horst et al. (as cited in Lu, Huang, & Lo,
2010), TAM is not only applied to examine new information technology
acceptance, intention to use or behavior, and further to ensure TAM suitable for
the explanation of online user behavior issues. The rationale of the technology
acceptance model is that the influence of external variables on technology
acceptance behaviour is mediated through user beliefs and attitudes, in which
beliefs represent a degree of instrumentality tied to action and attitudes are purely
affective. Beliefs relate to an individual’s subjective assessment that performing
some behaviour will result in a specific consequence, whereas attitudes relate to
an individual’s positive or negative affective feelings about performing the
behaviour (Lee et al. (as cited in Erasmus, Rothmann, & Van Eeden, 2015).
23
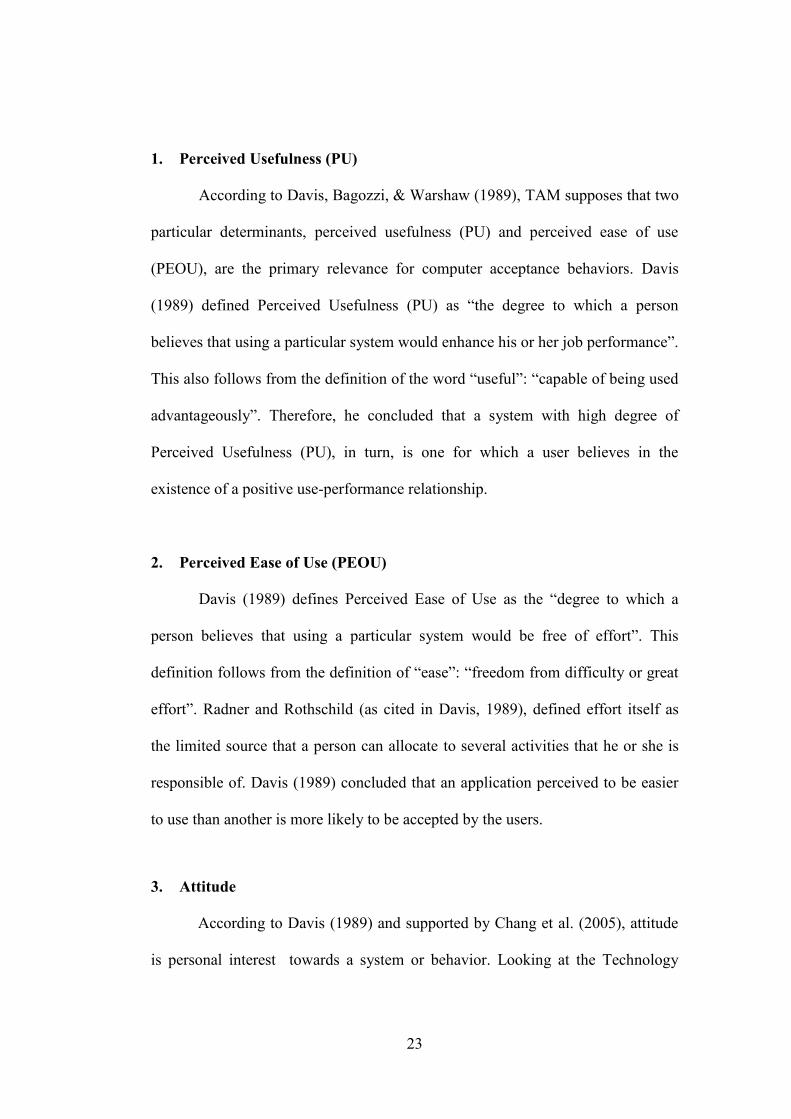
1. Perceived Usefulness (PU)
According to Davis, Bagozzi, & Warshaw (1989), TAM supposes that two
particular determinants, perceived usefulness (PU) and perceived ease of use
(PEOU), are the primary relevance for computer acceptance behaviors. Davis
(1989) defined Perceived Usefulness (PU) as “the degree to which a person
believes that using a particular system would enhance his or her job performance”.
This also follows from the definition of the word “useful”: “capable of being used
advantageously”. Therefore, he concluded that a system with high degree of
Perceived Usefulness (PU), in turn, is one for which a user believes in the
existence of a positive use-performance relationship.
2. Perceived Ease of Use (PEOU)
Davis (1989) defines Perceived Ease of Use as the “degree to which a
person believes that using a particular system would be free of effort”. This
definition follows from the definition of “ease”: “freedom from difficulty or great
effort”. Radner and Rothschild (as cited in Davis, 1989), defined effort itself as
the limited source that a person can allocate to several activities that he or she is
responsible of. Davis (1989) concluded that an application perceived to be easier
to use than another is more likely to be accepted by the users.
3. Attitude
According to Davis (1989) and supported by Chang et al. (2005), attitude
is personal interest towards a system or behavior. Looking at the Technology

24
Acceptance Model (TAM), an attitude toward behaviour is an output of users’
beliefs which are Perceived Usefulness (PU) and Perceived Ease of Use (PEOU)
and an input to Behavioural Intention (BI) to use certain system. It is found by
Davis (1989) that attitude toward system’s usage is indirectly affect actual system
use. The attitude to use is concerned with the user’s evaluation of the desirability
of employing a particular information system application (Surendran, 2012).
4. Information Quality and Information System Quality
As mentioned by Chang et al, (2005), information quality represents the
quality of the output from a system or a behavior regarding the users’ needs.
Meanwhile information system quality, as stated by DeLone and McLean (2003),
is associated with the issue of whether the technical components of delivered is
provide the quality of information and service required by stakeholders.
5. Perceived Credibility
Perceived credibility is assumed as users’ security and confidency towards
their personal information shared on a new system (Wang, 2002). According to
Chang et al. (as cited in Ilias, Abd Razak, & Yasoa', 2014), a credible website
needs to safeguard personal information from unauthorized access or disclosure,
accidental loss and alteration or destruction.

25
2.3. HYPOTHESIS DEVELOPMENT
2.3.1. Perceived Ease of Use (PEOU) and E-Filing
According to Technology Acceptance Model (TAM) developed by Davis
(1989), perceived ease of use is relevant in computer use behaviours. Perceived
Ease of Use (PEOU) itself defined as the degree to which the prospective user
expects the target system to be free of effort. Perkasa & Rustam (2016) also stated
that the higher the degree of ease a technology can offer, taxpayers tend to think
that e-filing is acceptable. Still according to the findings in TAM, individuals
accept a particular system if they believe in the system, it is stated that one of the
beliefs is perceived ease of use. Therefore, the more a user thinks that e-filing
usage is easy, the more likely e-filing is used and applied in tax return activity.
This theory is supported by recent research done by Ojha, Sahu, & Gupta (2009),
Noviandini (2012), Laihad (2013), Perkasa & Rustam (2016), and Claudia (2016)
who found that PEOU have a significant relationship regarding e-filing usage.
However, Azmi & Kamarulzaman (2012) stated that Perceived Ease of Use
(PEOU) does not significantly affect the e-filing usage.
H1 : There is a positive relationship between Perceived Ease of Use (PEOU)
and e-filing usage.
2.3.2. Attitude and E-Filing
Technology acceptance mode (TAM) has been based on theory of
reasoned action (TRA) and has been used to explain individual’s acceptance
26
behaviour. According to theory of reasoned action the individual attitude is
motivated by behavioural objectives and these are a function of an individual's
attitude toward the behaviour and subjective norms surrounding the performance
of the behaviour (Davis F. D., 1989). The attitude to use is concerned with the
user’s evaluation of the desirability of employing a particular information system
application (Surendran, 2012). As a general rule, the stronger the intention to
engage in a new system, the more likely should be its performance (Ajzen, 1991).
According to that, we can conclude that the more a user enjoy the usage of e-
filing, the higher the acceptance of e-filing and the more successful the usage is.
The statement above is supported by previous research done by Sondakh (2017)
who proved that attitude shows significant effect on usage of e-filing yet opposed
by Laihad (2013) who found that attitude does not significantly affect the usage of
e-filing.
H2 : There is a positive relationship between attitude and the e-filing usage.
2.3.3. Perceived Risk (PR) and E-Filing
Featherman & Pavlou (2002) stated that Perceived Risk (PR) is commonly
thought of as an uncertainty regarding possible negative consequences of using a
product or service. Following this description, he then define PR as “the potential
for loss in the pursuit of a desired outcome of using an e-service”. However,
Chittoo & Dhotah (2016) stated that the definition of PR has changed since online
transactions have become popular. As stated in Chittoo & Dhotah (2016), Kumar
Mukerjiet al. (2007) found another definition of PR. It would be “a fear of losing

27
personal information and fear of being monitored on the internet”. Perceived risk
has two facets, namely privacy risk and performance risk. Privacy risk refers to
the safeguard of the data, while performance risk refers to the possibility of
system failure. As an addition, Azmi & Bee (2010) stated that systems that are
perceived to be complex, with steep learning curves are likely to be thought as
risky to adopt and use. Taxpayers will perceive the system to be problematic,
suffer from performance problems and usage uncertainties. On the contrary, if
taxpayers perceive the system as easy to use, taxpayers evaluate the system
positively and this leads to adoption. Featherman & Pavlou (2002) found that e-
services that may not work properly and process financial payments incorrectly
are evaluated more poorly and therefore less likely to be adopted. Thus, if e-fling
is proved to be secure and reliable, users tend to use e-filing as an effective and
efficient alternative of tax return activity. This statement is supported by the
research done by Schaupp & Carter (2010). They found that perceived risk is
sgnificant on the usage of e-filing. They also added that higher levels of perceived
risk decrease the usage of e-filing system. In contrast, Chittoo & Dhotah’s (2016)
stated that PR is insignificant to the e-filing usage.
H3 : There is a negative relationship between Perceived Risk (PR) and e-
filing usage.

28
CHAPTER 3
RESEARCH METHOD
3.1. TYPE OF STUDY
This study is classified into quantitative-primary study because it uses
numerical data which will be processed statistically, and the data obtained and
analyzed in this study will be taken from external sources using questionnaire.
3.2. POPULATION AND SAMPLE
The population of this study is Individual Taxpayers in Daerah Istimewa
Yogyakarta because the current subject of e-SPT are the individual taxpayers.
Convenience sampling was used in this study. Convenience sampling is
the freedom to choose anyone they meet (Umar, 2011), therefore sampling was
done by selecting samples randomly by researcher.
3.3. SOURCES AND DATA COLLECTION METHOD
The data were obtained using survey method through online questionnaires
with 4-point interval scales given to respondents. The questionnaire consists of
questions with an explanation for each question to make it easier for respondents
to answer.
29
3.4. RESEARCH VARIABLES
3.4.1. Dependent Variable
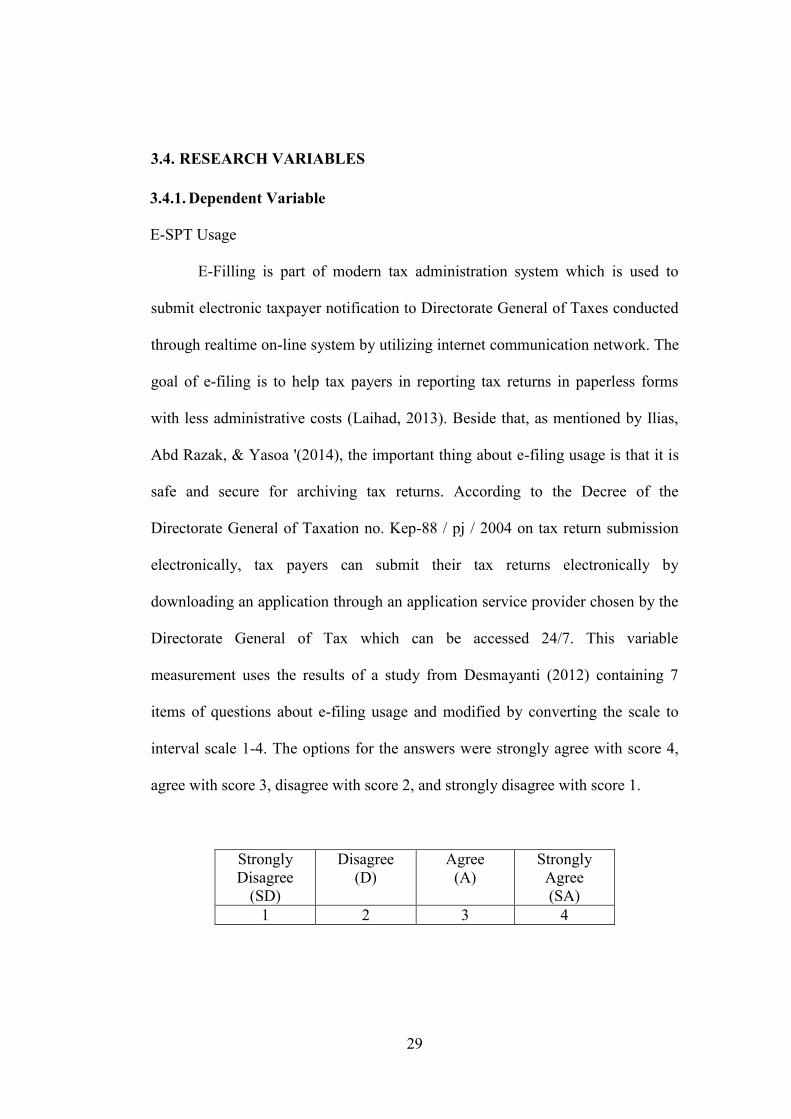
E-SPT Usage
E-Filling is part of modern tax administration system which is used to
submit electronic taxpayer notification to Directorate General of Taxes conducted
through realtime on-line system by utilizing internet communication network. The
goal of e-filing is to help tax payers in reporting tax returns in paperless forms
with less administrative costs (Laihad, 2013). Beside that, as mentioned by Ilias,
Abd Razak, & Yasoa '(2014), the important thing about e-filing usage is that it is
safe and secure for archiving tax returns. According to the Decree of the
Directorate General of Taxation no. Kep-88 / pj / 2004 on tax return submission
electronically, tax payers can submit their tax returns electronically by
downloading an application through an application service provider chosen by the
Directorate General of Tax which can be accessed 24/7. This variable
measurement uses the results of a study from Desmayanti (2012) containing 7
items of questions about e-filing usage and modified by converting the scale to
interval scale 1-4. The options for the answers were strongly agree with score 4,
agree with score 3, disagree with score 2, and strongly disagree with score 1.
Strongly
Disagree
(SD)
Disagree
(D)
Agree
(A)
Strongly
Agree
(SA)
1 2 3 4

30
The following are questions regarding Perceived Usefulness (PU):
1. I have a lot of experiences in using e-filing.
2. I have been using e-filing for years.
3. I always try to use e-filing for tax reporting, because e-filing has the
features that help me.
4. I always try to use e-filing for tax reporting.
5. I plan on continue using e-filing in the future.
6. I am willing to continue using e-filing in the future.
7. I expect the usage of e-filing will be continues in the future.
3.4.2. Independent Variables
Perceived Ease of Use (PEOU)
Perceived Ease of Use (PEOU) defined as how respondent interpret
easiness on learning and using this system. This variable measurement uses the
results of a study from Desmayanti (2012) containing 6 items of questions about
Perceived Usefulness (PU) and modified by converting converting the scale to
interval scale 1-4. The options for the answers were strongly agree with score 4,
agree with score 3, disagree with score 2, and strongly disagree with score 1.
Strongly
Disagree
(SD)
Disagree
(D)
Agree
(A)
Strongly
Agree
(SA)
1 2 3 4
31
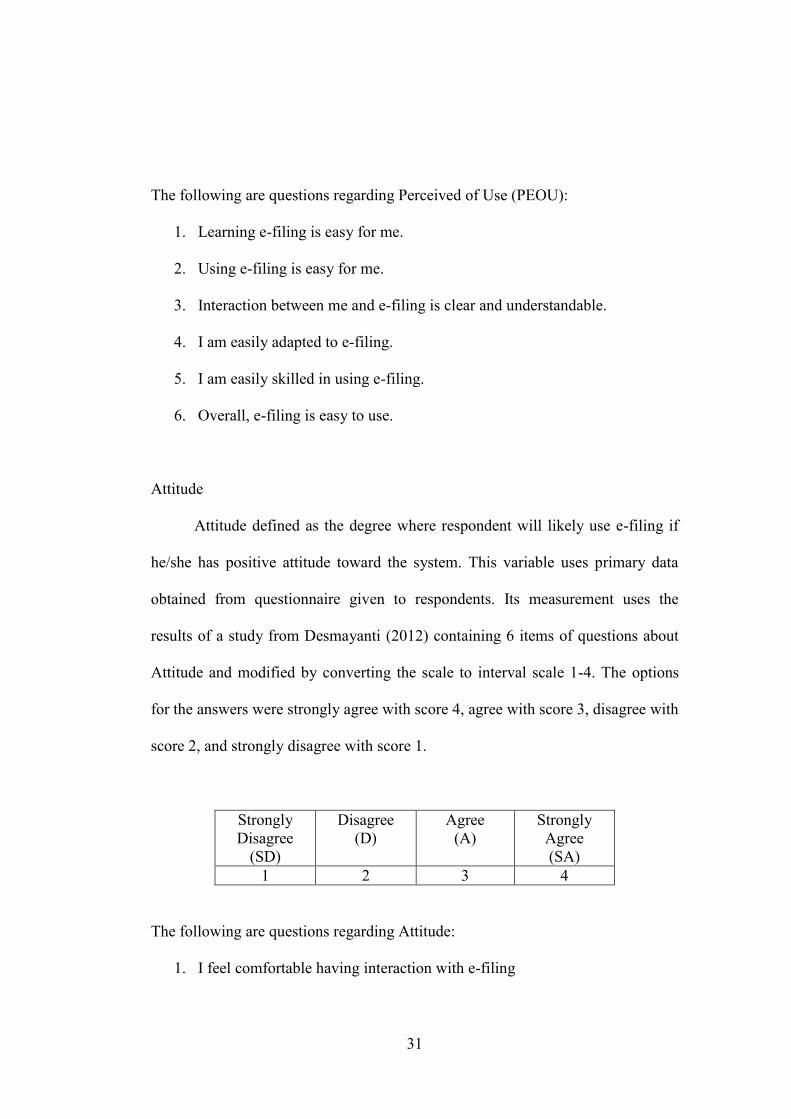
The following are questions regarding Perceived of Use (PEOU):
1. Learning e-filing is easy for me.
2. Using e-filing is easy for me.
3. Interaction between me and e-filing is clear and understandable.
4. I am easily adapted to e-filing.
5. I am easily skilled in using e-filing.
6. Overall, e-filing is easy to use.
Attitude
Attitude defined as the degree where respondent will likely use e-filing if
he/she has positive attitude toward the system. This variable uses primary data
obtained from questionnaire given to respondents. Its measurement uses the
results of a study from Desmayanti (2012) containing 6 items of questions about
Attitude and modified by converting the scale to interval scale 1-4. The options
for the answers were strongly agree with score 4, agree with score 3, disagree with
score 2, and strongly disagree with score 1.
Strongly
Disagree
(SD)
Disagree
(D)
Agree
(A)
Strongly
Agree
(SA)
1 2 3 4
The following are questions regarding Attitude:
1. I feel comfortable having interaction with e-filing

32
2. I am content of using e-filing
3. I enjoy using e-filing
4. Using on-line tax filing system is boring
5. I like the idea of using on-line tax filing system for tax-filling action
6. Using on-line tax filing system would be a pleasant experience.
Perceived Risk (PR)
Perceived Risk (PR) is defined as the citizen’s subjective expectation of
suffering a loss in pursuit of a desired outcome. This variable uses primary data
obtained from questionnaire given to respondents. Its measurement uses the
results of a study from Desmayanti (2012) containing 10 items of questions about
Perceived Risk (PR) and modified by converting the scale to interval scale 1-4.
The options for the answers were strongly agree with score 4, agree with score 3,
disagree with score 2, and strongly disagree with score 1.
Strongly
Agree
(SA)
Agree
(A)
Disagree
(DA)
Strongly
Disagree
(SD)
1 2 3 4
The following are questions regarding Perceived Risk (PR):
1. The decision of whether to use a state e-government service is risky.
2. In general, I believe using state government services over the Internet is
risky.
3. E-filing usage can cause my tax information and details stolen.
4. Psychologically, I don.t feel comfortable using e-filing.

33
5. Using e-filing is not safe due to privacy and security issues.
6. Chances of using e-filing system will cause me to lose control over the
privacy of my personal information.
7. By using e-filing system my personal information would be used without
my knowledge.
8. Internet hacker might take control of my personal information if I use e-
filing system.
9. The security system built into the e-filing system is not strong enough to
protect my account.
10. E-filing system server may not perform well and process data transmission
incorrectly.
3.4.3. Control Variable
Perceived Usefulness (PU)
Perceived Usefulness (PU) is defined as how individuals interpret the
usefulness or benefits of system usage. If the individual interprets that e-filling
can be profitable then it will directly use the e-filling system. But otherwise if the
individual feels less trust or do not know the benefits of the e-filling system will
hesitate to use it. This variable measurement uses the results of a study from
Desmayanti (2012) containing 4 items of questions about Perceived Usefulness
(PU) and modified by converting the scale to interval scale 1-4. The options for
the answers were strongly agree with score 4, agree with score 3, disagree with
score 2, and strongly disagree with score 1.

34
Strongly
Disagree
(SD)
Disagree
(D)
Agree
(A)
Strongly
Agree
(SA)
1 2 3 4
The following are questions regarding Perceived Usefulness (PU):
1. Use of e-filling can improve my tax reporting performance.
2. The use of e-filling can improve the effectiveness of tax reporting.
3. The use of e-filling can simplify the tax reporting process.
4. Use of e-filling can increase productivity.
3.5. METHOD OF ANALYSIS
3.5.1. Structural Equation Model – Partial Least Squares
PLS is a second-generation multivariate technique that facilitates testing of
the psychometric properties of the scales used to measure a variable, as well as
estimation of the parameters of a structural model which involve the direction and
strength of the relationships among the model variables (Al-Gahtani, 1998). Al-
Gahtani (1998) stated that SEM allows the simultaneous examination of the
effects of the antecedents on user acceptance as opposed to ordinary regression
analysis. Susanto (2011) and Gujarati (1995) showed that the use of latent
variables in multiple regression leads to measurement errors that affect the
estimation of parameters from biased-unbiased angles and variance. The problem
of measurement error is solved by SEM through the equations present in the
measurement model.
35
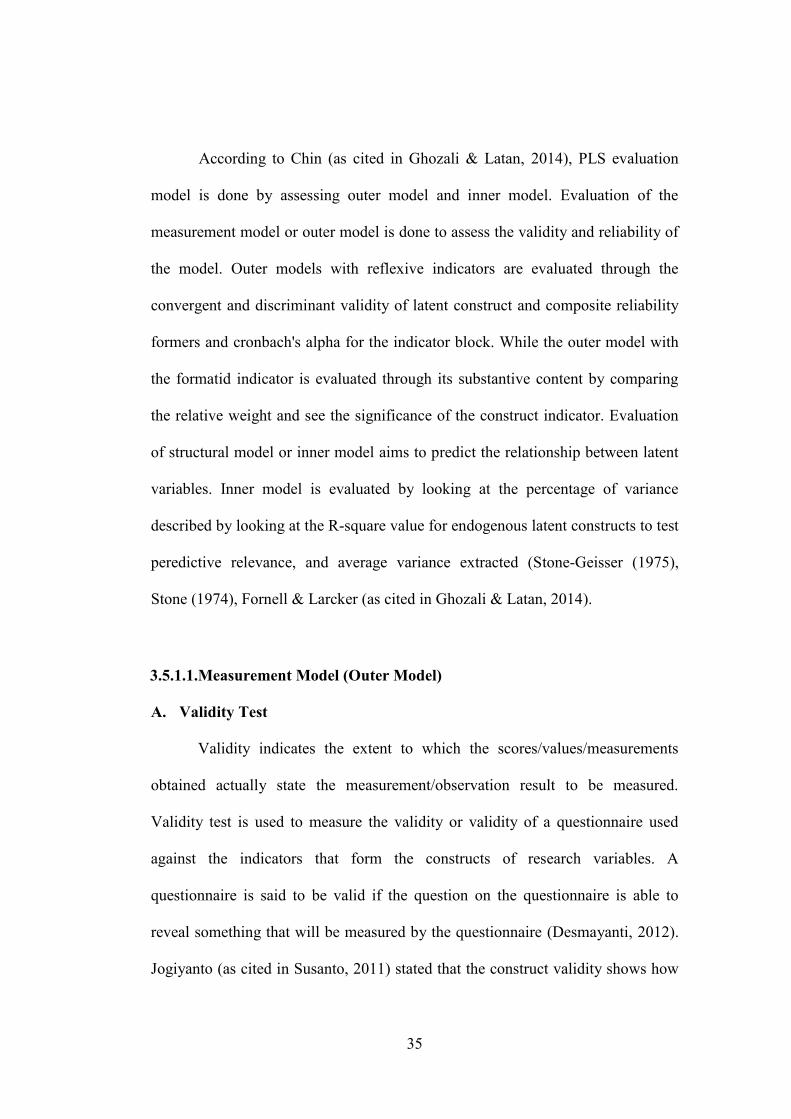
According to Chin (as cited in Ghozali & Latan, 2014), PLS evaluation
model is done by assessing outer model and inner model. Evaluation of the
measurement model or outer model is done to assess the validity and reliability of
the model. Outer models with reflexive indicators are evaluated through the
convergent and discriminant validity of latent construct and composite reliability
formers and cronbach's alpha for the indicator block. While the outer model with
the formatid indicator is evaluated through its substantive content by comparing
the relative weight and see the significance of the construct indicator. Evaluation
of structural model or inner model aims to predict the relationship between latent
variables. Inner model is evaluated by looking at the percentage of variance
described by looking at the R-square value for endogenous latent constructs to test
peredictive relevance, and average variance extracted (Stone-Geisser (1975),
Stone (1974), Fornell & Larcker (as cited in Ghozali & Latan, 2014).
3.5.1.1.Measurement Model (Outer Model)
A. Validity Test
Validity indicates the extent to which the scores/values/measurements
obtained actually state the measurement/observation result to be measured.
Validity test is used to measure the validity or validity of a questionnaire used
against the indicators that form the constructs of research variables. A
questionnaire is said to be valid if the question on the questionnaire is able to
reveal something that will be measured by the questionnaire (Desmayanti, 2012).
Jogiyanto (as cited in Susanto, 2011) stated that the construct validity shows how

36
well the results obtained from the use of a measurement are in accordance with
the theories used to define a construct.
The validity of the construct consists of convergent validity and
discriminant validity. Good discriminant validity is shown from the Average
Variance Extrated (AVE) square root for each construct greater than the
correlation between constructs in the model. The formula used to measure AVE
is:
( )
( )
Where:
= factor loading
= factor variance
= error variance
The value of AVE is recommended to be grater than 0.50 which means
that 50% or more of the indicator variance is explainable.
Table 3.1. Validity Test parameter in PLS
Source: Ghozali & Latan (2014)
B. Reliability Test
Validity Test Parameter Rule of Thumbs
Convergent Loading factor >0.7
Average Variance
Extracted (AVE
>0.5
Discriminant Root of AVE and
correlation between
constructs
Root of AVE >
correlation between
constructs

37
Reliability is a tool for measuring a questionnaire that is an indicator of a
variable or construct (Ghozali, 2011). It is used for measuring the consistency of
an instrument in sequence. Reliability shows the accuracy, consistency and
precision of a measuring instrument in measuring. Each measuring device should
have the ability to deliver relatively consistent measurement results over time,
then the questionnaire is stated reliably.
In PLS-SEM, the measurement of the reliability of a construct can be done
with Cronbach's Alpha and Composite Reliability or Dillon-Goldstein. The
formula used to measure the composite reliability is:
( )
( )
Where:
= factor loading
= factor variance
= error variance
On the other hand, the formula to measure Cronbach’s Alpha is:
( )
( )
Where:
= sum of indicators or variable manifest
q = indicator block
Table 3.2. Reliability Test Parameter in PLS
Source: Ghozali & Latan (2014)
Reliability Test Parameter Rule of Thumb
Cronbach’s Alpha >0.6
Composite Reliability >0.6

38
3.5.1.2. Structural Model (Inner Model)
In assessing the structural model with PLS, R-square (R2) value for
each endogenous latent variable as the predicted power of the structural model
was considered. The interpretation is the same as the interpretation of the
regression. Changes in R-square values can be used to explain the effect of
particular exogenous latent variables on endogenous latent variables whether they
have substantive effects. The coefficient of determination is seen by looking at the
value of R-square (R2). The value of R
2 is between 0 and 1. If R
2 is 0, it means
that R2
can not explain any variance to the dependent variable. If R2 is worth 1
meaning independent variable explains one hundred percent variance to dependent
variable. The value of R2 is also used to see the accuracy of the prediction model.
3.6. HYPOTHESIS TESTING
Hypothesis testing was done using multiple linear regression with equation
as follows:
Y1 = α + β1X1 + β2X2 + β3X3 + β4X4 + ε…………….3.1
Y2 = α + β2X2 + ε……………………………………3.2
Where,
Y1 = E-Filing usage
Y2 = Perceived of Usefulness (PU)
α = Constanta
β1 = Coefficient of Perceived Usefulness (PU)
β2 = Coefficient of Perceived Ease of Use (PEOU)
β3 = Coefficient of Attitude
β4 = Coefficient of Perceived Risk (PR)
X1 = Perceived Usefulness (PU)
X2 = Perceived Ease of Use (PEOU)

39
X3 = Attitude
X4 = Perceived Risk (PR)
ε = Error term
3.6.1. Perceived Ease of Use (PEOU)
H01; β1 ≤ 0 : There is no positive relationship between Perceived Ease of Use
(PEOU) and e-filing usage.
HA1; β1 > 0 : There is positive relationship between Perceived Ease of Use
(PEOU) and e-filing usage.
3.6.2. Attitude
H02; β2 ≤ 0 : There is no positive relationship between Attitude and e-filing
usage.
HA2; β2 > 0 : There is positive relationship between Attitude and e-filing usage.
3.6.3. Perceived Risk (PR)
H03; β3 ≥ 0 : There is no negative relationship between Perceived Risk (PR) and
e-filing usage.
HA3; β2 < 0 : There is negative relationship between Perceived Risk (PR) and e-
filing usage.

40
CHAPTER IV
DATA ANALYSIS AND DISCUSSIONS
4.1.GENERAL EXPLANATION OF RESEARCH OBJECTS
This chapter contains data analysis and the results of the study on the
impact of perceived ease of use, attitude, and perceived risk on the usage of e-
filing. According to the theory that has been stated in the previous chapter,
researcher will analyze the data that has been obtained in accordance with the
main problems and hypothesis formulation which is also have stated in the
previous chapter to later know whether the hypothesis stated is accepted or
rejected.
41
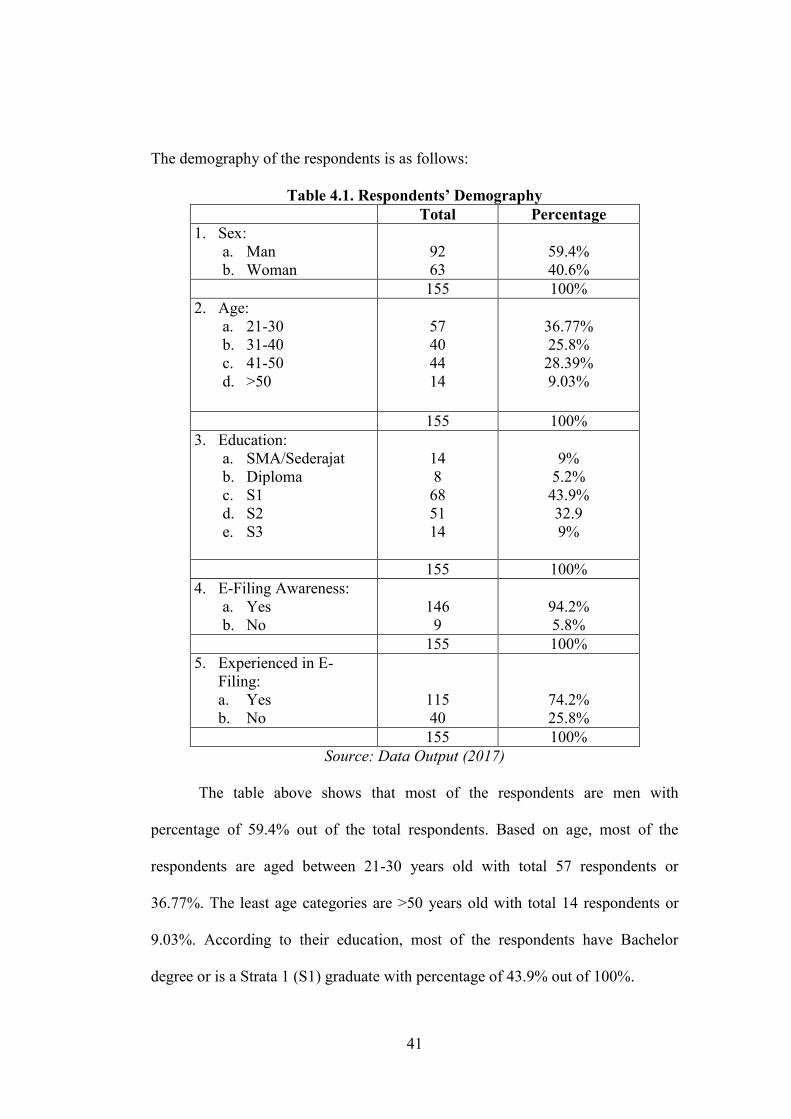
The demography of the respondents is as follows:
Table 4.1. Respondents’ Demography
Total Percentage
1. Sex:
a. Man
b. Woman
92
63
59.4%
40.6%
155 100%
2. Age:
a. 21-30
b. 31-40
c. 41-50
d. >50
57
40
44
14
36.77%
25.8%
28.39%
9.03%
155 100%
3. Education:
a. SMA/Sederajat
b. Diploma
c. S1
d. S2
e. S3
14
8
68
51
14
9%
5.2%
43.9%
32.9
9%
155 100%
4. E-Filing Awareness:
a. Yes
b. No
146
9
94.2%
5.8%
155 100%
5. Experienced in E-
Filing:
a. Yes
b. No
115
40
74.2%
25.8%
155 100%
Source: Data Output (2017)
The table above shows that most of the respondents are men with
percentage of 59.4% out of the total respondents. Based on age, most of the
respondents are aged between 21-30 years old with total 57 respondents or
36.77%. The least age categories are >50 years old with total 14 respondents or
9.03%. According to their education, most of the respondents have Bachelor
degree or is a Strata 1 (S1) graduate with percentage of 43.9% out of 100%.
42
According to their awareness on e-filing usage, 94.2% respondents have
heard the information about e-filing but, correspondents who have the experience
on using the e-filing is shown as 74.2% out of the total respondents. By that, it can
be concluded that most of the respondents participated in this study have
experienced the usage of e-filing.
4.2.OUTER MODEL EVALUATION RESULT
4.2.1. Convergent validity Test
Convergent validity test is done by algorythm calculation in PLS which
then seen in Loading Factor. According to Hair et al. (as cited in Susanto, 2011),
Loading Factor is the correlation between each component’s score while Average
Variance Extracted (AVE) is the average percentage of the variance score
extracted from a set of latent variables estimated by loading standardize the
indicator in the iteration of the PLS algorithm. For an indicator to be categorized
as valid, the score of loading factor must be greater than 0.7 and the AVE score
must be greater than 0.5. If the loading score is less than 0,5 then the indicator can
be removed because it is not loaded to the representative construct. If the loading
score is between 0.5 - 0.7, it doesn’t need to be removed as long as the AVE of the
variable is greater than 0.5.

43
The data obtained is calculated using PLS algorythm method using
SmartPLS and the result is shown as follows:
Table 4.2. Convergent Validity
Source: Data Output, 2017
No Variable Indicator Loading Factor
1 E-Filing Usage
U1 0.725
U2 0.721
U3 0.861
U4 0.827
U5 0.882
U6 0.857
U7 0.833
2 Perceived Usefulness (PU)
PU1 0.758
PU2 0.921
PU3 0.911
3 Perceived Ease of Use
(PEOU)
PEOU1 0.939
PEOU2 0.937
PEOU3 0.937
PEOU4 0.928
PEOU5 0.921
PEOU6 0.895
4 Attitude (A)
A1 0.880
A2 0.944
A3 0.894
A5 0.711
A6 0.904
5 Perceived Risk (PR)
PR2 0.859
PR3 0.908
PR4 0.867
PR5 0.926
PR6 0.914
PR7 0.896
PR8 0.862
PR9 0.822
PR10 0.859

44
According to the table 4.1., the indicator A4, PU1, and PR1 is not shown
and are removed from the table because the loading factor for each of the
indicator is less than 0.7.
4.2.2. Discriminant Validity Test
Discriminant validity can be seen from the Average Variance Extracted
(AVE) and a construct is stated as valid if AVE is greater than 0.5. The result of
the AVE calculation is as follows:
Table 4.3. Discriminant Validity
Variable Average Variance Extracted (AVE)
E-Filing Usage 0.668 Valid
Perceived Usefulness 0.652 Valid
Perceived Ease of Use 0.858 Valid
Attitude 0.757 Valid
Perceived Risk 0.741 Valid
Source: Data Output (2017)
As seen from Table 4.3., we can conclude that all the variables used in this
study is valid.
4.2.3. Reliability Test
Reliability is a tool for measuring a questionnaire that is an indicator of a
variabel or construct (Ghozali, 2011). It is used for measuring the consistency of
an instrument in sequence. Reliability shows the accuracy, consistency and
precision of a measuring instrument in measuring. Each measuring device should
have the ability to deliver relatively consistent measurement results over time,
then the questionnaire is stated reliably.

45
In PLS-SEM, the measurement of the reliability of a construct can be done
with Cronbach's Alpha and Composite Reliability or Dillon-Goldstein. Cronbach's
Alpha is a reliability coefficient that shows how well items in a set are positively
correlated with each other. The closer to Cronbach's Alpha with 1 the higher the
consistency. Composite Reliability is a statistical technique for reliabiliity test that
measures the true reliability value of a variable. The composite reliability
estimates the reliability based on the inter-correlations of the indicator variables of
a specific construct (Zogheib, Rabaa'i, Zogheib, & Elsaheli, 2015). A construct is
stated as reliable if each of the construct’s Cronbach’s Alpha score and its
Composite Reliability score is greater than 0.6 (Ghozali & Latan, 2014).
The calculation of Cronbach’s Alpha and Composite Reliability for each
variable used in this study is shown as follows:
Table 4.4. Cronbach’s Alpha
Variable Cronbach’s Alpha
E-Filing Usage 0.918 Reliable
Perceived Usefulness 0.967 Reliable
Perceived Ease of Use 0.964 Reliable
Attitude 0.831 Reliable
Perceived Risk 0.961 Reliable
Source: Data Output. 2017
Table 4.5. Composite Reliability
Variable Composite Reliability
E-Filing Usage 0.933
Perceived Usefulness 0.882
Perceived Ease of Use 0.973
Attitude 0.939
Perceived Risk 0.966
Source: Data Output, 2017

46
Table 4.4. and table 4.5. shown that the result of the Cronbach’s Alpha and
Composite Reliability for each variable used in this study is greater than 0.6.
Therefore, we can conclude from the result of the calculation that each variable is
reliable to be used as an indicator for this study.
4.3.INNER MODEL EVALUATION RESULT
The structural model evaluation can be done by looking at R-square for the
dependent construct, and shown by t-statistics value and path coefficient value. R-
Square indicates the extent to which a construct can explain the model or in other
words to know the magnitude of the effect of a particular latent variable to a
dependent latent variable and whether it has a substantive effect. The R-square
interpretation of SmartPLS is the same as the regression interpretation.
The R-square value of each variable is as follows:
Table 4.6. R-Square
Variable R-Square
E-Filing Usage 0.414
Perceived Usefulness 0.333
Perceived Ease of Use
Attitude
Perceived Risk
Source: Data Output, 2017
From the result of the output above, it can be seen that the value of r-
square generated for e-filing usage variable is 0.414 which means that the effect
of peceived usefulness (X1), perceived ease of use (X2), attitude (X3), and
perceived risk (X4) to e-filing usage (Y1) is 41.4% and the remaining 58.6% is
47
influenced by other variables outside this research model. Furthermore, for
perceived usefulness (Y2) which has the r-square value as much as 0.333 means
that perceived ease of use (X2) effect to perceived usefulness (Y2) is 33.3% and
the remaining 66.7% is influenced by other variables outside this research model.
4.4.HYPOTHESIS TESTING
Hypothesis testing is done by looking at the t-statistics and path-
coefficient. The value of t-statistics shows construct’s significanace, meanwhile
path-coefficient shows the positive-negative correlation between each construct.
Hypothesis testing is done by looking at the value of path coefficient
showing parameter coefficient and t-statistic value. Assessing the path of
coefficients is to evaluate the latent constructs or variables that have been
hypothesized in this study. Hypothesis testing using multiple regression analysis
is done using SmartPLS. Testing of the hypothesis that has been stated in the
previous chapter is examined by looking at the result of the inner weights.
The result of hypothesis testing using t-statistic calculation and path-
coefficient can be seen in table 4.7.

48
Table 4.7. Inner Weights Output
Original
Sample
Estimate
Mean of
Subsamples
Standard
Deviation T-Statistic P-Value
Perceived
Usefulness →
E-Filing Usage
0.489 0.488 0.017 29.028 0.00000
Perceived Ease of
Use →
E-Filing Usage
0.103 0.102 0.018 5.683 0.00000
Attitude →
E-Filing Usage 0.185 0.185 0.024 7.694 0.00000
Perceived Risk →
E-Filing Usage -0.093 -0.094 0.018 5.058 0.00000
Perceived Ease of
Use →
Perceived
Usefulness
0.577 0.578 0.012 48.208 0.00000
Source: Data Output, 2017
According to table 4.7 which shows the result of inner weights, we can
conclude that into the following model function:
U = 0.489PU + 0.103PEOU + 0.185A – 0.093PR
PU = 0.577PEOU
4.5.DISCUSSIONS
4.5.1. Perceived Ease of Use is Positively and Significantly Affect E-Filing
Usage
By looking at the table, it can be concluded that the original sample
estimate shows the value of 0.103 for the relation between perceived ease of use
and e-filing usage. It indicates that there is positive relation between these two
variables. Besides, the p-value and t-statistics for the relationship between
perceived ease of use and e-filing usage shows the value of 0.00000 (<0.05) and

49
5.683 (>1.96) consecutively which means that perceived ease of use significantly
influences e-filing usage.
According to this result and the hypothesis formulation, it can be
concluded that H01 is rejected, therefore HA1 is accepted. This means that if the
perceived ease of use is increasing, so does the usage of e-filing. This result match
with previous research done by Ojha, Sahu, & Gupta (2009), Noviandini (2012),
Laihad (2013), Claudia (2016), and Chandra (2016) which given the result that
perceived ease of use have significant and positive influence on the usage of e-
filing.
Ojha, Sahu, & Gupta (2009) stated that perceived ease of use is found to
be the significant antecedents of the usage of the income tax paperless e-filing
service. Meanwhile, Noviandini (2012) and Laihad (2013) also found that
perceived ease of use is positively and significantly influences perceived ease of
use based on their research. Additionally, Claudia (2016) found that there is
significant impact from perceived ease of use to e-filing usage. She also stated
that if users found that e-filing service is easy, there is great possibility that they
will continously using e-filing. Lastly, Chandra (2016) also supported this result,
it is stated that there is positive and significant impact from perceived of use to the
usage of e-filing.
Also, according to the Technology Acceptance Model (Davis, 1989),
individuals accept a particular system if they believe in the system, it is stated that
one of the believe is perceived ease of use. Perceived ease of use itself defined as
the degree to which a person believes that using a particular system would be free

50
of effort. In addition, Radner and Rothschild (as cited in Davis F. D., 1989) stated
that effort itself defined as the limited source that a person can allocate to several
activities which he or she is responsible of. Therefore, the more a user thinks that
using e-filing needs less of effort or limited source that a person can allocate, the
more likely e-filing is used and applied in tax return activity.
4.5.2. Attitude is Positively and Significantly Affect E-Filing Usage
As seen from the table above, we can derived that the original sample
estimate shows the value of 0.185 for the relation between attitude and e-filing
usage. It concludes that there is positive relation between these two variables.
Besides, the p-value and t-statistics for the relationship between perceived ease of
use and e-filing usage shows the value of 0.00000 (<0.05) and 7.694 (>1.96)
consecutively which means that attitude significantly influences e-filing usage.
Based on this result, we can conclude that H02 is rejected, and by that, HA2 is
accepted which means that attitude have significant and positive influence on the
usage of e-filing.
This result is supported by previous study done by Sondakh (2017) which
shows that attitude is having positive significant effect toward the usage of e-
filing. As an addition, a study done by Jimantoro & Tjondro (2014) also shows
that attitude influences the usage of e-filing by the taxpayers. They concluded that
attitude toward using is having a significant impact toward e-filing usage. They
also adds that the impact of attitude on e-filing usage is shown to be positive.
Kim, Chun, & Song (2009) stated that a user who strongly holds a favorable

51
attitude toward using a certain technology may adopt and continuously use the
technology; but a user who weakly holds a favorable attitude toward using a
technology may be easily persuaded to change his or her favorable attitude,
preventing adoption or continued use of the technology.
Looking at the Technology Acceptance Model (TAM), an attitude toward
certain behaviour is an output of users’ beliefs which are perceived ease of use
and perceived usefulness. It is found by (Davis F. D., 1989) that attitude toward
system’s usage is indirectly affected actual system use. As an addition,
(Surendran, 2012) stated that attitude is concerned with the user’s evaluation of
the desirability of employing a particular information system application. The
individual attitude is motivated by behavioural objectives and these are a function
of an individual's attitude toward the behaviour and subjective norms surrounding
the performance of the behaviour (Davis F. D., 1989). As a general rule, the
stronger the intention to engage in a new system, the more likely should be its
performance (Ajzen, 1991). According to that, we can conclude that the more a
user enjoy the usage of e-filing, the higher the acceptance of e-filing and the more
successful the usage is.
4.5.3. Perceived Risk is Negatively and Significantly Affect E-Filing Usage
As seen from the table above, we can derived that the original sample
estimate shows the value of -0.093 for the relation between perceived risk and e-
filing usage. It concludes that there is negative relation between these two
variables. Besides, the p-value and t-statistics for the relationship between

52
perceived risk and e-filing usage shows the value of 0.00000 (<0.05) and 5.058
(>1.96) consecutively which means that perceived risk significantly affects e-
filing usage. Based on this result, we can conclude that H03 is rejected, and by
that, HA3 is accepted which means that perceived risk have significant and
negative influence on the usage of e-filing.
This results match with the previous studies done by Schaupp & Carter
(2010) which found that perceived risk is negative significant on the usage of e-
filing. They also added that higher levels of perceived risk will decrease the usage
of e-filing system. In contrast, Chittoo & Dhotah’s (2016) stated that PR is
insignificant to the e-filing usage.
Thus, systems that are perceived to be complex, with steep learning curves
are likely to be thought as risky to adopt and use. Taxpayers will perceive the
system to be problematic, suffer from performance problems and usage
uncertainties. On the contrary, if taxpayers perceive the system as easy to use,
taxpayers evaluate the system positively and this leads to adoption (Azmi & Bee,
2010). To support this result, Featherman & Pavlou (2002) mentioned that e-
services that may not work properly and process financial payments incorrectly
are evaluated more poorly and therefore less likely to be adopted. Thus, if e-filing
is proved to be secure and reliable, users tend to use e-filing as an effective and
efficient alternative of tax return activity.
From the TAM perspective, as stated by (Alraja' & Aref, 2015), perceived
risk reflects the belief, intention and ability of users about using online system. To
do the same, they believed that the risk level of misuse of financial information

53
and personal information must be at the lowest level because this risk influences
negatively on the acceptance of the system itself. Moreover, (Azmi &
Kamarulzaman, 2012) added that perceived risk, when divided into different
characters will be seen as a significant negative influence to the usefulness of e-
filing. To add, a study done by Azmi & Bee (2010) shows that perceived risk
responds negatively towards perceived usefulness. This means that, if taxpayers
perceived that the electronic tax-filing system is risky, their perception on the
usefulness of the system will decrease.
Table 4.8. Recapitulation of Hypothesis Testing Results
Hypothesis Statements Results
HA1 Perceived ease of use positively
influences e-filing usage.
Supported
HA2 Attitude positively influences e-
filing usage.
Supported
HA3 Perceived risk negatively influences
e-filing usage.
Supported
54
CHAPTER V
CONCLUSIONS AND RECOMMENDATIONS
This chapter includes the conclusions of study findings and discussions,
study limitations, and recommendations for future research regarding this topic.
5.1. CONCLUSIONS
This study is expected to answer the question about the effect of Perceived
Ease of Use, Attitude, and Perceived risk to e-SPT usage. The respondents of this
study is 155 individual taxpayers in Yogyakarta.
According to the results of hypothesis testing using Structural Equation
Modelling - Partial Least Square (SEM-PLS) based on the feedback from the
respondents, it can be concluded that Perceived ease of Use, and Attitude is
significantly positive affecting e-SPT usage, but in contrary, Perceived Risk is
negatively affecting the usage of e-SPT, explanations as follows:
1. Perceived ease of use positively affects e-SPT usage. This impact is positive
which means that perceived ease of use can increase the e-filing usage.
Perceived ease of use in e-filing users’ perspective includes the level of
easiness on learning, using, and adapting to e-SPT. This degree of easiness,
can be seen from systems that are easy to use, and have easy, simple
interfaces. The more users of e-filing feeling that it is easy to use, the more
likely e-filing usage is increasing.

55
2. Attitude positively influence e-SPT usage. It indicates that the more a system
is enjoyable and users of the system is comfortable in learning, using, and
adapting to it, they will be likely less reluctant to the usage of the system.
3. Perceived risk negatively influence e-SPT usage. This finding means that
perceived risk and e-SPT usage is in contrary. If perceived risk tend to be
high, e-SPT usage will decrease as much as the perceived risk degree, on the
other hand if users tend to feel like they have nothing to lose by using e-SPT,
the more intense the usage of e-SPT itself. Therefore, the less risky e-SPT is,
in which way; secure and credible, the more users of e-SPT.
5.2. RESEARCH IMPLICATIONS
1. Scholars
As suggested by previous studies, this study is aimed to analyze the
influence of perceived ease of use, attitude, and perceived risk on e-SPT
usage. The findings of this study proved that perceived ease of use and
attitude is positive and significant to e-SPT usage, meanwhile perceived risk
is negative and significant to e-SPT usage. Therefore, based on the results of
this study, it is hopefully can give deeper understanding and adds knowledge
that perceived ease of use, attitude, and perceived risk is significantly have an
impact on the usage of e-SPT and it is also expected to be useful in future
research as a reference for developing studies about related topics.
56
2. The Directorate General of Taxation
After conducting this study, it is found that perceived ease of use and
attitude is positive significant to e-SPT usage. This means that the more users
feel comfortable, enjoy and use less effort in using e-SPT for tax reporting,
the more probability of e-SPT usage is increasing. On the other hand,
perceived risk is found to be negative significant to the usage of e-SPT, this
concludes that if e-SPT tends to be lack of security and can cause possibility
in users’ information lost or stolen, the more e-filing usage is used for tax
reporting. Beside that, 40 respondents out of the total 155 respondents that
have participated in this research found to have not used e-filing yet for tax
reporting, therefore we can also conclude from this finding that e-filing usage
is not yet maximum.
In accordance with the results, this study is aimed to give relevant and
reliable information to the Directorate General of Taxation in Indonesia to
develop e-filing usage in Indonesia. Thus, Directorate General of Taxation is
expected to do more socialization regarding e-filing system and its benefits
from using to citizens using all kinds of media possible such as direct
socialization and through the internet or social media, because, based on this
study, it is found that there are some people that have not used e-filing or
heard about this system. It shows that the socialization regarding e-filing is
not correspondingly given to all taxpayers in Indonesia, therefore the
socialization of e-filing is expected to be more equally given to all taxpayers
in Indonesia. By that, if taxpayers are aware of the usage of e-filing, can
57
increase and later will be fully used by Indonesian taxpayers. As an addition,
Directorate General of Taxation is expected to continually revitalize and
develop the e-filing system so that it shows increasement wether in its
interface or security in order to make taxpayers/users feel safe and
comfortable in using e-filing. Thus, when e-filing is more secure and easy to
use, more taxpayers will use it as a priority on filing the tax returns.
5.3. RESEARCH LIMITATIONS
In conducting this study, there are several limitations and constraints found
that indirectly affect the result of this study. Those limitations are as follows:
1. There are more factors that exist that could influence the usage of e-filing,
therefore a more reliable results regarding this study can be improved if
another variable is taken into consideration such as information quality,
information system quality, and perceived credibility.
2. The data obtaining method in this study may caused invalidity in the data
because there is possibilities that respondents does not fill in the questionnaire
well.
5.4. RECOMMENDATIONS
Considering the limitations that occur during this study, some
recommendations are suggested for future studies and parties that is directly or
indirectly involved in this study in order to decrease the gap and giving continous
improvements whether on the results of the study or the implementation of e-
58
government services. Further studies regarding this topic should cover broader
object of studies and use more variance of factors that will later can show a better
result of analysis that will help both taxpayers and Indonesian government.

59
REFRENCES
Abdurrohman, S., Domai, T., & Shobaruddin, M. (2015). Implementasi Program
E-Filing dalam Upaya Peningkatan Kepatuhan Wajib Pajak Orang
Pribadi (Studi pada Kantor Pelayanan Pajak Pratama Bojonegoro). Jurnal
Administrasi .
Agustin, R. S. (2014). Pengaruh Minat Perilaku Wajib Pajak terhadap Efektifitas
E-Filing dan Implikasinya terhadap Kepatuhan Formal Perpajakan
(Survei pada Wajib Pajak Orang Pribadi di Bank Mega Regional
Bandung).
Ajzen, I. (1991). The Theory of Planned Behavior. Organizational Behavior and
Human Decision Processes, 50 (2), 179-211.
Al-Gahtani, S. S. (1998). System Characteristics, User Perceptions and Attitudes
in the Prediction of Information Technology Acceptance: A Structural
Equation Model. Proceedings of the DIGIT Conference.
Alsaghier, H., Ford, M., Nguyen, A., & Hexel, R. (2009). Conceptualising
Citizen’s Trust in e-Government: Application of Q Methodology.
Electronic Journal of E-Government , 7 (4), 295-310.
Ambali, A. R. (2009). E-Government Policy: Ground Issue in E-Filing System.
European Journal of Social Sciences , 11 (2).
Amianti, G. D. (2017, February 14). Electronic filing for annual tax forms
revamped. Retrieved August 11, 2017, from The Jakarta Post:
http://www.thejakartapost.com/news/2017/02/14/electronic-filing-for-
annual-tax-forms-revamped.html
Anthony, R. N., & Govindarajan, V. (2007). Management Control Systems (12th
ed.). New York, United States: McGraw-Hill/Irwin.
Asianzu, E., & Maiga, G. (2012). A Consumer Based Model for Adoption of E-
Tax Services in Uganda.
Azmi, A. C., & Bee, N. L. (2010). The Acceptance of the E-Filing System by
Malaysian Taxpayers: A Simplified Model. Electronic Journal of e-
Government , 8 (1).
Azmi, A. C., & Kamarulzaman, Y. (2012, January). Perceived Risk and the
Adoption of Tax E-Filing. World Applied Sciences Journal .
Chandra, I. R. (2016). Pengaruh Kemudahan Penggunaan, Kepercayaan, dan
Computer Self Efficacy terhadap inat Penggunaan E-SPT dalam
Pelaporan Pajak. Jurnal Nominal , 5 (1).
Chittoo, H. B., & Dhotah, R. (2016). Electronic Tax Filing in Mauritius: Insights
into Factors Leading to Technology Adoption. IOSR Journal of
Humanities and Social Science (IOSR-JHSS) , 21 (8), 34-38.
Claudia, M. I. (2016). Pengaruh Persepsi Kemudahan dan Kepuasan Wajib Pajak
Terhadap Penggunaan E-Filing (Survei pada Wajib Pajak Orang Pribadi
di KPP Pratama Majalaya).
Davis, F. D. (1989). Perceived Usefulness, Perceived Ease of Use, and User
Acceptance of Information Technology. MIS Quarterly .

60
Davis, F. D., Bagozzi, R. P., & Warshaw, P. R. (1989). USer Acceptance of
Computer Technology: A Comparison of Two Theoretical Models.
Management Science , 35 (8).
Desmayanti, E. (2012). Faktor-Faktor yang Mempengaruhi Penggunaan Fasilitas
E-Filing oleh Wajin Pajak Sebagai Sarana Penyampaian SPT Masa
Secara Online dan Realtime (Kajian Empiris di Wilayah Kota
Semarang). Universitas Diponegoro, Fakultas Ekonomika dan Bisnis,
Semarang.
Dombrowski, L., Hayes, G. R., & Mazmanian, M. (2014). E-Government
Intermediaries and the Challenges of Access and Trust. ACM
Transaction on Human-Computer Interaction .
Dorasamy, M., Marimuthu, M., Raman, M., & Kaliannan, M. (2012). E-
Government Services Online: An Exploratory Study on Tax E-Filing in
Malaysia.
Erasmus, E., Rothmann, S., & Van Eeden, C. (2015). A Structural Model of
Technology Acceptance. SA Journal of Industrial Psychology , 41 (1).
Featherman, M. S., & Pavlou, P. A. (2002). Predicting E-Services Adoption: A
Perceived Risk Facets Perspective. Human-Computer Interaction Studies
in MIS .
Ghozali, I., & Latan, H. (2014). Partial Least Squares Konsep, Teknik dan
Aplikasi Menggunakan Program SmartPLS 3.0 Untuk Penelitian
Empiris. Semarang, Indonesia: Badan Penerbit Universitas Diponegoro
Semarang.
Glanz, K., Rimer, B. K., & K., V. (2015). Health Behavior: Theory, Research,
and Practice. Jogn Wiley & Sons.
Hale, J. L., Householder, B. J., & Greene, K. L. (2002). The Persuasion
Handbook: Developments in Theory and Practice. Theories of
Persuasion .
Ibrahim, A., & Chandra, P. (2015). Exploring the Influence of Trust and
Perceived System Quality on Continuance Intention toward E-Filing
System of Malaysian E-Government Service. A Literature Review.
Journal of Technology and Operations Management , 10 (2), 65-76.
Ilias, A., Abd Razak, M. Z., & Yasoa', M. R. (2014). Taxpayers’ Attitude In
Using E-Filing System: Is There Any Significant Difference Among
Demographic Factors? Journal of Internet Banking and Commerce , 14
(1).
Illias, A., Abd Razak, M. Z., & Yasoa', M. R. (2009). Taxpayrs' Attitude in Using
E-Filing System: Is There any Significant Difference Among
Demographic Factors? Journal of Internet Banking and Commerce , 14
(1).
Jimantoro, C., & Tjondro, E. (2014). Analisis Niat Penggunaan E-Filing di PT
"X" dan PT "Y" Surabaya Dengan Structural Equation Modeling. Tax &
Accounting Review , 4 (2), 1-8.
Khasawneh, R. T., Rabayah, W. A., & Abu-Shanab, E. A. (2013, May 8). E-
Government Acceptance Factors: Trust and Risk. ICIT 2013 The 6th
International Conference on Information Technology 2.

61
Kim, Y. J., Chun, J. U., & Song, J. K. (2009). Investigating the Role of Attitude in
TEchnology Acceptance from an Attitude Strength Perspective.
International Journal of Information Management .
Kumar, S., & Gupta, S. (2017). A Study on Income Tax Payers Perception
towards Electronic Filing. Journal of Internet Banking and Commerce ,
22 (S7).
Kusuma, H. (2017, March 25). 4 Juta Wajib Pajak Lapor SPT Tahunan Pakai e-
Filing. Retrieved August 11, 2017, from Detik Finance:
https://finance.detik.com/berita-ekonomi-bisnis/d-3456758/4-juta-wajib-
pajak-lapor-spt-tahunan-pakai-e-filing
Laihad, R. C. (2013). Pengaruh Perilaku Wajib Pajak Terhadap Penggunaan E-
Filing Wajib Pajak di Kota Manado. Jurnal EMBA , 1 (3), 44-51.
Lu, C.-T., Huang, S.-Y., & Lo, P.-Y. (2010). An Empirical Study of Online Tax
Filing Acceptance Model: Integrating TAM and TPB. African Journal of
Business Management , 4 (5).
Lyytinen, K. (1987). Different Perspectives on Information Systems: Problem and
Solutions. ACM Computing Surveys , 19 (1).
Mayeh, M., Ramayah, T., & Ramadass, S. (2013). Antecedents of E-trust: A
Study among Taxpayers in Malaysia. Proceedings of the International
Conference on e-Learning, e-Business, Enterprise Information Systems,
and e-Government (EEE). The Steering Committee of The World
Congress in Computer Science, Computer Engineering and Applied
Computing (WorldComp) .
Noviandini, N. C. (2012). Pengaruh Persepsi Kebermanfaatan, Persepsi
Kemudahan Penggunaan, dan Kepuasan Wajib Pajak terhadap
Penggunaan E-Filing Bagi Wajib Pajak di Yogyakarta. Jurnal Nominal ,
1 (1), 15-22.
Nurhasanah, Firmansyah, & Novrida, I. (2015). Pengaruh Persepsi Wajib Pajak
Orang Pribadi Terhadap Penggunaan Electronic Filling (e- filling) di
KPP Pratama Palembang Ilir Barat. Jurnal Akuntanika , 1 (1).
Ojha, A., Sahu, G. P., & Gupta, M. P. (2009). Antecedents of Paperless Income
Tax Filing by Young Professionals in India: an Exploratory Study.
Paperless Income Tax Feeling , 3 (1), 65-90.
Perkasa, A. T., & Rustam, A. R. (2016). Pengaruh Persepsi Kebermanfaatan,
Persepsi Kemudahan Penggunaan dan Persepsi Kepercayaan Wajib Pajak
Terhadap Minat Menggunakan E-filing Sebagai Sarana Pelaporan
Pelaporan Pajak (Study Kasus di PT Pelabuhan Indonesia III Cabang
Benoa).
Sondakh, J. J. (2017). Behavioral Intention to Use E-Tax Service System: An
Application of Technology Acceptance Model. European Research
Studies Journal , 20 (2A).
Surendran, P. (2012). Technology Acceptance Model: A Survey of Literature.
International Journal of Business and Sosial Research (UBSR) , 2 (4).
Susanto, N. A. (2011). Analisis Perilaku Wajib Pajak Terhadap Penerapan Sistem
E-Filing Direktorat Jenderal Pajak. Universitas Indonesia, Fakultas
Ekonomi Program Magister Perencanaan dan Kebijakan Publik, Jakarta.

62
Tallaha, A. M., Abdul-Shukor, Z., & Abu Hassan, N. S. (2014). Factors
Influencing E-Filing Usage Among Malaysian Taxpayers: Does Tax
Knowledge Matters? Jurnal Pengurusan , 40, 91-101.
Umar, H. (2011). Metode Penelitian untuk Skripsi dan Tesis Bisnis. Jakarta,
Indonesia: PT Rajagrafindo Persada.
Wowor, R. A., Morasa, J., & Elim, I. (2014). Analisis Faktor-Faktor yang
Mempengaruhi Perilaku Wajib Pajak untuk Menggunakan E-Filing.
Jurnal EMBA , 2 (3), 1340-1349.
Zogheib, B., Rabaa'i, A., Zogheib, S., & Elsaheli, A. (2015). University Student
Perceptions of Technology Use in Mathematics Learning. Journal of
Information Technology Education: Research , 14, 417-438.

63
APPENDICES

64
APPENDIX 1
QUESTIONNAIRE
Yth, Bapak/Ibu/Saudarai/i Responden,
Nama saya Aulia Fatima, saya adalah mahasiswa tingkat akhir Fakultas Ekonomi
Universitas Islam Indonesia Jurusan Akuntansi International Program yang
sedang menyusun tugas akhir yang berjudul “Analysis of Perceived Ease of Use,
Attitude, and Perceived Risk as Factors Influencing E-Filing Use” (“Analisis
Persepsi Kemudahan, Sikap, dan Persepsi Resiko Sebagai Faktor yang
Mempengaruhi Penggunaan E-Filing”). Sehubungan dengan hal tersebut, saya
mengharapkan kerjasama Anda untuk ikut berpartisipasi sebagai responden dalam
penelitian ini. Agar penelitian ini dapat berlangsung dengan baik, saya
mengharapkan Bapak/Ibu/Saudara/i mengisi kuesioner ini dengan baik dan benar.
Atas perhatian, waktu, dan partisipasinya, saya ucapkan terima kasih.
Hormat saya,
Aulia Fatima

65
Data Diri Responden (* = Lingkari yang sesuai)
1. Nama :
2. Jenis Kelamin* :
a. Pria
b. Wanita
3. Usia : Tahun
4. Pendidikan Terakhir :
a. SMA/Sederajat
b. Diploma
c. S1
d. S2
e. S3
f. Lain-Lain: …
5. Pekerjaan :
6. Jabatan :
7. Pernah mendengar tentang e-filing*:
a. Ya
b. Tidak
8. Dari mana anda mendengar tentang e-filing*:
a. Penyuluhan dari Direktorat Jenderal Pajak (DJP)
b. Keluarga
c. Teman
d. Jejaring Sosial
e. Belum Pernah Mengengar Tentang E-Filing
f. Lain-Lain: …
9. Pernah menggunakan e-filing*:
a. Ya
b. Tidak

66
Petunjuk Pengisian
Untuk mengisi daftar pernyataan ini, Bapak/Ibu/Saudara/i Responden
cukup memberikan tanda centang (√) pada pilihan jawaban yang tersedia yang
sesuai dengan kondisi Bapak/Ibu/Saudara/i Responden. Setiap poin pertanyaan
hanya membutuhkan satu jawaban.
Skala Penilaian
1 = Sangat Tidak Setuju
2 = Tidak Setuju
3 = Setuju
4 = Sangat Setuju

67

68
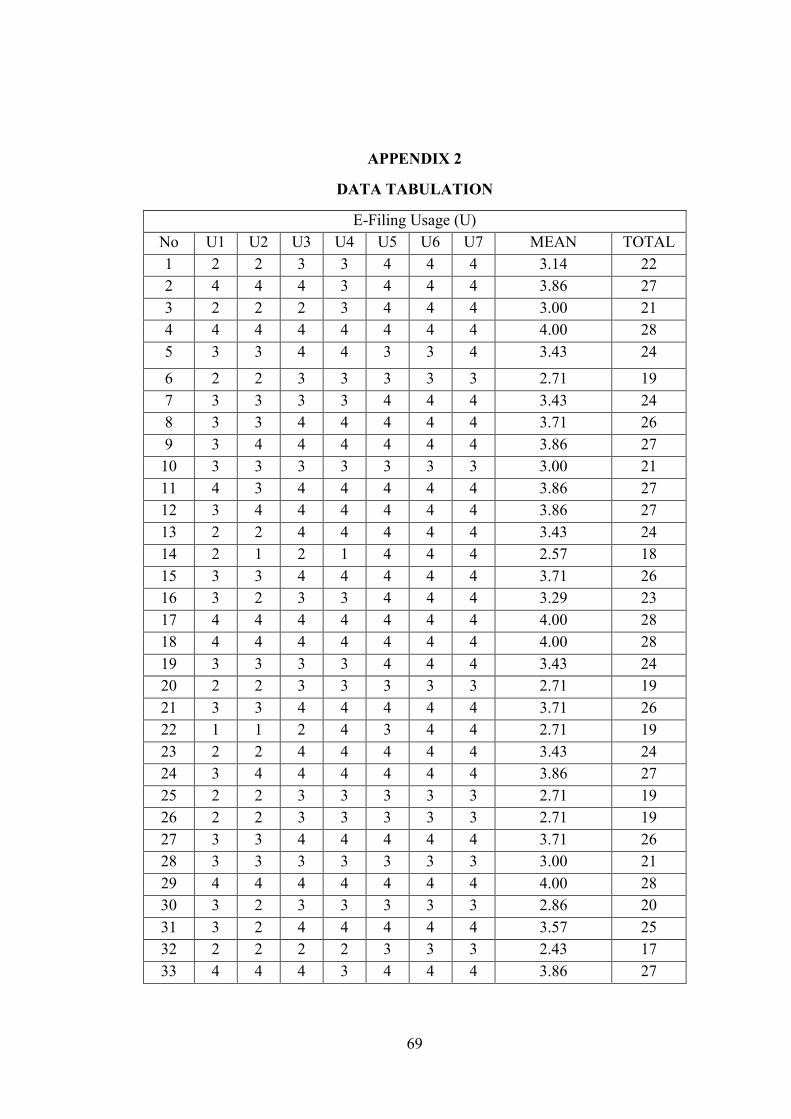
69
APPENDIX 2
DATA TABULATION
E-Filing Usage (U)
No U1 U2 U3 U4 U5 U6 U7 MEAN TOTAL
1 2 2 3 3 4 4 4 3.14 22
2 4 4 4 3 4 4 4 3.86 27
3 2 2 2 3 4 4 4 3.00 21
4 4 4 4 4 4 4 4 4.00 28
5 3 3 4 4 3 3 4 3.43 24
6 2 2 3 3 3 3 3 2.71 19
7 3 3 3 3 4 4 4 3.43 24
8 3 3 4 4 4 4 4 3.71 26
9 3 4 4 4 4 4 4 3.86 27
10 3 3 3 3 3 3 3 3.00 21
11 4 3 4 4 4 4 4 3.86 27
12 3 4 4 4 4 4 4 3.86 27
13 2 2 4 4 4 4 4 3.43 24
14 2 1 2 1 4 4 4 2.57 18
15 3 3 4 4 4 4 4 3.71 26
16 3 2 3 3 4 4 4 3.29 23
17 4 4 4 4 4 4 4 4.00 28
18 4 4 4 4 4 4 4 4.00 28
19 3 3 3 3 4 4 4 3.43 24
20 2 2 3 3 3 3 3 2.71 19
21 3 3 4 4 4 4 4 3.71 26
22 1 1 2 4 3 4 4 2.71 19
23 2 2 4 4 4 4 4 3.43 24
24 3 4 4 4 4 4 4 3.86 27
25 2 2 3 3 3 3 3 2.71 19
26 2 2 3 3 3 3 3 2.71 19
27 3 3 4 4 4 4 4 3.71 26
28 3 3 3 3 3 3 3 3.00 21
29 4 4 4 4 4 4 4 4.00 28
30 3 2 3 3 3 3 3 2.86 20
31 3 2 4 4 4 4 4 3.57 25
32 2 2 2 2 3 3 3 2.43 17
33 4 4 4 3 4 4 4 3.86 27

70
34 3 3 3 3 3 3 3 3.00 21
35 3 3 3 3 3 3 3 3.00 21
36 2 2 3 3 4 4 4 3.14 22
37 3 3 3 3 3 3 3 3.00 21
38 2 2 3 3 3 3 3 2.71 19
39 3 3 3 3 4 4 4 3.43 24
40 4 4 4 4 4 4 4 4.00 28
41 1 1 1 1 1 1 1 1.00 7
42 2 1 2 2 3 3 4 2.43 17
43 1 2 2 2 3 3 3 2.29 16
44 2 2 3 3 3 3 3 2.71 19
45 2 2 2 4 4 4 4 3.14 22
46 2 2 3 3 3 3 3 2.71 19
47 3 3 3 3 4 4 4 3.43 24
48 3 3 3 2 3 3 3 2.86 20
49 3 2 4 4 4 4 4 3.57 25
50 2 2 3 2 3 3 3 2.57 18
51 1 2 1 1 3 3 3 2.00 14
52 4 3 4 4 4 4 4 3.86 27
53 3 3 4 4 4 4 4 3.71 26
54 3 2 2 2 4 4 4 3.00 21
55 3 3 3 2 3 3 4 3.00 21
56 3 4 3 3 3 4 4 3.43 24
57 2 2 2 2 3 3 3 2.43 17
58 2 2 3 3 4 4 4 3.14 22
59 2 2 4 4 4 4 4 3.43 24
60 2 2 3 3 3 3 3 2.71 19
61 1 2 3 3 4 4 4 3.00 21
62 3 3 4 4 4 4 4 3.71 26
63 1 2 3 3 4 4 4 3.00 21
64 2 3 4 4 4 4 4 3.57 25
65 3 3 3 3 3 3 3 3.00 21
66 3 3 4 4 4 4 4 3.71 26
67 3 4 4 4 4 4 4 3.86 27
68 1 1 3 3 3 3 3 2.43 17
69 3 3 4 4 4 4 4 3.71 26
70 3 2 4 3 4 3 4 3.29 23
71 2 1 2 2 3 4 4 2.57 18

71
72 3 2 3 3 3 4 4 3.14 22
73 3 3 4 4 4 4 4 3.71 26
74 3 3 4 4 4 4 4 3.71 26
75 4 4 4 4 4 4 4 4.00 28
76 3 3 4 4 4 4 4 3.71 26
77 4 4 4 4 4 4 4 4.00 28
78 3 3 3 3 3 3 3 3.00 21
79 3 3 4 4 4 4 4 3.71 26
80 4 4 4 4 4 4 4 4.00 28
81 3 3 4 4 4 4 4 3.71 26
82 2 2 4 4 4 4 4 3.43 24
83 4 4 4 4 4 4 4 4.00 28
84 2 1 3 3 3 3 3 2.57 18
85 3 3 4 4 4 4 4 3.71 26
86 2 2 4 4 4 4 4 3.43 24
87 2 2 3 3 4 4 4 3.14 22
88 3 3 4 4 4 4 4 3.71 26
89 2 2 3 3 3 3 3 2.71 19
90 3 3 4 4 4 4 4 3.71 26
91 3 3 3 3 4 4 4 3.43 24
92 4 3 4 4 4 4 4 3.86 27
93 3 3 3 3 4 4 4 3.43 24
94 3 3 3 2 3 3 3 2.86 20
95 3 3 3 2 3 3 3 2.86 20
96 3 3 3 2 3 3 3 2.86 20
97 3 3 3 2 3 3 3 2.86 20
98 3 3 4 4 4 4 4 3.71 26
99 2 2 4 4 4 4 4 3.43 24
100 3 3 4 4 4 4 4 3.71 26
101 4 4 4 4 4 4 4 4.00 28
102 3 3 4 4 4 4 4 3.71 26
103 3 3 4 3 4 4 4 3.57 25
104 2 3 3 3 4 4 4 3.29 23
105 4 4 4 4 4 4 4 4.00 28
106 3 3 4 4 4 4 4 3.71 26
107 4 4 4 4 4 4 4 4.00 28
108 2 2 3 3 3 3 4 2.86 20
109 4 4 4 4 4 4 4 4.00 28

72
110 3 3 4 4 4 4 4 3.71 26
111 4 4 4 4 4 4 4 4.00 28
112 4 4 4 4 4 4 4 4.00 28
113 4 4 4 4 4 4 4 4.00 28
114 4 4 4 4 4 4 4 4.00 28
115 2 2 4 4 4 4 4 3.43 24
Perceived Usefulness (PU)
No PU1 PU2 PU3 PU4 MEAN TOTAL
1 3 3 3 3 3.00 12
2 3 4 4 4 3.75 15
3 2 3 3 3 2.75 11
4 3 4 4 3 3.50 14
5 3 4 4 3 3.50 14
6 3 3 3 3 3.00 12
7 3 3 4 3 3.25 13
8 4 4 4 4 4.00 16
9 4 4 4 4 4.00 16
10 4 4 4 3 3.75 15
11 4 4 4 4 4.00 16
12 3 4 4 4 3.75 15
13 3 4 4 4 3.75 15
14 3 4 3 3 3.25 13
15 3 4 4 3 3.50 14
16 4 4 4 4 4.00 16
17 4 4 4 4 4.00 16
18 2 3 3 3 2.75 11
19 2 3 4 3 3.00 12
20 3 4 4 3 3.50 14
21 4 4 4 4 4.00 16
22 2 4 4 3 3.25 13
23 3 3 4 4 3.50 14
24 3 4 4 4 3.75 15
25 3 3 3 3 3.00 12
26 3 3 3 3 3.00 12
27 3 3 3 3 3.00 12
28 3 3 3 3 3.00 12
29 4 4 4 4 4.00 16

73
30 4 4 4 4 4.00 16
31 2 4 4 3 3.25 13
32 3 2 3 2 2.50 10
33 2 4 3 3 3.00 12
34 3 3 4 2 3.00 12
35 2 3 3 2 2.50 10
36 4 4 4 4 4.00 16
37 3 3 3 3 3.00 12
38 3 3 3 2 2.75 11
39 3 4 4 4 3.75 15
40 4 4 4 4 4.00 16
41 1 1 1 1 1.00 4
42 3 3 3 3 3.00 12
43 3 4 4 3 3.50 14
44 3 3 3 3 3.00 12
45 2 4 4 1 2.75 11
46 3 3 3 3 3.00 12
47 4 4 4 3 3.75 15
48 4 4 4 3 3.75 15
49 4 4 4 3 3.75 15
50 4 3 3 3 3.25 13
51 3 3 2 1 2.25 9
52 4 4 4 4 4.00 16
53 4 4 4 4 4.00 16
54 3 3 3 3 3.00 12
55 4 4 4 3 3.75 15
56 3 3 3 3 3.00 12
57 3 3 3 3 3.00 12
58 3 4 3 4 3.50 14
59 4 4 4 4 4.00 16
60 3 3 3 3 3.00 12
61 3 4 4 3 3.50 14
62 4 4 4 4 4.00 16
63 3 4 4 3 3.50 14
64 3 3 3 3 3.00 12
65 4 4 4 4 4.00 16
66 3 3 3 3 3.00 12
67 4 4 4 4 4.00 16
68 3 3 3 3 3.00 12
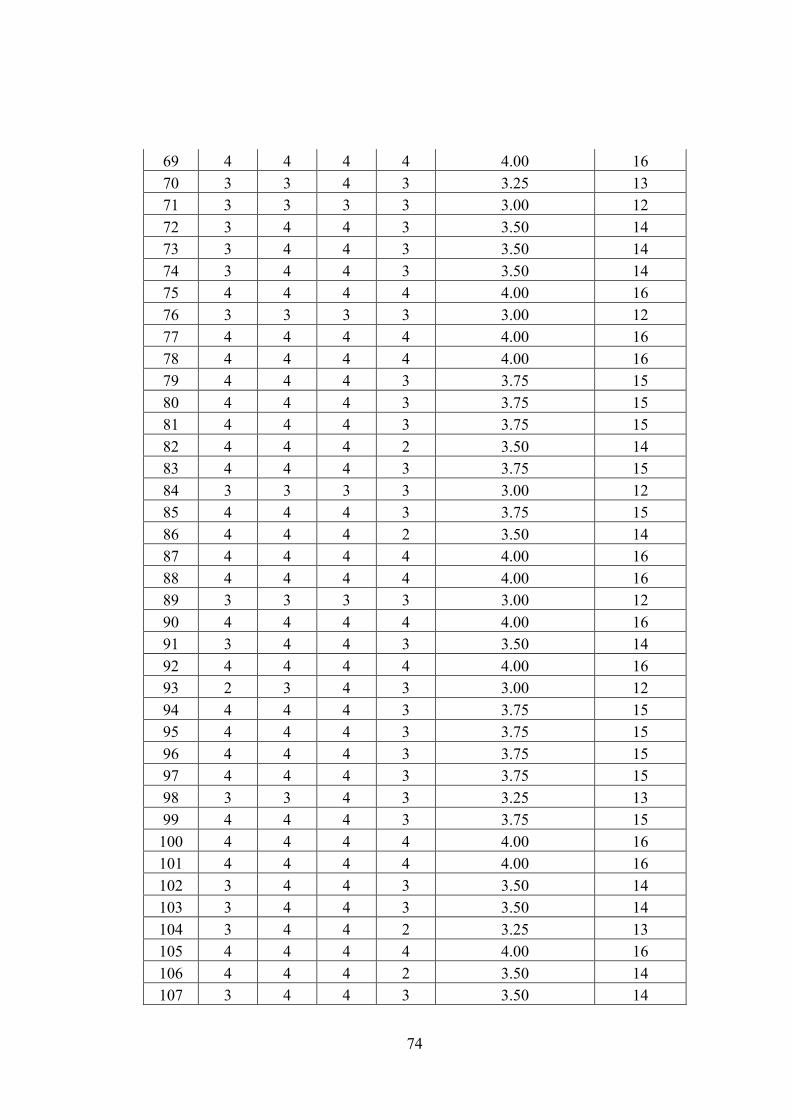
74
69 4 4 4 4 4.00 16
70 3 3 4 3 3.25 13
71 3 3 3 3 3.00 12
72 3 4 4 3 3.50 14
73 3 4 4 3 3.50 14
74 3 4 4 3 3.50 14
75 4 4 4 4 4.00 16
76 3 3 3 3 3.00 12
77 4 4 4 4 4.00 16
78 4 4 4 4 4.00 16
79 4 4 4 3 3.75 15
80 4 4 4 3 3.75 15
81 4 4 4 3 3.75 15
82 4 4 4 2 3.50 14
83 4 4 4 3 3.75 15
84 3 3 3 3 3.00 12
85 4 4 4 3 3.75 15
86 4 4 4 2 3.50 14
87 4 4 4 4 4.00 16
88 4 4 4 4 4.00 16
89 3 3 3 3 3.00 12
90 4 4 4 4 4.00 16
91 3 4 4 3 3.50 14
92 4 4 4 4 4.00 16
93 2 3 4 3 3.00 12
94 4 4 4 3 3.75 15
95 4 4 4 3 3.75 15
96 4 4 4 3 3.75 15
97 4 4 4 3 3.75 15
98 3 3 4 3 3.25 13
99 4 4 4 3 3.75 15
100 4 4 4 4 4.00 16
101 4 4 4 4 4.00 16
102 3 4 4 3 3.50 14
103 3 4 4 3 3.50 14
104 3 4 4 2 3.25 13
105 4 4 4 4 4.00 16
106 4 4 4 2 3.50 14
107 3 4 4 3 3.50 14

75
108 3 3 3 2 2.75 11
109 3 4 4 3 3.50 14
110 3 4 4 2 3.25 13
111 3 4 4 2 3.25 13
112 3 3 4 3 3.25 13
113 3 4 4 3 3.50 14
114 3 4 4 2 3.25 13
115 3 4 4 2 3.25 13
Perceived Ease of Use (PEOU)
No PEOU1 PEOU2 PEOU3 PEOU4 PEOU5 PEOU6 MEAN TOTAL
1 3 3 3 3 4 3 3.17 19
2 4 4 4 4 4 4 4.00 24
3 3 3 2 3 3 3 2.83 17
4 4 4 4 4 4 4 4.00 24
5 3 3 4 3 3 3 3.17 19
6 2 2 2 2 2 2 2.00 12
7 3 3 3 3 3 3 3.00 18
8 3 4 3 4 3 3 3.33 20
9 4 4 4 4 4 4 4.00 24
10 3 3 3 3 3 3 3.00 18
11 4 4 4 4 4 4 4.00 24
12 3 3 3 4 4 4 3.50 21
13 4 4 3 3 3 3 3.33 20
14 4 4 4 4 4 4 4.00 24
15 3 3 3 3 3 3 3.00 18
16 4 4 4 4 4 4 4.00 24
17 4 4 4 4 4 4 4.00 24
18 3 3 3 3 2 3 2.83 17
19 3 3 3 3 3 3 3.00 18
20 2 2 2 2 2 2 2.00 12
21 4 4 4 4 4 4 4.00 24
22 2 1 2 2 2 2 1.83 11
23 3 3 3 3 4 3 3.17 19
24 3 3 3 3 3 3 3.00 18
25 2 2 2 2 2 2 2.00 12
26 3 3 3 3 3 3 3.00 18
27 4 4 4 4 4 4 4.00 24

76
28 3 3 3 3 3 3 3.00 18
29 3 3 3 3 3 3 3.00 18
30 4 4 4 4 4 4 4.00 24
31 2 3 2 3 3 4 2.83 17
32 3 3 3 3 3 2 2.83 17
33 2 2 2 3 3 2 2.33 14
34 3 3 3 3 3 3 3.00 18
35 3 3 3 3 3 3 3.00 18
36 4 4 4 4 4 4 4.00 24
37 3 3 3 3 3 3 3.00 18
38 2 2 2 2 2 3 2.17 13
39 3 3 3 3 3 3 3.00 18
40 4 4 4 4 4 4 4.00 24
41 1 1 1 1 1 1 1.00 6
42 3 3 3 3 2 2 2.67 16
43 3 3 3 3 3 3 3.00 18
44 3 3 3 3 3 3 3.00 18
45 4 4 4 3 3 3 3.50 21
46 2 3 2 2 3 3 2.50 15
47 3 3 3 3 3 3 3.00 18
48 4 4 4 4 4 4 4.00 24
49 2 2 3 3 2 3 2.50 15
50 3 4 3 3 3 3 3.17 19
51 1 2 2 2 2 2 1.83 11
52 4 4 4 4 4 4 4.00 24
53 4 4 4 4 4 4 4.00 24
54 4 4 4 4 4 4 4.00 24
55 3 4 3 3 3 3 3.17 19
56 3 3 3 3 3 3 3.00 18
57 3 2 2 3 3 2 2.50 15
58 2 2 2 2 2 2 2.00 12
59 3 3 3 3 3 3 3.00 18
60 4 4 4 4 4 4 4.00 24
61 3 3 3 3 3 4 3.17 19
62 4 4 4 4 4 4 4.00 24
63 3 3 3 3 3 4 3.17 19
64 4 4 4 4 4 4 4.00 24
65 4 4 4 4 4 4 4.00 24
66 4 4 4 4 4 4 4.00 24

77
67 4 4 4 4 4 4 4.00 24
68 4 4 4 4 4 4 4.00 24
69 4 4 4 4 4 4 4.00 24
70 2 3 2 2 2 3 2.33 14
71 2 2 2 2 2 2 2.00 12
72 3 3 3 4 3 4 3.33 20
73 4 4 4 4 4 4 4.00 24
74 4 4 4 4 4 4 4.00 24
75 4 4 4 4 4 4 4.00 24
76 4 4 4 3 3 4 3.67 22
77 4 4 4 4 4 4 4.00 24
78 4 4 4 4 4 4 4.00 24
79 3 3 3 3 3 4 3.17 19
80 4 4 3 3 4 4 3.67 22
81 4 4 4 4 4 4 4.00 24
82 3 3 3 3 3 4 3.17 19
83 3 3 3 3 3 3 3.00 18
84 3 2 2 2 2 3 2.33 14
85 3 3 3 3 3 3 3.00 18
86 4 4 4 4 4 4 4.00 24
87 3 3 3 3 3 3 3.00 18
88 4 4 4 4 4 4 4.00 24
89 3 3 3 3 3 3 3.00 18
90 4 4 4 4 4 4 4.00 24
91 4 4 4 4 4 4 4.00 24
92 4 4 4 4 4 4 4.00 24
93 3 3 3 3 3 3 3.00 18
94 4 4 4 4 4 4 4.00 24
95 4 4 4 4 4 4 4.00 24
96 4 4 4 4 4 4 4.00 24
97 4 4 4 4 4 4 4.00 24
98 3 3 3 3 3 4 3.17 19
99 3 3 3 3 3 3 3.00 18
100 4 4 4 3 3 4 3.67 22
101 4 4 4 4 4 4 4.00 24
102 3 3 3 3 3 4 3.17 19
103 2 3 3 2 2 3 2.50 15
104 3 3 3 2 2 3 2.67 16
105 4 4 4 4 4 4 4.00 24

78
106 4 4 3 3 3 4 3.50 21
107 3 3 3 2 2 3 2.67 16
108 3 3 4 3 3 4 3.33 20
109 4 4 4 4 4 4 4.00 24
110 3 3 3 3 3 4 3.17 19
111 2 3 3 2 3 3 2.67 16
112 3 4 4 3 3 4 3.50 21
113 3 4 4 3 3 4 3.50 21
114 3 4 4 3 3 4 3.50 21
115 3 4 4 3 3 4 3.50 21
Attitude (A)
No A1 A2 A3 A4 A5 A6 MEAN TOTAL
1 3 3 3 2 3 3 2.83 17
2 4 4 3 4 3 3 3.50 21
3 3 3 3 2 3 3 2.83 17
4 3 4 3 1 4 4 3.17 19
5 3 3 4 2 3 3 3.00 18
6 2 3 3 3 3 2 2.67 16
7 3 3 3 2 3 3 2.83 17
8 4 4 4 1 3 4 3.33 20
9 4 4 4 1 4 4 3.50 21
10 3 3 2 3 3 2 2.67 16
11 4 4 4 1 4 4 3.50 21
12 3 4 4 2 3 3 3.17 19
13 3 3 3 2 4 3 3.00 18
14 4 4 4 1 4 3 3.33 20
15 3 3 3 1 3 3 2.67 16
16 4 4 4 1 4 4 3.50 21
17 4 4 4 1 4 4 3.50 21
18 3 3 2 1 3 2 2.33 14
19 3 4 4 4 4 4 3.83 23
20 3 3 3 1 3 3 2.67 16
21 4 4 4 1 4 4 3.50 21
22 2 3 3 1 4 3 2.67 16
23 2 3 3 1 3 4 2.67 16
24 3 3 3 1 3 3 2.67 16
25 2 2 2 2 3 2 2.17 13

79
26 3 3 3 2 3 3 2.83 17
27 4 4 4 1 4 4 3.50 21
28 3 2 2 2 3 3 2.50 15
29 3 3 3 1 4 3 2.83 17
30 3 3 3 1 3 3 2.67 16
31 3 3 3 1 3 2 2.50 15
32 2 2 2 3 2 2 2.17 13
33 3 3 3 1 4 4 3.00 18
34 3 3 3 2 3 3 2.83 17
35 2 2 2 2 3 3 2.33 14
36 4 4 4 1 4 4 3.50 21
37 3 3 3 2 3 3 2.83 17
38 3 3 3 2 3 3 2.83 17
39 3 3 4 1 3 3 2.83 17
40 4 4 4 1 1 4 3.00 18
41 1 1 1 1 1 1 1.00 6
42 2 2 3 3 3 2 2.50 15
43 3 3 3 2 3 3 2.83 17
44 3 3 3 2 3 3 2.83 17
45 3 4 3 1 4 4 3.17 19
46 3 3 3 2 3 3 2.83 17
47 3 3 2 2 3 2 2.50 15
48 4 4 4 1 4 4 3.50 21
49 3 3 3 1 4 3 2.83 17
50 3 3 4 2 3 3 3.00 18
51 2 2 2 3 3 2 2.33 14
52 4 4 4 1 4 4 3.50 21
53 4 4 4 1 4 4 3.50 21
54 3 4 4 1 4 4 3.33 20
55 3 3 3 2 4 3 3.00 18
56 3 3 3 3 3 3 3.00 18
57 3 3 3 2 3 2 2.67 16
58 2 2 3 2 4 3 2.67 16
59 4 4 4 1 4 4 3.50 21
60 3 3 3 2 3 3 2.83 17
61 4 4 4 1 3 3 3.17 19
62 4 4 4 1 4 4 3.50 21
63 3 3 4 1 3 3 2.83 17
64 4 4 4 2 3 3 3.33 20
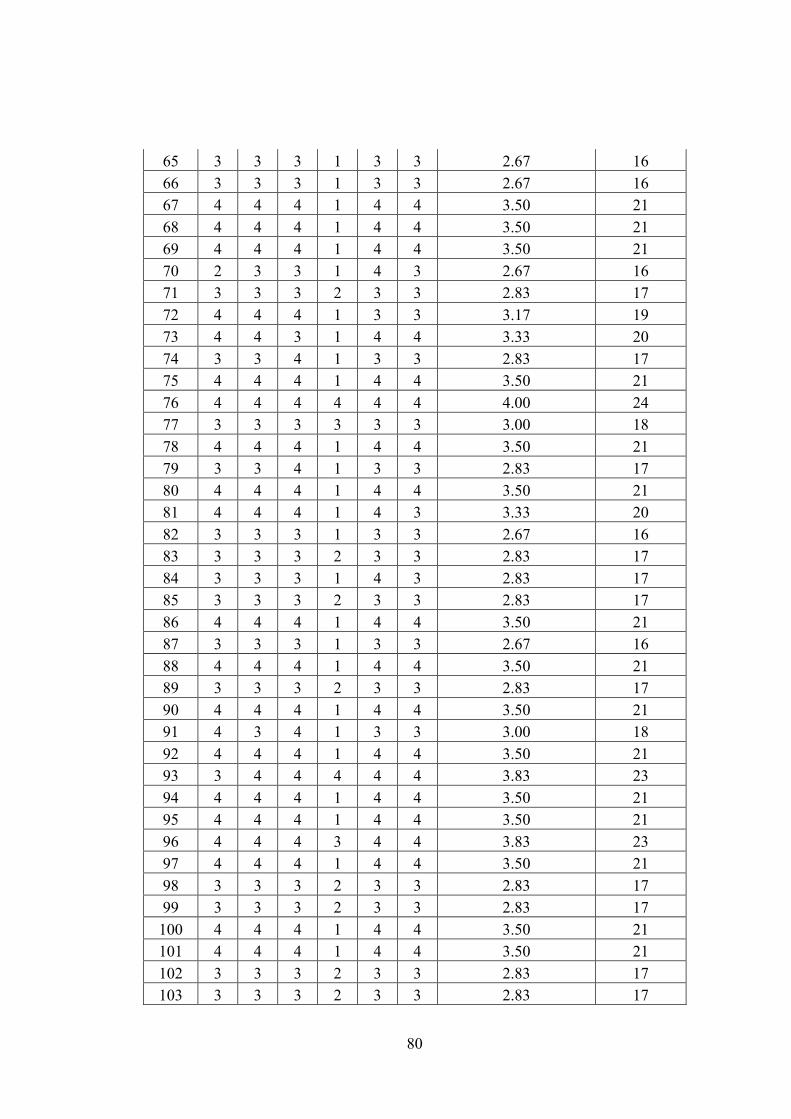
80
65 3 3 3 1 3 3 2.67 16
66 3 3 3 1 3 3 2.67 16
67 4 4 4 1 4 4 3.50 21
68 4 4 4 1 4 4 3.50 21
69 4 4 4 1 4 4 3.50 21
70 2 3 3 1 4 3 2.67 16
71 3 3 3 2 3 3 2.83 17
72 4 4 4 1 3 3 3.17 19
73 4 4 3 1 4 4 3.33 20
74 3 3 4 1 3 3 2.83 17
75 4 4 4 1 4 4 3.50 21
76 4 4 4 4 4 4 4.00 24
77 3 3 3 3 3 3 3.00 18
78 4 4 4 1 4 4 3.50 21
79 3 3 4 1 3 3 2.83 17
80 4 4 4 1 4 4 3.50 21
81 4 4 4 1 4 3 3.33 20
82 3 3 3 1 3 3 2.67 16
83 3 3 3 2 3 3 2.83 17
84 3 3 3 1 4 3 2.83 17
85 3 3 3 2 3 3 2.83 17
86 4 4 4 1 4 4 3.50 21
87 3 3 3 1 3 3 2.67 16
88 4 4 4 1 4 4 3.50 21
89 3 3 3 2 3 3 2.83 17
90 4 4 4 1 4 4 3.50 21
91 4 3 4 1 3 3 3.00 18
92 4 4 4 1 4 4 3.50 21
93 3 4 4 4 4 4 3.83 23
94 4 4 4 1 4 4 3.50 21
95 4 4 4 1 4 4 3.50 21
96 4 4 4 3 4 4 3.83 23
97 4 4 4 1 4 4 3.50 21
98 3 3 3 2 3 3 2.83 17
99 3 3 3 2 3 3 2.83 17
100 4 4 4 1 4 4 3.50 21
101 4 4 4 1 4 4 3.50 21
102 3 3 3 2 3 3 2.83 17
103 3 3 3 2 3 3 2.83 17

81
104 3 3 3 2 3 3 2.83 17
105 4 4 4 1 4 4 3.50 21
106 4 3 3 2 3 3 3.00 18
107 3 3 3 2 3 3 2.83 17
108 3 3 3 2 3 3 2.83 17
109 4 4 4 1 4 4 3.50 21
110 3 3 3 2 3 3 2.83 17
111 3 3 3 2 3 3 2.83 17
112 4 3 4 1 3 4 3.17 19
113 3 4 4 1 3 4 3.17 19
114 3 4 4 1 3 4 3.17 19
115 3 4 4 1 3 4 3.17 19
Perceived Risk (PR)
No PR1 PR2 PR3 PR4 PR5 PR6 PR7 PR8 PR9 PR10 MEAN TOTAL
1 2 3 2 3 3 3 3 2 2 2 2.50 25
2 2 2 1 3 3 2 1 2 2 2 2.00 20
3 3 3 2 3 3 3 3 2 3 2 2.70 27
4 4 4 4 4 4 4 4 4 4 4 4.00 40
5 3 3 3 4 3 3 2 1 2 2 2.60 26
6 3 3 2 3 2 2 3 3 3 3 2.70 27
7 3 3 3 3 3 3 3 3 3 3 3.00 30
8 4 4 4 4 4 4 3 3 3 3 3.60 36
9 4 4 4 4 4 4 4 4 4 4 4.00 40
10 3 3 3 3 3 3 3 3 3 3 3.00 30
11 3 4 4 4 4 4 4 3 3 3 3.60 36
12 3 3 2 3 3 3 2 2 2 2 2.50 25
13 3 3 4 4 4 4 3 3 4 3 3.50 35
14 3 3 3 4 4 4 4 3 3 3 3.40 34
15 3 3 3 3 3 3 3 2 3 3 2.90 29
16 3 4 3 4 3 3 4 3 3 2 3.20 32
17 3 3 3 4 4 4 4 3 3 3 3.40 34
18 1 1 1 1 1 1 1 2 2 1 1.20 12
19 4 2 4 4 4 4 3 3 3 3 3.40 34
20 3 3 3 3 3 3 3 2 2 2 2.70 27
21 4 4 4 4 4 4 4 4 4 4 4.00 40
22 3 4 2 4 3 4 3 2 1 3 2.90 29
23 2 1 1 2 2 2 2 1 2 1 1.60 16
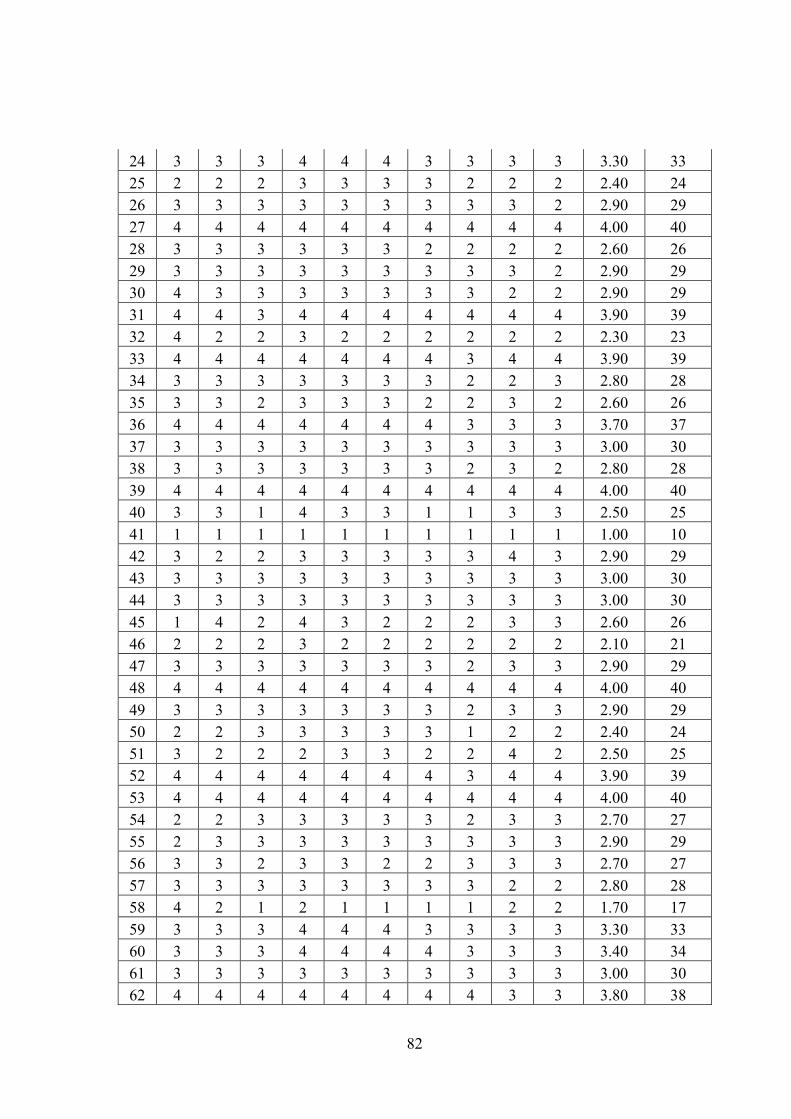
82
24 3 3 3 4 4 4 3 3 3 3 3.30 33
25 2 2 2 3 3 3 3 2 2 2 2.40 24
26 3 3 3 3 3 3 3 3 3 2 2.90 29
27 4 4 4 4 4 4 4 4 4 4 4.00 40
28 3 3 3 3 3 3 2 2 2 2 2.60 26
29 3 3 3 3 3 3 3 3 3 2 2.90 29
30 4 3 3 3 3 3 3 3 2 2 2.90 29
31 4 4 3 4 4 4 4 4 4 4 3.90 39
32 4 2 2 3 2 2 2 2 2 2 2.30 23
33 4 4 4 4 4 4 4 3 4 4 3.90 39
34 3 3 3 3 3 3 3 2 2 3 2.80 28
35 3 3 2 3 3 3 2 2 3 2 2.60 26
36 4 4 4 4 4 4 4 3 3 3 3.70 37
37 3 3 3 3 3 3 3 3 3 3 3.00 30
38 3 3 3 3 3 3 3 2 3 2 2.80 28
39 4 4 4 4 4 4 4 4 4 4 4.00 40
40 3 3 1 4 3 3 1 1 3 3 2.50 25
41 1 1 1 1 1 1 1 1 1 1 1.00 10
42 3 2 2 3 3 3 3 3 4 3 2.90 29
43 3 3 3 3 3 3 3 3 3 3 3.00 30
44 3 3 3 3 3 3 3 3 3 3 3.00 30
45 1 4 2 4 3 2 2 2 3 3 2.60 26
46 2 2 2 3 2 2 2 2 2 2 2.10 21
47 3 3 3 3 3 3 3 2 3 3 2.90 29
48 4 4 4 4 4 4 4 4 4 4 4.00 40
49 3 3 3 3 3 3 3 2 3 3 2.90 29
50 2 2 3 3 3 3 3 1 2 2 2.40 24
51 3 2 2 2 3 3 2 2 4 2 2.50 25
52 4 4 4 4 4 4 4 3 4 4 3.90 39
53 4 4 4 4 4 4 4 4 4 4 4.00 40
54 2 2 3 3 3 3 3 2 3 3 2.70 27
55 2 3 3 3 3 3 3 3 3 3 2.90 29
56 3 3 2 3 3 2 2 3 3 3 2.70 27
57 3 3 3 3 3 3 3 3 2 2 2.80 28
58 4 2 1 2 1 1 1 1 2 2 1.70 17
59 3 3 3 4 4 4 3 3 3 3 3.30 33
60 3 3 3 4 4 4 4 3 3 3 3.40 34
61 3 3 3 3 3 3 3 3 3 3 3.00 30
62 4 4 4 4 4 4 4 4 3 3 3.80 38
83
63 3 3 2 3 2 2 2 3 4 3 2.70 27
64 3 3 3 3 3 3 3 3 3 3 3.00 30
65 4 4 4 4 4 4 4 4 4 4 4.00 40
66 4 4 4 4 4 4 4 4 4 4 4.00 40
67 4 4 4 4 4 4 4 4 4 4 4.00 40
68 4 4 4 4 4 4 4 4 4 4 4.00 40
69 2 3 3 3 3 3 3 3 3 3 2.90 29
70 2 4 3 4 3 3 3 2 3 2 2.90 29
71 2 4 3 4 4 4 4 3 3 3 3.40 34
72 4 4 4 4 4 4 4 3 4 4 3.90 39
73 4 3 2 3 2 2 2 2 3 2 2.50 25
74 3 3 3 3 3 3 3 3 3 3 3.00 30
75 4 4 4 4 4 4 4 4 4 4 4.00 40
76 4 4 4 4 4 4 4 4 4 4 4.00 40
77 4 4 4 4 4 4 4 4 4 4 4.00 40
78 1 4 4 4 4 4 4 4 4 4 3.70 37
79 2 3 3 3 3 3 3 3 3 3 2.90 29
80 4 4 4 4 4 4 4 4 4 4 4.00 40
81 3 3 3 3 3 3 3 3 3 3 3.00 30
82 3 3 3 3 3 3 3 3 3 3 3.00 30
83 3 3 3 3 3 3 3 3 3 3 3.00 30
84 4 3 3 3 3 3 3 3 3 3 3.10 31
85 3 3 3 3 3 3 3 3 3 3 3.00 30
86 4 4 4 4 4 4 4 4 4 4 4.00 40
87 3 3 3 3 3 3 3 3 3 3 3.00 30
88 4 4 4 4 4 4 4 4 4 4 4.00 40
89 3 3 3 3 3 3 3 3 3 3 3.00 30
90 4 4 4 4 4 4 4 4 4 4 4.00 40
91 4 4 3 3 3 3 4 3 3 3 3.30 33
92 3 4 4 4 4 4 4 3 3 3 3.60 36
93 4 3 4 4 4 4 3 3 3 3 3.50 35
94 4 4 4 4 4 4 4 4 4 4 4.00 40
95 4 4 4 4 4 4 4 4 4 4 4.00 40
96 4 4 4 4 4 4 4 4 4 4 4.00 40
97 4 4 4 4 4 4 4 4 4 1 3.70 37
98 3 3 3 3 3 3 3 3 3 3 3.00 30
99 3 3 3 3 3 3 3 3 3 3 3.00 30
100 3 3 3 3 3 3 3 3 3 3 3.00 30
101 4 4 4 4 4 4 4 4 4 4 4.00 40

84
102 3 3 3 3 3 3 3 3 3 3 3.00 30
103 3 2 2 3 3 2 3 3 3 2 2.60 26
104 3 3 3 3 3 3 3 3 3 3 3.00 30
105 4 4 4 4 4 4 4 4 4 4 4.00 40
106 3 2 3 3 3 3 3 3 3 3 2.90 29
107 3 3 3 3 3 3 3 3 3 3 3.00 30
108 4 2 3 3 3 3 2 3 3 3 2.90 29
109 3 3 3 3 3 3 3 3 3 3 3.00 30
110 3 3 3 3 3 3 3 3 3 3 3.00 30
111 2 2 2 3 3 3 2 2 2 3 2.40 24
112 3 3 3 3 3 3 3 3 3 3 3.00 30
113 4 4 4 4 4 4 4 4 4 4 4.00 40
114 4 4 4 4 4 4 4 4 4 4 4.00 40
115 4 3 3 4 3 3 3 3 3 3 3.20 32