Analysis of Genetic Diversity in Theobroma cacao with Emphasis on Witches' Broom Disease Resistance
12
MARITA ET AL.: GENETIC DIVERSITY IN THEOBROMA CACAO 1305 Rep. INT-GTR-372. U.S. Department of Agriculture, Forest Ser- Stebbins, G.L., Jr., and R.M. Love. 1941. A cytological study of Cali- fornia forage grasses. Am. J. Bot. Syst. Bot. 11:559–566. vice, Intermountain Research Station, Ogden, UT. Roundy, B.A. 1999. Lessons from historical rangeland revegetation Stark, R.H., A.L. Hafenrichter, and W.A. Moss. 1950. Adaptation of grasses for soil and water conservation at high altitudes. Agron. for todays restoration. p. 33–38. In L.K. Holzworth and R.W. Ray (comps.) Revegetation with native species: Proceedings. RMRS- J. 42:124–127. Usberti, J.A., and S.K. Jain. 1978. Variation in Panicum maximum; P-8. USDA, Forest Service, Rocky Mountain Research Station, Ogden, UT. a comparison of sexual and asexual populations. Bot. Gaz (Chi- cago) 139:112–116. Soreng, R.J. 1990. Chloroplast-DNA phylogenetics and biogeography in a reticulating group: study in Poa (Poaceae). Am. J. Bot. 77: Vos, P., R. Hogers, M. Bleeker, M. Reijans, T. Van de Lee, M. Hornes, A. Frijters, L. Pot, J. Peleman, M. Kuiper, and M. Zabeau. 1995. 1383–1400. Soreng, R.J. 1991. Systematics of the Epiles group of Poa (Poaceae). AFLP: A new technique for DNA fingerprinting. Nucleic Acids Res. 23:4407–4414. Syst. Bot. 16:507–583. Analysis of Genetic Diversity in Theobroma cacao with Emphasis on Witches’ Broom Disease Resistance J. M. Marita,* J. Nienhuis, J. L. Pires, and W. M. Aitken ABSTRACT and morphological characteristics, are Criollo, Forast- ero, and Trinitario (Cheesman, 1944). The Criollo group To facilitate the identification of Theobroma cacao L. that possess represents the first domesticated cacaos, and is com- desirable traits to meet changing production and market conditions, posed of trees with thick, white or rosy beans that yield there is a need to understand the genetic relationships among T. cacao the most flavored and finest chocolate. Criollo was origi- germplasm. In addition, new cultivars are needed to provide more broadly based resistance to devastating diseases such as witches’ nally cultivated in Central America but because of its broom disease [Crinipellis perniciosa (Stahel) Singer]. A subset of susceptibility to diseases is infrequently cultivated today 270 T. cacao accessions based on (i) witches’ broom disease resistance (Soria, 1970). Because of higher yields and greater dis- data, (ii) genetic characterization experiments, and (iii) a random ease resistance, Forastero is currently the most widely sampling of recently acquired accessions was selected from the exten- cultivated group accounting for over 80% of the world’s sive germplasm collection at the Centro de Pesquisa do Cacau (CEPEC; production of cacao. The Forastero group is further Itabuna, Bahia, Brazil) in collaboration with Fazenda Almirante, a subdivided into Lower and Upper Amazon Forastero division of M&M Mars Incorporated in Itajuipe, Bahia, Brazil. Esti- with the Upper Amazon group considered more geneti- mates of genetic distance based on random amplified polymorphic cally diverse and exhibiting superior agronomic perfor- DNA (RAPD) markers were used to evaluate the genetic diversity mance (Bartley, 1969; Lockwood, 1976). The Trinitario among the selected accessions. Incorporation of recently acquired group represents hybrid forms from crosses between the accessions (Accessions 181–270) did not increase the breadth of the distribution of genetic diversity already present within the “original” Criollo and Forastero groups (Wood and Lass, 1985). group sampled (Accessions 1–180) suggesting new accessions collected The first attempts to collect and conserve cacao germ- from already sampled geographic regions do not increase the existing plasm began in the early 20th century (Kennedy et al., genetic diversity in the germplasm collection. In addition, differences 1987). These early collections were based on phenotypic in RAPD marker frequencies were associated with accessions that selection within populations of Forastero, Criollo, and had a high threshold of tolerance to witches’ broom disease. Most Trinitario and were later referred to as “land variety” accessions exhibiting tolerance to witches’ broom disease were from collections (Kennedy et al., 1987). In later years, addi- the Upper Amazon region, with the exception of SGU 26, a hybrid tional expeditions were undertaken for collection of from Guatemala. This suggests that the Upper Amazon is not the phenotypically superior germplasm that explored un- only region to have genes for resistance to witches’ broom disease and der-represented regions of the upper Amazon (Baker, stresses the need for further collection and examination of germplasm 1953). Currently, the International Plant Genetic Re- from other regions. sources Institute (IPGRI, Rome, Italy) considers geo- graphic areas that are under-represented in existing col- T heobroma cacao, the source of chocolate, is the lections and areas of variability that are under the predominant cultivated species in the genus and greatest threat as the two most important criteria in is grown throughout the tropics of Central and South determining priorities for collection (Williams, 1984). America, Asia, and Africa. The three main groups With these objectives in mind, present day collecting within T. cacao, which are based on geographic location expeditions have expanded to regions of Brazil, Colom- bia, Mexico, and Venezuela. Witches’ broom disease, one of the most serious J.M. Marita, Dep. of Forestry, 1925 Linden Drive, USDFRC, Madison, threats to cacao production, was first described by Went WI 53706; J. Nienhuis, Dep. of Horticulture, 1575 Linden Drive, Univ. (1904), and the fungus (C. perniciosa ) responsible for of Wisconsin, Madison, WI 53706; J.L. Pires, Centro de Pesquisa do Cacau-Cepec, Km 22 Rod, CEP45600-000, Itabuna, Bahia, Brazil; W.M. Aitken, Almirante Cacau Agrı ´cola Comercio E Exp Ltda., Abbreviations: CB, cushion brooms; CEPEC, Centro de Pesquisa do Caixa Postal 55, CEP 45630-000, Itajuipe, Bahia, Brazil. Received 12 Cacau; IPGRI, International Plant Genetic Resources Institute; MDS, April 2000. *Corresponding author ([email protected]). multi-dimensional scaling; RAPD, random amplified polymorphic DNA; VB, vegetative brooms. Published in Crop Sci. 41:1305–1316 (2001).
-
Upload
independent -
Category
Documents
-
view
0 -
download
0
Transcript of Analysis of Genetic Diversity in Theobroma cacao with Emphasis on Witches' Broom Disease Resistance

MARITA ET AL.: GENETIC DIVERSITY IN THEOBROMA CACAO 1305
Rep. INT-GTR-372. U.S. Department of Agriculture, Forest Ser- Stebbins, G.L., Jr., and R.M. Love. 1941. A cytological study of Cali-fornia forage grasses. Am. J. Bot. Syst. Bot. 11:559–566.vice, Intermountain Research Station, Ogden, UT.
Roundy, B.A. 1999. Lessons from historical rangeland revegetation Stark, R.H., A.L. Hafenrichter, and W.A. Moss. 1950. Adaptation ofgrasses for soil and water conservation at high altitudes. Agron.for todays restoration. p. 33–38. In L.K. Holzworth and R.W. Ray
(comps.) Revegetation with native species: Proceedings. RMRS- J. 42:124–127.Usberti, J.A., and S.K. Jain. 1978. Variation in Panicum maximum;P-8. USDA, Forest Service, Rocky Mountain Research Station,
Ogden, UT. a comparison of sexual and asexual populations. Bot. Gaz (Chi-cago) 139:112–116.Soreng, R.J. 1990. Chloroplast-DNA phylogenetics and biogeography
in a reticulating group: study in Poa (Poaceae). Am. J. Bot. 77: Vos, P., R. Hogers, M. Bleeker, M. Reijans, T. Van de Lee, M. Hornes,A. Frijters, L. Pot, J. Peleman, M. Kuiper, and M. Zabeau. 1995.1383–1400.
Soreng, R.J. 1991. Systematics of the Epiles group of Poa (Poaceae). AFLP: A new technique for DNA fingerprinting. Nucleic AcidsRes. 23:4407–4414.Syst. Bot. 16:507–583.
Analysis of Genetic Diversity in Theobroma cacao with Emphasis on Witches’ BroomDisease Resistance
J. M. Marita,* J. Nienhuis, J. L. Pires, and W. M. Aitken
ABSTRACT and morphological characteristics, are Criollo, Forast-ero, and Trinitario (Cheesman, 1944). The Criollo groupTo facilitate the identification of Theobroma cacao L. that possessrepresents the first domesticated cacaos, and is com-desirable traits to meet changing production and market conditions,posed of trees with thick, white or rosy beans that yieldthere is a need to understand the genetic relationships among T. cacaothe most flavored and finest chocolate. Criollo was origi-germplasm. In addition, new cultivars are needed to provide more
broadly based resistance to devastating diseases such as witches’ nally cultivated in Central America but because of itsbroom disease [Crinipellis perniciosa (Stahel) Singer]. A subset of susceptibility to diseases is infrequently cultivated today270 T. cacao accessions based on (i) witches’ broom disease resistance (Soria, 1970). Because of higher yields and greater dis-data, (ii) genetic characterization experiments, and (iii) a random ease resistance, Forastero is currently the most widelysampling of recently acquired accessions was selected from the exten- cultivated group accounting for over 80% of the world’ssive germplasm collection at the Centro de Pesquisa do Cacau (CEPEC; production of cacao. The Forastero group is furtherItabuna, Bahia, Brazil) in collaboration with Fazenda Almirante, a
subdivided into Lower and Upper Amazon Forasterodivision of M&M Mars Incorporated in Itajuipe, Bahia, Brazil. Esti-with the Upper Amazon group considered more geneti-mates of genetic distance based on random amplified polymorphiccally diverse and exhibiting superior agronomic perfor-DNA (RAPD) markers were used to evaluate the genetic diversitymance (Bartley, 1969; Lockwood, 1976). The Trinitarioamong the selected accessions. Incorporation of recently acquiredgroup represents hybrid forms from crosses between theaccessions (Accessions 181–270) did not increase the breadth of the
distribution of genetic diversity already present within the “original” Criollo and Forastero groups (Wood and Lass, 1985).group sampled (Accessions 1–180) suggesting new accessions collected The first attempts to collect and conserve cacao germ-from already sampled geographic regions do not increase the existing plasm began in the early 20th century (Kennedy et al.,genetic diversity in the germplasm collection. In addition, differences 1987). These early collections were based on phenotypicin RAPD marker frequencies were associated with accessions that selection within populations of Forastero, Criollo, andhad a high threshold of tolerance to witches’ broom disease. Most Trinitario and were later referred to as “land variety”accessions exhibiting tolerance to witches’ broom disease were from
collections (Kennedy et al., 1987). In later years, addi-the Upper Amazon region, with the exception of SGU 26, a hybridtional expeditions were undertaken for collection offrom Guatemala. This suggests that the Upper Amazon is not thephenotypically superior germplasm that explored un-only region to have genes for resistance to witches’ broom disease andder-represented regions of the upper Amazon (Baker,stresses the need for further collection and examination of germplasm1953). Currently, the International Plant Genetic Re-from other regions.sources Institute (IPGRI, Rome, Italy) considers geo-graphic areas that are under-represented in existing col-
Theobroma cacao, the source of chocolate, is the lections and areas of variability that are under thepredominant cultivated species in the genus and greatest threat as the two most important criteria in
is grown throughout the tropics of Central and South determining priorities for collection (Williams, 1984).America, Asia, and Africa. The three main groups With these objectives in mind, present day collectingwithin T. cacao, which are based on geographic location expeditions have expanded to regions of Brazil, Colom-
bia, Mexico, and Venezuela.Witches’ broom disease, one of the most serious
J.M. Marita, Dep. of Forestry, 1925 Linden Drive, USDFRC, Madison, threats to cacao production, was first described by WentWI 53706; J. Nienhuis, Dep. of Horticulture, 1575 Linden Drive, Univ.(1904), and the fungus (C. perniciosa) responsible forof Wisconsin, Madison, WI 53706; J.L. Pires, Centro de Pesquisa do
Cacau-Cepec, Km 22 Rod, CEP45600-000, Itabuna, Bahia, Brazil;W.M. Aitken, Almirante Cacau Agrıcola Comercio E Exp Ltda.,
Abbreviations: CB, cushion brooms; CEPEC, Centro de Pesquisa doCaixa Postal 55, CEP 45630-000, Itajuipe, Bahia, Brazil. Received 12Cacau; IPGRI, International Plant Genetic Resources Institute; MDS,April 2000. *Corresponding author ([email protected]).multi-dimensional scaling; RAPD, random amplified polymorphicDNA; VB, vegetative brooms.Published in Crop Sci. 41:1305–1316 (2001).

1306 CROP SCIENCE, VOL. 41, JULY–AUGUST 2001
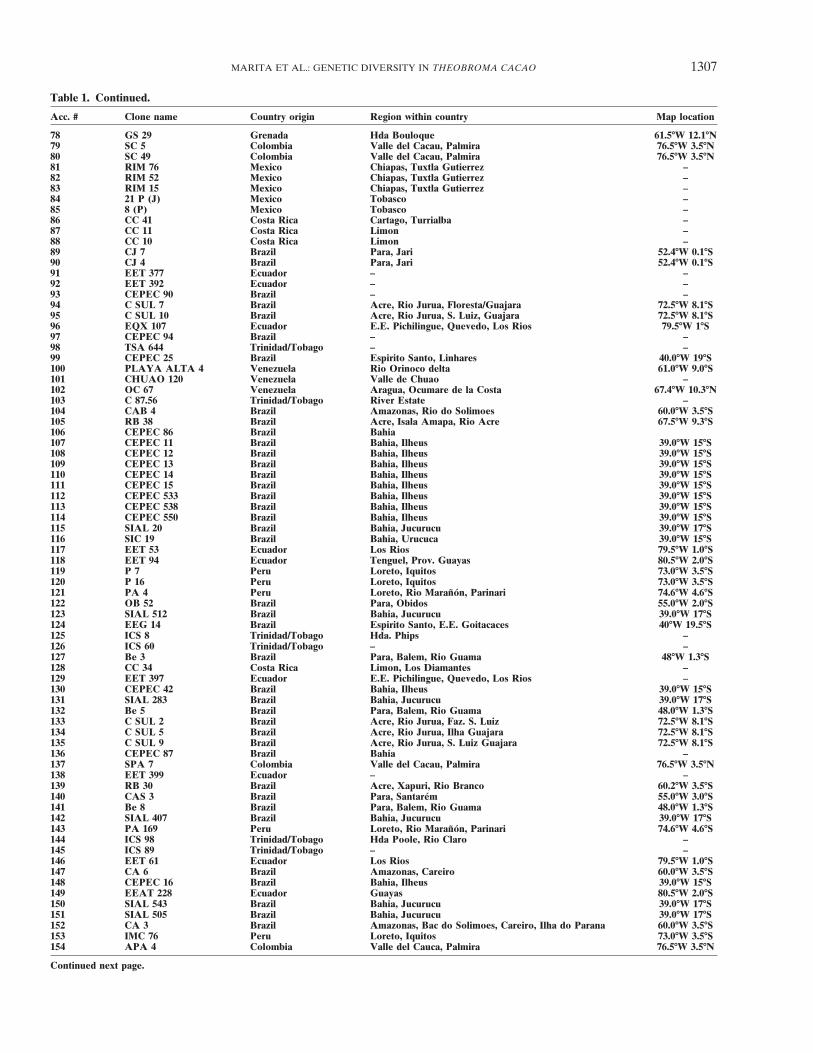
Table 1. Passport information for the 270 accessions from the Centro de Pesquisa do Cacau germplasm collection included in the RAPDmarker analysis.
Acc. # Clone name Country origin Region within country Map location
1 AMAZON 2-1 Peru Loreto, Rio Amazonas 73.1�W 3.4�S2 AMAZON 3-2 Peru Loreto, Rio Amazonas 73.1�W 3.4�S3 CAB 5.003-23 Brazil Roraima –4 CAB 36 Brazil Para, Rio Acara 48.0�W 3.0�S5 CAB 15 Brazil Roraima, Rio Jiparana 61.5�W 11�S6 CCN 10 Ecuador – –7 CCN 34 Ecuador – –8 CCN 51 Ecuador – –9 C SUL 8 Brazil Acre, Rio Jurua, Floresta/Guajara 72.5�W 8.1�S10 C SUL 3 Brazil Acre, Rio Jurua, Ilha Guajara 72.5�W 8.1�S11 C SUL 4 Brazil Acre, Rio Jurua, Ilha Guajara 72.5�W 8.1�S12 SCA 6 Peru Loreto 73.0�W 3.4�S13 SCA 12 Peru Loreto 73.0�W 3.4�S14 TSA 516 Trinidad/Tobago – –15 TSA 641 Trinidad/Tobago – –16 TSH 1188 Trinidad/Tobago – –17 TSH 565 Trinidad/Tobago – –18 EET 376 Ecuador Los Rios 79.5�W 1�S19 EET 390 Ecuador Los Rios 79.5�W 1�S20 IAC 1 Brazil – 69�W 10�S21 CEPEC 38 Brazil Bahia, Ilheus 39�W 15�S22 CEPEC 46 Brazil Bahia, Ilheus 39�W 15�S23 CEPEC 89 Brazil – –24 CEPEC 92 Brazil – –25 NA 33 Peru Loreto, Rio Nanay 73.0�W 3.3�S26 NA 312 Peru Loreto, Rio Nanay 73.0�W 3.3�S27 NA 727 Peru Loreto, Rio Nanay 73.0�W 3.3�S28 MA 16 Brazil Amazonas, Rio Amazonas, Terra Nova 60.0�W 3.0�S29 MA 13 Brazil Amazonas, Santo Antonio, Terra Nova 60.0�W 3.0�S30 MA 15 Brazil Amazonas, Santo Antonio, Terra Nova 60.0�W 3.0�S31 IMC 67 Peru Loreto, Iquitos 73.0�W 3.5�S32 IMC 27 Peru Loreto, Iquitos 73.0�W 3.5�S33 IMC 47 Peru Loreto, Iquitos 73.0�W 3.5�S34 MOQ 216 Ecuador Hda. Moquique –35 MOQ 417 Ecuador Hda. Moquique –36 CA 1 Brazil Amazonas, Bac. do Solimoes, Careiro, Ilha do Parana 60.0�W 3.5�S37 CA 5 Brazil Amazonas, Bac. do Solimoes, Careiro 60.0�W 3.5�S38 CA 2 Brazil Amazonas, Bac. do Solimoes, Careiro, Ilha do Parana 60.0�W 3.5�S39 OC 77 Venezuela Aragua, Ocumare de la Costa 67.4�W 10.3�S40 OC 66 Venezuela Aragua, Ocumare de la Costa 67.4�W 10.3�S41 SGU 26 Guatemala E.E. Los Brillantes, Santa Cruz, Mulua, Retalhuleu –42 SGU 50 Guatemala E.E. Los Brillantes, Santa Cruz, Mulua, Retalhuleu –43 SGU 54 Guatemala E.E. Los Brillantes, Santa Cruz, Mulua, Retalhuleu –44 EET 45 Ecuador Los Rios 79.5�W 1.0�S45 EET 62 Ecuador Los Rios 79.5�W 1.0�S46 EET 59 Ecuador Los Rios 79.5�W 1.0�S47 SIAL 84 Brazil Bahia, Jucurucu 39.0�W 17.0�S48 SIAL 70 Brazil Bahia, Jucurucu 39.0�W 17.0�S49 SIC 24 Brazil Bahia, Urucuca 39.0�W 15�S50 SIC 662 Brazil Bahia, Urucuca 39.0�W 15�S51 EEG 29 Brazil Espirito Santo, E.E. Goitacaces 40�W 19.5�S52 EEG 50 Brazil Espirito Santo, E.E. Goitacaces 40�W 19.5�S53 ICS 9 Trinidad/Tobago Hda. Phips –54 ICS 1 Trinidad/Tobago River Estate –55 ICS 39 Trinidad/Tobago River Estate –56 UF 221 Costa Rica Limon Almirante –57 UF 667 Costa Rica Atlantic Coast –58 UF 677 Costa Rica Atlantic Coast –59 CAS 2 Brazil Para, Santarem 55.0�W 3.0�S60 MOCO 1 Brazil Para, Santarem 55.0�W 3.0�S61 P 19 Peru Loreto, Iquitos 73.0�W 3.5�S62 P 4 B Peru Loreto, Iquitos 73.0�W 3.5�S63 P 11 Peru Loreto, Iquitos 73.0�W 3.5�S64 SPA 12 Colombia Valle del Cacau, Palmira 76.5�W 3.5�N65 SPA 5 Colombia Valle del Cacau, Palmira 76.5�W 3.5�N66 SPA 17 Colombia Valle del Cacau, Palmira 76.5�W 3.5�N67 PA 51 Peru Loreto, Rio Maranon, Parinari 74.6�W 4.6�S68 PA 150 Peru Loreto, Rio Maranon, Parinari 74.6�W 4.6�S69 PA 13 Peru Loreto, Rio Maranon, Parinari 74.6�W 4.6�S70 Be 4 Brazil Para, Belem, Rio Guama, Abaetetuba 48.0�W 1.3�S71 Be 6 Brazil Para, Belem, Rio Guama, Fuio Grande 48.0�W 1.3�S72 SPEC 54-1 Colombia Vaupes, Rio Papuri 69.0�W 1.0�S73 SPEC 138-8 Colombia Valle del Cacau, Palmira 76.2�W 1.3�N74 RB 36 Brazil Acre, Isla Amapa, Rio Acre 67.5�W 9.3�S75 RB 39 Brazil Acre, Isla Amapa, Rio Acre 67.5�W 9.3�S76 RB 37 Brazil Acre, Isla Amapa, Rio Acre 67.5�W 9.3�S77 GS 36 Grenada Hda Bouloque 61.5�W 12.1�N
Continued next page.
MARITA ET AL.: GENETIC DIVERSITY IN THEOBROMA CACAO 1307
Table 1. Continued.
Acc. # Clone name Country origin Region within country Map location
78 GS 29 Grenada Hda Bouloque 61.5�W 12.1�N79 SC 5 Colombia Valle del Cacau, Palmira 76.5�W 3.5�N80 SC 49 Colombia Valle del Cacau, Palmira 76.5�W 3.5�N81 RIM 76 Mexico Chiapas, Tuxtla Gutierrez –82 RIM 52 Mexico Chiapas, Tuxtla Gutierrez –83 RIM 15 Mexico Chiapas, Tuxtla Gutierrez –84 21 P (J) Mexico Tobasco –85 8 (P) Mexico Tobasco –86 CC 41 Costa Rica Cartago, Turrialba –87 CC 11 Costa Rica Limon –88 CC 10 Costa Rica Limon –89 CJ 7 Brazil Para, Jari 52.4�W 0.1�S90 CJ 4 Brazil Para, Jari 52.4�W 0.1�S91 EET 377 Ecuador – –92 EET 392 Ecuador – –93 CEPEC 90 Brazil – –94 C SUL 7 Brazil Acre, Rio Jurua, Floresta/Guajara 72.5�W 8.1�S95 C SUL 10 Brazil Acre, Rio Jurua, S. Luiz, Guajara 72.5�W 8.1�S96 EQX 107 Ecuador E.E. Pichilingue, Quevedo, Los Rios 79.5�W 1�S97 CEPEC 94 Brazil – –98 TSA 644 Trinidad/Tobago – –99 CEPEC 25 Brazil Espirito Santo, Linhares 40.0�W 19�S100 PLAYA ALTA 4 Venezuela Rio Orinoco delta 61.0�W 9.0�S101 CHUAO 120 Venezuela Valle de Chuao –102 OC 67 Venezuela Aragua, Ocumare de la Costa 67.4�W 10.3�N103 C 87.56 Trinidad/Tobago River Estate –104 CAB 4 Brazil Amazonas, Rio do Solimoes 60.0�W 3.5�S105 RB 38 Brazil Acre, Isala Amapa, Rio Acre 67.5�W 9.3�S106 CEPEC 86 Brazil Bahia107 CEPEC 11 Brazil Bahia, Ilheus 39.0�W 15�S108 CEPEC 12 Brazil Bahia, Ilheus 39.0�W 15�S109 CEPEC 13 Brazil Bahia, Ilheus 39.0�W 15�S110 CEPEC 14 Brazil Bahia, Ilheus 39.0�W 15�S111 CEPEC 15 Brazil Bahia, Ilheus 39.0�W 15�S112 CEPEC 533 Brazil Bahia, Ilheus 39.0�W 15�S113 CEPEC 538 Brazil Bahia, Ilheus 39.0�W 15�S114 CEPEC 550 Brazil Bahia, Ilheus 39.0�W 15�S115 SIAL 20 Brazil Bahia, Jucurucu 39.0�W 17�S116 SIC 19 Brazil Bahia, Urucuca 39.0�W 15�S117 EET 53 Ecuador Los Rios 79.5�W 1.0�S118 EET 94 Ecuador Tenguel, Prov. Guayas 80.5�W 2.0�S119 P 7 Peru Loreto, Iquitos 73.0�W 3.5�S120 P 16 Peru Loreto, Iquitos 73.0�W 3.5�S121 PA 4 Peru Loreto, Rio Maranon, Parinari 74.6�W 4.6�S122 OB 52 Brazil Para, Obidos 55.0�W 2.0�S123 SIAL 512 Brazil Bahia, Jucurucu 39.0�W 17�S124 EEG 14 Brazil Espirito Santo, E.E. Goitacaces 40�W 19.5�S125 ICS 8 Trinidad/Tobago Hda. Phips –126 ICS 60 Trinidad/Tobago – –127 Be 3 Brazil Para, Balem, Rio Guama 48�W 1.3�S128 CC 34 Costa Rica Limon, Los Diamantes –129 EET 397 Ecuador E.E. Pichilingue, Quevedo, Los Rios –130 CEPEC 42 Brazil Bahia, Ilheus 39.0�W 15�S131 SIAL 283 Brazil Bahia, Jucurucu 39.0�W 17�S132 Be 5 Brazil Para, Balem, Rio Guama 48.0�W 1.3�S133 C SUL 2 Brazil Acre, Rio Jurua, Faz. S. Luiz 72.5�W 8.1�S134 C SUL 5 Brazil Acre, Rio Jurua, Ilha Guajara 72.5�W 8.1�S135 C SUL 9 Brazil Acre, Rio Jurua, S. Luiz Guajara 72.5�W 8.1�S136 CEPEC 87 Brazil Bahia –137 SPA 7 Colombia Valle del Cacau, Palmira 76.5�W 3.5�N138 EET 399 Ecuador – –139 RB 30 Brazil Acre, Xapuri, Rio Branco 60.2�W 3.5�S140 CAS 3 Brazil Para, Santarem 55.0�W 3.0�S141 Be 8 Brazil Para, Balem, Rio Guama 48.0�W 1.3�S142 SIAL 407 Brazil Bahia, Jucurucu 39.0�W 17�S143 PA 169 Peru Loreto, Rio Maranon, Parinari 74.6�W 4.6�S144 ICS 98 Trinidad/Tobago Hda Poole, Rio Claro –145 ICS 89 Trinidad/Tobago – –146 EET 61 Ecuador Los Rios 79.5�W 1.0�S147 CA 6 Brazil Amazonas, Careiro 60.0�W 3.5�S148 CEPEC 16 Brazil Bahia, Ilheus 39.0�W 15�S149 EEAT 228 Ecuador Guayas 80.5�W 2.0�S150 SIAL 543 Brazil Bahia, Jucurucu 39.0�W 17�S151 SIAL 505 Brazil Bahia, Jucurucu 39.0�W 17�S152 CA 3 Brazil Amazonas, Bac do Solimoes, Careiro, Ilha do Parana 60.0�W 3.5�S153 IMC 76 Peru Loreto, Iquitos 73.0�W 3.5�S154 APA 4 Colombia Valle del Cauca, Palmira 76.5�W 3.5�N
Continued next page.

1308 CROP SCIENCE, VOL. 41, JULY–AUGUST 2001
Table 1. Continued.
Acc. # Clone name Country origin Region within country Map location
155 PA 148 Peru Loreto, Rio Maranon, Parinari 74.6�W 4.6�S156 RIM 10 Mexico Chiapas, Tuxtla Gutierrez –157 ICS 6 Trinidad/Tobago River Estate –158 EEG 65 Brazil Espirito Santo, E. E. Goitacaces 40�W 19.5�S159 SIC 328 Brazil Bahia, Urucuca 39.0�W 15�S160 TSA 654 Trinidad/Tobago – –161 TSH 774 Trinidad/Tobago – –162 CEPEC 523 Brazil Bahia, Ilhues 39.0�W 15�S163 CEPEC 541 Brazil Bahia, Ilheus 39.0�W 15�S164 ICS 16 Trinidad/Tobago Hda. Phips165 CEPEC 73 Brazil Bahia, Ilheus 39.0�W 15�S166 JA 546 Ecuador Hda. Javilla –167 C 13.5 Nicaragua – –168 CCN 2 Ecuador – –169 MO 9 Peru Loreto, Rio Morona 76.8�W 4.8�S170 CJ 8 Brazil Para, Jari 52.4�W 0.1�S171 10 (P) Mexico Tabasco –172 UF 12 Costa Rica Limon Almirante –173 CEPEC 519 Brazil Bahia, Ilheus 39.0�W 15�S174 CEPEC 48 Brazil Bahia, Ilheus 39.0�W 15�S175 CEPEC 30 Brazil Bahia, Ilheus 39.0�W 15�S176 UF 296 Costa Rica Atlantic Coast –177 ICS 75 Trinidad/Tobago – –178 CEPEC 532 Brazil Bahia, Ilheus 39.0�W 15�S179 RIM 105 Mexico Chiapas, Tuxtla Gutierrez –180 22 (P) Brazil Tabasco –181 CAB 2 Brazil Amazonas, Rio Solimoes 66.0�W 3.5�S182 CEPEC 95 Brazil Bahia –183 CEPEC 108 Brazil Bahia, Belmonte 39.0�W 16�S184 CEPEC 131 Brazil Bahia, Canavieras 39.0�W 16�S185 CEPEC 171 Brazil Bahia, Santa Luzia –186 CAB 262 Brazil Amazonas, Rio Solimoes, B. Japura 65.0�W 3.0�S187 CAB 263 Brazil Amazonas, Rio Solimoes, B. Japura 65.0�W 3.0�S188 CAB 148 Brazil Acre, Rio Acre 67.5�W 9.3�S189 CAB 94 Brazil Amazonas, Rio Purus 67.4�W 8.0�S190 CAB 520 Brazil Amazonas, Rio Solimoes, B. Japura 65.0�W 3.0�S191 CAB 157 Brazil Amazonas, Rio Acre 67.5�W 9.3�S192 LCTEEN 28s1 Ecuador Itaya, Rio Capocuy 76.34�W 0.2�S193 GU 125 C French Guiana Haut Camopi, Rio Camopi 56.1�W 2.3�N194 GU 136 H French Guiana Haut Camopi, Rio Camopi 56.1�W 2.3�N195 CAB 414 Brazil Rondonia, Rio Jamari 63.2�W 8.5�S196 CAB 61 Brazil Para, Rio Tapajos 55.4�W 10�S197 CEPEC 144 Brazil Bahia, Itabuna 39.0�W 15�S198 CEPEC 148 Brazil Bahia, Mata de Sao Joao 38.0�W 11�S199 CAB 275 Brazil Amazonas, Rio Solimoes, B. Japura 65.0�W 3.0�S200 CAB 53 Brazil Para, Salgado (Zona) 48.0�W 1.0�S201 CAB 65 Brazil Acre, Rio Iaco 69.0�W 9.0�S202 CEPEC 159 Brazil Bahia, Mucuri 40.0�W 18�S203 CEPEC 125 Brazil Bahia, Canavieras 39.0�W 16�S204 H 28 Peru Loreto, Rio Huallago 75.5�W 5.5�S205 LCTEEN 37F Ecuador Rio Napo, Rio Anangu 76.34�W 0.2�S206 CAB 194 Brazil Amazonas, Rio Purus 67.4�W 8.0�S207 CAB 103 Brazil Amazonas, Rio Purus 67.4�W 8.0�S208 CEPEC 151 Brazil Bahia, Mata de Sao Joao 38.0�W 11.�S209 H 7 Peru Loreto, Rio Huallaga 75.5�W 5.5�S210 CAB 486 Brazil Amazonas, Rio Japura 68.0�W 1.5�S211 H 39 Peru Loreto, Rio Huallaga 75.5�W 5.5�S212 CAB 21 Brazil Para, Rio Maicuru 54.1�W 2.0�S213 CAB 155 Brazil Acre, Rio Acre 67.5�W 9.3�S214 CEPEC 158 Brazil Bahia, Mucuri 40.0�W 18�S215 H 17 Peru Loreto, Rio Huallaga 75.5�W 5.5�S216 CEPEC 166 Brazil Bahia, Mucuri 40.0�W 18�S217 CEPEC 147 Brazil Bahia, Mata de Sao Joao 38.0�W 11�S218 H 9 Peru Loreto, Rio Huallaga 75.5�W 5.5�S219 CEPEC 150 Brazil Bahia, Mata de Sao Joao 38.0�W 11�S220 CEPEC 136 Brazil Bahia, Canavieras 39.0�W 16�S221 U 14 Peru Loreto, Rio Ucayali 74.0�W 5�S222 CAB 312 Brazil Amazonas, Rio Solimoes, B. Japura 65.0�W 3�S223 CAB 201 Brazil Acre, Rio Tarauaca 71.3�W 8.3�S224 CAB 505 Brazil Amazonas, Rio Japura 68.0�W 1.5�S225 CAB 299 Brazil Amazonas, Rio Solimoes, B. Japura 65.0�W 3�S226 CAB 531 Brazil Amazonas, Rio Solimoes, B. Japura 65.0�W 3�S227 CAB 108 Brazil Acre, Rio Acre 67.5�W 9.3�S228 CAB 68 Brazil Acre, Rio Iaco 69.0�W 9�S229 CAB 165 Brazil Amazonas, Rio Acre 67.5�W 9.3�S230 CAB 130 Brazil Acre, Rio Purus 67.4�W 8.0�W231 SA 3 Brazil Rondonia232 CAB 382 Brazil Rondonia, Rio Jamari 63.2�W 8.5�S
Continued next page.

MARITA ET AL.: GENETIC DIVERSITY IN THEOBROMA CACAO 1309
Table 1. Continued.
Acc. # Clone name Country origin Region within country Map location
233 CAB 223 Brazil Rondonia, Rio Jamari 63.2�W 8.5�S234 CAB 231 Brazil Rondonia, Rio Jamari 63.2�W 8.5�S235 CAB 44 Brazil Mato Grosso, Maranhao Goias, Rio Paranaita 56.4�W 10�S236 CAB 283 Brazil Amazonas, Rio Solimoes, B. Japura 65.0�W 3�S237 CAB 353 Brazil Amazonas, Rio Curuca 72.0�W 4.5�S238 CAB 460 Brazil Rondonia, Rio Jiparana 61.5�W 11�S239 CAB 224 Brazil Rondonia, Rio Jamari 63.2�W 8.5�S240 U 32 Peru Loreto, Rio Ucayali 74.0�W 5�S241 COCA 3370-5 Ecuador Rio Napo, Rio Coca 77.0�W 0.2�S242 AMAZON 15 Peru Loreto, Rio Amazonas 72.0�W 3.0�S243 GU 221 C French Guiana Haut Camopi, Rio Camopi 56.1�W 2.3�N244 CAB 121 Brazil Acre, Rio Chandless 70.0�W 10�S245 CAB 305 Brazil Amazonas, Rio Solimoes, B. Japura 65.0�W 3.0�S246 CAB 380 Brazil Rondonia, Rio Jamari 63.2�W 8.5�S247 CAB 389 Brazil Rondonia, Rio Jamari 63.2�W 8.5�S248 CAB 252 Brazil Rondonia, Rio Jamari 63.2�W 8.5�S249 LCTEEN 7A Ecuador Sucumbıos, Rio Aguarico 76.3�W 0.2�S250 GU 154 C French Guiana Haut Camopi, Rio Camopi 56.1�W 2.3�N251 PA 175 Peru Loreto, Rio Maranon, Parinari 74.6�W 4.6�S252 LCTEEN 163A Ecuador Rio Payamino 77.05�W 0.2�S253 U 2 Peru Loreto, Rio Ucayali 74.0�W 5�S254 GNV 225 USA – –255 IMC 83 Peru Loreto, Iquitos 73.0�W 3.5�S256 GNV 31 USA – –257 GNV 111 USA – –258 EET 19 Ecuador Guayas 80.5�W 2.0�S259 EET 58 Ecuador Los Rios 79.5�W 1.0�S260 P 18 Peru – –261 SC 10 Colombia Valle del Cauca, Palmira 76.5�W 3.5�N262 EQXZ Ecuador Rio Payamino –263 SPEC 160.9 Colombia Antioquia Rio Cauca 75.5�W 6.4�N264 GU 121 French Guiana Haut Camopi, Rio Camopi 56.1�W 2.3�N265 GU 133 C French Guiana Haut Camopi, Rio Camopi 56.1�W 2.3�N266 LCTEEN 241 Ecuador Para, Rio Villano 77.27�W 1.3�S267 SC 3 Colombia Valle del Cauca, Palmira 76.5�W 3.5�N268 SCA 2 Peru Loreto 73.0�W 3.4�S269 P 5 C Peru – –270 MO 20 Peru Loreto, Rio Morona 77.0�W 4.0�S
the disease by Stahel (1915) in Surinam. It has since diversity within the collections can permit more efficientsampling of germplasm resources to maximize diversityspread to many other cacao producing countries (Per-
eira et al., 1990). Vegetative flushes are the most abun- and minimize redundancy. Better understanding of thegenetic relationships among cacao germplasm collectionsdant infection sites for the witches’ broom pathogen
(Sreenivasan and Dabydeen, 1989); however, petioles, will facilitate the identification of germplasm closely re-lated to resistant accessions for use as additional parentalpulvini, and stems are also susceptible to infection
(Cronshaw and Evans, 1978). In Bahia, Brazil, where sources of resistance.Several studies have demonstrated the usefulness of85% of Brazilian cocoa grows in the understory of the
rainforest under humid conditions favoring germination RAPDs in studying cacao. RAPDs have been appliedin studying cacao genetic diversity (Whitkus et al., 1998;of the fungus’ basidiospores (Frias et al., 1991; Pereira
et al., 1990), the pathogen has coevolved with cacao and Lerceteau et al., 1997: Figueira et al., 1994; N’Goranet al., 1994; Laurent et al., 1994), creating genetic link-targets the cushion of the cacao tree. Loss of production
due to witches’ broom disease in important cacao grow- age maps (Crouzillat et al., 1996; Lanaud et al., 1995),and DNA fingerprinting (Wilde et al., 1992). Molecu-ing areas such as Bahia, Brazil, has generated a strong
demand for resistant varieties. lar marker techniques, specifically using RAPDs, allowan effective and accurate method of characterizingAlthough considerable genetic diversity exists in ca-
cao germplasm collections, the genotypes used in pro- germplasm resources. The extensive collection held atCEPEC provides an opportunity to sample and accu-duction have a very narrow genetic base derived from
few genotypes (Cope, 1976). The impact of diseases rately characterize a significant portion of the cacao germ-plasm available to breeders and breeding programs.such as witches’ broom on cacao yield and production
has highlighted the need to characterize existing germ- The objective of this study was to characterize thegenetic diversity within the germplasm collection atplasm collections and examine the genetic diversity
within the collections for sources of resistance. In addi- CEPEC by means of RAPD marker based estimatesof genetic relationships among a sample of 270 cacaotion, the expense associated with the maintenance of
cacao collections suggests the need for accurate and accessions. A second objective was to assess diseasetolerance relationships among a subset of 180 cacaodetailed accession characterization to manage collec-
tions efficiently. Understanding the structure of genetic accessions to identify the relationship between the struc-

1310 CROP SCIENCE, VOL. 41, JULY–AUGUST 2001
where i and j represented a pairwise combination of accessionsture of genetic diversity and the distribution of acces-and n represented the number of markers scored for thosesions resistant to witches’ broom disease.two accessions. Genetic distance was the ratio of discordantcomparisons to the total number of comparisons. A genetic
MATERIALS AND METHODS distance equaling 0 or 1 indicated maximum similarity or dif-ference between the pair of accessions, respectively. To visual-Germplasm ize the relationships among the accessions, the genetic distancematrix was converted to two-dimensional coordinates by theA subset of 270 cacao accessions (Table 1; Marita et al.,monotonic multidimensional scaling procedure (MDS) by the2000) from the more than 1000 accessions housed at CEPECKruskal scaling option in Systat ver. 5.2 (Wilkinson et al.,was sampled for germplasm evaluation. Accessions examined1992).formed a diverse collection of selections from normally culti-
Thirteen randomly selected accessions were sampled twicevated germplasm, trees grown on farms heavily infected withand each separate DNA extraction treated as a separate entry.witches’ broom disease, and unadapted material. The first setThe reproducibility error was calculated as the failure of acces-of accessions sampled (1–90; Table 1) included two to threesions to be scored consistently over replications because ofaccessions from many important agronomic “series” selectedrandom error in the generation and scoring of data.by the cacao breeder at CEPEC, representing unique clones
with possible resistance to witches’ broom disease. A “series”represents accessions categorized under a single acronym. For Germplasm Characterizationexample, C SUL accessions are unique clones collected from
Differences in the distribution of genetic diversity presentCruzeiro do Sol in the Upper Amazon region of Brazil. Manywithin the original group sampled (Accessions 1–180) com-series represent accessions collected during some of the firstpared with the newly acquired accessions (181–270) were esti-collection expeditions and form the parental basis of earlymated as RAPD marker diversity for each subgroup by Nei’scacao breeding programs. The second set (91–180; Table 1)genetic diversity at a locus,included a sample of accessions included in genetic character-
ization experiments conducted by CEPEC. The third set (181– h � (1 � �x2i )ni /(ni � 1) � (2pqn)/(n � 1),
270; Table 1) represented randomly selected accessions fromwhere xi was the allele frequency at the ith locus, p was theamong newly acquired accessions not available initially. Threefrequency of presence, and q was the frequency of absenceaccessions classified as USA (254, 256, and 257) referencedof RAPD bands among n accessions for the ith RAPD markerthe location where the crosses were made and not the origin(Nei, 1987). The two groups could be defined genetically byof the genetic material involved in the crosses.allele frequencies such that changes in these frequencies reflectgenetic changes in the population (Nei, 1987). In addition, weDNA Extraction and RAPD Reactionsexamined whether the breadth of genetic diversity represented
Fresh leaf tissue was supplied from CEPEC’s living field by the origianl group increased with the inclusion of newly ac-cacao collection where leaf tissue from 10 clonal cacao trees quired accessions. The unique clustering of each group was de-was pooled for each accession. DNA extractions were done termined by differences in RAPD marker frequency betweenin cooperation with Fazenda Almirante. DNA was extracted the same two groups. The significance level of each compari-from approximately 50 mg of mature leaf tissue per individual son was determined by randomization tests (Edgington, 1980)cacao tree. The DNA isolation followed a modified method on the basis of 10 000 permutations appropriate to each com-from Doyle and Doyle (1990). The DNA was subsequently parison.purified following the protocol from the Prep-A-Gene DNA To assess the clustering of accessions within an individualPurification Systems kit (BIO-RAD Laboratories, Hercules, country of origin compared with all other countries, differ-CA). The RAPD reaction mixtures followed Skroch and Nien- ences in mean RAPD marker frequencies were analyzed.huis (1995a) while RAPD cycling conditions followed Johns Those countries with fewer than five accessions were excludedet al. (1997). A total of 38 RAPD markers were used. RAPD from the analysis since results were difficult to interpret. Theprimers A15, A17, A19, B1, B5, B6, B8, B12, B15, C1, C2, frequency of each RAPD marker was calculated as the fre-C8, C9, C13, E11, E18, E19, F2, F9, F16, I11, J10, J19, K7, quency of the presence of RAPD amplification among acces-K8, L5, M17, Z6, AJ2, and AP2 (Operon Technologies, Inc., sions in a subgroup defined by a country of origin. Compari-Alameda, CA) were selected for screening on the basis of sons were made between accessions within an individualreports of RAPD polymorphisms in cacao (Ronning et al., country of origin and all remaining accessions. To test the1995; N’Goran et al., 1994; Figueira et al., 1994). To maximize difference in mean RAPD marker frequencies between a sub-sampling of the entire cacao genome, additional primers (C15, group and remaining accessions, the sum of the absolute valueM10, P14, Q4, R19, AP4, AW18, and AX15; Operon Technol- of the difference between RAPD marker frequencies of com-ogies, Inc., Alameda, CA) were selected on the basis of dis- parison groups was divided by the number of RAPD markerspersal on published linkage maps (Crouzillat et al., 1996; La- evaluated. The significance level for each paired comparisonnaud et al., 1995). Data were scored as the presence (1) or was determined by a randomization test on the basis of 10 000absence (0) of a fragment for each polymorphic marker (Ma- random permutations appropriate to each comparison (Edg-rita, 1998). ington, 1980).
RAPD Analysis Witches’ Broom Disease ResistanceGenetic distances were calculated among all pairwise com- Witches’ broom disease data were taken at CEPEC on the
binations of the 270 accessions by means of the complement basis of natural infestation for Accessions 1 to 180 (Marita,to the simple matching coefficient (Gower, 1985). 1998). The total number of vegetative brooms per plant and
the total number of cushion brooms per plant averaged overGenetic Distance (i,j) � �n(i � j)/[�n(i � j)10 plants were reported and Pearson product moment correla-tions calculated. Accessions 4 and 146, were excluded from� �n(i � j)],

MARITA ET AL.: GENETIC DIVERSITY IN THEOBROMA CACAO 1311
Table 2. Estimate of reproducibility error based on the failure ofanalysis because of discrepancies in age of tissue and plant13 replicated accessions to be scored consistently.location on the farm, respectively. A MDS plot representing
accessions tolerant to vegetative broom infection and tolerant Number ofAcc. Number of RAPD bands Percentto cushion broom infection was examined to evaluate relation-Number Clone Name inconsistencies scored† Errorships between the two categories of infection.33 IMC 47 1 144 0.7Differences in RAPD marker frequency of groups defined39 OC 77 0 145 0.0as accessions within the lower 15% of the total infected broom50 SIC 662 1 144 0.7distribution were compared with (i) remaining accessions and 60 Mocorongo 1 0 145 0.0
(ii) accessions within the upper 15% of the distribution. These 82 RIM 52 2 143 1.383 RIM 15 2 143 1.3analyses were based on variation in polymorphic marker fre-95 C SUL 10 4 141 2.8quency between comparison sets. The significance of these111 CEPEC 15 3 142 2.1observed differences was tested using a chi-square test for 122 OB 52 2 143 1.3
goodness of fit (Snedecor and Cochran, 1992). 126 ICS 60 2 143 1.3146 EET 61 3 142 2.1Differences in RAPD marker frequency for individual151 SIAL 505 1 144 0.7RAPD loci evaluated were analyzed by means of two-way173 CEPEC 519 3 142 2.1cross tabulation tables (PROC FREQ; SAS Institute, 1990).Mean reproducibility error 1.26An individual RAPD marker frequency was equal to �(pi )/n
where pi is the frequency of the presence of RAPD bands † Number of comparisons excluding bands with missing data. Total possi-ble is 145 RAPD markers.among accessions in a subpopulation for the ith RAPD marker
and n is the number of accessions. Comparison groups wereidentical to those used to test differences in RAPD marker sons were indistinguishable. Since scoring errors arefrequency of subgroups defined above. The low frequency of non-randomly distributed with a large portion distrib-RAPD alleles in some cases required that the significance uted within a relatively small subset of RAPD markerstests be based on exact probabilities rather than approxima- (Skroch and Nienhuis, 1995b), the removal of 12 RAPDtions. Thus, all P-values were computed by Fisher’s exact t-test
markers (8%) with inconsistent amplification acrossand compared at the 5% significance level (P-values � 0.025)replications was warranted. In general, the low repro-(Steel and Torrie, 1980).ducibility error suggested that genetic distance estimatesTwo comparisons were performed (i) to test whether Upperbased on RAPD markers were highly reliable (and re-Amazon accessions formed a unique cluster, and (ii) to test
whether Upper Amazon accessions and resistant accessions peatable) among cacao accessions and the markers usedformed the same cluster by testing the difference in mean in this study could uniquely distinguish among most ac-RAPD marker frequencies between the two groups (see Germ- cessions.plasm Characterization). For comparison purposes, an acces-sion collected west of the 58� longitude was classified as Upper Germplasm Genetic RelationshipsAmazon and an accession within the lower 15% of the totalinfected broom distribution was classified as tolerant. Analyzing 270 accessions from CEPEC’s more than
1000 accessions was a critical step towards understand-ing the genetic relationships of accessions that compriseRESULTS AND DISCUSSIONthe entire collection. The genetic relationships among
RAPD Analysis all cacao accessions were displayed as a MDS plot ofthe 270-by-270 genetic distance matrix (Fig. 1). No dif-The 38 RAPD primers resulted in 133 scorable poly-ference was observed between the original group (Ac-morphic RAPD markers. Between one and seven poly-cessions 1–180) sampled and the “new” group (Acces-morphic markers per primer were scored with a meansions 181–270) on the basis of analysis of RAPDof 3.5 markers per primer. This is consistent with pre-frequency. In addition, differences based on Nei’s ge-viously reported average number of markers per primernetic diversity were not observed between the two(N’Goran et al., 1994; Figueira et al., 1994). The usegroups. The incorporation of the new accessions didof prior publications and linkage maps to help selectnot increase the magnitude of genetic diversity alreadymarkers that were not clustered genetically did not re-present within the original group sampled. This maysult in a reduction in observed polymorphism.be a result of resampling geographic origins alreadyThe distribution of simple linear correlations betweenrepresented in the original collection, since many of the133 RAPD markers among 270 cacao accessions (8778new accessions came from the same geographic regionspairwise combinations) resulted in a normal distributionor were hybrids between parents from regions sampledwith a mean (SD) of 0.022 (0.167). No two RAPDin the original collection (Table 1). This suggests thatmarkers had identical amplification patterns across anynew collections of accessions within already sampledpair of accessions, suggesting the RAPD markers usedgeographic regions did not increase the existing geneticin this study were distributed with minimal clusteringdiversity in the cacao germplasm, and additional acces-on the cacao genetic linkage map.sions need to be evaluated to assess whether they repre-Genetic distances among the 36 315 pairwise combi-sent unique genetic diversity compared with accessionsnations of accessions ranged from 0.000 to 0.5691 withalready present in the collection.a mean (SD) genetic distance of 0.310 (0.09). The
The number of accessions represented by each coun-mean reproducibility error calculated from 13 replicatestry varied from 1 (Nicaragua) to 134 (Brazil). A totalwas 1.26% (Table 2). Genetic distances less than 1.26%of 134 accessions were classified as “Brazilian” but these(0.0126) could not be discriminated between different
accessions. Fewer than 0.08% of the pairwise compari- represented both unique accessions and hybrids be-

1312 CROP SCIENCE, VOL. 41, JULY–AUGUST 2001
Fig. 1. A multidimensional scaling plot of 270 cacao accessions analyzed from CEPEC’s germplasm collection determined on the basis ofRAPD data.
tween accessions from Brazil and other countries. As a did not form a distinct cluster but were dispersed amongresult, accessions categorized as “Brazil” were distrib- Brazilian hybrids and the clusters formed by Peru, Vene-uted throughout the MDS plot (Fig. 1). Peru, Ecuador, zuela, and Trinidad–Tobago (Table 3; Fig. 1).Trinidad–Tobago, Mexico, Costa Rica, Venezuela, and Listed sources of germplasm carried many contradic-French Guiana formed unique but nondiscrete clusters tions. In some cases, a region within a country listed anin the MDS plot (Table 3; Fig. 1). Colombian accessions experiment station (e.g., E.E. Los Brillantes for Acces-
sions 41–43) as opposed to a river, farm, or village loca-Table 3. Difference in mean RAPD marker frequencies between tion as its collection source. In such cases, the map
individual countries of origin and all other countries deter-coordinates identified the city where the experimentmined by 10 000 random permutations of a randomization test.station was located and not the map coordinate of collec-
Mean tion (Table 1). When an experiment station was listedMean frequencyCountry of # of frequency of all other under a region within a country, often the accessionOrigin accessions of country countries P-value listed was a hybrid (i.e., many SGU accessions fromBrazil – – – – Guatemala, OC accessions from Venezuela, and CEPECPeru 38 0.4235 0.4334 0.000 accessions from Brazil). In addition, most EET acces-Colombia 12 0.4572 0.4309 �0.0619
sions from Ecuador, some CC accessions from CostaEcuador 30 0.4750 0.4269 0.000French Guiana 6 0.3697 0.4335 �0.0007 Rica, and TSA, TSH, or ICS accessions from Trinidad–Trinidad/Tobago 18 0.4727 0.4293 0.000
Tobago were hybrids categorized by a single countryVenezuela 5 0.4881 0.4310 �0.0063Mexico 9 0.5759 0.4272 0.000 of origin. Furthermore, certain accession origins wereGuatemala – – – unknown, such as several accessions listed under theCosta Rica 9 0.5452 0.4281 �0.0003
CEPEC designation (Accessions 86–92). Some of theseGrenada – – – –Nicaragua – – – – accessions were from seed confiscated at quarantine
stations and then incorporated into CEPEC’s collection.

MARITA ET AL.: GENETIC DIVERSITY IN THEOBROMA CACAO 1313
Fig. 2. A multidimensional scaling plot representing accessions in the lower 15% of vegetative and cushion broom distribution determined onthe basis of RAPD data. Accessions listed in the lower 15% of both categories are represented by an X.
Other accessions may have been misnamed during han- rivers were reviewed (End et al., 1992). Many accessionsanalyzed were collected along main arteries of the Ama-dling. Identification of closely related accessions and/or
probable identification of such accessions was aided by zon River. Consequently, large gaps existed along minorrivers and lakes throughout the basin. A list was com-our analyses. CEPEC 87 (136) was identified as most
closely related to C SUL accessions collected along the piled of the rivers flowing into the Amazon River, begin-ning at the mouth of the river in Para, Brazil, and endingJurua River in the northwest region of Brazil. In addi-
tion, CEPEC 86 (106) was identified as most closely in Loreto, Peru, (Marita, 1998). The list contained ap-proximately 272 rivers and lakes flowing into the Ama-related to RB or CAB accessions collected along the
Acre River in the state of Acre (Table 1; Fig. 1). Acces- zon River. With 270 cacao accessions analyzed (134accessions listed from Brazil), only 22 (8%) of the moresions designated as CEPEC typically lay along with
SIAL and SIC accessions within one cluster representedTable 4. Band frequency comparisons between accessions of ca-by the lower, middle, right-hand cluster on the full MDS
cao most tolerant to witches’ broom disease and two groupingsplot (Fig. 1). As a group, these accessions were represen- of remaining accessions of cacao.tative of early collection expeditions brought back to
prob �Bahia, Brazil, and farmed for many years. One mightComparison df Chi-square chi-square
hypothesize that they form a unique cluster where cross-Lower 15%† vs remaining set‡ 132 561.8 0.000and self-pollination among accessions within this popu-Lower 15% vs upper 15%§ 130¶ 316.7 0.000
lation has existed for many years without new sources† This group represents accessions most tolerant to witches’ broomof genetic material entering the gene pool of the cluster. disease.
Since Brazil covers such a large area compared with ‡ Those accessions represented in sets # 1 and 2 minus those accessionsin the lower 15% category.all other country origins, particular attention was paid
§ This group represents accessions least tolerant to witches’ broom disease.to where accessions were collected. Sites of collection ¶ Two markers monomorphic (no band) across two comparison groupswere excluded from the analysis.within Brazil along the Amazon River and its minor

1314 CROP SCIENCE, VOL. 41, JULY–AUGUST 2001
Table 5. RAPD markers with significant differences in frequency among accessions in two sub-population comparisons; specifically,accessions within the lowest quartile of the marker distribution compared with the remaining accessions analyzed (comparison #1)and accessions within the lowest quartile of the marker distribution compared with accessions within the upper quartile of the markerdistribution (comparison #2).
RAPD Comparison #1 Freq Fisher exact test Comparison #2 Freq Fisher exact testmarker† lower‡ rest‡ P-values§ lower‡ upper‡ P-values§
B5875 0.48 0.02 0.000 0.48 0.00 0.000E18450 0.41 0.04 0.000 0.41 0.00 0.000E181000 0.50 0.78 0.007 0.50 0.93 0.000B121250 0.58 0.85 0.003 0.58 0.96 0.000C81050 0.77 0.96 0.003 0.77 1.00 0.010C82100 0.88 0.18 0.000 0.88 0.08 0.000I11900 0.67 0.88 0.009 0.67 0.96 0.011I111050 0.19 0.05 0.023 – – –K7300 0.68 0.35 0.011 – – –K7500 – – – 0.11 0.54 0.001K7575 0.50 0.86 0.000 0.50 0.96 0.000K8275 0.59 0.03 0.000 0.59 0.00 0.000K82200 0.26 0.08 0.013 – – –C1725 0.35 0.87 0.000 0.35 1.00 0.000C1800 0.54 0.80 0.010 – – –C11200 0.55 0.87 0.000 0.55 0.96 0.001E19750 0.96 0.76 0.018 – – –E191200 0.52 0.89 0.000 0.52 1.00 0.000F9800 – – – 0.44 0.11 0.014J19475 0.41 0.78 0.000 0.41 0.92 0.000J10600 0.50 0.15 0.000 0.50 0.11 0.003J101100 – – – 0.20 0.00 0.020J101250 0.04 0.25 0.011 0.04 0.52 0.000A151300 – – – 0.15 0.48 0.018B6550 0.56 0.07 0.000 0.56 0.00 0.000B61250 0.30 0.65 0.001 0.30 0.93 0.000B61500 0.56 0.85 0.001 0.56 0.96 0.000C9600 0.26 0.09 0.018 0.26 0.00 0.010C91200 0.85 0.50 0.000 0.85 0.52 0.018C13600 0.96 0.55 0.000 0.96 0.50 0.000F161350 – – – 0.15 0.56 0.004L5700 0.92 0.36 0.000 0.92 0.19 0.000A7500 0.72 0.96 0.000 0.72 1.00 0.004A17700 0.25 0.59 0.003 0.25 0.64 0.010A171550 0.93 0.46 0.000 – – –A172000 – – – 0.11 0.48 0.006M17650 0.37 0.72 0.000 0.37 0.88 0.000B15700 0.39 0.68 0.011 – – –B15900 0.52 0.81 0.004 0.52 0.96 0.000B151200 – – – 0.11 0.48 0.006E111050 0.48 0.88 0.000 0.48 1.00 0.000M101000 0.56 0.02 0.000 0.56 0.04 0.000M101250 0.56 0.95 0.000 0.56 1.00 0.000P14475 – – – 0.15 0.48 0.018P141150 0.41 0.05 0.000 0.41 0.04 0.002Q4925 0.27 0.07 0.005 0.27 0.04 0.024R19525 0.58 0.88 0.000 0.58 0.96 0.002R19700 0.41 0.83 0.000 0.41 0.89 0.000R191100 0.33 0.09 0.002 – – –AP2600 0.62 0.93 0.000 0.62 1.00 0.000AP21725 0.74 0.39 0.001 – – –AP21775 0.67 0.41 0.020 – – –Z6750 0.04 0.24 0.018 – – –AW18500 – – – 0.15 0.48 0.018AW18775 0.41 0.04 0.000 0.41 0.00 0.000AW181050 0.44 0.19 0.006 – – –AJ21075 0.52 0.15 0.000 0.52 0.00 0.000AJ21475 0.67 0.39 0.011 – – –AX15975 0.64 0.97 0.000 0.64 1.00 0.000AX151000 0.46 0.13 0.000 0.46 0.04 0.000AP4475 – – – 0.58 0.19 0.005AP41800 0.04 0.25 0.011 0.04 0.50 0.000
† RAPD marker size in subscripts estimated to the nearest 25 base pairs.‡ Rapid marker frequency � �(pi )/ni where p is the presence of a RAPD band among accessions and n is the number of accessions evaluated in a sub-
population for the ith RAPD marker.§ P-value computed by Fishers’ exact test (two tailed). P-values �0.025 and �0.005 are significant at the 5% and 1% levels, respectively.
than 272 rivers and lakes were represented as sites of gin. Considering the immense area the Amazon Riverflows through, major areas throughout the states oforigin in the collection. This does not include any mate-
rial designated CEPEC, SIC, or SIAL consisting of hy- Para, Roraima, Rondonia, and Amazonas in Brazil wereunderrepresented. This reaffirms our earlier results thatbrids between accessions with different countries of ori-
MARITA ET AL.: GENETIC DIVERSITY IN THEOBROMA CACAO 1315
accessions with a high probability of having resistancesampling within areas already collected did not increaseor tolerance genes. Such studies seem worthwhile tothe genetic diversity, and future cacao collection expedi-pursue considering the eventual cost savings.tions should be supported to investigate nonrepresented
areas to expand the genetic diversity that currently existsin cacao germplasm collections. Resistance to Witches’ Broom Disease
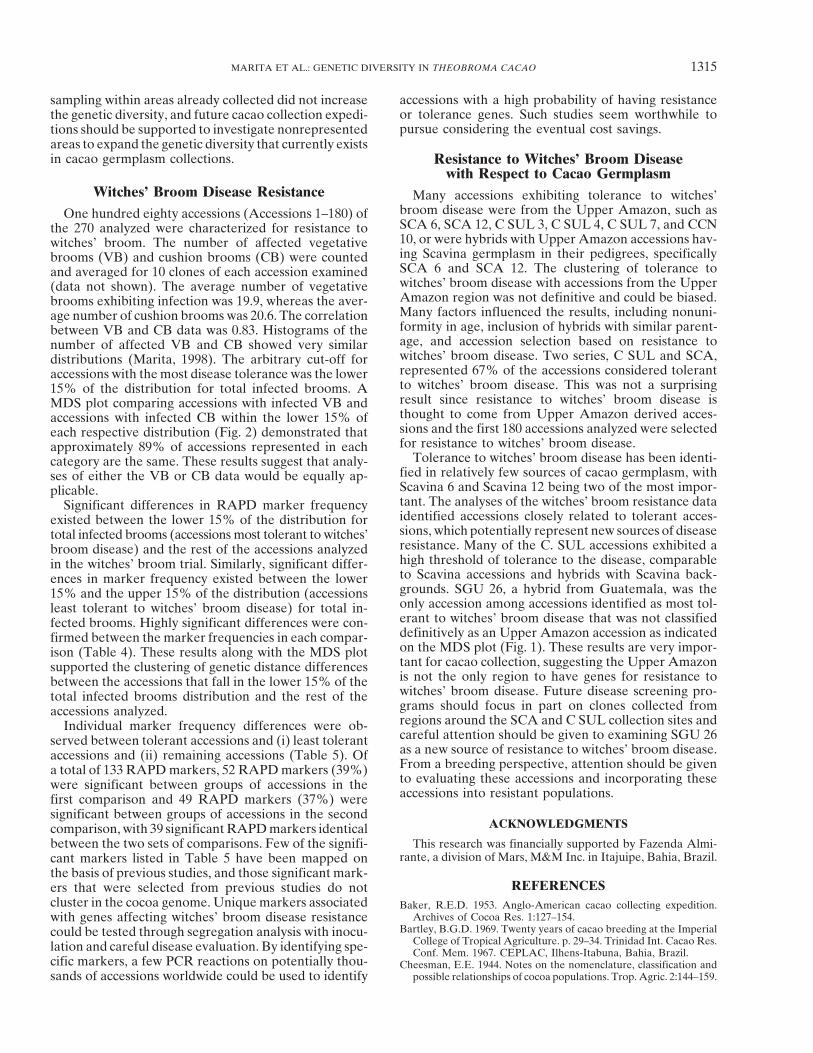
with Respect to Cacao GermplasmWitches’ Broom Disease Resistance Many accessions exhibiting tolerance to witches’
broom disease were from the Upper Amazon, such asOne hundred eighty accessions (Accessions 1–180) ofSCA 6, SCA 12, C SUL 3, C SUL 4, C SUL 7, and CCNthe 270 analyzed were characterized for resistance to10, or were hybrids with Upper Amazon accessions hav-witches’ broom. The number of affected vegetativeing Scavina germplasm in their pedigrees, specificallybrooms (VB) and cushion brooms (CB) were countedSCA 6 and SCA 12. The clustering of tolerance toand averaged for 10 clones of each accession examinedwitches’ broom disease with accessions from the Upper(data not shown). The average number of vegetativeAmazon region was not definitive and could be biased.brooms exhibiting infection was 19.9, whereas the aver-Many factors influenced the results, including nonuni-age number of cushion brooms was 20.6. The correlationformity in age, inclusion of hybrids with similar parent-between VB and CB data was 0.83. Histograms of theage, and accession selection based on resistance tonumber of affected VB and CB showed very similarwitches’ broom disease. Two series, C SUL and SCA,distributions (Marita, 1998). The arbitrary cut-off forrepresented 67% of the accessions considered tolerantaccessions with the most disease tolerance was the lowerto witches’ broom disease. This was not a surprising15% of the distribution for total infected brooms. Aresult since resistance to witches’ broom disease isMDS plot comparing accessions with infected VB andthought to come from Upper Amazon derived acces-accessions with infected CB within the lower 15% ofsions and the first 180 accessions analyzed were selectedeach respective distribution (Fig. 2) demonstrated thatfor resistance to witches’ broom disease.approximately 89% of accessions represented in each
Tolerance to witches’ broom disease has been identi-category are the same. These results suggest that analy-fied in relatively few sources of cacao germplasm, withses of either the VB or CB data would be equally ap-Scavina 6 and Scavina 12 being two of the most impor-plicable.tant. The analyses of the witches’ broom resistance dataSignificant differences in RAPD marker frequencyidentified accessions closely related to tolerant acces-existed between the lower 15% of the distribution forsions, which potentially represent new sources of diseasetotal infected brooms (accessions most tolerant to witches’resistance. Many of the C. SUL accessions exhibited abroom disease) and the rest of the accessions analyzedhigh threshold of tolerance to the disease, comparablein the witches’ broom trial. Similarly, significant differ-to Scavina accessions and hybrids with Scavina back-ences in marker frequency existed between the lowergrounds. SGU 26, a hybrid from Guatemala, was the15% and the upper 15% of the distribution (accessionsonly accession among accessions identified as most tol-least tolerant to witches’ broom disease) for total in-erant to witches’ broom disease that was not classifiedfected brooms. Highly significant differences were con-definitively as an Upper Amazon accession as indicatedfirmed between the marker frequencies in each compar-on the MDS plot (Fig. 1). These results are very impor-ison (Table 4). These results along with the MDS plottant for cacao collection, suggesting the Upper Amazonsupported the clustering of genetic distance differencesis not the only region to have genes for resistance tobetween the accessions that fall in the lower 15% of thewitches’ broom disease. Future disease screening pro-total infected brooms distribution and the rest of thegrams should focus in part on clones collected fromaccessions analyzed.regions around the SCA and C SUL collection sites andIndividual marker frequency differences were ob-careful attention should be given to examining SGU 26served between tolerant accessions and (i) least tolerantas a new source of resistance to witches’ broom disease.accessions and (ii) remaining accessions (Table 5). OfFrom a breeding perspective, attention should be givena total of 133 RAPD markers, 52 RAPD markers (39%)to evaluating these accessions and incorporating thesewere significant between groups of accessions in theaccessions into resistant populations.first comparison and 49 RAPD markers (37%) were
significant between groups of accessions in the secondACKNOWLEDGMENTScomparison, with 39 significant RAPD markers identical
This research was financially supported by Fazenda Almi-between the two sets of comparisons. Few of the signifi-rante, a division of Mars, M&M Inc. in Itajuipe, Bahia, Brazil.cant markers listed in Table 5 have been mapped on
the basis of previous studies, and those significant mark-REFERENCESers that were selected from previous studies do not
cluster in the cocoa genome. Unique markers associated Baker, R.E.D. 1953. Anglo-American cacao collecting expedition.Archives of Cocoa Res. 1:127–154.with genes affecting witches’ broom disease resistance
Bartley, B.G.D. 1969. Twenty years of cacao breeding at the Imperialcould be tested through segregation analysis with inocu-College of Tropical Agriculture. p. 29–34. Trinidad Int. Cacao Res.lation and careful disease evaluation. By identifying spe- Conf. Mem. 1967. CEPLAC, Ilhens-Itabuna, Bahia, Brazil.
cific markers, a few PCR reactions on potentially thou- Cheesman, E.E. 1944. Notes on the nomenclature, classification andpossible relationships of cocoa populations. Trop. Agric. 2:144–159.sands of accessions worldwide could be used to identify

1316 CROP SCIENCE, VOL. 41, JULY–AUGUST 2001
Cope, F.W. 1976. Theobroma cacao (Sterculiacae). p. 285–289. In N.W. Marita, J.M., J.M. Rodriguez, and J. Nienhuis. 2000. Development ofan algorithm identifying maximally diverse core collections. Genet.Simmonds (ed.) Evolution of crop plants. Longman, New York.
Cronshaw, D.K., and H.C. Evans. 1978. Witches’ broom disease of Res. Crop Evol. 47(5):515–526.N’Goran, J.A.K., V. Laurent, A.M. Risterucci, and C. Lanaud. 1994.cocoa (Crinipellis perniciosa ) in Ecuador: II. Methods of infection.
Ann. Appl. Biol. 89:193–200. Comparative genetic diversity studies of Theobroma cacao L. usingRFLP and RAPD markers. Heredity 73:589–597.Crouzillat, D., E. Lerceteau, V. Petiard, J. Morera, H. Rodriguez, D.
Walker, W. Phillips, C. Ronning, R. Schnell, J. Osei, and P. Fritz. Nei, M. 1987. Genetic variation within species. p. 176–207. In Molecu-lar evolutionary genetics. Columbia University Press, New York.1996. Theobroma cacao L.: a genetic linkage map and quantitative
trait loci analysis. Theor. Appl. Genet. 93:205–214. Pereira, J.L., A. Ram, J.M. de Figueiredo, and L.C.C. de Almeida.1990. First occurrence of witches’ broom disease in the principalDoyle, J.J., and J.L. Doyle. 1990. Isolation of plant DNA from fresh
tissue. Focus 12:13–15. cocoa-growing region of Brazil. Trop. Agric. 67(2):188–189.Ronning, C.M., R.J. Schnell, and D.N. Kuhn. 1995. Inheritance ofEdgington, E.S. 1980. Randomization tests. Marcel Dekker Inc.,
New York. random amplified polymorphic DNA (RAPD) markers in Theo-broma cacao L. J. Am. Soc. Hort. Sci. 120(4):681–686.End, M.J., R.M. Wadsworth, and P. Hadley. 1992. International cocoa
germplasm database. The Biscuit, Cake, Chocolate, and Confec- SAS Institute. 1990. SAS/STAT User’s Guide, ver. 6. 4th ed. SAS Inst.,Cary, NC.tionary Alliance, London, England.
Figueira, A., J. Janick, M. Levy, and P. Goldsbrough. 1994. Reexamin- Skroch, P.W., and J. Nienhuis. 1995a. Qualitative and quantitativecharacterization of RAPD variation among snap bean (Phaseolusing the classification of Theobroma cacao L. using molecular mark-
ers. J. Am. Soc. Hort. Sci. 119:1073–1082. vulgaris ) genotypes. Theor. Appl. Genet. 91:1078–1085.Skroch, P.W., and J. Nienhuis. 1995b. Impact of scoring error andFrias, G.A., L.H. Purdy, and R.A. Schmidt. 1991. Infection biology
of Crinipellis perniciosa on vegetative flushes of cacao. Plant Dis. reproducibility of RAPD data on RAPD based estimates of geneticdistance. Theor. Appl. Genet. 91:1086–1091.75:552–556.
Gower, J.C. 1985. Measures of similarity, dissimilarity, and distance. Snedecor, G.W., and W.G. Cochran. 1992. Statistical Methods. 8thed. Iowa State University Press, Ames, IA.p. 297–405. In S. Kotz and N.L. Johnson (ed.) Encyclopedia of
statistical sciences. Volume 5. Wiley, New York. Soria, J.V. 1970. Principal varieties of cocoa cultivated in tropicalamerica. Cocoa Growers’ Bull. 19:12–21.Johns, M.A., P.W. Skroch, J. Nienhuis, P. Hinrichsen, G. Bascur, and
C. Munoz-Schick. 1997. Gene pool classification of common bean Sreenivasan, T.N., and S. Dabydeen. 1989. Modes of penetration ofyoung cocoa leaves by Crinipellis perniciosa. Plant Dis. 73:478–481.landraces from Chile based on RAPD and morphological data.
Crop Sci. 37:605–613. Stahel, G. 1915. Marasmius perniciosus nov spec. Bull. Dep. Land-bouw Suriname 33:1–26.Kennedy, A.J., G. Lockwood, G. Mossu, N.W. Simmonds, and G.Y.
Tan. 1987. Cocoa breeding: past, present and future. Cocoa Grow- Steel, R.G.D., and J.H. Torrie. 1980. Principles and procedures ofstatistics: a biometrical approach. McGraw-Hill Inc., New York.ers’ Bull. 38:5–22.
Lanaud, C., A.M. Risterucci, A.K.J. N’Goran, D. Clement, M.H. Went, F.A.F.C. 1904. Krulloten en versteende vruchten van de cacaoin Suriname, Verhandelingen der K akademie van wetenschappen.Flament, V. Laurent, and M. Falque. 1995. A genetic linkage map
of Theobroma cacao L. Theor. Appl. Genet. 91:987–993. Amsterdam 2(10):1–40.Whitkus, R., M. de la Cruz, L. Mota-Bravo, and A. Gomez-Pompa.Laurent, V., A.M. Risterucci, and C. Lanaud. 1994. Genetic diversity
in cocoa revealed by cDNA probes. Theor. Appl. Genet. 88:193–198. 1998. Genetic diversity and relationships of cacao (Theobromacacao L.) in southern Mexico. Theor. Appl. Genet. 96:621–627.Lerceteau, E., R. Robert, V. Petiard, and D. Crouzillat. 1997. Evalua-
tion of the extent of genetic variability among Theobroma cacao Wilde, J., R. Waugh, and W. Powell. 1992. Genetic fingerprinting ofTheobroma clones using randomly amplified polymorphic DNAaccessions using RAPD and RFLP markers. Theor. Appl. Genet.
95:10–19. markers. Theor. Appl. Genet. 83:871–877.Wilkinson, L., M. Hill, S. Miceli, P. Howe, and E. Vang. 1992. SYSTATLockwood, G. 1976. A comparison of the growth and yield during a
20 year period of Amelonado and Upper Amazon hybrid cocoa for the Macintosh, ver. 5.2. SYSTAT Inc., Evanstan, IL.Williams, J.T. 1984. A decade of crop genetic resources research. In(Theobroma cacao ) in Ghana. Euphytica 24(3):647–658.
Marita, J.M. 1998. Characterization of Theobroma cacao using RAPD- J.H.W. Holden and J.T. Williams (ed.) Crop genetic resources,conservation and evaluation. Allen and Unwin, London, England.marker based estimates of genetic distance and recommendations
for a core collection to maximize genetic diversity. MS Thesis, Wood, G.A.R. and R.A. Lass. 1985. Cocoa. 4th ed. Longman GroupLimited, New York.Univ. of Wisconsin, Madison, WI.