Discovery and mapping of a new expressed sequence tag-single nucleotide polymorphism and simple...
13
Discovery and mapping of a new expressed sequence tag-single nucleotide polymorphism and simple sequence repeat panel for large-scale genetic studies and breeding of Theobroma cacao L. MATHILDE Allegre 1,† ,XAVIER Argout 1,*,† ,MICHEL Boccara 1,2 ,OLIVIER Fouet 1 ,YOLANDE Roguet 1 ,AURE ´ LIE Be ´rard 3 , JEAN MARC The ´venin 4 ,AURE ´ LIE Chauveau 3 ,RONAN Rivallan 1 ,DIDIER Clement 1,5 ,BRIGITTE Courtois 1 , KARINA Gramacho 5 ,ANNE Boland-Auge ´ 3 ,MATHIAS Tahi 6 ,PATHMANATHAN Umaharan 2 ,DOMINIQUE Brunel 3 , and CLAIRE Lanaud 1 CIRAD, UMR 1334 AGAP, TA 108/03-34398, Montpellier Cedex 5, France 1 ; University of the West Indies, Cocoa Research Unit (CRU), St Augustine, Trinidad and Tobago 2 ; INRA, UR 1279 Etude du Polymorphisme des Ge ´nomes Ve ´ge ´taux, CEA Institut de Ge ´nomique, Centre National de Ge ´notypage, 2, rue Gaston Cre ´mieux, CP5724, 91057 Evry, France 3 ; CIRAD, Biological Systems Department, UPR Bioagresseurs, 97387 Kourou Cedex, French Guiana 4 ; Comissa ˜o Executiva de Planejamento da Lavoura Cacaueira (CEPLAC), Km 22 Rod. Ilheus Itabuna, Cx. postal 07, Itabuna 45600-00, Bahia, Brazil 5 and Centre National de la Recherche Agronomique (CNRA), B.P. 808, Divo, Co ˆte d’Ivoire 6 *To whom correspondence should be addressed. Fax. þ33 4-67-61-56-05. Email: [email protected] Edited by Dr. Satoshi Tabata (Received 30 June 2011; accepted 11 October 2011) Abstract Theobroma cacao is an economically important tree of several tropical countries. Its genetic improve- ment is essential to provide protection against major diseases and improve chocolate quality. We discov- ered and mapped new expressed sequence tag-single nucleotide polymorphism (EST-SNP) and simple sequence repeat (SSR) markers and constructed a high-density genetic map. By screening 149 650 ESTs, 5246 SNPs were detected in silico, of which 1536 corresponded to genes with a putative function, while 851 had a clear polymorphic pattern across a collection of genetic resources. In addition, 409 new SSR markers were detected on the Criollo genome. Lastly, 681 new EST-SNPs and 163 new SSRs were added to the pre-existing 418 co-dominant markers to construct a large consensus genetic map. This high-density map and the set of new genetic markers identified in this study are a milestone in cocoa gen- omics and for marker-assisted breeding. The data are available at http://tropgenedb.cirad.fr. Key words: Theobroma cacao; genetic map; SNP; molecular marker 1. Introduction Theobroma cacao L. is a diploid species (2n ¼ 2x ¼ 20) with a small genome ranging in size from 411 to 494 Mb. 1 According to Cheesman, 2 its centre of origin is at the lower eastern equatorial slopes of the Andes. Theobroma cacao is grown as a major cash crop that provides income to 14 million small-scale farmers in more than 50 tropical countries. However, cocoa pro- duction is markedly affected by a number of major diseases caused by several Phytophthora species, or by Moniliophthora perniciosa and Moniliophthora roreri. Several sources of disease resistance have been identified and the search for sustainable disease resistance by cumulating the different resist- ance genes is one of the major challenges facing † These authors contributed equally to this work. # The Author 2011. Published by Oxford University Press on behalf of Kazusa DNA Research Institute. This is an Open Access article distributed under the terms of the Creative Commons Attribution Non-Commercial License (http:// creativecommons.org/licenses/by-nc/3.0/), which permits unrestricted non-commercial use, distribution, and reproduction in any medium, provided the original work is properly cited. DNA RESEARCH 19, 23–35, (2012) doi:10.1093/dnares/dsr039 Advance Access Publication on 30 December 2011
-
Upload
independent -
Category
Documents
-
view
7 -
download
0
Transcript of Discovery and mapping of a new expressed sequence tag-single nucleotide polymorphism and simple...

Discovery and mapping of a new expressed sequence tag-singlenucleotide polymorphism and simple sequence repeat panelfor large-scale genetic studies and breeding of Theobroma cacao L.
MATHILDE Allegre1,†, XAVIER Argout1,*,†, MICHEL Boccara1,2, OLIVIER Fouet1, YOLANDE Roguet1, AURELIE Berard3,JEAN MARC Thevenin4, AURELIE Chauveau3, RONAN Rivallan1, DIDIER Clement1,5, BRIGITTE Courtois1,KARINA Gramacho5, ANNE Boland-Auge3, MATHIAS Tahi6, PATHMANATHAN Umaharan2, DOMINIQUE Brunel3,and CLAIRE Lanaud1
CIRAD, UMR 1334 AGAP, TA 108/03-34398, Montpellier Cedex 5, France1; University of the West Indies, CocoaResearch Unit (CRU), St Augustine, Trinidad and Tobago2; INRA, UR 1279 Etude du Polymorphisme des GenomesVegetaux, CEA Institut de Genomique, Centre National de Genotypage, 2, rue Gaston Cremieux, CP5724, 91057Evry, France3; CIRAD, Biological Systems Department, UPR Bioagresseurs, 97387 Kourou Cedex, French Guiana4;Comissao Executiva de Planejamento da Lavoura Cacaueira (CEPLAC), Km 22 Rod. Ilheus Itabuna, Cx. postal 07,Itabuna 45600-00, Bahia, Brazil5 and Centre National de la Recherche Agronomique (CNRA), B.P. 808, Divo, Coted’Ivoire6
*To whom correspondence should be addressed. Fax. þ33 4-67-61-56-05. Email: [email protected]
Edited by Dr. Satoshi Tabata(Received 30 June 2011; accepted 11 October 2011)
AbstractTheobroma cacao is an economically important tree of several tropical countries. Its genetic improve-
ment is essential to provide protection against major diseases and improve chocolate quality. We discov-ered and mapped new expressed sequence tag-single nucleotide polymorphism (EST-SNP) and simplesequence repeat (SSR) markers and constructed a high-density genetic map. By screening 149 650ESTs, 5246 SNPs were detected in silico, of which 1536 corresponded to genes with a putative function,while 851 had a clear polymorphic pattern across a collection of genetic resources. In addition, 409 newSSR markers were detected on the Criollo genome. Lastly, 681 new EST-SNPs and 163 new SSRs wereadded to the pre-existing 418 co-dominant markers to construct a large consensus genetic map. Thishigh-density map and the set of new genetic markers identified in this study are a milestone in cocoa gen-omics and for marker-assisted breeding. The data are available at http://tropgenedb.cirad.fr.Key words: Theobroma cacao; genetic map; SNP; molecular marker
1. Introduction
Theobroma cacao L. is a diploid species (2n¼ 2x¼ 20)with a small genome ranging in size from 411 to494 Mb.1 According to Cheesman,2 its centre oforigin is at the lower eastern equatorial slopes of theAndes.
Theobroma cacao is grown as a major cash crop thatprovides income to 14 million small-scale farmers inmore than 50 tropical countries. However, cocoa pro-duction is markedly affected by a number of majordiseases caused by several Phytophthora species, orby Moniliophthora perniciosa and Moniliophthoraroreri. Several sources of disease resistance havebeen identified and the search for sustainabledisease resistance by cumulating the different resist-ance genes is one of the major challenges facing† These authors contributed equally to this work.
# The Author 2011. Published by Oxford University Press on behalf of Kazusa DNA Research Institute.This is an Open Access article distributed under the terms of the Creative Commons Attribution Non-Commercial License (http://creativecommons.org/licenses/by-nc/3.0/), which permits unrestricted non-commercial use, distribution, and reproduction in any medium,provided the original work is properly cited.
DNA RESEARCH 19, 23–35, (2012) doi:10.1093/dnares/dsr039Advance Access Publication on 30 December 2011

T. cacao-breeding programmes.3 The quality of choc-olate is another important trait in cocoa breeding,and consumer demand for high-quality chocolate isincreasing. A better understanding of the molecularand genetic bases of these traits is a key goal ofcocoa genetic research.
High-density genetic maps are essential tools for traitgenetic studies. Several molecular marker types havebeen developed in T. cacao in recent decades: restric-tion fragment length polymorphism (RFLP), microsa-tellites or simple sequence repeats (SSRs), randomamplified polymorphic DNA, amplified fragmentlength polymorphism and isozymes.4–6 Among them,only RFLP, SSR and single-nucleotide polymorphism(SNP) are co-dominant markers, and therefore morepowerful for genetic analyses. Compared with RFLP,the advantage of SSR and SNP markers is that theycan be revealed using high-throughput technologieswith scant amounts of DNA. Semagn et al.7 made adetailed comparison of the characteristics of eachkind of marker. A high-density cocoa linkage mapenriched with SSR genomic markers, including onlyco-dominant markers, was developed by Pugh et al.8
More recently, that map was supplemented with 114EST-SSRs.9
In recent years, the use of SNP markers has substan-tially increased in plant genetics such as inArabidopsis,10 grapevine,11 wheat,12 and also a fewwoody perennial species.13–15 SNP is one of themost abundant types of DNA sequence polymorph-ism and the SNP markers are suitable for large-scalegenome analysis using high-throughput automatedgenotyping techniques. SNPs have been used to con-struct high-resolution genetic maps16,17 or to traceevolution, particularly in the human genome, usinglarge-scale SNP datasets.18,19 Knowledge of nucleo-tide substitution dynamics is an important basis formolecular evolutionary studies, phylogeny reconstruc-tion and natural selection studies.20,21 Transitions aregenerally observed with higher frequencies thantransversions. During natural selection, transitionsare better tolerated because they generate morelikely synonymous mutations in protein-codingsequences than transversions.22–25
Of existing SNP markers, EST-SNPs (i.e. SNPs locatedwithin a gene expressed sequence) are of particularinterest for studying functional genetic diversity andidentifying candidate genes as the functional base ofquantitative trait loci (QTLs). EST-SNPs have beendeveloped for numerous plant models such asmelon,26,27 Brassica rapa,28 barley,29 poplar,14 andsugarcane30 to detect QTLs for many traits and facili-tate the selection of resistant and productive plants. InT. cacao, a few SNPs were detected in ESTs fromexpression libraries representing T. cacao/M. perni-ciosa interactions.31
In our study, we discovered and mapped severalhundred EST-SNP markers detected in an exhaustivecollection of cocoa ESTs32 homologous to geneswith a known function. These SNP markers were sup-plemented by 163 new SSR markers to construct avery high-density genetic map suitable for large-scale genetic studies.
2. Materials and Methods
2.1. Plant materialSNP polymorphisms were screened in a collection of
diverse germplasm representing the major part of theT. cacao diversity and two existing mapping popula-tions denominated UPA402 � UF676 and F2.
The collection of diverse germplasm consisted of249 genotypes from various genetic groups and geo-graphical origins (Table 1). Most of these accessionsare maintained at the International CocoaGenebank (ICG) at the Cocoa Research Unit (CRU),University of the West Indies, Trinidad and Tobago.
The UPA402 � UF676 mapping population con-sisted of 264 individuals derived from a cross of twounrelated heterozygous tree accessions; UPA402, anUpper Amazon Forastero from Peru, and UF676, aTrinitario (Forastero � Criollo hybrid) selected inCosta Rica. This progeny was maintained by CentreNational de Recherche Agronomique (CNRA) inBingerville and Divo, Cote d’Ivoire. It was used to
Table 1. Theobroma cacao genotypes of various geographicalorigins used to screen the polymorphism of the 1536GoldenGate SNP panel
Accession collection groupname
Number ofgenotypes
Geographicalorigin
AMAZ 2 Ecuador
APA 1 Colombia
Nacional 3 Ecuador
Criollo 14 Mexico-Belize
EBC 4 Colombia
Trinitario 28 Trinidad
GU 12 French Guiana
IMC 19 Peru
LCTEEN 46 Ecuador
MORONA 3 Peru
NANAY 49 Peru
PARINARI 40 Peru
POUND 6 Peru
SC 5 Colombia
SCAVINA 8 Peru
Amelonado type 3 Brazil
SPEC 6 Colombia
Total 249
24 T. Cacao High-Density Genetic Map [Vol. 19,

establish genetic map as a reference in our labora-tory.4,6,8,9 We mapped the new SSR and SNPmarkers in this population.
The F2 second progeny of 132 individuals wasobtained by selfing a hybrid between two heterozy-gous parents: Scavina 6, an Upper Amazon Forasterocollected in Peru, and ICS1, a Trinitario selected inTrinidad. This progeny was produced by ComissaoExecutiva do Plano da Lavoura Cacaueira (CEPLAC)at Itabuna, Brazil.
2.1.1. Genotypes used for EST-SNP detection andselection
Most of the ESTs screened for SNPs had beenobtained from the contrasting genotypes Scavina 6,an upper Amazon Forastero genotype from Peru andICS1, a Trinitario selected in Trinidad, a hybridbetween a Criollo from Central America and aForastero from Lower Amazonia of Brazil.
These two genotypes, which represent the threedistinct genetic origins, Upper Amazon Forastero,Lower Amazon Forastero, and Criollo, were also theparents of the F2 population from Brazil used tomap SNPs.
Eleven other genotypes were involved in the con-struction of the cDNA libraries and SNP identification:B97-CC2, a Criollo from Belize, P7, IMC47, UPA 134,Upper Amazon Forastero genotypes from Peru, Jaca,an Upper Amazon Forastero from Brazil, GU255V, col-lected in French Guiana, B240 and 33–49, twoNacional genotypes from Ecuador, UF676, UF273,two Trinitario, and seedlings from a hybrid selectedin Papua New Guinea.
SSRs were screened in three T. cacao genotypes: thetwo parents of the reference map (UPA402 andUF676), and the sequenced Criollo genotype (B97-61/B2).
2.2. DNA extraction and purificationGenomic DNA was extracted according to a protocol
using MATAB buffer already described for the isolationof genomic DNA.6 DNA was resuspended with 1 ml ofTE (10 mM Tris–HCl and 1 mM EDTA, pH 8.0).
DNA was purified with the Nucleobondw PC 20 kit(Macherey-Nagel, Cat. No. 740.571.100) with themodification that steps 1 and 2 were omitted andthe DNA was purified directly after its isolation. A1 ml mixture composed of 200 ml of crude DNA(20 mg DNA maximum), 450 ml water and 350 mlS3 buffer þ RNAse (buffers provided with the kit)was passed through the column (step 3). This solutionwas homogenized on a rocking table for at least 1 h.After precipitation of the eluate with an equalvolume of isopropyl alcohol, the pellet was resus-pended in 70 ml of TE.
The quality and quantity of DNA were first checkedon 0.8% agarose gel, compared with a standard range,and then the Quant-iTTM PicoGreenw dsDNA Assayfrom InvitrogenTM was used. A quality test was per-formed for each sample by amplifying microsatellitemarkers in a PCR mixture with a high DNA concentra-tion (100 ng DNA in a 10 ml reaction volume). Thepurification step was repeated when the amplificationfailed.
2.3. In silico SNP discovery and verificationA collection of 149 650 ESTs (EMBL accession
number CU469588 to CU633156), correspondingto 48 594 unigenes, was produced after sequencing56 cDNA libraries constructed from material collectedfrom different organs, genotypes, and under differentenvironmental conditions.32
SNPs were detected in silico and quality checkedusing the QualitySNP pipeline,33 as reported inArgout et al.32 and in ESTtik (http://esttik.cirad.fr).
QualitySNP uses quality information related to eachEST and a haplotype-based strategy to predict reliableSNPs. In order to detect SNPs in known homologouscoding sequences, we selected contigs displaying a sig-nificant similarity with proteins from a non-redundantprotein sequence database (NR), with entries fromGenPept, Swissprot, PIR, PDF, PDB, and NCBI RefSeq,and as described in Argout et al.32
2.4. Validation of SNPs via golden gate assayA total of 30–50 ng of genomic DNA per plant was
used for Illumina SNP genotyping with the IlluminaBeadArray platform at the French NationalGenotyping Centre (CNG, CEA-IG, Evry, France),according to the GoldenGate Assay manufacturer’sprotocol. Three 3-day assays were carried out to geno-type the progeny samples for the 1536 SNP setrevealed by the GoldenGate assay (SupplementaryTable S1). The protocol was similar to that brieflydescribed by Hyten et al.34 except for the number ofoligonucleotides involved in a single DNA reaction,thus comprising 4608 custom oligos assembled inthe oligo pooled assays (OPA) designed by IlluminaInc. Raw hybridization, intensity data processing, clus-tering, and genotype calling were performed usingthe genotyping module in the BeadStudio/GenomeStudio package (Illumina, San Diego, CA,USA). Illumina has developed a self-normalizationalgorithm that relies on information contained ineach array, as described by Akhunov et al.35
The clustering and genotype calling of each of the1536 SNP markers were checked for their conformityand correct genotype distribution using knownhomozygous and heterozygous genotypes, includedin the collection of diverse genotypes, as standards.
No. 1] M. Allegre et al. 25

2.5. SSR in silico discovery and genotypingThe MIcroSAtellite identification tool (MISA
http://pgrc.ipk-gatersleben.de/misa) was used toperform SSR searches, and primers were designedwith Primer3 software.36
Primers flanking microsatellite loci were designed ateach end of the scaffolds to orient and anchor themto the genetic map.
SSRs identified in the scaffolds were mapped onlyon the reference map established from theUPA402 � UF676 cross.
A total of 409 primer pairs (Supplementary TableS2) were defined in the 100 larger non-anchoredscaffolds using Primer3 software36 and screened fortheir ability to segregate in the UPA402 � UF676progeny.
For a given SSR locus, the forward primer wasdesigned with a 50-end M13 tail (50-CACGACGTTGTAAAACGAC-30). PCR amplifications were per-formed in a Mastercycler ep384 thermocycler(Eppendorf, Germany) with 5 ng of purified DNA in a10 ml final volume of buffer containing 10 mM Tris–HCl (pH 8), 50 mM KCl, 0.001% glycerol, 2.0 mMMgCl2, 0.08 mM of the M13-tailed forward primer,0.1 mM of the reverse primer, 200 mM of dNTP, 1 U ofTaq DNA polymerase (Life Technologies, USA), 0.1 mMof M13 primer-fluorescent dye 6-FAMTM, NEDw, VICw,or PETw (Applied Biosystems, CA, USA). The DNA andbuffer were distributed in 384 plates using a BiomekNX automatic pipetting robot (Beckman Coulter, CA,USA). The touchdown PCR programme used was asfollows: initial denaturation at 958C for 5 min, followedby 10 cycles at 958C for 45 s, Tm of 56–468C (218C/cycle) for 1 min, and 728C for 1 min 30 s. After thesecycles, an additional round of 25 cycles were per-formed at 958C for 45 s, Tm of 508C for 1 min, and728C for 1 min, with a final elongation step at 728Cfor 30 min.
PCR products were diluted specifically for each dyeand pooled for multiplex SSR genotyping (revealingtwo SSRs having different sizes of amplified productper dye). A mixture of 15 ml of Hi-DiTM formamide(Applied Biosystems) and 0.12 ml of size markerGeneScanTM 600-LIZ-Sizew Standard V2.0. (AppliedBiosystems) was added to 2 ml of the diluted PCRpool. This pool was then analysed using the ABI3500xL automatic sequencer (Applied Biosystems).
Images were analysed using Genemapper 4.0 soft-ware (Applied Biosystems) and exported as a datatable.
2.6. Genetic mappingThe UPA402 � UF676 population was the result of
a cross between two heterozygous cocoa clones,UPA402 (C) an Upper-Amazon Forastero and
UF676 (F) a Trinitario. In this case, there werethree segregation possibilities: loci that were homozy-gous for one parent and heterozygous for the other,segregation (1:1), and those that segregated in bothparents (1:2:1 or 1:1:1:1).
Segregations were checked for goodness-of-fit tothe expected Mendelian ratio using a chi-square testat significance levels of 0.05 and 0.01.
Individual and consensus maps were constructedusing Joinmap software, version 4.0.37
Joinmap is able to combine data of several segrega-tion types to construct a consensus genetic map. Herewe used population type CP for the UPA402 � UF676map, and population type F2 for the F2 populationfrom Brazil. A lod score of 6 was used to identify 10linkage groups (LGs) independently for each map. Aconsensus genetic map was established from thetwo distinct genetic maps. The corresponding groupswere associated in pairs with JoinMap software. TheKosambi mapping function, with a lod score of 5and a jump threshold of 3, was used to convertrecombination frequencies into map distances.38
This consensus map combined the new EST-SNPsand genomic SSRs defined from the scaffolds, in add-ition to the previously mapped markers.9 This mapcontained only markers with a known nucleotidesequence.
3. Results
3.1. Identification of SNPs and development of thegolden gate assay
The assembly made from the 149 650 T. cacao ESTsequences (see Materials and Methods) generated12692 T. cacao contigs. The number of ESTs percontig ranged from 2 to 5102. To detect goodquality in silico SNPs, we assumed that contigs withmore than 100 members contained paralogoussequences.13,39 We therefore first selected 4818contigs that contained at least 4 but no more than100 EST members. A total of 5246 SNPs were identi-fied in silico in 2012 contigs.
We selected 4150 in silico SNPs detected in 1834contigs that had a significant BlastX annotation simi-larity with known proteins of the NCBI non-redun-dant protein sequence database (NR) with entriesfrom GenPept, Swissprot, PIR, PDF, PDB, and NCBIRefSeq, and as described in Argout et al.32
3.2. SNP performance and qualityThe set of 4150 in silico SNPs was selected in the
EST contigs and the SNP-harbouring sequences werethen submitted to Illumina for processing using theIlluminaw Assay Design Tool (ADT). ADT generatesscores for each SNP that can range from 0 to 1;
26 T. Cacao High-Density Genetic Map [Vol. 19,

SNPs with scores .0.6 have a high probability ofbeing converted into a successful genotyping assay.In the set of 4150 submitted SNPs, 83.5% showed ahigh conversion success rate (.0.6), 9.2% showed amoderate conversion success rate (between 0.4 and0.6), and 7.3% showed either a low conversionsuccess rate or no score. A total of 1536 SNP siteshaving ADT scores .0.4 and without any other SNPswithin the adjacent 60 bp was selected for the OPAdesign (Supplementary Table S1).
3.3. Analysis of base changesOne thousand and forty-four in silico SNPs (68%)
were transitions and 462 (32%) were transversions(Table 2). This ratio of transition/transversion SNPstallies with the results observed in other plantspecies, where transition SNPs are always more fre-quent than transversion SNPs.
3.4. SNP polymorphismFrom the 1536 SNPs, 841 (55%) with a
non-ambiguous polymorphic pattern across acces-sions were retained as true and verified SNPs anddenominated TcSNP. Of the rest, 113 (7%) failedto be genotyped, 436 (28%) had a monomorphicpattern, and 146 (10%) were polymorphic but didnot show any clear fluorescent pattern suitable forreliable genotype classification.
Of the 841 polymorphic SNPs, 461 segregated inthe mapping population (UPA402 � UF676) andcould be mapped on the reference map. Fivehundred and thirty-one were polymorphic andmapped on the F2 population map. Two hundredand thirty-nine SNP markers were segregating inboth maps, thus enabling construction of a consensusmap between them.
3.5. SSR polymorphismA high-density genetic map is a key tool to order
the scaffold assembly needed to generate a completecocoa genome sequence. SSR markers were defined inthe largest non-anchored scaffolds in order to
improve anchoring of the T. cacao genome assemblyprovided by the International Cocoa GenomeSequencing consortium1 on the genetic map.
From the 409 screened SSRs (Supplementary TableS2), 163 were polymorphic for the UPA402 � UF676progeny and could be mapped.
The new SSR markers defined from scaffolds werenamed mTcCIR450 to mTcCIR613 to extend the pre-viously identified SSR marker series; mTcCIR 1 tomTcCIR 2918 from genomic DNA and mTcCIR 292to mTcCIR 4479 from ESTs.
3.6. Individual genetic linkage maps3.6.1. Map of the UPA402 � UF676 populationA new set of 624 markers with their corresponding
sequences, including 461 EST-SNP and 163 new SSRmarkers located on scaffolds of the genome assem-bly,1 were added to the reference map (Fig. 1,Supplementary Table S3).
The new UPA402 � UF676 map contained 1043markers, including 461 EST-SNPs, 524 SSRs and 58RFLPs (Table 3). Of the 1043 markers, 571 corre-sponded to gene markers. The length of this mapwas 751.7 cM having an average distance of 0.7 cMbetween adjacent markers.
Skewed segregation was observed for 118 markers(11.3%). The skewed markers were mainly locatedin LGs 2, 3, 6 and 10, as is shown in Fig. 3.
3.6.2. Map of the F2 populationThe F2 map (Fig. 2, Supplementary Table S4) con-
tained 531 EST-SNP markers. This map had a totallength of 753.9 cM, with an average distance of1.4 cM between neighboring markers. The markerdensity varied, with an average distance betweenneighboring markers ranging from 0.9 cM in LG 9 to2.7 cM in LG7 (Table 4).
Skewed segregation was observed in 97 markers(18.3%). The skewed markers were mainly locatedin LGs 1, 3 and 4, as is shown in Fig. 3.
3.7. Consensus genetic linkage mapTwo hundred and thirty-nine SNP markers were
mapped in both populations.The complete consensus map (Table 5) contained
1262 codominant markers including 681 EST-SNPs,523 SSRs (163 scaffold-tagged-SSRs, 110 EST-SSRs,250 SSRs from genomic DNA) and 58 RFLPs including14 resistance gene analogues (Rgenes-RFLPs),arranged in 10 LGs corresponding to thehaploid chromosome number of T. cacao (Fig. 3,Supplementary Table S5). Among the 1262 markers,65% were gene-based markers, including SNPs, SSRsand RFLPs.
Table 2. Nucleotide substitution types of the 1536 selected insilico SNPs
Types Number of SNPs Percentage PercentageA $ C 126 8 Transversion 32
A $ T 128 8
C $ G 112 7
T $ C 126 8
T $ G 612 40 Transition 68
A $ G 432 29
No. 1] M. Allegre et al. 27

Figure 1. Genetic map constructed from an F1 progeny of 264 individuals (located in CNRA, Cote d’Ivoire) belonging to the UPA402 �UF676 cross. This map consists of 1043 markers of a known DNA sequence (461 SNPs, 524 SSRs, and 58 RFLPs), spanning 752 cM.The average distance between two markers is 0.7 cM. The new markers added to this map are printed in red.
28 T. Cacao High-Density Genetic Map [Vol. 19,
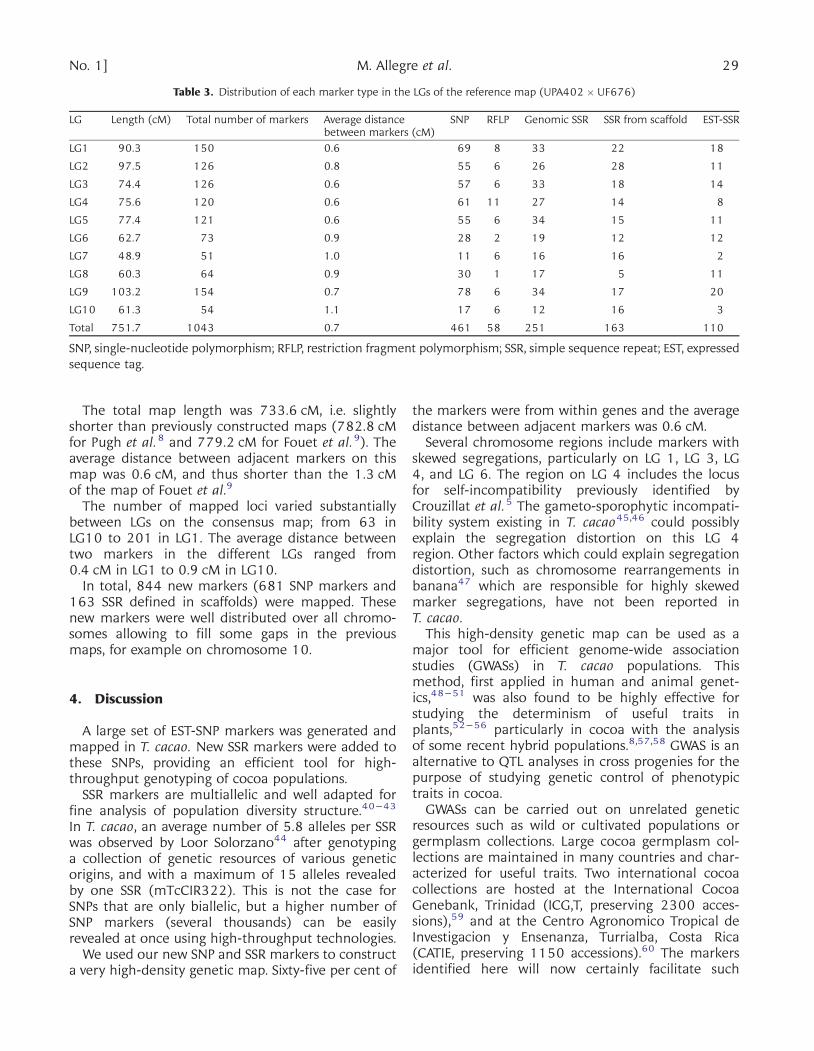
The total map length was 733.6 cM, i.e. slightlyshorter than previously constructed maps (782.8 cMfor Pugh et al.8 and 779.2 cM for Fouet et al.9). Theaverage distance between adjacent markers on thismap was 0.6 cM, and thus shorter than the 1.3 cMof the map of Fouet et al.9
The number of mapped loci varied substantiallybetween LGs on the consensus map; from 63 inLG10 to 201 in LG1. The average distance betweentwo markers in the different LGs ranged from0.4 cM in LG1 to 0.9 cM in LG10.
In total, 844 new markers (681 SNP markers and163 SSR defined in scaffolds) were mapped. Thesenew markers were well distributed over all chromo-somes allowing to fill some gaps in the previousmaps, for example on chromosome 10.
4. Discussion
A large set of EST-SNP markers was generated andmapped in T. cacao. New SSR markers were added tothese SNPs, providing an efficient tool for high-throughput genotyping of cocoa populations.
SSR markers are multiallelic and well adapted forfine analysis of population diversity structure.40–43
In T. cacao, an average number of 5.8 alleles per SSRwas observed by Loor Solorzano44 after genotypinga collection of genetic resources of various geneticorigins, and with a maximum of 15 alleles revealedby one SSR (mTcCIR322). This is not the case forSNPs that are only biallelic, but a higher number ofSNP markers (several thousands) can be easilyrevealed at once using high-throughput technologies.
We used our new SNP and SSR markers to constructa very high-density genetic map. Sixty-five per cent of
the markers were from within genes and the averagedistance between adjacent markers was 0.6 cM.
Several chromosome regions include markers withskewed segregations, particularly on LG 1, LG 3, LG4, and LG 6. The region on LG 4 includes the locusfor self-incompatibility previously identified byCrouzillat et al.5 The gameto-sporophytic incompati-bility system existing in T. cacao45,46 could possiblyexplain the segregation distortion on this LG 4region. Other factors which could explain segregationdistortion, such as chromosome rearrangements inbanana47 which are responsible for highly skewedmarker segregations, have not been reported inT. cacao.
This high-density genetic map can be used as amajor tool for efficient genome-wide associationstudies (GWASs) in T. cacao populations. Thismethod, first applied in human and animal genet-ics,48–51 was also found to be highly effective forstudying the determinism of useful traits inplants,52–56 particularly in cocoa with the analysisof some recent hybrid populations.8,57,58 GWAS is analternative to QTL analyses in cross progenies for thepurpose of studying genetic control of phenotypictraits in cocoa.
GWASs can be carried out on unrelated geneticresources such as wild or cultivated populations orgermplasm collections. Large cocoa germplasm col-lections are maintained in many countries and char-acterized for useful traits. Two international cocoacollections are hosted at the International CocoaGenebank, Trinidad (ICG,T, preserving 2300 acces-sions),59 and at the Centro Agronomico Tropical deInvestigacion y Ensenanza, Turrialba, Costa Rica(CATIE, preserving 1150 accessions).60 The markersidentified here will now certainly facilitate such
Table 3. Distribution of each marker type in the LGs of the reference map (UPA402 � UF676)
LG Length (cM) Total number of markers Average distancebetween markers (cM)
SNP RFLP Genomic SSR SSR from scaffold EST-SSR
LG1 90.3 150 0.6 69 8 33 22 18
LG2 97.5 126 0.8 55 6 26 28 11
LG3 74.4 126 0.6 57 6 33 18 14
LG4 75.6 120 0.6 61 11 27 14 8
LG5 77.4 121 0.6 55 6 34 15 11
LG6 62.7 73 0.9 28 2 19 12 12
LG7 48.9 51 1.0 11 6 16 16 2
LG8 60.3 64 0.9 30 1 17 5 11
LG9 103.2 154 0.7 78 6 34 17 20
LG10 61.3 54 1.1 17 6 12 16 3
Total 751.7 1043 0.7 461 58 251 163 110
SNP, single-nucleotide polymorphism; RFLP, restriction fragment polymorphism; SSR, simple sequence repeat; EST, expressedsequence tag.
No. 1] M. Allegre et al. 29

Figure 2. Genetic map constructed from an F2 progeny of 132 individuals (located at CEPLAC, Brazil) obtained by selfing of a single(Scavina 6 � ICS1) selected hybrid. This map consists of 531 SNP markers, spanning 754 cM. The average distance between twomarkers is 1.4 cM.
30 T. Cacao High-Density Genetic Map [Vol. 19,

Figure 3. Consensus map of (UPA402 � UF676) and F2 progenies. Markers segregating in both progenies are indicated in black, thosesegregating only in (UPA402 � UF676) are printed in green (previously mapped markers) and blue (newly mapped markers).Markers segregating only in the F2 progeny are printed in pink. This consensus map consists of 1262 markers of a known DNAsequence, and it has a length of 734 cM. The average distance between two markers is 0.6 cM. Among the 1262 markers, 810correspond to markers defined in expressed genes. Significant skewed segregations are indicated by asterisks (*P , 0.05, **P , 0.01)or dots (F2 population).
No. 1] M. Allegre et al. 31

GWASs, providing added-value to this wide character-ization work, thus boosting knowledge on the geneticdeterminants of useful cocoa traits.
Another benefit of this large set of mapped markersis the possible integration of molecular information inconventional cocoa breeding schemes using marker-assisted selection (MAS).
In cocoa, few MAS experiments are currently under-way.3,61 The efficiency of MAS in selecting P.palmivora-resistant cocoa plants has been reportedby Lanaud et al.3
Until now, MAS studies have mainly been focusedon traits controlled by a small number of genes,using only markers close to QTLs. However, suchmethods are of limited use for traits that aredetermined by a large number of genes of smalleffects.
Substantial genome-wide molecular data can nowbe generated at lower cost by high-throughput tech-nologies, such as SNP genotyping. This progress haspaved the way for the development of new methodsto predict genotype value via MAS. The genome-wide selection or genomic selection (GS) methodwas recently successfully applied in animal or plantbreeding62–66 and allows to predict phenotypesusing all marker information.
The integration of molecular markers in cocoarecurrent breeding programmes67–72 could befacilitated by the GS approach in order to accelerategeneticgains.TheGSstrategyseemsparticularlysuitablefor the selection of multigenic traits such as yield anddisease resistance. Cumulating a large number of resist-ance alleles is one of the main objectives of cocoa breed-ing for sustainable cocoa resistance. The large set ofavailable SNP markers could facilitate the selection of re-sistant and high yielding cocoa trees via GS approachesenabling the use of all genome regions tagged by SNPmarkers, even those with very small effects.
The search for candidate genes underlying traitvariation is another major challenge for plantbiologists, with the aim of gaining further insight intothe mechanisms underlying trait variation, and produ-cing tools to efficiently screen and exploit geneticresources.
The consensus map produced in this work has beenused efficiently for anchoring an assembly of T. cacaoCriollo genome sequences, and for constituting pseu-domolecules.1 Recently, two different cocoa varieties,i.e. Criollo1 and Forastero from the LowerAmazon region (http://www.cacaogenomedb.org/),were sequenced, with 28 798 and 35 000 annotatedgenes, respectively. These sequences will greatlyfacilitate the identification of candidate genes, allowing
Table 4. Distribution of SNP markers in the LGs of the F2 map(SCA6 � ICS1) selfing
LG Length(cM)
Number of SNPmarkers
Average distance betweenmarkers (cM)
LG1 98.6 104 0.9
LG2 102.8 74 1.4
LG3 78.7 73 1.1
LG4 69.1 49 1.4
LG5 85.4 56 1.5
LG6 71.0 28 2.5
LG7 48.7 19 2.6
LG8 43.3 28 1.5
LG9 104.9 78 1.3
LG10 51.5 22 2.3
Total 753.9 531 1.4
SNP, single-nucleotide.
Table 5. Distribution of each marker type in the LGs of the consensus genetic map
LG Length (cM) Total number ofmarkers
Average distancebetween markers (cM)
SNP RFLP Genomic SSR SSR from scaffold EST-SSR
LG1 77.1 201 0.4 120 8 33 22 18
LG2 101.1 156 0.6 85 6 26 28 11
LG3 76.9 162 0.5 91 6 33 18 14
LG4 64.2 135 0.5 75 11 27 14 8
LG5 78.1 147 0.5 81 6 34 15 11
LG6 64 81 0.8 36 2 19 12 12
LG7 52.6 62 0.8 22 6 16 16 2
LG8 59.2 73 0.8 39 1 17 5 11
LG9 100.9 182 0.6 106 6 33 17 20
LG10 59.5 63 0.9 26 6 12 16 3
Total 733.6 1262 0.6 681 58 250 163 110
SNP, single nucleotide polymorphism; RFLP, restriction fragment polymorphism; SSR, simple sequence repeat; EST, expressedsequence tag.
32 T. Cacao High-Density Genetic Map [Vol. 19,

integration of both genetic and genomic (functionaland structural) data. Overall, about 300 QTLs ormarker/trait associations have already been identifiedin T. cacao. High-throughput genotyping associatedwith a high marker density will facilitate fine mappingof genes involved in trait variation (with GWAS or clas-sical QTL analyses conducted on large progenies),thus allowing to refine the QTL position in thegenome, while facilitating the search for candidategenes in corresponding genome sequences. Severalfunctional studies have already been conducted incocoa, focused mainly on genes generally expressed inspecific physiological conditions or metabolisms.73 Itwill be now possible to focus more specifically on theexpression of genes directly responsible for trait vari-ation after candidate gene validation.
Analysing genome evolution during domesticationprocesses or adaptation to climate change can alsohelp us to identify key genes underlying adaptivetraits.74 Loss of diversity generally occurs duringgenome evolution, and some genes are selectivelyinvolved in natural selection or domestication. A largeset of SNPs defined in expressed genes, such as thoseidentified in this study, provides a key tool for identifyingselection signatures or adaptive substitutions, and thenhighlighting candidate genes potentially involved inthe adaptation60 or domestication processes and theircorresponding molecular functions.75 All SNPs reportedin this paper were identified in orthologous genes orgene families, thus facilitating comparative genomicapproaches, and benefiting from gene knowledge accu-mulated in other species to accelerate cocoa breeding.
5. Availability
Information on the consensus linkage map,molecular markers, and primers are available in theMap Study ‘SSR_SNP_consensus_map’ of the cocoamodule of TropGeneDB database (http://tropgenedb.cirad.fr).
Acknowledgements: We acknowledge ChantalHamelin for TropGeneDB support. We thank PeterBiggins for improving the English in this paper, andthe reviewers for their useful comments and editingjob of this paper.
Supplementary Data: Supplementary Data areavailable at www.dnaresearch.oxfordjournals.org.
Funding
We thank the Region Languedoc-Roussillon,Valrhona and the Fondation Agropolis for their finan-cial support in this work.
References
1. Argout, X., Salse, J., Aury, J.M., et al. 2011, The genome ofTheobroma cacao, Nat. Genet., 43, 101–8.
2. Cheesman, E.E. 1944, Notes on the nomenclature, clas-sification and possible relationships of cocoa popula-tions, Trop. Agricult., 21, 144–59.
3. Lanaud, C., Fouet, O., Clement, D., et al. 2009, A meta-QTL analysis of disease resistance traits of Theobromacacao L., Mol. Breed., 24, 361–74.
4. Lanaud, C., Risterucci, A.M., Ngoran, A.K.J., et al. 1995, Agenetic-linkage map of Theobroma cacao L., Theor. Appl.Genet., 91, 987–93.
5. Crouzillat, D., Lerceteau, E., Petiard, V., et al. 1996,Theobroma cacao L.: a genetic linkage map and quantita-tive trait loci analysis, Theor. Appl. Genet., 93, 205–14.
6. Risterucci, A.M., Grivet, L., N’Goran, J.A.K., Pieretti, I.,Flament, M.H. and Lanaud, C. 2000, A high-densitylinkage map of Theobroma cacao L., Theor. Appl. Genet.,101, 948–55.
7. Semagn, K., Bjornstad, A.A. and Ndjiondjop, M.N. 2006,An overview of molecular marker methods for plants,Afr. J. Biotechnol., 5, 2540–68.
8. Pugh, T., Fouet, O., Risterucci, A.M., et al. 2004, A newcacao linkage map based on codominant markers: de-velopment and integration of 201 new microsatellitemarkers, Theor. Appl. Genet., 108, 1151–61.
9. Fouet, O., Allegre, M., Argout, X., et al. 2011, Structural char-acterization and mapping of functional EST-SSR markersin Theobroma cacao, Tree Genet. Genomes, 99, 1–19.
10. Schmid KJ, R.S.T. 2003, Large-scale identification andanalysis of genome-wide single-nucleotide polymorph-isms for mapping in Arabidopsis thaliana, Genome Res.,13, 1250–7.
11. Lijavetzky, D., Cabezas, J.A., Ibanez, A., Rodriguez, V. andMartinez-Zapater, J.M. 2007, High throughput SNP dis-covery and genotyping in grapevine (Vitis vinifera L.) bycombining a re-sequencing approach and SNPlex tech-nology, BMC Genomics, 8, 424.
12. Berard, A., Le Paslier, M.C., Dardevet, M., et al. 2009,High-throughput single nucleotide polymorphismgenotyping in wheat (Triticum spp.), Plant Biotechnol.J., 7, 364–74.
13. Dantec, L.L., Chagne, D., Pot, D., et al. 2004, AutomatedSNP detection in expressed sequence tags: statisticalconsiderations and application to maritime pinesequences, Plant Mol. Biol., 54, 461–70.
14. Zhang, B., Zhou, Y., Zhang, L., Zhuge, Q., Wang, M.X. andHuang, M.R. 2005, Identification and validation ofsingle nucleotide polymorphisms in poplar using pub-licly expressed sequence tags, J. Integr. Plant Biol., 47,1493–9.
15. Pavy, N., Parsons, L.S., Paule, C., MacKay, J. andBousquet, J. 2006, Automated SNP detection from alarge collection of white spruce expressed sequences:contributing factors and approaches for the categoriza-tion of SNPs, BMC Genomics, 7, 174.
16. Cho, R.J., Mindrinos, M., Richards, D.R., et al. 1999,Genome-wide mapping with biallelic markers inArabidopsis thaliana, Nat. Genet., 23, 203–7.
No. 1] M. Allegre et al. 33

17. Hoskins, R.A., Phan, A.C., Naeemuddin, M., et al. 2001,Single nucleotide polymorphism markers for geneticmapping in Drosophila melanogaster, Genome Res., 11,1100–13.
18. Tian, C., Plenge, R.M., Ransom, M., et al. 2008, Analysisand application of European genetic substructureusing 300 K SNP information, PLoS Genet., 4, e4.
19. Novembre, J., Johnson, T., Bryc, K., et al. 2008, Genesmirror geography within Europe, Nature, 456, 98–101.
20. Yang, Z. and Yoder, A.D. 1999, Estimation of the transi-tion/transversion rate bias and species sampling, J. Mol.Evol., 48, 274–83.
21. Swofford, D.L., Olsen, G.J., Waddell, P.J. and Hillis, D.M.1990, Phylogeny reconstruction, Mol. Syst., 411, 501.
22. Brown, W.M., Prager, E.M., Wang, A. and Wilson, A.C.1982, Mitochondrial DNA sequences of primates:tempo and mode of evolution, J. Mol. Evol., 18,225–39.
23. Gojobori, T., Li, W.H. and Graur, D. 1982, Patterns of nu-cleotide substitution in pseudogenes and functionalgenes, J. Mol. Evol., 18, 360–9.
24. Wakeley, J. 1994, Substitution-rate variation amongsites and the estimation of transition bias, Mol. Biol.Evol., 11, 436–42.
25. Wakeley, J. 1996, The excess of transitions among nu-cleotide substitutions: new methods of estimating tran-sition bias underscore its significance, Trends Ecol. Evol.(Amst.), 11, 158–62.
26. Morales, M., Roig, E., Monforte, A.J., Arus, P. and Garcia-Mas, J. 2004, Single-nucleotide polymorphismsdetected in expressed sequence tags of melon(Cucumis melo L.), Genome, 47, 352–60.
27. Deleu, W., Esteras, C., Roig, C., et al. 2009, A set of EST-SNPs for map saturation and cultivar identification inmelon, BMC Plant Biol., 9.
28. Li, F., Kitashiba, H., Inaba, K. and Nishio, T. 2009, ABrassica rapa linkage map of EST-based SNP markersfor identification of candidate genes controlling flower-ing time and leaf morphological traits, DNA Res., 16,311–23.
29. Kota, R., Varshney, R., Prasad, M., Zhang, H., Stein, N. andGraner, A. 2008, EST-derived single nucleotide poly-morphism markers for assembling genetic and physicalmaps of the barley genome, Funct. Integr. Genomics, 8,223–33.
30. Cordeiro, G.M., Eliott, F., McIntyre, C.L., Casu, R.E. andHenry, R.J. 2006, Characterisation of single nucleotidepolymorphisms in sugarcane ESTs, Theor. Appl. Genet.,113, 331–43.
31. Lima, L.S., Gramacho, K.P., Carels, N., et al. 2009, Singlenucleotide polymorphisms from Theobroma cacaoexpressed sequence tags associated with witches’broom disease in cacao, Genet. Mol. Res., 8, 799–808.
32. Argout, X., Fouet, O., Wincker, P., et al. 2008, Towardsthe understanding of the cocoa transcriptome: produc-tion and analysis of an exhaustive dataset of ESTs ofTheobroma cacao L. generated from various tissues andunder various conditions, BMC Genomics.
33. Tang, J., Vosman, B., Voorrips, R.E., van der Linden, C.G.and Leunissen, J.A. 2006, QualitySNP: a pipeline fordetecting single nucleotide polymorphisms and
insertions/deletions in EST data from diploid and poly-ploid species, BMC Bioinformatics, 7, 438.
34. Hyten, D.L., Song, Q., Choi, I.-Y., et al. 2008, High-throughput genotyping with the GoldenGate assay inthe complex genome of soybean, Theor. Appl. Genet.,116, 945–52.
35. Akhunov, E., Nicolet, C. and Dvorak, J. 2009, Single nu-cleotide polymorphism genotyping in polyploid wheatwith the Illumina GoldenGate assay, Theor. Appl.Genet., 119, 507–17.
36. Rozen, S. and Skaletsky, H. 2000, Primer3 on the WWWfor general users and for biologist programmers,Methods Mol. Biol., 132, 365–86.
37. Van Ooijen, J.W. 2006, Joinmap, Software for theCalculation of Genetic Linkage Maps. Wageningen: TheNetherlands.
38. Kosambi, D.D. 1944, The estimation of map distancefrom recombination values, Ann. Eugen., 12, 172–5.
39. Batley, J., Barker, G., O’Sullivan, H., Edwards, K.J. andEdwards, D. 2003, Mining for single nucleotide poly-morphisms and insertions/deletions in maize expressedsequence tag data, Plant Physiol., 132, 84–91.
40. Zhang, D., Mischke, S., Johnson, E.S., Phillips-Mora, W.and Meinhardt, L. 2008, Molecular characterization ofan international cacao collection using microsatellitemarkers, Tree Genet. Genomes, 5, 1–10.
41. Lachenaud, P. and Zhang, D. 2008, Genetic diversityand population structure in wild stands of cacao trees(Theobroma cacao L.), in French Guiana, Ann. For. Sci.,65, 7.
42. Zhang, D., Arevalo-Gardini, E., Mischke, S., Zuniga-Cernades, L., Barreto-Chavez, A. and Del Aguila, J.A.2006, Genetic diversity and structure of managed andsemi-natural populations of cocoa (Theobroma cacao)in the Huallaga and Ucayali Valleys of Peru, Ann. Bot.,98, 647–55.
43. Motamayor, J.C., Lachenaud, P., da Silva E Mota, J.W.,et al. 2008, Geographic and genetic population differ-entiation of the Amazonian chocolate tree (Theobromacacao L.), PLoS ONE, 3, e3311.
44. Loor Solorzano, R.G. 2007, Contribution a l’etude de ladomestication de la variete Nacional d’Equateur: re-cherche de la variete native et de ses ancetres sauvages.PhD Thesis, Montpellier SUPAGRO- ED SIBAGHE- specia-lite: biologie integrative des plantes.
45. Knight, R. and Rogers, H. 1955, Incompatibility inTheobroma cacao, Heredity, 9, 69–77.
46. Cope, F.W. 1958, Incompatibility in Theobroma cacao,Nature, 181, 279.
47. Faure, S., Noyer, J.L., Horry, J.P., Bakry, F., Lanaud, C. andGonzalez de Leon, D. 1993, A molecular marker-based linkage map of diploid bananas (Musa acumi-nata), Theor. Appl. Genetics, 87, 517–26.
48. Blott, S., Kim, J.-J., Moisio, S., et al. 2003, Molecular dis-section of a quantitative trait locus: a phenylalanine-to-tyrosine substitution in the transmembrane domain ofthe bovine growth hormone receptor is associated witha major effect on milk yield and composition, Genetics,163, 253–66.
49. Cardon, L.R. and Bell, J.I. 2001, Association studydesigns for complex diseases, Nat. Rev. Genet., 2, 91–9.
34 T. Cacao High-Density Genetic Map [Vol. 19,

50. Liu, P., Wang, Y., Vikis, H., et al. 2006, Candidate lungtumor susceptibility genes identified through whole-genome association analyses in inbred mice, Nat.Genet., 38, 888–95.
51. Meuwissen, T.H.E., Karlsen, A., Lien, S., Olsaker, I. andGoddard, M.E. 2002, Fine mapping of a quantitativetrait locus for twinning rate using combined linkage andlinkage disequilibrium mapping, Genetics, 161, 373–9.
52. Zhang, Y.-M., Mao, Y., Xie, C., Smith, H., Luo, L. and Xu, S.2005, Mapping quantitative trait loci using naturallyoccurring genetic variance among commercial inbredlines of maize (Zea mays L.), Genetics, 169, 2267–75.
53. Aranzana, M.J., Kim, S., Zhao, K., et al. 2005, Genome-wide association mapping in Arabidopsis identifies pre-viously known flowering time and pathogen resistancegenes, PLoS Genet., 1, e60.
54. Jannoo, N., Grivet, L., Dookun, A., D’hont, A. andGlaszmann, J.C. 1999, Linkage disequilibrium amongmodern sugarcane cultivars, Theor. Appl. Genet., 99,1053–60.
55. Wei, X., Jackson, P.A., McIntyre, C.L., Aitken, K.S. andCroft, B. 2006, Associations between DNA markersand resistance to diseases in sugarcane and effects ofpopulation substructure, Theor. Appl. Genet., 114,155–64.
56. Agrama, H.A., Eizenga, G.C. and Yan, W. 2007,Association mapping of yield and its components inrice cultivars, Mol. Breed., 19, 341–56.
57. Marcano, M., Pugh, T., Cros, E., et al. 2007, Adding valueto cocoa (Theobroma cacao L.) germplasm informationwith domestication history and admixture mapping,Theor. Appl. Genet., 114, 877–84.
58. Marcano, M., Morales, S., Hoyer, M.T., et al. 2009, A gen-omewide admixture mapping study for yield factors andmorphological traits in a cultivated cocoa (Theobromacacao L.) population, Tree Genet. Genomes, 5, 329–37.
59. Iwaro, A.D., Bekele, F.L. and Butler, D.R. 2003, Evaluationand utilisation of cacao (Theobroma cacao L.) germ-plasm at the International Cocoa Genebank, Trinidad,Euphytica, 130, 207–21.
60. IBPGR Working Group on Genetics Resources of Cocoa.1981, Genetic Resources of Cocoa. Rome, Italy, p. 25.
61. Schnell, R.J., Kuhn, D.N., Brown, J.S., et al. 2007,Development of a marker assisted selection programfor cacao, Phytopathology, 97, 1664–9.
62. Meuwissen, T.H., Hayes, B.J. and Goddard, M.E. 2001,Prediction of total genetic value using genome-widedense marker maps, Genetics, 157, 1819–29.
63. Heffner, E.L., Sorrells, M.E. and Jannink, J.L. 2009,Genomic selection for crop improvement, Crop Sci.,49, 1–12.
64. Bernardo, R. and Yu, J. 2007, Prospects for genomewideselection for quantitative traits in maize, Crop Sci., 47,1082.
65. Wong, C.K. and Bernardo, R. 2008, Genomewide selec-tion in oil palm: increasing selection gain per unit timeand cost with small populations, Theor. Appl. Genet.,116, 815–24.
66. Jannink, J.L., Lorenz, A.J. and Iwata, H. 2010, Genomicselection in plant breeding: from theory to practice,Brief. Funct. Genomic., 9, 166.
67. Clement, D., Eskes, A.B., Sounigo, O. and N’Goran, J.1993, Amelioration genetique du cacaoyer en Coted’Ivoire-Presentation d’un nouveau schema de selec-tion, In: Proceedings of the 11th International CocoaResearch Conference, pp. 18–24.
68. Paulin, D. and Eskes, A.B. 1995, Le cacaoyer: strategiesde selection, Plant. Recherche Devel., 2, 5–18.
69. Pires, J.L., Monteiro, W.R., Pinto, L.R.M., Figueira, A.,Yamada, M.M. and Ahnert, D. 1996, A proposal forcocoa breeding, In: Proceedings of the 12thInternational Cocoa Research Conference, pp. 17–23.
70. Iwaro, A.D., Singh, V., Bharath, S.M., Perez, C., Ali, L. andButler, D.R. 2010, Germplasm enhancement for resist-ance to black pod disease – final stages and achieve-ments, In: Proceedings of the 16th International CocoaResearch Conference, pp. 493–499.
71. Tahi, M., Lachenaud, P., N’Goran, J., et al. 2010, Secondcycle de selection recurrente du cacaoyer (Theobromacacao L.) en Cote d’Ivoire: bilan a mi-parcours etpropositions de sorties varietales, In: Proceedings ofthe 16th International Cocoa Research Conference,pp. 3–12.
72. Lopes, U.V., Monteiro, W.R., Pires, J.L., Clement, D.,Yamada, M.M. and Gramacho, K.P. 2011, Cacao breed-ing in Bahia, Brazil—strategies and results, Crop Breed.Appl. Biotechnol., 1, 73–81.
73. Micheli, F., Guiltinan, M., Gramacho, K.P., et al. 2010,Functional genomics of Cacao, In: Jean-Claude, K. andMichel, D., (eds.), Advances in Botanical Research, vol.55. Academic Press: Londres, pp. 119–77.
74. Doebley, J.F., Gaut, B.S. and Smith, B.D. 2006, Themolecular genetics of crop domestication, Cell, 127,1309–21.
75. Nielsen, R. 2005, Molecular signatures of natural selec-tion, Annu. Rev. Genet., 39, 197–218.
No. 1] M. Allegre et al. 35