
ANALYSIS OF BLASTING ROCKS PREDICTION AND ROCK ...
9
22 Tecnol. Metal. Mater. Miner., São Paulo, v. 15, n. 1, p. 22-30, jan./mar. 2018 http://dx.doi.org/10.4322/2176-1523.1234 Original Article 2176-1523 © 2016 Associação Brasileira de Metalurgia, Materiais e Mineração. Published by ABM. This is an open access paper, published under the Creative Commons CC BY-NC-ND license (Attribution-NonCommercial-NoDerivs) - https://creativecommons.org/licenses/ by-nc-nd/4.0/. a Abstract One way to optimize the rock blasting operation is to conduct detailed structural analysis of the rock mass. For this, it makes use of algorithms that allows analyze the degree of fragmentation by changing the geometrical and geomechanical parameters, such as the equations proposed by Kuznetsov (1973), used for studying the interaction between explosive and rock. In this context, this study aimed to compare the classical methodology for the fragmentation of rocks with the method of fragmentation analysis by image. The study was done through field data provided by Herval Quarry which were analyzed for evaluation of fragmentation through images of blasted material muck piles. Were analyzed the P 50 , P 80 and P 100 of granulometric distribution curves. The optimization of blasting was done by adjusting the mesh of the fire plan (burden and spacing) and stemming length. Keywords: Kuz-Ram equations; Blasting; Rock fragmentation; Split-desktop. ANÁLISE DA PREVISÃO DO DESMONTE DE ROCHAS E DOS RESULTADOS DA FRAGMENTAÇÃO UTILIZANDO O SOFTWARE SPLIT-DESKTOP Resumo Uma maneira de otimizar a operação de desmonte de rochas é a realização de uma análise estrutural detalhada do maciço rochoso. Para isso, faz-se uso de algoritmos que permitem analisar o grau de fragmentação, alterando os parâmetros geométricos e geomecânicos, tais como as equações propostas por Kuznetsov (1973), utilizadas para estudar a interação entre o explosivo e a rocha. Neste contexto, este estudo teve como objetivo comparar a metodologia clássica para a previsão da fragmentação de rochas com o método de análise de fragmentação por imagem. O estudo foi feito por meio de levantamento de campo realizado na Pedreira Herval para avaliação da fragmentação através de tratamento de imagens obtidas na pilha de material desmontado. Foram analisados o P 50 , P 80 e P 100 das curvas de distribuição granulométrica. A otimização da detonação foi feita com o ajuste da malha do plano de fogo (afastamento e espaçamento) e o comprimento do tampão. Palavras-chave: Equações de Kuz-Ram; Desmonte com explosivos; Fragmentação da rocha; Split-desktop. 1 INTRODUCTION Various authors have studied explosive-rock interaction models, which provide a useful description of the blasting process as a “background” process for modeling the fragmentation of the rock by explosives, such as Kuznetsov [1], Cunningham [2], Lilly [3], Sarma [4], and Djordjevic [5]. The rocks have geomechanical characteristics that depend on the geology of the rocks that form them and also some geotechnical parameters that are intrinsic of each mass and its tectonic history [6]. Rarely rock masses have a homogeneous structure, possessing a set of discontinuities that will have significant impacts on their geomechanical behavior [7,8]. Therefore, there is a need to previously determine the discontinuities in the rock mass and deforming stage reached in order to reduce rock blasting costs. An effective method in this process that will be object of study in this project is the evaluation of discontinuities, analyzing the deformation markers in rock masses, structural and petrographically for subsequent application of these discontinuities in the blast design through the mathematical model Kuz- Ram. 1 Universidade Federal de Pernambuco – UFPE, Recife, PE, Brazil. E-mail: [email protected] ANALYSIS OF BLASTING ROCKS PREDICTION AND ROCK FRAGMENTATION RESULTS USING SPLIT-DESKTOP SOFTWARE Júlio César de Souza 1 Andrêvhity Carlos Santos da Silva 1 Suelen Silva Rocha 1
-
Upload
khangminh22 -
Category
Documents
-
view
2 -
download
0
Transcript of ANALYSIS OF BLASTING ROCKS PREDICTION AND ROCK ...
22 Tecnol. Metal. Mater. Miner., São Paulo, v. 15, n. 1, p. 22-30, jan./mar. 2018
http://dx.doi.org/10.4322/2176-1523.1234Original Article
2176-1523 © 2016 Associação Brasileira de Metalurgia, Materiais e Mineração. Published by ABM. This is an open access paper, published under the Creative Commons CC BY-NC-ND license (Attribution-NonCommercial-NoDerivs) - https://creativecommons.org/licenses/by-nc-nd/4.0/.
a
Abstract
One way to optimize the rock blasting operation is to conduct detailed structural analysis of the rock mass. For this, it makes use of algorithms that allows analyze the degree of fragmentation by changing the geometrical and geomechanical parameters, such as the equations proposed by Kuznetsov (1973), used for studying the interaction between explosive and rock. In this context, this study aimed to compare the classical methodology for the fragmentation of rocks with the method of fragmentation analysis by image. The study was done through field data provided by Herval Quarry which were analyzed for evaluation of fragmentation through images of blasted material muck piles. Were analyzed the P50, P80 and P100 of granulometric distribution curves. The optimization of blasting was done by adjusting the mesh of the fire plan (burden and spacing) and stemming length.Keywords: Kuz-Ram equations; Blasting; Rock fragmentation; Split-desktop.
ANÁLISE DA PREVISÃO DO DESMONTE DE ROCHAS E DOS RESULTADOS DA FRAGMENTAÇÃO UTILIZANDO O SOFTWARE SPLIT-DESKTOP
Resumo
Uma maneira de otimizar a operação de desmonte de rochas é a realização de uma análise estrutural detalhada do maciço rochoso. Para isso, faz-se uso de algoritmos que permitem analisar o grau de fragmentação, alterando os parâmetros geométricos e geomecânicos, tais como as equações propostas por Kuznetsov (1973), utilizadas para estudar a interação entre o explosivo e a rocha. Neste contexto, este estudo teve como objetivo comparar a metodologia clássica para a previsão da fragmentação de rochas com o método de análise de fragmentação por imagem. O estudo foi feito por meio de levantamento de campo realizado na Pedreira Herval para avaliação da fragmentação através de tratamento de imagens obtidas na pilha de material desmontado. Foram analisados o P50, P80 e P100 das curvas de distribuição granulométrica. A otimização da detonação foi feita com o ajuste da malha do plano de fogo (afastamento e espaçamento) e o comprimento do tampão.Palavras-chave: Equações de Kuz-Ram; Desmonte com explosivos; Fragmentação da rocha; Split-desktop.
1 INTRODUCTION
Various authors have studied explosive-rock interaction models, which provide a useful description of the blasting process as a “background” process for modeling the fragmentation of the rock by explosives, such as Kuznetsov [1], Cunningham [2], Lilly [3], Sarma [4], and Djordjevic [5].
The rocks have geomechanical characteristics that depend on the geology of the rocks that form them and also some geotechnical parameters that are intrinsic of each mass and its tectonic history [6]. Rarely rock masses have a homogeneous structure, possessing a set of discontinuities that will have
significant impacts on their geomechanical behavior [7,8]. Therefore, there is a need to previously determine the discontinuities in the rock mass and deforming stage reached in order to reduce rock blasting costs. An effective method in this process that will be object of study in this project is the evaluation of discontinuities, analyzing the deformation markers in rock masses, structural and petrographically for subsequent application of these discontinuities in the blast design through the mathematical model Kuz- Ram.
1 Universidade Federal de Pernambuco – UFPE, Recife, PE, Brazil. E-mail: [email protected]
ANALYSIS OF BLASTING ROCKS PREDICTION AND ROCK FRAGMENTATION RESULTS USING SPLIT-DESKTOP SOFTWARE
Júlio César de Souza 1
Andrêvhity Carlos Santos da Silva 1
Suelen Silva Rocha 1

Analysis of blasting rocks prediction and rock fragmentation results using split-desktop software
23Tecnol. Metal. Mater. Miner., São Paulo, v. 15, n. 1, p. 22-30, jan./mar. 2018
1.1 The Kuz-Ram Fragmentation Model
In this model, the properties of the rocks, the properties of the explosives and the geometric variables of blast plan are combined using five equations that make up the model of Kuz-Ram fragmentation [3]:
• Breaking theory: the amount of breakage that occurs with a known quantity of an explosive energy can be estimated using the Kuznetsov’s Equation 1 [1].
( )0,8 19
3010 650
115ee
V EX A x x Q xQ
− =
(1)
where X50 is the average particle size (cm), A is the rock factor, V0 is the volume of blasted rock by hole (m3), Qe is the mass of the explosive used (kg) and represents the relative energy mass (RWS) of the explosive compared to ANFO [1].
• Theory size particle distribution (Equation 2): size distribution of the fragmented rock particles can be determined from the average size, the breakage model is known [9].
500,693
100 1n
Xx XP x e −
= −
(2)
where P is the percentage passing, X is the mesh size sieve, and n is the uniformity index [9].
• Explosive Detonation Theory: the amount of energy released by explosive is calculated using Tidman’s equation 3:
2
e
n
VODE x RWS
VOD
=
(3)
where E is the effective power by relative mass of an explosive; VODe is the speed of effective explosive detonation (measured in the field); VODn is the nominal velocity of detonation of the explosive (m/s) and RWS is the energy per mass relative to ANFO (%) [10].
• Correlation of blast design parameters (Equation 4): there is a correlation between the various configurations of the blast plans and model of rock fragmentation [2]:
( ) 0,51 /
2, 2 14 12S BB W Ln x x x x
D B H+ = − −
(4)
where B is the burden (m); S is the spacing (m); D is the hole diameter (mm); W is the drilling standard deviation (m); L is the total length (m), and H is the bench height (m). When using two explosives in the hole (bottom load and column load), the equation is modified to Equation 5:
( ) 0,50,1
2, 2 14
1
1 /
20,1
Bn x xD
W xB
S Bx abs x
LxBCL CCLH
L
= − − +
− +
(5)
where BCL is the length of the bottom charge (m); CCL is the length of the column load (m); abs is the absolute value concerning (BCL - CCL)/L [2].
• Rock type’s correlation (Equation 6): the properties and characteristics of the rock mass interfere with the result of the fragmentation. The Lilly’s geomechanical classification subsequently modified by Cunningham is used in Kuz-Ram fragmentation model [3]:
( )0,06 A x RMD RDI HF= + + (6)
where A is the rock factor, the values of RMD (Rock Mass Description) are obtained from the geomechanical classification of Lilly, and other parameters are obtained with the help of equations 7, 8 and 9:
25 50RDI d= − (7)
/ 3, 50HF E se E GPa= < (8)
/ 5, 50HF UCS se E GPa= > (9)
where d is the density of the rock, E is Young’s modulus (GPa), and UCS to the uniaxial compressive strength of the rock (MPa) [3].
The uniaxial compression strength was obtained through the equation proposed by Barton et al. [11] and modified by Gokceoglu et al. [12], which considers the classification of the rock mass by the Q system (Equation 10). As the rock mass was already classified according to the RMR system, a correlation was proposed by Goet et al. [13] between the RMR and Q systems to determine this system through the RCR index, which corresponds to RMR without the values referring to joint orientations and intact rock strength (Equation 11):
( )1/310 ; /100c cE xQ Q Q x UCS= = (10)
8 30RCR lnN= + (11)
being N (number of rock mass) equivalent to the Q classification system considering the value of the Stress Reduction Factor (SRF) equal to 1.
Souza; Silva; Rocha
24 Tecnol. Metal. Mater. Miner., São Paulo, v. 15, n. 1, p. 22-30, jan./mar. 2018
1.2 Fragmentation Analysis by Image Processing
For the analysis of rock fragmentation in blasting was used the Split-Desktop Version 3.1 program and pictures got in the field. This program is a resource used in image processing to calculate the rock fragments PSD (Particle Size Distribution) through digital image analysis. Digital images can be acquired using a digital camera, and can come from the material in the square (muck pile), transport truck or conveyor belt.
2 METHODOLOGY
The methodology consisted basically in three stages. The first consisted in the recognition of the study area, which is the Herval Quarry, located in the city of Barreiros - PE, as well as the collection of technical data to determine the necessary parameters for geomechanical classification of rock mass; the second step consisted in the simulation of fragmentation through the Kuz-Ram model to obtain the particle size distribution curve; and at the third step was carried out the analysis of image processing for fragmentation using the Split-Desktop software.
The activities mentioned in the quarry for data collection were: recognition of mining fronts, fronts of measurement to determine the points of existing fractures, orientation of fractures attitudes (sense and diving) and detailed survey of the blast design. The Herval Quarry has two mining fronts and their extraction is done in benches, each mining front has three floors, subparallel and horizontal. After collecting the bench data provided by Herval Quarry, it was made a rock blasting, which was held on May 8, 2015.
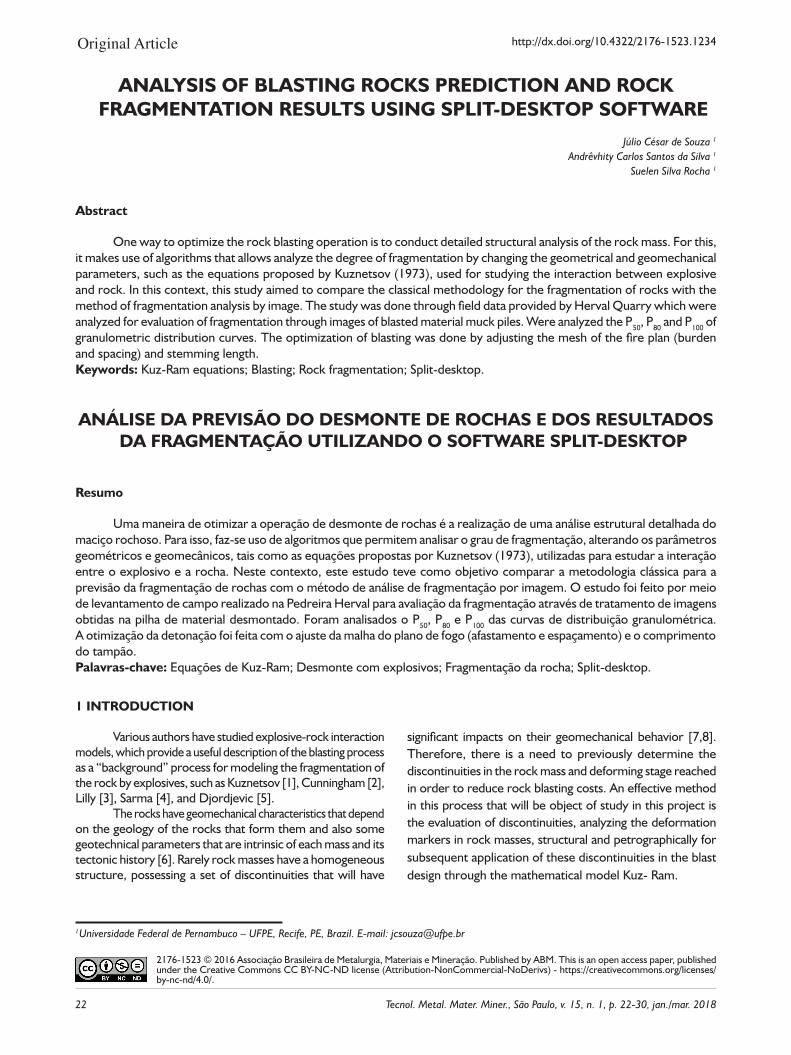
To determine the RMR was necessary to identify the discontinuities presents on the bench face and measured the distances between them, as shown in Figure 1, the presence
of water in the discontinuities, the weathering degree of the discontinuities and the characteristics of surface roughness. All information was measured in the field during the visit to Herval Quarry, as shown in Table 1.
The uniaxial compression strength was defined according to Equations 10 and 11. The RCR index value is 70; ergo, according to Equation 11, the value of N and consequently the value of Q is 148.41. Substituting in Equation 10, the UCS value found is 176.63 MPa. According to the Geomechanical classification table of Bieniawski [14], for this value of UCS, the RMR weight is 12 (Table 1).
2.1 Fragmentation simulation by Kuz-Ram model
This model requires information about the rock mass. In the equations given there are factors that concern about the geomechanical and geological characteristics of the rock. For this, the classification was made based on geomechanical classification proposed by Bieniawski [14]. For the simulation a spreadsheet was developed using Excel software to assist in the calculations of the equations proposed. The simulation results are presented in Tables 2 to 4 which show the blast design parameters, data from the Kuz-Ram model and rock fragmentation results of the Rosin-Rammler model to blasting.
Table 1. Rock mass classification of the Herval Quarry
Parameters WeightsUniaxial compressive strength 12
RQD (%) 20Spacing between discontinuities 15
Condition of discontinuities 20Water presence in discontinuities 15
TOTAL WEIGHT 82
Figure 1. Bench face showing the discontinuities and the distances between them.

Analysis of blasting rocks prediction and rock fragmentation results using split-desktop software
25Tecnol. Metal. Mater. Miner., São Paulo, v. 15, n. 1, p. 22-30, jan./mar. 2018
The Figure 2 shows the theoretical particle size distribution of the blasting at Herval Quarry obtained by the Rosin-Rammler model.
2.2 Fragmentation Analysis by Image Processing
For analysis of the blasting fragmentation at the Herval Quarry by image processing, it was used the Split-Desktop Version 3.1 program and photos of the blasting results acquired in field stage. Split-Desktop program is a resource used in image processing to calculate the size distribution of rock fragments through digital image analysis in grayscale. Digital images can be acquired using digital camera or cellphone.
After image acquisition, analysis of fragmentation from the blasting is carried out in five stages: opening of the images by the program; delineation of images; manual delineation edition to minimize errors; determination of images scale; analysis of the particle size of each image and blasting.
The acquisition and scheduling of the images were obtained with the aid of two spherical objects that were positioned apart in the lower and upper part of the image, so that their diameters were perpendicular to the optical axis of the image for that it did not differ from the real size.
Were captured 5 images of the blasting, which were delineated by the Split-Desktop. After processing the blasting pictures it was combined the graphs through the own Split-Desktop and generated a single graph for analysis of fragmentation. Figure 3 shows an example of the images captured for analysis of fragmentation along with
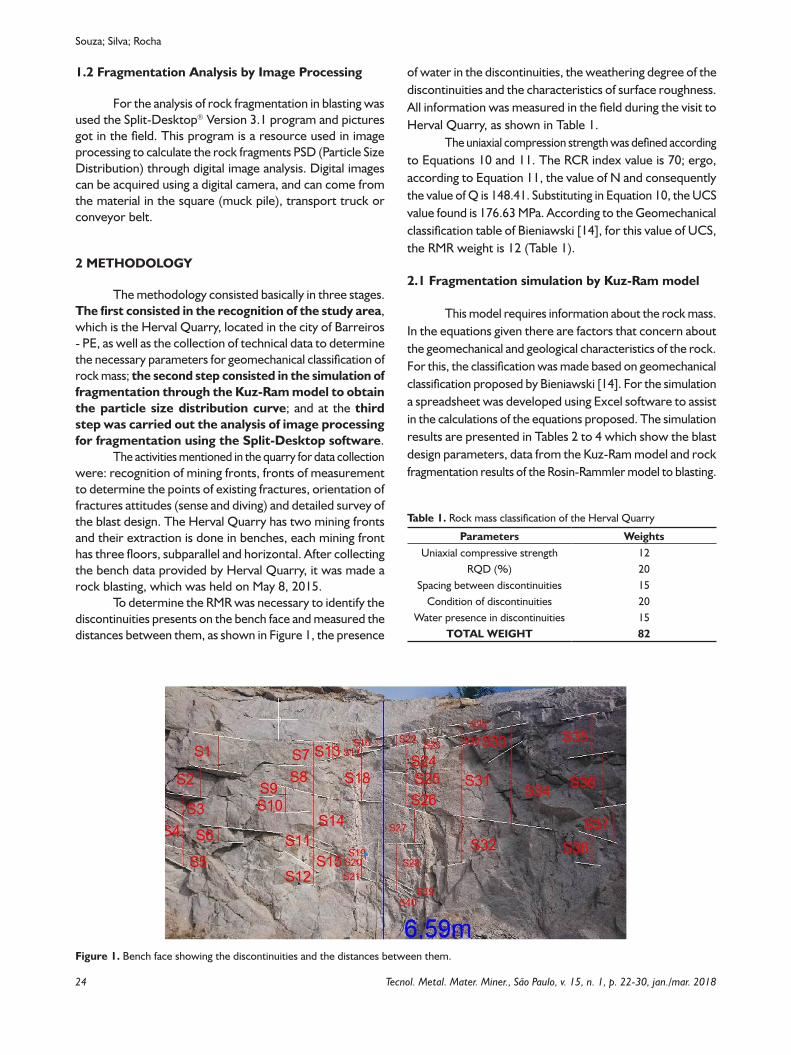
their delineation by software, and Figure 4 shows the size distribution curve obtained by combination of all graphs of blasting rocks analysis by image processing.
3 RESULTS AND DISCUSSIONS
To compare the size distribution curves of the simulations and results of imaging were analyzed three basic points of the curves:
• P50 - The diameter size through which 50% pass (fifty percent of the particles);
• P80 - The diameter size through which 80% pass (eighty percent of the particles);
• P100 - The maximum diameter through which 100% pass (one hundred percent of the particles).
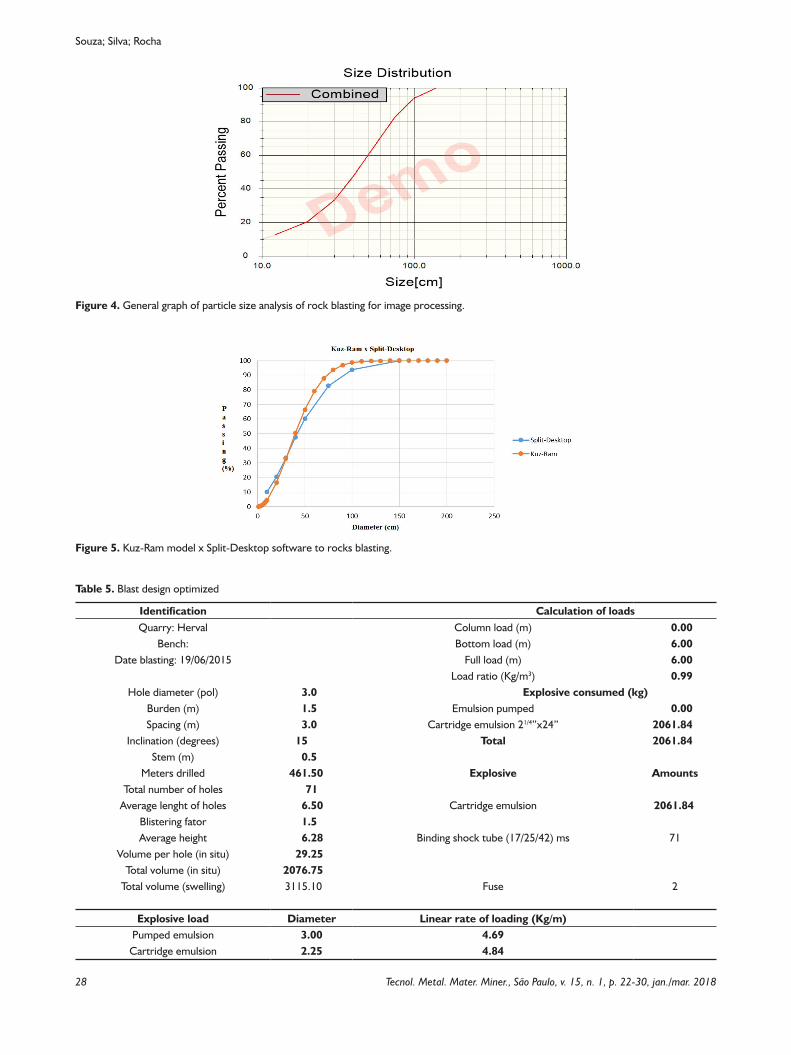
The evaluation of these curves showed that the Kuz-Ram model features a higher percentage of fines that the analysis processing of image curve. The two curves are similar in the range of about 20 cm to about 50 cm; above 50 cm the Kuz-Ram model has more fines. This can be demonstrated by plotting the two curves in the same simulation screen, as shown in Figure 5.
With regard to the P80, it may be noted that there is a small difference. This parameter obtained the value of approximately 60 cm for the simulation and the value of about 72.50 cm for size analysis by image. The discrepancy with the value by image analysis is approximately 17.24%.
Table 2. Monitoring the blasting at the Herval Quarry
Identification Calculation of loadsQuarry: Herval Column load (m) 0.00
Bench: Bottom load (m) 5.50Date blasting: 19/06/2015 Full load (m) 5.50
Load ratio (Kg/m3) 0.80Hole diameter (pol) 3.0 Explosive consumed (kg)
Burden (m) 1.6 Emulsion pumped 0.00Spacing (m) 3.2 Cartridge emulsion 21/4”x24” 1650.00
Inclination (degrees) 15 Total 1650.00Stem (m) 1.0
Meters drilled 403.00 Explosive AmountsTotal number of holes 62
Average lenght of holes 6.50 Cartridge emulsion 1650.00Blistering fator 1.5Average height 6.28 Binding shock tube (17/25/42) ms 61
Volume per hole (in situ) 33.28Total volume (in situ) 2063.36
Total volume (swelling) 3095.00 Fuse 2
Explosive load Diameter Linear rate of loading (Kg/m)Pumped emulsion 3.00 4.69
Cartridge emulsion 2.25 4.84

Souza; Silva; Rocha
26 Tecnol. Metal. Mater. Miner., São Paulo, v. 15, n. 1, p. 22-30, jan./mar. 2018
Table 3. Kuz-Ram model data from rock blasting
RMD
Description Classification Index
Description of the rock mass Friable 10
Fractured JF
Massive 50
JF Fractured massive JPS + JPA
JPS
Spacing of discontinuities (m) < 0.10 m 10
0.10 a MS 20
MS - DP 50
MS Oversize primary crushing (m)
DP Drilling loop parameters (m)
JPA
Direction and dip with respect to free face Horizontal 10
Dipped out the free face 20
Direction perpendicular to the free face 30
Plunged into the free face 40
RDI Influence density (g/cm3) RDI = 25d - 50 18.75
HFIf E < 50 GPa HF = E/3 0
If E > 50 GPa HF = UCS/5 35.33
E Young’s Modulus (GPa) 64
USC Uniaxial compressive strength (MPa) 176.63
Rock factor (A) Tidman equation: Energy Explosive (Er)
RMD 50 VODe 4100
RDI 18.75 VODn 5000
HF 35.33 RWS 86
A 6.2448 Er 57.8264
Kuznetsov equation
V0 Rock blasting volume 2063.36
Qe Explosive mass (Kg) 1650.44
K Load ratio (Kg/m3) 0.80
X50 Average size of the particle (cm) 39.76
Cunningham Uniformity Index (n)
B Burden (m) 1.6
S Spacing (m) 3.2
D Hole diameter (mm) 76.2
W Standard deviation drilling (m) 0.00
L Total length of the load (m) 5.50
H Bench height (m) 6.50
N 1.975
In relation to P50, there is a small discrepancy in relation to the simulated curve obtained by imaging of about 5.67%, having a diameter of 42.15 centimeters in image analysis and 39.76 cm for the simulation through Kuz-Ram.
It may be noted that the slope in curves appear to be the same, since it is the same blast plan; another common characteristic between the two curves is that they are in different size ranges; and a last observable characteristic is that the curve for the image processing analysis does not
show results for sizes smaller than 10 cm, unlike the curve referring to the Kuz-Ram model, which provides sizes in the range of 0 to 10 cm.
In order to optimize the blast, the particle size was adjusted so that P80 had value approximately less than or equal to 50 cm, which corresponds to the primary crusher feeding, which is a jaw crusher model FAÇO Of 80x50 cm.
For this, an optimized blast design was developed, adjusting the drilling grid and the stem, based on the simulation

Analysis of blasting rocks prediction and rock fragmentation results using split-desktop software
27Tecnol. Metal. Mater. Miner., São Paulo, v. 15, n. 1, p. 22-30, jan./mar. 2018
Table 4. Data of rock fragmentation in the blasting
Rosin-Rammler equation (P)Rock Fragmentation
X
Sieve (cm) Passing (%)1 0.0480083882 0.1886368983 0.4197118104 0.7396744705 1.147023734
10 4.43483392350 66.37139288
100 98.62275220150 99.99284590160 99.99804600170 99.99950810180 99.99988590190 99.99997560200 99.99999520
Figure 2. Particle size curve simulation of rock blasting.
Figure 3. Image captured for analysis and their delineation by Split-Desktop program.
of the Kuz-Ram model that has already been performed (Table 3). In relation to the drilling grid, there was a change in spacing, which decreased from 3.2 meters to 3 m, and in the burden, which decreased from 1.6 to 1.5 m; the stem, which was 1.0 m, decreased to 50 cm. With these changes, the number of holes increased from 62 to 71, increasing the cost of drilling and with explosives, but reducing with crushing and secondary blasting.
The results of optimization of blast design parameters are shown in Table 5.
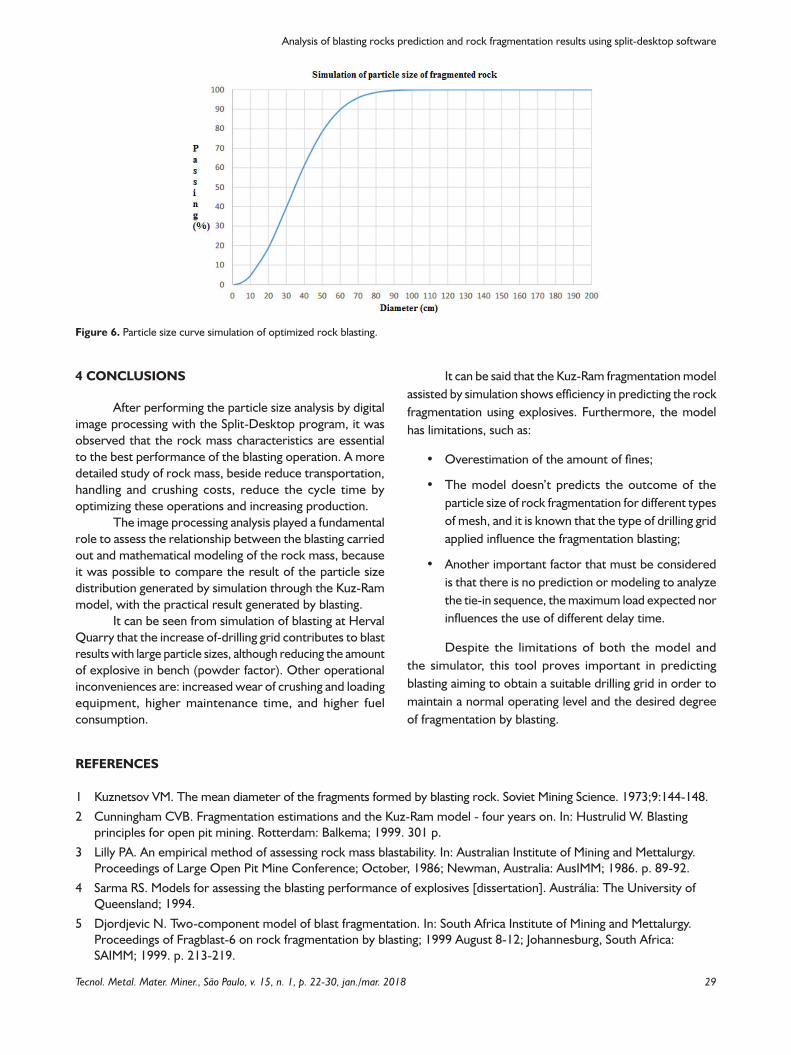
The graph of Figure 6 shows the particle size curve of the optimized blast through the Rosin-Rammler equation:
It can be seen that through the small changes in the geometry of the fire plane it was possible to increase the fragmentation and obtain a P80 of approximately 50 cm, which optimizes the crushing operation and will probably cause a reduction in production costs.
Souza; Silva; Rocha
28 Tecnol. Metal. Mater. Miner., São Paulo, v. 15, n. 1, p. 22-30, jan./mar. 2018
Figure 4. General graph of particle size analysis of rock blasting for image processing.
Figure 5. Kuz-Ram model x Split-Desktop software to rocks blasting.
Table 5. Blast design optimized
Identification Calculation of loadsQuarry: Herval Column load (m) 0.00
Bench: Bottom load (m) 6.00Date blasting: 19/06/2015 Full load (m) 6.00
Load ratio (Kg/m3) 0.99Hole diameter (pol) 3.0 Explosive consumed (kg)
Burden (m) 1.5 Emulsion pumped 0.00Spacing (m) 3.0 Cartridge emulsion 21/4”x24” 2061.84
Inclination (degrees) 15 Total 2061.84Stem (m) 0.5
Meters drilled 461.50 Explosive AmountsTotal number of holes 71
Average lenght of holes 6.50 Cartridge emulsion 2061.84Blistering fator 1.5Average height 6.28 Binding shock tube (17/25/42) ms 71
Volume per hole (in situ) 29.25Total volume (in situ) 2076.75
Total volume (swelling) 3115.10 Fuse 2
Explosive load Diameter Linear rate of loading (Kg/m)Pumped emulsion 3.00 4.69
Cartridge emulsion 2.25 4.84
Analysis of blasting rocks prediction and rock fragmentation results using split-desktop software
29Tecnol. Metal. Mater. Miner., São Paulo, v. 15, n. 1, p. 22-30, jan./mar. 2018
It can be said that the Kuz-Ram fragmentation model assisted by simulation shows efficiency in predicting the rock fragmentation using explosives. Furthermore, the model has limitations, such as:
• Overestimation of the amount of fines;
• The model doesn’t predicts the outcome of the particle size of rock fragmentation for different types of mesh, and it is known that the type of drilling grid applied influence the fragmentation blasting;
• Another important factor that must be considered is that there is no prediction or modeling to analyze the tie-in sequence, the maximum load expected nor influences the use of different delay time.
Despite the limitations of both the model and the simulator, this tool proves important in predicting blasting aiming to obtain a suitable drilling grid in order to maintain a normal operating level and the desired degree of fragmentation by blasting.
4 CONCLUSIONS
After performing the particle size analysis by digital image processing with the Split-Desktop program, it was observed that the rock mass characteristics are essential to the best performance of the blasting operation. A more detailed study of rock mass, beside reduce transportation, handling and crushing costs, reduce the cycle time by optimizing these operations and increasing production.
The image processing analysis played a fundamental role to assess the relationship between the blasting carried out and mathematical modeling of the rock mass, because it was possible to compare the result of the particle size distribution generated by simulation through the Kuz-Ram model, with the practical result generated by blasting.
It can be seen from simulation of blasting at Herval Quarry that the increase of-drilling grid contributes to blast results with large particle sizes, although reducing the amount of explosive in bench (powder factor). Other operational inconveniences are: increased wear of crushing and loading equipment, higher maintenance time, and higher fuel consumption.
Figure 6. Particle size curve simulation of optimized rock blasting.
REFERENCES
1 Kuznetsov VM. The mean diameter of the fragments formed by blasting rock. Soviet Mining Science. 1973;9:144-148.2 Cunningham CVB. Fragmentation estimations and the Kuz-Ram model - four years on. In: Hustrulid W. Blasting
principles for open pit mining. Rotterdam: Balkema; 1999. 301 p.3 Lilly PA. An empirical method of assessing rock mass blastability. In: Australian Institute of Mining and Mettalurgy.
Proceedings of Large Open Pit Mine Conference; October, 1986; Newman, Australia: AusIMM; 1986. p. 89-92.4 Sarma RS. Models for assessing the blasting performance of explosives [dissertation]. Austrália: The University of
Queensland; 1994.5 Djordjevic N. Two-component model of blast fragmentation. In: South Africa Institute of Mining and Mettalurgy.
Proceedings of Fragblast-6 on rock fragmentation by blasting; 1999 August 8-12; Johannesburg, South Africa: SAIMM; 1999. p. 213-219.
Souza; Silva; Rocha
30 Tecnol. Metal. Mater. Miner., São Paulo, v. 15, n. 1, p. 22-30, jan./mar. 2018
6 Hudson JA, Cosgrove JW. Integrated structural geology and engineering rock mechanics approach to site characterization. International Journal of Rock Mechanics and Mining Sciences. 1997;34:1-15.
7 Gama CD. Aspectos geotécnicos y de fracturación en la explotación de Canteras. In: Jimeno CL, editors. Manual de Rocas Ornamentales. Madrid: Entorno Gráfico; 1995. p. 231-246.
8 Rocha M. Mecânica das rochas. Lisboa: Laboratório Nacional de Engenharia Civil; 1981. 445 p.
9 Rosin P, Rammler E. The Laws Governing the Fineness of Powdered Coal. Journal of the Institute of Fuel. 1933;7:29-36.
10 Tidman JP. (1991). Target for blast fragmentation models. In: International Society of Explosives Engineers. Proceedings of 7th Annual Symposium of Explosives and Blasting Research; 1991 February 6-7; Las Vegas, Nevada: ISEE. p. 159-166.
11 Barton N, Lin R, Lunden J. Engineering classification of rock masses for the design of tunnel suport. Rock Mechanics. 1974;6(4):189-236.
12 Gokceoglu C, Sonmez H, Kayabasi A. Predicting the deformation moduli of rock masses. International Journal of Rock Mechanics and Mining Sciences. 2003;40(5):701-710.
13 Goet RK, Jethwa JL, Dhar BB. Effect of tunnel size on support pressure. International Journal of Rock Mechanics and Mining Sciences & Geomechanics Abstracts. 1996;33(7):749-755.
14 Bieniawski ZT. Engineering rock mass classifications: a complete manual for engineers and geologists in mining, civil, and petroleum engineering. New York: Interscience, John Wiley & Sons; 1989. 272 p.
Recebido em: 26 Set. 2016 Aceito em: 13 Maio 2017