Analysis and estimative of schistosomiasis prevalence for the state of Minas Gerais, Brazil, using...
6
91 91 91 91 91 Mem Inst Oswaldo Cruz, Rio de Janeiro, Vol. 101(Suppl. I): 91-96, 2006 Analysis and estimative of schistosomiasis prevalence for the state of Minas Gerais, Brazil, using multiple regression with social and environmental spatial data Ricardo JPS Guimarães*****, Corina C Freitas/ + , Luciano V Dutra, Ana CM Moura*, Ronaldo S Amaral**, Sandra C Drummond***, Márcio Guerra******, Ronaldo GC Scholte****/*****, Charles R Freitas*, Omar S Carvalho**** Instituto Nacional de Pesquisas Espaciais, Caixa Postal 515, 12201-970 São José dos Campos, SP, Brasil *Universidade Federal de Minas Gerais/UFMG, Belo Horizonte, MG, Brasil **Secretaria de Vigilância em Saúde/MS, Brasíla, DF, Brasil ***Secretaria Estadual de Saúde, Belo Horizonte, MG, Brasil ****Centro de Pesquisas René Rachou-Fiocruz, Belo Horizonte, MG, Brasil *****Programa de Pós-Graduação em Clínica Médica/Biomedicina da Santa Casa de Misericórdia de Belo Horizonte, Belo Horizonte, MG, Brasil ******Companhia de Tecnologia da Informação do Estado de Minas Gerais, Belo Horizonte, MG, Brasil The aim of this work is to establish a relationship between schistosomiasis prevalence and social-environmental variables, in the state of Minas Gerais, Brazil, through multiple linear regression. The final regression model was established, after a variables selection phase, with a set of spatial variables which contains the summer minimum temperature, human development index, and vegetation type variables. Based on this model, a schistosomiasis risk map was built for Minas Gerais. Key words: schistosomiasis - risk map - geographical information system - multiple linear regression Schistosomiasis is endemic in 74 tropical developing countries. It is estimated that 200 million people are al- ready infected, and that 600 million people are at risk of becoming infected (WHO 1999). Disease prevalence is heterogeneous in vulnerable locales and tends to be worse in areas with extreme poverty, poor sanitation, increased freshwater irrigation usage, and with inadequacy or total lack of public health facilities. The treatment for schistosomiasis is simple, due to the availability of fast action drugs prescribed in one single oral dose (Katz et al. 1989). However, the disease preva- lence remains unchanged in endemic regions and it is ex- panding mainly in the urban centers periphery (Neves 2005). The extensive distribution of the intermediate hosts, from Biomphalaria species, in Minas Gerais, Brazil gives to schistosomiasis an expansive characteristic, even for indene areas (Katz & Carvalho 1983, Carvalho et al. 1988, 1989). In the endemic areas, the high concentration of the hosts, associated to other risk factors, favors the exist- ence of communities with high prevalence of schistoso- miasis. The distribution of the schistosomiasis in the state of Minas Gerais is not regular, intercalating areas of high prevalence with others where the transmission is low or null. The disease is endemic in the north (comprising the Médio São Francisco and Itacambira zones), oriental, and center regions (zones of Alto Jequitinhonha, Metalúrgica, Oeste, and Alto São Francisco). The higher infection indi- ces are found in the northeast and in the east part of the state, which includes the zones of Mucuri, Rio Doce, and Mata (Pellon & Teixeira 1950, Katz et al. 1978, Carvalho et al. 1987, Lambertucci et al. 1987). Since schistosomiasis is a disease determined in space and time by risk factors, the Geographical Information System (GIS) is a very powerful tool that might be used for better understanding the disease prevalence and risk factors distributions. The use of GIS in the identification of environmental characteristics allows the determination and the delimitation of factors and risk areas, leading to the optimization of the resources and to the choice of better strategies for controlling the disease. The predic- tion of schistosomiasis using GIS was first attempted in the Philippines and the Caribbean by Cross et al. (1984). The influence of climate and environmental variables to the distribution of schistosomiasis was documented by Brown (1994) and Appleton (1978). The use of GIS for the study of schistosomiasis was also done in several other countries: in Asia (Cross et al. 1996), China (Zhou et al. 2001, Seto et al. 2002, Yang et al. 2005), Ethiopia (Kristensen et al. 2001, Malone et al. 2001), Egypt (Malone et al. 1994, 1997, Abdel-Rahman et al. 2001), Uganda (Kabatereine et al. 2004), Tanzania (Brooker et al. 2001), Chad (Beasley et al. 2002, Brooker et al. 2002). In Brazil, one of the first studies trying to correlate disease distri- bution with environmental variables was conducted by Bavia et al. (2001), in Bahia. The objective of this paper is to provide a risk map for the state of Minas Gerais, by establishing a relationship between prevalence of schistosomiasis and social-envi- ronmental variables through multiple linear regression and Financial support: Inpe, CNPq (309922/2003-8; 305546/2003- 1; 380203/2004-9), Fapemig (EDT 1775/03; EDT 61775/03; CRA 0070/04) + Corresponding author: [email protected] Received 25 May 2006 Accepted 26 June 2006
Transcript of Analysis and estimative of schistosomiasis prevalence for the state of Minas Gerais, Brazil, using...

9191919191Mem Inst Oswaldo Cruz, Rio de Janeiro, Vol. 101(Suppl. I): 91-96, 2006
Analysis and estimative of schistosomiasis prevalence for the stateof Minas Gerais, Brazil, using multiple regression with social
and environmental spatial dataRicardo JPS Guimarães*****, Corina C Freitas/+, Luciano V Dutra, Ana CM Moura*,
Ronaldo S Amaral**, Sandra C Drummond***, Márcio Guerra******,Ronaldo GC Scholte****/*****, Charles R Freitas*, Omar S Carvalho****
Instituto Nacional de Pesquisas Espaciais, Caixa Postal 515, 12201-970 São José dos Campos, SP, Brasil*Universidade Federal de Minas Gerais/UFMG, Belo Horizonte, MG, Brasil **Secretaria de Vigilância em Saúde/MS, Brasíla,DF, Brasil ***Secretaria Estadual de Saúde, Belo Horizonte, MG, Brasil ****Centro de Pesquisas René Rachou-Fiocruz, Belo
Horizonte, MG, Brasil *****Programa de Pós-Graduação em Clínica Médica/Biomedicina da Santa Casa de Misericórdia deBelo Horizonte, Belo Horizonte, MG, Brasil ******Companhia de Tecnologia da Informação do Estado de Minas Gerais,
Belo Horizonte, MG, Brasil
The aim of this work is to establish a relationship between schistosomiasis prevalence and social-environmentalvariables, in the state of Minas Gerais, Brazil, through multiple linear regression. The final regression model wasestablished, after a variables selection phase, with a set of spatial variables which contains the summer minimumtemperature, human development index, and vegetation type variables. Based on this model, a schistosomiasis riskmap was built for Minas Gerais.
Key words: schistosomiasis - risk map - geographical information system - multiple linear regression
Schistosomiasis is endemic in 74 tropical developingcountries. It is estimated that 200 million people are al-ready infected, and that 600 million people are at risk ofbecoming infected (WHO 1999). Disease prevalence isheterogeneous in vulnerable locales and tends to be worsein areas with extreme poverty, poor sanitation, increasedfreshwater irrigation usage, and with inadequacy or totallack of public health facilities.
The treatment for schistosomiasis is simple, due tothe availability of fast action drugs prescribed in one singleoral dose (Katz et al. 1989). However, the disease preva-lence remains unchanged in endemic regions and it is ex-panding mainly in the urban centers periphery (Neves2005).
The extensive distribution of the intermediate hosts,from Biomphalaria species, in Minas Gerais, Brazil givesto schistosomiasis an expansive characteristic, even forindene areas (Katz & Carvalho 1983, Carvalho et al. 1988,1989). In the endemic areas, the high concentration of thehosts, associated to other risk factors, favors the exist-ence of communities with high prevalence of schistoso-miasis. The distribution of the schistosomiasis in the stateof Minas Gerais is not regular, intercalating areas of highprevalence with others where the transmission is low ornull. The disease is endemic in the north (comprising the
Médio São Francisco and Itacambira zones), oriental, andcenter regions (zones of Alto Jequitinhonha, Metalúrgica,Oeste, and Alto São Francisco). The higher infection indi-ces are found in the northeast and in the east part of thestate, which includes the zones of Mucuri, Rio Doce, andMata (Pellon & Teixeira 1950, Katz et al. 1978, Carvalho etal. 1987, Lambertucci et al. 1987).
Since schistosomiasis is a disease determined in spaceand time by risk factors, the Geographical InformationSystem (GIS) is a very powerful tool that might be usedfor better understanding the disease prevalence and riskfactors distributions. The use of GIS in the identificationof environmental characteristics allows the determinationand the delimitation of factors and risk areas, leading tothe optimization of the resources and to the choice ofbetter strategies for controlling the disease. The predic-tion of schistosomiasis using GIS was first attempted inthe Philippines and the Caribbean by Cross et al. (1984).The influence of climate and environmental variablesto the distribution of schistosomiasis was documentedby Brown (1994) and Appleton (1978). The use of GIS forthe study of schistosomiasis was also done in severalother countries: in Asia (Cross et al. 1996), China (Zhouet al. 2001, Seto et al. 2002, Yang et al. 2005), Ethiopia(Kristensen et al. 2001, Malone et al. 2001), Egypt (Maloneet al. 1994, 1997, Abdel-Rahman et al. 2001), Uganda(Kabatereine et al. 2004), Tanzania (Brooker et al. 2001),Chad (Beasley et al. 2002, Brooker et al. 2002). In Brazil,one of the first studies trying to correlate disease distri-bution with environmental variables was conducted byBavia et al. (2001), in Bahia.
The objective of this paper is to provide a risk map forthe state of Minas Gerais, by establishing a relationshipbetween prevalence of schistosomiasis and social-envi-ronmental variables through multiple linear regression and
Financial support: Inpe, CNPq (309922/2003-8; 305546/2003-1; 380203/2004-9), Fapemig (EDT 1775/03; EDT 61775/03;CRA 0070/04)+Corresponding author: [email protected] 25 May 2006Accepted 26 June 2006

9292929292 Schistosomiasis prevalence using spatial data • Ricardo JPS Guimarães et al.
geographical information system. Also, we extend themethodology in several directions by introducing newexplicative variables: climate variables and categorical datafrom standard biomes in Minas Gerais.
MATERIALS AND METHODS
Variables acquisition - The geo determination qual-ity of a spatial model depends on how accurate the spatialpositioning of involved variables is. Ideally it is desirablethat each disease occurrence would be geo located byGeographic coordinates. Prevalence data, however, hasbeen acquired for several years- even before the GPS tech-nology became commonly available- being associated withthe municipality center or some countryside village. Be-cause of this limitation it was decided to integrate theenvironmental variables over the municipality territory tobe used as an input to the modeling process. This is alsocoherent with the fact that the sociological indexes, alsoused here, are associated with the municipalities.
The schistosomiasis prevalence data (dependent vari-able) for 189 municipalities in Minas Gerais were obtainedfrom Brazilian Health Ministry and from Health Secretariatof Minas Gerais State Annual Reports. The prevalencespatial distribution for Minas Gerais can be observed inFig. 1.
Fourteen quantitative independent variables wereused in the statistical analysis: three climatic variables(total precipitation, minimum and maximum temperature)in summer (from 17/Jan/2002 to 01/Feb/2002 period) andin winter (from 28/Jul/2002 to 12/Aug/2002 period) sea-sons, and four social variables [human development in-dex (HDI), income, longevity and education indices] forthe years of 1991 and 2000. Besides quantitative variables,two qualitative variables (binary) were also used, to rep-resent three vegetation types: savanna, caatinga, and for-est. The climatic variables were obtained from CPTEC/Inpe, the sociological ones from Brazilian Human Devel-
oping Atlas, and the qualitative variable from GeominasProject (Prodemge 1996). All independent and dependentdata were given in a municipality base, with exception ofthe climatic data, which were given in a grid of 250 × 250m. These data were, however, integrated over the munici-pality territory as explained.
Variables selection - The independent variables wereused as input variables to establish the multiple regres-sion model for prevalence risk. Since multicollinearity ef-fects among the independent variables were detected,variables selection techniques were used in order tochoose a set of variables (or transformations of them)that better explain the dependent variable.
A logarithmic transformation for the dependent vari-able (prevalence, denoted by PREV) was made as it im-proved the correlation with independent variables.
The variables selection was done by the R2 criterion,using all possible regression procedure (Neter et al. 1996).This selection technique consists in the identification ofa subset with few variables and a coefficient of determi-nation R2 sufficiently closed to that when all variables areused in the model. Interaction effects were also includedin the model.
After choosing the model, the estimated regressionfunction was applied to all municipalities to build a riskmap for schistosomiasis prevalence.
RESULTS
To illustrate the variables selection technique, Fig. 2contains a plot of the highest R2 values against the num-ber of variables in the model. In this figure the chosenmodel is highlighted in red, with R2 = 0.3774, consisting ofa model with five variables: summer precipitation (PCs),summer minimum temperature (TNs), 1991 Human Devel-opment Index (HDI91) and two binary variables represent-ing the vegetation types:
Fig. 1: schistosomiasis prevalence in Minas Gerais.

9393939393Mem Inst Oswaldo Cruz, Rio de Janeiro, Vol. 101(Suppl. I), 2006
=otherwise0
savannaisvegetationif11V
and
=otherwise0
forestisvegetationif12V
The analysis of this model showed that the regressioncoefficient of the variable PCs was not statistically signifi-cant at 5% level. Therefore, this variable was also dis-carded from the model. The model with four variables (TNs,HDI91, V1, and V2) has a coefficient of determination of0.3569, and it is highlighted in green in Fig. 2.
After choosing the variables, the significance of sev-eral cross-product interaction effects were tested. The
final selected model, with R2 = 0.3631, consisted of theaforementioned variables and the interaction betweenHDI91, and V1, showing that the influence of HDI for theexplanation of prevalence is different for savanna whencompared to forest and caatinga.
The general estimated regression function is:
1) 1,1680 1,1538 4,4012 - 0,2113 0,2012( 191291 −= +++−e VHDIVHDITN sPREV
This model for each vegetation type can be written as:- Forest => 1) 4,4012 - 0,2113 0,9526( 91 −= +e HDITN sPREV
- Savanna => 1) HDI 3,2332 - 0,2113 0,2012( 91 −= +−e sTNPREV
- Caatinga => 1) 4,4012 - 0,2113 0,2012( 91 −= +−e HDITN sPREV
Fig. 3a shows the estimated prevalence and Fig. 3b itscorresponding estimated standard deviation, for all mu-nicipalities of the state of Minas Gerais.
Fig. 2: R² x number of variables
Fig. 3A: estimated schistosomiasis prevalence; B: corresponding estimated standard deviation for the state of Minas Gerais.
9494949494 Schistosomiasis prevalence using spatial data • Ricardo JPS Guimarães et al.
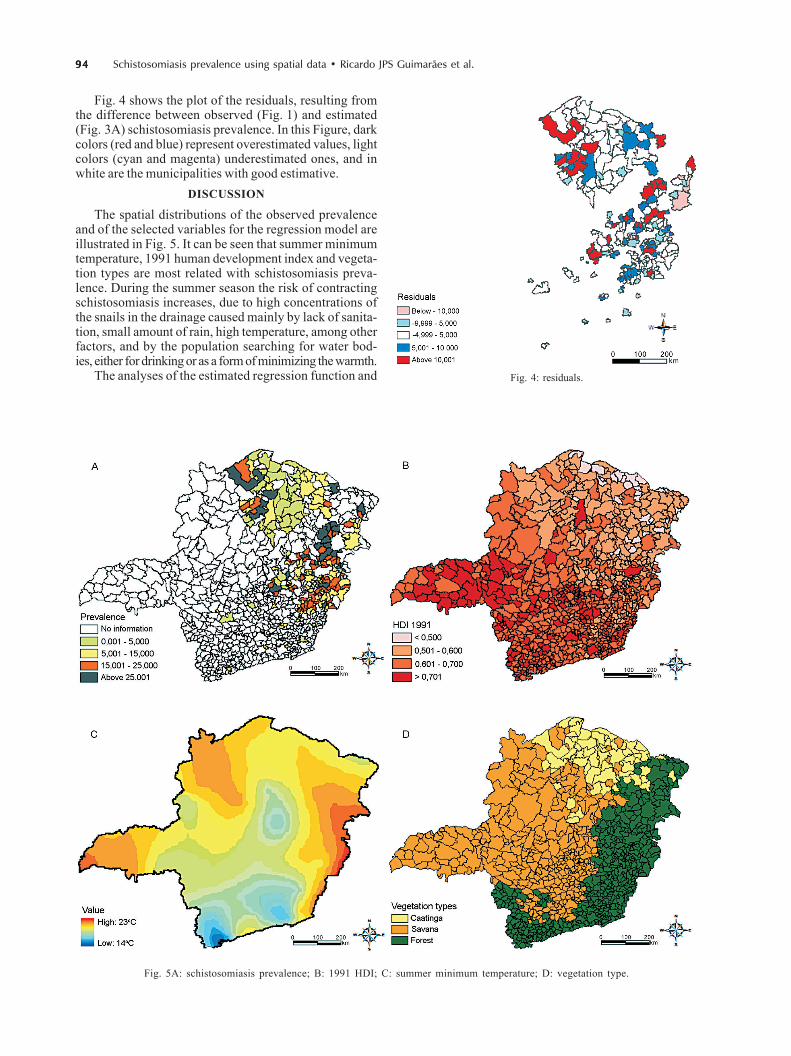
Fig. 4: residuals.
Fig. 4 shows the plot of the residuals, resulting fromthe difference between observed (Fig. 1) and estimated(Fig. 3A) schistosomiasis prevalence. In this Figure, darkcolors (red and blue) represent overestimated values, lightcolors (cyan and magenta) underestimated ones, and inwhite are the municipalities with good estimative.
DISCUSSION
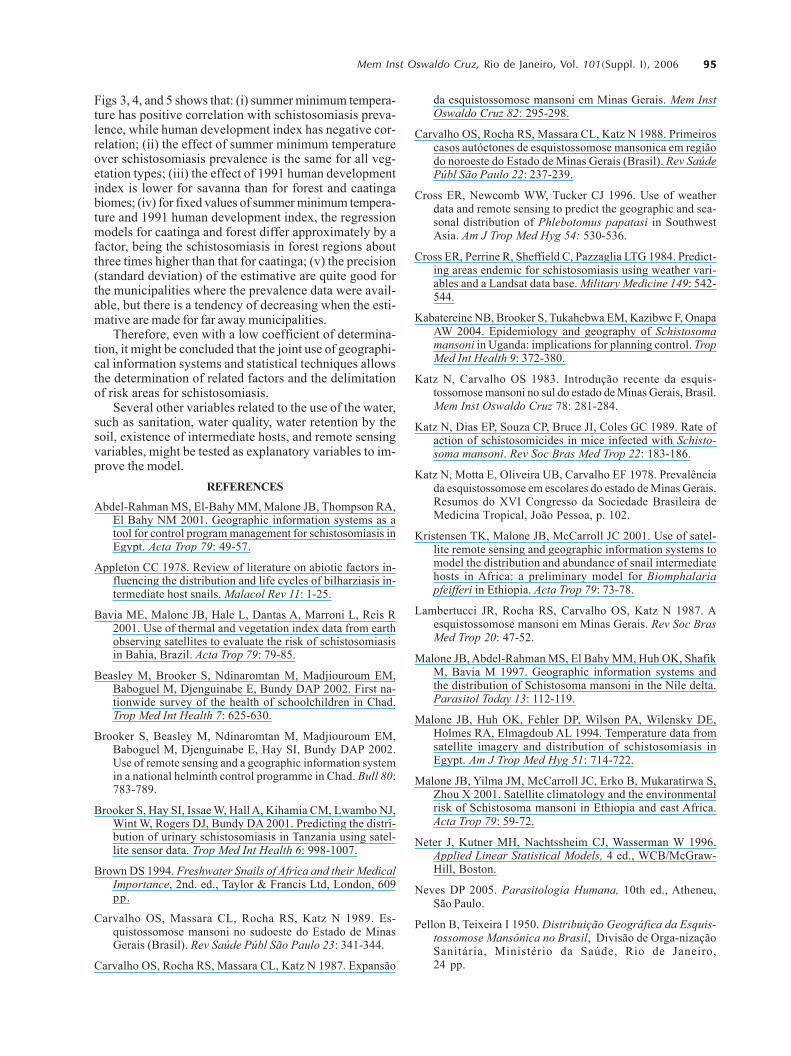
The spatial distributions of the observed prevalenceand of the selected variables for the regression model areillustrated in Fig. 5. It can be seen that summer minimumtemperature, 1991 human development index and vegeta-tion types are most related with schistosomiasis preva-lence. During the summer season the risk of contractingschistosomiasis increases, due to high concentrations ofthe snails in the drainage caused mainly by lack of sanita-tion, small amount of rain, high temperature, among otherfactors, and by the population searching for water bod-ies, either for drinking or as a form of minimizing the warmth.
The analyses of the estimated regression function and
Fig. 5A: schistosomiasis prevalence; B: 1991 HDI; C: summer minimum temperature; D: vegetation type.
9595959595Mem Inst Oswaldo Cruz, Rio de Janeiro, Vol. 101(Suppl. I), 2006
Figs 3, 4, and 5 shows that: (i) summer minimum tempera-ture has positive correlation with schistosomiasis preva-lence, while human development index has negative cor-relation; (ii) the effect of summer minimum temperatureover schistosomiasis prevalence is the same for all veg-etation types; (iii) the effect of 1991 human developmentindex is lower for savanna than for forest and caatingabiomes; (iv) for fixed values of summer minimum tempera-ture and 1991 human development index, the regressionmodels for caatinga and forest differ approximately by afactor, being the schistosomiasis in forest regions aboutthree times higher than that for caatinga; (v) the precision(standard deviation) of the estimative are quite good forthe municipalities where the prevalence data were avail-able, but there is a tendency of decreasing when the esti-mative are made for far away municipalities.
Therefore, even with a low coefficient of determina-tion, it might be concluded that the joint use of geographi-cal information systems and statistical techniques allowsthe determination of related factors and the delimitationof risk areas for schistosomiasis.
Several other variables related to the use of the water,such as sanitation, water quality, water retention by thesoil, existence of intermediate hosts, and remote sensingvariables, might be tested as explanatory variables to im-prove the model.
REFERENCES
Abdel-Rahman MS, El-Bahy MM, Malone JB, Thompson RA,El Bahy NM 2001. Geographic information systems as atool for control program management for schistosomiasis inEgypt. Acta Trop 79: 49-57.
Appleton CC 1978. Review of literature on abiotic factors in-fluencing the distribution and life cycles of bilharziasis in-termediate host snails. Malacol Rev 11: 1-25.
Bavia ME, Malone JB, Hale L, Dantas A, Marroni L, Reis R2001. Use of thermal and vegetation index data from earthobserving satellites to evaluate the risk of schistosomiasisin Bahia, Brazil. Acta Trop 79: 79-85.
Beasley M, Brooker S, Ndinaromtan M, Madjiouroum EM,Baboguel M, Djenguinabe E, Bundy DAP 2002. First na-tionwide survey of the health of schoolchildren in Chad.Trop Med Int Health 7: 625-630.
Brooker S, Beasley M, Ndinaromtan M, Madjiouroum EM,Baboguel M, Djenguinabe E, Hay SI, Bundy DAP 2002.Use of remote sensing and a geographic information systemin a national helminth control programme in Chad. Bull 80:783-789.
Brooker S, Hay SI, Issae W, Hall A, Kihamia CM, Lwambo NJ,Wint W, Rogers DJ, Bundy DA 2001. Predicting the distri-bution of urinary schistosomiasis in Tanzania using satel-lite sensor data. Trop Med Int Health 6: 998-1007.
Brown DS 1994. Freshwater Snails of Africa and their MedicalImportance, 2nd. ed., Taylor & Francis Ltd, London, 609pp.
Carvalho OS, Massara CL, Rocha RS, Katz N 1989. Es-quistossomose mansoni no sudoeste do Estado de MinasGerais (Brasil). Rev Saúde Públ São Paulo 23: 341-344.
Carvalho OS, Rocha RS, Massara CL, Katz N 1987. Expansão
da esquistossomose mansoni em Minas Gerais. Mem InstOswaldo Cruz 82: 295-298.
Carvalho OS, Rocha RS, Massara CL, Katz N 1988. Primeiroscasos autóctones de esquistossomose mansonica em regiãodo noroeste do Estado de Minas Gerais (Brasil). Rev SaúdePúbl São Paulo 22: 237-239.
Cross ER, Newcomb WW, Tucker CJ 1996. Use of weatherdata and remote sensing to predict the geographic and sea-sonal distribution of Phlebotomus papatasi in SouthwestAsia. Am J Trop Med Hyg 54: 530-536.
Cross ER, Perrine R, Sheffield C, Pazzaglia LTG 1984. Predict-ing areas endemic for schistosomiasis using weather vari-ables and a Landsat data base. Military Medicine 149: 542-544.
Kabatereine NB, Brooker S, Tukahebwa EM, Kazibwe F, OnapaAW 2004. Epidemiology and geography of Schistosomamansoni in Uganda: implications for planning control. TropMed Int Health 9: 372-380.
Katz N, Carvalho OS 1983. Introdução recente da esquis-tossomose mansoni no sul do estado de Minas Gerais, Brasil.Mem Inst Oswaldo Cruz 78: 281-284.
Katz N, Dias EP, Souza CP, Bruce JI, Coles GC 1989. Rate ofaction of schistosomicides in mice infected with Schisto-soma mansoni. Rev Soc Bras Med Trop 22: 183-186.
Katz N, Motta E, Oliveira UB, Carvalho EF 1978. Prevalênciada esquistossomose em escolares do estado de Minas Gerais.Resumos do XVI Congresso da Sociedade Brasileira deMedicina Tropical, João Pessoa, p. 102.
Kristensen TK, Malone JB, McCarroll JC 2001. Use of satel-lite remote sensing and geographic information systems tomodel the distribution and abundance of snail intermediatehosts in Africa: a preliminary model for Biomphalariapfeifferi in Ethiopia. Acta Trop 79: 73-78.
Lambertucci JR, Rocha RS, Carvalho OS, Katz N 1987. Aesquistossomose mansoni em Minas Gerais. Rev Soc BrasMed Trop 20: 47-52.
Malone JB, Abdel-Rahman MS, El Bahy MM, Huh OK, ShafikM, Bavia M 1997. Geographic information systems andthe distribution of Schistosoma mansoni in the Nile delta.Parasitol Today 13: 112-119.
Malone JB, Huh OK, Fehler DP, Wilson PA, Wilensky DE,Holmes RA, Elmagdoub AL 1994. Temperature data fromsatellite imagery and distribution of schistosomiasis inEgypt. Am J Trop Med Hyg 51: 714-722.
Malone JB, Yilma JM, McCarroll JC, Erko B, Mukaratirwa S,Zhou X 2001. Satellite climatology and the environmentalrisk of Schistosoma mansoni in Ethiopia and east Africa.Acta Trop 79: 59-72.
Neter J, Kutner MH, Nachtssheim CJ, Wasserman W 1996.Applied Linear Statistical Models, 4 ed., WCB/McGraw-Hill, Boston.
Neves DP 2005. Parasitologia Humana, 10th ed., Atheneu,São Paulo.
Pellon B, Teixeira I 1950. Distribuição Geográfica da Esquis-tossomose Mansônica no Brasil, Divisão de Orga-nizaçãoSanitária, Ministério da Saúde, Rio de Janeiro,24 pp.
9696969696 Schistosomiasis prevalence using spatial data • Ricardo JPS Guimarães et al.
Prodemge 1996. Geominas. Prodemge. Disponível em: http://www.geominas.mg.gov.br. Acesso em: 14 de fev. de 2006.
Seto E, Xu B, Liang S, Gong P, Wu W, Davis GM, Qui D, Gu X,Spear R 2002. The use of remote sensing for predictivemodeling of schistosomiasis in China. Photogram Eng RemS 68: 167-174.
WHO 1999. Schistosomiasis. W.H.O. Disponível em: http://www.tulane.edu/~dmsander/WWW/224/Schisto.html.
Acess: 31 Jan. 2006.Yang G-J, Vounatsou P, Xiao-Nong Z, Utzinger J, Tanner M
2005. A review of geographic information system and re-mote sensing with applications to the epidemiology andcontrol of schistosomiasis in China. Acta Trop 96: 117-129.
Zhou XN, Malone JB, Kristensen TK, Bergquist NR 2001.Application of geographic information systems and remotesensing to schistosomiasis control in China. Acta Trop 79:97-106.