An Unsettling Profile - Squarespace
124
The African American Community in Multnomah County: An Unsettling Profile & A partnership between
-
Upload
khangminh22 -
Category
Documents
-
view
1 -
download
0
Transcript of An Unsettling Profile - Squarespace

The African American Community in Multnomah County:An Unsettling Profile
&A partnership between

Coalition of Communities of ColorJulia Meier, Director5135 NE Columbia Blvd.Portland, OR 97218
Tel. (503) 288-8177 x295Email: [email protected]: www.coalitioncommunitiescolor.org
ISBN 978-0-9845216-3-0
CitationBates, L., Curry-Stevens, A. & Coalition of Communities of Color (2014). The African-American Community in Multnomah County: An Unsettling Profile. Portland, OR: Portland State University.
contact informati
on


Dear Reader, We are pleased to present the African-American Community in Multnomah County: An Unsettling Profile. This report is part of a broader effort led by the Coalition of Communities of Color to utilize data to better understand the needs of Oregon’s culturally diverse communities. As you are aware, African-Americans and other communities of color in Oregon experience grave disparities and inequitable levels of treatment across a wide range of determinants – education, economic development, health, housing and employment. In particular, the African-American community has faced continued upheaval and devastation since our migration here due to the ongoing discriminatory systems of development and decision making by city government and other mainstream jurisdictions. Over the last 60 years, three vibrant Black business districts and four communities have been scattered, including the most recent gentrification and displacement of African-Americans living in North and Northeast Portland. Yet despite these grave systemic inequities, our community continues to remain resilient, with our population, along with other communities of color, growing at rapid rates. While the white population increased by 30 percent over the last 11 years, the Black population increased by 66 percent. These changing demographics, coupled with the grave disparities currently experienced by our community, call for urgent action by the City of Portland, Multnomah County and other local jurisdictions to implement a plan for addressing our needs. Existing data that informs decision-making in Multnomah County inadequately captures the lived experiences of communities of color. As such, it is often the case that policies, which on the surface appear racially-neutral, when implemented actually have grave implications for diverse communities. Whether intentional or unintentional, data often serves to obscure and oppress rather than to empower African-Americans and eliminate disparities. As such, we ask that you use the granular race/ethnicity data in this report, and in other data collection mechanisms, as an important means (and not an end) to ensuring that your policy and programmatic decisions best meet the needs of African-Americans and other groups. While the findings in this report may be surprising or unsettling to readers, they represent the generational experiences of African-American community members. Thus, we hope this report does not simply sit on a shelf, but rather fosters action and accountability in local government to develop pro-active policy and programmatic solutions that will eliminate the disparities identified. In closing, we must express our deepest gratitude to our partners who have made this report possible, including authors Dr. Lisa K. Bates and Dr. Ann Curry-Stevens, the Coalition of Communities of Color and Portland State University. We also thank Self Enhancement, Inc., PCRI, Black Parent Initiative, Avel Gordly Center for Healing, Black United Fund, REAP, and other African-American organizations and activists who carry on the work to support our community in every way, and whose contributions to this report made it possible to verify the community’s needs.

PAALF gratefully acknowledges the Urban League of Portland, created the space for this document through their groundbreaking work The State of Black Oregon in 2009. May we all remain united in these facts, and plan for the best future for our community! Sincerely,
Tony Hopson, Sr. Maxine Fitzpatrick PAALF Co-Chair PAALF Co-Chair
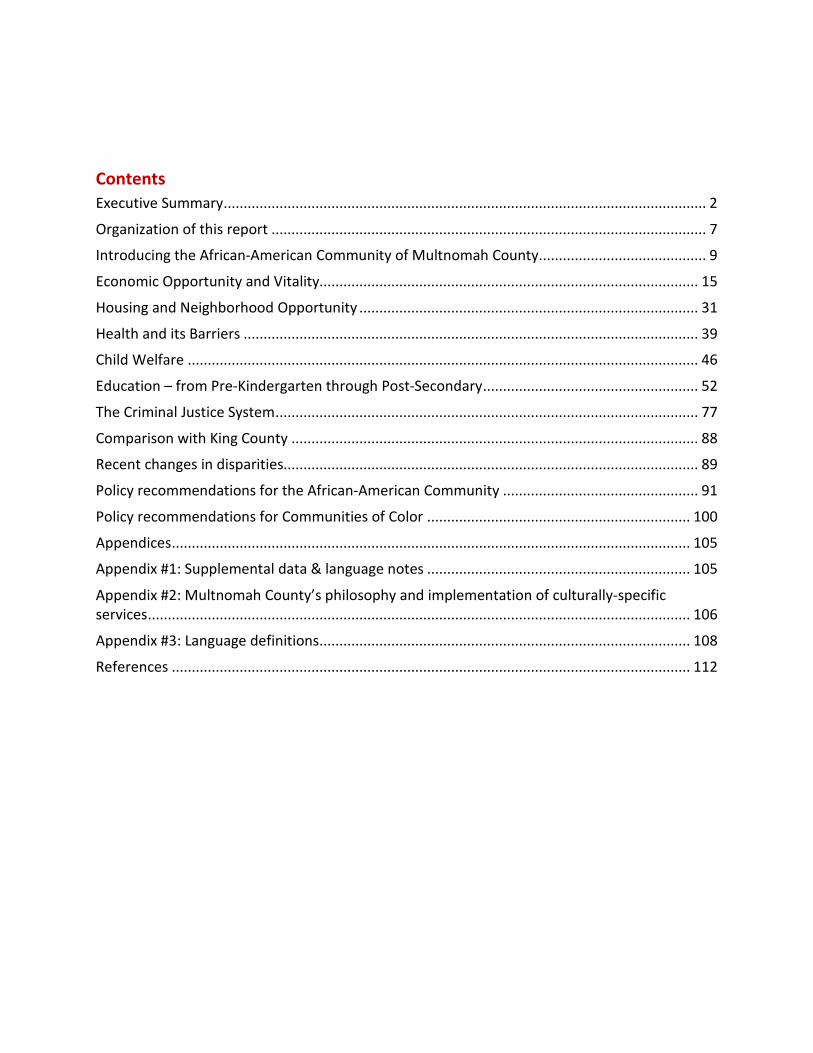
Contents Executive Summary ......................................................................................................................... 2
Organization of this report ............................................................................................................. 7
Introducing the African-American Community of Multnomah County .......................................... 9
Economic Opportunity and Vitality............................................................................................... 15
Housing and Neighborhood Opportunity ..................................................................................... 31
Health and its Barriers .................................................................................................................. 39
Child Welfare ................................................................................................................................ 46
Education – from Pre-Kindergarten through Post-Secondary ...................................................... 52
The Criminal Justice System .......................................................................................................... 77
Comparison with King County ...................................................................................................... 88
Recent changes in disparities........................................................................................................ 89
Policy recommendations for the African-American Community ................................................. 91
Policy recommendations for Communities of Color .................................................................. 100
Appendices .................................................................................................................................. 105
Appendix #1: Supplemental data & language notes .................................................................. 105
Appendix #2: Multnomah County’s philosophy and implementation of culturally-specific services ........................................................................................................................................ 106
Appendix #3: Language definitions ............................................................................................. 108
References .................................................................................................................................. 112

Executive Summary African-Americans have been present in Multnomah County and have made significant contributions to the life, culture, and development of the county since before the Oregon territory was established. Our legacy is interwoven with the state’s own history of racialized discrimination and exclusion. It is also a legacy of resistance to social and economic inequity. The struggles of African-Americans in Oregon have been a powerful agent of social change and progress. But as this report confirms, there is much to do to eliminate institutional structures that perpetuate racial injustice, poverty and disparities in opportunity for our community. Oregon has been slow to dismantle overtly racist policies, such as mortgage lenders’ redlining practices that continued into the 1990s, long after they were prohibited through the federal Fair Housing Act of 1968. These local practices deepened the well-recognized discrimination faced by African-Americans when they were denied access to both low-interest mortgages and free tuition supports after World War II. Discriminatory policies in employment, education, housing, the criminal justice system, policing, and in economic development have had the effect of limiting the ways our community has been able to advance and thrive. Historic barriers to quality education and homeownership have resulted in few opportunities to generate and sustain wealth and economic stability. Today, the African-American community nationally holds 5 cents in wealth for every $1 in wealth held by Whites. This disparity narrows our ability to develop resources for our community and its future generations. It impedes our capacity to withstand stress, and to weather crises and economic recessions. Communities that are denied access to critical opportunity structures become more dependent on social services and social programs, which often perpetuate the status quo, and are subject to shrinking budgets and shifts in political priorities. Many services do not meet the cultural needs of our communities. Ongoing discrimination in housing, in lending practices, in school discipline and racial profiling with police, draw us more heavily into punitive systems like juvenile justice and child welfare, and away from systems that would benefit us like higher education, economic opportunity, protected contracting practices, private sector and civil service employment. African-Americans in Multnomah County continue to live with the effects of racialized policies, practices, and decision-making. The stress of racism has a profound impact on health and wellness, as do other social determinants of health, such as ongoing discrimination in housing, school discipline, and racial profiling by police. Multiple systems of inequity and institutional racism results in over-representation in punitive systems like juvenile justice and child welfare, and underrepresentation in systems that advance opportunities, like higher education and civil services employment.
The African American Community in Multnomah County Coalition of Communities of Color & Portland State University
2 | P a g e

The result is to narrow opportunities for our future, for our children and indeed for the future of all of us, White and Black alike. Without addressing the social, racial, and economic inequities in Multnomah County, all of our futures are compromised. We affirm and applaud efforts that aim to dismantle, not perpetuate, systems of inequity. We assert the right and responsibility to hold policymakers and institutions—both public and private—accountable for progress toward racial equity. We affirm and applaud efforts to address institutional racism and racial inequities, and seek to push these efforts further – for we must also be afforded the right and responsibility to hold public policy to account for progress towards racial equity. The data compiled in this report demonstrate that African-Americans in Multnomah County face pronounced challenges:
• African-American family income is less than half that of White families, and the poverty rate among African-American children is nearly 50% compared to 13% for white children.
• African-Americans are deeply affected by unemployment with local unemployment levels in 2009 nearly double the white unemployment rate.
• Fewer than one-third of African-American households own their homes, compared to about 60% of white households in Multnomah County. African-Americans have experienced housing displacement and the loss of community as the historic Albina District has gentrified.
• African-Americans face substantial disparities for health outcomes like diabetes, stroke, and low birth weight, and in access to health insurance, prenatal care, and mental health care.
• In the child welfare system, African-American children are three times more likely to be placed in foster care than White children. Once in foster care, we are likely to stay in care much longer than White children.
• More than half of African-American youth do not complete high school, compared to just over a third of White students. School administrators are much more likely to discipline Black youth with suspensions and expulsions – at levels more than double those of Whites. This pattern exists despite studies that reveal Black children do not misbehave more frequently than White students.
• Black youth are 6½ times more likely to be charged with a crime than White youth, and 33% more likely to be held in detention. A White youth found guilty stands a one-in-ten chance of receiving a custodial sentence while a Black youth faces a one-in-four chance.
The composite picture of the Black community is one of deep challenges, as we strive to fulfill our aspirations for ourselves, for our families, and for our community. The evidence before us in this report must result in specific action and measurable outcomes. Approaches should consider the structures that are creating and perpetuating disparities and work to reform them for lasting change. We call for action to eliminate the County gap in income, health outcomes, social progress and educational attainment. Our County cannot afford to squander the creativity, innovation, and human potential our communities
The African American Community in Multnomah County Coalition of Communities of Color & Portland State University
3 | P a g e

bring to the region. African-American communities that thrive will make our entire County stronger and more competitive. Inaction is not an option. This report includes recommendations for policies and actions that target the disparities faced by Portland’s African-American community. The Portland African-American Leadership Forum (PAALF) supports and endorses the priorities of the Coalition of Communities of Color, and also acknowledges the specific needs of the African-American community to address historic and current racism. For each issue area, we present specific targeted recommendations for changing practices. To advance these interests, we affirm the priorities advanced in our earlier work and provides specific recommendations for African-American community-defined issues.1 The PAALF is committed to Portland becoming a livable city for all people, where race and economic status are not the key determinants to success in life. African-Americans must participate in and have equitable access to opportunity, and the playing field for African-Americans must be fair. Disparities in education, health, housing and economic development, and civic engagement and leadership must be eradicated. The City of Portland, Multnomah County, and Metro must employ a race-conscious equity strategy in planning, policy-making, and program delivery. This strategy should focus on the elimination of institutional racism: “policies, practices and programs that work to the benefit of white people and the detriment of people of color, usually unintentionally or inadvertently.”2 Eradicating institutional racism requires the examination of systemic policies and practices that serve to perpetuate disparities. Putting the value of equity into practice will require changing the way these public institutions work: how government and partners make decisions; where they invest; how services and programs are delivered; how they engage with all Portlanders and newcomer communities; and how success is measured. Public sector institutions will develop and apply a set of equity tools to evaluate the development and implementation of policies, programs and business operations to reduce critical disparities. This includes work identified in the Portland Plan and for the City’s Office of Equity and Human Rights plan to address deep and well documented racial disparities; Multnomah County’s equity initiative; and Metro equity and diversity strategies. The following recommendations are current, achievable, and specific to the African-American community.
Economic Opportunity and Vitality
Support Black business ownership, from entrepreneurship to growth and development. Public agency contracting and purchasing disparities must be eliminated. Public agencies must
assess the opportunities and barriers for Minority Business Enterprise participation in purchasing, consulting, and construction, and must utilize best practices for eliminating procurement disparities.
Public subsidies for development must advance racial equity. Major public projects should include Community Benefits Agreements defined through public participation. These policies must go
The African American Community in Multnomah County Coalition of Communities of Color & Portland State University
4 | P a g e

beyond ‘good faith agreements’ to achieve measurable goals and targets that must be met for MBE utilization and workforce diversity.
Housing and Neighborhood Opportunity Implement plans and policies to ensure that African-American residents have affordable housing in
high opportunity areas. Anticipate and manage future development. Where there are public investments to revitalize or redevelop neighborhoods, there must be an anti-displacement strategy in place to prevent displacement. This strategy must be race-conscious in addressing particular housing barriers for African-Americans.
Expand support for homeownership to reduce the African-American homeownership and wealth gap in Multnomah County.
Health
Healthcare delivery, particularly during healthcare reform, must assess health equity metrics, including cultural competency indicators.
Community health workers must be supported as a vital component of culturally-specific prevention and wellness strategies.
Address ‘upstream’ factors that disproportionately impact African-American health through equitable access to healthy, affordable and culturally relevant food; housing and neighborhood stability; and support environmental justice to reduce disproportionate exposure to hazards, ensuring access to transit, and to parks and recreation opportunities.
Child Welfare
Shift from intervention to prevention model, committed to internal system improvement including data-based decision-making.
Build community resources for African-American families, and collaborate with established family networks and community resources. Develop and sustain culturally responsive and community-based systems of family supports and preservation.
Address cultural competency as a core component of Oregon Department of Human Services Workforce Development. Enhance and transform recruitment and retention efforts for professionals of color.
Ensure accountability and enforcement protection by creating a plan for accountability and infrastructure.
Education
Define equity metrics and accountability for African-American achievement. True education reform focuses on outcomes—closing the achievement gaps, building a culture of high expectations, and
The African American Community in Multnomah County Coalition of Communities of Color & Portland State University
5 | P a g e

meeting 21st century challenges for building towards careers. School districts must create equity plans that specifically address racial achievement gaps.
Ensure that African-American youth are prepared to enter school by investing in affordable, high quality early childhood interventions.
End discipline disparities that lead to disengagement and dropout of African-American youth. Ensure that African-American youth are supported in and out of school to complete their education. Criminal Justice System Change practices that contribute to disparities/disproportionate representation of African-
Americans, and other minorities in Oregon state prisons. Reduce Oregon's over-reliance on incarceration as a response to crime and social problems, and shift toward more effective evidence based programs proven to reduce future crime.
Reduce recidivism and increase cost-effective crime prevention through stronger non-prison and post-prison programs. Remove the barriers to successful community re-entry faced by formerly incarcerated people.
Prevent new mandatory minimum sentences, which have a disproportionate impact on African-Americans and other people of color. Additionally, bring back judicial discretion for youth tried for Measure 11 offenses to minimize youth placement in the adult criminal justice system.
Adopt an approach to public safety that focuses on prevention, curbs the unsustainable growth of our prison system, invests in programs that are proven to reduce crime and save money, and strengthens support systems and services for crime survivors.
Civic Engagement
Ensure African-Americans are included at all the tables where African-Americans need to be engaged in policy-making and reform. To make sure African-Americans are included every step of the way, with impact, and proactive rather than reactionary, we must be intentionally inclusive.
As African-American community based organizations, ensure the Black community is involved, remaining relevant and engaged in policies that affect our community.
We implore each and every one of us to act on these recommendations. Begin today with an action plan that shows concern, compassion and a commitment to justice. To not act is unconscionable.
The African American Community in Multnomah County Coalition of Communities of Color & Portland State University
6 | P a g e

Organization of this report This report covers topics of importance for the African-American community, highlighting critical areas of disparity and disproportionate representation. The areas of analysis include: economic opportunity, housing and neighborhoods, education, health, child welfare, the criminal justice system, and civic engagement. In each area, we provide history and context, followed by data analysis that demonstrates the extent of racial disparity. Taken together, the data on inequities show a community facing real and persistent challenges. These data point to a need for fundamental change and help to focus attention on some key drivers of that change. The depth and breadth of disparities profiled in this report, while perhaps surprising to White readers, is an affirmation of the difficult lives of many African-Americans. Importantly, this report also highlights the work of organizations that improve conditions for and in the African-American community. The approaches these organizations take to specifically confronting racial inequality demonstrate results. Their success—in improving educational outcomes, preserving homeownership, supporting parents, and increasing civic and political participation—provide models for closing the gaps. Their successes show that the disparities faced by the African-American community are neither inherent nor inevitable. While many aspects of the African-American community’s experience today are disheartening, with different approaches to equitable policy-making and resource allocation, culturally-specific program delivery, and community-driven, community-defined models, we can work towards a better future. One general caveat for the analysis provided here relates to how data sources define racial identify. This report aims to present the conditions of the African-American community as distinct from the growing community of African immigrants. The report “The African Immigrant and Refugee Community in Multnomah County: An Unsettling Profile” denotes the unique cultural contributions and challenges for this population, and the separate effort recognizes how the history of race in America differently affects African-Americans who have experienced that history over a long term.3 However, due to the relatively imprecise ways that many data sets identify race and ethnicity, it is often difficult to determine from existing data whether Black people identify as African or African-American. This failure to distinguish culture from race means definitive statements on African-Americans alone are at times difficult to make. As Multnomah County becomes home to increasing numbers of Black immigrants, it will be more important to administrative data and institutions to make the distinction among Black people in order to focus properly on the particular issues of each group. Until that time, it is important to consider when the analysis of racial disparities for Blacks may reflect not only the long term inequality experienced by African-American but also challenges of the African immigrant population that includes a substantial numbers of refugees and English language-learning students, and experiences different challenges engaging economically and politically. The methods employed in this analysis look for two related but distinct concepts: disproportionality and disparity. Throughout this analysis, these terms have the following meanings:
The African American Community in Multnomah County Coalition of Communities of Color & Portland State University
7 | P a g e

Disproportionality analysis asks whether African-Americans are overrepresented among the population with a given problem compared to African-Americans’ representation in the general population. For example, if Multnomah County is about 7% Black, it is disproportionate that the population of people in emergency homeless shelters is 19% Black. Disparity asks whether the incidence of a problem within the African-American population is higher than the incidence of that problem within the dominant group. The Disparity Index (DI) is calculated as a ratio of the rate of a problem within a “Target Group” relative to the rate within a “Control Group” (in this instance, African-Americans are target, and Whites are the control). If the Target Group has a higher problem rate relative to the Control Group, the Disparity Index will have a value greater than one. Any DI substantially greater than one is an indication of disparity between the racial groups.
The African American Community in Multnomah County Coalition of Communities of Color & Portland State University
8 | P a g e

Introducing the African-American Community of Multnomah County Historical roots of the Black population African-Americans have lived in Multnomah County since before Oregon became a state. Oregon’s racial history has been troubled, to say the least, but Black Oregonians have made an impact and today are present in all walks of life. Oregon’s earliest history was as a sundown state—where African-Americans could not live or “let the sun set on them.” Laws passed in 1844 to ban slavery also excluded all Blacks, free and slave, from the Oregon territory. African-Americans were required to leave Oregon after two years, or “be flogged publicly for every six months until they did so.” Five years later, a law was enacted forbidding the entrance of free African-Americans into Oregon. The state Constitution, adopted in 1857, refused admittance to African-Americans: “no free Negro or mulatto not residing in the state at the adoption of this constitution shall come, reside or be within this state or hold real estate, or many contracts therein.”4 With the passage of the 14th Amendment, African-Americans had the right to freely enter Oregon and began to migrate to Portland,5 where African-Americans could work in railroad yards and as domestic servants.6 By 1900, the population of Oregon’s African-Americans was 1,105, with 66% living in the city of Portland.7 Many African-Americans ultimately settled on the east side of the Willamette River in the Williams Avenue district.8 In the district an African-American-owned business community emerged,9 along with churches and other social institutions.10 By 1930, there were 84 business enterprises run by African-Americans in Portland, and the city had an African-American physician, dentist, three African-American lawyers, and six African-American ministers.11 World War II marked a turning point when more than 22,000 African-American workers flocked to the city to work in the Kaiser shipyards.12 The large influx of war industry workers caused an acute housing shortage in Portland and Vanport, a giant temporary housing project, was built on the banks of the Columbia River between Portland and Vancouver. By 1945, Vanport had 30,842 residents, making it the second largest community in Oregon and the single largest wartime housing project in the country. Vanport housed 6,317 African-Americans, more than double the Black population for the entire state in 1940.13 In Vanport, schools and parks were integrated, unlike in the rest of the City.14 At the end of the war, thousands of African-American workers left Portland’s hostile environment and closed housing market, leaving the African-American population in the area at about 12,000. On Memorial Day in 1948, the Columbia River flooded, destroying Vanport; most of those displaced by the flood were moved into an area east of the old Williams Avenue neighborhood in north central Portland,
The African American Community in Multnomah County Coalition of Communities of Color & Portland State University
9 | P a g e
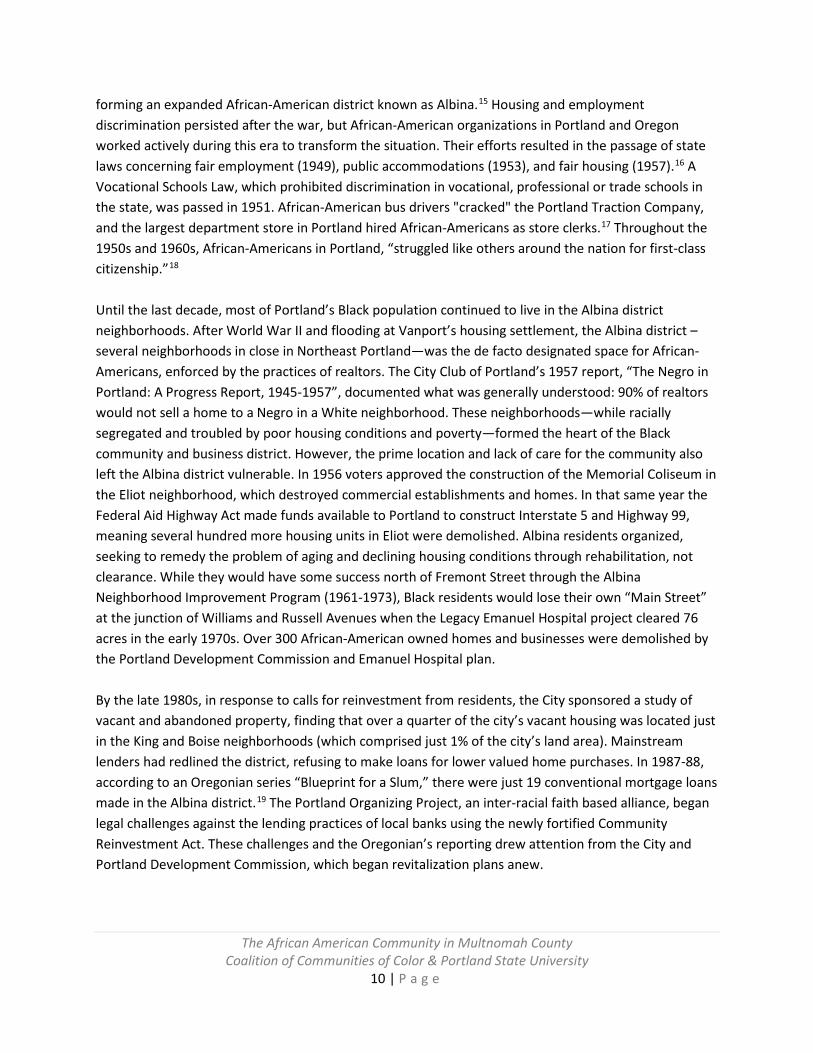
forming an expanded African-American district known as Albina.15 Housing and employment discrimination persisted after the war, but African-American organizations in Portland and Oregon worked actively during this era to transform the situation. Their efforts resulted in the passage of state laws concerning fair employment (1949), public accommodations (1953), and fair housing (1957).16 A Vocational Schools Law, which prohibited discrimination in vocational, professional or trade schools in the state, was passed in 1951. African-American bus drivers "cracked" the Portland Traction Company, and the largest department store in Portland hired African-Americans as store clerks.17 Throughout the 1950s and 1960s, African-Americans in Portland, “struggled like others around the nation for first-class citizenship.”18 Until the last decade, most of Portland’s Black population continued to live in the Albina district neighborhoods. After World War II and flooding at Vanport’s housing settlement, the Albina district –several neighborhoods in close in Northeast Portland—was the de facto designated space for African-Americans, enforced by the practices of realtors. The City Club of Portland’s 1957 report, “The Negro in Portland: A Progress Report, 1945-1957”, documented what was generally understood: 90% of realtors would not sell a home to a Negro in a White neighborhood. These neighborhoods—while racially segregated and troubled by poor housing conditions and poverty—formed the heart of the Black community and business district. However, the prime location and lack of care for the community also left the Albina district vulnerable. In 1956 voters approved the construction of the Memorial Coliseum in the Eliot neighborhood, which destroyed commercial establishments and homes. In that same year the Federal Aid Highway Act made funds available to Portland to construct Interstate 5 and Highway 99, meaning several hundred more housing units in Eliot were demolished. Albina residents organized, seeking to remedy the problem of aging and declining housing conditions through rehabilitation, not clearance. While they would have some success north of Fremont Street through the Albina Neighborhood Improvement Program (1961-1973), Black residents would lose their own “Main Street” at the junction of Williams and Russell Avenues when the Legacy Emanuel Hospital project cleared 76 acres in the early 1970s. Over 300 African-American owned homes and businesses were demolished by the Portland Development Commission and Emanuel Hospital plan. By the late 1980s, in response to calls for reinvestment from residents, the City sponsored a study of vacant and abandoned property, finding that over a quarter of the city’s vacant housing was located just in the King and Boise neighborhoods (which comprised just 1% of the city’s land area). Mainstream lenders had redlined the district, refusing to make loans for lower valued home purchases. In 1987-88, according to an Oregonian series “Blueprint for a Slum,” there were just 19 conventional mortgage loans made in the Albina district.19 The Portland Organizing Project, an inter-racial faith based alliance, began legal challenges against the lending practices of local banks using the newly fortified Community Reinvestment Act. These challenges and the Oregonian’s reporting drew attention from the City and Portland Development Commission, which began revitalization plans anew.
The African American Community in Multnomah County Coalition of Communities of Color & Portland State University
10 | P a g e

However, reinvestment occurring without adequate safeguards against displacement, has been a double-edged sword. Research conducted by the Oregonian’s Nikole Hannah-Jones finds that the core of the city—particularly inner Northeast—has become significantly whiter since 2000. While in 2000, there were ten Census tracts in Albina that were majority Black, in 2010, there are none—after nearly 10,000 people of color (mostly Black) moved out.20 In all, 38 tracts in the city became more White and less diverse than in 2000. Hannah-Jones writes:
“…those who left didn't move to nicer areas. Pushed out by gentrification, most settled on the city's eastern edges, according to the census data, where the sidewalks, grocery stores and parks grow sparse, and access to public transit is limited. As a result, the part of Portland famous for its livability -- for charming shops and easy transit, walkable streets and abundant bike paths—increasingly belongs to affluent whites.”21
African-Americans displaced by the construction of the stadium, freeway, and hospital expansion continue to await significant acknowledgement of this history. In 2012, Legacy Emanuel Hospital’s centennial, the hospital board signed a new “covenant” promising the neighborhood not to participate in further urban renewal displacement. The public apology did not include the City of Portland or the Portland Development Commission’s participation—and the PDC simply counts the Emanuel Urban Renewal as among its historic projects, without any indication of harmful past practices. Many residents attending the Legacy Emanuel event await full recognition of the emotional and community losses, as the financial losses due to relocation without adequate compensation, loss of homeownership in a now-high value neighborhood, and ongoing interventions in the neighborhood that have happened without a racial equity component. African-Americans in Portland still seek reparative justice from the City, Portland Development Commission, and other private market actors who have offered only words of reconciliation without any restitution.
Unfortunately, while making great strides in some areas, many of the conditions for which elder generations sought redress still plague our community and constrain opportunity. Still, resistance and advocacy efforts of communities and African-American-led organizations have continuously sought to make a difference in the lives of African-Americans in Multnomah County. Population Demographics The 2010 Census identifies approximately 52,000 Black or African-American people living in Multnomah County. This number, which includes both people identifying as Black alone or Black in combination with other races, represents 7.1% of Multnomah County’s population. The Black/African-American population has grown since 1990, when the Census reported 35,133 people as Black or African-American in Multnomah County,22 and in 2000, when 44,755 people so identified.23 This represented a 27% jump in the Black population. Some of this growth can be attributed to the immigration of a substantial number of Black Africans, who are not counted separately in Census racial classifications. The growth in population from 1990 to 2000 also reflected a change in the way that individuals could be defined and identified in the Census figures. Since 2000, individuals can self-identify with multiple races,
The African American Community in Multnomah County Coalition of Communities of Color & Portland State University
11 | P a g e

so some who now choose “Black in combination…” may not have been counted in 1990 if they identified another single race at that time.
Source: 1990 Census, 2000 Census, 2010 Census and American Community Survey, selected years. The Black/African-American population in Multnomah County is substantially younger than the overall population. While 21% of Multnomah County residents are children under 18, 35% of Black/African-American residents are children. About 60% of Black Multnomah residents are under 35; the Black median age is 28, compared to the White population median age of 38.
35,133
44,755 44,931 45,684 44,360 44,775 45,98347,838 48,776
50,865 52,090
0
10,000
20,000
30,000
40,000
50,000
60,000
1990 2000 2002 2003 2004 2005 3006 2007 2008 2009 2010
Black Population, Multnomah County
The African American Community in Multnomah County Coalition of Communities of Color & Portland State University
12 | P a g e

Source: American Community Survey, 2010.
A higher percentage of Blacks than Whites in Multnomah County live in family households with children under 18 years of age (32%, as compared with 22% of Whites).24 Indeed, the number of women who gave birth in this community in the prior 12 months is 7%, instead of 4% as among White women.25 While our current numbers place us at 7% of Multnomah County’s population, our numbers are anticipated to grow rapidly as young people come of age and begin their own families, becoming a larger portion of Portland’s population in the years to come.
Community-Verified Population Counts It is difficult to provide exact counts of Multnomah County’s African-American population. While the U.S. Census is a “full population” count, it is not precisely accurate for determining size of the Black population in Multnomah County due to its methods for determining racial categories, procedures on “usual residences,” and undercount of populations of color due to survey response issues.
The undercounting of populations of color in the US Census has been well documented. One reason for undercount is survey design and implementation: non-return of Census forms, non-response to Census survey enumerators, and inaccurate reporting on Census forms are more likely in urban areas, for populations with lower literacy, for those working irregular hours, and among people with a fear or
4.9%
11.3%
9.1%
18.5%
15.4%
14.9%
13.5%
6.2%
6.2%
10.9%
22.7%
11.5%
14.4%
12.4%
12.5%
8.5%
4.2%
2.8%
0% 5% 10% 15% 20% 25%
Under 5 years
5-17 years
18-24 years
25-34 years
35-44 years
45-54 years
55-64 years
65-74 years
75 years +
Population by age, Multnomah County, 2010
Black
White
The African American Community in Multnomah County Coalition of Communities of Color & Portland State University
13 | P a g e

suspicion of the government. The Census’ definition of “usual residence” as the basis for population counts may also lead to fewer African-Americans being counted in Multnomah County than the community may recognize as members. Populations “in institutions,” which include correctional facilities, halfway houses, juvenile corrections, and residential care facilities for child welfare systems, are not counted by the Census at “home,” but rather at the institution. Given the disparities in African-American institutionalization (described later in this report), this method will undercount those who would normally reside in the County. We also know that the Census, American Community Survey, and many other administrative data sets do not distinguish between Africans and African-Americans, but only designate both groups as “Black.” This conflation of two very distinct populations (with distinct histories and cultures) creates real difficulty for interpreting the status of African-Americans in Multnomah County, where there have been substantial numbers of Africans emigrating in recent years. Finally, recent changes to racial classifications in the Census—for example allowing for multiple race identifications and write-in options—may also blur estimations for people of color whose self-identification does not match the available, pre-defined terminology. The American Community Survey—where intercensal data are collected by the Census Bureau—presents another challenge for estimating population characteristics. Because the ACS is a sample survey, it represents the population within a margin of error. For small populations—such as Multnomah County’s Black population—margins of error are not insubstantial, and become large when additional variables are added. There are numerous conventional institutions that have been estimating the size of undercounts across the nation. These include the Census Bureau itself, Immigration and Naturalization Service (INS), California’s Department of Finance and Statistics.26 To address population undercount, the Coalition of Communities of Color has been working in partnership with researchers to develop methods and approaches for working with communities to establish more robust and accurate community population measures.
The African American Community in Multnomah County Coalition of Communities of Color & Portland State University
14 | P a g e

Economic Opportunity and Vitality Economic opportunity is critical to a community’s ability to thrive. Stable employment and income are of course critical to maintaining decent housing and are closely related to educational attainment and health. In this section, we review data on the status of African-American employment, incomes, poverty rates, and the wealth and asset gap. Employment and Occupations
It is important to recognize that the relatively poor status of African-Americans in the local economy is not merely a result of the current global recession. African-Americans have long struggled against economic marginalization in Multnomah County. For example, African-American workers in the Kaiser shipyards during and after WWII faced significant discrimination, from local labor unions, including the International Brotherhood of Boilermakers, Iron Shipbuilders, and Helpers of America, the main union of the shipping industry.27 African-American members of the segregated Auxiliary 32 paid regular membership dues to the IBB Local 72, but had no voice in contract negotiations and could make complaints only through a White steward. This kind of discrimination was not limited to the shipyards. Portland’s African-American defense workers faced exclusion and segregation at other employment sites, including at Commercial Iron Works, in the Union Pacific’s Albina yard, and on Portland’s docks.28
Urban League reports have stressed that high unemployment rates have been a condition for the community since the late 1970s, and some families are experiencing multiple generations of unemployed adults. The current recession deepens the racial disparities in employment, with African-Americans facing not only higher unemployment rates, but longer stretches of unemployment and more frequent periods of unemployment. These disparities remain even when holding constant for education level.
Unemployment Rates & Black-White Ratios, Portland and United States, 1970-2006
Portland United States
Males White Black B/W Ratio White Black B/W Ratio 1970 7.4% 11.9% 1.6 3.6% 6.3% 1.8 1980 6.2% 15.2% 2.5 5.9% 12.3% 2.1 1990 5.9% 15.0% 2.5 5.3% 13.7% 2.6 2000 6.6% 15.6% 2.4 4.4% 12.3% 2.8 2006 6.2% 16.6% 2.7 5.0% 13.4% 2.7
Females 1970 5.4% 8.1% 1.5 4.8% 7.7% 1.6 1980 5.1% 13.4% 2.6 5.7% 11.3% 2.0 1990 5.2% 10.6% 2.1 5.0% 12.2% 2.4 2000 4.9% 11.5% 2.4 4.3% 10.9% 2.6 2006 4.8% 10.4% 2.2 5.1% 11.9% 2.3
Source: U.S. Census & 2006 ACS. Note that data from 2000 & 2006 are used for Non-Hispanic Whites
The African American Community in Multnomah County Coalition of Communities of Color & Portland State University
15 | P a g e
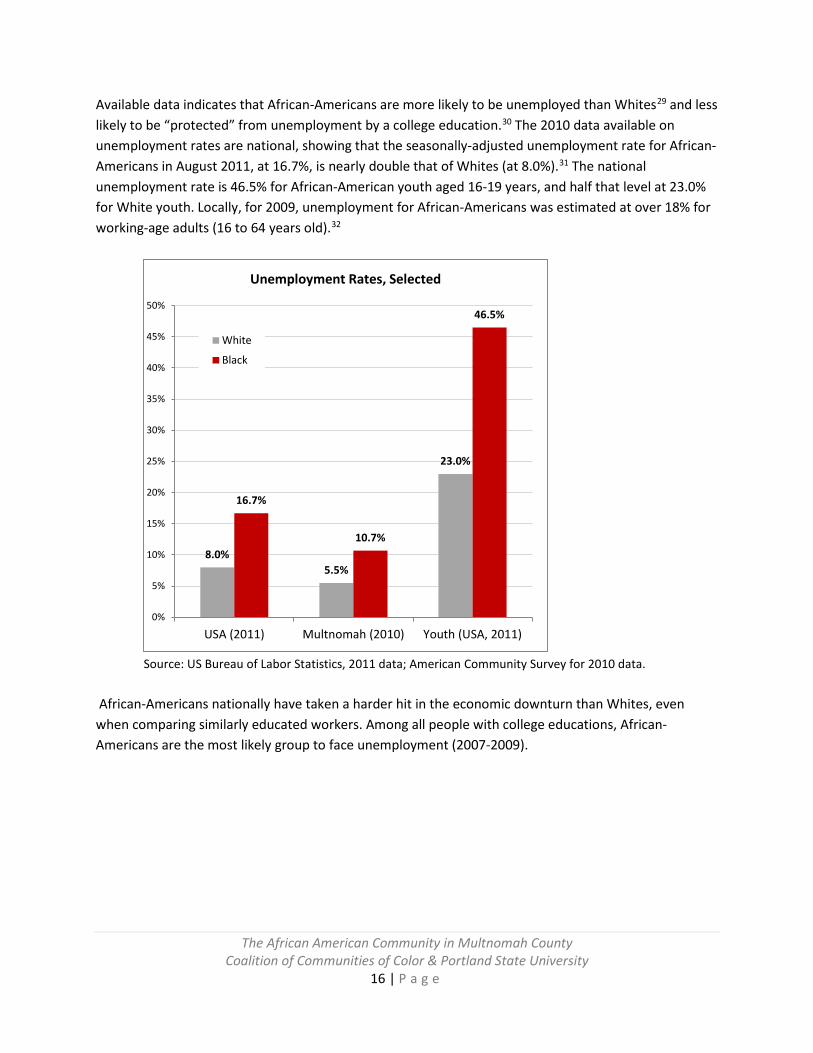
Available data indicates that African-Americans are more likely to be unemployed than Whites29 and less likely to be “protected” from unemployment by a college education.30 The 2010 data available on unemployment rates are national, showing that the seasonally-adjusted unemployment rate for African-Americans in August 2011, at 16.7%, is nearly double that of Whites (at 8.0%).31 The national unemployment rate is 46.5% for African-American youth aged 16-19 years, and half that level at 23.0% for White youth. Locally, for 2009, unemployment for African-Americans was estimated at over 18% for working-age adults (16 to 64 years old).32
Source: US Bureau of Labor Statistics, 2011 data; American Community Survey for 2010 data.
African-Americans nationally have taken a harder hit in the economic downturn than Whites, even when comparing similarly educated workers. Among all people with college educations, African-Americans are the most likely group to face unemployment (2007-2009).
8.0%5.5%
23.0%
16.7%
10.7%
46.5%
0%
5%
10%
15%
20%
25%
30%
35%
40%
45%
50%
USA (2011) Multnomah (2010) Youth (USA, 2011)
Unemployment Rates, Selected
White
Black
The African American Community in Multnomah County Coalition of Communities of Color & Portland State University
16 | P a g e
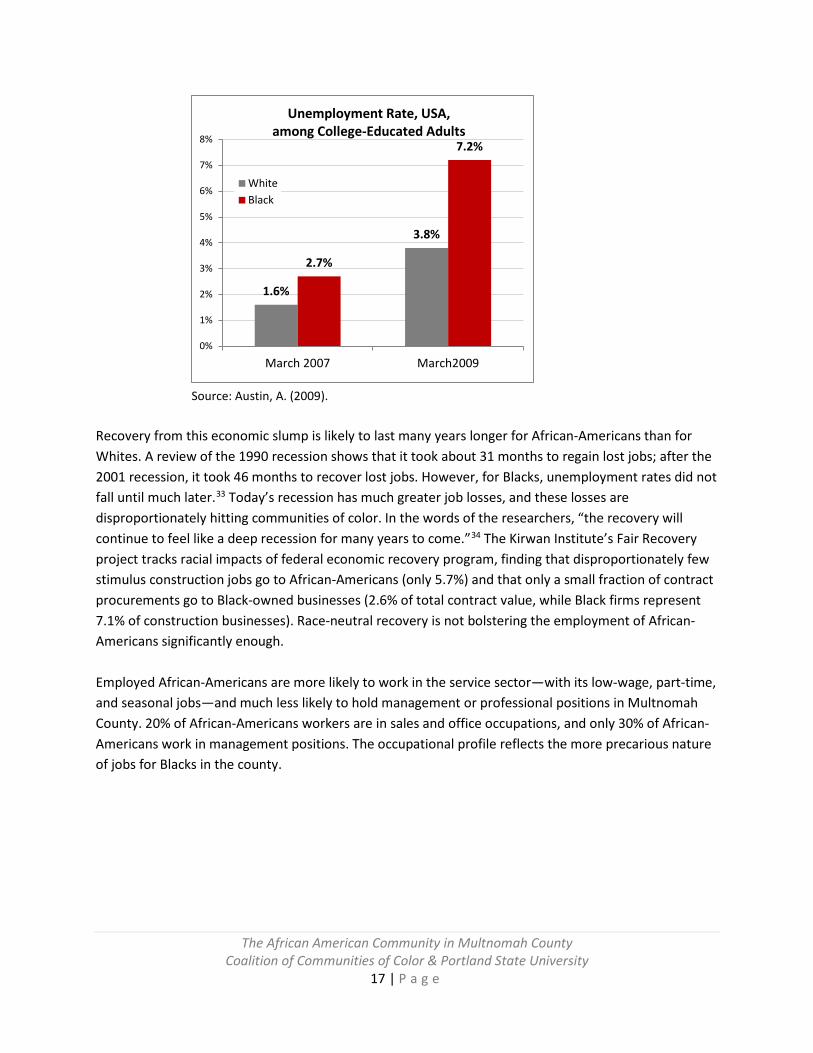
Source: Austin, A. (2009).
Recovery from this economic slump is likely to last many years longer for African-Americans than for Whites. A review of the 1990 recession shows that it took about 31 months to regain lost jobs; after the 2001 recession, it took 46 months to recover lost jobs. However, for Blacks, unemployment rates did not fall until much later.33 Today’s recession has much greater job losses, and these losses are disproportionately hitting communities of color. In the words of the researchers, “the recovery will continue to feel like a deep recession for many years to come.”34 The Kirwan Institute’s Fair Recovery project tracks racial impacts of federal economic recovery program, finding that disproportionately few stimulus construction jobs go to African-Americans (only 5.7%) and that only a small fraction of contract procurements go to Black-owned businesses (2.6% of total contract value, while Black firms represent 7.1% of construction businesses). Race-neutral recovery is not bolstering the employment of African-Americans significantly enough. Employed African-Americans are more likely to work in the service sector—with its low-wage, part-time, and seasonal jobs—and much less likely to hold management or professional positions in Multnomah County. 20% of African-Americans workers are in sales and office occupations, and only 30% of African-Americans work in management positions. The occupational profile reflects the more precarious nature of jobs for Blacks in the county.
1.6%
3.8%
2.7%
7.2%
0%
1%
2%
3%
4%
5%
6%
7%
8%
March 2007 March2009
Unemployment Rate, USA, among College-Educated Adults
WhiteBlack
The African American Community in Multnomah County Coalition of Communities of Color & Portland State University
17 | P a g e

Source: American Community Survey data, 2010. Incomes Given the differential occupational profile of African-Americans, it is no surprise that there are substantial income differences between Black and White workers. The median income of a full-time, year-round African-American worker is $36,483 while a similar White worker makes $45,353. Per capita income for African-Americans in Multnomah County is less than half the per capita income for Whites in the County.
45.6%
24.3%
5.6% 5.5%
9.7%
30.2% 29.2%
20.7%
2.3%
17.5%
0%
5%
10%
15%
20%
25%
30%
35%
40%
45%
50%
Management &professional
Service Sales & office Constrn, maintance,repair
Production &transportation
Occupational profile for Whites and Blacks, Multnomah County, 2010
White
Black
The African American Community in Multnomah County Coalition of Communities of Color & Portland State University
18 | P a g e

Source: Curry-Stevens’ calculations of American Community Survey, 2009. The gap between the incomes of Whites and African-Americans has remained stubbornly constant, no better in 2010 than it was a generation ago. African-Americans have not gained economic ground over twenty years in terms of income gaps.
$32,945
$45,353
$69,614
$80,661
$35,348
$23,152
$15,985
$36,483$31,957
$59,789
$19,969$16,475
0
10000
20000
30000
40000
50000
60000
70000
80000
90000
Per capita income Full-time, year-roundworkers
All families Married couplefamilies
Female single parent Retirees
Yearly incomes for Whites and African Americans, Multnomah County, 2010
White
Black
The African American Community in Multnomah County Coalition of Communities of Color & Portland State University
19 | P a g e

Source: Curry-Stevens’ calculations of 1990 Census, Census 2000, and American Community Survey, 2008.
Income disparities for African-Americans locally are worse than national averages. Below, the chart depicts income by race for the County compared to nationwide.
Source: Curry-Stevens’ calculations of American Community Survey, 2009.
45% 46% 45%
64%66% 66%
0%
10%
20%
30%
40%
50%
60%
70%
1989 1999 2008
Households Earning Below Average Incomes in Multnomah County White
African American
$31,735
$69,636
$35,432 $32,740
$69,863
$37,484
$17,549
$40,861
$25,555
$15,145
$34,380
$22,439
$-
$10,000
$20,000
$30,000
$40,000
$50,000
$60,000
$70,000
$80,000
Per Capita Income Family Incomes Female single parent
Annual Incomes, 2009, National & County
White - USAWhite - MultnomahBlack - USABlack Multnomah
The African American Community in Multnomah County Coalition of Communities of Color & Portland State University
20 | P a g e
African-Americans in Multnomah County appear to fare worse economically than African-Americans do overall. This is especially concerning given that white families in Multnomah County have higher than average earnings—meaning disparities are greater here than the national average. The structure of employment in Multnomah County is racialized and impacts are clear in income. The review of these patterns over the last 20 years shows that these dynamic is persistent – with 66% of the Black community earning below-average incomes, while only 45% of White households earn incomes below the County average. Poverty Levels Poverty requires a special focus beyond the analysis of low incomes. The Census defined poverty threshold—income of about $22,000 for a family of four in 2009—represents the inability to provide a minimum level of food nutrition for the household. While material deprivation in terms of housing, healthcare, mobility, etc. certainly occur at higher incomes, the official poverty level represents a deeper level of “going without.” African-Americans in Multnomah County are disproportionately poor compared to Whites. One of every three African-American individuals live in poverty in this County, while only one of eight Whites are poor. While only 7% of White families live in poverty, 27% of all African-American families do. If you are a single African-American mother with school aged children, your family has a two-in-five chance of living in poverty – if your children are under five, this ratio rises, giving you a three-in-five chance of living in poverty.
The African American Community in Multnomah County Coalition of Communities of Color & Portland State University
21 | P a g e

Source: Curry-Stevens’ calculations of American Community Survey, 2010. All of these poverty rates represent significant disparities compared with Whites. Disparities—the relative difference in poverty rates between Blacks and Whites—are substantial. Disparity ratios range from individual poverty rates being 1.5 times greater for Blacks than Whites, to Black families with children facing poverty at rates 4.25 times greater than Whites. Nationwide, poverty disproportionately affects African-Americans. However, racial disparity in poverty rates is greater in Multnomah County than the national average. Below is a chart that compares the same poverty measures for African-Americans in Multnomah County with the national levels. In particular, families with children under five and single moms with children under age five fare much worse in Multnomah County.
12.8%14.4%
10.1%7.6%
11.9%
3.7%
22.7%
39.8%
34.0%
40.7%
25.5%
31.8%
45.1%
12.1%
46.1%
64.2%
0%
10%
20%
30%
40%
50%
60%
70% Poverty Rates in Multnomah County, 2010
White
Black
The African American Community in Multnomah County Coalition of Communities of Color & Portland State University
22 | P a g e

Source: Curry-Stevens’ calculations of American Community Survey, 2010. Poverty rates have increased for all races over the past decade, with significant rise in poverty during the recession. Poverty rates for African-Americans increased 12% between 2000 and 2009 (see charts below). The hit from the last decade has particularly impacted African-American children under age 5. Poverty rates increased 12% for African-American children under age 5. While poverty for those under 18 declined slightly for African-Americans, the significant disparity in poverty between White and African-American children continues.
25.7%
35.0%
19.4%21.9%
29.6%
7.5%
35.7%
49.1%
34.0%
40.7%
25.5%
31.8%
45.1%
12.1%
46.1%
64.2%
0%
10%
20%
30%
40%
50%
60%
70%
All people Under 18 65 and over All Families With children<5
Marriedcouple families
Female singleparents
Females solo,with kids < 5
Poverty among Blacks, Comparison of Local and National Levels, 2010
USA
Multnomah County
The African American Community in Multnomah County Coalition of Communities of Color & Portland State University
23 | P a g e

Source: American Community Survey, 2010 and Census 2000.
Source: American Community Survey, 2009 and Census 2000. Poverty requires significant attention in our public policy: direct income support, food assistance, housing subsidy, and employment assistance. Structures that create poverty traps must be eliminated, with specific attention paid to African-Americans as a particularly impacted population.
10.0%12.8%
26.1%
34.0%
0%
10%
20%
30%
40%
2000 2010
Poverty Rates - All People, Multnomah County
White
Black
9.0%10.1%
22.6%
25.5%
0%
5%
10%
15%
20%
25%
30%
2000 2010
Poverty Rates - Elders (65+)
12.5% 13.1%
37.6%
49.8%
0%
10%
20%
30%
40%
50%
60%
2000 2010
Poverty Rates - Children Under 5
White Black
8.2%
14.4%
44.5%40.7%
0%
10%
20%
30%
40%
50%
2000 2010
Poverty Rates - Child Poverty
The African American Community in Multnomah County Coalition of Communities of Color & Portland State University
24 | P a g e

Public sector hiring and contracting The public sector has historically led the way in employing African-Americans—consider the role of the US Postal Service in lifting many Black families into the middle class—and, as it is governed by federal civil rights law, should also operate equitably in its employment of contractors and professional services. Civil service holds a mandate for representing the needs of the entire population and is a source of generally excellent jobs with decent incomes, unionization protections and good working conditions. In Multnomah County, the City of Portland, Portland Community College, and area school districts, the data show that these goals are not achieved. In the City of Portland, Whites are over-represented in the workforce, making up 83.9% of the full-time employees, compared to 73% of the population. Blacks hold just 5.2% of full-time jobs yet make up 8.1% of the population of Portland.
Source: Office of Management and Finance, City of Portland, 2010.
In Multnomah County, the outcomes are a little better: African-Americans hold 6.9% of the positions across the County, while Whites hold 78.5%. Within this institution, Blacks are most underrepresented in the following offices: District Attorney (5.3%), County Management (5.8%), County Services (4.1%), and at the Library (2.1%). Turning to Portland Community College, we are troubled by the deep underrepresentation among Faculty Instructors where Black students do not see themselves represented as leaders in their
86.5% 83.9%
4.9% 5.2%
0%
10%
20%
30%
40%
50%
60%
70%
80%
90%
100%
1999 2009
City of Portland Full-Time Employment, 1999 and 2009
White
Black
target for white proportionality
target for Black proportionality
The African American Community in Multnomah County Coalition of Communities of Color & Portland State University
25 | P a g e

respective fields. Unfortunately, opportunities to diversity the pool of instructors through new hiring have not been taken. There were 58 new faculty hired at PCC in 2010, and of these new hires, 86.2% were White.35 African-Americans are only fully represented at PCC in the service and maintenance sector (at 11.9% of employees).
Source: Curry-Stevens’ summary of Workforce Analysis Report (2010) from Portland Community College.36 The Multnomah Educational Service District (MESD) has a workforce of 658 people; only 12.9% are people of color. Looking just at the administrative and professional ranks (of 344 people), representation of people of color falls to 7.8%.37 MESD’s reporting practices do not disaggregate further by race, so it is not possible to ascertain how people of color are represented. These employee figures also are reported without disaggregating by full-time or part-time/temporary workers. If people of color are disproportionately working in part-time or temporary positions, then representation is worse than it appears. MESD has not improved its racial diversity in 2010—of 15 new hires, none were filled by people of color—despite diversifying the workforce having been a stated priority. The public sector affects economic opportunity not only in its hiring, but also in its contracting and purchasing from private businesses. In 2010, the City of Portland commissioned a study on the utilization of Minority-owned Business Enterprises (MBEs) and Women-Owned Business Enterprises (WBEs) by the City and the Portland Development Commission. This report, assessing City practices from 2004 through 2009, found both contracting disparities and shed light on practices relating to qualification for contracts that disadvantage MBEs. It is important to first note that some assumptions
81.9%
71.3%
87.2%
78.4%80.6%
85.7%
63.4%
6.8% 6.7%
1.8%5.3% 4.6%
0.0%
11.9%
0%
10%
20%
30%
40%
50%
60%
70%
80%
90%
100%
Administration Professional Faculty Instructors Secretarial Technical Skilled Craft Service/Maintenance
Workforce of Portland Community College, 2010 White
AfricanAmerican
The African American Community in Multnomah County Coalition of Communities of Color & Portland State University
26 | P a g e

made in this study have been questioned by MBE-representing organizations: noting the disparate impacts of the definition of “qualified” firms on MBE/WBEs, the numbers used to count the pool of qualified businesses may be too low, meaning the entire study undercounts disparity, since the study defines proportionate representation as numbers equivalent to representation among available businesses (not to representation among the population at large, for example). Although further study is clearly needed on these issues, the report itself still finds disparities in City and PDC contracts. While contracts made as part of “sheltered market” and “good faith effort” programs meet the City’s equity goals (again, noting the goals are low), outside of these specific programs, there is a failure to utilize MBE/WBE firms at the expected level, given their availability. Overall, MBEs receive 2.9% of construction contract dollars—not considered a disparity by this study, but certainly very low compared to the presence of people of color in Portland. The contracting study reports that outside of the “good faith effort” program, only one of the City’s 76 prime construction contracts over $100,000 was awarded to a MBE firm. For PDC-funded projects, fewer than 1% of all MBE/WBEs available received contracts, despite a business equity program for subcontractors. These disparities were also present for professional services contracts. The study concludes that MBE/WBEs face disparate challenges in qualifying due to lower annual revenue, disadvantages in seeking capital, and bonding and insurance requirements, stating that the availability of qualified businesses is “less than what might be expected if minorities and women had the same opportunities as non-minorities and men to enter and advance within these industries, and form and grow their businesses.”38 Existing “business equity” and “good faith effort” programs are simply not sufficient to expand the opportunity for MBEs to access public sector contracts in Portland. These conclusions echo a report by the City of Portland auditor in 2010 that found that Sheltered Market Program participation by City bureaus and other agencies was on the decline and that there had been no attempt to assess whether the program was effective in developing successful prime contractors. Furthermore, the auditor found that half of Sheltered Market contracts were awarded to White Male-owned firms (as small businesses), rather than closing the acknowledged disparity for African-American owned firms.39 Implementing real workforce diversity and contracting equity policies in the public sector can be difficult and fraught with political tensions, but they are essential for addressing racial inequities in leading civic institutions. In this region, many promises have been made to move forward on employment parity for communities of color. These good intentions have never been sufficient to move durably to improved outcomes.
The African American Community in Multnomah County Coalition of Communities of Color & Portland State University
27 | P a g e

Wealth and Affluence Beyond income, economic opportunity and prosperity is measured by wealth. Wealth (the sum total of assets minus debts) serves as a protective factor for income fluctuations. Having assets enables one to take risks, such as opening a business or returning to school. Housing wealth also allows one to secure better loans. The net impact of discriminatory policies and ongoing disparities is to significantly diminish the wealth of the African-American community. The history of discrimination is profound—White families benefited significantly through home ownership when lending practices and policy denied access to Black households, and these benefits compound due to the federal government’s subsidy of mortgage interest payments and access to desirable communities where house values rise. African-American communities did not benefit from the GI Bill’s promotion of homeownership in new suburbs, and have faced ongoing denial of access to credit on decent terms. The lack of wealth means that African-American children do not inherit money nor property that provide resources for education, home purchase, or entrepreneurship. Today in the USA, African-Americans have 5 cents in wealth for each dollar of wealth for Whites. African-American wealth has been falling precipitously through the mortgage crisis and recession—declining by more than half. Furthermore, about 35% of African-Americans have zero or negative net wealth, compared to just 15% of Whites. Today’s wealth gaps are the largest they have been in over twenty years of measurement.
Source: Federal Reserve Board’s Survey of Consumer Finances as cited by Pew Research Center.40
$134,992
$12,124
$113,149
$5,677
0
20000
40000
60000
80000
100000
120000
140000
160000
White Black
Wealth, USA, 2007 & 2009 (all figures in 2009 dollars)
The African American Community in Multnomah County Coalition of Communities of Color & Portland State University
28 | P a g e

With so little wealth, African-Americans lack an economic cushion for taking risks and for surviving financial crises. The impact of this wealth gap is especially significant in a rough economy, because it deeply compromises resilience to job loss. African-American bankruptcy rates are higher and foreclosure rates vastly outnumber those in White communities. It also means that African-Americans are less able to support community assets, such as foundations, community centers, radio stations, universities, neighborhoods, arts and culture and small businesses. This precariousness leaves African-Americans more reliant upon and vulnerable to changes in public policy for health, education, and social programs.
Economic Opportunity and Vitality: policy recommendations
Support Black business ownership, from entrepreneurship to growth and development.
• Economic development strategies, including urban renewal area plans, must include business development and retention programming that recognizes and mitigates for racial disparities in access to entrepreneurial opportunities, including differential access to business capital.
• Increase access to capital financing; recognizing that barriers to such capital undermine the viability of minority entrepreneurship. Financial institutions must be encouraged to develop and monitor equity financing for these businesses, whether small start-ups or those seeking to expand. Cities must also commit to keeping economic development dollars in the budget, even in these economically hard times, and to distributing them in a way that assists minority businesses.
• Link economic development activities around green and high tech jobs to racial equity strategies in education and workforce development. Bring African-American youth into growing job sectors through educational opportunities and address barriers to work entry for adults through job training, job readiness, and policies that address the disproportionate impact of criminal convictions on employment for Black men. Forge partnerships with workforce training programs for recruitment of African-American workers, such as Urban League of Portland Workforce Development program
Public agency contracting and purchasing disparities must be eliminated. Public agencies must assess the opportunities and barriers for MBE participation in purchasing, consulting, and construction, and utilize best practices for eliminating procurement disparities.
• The City, PDC, and other agencies must address documented barriers to MBE firms’ contracting with the city, including for professional services. These efforts should go beyond “good faith efforts” to include targets and practices to assist MBE firms in achieving equity. Prime contractors working with public projects must be held to the high standards for subcontracting and workforce diversity.
The African American Community in Multnomah County Coalition of Communities of Color & Portland State University
29 | P a g e

• The State must enforce Title VI compliance for all federally funded projects; require all public and private sector projects receiving federal funds to adopt specific and measurable hiring goals for communities with the highest unemployment rates; with penalties for non-compliance.
Public subsidies for development must advance racial equity. Major public projects should include Community Benefits Agreements defined through public participation. These policies must go beyond ‘good faith agreements’ to achieve measurable goals and targets that must be met for MBE utilization and workforce diversity. These community economic development strategies should also include programs to prevent commercial displacement in revitalizing areas.
• CBAs should include targets for contracting for MBEs. Prime contractors must be held accountable for the composition of their subs, and supported in finding and hiring subcontractors from qualified MBE firms.
• Public projects should include First Source Hiring and additional workforce agreements that support living wage jobs with benefits for African-American workers.
• Development subsidies, such as Transit-Oriented Development tax breaks, must include affordable housing units, and construction that utilizes MBEs and local workers.
Public agencies must develop and support a diverse workforce. Public sector agencies such as the City of Portland, Metro, and TriMet should:
• Commit to creating and preserving a diverse workforce on multiple occupational levels, from entry-level to senior management
• Dedicate a specific percentage of each new development project, including federally funded projects, to training and hiring the chronically unemployed
• Support pipeline training and career programs that align with the Governor’s 10 Year Business Plan and the Oregon Business Plan to prepare African-American youth and adults for emerging industries
• Enforce Title VI compliance for all federally funded projects and file suit when action is required; require all public and private sector projects receiving public funds to adopt specific and measurable hiring goals for populations with the highest unemployment rates – with penalties for non-compliance
The African American Community in Multnomah County Coalition of Communities of Color & Portland State University
30 | P a g e

Housing and Neighborhood Opportunity Issues of housing and neighborhood opportunity have special salience for the African-American community. A long national and local history of exclusion from housing and homeownership opportunities, neighborhood segregation and disinvestment (and its subsequent corollary of gentrification) have especially affected African-Americans. Despite over fifty years of Fair Housing law, African-Americans continue to face serious disparities as described here in terms of housing affordability, homeownership and access to mortgages, homelessness, and discrimination. In Portland, as in other cities, strong and cohesive Black neighborhoods were formed out of segregation, but were partially dismantled by highway and redevelopment construction and redlined, or systematically denied credit and investment, leading to decline. As policymakers targeted these neighborhoods in the Albina district, market pressures quickly escalated, causing another displacement for African-Americans from well-situated neighborhoods with new amenities to more distant, less accessible and amenity-deficient neighborhoods in the mid-County. In this section of the report, we cover housing challenges, the role of housing in neighborhood access, and discuss the potential for fair housing enforcement. Housing Costs and affordability Housing is usually the first claim on income—in other words, when faced with budget problems, households keep themselves sheltered and reduce their spending on other essentials such as food and health care. The standard guideline for housing affordability is to pay no more than 30% of monthly income on housing costs. Households spending more than 30% of their income on housing are considered cost burdened; those spending more than half their monthly income on housing are severely cost burdened. There are clear racial disparities for cost burden for both renters and owners. It is particularly concerning that over half of African-American homeowners in Multnomah County are burdened by housing costs. The high levels of cost burden across races shows the difficulty for many with keeping up with rising local housing costs.
The African American Community in Multnomah County Coalition of Communities of Color & Portland State University
31 | P a g e
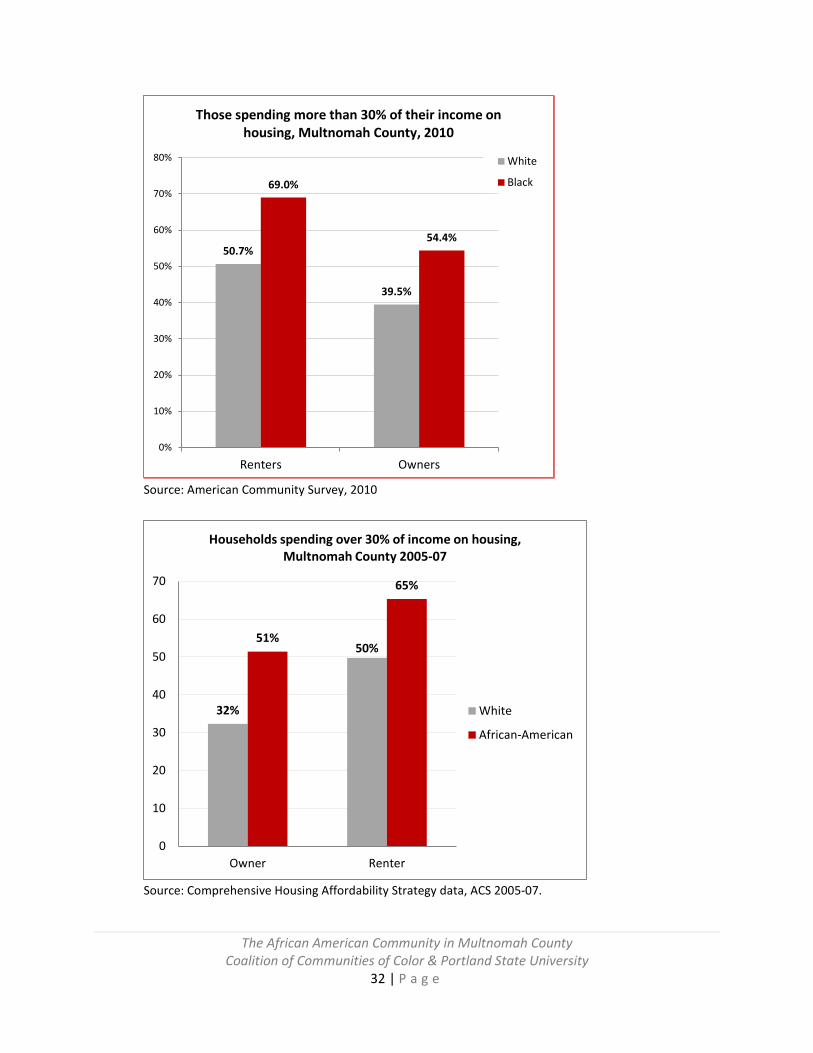
Source: American Community Survey, 2010
Source: Comprehensive Housing Affordability Strategy data, ACS 2005-07.
50.7%
39.5%
69.0%
54.4%
0%
10%
20%
30%
40%
50%
60%
70%
80%
Renters Owners
Those spending more than 30% of their income on housing, Multnomah County, 2010
White
Black
32%
50%51%
65%
0
10
20
30
40
50
60
70
Owner Renter
Households spending over 30% of income on housing, Multnomah County 2005-07
White
African-American
The African American Community in Multnomah County Coalition of Communities of Color & Portland State University
32 | P a g e

Black households are significantly more likely than average to suffer a severe cost burden. For owner-occupants, the Black-White disparity ratio is 2.3—with 28% of Black homeowners spending more than half their monthly income on housing costs. For renters, the disparities are also substantial (a 1.6 ratio), and over 40% of Black renters are severely burdened. These kinds of severe housing cost burdens leave households extremely vulnerable to housing loss and homelessness.
Source: Comprehensive Housing Affordability Strategy data, ACS 2005-07. For renters who cannot afford housing in the market, there are several subsidized housing programs, mostly delivered via Home Forward, the Housing Authority of Portland. These programs include traditional public housing and Housing Choice Vouchers (which allow for renting in the private market). Since the release of the Coalition of Communities of Color’s first report, there have been improvements in access to subsidized housing for people of color, including targeted outreach efforts and improved tenant screening practices (including increased use of interviews and the waiving of criminal reference checks, which were determined to have racial bias). African-Americans make up 14.3% of those living in poverty, and receive 36.3% of the tenant vouchers available in the county and are 23.7% of those living in public housing.
12%
25%28%
43%
0
5
10
15
20
25
30
35
40
45
50
Owner Renter
Households spending over 50% of income on housing, Multnomah County 2005-07
White
African-American
The African American Community in Multnomah County Coalition of Communities of Color & Portland State University
33 | P a g e

Homeownership and Lending Homeownership is advantageous to most buyers because it is a primary way to build equity, strengthen credit, and maintain a stable residence with control over the space. Nationally, the advantages of homeownership disproportionately benefit certain populations. There are substantial homeownership rate disparities for communities of color. According to the State of the Nation’s Housing 2011 report, while overall homeownership rates currently stand at 66.9%, the racial homeownership gap is growing. White homeownership in 2010 was over 73%. The national 2010 homeownership rates for households of color were:
• Latinos 47.5% • African-Americans 45.9% • Asians 58.2% • Other races 48.9%
The reasons for these gaps include both current, ongoing discriminatory practices in lending and real estate—fair housing issues—as well as a legacy of historical discrimination in housing. Since the post-WW II homeownership boom almost exclusively benefitted White households, there is a persistent gap in the intergenerational transfer of wealth for people of color, who today have fewer assets to use as a down payment. The historical practice of mortgage redlining (refusing to make loans in certain neighborhoods) meant many Black households remained renters. Black owners who bought in declining or low-value neighborhoods due to segregation have not realized appreciation of their assets. There are also non-housing issues that affect the racial homeownership gap—historical and ongoing discrimination and differential outcomes in employment and education affect job stability, earnings, and wealth. Finally, in today’s mortgage crisis, Black homeowners have been disproportionately affected by subprime loans and foreclosure, causing homeownership (and wealth) to fall. In Multnomah County, the pervasive disparity in homeownership levels for African-Americans and Whites holds true, with almost double the levels of homeownership among White households. Black homeownership rates are 40% worse locally than the national homeownership rates for the community.
2010 White African-American
Mult County USA Mult County USA Median house value $293,300 $190,100 $293,500 $139,900 % owners 58.9% 73.1% 31.9% 44.7%
Source: Curry-Stevens’ calculations from American Community Survey, 2010.
Homeownership levels for African-Americans are actually declining. At the local level, earlier predictions that the local African-American community would be hard-hit by this ongoing mortgage crisis have proved accurate. 41 The combination of a lack of affordability with the predatory and subprime lending crisis has led to an erosion of homeownership since 2000. 42 In 2000, Black homeownership in Multnomah County was over 37%; as of the 2010 Census, it was 31%. Even more current insights
The African American Community in Multnomah County Coalition of Communities of Color & Portland State University
34 | P a g e

suggest a worsening crisis for African-Americans: the Portland Housing Center assists more than 350 people annually to buy a home, most for the first time: in 2006/07, African-Americans made up 12% of their clients, but today this number has dropped to 4%.43 As described above, the causes of homeownership disparities involve both historical and current-day policies and practices. Analysis of Home Mortgage Disclosure Act (HMDA) data provide information about one aspect of the homeownership gap, the current application, origination, and cost of home mortgage loans. One cause of low homeownership rates are the rates at which mortgages are granted. Mortgage loan origination to African-Americans in Multnomah County rose during the mid-2000s, but fell sharply during the mortgage crisis around 2007.44 The high number of loans originated to Black buyers was under 500 loans in the County in 2005, and as we will discuss, many of these were subprime and high-cost mortgages. By 2010, only 30 loans were originated to African-Americans for 68 total applications, showing how very few African-Americans even attempted to purchase homes last year as the housing and unemployment crisis hit hard. Loan denial rates also show how African-Americans are able to access mortgage credit to buy homes, but the analysis is complicated by the sudden rise of subprime lending in the mid-2000s. In 2003 through 2005, loan denial rates for Blacks were double those of Whites—around 17% compared to just 8%.45 Even higher-income African-Americans faced denial by mortgage lenders at much higher rates than Whites of comparable incomes (see table below for 2004 data).
Loan Denial by Race and Income, 2004 HMDA
Home Ownership Rate Loan Application Denial Rate
Tier 1 Tier 2 Tier 3 Tier 1 Tier 2 Tier 3
White 77% 58% 48% 7% 10% 11% African-American 67% 45% 33% 15% 19% 18%
Source: Housing and Development Corporation, City of Portland, 200446 Definitions for the terms used are: Tier 1 = households with incomes 95% of the median income Tier 2 = households with incomes 80-95% of the median income Tier 3 = households with incomes 50-80% of the median income
By 2006, at the height of the subprime lending bubble, Black loan denial rates were lower than Whites—still very high for both racial groups, but African-Americans were getting mortgage credit at rates similar to Whites. Not until 2009, when the financial crisis had fully taken hold, did Black denial rates spike up to 26% (while White denial rates were at a still very high 17.5%). Unfortunately, increased availability of mortgage credit to African-Americans came at a price of loan products that are higher-priced and often carry terms that make them more difficult to repay, putting Black homeowners at much higher risk for foreclosure and bankruptcy.
The African American Community in Multnomah County Coalition of Communities of Color & Portland State University
35 | P a g e

The crisis of defaulted mortgages has been disproportionately experienced by communities of color, as a result of lower incomes, fewer assets, more unstable employment, and higher unemployment—but also, importantly, by predatory practices by lending institutions that have targeted communities of color. Says one member of the Congressional Black Caucus:
“We have a mortgage-foreclosure crisis in this nation, most acutely in the Black community. Nationally, the mortgage crisis has disproportionally crippled the African-American Community. According to the Center for Responsible Lending (CRL), 2.5 million homes were foreclosed between 2007 and 2009. Eight percent of all African-American homes have been foreclosed, almost twice the rate for white Americans. An African-American family is 76 percent more likely to go through foreclosure than a white family. By 2012, the CRL predicts these closures will drain an estimated $177 billion from African-American communities nationwide. The causes associated with the foreclosure crisis are widespread. However, many of the causes came from changes in laws from previous Congresses. The promotion of lax lending standards increased the prevalence of lower and middle-income loans, playing a significant role in the current housing crisis.”47
Research shows that higher-cost loans and other features have a significant impact on an owner’s ability to maintain payments on a loan. Subprime loans that include features like adjustable rates, interest-only options, and hidden costs have a significant impact on whether a homeowner defaults on the mortgage. Multnomah County’ Analysis of Impediments to Fair Housing Report for 2010 shows the dramatic difference in subprime lending to African-Americans and people of color generally than to Whites. In 2005 and 2006, high activity years for subprime lending, 52% and 41%, respectively, of borrowing by African-Americans to purchase homes was from subprime lenders. Subprime refinance lending (home equity loans and lines of credit, for example) has been cited as a major cause for default and foreclosure. For refinance loans, over 40% of borrowing by African-Americans was from subprime lenders in 2005 and 2006. These loans are also higher cost: nearly half of loans to African-Americans in 2005-6 were high cost, compared to just 25% of White borrowing. There was a dramatic decrease in high-cost lending after 2007, but high-cost loans are still originated for African-Americans at twice the rate they are for Whites. With the collapse of most of the subprime market, by 2009, African-American subprime borrowing was extremely minimal, but with conventional borrowing remaining very constrained, this means limited access to home mortgage credit for the Black community. Continuing changes in the mortgage industry must be monitored carefully to understand the impacts for African-American homeownership and ensure that new homebuying is stable and affordable. Homelessness Homelessness is the most severe housing problem, and puts people at high risk for violence, disease, and death. For children, homelessness interrupts schooling and family life, and has lasting consequences. African-Americans are overrepresented in most aspects of the population of homeless persons and in the system. It is very difficult to accurately count homeless persons, but we can estimate based on annual counts in shelters and on the streets. According to the 2009 Multnomah homeless
The African American Community in Multnomah County Coalition of Communities of Color & Portland State University
36 | P a g e

count, African-Americans make up 18% of the homeless population, compared to just 7% of the general population, up dramatically from 11.6% in the previous year.48 Of sheltered homeless persons, African-Americans are again overrepresented in emergency shelters and transitional housing. Nearly one-third of families in emergency shelters and transitional in Multnomah County in 2008 were Black. Fair housing and discrimination While all of the above problems with housing indicate issues and impediments to fair housing choice, we also have some evidence of direct discrimination in the housing market. The Oregon Fair Housing Council in Portland recently conducted 25 tests of rental housing with African-Americans, finding illegal discriminatory acts in 60% of the tests.49 These audit tests pair Black and White potential renters to check for different treatment by race. Acts contrary to the Fair Housing Act included being told the unit was already rented (yet still available to Whites) to being required to make higher deposits. These findings reveal that discrimination here is very similar to federal studies showing that African-Americans continue to face significant barriers in access to private-market housing. Neighborhood gentrification and displacement Housing is more than just shelter—it is part of a neighborhood, with access to amenities, services, and schools. But neighborhoods are more than just the opportunities in geographic proximity—they are communities that support families, social networks, and religious, social, and cultural institutions. When neighborhoods and communities are disrupted by redevelopment and market forces, there are real consequences for the well-being of communities and the individuals they support. These impacts have been likened by researcher Mindy Fullilove to “root shock”—as when a plant is ripped from its soil, it may survive, but it does not fully recovery as a robust organism. When people are displaced from their emotional ecosystems, they are stressed, and communities falter. The experience of African-Americans in Portland has been marked by several cycles of traumatic displacement—from forced moves out of wartime worker housing to Vanport; in the (un)natural disaster that was the Vanport flood to the Albina district neighborhoods; and through the construction of the Memorial Coliseum, I-5 and other highway expansion projects, Legacy Emanuel Hospital’s planned expansion, and today by revitalization as a designated urban renewal area that fomented rapid gentrification. Some have been displaced involuntarily by rising housing prices; others have departed historically Black neighborhoods where they no longer feel at home. Many African-American residents of Albina were not able to take advantage of new funding for housing and business development that came with urban renewal designation in 2000. While some homeowners were able to reap home equity benefits from higher prices when they sold, others struggled with repairs, taxes, and insurance due to rising values. City programs focused more on new buyers (mostly
The African American Community in Multnomah County Coalition of Communities of Color & Portland State University
37 | P a g e
Whites) than on preserving existing homeownership. Typical of gentrifying neighborhoods, renters have been highly vulnerable to rising prices and conversion to owner-occupancy. The result is that the distribution of the African-American population across the region has changed markedly over the last ten years.50 Data comparing the distribution of African-Americans in 1990 and 2000 showed that over the decade the African-American population shifted from close-in Northeast to North and East Portland, central and urban Gresham, and outer Southeast Portland.51 Today, the population of neighborhoods in the Albina district shows a marked bifurcation. After housing policies with a dual focus on new homebuying and deeply subsidized rental housing, the population has become divided: affluent, White homeowners and poor, Black renters. The combination of race and class makes “integration” in Albina neighborhoods a significant challenge. While neighborhoods are majority White, many public schools remain Black, Brown, and poor, as newcomers transfer their children away from neighborhood schools (see Education section for further discussion). African-Americans continue to speak out to challenge “revitalization” policies and programs that fail to address historical and current inequities, voicing the particular needs of Blacks in Albina for affordable housing, business opportunities, and safety. Black residents challenge urban renewal activities, including the racialized distribution of funds, equity in contracting on projects, and ramifications of potential urban renewal area expansion for further Rose Quarter development, including the continued erasure of Black cultural heritage from these neighborhoods.
Housing and Neighborhood Opportunity: policy recommendations
Implement plans and policies to ensure that African-American residents have affordable housing in high opportunity areas. Anticipate and manage future development. Where there are public investments to revitalize or redevelop neighborhoods, there must be an anti-displacement strategy in place to prevent displacement. This strategy must be race-conscious in addressing particular housing barriers for African-Americans.
• Neighborhood economic development and infrastructure investment must also include the creation and preservation of affordable housing in place for both renters and homeowners.
• Anti-displacement policies and programs must be deployed at all stages, from early risk of gentrification, to include housing units that remain affordable over the long term, including community land trust units.
• Resources from state and local government entities must be targeted at supporting community development corporations that work in poor and disenfranchised communities. Preserve the stock of affordable housing.
• Develop incentive-based inclusionary zoning for private development, and require the inclusion of affordable units in any project receiving subsidies for transit-oriented development (TOD), from Tax Increment Financing districts, or other tax breaks. Market new affordable housing units affirmatively using culturally-specific organizations.
The African American Community in Multnomah County Coalition of Communities of Color & Portland State University
38 | P a g e
Expand support for homeownership to reduce the African-American homeownership and wealth gap in Multnomah County.
• Support resources for financial education and preparedness and homeownership counseling that take a culturally-specific approach to the African-American community.
• Support financial assistance, such as down payment assistance and lending through community development financial institutions (CDFIs), aimed to reduce the racial homeownership gap.
• Support the community land trust model for homeownership and neighborhood stability. • Explore new ways to buy or keep a home. Partnerships between state and local agencies,
financial institutions and non-profits must provide early and aggressive foreclosure mitigation efforts, such as counseling and refinancing. Non-traditional avenues to homeownership must be explored and developed—such as individual development accounts, land trusts and sweat-equity homebuilding.
Health and its Barriers Health is determined not only by genes, personal behaviors, and access to medical technology, but by social and economic factors that significantly impact the individual. What are called “upstream” factors—jobs and wages, safe and healthy housing, food security, stress caused by racism, and neighborhood environmental quality—have real consequences for chronic disease and mental health. Current research demonstrates that nutrition, stress, and other social factors affect people of color from the womb with negative impacts that are difficult to overcome with behavioral and medical approaches. These social determinants are at the root of health disparities—preventable and avoidable differences in the health of racial minorities. Individual behavior-oriented preventative health and intervention programs are important, but have a limited effect without addressing the underlying social determinants of health. Given our knowledge about how social determinants negatively affect the health of communities of color, it is futile to suggest that merely exercising, forgoing smoking, and eating healthy foods will place health and well-being within our individual control. Health is related to one’s place in the social hierarchy. 52 This report illustrates a wide array of disparities between African-Americans and White members of our community. Taking a health equity approach to reducing these disparities will require addressing inequalities across a broad spectrum as well as promoting prevention. This section addresses how racism affects health generally, specific health outcomes for which severe disparities exist, and the relationship of health to insurance access.
The African American Community in Multnomah County Coalition of Communities of Color & Portland State University
39 | P a g e

Racism and health outcomes There is a growing body of literature suggesting racism itself is a stressor that affects health from pre-natal stages through adulthood. Race-based discrimination—both interpersonal and institutional—gets “under the skin” of African-Americans and contributes to the racial disparities in health.53 This happens through internal processes of the physiological stress response system, and also through limited access to the healthy environments and lifestyles found in some neighborhoods (clean air, healthy homes, walkable streets). The combination of internal physiological responses, coping responses, and segregation in disadvantaged social and physical environments have a significant impact on health outcomes. Chronic experiences with race-based discrimination (actual and perceived) may set off alarms in the brain which trigger the body’s stress response. For example, some African-Americans, facing environments of high stress, including financial or familial instability, violence in neighborhoods, and discrimination in the workplace, respond with “high-effort coping” in a phenomenon called John Henryism. 54 The John Henryism hypothesis suggests that Black men, in particular, who do not have sufficient resources but actively work to achieve goals experience higher levels of stress, leading to increased prevalence of hypertension (high blood pressure) and cardiovascular disease among this group.55 African-Americans are more likely to have high blood pressure than their White counterparts, even though they tend to have the same or a lower rate of high cholesterol.56 Some posit that this is an effect of persistent experiences of differential treatment.57 Perceived racial discrimination has been found to relate negatively to psychological health and well-being as well as physical health. People of color who report feeling stress from discrimination also rate their own health as worse than Whites who do not experience racial discrimination. The stress of racial discrimination may also play an important role in the adoption of other behaviors that represent maladaptive coping responses. For example, discrimination has been found to be the best predictor of smoking among African-American adults in two studies. Moreover, smokers reported the experience of discrimination as subjectively more stressful than non-smokers.58 Outcomes disparities-an overview Health outcome disparities for African-Americans in Multnomah County are severe for some indicators. African-Americans have the highest rate of homicide mortality among all racial groups—a rate more than six times higher for African-Americans than for Whites.59 On eleven of eighteen measures tracked by the Multnomah County Health Equity Initiative (HEI) for 2003-2007, the community faces inequities. The HEI found no disparities for lung and breast cancer deaths and heart disease incidence, but substantial disparities for several important factors in health. The italicized indicators are those the County defines as requiring immediate intervention because of the depth of the disparity; for other
The African American Community in Multnomah County Coalition of Communities of Color & Portland State University
40 | P a g e

inequalities the County considers improvement needed. The Black community experiences disparities across a greater range of health indicators than any other community of color in Multnomah County.
2003-2007 White African-American Disparity Ratio Homicide mortality (per 100,000 pop) 2.6 16.6 6.4 Gonorrhea incidence-new cases (per 100,000 pop) 73.3 420.9 5.7 Chlamydia incidence-new cases (per 100,000 pop) 244.6 1195.1 4.9 Death from HIV disease (per 100,000 pop) 4 5.5 1.4 No prenatal care 16.0% 27.2% 1.7 Teen birth rate (per 1,000) 10.7 27.5 2.6 Low birth weight babies 5.9% 11.1% 1.9 Infant mortality (per 1,000) 5.1 9.1 1.8 Death from diabetes (per 100,000 pop) 29.7 71.1 2.4 Death from prostate cancer (per 100,000 pop) 29.2 56.5 1.9 Death from stroke (per 100,000 pop) 58.8 97.3 1.7
Source: Bhat, 2011.60 Maternal and child health The health of mothers, infants, and children is of utmost importance, both as a reflection of the commitment to protecting the health and well-being of a large and vulnerable segment of the population and as an indicator of the health of the next generation. Indeed, the influence of maternal nutrition and stress during pregnancy is profound for infants and carries through to adulthood. When African-American women have poor health, their children suffer not only at birth but face higher risk of cardiovascular disease, diabetes, and hypertension as adults. In Multnomah County, African-American mothers are almost twice more likely than Whites to give birth to low birth weight (LBW) babies. LBW infants may be premature, and small due to not reaching full gestational age; but other LBW infants are simply underweight despite having been carried the full term. The latter are considered growth-restricted: something happened that halted their development. Birth weight is one of the most important indicators of an infant’s subsequent health and survival. Infants born too small or too soon have a much greater risk of death and short-term and long-term disability than those born at normal birth weight. This is part of the reason why African-American infant mortality rates in Multnomah County are nearly twice as high as those of Whites.61 LBW in general is thought to place the infant at greater risk of later adult chronic medical conditions such as diabetes, hypertension, and heart disease.62 In other words, infants who survive are at risk for poor health outcomes over the life course. When pregnant mothers have poor nutrition it may result in LBW infants.63 Women who live in poverty, experience stress or lack of social supports, or are under 20 are more likely to have LBW babies. These
The African American Community in Multnomah County Coalition of Communities of Color & Portland State University
41 | P a g e

factors are undoubtedly present for African-Americans in Multnomah County. In particular, lower access to prenatal care and high rates of teen births are likely a factor in LBW and infant mortality for African-Americans. Diabetes In Multnomah County, African-Americans are more than twice as likely as Whites to die of diabetes. This fits with national trends showing African-Americans are diagnosed with diabetes at double the rate of Whites.64 Diabetes is associated with an increased risk for a number of serious, sometimes life-threatening complications. In general, African-Americans are more likely to experience these complications: African-Americans are almost 50% more likely to develop diabetic retinopathy (blindness) as Whites and almost three times as likely to suffer from lower-limb amputations.65 African-American men are also twice as likely as White men to require treatment for end-stage renal (kidney) disease related to diabetes. Not surprisingly, diabetic African-Americans are almost twice as likely as diabetic Whites to be hospitalized with diabetic complications.66 Living with this chronic disease can place a high burden on individuals and families. Factors often blamed for the disparities in diabetes are genetics, lack of access to health care, and individual lifestyle behaviors. While some diseases, such as diabetes, do have a genetic component, it is “not deterministic, rather, the actual consequences of genetic predispositions are highly influenced by their interactions with the environment and life experiences.”67 Often adult lifestyle factors are considered to pose the biggest risks to development of disease. Currently, public health practices seeking to lessen the impact of chronic disease, such as diabetes, focus mainly on trying to orient individuals toward healthful behaviors. A health equity approach that addresses upstream determinants of health would further ask: do African-Americans live and work in places that support healthful behaviors? For example, if African-Americans live in neighborhoods with fewer parks or where it is unsafe to walk, they may be much less active. When nutritious foods are not available at affordable prices, diets may be less supportive of health. Health equity requires that we consider these social determinants as critical factors in individual behavior that can result in diabetes. Health insurance Access to health care via insurance is also important for outcomes. Disparities in health insurance coverage had narrowed significantly as of 2000, but have since been widening again. Of course, with the new Affordable Care Act and implementation of national and state health exchanges, insurance coverage will change dramatically in the coming year.
The African American Community in Multnomah County Coalition of Communities of Color & Portland State University
42 | P a g e

Source: Oregon Population Survey, Oregon Health Policy & Research, 1990-2006.68 Data for 2010 is from the American Community Survey.
Prior to the national policy reform, both Whites and African-Americans were losing health insurance – likely as a result of losing employer-supported insurance and also in finding health insurance rates rising out of reach. The African-American community, however, was experiencing a more rapidly deteriorating situation. Lack of health insurance can lead to delaying treatment, not receiving treatment at all, and not managing chronic diseases, as well as having serious financial consequences. A particular crisis in health insurance is a lack of coverage for African-American children from poor families. Oregon has committed to making advances in providing health insurance for children, expanding access through its Healthy Kids program—and insurance rates for children have remained steady over the past decade. However, significant numbers of eligible African-American children are not signed up for Healthy Kids. Black children represent 6.5% of poor children in Oregon, but only 4% of those covered under Healthy Kids. As the Affordable Care Act requirements for health insurance kick in and the Oregon health exchange is implemented, the State must consider its outreach and awareness methods to ensure that eligible children of color are getting coverage.
14%
11.6%
14%
20.1%
11.8%
17%
0
5
10
15
20
25
1990 2000 2010
Oregonians without health insurance, 1990, 2000 and 2009
White
Black
The African American Community in Multnomah County Coalition of Communities of Color & Portland State University
43 | P a g e

Source: Healthy Kids, Oregon, “Enrollment by Race/Ethnicity” for 2010 The health disparities experienced by African-Americans in Multnomah County point to a need for significant change that must be rooted in addressing the social determinants of health –inequality, poverty, housing, employment, working conditions, food security, and health insurance. Most immediately, if we can reform the institutions through which services and supports are offered and which employ people from our community, we can reduce the institutional racism that takes its toll on our stress, our wellbeing, our bodies and our psyches. The mandate of undoing institutional racism will move us well towards improved health and well-being.
Health: policy recommendations
Healthcare delivery, particularly during healthcare reform, must assess health equity metrics, including cultural competency indicators.
• Organizations, local and state governments adopt proclamations, and corresponding actions to eliminate health inequities for African-Americans and other communities unfairly shouldering the burden of poor health outcomes.
• Health care providers and health systems should routinely offer education about sexual health, as well as screening and treatment for African-Americans between the ages of 14 and 34 for chlamydia, gonorrhea, and HIV in order to close the current gap in prevalence.
53.0% 53.0%
4.1%6.5%
0%
10%
20%
30%
40%
50%
60%
% of community's children signedup for Healthy Kids
Distribution of poor children inOregon
Enrollment in Healthy Kids, Oregon, September 2010
White
Black
Target
The African American Community in Multnomah County Coalition of Communities of Color & Portland State University
44 | P a g e

• Hospitals, Mental Health Authorities, Public Health Departments, and Coordinated Care Organizations required to do community health assessments and create Community Health Improvement Plans (CHIPs) should contract with culturally specific Faith and Community Based Organizations to identify needs of African-American Community.
• The Oregon Health Authority and its Coordinated Care Organizations in the Portland Metropolitan Area (Tri-County Medicaid Collaborative and FamilyCare) should include health equity and cultural competency indicators as part of healthcare reform metrics and integrate them into an on-going evaluation of process and health outcomes.
Community health workers are supported as a vital component of culturally-specific prevention and wellness strategies.
• The Oregon Health Authority, Coordinated Care Organizations, commercial insurance carriers, and health care providers should implement deployment and re-imbursement strategies for culturally specific Community Health Workers, doulas (traditional childbirth attendants), and chronic disease self-management programs for those with chronic diseases in community and clinical settings.
• The Oregon Health Authority, Coordinated Care Organizations, commercial insurance carriers, health care providers, and the local public health departments in the tri-County area should ensure adequate funding and support for culturally-specific maternal and child health strategies to reduce infant mortality, low birth weight and support African-American parents, including women’s preconception health and interconception health promotion, doulas, culturally specific child birth education and breastfeeding promotion, and father involvement and support.
• Increase funding and support for community based, culturally-specific community health workers to provide education and access to screening and treatment for sexually transmitted diseases, such as gonorhhea, chlamydia, and HIV.
Address ‘upstream’ factors that disproportionately impact African-American health.
• City, school district, county and metro governments should adopt and implement policies that ensure equitable access to healthy, affordable and culturally relevant food in low income neighborhoods, schools, institutions, public housing sites, and African-American communities.
• City, county and metro governments should adopt and implement policies that restrict disproportionate exposure to, and marketing of, tobacco products in low income communities and African-American neighborhoods.
• City, county and metro governments should adopt and implement policies that support housing and neighborhood stability for African-American and Black households, including supporting access to healthy housing, supporting environmental justice-oriented work to reduce disproportionate exposure to hazards, ensuring access to transit, and to parks and recreation opportunities.
The African American Community in Multnomah County Coalition of Communities of Color & Portland State University
45 | P a g e

• Portland Public Schools, community colleges in the tri-county region, and higher education institutions should partner with health care, behavioral health and public health employers to promote increased access by African-Americans to health care related living wage jobs, including non-traditional health workers, public health professionals, allied health professionals, and primary care providers by investing in the health care pipeline and health career opportunity programs.
• City, school district, county and metro governments should adopt and implement policies that assure representation of African-Americans proportionate to their client/student population in their workforce and advisory/governing boards and committees.
• Cities and counties in the tri-county area should adopt tougher inspection codes to ensure healthy homes. These should aim to eliminate conditions like damp and mold that increase rates of asthma and other respiratory illness and ensure the rights of renters to report unhealthy living conditions.
• City, county and metro governments should disaggregate data on environmental disparities by race, ethnicity and income. Anecdotal evidence shows that people of color and low income tend to live in areas with higher toxic air emissions, brownfields and other environmental hazards. An inter-agency study should map the location of these hazards and their proximity to specific populations.
Child Welfare Racial disproportionality and disparity in state child welfare systems have been of growing concern in the state of Oregon. This issue rose to the level of an executive order from then-Governor Kulongoski in 2009 establishing a Child Welfare Equity Task Force charged with reducing racial disproportionality in the state system. Additionally, the Department of Human Services (DHS), Multnomah County Juvenile Courts, State and local Commission of Children, Families, and Community, and Casey Family Programs collaborated to safely and equitably reduce the numbers of children in foster care and to also lend support the Task Force. Oregon has taken the opportunity over the past three years to address the high numbers of children in the State’s foster care system, with emphasis on targeting the disproportionate numbers of African-American children.
Child welfare data for children and families in Multnomah County shows considerable disparities for African-Americans.69 African-American children are nearly three times more likely to be in the foster care system, as seen in the graphic of foster care rates (per 1,000 child population).70 Through a review of the essential decision points in child welfare, we can study how institutional practices lead African-American children to have different experiences in the system.
The African American Community in Multnomah County Coalition of Communities of Color & Portland State University
46 | P a g e

Source: Curry-Stevens’ calculations for Multnomah County from data from Miller et al. (2009); for national data, see Child Welfare League of America (2008).
When we turn to the patterns of African-American children becoming involved with child welfare, we look at different points in intervention, ranging from being reported to child welfare, a worker deciding to investigate a claim of abuse or neglect, determining a finding of abuse or neglect, being taken into care, and remaining in care beyond the mandated limit of four years. Below we see the patterns of disparities at which African-American families are being mandated to be involved with child welfare.
Source: Adapted from Miller, Cahn, Bender, Cross-Hemmer, Feyerherm & White (2009).
5
16
11
32
0
5
10
15
20
25
30
35
USA Multnomah County
Foster Care Rates, Comparison of Local and National Level, 2009, (rate is # per 1000 children)
White
Black
86.0%
63.7%
56.7%
20.0%
41.6%
23.1%
6.0%
13.7%
58.7%
18.5%
43.1%
28.2%
0%
10%
20%
30%
40%
50%
60%
70%
80%
90%
Population Referred Investigated Find concerns Taken into care Remain in care formore than 4 years
Child Welfare Decisions, 2008-2009, Multnomah County
White
Black
The African American Community in Multnomah County Coalition of Communities of Color & Portland State University
47 | P a g e
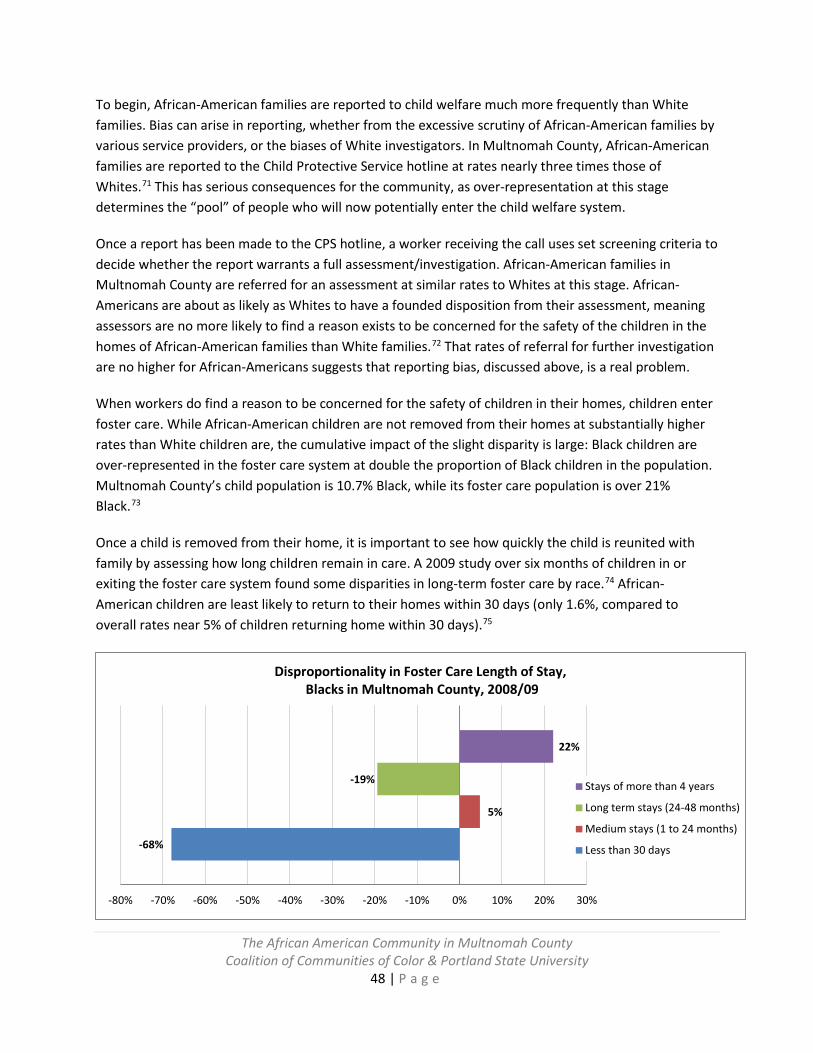
To begin, African-American families are reported to child welfare much more frequently than White families. Bias can arise in reporting, whether from the excessive scrutiny of African-American families by various service providers, or the biases of White investigators. In Multnomah County, African-American families are reported to the Child Protective Service hotline at rates nearly three times those of Whites.71 This has serious consequences for the community, as over-representation at this stage determines the “pool” of people who will now potentially enter the child welfare system.
Once a report has been made to the CPS hotline, a worker receiving the call uses set screening criteria to decide whether the report warrants a full assessment/investigation. African-American families in Multnomah County are referred for an assessment at similar rates to Whites at this stage. African-Americans are about as likely as Whites to have a founded disposition from their assessment, meaning assessors are no more likely to find a reason exists to be concerned for the safety of the children in the homes of African-American families than White families.72 That rates of referral for further investigation are no higher for African-Americans suggests that reporting bias, discussed above, is a real problem.
When workers do find a reason to be concerned for the safety of children in their homes, children enter foster care. While African-American children are not removed from their homes at substantially higher rates than White children are, the cumulative impact of the slight disparity is large: Black children are over-represented in the foster care system at double the proportion of Black children in the population. Multnomah County’s child population is 10.7% Black, while its foster care population is over 21% Black.73
Once a child is removed from their home, it is important to see how quickly the child is reunited with family by assessing how long children remain in care. A 2009 study over six months of children in or exiting the foster care system found some disparities in long-term foster care by race.74 African-American children are least likely to return to their homes within 30 days (only 1.6%, compared to overall rates near 5% of children returning home within 30 days).75
-68%
5%
-19%
22%
-80% -70% -60% -50% -40% -30% -20% -10% 0% 10% 20% 30%
Disproportionality in Foster Care Length of Stay, Blacks in Multnomah County, 2008/09
Stays of more than 4 years
Long term stays (24-48 months)
Medium stays (1 to 24 months)
Less than 30 days
The African American Community in Multnomah County Coalition of Communities of Color & Portland State University
48 | P a g e

Source: Adapted from Miller, Cahn, Bender, Cross-Hemmer, Feyerherm, & White (2009).76
African-American families are reported to child welfare much more frequently than White families. Although children are not removed from the home more often, the differences in foster care placement and length of stay result in there being disproportionate numbers of Black children in foster care. The differences exist because of the practices of referral and decisions of those involved throughout the system to place children and keep them in care. We have frequently compared our experiences with those in King County (home to Seattle) and found that Seattle has been able to create a much more equitable environment for our communities of color. Below we can see that while there are troubling rates of removing Black children from their homes in King County, this pattern is much worse in Multnomah County.
Sources: Miller (2008) for King County data and Miller et al (2009) for Multnomah County Data.77 The years of study differ with King County being 2004 data and Multnomah being 2008 data.
While King County officials have a significant problem with its disparate treatment of the African-American community, one can see quickly from the above chart that the magnitude of this problem is much higher in Multnomah County, even though if we calculate disparity indexes the practice pattern is statistically worse in King County (for workers are 3.8 times more likely to take Black children away from their homes, yet “only” 2.9 times more likely to do so in Multnomah County). The impact of Multnomah County practices on our community is, however, much greater because DHS harms many more of our families than in King County.
1.10%
0.13%
3.20%
0.49%
0%
1%
1%
2%
2%
3%
3%
4%
Multnomah County DHS King County DHS
Children taken into foster care, Multnomah County DHS and King County DHS, various years
White Children
Black Children
target
The African American Community in Multnomah County Coalition of Communities of Color & Portland State University
49 | P a g e

We have added the “target” line to the above chart to illustrate that we should aim for foster care rates to be only 0.13%. If King County can hold off on taking children from their White families at this level, we should aspire for the same in all our communities. Remember that Black parents are no more likely to harm their children than White parents.78 Based on its review of the data and the research, the Task Force found that the disparities and overrepresentation of children of color in the child welfare system result from three primary causes:
• Structural inequalities such as policy/practice, budget deficits, staffing challenges and culturally biased decision-making inside the juvenile dependency system;
• External disparities such as poverty, access to health care, inadequate education and the related consequences. These risks and stressors outside the child welfare system, impact child safety and family stability and lead to an increased need for state intervention in various communities; and
• Lack of a diverse workforce, training and accountability for existing policies and mandates designed to improve the cultural responsiveness of the system and eliminate disparities.
Although disproportionality continues to be evident, DHS Multnomah County has actively made efforts to adhere to the recommendations of the Task Force in the past two years. While it is too early to determine the outcomes of these partnerships and efforts, community-based service providers observe that more African-American children are being served by people who are from and understand the unique dynamics of the Black community in the Portland area. DHS Multnomah County has used race-based data to help make program improvements and equitable funding decisions to provide culturally-specific services through community based agencies. More African-American human service professionals are involved in local program decision making. In addition, more African-American children appear to be served earlier and in their home or community context, without having to be initially removed. Each of these actions demonstrates a changed position of the DHS in its relationship with the African-American community, although to date the impact is unknown and much work still needs be done collaboratively.
There are several explanations as to why alleviating disproportionality is proving to be so challenging. One significant reason is that while DHS has the authority to intervene in the lives of families to mitigate concerns regarding child safety and wellbeing, the department does not operate in a vacuum. There are typically multiple other systems that child welfare interfaces with that greatly impacts the wellbeing of families. For example, it is not unusual for African-American families who are involved with Child Welfare to also have struggles related to housing, employment, mental health, health, criminal justice, and other areas that impede their ability to establish and maintain stability in their lives. In order for DHS to effectively assist parents in meeting the wellbeing and safety needs of their children, the department must develop significant alliances with these other systems. As DHS advances the practice of shared responsibility within the African-American community, it must also align relations with those
The African American Community in Multnomah County Coalition of Communities of Color & Portland State University
50 | P a g e

other vital systems impacting vulnerable African-American families. Additionally, the focus has to include collaborative prevention strategies, as well as interventions. DHS serves as the last line of defense for struggling families. Waiting for problems within a family to reach the level of needing intervention from child protective services is often too late. All too often, parents are confronted with numerous varied challenges while simultaneously trying to assure their capacity to adequately meet the needs of their children.
Child Welfare: policy recommendations
Shift from intervention to prevention model, committed to internal system improvement including data-based decision-making.
• Establish consistent racial/ethnic impact data collection; require evidence based programs and evidence-based management, incorporate cultural knowledge in decision making and mandate that cultural data be collected. Require consistent use of evidence for practice and policy developments through organized systems including reporting of race/ethnicity.
Build community resources for African-American families, and collaborate with established family networks and community resources. Develop and sustain culturally responsive and community-based systems of family supports and preservation, shifting the paradigm from primarily an ‘intervention’ model to a ‘prevention’ model.
• Recruit African-American foster and adoptive homes by implementing targeted recruitment and support strategies. Expand racially and culturally diverse pool of relative and non-relative foster and adoptive resources
• Enhance equity through the adoption of specific practices such as community partnerships, family group decision-making and structured decision-making that can minimize bias where discretion exists.
Address cultural competency as a core component of DHS workforce development. Enhance and transform recruitment and retention efforts for professionals of color; create an advisory committee for hiring rules and provide continuous training.
• Hire more bi-cultural and multi-cultural staff; add cultural competency as a core requirement for all agency policies, procedures and training. Enhance recruitment, hiring and retention practices across programs to achieve a diverse workforce at all levels; develop, implement and sustain culturally responsive training curricula, in collaboration with communities of color, for child welfare staff and partners
The African American Community in Multnomah County Coalition of Communities of Color & Portland State University
51 | P a g e

Ensure accountability and enforcement protection (protection through the enforcement of laws, policies, and agreements) by creating a plan for accountability and infrastructure.
• Ensure that the voices of communities of color are meaningfully engaged at the state and local levels in assessing racial impacts of criminal justice and child welfare policies.
• Track progress toward safe and equitable foster care reduction goals and hold DHS and the Juvenile Dependency System accountable for change.
• Ensure highly skilled and competent legal representation for families and establish a coordinated system of care by linking the equity goal to the state’s evidence-based program legislation and its expertise in poverty, child abuse and neglect, and juvenile crime prevention.
Education – from Pre-Kindergarten through Post-Secondary African-Americans in Portland have been active in demanding educational equality for decades with few results. School segregation and racial gaps in achievement have been addressed with a variety of “solutions,” many offered with little community input or even opposition. Experiments with education policies have created more problems for the Black community than they have solved. In the mid-1960s, Portland Public Schools (PPS) attempted to address school segregation by bussing Black children to 41 different schools; no White children were transferred into schools in the predominantly Black Albina district. By 1980, Black parents and community members, led by the Black United Front, sought to end bussing and its inequitable burden on Black families with children travelling all over Portland for school. PPS responded with a voluntary desegregation plan that ended forced busing, put more money in Black neighborhood schools, and also allowed all children to transfer out of their neighborhood schools if they wished—a remedy that was supposed to improve schools in majority Black neighborhoods. But voluntary measures have actually increased segregation by race and class and the unequal quality of schooling persists. Jefferson High—the only majority Black high school in Oregon—has seen no real improvement to its physical building, resources for teaching, or graduation rates, and gentrification in the neighborhood combined with a generous transfer policy mean its enrollment has shrunken to less than half of the school’s capacity. African-Americans are deeply concerned about their children’s progress through school and have been active in challenging the public school system to do better for children of color. Yet, disparities with Whites are deep and widening with harmful consequences. We will look at several dimensions of disparities in education, including the overall education levels of the community, disparities in scores on standardized tests, graduation rates, school discipline and dropout rates. In each area we review, disparities are profound and of deep concern to the community, as education is an important pathway
The African American Community in Multnomah County Coalition of Communities of Color & Portland State University
52 | P a g e

to accessing a better quality of life—economic opportunity, health, and general well-being. By understanding the systemic barriers to access that African-Americans have faced, we can acknowledge the challenges that have created considerable obstacles to achievement. One issue of great concern for the African-American community is the lack of Black teachers in Oregon schools, as having teachers who serve as Black role models and who better understand the cultural background of students can improve Black children’s success in school. As of the 2011-2012 school year, just half of one percent of Oregon teachers are Black (0.6%).79 Current Educational Attainment African-American educational attainment is often hampered by discriminatory policies that fail to acknowledge the limited access to early childhood programs, housing, health care, and economic opportunities that impact families over generations. The long standing problems for education in the African-American community are illustrated in the current profile of educational attainment for adults. In 2010, 17% of Black adults in Multnomah County have not completed high school, compared to only 6% of Whites. Multnomah County’s White population is highly educated—43% have a post-secondary (college or graduate/professional) degree. Black adults are not nearly as likely to have a post-secondary degree: only 14% have a bachelor’s degree, and in total, just 21% of Black adults have a college or graduate/professional degree.
6.3%
19.5%
31.5%
26.3%
16.5%16.7%
25.6%
36.8%
14.0%
6.9%
0%
5%
10%
15%
20%
25%
30%
35%
40%
Does not completehigh school
Only completes highschool
Some college orAssociate's degree
Bachelor's degree Graduate/profdegree
Educational attainment, Multnomah County, 2010
WhiteBlack
The African American Community in Multnomah County Coalition of Communities of Color & Portland State University
53 | P a g e
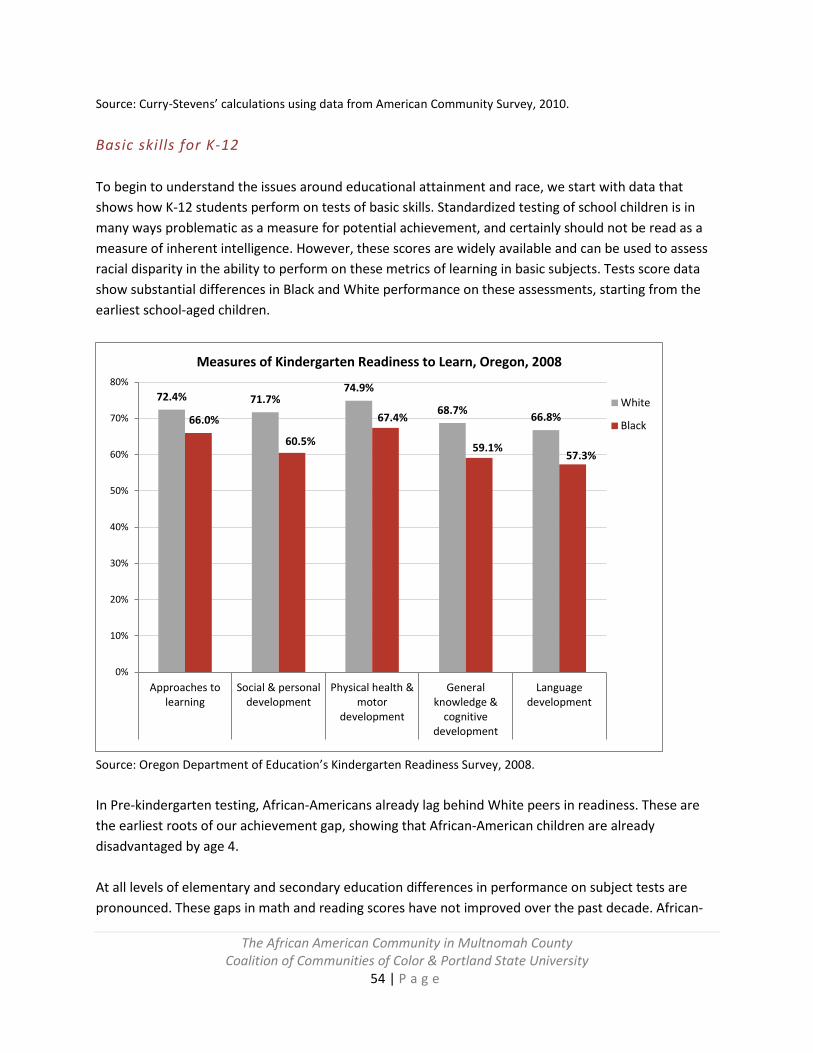
Source: Curry-Stevens’ calculations using data from American Community Survey, 2010. Basic skills for K-12 To begin to understand the issues around educational attainment and race, we start with data that shows how K-12 students perform on tests of basic skills. Standardized testing of school children is in many ways problematic as a measure for potential achievement, and certainly should not be read as a measure of inherent intelligence. However, these scores are widely available and can be used to assess racial disparity in the ability to perform on these metrics of learning in basic subjects. Tests score data show substantial differences in Black and White performance on these assessments, starting from the earliest school-aged children.
Source: Oregon Department of Education’s Kindergarten Readiness Survey, 2008. In Pre-kindergarten testing, African-Americans already lag behind White peers in readiness. These are the earliest roots of our achievement gap, showing that African-American children are already disadvantaged by age 4. At all levels of elementary and secondary education differences in performance on subject tests are pronounced. These gaps in math and reading scores have not improved over the past decade. African-
72.4% 71.7%74.9%
68.7% 66.8%66.0%
60.5%
67.4%
59.1%57.3%
0%
10%
20%
30%
40%
50%
60%
70%
80%
Approaches tolearning
Social & personaldevelopment
Physical health &motor
development
Generalknowledge &
cognitivedevelopment
Languagedevelopment
Measures of Kindergarten Readiness to Learn, Oregon, 2008
White
Black
The African American Community in Multnomah County Coalition of Communities of Color & Portland State University
54 | P a g e

American students are improving performance on state tests. However, the gains are not enough to close the achievement gap with Whites. While there are some real improvements in reading, achievement gaps for math are becoming worse.
Source: Curry-Stevens’ calculations from Oregon Department of Education data tallied by Pat Burk for data to 2008; ODE website for data in 2009 and 2010. Black students in Multnomah County are not acquiring basic skills in math as measured by standardized tests. As of 2010, only 48% of Black students in Multnomah County met math achievement benchmarks—in other words, over half fail these tests of knowledge. These alarming numbers compared to over three-quarters of White students’ achieving a passing score by 2010, after a decade of improvement. While African-American achievement has also improved during the decade—up from a 2000 pass rate of just 37.8%--the achievement gap is unchanged (27.5 percentage points in 2000—to 28.9 percentage points in 2010). Black-White disparities in math proficiency have widened from 2005 to 2011, as shown in the next chart.
65.3% 66.3%68.4% 69.7% 70.3%
74.2% 74.7% 72.7%75.7% 75.3% 76.9%
37.8% 38.3% 38.8%42.8%
45.8%50.6% 51.1%
42.8%45.4%
48.5%
48.0%(60.2% worse)
0%
10%
20%
30%
40%
50%
60%
70%
80%
90%
2000 2001 2002 2003 2004 2005 2006 2007 2008 2009 2010
Achievment Gap, Math, Multnomah County (% who meet/exceed benchmarks)
White
AfricanAmerican
The African American Community in Multnomah County Coalition of Communities of Color & Portland State University
55 | P a g e

Source: Curry-Stevens’ calculations from Oregon Department of Education data, selected years. While reading and language test scores show modest gains over the decade, in 2010 45% of African-American students are still failing to meet standards, compared to just 20% of white students. The gap between Whites and African-Americans on reading achievement has remained stagnant over the last decade.
52.1%
108.5%
34.2%
116.9%
58.2%
86.8%
40.9%
70.2%
35.5%
87.2%
41.4%
96.8%
0%
20%
40%
60%
80%
100%
120%
2005 2006 2007 2008 2009 2010 2011
Disparities between Black & White Achievement Scores, Math, Multnomah County
(measuring disparity among students who "meet or exceed" benchmarks")
PortlandReynoldsParkroseGresham-BarlowDavid DouglasCentennial
The African American Community in Multnomah County Coalition of Communities of Color & Portland State University
56 | P a g e

Source: Curry-Stevens’ calculations from Oregon Department of Education data tallied by Pat Burk for data to 2008; ODE website for data in 2009 and 2010. Reading disparities exist, but are less than math disparities. Some school districts have made progress in reducing reading test score gaps—Gresham-Barlow and Centennial both have lower gaps in 2011 than in 2005. Gresham-Barlow now has the smallest achievement gap in reading among Portland area schools—yet this is still a 30% gap.
72.2% 72.2%74.7%
72.2% 71.0%74.8% 76.7% 77.7% 78.7% 77.5% 79.1%
46.3% 45.3%49.2% 49.9% 48.4%
53.1%55.9%
51.6% 50.8%
58.4%55.2%
0%
10%
20%
30%
40%
50%
60%
70%
80%
90%
2000 2001 2002 2003 2004 2005 2006 2007 2008 2009 2010
Achievement Gap, Language Arts, Multnomah County (% who meet/exceed benchmarks)
White
AfricanAmerican
The African American Community in Multnomah County Coalition of Communities of Color & Portland State University
57 | P a g e

Source: Curry-Stevens’ calculations from the Oregon Department of Education data, multiple years. Another level of complexity to measuring the achievement gap is to look separately at achievement rates for 3rd, 5th, 8th, and 10th grades. Educational disparities exist early in elementary school, and are much greater for high school students.
45.1%
30.4%
26.9%
58.2%
28.9%
45.6%
51.4%
62.9%
36.0%33.3%
47.4%
35.9%
46.1%
48.6%
33.8%
29.9%
42.1%
33.7%
0%
10%
20%
30%
40%
50%
60%
70%
Portland Reynolds Parkrose Gresham-Barlow David Douglas Centennial
Disparities between Blacks and Whites in Achievement Scores, Reading, Multnomah County
(as measured by those who meet/exceed benchmarks) 2005
2010
2011
The African American Community in Multnomah County Coalition of Communities of Color & Portland State University
58 | P a g e

Source: Author’s calculations from Oregon Department of Education data tallied by Pat Burk. In 2008 tests of reading, Black 10th graders met benchmarks at a much lower rate than Black 3rd graders. The achievement gap is much wider at the middle and high school level than for elementary students. Only one-third of African-American students meet or exceed standards for 10th grade literacy, while nearly three-quarters of White students meet or exceed standards. Similarly, in mathematics, the score gaps are large and are worse for high school students. In 10th grade, only one-in-five African-American students meet math standards. African-American students reach 3rd grade already significantly disadvantaged in reading and math. Intervention to improve early disparities is necessary, but attention should also be paid to preventing continuing or worsening gaps in higher grades as well. Critical attention must be paid to assessing the cause of the dramatic difference in achievement between young elementary students and high school students.
87%82%
75% 71%71%
54%
44%
34%
0%
10%
20%
30%
40%
50%
60%
70%
80%
90%
100%
Grade 3 Grade 5 Grade 8 Grade 10
Reading/Literature Scores, Multnomah County, 2008 (% who meet/exceed benchmarks)
White
AfricanAmerican
The African American Community in Multnomah County Coalition of Communities of Color & Portland State University
59 | P a g e

Source: Curry-Stevens’ calculations from Oregon Department of Education data tallied by Pat Burk. Given these testing results and the reality that African-American students rarely thrive in standardized tests, it is of little surprise that Black students are far less likely to be identified for the Talented and Gifted Program. White students are placed in these programs at twice the rate of African-American students. Not being identified as gifted goes along with the lower rates of African-American enrollment in challenging Advanced Placement and International Baccalaureate coursework at the high school level, disadvantaging college-bound African-American students.
Source: Oregon Department of Education, TAG Demographics, 2010.
8.7%
4.2%
0%
1%
2%
3%
4%
5%
6%
7%
8%
9%
10%
White Black
Rate of Participation in Talented & Gifted Program, Oregon, 2010
85% 83%76%
59%60% 58%
44%
19%
0%
10%
20%
30%
40%
50%
60%
70%
80%
90%
100%
Grade 3 Grade 5 Grade 8 Grade 10
Mathematics Scores, Multnomah County, 2008 (% who meet/exceed adequacy)
White
AfricanAmerican
The African American Community in Multnomah County Coalition of Communities of Color & Portland State University
60 | P a g e

There are ongoing debates on the worth of standardized subject testing in general, and the questions of validity and reliability of these tests---especially for children of color---are important. Factors that affect success on standardized testing include:
• School conditions such as the preschool experiences, quality of education, facilities, crowding, and funding levels. The presence of institutional racism and its corollary of White privilege must also be factored into school contributions.
• Family contributions such as income, wealth, health and nutrition, supports for homework and quiet working space.
• Neighborhood and environmental conditions such as pollution, violence, gang presence, healthy foods, affordable housing, and after-school programs.
• Testing conditions when IQ tests are administered to African-Americans after they self-identify their race, test scores fall—a psychological effect of internalized racism.80
Racialized inequalities in all of these conditions overlap and reinforce racial disparities in school achievement. Schools alone cannot resolve these social, economic and health factors, but it is particularly essential that schools not deepen disparities that might exist due to environmental or family conditions. Yet we routinely have African-American children working with the lowest credentialed teachers, the newest teachers, in the most broken down schools, with the lowest resources from fundraising activities, with overreliance on suspensions and expulsions for discipline, and also with the lowest per student funding. High School Graduation and Dropout High school graduation is a critical milestone for individual achievement and opportunities for economic mobility. Beyond the individual, high school dropout has real consequences in the regional economy: studies estimate that cutting the dropout rate by half would generate a total economic impact of $55 million annually, plus an extra $119 million in expanded home sales and the creation of 350 new jobs in the Portland metropolitan area alone.81 Statewide, high school graduation rates for Black students who start Grade 12 are substantially lower than Whites’ and are declining. Black students have lost significant ground over the last six years, falling ten percentage points in this time, while the loss for White students has fallen only two percentage points.
The African American Community in Multnomah County Coalition of Communities of Color & Portland State University
61 | P a g e

Source: Curry-Stevens’ calculations from Oregon Department of Education’s data on High School Completers.
The impact of race and racism on African-American students’ graduation rates is persistent, with race remaining a key predictor even when holding income constant. If the primary driver of lower African-American graduation rates were lower family incomes, we would expect to see higher income Black students achieving the diploma at a rate similar to higher income Whites. However, graduation rates across income classes for African-Americans are nearly the same—while for Whites, having higher family income dramatically increases the graduation rate by ten percentage points. More affluent Blacks graduate at a rate of 71.8%, while poorer Blacks are only a little less likely to gain their diplomas (at 70.7%). Thus the impact of income on graduation rates is very small for Blacks.
90.8% 91.6%89.4% 88.7%
80.9%
82.6%
76.0%
79.0%
71.1%
50%
55%
60%
65%
70%
75%
80%
85%
90%
95%
2003 2004 2005 2006 2007 2008 2009
% of Oregon's students who begin grade 12 and graduate with a regular diploma
White
Black
The African American Community in Multnomah County Coalition of Communities of Color & Portland State University
62 | P a g e

Source: Oregon Department of Education, High School Completers, 2009 by economic disadvantage and race.82
We draw some troubling conclusions from these data: high incomes do not protect Black students from the harmful effects of racial disadvantage, while at the same time, and in the same schools, White students benefit from high incomes. New data for assessing the progress of high school students in Multnomah County reveal further distressing trends. Data have been improved by the Oregon Department of Education’s recent ability to track students as a cohort,83 reporting the number of students who graduated with a regular diploma within four years of entering high school in Multnomah County. This measure gives a more robust picture of what is happening to students than previous methods of calculating graduation rates only for students who entered the 12th grade. The graduation rate for students who entered 9th grade in 2008 in Multnomah school districts is 58.2% for the standard diploma. While this rate is appallingly low, the rate for African-American students is worse. More than half (47%) of Black youth entering the 9th grade do not successfully complete high school on time. The graph illustrates that while rates improved for both African-American students and white students recently, the successful graduation for African-Americans tumbled for the most recent
82.0%Poor
70.7%Poor
90.2%Non-Poor
71.8%Non-Poor
0%
10%
20%
30%
40%
50%
60%
70%
80%
90%
100%
White Black
Graduation Rates, Oregon, for different income groups, 2009
The African American Community in Multnomah County Coalition of Communities of Color & Portland State University
63 | P a g e

year, while at the same time, a growing portion of white students graduated with a regular diploma in the same four year span.
Source: Curry-Stevens’ calculations of Oregon Department of Education’s data on the Cohort Graduation Rates.84
The cohort graduation rate varies by district, as shown below. Reynolds is performing worst in graduating African-American students. The second worst Portland Public Schools. The chart below shows that the best performing districts still only successfully graduate just over half of their Black students.
64.0%2009
46.4%2009
63.2%2010
47.5%2010
64.9%2011
52.0%2011
66.1%2012
47.1%2012
0%
10%
20%
30%
40%
50%
60%
70%
White Black
Graduation Rates, Multnomah County, 2009-12
The African American Community in Multnomah County Coalition of Communities of Color & Portland State University
64 | P a g e

Source: Curry-Stevens’ calculations of Oregon Department of Education’s data on the Cohort Graduation Rate. The cohort graduation rate puts into perspective other measures looking at students who become disengaged from the education system. Often we look at the drop-out rate as a measure of non-completion. Dropout indicates a student has withdrawn from or been pushed out of the education system. For African-American students dropout rates have been about 7%—a figure that has improved from a decade ago, but it still substantially higher than for White students.
64.9% 63.9% 64.9%
74.8%
68.4%65.6%
51.7%52.0%50.2% 51.5%
55.6% 54.7% 54.6%
45.1%
0%
10%
20%
30%
40%
50%
60%
70%
80%
MultnomahCounty
Portland Parkrose Gresham-Barlow David Douglas Centennial Reynolds
Cohort Graduation Rate, 2011, Multnomah County School Districts
White
Black
The African American Community in Multnomah County Coalition of Communities of Color & Portland State University
65 | P a g e

Source: Curry-Stevens’ calculations from Oregon Department of Education data tallied by Pat Burk, and most recent year from Oregon Department of Education. The cohort graduation numbers show that dropout rates calculated for students leaving school during a single year understate how many Black students actually don’t graduate high school on time. In a single year (09-10), fewer than 7% of Black students dropped out; but the graduation rate for the cohort that should have graduated in 2010 was less than 50%. Dropout accumulates over each year. We must address dropout as critical, keeping in mind the overall impact of dropouts and pushouts on cohort success. School Discipline Dropout, on-time graduation, and school achievement are tied to school discipline. Students dropping out due to contact with the disciplinary system may be better understood as having been pushed out of school. Discipline rates reveal deep and pervasive racial disparities. Given that prior research illustrates that students of color are not more disruptive in class, we would expect similar discipline rates across all student groups. Yet, across Multnomah County, African-American students are suspended and expelled from schools at higher rates than White students—often at rates more than double those of Whites. These exclusionary discipline methods result in disengagement from school and exacerbate the achievement gap.
7.7
8.17.6
6.8
5.9
4.55.6
3.9
10.8
12.6
11.1
11.4
9.4
6.8
8.6
6.7
0
2
4
6
8
10
12
14 High School Dropout Rates, Multnomah County
WhiteBlack
The African American Community in Multnomah County Coalition of Communities of Color & Portland State University
66 | P a g e

We know that students of color are no more likely to misbehave in classrooms than White students,85 but that they are handled differently by teachers and administrators. And once identified as behavior problems, students are more likely to continue to be disciplined, even when their behavior improves.86 Researchers in this field conclude that “there is no evidence that frequent reliance on removing misbehaving students improves school safety or student behavior.”87 Given also that discipline practices (suspensions and expulsions) are strongly linked to youth involvement in the juvenile justice system and greater likelihood of dropping out of school,88 we want to ensure that institutional racism does not contribute to uneven or heavy-handed uses of discipline with Black children. Out-of-school suspension and expulsion are the most severe discipline tools. These disciplinary actions exclude students from school and can leave them disengaged from education, teachers, and youth programs. Suspension and expulsion rates have worsened in the county since 2004-05 for all students, but African-American students have been particularly impacted. Rates have risen faster and higher over the last five years for African-American students than for other students of color or White students.
Source: EcoNorthwest analysis of ODE data on student suspensions and expulsions by demographic characteristics and county, 2004-05 to 2007-08. In-school suspensions also have disproportionate effects on African-American studies –who represented less than 3% of the student body, but 4% of in-school suspensions.
5.97.3 7
9.99.0
11.7
14.7
20.2
22.7
20.5
0.0
5.0
10.0
15.0
20.0
25.0
2004-05 2005-06 2006-07 2007-08 2008-09
Percent of Students with Suspension & Expulsion, Multnomah County
White
AfricanAmerican
The African American Community in Multnomah County Coalition of Communities of Color & Portland State University
67 | P a g e

Source: American Civil Liberties Union of Oregon, 2010, using ODE data.89
African-American students are disproportionately disciplined in every school district with the greatest disparities in David Douglas, Gresham-Barlow, and Reynolds school districts. African-Americans’ discipline rates are the worst of any community of color in all districts except Parkrose (where Latino and Native American discipline rates are equally high). These extreme disparities indicate there is a troubling problem with the perception of and reaction to behavior by Black children in school, and a need for systematic assessment and dismantling of institutional racism in discipline. Recent data shows the depth of this problem of discipline disparity. Using a more robust database, the Multnomah County Commission on Children, Families and Communities looked at frequency of suspensions (in-school and out-of-school) and expulsions and the reasons for these disciplinary acts. For exclusionary discipline, rates among African-American students are 40 out of every 100 students—almost 3.5 times the levels of White students.90 Across the School Districts, there is considerable variation. In 2010, Reynolds School District disciplined Black students at a rate that was 3.79 times higher than Whites, and all Districts disciplined African-American students at levels at least twice higher than White students.
68.4% 66.5%
2.9% 4.1%
0%
10%
20%
30%
40%
50%
60%
70%
80%
% of students % of suspensions
In-School Suspensions, Oregon, 2008/2009
White
Black
The African American Community in Multnomah County Coalition of Communities of Color & Portland State University
68 | P a g e

Source: Multnomah County Commission on Children, Families and Communities, 2012.91 Below we can see the reach of the populations affected by this issue, illustrating the much heavier involvement of Black students in school discipline.
Source: Adapted from Multnomah County Commission on Children, Families and Communities, 2012.92 Levels have been adjusted by using approximate values for the number of discipline incidents per student who faces discipline. The reasons students get suspended and expelled are relatively similar between White and African-American students. African-American students are slightly more likely than White students to have “conduct” or “school rules” reasons for discipline, with these incidents making up 49% of total incidents for Black students, compared with 47% of White students’ incidents. Such events are more discretionary
1
1
1
1
1
1
2.8
2.83
2.64
2.35
3.52
3.79
0 0.5 1 1.5 2 2.5 3 3.5 4
Centennial
David Douglas
Gresham-Barlow
Parkrose
Portland
Reynolds
Relative Rate Index, African American StudentsMultnomah County, 2010
BlackWhite
2,91010.4%
25,205 89.6%
Approx. Discipline levels among White students Multnomah County, 2010
Disciplined
Non-Disciplined
1,92930.3%
4,43569.7%
Approx. Discipline levels among Black students, Multnomah County, 2010
DisciplinedNon-Disciplined
The African American Community in Multnomah County Coalition of Communities of Color & Portland State University
69 | P a g e

for school administrators, and as such are an important element of racial disparities – as this is where individual bias, assumptions and stereotypes influence behavior. The Commission on Children, Families and Communities concluded that students of color are excluded for more subjective reasons than White students are. It is more likely that an excluded White student was disciplined for violence than an excluded Black student. The risks of heightened discipline rates are significant, with the most immediate being increased challenges in strong grade attainment, and later impacts being a greater likelihood of dropping out of school, becoming involved in the justice system, and the loss of engagement between youth and the school system – with pronounced concerns about fairness and justice being raised. Students of color who have been disciplined unfairly tend to lose trust in administration and in turn are more likely to disengage with the entire school system.93 Discipline disparities have cost not only African-American students and their families, but the district as a whole. Portland Public Schools has been singled out for racial disparities in disciplining students in special education classes – as it suspended and expelled a higher percentage of African-American students in 2009 and 2011. As a penalty, PPS was required to shift 15% of its federal special education money towards keeping students out of special education through early intervention programs. Additionally, the Board is required to fill the hole in special education with core funds. The cost of this redirection of funds was $4.4 million to the PPS Board.94 College admissions and graduation On a positive note, over the past ten years, more African-Americans have decided to aim for college, and have been successful in getting admitted. Since 2001, Black students have been headed to college in record numbers.
The African American Community in Multnomah County Coalition of Communities of Color & Portland State University
70 | P a g e

Source: Oregon University System, 2006.95
More African-American students are entering the community college system in Oregon than they are entering the state university system.96 Only 17.6% of African-American youth enter Oregon public universities, compared to 22.5% of White students.97 While college/university entry rates are high, retention and graduate rates are lower. Abundant research exists to find the causes of the loss of students of color from higher education. Key factors are understood to include the following: failure to recognize the forces of imperialism and oppression in the explicit and implicit curriculum, lack of support systems for students of color, lack of instructors of color, expense of higher education, disparate ability to secure affordable loans, and lack of shifts within conventional institutional culture that results in students of color being perpetual outsiders.98 Community colleges generally have low retention rates, as students exit for universities, take programs of varied duration, and move between full and part-time status—a flexibility that makes community college a good fit for many. At Mount Hood Community College, the overall graduation rate is just 3.8% of all attendees achieving the Associates’ Degree (AD). Only 1.9% of Black entering students complete the AD. Portland Community College (PCC) does not publish rates of graduation for all entering students, but proportions can be compared based on the graduating student data. Black students make up about 6% of PCC enrollees, similar to Black representation in Multnomah County. However, Black students make up only 2.8% of PCC’s graduates.
50.0%
80.0%
63.5% 70.3%
0%
10%
20%
30%
40%
50%
60%
70%
80%
90%
1993 1995 1997 1999 2001 2003 2005
High school graduates entering college, Oregon
Black
White
The African American Community in Multnomah County Coalition of Communities of Color & Portland State University
71 | P a g e

In Oregon’s state university system, racial disparities in retention begin to appear by the end of the first year of study.
Source: Keiran, B. (2009) citing OUS Institutional Research.99 While the above data (beginning in 2008) do not yet represent a full four-year cohort effect, we have more complete data for earlier in the decade. Across OUS institutions,100 Black students stay in school at a lower rate than do White students. Pronounced differences in retention are seen at the third and fourth year, and by the fifth year, just a third of Black students have graduated from OUS schools.
100.0%
91.9%
81.6%
89.1%
79.6%
70%
75%
80%
85%
90%
95%
100%
Total FreshmanCohort, Fall 2008
Retained toWinter 2009
Retained toSpring 2009
Retained to Fall2009
Oregon University System, Retention levels for 2008 Cohort
White
Black
The African American Community in Multnomah County Coalition of Communities of Color & Portland State University
72 | P a g e

Source: Holliday, J. (2009).101
At Portland State University, a school that is most accessible to the majority of Oregon’s Black population (both academically and geographically), six-year graduation rates show African-American graduation rates have generally been lower than Whites, and significantly lower in the most recent years.
Source: Office of Diversity and Equity, Portland State University.102 Note this data includes those who transfer to other universities and colleges.
19.8%(both groups at
same level at end of Y1)
30.8%34.6%
37.7%
49.4%
0%
5%
10%
15%
20%
25%
30%
35%
40%
45%
50%
2003 2004 2005 2006 2007 2008
Students who stop attending OUS universities, 2002 Cohort
White
African/Black
33.1%34.5% 29.1%
27.3%
44.4%
10.2%
0%
5%
10%
15%
20%
25%
30%
35%
40%
45%
50%
1998 1999 2000 2001 2002
Graduation rates of student cohorts within 6 years at Portland State University (undergraduate)
WhiteBlack
The African American Community in Multnomah County Coalition of Communities of Color & Portland State University
73 | P a g e

Below we see the net impacts of differential access rates and retention rates as the pattern of graduation within our public universities has barely budged in the last decade. Fewer than 2% of OUS graduates are Black.
Source: Curry-Stevens’ calculations from Oregon Univeristy System Fact Books, selected years.
The profile of educational attainment for all African-American adults in Multnomah County that began our discussion about education is not likely to change in the coming generation, as so few of our youth successfully graduate school and so few obtain university educations. Education and earnings: A troubling caveat While education is an important pathway out of poverty, improving the chance of earning a living wage and higher—the chart below illustrates the pattern of incomes for African-Americans by education. However, educational attainment alone cannot overcome workplace discrimination and institutional racism that limits Black earnings. In fact, the earnings disparity between Blacks and Whites actually worsen as education levels rise.
87.3%
1.5%
86.1%
1.7%0%
10%
20%
30%
40%
50%
60%
70%
80%
90%
100%
White Black
Degrees awarded by Oregon's Public Universities, 1998 to 2008
1997-98
1999-00
2001-02
2003-04
2005-06
2007-08
The African American Community in Multnomah County Coalition of Communities of Color & Portland State University
74 | P a g e

Source: Adapted by Curry-Stevens from Kelly (2005) using Census 2000 data.103 In essence, African-Americans—and other communities of color—are unable to “cash in” on the full value of their education.104 In the labor market, the same degrees are able to leverage much higher incomes when wielded by Whites than by African-Americans. African-Americans remain deeply invested in education as it is the most important pathway out of poverty and towards improved jobs, incomes, security and quality of life. African-Americans in Multnomah County have long fought for equal opportunity in public education, and have developed models that are successful in reaching at-risk urban youth. Sadly, the distress in the entire education system, from kindergarten through post-secondary education, persists, pointing to a need for significant change. The attention to education and achievement gaps over the past decade has not so far resulted in substantial improvements, suggesting new models that are culturally-specific and address institutional racism in the school system are needed.
$30,867(premium
of 20%)
$37,253 $39,076
$54,631
$72,778(premium
of 28%)
$25,766
$30,300$33,324
$42,279
$56,862
-
10,000
20,000
30,000
40,000
50,000
60,000
70,000
80,000
High School Some college Associates Bachelors Graduate/professional
Average Annual Incomes, By Education Level, USA, 1999
White
Black
The African American Community in Multnomah County Coalition of Communities of Color & Portland State University
75 | P a g e

Education: policy recommendations
Define equity metrics and accountability for African-American achievement. True education reform focuses on outcomes—closing the achievement gaps, building a culture of high expectations, and meeting 21st century challenges for building towards careers.
• School districts create equity plans that specifically address racial achievement gaps. All inequities, including lower expectations for African-Americans, over-identification for special educations and under identification for Talented and Gifted (TAG) must be addressed and subsequently eliminated.
• Align all schools with the Teachers Standards and Practices Services (TSPC) administrative standards that say school administrators must be culturally competent. Hold administrators accountable to this policy through administrator evaluations and outcomes of diverse youth. Assess teaching, curriculum content and delivery for culturally-specific needs. Provide professional development support for adopting new materials and methods. Ensure that staff members are culturally competent.
• Adopt affirmative action policies that allow for the hiring of more teachers and administrators of color. Strategic efforts must be made in all Portland districts to ensure that teachers are not only culturally competent, but more adequately match the demographics of students being served.
• Implement and evaluate Cradle to Career as a collective impact strategy that focuses on making sure youth enter school ready to learn, that they are supported inside and outside of school, that they succeed academically in school, that they enroll in post-secondary education and training, and that they graduate ready to begin a career. Ensure that Cradle to Career goals are met for Black youth.
• Address inequities in resources, including funding, facilities, and teacher experience, with meaningful policy reform.
Ensure that African-American youth are prepared to enter school.
• Invest in affordable, high quality early childhood interventions. As federal and state investments expand in Head Start, Early Head Start and Oregon Pre-kindergarten, local policy-makers must ensure that African-American children have proportional access to the services, and that the early childhood education models are culturally relevant and effective. For those youth that don’t have access to head start, there needs to be other affordable options that ensure all youth are entering kindergarten ready to learn.
• Implement supports that address kindergarten absenteeism. Develop policies that address high absenteeism for young children, and provide supports to youth and their families that enable success and attendance in kindergarten. Schools in neighborhoods that are predominantly youth of color should provide all-day kindergarten.
The African American Community in Multnomah County Coalition of Communities of Color & Portland State University
76 | P a g e

End discipline disparities that lead to disengagement and dropout of African-American youth.
• Continue to implement and evaluate Positive Behavior Intervention and Supports (PBIS) strategies that include conflict resolution and restorative justice programs to prevent misconduct, repair harms, and establish responsibility and accountability for students.
• Utilize in-school suspensions that maintain meaningful, culturally-competent engagement with students, including individualized academic supports and problem-solving skill development for students, instead of exclusionary discipline that leads to detachment.
• Hold teachers and administrators accountable for disparities in suspensions and expulsions. Monitor and evaluate discipline rates and reasons for bias. Provide training for teachers and administrators in alternatives to exclusionary discipline.
Ensure that African-American youth are supported in and out of school to complete their education.
• Invest in in-school supports that youth need to excel academically; invest in after school and summer academic supports that promote positive youth development. Invest in wraparound services for families.
• Support and expand education initiatives that work for African-American students. Programs such as Self Enhancement Inc have a proven track record in increasing achievement for African-American students.
• Increase the number of African-American students using AVID, a rigorous college preparatory program and enrollment, participation, and completion rates of African-American students in AP/IB courses. Gaining access to AP coursework means gaining college credits towards a degree which both assists with college completion and post-secondary affordability.
• Invest in contextual learning opportunities for youth to combine college prep with technical and occupational courses that provide real-world experiences in business and industry, so youth view education as a connection to opportunities in the labor market.
The Criminal Justice System The review of the criminal justice system addresses policing and racial profiling, the adult system, and the juvenile justice system. African-Americans have long been active on issues of bias in criminal justice, but the issue was raised to the level of statewide attention in the 1994 Supreme Court of Oregon’s audit of racial bias. It concluded that “people of color are more likely to be arrested, charged, convicted and incarcerated, and less likely to be released on bail or put on probation.”105 This audit came over 25 years after the City Club of Portland’s Racial Justice Report that enumerated police discrimination against
The African American Community in Multnomah County Coalition of Communities of Color & Portland State University
77 | P a g e

minorities, including reports of slow responses to calls from Black neighborhoods, police harassment, rudeness, and abusive behavior. Policing, racial profiling, and brutality Racial profiling is “the inappropriate reliance on race as a factor in deciding to stop and/or search an individual.”106 African-Americans are policed more heavily than Whites, and are more likely to be stopped and searched more often by the police while driving.107 It is little surprise that African-Americans in Portland, surveyed as part of a police bureau assessment, were much more likely to perceive unfair treatment by Portland police officers regarding “race, skin color, or national origin.” African-Americans were also significantly more likely to report that a member of their household has been stopped by the police.108 There is a lengthy history of policing practices in Multnomah County that treat people differently by race. Recently, Portland’s controversial “drug-free zones” were used from 1992-1997 to ban people from neighborhoods based on suspicion—not conviction—of drug possession or sale. The exclusions were most likely to be enforced against African-Americans, representing nearly two-thirds of all violations and exclusions. In contrast, overwhelmingly White methamphetamine –related arrestees were rarely excluded. Due to this racial bias, the practice was terminated. Faced with extensive evidence, the Portland Police Bureau officially confirmed that racial profiling existed within the police force in 2006. Numerous community dialogues have occurred in the last ten years leading to a set of demands including requiring the Portland Police Bureau to release its own plan to address racial profiling. Released in 2008, the report issued commitments to diversify its workforce, to upgrade the skills of officers, to build trust and understanding with communities of color, and to research police stop data more accurately and reliably.109 The police force has a way to go to diversify. Current police hiring practices lead to the hiring of too few people of color, with White officers holding 86% of the jobs, while making up (in 2006) only 77.9% of the population. For equity to be achieved in this police department, an additional 65 people of color (of a police force numbering approximately 900) would need to be hired.110 Additional police officers of color may affect racial stereotyping by the force, but would not ameliorate the need to continue to collect and report data on stops and searches with emphasis on racial profiling behaviors. Of urgent concern for the African-American community—and, indeed, all Portlanders—is an ongoing and serious problem with police brutality and use of force. From late September 2004 to December 2006, 29% of all uses of force by police were against Blacks. These uses of force included takedowns, control holds, pepper spray, taser strikes, and “point weapon” use of firearms. Use of deadly force has resulted in community outrage. The shooting deaths of Aaron Campbell and Keaton Dupree Otis have particularly sparked protest and calls for more serious investigations and discipline for officer-involved shootings. A review of the data on police shooting deaths and deaths in custody of the Portland Police Bureau over the last ten years shows that 26 people have been killed
The African American Community in Multnomah County Coalition of Communities of Color & Portland State University
78 | P a g e

through the use of deadly force. Of these 26, eight (30%) were people of color—mostly African-American; this is hugely disproportionate.111 These incidents, along with the death of James Chasse, have driven a federal Department of Justice investigation of the Portland Police Bureau. The review was based on potential discrimination against persons with mental illness as the precipitating factor, but DOJ officials promised to include racial bias in their comprehensive investigation. After a lengthy investigation and negotiation, the DOJ and City of Portland have reached preliminary agreements to change practices, training, and supervision, as well as response to use of force. A new Community Oversight Advisory Board is being formed, and the predominantly African-American Albina Ministerial Alliance will have a role in selecting representatives to be part of that monitoring board.112 Crime & Adult Corrections A 2000 analysis of patterns of arrest, prosecution, sentencing and supervision in Multnomah County revealed over-representation of racial/ethnic minorities permeated most crime categories. Disparities exist at each stage of the criminal justice system: arrest, prosecution, verdicts, and sentencing. African-Americans had the highest degree of over-representation in arrests for drug crimes, but were also disproportionately represented in other categories as well. While African-Americans made up less than ten percent of the population of Multnomah County, they accounted for 21.7% of the Justice Department’s active adult caseload. At that time, African-Americans in the County were over three times more likely to be represented in the Justice system than they were represented in the population as a whole.113 In addition, disparity existed in terms of supervision. In Multnomah County in 2009, Black, non-Hispanic adults made up 5.2% of the population and 24.11% of the population under supervision; White, non-Hispanic adults made up 73.35% of the population and 65.47% of the population under supervision.114 Additionally, African-Americans were assessed at high risk to re-offend more often than Whites. Whites were more often assessed at limited risk to re-offend than other groups.115 While rates of prosecution, dismissal, and guilty verdicts were fairly consistent across groups, harsher sentences were more often applied to African-Americans. The state’s prison population is disproportionately Black. African-Americans are six times more likely to be incarcerated than Whites in Oregon.116 Among our community, 3.0% of our adult population is imprisoned – while only 0.4% of the White adult population is imprisoned. 117 This evidence of unequal treatment suggests that the system is ripe with institutional racism that has its roots in a combination of over-policing, over-charging, inequities in being held in detention plus inequities in how probation officers make recommendations and how judges adjudicate a case.
The African American Community in Multnomah County Coalition of Communities of Color & Portland State University
79 | P a g e

Juvenile Justice The juvenile justice system is a special concern, as encounters with the juvenile system have profound consequences for youth. There are significant disparities for youth of color in charges, sentencing, and detention. This problem is urgent and requires intervention around many dimensions including family support and the education system. Perhaps the most troubling of all the data on youth in the criminal justice system is the finding that police are 6½ times more likely to charge an African-American youth after arrest than a White youth. Only 23 percent of African-American youth referrals are dismissed, not petitioned or not adjudicated, compared with 54 percent of White youth referrals dismissed, as reported by Oregon Youth Authority’s 2008 data.
Sources: Rhyne & Pascual (2009) for 2007 & 2008 data118 and Wu & Rhyne (2010) for 2009 data.
In each step of involvement with the juvenile justice system, Black youth are much more likely to be the recipients of more harsh and punitive involvement with the system. While all youth of color were also
5.0%2007
19.2%2007
3.5%2008
19.4%2008
2.9%2009
18.8%2009
0%
5%
10%
15%
20%
25%
White Black
Overrepresentation of African Americans in Police Charges of Youth, Multnomah County
The African American Community in Multnomah County Coalition of Communities of Color & Portland State University
80 | P a g e

more likely than Whites to be detained if brought to a facility, African-American youth were the least likely to be released. Black youth are more likely to be charged, more likely to be brought to detention, more likely to be detained and more likely to be found guilty. Black youth are also less likely to be steered out of the justice system into diversion programs. When sentenced (the two right columns below), they are less likely to be involved in probation, but much more likely to be committed to the youth authority for custodial sentences. One-in-four African youth sentences are likely to be committed to youth correctional facility, while only one-in-ten White youth is likely to receive the same sentence. In the juvenile justice system overall, more than 60% of total custody sentences were incurred by African-American youth, while these youth make up less than 10% of the youth population.
Source: Curry-Stevens’ calculations based on data from Wu & Rhyne (2010).119 These data are for the juvenile system only. They do not cover youth charged under Oregon’s Measure 11, which allows youth to be charged and convicted in the adult criminal system. This Measure means that charged youth spend time in adult correctional facilities before trial and those convicted are marked with adult convictions for life, creating barriers to school and employment—all factors in further
2.9%
14.0%
39.5%
20.7%
67.9%
62.3%
10.3%
18.8% 18.2%
52.7%
23.5%
55.8%
50.5%
24.2%
0%
10%
20%
30%
40%
50%
60%
70%
Charged Brought todetention
Detained Found guilty Diversion Probation Committed
Juvenile Justice Decisions, Multnomah County, 2009
White
Black
The African American Community in Multnomah County Coalition of Communities of Color & Portland State University
81 | P a g e

detaching youth from their communities and productive futures. In early 2011, the Campaign for Youth Justice and the Partnership for Safety and Justice released a report on Measure 11 that clearly shows racial disparity in the application of Measure 11. In Multnomah County there were nearly 1,000 Measure 11 indictments from 1995 to 2008. While African-Americans make up just 11% of youth, 45% of these indictments were against Black youth—a rate nearly seven times that of White youth’s Measure 11 indictments. However, once indicted, Black youth are no more likely to be convicted than are Whites—in fact, Black youth indicted under Measure 11 are much more likely not to be convicted (14% of indicted Black youth have no adult conviction, compared to 3% of White youth). This outcome demonstrates that it is at the decision to move to Measure 11 indictments that racial bias is most prevalent—if the indictment itself was unbiased, we would expect similar rates of conviction across races. While it is known widely that Multnomah County was on the leading edge of disparity reduction efforts in the detention system, it is less well known is that these disparities have reappeared and are now higher than they were before such efforts were undertaken.
Source: Rhyne & Pascual (2009). Many argue that that elimination of disparities was the function of additional culturally-specific resources being made available to keep youth of color out of the system. The explicit mandate to reduce disproportional minority confinement set an intention for all decision makers in the system, and was believed to have temporarily shifted the discourse about race in the juvenile justice system. This cultural
42%
25%22%
38%
48%
32% 32%
0%
10%
20%
30%
40%
50%
60%
1994 1995 1996 1997 1998 1999 2000 2001 2002 2003 2004 2005 2006 2007 2008
Juvenile detention rates, Multnomah County, 1994 to 2008 (calculated as % of those detained once brought in)
Youth of Color
White youth
The African American Community in Multnomah County Coalition of Communities of Color & Portland State University
82 | P a g e

shift including making public commitments to goals, external monitoring for accountability, culturally-specific service expansion and supplemental funding narrowed racial inequities. This needs to stay alive in our memory as an exemplar from which we might draw upon to design reform efforts again. Many factors contribute to over-representation in the juvenile justice system. Inadequate preventative social services, lower socio-economic status, law enforcement practices and policies, statutory mandates, inadequate cross-cultural training, lack of culturally appropriate resources, placements, and services, and bias of decision makers are all factors creating disproportionate minority contact with the justice system. Consider the impacts of racial profiling: as a form of over-surveillance, racial profiling will result in more charges, regardless if the rate of criminal activity is exactly the same. The most insidious outcome of such over-surveillance is that it results in higher charging of African-American youth – and this in turn becomes the statistical rationale for racial profiling. At-risk youth While there are real issues of racial bias in the juvenile justice system, it is also the case that too many Black youth are at-risk for or engaged in gang activity. The story for African-American youth in terms of recidivism continues the troubling trends seen at the front end of the juvenile system. African-American youth continue to have a higher recidivism rate and higher chronic offense rate than any other group.120 Compared to Whites, African-American youth are much more likely to reoffend. 121 Without additional attention to youth programs and family supports, these youth may continue into the adult criminal justice system, missing the opportunity to thrive as community members.
Source: Wu & Rhyne (2009).
56.7%
74.9%
31.4%
21.6%
11.9%
3.5%0%
10%
20%
30%
40%
50%
60%
70%
80%
African American White
Juvenile Re-offense Status in Multnomah County, 2007
No re-offense
1-2 re-offense
Chronic
The African American Community in Multnomah County Coalition of Communities of Color & Portland State University
83 | P a g e

Overall, African-American over-involvement with the justice system is a stark reminder of the continued presence of racial bias and the long-term impacts of early involvement with the criminal justice system. Reforms must return as an essential part of the policy landscape. It is time to take a closer look at why these phenomena are occurring and what can be done to change this trajectory. Without essential reforms, the criminal justice system reinforces damaging messages for African-American youth: “No matter how well you behave, how hard you try, being Black means that you will always be considered one of the ‘usual suspects.’”122
Criminal Justice System: policy recommendations
Change practices that contribute to disparities/disproportionate representation of African-Americans, and other minorities in Oregon State Prisons. Reduce Oregon's over-reliance on incarceration as a response to crime and social problems, and shift toward more effective evidence based programs proven to reduce future crime. Adopt an approach to public safety that focuses on prevention, curbs the unsustainable growth of our prison system, invests in programs that are proven to reduce crime and save money, and strengthens support systems and services for crime survivors.
• Prevent New Mandatory Minimum Sentences, which have a disproportionate impact on African-Americans and other people of color. Avoid youth placement in the adult criminal justice system by bringing back judicial discretion for youth tried under Measure 11 offenses.
• Disaggregate race ethnicity/data to identify points of differential treatment. At every phase of the justice process, disaggregated race/ethnicity data must be collected and analyzed. Reform strategies like adequate and just alternatives to detention can reduce racial disparity in the prison system.
Reduce recidivism and increase cost-effective crime prevention through stronger non-prison and post-prison programs.
• Drug and alcohol diversion court, community court and mental health court need greater financial support. When participants can successfully address treatment, housing and other issues while remaining in the community, the state ends up saving money.
• Remove the barriers to successful community re-entry faced by formerly incarcerated people. Strengthen investments in prison programs that reduce recidivism: programs that actually help prisoners succeed when they return to their communities, such as education, job training, mental health, and family support services. Release state prisoners back to the communities where they have the strongest support systems, rather than the county where they were convicted.
• Support legislation and programs that enable people to successfully transition from prison to the community. Enact antidiscrimination legislation that prevents employers from dismissing job applicants based solely on arrest and conviction history.
The African American Community in Multnomah County Coalition of Communities of Color & Portland State University
84 | P a g e

• Remove employment and other re-entry barriers by supporting and expanding programs like “Project Clean Slate,” which helps to navigate barriers by providing assistance with driver’s licenses, job training, etc.
Civic Engagement Civic engagement includes a variety of activities—individual and collective—that are taken to identify and address issues of public concern. Civic engagement could include voting, activism, participation in community groups, and volunteering and charity. The level of civic engagement is one indicator of community-wide well-being. Civic health and social capital have well-established connections to issues such as crime, education, public health, and democracy.123
Voting is the most easily measured form of engagement. Voting data include registration, signaling a lasting intention to participate in elections, and turnout, the actual numbers of people who voted. Nationally, the 2008 presidential election saw a significant increase in voter turnout among African-Americans, and this trend held true in Oregon, as seen in the chart below. With voter turnout at 63%, African-Americans turned out at rates similar to the national average (65%).124 In addition, levels of reported voting among African-Americans increased in 2008 from the previous presidential election year (2004).125 Levels of voter registration among African-Americans approached the levels of Whites in 2008; this is in contrast to voter registration in the previous presidential election year (2004), when levels of registration among African-Americans were nearly half those of Whites.126
The African American Community in Multnomah County Coalition of Communities of Color & Portland State University
85 | P a g e

Source: November Current Population Survey 2004, 2006, and 2008.
Source: November Current Population Survey 2004, 2006, and 2008.
81%'04
44%'04
73%'06
43%'06
75%'08 69%
'08
0%
10%
20%
30%
40%
50%
60%
70%
80%
90%
White Black
Voter Registration in Oregon, 2004 to 2008
76.7%
61.5%
69.8%
43.8% 43.2%
63.0%
0%
10%
20%
30%
40%
50%
60%
70%
80%
90%
2004 2006 2008
Voting Patterns in Oregon, 2004 to 2008White
The African American Community in Multnomah County Coalition of Communities of Color & Portland State University
86 | P a g e
The current economic recession seems to be taking a toll on civic engagement overall. America’s Civic Health Index for 2009 found that 72% of Americans cut back on time spent volunteering, participating in groups, and doing other civic activities in the past year.127 Even in these difficult times, however, levels of volunteering among African-Americans rose slightly from 2006 to 2009.128 Another measure of equity within civic institutions is to assess philanthropic giving through grants made by foundations.129 Despite communities of color making up 19.6% of the population of Oregon in 2008, just 9.6% of foundation grants appear to have reached people of color in the state. For the African-American community across Oregon, the number slips to just 0.5% of the total dollars, despite making up 2.4% of the population in Oregon.
Civic Engagement: policy recommendations
Ensure African-Americans are included at all the tables where African-Americans need to be engaged in policy-making and reform. To make sure African-Americans are included every step of the way, with impact, and proactive rather than reactionary, we must be intentionally inclusive.
• Implement recommendations of the City of Portland Public Involvement Advisory Committee (PIAC) to include people not generally represented in decision-making, advisory committees and technical teams.
• Expand community-based leadership training programs to build community organizing capacity and the capacity for people to engage in shared governance, focusing on under-represented and underserved communities. Train and support leadership candidates from these communities to run for office.
• Invest in Early Civics Education in Schools. Understanding government processes is the first step toward civic engagement. School districts should ensure that all students take classes in civics and have a working knowledge of the Civil Rights Movement that earned the right to vote for African-Americans.
As African-American community based organizations, ensure the Black community is involved, remaining relevant and engaged in policies that affect our community.
• Advocate for funding resources that support initiatives through city and county governments in areas of economic development, education, housing, and health equity for communities of color.
• Participate in coordinating civic engagement activities that include voter registration, education, and mobilization to ensure that African-Americans are informed and mobilized to reduce barriers to representation in a fair and equitable election process.
The African American Community in Multnomah County Coalition of Communities of Color & Portland State University
87 | P a g e

Comparison with King County King County, where Seattle is located, is an important comparison point for assessing the status of communities of color as a neighbor with similar demographics. On every measure, King County’s African-American population fares better than its counterpart in Multnomah County. Compared with King County, Multnomah County’s African-American population has worse rates of child poverty, is housed more precariously, has lower income, and less educational attainment.
2009 Child Poverty
Rent Burden Full-time, year-round
worker incomes Occupation as
management/prof Hold a university
degree (paying 30% or more)
Multnomah King Multnomah King Multnomah King Multnomah King Multnomah King White 14.0% 5.5% 48.9% 43.9% $44,262 $57,822 44.7% 50.9% 41.9% 48.4%
African-American
35.8% 31.1% 65.2% 58.2% $34,741 $37,692 27.7% 29.5% 19.2% 21.9%
Disparity 156% 465% 33% 33% 27% 53% 61% 73% 118% 121% Disparity Better Same Better Better Better
Source: Curry-Stevens’ calculations from American Community Survey, 2009.
Source: Curry-Stevens’ calculations from American Community Survey, 2009.
35.8%
65.2%
27.7%
19.2%
31.1%
58.2%
29.5%
21.9%
0%
10%
20%
30%
40%
50%
60%
70%
Child Poverty Rent Burden Occupation asmgmt/professional
Holds UniversityDegree
Comparison between King County & Multnomah County African Americans, 2009
Multnomah
King
The African American Community in Multnomah County Coalition of Communities of Color & Portland State University
88 | P a g e

While King County’s Black population fares better, White-Black disparities are actually worse in King County. This difference in relative position can be attributed to the much stronger local economy in the Seattle area. On each measure, the situation of King County’s Whites is so much better than Multnomah County’s Whites that disparities are worse. With the deteriorating situation for Whites in Multnomah County during the Great Recession, disparities lessen as everyone is worse off.
Recent changes in disparities The trend in disparities is troubling, with many disparities worsening. The table below shows 29 measures for which we had data on disparities for the Black community in the last two years. Of these 29 measures, 17 are improving. Within these, one is the result of a more rapidly deteriorating condition for Whites, resulting in a reduction in disparity level, but not an improvement in conditions. Improvements in equity have occurred in the areas of poverty rates, education (gaining a university degree and high school discipline rates), and incomes (with the exception of the elderly). Still, in almost every one of these measures, the African-American situation is more than doubly worse than that of Whites. More critically, the status and progress of African-Americans over the past several years is cause for alarm. While we value the approach to reflecting on the achievements in narrowing disparities, this approach tends to overly focus us on how the size the gap between the two communities change – and it minimizes the conditions experienced by these two communities. As Multnomah County and the City of Portland work to emerge from today’s recession, we must do so in a way that benefits all communities to eliminate these intolerable conditions.
The African American Community in Multnomah County Coalition of Communities of Color & Portland State University
89 | P a g e
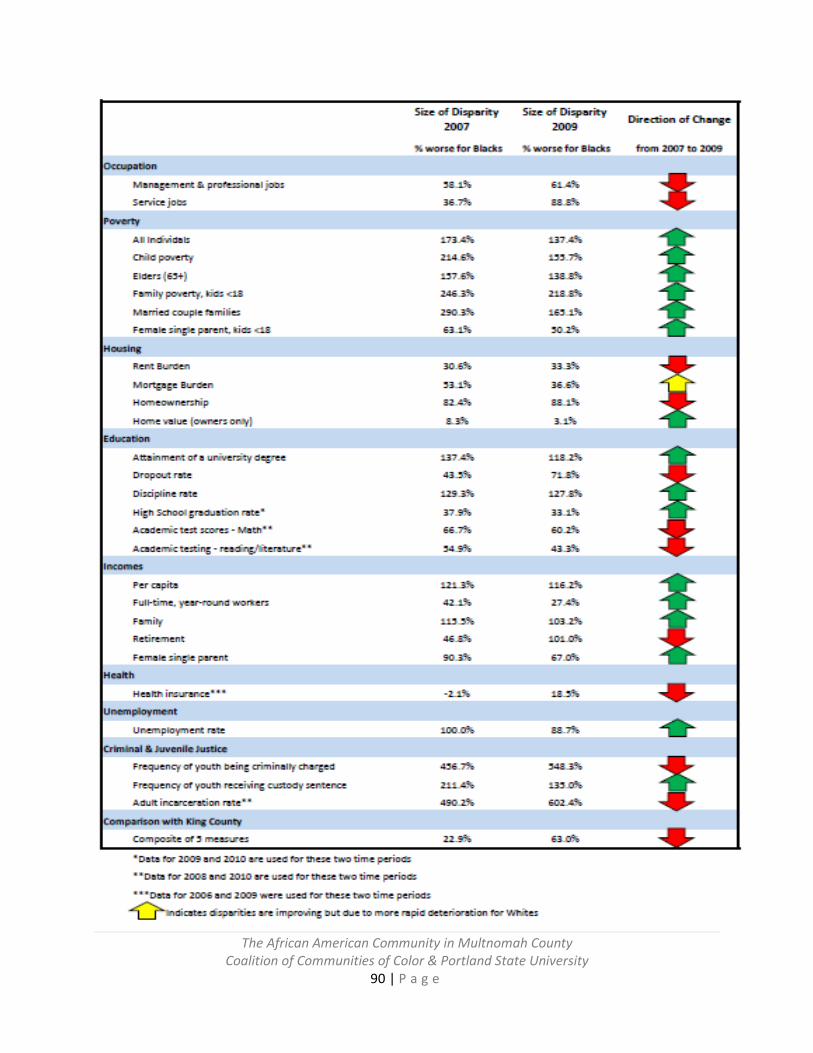
The African American Community in Multnomah County Coalition of Communities of Color & Portland State University
90 | P a g e

Policy recommendations for the African-American Community Overarching The Portland African-American Leadership Forum (PAALF) is committed to Portland becoming a livable city for all people, where race and economic status are not the key determinants to success in life. African-Americans must participate in and have equitable access to opportunity, and the playing field for African-Americans must be fair. Disparities in education, health, housing and economic development, and civic engagement and leadership must be eradicated. The City of Portland, Multnomah County, and Metro must employ a race-conscious equity strategy in planning, policy-making, and program delivery. This strategy should focus on the elimination of institutional racism: “policies, practices and programs that work to the benefit of white people and the detriment of people of color, usually unintentionally or inadvertently.”130 Eradicating institutional racism requires the examination of systemic policies and practices that serve to perpetuate disparities. Putting the value of equity into practice will require changing the way these public institutions work: how government and partners make decisions; where they invest; how services and programs are delivered; how they engage with all Portlanders and newcomer communities; and how success is measured. Public sector institutions will develop and apply a set of equity tools to evaluate the development and implementation of policies, programs and business operations to reduce critical disparities. This includes work identified in the Portland Plan and for the City’s Office of Equity and Human Rights plan to address deep and well documented racial disparities; Multnomah County’s equity initiative; and Metro’s equity and diversity strategies. The following recommendations are current, achievable, and specific to the African-American community.
Economic Opportunity and Vitality: policy recommendations
Support Black business ownership, from entrepreneurship to growth and development.
• Economic development strategies, including urban renewal area plans, must include business development and retention programming that recognizes and mitigates for racial disparities in access to entrepreneurial opportunities, including differential access to business capital.
• Increase access to capital financing; recognizing that barriers to such capital undermine the viability of minority entrepreneurship. Financial institutions must be encouraged to develop and monitor equity financing for these businesses, whether small start-ups or those seeking to expand. Cities must also commit to keeping economic development dollars in the budget, even in these economically hard times, and to distributing them in a way that assists minority businesses.
The African American Community in Multnomah County Coalition of Communities of Color & Portland State University
91 | P a g e

• Link economic development activities around green and high tech jobs to racial equity strategies in education and workforce development. Bring African-American youth into growing job sectors through educational opportunities and address barriers to work entry for adults through job training, job readiness, and policies that address the disproportionate impact of criminal convictions on employment for Black men. Forge partnerships with workforce training programs for recruitment of African-American workers, such as Urban League of Portland Workforce Development program
Public agency contracting and purchasing disparities must be eliminated. Public agencies must assess the opportunities and barriers for MBE participation in purchasing, consulting, and construction, and utilize best practices for eliminating procurement disparities.
• The City, PDC, and other agencies must address documented barriers to MBE firms’ contracting with the city, including for professional services. These efforts should go beyond “good faith efforts” to include targets and practices to assist MBE firms in achieving equity. Prime contractors working with public projects must be held to the high standards for subcontracting and workforce diversity.
• The State must enforce Title VI compliance for all federally funded projects; require all public and private sector projects receiving federal funds to adopt specific and measurable hiring goals for communities with the highest unemployment rates; with penalties for non-compliance.
Public subsidies for development must advance racial equity. Major public projects should include Community Benefits Agreements defined through public participation. These policies must go beyond ‘good faith agreements’ to achieve measurable goals and targets that must be met for MBE utilization and workforce diversity. These community economic development strategies should also include programs to prevent commercial displacement in revitalizing areas.
• CBAs should include targets for contracting for MBEs. Prime contractors must be held accountable for the composition of their subs, and supported in finding and hiring subcontractors from qualified MBE firms.
• Public projects should include First Source Hiring and additional workforce agreements that support living wage jobs with benefits for African-American workers.
• Development subsidies, such as Transit-Oriented Development tax breaks, must include affordable housing units, and construction that utilizes MBEs and local workers.
Public agencies must develop and support a diverse workforce. Public sector agencies such as the City of Portland, Metro, and TriMet should:
• Commit to creating and preserving a diverse workforce on multiple occupational levels, from entry-level to senior management.
The African American Community in Multnomah County Coalition of Communities of Color & Portland State University
92 | P a g e

• Dedicate a specific percentage of each new development project, including federally funded projects, to training and hiring the chronically unemployed
• Support pipeline training and career programs that align with the Governor’s 10 Year Business Plan and the Oregon Business Plan to prepare African-American youth and adults for emerging industries
• Enforce Title VI compliance for all federally funded projects and file suit when action is required; require all public and private sector projects receiving public funds to adopt specific and measurable hiring goals for populations with the highest unemployment rates – with penalties for non-compliance
Housing and Neighborhood Opportunity: policy recommendations
Implement plans and policies to ensure that African-American residents have affordable housing in high opportunity areas. Anticipate and manage future development. Where there are public investments to revitalize or redevelop neighborhoods, there must be an anti-displacement strategy in place to prevent displacement. This strategy must be race-conscious in addressing particular housing barriers for African-Americans.
• Neighborhood economic development and infrastructure investment must also include the creation and preservation of affordable housing in place for both renters and homeowners.
• Anti-displacement policies and programs must be deployed at all stages, from early risk of gentrification, to include housing units that remain affordable over the long term, including community land trust units.
• Resources from state and local government entities must be targeted at supporting community development corporations that work in poor and disenfranchised communities. Preserve the stock of affordable housing.
• Develop incentive-based inclusionary zoning for private development, and require the inclusion of affordable units in any project receiving subsidies for transit-oriented development (TOD), from Tax Increment Financing districts, or other tax breaks. Market new affordable housing units affirmatively using culturally-specific organizations.
Expand support for homeownership to reduce the African-American homeownership and wealth gap in Multnomah County.
• Support resources for financial education and preparedness and homeownership counseling that take a culturally-specific approach to the African-American community.
• Support financial assistance, such as down payment assistance and lending through community development financial institutions (CDFIs), aimed to reduce the racial homeownership gap.
• Support the community land trust model for homeownership and neighborhood stability.
The African American Community in Multnomah County Coalition of Communities of Color & Portland State University
93 | P a g e

• Explore new ways to buy or keep a home. Partnerships between state and local agencies, financial institutions and non-profits must provide early and aggressive foreclosure mitigation efforts, such as counseling and refinancing. Non-traditional avenues to homeownership must be explored and developed—such as individual development accounts, land trusts and sweat-equity homebuilding.
Health: policy recommendations
Healthcare delivery, particularly during healthcare reform, must assess health equity metrics, including cultural competency indicators.
• Organizations, local and state governments adopt proclamations, and corresponding actions to eliminate health inequities for African-Americans and other communities unfairly shouldering the burden of poor health outcomes.
• Health care providers and health systems should routinely offer education about sexual health, as well as screening and treatment for African-Americans between the ages of 14 and 34 for chlamydia, gonorrhea, and HIV in order to close the current gap in prevalence.
• Hospitals, Mental Health Authorities, Public Health Departments, and Coordinated Care Organizations required to do community health assessments and create Community Health Improvement Plans (CHIPs) should contract with culturally specific Faith and Community Based Organizations to identify needs of African-American Community.
• The Oregon Health Authority and its Coordinated Care Organizations in the Portland Metropolitan Area (Tri-County Medicaid Collaborative and FamilyCare) should include health equity and cultural competency indicators as part of healthcare reform metrics and integrate them into an on-going evaluation of process and health outcomes.
Community health workers are supported as a vital component of culturally-specific prevention and wellness strategies.
• The Oregon Health Authority, Coordinated Care Organizations, commercial insurance carriers, and health care providers should implement deployment and re-imbursement strategies for culturally specific Community Health Workers, doulas (traditional childbirth attendants), and chronic disease self-management programs for those with chronic diseases in community and clinical settings.
• The Oregon Health Authority, Coordinated Care Organizations, commercial insurance carriers, health care providers, and the local public health departments in the tri-County area should ensure adequate funding and support for culturally-specific maternal and child health strategies to reduce infant mortality, low birth weight and support African-American parents, including women’s preconception health and interconception health promotion, doulas, culturally specific child birth education and breastfeeding promotion, and father involvement and support.
The African American Community in Multnomah County Coalition of Communities of Color & Portland State University
94 | P a g e

• Increase funding and support for community based, culturally-specific community health workers to provide education and access to screening and treatment for sexually transmitted diseases, such as gonorhhea, chlamydia, and HIV.
Address ‘upstream’ factors that disproportionately impact African-American health.
• City, school district, county and metro governments should adopt and implement policies that ensure equitable access to healthy, affordable and culturally relevant food in low income neighborhoods, schools, institutions, public housing sites, and African-American communities.
• City, county and metro governments should adopt and implement policies that restrict disproportionate exposure to, and marketing of, tobacco products in low income communities and African-American neighborhoods.
• City, county and metro governments should adopt and implement policies that support housing and neighborhood stability for African-American and Black households, including supporting access to healthy housing, supporting environmental justice-oriented work to reduce disproportionate exposure to hazards, ensuring access to transit, and to parks and recreation opportunities.
• Portland Public Schools, community colleges in the tri-county region, and higher education institutions should partner with health care, behavioral health and public health employers to promote increased access by African-Americans to health care related living wage jobs, including non-traditional health workers, public health professionals, allied health professionals, and primary care providers by investing in the health care pipeline and health career opportunity programs.
• City, school district, county and metro governments should adopt and implement policies that assure representation of African-Americans proportionate to their client/student population in their workforce and advisory/governing boards and committees.
• Cities and counties in the tri-county area should adopt tougher inspection codes to ensure healthy homes. These should aim to eliminate conditions like damp and mold that increase rates of asthma and other respiratory illness and ensure the rights of renters to report unhealthy living conditions.
• City, county and metro governments should disaggregate data on environmental disparities by race, ethnicity and income. Anecdotal evidence shows that people of color and low income tend to live in areas with higher toxic air emissions, brownfields and other environmental hazards. An inter-agency study should map the location of these hazards and their proximity to specific populations.
The African American Community in Multnomah County Coalition of Communities of Color & Portland State University
95 | P a g e

Child Welfare: policy recommendations
Shift from intervention to prevention model, committed to internal system improvement including data-based decision-making.
• Establish consistent racial/ethnic impact data collection; require evidence based programs and evidence-based management, incorporate cultural knowledge in decision making and mandate that cultural data be collected. Require consistent use of evidence for practice and policy developments through organized systems including reporting of race/ethnicity.
Build community resources for African-American families, and collaborate with established family networks and community resources. Develop and sustain culturally responsive and community-based systems of family supports and preservation, shifting the paradigm from primarily an ‘intervention’ model to a ‘prevention’ model.
• Recruit African-American foster and adoptive homes by implementing targeted recruitment and support strategies. Expand racially and culturally diverse pool of relative and non-relative foster and adoptive resources
• Enhance equity through the adoption of specific practices such as community partnerships, family group decision-making and structured decision-making that can minimize bias where discretion exists.
Address cultural competency as a core component of DHS workforce development. Enhance and transform recruitment and retention efforts for professionals of color; create an advisory committee for hiring rules and provide continuous training.
• Hire more bi-cultural and multi-cultural staff; add cultural competency as a core requirement for all agency policies, procedures and training. Enhance recruitment, hiring and retention practices across programs to achieve a diverse workforce at all levels; develop, implement and sustain culturally responsive training curricula, in collaboration with communities of color, for child welfare staff and partners
Ensure accountability and enforcement protection (protection through the enforcement of laws, policies, and agreements) by creating a plan for accountability and infrastructure.
• Ensure that the voices of communities of color are meaningfully engaged at the state and local levels in assessing racial impacts of criminal justice and child welfare policies.
• Track progress toward safe and equitable foster care reduction goals and hold DHS and the Juvenile Dependency System accountable for change.
The African American Community in Multnomah County Coalition of Communities of Color & Portland State University
96 | P a g e

• Ensure highly skilled and competent legal representation for families and establish a coordinated system of care by linking the equity goal to the state’s evidence-based program legislation and its expertise in poverty, child abuse and neglect, and juvenile crime prevention.
Education: policy recommendations
Define equity metrics and accountability for African-American achievement. True education reform focuses on outcomes—closing the achievement gaps, building a culture of high expectations, and meeting 21st century challenges for building towards careers.
• School districts create equity plans that specifically address racial achievement gaps. All inequities, including lower expectations for African-Americans, over-identification for special educations and under identification for Talented and Gifted (TAG) must be addressed and subsequently eliminated.
• Align all schools with the Teachers Standards and Practices Services (TSPC) administrative standards that say school administrators must be culturally competent. Hold administrators accountable to this policy through administrator evaluations and outcomes of diverse youth. Assess teaching, curriculum content and delivery for culturally-specific needs. Provide professional development support for adopting new materials and methods. Ensure that staff members are culturally competent.
• Adopt affirmative action policies that allow for the hiring of more teachers and administrators of color. Strategic efforts must be made in all Portland districts to ensure that teachers are not only culturally competent, but more adequately match the demographics of students being served.
• Implement and evaluate Cradle to Career as a collective impact strategy that focuses on making sure youth enter school ready to learn, that they are supported inside and outside of school, that they succeed academically in school, that they enroll in post-secondary education and training, and that they graduate ready to begin a career. Ensure that Cradle to Career goals are met for Black youth.
• Address inequities in resources, including funding, facilities, and teacher experience, with meaningful policy reform.
Ensure that African-American youth are prepared to enter school.
• Invest in affordable, high quality early childhood interventions. As federal and state investments expand in Head Start, Early Head Start and Oregon Pre-kindergarten, local policy-makers must ensure that African-American children have proportional access to the services, and that the early childhood education models are culturally relevant and effective. For those youth that don’t have access to head start, there needs to be other affordable options that ensure all youth are entering kindergarten ready to learn.
The African American Community in Multnomah County Coalition of Communities of Color & Portland State University
97 | P a g e

• Implement supports that address kindergarten absenteeism. Develop policies that address high absenteeism for young children, and provide supports to youth and their families that enable success and attendance in kindergarten. Schools in neighborhoods that are predominantly youth of color should provide all-day kindergarten.
End discipline disparities that lead to disengagement and dropout of African-American youth.
• Continue to implement and evaluate Positive Behavior Intervention and Supports (PBIS) strategies that include conflict resolution and restorative justice programs to prevent misconduct, repair harms, and establish responsibility and accountability for students.
• Utilize in-school suspensions that maintain meaningful, culturally-competent engagement with students, including individualized academic supports and problem-solving skill development for students, instead of exclusionary discipline that leads to detachment.
• Hold teachers and administrators accountable for disparities in suspensions and expulsions. Monitor and evaluate discipline rates and reasons for bias. Provide training for teachers and administrators in alternatives to exclusionary discipline.
Ensure that African-American youth are supported in and out of school to complete their education.
• Invest in in-school supports that youth need to excel academically; invest in after school and summer academic supports that promote positive youth development. Invest in wraparound services for families.
• Support and expand education initiatives that work for African-American students. Programs such as Self Enhancement Inc have a proven track record in increasing achievement for African-American students.
• Increase the number of African-American students using AVID, a rigorous college preparatory program and enrollment, participation, and completion rates of African-American students in AP/IB courses. Gaining access to AP coursework means gaining college credits towards a degree which both assists with college completion and post-secondary affordability.
• Invest in contextual learning opportunities for youth to combine college prep with technical and occupational courses that provide real-world experiences in business and industry, so youth view education as a connection to opportunities in the labor market.
Criminal Justice System: policy recommendations
Change practices that contribute to disparities/disproportionate representation of African-Americans, and other minorities in Oregon State Prisons. Reduce Oregon's over-reliance on incarceration as a response to crime and social problems, and shift toward more effective evidence based programs proven to reduce future crime. Adopt an approach to public safety that focuses on prevention, curbs the
The African American Community in Multnomah County Coalition of Communities of Color & Portland State University
98 | P a g e

unsustainable growth of our prison system, invests in programs that are proven to reduce crime and save money, and strengthens support systems and services for crime survivors.
• Prevent New Mandatory Minimum Sentences, which have a disproportionate impact on African-Americans and other people of color. Avoid youth placement in the adult criminal justice system by bringing back judicial discretion for youth tried under Measure 11 offenses.
• Disaggregate race ethnicity/data to identify points of differential treatment. At every phase of the justice process, disaggregated race/ethnicity data must be collected and analyzed. Reform strategies like adequate and just alternatives to detention can reduce racial disparity in the prison system.
Reduce recidivism and increase cost-effective crime prevention through stronger non-prison and post-prison programs.
• Drug and alcohol diversion court, community court and mental health court need greater financial support. When participants can successfully address treatment, housing and other issues while remaining in the community, the state ends up saving money.
• Remove the barriers to successful community re-entry faced by formerly incarcerated people. Strengthen investments in prison programs that reduce recidivism: programs that actually help prisoners succeed when they return to their communities, such as education, job training, mental health, and family support services. Release state prisoners back to the communities where they have the strongest support systems, rather than the county where they were convicted.
• Support legislation and programs that enable people to successfully transition from prison to the community. Enact antidiscrimination legislation that prevents employers from dismissing job applicants based solely on arrest and conviction history.
• Remove employment and other re-entry barriers by supporting and expanding programs like “Project Clean Slate,” which helps to navigate barriers by providing assistance with driver’s licenses, job training, etc.
Civic Engagement: policy recommendations
Ensure African-Americans are included at all the tables where African-Americans need to be engaged in policy-making and reform. To make sure African-Americans are included every step of the way, with impact, and proactive rather than reactionary, we must be intentionally inclusive.
• Implement recommendations of the City of Portland Public Involvement Advisory Committee (PIAC) to include people not generally represented in decision-making, advisory committees and technical teams.
The African American Community in Multnomah County Coalition of Communities of Color & Portland State University
99 | P a g e

• Expand community-based leadership training programs to build community organizing capacity and the capacity for people to engage in shared governance, focusing on under-represented and underserved communities. Train and support leadership candidates from these communities to run for office.
• Invest in Early Civics Education in Schools. Understanding government processes is the first step toward civic engagement. School districts should ensure that all students take classes in civics and have a working knowledge of the Civil Rights Movement that earned the right to vote for African-Americans.
As African-American community based organizations, ensure the Black community is involved, remaining relevant and engaged in policies that affect our community.
• Advocate for funding resources that support initiatives through city and county governments in areas of economic development, education, housing, and health equity for communities of color.
• Participate in coordinating civic engagement activities that include voter registration, education, and mobilization to ensure that African-Americans are informed and mobilized to reduce barriers to representation in a fair and equitable election process.
Policy recommendations for communities of color The policy recommendations that follow are those which the Coalition of Communities of Color have developed and endorsed. These measures will advance the needs of our people.
1. Reduce disparities with firm timelines, policy commitments and resources. Disparity reduction across systems must occur and must ultimately ensure that one’s racial and ethnic identity ceases to determine one’s life chances. The Coalition urges the State, County and City governments, including school boards, to establish firm timelines with measurable outcomes to assess disparities each and every year. There must be zero-tolerance for racial and ethnic disparities. Accountability structures must be developed and implemented to ensure progress on disparity reduction. As a first step, plans for disparities reduction must be developed in every institution and be developed in partnership with communities of color. Targeted reductions with measurable outcomes must be a central feature of these plans. Elements of such an initiative would include:
• Policies to reflect these commitments are needed to ensure accountability exists in legislation.
• Accountability structures must be developed and implemented to ensure progress on disparity reduction. As a first step, plans for disparities reduction must be developed in every institution and be developed in partnership with communities of color. Targeted reductions with measurable outcomes must be a central feature of these plans.
The African American Community in Multnomah County Coalition of Communities of Color & Portland State University
100 | P a g e

• Disparities must be understood institutionally, ideologically, behaviorally and historically. Institutional racism must be a major feature of disparity reduction work.
• Effectively resource these initiatives and place control of these initiatives in the leadership of communities of color who will lead us to real solutions.
• Accountability and transparency must feature across all institutional efforts. • Annual updates must be conducted and the results available to the general public.
2. Expand funding for culturally-specific services. Designated funds are required, and these funds
must be adequate to address needs. Allocation must recognize the size of communities of color, must compensate for the undercounts that exist in population estimates, and must be sufficiently robust to address the complexity of need that are tied to communities of color. Recognizing the complexity and depth of need that exists for communities of color requires that we are provided with a higher funding base in recognition of the urgent need for ameliorative interventions. Culturally-specific services are the most appropriate service delivery method for our people. Service providers within culturally-specific services must be involved in establishing funding formulas for such designations. Culturally-specific services are best able to address the needs of communities of color. These services have the following unique features:
• We provide respite from racism. People of color enter culturally-specific services as insiders instead of outsiders.
• We hold the trust of our communities. Mainstream services do not, and relationships are instead marked by distrust. This supports our ability to respond to community needs and to work in solidarity with them to address larger injustices.
• Accountability to the specific community of color for whom services are delivered. • Top leadership (Board of Directors or equivalent) are primarily composed of
community members who share the same racial and ethnic identity. This means they have a lived experience of racism and discrimination and will address these at all levels of practice.
• Located in the specific community of color that is being served and reflect the cultural values of the community throughout their services. Users of such services are likely to be welcomed and affirmed.
• Staffed and led primarily by those who share the racial and ethnic characteristics of the community. This means we have walked a similar path as those we serve, and have experienced the types of racism typically targeted against the community. This provides deep and lasting commitments to eliminating racism in all its forms.
• Such services are typically involved in many advocacy practices, and are involved in challenging institutional racism in its many forms. Given this engagement, service users are more likely to have their needs better understood and more hopeful
The African American Community in Multnomah County Coalition of Communities of Color & Portland State University
101 | P a g e

about prospects for change. As their organizations are involved in social justice efforts, this increases the social capital of the community and its members.
3. Implement needs-based funding for communities of color. This report illuminates the
complexity of needs facing communities of color, and highlights that Whites do not face such issues or the disparities that result from them. Accordingly, providing services for these communities is similarly more complex. We urge funding bodies to begin implementing an equity-based funding allocation that seeks to ameliorate some of the challenges that exist in resourcing these communities.
4. Emphasize poverty reduction strategies. Poverty reduction must be an integral element of meeting the needs of communities of color. A dialogue is needed immediately to kick-start economic development efforts that hold the needs of communities of color high in policy implementation. Improving the quality and quantity of jobs that are available to people of color will reduce poverty. Current economic development initiatives and urban renewal activities do not address equity concerns nor poverty and unemployment among communities of color. Protected initiatives to support access of minority-owned businesses to contracting dollars, along with small business development initiatives must ensure equitable distribution of resources and the public benefits that flow from such investments.
5. Count communities of color. Immediately, we demand that funding bodies universally use the
most current data available and use the “alone or in combination with other races, with or without Hispanics” as the official measure of the size of our communities. The minor over-counting that this creates is more than offset by the pervasive undercounting that exists when outsiders measure the size of our communities. When “community-verified population counts” are available, we demand that these be used.
6. Prioritize education and early childhood services. The Coalition prioritizes education and early childhood services as a significant pathway out of poverty and social exclusion, and urges that disparities in achievement, dropout, post-secondary education and even early education be prioritized. Significant reductions in dropout rates of youth of color, improvements in graduation rates, increased access to early childhood education (with correlated reductions on disparities that exist by the time children enter kindergarten) and participation in post-secondary education and training programs is essential for the success of our youth.
The African American Community in Multnomah County Coalition of Communities of Color & Portland State University
102 | P a g e
7. Expand the role for the Coalition of Communities of Color. The Coalition of Communities of Color seeks an ongoing role in monitoring the outcomes of disparity reduction efforts and seeks appropriate funding to facilitate this task. Disparity reduction efforts will include the following:
• Establishing an external accountability structure that serves an auditing function to keep local and state governments accountable. This leaves the work less vulnerable to changes in leadership.
• Creating annual reports on the status of inequities on numerous measures, similar to the disparity tally included in this document.
• Continuing to work with mainstream groups to advise on changes in data collection, research and policy practices to reduce disparities, undercounting and the invisibility of communities of color.
8. Research practices that make the invisible visible. Implement research practices across
institutions that are transparent, easily accessible and accurate in the representation of communities of color. Draw from the expertise within the Coalition of Communities of Color to conceptualize such practices. This will result in the immediate reversal of invisibility and tokenistic understanding of the issues facing communities of color. Such practices will expand the visibility of communities of color. Better data collection practices on the race and ethnicity for service users needs to exist. Self-identification is essential, with service providers helping affirm a prideful identification of one’s race and ethnicity as well as assurances that no harm will come from identifying as a person of color. We also want people to be able to identify more than one race or ethnicity, by allowing multiple identifiers to be used. The “multiracial” category is not helpful because no information about one’s identity is possible. The Coalition of Communities of Color then wants research practices and usage statistics to accurately and routinely reveal variances and disproportionality by race and ethnicity. The Coalition will consult with researchers and administrators as needed on such improvements.
9. Fund community development. Significantly expand community development funding for communities of color. Build line items into state, county and city budgets for communities of color to self-organize, network our communities, develop pathways to greater social inclusion, build culturally-specific social capital and provide leadership within and outside our own communities.
10. Disclose race and ethnicity data for mainstream service providers. Mainstream service
providers and government providers continue to have the largest role in service delivery. Accounting for the outcomes of these services for communities of color is essential. We expect each level of service provision to increasingly report on both service usage and service outcomes for communities of color.
The African American Community in Multnomah County Coalition of Communities of Color & Portland State University
103 | P a g e

Data collection tools must routinely ask service users to identify their race and ethnicity, and allow for multiple designations to be specified. These data must then be disclosed in an open and transparent manner. The Coalition of Communities of Color expects to be involved in the design of these data collection tools. Outcomes by race and ethnicity need to be publicly available on an annual basis.
11. Name racism. Before us are both the challenge and the opportunity to become engaged with issues of race, racism and whiteness. Racial experiences are a feature of daily life whether we are on the harmful end of such experience or on the beneficiary end of the spectrum. The first step is to stop pretending race and racism do not exist. The second is to know that race is always linked to experience. The third is to know that racial identity is strongly linked to experiences of marginalization, discrimination and powerlessness. We seek for those in the White community to aim to end a prideful perception that Multnomah County is an enclave of progressivity. Communities of color face tremendous inequities and a significant narrowing of opportunity and advantage. This must become unacceptable for everyone.
The legacy of our past stretches into today, deepened and confounded by ongoing structural and cultural inequities. While we would like to believe that racism is a matter only of history, the evidence before us is that it is not. Racist practices of the past have decimated our community, our culture and our well being, and they continue today. Indeed, the depths to which mainstream society in Oregon has gone to in denial and minimization of racism are likely the cause of the trend that as we move closer to the African-American experience in this county, the worse our disparities are.
The African American Community in Multnomah County Coalition of Communities of Color & Portland State University
104 | P a g e

Appendices
Appendix #1: Supplemental data & language notes
Language We use the terms, “African-American” and “Black” interchangeably in this report. Data Notes
For data that draws from the American Community Survey the following notes are needed. 1. We have used the following data for our main categories:
a. African-American: African-American alone or in combination with one or more other races; not Hispanic or Latino.
b. White: White alone: Not Hispanic or Latino 2. Given that these data are drawn from a sample, and in order for the Census Bureau to provide
fuller reporting, they have amalgamated the results of three years into one data set. This occurs in the following time periods: 2005-2007, 2006-2008 and 2008-2010. The authors of this report have aimed to be as clear as possible in their rendering of the data, and giving a three-year name to a single data point is needlessly confusing. Accordingly, we have named the data sets “2007” (for the 2005-2007 range), “2008” (for the 2006-2008 range) and “2010” (for the 2008-2010 range).
3. When we present data that are “communities of color” composites, we accomplish this by averaging the figures of the four traditional communities of color (Latino, African-American, Asian and Native American). These figures are not weighted by the size of the community. In many cases, data was not available on the size. When we present data on “people of color,” these figures represent the average for all people of color, and are not averages of the communities.
The African American Community in Multnomah County Coalition of Communities of Color & Portland State University
105 | P a g e

Appendix #2: Multnomah County’s philosophy and implementation of culturally-specific services
Philosophy of Culturally Specific Service Delivery: Multnomah County believes that funding should follow the client and not the other way around. In the business world, this is known as “customer choice.” Over years of service delivery to communities of color it has been made clear that consumer choice for people of color and ethnic communities is based on three dimensions: comfort, confidence, and trust. These dimensions are strongest in an environment where the organizations and/or institutions providing the services reflect the values, histories and cultures of those being served. Agencies which hire one or two culturally specific staff members do not provide an environment where comfort, confidence and trust are maximized for clients. Communities of color are characterized by significant language and cultural differences from the majority culture of the United States. One of these characteristics is a personal or relational way of interacting with service providers, rather than an impersonal bureaucratic way of interacting with service providers, which is more common in mainstream culture. This fact makes it important that the overall “feel” of an organization be familiar and comfortable to the client receiving services. While the specifics of these characteristics vary in the African-American, Latino, Asian/Pacific Islander, Native American, Slavic and the many African and Refugee cultures in Multnomah County, all of these communities share the need for a culturally specific style of personal interaction, language, and organizational culture.
Indeed, in our experience not only do members of the various communities of color prefer to seek services from culturally-specific providers, but there are many issues that clients may not have the trust to openly discuss and confront outside a culturally-specific context. Some of these issues include but are not limited to domestic violence, drug and alcohol addiction, gang involvement, financial hardships, youth sexuality, and family and relationship problems. Thus, culturally-specific services are not only the preferred service provider for many people of color and immigrants, in many cases they may be the only provider in which individuals and families will feel comfortable asking for and receiving appropriate services. Values Statement: Multnomah County values and celebrates the rich diversity of our community. Through diversity comes a sense of community. Community provides a wealth of experience and different perspectives that enriches everyone's life. Communities in Multnomah County have a long tradition of supporting each other through families, churches and community organizations. Cultural minorities are more likely to engage individuals and organizations that are intimately knowledgeable of the issues of poverty and minority disproportionality facing the community today, and further, whose services are culturally specific, accessible and provided with compassion. Therefore, we are committed to providing a continuum of culturally specific services including prevention, intervention and anti-poverty services throughout Multnomah County that ensures the welfare, stability and growth of children and families
The African American Community in Multnomah County Coalition of Communities of Color & Portland State University
106 | P a g e

who are part of at-risk, minority populations. By so doing, these individuals will be able to contribute and participate in the civic life of our county. Criteria for Culturally Specific Service Providers: The following section identifies specific criteria that Multnomah uses to identify and designate organizations which have developed the capacity to provide culturally specific services. The following criteria should be used in Request for Proposals, contracting, and other funding processes to determine the appropriateness and eligibility of specific organizations to receive culturally specific funding. Both geographic hubs and culturally specific service organizations should be required to meet these criteria in order to receive funding from the resources that are dedicated to culturally specific service provision. These agency characteristics are expected to be in place at the time the organization applies for culturally specific services and not be characteristics or capacities that the agency proposes to develop over a period of time after contracts are signed. The criteria include: • Majority of agency clients served are from a particular community of color: African-American,
Asian/Pacific Islander, Native American, Latino, African and Refugee, and Slavic. • Organizational environment is culturally focused and identified as such by clients. • Prevalence of bilingual and/or bicultural staff reflects the community that is proposed to be served. • Established and successful community engagement and involvement with the community being
served.
Contracting Implementation: Steps will be taken throughout all phases of the Request for Proposals process to ensure that Multnomah County contracts are given to organizations that have the capacity to provide the best culturally specific services. Those steps include, but are not limited to, the following: • Refer to the definition of culturally specific service providers when reviewing funding applications. • Create and implement an effective process to validate the accuracy of an organization’s claim that
they’re a culturally specific service provider using the aforementioned definition and eliminate applications that do not meet the criteria.
• Include a requirement to submit past performance documentation regarding County contracts to ensure contracting with the most qualified providers and to achieve the highest quality of service delivery.
• Verify with partnering organization(s) that the relationship(s) referred to in an application exist and that the scope of work is targeted toward the work Multnomah County is supporting.
• Include representation from the communities that are proposed to be served on committee and review panels for their respective communities.
The African American Community in Multnomah County Coalition of Communities of Color & Portland State University
107 | P a g e

Appendix #3: Language definitions131
Ally: “A member of an oppressor group who works to end a form of oppression which gives her or him privilege. For example, a white person who works to end racism, or a man who works to end sexism” (Bishop, 1994, p. 126).
Anti-Oppressive Practice: a person-centered philosophy; and egalitarian value system concerned with reducing the deleterious effects of structural inequalities upon people’s lives; a methodology focusing on both process and outcome; and a way of structuring relationships between individuals that aims to empower users by reducing the negative effects of social hierarchies on their interaction and the work they do together. (Dominelli, 1994, p.3) Communities of color: Four communities are traditional recognized as being of color – Native American, African-American, Asian and Latino. To these four groups, the Coalition of Communities of Color also recognizes and includes two communities: Slavic and African immigrant and refugee. Note that there is some tension in whether Latinos are a racial or an ethnic group. Most databases define them as a separate ethnic group, as opposed to a racial group. In Multnomah County, we define Latinos as a community of color and primarily understand the Latino experience as one significantly influenced by racism. Cultural competence: A set of congruent behaviors, attitudes, and policies that come together in a system, agency, or professional and enable that system, agency, or profession to work effectively in cross-cultural situations. The goal is to build skills and cultures that support the ability to interact effectively across identities. The word culture is used because it implies the integrated pattern of human behavior that includes thoughts, communications, actions, customs, beliefs, values and institutions of a racial, ethnic, religious or social group. The word competence is used because it implies having the capacity to function effectively. Five essential elements contribute to a system, institution or agency's ability to become more culturally competent: valuing diversity; having the capacity for cultural self-assessment; being conscious of the dynamics inherent when cultures interact; having institutionalized cultural knowledge, and; having developed adaptations to service delivery and reflecting an understanding of cultural diversity (Cross, Bazron, Dennis & Isaacs, 1989) A significant critique is emerging about the capacity of “cultural competency” to address racial disparities. The basis of this critique is that it idealizes the ability of mainstream service providers to work outside their own cultural context and provide services to communities of color. As a response to racial disparities, cultural competency fails to generate the comprehensive reforms needed to promote racial equity. So too this “movement” fails to legitimate the urgent needs of communities of color and the requisite funding of culturally-specific organizations.
Cultural proficiency: See “cultural competence”
Discourse: “A set of assumptions, socially shared and often unconscious, reflected in the language that positions people who speak within them and frames knowledge” (Ristock & Pennell, 1996, p.114).
The African American Community in Multnomah County Coalition of Communities of Color & Portland State University
108 | P a g e

Discrimination: “The prejudgment and negative treatment of people based on identifiable characteristics such as race, gender, religion, or ethnicity” (Barker, 1995, p.103).
Disparities: Are differences between population groups in the presence of any form of incidence or outcomes, including access to services. Disparities include both acceptable and unacceptable differences. (Adapted from Multnomah County Health Department, Health Equity Initiative) Diversity: “Diversity refers to the broad range of human experience, emphasizing the following identities or group memberships: race, class, ethnicity, national origin, color, sex, sexual orientation, gender identity or expression, age marital status, political belief, religion, mental or physical disability, immigration status, language and linguistics.” (Portland State University, 2009)
Dominant discourse: Refers to the prevailing discourses that typically consolidate a set of myths about particular groups of people and then reproduce these myths through language, images, and generalized beliefs about who such people are and what they are capable of. These discourses are created by those with privileged identities and serve the function of maintaining oppressive systems such as racism, thus becoming an act of oppression themselves. When these characterizations are reproduced widely, they become the accepted way of speaking about and understanding particular groups of people. An example is the dominant discourse around “Black” and all this implies, and the corollary of “White” and all this implies.
Ethnicity: Refers to arbitrary classifications of human populations based on the sharing common ancestry including features such as nationality, language, cultural heritage and religion.
Exploitation: “When a person or people control another person or people, they can make use of the controlled people’s assets, such as resources, labor, and reproductive ability, for their own purposes. The exploiters are those who benefit, and the exploited are those who lose” (Bishop, 1994, p.129-130).
Individual racism: “The beliefs, attitudes, and actions of individuals that support or perpetuate racism. Individual racism can occur at both an unconscious and conscious level, and can be both active and passive” (Wijeyesinghe, Griffin & Lowe, 1997, p.89).
Inequities: Are disparities that result from a variety of social factors such as income inequality, economic forces, educational quality, environmental conditions, individual behavior choices, and access to services. Health inequities are unfair and avoidable. (Adapted from Multnomah County Health Department, Health Equity Initiative). Institutional racism: “The network of institutional structures, policies, and practices that create advantages and benefits
for Whites, and discrimination, oppression, and disadvantage for people from targeted racial groups. The advantages to Whites are often invisible to them, or are considered “rights” available to everyone as opposed to “privileges” awarded to only some individuals and groups” (Wijeyesinghe, Griffin & Lowe, 1997, p.93).
Institutional racism consists of those established laws, customs and practices which systematically reflect and produce racial inequalities… whether or not the individuals maintaining those practices have racist intentions (Jones, 1972, p.131).
The African American Community in Multnomah County Coalition of Communities of Color & Portland State University
109 | P a g e

Institutional racism is understood to exist based on the experiences of people of color, rather than intention to create inequities. One does not need to “prove” intent to discriminate in order for institutional racism to exist. Institutional racism exists by impact rather than intention.
Internalized Dominance: Occurs “when members of the agent group accept their group’s socially superior status as normal and deserved” (Griffin, 1997, p.76).
Internalized Oppression: Occurs “when members of the target group have adopted the agent group’s ideology and accept their subordinate group status as deserved, natural, and inevitable” (Griffin, 1997, p.76). Furthermore, “oppressed people usually come to believe the negative things that are said about them and even act them out” (Bishop, 1994, p.131).
Mainstream services: These are large service organizations that are largely devoid of specific services for communities of color, or having minimal or tokenistic responses to the specific needs of these communities. They operate from the presumption that service needs are independent from racial and cultural needs, and that staff can be trained in “cultural sensitivity” or “cultural competence” to ensure delivery of quality services regardless of clients’ race and ethnicity. Marginalized/margins: “Groups that have a history of oppression and exploitation are pushed further and further from the centres of power that control the shape and destiny of the society. These are the margins of society, and this is the process of marginalization” (Bishop, 1994, p.133).
Power: “A relational force, not a fixed entity, that operates in all interactions. While it can be oppressive, power can also be enabling” (Ristock & Pennell, 1996, p.116).
Prejudice: “An opinion about an individual, group, or phenomenon that is developed without proof or systematic evidence. This prejudgment may be favorable but is more often unfavorable and may become institutionalized in the form of a society’s laws or customs” (Barker, 1995, p.290).
Privilege: “Privilege exists when one group has something of value that is denied to others simply because of the groups they belong to, rather than because of anything they’ve done or failed to do. Access to privilege doesn’t determine one’s outcomes, but it is definitely an asset that makes it more likely that whatever talent, ability, and aspirations a person with privilege has will result in something positive for them.” (Peggy McIntosh) Racialized: “Process by which racial categories are constructed as different and unequal in ways that have social, economic and political consequences” (Galabuzi, 2006, p.251). Racism: “A system in which one group of people exercises power over another or others on the basis of social constructed categories based on distinctions of physical attributes such as skin color” (Galabuzi, 2006, p.252). Relative Rate Index (RRI): Is a methodology for measuring rate differences between groups to estimate disparity of a phenomenon. It involves calculating the occurrence rate of a reference and a second group and comparing the resulting ratio to 1. For a more in depth discussion of RRI and methods for
The African American Community in Multnomah County Coalition of Communities of Color & Portland State University
110 | P a g e
calculating, see U.S. Department of Justice (2006). Disproportionate Minority Contact Technical Assistance Manual, 3rd Edition. Washington D.C.: Office of Juvenile Justice and Delinquency Prevention. Social justice: “Social justice is both a process and a goal that (1) seeks equitable (re)distribution of resources, opportunities and responsibilities; (2) challenges the roots of oppression and injustice; (3) empowers all people to enhance self-determination and realize their full potential; (4) and builds social solidarity and community capacity for collaborative action.” (Portland State University, 2009)
Stereotype: “An undifferentiated, simplistic attribution that involves a judgment of habits, traits, abilities, or expectations and is assigned as a characteristic to all members of a group regardless of individual variation and with no attention to the relation between the attributions and the social contexts in which they have arisen” (Weinstein & Mellen, 1997, p.175).
Systemic racism: “Refers to social processes that tolerate, reproduce and perpetuate judgments about racial categories that produce racial inequality in access to life opportunities and treatment” (Galabuzi, 2006, p.253).
Tokenism: “A dominant group sometimes promotes a few members of an oppressed group to high positions, and then uses them to claim there are no barriers preventing any member of that group from reaching a position with power and status. The people promoted are tokens, and the process is called tokenism. Tokens can also be used as a buffer between the dominant and oppressed groups. It is harder for the oppressed group to name the oppression and make demands when members of their own groups are representing the dominant group” (Bishop, 1994, p.136).
White: Refers to the racial identity as Caucasian, regardless of ancestry or ethnicity. While conventional definitions of being White can include being Latino as well, we exclude such a definition from this text. In our situation, being White means having the racial identity as Caucasian, without being Latino. Whiteness: Whiteness refers to the social construction of being White that coexists with privilege in all its forms, including being on the privileged end of history, including colonization, slavery, colonialism, and imperialism. It also includes being the beneficiaries of institutionalized and systemic racism, dominant discourses, internalized racism and individual acts of discrimination and micro-aggressions of racism in everyday life. White Privilege: “White privilege is the other side of racism. Unless we name it, we are in danger of wallowing in guilt or moral outrage with no idea of how to move beyond them. It is often easier to deplore racism and its effects than to take responsibility for the privileges some of us receive as a result of it...Once we understand how white privilege operates, we can begin addressing it on an individual and institutional basis.” (Paula Rothenberg)
The African American Community in Multnomah County Coalition of Communities of Color & Portland State University
111 | P a g e

References
1 Curry-Stevens, A., Cross-Hemmer, A. & the Coalition of Communities of Color (2010). Communities of color in Multnomah County: An unsettling profile. Portland, OR: Portland State University. 2 Taken from Seattle’s Racial and Social Justice Initiative core equity definitions. 3 Curry-Stevens, A. & Coalition of Communities of Color. (2013). The African Immigrant and Refugee Community in Multnomah County: An Unsettling Profile. Portland, OR: Portland State University. 4 O’Brien, R.W. & Brooks, L.M. (1946). Race relations in the Pacific Northwest. Phylon, 7(1), 21-31. 5 Hogg, T.C. (1969). Negroes and their institutions in Oregon. Phylon, 30(3), 272-285. 6 Berry, E.C. (1945). Profiles: Portland. Journal of Educational Sociology, 19(3), 158-165. 7 Hogg, T.C. (1969). Negroes and their institutions in Oregon. Phylon, 30(3), 272-285. 8 Berry, E.C. (1945). 9 Urban League of Portland. (2009). 10 Hogg, T.C. (1969). 11 Hill, D.G. (1932). The Negro in Oregon: A survey. (M.A. thesis, University of Oregon, 1932). 12 Urban League of Portland. (2009). 13 Taylor, Q. (1981). 14 Kilbourn, C. & Lantis, M. (1946). 15 Taylor, Q. (1981). 16 Urban League of Portland. (2009). 17 Hogg, T.C. (1969). 18 Urban League of Portland. (2009). 19 Lane, Dee. "Buyers Say Home Loans Refused for Some NE Sites." The Oregonian, 10 September 1990, A11. ----------. "Major Lenders Aid Decline of NE Portland." The Oregonian, 10 September 1990, A01. Lane, Dee and Steve Mayes. “Dominion Requests Protection By Court.” The Oregonian, 26 October, 1990. 20 The graphic prepared for this article can be found at http://www.oregonlive.com/pacific-northwest-news/index.ssf/2011/04/graphic_portlands_central_city_gets_whiter.html. 21 Hannah-Jones, N. (2011, May 6). In Portland’s heart, 2010 Census shows diversity dwindling. The Oregonian, A1. 22 U.S. Census Bureau (2008). American Fact Finder, 1990 Census, Table P007: Detailed Race. Data Set: 1990 Summary Tape File 1 (STF 1)-100-Percent data for Multnomah County, Oregon. ii U.S. Census Bureau (2008). American Fact Finder, Census 2000, Table P9: Race (Total Races Tallied). Data Set: Census 2000 Summary File 1 (SF1) 100-Percent Data for Multnomah County, Oregon. 24 U.S. Census Bureau, American Community Survey (2009). American Fact Finder; Selected population profile in the United States: Multnomah County, Oregon. Table: S0201. Black or African American alone or in combination with one or more other races & White alone, not Hispanic or Latino. 2006-2008 American Community Survey 3-year Estimates. 25 U.S. Census Bureau, American Community Survey (2009). American Fact Finder; Selected population profile in the United States: Multnomah County, Oregon. Table: S0201. Black or African American alone or in combination with one or more other races & White alone, not Hispanic or Latino. 2006-2008 American Community Survey 3-year Estimates. 26 For more information, please see Curry-Stevens, A., Cross-Hemmer, A. & Coalition of Communities of Color (2011). The Native American community in Multnomah County: An unsettling profile. Portland, OR: Portland State University. 27 Taylor, Q. (1981). 28 Taylor, Q. (1981). 29 Miller, J. (2009). The real unemployment rate hits a 68-year high. Dollars & Sense, July-August, 29-30. 30 Austin, A. (2009). Among college-educated, African Americans hardest hit by unemployment. Economic Policy Institute.
The African American Community in Multnomah County Coalition of Communities of Color & Portland State University
112 | P a g e

31 Bureau of Labor Statistics, U.S. Department of Labor. (2010). Economic news release. Table A-2: Employment status of the civilian population by race, sex, and age. Retrieved August 9, 2010 from: http://www.bls.gov/news.release/empsit.t02.htm 32 Counting unemployment is difficult. The most up-to-date employment data are not available locally by race and ethnicity. The Census Bureau’s American Community Survey (ACS) does offer some approximations, however, although these unemployment data are calculated very differently than the customary national and state data. The definition of unemployment in the ACS asks if someone is looking for work in the past 4 weeks – requiring them to count people whose job search is “active” meaning they are making calls. This serves to narrow the numbers of those who count as unemployed. So too are measures of those collecting unemployment insurance payments. Such a measure doesn’t count anyone who was ineligible for unemployment insurance, who has not received payments yet, and whose benefits have expired. 33 Allegretto, S. & Pitts, S. (2010). The end of the recession? How Blacks might fare in the jobless recovery. Dollars and Sense,291 (6), 25-26. 34 Allegretto & Pitts (2010), p.26. 35 Portland Community College (2011). Institutional effectiveness reporting to the PCC Board of Directors: Diversity goal report. Downloaded on July 30, 2011 from http://www.pcc.edu/ir/iereporting/ie_1011/Diversity2010Reportpdf.pdf. 36 Office of Affirmative Action and Equity (2010). Workforce analysis report: October 2010. Downloaded on August 20, 2011 from http://www.pcc.edu/about/affirmative-action/documents/2010WFA.pdf. 37 Multnomah Educational Service District (2011). 2010 MESD Affirmative Action report. Downloaded on September 12, 2011 from http://www.mesd.k12.or.us/pa/2010AAnarrative.pdf. 38 BBC, Study of City and Portland and PDC Contracting practices. 2010. P. 15 39 Sheltered Market Program: Need for clearer forcus and stronger management. January 2010 report from Office of the City Auditor, Report #379.Portland, OR. LaVonne Griffin-Valade, City Auditor. 40 Pew Research Center (2011). Wealth gaps rise to record highs between Whites, Blacks and Hispanics. Downloaded on July 27, 2011 from http://pewresearch.org/pubs/2069/housing-bubble-subprime-mortgages-hispanics-Blacks-household-wealth-disparity. 41 Oregon Progress Board. (2008). Oregon benchmark race & ethnicity report: A report on the progress of Oregon’s racial and ethnic diverse populations. Retrieved December 22, 2008 from the State or Oregon’s website: http://www.oregon.gov/DAS/OPB/docs/Reports/REreport2008.pdf. 42 Law, S. (2011, August 18). Blacks fall behind in home buying: Hispanics, others post gains in Portland homeownership. The Portland Tribune. 43 Law, S. (2011, August 18). Blacks fall behind in home buying: Hispanics, others post gains in Portland homeownership. The Portland Tribune. 44 Portland Housing Bureau, HMDA data. Loans originated for home purchase and occupation for Multnomah County 2001-2010, by HUD MFI groups. 45 Portland Housing Bureau, HMDA data. Loan denials for home purchase and occupation for Multnomah County 2001-2010, by HUD MFI groups. 46 Anderson, T., Kuhn, S. & Sack, B. (2004). Strategies to improve minority homeownership rates. Portland, OR: Housing and Community Development Corporation, City of Portland. 47 West, A. (2011). The mortgage crisis in the Black community. Downloaded on September 17, 2011 from http://thecongressionalBlackcaucus.com/2011/03/22/the-mortgage-crisis-in-the-Black-community-by-congressman-allen-west-fl-22/. 48 Smock, K. (2009). Report on the 2009 Portland/Multnomah County street count of unsheltered persons. Portland, OR: City of Portland Bureau of Housing & Community Development. 49 Research was conducted in 2011 by the Fair Housing Council of Oregon and reported in the following report: Hannah-Jones, N. (2011). Portland housing audit finds discrimination in 64% of tests; city has yet to act against landlords. The Oregonian, p.B1. 50 Hannah-Jones, N. (2011, May 6). In Portland’s heart, 2010 Census shows diversity dwindling. The Oregonian, A1. 51 Coalition for a Livable Future & Portland State University. (2007). The regional equity atlas: Metropolitan Portland’s Geography of Opportunity. Portland, OR. The African American Community in Multnomah County
Coalition of Communities of Color & Portland State University 113 | P a g e

52 Marmot, M. (2006). Introduction. In M. Marmot & R.G. Wilkinson (Ed.), Social Determinants of Health (2nd ed., pp. 1-5). New York: Oxford University Press. 53 Mays, V.M., Cochran, S.D. & Barnes, N.W. (2007). Race, race-based discrimination, and health outcomes among African Americans. Annual Review of Psychology, 58, 201-225. 54 James, S., Keenan, N., Strogatz, D., Browning, S., & Garrett, J. (1992). Socioeconomic status, John Henryism, and blood pressure in Black adults. American Journal of Epidemiology, 135(1), 59-67. 55 Roberts, C.B., Vines, A.I., Kaufman, J.S. & James, S.A. (2008). Cross-sectional association between perceived discrimination and hypertension in African-American men and women: The Pitt County study. American Journal of Epidemiology, 167(5), 624-632. 56 U.S. Department of Health & Human Services, Office of Minority Health. (2009). 57 Mays et al. (2007). 58 Landrine, H. & Klonoff, E.A. (2000). Racial discrimination and cigarette smoking among Blacks: Findings from two studies. Ethnicity & Disease, 10(2), 195-202. 59 Bhat, M. & Vance, S. (2008). Multnomah County Health Department Report Card on Racial and Ethnic Health Disparities. Retrieved December 27, 2008 from the Multnomah County website: http://www.co.multnomah.or.us/health/hra/reports/reportcard.pdf 60 Bhat, M. (2011). Report card on racial and ethnic health disparities. Portland, OR: Multnomah County Health Department. 61 Bhat, M. & Vance, S. (2008). 62 Goldenberg M, Culhane, J. (2007). Low birth weight in the United States. American Journal of Clinical Nutrition, 85(suppl), 584S-90S. 63 Hobel, C.J., Goldstein, A. &Barrett, ES. (2008). Psychosocial stress and pregnancy outcomes. Clinical Obstetrical Gynecology, 51(2), 33-348. 64 U.S. Department of Health & Human Services, Office of Minority Health. (2009). African Americans profile, quick facts. Retrieved May 22, 2009, from: http://www.omhrc.gov/templates/browse.aspx?lvl=2&lvlID=51 65 American Diabetes Association. (2009). African Americans and diabetes. Retrieved May 22, 2009, from http://www.diabetes.org/communityprograms-and-localevents/africanamericans.jsp 66 U.S. Department of Health & Human Services, Office of Minority Health. (2009). 67 Phuong Do, D., Finch, B.K, Basurto-Davila, R., Bird, C. Escarce, J. & Lurie, N. (2008). Does place explain racial health disparities? Quantifying the contribution of residential context to the Black/white health gap in the United States. Social Science & Medicine, 67, 1258-1268. 68 Oregon Population Survey, Oregon Health Policy & Research http://www.oregon.gov/OHPPR/RSCH/index.shtml. Summary & Reports from http://www.ohpr.state.or.us/DAS/OHPPR/RSCH/summarytables.shtml. 69 Miller, K., Cahn, K., Bender, R., Cross-Hemmer, A., Feyerherm, B., & White, J. (2009). What we know about racial disproportionality and disparity in Multnomah County’s child welfare system: Decision point analysis quantitative report. Portland, OR: Portland State University. 70 Curry-Stevens’ calculations for Multnomah County from data from Miller, Cahn, Bender, Cross-Hemmer, Feyerherm & White (2009); for national data, see Child Welfare League of America. (2008). CWLA Fact Sheet and Relevant Research. Downloaded from CWLA website on 5/7/10 from http://ndas.cwla.org/research_info/specialtopic1a.asp 71 Miller, K., Cahn, K., Bender, R., Cross-Hemmer, A., Feyerherm, B., & White, J. (2009). 72 Miller, Cahn, Bender, Cross-Hemmer, Feyerherm, & White (2009). 73 Miller, Cahn, Bender, Cross-Hemmer, Feyerherm, & White (2009). 74 To determine which children in foster care might experience longer lengths of stay in foster care, data from a cohort of children (n=1,966) who were continuously in foster care (did not exit care) during a six-month analysis period was analyzed. 75 Miller, Cahn, Bender, Cross-Hemmer, Feyerherm, & White (2009). 76 This chart varies from the data in Miller et al (2009) because the research team was able to recalculate the data in such a way so as to eliminate the Latino community being counted as “white” in the original data source. We were able to extract the Latino community from the White community, and this resulted in a re-balancing of the
The African American Community in Multnomah County Coalition of Communities of Color & Portland State University
114 | P a g e

statistics for White children in foster care – with ripples extending to the relative rate index for all communities of color. We have also aggregated some stays of different lengths to simplify this chart. 77 Miller, Marna. (2008). Racial disproportionality in Washington State’s child welfare system. Olympia,: Washington State Institute for Public Policy, Document No. 08-06-3901. Miller, Cahn, Bender, Cross-Hemmer, Feyerherm, & White (2009). 78 Hill, R. (2006). Synthesis of research on disproportionality in child welfare: An Update. Seattle, WA: Casey Family Programs. 78 US Department of Health and Human Services (2009). Adoption and Foster Care Analysis and Reporting System (AFCARS), 2009. Downloaded from http://www.acf.hhs.gov/programs/cb/stats_research/afcars/statistics/entryexit2008.htm with state population figures added and rankings recorded by Administration for Children & Families. 79 Oregon Department of Education (2013). Statewide Report Card: An annual report to the Legislature on Oregon public schools. Salem, OR: Oregon Department of Education. 80 Jenkins & Ramsay (1991) as cited in Paniagua (2005). Assessing and treating culturally diverse clients: A practical guide. Thousand Oaks, CA: Sage. 81 Alliance for Excellent Education (2011). Education and the economy: Boosting the economy in the Portland-Vancouver-Beaverton, OR-WA metropolitan statistical area by improving high school graduation rates. Downloaded on March 6, 2012 from http://www.all4ed.org/files/PortlandOR_leb.pdf. 82 The definition of “low income” in this figure is that of “economic disadvantage” as measured by Oregon’s school boards, which is those who are enrolled in “free and reduced lunch” programs. To be eligible for this program, families must hold incomes less than 200% of the poverty line. Non-low income students are those who are not enrolled in such programs. 83 The cohort graduation rate is calculated by taking the number of students who entered 9th grade in a given year who graduated with a regular diploma within four years and dividing that by the total number of students in the cohort. The total number of students in the cohort is adjusted for students who move into or out of the system, emigrate to another country, or are deceased. Therefore, the 2008-09 cohort is made up of students who first entered high school in 2005-06, who did not move or die, and who graduated with a regular diploma in 2008-09. 84 Oregon Department of Education. (2012). Cohort graduation rate; Cohort media files from 2008-2009 through 2011-12 (Excel file). Downloaded from http://www.ode.state.or.us/search/page/?id=2644. 85 Skiba,R., Michael, R. & Nardo, A. (2000). The color of discipline: Sources of racial and gender disproportionality in school punishment. Bloomington, IN: Indiana Educational Policy Center. Loden, D. & Skiba, R. (2010). Suspended education: Urban middle schools in crisis. Montgomery, AL: Southern Poverty Law Center. McCarthy, D. & Hoge, D. (1978). The social construction of school punishment: Racial disadvantage out of universalistic process. Social Forces, 65, 1101-1120. McFadden, A., Marsh, G. Price, B. & Hwang, Y. (1992). A study of race and gender bias in the punishment of handicapped school children. Urban Review, 24, 239-251. Shaw & Braden (1990) 86 Wu, S., Pink, W., Crain, R., & Moles, O. (1982). Student suspension: A critical reappraisal. The Urban Review, 14, 245-303. 87 Loden & Skiba (2010), p.2. 88 Nicholson-Crotty, S., Birchmeier, Z. & Valentine, D. (2009). Exploring the impact of school discipline on racial disproportion in the juvenile justice system. Social Science Quarterly, 90(4), 1003-1018. 89 American Civil Liberties Union of Oregon (2010). Oregon’s school-to-prison pipeline. Downloaded on January 5, 2011 from http://www.aclu-or.org/sites/default/files/ACLU_STPP_FINAL.pdf. 90 Multnomah County Commission on Children, Families and Community (2012). Exclusionary discipline in Multnomah County schools: How suspensions and expulsions impact students of color. Portland, OR: Multnomah County. 91 Multnomah County Commission on Children, Families and Community (2012). Exclusionary discipline in Multnomah County schools: How suspensions and expulsions impact students of color. Portland, OR: Multnomah County. The African American Community in Multnomah County
Coalition of Communities of Color & Portland State University 115 | P a g e

92 Note that the number of disciplinary actions was based on the number of discipline incidents over the course of a year, and thus not specifically tied to a different student – but we used the same convention as did the Commission in applying these numbers to the population of students to determine rates of incidence. We then used a second source that documents that there are, on average, two discipline incidents per student over the course of a year, and so we divided the incidence numbers in half to create these charts. Source for student frequency rates: Ali, T. & Dufresne, A. (2008). Missing out: Suspended students from Connecticut schools. New Haven, CT: Connecticut Voices for Children. Source for local data: Multnomah County Commission on Children, Families and Community (2012). Exclusionary discipline in Multnomah County schools: How suspensions and expulsions impact students of color. Portland, OR: Multnomah County. 93 Adams, A. (2000). The status of school discipline and violence. Annals of the American Academy of Political and Social Science, 567(1), 140-156. 94 Owen, W. (2011, July 8). Portland-area schools hit for minority stats: The higher disciplinary rates for those in special education put three districts afoul of a federal law. The Oregonian, page A1. 95 Office of Strategic Planning and Programs (2006). Where have Oregon’s graduates gone? Survey of the Oregon high school graduating class of 2005. Eugene, OR: Oregon University System. 96 OUS institutions include Portland State University, the University of Oregon, Eastern Oregon University, Oregon Institute of Technology, Oregon State University, Southern Oregon University and Western Oregon University. 97 Portland State University and the Leaders Roundtable (2010). Partnering for student success – the cradle to career framework: 2010 Report to the Community. Portland, OR: PSU Center for Student Success. 98 Braxton, J. (Ed.) (2000). Reworking the student departure puzzle. Nashville, TN: Vanderbilt University Press. 99 Kieran, B. (2009). Student participation and completion: A current perspective. Downloaded on February 7, 2011 from http://www.ous.edu/symp/files/StudentParticipationCurrentPerspective-11-2009update.pdf. 100 OUS institutions include Portland State University, the University of Oregon, Eastern Oregon University, Oregon Institute of Technology, Oregon State University, Southern Oregon University and Western Oregon University. 101 Holliday, J. (2009). OUS retention, attrition and graduation of OUS freshman entering fall 2002. OUS Institutional Research Services. Downloaded on February 7, 2011 from http://www.ous.edu/symp/files/OUS%20Retention,%20Attrition,%20and%20Graduation%20of%20OUS%20Freshmen.pdf. 102 Office of Institutional Research & Planning (2009). Diversity Assessment at Portland State. Downloaded on April 2, 2010 from http://www.pdx.edu/diversity/daps-c1-graduation-rates-other-methods. 103 Kelly, P. (2005). As America becomes more diverse: The impact of state higher education inequality. Boulder, CO: National Center for State Higher Education Management Systems. 104 P.34 in Curry-Stevens, A., Cross-Hemmer, A. & the Coalition of Communities of Color (2010). Communities of color in Multnomah County: An unsettling profile. Portland, OR: Portland State University. 105 As cited by Oregon Action, Center for Intercultural Organizing, Northwest Constitutional Rights Center, Portland Police Bureau & NW Federation of Community Organizations (2006). Listening sessions report: A community and police partnership to eliminate racial profiling. Portland OR. (p.20). 106 Oregon Action, Center for Intercultural Organizing, Northwest Constitutional Rights Center, Portland Police Bureau & NW Federation of Community Organizations (2006). Listening sessions report: A community and police partnership to eliminate racial profiling. Portland OR. (p.16). 107 Portland Police Bureau (2009). 108 Campbell DeLong Resources, Inc. (2005). Portland Police Bureau: 2005 Community Assessment Survey. Retrieved December 27, 2008 from the Portland Police Bureau website: http://www.portlandonline.com/police/index.cfm?c=29864&a=105839. 109 Portland Police Bureau (2009). Portland Police Bureau plan to reduce racial profiling. Downloaded on April 11, 2010 from http://www.portlandonline.com/police/index.cfm?a=230887&c=29870. 110 Oregon Action (2006). Listening sessions report. 111 This data was retrieved from CopWatch, Portland, OR branch. Downloaded on April 11, 2010 from http://www.portlandcopwatch.org/listofshootings.html.
The African American Community in Multnomah County Coalition of Communities of Color & Portland State University
116 | P a g e

112 Bernstein, Maxine. 2013. “Portland Community Group Wins Role in Overseeing Police Reforms.” The Oregonian, July 24, 2013. 113 Multnomah County Department of Community Justice (2000). Adult Minority Issues Archives: Minority Over-Representation--January, 2000 (PowerPoint). Retrieved December 27, 2008 from the Multnomah County Department of Justice website: http://www.co.multnomah.or.us/dcj/evaluation_archive.shtml#minority_issues. 114 Oregon Department of Corrections. (2009). Community population statistics: Community population profile for 10/1/2009. Retrieved February 5th, 2010 from the Oregon Department of Corrections Research and Statistics website: http://www.oregon.gov/DOC/RESRCH/docs/community_profile_200908.pdf and U.S. Census Bureau, American Community Survey (2008). American Fact Finder; Detailed Tables: Multnomah County. Table: S0201. Selected Population Profile in the United States. Hispanic or Latino & White alone, not Hispanic or Latino. 2008 American Community Survey 1-year Estimates. 115 Multnomah County Public Safety Coordinating Council. (2000). Ensuring equitable treatment in the criminal justice system: Addressing over-representation of racial and ethnic minorities, an assessment and action plan. Retrieved December 27, 2008 from www.lpscc.org/docs/orreport.pdf. 116 Curry-Stevens’ calculations of data from Oregon Department of Corrections, Inmate population profile for 04/01/2010 retrieved from the Oregon Department of Corrections Research and Statistics website. To determine disproportionality, we used 2008 American Community Survey figures (most recent available) for the adult population (aged 18 or over). 117 To determine disproportionality, we used 2008 ACS figures (most recent available) for the adult population (aged 18 or over). 118 Rhyne, C. & Pascual, K. (2009). Juvenile minority over-representation in Multnomah County’s Department of Community Justice: Calendar Year 2008 Youth Data. Retrieved February 1, 2010 from http://www.co.multnomah.or.us/dcj/jsd_min_overrep2009.pdf. 119 Wu, L. & Rhyne, C. (2010). Juvenile minority over-representation in Multnomah County’s Department of Community Justice: Calendar Year 2009 Youth Data. Retrieved August 19, 2011 from http://www.co.multnomah.or.us/dcj/jsd_min_overrep2010.pdf. 120 Wu, L. & Rhyne, C. (2009). Juvenile Crime Trends and Recidivism Report: October, 2009. Retrieved February 1, 2010 from: http://www.co.multnomah.or.us/dcj/jsd_juvenile_crime_trends122309.pdf 121 Rhyne, C., Churchill, E. & Hamblin, L. (2008). Juvenile Crime Trends and Recidivism Report: September, 2008. Retrieved December 27, 2008 from the Multnomah County website: http://www.co.multnomah.or.us/dcj/jsd_juvenile_crime_trends082808.pdf 122 P.200 in Wortley, S. & Tanner, J. (2004). Discrimination or good policing? The racial profiling debate in Canada. Our Diverse Cities, 1, 197-201. 123 National Conference on Citizenship, Civic Enterprises, Center for Information and Research on Civic Learning and Engagement & Saguaro Seminar (2009). America’s Civic Health Index: Civic Health in Hard Times. Washington, D.C.: National Conference on Citizenship. 124 U.S. Census Bureau. (2009). Voter turnout increases by 5 million in 2008 presidential election: U.S. Census Bureau reports data show significant increases among Hispanics, Black and young voters. U.S. Census Bureau News [Press Release]. Washington, D.C.: U.S. Department of Commerce. Retrieved January 20, 2010 from: http://www.census.gov/Press-Release/www/releases/archives/voting/013995.html 125 U.S. Census Bureau. (2004, 2006, and 2008). Current Population Survey. Table 4a: Reported voting and registration of the total voting-age population by sex, race, and Hispanic origin, for states: November 2004 retrieved January 20, 2010 from: www.census.gov/hhes/www/socdemo/voting/publications/p20/2004/tab04a.xls. Table 4b Reported voting and registration of the total voting-age population, by sex, race, and Hispanic origin, for states: November 2006 retrieved January 20, 2010 from: www.census.gov/hhes/www/socdemo/voting/publications/p20/2006/tab04b.xls. Table 4b Reported voting and registration of the total voting-age population, by sex, race, and Hispanic origin, for states: November 2008 retrieved January 20, 2010 from: www.census.gov/hhes/www/socdemo/voting/publications/p20/2008/table%2004b.xls.
The African American Community in Multnomah County Coalition of Communities of Color & Portland State University
117 | P a g e
126 U.S. Census Bureau. (2004, 2006, and 2008). Current Population Survey. Table 4a: Reported voting and registration of the total voting-age population by sex, race, and Hispanic origin, for states: November 2004 retrieved January 20, 2010 from: www.census.gov/hhes/www/socdemo/voting/publications/p20/2004/tab04a.xls. Table 4b Reported voting and registration of the total voting-age population, by sex, race, and Hispanic origin, for states: November 2006 retrieved January 20, 2010 from: www.census.gov/hhes/www/socdemo/voting/publications/p20/2006/tab04b.xls. Table 4b Reported voting and registration of the total voting-age population, by sex, race, and Hispanic origin, for states: November 2008 retrieved January 20, 2010 from: www.census.gov/hhes/www/socdemo/voting/publications/p20/2008/table%2004b.xls. 127 National Conference on Citizenship, Civic Enterprises, Center for Information and Research on Civic Learning and Engagement & Saguaro Seminar (2009). America’s Civic Health Index: Civic Health in Hard Times. Washington, D.C.: National Conference on Citizenship. 128 U.S. Department of Labor, Bureau of Labor Statistics (2010). Volunteering in the United States—2009. [Press Release]. Washington, D.C.: U.S. Department of Labor, Bureau of Labor Statistics. Retrieved January 28, 2010 from: http://www.bls.gov/news.release/volun.nr0.htm 129 Foundation Center (2010). Grantmaking to communities of color in Oregon. Washington, DC: Foundation Center. 130 Taken from Seattle’s Racial and Social Justice Initiative core equity definitions. 131 Many of the terms here were found in Campbell, C. (2003). Anti-oppressive social work. Promoting equity and social justice. Downloaded on April 25, 2009 from http://aosw.socialwork.dal.ca/glossary.html.
The African American Community in Multnomah County Coalition of Communities of Color & Portland State University
118 | P a g e