An overview of women's work and employment in India - AWS
112
AIAS Amsterdam Institute for Advanced labour Studies University of Amsterdam AIAS An overview of women’s work and employment in India Maarten van Klaveren, Kea Tijdens, Melanie Hughie-Williams, Nuria Ramos Martin Working Paper 10-90 May 2010
-
Upload
khangminh22 -
Category
Documents
-
view
1 -
download
0
Transcript of An overview of women's work and employment in India - AWS

AIASAmsterdam Institute for
Advanced labour Studies
University of AmsterdamAIAS
An overview of women’s work and employment in India
Maarten van Klaveren, Kea Tijdens, Melanie Hughie-Williams, Nuria Ramos Martin
Working Paper 10-90May 2010

May 2010
© M. van Klaveren, K.G. Tijdens, N.E. Ramos Martin, M. Hughie-Williams, Amsterdam
Contact: [email protected]
Information may be quoted provided the source is stated accurately and clearly.
Reproduction for own/internal use is permitted.
This paper can be downloaded from our website www.uva-aias.net under the section
Publications/Working papers.

An overview of women’s work and employment in
India
Decisions for Life MDG3 Project
Country Report no. 13
WP 10/90
Maarten van Klaveren
Kea Tijdens
Melanie Hughie-Williams
Nuria Ramos Martin
AIAS
University of Amsterdam

Page ● 4
M. van Klaveren, K.G. Tijdens, M. Hughie-Williams and N.E. Ramos Martin

Page ● 5
An overview of women’s work and employment in India
Table of contentsMANAGEMENT SUMMARY ..................................................................................................................7
1. INTRODUCTION: THE DECISIONS FOR LIFE PROJECT .........................................................................11
2. GENDER ANALYSIS REGARDING WORK AND EMPLOYMENT ..................................................................13
2.1. Introduction: the general picture ...............................................................................................................132.1.1. History 132.1.2. Governance 172.1.3. Prospects 22
2.2. Communication..............................................................................................................................................24
2.3. The sectoral labour market structure ..........................................................................................................282.3.1. Population and employment 282.3.2. Formal and informal employment 312.3.3. Unemployment 34
2.4. National legislation and labour relations ....................................................................................................352.4.1. Legislation 352.4.2. Labour relations and wage-setting 39
2.5. Minimum wage and poverty.........................................................................................................................422.5.1. The statutory minimum wage 422.5.2. Inequality and poverty 45
2.6. Demographics and female labour force .....................................................................................................492.6.1. Population and fertility 492.6.2. Health 542.6.3. Women’s labour market share 572.6.4. Agriculture 582.6.5. Mining and manufacturing 602.6.6. Services 612.6.7. Government 63
2.7. Education and skill levels of the female labour force..............................................................................642.7.1. Literacy 642.7.2. Education of girls 652.7.3. Female skill levels 70
2.8. Wages and working conditions of the target group .................................................................................752.8.1. Wages 752.8.2. Working conditions 76
3. BASIC INFORMATION FOR WAGEINDICATOR QUESTIONNAIRE ............................................................79
3.1. Introduction ....................................................................................................................................................79
3.2. List of educational categories and ISCED levels .....................................................................................79
1.1. List of regions ................................................................................................................................................80
3.3. List of ethnic groups and languages ..........................................................................................................903.3.1. Ethnic groups 903.3.2. Languages 91

Page ● 6
M. van Klaveren, K.G. Tijdens, M. Hughie-Williams and N.E. Ramos Martin
REFERENCES .................................................................................................................................93
WHAT IS WAGEINDICATOR? .........................................................................................................103
AIAS WORKING PAPERS ..............................................................................................................105
INFORMATION ABOUT AIAS .........................................................................................................111

Page ● 7
An overview of women’s work and employment in India
Management summary
This report provides information on India on behalf of the implementation of the DECISIONS FOR
LIFE project in that country. The DECISIONS FOR LIFE project aims to raise awareness amongst young
female workers about their employment opportunities and career possibilities, family building and the work-
family balance. This report is part of the Inventories, to be made by the University of Amsterdam, for all
14 countries involved. It focuses on a gender analysis of work and employment.
History (2.1.1). After Independence, Prime Minister (PM) Nehru and the Congress Party pursued social-
ist-oriented economic policies. After Nehru’s death (1964), policies changed from urban industrial to agri-
cultural development, continuing under PM Indira Ghandi. From 1984 on, PM Rajiv Ghandi encouraged
science and technology and started to depart from socialist policies. After his death in 1991, a liberalisation
process was put in motion, which has been supported by various government coalitions. From 2003 on, the
Indian economy has shown high macro-economic growth fi gures.
Governance (2.1.2). In spite of a democratic system of government, a progressive Constitution and many
laws to protect women’s rights, serious problems with compliance remain, especially in maintaining hu-
man and women’s rights. The position of women in politics is weak, though at top level there were and are
remarkable exceptions. With the 2009 elections, women representation in the lower house of parliament
increased to 11%. In recent years many women have been confronted with domestic violence and sexual
harassment.
Prospects (2.1.3). The global economic crisis has had a rather modest impact on India’s economy, and the
prospects for the country’s rebound seem bright. Yet, in 2008-09 the decline in manufacturing exports has
caused serious problems for in particular women.
Communication (2.2). Telephone use is rapidly switching from fi xed line to cellular phone networks. In
2009, already 365 of each 1,000 in the population used a cell phone. Internet coverage is growing but still
low, with one in 12 surfi ng on the Internet. Television is a popular medium: over half of all households have
a TV set. Cable TV proves to have emancipatory force, especially for rural women.

Page ● 8
M. van Klaveren, K.G. Tijdens, M. Hughie-Williams and N.E. Ramos Martin
The sectoral labour market structure – Population and employment (2.3.1). Being slightly below 36%, women’s
Labour Participation Rate (LPR) in 2008 was extremely low, whereas with 85% the male rate was high. LPRs
hardly changed in the 2000s.
The sectoral labour market structure – Formal and informal employment (2.3.2) Less than 15% of all employed is
currently working in the formal (in India: organised) sector, and less than 8% are formal (organised) work-
ers. Just over half of the total labour force is self-employed. In 2008-09 about 50% of all employed worked
in agriculture, 20% in manufacturing, and 30% in services.
The sectoral labour market structure – Unemployment (2.3.3). In recent years unemployment for women has
gone up. Unemployment is highest among youngsters, with for girls and young women in 2006 offi cial un-
employment rates between 17 and 22%.
Legislation (2.4.1). India has ratifi ed only four of eight core ILO Labour Conventions. In practice work-
ers’ rights are only legally protected for the small minority working in the organised sector. Even formally
the freedom of association is limited. Strikes are prohibited in the public sector. Child labour is widespread,
and the number of child labourers estimated at 55-60 million.
Labour relations and wage-setting (2.4.2). The trade union landscape in India is complex and diversifi ed.
The union movement opposed liberalisation taking place after 1991, in which period centralized collective
bargaining declined. We found that union membership in the 2000s remained at about 6.5% of the labour
force. On average the female share in membership and decision-making remains low. In contrast, strong-
holds of female organizing have emerged as responses to problems in informal labour.
The statutory minimum wage (2.5.1). There is a complex system of statutory minimum wages (MW) in place,
with 1,232 occupational and sectoral minimum wage rates. In practice, only average wages in the manufac-
turing part of the organised sector are above the MW level. In 2004-05 80% of casual workers and 31%
of regular salaried/wage workers did not receive the MW, with the proportions of females even larger. In-
novative is the National Rural Employment Guarantee Act (NREGA), a combination of a minimum wage
provision and a public employment scheme.
Poverty (2.5.2). For 2005, it has been estimated that 76% of the population lived under the poverty line
of USD 2 a day, and that 42% had to make ends meet with an income below USD 1.25 a day. The poverty
gap remains relatively large. In and through the nationwide liberalisation process, the seven states with the
lowest incomes are lagging behind. In 2006, India ranked 132nd on the human development index (HDI),
six places below its GDP per capita rank.

Page ● 9
An overview of women’s work and employment in India
Population and fertility (2.6.1). For over two decades the population growth rate is falling, but further de-
crease seems to stagnate. For 2005-2010 the growth projection is 1.5% per year. Due to the preference for
sons the country’s sex ratio is 1.12 male/female. The total fertility rate (2.8-2.9 children per woman) and the
adolescent fertility rate (90 per 1,000) are rather high. In 2006 the median age for women at fi rst marriage
was 17.8 years, and by then 42% of all Indian women aged 20-24 gave birth before age 20.
Health (2.6.2). In 2007, about 2.3 million Indians lived with HIV. Though HIV/AIDS is in India more
a man’s disease, there is a shift going on toward women and young people. The country’s health disparities
are large, also because of relatively low public expenditure on health.
Women’s labour market share (2.6.3). With 19% the female share in the organised sector is low. In both
manufacturing and in commercial services about one in six employees was female. The public sector is by
far the largest employer in the formal sector, employing 70% of all women engaged in that sector.
Agriculture (2.6.4). It is estimated that about 60% of all agricultural operations are handled exclusively
by women. Female hourly wage rates in agriculture vary from 50 to 75% of male rates, and are too low to
overcome absolute poverty. Working conditions are often appalling. Young women living in cities and trying
to make a career rarely can rely on a “fall-back scenario” in which they can go back to their families living
from agriculture.
Mining and manufacturing (2.6.5). Since the early 1990s, informalisation and casualisation of employment
and decreasing wage rates show up as main trends. Thus, manufacturing has become a less promising source
of employment for women.
Services (2.6.6). In the last two decades the service sector share in total employment doubled, and in
2004-2008 employment and export growth have even speeded up. The motor of growth is the IT/BPO
industry. Yet, at the same time informalisation has grown: currently over seven in ten service employees
are in informal labour. Women may comprise less than one third of the IT/BPO workforce but their share
may soon increase.
Government (2.6.7). In spite of a recent decline in public sector employment, the share of females are
gradually increasing at central, regional and local state levels. Relatively high wages and maternity and sick-
ness benefi ts may make the public service attractive for young women.
Literacy (2.7.1). The adult literacy rate –those age 15 and over that can read and write—was in 2007 66%,
with a considerable gender gap: the female literacy was 54.5% and the male 77.1%. For 2007 the literacy rate
for 15-24-year-olds was set at 82.1%, with a smaller gender difference: 77.1% for young females and 86.7%
for young males.

Page ● 10
M. van Klaveren, K.G. Tijdens, M. Hughie-Williams and N.E. Ramos Martin
Education of girls (2.7.2). Girls are lagging behind in enrollment rates for all educational types. For 2006,
combined gross enrollment in education was 61%, with 57.4% for girls. For 2007, international sources set
net enrollment in primary education at 90%: 88% for girls and 91% for boys, but the drop-out rates were
quite high. In the same year, gross enrollment in secondary education was 57%: 52% for females and 61%
for males. And in tertiary education, 13% of the 17-25 of age were enrolled: 11% of females and 16% of
males.
Female skill levels (2.7.3). The gender gap in educational level of the labour force is immense. Whereas
in 2004-05 60% of the female employed was illiterate and 3.7% was graduated, these shares for the males
labour force were less than 28% and nearly 8% respectively. Nevertheless, the female shares of graduated
were higher than the male shares in banking and fi nance; real estate and business services, and transport.
Among the 15-29 of age, the gender gap was considerably smaller. We estimate the current size of the tar-
get group of DECISIONS FOR LIFE for India at about 1.8 million girls and young women 15-29 of age
working in urban areas in commercial services.
Wages (2.8.1). We found for 2004-05 the very large gender pay gap of 57% in the formal (organised)
sector. Comparisons with the unorganised sector showed that wages rates here were 20-30% of those in the
organised sector, though wage rates varied widely across states and activities. Among casual workers, gender
pay gaps showed up of 35-37%.
Working conditions (2.8.2). In 2000 female employees in the organised sector made longer hours than their
male colleagues: an average working week of 48.1 hours against 46.3. Between 2000 and 2006, the average
working week of females has been shortened by 1.3 hours, whereas the male working week has been pro-
longed by 0.5 hours.

Page ● 11
An overview of women’s work and employment in India
Introduction: The Decisions for Life 1. project
The DECISIONS FOR LIFE project aims to raise awareness amongst young female workers about
their employment opportunities and career possibilities, family building and the work-family balance. The
lifetime decisions adolescent women face, determine not only their individual future, but also that of soci-
ety: their choices are key to the demographic and workforce development of the nation.
DECISIONS FOR LIFE is awarded a MDG3 grant from the Netherlands Ministry of Foreign Af-
fairs as part of its strategy to support the United Nations’ Millennium Development Goals no 3 (MDG3):
“Promote Gender Equality and Empower Women”. DECISIONS FOR LIFE more specifi cally focuses on
MDG3.5: “Promoting formal employment and equal opportunities at the labour market”, which is one of
the four MDG3 priority areas identifi ed in Ministry’s MDG3 Fund. DECISIONS FOR LIFE runs from
October 2008 until June 2011 (See www.wageindicator.org/main/projects/decisions-for-life).
DECISIONS FOR LIFE focuses on 14 developing countries, notably Brazil, India, Indonesia, the CIS
countries Azerbaijan, Belarus, Kazakhstan, Ukraine, and the southern African countries Angola, Botswana,
Malawi, Mozambique, South Africa, Zambia and Zimbabwe. Project partners are International Trade Union
Confederation (ITUC), Union Network International (UNI), WageIndicator Foundation, and University of
Amsterdam/AIAS.
This report is part of the Inventories, to be made by the University of Amsterdam, for all 14 countries
involved. These Inventories and the underlying gender analyses are listed in the Table. All reports will be
posted at the project website. In this country report on India the sequence of the sections differs from the
table. The report covers mainly Activity nr 1.03, the Gender analysis regarding pay and working conditions
(or, as Chapter 2 is called here, work and employment). Partly included (in section 2.4.1) is Activity 1.01,
Inventories of national legislation; partly the analysis of national legislation has resulted in a separate prod-
uct, the DecentWorkCheck for India. Activity 1.02, Inventories of companies’ regulations, will take place
through a company survey. Preparations for Activities 1.03a and 1.03b have resulted in a number of lists,
to be used in the WageIndicator web-survey for country-specifi c questions and their analyses (Chapter 3).
References can be found in Chapter 4; Chapter 5 gives more insight in the WageIndicator.
The authors would like to thank the Indian WageIndicator/Paycheck team for their valuable corrections
and additions on an earlier draft of this country report. Of course, all errors remain ours.

Page ● 12
M. van Klaveren, K.G. Tijdens, M. Hughie-Williams and N.E. Ramos Martin
Table 1. Activities for DECISIONS FOR LIFE by the University of Amsterdam
No Inventories1.01 Inventories of national legislation1.02 Inventories of companies’ regulations1.03 Gender analysis regarding pay and working conditions1.03a Gender analysis start-up design of off-line gender analyses inventory1.03b Gender analysis data-entry for off-line use inventories

Page ● 13
An overview of women’s work and employment in India
Gender analysis regarding work and 2. employment
Introduction: the general picture 2.1.
History2.1.1.
India is, with about 1,170 million inhabitants, the second most populous country, the seventh-largest
country by geographical area, and the most populous democracy in the world. Home to the Indus Valley
Civilisation and a region of historic trade routes and vast empires, the Indian subcontinent was identifi ed
with its commercial and cultural wealth for much of its history. From the 16th century, European powers
such as Portugal, the Netherlands, France, and the United Kingdom established trading posts and later
established colonies in the country. By the mid-19th century, most of India was under the control of the
British East India Company. A major turning point in the colonial occupation occurred with the Indian-led
Sepoy Rebellion of 1857 to 1858, which seriously threatened British rule and led to a marked shift in colo-
nial attitudes and practices. Although the British made some legal and administrative adjustments to placate
Indians, colonial attitudes toward Indians shifted from cultural engagement—albeit to change Indians with
Western ideas and technology—to insularity and xenophobia. India was brought under the direct rule of the
British Crown. In the 20th century, a nationwide struggle for independence was launched by the Indian Na-
tional Congress (INC) and other political organisations. Mahatma Gandhi led millions of people in several
national campaigns of non-violent civil disobedience. On 15 August 1947, India gained independence from
British rule, but the Muslim-majority areas were partitioned to form a separate state, Pakistan. The partition
and related violence displaced up to 12.5 million people in the former British Indian Empire, with estimates
of loss of life varying from several hundred thousand to a million. On 26 January 1950, India became a re-
public and a new Constitution came into force. Jawaharlal Nehru became the country’s fi rst Prime Minister
(PM) (wikipedia India; wikipedia History of the Republic of India; Metcalfe and Metcalfe 2006).
The British had left India with a rudimentary industrial and scientifi c base; tremendous poverty; social
cleavages along caste and economic lines; and contentious territorial boundaries that led to armed confl icts
with Pakistan (1947 to 1949, 1965, 1971), China (1962), and numerous insurgent groups. In spite of such
diffi culties, the nation can count a number of successes. With the exception of the state of emergency

Page ● 14
M. van Klaveren, K.G. Tijdens, M. Hughie-Williams and N.E. Ramos Martin
from 1975 to 1977, India has maintained a democratic political system. Building on the British-established
education system, India developed an educational infrastructure that has trained one of the world’s largest
scientifi c and technical populations. Using Green Revolution agricultural technologies, the country has be-
come self-suffi cient in food production (Library of Congress 2004). Especially since the mid-1990s, India
shows impressive macro-economic growth fi gures, jointly with Brazil, Russia and China (the BRICs) taking
a prominent place among the upcoming economic powers. However, poverty remains widespread, income
and consumption inequalities are growing, and many lack the skills to participate in the expansion of mod-
ern services and manufacturing. We will return to such pros and cons of recent developments after having
summarized political and economic change in the fi rst forty years after Independence.
From 1950 to 1990, barring two brief periods, the INC enjoyed a federal parliamentary majority. The
fi rst national elections were held in 1952; INC won an overwhelming majority, and Nehru began a second
term as PM. He also led the Congress to major election victories in 1957 and 1962. The Indian Union was
reshaped as the States Reorganization Act was passed in 1956: old states were dissolved and new states
created on the lines of shared linguistic and ethnic demographics. The Parliament also passed extensive
reforms that increased the legal rights of women in Hindu society, and further legislated against caste dis-
crimination and untouchability. Nehru and the Congress Party parliamentary majority advocated socialist-
oriented economic policies: no taxation for farmers, a statutory minimum wage and benefi ts for blue-collar
workers, and the nationalization of heavy industries such as steel, aviation, shipping, electricity and mining.
The various Five-Year Plans were leading. A number of industrial sectors were reserved for state-owned
companies alone. And though private fi rms were allowed to operate in other sectors, they had to take the
central government’s permission before activities being set up (OECD 2007; wikipedia History of the Re-
public of India).
After Jawaharlal Nehru’s death in May 1964, under his successor Lal Bahadur Shastri economic policies
changed from urban to agricultural development, including the procurement of food grains at above-mar-
ket prices. Combined with subsidies for fertilizers, these price incentives sparked India’s Green Revolution
during the late 1960s and the 1970s. When Shastri died shortly afterwards, a leadership election resulted
in the elevation of Indira Gandhi, Nehru’s daughter, as the third PM. She continued the political orienta-
tion towards the rural masses. Right-wing leader Morarji Desai entered Gandhi’s government as Deputy
Prime Minister and Finance Minister, and with senior Congress politicians attempted to constrain Gandhi’s
authority. She resuscitated her popular appeal by a major shift towards socialist policies. In 1971, Gandhi

Page ● 15
An overview of women’s work and employment in India
and her own Congress (R) were returned to power with a massively increased majority. The nationaliza-
tion of banks was carried out, and many other socialist-oriented economic and industrial policies enacted.
In 1974-75 allegations of corruption caused increasing political unrest. The Allahabad High Court found
Indira Gandhi guilty of misusing the government machinery for election purposes, and opposition parties
conducted nationwide strikes and protests demanding her immediate resignation. In 1975, under pressure
of Ms. Gandhi the President declared the state of emergency. Civil liberties were suspended, elections at
national and state levels postponed, and opposition leaders and activists imprisoned. The 1977 elections
were won by the Janata Party, an amalgamation of opposition parties, and Morarji Desai became the coun-
try’s fi rst non-Congress PM. Yet, Janata did not offer any leadership on solving India’s growing problems,
the coalition crumbled and the 1980 elections brought Indira Ghandi and the Congress (I) Party back in
power. The early 1980s were characterized by communal violence and insurgencies in various Indian states.
On 31 October 1984, the Prime Minister’s own Sikh bodyguards killed her. The Congress party chose Rajiv
Gandhi, Indira’s older son, as the next PM. In the next elections Rajiv led the Congress party to its largest
majority ever. Rajiv Ghandi initiated some economic reforms, lifting limitations to Foreign Direct Invest-
ment (FDI). His encouragement of science and technology resulted in a major expansion of the telecom
industry, sparking the fi rst steps towards a domestic IT and software industry (wikipedia History of the
Republic of India; Metcalfe and Metcalfe 2006; Nilekani 2008, 14, 21).
However, Rajiv Ghandi’s departure from socialist policies –though carefully-- did not sit well with the
masses, who did not benefi t from the innovations. Moreover, his image as an honest politician was shattered
by a corruption scandal. In 1989, a Janata Dal-led National Front coalition in alliance with the Left Front
coalition won the elections, but in turn managed to stay in power for only two years. On 21 May 1991, while
Rajiv Gandhi campaigned on behalf of Congress (I), a Tamil Tigers suicide bomber killed him and many
others. Based on the election result, Congress (I) put together a coalition, returning to power under the
leadership of P.V. Narasimha Rao. This Congress-led government, which served a full 5-year term, initiated
a gradual process of economic liberalisation and reform. Initially through external persuasion, India moved
away from its dirigiste model. In August 1991, in an atmosphere of political uncertainty after the assassina-
tion of Rajiv Gandhi, shaking investor confi dence and a severe balance of payments crisis, the government
took refuge to unanticipated reform measures pressed by an International Monetary Fund (IMF) adjust-
ment program. Direct tax rates were signifi cantly reduced, pervasive government licensing of industrial
activity was almost eliminated, and restrictions on investment by large companies were eased. In the 1990s,
Page ● 16
M. van Klaveren, K.G. Tijdens, M. Hughie-Williams and N.E. Ramos Martin
the list of industries reserved for the public sector was reduced from 17 to six. The fi nal months of the Rao-
led government suffered the effects of several major political corruption scandals, which contributed to the
worst electoral performance by the Congress Party in its history. The years 1996–1998 were a period of tur-
moil in the federal government with several short-lived alliances holding sway. In 1998, the Bharatiya Janata
Party (BJP) formed the National Democratic Alliance (NDA) with several other parties and became the fi rst
non-Congress government to complete a full fi ve-year term. In the 2004 elections, the INC won the largest
number of seats in parliament and formed a government with a coalition called the United Progressive Al-
liance (UPA), supported by various Left-leaning parties and members opposed to the BJP. The UPA again
came into power after the 2009 general election; however, the representation of the Left leaning parties
within the coalition has signifi cantly reduced. Concerning economic policies, the process of reform basically
has continued after 2000 with a further opening of India’s economy to competition, rather irrespective of
the ruling coalition. The number of industries reserved for very small fi rms has been signifi cantly reduced,
and foreign suppliers have been encouraged to enter the market by a progressive lowering of tariffs to an
average of 10% in 2007. Yet, plans to privatise state enterprises have been largely stalled (wikipedia India;
wikipedia History of the Republic of India; wikipedia Economic liberalisation in India; OECD 2007; Kapur
2008; Bhaumik and Kumbhakar 2008).
In the period 1978-2004, India’s output grew by 5.4% average per year, speeding up in the second half
of this period: whereas between 1978-1993 output growth was an average 4.5% yearly, between 1993-2004
this accelerated to 6.5%. However, as output per worker also accelerated, from 2.4% per year in 1978-1993
to 4.5% in 1993-2004, employment growth fell slightly, from an average 2.1% yearly in the fi rst period to
1.9% in the second. Manufacturing industry and services showed rather similar employment growth rates
per year, respectively on average 3.3% in 1978-1993 and 3.6% in 1993-2004 for manufacturing as against
3.8% and 3.7% for services. Remarkable enough employment in agriculture kept on growing too, with 1.4%
yearly in 1978-1993 and 0.7% afterwards – though these rates hide growing underemployment, of many
working hard but not earning suffi cient incomes (Bosworth and Collins 2007).
In the 2000s, and especially from 2003 on, the Indian economy from year to year showed high growth
fi gures. GDP (Gross Domestic Product) growth per person employed was 2.4% in 2000, 2.0% in 2001,
0.9% in 2002, 7.7% in 2003, 7.4% in 2004, 7.0% in 2005, 7.4% in 2006, and most recently 7.3% in 2007
and 5.4% in 2008 (UN MDG Indicators). Thus, the GDP growth rate per person employed for 2001-2006
averaged 5.4%, surpassed by an average growth of 7.0% for 2003-2008. Yet, as we will see the decline of
Page ● 17
An overview of women’s work and employment in India
poverty has been low. Obviously growth has not benefi ted the poor, nor has new employment gone to them,
mechanisms that have been recognized by the current administration. The Approach Paper to the Eleventh
Plan (2007-2012) calls for more ‘inclusive’ growth and envisages employment as a central element of such
growth. While a target of 58 million employment opportunities is proposed, the emphasis is on two aspects
of employment: productivity and incomes to address the problem of the working poor, and improvement
in the employability of the poor through a concerted and large-scale program for training and upgrading
skills. The government has recognized that a massive skills mismatch is restricting the shift of employment
from agriculture to industry and services. Various recent reports warn that limited skills and training are
a major bottleneck for continuing growth (Dutz 2007; Papola 2008). The mismatch is aggravated by the
brain drain on many of India’s high-skilled potential. About 20 million people or about 2% of the coun-
try’s population live and work abroad, where they earn the equivalent of two-thirds of India’s GDP (Dutz
2007); their immense remittances, how advantageous for the home country they may be, cannot solve the
skill problem.
In a global perspective, India is located in the lower ranks of medium human development, though cur-
rently the country is poised to cross the threshold to join the ranks of the world’s middle-income countries.
In 2006 its GDP per capita reached USD (PPP) 2,489, ranking no. 134 in the world. The estimated earned
income for men was USD 3,698, and for women USD 1,185 (UNDP 2008), implying a women to men par-
ity rate of 32%. As we will see, this extremely low rate is indicative for the position of Indian women in the
fi eld of work and employment.
Governance2.1.2.
India is a multiparty, federal, parliamentary democracy with a bicameral parliament and an active civil
society. The Prime Minister (PM), appointed by the President, is the head of government and exercises most
executive powers. The country has 28 states and seven union territories. States and union territories contain
601 districts that are further subdivided into townships containing from 200 to 600 villages. The division of
power between the union and state governments can appear blurred and even chaotic at times, and relation-
ships between some state governments and the union government have been contentious. However, the un-
ion government still exercises considerable infl uence on states. Since Independence, India has experienced
a plethora of political successes and problems. The country maintains a democratic system of government
with civil liberties that are often lacking in many poor, ethnically diverse societies. Its Consitution may
be called progressive. India also has an impressive record of economic development and a demonstrable

Page ● 18
M. van Klaveren, K.G. Tijdens, M. Hughie-Williams and N.E. Ramos Martin
commitment to correcting traditional social oppression (Library of Congress 2004; wikipedia). Manmohan
Singh became PM following his Congress Party-led coalition’s victory in the 2004 general elections, which
were considered free and fair, despite scattered instances of violence. In May 2009, Singh began his second
term. In recent years political parties could operate without restriction or outside interference. Serious inter-
nal confl icts affected the states of Jammu and Kashmir, as well as several states in North-East India. While
civilian authorities generally maintained effective control of the security forces, security forces occasionally
acted independently of government authority during incidents of communal tensions in states such as Kar-
nataka (US Dept of State 2009).
The US Dept of State (2009) over 2008 reported that, though the government generally respected the
rights of its citizens; serious problems remained. Major problems included extrajudicial killings of persons
in custody, disappearances, and torture and rape by police and other security forces. Investigations into indi-
vidual abuses and legal punishment for perpetrators occurred, but for the majority of abuses, the lack of ac-
countability created an atmosphere of impunity. Poor prison conditions and lengthy detentions during both
pretrial and trial proceedings remained signifi cant problems. Offi cials used special antiterrorism legislation
to justify the excessive use of force. Corruption existed at all levels of government and police. The govern-
ment applied restrictions to the travel and activities of visiting experts and scholars. Signifi cant restrictions
remained on the funding and activities of Non-Governmental Organisations (NGOs). NGOs must secure
approval from the Ministry of Home Affairs before organizing international conferences. In 2008 human
rights groups contended that this provided the government with political control over the work of NGOs
and restricted their freedom of assembly and association. NGOs alleged that some members from abroad
were denied visas arbitrarily (US Dept of State 2009).
In 2008, increasing attacks against religious minorities and the promulgation of antireligious conversion
laws were concerns. Violence associated with caste-based discrimination occurred. Domestic violence, child
marriage, dowry-related deaths, honor crimes, female infanticide and feticide remain serious problems. Traf-
fi cking in persons and exploitation of indentured, bonded, and child labor were continuing problems. As in
2007, there were credible reports that police throughout the country failed to fi le required arrest reports for
detained persons, resulting in hundreds of unresolved disappearances. Police usually denied these claims.
Prison conditions in some states were life threatening and did not meet international standards. Prisons were
severely overcrowded, and food and medical care were inadequate. The legal system was overburdened.
The federal Ministry for Home Affairs controls most paramilitary forces, the internal intelligence bureaus,

Page ● 19
An overview of women’s work and employment in India
and the nationwide police service, and provides training for senior police offi cers of the state-organized
police forces. In 2008, according to the US Dept of State corruption in the police force was pervasive
and acknowledged by many government offi cials. Offi cers at all levels acted with impunity and were rarely
held accountable for illegal actions. Police routinely employed arbitrary and incommunicado detention and
denied detainees, particularly the destitute, access to lawyers and medical attention to extract confessions.
Lower-caste individuals were more likely to be illegally detained than others (US Dept of State 2009).
Unless all these observations, it has to be noted that according to the World Bank’s worldwide gover-
nance indicators (WGI) India’s comparative position in the 2000s is rather stable –be it at various levels-- on
all six governance indicators: voice and accountability (in 2008 in the fi fth percentile, indicating that 35-
40% of countries worldwide have better ratings); political stability and absence of violence (in the ninth
percentile in 2008, thus with about 80% of countries rated better); government effectiveness (in the fi fth
percentile); regulatory quality (in the sixth percentile); rule of law (in the fi fth percentile); and control of
corruption (in 2008 in the sixth percentile)(World Bank 2009c).
The position of women in politics is weak, although at top level there were and are remarkable excep-
tions. Since the 2009 elections, women occupy 9.1% of the seats (73 out of 784) in both chambers of parlia-
ment, of which 59 out of 543 in the lower house, Lok Sabha (10.9%). Earlier, this share never passed 10%;
it stopped at 9.0% in 1999. However, there has been no change in the number of women candidates fi elded
by the major parties in recent elections, their number remaining under one in every 10 candidates. Most
parties say women candidates are low on the “winnability” factor. But in the fi ve Lok Sabha elections since
1996, the winnability of women candidates has been an average 12.5%, against 8.3% for men (Mishra 2009).
In 2009 women made up 10% of those in ministerial positions. The constitution reserves 33% of seats
for women in elected village councils (US Dept of State 2009). As said, women have occupied various top
positions in Indian politics. In July 2007 Pratibha Patil became the country’s fi rst female president. In four
periods, Miss Mayawati has been and is Chief Minister of Uttar Pradesh, the country’s largest state with a
population of 190 million. As already mentioned, Indira Gandhi was India’s fi rst female PM; Sonia Gandhi’s
involvement with Indian public life as president of Indian National Congress and chairperson of the ruling
UPA in the Lok Sabha began after the assassination of her mother-in-law and her husband Rajiv’s election
as PM. Since 1998, the National Capital Territory of Delhi is ruled by the female Chief Minister Sheila Dixit.

Page ● 20
M. van Klaveren, K.G. Tijdens, M. Hughie-Williams and N.E. Ramos Martin
Meira Kumar is the fi rst woman Speaker in India (wikipedia; information Indian WageIndicator team).
India’s government has promulgated many laws to protect women’s rights. The Ministry of Women and Child
Development is the nodal department on the issue of female employment. Within the Ministry of Labour and Em-
ployment, a separate Cell for women’s labour was set up in 1975. Among other things, the Cell has the task to imple-
ment and evaluate the Equal Remuneration Act of 1976, and to undertake follow-up action on the Supreme Court
judgements in matters of prevention of sexual harassment of women at their workplace. Moreover, the Cell is ad-
ministering a grants-in-aid Scheme for providing fi nancial assistance to civil society organizations (CSOs) (voluntary
and non-government) for taking up action programmes and projects for the benefi t of female employment (website
Ministry of Labour and Employment).
In general, the application of laws concerning women’s rights is weak. The legal framework has less
infl uence on women’s position than do the nation’s religions. According to the 2001 Census, 80.5% of the
population lives according to Hinduism and its customs and laws; by the time 13.4% of the population was
Muslim (Offi ce of the Registrar website, Census of India; CIA World Factbook). Indian women hold a
moderate level of authority and status in relation to family matters. The authorities have fought against early
marriage since the 19th century and have continually raised the legal marriage age – from 12 in 1891, to 14
in 1929, 15 in 1955 and fi nally to 18 in 1976 (OECD-SIGI website). However, we will show in section 2.6.1
that in practice marriage law is widely violated. Polygamy is legal for Muslim men, who are allowed to take
up to four wives. It also exists to a lesser extent amongst Hindus, particularly in cases where the fi rst wife has
not given birth to any sons. Divorce by mutual consent is the legal practice but women who initiate divorce
are condemned by public opinion; as a result, divorce remains very rare. Fathers alone have parental author-
ity in both Hindu and Muslim families. If divorce does occur, the law assures some equality with regard to
child custody, but any advantages granted to the mother are often disregarded (OECD-SIGI website).
In matters of inheritance, Hindu traditions privilege men as only sons are able to inherit from their
parents. In theory, these traditions were abolished by law after Independence but many women, especially
in Northern India, are still deprived of inheritance. Contrary to national laws, several states allow the ex-
clusion of widows and daughters in land inheritance. The situation is more favourable for women in the
South, where the national laws carry more weight. The Muslim population mostly follows strict inheritance
guidelines set out in Shari’a law, which are also discriminatory: daughters, for example, inherit half as much
as sons. This is commonly justifi ed by the argument that women have no fi nancial responsibility towards
their husbands and children. Indian legislation supports the fi nancial independence for women to a moder-

Page ● 21
An overview of women’s work and employment in India
ate degree. Several laws guarantee women’s access to land and access to property other than land, but these
laws are often ignored in the North, as are those pertaining to women’s access to bank loans. This is different
in the South: recent surveys report that here 70 to 80% of women have equal access to land, property, and
loans and credit. Women’s civil liberty in India is relatively low, largely because of traditions and customs.
Women’s and girls’ freedom of movement is limited particularly in village communities; amongst Mus-
lim and Hindu communities in the North 80 to 85% of women have virtually no freedom of movement
(OECD-SIGI website).
The Constitution of India prohibits discrimination on the basis of race, sex, religion, place of birth, or
social status, and the government worked to enforce these provisions with varying degrees of success. The
law provides for protection from all forms of abuse against women in the home, including physical, sexual,
verbal, emotional, or economic abuse. Domestic violence includes actual abuse or the threat of abuse. The
law recognizes the right of a woman to reside in a shared household with her spouse or partner while the
dispute continues, although a woman can be provided with alternative accommodations, for which the
spouse pays. The law also provides women with the right to police assistance, legal aid, shelter, and access
to medical care. The law bans harassment by way of dowry demands and empowers magistrates to issue
protection orders where needed. Dowry-related violence increased more than three-fold between 1990 and
2000; dowry deaths in that periode rose by 38% and since then, about 6,000 to 7,000 women have been
murdered each year. The law criminalizes spousal rape. Punishment ranges from jail terms of up to one year
and/or a fi ne of approximately Rupees (INR or Rs.) 19,800 rupees (approximately USD 425)(US Dept of
State 2009; OECD-SIGI website; Ruiz 2006). In section 2.6.2 we go into the huge problem of the prefer-
ence for sons and the “missing women.”
In practice rape and other violent attacks against women continued to be a serious problem in large
parts of the country. There has been a dramatic increase in reported crimes against women, which cred-
ible sources stated was due to a growing sense of security in reporting such crimes. The 2005-06 National
Family Health Survey (NFHS) reported that one-third of women aged 15 to 49 had experienced physical
violence, and approximately one in 10 had been a victim of sexual violence. The survey also found that
that only one in four abused women had ever sought help, and that 54% of women believed it was justifi ed
for a husband to beat his wife. NGOs asserted that rape by police, including custodial rape, was common.
The law sets criminal penalties for rape, including spousal rape, but the government did not enforce the law
effectively. Only 10% of rape cases were adjudicated fully by the courts, and police often failed to arrest

Page ● 22
M. van Klaveren, K.G. Tijdens, M. Hughie-Williams and N.E. Ramos Martin
rapists, perpetuating a climate of impunity (US Dept of State 2009). Sexual harassment of women in the
workplace included physical and verbal abuse from male supervisors, restricted use of toilets, and the denial
of lunch breaks. In 2006 the Supreme Court instructed all state chief secretaries to comply with its mandate
that all state departments and institutions with over 50 employees establish committees to deal with matters
of sexual harassment. Earlier, the Court had recognized the absence of legal provisions in this fi eld, and laid
down the policy and procedure to deal with sexual harassment. According to the National Crime Records
Bureau (NCRB), over 4,500 cases of sexual harassment were fi led in 2006. Like Brazil, India has started up
all-women police stations as to address domestic violence against women. In 2005 India had 295 of such
units (Ruiz 2006; US Dept of State 2008, 2009).
Prospects2.1.3.
In the short run, the global credit crunch had its effects on India’s economy. Its GDP growth declined
from 9.7% in 2006-07 to 6.1% in April-June 2009 (World Bank 2009d). Yet, compared to the US and Eu-
rope, India did not face a number of banking problems and weathered the global crisis relatively well. Its
relatively small fi nance sector, still largely government-owned and functioning robust and prudently, avoided
the excesses that marred American fi nancial markets (cf. Stiglitz 2009). India’s recovery has been remarkably
strong. Although FDI infl ows to India declined in 2009, estimated at USD 35 billion compared to USD 41
billion in 2008, the country remains one of the three developing country destinations for foreign investors
(World Bank 2010; website World Bank). Already in mid-2009, high-ranking government offi cials predicted
a return to a 9% growth rate (Mohan 2009); the World Bank (2009d) indeed expects 9.0% GDP growth to
become the average outcome for 2008-09. Obviously they did and do not agree with the conclusions of
a World Bank research note as of July 2009, stating: “The global economic crisis is exposing households
in virtually all developing countries to increased risk of poverty and hardship”, and adding “While in the
short-run, the non-poor may be the most affected by the crisis, experience from past economic and fi nancial
crises suggests that the adverse impacts are likely to spread in the medium-term to poor households.” This
note ranked India among the 43 countries that would be highly exposed to the crisis, showing decelerating
growth. It is rated in the category of countries with low fi scal capacity, meaning there is little or now toler-
ance for fi scal defi cits as to counteract the poverty effects of the crisis (Cord et al 2009).
Most recently, international sources emphasize that, while most developing countries operate in a highly
constrained fi scal environment, notably India and China were in a position to counteract the impact of the
downturn through increased public spending and expansionary fi scal policies (cf. UNESCO 2010, 28). In-

Page ● 23
An overview of women’s work and employment in India
deed, India in December 2008 and January 2009 launched two fi scal stimulus packages, together amounting
to 3% of GDP and including additional public expenditure. The Reserve Bank of India Governor claims
that these measures have been effective, also to have India’s fi nancial markets continuining to function or-
derly. Indeed, the World Bank (2010, 23) labels India’s macro-economic management as “skillful.” It helped,
as the Governor argued, that the country has only to a certain part been integrated in the world economy
and that consequently large parts of its economy remained insulated from the global downturn (Subbarao
2009). In spite of substantial increases, the shares of imports / exports and FDI in India’s GDP remain
relatively limited: by 2006 the imports / exports share was 24% (1985: 6%), and the FDI share 2% (1990:
0.1%)(OECD 2007; UNCTAD 2009). On economic globalization rankings India invariably scores low. For
example, on the KOF Globalization Index 2010 the country ranked no. 122 of 141 countries, considerably
lower than the other BRIC countries Brazil (no. 91), China (97), and Russia (92)(KOF Swiss Economic
Institute 2010). In UNCTAD’s Transnationality Index 2005 India got the lowest spot of 32 developing
countries (UNCTAD 2008, 12).
In spite of the generally rather favourable picture, serious problems for Indian (women) workers have
resulted from the decline in industrial production and exports, especially in manufacturing exports, in 2008-
09. In 2008, the growth of industrial output decelerated to 2.4% (against 8.6% in 2007), followed by only
0.7% growth in the fi rst fi ve months of 2009 compared to the same period of 2008. In 2008, manufacturing
output in food products, jute textiles and furniture fell by about 10% (ADB 2009b). In the second half of
2008, the country’s manufacturing exports fell by about 20%, and exports in the fi rst four months of 2009
were about 30% below the level seen a year earlier (ADB 2009c). In the fi rst quarter of 2009 alone, over
500,000 jobs in the export-oriented formal sector were shed, mostly in the jewelry, civil aviation, automotive,
textiles and garment industries. Women’s jobs may have accounted for 40 to 50% of those that formally
disappeared (cf. World Bank 2009e). There is evidence that large numbers of informal workers have lost
jobs (NCEUS 2009a, 19). The indirect effects of the crisis on the informal sector may have even stronger
hit women’s work; these effects may have been more in terms of declining incomes and a decrease in avail-
able days of work. Though –understandably-- statistical information is lacking, there is evidence that besides
women in homework in garments and handwork, female waste collectors and female construction workers
have felt drops in income up to 50%, leading to increasing indebtedness and increasing use of child labour,
taking children off school (SEWA 2009). Nevertheless, also for the poor the impact of the crisis has not
been as strongly felt as in other Asian countries, most likely mainly thanks to the existing social safety nets:
Page ● 24
M. van Klaveren, K.G. Tijdens, M. Hughie-Williams and N.E. Ramos Martin
a relatively robust social protection infrastructure; existing food security and social assistance programmes;
the National Rural Employment Guarantee Act (NREGA, see section 2.5.1), and the national midday meal
scheme provision in primary schools (Jones and Holmes 2009).
The prospects for India’s rebound from the crisis are broadly perceived as bright. In the 2009-2010
Global Competitiveness Report, India is ranked by a panel of leading economists as second, after Brazil,
among countries according to their competitiveness prospect, with this position slightly positively affected
by the crisis. India improved one place since 2008, ending up at rank no. 49 (of 133 countries). The country
had the no. 54 ranking in the latest Global Competitiveness index on institutions, was lower ranked on the
pillars infrastructure (no. 76), health and primary education (no. 101), higher education and training (no. 66),
and technological readiness (no. 83), and higher on the pillars goods market effi ciency (no. 48), fi nancial
market sophistication (no. 16), business sophistication (no. 27), innovation (no. 30), and of course on mar-
ket size (no. 4)(Sala-I-Martin et al 2009). The most recent World Bank forecast predicts for India 6.0% real
GDP growth in 2009, 7.5% in 2010 and 8.0% in 2011 (World Bank 2010). In spite of the generally rather
favourable picture, the World Bank (2009d, 2010) emphasizes that the most binding constraints to pro-
poor or inclusive growth will need to be addressed: improving infrastructure (power supply, roads, railways,
ports and transportation systems); developing the small and medium enterprises (SME) sector; improving
longer-term sustainability; improving the effectiveness of public services and social protection, especially to
the poor; and building skills. In strategies to overcome these constraints, the prospects for India’s girls and
women need to be prioritized. As we will analyse in the next sections, much will depend on further political
empowerment and progress of girls and women in employment, education and health.
Communication2.2.
Adequate communication facilities are absolutely essential for the DECISIONS FOR LIFE project.
India is witnessing a huge period of change in communications, with increasing shifts from government
to private providers and greater public use of various technologies. Some basic telephone services were
opened to private-sector competition in 1994, and portions of state-owned telecommunications services
have been purchased by private entities (Library of Congress 2004). At fi rst sight surprisingly, the number
of fi xed telephone lines is currently decreasing. Whereas in 2005 there were 4.55 fi xed telephone lines per
100 inhabitants in use, or 50.2 million, by 2007 this rate had fallen to 3.37 per 100 or 39.4 million lines (UN
Data). With 37.5 millions, for 2009 the number of fi xed main lines in use was estimated lower again (CIA
Page ● 25
An overview of women’s work and employment in India
World Factbook). Yet, in India very clearly the future is on cellular telephone services, including possible
access to mobile Internet. Cellular service, introduced in 1994, in the 2000s has grown extremely rapid. In
2005, there were in total 81.7 telephone subscribers per 1,000 inhabitants, or 90 million users, exploding to
208 per 1,000 inhabitants or 240 million users in 2007 (UN MDG Indicators). In 2007-2009, the amount
of cell phone users nearly doubled again, to 365.2 per 1,000 or over 427 million users in 2009 (CIA World
Factbook).
Actually 14 million cell phones are added each month to India’s total. Cell phone providers have discov-
ered the countryside as a huge potential outlet. In rural areas mobile phones are offered for about USD 15,
and subscriptions start with one-minute calls for USD 0.10. Notably text message information can be highly
useful in daily life. For example, one of the largest Indian providers offers farmers text message services
with weather forecasts, market prices, and other agricultural information (Van der Maten 2009)1. In 2007
the average mobile phone use was 447 minutes per user per month, across countries quite long. With USD
2.50 per month, the price basket for mobile service was rather low, even lower than the price basket for
residential fi xed line service: USD 3.30 (UN MDG Indicators; World Bank 2009a). 90% of all mobile phone
accounts are prepaid (Nilekani 2008, 112). Already in 2007 61% of the Indian population was covered by
mobile cellular networks (World Bank 2009a). Currently, the mobile cellular service is organized into four
metropolitan areas and 19 telecom circles, each with multiple private service providers and one or more
state-owned providers. In recent years signifi cant trunk capacity has been added in the form of fi ber-optic
cable and one of the world’s largest domestic satellite systems, the Indian National Satellite system (INSAT),
with six satellites supporting 33,000 very small aperture terminals (VSAT) (CIA World Factbook). Yet, a
World Bank report argues that India’s “connectivity” is still quite low compared to China, the US and EU
countries, and that targeted subsidies for rolling out rural mobile and broadband should be increased (Dutz
2007).
Internet coverage is growing but still rather low. Currently about one in 12 Indians is regularly surfi ng on
the Internet. For 2008, the CIA World Factbook set Internet coverage at 6.9%, implying a total of 81 million
Internet users and nearly doubling the coverage rate of 2005 (3.8% or 42 million users). Yet, other sources
have mentioned the 6.9 coverage rate already for 2007 (cf. ADB 2009a), or even mentioned a ratio of 7.2
for that year (World Bank 2009a). The (international) Internet infrastructure is still in its infancy; neverthe-
less, in 2007 23% of all Internet subscribers were fi xed broadband subscribers. By 2009, the country had
1 The more specifi c impact of cell phone use on the empowerment of adolescent girls in developing countries is, as more generally with IT use, not systematically assessed; more research is needed (Donahue 2010, 22).

Page ● 26
M. van Klaveren, K.G. Tijdens, M. Hughie-Williams and N.E. Ramos Martin
over 3.6 million Internet hosts, and by December 2008 a rather low 1.3 secure Internet servers per 1 million
people (CIA World Factbook; World Bank 2009a). With USD 6.60 per month in 2007 the price basket for
Internet service was low (World Bank 2009a). Several Indian companies have installed Internet community
centres and kiosks, offering low-cost computing and networking services across villages (Nilekani 2008, 110;
website Comat).
In response to cyber-crime and cyber-terrorism perpetrated by parties in both India and Pakistan, India
passed the Information Technology Act of 2000, which allows Internet cafés and Internet users’ homes
to be searched without warrants at any time as part of criminal investigations. The Act also provides for
censoring the Internet on public morality grounds and defi nes “unauthorized access to certain types of elec-
tronic information” as a crime. The government retained the right to limit access to the Internet, specifi cally
information deemed detrimental to national security. The act requires Internet cafés to monitor Internet
use and inform the authorities of offenses (Library of Congress 2004; US Dept of State 2009). The Indian
Telegraph Act authorizes the surveillance of communications, including monitoring telephone conversa-
tions and intercepting personal mail in cases of public emergency or “in the interest of the public safety or
tranquility.” The central government and state governments used these surveillance techniques during 2008.
Although the Telegraph Act gives police the power to intercept telephonic conversations, such evidence is
inadmissible in court (US Dept of State 2009).
While the incidence of personal computers (PCs) in 2005 was 1.54%, implying 17 million PCs, in 2007
this incidence had more than doubled, to 3.3% or 37 million PCs (UN MDG Indicators; World Bank 2009a).
In 2008, PC sales in India rose by 12% (Farrell 2009). Consequently, in early 2009 personal computer cover-
age may have passed the 4% mark. In February 2009, India i.e. the University of Andhra Pradesh launched
a prototype of the Sakshat, an ultra-cheap laptop that ultimately would cost RS 500 (USD 11.50) -- one of
the many low-cost innovations the country has produced recently (Ramesh 2009).
By 2006, there were more than 312 radio and 562 TV stations in India (website Britannica Online En-
cyclopedia). Concerning radio, AM radio broadcasting remained a government monopoly (All India Radio).
Private FM radio station ownership was legal, but licenses only authorized entertainment and educational
content (US Dept of State 2009). Since its introduction in 1959, for over three decades television broadcast-
ing in India was dominated by the government-owned Doordarshan network, till in the early 1990s CNN
and STAR TV introduced the possibility of access to non-government programming via satellite. In the
2000s ownership of television sets has spread rapidly. By 2007, 53% of all households had a television set,

Page ● 27
An overview of women’s work and employment in India
whereas in 2000 this was only 30% (World Bank 2009a). Currently about three in fi ve of those households
has cable or satellite transmission; this penetration is even that high in poor rural states. Viewership of
the government channel is extremely low among those with cable TV. Radio listening is being replaced by
watching television, defi nitely among young people. In 1992-93 41% of the ever-married adolescent girls
15-19 of age listened to radio at least once a week, but this percentage fell to 28% in 2005-06, whereas in
1992-93 23% of this group watched TV at least once a week, a share that had nearly doubled to 40% in
2005-06. In urban areas, the 2005-06 share even was 73% (rural areas: 33%). Clearly, both media are impor-
tant vehicles to reach adolescent women (Moore et al 2009). The most popular TV serials revolve around
issues of family and gender, mostly taking place in urban settings. The emancipatory force of exposure to
cable television seems considerable, notably in rural settings. Thorough research on the effects of the intro-
duction of cable TV in villages shows that this introduction reduced preference for sons and fertility (see
section 2.6.1), and increases women’s autonomy and female school enrollment – despite there being little or
no targeted appeals, such as explicitly socially-oriented programming (Jensen and Oster 2006).2
Article 19 of India’s constitution ensures freedom of speech and expression, however, freedom of the
press is not explicitly mentioned. In 2008 the government generally respected these rights in practice. Under
the 1923 Offi cial Secrets Act, the government may prosecute any person who publishes or communicates
information that could be harmful to the state. However, no such cases were reported during 2008. The
Press Council is a statutory body of journalists, publishers, academics, and politicians, with a government-
appointed chairman, that investigates what it believes is irresponsible journalism and sets a code of con-
duct for publishers. Independent newspapers and magazines regularly published and television channels
broadcast investigative reports, including allegations of government wrongdoing, and the press generally
promoted human rights and criticized perceived government lapses. With the exception of radio, foreign
media generally were allowed to operate freely (US Dept of State 2009). With 70.9 per 1,000 inhabitants
in the mid-2000s, the registered newspaper circulation is rather low, though this rate looks underestimated3
(UN Data). By 2003, there were 5,600 daily newspapers and more than 46,000 non-daily newspapers. About
ten newspapers had national coverage, the largest being the Times of India, in English with 13.3 million
readers, followed by the Hindustan Times (English, 6.3 million) and The Hindu (English, 5.2 million). Yet,
some newspapers in Hindi are much more widely read, notably Dainik Jagran (with 55.7 million readers) and
Dainik Bhaskar (31.9 million) (Library of Congress 2004; website Press reference; Times of India website;
2 Another initiative was Same Language Subtitling (SLS), a technique with enormous potential to create literacy skill acquisition and improvement in reading (Kothari 1998).
3 Includes only newspapers which report to a governmental or national institution.

Page ● 28
M. van Klaveren, K.G. Tijdens, M. Hughie-Williams and N.E. Ramos Martin
2009 Indian Readership Survey, cited in wikipedia). Since September 2008, printing local editions of foreign
press is allowed; previously only scientifi c, technical, and specialty periodicals were allowed to be printed by
foreign magazines (US Dept of State 2009).
The sectoral labour market structure2.3.
Population and employment2.3.1.
In this section we present a statistical picture of the development of employment in India, and of the
working age and economically active population (labour force). Yet, it is far from easy to provide a reliable
and up-to-date picture. Longer-term developments are diffi cult to trace, also because of changes over time
of defi nitions and questioning in the country’s censuses and other data sources (Pandey w.y.). Employment
statistics allowing long-term and international comparison in the 2000s date back from 1999-2000 (National
Sample Survey); newer statistics as from 2004-2005 (National Sample Survey and other sources4) are useful
but grouped differently. These fi gures count only those who are considered to have “engaged in economi-
cally productive activity for 183 days or more.” Moreover, international sources show varying outcomes for
recent years. Due to these statistical problems and to the huge number of people that are behind the various
Indian fi gures, we feel the need to fi rst present –departing from other DECISIONS FOR LIFE country
reports—an overview of the main facts and trends that are discernible.
The CIA World Factbook estimated for July 2009 India’s population at 1,166 million, of which 31.3%
0-14 years, and 63.6% 15-64 years, and 5.3% 65 years and over. The amount of girls and young women aged
15-29 can be estimated at 160 million, or nearly 14% of the population. The adolescent girls 15-19 of age
alone make up nearly 58 million (based on CIA World Factbook and ILO Laborsta EAPEP simulations).
Each year 8 to 9 million young people join the ranks of the (potential) labour force! It is an immense chal-
lenge to provide jobs for this legion and, before that, provide them with the necessary knowledge, skill and
attitudes to offer them access to the labour market, notably to the better-paid jobs in skilled services and
manufacturing (cf. World Bank website Secondary education in India). In 2005 the three states with the
largest female adolescent population (Andhra Pradesh, Maharashtra and Uttar Pradesh) together accounted
for one-third of all adolescent girls in the country. Young women’s marital and reproductive behaviour is
conditioned by where they live, and most adolescents still live in rural areas. In 2005 fewer than three in ten
4 Information (EMI) of the Director General Employment & Training (DGET) of the Ministry of Labour and Employment for employment statistics relating to the organised or formal sector, and data on industries collected by India’s Central Statisti-cal Organisation (CSO) in the Annual Survey of Industries (ASI) (NCEUS 2009a, 2009b).

Page ● 29
An overview of women’s work and employment in India
women aged 15-19 (28%, or 15.7 million) resided in urban areas. The largest amounts of 15-19-year-old
females lived in Uttar Pradesh (7.9 million, of which 26% on urban areas); Maharashtra (4.8 million, 44%
in urban areas); Andhra Pradesh (3.9 million, 32% in urban areas); West Bengal (3.8 million, 29% in urban
areas); Bihar (3.3 million, only 16% in urban areas), and Rajasthan (2.8 million, 26% in urban areas) (Moore
et al 2009).
For our calculation of the Labour Participation Rate (LPR) or Employment-to-Population ratio (EPOP),
we chose the CIA World Factbook estimates for 2008 as a point of departure. According to this source,
India had an economically active population (labour force) of 523.5 million, in a working age population
of 730 millions. This would imply an overall LPR (EPOP) of 71.7% (MDG indicator 1.5), among the 14
countries in our project a participation rate in the upper middle ranks. Yet, following the EAPEP population
and employment simulations of the ILO India’s working age population would amount to 750.1 millions
in 2008. Combined with a much lower amount of 457.6 million men and women being economically ac-
tive according to ILO EAPEP, this ends up in a LPR (EPOP) of just 61.0%, giving India a position in the
lower middle ranks. The available “hard” Indian 2004-05 data do not offer a fi nal solution. Because fi ve
different measures are in use as to compute the size of the labour force and labour force participation, the
highest and lowest outcomes showing gaps of 11.4 million for men and 40.2 million for women. Use of
the most robust measure according to Indian experts (“MCWS”) leads to a labour force of 429.9 million by
2004-2005 (NCEUS 2009a, 36-7). Extrapolation of this fi gure would for 2008 bring about a labour force
size close to the ILO EAPEP outcome. Against this backdrop, the CIA estimate seems unrealistically high.
Therefore we stick to the ILO estimates, that also provide more detailed information by age and gender and
in this respect allow for international comparison.
By gender ILO EAPEP estimates India’s working age population in 2008 to amount to 388.6 million
men and 361.5 million women. With 328.6 million men and 129.0 million women being economically ac-
tive, this implies LPRs of respectively 84.6% for men and only 35.7% for women, leading to the total rate
of 61.0% (MDG indicator 1.5).5 The 2008 female rate is only 42% of the male rate, and by far the lowest
female rate across the 14 DECISIONS FOR LIFE countries. For 2000, the ILO estimates resulted in LPR’s
5 As the internationally comparable LPR / EPOP only takes stock of the 15-64 of age, these fi gures leave out the 10-14-year-old children, which according to the 2001 Census had LPR’s in the 8% range: girls 8.5%, boys 8.8%. They also leave out the 70-79-of age, in which cohort according to the Census in 2001 men still had a high LPR (49.3%) while that of women was 13.3%, as well as the 80 of age and over, among which still 34.6% of the men were employed, against 8.6% of the women stricken of years. The Census 2001 as presented in ILO Laborsta only contains LPR’s for the 10-years’ cohort of 60-69 of age: not directly comparable with the ILO EAPEP 5-years’ cohorts. Following the Census, the LPR’s for the 60-69 of age were: men 69.7%, women 26.3%, total 47.5%. Unfortunately, most Indian reports use the total population in the denominator in computing the overall LPR, instead of the 15-64 of age. As to compare with our fi gures, overall, male and female total LPRs from these reports have to be multiplied by 1.64.

Page ● 30
M. van Klaveren, K.G. Tijdens, M. Hughie-Williams and N.E. Ramos Martin
of respectively 85.2% (men), 35.2% (women) and 61.1% (total) – thus, a very slightly higher total rate than
in 2008, slightly lower for women and somewhat higher for men.6
Table 2 presents the LPR’s by gender and 5-years’ age group for 2000 and 2008, again following the ILO
EAPEP estimates.
Table 2. Labour participation rates by gender and by age group, India, 2000 and 2008
2000 2008
all women men all women men15-19 35.9 23.1 47.6 33.4 20.6 45.020-24 58.3 30.9 83.6 57.8 29.3 82.325-29 67.3 36.4 95.7 68.0 37.7 95.930-34 71.0 41.6 97.8 71.1 42.9 97.135-39 72.2 44.4 97.6 73.8 47.9 97.740-44 72.4 45.1 97.4 72.3 46.3 96.545-49 71.2 43.2 96.8 71.9 45.8 96.350-54 67.5 39.9 93.8 67.4 39.6 93.455-59 61.6 34.8 87.9 60.5 35.4 84.860-64 42.2 10.6 74.7 39.9 7.8 72.7Total 15-64 61.1 35.2 85.2 61.0 35.7 84.6total 15-64 econom. active (x million) 387,1 107,1 279,9 457,6 129,0 328,6total 15-64 working age (x million) 633,0
304,4328,6 750,1 361,5 388,6
Source: ILO Laborsta (EAPEP simulations, Table E5)
The table reveals that in no cohort the female LPRs were over half of the male rates, and repeatedly
much lower, especially among the 20-24 and the 60-64 of age. As for trends, the table shows that between
2000-2008 the LPRs for the 15-19-year-olds have fallen for both genders by respectively 2.5% points for
females and 2.6% points for males, most likely mainly because of higher school attendance. This fi ts in the
longer-term trend to be derived from the National Sample Surveys, indicating a substantial fall of the LPR
for the male 15-19 of age from 63.8% in 1983 to 48.1% in 2004-05, and, similarly, for the female 15-19-aged
from 38.3% in 1983 to 27.3% in 2004-05. Between 2000-2008, the LPRs of the 20-24-aged cohort also fell
for both genders, be it less. Again, this is quite in line with the National Sample Survey (NSS) outcomes,
indicating a fall of the LPR for the males from 90.0% in 1983 to 84.8% in 2004-05 and a similar fall for the
female 20-24-aged, from 42.5% in 1983 to 37.7% in 2004-05. According to our table, between 2000-2008
6 Another source, the UN MDG Indicators website, for 2000-2007 presents lower LPR’s for both genders, with both also show-ing from 2003 on a decreasing trend. According to this source, the female LPR increased from 32.9% in 2000 to 33.3% in 2002 before falling to 32.3% in 2007, whereas the male LPR increased from 79.0% in 2000 to 80.3% in 2002 before falling to 77.2% in 2007. As a result, the total LPR grew from 56.8% in 2000 to 57.6% in 2002 before it fell to 55.4% in 2007. It should be noted that for 2004-05 these outcomes were even below the lowest National Sample Survey outcomes (cf. NCEUS 2009a, 37).

Page ● 31
An overview of women’s work and employment in India
the LPRs for both genders aged 25-29 slightly went up; by contrast, the age-specifi c LPRs derived from the
NSSs indicate between 1983 and 2004-05 a stable rate for males aged 25-29 at 97% level, and a slight de-
crease for females of the same age, from 47.7% in 1983 to 44.8% in 2004-05 (all data from NSSs in NCEUS
2009a, 487). It is relevant to note that the 2004-05 fi gures indicate LPRs to be highest for urban males, with
rural males slightly (1.6%point) behind. The LPR of urban females is by far lowest. Strikingly, the LPR of
rural females nearly doubled the participation rate of urban females (NCEUS 2009a, 45). Consequently, the
2008 LPR for urban females has to be estimated at about 25%, against 46% for rural females.
Partly based on the NSS time series, the National Commission for Enterprises in the Unorganised
Sector (NCEUS) projected for 2007 the female labour force aged 15-29 to be 42.4 million, including for
2007-2012 a yearly net growth of about 700,000 girls and young women – which set for 2008 the size of
the female labour force aged 15-29 at slightly over 43 million (NCEUS 2009b, 117). If we follow the ILO
estimates, then by 2008 the economically active females aged 15-29 would have amounted to about 44 mil-
lion, on a total female population in this age group of 157 million – implying a LPR of 28%. On behalf of
estimating the size of the target group of the DECISIONS FOR LIFE project, we depart from the average
of both estimates, thus 43.5 million, as the number of girls and young women aged 15-29 in employment
in 2008. Based on the rural / urban LPRs mentioned above and on the NCEUS projection for 2007, we
assume that about 9 million of them in 2008 were employed in urban areas.
Formal and informal employment2.3.2.
Table 3 (next page) presents an overview of the development of employment in India between 1999-
2000 and 2008 by type (employment status). Here, the statistical problems abound and our fi gures cannot be
more than rough indications. Crucially important is the notion of formal and informal labour markets. The
informal sector, in India mostly called the unorganised sector, is very large,8 but the statistical problems to
grasp its development and to draw the line between “organised” and “unorganised” are immense (cf. Bhalla
2008). We already found that fi ve different measures are in use to calculate the labour force. Nevertheless,
according to every yardstick in the 2000s roughly 92-94% of all employed in India are informal / unor-
ganised workers. Additionally, the matter is complicated as the informal / unorganised sector –-following
the most reliable method-- includes a relatively small number of formal / organised workers (1.4 million in
7 Comparison between the ILO 2008 age-specifi c rates and those of the 2004-05 NSS learns that the male LPRs of the latter were 1-3%points and the female rates 6-8%points higher per cohort.
8 As regards India, the informal economy is not similar to the shadow or hidden economy, measured through the relative size of unregistered or unrecorded economic activities. Across Asian countries, with 20% of the “offi cial” GDP in 1994-95 the size of India’s shadow economy was in the middle fi eld (Chaudhuri et al 2006).

Page ● 32
M. van Klaveren, K.G. Tijdens, M. Hughie-Williams and N.E. Ramos Martin
2004-05), while the formal / organised sector includes a number of informal / unorganised workers. The
latter amount is much larger, in 2004-05 it was set at 28.9 million of all 62.6 million workers in the formal
sector (46%). Thus, in 2004-05 the formal / organised sector employed 62.6 million or 14.6% of all em-
ployed in India, but the amount of formal / organised workers was 35.0 million, or 7.7% of all employed
(of which 33.7 million or 7.4% working in the formal sector -- NCEUS 2009a, 13). By using various meth-
ods, the number of formal workers in the formal sector in 2004-05 varied between 30 and 36 million, most
likely increased in 2008 to 33-40 million. Of this group, 26.5 million (66-80%) have been included as “em-
ployees” in the ILO statistics (ILO-Laborsta). We used this last group for further statistical evidence in this
report, as it allows more detailed analysis. Compared with the Indian 2004-05 statistics, the share of public
services in ILO Laborsta is slightly higher: 69-70%, against 62-64%. Table 3 indicates that a majority (51%)
of all employed in 2008 were self-employed, though their share is falling. Indeed, the category of enterprises
in question (OAME9) already in the early 2000s performed on average badly, with turnover and earnings per
worker declining (Majumder 2006). Contributing family members are also concentrated (though not fully)
in this category. Thus, the proportion of all own-account and contributing family workers in total employ-
ment came in 2008 at 51%, in our estimate divided in 60% of the female employed and 47% of the male
employed (MDG Indicator 1.7).
Table 3. Labour force participation and type of employment, India, 1999/2000-2008*)
1999-2000 2008
Labour force participation 61% 61%
Unemployed in % of labour force 7% 9%
Employed in % of labour force 92% 91%
of which
regular paid employment (employees) 14% 12%
of whichformal (organised) worker 7% 8%
informal (unorganised) worker 7% 5%
casual wage workers 33% 36%
own-account workers (self-employed) 53% 51%
Sources: authors’ calculations based on Papola 2006, 2007; NCEUS 2009a, 2009b; Majumder 2006; Rajesh Raj 2009; Sakhtivel and Joddar 2006; ILO Laborsta*) persons 15 years and over
9 OAME - Own Account Manufacturing Enterprise: a manufacturing enterprise operating with no hired worker employed on a fairly regular basis (Majumder 2006).

Page ● 33
An overview of women’s work and employment in India
Following the MCWS method, it can be estimated that in 2008-09 of all employed in India (449 million
according to this method) 223.6 million worked in agriculture (49.8%), 91.5 million in manufacturing indus-
try (20.4%), and 133.9 million in services (29.8%). In 2004-05, the respective shares were 53.1%, 19.5% and
27.4%. Between 2004-05 and 2008-09, the amount of economically active in services grew most rapidly, by
23.9 million, followed by manufacturing with 13.5 million and agriculture with 10.5 million. Most of this
growth was in informal labour: formal sector workers took only 0.8% of employment growth in agricul-
ture, 18% of growth in manufacturing, and 12% of employment growth in services. As a result, formal
sector workers in 2008-09 had an estimated share in agricultural employment of 2.3%, in manufacturing
employment of 28.1%, and in services employment of 24.7% -- resulting in an overall share of formal
sector workers of 14.2%, against the 14.6% mentioned earlier for 2004-05 (authors’ calculations based on
NCEUS 2009a, 18). According to the UN MDG Indicators, the share of women in wage employment in
the non-agricultural sector has grown slowly but continuously: from 12.7% in 1990, via 16.6% in 2000, to
18.1% in 2005.
As announced, Table 4 (next page) shows the division of that part of the Indian labour force that is
in paid employment (employees) in the formal / organised sector, for 2005 –the latest available year-- by
industry and gender. The fi gures cover just over 5 million women and 21.5 million men. It should be noted
that, even within the organised sector data on employment cause quite some headaches. For manufacturing,
there is the Annual Survey of Industries, in 2004-05 covering nearly 8.5 million workers in manufacturing,
of which 5.6 million in the organised sector and 2.9 million in unorganised labour. Outside manufacturing
there is “a database chaos” (Bhalla 2008, 12) and no regular registration like a Business Register. As a re-
sult, the boundaries between organised and unorganised labour outside manufacturing also remain unclear.
Estimates concerning amounts of enterprises and workers in especially the rural areas vary largely (Bhalla
2008).
The table reveals that the public sector is by far the largest employer in the organised sector, with 70%
of all women and 58% of men employed, of which majorities in regional government. Second largest em-
ployer for both sexes is manufacturing, with nearly 19% of all females employed and 22% of all males. The
third spot is for transport, storage and communication, though this applies for men, with over 12% of their
organised employment against less than 4% for females. For females, with 7.5% fi nance, real estate and busi-
ness services is the third largest employer. In the end the share of commercial services in organised sector
employment is extremely limited: at least 7% among females and 10% among males, plus an unknown but

Page ● 34
M. van Klaveren, K.G. Tijdens, M. Hughie-Williams and N.E. Ramos Martin
limited part of community, social and personal services. If public sector services are included, the service
sector share increases to 68% for females (nearly 3.4 million employed) and 60% for men (12.9 million).
More detailed breakdowns of female labour market shares will follow in section 2.6.3.
Table 4. Employment by industry and gender, employees (organised sector), India, 2005
all women men
mln. % mln. % mln. %agriculture, forestry, fi shing 1,48 5.6 0,48 9.6 1,00 4.7mining 1,09 4.1 0,08 1.5 1,01 4.7manufacturing 5,62 21.3 0,94 18.7 4,78 22.2utilities 0,91 3.4 0,05 1.1 0,86 4.0construction 0,96 3.6 0,07 1.3 0,89 4.1transport, storage, communication 2,84 10.7 0,19 3.8 2,65 12.3wholesale, retail, restaurants, hotels 0,56 2.1 0,05 1.0 0,51 2.4fi nance, real estate, business serv-ices 1,93 7.3 0,30 6.0 1,63 7.6
community, social, personal services 11,07 41.9 2,85 56.9 8,22 38.3Total 26,46 100 5,02 100 21,44 100
of which
private sector 8,45 31.9 2,10 41.8 6,35 29.6public sector 18,01 68.1 2,92 58.2 15,09 70.4
of which
central 6,22 23.5 0,61 12.2 5,61 26.2regional 9,67 36.6 1,73 34.4 7,93 37.0local 2,12 8.0 0,58 11.6 1,54 7.2
Source: authors’ calculations based on ILO Laborsta
Unemployment2.3.3.
We now turn to unemployment. Between 2000-2006, the period for which detailed fi gures are available,
offi cial unemployment fl uctuated between 39.3 million and 42.0 million; the 2006 average was 41,47 million
unemployed of 14 years and older, making up approximately 9.5% of the economically active population, and
that of 2008 39,11 million unemployed, or about 8.3% of the economically active population: 26,78 million men
(about 7.9%) and 12,33 million women (about 9.4%). Whereas Table 5 (next page) shows nearly equal unemploy-
ment rates rates for females and males, also by age, the decrease in 2006-2008 was only advantegous for men: the
amount of male unemployed decreased by 2,90 million while the number of female unemployed rose by nearly
550,000 (all data: ILO Laborsta).
Important for the DECISIONS FOR LIFE project is, as the table reveals, that the categories by far most
affected by unemployment were the young women and men aged 14-19 and 20-29. In 2006 the offi cial unem-
ployment rates for the girls aged 15-19 and the young women aged 20-29 were respectively 21 and 17%. In 2006
there were on average 8,21 million female unemployed 14 (!) to 29-year-olds, bringing their joint unemployment

Page ● 35
An overview of women’s work and employment in India
rate at 18.0%. These young unemployed females accounted for 70% of all unemployed women and 20% of
all unemployed (authors’ calculations based on ILO Laborsta).
Table 5. Unemployment rates by gender and by age group, India, 2006
sharesshares totaltotal male male femalefemale14-19*) 21.9 22.3 21.2
20-29 15.8 15.3 17.0
30-39 8.9 9.0 8.540-49 2.3 2.2 2.450-59 0.5 0.4 0.660+ 0.1 0.1 0.1Total*) 9.5 9.5 9.6
Source: authors’ calculations based on ILO, Laborsta*) estimate, as fi gures on economically active population use a different age division (10-14, 15-19 of age). The unem- ployment statistics also combine the 20-24- and 25-29-year-olds.
National legislation and labour relations2.4.
Legislation2.4.1.
India has ratifi ed only four of eight core ILO Labour Conventions, i.e. no’s 29, 100, 105 and 111. India
has a wide array of labour laws: by 2007-08 already 43 labour laws in the central sphere. Yet, coverage and
compliance is another story. The National Commission for Enterprises in the Unorganised Sector (NCEUS)
was quite clear in its conclusion that “if we take the effectiveness of coverage of different labour regulations
into consideration, the actual coverage of the labour regulations in India is very small: the laws themselves
apply only to a small proportion of workforce and they are actually implemented in the case of even smaller
segments” (NCEUS 2009a, 170). Somewhat later, it reads: “(….) there is hardly any regulation of conditions
of work and no provision for social security of any kind for the workers working in establishments employ-
ing less than ten workers. And they constitute an overwhelming majority – 92% of all workers and 84% of
all wage earners” (NCEUS 2009a, 180). In 1999-2000, legislation concerning working conditions “techni-
cally” (by defi nition) covered 2.5-3.9% of the total labour force; laws concerning wages and remuneration
5.2-10.5%, with the relatively positive exception of the Minimum Wages Act (38.1%), and laws concerning
social security covered 2.2-3.7% of the labour force. The effective coverage is much lower, in particular that
of the Minimum Wages Act (9.3%)(NCEUS 2009a, 187).

Page ● 36
M. van Klaveren, K.G. Tijdens, M. Hughie-Williams and N.E. Ramos Martin
Over 2008, the ITUC (2009a) found that barriers to the organising of trade unions continued in law and
practice, and that the government maintained strong restrictions on the right to strike. The law allows work-
ers to form and join unions of their choice without previous authorization or excessive requirements. The
2001 Trade Union Act prohibits discrimination against union members and organizers, and employers can
be penalized if they discriminate against employees engaged in union activity. The Trade Union Act and the
Minimum Wages Act (see section 2.5.1) are in principle applicable to all workers. However, there is no legal
obligation on employers to recognise a union or to engage in collective bargaining.10 Both the ITUC and the
US Dept of State (2009) concluded that in practice workers’ rights are only legally protected for the small
minority of workers who work in the organised industrial sector. Here, according to the US Dept of State
authorities generally prosecuted and punished those persons responsible for intimidation or suppression of
legitimate trade union activities. Lack of legislation as such may not be the largest problem; the absence of
credible enforcement mechanisms seems crucial. In the absence of such mechanisms, labour legislation
in the unorganised sector has quite limited effectiveness. As we will discuss in the next section, under such
conditions it is hard to encourage especially women workers to organize in trade unions.
The ITUC (2009a) notes that even formally the freedom of association is limited. Under the Trade
Unions (Amendment) Act 2001, a union has to represent a minimum of 100 workers –which is excessive by
international standards—or 10% of the workforce, whichever is less. The act also sets limits on the number
of “outsiders” (those not employed at the enterprise) allowed to sit on a union executive committee and
requires unions to submits their accounts for auditing. When parties cannot agree on equitable wages, the
government may establish boards of union, management, and government representatives to make a deter-
mination. Specialized labour courts adjudicate labour disputes; however, in 2007 and 2008 there were long
delays and a backlog of unresolved cases (US Dept of State 2008, 2009). The legislation makes a very clear
distinction between civil servants and other workers. Public service employees have very limited organising
and collective bargaining rights. The Central Civil Service Act (1964) stipulates that no government servant
shall resort to, or in any way abet, any form of strike. The Essential Services Maintenance Act (ESMA) ena-
10 The central government has made some efforts through the Trade Union Act 1948, introducing two bills; the labour relations bill and the trade union bill in 1950; and proposing two industrial relations bills in 1978 and 1988, to bring out the central en-actment of trade unions. However, these efforts did not take any concrete shape. Some states (Maharashtra, Gujarat, Madhya Pradesh, Rajasthan and West Bengal) have legislated on the subject of recognition of trade unions for collective bargaining. For the rest of the country the criteria prescribed under the Code of Discipline adopted at the 16th session of the Indian Labour Conference, 1958 at Nainital, have been followed for the purpose of recognition for a number of years. There is some protection for workers in the informal sector. For example, the Contract Labour (Regulation and Abolition) Act, 1971, does provide this category of workers with some minimal rights. However, the way this legislation has been formulated leaves quite some loopholes. The importance of legal rights is borne out by the fact that the Supreme Court has on many occasions upheld the right of informal workers to be made permanent in the face of employers’ attempts to use casual or contract workers for permanent jobs (Hensman 2001, 6-7).

Page ● 37
An overview of women’s work and employment in India
bles the government to ban strikes in any enterprise that provides public service, and demands arbitration in
certain “essential” industries; according to the ITUC the Act does not defi ne which these essential service
are; interpretation therefore varies from state to state. In 2008, state and local authorities occasionally used
their power to declare strikes illegal and force adjudication (US Dept of State 2009). In Export Processing
Zones (EPZs) the law provides workers the right to join trade unions and bargain collectively. Yet, the Trade
Union Act designates the EPZs as “public utilities”, requiring a 45-day strike notice period (ITUC 2009a;
US Dept of State 2009).
The Bonded Labour System Abolition Act 1976 has abolished bonded labour, including by children,
and those who violate will be punished. However, the US Dept of State concluded that in 2008 bonded la-
bour practices remained widespread. The penalties include imprisonment for a term which may extend to 3
years and also with fi ne which may extend to Rs.2,000, but successful prosecutions were rare. Enforcement
and compensation for victims were the responsibility of state and local governments; they varied in effec-
tiveness due to inadequate resources and societal acceptance of bonded or forced labour. NGOs estimated
that there were 20 to 65 million bonded labourers in the country, including a large number of children.
There is no overall minimum age for child labour; however, according to the Child Labour (Prohibition
and Regulation) Act (1986) work by children under 14 is prohibited in 13 hazardous occupations and 57
processes. In occupations and processes in which child labour is permitted, work by children is permissible
only for six hours between 8 a.m. and 7 p.m., with one day’s rest weekly. A ruling, effective 2006, prohibits
children under the age of 14 from labour in the domestic sector and the hospitality industry, although child
labour in some other non-hazardous industries is legally permissible. Estimates of the number of child
labourers vary widely. The government’s 2004 national survey estimated the number of working children in
the age group of fi ve to 14 at 16.4 million. However, NGOs reported the number of child labourers was
closer to 60 million (US Dept of State 2009). We calculated that currently about 55 million children under
the age of 14 may not be in school (see section 2.7.2). A large majority of them is working in the informal
sector, often in private homes, but also in many industries, not rarely exposed to hazardous working condi-
tions (website CRY).11
11 The NCEUS concluded to a lot of inconsistencies in Indian labour law. A striking example, relevant for our subject: according to child labour laws, a young person can be in the labour market from the age of 14 years on, but the Trade Unions Act denies the right of membership of a trade union to a worker below the age of 18 years and the right of being an offi ce bearer until the age of 21 years (cf. NCEUS 2009a, 175).

Page ● 38
M. van Klaveren, K.G. Tijdens, M. Hughie-Williams and N.E. Ramos Martin
India does not have a publicly funded social security scheme, with three exceptions. A small segment
of the organised sector is covered by the Payment of Gratuity Act (1972). It applies to every factory, mine,
plantation, port, railway, company, shop and establishment employing 10 or more persons. An employee
who has completed a continuous service of not less than fi ve years is entitled to a gratuity on termination
of his employment. Second, also a small segment is covered by the Employees’ Pension Scheme. Under this
scheme pension is payable from the age of 58, provided 20 years of service was completed. The scheme
provides for a widow’s or widower’s pension as well (website WageIndicator-Paycheck). The employees’
provident funds (EPFs) make up the third exception: statutory forms of compulsory saving schemes that
enable old and retiring workers to maintain their living standards in post-retirement years. Coverage differs
hugely between the organised and organised sectors: in 1999-2000, EPF covered 84% of organised sector
workers and only 2% of unorganised sector workers, bringing total coverage at 19%. Yet, EPF coverage
among the poorest 20% workers of both sectors was just 5% (Sakhtivel and Joddar 2006).
Of particular relevance for the young female target group of the DECISIONS FOR LIFE project is
the following (lack of) labour legislation (website WageIndicator-Paycheck/DecentWorkCheck; ILO-Travail
database; ILO-Natlex):
(regular pay) The Payment of Wages Act (1936) regulates payment of employees in industries as a ●
remedy against illegal deductions and/or unjustifi ed delay in payment of wages.
(maternity leave) Women working in factories, mines, plantations, performance establishments and ●
shops with more than 10 employees are entitled to paid maternity leave according to the Maternity
Benefi t Act (1961). Female employees employed by the Central Government are entitled to maternity
leave for a period of 90 days; mothers suffering from illness related to pregnancy, delivery or prema-
ture birth of child are entitled to additional leave for a maximum period of one month.
(maternity benefi t) The maternity benefi t consists of payment at the rate of the average daily wage for ●
the period of the actual absence. Workers covered by the Employees’ State Insurance Act (1948) can
claim a maternity benefi t of 70 percent of their salary. During maternity leave government employees
are paid equal to the pay drawn immediately before the leave period. The Central Government has a
scheme under which all women workers can claim maternity benefi t for their fi rst two live born. For
the unorganised and self-employed women workers, certain schemes have been introduced at the cen-
tral, state and local levels. Under the Bidi and Cigar Workers Act (1966) maternity benefi ts are availa-

Page ● 39
An overview of women’s work and employment in India
ble to home-based workers also. The schemes to benefi t women agricultural workers are implemented
in Andhra Pradesh, Karnataka, Kerala and Gujarat.
(paid holidays) There is no general law stipulating a minimum paid leave for all workers. There is also ●
no general law stipulating a paid leave on national and religious holidays for all workers. One does not
have to work on public holidays, unless an agreement says one has to.
(sickness benefi t and sick leave) (Only) workers covered by the Employees’ State Insurance Act 1948 ●
can claim a sickness benefi t. There is neither minimum income guaranteed nor special employment
protection during sick leave.
(equal pay) The Equal Renumeration Act applies to an extensive range of employment including the ●
informal sector. The same work, or work of a similar nature, must be equally rewarded and under
similar conditions of employment. This Act is supported by penal provisions. Appointed inspectors
have powers of entry at the workplace and Advisory Committees can be established under the Act.
(sexual harassment) Two sections of the Penal Code have been used in sexual harassment cases. The ●
Indecent Representation of Women (Prohibition) Act (1987) deals with the (forbidden) use of porno-
graphic material, and art. 16 of the Constitution entails a prohibition of discrimination on the basis of
sex.
(health and safety at work) Health and safety legislation is rare, except for the Factories Act (see sec- ●
tion 2.8.2).
Labour relations and wage-setting2.4.2.
The trade union landscape in India is complex and diversifi ed. Actually 11 confederations or Central
Trade Union Organisations (CTUOs) are recognised by the Ministry of Labour and Employment (website).
Besides, a huge number of other national union centres and (partly unaffi liated) unions at industry and
company level are in existence. Though Indian unions perhaps have the most supportive instutional envi-
ronment in Asia, overall union density remains rather low. Traditionally, the strong ties between unions and
political parties have resulted in labour-friendly policies –that is to say, mainly for the organised sector-- both
at central and at state level. The logic of industrial peace was strong: a complex legal framework was preoc-
cupied with preventing and settling industrial disputes. However, the economic liberalisation of the 1990s
has brought about a sea change in labour relations. Employers growingly resisted any negotiations with
unions. The centralized industry or region-wide collective bargaining mechanisms declined; the dominance
of company-level bargaining was established (Bhattacherjee 2001; Najaran 2007). In key industries and
Page ● 40
M. van Klaveren, K.G. Tijdens, M. Hughie-Williams and N.E. Ramos Martin
fi rms union membership declined, not least because of employers’ fl exible staffi ng strategies, informalisa-
tion, subcontracting and the use of temporary workers (Kuruvilla et al 2002; Frenkel and Kuruvilla 2002).
Political alliances weakened as well. Virtually all political parties basically supported liberalisation, whereas
the union movement opposed it. In the last decade union constituencies obviously mainly perceived com-
munist parties as allies: the mere existence of such parties in a state facilitated unionisation signifi cantly (Pal
2008).
Union density estimates for India are notoriously unreliable (Das 2000, cited in Frenkel and Kuruvilla
2002, 397). According to the Ministry of Labour and Employment (website), total union membership
increased from 12.3 million in 1989 to 24.6 million in 2002, implying a growth in density rates from 4.1%
to 6.4% of the total labour force. For more recent years we had to rely on own counting based on often
questionable sources (a.o. Global Union Directory, various confederation websites; news messages); our
2008 estimate in the end is about 31 million, implying a slight density rise to 6.7% of the labour force. If it
is assumed that unions --with the exception of the SEWA (see below)-- only organise formal sector workers,
union density can be estimated at 46%. Three of the national confederations are affi liated with the ITUC:
Hind Mazdoor Sabha (HMS, with 5,745,000 reported members), the Indian National Trade Union Congress
(INTUC, 8.2 million members), and the Self-Employed Women’s Association of India (SEWA, 1,123,000
members) (information ITUC). The fi gures mentioned would imply that the share of these three confedera-
tions in total membership of the Indian union movement increased from 32% in 2002 to 49% in 2008.
The stability, or even slight rise, in union density in the 2000s is remarkable in view of various authors’
opinion that the Indian trade union movement since the turn of the century has been weakened, for exam-
ple made visible in the decrease in the number of strikes compared to that of lockouts by employers, the
declining frequency of industrial disputes, and in the weakening of enforcement of labour legislation (cf.
Dhatta and Mill 2007). We indeed noted that, in the absence of credible enforcement mechanisms, currently
in India labour legislation has limited effectiveness. For example, the Factories Act of 1948, the cornerstone
of regulation in the industrial sector, is widely violated. Already in 1990, three in fi ve manufacturing enter-
prises employing 10 or more workers did not fulfi ll their mandated registration, and the extent of under-
registration is likely to have gone up sharply in the 1990s, as the enforcement of many legal provisions was
given a go by under the liberal regime. Smaller factories usually do not have the presence of durable trade
unions, given poor bargaining power of workers vis-à-vis their employers. Considering the poor record of
enforcement, both by administration and the courts, and given the prevailing situation of abundant (sur-

Page ● 41
An overview of women’s work and employment in India
plus) labour supply, notably unorganised sector workers have very little protection against non-compliance
of contracts or labour laws. Mostly, an attempt to claim one’s rights is an outright invitation for dismissal
(Hensman 2001; Najaran 2007).
These constraints come on top of the fact that the majority of India’s working women is engaged in
jobs without clear employer-employee relationship. And there is more. Their subordinate position in Indian
society at large and in in workplaces and family life in particular further complicates organizing and activat-
ing women in trade unions. Most workplaces are charaterized by strict job segregation and male supervi-
sion; “normally” union organisations refl ect such power structures. Women need to go home after having
worked mostly long hours (section 2.8.2) and tend to domestic chores, usually without any support from
male family members (cf. Venkata Ratnam and Jain 2002). Against this backdrop, it is not surprising that the
female share in membership and decision-making in the regular trade unions remains low. In the late 1990s,
according to a survey of the ICFTU –predecessor of ITUC--, in 36 of 50 national union centres that re-
sponded the percentage of female members was less than 50%, as well as in 78 of 144 single unions (54%).
Similarly, in 49 of 53 union centres (92%) and in 119 of 154 single unions (77%) women made up less
than half in the highest decision-making body (cited in Venkata Ratnam and Jain 2002). In the early 2000s,
two leading authors estimated the female membership share in most unions to vary between 5 and 20%.
Women are mostly represented in separate women’s wings. The authors at stake argued that traditionally the
incidence of union membership and union leadership among women was higher in certain industries and
occupations where they had a clear majority in the labour force. In garment workers’ unions, for example,
the female share could be up to 70%. In unions organizing plantations, hospitals, hotels, telecom and public
service, women have occupied positions as joint secretary / secretary, and in teaching and nursing they were
reported to hold even higher positions. However, women’s participation in collective bargaining delegations
turned out to be extremely low (Venkata Ratnam and Jain 2002).
In contrast, India has long taken the lead in the self-organisation of in particular women in the informal
sector. We briefl y treat here two of many examples of workers’ responses to the specifi c labour market
dynamics in India. Worldwide the Self-Employed Women’s Association (SEWA), a combination of trade
union and workers’ co-operatives, is reckoned as an outstanding example of empowering self-employed
women, that is to say home-based women workers and poor urban self-employed. The SEWA, founded by
civil rights leader Ela Bhatt, grew out of the Textile Labour Association (TLA), India’s oldest and largest
textile workers’ union. SEWA was registered as a trade union in 1972. Since then SEWA grew continuously,

Page ● 42
M. van Klaveren, K.G. Tijdens, M. Hughie-Williams and N.E. Ramos Martin
even quicker after (in 1981) being expelled from the TLA. The growth of many new co-operatives, a more
militant union and many supportive services (Bank, Academy, Research, Housing, ICT, newsletters and
magazines, et cetera) has given SEWA a new shape and direction (website SEWA; wikipedia SEWA). In 1995
several organisations mobilizing men and women workers in casual, construction and contract jobs have
established the National Centre for Labour (NCL). The mainstay of this social coalition is lobbying and
pressurizing the state to secure labour rights and to comply with existing legislation. In recent years, under
pressure of the successes of SEWA, NCL and other new forms of workers’ organisation, most national un-
ion federations have begun co-operating with independent unions, NGOs, and other social movements in
efforts to form social coalitions and leverage pro-poor public policies. The passing into law of, as examples,
the National Rural Employment Guarantee Act (NREGA, see next section) and the Unorganised Work-
ers’ Social Security Bill 2008 has been regarded as important successes of this “new unionism” (Mohanty
2009).
Minimum wage and poverty2.5.
The statutory minimum wage2.5.1.
The Minimum Wages Act 1948 is considered to be one of the most important pieces of labour legisla-
tion in India. The Act provides for fi xation and enforcement of minimum wages in respect of schedule
employments to prevent sweating or exploitation of labour through payment of low wages. The system is
complex: the Act requires “ appropriate government” to fi x minimum rates of wages in respect of employ-
ment specifi ed in the schedule, and review and revise the minimum rates of wages at intervals not exceeding
fi ve years. Currently the number of scheduled employments (occupations and activities) in the central gov-
ernment is 45, and where state governments do the same at their level, this results in 1,232 occupational and
sectoral minimum wage rates across the country.12 The variation in these minimum rates is quite large. In
September 2007, the National Floor Level Minimum Wage (NMW) was set at Rs. 80 (USD 1.72). In Decem-
ber 2009 this was, backdated 1 November 2009, increased to Rs. 100 (USD 2.15) per day. According to the
Minimum Wages Act, the norms for fi xing the NMW are the following: three consumption units per earner;
minimum food requirement of 2,700 calories per average Indian adult; rent corresponding to the minimum
area provided under the Government’s Industrial Housing Scheme and fuel, lighting and other miscel-
12 The central government excludes domestic work from the NMW. Nonetheless, regional governments are allowed, with previ-ous notifi cation, to set minimum wages for additional (not listed) occupations; the states of Karnataka, Kerala, Andra Pradesh, Tamil Nadu, Bihar and Rajasthan have done so for domestic work (ILO 2008, 53).

Page ● 43
An overview of women’s work and employment in India
laneous items of expenditure to constitute 20 % of the total NMW. Further, children education, medical
requirement, minimum recreation including festivals/ceremonies and provision for old age, marriage etc.
should constitute 25% of the total NMW (website WageIndicator/Paycheck – pages offi cialminimumwages
and FAQs; ILO Travail database).
In practice, only average wages in the manufacturing part of the organised sector are above the NMW
level (see section 2.8.1). Large shares of unorganised sector workers and even considerable shares of or-
ganised sector workers outside manufacturing receive incomes below the NMW. The NCEUS recently sum-
marized the available evidence as follows: “Most studies that have examined the application of minimum
wage legislation to workers in the unorganized sector show that the Act has not been used to protect the
interests of the poor and the unorganized sector workers. Other limitations of the Act included infrequent
revisions and inadequate cost of living adjustment leading to a fall in the real minimum wage over time”
(NCEUS 2009a, 141). We already referred to the fi ndings of the National Commission that in 1999-2000
the “technical” coverage of the Minimum Wages Act was 38.1% of the labour force, but the effective cov-
erage only a fraction. The Commission computed for 2004-05 that 80% of the casual workers and 31% of
the regular salaried/wage workers did not receive the NMW (by then Rs. 66 per day). Among the casual
workers in rural areas, over 84% did not receive the NMW as against 57% in this category working in urban
areas. The proportion of female casual workers receiving less than the required minimum was even 95%,
as against 74% in the case of males. For regular salaried/wage employed, the shares below the NMW were
42% for rural areas and 25% for urban areas respectively, as well as 26% for males and 54% for females. The
difference in the proportion of workers below the NMW in rural and urban areas was more marked for the
non-agricultural workers, with urban workers being considerably worse-off. As for industries, the propor-
tion of men below the NMW was highest in trade, where as among women in both rural and urban areas
it was highest in manufacturing. Among casual workers, with 92% the largest share with wages below the
NMW was found for rural workers in the tobacco industry – mainly women (NCEUS 2007, 44-47; 2009a,
39, 141). Taking into account the rise of consumer prices between 2004-05 and 2009 (cf. ILO Laborsta), it
is unlikely that this picture since then will have essentially changed.
In an effort to alleviate rural poverty and mitigate migration to the cities, the government in 2005 initi-
ated the National Rural Employment Guarantee Act (NREGA), an innovative combination of a minimum
wage provision with a public employment annex rural development scheme. A similar system was already
for many years in existence in the state of Maharashtra. The NREGA legally guarantees 100 days of un-

Page ● 44
M. van Klaveren, K.G. Tijdens, M. Hughie-Williams and N.E. Ramos Martin
skilled manual work at statutory minimum wages to each rural household in a year. The Act was mainly
targeted to benefi t landless labourers, Scheduled Castes (SC), Scheduled Tribes (ST), and women. Under
the NREG scheme (NREGS), many projects have been undertaken to build sustainable and productive
assets at village level. These include water conservation, irrigation to land owned by SC or ST members,
rural connectivity, and land development. Formally a number of provisions can improve access for women;
for example, conditions should be in place to allow women to undertake jobs in construction by providing
water, child care facilities, and shade for children, as well as mandating that jobs should be within a certain
distance from the women’s dwellings. The initial results of NREGS were promising. Already during its fi rst
phase, in 2006-07, when the scheme was implemented in 200 districts (it has been extended to all 605 dis-
tricts during 2007-08), it was reported to have provided employment to 18.7 million households at an aver-
age of 40 days per household. In May 2009, the scheme was reaching 49.4million households throughout
the country. The participation rate of women workers in the scheme grew from 41% in 2006-07 to 47%
in 2008-09. In the Southern states, notably in Kerala (86%) and Tamil Nadu (80%), in 2008-09 women’s
involvement in the scheme proves to be much higher than their overall labour participation. Exceptions to
this rule are to be found in the North, though in the state of Rajasthan the female share in NREGS has
reached 68%. An evaluation study in six Northern states learned that in agriculture the NREGA wage has
raised the bar for the determination of wages. Women in particular were seen to favour NREGA because of
social dignity involved in government sponsored employment. The study revealed that a majority of women
collected their NREGA wages themselves and retained with them. Further, NREGA employment served as
a primary wage earning opportunity for a large section of women (Papola 2007, 2008; Goparaju and Shome
2009; Antonopoulos 2009; NCEUS 2009a, 214-222; website Government of India / NREGA). In contrast,
recently concerns have been raised that in some states the scheme is exacerbating gendered labour market
discrimination (especially the gender pay gap) owing to high productivity norms and piece-rate payments
based on outturn by men. Moreover, due to a lack of administrative commitment of lower authorities to
invest in decent child care facilities, such facilities seem absent in the majority of NREGS worksites (Jones
and Holmes 2009).

Page ● 45
An overview of women’s work and employment in India
Inequality and poverty2.5.2.
In international perspective, India’s income distribution is rather equal, though disquieting develop-
ments are going on. The Gini coeffi cient, a measure that rates 0 as perfect equality and 100 as perfect ine-
quality, fl uctuates over time between 0.30 and 0.36, with signs of rising inequality during the 1990s and early
2000s – both in urban and in rural areas (Datt and Ravallion 2009). From 0.35 (or, more precisely, 0.351)
in 1981, the ‘Gini’ or income inequality fell to 0.31 (0.308) in 1993, as to rise to 0.33 (0.334) in 2004-05. As
could be expected, urban inequality is larger: by 2004-05, the urban Gini coeffi cient stood at 0.38 (0.378)
(Ravallion 2009; Belser and Amara 2009; World Bank 2008). In 2005, the share of the poorest 20% in the
country’s total household income was 8.1%, in international perspective a high fi gure and also pointing at
a relatively egalitarian income distribution (MDG Indicator 1.3, derived from UN MDG Indicators and
based on National Sample Survey (NSS) Round 61). Yet, the conclusion is defendable that between 1993-
94 and 2004-05 inequalities in the distribution of income and consumption have grown considerably. The
National Commission for Enterprises in the Unorganised Sector (NCEUS) showed that in this period the
share in the population of what they call the “poor and vulnerable” (below twice the poverty line) fell from
82 to 77%, but that their numbers increased from 733 million to 836 million. This 77% lived on an average
consumption level of less than Rs. 20 per day. Moreover, the average increase of consumption of the poor
and vulnerable group since 1993-94 had been less than 1% per year, against 4.3% respectively 6.8% yearly
increases for the middle and high income groups. The poor segments consist predominantly of informal
workers, among whom socially deprived groups and women are over-represented (NCEUS 2009a, 18-20).
As yet the Indian development and income distribution pattern is essentially that of “shared poverty”. In
general, economies with more equal income distributions can be expected to have lower shares of poor peo-
ple, but this is not the case for India.13 In spite of its rather equal distribution and recent economic growth,
poverty remains very widespread. The largely urban-based, heavily protected industrialisation process in the
fi rst forty years after Independence has not brought about lasting longer-terms gains for both the urban
and rural poor. Obviously human resource development is a major precondition for pro-poor growth that
has insuffi ciently been met in India. Compared to for example China, India’s educational inequalities, and
especially gender inequalities in school enrollment and literacy (see our sections 2.7.1 and 2.7.2), have played
a major role in hampering pro-poor development. Subsidies on food and fertilizers have been costly and
ineffi cient, and the bulk of subsidies has failed to reach the poor (Panagariya 2001). Survey data for 2004-
13 Synchronous decreases over time of inequality and poverty are not self-evident, as the statistical relation between the two conceptions can be rather complex. The development of the Gini coeffi cient does not necessarily refl ect how shifts in the income distribution impact on poverty.
Page ● 46
M. van Klaveren, K.G. Tijdens, M. Hughie-Williams and N.E. Ramos Martin
05 indicate that the poorest 20% are the least likely to have access to subsidized goods and the wealthiest
20% the most likely (Ravallion and Datt 1999; Datt and Ravallion 2002; Ravallion 2009; Datt and Ravallion
2009). Import liberalization does not seem to have contributed to a decline of income inequality, and seems
to have mainly had advantages for the wealthiest 10% or 20% of households too (Topalova 2005; Acharyya
2006). Moreover, periods of high infl ation have hurt India’s poor (Ravallion and Datt 2002). Finally, the
inter-state distribution of income per capita, governmental capital expenditure and FDI is extremely skewed
(see section 2.5.2). The main positive conclusion may well be that since 1991 the non-farm sectors that
use unskilled labour more intensively –notably trade, construction and the “unorganised” manufacturing
sectors—have seen higher employment growth (Datt and Ravallion 2009). However, even that employment
growth has its shadow side, as it has been accompanied by falling real wages of large groups of unorganised
workers, notably between 1999 and 2004-05 in urban areas and for women (Kundu and Sarangi 2009).
For 2005, it was estimated that 75.6% of the Indian population –or 816 million people-- lived below
the common UN income poverty yardstick of USD 2 a day (in PPP terms). Also for 2005 it was estimated
that 41.6% –or 450 million people-- had to make ends meet with an income below USD 1.25 a day. This
represents a signifi cant decline in poverty from 60% in 1981 to below 42%.14 However, the “poverty gap”
is still considerable. This gap is measured as the distance from USD 1.25 of the average income of persons
living on less than USD 1.25 a day multiplied by the percentage of the population below the USD 1.25-a-day
poverty line. The smaller the poverty gap, the easier it will be for countries to bring people above the USD
1.25-a-day threshold, but India has a relatively large poverty gap of 10.5% (ADB 2009a; UNDP 2008).
In 2004-05, the Planning Commission, using its own criteria, estimated that 27.5% of the population
was living below the national poverty line: 28.3% in rural areas and 25.7% in urban areas.15 On the one
hand this meant considerable progress, as the (fully comparable) overall rate came down from 51.3% in
1977–1978, and 36% in 1993-1994 (wikipedia Poverty in India). On the other hand, the available fi gures also
clarify that the growth of the Indian economy over the last two decades has been uneven when comparing
different social and economic groups, geographic regions, and notably rural and urban areas. The 1980s
saw no rise in regional disparities, but from the late 1990s till recently the inter-state inequality in per capita
income was steady on the increase. In 2004-05 over 35% of India’s population lived below the poverty line
in each of the seven states with the lowest incomes: Bihar, Orissa, Jharkhand, Madya Pradesh, Rajasthan,
14 Although the Rupee has decreased in value since then, while the offi cial standard of Rs. 538/356 rupees per month has remained the same (wikipedia Poverty in India).
15 The source for this was the 61st round of the National Sample Survey (NSS) and the criterion used was monthly per capita consumption expenditure below Rs. 356.35 for rural areas and Rs. 538.60 for urban areas (wikipedia Poverty in India).

Page ● 47
An overview of women’s work and employment in India
Chattisgarh, and Uttar Pradesh, with poverty rates in rural Orissa (43%) and rural Bihar (41%) remaining
extremely high. These states recorded very low growth rates during the 1980s, which fell further in the 1990s
(World Bank 2006; Kundu and Mohanan 2009; Kundu and Sarangi 2009).
The dynamics of moving in and out of poverty should not be overlooked. 15-country research, in India
covering four states between 1995 and 2005, has shown that in this period 7 to 19% of the originally poor
–depending on the state—succeeded to move out of poverty, while 3 – 8% fell (back) into poverty, resulting
in net gains between 1.5% and 11% (World Bank India website, Moving Out of Poverty). State and regional
development anti-poverty programmes can bring about such effects, but notably the relatively backward
states encounter major problems in this respect. First, they experience the awkward combination of rapid
demographic growth and low rates of economic growth, and second, they show an inability to initiate ef-
fective and strong anti-poverty programmes – partly because of organisational reasons, partly because of
fi nancial constraints. The devolution of resources to state governments via the central government has been
inadequate in alleviating the budgetary defi cits of the states with the lowest per capita incomes. Instead of
increasing revenues through tax reforms, following the liberalization credo the central government mas-
sively reduced its capital expenditure: this capital expenditure declined steadily from 7% of GDP in 1986-87
to as low as 1.6% in 2006-07. Public investments in crucial areas such as agriculture, rural development,
and infrastructure were scaled down. Fourth, the extremely skewed distribution of both domestic and for-
eign direct investment (FDI) across states has also contributed to increased spatial disparities throughout
India. Between 1991 and 2002, the top-10 states attracted more than 63% of total FDI in India, a share
that increased to 81% between 2002 and 2007. In 2002-2007, the state of Maharashtra alone attracted
nearly 25% of FDI infl ows, whereas in both periods the bottom-10 states jointly attracted less than 1%
respectively 1.2%. Finally, the most damaging impact was due to fi nancial liberalisation and policies easing
‘priority sector’ lending norms for nationalized banks. Until the 1980s, these banks had obligations to fulfi ll
priority sector lending targets, but the priority sector defi nition was widened to include more activities. As
a consequence, most banks started avoiding small farmers and small-scale industries as they were perceived
to be less credit-worthy customers. Particularly in backward regions this has contributed substantially to the
persistence of inequality and poverty (Kundu and Sarangi 2009, 122-124).
In 2007 the share under the national poverty line is preliminary reported to have fallen to 19.3%, divided
over 21.1% for rural areas and 15.1% for urban areas (website EconomyWatch). In spite of expectations of
the contrary of quite some observers, the urban – rural gap seems to have widened again. Physical indicators

Page ● 48
M. van Klaveren, K.G. Tijdens, M. Hughie-Williams and N.E. Ramos Martin
also point at both widespread poverty and persistent inequalities between urban and rural areas. Reconstruc-
tion programmes seem to have affected city dwellers mostly. Whereas in 1996 three of fi ve in the urban pop-
ulation (60.8%) lived in slums, according to the offi cial fi gures this proportion was pushed back to 55.5%
in 2001 –when it concerned 158 million urban inhabitants—and even to just over one in three (34.8%) in
2005 – when 110 million urban inhabitants lived in slums (ADB 2009a; UN MDG Indicators). In 2006 only
28% of the Indian population had access to improved sanitation facilities, in spite of rapid progress (14%
in 1990, 23% in 2000) still a low share in international perspective. In rural areas, the incidence of such ac-
cess was only 18%, against 52% in urban areas (WHO 2009). By contrast, as regards access to a safe (in UN
terms improved) water source, India has succeeded in largely eliminating the urban – rural gap: whereas in
1990 this gap was 25%points (65% access in rural areas, 90% in urban areas), in 2006 this was 10%: behind
the 89% average lies 86% access in rural areas and 96% access in urban areas (WHO 2009).
On the human development index (HDI) India ranked in 2006 no. 132 on a total of 179 countries,
with a score of 0.609, in the lower ranks of the countries with medium human development. The period
2000-2006 showed an increase in India’s score of 0.048%-points on the HDI, and the longer term (1980-
2006) the large improvement of 0.181%-points. Its relative position has increased too over time (compare
to number 114 of 130 countries in 1990). The country’s GDP per capita index was six places higher than its
HDI index. India’s relative position in the Gender-adjusted Development Index (GDI) was, with a no. 116
ranking among 157 countries, in 2006 about the same. Its GDI value was 97.1% of its HDI value (UNDP
2008). As said, the estimated earned income for men was in 2006 (PPP adjusted) USD 3,698, and for women
USD 1,185, suggesting a women to men parity rate of 0.32.
For 2008 the Gender Gap Index of the World Economic Forum ranked India no. 113 of 130 countries.
For three of the four yardsticks used, quite low scores were attached to India: for the position of women in
economic participation and opportunity, the country ranked 125th , for educational attainment 116th , for
health and survival–with other countries—128th, while for political empowerment India could claim the
25th spot. The editors noted that while much work needs to be done across the board, in particular to close
gender gaps in education, India is distinctive for performing above average in political empowerment (Haus-
mann et al 2008, 21). Finally, it is worth mentioning that the SIGI Gender Equality and Social Institutions
(SIGI) Index ranked India 96th of 102 countries in 2008 (OECD-SIGI website; see also section 2.1.2).
Page ● 49
An overview of women’s work and employment in India
Demographics and female labour force2.6.
Population and fertility2.6.1.
Here we underpin the earlier estimates of the working age population, the economically active and the
unemployed by estimates of India’s immense population. Again, these estimates vary, which largely reaches
back on gaps in civil registration of births and deaths. For 2000-2007, the World Health Organization
(WHO 2009) estimated India’s civil registration coverage concerning births at 41% (though national sources
argue that by the end of 2008 this fi gure has been lifted to about 55%16) and concerning deaths at less than
25%. For 2007, the WHO estimated India’s population at 1,169 million, of which nearly 32% under age 15
and 8% over age 60. The median age was estimated at 24 years. The CIA World Factbook17 estimates are
somewhat lower: its July 2009 population estimate of 1,166 million nearly equals that of WHO for 2007.
The CIA Factbook 2009 estimates end up with somewhat lower share of India’s population under age 15
(31.1%) and a higher median age (25.3 years, of which 24.9 years for males and 25.8 for females). Of course,
the absolute fi gures remain huge. Following the CIA World Factbook by 2009 it regarded 190 million males
and 172.8 million females of 0-14 years, and –as noted-- a working age population of 381.5 million males
and 359.8 million females, totaling 741.3 million. Also by 2009 an estimated 5.3% of the population was 65
years and over: 29.3 million males and 32.6 million females. Again according to this source, in the current
population at large the female share is 48.5%, or a sex ratio of 1.06 male/females: 565.2 million women,
against 600.9 million men.
For India’s future, the outcomes of population growth are of crucial importance, as are its projections.
The experts agree as for the longer-term trends. Over 1997-2007, population grew with an estimated aver-
age of 1.6% yearly and over 2001-2009 with 1.4% yearly, a considerable slow-down compared to the periods
1987-1997 or 1981-1993, both witnessing an average 2.1% increase per year (WHO 2009; Ravallion 2009;
own calculation based on Census 2001 and these sources). A further slow-down is expected, but to a more
limited extent than a few years ago. The CIA World Factbook sets the 2009 growth rate at 1.55%, whereas
the UN expects population growth for 2005-2010 to result in 1.5% per year (UN Data).
16 The standard defi nition includes the percentage of children less than fi ve years of age who were registered at the moment of the survey. The numerator of this indicator includes children whose birth certifi cate was seen by the interviewer or whose mother or carer says the birth has been registered. According to the National Commission on Population, by the end of 2008 55% of national births were administered (US Dept of State 2009).
17 Or, as a matter of fact, the US Census Bureau.

Page ● 50
M. van Klaveren, K.G. Tijdens, M. Hughie-Williams and N.E. Ramos Martin
Another source of population estimates is the ILO EAPEP database. According to these simulations,
by 2008 India counted 1,181 million inhabitants, an increase of 1.5% compared to the 1,165 millions of
2007. In this model, in 2008 31.7% was 0-14 of age: 32.0% of the male population and 31.4% of the female
part. The relatively low share of 4.5% was 65 of age or older: 4.3% of all males and 4.8% of all females.
Accotding to EAPEP from 2000-2008 the total population has grown by nearly 139 million or 13.3%, of
which the male population by 13.0% and the female population by 13.7% (ILO Laborsta). One may wonder
if the continuous preference for sons –see below-- is well covered in these fi gures.
India is only to a limited extent urbanised, with in 2007 offi cially 29.2% of the population living in urban
areas (UN Data). Unlike in most other developing countries, including China, Indonesia and Brazil, the ur-
banisation rate has progressed rather slowly, from 26% in 1990 and 28% in 2000. Nevertheless, a number of
Indian urban agglomerations are huge, the largest being Mumbai, with in 2007 nearly 19 million inhabitants,
followed by Kolkata (Calcutta), New Delhi, Chennai (Madras), Bangalore, Hyderabad, and Ahmadabad. In
a regional division, the West and South show the largest urban population concentrations; by 2005-06, 50%
of the population in the Western states (Goa, Gujarat and Maharashtra) lived in urban areas, followed by the
South (Andhra Pradesh, Karnataka, Kerala and Tamil Nadu) with 40%; by contrast, Central (Chhattisgarh,
Madya Pradesh and Uttar Pradesh) with 26% living in urban areas and East (Bihar, Jharkhand, Orissa and
West Bengal) with 25% showed the most rural picture (Moore et al 2009). The UN predicts for 2005-2010
a population growth rate in the country’s urban areas of 2.4% yearly, though there would also be growth in
rural areas, at a predicted rate of 1.1% yearly (UN Data; WHO 2009).
The birth rate estimated for 2009 is 21.8 births per 1,000 of the population, the death rate 6.2 deaths per
1,000. The total fertility rate (TFR, the number of births a woman would have if she survived to age 50) for
2007 is estimated at 2.8 (UN Data) or 2.9 (Hausmann et al 2009). Though still high in international perspec-
tive, the TFR has shown a considerable decrease, dropping from 4.0 in 1990 via 3.3 in 2000 to the current
level, estimated at 2.7 – 2.8. For 2009, the CIA World Factbook estimates the Indian TFR at 2.72, whereas
for 2005-2010 the UN expects stabilisation at the 2.8 level (WHO 2009; UN Data). The regional differ-
ences are large. In 2005-06 the TFRs among women aged 15-49 varied between 1.88 in the South (Andhra
Pradesh, Karnataka, Kerala and Tamil Nadu) and 3.53 in Central India (Chhattisgarh, Madhya Pradesh and
Uttar Pradesh)(Moore et al 2009).

Page ● 51
An overview of women’s work and employment in India
The preference for sons in India is well known. The country’s sex ratio at birth is extremely skewed,
and currently estimated at 1.12 male/female (CIA World Factbook; US Dept of State 2009). Already in 1992
Nobel laureate Amartya Sen argued that at the time there were 41 million “missing women” in India: girls
and women who died prematurely due to, as he called it, mistreatment (Sen 1992, 2003). In the past two
decades the male population bias even seems to have intensifi ed, as sex selective abortion (female feticide)
helped by prenatal sex determination techniques such as ultrasound technology has become more widely
used to avoid female births. The trend towards masculinity has increased in urban areas, which have higher
literacy rates and better coverage of vital registration and health services, suggesting this is due to female
feticide. Here, son preference may even persist among educated women (Sudha and Rajan 1998; Das Gupta
et al 2003; Jha et al 2006). With the Pre-Conception and Pre-Natal Diagnostic Techniques Act of 1994, the
government placed strict limits on the use of technology to determine the sex of the fetus, but sex-selective
abortion practice obviously only has grown; indeed, governmental health offi cials confi rm that the practice
is prominent among educated and urban sections of society. Over 2008, female feticide was reported to be
an acute problem in Punjab, Haryana, and Rajasthan. The states of Punjab, Haryana, Gujarat, Uttar Pradesh,
Himachal Pradesh, Delhi, parts of Tamil Nadu, Maharashtra, and Karnataka reported particularly low fe-
male/male ratios (Moore et al 2009; US Dept of State 2009). It has been estimated that currently each year
nearly half a million female fetuses are snuffed out (WHO, WageIndicator website).18 Older practices regu-
lating the numbers of female children in a family, including female infanticide at birth, under-reporting of
female births, abandonment or out-adoption of girls, and selective neglect of girl children leading to higher
death rates among them, are still common in many parts of the country, predominantly in rural areas. For
example, when children are ill, Indian fathers are more likely to pay for treatment for sons than for daughters
(Sudha and Rajan 1998; US Dept of State 2008; OECD-SIGI website).
Life expectancy at birth has increased substantially, from 57 years in 1990, via 61 years in 2000 to 64.1
years in 2006, the latter fi gure divided in 65.7 years for females and 62.7 years for males (WHO 2009; UNDP
2008). For 2009, the CIA World Factbook estimates are considerable higher, with 72.6 years for females and
67.5 years for males, whereas for 2005-2010 the UN (UN Data) expects life expectancy for women to be
66.4 years and for men 63.2 years. For 2000-2005, the probability of not surviving to age 40 was estimated
16.8% of the relevant age cohort (UNDP 2008).
18 Efforts to combat feticide include a program by the Health and Family Welfare Ministry to target and apprehend those who carry out female feticide. In 2008, the central government also launched a “Save the Girl Child” campaign. The New Delhi municipal government sponsored a program that provided every girl born in a government hospital with a gift deposit of Rs. 5,000 (USD 114) that accumulated interest until cashed at the child’s age of 18 (US Dept of State).

Page ● 52
M. van Klaveren, K.G. Tijdens, M. Hughie-Williams and N.E. Ramos Martin
By contrast, child mortality is still considerable in India. In 2004 neonatal mortality (deaths during the
fi rst 28 days of life per 1000 live births) stood at 39 per 1,000 live births, in international comparison a rather
high rate (WHO 2009). The infant mortality rate (probability of dying between birth and age 1 per 1,000 live
births) stood at 54 in 2007, yet considerable progress as the rate for 1990 was 84 and that for 2000 67. For
2005-2010 the UN expects stabilisation of the infant mortality rate at a level of 55 per 1,000. The Indian
average for the under 5 mortality rate (probability of dying between by age 5 per 1,000 live births) was 72 by
2007, still one of the highest rates in Asia but coming down from 117 in 1990 and 91 in 2000 (ADB 2009a;
WHO 2009; UN Data).
For an indication of the situation of our target group, the adolescent fertility rate (births per 1,000
women 15-19 of age) is of special importance. For 2005-06 the Indian rate was set at 90, in international
perspective a high fi gure.19 The overall rate came down from 116 in 1992-93. In 2005-06 over two in fi ve
Indian women aged 40 had by age 20 (49%) given birth – though twenty years earlier, in women that in
1992-93 aged 40, this proportion was even 58% (Singh 1998, 121-3). The adolescent fertility rate remained
much lower in urban areas: the decrease between 1993 and 2006 was slightly larger in urban areas (24%) than
in rural areas (20%). Yet, at the level of states neither the urbanisation levels nor the poverty rates were de-
cisive per se, and regional habits and attitudes seem more important. In 2005-06 the adolescent fertility rate
was lowest in Himachal Pradesh (27, with in 2005 only 9% of adolescent girls living in urban areas); Jammu
and Kashmir (32, with 24% urban), and Kerala (35, with 25% urban), and highest in Bihar (128, with 17%
urban); Jharkand (123, urbanisation rate unavailable); West Bengal (122, 29% urban), and Andhra Pradesh
(99, 32% urban). Indeed, of the four poorest states Bihar fi gured on this list, while the rates in the three
other poor states were high but not extreme: Rajasthan with 98, and Madhya Pradesh and Uttar Pradesh
with both 96. Nevertheless, it is important to be aware that these seven states with adolescent fertility rates
over the nationwide average of 90 in 2005 jointly accounted for 23.3 million 15-19-year old women, or 46%
of all 50.5 million adolescent women in India (Moore et al 2009, Appendix Tables 1 and 2).
As of 2006, according to the 2005-06 National Family Health Survey (NFHS) roughly 8% of all Indian
women aged 20-24 became mothers before age 16, when the health risks are quite large (see our next sec-
tion); 22% of this cohort already became mothers before age 18, and 42% before age 20. Though coming
down 7%points from 1992-93, the percentage of 42 is still very high, and implies that each year over 3.3
million Indian adolescent girls give birth. In 2006, the share of those becoming mothers before age 20 was
19 Based on the National Family Health Survey 2005-2006 (Moore et al 2009; Macro International 2007a); it is not clear what source(s) WHO (2009) and ADB (2009) have relied on for their low and unlikely estimate of the Indian adolescent fertility rate (45 for 2006).

Page ● 53
An overview of women’s work and employment in India
28% in urban areas, against still nearly half of all (48%) in rural areas. Young women were most likely to
give birth as teenagers in Eastern states (54-58% in Jharkhand, Bihar and West Bengal), and the shares in
question were lowest in Goa (11%), Himachal Pradesh (15%), and Kerala (16%). In the large central states
the shares were 46-49% (Moore et al 2009; IIPS / Macro International 2007a).
There is a rather close link between adolescent fertility and marriage patterns. The interval between
marriage and having the fi rst birth remained overall 2.1-2.3 years between 1993-2006. For women aged 25-
29, the median age at fi rst marriage in 2005-06 was 17.8 years and the median age at fi rst birth 19.9 years.
These fi gures already indicate that the marriage age for females in India is still very low. In 2005-06 45% of
women aged 20-24 married before the legal age of 18: 53% in rural and 28% in urban areas. The propor-
tion marrying that early was as high as 60-61% in the states of Jharkhand and Bihar, and as low as 12% in
Himachal Pradesh and Goa – the states with the lowest and highest educational levels, respectively, which
suggest an inverse relationship between education and early marriage. There is quite some evidence that
marriage before age 18 constrains adolescent women’s opportunities to obtain higher education, and se-
verely restricts their autonomy. The decline of this “early marriage rate” has been slow, with only 5%points
from 50% of all Indian women in 1993 to 45% in 2006. State-level fi gures have converged. In some states
a decline between 1993-2006 could be noted, like in Himachal Pradesh (from 24 to 12%) and Tamil Nadu
(from 36 to 24%), but other states saw increases from low levels, like Goa (from 7 to 12%), Punjab (from
14 to 19%), and Gujarat (from 29 to 33%). In several large states the proportion marrying before age 18
remained basically unchanged. In the same period, the median age at fi rst marriage at national level rose
from 17.2 to 17.8 years, only a seven-month increase (Moore et al 2009; IIPS / Macro International 2007a).
There is some evidence, be it rather anecdotal, that in the aftermath of the 2004 Tsunami pressure grew on
girls to marry at an earlier age to much older husbands in response to the enormous family losses wrought
by the disaster (Donahue 2010, 15-16).
More generally, the fi gures presented above have to be considered against the backdrop of the disadvan-
taged position of adolescent girls in India. Girls are still discriminated against in terms of health (nutrition,
medical care and vaccination) and education (Jensen and Oster 2007; Moore et al 2009). Yet, promising
initiatives are under way in India to delay early marriage or childbearing, recognized as essential barriers for
women’s labour participation and autonomy. For example, a conditional cash transfer (CCT) program in
the state of Haryana is attempting to provide incentives for delayed marriage. The project aims to improve
the nutritional and health status of adolescent girls between 11-18 years of age, to train and equip them to

Page ● 54
M. van Klaveren, K.G. Tijdens, M. Hughie-Williams and N.E. Ramos Martin
improve home-based and vocational skills, to promote awareness of health hygiene, nutrition, home man-
agement, child care, and take all measures as to facilitate their marriage after attaining the age of 18 years
and later (Vij 2010 ; website GoI - Haryana adolescent girls project).
Health2.6.2.
One of the major health risk factors for young people in India, though considerably less widespread
than in the African countries we covered in other DECISIONS FOR LIFE reports, is HIV/AIDS. By
2007, according to revised estimates of the National AIDS Control Organization (NACO, the government
agency responsible for monitoring HIV/AIDS), the HIV adult prevalence rate (of those aged 15-49) was
360 per 100,000, or 0.36%. By then, in India about 2.31 million people lived with the virus, of which 35%
in the age group of 15-24 years. Be it not so outspoken like elsewhere in Asia, HIV in India is more a man’s
disease; about 40% or over 900,000 people of those suffering are female, though the female share was with
about 30% lower among those with HIV/AIDS in the 15-29 years age group (UNAIDS 2007; CIA World
Factbook; GoI 2008; ADB 2009a; WHO 2009). The economic consequences of HIV/AIDS may be seri-
ous. Unskilled labour-intensive industries like tourism will suffer losses of up to 18% and the annual GDP
growth rate will fall by 1% in the next 14 years if the present rate of HIV infections continues, a 2006 study
of the National Council of Applied Economic Research concluded (NN 2006). According to more recent
evidence, the epidemic continues to shift toward women and young people. In 2004, it was estimated that
22% of new HIV cases in India were housewives in relationships with one partner. These women were in-
fected by husbands who frequented sex workers, one of the major driving forces behind the spread of HIV
into the non-high-risk population (Kodandapani and Alpert 2007).
Public knowledge of HIV/AIDS is rather limited, in line with the limited general knowledge of sex and
reproduction – though adolescent women have on average good knowledge of modern contraceptive use
(CEPA 2001; Moore et al 2009). The proportion of Indian males with comprehensive correct knowledge
of HIV/AIDS was in 2000-2007 36%; with 20% the proportion of females with such knowledge was much
lower (WHO 2009). Discrimination, stigmatization and denial are widespread. According to the Interna-
tional Labor Organization (ILO), 70% of persons suffering from HIV/AIDS faced discrimination. Because
of HIV/AIDS-related discrimination, appropriate policies and models of good practice remain underde-
veloped. People living with HIV and AIDS continue to be burdened by poor care and inadequate services,
whereas those with the power to help do little to make the situation better (Kodandapani and Alpert 2007).
In 2008 Human Rights Watch (HRW) reported that many doctors refused to treat HIV-positive children
Page ● 55
An overview of women’s work and employment in India
and that some schools expelled or segregated them because they or their parents were HIV-positive. Many
orphanages and other residential institutions rejected HIV-positive children or denied them housing (US
Dept of State 2009).
The Indian government in recent years seems to have shaken off the earlier rather slack approach
of HIV/AIDS. Its National AIDS Control Program (NACP) III (2007-2011) has set ambitious targets
to achieve the MDGs for HIV and AIDS before schedule. Compared to NACP II the national program
budget has quadrupled, to around USD 2.5 billion. Almost 70% of the budget is earmarked for prevention
(Claeson and Alexander 2008). In October 2009 the Ministry of Labour and Employment (2009b) issued a
more offensive policy document, now departing from the viewpoint that HIV/AIDS “is a major threat to
the world of work and that it has shown maximum impact on the most productive segment of the labour
force”. The use of such “hard” economic arguments (see also Haacker 2009, and Das et al 2009) may help
to push for more offensive government policies, also regarding health in general. It should be noted that
currently a very low share of the country’s GDP –less than 1%-- is dedicated to public spending on all
aspects of health, a level that has remained unchanged for the past decade and a half. As a result, roughly
three-quarters of health services are provided by the private sector (Moore et al 2009, 20). A larger share
of public expenditure on health would notably improve health conditions of the poor, like through more
effective prevention and treatment of major infectious diseases (cf. WHO 2009; ADB 2009a). It would, in
the end, bring down the persistent inequalities in health in India.
We already came across large inequalities in various fi elds in India; the country’s health disparities are
also large. We limit ourselves here to two issues related to birth: the percentage of births attended by skilled
health personnel (a health professional), and the under 5 mortality rate. In 2005-06 the percentage of births
attended by such personnel was 47%. This general share hides considerable differences across the urban/
rural divide, regions, the income level of the family at stake, and the education level of the mother. The inci-
dence of skilled health personnel attending birth was 38% in rural areas and nearly double that share (74%)
in urban areas, whereas it was 19% among the lowest 20% in the income distribution and 89% among the
wealthiest 20% (WHO 2009; ADB 2009a). Across India’s regions, with 81% in 2005-06 the proportion
of births attended by skilled health staff was highest in the Southern states (Andhra Pradesh, Karnataka,
Kerala and Tamil Nadu), followed by the West (Goa, Gujarat and Maharashtra) with 74%; with 33% the
Central states (Chhattisgarh, Madya Pradesh and Uttar Pradesh) were worst off on this respect (Moore et al
2009). As said, the under 5 mortality rate (probability of dying between birth and age 5 per 1,000 live births)

Page ● 56
M. van Klaveren, K.G. Tijdens, M. Hughie-Williams and N.E. Ramos Martin
by 2007 stood at an average 72, with a substantial spatial difference: 82 in rural areas against 52 in urban
areas. However, the socio-economic difference was even larger: 101 under age 5 dying per 1,000 live births
among the poorest 20% and only 34 among the 20% highest in the income distribution (WHO 2009; ADB
2009a). Health hazards for women working in agriculture and small-scale manufacture are mostly consider-
able: see notably section 2.6.4.
We found that early marriages and teenage pregnancy remain widespread. Early pregnancy goes along
with considerable health risks. In terms of health, millions of adolescent girls in India are disadvantaged.
Concerning food intake, access to health care, and growth patterns, they are worse off than their brothers.
By the time they reach adolescence many are grossly underweight and stunted. Pregnancy at a young age
further exacerbates their poor health (Jejeebhoy 1998; CEDPA 2001). Against this backdrop the outcome
of the 2002-04 Household Survey does not surprise that pregnancy complications were highest among ado-
lescent mothers. Similarly, any delivery and post delivery complications were highest among these mothers
(IIPS 2005). There is clear evidence that the risk of maternal morbidity is highest in adolescents and further
enhances the risk of maternal death. Moreover, peri-natal mortality rate is also high among infants of ado-
lescent mothers. Combined with their already poor health status, these risks are especially large among the
poor and illiterate (IIPS/Macro-International 2007a). According to a 2005 report from the Offi ce of the
Registrar General of India, 240 girls died every day due to pregnancy-related complications in early child
marriages. Marital abuse and rape are also common problems in such marriages. In 2008 the International
Center for Research on Women (ICRW) concluded that those married under the age of 18 were twice as
likely to be abused by their husbands compared with women married later; they were even three times more
likely to report marital rape. ICRW reported that child brides often showed signs of child sexual abuse and
post-traumatic stress (cited in US Dept of State 2009). Though there is a large number of small-scale ini-
tiatives and programs aiming at improving adolescent girls’ reproductive health, growingly in combination
with education, political intentions at national level still have to be translated in large-scale programs (Moore
et al 2009, 20).
Health problems of boys encompass to a larger extent alcohol and drug addiction. A recent government
report states that “The tentacles of drug have captured a substantial section of adolescents and youth” (GoI
2008, 59). It adds that the reported incidents of alcoholism, drug addiction and crime amongst adolescents
have seen a rise. Most of the offenders were boys; a large number of them had only studied up to primary
school level (41%) or were illiterate (20%); for a large part they were school drop-outs. Current government

Page ● 57
An overview of women’s work and employment in India
programs mainly focus on building “life skills (….) as the abilities for adaptive and positive behaviour that
enable individuals to deal effectively with the demands and changes of everyday life” (GoI 2008, 62).
Women’s labour market share2.6.3.
Table 6 presents an overview of the female employment shares by industry, for those in the organised
sector, for 2005 – the latest year for which fi gures are available. One again has to be aware that these fi gures
only cover a limited group: about 4% of India’s about 129 million economically active women.
Table 6. Female employment shares by industry, employees (organised sector), India, 2005
x mln. %agriculture 0,48 32.7mining 0,08 7.1manufacturing 0,94 16.7utilities 0,05 5.8
construction 0,07 7.0
transport, storage, communication 0,19 6.8wholesale and retail 0,05 8.9fi nance, real estate, business services 0,30 15.6community, social, personal services 2,85 25.8Total 5,02 19.0
of which
private sector 2,10 24.8public sector 2,92 16.2
of whichcentral 0,61 9.8regional 1,73 17.9local 0,58 27.5
Source: authors’ calculations based on ILO Laborsta (Tables 2E and PS)
With 19.0% the female share in (the registered part of) the organised sector turns out to be low, defi -
nitely in international perspective. The table shows that female employees in 2005 nowhere formed a major-
ity. With nearly one in three their largest share was in agriculture (organised, that means with more than 10
employees), followed by community, social and personal services with 26% -- obviously mainly in the com-
mercial part of these services, as their share in the public sector (16%) remained much lower. In both manu-
facturing and in fi nance, real estate and (other) business services, about one in six employees was female. In
the other industries the female share was below one in ten. Comparing 2005 with 2000, the total share of
women in the organised sector showed some increase: by 2000 it was 17.6% (4,92 million women on 27,96
million employed), implying 1.4%points growth The female share in the private sector grew by 0.9%point,
but their share in the public sector rose more, by 1.4%points. With 1.8%points, the female share in regional

Page ● 58
M. van Klaveren, K.G. Tijdens, M. Hughie-Williams and N.E. Ramos Martin
government showed the largest increase between 2000-2005 (all data: ILO Laborsta).
Table 7 specifi es the female part of our Table 4, showing the shares of the respective industries in fe-
male employment. For an explanation, see section 2.3.2.
Table 7. Shares of industries in female employment, employees (organised sector), India, 2005
x mln. %agriculture 0,48 9.6mining 0,08 1.5manufacturing 0,94 18.7utilities 0,05 1.1construction 0,07 1.3transport, storage, communication 0,19 3.8wholesale, retail, hotels, restaurants 0,05 1.0fi nance, real estate, business services 0,30 6.0community, social, personal services 2,85 56.9Total 5,02 100.0
of which
private sector 2,10 41.8
public sector 2,92 58.2central 0,61 12.2regional 1,73 34.4local 0,58 11.6
Source: authors’ calculations based on ILO Laborsta
Below, we shortly describe developments in large sectors with –wherever possible-- special attention
to the position of women. Unlike in other DECISIONS FOR LIFE country reports, we have bundled the
sections on commerce and services under the heading “services”. We did so in view of the importance of
India’s services sector, notably its IT (Information Technology) annex BPO (Business Process Outsourcing)
part, also for female employment.
Agriculture2.6.4.
In 2004-05, the surprisingly large share of 53% of the Indian labour force was still employed in agri-
culture, producing a little over one-fi fth of the country’s GDP. An overwhelming majority was in informal
labour. In formal labour, by then only nearly 5 million were employed (2.3%), against 208 million in infor-
mal labour. For 2008-09, these amounts were estimated at respectively slightly over 5 million (2.2%) and 218
million. Between 1978-2004, agriculture’s share in total employment fell by 14%points, and its share in the
country’s value added halved to 22%. In this period, its output yearly grew by 2.5%, while employment rose
by 1.1% yearly (NCEUS 2009a, 18). Between 1998 and 2004, underemployment in agriculture increased
widely. In a number of agricultural areas, employment measured in hours declined by 20 to 77%. Around

Page ● 59
An overview of women’s work and employment in India
47% of total land is cultivated, of which only about 30% irrigated. Cultivators (small land-holders) and their
families form nearly one third of the rural workforce, agricultural labourers 27% and other workers 42%.
In 1999-2000, 10.4% of rural households were female-headed; 97% of these households cultivated plots
of two hectares or less. Women play major roles in agriculture. In the early 2000s, on average about 60%
of all agricultural operations like sowing of seeds, transportation of sapling, winnowing, storage of grain,
et cetera were handled exclusively by women. Currently many farmers seem to prefer women workers over
males, but a large proportion of all women workers in agriculture continue to receive lower wages than men;
female hourly wage rates vary from 50 to 75% of male rates. Working conditions are often appalling. Due
to the use of agro-chemicals women are exposed to several health hazards such as gynecological infections,
arthritis, intestinal and parasitic infections (Research Foundation Science & Technology 2005).
As mentioned, the growth in agricultural output in the 1970s and 1980s by which India changed from
a net food importer to a food exporter (sugar, rice), was largely due to Green Revolution input such as
high-yield seed varieties and fertilizers. However, the rate of output for several products may have peaked
and problems with soil degradation, rural infrastructure and working conditions of agricultural workers ur-
gently need to be addressed (Library of Congress 2004; Research Foundation Science & Technology 2005).
Though with 2.5% yearly growth during in 1990-2005 India’s agricultural output reached a much higher
growth rate than in the previous two decades, it has been calculated that in this period agricultural output
growth has gradually slowed down. Moreover, the 2.5% growth rate compares to 4.6% output increase per
year in China. Both India and China benefi ted from the Green Revolution, but unlike India the Chinese
agricultural sector was also aided by major institutional reforms and improved infrastructure (Nagaraj 2007;
Bosworth and Collins 2007). Since the early 1980s, the real wage rates in India’s agriculture have steadily
risen, though with considerable interregional variation in the levels and growth rates. Yet the wage rates
remain lower than the offi cial minimum wages, and are too low to overcome absolute poverty. Moreover,
while the agricultural wages have gone up, the proportion of permanent farm servants in rural areas has
declined, suggesting that employment contracts have become less secure and casual (Nagaraj 2007). Under
the prevailing conditions in Indian agriculture it is unlikely that many young women living in urban areas
and trying to make a career can rely on a “fall-back scenario” in which they can go back to their families
living from agriculture.

Page ● 60
M. van Klaveren, K.G. Tijdens, M. Hughie-Williams and N.E. Ramos Martin
Mining and manufacturing2.6.5.
The secondary sector, or industry in its broad sense (mining, manufacturing, construction and utilities),
employed in 2004-05 about 19% of India’s total labour force and produced approximately 28% of India’s
GDP. Between 1978-2004, industry’s share in total employment increased by 6%points, and so did its share
in the country’s value added. Nevertheless, by international comparisons both shares remain rather small. In
this period, India’s industrial output yearly grew by 5.9%, while employment rose by 3.4% per year. Exports
were a major trigger for growth. Between 1995-2004 goods exports grew by 10.1% yearly. However, services
exports grew twice as much and the share of goods in total exports fell from 82% in 1995 to 67% in 2004
(Bosworth and Collins 2007, authors’correction baded on recent data from NCEUS 2009a). As critical ob-
stacles for stronger expansion of India’s manufacturing innovation, output and exports, tax and governance
issues, labour regulation, lack of skilled labour and the country’s crumbling infrastructure are mostly men-
tioned. These factors may lead to weak performance of labour-intensive industries (Gupta et al 2008). Some
add problems of management succession in Indian fi rms, a large proportion of which are group-affi liated
and family-owned (Bhaumik and Kumbhakar 2008). Lack of access to fi nance, related underinvestment and,
of course, lack of economies of scale are mentioned as specifi c problems in the unorganised sector (Rajesh
Raj 2009).
In 2004-05 over seven in ten industrial employed were in informal labour. In formal labour 23.2 million
(29.7%) were employed, against 54.8 million in informal labour. For 2008-09, the most reliable estimates
end up at respectively 25.7 million (28.1%) and 65.9 million employed in manufacturing, fi gures that point
at growing informalisation. That may well be a continuation of the trend witnessed between 1983 and 2004,
when most employment growth in manufacturing was in the unorganised sector, a trend widely ascribed to
increasing hire of casual and contract workers and of informal regular low-wage workers. Exceptions were
rare, the most prominent being the apparel, furniture, leather and refi ned petroleum industries, where in
1983-2004 the organised sector showed a larger employment growth than the unorganized sector (NCEUS
2009a, 172-173). Various authors have connected the general trend toward informalisation with the long-
term fall of the real wage rate in manufacturing (Majumder 2006; Gupta et al 2008; NCEUS 2009a, IV, 18).
Considering these developments, manufacturing has become a less promising source of employment for
women.

Page ● 61
An overview of women’s work and employment in India
Services2.6.6.
In the last two decades India’s economy has opened up, favouring trade and commerce. Trade (exports
plus imports) as percentage of GDP has increased from around 15 in 1980-81 to about 34 by 2005-06
(Papola 2008). Between 1978-2004, the service sector share in total employment increased by 9%points,
but its share in the country’s value added grew by 18%. In this period, India’s services output yearly grew
by 7.2%, while employment rose by 3.8% per year (Bosworth and Collins 2007, authors’correction based
on recent data from NCEUS 2009a). More than agriculture and manufacturing, the Indian services sector
has been the most powerful force in the development of the country (Ravallion 2009). The services sector
employed in 2004-05 over 27% of India’s total labour force and produced no less than about 50% of India’s
GDP. In 2004-05 over seven in ten service employees were in informal labour: in formal labour 30.4 million
(27.6%) were employed, against 79.6 million in informal labour. Between 2004-05 and 2008-09, employ-
ment in services grew by nearly 22%, but surprisingly this growth has been nearly fully in informal labour.
For 2008-09, the most reliable estimates end up at respectively 33.1 million employed formally (24.6%) and
100.9 million employed informally, fi gures clearly indicating at growing informalisation in the past four years
(NCEUS 2009a, 18).
In the 1990s and 2000s the expansion of India’s IT/BPO sector has been the cornerstone of the
growth of the services sector at large. Back in 2005, Thomas Friedman in “The World is Flat” gave stun-
ning examples of the possibilities of outsourcing sophisticated business activities from the US to India, like
the outsourcing of market research activities, reading CAT scans to doctors in India, or “having your own
personal remote executive assistant” in India. By then, he noted that 245,000 Indians were involved in call
centre work: low-wage, low-prestige jobs in America, but when shifted to India high-wage, high-prestige
jobs (Friedman 2005, 24, 31). Following earlier relocation within the UK, UK fi rms also offshored call
centre activities to India: initially some of the most simplifi ed and standardised workfl ows, later on more
complex activities including skilled jobs (Bain and Taylor 2008). Yet, such FDI of mainly US- and UK-based
multinationals cannot belittle the rise of a genuine Indian IT/BPO industry. In spite of quite some resist-
ance from the government bureaucracy, the New Computer Policy (NCP) that was shaped from 1984 on
under PM Rajiv Ghandi recognised software exports as a “delicensed industry”, invested in infrastructure,
and laid the foundation for the development of a world-class IT industry. Currently Indian IT fi rms like
Infosys, Wipro, Tata Consultancy Services (TCS) and others are renowned in the global market, fuelled the
growth of the domestic services sector, and changed the attitudes towards IT and computerisation of many

Page ● 62
M. van Klaveren, K.G. Tijdens, M. Hughie-Williams and N.E. Ramos Martin
employers and employees (Nilekani 2008, 97- 109). IT industry leaders claim that the spread effects of this
development are massive, and that India’s IT innovations in banking, retail, education, telecom and com-
modities are creating truly mass access to IT facilities till in even the most remote rural villages, like through
the text messages including weather forecasts and agricultural information cited earlier (cf. Nilekani 2008,
110-112). Others maintain that the IT industry is highly urban-centric and that the use of IT is confi ned
to large and modern organisations in industry and services (cf. Papola 2008). Some years ago, various re-
searchers regarded the employment outcomes of the IT/BPO boom as disappointing. They stressed that
especially software services have the highest productivity levels but a small employment potential (cf. Banga
2006). Recently, such objections are hardly heard. Nevertheless, in a larger, macro-economic, context the
contribution of the IT sector to India’s development can still be questioned.
India’s IT/BPO exports have skyrocketed from USD 105 million in 1989-1990, via 3.71 billion in 1999-
2000 and 18.05 billion in 2004-05, to 50.41 billion in 2008-09; jointly with domestic turnover accounting
for USD 22.98 billion, aggregate revenue was 73.39 billion. The software and services segment accounted
for 40.61 billion, or 55% (website Centre for Development Informatics). The sector proved to be relatively
resilient to the global crisis (World Bank 2010, 149).The importance of the domestic market is rapidly grow-
ing. In a recent Indian study domestic IT turnover in 2013 is rather conservatively estimated to be nearly
USD 38 billion, but the Dutch economic information agency (EVD) already for 2012 predicts USD 50
billion. This agency also points at the trend to shift IT activities from Bangalore, the current “capital” of
the Indian IT sector, to smaller urban centres (NN 2009; website EVD). The current government has an-
nounced promotion of IT as one of the fi ve priorities of the country. The development of the Indian IT
industry is closely linked with improvement of the country’s (higher) education system, combining technical
and analytical (mathematic) skills and English language abilities with relatively low labour costs. Currently
the industry can boast that ”over 120,000 IT professionals are being trained and added to the talent pool
every year as compared to 25,000 IT professionals in the USA” (ESC 2009). Unfortunately, for the last four
years reliable fi gures on the female employment share in India’s IT sector are lacking. It is likely that women
still comprise less than a third of those working in the sector, as earlier studies indicated (Donahue 2010).
If so, this share may anyway increase in the years ahead. As females constitute about 40% of all students
currently enrolled in institutions of higher education (see section 2.7.2), it may be estimated that yearly 40-
50,000 of these “new” IT professionals will be female.
Page ● 63
An overview of women’s work and employment in India
Government2.6.7.
The Indian civil service is notorious for its bureaucracy and ineffi ciency, with a proven record of resist-
ance to change. Early efforts to bring in development dynamics merely shipwrecked (Van Klaveren 1969).
As discussed, the beginning of the 1990s saw the initiation of economic reforms. Consequently, the public
sector was no longer seen as an employment provider; it has, in fact, experienced an absolute decline in em-
ployment in recent years (Papola 2007). In spite of this decline and of real wage decreases in the organised
manufacturing sector, earnings per employee in the public sector have grown at over 3% per year over the
last three decades, partly representing a higher return for education, skill and experience, partly superior
bargaining power of public servants (Nagaraj 2007).
Till very recently especially the federal civil service has been a male bulwark. As shown in Tables 4 and
6, in 2005 the total civil service in formal employment included slightly over 15 million employees, or 3.5%
of all employed in India. The central public sector employed 5.6 million people, of which only 9.8% female,
the regional public sector 7.9 million, of which nearly 18% female, whereas by then locally 1.5 million public
servants operated, of which 27.5% female. We also noted some growth of the female shares between in
the fi ve preceding years, most pronounced in regional government. Especially for young women the public
service may be an attractive employer, in particular in view of the benefi ts attached to be engaged here:
maternity and sickness benefi ts, and for those in central government service also paid maternity leave (see
section 2.4.1). Most likely, the best opportunities for young women applying for government jobs will be
in regional and local government, especially where –supported by World Bank, NGOs, and others-- rural
development and empowerment programmes take off.

Page ● 64
M. van Klaveren, K.G. Tijdens, M. Hughie-Williams and N.E. Ramos Martin
Education and skill levels of the female labour force2.7.
Literacy2.7.1.
The adult literacy rate –those age 15 and over that can read and write—for India in 2006 was, according
to the UNDP Human Development Indicators, 65.2%.The country has made major progress in this fi eld,
as the average literacy rate for the 1990-1999 period was only 48.2% (WHO 2009), while the 2004-05 NSSO
Survey found 61.7% (GoI 2008). The fi gures suggest that the country’s Total Literacy Campaign, under
the auspices of the National Literacy Mission,20 may be having an impact. Yet, India’s remaining about 270
million adult illiterates make up over one third of this category in the world. And once again, the regional
disparities are huge. Opposed to the high literacy rates in for example Kerala (91%), Chandigarh (87%) and
Delhi (85%) were in 2004-05 the low rates of Bihar and Rajasthan (both 48%), Jharkhand, Uttar Pradesh
(both 52%), and Madhya Pradesh (55%) (GoI 2008). Through the eleventh fi ve-year plan (2007-2012), the
Total Literacy Campaign that was launched in 1988 has been revitalized. In 2009 the government also sig-
naled a stronger focus on gender and equity, fi rst by recasting the National Literacy Mission as the National
Female Literacy Mission and then by announcing a strategy for targeting. Commitments have been made
to ensure that 85% of targeted benefi ciaries will be women (UNESCO 2010). There are ample reasons for
such policies. In 2006 the female literacy rate of 53.4% was opposed to a male rate of 76.4%, resulting in
70% women to men parity (UNDP 2008). Based on 2004-05 fi gures, women lagged behind extremely in
states with an low total literacy rate, in particular Rajasthan (29% female rate, 45% women to men parity),
Bihar (32% female rate, 51% women to men parity), Jharkhand (35% rate, 51% parity), Uttar Pradesh (36%
rate, 54% parity), and Madhya Pradesh (39% rate, 56% parity) (GoI 200821). In spite of these remaining
differences, the overall gender literacy gap has considerably decreased, as women to men parity grew from
49% in 1981, to 55% in 1993, 65% in 2001, and 68% in 2004-05. For 2007, India’s overall literacy rate was
estimated at 66.0%, indicating another 0.8% progress compared to the 2006 rate. Women to men parity
improved slightly further, to nearly 71%, with the female literacy rate rising to 54.5% and the male to 77.1%
20 The National Literacy Mission aims at bridging gender and regional disparities in adult literacy levels by achieving 80% literacy by 2011-12 (GoI 2008).
21 47 districts in the country had a female literacy rate below 30%. Since most of these districts were located in Uttar Pradesh, Bihar, Orissa and Jharkhand, special government programmes for promoting female literacy were taken up in these states (GoI 2008, 69).

Page ● 65
An overview of women’s work and employment in India
(GoI 2008; UIS website; UN MDG Indicators website).
For 2007 the youth (15-24-year-olds) literacy rate was with 82.1% over 16%points higher than the over-
all rate, divided in 86.7% for young males and 77.1% for young females, implying a women to men parity
ratio of 89%. This means that 15- to 24-year-old females are still about twice as likely to be illiterate as males
in that group (MDG Indicator 2.3, derived from UN MDG Indicators and based on UNESCO data). As
a category, girls and young women have made major strides in literacy, but many came from a situation of
backwardness. Compared with 1991, when 15-24-years-old females had a literacy rate of only 49.3%, their
progress was much larger than that of their male peers, by that time having reached the 77.1% mark (ADB
2009a).
Education of girls2.7.2.
In Article 15(1) the Constitution of India, on the right to equality, provides the basic policy framework
that enshrines the vision of girls’ education and the spirit in which their education is to be provided. Article
45 of the Constitution refers to “free and compulsory education for all children” up to 14 years but this
‘directive principle’ could not be enforced in court. The Right of Children to Free and Compulsory Educa-
tion Act adopted in 2009, however, now legally requires states to provide free education to children aged
6 to 14 and reserves 25% of private primary school places for disadvantaged children. Moreover, recently
public funding has attached weight to poverty-related factors, including defi cits in education. Before 2007,
equity played only a limited role in allocating resources for education. A new formula attaches more weight
to social indicators, including a district-level Education Development Index. In 2005-06 the differences in
per child allocation between high and low Education Development Index districts were negligible, but in
2008-09 districts in the lowest 25% on the index received twice as much per child as those in the highest
25% (UNESCO 2010).
Combined gross enrolment in education in India was in 2006 overall 61.0%: females 57.4%, males
64.3% -- or a women to parity of 89% (UNDP 2008). At fi rst sight India seems on track to achieve the
Millennium Development Goal (MDG) of Universal Primary Education (UPE) by 2015, especially if one
realises that India has come from far. Only about 55% of the population born between 1950 and 1970 at-
tended primary school or higher (2005 website Huebler). According to the MICS 2000 survey, almost 27

Page ● 66
M. van Klaveren, K.G. Tijdens, M. Hughie-Williams and N.E. Ramos Martin
million school-age children in India did not attend school, or one out of four; girls made up a majority of
57%. At the time, India’s exclusion rate was 15%, meaning that this proportion of children would likely
never attend school (UNICEF 2005). Against this backdrop, in 2001 the central government launched the
Sarva Shiksha Abhiyan (SSA) program to provide elementary education for all of India’s children. SSA is
one of India’s fi rst major programs to cover upper primary education –grades 6-8—as well. The program
aims to enroll all 6-14 year-olds in school by 2015, retain them in school, and provide them with quality
education at least till grade 8 – a tougher requirement than meeting the MDG by 2015 as such (GoI 2008;
World Bank website22).
Most international comparative sources give a rather rosy picture of progress thus far. Because of a
substantial increase in girls’ net enrollment rate in primary education, the total net enrollment rate in primary
education increased from 84.9% in 1991 (92.0% for boys and 77.1% for girls, resulting in 84% girls to boys
parity) to an overall 88% over 2000-2007, divided into 90% for boys and 87% for girls, or 97% girls to boys
parity (ADB 2009a; WHO 2009). The UN MDG Indicators even indicate for 2006 a net primary enrollment
rate of 94.3%, divided into 96.1% for boys and 92.2% for girls (96% parity). For 2007, primary net enroll-
ment was set at 90%: 91% for boys and 88% for girls, implying that nine of ten children of primary school
age (6-10 years) attended primary school (UIS website).
Yet, there are two caveats. First, domestic sources suggest less reasons for optimism. The 2005-06 Na-
tional Family Health Survey outcomes are a much lower primary net enrollment rate, namely 83%; 85% for
boys and 81% for girls (95% girls to boys parity), as well as gaps between urban and rural areas (89% versus
82%23), and especially between socio-economics groups, with 96% of children from the wealthiest 20% of
the population attending primary school, versus only 69% of children from the poorest 20% families. Sec-
ond, another important indicator concerning primary educational advancement is the primary completion
rate, taking account of drop-outs and indicating which share of the children who have enrolled in the fi rst
grade of primary education can be expected to reach the last grade. This gives a more realistic picture of
actual school attendance. Unless impressive progress in many educational fi elds, the Indian drop-out rates
22 On the World Bank India website impressive accounts can be found of activities in sub-programs under the SSA. See for example the account of Seema Bishnoi, teacher and warden of a residential primary school in one of the poorest parts of Rajasthan, for the huge diffi culties to overcome in catering for 11-16-year-old daughters of poor illiterate parents who either dropped out of school or have never been to school at all, but also for the opportunities coming with learning these girls can be offered (teaching hygiene, playing with the computer, learning to bike, et cetera), bringing about positive behavioural changes (cf. Ravaillion 2009, 22).
23 However, in a surprising result a more detailed (regression) analysis based on 2000 fi gures showed that rural children were as likely to be in school as urban children, all other variables being equal. The observed disparity in school attendance between urban and rural areas could be explained by other factors, such as household wealth or the parents’ education. For example, 67% of all primary school-age children had mothers without any formal education; in contrast, 93% of out-of-school children had mothers without formal education (UNICEF 2005, 51).

Page ● 67
An overview of women’s work and employment in India
are still comparatively high: in 2005-06 25.5% (girls: 21.5%) in primary schools (classes I-V), 48.7% (girls:
49.0%) in secondary schools (classes I-VIII), and 61.6% (girls: 63.6%) in secondary schools (classes I-X).
Consequently, with 65.8% in 2005-06 the overall primary completion rate remained low, though girls’ rate
(65.3%) had hardly any gap left compared to boys’ (66.2%) (GoI 2008; UIS website). For India, “the big
challenge is keeping children in school once they enroll” (UNESCO 2010, 60).
The most recent UNESCO report (2010) concludes that India’s wealth divides in education are among
the largest in the world – and that they are reinforced by regional and gender disparities. The report states
that in 2005 over three in 10 Indian females (30.7%) aged 17 to 22 were in “education poverty”, meaning
that they had fewer than four years of education, nearly double the proportion of males of the same age
(15.6%). Another source concludes for 2005-06 that 37% of Indian females aged 15 to 19 had less than six
years of education: 45% in the rural areas against 19% in the urban areas. In Bihar this share was even 61%,
in Jharkhand 56%, and in Chhattisgarh and Uttar Pradesh both 45%. By contrast, in Kerala only 2% of all
adolescent females had less than six years of education, in Himachal Pradesh 7%, in Goa 8%, in Tamil Nadu
12%, and in Maharashtra 17% (Moore et al 2009).
Living and health conditions of the poor are highly relevant here. Child malnutrition seriously ham-
pers cognitive development. Drawing on unique research that tracks children in four developing countries
--including India-- through their early years, marked nutrition-related disadvantages in test scores at age 4
to 5 have been revealed. By age 7 to 8, the malnutrition penalty is equivalent to the loss of a full term of
schooling. And in India in 2000-07 nearly two in fi ve children were stunted24: many of them will carry a
burden of disadvantage into primary school (UNESCO 2010, 43-4). Moreover, the available fi gures imply
that 17% or 21 million children of primary school age in India were out of school in 2006. Compared to
2000, the number of such children had decreased by six million. Yet, the MDG UPE goal for 2015 can only
be met if the increase in primary school attendance accelerates in the years to come, especially among the
poor. It should be noted that in 2005 children from the poorest 20% were over three times more likely to
be out of school than children from the richest 20%. Children with disabilities are heavily disadvantaged.
According to a World Bank analysis of India’s 2002 National Sample Survey, children with disabilities were
5.5 times more likely to be out of school. Almost three-quarters of children with severe impairments were
out of school. The most likely to be excluded were children with mental illness (of which two-thirds of
24 Stunting, or low height for age, is caused by long-term insuffi ciency of nutrient intake and frequent infections. It generally occurs before the age of 2 and the effects are largely irreversible (UNESCO 2010).

Page ● 68
M. van Klaveren, K.G. Tijdens, M. Hughie-Williams and N.E. Ramos Martin
whom never enroll in school) or blindness (of which over half never enroll) (UNICEF 2005; 2007 website
Huebler; IIPS / Macro International 2007b; UNESCO 201025).
In 2007, the gross enrollment rate in secondary education was 57%, again considerable progress as this
rate was in 1981 only 33%, in 1993 41%, in 1999 48% and in 2005-06 54% (Ravallion 2009; ADB 2009a;
UIS website). Moreover, over these years girls of secondary school age (11-17 years) diminished the gender
gap considerably. In 1991, women to men parity in secondary education was just 60%, which improved to
69% in 1999; in the 2000s the closing of the gender gap speeded up, with 83% parity in 2005-06 till in 2007
85% parity was reached, through gross enrollment rates of 61% for males and 52% for females (UIS web-
site; 2008 website Huebler). Nevertheless, with both a relatively low gross enrollment rate and a relatively
low women to men parity India does not compare favourably to other many Asian countries. Its results do
not match the rule that Asian women study longer than Asian men, and its 2005-06 women to men parity
ratio of 83% in secondary education was one of the lowest ratios of 41 Asian economies. Currently the
composition of the 40 million children enrolled in secondary education is skewed towards the urban areas
(64%, against 49% in rural areas) and even heavier towards children from the wealthier classes: 83% of
children from the wealthiest 20% of the population attend secondary school, against only 29% of children
from the poorest 20% families and 43% of children from the second poorest 20%. Also, secondary school
enrollment varies widely across states, from 92% in Kerala to 22% in Bihar and only 4% in Jharkhand (2008
website Huebler; IIPS / Macro International 2007b). The World Bank (website Secondary education in
India) argues that actually with larger numbers of children fi nishing primary school, the demand for sec-
ondary schooling –grades 9 to 12—is growing. Over the next decade an increasing share of these students
will come from rural and lower income groups, who will be less able to afford private secondary education.
Against this backdrop, the World Bank points at the risks of the situation that 60% of India’s secondary
school system is privately managed.
The Indian technical and vocational education (TVET) system is still in its infancy, and diffi cult to
access for females. By 2005, in the group 15-29 of age 6.8 million males and 4.3 million females were
receiving or had received formal vocational training. Another 14.2 million males and 8.1 million females
(had) received informal training; as to be expected, this kind of training dominates in the unorganised sec-
tor. Jointly, the categories of formal and informal trained made up only about 11.5% of this age group in
the labour force: 14% of the young males and 9% of the young females; for only the formally trained this
25 Following different yardsticks, the Government of India (2008) counted by March 2006 seven million children 6-13 years out of school.

Page ● 69
An overview of women’s work and employment in India
share was 3.7% -- a level with which India compares poorly across countries (NCEUS 2009a, 2009c). The
country’s Industrial Training Institutes (ITIs) and various craft centres are not accessible to the vast major-
ity of the poor. Moreover, the gender disparities reported in TVET are large, with girls accounting for just
7% of enrollment at the secondary level and their courses concentrated in traditional areas such as nursing
and sewing.26 In general, the benefi ts of vocational training are not immediately apparent. Some 60% of
graduates from ITIs are still unemployed three years later, also because they do not derive benefi ts in entry
to higher technical education courses. Industrial apprentices are more likely to get work, but generally not
in the trade for which they trained. The career paths of TVET teachers are uncertain and uninspiring, and
public awareness of the potential of TVET is very limited. Governance problems have hampered India’s
efforts to strengthen vocational education. Duplication and fragmentation are widespread, there is little con-
trol over quality and the certifi cation system is poorly understood by employers. Companies and employer
organizations are only marginally involved, though efforts are being made to strengthen their engagement.
Moreover, formal retraining of adult workers is virtually absent. Only 16% of Indian manufacturers offer
in-service training compared to over 90% in China (Rajput 2009; NCEUS 2009a, 2009c; World Bank 2009d;
UNESCO 2010).
The relative position of India’s women is also lagging behind in tertiary education, where in 2006-07
the country’s women to men enrollment ratio was 67%. It cannot be denied that in 1991, with a women /
men ratio of 54%, the situation was even worse for girls and young women, but between 1991 and 2007
India’s progress has remained comparatively limited (UIS website; ADB 2009a; UN MDG Indicators). In
2007, 13% of the 17-25 of age were enrolled in tertiary education: 16% of the young men of that age, and
11% of the young females (UIS website). Enrollment increases quickly. In 2006-07, the massive amount of
13,93 million students was enrolled in institutions of higher education, as against 11,78 million in 2005-06;
4,47 million were female, constituting 40.4% or a 67% women to men parity rate. In 2004-05 female Ph.D’s,
D.Sc’s and D.Phill’s made up 41% of this category; female MA’s made up 47% of all MA’s, and female MSc’s
46% of all MSc’s (website World Bank edstats; World Bank 2007).
As such, the growth of India’s higher education system is impressive. The Eleventh Five-Year Plan
(2007-2012) outlines major expansion plans, including funding for 30 new Central Universities, fi ve new In-
dian Institutes of Science, Education and Research, eight new Indian Institutes of Technology (IIT), seven
26 In 2004-05, 2,70 million males and 1,23 million females aged 15-29 were in VET institutes. The overall most popular fi eld of formal VET was ‘computer trades’ (30% for both sexes). For males the next most popular fi elds were electrical and electronic engineering (18%), mechanical engineering (12%), driving and motor mechanic work (9%), and civil engineering and construc-tion-related (5%). For females, after computer trades ‘textile related’ (22%) came next, followed by health and paramedical (10%), offi ce and business work (6%), and beautician, hairdressing and related work (4%) (NCEUS 2009c, Table 3.7).

Page ● 70
M. van Klaveren, K.G. Tijdens, M. Hughie-Williams and N.E. Ramos Martin
new Indian Institutes of Management and 20 new Indian Institutes of Information Technology. Qualitative
progress is impressive too. The top students of the Indian Institutes for Technology, for example, are al-
ready not just globally competive, in many ways they set the global standard – with many alumni careering in
California’s Silicon Valley and elsewhere in the US (Friedman 2005, 104-5). Also, recent graduates of Indian
Institutes of Management are so in demand that already in 2006 their very top salaries approached about
USD 225,000 (wikipedia, Tertiary education in India; Bhatnagar 2010). Yet, besides praising such academic
progress a World Bank Policy Review stressed the related societal contradictions. To cite just one example
of many: “Delhi’s new metro is a 21st century marvel while rural roads in many states are in poor repair
and often impassable” (World Bank 2006). Another World Bank report, regarding innovation in India, also
emphasizes these striking societal disparities and contradictions. The report argues that inclusive innovation,
and improved knowledge absorption, can play a critical role in lowering the costs of goods and services and
in creating income-earning opportunities for the poor (Dutz 2007).
Female skill levels2.7.3.
The mean years of education of non-agricultural workers in India differ widely across gender, but not
always and partly considerably more across the formal - informal and urban – rural divides. In 2004-05,
with 10.1 years both urban males and females working in the formal sector had the highest average years
of schooling, followed by rural males in the formal sector (7.6 years); urban males working in the informal
sector (7.0); rural females in the formal sector (5.7), and rural males in the informal sector (5.1), and urban
females in the informal sector (4.7). As to be expected, rural females working in the informal sector had by
far the lowest educational level (average 2.9 years of schooling -- NCEUS 2009, 24).
In Table 8 we present a frequency division of educational levels for the total economically active popula-
tion, based on the categories just mentioned.27
27 Note that these levels indicate the educational/skill levels of the economically active, not the skills demanded in the workplace. We did not fi nd Indian statistics concerning the latter, but it may well be that the gender gap in skills demanded and in job levels is considerably larger than Table 8 suggests.

Page ● 71
An overview of women’s work and employment in India
Table 8. Total economically active population by highest level of education completed, by sector (urban/ rural) and by gender, 2004-05
all women menwomen men urban rural urban rural
illiterate (ISCED 0) 59.9 27.5 34.3 65.1 12.8 33.7primary level (ISCED 1-2) 19.1 27.3 20.6 18.8 22.6 29.3middle (ISCED 3) 9.4 18.4 12.1 8.9 19.3 18.0secondary level and high school (ISCED 3-4) 7.9 18.9 17.0 6.0 28.0 15.0
graduate and above (ISCED 5-6) 3.7 7.9 16.1 1.2 17.2 4.0Total 100.0 100.0 100.0 100.0 100.0 100.0Total (x million) 150,8 316,0 25,7 125,1 94,0 222,0
Source: NCEUS 2009a (Tables 4.2 and 4.8).
The gender gap in educational level shows up as immense, and the largest of the 14 countries involved
in the DECISION FOR LIFE project. In 2004-05, 60% of the female labour force was illiterate – an even
larger proportion than in the population at large, where illiteracy at the same time was about 47% (section
2.7.1). By contrast, the share of illiterates in the male labour force was lower than 28%. Moreover, the de-
cline of the illiterate share in the last two decades has been stronger among males. In 1983, the respective
fi gures were 80.8% for females and 57.1% for males, implying a 26% decline for women against 39% for
men. By contrast, the share of graduates and above (ISCED levels 5 - 6) among men more than doubled
that among women: 7.9% against 3.7%, or 47% women to men parity.28 The gender gap among urban work-
ers is much smaller, especially at the top: 16.1% of all urban female workers was graduated and above, only
1.1%point behind urban males. On the other hand, in 2004-05 more than one in three females working in
urban areas was still illiterate, as against one in eight males. The fi gures confi rm that men in rural areas have
a lower educational level than urban females. As we pointed out before presenting the table, males working
in the formal sector may have attained a slightly higher educational level, but males in the informal rural
sector lagged behind urban females. Again, the educational level of rural women is by far lowest of the four
categories (all data: NCEUS 2009a).
The industry distribution of educational levels as of 2004-05 provides useful information for our proj-
ect. This distribution is extremely skewed. As for female workers, the industries with the highest shares of
graduates and above were, in this order, banking and fi nance (71%); real estate and business services (58%);
education (48%); public administration and defence (27%); transport, storage and communication (23%),
and health and social work (22%). It is interesting to note that these female shares were even higher than the
28 Projections for 2017 suggest that the shares of those graduated and above will increase to about 10% for men and 5% for women by then, implying about 50% women to men parity (NCEUS 2009a, Fig. 5.12).

Page ● 72
M. van Klaveren, K.G. Tijdens, M. Hughie-Williams and N.E. Ramos Martin
male shares in three industries, banking and fi nance (males: 54%); real estate and business services (males:
44%), and, at a lower level, transport et cetera (males: 7%). In other industries employing many women, the
shares of graduates and above were quite low in manufacturing (under 2%), wholesale and retail (4%), and
hotels and restaurants (3%), and other community, social and personal services (4%). On the low end of
the educational distribution, the highest proportions of illiterate women could be found in mining (90%);
construction (74%), and other community, social and personal services (62%). In these industries, the share
of illiterates among male workers was less than half of these female shares (NCEUS 2009a, Table 4.16).
A state-wise distribution of educational levels for 2004-05 reveals the largest proportion of least educat-
ed (illiterates and primary educated, Indian average 62.5%) in Rajasthan (75%); Chhattisgarh (74%), Madhya
Pradesh and Andhra Pradesh (both 73%). Except Madhya Pradesh, with a quite segmented labour force,
these states also showed low shares of graduates and above. With 33%, Kerala had the lowest share. On the
positive side, the highest shares of graduates and above (Indian average 6.6%) were in 2004-05 in “other
states” (including New Delhi, 23.6%), Maharashtra and Kerala (both 8.2%), Tamil Nadu (8.1%), and Hary-
ana (7.8%). For the female labour force, with an Indian average of 3.7%, by far the highest share of gradu-
ates and above was in “other states” (28.6%), followed by Kerala (11.1%), Punjab (8.0%), and West Bengal
(5.8%). The all-India average share of graduates and above in the male labour force in 2004-05 was 7.9%.
However, “other states”, Kerala and Punjab had higher shares of female graduates and higher than males,
most outspokenly in “other states” (5.9%points difference) and Kerala (4.6%points). The female share in
Kerala was even higher than the male shares in all states except for “other states”. By contrast, in eight states
the shares of male graduates and above still more than doubled those of females: Andhra Pradesh, Bihar,
Gujarat, Karnataka, Madhya Pradesh, Orissa, Rajasthan, and Uttar Pradesh. For 2004-05 very low female
rates of graduates and above were found in Bihar (1.2%), Rajasthan (1.5%), Andhra Pradesh (2.0%), Mad-
hya Pradesh (2.2%) and Uttar Pradesh (2.3%)(NCEUS 2009a, Tables 4.11 and 4.7.18).
As noted above, the gender gap for those graduated and above in urban labour markets was in 2004-05
only 1.1% or 93% women to men parity, considerable progress compared to 1983 (3.3%points difference)
and 1993-94 (2.4%points difference). In 2004-05 in all states the share of graduates and above in the female
urban labour force was higher than 10%. The highest shares were in “other states” (34.7%), followed by
Punjab (33.2%) and Assam (22.3%), and Himachal Pradesh (21.8%). This time, Kerala (21.4%), Haryana
(21.3%), Maharashtra (19.3%) and West Bengal (18.9%), states with rather developed labour markets, fol-
lowed. In the urban labour markets of all these seven states the shares of female graduates and above were

Page ● 73
An overview of women’s work and employment in India
higher than those in the male labour force; this was also the case in Jammu and Kashmir. The most spec-
tacular female advantage was in Punjab (19%points difference, more than double the male rate), followed
by Jammu and Kashmir (9.6%points difference), “other states” (9.5%points), and Kerala (9.4%points)
(NCEUS 2009a, Table 4.7.17). In the female rural labour force, the share of those at least graduated in
2004-05 was much lower. In 2004-05, 1.2% of all females in rural areas had reached that educational level,
against 4.0% of all males, implying a 2.8%points gap or 30% women to men parity. 12 states had 1% or
more graduates or above in their female rural labour force. Kerala was on top, with 7.9% female graduates
or above, followed by “other states” (7.4%); Himachal Pradesh took the third spot (4.0%). “Other states”
and Kerala were the only two with higher shares of female graduates and above in their rural labour forces
than men (NCEUS 2009a, Table 4.7.16).
Table 9 (next page) shows a frequency division of educational levels of the total population (not only
the labour force!) aged 15-29, thus including our target group. Unfortunately, the educational categories
used in these statistics are not fully comparable with those presented earlier for the economically active of
all ages. Yet, simple comparisons clarify India’s educational progress. For example, among the females aged
15-29 in 2004-05 nearly 40% was illiterate (Table 9), against nearly 60% in the female labour force at large
(Table 8). And whereas 29% of the females aged 15-29 had at least secondary education (Table 9), accord-
ing to comparable statistics (not shown) this share in the female labour force at large was 18%. This is not
to deny that for the 15-29 aged there remains a gender gap, in particular in the rural areas. Here, less than
20% of the young women had at least secondary education, against 30% of the young men. In urban areas
gender differences have become much smaller: here, 51% of the young women had at least secondary edu-
cation, compared with 55% among their male colleagues. These fi gure also confi rm that men in rural areas
are lower educated than urban females; especially the differences with those with high school and above are
striking.
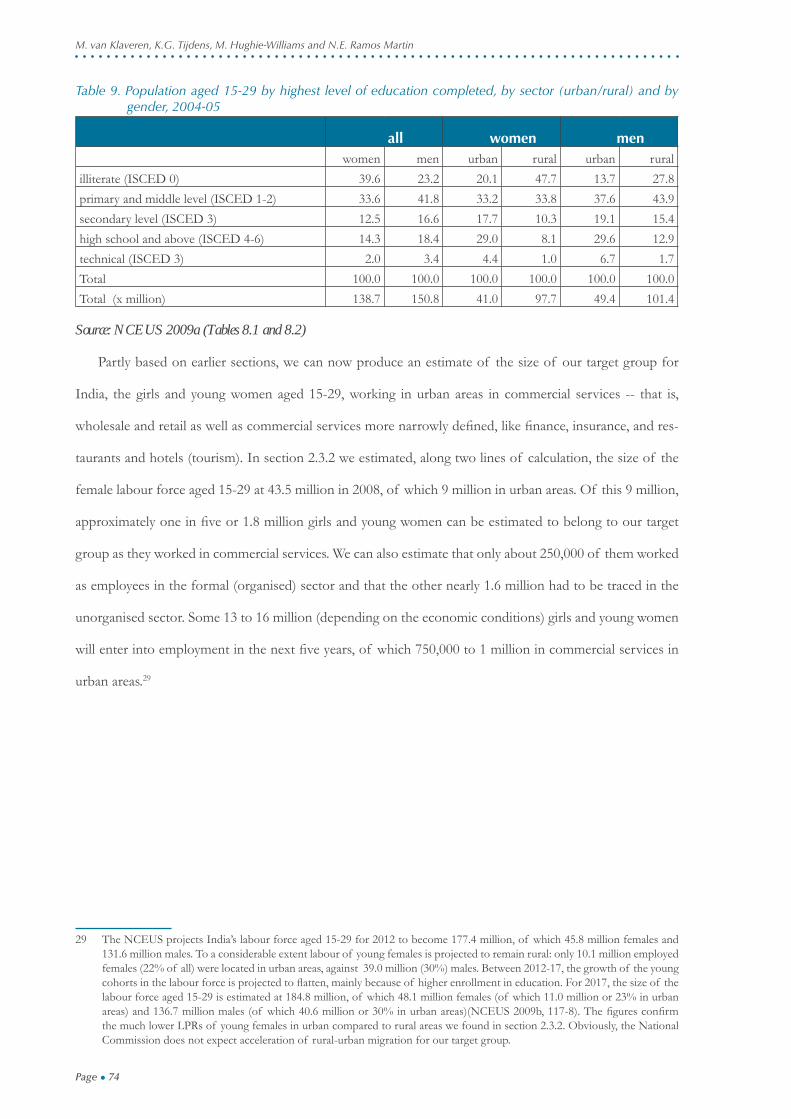
Page ● 74
M. van Klaveren, K.G. Tijdens, M. Hughie-Williams and N.E. Ramos Martin
Table 9. Population aged 15-29 by highest level of education completed, by sector (urban/rural) and by gender, 2004-05
all women menwomen men urban rural urban rural
illiterate (ISCED 0) 39.6 23.2 20.1 47.7 13.7 27.8primary and middle level (ISCED 1-2) 33.6 41.8 33.2 33.8 37.6 43.9secondary level (ISCED 3) 12.5 16.6 17.7 10.3 19.1 15.4high school and above (ISCED 4-6) 14.3 18.4 29.0 8.1 29.6 12.9technical (ISCED 3) 2.0 3.4 4.4 1.0 6.7 1.7Total 100.0 100.0 100.0 100.0 100.0 100.0Total (x million) 138.7 150.8 41.0 97.7 49.4 101.4
Source: NCEUS 2009a (Tables 8.1 and 8.2)
Partly based on earlier sections, we can now produce an estimate of the size of our target group for
India, the girls and young women aged 15-29, working in urban areas in commercial services -- that is,
wholesale and retail as well as commercial services more narrowly defi ned, like fi nance, insurance, and res-
taurants and hotels (tourism). In section 2.3.2 we estimated, along two lines of calculation, the size of the
female labour force aged 15-29 at 43.5 million in 2008, of which 9 million in urban areas. Of this 9 million,
approximately one in fi ve or 1.8 million girls and young women can be estimated to belong to our target
group as they worked in commercial services. We can also estimate that only about 250,000 of them worked
as employees in the formal (organised) sector and that the other nearly 1.6 million had to be traced in the
unorganised sector. Some 13 to 16 million (depending on the economic conditions) girls and young women
will enter into employment in the next fi ve years, of which 750,000 to 1 million in commercial services in
urban areas.29
29 The NCEUS projects India’s labour force aged 15-29 for 2012 to become 177.4 million, of which 45.8 million females and 131.6 million males. To a considerable extent labour of young females is projected to remain rural: only 10.1 million employed females (22% of all) were located in urban areas, against 39.0 million (30%) males. Between 2012-17, the growth of the young cohorts in the labour force is projected to fl atten, mainly because of higher enrollment in education. For 2017, the size of the labour force aged 15-29 is estimated at 184.8 million, of which 48.1 million females (of which 11.0 million or 23% in urban areas) and 136.7 million males (of which 40.6 million or 30% in urban areas)(NCEUS 2009b, 117-8). The fi gures confi rm the much lower LPRs of young females in urban compared to rural areas we found in section 2.3.2. Obviously, the National Commission does not expect acceleration of rural-urban migration for our target group.

Page ● 75
An overview of women’s work and employment in India
Wages and working conditions of the target group2.8.
Wages2.8.1.
Comprehensive and recent wage information from sources other than the WageIndicator is quite lim-
ited for India. The Annual Survey of Industries (ASI, CSO 2007) only provides non-detailed overviews
(divided over employees and (manual) workers, workers divided over male, female, child and contract work-
ers) in the “organised factory” sector, totaling nearly 8.5 million workers in 2004-05 – about 40% of total
in the organised manufacturing sector. The latest publicly available ASI fi gures, those of 2004-05, indicate
very large wage differentials. Whereas the average wage per “man day worked” for regular male workers was
Rs. 212.30 (USD 4.60), for female workers that was only Rs. 91.00 (USD 1.96), implying a gender pay gap30
of 57%. In 2000-01, with average wages of respectively Rs. 180.02 and 78.45, the gender gap was nearly
the same (56%). In turn, workers in the organised sector earned on average much more than those in the
unorganised sector. According to NCEUS calculations on 2004-05 NSS data, male casual workers employed
in the formal sector earned on average Rs. 73.00 per day, whereas male casual workers in the informal sector
earned an average Rs. 51.30; for female casual workers these amounts were respectively Rs. 47.40 and Rs.
32.40 (NCEUS 2009a, 24). Here, gender pay gaps show up of 35% in urban areas and 37% in rural areas.
Because of the much lower productive days per year in many unorganised trades, the intersectoral distance
measured in yearly earnings is mostly much larger.
Data for 2000 show that average yearly wages in the organised “factory sector” roughly more than tri-
pled those of the various categories of wage earners in unorganised and small-scale manufacturing. The av-
erage yearly wage in the organised sector was Rs. 13,150, against Rs. 2,620 - 4,240 in the unorganised sector,
depending on the category of enterprise – implying that wages in the unorganised sector were 20-30% of
those in the organised sector. It should be added that wage rates in the unorganised sector vary substantially
across states and activities, as well as across skills, occupations, and experience. In 2000 the textiles, textile
products, chemicals, rubber & plastic, basic metals, and equipment sectors had higher wage rates compared
to other manufacturing industries all throughout India. Also, consistently higher wages in the unorganised
segment were observed in Delhi, Gujarat, Haryana, Himachal Pradesh, Maharashtra, and Punjab than in the
other states (Majumder 2006; Nagaraj 2007).
30 We use the international standard formula for the gender pay (or wage) gap: ((wage men – wage women) : wage men) x100).

Page ● 76
M. van Klaveren, K.G. Tijdens, M. Hughie-Williams and N.E. Ramos Martin
Some detailed analyses have combined ASI fi gures with NSS household survey data, like recently on
the effects of international trade for the gender pay gap (Menon and Van der Meulen Rodgers 2009). How-
ever, as far as we know wage statistics covering services are lacking, even in the organised sector. Thus, we
cannot yet give insight in wages and wage developments for our target group. This situation underlines the
importance of the WageIndicator for India, though making a start with salary indications for industries and
occupations is not easy under these conditions.
Working conditions2.8.2.
Besides minimum wages, the state government also sets hours of work, and safety and health standards.
The Factories Act mandates an eight-hour working day, a 48-hour working week, and safe working condi-
tions, which include adequate provisions for rest rooms, canteens, medical facilities, and proper ventilation.
The law mandates a minimum rest period of 30 minutes after every four hours of work and premium pay
for overtime. Legislative provisions regulating the conditions of work and workplace to ensure safety as
well as safeguards to prevent occupational diseases are in place in case of factories, mines and docks, which
together account for less than 10% of the labour force. Provisions for compensation in case of injuries
at work and sickness benefi ts also apply only to workers in these establishments. After the accident in the
Bhopal plant of chemicals multinational Union Carbide (1985), which killed several thousand employees
and others and debilitated many more, the judiciary, civil society organizations and unions renewed pressure
on employers and government for strict enforcement of legal provisions and the right of workers to refuse
work in unhealthy and hazardous conditions without adequate safeguards. In contrast, employers’ associa-
tions have campaigned for doing away with the Labour Inspection and the introduction of a system of
self-certifi cation. The trade unions have strongly opposed these proposals (NCEUS 2009a, 177-178). The
current state of affairs, however, is that legal provisions regulating conditions of work are mainly enforced
in the organised industrial sector (Papola 2008; US Dept of State 2009). Studies by, among others, NCEUS
(2007) prove that most workers in the unorganised sector work in very poor physical conditions in unhy-
gienic, crowded and poorly lighted and ventilated workplaces. Many of them work in hazardous conditions
and processes, but have no adequate safeguards and even fi rst aid facilities available at the workplace. Even
enforcement of health and safety standards in the organised sector may be questionable. Earlier, researchers
doing fi eldwork in Gujarat found that, among other things, factory inspectors were routinely paid off by
employers, both in 1974 and 1998. It is quite unlikely that such practices remained and remain restricted to
one state (Streefkerk 2001; Breman 2004).

Page ● 77
An overview of women’s work and employment in India
There are hardly any adequate Indian statistics acailable concerning occupational health and safety. By
necessity, the limited available information has to be distributed over the various vategories of workers and
sectors (cf. NCEUS 2007, for an excellent overview). Offi cial reporting concentrates on occupational ac-
cidents but, except for mining, accidents seem grossly underreported (cf. Ministry of Labour and Employ-
ment 2009a). As, in contrast, Indian statistics –though a bit outdated and though overall data is missing--
provide rather good evidence on working hours at industry level, we concentrate here on this major issue
in working conditions. Table 10 (next page) presents average working week fi gures for employees detailed
by industry and gender, for 2000 and 2006. The results are quite remarkable. Contrary to the international
picture, in 2000 female employees in the Indian organised sector on average made longer hours than their
male colleagues: an average working week of 48.1 hours against 46.3. Also in international perspective the
working hours of notably female employees were quite long, community, social and personal services on
top, with an average 48.9 hours. Between 2000 and 2006, the average working week of females has clearly
been shortened, by 1.3 hours, whereas the male average working week has been prolonged by 0.5 hours,
resulting in equal working hours for both sexes in 2006: on average 46.8 hours. In 2006, women worked
shorter than men in two of the six large industries for which information is available (mining and manufac-
turing), in one sector they made equal hours (wholesale and retail), and in three sectors (utilities; transport et
cetera, and community, social and personal services) they still worked longer hours than men. In 2006, for
females working weeks were longest in community, social, personal services (47.6 hours on average31); for
males the working weeks in notably construction and fi nance et cetera have been prolonged, to a quite long
average 49.0 hours. Both averages even surpass the formal 48-hour working week.
31 Though suffi cient 2006 data is lacking for notably fi nance et cetera, with an 48-hours week in 2000.

Page ● 78
M. van Klaveren, K.G. Tijdens, M. Hughie-Williams and N.E. Ramos Martin
Table 10. Average working week (hours usually worked, employees, organised sector) by industry and gender, India, 2000 and 2006
total men women
2000 2006 2000 2006 2000 2006mining 47.5 45.4 46.7 46.1 47.6 41.6manufacturing 47.2 46.9 46.5 46.9 47.8 46.7
of which
food, beverages, tobacco 46.5 46.7 46.5 46.7 46.4 46.5textile, apparel, leather 46.1 47.0 46.1 47.0 46.6 47.6wood(products), furnit. 46.4 46.6 46.4 46.6 46.8 46.4paper(products),printing 47.0 46.8 47.0 46.8 46.6 46.5chemicals, petroleum etc. 46.4 47.0 46.4 47.0 46.6 46.4non-mineral metal prod. 46.3 46.3 46.3 46.3 46.5 45.2basic metal industries 46.5 46.7 46.5 46.7 46.3 46.7fabricated metal, machinery, equipment - 47.2 - 47.2 46.4 47.4
other manufacturing - 47.2 - 47.2 46.6 47.2utilities 47.5 46.4 47.0 46.4 48.0 46.5construction 47.0 49.0 46.6 49.0 47.4 -transport, storage, communication 46.3 45.0 45.2 44.9 47.4 46.5wholesale and retail 46.7 46.7 46.0 46.7 47.4 46.7fi nance, real estate, other business 45.7 49.0 43.5 49.0 48.0 -community, social, personal services 46.6 46.9 45.3 46.8 48.9 47.6Total organised sector*) 46.8 46.8 46.3 46.8 48.1 46.8
Source: ILO Laborsta (Total is authors’ calculation)*) excl. agriculture

Page ● 79
An overview of women’s work and employment in India
Basic information for WageIndicator 3. Questionnaire
Introduction3.1.
Preparations for the DECISIONS FOR LIFE Activities 1.03a and 1.03b have resulted in a number of
lists, grouped in this Chapter and to be used in the WageIndicator web-survey for country-specifi c questions
and their analyses. This basic information can be used on-line, but if needed also off-line. The lists contain
information on India’s educational categories and ISCED levels (3.2), regions (3.3), ethnic groups (3.4.1)
and languages (3.4.2).
List of educational categories and ISCED levels3.2.
Below, a full list of the educational categories used in India, designed for use in the web-survey, can be
found.
Table 11. List of educational categories in India (by 1/1/2009)
en_IN Master label Translation ISCED
356190 IND No formal education No formal education 0
356191 IND Below 10th standard Below 10th standard 2
356192 IND Plus 2 or equivalent Plus 2 or equivalent 3
356193IND Three year degree (B.com, BBA, B.Sc, B.A. etc.)
Three year degree (B.com, BBA, B.Sc, B.A. etc.) 5
356194 IND CA/CS/ICWA or equivalent CA/CS/ICWA or equivalent 6
356195IND Four/fi ve years degree (B.E., MBBS, B.Arch, B.Pharm, LLB, etc.)
Four/fi ve years degree (B.E., MBBS, B.Arch, B.Pharm, LLB, etc.) 5
356196IND Masters (arts, science, engineering, com-merce, MBA/equivalent)
Masters (arts, science, engineering, com-merce, MBA/equivalent) 5
356197 IND Advanced certifi cate/diplomas Advanced certifi cate/diplomas 5
356198 IND ITI/other certifi cates ITI/other certifi cates 3
356199 IND PhD or equivalent PhD or equivalent 6
356200 IND Post Doctoral Post Doctoral 6

Page ● 80
M. van Klaveren, K.G. Tijdens, M. Hughie-Williams and N.E. Ramos Martin
List of regions1.1.
Below, a full draft list of the regions in India, designed for use in the web-survey, can be found.
Table 12. List of regions in India (by 1/1/2009)
en_IN en_IN Source label Source label Translation Translation
3560100000 3560100104IND Andaman and Nicobar islands (U)
IND Andaman and Nicobar islands (U) Bamboo Flat
Andaman and Nicobar islands (U) Bamboo Flat
3560100000 3560100204IND Andaman and Nicobar islands (U)
IND Andaman and Nicobar islands (U) Garacherama
Andaman and Nicobar islands (U) Garacherāma
3560100000 3560100331IND Andaman and Nicobar islands (U)
IND Andaman and Nicobar islands (U) Port Blair
Andaman and Nicobar islands (U) Port Blair
3560100000 3560109704IND Andaman and Nicobar islands (U)
IND Andaman and Nicobar islands (U) A village (less than 10,000)
Andaman and Nicobar islands (U)
A village (less than 10,000)
3560100000 3560109805IND Andaman and Nicobar islands (U)
IND Andaman and Nicobar islands (U) Rural area
Andaman and Nicobar islands (U) Rural area
3560200000 3560200131 IND Andhra Pradesh IND Andhra Pradesh Anantapur Andhra Pradesh Anantapur3560200000 3560200231 IND Andhra Pradesh IND Andhra Pradesh Gajuwaka Andhra Pradesh Gajuwaka3560200000 3560200331 IND Andhra Pradesh IND Andhra Pradesh Guntur Andhra Pradesh Guntūr 3560200000 3560200407 IND Andhra Pradesh IND Andhra Pradesh Hyderabad Andhra Pradesh Hyderābād
3560200000 3560200502 IND Andhra Pradesh IND Andhra Pradesh The suburbs of Hyderabad Andhra Pradesh
The suburbs of Hyderābād
3560200000 3560200631 IND Andhra Pradesh IND Andhra Pradesh Kakinada Andhra Pradesh Kākināda 3560200000 3560200731 IND Andhra Pradesh IND Andhra Pradesh Karīmnagar Andhra Pradesh Karīmnagar 3560200000 3560200831 IND Andhra Pradesh IND Andhra Pradesh Kukatpalle Andhra Pradesh Kukatpalle3560200000 3560200931 IND Andhra Pradesh IND Andhra Pradesh Kurnool Andhra Pradesh Kurnool
3560200000 3560201031 IND Andhra Pradesh IND Andhra Pradesh Lalbahadur Nagar Andhra Pradesh
Lalbahadur Nagar
3560200000 3560201131 IND Andhra Pradesh IND Andhra Pradesh Nellore Andhra Pradesh Nellore3560200000 3560201231 IND Andhra Pradesh IND Andhra Pradesh Nizamabad Andhra Pradesh Nizāmābād
3560200000 3560201331 IND Andhra Pradesh IND Andhra Pradesh Qutubul-lapur Andhra Pradesh Qutubullapur
3560200000 3560201431 IND Andhra Pradesh IND Andhra Pradesh Rajahmun-dry Andhra Pradesh Rājahmundry
3560200000 3560201531 IND Andhra Pradesh IND Andhra Pradesh Ramagun-dam Andhra Pradesh Rāmagundam
3560200000 3560201631 IND Andhra Pradesh IND Andhra Pradesh Secundera-bad Cantonment Andhra Pradesh
Secunderābād Cantonment
3560200000 3560201731 IND Andhra Pradesh IND Andhra Pradesh Tirupati Andhra Pradesh Tirupati3560200000 3560201831 IND Andhra Pradesh IND Andhra Pradesh Vijayawada Andhra Pradesh Vijayawāda
3560200000 3560201931 IND Andhra Pradesh IND Andhra Pradesh Visakhap-atnam Andhra Pradesh Visākhapatnam
3560200000 3560202031 IND Andhra Pradesh IND Andhra Pradesh Warangal Andhra Pradesh Warangal
3560200000 3560209531 IND Andhra Pradesh IND Andhra Pradesh Another town (100,000 - 1 million) Andhra Pradesh
Another town (100,000 - 1 mil-lion)
3560200000 3560209632 IND Andhra Pradesh IND Andhra Pradesh A small city (10,000 - 100,000) Andhra Pradesh
A small city (10,000 - 100,000)
3560200000 3560209704 IND Andhra Pradesh IND Andhra Pradesh A village (less than 10,000) Andhra Pradesh
A village (less than 10,000)
3560200000 3560209805 IND Andhra Pradesh IND Andhra Pradesh Rural area Andhra Pradesh Rural area
3560300000 3560300132IND Arunachal Pradesh IND Arunachal Pradesh Itanagar Arunachal Pradesh Itānagar
3560300000 3560300232IND Arunachal Pradesh
IND Arunachal Pradesh Nahar-lagun Arunachal Pradesh Naharlagun

Page ● 81
An overview of women’s work and employment in India
3560300000 3560300332IND Arunachal Pradesh IND Arunachal Pradesh Pasighat Arunachal Pradesh Pāsighāt
3560300000 3560309632IND Arunachal Pradesh
IND Arunachal Pradesh Another small city (10,000 - 100,000) Arunachal Pradesh
Another small city (10,000 - 100,000)
3560300000 3560309704IND Arunachal Pradesh
IND Arunachal Pradesh A village (less than 10,000) Arunachal Pradesh
A village (less than 10,000)
3560300000 3560309805IND Arunachal Pradesh IND Arunachal Pradesh Rural area Arunachal Pradesh Rural area
3560400000 3560400132 IND Assam IND Assam Bongaigaon Assam Bongaigaon3560400000 3560400232 IND Assam IND Assam Dhubri Assam Dhubri3560400000 3560400331 IND Assam IND Assam Dibrugarh Assam Dibrugarh3560400000 3560400432 IND Assam IND Assam Diphu Assam Diphu3560400000 3560400531 IND Assam IND Assam Guwahati Assam Guwāhāti 3560400000 3560400632 IND Assam IND Assam Jorhat Assam Jorhāt 3560400000 3560400732 IND Assam IND Assam Karīmganj Assam Karīmganj
3560400000 3560400831 IND Assam IND Assam Nagaon (Nowgong) Assam Nagaon (Nowgong)
3560400000 3560400932 IND Assam IND Assam North Lakhimpur Assam North Lakhim-pur
3560400000 3560401032 IND Assam IND Assam Sibsagar Assam Sibsāgar 3560400000 3560401131 IND Assam IND Assam Silchar Assam Silchar3560400000 3560401232 IND Assam IND Assam Tezpur Assam Tezpur3560400000 3560401332 IND Assam IND Assam Tinsukia Assam Tinsukia
3560400000 3560409632 IND Assam IND Assam Another small city (10,000 - 100,000) Assam
Another small city (10,000 - 100,000)
3560400000 3560409704 IND Assam IND Assam A village (less than 10,000) Assam
A village (less than 10,000)
3560400000 3560409805 IND Assam IND Assam Rural area Assam Rural area3560500000 3560500131 IND Bihar IND Bihar Ara (Arrah) Bihar Ara (Arrah)3560500000 3560500231 IND Bihar IND Bihar Bhagalpur Bihar Bhāgalpur 3560500000 3560500331 IND Bihar IND Bihar Bihar Sharīf Bihar Bihār Sharīf3560500000 3560500431 IND Bihar IND Bihar Chapra Bihar Chāpra 3560500000 3560500531 IND Bihar IND Bihar Darbhanga Bihar Darbhanga3560500000 3560500631 IND Bihar IND Bihar Gaya Bihar Gaya3560500000 3560500731 IND Bihar IND Bihar Katihar Bihar Katihār
3560500000 3560500831 IND Bihar IND Bihar Munger (Monghyr) Bihar Munger (Mon-ghyr)
3560500000 3560500931 IND Bihar IND Bihar Muzaffarpur Bihar Muzaffarpur3560500000 3560501001 IND Bihar IND Bihar Patna Bihar Patna
3560500000 3560501102 IND Bihar IND Bihar The suburbs of Patna Bihar The suburbs of Patna
3560500000 3560501231 IND Bihar IND Bihar Purnia (Purnea) Bihar Pūrnia (Purnea)
3560500000 3560509531 IND Bihar IND Bihar Another town (100,000 - 1 million) Bihar
Another town (100,000 - 1 mil-lion)
3560500000 3560509632 IND Bihar IND Bihar A small city (10,000 - 100,000) Bihar
A small city (10,000 - 100,000)
3560500000 3560509704 IND Bihar IND Bihar A village (less than 10,000) Bihar
A village (less than 10,000)
3560500000 3560509805 IND Bihar IND Bihar Rural area Bihar Rural area3560600000 3560600131 IND Chandigarh (U) IND Chandigarh (U) Chandīgarh Chandigarh (U) Chandīgarh
3560600000 3560609632 IND Chandigarh (U) IND Chandigarh (U) A small city (10,000 - 100,000) Chandigarh (U)
A small city (10,000 - 100,000)
3560600000 3560609704 IND Chandigarh (U) IND Chandigarh (U) A village (less than 10,000) Chandigarh (U)
A village (less than 10,000)
3560600000 3560609805 IND Chandigarh (U) IND Chandigarh (U) Rural area Chandigarh (U) Rural area

Page ● 82
M. van Klaveren, K.G. Tijdens, M. Hughie-Williams and N.E. Ramos Martin
3560700000 3560700131 IND Chhattisgarh IND Chhattisgarh Bhilai (Bhilai Nagar) Chhattisgarh
Bhilai (Bhilai Nagar)
3560700000 3560700231 IND Chhattisgarh IND Chhattisgarh Bilaspur Chhattisgarh Bilāspur3560700000 3560700331 IND Chhattisgarh IND Chhattisgarh Durg Chhattisgarh Durg3560700000 3560700431 IND Chhattisgarh IND Chhattisgarh Korba Chhattisgarh Korba3560700000 3560700531 IND Chhattisgarh IND Chhattisgarh Raigarh Chhattisgarh Raigarh3560700000 3560700631 IND Chhattisgarh IND Chhattisgarh Raipur Chhattisgarh Raipur
3560700000 3560700731 IND Chhattisgarh IND Chhattisgarh Raj Nandgaon {Raj Nandgaon} Chhattisgarh
Rāj Nāndgaon {Raj Nandgaon}
3560700000 3560709531 IND Chhattisgarh IND Chhattisgarh Another town (100,000 - 1 million) Chhattisgarh
Another town (100,000 - 1 mil-lion)
3560700000 3560709632 IND Chhattisgarh IND Chhattisgarh A small city (10,000 - 100,000) Chhattisgarh
A small city (10,000 - 100,000)
3560700000 3560709704 IND Chhattisgarh IND Chhattisgarh A village (less than 10,000) Chhattisgarh
A village (less than 10,000)
3560700000 3560709805 IND Chhattisgarh IND Chhattisgarh Rural area Chhattisgarh Rural area
3560800000 3560800132IND Dadra and Na-gar Haveli (U)
IND Dadra and Nagar Haveli (U) amli
Dadra and Nagar Haveli (U) Āmli
3560800000 3560800232IND Dadra and Na-gar Haveli (U)
IND Dadra and Nagar Haveli (U) Silvassa
Dadra and Nagar Haveli (U) Silvassa
3560800000 3560809632IND Dadra and Na-gar Haveli (U)
IND Dadra and Nagar Haveli (U) Another small city (10,000 - 100,000)
Dadra and Nagar Haveli (U)
Another small city (10,000 - 100,000)
3560800000 3560809704IND Dadra and Na-gar Haveli (U)
IND Dadra and Nagar Haveli (U) A village (less than 10,000)
Dadra and Nagar Haveli (U)
A village (less than 10,000)
3560800000 3560809805IND Dadra and Na-gar Haveli (U)
IND Dadra and Nagar Haveli (U) Rural area
Dadra and Nagar Haveli (U) Rural area
3560900000 3560900132IND Daman and Diu (U) IND Daman and Diu (U) Daman Daman and Diu (U) Damān
3560900000 3560900232IND Daman and Diu (U) IND Daman and Diu (U) Diu Daman and Diu (U) Diu
3560900000 3560909704IND Daman and Diu (U)
IND Daman and Diu (U) A village (less than 10,000) Daman and Diu (U)
A village (less than 10,000)
3560900000 3560909805IND Daman and Diu (U)
IND Daman and Diu (U) Rural area Daman and Diu (U) Rural area
3561000000 3561000131 IND Delhi IND Delhi Bhalswa Jahangirpur Delhi Bhalswa Jahangir-pur
3561000000 3561000231 IND Delhi IND Delhi Dallo Pura Delhi Dallo Pura3561000000 3561000307 IND Delhi IND Delhi Delhi Delhi Delhi
3561000000 3561000402 IND Delhi IND Delhi The suburbs of Delhi Delhi The suburbs of Delhi
3561000000 3561000531 IND Delhi IND Delhi Delhi Cantonment Delhi Delhi Canton-ment
3561000000 3561000631 IND Delhi IND Delhi Deoli Delhi Deoli3561000000 3561000731 IND Delhi IND Delhi Karawal Nagar Delhi Karawal Nagar
3561000000 3561000831 IND Delhi IND Delhi Kirari Suleman Nagar Delhi Kirari Suleman Nagar
3561000000 3561000931 IND Delhi IND Delhi Nangloi Jat {Nangloi Jat} Delhi
Nāngloi Jāt {Nangloi Jat}
3561000000 3561001031 IND Delhi IND Delhi New Delhi Delhi New Delhi3561000000 3561001131 IND Delhi IND Delhi Sultanpur Majra Delhi Sultanpur Majra
3561000000 3561009632 IND Delhi IND Delhi Another small city (10,000 - 100,000) Delhi
Another small city (10,000 - 100,000)
3561000000 3561009704 IND Delhi IND Delhi A village (less than 10,000) Delhi
A village (less than 10,000)
3561000000 3561009805 IND Delhi IND Delhi Rural area Delhi Rural area

Page ● 83
An overview of women’s work and employment in India
3561100000 3561100132 IND Goa IND Goa Curchorem Cacora Goa Curchorem Cacora
3561100000 3561100232 IND Goa IND Goa Mapuca (Mapusa) Goa Māpuca (Mapusa)
3561100000 3561100332 IND Goa IND Goa Margao (Madgaon) Goa Margao (Madgaon)
3561100000 3561100431 IND Goa IND Goa Mormugao Goa Mormugao 3561100000 3561100532 IND Goa IND Goa Panaji (Panjim) Goa Panaji (Panjim)
3561100000 3561109632 IND Goa IND Goa Another small city (10,000 - 100,000) Goa
Another small city (10,000 - 100,000)
3561100000 3561109704 IND Goa IND Goa A village (less than 10,000) Goa
A village (less than 10,000)
3561100000 3561109805 IND Goa IND Goa Rural area Goa Rural area3561200000 3561200107 IND Gujarat IND Gujarat Ahmadabad Gujarat Ahmadābād
3561200000 3561200202 IND Gujarat IND Gujarat The suburbs of Ahmadabad Gujarat
The suburbs of Ahmadābād
3561200000 3561200331 IND Gujarat IND Gujarat Bhavnagar Gujarat Bhāvnagar 3561200000 3561200431 IND Gujarat IND Gujarat Gandhinagar Gujarat Gāndhinagar 3561200000 3561200531 IND Gujarat IND Gujarat Jamnagar Gujarat Jamnagar3561200000 3561200602 IND Gujarat IND Gujarat Rajkot Gujarat Rājkot 3561200000 3561200707 IND Gujarat IND Gujarat Surat Gujarat Sūrat
3561200000 3561200802 IND Gujarat IND Gujarat The suburbs of Surat Gujarat
The suburbs of Sūrat
3561200000 3561200901 IND Gujarat IND Gujarat Vadodara (Baroda) Gujarat Vadodara (Bar-oda)
3561200000 3561201002 IND Gujarat IND Gujarat The suburbs of Vadodara Gujarat
The suburbs of Vadodara
3561200000 3561209531 IND Gujarat IND Gujarat Another town (100,000 - 1 million) Gujarat
Another town (100,000 - 1 mil-lion)
3561200000 3561209632 IND Gujarat IND Gujarat A small city (10,000 - 100,000) Gujarat
A small city (10,000 - 100,000)
3561200000 3561209704 IND Gujarat IND Gujarat A village (less than 10,000) Gujarat
A village (less than 10,000)
3561200000 3561209805 IND Gujarat IND Gujarat Rural area Gujarat Rural area3561300000 3561300131 IND Haryana IND Haryana Bhiwani Haryana Bhiwāni
3561300000 3561300201 IND Haryana IND Haryana Farīdabad (New Township) Haryana
Farīdābād (New Township)
3561300000 3561300302 IND Haryana IND Haryana The suburbs of Farīdabad Haryana
The suburbs of Farīdābād
3561300000 3561300431 IND Haryana IND Haryana Gurgaon Haryana Gurgaon3561300000 3561300531 IND Haryana IND Haryana Hisar Haryana Hisār 3561300000 3561300631 IND Haryana IND Haryana Karnal Haryana Karnāl 3561300000 3561300731 IND Haryana IND Haryana Panīpat Haryana Pānīpat 3561300000 3561300831 IND Haryana IND Haryana Rohtak Haryana Rohtak3561300000 3561300931 IND Haryana IND Haryana Sirsa Haryana Sirsa3561300000 3561301031 IND Haryana IND Haryana Sonīpat Haryana Sonīpat 3561300000 3561301131 IND Haryana IND Haryana Yamunanagar Haryana Yamunānagar
3561300000 3561309531 IND Haryana IND Haryana Another town (100,000 - 1 million) Haryana
Another town (100,000 - 1 mil-lion)
3561300000 3561309632 IND Haryana IND Haryana A small city (10,000 - 100,000) Haryana
A small city (10,000 - 100,000)
3561300000 3561309704 IND Haryana IND Haryana A village (less than 10,000) Haryana
A village (less than 10,000)
3561300000 3561309805 IND Haryana IND Haryana Rural area Haryana Rural area
3561400000 3561400132IND Himachal Pradesh IND Himachal Pradesh Mandi Himachal Pradesh Mandi

Page ● 84
M. van Klaveren, K.G. Tijdens, M. Hughie-Williams and N.E. Ramos Martin
3561400000 3561400232IND Himachal Pradesh IND Himachal Pradesh Nahan Himachal Pradesh Nāhan
3561400000 3561400331IND Himachal Pradesh IND Himachal Pradesh Shimla Himachal Pradesh Shimla
3561400000 3561400432IND Himachal Pradesh IND Himachal Pradesh Solan Himachal Pradesh Solan
3561400000 3561409632IND Himachal Pradesh
IND Himachal Pradesh Another small city (10,000 - 100,000) Himachal Pradesh
Another small city (10,000 - 100,000)
3561400000 3561409704IND Himachal Pradesh
IND Himachal Pradesh A village (less than 10,000) Himachal Pradesh
A village (less than 10,000)
3561400000 3561409805IND Himachal Pradesh IND Himachal Pradesh Rural area Himachal Pradesh Rural area
3561500000 3561500132IND Jammu and Kashmir
IND Jammu and Kashmir Anant-nag Jammu and Kashmir Anantnāg
3561500000 3561500232IND Jammu and Kashmir
IND Jammu and Kashmir Bara-mula Jammu and Kashmir Bāramūla
3561500000 3561500331IND Jammu and Kashmir IND Jammu and Kashmir Jammu Jammu and Kashmir Jammu
3561500000 3561500432IND Jammu and Kashmir IND Jammu and Kashmir Kathua Jammu and Kashmir Kathua
3561500000 3561500532IND Jammu and Kashmir IND Jammu and Kashmir Sopore Jammu and Kashmir Sopore
3561500000 3561500631IND Jammu and Kashmir IND Jammu and Kashmir Srīnagar Jammu and Kashmir Srīnagar
3561500000 3561500732IND Jammu and Kashmir
IND Jammu and Kashmir Ud-hampur Jammu and Kashmir Udhampur
3561500000 3561509632IND Jammu and Kashmir
IND Jammu and Kashmir Anoth-er small city (10,000 - 100,000) Jammu and Kashmir
Another small city (10,000 - 100,000)
3561500000 3561509704IND Jammu and Kashmir
IND Jammu and Kashmir A vil-lage (less than 10,000) Jammu and Kashmir
A village (less than 10,000)
3561500000 3561509805IND Jammu and Kashmir
IND Jammu and Kashmir Rural area Jammu and Kashmir Rural area
3561600000 3561600131 IND Jharkhand IND Jharkhand Adītyapur Jharkhand Adītyapur 3561600000 3561600231 IND Jharkhand IND Jharkhand Bokaro Steel City Jharkhand Bokāro Steel City 3561600000 3561600331 IND Jharkhand IND Jharkhand Dhanbad Jharkhand Dhanbād 3561600000 3561600431 IND Jharkhand IND Jharkhand Hazarībag Jharkhand Hazārībāg 3561600000 3561600531 IND Jharkhand IND Jharkhand Jamshedpur Jharkhand Jamshedpur3561600000 3561600631 IND Jharkhand IND Jharkhand Mango Jharkhand Mango3561600000 3561600731 IND Jharkhand IND Jharkhand Ranchi Jharkhand Rānchi
3561600000 3561609531 IND Jharkhand IND Jharkhand Another town (100,000 - 1 million) Jharkhand
Another town (100,000 - 1 mil-lion)
3561600000 3561609632 IND Jharkhand IND Jharkhand A small city (10,000 - 100,000) Jharkhand
A small city (10,000 - 100,000)
3561600000 3561609704 IND Jharkhand IND Jharkhand A village (less than 10,000) Jharkhand
A village (less than 10,000)
3561600000 3561609805 IND Jharkhand IND Jharkhand Rural area Jharkhand Rural area3561700000 3561700107 IND Karnataka IND Karnataka Bangalore Karnataka Bangalore
3561700000 3561700202 IND Karnataka IND Karnataka The suburbs of Bangalore Karnataka
The suburbs of Bangalore
3561700000 3561700331 IND Karnataka IND Karnataka Belgaum Karnataka Belgaum3561700000 3561700431 IND Karnataka IND Karnataka Bellary Karnataka Bellary3561700000 3561700531 IND Karnataka IND Karnataka Bijapur Karnataka Bijāpur 3561700000 3561700631 IND Karnataka IND Karnataka Bommanahalli Karnataka Bommanahalli3561700000 3561700731 IND Karnataka IND Karnataka Dasarahalli Karnataka Dasarahalli3561700000 3561700831 IND Karnataka IND Karnataka Davanagere Karnataka Dāvanagere 3561700000 3561700931 IND Karnataka IND Karnataka Gulbarga Karnataka Gulbarga

Page ● 85
An overview of women’s work and employment in India
3561700000 3561701031 IND Karnataka IND Karnataka Hubli-Dharwar Karnataka Hubli-Dhārwār 3561700000 3561701131 IND Karnataka IND Karnataka Mangalore Karnataka Mangalore3561700000 3561701231 IND Karnataka IND Karnataka Mysore Karnataka Mysore3561700000 3561701331 IND Karnataka IND Karnataka Raichur Karnataka Rāichūr 3561700000 3561701431 IND Karnataka IND Karnataka Shimoga Karnataka Shimoga3561700000 3561701531 IND Karnataka IND Karnataka Tumkur Karnataka Tumkūr
3561700000 3561709531 IND Karnataka IND Karnataka Another town (100,000 - 1 million) Karnataka
Another town (100,000 - 1 mil-lion)
3561700000 3561709632 IND Karnataka IND Karnataka A small city (10,000 - 100,000) Karnataka
A small city (10,000 - 100,000)
3561700000 3561709704 IND Karnataka IND Karnataka A village (less than 10,000) Karnataka
A village (less than 10,000)
3561700000 3561709805 IND Karnataka IND Karnataka Rural area Karnataka Rural area
3561800000 3561800131 IND Kerala IND Kerala Alappuzha (Alleppey) Kerala Alappuzha (Alleppey)
3561800000 3561800231 IND Kerala IND Kerala Kochi (Cochin) Kerala Kochi (Cochin)3561800000 3561800331 IND Kerala IND Kerala Kollam (Quilon) Kerala Kollam (Quilon)
3561800000 3561800431 IND Kerala IND Kerala Kozhikode (Calicut) Kerala Kozhikode (Calicut)
3561800000 3561800531 IND Kerala IND Kerala Palakkad (Palghat) Kerala Palakkad (Pālghāt)
3561800000 3561800631 IND Kerala IND Kerala Thiruvananthapuram (Trivandrum) Kerala
Thiruvanan-thapuram (Trivandrum)
3561800000 3561800731 IND Kerala IND Kerala Thrissur (Trichur) Kerala Thrissur (Trichūr)
3561800000 3561809531 IND Kerala IND Kerala Another town (100,000 - 1 million) Kerala
Another town (100,000 - 1 mil-lion)
3561800000 3561809632 IND Kerala IND Kerala A small city (10,000 - 100,000) Kerala
A small city (10,000 - 100,000)
3561800000 3561809704 IND Kerala IND Kerala A village (less than 10,000) Kerala
A village (less than 10,000)
3561800000 3561809805 IND Kerala IND Kerala Rural area Kerala Rural area
3561900000 3561900104IND Lakshadweep (U) IND Lakshadweep (U) Amini Lakshadweep (U) Amini
3561900000 3561900232IND Lakshadweep (U) IND Lakshadweep (U) Kavaratti Lakshadweep (U) Kavaratti
3561900000 3561900332IND Lakshadweep (U) IND Lakshadweep (U) Minicoy Lakshadweep (U) Minicoy
3561900000 3561909704IND Lakshadweep (U)
IND Lakshadweep (U) A village (less than 10,000) Lakshadweep (U)
A village (less than 10,000)
3561900000 3561909805IND Lakshadweep (U) IND Lakshadweep (U) Rural area Lakshadweep (U) Rural area
3562000000 3562000101 IND Madhya Pradesh IND Madhya Pradesh Bhopal Madhya Pradesh Bhopāl
3562000000 3562000202 IND Madhya Pradesh IND Madhya Pradesh The sub-urbs of Bhopal Madhya Pradesh
The suburbs of Bhopāl
3562000000 3562000331 IND Madhya Pradesh IND Madhya Pradesh Gwalior Madhya Pradesh Gwalior3562000000 3562000401 IND Madhya Pradesh IND Madhya Pradesh Indore Madhya Pradesh Indore
3562000000 3562000502 IND Madhya Pradesh IND Madhya Pradesh The sub-urbs of Indore Madhya Pradesh
The suburbs of Indore
3562000000 3562000601 IND Madhya Pradesh IND Madhya Pradesh Jabalpur Madhya Pradesh Jabalpur
3562000000 3562000702 IND Madhya Pradesh IND Madhya Pradesh The sub-urbs of Jabalpur Madhya Pradesh
The suburbs of Jabalpur
3562000000 3562000831 IND Madhya Pradesh IND Madhya Pradesh Ujjain Madhya Pradesh Ujjain
3562000000 3562009531 IND Madhya Pradesh IND Madhya Pradesh Another town (100,000 - 1 million) Madhya Pradesh
Another town (100,000 - 1 mil-lion)

Page ● 86
M. van Klaveren, K.G. Tijdens, M. Hughie-Williams and N.E. Ramos Martin
3562000000 3562009632 IND Madhya Pradesh IND Madhya Pradesh A small city (10,000 - 100,000) Madhya Pradesh
A small city (10,000 - 100,000)
3562000000 3562009704 IND Madhya Pradesh IND Madhya Pradesh A village (less than 10,000) Madhya Pradesh
A village (less than 10,000)
3562000000 3562009805 IND Madhya Pradesh IND Madhya Pradesh Rural area Madhya Pradesh Rural area
3562100000 3562100131 IND Maharashtra IND Maharashtra Aurangabad (Shambajinagar) Maharashtra
Aurangābād (Shambajinagar)
3562100000 3562100201 IND Maharashtra IND Maharashtra Kalyan (-Dom-bivali) Maharashtra
Kalyān (-Dom-bivali)
3562100000 3562100307 IND Maharashtra IND Maharashtra Mumbai [Bom-bay] Maharashtra
Mumbai [Bom-bay]
3562100000 3562100402 IND Maharashtra IND Maharashtra The suburbs of Mumbai Maharashtra
The suburbs of Mumbai
3562100000 3562100507 IND Maharashtra IND Maharashtra Nagpur Maharashtra Nāgpur
3562100000 3562100602 IND Maharashtra IND Maharashtra The suburbs of Nagpur Maharashtra
The suburbs of Nāgpur
3562100000 3562100701 IND Maharashtra IND Maharashtra Nashik Maharashtra Nāshik
3562100000 3562100802 IND Maharashtra IND Maharashtra The suburbs of Nashik Maharashtra
The suburbs of Nāshik
3562100000 3562100931 IND Maharashtra IND Maharashtra Navi Mumbai (New Bombay) Maharashtra
Navi Mumbai (New Bombay)
3562100000 3562101001 IND Maharashtra IND Maharashtra Pimpri-Chinchwad Maharashtra
Pimpri-Chinchwad
3562100000 3562101107 IND Maharashtra IND Maharashtra Pune Maharashtra Pune 3562100000 3562101231 IND Maharashtra IND Maharashtra Solapur Maharashtra Solāpur 3562100000 3562101301 IND Maharashtra IND Maharashtra Thana Maharashtra Thāna
3562100000 3562101402 IND Maharashtra IND Maharashtra The suburbs of Pune Maharashtra
The suburbs of Pune
3562100000 3562109531 IND Maharashtra IND Maharashtra Another town (100,000 - 1 million) Maharashtra
Another town (100,000 - 1 mil-lion)
3562100000 3562109632 IND Maharashtra IND Maharashtra A small city (10,000 - 100,000) Maharashtra
A small city (10,000 - 100,000)
3562100000 3562109704 IND Maharashtra IND Maharashtra A village (less than 10,000) Maharashtra
A village (less than 10,000)
3562100000 3562109805 IND Maharashtra IND Maharashtra Rural area Maharashtra Rural area3562200000 3562200131 IND Manipur IND Manipur Imphal Manipur Imphāl 3562200000 3562200232 IND Manipur IND Manipur Kakching Manipur Kakching3562200000 3562200332 IND Manipur IND Manipur Mayang Imphal Manipur Mayāng Imphāl 3562200000 3562200432 IND Manipur IND Manipur Thoubal Manipur Thoubāl
3562200000 3562209632 IND Manipur IND Manipur Another small city (10,000 - 100,000) Manipur
Another small city (10,000 - 100,000)
3562200000 3562209704 IND Manipur IND Manipur A village (less than 10,000) Manipur
A village (less than 10,000)
3562200000 3562209805 IND Manipur IND Manipur Rural area Manipur Rural area3562300000 3562300132 IND Meghalaya IND Meghalaya Jowai Meghalaya Jowai3562300000 3562300232 IND Meghalaya IND Meghalaya Mawlai Meghalaya Mawlai3562300000 3562300332 IND Meghalaya IND Meghalaya Nongstoin Meghalaya Nongstoin3562300000 3562300432 IND Meghalaya IND Meghalaya Nongthymmai Meghalaya Nongthymmai3562300000 3562300532 IND Meghalaya IND Meghalaya Pynthorumkhrah Meghalaya Pynthorumkhrah3562300000 3562300631 IND Meghalaya IND Meghalaya Shillong Meghalaya Shillong3562300000 3562300732 IND Meghalaya IND Meghalaya Tura Meghalaya Tura
3562300000 3562309632 IND Meghalaya IND Meghalaya Another small city (10,000 - 100,000) Meghalaya
Another small city (10,000 - 100,000)
3562300000 3562309704 IND Meghalaya IND Meghalaya A village (less than 10,000) Meghalaya
A village (less than 10,000)

Page ● 87
An overview of women’s work and employment in India
3562300000 3562309805 IND Meghalaya IND Meghalaya Rural area Meghalaya Rural area3562400000 3562400131 IND Mizoram IND Mizoram aīzawl Mizoram Āīzawl 3562400000 3562400232 IND Mizoram IND Mizoram Champhai Mizoram Champhai3562400000 3562400332 IND Mizoram IND Mizoram Kolosib Mizoram Kolosib3562400000 3562400432 IND Mizoram IND Mizoram Lunglei Mizoram Lunglei3562400000 3562400532 IND Mizoram IND Mizoram Saiha Mizoram Saiha
3562400000 3562409632 IND Mizoram IND Mizoram Another small city (10,000 - 100,000) Mizoram
Another small city (10,000 - 100,000)
3562400000 3562409704 IND Mizoram IND Mizoram A village (less than 10,000) Mizoram
A village (less than 10,000)
3562400000 3562409805 IND Mizoram IND Mizoram Rural area Mizoram Rural area3562500000 3562500131 IND Nagaland IND Nagaland Dimapur Nagaland Dimāpur 3562500000 3562500232 IND Nagaland IND Nagaland Kohīma Nagaland Kohīma 3562500000 3562500332 IND Nagaland IND Nagaland Mokokchung Nagaland Mokokchūng 3562500000 3562500432 IND Nagaland IND Nagaland Tuensang Nagaland Tuensang3562500000 3562500532 IND Nagaland IND Nagaland Wokha Nagaland Wokha3562500000 3562500632 IND Nagaland IND Nagaland Zunheboto Nagaland Zunheboto
3562500000 3562509632 IND Nagaland IND Nagaland Another small city (10,000 - 100,000) Nagaland
Another small city (10,000 - 100,000)
3562500000 3562509704 IND Nagaland IND Nagaland A village (less than 10,000) Nagaland
A village (less than 10,000)
3562500000 3562509805 IND Nagaland IND Nagaland Rural area Nagaland Rural area
3562600000 3562600131 IND Orissa IND Orissa Baleshwar (Balasore) Orissa Bāleshwar (Bala-sore)
3562600000 3562600231 IND Orissa IND Orissa Bhubaneswar Orissa Bhubaneswar3562600000 3562600331 IND Orissa IND Orissa Brahmapur Orissa Brahmapur 3562600000 3562600431 IND Orissa IND Orissa Cuttack Orissa Cuttack3562600000 3562600531 IND Orissa IND Orissa Puri Orissa Puri3562600000 3562600631 IND Orissa IND Orissa Raurkela Orissa Raurkela 3562600000 3562600731 IND Orissa IND Orissa Sambalpur Orissa Sambalpur
3562600000 3562609531 IND Orissa IND Orissa Another town (100,000 - 1 million) Orissa
Another town (100,000 - 1 mil-lion)
3562600000 3562609632 IND Orissa IND Orissa A small city (10,000 - 100,000) Orissa
A small city (10,000 - 100,000)
3562600000 3562609704 IND Orissa IND Orissa A village (less than 10,000) Orissa
A village (less than 10,000)
3562600000 3562609805 IND Orissa IND Orissa Rural area Orissa Rural area
3562700000 3562700132IND Puducherry (Pondicherry)
IND Puducherry (Pondicherry) Karaikal
Puducherry (Pon-dicherry) Kāraikāl
3562700000 3562700232IND Puducherry (Pondicherry)
IND Puducherry (Pondicherry) Mahe
Puducherry (Pon-dicherry) Mahe
3562700000 3562700331IND Puducherry (Pondicherry)
IND Puducherry (Pondicherry) Ozhukarai
Puducherry (Pon-dicherry) Ozhukarai
3562700000 3562700431IND Puducherry (Pondicherry)
IND Puducherry (Pondicherry) Puducherry (Pondicherry)
Puducherry (Pon-dicherry)
Puducherry (Pon-dicherry)
3562700000 3562700532IND Puducherry (Pondicherry)
IND Puducherry (Pondicherry) Yanam
Puducherry (Pon-dicherry) Yanam
3562700000 3562709632IND Puducherry (Pondicherry)
IND Puducherry (Pondicherry) Another small city (10,000 - 100,000)
Puducherry (Pon-dicherry)
Another small city (10,000 - 100,000)
3562700000 3562709704IND Puducherry (Pondicherry)
IND Puducherry (Pondicherry) A village (less than 10,000)
Puducherry (Pon-dicherry)
A village (less than 10,000)
3562700000 3562709805IND Puducherry (Pondicherry)
IND Puducherry (Pondicherry) Rural area
Puducherry (Pon-dicherry) Rural area
3562800000 3562800102 IND Punjab IND Punjab Amritsar Punjab Amritsar3562800000 3562800231 IND Punjab IND Punjab Bathinda Punjab Bathinda

Page ● 88
M. van Klaveren, K.G. Tijdens, M. Hughie-Williams and N.E. Ramos Martin
3562800000 3562800331 IND Punjab IND Punjab Jalandhar Punjab Jalandhar 3562800000 3562800401 IND Punjab IND Punjab Ludhiana Punjab Ludhiāna
3562800000 3562800502 IND Punjab IND Punjab The suburbs of Ludhiana Punjab
The suburbs of Ludhiāna
3562800000 3562800631 IND Punjab IND Punjab Patiala Punjab Patiāla
3562800000 3562809531 IND Punjab IND Punjab Another town (100,000 - 1 million) Punjab
Another town (100,000 - 1 mil-lion)
3562800000 3562809632 IND Punjab IND Punjab A small city (10,000 - 100,000) Punjab
A small city (10,000 - 100,000)
3562800000 3562809704 IND Punjab IND Punjab A village (less than 10,000) Punjab
A village (less than 10,000)
3562800000 3562809805 IND Punjab IND Punjab Rural area Punjab Rural area3562900000 3562900131 IND Rajasthan IND Rajasthan Ajmer Rajasthan Ajmer3562900000 3562900231 IND Rajasthan IND Rajasthan Alwar Rajasthan Alwar3562900000 3562900331 IND Rajasthan IND Rajasthan Bharatpur Rajasthan Bharatpur3562900000 3562900431 IND Rajasthan IND Rajasthan Bhīlwara Rajasthan Bhīlwāra 3562900000 3562900531 IND Rajasthan IND Rajasthan Bīkaner Rajasthan Bīkāner 3562900000 3562900631 IND Rajasthan IND Rajasthan Ganganagar Rajasthan Gangānagar 3562900000 3562900707 IND Rajasthan IND Rajasthan Jaipur Rajasthan Jaipur
3562900000 3562900802 IND Rajasthan IND Rajasthan The suburbs of Jaipur Rajasthan
The suburbs of Jaipur
3562900000 3562900931 IND Rajasthan IND Rajasthan Jodhpur Rajasthan Jodhpur3562900000 3562901031 IND Rajasthan IND Rajasthan Kota Rajasthan Kota3562900000 3562901131 IND Rajasthan IND Rajasthan Udaipur Rajasthan Udaipur
3562900000 3562909531 IND Rajasthan IND Rajasthan Another town (100,000 - 1 million) Rajasthan
Another town (100,000 - 1 mil-lion)
3562900000 3562909632 IND Rajasthan IND Rajasthan A small city (10,000 - 100,000) Rajasthan
A small city (10,000 - 100,000)
3562900000 3562909704 IND Rajasthan IND Rajasthan A village (less than 10,000) Rajasthan
A village (less than 10,000)
3562900000 3562909805 IND Rajasthan IND Rajasthan Rural area Rajasthan Rural area3563000000 3563000132 IND Sikkim IND Sikkim Gangtok Sikkim Gangtok3563000000 3563000232 IND Sikkim IND Sikkim Upper Tadong Sikkim Upper Tādong
3563000000 3563009632 IND Sikkim IND Sikkim Another small city (10,000 - 100,000) Sikkim
Another small city (10,000 - 100,000)
3563000000 3563009704 IND Sikkim IND Sikkim A village (less than 10,000) Sikkim
A village (less than 10,000)
3563000000 3563009805 IND Sikkim IND Sikkim Rural area Sikkim Rural area3563100000 3563100131 IND Tamil Nadu IND Tamil Nadu Ambattur Tamil Nadu Ambattur3563100000 3563100231 IND Tamil Nadu IND Tamil Nadu Avadi Tamil Nadu Avadi
3563100000 3563100307 IND Tamil Nadu IND Tamil Nadu Chennai [Ma-dras] Tamil Nadu Chennai [Madras]
3563100000 3563100402 IND Tamil Nadu IND Tamil Nadu The suburbs of Chennai Tamil Nadu
The suburbs of Chennai
3563100000 3563100531 IND Tamil Nadu IND Tamil Nadu Coimbatore Tamil Nadu Coimbatore3563100000 3563100631 IND Tamil Nadu IND Tamil Nadu Madurai Tamil Nadu Madurai3563100000 3563100731 IND Tamil Nadu IND Tamil Nadu Nagercoil Tamil Nadu Nāgercoil 3563100000 3563100831 IND Tamil Nadu IND Tamil Nadu Salem Tamil Nadu Salem3563100000 3563100931 IND Tamil Nadu IND Tamil Nadu Thanjavur Tamil Nadu Thanjāvūr
3563100000 3563101031 IND Tamil Nadu IND Tamil Nadu Thoothukkudi (Tuticorin) Tamil Nadu
Thoothukkudi (Tuticorin)
3563100000 3563101131 IND Tamil Nadu IND Tamil Nadu Tiruchirappalli Tamil Nadu Tiruchirāppalli 3563100000 3563101231 IND Tamil Nadu IND Tamil Nadu Tirunelveli Tamil Nadu Tirunelveli3563100000 3563101331 IND Tamil Nadu IND Tamil Nadu Tiruppur Tamil Nadu Tiruppūr 3563100000 3563101431 IND Tamil Nadu IND Tamil Nadu Tiruvottiyur Tamil Nadu Tirūvottiyūr

Page ● 89
An overview of women’s work and employment in India
3563100000 3563109531 IND Tamil Nadu IND Tamil Nadu Another town (100,000 - 1 million) Tamil Nadu
Another town (100,000 - 1 mil-lion)
3563100000 3563109632 IND Tamil Nadu IND Tamil Nadu A small city (10,000 - 100,000) Tamil Nadu
A small city (10,000 - 100,000)
3563100000 3563109704 IND Tamil Nadu IND Tamil Nadu A village (less than 10,000) Tamil Nadu
A village (less than 10,000)
3563100000 3563109805 IND Tamil Nadu IND Tamil Nadu Rural area Tamil Nadu Rural area3563200000 3563200131 IND Tripura IND Tripura Agartala Tripura Agartala3563200000 3563200232 IND Tripura IND Tripura Badharghat Tripura Badharghat3563200000 3563200332 IND Tripura IND Tripura Dharmanagar Tripura Dharmanagar3563200000 3563200432 IND Tripura IND Tripura Jogendranagar Tripura Jogendranagar
3563200000 3563209632 IND Tripura IND Tripura Another small city (10,000 - 100,000) Tripura
Another small city (10,000 - 100,000)
3563200000 3563209704 IND Tripura IND Tripura A village (less than 10,000) Tripura
A village (less than 10,000)
3563200000 3563209805 IND Tripura IND Tripura Rural area Tripura Rural area3563400000 3563400101 IND Uttar Pradesh IND Uttar Pradesh agra Uttar Pradesh Āgra
3563400000 3563400202 IND Uttar Pradesh IND Uttar Pradesh The suburbs of agra Uttar Pradesh
The suburbs of Āgra
3563400000 3563400331 IND Uttar Pradesh IND Uttar Pradesh Alīgarh Uttar Pradesh Alīgarh 3563400000 3563400402 IND Uttar Pradesh IND Uttar Pradesh Allahabad Uttar Pradesh Allahābād 3563400000 3563400531 IND Uttar Pradesh IND Uttar Pradesh Bareilly Uttar Pradesh Bareilly3563400000 3563400602 IND Uttar Pradesh IND Uttar Pradesh Ghaziabad Uttar Pradesh Ghāziābād 3563400000 3563400731 IND Uttar Pradesh IND Uttar Pradesh Gorakhpur Uttar Pradesh Gorakhpur3563400000 3563400831 IND Uttar Pradesh IND Uttar Pradesh Jhansi Uttar Pradesh Jhānsi 3563400000 3563400907 IND Uttar Pradesh IND Uttar Pradesh Kanpur Uttar Pradesh Kānpur
3563400000 3563401002 IND Uttar Pradesh IND Uttar Pradesh The suburbs of Kanpur Uttar Pradesh
The suburbs of Kānpur
3563400000 3563401107 IND Uttar Pradesh IND Uttar Pradesh Lucknow Uttar Pradesh Lucknow
3563400000 3563401202 IND Uttar Pradesh IND Uttar Pradesh The suburbs of Lucknow Uttar Pradesh
The suburbs of Lucknow
3563400000 3563401301 IND Uttar Pradesh IND Uttar Pradesh Meerut Uttar Pradesh Meerut
3563400000 3563401402 IND Uttar Pradesh IND Uttar Pradesh The suburbs of Meerut Uttar Pradesh
The suburbs of Meerut
3563400000 3563401531 IND Uttar Pradesh IND Uttar Pradesh Moradabad Uttar Pradesh Morādābād 3563400000 3563401631 IND Uttar Pradesh IND Uttar Pradesh Saharanpur Uttar Pradesh Sahāranpur
3563400000 3563401701 IND Uttar Pradesh IND Uttar Pradesh Varanasi [Benares] Uttar Pradesh
Vārānasi [Benares]
3563400000 3563401802 IND Uttar Pradesh IND Uttar Pradesh The suburbs of Varanasi Uttar Pradesh
The suburbs of Vārānasi
3563400000 3563409531 IND Uttar Pradesh IND Uttar Pradesh Another town (100,000 - 1 million) Uttar Pradesh
Another town (100,000 - 1 mil-lion)
3563400000 3563409632 IND Uttar Pradesh IND Uttar Pradesh A small city (10,000 - 100,000) Uttar Pradesh
A small city (10,000 - 100,000)
3563400000 3563409704 IND Uttar Pradesh IND Uttar Pradesh A village (less than 10,000) Uttar Pradesh
A village (less than 10,000)
3563400000 3563409805 IND Uttar Pradesh IND Uttar Pradesh Rural area Uttar Pradesh Rural area3563300000 3563300131 IND Uttarakhand IND Uttarakhand Dehra Dun Uttarakhand Dehra Dūn 3563300000 3563300231 IND Uttarakhand IND Uttarakhand Haldwani Uttarakhand Haldwāni 3563300000 3563300331 IND Uttarakhand IND Uttarakhand Hardwar Uttarakhand Hardwār 3563300000 3563300432 IND Uttarakhand IND Uttarakhand Kashīpur Uttarakhand Kāshīpur 3563300000 3563300531 IND Uttarakhand IND Uttarakhand Roorkee Uttarakhand Roorkee3563300000 3563300632 IND Uttarakhand IND Uttarakhand Rudrapur Uttarakhand Rudrapur

Page ● 90
M. van Klaveren, K.G. Tijdens, M. Hughie-Williams and N.E. Ramos Martin
3563300000 3563309632 IND UttarakhandIND Uttarakhand Another small city (10,000 - 100,000) Uttarakhand
Another small city (10,000 - 100,000)
3563300000 3563309704 IND UttarakhandIND Uttarakhand A village (less than 10,000) Uttarakhand
A village (less than 10,000)
3563300000 3563309805 IND Uttarakhand IND Uttarakhand Rural area Uttarakhand Rural area3563500000 3563500131 IND West Bengal IND West Bengal Asansol West Bengal Asansol3563500000 3563500231 IND West Bengal IND West Bengal Bhatpara West Bengal Bhātpāra 3563500000 3563500331 IND West Bengal IND West Bengal Durgapur West Bengal Durgāpur 3563500000 3563500401 IND West Bengal IND West Bengal Haora (Howrah) West Bengal Hāora (Howrah)
3563500000 3563500502 IND West Bengal IND West Bengal The suburbs of Haora West Bengal
The suburbs of Hāora
3563500000 3563500631 IND West Bengal IND West Bengal Kamarhati West Bengal Kamarhati
3563500000 3563500707 IND West Bengal IND West Bengal Kolkata [Cal-cutta] West Bengal
Kolkata [Cal-cutta]
3563500000 3563500802 IND West Bengal IND West Bengal The suburbs of Kolkata West Bengal
The suburbs of Kolkata
3563500000 3563500931 IND West Bengal IND West Bengal Maheshtala West Bengal Maheshtala3563500000 3563501031 IND West Bengal IND West Bengal Panihati West Bengal Pānihāti 3563500000 3563501131 IND West Bengal IND West Bengal Rajpur Sonarpur West Bengal Rājpur Sonārpur
3563500000 3563501231 IND West Bengal IND West Bengal South Dum Dum West Bengal South Dum Dum
3563500000 3563509531 IND West Bengal IND West Bengal Another town (100,000 - 1 million) West Bengal
Another town (100,000 - 1 mil-lion)
3563500000 3563509632 IND West Bengal IND West Bengal A small city (10,000 - 100,000) West Bengal
A small city (10,000 - 100,000)
3563500000 3563509704 IND West Bengal IND West Bengal A village (less than 10,000) West Bengal
A village (less than 10,000)
3563500000 3563509805 IND West Bengal IND West Bengal Rural area West Bengal Rural area
List of ethnic groups and languages3.3.
Ethnic groups3.3.1.
Below, a list of the main ethnic groups distinguished in India and designed for use in the web-survey,
can be found (ST = Scheduled Tribe; SC = Scheduled Caste; OBC = Other Backward Caste).
Table 13. List of ethnic groups in India (by 1/1/2009)
en_IN Master label Translation356001 IND SC SC356002 IND ST ST356003 IND OBC OBC356099 IND Other Other

Page ● 91
An overview of women’s work and employment in India
Languages3.3.2.
Hindi is the offi cial language and the most commonly spoken (about 40% of the population), but not
all dialects are mutually comprehensible. English also has offi cial status and is widely used in business and
politics, although knowledge of English varies much. The teaching of Hindi and English is compulsory in
most states and union territories. Twenty-two languages are legally recognized by the constitution for vari-
ous political, educational, and other purposes (Library of Congress 2004; wikipedia). Below, a list of the
main languages distinguished in India and designed for use in the web-survey, can be found.
Table 14. List of languages in India (by 1/1/2009)
en_IN Master label Translation356001 IND Hindi Hindi356002 IND Bengali Bengali356003 IND Telugu Telugu356004 IND Marathi Marathi 356005 IND Tamil Tamil 356006 IND Urdu Urdu 356007 IND Gujarati Gujarati 356008 IND Kannada Kannada 356009 IND Malayalam Malayalam 356010 IND English English 356998 IND Local dialect Local dialect356999 IND Other language Other language

Page ● 92
M. van Klaveren, K.G. Tijdens, M. Hughie-Williams and N.E. Ramos Martin

Page ● 93
An overview of women’s work and employment in India
References
Acharyya, Rajat (2006) Trade Liberalization, Poverty, and Income Inequality in India. New Delhi: Asian Develop-ment Bank (ADB) INRM Policy Brief No. 10: 1-12
Antonopoulos, Rania (2009) The Current Economic and Financial Crisis: A Gender Perspective. W,p.: UNDP / The Levy Economics Institute of Bard College, Working Paper No. 562
Asian Development Bank (ADB) (2008) Key Indicators for Asia and the Pacifi c 2009. India. New Delhi
ADB (2009a) Millennium Development Goals. Key Indicators for Asia and the Pacifi c 2009. New Delhi
ADB (2009b) ADB India Economic Bulletin, April-June. New Delhi: ADB India Resident Mission
ADB (2009c) (Hiranya Mukhopadhyay) Update: India. New Delhi: ADB India Resident Mission
Bain, Peter, Phil Taylor (2008) No passage to India? Initial responses of UK trade unions to call centre offshoring, Industrial Relations Journal, 39(1): 5-23
Banga, Rashmi (2006) Critical Issues in India’s Services-led Growth. New Delhi: Asian Development Bank (ADB) INRM Policy Brief No. 2: 1-9
Belser, Patrick, Uma Rani Amara (2009) At what level should minimum wage be set? Insights from household data in India. Powerpoint presentation ILO Conference on Regulating for Decent Work (RDW), Geneva, 8-10 July
Bhalla, Sheila (2008) Defi nitional and Statistical Issues Relating to Workers in Informal Employment. New Delhi: National Commission for Enterprises in the Unorganised Sector (NCEUS) Working Paper No. 3
Bhatnagar, Ekta (2010) “Fresher salary mayhem!”( www.paycheck.in/main/fresher-paycheck-1/fresher-arti-cle3)
Bhattacherjee, Debashish (2001) The evolution of Indian industrial relations: a comparative perspective, Industrial Relations Journal, 32(3): 244-263
Bhaumik, Sumon Kumar, Subal C. Kumbhakar (2008) Impact of Reforms on Plant Level Productivity and Techni-cal Effi ciency: Evidence from the Indian Manufacturing Sector. Bonn: IZA, Discussion Paper No. 3347
Bosworth, Barry, Susan M. Collins (2007) Accounting for Growth: Comparing China and India. Cambridge, MA: National Bureau of Economic Research (NBER): Working Paper 12943
Breman, Jan (2004) The Making and Unmaking of an Industrial Working Class. New Delhi etc.: Oxford Univer-sity Press
Central Statistical Organisation (CSO) (2007) Annual Survey Of Industries. Summary Results for Factory Sector 2005-2006. New Delhi (www.mospi.nic.in)
Centre for Development and Population Activities (CEDPA) (2001) Adolescent Girls in India Choose a Better Future: An Impact Assessment. W.p., September
Chaudhuri, Kausik, Friedrich Schneider, Sumana Chattopadhyay (2006) The size and development of the shadow economy: An empirical investigation from states of India, Journal of Development Economics, 80: 428-443
CIA World Factbook. India (ongoing, last update used: December 18, 2009) (www.cia.gov/library/publica-tions/the-world-factbook/geos/in.html)
Page ● 94
M. van Klaveren, K.G. Tijdens, M. Hughie-Williams and N.E. Ramos Martin
Claeson, Mariam, Ashok Alexander (2008) Tackling HIV in India: Evidence-Based Priority-Setting and Program-ming. New Delhi: World Bank / Gates Foundation
Cord, Louise, Marijn Verhoeven, Camilla Blomquist, Bob Rijkers (2009) The Global Economic Crisis: Assessing Vulnerability with a Poverty Lens. Washington D.C.: World Bank research note
Das, Sanghamitra, Abhiroop Mukhopadhyay, Tridip Ray (2009) Economic Cost of HIV and AIDS in In-dia, in Markus Haacker, Mariam Claeson (eds) HIV and AIDS in South Asia: an economic development risk. Washington D.C.: World Bank: 123-154
Das Gupta, Monica, Jiang Zhengua, et al (2003) Why is Son Preference so Persistent in East and South Asia? A Cross-Country Study of China, India and the Republic of Korea, The Journal of Development Studies, (40)2: 153-187
Datt, Gaurav, Martin Ravallion (2002) Is India’s Economic Growth Leaving the Poor Behind? Washington D.C.: World Bank, Policy Research Working Paper 2846
Datt, Gaurav, Martin Ravallion (2009) Has India’s Economic Growth Become Less Pro-Poor in the Wake of Eco-nomic Reforms? Washington D.C.: World Bank, Policy Research Working Paper 5103
De Ruyter, Alex, Ajit Singh, Tonia Warnecke, Ann Zammit (2009) Core vs. non-core standards, gender and devel-oping countries: a review with recommendations for policy and practice. Paper ILO Conference on Regulating for Decent Work (RDW), Geneva, 8-10 July
Dhatta, R.C., Milly Sil (2007) Contemporary Issues on Labour Law Reform in India. An Overview. Mumbai: Tata Institute of Social Sciences, ATLMRI Discussion Paper
Donahue, Asmaa (2010) Background Paper 5th UNICEF-GPIA International Adolescent Girls, Cornerstone of Society: Building Evidence and Policies for Inclusive Societies. New York City: The New School, April 26-28
Dutz, Mark (ed.) (2007) Unleashing India’s Innovation. Washington D.C.: World Bank (http://go.worldbank.org/GOIFSXUF10)
Electronics and Computer Software Export Promotion Council (ESC) (2009) IT Software & Services Indus-try in India – an Overview. Leafl et, New Delhi: ESC
Farrell, Nick (2009) “PC Sales Rise in India”, The Inquirer, 10 February (www.theinquirer.net/inquirer/news/1050918/pc-sales-rise-india)
Frenkel, Stephen, Sarosh Kuruvilla (2002) Logics of Action, Globalization, and Changing Employment Relations in China, India, Malaysia, and the Philippines, Industrial and Labor Relations Review, 55(3): 387-412
Friedman, Thomas L. (2005) The World is Flat. A Brief History of the Globalized World in the Twenty-First Cen-tury. London etc.: Allen Lane
Global Union Directory, India (www.younionize.info/directory/?show=i)
Goparaju, Srikanth, Samik Shome (2009) Techniques in Innovative Policy Making – Examples from India. Paper ILO Conference on Regulating for Decent Work (RDW), Geneva, 8-10 July
Government of India (GoI) (2008) Education for All. Mid-Decade Assessment. Reaching the Unreached. New Delhi: Ministry of Human Resource Development
Gupta, Poonam, Rana Hasan, Utsav Kumar (2008) What Constrains Indian Manufacturing? Manila: Asian Development Bank (ADB) Working Paper Series No. 119
Haacker, Markus (2009) Development Impact of HIV and AIDS in South Asia, in Markus Haacker, Mariam Claeson (eds) HIV and AIDS in South Asia: an economic development risk. Washington D.C.: World Bank: 75-121
Page ● 95
An overview of women’s work and employment in India
Hausmann, Ricardo, Laura D. Tyson, Saadia Zahidi (2008) The Global Gender Gap Report 2008. Geneva: World Economic Forum
Hensman, Robini (2001) The Impact of Globalisation on Employment in India and Responses from the Formal and Informal Sectors. Amsterdam: IIAS/IISG, CLARA Working Paper No. 15
International Institute for Population Sciences (IIPS) (2005) District Level Household Survey - Reproductive and Child Health (DLHS-RCH), 2002-04. Mumbai: IIPS
IIPS / Macro International (2007a) The National Family Health Survey-3, 2005-06. India (Volume I). Mumbai: IIPS and Macro-International
IIPS / Macro International (2007b) The National Family Health Survey-3, 2005-06. India (Volume II). Mumbai: IIPS and Macro-International
International Labour Offi ce (ILO) Labour Statistics (Laborsta) (Ongoing: http://laborsta.ilo.org/)
ILO TRAVAIL Database of Conditions of Work and Employment Laws, India (last accessed January 22, 2010) (http://www.ilo.org/dyn/travail/travmain.byCountry2 )
ILO Natlex Database, India (Ongoing: www.ilo.org/dyn/natlex/natlex_browse.country?p_lang=en&p_country=IND)
ILO (2008) Global Wage Report 2008/09. Minimum Wages and Collective Bargaining. Towards policy coherence. Geneva
International Trade Union Confederation (ITUC) (2009a) Annual Survey of Violations of Trade Union Rights. India. Brussels
ITUC (2009b) (Stephen Glenn, Simone Melis, Louisa Withers) Gender (in)equality in the labour market: an overview of global trends and developments. Brussels, March 8
ITUC (2009c) (Jo Morris) Decent Work, Decent Life for Women: Discussion Guide. Brussels: ITUC, 1st World Women’s conference, October 19-21
ITUC (2009d) (IDS) The Decent Work Agenda: a gender perspective. Brussels: ITUC, 1st World Women’s con-ference, October 19-21
Jejeebhoy, Shireen J. (1998) Adolescent Sexual and Reproductive Behavior: A Review of the Evidence from India, Soc. Sci. Med., 46(10); 1275-1290
Jensen, Robert, Emily Oster (2007) The power of TV: cable television and women’s status in India. Washington D.C.: National Bureau of Economic Research, NBER Working Paper No. 13305
Jha, Prahbat, Rajesh Kumar, Priya Vasa, Neeraj Dhingra, Deva Thiruchelvam, Rahim Moineddin (2006) Low male-to-female sex ratio of children born in India: National Survey of 1.1 Million Households, The Lancet, 367: 211-218
Jones, Nicola, Rebecca Holmes, with Hannah Marsden, Shreya Mitra, David Walker (2009) Gender and Social Protection in Asia: What Does the Crisis Change? Background Paper for Conference on the Impact of the Global Economic Slowdown on Poverty and Sustainable Development in Asia and the Pacifi c, 28-30 September, Hanoi. London: Overseas Development Institute (ODI)
Kapur, Shilpi (2008) Trade Liberalization in India: Impact on Occupational Sex Segregation. St Louis: Washington University in St Louis, paper
Kodandapani, Keshavan, Patricia T. Alpert (2007) AIDS in India: When Denial Kills, Home Health Care Management Practice, 20(1): 21-26

Page ● 96
M. van Klaveren, K.G. Tijdens, M. Hughie-Williams and N.E. Ramos Martin
KOF Swiss Economic Institute (2010) KOF Index of Globalization 2010. Press Release, 22 January (www.kof.ethz.ch; http://globalization.kof.ethz.ch)
Kothari, Brij (1998) Film Songs as Continuing Education: Same Language Subtitling for Literacy, Economic and Political Weekly, September 26: 2507-2510
Kundu, Amitabh, Niranjan Sarangi (2009) Chapter 5. Inclusive Growth and Economic Inequality in India under Globalization. Causes, Consequences and Policy Responses, in Country Policy Dialogues on Inequal-ity. Colombo: UNDP Regional Offi ce: 97-138
Kundu, Amitabh, P. C. Mohanan (2009) Employment and Inequality Outcomes in India. New Delhi: Jawaharlal Nehru University/Indian Statistical Service, paper
Library of Congress – Federal Research Division (USA) (2004) Country Profi le: India, December 2004. Washington D.C.
Majumder, Rajarshi (2006) Employment and Wages in the Liberalised Regime: A Study of Indian Manufacturing Sec-tor. Munich: MPRA Paper No. 12809 (online 2009)
Menon, Nidhiya, Yana Van der Meulen Rodgers (2009) International Trade and the Gender Wage Gap: New Evidence from India’s Manufacturing Sector, World Development, 37(5): 965-981
Metcalfe, Barbara, Thomas R. Metcalfe (2006) A Concise History of Modern India. Cambridge/New York: Cambridge University Press
Ministry of Labour and Employment (2009a) Annual Report 2008-2009. New Delhi
Ministry of Labour and Employment (2009b) “National Policy on HIV/AIDS and the World of Work” launched at 43rd session of the Standing Labour Committee. New Delhi: Press Information Bureau Govern-ment of India, October 30
Mishra, Vandita (2009) ”Lok Sabha will have most women MPs ever”, Indian Express, 25 May (www.indian-express.com/news/new-lok-sabha-will-have-most-women-mps-ever/465283/)
Mohan, Rakesh (2009) “The Worst is Over for India: 9% plus Growth Soon, Says Dr Rakesh Mohan” (Excerpts from TB Deputy Mohan’s address to IMC’s 101st Annual General Meeting held on May 11)
Mohanty, Mritiunjoy (2009) A note on new trends of unionization in India. Kolkata: Indian Institute of Manage-ment Calcutta, Working Paper Series No. 641
Moore, Ann M., Susheela Singh, Usha Ram, Lisa Remez, Suzette Audam (2009) Adolescent Marriage and Childbearing in India: Current Situation and Recent Trends. New York/Washington D.C.: Guttmacher Insti-tute
Nagaraj, R. (2007) India, Introduction in OECD Seminar on Labour Markets in Brazil, China and India, Paris, 28 March
National Commission for Enterprises in the Unorganised Sector (NCEUS) (2007) Report on Conditions of Work and Promotion of Livelihoods in the unorganised sector. New Delhi: Government of India
NCEUS (2009a) The Challenge of Employment in India. An Informal Economy Perspective. Volume I. Main Report. New Delhi: Government of India
NCEUS (2009b) The Challenge of Employment in India. An Informal Economy Perspective. Volume II. Annexures. New Delhi Government of India
NCEUS (2009c) Skill Formation and Employment Assurance in the Unorganised Sector. New Delhi: Government of India
Nilekani, Nandan (2008) Imagining India. Ideas for the New Century. London etc.: Allen Lane

Page ● 97
An overview of women’s work and employment in India
NN (2006) “GDP growth rate may fall due to HIV spread”, Business Standard, 24 January
NN (2009) ”Indian IT sector spendings to touch USD 37.6 billion by 2013”, The Economic Times, 12 Octo-ber
Organisation for Economic Co-operation and Development (OECD) (2007) Economic Survey of India, 2007, OECD Policy Brief, October. Paris
Pal, Rupayan (2008) Estimating the Probability of Trade Union Membership in India: Impact of Communist Parties, Personal Attributes and Industrial Characteristics. Mumbai: Indira Gandhi Institute of Development Re-search, WP-2008-015
Pandey, R.N. (w.y.) Status of Employment and Unemployment Statistics in India. New Delhi: Ministry of Statistics & Programme Implementation
Panagariya, Arvind (2001) India’s Economic Reforms. What Has Been Accomplished? What Remains to Be Done? W.p.: Asian Development Bank (ADB) ERD Policy Brief Series No. 2
Papola, T.S. (2006) Employment Trends in India. New Delhi: Institute for Studies in Industrial Development, paper
Papola, T.S. (2007) Employment in the development agenda: Economic and social policies. Geneva: International Institute for Labour Studies. Discussion Paper DP/170/2007
Papola, T.S. (2008) Employment Challenge and Strategies in India. New Delhi: ILO Subregional Offi ce for South Africa, ILO Asia-Pacifi c Working Paper Series
Rajesh Raj, S.N. (2009) Structure, Employment and Productivity Growth in the Indian Unorganized Man-ufacturing Sector: An Industry Level Analysis, The Singapore Economic Review (forthcoming)
Rajput, Jagmohan Singh (2009) Chapter 25. India: Policy Perspectives and Challenges Ahead, in John Fien, Rupert Maclean, Man-Gon Park (eds) Work, Learning and Sustainable Development. New York: Springer: 343-359
Ramesh, Randeep (2009) “India to unveil the UKP7 laptop”, The Guardian, 2 February
Ravallion, Martin (2009) A Comparative Perspective on Poverty Reduction in Brazil, China and India. Washington D.C.: The World Bank Development Research Group, Policy Research Working Paper 5080
Ravallion, Martin, Gaurav Datt (1999) When Is Growth Pro-Poor? Evidence from the Diverse Experiences of India’s States. Washington D.C.: World Bank, Policy Research Working Paper 2263
Ravallion, Martin, Gaurav Datt (2002) Why Has Economic Growth Been More Pro-Poor in Some States of India than Others?, Journal of Development Economics, 68: 381-400
Research Foundation Science & Technology (2005) Impact of WTO on Women in Agriculture. New Delhi; National Commission for Women
Ruiz, Rebecca (2006) “India All-Women Police Pursue Dowry Complaints”, We-News, 13 September (www.womensenews.org/story/the-world/060913/indias-all-women-police-pursue-dowry-complaints)
Sakhtivel, S., Pinaki Joddar (2006) Unorganised Sector Workforce in India. Trends, Patterns and Social Security Coverage, Economic and Political Weekly, May 27: 2107-2114
Sala-I-Martin, Xavier, Jennifer Blanke, Margareta Drzeniek Hanouz, Thierry Geiger, Irene Mia (2009) Chapter 1.1., The Global Competitiveness Index 2009-2010: Contributing to Long-Term Prosperity amid the Global Economic Crisis, in World Economic Forum (2009) The Global Competitiveness Report 2009-2010. Geneva: World Economic Forum
Self-Employed Women’s Association (SEWA) (2009) Financial Crisis Based on Experiences of SEWA. Gujarat:

Page ● 98
M. van Klaveren, K.G. Tijdens, M. Hughie-Williams and N.E. Ramos Martin
SEWA.
Sen, Amartya (1992) Missing Women, British Medical Journal, 304: 587-588
Sen, Amartya (2003) Missing Women – Revisited. Reduction in Female Mortality Has Been Counterbal-anced by Sex Selective Abortions, British Medical Journal, 327: 1297-1298
Sikdar, Soumyen (2006) Foreign Capital Infl ow into India: Determinants and Management. New Delhi: Asian De-velopment Bank (ADB) INRM Policy Brief No. 4 (INDIA-FDI-inrm 4)
Singh, Susheela (1998) Adolescent Childbearing in Developing Countries: A Global Review, Studies in Fam-ily Planning, 29(2): 117-136
Stiglitz, Joseph (2009) The global crisis, social protection and jobs, International Labor Review, 148(1/2): 1-13
Streefkerk, Hein (2001) Thirty Years of Industrial Labour in South Gujarat: Trends and Signifi cance, Eco-nomic and Political Weekly, June 30: 2398-2411
Subbarao, Duvvuri (2009) Impact of the global crisis on India – collateral damage and response, BIS Review, 20
Sudha, S., S. Irudaya Rajan (1998) Intensifying Masculinity of Sex Ratios in India: New Evidence 1981-1991. Thiruvananthapuram: Centre for Development Studies, paper
Topalova, Petia (2005) Trade Liberalization, Poverty and Inequality: Evidence from Indian Districts. Washington D.C.: National Bureau of Economic Research, NBER Working Paper 11614
United Nations (UN) (2006) Demographic Yearbook (http://unstats.un.org/unsd/demographic/products/dyb/dyb2.htm)
UN (2007) UN Gender Info 2007 Database (http://data.un.org/Browse.aspx?d=GenderStat)
UNAIDS (Joint United Nations Programme on HIV/AIDS / World Health Organisation (WHO)) (2007) 07 AIDS Epidemic Update. Geneva
United Nations Conference on Trade and Development (UNCTAD) (2008) World Investment Report 2008. New York and Geneva (http://www.unctad.org/en/docs/wir2008_en.pdf)
UNCTAD (2009) World Investment Report 2009. New York and Geneva (http://www.unctad.org/en/docs/wir2009_en.pdf)
United Nations Development Programme (UNDP) (2008) UNDP Human Development Indices (2008) (http://hdr.undp.org/en/media/HDI_2008_EN_Tables.pdf)
UNESCO (United Nations Educational, Scientifi c and Cultural Organisation) Institute of Statistics (UIS) UIS Statistics in Brief. Education in India. Montreal (http://stats.uis.unesco.org/unesco) (last accessed January 5, 2009)
UNESCO (2010) EFA Global Monitoring Report 2010, Reaching the marginalized. Oxford / Paris: Oxford University Press / UNESCO
United Nations Children’s Fund (UNICEF) (2005) Children Out Of School: Measuring Exclusion from Primary Education. Montreal: UIS
UNICEF (2008) Education statistics: India. New York: Division of Policy and Practice, Statistics and Moni-toring Section, May (www.childinfo.org)
US Dept of State, Bureau of Democracy, Human Rights, and Labor (2008) 2007 Human Rights Report: India. Washington D.C.

Page ● 99
An overview of women’s work and employment in India
US Dept of State, Bureau of Democracy, Human Rights, and Labor (2009) 2008 Human Rights Report: India Washington D.C. (www.state.gov/g/drl/rls/hrrpt/2008/wha/119150.htm)
US Library of Congress, Law online (http://www.loc.gov/law/help/guide/nations/india.php)
Van der Maten, Wilma (2009) “Ook Indiase boer aan het mobieltje” (“Indian farmer also cell phone ad-dict”), De Volkskrant (Dutch daily newspaper), December 2
Van Klaveren, Maarten (1969) India: de bureaucratie (India: The Bureaucracy). Amsterdam: University of Amsterdam, unpubl. paper
Venkata Ratnam, Harish C. Jain (2002) Women in trade unions in India, International Journal of Manpower, 23(3): 277-292
Vij, Vikas (2010) “Economic participation of adolescent girls in India: The hidden potential to transform the economy” (last accessed January 20, 2010) (http://www.paycheck.in/main/women-paycheck/articles/economic-participation-of-adolescent-girls-in-india-the-hidden-potential-to-transform-the-economy)
WageIndicator / website India (last accessed January20, 2010) (http://dfl .wageindicator.org/home/india)(http://www.womenpaycheck.in/main/) minimum wages (www.womenpaycheck.in/main/offi cial-minimumwages); FAQs www.paycheck.in/main/offi cialminimumwages/minfaqfolder).
website Asian Development Bank (ADB) India (last accessed January 5, 2010) (www.adb.org/India/de-fault.asp)
website / blog Friedrich Huebler 2005, International Education Statistics / educational attainment in India, 1950-2000 (last accessed January 6, 2010) (http://huebler.blogspot.com/2005/10/educational-attainment--in-india-1950.html
website / blog Friedrich Huebler 2007, International Education Statistics / Primary school attendance in India in 2006 (last accessed January 6, 2010) (http://huebler.blogspot.com/2007/11/primary-school-attendance-in-india-on.html)
website / blog Friedrich Huebler 2008, Primary school attendance in India in 2006 (last accessed January 6, 2010) (http://huebler.blogspot.com/2008/01/secondary-school-attendance-in-india-on.html)
website Centre for Development Informatics (CDI), University of Manchester, UK / Indian IT Sector Sta-tistics (last accessed January 28, 2010) (www.manchester.ac.uk/cdi)
website Comat / Sriram Raghavan (last accessed January 28, 2010) (www.comat.com/leadership_profi le.html)
website CRY (Child Rights and You) (last accessed January 28, 2010) (www.cry.org/newsandevents/cryinnews/60mchildlabourersinindia.html)
website EconomyWatch / Poverty in India (last accessed January 28, 2010) (www.economywatch.com/indi-aneconomy/poverty-in-india.html)
website EVD (Economische VoorlichtingsDienst) / India: IT-sector (in Dutch) (last accessed January 28, 2010) (www.evd.nl/zoeken/showbouwsteen.ssp?bstnum=80000)
website Government of India (GoI) / Ministry of Labour and Employment (last accessed January 28, 2010) (http://labour.nic.in/)
website Government of India (GoI) / Haryana adolescent girls project (last accessed January 28, 2010) (http://india.gov.in/citizen/health/viewscheme.php?schemeid=71)
website Government of India (GoI) / NREGA (last accessed January 28, 2010) (www.nrega.ap.gov.in)

Page ● 100
M. van Klaveren, K.G. Tijdens, M. Hughie-Williams and N.E. Ramos Martin
website Internet Governance in India (last accessed December 19, 2009) (www.nic.br/imprensa/clip-ping/2009/midia182.htm)
website OECD-SIGI (Social Institutions & Gender Index) India (last accessed December 20, 2009) (http://genderindex.org/country/india)
website Offi ce of the Registrar General and Census Commissioner / Census of India – religion (last accessed January 20, 2010) (http://censusindia.gov.in/Census_Data_2001/India_at_glance/religion.aspx)
website Self-Employed Women’s Association of India (SEWA) (last accessed January 20, 2010) (www.sewa.org/)
website Times of India (last accessed January 5, 2010) (http://timesofi ndia.indiatimes.com/default1.cms)
website United Nations (UN) Millenium Development Goals (MDG) indicators (last accessed December 20, 2009) (http://mdgs.un.org/unsd/mdg/Default.aspx)
website UN Data India (last accessed December 20, 2009) (http://data.un.org/CountryProfi le.aspx?crName=India)
website World Bank Governance (last accessed December 20, 2009) (http://info.worldbank.org/govern-ance/wgi/pdf_country.asp) (http://info.worldbank.org/governance/wgi/pdf/c104.pdf)
website Worldbank Edstats (last accessed January 12, 2009) (http://go.worldbank.org/47P3PLE940)
website World Bank India ( accessed January 10, 2010) (www.worldbank.org.in/WBSITE)(a.o. webpage Secondary education in India)
website World Health Organization (WHO) (last accessed January 12, 2009) Violence against women / India (www.who.int/mediacentre/factsheets/fs239/en/)
wikipedia India (last accessed December 20, 2009)
wikipedia Economy of India (last accessed December 20, 2009)
wikipedia Globalisation in India (last accessed January 20, 2010)
wikipedia History of the Republic of India (last accessed January 20, 2010)
wikipedia Poverty in India (last accessed January 20, 2010)
wikipedia Self-Employed Women’s Association of India (SEWA) (last accessed January 20, 2010)
wikipedia Tertiary education in India (last accessed December 20, 2009)
wikipedia Trade Unions in India (last accessed January 20, 2010)
Wilson, David, Mariam Claeson (2009) Dynamics of the HIV Epidemic in South Asia, in Markus Haack-er, Mariam Claeson (eds) HIV and AIDS in South Asia: an economic development risk. Washington D.C.: World Bank: 3-39
World Bank World Development Indicators online (in text: World Bank – WDI) (2006, 2007, 2008, 2009) v (http://web.worldbank.org/WBSITE/EXTERNAL/DATASTATISTICS/0,,contentMDK:21725423~pagePK:64133150~piPK:64133175~theSitePK:239419,00.html)
World Bank (2006) India Development Policy Review: Inclusive Growth and Service delivery: Building on India’s Success. Overview. New Delhi: MacMillan India Ltd.
World Bank (2007) India – Country Summary of Higher Education. Washington D.C.

Page ● 101
An overview of women’s work and employment in India
World Bank (2008) Poverty data. A supplement to World Development Indicators 2008 (in text: World Bank – WDI – Suppl)
World Bank (2009a) India, in World Bank (2009) Information and Communications for Development. Washington D.C. (http://devdata.worldbank.org/ict/ind_ict.pdf)
World Bank (2009b) Impact of Financial Crisis on Women and Families. W.p.: World Bank PREM Gender and Development (powerpoint presentation), February
World Bank (2009c) Governance Matters 2009. Worldwide Governance Indicators, 1996-2008. Country Data Re-port for India. Washington D.C.
World Bank (2009d) India Country Overview 2009. Washington D.C. (www.worldbank.org.in/WBSITE)
World Bank (2009e) Swimming against the Tide: How Developing Countries Are Coping With the Global Crisis. Background Paper prepared by World Bank Staff for the G-20 Finance Ministers and Central Bank Governors Meeting, Horsham, UK, March 13–14
World Bank (2010) Global Economic Prospects (GEP). Crisis, Finance, and Growth 2010. New Delhi / Washing-ton D.C.: IBRD / The World Bank
World Health Organization (WHO) (2009) World Health Statistics 2009. Rome

Page ● 102
M. van Klaveren, K.G. Tijdens, M. Hughie-Williams and N.E. Ramos Martin

Page ● 103
An overview of women’s work and employment in India
What is WageIndicator?
WageIndicator has websites in 50 countries. In every country, a national website has a free Salary Check.
This Check provides detailed information about the wages, on average earned in a wide range of occupations,
taken into account personal characteristics, such as tenure/age, education, supervisory position, region and
alike.
Apart from the Salary Check, the websites in many countries have attractive web-tools, such as Minimum
Wage Checks, DecentWorkCheck, Gross-Net Earnings Check, and alike. In addition, most websites have con-
tent about wages, working conditions, labor standards and related topics. Each country has at least one website.
Multilingual countries have two or more websites. In addition, many countries have websites for target groups,
for example women or youth. The project website is www.wageindicator.org.
Worldwide, the national WageIndicator websites attract large numbers of web-visitors. The websites are
consulted by workers for their job mobility decisions, annual performance talks or wage negotiations. They are
consulted by school pupils, students or re-entrant women facing occupational choices, or by employers in small
and medium sized companies when recruiting staff or negotiating wages with their employees.
In return for all free information provided, the web-visitors are encouraged to complete a web-survey,
which takes 10 to 20 minutes. The survey has detailed questions about earnings, benefi ts, working conditions,
employment contract, training, as well as questions about education, occupation, industry, and household
characteristics. This web-survey is comparable across all countries. The web-survey is continuously posted at
all WageIndicator websites, of course in the national language(s) and adapted to country-specifi c issues, where
needed. The data from the web-survey are used for the calculations, underlying the Salary Check. For occupa-
tions with at least 50 observations in the national database a salary indication can be calculated. The Salary
Checks are updated annually.
The project started in 2000 in the Netherlands with a large-scale, paper-based survey to collect data on
women’s wages. In 2001 the fi rst WageIndicator website with a Salary Check and a web-survey was launched.
Since 2004, websites were launched in European countries, in North and South America, in South-Africa, and
in countries in Asia. All large economies of the world currently have a WageIndicator website, among which
the USA, the Russian Federation, China, India and Brazil. From 2009 onwards, websites are being launched in
more African countries, as well as in Indonesia and in a number of post-soviet countries. More information
about the WageIndicator Foundation and its activities can be found at www.wageindicator.org.

Page ● 104
M. van Klaveren, K.G. Tijdens, M. Hughie-Williams and N.E. Ramos Martin

Page ● 105
An overview of women’s work and employment in India
AIAS Working Papers
Recent publications of the Amsterdam Institute for Advanced Labour Studies. They can be downloaded from our website www.uva-aias.net under the subject Publications.
10-89 Coordination of national social security in the EU 2010 - Jan Cremers
10-88 Geïntegreerde dienstverlening in de keten van Werk en Inkomen 2010 - Marloes de Graaf-Zijl, Marieke Beentjes, Eline van Braak
10-87 Emigration and labour shortages. An opportunity for trade unions in new member states? 2010 - Monika Ewa Kaminska and Marta Kahancová
10-86 Measuring occupations in web-surveys. The WISCO database of occupations 2010 - Kea Tijdens
09-85 Multinationals versus domestic fi rms: Wages, working hours and industrial relations 2009 - Kea Tijdens and Maarten van Klaveren
09-84 Working time fl exibility components of companies in Europe 2009 - Heejung Chung and Kea Tijdens
09-83 An overview of women’s work and employment in Brazil Decisions for Life Country Report 2009 - Maarten van Klaveren, Kea Tijdens, Melanie Hughie-Williams and Nuria Ramos
09-82 An overview of women’s work and employment in Malawi Decisions for Life Country Report 2009 - Maarten van Klaveren, Kea Tijdens, Melanie Hughie-Williams and Nuria Ramos
09-81 An overview of women’s work and employment in Botswana Decisions for Life Country Report 2009 - Maarten van Klaveren, Kea Tijdens, Melanie Hughie-Williams and Nuria Ramos
09-80 An overview of women’s work and employment in Zambia Decisions for Life Country Report 2009 - Maarten van Klaveren, Kea Tijdens, Melanie Hughie-Williams and Nuria Ramos
09-79 An overview of women’s work and employment in South Africa Decisions for Life Country Report 2009 - Maarten van Klaveren, Kea Tijdens, Melanie Hughie-Williams and Nuria Ramos
09-78 An overview of women’s work and employment in Angola Decisions for Life Country Report 2009 - Maarten van Klaveren, Kea Tijdens, Melanie Hughie-Williams and Nuria Ramos
09-77 An overview of women’s work and employment in Mozambique Decisions for Life Country Report 2009 - Maarten van Klaveren, Kea Tijdens, Melanie Hughie-Williams and Nuria Ramos
09-76 Comparing different weighting procedures for volunteer web surveys. Lessons to be learned from German and Dutch Wage indicator data 2009 - Stephanie Steinmetz, Kea Tijdens and Pablo de Pedraza
09-75 Welfare reform in the UK, the Netherlands, and Finland. Change within the limits of path dependence. 2009 - Minna van Gerven

Page ● 106
M. van Klaveren, K.G. Tijdens, M. Hughie-Williams and N.E. Ramos Martin
09-74 Flexibility and security: an asymmetrical relationship? The uncertain relevance of fl exicurity policies for segmented labour markets and residual welfare regimes 2009 - Aliki Mouriki (guest at AIAS from October 2008 - March 2009)
09-73 Education, inequality, and active citizenship tensions in a differentiated schooling system 2009 - Herman van de Werfhorst
09-72 An analysis of fi rm support for active labor market policies in Denmark, Germany, and the Netherlands 2009 - Moira Nelson
08-71 The Dutch minimum wage radical reduction shifts main focus to part-time jobs 2008 - Wiemer Salverda
08-70 Parallelle innovatie als een vorm van beleidsleren: Het voorbeeld van de keten van werk en inkomen 2008 - Marc van der Meer, Bert Roes
08-69 Balancing roles - bridging the divide between HRM, employee participation and learning in the Dutch knowledge economy 2008 - Marc van der Meer, Wout Buitelaar
08-68 From policy to practice: Assessing sectoral fl exicurity in the Netherlands October 2008 - Hesther Houwing / Trudie Schils
08-67 The fi rst part-time economy in the world. Does it work? Republication August 2008 - Jelle Visser 08-66 Gender equality in the Netherlands: an example of Europeanisation of social law and policy May 2008 - Nuria E.Ramos-Martin
07-65 Activating social policy and the preventive approach for the unemployed in the Netherlands January 2008 - Minna van Gerven
07-64 Struggling for a proper job: Recent immigrants in the Netherlands January 2008 - Aslan Zorlu
07-63 Marktwerking en arbeidsvoorwaarden – de casus van het openbaar vervoer, de energiebedrijven en de thuiszorg July 2007 - Marc van der Meer, Marian Schaapman & Monique Aerts
07-62 Vocational education and active citizenship behaviour in cross-national perspective November 2007 - Herman G. van der Werfhorst
07-61 The state in industrial relations: The politics of the minimum wage in Turkey and the USA November 2007 - Ruÿa Gökhan Koçer & Jelle Visser
07-60 Sample bias, weights and effi ciency of weights in a continuous web voluntary survey September 2007 - Pablo de Pedraza, Kea Tijdens & Rafael Muñoz de Bustillo
07-59 Globalization and working time: Work-Place hours and fl exibility in Germany October 2007 - Brian Burgoon & Damian Raess
07-58 Determinants of subjective job insecurity in 5 European countries August 2007 - Rafael Muñoz de Bustillo & Pablo de Pedraza
07-57 Does it matter who takes responsibility? May 2007 - Paul de Beer & Trudie Schils
07-56 Employement protection in dutch collective labour agreements April 2007 - Trudie Schils

Page ● 107
An overview of women’s work and employment in India
07-54 Temporary agency work in the Netherlands February 2007 - Kea Tijdens, Maarten van Klaveren, Hester Houwing, Marc van der Meer & Marieke van Essen
07-53 Distribution of responsibility for social security and labour market policy Country report: Belgium January 2007 - Johan de Deken
07-52 Distribution of responsibility for social security and labour market policy Country report: Germany January 2007 - Bernard Ebbinghaus & Werner Eichhorst
07-51 Distribution of responsibility for social security and labour market policy Country report: Denmark January 2007 - Per Kongshøj Madsen
07-50 Distribution of responsibility for social security and labour market policy Country report: The United Kingdom January 2007 - Jochen Clasen
07-49 Distribution of responsibility for social security and labour market policy Country report: The Netherlands January 2007 - Trudie Schils
06-48 Population ageing in the Netherlands: demographic and fi nancial arguments for a balanced approach January 2007 - Wiemer Salverda
06-47 The effects of social and political openness on the welfare state in 18 OECD countries, 1970-2000 January 2007 - Ferry Koster
06-46 Low pay incidence and mobility in the Netherlands - Exploring the role of personal, job and employer characteristics October 2006 - Maite Blázques Cuesta & Wiemer Salverda
06-45 Diversity in work: The heterogeneity of women’s labour market participation patterns September 2006 - Mara Yerkes
06-44 Early retirement patterns in Germany, the Netherlands and the United Kingdom October 2006 - Trudie Schils
06-43 Women’s working preferences in the Netherlands, Germany and the UK August 2006 - Mara Yerkes
05-42 Wage bargaining institutions in Europe: a happy marriage or preparing for divorce? December 2005 - Jelle Visser
05-41 The work-family balance on the union’s agenda December 2005 - Kilian Schreuder
05-40 Boxing and dancing: Dutch trade union and works council experiences revisited November 2005 - Maarten van Klaveren & Wim Sprenger
05-39 Analysing employment practices in western european multinationals: coordination, industrial relations and employment fl exibility in Poland October 2005 - Marta Kahancova & Marc van der Meer

Page ● 108
M. van Klaveren, K.G. Tijdens, M. Hughie-Williams and N.E. Ramos Martin
05-38 Income distribution in the Netherlands in the 20th century: long-run developments and cyclical properties September 2005 - Emiel Afman
05-37 Search, mismatch and unemployment July 2005 - Maite Blazques & Marcel Jansen
05-36 Women’s preferences or delineated policies? The development of part-time work in the Netherlands, Germany and the United Kingdom July 2005 - Mara Yerkes & Jelle Visser
05-35 Vissen in een vreemde vijver: Het werven van verpleegkundigen en verzorgenden in het buitenland May 2005 - Judith Roosblad
05-34 Female part-time employment in the Netherlands and Spain: an analysis of the reasons for taking a part-time job and of the major sectors in which these jobs are performed May 2005 - Elena Sirvent Garcia del Valle
05-33 Een functie met inhoud 2004 - Een enquête naar de taakinhoud van secretaressen 2004, 2000, 1994 April 2005 - Kea Tijdens
04-32 Tax evasive behavior and gender in a transition country November 2004 - Klarita Gërxhani
04-31 How many hours do you usually work? An analysis of the working hours questions in 17 large-scale surveys in 7 countries November 2004 - Kea Tijdens
04-30 Why do people work overtime hours? Paid and unpaid overtime working in the Netherlands August 2004 - Kea Tijdens
04-29 Overcoming marginalisation? Gender and ethnic segregation in the Dutch construction, health, IT and printing industries July 2004 - Marc van der Meer
04-28 The work-family balance in collective agreements. More female employees, more provisions? July 2004 - Killian Schreuder
04-27 Female income, the ego effect and the divorce decision: evidence from micro data March 2004 - Randy Kesselring (Professor of Economics at Arkansas State University, USA) was guest at AIAS in April and May 2003
04-26 Economische effecten van Immigratie – Ontwikkeling van een Databestand en eerste analyses Januari 2004 - Joop Hartog & Aslan Zorlu
03-25 Wage Indicator – Dataset Loonwijzer Januari 2004 - Kea Tijdens
03-24 Codeboek DUCADAM dataset December 2003 - Kilian Schreuder & Kea Tijdens
03-23 Household consumption and savings around the time of births and the role of education December 2003 - Adriaan S. Kalwij
03-22 A panel data analysis of the effects of wages, standard hours and unionisation on paid overtime work in Britain October 2003 - Adriaan S. Kalwij

Page ● 109
An overview of women’s work and employment in India
03-21 A two-step fi rst-difference estimator for a panel data tobit model December 2003 - Adriaan S. Kalwij
03-20 Individuals’ unemployment durations over the business cycle June 2003 - Adriaan Kalwei
03-19 Een onderzoek naar CAO-afspraken op basis van de FNV cao-databank en de AWVN-database December 2003 - Kea Tijdens & Maarten van Klaveren
03-18 Permanent and transitory wage inequality of British men, 1975-2001: Year, age and cohort effects October 2003 - Adriaan S. Kalwij & Rob Alessie
03-17 Working women’s choices for domestic help October 2003 - Kea Tijdens, Tanja van der Lippe & Esther de Ruijter
03-16 De invloed van de Wet arbeid en zorg op verlofregelingen in CAO’s October 2003 - Marieke van Essen
03-15 Flexibility and social protection August 2003 - Ton Wilthagen
03-14 Top incomes in the Netherlands and the United Kingdom over the Twentieth Century September 2003 - A.B.Atkinson & dr. W. Salverda
03-13 Tax evasion in Albania: An institutional vacuum April 2003 - Klarita Gërxhani
03-12 Politico-economic institutions and the informal sector in Albania May 2003 - Klarita Gërxhani
03-11 Tax evasion and the source of income: An experimental study in Albania and the Netherlands May 2003 - Klarita Gërxhani
03-10 Chances and limitations of “benchmarking” in the reform of welfare state structures - the case of pension policy May 2003 - Martin Schludi
03-09 Dealing with the “fl exibility-security-nexus: Institutions, strategies, opportunities and barriers May 2003 - Ton Wilthagen & Frank Tros
03-08 Tax evasion in transition: Outcome of an institutional clash -Testing Feige’s conjecture March 2003 - Klarita Gërxhani
03-07 Teleworking policies of organisations- The Dutch experiencee February 2003 - Kea Tijdens & Maarten van Klaveren
03-06 Flexible work - Arrangements and the quality of life February 2003 - Cees Nierop
01-05 Employer’s and employees’ preferences for working time reduction and working time differentia- tion – A study of the 36 hours working week in the Dutch banking industry 2001 - Kea Tijdens
01-04 Pattern persistence in europan trade union density October 2001 - Danielle Checchi & Jelle Visser
01-03 Negotiated fl exibility in working time and labour market transitions – The case of the Netherlands 2001 - Jelle Visser

Page ● 110
M. van Klaveren, K.G. Tijdens, M. Hughie-Williams and N.E. Ramos Martin
01-02 Substitution or segregation: Explaining the gender composition in Dutch manufacturing industry 1899 – 1998 June 2001 - Maarten van Klaveren & Kea Tijdens
00-01 The fi rst part-time economy in the world. Does it work? June 2000 - Jelle Visser

Page ● 111
An overview of women’s work and employment in India
Information about AIAS
AIAS is a young interdisciplinary institute, established in 1998, aiming to become the leading expert cen-
tre in the Netherlands for research on industrial relations, organisation of work, wage formation and labour
market inequalities. As a network organisation, AIAS brings together high-level expertise at the University
of Amsterdam from fi ve disciplines:
Law ●
Economics ●
Sociology ●
Psychology ●
Health and safety studies ●
AIAS provides both teaching and research. On the teaching side it offers a Masters in Comparative
Labour and Organisation Studies and one in Human Resource Management. In addition, it organizes spe-
cial courses in co-operation with other organisations such as the Netherlands Centre for Social Innovation
(NCSI), the Netherlands Institute for Small and Medium-sized Companies (MKB-Nederland), the National
Centre for Industrial Relations ‘De Burcht’, the National Institute for Co-determination (GBIO), and the
Netherlands Institute of International Relations ‘Clingendael’. AIAS has an extensive research program
(2004-2008) on Institutions, Inequalities and Internationalisation, building on the research performed by its
member scholars. Current research themes effectively include:
Wage formation, social policy and industrial relations ●
The cycles of policy learning and mimicking in labour market reforms in Europe ●
The distribution of responsibility between the state and the market in social security ●
The wage-indicator and world-wide comparison of employment conditions ●
The projects of the LoWER network ●

Amsterdam Institute for Advanced labour Studies
University of Amsterdam
Plantage Muidergracht 12 ● 1018 TV Amsterdam ● The Netherlands
Tel +31 20 525 4199 ● Fax +31 20 525 4301
[email protected] ● www.uva-aias.net