An Overview of Data Warehousing and OLAP Technology
11
IJARSCT ISSN (Online) 2581-9429 International Journal of Advanced Research in Science, Communication and Technology (IJARSCT) Volume 12, Issue 1, December 2021 Copyright to IJARSCT DOI: 10.48175/568 343 www.ijarsct.co.in Impact Factor: 5.731 An Overview of Data Warehousing and OLAP Technology Dr. Akhilesh Saini Associate Professor, Department of Computer Science Ch. K. R. Godara Memorial College, Bashir, Tibbi, Rajasthan, India Abstract: A data warehouse is a database that stores current and historical data so that it can be analyzed for market research, analytical reports, and decision-making. The key difference from traditional operational databases is that data warehouses are typically designed to give a historical view rather than to provide up-to-the-minute data. We describe back end tools for extracting, cleaning and loading data into a data warehouse; multidimensional data models typical of OLAP; front end client tools for querying and data analysis, server extensions for efficient query processing; and tools for metadata management and for managing the warehouse. In addition to surveying the state of the art, this paper also identifies some promising research issues, some of which are related to problems that the database research community has worked on for years, but others are only just beginning to be addressed. A data warehouse collects organize and makes information out there for the aim of study so as to allow management the flexibility to access and analyze info regarding its business. this sort is information is often referred to as informational data. The systems accustomed work with informational information area unit said as the online analytical process. OLTP systems that produce operational information, operational in formation focuses on transactional functions. This information is an element of the company infrastructure. it’s elaborate, non-redundant and updateable .OLAP is that the technology that allows shopper applications to with efficiency access information organized by information market and data warehouse. Information warehouse, offer an info organized for OLAP instead of OLTP, will solve OLTP issues. It is the foundation for many kinds of business applications for business performance management and marketing. Planning, budgeting, forecasting, financial reporting, analysis, simulation models, knowledge discovery and data warehouse reporting. Keywords: Data Warehouse, OLTP I. INTRODUCTION That is why data warehouses are perfectly suited for long-term comprehensive analytics. For instance, companies can use the information stored in data warehouses to monitor or modify their marketing campaigns or improve customer relationships. Data sources, such as CRM, HRM, SCM, and ERP, include operational databases that record the company’s daily transactions. Data warehouse application server is the bottom tier of the architecture represented by the relational database system. To build a data warehouse, organizations first need to copy the raw data from each of their data sources, cleanse, and optimize it. This process is called ETL (extract, transform, load). OLAP server is the middle tier and one of the most important components. OLAP stands for online analytical processing and allows for rapid calculation of key business metrics, planning and forecasting functions, as well as what-if analysis of large data volumes. That is why data warehouses are perfectly suited for long-term comprehensive analytics. For instance, companies can use the information stored in data warehouses to monitor or modify their marketing campaigns or improve customer relationships. Data sources, such as CRM, HRM, SCM, and ERP, include operational databases that record the company’s daily transactions. Data warehouse application server is the bottom tier of the architecture represented by the relational database system. To build a data warehouse, organizations first need to copy the raw data from each of their data
-
Upload
khangminh22 -
Category
Documents
-
view
0 -
download
0
Transcript of An Overview of Data Warehousing and OLAP Technology
IJARSCT ISSN (Online) 2581-9429
International Journal of Advanced Research in Science, Communication and Technology (IJARSCT)
Volume 12, Issue 1, December 2021
Copyright to IJARSCT DOI: 10.48175/568 343
www.ijarsct.co.in
Impact Factor: 5.731
An Overview of Data Warehousing and OLAP
Technology Dr. Akhilesh Saini
Associate Professor, Department of Computer Science
Ch. K. R. Godara Memorial College, Bashir, Tibbi, Rajasthan, India
Abstract: A data warehouse is a database that stores current and historical data so that it can be
analyzed for market research, analytical reports, and decision-making. The key difference from
traditional operational databases is that data warehouses are typically designed to give a historical view
rather than to provide up-to-the-minute data. We describe back end tools for extracting, cleaning and
loading data into a data warehouse; multidimensional data models typical of OLAP; front end client
tools for querying and data analysis, server extensions for efficient query processing; and tools for
metadata management and for managing the warehouse. In addition to surveying the state of the art, this
paper also identifies some promising research issues, some of which are related to problems that the
database research community has worked on for years, but others are only just beginning to be
addressed. A data warehouse collects organize and makes information out there for the aim of study so
as to allow management the flexibility to access and analyze info regarding its business. this sort is
information is often referred to as informational data. The systems accustomed work with informational
information area unit said as the online analytical process. OLTP systems that produce operational
information, operational in formation focuses on transactional functions. This information is an element
of the company infrastructure. it’s elaborate, non-redundant and updateable .OLAP is that the
technology that allows shopper applications to with efficiency access information organized by
information market and data warehouse. Information warehouse, offer an info organized for OLAP
instead of OLTP, will solve OLTP issues. It is the foundation for many kinds of business applications for
business performance management and marketing. Planning, budgeting, forecasting, financial reporting,
analysis, simulation models, knowledge discovery and data warehouse reporting.
Keywords: Data Warehouse, OLTP
I. INTRODUCTION
That is why data warehouses are perfectly suited for long-term comprehensive analytics. For instance, companies can
use the information stored in data warehouses to monitor or modify their marketing campaigns or improve customer
relationships. Data sources, such as CRM, HRM, SCM, and ERP, include operational databases that record the
company’s daily transactions.
Data warehouse application server is the bottom tier of the architecture represented by the relational database system.
To build a data warehouse, organizations first need to copy the raw data from each of their data sources, cleanse, and
optimize it. This process is called ETL (extract, transform, load).
OLAP server is the middle tier and one of the most important components. OLAP stands for online analytical
processing and allows for rapid calculation of key business metrics, planning and forecasting functions, as well as
what-if analysis of large data volumes. That is why data warehouses are perfectly suited for long-term comprehensive
analytics. For instance, companies can use the information stored in data warehouses to monitor or modify their
marketing campaigns or improve customer relationships.
Data sources, such as CRM, HRM, SCM, and ERP, include operational databases that record the company’s daily
transactions. Data warehouse application server is the bottom tier of the architecture represented by the relational
database system. To build a data warehouse, organizations first need to copy the raw data from each of their data

IJARSCT ISSN (Online) 2581-9429
International Journal of Advanced Research in Science, Communication and Technology (IJARSCT)
Volume 12, Issue 1, December 2021
Copyright to IJARSCT DOI: 10.48175/568 344
www.ijarsct.co.in
Impact Factor: 5.731
sources, cleanse, and optimize it. This process is called ETL (extract, transform, load). OLAP server is the middle tier
and one of the most important components. OLAP stands for online analytical processing and allows for rapid
calculation of key business metrics, planning and forecasting functions, as well as what-if analysis of large data
volumes. Frontend tools are in the top tier of the data warehouse architecture. They are comprised of the query,
reporting, analysis, and data mining tools.
As seen in the data warehouse architecture, OLAP plays an important role in data analysis. It transforms historical
data into derived and projected data and enables users to easily and selectively view data from different perspectives.
II. THE USE OF OLAP IN DATA WAREHOUSE FOR MULTIDIMENSIONAL ANALYSIS
OLAP’s biggest value lies in its multidimensional approach to organizing and analyzing data. OLAP breaks down
data into dimensions; for example, total sales might be broken into such dimensions as geography and time. The
geography dimension might contain the levels of country, state, and county, while the time dimension might be broken
down by year, month, and day. Thus, OLAP in a data warehouse enables companies to organize information in multiple
dimensions, which makes it easy for businesses to understand and use data. Since OLAP contains multidimensional
data usually obtained from different and unrelated sources, it requires a special method of storing that
data. Using a spreadsheet with rows and columns is good for two-dimensional data, but not for multidimensional data.
Instead, OLAP cubes should be used for that purpose. They are structured in a way that allows for storing various data
types from heterogeneous sources and analyzing it in a logical and orderly manner.
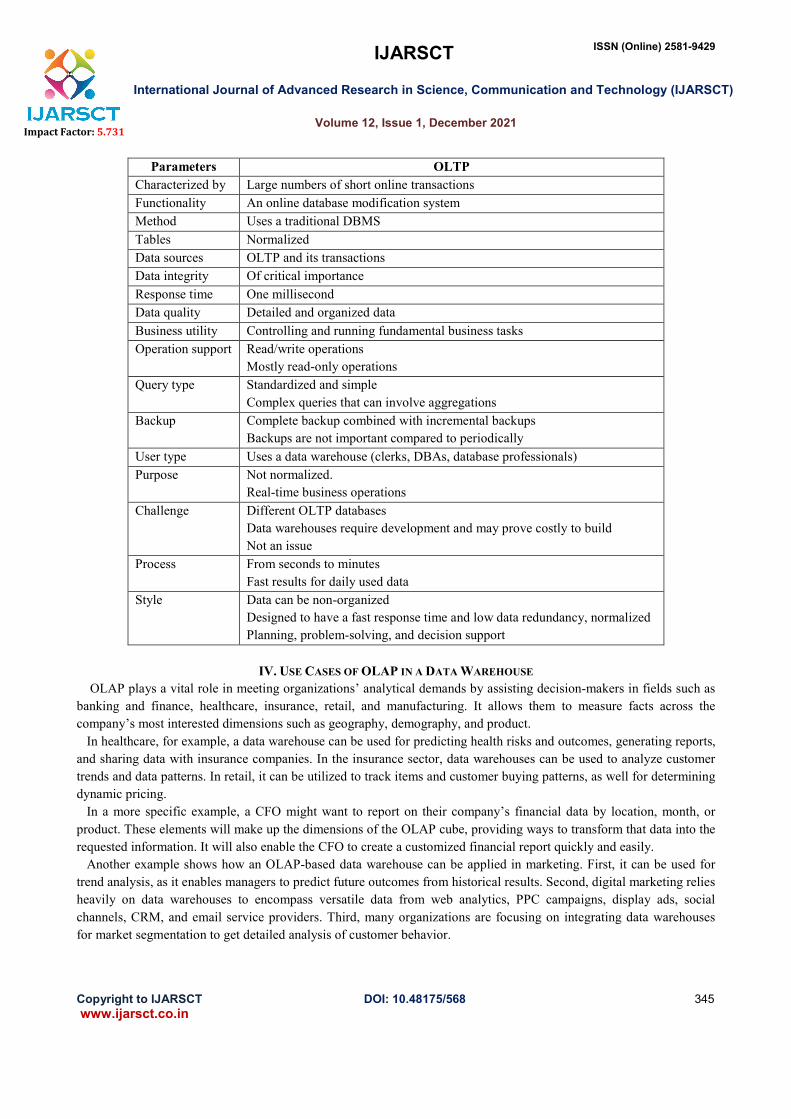
III. OLAP vs OLTP
OLAP demonstrates a slight variation from the Online Transaction Processing (OLTP), which is a more traditional
technology. They are both common systems for data management. However, OLTP and OLAP differ in terms of their
objectives: while the former aims at data processing, the latter is focused on data analysis. The table below summarizes
the other differences between OLTP and OLAP system design.
IJARSCT ISSN (Online) 2581-9429
International Journal of Advanced Research in Science, Communication and Technology (IJARSCT)
Volume 12, Issue 1, December 2021
Copyright to IJARSCT DOI: 10.48175/568 345
www.ijarsct.co.in
Impact Factor: 5.731
Parameters OLTP
Characterized by Large numbers of short online transactions
Functionality An online database modification system
Method Uses a traditional DBMS
Tables Normalized
Data sources OLTP and its transactions
Data integrity Of critical importance
Response time One millisecond
Data quality Detailed and organized data
Business utility Controlling and running fundamental business tasks
Operation support Read/write operations
Mostly read-only operations
Query type Standardized and simple
Complex queries that can involve aggregations
Backup Complete backup combined with incremental backups
Backups are not important compared to periodically
User type Uses a data warehouse (clerks, DBAs, database professionals)
Purpose Not normalized.
Real-time business operations
Challenge Different OLTP databases
Data warehouses require development and may prove costly to build
Not an issue
Process From seconds to minutes
Fast results for daily used data
Style Data can be non-organized
Designed to have a fast response time and low data redundancy, normalized
Planning, problem-solving, and decision support
IV. USE CASES OF OLAP IN A DATA WAREHOUSE
OLAP plays a vital role in meeting organizations’ analytical demands by assisting decision-makers in fields such as
banking and finance, healthcare, insurance, retail, and manufacturing. It allows them to measure facts across the
company’s most interested dimensions such as geography, demography, and product.
In healthcare, for example, a data warehouse can be used for predicting health risks and outcomes, generating reports,
and sharing data with insurance companies. In the insurance sector, data warehouses can be used to analyze customer
trends and data patterns. In retail, it can be utilized to track items and customer buying patterns, as well for determining
dynamic pricing.
In a more specific example, a CFO might want to report on their company’s financial data by location, month, or
product. These elements will make up the dimensions of the OLAP cube, providing ways to transform that data into the
requested information. It will also enable the CFO to create a customized financial report quickly and easily.
Another example shows how an OLAP-based data warehouse can be applied in marketing. First, it can be used for
trend analysis, as it enables managers to predict future outcomes from historical results. Second, digital marketing relies
heavily on data warehouses to encompass versatile data from web analytics, PPC campaigns, display ads, social
channels, CRM, and email service providers. Third, many organizations are focusing on integrating data warehouses
for market segmentation to get detailed analysis of customer behavior.

IJARSCT ISSN (Online) 2581-9429
International Journal of Advanced Research in Science, Communication and Technology (IJARSCT)
Volume 12, Issue 1, December 2021
Copyright to IJARSCT DOI: 10.48175/568 346
www.ijarsct.co.in
Impact Factor: 5.731
That is only a small number of the possible scenarios of how businesses can adopt data warehouses, and OLAP in
particular, to improve their decision-making and increase organizational performance. There are many more use cases
proving that data warehouses are evolving quickly and that companies are seeing their importance.
V. TYPES OF OLAP SERVERS
We have four types of OLAP servers −
Relational OLAP (ROLAP)
Multidimensional OLAP (MOLAP)
Hybrid OLAP (HOLAP)
Specialized SQL Servers
5.1 Relational OLAP
ROLAP servers are placed between relational back-end server and client front-end tools. To store and manage
warehouse data, ROLAP uses relational or extended-relational DBMS. ROLAP includes the following
Implementation of aggregation navigation logic.
Optimization for each DBMS back end.
Additional tools and services.
5.2 Multidimensional OLAP
MOLAP uses array-based multidimensional storage engines for multidimensional views of data. With
multidimensional data stores, the storage utilization may be low if the data set is sparse. Therefore, many MOLAP
server use two levels of data storage representation to handle dense and sparse data sets.
5.3 Hybrid OLAP
Hybrid OLAP is a combination of both ROLAP and MOLAP. It offers higher scalability of ROLAP and faster
computation of MOLAP. HOLAP servers allows to store the large data volumes of detailed information. The
aggregations are stored separately in MOLAP store.
IJARSCT ISSN (Online) 2581-9429
International Journal of Advanced Research in Science, Communication and Technology (IJARSCT)
Volume 12, Issue 1, December 2021
Copyright to IJARSCT DOI: 10.48175/568 347
www.ijarsct.co.in
Impact Factor: 5.731
5.4 Specialized SQL Servers
Specialized SQL servers provide advanced query language and query processing support for SQL queries over star
and snowflake schemas in a read only environment.
VI. OLAP OPERATIONS
Since OLAP servers are based on multidimensional view of data, we will discuss OLAP operations in
multidimensional data. Here is the list of OLAP operations
Roll-up
Drill-down
Slice and dice
Pivot (rotate)
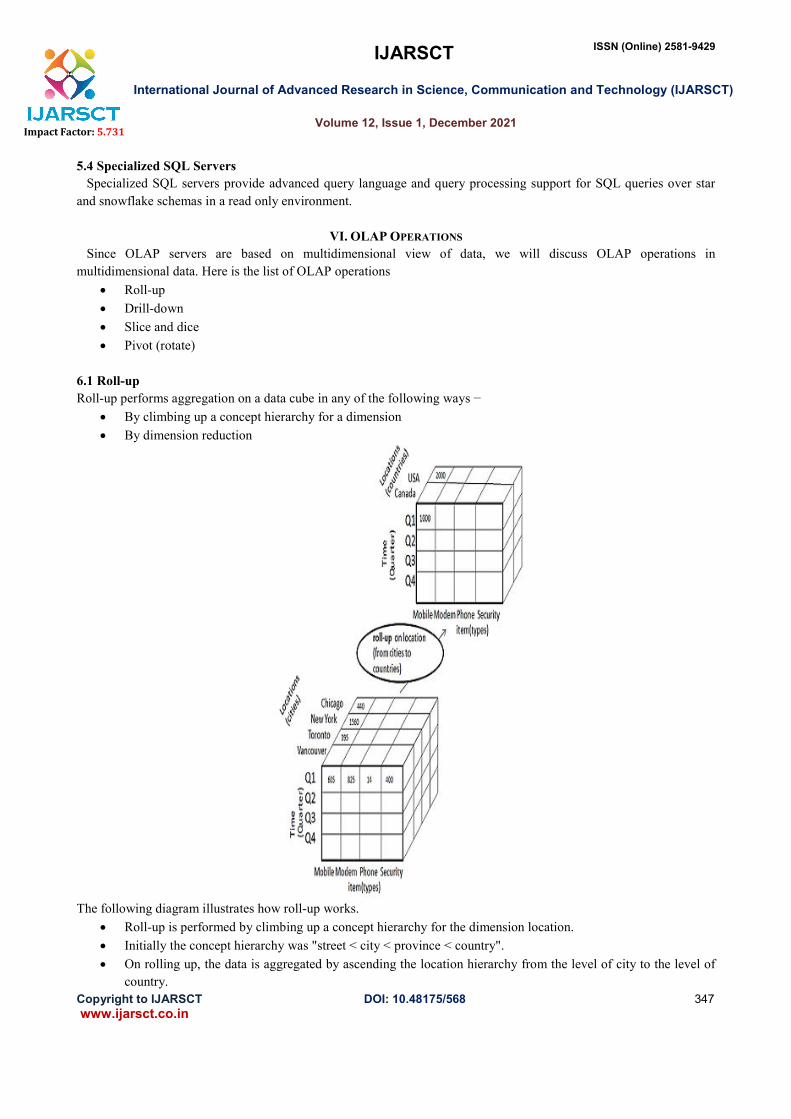
6.1 Roll-up
Roll-up performs aggregation on a data cube in any of the following ways −
By climbing up a concept hierarchy for a dimension
By dimension reduction
The following diagram illustrates how roll-up works.
Roll-up is performed by climbing up a concept hierarchy for the dimension location.
Initially the concept hierarchy was "street < city < province < country".
On rolling up, the data is aggregated by ascending the location hierarchy from the level of city to the level of
country.
IJARSCT ISSN (Online) 2581-9429
International Journal of Advanced Research in Science, Communication and Technology (IJARSCT)
Volume 12, Issue 1, December 2021
Copyright to IJARSCT DOI: 10.48175/568 348
www.ijarsct.co.in
Impact Factor: 5.731
The data is grouped into cities rather than countries.
When roll-up is performed, one or more dimensions from the data cube are removed.
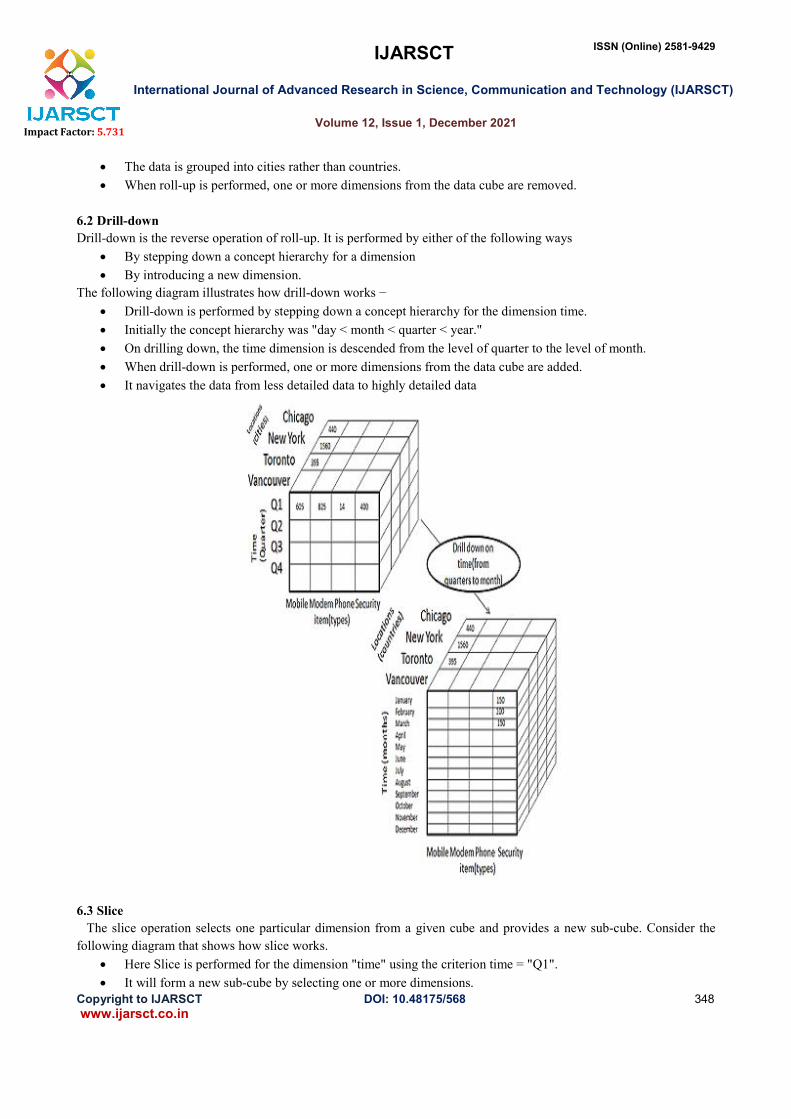
6.2 Drill-down
Drill-down is the reverse operation of roll-up. It is performed by either of the following ways
By stepping down a concept hierarchy for a dimension
By introducing a new dimension.
The following diagram illustrates how drill-down works −
Drill-down is performed by stepping down a concept hierarchy for the dimension time.
Initially the concept hierarchy was "day < month < quarter < year."
On drilling down, the time dimension is descended from the level of quarter to the level of month.
When drill-down is performed, one or more dimensions from the data cube are added.
It navigates the data from less detailed data to highly detailed data
6.3 Slice
The slice operation selects one particular dimension from a given cube and provides a new sub-cube. Consider the
following diagram that shows how slice works.
Here Slice is performed for the dimension "time" using the criterion time = "Q1".
It will form a new sub-cube by selecting one or more dimensions.

IJARSCT ISSN (Online) 2581-9429
International Journal of Advanced Research in Science, Communication and Technology (IJARSCT)
Volume 12, Issue 1, December 2021
Copyright to IJARSCT DOI: 10.48175/568 349
www.ijarsct.co.in
Impact Factor: 5.731
6.4 Dice
Dice selects two or more dimensions from a given cube and provides a new sub-cube. Consider the following
diagram that shows the dice operation.
The dice operation on the cube based on the following selection criteria involves three dimensions.
(location = "Toronto" or "Vancouver")
(time = "Q1" or "Q2")
(item =" Mobile" or "Modem")
6.5 Pivot
The pivot operation is also known as rotation. It rotates the data axes in view in order to provide an alternative
presentation of data. Consider the following diagram that shows the pivot operation.

IJARSCT ISSN (Online) 2581-9429
International Journal of Advanced Research in Science, Communication and Technology (IJARSCT)
Volume 12, Issue 1, December 2021
Copyright to IJARSCT DOI: 10.48175/568 350
www.ijarsct.co.in
Impact Factor: 5.731
What is a data warehouse exactly? Simply it is a decision support database that is maintained separately from the
organization’s operational database. And it is a repository of information collected from multiple sources, stored under
a unified schema, and that usually resides at a single site. A data warehouse further identified as a semantically
consistent data store that serves as a physical implementation of a decision support data model and stores the
information on which an enterprise needs to make strategic decisions. Let’s take a closer look at each of the key
features of a data warehouse;
Subject-oriented: A data warehouse is organized around major subjects such as customer, supplier, product,
and sales. Rather than concentrating on the day-to-day operations and transaction processing of an
organization, a data warehouse focuses on the modeling and analysis of data for decision makers.
Integrated: A data warehouse is usually constructed by integrating multiple heterogeneous sources, such as
relational databases, flat files, and online transaction records. Data cleaning and data integration techniques are
applied to ensure consistency in naming conventions, encoding structures, attribute measures, and so on.
Time-variant: Data is stored to provide information from a historic perspective (e.g., the past 5–10 years).
Every key structure in the data warehouse contains, either implicitly or explicitly, a time element.
Nonvolatile: A data warehouse is always a physically separate store of data transformed from the application
data found in the operational environment. Due to this separation, a data warehouse does not require
transaction processing, recovery, and concurrency control mechanisms. It usually requires only two operations
in data accessing: initial loading of data and access to data.
Why separate Data Warehouse?
A data warehouse is kept separate from operational databases due to the following reasons −
An operational database is constructed for well known tasks and workloads such as searching particular
records, indexing, etc. In contrast, data warehouse queries are often complex and they present a general form
of data.
Operational databases support concurrent processing of multiple transactions. Concurrency control and
recovery mechanisms are required for operational databases to ensure the robustness and consistency of the
database.
An operational database query allows us to read and modify operations, while an OLAP query needs only
read-only access to stored data.
An operational database maintains current data. On the other hand, a data warehouse maintains historical data.
VII. DATA WAREHOUSE MODELING: DATA CUBE AND OLAP
Data warehouses and OLAP tools are based on a multidimensional data model. This model views data in the form of
a data cube. “What is a data cube?” A data cube allows data to be modeled and viewed in multiple dimensions. It is
defined by dimensions and facts.
Dimensions: dimensions are the perspectives or entities with respect to which an organization wants to keep
records. Each dimension may have a table associated with it, called a dimension table, which further describes
the dimension.
Facts: Facts are numeric measures. The fact table contains the names of the facts, or measures, as well as keys
to each of the related dimension tables.
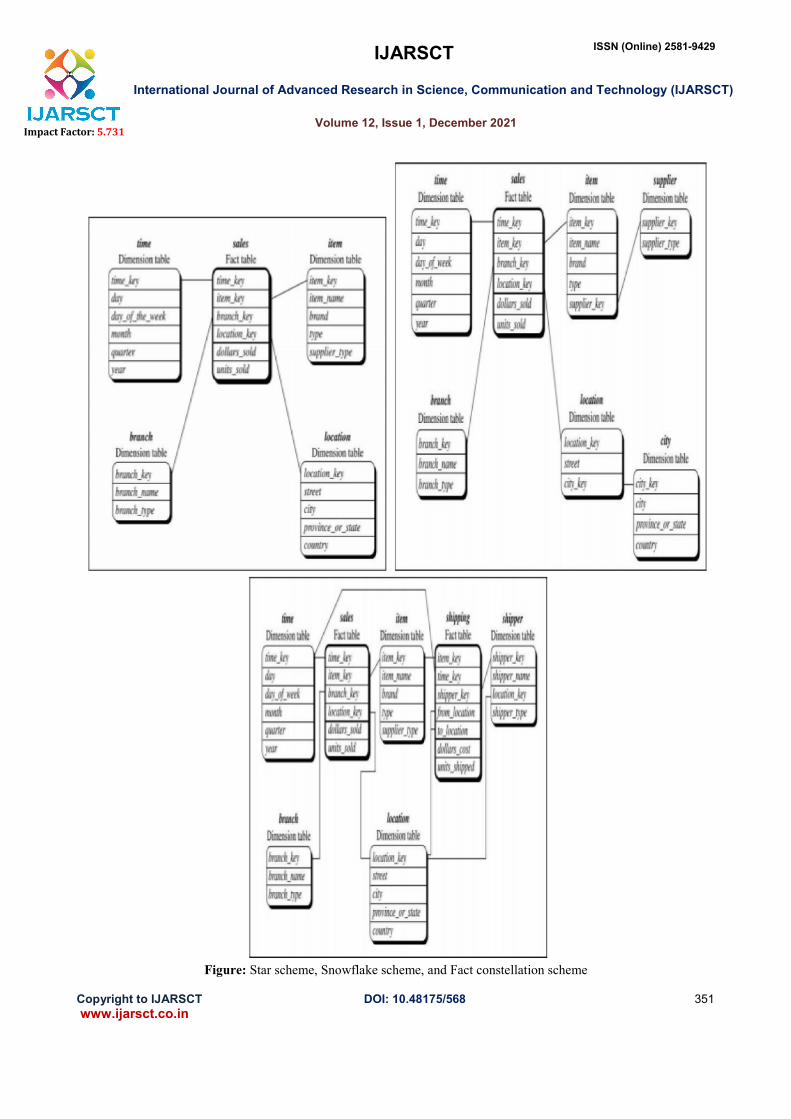
The multidimensional model of a data warehouse can be modeled in the form of a star schema, a snowflake schema,
or a fact constellation schema.
Star schema: A fact table in the middle connected to a set of dimension tables
Snowflake schema: A refinement of star schema where some dimensional hierarchy is normalized into a set
of smaller dimension tables, forming a shape similar to a snowflake.
Fact constellation schema: Multiple fact tables share dimension tables, viewed as a collection of stars,
therefore called galaxy schema or fact constellation.
IJARSCT ISSN (Online) 2581-9429
International Journal of Advanced Research in Science, Communication and Technology (IJARSCT)
Volume 12, Issue 1, December 2021
Copyright to IJARSCT DOI: 10.48175/568 351
www.ijarsct.co.in
Impact Factor: 5.731
Figure: Star scheme, Snowflake scheme, and Fact constellation scheme
IJARSCT ISSN (Online) 2581-9429
International Journal of Advanced Research in Science, Communication and Technology (IJARSCT)
Volume 12, Issue 1, December 2021
Copyright to IJARSCT DOI: 10.48175/568 352
www.ijarsct.co.in
Impact Factor: 5.731
7.1 Measures
A data cube measure is a numeric function that can be evaluated at each point in the data cube space. A measure
value is computed for a given point by aggregating the data corresponding to the respective dimension–value pairs
defining the given point. Measures can be organized into three categories as distributive, algebraic, and holistic
based on the kind of aggregate functions used.
Distributive: If the result derived by applying the function to n aggregate values is the same as that derived by
applying the function on all the data without partitioning. E.g., count(), sum(), min(), max()
Algebraic: If it can be computed by an algebraic function with M arguments (where M is a bounded integer),
each of which is obtained by applying a distributive aggregate function. E.g., avg(), min_N(),
standard_deviation()
Holistic: If there is no constant bound on the storage size needed to describe a sub aggregate. E.g., median(),
mode(), rank()
VIII. OLAP OPERATIONS
Since OLAP servers are based on a multidimensional view of data, have to perform some typical OLAP operations
for multidimensional data.
1. Roll up (drill-up): summarize data by climbing up the hierarchy or by dimension reduction
2. Drill down (roll down): reverse of roll-up from higher-level summary to lower level summary or detailed
data, or introducing new dimensions
3. Slice and dice: project and select
4. Pivot (rotate): reorient the cube, visualization, 3D to series of 2D planes
To get a better understanding of the concepts, python implementation of OLAP operations are described below.
8.1 Step-by-Step Implementation of Cubes and OLAP Operations
Let’s move on to practical and see how a lightweight Python framework and set of tools for the development of
reporting and analytical applications, Online Analytical Processing (OLAP), multidimensional analysis, and browsing
of aggregated data.
IX. CONCLUSION
Data warehouses and OLAP provide tools to construct, populate, view, and access microarray data in an efficient and
fast manner. The fundamental unit of OLAP software is the cube, which is a repository of integrated information from
the existing data sources. In our cube design the data sources were the relational tables in SGMD, a gene expression
database . Microarray databases are in fact data warehouses because of their consistent and stable data, and little if any
modifications to the database model need to be made to use OLAP. OLAP proved to be more efficient than standard
relational database queries that rely on time-consuming multitable joins. Although the results obtained from OLAP and
these standard SQL queries are the same, the time it takes to execute an OLAP query was found to be 25 times greater
than standard SQL queries.
REFERENCES
[1]. Inmon, W.H., Building the Data Warehouse. John Wiley, 1992.
[2]. http://www.olapcouncil.org
[3]. Codd, E.F., S.B. Codd, C.T. Salley, ―Providing OLAP (On-Line Analytical Processing) to User Analyst: An
IT Mandate.‖ Available from Arbor Software’s web site http://www.arborsoft.com/OLAP.html.
[4]. http://pwp.starnetinc.com/larryg/articles.html
[5]. Kimball, R. The Data Warehouse Toolkit. John Wiley, 1996.
[6]. Barclay, T., R. Barnes, J. Gray, P. Sundaresan, Loading Databases using Dataflow Parallelism.‖ SIGMOD
Record, Vol. 23, No. 4, Dec.1994.
IJARSCT ISSN (Online) 2581-9429
International Journal of Advanced Research in Science, Communication and Technology (IJARSCT)
Volume 12, Issue 1, December 2021
Copyright to IJARSCT DOI: 10.48175/568 353
www.ijarsct.co.in
Impact Factor: 5.731
[7]. Blakeley, J.A., N. Coburn, P. Larson. ―Updating Derived Relations: Detecting Irrelevant and Autonomously
Computable Updates.‖ ACM TODS, Vol.4, No. 3, 1989.
[8]. Gupta, A., I.S. Mumick, ―Maintenance of Materialized Views: Problems, Techniques, and Applications.‖
Data Eng. Bulletin, Vol. 18, No. 2, June 1995.
[9]. Zhuge, Y., H. Garcia-Molina, J. Hammer, J. Widom, ―View Maintenance in a Warehousing Environment,
Proc. of SIGMOD Conf., 1995.
[10]. Roussopoulos, N., et al., ―The Maryland ADMS Project: Views R Us.” Data Eng. Bulletin, Vol. 18, No.2,
June 1995.
[11]. O’Neil P., Quass D. ―Improved Query Performance with Variant Indices‖, To appear in Proc. of SIGMOD
Conf., 1997.
[12]. O’Neil P., Graefe G. ―Multi-Table Joins through Bitmapped Join Indices‖ SIGMOD Record, Sep 1995.
[13]. Harinarayan V., Rajaraman A., Ullman J.D. ― Implementing Data Cubes Efficiently‖ Proc. of SIGMOD
Conf., 1996.
[14]. Chaudhuri S., Krishnamurthy R., Potamianos S., Shim K. ―Optimizing Queries with Materialized Views‖
Intl. Conference on Data Engineering, 1995.
[15]. Levy A., Mendelzon A., Sagiv Y. ―Answering Queries Using Views‖ Proc. of PODS, 1995.
[16]. Yang H.Z., Larson P.A. ―Query Transformations for PSJ Queries‖, Proc. of VLDB, 1987.
[17]. Kim W. ―On Optimizing a SQL-like Nested Query‖ ACM TODS, Sep 1982.
[18]. Ganski,R., Wong H.K.T., ―Optimization of Nested SQL Queries Revisited ‖ Proc. of SIGMOD Conf., 1987.
[19]. Dayal, U., ―Of Nests and Trees: A Unified Approach to Processing Queries that Contain Nested Subqueries,
Aggregates and Quantifiers‖ Proc. VLDB Conf., 1987.20
[20]. Murlaikrishna, ―Improved Unnesting Algorithms for Join Aggregate SQL Queries‖ Proc. VLDB Conf.,
1992.
[21]. Seshadri P., Pirahesh H., Leung T. ―Complex Query Decorrelation‖ Intl. Conference on Data Engineering ,
1996.
[22]. Mumick I.S., Pirahesh H. ―Implementation of Magic Sets in Starburst‖ Proc.of SIGMOD Conf., 1994.
[23]. Chaudhuri S., Shim K. ―Optimizing Queries with Aggregate Views‖, Proc. of EDBT, 1996.
[24]. Chaudhuri S., Shim K. ―Including Group By in Query Optimization‖, Proc. of VLDB, 1994.
[25]. Yan P., Larson P.A. ―Eager Aggregation and Lazy Aggregation‖, Proc. of VLDB, 1995.
[26]. Gupta A., Harinarayan V., Quass D. ―Aggregate-Query Processing in Data Warehouse Environments‖, Proc.
of VLDB, 1995.
[27]. Chaudhuri S., Shim K. ―An Overview of Costbased Optimization of Queries with Aggregates” IEEE Data
Enginering Bulletin, Sep 1995.
[28]. Dewitt D.J., Gray J. ―Parallel Database Systems: The Future of High Performance Database Systems‖
CACM, June 1992.