
An Object-Level Feature Representation Model for the Multi ...
13
Copyright 2014. The Korean Institute of Information Scientists and Engineers pISSN: 1976-4677 eISSN: 2093-8020 Regular Paper Journal of Computing Science and Engineering, Vol. 8, No. 2, June 2014, pp. 65-77 An Object-Level Feature Representation Model for the Multi-target Retrieval of Remote Sensing Images Zhi Zeng * Huizhou University, Computer Science [email protected] Zhenhong Du and Renyi Liu Zhejiang University, Earth Science [email protected], [email protected] Abstract To address the problem of multi-target retrieval (MTR) of remote sensing images, this study proposes a new object-level feature representation model. The model provides an enhanced application image representation that improves the effi- ciency of MTR. Generating the model in our scheme includes processes, such as object-oriented image segmentation, feature parameter calculation, and symbolic image database construction. The proposed model uses the spatial represen- tation method of the extended nine-direction lower-triangular (9DLT) matrix to combine spatial relationships among objects, and organizes the image features according to MPEG-7 standards. A similarity metric method is proposed that improves the precision of similarity retrieval. Our method provides a trade-off strategy that supports flexible matching on the target features, or the spatial relationship between the query target and the image database. We implement this retrieval framework on a dataset of remote sensing images. Experimental results show that the proposed model achieves competitive and high-retrieval precision. Category: Smart and intelligent computing Keywords: Remote sensing; Image processing; Spatial representation; 9DLT; Content-based remote sensing image retrieval I. INTRODUCTION Along with the rapid progress of satellite sensor tech- nology and their application to high-resolution remote sensing images in Earth observation systems, a large amount of remote sensing data have become readily avail- able for acquisition. In terms of spatial information, ter- rain geometry, and texture information, high-resolution remote sensing images have more features than middle or low-resolution images. To use the image database fully and to retrieve interesting information automatically and intelligently, a new efficient technology for multi-target retrieval (MTR) in an image, particularly in a specified region, is expected to be developed. The number of image-processing applications for target retrieval is increasing, such as query by image content from IBM [1]. Most studies in this area have focused on content-based image retrieval (CBIR) and content-based Received 25 December 2013; Accepted 10 March 2014 *Corresponding Author Open Access http://dx.doi.org/10.5626/JCSE.2014.8.2.65 http://jcse.kiise.org This is an Open Access article distributed under the terms of the Creative Commons Attribution Non-Commercial License (http://creativecommons.org/licenses/ by-nc/3.0/) which permits unrestricted non-commercial use, distribution, and reproduction in any medium, provided the original work is properly cited.
-
Upload
khangminh22 -
Category
Documents
-
view
4 -
download
0
Transcript of An Object-Level Feature Representation Model for the Multi ...
Copyright 2014. The Korean Institute of Information Scientists and Engineers pISSN: 1976-4677 eISSN: 2093-8020
Regular PaperJournal of Computing Science and Engineering,
Vol. 8, No. 2, June 2014, pp. 65-77
An Object-Level Feature Representation Model for the Multi-target Retrieval of Remote Sensing Images
Zhi Zeng*
Huizhou University, Computer Science
Zhenhong Du and Renyi Liu
Zhejiang University, Earth Science
[email protected], [email protected]
AbstractTo address the problem of multi-target retrieval (MTR) of remote sensing images, this study proposes a new object-level
feature representation model. The model provides an enhanced application image representation that improves the effi-
ciency of MTR. Generating the model in our scheme includes processes, such as object-oriented image segmentation,
feature parameter calculation, and symbolic image database construction. The proposed model uses the spatial represen-
tation method of the extended nine-direction lower-triangular (9DLT) matrix to combine spatial relationships among
objects, and organizes the image features according to MPEG-7 standards. A similarity metric method is proposed that
improves the precision of similarity retrieval. Our method provides a trade-off strategy that supports flexible matching on
the target features, or the spatial relationship between the query target and the image database. We implement this
retrieval framework on a dataset of remote sensing images. Experimental results show that the proposed model achieves
competitive and high-retrieval precision.
Category: Smart and intelligent computing
Keywords: Remote sensing; Image processing; Spatial representation; 9DLT; Content-based remote sensing image
retrieval
I. INTRODUCTION
Along with the rapid progress of satellite sensor tech-
nology and their application to high-resolution remote
sensing images in Earth observation systems, a large
amount of remote sensing data have become readily avail-
able for acquisition. In terms of spatial information, ter-
rain geometry, and texture information, high-resolution
remote sensing images have more features than middle or
low-resolution images. To use the image database fully
and to retrieve interesting information automatically and
intelligently, a new efficient technology for multi-target
retrieval (MTR) in an image, particularly in a specified
region, is expected to be developed.
The number of image-processing applications for target
retrieval is increasing, such as query by image content
from IBM [1]. Most studies in this area have focused on
content-based image retrieval (CBIR) and content-based
Received 25 December 2013; Accepted 10 March 2014
*Corresponding Author
Open Access http://dx.doi.org/10.5626/JCSE.2014.8.2.65 http://jcse.kiise.orgThis is an Open Access article distributed under the terms of the Creative Commons Attribution Non-Commercial License (http://creativecommons.org/licenses/
by-nc/3.0/) which permits unrestricted non-commercial use, distribution, and reproduction in any medium, provided the original work is properly cited.
Journal of Computing Science and Engineering, Vol. 8, No. 2, June 2014, pp. 65-77
http://dx.doi.org/10.5626/JCSE.2014.8.2.65 66 Zhi Zeng et al.
remote sensing image retrieval (CBRSIR), and have achieved
significant results. In these processes, the contents of an
image, which specify several low-level features, such as
color, texture, shape, longitude and latitude, and spatial
relationships among objects, are the bases of multi-
dimensional image feature vectors. Regarding the differ-
ences in imaging conditions of various forms of remote
sensing images, we cannot exactly express image con-
tents by using only a single feature. Therefore, construct-
ing the comprehensive features of an image is the key to
improving extraction performance [2]. However, if the
combined features cannot be purified to form a unified
model, then the accuracy of the similarity extraction and
efficiency improvement of the images will be affected.
For example, if we focus more on spatial relationship,
then the detail of each target will be minimal. Thus, the
efficiency of MTR will be higher than comparing the fea-
tures of a single object. To effectively reveal the information
retrieval process for remote sensing images, an object-
level model is proposed, which can represent the contents
of an image with overall accuracy. By using this model,
we can retrieve and operate the information pre-stored in
a symbolic image database (SID) with high efficiency,
and neglect intrinsic information, such as color, texture,
and shape. To date, research on feature representation
models of image data for MTR remains limited. To build
feature indices and to realize rapid retrieval, we propose
an object-level feature representation model, based on a
previous research on CBRSIR and the reference for
MPEG-7 standards, starting with representing the con-
tents of an image on an object-level feature, particularly
the spatial relationship among targets.
The rest of this paper is organized as follows. Section
II discusses related literature on representation techniques
of image contents for CBIR or CBRSIR. Section III
introduces calculation and representation feature values,
and mainly describes the spatial representations of the
extended nine-direction lower-triangular matrix (9DLT).
Section IV presents a model of image content feature rep-
resentation. Section V proposes an MTR model and
similarity calculation. The last section presents several
experiments to validate the accuracy of the content-based
feature representation model and the efficiency of image
target extraction. A conclusion to the study is also pre-
sented in this section.
II. RELATED STUDIES
In the past three decades, academia has achieved a
large number of results on CBIR and CBRSIR. At present,
CBIR has many successful applications in the fields of
facial recognition, medical diagnosis, and trade registra-
tion. Most of these systems have adopted single feature
or combined features as image indices [3-10]. CBRSIR is
similar to CBIR, because both contain visual and geo-
graphic information. Several systems have focused on the
issue of spectral retrieval, such as texture representation,
and different combinations with spectral bands [11]. A
special feedback approach has been employed to pre-
cisely describe the desired search characteristic in a
remote sensing image [12]. Some researchers even pre-
sented a code stream of images for remote sensing image
retrieval [13]. In addition, other scholars combined a
scheme with an automatic classifier, and proposed the use
of new feature ‘texton histograms’, to capture the weak-
textured characteristic of remote sensing images for
image retrieval [14]. Meanwhile, others applied a texture
analysis approach, called the local binary pattern opera-
tor, to implement image retrieval [15]. Some of these
studies even applied independent component analysis to
extract independent components of feature values via lin-
ear combinations to realize multi-spectral image retrieval
[16]; or adopted principal component analysis and a clus-
tering technique to index remote sensing images for
image retrieval [17]. Considering various features, such
as color, texture, and spectra, a prototype model for
CBRSIR based on color moment and gray level co-occur-
rence matrix feature was proposed [18]. A number of
researchers combined several properties (color, texture,
and points of interest) that were automatically extracted
and immediately indexed images [19]. In addition, some
researchers proposed a framework based on a domain-
dependent ontology to perform semantic retrieval in image
archives [20]. Other scholars also presented a universal
semantic data model for image retrieval [21]. Regardless
of how a feature vector is established, this vector still
depends upon the representation of contents in images.
To date, the contents of images can be represented in
numerous ways. Some approaches adopt a quad-tree struc-
ture or a quin-tree method that splits large-scale remote
sensing images into sub-images, to extract multiple fea-
tures, such as color and texture [22, 23]. Others use the
2D C-string to represent spatial knowledge of an image
database [24]; or the spanning representation of an object
to realize spatial inference and similarity retrieval in an
image database, through directional relation referenced
frames [25]. Others depict the relationships among spa-
tial objects by using the methods of the nine-direction
spanning area [26] or 9DLT [27]; and represent image
colors by using pyramid technology [28]; or express an
image by employing a symbol index, which is established
in image space stratification [29]. All the aforementioned
related representations include color, space, and sub-
images that belong to the feature representation method
on image contents. Implementing rapid and accurate
retrieval with a massive remote sensing image is difficult,
because its features include various data types, resolution
scales, and data sources. In our investigation, we analyze
the contents of an image based on the MPEG-7 standard
An Object-Level Feature Representation Model for the Multi-target Retrieval of Remote Sensing Images
Zhi Zeng et al. 67 http://jcse.kiise.org
to organize the features of the image, build an SID, and
index the SID to accelerate target retrieval.
III. CALCULATING FEATURE VALUE
The key to improving image retrieval efficiency is the
index technique, which involves obtaining objects after
image segmentation and building an SID for the image
database. In the present study, we adopt a mature algo-
rithm, called object-oriented multiscale image segmenta-
tion. The object-oriented image processing algorithm is a
synthetic algorithm that fuses spectrum characteristics,
geometric information, and structural information. This
algorithm regards an object as a minimal process unit by
retrieving its multiple characteristics to form a logical
relationship among images and objects. Then, we analyze
the image from the local to the entire level, and ulti-
mately, implement its understanding. In general, multi-
scale image segmentation begins with any pixel by using
a region merging method, from the bottom to the top, to
form objects. Small objects can be merged to form large
objects, and the size of each object must satisfy the
demand of which the heterogeneity of a merged object is
less than a given threshold. In this case, heterogeneity is
decided by differences in the spectra and shapes of
objects. However, various features correspond to differ-
ent scales of observation, in which each feature can be
extracted and accurately analyzed in an image layer on a
proper scale [30]. In particular, we use the threshold
value method on a multiple scale to segment an image.
After processing the calibration, segmentation, and ras-
ter vectorization of the image based on a specified region
of latitude and longitude, the basic unit of the image is no
longer a single pixel, but a polygon that is composed of
homogeneous pixels. Each polygon can be used to calcu-
late the spectral information of pixels, including shape,
texture, color information, and topological relationships
among the polygons. Next, we will introduce the method
for calculating the feature vectors to implement the repre-
sentation model.
A. Shape
Shape is a key feature used to differentiate two objects.
It is also the basis for characteristic retrieval, and the clas-
sified process mentioned in the latter part of this paper. In
general, in the field of object-level content retrieval, shape
remains as the most basic feature for distinguishing
objects. At present, two approaches are used to describe
shapes: parametric and geometric approaches. In the
present investigation, we adopt a geometric approach to
characterize the shapes of different objects, namely, the
model of centroid radii representation [31].
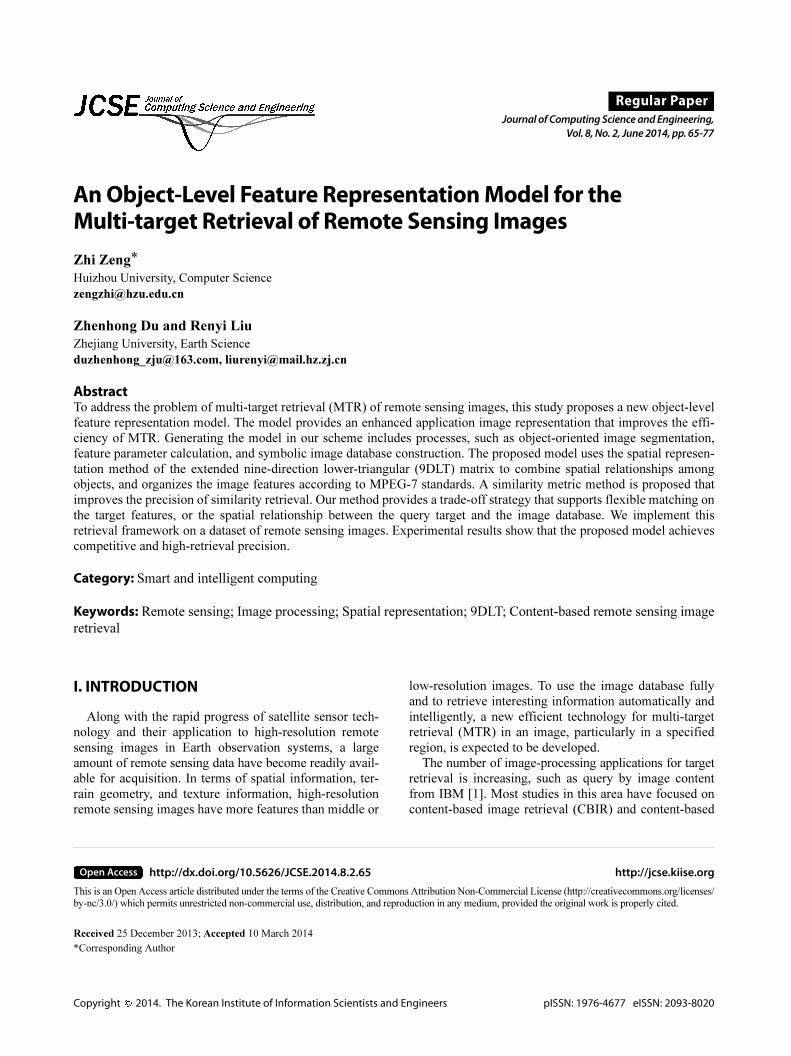
For an arbitrary polygon, such as the one shown in
Fig. 1(a), the results of resampling an image with the
angle θ interval around, and counterclockwise to the y
axis, are shown as Fig. 1(b). Let lk be the distance
between the centroid of the polygon, and the boundary
sampling point. The shape descriptor of the polygon can
be expressed by a centroid-radius model, as follows:
,
, . (1)
The condition for measuring similarity between two
polygons based on shape is: if and only if the numerical
difference between the central radii in all directions is
less than a given minor threshold value ε. That is, when
two polygons are similar, the shape descriptor must satisfy
the following regulation:
. (2)
To ensure scale invariance of shape by using regulation
(2), we need to normalize the Euclidean distance between
the centroid and each vertex, within the range of [0, 1]. In
this study, we discuss most of the possible transforma-
tions between two feature vectors. One of these transfor-
mations involves the possible rotations between two
shapes, and the distances that are independent from rota-
tion, including the starting and ending points.
After transforming image shape into matrix space, we
store data, using the antipole tree structure [32].
B. Texture
Different features in high-resolution images typically
have similar spectral appearances to human vision. The
mean value floating of a spectral feature may also cause
similar spectra among different homogeneity samples to
converge as similar modes in a feature space, thus result-
ing in spectra with similar features. This phenomenon is
attributed to the human eyes being insensitive to some
portion of visible light. Therefore, we can improve the
reliability of retrieval results by using features, such as
Fshape l0, lθ, l2θ, ..., liθ, ..., l k 1–( )θ( )=
k 360° θ⁄= 0 i k 1–≤ ≤
l1iθ l2iθ– ε< , i∀ 0, k 1–[ ]∈
Fig. 1. Model of the centroid radii. (a) Resampled polygon withθ interval around, and counterclockwise to, the y axis; and (b)expression of the resampling result.

Journal of Computing Science and Engineering, Vol. 8, No. 2, June 2014, pp. 65-77
http://dx.doi.org/10.5626/JCSE.2014.8.2.65 68 Zhi Zeng et al.
shape, texture, and spatial relationships as references.
Texture is a significant geometric (spatial) feature that
can be used to distinguish among different objects and
regions to reflect the changing discipline in gray space. A
2D Gabor filter is suitable for narrow-band coding of tex-
ture, because of its adjustable filtering direction, band-
width, general band-center frequency, and optimal time-
domain and spatial-domain analysis abilities. After fin-
ishing gray-scaling and normalization processes on
image segmentation, we apply a Gabor filter to extract
the texture feature of the objects. The Gabor filter func-
tion g(x, y) is a 2D Gaussian function that is modulated
by the complex sine window function g(x, y). Its Fourier
transform function G(u, v) can be expressed by the fol-
lowing equations:
,
(3)
where, , , and are the Gabor filter
spatial range and bandwidth of the frequency domain,
respectively. In this case, is the central frequency in
the filter of the orthogonal coordinate in the frequency
domain. Let g(x, y) be a function of the mother that gen-
erates the Gabor filter family. The set of functions gm,n(x, y),
which is a complete non-orthogonal dataset, can be gen-
erated through rotation and scaling, according to Eq. (4).
gm,n(x,y) = a−2mg(x', y'), (4)
where x' = a−m(xcosθn + ysinθn), y' = a−m(−xsinθn + ycosθn),
a > 1, θn = nπ/K, m = 0, 1, ..., S − 1, and n = 0, 1, ..., K − 1.
Parameter θn is the counterclockwise rotation angle along
the filter axis. S, K are the total scale and rotation, respec-
tively. After obtaining the energy value of each filter and
the convolution of the image, we calculate the mean
value and the mean square deviation of the filtering value
on the energy of each object. Finally, we mark the texture
feature vector of the object, as shown in Eq. (5).
. (5)
where, K is the central frequency, and L is the directional
angle. k = 0, 1 ..., K − 1, l = 0, 1, ......, L − 1, and Ek,l(x, y)
is the filtering energy value of the filter (k, l). Nor-
malization is required to proceed toward Ek,l(x, y), to
ensure that the energy value of each element in the
energy information is not affected by the actual size. We
commonly use Ek,l(x, y) = to calculate the
energy value, according to the gray value p(x, y) in loca-
tion (x, y). Finally, the mean value µ of the energy, and
the mean square deviation σ of the target object (n × n
pixels), can be obtained as Eqs. (6) and (7), respectively.
, (6)
. (7)
C. Spatial Representation of the Extended9DLT
The spatial representation of an image describes the
spatial relationships among objects to easily distinguish
images with multiple targets. The spatial relationships in
an image can be classified into two categories: positional
and directional relationships. The former can be repre-
sented by a 2D string; whereas, the latter can be repre-
sented by 9DLT methods [25]. For a calibrated remote
sensing image within the region of a certain latitude and
longitude, the directional relationship relative to the four
corners among the objects is confirmed. In this section,
we introduce problem definitions and preliminary con-
cepts, through formal methods.
DEFINITION 1. Let α = (α1, α2, ..., αk) be a set of
objects in the same image. Hence, αi is a subset of α.
DEFINITION 2. The spatial relationship between two
objects can be defined as one of the codes in nine direc-
tions, which is called 9DLT.
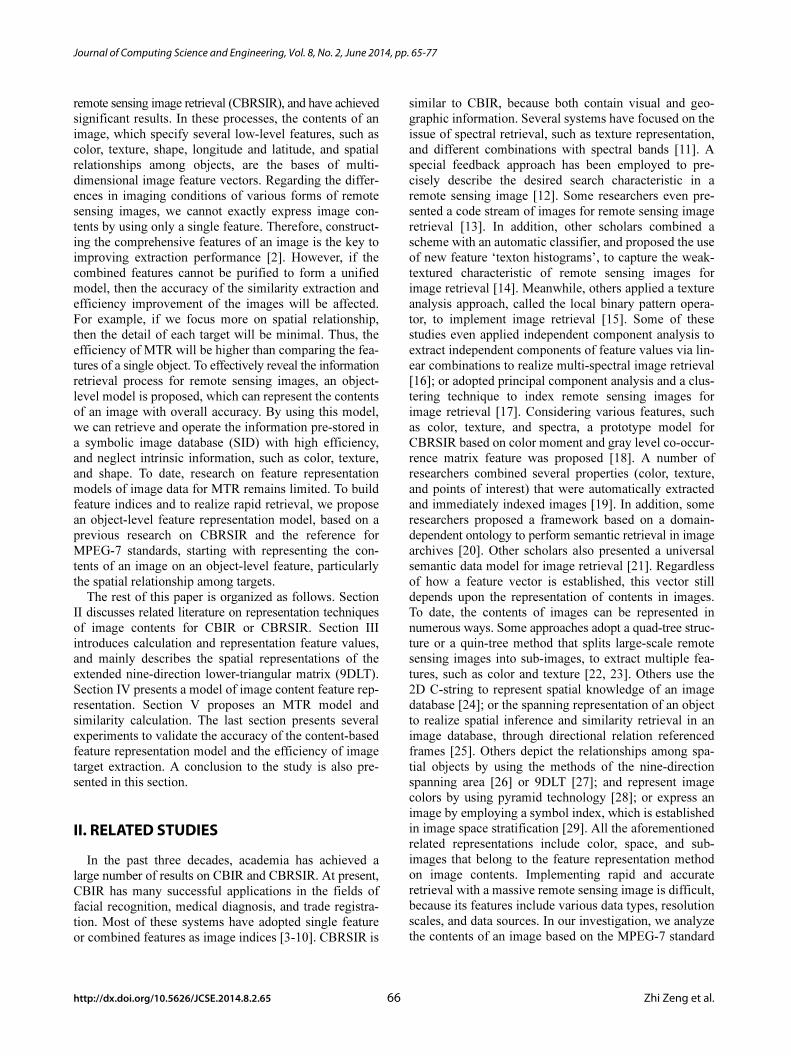
DEFINITION 3 (The 9DLT matrix). Let V = {v1, v2, v3,
..., vm} be composed of m distinct sets of objects, and Z be
composed of z1, z2, z3, ..., zs in order, where = 1, 2, ...,
s, . Suppose C is a collection of 9D encodings, as
shown in Fig. 2(a). Each direction code can then be used
to specify the spatial relationship between two objects.
g x, y( ) 12πσxσy
-----------------exp 12--- x
2
σx
2----- y
2
σy
2-----+⎝ ⎠
⎛ ⎞ 2πifx+–=
G u, v( ) exp 12---
u f–( )2
σu
2--------------- v
2
σv
2-----+–⎝ ⎠
⎛ ⎞=
σu1
2πσx
-----------= σv1
2πσy
-----------= σx, σy
f, 0( )
Ftexture µ0,0
texture, σ0,0
texture, µ0,1
texture, σ0,1
texture, ...,{=
µk,ltexture
, σk,ltexture
, ..., µK 1– ,L 1–
texture, σK 1– ,L 1–
texture }
p x, y( )2x,y∑
µk,l
texture
Ek,l x, y( )y∑
x∑
n n×--------------------------------=
σk,ltexture
Ek,l x, y( ) µk,ltexture
–( )2
y∑
x∑
n n×--------------------------------------------------------=
i∀zi V∈
Fig. 2. Representation of nine-direction lower-triangular. (a)Nine-direction code and (b) symbolic figure of the object.
An Object-Level Feature Representation Model for the Multi-target Retrieval of Remote Sensing Images
Zhi Zeng et al. 69 http://jcse.kiise.org
Thus, a 9DLT matrix T is an s × s matrix that is com-
posed of tij, which belongs to the collection of 9D encod-
ing C. The item tij at row i column j represents the
direction code from zj to zi, only when i and j satisfy the
condition .
As shown in Fig. 2(a), let R be the referred object
expressed by 0, in which we define the direction code in a
45º interval from the northern counterclockwise, as 1…8.
Each object from the source image will be represented by
one centroid in a 9DLT expression. Fig. 2(b) shows a fea-
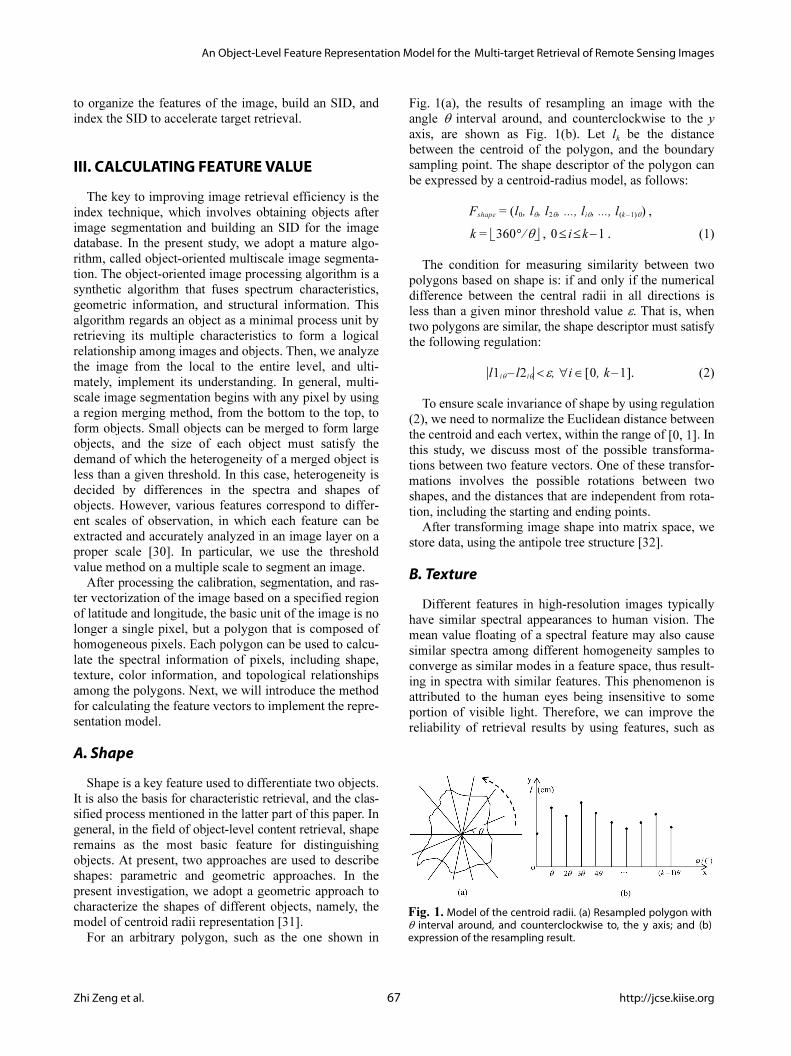
ture image that contains four objects. Fig. 3(a) exhibits
the direction map in the grid between the objects;
whereas, the direction code of the LT matrix in Fig. 3(b)
demonstrates the spatial relationships among objects. The
9DLT string is (A, B, C, D, 6, 6, 6, 7, 5, 4) in column
order. A relationship between two objects exists in the
matrix.
DEFINITION 4. A pattern consists of the sets of objects
and the spatial relationships among these objects. For
example, α = (α1, α2, ..., αk, αr1, αr2, ..., αrm) is a pattern,
α i is an object and αrj is the corresponding spatial rela-
tionship, where , , ,
and . That is, the spatial relationships between any
two objects in this pattern are recorded. The length of a
pattern is equal to the amount of objects. A pattern with a
length that is equal to k is called the k-pattern.
Constraints:
(1) An item or object in a pattern is stored in alphabeti-
cal order.
(2) No spatial relationship exists, if the length of a pat-
tern is equal to 1.
The 9DLT expression is in accordance with the defini-
tion of the pattern.
DEFINITION 5. Pattern α = (α1, α2, ..., αi, αr1, αr2, ...,
αrm) is a sub-pattern of pattern β = (β1, β2, ..., βj, βr1, βr2,
..., βrn), where is a subset of ,
where . The spatial relationship between any two
items in α is the same as in β. Pattern β contains pattern
α, where . The amount of a sub-pattern is N =
. For example, pattern α = (A, B, C, 6,
6, 7) is a sub-pattern of pattern β = (A, B, C, D, 6, 6, 6, 7,
5, 4), because (A, B, C) is a subset of (A, B, C, D), and the
code values of the spatial relationship of objects A, B, and
C are the same as the code values underlined in pattern β.
DEFINITION 6. The minimum support is the amount of
objects that satisfy the spatial relationships, which is
equal to the required amount of search objects.
Inference 1. Two k-patterns can be joined, only if k–1
objects and the corresponding relationships between
them are the same, and k satisfies condition .
Inference 2. Suppose a pattern does not contain any
(k–1) pattern; then, this pattern cannot be contained in the
k-pattern.
Inference 3. The pattern of feature images and their
specific sub-pattern can be obtained from a 9DLT string.
By contrast, if (k–1)-pattern, k–1 objects, and the spatial
relationships in the object sets are given, then the relative
candidate sets of the k-pattern can be acquired.
Generating candidate sets can significantly help object
retrieval. To extract the image with the object (A, B, C) of
minimum support 3 and spatial relationship αr in the
image database, two 2-patterns are required, namely, (A,
B, 4) and (A, B, 5), in which the same object A belongs to
both patterns, and satisfies the joining condition. Then,
we can calculate the candidate 3-pattern (A, B, C, 4, 5, ∆).
As shown in Fig. 4, the possible results are (A, B, C, 4, 5,
7), (A, B, C, 4, 5, 8), and (A, B, C, 4, 5, 6). The direction
codes of the possible relationship between B and C are 7,
8, and 6; therefore, the spatial representation model is
ABC(4, 5, X : {7, 8, 6}).
Similarly, the 9DLT string of each image is known in
the image database. That is, the spatial relationship
between objects has been confirmed, and the problem of
finding all images that satisfy minimum support is the
process of matching patterns. In fact, the process can be
converted to search the LT matrix with a problem on
inclusion relationship. As shown in Fig. 5, according to
the difference of the given objects and the minimum sup-
port, the position of matching matrix P in the LT matrix
may only be a part of the relation direction codes. The
range of mapping to candidate matrix C is also in k × k.
j i 1, s( )∈<
1 i k≤ ≤ m C2
kk k 1–( ) 2⁄= = 1 j m≤ ≤
k 2≥
α1, α2, ..., αi( ) β1, β2, ..., βj( )j i 2≥ ≥
β α⊇Ci
i 1–Ci
i 2– ... Ci
2+ + +
k 2≥
Fig. 3. Map of the matrix expression in nine-direction lower-triangular (9DLT). (a) Direction map in grids between objects and(b) matrix expression of four objects in 9DLT.
Fig. 4. Generation of candidate 3-pattern from 2-pattern.

Journal of Computing Science and Engineering, Vol. 8, No. 2, June 2014, pp. 65-77
http://dx.doi.org/10.5626/JCSE.2014.8.2.65 70 Zhi Zeng et al.
The description of the match algorithm is as follows.
IV. THE OBJECT-LEVEL FEATURE REPRESEN-TATION MODEL
Typically, a data model is a framework that can be used
to provide representation for information, and an opera-
tion method in the database system. The object-level fea-
ture representation model belongs to a section of this data
model. For remote sensing images, the data model also
includes metadata, such as location, resolution, and light
intensity. However, the standard of measurement for a
content retrieval system determines the efficiency and
accuracy of extraction. Hence, each image needs a good
model with an efficient content-based representation.
Moreover, selecting a formula for similarity calculation is
also vital. Based on this concept, we present the object-
level feature representation model for the image data in
the next section.
According to MPEG-7 standards and the object-ori-
ented concept, the object-level feature representation
model for image data is described as a structural tree via
layers [33]. As Fig. 6 shows, the first layer is the object
name, while the second layer is the feature name of the
feature information that the object contains. Further
down are the layers for sub-features, feature attributes,
attribute values, etc. Constructing this structural tree is
convenient for indexing feature information.
The overall model of the feature image can be repre-
sented by a formal method, as follows:
Feature Im age = (Im ageID, MataData, Objs),
MetaData = (Location, Scal, Im ageID),
Objs = {obj1, obj2, ..., objn},
Obji = (objID, objName, ..., Fobj), 2 ≤ i ≤ n.
Fobj = (objID, V, EA, MA),
where, EA stands for the description of the object extrac-
tion algorithm, and MA stands for the description of the
object matching algorithm.
V = {Fshape, Fspace, Ftexture, ...}.
We adopt the centroid-radii model Fshape = (objID, Cen-
triod, Radii) = in Section III-A, the 9DLT extended
model Fspace = (objID, Flocal, Fdirec) in Section III-C, and
the calculation value of the different direction angle
energy Ftexture in Section III-B. We choose parameters that
refer to the methods in the literature [34]. The color fea-
ture of an object can be expressed as Fcolor = {µcolor, σcolor},
through the mean value and the mean square deviation of
its color.
Algorithm 1 Match algorithm
Fig. 5. Map of the candidate matrix to match the threshold.
Fig. 6. Model of representation of feature objects.
An Object-Level Feature Representation Model for the Multi-target Retrieval of Remote Sensing Images
Zhi Zeng et al. 71 http://jcse.kiise.org
Through this model, we can express the content of
multiple targets in an image by using multiple records to
represent a single object, such as color, shape, and texture
features. Then, a logical expression is implemented by
the spatial relationship among objects. Thus, we trans-
form the MTR problem into a record-querying problem
to enable the image indexing technology to further accel-
erate target retrieval in CBRSIR.
V. MTR AND THE SIMILARITY METRIC
MTR is a branch of CBRSIR, which is an application
based on multiple targets, and the representation of spa-
tial relationships. In general, users employ two forms for
CBIR, namely, sample and sketch retrievals. In terms of
searching image-by-image, or ranking by similarity value,
the key point is similarity calculation of the model of fea-
ture representation as a metric standard. In our investigation,
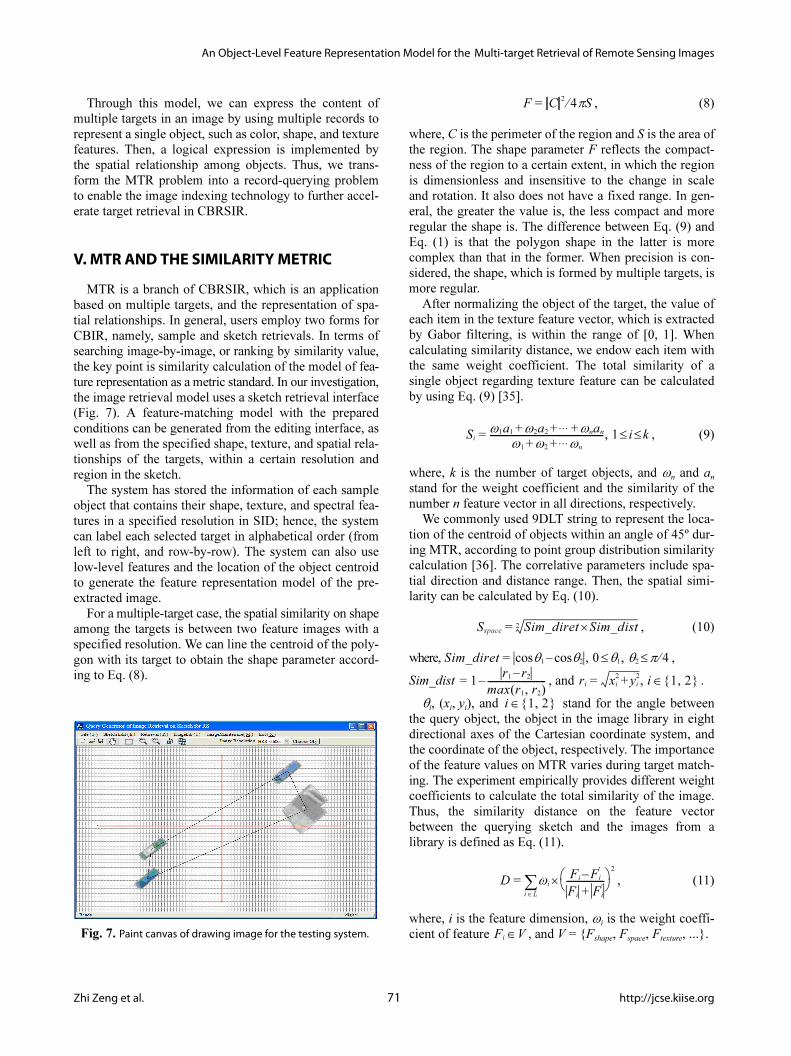
the image retrieval model uses a sketch retrieval interface
(Fig. 7). A feature-matching model with the prepared
conditions can be generated from the editing interface, as
well as from the specified shape, texture, and spatial rela-
tionships of the targets, within a certain resolution and
region in the sketch.
The system has stored the information of each sample
object that contains their shape, texture, and spectral fea-
tures in a specified resolution in SID; hence, the system
can label each selected target in alphabetical order (from
left to right, and row-by-row). The system can also use
low-level features and the location of the object centroid
to generate the feature representation model of the pre-
extracted image.
For a multiple-target case, the spatial similarity on shape
among the targets is between two feature images with a
specified resolution. We can line the centroid of the poly-
gon with its target to obtain the shape parameter accord-
ing to Eq. (8).
, (8)
where, C is the perimeter of the region and S is the area of
the region. The shape parameter F reflects the compact-
ness of the region to a certain extent, in which the region
is dimensionless and insensitive to the change in scale
and rotation. It also does not have a fixed range. In gen-
eral, the greater the value is, the less compact and more
regular the shape is. The difference between Eq. (9) and
Eq. (1) is that the polygon shape in the latter is more
complex than that in the former. When precision is con-
sidered, the shape, which is formed by multiple targets, is
more regular.
After normalizing the object of the target, the value of
each item in the texture feature vector, which is extracted
by Gabor filtering, is within the range of [0, 1]. When
calculating similarity distance, we endow each item with
the same weight coefficient. The total similarity of a
single object regarding texture feature can be calculated
by using Eq. (9) [35].
, (9)
where, k is the number of target objects, and ωn and an
stand for the weight coefficient and the similarity of the
number n feature vector in all directions, respectively.
We commonly used 9DLT string to represent the loca-
tion of the centroid of objects within an angle of 45º dur-
ing MTR, according to point group distribution similarity
calculation [36]. The correlative parameters include spa-
tial direction and distance range. Then, the spatial simi-
larity can be calculated by Eq. (10).
, (10)
where, ,
Sim_dist , and .
θi, (xi, yi), and stand for the angle between
the query object, the object in the image library in eight
directional axes of the Cartesian coordinate system, and
the coordinate of the object, respectively. The importance
of the feature values on MTR varies during target match-
ing. The experiment empirically provides different weight
coefficients to calculate the total similarity of the image.
Thus, the similarity distance on the feature vector
between the querying sketch and the images from a
library is defined as Eq. (11).
, (11)
where, i is the feature dimension, ωi is the weight coeffi-
cient of feature , and V = {Fshape, Fspace, Ftexture, ...}.
F C2
4πS⁄=
Siω1a1 ω2a2
... ωnan+ + +
ω1 ω2...ωn+ +
---------------------------------------------------, 1 i k≤ ≤=
Sspace Sim_diret Sim_dist×2=
Sim_diret cosθ1 cosθ2– , 0 θ1≤ , θ2 π≤ 4⁄=
1r1 r2–
max r1, r2( )--------------------------–= ri xi
2yi2
+ , i 1, 2{ }∈=
i 1, 2{ }∈
D ω i
i L∈∑
Fi Fi
′–
Fi Fi′
+-----------------⎝ ⎠⎛ ⎞
2
×=
Fi V∈Fig. 7. Paint canvas of drawing image for the testing system.

Journal of Computing Science and Engineering, Vol. 8, No. 2, June 2014, pp. 65-77
http://dx.doi.org/10.5626/JCSE.2014.8.2.65 72 Zhi Zeng et al.
VI. EXPERIMENTS AND CONCLUSION
A. Testing and Experiments
We collect 3,650 pieces of high-resolution images
from different sensors as samples with the amount reach-
ing the terabyte level. Each image measures 0.60 m, and
has a resolution of 5,000 × 5,000. We use the segmenta-
tion algorithm of a multiscale threshold value based on
the minimum of heterogeneity with a scale parameter of
150 and a color parameter of 0.90 to conduct a quantita-
tive analysis on the object-level feature representation
model to validate its rationality and retrieval efficiency.
Our testing system adopts C++ language, ArcGIS, and
MATLAB to implement the image retrieval system based
on the content of the image, in which high-resolution
images processed by geometric calibration are covered.
After object-oriented segmentation obtains and vector-
izes the target objects, the system calculates the feature
values of shape and texture, and imports them into the
image library, along with the image metadata, thus
forming an SID from the feature model. Then, we calcu-
late the similarity, and match it with the query vector fea-
ture generated from the retrieval sketch by sample
querying in the SID to obtain the result sets. The specific
retrieval process is illustrated in Fig. 8.
Fig. 9(a) is a QuickBird 0.6 m high-resolution image
before segmentation, which contains extraction targets.
Fig. 9(b) is the result of the symbolic image after image
segmentation was performed with the given parameters
to achieve minimum heterogeneity.
For the symbolic image, raster vectorization is per-
formed after image segmentation. Then, to obtain the rel-
ative coordinate of the centroid of the object, a coordinate
in the left corner, within the given longitude and latitude,
is designated as a relative coordinate. Next, we progres-
sively scan the centroid coordinate of the polygon from
each object from left to right, and label them in alphabet-
ical order. For convenient calculation, we use the poly-
gons marked A to D, as shown in Fig. 9(b). The steps for
the entire process are described below.
First, for the representation model of the centroid-radii,
we use the antipole tree structure, which is described in
Section III-A to store the data. Then, we proceed to gray
scaling and normalization of the object resulting from the
segmentation by using the calculation model of texture in
Section III-B. Normalization, which calculates the energy
ratio between each element and the maximum ratio of
size and direction of the energy sets of the image target
pixel, can eliminate the influence of the actual size of
objects. Thus, we obtain the filtering energy values of the
Gabor filters under different frequencies and azimuth
angles by calculating the mean value and the mean square
deviation of the energy values of each object, and by con-
sidering them as the texture feature vector of the object.
This study applies the result from the Fourier transform
to the convolution translation between a group of differ-
ent frequencies and Gabor filters with different directions
Fig. 8. Retrieval process of the testing system.
Fig. 9. Images before and after object-level segmentation. (a) Original image of high-resolution remote sensing and (b) symbolic imageusing object-level segmentation.
An Object-Level Feature Representation Model for the Multi-target Retrieval of Remote Sensing Images
Zhi Zeng et al. 73 http://jcse.kiise.org
and objects [37]. In this case, we only calculate the fea-
ture values by using a Gabor filter to construct a texture
feature vector.
Afterward, we obtain 9DLT string (A, B, C, D, 5, 4, 4,
4, 4, 4), according to Section III-C.
Finally, Section III explains that the system can orga-
nize all relevant calculation results as records in the
model library. According to the query generator of the
image retrieval on the sketch, our testing system can cal-
culate the similarity among objects, which is conve-
niently derived from an image library and sketched.
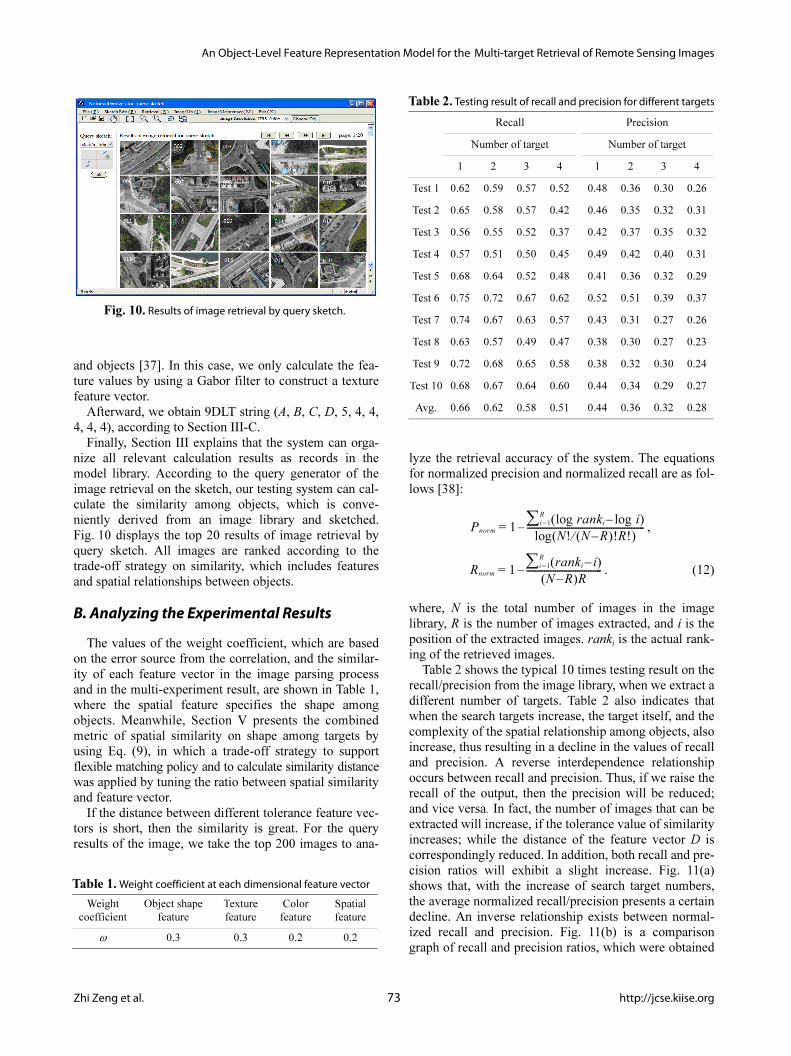
Fig. 10 displays the top 20 results of image retrieval by
query sketch. All images are ranked according to the
trade-off strategy on similarity, which includes features
and spatial relationships between objects.
B. Analyzing the Experimental Results
The values of the weight coefficient, which are based
on the error source from the correlation, and the similar-
ity of each feature vector in the image parsing process
and in the multi-experiment result, are shown in Table 1,
where the spatial feature specifies the shape among
objects. Meanwhile, Section V presents the combined
metric of spatial similarity on shape among targets by
using Eq. (9), in which a trade-off strategy to support
flexible matching policy and to calculate similarity distance
was applied by tuning the ratio between spatial similarity
and feature vector.
If the distance between different tolerance feature vec-
tors is short, then the similarity is great. For the query
results of the image, we take the top 200 images to ana-
lyze the retrieval accuracy of the system. The equations
for normalized precision and normalized recall are as fol-
lows [38]:
,
. (12)
where, N is the total number of images in the image
library, R is the number of images extracted, and i is the
position of the extracted images. ranki is the actual rank-
ing of the retrieved images.
Table 2 shows the typical 10 times testing result on the
recall/precision from the image library, when we extract a
different number of targets. Table 2 also indicates that
when the search targets increase, the target itself, and the
complexity of the spatial relationship among objects, also
increase, thus resulting in a decline in the values of recall
and precision. A reverse interdependence relationship
occurs between recall and precision. Thus, if we raise the
recall of the output, then the precision will be reduced;
and vice versa. In fact, the number of images that can be
extracted will increase, if the tolerance value of similarity
increases; while the distance of the feature vector D is
correspondingly reduced. In addition, both recall and pre-
cision ratios will exhibit a slight increase. Fig. 11(a)
shows that, with the increase of search target numbers,
the average normalized recall/precision presents a certain
decline. An inverse relationship exists between normal-
ized recall and precision. Fig. 11(b) is a comparison
graph of recall and precision ratios, which were obtained
Pnorm 1log ranki log i–( )R
i=1∑log N! N R–( )!R!⁄( )
-----------------------------------------------------–=
Rnorm 1ranki i–( )R
i=1∑N R–( )R
----------------------------------–=
Fig. 10. Results of image retrieval by query sketch.
Table 1. Weight coefficient at each dimensional feature vector
Weight
coefficient
Object shape
feature
Texture
feature
Color
feature
Spatial
feature
ω 0.3 0.3 0.2 0.2
Table 2. Testing result of recall and precision for different targets
Recall Precision
Number of target Number of target
1 2 3 4 1 2 3 4
Test 1 0.62 0.59 0.57 0.52 0.48 0.36 0.30 0.26
Test 2 0.65 0.58 0.57 0.42 0.46 0.35 0.32 0.31
Test 3 0.56 0.55 0.52 0.37 0.42 0.37 0.35 0.32
Test 4 0.57 0.51 0.50 0.45 0.49 0.42 0.40 0.31
Test 5 0.68 0.64 0.52 0.48 0.41 0.36 0.32 0.29
Test 6 0.75 0.72 0.67 0.62 0.52 0.51 0.39 0.37
Test 7 0.74 0.67 0.63 0.57 0.43 0.31 0.27 0.26
Test 8 0.63 0.57 0.49 0.47 0.38 0.30 0.27 0.23
Test 9 0.72 0.68 0.65 0.58 0.38 0.32 0.30 0.24
Test 10 0.68 0.67 0.64 0.60 0.44 0.34 0.29 0.27
Avg. 0.66 0.62 0.58 0.51 0.44 0.36 0.32 0.28

Journal of Computing Science and Engineering, Vol. 8, No. 2, June 2014, pp. 65-77
http://dx.doi.org/10.5626/JCSE.2014.8.2.65 74 Zhi Zeng et al.
by using different methods to retrieve the number of tar-
gets. The graph shows that the method we proposed is
more effective than the two methods introduced in the lit-
erature [6]. The broken lines in Fig. 12 indicate the slight
increase in recall and precision, when the tolerance val-
ues of similarity increase from 1% to 10% by applying
the same method.
Next, we discuss the change in time-consuming retrieval
from the perspective of the retrieval efficiency of a sys-
tem, thus combining the number of targets that require
retrieval under the amount of different image data. Here,
we ignore the majority of the time on image calibration
and the generation of a vector feature library. The total
time of the image retrieval process is shown as follows:
Ttotal = Tgen_cond(Nobjects) + Tsearch(Nimgs, Area(lon, lat))
+ . (13)
where, Tgen_cond(Nobjects) stands for the time of generation
from the sketch, which is relative to the amount of search
targets (Nobjects). Tsearch(Nimgs, Area(lon, lat)) is relative to
the amount of images, and the region of a given longitude
and latitude, which represents the search time of the
model that matches that from SID. is the
transportation and display time of n images that satisfy
the given threshold value, and is relative to the amount of
images . Fig. 13(a) shows a time-consuming situ-
ation under the same condition, which includes the num-
ber of SID for searching different targets to constrain the
display time of the top 20 miniature images that satisfy
the given threshold value of similarity. Based on the
chart, spatial complexity increases with the increase in
the number of search targets, in which the search time
also presents an upward trend. Fig. 13(b) shows the aver-
age time consumed by querying different targets in quan-
tity among the methods proposed in this paper, GIFT, and
imgSeek, under the same image library and query condi-
tions. Although the total consumed time in our method is
slightly more than that of the GIFT method, its recall and
precision are higher than those of the other two methods.
The results are consistent with the previous analysis
shown in Fig. 11(b). In summary, the experiments dem-
Ttrans Ndata i( )( )i=1
n
∑
Ttrans Ndata i( )( )
Ndata i( )
Fig. 11. Case of average recall and precision with targets'number. (a) Relationship of average recall and average precisionwith different targets. (b) Comparison of average recall andprecision with targets for different algorithms.
Fig. 12. Case of normalized recall and precision with targets'number. (a) Comparison of normalized recall with differentallowance values. (b) Comparison of normalized precision withdifferent allowance value.

An Object-Level Feature Representation Model for the Multi-target Retrieval of Remote Sensing Images
Zhi Zeng et al. 75 http://jcse.kiise.org
onstrate the effectiveness of our proposed framework,
which has better precision than the other methods, partic-
ularly in multiple targets. However, our method requires
more computing power.
C. Conclusion
This study, which was based on the inherent character-
istics of high-resolution images, such as shape, texture,
color, and spatial features, proposed an object-level fea-
ture representation model for image contents. Through
experiments, we verified the feasibility and the effective-
ness of the proposed model with two quantitative indica-
tors in recall and precision. Given the difference among
amount, classification, and spatial complexity of features
among images, the proportion of the overall shape of two
images also results in differences in recall and precision
in spatial relationships with a fixed resolution or scale.
Therefore, the time spent on searching for targets is dif-
ferent, and the performance is also affected. Further stud-
ies on evaluation standards of the similarity metric,
particularly for multiple targets, should be conducted to
improve the efficiency and precision of retrieving targets.
AKNOWLEDGMENTS
This work is supported in part by the National Natural
Science Foundation of China (No. 41001227) and the doc-
toral startup fund of Huizhou University (No. C513.0201).
We would also like to thank the referees for their valuable
comments and suggestions.
REFERENCES
1. M. Flickner, H. Sawhney, W. Niblack, J. Ashley, Q. Huang,
B. Dom, ... P. Yanker, “Query by image and video content:
the QBIC system,” Computer, vol. 28, no. 9, pp. 23-32,
1995.
2. L. Z. Lu, R. Y. Ren, and N. Liu, “Remote sensing image
retrieval using color and texture fused features,” China Jour-
nal of Image and Graphics, vol. 9, no. 3, pp. 74-78, 2004.
3. E. Guldogan and M. Gabbouj, “Feature selection for con-
tent-based image retrieval,” Signal, Image and Video Pro-
cessing, vol. 2, no. 3, pp. 241-250, 2008.
4. R. Kapela, P. Sniatala, and A. Rybarczyk, “Real-time visual
content description system based on MPEG-7 descriptors,”
Multimedia Tools and Applications, vol. 53, no. 1, pp. 119-
150, 2011.
5. A. Capar, B. Kurt, and M. Gokmen, “Gradient-based shape
descriptors,” Machine Vision and Applications, vol. 20, no.
6, pp. 365-378, 2009.
6. C. M. Pun and C. F. Wong, “Fast and robust color feature
extraction for content-based image retrieval,” International
Journal of Advancements in Computing Technology, vol. 3,
no. 6, pp. 75-83, 2011.
7. M. B. Rao, B. P. Rao, and A. Govardhan, “Content based
image retrieval using dominant color, texture and shape,”
International Journal on Engineering Science and Technol-
ogy, vol. 3, no. 4, pp. 2887-2896, 2011.
8. J. Yue, Z. Li, L. Liu, and Z. Fu, “Content-based image
retrieval using color and texture fused features,” Mathemati-
cal and Computer Modelling, vol. 54, no. 3-4, pp. 1121-
1127, 2011.
9. C. Kavitha, B. P. Rao, and A. Govardhan, “Image retrieval
based on combined features of image sub-blocks,” Interna-
tional Journal on Computer Science and Engineering, vol. 3,
no. 4, pp. 1429-1438, 2011.
10. W. H. Yeh and Y. I. Chang, “An efficient iconic indexing
strategy for image rotation and reflection in image data-
bases,” Journal of Systems and Software, vol. 87, no. 7, pp.
1184-1195, 2008.
11. S. D. Newsam and C. Kamath, “Retrieval using texture fea-
tures in high resolution multi-spectral satellite imagery,” in
Data Mining and Knowledge Discovery: Theory, Tools, and
Fig. 13. Time costs for number of feature lib with number ofretrieval targets. (a) Trends of total of search time and number ofvector feature lib with different targets. (b) Comparison ofaverage retrieval time and number of retrieval targets underdifferent algorithms.
Journal of Computing Science and Engineering, Vol. 8, No. 2, June 2014, pp. 65-77
http://dx.doi.org/10.5626/JCSE.2014.8.2.65 76 Zhi Zeng et al.
Technology VI (Proceedings of SPIE), Bellingham, WA:
SPIE, pp. 21-32, 2004.
12. Y. Li and T. Bretschneider, “Supervised content-based satel-
lite image retrieval using piecewise defined signature similar-
ities,” in Proceedings of the IEEE International Geoscience
and Remote Sensing Symposium, Toulouse, France, 2003,
pp. 734-736.
13. L. Niu, L. Ni, W. Lu, and M. Yuan, “A method of remote
sensing image retrieval based on ROI,” in Proceeding of the
3rd International Conference on Information Technology and
Applications, Sydney, Australia, 2005, pp. 226-229.
14. N. Sawant, S. Chandran, and B. Krishna Mohan, “Retriev-
ing images for remote sensing applications,” in Proceedings
of the 5th Indian Conference on Computer Vision, Graphics
and Image Processing, Madurai, India, 2006, pp. 849-860.
15. A. P. Wang and S. G. Wang, “Content-based high-resolution
remote sensing image retrieval with local binary patterns,” in
Geoinformatics 2006: Remotely Sensed Data and Informa-
tion (Proceedings of SPIE), Bellingham, WA: SPIE, 2006.
16. H. Shahbazi, P. Kabiri, and M. Soryani, “Content based mul-
tispectral image retrieval using independent component anal-
ysis,” in Proceedings of the 1st International Congress on
Image and Signal Processing, Sanya, China, 2008, pp. 485-
489.
17. D. Peijun, C. Yunhao, T. Hong, and F. Tao, “Study on con-
tent-based remote sensing image retrieval,” in Proceedings
of the IEEE International Geoscience and Remote Sensing
Symposium, Seoul, Korea, 2005.
18. P. Maheshwary and N. Srivastava, “Retrieval of remote sens-
ing images using color, texture, and spectral feature,” Inter-
national Journal of Engineering Science and Technology,
vol. 2, no. 9, pp. 4306-4311, 2010.
19. S. Ait-Aoudia, R. Mahiou, and B. Benzaid, “YACBIR: yet
another content based image retrieval system,” in Proceed-
ings of the14th International Conference on Information
Visualisation, London, UK, 2010, pp. 570-575.
20. N. Ruan, N. Huang, and W. Hong, “Semantic-based image
retrieval in remote sensing archive: an ontology approach,”
in Proceedings of the IEEE International Conference on
Geoscience and Remote Sensing Symposium, Denver, CO,
2006, pp. 2903-2906.
21. L. Wei, W. Weihong, and L. Feng, “Research on remote
sensing image retrieval based on geographical and semantic
features,” in Proceedings of the International Conference on
image Analysis and Signal Processing, Taizhou, China,
2009, pp. 162-165.
22. E. El-Qawasmeh, “A quadtree-based representation tech-
nique for indexing and retrieval of image databases,” Jour-
nal of Visual Communication and Image Representation, vol.
14, no. 3, pp. 340-357, 2003.
23. Q. Wan, M. Wang, X. Zhang, S. Jiang, and Y. Xie, “High
resolution remote sensing image retrieval using quin-tree and
multi-feature histogram,” Journal of Geo-Information Sci-
ence, vol. 12, no. 2, pp. 275-280, 2010.
24. S. Y. Lee and F. J. Hsu, “2D C-string: a new spatial knowl-
edge representation for image database systems,” Pattern
Recognition, vol. 23, no. 10, pp. 1077-1087, 1990.
25. P. W. Huang, L. Hsu, Y. W. Su, and P. L. Lin, “Spatial infer-
ence and similarity retrieval of an intelligent image database
system based on object’s spanning representation,” Journal
of Visual Languages and Computing, vol. 19, no. 6, pp. 637-
651, 2008.
26. P. W. Huang and C. H. Lee, “Image database design based
on 9D-SPA representation for spatial relations,” IEEE Trans-
actions on Knowledge and Data Engineering, vol. 16, no.
12, pp. 1486-1496, 2004.
27. A. J. T. Lee, R. W. Hong, W. M. Ko, W. K. Tsao, and H. H.
Lin, “Mining spatial association rules in image databases,”
Information Sciences, vol. 177, no. 7, pp. 1593-1608, 2007.
28. C. Urdiales, M. Dominguez, C. de Trazegnies, and F. Sando-
val, “A new pyramid-based color image representation for
visual localization,” Image and Vision Computing, vol. 28,
no. 1, pp. 78-91, 2010.
29. N. M. Khan and I. S. Ahmad, “An efficient signature repre-
sentation for retrieval of spatially similar images,” Signal,
Image and Video Processing, vol. 6, no. 1, pp. 55-70, 2012.
30. Q. Tan, Z. Liu, and W. Shen, “An algorithm for object-ori-
ented multi-scale remote sensing image segmentation,” Jour-
nal of Beijing Jiaotong University, vol. 31, no. 4, pp. 111-
119, 2007.
31. K. L. Tan, B. C. Ooi, and L. F. Thiang, “Indexing shapes in
image databases using the centroid-radii model,” Data
Knowledge Engineering, vol. 32, no. 3, pp. 271-289, 2000.
32. D. Cantone, A. Ferro, A. Pulvirenti, D. R. Recupero, and D.
Shasha, “Antipole tree indexing to support range search and
k-nearest neighbor search in metric spaces,” IEEE Transac-
tions on Knowledge and Data Engineering, vol. 17, no. 4,
pp. 535-550, 2005.
33. A. Vetro, “MPEG-7 applications document v.10,” ISO/IEC
JTC1/SC29/WG11/N3934, 2001.
34. S. E. Grigorescu, N. Petkov, and P. Kruizinga, “Comparison
of texture features based on Gabor filters,” IEEE Transac-
tions on Image Processing, vol. 11, no. 10, pp. 1160-1167,
2002.
35. C. Nastar, M. Mitschke, and C. Meilhac, “Efficient query
refinement for image retrieval,” in Proceedings of the IEEE
Computer Society Conference on Computer Vision and Pat-
tern Recognition, Santa Barbara, CA, 1998, pp. 547-552.
36. T. Liu, Q. Du, and H. Yan, “Spatial similarity assessment of
point cluster,” Geomatics and Information Science of Wuhan
University, vol. 36, no. 10, pp. 1149-1152, 2011.
37. P. Kruizinga, N. Petkov, and S. E. Grigorescu, “Comparison
of texture features based on Gabor filters,” in Proceedings of
the 10th International Conference on Image Analysis and
Processing, Venice, Italy, 1999, pp. 142-147.
38. G. Salton and M. J. McGill, Introduction to Modern Infor-
mation Retrieval, New York, NY: McGraw-Hill, 1983.
An Object-Level Feature Representation Model for the Multi-target Retrieval of Remote Sensing Images
Zhi Zeng et al. 77 http://jcse.kiise.org
Zhi Zeng
Zhi Zeng is currently a teacher in the Department of Computer Science at Huizhou University in GuangdongProvince, China. He received his B.E. in Computer Science from Jiangxi Normal University, M.E. in ComputerScience from Zhejiang University, and Ph.D. in GIS from Zhejiang University, China. His research interestsinclude GIS and remote sensing image processing with a focus on massive data processing in gridcomputing and cloud computing. In recent years, he has published more than 10 papers.
Zhenhong Du
Zhenhong Du is an associate professor in the Department of Earth Science at Zhejiang University. Hereceived both his M.S. and Ph.D. in the field of GIS from Zhejiang University, China. He also completedpostdoctoral research in GIS at Zhejiang University. His research interest areas include informationdevelopment in marine remote sensing, massive data processing in grid computing or cloud computing,three-dimensional city, underground pipeline, water conservancy, etc. In recent years, he has publishedmore than 20 papers.
Renyi Liu
Renyi Liu is a professor in the Department of Earth Science at Zhejiang University, and the director of theInstitute of Geographical Information Science. He received his B.S. in Geomatics and Geodesy from WuhanUniversity, and his Ph.D. in the field of Geographical Information Science from Zhejiang University, China. Hisresearch interest areas include information development in marine remote sensing, basic geographyinformation, three-dimensional city, underground pipeline, water conservancy, etc. In recent years, he haspublished more than 30 papers.

![KLV-30MR1 - Error: [object Object]](https://static.fdokumen.com/doc/165x107/631786651e5d335f8d0a6a63/klv-30mr1-error-object-object.jpg)