Visual recognition of gestures using dynamic naive Bayesian classifiers
An Investigation Concerning the Generation ofText Summarisation Classifiers using Secondary
Data
Matias Garcia-Constantino1, Frans Coenen1, P-J Noble2, Alan Radford2,Christian Setzkorn2 and Aine Tierney2
(1) Department of Computer Science, The University of Liverpool, Liverpool, L693BX, UK; (2) School of Veterinary Science, University of Liverpool, Leahurst,
Neston, CH64 7TE, UK.{mattgc,coenen,Rtnorle,alanrad,c.setzkorn,Aine.Tierney}@liverpool.ac.uk
Abstract. An investigation into the potential effectiveness of generat-ing text classifiers from secondary data for the purpose of text summari-sation is described. The application scenario assumes a questionnairecorpus where we wish to provide a summary regarding the nature of thefree text element of such questionnaires, but no suitable training data isavailable. The advocated approach is to build the desired text summari-sation classifiers using secondary data and then apply these classifiers,for the purpose of text summarisation, to the primary data. We refer tothis approach using the acronym CGUSD (Classifier Generation UsingSecondary Data). The approach is evaluated using a real questionnairedata obtained as part of the SAVSNET project.
Keywords: Text Summarisation, Text Classification Using SecondaryData
1 Introduction
Text summarisation has been a domain of research for many years. An early ex-ample (c1958) can be found in [15] in the context of literature abstracts. Withinthe context of data mining and machine learning researchers have looked atthe application of a variety of techniques to achieve the desired summarisation,concentrating on supervised and semi-supervised learning (see for example [4]).These techniques can be further divided into statistical and linguistic techniques.The text summarisation problem is typically characterised by a large number oflabels coupled with a small number of examples for each label. The require-ment for supervised (and semi-supervised) learning techniques to have access tolabelled training data is well recognised. The labelling of example documents typ-ically requires recourse to hand annotation which in turn requires a substantialresource overhead to the extent that this approach is often rendered impracticalfor most applications.
This paper reports on an investigation to determine whether the desired textsummarisation classifier(s) can be generated using secondary data, and whether
the resulting classifier(s) can then be successfully applied to the primary dataso as to produce adequately the desired summarisation (assuming, of course,that appropriate secondary data is available). We refer to this approach usingthe acronym CGUSD (Classifier Generation Using Secondary Data). The work isdirected at a particular application, the summarisation of the free text element(s)often found in survey questionnaires. To evaluate the work a corpus of question-naire returns from veterinary practices (where each questionnaire is concernedwith a single consultation) collected as part of the SAVSNET project1 was used.The secondary data used for evaluation purposes was the MEDLINE (MedicalLiterature Analysis and Retrieval System Online) life science and biomedicalbibliographic database maintained by the United States Library of Medicine2.
The rest of this paper is organised as follows. A short review of relatedwork is presented in Section 2, and a formal definition of the problem domain ispresented in Section 3. Section 4 gives a review of the proposed CGUSD process.A brief overview of the SAVSNET project is given in Section 5 together with adescription of the SAVSNET veterinary questionnaire corpus. A comprehensiveevaluation of CGUSD is then presented in Section 6. A summary of the mainfindings and some conclusions are presented in Section 7.
2 Related Work
Text summarisation techniques have been categorised in many ways according tothe field of study and to other factors inherent to the text. Jones et al. [14] pro-posed that the key factors involved in the summarisation of text be categorisedaccording to: (i) the input, (ii) the purpose of the summarisation and (iii) thedesired output (this last category is of course related to the second). Afantenos etal. [1] provided a more “fine grained” categorisation founded on that of Jones etal. The input factors considered were: (i) the number of documents used (single-document or multi-document), (ii) the data format in which the documents arepresented (text or multimedia) and (iii) the language or languages in which thetext was written (monolingual, multilingual and cross-lingual). The purpose fac-tors were sub-categorised in terms of: (i) the nature of the text (indicative orinformative), (ii) how specific the summary must be for the intended audience(generic or user oriented) and (iii) how specific the summary must be in termsof the domain or field of study (general purpose or domain specific). The mostsignificant identified output factors (amongst others) were: (i) if the summaryis to be “complete”, (ii) accurate and (iii) coherent. Using the categorisationproposed by Afantenos et al. the factors used in the CGUSD approach are:
– Input: multi-document, text and monolingual.– Purpose: indicative (the relevant contents are indicated), generic and general
purpose.– Output: completeness, accuracy and coherency.
1 http://www.liv.ac.uk/savsnet/2 http://www.nlm.nih.gov/databases/databases medline.html
The “traditional” phases of text summarisation that most researchers followare identified in [3]: (i) analysis of the input text, (ii) transformation of theinput text into a form to which the adopted text summarisation technique canbe applied and (iii) synthesis of the output from phase two to produce the desiredsummaries. For practical purposes text summarisation techniques can be dividedinto statistical [19, 4] and linguistic [10, 17] techniques. In this context CGUSDcan be thought of as a statistical technique.
The mechanism advocated by CGUSD is to undertake the desired text sum-marisation using a classifier (alternative techniques found in the literature in-clude machine learning methods founded on Naive-Bayes and Hidden MarkovModels, and expert system based techniques). Text summarisation classifierscan be built using either supervised or unsupervised techniques, the distinc-tion between the two is that the latter requires pre labelled (summarised) data.Examples of supervised techniques can be found in [7] and [5]. The techniquepresented in [7] uses marked segments of sentences (marked according to theirsignificance and rethorical relations) with a set of features related to each oneof them, which in turn form feature vectors that may be used by supervisedlearning algorithms (e.g. Naive Bayes) to extract relevant segments from thetest set, thus producing the desired summarisation. The techniques presentedin [5] is a semi-supervised technique based on the Classification Expectation-Maximization (CEM) unsupervised algorithm [12] (which estimates parametersof a distribution in the case of an incomplete data set) whereby a very smallnumber of labelled examples are used to train summarisers that are based onthe extraction of segments of sentences. The significance of the technique isthat reported experiments indicated that it outperformed other systems thatuse larger amounts of labelled data. Whatever the case, the need for labelledtexts, typically requiring hand labelling by domain experts, represents a costlyand time-consuming overhead. Consequently, unsupervised techniques are desir-able. An example of an unsupervised technique is that proposed in [16] where agraph-based ranking algorithm is applied to extract important sentences takinginto account the local context of a word and information recursively producedfrom the entire text. Another example of an unsupervised text summerisationtechnique can be found in [17], where an improved version of a linear time al-gorithm for lexical chain computation is proposed, together with a method forevaluating lexical chains as an intermediate step. An alternative approach, andthat advocated by CGUSD, is to generate a text summarisation classifier usingan alternative pre-labelled data set. The use of secondary data to generate aclassifier for text summarisation of questionnaire data, to the best knowledge ofthe authors, has not been previously reported in the literature.
Questionnaires typically comprise a tabular component and a free text com-ponent. A number of previous approaches to questionnaire mining have beenreported in the literature. The application of data mining techniques to the tab-ular element of questionnaires does not present a particular challenge, tabulardata mining is well understood. One example of the use of established data min-ing techniques directed at the tabular component of questionnaires is reported in

[6] where Fuzzy Association Rule Mining (FARM) is used to extract knowledgefrom the questionnaires. The mining of the free text component of questionnairesis more challenging and requires recourse to text mining techniques. An examplecan be found in [21] where two statistical learning techniques are used (rule anal-ysis and correspondence analysis). The mining of complex (multi-media) dataremains a focus for current research. The authors have been unable to find anyreported work that uses both the tabular and the free text components of thequestionnaires in the context of data mining.
3 Problem Definition
CGUSD is directed at the summarisation of questionnaire returns. The input isa collection of n questionnaires, Q = {q1, q2, . . . , qn}, where each questionnairecomprises a tabular component and a free text component, qi = {Tablei, T exti}(where i is a numeric questionnaire identifier). The tabular component, in turn,comprises a subset of a global set ofm attribute-value pairs A = {a1, a2, . . . , am};thus Tablei ⊂ A. The text element comprises sequences of words, numbers,punctuation and other printable characters. The objective is then to summarisethe free text element of the questionnaires in terms of a sequence of p labels(classes), {c1, c2, . . . , cp}, where each label is drawn from k categories of labels{C1, C2, . . . , Ck}, one label per category; c1 ∈ C1, c2 ∈ C2 and so on. We in-dicate the complete set of labels using the identifier C. The overall objective isthus to translate the input Q = {q1, q2, . . . , qn} to a sequence of sets of labels{{c11 , c12 , . . . , c1p}, {c21 , c22 , . . . , c2p}, . . . , {cn1 , cn2 , . . . , cnp}} such that one setof labels {ci1 , ci2 , . . . , cip} is associated with each questionnaire qi.
4 Classifier Generation Using Secondary Data
In this section the CGUSD approach is described in more detail. CGUSD com-prises 3 stages:
1. Construction of the secondary data set.2. Preprocessing of the secondary data.3. Generating a classifier using the extracted and preprocessed secondary data.
The first stage involves interacting with the source from which the secondarydata will be extracted, which in our case will be some kind of document collec-tion. Recall that we wish to build k classifiers, one per category of class label.We thus require k document collections {D1, D2, · · · , Dk}. We retrieve the doc-uments required to build each classifier, utilising an “off the shelf” documentretrieval system, using the individual class labels associated with the requiredclass category Ci as the “search terms”. Thus, we conduct |Ci| searches. Foreach search we retrieve r documents; thus, in total, for each classifier we re-trieve a document collection Di comprising |Ci| × r documents (records) (i.e|Di| = |Ci| × r). The value of r is user defined, the larger the value of r the

larger the size of Di. Experience shows that a better classifier is generated if thenumber of documents in Di is such that all potential cases are “covered”, andthus typically Di needs to be of a reasonable size. However we have also dis-covered that in some cases, depending on the nature of the application domain,very few documents may be discovered with respect to certain search terms. Ifthe number of documents returned is less than r we place all of the identifieddocuments in D (running the risk, of course, that some of the documents maybe only very loosely related to the search term). The reverse is also true, somesearch terms return a great many documents, in this case we select the “best” r(most document retrieval engines rank their results). In this manner we producek document collections, D = {D1, D2, · · · , Dk}.
In the second stage of this approach, the documents extracted from the sec-ondary source are preprocessed in order to produce the input to be used with theselected classification software. In our case we used the widely accepted bag-of-words representation. Firstly, stop words (common words that are not significantfor the text summarisation process) were removed from the free text (using a stopword list) together with punctuation. The remaining words, where appropriate,were then stemmed using an implementation of the Porter Stemming algorithm[20]. The entire document set was then recast into “lower-case”. The documentcollection was then further processed so as to identify keywords, as a result ofwhich each document could be represented, in terms of the identified keywords,using feature vectors (one per document). In the context of text mining anddocument retrieval, keywords may be identified in a variety of manners, howeverwe used the well established TF-IDF (Term Frequency - Inverse Document Fre-quency) measure [18, 13]. TF-IDF weights are calculated for each term and themost significant terms, according to their weight, are selected.
The third stage of the proposed approach is to generate the desired classifiers,one for each category of label. There are a number of established text miningtechniques that may be applied with respect to feature vector representations.With respect to the evaluation of CGUSD approach described here, the TFPC(Total From Partial Classification) algorithm [9] was adopted. This is a Classi-fication Association Rule Mining (CARM) approach based on the Apriori-TFP(Total From Partial) Association Rule Mining (ARM) algorithm [8]. Apriori-TFP, in turn, is founded on the classic Apriori algorithm [2]. The classifiers thusgenerated with the secondary data may then be applied to the primary data,which must be preprocessed and prepared so that it is in a compatible formatwith the specific bag-of-words format identified with respect to the primary data.
Although the CGUSD approach advocates the creation of a number of classi-fiers, an alternative approach would be to generate a single multi-class classifier.However, some initial experiments (not reported in this paper) immediately in-dicated that this was not an effective mechanism.
5 The SAVSNET Application
The focus of the work described in this paper is the collection of questionnairereturns obtained as part of SAVSNET initiative3. SAVSNET stands for SmallAnimal Veterinary Surveillance Network, and is an initiative that is currentlyin progress within the Small Animal Teaching Hospital at the University ofLiverpool. The objective of the SAVSNET surveillance project is to determinethe disease status of small animals (mainly dogs and cats) in the UK. The projectis partly supported by Vet Solutions, a software company whose software is usedby 20% of the veterinary practitioners located across the UK. Some 30 veterinarypractices have “signed up” to the SAVSNET initiative.
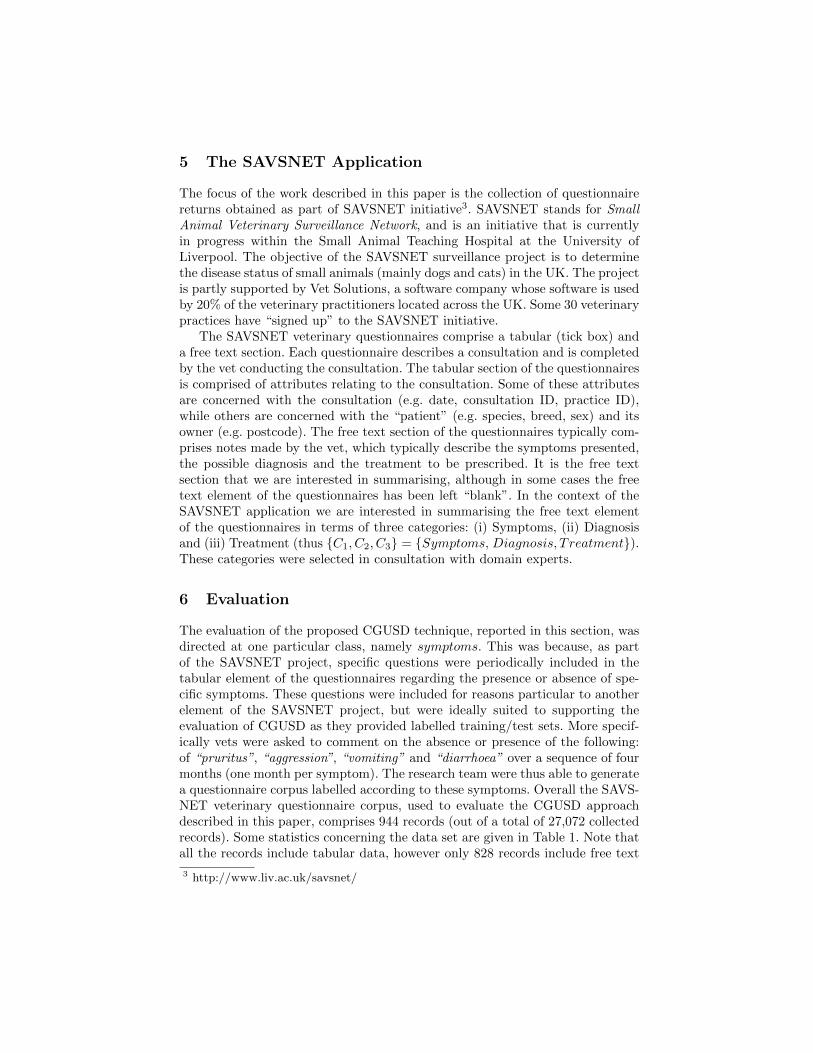
The SAVSNET veterinary questionnaires comprise a tabular (tick box) anda free text section. Each questionnaire describes a consultation and is completedby the vet conducting the consultation. The tabular section of the questionnairesis comprised of attributes relating to the consultation. Some of these attributesare concerned with the consultation (e.g. date, consultation ID, practice ID),while others are concerned with the “patient” (e.g. species, breed, sex) and itsowner (e.g. postcode). The free text section of the questionnaires typically com-prises notes made by the vet, which typically describe the symptoms presented,the possible diagnosis and the treatment to be prescribed. It is the free textsection that we are interested in summarising, although in some cases the freetext element of the questionnaires has been left “blank”. In the context of theSAVSNET application we are interested in summarising the free text elementof the questionnaires in terms of three categories: (i) Symptoms, (ii) Diagnosisand (iii) Treatment (thus {C1, C2, C3} = {Symptoms, Diagnosis, T reatment}).These categories were selected in consultation with domain experts.
6 Evaluation
The evaluation of the proposed CGUSD technique, reported in this section, wasdirected at one particular class, namely symptoms. This was because, as partof the SAVSNET project, specific questions were periodically included in thetabular element of the questionnaires regarding the presence or absence of spe-cific symptoms. These questions were included for reasons particular to anotherelement of the SAVSNET project, but were ideally suited to supporting theevaluation of CGUSD as they provided labelled training/test sets. More specif-ically vets were asked to comment on the absence or presence of the following:of “pruritus”, “aggression”, “vomiting” and “diarrhoea” over a sequence of fourmonths (one month per symptom). The research team were thus able to generatea questionnaire corpus labelled according to these symptoms. Overall the SAVS-NET veterinary questionnaire corpus, used to evaluate the CGUSD approachdescribed in this paper, comprises 944 records (out of a total of 27,072 collectedrecords). Some statistics concerning the data set are given in Table 1. Note thatall the records include tabular data, however only 828 records include free text
3 http://www.liv.ac.uk/savsnet/
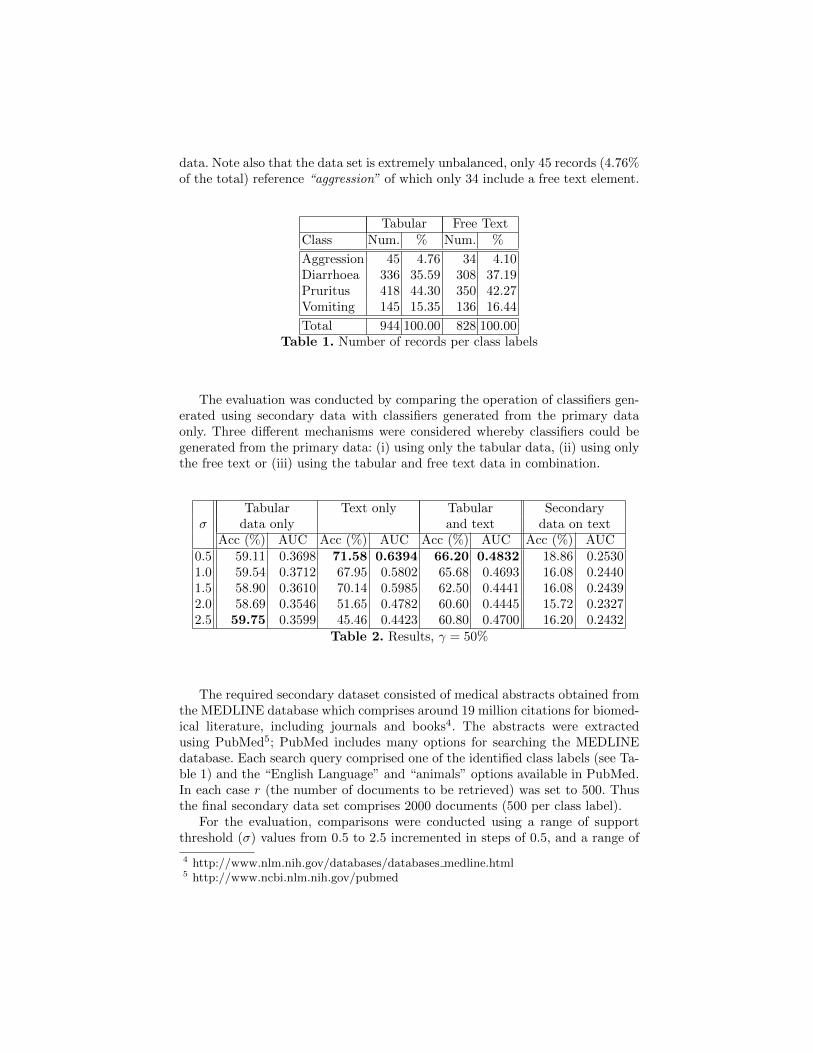
data. Note also that the data set is extremely unbalanced, only 45 records (4.76%of the total) reference “aggression” of which only 34 include a free text element.
Tabular Free TextClass Num. % Num. %
Aggression 45 4.76 34 4.10Diarrhoea 336 35.59 308 37.19Pruritus 418 44.30 350 42.27Vomiting 145 15.35 136 16.44
Total 944 100.00 828 100.00Table 1. Number of records per class labels
The evaluation was conducted by comparing the operation of classifiers gen-erated using secondary data with classifiers generated from the primary dataonly. Three different mechanisms were considered whereby classifiers could begenerated from the primary data: (i) using only the tabular data, (ii) using onlythe free text or (iii) using the tabular and free text data in combination.
Tabular Text only Tabular Secondaryσ data only and text data on text
Acc (%) AUC Acc (%) AUC Acc (%) AUC Acc (%) AUC0.5 59.11 0.3698 71.58 0.6394 66.20 0.4832 18.86 0.25301.0 59.54 0.3712 67.95 0.5802 65.68 0.4693 16.08 0.24401.5 58.90 0.3610 70.14 0.5985 62.50 0.4441 16.08 0.24392.0 58.69 0.3546 51.65 0.4782 60.60 0.4445 15.72 0.23272.5 59.75 0.3599 45.46 0.4423 60.80 0.4700 16.20 0.2432
Table 2. Results, γ = 50%
The required secondary dataset consisted of medical abstracts obtained fromthe MEDLINE database which comprises around 19 million citations for biomed-ical literature, including journals and books4. The abstracts were extractedusing PubMed5; PubMed includes many options for searching the MEDLINEdatabase. Each search query comprised one of the identified class labels (see Ta-ble 1) and the “English Language” and “animals” options available in PubMed.In each case r (the number of documents to be retrieved) was set to 500. Thusthe final secondary data set comprises 2000 documents (500 per class label).
For the evaluation, comparisons were conducted using a range of supportthreshold (σ) values from 0.5 to 2.5 incremented in steps of 0.5, and a range of
4 http://www.nlm.nih.gov/databases/databases medline.html5 http://www.ncbi.nlm.nih.gov/pubmed
Tabular Text only Tabular Secondaryσ data only and text data on text
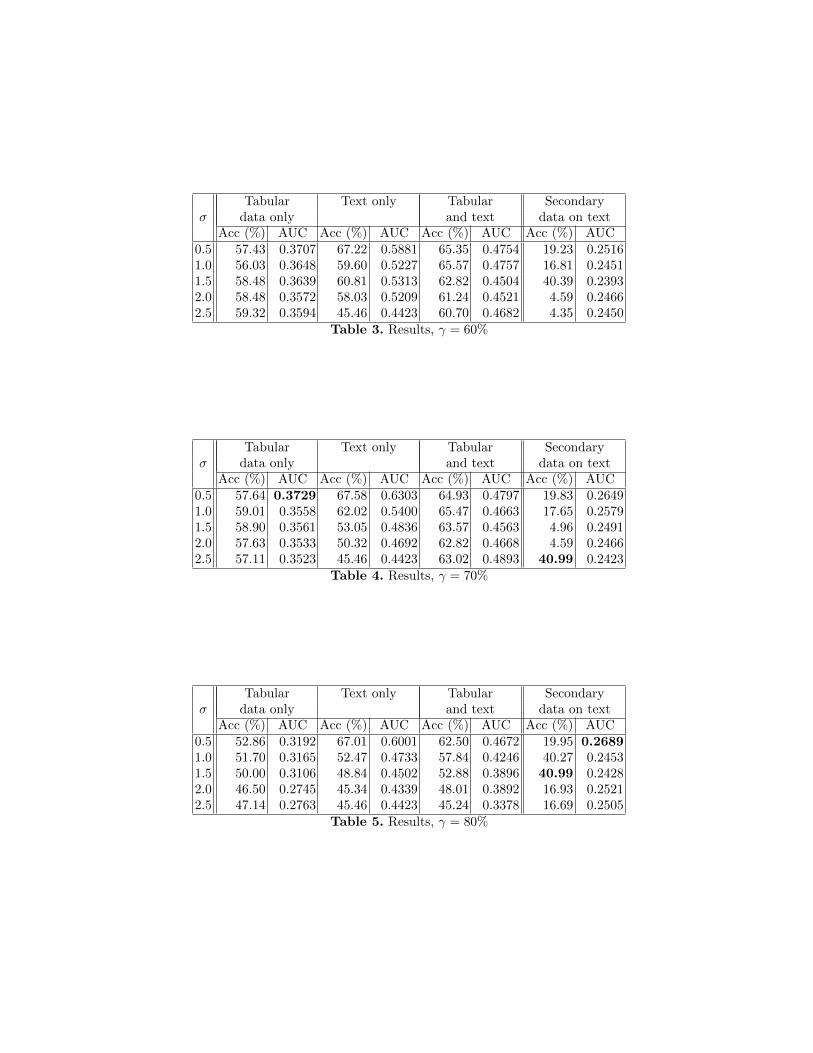
Acc (%) AUC Acc (%) AUC Acc (%) AUC Acc (%) AUC0.5 57.43 0.3707 67.22 0.5881 65.35 0.4754 19.23 0.25161.0 56.03 0.3648 59.60 0.5227 65.57 0.4757 16.81 0.24511.5 58.48 0.3639 60.81 0.5313 62.82 0.4504 40.39 0.23932.0 58.48 0.3572 58.03 0.5209 61.24 0.4521 4.59 0.24662.5 59.32 0.3594 45.46 0.4423 60.70 0.4682 4.35 0.2450
Table 3. Results, γ = 60%
Tabular Text only Tabular Secondaryσ data only and text data on text
Acc (%) AUC Acc (%) AUC Acc (%) AUC Acc (%) AUC0.5 57.64 0.3729 67.58 0.6303 64.93 0.4797 19.83 0.26491.0 59.01 0.3558 62.02 0.5400 65.47 0.4663 17.65 0.25791.5 58.90 0.3561 53.05 0.4836 63.57 0.4563 4.96 0.24912.0 57.63 0.3533 50.32 0.4692 62.82 0.4668 4.59 0.24662.5 57.11 0.3523 45.46 0.4423 63.02 0.4893 40.99 0.2423
Table 4. Results, γ = 70%
Tabular Text only Tabular Secondaryσ data only and text data on text
Acc (%) AUC Acc (%) AUC Acc (%) AUC Acc (%) AUC0.5 52.86 0.3192 67.01 0.6001 62.50 0.4672 19.95 0.26891.0 51.70 0.3165 52.47 0.4733 57.84 0.4246 40.27 0.24531.5 50.00 0.3106 48.84 0.4502 52.88 0.3896 40.99 0.24282.0 46.50 0.2745 45.34 0.4339 48.01 0.3892 16.93 0.25212.5 47.14 0.2763 45.46 0.4423 45.24 0.3378 16.69 0.2505
Table 5. Results, γ = 80%

confidence threshold (γ) values from 50% to 80% incremented in steps of 10%.The evaluation metrics used were overall accuracy expressed as a percentage andthe Area Under the receiver operating Curve (AUC) [11]. The later was deemedto be appropriate because of the unbalanced nature of the input data. The resultsare presented in Tables 2, 3, 4 and 5, where each table corresponds to one of theselected confidence thresholds (γ) used: 50%, 60%, 70% and 80% respectively.Note that using primary data only the reported results were obtained using Ten-fold Cross Validation (TCV). For the CGUSD approach the accuracy and AUCvalues were obtained as a result of applying the generated classifier to the entireprimary data set. For the “Tabular data only” experiments the primary dataset comprised all 944 records, while for the remaining experiments the primarydata set comprised only the 828 records that included a free text element. Thebest accuracy and AUC values obtained with respect to each category are givenin bold font in Tables 2 to 5.
Fig. 1. Tabular data TCV (accuracy) Fig. 2. Text TCV (accuracy)
Fig. 3. Tabular and text data TCV(accuracy)
Fig. 4. Secondary data on free text(accuracy)
The same results as given in Tables 2, 3, 4 and 5 are presented in graph formatin Figures 1 to 8. Figures 1 to 4 plot the obtained accuracy values against thesupport thresholds used with respect to the range of confidence thresholds (the
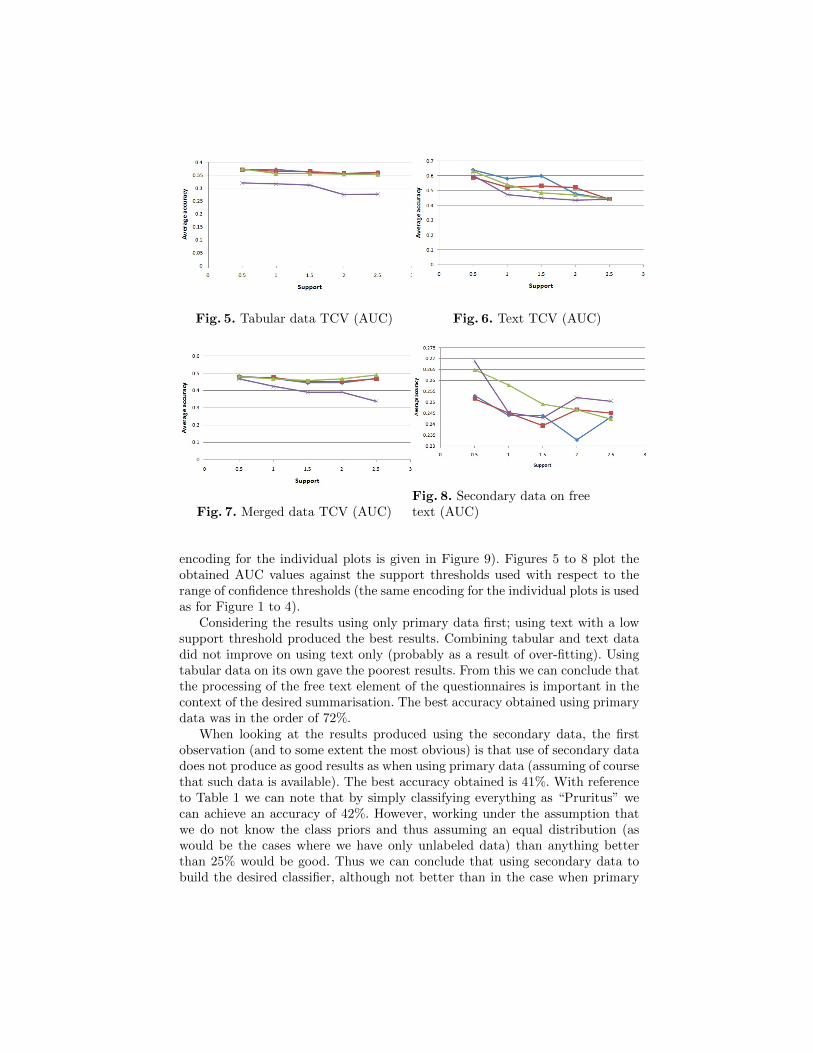
Fig. 5. Tabular data TCV (AUC) Fig. 6. Text TCV (AUC)
Fig. 7. Merged data TCV (AUC)Fig. 8. Secondary data on freetext (AUC)
encoding for the individual plots is given in Figure 9). Figures 5 to 8 plot theobtained AUC values against the support thresholds used with respect to therange of confidence thresholds (the same encoding for the individual plots is usedas for Figure 1 to 4).
Considering the results using only primary data first; using text with a lowsupport threshold produced the best results. Combining tabular and text datadid not improve on using text only (probably as a result of over-fitting). Usingtabular data on its own gave the poorest results. From this we can conclude thatthe processing of the free text element of the questionnaires is important in thecontext of the desired summarisation. The best accuracy obtained using primarydata was in the order of 72%.
When looking at the results produced using the secondary data, the firstobservation (and to some extent the most obvious) is that use of secondary datadoes not produce as good results as when using primary data (assuming of coursethat such data is available). The best accuracy obtained is 41%. With referenceto Table 1 we can note that by simply classifying everything as “Pruritus” wecan achieve an accuracy of 42%. However, working under the assumption thatwe do not know the class priors and thus assuming an equal distribution (aswould be the cases where we have only unlabeled data) than anything betterthan 25% would be good. Thus we can conclude that using secondary data tobuild the desired classifier, although not better than in the case when primary
data can be used, does provide a result that is better than a “guess”. We canidentify a number of reasons why the operation of the CGUSD approach maynot have been as effective as expected, as follows.
1. Compatibility between secondary training set and primary test set.The quality of any supervised learning method is very much dependent onthe quality of the input. In the case of the evaluation, MEDLINE abstractswere used. The purpose of abstracts (a brief summary of a research articledesigned to inform potential readers) is very different to the notes found inthe free text of SAVSNET questionnaires. It may therefore be that there mayhave only been a limited compatibility between the secondary training dataset and the primary test data set and thus the generated classifier would nothave been precisely suited to classifying examples contained in the primarydata.
2. Class priors. As noted above the primary data was unbalanced, whilst thesecondary data was balanced. Knowledge of the class priors, reflected in theclassifiers generated directly from the primary data, would produce a bet-ter classifier. However, as also noted above, then assumption underpinningCGUSD is that this knowledge is not available.
3. Evaluation environment. The evaluation environment, as described above,compares accuracy and AUC values obtained using two different mecha-nisms, TCV and application to an entire data set. The first obvious distinc-tion is that the relative size of the test sets are very different (by a ration often to one). Secondly the quoted values using TCV are the result of an av-eraging process. It may therefore be conjectured that we are not comparinglike-with-like; although it is difficult to see any reasonable alternative.
7 Conclusion
This paper reports on experiments conducted to ascertain the effectiveness of aprocess whereby a classifier is generated using an alternative data source to thatfor which it is intended. The application scenario where this is seen as applicableis where we wish to build and apply a classifier to data, but have no labelleddata with which to “train” the classifier. More specifically where we wish to buildtext summarisation classifiers, that can be applied to the free text element ofquestionnaire data, where no labelled training data is available. The advocatedapproach is therefore to build the classifier using an alternative secondary datasource which is labelled and then apply this to the primary data source. Anapproach, which we have called CGUSD, is therefore proposed whereby this canbe achieved. The focus of the work described is text summarisation and CGUSDassumes that this is the intended objective.
The operation of CGUSD was tested using questionnaire data obtained aspart of the SAVSNET project. The secondary data set was generated usingMEDLINE abstracts. The results obtained, although not as good as was hopedfor, indicate that (in the absence of any alternative) CGUSD does present a po-tential solution; although the technique does require further refinement. (Clearly
we could not expect to produce a better result than when using primary data.)However, the research team has been encouraged by the results that have beenproduced to date.
References
1. Afantenos, S. and Karkaletsis, V. and Stamatopoulos, P. (2005). Summarizationfrom medical documents: a survey. Artificial Intelligence in Medicine Vol. 33,pp157-177.
2. Agrawal, R. and Srikant, R. (1994). Fast algorithms for mining association rules.Proceedings of the 20th International Conference on Very Large Data Bases.
3. Alonso, L. and Castellon, I. and Climent, S. and Fuentes, M. and Padro, L. andRodrıguez, H. (2004). Approaches to text summarization: Questions and answers.Inteligencia Artificial Vol. 8, pp22.
4. Amini, M-R. and Gallinari, P. (2001). Automatic Text Summarisation Using Unsu-pervised and Semi-Supervised Learning. Proc. PKDD 2001. Springer LNAI 2168,pp16-28.
5. Amini, M-R. and Gallinari, P. (2002). The use of unlabeled data to improve super-vised learning for text summarization. SIGIR ’02: Proceedings of the 25th annualinternational ACM SIGIR conference on Research and development in informationretrieval.
6. Chen, Y.L. and Weng, C.H. (2009). Mining fuzzy association rules from question-naire data. Knowledge-Based Systems Vol. 22, pp46-56.
7. Chuang, W.T. and Yang, J. (2000). Extracting sentence segments for text summa-rization: a machine learning approach. SIGIR ’00: Proceedings of the 23rd annualinternational ACM SIGIR conference on Research and development in informationretrieval, pp152-159.
8. Coenen, F. (2004). The LUCS-KDD TFP Association Rule Mining Algorithm.http://www.csc.liv.ac.uk/~frans/KDD/Software/Apriori_TFP/aprioriTFP.
html Department of Computer Science, The University of Liverpool, UK.9. Coenen, F. (2004). The LUCS-KDD TFPC Classification Association Rule
Mining Algorithm. http://www.cSc.liv.ac.uk/~frans/KDD/Software/Apriori_TFPC/aprioriTFPC.html Department of Computer Science, The University of Liv-erpool, UK.
10. Fuentes, M. and Rodrıguez, H. (2002). Using cohesive properties of text for auto-matic summarization. JOTRI02.
11. Hand, D.J. and Till, R.J. (2001). A Simple Generalisation of the Area Underthe ROC Curve for Multiple Class Classication Problems. Machine Learning, 45,pp171186.
12. Jebara, T. and Pentland, A. (1999). Maximum conditional likelihood via boundmaximization and the CEM algorithm. Advances in neural information processingsystems, pp494-500.
13. Jing, L.P. and Huang, H.K. and Shi, H.B. (2002). Improved feature selection ap-proach TFIDF in text mining. Proceedings of the First International Conferenceon Machine Learning and Cybernetics.
14. Jones, K.S. and others. (1999). Automatic summarizing: factors and directions.Advances in automatic text summarization, pp1-12.
15. Luhn, P.H. (1958). Automatic creation of Literature Abstracts. IBM Journal,pp159-165.
16. Mihalcea, R. (2004). Graph-based ranking algorithms for sentence extraction, ap-plied to text summarization. Proceedings of the 42nd Annual Meeting of the As-sociation for Computational Lingusitics (ACL 2004)(companion volume).
17. Silber, H.G. and McCoy, K.F. (2002). Efficiently computed lexical chains as an in-termediate representation for automatic text summarization. Computational Lin-guistics Vol. 28, pp487-496.
18. Sparck Jones, Karen (1972). A statistical interpretation of term specificity and itsapplication in retrieval. Journal of Documentation 28 (1): pp1121,
19. Strzalkowski, T. and Wang, J. and Wise, B. (1999). A robust practical text summa-rization. Proceedings of the AAAI Symposium on Intelligent Text Summarization.
20. Willett, P. (2006). The Porter stemming algorithm: then and now. Program: elec-tronic library and information systems Vol. 40, pp219-223.
21. Yamanishi, K. and Li, H. (2002). Mining open answers in questionnaire data. IEEEIntelligent Systems, pp58-63.
Copyright © 2022 FDOKUMEN