An International Analysis of Dividend Payment Behavior
27
Journal of Business Finance & Accounting, 36(3) & (4), 496–522, April/May 2009, 0306-686X doi: 10.1111/j.1468-5957.2009.02126.x An International Analysis of Dividend Payment Behavior Stephen P. Ferris, Nilanjan Sen and Emre Unlu ∗ Abstract: This study investigates patterns in dividend payment across nine common law and sixteen civil law countries over 1994-2007. We begin by examining whether the recent decline in the number of dividend payers is solely a US phenomenon or part of a more global trend. We find that at the beginning of our sample period, 72% of our sample firms pay dividends, but by 2007, this percentage decreases to 55%, with the decline more acute in common law countries. Our analysis further shows that the growing incidence of non-dividend paying firms can be explained by an increase in the percentage of firms that have never paid dividends. We find that common law firms are less likely to initiate new dividend programs than those in civil law nations, although they tend to have more abundant growth opportunities. We further establish that this global decline in the propensity to pay dividends is more pronounced in firms incorporated in common law jurisdictions. Finally, we find that both the percentage increase in aggregate dividends and the dividend payout ratio is higher in civil law countries. Keywords: international dividends, common law, propensity to pay 1. INTRODUCTION Fama and French (2001 and 2004) find that the number of US firms paying cash dividends has declined significantly over the last twenty-five years. They contend that two effects account for this result. The first is a changing composition effect which asserts that the nature of exchange new lists has tilted towards firms with lower profitability and stronger growth opportunities. They note that these are precisely the characteristics that cause firms to avoid paying dividends. But Fama and French further report that even after controlling for these characteristics, firms continue to pay dividends at a lower frequency than expected. They refer to this second effect as a declining propensity to pay. ∗ The first author is from the Department of Finance, University of Missouri, USA. The second author is from the Department of Finance, Nanyang Technological University, Singapore. The third author is from the Department of Finance, University of Nebraska-Lincoln, USA. They would like to thank Martin Walker (editor), for his many helpful suggestions on prior versions of this paper as well as the comments of the discussant, Graham Partington, and delegates at the JBFA Capital Markets Conference, University of Lancaster, May 2008. (Paper received October 2006, revised version accepted January 2009) Address for correspondence: Stephen P. Ferris, Department of Finance, 404 Cornell Hall, University of Missouri, Columbia, MO 65211-2600, USA. e-mail: [email protected] C 2009 The Authors Journal compilation C 2009 Blackwell Publishing Ltd, 9600 Garsington Road, Oxford OX4 2DQ, UK and 350 Main Street, Malden, MA 02148, USA. 496
-
Upload
independent -
Category
Documents
-
view
0 -
download
0
Transcript of An International Analysis of Dividend Payment Behavior

Journal of Business Finance & Accounting, 36(3) & (4), 496–522, April/May 2009, 0306-686Xdoi: 10.1111/j.1468-5957.2009.02126.x
An International Analysis of DividendPayment Behavior
Stephen P. Ferris, Nilanjan Sen and Emre Unlu∗
Abstract: This study investigates patterns in dividend payment across nine common law andsixteen civil law countries over 1994-2007. We begin by examining whether the recent declinein the number of dividend payers is solely a US phenomenon or part of a more global trend.We find that at the beginning of our sample period, 72% of our sample firms pay dividends,but by 2007, this percentage decreases to 55%, with the decline more acute in common lawcountries. Our analysis further shows that the growing incidence of non-dividend paying firmscan be explained by an increase in the percentage of firms that have never paid dividends.We find that common law firms are less likely to initiate new dividend programs than those incivil law nations, although they tend to have more abundant growth opportunities. We furtherestablish that this global decline in the propensity to pay dividends is more pronounced in firmsincorporated in common law jurisdictions. Finally, we find that both the percentage increase inaggregate dividends and the dividend payout ratio is higher in civil law countries.
Keywords: international dividends, common law, propensity to pay
1. INTRODUCTION
Fama and French (2001 and 2004) find that the number of US firms paying cashdividends has declined significantly over the last twenty-five years. They contend that twoeffects account for this result. The first is a changing composition effect which assertsthat the nature of exchange new lists has tilted towards firms with lower profitability andstronger growth opportunities. They note that these are precisely the characteristics thatcause firms to avoid paying dividends. But Fama and French further report that evenafter controlling for these characteristics, firms continue to pay dividends at a lowerfrequency than expected. They refer to this second effect as a declining propensity topay.
∗The first author is from the Department of Finance, University of Missouri, USA. The second authoris from the Department of Finance, Nanyang Technological University, Singapore. The third author isfrom the Department of Finance, University of Nebraska-Lincoln, USA. They would like to thank MartinWalker (editor), for his many helpful suggestions on prior versions of this paper as well as the commentsof the discussant, Graham Partington, and delegates at the JBFA Capital Markets Conference, University ofLancaster, May 2008. (Paper received October 2006, revised version accepted January 2009)
Address for correspondence: Stephen P. Ferris, Department of Finance, 404 Cornell Hall, University ofMissouri, Columbia, MO 65211-2600, USA.e-mail: [email protected]
C© 2009 The AuthorsJournal compilation C© 2009 Blackwell Publishing Ltd, 9600 Garsington Road, Oxford OX4 2DQ, UKand 350 Main Street, Malden, MA 02148, USA. 496

ANALYSIS OF DIVIDEND PAYMENT BEHAVIOR 497
Yet, we do not know whether this decline in the number of exchange-listed firmspaying dividends and the corresponding decline in the propensity to pay is merelya US phenomenon or is part of a more general trend in the global equity markets.Few studies examine the nature of international dividend policy and those that doare typically limited in their coverage. Aivazian, Booth and Cleary (2003) focus on asample of eight developing countries and conclude that both profitability and countryeffects are relevant in explaining national dividend policies. Ferris, Sen and Yui (2006a)examine the pattern of dividend payments in the UK and report a similar, but lesspronounced trend of declining dividends than that observed for the US.
A recent set of studies explores the issue of dividend policy across a sample ofdeveloped and developing countries. Denis and Osobov (2008) study six developedcountries, including the US, and find international evidence consistent with Fama andFrench (2001) of a declining propensity to pay dividends. Eije and Megginson (2008)examine the evolution of dividend policy from 1989 to 2003 in fifteen countries of theEuropean Union (EU) and find neither systematic dividend catering nor evidence ofa European convergence in dividend policies.
This study makes a number of important contributions relative to this existingresearch. First, this study is more comprehensive regarding the number of samplecountries than either study. We examine twenty-five countries compared with the sixexamined by Denis and Osobov (2008) and the fifteen analyzed by Eije and Megginson(2008). Because of our larger sample, we are able to test more rigorously for differencesin dividend policy across legal regimes and to more authoritatively ascertain thenature of international dividend policy. Eije and Megginson, for instance, include onlyone common law country in their analysis while Denis and Osobov limit themselvesto three. This study utilizes nine common law countries, including both developedand developing economies. Further, our sample is geographically diverse, includingAustralia and a number of Asian countries compared with the European focus of Eijeand Megginson and the limited inclusion of Asian and European markets by Denis andOsobov.
Beyond issues of sample breadth, this study provides other contributions to theliterature. Unlike Denis and Osobov (2008) and Eije and Megginson (2008), ourstudy examines the dividend behavior of a variety of firm types that allow us to betterunderstand how dividend policies differ globally. More specifically, we examine thenature of dividend payouts for firms that never paid dividends, that were former payers,and that are new lists. We also compare the rates of dividend initiation and continuationfor our sample firms. Additionally, our sample period is more recent than those of Denisand Osobov (2008) or Eije and Megginson (2008). Our sample period extends from1994 through 2007 compared to the 1989 to 2003 analysis of Eije and Megginson andthe nine year period, 1994 to 2002, used by Denis and Osobov. Our study also employsa richer model to estimate the propensity to pay dividends that includes size, risk andlife cycle effects that are excluded in these previous studies. This allows us to moreprecisely control for other factors in estimating the propensity to pay dividends.
LaPorta, Lopez de Silanes, Shleifer and Vishny (2000) develop two competingtheories regarding how international dividend policy might be influenced by the legalprotections provided to minority shareholders. Their outcome theory of dividendscontends that the protections enjoyed by shareholders in a common law jurisdictionallows minority shareholders to extract more dividends from controlling shareholdersthan in civil law nations where such protections are weaker. Alternatively, their substitute
C© 2009 The AuthorsJournal compilation C© Blackwell Publishing Ltd. 2009

498 FERRIS, SEN AND UNLU
theory of dividends argues that dividends substitute for the legal protection of minorityshareholders. Hence, dividends are more likely to be paid in countries where fewerlegal protections are available to external investors. These theories suggest that we willobserve important distinctions in dividend practices between common and civil lawcountries.
DeAngelo, DeAngelo and Skinner (2004) report that in spite of a declining numberof dividend payers in the US, the level of aggregate dividends is increasing. This studytests to see if a similar phenomenon occurs internationally. Although Denis and Osobov(2008) find an increase in aggregate dividend levels for their sample of six developedcountries, it is unclear whether such a result holds for a more diverse set of countries,especially those with less developed capital markets. Further, unlike this study, Denisand Osobov do not test to determine what effect the legal protection of investors mightexert on dividend payouts.
Our initial empirical analysis provides us with a number of interesting results. Wefind that the number of firms paying dividends declines over our sample period and ismost pronounced for firms incorporated in common law countries. We find that at thebeginning of our sample period, the median number of firms paying dividends in agiven country is 81%. But by 2007, only 45% of the firms do so. This decline occurs moredramatically in common law countries, where the median percentage reduction in thenumber of dividend paying firms is 42% compared to only 23% for firms incorporatedin civil law nations. Our analysis further shows that the growing percentage of non-dividend paying firms can be explained by an increase in the percentage of firms thathave never paid dividends. We find that this effect is significantly greater in commonthan civil law countries. Finally, we observe that changes in the average size of dividendsdiffers between the common and civil law regimes. Firms in civil law countries areincreasing the size of their mean dividend while those in common law countries aredeclining.
We also find that firms which pay dividends tend to continue paying dividends. Thispattern does not appear to be sensitive to the legal environment in which the firm isincorporated. The popularity of initiating dividends does, however, appear to differacross regimes. There seems to be less willingness to initiate a program of dividendpayments in common law countries. Firms in civil law nations are more willing toinitiate new dividend programs.
To better understand the cross-sectional variation in dividend payment patternsboth within and between legal regimes, we compare five important determinants ofdividends. We find that common and civil law countries appear to be equally profitableand have comparable asset growth rates. Investment opportunities as measured by themarket-to-book ratio, however, appear to be higher within common law countries. Butthe difference in market-to-book ratios is significant only at the ten percent level forthe mean values. We further determine that firms in civil law countries are larger thantheir common law counterparts, perhaps attributable to their greater need for internalcapital markets to obtain necessary financing. We find no significant differences in therisk and percentage of retained earnings between common and civil law firms.
Our examination of the propensity to pay dividends shows that there is a declinein the willingness of firms to pay dividends even after controlling for those char-acteristics associated with the payment of dividends by firms. This finding appearsto be global and applies to firms incorporated in both common and civil lawjurisdictions.
C© 2009 The AuthorsJournal compilation C© Blackwell Publishing Ltd. 2009

ANALYSIS OF DIVIDEND PAYMENT BEHAVIOR 499
We find that the level of aggregate dividends paid has increased in spite of ageneral decline in the propensity to pay dividends. This result holds regardless ofwhether aggregate dividends are measured in nominal or real terms. These findingsare consistent with those reported by DeAngelo, DeAngelo and Skinner (2004) forthe US and Denis and Osobov (2008). We find that both common and civil law firmsexperience an increase in aggregate dividends, but that the percentage increase inaggregate dividends is greater for civil law countries. We also examine differences inthe dividend payout ratio across legal regimes and find limited evidence for higherpayout ratios among civil law incorporated firms.
We organize this paper into eight sections. In Section 2 we describe our data anddiscuss our method of sample construction. Section 3 provides an initial overview ofglobal dividend behavior while Section 4 contains a detailed time-series analysis oftrends in international dividend payment. A comparative analysis of factors influencingcorporate dividend payment is presented in Section 5. In Section 6 we calculatethe annual propensities to pay for our sample firms using an enhanced logisticmodel and following the general approach of Fama and French (2001). We examineaggregate dividend levels in Section 7 and provide a brief discussion and conclusion inSection 8.
2. DATA DESCRIPTION AND SAMPLE CONSTRUCTION
Our empirical data is obtained from several different databases. Firm-level datacomes from Worldscope (financial accounting information) and Datastream (marketinformation). Country-level data (exchange rates and consumer price index) arecompiled from FRED database of the St. Louis Federal Reserve, Penn World Tables,World Development Indicators, and Datastream.
Our sample initially begins with the 33 countries that LaPorta, Lopez de Silanes,Shleifer and Vishny (2000) use in their study of international dividend policy. We theneliminate eight of these nations from the sample because they contain too few firmswith available data to allow stable statistical estimation. We then employ the LaPorta,Lopez de Silanes, Shleifer and Vishny (1997) classifications to assign these twenty-five remaining countries to either common or civil law categories. The nine commonlaw countries of our sample are Australia, Canada, Hong Kong, Ireland, Malaysia,Singapore, South Africa, the US and the UK. The sixteen civil law nations that weexamine are Austria, Denmark, Finland, France, Germany, Indonesia, Italy, Japan,Korea, Mexico, Norway, Philippines, Portugal, Spain, Sweden and Switzerland. Ourfinal sample contains 225,592 firm-year observations from 1994 to 2007.1 This samplecontains a greater number of countries and is more current than those appearing in themost recent studies of international dividend policy such as Denis and Osobov (2008)and Eije and Megginson (2008).
We then classify firm-year observations into several categories based on their dividendpolicies. We define a firm as a dividend payer in calendar year t if it pays a dividend in
1 To be included in our final sample, we require that for each firm-year observation (1) common dividendsand total assets are available, (2) firms consolidate their major subsidiaries or have at most 20% of the totalassets as total investment in unconsolidated subsidiaries (this criterion alleviates the potential inflation effectof off-balance sheet leverage on reported assets), (3) firms operate in non-financial industries. Our sampleperiod starts in 1994 due to relatively sparse coverage prior to 1994.
C© 2009 The AuthorsJournal compilation C© Blackwell Publishing Ltd. 2009

500 FERRIS, SEN AND UNLU
year t. A firm is defined as a new list in calendar year t if it is added to the Worldscopedatabase between January and December of year t. Firms that do not pay a dividendin year t are classified as non-payers. Non-payers are further classified into two. Non-payers with a dividend payment in year t − 1 are classified as former payers, or otherwiseclassified as never payers.
3. AN OVERVIEW OF GLOBAL DIVIDEND BEHAVIOR
We begin our analysis of global dividend policy by providing an initial overview ofkey dividend characteristics for our sample of globally distributed firms. Specifically,we compare three different measures of dividend activity between the beginning andend of the examination period across our sample countries. These measures are thenumber of dividend payers, the percentage of firms paying dividends, and the average(mean and median) dividend paid per firm. We provide separate analyses for civil andcommon law countries due to the effect that differing levels of shareholder protectionfor minority investors might exert on corporate dividend decisions.
We observe in Table 1 that the average number of dividend payers among thecommon law countries increases. This increase, however, does not occur uniformlyacross the sample. Indeed, we observe a decline in the number of dividend payers forthe two largest common law markets: the UK and the US. This result is comparableto the findings reported by Fama and French (2001) and Ferris, Sen and Yui (2006a)for the US and the UK markets, respectively. The increase in the number of dividendpaying firms is most dramatic in the Far East, with Hong Kong, Singapore, and Malaysiaexperiencing an average 252% increase in the number of firms paying dividends. Withthe notable exception of the US and the UK, our evidence suggests that more firms incommon law countries pay dividends.
The findings presented in Table 1 also show that there is an increase in thenumber of dividend payers among civil law firms. Eleven of the sixteen samplecountries experience an increase in the number of dividend payers, while fourcountries experience only a nominal change (less than five percent) in the numberof dividend paying firms. The mean (median) increase in the number of dividendpaying firms is greater in common than in civil law countries, but the significantvariation within the subsamples prevents these differences from being statisticallysignificant.
In the fourth column of Table 1, we estimate the percentage of firms that aredividend payers. Use of this comparison reverses our initial conclusions regarding theincreased frequency of dividend payment by our sample firms. After standardizing thenumber of dividend paying firms by the total number of firms publicly traded in aparticular country, we observe a decline in the frequency of dividend payment. We finda uniform decline in the percentage of dividend paying firms across all the commonlaw firms. Indeed, the mean (median) change in the percentage of common law firmspaying dividends is −42% (−42%).
Similar results hold for civil law countries, where the mean (median) percentage ofdividend paying firms declines from 72% (71%) in 1994 to 55% (57%) in 2007. Tests ofmean and median differences indicate that this decline in the percentage of dividendpaying firms is greater in common than in civil law countries. That is, on average, ahigher percentage of firms located in common law countries reduce their dividendsthan in civil law firms. The difference in the median (mean) change in the percentage
C© 2009 The AuthorsJournal compilation C© Blackwell Publishing Ltd. 2009

ANALYSIS OF DIVIDEND PAYMENT BEHAVIOR 501T
able
1O
verv
iew
ofG
loba
lDiv
iden
dB
ehav
ior
Tota
lNum
ber
ofFi
rms
Num
ber
ofPa
yers
Perc
enta
geof
Paye
rsM
edia
nR
ealD
ivid
end
Per
Firm
Cou
ntry
/Leg
alR
egim
e19
9420
0719
9420
07%
Cha
nge
1994
2007
Cha
nge
%C
hang
e19
9420
07%
Cha
nge
Aus
tral
ia17
81,
409
132
357
170%
74%
25%
−49%
−66%
5.99
0.00
−100
%C
anad
a35
21,
200
171
319
87%
49%
27%
−22%
−45%
0.00
0.00
Hon
gK
ong
115
729
104
384
269%
90%
53%
−38%
−42%
11.1
20.
48−9
6%Ir
elan
d46
5332
19−4
1%70
%36
%−3
4%−4
8%2.
790.
00−1
00%
Mal
aysi
a17
384
415
848
320
6%91
%57
%−3
4%−3
7%3.
310.
41−8
8%Si
ngap
ore
104
518
9235
128
2%88
%68
%−2
1%−2
3%2.
951.
28−5
7%So
uth
Afr
ica
137
243
123
135
10%
90%
56%
−34%
−38%
9.85
0.63
−94%
Uni
ted
Kin
gdom
1,17
71,
407
955
633
−34%
81%
45%
−36%
−45%
1.87
0.00
−100
%U
nite
dSt
ates
3,80
04,
616
1,36
91,
163
−15%
36%
25%
−11%
−30%
0.00
0.00
Com
mon
Law
Mea
n67
61,
224
348
427
104%
74%
43%
−31%
−42%
4.21
0.31
−91%
Com
mon
Law
Med
ian
173
844
132
357
87%
81%
45%
−34%
−42%
2.95
0.00
−96%
Aus
tria
4654
3435
3%74
%65
%−9
%−1
2%3.
072.
45−2
0%D
enm
ark
108
9572
60−1
7%67
%63
%−4
%−5
%0.
731.
8315
0%Fi
nlan
d74
107
5086
72%
68%
80%
13%
19%
1.47
8.59
482%
Fran
ce40
747
428
729
32%
71%
62%
−9%
−12%
1.64
1.06
−35%
Ger
man
y34
452
324
524
0−2
%71
%46
%−2
5%−3
6%2.
860.
00−1
00%
Indo
nesi
a80
114
7758
−25%
96%
51%
−45%
−47%
2.41
0.19
−92%
Ital
y13
220
780
136
70%
61%
66%
5%8%
1.26
3.81
203%
Japa
n2,
049
3,23
21,
807
2,79
455
%88
%86
%−2
%−2
%3.
171.
71−4
6%K
orea
189
844
146
575
294%
77%
68%
−9%
−12%
2.08
1.20
−42%
Mex
ico
7491
4552
16%
61%
57%
−4%
−6%
4.44
3.49
−21%
Nor
way
9013
459
57−3
%66
%43
%−2
3%−3
5%1.
400.
00−1
00%
Phili
ppin
es42
122
2147
124%
50%
39%
−11%
−23%
0.00
0.00
−100
%Po
rtug
al38
3928
23−1
8%74
%59
%−1
5%−2
0%1.
011.
4745
%Sp
ain
9192
5873
26%
64%
79%
16%
24%
4.95
18.1
826
7%Sw
eden
131
226
8313
158
%63
%58
%−5
%−9
%1.
022.
1611
1%Sw
itzer
land
139
165
104
119
14%
75%
72%
−3%
−4%
5.28
6.01
14%
Civ
ilL
awM
ean
252
407
200
299
42%
70%
62%
−8%
−11%
2.30
3.26
45%
Civ
ilL
awM
edia
n10
012
875
8015
%69
%62
%−7
%−1
0%1.
861.
77−2
1%A
ggre
gate
Mea
n40
570
225
334
564
%72
%55
%−1
6%−2
2%2.
992.
203%
Agg
rega
teM
edia
n13
122
692
135
16%
71%
57%
−11%
−23%
2.41
1.06
−46%
Dif
fere
nces
betw
een
com
mon
and
civi
llaw
mea
nsan
dm
edia
ns:p
-val
ues
Dif
fere
nce
inm
eans
0.44
0.53
0.22
0.58
0.00
0.00
0.00
0.20
0.02
0.00
Dif
fere
nce
inm
edia
ns0.
070.
030.
520.
220.
010.
000.
000.
320.
010.
01
Not
es:
Thi
sta
ble
pres
ents
the
chan
ges
inse
lect
char
acte
rist
ics
ofdi
vide
ndpa
yers
from
1994
to20
07fo
r25
coun
trie
s.T
hepe
rcen
tage
ofpa
yers
isth
enu
mbe
rof
divi
dend
payi
ngfir
ms
rela
tive
toth
eto
taln
umbe
rof
firm
s.T
hem
ean
(med
ian)
real
divi
dend
isth
em
ean
(med
ian)
divi
dend
amou
nt(i
n20
07U
Sdo
llars
)am
ong
divi
dend
payi
ngfir
ms.
The
perc
enta
gech
ange
ofa
give
nva
riab
leis
com
pute
dby
divi
ding
abso
lute
chan
geby
1994
valu
eof
the
corr
espo
ndin
gva
riab
le.
C© 2009 The AuthorsJournal compilation C© Blackwell Publishing Ltd. 2009

502 FERRIS, SEN AND UNLU
of dividend paying firms between legal regimes is statistically significant, indicating thatcivil law firms in general have been slower to reduce their payment of dividends.
In the fifth column we examine the size of the median real dividend per firm. Forthe common law firms, we immediately notice the almost uniform decline in the sizeof the median dividend. Changes in the magnitude of dividends paid by firms locatedin common law countries range from zero to −100%, with a median change of −91%.
We obtain mixed results regarding the median real dividend for the civil lawcountries. Changes in the median real dividend paid range from a 482% increasefor Finland to −100% decline for Germany. The median real dividend in civil lawcountries declines by 21% between 1994 and 2007. We also find that the median (mean)difference in the size of dividends paid between legal regimes is statistically significant.
The results in Table 1 reveal some initial similarities along with important differencesin the dividend policies between civil and common law countries. Both regimesexperience an increase in the absolute number of dividend paying firms. But afterstandardizing by the number of firms trading in a country’s stock market, we observe adecline in the percentage of firms paying dividends that is consistent with the patternfirst detected by Fama and French (2001) for the US. We further determine that thisdecline is more pronounced among common law firms. Accompanying this decline inthe percentage of firms paying dividends is the reduction in the average size of dividendsbeing paid. The reduction in amount of dividends being paid is again more pronouncedamong common law firms, with the average percentage reduction in dividends by civillaw firms less than a quarter of that observed by common law firms.
4. TIME –SERIES PATTERNS IN INTERNATIONAL DIVIDEND PAYMENT
(i) An Aggregate Time-Series Analysis
In this section we provide a more detailed time-series analysis of dividend practicesamong our sample firms. Using the dividend payment categories described in Section 2,we present in Table 2 the percentage of firms contained in each of the different dividendgroups separately for each regime. We calculate the mean (median) values of thepercentage of firms in each of these categories for each of the sample years.
We observe in Panel A of Table 2 that the percent of firms paying dividendsdeclines over time for most of the sample firms. These annual results are consistent withour initial findings contained in Table 1. All of the common law countries experiencea decline in dividends along with most of the civil law countries, with the exception ofFinland, Italy and Spain. Although there are some annual reversals, the general trendpresented in the time-series of Table 2 is that of a declining number of firms payingdividends.2
We define the decline in the percentage of dividend-paying firms as the differencebetween the percentage of firms paying dividends in 1994 and that in 2007. The mediandecline is 34% for the common law countries, with a corresponding value of 11%for the civil law nations. The difference in both the mean and median percentage
2 In un-tabulated results we separately regress for each country the percent of firms paying dividends againsta time trend variable. We find that 24 of the 25 coefficients are negative, with 20 statistically significant. Theseresults confirm our conclusion of a generalized declining trend in the percent of firms paying dividends acrossour sample.
C© 2009 The AuthorsJournal compilation C© Blackwell Publishing Ltd. 2009

ANALYSIS OF DIVIDEND PAYMENT BEHAVIOR 503
Tab
le2
Tim
eSe
ries
Dis
trib
utio
nof
Div
iden
dPo
licie
sA
mon
gFi
rms
inD
iffe
rent
Cou
ntri
esP
anel
A:P
erce
ntag
eof
Firm
sP
ayin
gD
ivid
ends
Year
sD
iffer
ence
Cou
ntry
/Leg
alR
egim
e19
9419
9519
9619
9719
9819
9920
0020
0120
0220
0320
0420
0520
0620
07(2
007–
1994
)
Aus
tral
ia0.
740.
710.
690.
720.
660.
570.
410.
320.
280.
300.
280.
290.
270.
25−0
.49
Can
ada
0.49
0.47
0.43
0.43
0.29
0.25
0.23
0.22
0.20
0.21
0.23
0.26
0.28
0.27
−0.2
2H
ong
Kon
g0.
900.
910.
810.
770.
710.
530.
460.
440.
400.
440.
470.
510.
530.
53−0
.38
Irel
and
0.70
0.73
0.60
0.57
0.54
0.52
0.54
0.52
0.49
0.44
0.44
0.38
0.38
0.36
−0.3
4M
alay
sia
0.91
0.91
0.90
0.86
0.77
0.65
0.62
0.62
0.60
0.57
0.55
0.56
0.57
0.57
−0.3
4Si
ngap
ore
0.88
0.88
0.86
0.81
0.83
0.72
0.65
0.60
0.52
0.52
0.54
0.59
0.64
0.68
−0.2
1So
uth
Afr
ica
0.90
0.93
0.88
0.87
0.60
0.54
0.52
0.46
0.49
0.55
0.59
0.60
0.58
0.56
−0.3
4U
nite
dK
ingd
om0.
810.
830.
760.
750.
750.
700.
620.
550.
510.
480.
450.
440.
420.
45−0
.36
Uni
ted
Stat
es0.
360.
330.
280.
240.
190.
180.
180.
180.
180.
200.
220.
240.
240.
25−0
.11
Com
mon
Law
Mea
n0.
740.
740.
690.
670.
590.
520.
470.
440.
410.
410.
420.
430.
430.
43−0
.31
Com
mon
Law
Med
ian
0.81
0.83
0.76
0.75
0.66
0.54
0.52
0.46
0.49
0.44
0.45
0.44
0.42
0.45
−0.3
4
Aus
tria
0.74
0.78
0.80
0.76
0.72
0.70
0.68
0.59
0.58
0.61
0.68
0.64
0.64
0.65
−0.0
9D
enm
ark
0.67
0.74
0.69
0.70
0.76
0.73
0.71
0.65
0.51
0.52
0.56
0.59
0.65
0.63
−0.0
4Fi
nlan
d0.
680.
830.
800.
840.
880.
860.
820.
790.
780.
730.
760.
760.
760.
800.
13Fr
ance
0.71
0.75
0.69
0.63
0.66
0.62
0.60
0.59
0.56
0.56
0.54
0.55
0.58
0.62
−0.0
9G
erm
any
0.71
0.72
0.67
0.57
0.57
0.56
0.49
0.47
0.41
0.38
0.36
0.40
0.43
0.46
−0.2
5In
done
sia
0.96
0.95
0.92
0.91
0.38
0.32
0.46
0.36
0.38
0.43
0.41
0.43
0.42
0.51
−0.4
5It
aly
0.61
0.62
0.65
0.69
0.65
0.65
0.68
0.65
0.61
0.58
0.57
0.59
0.63
0.66
0.05
Japa
n0.
880.
850.
840.
860.
870.
850.
820.
820.
820.
790.
810.
840.
860.
86−0
.02
Kor
ea0.
770.
790.
780.
730.
570.
530.
540.
560.
550.
580.
590.
650.
690.
68−0
.09
Mex
ico
0.61
0.45
0.48
0.54
0.50
0.31
0.35
0.39
0.38
0.42
0.40
0.42
0.51
0.57
−0.0
4N
orw
ay0.
660.
690.
620.
580.
520.
420.
430.
360.
330.
420.
410.
440.
390.
43−0
.23
Phili
ppin
es0.
500.
510.
490.
430.
330.
270.
220.
180.
250.
260.
270.
320.
340.
39−0
.11
Port
ugal
0.74
0.79
0.67
0.70
0.74
0.70
0.71
0.55
0.67
0.57
0.60
0.63
0.60
0.59
−0.1
5Sp
ain
0.64
0.68
0.69
0.75
0.67
0.70
0.73
0.72
0.66
0.67
0.73
0.77
0.79
0.79
0.16
Swed
en0.
630.
790.
770.
670.
630.
580.
530.
470.
430.
440.
470.
490.
520.
58−0
.05
Switz
erla
nd0.
750.
770.
760.
740.
790.
800.
770.
760.
620.
610.
640.
660.
690.
72−0
.03
Civ
ilL
awM
ean
0.70
0.73
0.71
0.69
0.64
0.60
0.60
0.56
0.53
0.53
0.55
0.57
0.59
0.62
−0.0
8C
ivil
Law
Med
ian
0.69
0.76
0.69
0.70
0.65
0.64
0.64
0.57
0.55
0.56
0.57
0.59
0.61
0.62
−0.0
7A
ggre
gate
Mea
n0.
720.
740.
700.
690.
620.
570.
550.
510.
490.
490.
500.
520.
540.
55−0
.16
Agg
rega
teM
edia
n0.
710.
770.
690.
720.
660.
580.
540.
550.
510.
520.
540.
550.
570.
57−0
.11
Dif
fere
nces
betw
een
com
mon
and
civi
llaw
mea
nsan
dm
edia
ns:p
-val
ues
Dif
fere
nce
inm
eans
0.58
0.87
0.83
0.76
0.55
0.30
0.10
0.11
0.07
0.05
0.05
0.03
0.02
0.00
0.00
Dif
fere
nce
inm
edia
ns0.
220.
440.
760.
710.
800.
250.
090.
090.
080.
070.
070.
040.
030.
010.
00
C© 2009 The AuthorsJournal compilation C© Blackwell Publishing Ltd. 2009

504 FERRIS, SEN AND UNLU
Tab
le2
(Con
tinu
ed)
Pan
elB
:Per
cent
age
ofFi
rms
Tha
tNev
erP
aid
Div
iden
dsYe
ars
Diff
eren
ceC
ount
ry/L
egal
Reg
ime
1994
1995
1996
1997
1998
1999
2000
2001
2002
2003
2004
2005
2006
2007
(200
7–19
94)
Aus
tral
ia0.
220.
270.
280.
270.
300.
410.
560.
660.
670.
680.
690.
700.
700.
730.
51C
anad
a0.
500.
520.
540.
550.
690.
730.
750.
760.
780.
780.
760.
740.
720.
720.
22H
ong
Kon
g0.
080.
070.
140.
140.
180.
300.
480.
510.
520.
510.
480.
440.
430.
420.
34Ir
elan
d0.
300.
250.
400.
410.
420.
450.
460.
470.
470.
490.
530.
550.
620.
600.
30M
alay
sia
0.06
0.09
0.08
0.10
0.11
0.22
0.35
0.33
0.35
0.37
0.40
0.39
0.38
0.37
0.30
Sing
apor
e0.
070.
110.
110.
160.
110.
200.
320.
330.
390.
420.
400.
370.
310.
260.
19So
uth
Afr
ica
0.08
0.07
0.08
0.11
0.36
0.38
0.42
0.44
0.45
0.43
0.38
0.37
0.38
0.40
0.31
Uni
ted
Kin
gdom
0.16
0.15
0.22
0.23
0.22
0.27
0.34
0.40
0.44
0.49
0.52
0.54
0.55
0.53
0.38
Uni
ted
Stat
es0.
620.
660.
700.
750.
800.
810.
810.
810.
810.
790.
770.
750.
740.
740.
11C
omm
onL
awM
ean
0.23
0.24
0.28
0.30
0.36
0.42
0.50
0.52
0.54
0.55
0.55
0.54
0.54
0.53
0.30
Com
mon
Law
Med
ian
0.16
0.15
0.22
0.23
0.30
0.38
0.46
0.47
0.47
0.49
0.52
0.54
0.55
0.53
0.30
Aus
tria
0.20
0.20
0.16
0.23
0.24
0.29
0.27
0.33
0.35
0.36
0.30
0.31
0.34
0.35
0.16
Den
mar
k0.
300.
230.
280.
280.
220.
230.
250.
270.
370.
400.
410.
410.
340.
290.
00Fi
nlan
d0.
280.
170.
190.
150.
120.
120.
120.
170.
160.
220.
220.
200.
170.
17−0
.12
Fran
ce0.
220.
240.
280.
310.
310.
330.
340.
350.
380.
390.
420.
410.
380.
350.
13G
erm
any
0.22
0.24
0.27
0.36
0.38
0.39
0.44
0.46
0.50
0.55
0.59
0.58
0.54
0.50
0.29
Indo
nesi
a0.
010.
040.
070.
060.
110.
550.
520.
470.
550.
530.
540.
520.
500.
440.
43It
aly
0.26
0.31
0.33
0.29
0.32
0.31
0.29
0.28
0.30
0.34
0.35
0.38
0.35
0.31
0.06
Japa
n0.
070.
110.
130.
130.
110.
100.
120.
150.
160.
170.
170.
150.
130.
120.
04K
orea
0.18
0.17
0.17
0.17
0.25
0.40
0.40
0.39
0.39
0.37
0.37
0.31
0.28
0.27
0.09
Mex
ico
0.30
0.38
0.48
0.41
0.47
0.50
0.61
0.56
0.56
0.55
0.54
0.56
0.49
0.43
0.13
Nor
way
0.34
0.28
0.36
0.36
0.42
0.49
0.51
0.56
0.60
0.56
0.58
0.54
0.56
0.53
0.19
Phili
ppin
es0.
430.
430.
450.
460.
550.
650.
710.
760.
720.
670.
700.
650.
630.
580.
15Po
rtug
al0.
210.
190.
260.
290.
220.
240.
270.
290.
290.
290.
350.
350.
360.
360.
15Sp
ain
0.31
0.31
0.29
0.22
0.27
0.28
0.24
0.25
0.30
0.32
0.27
0.22
0.21
0.18
−0.1
2Sw
eden
0.34
0.21
0.22
0.27
0.32
0.38
0.43
0.49
0.50
0.52
0.50
0.50
0.46
0.41
0.08
Switz
erla
nd0.
190.
190.
210.
200.
170.
160.
190.
200.
240.
330.
330.
310.
280.
250.
06C
ivil
Law
Mea
n0.
240.
230.
260.
260.
280.
340.
360.
370.
400.
410.
410.
400.
380.
350.
11C
ivil
Law
Med
ian
0.24
0.22
0.27
0.27
0.26
0.32
0.31
0.34
0.37
0.38
0.39
0.40
0.35
0.35
0.11
Agg
rega
teM
ean
0.24
0.24
0.27
0.28
0.31
0.37
0.41
0.43
0.45
0.46
0.46
0.45
0.43
0.41
0.17
Agg
rega
teM
edia
n0.
220.
210.
260.
270.
270.
330.
400.
400.
440.
430.
420.
410.
380.
400.
15
Dif
fere
nces
betw
een
com
mon
and
civi
llaw
mea
nsan
dm
edia
ns:p
-val
ues
Dif
fere
nce
inm
eans
0.92
0.86
0.76
0.61
0.41
0.30
0.06
0.05
0.04
0.03
0.04
0.04
0.02
0.01
0.00
Dif
fere
nce
inm
edia
ns0.
520.
550.
840.
840.
710.
550.
070.
060.
060.
070.
080.
070.
030.
020.
00
C© 2009 The AuthorsJournal compilation C© Blackwell Publishing Ltd. 2009

ANALYSIS OF DIVIDEND PAYMENT BEHAVIOR 505
Tab
le2
(Con
tinu
ed)
Pan
elC
:Per
cent
age
ofFi
rms
Tha
tFor
mer
lyP
aid
Div
iden
dsYe
ars
Diff
eren
ceC
ount
ry/L
egal
Reg
ime
1994
1995
1996
1997
1998
1999
2000
2001
2002
2003
2004
2005
2006
2007
(200
7–19
94)
Aus
tral
ia0.
030.
010.
030.
010.
040.
020.
030.
020.
050.
020.
030.
010.
030.
01−0
.02
Can
ada
0.01
0.01
0.03
0.02
0.02
0.02
0.02
0.02
0.02
0.00
0.01
0.01
0.01
0.01
0.00
Hon
gK
ong
0.02
0.02
0.05
0.08
0.11
0.16
0.05
0.04
0.08
0.05
0.05
0.04
0.04
0.06
0.04
Irel
and
0.00
0.02
0.00
0.02
0.03
0.03
0.00
0.02
0.03
0.07
0.04
0.07
0.00
0.04
0.04
Mal
aysi
a0.
020.
000.
020.
040.
120.
140.
030.
040.
050.
060.
050.
050.
050.
060.
04Si
ngap
ore
0.05
0.01
0.02
0.03
0.06
0.08
0.03
0.07
0.09
0.06
0.06
0.04
0.05
0.06
0.01
Sout
hA
fric
a0.
020.
010.
040.
020.
040.
080.
060.
090.
060.
020.
030.
030.
040.
050.
03U
nite
dK
ingd
om0.
030.
020.
020.
030.
030.
030.
040.
050.
040.
030.
030.
020.
030.
02−0
.02
Uni
ted
Stat
es0.
020.
010.
010.
010.
010.
010.
010.
010.
010.
010.
010.
010.
020.
010.
00C
omm
onL
awM
ean
0.02
0.01
0.03
0.03
0.05
0.06
0.03
0.04
0.05
0.04
0.03
0.03
0.03
0.04
0.01
Com
mon
Law
Med
ian
0.02
0.01
0.02
0.02
0.04
0.03
0.03
0.04
0.05
0.03
0.03
0.03
0.03
0.04
0.01
Aus
tria
0.07
0.02
0.03
0.01
0.04
0.01
0.05
0.09
0.08
0.04
0.02
0.05
0.02
0.00
−0.0
7D
enm
ark
0.04
0.04
0.04
0.03
0.02
0.04
0.05
0.07
0.12
0.08
0.03
0.00
0.01
0.07
0.04
Finl
and
0.04
0.00
0.01
0.01
0.01
0.03
0.06
0.05
0.06
0.05
0.03
0.04
0.07
0.03
−0.0
1Fr
ance
0.07
0.01
0.03
0.06
0.04
0.05
0.06
0.06
0.07
0.05
0.04
0.03
0.04
0.03
−0.0
4G
erm
any
0.07
0.05
0.06
0.07
0.04
0.05
0.07
0.07
0.08
0.07
0.05
0.02
0.03
0.04
−0.0
3In
done
sia
0.03
0.02
0.02
0.03
0.51
0.14
0.02
0.17
0.07
0.04
0.06
0.05
0.08
0.05
0.03
Ital
y0.
140.
070.
030.
010.
020.
030.
030.
070.
090.
080.
080.
030.
030.
03−0
.11
Japa
n0.
050.
040.
030.
020.
010.
050.
060.
020.
030.
050.
020.
020.
020.
02−0
.03
Kor
ea0.
050.
040.
040.
090.
180.
070.
060.
050.
060.
050.
040.
040.
040.
040.
00M
exic
o0.
090.
180.
040.
050.
040.
190.
050.
050.
060.
030.
060.
020.
000.
00−0
.09
Nor
way
0.00
0.02
0.02
0.06
0.06
0.08
0.06
0.09
0.07
0.02
0.02
0.01
0.05
0.04
0.04
Phili
ppin
es0.
070.
070.
060.
110.
120.
080.
070.
060.
030.
060.
030.
020.
030.
03−0
.04
Port
ugal
0.05
0.02
0.07
0.02
0.04
0.06
0.02
0.16
0.04
0.14
0.04
0.02
0.04
0.05
0.00
Spai
n0.
050.
010.
020.
030.
060.
020.
040.
030.
040.
010.
000.
010.
000.
02−0
.03
Swed
en0.
030.
000.
010.
070.
050.
040.
050.
040.
070.
040.
030.
010.
020.
01−0
.02
Switz
erla
nd0.
060.
040.
030.
060.
040.
040.
030.
040.
140.
060.
030.
030.
030.
03−0
.03
Civ
ilL
awM
ean
0.06
0.04
0.03
0.05
0.08
0.06
0.05
0.07
0.07
0.05
0.04
0.03
0.03
0.03
−0.0
3C
ivil
Law
Med
ian
0.05
0.03
0.03
0.04
0.04
0.05
0.05
0.06
0.07
0.05
0.03
0.02
0.03
0.03
−0.0
3A
ggre
gate
Mea
n0.
040.
030.
030.
040.
070.
060.
040.
060.
060.
050.
030.
030.
030.
03−0
.01
Agg
rega
teM
edia
n0.
040.
020.
030.
030.
040.
050.
050.
050.
060.
050.
030.
020.
030.
03−0
.01
Dif
fere
nces
betw
een
com
mon
and
civi
llaw
mea
nsan
dm
edia
ns:p
-val
ues
Dif
fere
nce
inm
eans
0.00
0.03
0.28
0.14
0.39
0.87
0.01
0.08
0.12
0.14
0.58
0.40
0.81
0.61
0.02
Dif
fere
nce
inm
edia
ns0.
000.
020.
320.
170.
570.
710.
020.
040.
150.
170.
800.
520.
980.
670.
02
C© 2009 The AuthorsJournal compilation C© Blackwell Publishing Ltd. 2009

506 FERRIS, SEN AND UNLU
Tab
le2
(Con
tinu
ed)
Pan
elD
:Per
cent
age
ofN
ewL
ists
Tha
tDo
Not
Pay
Div
iden
dsYe
ars
Diff
eren
ceC
ount
ry/L
egal
Reg
ime
1994
1995
1996
1997
1998
1999
2000
2001
2002
2003
2004
2005
2006
(200
7–19
94)
Aus
tral
ia0.
400.
570.
540.
500.
620.
730.
820.
820.
950.
700.
900.
950.
930.
53C
anad
a0.
750.
800.
840.
830.
910.
880.
890.
930.
860.
890.
830.
830.
60−0
.15
Hon
gK
ong
0.04
0.10
0.30
0.31
0.29
0.62
0.65
0.64
0.75
0.57
0.83
1.00
––
Irel
and
0.00
–0.
750.
601.
000.
601.
001.
001.
001.
000.
801.
001.
001.
00M
alay
sia
0.08
0.15
0.22
0.30
0.40
0.30
0.44
0.54
0.76
0.77
0.71
0.86
0.64
0.56
Sing
apor
e0.
050.
210.
280.
350.
000.
550.
500.
660.
730.
700.
750.
580.
900.
85So
uth
Afr
ica
0.33
0.00
0.25
0.27
0.55
0.62
0.50
0.80
0.50
0.70
0.81
0.59
1.00
0.67
Uni
ted
Kin
gdom
0.38
0.53
0.56
0.57
0.62
0.84
0.86
0.84
0.79
0.83
0.90
0.94
0.98
0.61
Uni
ted
Stat
es0.
910.
900.
950.
960.
960.
980.
960.
950.
950.
930.
910.
890.
950.
05C
omm
onL
awM
ean
0.33
0.41
0.52
0.52
0.59
0.68
0.74
0.80
0.81
0.79
0.83
0.85
0.88
0.51
Com
mon
Law
Med
ian
0.33
0.37
0.54
0.50
0.62
0.62
0.82
0.82
0.79
0.77
0.83
0.89
0.94
0.58
Aus
tria
––
0.46
0.75
0.83
0.75
1.00
1.00
0.50
0.00
0.50
0.00
1.00
–D
enm
ark
0.33
0.75
0.52
0.56
0.67
0.67
0.60
0.00
1.00
–1.
001.
00–
–Fi
nlan
d0.
501.
000.
360.
400.
360.
500.
50–
1.00
0.60
0.50
1.00
––
Fran
ce0.
420.
500.
520.
580.
590.
700.
810.
690.
610.
700.
790.
781.
000.
58G
erm
any
0.67
0.86
0.49
0.67
0.74
0.93
0.86
1.00
0.90
0.77
0.92
0.75
1.00
0.33
Indo
nesi
a0.
330.
060.
750.
330.
500.
660.
710.
750.
751.
000.
910.
670.
750.
42It
aly
0.20
0.80
0.33
0.87
0.67
0.65
0.60
0.29
0.65
0.80
0.63
1.00
1.00
0.80
Japa
n0.
030.
000.
060.
040.
080.
360.
270.
280.
420.
440.
370.
290.
450.
42K
orea
0.10
0.15
0.22
0.16
0.34
0.53
0.78
0.69
0.67
0.59
0.64
0.80
1.00
0.90
Mex
ico
0.33
1.00
0.70
0.60
0.78
0.80
1.00
0.50
1.00
1.00
1.00
1.00
0.00
−0.3
3N
orw
ay0.
801.
000.
560.
750.
670.
670.
901.
000.
881.
001.
000.
931.
000.
20Ph
ilipp
ines
0.75
0.48
0.89
0.33
1.00
0.82
1.00
0.75
1.00
1.00
0.67
1.00
––
Port
ugal
0.25
0.50
0.78
0.00
0.33
0.50
0.67
1.00
0.50
1.00
0.00
1.00
––
Spai
n0.
000.
500.
500.
330.
830.
000.
431.
000.
50–
0.25
1.00
––
Swed
en0.
770.
630.
380.
670.
820.
720.
571.
000.
710.
850.
830.
860.
00−0
.77
Switz
erla
nd0.
500.
500.
370.
380.
750.
170.
611.
000.
750.
500.
670.
50–
–C
ivil
Law
Mea
n0.
400.
580.
490.
460.
620.
590.
710.
730.
740.
730.
670.
790.
720.
28C
ivil
Law
Med
ian
0.33
0.50
0.50
0.48
0.67
0.66
0.69
0.75
0.73
0.78
0.67
0.89
1.00
0.42
Agg
rega
teM
ean
0.37
0.52
0.50
0.48
0.61
0.62
0.72
0.76
0.77
0.75
0.72
0.81
0.79
0.39
Agg
rega
teM
edia
n0.
330.
500.
500.
500.
670.
660.
710.
810.
750.
770.
800.
890.
970.
53
Dif
fere
nces
betw
een
com
mon
and
civi
llaw
mea
nsan
dm
edia
ns:p
-val
ues
Dif
fere
nce
inm
eans
0.56
0.24
0.77
0.59
0.81
0.36
0.75
0.50
0.37
0.52
0.05
0.50
0.30
0.33
Dif
fere
nce
inm
edia
ns0.
530.
400.
910.
950.
820.
510.
890.
830.
390.
970.
281.
000.
740.
31
Not
es:
Thi
sta
ble
show
sth
etim
ese
ries
dist
ribu
tion
ofdi
vide
ndpo
licie
sfr
om19
94to
2007
for
25co
untr
ies.
Paye
rsar
eth
efir
ms
that
pay
divi
dend
sin
year
t.N
on-
paye
rsar
ecl
assi
fied
into
two
grou
ps:f
irm
sth
atha
vene
ver
paid
divi
dend
san
dfo
rmer
paye
rs.F
orm
erpa
yers
are
firm
sth
atdo
notp
aydi
vide
nds
inye
art,
butd
idpa
ydi
vide
nds
inpr
evio
usye
ars.
Ane
wlis
tis
firm
sth
atfir
stap
pear
onW
orld
scop
ein
year
t.N
ewlis
tsth
atpa
yar
efir
ms
that
pay
divi
dend
sin
the
year
oflis
ting.
Cou
ntri
esar
eas
sign
edto
ale
galr
egim
eac
cord
ing
toL
aPor
taet
al.(
1997
).
C© 2009 The AuthorsJournal compilation C© Blackwell Publishing Ltd. 2009

ANALYSIS OF DIVIDEND PAYMENT BEHAVIOR 507
of dividend payers is statistically significant across legal regimes. The high level ofdividend reduction observed for the common law firms is driven by the large percentagereduction occurring in three countries: 49% in Australia, 38% in Hong Kong and 36%in the UK. For comparison purposes, the largest decline among civil law countries isIndonesia with 45%, followed by Germany with 26% and Norway with 23%. Althoughthe findings presented in Table 2 confirm that a reduction in the frequency of dividendpayers is an international phenomenon, it appears most dramatically among firmsincorporated in common law countries.
In Panel B of Table 2 we present a time-series of the percentage of firms that neverpaid dividends. The trend in this variable complements that observed in Panel A fordividend payers. We find a general increase in the percentage of firms not payingdividends over the 1994–2007 sample period, although this effect is more pronouncedamong common law countries. Within common law countries, the percentage of firmsthat have never paid dividends increases by 30% compared to only a median increaseof 15% among firms within civil law countries. Again, this increase in the percentage offirms never paying dividends is most prominent in Australia, Hong Kong and the UK.
The combined findings of Panels A and B show that there is a consistent downwardtrend in the international payment of dividends. Since 1994 there has been a generaldecrease in the percentage of firms paying dividends. This decline in the percentageof dividend payers occurs within both the common and civil legal regimes. Our dataindicate, however, that this reduction in the frequency of dividend payment is moreprominent among the common law countries.
In Panels C and D we examine more closely the non-dividend paying firms. We firstexamine former payers and then separately consider new lists. In Panel C we analyzethose firms that had formerly paid dividends, but now do not. We observe that thepercentage of former payers has increased over time, but that this increase is mostheavily concentrated among the common law countries. Seven of nine common lawcountries experience an increase in the percentage of former payers, while only five ofthe sixteen civil law countries report an increase in the percentage of former payers.Although the median increase in the percentage of former payers among the commonlaw firms is only 1%, it is significantly greater than that calculated for the civil law firms.This finding that the percentage of former dividend payers is higher among firms incommon law countries is consistent with our earlier result that fewer dividend payersnow incorporate in these nations.
We present our findings for newly listed firms in Panel D. For most of the sampleperiod, the percentage of common law new lists not paying dividends increases. Onlyin Canada does the number of new lists not paying a dividend decline. Indeed, themedian change among common law countries is a 58% increase in the percentage ofnew lists not paying dividends. Comparable results obtain for the civil law countries,with a median increase of 53%. We conclude that the difference in the percentage ofdividend paying firms between civil and common law countries is due to differences inthe distribution of firms that never paid dividends or decided to stop paying dividendsrather than newly listing firms that elect not to pay dividends.
(ii) Changing Status of Dividend Payers and Non-Payers
In this section we examine the subsequent dividend payment decision of firms basedon their previous dividend payment status. That is, we examine the dividend payment
C© 2009 The AuthorsJournal compilation C© Blackwell Publishing Ltd. 2009

508 FERRIS, SEN AND UNLU
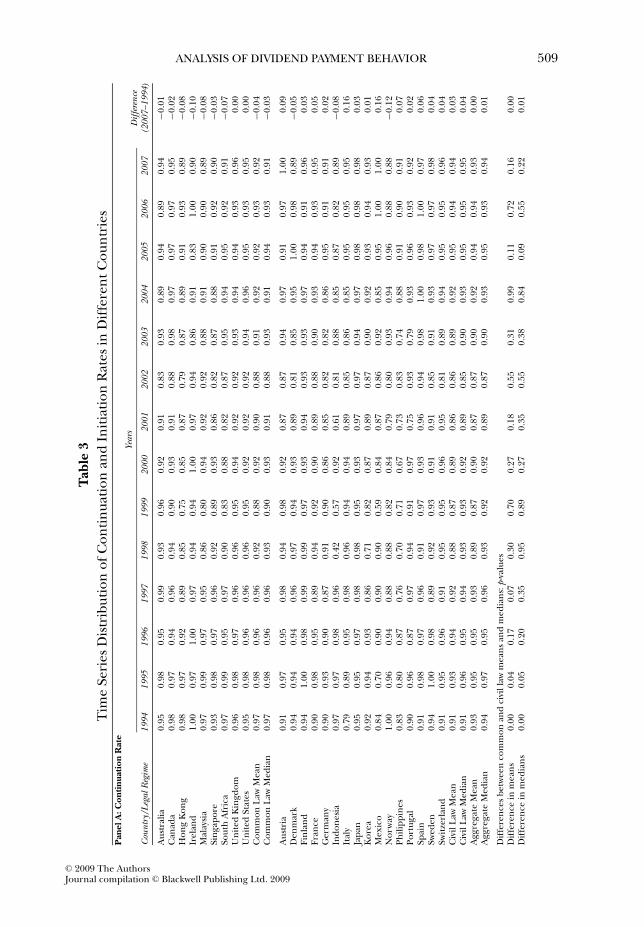
status in year t for firms that either paid or did not pay dividends in year t−1. Continuingfirms are those that paid a dividend in year t and continue to pay dividends in yeart+1. The continuation rate is thus defined as the number of firms that continue topay dividends in year t relative to the number of firms that pay dividends in year t−1.Initiating firms are those that did not pay a dividend in year t, but elect to pay a dividendin year t+1. The initiation rate is then estimated as the number of firms that initiatedividends in year t relative to the number of firms that do not pay dividends in yeart−1.
In Panel A of Table 3 we present the continuation rate across legal regimes. Wefind that most common law countries experience a decline in the number of firmscontinuing to pay dividends. Ireland, Malaysia and Hong Kong have the largest declinein dividend continuation rates of 10%, 8% and 8%, respectively. The two largestcommon law markets, the US and the UK, experience no change in continuationrates. None of the common law countries enjoy an increase in dividend continuationrates. The median (mean) dividend continuation rate for common law countries is−0.03 (−0.04).
The pattern of dividend continuation differs significantly for the civil law countries.Only three of the sixteen civil law countries reduce their dividend continuation rates.The other thirteen countries report an increase in the percentage of firms continuingtheir payment of dividends led by Mexico (16%), Italy (16%) and Austria (9%). Themedian (mean) change in dividend continuation is 0.01(0.0). This value is significantlyhigher than that calculated for the common law countries, leading us to concludethat dividends, once initiated, tend to persist longer among firms located in civil lawcountries.
In Panel B of Table 3, we compare initiation rates of dividends between firms incommon and civil law countries. Our findings reveal only a nominal difference inthe pattern of dividend initiations between the two legal regimes. Dividend initiationsdecline across firms incorporated in common law countries, led by Canada (−19%),South Africa (−16%) and the United Kingdom (−16%). All of the common lawcountries report either a decline or no change in the rate of dividend initiations.Indeed, the median (mean) change in initiation rates for our sample of common lawcountries is −12% (−9.0%).
The dividend initiation behavior of the civil law countries is more mixed. Approxi-mately one-third of them experience an increase in their dividend initiation rates, ledby Japan (12%), Finland (8%) and Switzerland (8%). The remaining countries havefalling initiation rates, ranging from an 84% decline in Germany to a 2% reductionamong Mexican firms. Overall, the median (mean) reduction in dividend initiation is5% (9%). Although these averages are not significantly different from those calculatedfor civil law countries, it is consistent with our earlier findings of a more modest declinein the percentage of dividend paying firms among the civil law countries.
The combined results of these two tables offer further insight into the nature ofinternational dividend policy. We find that firms paying dividends generally tend tocontinue paying dividends. The percentage of dividend continuing firms is high,averaging 93% across our entire sample of firms. We note, however, that there is atendency for a greater adherence to dividend continuation among firms incorporatedwithin the civil law countries.
We also observe that dividend initiation rates are generally low, averaging approxi-mately 16% for our aggregate sample. We find that there is a slight tendency for civil law
C© 2009 The AuthorsJournal compilation C© Blackwell Publishing Ltd. 2009
ANALYSIS OF DIVIDEND PAYMENT BEHAVIOR 509
Tab
le3
Tim
eSe
ries
Dis
trib
utio
nof
Con
tinua
tion
and
Initi
atio
nR
ates
inD
iffe
rent
Cou
ntri
esP
anel
A:C
onti
nuat
ion
Rat
eYe
ars
Diff
eren
ceC
ount
ry/L
egal
Reg
ime
1994
1995
1996
1997
1998
1999
2000
2001
2002
2003
2004
2005
2006
2007
(200
7–19
94)
Aus
tral
ia0.
950.
980.
950.
990.
930.
960.
920.
910.
830.
930.
890.
940.
890.
94−0
.01
Can
ada
0.98
0.97
0.94
0.96
0.94
0.90
0.93
0.91
0.88
0.98
0.97
0.97
0.97
0.95
−0.0
2H
ong
Kon
g0.
980.
970.
920.
890.
850.
750.
850.
870.
790.
870.
890.
910.
930.
89−0
.08
Irel
and
1.00
0.97
1.00
0.97
0.94
0.94
1.00
0.97
0.94
0.86
0.91
0.83
1.00
0.90
−0.1
0M
alay
sia
0.97
0.99
0.97
0.95
0.86
0.80
0.94
0.92
0.92
0.88
0.91
0.90
0.90
0.89
−0.0
8Si
ngap
ore
0.93
0.98
0.97
0.96
0.92
0.89
0.93
0.86
0.82
0.87
0.88
0.91
0.92
0.90
−0.0
3So
uth
Afr
ica
0.97
0.99
0.95
0.97
0.90
0.83
0.88
0.82
0.87
0.95
0.94
0.95
0.92
0.91
−0.0
7U
nite
dK
ingd
om0.
960.
980.
970.
960.
960.
950.
940.
920.
920.
930.
940.
940.
930.
960.
00U
nite
dSt
ates
0.95
0.98
0.96
0.96
0.96
0.95
0.92
0.92
0.92
0.94
0.96
0.95
0.93
0.95
0.00
Com
mon
Law
Mea
n0.
970.
980.
960.
960.
920.
880.
920.
900.
880.
910.
920.
920.
930.
92−0
.04
Com
mon
Law
Med
ian
0.97
0.98
0.96
0.96
0.93
0.90
0.93
0.91
0.88
0.93
0.91
0.94
0.93
0.91
−0.0
3
Aus
tria
0.91
0.97
0.95
0.98
0.94
0.98
0.92
0.87
0.87
0.94
0.97
0.91
0.97
1.00
0.09
Den
mar
k0.
940.
940.
940.
960.
970.
940.
930.
890.
810.
850.
951.
000.
980.
89−0
.05
Finl
and
0.94
1.00
0.98
0.99
0.99
0.97
0.93
0.94
0.93
0.93
0.97
0.94
0.91
0.96
0.03
Fran
ce0.
900.
980.
950.
890.
940.
920.
900.
890.
880.
900.
930.
940.
930.
950.
05G
erm
any
0.90
0.93
0.90
0.87
0.91
0.90
0.86
0.85
0.82
0.82
0.86
0.95
0.91
0.91
0.02
Indo
nesi
a0.
970.
970.
980.
960.
420.
570.
920.
610.
810.
880.
850.
870.
820.
89−0
.08
Ital
y0.
790.
890.
950.
980.
960.
940.
940.
890.
850.
860.
850.
950.
950.
950.
16Ja
pan
0.95
0.95
0.97
0.98
0.98
0.95
0.93
0.97
0.97
0.94
0.97
0.98
0.98
0.98
0.03
Kor
ea0.
920.
940.
930.
860.
710.
820.
870.
890.
870.
900.
920.
930.
940.
930.
01M
exic
o0.
840.
700.
900.
900.
900.
590.
840.
870.
860.
920.
850.
951.
001.
000.
16N
orw
ay1.
000.
960.
940.
880.
880.
820.
840.
790.
800.
930.
940.
960.
880.
88−0
.12
Phili
ppin
es0.
830.
800.
870.
760.
700.
710.
670.
730.
830.
740.
880.
910.
900.
910.
07Po
rtug
al0.
900.
960.
870.
970.
940.
910.
970.
750.
930.
790.
930.
960.
930.
920.
02Sp
ain
0.91
0.98
0.97
0.96
0.91
0.97
0.93
0.96
0.94
0.98
1.00
0.98
1.00
0.97
0.06
Swed
en0.
941.
000.
980.
890.
920.
930.
910.
910.
850.
910.
930.
970.
970.
980.
04Sw
itzer
land
0.91
0.95
0.96
0.91
0.95
0.95
0.96
0.95
0.81
0.89
0.94
0.95
0.95
0.96
0.04
Civ
ilL
awM
ean
0.91
0.93
0.94
0.92
0.88
0.87
0.89
0.86
0.86
0.89
0.92
0.95
0.94
0.94
0.03
Civ
ilL
awM
edia
n0.
910.
960.
950.
940.
930.
930.
920.
890.
850.
900.
930.
950.
950.
950.
04A
ggre
gate
Mea
n0.
930.
950.
950.
930.
890.
870.
900.
870.
870.
900.
920.
940.
940.
930.
00A
ggre
gate
Med
ian
0.94
0.97
0.95
0.96
0.93
0.92
0.92
0.89
0.87
0.90
0.93
0.95
0.93
0.94
0.01
Dif
fere
nces
betw
een
com
mon
and
civi
llaw
mea
nsan
dm
edia
ns:p
-val
ues
Dif
fere
nce
inm
eans
0.00
0.04
0.17
0.07
0.30
0.70
0.27
0.18
0.55
0.31
0.99
0.11
0.72
0.16
0.00
Dif
fere
nce
inm
edia
ns0.
000.
050.
200.
350.
950.
890.
270.
350.
550.
380.
840.
090.
550.
220.
01
C© 2009 The AuthorsJournal compilation C© Blackwell Publishing Ltd. 2009

510 FERRIS, SEN AND UNLU
Tab
le3
(Con
tinu
ed)
Pan
elB
:Ini
tiat
ion
Rat
eYe
ars
Diff
eren
ceC
ount
ry/L
egal
Reg
ime
1994
1995
1996
1997
1998
1999
2000
2001
2002
2003
2004
2005
2006
2007
(200
7–19
94)
Aus
tral
ia0.
240.
210.
190.
220.
120.
150.
090.
100.
050.
070.
050.
070.
040.
05−0
.19
Can
ada
0.03
0.09
0.04
0.07
0.02
0.03
0.03
0.04
0.02
0.03
0.04
0.04
0.03
0.02
−0.0
1H
ong
Kon
g0.
220.
450.
240.
350.
230.
080.
130.
170.
120.
150.
160.
160.
120.
10−0
.12
Irel
and
0.07
0.08
0.00
0.05
0.08
0.00
0.07
0.00
0.00
0.04
0.10
0.06
0.00
0.03
−0.0
4M
alay
sia
0.29
0.33
0.32
0.34
0.17
0.07
0.15
0.19
0.14
0.19
0.17
0.20
0.18
0.16
−0.1
3Si
ngap
ore
0.25
0.36
0.33
0.17
0.44
0.10
0.30
0.32
0.19
0.21
0.20
0.23
0.27
0.28
0.03
Sout
hA
fric
a0.
250.
310.
110.
430.
200.
260.
140.
050.
140.
180.
200.
140.
150.
09−0
.16
Uni
ted
Kin
gdom
0.26
0.26
0.21
0.22
0.21
0.13
0.12
0.06
0.06
0.07
0.07
0.10
0.08
0.10
−0.1
6U
nite
dSt
ates
0.03
0.02
0.02
0.02
0.01
0.01
0.01
0.01
0.01
0.03
0.04
0.04
0.03
0.03
0.00
Com
mon
Law
Mea
n0.
180.
240.
160.
210.
160.
090.
110.
100.
080.
110.
110.
120.
100.
10−0
.09
Com
mon
Law
Med
ian
0.24
0.26
0.19
0.22
0.17
0.08
0.12
0.06
0.06
0.07
0.10
0.10
0.08
0.09
−0.1
2
Aus
tria
0.00
0.18
0.56
0.08
0.38
0.16
0.19
0.05
0.09
0.09
0.27
0.11
0.11
0.00
0.00
Den
mar
k0.
090.
350.
240.
190.
280.
060.
190.
060.
020.
170.
120.
090.
180.
130.
03Fi
nlan
d0.
200.
520.
230.
410.
470.
210.
330.
130.
290.
180.
170.
150.
300.
280.
08Fr
ance
0.15
0.25
0.24
0.16
0.23
0.14
0.14
0.14
0.10
0.13
0.06
0.12
0.14
0.11
−0.0
4G
erm
any
0.15
0.25
0.18
0.18
0.19
0.15
0.11
0.10
0.08
0.07
0.07
0.09
0.11
0.10
−0.0
5In
done
sia
1.00
0.33
0.67
0.44
0.18
0.14
0.36
0.14
0.16
0.16
0.11
0.14
0.10
0.16
−0.8
4It
aly
0.21
0.23
0.15
0.32
0.15
0.26
0.31
0.15
0.24
0.17
0.21
0.15
0.15
0.16
−0.0
5Ja
pan
0.09
0.06
0.08
0.20
0.17
0.15
0.17
0.18
0.17
0.15
0.22
0.25
0.24
0.21
0.12
Kor
ea0.
250.
270.
230.
230.
100.
210.
220.
240.
170.
200.
180.
230.
180.
16−0
.09
Mex
ico
0.11
0.12
0.18
0.19
0.19
0.04
0.14
0.09
0.06
0.15
0.10
0.08
0.08
0.10
−0.0
2N
orw
ay0.
270.
190.
290.
170.
060.
030.
130.
070.
060.
210.
070.
150.
070.
13−0
.14
Phili
ppin
es0.
250.
200.
210.
090.
080.
110.
150.
020.
130.
110.
040.
100.
090.
10−0
.15
Port
ugal
0.30
0.40
0.30
0.24
0.31
0.18
0.09
0.15
0.35
0.13
0.11
0.16
0.06
0.00
−0.3
0Sp
ain
0.10
0.15
0.21
0.25
0.12
0.15
0.14
0.12
0.04
0.09
0.19
0.27
0.13
0.11
0.01
Swed
en0.
310.
500.
330.
270.
280.
130.
060.
070.
060.
100.
110.
090.
120.
12−0
.19
Switz
erla
nd0.
140.
260.
240.
290.
400.
290.
190.
190.
070.
120.
200.
160.
200.
230.
08C
ivil
Law
Mea
n0.
230.
270.
270.
230.
220.
150.
180.
120.
130.
140.
140.
150.
140.
13−0
.10
Civ
ilL
awM
edia
n0.
180.
250.
230.
210.
190.
150.
160.
130.
090.
140.
120.
150.
130.
12−0
.04
Agg
rega
teM
ean
0.21
0.26
0.23
0.22
0.20
0.13
0.16
0.11
0.11
0.13
0.13
0.14
0.13
0.12
−0.0
9A
ggre
gate
Med
ian
0.21
0.25
0.23
0.22
0.19
0.14
0.14
0.10
0.09
0.13
0.11
0.14
0.12
0.11
−0.0
5
Dif
fere
nces
betw
een
com
mon
and
civi
llaw
mea
nsan
dm
edia
ns:p
-val
ues
Dif
fere
nce
inm
eans
0.52
0.61
0.07
0.62
0.25
0.07
0.07
0.68
0.19
0.29
0.37
0.25
0.22
0.30
0.87
Dif
fere
nce
inm
edia
ns0.
930.
820.
150.
610.
280.
040.
040.
350.
180.
290.
270.
220.
180.
130.
48
Not
es:
The
cont
inua
tion
rate
isde
fined
asth
enu
mbe
rof
firm
sth
atco
ntin
ueto
pay
divi
dend
sin
year
tre
lativ
eto
the
num
ber
offir
ms
that
pay
divi
dend
sin
year
t−
1.T
hein
itiat
ion
rate
isde
fined
asth
enu
mbe
rof
firm
sth
atbe
gin
topa
ydi
vide
nds
inye
art
rela
tive
toth
enu
mbe
rof
firm
sth
atdo
notp
aydi
vide
nds
inye
art−
1.
C© 2009 The AuthorsJournal compilation C© Blackwell Publishing Ltd. 2009

ANALYSIS OF DIVIDEND PAYMENT BEHAVIOR 511
firms to more frequently initiate dividends than firms located in common law countries,although the difference between the legal regimes is not statistically significant.
5. FIRM CHARACTERISTICS INFLUENICNG DIVIDEND POLICY
A variety of researchers identify factors that are essential to the firm’s willingnessand ability to pay dividends. Smith and Watts (1992), Gaver and Gaver (1993),Barclay, Smith and Watts (1995), Fama and French (2001) and Hand and Landsman(2005) contend that dividend policy is linked to firm profitability, size, and availableinvestment opportunities. Hoberg and Prabhala (2007) establish that both systematicand idiosyncratic risk are important determinants of a firm’s decision to pay dividendswhile DeAngelo, DeAngelo and Stulz (2006) report the presence of life cycle effects individend payment as measured by the ratio of retained earnings to total equity.
To examine the country level distribution of five factors that can influence thepayment of dividends, we present the country level medians for our measures ofprofitability, investment opportunities, size, risk and maturity in Table 4. Our analysisalso includes an examination of differences in these firm characteristics across the civiland common law regimes.
(i) Profitability
We measure profitability as earnings before taxes and interest standardized by totalassets. We elect to use this measure of profitability rather than a market-based measuresince as noted by Fama and French (2001), it captures the accounting profits that areavailable for distribution to the firm’s shareholders and hence is more likely to berelevant for boards of directors in setting the level of corporate dividends. Profitabilityis separately averaged across the entire sample period for each firm-year observation.
The common law firms demonstrate an annual profitability that ranges from a lowof 0.3% (Australia) to a high of 12.1% (South Africa). The mean (median) profitabilityfor firms in common law countries is 5.9% (5.6%). Profitability for civil law countriesextends from a low of 3.7% (Japan) to a high of 8.9% (Finland). The mean (median)profitability for firms operating under civil law is 6.3% (6.2%). The differences in themean (median) profitability between common and civil law countries are statisticallyinsignificant, leading us to conclude that firms incorporated in common law countriesare no more profitable than their civil law counterparts.
(ii) Investment Opportunities
We employ two different proxies for the comparative analysis of corporate investmentopportunities across our sample firms. The first measure is the annual percentagechange in the value of the firm’s total assets. The lowest rate of asset growth amongcommon law countries is found in Malaysia (6.2%), while the highest value occurs inIreland (15%) and Canada (15%), followed by Australia (14.1%). The mean (median)asset growth rate within the set of common law countries is 9.7% (7.4%).
Firms in civil law countries demonstrate a wider range of asset growth rates, rangingfrom 2.8% in the Philippines to 11.9% in Sweden. The aggregate mean (median)asset growth rates for civil law countries is 8.4% (8.6%). Table 4 fails to reveal anystatistically significant differences across legal regimes when investment opportunitiesare measured by the asset growth rate.
C© 2009 The AuthorsJournal compilation C© Blackwell Publishing Ltd. 2009

512 FERRIS, SEN AND UNLU
Table 4Dividend Related Firm Characteristics
Growth in Market-to- FirmCountry/Legal Regime Profitability Assets Book Ratio Size Risk RE/TE
Australia 0.3% 14.1% 1.52 31.03 0.15 −0.26Canada 3.9% 15.0% 1.48 108.10 0.13 −0.02Hong Kong 4.7% 7.0% 1.05 62.11 0.15 0.25Ireland 7.6% 15.0% 1.39 153.52 0.10 0.24Malaysia 5.6% 6.2% 0.99 32.00 0.11 0.22Singapore 5.4% 7.4% 1.10 43.58 0.13 0.24South Africa 12.1% 6.5% 1.27 90.43 0.13 0.47United Kingdom 7.2% 9.8% 1.43 81.02 0.11 0.28United States 6.2% 6.5% 1.53 189.02 0.14 0.18Common Law Mean 5.9% 9.7% 1.31 87.87 0.13 0.18Common Law Median 5.6% 7.4% 1.39 81.02 0.13 0.24
Austria 5.7% 8.6% 1.14 145.90 0.08 0.35Denmark 7.7% 9.8% 1.22 78.64 0.09 0.59Finland 8.9% 9.0% 1.31 158.01 0.09 0.50France 6.4% 11.2% 1.25 93.56 0.10 0.10Germany 5.4% 8.0% 1.28 98.09 0.10 0.18Indonesia 8.5% 5.5% 1.05 38.28 0.24 0.27Italy 5.6% 9.2% 1.18 233.46 0.09 0.11Japan 3.7% 3.4% 1.07 151.39 0.10 0.48Korea 6.7% 8.3% 0.90 66.04 0.17 0.17Mexico 8.4% 6.1% 1.10 420.52 0.12 0.62Norway 6.2% 12.8% 1.35 154.48 0.11 0.25Philippines 4.4% 2.8% 0.95 35.90 0.16 0.14Portugal 5.4% 8.6% 1.08 106.01 0.08 0.01Spain 7.6% 11.2% 1.30 476.37 0.08 0.17Sweden 7.0% 11.9% 1.48 108.79 0.11 0.14Switzerland 7.0% 7.6% 1.24 279.36 0.08 0.31Civil Law Mean 6.6% 8.4% 1.18 165.30 0.11 0.28Civil Law Median 6.6% 8.6% 1.20 127.35 0.10 0.22Aggregate Mean 6.3% 8.9% 1.23 137.42 0.12 0.24Aggregate Median 6.2% 8.6% 1.24 106.01 0.11 0.24
Differences between common and civil law means and medians: p-valuesDifference in means 0.57 0.33 0.10 0.05 0.23 0.24Difference in medians 0.32 0.67 0.17 0.08 0.04 0.63
Notes:This table compares firm characteristics related to the payment of dividends across legal regimes.Reported values of the variables are the sample medians. Profitability is defined as EBIT scaled by the bookvalue of assets. Growth in assets is the rate of growth in book value of assets. The market-to-book ratio isthe ratio of the aggregate market value to the aggregate book value of assets. Firm size is the market valueof assets in millions of US dollars. Risk is measured as the volatility of the firm’s equity return. RE/TErepresents the ratio of retained earnings to shareholders’ equity.
We also estimate investment opportunities with the market-to-book ratio. Wecalculate this measure by calculating the ratio of the firm’s market value (i.e., marketvalue of equity and the book value of liabilities) to the book value of its assets.Firms within common law countries have market-to-book ratios that range from 0.99(Malaysia) to 1.53 (US). The mean (median) market-to-book ratio for the common lawfirms is 1.31 (1.39). The range of market-to-book ratios for firms in civil law countriesextends from a low of 0.90 (South Korea) to a high of 1.48 (Sweden). The mean
C© 2009 The AuthorsJournal compilation C© Blackwell Publishing Ltd. 2009
ANALYSIS OF DIVIDEND PAYMENT BEHAVIOR 513
(median) market-to-book ratio for these civil law firms is 1.23 (1.24). We find weakevidence that the difference in firm investment opportunities between legal regimes asmeasured by the market-to-book ratio is statistically significant (p-values are 10% and17%, for means and medians respectively).
(iii) Size
We measure size as the market value of equity in millions of US dollars. Among thecommon law countries, we observe that Malaysia, Australia, Singapore and Hong Kongtend to have smaller firms relative to the US, the UK, Canada, Ireland and South Africa.Among the civil law countries, small firms tend to be incorporated in Indonesia and thePhilippines whereas large firms tend to be incorporated in Spain, Mexico, Switzerlandand Italy. Table 4 shows that country-level differences in mean and median size arestatistically significant, with the largest firms located in civil law countries.
In the logit analysis which follows in the next section, we measure size as thepercentile in which a firm falls based on the cross-sectional distribution of the marketvalues of equity for all firms in a particular country. We use this measure since thecross-sectional distribution of total assets varies over time.
(iv) Risk
Hoberg and Prabhala (2007) find that both systematic and idiosyncratic risk reduce thelikelihood that a firm is a dividend payer. Consequently, we include a measure of firmrisk, the standard deviation of returns, in our dividend payment propensity model.Among common law countries, firms incorporated in Ireland have the lowest risk,while US firms have the most risk. The least risky civil law firms are located in Austria,Portugal and Spain, while the most risky are incorporated in Korea. The difference inrisk between common and civil law firms is statistically significant (for medians). Wefind that common law countries, on average, serve as home for more risky firms.3
(v) Ratio of Retained Earnings to Total Equity
DeAngelo, DeAngelo and Stulz (2006) find that firms are more likely to pay dividendswhen retained earnings represent a large percentage of their total equity and declineswhen the majority of equity is contributed rather than earned. Consequently, we includethis ratio as the final regressor in our propensity model for the payment of dividends. Wefail to find any significant difference in the value of this ratio between firms in civil andcommon law countries. These findings suggest that our sample firms are approximatelyequally mature, with legal regime exerting no measurable effect on where the averagefirm is located in its life cycle.
The results from this comparative analysis of dividend-related characteristics revealthat firms incorporated in common law countries are somewhat different from civillaw firms. These differences can be important to an analysis of international dividendpolicy since they are generally the determining factors in any corporate decision to
3 In the logit analysis, we use the natural logarithm of the standard deviation of returns to eliminate apotential bias in the estimation of coefficients due to a skewed distribution. Our findings remain unchangedwhen we do fail to undertake this transformation.
C© 2009 The AuthorsJournal compilation C© Blackwell Publishing Ltd. 2009

514 FERRIS, SEN AND UNLU
pay dividends. First, we observe that common law firms appear to have more attractiveinvestment opportunities. Second, we find that firms located in common law countriesare smaller than their civil law counterparts. We further observe that common law firmstend to be more risky than their common law counterparts, although they seem to beat about the same stage in their life cycles as their civil law counterparts.
6. THE INTERNATIONAL PROPENSITY TO PAY DIVIDENDS
Fama and French (2001 and 2004) note that the changing nature of new lists has causedthe population of listed firms in the US to shift toward characteristics that encouragethe non-payment of dividends. They find, however, that even after controlling for thesecharacteristics, firms remain less likely to pay dividends. They refer to this phenomenonas a declining propensity to pay. In this section we undertake a similar analysis for oursample of firms to determine whether this declining propensity to pay dividends occursinternationally and the extent to which it might be related to the legal environment inwhich the firm operates.
Our methodology to test for the existence of a declining propensity to pay dividendsoccurs in several steps. We begin by specifying a logistic regression model that is morecomprehensive than those appearing in the most recent literature and uses the firmcharacteristics of size, profitability, investment opportunities, risk, and the ratio ofretained earnings to total equity as regressors. We then estimate our model of whethera firm pays dividends over the 1994–1997 base period for each of our sample countries.We apply these estimated coefficients from the 1994–1997 base period regression toour sample firm characteristics to calculate the expected percent of dividend payers foran out-of-sample sub-period (1998–2007) as well as the in-sample sub-period. Since theprobabilities associated with these characteristics are fixed at their base period values,variation in the number of firms expected to pay dividends is due to the changingcharacteristics of the sample firms. We then estimate the firm’s propensity to paydividends as the difference between the actual and the expected percentage of payersfor a given year, using the base period probabilities. A reduced propensity to pay impliesa negative difference between the actual and expected percentage of payers.
In Table 5 we present the annual propensity scores as well as the mean (median)propensity scores for the in-sample and out-of-sample periods. We note that the averagein-sample propensity scores are very close to zero, indicating that the logit modelpossesses strong explanatory power.4
The rightmost column in Table 5 reports the mean and median out-of-samplepropensity scores. We find evidence of a declining propensity to pay throughout thecommon law countries. With the exception of Australia and Canada, all common lawcountries have a negative average propensity score. The common law mean (median)propensity to pay is −0.08 (−0.08). There is also evidence of a declining propensityto pay among civil law firms. Civil law countries report a median propensity to pay
4 We also examine other statistics for the quality of fit: (1) proportion of concordant/discordant/tied casesand (2) c -stat. Specifically, we find that that proportion of concordant (discordant) cases are high, rangingfrom 73% (8%) to 92% (27%) with a median of 84% (16%). Similarly, the c -stat values suggest a strong fit(A higher c -statistic implies stronger predictive power for the logistic regression. For example, a value ofc = 0.5 implies that the logit model randomly predicts the dependent variable, whereas c = 1.0 implies thatthe logit model perfectly discriminates the dependent variable. The median c -stat for the full sample is 0.84ranging between 0.71 and 0.95. These results are available upon request from the authors.
C© 2009 The AuthorsJournal compilation C© Blackwell Publishing Ltd. 2009

ANALYSIS OF DIVIDEND PAYMENT BEHAVIOR 515T
able
5A
Tim
eSe
ries
ofIn
divi
dual
Nat
iona
lEst
imat
esof
the
Prop
ensi
tyto
Pay
Div
iden
dsIn
-Sam
ple
(199
4–19
97)
Out
-of-S
ampl
e(1
998–
2007
)In
-Sam
ple
Out
-of-S
ampl
e
Cou
ntry
1994
1995
1996
1997
1998
1999
2000
2001
2002
2003
2004
2005
2006
2007
Mea
nM
edia
nM
ean
Med
ian
Aus
tral
ia−0
.01
−0.0
2−0
.02
0.04
0.05
0.05
0.05
0.06
0.01
0.03
−0.0
1−0
.01
0.00
0.01
0.00
−0.0
10.
020.
02C
anad
a0.
000.
02−0
.02
0.00
0.00
−0.0
1−0
.02
−0.0
1−0
.02
0.03
0.04
0.07
0.07
0.08
0.00
0.00
0.02
0.01
Hon
gK
ong
−0.0
10.
000.
010.
000.
04−0
.09
−0.1
4−0
.10
−0.1
2−0
.09
−0.1
2−0
.12
−0.0
9−0
.13
0.00
0.00
−0.1
0−0
.11
Irel
and
0.04
−0.0
30.
00−0
.01
0.02
−0.0
7−0
.01
0.02
0.01
−0.0
4−0
.06
−0.1
7−0
.20
−0.2
10.
00−0
.01
−0.0
7−0
.05
Mal
aysi
a−0
.01
−0.0
10.
04−0
.02
−0.1
0−0
.20
−0.1
8−0
.13
−0.1
6−0
.18
−0.2
0−0
.19
−0.2
0−0
.22
0.00
−0.0
1−0
.18
−0.1
9Si
ngap
ore
0.06
0.02
−0.0
3−0
.03
0.08
−0.0
2−0
.04
−0.0
3−0
.11
−0.1
3−0
.14
−0.1
3−0
.08
−0.0
80.
010.
00−0
.07
−0.0
8So
uth
Afr
ica
−0.0
10.
00−0
.02
0.03
−0.0
2−0
.11
−0.1
5−0
.20
−0.1
8−0
.14
−0.0
9−0
.10
−0.1
3−0
.24
0.00
0.00
−0.1
4−0
.14
Uni
ted
Kin
gdom
0.00
0.01
0.02
−0.0
20.
01−0
.02
−0.0
4−0
.09
−0.1
0−0
.11
−0.1
6−0
.20
−0.2
0−0
.21
0.00
0.00
−0.1
1−0
.11
Uni
ted
Stat
es0.
020.
010.
00−0
.02
0.00
−0.0
1−0
.02
−0.0
5−0
.08
−0.1
0−0
.06
−0.0
6−0
.08
−0.0
80.
000.
00−0
.05
−0.0
6C
omm
onla
wM
ean
0.01
0.00
0.00
0.00
0.01
−0.0
5−0
.06
−0.0
6−0
.08
−0.0
8−0
.09
−0.1
0−0
.10
−0.1
20.
000.
00−0
.07
−0.0
8C
omm
onla
wM
edia
n0.
000.
000.
00−0
.01
0.01
−0.0
2−0
.04
−0.0
5−0
.10
−0.1
0−0
.09
−0.1
2−0
.09
−0.1
30.
000.
00−0
.07
−0.0
8
Aus
tria
−0.0
5−0
.04
0.08
0.00
−0.0
1−0
.03
−0.0
4−0
.14
−0.1
1−0
.13
−0.0
5−0
.10
−0.1
0−0
.09
0.00
−0.0
2−0
.08
−0.1
0D
enm
ark
−0.0
30.
030.
01−0
.01
0.03
0.07
0.08
0.01
−0.1
4−0
.13
−0.1
3−0
.11
−0.1
0−0
.14
0.00
0.00
−0.0
6−0
.11
Finl
and
−0.0
50.
040.
000.
000.
070.
040.
010.
020.
040.
000.
02−0
.03
−0.0
7−0
.03
0.00
0.00
0.01
0.01
Fran
ce−0
.02
0.02
0.04
−0.0
30.
040.
010.
030.
02−0
.01
−0.0
1−0
.07
−0.0
8−0
.08
−0.1
30.
000.
00−0
.03
−0.0
1G
erm
any
−0.0
20.
020.
03−0
.02
−0.0
3−0
.06
−0.1
2−0
.04
−0.0
6−0
.12
−0.1
6−0
.15
−0.1
9−0
.21
0.00
0.00
−0.1
1−0
.12
Indo
nesi
a0.
00−0
.04
0.01
0.01
−0.5
2−0
.58
−0.3
0−0
.50
−0.4
5−0
.42
−0.3
8−0
.34
−0.3
4−0
.34
0.00
0.01
−0.4
2−0
.40
Ital
y0.
03−0
.04
−0.0
30.
030.
08−0
.03
0.00
0.01
0.01
−0.0
3−0
.10
−0.1
1−0
.10
−0.0
90.
000.
00−0
.04
−0.0
3Ja
pan
0.00
−0.0
1−0
.02
0.03
0.06
0.07
0.03
0.05
0.05
0.02
0.01
0.02
0.02
0.02
0.00
0.00
0.04
0.03
Kor
ea−0
.02
−0.0
3−0
.01
0.05
−0.1
2−0
.04
−0.1
2−0
.07
−0.1
0−0
.11
−0.0
6−0
.04
−0.0
3−0
.04
−0.0
1−0
.02
−0.0
7−0
.06
Mex
ico
0.07
−0.0
5−0
.01
−0.0
10.
10−0
.13
−0.1
2−0
.11
−0.1
0−0
.05
−0.0
8−0
.06
−0.0
8−0
.03
0.00
−0.0
1−0
.07
−0.0
8N
orw
ay0.
020.
03−0
.06
0.01
0.07
−0.1
0−0
.01
−0.1
0−0
.09
−0.0
4−0
.05
−0.0
9−0
.08
−0.1
60.
000.
01−0
.07
−0.0
9Ph
ilipp
ines
0.00
−0.0
40.
020.
01−0
.03
−0.0
40.
04−0
.03
0.07
0.07
0.07
0.08
0.06
0.03
0.00
0.00
0.03
0.05
Port
ugal
−0.0
30.
000.
000.
02−0
.01
0.00
0.05
−0.1
10.
03−0
.06
−0.0
7−0
.04
−0.0
7−0
.12
0.00
0.00
−0.0
4−0
.05
Spai
n−0
.02
0.00
−0.0
10.
03−0
.07
−0.0
7−0
.07
−0.0
4−0
.10
−0.1
0−0
.05
−0.0
20.
01−0
.04
0.00
0.00
−0.0
5−0
.06
Swed
en−0
.07
0.01
0.05
0.01
0.01
0.03
−0.0
1−0
.02
−0.1
0−0
.09
−0.1
1−0
.15
−0.1
5−0
.13
0.00
0.01
−0.0
7−0
.09
Switz
erla
nd−0
.03
0.00
0.02
0.01
0.08
0.07
0.04
0.07
−0.0
5−0
.08
−0.1
0−0
.08
−0.0
8−0
.09
0.00
0.00
−0.0
2−0
.06
Civ
ilL
awM
ean
−0.0
1−0
.01
0.01
0.01
−0.0
2−0
.05
−0.0
3−0
.06
−0.0
7−0
.08
−0.0
8−0
.08
−0.0
9−0
.10
0.00
0.00
−0.0
7−0
.07
Civ
ilL
awM
edia
n−0
.02
0.00
0.01
0.01
0.02
−0.0
30.
00−0
.03
−0.0
7−0
.07
−0.0
7−0
.08
−0.0
8−0
.09
0.00
0.00
−0.0
5−0
.06
Agg
rega
teM
ean
−0.0
10.
000.
000.
00−0
.01
−0.0
5−0
.04
−0.0
6−0
.07
−0.0
8−0
.09
−0.0
9−0
.09
−0.1
10.
000.
00−0
.07
−0.0
7A
ggre
gate
Med
ian
−0.0
10.
000.
000.
000.
01−0
.03
−0.0
2−0
.04
−0.0
9−0
.09
−0.0
7−0
.09
−0.0
8−0
.09
0.00
0.00
−0.0
7−0
.06
Dif
fere
nces
betw
een
com
mon
and
civi
llaw
mea
nsan
dm
edia
ns:p
-val
ues
Dif
fere
nce
inm
eans
0.07
0.55
0.39
0.22
0.57
0.92
0.44
0.97
0.75
0.96
0.85
0.60
0.70
0.62
0.03
0.65
0.82
0.91
Dif
fere
nce
inm
edia
ns0.
060.
520.
350.
150.
930.
440.
170.
760.
250.
550.
550.
320.
440.
480.
060.
800.
220.
52
Not
es:
Thi
sta
ble
pres
ents
the
time
seri
esof
the
prop
ensi
tyto
pay
divi
dend
sfr
om19
94to
2007
.T
hepr
open
sity
topa
ydi
vide
nds
isde
fined
asth
eac
tual
perc
enta
geof
divi
dend
paye
rsm
inus
the
expe
cted
perc
enta
ge.T
hees
timat
ion
peri
od(i
n-sa
mpl
e)is
1994
–199
7fo
rea
chco
untr
y.L
ogit
estim
atio
nsus
epr
ofita
bilit
y,gr
owth
inas
sets
,mar
ket-t
o-bo
okra
tio,t
hem
arke
tcap
italiz
atio
nra
nk,r
etai
ned
earn
ings
scal
edby
shar
ehol
der
equi
tyan
dst
ock
retu
rnvo
latil
ityas
the
inde
pend
entv
aria
bles
.
C© 2009 The AuthorsJournal compilation C© Blackwell Publishing Ltd. 2009

516 FERRIS, SEN AND UNLU
ranging from −0.40 in Malaysia to 0.05 in the Philippines. The mean (median) for theout-of-sample average propensity score is −0.07 (−0.06). The difference in the mean(median) propensities to pay are not significantly different between the common andcivil law regimes.5
Overall, we conclude from these results that the lower propensity to pay dividends is aglobal phenomenon. As of 2007, 11% of the firms that were predicted to pay dividendsdid not actually pay dividends. This unexplained reduction in the propensity to paydividends is equally pronounced across the common and civil law regimes.
7. AGGREGATE DIVIDENDS
DeAngelo, DeAngelo and Skinner (2004) document that aggregate dividends in the USdo not decline in spite of the conclusion by Fama and French (2001) that the number ofdividend paying firms has fallen. That is, although the number of firms paying dividendshas declined in the US, the total dividend payout by US firms has actually increased. InTable 6 we test whether a similar phenomenon holds internationally. Ferris, Sen andYui (2006b) for instance, present evidence that dividend concentration has increasedin the UK over the 1990–2001 sub-period, but that aggregate dividends have remainedconstant in Japan during the same time interval.
Panel A of Table 6 presents our findings for nominal dividends. We observe thataggregate nominal dividends increase for all common law countries. Over the 1994–2007 sample period, the largest absolute increase in dividends occurs for US firms($122.7 billion) followed by the UK ($57.66 billion). On a percentage basis, however,the largest increase in aggregate dividends distributed occurs in Singapore (628%)followed by Hong Kong (621%) and Australia (445%). The mean (median) percentageincrease in aggregate dividends is 377% (357%).
The civil law countries also experience an increase in nominal aggregate dividends.France experiences the greatest increase in total dividends of $48 billion followed byGermany ($32.3 billion) and Italy ($22.7 billion). The dollar value of the increase inaggregate dividends is nominally lower in civil law compared to common law countrieswith median values of $15.5 billion and $10.02 billion, respectively. The differences,however, are not statistically significant.
We find that the percentage increase in aggregate dividends is much higher in civillaw countries. Finland, Italy and Portugal, for instance, average an increase of 2,425%in aggregate dividends followed by 1,695% for the Philippines and 1,527% for Norway.Both the mean (median) percentage change in aggregate dividends is significantlyhigher in civil than in common law countries.
Panel B examines aggregate dividends using real dividends calculated by deflatingaggregate annual dividends by the corresponding price index for that country. Ourconclusions are largely identical to those in Panel A. In general, the level of aggregatereal dividends increases over the sample period for most countries, regardless of legalregime. The dollar value of the increase in aggregate dividends remains higher for
5 We also replicate this analysis using a payout dummy variable that equals one if the firm pays dividendsor buys back common stock during the year; otherwise it is zero. We find that our results remain essentiallyunchanged. These results are not surprising because repurchases were either illegal or allowed only underspecial circumstances for many of our sample countries for most of the sample period.
C© 2009 The AuthorsJournal compilation C© Blackwell Publishing Ltd. 2009

ANALYSIS OF DIVIDEND PAYMENT BEHAVIOR 517
Tab
le6
Glo
balA
ggre
gate
Nom
inal
and
Rea
lDiv
iden
dsP
anel
A:N
omin
alD
ivid
ends
Year
sD
iffer
ence
(200
7–19
94)
Cou
ntry
/Leg
alR
egim
e19
9419
9519
9619
9719
9819
9920
0020
0120
0220
0320
0420
0520
0620
07C
hang
e%
Cha
nge
Aus
tral
ia3.
485.
026.
537.
425.
296.
036.
636.
607.
529.
7510
.48
12.5
916
.17
19.0
015
.52
445%
Can
ada
4.69
4.80
5.05
5.46
4.92
5.55
6.11
8.05
5.84
9.65
12.5
517
.42
20.6
324
.72
20.0
342
7%H
ong
Kon
g3.
283.
834.
565.
085.
144.
725.
596.
146.
178.
499.
7012
.25
15.9
823
.61
20.3
362
1%Ir
elan
d0.
200.
290.
310.
270.
320.
360.
400.
460.
470.
481.
080.
590.
840.
900.
7035
7%M
alay
sia
1.42
1.54
1.99
1.38
1.03
1.31
1.75
1.93
2.38
2.34
3.14
3.47
4.43
6.00
4.58
323%
Sing
apor
e0.
981.
151.
231.
051.
121.
312.
572.
241.
932.
613.
175.
055.
717.
106.
1262
8%So
uth
Afr
ica
2.44
2.47
1.78
2.29
2.20
2.94
2.19
1.81
2.59
3.91
3.83
5.21
7.47
8.40
5.96
244%
Uni
ted
Kin
gdom
26.3
632
.12
42.8
040
.12
45.1
952
.33
45.2
845
.09
45.4
851
.07
62.5
961
.62
90.8
084
.03
57.6
621
9%U
nite
dSt
ates
93.9
910
1.77
105.
7611
2.51
118.
9612
5.40
123.
9411
9.48
122.
7013
4.99
155.
7021
1.96
198.
6521
6.68
122.
7013
1%C
omm
onL
awM
ean
15.2
017
.00
18.8
919
.51
20.4
622
.22
21.6
121
.31
21.6
824
.81
29.1
436
. 68
40.0
843
.38
28.1
837
7%C
omm
onL
awM
edia
n3.
283.
834.
565.
084.
924.
725.
596.
145.
848.
499.
7012
.25
15.9
819
.00
15.5
235
7%
Aus
tria
0.25
0.37
0.43
0.42
0.79
0.88
0.64
0.49
0.61
0.58
0.95
1.03
2.30
2.73
2.48
980%
Den
mar
k0.
310.
530.
590.
600.
870.
810.
861.
481.
041.
491.
692.
9810
.94
2.53
2.23
726%
Finl
and
0.36
0.83
1.25
1.18
2.14
2.28
3.02
3.29
3.92
4.97
6.43
5.31
7.97
9.87
9.51
2,63
7%Fr
ance
5.39
6.83
7.35
7.21
10.9
112
.09
13.5
018
.02
19.2
622
.33
29.7
827
.30
42.7
153
.39
48.0
089
0%G
erm
any
6.68
7.52
8.05
8.61
22.7
415
.49
13.5
714
.85
13.5
815
.25
16.8
219
.46
27.9
139
.49
32.8
249
1%In
done
sia
0.65
16.8
38.
733.
990.
210.
360.
620.
420.
741.
211.
531.
582.
153.
452.
8042
8%It
aly
0.96
2.67
3.89
4.02
5.38
10.3
08.
1413
.48
14.0
610
.37
25.6
721
.44
22.6
523
.71
22.7
42,
360%
Japa
n22
.90
21.2
519
.61
18.4
822
.77
23.5
521
.58
20.6
021
.79
22.8
627
.29
28.0
835
.15
47.1
824
.28
106%
Kor
ea0.
791.
071.
460.
720.
731.
242.
202.
873 .
044.
658.
269.
5710
.28
11.1
610
.37
1,30
6%M
exic
o1.
330.
861.
442.
002.
331.
521.
852.
402.
122.
412.
893.
975.
646.
144.
8136
1%N
orw
ay0.
630.
851.
121.
041.
380.
760.
971.
441.
922.
243.
854.
315.
8310
.30
9.67
1,52
7%Ph
ilipp
ines
0.11
0.20
0.29
0.24
0.20
0.27
0.22
0.16
0.29
0.28
0.37
0.65
1.02
2.01
1.90
1,69
5%Po
rtug
al0.
140.
230.
670.
790.
960.
921.
060.
860.
971.
161.
491.
924.
173.
253.
122,
279%
Spai
n2.
583.
573.
653.
674.
073.
385.
604.
143.
899.
1413
.65
11.7
615
.90
20.1
317
.55
679%
Swed
en1.
412.
593.
523.
903.
983.
883.
623.
603.
144.
777.
057.
2711
.67
14.2
512
.84
910%
Switz
erla
nd4.
726.
135.
434.
986.
425.
356.
136.
468.
257.
949.
589.
3612
.20
15.9
511
.23
238%
Civ
ilL
awM
ean
3.08
4.52
4.22
3.87
5.37
5.19
5.22
5.91
6.16
6.98
9.83
9.75
13.6
616
.60
13.5
21,
101%
Civ
ilL
awM
edia
n0.
881.
832.
492.
832.
241.
902.
613.
083.
094.
716.
746.
2910
.61
10.7
310
.02
900%
Agg
rega
teM
ean
7.44
9.01
9.50
9.50
10. 8
011
.32
11.1
211
.45
11.7
513
.40
16.7
819
.45
23.1
726
.24
18.8
084
0%A
ggre
gate
Med
ian
1.41
2.59
3.52
3.67
2.33
2.94
3.02
3.29
3.14
4.77
7.05
7.27
10.9
411
.16
10.3
762
1%
Dif
fere
nces
betw
een
com
mon
and
civi
llaw
mea
nsan
dm
edia
ns:p
-val
ues
Dif
fere
nce
inm
eans
0.27
0.30
0.25
0.24
0.29
0.26
0.27
0.28
0.29
0.26
0.29
0.27
0.26
0.29
0.31
0.00
Dif
fere
nce
inm
edia
ns0.
110.
290.
380.
220.
410.
270.
410.
410.
440.
380.
480.
410.
550.
480.
520.
01
C© 2009 The AuthorsJournal compilation C© Blackwell Publishing Ltd. 2009

518 FERRIS, SEN AND UNLU
Tab
le6
(Con
tinu
ed)
Pan
elB
:Rea
lDiv
iden
dsYe
ars
Diff
eren
ce(2
007–
1994
)
Cou
ntry
/Leg
alR
egim
e19
9419
9519
9619
9719
9819
9920
0020
0120
0220
0320
0420
0520
0620
07C
hang
e%
Cha
nge
Aus
tral
ia4.
916.
918.
689.
716.
817.
568.
037.
888.
7511
.12
11.5
713
.44
16.8
419
.00
14.0
928
7%C
anad
a6.
626.
606.
717.
156.
346.
967.
409.
616.
8011
.01
13.8
618
.60
21.4
824
.72
18.1
027
4%H
ong
Kon
g4.
625.
276.
066.
656.
615.
916.
787.
337.
199.
6810
.71
13.0
916
.64
23.6
118
.99
411%
Irel
and
0.28
0.40
0.41
0.35
0.41
0.45
0.48
0.54
0.55
0.55
1.20
0.63
0.88
0.90
0.62
224%
Mal
aysi
a2.
002.
122.
641.
801.
321.
642.
122.
302.
772.
673.
473.
704.
626.
004.
0020
0%Si
ngap
ore
1.38
1.58
1.63
1.37
1.44
1.64
3.12
2.68
2.25
2.98
3.51
5.39
5.94
7.10
5.72
416%
Sout
hA
fric
a3.
443.
392.
373.
002.
833.
692.
652.
163.
014.
464.
235.
577.
788.
404.
9614
4%U
nite
dK
ingd
om37
.18
44.1
856
.94
52.4
958
.19
65.6
354
.89
53.8
052
.96
58.2
869
.11
65.8
194
.55
84.0
346
.85
126%
Uni
ted
Stat
es13
2.55
139.
9714
0.71
147.
2015
3.17
157.
2515
0.27
142.
5714
2.86
154.
0517
1.93
226.
3820
6.84
216.
6884
.14
63%
Com
mon
Law
Mea
n21
.44
23.3
825
.13
25.5
226
.35
27.8
626
.19
25.4
325
.24
28.3
132
.18
39. 1
841
.73
43.3
821
.94
238%
Com
mon
Law
Med
ian
4.62
5.27
6.06
6.65
6.34
5.91
6.78
7.33
6.80
9.68
10.7
113
.09
16.6
419
.00
14.0
922
4%
Aus
tria
0.36
0.50
0.57
0.55
1.02
1.11
0.77
0.59
0.71
0.66
1.05
1.10
2.40
2.73
2.37
666%
Den
mar
k0.
430.
730.
780.
791.
121.
011.
041.
771.
211.
711.
873.
1911
.39
2.53
2.10
486%
Finl
and
0 .51
1.14
1.66
1.55
2.76
2.86
3.66
3.93
4.56
5.67
7.10
5.67
8.29
9.87
9.36
1,84
1%Fr
ance
7.61
9.39
9.78
9.43
14.0
515
.16
16.3
721
.50
22.4
225
.48
32.8
829
.16
44.4
753
.39
45.7
960
2%G
erm
any
9.42
10.3
510
.71
11.2
629
.28
19.4
316
.45
17.7
215
.81
17.4
018
.57
20.7
829
.06
39.4
930
.08
319%
Indo
nesi
a0.
9223
.14
11.6
25.
220 .
270.
450.
760.
500.
861.
381.
691.
692.
243.
452.
5327
4%It
aly
1.36
3.67
5.17
5.26
6.93
12.9
29.
8716
.08
16.3
711
.83
28.3
522
.90
23.5
923
.71
22.3
51,
644%
Japa
n32
.29
29.2
326
.09
24.1
829
.32
29.5
326
.17
24.5
825
.37
26.0
930
.14
29.9
936
.60
47.1
814
.89
46%
Kor
ea1.
121.
471.
940.
940.
941.
552.
663.
423 .
545.
319.
1210
.22
10.7
011
.16
10.0
489
7%M
exic
o1.
881.
181.
922.
613.
001.
912.
252.
872.
472.
753.
194.
235.
876.
144.
2622
7%N
orw
ay0.
891.
171.
491.
361.
770.
951.
181.
722.
232.
554.
254.
616.
0710
.30
9.41
1,05
4%Ph
ilipp
ines
0.16
0.28
0.39
0.32
0.25
0.34
0.26
0.19
0.33
0.31
0.41
0.70
1 .06
2.01
1.86
1,17
3%Po
rtug
al0.
190.
310.
891.
041.
241.
151.
291.
031.
131.
321.
652.
054.
353.
253.
061,
587%
Spai
n3.
644.
924.
854.
805.
244.
236.
794.
944.
5310
.43
15.0
812
.56
16.5
620
.13
16.4
945
3%Sw
eden
1.99
3.57
4.68
5.10
5.13
4.86
4.39
4.29
3.66
5.44
7.79
7.77
12.1
514
.25
12.2
661
6%Sw
itzer
land
6.65
8.43
7.22
6.51
8.27
6.71
7.43
7.70
9.61
9.06
10.5
810
.00
12.7
015
.95
9.29
140%
Civ
ilL
awM
ean
4.34
6.22
5.61
5.06
6.91
6.51
6.33
7.05
7.18
7.96
10.8
610
.41
14.2
216
.60
12.2
675
2%C
ivil
Law
Med
ian
1.24
2.52
3.31
3.71
2.88
2.39
3.16
3.68
3.60
5.37
7.44
6.72
11.0
510
.73
9.39
609%
Agg
rega
teM
ean
10.5
012
.40
12.6
412
.43
13. 9
114
.20
13.4
813
.67
13.6
815
.29
18.5
320
.77
24.1
226
.24
15.7
456
7%A
ggre
gate
Med
ian
1.99
3.57
4.68
4.80
3.00
3.69
3.66
3.93
3.66
5.44
7.79
7.77
11.3
911
.16
9.41
411%
Dif
fere
nces
betw
een
com
mon
and
civi
llaw
mea
nsan
dm
edia
ns:p
-val
ues
Dif
fere
nce
inm
eans
0.27
0.30
0.25
0.24
0.29
0.26
0.27
0.28
0.29
0.26
0.29
0.27
0.26
0.29
0.33
0.00
Dif
fere
nce
inm
edia
ns0.
110.
290.
380.
220.
410.
270.
410 .
410.
440.
380.
480.
410.
550.
480.
440.
01
C© 2009 The AuthorsJournal compilation C© Blackwell Publishing Ltd. 2009

ANALYSIS OF DIVIDEND PAYMENT BEHAVIOR 519T
able
6(C
onti
nued
)P
anel
C:A
ggre
gate
Pay
outR
atio
Year
sD
iffer
ence
Cou
ntry
/Leg
alR
egim
e19
9419
9519
9619
9719
9819
9920
0020
0120
0220
0320
0420
0520
0620
07(2
007–
1994
)
Aus
tral
ia0.
280.
300.
360.
540.
370.
340.
450.
480.
410.
420.
360.
390.
430.
380.
10C
anad
a0.
170.
150.
160.
170.
190.
170.
1619
.16
0.25
0.29
0.25
0.28
0.28
0.27
0.09
Hon
gK
ong
0.33
0.30
0.32
0.31
0.58
0.20
0.26
0.32
0.28
0.39
0.32
0.27
0.30
0.39
0.06
Irel
and
0.12
0.14
0.15
0.13
0.14
0.13
0.11
0.28
−0.3
40.
190.
270.
110.
140.
11−0
.01
Mal
aysi
a0.
200.
170.
170.
170.
460.
230.
230.
250.
300.
260.
250.
240.
290.
310.
10Si
ngap
ore
0.21
0.20
0.18
0.18
0.24
0.22
0.34
0.39
0.33
0.42
0.32
0.42
0.38
0.39
0.18
Sout
hA
fric
a0.
230.
190.
160.
200.
190.
280.
170.
270.
220.
260.
230.
250.
310.
250.
01U
nite
dK
ingd
om0.
270.
300.
330.
300.
380.
390.
300.
490.
810.
600.
380.
300.
380.
290.
02U
nite
dSt
ates
0.21
0.20
0.19
0.19
0.20
0.18
0.17
0.30
0.30
0.26
0.20
0.25
0.19
0.20
−0.0
1C
omm
onL
awM
ean
0.22
0.22
0.22
0.24
0.31
0.24
0.24
2.44
0.28
0.34
0.29
0.28
0.30
0.29
0.06
Com
mon
Law
Med
ian
0.21
0.20
0.18
0.19
0.24
0.22
0.23
0.32
0.30
0.29
0.27
0.27
0.30
0.29
0.06
Aus
tria
0.14
0.16
0.16
0.15
0.27
0.33
0.21
0.27
0.18
0.13
0.18
0.16
0.26
0.24
0.10
Den
mar
k0.
070.
110.
130.
130.
150.
160.
130.
250.
120.
160.
130.
270.
800.
130.
06Fi
nlan
d0.
060.
110.
180.
130.
190.
170.
170.
290.
320.
350.
410.
330.
440.
350.
29Fr
ance
0.10
0.14
0.14
0.12
0.14
0.17
0.13
0.31
0.36
0.33
0.24
0.17
0.24
0.26
0.15
Ger
man
y0.
200.
140.
160.
160.
300.
230.
190.
480.
410.
300.
200.
210.
230.
260.
05In
done
sia
0.25
2.92
1.23
2.31
0.11
0.07
−0.9
00.
160.
100.
190.
270.
250.
240.
370.
12It
aly
0.04
0.08
0.11
0.12
0.14
0.20
0.16
0.45
0.61
0.36
0.49
0.46
0.28
0.25
0.21
Japa
n0.
130.
120.
110.
110.
130.
150.
170.
130.
300.
120.
100.
110.
110.
130.
00K
orea
0.03
0.03
0.06
0.07
0.05
0.03
0.09
0.10
0.07
0.09
0.10
0.13
0.13
0.12
0.08
Mex
ico
0.35
0.09
0.10
0.13
0.21
0.07
0.08
0.10
0.13
0.16
0.16
0.16
0.19
0.18
−0.1
8N
orw
ay0.
090.
100.
130.
140.
250.
140.
090.
120.
160.
190.
190.
190.
150.
210.
12Ph
ilipp
ines
0.05
0.07
0.08
0.13
0.08
0.14
0.14
0.13
0.18
0.17
0.13
0.14
0.19
0.25
0.20
Port
ugal
0.11
0.12
0.19
0.25
0.25
0.28
0.29
0.30
0.27
0.24
0.22
0.28
0.42
0.31
0.20
Spai
n0.
190.
210.
220.
230.
200.
170.
210.
19−0
.95
−9.1
00.
330.
270.
270.
260.
07Sw
eden
0.09
0.12
0.17
0.19
0.22
0.21
0.21
0.72
0.48
0 .57
0.37
0.30
0.32
0.37
0.29
Switz
erla
nd0.
140.
130.
180.
160.
180.
160.
160.
250.
350.
260.
230.
250.
220.
240.
09C
ivil
Law
Mea
n0.
130.
290.
210.
280.
180.
170.
100.
270.
19−0
.34
0.24
0.23
0.28
0.25
0.12
Civ
ilL
awM
edia
n0.
110.
120.
150.
130.
180.
170.
160.
250.
230.
190.
210.
230.
240.
250.
11A
ggre
gate
Mea
n0.
160.
260.
210.
270.
230.
190.
151.
050.
23−0
.10
0.25
0.25
0.29
0.26
0.10
Agg
rega
teM
edia
n0.
140.
140.
160.
160.
200.
170.
170.
280.
280.
260.
240.
250.
270.
260.
09
Dif
fere
nces
betw
een
com
mon
and
civi
llaw
mea
nsan
dm
edia
ns:p
-val
ues
Dif
fere
nce
inm
eans
0.01
0.68
0.84
0.78
0.04
0.04
0.07
0.33
0.51
0.26
0.16
0.18
0.71
0.25
0.20
Dif
fere
nce
inm
edia
ns0.
010.
000.
060.
020.
040.
040.
030.
030.
440.
040.
110.
220.
250.
200.
09
Not
es:
Thi
sta
ble
show
sth
eag
greg
ate
nom
inal
(Pan
elA
)an
dre
aldi
vide
nd(P
anel
B)
amou
nt(i
n$b
illio
ns)
and
payo
utra
tio(P
anel
C)
for
25co
untr
ies
over
the
1994
–200
7sa
mpl
epe
riod
.Rea
lam
ount
sar
ere
port
edin
2007
$US.
The
aggr
egat
epa
yout
ratio
isth
eva
lue
ofto
tald
ivid
ends
rela
tive
toto
talc
orpo
rate
earn
ings
ofa
coun
try.
C© 2009 The AuthorsJournal compilation C© Blackwell Publishing Ltd. 2009

520 FERRIS, SEN AND UNLU
common law countries, but not significantly greater than that observed for the civil lawcountries. The percentage increase in aggregate real dividends, however, is significantlyhigher within the civil law countries.
We conclude from Panels A and B of Table 6 that aggregate dividends generallyincrease over time across our sample countries. This results holds regardless of whetheraggregate dividends are measured nominally or in real terms. Further, we find thatthis conclusion is not sensitive to the legal regime in which a firm is incorporated.Both common and civil law countries report increases in the total level of dividendsdistributed to shareholders.6 Although the dollar value of aggregate dividends is higheramong common law countries, it is not significantly higher than that estimated for civillaw countries. The percentage increase in aggregate dividends, however, is significantlyhigher for civil law countries.
In Panel C we examine aggregate dividend behavior from a different perspective–the aggregate payout ratio. That is, what percentage of earnings do firms pay out asdividends? We observe for those firms in common law countries that payout ratiosare generally increasing. The only exceptions are Ireland and the US where there is a1% decline in dividend payout ratios. Indeed, for the entire set of nine common lawcountries, payout ratios increase by an average of 6% over our sample period.
The dividend payout ratios also increase for the civil law countries. Fifteen of thesixteen civil law countries experience an increase in the dividend payout ratio overour sample period. The only exception is Mexico. The mean (median) increase inthe dividend payout ratio is 12% (11%) which is higher than that estimated for thecommon law countries, with the medians being significantly different across regimes.
8. DISCUSSION AND CONCLUSION
This study examines the nature of dividend policy across an extensive sample ofdeveloped and emerging countries. It tests whether a number of recent trends reportedfor the US are also observed in the world’s other capital markets. Because of an extensiveexisting literature concerning the ability of a country’s legal regime to influencecorporate payout decisions, we elect to perform this analysis separately on civil andcommon law countries.
We observe some important similarities as well as differences in dividend policybetween civil and common law countries. Both regimes experience a decline in thenumber of firms paying dividends, but the percentage decline is significantly higherwithin common law countries. We further determine that this increase in the percentageof non-dividend paying firms can be partially explained by an increase in the percentageof firms that have never paid dividends. We also find that the increase in the averagesize of dividends by civil law firms is significantly higher than that observed for commonlaw firms.
We also determine that the practice of paying dividends, once begun, appears tobe persistent. This dividend persistence is present within both common and civil lawcountries. The practice of initiating dividends, however, does differ across regimes.
6 To ensure that variation of exchange rates do not affect our findings, we replicate the analysis using localcurrencies and inflation rates. Consistent with Eije and Megginson (2008) we use pseudo-euro exchange ratesprior to 1999 for the European Monetary Union countries. Our conclusions remain qualitatively identical.
C© 2009 The AuthorsJournal compilation C© Blackwell Publishing Ltd. 2009

ANALYSIS OF DIVIDEND PAYMENT BEHAVIOR 521
There seems to be less willingness to initiate dividend programs by common law firms.Civil law firms appear slightly more willing to initiate new dividend programs.
We document few differences in the characteristics related to the ability to paydividends between firms based on legal regime. We find that the profitability, riskinessand life cycle state are approximately equivalent for common and civil law firms.The differences that do occur are related to size and growth opportunities. Weobserve that firms in civil law countries are larger than those in common lawjurisdictions, perhaps reflecting their need for an internal capital market to obtainrequired financing. Market-to-book ratios are slightly higher for common law countries,suggesting that such firms might be more effective in developing their investmentopportunities.
Although the decline in the propensity to pay dividends is a global phenomenon,we find that the level of aggregate dividends paid has increased. We further establishthat both common and civil law firms enjoy increased aggregate dividends, but thepercentage increase in aggregate dividends is greater in civil law countries. We alsoobtain limited evidence for higher payout ratios among civil law firms.
A number of different interpretations can be attached to our findings regardingdividend practices and how they relate to differences in legal regime. Our resultsconcerning a higher percentage of dividend paying firms, greater rates of dividendcontinuation, higher percentage increase in aggregate dividends, and more generouspayout ratios for firms in civil law countries are consistent with the substitute theoryof dividends as developed by LaPorta et al (2000). That is, firms in civil law countriesmight elect to pay dividends to reassure minority investors that their wealth will notbe expropriated due to the weak investor protection laws that are characteristic ofthese countries. Some countries also require their mutual funds to hold dividendpaying stocks or even mandate the payment of minimum dividends by listed firms.These legislative requirements will have the effect of increasing both the percentageof firms within a country paying dividends as well as the aggregate value of dividendsdistributed.
As noted by Gillan and Starks (2003), among others, institutional investors arebecoming dominant players in the equity markets of many countries. Institutionalinvestors often prefer that the firms in which they hold large equity stakes pay dividends.This might be due to the tax advantages associated with dividends (Han, Lee and Suk,1999) or as a way to reduce the agency costs associated with free cash flow and thedifficulty of managerial monitoring (Farinha, 2003). Thus, it might be that the patternsin dividends we observe for our sample countries reflect the growing influence ofinstitutional investors over corporate dividend decision-making.
Deakin and Hughes (1997), Armour, Deakin and Konzelmann (2003) and Deakin(2005) discuss the issue of shareholder primacy and describe how future corporategovernance is likely to evolve to include a greater stakeholder representation. Ourfindings of a decline in the payment of dividends within common law countries mightbe an indication of erosion of shareholder primacy and the initial emergence ofstakeholder-oriented governance orientation.
REFERENCES
Aivazian, V., I. Booth and S. Cleary (2003), ‘Do Emerging Market Firms Follow DifferentDividend Policies From U.S. Firms?’ Journal of Financial Research, Vol. 26, pp. 371–87.
C© 2009 The AuthorsJournal compilation C© Blackwell Publishing Ltd. 2009

522 FERRIS, SEN AND UNLU
Armour, J., S. Deakin and S. Konzelmann (2003), ‘Shareholder Primacy and the Trajectoryof UK Corporate Governance’, British Journal of Industrial Relations, Vol. 41, pp. 531–55.
Barclay, M., C. Smith and R. Watts (1995), ‘The Determinants of Corporate Leverage andDividend Policies’, Journal of Applied Corporate Finance, Vol. 17, pp. 4–19.
Deakin, S. (2005), ‘The Coming Transformation of Shareholder Value’, Corporate Governance:An International Review, Vol. 13, pp. 11–18.
——— and A. Hughes (1997), ‘Comparative Corporate Governance: An InterdisciplinaryAgenda’, Journal of Law & Society, Vol. 24, pp. 1–9.
DeAngelo, H., L. DeAngelo and D. Skinner (2004), ‘Are Dividends Disappearing? DividendConcentration and the Consolidation of Earnings’, Journal of Financial Economics, Vol. 72,pp. 425–56.
——— ——— and R. Stulz (2006), ‘Dividend Policy and the Earned/Contributed CapitalMix: A Test of the Life-Cycle Theory’, Journal of Financial Economic, Vol. 81, pp. 227–54.
Denis, D. and I. Osobov (2008), ‘Why Do Firms Pay Dividends? International Evidence on theDeterminants of Dividend Policy’, Journal of Financial Economics, Vol. 89, pp. 62–82.
Eije, H. and W. Megginson (2008), ‘Dividend and Share Repurchases in the European Union’,Journal of Financial Economics, Vol. 89, pp. 347–74.
Fama, E. and K. French (2001), ‘Disappearing Dividends: Changing Firm Characteristics orLower Propensity to Pay?’, Journal of Financial Economics, Vol. 60, pp. 3–43.
——— ——— (2004), ‘New Lists and Seasoned Firms: Fundamentals and Survival Rates’,Journal of Financial Economics, Vol. 73, pp. 229–70.
Farinha, J. (2003), ‘Dividend Policy, Corporate Governance and the Managerial EntrenchmentHypothesis: An Empirical Analysis’, Journal of Business Finance & Accounting , Vol. 30,pp. 1173–209.
Ferris, S., N. Sen and H. Yui (2006a), ‘God Save the Queen and Her Dividends: CorporatePayouts in the U.K.’, Journal of Business, Vol. 79, pp. 1149–73.
——— ——— ——— (2006b), ‘Are Fewer Firms Paying More Dividends? The InternationalEvidence’, Journal of Multinational Financial Management, Vol. 16, pp. 333–62.
Gaver, J. and K. Gaver (1993), ‘Additional Evidence on the Association Between the InvestmentOpportunity Set and Corporate Financing, Dividend and Compensation Policies’, Journalof Accounting & Economics, Vol. 16, pp. 125–60.
Gillan, S. and L. Starks (2003), ‘Corporate Governance, Corporate Ownership, and the Roleof Institutional Investors: A Global Perspective’, Journal of Applied Corporate Finance, Vol.13, pp. 20–32.
Han, K., S. Lee and D. Yuk (1999), ‘Institutional Shareholders and Dividends’, Journal ofFinancial & Strategic Decisions, Vol. 12, pp. 53–62.
Hand, J. and W. Landsman (2005), ‘The Pricing of Dividends in Equity Valuation’, Journal ofBusiness Finance & Accounting , Vol. 32, pp. 435–69.
Hoberg, G. and N. Prabhala (2007), ‘Disappearing Dividends, Catering, and Risk’, WorkingPaper (University of Maryland).
LaPorta, R., F. Lopez deSilanas, A. Shleifer and R. Vishny (1997), ‘Legal Determinants ofExternal Finance’, Journal of Finance, Vol. 52, pp. 1131–50.
——— ——— ——— ——— (2000), ‘Agency Problems and Dividend Policies Around theWorld’, Journal of Finance, Vol. 55, pp. 1–33.
Smith, C. and R. Watts (1992), ‘The Investment Opportunity Set and Corporate Financing,Dividend and Compensation Policies’, Journal of Financial Economics, Vol. 32, pp. 263–92.
C© 2009 The AuthorsJournal compilation C© Blackwell Publishing Ltd. 2009