An interactive electronic technical manual for an advanced aerospace assembly machine
21
1 International Journal of Advanced Manufacturing Technology, v33 (9), 1045-1055 An Interactive Electronic Technical Manual for an Advanced Aerospace Assembly Machine R ICHARD M. G REENOUGH B ENNY T JAHJONO Dr Richard M Greenough School of Industrial and Manufacturing Science, Cranfield University, Bedford, MK430AL r. [email protected] Tel: 01234 750111 Fax: 01234 752159 Dr Benny Tjahjono School of Industrial and Manufacturing Science, Cranfield University, Bedford, MK430AL Abstract This paper describes the design and evaluation of a pilot information system to ease the burden of document configuration management for an aerospace manufacturer. The documents that comprised the content of the system are used to control manual activities associated with a large automated machine tool, such as machine setup, test piece checking and maintenance. The information content was in the form of web pages and PDF documents, both of which were presented to users via an Internet kiosk, in order to maximise usability and system security. The system was designed using a formal task analysis and evaluated using a method based on task-technology-fit theory and the technology acceptance model. It was shown that users would accept such a system and use it in preference to other sources of similar information. The greatest financial benefit of such systems is likely to be due to a reduced mean time to repair the machine. Keywords Technical documentation, aerospace industry, machine tools, evaluation, hypermedia.
Transcript of An interactive electronic technical manual for an advanced aerospace assembly machine

1
International Journal of Advanced Manufacturing Technology, v33 (9), 1045-1055
An Interactive Electronic Technical Manual for
an Advanced Aerospace Assembly Machine
R IC H AR D M. GR E E N O U G H
BE N N Y T J AH J O N O
Dr Richard M Greenough
School of Industrial and Manufacturing Science,Cranfield University, Bedford, MK430ALr. [email protected]: 01234 750111Fax: 01234 752159
Dr Benny Tjahjono
School of Industrial and Manufacturing Science,Cranfield University, Bedford, MK430AL
Abstract
This paper describes the design and evaluation of a pilot information system to ease the burden of
document configuration management for an aerospace manufacturer. The documents that comprised the
content of the system are used to control manual activities associated with a large automated machine
tool, such as machine setup, test piece checking and maintenance. The information content was in the
form of web pages and PDF documents, both of which were presented to users via an Internet kiosk,
in order to maximise usability and system security. The system was designed using a formal task
analysis and evaluated using a method based on task-technology-fit theory and the technology
acceptance model. It was shown that users would accept such a system and use it in preference to
other sources of similar information. The greatest financial benefit of such systems is likely to be due
to a reduced mean time to repair the machine.
Keywords
Technical documentation, aerospace industry, machine tools, evaluation, hypermedia.

2
Introduction
This paper is a case study of a project to investigate, demonstrate and evaluate the use of
electronic documents to support the operation of advanced manufacturing technology.
The research took place in a UK factory of a European airframe manufacturer which is
responsible for the manufacture of the wings for large commercial aircraft. Wing
manufacture occurs in several phases, and this project was concerned with Stage 00 in
which the top and bottom skins of a wing box are stiffened by the assembly of stringers
to the inside face of large machined panels. The Stage 00 process is largely automated
and features advanced CNC technology of the type described by Hogan (2005). The
particular machine featured in this project is used to locate the parts to be assembled
and position and drill thousands of holes for each wing panel before riveting or bolting
the stringers to the wing skins. Although the assembly process itself is automated, it is
supported by several manual processes related to machine setup, operation,
maintenance and quality control. The personnel responsible for the manual processes
are supported by a wide range of documents originating from various functions within
the organisation. Traditionally these documents have been supplied to users in paper
form, although some of them are now available on the organisation’s intranet.
Compared to paper, electronic documentation offers many advantages which have been
understood since the 1 980s. Ventura (1988) links the problems of paper
documentation to the rapidly increasing complexity of the systems the documents are
intended to support. Such problems include the sheer volume and weight of paper
support documents, the growing problem of inaccurate, incomplete and outdated
information, the disorienting effect of large amounts of information on paper and a lack
of access. The latter is related to poor portability and the cost of reproduction which
create a tendency to store documents in large centralised stores and encourages users to
hold onto uncontrolled copies. These problems tend to cause maintenance technicians
to rely on wrong information that is poorly presented, leading to ineffective
maintenance activities. Although Ventura’s (1988) views are based on a study of
support documents for weapons systems, the problems she describes are similar in
nature, if not in scale, to those experienced by users and maintainers of complex
manufacturing technology. She argues that electronic documentation

3
provides a solution, and this paper describes a pilot study to evaluate a particularly
cost-effective type of electronic document - called an interactive electronic technical
manual (IETM) - in a factory environment. Studies of the use of IETMs in the US
military have shown significant benefits such as 50% reductions in mean time to repair
and 40% increase in maintenance accuracy (replacing the correct components during
fault diagnosis), while other benefits include the familiar paperless documentation
benefits of reduced weight of documentation and reduced distribution costs (Litman,
1996). There have been few applications of IETMs in the factory, but Setchi and White
(2003) describe a similar system that they call a hypermedia maintenance manual
(HMM). This was designed to support the maintenance of advanced winding
machinery. Managers in the factory who evaluated this system believed it would
decrease fault isolation time, increase the effectiveness of inexperienced staff and
improve safety. Greenough et al. (2001) have also shown how a hypermedia
maintenance information system can be used to reduce troubleshooting time on an
automated assembly machine.
Configuration management and IT
As an airframe manufacturer, the case study company has strictly audited processes for
configuration management (CM) to ensure compliance with internationally agreed
aerospace standards such as AS9 100. CM ensures that documents in use are current
and that those documents which have been superseded are removed from the factory
floor. Although this activity represents an expensive administrative overhead, it is
essential. Aircraft manufacturers can expect to be audited by the FAA or EASA to
ensure compliance, and there are severe financial penalties for non-compliance; as
Boeing found in 2004 when it was fined $824,000 by the FAA (Seattle Post-
Intelligencer, 2004). One solution to the high cost of CM is to use specialist software in
the form of a manufacturing execution system such as HMS-CAPP
(www.hmssoftware.com) or Solumina (www.ibaset.com). The latter is claimed to have
increased productivity and throughput on the Lockheed C- 17 programme and is
expected to save the programme $ 100M in cost avoidance (iBASEt, 2005). Despite
these claims, a study of CM within European aerospace manufacturers found that the
majority of current information systems did not adequately cover the requirements for
CM, and that for this reason a combination of paper and IT was necessary. This study

4
found that companies seemed to regard CM as a compliance issue rather than a
business one (Burgess et al. 2005). This finding is echoed in the opinion of a senior
quality manager at the case study company who expressed a desire for the company’s
documentation system to go beyond quality management and be integrated more
closely into its business systems.
Electronic documentation is therefore claimed to improve maintenance and support
operations as well as reducing the cost of CM. Despite these claimed benefits, any
investment in electronic documentation technology is unlikely to be cost effective if
users are not satisfied. The aim of this research, therefore, was to evaluate the
usability and the likely impact on quality and training of a bespoke electronic
documentation system to support an aerospace assembly process.
Research Design
The approach taken was to create a pilot information system comprising a suitable
presentation device and the content to be presented. An evaluation of the pilot system
would be used to indicate the likely benefits of any similar full-scale information
system. Development of the pilot system took place with the full involvement of all
stakeholders, including future users, to improve the likelihood that the any future
system would fulfil their requirements. The pilot system was deployed on the shop
floor for three months while usage was monitored and a formal set of evaluation trials
was carried out. The design of these trials was based on existing theories of
information system usability, as far as these could be applied to the industrial context
of the application.
Kiosk presentation device
As remarked by Setchi and White (2003), web technologies have been shown to be
effective means of deploying technical information. Due to the ubiquity and
consequent low cost of web technologies, and it was decided early in the project to use
a web browser to access electronic content. Two consequences of this decision were
the need to convert some existing electronic content (such as spreadsheets) to a more
suitable format and the possibility of using an Internet kiosk as the hardware for
presentation. Internet kiosks have become commonplace in public spaces such as
banks, hospitals and airports but they are still very unusual in factories. The two big

5
advantages of kiosks over a conventional desktop PC and web browser are security and
usability. Environment and purpose dictate which components are used and the
specification of those components. The kiosk used in this research, which is shown in
Figure 1, comprised a conventional desktop PC within a rugged lockable steel cabinet
equipped with a touch monitor. The keyboard and mouse remained connected but
locked in the cabinet, for administrator use only. Users interacted with the information
content via the touch monitor, accessing web pages via specialist kiosk software called
a Public Browser Interface (PBI). The PBI used in this research was SiteKiosk by
Provisio, which also requires Microsoft™ Internet Explorer and Windows XP to allow
users to interact with web pages. PBI software has many functions that are not present
in desktop computers, in order to provide the additional security and usability that are
essential for 24/7 operation in public spaces, where technicians may not be on-hand for
system support.
Usability features
SiteKiosk contains many features to enhance usability, including:
Object oriented design tools that allow developers to customise the user
interface via ‘skins’ to suit different types of user. The user interface is shown in
Figure 2.
A customisable icon to show users that the device is busy/working.
A configurable ‘attract mode’ to display images when the kiosk is not being
used, such as a sequence of web pages or video clips.
Banner areas for static or cycled graphics.
Support for touch monitors if required, instead of mouse and keyboard.
An optional pop-up visual keyboard for touch text entry.
Security features
SiteKiosk contains many features to enhance security, including:
An application called ‘System Security Manager’ to create a secure operating
environment via a locked down user account. The range of functions available to
users can be configured.
Blocking of certain key-stroke combinations such as ctrl-alt-delete. This is
particularly useful if a hardware keyboard is used.

6
Logging of all events (pages browsed, actions done, applications run etc.) as
they happen, in the client.
Control of browser pop-up windows. These can compromise security and
reduce ease of use, so they can be recognised and closed safely.
A software watchdog that restarts the PC following a crash or system freeze.
Compatibility with hardware watchdog cards for the PC that allow automatic
recovery from serious system errors such as ‘blue screen’ crashes.
Protocol and file type blocking that can prevent invasive protocols and files
from being downloaded onto the system.
URL filtering that allows the system to control pages that a user can access
and what can be printed.
Prevention of users from accessing system files through ‘back door’ prompts
from the Internet, or from running malicious applications.
Remote monitoring of kiosk usage and remote support over the Internet.
Figure 1: Internet kiosk and pilot information system

7
Figure 2: User interface of kiosk-based information system
Kiosk information content
The information accessible via the kiosk was divided into two sections, core and
external. Core information concerned the function of the kiosk as an interactive
electronic technical manual, and this section contained information about operation
and maintenance of the automated assembly machine. The core section is structured
into five sub-sections accessed by five menus. These are Operations, Maintenance,
Tooling & Spares, Documentation, and Reference. The external section contained
information that is not directly relevant to the technical manual, for example
information on people, the local organisation and the company in general. The
external section is also structured into five sub-sections, which are Organisation,
Training, Administration, Contacts and a link to the intranet. Each sub-section
contains further levels of information accessible via menu trees. Both core and
external sections contained content that was stored locally on the kiosk client as well as
providing access to information stored on the corporate intranet.
Core in formation
The first menu in the core section is the operations menu that contains procedural
information in hypermedia form. This information describes the machine alignment

8
procedures, changeover guides, machine recovery procedures, test piece failure
procedures and procedures for defective or missing tooling.
The machine alignment procedures were extracted from the existing operator manual,
which is in PDF format, and recompiled into HTML with hyperlinks to relevant
objects, such as pictures. The main features of the machine alignment procedures are
the step-by-step instructions on how to re-align the machine following a collision.
Unlike the PDF version of the manual each step is accompanied by a video clip
describing how that step should be carried out.
The tool changeover guide was specially created to support one of the most important of
manual tasks on this automated machine and this guide is described in a separate
section below.
Machine recovery procedures were extracted from the existing maintenance manual,
which is in PDF format and recompiled into HTML tables using active server pages.
Machine error messages are displayed along with possible causes for that error and its
solution. To use a machine recovery procedure in response to a control error, a user
enters the error code displayed at the machine controller and the kiosk retrieves the
appropriate recovery procedure from a database. The full solution is given when a user
selects a ‘View’ button. Although most of the information is taken from the
maintenance manual, it is presented in a more usable form and enhanced by the use of
video clips.
The test piece failure procedure is a flowchart-based set of instructions. Each of these
flowcharts is linked to information on failure modes, causes of failure and corrective
actions necessary. There are three different flowcharts for bolts, rivets and cold work.
The second menu in the core section is the maintenance menu that contains sets of
documents in PDF form that have been extracted from the supplier’s maintenance
manuals. Total Productive Maintenance (TPM) documents are also available here. The
third menu in the core section is the tooling and spares menu that allows users to
retrieve information from a tooling database via a search facility. This database
contains data from the machine supplier, for example machine perishables, machine
non-perishables and machine fixture spares. In addition, the organisation’s own cutting
tool database is also accessible from this section. Users can search the database using
various parameters such as tool number, assembly number or drill number and the
search result is presented along with the details of the tools.

9
The fourth and fifth menus allow access to a wide range of procedures documents
such as engineering drawings, manufacturing instructions, working instructions,
machine voltage tables, PLC ladder logic diagrams, tooling maps etc. Many of these
documents are retrieved from the intranet.
Tool changeover guide
The automated riveting machine is very complex and it requires significant manual
intervention for tool changing in between runs of dissimilar fasteners. After each tool
change the machine must be checked to ensure it remains in calibration, and test
coupons must be produced to ensure the process remains capable before the next
fastening run is allowed to proceed. The machine is used with a range of fasteners of
different types and sizes, in a range of different processes. To ensure that operators set up
the machine correctly for each combination of process, fastener and wing panel, they
are required to follow a log sheet that describes the task and gives information
concerning the tooling and test coupon required. Operators must also enter related
information into the machine controller, as described in the documentation. To carry
out a tool change, operators must identify the tooling numbers, the fastener size and
type and the numbers of relevant CNC programs. This information is held in 57 pages of
paper documentation of which the format and information structure is inconsistent,
ambiguous and difficult to understand. The use of such paper documents makes it
expensive for the organisation to maintain the quality of the riveting process, the
changeovers take longer than they need to and some documents are not fully used by all
operators. Although the automated process is under CNC control, the manual
interventions are controlled by paperwork, which the hypermedia tool changeover
guide was designed to replace.
As well as consolidating existing information in a more usable form, the changeover
guide was intended to be a training application for inexperienced operators, since
experienced operators were being transferred to a new manufacturing facility.
Hypermedia technology is very commonly used for computer-based training (Setchi
and White, 2003) and in this context, the media chosen were movies, full colour still
images, engineering drawings (in PDF format) as well as text.
A formal method known as hierarchical task analysis (Kirwan and Ainsworth, 1992)
was used to structure the information in a suitable manner to support changeover
10
operations. Hierarchical task analysis (HTA) allows the analyst to identify when
operators must do things, how quickly they should do them and what kind of
difficulties they may have. Despite the differences between operations for different
types of fastener, it was possible to standardise the operations to a large extent and to
present a consistent order of operations to the user. By working with the operators, it
was possible to agree the ‘one best way’ of changing tooling and to present this in the
hypermedia guide.
The full set of around thirty changeover tasks was drawn up and these were grouped
into six main headings which are consistent for each fastener:
1. Jog machine
2. Tool change
3. Calibration
4. Test piece production
5. Test piece check
6. Panel production
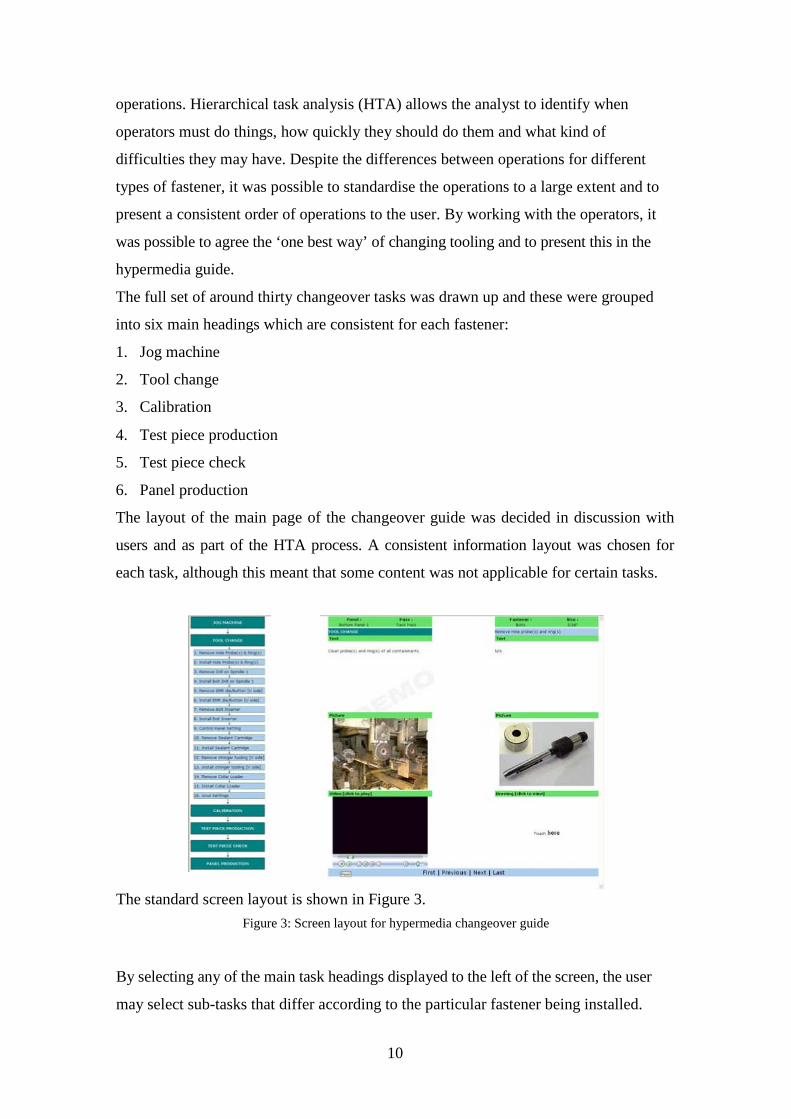
The layout of the main page of the changeover guide was decided in discussion with
users and as part of the HTA process. A consistent information layout was chosen for
each task, although this meant that some content was not applicable for certain tasks.
The standard screen layout is shown in Figure 3.Figure 3: Screen layout for hypermedia changeover guide
By selecting any of the main task headings displayed to the left of the screen, the user
may select sub-tasks that differ according to the particular fastener being installed.

11
The decision to present a consistent menu structure at task level, with different content
at sub-task level according to the fastener, means that before viewing the main screen, the
user must select the type of fastener for which the machine is being set up. This is done
via a set of nested drop down menus with which users select the particular machine,
panel, type of operation, fastener and fastener size. Having made a selection, the user
must validate it before the tooling information screen is presented.
Theoretical basis for evaluation
According to Bawden (1990), the evaluation of an information system can be carried
out at any one of six levels. In order of increasing complexity, these are:
1. Cost - a measure in financial terms of the resources expended on a service.
2. Effectiveness - a measure of the extent to which users’ needs are satisfied.
3. Benefit - a measure of the value of the information supplied. This is very difficult
to quantify so most studies use some surrogate measure, such as ‘perceived user
satisfaction’, or some observable aspect of user behaviour.
4. Cost-effectiveness - a comparison between the cost of a system and some level of
effectiveness.
5. Cost-benefit - a comparison between cost and overall benefits.
6. Cost-performance-benefit - a view of the entire set of interrelationships between
information system cost, performance, and benefits.
In this case, although the cost of the pilot system could be measured, at best it would
only provide an insight into the typical cost of a full-scale rollout. Nevertheless,
estimates were made of both the costs and the benefits of the information system, and
these are described later. It was also recognised that whatever the benefits of the
information system, they would not actually be realised if users did not choose to use
the system. Since the pilot system was a research instrument and not an officially
sanctioned information system, its level of use could not be assumed to indicate the
likely use or effectiveness of a full-scale system. It was therefore necessary to estimate
the likely effectiveness of a full-scale information system by using theories that relate
user performance to information system features and by carrying out a structured
system evaluation.

12
The Technology-to-Performance Chain (TPC) model of Goodhue and Thompson
(1995) relates the features of an information system to operational performance. The
model incorporates insights from two complementary streams of research; utilisation
focused research and Task-Technology-Fit (TTF) focused research. In the former, user
attitudes are predictors of utilisation, whereas in the latter TTF is a predictor of
performance. TPC theory claims that for an information technology to have a positive
impact on individual performance, the technology must be both utilised and be a good fit
with the tasks it supports. The questionnaire-based method of Goodhue and Thompson
(1995) was used to evaluate TTF, whilst methods based on the Technology Acceptance
Model (TAM) of Davis (1989) were used to evaluate likely utilisation. According to
TAM, the user’s cognitive response to the features of an information system can be
represented simply by the perceived usefulness (U) of the system and its perceived ease
of use (EOU). Both can be measured using questionnaires and both affect positively the
user’s attitude towards use of the system, and therefore the actual system use.
TTF can be represented by eight theoretical constructs which can also be measured by
questionnaires. These are data quality, locatability of data, authorisation to access data,
data compatibility (between systems), training and ease of use, production timeliness,
systems reliability and IS relationship with users.
For this research, it was decided to design a questionnaire to evaluate perceived
usefulness, perceived ease of use and the one factor from TTF theory that was
considered key to success of the application, namely data quality. According to
Goodhue and Thompson (1995), data quality depends on data currency, the right data
and the right level of detail. Since it was known that some of the data in the pilot
system was uncontrolled, users were asked only whether the data presented were
correct and at the right level of detail. The emphasis on data quality was because the
main purpose of the system was to reduce the burden of configuration management,
which would only be possible if the quality of the data was considered good and if the
system was actually used. The secondary aim of the system was to improve training, so
additional questions were designed to evaluate the impact of the system on training.
13
Task scenarios and questionnaires
Seven task scenarios were developed based on analyses of users and tasks. Scenarios 1
to 3 are related to tool changeover, scenario 4 is related to test coupon inspection,
scenario 5 is a search for tooling information, scenario 6 is a search for M and G codes
for the machine and scenario 7 is a search within the documentation related to machine
operations. Following the completion of each task scenario, a questionnaire with four
semantic differential scale questions was used to gauge users’ feelings about their
experience of using the information system. In each case, the scale used was from 1 to
7, where 1 meant difficult, confusing, non-intuitive or frustrating, and 7 meant easy,
clear, intuitive or satisfying. After completion of the task scenarios, users were given a
second questionnaire to evaluate their perceptions of ease of use, usability, data quality
and impact on training. Questions were in the form of sets of statements with which
users had to record the extent to which they agreed or disagreed. Again, the users’
responses were on a scale of 1 to 7 where 1 meant ‘strongly disagree with the
statement’ and 7 meant ‘strongly agree with the statement’. Questions are based on a
selection of the initial scale items described by Davis (1989) that were designed to
measure ‘ease of use’ and ‘usefulness’ and a selection of items described by Goodhue
and Thompson (1995) to measure ‘right data’ and ‘right level of data’. In both cases
questions were selected according to their relevance to the tasks that the information
system was designed to support, with the wording modified slightly to suit. A typical
modification was to replace all references to ‘electronic mail’ with ‘the program’. The
three questions on training were designed by the author to evaluate the information
system as a training aid since this was considered important by the case study
organisation. The complete usability questionnaire is shown in Table 1. Note that the
purpose of this questionnaire is to evaluate an information system in a factory
environment using techniques based on those that have been rigorously tested by
information systems researchers. It was not intended to demonstrate the statistical
reliability and validity of the questions themselves since the sample size would be far
smaller than that used by Davis (for example) and test environment was difficult to
control, due to production pressures. Instead, the questionnaire was intended to indicate
whether an IS similar to the pilot system would actually be used, whether it would
support the activities carried out by users and whether it would enhance training.

14
Index Evaluation Statement
EOU1 I find the program cumbersome to use
EOU2 Learning to use the program is easy for me
EOU3 Interacting with the program is frustrating for me
EOU4 I find it takes a lot of effort to become skilful at using the program
EOU5 My interaction with the program is clear and understandable
EOU6 I found it easy to get the program to do what I want it to do
EOU7 Overall, I find the program easy to use
U1 The program will make it easier for me to do my job
U2 Using this program will save me time
U3 The program enables me to accomplish tasks more quickly
U4 The program supports critical aspects of my job
U5 Using the program would improve the quality of the task I do.
U6 Using the program would enhance my effectiveness on the job
U7 Overall, I find the program is useful in my job
DQ1 The data in the program is pretty much what I need to carry out my work.
DQ2 The program is missing critical data that would be very useful to me in my job.
DQ3 The program data is at an appropriate level of detail and sufficient for my tasks.
DQ4 The structured task procedure could prevent human error significantly.
T1 The program provides useful and sufficient information for new operators toperform their tasks.
T2 The program allows new operators to learn themselves, easily and without anyadditional training
T3 The program with pictures & videos provides better communication to achievethe task goal.
Table 1: Questionnaire used to evaluate pilot information system

15
Pilot testing the questionnaires
Pilot testing an evaluation questionnaire is important because it can identify problems
with both the information system and/or the experimental method. According to Rubin
(1994) the pilot test can be used to refine a questionnaire and provide ideas for further
questions, an identification of any questions that are superfluous and a sense of how long
it takes to fill out the questionnaire.
The first pilot test was held at Cranfield University, using two students. The results
were disappointing, with each evaluation taking about three hours. Both students
commented that most of the subjects in the questionnaire were not familiar to them
and that the task scenarios were too difficult. It was decided not to change the
evaluation method on the basis of this pilot study because the students did not
adequately represent the potential end users of the system. However, some system
deficiencies were identified and rectified.
The second pilot test was held at the factory, involving one participant from the factory
support team and one participant from the manufacturing system engineering function.
Both participants have three year’s work experience on the machine and they were
familiar with the contents and operation of the information system. It was felt that the
familiarity of the participants with the system and their stake in its success might affect
the results of the test, so the results were used mainly as a reference, as a check of the
questionnaire and to estimate the duration of the test. Each test took approximately one
hour to complete. As a result of this pilot, some of the wording used in the
questionnaires was modified. Table 1 shows the final version of the questionnaire.
Results
The trials took place over three days in August 2004 and involved ten users from three
of the five shifts that worked with the assembly machine. All were either machinists or
team leaders and all were potential users of a future information system. The sample size
was chosen to be as large as possible given that relatively few employees had used the
system regularly and there was limited time available to demonstrate the system to
those who were unfamiliar with it. As such it the results are unlikely to be statistically
valid and average scores are considered adequate to judge the information system. A
larger sample size and a controlled test environment would

16
have allowed meaningful statistical analysis of the test data but that was not possible
in the factory. Users’ feelings about the use of the information system following each
task scenario are shown in Figure 4.
Figure 4: Users’ feelings following each task scenario
Figure 5: Average measures of perceived ease of use
Overall, I find the program is useful in my job
Using the program would enhance my effectiveness on the job
Using the program would improve the quality of the task I do.
The program supports critical aspects of my job
The program enables me to accomplish tasks more quickly
Using this program will save me time
The program will make it easier for me to do my job
1 2 3 4 5 6 7
Figure 6: Average measures of perceived usefulness
Difficult / Easy
Confusing / Clear Non-
Intutive / Intuitive
Frustrating / Satisfying
Overall, I find the program easy to use
I found it easy to get the program to do what I want it to do
My interaction with the program is clear and understandable
I find it takes a lot of effort to become skilful at using the program
Interacting with the program is frustrating for me
Learning to use the program is easy for me
I find the program cumbersome to use
1 2 3 4 5 6 7

17
Figure 7: Average measures of perceived data quality
The program with pictures &videos provides better
communications to achieve thetask goal.
The program allows the newoperators to learn themselves
easily without any additionaltraining
The program provides usefuland sufficient information for
new operators to perform their
tasks.
1 2 3 4 5 6 7
Figure 8: Average measures of perceived impact on training
The average perceptions of the ease of use and usefulness of the system are shown in
Figures 5 and 6 respectively. The average perceptions of the quality of information in
and its impact upon training are shown in Figure 7 and 8 respectively.
Comments and feedback were collected from users during the usability trials. These
are felt to be important sources of qualitative information, and a typical selection of
these is given below:
“After practice, very beneficial to me. Everything at finger tips”.
“Good information. When support teams are not available, it is on the system”. “Well
presented and very informative, after practice it will become second nature”. “It
seems a very helpful system; it will help/benefit new and old operators. Overall, very
useful”.
“Once I have found my way around it, I feel it will become very useful”.
“Doing the job faster does not enter into this exercise, doing the job correctly and to
procedure is paramount”.
The structured task procedurecould prevent human error
significantly.
The program data is at anappropriate level of detail and
sufficient for my tasks.
The program is missing criticaldata that would be very useful
to me in my job.
The data in the program ispretty much what I need to carry
out my work.

18
“The system is useful provided the programs are put on each LVER machine”.
Typical of the more negative comments are:
“The tooling information table could be shaded to make data separate and clear”.
“Could do with bigger buttons, fat fingers!”
“The cleaning sub-task should be in Tool Change task, not in Jog Machine task”. “I
found the system quite slow at first but it became easier with more experience”.
Discussion
The results for both perceived ease of use and perceived usefulness are generally very
encouraging. According to TAM theory, the results suggest that if a system like the
pilot system were deployed, it would actually be used by factory workers. The two
lowest scores for perceived usefulness related to quality and task time. These questions
were discussed with test subjects in a debriefing that followed the trials. The reasons for
the low scores are:
Some operators felt that the system could not improve the quality of their
work because this depends on the machine. One operator gave this question a
low score as he felt that his quality level was already at 100%.
Some operators feel that the system cannot enable them to carry out their tasks
more quickly because it is only a prototype system in which the information is
not certified or controlled.
The results for data quality are positive. Users feel that the data provided in the system
are at the right level of detail and are sufficient for the related tasks. There was a strong
belief that the structured task procedure could reduce human error significantly.
Regarding training, the participants felt that the system was useful and sufficient for
new operators to perform their tasks. They also felt that it could reduce the training
requirement for them. One comment that explained the low score for question 2 was
“New labour would struggle with information, it is easier to be shown than it is to read.
It would be useful as a training aid and to jog the memory of new labour”. This
comment may also explain why the pilot tests at Cranfield University were
disappointing.

19
Cost benefits
The fixed costs of the information system are dominated by the cost of content creation,
as recognised by Crowder et al. (1999). In this case the fixed cost of the kiosk hardware
and software (£2613) was dwarfed by the fixed cost of content creation and
configuration, estimated to be up to £62,000. The variable cost of content maintenance
was estimated as the cost of maintenance of the content that was created specifically for
the kiosk system, excluding that which exists on the intranet. Annual variable costs
were estimated to be up to £8,000. Annual benefits are estimated from literature and
experience in terms of best case, worst case and expected savings. Benefits might be
expected in the following areas:
Training time (a reduction of at least 10%)
Paper distribution time (a reduction of at least 75%)
Printing requirements (a reduction of at least 40% since some printing is
expected due to the need for portable information)
Information search time (a reduction of at least 50%)
Increased quality (a reduction of at least 10% fewer bad setups, etc.)
Reduced mean time to repair (a reduction of at least 10%)
Reduced setup time (a reduction of at least 5%)
Based on figures supplied by the airframe manufacturing organisation, total annual
benefits are estimated to be at least £110,000. The majority of these savings were due to
the reduction in mean time to repair, which supports the view that maintenance is
indeed the most suitable application for this type of information system (Greenough et al.
2001). This gives a worst case return on investment of 11 months. The best case was 2
months. Full details of cost benefits will be reported in a future paper.
Conclusions
The development of a web-based information system to support the users of a complex
automated machine tool has demonstrated the benefits that such a system can make
possible. Furthermore, this use of kiosk technology in this research has shown how the
use of conventional information technology from the service sector can have benefits in
manufacturing. Crucially, this research supports the view that users will accept such
technology and will use it in preference to other sources of information,

20
which is essential for control of documentation. Although the aim of the developers was
to ease the burden of configuration management, the main financial benefit of the
system may in fact be the likely reduction in mean time to repair the machine tool in the
case of breakdown. It is felt that system success depends on user involvement during
the authoring process, a structured design methodology such as hierarchical task
analysis (HTA) and the availability of documents in a form suitable for access via a
browser. It is recommended that in future, organisations that wish to make
manufacturing process information available electronically do so using web
technologies. This will require the creation of teams of technical writers that combine
the traditional skills of manufacturing engineering with those of the web creation and
content management.
There are many improvements that could be made to the information system described
here. It could be linked more closely to the machine tool so that error messages from
the machine controller might automatically trigger the display of a relevant content at
the kiosk. The information system might be integrated with devices for mobile data
presentation and collection, which would be particularly useful on a very large machine
like the wing assembly machine used here. The system might also be enhanced with
some kind of expert fault diagnosis system, or linked to systems supporting similar
machines to allow users to collaborate in troubleshooting. The evaluation methods used
are felt to be particularly useful for future developers of industrial hypermedia
information systems.
Acknowledgements. The authors wish to acknowledge the support of Airbus UK,
particularly the manufacturing engineers and operators at the Broughton plant for
their help in this research.
References
Bawden, D. (1990), ‘User-Oriented Evaluation of Information Systems and Services’, Gower Publishing Company
Limited, England.
Burgess, T.F., McKee, D. and Kidd, C. (2005), ‘Configuration management in the aerospace industry; a review of
industry practice’, International Journal of Operations and Production Management, Vol. 25 No. 3, pp. 290-301.
Crowder, R., Hall, W., Heath, I. and Wills, G. (1999), ‘Integration of manufacturing information using open
hypermedia’, Computers in Industry, Vol. 38, pp. 31-42.
Davis, F. D. (1989), ‘Perceived usefulness, ease of use and user acceptance of information technology’, MIS
Quarterly, Vol. 13, No. 3, pp. 3 19-342.

21
Goodhue, D. L. and Thompson, R. L. (1995), ‘Task-technology fit and individual performance’, MIS Quarterly, Vol.
19, No. 2, pp. 2 13-236.
Greenough, R.M., Fakun, D. and Kay, J.M. (2001), ‘Development of a digital manual for a manufacturing system - a
case study’, Integrated Manufacturing Systems, Vol. 12, No. 6 , pp. 387-393.
Hogan, B.J. (2005), ‘Automation speeds A380 wing assembly’, Manufacturing Engineering, Vol. 134, No. 3, pp.
121-13 1.
iBASEt. (2005), http://www.ibaset.com/solumina/casestudies/boeingc17.html (accessed 2nd February 2005).
Kirwan, B. and Ainsworth, L.K. (1992), ‘A Guide to Task Analysis’, Taylor & Francis, London.
Litman, E.F. (1996), ‘CALS – a strategy for business engineering’, Logistics Information Management, Vol. 9,
No.1, pp. 18-23.
Rubin, J. (1994), ‘Handbook of Usability Testing: How to Plan, Design, and Conduct Effective Tests’, John Wiley &
Sons, Inc., New York.
Seattle Post-Intelligencer (2004), ‘Boeing, American Airlines settle fines’, available online at
http://seattlepi.nwsource.com (accessed 7th July 2005).
Setchi, R. and White, D. (2003), ‘The development of a hypermedia maintenance manual for an advanced
manufacturing company’, International Journal of Advanced Manufacturing Technology, Vol. 22, pp. 456-464.
Ventura, C.A. (1988), ‘Why Switch from Paper to Electronic Manuals?’, In: Proceedings of the ACM conference
on document processing systems, Santa Fe, New Mexico, December 5-9, 1988.