An integrated stable isotope study of plants and animals from Kouphovouno, southern Greece: a new...
15
An integrated stable isotope study of plants and animals from Kouphovouno, southern Greece: a new look at Neolithic farming Petra Vaiglova a, * , Amy Bogaard a , Matthew Collins b , William Cavanagh c , Christopher Mee d , Josette Renard e , Angela Lamb f , Armelle Gardeisen g , Rebecca Fraser a a Research Laboratory for Archaeology and the History of Art, University of Oxford, Dyson Perrins Building, South Parks Road, Oxford OX1 3QY, United Kingdom b Department of Archaeology, University of York, Wentworth Way, York YO10 5DD, United Kingdom c Department of Archaeology, University of Nottingham, University Park, Nottingham NG7 2RD, United Kingdom d School of Archaeology, Classics and Egyptology, University of Liverpool,12-14 Abercromby Square, Liverpool L69 7WZ, United Kingdom e Universté Paul-Valéry, Montpelier 3, Route de Mende, F-34199 Montpellier, France f NERC Isotope Geosciences Laboratory, British Geological Survey, Keyworth, Nottingham NG12 5GG, United Kingdom g UMR 5140 - CNRS - UM3, Labex Archimède, Montpellier, France article info Article history: Received 18 July 2013 Received in revised form 19 October 2013 Accepted 21 October 2013 Keywords: Stable isotopes Carbon Nitrogen ZooMS Archaeobotany Archaeozoology Aegean Neolithic abstract This paper presents the first study that combines the use of ancient crop and animal stable isotopes (carbon and nitrogen) and Zooarchaeology Mass Spectrometry species identification (ZooMS) for reconstructing early farming practices at Kouphovouno, a MiddleeLate Neolithic village in southern Greece (c. 5950e4500 cal. BC). Debate surrounding the nature of early farming predominantly revolves around the intensity of crop cultivation: did early farmers move around the landscape while practicing temporary farming methods such as slash and burn agriculture or did they create more permanent fields by investing high labor inputs into smaller pieces of land that produced higher crop yields? The need to address these questions using a direct assessment of the intensity and scale of cultivation is apparent, and an integrated stable isotope approach provides such an opportunity. The results of this study support the model of small-scale mixed farming, where crop cultivation and animal husbandry are closely in- tegrated. The farmers directed their intensive management towards crops grown for human consump- tion (free-threshing wheat), while growing fodder crop (hulled barley) more extensively. Pulses were cultivated under a high-manuring/high-watering regime, likely in garden plots in rotation with free- threshing wheat. The diets of the livestock enable us to investigate which parts of the landscape were used for browsing and grazing and indicate that animal management changed in the Late Neolithic. The sheep and goats were now kept in smaller numbers and grazed together and new pasture grasses may have been sought for the grazing of cattle. This study demonstrates that beyond its applicability for palaeodietary reconstruction, analysis of stable isotopes of archaeological crop and animal remains has important implications for understanding the relationship between humans, plants and animals in an archaeological context. Ó 2013 Elsevier Ltd. All rights reserved. 1. Introduction Recent investigations in the field of stable isotope analysis have demonstrated the potential of obtaining direct evidence of ancient agricultural practices from d 15 N and d 13 C analysis of archae- obotanical remains (Araus et al., 1997, 1999; Bogaard et al., 2007, 2013; Fraser et al., 2011, 2013a; Kanstrup et al., 2011, 2012, in press; Lightfoot and Stevens, 2012; Wallace et al., 2013). Analysis of mod- ern crops grown under a range of experimental and traditional farming regimes has shown that d 15 N and d 13 C values reflect crop growing conditions, such as soil nitrogen composition and crop water availability. In addition, some of this work (Bogaard et al., 2007, 2013; Fraser et al., 2011, 2013a, 2013b; Lightfoot and Stevens, 2012) has highlighted the fact that where possible, the isotopes of plants must be measured alongside the isotopes of human and faunal re- mains in order to better understand ancient palaeodiets. The current paper builds on this work by integrating the analysis of ancient crop and faunal remains in order to explore the nature of agricultural economy at the MiddleeLate Neolithic site of Kou- phovouno (5950e4500 cal. BC). It has long been argued that management of domestic plants and animals in a farming context * Corresponding author. Tel.: þ44 (0)1865 285222. E-mail address: [email protected] (P. Vaiglova). Contents lists available at ScienceDirect Journal of Archaeological Science journal homepage: http://www.elsevier.com/locate/jas 0305-4403/$ e see front matter Ó 2013 Elsevier Ltd. All rights reserved. http://dx.doi.org/10.1016/j.jas.2013.10.023 Journal of Archaeological Science 42 (2014) 201e215
Transcript of An integrated stable isotope study of plants and animals from Kouphovouno, southern Greece: a new...
lable at ScienceDirect
Journal of Archaeological Science 42 (2014) 201e215
Contents lists avai
Journal of Archaeological Science
journal homepage: http : / /www.elsevier .com/locate/ jas
An integrated stable isotope study of plants and animals fromKouphovouno, southern Greece: a new look at Neolithic farming
Petra Vaiglova a,*, Amy Bogaard a, Matthew Collins b, William Cavanagh c,Christopher Mee d, Josette Renard e, Angela Lamb f, Armelle Gardeisen g, Rebecca Fraser a
aResearch Laboratory for Archaeology and the History of Art, University of Oxford, Dyson Perrins Building, South Parks Road,Oxford OX1 3QY, United KingdombDepartment of Archaeology, University of York, Wentworth Way, York YO10 5DD, United KingdomcDepartment of Archaeology, University of Nottingham, University Park, Nottingham NG7 2RD, United Kingdomd School of Archaeology, Classics and Egyptology, University of Liverpool, 12-14 Abercromby Square, Liverpool L69 7WZ, United KingdomeUniversté Paul-Valéry, Montpelier 3, Route de Mende, F-34199 Montpellier, FrancefNERC Isotope Geosciences Laboratory, British Geological Survey, Keyworth, Nottingham NG12 5GG, United KingdomgUMR 5140 - CNRS - UM3, Labex Archimède, Montpellier, France
a r t i c l e i n f o
Article history:Received 18 July 2013Received in revised form19 October 2013Accepted 21 October 2013
Keywords:Stable isotopesCarbonNitrogenZooMSArchaeobotanyArchaeozoologyAegeanNeolithic
* Corresponding author. Tel.: þ44 (0)1865 285222.E-mail address: [email protected] (P. V
0305-4403/$ e see front matter � 2013 Elsevier Ltd.http://dx.doi.org/10.1016/j.jas.2013.10.023
a b s t r a c t
This paper presents the first study that combines the use of ancient crop and animal stable isotopes(carbon and nitrogen) and Zooarchaeology Mass Spectrometry species identification (ZooMS) forreconstructing early farming practices at Kouphovouno, a MiddleeLate Neolithic village in southernGreece (c. 5950e4500 cal. BC). Debate surrounding the nature of early farming predominantly revolvesaround the intensity of crop cultivation: did early farmers move around the landscape while practicingtemporary farming methods such as slash and burn agriculture or did they create more permanent fieldsby investing high labor inputs into smaller pieces of land that produced higher crop yields? The need toaddress these questions using a direct assessment of the intensity and scale of cultivation is apparent,and an integrated stable isotope approach provides such an opportunity. The results of this study supportthe model of small-scale mixed farming, where crop cultivation and animal husbandry are closely in-tegrated. The farmers directed their intensive management towards crops grown for human consump-tion (free-threshing wheat), while growing fodder crop (hulled barley) more extensively. Pulses werecultivated under a high-manuring/high-watering regime, likely in garden plots in rotation with free-threshing wheat. The diets of the livestock enable us to investigate which parts of the landscape wereused for browsing and grazing and indicate that animal management changed in the Late Neolithic. Thesheep and goats were now kept in smaller numbers and grazed together and new pasture grasses mayhave been sought for the grazing of cattle. This study demonstrates that beyond its applicability forpalaeodietary reconstruction, analysis of stable isotopes of archaeological crop and animal remains hasimportant implications for understanding the relationship between humans, plants and animals in anarchaeological context.
� 2013 Elsevier Ltd. All rights reserved.
1. Introduction
Recent investigations in the field of stable isotope analysis havedemonstrated the potential of obtaining direct evidence of ancientagricultural practices from d15N and d13C analysis of archae-obotanical remains (Araus et al., 1997, 1999; Bogaard et al., 2007,2013; Fraser et al., 2011, 2013a; Kanstrup et al., 2011, 2012, in press;Lightfoot and Stevens, 2012; Wallace et al., 2013). Analysis of mod-ern crops grown under a range of experimental and traditional
aiglova).
All rights reserved.
farming regimes has shown that d15N and d13C values reflect cropgrowing conditions, such as soil nitrogen composition and cropwater availability. In addition, someof thiswork (Bogaard et al., 2007,2013; Fraser et al., 2011, 2013a, 2013b; Lightfoot and Stevens, 2012)has highlighted the fact that where possible, the isotopes of plantsmust be measured alongside the isotopes of human and faunal re-mains in order to better understand ancient palaeodiets.
The current paper builds on this work by integrating the analysisof ancient crop and faunal remains in order to explore the nature ofagricultural economy at the MiddleeLate Neolithic site of Kou-phovouno (5950e4500 cal. BC). It has long been argued thatmanagement of domestic plants and animals in a farming context

P. Vaiglova et al. / Journal of Archaeological Science 42 (2014) 201e215202
can be functionally interdependent (Bogaard, 2004a, 2004b, 2005;Bogaard and Isaakidou, 2010; Byrd, 2000; Flannery, 1969; Halstead,1989). Animals can be used to regulate and promote crop produc-tivity as well as for “indirect storage” of surplus grain and crops/arable fields can serve as fodder and graze for the animals. In lightof this view, it has been suggested that early farming systems inGreece, and in fact the rest of Europe, employed some version of asmall-scale mixed farming economy (Bogaard, 2004a, 2004b, 2005;Halstead, 1996, 2000, 2006). Thus, the aim of this paper is toinvestigate if the stable isotope data support or refute an intensivemixed farming model and if the changes in pottery styles observedbetween the Middle and Late Neolithic were accompanied by shiftsin agricultural management.
1 http://web.udl.es/usuaris/x3845331/AIRCO2_LOESS.xls.
2. Methodological background
Stable isotope signatures of archaeological material (such asbone collagen or charred plant material) are useful for recon-structing not only past human and animal diets, but practices suchas land use and agricultural management (for examples of palae-odietary studies, see Chisholm et al., 1982; Richards et al., 2003;Schulting and Richards, 2002; Schwarcz et al., 1985). The stableisotope values of carbon and nitrogen, expressed as d13C and d15N,represent the ratios of the heavier to lighter isotopes (13C:12C and15N:14N) in a given sample compared to internationally set stan-dards (PeeDee Belemnite for carbon and AIR for nitrogen). The ra-tios are expressed in parts per thousand, &, and are calculatedusing the following equation:
d13Cð&Þ ¼
d13Csample
d13Cstandard� 1
!� 1000
For a comprehensive review of the technique, see Lee-Thorp(2008), O’Connell and Hedges (1999), Schoeninger and Moore(1992), Schwarcz and Schoeninger (1991).
Plants andanimals obtain carbon andnitrogen throughmetabolicprocesses such as breathing, photosynthesis and digestion. Theseprocesses are governed by principles of biochemical fractionationthat determine the proportions in which the different isotopes ofeach element get assimilated into the organisms' tissues (such asanimal muscles/bones, and crop grain/straw). When another or-ganism consumes those tissues, the isotope chemistry of the con-sumer reflects the distinct signature of the food source plus anenrichment factor. Thus, herbivores have higher d15N and to a lesserextentd13Ccompared to theplant foods theyconsumeandcarnivoreshave higher values than the herbivores they eat (Bocherens et al.,1995; Chisholm et al., 1982; DeNiro and Epstein, 1978; Hedges,2006; Hedges and Reynard, 2007; Lee-Thorp et al., 1989; Sillenet al., 1989; Vogel and van der Merwe, 1977). Collagen d13C and d15Nvalues predominantly reflect the protein portion of the consumers’diets (Ambrose and Norr, 1993; Chisholm et al., 1982), with manyamino acids being directly assimilated from the food source(Chikaraishi et al., 2009; Corr et al., 2005; McCullagh et al., 2006).
The d15N of crops reflects the isotopic composition of their nitro-gen source. N2-fixers, such as lentils and other pulses, host Rhizobiumbacteria in the nodules of their roots, which convert atmosphericnitrogen to ammonium ions and pass them to the plant or sur-rounding soil. This process does not cause substantial fractionationand as a result, N2-fixers have d15N values closer to the value of at-mospheric nitrogen, which is 0& (Bernhard, 2012; Delwiche et al.,1979; Högberg, 1997). Non-N2-fixers, such as cereals, obtain theirnitrogen from the soil and are thusdirectlyaffected by the factors thatcause soil 15N enrichment discussed below (Bogaard et al., 2007;Fraser et al., 2011; Kanstrup et al., 2011, in press). Although in
traditional farming contexts, N2-fixers fix mostly atmospheric nitro-gen, they are also affected by manuring, albeit to a lesser extent thannon-N2-fixers (Fraser et al., 2011). A possible mechanism for this isdirect uptake of amino acids present in soil (as has been found to bethe case in the non-leguminous wheat (Hill et al., 2011)).
Soil 15N enrichment can be caused by natural factors such as soilsalinity (Ambrose, 1991; Heaton, 1987; although for oppositeargument see Yousfi et al., 2010), sea-spray of nitrates (Heaton,1987; Virginia and Delwiche, 1982), and denitrification (Högberg,1997; Tiedje et al., 1982). Significant denitrification occurs inwaterlogged conditions such as marshlands. Elevated d15N valueshave also been correlated with decreased precipitation in experi-mental and field studies in arid regions in South Africa, thesouthwestern United States, Namibia, and the Kenya Rift Valley(Ambrose, 1991; Evans and Ehleringer, 1993, 1994; Heaton, 1987;Heaton et al., 1986; Lopes and Araus, 2006; Sealy et al., 1987;Swap et al., 2004). Aranibar et al. (2004) observed an aridity ef-fect across a precipitation gradient (978e230 mm of annual rain-fall) in the Kalahari desert, but argue that 15N enrichment in aridclimates may be more affected by unpredictability of precipitationrather than lower overall annual rainfall levels. Fraser et al. (2011)assert that the aridity effect may be buffered through crop man-agement and therefore invisible in agricultural settings.
Anthropogenic factors that cause 15N enrichment include mid-denning (cf Guttmann, 2005; Bogaard, 2012), manuring (Bogaardet al., 2007; Fraser et al., 2011; Kanstrup et al., 2011, in press),clear-cutting of forests (Pardo et al., 2002) and burning of fossilfuels (Templer et al., 2007).
d15N from animal and human collagen can be used to assess thetrophic level of the individual, which is an indication of where theindividual was situated in the food chain (DeNiro and Epstein,1981;Hedges and Reynard, 2007; Minagawa and Wada, 1984). For manyyears, the widely accepted value for isotopic spacing between dietand consumer tissue has been 3e5& (Ambrose, 2000; Bocherensand Drucker, 2003; Hedges and Reynard, 2007), but recent workon isotope spacing in humans by O’Connell et al. (2012) suggeststhat this valuemay be higher, between 4.6 and 6&. Taking all of thiswork into account and assuming that trophic enrichment forhumans is comparable to that for domestic animals, in this study,we use 5 � 1& as an approximation of tissue-diet spacing.
Plant d13C values are determined by the d13C of atmospheric CO2at the time of the plant’s growth as well as the degree of frac-tionation that occurs during photosynthesis. Since the concentra-tion of CO2 in the atmosphere has fluctuated over time, differencesin plant d13C values from different periods do not simply reflectgrowing conditions and fractionation, but the isotopic compositionof the carbon source as well. For this reason, when comparing cropd13C across different periods, the values need to be converted intoD13C, which reflect the carbon isotope discrimination independentof atmospheric CO2 concentration (Farquhar et al., 1982, 1989;Jackson et al., 1994; Wallace et al., 2013). The conversion is donefollowing the principles outlined by Farquhar et al. (1989) and usingthe equation:
D13Cð&Þ ¼ d13Cair � d13Cplant
1þ d13Cplant
!
d13Cair is the isotopic composition of atmospheric CO2 at the timethat the plant was growing. Its values have been preserved insequence in Antarctic ice-cores and can be estimated using theAIRCO2_LOESS data calibrator1 for the time period between 16,100
P. Vaiglova et al. / Journal of Archaeological Science 42 (2014) 201e215 203
B.C.E. and 2003 C.E. (Cleveland, 1979; Ferrio et al., 2005; Franceyet al., 1999; Indermühle et al., 1999; Lauenberger et al., 1992).Converting d13C into D13C changes the directionality of the effect(i.e. higher d13C values equate to lower D13C values), and the sign(negative d13C values become positive).
Carbon isotope discrimination in plants, encoded in their D13C,is driven by the photosynthetic mechanism. Many factors areinvolved in this process (including light intensity, temperature, andconcentration of CO2 in the atmosphere), but it is argued that insemi-arid climates, D13C is most notably affected by water avail-ability (Farquhar et al., 1982, 1989; Farquhar and Richards, 1984;Wallace et al., 2013). The amount of water available controls theaction of the plant stomata (pores on the surface of the plants),which affects how the CO2 is used during photosynthesis. Whensufficient amounts of water are available, the plant stomata stayopen for longer periods of time and CO2 is replenished duringphotosynthesis so that more of the lighter 12C (which reacts morequickly in chemical reactions) is available for assimilation. Whenthe water supply is limited, the plant periodically closes its stomatato conserve the water. This causes the CO2 to be recycled and moreof the heavier 13C to be assimilated (Farquhar et al., 1982, 1989;O’Leary, 1981; Smith et al., 1976; Wallace et al., 2013). Measure-ment of D13C of crops is thus instrumental for inferring the waterstatus of the crops during their growth season.
3. The site
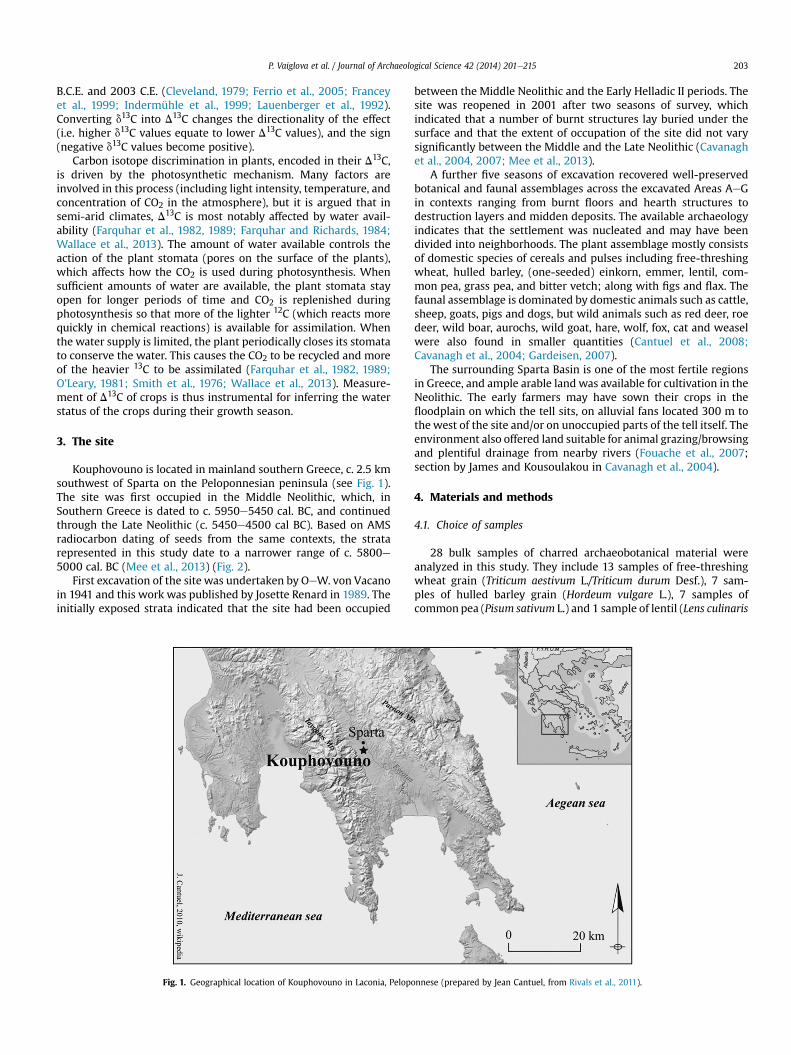
Kouphovouno is located in mainland southern Greece, c. 2.5 kmsouthwest of Sparta on the Peloponnesian peninsula (see Fig. 1).The site was first occupied in the Middle Neolithic, which, inSouthern Greece is dated to c. 5950e5450 cal. BC, and continuedthrough the Late Neolithic (c. 5450e4500 cal BC). Based on AMSradiocarbon dating of seeds from the same contexts, the stratarepresented in this study date to a narrower range of c. 5800e5000 cal. BC (Mee et al., 2013) (Fig. 2).
First excavation of the site was undertaken by OeW. von Vacanoin 1941 and this work was published by Josette Renard in 1989. Theinitially exposed strata indicated that the site had been occupied
Fig. 1. Geographical location of Kouphovouno in Laconia, Pelopo
between the Middle Neolithic and the Early Helladic II periods. Thesite was reopened in 2001 after two seasons of survey, whichindicated that a number of burnt structures lay buried under thesurface and that the extent of occupation of the site did not varysignificantly between the Middle and the Late Neolithic (Cavanaghet al., 2004, 2007; Mee et al., 2013).
A further five seasons of excavation recovered well-preservedbotanical and faunal assemblages across the excavated Areas AeGin contexts ranging from burnt floors and hearth structures todestruction layers and midden deposits. The available archaeologyindicates that the settlement was nucleated and may have beendivided into neighborhoods. The plant assemblage mostly consistsof domestic species of cereals and pulses including free-threshingwheat, hulled barley, (one-seeded) einkorn, emmer, lentil, com-mon pea, grass pea, and bitter vetch; along with figs and flax. Thefaunal assemblage is dominated by domestic animals such as cattle,sheep, goats, pigs and dogs, but wild animals such as red deer, roedeer, wild boar, aurochs, wild goat, hare, wolf, fox, cat and weaselwere also found in smaller quantities (Cantuel et al., 2008;Cavanagh et al., 2004; Gardeisen, 2007).
The surrounding Sparta Basin is one of the most fertile regionsin Greece, and ample arable land was available for cultivation in theNeolithic. The early farmers may have sown their crops in thefloodplain on which the tell sits, on alluvial fans located 300 m tothe west of the site and/or on unoccupied parts of the tell itself. Theenvironment also offered land suitable for animal grazing/browsingand plentiful drainage from nearby rivers (Fouache et al., 2007;section by James and Kousoulakou in Cavanagh et al., 2004).
4. Materials and methods
4.1. Choice of samples
28 bulk samples of charred archaeobotanical material wereanalyzed in this study. They include 13 samples of free-threshingwheat grain (Triticum aestivum L./Triticum durum Desf.), 7 sam-ples of hulled barley grain (Hordeum vulgare L.), 7 samples ofcommonpea (Pisum sativum L.) and 1 sample of lentil (Lens culinaris
nnese (prepared by Jean Cantuel, from Rivals et al., 2011).

Fig. 2. Plan of the archaeological excavations at Kouphovouno undertaken between 2001 and 2007.
P. Vaiglova et al. / Journal of Archaeological Science 42 (2014) 201e215204
Medik.). Other species recovered in the archaeobotanical record(Bogaard unpublished data) include wheat of the hulled variety,einkorn (Triticum monococcum L.) and emmer (Triticum dicoccumShrank); these were recovered in smaller quantities, however, andcould not be included in the isotope sampling.
68 samples of animal bone were analyzed in this study. Theseinclude 15 samples of domestic cattle (Bos taurus), 7 dogs (Canislupus familiaris), 12 domestic sheep (Ovis aries), 7 domestic goats(Capra hircus), 23 domestic pigs (Sus scrofa domesticus), 1 wild boar(Sus scrofa scrofa),1 hare (Lepus europaeus), 1 bear (Ursus arctos) and1 sample of wild goat (Capra aegagrus/Capra ibex).
See Inline Supplementary Table S1 for details on the archaeo-logical context of the samples. Due to the limited number of sam-ples, we have grouped them only into two chronological phases:Middle Neolithic and Late Neolithic. Elsewhere, some of thesecontexts are discussed to be Transitional MN/LN (Mee et al. inpress). In this study, the transitional contexts are treated as LateNeolithic due to the occurrence of Black Ware pottery, which istaken to signal the onset of the Late Neolithic.
Inline Supplementary Table S1 can be found online at http://dx.doi.org/10.1016/j.jas.2013.10.023.
4.2. Wild vs. domestic plants
Most of the samples analyzed in this study represent domesticforms of plants and animals. While it would be useful to have alarge sample size of wild animals for comparison, the 1 sample ofbear, 1 sample of hare, 1 sample of wild goat and 1 sample of wildboar were all that was available from the wild faunal assemblage.As for the crops, there are two reasons why we did not sample anywild species. First, the only wild plant that is available in a usablequantity from this site is fig and measuring it would not provide uswith any useful information. It could not serve as a reference for the“environmental background” as it is unknown where the fig treesgrew. They may have been located adjacent to the fields and thusbeen affected by arable management. Additionally, the isotopiccomposition of this one species would not illustrate the diversity ofthe isotopic composition of all the grasses and browse available forthe herbivores to consume. Second, we hesitate to measure thestable isotopes of wild plant species, as these have not been studiedexperimentally and so it is unknown how these plants respond to
charring and soil 15N enrichment. In light of these limitations, theinterpretations made in this study are primarily based on relativedifferences between (predominantly domestic) species, and refer-ence is made to forage values estimated from local herbivorecollagen.
4.3. Pretreatment
Pretreatment of the plant material followed an acid-base-acidprotocol described by Fraser et al. (2011). The samples were firstsoaked in 0.5 M HCl at 70 �C for 30e60 min and subsequentlyrinsed 3 times in distilled water. Next, they were soaked in 0.1 MNaOH at 70 �C for 60 min and rinsed as many times as it took towash out the brown humic substances (up to 9 rinses). Lastly, thesamples were heated in 0.5 M HCl at 70 �C for 25 min and rinsed 3times in distilled water. Kanstrup et al. (in press) used stronger acidand base to pre-treat their archaeobotanical samples (1 M HCl and1 M NaOH for 1 h, 3 h and 16 h). They found a difference of 0.9&between their pre-treated and non-pretreated samples; however, itremains to be determinedwhether this differencewas solely due tothe removal of contamination or the use of more vigorous pre-treatment.
Pre-treatment of the faunal material followed the standardprocedure for bone collagen extraction (modified Longin (1971)method described by Richards and Hedges (1999)). Bone pieceswere demineralized using 0.5 M HCl at 5 �C over a period of 3e10days and subsequently washed three times in distilled water. Theresidue was gelatinized in pH3 HCl solution for 48 h at 75 �C andsubsequently freeze-dried.
4.4. Isotope measurements and precision
Measurements of plant d13C were performed at the NERCIsotope Geosciences Laboratory on a Costech 4010 on-line to a VGTripleTrap and Optima dual-inlet mass spectrometer. Measure-ments of plant d15N and faunal d13C and d15N were analyzed usingContinuous Flow Isotope Ratio Mass Spectrometry (CFIRMS)comprised of an Elemental analyser (Flash/EA) coupled to a ThermoFinnigan DeltaPlus XL isotope ratio mass spectrometer via a ConFloIII interface. Collagen d13C and d15N ratios were calibrated usinginternal reference material M1360p (powdered gelatine from
0
1
2
3
4
5
6
7
8
9
20 30 40 50 60 70
%N
%C
KFO wheatKFO barleyKFO peacharred cerealscharred pulsesuncharred cerealsuncharred pulses
uncharred cereals
uncharred pulses
charred pulses
charred cereals
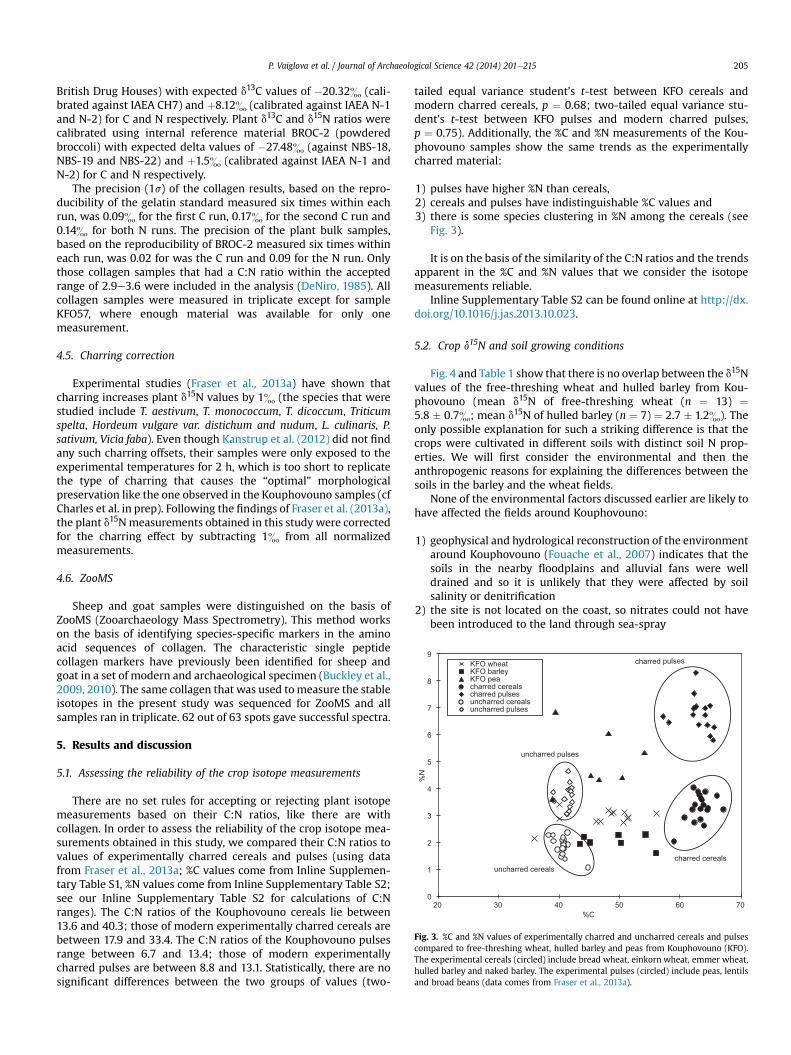
Fig. 3. %C and %N values of experimentally charred and uncharred cereals and pulsescompared to free-threshing wheat, hulled barley and peas from Kouphovouno (KFO).The experimental cereals (circled) include bread wheat, einkorn wheat, emmer wheat,hulled barley and naked barley. The experimental pulses (circled) include peas, lentilsand broad beans (data comes from Fraser et al., 2013a).
P. Vaiglova et al. / Journal of Archaeological Science 42 (2014) 201e215 205
British Drug Houses) with expected d13C values of �20.32& (cali-brated against IAEA CH7) and þ8.12& (calibrated against IAEA N-1and N-2) for C and N respectively. Plant d13C and d15N ratios werecalibrated using internal reference material BROC-2 (powderedbroccoli) with expected delta values of �27.48& (against NBS-18,NBS-19 and NBS-22) and þ1.5& (calibrated against IAEA N-1 andN-2) for C and N respectively.
The precision (1s) of the collagen results, based on the repro-ducibility of the gelatin standard measured six times within eachrun, was 0.09& for the first C run, 0.17& for the second C run and0.14& for both N runs. The precision of the plant bulk samples,based on the reproducibility of BROC-2 measured six times withineach run, was 0.02 for was the C run and 0.09 for the N run. Onlythose collagen samples that had a C:N ratio within the acceptedrange of 2.9e3.6 were included in the analysis (DeNiro, 1985). Allcollagen samples were measured in triplicate except for sampleKFO57, where enough material was available for only onemeasurement.
4.5. Charring correction
Experimental studies (Fraser et al., 2013a) have shown thatcharring increases plant d15N values by 1& (the species that werestudied include T. aestivum, T. monococcum, T. dicoccum, Triticumspelta, Hordeum vulgare var. distichum and nudum, L. culinaris, P.sativum, Vicia faba). Even though Kanstrup et al. (2012) did not findany such charring offsets, their samples were only exposed to theexperimental temperatures for 2 h, which is too short to replicatethe type of charring that causes the “optimal” morphologicalpreservation like the one observed in the Kouphovouno samples (cfCharles et al. in prep). Following the findings of Fraser et al. (2013a),the plant d15Nmeasurements obtained in this study were correctedfor the charring effect by subtracting 1& from all normalizedmeasurements.
4.6. ZooMS
Sheep and goat samples were distinguished on the basis ofZooMS (Zooarchaeology Mass Spectrometry). This method workson the basis of identifying species-specific markers in the aminoacid sequences of collagen. The characteristic single peptidecollagen markers have previously been identified for sheep andgoat in a set of modern and archaeological specimen (Buckley et al.,2009, 2010). The same collagen that was used tomeasure the stableisotopes in the present study was sequenced for ZooMS and allsamples ran in triplicate. 62 out of 63 spots gave successful spectra.
5. Results and discussion
5.1. Assessing the reliability of the crop isotope measurements
There are no set rules for accepting or rejecting plant isotopemeasurements based on their C:N ratios, like there are withcollagen. In order to assess the reliability of the crop isotope mea-surements obtained in this study, we compared their C:N ratios tovalues of experimentally charred cereals and pulses (using datafrom Fraser et al., 2013a; %C values come from Inline Supplemen-tary Table S1, %N values come from Inline Supplementary Table S2;see our Inline Supplementary Table S2 for calculations of C:Nranges). The C:N ratios of the Kouphovouno cereals lie between13.6 and 40.3; those of modern experimentally charred cereals arebetween 17.9 and 33.4. The C:N ratios of the Kouphovouno pulsesrange between 6.7 and 13.4; those of modern experimentallycharred pulses are between 8.8 and 13.1. Statistically, there are nosignificant differences between the two groups of values (two-
tailed equal variance student’s t-test between KFO cereals andmodern charred cereals, p ¼ 0.68; two-tailed equal variance stu-dent’s t-test between KFO pulses and modern charred pulses,p ¼ 0.75). Additionally, the %C and %N measurements of the Kou-phovouno samples show the same trends as the experimentallycharred material:
1) pulses have higher %N than cereals,2) cereals and pulses have indistinguishable %C values and3) there is some species clustering in %N among the cereals (see
Fig. 3).
It is on the basis of the similarity of the C:N ratios and the trendsapparent in the %C and %N values that we consider the isotopemeasurements reliable.
Inline Supplementary Table S2 can be found online at http://dx.doi.org/10.1016/j.jas.2013.10.023.
5.2. Crop d15N and soil growing conditions
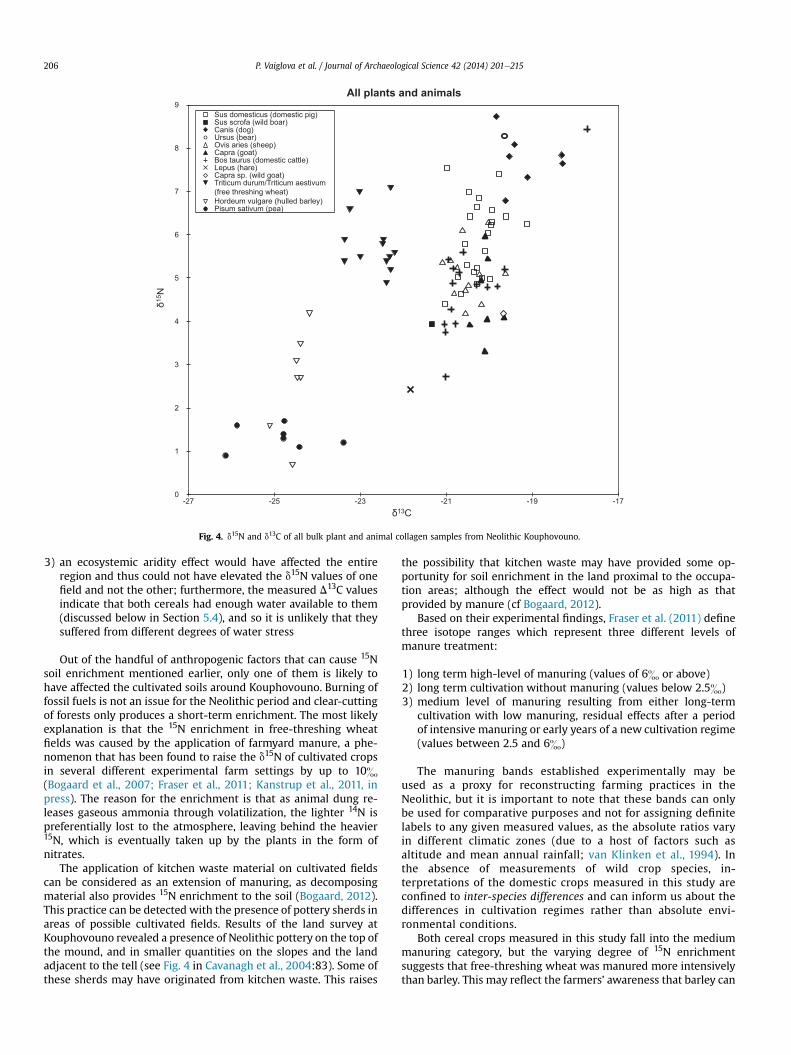
Fig. 4 and Table 1 show that there is no overlap between the d15Nvalues of the free-threshing wheat and hulled barley from Kou-phovouno (mean d15N of free-threshing wheat (n ¼ 13) ¼5.8 � 0.7&; mean d15N of hulled barley (n ¼ 7) ¼ 2.7 � 1.2&). Theonly possible explanation for such a striking difference is that thecrops were cultivated in different soils with distinct soil N prop-erties. We will first consider the environmental and then theanthropogenic reasons for explaining the differences between thesoils in the barley and the wheat fields.
None of the environmental factors discussed earlier are likely tohave affected the fields around Kouphovouno:
1) geophysical and hydrological reconstruction of the environmentaround Kouphovouno (Fouache et al., 2007) indicates that thesoils in the nearby floodplains and alluvial fans were welldrained and so it is unlikely that they were affected by soilsalinity or denitrification
2) the site is not located on the coast, so nitrates could not havebeen introduced to the land through sea-spray
0
1
2
3
4
5
6
7
8
9
-27 -25 -23 -21 -19 -17
All plants and animals
Sus domesticus (domestic pig)Sus scrofa (wild boar)Canis (dog)Ursus (bear)Ovis aries (sheep)Capra (goat)Bos taurus (domestic cattle)Lepus (hare)Capra sp. (wild goat)Triticum durum/Triticum aestivum(free threshing wheat)Hordeum vulgare (hulled barley)Pisum sativum (pea)
13C
15N
Fig. 4. d15N and d13C of all bulk plant and animal collagen samples from Neolithic Kouphovouno.
P. Vaiglova et al. / Journal of Archaeological Science 42 (2014) 201e215206
3) an ecosystemic aridity effect would have affected the entireregion and thus could not have elevated the d15N values of onefield and not the other; furthermore, the measured D13C valuesindicate that both cereals had enough water available to them(discussed below in Section 5.4), and so it is unlikely that theysuffered from different degrees of water stress
Out of the handful of anthropogenic factors that can cause 15Nsoil enrichment mentioned earlier, only one of them is likely tohave affected the cultivated soils around Kouphovouno. Burning offossil fuels is not an issue for the Neolithic period and clear-cuttingof forests only produces a short-term enrichment. The most likelyexplanation is that the 15N enrichment in free-threshing wheatfields was caused by the application of farmyard manure, a phe-nomenon that has been found to raise the d15N of cultivated cropsin several different experimental farm settings by up to 10&(Bogaard et al., 2007; Fraser et al., 2011; Kanstrup et al., 2011, inpress). The reason for the enrichment is that as animal dung re-leases gaseous ammonia through volatilization, the lighter 14N ispreferentially lost to the atmosphere, leaving behind the heavier15N, which is eventually taken up by the plants in the form ofnitrates.
The application of kitchen waste material on cultivated fieldscan be considered as an extension of manuring, as decomposingmaterial also provides 15N enrichment to the soil (Bogaard, 2012).This practice can be detected with the presence of pottery sherds inareas of possible cultivated fields. Results of the land survey atKouphovouno revealed a presence of Neolithic pottery on the top ofthe mound, and in smaller quantities on the slopes and the landadjacent to the tell (see Fig. 4 in Cavanagh et al., 2004:83). Some ofthese sherds may have originated from kitchen waste. This raises
the possibility that kitchen waste may have provided some op-portunity for soil enrichment in the land proximal to the occupa-tion areas; although the effect would not be as high as thatprovided by manure (cf Bogaard, 2012).
Based on their experimental findings, Fraser et al. (2011) definethree isotope ranges which represent three different levels ofmanure treatment:
1) long term high-level of manuring (values of 6& or above)2) long term cultivation without manuring (values below 2.5&)3) medium level of manuring resulting from either long-term
cultivation with low manuring, residual effects after a periodof intensive manuring or early years of a new cultivation regime(values between 2.5 and 6&)
The manuring bands established experimentally may beused as a proxy for reconstructing farming practices in theNeolithic, but it is important to note that these bands can onlybe used for comparative purposes and not for assigning definitelabels to any given measured values, as the absolute ratios varyin different climatic zones (due to a host of factors such asaltitude and mean annual rainfall; van Klinken et al., 1994). Inthe absence of measurements of wild crop species, in-terpretations of the domestic crops measured in this study areconfined to inter-species differences and can inform us about thedifferences in cultivation regimes rather than absolute envi-ronmental conditions.
Both cereal crops measured in this study fall into the mediummanuring category, but the varying degree of 15N enrichmentsuggests that free-threshing wheat was manured more intensivelythan barley. This may reflect the farmers’ awareness that barley can
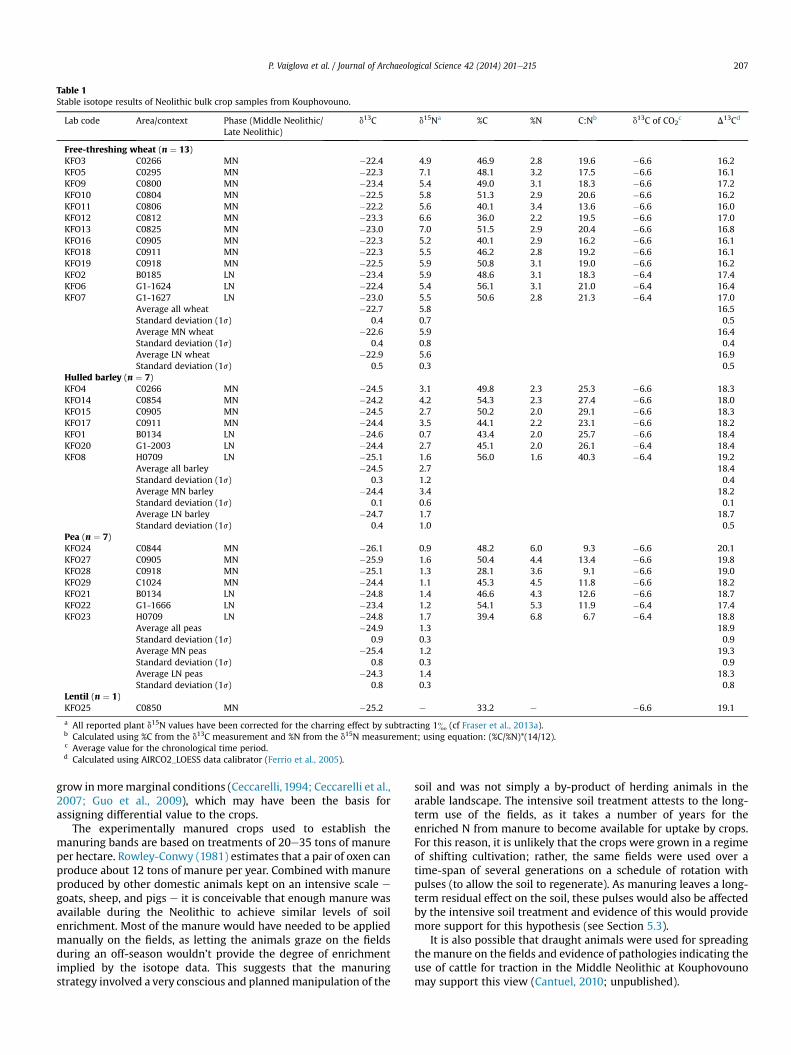
Table 1Stable isotope results of Neolithic bulk crop samples from Kouphovouno.
Lab code Area/context Phase (Middle Neolithic/Late Neolithic)
d13C d15Na %C %N C:Nb d13C of CO2c D13Cd
Free-threshing wheat (n ¼ 13)KFO3 C0266 MN �22.4 4.9 46.9 2.8 19.6 �6.6 16.2KFO5 C0295 MN �22.3 7.1 48.1 3.2 17.5 �6.6 16.1KFO9 C0800 MN �23.4 5.4 49.0 3.1 18.3 �6.6 17.2KFO10 C0804 MN �22.5 5.8 51.3 2.9 20.6 �6.6 16.2KFO11 C0806 MN �22.2 5.6 40.1 3.4 13.6 �6.6 16.0KFO12 C0812 MN �23.3 6.6 36.0 2.2 19.5 �6.6 17.0KFO13 C0825 MN �23.0 7.0 51.5 2.9 20.4 �6.6 16.8KFO16 C0905 MN �22.3 5.2 40.1 2.9 16.2 �6.6 16.1KFO18 C0911 MN �22.3 5.5 46.2 2.8 19.2 �6.6 16.1KFO19 C0918 MN �22.5 5.9 50.8 3.1 19.0 �6.6 16.2KFO2 B0185 LN �23.4 5.9 48.6 3.1 18.3 �6.4 17.4KFO6 G1-1624 LN �22.4 5.4 56.1 3.1 21.0 �6.4 16.4KFO7 G1-1627 LN �23.0 5.5 50.6 2.8 21.3 �6.4 17.0
Average all wheat �22.7 5.8 16.5Standard deviation (1s) 0.4 0.7 0.5Average MN wheat �22.6 5.9 16.4Standard deviation (1s) 0.4 0.8 0.4Average LN wheat �22.9 5.6 16.9Standard deviation (1s) 0.5 0.3 0.5
Hulled barley (n ¼ 7)KFO4 C0266 MN �24.5 3.1 49.8 2.3 25.3 �6.6 18.3KFO14 C0854 MN �24.2 4.2 54.3 2.3 27.4 �6.6 18.0KFO15 C0905 MN �24.5 2.7 50.2 2.0 29.1 �6.6 18.3KFO17 C0911 MN �24.4 3.5 44.1 2.2 23.1 �6.6 18.2KFO1 B0134 LN �24.6 0.7 43.4 2.0 25.7 �6.6 18.4KFO20 G1-2003 LN �24.4 2.7 45.1 2.0 26.1 �6.4 18.4KFO8 H0709 LN �25.1 1.6 56.0 1.6 40.3 �6.4 19.2
Average all barley �24.5 2.7 18.4Standard deviation (1s) 0.3 1.2 0.4Average MN barley �24.4 3.4 18.2Standard deviation (1s) 0.1 0.6 0.1Average LN barley �24.7 1.7 18.7Standard deviation (1s) 0.4 1.0 0.5
Pea (n ¼ 7)KFO24 C0844 MN �26.1 0.9 48.2 6.0 9.3 �6.6 20.1KFO27 C0905 MN �25.9 1.6 50.4 4.4 13.4 �6.6 19.8KFO28 C0918 MN �25.1 1.3 28.1 3.6 9.1 �6.6 19.0KFO29 C1024 MN �24.4 1.1 45.3 4.5 11.8 �6.6 18.2KFO21 B0134 LN �24.8 1.4 46.6 4.3 12.6 �6.6 18.7KFO22 G1-1666 LN �23.4 1.2 54.1 5.3 11.9 �6.4 17.4KFO23 H0709 LN �24.8 1.7 39.4 6.8 6.7 �6.4 18.8
Average all peas �24.9 1.3 18.9Standard deviation (1s) 0.9 0.3 0.9Average MN peas �25.4 1.2 19.3Standard deviation (1s) 0.8 0.3 0.9Average LN peas �24.3 1.4 18.3Standard deviation (1s) 0.8 0.3 0.8
Lentil (n ¼ 1)KFO25 C0850 MN �25.2 e 33.2 e �6.6 19.1
a All reported plant d15N values have been corrected for the charring effect by subtracting 1& (cf Fraser et al., 2013a).b Calculated using %C from the d13C measurement and %N from the d15N measurement; using equation: (%C/%N)*(14/12).c Average value for the chronological time period.d Calculated using AIRCO2_LOESS data calibrator (Ferrio et al., 2005).
P. Vaiglova et al. / Journal of Archaeological Science 42 (2014) 201e215 207
grow inmoremarginal conditions (Ceccarelli, 1994; Ceccarelli et al.,2007; Guo et al., 2009), which may have been the basis forassigning differential value to the crops.
The experimentally manured crops used to establish themanuring bands are based on treatments of 20e35 tons of manureper hectare. Rowley-Conwy (1981) estimates that a pair of oxen canproduce about 12 tons of manure per year. Combined with manureproduced by other domestic animals kept on an intensive scale e
goats, sheep, and pigs e it is conceivable that enough manure wasavailable during the Neolithic to achieve similar levels of soilenrichment. Most of the manure would have needed to be appliedmanually on the fields, as letting the animals graze on the fieldsduring an off-season wouldn’t provide the degree of enrichmentimplied by the isotope data. This suggests that the manuringstrategy involved a very conscious and plannedmanipulation of the
soil and was not simply a by-product of herding animals in thearable landscape. The intensive soil treatment attests to the long-term use of the fields, as it takes a number of years for theenriched N from manure to become available for uptake by crops.For this reason, it is unlikely that the crops were grown in a regimeof shifting cultivation; rather, the same fields were used over atime-span of several generations on a schedule of rotation withpulses (to allow the soil to regenerate). As manuring leaves a long-term residual effect on the soil, these pulses would also be affectedby the intensive soil treatment and evidence of this would providemore support for this hypothesis (see Section 5.3).
It is also possible that draught animals were used for spreadingthemanure on the fields and evidence of pathologies indicating theuse of cattle for traction in the Middle Neolithic at Kouphovounomay support this view (Cantuel, 2010; unpublished).
0
2
4
6
8
-28 -27 -26 -25 -24 -23 -22
MN barley MN ft wheatMN pea LN ft wheatLN h barley LN pea
13C
15C
Fig. 5. d15N and d13C of bulk samples of Middle Neolithic (MN) and Late Neolithic (LN)crops from Kouphovouno.
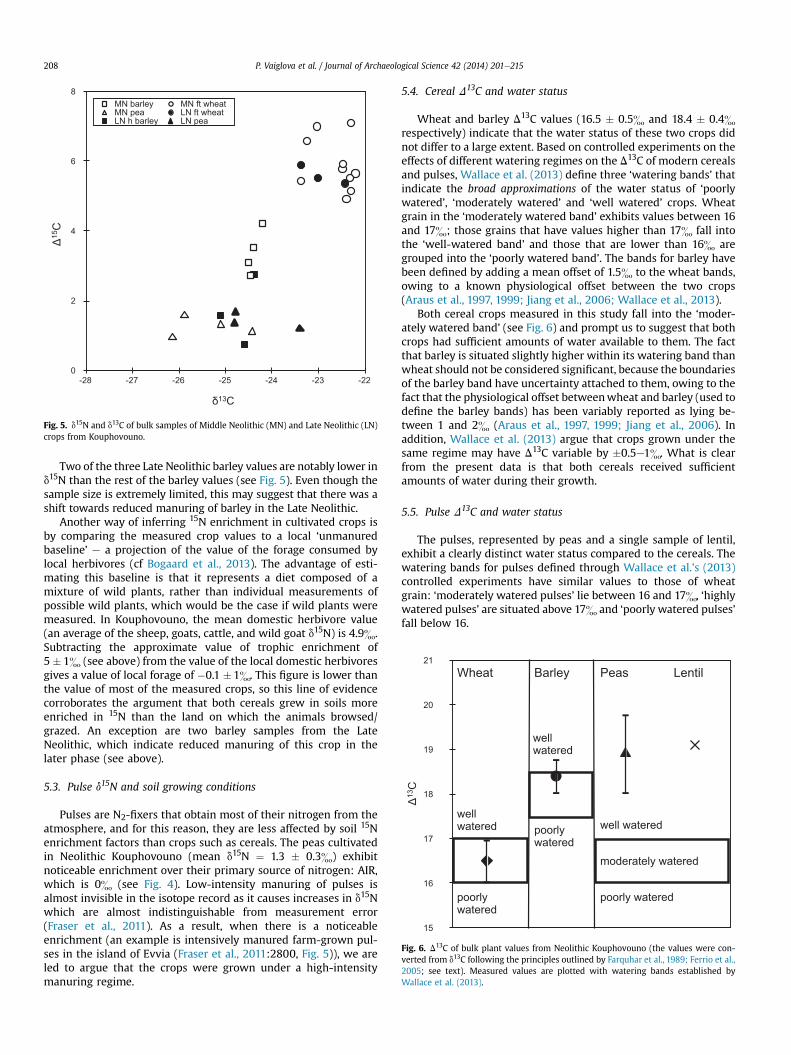
Fig. 6. D13C of bulk plant values from Neolithic Kouphovouno (the values were con-verted from d13C following the principles outlined by Farquhar et al., 1989; Ferrio et al.,2005; see text). Measured values are plotted with watering bands established byWallace et al. (2013).
P. Vaiglova et al. / Journal of Archaeological Science 42 (2014) 201e215208
Two of the three Late Neolithic barley values are notably lower ind15N than the rest of the barley values (see Fig. 5). Even though thesample size is extremely limited, this may suggest that there was ashift towards reduced manuring of barley in the Late Neolithic.
Another way of inferring 15N enrichment in cultivated crops isby comparing the measured crop values to a local ‘unmanuredbaseline’ e a projection of the value of the forage consumed bylocal herbivores (cf Bogaard et al., 2013). The advantage of esti-mating this baseline is that it represents a diet composed of amixture of wild plants, rather than individual measurements ofpossible wild plants, which would be the case if wild plants weremeasured. In Kouphovouno, the mean domestic herbivore value(an average of the sheep, goats, cattle, and wild goat d15N) is 4.9&.Subtracting the approximate value of trophic enrichment of5 � 1& (see above) from the value of the local domestic herbivoresgives a value of local forage of �0.1 � 1&. This figure is lower thanthe value of most of the measured crops, so this line of evidencecorroborates the argument that both cereals grew in soils moreenriched in 15N than the land on which the animals browsed/grazed. An exception are two barley samples from the LateNeolithic, which indicate reduced manuring of this crop in thelater phase (see above).
5.3. Pulse d15N and soil growing conditions
Pulses are N2-fixers that obtain most of their nitrogen from theatmosphere, and for this reason, they are less affected by soil 15Nenrichment factors than crops such as cereals. The peas cultivatedin Neolithic Kouphovouno (mean d15N ¼ 1.3 � 0.3&) exhibitnoticeable enrichment over their primary source of nitrogen: AIR,which is 0& (see Fig. 4). Low-intensity manuring of pulses isalmost invisible in the isotope record as it causes increases in d15Nwhich are almost indistinguishable from measurement error(Fraser et al., 2011). As a result, when there is a noticeableenrichment (an example is intensively manured farm-grown pul-ses in the island of Evvia (Fraser et al., 2011:2800, Fig. 5)), we areled to argue that the crops were grown under a high-intensitymanuring regime.
5.4. Cereal D13C and water status
Wheat and barley D13C values (16.5 � 0.5& and 18.4 � 0.4&respectively) indicate that the water status of these two crops didnot differ to a large extent. Based on controlled experiments on theeffects of different watering regimes on the D13C of modern cerealsand pulses, Wallace et al. (2013) define three ‘watering bands’ thatindicate the broad approximations of the water status of ‘poorlywatered’, ‘moderately watered’ and ‘well watered’ crops. Wheatgrain in the ‘moderately watered band’ exhibits values between 16and 17&; those grains that have values higher than 17& fall intothe ‘well-watered band’ and those that are lower than 16& aregrouped into the ‘poorly watered band’. The bands for barley havebeen defined by adding a mean offset of 1.5& to the wheat bands,owing to a known physiological offset between the two crops(Araus et al., 1997, 1999; Jiang et al., 2006; Wallace et al., 2013).
Both cereal crops measured in this study fall into the ‘moder-ately watered band’ (see Fig. 6) and prompt us to suggest that bothcrops had sufficient amounts of water available to them. The factthat barley is situated slightly higher within its watering band thanwheat should not be considered significant, because the boundariesof the barley band have uncertainty attached to them, owing to thefact that the physiological offset betweenwheat and barley (used todefine the barley bands) has been variably reported as lying be-tween 1 and 2& (Araus et al., 1997, 1999; Jiang et al., 2006). Inaddition, Wallace et al. (2013) argue that crops grown under thesame regime may have D13C variable by �0.5e1&. What is clearfrom the present data is that both cereals received sufficientamounts of water during their growth.
5.5. Pulse D13C and water status
The pulses, represented by peas and a single sample of lentil,exhibit a clearly distinct water status compared to the cereals. Thewatering bands for pulses defined through Wallace et al.’s (2013)controlled experiments have similar values to those of wheatgrain: ‘moderately watered pulses’ lie between 16 and 17&, ‘highlywatered pulses’ are situated above 17& and ‘poorly watered pulses’fall below 16.

Table 2Stable isotope results of Neolithic faunal samples from Kouphovouno.
Lab no. Area/context
Phase (MiddleNeolithic/LateNeolithic)
d13C d15N %C %N C:N
Bos taurus (n ¼ 15)KOUP-26 C1705 MN �21.0 5.4 22.1 7.3 3.5KOUP-27 C1705 MN �17.7 8.4 33.7 11.7 3.4KOUP-30 C1705 MN �20.7 5.1 26.0 8.7 3.5KOUP-52 C1713 MN �20.6 5.6 25.7 9.1 3.3KOUP-57 G1-2000 LN �19.8 4.8 35.7 12.7 3.3KOUP-58 G1-2000 LN �21.0 3.8 32.4 11.9 3.2KOUP-68 G1-2001 LN �20.9 4.3 37.1 13.0 3.3KOUP-69 G1-2001 LN �20.9 4.9 32.7 11.5 3.3KOUP-70 G1-2001 LN �20.3 4.8 36.1 12.7 3.3KOUP-71 G1-2001 LN �20.9 5.2 38.7 13.8 3.3KOUP-75 G2-1102 LN �20.1 4.8 42.0 14.1 3.5KOUP-84 G2-1115 LN �19.7 5.2 38.2 13.4 3.3KOUP-93 G2-1136 LN �20.8 3.9 24.6 8.0 3.6KOUP-96 G2-1139 LN �21.0 2.7 40.2 13.5 3.5KOUP-97 G2-1139 LN �21.1 3.9 39.7 13.7 3.4
Average all cattle �20.4 4.9Standard deviation (1s) 0.9 1.2Average MN cattle �20.0 6.1Standard deviation (1s) 1.5 1.5Average LN cattle �20.6 4.4Standard deviation (1s) 0.5 0.8
Canis (n ¼ 7)KFO51 C1705 MN �19.1 7.3 38.9 13.8 3.3KFO52 C1705 MN �18.3 7.8 40.6 14.3 3.3KFO53 C1705 MN �18.3 7.6 39.7 14.2 3.3KFO65 G1-2000 LN �19.6 7.8 41.1 14.8 3.3KFO68 G1-2001 LN �19.6 6.8 44.3 15.4 3.4KFO74 G2-1132 LN �19.4 8.1 38.9 14.0 3.2KFO76 G2-1136 LN �19.9 8.7 34.4 12.7 3.2
Average all dog �19.2 7.7Standard deviation (1s) 0.6 0.6Average MN dog �18.6 7.6Standard deviation (1s) 0.5 0.3Average LN dog �19.6 7.9Standard deviation (1s) 0.2 0.8
Ovis aries (n ¼ 12)KOUP-13 C1705 MN �20.8 5.2 35.9 12.4 3.4KOUP-16 C1705 MN �20.6 4.2 34.1 11.7 3.4KOUP-39 C1713 MN �20.5 4.8 24.7 8.9 3.2KOUP-41 C1713 MN �21.1 5.3 32.0 11.5 3.2KOUP-42 C1713 MN �20.8 4.6 40.0 14.2 3.3KOUP-65 G1-2001 LN �20.6 6.1 32.0 11.7 3.2KOUP-66 G1-2001 LN �20.6 4.7 40.9 14.1 3.4KOUP-67 G1-2001 LN �19.6 5.1 38.4 13.4 3.4KOUP-79 G2-1103 LN �20.0 6.3 40.8 14.3 3.3KOUP-81 G2-1104 LN �20.9 5.4 39.0 13.2 3.5KOUP-83 G2-1115 LN �20.2 4.4 16.6 5.8 3.3KOUP-92 G2-1136 LN �20.2 5.1 40.3 13.2 3.6
Average all sheep �20.5 5.1Standard deviation (1s) 0.4 0.6Average MN sheep �20.8 4.8Standard deviation (1s) 0.2 0.4Average LN sheep �20.3 5.3Standard deviation (1s) 0.4 0.7
Capra (n ¼ 7)KOUP-12 C1705 MN �20.2 4.9 31.2 10.6 3.5KOUP-14 C1705 MN �20.1 6.0 38.2 13.2 3.4KOUP-37 C1713 MN �20.1 4.0 35.1 12.4 3.3KOUP-59 G1-2000 LN �20.1 5.4 33.8 11.9 3.3KOUP-60 G1-2000 LN �19.7 4.1 35.7 12.6 3.3KOUP-64 G1-2001 LN �20.1 3.3 35.1 12.9 3.2KOUP-88 G2-1132 LN �20.5 3.9 37.6 13.3 3.3
Average all goat �20.1 4.5Standard deviation (1s) 0.2 1.0Average MN goat �20.1 5.0Standard deviation (1s) 0.1 1.0Average LN goat �20.1 4.2Standard deviation (1s) 0.3 0.9
Sus domesticus (n ¼ 23)KFO44 C1705 MN �20.7 5.0 45.5 15.6 3.4KFO45 C1705 MN �20.5 5.3 39.9 14.3 3.3KFO46 C1705 MN �20.0 6.6 38.1 13.0 3.5
Table 2 (continued )
Lab no. Area/context
Phase (MiddleNeolithic/LateNeolithic)
d13C d15N %C %N C:N
KFO48 C1705 MN �19.8 7.4 40.4 14.1 3.4KFO49 C1705 MN �20.0 6.3 41.1 14.5 3.3KFO50 C1705 MN �20.2 6.9 39.5 13.9 3.3KFO54 C1710 MN �20.5 7.0 39.9 14.3 3.3KFO55 C1713 MN �20.3 4.9 37.8 13.9 3.2KFO56 C1713 MN �20.2 5.0 43.1 15.0 3.4KFO57 C1713 MN �20.3 5.2 38.3 13.3 3.4KFO58 C1713 MN �20.1 5.6 42.8 15.2 3.3KFO59 C1713 MN �20.0 5.0 38.6 14.0 3.2KFO60 C1713 MN �19.1 6.3 40.3 14.6 3.2KFO61 G1-2000 LN �20.1 6.0 40.3 14.4 3.3KFO62 G1-2000 LN �20.0 6.2 41.5 14.9 3.3KFO63 G1-2000 LN �20.6 5.8 42.7 15.3 3.3KFO66 G1-2001 LN �21.1 4.4 39.9 14.3 3.3KFO67 G1-2001 LN �19.6 6.4 42.1 14.9 3.3KFO69 G2-1103 LN �21.0 7.5 36.5 12.7 3.4KFO71 G2-1104 LN �20.7 4.6 38.1 13.4 3.3KFO72 G2-1132 LN �20.5 6.4 45.2 14.9 3.5KFO73 G2-1132 LN �20.3 6.7 38.9 14.2 3.2KFO75 G2-1136 LN �20.4 5.1 38.1 14.1 3.2
Average all pig �20.3 5.9Standard deviation (1s) 0.4 0.9Average MN pig �20.1 5.9Standard deviation (1s) 0.4 0.9Average LN pig �20.4 5.9Standard deviation (1s) 0.5 1.0
Sus scrofa (n ¼ 1)KFO47 C1705 MN �21.4 3.9 41.0 14.3 3.4Lepus (n ¼ 1)KOUP-53 C1713 MN �21.8 2.4 35.4 13.4 3.1Ursus (n ¼ 1)KFO64 G1-2000 LN �19.7 8.3 37.2 13.8 3.2Capra sp. (n ¼ 1)KOUP-38 C1713 MN �19.7 4.2 17.4 6.4 3.2
P. Vaiglova et al. / Journal of Archaeological Science 42 (2014) 201e215 209
The mean D13C of the peas (18.9 � 0.9&) and the value of thelentil (19.1&) (Fig. 6) lie c. 2& above the well-watered pulse band.Experimental studies have shown that there are no obvious trendswith seasonality and D13C, only that pulses seem to be more sen-sitive to water input than cereals (pulses grown in dry soils look‘very dry’ and pulses grown in wet soils look ‘very wet’) (Wallaceet al., 2013). The effect this sensitivity would have on the pulseD13C, however, would not be as great as to account for the highD13Cvalues measured in this study. For this reason, we argue that thepulses were watered artificially.
The higher standard deviation of the peas (0.9& compared 0.5&and 0.4& of the cereals) may indicate that the pulses were beingwatered by hand, a practice that has been suggested as a possiblecause of high D13C variability in archaeobotanical remains fromAssiros Toumba (Wallace, 2011; unpublished). There is no archae-ological evidence for the use of irrigation at Kouphovouno. Inmodern collections, such higher D13C variability was observed at asmall-scale ‘traditional farm’ situation on the Greek island of Evvia,where the application of water was not standardized amongdifferent farmers (Wallace et al., 2013).
Thus, both the carbon and nitrogen lines of evidence suggestthat pulse crops were being cultivated on an intensive, likely ‘gar-den type’ scale. Note that even though there is a slight suggestionthat in the Late Neolithic, the d13C of peas increased (see Fig. 5) (andtherefore D13C decreased), all the peas still fall well above themoderately watered band.
5.6. Animal d13C & d15N and diets
The d13C and d15N values of the animal bone collagen reflectpatterns that conform to general expectations, but also enable us to
P. Vaiglova et al. / Journal of Archaeological Science 42 (2014) 201e215210
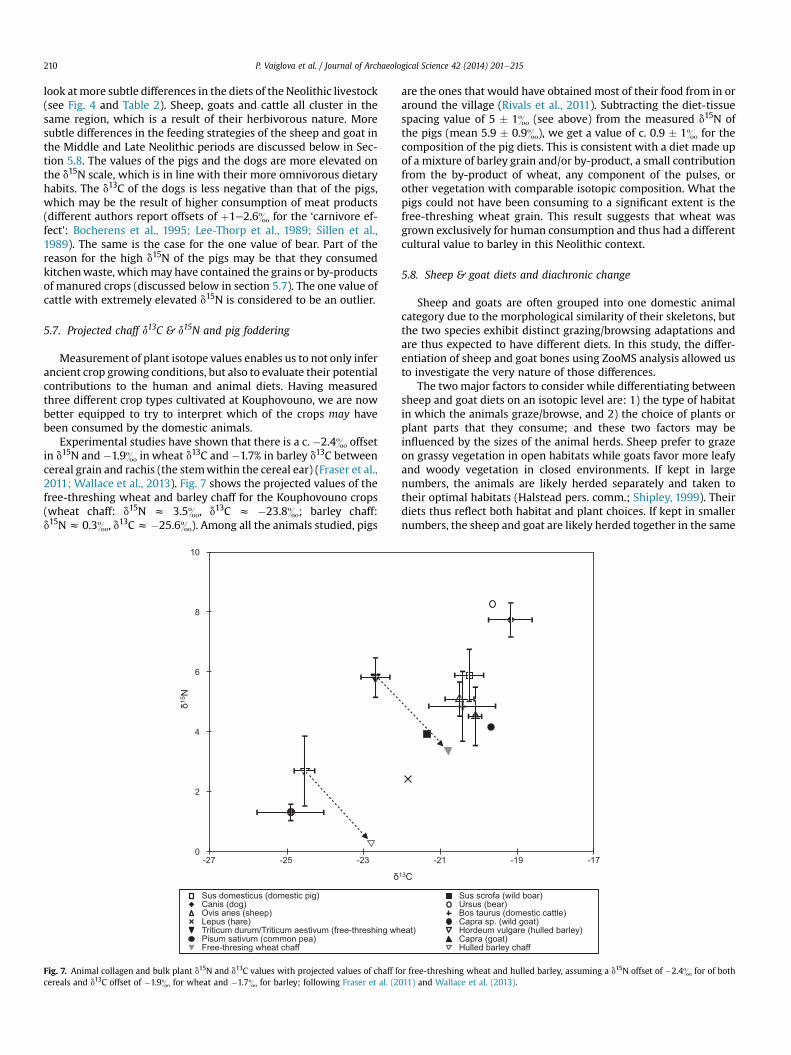
look atmore subtle differences in the diets of the Neolithic livestock(see Fig. 4 and Table 2). Sheep, goats and cattle all cluster in thesame region, which is a result of their herbivorous nature. Moresubtle differences in the feeding strategies of the sheep and goat inthe Middle and Late Neolithic periods are discussed below in Sec-tion 5.8. The values of the pigs and the dogs are more elevated onthe d15N scale, which is in line with their more omnivorous dietaryhabits. The d13C of the dogs is less negative than that of the pigs,which may be the result of higher consumption of meat products(different authors report offsets of þ1e2.6& for the ‘carnivore ef-fect’: Bocherens et al., 1995; Lee-Thorp et al., 1989; Sillen et al.,1989). The same is the case for the one value of bear. Part of thereason for the high d15N of the pigs may be that they consumedkitchenwaste, whichmay have contained the grains or by-productsof manured crops (discussed below in section 5.7). The one value ofcattle with extremely elevated d15N is considered to be an outlier.
5.7. Projected chaff d13C & d15N and pig foddering
Measurement of plant isotope values enables us to not only inferancient crop growing conditions, but also to evaluate their potentialcontributions to the human and animal diets. Having measuredthree different crop types cultivated at Kouphovouno, we are nowbetter equipped to try to interpret which of the crops may havebeen consumed by the domestic animals.
Experimental studies have shown that there is a c. �2.4& offsetin d15N and �1.9& in wheat d13C and �1.7% in barley d13C betweencereal grain and rachis (the stemwithin the cereal ear) (Fraser et al.,2011; Wallace et al., 2013). Fig. 7 shows the projected values of thefree-threshing wheat and barley chaff for the Kouphovouno crops(wheat chaff: d15N z 3.5&, d13C z �23.8&; barley chaff:d15Nz 0.3&, d13Cz �25.6&). Among all the animals studied, pigs
0
2
4
6
8
10
-27 -25 -23
Sus domesticus (domestic pig)Canis (dog)Ovis aries (sheep)Lepus (hare)Triticum durum/Triticum aestivum (free-threshing whPisum sativum (common pea)Free-thresing wheat chaff
15N
Fig. 7. Animal collagen and bulk plant d15N and d13C values with projected values of chaff fcereals and d13C offset of �1.9& for wheat and �1.7& for barley; following Fraser et al. (2
are the ones that would have obtained most of their food from in oraround the village (Rivals et al., 2011). Subtracting the diet-tissuespacing value of 5 � 1& (see above) from the measured d15N ofthe pigs (mean 5.9 � 0.9&), we get a value of c. 0.9 � 1& for thecomposition of the pig diets. This is consistent with a diet made upof a mixture of barley grain and/or by-product, a small contributionfrom the by-product of wheat, any component of the pulses, orother vegetation with comparable isotopic composition. What thepigs could not have been consuming to a significant extent is thefree-threshing wheat grain. This result suggests that wheat wasgrown exclusively for human consumption and thus had a differentcultural value to barley in this Neolithic context.
5.8. Sheep & goat diets and diachronic change
Sheep and goats are often grouped into one domestic animalcategory due to the morphological similarity of their skeletons, butthe two species exhibit distinct grazing/browsing adaptations andare thus expected to have different diets. In this study, the differ-entiation of sheep and goat bones using ZooMS analysis allowed usto investigate the very nature of those differences.
The twomajor factors to consider while differentiating betweensheep and goat diets on an isotopic level are: 1) the type of habitatin which the animals graze/browse, and 2) the choice of plants orplant parts that they consume; and these two factors may beinfluenced by the sizes of the animal herds. Sheep prefer to grazeon grassy vegetation in open habitats while goats favor more leafyand woody vegetation in closed environments. If kept in largenumbers, the animals are likely herded separately and taken totheir optimal habitats (Halstead pers. comm.; Shipley, 1999). Theirdiets thus reflect both habitat and plant choices. If kept in smallernumbers, the sheep and goat are likely herded together in the same
-21 -19 -17
Sus scrofa (wild boar)Ursus (bear)Bos taurus (domestic cattle)Capra sp. (wild goat)
eat) Hordeum vulgare (hulled barley)Capra (goat)Hulled barley chaff
13C
or free-threshing wheat and hulled barley, assuming a d15N offset of �2.4& for of both011) and Wallace et al. (2013).
2
3
4
5
6
7
-22 -21 -20 -19
MN goat LN goat MN sheepLN sheep Wild goat
4
6
7
9
10
-21 -20 -19 -18
MN dog LN dog0
2
4
6
8
-22 -21 -20 -19
MN cattle LN cattle
0
2
4
6
8
10
-22 -21 -20 -19
MN pig LN pig
a b
c d
13C 13C
13C 13C
15N
15N
15N
15N
Fig. 8. d15N and d13C of Middle Neolithic (MN) and Late Neolithic (LN) (a) sheep and goat, (b) pigs, (c) dogs and (d) cattle.
P. Vaiglova et al. / Journal of Archaeological Science 42 (2014) 201e215 211
pasture areas or on parts of the arable landscape (Halstead, 2006;Halstead pers. comm.). Differences in their isotope values are thusmostly influenced by the plant part choices made by each species.
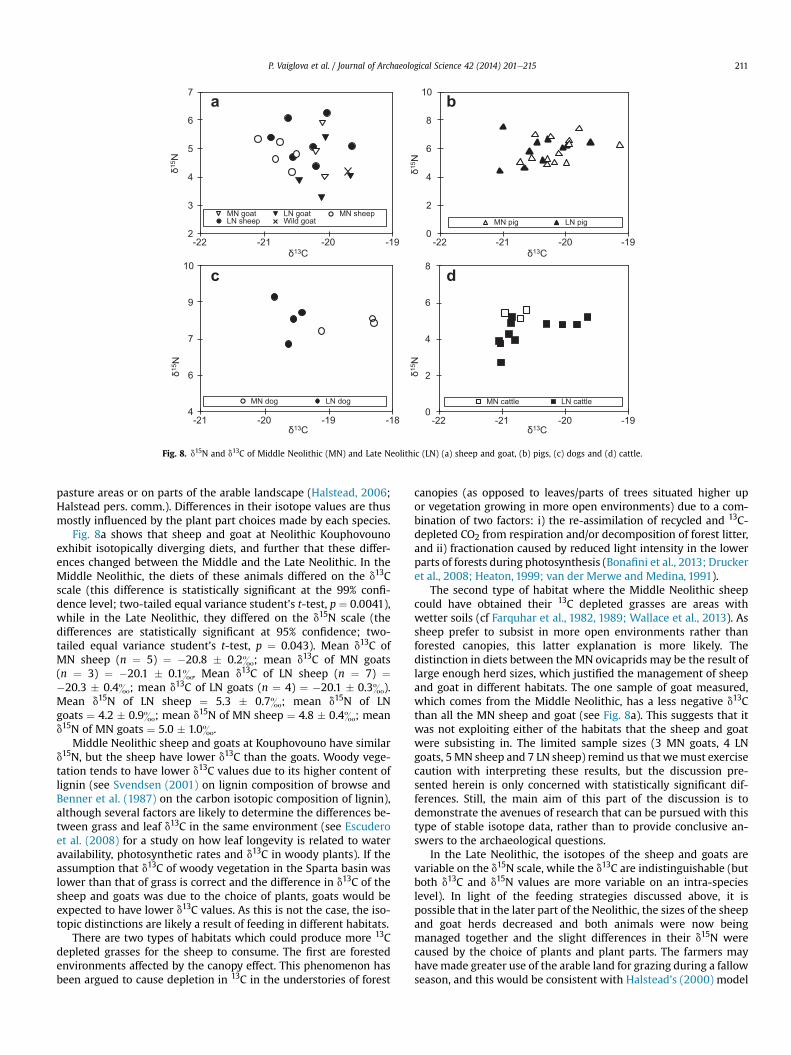
Fig. 8a shows that sheep and goat at Neolithic Kouphovounoexhibit isotopically diverging diets, and further that these differ-ences changed between the Middle and the Late Neolithic. In theMiddle Neolithic, the diets of these animals differed on the d13Cscale (this difference is statistically significant at the 99% confi-dence level; two-tailed equal variance student’s t-test, p ¼ 0.0041),while in the Late Neolithic, they differed on the d15N scale (thedifferences are statistically significant at 95% confidence; two-tailed equal variance student’s t-test, p ¼ 0.043). Mean d13C ofMN sheep (n ¼ 5) ¼ �20.8 � 0.2&; mean d13C of MN goats(n ¼ 3) ¼ �20.1 � 0.1&. Mean d13C of LN sheep (n ¼ 7) ¼�20.3 � 0.4&; mean d13C of LN goats (n ¼ 4) ¼ �20.1 � 0.3&).Mean d15N of LN sheep ¼ 5.3 � 0.7&; mean d15N of LNgoats ¼ 4.2 � 0.9&; mean d15N of MN sheep ¼ 4.8 � 0.4&; meand15N of MN goats ¼ 5.0 � 1.0&.
Middle Neolithic sheep and goats at Kouphovouno have similard15N, but the sheep have lower d13C than the goats. Woody vege-tation tends to have lower d13C values due to its higher content oflignin (see Svendsen (2001) on lignin composition of browse andBenner et al. (1987) on the carbon isotopic composition of lignin),although several factors are likely to determine the differences be-tween grass and leaf d13C in the same environment (see Escuderoet al. (2008) for a study on how leaf longevity is related to wateravailability, photosynthetic rates and d13C in woody plants). If theassumption that d13C of woody vegetation in the Sparta basin waslower than that of grass is correct and the difference in d13C of thesheep and goats was due to the choice of plants, goats would beexpected to have lower d13C values. As this is not the case, the iso-topic distinctions are likely a result of feeding in different habitats.
There are two types of habitats which could produce more 13Cdepleted grasses for the sheep to consume. The first are forestedenvironments affected by the canopy effect. This phenomenon hasbeen argued to cause depletion in 13C in the understories of forest
canopies (as opposed to leaves/parts of trees situated higher upor vegetation growing in more open environments) due to a com-bination of two factors: i) the re-assimilation of recycled and 13C-depleted CO2 from respiration and/or decomposition of forest litter,and ii) fractionation caused by reduced light intensity in the lowerparts of forests during photosynthesis (Bonafini et al., 2013; Druckeret al., 2008; Heaton, 1999; van der Merwe and Medina, 1991).
The second type of habitat where the Middle Neolithic sheepcould have obtained their 13C depleted grasses are areas withwetter soils (cf Farquhar et al., 1982, 1989; Wallace et al., 2013). Assheep prefer to subsist in more open environments rather thanforested canopies, this latter explanation is more likely. Thedistinction in diets between the MN ovicaprids may be the result oflarge enough herd sizes, which justified the management of sheepand goat in different habitats. The one sample of goat measured,which comes from the Middle Neolithic, has a less negative d13Cthan all the MN sheep and goat (see Fig. 8a). This suggests that itwas not exploiting either of the habitats that the sheep and goatwere subsisting in. The limited sample sizes (3 MN goats, 4 LNgoats, 5 MN sheep and 7 LN sheep) remind us that wemust exercisecaution with interpreting these results, but the discussion pre-sented herein is only concerned with statistically significant dif-ferences. Still, the main aim of this part of the discussion is todemonstrate the avenues of research that can be pursued with thistype of stable isotope data, rather than to provide conclusive an-swers to the archaeological questions.
In the Late Neolithic, the isotopes of the sheep and goats arevariable on the d15N scale, while the d13C are indistinguishable (butboth d13C and d15N values are more variable on an intra-specieslevel). In light of the feeding strategies discussed above, it ispossible that in the later part of the Neolithic, the sizes of the sheepand goat herds decreased and both animals were now beingmanaged together and the slight differences in their d15N werecaused by the choice of plants and plant parts. The farmers mayhavemade greater use of the arable land for grazing during a fallowseason, and this would be consistent with Halstead’s (2000) model
P. Vaiglova et al. / Journal of Archaeological Science 42 (2014) 201e215212
of intensive mixed farming, where small flocks are managed withinthe interstices of the cultivated land.
Beyond informing us about the possible distinctions in thefeeding strategies of the Neolithic sheep and goat, the results pre-sented herein indicate that there was a shift in the managementstrategy of the ovicaprids between the two Neolithic phases. Thisshift may have manifested itself with a decrease in the size of thesheep herds, leading to a reduced predominance of sheep in thelivestock population. A similar shift has been observed morebroadly by Halstead (2000) between the Early and the Late GreekNeolithic: in the Early Neolithic, faunal assemblages were domi-nated by sheep, while Late Neolithic assemblages show a morebalanced representation of all the domestic animals.
The changes in animal management at Kouphovouno happenedin the context of shifts in ceramic styles and expression of socio-cultural identity. In the Middle Neolithic, the pottery style wasmore uniform and greater emphasis was placed on expression ofgroup identity, while in the Late Neolithic, a more diversified pot-tery style signaled a movement towards greater individuality (Meeet al. in prep.). At the same time, different livestock managementstrategiesmay have been fueled by a changed attitude towards landownership.
5.9. Cattle & dog diets and environmental change?
The results discussed so far indicate that there was a diachronicchange in the feeding strategies of the sheep and goats. Conversely,Fig. 8b shows that the diets of pigs did not change through time(the differences are not statistically significant: two-tailed equalvariance student’s t-test for the d13C values, p ¼ 0.11; two tailedequal variance student’s t-test for the d15N values, p ¼ 0.95). Acloser look at the other major domestic animals, cattle and dogs,add to the story about change in animal management strategies inthe Late Neolithic.
All the Late Neolithic dogs have more negative d13C valuesthan all the Middle Neolithic dogs (d13C of MN dogs (n ¼ 3) ¼�18.6 � 0.5&; d13C of LN dogs (n¼ 4) ¼ �19.6 � 0.1&) (see Fig. 8c;two-tailed equal variance student’s t-test shows significance at the99% confidence level, p ¼ 0.0088). Their d15N values are indistin-guishable (two-tailed student’s equal variance t-test, p ¼ 0.58). Asthe bulk of dog diet is not composed of just grasses and leaves butof a more diverse range of food sources which have undergonefurther fractionation after being consumed by primary herbivores,their d13C do not reflect the water status of the areas from whichtheir foods were derived. Thus, the lower d13C values cannot be aresult of subsisting on food items grown in wetter soils (as is thecase with Middle Neolithic sheep).
The diachronic difference in d13C could be the result of reducedconsumption of meat products in the Late Neolithic in conjunctionwith an increased consumption of cultivated crops. Meat productshave a positive effect onboth d13C and d15N (for the carnivore effect ind13C see Bocherens et al., 1995; Lee-Thorp et al., 1989; Sillen et al.,1989; for trophic level enrichment in d15N see DeNiro and Epstein,1981; Hedges and Reynard, 2007; Minagawa and Wada, 1984).Consumption of less meat in the Late Neolithic would decrease thedogs’ d13C and d15N values, but an increased consumption ofmanured crop products would compensate for the decrease in d15Nso in the end, only the effect on carbonwould be detectable. The cropproducts could have been obtained by scavenging on human foodwaste. Note that this suggestion does not exclude the possibility ofmeat consumption in the LN altogether. It is still likely that dogsconsumedmoremeat thanpigs due to their less negative d13C values,but what this discussion centers on (once again taking the limitedsample size into account) is the likelihood that in the Late Neolithic,the dogs consumed it to a smaller extent than in the Middle Neolithic.
The browsing and grazing adaptations of herbivores exist on acontinuum, in a way that the animals pick and chose the mostnutritious food that is available, whether it be grass or browse (LisaShipley, pers. comm.). For this reason, there is a lot of overlap be-tween the dietary choices of sheep, goat and cattle. There is a sta-tistically significant difference at the 95% confidence between thed15N values of the Middle Neolithic cattle (n ¼ 4) and Late Neolithiccattle (n¼ 11) (two-tailed equal variance student’s t-test, p¼ 0.010).Despite the limited sample size, we will attempt to explain whatsuch a difference may mean. As with the ovicaprids, the feedingstrategy of the cattle changed in the Late Neolithic (see Fig. 8d). TheMiddle Neolithic cattle are situated in the same d13C region as theMiddle Neolithic sheep (two-tailed equal variance student’s t-test,p ¼ 0.40) and this may be because they shared the same wetterpasture grasses, perhaps along the banks of the Eurotas river. In theLate Neolithic, the cattle seems to divide into two clusters; one thatoverlapswith theMiddle Neolithic sheep and one that does not (seeFig. 8d). This may mean that while the same pasture grasses werestill consumed by cattle in the Late Neolithic, some cattle may havebeen kept in other, drier, areas as well. The cattle that may havegrazed along the banks of the Eurotas also exhibit quite awide rangeof d15N values, which includes the lowest d15N value of all the do-mestic animals at Kouphovouno. This may be related to consump-tion of a wide range of different grasses in this habitat.
Most of the domestic animals apart from pigs seem to haveexperienced a shift in feeding strategies between the Middle andthe Late Neolithic. On the isotopic scale, these shifts did notmove inthe same direction. The dogs’ d13C decreased, the sheep d13Cincreased, the goats’ and cattle d15N decreasedwhile the sheep d15Nincreased. This suggests that the changes were not the result ofsome environmental change (one that would cause an increase ind15N in all Late Neolithic vegetation, for example), but that theywere related to shifts in management of the farm animals.
6. Synthesis and conclusion
This study is one of the first to integrate plant and animal dietaryisotopes (see also Fraser et al. (2013b) and Lightfoot and Stevens(2012)) and the first to combine this methodology with collagensequencing of sheep and goats. The data provide support for themodel of small-scalemixed agriculture and settlement organizationput forth by previous archaeobotanical and archaeozoological in-vestigations (Bogaard, 2004a, 2004b, 2005; Bogaard and Isaakidou,2010;Halstead,1996, 2000, 2006; Kotsakis,1999). Beyond providingsupport to this theory, however, the stable isotopic method offersnew insight for understanding the integration of the crop cultiva-tion and animal husbandry and how these regimes functionedwithin the given settlement organization over the long-term. Someof the interpretations in this study are limited by small sample sizes,and their primary value is in demonstrating what sorts of questionsthis methodology can address rather than for providing definiteanswers for the prehistoric farming techniques.
Even though the tell at Kouphovouno was not excavated in itsentirety and we therefore do not know how dense the settlementwas, the available archaeology indicates that the village wasnucleated or organized into neighborhoods. Such settlementconfiguration would have provided opportunity for intensiveagriculture either on the periphery of the settlement and/or inplots adjacent to the neighborhoods. The more proximal fieldswould have been more valuable as they provided the opportunityfor high labor-investment under a small-scale intensive treatment(cf Jones et al., 1999). This is where the crops grown for humanconsumption e free-threshing wheat and pulses e were likelygrown in rotation with one another, receiving manure in the formof dung from the domestic animals.
P. Vaiglova et al. / Journal of Archaeological Science 42 (2014) 201e215 213
In the Late Neolithic, the application of manure may have beenless labor-intensive. The few LN barley samples indicates that thiscrop likely received less manure than it did during the MiddleNeolithic and the wheat/pulse fields may have been manureddirectly by sheep and goat grazing on the arable plots. Furthermorein this Neolithic phase, the scale of sheep/goat management seemsto have decreased, dogs fed on smaller amounts of meat productsand larger amounts of cultivated crops and cattle were likely takento two different areas for grazing. These diachronic shifts in cropand animal management highlight the fact that even though small-scale mixed farming embraced the “Neolithic package” in a seem-ingly consistent fashion across the continent, it did allow for flex-ibility in the scale of crop and animal husbandry and the amount oflabor-investment.
Acknowledgments
The authors would like to thank Paul Halstead, Michael Wallace,Erika Nitsch, Peter James, Richard Pope, Tim Heaton and NikeDattani for very helpful discussion, Jessica Hendry for performingthe ZooMS analysis and Amy Styring for commenting on a draft ofthis paper. We are also grateful for the helpful comments providedby the four anonymous reviewers. This study was made possible bythe financial support of the Natural Environment Research Council(standard grant NE/E003761/1, PI Bogaard), the British School atAthens, the French Ministry of Foreign Affairs, the Centre Nationalde la Recherche Scientifique and the French School at Athens. Itsshortcomings are entirely the authors’ responsibility.
References
Ambrose, S.H., 1991. Effects of diet, climate and physiology on nitrogen isotopeabundances in terrestrial foodwebs. J. Archaeol. Sci. 18, 293e317.
Ambrose, S.H., 2000. Controlled diet and climate experiments on nitrogen isotoperatios of rats. In: Ambrose, S.H., Katzenberg, A.M. (Eds.), Biogeochemical Ap-proaches to Paleodietary Analysis. Kluwer Academic/Plenum, New York,pp. 243e259.
Ambrose, S.H., Norr, L., 1993. Experimental evidence for the relationship of thecarbon isotope ratios of whole diet and dietary protein to those of bonecollagen and carbonate. In: Lambert, J.B., Grupe, G. (Eds.), Prehistoric HumanBone: Archaeology at the Molecular Level. Springer, Berlin, pp. 1e37.
Aranibar, J.N., Otter, L., Macko, S.A., Feral, C.J.W., Epstein, H.E., Dowty, P.R., Eckardt, F.,Shugart, H.H., Swap, R.J., 2004. Nitrogen cycling in the soileplant system alonga precipitation gradient in the Kalahari sands. Glob. Change Biol. 10, 359e373.
Araus, J., Febrero, A., Buxó, R., Rodríguez-Ariza, M., Molina, F., Camalich, M.,Martín, D., Voltas, J., 1997. Identification of ancient irrigation practices based onthe carbon isotope discrimination of plant seeds: a case study from the South-East Iberian peninsula. J. Archaeol. Sci. 24, 729e740.
Araus, J.L., Febrero, A., Catala, M., Molist, M., Voltas, J., Romagosa, I., 1999. Cropavailability in early agriculture: evidence from carbon isotope discrimination ofseeds from a tenth millennium B.P. site on the Euphrates. Glob. Change Biol. 5,201e212.
Benner, R., Fogel, M.L., Sprague, E.K., Hodson, R.E., 1987. Depletion of 13C in lignin andits implications for stable carbon isotope studies. Nature 329 (6141), 708e710.
Bernhard, A., 2012. The nitrogen cycle: processes, players, and human impact. Nat.Educ. Knowl. 3 (10), 25.
Bocherens, H., Drucker, D., 2003. Trophic level isotopic enrichment of carbon andnitrogen in bone collagen: case studies from recent and ancient terrestrialecosystems. Int. J. Osteoarchaeol. 13, 46e53.
Bocherens, H., Fogel, M.L., Tuross, N., Zeder, M., 1995. Trophic structure and climaticinformation from isotopic signatures in Pleistocene cave fauna of southernEngland. J. Archaeol. Sci. 22, 327e340.
Bogaard, A., 2004a. Neolithic Farming in Central Europe: an Archaeobotanical Studyof Crop Husbandry Practices. Routledge, London.
Bogaard, A., 2004b. The nature of early farming in Central and South-East Europe.Doc. Praehist. 31, 49e58.
Bogaard, A., 2005. ‘Garden agriculture’ and the nature of early farming in Europeand the Near East. World Archaeol. 37 (2), 177e196.
Bogaard, A., 2012. Middening and manuring in Neolithic Europe: issues of plausi-bility, intensity and archaeological method. In: Jones, R. (Ed.), Manure Matters:Historical, Archaeological and Ethnographic Perspectives. Ashgate, Surrey,pp. 25e40.
Bogaard, A., Isaakidou, V., 2010. From megasites to farmsteads: community size,ideology and the nature of early farming landscapes in Western Asia andEurope. In: Finlayson, B., Warren, G. (Eds.), Landscapes in Transition:
Understanding HuntereGatherer and Farming Landscapes in the Early Holo-cene of Europe and the Levant, Levant Supplementary Series & CBRL, pp. 192e207. London.
Bogaard, A., Heaton, T.H.E., Poulton, P., Merbach, I., 2007. The impact of manuring onnitrogen isotope ratios in cereals: archaeological implications for reconstruc-tion of diet and crop management practices. J. Archaeol. Sci. 34, 335e343.
Bogaard, A., Fraser, R.A., Heaton, T.H.E., Wallace, M., Vaiglova, P., Charles, M.,Jones, G., Evershed, R.P., Styring, A.K., Andersen, N.H., Arbogast, R.-M.,Bartosiewicz, L., Gardeisen, A., Kanstrup, M., Maier, U., Marinova, E., Ninov, L.,Schäfer, M., Stephan, E., 2013. Crop manuring and intensive land managementby Europe’s first farmers. Proc. Nat. Acad. Sci. 110 (31), 12589e12594.
Bonafini, M., Pellegrini, M., Ditchfield, P., Pollard, A.M., 2013. Investigation of the‘canopy effect’ in the isotope ecology of temperate woodlands. J. Archaeol. Sci.40, 3926e3935.
Buckley, M., Collins, M., Thomas-Oates, J., Wilson, J.C., 2009. Species identificationby analysis of bone collagen using matrix-assisted laser desorption/ionisationtime-of-light mass spectrometry. Rapid Commun. Mass Spectrom. 23, 3843e3854.
Buckley, M., Kansa, S.W., Howard, S., Campbell, S., Thomas-Oates, J., Collins, M.,2010. Distinguishing between archaeological sheep and goat bones using asingle collagen peptide. J. Archaeol. Sci. 37, 13e20.
Byrd, B.F., 2000. Households in transition: Neolithic social organization withinsouthwest Asia. In: Kuijt, I. (Ed.), Life in Neolithic Farming Communities: SocialOrganisation, Identity and Differentiation. Academic/Plenum, New York,pp. 63e98.
Cantuel, J., 2010. L’exploitation de la faune Durant le Néolitique en Grèce con-tinentale. Unpublished PhD dissertation. Laboratoire de Géographie Physique etEnvironnementale, Université de Clermont-Ferrand II, Clermont-Ferrand.
Cantuel, J., Gardeisen, A., Renard, J., 2008. L’exploitation de la faune durant le Néo-lithique dans le bassin Egéen. In: Vila, E., Gourichon, L., Choyke, A.M.,Buitenhus, H. (Eds.), Archaeozoology of the Near East VIII. Proceedings of theEighth International Symposium on the Archaeozoology of Southwestern Asiaand Adjacent Areas. Maison de l’Orient et de laMéditerranée, Lyon, pp. 279e298.
Cavanagh, W., Mee, C., Renard, J., 2004. ‘Sparta before Sparta’: report on theintensive survey at Kouphovouno 1999e2000. Annu. Br. Sch. Athens 99, 49e128.
Cavanagh, W., Mee, C., Renard, J., 2007. Excavations at Kouphovouno, Laconia: re-sults from the 2001 and 2002 seasons. Annu. Br. Sch. Athens 102, 11e101.
Ceccarelli, S., 1994. Specific adaptation and breeding for marginal conditions. Dev.Plant Breed. 2, 101e127.
Ceccarelli, S., Grando, S., Baum, M., 2007. Participatory plant breeding in water-limited environments. Exp. Agric. 43, 411e435.
Chikaraishi, Y., Ogawa, N.O., Kashiyama, Y., Takano, Y., Suga, H., Tomitani, A.,Miyashita, H., Kitazato, H., Ohkouchi, N., 2009. Determination of aquatic food-web structure based on compound-specific nitrogen isotopic composition ofamino acids. Limnol. Oceanogr. Methods 7, 740e750.
Chisholm, B.S., Nelson, D.E., Schwarcz, H.P., 1982. Stable-carbon isotope ratios as ameasure of marine versus terrestrial protein in ancient diets. Science 216, 1131e1132.
Cleveland, W.S., 1979. Robust locally weighted regression and smoothing scatter-plots. J. Am. Stat. Assoc. 74, 829e836.
Corr, L.T., Sealy, J.C., Horton, M.C., Evershed, R.P., 2005. A novel marine dietary in-dicator utilizing compound-specific bone collagen amino acid d13C values ofancient humans. J. Archaeol. Sci. 32, 321e330.
Delwiche, C.C., Zinke, P.J., Johnson, C.M., Virginia, R.A., 1979. Nitrogen isotopedistribution as a presumptive indicator of nitrogen fixation. Bot. Gaz. S140,65e69.
DeNiro, M.J., 1985. Postmortem preservation and alteration of in vivo bone collagenisotope ratios in relation to palaeodietary reconstruction. Nature 317, 806e809.
DeNiro, M.J., Epstein, S., 1978. Influence of diet on the distribution of carbon iso-topes in animals. Geochim. Cosmochim. Acta 42, 495e506.
DeNiro, M.J., Epstein, S., 1981. Influence of diet on the distribution of nitrogenisotopes in animals. Geochim. Cosmochim. Acta 45, 341e351.
Drucker, D.G., Bridault, A., Hobson, K.A., Szuma, E., Bocherens, H., 2008. Can carbon-13 in large herbivores reflect the canopy effect in temperate and boreal eco-systems? Evidence from modern and ancient ungulates. Palaeogeogr. Palae-oclimatol. Palaeoecol. 266, 69e82.
Escudero, A., Mediavilla, S., Heilmeier, H., 2008. Leaf longevity and drought:avoidance of the costs and risks of early leaf abscission as inferred from the leafcarbon isotopic composition. Funct. Plant Biol. 35, 705e713.
Evans, R.D., Ehleringer, J.R., 1993. A break in the nitrogen cycle in arid lands? Evi-dence from d15N of soils. Oecologia 94, 314e317.
Evans, R.D., Ehleringer, J.R., 1994. Water and nitrogen dynamics in an arid wood-land. Oecologia 99, 233e242.
Farquhar, G.D., Richards, R., 1984. Isotopic composition of plant carbon correlateswith water-use efficiency of wheat genotypes. Aust. J. Plant Physiol. 11, 539e552.
Farquhar, G.D., O’Leary, M.H., Berry, J.A., 1982. On the relationship between carbonisotope discrimination and the intercellular carbon dioxide concentration inleaves. Aust. J. Plant Physiol. 9, 121e137.
Farquhar, G.D., Ehleringer, J.R., Hubick, K.T., 1989. Carbon isotope discrimination andphotosynthesis. Annu. Rev. Plant Physiol. Mol. Biol. 40, 503e537.
Ferrio, J.P., Araus, J.L., Buxó, R., Voltas, J., Bort, J., 2005. Water management practicesand climate in ancient agriculture: inferences from the stable isotope compo-sition of archaeobotanical remains. Veg. Hist. Archaeobot. 14, 510e517.
P. Vaiglova et al. / Journal of Archaeological Science 42 (2014) 201e215214
Flannery, K., 1969. Origins and ecological effects of early domestication in Iran andthe Near East. In: Ucko, P.J., Dimbleby, G.W. (Eds.), The Domestication andExploitation of Plants and Animals. Gerald Duckworth & Co., London, pp. 73e100.
Fouache, E., Cosandey, C., Renard, J., Ribière, M., Cez, L., 2007. Contexte géo-morphologique du bassin de Sparte et ressources en eau du site néolithique deKouphovouno (Péloponnèse, Grèce). Bull. Corresp. Hell. 131, 805e819.
Francey, R.J., Allison, C.E., Etheridge, D.M., Trudinger, C.M., Enting, I.G.,Leuenberger, M., Langenfelds, R.L., Michel, E., Steele, L.P., 1999. A 1000-year highprecision record of d13C in atmospheric CO2. Tellus 51B, 170e193.
Fraser, R.A., Bogaard, A., Heaton, T.H.E., Charles, M., Jones, G., Christensen, B.T.,Halstead, P., Merbach, I., Poulton, P.R., Parkes, D., Styring, A.K., 2011. Manuringand stable nitrogen isotope ratios in cereals and pulses: towards a newarchaeobotanical approach to the inference of land use and dietary practices.J. Archaeol. Sci. 38, 2790e2804.
Fraser, R.A., Bogaard, A., Charles, M., Styring, A.K., Wallace, M., Jones, G.,Ditchfield, P., Heaton, T.H.E., 2013a. Assessing natural variation and the effectsof charring, burial and pre-treatment on the stable carbon and nitrogen isotopevalues of archaeobotanical cereals and pulses. J. Archaeol. Sci. 40 (12), 4754e4766.
Fraser, R.A., Bogaard, B., Schäfer, M., Arbogast, R., Heaton, T.H.E., 2013b. Integratingbotanical, faunal and human stable carbon and nitrogen isotope values toreconstruct land use and palaeodiet at LBK Vaihingen an der Enz, Baden-Wüfttemberg. World Archaeol. 45 (3), 492e517.
Gardeisen, A., 2007. Economie vivrière et alimentation carnée en Grèce méridionaledu Néolithique moyen à la fin de l’ âge du Bronze. In: Mee, C., Renard, J. (Eds.),Cooking up the Past. Oxbow, Oxford, pp. 49e60.
Guo, P., Baum, M., Grando, S., Ceccarelli, S., Bai, G., Li, R., von Korff, M.,Varshney, R.K., Graner, R., Valkoun, J., 2009. Differentially expressed genes be-tween drought-tolerant and drought-sensitive barley genotypes in response todrought stress during the reproductive stage. J. Exp. Bot. 60 (12), 3531e3544.
Guttmann, E.B.A., 2005. Midden cultivation in prehistoric Britain: arable crops ingardens. World Archaeol. 37, 224e239.
Halstead, P., 1989. Like rising damp? An ecological approach to the spread offarming in South East and Central Europe. In: Milles, A., Williams, D.,Gardner, N. (Eds.), The Beginnings of Agriculture, BAR International Series,pp. 23e53. Oxford.
Halstead, P., 1996. Pastoralism or household herding? Problems of scale andspecialization in early Greek animal husbandry. World Archaeol. 28 (1), 20e42.
Halstead, P., 2000. Land use in postglacial Greece: cultural causes and environ-mental effects. In: Halstead, P., Frederick, C. (Eds.), Landscape and Land Use inPostglacial Greece. Sheffield Academic Press, Sheffield, pp. 110e128.
Halstead, P., 2006. Sheep in the garden: the integration of crop and livestockhusbandry in early farming regimes of Greece and Southern Europe. In:Serjeantson, E., Field, D. (Eds.), Animals in the Neolithic of Britain andEurope: Neolithic Studies Group Seminar Papers, vol. 7. Oxbow, Oxford,pp. 42e55.
Heaton, T.H.E., 1987. The 15N/14N ratios of plants in South Africa and Namibia:relationship to climate and coastal/saline environments. Oecologia (Berlin) 74,236e246.
Heaton, T.H.E., 1999. Spatial, species, and temporal variations in the 13C/12C ratios ofC3 plants: implications for palaeodiet studies. J. Archaeol. Sci. 26, 637e649.
Heaton, T.H.E., Vogel, J.C., von la Chevallerie, G., Collett, G., 1986. Climatic influenceon the isotopic composition of bone nitrogen. Nature 322, 822e823.
Hedges, R.E.M., 2006. Where does our protein carbon come from? Br. J. Nutr. 95,1031e1032.
Hedges, R.E.M., Reynard, L.M., 2007. Nitrogen isotopes and the trophic level ofhumans in archaeology. J. Archaeol. Sci. 34, 1240e1251.
Hill, P.W., Quilliam, R.S., DeLuca, T.H., Farrar, J., Farrell, M., Roberts, P.,Newsham, K.K., Hopkins, D.W., Bardgett, R.D., Jones, D.L., 2011. Acquisition andassimilation of nitrogen as peptide-bound and D-enantiomers of amino acidsby wheat. PLoS One 6 (4), e19220.
Högberg, P., 1997. 15N natural abundance in soileplant systems. New Phytol. 137,179e203.
Indermühle, A., Stocker, T.F., Joos, F., Fischer, H., Smith, H.J., Wahlen, M., Deck, B.,Mastroianni, D., Tschumi, J., Blunier, T., Meyer, R., Stauffer, B., 1999. Holocenecarbon-cycle dynamics based on CO2 trapped in ice at Taylor Dome, Antarctica.Nature 398, 121e126.
Jackson, P.C., Meinzer, F.C., Goldstein, G., Holbrook, N.M., Cavelier, J., Rada, R., 1994.Environmental and physiological influences on carbon isotope composition ofgap and understory plants in a lowland tropical forest. In: Ehleringer, J.R.,Hall, A.E., Farquhar, G.D. (Eds.), Stable Isotopes and Plant CarboneWater Re-lations. Academic Press, London, pp. 131e140.
Jiang, Q., Roche, D., Hole, D., 2006. Carbon isotope discrimination of two-rowed andsix-rowed barley genotypes under irrigated and non-irrigated field conditions.Can. J. Plant Sci. 86, 433e441.
Jones, G., Bogaard, A., Halstead, P., Charles, M., Smith, H., 1999. Identifying the in-tensity of crop husbandry practices on the basis of weed floras. Annu. Br. Sch.Athens 94, 167e189.
Kanstrup, M., Thomsen, I.K., Andersen, A.J., Bogaard, A., Christensen, B.T., 2011.Abundance of 13C and 15N in emmer, spelt, and naked barley grown on differ-ently manured soils: towards a method for identifying past manuring practice.Rapid Commun. Mass Spectrom. 25, 2879e2887.
Kanstrup, M., Thomsen, I.K., Mikkelsen, P.H., Christensen, B.T., 2012. Impact ofcharring on cereal grain characteristics: linking prehistoric manuring practice
to d15N signatures in archaeobotanical material. J. Archaeol. Sci. 39 (7), 2533e2540.
Kanstrup, M., Holst, M.K., Jensen, P.M., Thomsen, I.K., Christensen, B.T., Searchingfor long-term trends in prehistoric manuring practice. d15N analyses of char-red cereal grains from the 4th to the 1st millennium BC. J. Archaeol. Sci. inpress.
Kotsakis, K., 1999. What tells can tell: social space and settlement in the GreekNeolithic. In: Halstead, P. (Ed.), Neolithic Society in Greece. Sheffield AcademicPress, Sheffield, pp. 66e76.
Lauenberger, M., Siegenthaler, L., Langway, C., 1992. Carbon isotope composition ofatmospheric CO2 during the last ice age from an Antarctic ice core. Nature 357,488e490.
Lee-Thorp, J.A., 2008. On isotopes and old bones. Archaeometry 50, 925e950.Lopes, M.S., Araus, J.L., 2006. Nitrogen source and water regime effects on durum
wheat photosynthesis and stable carbon and nitrogen isotope composition.Physio. Plantarum 126, 435e445.
Lee-Thorp, J.A., Sealy, J.C., van der Merwe, N.J., 1989. Stable carbon isotope ratiodifferences between bone collagen and bone apatite, and their relationship todiet. J. Archaeol. Sci. 16, 585e599.
Lightfoot, E., Stevens, R., 2012. Stable isotope investigations of charred barley(Hordeum vulgare) and wheat (Tricitum spelta) grains from Danebury Hillfort:implications for palaeodietary reconstructions. J. Archaeol. Sci. 39, 656e662.
Longin, R., 1971. New method of collagen extraction for radiocarbon dating. Nature230, 241e242.
McCullagh, J.S.O., Juchelka, D., Hedges, R.E.M., 2006. Analysis of amino acid 13Cabundance from human and faunal bone collagen using liquid chromatography/isotope ratio mass spectrometry. Rapid Commun.Mass Spectrom. 20, 2761e2768.
Mee, C., Cavanagh, W., Renard, J., The Middle–Late Neolithic transition at Kou-phovouno, Annu. Br. Sch. Athens (in press).
Minagawa, M., Wada, E., 1984. Stepwise enrichment of 15N along food chains:further evidence and the relation between d15N and animal age. Geochim.Cosmochim. Acta 48, 1135e1140.
O’Connell, T.C., Hedges, R.E.M., 1999. Investigations into the effect of diet on modernhuman hair isotopic values. Am. J. Phys. Anthropol. 108, 409e425.
O’Connell, T.C., Kneale, C.J., Tasevska, N., Kuhnle, G.G.C., 2012. The diet-body offsetin human nitrogen isotopic values: a controlled dietary study. Am. J. Phys.Anthropol. 149, 426e434.
O’Leary, M.H., 1981. Carbon isotope fractionation in plants. Phytochemistry 20,553e567.
Pardo, L.H., Hemond, H.F., Montoya, J.P., Fahey, T.J., Siccama, T.G., 2002. Response ofthe natural abundance of 15N in forest soils and foliage to high nitrate lossfollowing clear-cutting. Can. J. For. Res. 32, 1126e1136.
Renard, J., 1989. Le site Néolithique et Helladique Ancien de Kouphovouno (Laco-nie): fouilles de O.-W. von Vacano (1941). In: Aegaeum, vol. 4. Liège.
Richards, M.P., Hedges, R.E.M., 1999. Stable isotope evidence for similarities in thetypes of marine foods used by Late Mesolithic humans at sites along theAtlantic coast of Europe. J. Archaeol. Sci. 26, 717e722.
Richards, M.P., Schulting, R.J., Hedges, R.E.M., 2003. Sharp shift in diet at onset ofNeolithic. Nature 425, 366.
Rivals, F., Gardeisen, A., Cantuel, J., 2011. Domestic and wild ungulate dietary traitsat Kouphovouno (Sparta, Greece): implications for livestock management andpalaeoenvironment in the Neolithic. J. Archaeol. Sci. 38, 528e537.
Rowley-Conwy, P., 1981. Slash and burn in the temperate European Neolithic. In:Mercer, R. (Ed.), Farming Practice in British Prehistory. University Press, Edin-burgh, pp. 85e96.
Schoeninger, M.J., Moore, K., 1992. Stable bone isotope studies in archaeology.J. World Prehist. 6, 247e296.
Schwarcz, H.P., Schoeninger, M.J., 1991. Stable isotope analyses in human nutritionalecology. Yearb. Phys. Anthropol. 34, 283e321.
Schwarcz, H.P., Melbye, J., Katzenberg, M.A., Knyf, M., 1985. Stable isotopes in hu-man skeletons of southern Ontario: reconstructing palaeodiet. J. Archaeol. Sci.12, 187e206.
Schulting, R.J., Richards, M.P., 2002. The wet, the wild and the domesticated: theMesolithiceNeolithic transition on the west coast of Scotland. Eur. J. Archaeol.5, 147e189.
Sealy, J.C., van der Merwe, N.J., Lee-Thorp, J.A., Lanham, J.L., 1987. Nitrogen isotopicecology in southern Africa: implications for environmental and dietary tracing.Geochim. Cosmochim. Acta 51, 2707e2717.
Shipley, L.A., 1999. Grazers and browsers: how digestive morphology affects dietselection. In: Launchbaugh, K.L., Sanders, K.D., Moseley, J.C. (Eds.), GrazingBehavior of Livestock and Wildlife. Idaho Forest, Wildlife and Range Experi-mental Station Bulletin, Moscow ID, pp. 20e27.
Sillen, A., Sealy, J., Lee-Thorp, J., Horwitz, L.K., van der Merwe, N.J., 1989. Traceelement and isotope research in progress: implications for Near EasternArchaeology. In: Hershowitz, I. (Ed.), Proceedings of the Second Symposium onUpper Palaeolithic, Mesolithic and Neolithic Populations of Europe and Medi-terranean Basin, BAR International Series, 508, pp. 321e334 (ii), Oxford.
Smith, B.N., Oliver, J., McMillan, C., 1976. Influence of carbon source, oxygen con-centration, light intensity, and temperature on 13C/12C ratios in plant tissues.Bot. Gaz. 137, 99e104.
Svendsen, C.R., 2001. Effects of marcescent leaves on winter browsing by largeherbivores in northern temperate deciduous forests. Alces 37 (2), 475e482.
Swap, R.J., Aranibar, J.N., Dowty, P.R., Gilhooly III, W.P., Macko, S.A., 2004. Naturalabundance of 13C and 15N in C3 and C4 vegetation of southern Africa: patternsand implications. Glob. Change Biol. 10, 350e358.

P. Vaiglova et al. / Journal of Archaeological Science 42 (2014) 201e215 215
Templer, P.H., Arthur, M.A., Lovett, G.M., Weathers, K.C., 2007. Plant and soil naturalabundance d15N: indicators of relative rates of nitrogen cycling in temperateforest ecosystems. Oecologia 153, 399e406.
Tiedje, J.M., Sexstone, A.J., Myrold, D.D., Robinson, J.A., 1982. Denitrification:ecological niches, competition and survival. Antonie van Leeuwenhoek 48,569e583.
van der Merwe, N.J., Medina, E., 1991. The canopy effect, carbon isotope ratios andfoodwebs in Amazonia. J. Archaeol. Sci. 18, 249e259.
van Klinken, G.J., van der Plicht, H., Hedges, R.E.M., 1994. Bond 13C/12C ratios reflect(palaeo-)climatic variations. Geophys. Res. Lett. 21 (6), 445e448.
Virginia, R.A., Delwiche, C.C., 1982. Natural 15N abundance of presumed N2-fixingand non-N2-fixing plants from selected ecosystems. Oecologia (Berlin) 54,317e325.
Vogel, J.C., van der Merwe, N.J., 1977. Isotopic evidence for early maize cultivation inNew York State. Am. Antiq. 42, 238e242.
Wallace, M.P., 2011. Crop Watering Practices in the Neolithic and Bronze Age: theStable Carbon Isotope Approach. Unpublished Ph.D. dissertation. Department ofArchaeology, The University of Sheffield, Sheffield.
Wallace, M., Jones, G., Charles, M., Fraser, R., Halstead, P., Heaton, T.H.E., Bogaard, A.,2013. Stable carbon isotope analysis as a direct means of inferring crop waterstatus. World Archaeol. 45 (3), 388e409.
Yousfi, S., Serret, M.D., Voltas, J., Araus, J.L., 2010. Effect of salinity and water stressduring the reproductive stage on growth, ion concentrations, D13C, and d15N ofdurum wheat and related amphiploids. J. Exp. Bot. 61, 3529e3542.