
An Integrated Effectiveness Framework of Mobile In-App ...
225
An Integrated Effectiveness Framework of Mobile In-App Advertising A thesis submitted in fulfilment of the requirements for the degree of Doctor of Philosophy Vinh Nguyen Xuan Truong Master of Science, University of Gothenburg, Sweden Bachelor of Engineering, University of Adelaide, Australia Graduate School of Business and Law College of Business and Law RMIT University April 2021
-
Upload
khangminh22 -
Category
Documents
-
view
2 -
download
0
Transcript of An Integrated Effectiveness Framework of Mobile In-App ...
An Integrated Effectiveness Framework of Mobile In-App
Advertising
A thesis submitted in fulfilment of the requirements for the degree of Doctor of Philosophy
Vinh Nguyen Xuan Truong Master of Science, University of Gothenburg, Sweden
Bachelor of Engineering, University of Adelaide, Australia
Graduate School of Business and Law
College of Business and Law RMIT University
April 2021

An Integrated Effectiveness Framework of Mobile In-App Advertising
ii

An Integrated Effectiveness Framework of Mobile In-App Advertising
iii
I certify that except where due acknowledgement has been made, the work is that of the
author alone; the work has not been submitted previously, in whole or in part, to qualify for
any other academic award; the content of the thesis is the result of work which has been
carried out since the official commencement date of the approved research program; any
editorial work, paid or unpaid, carried out by a third party is acknowledged; and, ethics
procedures and guidelines have been followed.
Vinh Nguyen Xuan Truong
07 April 2021

An Integrated Effectiveness Framework of Mobile In-App Advertising
iv

An Integrated Effectiveness Framework of Mobile In-App Advertising
v
ACKNOWLEDGEMENTS
Writing a PhD thesis takes a long time, but not as long as it takes, surprisingly. I want to thank
the people who helped me so much during the writing of this thesis.
First of all, I was very fortunate with my supervisors. Professor Mathews Nkhoma and Dr
Wanniwat Pansuwong were great supervisors who complemented each other wonderfully well,
were both very friendly, and were more than anything knowledgeable. Professor Mathews and
Dr Wanni helped me write a research proposal that enabled me to hit the running ground, which
is always a nice start. Dr Wanni helped me with questions regarding social science concepts
and their statistical techniques. No mere feat, Professor Mathews provided compelling insight,
critical questions and ironic common sense. I have also been received expertise support from
time to time from Associate Professor Robert McClelland, my HDR coordinator whenever I
found a problem with the research methodology.
Many other people gave interesting feedback and valuable suggestions for which I thank them:
the Milestones Panel members, Professor Christophe Schinckus, Associate Professor Victor
Kane, Associate Professor Eric Dimla, Dr Seng Kok and Professor Joan Richardson who during
my review sessions have given me so many constructive feedbacks; the Research Office, Dr
Thuy Nguyen, Dr Mahi Narayanan and Ms Thao Vu, who has helped me keep up with the
milestone submissions; and lastly the PhD candidates who have shared with me their
publications, conference proceedings and motivated me to do the same.
Data were essential to this research. I have collected lots of them. Many people helped with
this for which I want to thank them wholeheartedly. Thousands of people downloaded my apps.
Without their support, there is nothing for me to work with.
Finally, I want to thank my family for their love and endless support, especially to my late
father, who had always been encouraging me to keep learning, explore new things and live
mindfully.

An Integrated Effectiveness Framework of Mobile In-App Advertising
vi
An Integrated Effectiveness Framework of Mobile In-App Advertising
vii
Table of Contents ACKNOWLEDGEMENTS ....................................................................................................... v
Table of Contents ..................................................................................................................... vii
List of Tables ............................................................................................................................ xi
List of Figures ........................................................................................................................ xiii
List of Equations ...................................................................................................................... xv
Abbreviations ......................................................................................................................... xvii
Glossary of Technical Terms .................................................................................................. xix
ABSTRACT ......................................................................................................................... xxiii
Chapter 1. INTRODUCTION .................................................................................................... 1
1. 1. Research Problem ........................................................................................................... 1
1. 2. Research Questions ........................................................................................................ 5
1. 3. Research Objectives ....................................................................................................... 5
1. 4. Research Variables ......................................................................................................... 6
1. 5. Research Methods .......................................................................................................... 7
1. 6. Research Contributions .................................................................................................. 7
1. 7. Research Plan ................................................................................................................. 8
Chapter 2. BACKGROUND .................................................................................................... 10
2. 1. Online Advertising ....................................................................................................... 10
2. 2. Programmatic Advertising ........................................................................................... 14
2. 3. Mobile Advertising ...................................................................................................... 17
Chapter 3. MOBILE IN-APP ADVERTISING ....................................................................... 20
3. 1. Mobile In-App Advertising Processes ......................................................................... 21
Guaranteed vs Unguaranteed Contract Settings ............................................................... 21
Demand vs Supply ............................................................................................................ 23
Design vs Display ............................................................................................................. 25
3. 2. Mobile In-App Advertising Participants ...................................................................... 27
Users ................................................................................................................................. 27
Advertisers ........................................................................................................................ 27
Ad networks ...................................................................................................................... 28
Publishers.......................................................................................................................... 28
3. 3. Mobile In-App Advertising Goals and Metrics............................................................ 30
Goals ................................................................................................................................. 30
Metrics .............................................................................................................................. 33
CTRe ................................................................................................................................. 35
3. 4. Mobile In-App Advertising Factors ............................................................................. 36
An Integrated Effectiveness Framework of Mobile In-App Advertising
viii
Advertisers-controlled factors .......................................................................................... 36
Consumers-controlled factors ........................................................................................... 38
Ad networks-controlled factors ........................................................................................ 39
Chapter 4. THEORETICAL FRAMEWORK ......................................................................... 42
4. 1. Publishers-controlled factors ........................................................................................ 42
4. 2. Moderating effects........................................................................................................ 46
4. 3. An integrated effectiveness framework........................................................................ 51
4. 4. The conceptual model .................................................................................................. 54
Chapter 5. METHODOLOGY ................................................................................................. 57
5. 1. Research Philosophy .................................................................................................... 57
5. 2. Research Approach ...................................................................................................... 59
5. 3. Research Strategy ......................................................................................................... 60
5. 4. Research Choice ........................................................................................................... 61
5. 5. Time Horizon ............................................................................................................... 62
5. 6. Data Collection ............................................................................................................. 65
Data Sources ..................................................................................................................... 65
Procedure .......................................................................................................................... 65
Apps .................................................................................................................................. 67
Ad Spaces ......................................................................................................................... 68
Ads .................................................................................................................................... 69
Sampling ........................................................................................................................... 72
Chapter 6. DATA ANALYSIS ................................................................................................ 74
6. 1. Data Screening ............................................................................................................. 74
Missing data ...................................................................................................................... 74
Outliers ............................................................................................................................. 75
Normality .......................................................................................................................... 76
6. 2. Reliability and Validity Checks ................................................................................... 78
Reliability ......................................................................................................................... 78
Validity ............................................................................................................................. 79
6. 3. Descriptive Analysis .................................................................................................... 81
6. 4. Proportional z-Test ....................................................................................................... 82
6. 5. Analysis of Variance .................................................................................................... 87
6. 6. Moderated Regression Analysis ................................................................................... 90
Location ............................................................................................................................ 92
Time .................................................................................................................................. 94
Ad Type ............................................................................................................................ 96
Ad Medium ..................................................................................................................... 100
An Integrated Effectiveness Framework of Mobile In-App Advertising
ix
6. 7. Multigroup Moderation Analysis ............................................................................... 103
Location .......................................................................................................................... 107
Time ................................................................................................................................ 109
Ad Type .......................................................................................................................... 111
Ad Medium ..................................................................................................................... 112
6. 8. Summary .................................................................................................................... 114
Chapter 7. DISCUSSION AND CONCLUSIONS ................................................................ 117
7. 1. Key Findings .............................................................................................................. 117
Publishers-controlled factors .......................................................................................... 117
An Integrated Effectiveness Framework ........................................................................ 120
7. 2. Contributions .............................................................................................................. 126
7. 3. Limitations ................................................................................................................. 129
7. 4. Conclusions ................................................................................................................ 131
REFERENCES ...................................................................................................................... 134
APPENDIX A: Real-time bidding process ............................................................................ 164
APPENDIX B: Money Flow ................................................................................................. 165
APPENDIX C: Interactive Advertising Model...................................................................... 166
APPENDIX D: Mobile Advertising Effectiveness Framework ............................................ 167
APPENDIX E: Framework of Online Behavioural Advertising ........................................... 168
APPENDIX F: App Setup ..................................................................................................... 169
APPENDIX G: Ad Space Setup ............................................................................................ 171
APPENDIX H: List of allowed categories ............................................................................ 175
APPENDIX I: Ad Click Data ................................................................................................ 176
APPENDIX J: Literature Review .......................................................................................... 184
APPENDIX K: Model Fit Analysis ....................................................................................... 189
APPENDIX L: Participant Information Sheet ....................................................................... 192
APPENDIX M: Research Data Management Plan ................................................................ 197
APPENDIX N: Ethics Approval Letter ................................................................................. 199

An Integrated Effectiveness Framework of Mobile In-App Advertising
x
An Integrated Effectiveness Framework of Mobile In-App Advertising
xi
List of Tables Table 1.1: Linkage between research gaps, questions and objectives ....................................... 6 Table 2.1: Most of the mobile advertising spending is on in-apps (source: eMarket 2019) ... 18
Table 3.1: Current advertising optimisation research issues grouped by the participant. ....... 29 Table 3.2: The goals of the four participants. These four players actually have different goals
in mind when involving advertising. ....................................................................................... 32 Table 3.3: CTR is the metric to measure advertising goals ..................................................... 35 Table 3.4: List of factors controlled by advertisers according to Interactive Advertising
Model, Online Behavior Advertising Framework and Mobile Advertising Effective
Framework ............................................................................................................................... 37 Table 3.5: List of factors controlled by consumers according to Interactive Advertising Model
and Mobile Advertising Effective Framework ........................................................................ 39
Table 3.6: List of contextual factors according to Mobile Advertising Effectiveness
Framework ............................................................................................................................... 41 Table 4.1: Current mobile advertising effectiveness frameworks only involve two or three
participants without publishers ................................................................................................ 52 Table 4.2: Linkages between the research questions and the proposed hypotheses ................ 56 Table 5.1: List of ad spaces with different combinations of factors’ variants ......................... 68 Table 5.2: A sample Admob report. Based on this report information about Location, Time
and Ad Type can be extracted. With the first four characters of the ad names, the Ad Medium
can be identified: App1 or App2. Moreover, by knowing the full ad ids, Ad Space Duration,
Ad Space Size, Ad Space Position and Ad Space Timing can be derived .............................. 71
Table 6.1: Outlier check results with information about the lower and upper bounds and their
5% trimmed mean .................................................................................................................... 76 Table 6.2: Kolmogorov-Smirnova and Shapiro-Wilk test results ........................................... 77
Table 6.3: Reliability test results ............................................................................................. 79
Table 6.4: The correlation matrix shows no correlations among the eight independent
variables ................................................................................................................................... 80 Table 6.5: Average click-through rates of the world largest ad networks ............................... 81
Table 6.6: Descriptive statistics of the collected data .............................................................. 82 Table 6.7: The proportional z-test results ................................................................................ 84
Table 6.8: ANOVA test results ................................................................................................ 89 Table 6.9: Moderated Regression Analysis - Location ............................................................ 93
Table 6.10: Moderated Regression Analysis - Time ............................................................... 95 Table 6.11: Moderated Regression Analysis – Ad Type ......................................................... 96 Table 6.12: Moderated Regression Analysis – Ad Medium .................................................. 100 Table 6.13: Recommended fit indices ................................................................................... 104 Table 6.14: Correlation results ............................................................................................... 105
Table 6.15: Comparing the two groups of Location .............................................................. 107 Table 6.16: Moderating effect of Location on the relationship between Ad Space Duration
and CTRe ................................................................................................................................ 108 Table 6.17: Moderating effect of Location on the relationship between Ad Space Size and
CTRe ....................................................................................................................................... 108 Table 6.18: Moderating effect of Location on the relationship between Ad Space Position and
CTRe ....................................................................................................................................... 108
Table 6.19: Moderating effect of Location on the relationship between Ad Space Timing and
CTRe ....................................................................................................................................... 108 Table 6.20: Comparing the two groups of Time .................................................................... 109
An Integrated Effectiveness Framework of Mobile In-App Advertising
xii
Table 6.21: Moderating effect of Time on the relationship between Ad Space Duration and
CTRe ....................................................................................................................................... 109 Table 6.22: Moderating effect of Time on the relationship between Ad Space Size and CTRe
................................................................................................................................................ 110
Table 6.23: Moderating effect of Time on the relationship between Ad Space Position and
CTRe ....................................................................................................................................... 110 Table 6.24: Moderating effect of Time on the relationship between Ad Space Timing and
CTRe ....................................................................................................................................... 110 Table 6.25: Comparing the two groups of Ad Type .............................................................. 111
Table 6.26: Moderating effect of Ad Type on the relationship between Ad Space Duration
and CTRe ................................................................................................................................ 111 Table 6.27: Moderating effect of Ad Type on the relationship between Ad Space Position and
CTRe ....................................................................................................................................... 112
Table 6.28: Moderating effect of Ad Type on the relationship between Ad Space Position and
CTRe ....................................................................................................................................... 112 Table 6.29: Moderating effect of Ad Type on the relationship between Ad Space Timing and
CTRe ....................................................................................................................................... 112 Table 6.30: Comparing the two groups of Ad Medium ......................................................... 113 Table 6.31: Moderating effect of Ad Medium on the relationship between Ad Space Duration
and CTRe ................................................................................................................................ 113
Table 6.32: Moderating effect of Ad Medium on the relationship between Ad Space Size and
CTRe ....................................................................................................................................... 114
Table 6.33: Moderating effect of Ad Medium on the relationship between Ad Space Position
and CTRe ................................................................................................................................ 114 Table 6.34: Moderating effect of Ad Medium on the relationship between Ad Space Timing
and CTRe ................................................................................................................................ 114
Table 6.35: Hypothesis testing results ................................................................................... 115
An Integrated Effectiveness Framework of Mobile In-App Advertising
xiii
List of Figures Figure 1.1 Ad space could take different form factors and designed and displayed by
publishers ................................................................................................................................... 4
Figure 1.2: The research process ............................................................................................... 9 Figure 2.1: By 2021, 86.5 per cent of the advertising is programmatic (source: eMarketer,
2020) ........................................................................................................................................ 16 Figure 3.1: Ad space loading process ...................................................................................... 26 Figure 3.2: Ad space displaying process.................................................................................. 26
Figure 4.1: The Integrated Mobile In-App Advertising Effectiveness Framework................. 53 Figure 4.2: The conceptual model of the present study ........................................................... 55 Figure 5.1: The experimental procedure - the users are randomly allocated to 16 different
groups of ad space characteristics ............................................................................................ 66
Figure 6.1: Outlier check diagram ........................................................................................... 76 Figure 6.2: Click-through rates are normally distributed......................................................... 78 Figure 6.3: Shorter ads are shown to be significantly more effective than the longer ones .... 85
Figure 6.4: Smaller ads are shown to be significantly more effective than the larger ones .... 85 Figure 6.5: Top ads are shown to be significantly more effective than the middle ones ......... 86 Figure 6.6: Ending ads are shown to be significantly more effective than the beginning ones
.................................................................................................................................................. 86 Figure 6.7: Location moderates the relationship between Ad Space Duration and CTRe ....... 94
Figure 6.8: Ad Type moderates the relationship between Ad Space Duration and CTRe ....... 97 Figure 6.9: Ad Type moderates the relationship between Ad Space Size and CTRe .............. 98
Figure 6.10: AdType moderates the relationship between Ad Space Position and CTRe ....... 99 Figure 6.11: AdType moderates the relationship between Ad Space Timing and CTRe ...... 100 Figure 6.12: Ad Medium moderates the relationship between Ad Space Duration and CTRe
................................................................................................................................................ 101
Figure 6.13: Ad Medium moderates the relationship between Ad Space Position and CTRe
................................................................................................................................................ 102 Figure 6.14: The path diagram ............................................................................................... 106
Figure 6.15: Region 1 and Region 2 ...................................................................................... 107 Figure 6.16: Weekdays and Weekend ................................................................................... 109
Figure 6.17: Text and Image .................................................................................................. 111 Figure 6.18: App 1 and App 2 ............................................................................................... 113

An Integrated Effectiveness Framework of Mobile In-App Advertising
xiv

An Integrated Effectiveness Framework of Mobile In-App Advertising
xv
List of Equations (1) ............................................................................................................................................. 36 (2) ............................................................................................................................................. 72
(3) ............................................................................................................................................. 84 (4) ............................................................................................................................................. 88

An Integrated Effectiveness Framework of Mobile In-App Advertising
xvi
An Integrated Effectiveness Framework of Mobile In-App Advertising
xvii
Abbreviations
CMH Cochran-Mantel-Haenszel
CPC Cost per Click
CPM Cost Per Mille
CPH Click Per Hour
CTR Click-Through Rate
DAGMAR Defining Advertising Goals for Measured Advertising Results
DSP Demand-Side Platform
GPS Global Positioning System
IAM Interactive Advertising Model
MAEF Mobile Advertising Effectiveness Framework
OBA Online Behavioural Advertising
OEC Overall Evaluation Criteria
OTC Over The Counter
P.C. Personal Computer
PII Personally Identifiable Information
PSA Public Service Announcement
RPC Revenue Per Click
RPM Revenue Per Mille
RTB Real-Time Bidding
SSP Supply-Side Platform
WWW World Wide Web

An Integrated Effectiveness Framework of Mobile In-App Advertising
xviii
An Integrated Effectiveness Framework of Mobile In-App Advertising
xix
Glossary of Technical Terms
A/A: also called a NullTest. Instead of an A/B test, one of two groups is allocated to users but
subjected to the same experience. An A/A test should be used to gather data, determine the
uncertainty for power measurements, and test the experimentation system (the Null hypothesis
can be discarded around 5% of the time using a 95% confidence level).
Ad: promotional component of message material that an advertiser has charged or may pay for
when a user views the content.
Ad space: or also called ad slot is the allotted real estate on a website or app where an ad can
be placed. Each space on a website or app is unique so that several ad spaces may reside on a
single page.
Advertiser: sometimes called marketer, the company is paying for ad showing or tapping.
App: a programming programme or piece of software designed for a function that a person can
download on their cell phone or other mobile devices.
Banner ad: a rectangular website and app ad typically designed to divert traffic to a particular
address by connecting to the advertiser’s domain.
Click: click an ad that brings a person to another location.
Click-through rate (CTR): the ratio of the number of clicks and the number of impressions.
Confidence level: likelihood to accept (i.e. retain) the null hypothesis when correct.
Cost per click (CPC): Also called pay-per-click (PPC). An Internet measurement model is used
to direct visitors to websites where an advertiser pays a search engine (or publisher) when an
online client clicks the ad.
Cost per mille (CPM): also known as pay-per-mille (PPM). It is an internet advertising
calculation model used to guide visitors to websites where an advertiser pays a search engine
(or publisher) whenever an online customer views the advertisement 1000 times.
Demand-side platform (DSP): An integrated advertiser bidding platform to get good
impressions at low cost, engaging simultaneously in numerous auctions among various ad
exchanges.
Display advertising: convey ads visually through text, icons, animations, images, photographs
or other graphics. Advertisers also target users with unique features to customise ads.
Email advertisement: Email advertising is an ad duplication or part of an email address. Email
marketing may not be requested, in which case the sender may allow the recipient to opt-out
of future emails or with the recipient’s prior permission (opt-in).
Expanding ad: An expanding ad is a rich media frame ad that changes dimensions in a
predefined situation, such as the predetermined amount of time a visitor spends on a web page
the user clicks on an ad, or the user’s mouse cursor moves through an ad. Expanding advertising
encourages advertisers to add small ad space details.
An Integrated Effectiveness Framework of Mobile In-App Advertising
xx
Experimental unit: often it is considered as an object. The user is an app’s standard
experimental unit. The overall metrics are calculated on each unit up to average over the whole
experiment. While specific metrics can include user-day, user-session or page views as
experimental units. During an experiment, the user must have explicit knowledge, and a
randomisation mechanism based on user I.D.s usually accomplishes this.
Factor: A controllable experimental element assumed to affect overall assessment parameters.
Factors are given weights, often called Levels or Versions. Factors themselves are called
variables. Quick A/B tests have one element of two values: A and B.
Frame ad (traditional banner): the first type of advertising. “Banner Advertising” also refers to
traditional frame advertisements.
Floating ad: A floating ad is a form of rich media advertising usually superimposed on the
content of the website. After a preset time, floating ads can vanish or become less obtrusive.
Impression: a consumer ad view on a web page or app. Notice that if the page has more than
one ad space, a single page view will provide more than one impression.
Interstitial ad: An interstitial ad appears before a user can access searched content, even when
the user is waiting to load the content. Interstitial advertisements are interruptive advertising.
Keyword: a particular word or combination of terms that a searcher can type into a search field.
Advertisers can buy keywords to show their website and app content prominently.
Mobile ad: Mobile advertisements are ad copies made available by handheld users, including
smartphones or tablets. Mobile advertising may take the form of mobile search ads, mobile
website ads or mobile application ads or games ads. It may also take the form factor of static
or dynamic display ads, short messages, or interactive ads.
Null hypothesis: The hypothesis, sometimes referred to as H0, is that the dependent variable
(DV) value for the independent variable variants is not different and that any differences
observed during the experiment are due to random variability.
Pop-ups/pop-unders: A pop-up ad is seen in a new window above the original window. A pop-
under ad opens a new window under the original window.
Publisher: a person or association that plans, issues and disseminates public content. Simply, a
publisher has space to show advertisements.
Power: Likelihood of a correct null hypothesis dismissal, H0, if incorrect. Power tests our
capacity to see the distinction as it happens.
Query: a set of words entered by a search engine searcher, starting a search and resulting in a
search engine result page (SERP) of organic and paid listings.
Real-time bidding: ad inventory is purchased and sold per impression, via instant programmatic
auction, close to financial markets.
Search engine: a software that indexes web pages and then seeks to align user search requests
by relevance. Google, Bing, Baidu are search engine instances.
An Integrated Effectiveness Framework of Mobile In-App Advertising
xxi
Search engine results page (SERP): a page that online users see after accessing the search box.
SERP has two forms of result listings in response to the query sent: organic results and paid
results. Organic search results are webpage lists that more precisely complement the user’s
specific search query. Paid results are advertisements that companies have paid to advertise
their web pages with specific keywords, so these lists appear as someone performs a search
query with such keywords.
Search Engine Marketing (SEM): Search Engine Marketing (SEM) seeks to improve website
exposure on the Search Engine Results Page (SERPs). Search engines provide paid search
results and organic search results. Search engines also use a visual separator to separate
sponsored organic data. Search engine marketing scans all past actions of the advertiser to
make website listing more appropriate and customised in alignment with selected keywords.
Search Engine Optimisation: or also called SEO, aims to boost search rankings in SERPs by
growing website content to search words. Search engines often adjust their algorithms to
penalise low-quality, rank-fitting pages, making optimisation a moving target for advertisers.
Many service vendors offer SEO.
Social media marketing: a method of commercial advertisement on social media sites. Many
companies market their goods by daily notifications and exclusive promotions through their
social media pages.
Sponsored search: often called sponsored links that allow the search result pages to contain
advertising. This search ad is also sold via real-time bidding.
Standard deviation (Std-Dev): a calculation of variance commonly referred to as σ. That is the
standard deviation of a statistical distribution.
Supply-side platform (SSP): an integrated publisher platform to sell impressions at an optimal
price. It created several auctions for the same impression in various ad exchanges to reach more
bidding advertisers.
Text ads: or ads, also called text-based ads, contain either text or hyperlinks.
User: a person with the Internet and World Wide Web access and issues ad-hoc topics to
communicate his or her knowledge needs, such as web search or browsing.
Variant: often called Levels or Versions are a specific value of a variable.
Webpage: a web presentation of knowledge. Websites consist of web pages, similar to a book’s
pages.
Web banner advertising: Web banners or banner advertising usually appear on a website.
Banner advertising can combine video, audio, graphics, buttons, shapes, or other multimedia
features with Java applets, HTML5, Adobe Flash, and other programmes.

An Integrated Effectiveness Framework of Mobile In-App Advertising
xxii
An Integrated Effectiveness Framework of Mobile In-App Advertising
xxiii
ABSTRACT
Considering mobile in-app advertising as a subject of its own, this study examines the roles,
goals, and controlled factors of all participants to create an integrated framework for mobile
in-app advertising. The main emphasis is on the app publisher – who has earned the least
publicity in the advertisement literature, almost absent in previous effectiveness frameworks,
mobile and non-mobile. However, their aim of optimising revenue often contradicts other
participants. This study ultimately aimed to identify the publishers-controlled factors and
evaluate their impacts on mobile in-app advertising effectiveness. It also aimed to construct an
integrated effectiveness framework for mobile in-app advertising and evaluate the moderating
effects of factors controlled by advertisers, consumers and ad networks on the relationships
between publishers-controlled factors and the mobile in-app advertising effectiveness.
Consequently, in this study, four publishers-controlled factors are detected and used to assess
the interactive effects. An online experiment was set up to test the research’s conceptual model.
A common goal of participants and a common outcome metric were also formulated in this
study. An integrated effectiveness framework was subsequently built around that common
goal. Enhancing the common outcome metric is to enhance the effectiveness of all participants.
The framework was tested successfully with the data of more than 15,000 ad impressions, more
than 800 ad clicks from thousands of mobile users in more than 160 countries worldwide. This
study employed both proportional z-test and analysis of variance techniques to test the main
effects of publishers-controlled factors in the data analysis phase. To test the moderating
effects, both Structured Equation Modelling-based Multigroup Moderation Analysis and
regression-based Moderated Regression Analysis techniques were then used. The use of more
than one statistics technique is called method triangulation. Its purpose is to cross-check each
other technique’s results and improve the credibility of the findings.
Mobile in-app advertising is a new subject. This study is one of the first attempts to dig into
this promising area, searching for new knowledge about its participants, its roles, its goals, its
outcome metrics and its factors. Considering mobile in-app advertising as a subject of its own,
theoretically, this study contributes with an integrated effectiveness framework, including new
conceptual constructs and relationships. Practically, the study suggests newly integrated
advertising strategies associated with publishers to enhance the effectiveness of mobile in-app
advertising further. By which, this study could help to increase the global mobile in-app
advertising revenue significantly higher by balancing the benefits of all participants involved.
Keywords: mobile in-app advertising, programmatic advertising, effectiveness framework,
advertising factors, ad click, ad space, advertisements

An Integrated Effectiveness Framework of Mobile In-App Advertising
xxiv

An Integrated Effectiveness Framework of Mobile In-App Advertising
xxv
The difference between theory and practice is larger in practice than the
difference between theory and practice in theory.
– Jan L.A. van de Snepscheu

An Integrated Effectiveness Framework of Mobile In-App Advertising
xxvi
An Integrated Effectiveness Framework of Mobile In-App Advertising
1
Chapter 1. INTRODUCTION
Research is a journey. Therefore, one should take it one step at a time. This chapter presents
an introduction to the “Integrated Effectiveness Framework of Mobile In-App Advertising”,
with the purpose to establish the context of the topic, the motivation for undertaking the study
and its importance. The following are accordingly discussed:
• Research Problem (Section 1.1)
• Research Questions (Section 1.2)
• Research Objectives (Section 1.3)
• Research Variables (Section 1.4)
• Research Methods (Section 1.5)
• Research Contributions (Section 1.6)
• Research Plan (Section 1.7)
1. 1. Research Problem
Technology has changed communication. At first, traditional advertising reaches consumers
through newspapers, magazines, radios and televisions. The radio allowed for fast, effective
audio broadcasting to the masses (Gugliotta 2007). The television added video, allowing
viewers to see colourful imagery from societies and environments entirely different from their
own (Kent 1993). On television, events such as the Super Bowl (the final game in the NFL
season) are famous for their advertisements, with companies spending millions of dollars for a
short spot to be seen by many viewers (Norris & Colman 1993).
The invention of the Internet was, however, even more disruptive (Drèze & Hussherr 2003).
At first, it allowed people to get access to electronic mail and static pages of information.
However, it later developed to enable social networking, shopping, instant messaging, banking,
advanced searching and more (Laudon & Traver 2018). Companies have always been using
these formats to communicate and promote their products. Today, many marketing messages
are delivered via the Internet and the World Wide Web to their online customer (Evans 2009).
On the Internet, video sharing sites such as YouTube has made viral marketing campaigns
possible, with advertisements reaching many million viewers (Berger & Milkman 2012).
Evidently, advertisers have been able to utilise the strengths of these new mediums to engage
more consumers. The fast Internet and World Wide Web development have changed how
information is accessed and used. They have also changed the business of advertising (Bucklin
& Hoban 2017).
A more sophisticated evolution of technology can be seen recently through the smartphone.
This mobile device allows for all these forms of communication to happen on the go, for the
consumer to utilise it at their convenience (Coustan & Strickland 2016). The next frontier for
advertisers is, therefore, to understand their niche in mobile marketing. Until now, the fastest
growing platform that can be utilised by advertisers today is mobile, as its usage increased five
times worldwide between 2010 and 2020 (Interactive Advertising Bureau 2010-2020). In 2018,
An Integrated Effectiveness Framework of Mobile In-App Advertising
2
30 per cent of online shopping in the U.S. was on mobile (Laudon & Traver 2018). Popular
mobile apps also integrate advertisements, leaving consumers constantly messaged by
businesses who want to sell their products (Petsas et al. 2013). As many ads allow consumers
to click them and go straight to online purchasing simply, revenue can grow dramatically as
action from consumers is immediate (Djamasbi, Hall-Phillips & Yang 2013; Hao, Guo &
Easley 2017).
Mobile in-app advertising interacts with its audience through a mobile device in the form of a
mobile web interface, an in-app display and a search function (Djamasbi, Hall-Phillips & Yang
2013). There are multiple formats by which mobile advertisement can be conveyed. They could
be banner ads, interstitials, video ads or native ads (Sweetser et al. 2016). The first is a format
that has popularly been used – a small strip on the bottom or top of the screen that is generally
made to generate awareness. The second is a full-screen ad with more space to show creative
ideas and deliver more extensive content to the consumer. The third is video ads – generally,
30-second clips that are similarly made to engage customers (Nitza & Ruti 2015). The final
form, native advertising, give the publisher of the ads a template of what elements should be
on the platform, which can then be contextualised into the content and the context. It is expected
that revenues from these types of ads will continue to grow in the future. According to
eMarketer (2020), total mobile in-app ad spending was almost $77 billion, four times that on
mobile web ads. It constitutes 57% of all online ads worldwide (Interactive Advertising Bureau
2019). Apparently, mobile in-app advertising has become the most popular marketing medium
for companies.
In the second decade of the millennium, businesses create and run in-app advertising
campaigns to improve brand recognition, customer preferences and buying intention (Barwise
& Strong 2002; Kim & Han 2014; Trivedi 2015) and also to increase online conversion,
customer engagement and advocacy (Brakenhoff & Spruit 2017; Ghose & Todri 2015).
Businesses can run their mobile in-app advertising campaigns through guaranteed contracts or
more popularly through an unguaranteed real-time bidding process (Choi et al. 2020; Fisher
2018). The Real-Time Bidding (RTB) mechanism was designed and maintained by the2017
(IAB), which has identified and maintained the specifications for this ad serving process.
There are two main parties involved in the ad serving process: the advertiser delivering the
advertisements and the publisher offering the ad spaces in their mobile applications (Busch
2016). There are two other contract parties between the advertiser and the publisher: the
bidding service and the auction service (see Appendix A). When a customer opens an app, they
will auction in milliseconds, and the winner can make an impression (Perlich et al. 2012). Data
and models promote and automate the bids – that is the reason why RTB-based advertising is
sometimes called programmatic advertising (Busch 2016; Laudon & Traver 2018) or
computational advertising (Yang et al. 2017; Yuan, Wang & Zhao 2013). In 2017,
programmatic advertising accounted for nearly 80% of digital display ad spending (Fisher
2018).
With the aid of ad networks such as Google Ads, Facebook Audience Network and Twitter
MoPub, advertisers these days have several options to improve the effectiveness of their
advertising campaigns by making use of interactive and personalised targeting (Andrews 2017;
Luo et al. 2014), needless to mention the conventional use of ad designs which are controlled
by the advertisers. Basically, nowadays in practice, there are three types of advertisement
targeting methods related to the ad characteristics, the consumer information and the context
factors (Chen & Hsieh 2011; De Pelsmacker, Geuens & Anckaert 2002).
An Integrated Effectiveness Framework of Mobile In-App Advertising
3
On the theoretical side, the Interactive Advertising Model (IAM) proposed by Rodgers and
Thorson (2000) categorised all the factors affecting the interactive advertising effectiveness
into either advertiser or consumer-controlled (see Appendix B). The Online Behavioral
Advertising (OBA) framework recently proposed by Boerman, Kruikemeier and Zuiderveen
Borgesius (2017) extended the IAM to include more factors but basically are those who are
controlled by advertisers or consumers also (see Appendix E).
Nonetheless, while these factors are brought up in mobile research more often, there is no
emphasis on studying mobile advertising as a subject of its own. Instead, they study mobile
advertising using a theoretical framework made for different kinds of mediums, such as the
Internet or television (Hao, Guo & Easley 2017; Okazaki & Barwise 2011). It seems that
researchers have assumed that ad characteristics in mobile advertising are equivalent to those
for other forms (Choi et al. 2020; Paulson 2017; Rosenkrans & Myers 2012). As a consequence,
it was seen that literature saturated with inconsistent research trying to adapt existing theories
into mobile advertising and very little research trying to understand mobile advertising from
the foundation. That causes an issue, as researchers often have the aim to explain correlations
based on previously developed theoretical standpoints (Bryman & Bell 2011; Ma 2016). In the
context of advertising platforms, Prerna (2015) explained that continuous innovation in mobile
technologies allows for new ways of advertising, something that is not found on more
traditional mediums like television and the web. Thus, if one tries to repeatedly apply findings
from other mediums to the mobile platform without concern for its uniqueness, one will
repeatedly find different results as seen so far in the literature. Not because the conduction of
the research in itself was flawed, but because proper theoretical foundations and framework
were not present in order to support those correlations and account for those differences (Goh,
Chu & Wu 2015; Hao, Guo & Easley 2017; Persaud & Azhar 2012; Trivedi 2015).
Andrews (2017) recently stated that there is not much research on mobile advertising.
Moreover, to make matters worse, the few existing studies are usually specific to particular
contexts, present inconsistent views. For example, while Gupta, Khirbat and Singh (2014)
claimed that ads that take too much space and time are perceived negatively, Su et al. (2016)
supported an opposing view and encouraged the use of interstitial ads (videos and ads that take
the whole screen). Even within studies, like the one conducted by Sinkovics, Pezderka and
Haghirian (2012), there are considerable inconsistencies, where one sample group finds
irritation to be a significant factor while the other does not. Due to that, Bhave, Jain and Roy
(2013) stated that there are “contradictory results in the prior academic advertising literature”.
As a consequence, it becomes hard to assess the impact of mobile advertising factors.
Moreover, the increase in usage of mobile devices in combination with this inconsistent body
of knowledge has implications for practitioners, too. In practice, while social media and videos
have been well adopted (with over 50 per cent of mobile users adopting the former), product
searches via mobile devices as well as ad-blockers have proven to be problematic until now
(O'Reilly 2015). As stated by Le and Nguyen (2014), a lack of knowledge regarding the mobile
format is an issue. Hence it is not surprising that practitioners are having trouble with ad-
blocking programs. Some even argue that the right way to deal with this matter is to design
advertisements properly in order to diminish irritation (Delafrooz & Zanjankhah 2015; Trivedi
2015).
Nevertheless, again, this field of mobile advertising research is theoretically inconsistent, and
so far “properly” is an imprecise term (Sanakulov & Karjaluoto 2015). Therefore,
comprehensive research on mobile in-app advertising is urgently needed to help practitioners
avoid the consequences of negative attitudes, such as in the example of ad blockers (Ma 2016).
An Integrated Effectiveness Framework of Mobile In-App Advertising
4
Moreover, it is essential to step back and look at smartphones as an independent medium rather
than an extension of other mediums (Luo et al. 2014; Shelly & Esther 2017). Thus,
investigating mobile advertising effectiveness can create value to this emergent body of
knowledge by giving context to existing theoretical frameworks and additionally opening the
possibility for new findings to surface. In line with that demand, Grewal et al. (2016) recently
proposed the Mobile Advertising Effective Framework (MAEF). That effectiveness framework
is built around the mobile advertiser goals and categorise factors affecting the outcome metric
into ad elements, context, consumer, market, and firm, extending previous effectiveness
framework with additional factors being controlled by ad networks (see Appendix D).
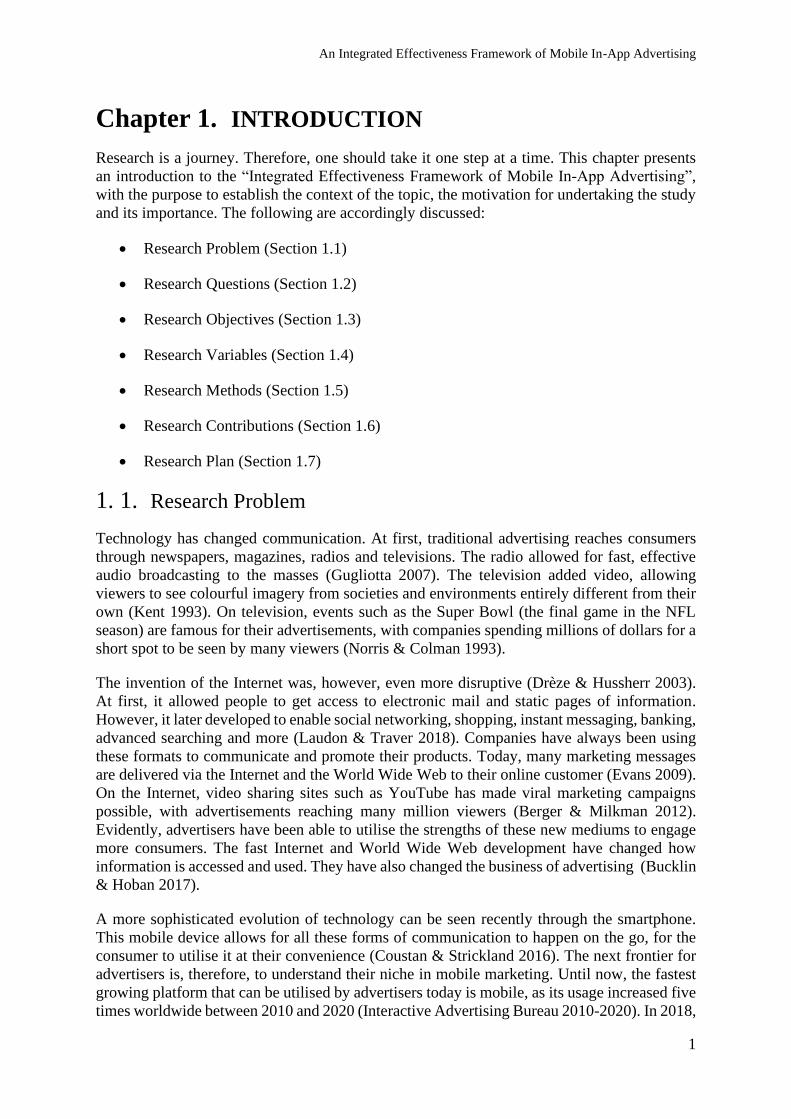
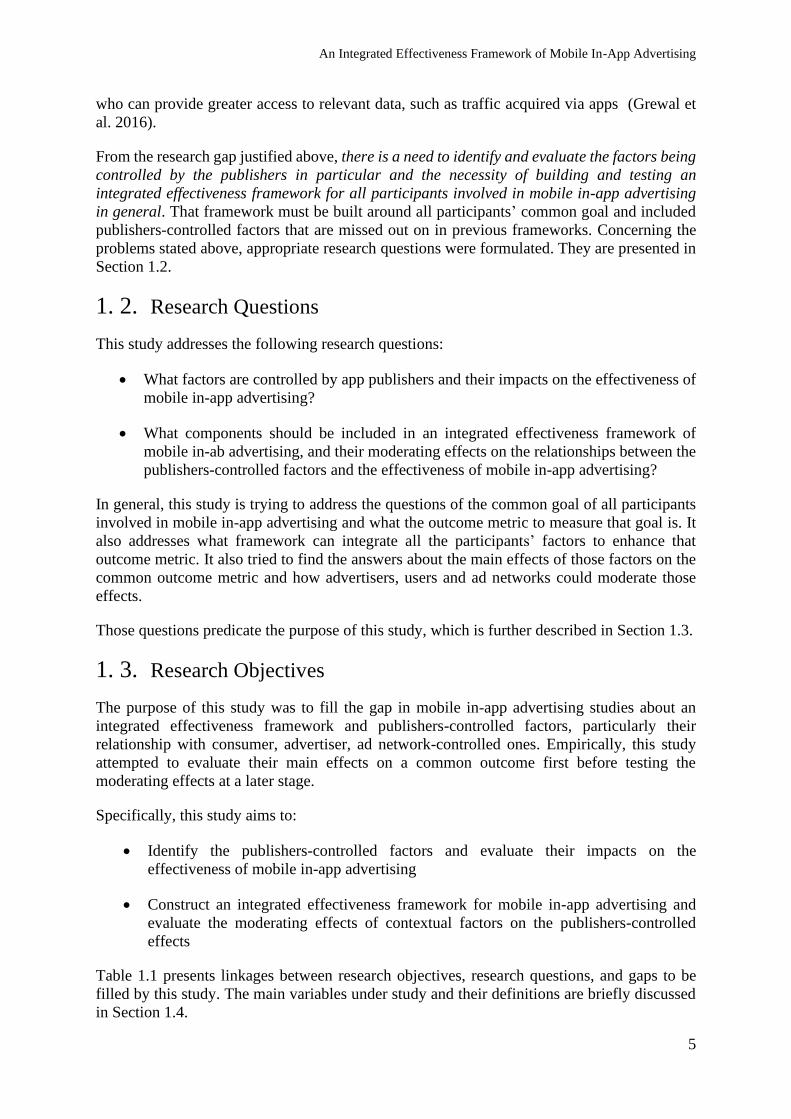
Figure 1.1 Ad space could take different form factors and designed and displayed by publishers
However, despite the seeming utility of MAEF, and even IAM, OBA previously, it basically
includes only factors related to consumers, advertisers, ad networks and built around the goals
of advertisers – the demand side of an ad serving process (Brakenhoff & Spruit 2017; Grewal
et al. 2016; Rodgers & Thorson 2000). On the unexplored supply side, the publishers still have
their own control of supplying ad spaces (Brakenhoff & Spruit 2017; Hao, Guo & Easley 2017)
and delivering ad impressions on those ad spaces (Choi et al. 2017). An ad space or also called
an ad slot is the allotted real estate on a website or app where an ad can be placed. An ad space
could take different form factors, as shown in Figure 1.1. The fact is that 30% of the global
mobile in-app advertising spending is actually paid to publishers (Aimonetti 2012; Nairn 2018).
The publishers definitely have their own goal of maximising their revenue, which sometimes
contradicts with the advertiser goal (Adler, Gibbons & Matias 2002; Choi et al. 2017; Korula,
Mirrokni & Nazerzadeh 2016; Kumar, Jacob & Sriskandarajah 2006). The publishers are
indeed a key party involved in the money flow (see Appendix B). However, surprisingly the
studies on the app publisher role are even limited, and there are not that many optimisation
options available for app publishers. On the one hand, mobile-related instructional materials
are shockingly scarce (Billore & Sadh 2015; Choi et al. 2020; Nittala 2011; Okazaki 2012). On
the other hand, there are ongoing challenges in assessing and maximising the efficacy of ads
(Interactive Advertising Bureau 2019). This lack of academic interest is not surprising given
the inherent technological and organisational difficulty of implementing a realistic field
experiment with mobile ads and the need for close cooperation with practitioners/publishers
An Integrated Effectiveness Framework of Mobile In-App Advertising
5
who can provide greater access to relevant data, such as traffic acquired via apps (Grewal et
al. 2016).
From the research gap justified above, there is a need to identify and evaluate the factors being
controlled by the publishers in particular and the necessity of building and testing an
integrated effectiveness framework for all participants involved in mobile in-app advertising
in general. That framework must be built around all participants’ common goal and included
publishers-controlled factors that are missed out on in previous frameworks. Concerning the
problems stated above, appropriate research questions were formulated. They are presented in
Section 1.2.
1. 2. Research Questions
This study addresses the following research questions:
• What factors are controlled by app publishers and their impacts on the effectiveness of
mobile in-app advertising?
• What components should be included in an integrated effectiveness framework of
mobile in-ab advertising, and their moderating effects on the relationships between the
publishers-controlled factors and the effectiveness of mobile in-app advertising?
In general, this study is trying to address the questions of the common goal of all participants
involved in mobile in-app advertising and what the outcome metric to measure that goal is. It
also addresses what framework can integrate all the participants’ factors to enhance that
outcome metric. It also tried to find the answers about the main effects of those factors on the
common outcome metric and how advertisers, users and ad networks could moderate those
effects.
Those questions predicate the purpose of this study, which is further described in Section 1.3.
1. 3. Research Objectives
The purpose of this study was to fill the gap in mobile in-app advertising studies about an
integrated effectiveness framework and publishers-controlled factors, particularly their
relationship with consumer, advertiser, ad network-controlled ones. Empirically, this study
attempted to evaluate their main effects on a common outcome first before testing the
moderating effects at a later stage.
Specifically, this study aims to:
• Identify the publishers-controlled factors and evaluate their impacts on the
effectiveness of mobile in-app advertising
• Construct an integrated effectiveness framework for mobile in-app advertising and
evaluate the moderating effects of contextual factors on the publishers-controlled
effects
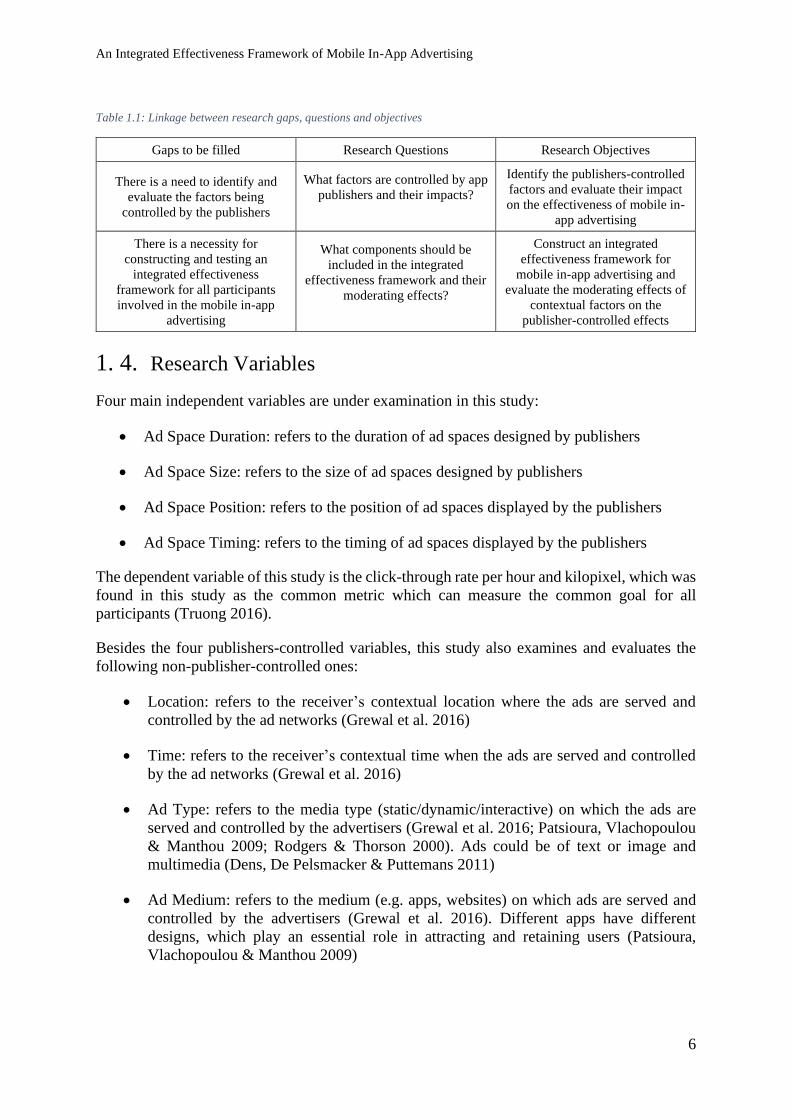
Table 1.1 presents linkages between research objectives, research questions, and gaps to be
filled by this study. The main variables under study and their definitions are briefly discussed
in Section 1.4.
An Integrated Effectiveness Framework of Mobile In-App Advertising
6
Gaps to be filled Research Questions Research Objectives
There is a need to identify and
evaluate the factors being
controlled by the publishers
What factors are controlled by app
publishers and their impacts?
Identify the publishers-controlled
factors and evaluate their impact
on the effectiveness of mobile in-
app advertising
There is a necessity for
constructing and testing an
integrated effectiveness
framework for all participants
involved in the mobile in-app
advertising
What components should be
included in the integrated
effectiveness framework and their
moderating effects?
Construct an integrated
effectiveness framework for
mobile in-app advertising and
evaluate the moderating effects of
contextual factors on the
publisher-controlled effects
1. 4. Research Variables
Four main independent variables are under examination in this study:
• Ad Space Duration: refers to the duration of ad spaces designed by publishers
• Ad Space Size: refers to the size of ad spaces designed by publishers
• Ad Space Position: refers to the position of ad spaces displayed by the publishers
• Ad Space Timing: refers to the timing of ad spaces displayed by the publishers
The dependent variable of this study is the click-through rate per hour and kilopixel, which was
found in this study as the common metric which can measure the common goal for all
participants (Truong 2016).
Besides the four publishers-controlled variables, this study also examines and evaluates the
following non-publisher-controlled ones:
• Location: refers to the receiver’s contextual location where the ads are served and
controlled by the ad networks (Grewal et al. 2016)
• Time: refers to the receiver’s contextual time when the ads are served and controlled
by the ad networks (Grewal et al. 2016)
• Ad Type: refers to the media type (static/dynamic/interactive) on which the ads are
served and controlled by the advertisers (Grewal et al. 2016; Patsioura, Vlachopoulou
& Manthou 2009; Rodgers & Thorson 2000). Ads could be of text or image and
multimedia (Dens, De Pelsmacker & Puttemans 2011)
• Ad Medium: refers to the medium (e.g. apps, websites) on which ads are served and
controlled by the advertisers (Grewal et al. 2016). Different apps have different
designs, which play an essential role in attracting and retaining users (Patsioura,
Vlachopoulou & Manthou 2009)
Table 1.1: Linkage between research gaps, questions and objectives
An Integrated Effectiveness Framework of Mobile In-App Advertising
7
1. 5. Research Methods
Academic literature relating to mobile in-app advertising processes and factors were
systematically reviewed. Firstly, this study reviewed literature in online advertising,
programmatic advertising, and mobile advertising. The factors, when found, were grouped by
their participants. Next, academic literature relating to the mobile in-app advertising goals and
outcome metrics were systematically reviewed to determine the metric to measure that
common goal. Any discussion of advertising effectiveness would inevitably entail discussing
advertising goals (Li & Leckenby 2004). Based on a critical review of the previous effective
frameworks, this study then proposed its own integrated effectiveness framework.
For the empirical parts of the research questions, this study first attempted to investigate the
descriptive and explanatory relationships between publishers-controlled factors and the
effectiveness of mobile in-app advertising. Therefore, it was found suitable to pursue a
hypothetical-quantitative approach. It started by testing hypotheses deduced from the proposed
integrated effectiveness framework with the data collected from developed mobile
applications. With eight independent factors being studied, a factorial experiment design was
selected, and a multi-way online experiment was set up (Collins et al. 2014; Dixon, Enos &
Brodmerkle 2011; Kohavi et al. 2009b). This study employed both proportional z-test and
analysis of variance techniques to test the main effects of publishers-controlled factors on the
data analysis phase. To test the moderating effects, both Structured Equation Modelling-based
Multigroup Moderation Analysis and regression-based Moderated Regression Analysis were
used. Each technique has its advantages and disadvantages. The use of more than one statistics
technique is called method triangulation (Carter et al. 2014). Its purpose is to cross-check each
other technique’s results and improve the credibility of the findings (Denzin 2017; Webb
2017).
1. 6. Research Contributions
The contributions of this study can be presented from three perspectives, i.e. theoretical,
empirical and practical, which are described below.
Theoretically, this study proposed a newly integrated effectiveness framework that extends
previous effectiveness frameworks to include new conceptual constructs and relationships.
Besides that, this study also contributes to a new metric to measure the effectiveness of mobile
in-app advertising, taking into account the ad duration and the ad size. This new metric is found
necessary, especially in the context of mobile devices where the screen size and the screen time
are both limited (Truong 2016).
Empirically, this study set up a new way of designing multiple ad spaces in a single app. By
doing so, multiple factors can be tested interactively and concurrently. That helps to save the
time of doing multiple nested A/B tests. Software programs that could do nested A/B tests, or
multivariate tests, are typically commercial and the mathematics behind them is not publicly
available (Siroker et al. 2014). This study actually contributed by finding and explaining the
nested A/B testing using both Multigroup Moderation Analysis and Moderated Regression
Analysis techniques.
Practically, this study suggests newly integrated advertising strategies associated with
publishers to enhance the effectiveness of mobile in-app advertising further. By which, this
study could help increasing mobile in-app advertising revenue significantly higher by
An Integrated Effectiveness Framework of Mobile In-App Advertising
8
balancing the benefits of all participants involved. The study carried out on a large-scale online
experiment that involved thousands of ad impressions, with hundreds of ad clicks from
thousands of mobile users worldwide. The results have shown a significant increase in ad
clicking when employing the new integrated effectiveness framework.
1. 7. Research Plan
Professionally, the researcher of this study has long experience working in the mobile app
industry, and have experienced a lack of theoretical background in the field. Motivated by the
mentioned contributions especially the practical ones bringing back for the research’s industry,
the researcher found it worthy to carry out the study at its full scale with a detailed and feasible
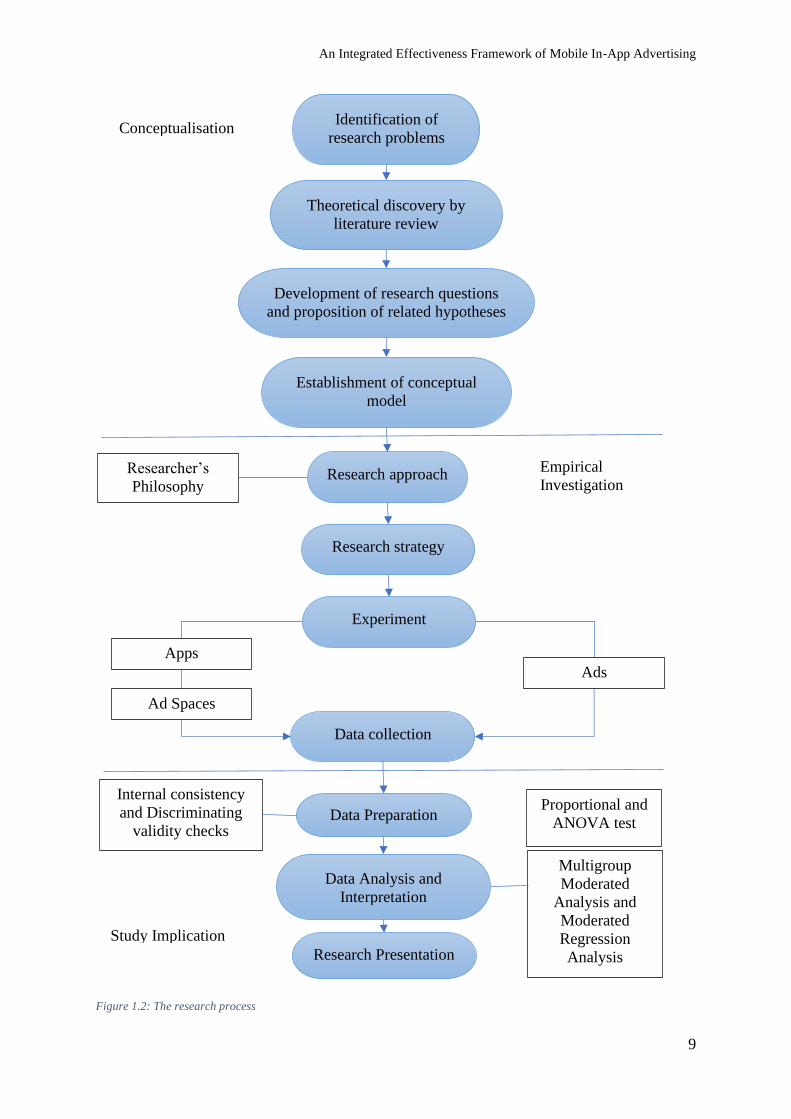
research plan explained in this section. Figure 1.2 briefly illustrates the research activities
undertaken in this study. The activities are categorised into three steps.
Step one relates to the activities that grounded this study in a solid research background,
enabled identification of research problems and set the study boundaries. That firstly involved
an extensive review of literature in mobile in-app advertising fields. Based on that, the research
questions and hypotheses specific to the proposed problems were derived.
Step two concerns activities supportive of the methodological design. The activities were the
identification of research methodology, as well as data collection and analysis methods. This
stage helped the researcher plan more experiments to uncover results that would explain the
problems of the study later. The tasks included the definition of the empirical research
methodology, the selection of suitable data collection methods and the sample from which the
data were obtained, the creation of a research tool, and data collection activities to obtain the
data needed for the analysis. The methods of planning, evaluating and interpreting data were
then carried out once the data collection step was completed.
Step three included activities to review the findings of the study, abstract conclusions and
consequences of the study and statements of study limitations and guidelines useful for future
research. This step also involves finalising the research findings, the study implications and the
conclusions in the final presentation.
For the rest of this thesis, the contents are organised as follows. Chapter 2 presents the literature
review about the background of online advertising, programmatic advertising and mobile
advertising. Chapter 3 is for a review of the related works in mobile in-app advertising
processes, goals, outcome metrics, and factors. These two chapters grounded this study in a
concrete research background enabled the identification of research problems and set the study
scope. Chapter 4 contains a systematic review of literature specialising in publishers-controlled
factors and advertising effectiveness frameworks. Based on those reviews, the factors
controlled by publishers were identified, and an integrated effectiveness framework of mobile
in-app advertising was constructed. The research variables of this study were also identified
and formulated accordingly in this chapter. Chapter 5 discussed the methodological design with
details on the data collection procedures and methods. Chapter 6 is dedicated to the data
analysis part. In this chapter, the results of the single and multiple variable analyses were
presented. Next, based on the analysis results, Chapter 7 discussed the research findings. It
starts by connecting the findings to the research problems set at the beginning. This chapter
expands with discussions on the limitations of this study and suggestions for prospective
researchers. The chapter concludes this thesis with a summary of the main points out of this
study and their implications into theoretical, empirical, and practical areas.
An Integrated Effectiveness Framework of Mobile In-App Advertising
9
Figure 1.2: The research process
Identification of
research problems
Theoretical discovery by
literature review
Development of research questions
and proposition of related hypotheses
Establishment of conceptual
model
Research approach
Data collection
Apps
Data Preparation
Data Analysis and
Interpretation
Internal consistency
and Discriminating
validity checks
Proportional and
ANOVA test
Multigroup
Moderated
Analysis and
Moderated
Regression
Analysis
Research strategy
Conceptualisation
Empirical
Investigation
Study Implication
Research Presentation
Researcher’s
Philosophy
Experiment
Ad Spaces
Ads
An Integrated Effectiveness Framework of Mobile In-App Advertising
10
Chapter 2. BACKGROUND
From its humble beginnings, mobile in-app advertising has come a long way. Even though it
is a relatively new technology used by advertisers, it appears that mobile ads have been
appearing on our digital devices for much longer than they actually did (Ashari Nasution,
Arnita & Fatimah Azzahra 2021). The days of clunky reformatted banner ads are long gone.
And today, these new, well-designed, and personalized ad types are still evolving — and
pleasing both advertisers and consumers (Kurtz, Wirtz & Langer 2021). Mobile in-app
advertising would not exist today without its forefathers, which laid the groundwork for its
success.
Ultimately, mobile in-app advertising refers to online ads and programmatic ad campaigns
expressly designed for apps on mobile devices (Bidmon & Röttl 2018). This study of mobile
in-app advertising is, therefore, grounded in online advertising, programmatic advertising and
mobile advertising.
This chapter accordingly covers the following:
• Online Advertising (Section 2.1)
• Programmatic Advertising (Section 2.2)
• Mobile Advertising (Section 2.3)
2. 1. Online Advertising
There are different definitions of advertisements (ads). Richards and Curran (2002) suggested
that advertising should be defined as a message aimed at encouraging the public to take action,
either immediately or in the near future. Advertising is usually paid from a known source and
can be transmitted by print, T.V., web and other means of communication (Kotler, Kartajaya
& Setiawan 2016). Online advertising is a type of advertising where the message is delivered
over the Internet. On May 3, 1978, Gary Thuerk sent the first online advertisement (Templeton
2008). He was a marketing manager of Digital Equipment Corporation (DEC) at that time, also
known as spam founders. His recipient list was around 400 users on America’s West Coast.
His email invited users to reveal a new DEC product (Templeton 2008). While some users
were pleased with the notification, most felt irritated. Despite initial negative reactions, online
advertising has since proliferated (Choi et al. 2020).
For many online businesses, such as Google and Facebook, online advertising became a multi-
billion dollar industry in the second decade of the millennium (Statista 2018). According to the
Interactive Advertising Bureau, 2018’s US-only annual online advertising sales totalled $107
billion, up to $19 billion (or 18 per cent) from 2017. The above number indicates that online
advertising has become one of the fastest-growing industries, which also means rising demand
for further research. Online advertising becomes a modern scientific sub-discipline in the field
of computer science, bridging the gap between economics, marketing science, organisational
analysis, information systems, data processing, artificial intelligence and machine learning
(Laudon & Traver 2018). Numerous interdisciplinary problems arise, including re-targeting
models, programmatic bidding techniques, advertisement auction process architecture, and
risk-aware advertising technologies (Radovanovic & Heavlin 2012). Reasonable solutions to
these problems will return a better product or business design that creates more economic value
An Integrated Effectiveness Framework of Mobile In-App Advertising
11
and benefits associated with individuals and companies (Stavrogiannis, Gerding & Polukarov
2014).
It is hard to use today’s Internet without seeing advertisements online. In nearly all types of
web pages, advertisements can be found, including online newspapers, search engine results
pages (SERP) and Facebook homepage (Hollis 2005). Online advertising is one of the
information technology industry’s fastest-growing fields (Fisher 2019). Revenues rose from
$8.1 billion in 2000 to $124.6 billion (2019) over the past 19 years, with a compound annual
growth rate of 16.0 per cent (Guttman 2020). Online advertising has received considerable
interest from both industry and academia in recent years. Nonetheless, it is still a relatively new
sub-discipline and requires good field knowledge, such as terminology and business models,
to recognise its unique challenges (Kumar 2016; Shelly & Esther 2017).
Two major types of advertising exist in the online environment: search and display (Jansen
2011). For research purposes, search advertising can usually be defined as sponsored search
advertising (Lahaie et al. 2007). Search ads are created by user behaviour (Edizel, Mantrach &
Bai 2017). In the search box, a customer sent one word to the search engine, which is commonly
referred to as the query (Jansen 2011). The query term is what causes results to appear along
with the search button on the Search Engine Result Pages (SERP). The user explicitly identifies
the purpose by entering the query. The search engine will then display advertisements based
on search information. The search engine must infer its browsing history information to return
the most relevant results (Jafarzadeh et al. 2015). User queries are usually given very high
weight in this type of advertising as they clearly show what users want (Edizel, Mantrach &
Bai 2017). Ads are displayed along with search results, based on keywords and other variables
(Atkinson, Driesener & Corkindale 2014). SERP has two outcome listing forms, organic and
paid listings (Blask 2018). On the one hand, organic search results are the most crucial web
page listings for the search query (Chuklin, Markov & Rijke 2015). On the other hand, paid
ads are simply advertisements—brands have paid on their websites to advertise certain
keywords, and these listings appear when anyone conducts a search query containing these
keywords (Blask 2018). In sponsored search, impressions are not used to measure ad value. If
the user clicks, it is weighed instead. The model is called the cost per click model (CPC)
(Kumar, Jacob & Sriskandarajah 2006).
Apart from user queries, other factors make search advertising and display advertising
distinctive. First, in the case of a sponsored search, ads are usually limited to certain formats.
For general search engines like Google, there is one line of text for the title, one line for the
Uniform Resource Location (URL), two lines for the description, and probably some
extensions like a phone number (Jansen & Spink 2007). For product search engines such as
Amazon and eBay, photos and more product details could be included in the ads, but the
formats are still limited. Secondly, the Cost Per Click (CPC) pricing model and Generalised
Second Price auction (where the winner is charged based on quality scores and the second
highest bid) are usually the standards in search advertising (Gupta, Khirbat & Singh 2014).
Thirdly, the search usually has a centralised structure where search engines take almost full
control of auctions and ranking because they have full knowledge of advertisers and their
campaigns (Garg & Narahari 2009; Lahaie et al. 2007).
On the contrary, display ads have much more flexible formats, including various sizes,
animation, video clips, sound, and interactive features (Choi et al. 2017). Impressions in display
advertising are mostly marketed using the Cost Per Mille (CPM) pricing model. Mille, which
represents 1000, has been used to make data more comfortable to read and write because the
cost of a single print is usually low (Rosenkrans 2007). Display advertising has traditionally
An Integrated Effectiveness Framework of Mobile In-App Advertising
12
been introduced by web publishers who provide free content (e.g. news, forums, product
comparison) and services (e.g. email, domain names, storage and hosting) to consumers and
cover the running costs of advertising revenue (Goldfarb & Tucker 2011). Display advertising
is one of online advertising’s most popular types (Jansen 2011). In addition to the content on
web pages, emails, timelines, and graphical contents also exist (Burns & Lutz 2006). These ads
are also referred to as banners, come in uniform ad sizes and can contain text, photos or more
recently, rich media (Jansen & Schuster 2011). There are three ad slots on the CNN web page,
and CNN can simultaneously display these three ads when user visits (Kohavi & Longbotham
2017).
In the early era, when less than one-third of U.S. households had computers, and less than half
had internet access, only conventional advertisement methods were used (Thorson &
Schumann 1999). By 1994, online advertising became the standard when, for the first time, a
banner ad is shown on the website of AT&T (Briggs & Hollis 1997; Lohtia, Donthu &
Hershberger 2003). HotWired (today Wired News) signed 14 banner ads with AT&T, Club
Med and Coor’z Zima on October 27 1994 (Bruner II & Kumar 2005; Evans 2009). These
banner ads were mainly advertised on the number of impressions – people who saw the
commercial – this was the model most conventional media used for brand advertising
(Robinson, Wysocka & Hand 2007). Banner advertising was used as links to online newspaper
editions, business directories, or other related services at that time (Evans 2009). Also, at that
time, banner ads were one of the most common types of online ads (Hoffman & Novak 2000;
Mangani 2004). Banner ads are considered as parts of display advertising (Edizel, Mantrach &
Bai 2017). They are a form of graphic advertising embedded in a website that is usually used
as a combination of static/animated images or text and video (Huang & Yang 2012). They are
meant to convey a commercial message and inspire users to take action (Ha 2008). Banner ad
dimensions, as shown in pixels, are generally defined by width and height (Aksakallı 2012).
By 1996, the banner ads on the web brought back a revenue of $267 million (Interactive
Advertising Bureau 2016).
Since 1997, online advertisers have become more sophisticated and focused on targeting online
advertising (Briggs & Hollis 1997; Shavitt, Lowrey & Haefner 1998). Instead of ad
characteristics, they are more worried about location and personalisation (Thorson &
Schumann 1999). The websites requested their users to register the zip codes in order to
overcome the geographical limitation of online advertising at the time (Gidofalvi 2008).
According to the needs, desires, and preferences of individuals, ads and purchasing experience
are referred to as personalisation (Chellappa & Sin 2005). Personalisation is an antecedent of
online service quality (Wolfinbarger & Gilly 2003). Mokbel and Levandoski (2009) claimed
that the content of ads should be tailored to user preferences and profiles. Online advertising
may be in the form of posters, skyscrapers and rich media to raise brand awareness and
encourage clicking on the target website (Li & Leckenby 2004). In one of the early studies of
banner advertisement effects, Briggs and Hollis (1997), it has been found that banner
advertising resulted in increased recognition, brand preferences and attitudinal changes for
brands.
In 1998, a different form of advertisement was created. These are interstitial advertisements.
This type of advertising may appear as users are waiting to download the screens (Kumar
2016). Through taking advantage of the loading time, advertisers have learned to boost their
advertising revenue. The year 1998 is also the year when contextual advertising history began
(Karp 2008). How many advertisements to put on a website is a critical issue facing many
website publishers at that time. On the one hand, it is possible to increase revenue by increasing
An Integrated Effectiveness Framework of Mobile In-App Advertising
13
the real estate offered to advertisers. On the other hand, the user experience could be impaired
(Kohavi et al. 2009b). Trading between improved revenue and loss of end-user experience is
difficult to assess. That was the issue MSN’s homepage team faced in 2007 (Kohavi et al.
2009a). By then, web publishers have started thinking of maximising revenue through their ad
spaces while balancing that with user experience. The display-related advertisement that was
set as the backdrop to this study amounted to $33.5 billion in 2018, representing a 21.9%
increase from 2017 ($27.5 billion) (Interactive Advertising Bureau 2018).
In those years, with the invention of search engines, notably Google, online advertising
revenues grew even higher (Evans 2009). Advertisers are more open to customer interest and
behaviour with these search engines, which in turn helped improve advertising targeting and
customisation (Ha 2008). Since then, the advertising campaigns become more interactive
(Park, Shenoy & Salvendy 2008). During this time, websites, originating from cookies, flash
cookies, web beacons, browsers and other meta-data, have begun to use Personal Identifiable
Information (PII) sets of users while accessing the website. This PII is used to provide profile
users with unique, targeted ads (Chen & Hsieh 2011). A study by Yan et al. (2009) has provided
further empirical evidence of advertising effectiveness improvement by using behavioural
targeting. Though cookies and other monitoring data are not available, browser-based user
profiling can be performed on its own and can also help bring benefits to advertisers (Kohavi
et al. 2009a).
During this time, a higher number of studies were reported about the contextual factors, e.g.
Adler, Gibbons and Matias (2002), Nakamura and Abe (2005), Kumar, Jacob and
Sriskandarajah (2006) and Menon et al. (2011). Although technology has progressed,
professionals were more concerned with making modern technologies more useful, such as
contextual analysis and location (Idwan et al. 2008). Online advertising’s success continued to
grow in the twenty-first century with the help of social media (such as Facebook, Twitter, and
LinkedIn). In 2013, about $11.4 billion had already been spent on social advertising (eMarketer
2015).
The online advertising practice is basically based on traditional advertising theories (Okazaki
2012). Firstly, it is based on Katz, Blumler and Gurevitch (1973)‘s Theory of Uses and
Gratifications. The question of driving uses and gratifications is why people use media and for
what they use them. The Theory of Uses and Gratifications discusses how users selectively
choose media that will meet specific needs and enable content, relaxation, social interactions,
diversion, or escape to be enhanced. Users are usually involved in choosing content and mass
media messages. The Theory of Uses and Gratifications in advertising implies that the
consumer is not a passive, helpless advertising fodder (Hedges, Ford-Hutchinson & Stewart-
Hunter 1997). Instead, advertisers and consumers factors interactively affect the outcome of
advertising, and they should be consumer-based, not vice versa (Rodgers & Thorson 2012).
The Principle of Reasoned Action developed by Fishbein and Ajzen (1975), is another popular
advertising theory. The theory is used to explain the relationship between user attitudes and
behaviours. Based on the Principle of Reasoned Action, Ducoffe (1996) developed a well-
defined Model of Advertising Value. It is a framework for predicting attitudes toward online
advertising. The Technology Acceptance Model was later developed by Davis (1985). The
model suggests that the user’s attitude to the technologies would directly affect the user’s
purpose. In contrast, the perceived utility and ease of use will affect the user’s attitude to the
technologies, including advertisement clicks. Okazaki and Barwise (2011) claimed that the
Technology Acceptance Model is the most commonly used in the field of online advertising.
An Integrated Effectiveness Framework of Mobile In-App Advertising
14
2. 2. Programmatic Advertising
The introduction of ad networks was the next milestone in online advertising. The original ad
networks were set up in 1997 to address the problem for advertisers who want to advertise
across many different websites at the same time (Muthukrishnan 2009). Through distributing
inventory across multiple sites, ad networks have provided advertisers with a new ability to
reach the scale of the market they have used from traditional channels, such as televisions
(Broder 2008). Oingo, Inc., a privately owned company set up by Adam Weissman and Gilad
Elbaz, developed a proprietary word meaning search algorithm based on an entire lexicon
called WordNet. In April 2003, Google bought Oingo and renamed as the AdSense system
(Karp 2008). Subsequently, Yahoo Publish Network, Microsoft adCenter and Advertising.com
Sponsored Listings were created (Kenny & Marshall 2001). Contextual advertising channels
have developed to respond to a more prosperous media environment, such as video, audio and
web information networks (Broder et al. 2007). These networks enabled publishers to earn
revenue by selling ad spaces on their websites, video clips and mobile apps (Ghosh et al.
2009b). These services are usually called ad networks or display networks. Usually, these are
not performed by search engines themselves and may consist of several individual publishers
and advertisers (Yuan et al. 2012).
On February 21, 1998, GoTo.com launched a sponsored search business model in which search
engines ranked websites based on their willingness to pay to position a fair bid in real-time at
the top of their search results (Jansen 2011). Every advertiser submitted a per-click offer in
GoTo.com’s original auction concept stating their willingness to pay for a particular search
keyword. Instead of paying for a banner ad displayed to anyone visiting a website, advertisers
could target their ads and recognise keywords used for their products. The question is how
much each keyword worth based on user clicks (Jansen & Schuster 2011). The solution is that
ads should be sold with a CPC-based model. When a user clicked on a sponsored link, the latest
bid amount was automatically paid by an advertiser’s account. The sponsored advertisers ties
were arranged in decreasing bid order, making the highest bids popular. GoTo auction is a
general first-price auction (GFP) (Edelman, Ostrovsky & Schwarz 2007). User-friendliness,
meagre entry costs and method transparency rapidly contributed to GoTo’s paid search
platform’s success (Börgers et al. 2013). Yahoo and MSN soon adopted GoTo’s concept and
launched similar GFP auction sites (Parsons 2009). The auction scheme was far from perfect,
however. Under the GFP auction system, there was a significant benefit for the advertiser to
respond fastest to competitors’ movements. Thus, the process promoted inefficient investment
in the scheme, leading to unpredictable prices and allocation inefficiencies (Jansen & Schuster
2011).
Google addressed these problems by releasing its own Google AdWords search platform in
February 2002 (Edelman, Ostrovsky & Schwarz 2007). Google AdWords followed many of
GoTo.com’s principles but made some significant changes. First, Google continued the sales-
by-print CPM model in parallel before eventually dropping it entirely for the CPC calculation
model. Second, Google modified the GFP auction model to a more robust GSP auction.
(Atkinson, Driesener & Corkindale 2014). The most simple GSP auction had n ad locations.
The advertiser in place i shall charge a CPC, equivalent to the bid of i+1 advertiser plus a
minimum increase. This model makes the business more comfortable to use (Edelman,
Ostrovsky & Schwarz 2007; Varian 2007). Third, Google modified the traditional allocation
rule. The platform measured bid number and click-through rate (CTR) quality score, rather
than ranking ads by bid price alone (Mitti 2018). CTR calculates the rate searchers click on the
ad hyperlinks. Both considerations of bid number and CTR were further reinforced with other
An Integrated Effectiveness Framework of Mobile In-App Advertising
15
factors, such as keywords and landing page consistency (Weller & Calcott 2012). Google’s
strategy meant that no advertiser could purchase their way to top search results without
clicking, as in the GFP model. Yahoo, Microsoft and other big search engines then gradually
migrated from GFP auctions to GSP auctions (Varian 2007).
However, there are several limitations to ad networks, either GSP or GFP-based. First, there
are many intermediaries in the value chain between publishers and advertisers, each taking a
slice of the cake. For instance, an ad network that cannot sell some particular inventories may
offer them lower prices to another ad network (Yuan, Wang & Zhao 2013). Second, advertisers
may spend much time and effort on exploring and selecting which network is the best one to
purchase inventories (Stavrogiannis, Gerding & Polukarov 2014). Third, to maximise their
revenue, publishers may spend much time and effort on the allocation of inventories among
different ad networks as well (Choi et al. 2017). Ad exchanges came up to overcome the
limitations of ad networks. They are marketplaces for purchasing and selling ad inventories
from various ad networks (Muthukrishnan 2009). Three big exchanges were purchased in
2007, including Yahoo purchased Right Media in April, Google purchased DoubleClick in
May, and Microsoft purchased AdECN in August (Graham 2010). Those companies made
enormous pools of ad inventories exchange rapidly, which significantly improved the
experience for many participants to transact centrally (Mansour, Muthukrishnan & Nisan
2012).
Individual publishers and advertisement networks can benefit from the implementation of
advertising exchanges because thousands of advertising networks are accessible on the
Internet, which can act as a barrier to the participation of advertisers and publishers in online
advertising (Yuan, Wang & Zhao 2013). Such ad exchanges, unlike conventional ad networks,
combine multiple ad networks to align customer demand and supply (Muthukrishnan 2009). In
many instances, advertisers need to develop and maintain better coverage strategies and analyse
data for better effect across multiple platforms. In order to get maximum revenue, advertisers
must properly register with and compare a variety of ad networks. The ad exchange has come
as a forum for multiple ad networks to help solve these problems (Meyer et al. 2018).
Advertisers may plan their strategies and set the goal once and check the output data stream at
a single location. Advertisers can register with ad exchanges and earn maximum revenue
without much manual intervention (Yang et al. 2017).
The advent of ad exchanges and ad networks has brought online advertising a real-time bidding
(RTB) process – another groundbreaking trading platform. It is a programmatic trading
technique designed to help advertisers benefit from increased data and liquidity in inventories
(Chakraborty et al. 2010). Before RTB, it was really time-consuming and inefficient for
advertisers to buy from multiple exchanges. To access each exchange, they had to use a
different system, which was not capable of each other. Moreover, since a standard campaign
would pull inventories from more than one sale, there was no simple way to reach unduplicated
reach or cap the number of impressions from any particular campaign that the viewer would
get (Chen et al. 2011).
Therefore, RTB was initially conceived as a solution focusing on advertisers, and many
advertisers subsequently provided services based on it (Fruergaard, Hansen & Hansen 2013).
Furthermore, the presence of these organisations will support individual publishers and
advertising networks (Yuan et al. 2014). On the one hand, advertisers who are interested in
the related user profile and user background sell impressions to advertisers. On the other hand,
for better matching, advertisers could also get in touch with more publishers. Many related
platforms emerged during this time: the demand-side platform (DSP) and the supply-side
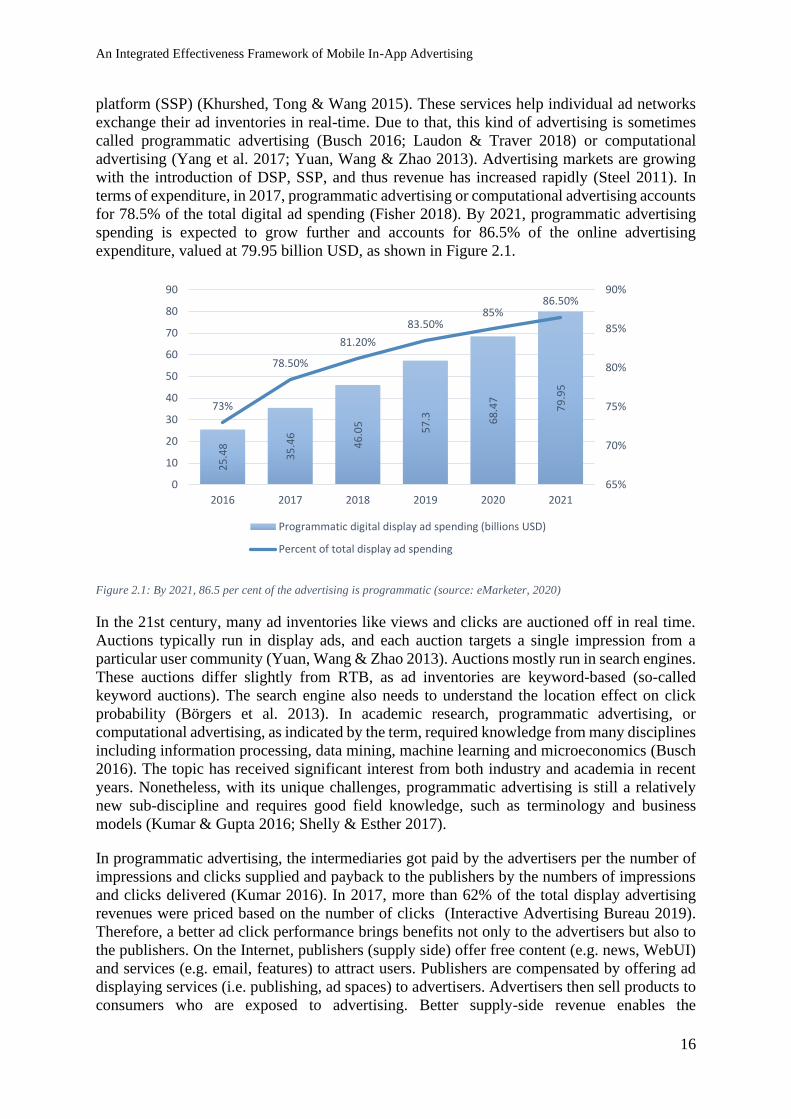
An Integrated Effectiveness Framework of Mobile In-App Advertising
16
platform (SSP) (Khurshed, Tong & Wang 2015). These services help individual ad networks
exchange their ad inventories in real-time. Due to that, this kind of advertising is sometimes
called programmatic advertising (Busch 2016; Laudon & Traver 2018) or computational
advertising (Yang et al. 2017; Yuan, Wang & Zhao 2013). Advertising markets are growing
with the introduction of DSP, SSP, and thus revenue has increased rapidly (Steel 2011). In
terms of expenditure, in 2017, programmatic advertising or computational advertising accounts
for 78.5% of the total digital ad spending (Fisher 2018). By 2021, programmatic advertising
spending is expected to grow further and accounts for 86.5% of the online advertising
expenditure, valued at 79.95 billion USD, as shown in Figure 2.1.
Figure 2.1: By 2021, 86.5 per cent of the advertising is programmatic (source: eMarketer, 2020)
In the 21st century, many ad inventories like views and clicks are auctioned off in real time.
Auctions typically run in display ads, and each auction targets a single impression from a
particular user community (Yuan, Wang & Zhao 2013). Auctions mostly run in search engines.
These auctions differ slightly from RTB, as ad inventories are keyword-based (so-called
keyword auctions). The search engine also needs to understand the location effect on click
probability (Börgers et al. 2013). In academic research, programmatic advertising, or
computational advertising, as indicated by the term, required knowledge from many disciplines
including information processing, data mining, machine learning and microeconomics (Busch
2016). The topic has received significant interest from both industry and academia in recent
years. Nonetheless, with its unique challenges, programmatic advertising is still a relatively
new sub-discipline and requires good field knowledge, such as terminology and business
models (Kumar & Gupta 2016; Shelly & Esther 2017).
In programmatic advertising, the intermediaries got paid by the advertisers per the number of
impressions and clicks supplied and payback to the publishers by the numbers of impressions
and clicks delivered (Kumar 2016). In 2017, more than 62% of the total display advertising
revenues were priced based on the number of clicks (Interactive Advertising Bureau 2019).
Therefore, a better ad click performance brings benefits not only to the advertisers but also to
the publishers. On the Internet, publishers (supply side) offer free content (e.g. news, WebUI)
and services (e.g. email, features) to attract users. Publishers are compensated by offering ad
displaying services (i.e. publishing, ad spaces) to advertisers. Advertisers then sell products to
consumers who are exposed to advertising. Better supply-side revenue enables the
25
.48
35
.46
46
.05
57
.3 68
.47
79
.95
73%
78.50%
81.20%
83.50%85%
86.50%
65%
70%
75%
80%
85%
90%
0
10
20
30
40
50
60
70
80
90
2016 2017 2018 2019 2020 2021
Programmatic digital display ad spending (billions USD)
Percent of total display ad spending
An Integrated Effectiveness Framework of Mobile In-App Advertising
17
development of more free content and services, thereby helping everyone in the entire online
advertisement ecosystem (Yuan, Wang & Zhao 2013). When an author produces an ad-
supported website or mobile app, he or she must first decide how to make use of ad spaces
(Korula, Mirrokni & Nazerzadeh 2016).
The next section, Section 2.3, will be dedicated to Mobile Advertising and discuss more
programmatic advertising with mobile apps.
2. 3. Mobile Advertising
Mobile advertising is closely related to online advertising but with a much further reach
(Kumar 2016). Research shows that click-through rates of mobile banner ads are far higher
than non-mobile banner ads (Matheson 2011). Rosenkrans and Myers (2012)‘s study uses the
Technology Acceptance Model and the Theory of Uses and Gratifications to compare mobile
banner ads to non-mobile banner ads on a local newspaper website. Their result indicated that
mobile banner ads are more effective than non-mobile ones. In 2017, USD 70 billion was spent
on mobile advertising (Statista 2018). A mobile advertisement is known as an advertising or
marketing message sent to mobile devices, either by synchronised download or by air (Laszlo
2009). Variations between fixed devices (e.g. PC, web) and portable devices create new
possibilities for advertisers but also prohibit them from generalising research findings from
fixed online environments to mobile online environments (Okazaki & Barwise 2011). Ads on
mobile devices have a long history, especially after Short Message Service (SMS) became
popular (Yunos, Gao & Shim 2003).
Mobile advertising was actually introduced in the late 1990s when a Finnish news network
started sending people sponsored advertisement headlines via SMS (Park, Shenoy & Salvendy
2008). In terms of targeting and ad creatives, very little was possible back then, so the outcome
was a pushing approach with nothing but text (Barwise & Strong 2002). Carriers were also all-
powerful because they formed the only gateway to mobile phones. Mobile phones and their
technologies improved drastically through the early 2000s (e.g. mobile internet, colour
displays, touch screens), but mobile advertising did not catch up (Okazaki & Barwise 2011).
For that reason, in the early days, mobile advertising was usually considered SMS advertising
(Barwise & Strong 2002; Haghirian & Inoue 2007). Actually, the dawn of mobile
advertisement research started with two significant SMS-related works: Barnes (2002) and
Barwise and Strong (2002). Then, the rise of iPhone and Android smartphones brought a new
wave of mobile advertising through mobile web and mobile apps (Petsas et al. 2013).
Generally speaking, mobile ads in the form of SMS messages and display ads on mobile
websites and apps are different. According to Barnes (2002), mobile advertising has two forms:
push and pull. Push promotional includes pushing advertising messages to customers, usually
by warnings or short messages (Grewal et al. 2016). Pull ads involves placing advertisements
on browsed wireless content and promoting free content (Ha 2008). On mobile web and
phones, messages are passed to the people’s free will, which is known to be a pull-out
smartphone display of ads (Park, Shenoy & Salvendy 2008).
In the beginning, mobile display (or pull) advertising was only less effective than other ads
because they lack the cookies in typical desktop advertising offering behavioural and
contextual targeting options (Huizingh & Hoekstra 2003). There is also a lack of transparency,
which makes fraud a significant issue, and advertisers guess whether people watch their ads.
Moreover, several different screen sizes and poor internet connections pose another technical
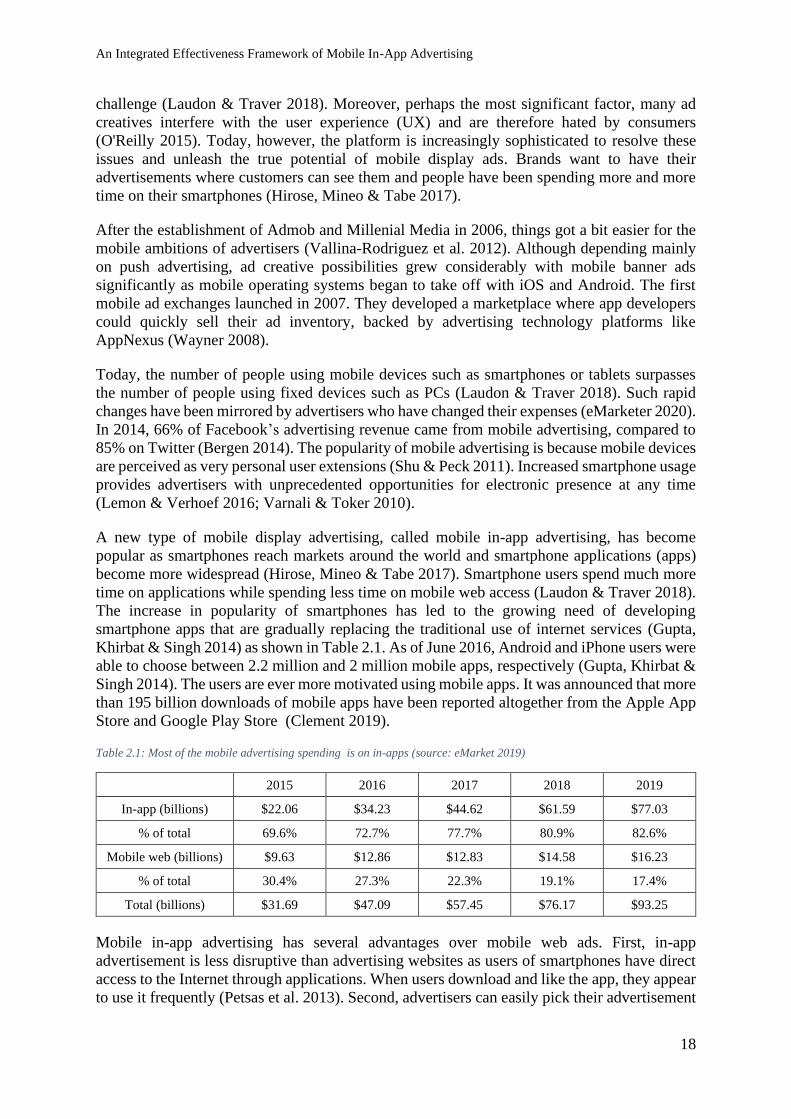
An Integrated Effectiveness Framework of Mobile In-App Advertising
18
challenge (Laudon & Traver 2018). Moreover, perhaps the most significant factor, many ad
creatives interfere with the user experience (UX) and are therefore hated by consumers
(O'Reilly 2015). Today, however, the platform is increasingly sophisticated to resolve these
issues and unleash the true potential of mobile display ads. Brands want to have their
advertisements where customers can see them and people have been spending more and more
time on their smartphones (Hirose, Mineo & Tabe 2017).
After the establishment of Admob and Millenial Media in 2006, things got a bit easier for the
mobile ambitions of advertisers (Vallina-Rodriguez et al. 2012). Although depending mainly
on push advertising, ad creative possibilities grew considerably with mobile banner ads
significantly as mobile operating systems began to take off with iOS and Android. The first
mobile ad exchanges launched in 2007. They developed a marketplace where app developers
could quickly sell their ad inventory, backed by advertising technology platforms like
AppNexus (Wayner 2008).
Today, the number of people using mobile devices such as smartphones or tablets surpasses
the number of people using fixed devices such as PCs (Laudon & Traver 2018). Such rapid
changes have been mirrored by advertisers who have changed their expenses (eMarketer 2020).
In 2014, 66% of Facebook’s advertising revenue came from mobile advertising, compared to
85% on Twitter (Bergen 2014). The popularity of mobile advertising is because mobile devices
are perceived as very personal user extensions (Shu & Peck 2011). Increased smartphone usage
provides advertisers with unprecedented opportunities for electronic presence at any time
(Lemon & Verhoef 2016; Varnali & Toker 2010).
A new type of mobile display advertising, called mobile in-app advertising, has become
popular as smartphones reach markets around the world and smartphone applications (apps)
become more widespread (Hirose, Mineo & Tabe 2017). Smartphone users spend much more
time on applications while spending less time on mobile web access (Laudon & Traver 2018).
The increase in popularity of smartphones has led to the growing need of developing
smartphone apps that are gradually replacing the traditional use of internet services (Gupta,
Khirbat & Singh 2014) as shown in Table 2.1. As of June 2016, Android and iPhone users were
able to choose between 2.2 million and 2 million mobile apps, respectively (Gupta, Khirbat &
Singh 2014). The users are ever more motivated using mobile apps. It was announced that more
than 195 billion downloads of mobile apps have been reported altogether from the Apple App
Store and Google Play Store (Clement 2019).
Table 2.1: Most of the mobile advertising spending is on in-apps (source: eMarket 2019)
2015 2016 2017 2018 2019
In-app (billions) $22.06 $34.23 $44.62 $61.59 $77.03
% of total 69.6% 72.7% 77.7% 80.9% 82.6%
Mobile web (billions) $9.63 $12.86 $12.83 $14.58 $16.23
% of total 30.4% 27.3% 22.3% 19.1% 17.4%
Total (billions) $31.69 $47.09 $57.45 $76.17 $93.25
Mobile in-app advertising has several advantages over mobile web ads. First, in-app
advertisement is less disruptive than advertising websites as users of smartphones have direct
access to the Internet through applications. When users download and like the app, they appear
to use it frequently (Petsas et al. 2013). Second, advertisers can easily pick their advertisement
An Integrated Effectiveness Framework of Mobile In-App Advertising
19
channels because most applications have a specific purpose (Sandberg & Rollins 2013). Third,
for mobile apps, advertisers may create highly customised advertisements. In-app ads can be
linked to personal information obtained through the Global Positioning System (GPS) similar
to mobile website advertisements (Hirose, Mineo & Tabe 2017).
Compared to traditional advertisements, mobile in-app advertising has a significant difference.
Mobile remains the ‘most’ programmatic format as more than 80% of mobile ads are traded
programmatically (Interactive Advertising Bureau 2017a). That means this type of advertising
requires more ad networks. An ad network typically has a split-up deal with the website owner
and the app developer jointly delivering both the app and the advertisement (Hao, Guo &
Easley 2017). When the iAd ad network of Apple was initially launched in April 2010, the
volume of advertising revenue iAd passed on to the user was 60%. In 2012, Apple decided to
increase the percentage of ad revenue sharing of the developer from 60 to 70 per cent, reducing
its own percentage of ad revenue to the benefit of the app developer (Aimonetti 2012). Typical
(but fixed) online advertising tactics are not available or need to be adjusted to be effective.
Therefore, mobile in-app advertising is seen as a new type of advertising and requires new
academic research and practical strategies (Kumar 2016).
The role of an app publisher is another difference between a mobile in-app advertisement and
a mobile web ad. It is noted that more app developers are pursuing a pure ad strategy, i.e. free
apps with advertisements. That could be due to: user learning about device valuation
(Niculescu & Wu 2014); most developers pursue a freemium model where the software is free
to promote user referrals (Cheng, Li & Liu 2015); some developers offer free trials to minimize
consumer uncertainty about their product’s functionality and leverage the network effect
among users (Cheng, Li & Liu 2015; Cheng & Liu 2012). App publishers have more power
over mobile in-app ads than any other type of advertising (Matheson 2011). For example,
unlike conventional newspaper and television companies that control their ad publishing
networks, a mobile platform owner must compel developers of mobile apps to publish
advertisements in their apps so that advertising can reach any app user (Brakenhoff & Spruit
2017). If the developer wants to post in-app ads, based on a revenue-sharing agreement, the
site owner must share part of the advertising revenue with the app developer (Hao, Guo &
Easley 2017).
Theoretically, between the two forms of mobile advertising, research patterns have been
distorted to move to the pull-type (Choi et al. 2020; Okazaki 2012). Empirical field research in
mobile advertising mainly investigates the effectiveness of mobile coupons delivered via SMS,
which are of push-type (Grewal et al. 2016) leaving the pull-type mobile display advertising
largely unexplored (Korula, Mirrokni & Nazerzadeh 2016). Although largely unattended in
academic literature, the revenue of pull-type mobile in-app advertising keeps increasing year
after year recently (Interactive Advertising Bureau 2010-2020). The trend in online journalism
shows that online news outlets rely primarily on mobile ads to generate revenue, as most
readers refuse to pay online news fees (Newman et al. 2016). According to eMarketer (2020),
global mobile in-app advertising spending amounted to USD 77 billion, four times as much as
mobile web advertising. That, therefore, constitutes 57 per cent of the total worldwide income
from online advertising (Interactive Advertising Bureau 2019).
Mobile in-app advertising has apparently become one of the most influential business
marketing channels and has become a significant revenue source for publishers. This new trend
of advertising also brings new challenges that will be discussed in the next chapter.
An Integrated Effectiveness Framework of Mobile In-App Advertising
20
Chapter 3. MOBILE IN-APP ADVERTISING
Any discussion of advertising effectiveness would inevitably include discussing advertising
objectives (Li & Leckenby 2004). Objectives often act as a function whereby outcomes can be
evaluated (Kohavi & Longbotham 2017). Moreover, priorities force those involved to obtain a
better understanding of the mechanisms underlying their specific problems. Fair campaign
targets cannot be set without understanding how the advertising process works (Grewal et al.
2016; Shelly & Esther 2017).
An abundant search in relation to in-app advertising of the most common digital advertisement
and communication databases (i.e., Scopus, SpringerLink, Taylor & Francis, Wiley and
Science Direct), therefore, was conducted. The search query included the keyword of “mobile
application” or “mobile app” or “smartphone” in conjunction with “advertising” or
“advertisement” in the title or abstract. The search period included all manuscripts from 2008,
the starting year of mobile apps (Clement 2019). Furthermore, as this is a rather new subject,
this study used a wide variety of methods to search for materials and research produced by
organizations outside of the traditional academic publishing and distribution channels. Firstly,
this study searched the relevant texts in grey literature databases (e.g. www.opengrey.eu),
websites of advertising organisations (e.g. IAB), repositories of theses and dissertations (e.g.
ProQuest), and popular internet search engines for government reports (i.e. www.google.com
site:.gov). This study also contacted those working in the related areas for additional
manuscripts from professional organisations and groups. Furthermore, the researcher checked
the references of the collected articles and used the same procedures to find additional eligible
articles.
After collecting full texts from databases and other sources, the study will apply inclusion and
exclusion criteria to select suitable texts. Full texts were selected if the study involved
participants, processes, goals, outcome metrics or factors related to mobile in-app advertising.
That inclusion criterion is similar to those in other mobile advertising systematic review studies
(e.g. Choi et al. (2020) and Yuan et al. (2014)). Furthermore, any duplicates or studies
conducted in languages other than English, out of the time frame and not relating to the topic
of this study - advertising effectiveness were excluded. Studies about mobile in-app advertising
but contains no empirical data or related to auction and prediction models and mechanisms
were also left out. That exclusion criterion resembles the way the literature review process is
conducted in the studies of Park, Shenoy and Salvendy (2008), Rosenkrans and Myers (2012)
and Boerman, Kruikemeier and Zuiderveen Borgesius (2017).
Following the initial screening, a full-paper screening was conducted, in which various sections
of articles were to be screened. This was the most stringent screening for eligibility to be
included or excluded. Finally, thirty-nine manuscripts match the criteria and are selected for
the literature review. The overall literature search process is demonstrated in a PRISMA
(Preferred Reporting Items for Systematic Reviews and Meta-analysis) flow chart in Appendix
J1, with details about the numbers of included and excluded texts and the reasons why they are
included or excluded. The characteristics of those studies have been summarised in Appendix
J2.
This study is ultimately related to literature in four areas of mobile in-app advertising:
processes, participants, goals and outcome metrics and factors. Accordingly, in this chapter,
the following issues will be discussed:
An Integrated Effectiveness Framework of Mobile In-App Advertising
21
• Mobile In-App Advertising Processes (Section 3.1)
• Mobile In-App Advertising Participants (Section 3.2)
• Mobile In-App Advertising Goals and Outcome metrics (Section 3.3)
• Mobile In-App Advertising Factors (Section 3.4)
3. 1. Mobile In-App Advertising Processes
Users consume advertisement content on mobile apps by clicking or tapping on the
advertisements (Laudon & Traver 2018). There are two ways that ads can be supplied to a
mobile application: through guaranteed contracts or an unguaranteed Real-Time Bidding
process (Korula, Mirrokni & Nazerzadeh 2016).
Guaranteed vs Unguaranteed Contract Settings
In the guaranteed contract setting, the publisher supplies the ad spaces and delivers the ad
impressions strictly following the contract commitments (Korula, Mirrokni & Nazerzadeh
2016). That guaranteed process involves typically only one publisher and one advertiser (Yuan,
Wang & Zhao 2013). There are long-term and wide-ranging arrangements between advertisers
and publishers or between ad networks. Yuan et al. (2012) called that kind of private contract
over-the-counter (OTC). The assured contracts emerged early in online ads and were negotiated
privately by advertisers and publishers (Edelman, Ostrovsky & Schwarz 2007). Each contract
typically specifies the number of inventories needed over time and at a pre-specified fixed price
(Choi et al. 2017). Therefore the following problems must be addressed when considering the
guaranteed contract: allocation and pricing (Turner 2012).
Feldman et al. (2009) researched an ad discovery algorithm for publishers whose goal is not
only to fulfil the promised contracts but also to give advertisers well-targeted display
impressions. Their work led to the issue of allocation balance arising at that time (Chen et al.
2011). Ghosh et al. (2009a) learned how to spread guaranteed networking experiences. Their
modelling was reasonably decent, as the publisher works as a bidder who would only assign
impressions to online auctions if other winning bids were high enough. Roels and
Fridgeirsdottir (2009) proposed a new allocation scheme whereby the publisher will
dynamically pick up assured purchase requests and impressions. Nonetheless, the variability in
purchase requests and website traffic is based on the goal of optimising revenue (Yuan et al.
2012).
Bharadwaj et al. (2012), later implemented a lightweight allocation system. Using a simple
greedy algorithm, they simplified estimating revenue maximisation. The authors addressed two
quality-assured display algorithms. Usually, the contract entails a wide variety of interactions,
and the proposed algorithms tackled the problem of user visit revenue optimisation (i.e. demand
level). Nevertheless, the auction effect on contract pricing was not considered in their work,
and the algorithms developed were focused solely on user visit statistics. Consider whether the
online advertisement market is bulling and whether unwarranted sales are more lucrative for
publishers, they can decide to cancel guaranteed contracts before targeted inventory was
produced. Babaioff, Hartline and Kleinberg (2009) suggested cancellation auctions. They said
the publisher could cancel the guaranteed contracts offered, but they would give the advertisers
a fine. The proposed cancellation of the auction included several economic properties, e.g.
An Integrated Effectiveness Framework of Mobile In-App Advertising
22
allocative efficiency and balancing. Nevertheless, there are cases where speculators may say
cancellation perfect. The cancellation penalty is close to over-selling ticket bookings (van
Ryzin & Talluri 2005).
Similarly, Salomatin, Liu and Yang (2012) have been studying a sponsored search delivery
system that allows advertisers to apply their guaranteed requests to a search engine. Each
guaranteed contract requires the appropriate number of clicks and the ad budget. Instead,
according to the search queries and available locations, the search engine decides on the
guaranteed delivery. Since the allocation decision focuses on shared optimising revenue from
guaranteed deliveries and keyword sales, some advertisers do not get all the clicks they need.
In such instances, the search engine would pay a fine (Salomatin, Liu & Yang 2012).
Nevertheless, the time and location of the ad distribution are still less controlled by advertisers.
That means advertisers are less likely to be able to satisfy their business needs in such a system.
The definition of the ad alternative was first introduced by Moon and Kwon (2011). When
CTR is finalised, the ad space buyer can be allowed to select the minimum payment between
CPM and CPC. Moon and Kwon (2011) suggested an assessment of the alternative in a Nash
bargaining game. Simply put, two utility functions were considered: the advertiser’s one and
the publisher’s. The objective function is the sum of the two functions, and bargaining power
limits each function of utility. The best solution to maximise shared value is the price choice
(Moon & Kwon 2011). Balseiro and Candogan (2017) have addressed the same allocation
problem, but have used multiple stochastic process models. In fact, they presumed that an
advertiser with a fixed reserve price might decide whether to apply it to an advertising exchange
or sell it at a negotiated contract price. Their decision-making process seeks to maximise
overall projected revenue using a semi-automatic mechanism.
In summary, the market for mobile in-app advertising was primarily divided into contracts
between advertisers and publishers (since 1994) and ad networks offering aggregation of
demand and supply (since 1996) before the Real-Time Bidding (RTB) came into being in 2009
(Chakraborty et al. 2010). Before RTB, contracts pre-sell advertisements as many as possible
at a high price, and advertisers have to negotiate and deal directly with advertisers. Advertisers
typically intend to buy several views from specific sites, regardless of user’s interest, when and
how many times they have seen the ad. The purchase focuses on partnerships, the author’s
credibility and audience profiles (Yuan et al. 2014). Contracts can usually not sell all available
impressions because it is almost impossible to predict future traffic volumes, so publishers tend
to be vigilant in avoiding under-delivery penalties (Choi et al. 2017).
CPM is primarily the model of pricing used in contracts. With these contracts, advertisers
usually have little influence on the market, so targeted advertisements with a behavioural
objective (e.g. booking tickets) are more challenging to implement than promotional strategies
with an informational objective (e.g. announcing a new product) (Bharadwaj et al. 2012). A
short-term targeted campaign compensates for long-term promotional campaigns. Target-
driven methods are more comfortable to implement because data is available to the viewer.
Those contracts are sometimes referred to as assured agreements (Bharadwaj et al. 2012).
Usually, these agreements are limited by geographic location, time of day, or even individual
auction winners (Turner 2012).
To sell the remaining impressions, ad networks are set up. Advertisers register placements with
ad networks (a slot on a web page used to display ads) and sell impressions of such placements.
Impressions are offered in ad networks primarily through the second price auction mechanism
(Hojjat et al. 2017). Advertisers are also allowed to take part in auctions with ad networks (or
An Integrated Effectiveness Framework of Mobile In-App Advertising
23
their delegates). Nevertheless, displays on advertising networks are not guaranteed in
comparison with premium contracts (Rosales, Cheng & Manavoglu 2012). In the unguaranteed
setting with RTB, there are two additional services between the advertiser and the publisher
that facilitate the ad serving process: the bidding service and the auction service (Balseiro &
Candogan 2017; Choi et al. 2017). The Interactive Advertising Bureau is an agency that
establishes and maintains Real-Time Bidding (RTB) guidelines and requirements to improve
the ad network environment (see Appendix A). Trading units are usually small when
advertising resources are traded in unjustified and open markets, although the total number of
advertising campaign impressions could be huge (Tang, Yuan & Mookerjee 2020; Yuan et al.
2012). In mobile in-app advertising, 80% of the publishers, 81% of the agencies and 82% of
the advertisers are using the unguaranteed ad serving process (Ratcliff 2015).
Between the guaranteed and unguaranteed contract settings, research tended to focus more on
the former one, leaving the RTB-based process with less attention (Choi et al. 2020; Korula,
Mirrokni & Nazerzadeh 2016; Yuan et al. 2012). The RTB-based ad serving process by itself
includes two processes: demand and supply, which will be next discussed.
Demand vs Supply
With the accessibility of metadata, RTB helps advertisers to turn from inventory-centric
optimisation to user-centric optimisation (Yuan et al. 2014). There are also significant attempts
to incorporate innovations from the financial sector to improve the bidding process (Chen et
al. 2011; Jansen & Schuster 2011). Both behaviours would make the sharing of advertisements
better and more efficient (Gomes & Mirrokni 2014). It should also be noted that advertising
exchanges are becoming popular with branding campaigns, partly due to the possibility of
finding cheap impressions on websites of good quality. The advertiser may choose to distribute
ads to the publisher directly, feed it into an ad network or an ad exchange. In that sense, the
RTB process helps to connect the supply and demand sides (Choi et al. 2017).
If advertisers want to take advantage of RTB, they usually operate on a third-party Demand
Side Platform (DSP) (Stavrogiannis, Gerding & Polukarov 2014). The advertiser does not
participate directly in the RTB-based advertising auction but outsources the bidding process to
the Demand Side Platform operation. DSPs are advertisers’ representatives who respond to
bidding requests (Aksakallı 2012). The auction’s decisions and results are fully automatic
(Yuan et al. 2014). Compared to ad networks, the advantages of using DSPs are to help
advertisers not need to track their registration with many ad networks to help advertisers tailor
their registration with finer granularity and higher frequency due to local history logs rather
than aggregated ad network reports and to help DSPs be more versatile to suit better
advertisers’ objectives (Chen et al. 2011). DSPs give the ad buyer a centralised system where
they can handle bidding, communicate and share with many ad networks and evaluate success
simultaneously (Stavrogiannis, Gerding & Polukarov 2014). DSPs use Data Management
Platforms (DMPs), other data providers and optimisers to calculate the value of impressions
that are sold in ad networks and exchanges. These are complicated services that try to predict
the outcomes of ad campaigns based on historical data (Busch 2016).
On the other side, Supply Side Platforms (SSPs) were built to support publishers. SSPs also
provide additional tools for publishers with the ultimate goal to optimize efficiency (Matheson
2011). For example, SSPs enables publishers to set reserve prices for a group of impressions.
Some SSPs often allow publishers to take priority over buyers through bid bias (Yuan, Wang
& Zhao 2013). Ad networks also identify websites, users and pick advertisers based on their
An Integrated Effectiveness Framework of Mobile In-App Advertising
24
predefined targeting criteria (Feldman et al. 2009). Website information is usually referred to
as contextual information, where ad networks crawl, decode and extract keywords that
summarize the target (Ma 2016). Using these keywords, advertisers bid very closely to
sponsored search. A more sophisticated approach is to research the website, including the
various features of the site, which can then measure the advertisers’ acceptable targeting score
(Doorn & Hoekstra 2013).
Unlike guaranteed contracts, in unguaranteed RTB-based demand-supply processes,
advertisers usually follow cost-per-click (CPC) or cost-per-purchase (CPA) pricing models
where they only pay when a particular target is reached. These options are perfect for goal-
driven campaigns. Nevertheless, since many publishers’ inventories are marketed using CPM,
ad networks have to plan for optimal clicks or conversions (Kumar 2016). The Generalized
Second Price (GSP) auction is therefore used to take into account performance metrics in ad
networks to allow bid biases (e.g. price scores) to be applied. Those scores are usually heavily
weighted by the standard Click-Through Rate (CTR) or Conversion Rate (CVR) (Gupta,
Khirbat & Singh 2014).
SSPs (Supply Side Platforms) tended to explicitly cater to publishers with the tools and services
to maximize their production (Matheson 2011). Advertisers did the same for DSPs (Demand
Side Platforms). Since the invention of SSPs and DSPs the ecosystem has increased
exponentially in size and complexity as ad exchanges, SSPs, DSPs and data providers and
management platforms (DMPs) have begun to take on different roles and activities from one
another, making differentiating between them almost impossible (Yuan et al. 2014).
With more and more ad networks, there was a problem developing ad exchanges: the
disproportionate interactions on some ad networks (McAfee 2011). Additional demand is better
than additional supply, as increased competition leads to higher network and publisher
revenues (Yuan, Wang & Zhao 2013). However, with many unrecognised views, ad networks
try hard to find customers. Therefore a standard practice for advertisers is to register with
various ad networks or find enough impressions within their budget constraints. They also
learned that multi-channel balancing (e.g. dividing the budget) was complicated and costly
(Choi et al. 2017). Ad exchanges like Google AdX, Yahoo Right Media, Microsoft Ad
Exchange and AppNexus were built to address this issue by linking thousands of ad networks
(Vega 2011). Advertisers are now more likely to find enough impressions with the preferred
targeting rule. More potential bidders could support publishers (Gomes & Mirrokni 2014).
Real-Time Bidding (RTB), which requires bidding systems to answer each request, is the most
critical feature implemented by ad exchanges. Besides advertisement characteristics, ad
exchanges share and make use of website/app information (aka context) and customer
information (Angel & Walfish 2013).
Due to the high volume and speed of incoming bid requests for each impression involving
background analysis of user profile and other information, the job cannot be done manually for
RTB-based ads (Yuan et al. 2012). Therefore, automated systems are used on RTB platforms,
enabling advertisers to quickly generate accurate offers using machine learning algorithms
(Chen et al. 2011). On the other hand, the publisher is responsible for the allocation of ad space
(Jason 2010). The Supply-Side Platform (SSP) will hold a bidder-to-bidder auction. The DSP
operates as an advertising agency by bidding and monitoring in selected advertising networks
(Vega 2011). On the other side, the SSP operates as an advertising agency by selling
impressions and choosing suitable bids. Upon fulfilment of the deal, the publisher provides the
ad impressions to the consumer through their ad spaces (Brakenhoff & Spruit 2017). An ad
exchange/ad network is typically an advertisement service offering an RTB-based platform
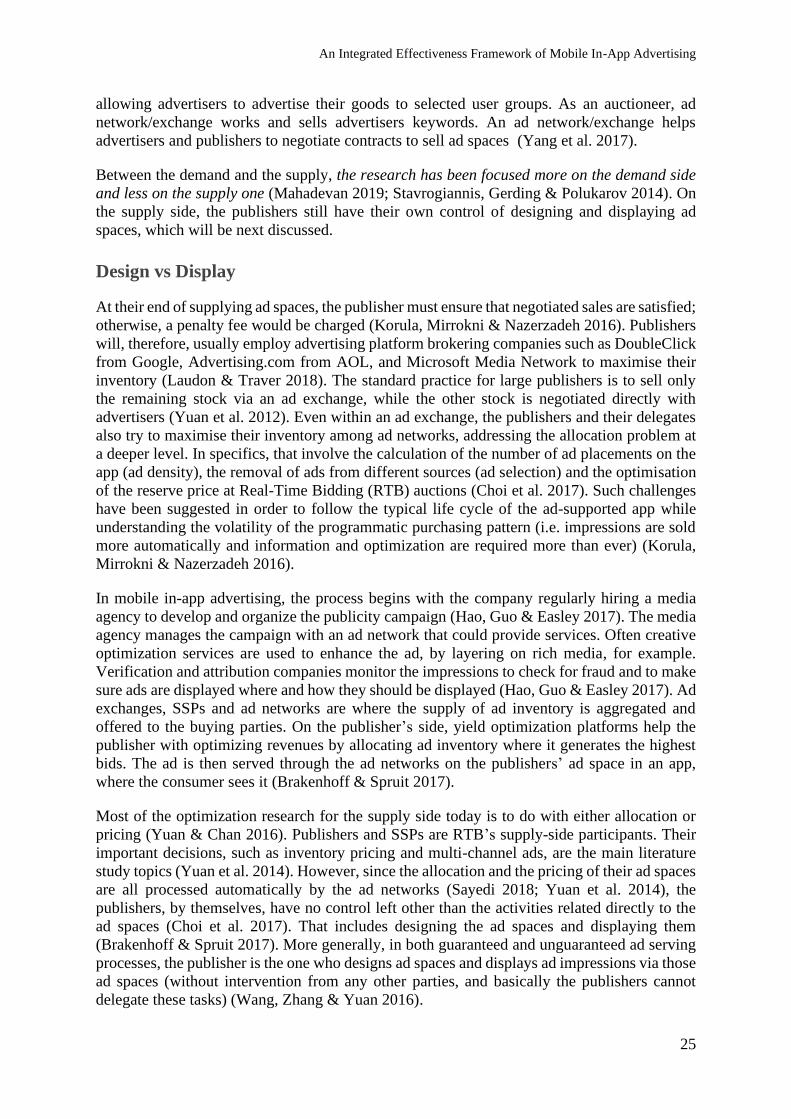
An Integrated Effectiveness Framework of Mobile In-App Advertising
25
allowing advertisers to advertise their goods to selected user groups. As an auctioneer, ad
network/exchange works and sells advertisers keywords. An ad network/exchange helps
advertisers and publishers to negotiate contracts to sell ad spaces (Yang et al. 2017).
Between the demand and the supply, the research has been focused more on the demand side
and less on the supply one (Mahadevan 2019; Stavrogiannis, Gerding & Polukarov 2014). On
the supply side, the publishers still have their own control of designing and displaying ad
spaces, which will be next discussed.
Design vs Display
At their end of supplying ad spaces, the publisher must ensure that negotiated sales are satisfied;
otherwise, a penalty fee would be charged (Korula, Mirrokni & Nazerzadeh 2016). Publishers
will, therefore, usually employ advertising platform brokering companies such as DoubleClick
from Google, Advertising.com from AOL, and Microsoft Media Network to maximise their
inventory (Laudon & Traver 2018). The standard practice for large publishers is to sell only
the remaining stock via an ad exchange, while the other stock is negotiated directly with
advertisers (Yuan et al. 2012). Even within an ad exchange, the publishers and their delegates
also try to maximise their inventory among ad networks, addressing the allocation problem at
a deeper level. In specifics, that involve the calculation of the number of ad placements on the
app (ad density), the removal of ads from different sources (ad selection) and the optimisation
of the reserve price at Real-Time Bidding (RTB) auctions (Choi et al. 2017). Such challenges
have been suggested in order to follow the typical life cycle of the ad-supported app while
understanding the volatility of the programmatic purchasing pattern (i.e. impressions are sold
more automatically and information and optimization are required more than ever) (Korula,
Mirrokni & Nazerzadeh 2016).
In mobile in-app advertising, the process begins with the company regularly hiring a media
agency to develop and organize the publicity campaign (Hao, Guo & Easley 2017). The media
agency manages the campaign with an ad network that could provide services. Often creative
optimization services are used to enhance the ad, by layering on rich media, for example.
Verification and attribution companies monitor the impressions to check for fraud and to make
sure ads are displayed where and how they should be displayed (Hao, Guo & Easley 2017). Ad
exchanges, SSPs and ad networks are where the supply of ad inventory is aggregated and
offered to the buying parties. On the publisher’s side, yield optimization platforms help the
publisher with optimizing revenues by allocating ad inventory where it generates the highest
bids. The ad is then served through the ad networks on the publishers’ ad space in an app,
where the consumer sees it (Brakenhoff & Spruit 2017).
Most of the optimization research for the supply side today is to do with either allocation or
pricing (Yuan & Chan 2016). Publishers and SSPs are RTB’s supply-side participants. Their
important decisions, such as inventory pricing and multi-channel ads, are the main literature
study topics (Yuan et al. 2014). However, since the allocation and the pricing of their ad spaces
are all processed automatically by the ad networks (Sayedi 2018; Yuan et al. 2014), the
publishers, by themselves, have no control left other than the activities related directly to the
ad spaces (Choi et al. 2017). That includes designing the ad spaces and displaying them
(Brakenhoff & Spruit 2017). More generally, in both guaranteed and unguaranteed ad serving
processes, the publisher is the one who designs ad spaces and displays ad impressions via those
ad spaces (without intervention from any other parties, and basically the publishers cannot
delegate these tasks) (Wang, Zhang & Yuan 2016).
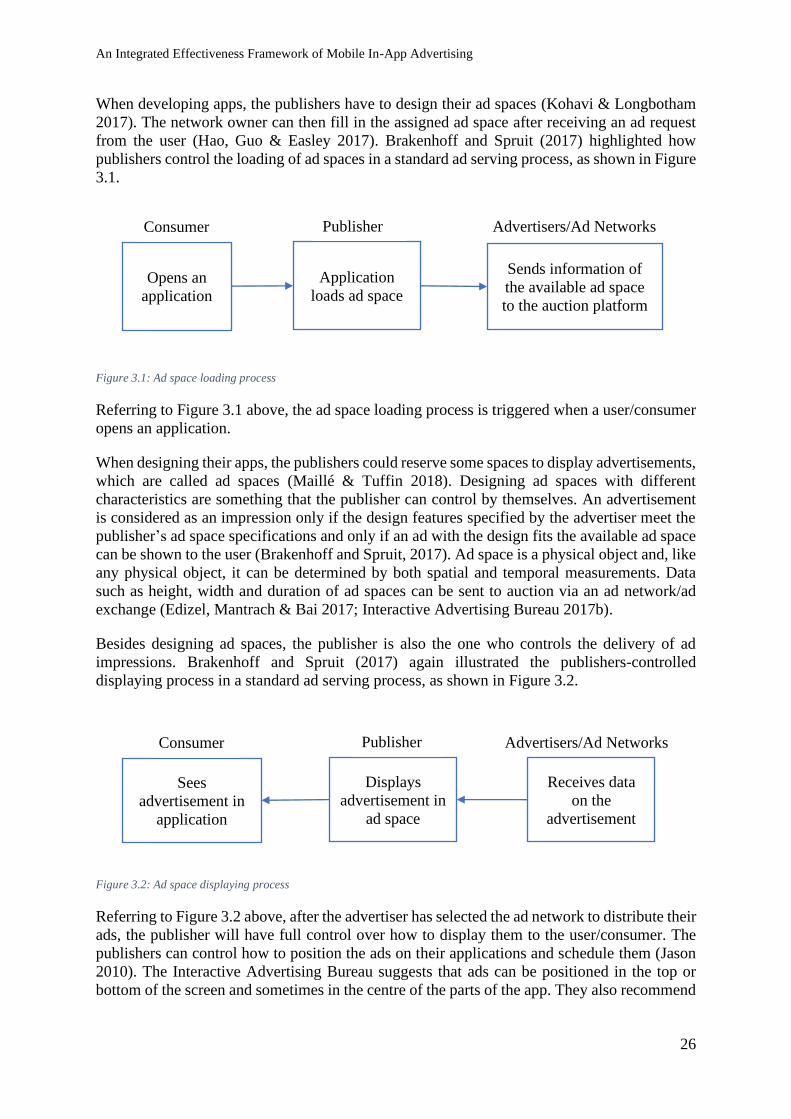
An Integrated Effectiveness Framework of Mobile In-App Advertising
26
When developing apps, the publishers have to design their ad spaces (Kohavi & Longbotham
2017). The network owner can then fill in the assigned ad space after receiving an ad request
from the user (Hao, Guo & Easley 2017). Brakenhoff and Spruit (2017) highlighted how
publishers control the loading of ad spaces in a standard ad serving process, as shown in Figure
3.1.
Figure 3.1: Ad space loading process
Referring to Figure 3.1 above, the ad space loading process is triggered when a user/consumer
opens an application.
When designing their apps, the publishers could reserve some spaces to display advertisements,
which are called ad spaces (Maillé & Tuffin 2018). Designing ad spaces with different
characteristics are something that the publisher can control by themselves. An advertisement
is considered as an impression only if the design features specified by the advertiser meet the
publisher’s ad space specifications and only if an ad with the design fits the available ad space
can be shown to the user (Brakenhoff and Spruit, 2017). Ad space is a physical object and, like
any physical object, it can be determined by both spatial and temporal measurements. Data
such as height, width and duration of ad spaces can be sent to auction via an ad network/ad
exchange (Edizel, Mantrach & Bai 2017; Interactive Advertising Bureau 2017b).
Besides designing ad spaces, the publisher is also the one who controls the delivery of ad
impressions. Brakenhoff and Spruit (2017) again illustrated the publishers-controlled
displaying process in a standard ad serving process, as shown in Figure 3.2.
Figure 3.2: Ad space displaying process
Referring to Figure 3.2 above, after the advertiser has selected the ad network to distribute their
ads, the publisher will have full control over how to display them to the user/consumer. The
publishers can control how to position the ads on their applications and schedule them (Jason
2010). The Interactive Advertising Bureau suggests that ads can be positioned in the top or
bottom of the screen and sometimes in the centre of the parts of the app. They also recommend
Opens an
application
Application
loads ad space
Sends information of
the available ad space
to the auction platform
Consumer Publisher Advertisers/Ad Networks
Sees
advertisement in
application
Displays
advertisement in
ad space
Receives data
on the
advertisement
Consumer Publisher Advertisers/Ad Networks
An Integrated Effectiveness Framework of Mobile In-App Advertising
27
ads be scheduled before, between or after the experience of the primary content (Interactive
Advertising Bureau 2017b; Rastogi et al. 2016).
The two processes have shown the importance of publishers in the complete ad serving process.
When a consumer loads an app on a mobile device, and at the same time loads a designed ad
space on that app, the publishers soon contact the advertisers via ad networks to advertise in
the ad space (Sayedi 2018). The process cannot be complete without the role of publishers.
Therefore, this study argued that by designing and displaying the ad spaces, the publishers
could actively influence and determine mobile in-app advertising effectiveness.
3. 2. Mobile In-App Advertising Participants
In mobile in-app adverting, there are four main participants involved, including users,
advertisers, ad networks/ad exchanges and publishers (Choi et al. 2017; Yuan et al. 2014).
Users
Users can be anybody using the Internet and the World Wide Web. According to Chaffey
(2019), 80 per cent of Internet users own a smartphone and spend 51 per cent of their time on
mobile digital media every day (about 3 hours) more than they spend on a personal computer
(42 per cent). Desktop visits last three times longer than smartphone visits on average, and
desktop visitors see more pages and bounce rates comparatively lower (Paulson 2017). Mobile
users usually expect a seamless, smooth experience when visiting and navigating an app.
Readability and proper location of relevant content and calls for action are critical when mobile
users browse the pages quickly (Ballard 2007; Kurtz, Wirtz & Langer 2021). Layout clarity
and interactive element visibility are critical provided smaller screen sizes. According to
Chaffey (2019), 89% of smartphone users’ media time is spent on apps and just 11% on mobile
websites.
Users usually issue keywords to communicate their information needs, such as Google
searching or online news browsing. Payers are buyers of the advertiser’s items or goods (Lin
et al. 2015). With consumers exchanging personal data online frequently and web cookies used
to track each user’s clicks, advertisers gained unparalleled visibility into customers and deliver
solutions customised to their individual needs (Hirose, Mineo & Tabe 2017). The results have
been impressive. According to a report by Frey et al. (2017), digital targeting significantly
increases advertisement response, and advertising efficiency declines as advertisers’ access to
consumer data decrease. However, there is also evidence that selling goods using personal
information can contribute to customer backlash (Prerna 2015). Clearly, the user is a key
participant in mobile in-app advertising.
Advertisers
Advertisers are those who design the advertisements and initiated the advertising campaigns.
They are those that need spaces or slots to place marketing messages–online ads–to draw
particular online users’ attention (Maillé & Tuffin 2018). In mobile in-app advertising,
advertisers often enter a real-time bidding process to get better or more low-cost ad spaces, via
the demand-side platform (DSP). With that, they are using ad networks/exchanges to bid and
distribute the advertisements to the publishers. Advertisers are the buyers in that process
(Dalessandro et al. 2015).
An Integrated Effectiveness Framework of Mobile In-App Advertising
28
In mobile in-app advertising, advertisers are typically a company or brand to give a particular
message about their product (for example, new user acquisition and retargeting campaigns)
(Boerman, Kruikemeier & Zuiderveen Borgesius 2017). Advertisers buy mobile publishers and
ad networks’ ad spaces to communicate their message to people interested in hearing the
message. For example, with a promotional game bid, an advertiser buys space from an ad
network sharing advertising to promote his or her photography app (Mahadevan 2019).
On phones, advertisements can be seen in almost every mobile application (Petsas et al. 2013).
That is usually the responsibility of the marketing team in most situations to reach for phone
users. Advertisers crunch numbers to decide whether the money they spend on advertising
campaigns offers consumer and sales return on investment (ROI). The most effective
advertisers are those who can reliably calculate their audience’s value and target their ROI
marketing spending (De Pelsmacker 2020). Clearly, the advertiser is a key participant in
mobile in-app advertising.
Ad networks
An ad network is a platform that bridges a group of advertisers and a group of publishers (Yuan
et al. 2014). Ad networks were actually one of the key inventions in the 1990s, which helped
raise internet advertising (McAfee 2011). They were responsible for helping advertisers buy
available ad spaces through different publishers.
Usually, ad networks collect anonymous ad space inventory from different publishers and
market it to advertisers at far lower rates than direct sales. Such inventory sales are also called
non-premium (Turner 2012). However, some networks today take a more strategic approach,
leaning to give their advertisers more exclusive offers at higher rates. They select inventories
from certain top-tier publishers and resell them at premium rates. Although this arrangement
could cost advertisers more, it guarantees that their advertisements are put in a premium
position (Ma 2016).
First, the ad network brings together a large number of publishers to offer auction-based
inventory to advertisers. The advertiser may then set up campaigns directly via a campaign-
management panel, or set up third-party ad servers for verification and monitoring purposes
(Olennikova 2019). It is useful when running the campaign through multiple ad networks
without communicating directly with publishers. Next, advertisers set campaign criteria with
frequency cap limits and input the budget details. On their side, the publisher imposes ad
network codes on their app. The advertiser will refresh ad banners on the ad network panel
when the ad is published (Busch 2016).
Initially, with fewer websites and advertisers, publishers can use just one ad network for
marketing their remaining inventory. Nevertheless, as the number of publishers grew, they soon
found they could not sell all their inventories on an ad network and had low filling rates. To
boost fill rates, advertisers started using various ad networks, some offering premium
inventories and others offering relics (Choi et al. 2017). Apparently, the ad network is a key
participant in mobile in-app advertising.
Publishers
A publisher is a person or an organization that plans and distributes ad spaces for public
distribution. Publishers are simply those with the spaces to display ads. A supply-side platform
An Integrated Effectiveness Framework of Mobile In-App Advertising
29
(SSP) is an intermediary company with the single mission of enabling publishers to manage
their display spaces and maximise revenue. The publishers are the sellers in that process. They
sell ad spaces to advertisers (Brakenhoff & Spruit 2017). Apparently, the publisher is a key
participant in mobile in-app advertising.
Out of the four participants, the roles of users and advertisers are most studied in the current
literature (Boerman, Kruikemeier & Zuiderveen Borgesius 2017; Yuan et al. 2014). For
example, Rodgers and Thorson (2000) categorized all the factors affecting the interactive
advertising effectiveness into either advertiser or consumer-controlled groups in their
Interactive Advertising Model. Researchers from different disciplines have widely used the
model since it was first introduced in 2000 (Rodgers, Ouyang & Thorson 2017). The IAM
offers an objective way to measure advertising impact from user-controlled and advertiser-
controlled perspectives. According to IAM, the consumer controls internet trends, mode and
information systems, while the advertiser controls ad forms, ad formats and ad features (see
Appendix C). Grewal et al. (2016) proposed Mobile Advertising Effectiveness Framework
(MAEF) to enhance the advertising effectiveness for advertisers using advertisers’ ad elements,
ad networks’ context and users’ consumer factors, but not publishers (see Appendix D).
Table 3.1: Current advertising optimisation research issues grouped by the participant.
Participant Research Topic Examples of Studies
Advertisers
Bidding algorithms
Balakrishnan and Bhatt (2015); Chen et al. (2011); Ghosh
et al. (2009a); Lang et al. (2011); Perlich et al. (2012);
Schain and Mansour (2012)
Behaviour analysis Angel and Walfish (2013); Feldman et al. (2009); Ghosh
et al. (2009a)
Frequency capping Bhalgat, Feldman and Mirrokni (2012); Hojjat et al.
(2017)
Budget allocation Lee, Jalali and Dasdan (2013)
Publishers
Channel allocation Balseiro et al. (2014); Boutilier et al. (2013); Chen
(2017); Mostagir (2010)
Inventory pricing Najafi-Asadolahi and Fridgeirsdottir (2014);
Radovanovic and Heavlin (2012)
Ad Networks
Mechanism design
Cavallo, Mcafee and Vassilvitskii (2015); Celis et al.
(2011); Gomes and Mirrokni (2014); Mansour,
Muthukrishnan and Nisan (2012); McAfee (2011);
McAfee and Vassilvitskii (2012); Stavrogiannis, Gerding
and Polukarov (2014)
Callout optimization Chakraborty et al. (2010); Lang et al. (2011)
Market Information structure Yuan et al. (2012)
Consumers
Evolution of market structure Yuan et al. (2012)
Market segmentation Lahaie, Parkes and Pennock (2008)
Ad performance predicting Azimi et al. (2012); Cheng et al. (2012); Yuan, Wang and
Zhao (2013)
Market specification and
security Angel and Walfish (2013); Stone-Gross et al. (2011)
Noted on publishers’ unexplored role, Choi et al. (2017) provided an extensive analysis of the
display ad ecosystem, including both guaranteed and non-guaranteed platforms. They
An Integrated Effectiveness Framework of Mobile In-App Advertising
30
suggested that publishers find the benefits by balancing the ad allocations between these two
channels. Their study highlights the publisher goal of maximizing revenues through clicks. As
shown in the money flow in Appendix B, advertisers are those who pay for their advertising
content to be shown on publishers’ ad spaces. They directly pay that to the ad networks, like
Google Ads, Facebook Audience Network. Those ad networks, in turn, will pay a portion of
their earnings back to the publishers. Once Apple’s ad network, iAd, was first introduced in
April 2010, the amount of iAd ad revenue transferred to the publishers was 60% (Apple Inc
2010). Two years later, in 2012, Apple decided to increase the product’s percentage of ad
revenue from 60 to 70 per cent, boosting its own percentage of ad revenue to the advantage of
the app’s publisher (Aimonetti 2012). In a bigger picture, the publishers’ revenue actually
accounts for nearly 30 per cents of the total mobile in-app advertising spending (Nairn 2018).
Mobile in-app advertising is therefore also intended for publishers’ benefits according to the
number of impressions and the number of clicks on their ad spaces (Yuan et al. 2012).
Apparently, each participant has their own goal when involving mobile in-app advertising.
However, researchers are recently focusing on optimising mobile in-app advertising, but for
each participant individually (Choi et al. 2017; Yuan et al. 2014) as summarized in Table 3.1.
Not only researches are focusing on optimising mobile in-app advertising for each participant
individually, but the publisher role studies are also limited. There are not many options for
publishers to optimize. The publishers’ studies rely mainly on either allocation or pricing (Yuan
et al. 2014). However, since the allocation and the pricing of their ad spaces are all processed
automatically by the ad networks (Sayedi 2018; Yuan et al. 2014), the publishers, by
themselves, have no control left other than the activities related directly to the ad spaces (Choi
et al. 2017).
Therefore, there is a need to recognize the ad space characteristics that the publishers controlled
in particular and the necessity to develop an integrated effectiveness framework for all
participants participating in mobile in-app ads in general. Such a framework must be based on
a common goal of all participants, including factors controlled by publishers that were not
found in previous studies. The purpose is to find a more integrated way to target mobile in-app
ads. To do so, each participant’s goals will be analysed in order to find out the common goal
for all. Then, a metric to measure that common goal needs to be identified. Those will be
discussed in more detail in Section 3.3.
3. 3. Mobile In-App Advertising Goals and Metrics
Goals
As analysed in Section 3.2, there are four participants involved in mobile in-app advertising.
These four players actually have different goals in mind when involving advertising.
Firstly, the users want to receive advertisements with their permissions, personalized and
relevant (Barwise & Strong 2002). Several empirical studies (e.g. Lin and Chen (2009), Lim,
Tan and Jnr Nwonwu (2013)) showed that consumers clicked on advertisements that they
considered being trustworthy, personalized and appropriate. In a study conducted by Cho
(2003), it was reported that a higher click-through rate existed for users who were active on the
platform and saw ads for goods and services similar to those on the web and were more likely
to click through those more critical to their company. That leads to the conclusion that the only
thing that matters from the consumer’s viewpoint is the relevance of advertisement (Boerman,
Kruikemeier & Zuiderveen Borgesius 2017). Kumar (2016) argued that consumer preferences
An Integrated Effectiveness Framework of Mobile In-App Advertising
31
for appropriate messaging are evolving; they seek customised contact to meet their individual
needs. As long as the advertising message is vital to either the consumer’s viewed material or
its usage goals, multimedia use does not adversely affect the effectiveness of an advertisement
(Angell et al. 2016). Some advertising research suggests that online advertising’s effectiveness
depends on its benefits for individual consumers (Čaić et al. 2015). Ultimately, advertisement
is both influenced and shaped by consumer preferences (Dalessandro et al. 2015; Pavlou &
Stewart 2000). Prior studies confirmed that relevance is the goal of users when involving
advertising and that is reflected as the ratio of the times they clicked on the advertisements and
the times they have to see them (Prerna 2015; Trivedi 2015). Accordingly, users seek to
increase the ratio of the number of clicks and the number of impressions.
Secondly, when running an online advertising campaign, the advertisers aimed to achieve two
main goals of informational and behavioural (Barwise & Strong 2002; Zhu & Wilbur 2011).
Concerning mobile in-app ads, advertisers’ main objectives are to raise awareness, promote
positive attitudes, increase engagement, increase conversion rates, encourage repurchases and
promote advocacy (Barwise & Strong 2002; Trivedi 2015). Those advertisers, who are willing
to spend on ads for brand awareness, attitude, and intention purposes, will aim to achieve the
informational goals, which are measured by the number of impressions (Dalessandro et al.
2015; Rafieian & Yoganarasimhan 2021). On the other hand, if the advertisers have
engagement, online conversion, advocacy goals in mind, they will pay for the performance of
their displayed ads, which are measured by the number of clicks (Kumar 2016). Between, the
informational and behavioural goals, the advertisers usually focus more on the informational
(Chandrasekaran, Srinivasan & Sihi 2018). Essentially, brand recognition is the cornerstone of
every advertiser-customer relationship (Chandrasekaran, Srinivasan & Sihi 2018; Li, Yang &
Liang 2015). The more a customer learns about a brand—the more information they have—
the more likely they are to trust, buy, and stay loyal to that company product line (Li & Lo
2015). Brand advertising is a type of advertising that helps link and develop deep, long-term
relationships over time. For that reason, companies using brand ads pursue long-term positive
awareness (Broussard 2000; Hollis 2005). Actually, large and mid-sized publicly listed
companies in the US focus on the long-term branding goal (Baxton 2018). Therefore,
advertisers seek to increase the number of impressions first, then the number of clicks when
involving mobile in-app advertising.
Thirdly, ad networks/exchanges naturally try to find the best match for their ad inventories.
The best match is not limited to “relevance” from the traditional sense of information-based
retrieval analysis, but also involves the best economic revenue (Yuan et al. 2012). Their
objective is to maximize revenue based on the probability of clicking on the ad and the value
of advertising to consumers (Richardson, Dominowska & Ragno 2007). One of the most
critical tasks of running a business as an ad network is sales management. It applies primarily
to big firms, where Google and Facebook together account for 70% of the advertising revenue
(Nairn 2018). They all aimed at maximizing the matching of the supply and the demand. An
ad network’s essential role is to aggregate ad space supply from publishers and balance
advertiser demand (Wang, Zhang & Yuan 2016). Ad networks also allow advertisers to buy
digital advertising through a slew of publisher sites and apps. Advertising networks offer a way
for media buyers to organise marketing campaigns effectively through dozens, hundreds or
even thousands of sites (Yuan et al. 2014). An ad network’s main feature is to accumulate ad
space and align it with the advertiser’s needs. The higher the matching rate, the higher their
revenue is (McMahan et al. 2013; Mitti 2018). That is why all the ad networks aim to increase
the ratio between the number of clicks and the number of impressions.
An Integrated Effectiveness Framework of Mobile In-App Advertising
32
Lastly, when the publishers involved with advertising, they are concerned with the revenue
(Choi et al. 2017). In order to maximize revenue from guaranteed contracts, the allocation and
inventory control of publishers must be efficient (Feige et al. 2008; Roels & Fridgeirsdottir
2009). For RTB-based ads, advertisers can make money based on the number of views and the
number of clicks on their ad spaces (Korula, Mirrokni & Nazerzadeh 2016). For that reason,
publishers tend to run a two-sided market. At first, they offer free content (e.g. news,
comments, and responses) and resources (e.g. email, maps, and various online tools) to attract
users whose navigating activity then generates impressions and clicks in turn (Matheson 2011).
Between impressions and clicks, clicks generate more revenue (Olennikova 2019). The average
RPM for Google AdSense ranges greatly depending on the niche, quality of the website, traffic
source, and the number of advertisers on the AdWords platform. On the medium end, it can
range from $5 to $10 per thousand impressions (Ilisin 2020). Google, however, charges
advertisers per click. Publishers get 68% of the click number (or 51 per cent when it comes to
AdSense for search). The commission the publishers get is highly dependent on niche
competition and CPC. In reality, commissions per click can hit $15 (Olennikova 2019).
Therefore, different from the advertisers, the publishers focus more on the number of clicks.
They seek to increase the number of clicks first, and the number of impressions later.
Table 3.2 summarized the goals of the participants.
Table 3.2: The goals of the four participants. These four players actually have different goals in mind when involving
advertising.
On the surface, all the participants’ goals have little in common. However, fundamentally, all
goals could be grouped into either informational or behavioural goals that do not contradict
each other (Kotler, Kartajaya & Setiawan 2016). Impressions are offered directly or through
advertisers (ad networks and exchanges). Publishers use advertisement revenue for operating
expenses. Hence, optimisations for publishers are essential not only to their business but also
to the entire advertising ecosystem. Hollis (2005) claimed that both paradigms, i.e.
informational and behavioural advertising, are not incompatible but complementary. The
applicability of either model depends not only on the advertiser’s intent but also on the viewer’s
thinking. Thus, it can be argued that these goals are not mutually exclusive. Kohavi et al.
Participant Goal Examples of Studies
User
RELEVANCE
Increasing the ratio of the
number of clicks and the
number of impressions
Lin and Chen (2009), Lim, Tan and Jnr Nwonwu (2013),
Čaić et al. (2015), Kumar and Gupta (2016), Angell et al.
(2016); Boerman, Kruikemeier and Zuiderveen Borgesius
(2017)
Advertiser
INFORMATION &
BEHAVIOUR
Increasing firstly the number
of impressions and secondly
the number of clicks
Broussard (2000), Barwise and Strong (2002), Zhu and
Wilbur (2011), Dalessandro et al. (2015), Kumar (2016),
Baxton (2018)
Ad network
MATCH
Increasing the ratio of the
number of clicks and the
number of impressions
Yuan et al. (2012), McMahan et al. (2013), Yuan et al.
(2014), Richardson, Dominowska and Ragno (2007),
Mitti (2018), Nairn (2018)
Publisher
REVENUE
Increasing firstly the number
of clicks and secondly the
number of impressions
Feige et al. (2008), Roels and Fridgeirsdottir (2009)
Korula, Mirrokni and Nazerzadeh (2016), Choi et al.
(2017), Olennikova (2019), Ilisin (2020)
An Integrated Effectiveness Framework of Mobile In-App Advertising
33
(2009a) also argued that a short-term measurement should already have long-term goals. For
example, when advertising is stuck in an app, it affects the consumer’s experience, so a useful
metric should include a penalty term for using unclicked ads and accurately quantify repeated
visits and abandonment. Similarly, delayed conversion steps should be measured for prior
events when exposing the user. Miller (2006) and Quarto-vonTivadar (2006) named these
latent conversions. According to Kohavi et al. (2009b), having a useful metric is hard, but what
is the alternative? The main point here is not tossing the baby out with the bathwater, but
recognising this restriction. If a short-term metric is used to assess success long enough, both
goals should have mirrored their effects (Kohavi et al. 2009b).
Computational advertising’s primary objective is to find the “best match” between a particular
user and a suitable advertisement in a given context (Broder 2008), which requires leveraging the information associated with consumers, advertisers, and publishers altogether (Yang
et al. 2017). In that way, the publishers do not need to encourage information as advertisers,
but share the same behavioural goal, aka click-throughs. The click-through is also used to
calculate the long-term relevance of ads to consumers (Kohavi et al. 2009b) and the best match
for ad networks/exchanges (Kumar 2016). Therefore, increasing the ratio of the number of
clicks and number of impressions in the interactive context such as mobile in-app ads is where
the publisher, advertisers, ad networks/exchange and consumer goals should meet.
To summarize, enhancing the ratio of the number of clicks and the number of impressions is
the common goal of all participants involved in mobile in-app advertising.
Metrics
The outcome metric measures the effectiveness of the goal. Before discussing the metric that
could measure the common goal, other metrics used to measure other goals will be first
discussed.
From a structurational point of view (Giddens 1986), both sets of measures have different but
complementary views on the role of interactive ads. One collection of tests focuses on
experiences. Such interventions may be descriptively classified as monitoring procedures
centralising around advertisers’ goals (Rosenkrans 2007). The second set of metrics focuses on
consumer impact using digital media. Variables such as perception, actions and product choice
are not only the products of digital media exposure; they are also the result of consumer
behaviours formed by customer desires and wishes (Pavlou & Stewart 2000). In that sense,
online advertising metrics can be grouped into either information-related, aka impressions or
behaviour-related, aka clicks (Kumar 2016).
An ad impression is a count of the cumulative number of times that digital advertisements are
shown on someone’s smartphone within the publisher’s application. This statistic estimates the
number of times a single commercial was shown to the audience. Based on how many times
an ad has shown up on the screens of the viewer, their impressions can be counted and
calculated. Impressions compensate for the cumulative number of times an ad was viewed
(Rettie, Grandcolas & McNeil 2004). On the other hand, clicking is the activity initiated by the
user to click on an ad object, resulting in a redirection to another page (Interactive Advertising
Bureau 2014). Clicking is used when users use a device to communicate with a web browser
or app. Click-through is when the user starts operation by clicking on an ad and clicking-
through directs the user to another online site, such as another website or an app store. An ad
An Integrated Effectiveness Framework of Mobile In-App Advertising
34
server tracks and documents click activity and ensure accurate and reliable measurements
(Rosenkrans 2007).
That distinction is also applied in the business of online advertising. Today, the two most
commonly used pricing models are Revenue Per Thousand Impressions (RPM) and Revenue
per Click (RPC) (Hagen, Robertson & Sadler 2006; Punyatoya 2011; Rosenkrans 2007). On
the costing side, there are also two models: Cost Per Thousand Impressions (CPM) and Cost
per Click (CPC) (Chuklin, Markov & Rijke 2015; Kumar 2016). If the cost is measured using
the Cost Per Thousand Exposure (CPM) model when the number of impressions is calculated,
and the revenue is estimated using the Revenue Per Thousand Exposure (RPM) metric
accordingly. On the other hand, if the cost is calculated with the Cost Per Click (CPC) model,
the revenue is estimated using the Revenue Per Click metric (Kumar 2016).
The RPM/CPM model was widely used in the past and has also been traditionally used in online
advertising for many traditional media, such as television and magazines (Rettie, Grandcolas
& McNeil 2004). However, this model has many disadvantages. Though highly unfavourable
consumers are unlikely to respond to ads, the RPM/CPM model charges exposure-based
advertisers regardless of ad efficacy (Kumar 2016). Another disadvantage of this model is that
impressions, virtually, do not monitor how users interact with an ad and definitely do not
measure the relevance of mobile ads (Rosenkrans 2007). On the other hand, expense and
revenue can be determined by an RPC/CPC model when the number of clicks is selected. Based
on user behaviour, the RPC/CPC model takes user actions into consideration (Bhat, Bevans &
Sengupta 2002). For example, advertisers only pay when their advertisements produce click-
throughs. Recently, in terms of revenue, the RPC/CPC model exceeded and continue to
dominate the RPM/CPM model (Kumar 2016).
However, both RPM/CPM and CPM/CPC metrics do not accurately measure the relevance of
advertisement. That relevance should be understood as to how effective the exposure is – how
many percentages of the total exposure finally yield clicks? Click-Through Rate (CTR) is a
metric that can quantify that ratio. Click-through rate is the ratio between the total number of
times an ad is clicked, and the total number of times an ad is viewed (Schonberg et al. 2000).
This statistic is already a method of calculating the effectiveness of online advertising
campaigns and is a useful tool for assessing targets for direct marketing (Zhou et al. 2017). In
practice, the click-through rate is the primary way to gather user reaction and analyze user
feedback and are commonly used in online advertising revenue models because of their
simplicity (Yuan et al. 2012). Click-through rate is an online advertising behavioural and
transparent metric as everyone can easily detect click-through indicators and present a
behavioural response. Clicks indicate an immediate interest in the item being promoted
(Chatterjee, Hoffman & Novak 2003; Singh, Dalal & Spears 2005). Kumar (2016) claimed that
CTR is widely used to determine banner ads’ effectiveness. For similar measurements, the CTR
is considered a good diagnostic tool (Bhat, Bevans & Sengupta 2002; Kumar 2016). Google
also determines that a high CTR is a good indication that users find the ads useful and essential
(Google 2019). It is estimated that CTR-based advertising accounts for a larger amount of all
online ad dollars spent. In 2017, more than 62% of the total display advertising revenues were
measured by CTR, and 4% were measured by both CTR and CPM/RPM (Interactive
Advertising Bureau 2019). Improving the outcome metric CTR is to enhance the advertising
effectiveness for all participants, as shown in Table 3.3. A better click-through rate, directly
and indirectly, means a better ad relevance (users’ goal), a better engagement (advertisers’
goal) and higher revenue (ad networks and publishers’ goal).
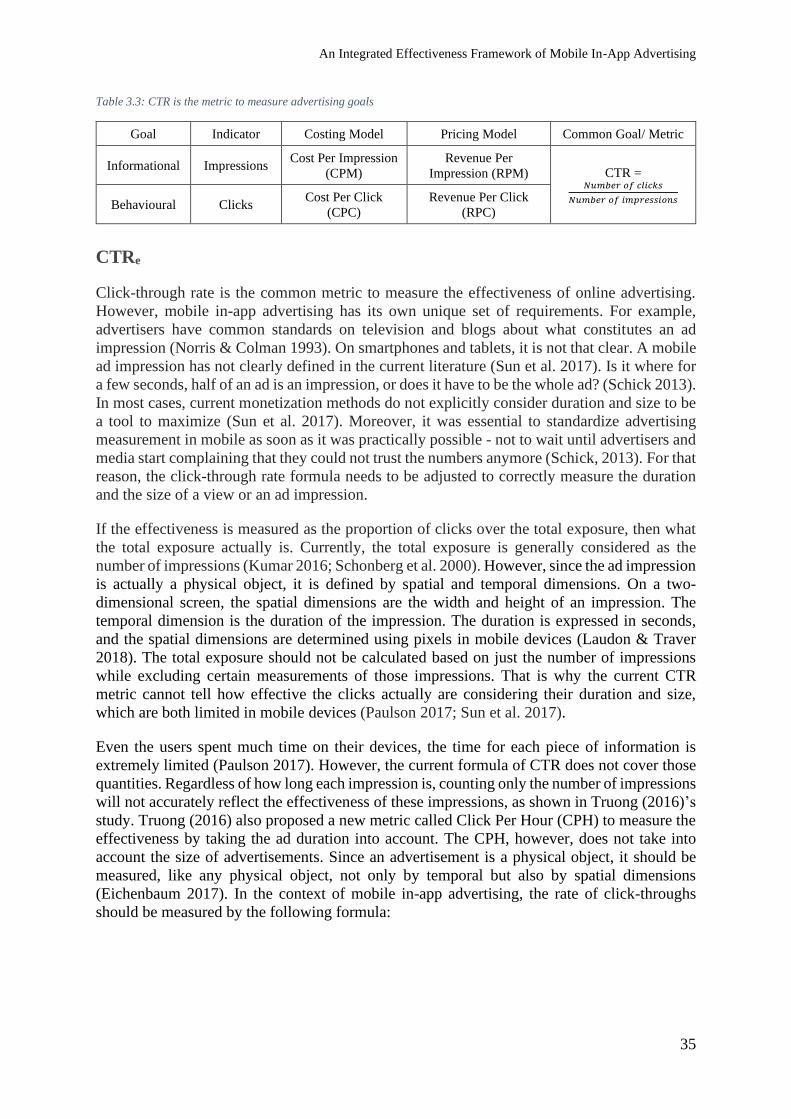
An Integrated Effectiveness Framework of Mobile In-App Advertising
35
Table 3.3: CTR is the metric to measure advertising goals
Goal Indicator Costing Model Pricing Model Common Goal/ Metric
Informational Impressions Cost Per Impression
(CPM)
Revenue Per
Impression (RPM) CTR = 𝑁𝑢𝑚𝑏𝑒𝑟 𝑜𝑓 𝑐𝑙𝑖𝑐𝑘𝑠
𝑁𝑢𝑚𝑏𝑒𝑟 𝑜𝑓 𝑖𝑚𝑝𝑟𝑒𝑠𝑠𝑖𝑜𝑛𝑠
Behavioural Clicks Cost Per Click
(CPC)
Revenue Per Click
(RPC)
CTRe
Click-through rate is the common metric to measure the effectiveness of online advertising.
However, mobile in-app advertising has its own unique set of requirements. For example,
advertisers have common standards on television and blogs about what constitutes an ad
impression (Norris & Colman 1993). On smartphones and tablets, it is not that clear. A mobile
ad impression has not clearly defined in the current literature (Sun et al. 2017). Is it where for
a few seconds, half of an ad is an impression, or does it have to be the whole ad? (Schick 2013).
In most cases, current monetization methods do not explicitly consider duration and size to be
a tool to maximize (Sun et al. 2017). Moreover, it was essential to standardize advertising
measurement in mobile as soon as it was practically possible - not to wait until advertisers and
media start complaining that they could not trust the numbers anymore (Schick, 2013). For that
reason, the click-through rate formula needs to be adjusted to correctly measure the duration
and the size of a view or an ad impression.
If the effectiveness is measured as the proportion of clicks over the total exposure, then what
the total exposure actually is. Currently, the total exposure is generally considered as the
number of impressions (Kumar 2016; Schonberg et al. 2000). However, since the ad impression
is actually a physical object, it is defined by spatial and temporal dimensions. On a two-
dimensional screen, the spatial dimensions are the width and height of an impression. The
temporal dimension is the duration of the impression. The duration is expressed in seconds,
and the spatial dimensions are determined using pixels in mobile devices (Laudon & Traver
2018). The total exposure should not be calculated based on just the number of impressions
while excluding certain measurements of those impressions. That is why the current CTR
metric cannot tell how effective the clicks actually are considering their duration and size,
which are both limited in mobile devices (Paulson 2017; Sun et al. 2017).
Even the users spent much time on their devices, the time for each piece of information is
extremely limited (Paulson 2017). However, the current formula of CTR does not cover those
quantities. Regardless of how long each impression is, counting only the number of impressions
will not accurately reflect the effectiveness of these impressions, as shown in Truong (2016)’s
study. Truong (2016) also proposed a new metric called Click Per Hour (CPH) to measure the
effectiveness by taking the ad duration into account. The CPH, however, does not take into
account the size of advertisements. Since an advertisement is a physical object, it should be
measured, like any physical object, not only by temporal but also by spatial dimensions
(Eichenbaum 2017). In the context of mobile in-app advertising, the rate of click-throughs
should be measured by the following formula:
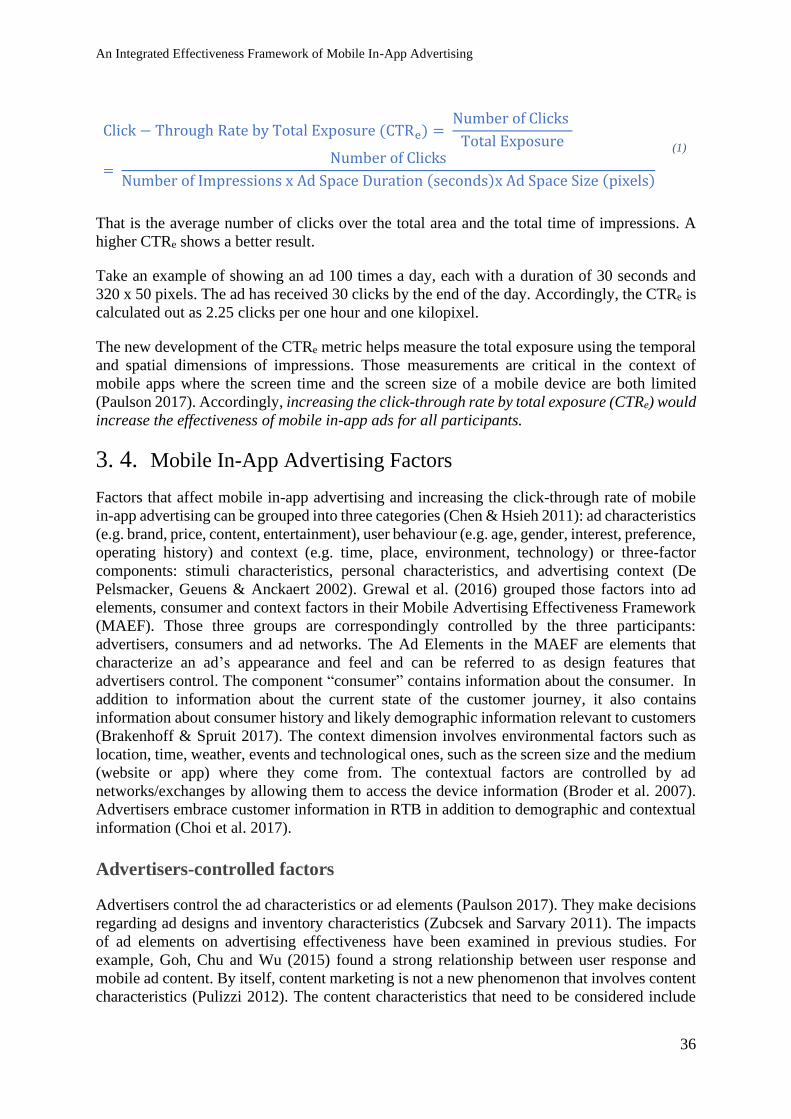
An Integrated Effectiveness Framework of Mobile In-App Advertising
36
Click − Through Rate by Total Exposure (CTRe) = Number of Clicks
Total Exposure
= Number of Clicks
Number of Impressions x Ad Space Duration (seconds)x Ad Space Size (pixels)
(1)
That is the average number of clicks over the total area and the total time of impressions. A
higher CTRe shows a better result.
Take an example of showing an ad 100 times a day, each with a duration of 30 seconds and
320 x 50 pixels. The ad has received 30 clicks by the end of the day. Accordingly, the CTRe is
calculated out as 2.25 clicks per one hour and one kilopixel.
The new development of the CTRe metric helps measure the total exposure using the temporal
and spatial dimensions of impressions. Those measurements are critical in the context of
mobile apps where the screen time and the screen size of a mobile device are both limited
(Paulson 2017). Accordingly, increasing the click-through rate by total exposure (CTRe) would
increase the effectiveness of mobile in-app ads for all participants.
3. 4. Mobile In-App Advertising Factors
Factors that affect mobile in-app advertising and increasing the click-through rate of mobile
in-app advertising can be grouped into three categories (Chen & Hsieh 2011): ad characteristics
(e.g. brand, price, content, entertainment), user behaviour (e.g. age, gender, interest, preference,
operating history) and context (e.g. time, place, environment, technology) or three-factor
components: stimuli characteristics, personal characteristics, and advertising context (De
Pelsmacker, Geuens & Anckaert 2002). Grewal et al. (2016) grouped those factors into ad
elements, consumer and context factors in their Mobile Advertising Effectiveness Framework
(MAEF). Those three groups are correspondingly controlled by the three participants:
advertisers, consumers and ad networks. The Ad Elements in the MAEF are elements that
characterize an ad’s appearance and feel and can be referred to as design features that
advertisers control. The component “consumer” contains information about the consumer. In
addition to information about the current state of the customer journey, it also contains
information about consumer history and likely demographic information relevant to customers
(Brakenhoff & Spruit 2017). The context dimension involves environmental factors such as
location, time, weather, events and technological ones, such as the screen size and the medium
(website or app) where they come from. The contextual factors are controlled by ad
networks/exchanges by allowing them to access the device information (Broder et al. 2007).
Advertisers embrace customer information in RTB in addition to demographic and contextual
information (Choi et al. 2017).
Advertisers-controlled factors
Advertisers control the ad characteristics or ad elements (Paulson 2017). They make decisions
regarding ad designs and inventory characteristics (Zubcsek and Sarvary 2011). The impacts
of ad elements on advertising effectiveness have been examined in previous studies. For
example, Goh, Chu and Wu (2015) found a strong relationship between user response and
mobile ad content. By itself, content marketing is not a new phenomenon that involves content
characteristics (Pulizzi 2012). The content characteristics that need to be considered include
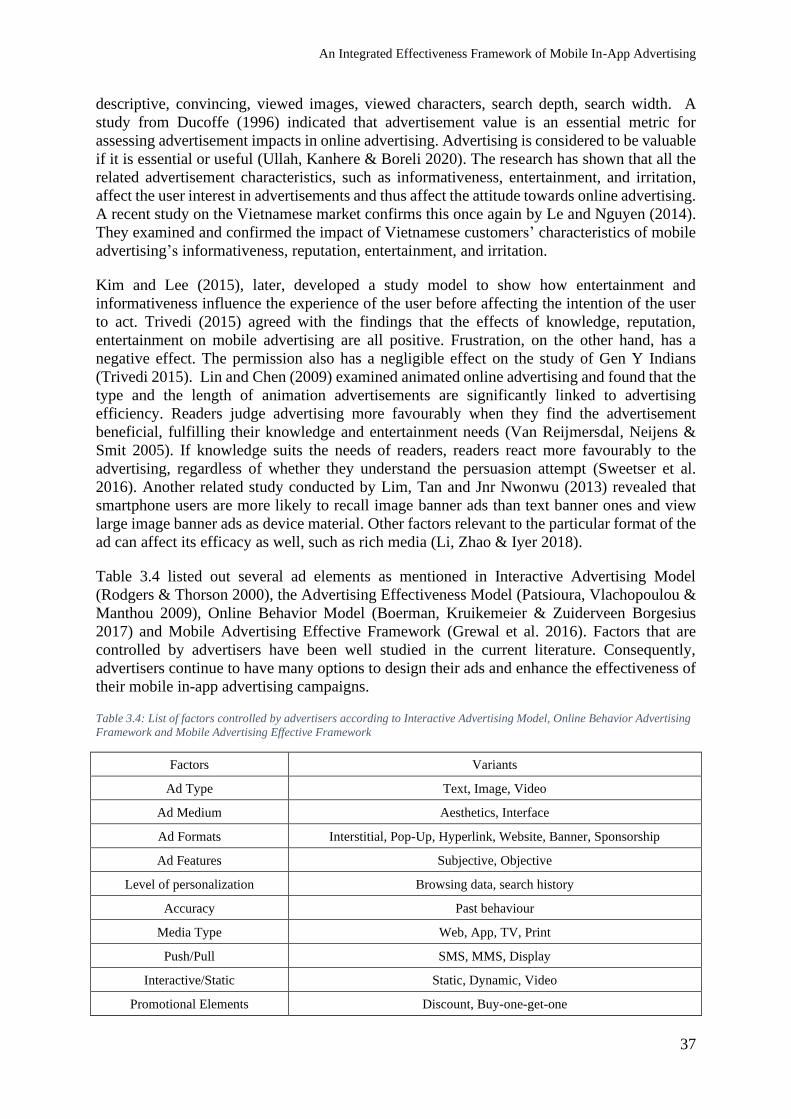
An Integrated Effectiveness Framework of Mobile In-App Advertising
37
descriptive, convincing, viewed images, viewed characters, search depth, search width. A
study from Ducoffe (1996) indicated that advertisement value is an essential metric for
assessing advertisement impacts in online advertising. Advertising is considered to be valuable
if it is essential or useful (Ullah, Kanhere & Boreli 2020). The research has shown that all the
related advertisement characteristics, such as informativeness, entertainment, and irritation,
affect the user interest in advertisements and thus affect the attitude towards online advertising.
A recent study on the Vietnamese market confirms this once again by Le and Nguyen (2014).
They examined and confirmed the impact of Vietnamese customers’ characteristics of mobile
advertising’s informativeness, reputation, entertainment, and irritation.
Kim and Lee (2015), later, developed a study model to show how entertainment and
informativeness influence the experience of the user before affecting the intention of the user
to act. Trivedi (2015) agreed with the findings that the effects of knowledge, reputation,
entertainment on mobile advertising are all positive. Frustration, on the other hand, has a
negative effect. The permission also has a negligible effect on the study of Gen Y Indians
(Trivedi 2015). Lin and Chen (2009) examined animated online advertising and found that the
type and the length of animation advertisements are significantly linked to advertising
efficiency. Readers judge advertising more favourably when they find the advertisement
beneficial, fulfilling their knowledge and entertainment needs (Van Reijmersdal, Neijens &
Smit 2005). If knowledge suits the needs of readers, readers react more favourably to the
advertising, regardless of whether they understand the persuasion attempt (Sweetser et al.
2016). Another related study conducted by Lim, Tan and Jnr Nwonwu (2013) revealed that
smartphone users are more likely to recall image banner ads than text banner ones and view
large image banner ads as device material. Other factors relevant to the particular format of the
ad can affect its efficacy as well, such as rich media (Li, Zhao & Iyer 2018).
Table 3.4 listed out several ad elements as mentioned in Interactive Advertising Model
(Rodgers & Thorson 2000), the Advertising Effectiveness Model (Patsioura, Vlachopoulou &
Manthou 2009), Online Behavior Model (Boerman, Kruikemeier & Zuiderveen Borgesius
2017) and Mobile Advertising Effective Framework (Grewal et al. 2016). Factors that are
controlled by advertisers have been well studied in the current literature. Consequently,
advertisers continue to have many options to design their ads and enhance the effectiveness of
their mobile in-app advertising campaigns.
Table 3.4: List of factors controlled by advertisers according to Interactive Advertising Model, Online Behavior Advertising
Framework and Mobile Advertising Effective Framework
Factors Variants
Ad Type Text, Image, Video
Ad Medium Aesthetics, Interface
Ad Formats Interstitial, Pop-Up, Hyperlink, Website, Banner, Sponsorship
Ad Features Subjective, Objective
Level of personalization Browsing data, search history
Accuracy Past behaviour
Media Type Web, App, TV, Print
Push/Pull SMS, MMS, Display
Interactive/Static Static, Dynamic, Video
Promotional Elements Discount, Buy-one-get-one
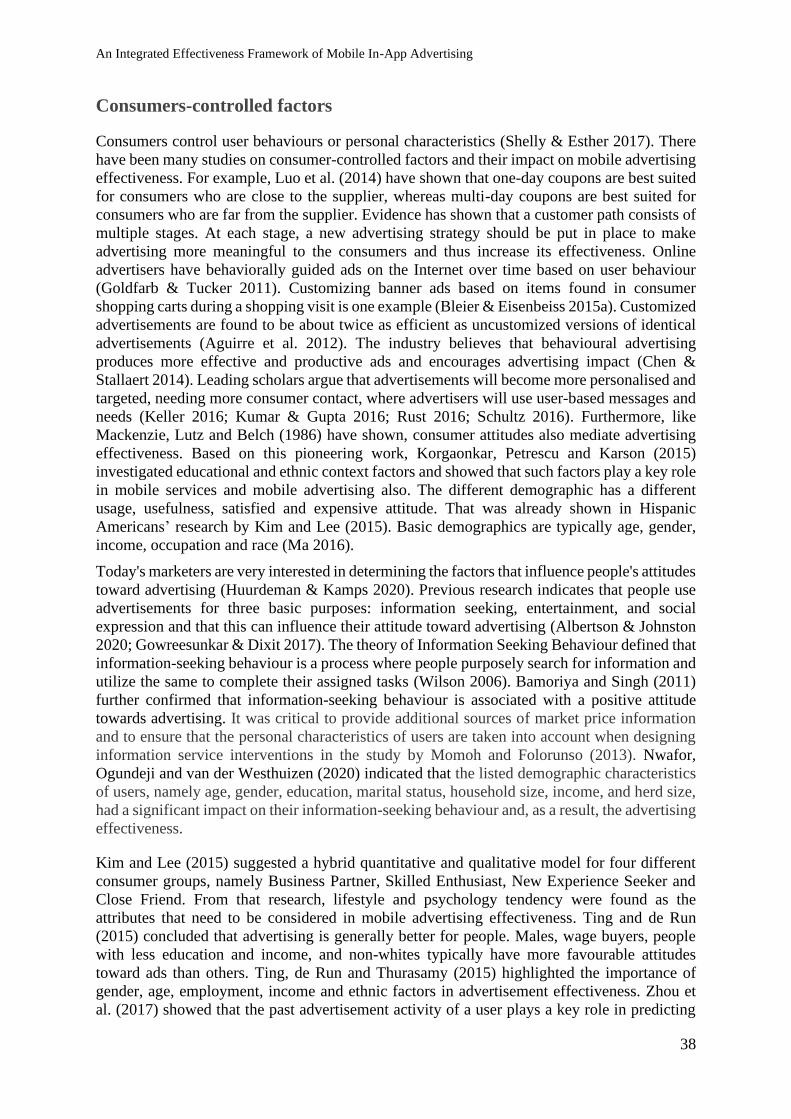
An Integrated Effectiveness Framework of Mobile In-App Advertising
38
Consumers-controlled factors
Consumers control user behaviours or personal characteristics (Shelly & Esther 2017). There
have been many studies on consumer-controlled factors and their impact on mobile advertising
effectiveness. For example, Luo et al. (2014) have shown that one-day coupons are best suited
for consumers who are close to the supplier, whereas multi-day coupons are best suited for
consumers who are far from the supplier. Evidence has shown that a customer path consists of
multiple stages. At each stage, a new advertising strategy should be put in place to make
advertising more meaningful to the consumers and thus increase its effectiveness. Online
advertisers have behaviorally guided ads on the Internet over time based on user behaviour
(Goldfarb & Tucker 2011). Customizing banner ads based on items found in consumer
shopping carts during a shopping visit is one example (Bleier & Eisenbeiss 2015a). Customized
advertisements are found to be about twice as efficient as uncustomized versions of identical
advertisements (Aguirre et al. 2012). The industry believes that behavioural advertising
produces more effective and productive ads and encourages advertising impact (Chen &
Stallaert 2014). Leading scholars argue that advertisements will become more personalised and
targeted, needing more consumer contact, where advertisers will use user-based messages and
needs (Keller 2016; Kumar & Gupta 2016; Rust 2016; Schultz 2016). Furthermore, like
Mackenzie, Lutz and Belch (1986) have shown, consumer attitudes also mediate advertising
effectiveness. Based on this pioneering work, Korgaonkar, Petrescu and Karson (2015)
investigated educational and ethnic context factors and showed that such factors play a key role
in mobile services and mobile advertising also. The different demographic has a different
usage, usefulness, satisfied and expensive attitude. That was already shown in Hispanic
Americans’ research by Kim and Lee (2015). Basic demographics are typically age, gender,
income, occupation and race (Ma 2016).
Today's marketers are very interested in determining the factors that influence people's attitudes
toward advertising (Huurdeman & Kamps 2020). Previous research indicates that people use
advertisements for three basic purposes: information seeking, entertainment, and social
expression and that this can influence their attitude toward advertising (Albertson & Johnston
2020; Gowreesunkar & Dixit 2017). The theory of Information Seeking Behaviour defined that
information-seeking behaviour is a process where people purposely search for information and
utilize the same to complete their assigned tasks (Wilson 2006). Bamoriya and Singh (2011)
further confirmed that information-seeking behaviour is associated with a positive attitude
towards advertising. It was critical to provide additional sources of market price information
and to ensure that the personal characteristics of users are taken into account when designing
information service interventions in the study by Momoh and Folorunso (2013). Nwafor,
Ogundeji and van der Westhuizen (2020) indicated that the listed demographic characteristics
of users, namely age, gender, education, marital status, household size, income, and herd size,
had a significant impact on their information-seeking behaviour and, as a result, the advertising
effectiveness.
Kim and Lee (2015) suggested a hybrid quantitative and qualitative model for four different
consumer groups, namely Business Partner, Skilled Enthusiast, New Experience Seeker and
Close Friend. From that research, lifestyle and psychology tendency were found as the
attributes that need to be considered in mobile advertising effectiveness. Ting and de Run
(2015) concluded that advertising is generally better for people. Males, wage buyers, people
with less education and income, and non-whites typically have more favourable attitudes
toward ads than others. Ting, de Run and Thurasamy (2015) highlighted the importance of
gender, age, employment, income and ethnic factors in advertisement effectiveness. Zhou et
al. (2017) showed that the past advertisement activity of a user plays a key role in predicting
An Integrated Effectiveness Framework of Mobile In-App Advertising
39
future user advertising actions. Conner and Armitage (1998) found out that when people
indulge in habits that are normal to them, they use simple decision-making principles that result
in the same actions as in the past. In effect, the previous behaviour tends to be a significant
predictor of future behaviour (Effendi & Ali 2017). Some of the social platforms, recognizing
the consumer information role, allow advertisers to target advertising using consumer social
profiles (Bakshy et al. 2012). New Internet technologies offer the ability to track consumer
behaviour automatically on the Internet. Such monitoring is used to create user profiles to
display advertisements that suit those individuals’ preferences (Goldfarb & Tucker 2011; Kim
& Han 2014; McDonald & Cranor 2010). Personalization is a marketing strategy for consumers
that aims to provide the right content to the right person at the right time, subsequently
optimizing business opportunities (Tam & Ho 2006). Sex, age, place, level of education, online
shopping activity, preferences, and search history were the types of information used (Tucker
2014). Their results indicate that the degree of customization affects customer-related factors,
including intrusion feelings (Ashari Nasution, Arnita & Fatimah Azzahra 2021; Doorn &
Hoekstra 2013). The level of flexibility also impacts outcomes such as click-through rates
(Aguirre et al. 2015).
Table 3.5 summarised the consumer-controlled factors in the Interactive Advertising Model
(Rodgers & Thorson 2000) and the Mobile Advertising Effectiveness Framework (Grewal et
al. 2016). Factors controlled by consumers have been well studied in the current literature.
Accordingly, in these days, advertisers have many consumer-focused methods to track their
mobile in-app advertising campaigns and enhance their effectiveness.
Table 3.5: List of factors controlled by consumers according to Interactive Advertising Model and Mobile Advertising
Effective Framework
Factors Variants
Motives Research, Shop, Entertain/Surf, Communicate/Socialize
Mode Serious, Playful
Cognitive Tools Attention, Memory, Attitude
Place in consumer history Need, pre-purchase, purchase, post-purchase
Past history Purchases, ad exposures
Psycho, Socio, demographics Age, Gender, Education, Income, etc.
Ad networks-controlled factors
Ad networks facilitate the programmatic and real-time buying and selling of advertisements
(Choi et al. 2017; Laudon & Traver 2018). Programmatic advertising provides consumers with
dynamic content based on location and time (Kumar & Gupta 2016). Context is generally
referred to as an advertisement’s editorial medium environment (Moorman 2003). According
to Norris and Colman (1993), “the same source delivering the same message to the same
audience on separate occasions might produce different effects depending on the differing
programming or editorial contexts in which the message appears”. Instead of showing everyone
the same advertisements, different advertisements with different locations, languages,
computers and other characteristics are displayed to maximize the use of advertising
opportunities (Flores, Chen & Ross 2014). Context refers to the physical and social context
that can be described as “situation”. Advertisers can use the context of consumer behaviour
and their personal information to target ads based on their preferences and desires, increase the
An Integrated Effectiveness Framework of Mobile In-App Advertising
40
number of clicks they receive for each ad and eventually increase their revenue (Belk 1975;
Maseeh, Ashraf & Rehman 2020).
Moorman (2003) proposed categorizing the context as objective or subjective. Objective
features include contextual variables such as genre, content and style, features that each user
can easily recognise and cannot be interpreted. On the other hand, subjective features are not
perceived universally but include the individual mental reactions people encounter in the face
of an editorial post. Data can also be classified as advertisement-specific data features and
advertising platform-related features: the medium context. The background of the recipient can
be defined as the situation in which a person is confronted with an advertisement. It includes
the physical environment of the individual before using the medium, the social environment,
the background of the person, and the mental state (Moorman 2003). The definition of the
medium is the environment of the news generated by the vehicle carrying it, such as a television
programme, a magazine issue or a website (Pieters & Raaij 1992). The editorial context can be
distinguished from the commercial context in a similar manner (Kent 1993, 1995).
There are several reports on the effects of the context factors. For example, Effendi and Ali
(2017) used Linear Regression along with some dynamically added features known as
keywords to improve the Click-Through Rate prediction for contextual advertisements by
serving more suitable ads to the viewers. Goh, Chu and Wu (2015) have investigated the
geographic position characteristics, the mobile service plan (pre/postpaid) and the last digit
indicators for market performance targets. Many factors may affect how each user evaluates
and responds to mobile display advertising, such as physical location and daytime. As shown
in Luo et al. (2014), different physical places and times of day associated with different
outcomes. Luo et al. (2014) also found that mobile ads that suit the user’s logical position are
more successful. Andrews (2017) have shown that advertising effectiveness varies with local
crowding. Ghose, Goldfarb and Han (2013) described the relationship as part of so-called
location-based ads in the distances between customer homes and the point of sale (Molitor,
Reichhart & Spann 2012). Spatial and temporal effects were identified as very important in
traditional advertising in the form of ambient advertising (Karimova 2012).
In the context of social networks, Li (2014) found that most Twitter tweets are from a small
portion of Twitter users, and there is a strong linear correlation between the city’s radius and
the distance. Twitter users are found to be active from 10:00 am to midnight with a peak at
9:00 pm. Twitter users are also found to have more activities during weekends than weekdays.
Likewise, it was shown by Baker, Fang and Luo (2014) that ad effectiveness differs from
daytime. Both business-to-business marketing professionals and researchers stress that
consumers need a shift in business culture from “selling” to “helping” (Holliman & Rowley
2014; Jefferson & Tanton 2015). Nasco and Bruner (2008) found strong contextual effects in
their report, which viewed weather information as the most significant, inclusive and likely to
influence future mobile use. These researchers responded to persistent calls to pay more
attention to assessing contextual factors on advertising effectiveness (Jiang, Liang & Tsai 2019;
Kenny & Marshall 2001).
Grewal et al. (2016) summarized these contextual factors in the Mobile Advertising
Effectiveness Framework, as shown in Table 3.6. Apparently, factors controlled by ad
networks have been well studied in the current literature. In these days, advertisers have a
variety of personalized targeting options to monitor their mobile in-app advertising campaigns
and enhance their effectiveness.
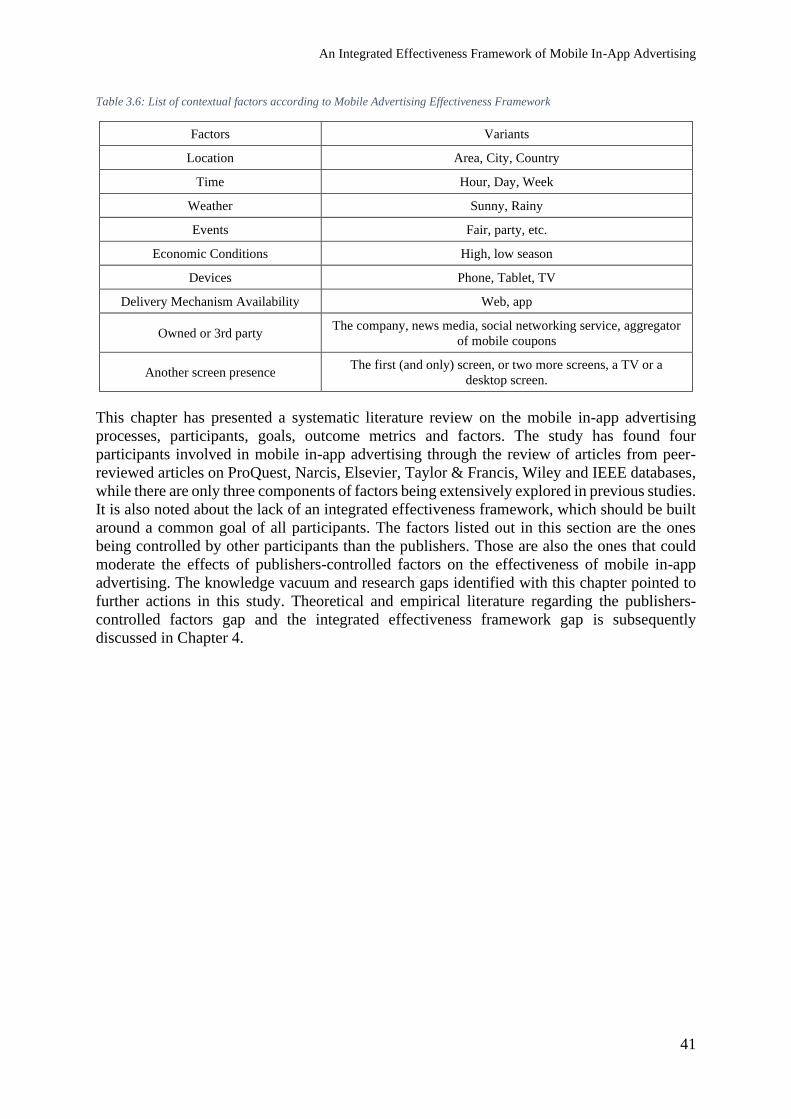
An Integrated Effectiveness Framework of Mobile In-App Advertising
41
Table 3.6: List of contextual factors according to Mobile Advertising Effectiveness Framework
Factors Variants
Location Area, City, Country
Time Hour, Day, Week
Weather Sunny, Rainy
Events Fair, party, etc.
Economic Conditions High, low season
Devices Phone, Tablet, TV
Delivery Mechanism Availability Web, app
Owned or 3rd party The company, news media, social networking service, aggregator
of mobile coupons
Another screen presence The first (and only) screen, or two more screens, a TV or a
desktop screen.
This chapter has presented a systematic literature review on the mobile in-app advertising
processes, participants, goals, outcome metrics and factors. The study has found four
participants involved in mobile in-app advertising through the review of articles from peer-
reviewed articles on ProQuest, Narcis, Elsevier, Taylor & Francis, Wiley and IEEE databases,
while there are only three components of factors being extensively explored in previous studies.
It is also noted about the lack of an integrated effectiveness framework, which should be built
around a common goal of all participants. The factors listed out in this section are the ones
being controlled by other participants than the publishers. Those are also the ones that could
moderate the effects of publishers-controlled factors on the effectiveness of mobile in-app
advertising. The knowledge vacuum and research gaps identified with this chapter pointed to
further actions in this study. Theoretical and empirical literature regarding the publishers-
controlled factors gap and the integrated effectiveness framework gap is subsequently
discussed in Chapter 4.
An Integrated Effectiveness Framework of Mobile In-App Advertising
42
Chapter 4. THEORETICAL FRAMEWORK
This study addresses the research question of what factors are controlled by app publishers and
their impacts on the effectiveness of mobile in-app advertising. It also examines what
components of effectiveness should be included in an integrated framework of mobile in-app
advertising and their moderating effects on the relationships between the publishers-controlled
factors and mobile in-app advertising effectiveness.
However, current literature about mobile in-app advertising generally covers factors controlled
by advertisers, consumers and ad networks only, while the mobile in-app advertising serving
process involves four participants (Choi et al. 2017; Yuan et al. 2014). The role of publishers
and their controlled factors are not included in previous effectiveness frameworks and have not
been fully explored in the current literature about mobile in-app advertising. From the research
gaps identified in Chapter 3, there is a need to identify factors being controlled by the publishers
in particular and the necessity of building an integrated effectiveness framework for all
participants involved in mobile in-app advertising in general.
The following issues are accordingly discussed:
• Publishers-controlled factors (Section 4.1)
• Moderating effects (Section 4.2)
• An integrated effectiveness framework (Section 4.3)
• The conceptual model (Section 4.4)
4. 1. Publishers-controlled factors
As shown in Section 3.1, any mobile in-app advertising ad serving process can be broken down
into ad space designing process and ad space displaying one from a publisher standpoint. By
designing the ad spaces with predefined and relevant characteristics and by displaying the ad
spaces with different schemes, the publisher could significantly enhance the effectiveness of
mobile in-app advertising. The question is what those design characteristics and display
schemes are?
Ad space is a website or app space used for advertising purposes (Jason 2010). In the early
days of web design, ad space or ad slot was not considered but is now a significant factor for
sites that are dependent on advertising revenue (Mahadevan 2019). One of the web design
problems is using ad space to offer advertisers without alienating their guests (Kohavi &
Longbotham 2017). Traditionally, the website consisted of upper and lower banner ad space
and the space for left and right buttons. Publishers recently experimented with larger ad sizes,
including skyscraper ads and rectangle ads (GuruFocus 2017).
Interactive Advertising Bureau stated that ads/ad spaces could have two characteristics:
duration and size (Interactive Advertising Bureau 2017b). That means publishers can control
how long they want the ads to last on their apps regardless of how long they are designed by
the advertisers (Maillé & Tuffin 2018). They can do that by setting the duration for their ad
spaces. Only ads with those elements are selected to be provided and displayed when the
publisher supplies an ad space with a predefined duration or a predefined size. The design of
An Integrated Effectiveness Framework of Mobile In-App Advertising
43
ad spaces and the design of ads are two different things (Maillé & Tuffin 2018). For example,
even if an advertiser has designed a video ad for 30 seconds long, that video ad could only be
played for 15 seconds due to the ad space limit (Mahadevan 2019).
However, while there were measurement standards for other forms of online advertisement,
mobile in-app advertising has its own unique set of challenges. For instance, on TV or
websites, there are relatively standard expectations from advertisers about what constitutes a
“view” of an ad. On smartphones, it is a little less certain. In the current mobile advertising
literature, a view is not clearly defined (Sun et al. 2017). Is it where half the ad is viewable for
a couple of seconds, or does it need to be the entire ad? (Schick 2013). For a fact, advertising
on an app is different from advertisements on TV and radio because ads on an app are typically
placed alongside content. In contrast, ads on TV and radio appear instead of content (Sun et al.
2017). Furthermore, on mobile devices, screen time is much shorter. On average, desktop visits
last three times longer than smartphone visits and more pages and bounce rates are
comparatively lower (Paulson 2017).
In the field of TV and website advertising, there are several related studies on the effectiveness
of ad duration. One example is a study by Kong et al. (2019). The study found a correlation
between increased exposure time and increased awareness and recall. In TV, increasing the
duration of a TV ad somewhat increases the likelihood of remembering the ad in the aided
recall task (Patzer 1991). Goldstein, McAfee and Suri (2011) found that displaying two shorter
ads results in a more general prompt than displaying a more extended ad twice the length. On
the other hand, Burke et al. (2005) indicated that it might be more challenging to remember
animated banners than static ones. Similarly, Cheung, Hong and Thong (2017) found that there
were fewer clicks on banners with long messages and several frames (animation). The author
concluded that these two variables increase the ad’s complexity and thus harm the viewer’s
reaction to the banner and its response. Wang, Shih and Peracchio (2013) and Khattab and
Mahrous (2016) observed that longer ads had higher click-through rates. When a banner ad is
difficult to process in the priming phase, there is a linear increase in respondent attitudes to the
target ad and brand during the test phase (Wang, Shih & Peracchio 2013). Studies about the
impact of ad duration on the advertising effectiveness actually delivered mixed results in the
context of online advertising. Some research could not point out if recollection relates to click-
through rates. In most cases, traditional monetisation methods do not specifically consider time
as an optimizing tool (Sun, et al, 2017).
All the mentioned studies have pointed out that the ad space duration has not been thoroughly
studied (and properly measured) in the past but at the same time could be a factor that can
significantly impact the click-through rate of mobile in-app advertising, especially when the ad
duration is taken into consideration. When the duration is taken into account, longer ads might
not be as effective as the shorter ones. This study, therefore, hypothesised that:
Hypothesis 1: The publishers-controlled design factor: ad space duration, has a negative effect
on CTRe
Similar to the ad space duration, publishers can set the size of their ad spaces (Interactive
Advertising Bureau 2017b). When the publisher supplies an ad space with a predefined ad size,
only ads with that characteristic are selected to be provided and displayed (Sayedi 2018). By
supplying the ad space with predefined and relevant characteristics, the publisher could
significantly enhance advertising effectiveness.
An Integrated Effectiveness Framework of Mobile In-App Advertising
44
Conventional industry’s wisdom has held that large banner ads should attract more viewer
attention as calculated by clicks, supporting past research findings (Marx 1996). The success
of more massive advertisements in securing attention also has an impact on the viewer’s
impression of brand quality. A more massive advertisement may indicate a higher level of
promotional cost and effort that the consumer should equate with a higher level of brand
reputation and popularity (Huang & Yang 2012). Concerning banner advertising, where a click
takes the viewer to another venue, this may positively impact user impressions and site
preferences, resulting in increased visitor response, i.e. clicks (Rejón-Guardia & Martínez-
López 2014). Kyung, Thomas and Krishna (2017) concluded that larger ads attract more
attention and are more likely to trigger a response. Wang, Shih and Peracchio (2013) observed
beneficial results from five banner sizes, but there was no significant difference between the
two larger ones.
In contrast, the empirical results from Li, Hairong and Bukovac (1999) showed that the click-
through rates do not proportionally increase accordingly to the size. Drèze and Hussherr (2003)
and Aghakhani et al. (2019) claimed both smaller and larger ads perform the same. Similarly,
North and Ficorilli (2017) found no prominent banner size-clicking relationship. The
relationship between banner size and click-through rate is, therefore, contradictory. Ad size
effect on mobile apps may also vary from online ads. That could be explained by the fact that
the customer cognitive ability is limited. Indeed, previous research has shown the limits of
consumer capacity called the Limited Capacity Model (Craik 2002; Miller 1956). In the mobile
context, there are limitations related to screen size. The screen size of mobile devices could be
as small as Apple Watch, while the smartphone screen is usually a fourth that of a personal
computer. That limitation should be taken into consideration. However, current metrics do not
support the measurement of size (Schick 2013). Herrewijn and Poels (2018) claimed that the
effect of ad size is neglectable partly because the current measurement methods did not take
into account the size variable.
All the mentioned studies have pointed out that the ad space size has not been thoroughly
studied (and properly measured) in the past but could be a factor that can significantly impact
the click-through rate of mobile in-app advertising, especially when the ad size is taken into
consideration. When the size is taken into account, the larger ads might not be as effective as
the smaller ones. This study, therefore, hypothesized that:
Hypothesis 2: The publishers-controlled design factor: ad space size, has a negative effect on
CTRe
Besides supplying ad spaces for bidding, the publisher is also the one who controls the delivery
of ad impressions. After the advertiser and the ad network have selected the ads, the publisher
will have full control over how to display them to the user. The publishers can control how to
position the ads on their applications and how to schedule them. Interactive Advertising Bureau
recommends ad positions to be top or bottom of the screen and sometimes in the middle of
page sections (Interactive Advertising Bureau 2017b). They also recommend ad scheduling to
be before, in between or after the primary content experience (Interactive Advertising Bureau
2017b). The publishers-related display factors are shown as being critical in the ad serving
process that will then enhance the click-through rate of mobile in-app advertising.
There are many studies on positioning and scheduling ads on a website, pioneering by Adler,
Gibbons and Matias (2002), Nakamura and Abe (2005) and Kumar, Jacob and Sriskandarajah
(2006). Those studies have shown the importance of position in online advertising. Herrewijn
and Poels (2018) claimed that spatial location is the most critical placement feature. Various
An Integrated Effectiveness Framework of Mobile In-App Advertising
45
authors found that the ad location in the Sponsored Search Result Pages has an important effect
on its CTR. Several studies showed an association between location and CTR (e.g. Richardson,
Dominowska and Ragno (2007)). This position effect has received intense research in the past,
but with contradicting results (Narayanan & Kalyanam 2015).
In several studies, banner advertisements at the top of the website were found to be clicked
more frequently than at other places (Josephson 2004; Sundar & Kalyanaraman 2004). Ansari
and Mela (2003) also found that a higher link location in an email campaign would increase
the likelihood of clicking. Johnson, EJ et al. (2004) said customers searched less than two stores
in a typical search session. Likewise, Brynjolfsson, Dick and Smith (2010) noticed that only
9% of shopbot users select offers outside the first page. Overall, consumers often concentrate
on a narrow variety of results due to the cognitive expense of comparing alternatives
(Montgomery, Hosanagar & Clay 2004).
However, brand placements (e.g. full ads, central advertisements) often found to succeed in
generating consumer awareness and have a significant effect on brand recognition (Jeong &
Biocca 2012; Lee & Faber 2007; Schneider, Systems & Cornwell 2005). In their report,
Agarwal, Hosanagar and Smith (2011) assessed the effect on sales and income of sponsored
search ad placement. The authors calculate the click-through and conversion-rate effect of ad
placement. They noted that the click-through rate declines with the ranking and, contrary to the
industry’s conventional wisdom, the top position is typically not the position of revenue or
profit-maximizing. They contradict those who already confirmed the effectiveness of the top
position (e.g. Sundar and Kalyanaraman (2004)).
What position, top or centre is the optimal position to display the ad space on mobile apps?
The difference is that for online advertising, the computer screen is always in a static mode,
while in mobile devices, users can move their screens around (Paulson 2017). Until the answer
is found, in the meantime, many publishers simply display some banner ads and never consider
how effective the placement of those ads is (Oak 2008). The question of optimizing mobile
advertising placements remains open (Grewal et al. 2016). If top ads are assumed to be more
effective than the lower ones, that leads to the following hypothesis:
Hypothesis 3: The publishers-controlled display factor: ad space position, has a negative effect
on CTRe
Ads can also be scheduled to be displayed before, after, or between sessions (Chatterjee,
Hoffman & Novak 2003; Kumar, Dawande & Mookerjee 2007; Sun et al. 2017). With different
display schemes like that, the click-through rate could be significantly different. However,
Goldstein, McAfee and Suri (2015) claimed that there is no guidance to advertisers on how
advertising should be scheduled. King (2017) recently called publishers to take back control of
the inventory and to remind them that timing is just as important as audience targeting.
Even without guidance, web publishers have tried one way or another to schedule the display
of their advertisements (Yuan et al. 2012). In online search advertising, Hoque and Lohse
(1999) found that consumers are more likely to choose advertisements close to the start of an
online directory than to use paper directories. Weingarten and Berger (2017) explored how
temporal location – be it past, present, or future events or experiences – affects word of mouth.
Bleier and Eisenbeiss (2015b) stressed the importance of what, when and where, aka
scheduling, is interplaying. The first seconds of exposure caused a sharp increase in the
commercial’s memory, and the effect on recall decreased in the time of further exposure (Sahni
2015).
An Integrated Effectiveness Framework of Mobile In-App Advertising
46
In comparison to TV networks, mobile app publishers can monitor traffic on their websites and
can, therefore, effectively plan an impression-generating strategy (Roels & Fridgeirsdottir
2009). Nakamura and Abe (2005) developed a linear programming algorithm to schedule
banner ads, incorporating three ad-related functions. That includes the advertising time (e.g.
afternoon), the form of advertisement (e.g. sports), and the number of impressions. The features
were then used to assess the best advertising time and place to optimise overall sales, rather
than depending solely on individual ad click-through rates. Their methodology demonstrated
improvement in over-greedy, random systems. Trope and Liberman (2010) found that the
distance from objects or events affected their perception. On the restaurant search website,
Sahni (2015) performed a field experiment. The key result of their work is that increasing the
time between exposures, up to two weeks, increases the likelihood of a purchase event.
All the mentioned studies gave a hint about how the timing of advertisements could affect
advertising effectiveness. In the context of apps, the timing that the publishers could control is
when to load the advertisements (Brakenhoff & Spruit 2017). With the assumption that ads
showing after the main event are more effective than those which are shown before, this study
hypothesized that:
Hypothesis 4: The publishers-controlled delivery factor: ad space timing, has a positive effect
on CTRe
4. 2. Moderating effects
The advertisers control the ad elements (Rodgers & Thorson 2012), the consumers control the
consumer factors (Shelly & Esther 2017), while the ad networks control contextual factors
(Busch 2016). Although a little attempt was made to determine the interrelationship between
these different inputs or their cost-effectiveness, there are few studies on the interactions among
themselves (Johnson & Lewis 2015). For example, a study by Zorn et al. (2012) showed that
different websites have different users. Consumers on one social networking site, myspace.no,
supported animated ads while consumers preferred static advertising on the other social
networking site, ebuddy. Animated advertisements performed much better than static ads on
websites. Nonetheless, myspace.no made up 96 per cent of all views of the surf site, and English
static ads worked best for the second surf site, ebuddy.no. There was an insignificant difference
in search sites when clicking on static advertisements and animated ads (Zorn et al. 2012). The
study by Lin and Lin (2006) showed the interaction between ad types and gender of users on
the click-through rate of online advertising. If an online customer is inspired to use the Internet
to shop, banner ads that fit this purpose are likely to be more compelling than banner ads that
do not, according to a study by Rodgers and Sheldon (2002). That study together with others
has shown the interactive effects between consumers, advertisers and ad networks-controlled
factors. How do those factors moderate the effects of the publishers-related ones?
Firstly, in the MAEF, ten contextual factors are being listed out, including Location, Time,
Weather, Events, Economic Conditions, Devices, Delivery Mechanism Availability, Owned or
3rd party, Another Screen presence. About Location, Goh, Chu and Wu (2015) further
categorized it as area, city, and country. Goh, Chu and Wu (2015) looked at regional location
functions, the pre/postpaid mobile service program, and last-digit promotional success goals
initiatives. Luo et al. (2014) found out that mobile ads that match users’ logical location are
more effective than those that do not.
An Integrated Effectiveness Framework of Mobile In-App Advertising
47
Location data remains a valuable tool for advertisers—nearly 9 out of 10 advertisers said
location-based ads and marketing resulted in higher revenue, led by customer base growth
(86%) and higher customer interaction (84 per cent) (Dusane 2019). Today, new data-driven
tools and strategies allow advertisers to understand better, test and analyse innovative
messaging and results. At the same time, modern distribution networks offer customer-specific,
relevant information everywhere they consume media. The location remains a critical
marketing campaign data point. Location data continues to increase effectiveness, drive
revenue and customer engagement (Thiga et al. 2016).
As the location is confirmed as a contextual factor that has a significant impact on the
effectiveness of online advertising in previous studies, this study, therefore, hypothesized that:
Hypothesis 5: Location moderates the relationship between the publishers-controlled factors
and CTRe
Or more especially,
Hypothesis 5a: Location moderates the relationship between the publishers-controlled factor,
Ad Space Duration and CTRe
Hypothesis 5b: Location moderates the relationship between the publishers-controlled factor,
Ad Space Size and CTRe
Hypothesis 5c: Location moderates the relationship between the publishers-controlled factor,
Ad Space Position and CTRe
Hypothesis 5d: Location moderates the relationship between the publishers-controlled factor,
Ad Space Timing and CTRe
Similarly, Time has been considered as an essential factor that could affect online advertising
effectiveness in previous studies. For example, Li (2014) found that most Twitter messages
were written from 10:00 AM to around midnight, with a high at 9:00 PM. Twitter users are
also found to have more activities on weekends than weekdays (Li 2014). Similarly, Baker,
Fang and Luo (2014) found that advertising’s effectiveness varies with daytime. Different
times of day associated with different outcomes, as shown in a study by Luo et al. (2014). Not
only the time of day but the day of the week is also considered as an essential factor. It was
found that the optimal days to send emails are during the business week on Tuesday,
Wednesday, and Thursday, especially for both the K-12 and Higher Ed markets (MDR
Education 2018). Open rates for the K-12 market were highest for emails delivered on
Thursdays, while open rates for the Higher Ed market were highest on Wednesdays. Similarly,
Tuesday and Friday are the best days when most Indian Internet users open and click on the
email communications sent to them (Octane Marketing 2015). More specifically, in their
report, Tuesday is the day when they see maximum engagement rates for email open rates.
In the case of video ads, while evenings are generally considered ideal due to the amount of
video viewership, early morning viewing has a higher degree of advertising receptivity and
willingness to accept a brand message. According to a national survey, customers watching an
advertisement early in the morning (3:00 a.m. – 11:59 a.m.) are 11% more likely to purchase
or respond favourably to offered products or services than in the evening (Chaffey 2020). That
is the highest purchase-intention timeline. Late night/early morning (9:00 p.m. – 2:59 a.m.) is
An Integrated Effectiveness Framework of Mobile In-App Advertising
48
the next highest time to buy at 5 per cent more likely than every other time of the day, except
the early morning time slot (Li & Lo 2015).
As Time is confirmed as a contextual factor that has a significant impact on the effectiveness
of online advertising in previous studies, this study, therefore, hypothesized that:
Hypothesis 6: Time moderates the relationship between the publishers-controlled factors and
CTRe
Or more especially,
Hypothesis 6a: Time moderates the relationship between the publishers-controlled factor, Ad
Space Duration and CTRe
Hypothesis 6b: Time moderates the relationship between the publishers-controlled factor, Ad
Space Size and CTRe
Hypothesis 6c: Time moderates the relationship between the publishers-controlled factor, Ad
Space Position and CTRe
Hypothesis 6d: Time moderates the relationship between the publishers-controlled factor, Ad
Space Timing and CTRe
Ads could also be of text, image or rich media types (Dens, De Pelsmacker & Puttemans 2011).
Those creative qualities are defined as interactive/static in the MAEF (Grewal et al. 2016). The
type of creativity in an ad may be relevant to how the ad is intended for interaction (Brakenhoff
& Spruit 2017). According to Edizel, Mantrach and Bai (2017), some advertisers have started
using animated banners to provide a gradual and sequential image. Due to its ability to use
moving images, it is well known that television is one of the most disruptive media forms.
When banners use animation, they also deal with the theme of television advertisements, which
may mean that animated banner ads attract more attention and thus click more (Wegert 2002).
Side-by-side analyses of TV commercials for different companies indicate that animation
increases the rate of clicks (Lohtia, Donthu & Hershberger 2003). Cheung, Hong and Thong
(2017) demonstrated that animation increases response time and banner ads recall.
However, with static text and static images are still widely used, most advertisements are static
(aka non-interactive) today. Lim, Tan and Jnr Nwonwu (2013) reported that mobile users are
more likely to remember static image ads than static text ads and often be confused with large
banner ads with application content. A static display ad is an ad that is unchanging on a web
page or an app. A static banner ad is a still single frame with a catchphrase (Soo Jiuan & Chia
2016). The results that static ads were more effective than dynamic ones can be explained by
the fact that static content usually helps past visitors recognise the brand logo instantly. On the
other hand, animated commercials have a series of photographs with no brand logo at all (Lim,
Tan & Jnr Nwonwu 2013). However, static is not limited to advertising banners. They can be
seen in many other forms, including webinars, blogs, eBooks, texts, and landing pages (Rejón-
Guardia & Martínez-López 2017).
Interactive advertisements have many advantages over static and animated ads. Besides being
inexpensive to set up, an interactive ad improves brand loyalty and reputation (Su et al. 2016).
It can be in the forms of consumer feedback, smartphone applications, social media
notifications and sharing, as well as blog comments. It comes with some drawbacks, however.
An Integrated Effectiveness Framework of Mobile In-App Advertising
49
It is easy to set up, but it is not inexpensive due to maintenance costs (Su et al. 2016). To keep
customers engaged, advertisers need new, relevant content. Indeed, it requires workforce,
training, and talent to do well (Rosenkrans 2009). Another example is the interactive advice
banners that only show the first question and then lead users to a campaign-specific landing
page where they can answer additional questions and get immediate feedback on relevant
issues. Users found this way attractive as people tend to seek for information to satisfy their
needs (Wilson 2006). Interactive banner advisors are an interactive way of generating
emotional customer loyalty, building high brand awareness and increasing click-through rates
through relevant content (Cheung, Hong & Thong 2017). Ad interactivity impacts outcomes
significantly. Studies have shown that customers are 2.5 times more likely to indulge in such
advertisements than regular ads (Su et al. 2016).
The difference between the effectiveness of ad types can be explained by the theory of
Information Seeking Behaviour (Wilson 2006). Information seeking behaviour is a purposive
seeking of information as a consequence of a need to satisfy some goal (Gowreesunkar & Dixit
2017). People with different goals in mind will come to different kinds and types of information
(Bukhari et al. 2018; Rollins et al. 2010).
As ad type has been confirmed as a factor that has a significant impact on the effectiveness of
online advertising in previous studies, this study, therefore, hypothesized that:
Hypothesis 7: Ad Type moderates the relationship between the publishers-controlled factors
and CTRe
Or more especially,
Hypothesis 7a: Ad Type moderates the relationship between the publishers-controlled factor,
Ad Space Duration and CTRe
Hypothesis 7b: Ad Type moderates the relationship between the publishers-controlled factor,
Ad Space Size and CTRe
Hypothesis 7c: Ad Type moderates the relationship between the publishers-controlled factor,
Ad Space Position and CTRe
Hypothesis 7d: Ad Type moderates the relationship between the publishers-controlled factor,
Ad Space Timing and CTRe
Grewal et al. (2016) identified six ad elements: ad medium, medium type, push/pull,
interactive/static, promotional elements. The ad medium is the platform through which the ad
is made available to the user. The ad medium might be a web page or a mobile application. The
content of a web page or application can affect the perception of an ad by itself (Grewal et al.
2016).
Ad Medium refers to the design/aesthetics of the app/website/medium on which ads are served
and controlled by the advertisers (Grewal et al. 2016). Aesthetics is of particular importance as
the consistency of design and advertisement in traditional media creates a familiarity that most
participants accepted (Patsioura, Vlachopoulou & Manthou). Advertisements mounted on
various designs could have different results, as seen in a study by Brakenhoff and Spruit (2017).
Some apps have robust cognitive consumption architecture. Cognitive consumption refers to
how much brainpower the app needs. The human brain has a limited amount of cognitive
An Integrated Effectiveness Framework of Mobile In-App Advertising
50
capacity, and when the app suddenly adds too much information, it may confuse the user and
cause them to abandon their task (Li & Bukovac 1999).
Some other applications have clutter issues. Clutter is one of good design’s worst rivals. By
cluttering the app screen, too many details confuse users. Any button, picture and icon added
will complicate the screen. Clutter is negligible on the desktop, but noticeable on the
smartphone because of its limited screen size and screen time (Paulson 2017). It is crucial to
get rid of anything that is not required in a mobile design because reducing clutters would boost
understanding. Besides aesthetics and clutters, some design apps need user-repeated effort, e.g.
re-entering data. Great app design is the perfect mix of beauty and functionality. That is what
app publishers should strive to do when creating an app, firstly improving user experience, and
secondly optimising their advertising success (Spence 2014).
The ad medium can also be the operating systems (e.g. iOS and Android) on which the app is
running. As these mobile platforms have very different characteristics, it could be assumed that
ads displaying on different platforms generate different click-through rates (Sandberg &
Rollins 2013). Since users differ in web access motivation, such as information seekers and
entertainers, website users may respond differently to news and website entertainment
advertisements (San José-Cabezudo, Gutiérrez-Cillán & Gutiérrez-Arranz 2008). A study
conducted by Zorn et al. (2012) found that different websites had different users. Consumers
on one social networking site, myspace.no, supported animated advertising while consumers
preferred static ads on the other social networking site, ebuddy. Animated advertisements
performed much better than static ads for surfing websites. Nonetheless, myspace.no made up
96% of all surf site videos, and English static ads performed best for the second surf site,
ebuddy.no (Zorn et al. 2012). That demonstrated an interaction between ad type and ad
medium.
As Ad Medium is confirmed as a factor that has a significant impact on the effectiveness of
online advertising in previous studies, this study, therefore, hypothesized that:
Hypothesis 8: Ad Medium moderates the relationship between the publishers-controlled
factors and CTRe
Or more especially,
Hypothesis 8a: Ad Medium moderates the relationship between the publishers-controlled
factor, Ad Space Duration and CTRe
Hypothesis 8b: Ad Medium moderates the relationship between the publishers-controlled
factor, Ad Space Size and CTRe
Hypothesis 8c: Ad Medium moderates the relationship between the publishers-controlled
factor, Ad Space Position and CTRe
Hypothesis 8d: Ad Medium moderates the relationship between the publishers-controlled
factor, Ad Space Timing and CTRe
In this section, four publishers-controlled factors and four moderators were identified. Their
main and moderating effects will be evaluated accordingly in subsequent chapters. These new
constructs and relationships themselves will be part of an integrated effectiveness framework,
which will be presented in Section 4.3.
An Integrated Effectiveness Framework of Mobile In-App Advertising
51
4. 3. An integrated effectiveness framework
Modelling the factors into an effectiveness framework has a long history, beginning with the
original ideas of Elmo St. Lewis in 1898 when he introduced a systematic approach to
addressing the requirements of effectiveness. In the personal sales sense, he did so with his
“Attention, Interest, Desire and Action” or AIDA model (Barry 1987).
Lavidge and Steiner (1961) later postulated a “hierarchy of effects” in a stair-step fashion with
attention to interest, belief, desire and, ultimately, action. Importantly, these components were
also grouped into the three general categories of “Cognition”, “Affection” and “Conation”.
“Conation” was then a common word for “Behaviour” (Davidavičienė 2012). Several
hierarchy-of-effect models have been developed for advertisement effectiveness since then.
One of the first models is DAGMAR (Defining Advertising Goals for Measured Advertising
Results). The model assumes advertising works in the sequence of awareness, understanding,
conviction and behaviour (Scholten 1996). The cycle was also almost inevitable. That is, if the
first were made, others would follow their natural order—with the help of an advertiser (Li &
Leckenby 2004). The hierarchy of effect model basically groups components into three
categories: perception, affection, and behaviour. However, the Web introduces a new
dimension–alienation (subject alienation from its culture, society). Therefore, the Web is an
active platform that moves the user to the active role from being a passive receiver
(Davidavičienė 2012).
Putting the Internet dimension into its framework, Rodgers and Thorson (2000) proposed the
Interactive Advertisement Model. According to Rodgers and Thorson (2000), one of the most
fundamental ways of thinking about how individuals view digital ads is to differentiate between
consumer-controlled and advertiser-controlled Internet facets. Traditionally, advertisers
checked what ads consumers see, where and how. However, on the Internet, power has shifted
from advertiser to customer. In reality, some researchers and practitioners argue that Internet
users have more influence than advertisers (Roehm & Haugtvedt 1999). Some have claimed
that digital advertisement campaigns will not work until practitioners step into the shoes of
customers (Marx 1996). The authors also group factors into customer and advertiser-controlled
categories. So most of these advertiser-controlled factors involve structural elements including
ad types, formats, and features. The model also includes consumer-controlled variables such
as online advertisement attitudes and website attitudes. Internet motivations, the inner desire
to perform internet activity, may explain why people use the internet. There were four reasons
for entering cyberspace, including search, networking, surfing and shopping. Mode, the degree
of goal-directness of a user’s internet operations, determines the level of motivated ad
processing as internet motivations can influence the way users use the Internet (Rodgers &
Sheldon 2002).
Individuals are also required to undergo many stages of online advertisement processing:
viewing, remembering and developing attitudes towards internet ads, as well as actions were
taken in response to internet ads (Boerman, Kruikemeier & Zuiderveen Borgesius 2017). The
IAM argued that online advertisements’ information processing would impact the interactive
ad appearance as well as the stimulus environment characteristics. The advertisement category
represented the general advertising structure and was divided into five main categories:
product/service, public service announcement (PSA), query, corporate and political. The ad
type is how online advertisements appear. The IAM model discussed several standard
interactive ad types: banners, interstitials (pop-ups), sponsorships, hyperlinks and websites
(Boerman, Kruikemeier & Zuiderveen Borgesius 2017). The IAM offers a detailed list of
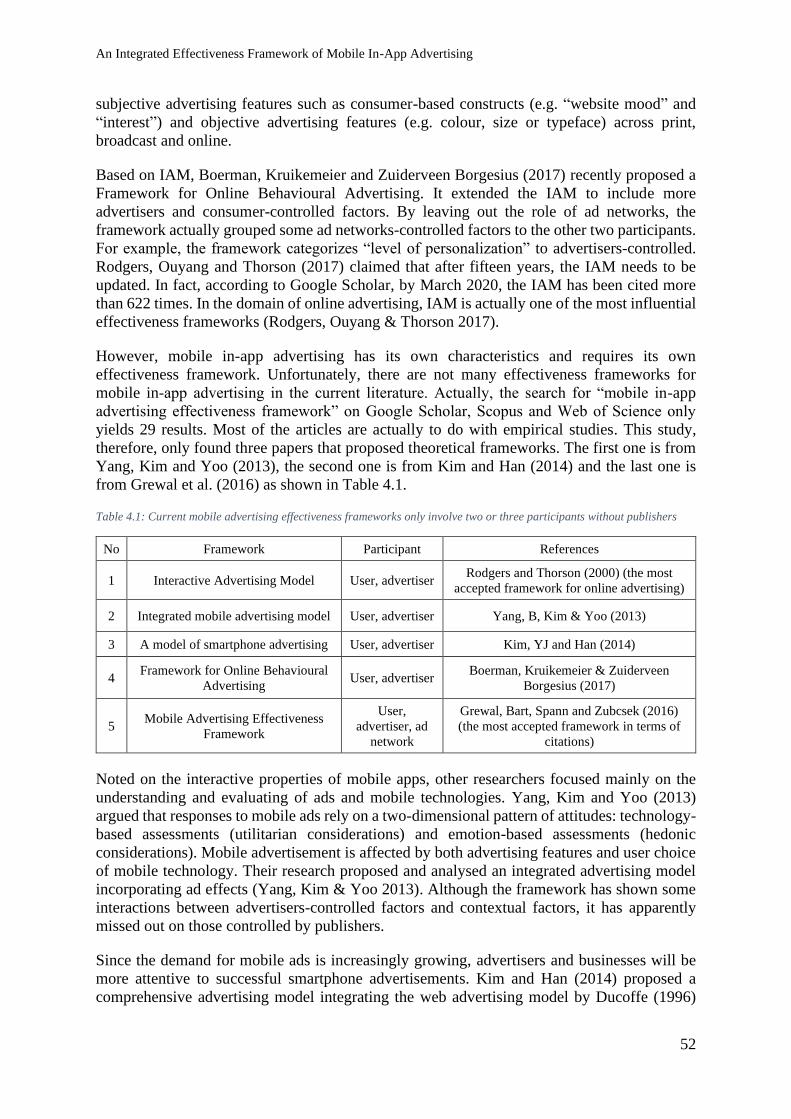
An Integrated Effectiveness Framework of Mobile In-App Advertising
52
subjective advertising features such as consumer-based constructs (e.g. “website mood” and
“interest”) and objective advertising features (e.g. colour, size or typeface) across print,
broadcast and online.
Based on IAM, Boerman, Kruikemeier and Zuiderveen Borgesius (2017) recently proposed a
Framework for Online Behavioural Advertising. It extended the IAM to include more
advertisers and consumer-controlled factors. By leaving out the role of ad networks, the
framework actually grouped some ad networks-controlled factors to the other two participants.
For example, the framework categorizes “level of personalization” to advertisers-controlled.
Rodgers, Ouyang and Thorson (2017) claimed that after fifteen years, the IAM needs to be
updated. In fact, according to Google Scholar, by March 2020, the IAM has been cited more
than 622 times. In the domain of online advertising, IAM is actually one of the most influential
effectiveness frameworks (Rodgers, Ouyang & Thorson 2017).
However, mobile in-app advertising has its own characteristics and requires its own
effectiveness framework. Unfortunately, there are not many effectiveness frameworks for
mobile in-app advertising in the current literature. Actually, the search for “mobile in-app
advertising effectiveness framework” on Google Scholar, Scopus and Web of Science only
yields 29 results. Most of the articles are actually to do with empirical studies. This study,
therefore, only found three papers that proposed theoretical frameworks. The first one is from
Yang, Kim and Yoo (2013), the second one is from Kim and Han (2014) and the last one is
from Grewal et al. (2016) as shown in Table 4.1.
Table 4.1: Current mobile advertising effectiveness frameworks only involve two or three participants without publishers
No Framework Participant References
1 Interactive Advertising Model User, advertiser Rodgers and Thorson (2000) (the most
accepted framework for online advertising)
2 Integrated mobile advertising model User, advertiser Yang, B, Kim & Yoo (2013)
3 A model of smartphone advertising User, advertiser Kim, YJ and Han (2014)
4 Framework for Online Behavioural
Advertising User, advertiser
Boerman, Kruikemeier & Zuiderveen
Borgesius (2017)
5 Mobile Advertising Effectiveness
Framework
User,
advertiser, ad
network
Grewal, Bart, Spann and Zubcsek (2016)
(the most accepted framework in terms of
citations)
Noted on the interactive properties of mobile apps, other researchers focused mainly on the
understanding and evaluating of ads and mobile technologies. Yang, Kim and Yoo (2013)
argued that responses to mobile ads rely on a two-dimensional pattern of attitudes: technology-
based assessments (utilitarian considerations) and emotion-based assessments (hedonic
considerations). Mobile advertisement is affected by both advertising features and user choice
of mobile technology. Their research proposed and analysed an integrated advertising model
incorporating ad effects (Yang, Kim & Yoo 2013). Although the framework has shown some
interactions between advertisers-controlled factors and contextual factors, it has apparently
missed out on those controlled by publishers.
Since the demand for mobile ads is increasingly growing, advertisers and businesses will be
more attentive to successful smartphone advertisements. Kim and Han (2014) proposed a
comprehensive advertising model integrating the web advertising model by Ducoffe (1996)
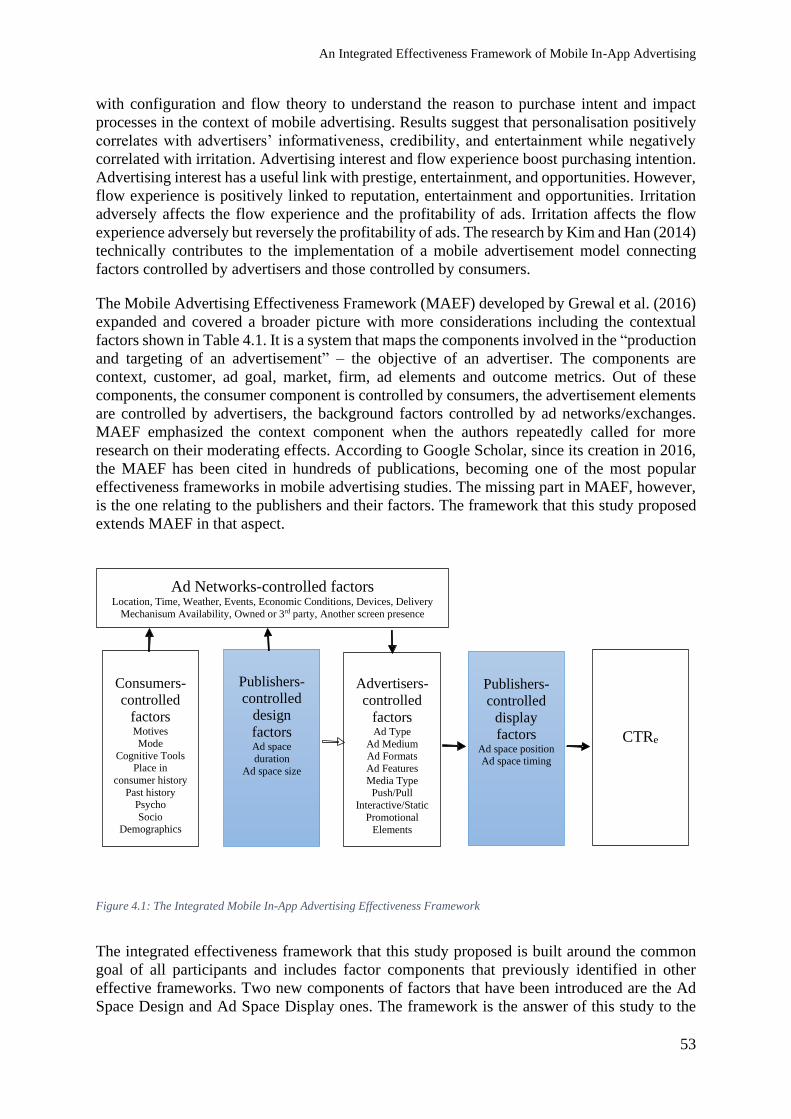
An Integrated Effectiveness Framework of Mobile In-App Advertising
53
with configuration and flow theory to understand the reason to purchase intent and impact
processes in the context of mobile advertising. Results suggest that personalisation positively
correlates with advertisers’ informativeness, credibility, and entertainment while negatively
correlated with irritation. Advertising interest and flow experience boost purchasing intention.
Advertising interest has a useful link with prestige, entertainment, and opportunities. However,
flow experience is positively linked to reputation, entertainment and opportunities. Irritation
adversely affects the flow experience and the profitability of ads. Irritation affects the flow
experience adversely but reversely the profitability of ads. The research by Kim and Han (2014)
technically contributes to the implementation of a mobile advertisement model connecting
factors controlled by advertisers and those controlled by consumers.
The Mobile Advertising Effectiveness Framework (MAEF) developed by Grewal et al. (2016)
expanded and covered a broader picture with more considerations including the contextual
factors shown in Table 4.1. It is a system that maps the components involved in the “production
and targeting of an advertisement” – the objective of an advertiser. The components are
context, customer, ad goal, market, firm, ad elements and outcome metrics. Out of these
components, the consumer component is controlled by consumers, the advertisement elements
are controlled by advertisers, the background factors controlled by ad networks/exchanges.
MAEF emphasized the context component when the authors repeatedly called for more
research on their moderating effects. According to Google Scholar, since its creation in 2016,
the MAEF has been cited in hundreds of publications, becoming one of the most popular
effectiveness frameworks in mobile advertising studies. The missing part in MAEF, however,
is the one relating to the publishers and their factors. The framework that this study proposed
extends MAEF in that aspect.
The integrated effectiveness framework that this study proposed is built around the common
goal of all participants and includes factor components that previously identified in other
effective frameworks. Two new components of factors that have been introduced are the Ad
Space Design and Ad Space Display ones. The framework is the answer of this study to the
Publishers-
controlled
display
factors Ad space position Ad space timing
Advertisers-
controlled
factors Ad Type
Ad Medium Ad Formats
Ad Features
Media Type Push/Pull
Interactive/Static
Promotional
Elements
Publishers-
controlled
design
factors Ad space
duration
Ad space size
Consumers-
controlled
factors Motives
Mode
Cognitive Tools Place in
consumer history
Past history Psycho
Socio Demographics
Ad Networks-controlled factors Location, Time, Weather, Events, Economic Conditions, Devices, Delivery
Mechanisum Availability, Owned or 3rd party, Another screen presence
CTRe
Figure 4.1: The Integrated Mobile In-App Advertising Effectiveness Framework
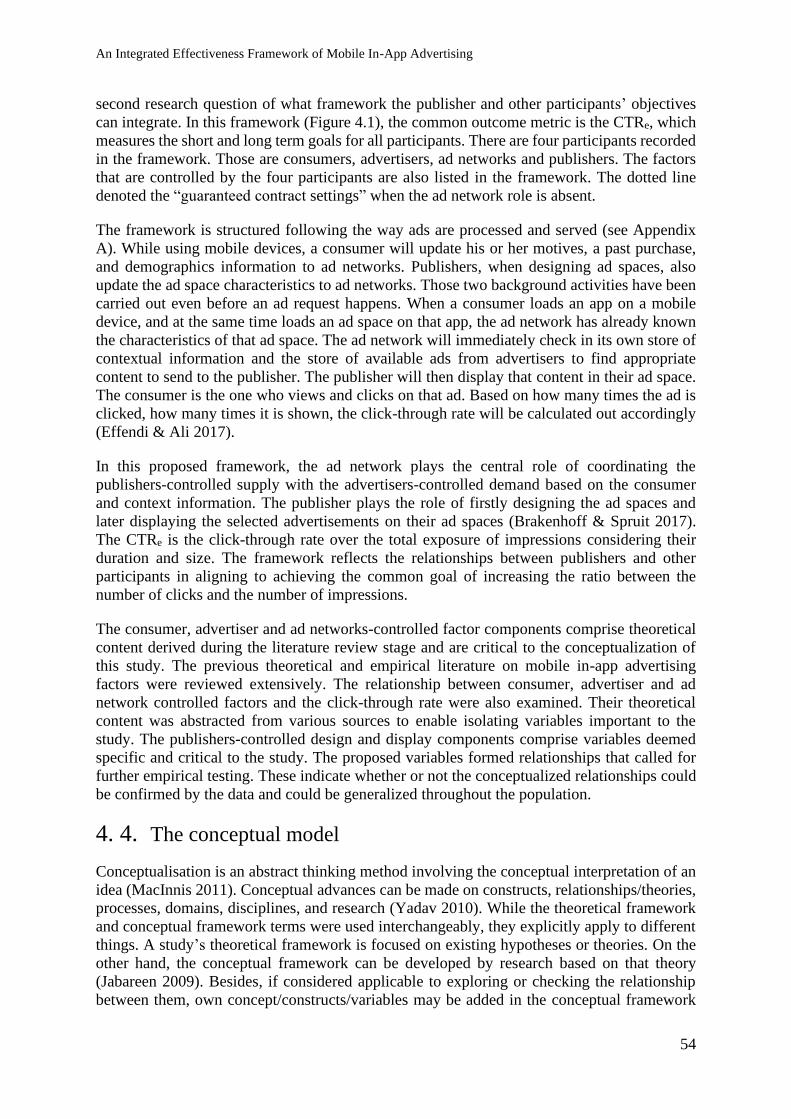
An Integrated Effectiveness Framework of Mobile In-App Advertising
54
second research question of what framework the publisher and other participants’ objectives
can integrate. In this framework (Figure 4.1), the common outcome metric is the CTRe, which
measures the short and long term goals for all participants. There are four participants recorded
in the framework. Those are consumers, advertisers, ad networks and publishers. The factors
that are controlled by the four participants are also listed in the framework. The dotted line
denoted the “guaranteed contract settings” when the ad network role is absent.
The framework is structured following the way ads are processed and served (see Appendix
A). While using mobile devices, a consumer will update his or her motives, a past purchase,
and demographics information to ad networks. Publishers, when designing ad spaces, also
update the ad space characteristics to ad networks. Those two background activities have been
carried out even before an ad request happens. When a consumer loads an app on a mobile
device, and at the same time loads an ad space on that app, the ad network has already known
the characteristics of that ad space. The ad network will immediately check in its own store of
contextual information and the store of available ads from advertisers to find appropriate
content to send to the publisher. The publisher will then display that content in their ad space.
The consumer is the one who views and clicks on that ad. Based on how many times the ad is
clicked, how many times it is shown, the click-through rate will be calculated out accordingly
(Effendi & Ali 2017).
In this proposed framework, the ad network plays the central role of coordinating the
publishers-controlled supply with the advertisers-controlled demand based on the consumer
and context information. The publisher plays the role of firstly designing the ad spaces and
later displaying the selected advertisements on their ad spaces (Brakenhoff & Spruit 2017).
The CTRe is the click-through rate over the total exposure of impressions considering their
duration and size. The framework reflects the relationships between publishers and other
participants in aligning to achieving the common goal of increasing the ratio between the
number of clicks and the number of impressions.
The consumer, advertiser and ad networks-controlled factor components comprise theoretical
content derived during the literature review stage and are critical to the conceptualization of
this study. The previous theoretical and empirical literature on mobile in-app advertising
factors were reviewed extensively. The relationship between consumer, advertiser and ad
network controlled factors and the click-through rate were also examined. Their theoretical
content was abstracted from various sources to enable isolating variables important to the
study. The publishers-controlled design and display components comprise variables deemed
specific and critical to the study. The proposed variables formed relationships that called for
further empirical testing. These indicate whether or not the conceptualized relationships could
be confirmed by the data and could be generalized throughout the population.
4. 4. The conceptual model
Conceptualisation is an abstract thinking method involving the conceptual interpretation of an
idea (MacInnis 2011). Conceptual advances can be made on constructs, relationships/theories,
processes, domains, disciplines, and research (Yadav 2010). While the theoretical framework
and conceptual framework terms were used interchangeably, they explicitly apply to different
things. A study’s theoretical framework is focused on existing hypotheses or theories. On the
other hand, the conceptual framework can be developed by research based on that theory
(Jabareen 2009). Besides, if considered applicable to exploring or checking the relationship
between them, own concept/constructs/variables may be added in the conceptual framework
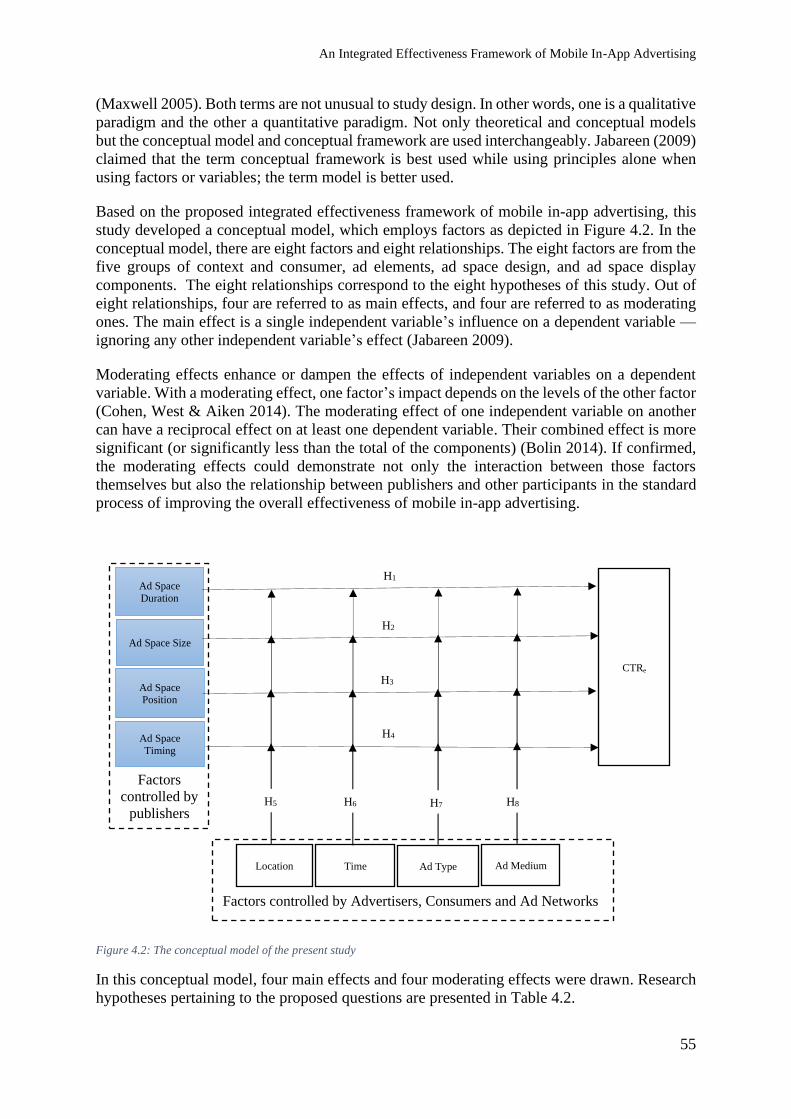
An Integrated Effectiveness Framework of Mobile In-App Advertising
55
(Maxwell 2005). Both terms are not unusual to study design. In other words, one is a qualitative
paradigm and the other a quantitative paradigm. Not only theoretical and conceptual models
but the conceptual model and conceptual framework are used interchangeably. Jabareen (2009)
claimed that the term conceptual framework is best used while using principles alone when
using factors or variables; the term model is better used.
Based on the proposed integrated effectiveness framework of mobile in-app advertising, this
study developed a conceptual model, which employs factors as depicted in Figure 4.2. In the
conceptual model, there are eight factors and eight relationships. The eight factors are from the
five groups of context and consumer, ad elements, ad space design, and ad space display
components. The eight relationships correspond to the eight hypotheses of this study. Out of
eight relationships, four are referred to as main effects, and four are referred to as moderating
ones. The main effect is a single independent variable’s influence on a dependent variable —
ignoring any other independent variable’s effect (Jabareen 2009).
Moderating effects enhance or dampen the effects of independent variables on a dependent
variable. With a moderating effect, one factor’s impact depends on the levels of the other factor
(Cohen, West & Aiken 2014). The moderating effect of one independent variable on another
can have a reciprocal effect on at least one dependent variable. Their combined effect is more
significant (or significantly less than the total of the components) (Bolin 2014). If confirmed,
the moderating effects could demonstrate not only the interaction between those factors
themselves but also the relationship between publishers and other participants in the standard
process of improving the overall effectiveness of mobile in-app advertising.
Figure 4.2: The conceptual model of the present study
In this conceptual model, four main effects and four moderating effects were drawn. Research
hypotheses pertaining to the proposed questions are presented in Table 4.2.
Factors controlled by Advertisers, Consumers and Ad Networks
Factors
controlled by
publishers
Ad Space Position
CTRe
Ad Space
Timing
Location Time
Ad Space Size
Ad Space
Duration
Ad Type Ad Medium
H1
H2
1
H3
1
H4
1
H5 H6
H7 H8
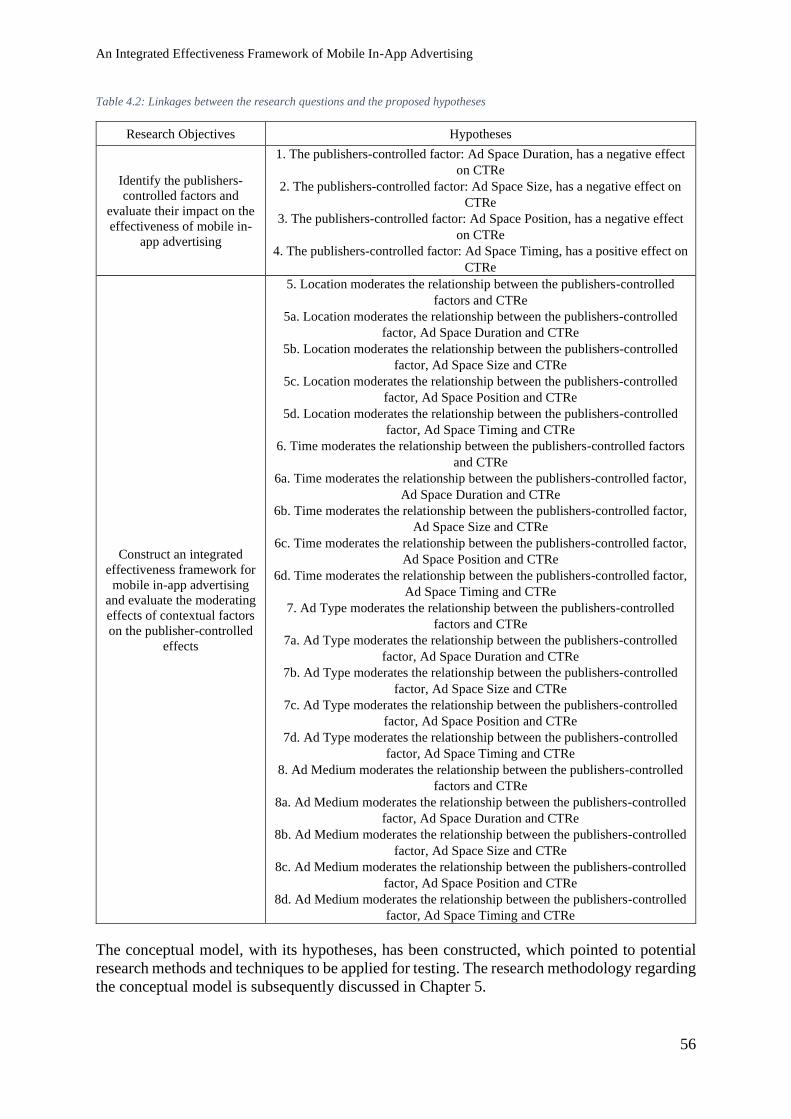
An Integrated Effectiveness Framework of Mobile In-App Advertising
56
Table 4.2: Linkages between the research questions and the proposed hypotheses
Research Objectives Hypotheses
Identify the publishers-
controlled factors and
evaluate their impact on the
effectiveness of mobile in-
app advertising
1. The publishers-controlled factor: Ad Space Duration, has a negative effect
on CTRe
2. The publishers-controlled factor: Ad Space Size, has a negative effect on
CTRe
3. The publishers-controlled factor: Ad Space Position, has a negative effect
on CTRe
4. The publishers-controlled factor: Ad Space Timing, has a positive effect on
CTRe
Construct an integrated
effectiveness framework for
mobile in-app advertising
and evaluate the moderating
effects of contextual factors
on the publisher-controlled
effects
5. Location moderates the relationship between the publishers-controlled
factors and CTRe
5a. Location moderates the relationship between the publishers-controlled
factor, Ad Space Duration and CTRe
5b. Location moderates the relationship between the publishers-controlled
factor, Ad Space Size and CTRe
5c. Location moderates the relationship between the publishers-controlled
factor, Ad Space Position and CTRe
5d. Location moderates the relationship between the publishers-controlled
factor, Ad Space Timing and CTRe
6. Time moderates the relationship between the publishers-controlled factors
and CTRe
6a. Time moderates the relationship between the publishers-controlled factor,
Ad Space Duration and CTRe
6b. Time moderates the relationship between the publishers-controlled factor,
Ad Space Size and CTRe
6c. Time moderates the relationship between the publishers-controlled factor,
Ad Space Position and CTRe
6d. Time moderates the relationship between the publishers-controlled factor,
Ad Space Timing and CTRe
7. Ad Type moderates the relationship between the publishers-controlled
factors and CTRe
7a. Ad Type moderates the relationship between the publishers-controlled
factor, Ad Space Duration and CTRe
7b. Ad Type moderates the relationship between the publishers-controlled
factor, Ad Space Size and CTRe
7c. Ad Type moderates the relationship between the publishers-controlled
factor, Ad Space Position and CTRe
7d. Ad Type moderates the relationship between the publishers-controlled
factor, Ad Space Timing and CTRe
8. Ad Medium moderates the relationship between the publishers-controlled
factors and CTRe
8a. Ad Medium moderates the relationship between the publishers-controlled
factor, Ad Space Duration and CTRe
8b. Ad Medium moderates the relationship between the publishers-controlled
factor, Ad Space Size and CTRe
8c. Ad Medium moderates the relationship between the publishers-controlled
factor, Ad Space Position and CTRe
8d. Ad Medium moderates the relationship between the publishers-controlled
factor, Ad Space Timing and CTRe
The conceptual model, with its hypotheses, has been constructed, which pointed to potential
research methods and techniques to be applied for testing. The research methodology regarding
the conceptual model is subsequently discussed in Chapter 5.
An Integrated Effectiveness Framework of Mobile In-App Advertising
57
Chapter 5. METHODOLOGY
The methodology of this study – the justification for selecting methods for testing the
conceptual model in Chapter 4 – is discussed in this chapter. The following are accordingly
presented:
• Research Philosophy (Section 5.1)
• Research Approach (Section 5.2)
• Research Strategy (Section 5.3)
• Research Choice (Section 5.4)
• Time Horizon (Section 5.5)
• Data Collection (Section 5.6)
5. 1. Research Philosophy
Science theory is a belief in how a concept can be produced, interpreted, and used (Popper
2014). Unlike doxology, the term epistemology (which is proven to be confirmed)
encompasses the various science theory philosophies. Therefore, the object of science is to turn
believed facts into known things: doxa into episteme. In Western science tradition, two major
research philosophies were generated, namely positivist (sometimes called scientific) and
interpretative (also called anti-positivist) philosophies (Galliers 1991).
Positivists believe that nature is consistent and objective, i.e. without interfering with the
phenomena being studied, measurable and interpretable (Saunders 2015). They argue that
isolating phenomena and repeating observations is necessary. That often involves manipulating
information with changes in a single independent variable to classify regularities and establish
relationships between individual components of the social world (Levin 2008). Predictions can
be made based on previously developed and clarified facts and inter-relationships (Straub,
Boudreau & Gefen 2004). Positivism has a rich literary history. It is so rooted in our culture
that claims of facts not based on positivist reasoning are automatically dismissed as false and
invalid (Hirschheim 1985). This opinion is shared in part by Alavi and Carlson (1992), who
considers all empirical studies to be positivist in approach with 902 research papers. Often,
positivism was highly influential in its physical and natural science subjects. As a positivist,
understanding the objects observed and testing the results helps the researcher approach reality
(Kolb 2016). That required the assumption that these things exist independently of the human
mind and can be observed objectively through measures (Straub, Boudreau & Gefen 2004).
Nevertheless, there has been much controversy about whether or not this positivist model is
entirely appropriate for the social sciences, and many scholars have called for a more pluralistic
approach to methodologies of studying social science subjects (e.g. Remenyi and Williams
(1996)). While this study is not going further on this topic, as it is also the case, online
advertising could also be considered to be social science, dealing not only with numbers but
also with people and technology interactions. Some of the challenges faced by marketing
science, however, such as the apparent inconsistency of experiments, may be due to the
inadequacy of the positivist paradigm of the domain (Straub, Boudreau & Gefen 2004).
An Integrated Effectiveness Framework of Mobile In-App Advertising
58
Similarly, under the positivist model, certain factors or constituent parts of existence can
historically be considered unmeasurable and therefore, uninvestigated (after Galliers (1991)).
Positivism criticism argues that it is analogous to viewing the world through a one-way mirror
due to a lack of direct science participation in theory. Conversely, the counter-argument is that
interpreters’ qualitative research is insufficient as a scientific research method (Locke,
Spirduso & Silverman 2014).
Indeed, interpretivists or anti-positivists argue that only subjective perception and action can
fully understand the truth (Walsham 1995). Observing phenomena in their natural environment
is fundamental to the philosophy of perception, as well as understanding that the phenomenon
they are investigating cannot avoid being influenced by scientists. They agree that there may
be other interpretations of truth, but they insist that they are part of their own scientific
knowledge (Saunders 2015). An interpretive approach would lead to a closer relationship with
participants, a more engaging position with individual subjects, rather than a search for
regularity among the population (Walsham 1995). Interpretivism has a past no less admirable
than or shorter than positivism. With Plato and Aristotle (positivists) on the one hand and
Socrates (anti-positivists) on the other, all study traditions begin in Classical Greek times
(Popper 2014). The Renaissance of Discipline came after a long, dark time in 16th and 17th-
century with European scientific thinking. Established positivists have since included Bacon,
Descartes, Mill, Durkheim, Russell, and Popper. Nietzsche, Marx, Freud, Polanyi and Kuhn
were on the opposite side (Hirschheim 1985). De Vreede (1995) stated that interpretive analysis
was the standard in social science, at least until the late 1970s. Since then, however, Dickson
and DeSanctis (1990) have taken hold of the positivist method. Orlikowski and Baroudi (1991)
indicated that this model is compatible with 96.8 per cent of work in leading United States
journals. In a study of the literature of 122 publications, Pervan (1994) points out that only 4
(3.27%) could be described as interpretivist.
Two listed research paradigms, positivism and interpretivism, actually originated from a broad
debate on research theory in social sciences that started in the early 1980s (Hunt 1991).
Different views on ontological, epistemological, and methodological premises and the role of
the researcher in scientific research influenced this debate. In a study that takes a positivist
approach, truth is seen as actual and singular or separate from the researcher (Chouliaraki &
Fairclough 1999). From a positivist viewpoint, it is apprehensible and logically observable to
understand reality as a concrete structure. Besides, the world exists as human imagination and
thus relies on the researcher (Morgan & Smircich 1980). Different epistemological
perspectives often illustrate specific differences in ontological positions (Saunders 2015). The
positivist approach considers the researcher independent of the research as opposed to the
researcher engaging with the research (Guba & Lincoln 1994). Lin (1998) argued that the
discovery of causal relationships is the positivist province, while the discovery of causal
mechanisms is the interpreter province.
Ultimately, the research philosophy connects with the research question (Saunders 2015).
Philosophy preference depends on the research question raised, and the researcher believes that
epistemology is the method to use. Jankowicz (2000) referred to epistemology as personal
information theory, and what the researcher feels like knowledge, what he or she considers the
evidence and what he or she does not. Specifically, this study uses a positivist approach by
evaluating hypotheses based on empirical observations, experimental conditions and previous
theoretical support. In particular, research questions were formulated based on established gaps
in the literature, with an overall emphasis on exploring the causal relationship between the
constructs of factors. The research questions concern mobile in-app ads’ click-through rates.
The belief that certain phenomena occur outside of the human mind and can be objectively
An Integrated Effectiveness Framework of Mobile In-App Advertising
59
observed by measures is in a philosophical position of positivism (Straub, Boudreau & Gefen
2004). Knowing the observed objects, setting up tests, and interpreting the data helps the
researcher approach reality (Kolb 2016).
5. 2. Research Approach
In business research, the use of theories concerning research can be split into two approaches:
deductive and inductive (Hyde 2000). Depending on the aim of the research, its ontological
and epistemological considerations, the selection can be made.
The deductive approach is opted for in the case of quantitative research where data is quantified
with the end goal of being generalizability as well as with the possibility to explain causality
(Ghauri & Grønhaug 2005). It starts with existing theories and literature serving as a framework
for the research. From this, hypothesis(es) is formulated and ultimately rejected or accepted
based on the empirical material gathered (Saunders 2015). As such, deductive research can be
seen as a linear process.
Theory → Hypothesis → Data collection → Findings → Reject or accept the hypothesis →
Revision of theory.
Or simply,
Theory → Observations/findings.
While the deductive approach is best explained as a linear process, the inductive approach is
not (Jankowicz 2000). Instead, the inductive approach contrasts with the deductive in several
ways. It starts with data collection (no theoretical framework), investigating a research question
derived from the empirical material gathered with the result focusing on gaining a more in-
depth understanding as well as the possibility of generating new theories rather than testing
them (Saunders 2015). They further claim that it is adopted in qualitative research as it shares
the aim of exploring phenomena from the eyes of the included sample. Thereby, general
presumptions are drawn from the empirical data gathered, serving as a basis for new theories
(Ghauri & Grønhaug 2005). Hence, it is very different from a deductive approach.
Observations/findings → Theory
This approach aims to propose new conceptual constructs and relationships as parts of a new
theory. Locke (2007) suggests that the development of theory should be inductive in social
sciences, management and psychology. The critical difference between inductive and
deductive approaches to analysis is that while a deductive approach is aimed at testing theory,
an inductive approach is concerned with creating new data theory (Locke 2007). Ultimately,
depending on the aim of the research, the selection will be made between the two approaches.
In this study, again, the aim is to test an integrated effectiveness framework, which is
constructed from previous theories with some modifications. When the conceptual model has
been built, it focuses on the relationships toward the click-through rate of mobile in-app ads.
The assumption that these things actually exist independently of the human mind and can be
observed either directly or indirectly through measures. This assumption allows the researcher
to collect and understand data (Saunders 2015). With this approach, knowing the data collected,
setting up experiments, and interpreting the measurement effects helps the researcher
deductively approach truth (Kolb 2016). For that reason, this study follows a deductive
An Integrated Effectiveness Framework of Mobile In-App Advertising
60
reasoning approach to draw conclusions from the data obtained after a conceptual model has
been developed. First, it started with the creation of a conceptual model and hypotheses. It then
created a research plan to evaluate these hypotheses (Hyde 2000).
5. 3. Research Strategy
It has often been found very clearly that no particular research technique is inherently better
than others and many researchers have called for a variety of research methods to improve the
quality of the study (Kaplan & Duchon 1988). Similarly, a certain customised approach has
been chosen by some organizations (Galliers 1991). That seems almost at odds with the fact
that is taking into account the variety and complexities of the real world; an approach should
be chosen that best fits the subject under consideration as well as the researcher’s aims. Studies
usually have tried to avoid what could be described as a methodological monism, i.e. depending
on using a single method of analysis. That is not due to the inability to distinguish the different
alternatives between the various merits and demerits (Pervan 1994). Galliers (1991) and Alavi
and Carlson (1992) used three-level and eighteen-category hierarchical taxonomy to
summarise the key characteristics of the deductive research strategies, including experiment,
survey, case study, simulation, forecasting, action and observation.
Among those types, laboratory experiments help the researcher define particular relationships
between a limited number of variables that are analysed intensively using quantitative
analytical techniques in a structured laboratory scenario to generalise conclusions applicable
to real-life situations (Siroker & Koomen 2013). The main drawback of laboratory experiments
is the limited degree to which established relationships exist in the real world due to the over-
simplification of the experimental situation and the exclusion of certain conditions from most
real-world variables (Coopers & Schindler 2006). Online experiments extend laboratory
experiments to online users and their real-life situations, thus gaining greater complexity and
the extent to which conditions can be dismissed as artificial (Kohavi et al. 2009a). Hewson,
Vogel and Laurent (2016) pointed out that using the Internet for experiments may reduce
potential observer bias and intrusion.
In this study, in order to simulate the ad space characteristics according to the requirements, it
needs to access the source code of the mobile apps. Furthermore, the study also aimed to
evaluate the behaviour of mobile users in online activities. Therefore, the online experiment is
the most suitable strategy for the present study in deductively testing the collected online data
of mobile users. Experimental analysis is also called causal testing because it enables the
researcher to control one or more independent variables or interventions and to assess or quantify
the effect of such manipulation on the dependent variable (s). In an online experiment, the
treatment conditions are chosen to check the specific characteristics of the importance of the
research project (Calder, Malthouse & Schaedel 2009). The researcher will then be able to assign
the participants these treatment conditions so that the behavioural differences between the groups
can be assessed and the root of these differences can be determined from the differences in
experimental treatment (Churchill & Iacobucci 2006). Across business and social sciences,
experimental design is widely used (Holland & Cravens 1973). Marketing is one of the fields where
such experiments have been commonly used to establish marketing strategies for consumers,
including market testing for new products; selling impact of advertising campaigns; size, promotion
and display influence on sales, and direct mail sales (Burns & Bush 2005). Besides, the
experimental design methodology was applied to behavioural sciences in terms of both
conventional retail and internet market analysis; for example, product and service bundling
decisions and buying intentions; the effect of product signals on price, value and buying intentions;
and online retail and customer environments (Hague, Hague & Morgan 2013). As the objective of
An Integrated Effectiveness Framework of Mobile In-App Advertising
61
this study is to investigate the impact on the click-through rate, the experimental research
strategy was found to be the most suitable to be used. Technically, the experiment allows the
researcher to test the differences among the variants of involved factors.
5. 4. Research Choice
An experiment is either quantitative or qualitative (Bryman & Bell 2011). According to Ghauri
and Grønhaug (2005), the critical difference between the two is the emphasis on numeric or
non-numeric data. Therefore, the distinction lies in the research strategy’s method, data
collection, interpretation and outcome (Jankowicz 2000).
People who support the qualitative methods normally stated that the ability to generalize the
results in the case of quantitative strategy is much less emphasized than in qualitative research.
Instead, they claim that the main preoccupation refers to the ability to see collected data through
the eyes of the sampled participants (Hyde 2000). Therefore, qualitative work is concerned
with identifying and investigating processes in the context of social life to achieve a proper
understanding of perceived reality. In addition, a qualitative strategy is synonymous with
exploratory research aimed at gaining a more in-depth understanding, with rich data from a
small sample in the form of words rather than numbers from a large sample (Al-Busaidi 2008).
Moreover, the qualitative strategy stems from an inductive approach, where data is collected
without a predefined framework of theories, not limiting researchers in collecting data as in the
case of quantitative research. Bryman and Bell (2011) added that, due to the unstructured
process of qualitative inductive research, researchers are more flexible, allowing them to go
back and collect more data if needed as well as do parallel work on both empirical and analysis
phases.
Therefore, the exploratory research design is widely used in theory-development research,
where the topic under examination is not well known or hard to understand. For cases where
more information is required, it is therefore essential to explore new insights or determine the
feasibility of a potential study area or project (Saunders 2015). It is also noted that the results
seldom provide any detailed answers to the research question(s) presented, mainly due to the
intention of trying to address with a few guidelines of “what” questions. It also starts with a
general approach to the problem of science, becoming more precise as work progresses
(Highhouse 2009). Therefore, exploratory work requires a flexibility dimension. Basically,
there are three approaches to perform this type of research: to scan for existing literature,
interview, or hold research expert focus groups (Cavana, Delahaye & Sekaran 2001). The
design of exploratory research fits well with the qualitative data (Pierre 2017).
On the other hand, the quantitative method is structured to measure and analyze the empirical
data obtained (Hyde 2000). From an ontological viewpoint of objectivism and an
epistemological point of positivism, the quantitative strategy requires a deductive approach. It
is further noted that the method is linear in its implementation from the formulation of a
hypothesis developed by the existing theory, the collection of data and, ultimately, the
acceptance or rejection of the hypothesis. The element of measurement is part of this process
(Blumberg, Cooper & Schindler 2008). By quantifying data, the ability to measure becomes
apparent. It allows for the testing of causal relationships among variables, serving as a
benchmark for the ability to generalize the results, which is the main preoccupation of
quantitative strategy (Ghauri & Grønhaug 2005). However, criticism has centred on
quantitative strategy as a paradigm of natural science for understanding and analyzing the
An Integrated Effectiveness Framework of Mobile In-App Advertising
62
social world. That is not sufficient due to data quantification, particularly when researching
human behaviour and attitudes (Bryman & Bell 2011).
The selection will be made between the two paradigms, again, depending on the aim of the
research, its ontological and epistemological considerations (Ghauri & Grønhaug 2005). In the
end, the quantitative method is selected and used in this study. With an emphasis on statistical
models, the quantitative approach adopted by this study is in line with the positivist research
paradigm (Carson et al. 2001). It helps researchers to remain distant from the study, allowing
greater bias control, more rigorous sampling and objectivity (Coolidge 2020). The quantitative
strategy is usually based on quantified evidence that is used to test hypotheses that result in the
formulation of theoretical conclusions in the specific research field (Saunders 2015). In other
words, quantitative analysis is a systematic way to integrate deductive logic with quantified
empirical evidence in order to define and test a set of probabilistic laws that can be used to
predict general patterns of phenomena (Cavana, Delahaye & Sekaran 2001). This is rationally
consistent with the attempt of this study to find out in the click-through rate of mobile in-app
ads (in numbers, not words) the predictability of publisher-controlled variables. The research
design of this study is based on a quantitative research approach, with an emphasis on
quantification in data collection, measurement and analysis. That follows a deductive and
quantitative approach. The deductive approach has opted for this study, where data is quantified
with the end goal being generalized as well as the possibility to explain causality (Gravetter et
al. 2020).
5. 5. Time Horizon
Research design requires time horizons, regardless of the research methodology used.
According to Saunders (2015), two different time horizons exist: longitudinal and cross-
sectional. Longitudinal studies repeat themselves over time. Instead, a specific period is limited
to cross-sectional research.
An empirical research design is the development of a comprehensive research strategy to gather
empirical evidence to resolve a proposed research issue. That includes collecting, measuring
and analysing data for a particular research study (Coopers & Schindler 2006). The design of
the study scheme is what characterizes the structure and quality of the research. That influences
how data will be obtained and interpreted for a specific study (Saunders 2015). The selection
of the design should be focused on which to design the best support to address the research
questions and research objectives that have been formulated. Besides, a number of the factors
- time horizon for the research project, the experience of research designs, resources, and
philosophy - also affect the design choice. Consequently, the selection of research design may
show the study’s nature as well as the researcher’s objectives, whether exploratory, descriptive
or explanatory (Bryman & Bell 2011).
Several experimental designs can be introduced during the experimental phase, depending on
the research methodology and complexity. That includes longitudinally One Factor at A Time
(OFAT) – controlled A/B experiment design and cross-sectionally factorial design (Kohavi &
Longbotham 2017).
In the former design, the experiment keeps all inputs except one set, and see the best outcome
when the one free input differs longitudinally. It will then address the feedback at the best
possible value. Next, with one more data differs, another check on the new output is carried
out. At that best value path, the second input is changed, and so on until running out of input
An Integrated Effectiveness Framework of Mobile In-App Advertising
63
factors (Harshman, Siroker & Koomen 2013). That is called a One Factor At A Time
experiment (OFAT) and is widely practised as it is used to be assumed this was the only
scientific approach (Cox & Reid 2000). OFAT experiments will work if, in general, the right
model within the black box looks exactly the same. This model is flat in all dimensions and is
considered the main effect model (Jankowicz 2000). Whichever point is started at on the
surface, and input always has the same effect on the output. Interactions do not occur between
inputs. In the online experiment, one factor at a time is also called a controlled experiment
design or A/B testing (Kohavi et al. 2009b).
A controlled experiment is the most popular form of experiment in online advertising (Kohavi
et al. 2009b). Many argued that controlled experiments are the best practical way to create a
causal relationship between changes and their effect on user-observable behaviour (Harshman,
Siroker & Koomen 2013). There is one dependent variable in this study, the click-through rate
by the total exposure. It is calculated as the ratio of the number of clicks and the cumulative
exposure as calculated in Equation 1. The click-through rate can also be called the Overall
Evaluation Criterion (OEC) (Roy 2001). The OEC is the quantitative measure of the
experiment’s function. That is often referred to as the response or dependent variable in
statistics (Anderson et al. 2016). Controlled experiments are the best scientific method to create
a causal relationship between change and its effect on user-observable behaviour (Box, Hunter
& Hunter 2005; Mason, Gunst & Hess 2003). Other synonyms for OEC include outcomes,
efficiency measure, metric assessment, or fitness function (Quarto-vonTivadar 2006).
The simplest form of a controlled experiment is known as an A/B test. The initial
variant/experience (A) against another variant/experience (B) is tested in an A/B test to see
what results in a higher conversion rate. Variation B may include several changes (i.e., cluster)
or isolated changes. An extension of the A/B test is the A/B/n test. “N” refers to the number of
website/app versions evaluated, varying from two versions to n versions. Users are exposed to
one of two variants randomly for each version. The key here is “random”. Users can only be
distributed randomly; no aspect can affect the decision. The overall evaluation criterion (OEC)
for each model is extracted based on the observations obtained. Such independent variables are
called factors. Controlled studies are those about factors that are believed to affect the OEC
(Kohavi & Longbotham 2017). Factors are assigned values, often referred to as levels or
versions (Kohavi et al. 2009b). In the OFAT or A/B experiment, one factor is controlled at a
time.
On the other hand, factorial designs allow the researcher to control two or more variables at
the same time in the same experiment cross-sectionally (Hair et al. 2006; Keppel 1991).
Factorial designs are commonly used in experiments involving several factors, and the
researcher is interested in finding their interactive effects (Montgomery 2017). The designs for
the experiment’s treatment conditions are combinations of factor levels. Factorial designs are
widely used in behavioural science and several fields because they are more successful than One
Factor At A Time experiments (Easton & McColl 2002). Independent variables can identify the
main effects separately. Furthermore, factorial designs allow the researcher to determine the
dependent variable the association or combined effects of independent variables. Factorial
designs also provide rich knowledge about variables’ interactions that cannot be done with the
One Factor At A Time testing. In a full factorial design, the model includes all significant
effects and interactions between factors (Rutherford 2011).
Also, factorial design can be defined as a numbering notation. For example, in factorial design
terms, factorial design 2x2 (two-by-two) means there are two variables, one having two levels
and the other having two, making a total of four combinations. Similarly, there will be 2k runs
An Integrated Effectiveness Framework of Mobile In-App Advertising
64
in the entire factorial design if there are k variables, each in two values or two levels (Collins
et al. 2014).
Factorial designs can be a full or fractional factorial design. In experimental designs involving
between two and four variables, a complete factorial design is recommended and aims to
determine which factors or effects are significant (Jaccard 1998). The unique feature of full
factorial designs is that all levels of each independent variable must be crossed by the other
independents. That independent variable will have its own main effect in a full factorial design.
Sometimes the main effect is what the researcher is interested in. However, more often, the
interaction effects are really what they are looking for (Jaccard 1998). Interaction is to test
whether the effect of independent variable 1 varies between the levels of independent variable
2. In doing so, researchers can infer that their second manipulation (independent variable 2)
causes a change in their interest effect. Such adjustments are then recorded and used to test the
underlying causal hypotheses regarding the effects of the interest factor (Cavana, Delahaye &
Sekaran 2001).
Full factorial designs have the benefits of being free of limiting statistical assumptions and
more comfortable to plan and interpret (Collins et al. 2014). However, the key drawbacks
include a large number of subjects and a relative lack of sensitivity in detecting the effects of
treatment conditions in experiments (Keppel 1991). All treatment criteria are allocated to each
topic and each subject. That is also referred to as a method of repetitive steps. Variations
between treatment conditions within the same group of subjects involved in the experiment all
need to be observed (Collins et al. 2014).
The downside of this k-level factorial design is that a large amount of data is needed.
(Harshman, Siroker & Koomen 2013). For full-factorial, each run is evaluated, isolated against
each other, by mixing and matching any possible combination available. This method is useful
because it shows each change’s positive or negative impact and every single variation of each
change, resulting in the most ideal combination (Jaccard 1998). However, in the real world,
this method is somewhat impractical. Even with much traffic, it would still take longer to
achieve any statistical significance than most advertisers have (Collins et al. 2014). The more
variables being studied, the more traffic will be divided during the analysis, and the longer it
takes to reach statistical significance. Most companies simply can not comply with the full
factorial design guidelines because they have inadequate traffic (Nielsen 2005). In fact, when
researching multiple factors, full factorial designs often need more than enough data to
represent all possible combinations of factor values, and high-order correlations between many
factors can become difficult to interpret (Newbold, Carlson & Thorne 2013).
A fractional factorial design is a useful alternative to the full-factorial design with many
variables. The full factorial design is ineffective when the number of factors is equal to five or
more because many runs are needed (Holland & Cravens 1973; Jaccard & Turrisi 2003).
Therefore, in those cases, to reduce the number of comparisons, a fractional factorial design is
suggested. Nevertheless, it is impossible to estimate all main effects and interaction effects
separately in a fractional factorial design (Collins et al. 2014). That reveals contradictory
patterns, in other words. The effects measured are not zero, but combined with the effects of
higher degrees of interaction that are thought to be negligible (Holland & Cravens 1973). A
fractional factorial design is widely used in behavioural sciences if it needs fewer subjects and
is more versatile than a completely randomised design (Keppel 1991).
In this study, there are four publishers-controlled variables and four factors controlled by other
participants. In total, there are eight factors. That total is actually higher than the recommended
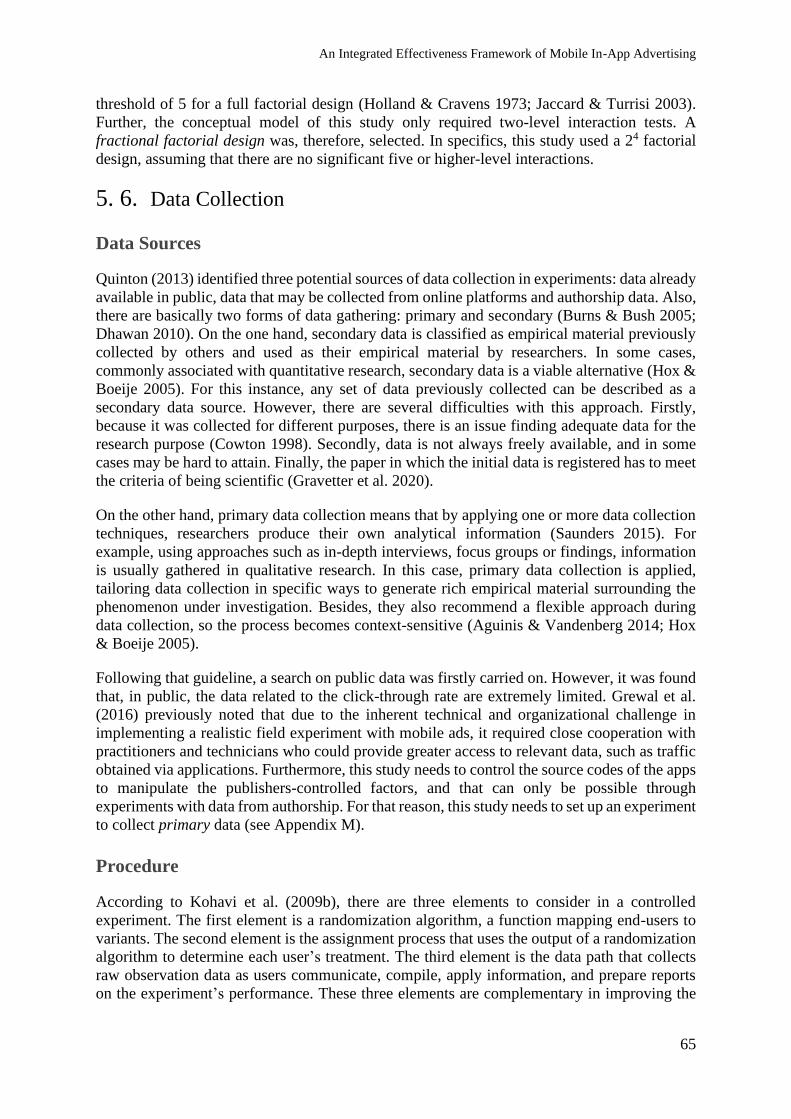
An Integrated Effectiveness Framework of Mobile In-App Advertising
65
threshold of 5 for a full factorial design (Holland & Cravens 1973; Jaccard & Turrisi 2003).
Further, the conceptual model of this study only required two-level interaction tests. A
fractional factorial design was, therefore, selected. In specifics, this study used a 24 factorial
design, assuming that there are no significant five or higher-level interactions.
5. 6. Data Collection
Data Sources
Quinton (2013) identified three potential sources of data collection in experiments: data already
available in public, data that may be collected from online platforms and authorship data. Also,
there are basically two forms of data gathering: primary and secondary (Burns & Bush 2005;
Dhawan 2010). On the one hand, secondary data is classified as empirical material previously
collected by others and used as their empirical material by researchers. In some cases,
commonly associated with quantitative research, secondary data is a viable alternative (Hox &
Boeije 2005). For this instance, any set of data previously collected can be described as a
secondary data source. However, there are several difficulties with this approach. Firstly,
because it was collected for different purposes, there is an issue finding adequate data for the
research purpose (Cowton 1998). Secondly, data is not always freely available, and in some
cases may be hard to attain. Finally, the paper in which the initial data is registered has to meet
the criteria of being scientific (Gravetter et al. 2020).
On the other hand, primary data collection means that by applying one or more data collection
techniques, researchers produce their own analytical information (Saunders 2015). For
example, using approaches such as in-depth interviews, focus groups or findings, information
is usually gathered in qualitative research. In this case, primary data collection is applied,
tailoring data collection in specific ways to generate rich empirical material surrounding the
phenomenon under investigation. Besides, they also recommend a flexible approach during
data collection, so the process becomes context-sensitive (Aguinis & Vandenberg 2014; Hox
& Boeije 2005).
Following that guideline, a search on public data was firstly carried on. However, it was found
that, in public, the data related to the click-through rate are extremely limited. Grewal et al.
(2016) previously noted that due to the inherent technical and organizational challenge in
implementing a realistic field experiment with mobile ads, it required close cooperation with
practitioners and technicians who could provide greater access to relevant data, such as traffic
obtained via applications. Furthermore, this study needs to control the source codes of the apps
to manipulate the publishers-controlled factors, and that can only be possible through
experiments with data from authorship. For that reason, this study needs to set up an experiment
to collect primary data (see Appendix M).
Procedure
According to Kohavi et al. (2009b), there are three elements to consider in a controlled
experiment. The first element is a randomization algorithm, a function mapping end-users to
variants. The second element is the assignment process that uses the output of a randomization
algorithm to determine each user’s treatment. The third element is the data path that collects
raw observation data as users communicate, compile, apply information, and prepare reports
on the experiment’s performance. These three elements are complementary in improving the
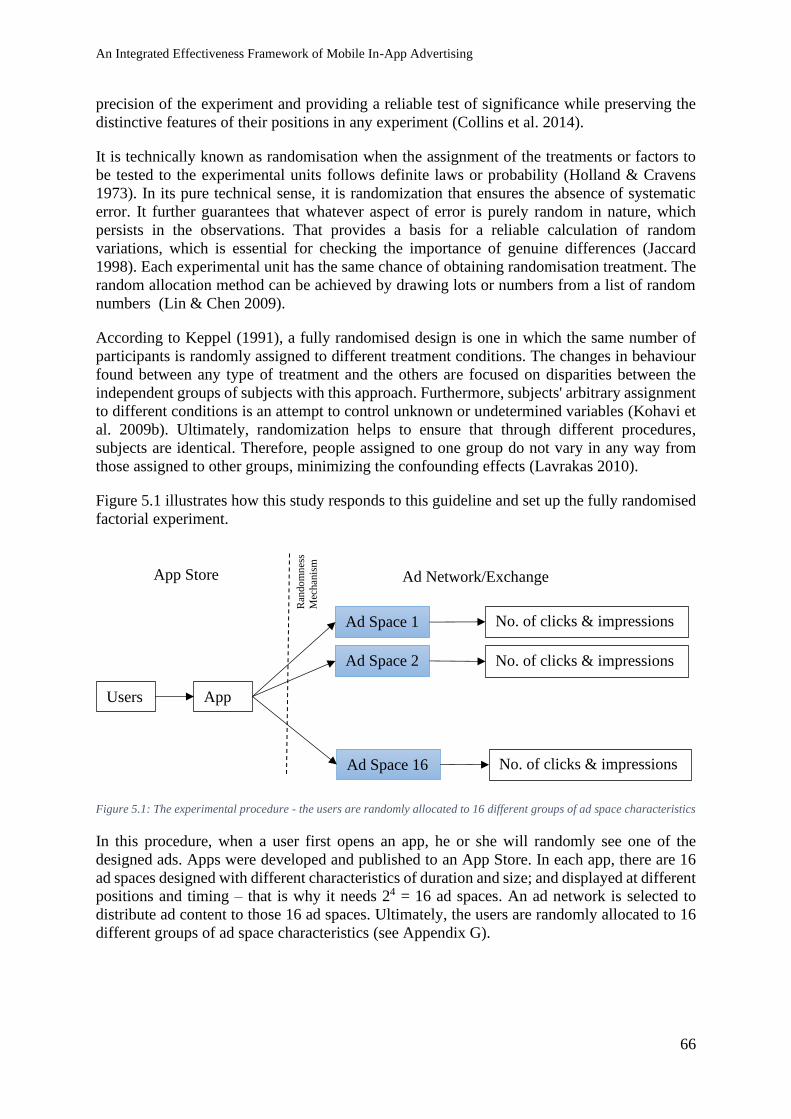
An Integrated Effectiveness Framework of Mobile In-App Advertising
66
precision of the experiment and providing a reliable test of significance while preserving the
distinctive features of their positions in any experiment (Collins et al. 2014).
It is technically known as randomisation when the assignment of the treatments or factors to
be tested to the experimental units follows definite laws or probability (Holland & Cravens
1973). In its pure technical sense, it is randomization that ensures the absence of systematic
error. It further guarantees that whatever aspect of error is purely random in nature, which
persists in the observations. That provides a basis for a reliable calculation of random
variations, which is essential for checking the importance of genuine differences (Jaccard
1998). Each experimental unit has the same chance of obtaining randomisation treatment. The
random allocation method can be achieved by drawing lots or numbers from a list of random
numbers (Lin & Chen 2009).
According to Keppel (1991), a fully randomised design is one in which the same number of
participants is randomly assigned to different treatment conditions. The changes in behaviour
found between any type of treatment and the others are focused on disparities between the
independent groups of subjects with this approach. Furthermore, subjects' arbitrary assignment
to different conditions is an attempt to control unknown or undetermined variables (Kohavi et
al. 2009b). Ultimately, randomization helps to ensure that through different procedures,
subjects are identical. Therefore, people assigned to one group do not vary in any way from
those assigned to other groups, minimizing the confounding effects (Lavrakas 2010).
Figure 5.1 illustrates how this study responds to this guideline and set up the fully randomised
factorial experiment.
Figure 5.1: The experimental procedure - the users are randomly allocated to 16 different groups of ad space characteristics
In this procedure, when a user first opens an app, he or she will randomly see one of the
designed ads. Apps were developed and published to an App Store. In each app, there are 16
ad spaces designed with different characteristics of duration and size; and displayed at different
positions and timing – that is why it needs 24 = 16 ad spaces. An ad network is selected to
distribute ad content to those 16 ad spaces. Ultimately, the users are randomly allocated to 16
different groups of ad space characteristics (see Appendix G).
Ran
do
mn
ess
Mec
han
ism
Users App
Ad Space 1
Ad Space 2
Ad Space 16
No. of clicks & impressions
No. of clicks & impressions
No. of clicks & impressions
App Store Ad Network/Exchange
An Integrated Effectiveness Framework of Mobile In-App Advertising
67
Apps
To simulate the ad space characteristics according to the four publishers-controlled factors, it
needs to access the source code of the apps. There are two ways to gain full control of the
source codes. Firstly, applications must be developed by the researcher. The applications can
be developed using Objective C, Swift and Java languages with Xcode and Android Studio
tools (Lim, Tan & Jnr Nwonwu 2013). Secondly, the researcher can use open source apps.
Many open-source apps can be used for non-commercial purposes. Any modifications to the
sources will then be made public as required by the open licenses. The popular source for open
source applications is GitHub. GitHub is a platform where developers can collaborate their
mobile app development online (Perkel 2016). The ad space designing and displaying factors
can be manipulated by accessing the source codes via the researcher’s own applications or open
sources. Next, applications could then be distributed freely onto an app store. The use of an
app store could also help ensure privacy for app users, as all publications to those app stores
need to go through extensive privacy checks (Martin et al. 2016). The apps are categorised in
the photography and social sharing ones. These are the most popular categories in app stores,
accounting for 95% of total revenue from publishers (Petsas et al. 2013). These apps will then
be distributed worldwide to every country. They are universal, which means they can run with
a wide range of mobile screen sizes on both smartphones and tablets.
Many open sources applications are studied. Among those, two are selected.
• App1: Link https://github.com/truongnguyenxuanvinh/Ananas. This app is based on
Utkarsh Tiwari’s Ananas Photo Editor’s open source as a built-in photo editor with the
main features of painting, filtering, and texting.
• App2: Link https://github.com/truongnguyenxuanvinh/PhotoEditor. This app is based
on Burhanuddin Rashid’s Photo Editor library’s open sources with simple, easy-to-use
image editing functionalities like paints, text, filters, emoji and stickers.
Although both apps are photo editing apps, they are different in their functionalities and
designs. The first application has a home screen where all functionalities are displayed.
Clicking on one button will lead to another screen. This kind of “button” design is quite
traditional and related more to the mouse click than touch. The second application has a more
compact design with only one screen where all the editing and camera functions are co-existed.
This kind of design is considered to be more modern and touch-friendly. In the first app, the
publisher will serve ads on the home screen, while in the second one the ads are served directly
on the editing screen. The two apps are for Android and written in the Java programming
language (see Appendix L).
The app users are the participants of this study, who have their own characteristics. For
example, participants use various Android mobile devices, including Samsung, Oppo and
Vivo, as shown in Appendix F.1. The participants are also from different countries globally,
including Vietnam, India, Brazil, the United States, as shown in Appendix F.2. These apps are
receptive in different regions of the world, helping to study the location factor, as explained in
Section 6.2. The demographics also illustrated that the data is proportionally collected
accordingly to their age and gender (see Appendix F.3).
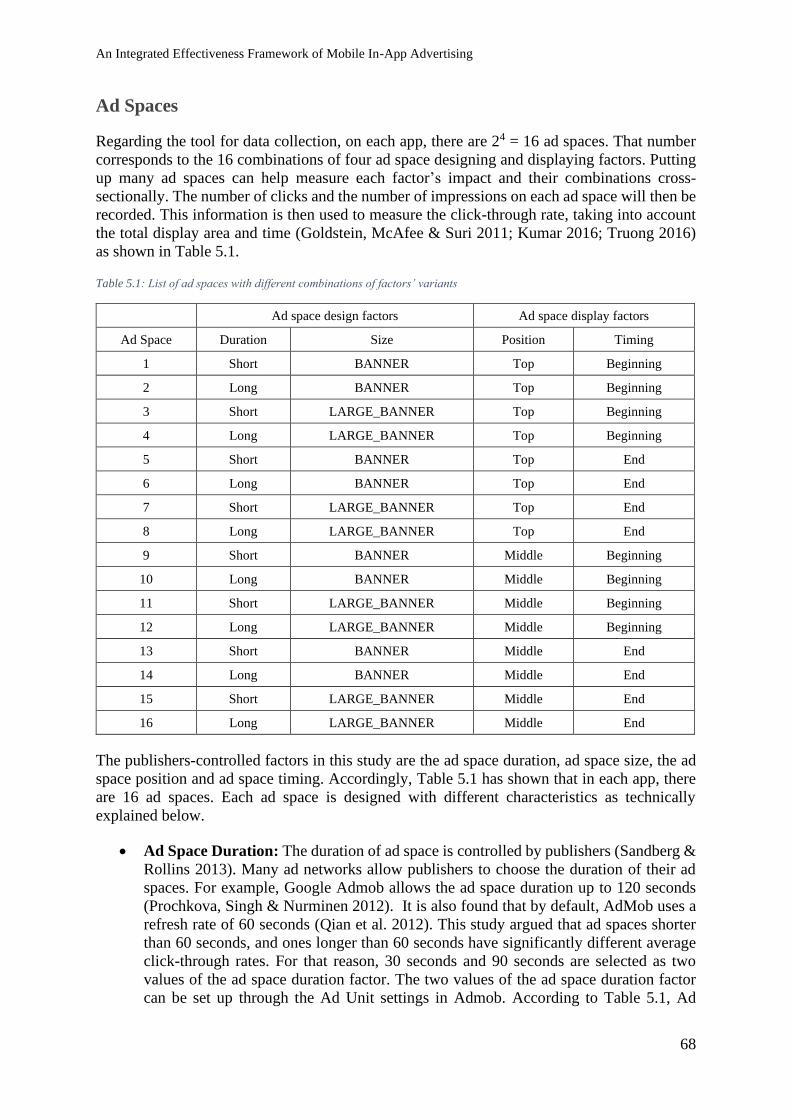
An Integrated Effectiveness Framework of Mobile In-App Advertising
68
Ad Spaces
Regarding the tool for data collection, on each app, there are 24 = 16 ad spaces. That number
corresponds to the 16 combinations of four ad space designing and displaying factors. Putting
up many ad spaces can help measure each factor’s impact and their combinations cross-
sectionally. The number of clicks and the number of impressions on each ad space will then be
recorded. This information is then used to measure the click-through rate, taking into account
the total display area and time (Goldstein, McAfee & Suri 2011; Kumar 2016; Truong 2016)
as shown in Table 5.1.
Table 5.1: List of ad spaces with different combinations of factors’ variants
Ad space design factors Ad space display factors
Ad Space Duration Size Position Timing
1 Short BANNER Top Beginning
2 Long BANNER Top Beginning
3 Short LARGE_BANNER Top Beginning
4 Long LARGE_BANNER Top Beginning
5 Short BANNER Top End
6 Long BANNER Top End
7 Short LARGE_BANNER Top End
8 Long LARGE_BANNER Top End
9 Short BANNER Middle Beginning
10 Long BANNER Middle Beginning
11 Short LARGE_BANNER Middle Beginning
12 Long LARGE_BANNER Middle Beginning
13 Short BANNER Middle End
14 Long BANNER Middle End
15 Short LARGE_BANNER Middle End
16 Long LARGE_BANNER Middle End
The publishers-controlled factors in this study are the ad space duration, ad space size, the ad
space position and ad space timing. Accordingly, Table 5.1 has shown that in each app, there
are 16 ad spaces. Each ad space is designed with different characteristics as technically
explained below.
• Ad Space Duration: The duration of ad space is controlled by publishers (Sandberg &
Rollins 2013). Many ad networks allow publishers to choose the duration of their ad
spaces. For example, Google Admob allows the ad space duration up to 120 seconds
(Prochkova, Singh & Nurminen 2012). It is also found that by default, AdMob uses a
refresh rate of 60 seconds (Qian et al. 2012). This study argued that ad spaces shorter
than 60 seconds, and ones longer than 60 seconds have significantly different average
click-through rates. For that reason, 30 seconds and 90 seconds are selected as two
values of the ad space duration factor. The two values of the ad space duration factor
can be set up through the Ad Unit settings in Admob. According to Table 5.1, Ad
An Integrated Effectiveness Framework of Mobile In-App Advertising
69
Spaces 1, 3, 5, 7, 9, 11, 13 and 15 are set with the refresh rate of 30 seconds, while Ad
Spaces 2, 4, 6, 8, 10, 12, 14 and 16 are set the with the refresh rate of 90 seconds.
• Ad Space Size: The size of ad spaces is selected by publishers (Interactive Advertising
Bureau 2015). Many ad networks allow publishers to choose the size of their ad spaces
in the form of banners. For example, Google AdMob allows the ad space size to be
Banner (320x50 pixel), Large Banner (320x100 pixel) or IAB Full-size Banner (468x60
pixel). Among those, Banner has the smallest size, while Large Banner is the biggest.
This study chose those two sizes as two values of the ad space size factor. The two ad
space size factor values are then set up in the Layout XML file in each app. In detail,
the attribute of adSize is set to BANNER or LARGE_BANNER. According to Table
5.1, Ad Spaces 1, 2, 5, 6, 9, 10, 13 and 14 are set with the adSize of BANNER, while
Ad Spaces 3, 4, 7, 9, 11, 12, 15 and 16 are set the with the adSize of LARGE_BANNER
as shown in Appendix G.
• Ad Space Position: Ad Space Position refers to the position of ad spaces displayed by
the publishers. Ad space can be on the top and bottom of the screen (Interactive
Advertising Bureau 2017b). Sometimes, they can be middle of the screen (Djamasbi,
Hall-Phillips & Yang 2013). The previous studies yield mixed results regarding the top
and the bottom of the screen. Some other research projects highlighted the importance
of native ads, which are usually displayed in the middle of the screen. For that reason,
the top and the middle of the screen are selected as two values of the ad space position
factor. The two values of ad space position factors are set in the Layout XML file.
Accordingly, on each app, there are two slots reserved for ad spaces. One is on top and
another is in the middle of the screen as shown in Appendix G. According to Table 5.1,
Ad Spaces 1, 2, 3, 4, 5, 6, 7 and 8 are set at the top position, while Ad Spaces 9, 10, 11,
12, 13, 14, 15 and 16 are set at the middle position.
• Ad Space Timing: Ad Space Timing refers to the timing of ad spaces delivered by the
publishers. For example, when a user first opens the application and has not done any
action yet, the ads showing at that time are considered the beginning. When the user
has performed the main activity, e.g. capture a photo, finish one level in games, and
finish a call, the ads showing during that time are considered the end (Hoque & Lohse
1999). This study selected Beginning and End as two values of the ad space timing
factor. The two values of ad space timing are set in the MainActivity.java file. In the
MainActivity.java file, there are two methods, onCreate() and onResume(). The method
onCreate() is called before the main activity is displayed. In contrast, the method
onResume() is called after an image is edited as shown in Appendix G. As coded, before
any image is edited, only Ad Space 1, 2, 3, 4, 9, 10, 11 and 12 are randomly displayed,
and when an image is edited, the activity is resumed, only Ad Space 5, 6, 7, 8, 13, 14,
15 and 16 are displayed. That complies with the sequence in Table 5.1.
Ads
This study also involved factors controlled by advertisers, consumers and ad networks. The
values of these factors are selected and explained below:
• Location: Location is a contextual factor (Grewal et al. 2016). Effendi and Ali (2017)
suggested three types of location: city, area and country. Besides, marketing studies
have shown that click-through rates vary considerably between the two regions of Latin
An Integrated Effectiveness Framework of Mobile In-App Advertising
70
America, Africa, the Middle East, South Asia and East Asia, North America, Europe,
Australia and New Zealand (AdDuplex 2012; SmartInsights 2010; Top Growth
Marketing 2012). Accordingly, this study selected those two regions as the two values
of the location factor.
• Time: Time is a contextual factor (Grewal et al. 2016). Some studies have confirmed
the effect of the time of day. For example, Li (2014) found that most Twitter tweets
were more successful at weekends than on weekdays. The Chitika Insights report shows
that advertisers can better focus on high-level CTR users on Saturdays and Sundays
when the pace at which users click and browse the web is well above weekday rates
(Donnini 2013). On weekdays, user CTRs are on average 7 – 12 per cent below CTRs
on weekends, depending on the day. Accordingly, this study selected weekdays and
weekends as the two values of the time factor.
• Ad Type: Interactive Advertising Bureau defines many different types of ads, including
static and dynamic advertisements (Interactive Advertising Bureau 2017b). Ad
networks usually can support all kinds of ad types like those. For example, AdMob is
available for text advertisements and image advertisements (Prochkova, Singh &
Nurminen 2012). Lim, Tan and Jnr Nwonwu (2013) have shown that mobile users are
more likely to remember static text ads than static image banner ads and perceive large
image banner ads as app content. For that reason, this study selected text and image as
two values of the ad type factor.
• Ad Medium: Ad medium is the channel through which the ad is served to a consumer.
The ad medium can be a webpage or a mobile application. The web page content or
application can influence the perception of an ad (Grewal et al. 2016). The ad medium
can also be the platform (e.g. iOS and Android) on which the app is running.
Advertisements placed on different apps could have different results, as shown in the
study of Brakenhoff and Spruit (2017). Accordingly, this study developed two apps
with two different designs and selected those as two values of the ad medium factor.
To collect the data relating to those factors, the publisher needs to work with an ad network.
With nearly 100,000 publishers and 10,000 advertisers, AdMob is the largest mobile
advertising network (Joe 2021). Google owns Admob and has two internet advertising
approaches: mobile websites and mobile applications. Both text advertisements and picture
banner ads are eligible. Although AdMob ads are predominantly static with web links, some
ads can be extended from still image banners to full-screen banners, making the user more
experienced (Prochkova, Singh & Nurminen 2012). A sample report (Table 5.2) shows that it
contains information about countries, days, and ad types. Therefore, Admob is found to be a
suitable ad network for this study to test Location, Time and Ad Type factors. The use of
Google Admob also helps protect the privacy of ad click users as Admob does not allow the
personal details of their users to be public (Prochkova, Singh & Nurminen 2012).
Furthermore, mobile device users are served with all sorts of advertisements via Admob,
including sports, entertainment, computers and electronics, food and beverages. That provides
the publisher with a mechanism to check that there are no constraints on the side of the ad
categories and that the data are unbiased and representative (see Appendix H). For all of those
reasons, this study decided to use Google Admob to distribute advertising content to the
designed ad spaces.
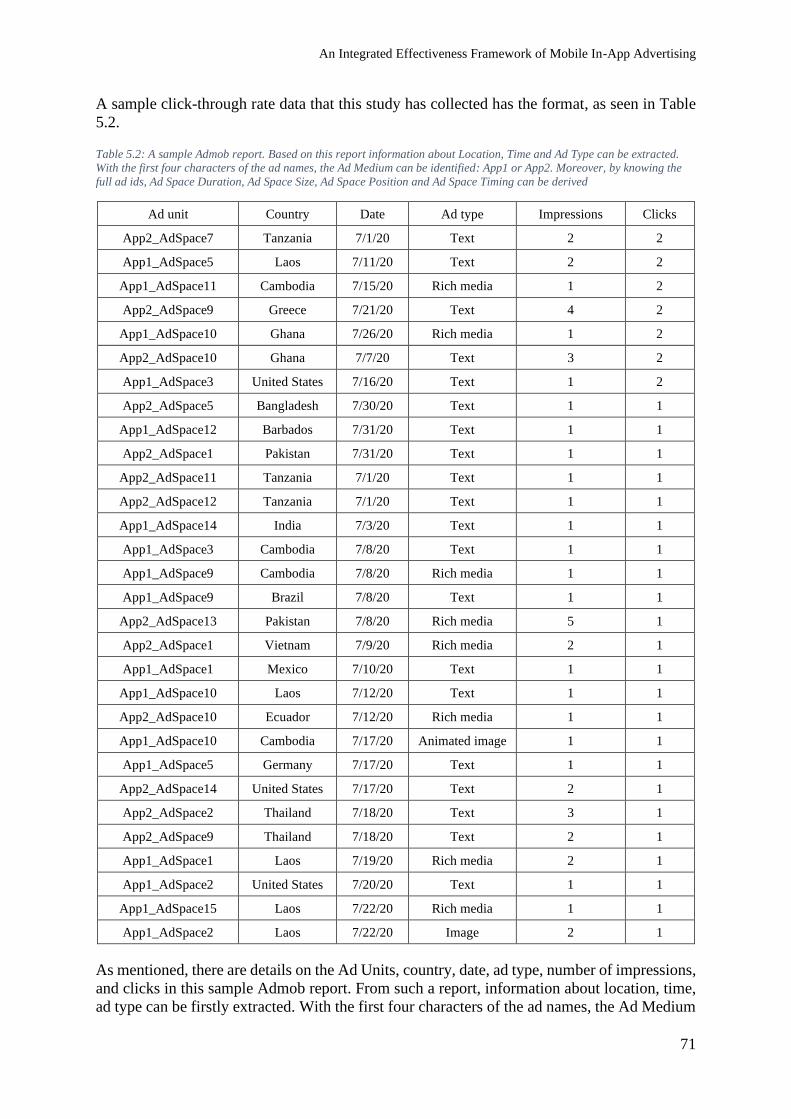
An Integrated Effectiveness Framework of Mobile In-App Advertising
71
A sample click-through rate data that this study has collected has the format, as seen in Table
5.2.
Table 5.2: A sample Admob report. Based on this report information about Location, Time and Ad Type can be extracted.
With the first four characters of the ad names, the Ad Medium can be identified: App1 or App2. Moreover, by knowing the
full ad ids, Ad Space Duration, Ad Space Size, Ad Space Position and Ad Space Timing can be derived
Ad unit Country Date Ad type Impressions Clicks
App2_AdSpace7 Tanzania 7/1/20 Text 2 2
App1_AdSpace5 Laos 7/11/20 Text 2 2
App1_AdSpace11 Cambodia 7/15/20 Rich media 1 2
App2_AdSpace9 Greece 7/21/20 Text 4 2
App1_AdSpace10 Ghana 7/26/20 Rich media 1 2
App2_AdSpace10 Ghana 7/7/20 Text 3 2
App1_AdSpace3 United States 7/16/20 Text 1 2
App2_AdSpace5 Bangladesh 7/30/20 Text 1 1
App1_AdSpace12 Barbados 7/31/20 Text 1 1
App2_AdSpace1 Pakistan 7/31/20 Text 1 1
App2_AdSpace11 Tanzania 7/1/20 Text 1 1
App2_AdSpace12 Tanzania 7/1/20 Text 1 1
App1_AdSpace14 India 7/3/20 Text 1 1
App1_AdSpace3 Cambodia 7/8/20 Text 1 1
App1_AdSpace9 Cambodia 7/8/20 Rich media 1 1
App1_AdSpace9 Brazil 7/8/20 Text 1 1
App2_AdSpace13 Pakistan 7/8/20 Rich media 5 1
App2_AdSpace1 Vietnam 7/9/20 Rich media 2 1
App1_AdSpace1 Mexico 7/10/20 Text 1 1
App1_AdSpace10 Laos 7/12/20 Text 1 1
App2_AdSpace10 Ecuador 7/12/20 Rich media 1 1
App1_AdSpace10 Cambodia 7/17/20 Animated image 1 1
App1_AdSpace5 Germany 7/17/20 Text 1 1
App2_AdSpace14 United States 7/17/20 Text 2 1
App2_AdSpace2 Thailand 7/18/20 Text 3 1
App2_AdSpace9 Thailand 7/18/20 Text 2 1
App1_AdSpace1 Laos 7/19/20 Rich media 2 1
App1_AdSpace2 United States 7/20/20 Text 1 1
App1_AdSpace15 Laos 7/22/20 Rich media 1 1
App1_AdSpace2 Laos 7/22/20 Image 2 1
As mentioned, there are details on the Ad Units, country, date, ad type, number of impressions,
and clicks in this sample Admob report. From such a report, information about location, time,
ad type can be firstly extracted. With the first four characters of the ad names, the Ad Medium
An Integrated Effectiveness Framework of Mobile In-App Advertising
72
can be identified: App1 or App2. Moreover, knowing the full ad ids, Ad Space Duration, Ad
Space Size, Ad Space Position and Ad Space Timing can be derived from Table 5.1. All eight
independent variables of this study can be identified with one Admob record. The next question
is, how many records this study needs to collect?
Sampling
The population of mobile users is limitless, and not all of them are given equal chances of
downloading the two apps. A non-probability sampling technique is, therefore, appropriate in
this case (Coopers & Schindler 2006). There are four non-probability sampling methods
(Lavrakas 2008).
• The most common sampling method may be convenience sampling. Samples are
collected as sampling is simple for the researcher. Subjects are selected because they
can be recruited quickly. They are known as the easiest, cheapest, and least time-
consuming techniques.
• Consistent sampling is somewhat similar to convenience sampling, except to include
all possible subjects in the survey. This non-probability sampling methodology can be
considered the strongest of all non-probability sampling approaches. It incorporates all
possible subjects to make the sample more representative of the entire population.
• Quota sampling is another non-probability sampling method in which the researcher
ensures that the samples are distributed uniformly or proportionately, depending on
what the quota base is.
• Most generally, judgmental sampling is referred to as unbiased sampling. In this
sampling method, participants are chosen for a specific purpose to be part of the study.
The researcher believes that, with judgmental screening, certain subjects are more
appropriate for review than others. That is why they are picked as subjects.
In this study, consistent sampling is first used when all kinds of ad impressions (e.g. sports,
entertainment) are selected for representative purposes as above mentioned. Then the quota
sampling is used to ensure the age and gender quotas are proportionally collected with the
purpose of minimising their confounding effects (Prew & Lin 2019).
Regarding the sample size of one-factor two-variant testing, this study follows Cochran’s
guideline (Cochran 1977). Accordingly, the sample size is calculated as:
𝑛 = 𝑧2 × 𝑝 × (1 − 𝑝)
𝑐2 (2)
Where the z-score that corresponds to 95% confidence is 1.96. p is the percentage of picking a
choice and is calculated as CTR, where CTR is the average CTR of the whole sample. c is the
confidence range (the change to be detected), being calculated as CTR(X1) – CTR(X2) (Yacko
2012), with CTR (X1) is the average CTR of the first variant of factor X, and CTR (X2) is the
average CTR of the second variant of factor X. With the average CTR of 5% and the confidence
range of 1%, the sample size is calculated as 1,278 impressions. It means that in order to test
the difference between two populations X1 and X2 statistically, the minimum sample size would
be 1,278 impressions. For the case of four factors, the total number of variants is 16.
An Integrated Effectiveness Framework of Mobile In-App Advertising
73
Accordingly, the required sample size is 10,224 impressions. In this study, the total number of
impressions recorded is 15,511 meeting the required sample size.
After data has been successfully collected, it will then be analysed. In this study, descriptive
statistics included descriptive quantities, percentages, mean and standard deviations. They are
used to review participants’ demographic profiles and model analysis variables. Proportional
z-test and analysis of variance (ANOVA) were then used to test the main effects. The usage of
the two techniques could help to cross-check the results and increase its credibility. Similarly,
this study also employs two techniques to test the moderating effects. They are Multigroup
Moderated Analysis and Moderated Regression Analysis.
Basically, this study used a combination of correlation, hierarchical multiple regression, and
structural equation modelling techniques to test the eight hypotheses. Structural equation
modelling (SEM) was used in the form of a path analysis. Analysis of Moment Structures
(AMOS) tool was employed. It is a module in the Social Sciences Statistical Package for Social
Sciences (SPSS). The results from all those tests on those tools are accordingly presented in
detail in Chapter 6.
An Integrated Effectiveness Framework of Mobile In-App Advertising
74
Chapter 6. DATA ANALYSIS
In this chapter, the results of the statistical tests are presented in detail. There are results from
the proportional and factorial ANOVA tests. These tests are needed to reconfirm if the factors
selected actually have significant impacts on the click-through rate as supposed. That is a
mandatory step before the test of the moderating effects can be performed. Next, this chapter
presents the Moderated Regression Analysis and Multigroup Moderation Analysis results via
SEM AMOS regarding the moderating effects. However, firstly, this chapter will discuss data
screening, normality, reliability and validity checks.
Accordingly, the following will be covered in this chapter:
• Data Screening (Section 6.1)
• Reliability and Validity Checks (Section 6.2)
• Descriptive Analysis (Section 6.3)
• Proportional Tests (Section 6.4)
• Analysis of Variance Tests (Section 6.5)
• Multigroup Moderation Analysis (Section 6.6)
• Moderated Regression Analysis (Section 6.7)
• Summary (Section 6.8)
6. 1. Data Screening
Missing data
The dataset was firstly checked for missing data. No data, or missing information, exist in
statistics when no data value is stored for the element in an observation (Anderson et al. 2016).
Data can be missing randomly or systematically. Any type of study may have missing data due
to an accident or a data entry error. According to Rubin (1976)’s typology, there are three
missing data mechanisms: missing not at random, missing at random and missing at completely
random.
In surveys, missing data may occur at random due to non-response: no information was given
for one or more items or an entire unit (Fowler Jr 2013). Missing data in field experiment
studies occur when a researcher is accidentally unable to collect an observation: poor weather
conditions may make observation impossible, a researcher becomes ill, or equipment
malfunctions (Little & Rubin 2019). The researchers randomly create missing values as well
— for example, when data collection is done incorrectly, or errors in data entry are made. Those
are regarded as human errors, which are occurred at random or not at random (Newman 2014).
In online experiments, however, missing data is completely random and can only be minimized
An Integrated Effectiveness Framework of Mobile In-App Advertising
75
by a randomized distribution of treatments and participants (Kohavi & Longbotham 2017) and
double sampling (Gomila & Clark 2020).
Understanding the reasons why missing data is crucial in the research design stage, this online
experiment study has employed a randomized algorithm when programming the displaying of
ads (treatments) to its participants (mobile users). This study has also collected 15511
impressions, 51% higher than the required sample size. When the data has been collected, it
was first prepared in the Statistical Packages for Social Sciences (SPSS) application. Figural
and score appointments first reported the data in an SPSS spreadsheet. Score reversal was also
done to accommodate more analytical procedures where necessary. The imputation techniques
(e.g. series mean) are ready to be applied on those inputs if needed.
The initial screening of the collected data has shown all the independent variables were filled
with their values. For the dependent variable, this study needs to calculate the ratio of the
collected number of clicks and the collected number of impressions. In order to ensure that
there is no missing data in this dependent variable, there must be no missing data in the numbers
of impressions in all combinations. As shown in Appendix I, all combinations recorded at least
one impression, leading to no missing values in the dependent variable. The missing data was
avoided completely. That can be explained by the usage of the two mentioned methods. The
randomness mechanism that this study employed has helped distribute the impressions among
those 256 combinations equally. Furthermore, the two apps were both receptive and recorded
a significantly higher number of impressions than the required sample size. Besides, this study
also employs a very stable ad network - Google Admob to collect the ad click data. By doing
so, it reduced the chance of missing data due to non-random errors as in other types of
experiments (Weissman Adam & Elbaz Gilad 2015).
Outliers
An outlier in statistics is a data point that is significantly different from other measurements
(Anderson et al. 2016). An outlier may be due to measurement uncertainty, or it may imply
experimental error; the latter is often omitted from the set of data (Hox & Boeije 2005). For
statistical analyses, an outlier can cause serious problems. Outliers may occur in any
distribution by chance, but they often signify either a measurement error or a heavy-tailed
distribution of the population. In the former case, one would like to ignore them or use resilient
statistics to outliers (Newbold, Carlson & Thorne 2013). The latter said that the distribution is
very distorted and that one should be very careful when using methods or intuitions that
presume normal distribution (Al-Busaidi 2008). A common outliers cause is a mixture of two
distributions, which can be two distinct sub-populations or “right trial” versus “measurement
error” (Hsiao 2014). Data outliers can also be examined by histogram and exploratory analyses
and by testing the difference between mean and 5% trimmed mean of the concerned variables
via SPSS (Anderson et al. 2016). Based on the collected data, as shown in Appendix I, a
histogram of click-through rates was first created. The histogram has recorded no outliers, as
shown in Figure 6.1. If there is an outlier, the histogram will show some starred points (i.e. *)
outside the upper and lower bounds.
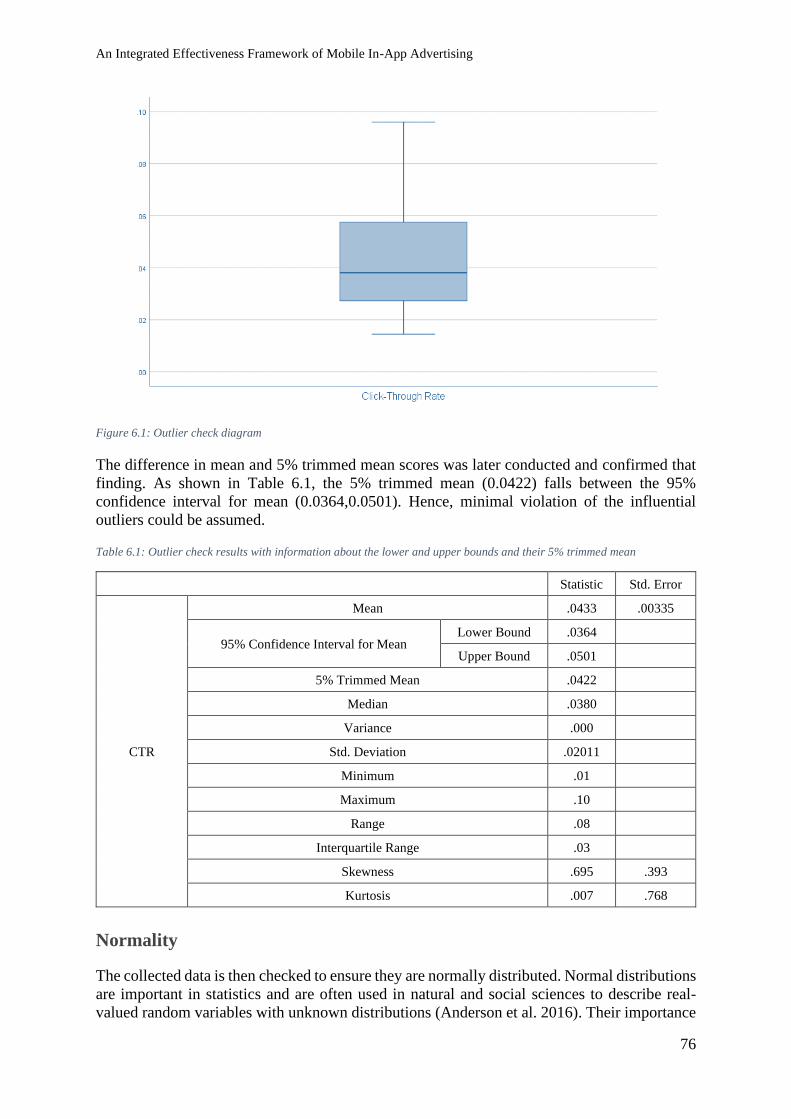
An Integrated Effectiveness Framework of Mobile In-App Advertising
76
Figure 6.1: Outlier check diagram
The difference in mean and 5% trimmed mean scores was later conducted and confirmed that
finding. As shown in Table 6.1, the 5% trimmed mean (0.0422) falls between the 95%
confidence interval for mean (0.0364,0.0501). Hence, minimal violation of the influential
outliers could be assumed.
Table 6.1: Outlier check results with information about the lower and upper bounds and their 5% trimmed mean
Statistic Std. Error
CTR
Mean .0433 .00335
95% Confidence Interval for Mean Lower Bound .0364
Upper Bound .0501
5% Trimmed Mean .0422
Median .0380
Variance .000
Std. Deviation .02011
Minimum .01
Maximum .10
Range .08
Interquartile Range .03
Skewness .695 .393
Kurtosis .007 .768
Normality
The collected data is then checked to ensure they are normally distributed. Normal distributions
are important in statistics and are often used in natural and social sciences to describe real-
valued random variables with unknown distributions (Anderson et al. 2016). Their importance
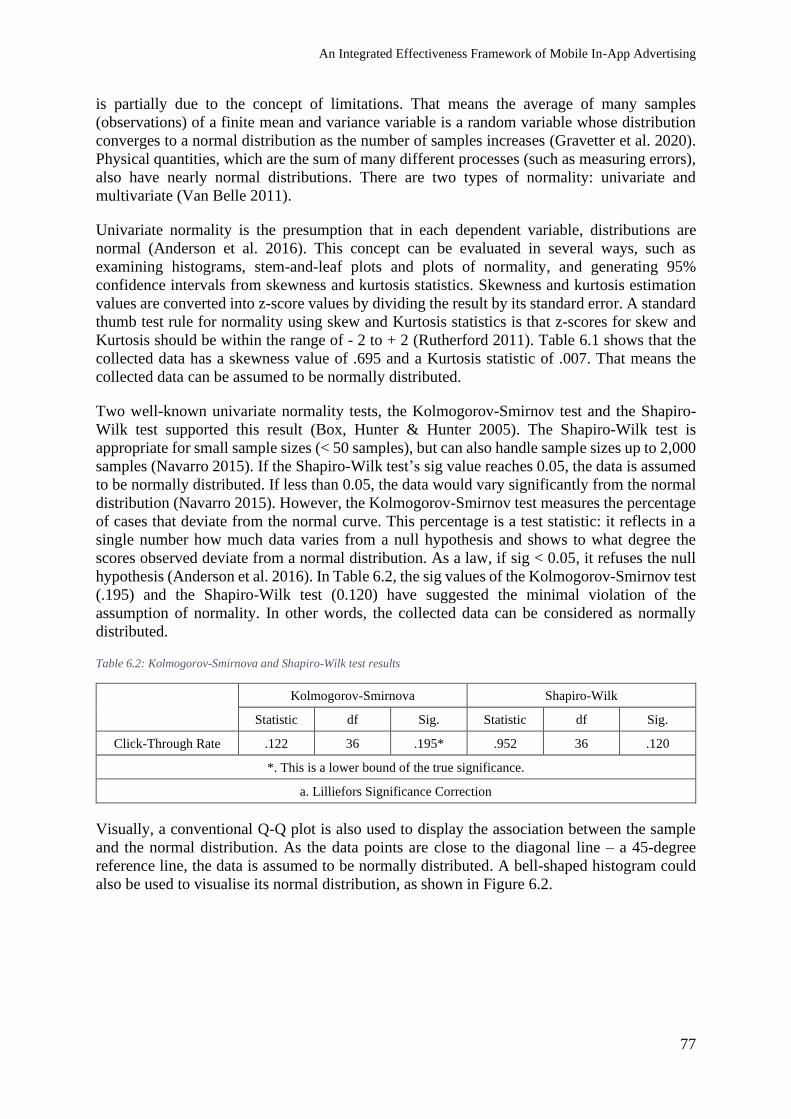
An Integrated Effectiveness Framework of Mobile In-App Advertising
77
is partially due to the concept of limitations. That means the average of many samples
(observations) of a finite mean and variance variable is a random variable whose distribution
converges to a normal distribution as the number of samples increases (Gravetter et al. 2020).
Physical quantities, which are the sum of many different processes (such as measuring errors),
also have nearly normal distributions. There are two types of normality: univariate and
multivariate (Van Belle 2011).
Univariate normality is the presumption that in each dependent variable, distributions are
normal (Anderson et al. 2016). This concept can be evaluated in several ways, such as
examining histograms, stem-and-leaf plots and plots of normality, and generating 95%
confidence intervals from skewness and kurtosis statistics. Skewness and kurtosis estimation
values are converted into z-score values by dividing the result by its standard error. A standard
thumb test rule for normality using skew and Kurtosis statistics is that z-scores for skew and
Kurtosis should be within the range of - 2 to + 2 (Rutherford 2011). Table 6.1 shows that the
collected data has a skewness value of .695 and a Kurtosis statistic of .007. That means the
collected data can be assumed to be normally distributed.
Two well-known univariate normality tests, the Kolmogorov-Smirnov test and the Shapiro-
Wilk test supported this result (Box, Hunter & Hunter 2005). The Shapiro-Wilk test is
appropriate for small sample sizes (< 50 samples), but can also handle sample sizes up to 2,000
samples (Navarro 2015). If the Shapiro-Wilk test’s sig value reaches 0.05, the data is assumed
to be normally distributed. If less than 0.05, the data would vary significantly from the normal
distribution (Navarro 2015). However, the Kolmogorov-Smirnov test measures the percentage
of cases that deviate from the normal curve. This percentage is a test statistic: it reflects in a
single number how much data varies from a null hypothesis and shows to what degree the
scores observed deviate from a normal distribution. As a law, if sig < 0.05, it refuses the null
hypothesis (Anderson et al. 2016). In Table 6.2, the sig values of the Kolmogorov-Smirnov test
(.195) and the Shapiro-Wilk test (0.120) have suggested the minimal violation of the
assumption of normality. In other words, the collected data can be considered as normally
distributed.
Table 6.2: Kolmogorov-Smirnova and Shapiro-Wilk test results
Kolmogorov-Smirnova Shapiro-Wilk
Statistic df Sig. Statistic df Sig.
Click-Through Rate .122 36 .195* .952 36 .120
*. This is a lower bound of the true significance.
a. Lilliefors Significance Correction
Visually, a conventional Q-Q plot is also used to display the association between the sample
and the normal distribution. As the data points are close to the diagonal line – a 45-degree
reference line, the data is assumed to be normally distributed. A bell-shaped histogram could
also be used to visualise its normal distribution, as shown in Figure 6.2.
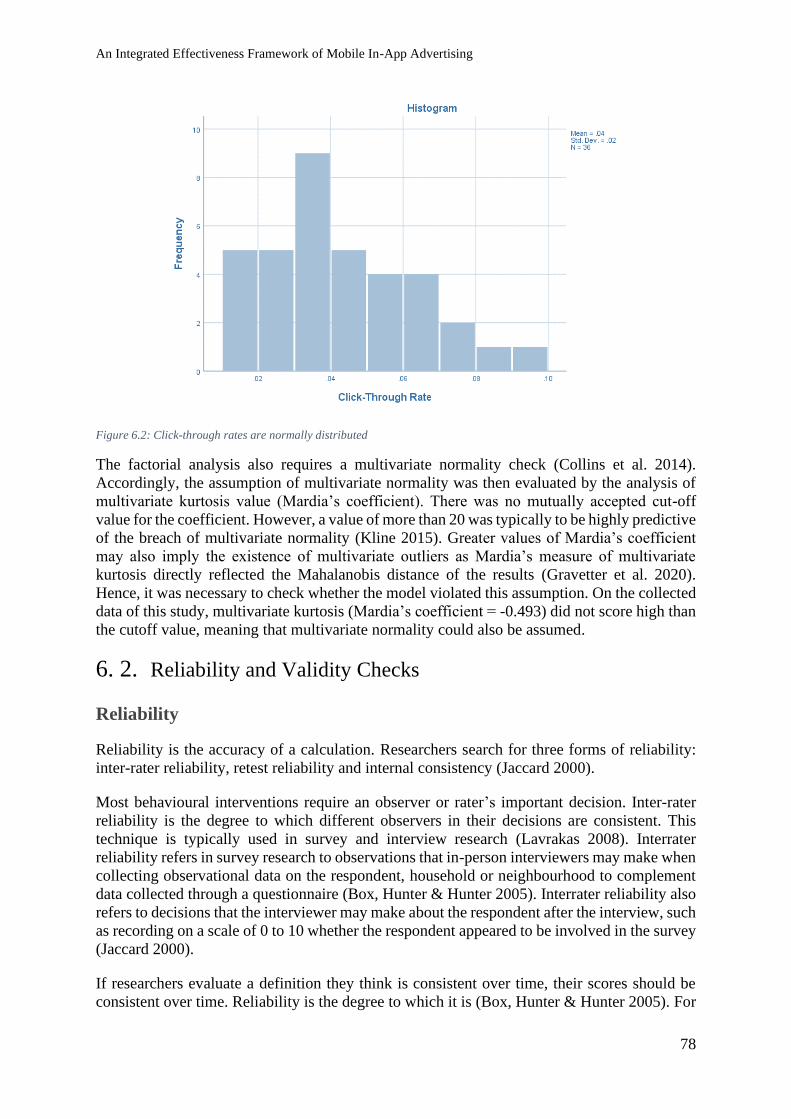
An Integrated Effectiveness Framework of Mobile In-App Advertising
78
Figure 6.2: Click-through rates are normally distributed
The factorial analysis also requires a multivariate normality check (Collins et al. 2014).
Accordingly, the assumption of multivariate normality was then evaluated by the analysis of
multivariate kurtosis value (Mardia’s coefficient). There was no mutually accepted cut-off
value for the coefficient. However, a value of more than 20 was typically to be highly predictive
of the breach of multivariate normality (Kline 2015). Greater values of Mardia’s coefficient
may also imply the existence of multivariate outliers as Mardia’s measure of multivariate
kurtosis directly reflected the Mahalanobis distance of the results (Gravetter et al. 2020).
Hence, it was necessary to check whether the model violated this assumption. On the collected
data of this study, multivariate kurtosis (Mardia’s coefficient = -0.493) did not score high than
the cutoff value, meaning that multivariate normality could also be assumed.
6. 2. Reliability and Validity Checks
Reliability
Reliability is the accuracy of a calculation. Researchers search for three forms of reliability:
inter-rater reliability, retest reliability and internal consistency (Jaccard 2000).
Most behavioural interventions require an observer or rater’s important decision. Inter-rater
reliability is the degree to which different observers in their decisions are consistent. This
technique is typically used in survey and interview research (Lavrakas 2008). Interrater
reliability refers in survey research to observations that in-person interviewers may make when
collecting observational data on the respondent, household or neighbourhood to complement
data collected through a questionnaire (Box, Hunter & Hunter 2005). Interrater reliability also
refers to decisions that the interviewer may make about the respondent after the interview, such
as recording on a scale of 0 to 10 whether the respondent appeared to be involved in the survey
(Jaccard 2000).
If researchers evaluate a definition they think is consistent over time, their scores should be
consistent over time. Reliability is the degree to which it is (Box, Hunter & Hunter 2005). For
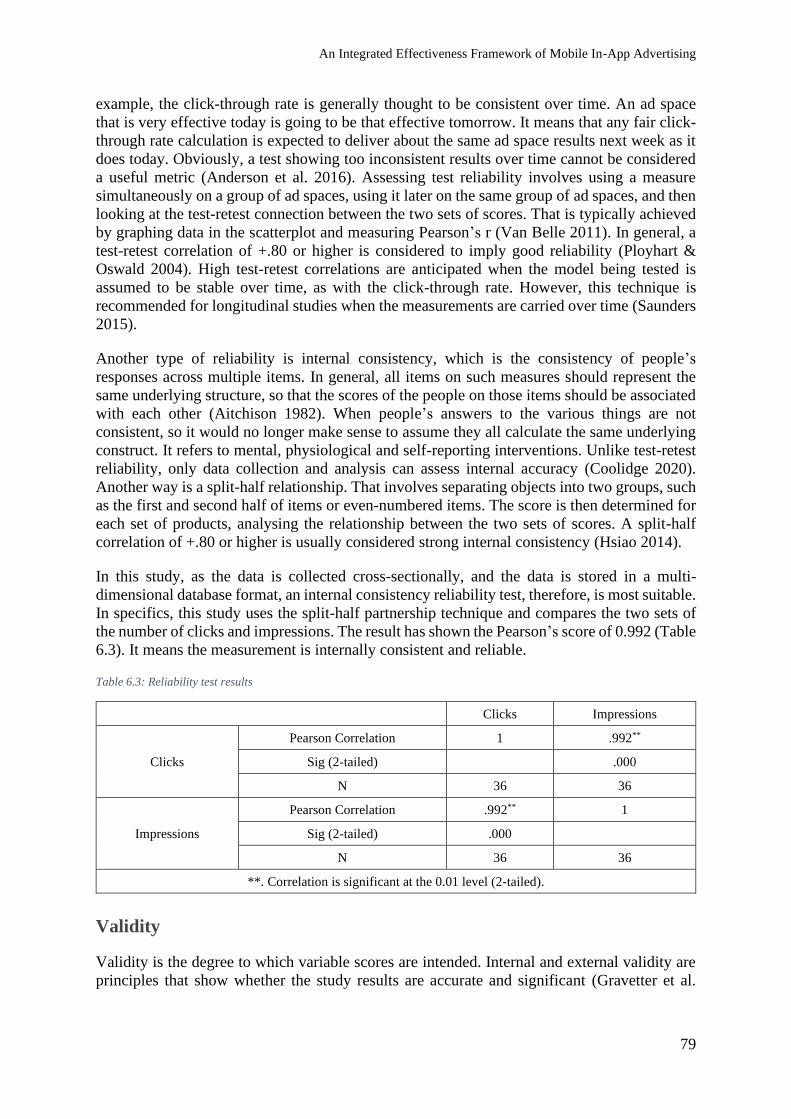
An Integrated Effectiveness Framework of Mobile In-App Advertising
79
example, the click-through rate is generally thought to be consistent over time. An ad space
that is very effective today is going to be that effective tomorrow. It means that any fair click-
through rate calculation is expected to deliver about the same ad space results next week as it
does today. Obviously, a test showing too inconsistent results over time cannot be considered
a useful metric (Anderson et al. 2016). Assessing test reliability involves using a measure
simultaneously on a group of ad spaces, using it later on the same group of ad spaces, and then
looking at the test-retest connection between the two sets of scores. That is typically achieved
by graphing data in the scatterplot and measuring Pearson’s r (Van Belle 2011). In general, a
test-retest correlation of +.80 or higher is considered to imply good reliability (Ployhart &
Oswald 2004). High test-retest correlations are anticipated when the model being tested is
assumed to be stable over time, as with the click-through rate. However, this technique is
recommended for longitudinal studies when the measurements are carried over time (Saunders
2015).
Another type of reliability is internal consistency, which is the consistency of people’s
responses across multiple items. In general, all items on such measures should represent the
same underlying structure, so that the scores of the people on those items should be associated
with each other (Aitchison 1982). When people’s answers to the various things are not
consistent, so it would no longer make sense to assume they all calculate the same underlying
construct. It refers to mental, physiological and self-reporting interventions. Unlike test-retest
reliability, only data collection and analysis can assess internal accuracy (Coolidge 2020).
Another way is a split-half relationship. That involves separating objects into two groups, such
as the first and second half of items or even-numbered items. The score is then determined for
each set of products, analysing the relationship between the two sets of scores. A split-half
correlation of +.80 or higher is usually considered strong internal consistency (Hsiao 2014).
In this study, as the data is collected cross-sectionally, and the data is stored in a multi-
dimensional database format, an internal consistency reliability test, therefore, is most suitable.
In specifics, this study uses the split-half partnership technique and compares the two sets of
the number of clicks and impressions. The result has shown the Pearson’s score of 0.992 (Table
6.3). It means the measurement is internally consistent and reliable.
Table 6.3: Reliability test results
Clicks Impressions
Clicks
Pearson Correlation 1 .992**
Sig (2-tailed) .000
N 36 36
Impressions
Pearson Correlation .992** 1
Sig (2-tailed) .000
N 36 36
**. Correlation is significant at the 0.01 level (2-tailed).
Validity
Validity is the degree to which variable scores are intended. Internal and external validity are
principles that show whether the study results are accurate and significant (Gravetter et al.
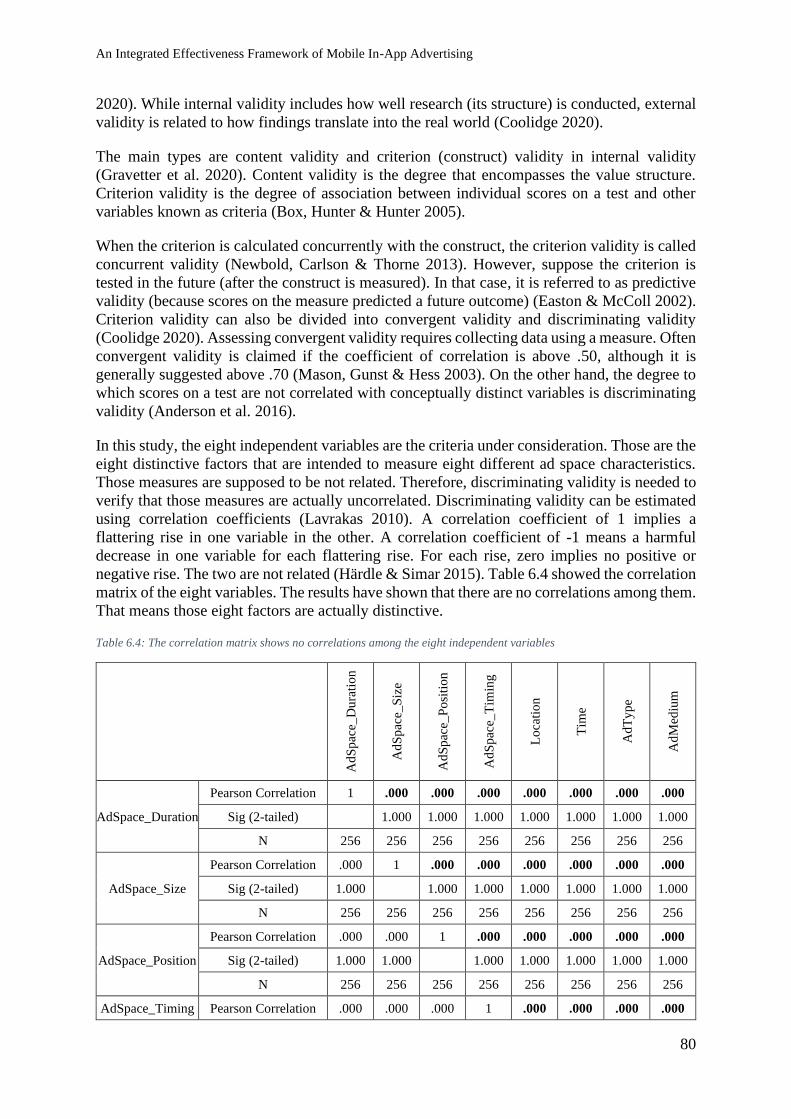
An Integrated Effectiveness Framework of Mobile In-App Advertising
80
2020). While internal validity includes how well research (its structure) is conducted, external
validity is related to how findings translate into the real world (Coolidge 2020).
The main types are content validity and criterion (construct) validity in internal validity
(Gravetter et al. 2020). Content validity is the degree that encompasses the value structure.
Criterion validity is the degree of association between individual scores on a test and other
variables known as criteria (Box, Hunter & Hunter 2005).
When the criterion is calculated concurrently with the construct, the criterion validity is called
concurrent validity (Newbold, Carlson & Thorne 2013). However, suppose the criterion is
tested in the future (after the construct is measured). In that case, it is referred to as predictive
validity (because scores on the measure predicted a future outcome) (Easton & McColl 2002).
Criterion validity can also be divided into convergent validity and discriminating validity
(Coolidge 2020). Assessing convergent validity requires collecting data using a measure. Often
convergent validity is claimed if the coefficient of correlation is above .50, although it is
generally suggested above .70 (Mason, Gunst & Hess 2003). On the other hand, the degree to
which scores on a test are not correlated with conceptually distinct variables is discriminating
validity (Anderson et al. 2016).
In this study, the eight independent variables are the criteria under consideration. Those are the
eight distinctive factors that are intended to measure eight different ad space characteristics.
Those measures are supposed to be not related. Therefore, discriminating validity is needed to
verify that those measures are actually uncorrelated. Discriminating validity can be estimated
using correlation coefficients (Lavrakas 2010). A correlation coefficient of 1 implies a
flattering rise in one variable in the other. A correlation coefficient of -1 means a harmful
decrease in one variable for each flattering rise. For each rise, zero implies no positive or
negative rise. The two are not related (Härdle & Simar 2015). Table 6.4 showed the correlation
matrix of the eight variables. The results have shown that there are no correlations among them.
That means those eight factors are actually distinctive.
Table 6.4: The correlation matrix shows no correlations among the eight independent variables
Ad
Sp
ace_
Du
rati
on
Ad
Sp
ace_
Siz
e
Ad
Sp
ace_
Po
siti
on
Ad
Sp
ace_
Tim
ing
Lo
cati
on
Tim
e
Ad
Ty
pe
Ad
Med
ium
AdSpace_Duration
Pearson Correlation 1 .000 .000 .000 .000 .000 .000 .000
Sig (2-tailed) 1.000 1.000 1.000 1.000 1.000 1.000 1.000
N 256 256 256 256 256 256 256 256
AdSpace_Size
Pearson Correlation .000 1 .000 .000 .000 .000 .000 .000
Sig (2-tailed) 1.000 1.000 1.000 1.000 1.000 1.000 1.000
N 256 256 256 256 256 256 256 256
AdSpace_Position
Pearson Correlation .000 .000 1 .000 .000 .000 .000 .000
Sig (2-tailed) 1.000 1.000 1.000 1.000 1.000 1.000 1.000
N 256 256 256 256 256 256 256 256
AdSpace_Timing Pearson Correlation .000 .000 .000 1 .000 .000 .000 .000
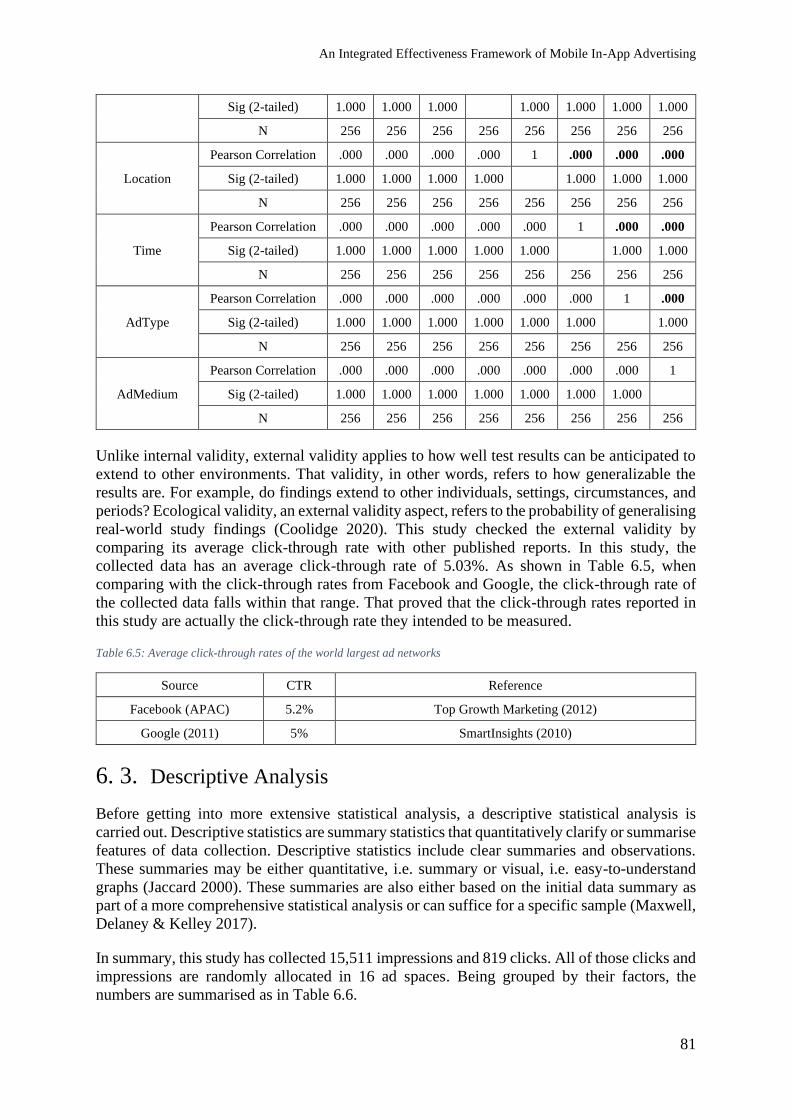
An Integrated Effectiveness Framework of Mobile In-App Advertising
81
Sig (2-tailed) 1.000 1.000 1.000 1.000 1.000 1.000 1.000
N 256 256 256 256 256 256 256 256
Location
Pearson Correlation .000 .000 .000 .000 1 .000 .000 .000
Sig (2-tailed) 1.000 1.000 1.000 1.000 1.000 1.000 1.000
N 256 256 256 256 256 256 256 256
Time
Pearson Correlation .000 .000 .000 .000 .000 1 .000 .000
Sig (2-tailed) 1.000 1.000 1.000 1.000 1.000 1.000 1.000
N 256 256 256 256 256 256 256 256
AdType
Pearson Correlation .000 .000 .000 .000 .000 .000 1 .000
Sig (2-tailed) 1.000 1.000 1.000 1.000 1.000 1.000 1.000
N 256 256 256 256 256 256 256 256
AdMedium
Pearson Correlation .000 .000 .000 .000 .000 .000 .000 1
Sig (2-tailed) 1.000 1.000 1.000 1.000 1.000 1.000 1.000
N 256 256 256 256 256 256 256 256
Unlike internal validity, external validity applies to how well test results can be anticipated to
extend to other environments. That validity, in other words, refers to how generalizable the
results are. For example, do findings extend to other individuals, settings, circumstances, and
periods? Ecological validity, an external validity aspect, refers to the probability of generalising
real-world study findings (Coolidge 2020). This study checked the external validity by
comparing its average click-through rate with other published reports. In this study, the
collected data has an average click-through rate of 5.03%. As shown in Table 6.5, when
comparing with the click-through rates from Facebook and Google, the click-through rate of
the collected data falls within that range. That proved that the click-through rates reported in
this study are actually the click-through rate they intended to be measured.
Table 6.5: Average click-through rates of the world largest ad networks
Source CTR Reference
Facebook (APAC) 5.2% Top Growth Marketing (2012)
Google (2011) 5% SmartInsights (2010)
6. 3. Descriptive Analysis
Before getting into more extensive statistical analysis, a descriptive statistical analysis is
carried out. Descriptive statistics are summary statistics that quantitatively clarify or summarise
features of data collection. Descriptive statistics include clear summaries and observations.
These summaries may be either quantitative, i.e. summary or visual, i.e. easy-to-understand
graphs (Jaccard 2000). These summaries are also either based on the initial data summary as
part of a more comprehensive statistical analysis or can suffice for a specific sample (Maxwell,
Delaney & Kelley 2017).
In summary, this study has collected 15,511 impressions and 819 clicks. All of those clicks and
impressions are randomly allocated in 16 ad spaces. Being grouped by their factors, the
numbers are summarised as in Table 6.6.
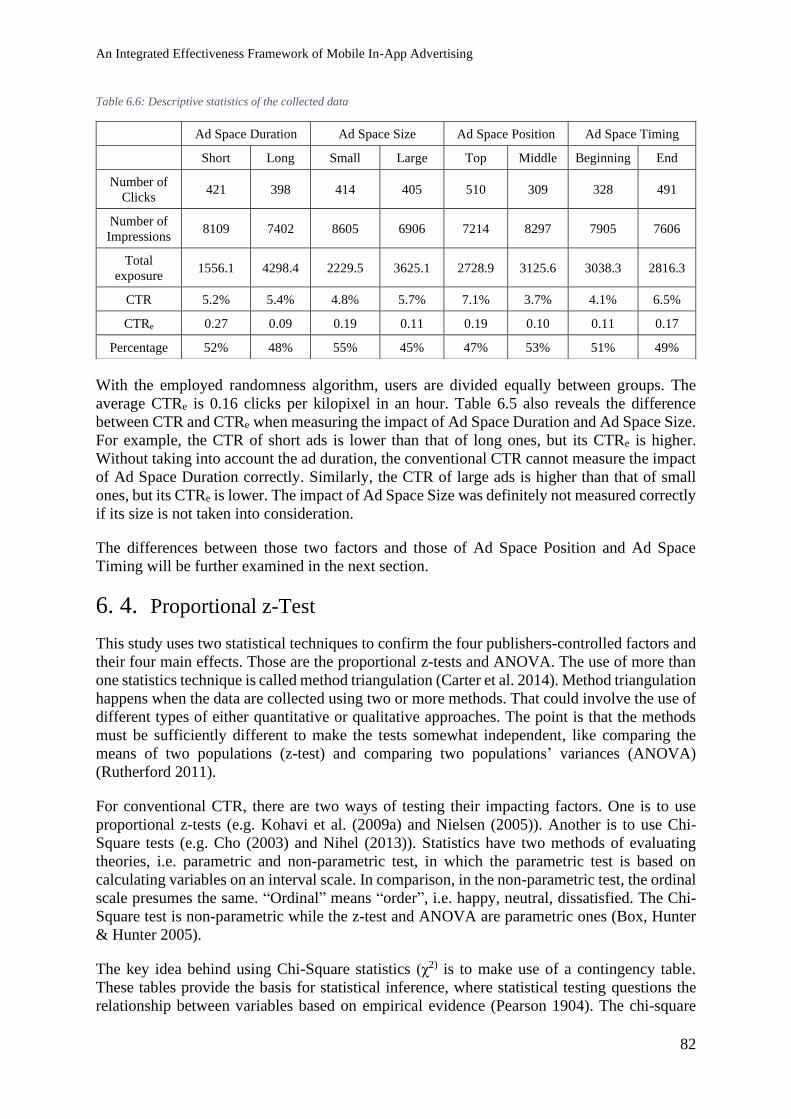
An Integrated Effectiveness Framework of Mobile In-App Advertising
82
Table 6.6: Descriptive statistics of the collected data
With the employed randomness algorithm, users are divided equally between groups. The
average CTRe is 0.16 clicks per kilopixel in an hour. Table 6.5 also reveals the difference
between CTR and CTRe when measuring the impact of Ad Space Duration and Ad Space Size.
For example, the CTR of short ads is lower than that of long ones, but its CTRe is higher.
Without taking into account the ad duration, the conventional CTR cannot measure the impact
of Ad Space Duration correctly. Similarly, the CTR of large ads is higher than that of small
ones, but its CTRe is lower. The impact of Ad Space Size was definitely not measured correctly
if its size is not taken into consideration.
The differences between those two factors and those of Ad Space Position and Ad Space
Timing will be further examined in the next section.
6. 4. Proportional z-Test
This study uses two statistical techniques to confirm the four publishers-controlled factors and
their four main effects. Those are the proportional z-tests and ANOVA. The use of more than
one statistics technique is called method triangulation (Carter et al. 2014). Method triangulation
happens when the data are collected using two or more methods. That could involve the use of
different types of either quantitative or qualitative approaches. The point is that the methods
must be sufficiently different to make the tests somewhat independent, like comparing the
means of two populations (z-test) and comparing two populations’ variances (ANOVA)
(Rutherford 2011).
For conventional CTR, there are two ways of testing their impacting factors. One is to use
proportional z-tests (e.g. Kohavi et al. (2009a) and Nielsen (2005)). Another is to use Chi-
Square tests (e.g. Cho (2003) and Nihel (2013)). Statistics have two methods of evaluating
theories, i.e. parametric and non-parametric test, in which the parametric test is based on
calculating variables on an interval scale. In comparison, in the non-parametric test, the ordinal
scale presumes the same. “Ordinal” means “order”, i.e. happy, neutral, dissatisfied. The Chi-
Square test is non-parametric while the z-test and ANOVA are parametric ones (Box, Hunter
& Hunter 2005).
The key idea behind using Chi-Square statistics (χ2) is to make use of a contingency table.
These tables provide the basis for statistical inference, where statistical testing questions the
relationship between variables based on empirical evidence (Pearson 1904). The chi-square
Ad Space Duration Ad Space Size Ad Space Position Ad Space Timing
Short Long Small Large Top Middle Beginning End
Number of
Clicks 421 398 414 405 510 309 328 491
Number of
Impressions 8109 7402 8605 6906 7214 8297 7905 7606
Total
exposure 1556.1 4298.4 2229.5 3625.1 2728.9 3125.6 3038.3 2816.3
CTR 5.2% 5.4% 4.8% 5.7% 7.1% 3.7% 4.1% 6.5%
CTRe 0.27 0.09 0.19 0.11 0.19 0.10 0.11 0.17
Percentage 52% 48% 55% 45% 47% 53% 51% 49%
An Integrated Effectiveness Framework of Mobile In-App Advertising
83
test is based on a statistical equation that calculates the difference under the null hypothesis
between the observed data and the expected values. That basically requires the data-based
estimation of the predicted values. The expected value is calculated as the total number of
observations in a row*total column number/total number of observations in a two-way array
for each cell. The contingency table (also known as cross-tab or crosstab) is the table type in a
matrix format that displays variable frequency distribution. It gives an overview of the
interrelationship between the two variables and can help them identify similarities (Gravetter
et al. 2020).
When the study of categorical outcomes requires more than one variable, it is possible to use
three-way contingency tables and stratified data. The stratified analysis is a powerful statistical
tool that is useful to test for conflict and ambiguity. This approach is useful in testing the
association between two categorical variables by adjusting for a third categorical variable. If
done correctly, it could even help investigate whether the third variable is a confounder or an
effect modifier (Prew & Lin 2019).
The key idea behind using Chi-Square statistics to test the click-through rates is to count the
number of clicks and non-clicks separately as two columns or rows in a three-way contingency
table. To test the relationship between a factor on the click-through rate in these contingency
tables or crosstabs, Cochran-Mantel-Haenszel (CMH) statistics can be used (Satorra & Bentler
2001). In the presence of a third variable, the Cochran-Mantel-Haenszel test is to verify the
conditional combination of two binary variables. The test aims to determine the extent of the
relationship between two dichotomous variables while regulating the nuisance variable. The
CMH statistic is equal to a degree of freedom in the chi-square percentile. The Cochran-
Mantel-Haenszel method only applies if there are three or more variables of classification, and
there are two degrees for the first two variables (Satorra & Bentler 2001).
With all of those advantages, researchers typically selected the Chi-Square technique to test
the impacts of factors on the click-through rate (Cho 2003; Huang & Yang 2012; Nihel 2013).
However, the disadvantage of Chi-Square tests is that they can only be applied to counts, not
to measured quantities (e.g. hours, seconds, pixels) (Box, Hunter & Hunter 2005). The click-
through rate by exposure as proposed in Equation 1 is, unfortunately, a measured quantity.
Therefore, this study must be looking for a parametric statistic technique to test that measured
quantity. Unlike non-parametric testing, e.g. the Chi-Square test, parametric testing can work
with measured quantities and ratio variables (Anderson et al. 2016).
There are two main types of parametric tests, t-test and z-test (Dixon, Enos & Brodmerkle
2011; Harshman, Siroker & Koomen 2013). T-test incorporates t-distribution, which is ideal if
the sample size is small, and the standard population deviation is unknown (Student 1908).
Usually, a sample size of fewer than 30 units is considered small (Coolidge 2020). On the other
hand, when the population variance is known, z-tests can be used, and the sample size is usually
over 30. The z-test is used when the data is distributed roughly as normal to determine if the
two data sets' results vary from each other (Anderson et al. 2016). The main effect tests of this
study required the tests to be carried out between proportions, and their sample size is greater
than 30. The variances are also known. Therefore, the z-test is found as the most suitable
technique to use. In fact, the z-test is the most popular technique in online controlled A/B
experiments (Kohavi & Longbotham 2017; Nielsen 2005).
When comparing the CTR difference between two populations with two variants in one factor,
the z-score can be calculated as (Van Belle 2011):
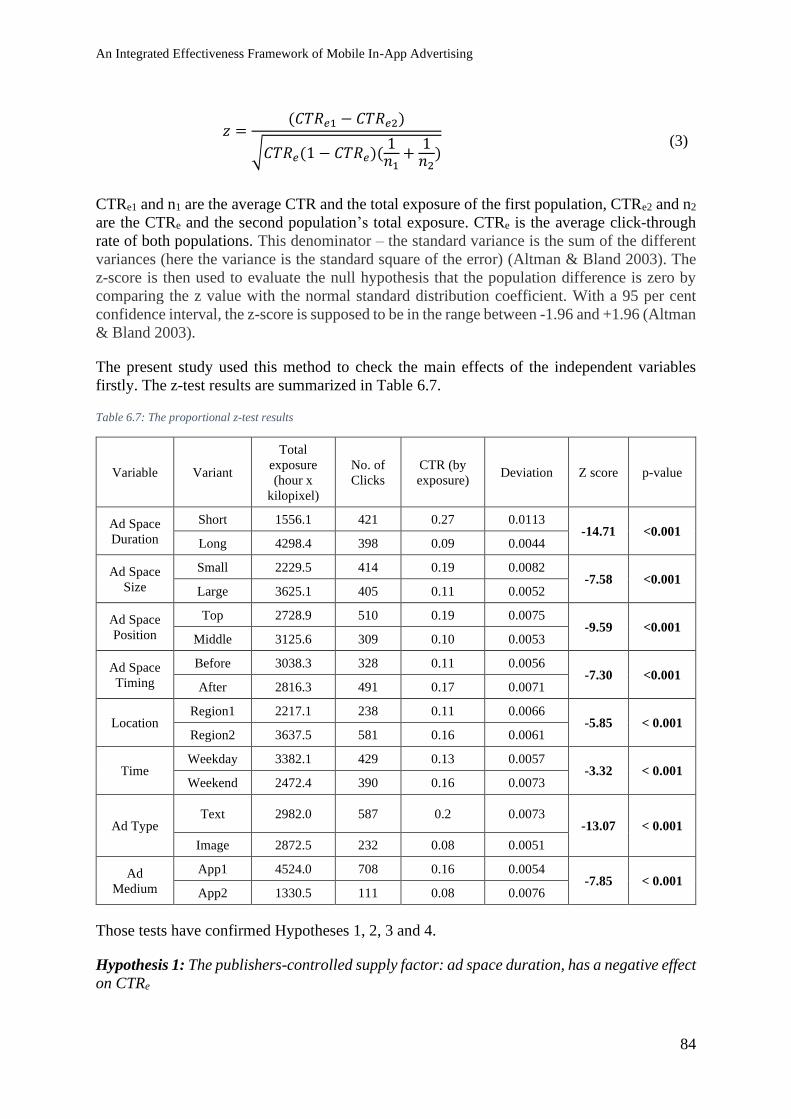
An Integrated Effectiveness Framework of Mobile In-App Advertising
84
𝑧 =(𝐶𝑇𝑅𝑒1 − 𝐶𝑇𝑅𝑒2)
√𝐶𝑇𝑅𝑒(1 − 𝐶𝑇𝑅𝑒)(1𝑛1
+1
𝑛2)
(3)
CTRe1 and n1 are the average CTR and the total exposure of the first population, CTRe2 and n2
are the CTRe and the second population’s total exposure. CTRe is the average click-through
rate of both populations. This denominator – the standard variance is the sum of the different
variances (here the variance is the standard square of the error) (Altman & Bland 2003). The
z-score is then used to evaluate the null hypothesis that the population difference is zero by
comparing the z value with the normal standard distribution coefficient. With a 95 per cent
confidence interval, the z-score is supposed to be in the range between -1.96 and +1.96 (Altman
& Bland 2003).
The present study used this method to check the main effects of the independent variables
firstly. The z-test results are summarized in Table 6.7.
Table 6.7: The proportional z-test results
Variable Variant
Total
exposure
(hour x
kilopixel)
No. of
Clicks
CTR (by
exposure) Deviation Z score p-value
Ad Space
Duration
Short 1556.1 421 0.27 0.0113 -14.71 <0.001
Long 4298.4 398 0.09 0.0044
Ad Space
Size
Small 2229.5 414 0.19 0.0082 -7.58 <0.001
Large 3625.1 405 0.11 0.0052
Ad Space
Position
Top 2728.9 510 0.19 0.0075 -9.59 <0.001
Middle 3125.6 309 0.10 0.0053
Ad Space
Timing
Before 3038.3 328 0.11 0.0056 -7.30 <0.001
After 2816.3 491 0.17 0.0071
Location Region1 2217.1 238 0.11 0.0066
-5.85 < 0.001 Region2 3637.5 581 0.16 0.0061
Time Weekday 3382.1 429 0.13 0.0057
-3.32 < 0.001 Weekend 2472.4 390 0.16 0.0073
Ad Type Text 2982.0 587 0.2 0.0073
-13.07 < 0.001
Image 2872.5 232 0.08 0.0051
Ad
Medium
App1 4524.0 708 0.16 0.0054 -7.85 < 0.001
App2 1330.5 111 0.08 0.0076
Those tests have confirmed Hypotheses 1, 2, 3 and 4.
Hypothesis 1: The publishers-controlled supply factor: ad space duration, has a negative effect
on CTRe
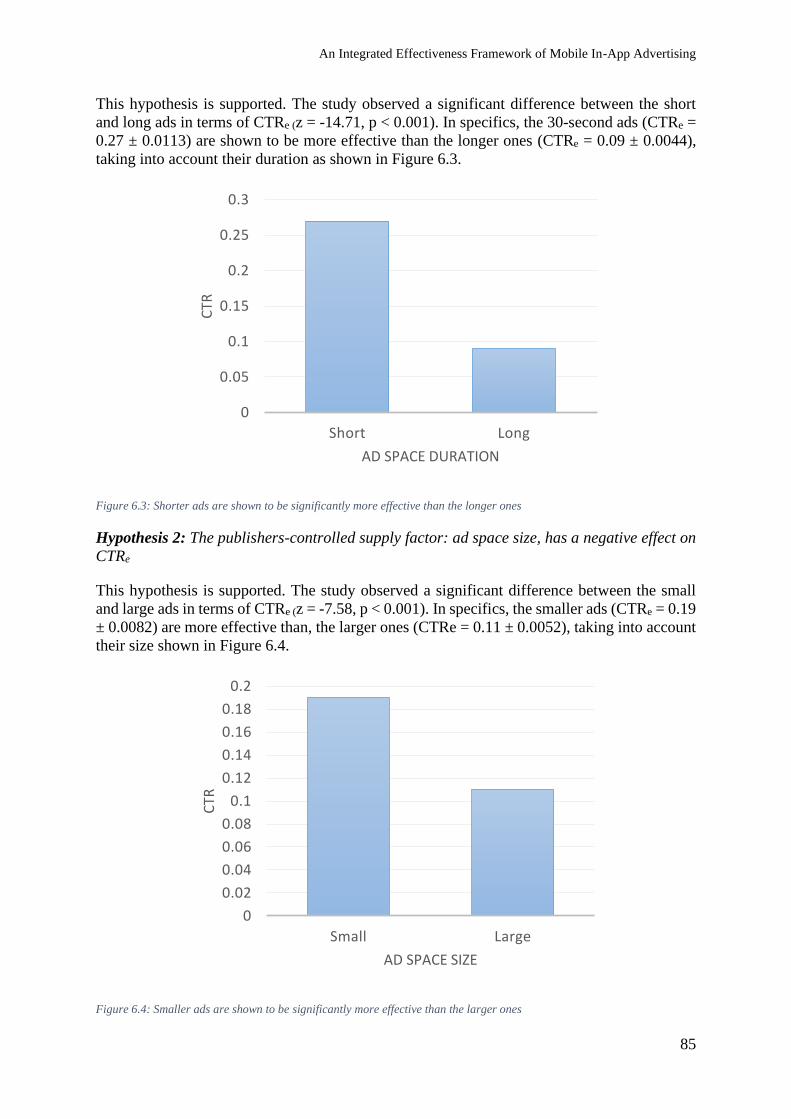
An Integrated Effectiveness Framework of Mobile In-App Advertising
85
This hypothesis is supported. The study observed a significant difference between the short
and long ads in terms of CTRe (z = -14.71, p < 0.001). In specifics, the 30-second ads (CTRe =
0.27 ± 0.0113) are shown to be more effective than the longer ones (CTRe = 0.09 ± 0.0044),
taking into account their duration as shown in Figure 6.3.
Figure 6.3: Shorter ads are shown to be significantly more effective than the longer ones
Hypothesis 2: The publishers-controlled supply factor: ad space size, has a negative effect on
CTRe
This hypothesis is supported. The study observed a significant difference between the small
and large ads in terms of CTRe (z = -7.58, p < 0.001). In specifics, the smaller ads (CTRe = 0.19
± 0.0082) are more effective than, the larger ones (CTRe = 0.11 ± 0.0052), taking into account
their size shown in Figure 6.4.
Figure 6.4: Smaller ads are shown to be significantly more effective than the larger ones
0
0.05
0.1
0.15
0.2
0.25
0.3
Short Long
CTR
AD SPACE DURATION
0
0.02
0.04
0.06
0.08
0.1
0.12
0.14
0.16
0.18
0.2
Small Large
CTR
AD SPACE SIZE
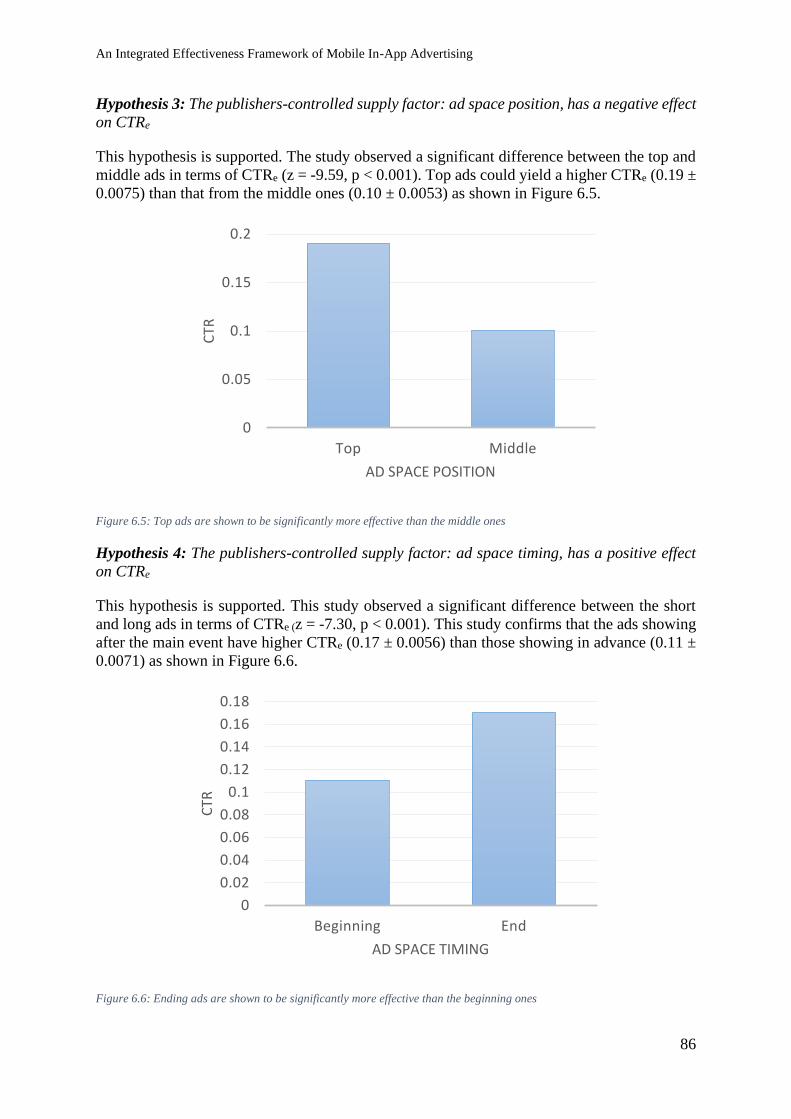
An Integrated Effectiveness Framework of Mobile In-App Advertising
86
Hypothesis 3: The publishers-controlled supply factor: ad space position, has a negative effect
on CTRe
This hypothesis is supported. The study observed a significant difference between the top and
middle ads in terms of CTRe (z = -9.59, p < 0.001). Top ads could yield a higher CTRe (0.19 ±
0.0075) than that from the middle ones (0.10 ± 0.0053) as shown in Figure 6.5.
Figure 6.5: Top ads are shown to be significantly more effective than the middle ones
Hypothesis 4: The publishers-controlled supply factor: ad space timing, has a positive effect
on CTRe
This hypothesis is supported. This study observed a significant difference between the short
and long ads in terms of CTRe (z = -7.30, p < 0.001). This study confirms that the ads showing
after the main event have higher CTRe (0.17 ± 0.0056) than those showing in advance (0.11 ±
0.0071) as shown in Figure 6.6.
Figure 6.6: Ending ads are shown to be significantly more effective than the beginning ones
0
0.05
0.1
0.15
0.2
Top Middle
CTR
AD SPACE POSITION
0
0.02
0.04
0.06
0.08
0.1
0.12
0.14
0.16
0.18
Beginning End
CTR
AD SPACE TIMING
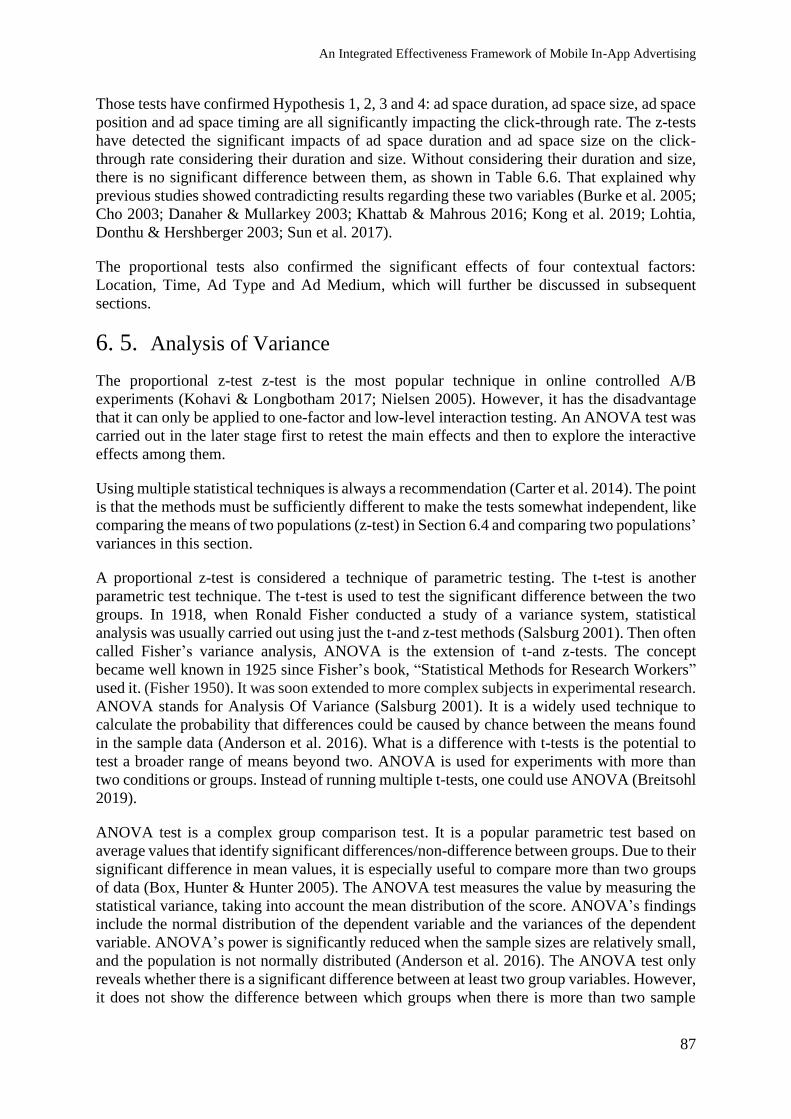
An Integrated Effectiveness Framework of Mobile In-App Advertising
87
Those tests have confirmed Hypothesis 1, 2, 3 and 4: ad space duration, ad space size, ad space
position and ad space timing are all significantly impacting the click-through rate. The z-tests
have detected the significant impacts of ad space duration and ad space size on the click-
through rate considering their duration and size. Without considering their duration and size,
there is no significant difference between them, as shown in Table 6.6. That explained why
previous studies showed contradicting results regarding these two variables (Burke et al. 2005;
Cho 2003; Danaher & Mullarkey 2003; Khattab & Mahrous 2016; Kong et al. 2019; Lohtia,
Donthu & Hershberger 2003; Sun et al. 2017).
The proportional tests also confirmed the significant effects of four contextual factors:
Location, Time, Ad Type and Ad Medium, which will further be discussed in subsequent
sections.
6. 5. Analysis of Variance
The proportional z-test z-test is the most popular technique in online controlled A/B
experiments (Kohavi & Longbotham 2017; Nielsen 2005). However, it has the disadvantage
that it can only be applied to one-factor and low-level interaction testing. An ANOVA test was
carried out in the later stage first to retest the main effects and then to explore the interactive
effects among them.
Using multiple statistical techniques is always a recommendation (Carter et al. 2014). The point
is that the methods must be sufficiently different to make the tests somewhat independent, like
comparing the means of two populations (z-test) in Section 6.4 and comparing two populations’
variances in this section.
A proportional z-test is considered a technique of parametric testing. The t-test is another
parametric test technique. The t-test is used to test the significant difference between the two
groups. In 1918, when Ronald Fisher conducted a study of a variance system, statistical
analysis was usually carried out using just the t-and z-test methods (Salsburg 2001). Then often
called Fisher’s variance analysis, ANOVA is the extension of t-and z-tests. The concept
became well known in 1925 since Fisher’s book, “Statistical Methods for Research Workers”
used it. (Fisher 1950). It was soon extended to more complex subjects in experimental research.
ANOVA stands for Analysis Of Variance (Salsburg 2001). It is a widely used technique to
calculate the probability that differences could be caused by chance between the means found
in the sample data (Anderson et al. 2016). What is a difference with t-tests is the potential to
test a broader range of means beyond two. ANOVA is used for experiments with more than
two conditions or groups. Instead of running multiple t-tests, one could use ANOVA (Breitsohl
2019).
ANOVA test is a complex group comparison test. It is a popular parametric test based on
average values that identify significant differences/non-difference between groups. Due to their
significant difference in mean values, it is especially useful to compare more than two groups
of data (Box, Hunter & Hunter 2005). The ANOVA test measures the value by measuring the
statistical variance, taking into account the mean distribution of the score. ANOVA’s findings
include the normal distribution of the dependent variable and the variances of the dependent
variable. ANOVA’s power is significantly reduced when the sample sizes are relatively small,
and the population is not normally distributed (Anderson et al. 2016). The ANOVA test only
reveals whether there is a significant difference between at least two group variables. However,
it does not show the difference between which groups when there is more than two sample
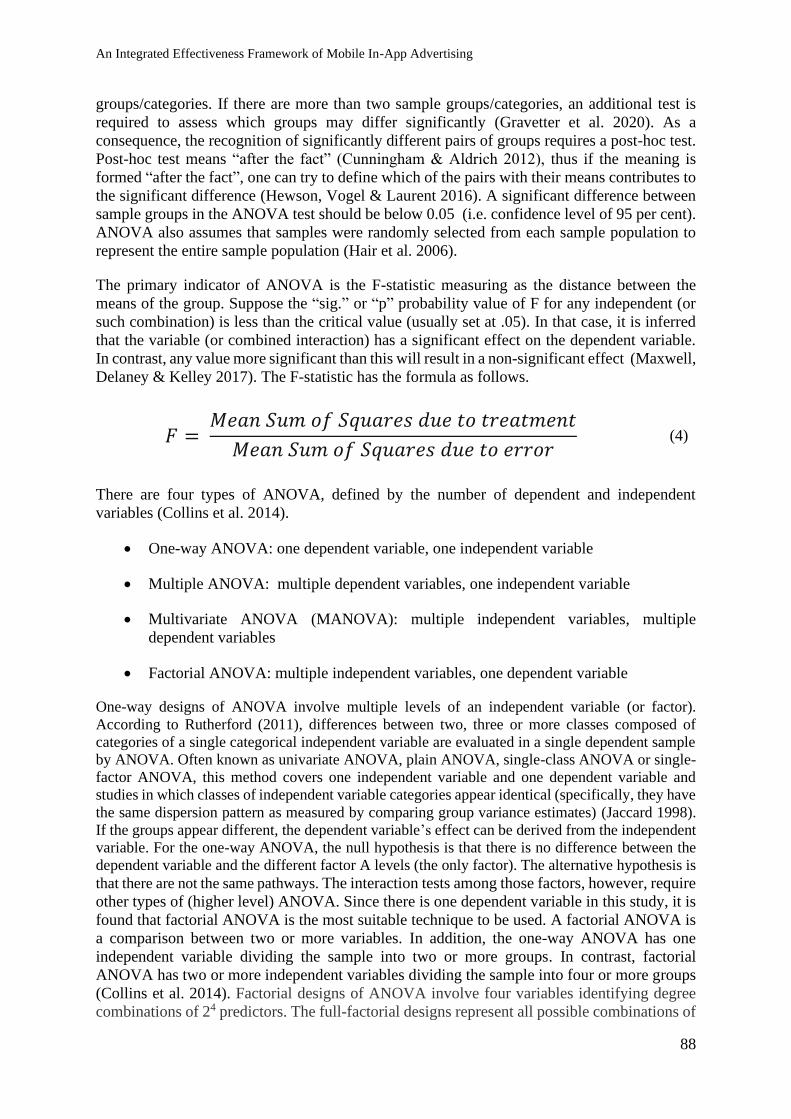
An Integrated Effectiveness Framework of Mobile In-App Advertising
88
groups/categories. If there are more than two sample groups/categories, an additional test is
required to assess which groups may differ significantly (Gravetter et al. 2020). As a
consequence, the recognition of significantly different pairs of groups requires a post-hoc test.
Post-hoc test means “after the fact” (Cunningham & Aldrich 2012), thus if the meaning is
formed “after the fact”, one can try to define which of the pairs with their means contributes to
the significant difference (Hewson, Vogel & Laurent 2016). A significant difference between
sample groups in the ANOVA test should be below 0.05 (i.e. confidence level of 95 per cent).
ANOVA also assumes that samples were randomly selected from each sample population to
represent the entire sample population (Hair et al. 2006).
The primary indicator of ANOVA is the F-statistic measuring as the distance between the
means of the group. Suppose the “sig.” or “p” probability value of F for any independent (or
such combination) is less than the critical value (usually set at .05). In that case, it is inferred
that the variable (or combined interaction) has a significant effect on the dependent variable.
In contrast, any value more significant than this will result in a non-significant effect (Maxwell,
Delaney & Kelley 2017). The F-statistic has the formula as follows.
𝐹 = 𝑀𝑒𝑎𝑛 𝑆𝑢𝑚 𝑜𝑓 𝑆𝑞𝑢𝑎𝑟𝑒𝑠 𝑑𝑢𝑒 𝑡𝑜 𝑡𝑟𝑒𝑎𝑡𝑚𝑒𝑛𝑡
𝑀𝑒𝑎𝑛 𝑆𝑢𝑚 𝑜𝑓 𝑆𝑞𝑢𝑎𝑟𝑒𝑠 𝑑𝑢𝑒 𝑡𝑜 𝑒𝑟𝑟𝑜𝑟 (4)
There are four types of ANOVA, defined by the number of dependent and independent
variables (Collins et al. 2014).
• One-way ANOVA: one dependent variable, one independent variable
• Multiple ANOVA: multiple dependent variables, one independent variable
• Multivariate ANOVA (MANOVA): multiple independent variables, multiple
dependent variables
• Factorial ANOVA: multiple independent variables, one dependent variable
One-way designs of ANOVA involve multiple levels of an independent variable (or factor).
According to Rutherford (2011), differences between two, three or more classes composed of
categories of a single categorical independent variable are evaluated in a single dependent sample
by ANOVA. Often known as univariate ANOVA, plain ANOVA, single-class ANOVA or single-
factor ANOVA, this method covers one independent variable and one dependent variable and
studies in which classes of independent variable categories appear identical (specifically, they have
the same dispersion pattern as measured by comparing group variance estimates) (Jaccard 1998).
If the groups appear different, the dependent variable’s effect can be derived from the independent
variable. For the one-way ANOVA, the null hypothesis is that there is no difference between the
dependent variable and the different factor A levels (the only factor). The alternative hypothesis is
that there are not the same pathways. The interaction tests among those factors, however, require
other types of (higher level) ANOVA. Since there is one dependent variable in this study, it is
found that factorial ANOVA is the most suitable technique to be used. A factorial ANOVA is
a comparison between two or more variables. In addition, the one-way ANOVA has one
independent variable dividing the sample into two or more groups. In contrast, factorial
ANOVA has two or more independent variables dividing the sample into four or more groups
(Collins et al. 2014). Factorial designs of ANOVA involve four variables identifying degree
combinations of 24 predictors. The full-factorial designs represent all possible combinations of
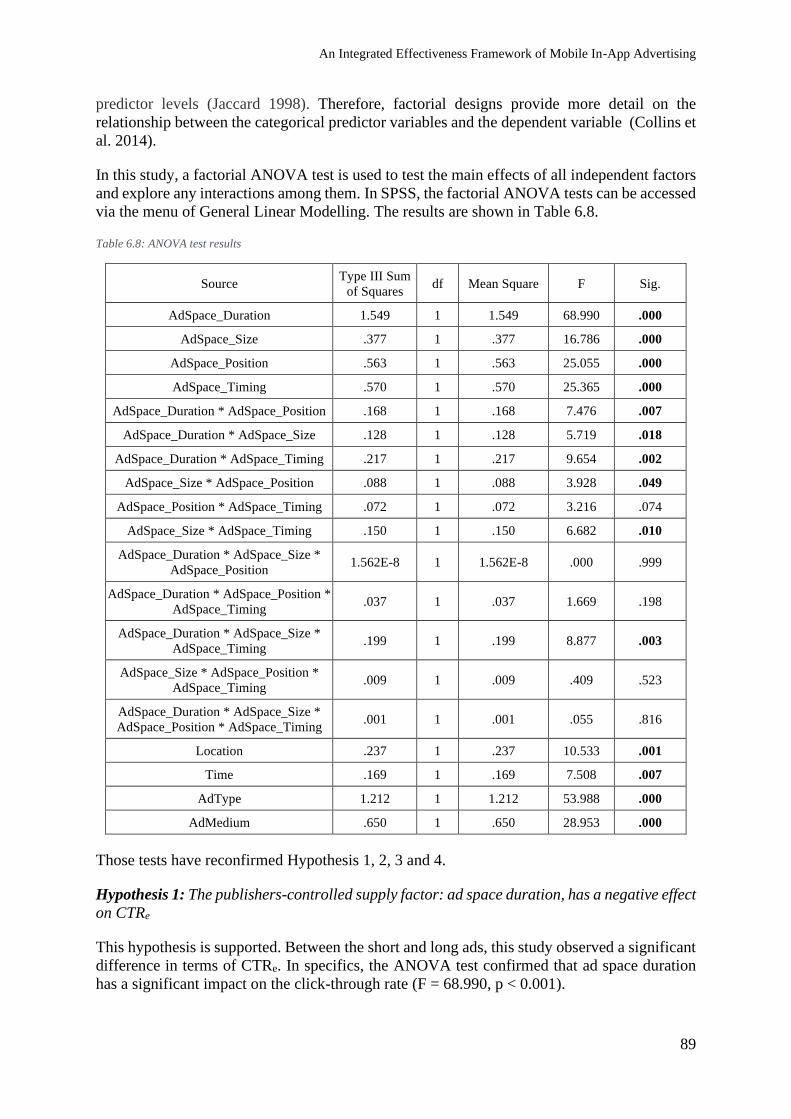
An Integrated Effectiveness Framework of Mobile In-App Advertising
89
predictor levels (Jaccard 1998). Therefore, factorial designs provide more detail on the
relationship between the categorical predictor variables and the dependent variable (Collins et
al. 2014).
In this study, a factorial ANOVA test is used to test the main effects of all independent factors
and explore any interactions among them. In SPSS, the factorial ANOVA tests can be accessed
via the menu of General Linear Modelling. The results are shown in Table 6.8.
Table 6.8: ANOVA test results
Source Type III Sum
of Squares df Mean Square F Sig.
AdSpace_Duration 1.549 1 1.549 68.990 .000
AdSpace_Size .377 1 .377 16.786 .000
AdSpace_Position .563 1 .563 25.055 .000
AdSpace_Timing .570 1 .570 25.365 .000
AdSpace_Duration * AdSpace_Position .168 1 .168 7.476 .007
AdSpace_Duration * AdSpace_Size .128 1 .128 5.719 .018
AdSpace_Duration * AdSpace_Timing .217 1 .217 9.654 .002
AdSpace_Size * AdSpace_Position .088 1 .088 3.928 .049
AdSpace_Position * AdSpace_Timing .072 1 .072 3.216 .074
AdSpace_Size * AdSpace_Timing .150 1 .150 6.682 .010
AdSpace_Duration * AdSpace_Size *
AdSpace_Position 1.562E-8 1 1.562E-8 .000 .999
AdSpace_Duration * AdSpace_Position *
AdSpace_Timing .037 1 .037 1.669 .198
AdSpace_Duration * AdSpace_Size *
AdSpace_Timing .199 1 .199 8.877 .003
AdSpace_Size * AdSpace_Position *
AdSpace_Timing .009 1 .009 .409 .523
AdSpace_Duration * AdSpace_Size *
AdSpace_Position * AdSpace_Timing .001 1 .001 .055 .816
Location .237 1 .237 10.533 .001
Time .169 1 .169 7.508 .007
AdType 1.212 1 1.212 53.988 .000
AdMedium .650 1 .650 28.953 .000
Those tests have reconfirmed Hypothesis 1, 2, 3 and 4.
Hypothesis 1: The publishers-controlled supply factor: ad space duration, has a negative effect
on CTRe
This hypothesis is supported. Between the short and long ads, this study observed a significant
difference in terms of CTRe. In specifics, the ANOVA test confirmed that ad space duration
has a significant impact on the click-through rate (F = 68.990, p < 0.001).
An Integrated Effectiveness Framework of Mobile In-App Advertising
90
Hypothesis 2: The publishers-controlled supply factor: ad space size, has a negative effect on
CTRe
This hypothesis is supported. Between the short and long ads, this study observed a significant
difference in terms of CTRe. In specifics, the ANOVA test confirmed that ad space size has a
significant impact on the click-through rate with F = 16.786, p < 0.001.
The 30-second ads and the smaller ads are more effective than, the longer and larger ones,
taking into account their duration and size.
Hypothesis 3: The publishers-controlled supply factor: ad space position, has a positive effect
on CTRe
This study observed a significant difference between the top and middle ads in terms of CTR
ad space position with F = 25.055, p < 0.001. Top ads could yield a different CTRe than those
from the middle ones. This hypothesis is supported.
Hypothesis 4: The publishers-controlled supply factor: ad space timing, has a negative effect
on CTRe
This study confirms that the ads showing after the main event have a different CTR than those
showing before (F = 25.365, p < 0.001). It confirms the impact of ad space timing as
hypothesized.
Those tests have confirmed Hypothesis 1, 2, 3 and 4: ad space duration, ad space size, ad space
position and ad space timing are all significantly impacting the click-through rate.
Besides that, the factorial ANOVA test also shows some two and three-way interactions among
publishers-controlled factors. It has also confirmed the main effects of contextual factors. Their
moderating effects will further be tested and discussed in the next section.
6. 6. Moderated Regression Analysis
Hypotheses 5, 6, 7 and 8 are about the moderating effects. Both the terms of interaction and
moderation are very similar (Bolin 2014). Scholars often use the two terms as synonyms, but
a thin line exists between interaction and moderation (Coolidge 2020). If X and M are indicated
to communicate in their outcomes on an outcome variable Y, there is no real difference between
X’s role and M’s role. Both are vector predictors. The effect is defined by interaction.
Mathematically, both can be modelled in the regression equation by using a product term
(Hayes 2017). Although there is a significant difference between predictor and moderator
variables, the influence of a predictor on a response (affected by moderator) is of interest. This
effect is known as an effect of moderation (Landau & Everitt 2003). In this study, the four
factors controlled by publishers are the predictors, while those controlled by other participants
are the moderators or the moderating variables.
Moderating variable is a variable moderating the influence on a dependent variable (Hayes
2017). Scientific researchers define a moderator as the variable influencing the relationship
between an independent variable and its dependent variable (Hayes 2017). Let M be the
moderator variable in the X-Y relationship. M’s moderation function is to “change” X-effects.
Until adding a moderator, the effects of independent variable X on its dependent variable Y
must be significant (Hayes 2017). Because of some “interaction effect” between independent
An Integrated Effectiveness Framework of Mobile In-App Advertising
91
variable X and moderator variable M, the causal effects would change when a moderator M
enters the model. Consequently, it could either increase or decrease the “damage” of X on Y.
In other words, depending on the degree of moderator variable, the influence of the independent
variable on its dependent variable changes (Awang 2012). While moderation implies
weakening a causal effect, a moderator can also increase the causal effect. The term
engagement and moderation has the same meaning for that reason. Interaction of the model
between the independent variable and moderator can decrease or increase dependent variable
effects. Calculating the causal influence of independent variable X on dependent variable Y for
individual moderator level M is a critical component of moderation (Hayes 2017). In statistics,
X’s effect on Y for a fixed value of M is called the “simple effect” or the main effect of the
independent variable (Landau & Everitt 2003).
There are two techniques to test moderating effects. Multigroup Moderation Analysis is one of
them. It is a technique of Structural Equation Modelling (Kock 2014). Another technique is
Moderated Regression Analysis which is based on Ordinary Least Square regression (Gravetter
et al. 2020). The Ordinary Least Square Regression (OLS) and Structural Equation Modeling
(SEM) can be used when measuring the dependent variable (Y) using an interval or ratio scale
(Awang 2012). In the framework of path analysis or general structural equation modelling,
Multigroup Moderation Analysis is where a researcher creates one model per one analysis
group. In one model, a researcher constrains path values to be equal across all groups. In the
other model, the researcher allows all (or really any number) paths to be free across all groups
(Henseler 2007). A model comparison approach is then used to see whether any paths vary
between constrained and unconstrained models. So in Multigroup Moderation Analysis, one
is looking for differences in the structure of how variables are related between groups (Kock
2014).
In comparison, the Moderated Regression Analysis is a regression-based methodology used to
define the moderating variable. In Moderated Regression Analysis, additional paths or
variables can be created within a single model representing interaction effects (Champoux &
Peters 1987). With these interaction effects, group differences between specific effects can be
assessed. When conducting these analyses between groups, Multigroup Moderation Analysis
is generally preferred. However, Moderated Regression Analysis can do one thing Multigroup
Moderation Analysis cannot. In Moderated Regression Analysis, continuous moderating
variables can be included (Spiller et al. 2013). That cannot be done in Multigroup Moderation
Analysis as Multigroup Moderation Analysis requires categorical groupings (e.g. Group 1,
Group 2). The two approaches can be combined when the moderating variable is continuous.
To check Location, Time, Ad Type and Ad Medium as potential moderators of the relationship
between publisher-controlled variables and CTRe, a Moderated Regression Analysis is first
used. A product term of interaction was created after standardizing both variables in testing
each factor as a moderator.
The moderated regression model has the following formula (Bolin 2014; Hayes 2017):
Y = a + β1X + β2M + β3XM + e
• For the moderating effect, β3 needs to be tested if it is significantly different from zero.
• Regression coefficient β3 measures the effect between independent variable X and
variable M. The regression coefficient β1 tests X’s simple effects when M=0 (no
An Integrated Effectiveness Framework of Mobile In-App Advertising
92
interaction effects). The calculation is then achieved by the product term XM (the
multiplication of independent variable X and moderator variable M).
• It is essential to measure β3 (the coefficient of interaction term XM) to test the variance
in a model. If β3 is significant, the moderator variable M could be concluded to
moderate the relationship between X and Y. The moderating effect on Y between X
and M corresponds to the β3 slope. If β3 is reliable (or “statistically significant”), X’s
impact on Y depends on M level (or otherwise, but it is the same, the effect of M on Y
depends on the level of X).
Accordingly, in SPSS, the following steps are performed (Bolin 2014; Hayes 2018):
1. Create the product terms: Additional columns in the database need to be generated to
analyse interactions within the framework of moderated regression. Thus, these
columns are almost equal to the product of each term, after the variables have been
centred. The study may involve one, two, three, or even more of these interaction terms.
2. Undertake a regression analysis. In SPSS, this can be done through the Analyse >
Regression > Linear menu
3. Interpretation of significance: To interpret this output, the column called “sig” will be
examined, reflecting the importance of p values about each independent variable.
4. Interpretation of direction: A positive interaction effect between two variables X and
M means, the increase of the moderating effect M will increase the significant effect of
the variable X (does not matter if the effect of X is positive or negative). If the effect of
X is negative, its effect will be more negative with increasing M. If the effect of X is
positive, its effect will be more positive with increasing M. In contrast, if the interaction
between X and M is negative means, the increase of M will decrease the significance
effect of X: if the effect of X is negative, its effect will be less harmful with increasing
A, and if the effect of X is positive, its effect will be less favourable with increasing M.
As a consequence, the negative interaction effect does not change the variable’s sign or
direction effect but instead decreases the value of the effect. Same thing with the
positive effect; it does not affect the sign of the two variables but raises it in the same
direction.
5. Create a graph to demonstrate the moderating effects
Following the above guideline, the moderating effects will be accordingly tested and
analyzed.
Location
Hypothesis 5: Location moderates the relationship between the publishers-controlled factors
and CTRe
The product terms AdSpace_Duration x Location, AdSpace_Size x Location,
AdSpace_Position x Location and AdSpace_Timing x Location were firstly created. To test
the moderating effect of Location on one publishers-controlled factor, i.e. AdSpace_Duration,
the following regression model was built:
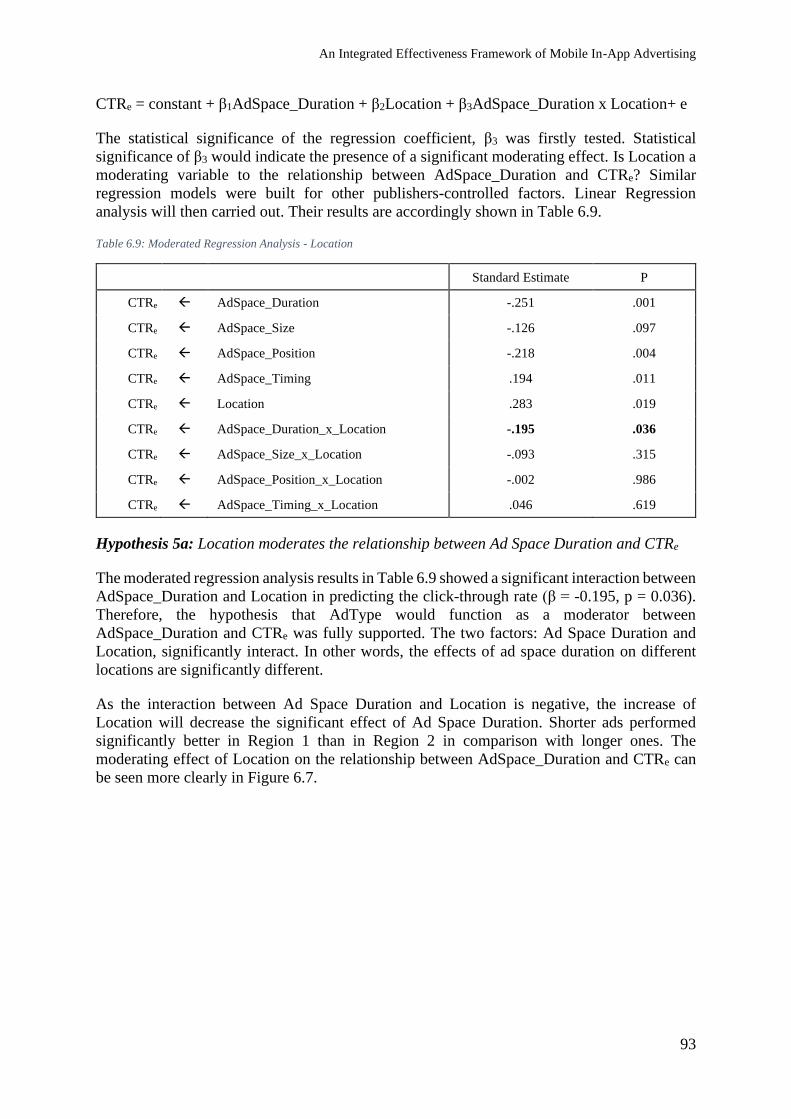
An Integrated Effectiveness Framework of Mobile In-App Advertising
93
CTRe = constant + β1AdSpace_Duration + β2Location + β3AdSpace_Duration x Location+ e
The statistical significance of the regression coefficient, β3 was firstly tested. Statistical
significance of β3 would indicate the presence of a significant moderating effect. Is Location a
moderating variable to the relationship between AdSpace_Duration and CTRe? Similar
regression models were built for other publishers-controlled factors. Linear Regression
analysis will then carried out. Their results are accordingly shown in Table 6.9.
Table 6.9: Moderated Regression Analysis - Location
Standard Estimate P
CTRe AdSpace_Duration -.251 .001
CTRe AdSpace_Size -.126 .097
CTRe AdSpace_Position -.218 .004
CTRe AdSpace_Timing .194 .011
CTRe Location .283 .019
CTRe AdSpace_Duration_x_Location -.195 .036
CTRe AdSpace_Size_x_Location -.093 .315
CTRe AdSpace_Position_x_Location -.002 .986
CTRe AdSpace_Timing_x_Location .046 .619
Hypothesis 5a: Location moderates the relationship between Ad Space Duration and CTRe
The moderated regression analysis results in Table 6.9 showed a significant interaction between
AdSpace_Duration and Location in predicting the click-through rate (β = -0.195, p = 0.036).
Therefore, the hypothesis that AdType would function as a moderator between
AdSpace_Duration and CTRe was fully supported. The two factors: Ad Space Duration and
Location, significantly interact. In other words, the effects of ad space duration on different
locations are significantly different.
As the interaction between Ad Space Duration and Location is negative, the increase of
Location will decrease the significant effect of Ad Space Duration. Shorter ads performed
significantly better in Region 1 than in Region 2 in comparison with longer ones. The
moderating effect of Location on the relationship between AdSpace_Duration and CTRe can
be seen more clearly in Figure 6.7.
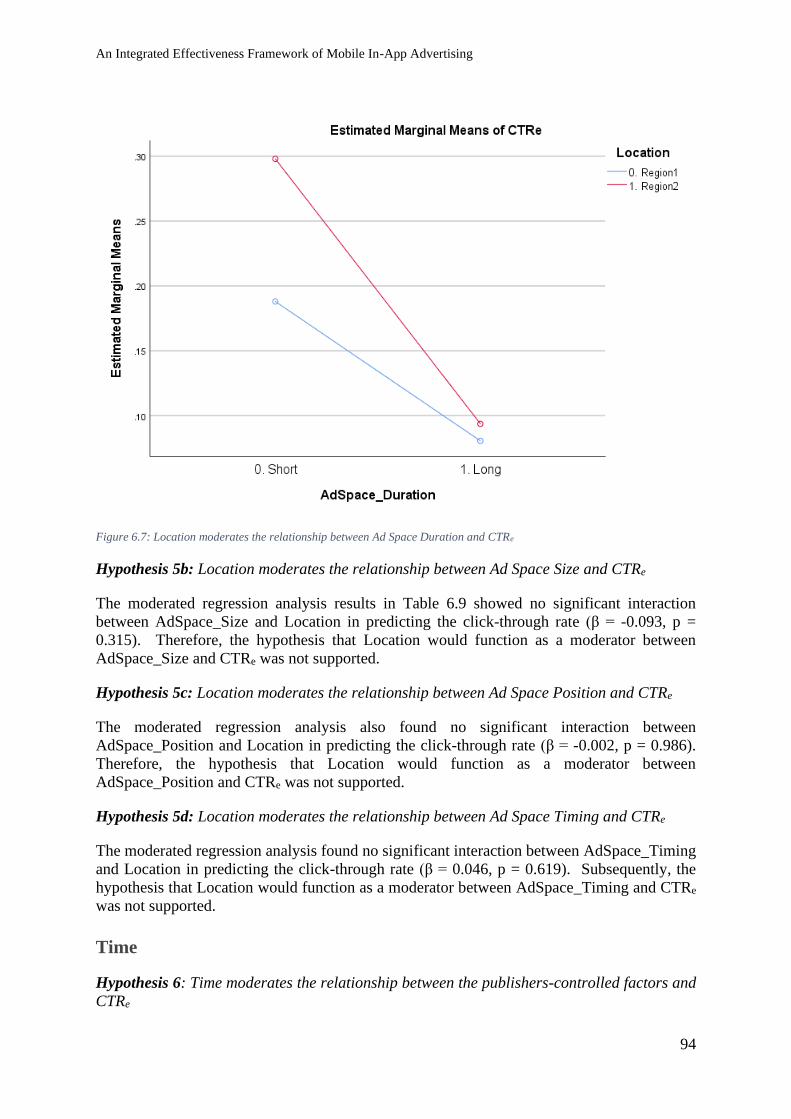
An Integrated Effectiveness Framework of Mobile In-App Advertising
94
Figure 6.7: Location moderates the relationship between Ad Space Duration and CTRe
Hypothesis 5b: Location moderates the relationship between Ad Space Size and CTRe
The moderated regression analysis results in Table 6.9 showed no significant interaction
between AdSpace_Size and Location in predicting the click-through rate (β = -0.093, p =
0.315). Therefore, the hypothesis that Location would function as a moderator between
AdSpace_Size and CTRe was not supported.
Hypothesis 5c: Location moderates the relationship between Ad Space Position and CTRe
The moderated regression analysis also found no significant interaction between
AdSpace_Position and Location in predicting the click-through rate (β = -0.002, p = 0.986).
Therefore, the hypothesis that Location would function as a moderator between
AdSpace_Position and CTRe was not supported.
Hypothesis 5d: Location moderates the relationship between Ad Space Timing and CTRe
The moderated regression analysis found no significant interaction between AdSpace_Timing
and Location in predicting the click-through rate (β = 0.046, p = 0.619). Subsequently, the
hypothesis that Location would function as a moderator between AdSpace_Timing and CTRe
was not supported.
Time
Hypothesis 6: Time moderates the relationship between the publishers-controlled factors and
CTRe
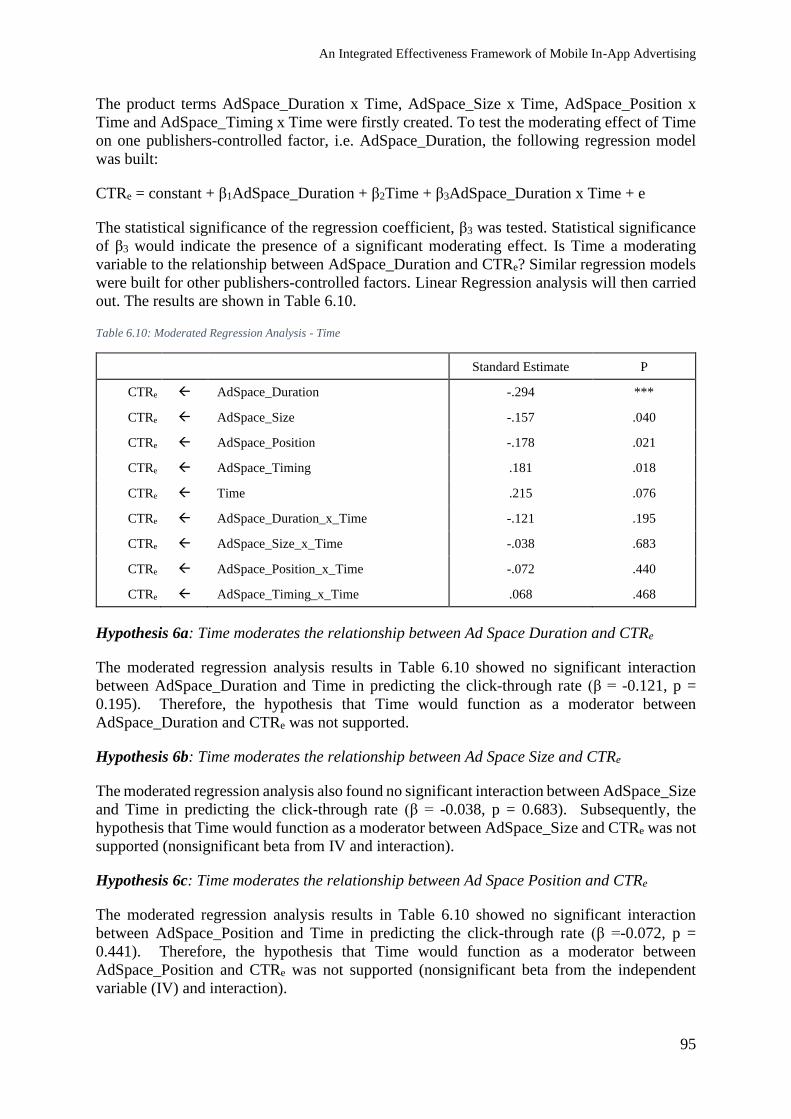
An Integrated Effectiveness Framework of Mobile In-App Advertising
95
The product terms AdSpace_Duration x Time, AdSpace_Size x Time, AdSpace_Position x
Time and AdSpace_Timing x Time were firstly created. To test the moderating effect of Time
on one publishers-controlled factor, i.e. AdSpace_Duration, the following regression model
was built:
CTRe = constant + β1AdSpace_Duration + β2Time + β3AdSpace_Duration x Time + e
The statistical significance of the regression coefficient, β3 was tested. Statistical significance
of β3 would indicate the presence of a significant moderating effect. Is Time a moderating
variable to the relationship between AdSpace_Duration and CTRe? Similar regression models
were built for other publishers-controlled factors. Linear Regression analysis will then carried
out. The results are shown in Table 6.10.
Table 6.10: Moderated Regression Analysis - Time
Standard Estimate P
CTRe AdSpace_Duration -.294 ***
CTRe AdSpace_Size -.157 .040
CTRe AdSpace_Position -.178 .021
CTRe AdSpace_Timing .181 .018
CTRe Time .215 .076
CTRe AdSpace_Duration_x_Time -.121 .195
CTRe AdSpace_Size_x_Time -.038 .683
CTRe AdSpace_Position_x_Time -.072 .440
CTRe AdSpace_Timing_x_Time .068 .468
Hypothesis 6a: Time moderates the relationship between Ad Space Duration and CTRe
The moderated regression analysis results in Table 6.10 showed no significant interaction
between AdSpace_Duration and Time in predicting the click-through rate (β = -0.121, p =
0.195). Therefore, the hypothesis that Time would function as a moderator between
AdSpace_Duration and CTRe was not supported.
Hypothesis 6b: Time moderates the relationship between Ad Space Size and CTRe
The moderated regression analysis also found no significant interaction between AdSpace_Size
and Time in predicting the click-through rate (β = -0.038, p = 0.683). Subsequently, the
hypothesis that Time would function as a moderator between AdSpace_Size and CTRe was not
supported (nonsignificant beta from IV and interaction).
Hypothesis 6c: Time moderates the relationship between Ad Space Position and CTRe
The moderated regression analysis results in Table 6.10 showed no significant interaction
between AdSpace_Position and Time in predicting the click-through rate (β =-0.072, p =
0.441). Therefore, the hypothesis that Time would function as a moderator between
AdSpace_Position and CTRe was not supported (nonsignificant beta from the independent
variable (IV) and interaction).
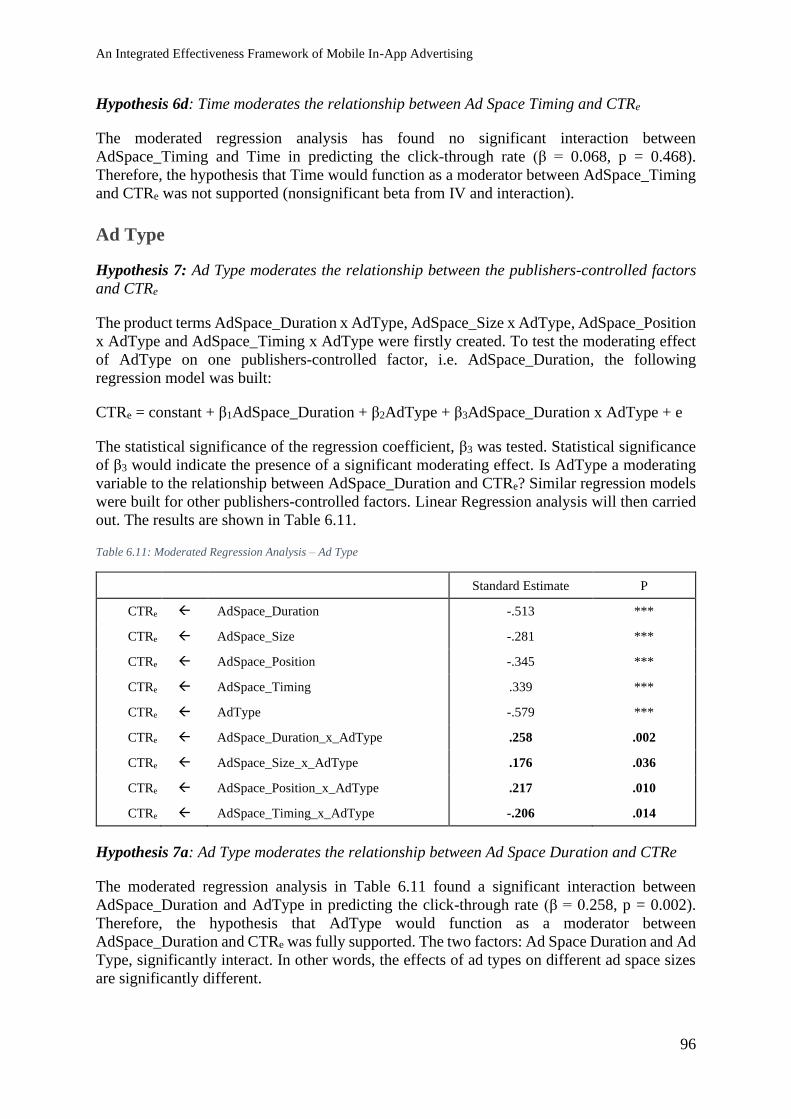
An Integrated Effectiveness Framework of Mobile In-App Advertising
96
Hypothesis 6d: Time moderates the relationship between Ad Space Timing and CTRe
The moderated regression analysis has found no significant interaction between
AdSpace_Timing and Time in predicting the click-through rate (β = 0.068, p = 0.468).
Therefore, the hypothesis that Time would function as a moderator between AdSpace_Timing
and CTRe was not supported (nonsignificant beta from IV and interaction).
Ad Type
Hypothesis 7: Ad Type moderates the relationship between the publishers-controlled factors
and CTRe
The product terms AdSpace_Duration x AdType, AdSpace_Size x AdType, AdSpace_Position
x AdType and AdSpace_Timing x AdType were firstly created. To test the moderating effect
of AdType on one publishers-controlled factor, i.e. AdSpace_Duration, the following
regression model was built:
CTRe = constant + β1AdSpace_Duration + β2AdType + β3AdSpace_Duration x AdType + e
The statistical significance of the regression coefficient, β3 was tested. Statistical significance
of β3 would indicate the presence of a significant moderating effect. Is AdType a moderating
variable to the relationship between AdSpace_Duration and CTRe? Similar regression models
were built for other publishers-controlled factors. Linear Regression analysis will then carried
out. The results are shown in Table 6.11.
Table 6.11: Moderated Regression Analysis – Ad Type
Standard Estimate P
CTRe AdSpace_Duration -.513 ***
CTRe AdSpace_Size -.281 ***
CTRe AdSpace_Position -.345 ***
CTRe AdSpace_Timing .339 ***
CTRe AdType -.579 ***
CTRe AdSpace_Duration_x_AdType .258 .002
CTRe AdSpace_Size_x_AdType .176 .036
CTRe AdSpace_Position_x_AdType .217 .010
CTRe AdSpace_Timing_x_AdType -.206 .014
Hypothesis 7a: Ad Type moderates the relationship between Ad Space Duration and CTRe
The moderated regression analysis in Table 6.11 found a significant interaction between
AdSpace_Duration and AdType in predicting the click-through rate (β = 0.258, p = 0.002).
Therefore, the hypothesis that AdType would function as a moderator between
AdSpace_Duration and CTRe was fully supported. The two factors: Ad Space Duration and Ad
Type, significantly interact. In other words, the effects of ad types on different ad space sizes
are significantly different.
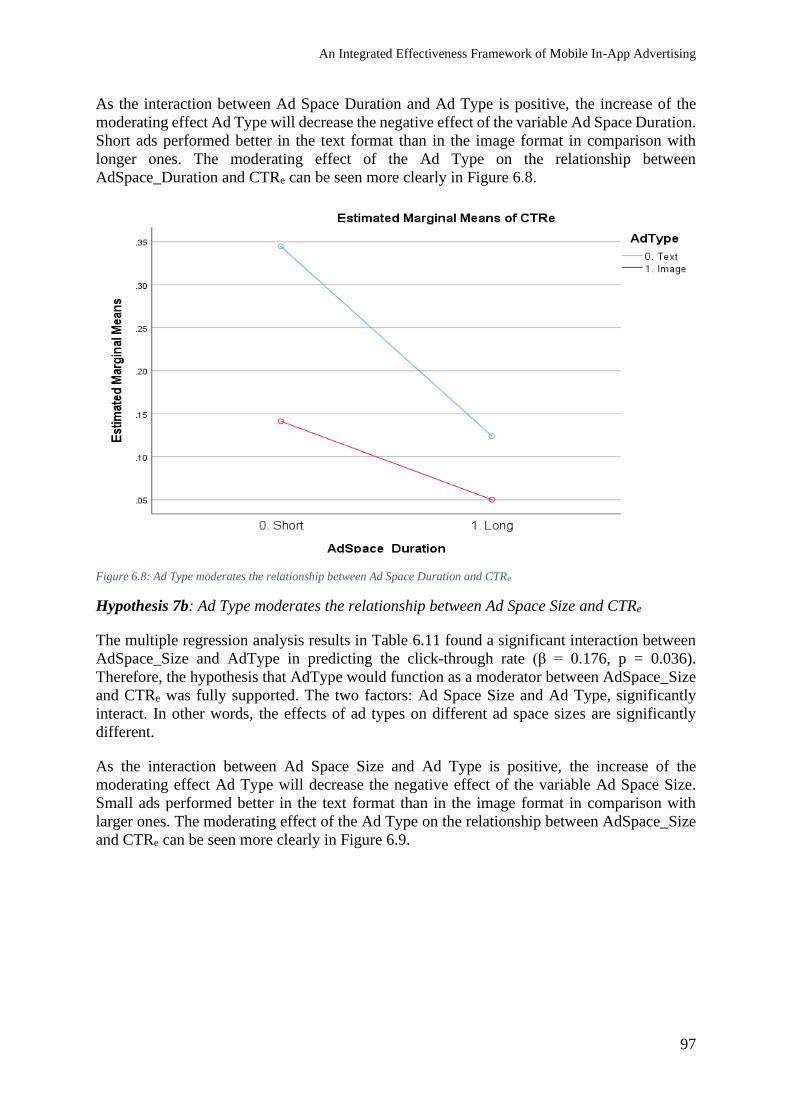
An Integrated Effectiveness Framework of Mobile In-App Advertising
97
As the interaction between Ad Space Duration and Ad Type is positive, the increase of the
moderating effect Ad Type will decrease the negative effect of the variable Ad Space Duration.
Short ads performed better in the text format than in the image format in comparison with
longer ones. The moderating effect of the Ad Type on the relationship between
AdSpace_Duration and CTRe can be seen more clearly in Figure 6.8.
Hypothesis 7b: Ad Type moderates the relationship between Ad Space Size and CTRe
The multiple regression analysis results in Table 6.11 found a significant interaction between
AdSpace_Size and AdType in predicting the click-through rate (β = 0.176, p = 0.036).
Therefore, the hypothesis that AdType would function as a moderator between AdSpace_Size
and CTRe was fully supported. The two factors: Ad Space Size and Ad Type, significantly
interact. In other words, the effects of ad types on different ad space sizes are significantly
different.
As the interaction between Ad Space Size and Ad Type is positive, the increase of the
moderating effect Ad Type will decrease the negative effect of the variable Ad Space Size.
Small ads performed better in the text format than in the image format in comparison with
larger ones. The moderating effect of the Ad Type on the relationship between AdSpace_Size
and CTRe can be seen more clearly in Figure 6.9.
Figure 6.8: Ad Type moderates the Ad Space Duration effect Figure 6.8: Ad Type moderates the relationship between Ad Space Duration and CTRe
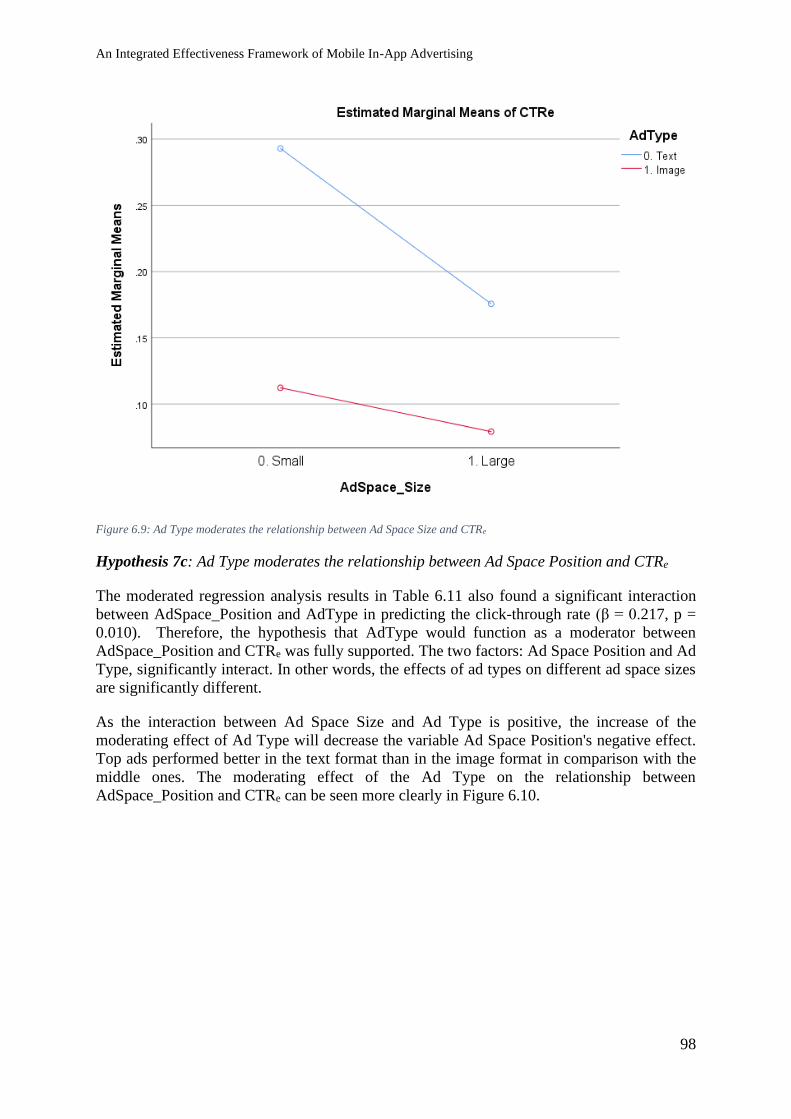
An Integrated Effectiveness Framework of Mobile In-App Advertising
98
Figure 6.9: Ad Type moderates the relationship between Ad Space Size and CTRe
Hypothesis 7c: Ad Type moderates the relationship between Ad Space Position and CTRe
The moderated regression analysis results in Table 6.11 also found a significant interaction
between AdSpace_Position and AdType in predicting the click-through rate (β = 0.217, p =
0.010). Therefore, the hypothesis that AdType would function as a moderator between
AdSpace_Position and CTRe was fully supported. The two factors: Ad Space Position and Ad
Type, significantly interact. In other words, the effects of ad types on different ad space sizes
are significantly different.
As the interaction between Ad Space Size and Ad Type is positive, the increase of the
moderating effect of Ad Type will decrease the variable Ad Space Position's negative effect.
Top ads performed better in the text format than in the image format in comparison with the
middle ones. The moderating effect of the Ad Type on the relationship between
AdSpace_Position and CTRe can be seen more clearly in Figure 6.10.
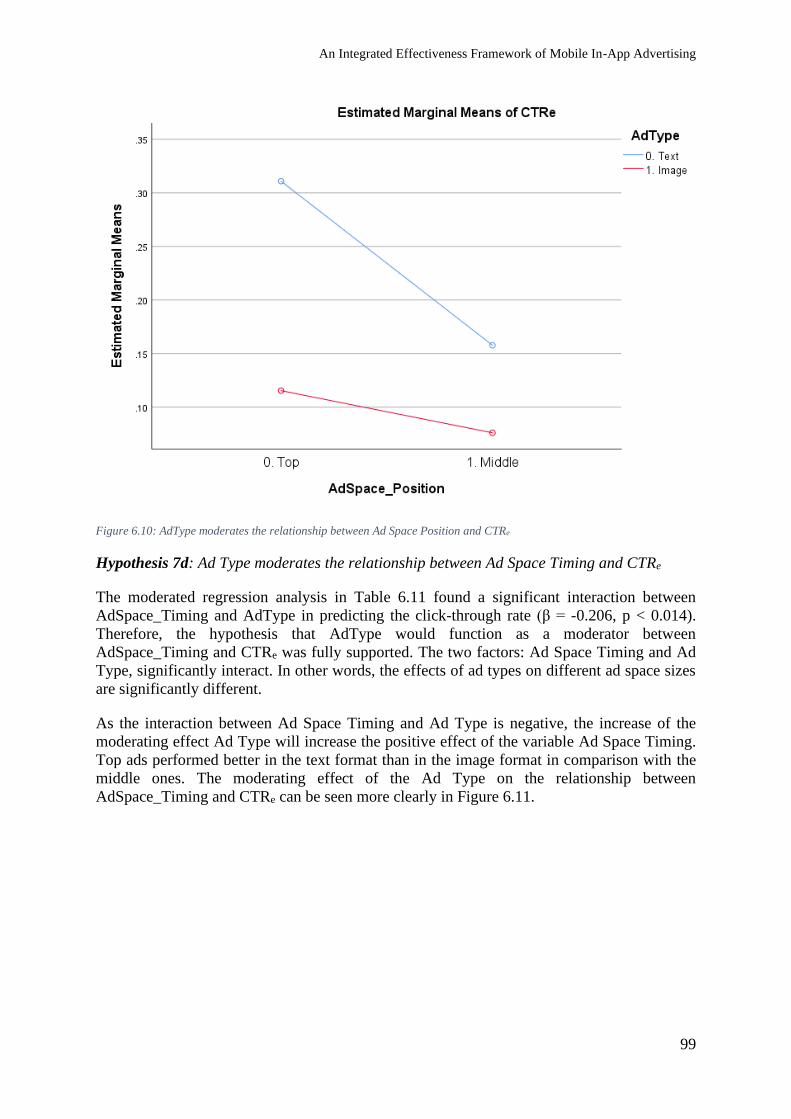
An Integrated Effectiveness Framework of Mobile In-App Advertising
99
Figure 6.10: AdType moderates the relationship between Ad Space Position and CTRe
Hypothesis 7d: Ad Type moderates the relationship between Ad Space Timing and CTRe
The moderated regression analysis in Table 6.11 found a significant interaction between
AdSpace_Timing and AdType in predicting the click-through rate (β = -0.206, p < 0.014).
Therefore, the hypothesis that AdType would function as a moderator between
AdSpace_Timing and CTRe was fully supported. The two factors: Ad Space Timing and Ad
Type, significantly interact. In other words, the effects of ad types on different ad space sizes
are significantly different.
As the interaction between Ad Space Timing and Ad Type is negative, the increase of the
moderating effect Ad Type will increase the positive effect of the variable Ad Space Timing.
Top ads performed better in the text format than in the image format in comparison with the
middle ones. The moderating effect of the Ad Type on the relationship between
AdSpace_Timing and CTRe can be seen more clearly in Figure 6.11.
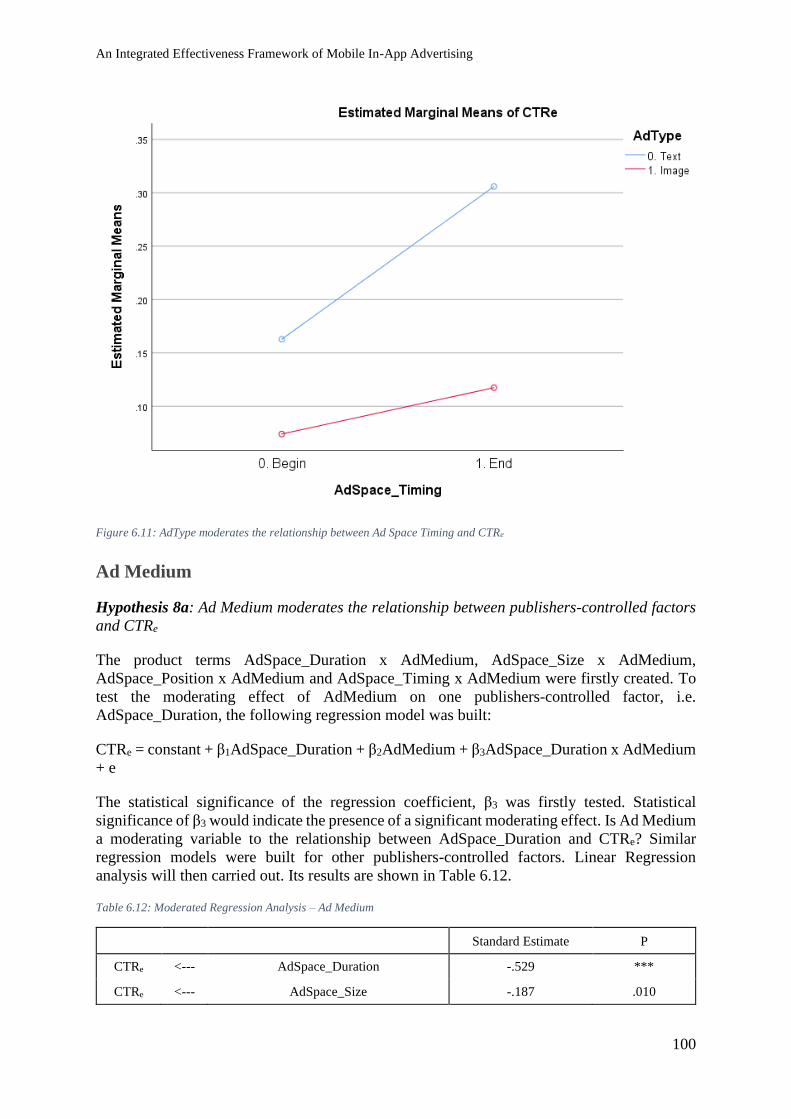
An Integrated Effectiveness Framework of Mobile In-App Advertising
100
Figure 6.11: AdType moderates the relationship between Ad Space Timing and CTRe
Ad Medium
Hypothesis 8a: Ad Medium moderates the relationship between publishers-controlled factors
and CTRe
The product terms AdSpace_Duration x AdMedium, AdSpace_Size x AdMedium,
AdSpace_Position x AdMedium and AdSpace_Timing x AdMedium were firstly created. To
test the moderating effect of AdMedium on one publishers-controlled factor, i.e.
AdSpace_Duration, the following regression model was built:
CTRe = constant + β1AdSpace_Duration + β2AdMedium + β3AdSpace_Duration x AdMedium
+ e
The statistical significance of the regression coefficient, β3 was firstly tested. Statistical
significance of β3 would indicate the presence of a significant moderating effect. Is Ad Medium
a moderating variable to the relationship between AdSpace_Duration and CTRe? Similar
regression models were built for other publishers-controlled factors. Linear Regression
analysis will then carried out. Its results are shown in Table 6.12.
Table 6.12: Moderated Regression Analysis – Ad Medium
Standard Estimate P
CTRe <--- AdSpace_Duration -.529 ***
CTRe <--- AdSpace_Size -.187 .010
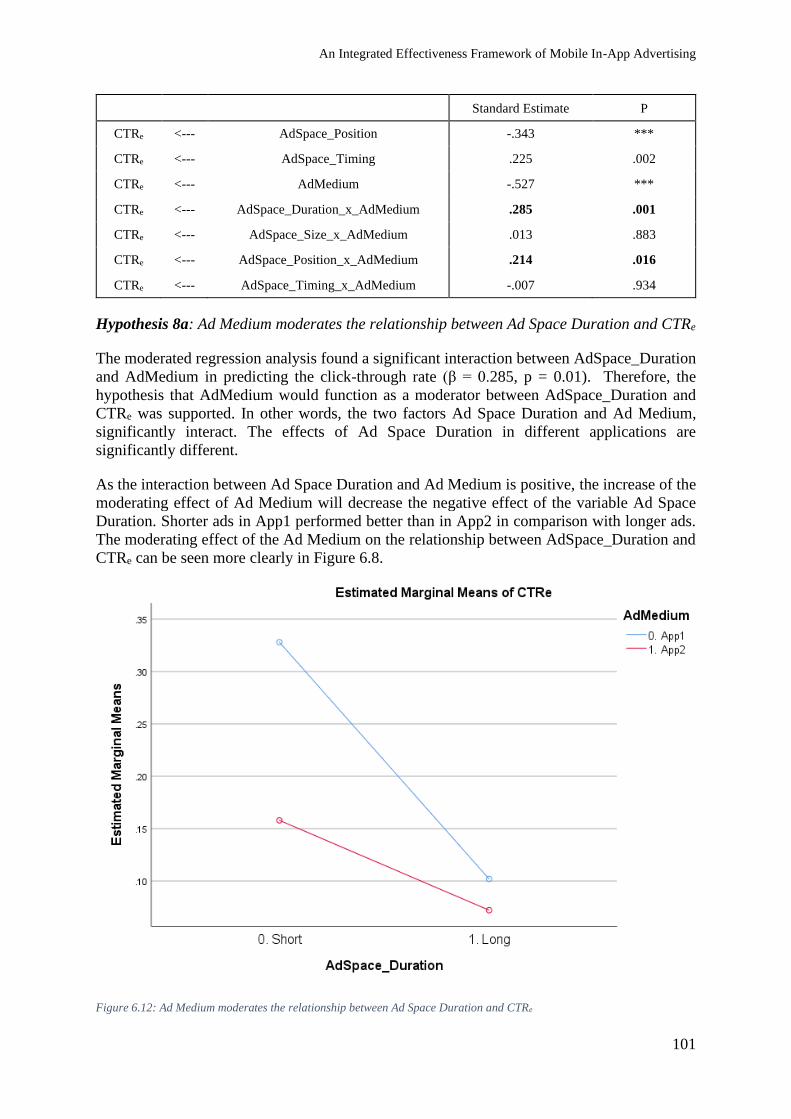
An Integrated Effectiveness Framework of Mobile In-App Advertising
101
Standard Estimate P
CTRe <--- AdSpace_Position -.343 ***
CTRe <--- AdSpace_Timing .225 .002
CTRe <--- AdMedium -.527 ***
CTRe <--- AdSpace_Duration_x_AdMedium .285 .001
CTRe <--- AdSpace_Size_x_AdMedium .013 .883
CTRe <--- AdSpace_Position_x_AdMedium .214 .016
CTRe <--- AdSpace_Timing_x_AdMedium -.007 .934
Hypothesis 8a: Ad Medium moderates the relationship between Ad Space Duration and CTRe
The moderated regression analysis found a significant interaction between AdSpace_Duration
and AdMedium in predicting the click-through rate (β = 0.285, p = 0.01). Therefore, the
hypothesis that AdMedium would function as a moderator between AdSpace_Duration and
CTRe was supported. In other words, the two factors Ad Space Duration and Ad Medium,
significantly interact. The effects of Ad Space Duration in different applications are
significantly different.
As the interaction between Ad Space Duration and Ad Medium is positive, the increase of the
moderating effect of Ad Medium will decrease the negative effect of the variable Ad Space
Duration. Shorter ads in App1 performed better than in App2 in comparison with longer ads.
The moderating effect of the Ad Medium on the relationship between AdSpace_Duration and
CTRe can be seen more clearly in Figure 6.8.
Figure 6.12: Ad Medium moderates the relationship between Ad Space Duration and CTRe
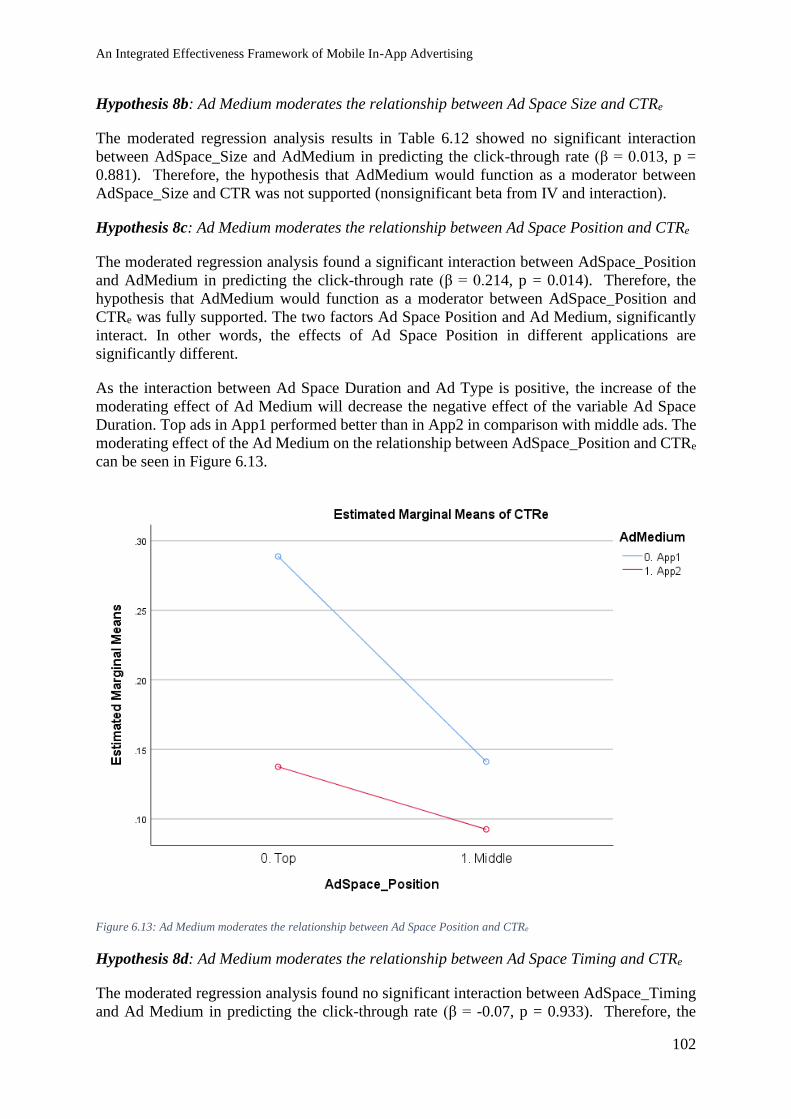
An Integrated Effectiveness Framework of Mobile In-App Advertising
102
Hypothesis 8b: Ad Medium moderates the relationship between Ad Space Size and CTRe
The moderated regression analysis results in Table 6.12 showed no significant interaction
between AdSpace_Size and AdMedium in predicting the click-through rate (β = 0.013, p =
0.881). Therefore, the hypothesis that AdMedium would function as a moderator between
AdSpace_Size and CTR was not supported (nonsignificant beta from IV and interaction).
Hypothesis 8c: Ad Medium moderates the relationship between Ad Space Position and CTRe
The moderated regression analysis found a significant interaction between AdSpace_Position
and AdMedium in predicting the click-through rate (β = 0.214, p = 0.014). Therefore, the
hypothesis that AdMedium would function as a moderator between AdSpace_Position and
CTRe was fully supported. The two factors Ad Space Position and Ad Medium, significantly
interact. In other words, the effects of Ad Space Position in different applications are
significantly different.
As the interaction between Ad Space Duration and Ad Type is positive, the increase of the
moderating effect of Ad Medium will decrease the negative effect of the variable Ad Space
Duration. Top ads in App1 performed better than in App2 in comparison with middle ads. The
moderating effect of the Ad Medium on the relationship between AdSpace_Position and CTRe
can be seen in Figure 6.13.
Figure 6.13: Ad Medium moderates the relationship between Ad Space Position and CTRe
Hypothesis 8d: Ad Medium moderates the relationship between Ad Space Timing and CTRe
The moderated regression analysis found no significant interaction between AdSpace_Timing
and Ad Medium in predicting the click-through rate (β = -0.07, p = 0.933). Therefore, the

An Integrated Effectiveness Framework of Mobile In-App Advertising
103
hypothesis that Ad Medium would function as a moderator between AdSpace_Timing and
CTRe was not supported.
In summary, with the Moderated Regression Analysis, this study detected seven moderating
effects. The factorial ANOVA test in Section 6.5 has detected several interactions among the
publisher-controlled and contextual factors. However, it has not pointed out which ones are the
moderator and the direction of their effects. The Moderated Regression Analysis presented in
this section has helped determine the moderating variables and whether they will increase or
decrease the publisher-controlled effects.
6. 7. Multigroup Moderation Analysis
Another technique to test moderating effects is to use Multigroup Moderation Analysis.
Multigroup Moderation Analysis is where a researcher generates one model per group of
studies within the context of path analysis or general structural equation modelling (SEM)
(Yuan & Chan 2016). A researcher in one model constrains path values to be equal across all
groups. In the other model, the researcher allows all (or really any number) paths to be free
across all groups (Henseler 2007). A model comparison approach is then used to see if any
paths differ between the constrained models and the unconstrained models. Variations in the
structure will be tried to check how variables are related between groups in Multigroup
Moderation Analysis (Kock 2014).
In fact, Multigroup Moderation Analysis or Multigroup structural equation modelling (MSEM)
is an extension of SEM, which is not yet commonly used in advertising disciplines due to its
complexities (Kock 2014). Nevertheless, the methodology was used in this study to examine
the moderating effects of contingency variables, since the technique could provide more precise
and insightful results compared to previous research in which the regression techniques were
primarily used (Breitsohl 2019).
Through MSEM, a moderating effect is investigated with statistical differences between groups
with different degrees of a hypothesized moderating variable. This technique is not based on
the use of hierarchical or nested models. Somewhat it limits parameters in the model to be
equal across groups and allows for a free estimation of those parameters for each group
(Matthews 2017). Statistical variations of constrained and unconstrained parameters between
different groups are further analyzed for the existence of the moderating effect (Yuan & Chan
2016). Moreover, with the calculation errors accounted for in the model, the moderating effects
can be measured more accurately, resulting in a more reliable study result. On the other hand,
other modern methods often fail to account for such flaws in the analysis, resulting in under-or
over-estimated results (Awang 2012). MSEM was considered appropriate for this study in this
regard.
For experimental researchers, Structural Equation Modeling (SEM) can provide useful
features. However, most researchers do not appear to be using such models when interpreting
their findings but instead, rely on more rigorous (and sometimes inappropriate) approaches
(Pansuwong 2009). Historically, researchers have used GLM to analyse data obtained through
experiments. For example, a simple count of 117 papers in the Journal of Applied Psychology’s
2015 volume reveals that of 28 papers reporting at least one experiment, 24 (86%) applied
GLM. This adherence to conventional approaches contrasts with non-experimental study
particularly at the individual level of analysis, where structural equation modelling (SEM) has
emerged as a general framework for analysis (e.g., Hancock and Mueller (2013)). SEM models
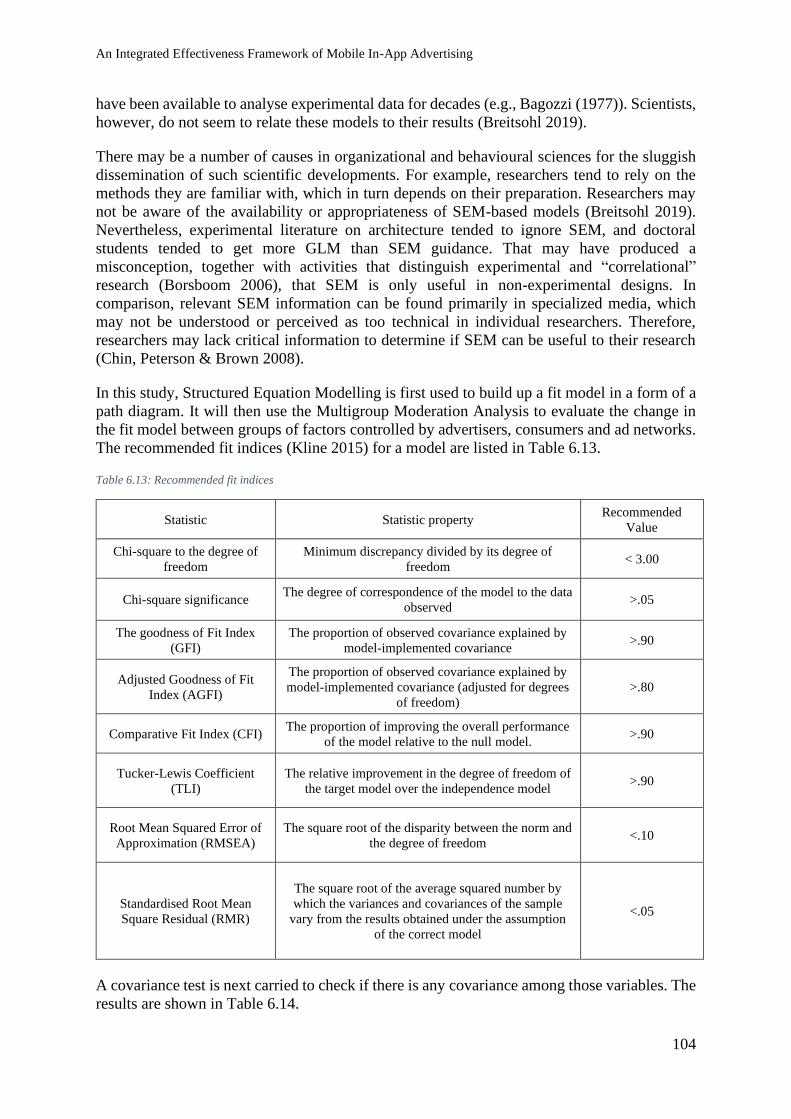
An Integrated Effectiveness Framework of Mobile In-App Advertising
104
have been available to analyse experimental data for decades (e.g., Bagozzi (1977)). Scientists,
however, do not seem to relate these models to their results (Breitsohl 2019).
There may be a number of causes in organizational and behavioural sciences for the sluggish
dissemination of such scientific developments. For example, researchers tend to rely on the
methods they are familiar with, which in turn depends on their preparation. Researchers may
not be aware of the availability or appropriateness of SEM-based models (Breitsohl 2019).
Nevertheless, experimental literature on architecture tended to ignore SEM, and doctoral
students tended to get more GLM than SEM guidance. That may have produced a
misconception, together with activities that distinguish experimental and “correlational”
research (Borsboom 2006), that SEM is only useful in non-experimental designs. In
comparison, relevant SEM information can be found primarily in specialized media, which
may not be understood or perceived as too technical in individual researchers. Therefore,
researchers may lack critical information to determine if SEM can be useful to their research
(Chin, Peterson & Brown 2008).
In this study, Structured Equation Modelling is first used to build up a fit model in a form of a
path diagram. It will then use the Multigroup Moderation Analysis to evaluate the change in
the fit model between groups of factors controlled by advertisers, consumers and ad networks.
The recommended fit indices (Kline 2015) for a model are listed in Table 6.13.
Table 6.13: Recommended fit indices
Statistic Statistic property Recommended
Value
Chi-square to the degree of
freedom
Minimum discrepancy divided by its degree of
freedom < 3.00
Chi-square significance The degree of correspondence of the model to the data
observed >.05
The goodness of Fit Index
(GFI)
The proportion of observed covariance explained by
model-implemented covariance >.90
Adjusted Goodness of Fit
Index (AGFI)
The proportion of observed covariance explained by
model-implemented covariance (adjusted for degrees
of freedom)
>.80
Comparative Fit Index (CFI) The proportion of improving the overall performance
of the model relative to the null model. >.90
Tucker-Lewis Coefficient
(TLI)
The relative improvement in the degree of freedom of
the target model over the independence model >.90
Root Mean Squared Error of
Approximation (RMSEA)
The square root of the disparity between the norm and
the degree of freedom <.10
Standardised Root Mean
Square Residual (RMR)
The square root of the average squared number by
which the variances and covariances of the sample
vary from the results obtained under the assumption
of the correct model
<.05
A covariance test is next carried to check if there is any covariance among those variables. The
results are shown in Table 6.14.
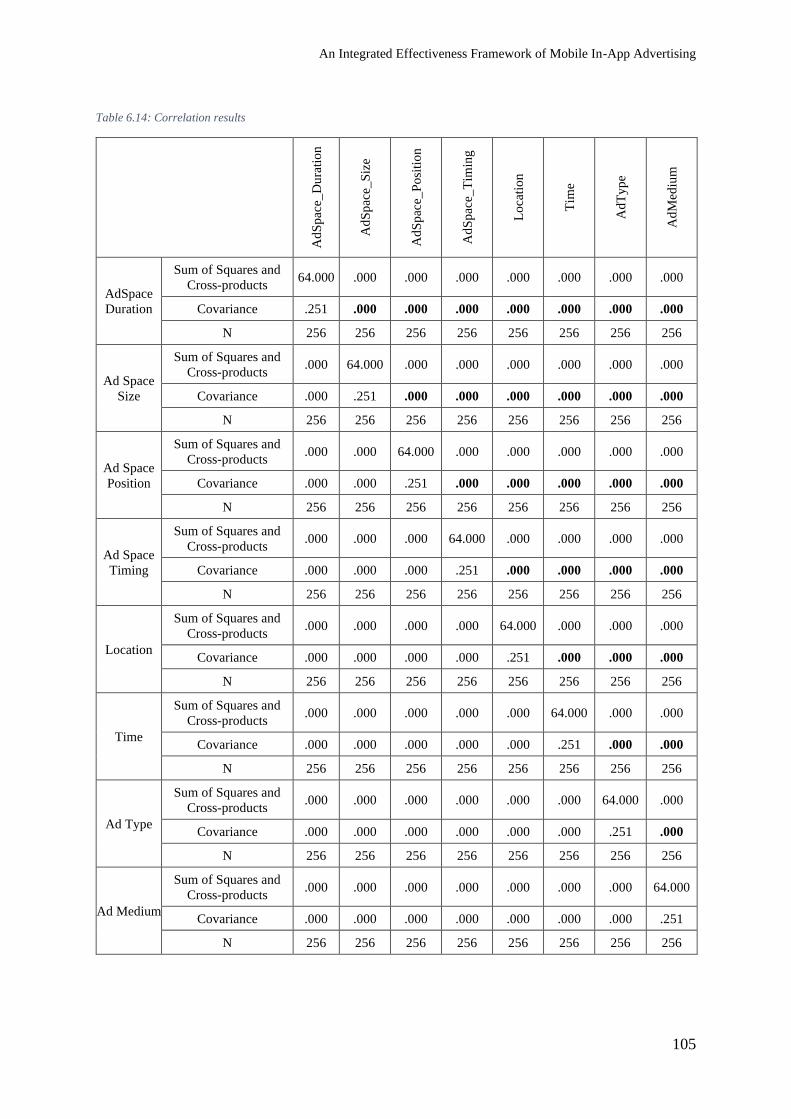
An Integrated Effectiveness Framework of Mobile In-App Advertising
105
Ad
Sp
ace_
Du
rati
on
Ad
Sp
ace_
Siz
e
Ad
Sp
ace_
Po
siti
on
Ad
Sp
ace_
Tim
ing
Lo
cati
on
Tim
e
Ad
Ty
pe
Ad
Med
ium
AdSpace
Duration
Sum of Squares and
Cross-products 64.000 .000 .000 .000 .000 .000 .000 .000
Covariance .251 .000 .000 .000 .000 .000 .000 .000
N 256 256 256 256 256 256 256 256
Ad Space
Size
Sum of Squares and
Cross-products .000 64.000 .000 .000 .000 .000 .000 .000
Covariance .000 .251 .000 .000 .000 .000 .000 .000
N 256 256 256 256 256 256 256 256
Ad Space
Position
Sum of Squares and
Cross-products .000 .000 64.000 .000 .000 .000 .000 .000
Covariance .000 .000 .251 .000 .000 .000 .000 .000
N 256 256 256 256 256 256 256 256
Ad Space
Timing
Sum of Squares and
Cross-products .000 .000 .000 64.000 .000 .000 .000 .000
Covariance .000 .000 .000 .251 .000 .000 .000 .000
N 256 256 256 256 256 256 256 256
Location
Sum of Squares and
Cross-products .000 .000 .000 .000 64.000 .000 .000 .000
Covariance .000 .000 .000 .000 .251 .000 .000 .000
N 256 256 256 256 256 256 256 256
Time
Sum of Squares and
Cross-products .000 .000 .000 .000 .000 64.000 .000 .000
Covariance .000 .000 .000 .000 .000 .251 .000 .000
N 256 256 256 256 256 256 256 256
Ad Type
Sum of Squares and
Cross-products .000 .000 .000 .000 .000 .000 64.000 .000
Covariance .000 .000 .000 .000 .000 .000 .251 .000
N 256 256 256 256 256 256 256 256
Ad Medium
Sum of Squares and
Cross-products .000 .000 .000 .000 .000 .000 .000 64.000
Covariance .000 .000 .000 .000 .000 .000 .000 .251
N 256 256 256 256 256 256 256 256
Table 6.14: Correlation results
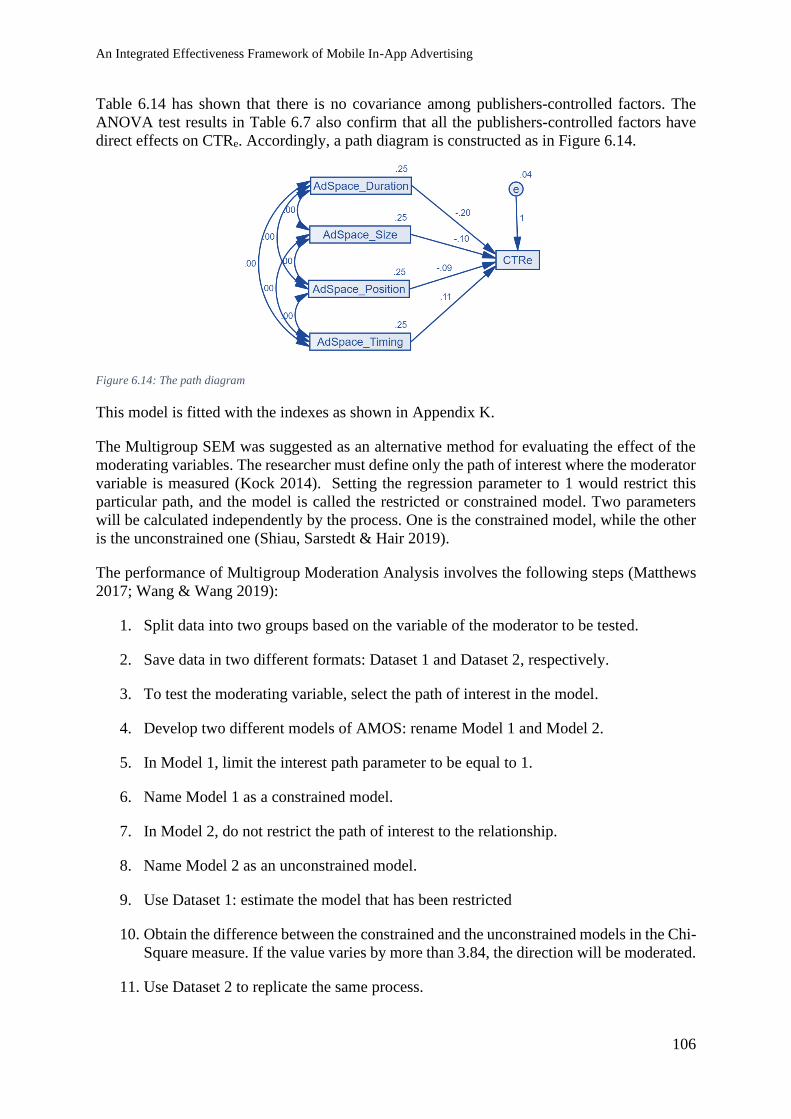
An Integrated Effectiveness Framework of Mobile In-App Advertising
106
Table 6.14 has shown that there is no covariance among publishers-controlled factors. The
ANOVA test results in Table 6.7 also confirm that all the publishers-controlled factors have
direct effects on CTRe. Accordingly, a path diagram is constructed as in Figure 6.14.
Figure 6.14: The path diagram
This model is fitted with the indexes as shown in Appendix K.
The Multigroup SEM was suggested as an alternative method for evaluating the effect of the
moderating variables. The researcher must define only the path of interest where the moderator
variable is measured (Kock 2014). Setting the regression parameter to 1 would restrict this
particular path, and the model is called the restricted or constrained model. Two parameters
will be calculated independently by the process. One is the constrained model, while the other
is the unconstrained one (Shiau, Sarstedt & Hair 2019).
The performance of Multigroup Moderation Analysis involves the following steps (Matthews
2017; Wang & Wang 2019):
1. Split data into two groups based on the variable of the moderator to be tested.
2. Save data in two different formats: Dataset 1 and Dataset 2, respectively.
3. To test the moderating variable, select the path of interest in the model.
4. Develop two different models of AMOS: rename Model 1 and Model 2.
5. In Model 1, limit the interest path parameter to be equal to 1.
6. Name Model 1 as a constrained model.
7. In Model 2, do not restrict the path of interest to the relationship.
8. Name Model 2 as an unconstrained model.
9. Use Dataset 1: estimate the model that has been restricted
10. Obtain the difference between the constrained and the unconstrained models in the Chi-
Square measure. If the value varies by more than 3.84, the direction will be moderated.
11. Use Dataset 2 to replicate the same process.
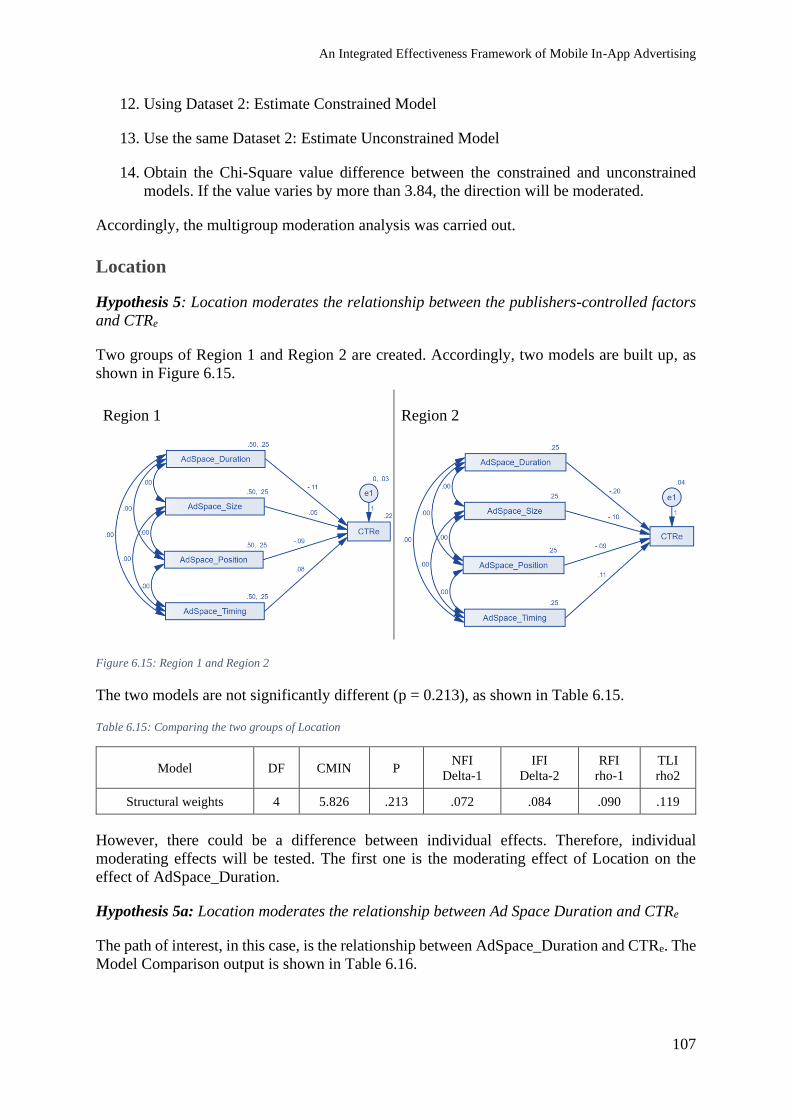
An Integrated Effectiveness Framework of Mobile In-App Advertising
107
12. Using Dataset 2: Estimate Constrained Model
13. Use the same Dataset 2: Estimate Unconstrained Model
14. Obtain the Chi-Square value difference between the constrained and unconstrained
models. If the value varies by more than 3.84, the direction will be moderated.
Accordingly, the multigroup moderation analysis was carried out.
Location
Hypothesis 5: Location moderates the relationship between the publishers-controlled factors
and CTRe
Two groups of Region 1 and Region 2 are created. Accordingly, two models are built up, as
shown in Figure 6.15.
Region 1
Region 2
Figure 6.15: Region 1 and Region 2
The two models are not significantly different (p = 0.213), as shown in Table 6.15.
Table 6.15: Comparing the two groups of Location
Model DF CMIN P NFI
Delta-1
IFI
Delta-2
RFI
rho-1
TLI
rho2
Structural weights 4 5.826 .213 .072 .084 .090 .119
However, there could be a difference between individual effects. Therefore, individual
moderating effects will be tested. The first one is the moderating effect of Location on the
effect of AdSpace_Duration.
Hypothesis 5a: Location moderates the relationship between Ad Space Duration and CTRe
The path of interest, in this case, is the relationship between AdSpace_Duration and CTRe. The
Model Comparison output is shown in Table 6.16.
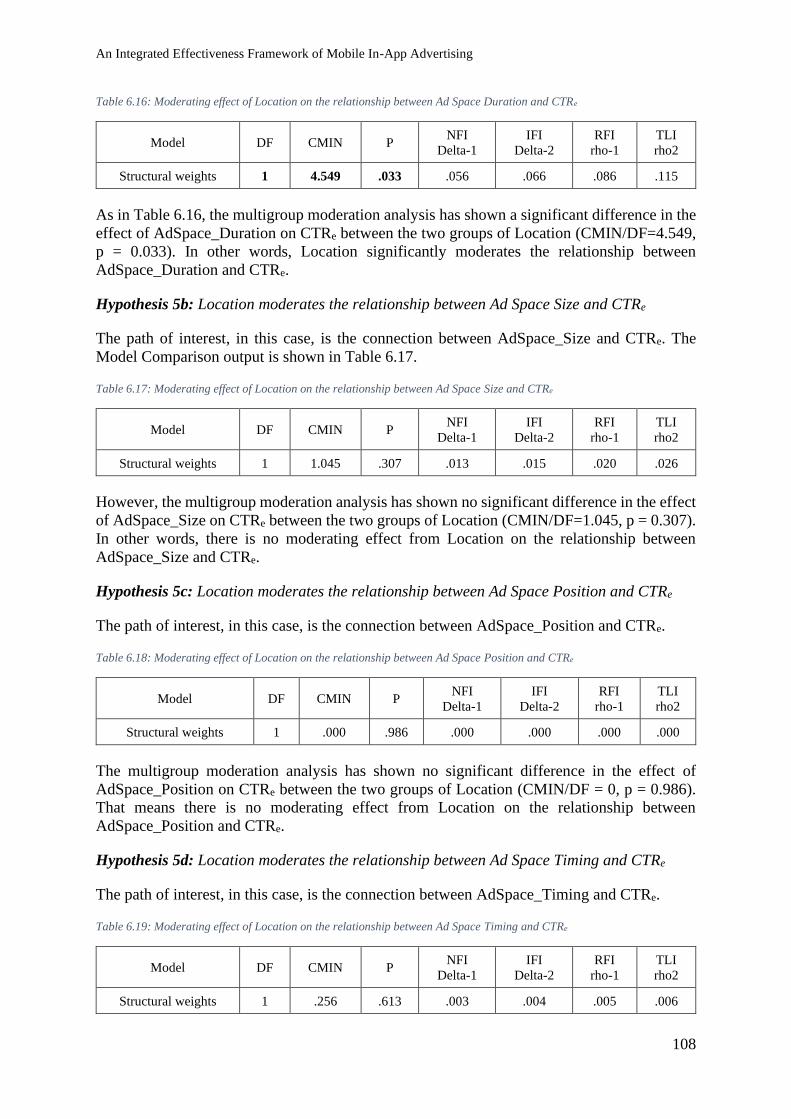
An Integrated Effectiveness Framework of Mobile In-App Advertising
108
Table 6.16: Moderating effect of Location on the relationship between Ad Space Duration and CTRe
Model DF CMIN P NFI
Delta-1
IFI
Delta-2
RFI
rho-1
TLI
rho2
Structural weights 1 4.549 .033 .056 .066 .086 .115
As in Table 6.16, the multigroup moderation analysis has shown a significant difference in the
effect of AdSpace_Duration on CTRe between the two groups of Location (CMIN/DF=4.549,
p = 0.033). In other words, Location significantly moderates the relationship between
AdSpace_Duration and CTRe.
Hypothesis 5b: Location moderates the relationship between Ad Space Size and CTRe
The path of interest, in this case, is the connection between AdSpace_Size and CTRe. The
Model Comparison output is shown in Table 6.17.
Table 6.17: Moderating effect of Location on the relationship between Ad Space Size and CTRe
Model DF CMIN P NFI
Delta-1
IFI
Delta-2
RFI
rho-1
TLI
rho2
Structural weights 1 1.045 .307 .013 .015 .020 .026
However, the multigroup moderation analysis has shown no significant difference in the effect
of AdSpace_Size on CTRe between the two groups of Location (CMIN/DF=1.045, p = 0.307).
In other words, there is no moderating effect from Location on the relationship between
AdSpace_Size and CTRe.
Hypothesis 5c: Location moderates the relationship between Ad Space Position and CTRe
The path of interest, in this case, is the connection between AdSpace_Position and CTRe.
Table 6.18: Moderating effect of Location on the relationship between Ad Space Position and CTRe
Model DF CMIN P NFI
Delta-1
IFI
Delta-2
RFI
rho-1
TLI
rho2
Structural weights 1 .000 .986 .000 .000 .000 .000
The multigroup moderation analysis has shown no significant difference in the effect of
AdSpace_Position on CTRe between the two groups of Location (CMIN/DF = 0, p = 0.986).
That means there is no moderating effect from Location on the relationship between
AdSpace_Position and CTRe.
Hypothesis 5d: Location moderates the relationship between Ad Space Timing and CTRe
The path of interest, in this case, is the connection between AdSpace_Timing and CTRe.
Table 6.19: Moderating effect of Location on the relationship between Ad Space Timing and CTRe
Model DF CMIN P NFI
Delta-1
IFI
Delta-2
RFI
rho-1
TLI
rho2
Structural weights 1 .256 .613 .003 .004 .005 .006
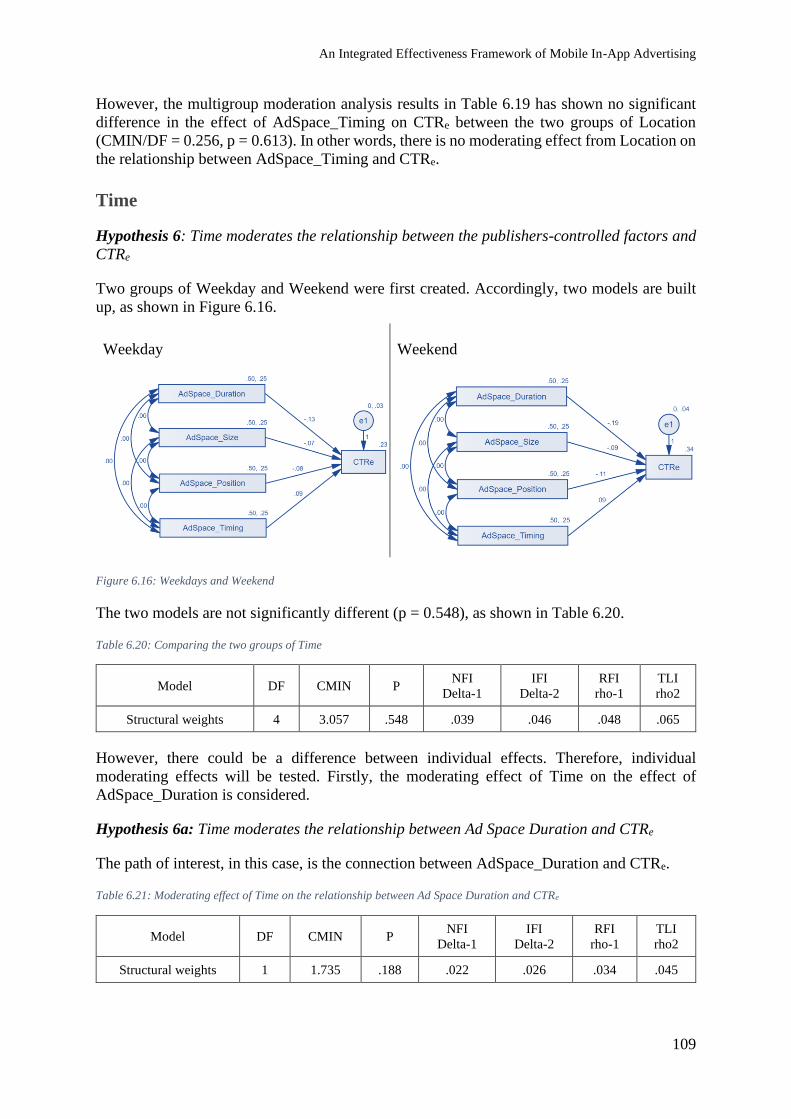
An Integrated Effectiveness Framework of Mobile In-App Advertising
109
However, the multigroup moderation analysis results in Table 6.19 has shown no significant
difference in the effect of AdSpace_Timing on CTRe between the two groups of Location
(CMIN/DF = 0.256, p = 0.613). In other words, there is no moderating effect from Location on
the relationship between AdSpace_Timing and CTRe.
Time
Hypothesis 6: Time moderates the relationship between the publishers-controlled factors and
CTRe
Two groups of Weekday and Weekend were first created. Accordingly, two models are built
up, as shown in Figure 6.16.
Weekday
Weekend
Figure 6.16: Weekdays and Weekend
The two models are not significantly different (p = 0.548), as shown in Table 6.20.
Table 6.20: Comparing the two groups of Time
Model DF CMIN P NFI
Delta-1
IFI
Delta-2
RFI
rho-1
TLI
rho2
Structural weights 4 3.057 .548 .039 .046 .048 .065
However, there could be a difference between individual effects. Therefore, individual
moderating effects will be tested. Firstly, the moderating effect of Time on the effect of
AdSpace_Duration is considered.
Hypothesis 6a: Time moderates the relationship between Ad Space Duration and CTRe
The path of interest, in this case, is the connection between AdSpace_Duration and CTRe.
Table 6.21: Moderating effect of Time on the relationship between Ad Space Duration and CTRe
Model DF CMIN P NFI
Delta-1
IFI
Delta-2
RFI
rho-1
TLI
rho2
Structural weights 1 1.735 .188 .022 .026 .034 .045
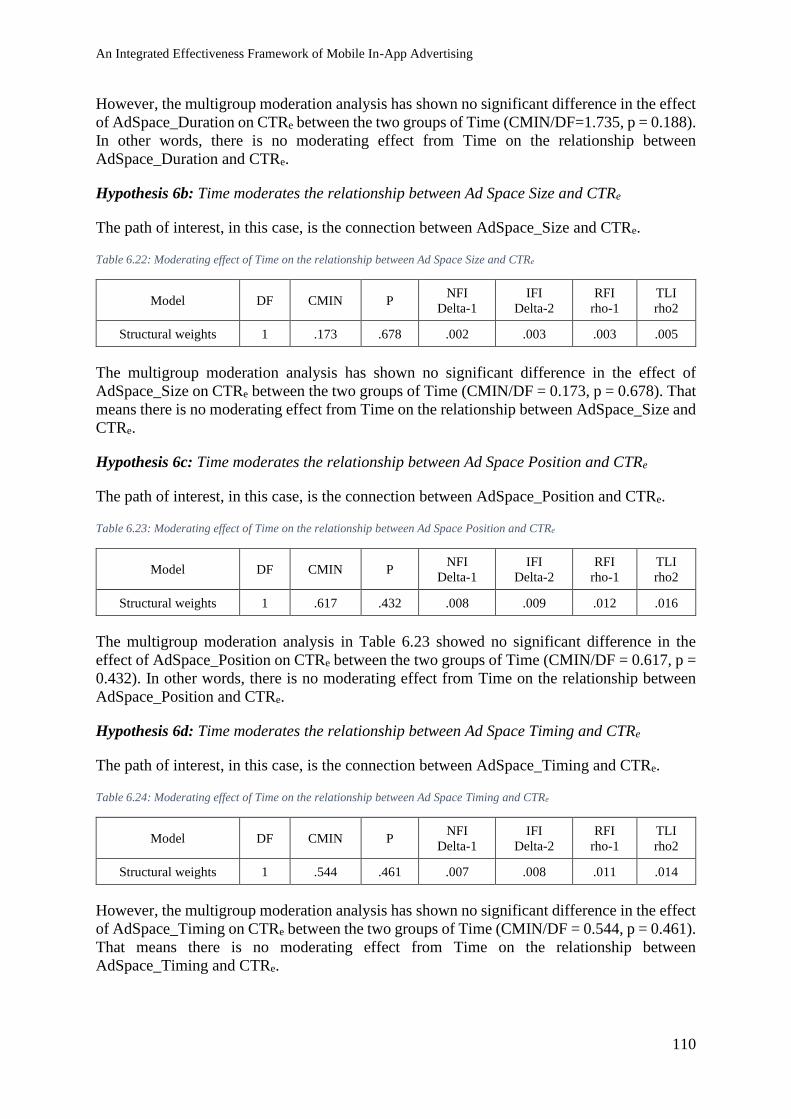
An Integrated Effectiveness Framework of Mobile In-App Advertising
110
However, the multigroup moderation analysis has shown no significant difference in the effect
of AdSpace_Duration on CTRe between the two groups of Time (CMIN/DF=1.735, p = 0.188).
In other words, there is no moderating effect from Time on the relationship between
AdSpace_Duration and CTRe.
Hypothesis 6b: Time moderates the relationship between Ad Space Size and CTRe
The path of interest, in this case, is the connection between AdSpace_Size and CTRe.
Table 6.22: Moderating effect of Time on the relationship between Ad Space Size and CTRe
Model DF CMIN P NFI
Delta-1
IFI
Delta-2
RFI
rho-1
TLI
rho2
Structural weights 1 .173 .678 .002 .003 .003 .005
The multigroup moderation analysis has shown no significant difference in the effect of
AdSpace_Size on CTRe between the two groups of Time (CMIN/DF = 0.173, p = 0.678). That
means there is no moderating effect from Time on the relationship between AdSpace_Size and
CTRe.
Hypothesis 6c: Time moderates the relationship between Ad Space Position and CTRe
The path of interest, in this case, is the connection between AdSpace_Position and CTRe.
Table 6.23: Moderating effect of Time on the relationship between Ad Space Position and CTRe
Model DF CMIN P NFI
Delta-1
IFI
Delta-2
RFI
rho-1
TLI
rho2
Structural weights 1 .617 .432 .008 .009 .012 .016
The multigroup moderation analysis in Table 6.23 showed no significant difference in the
effect of AdSpace_Position on CTRe between the two groups of Time (CMIN/DF = 0.617, p =
0.432). In other words, there is no moderating effect from Time on the relationship between
AdSpace_Position and CTRe.
Hypothesis 6d: Time moderates the relationship between Ad Space Timing and CTRe
The path of interest, in this case, is the connection between AdSpace_Timing and CTRe.
Table 6.24: Moderating effect of Time on the relationship between Ad Space Timing and CTRe
Model DF CMIN P NFI
Delta-1
IFI
Delta-2
RFI
rho-1
TLI
rho2
Structural weights 1 .544 .461 .007 .008 .011 .014
However, the multigroup moderation analysis has shown no significant difference in the effect
of AdSpace_Timing on CTRe between the two groups of Time (CMIN/DF = 0.544, p = 0.461).
That means there is no moderating effect from Time on the relationship between
AdSpace_Timing and CTRe.
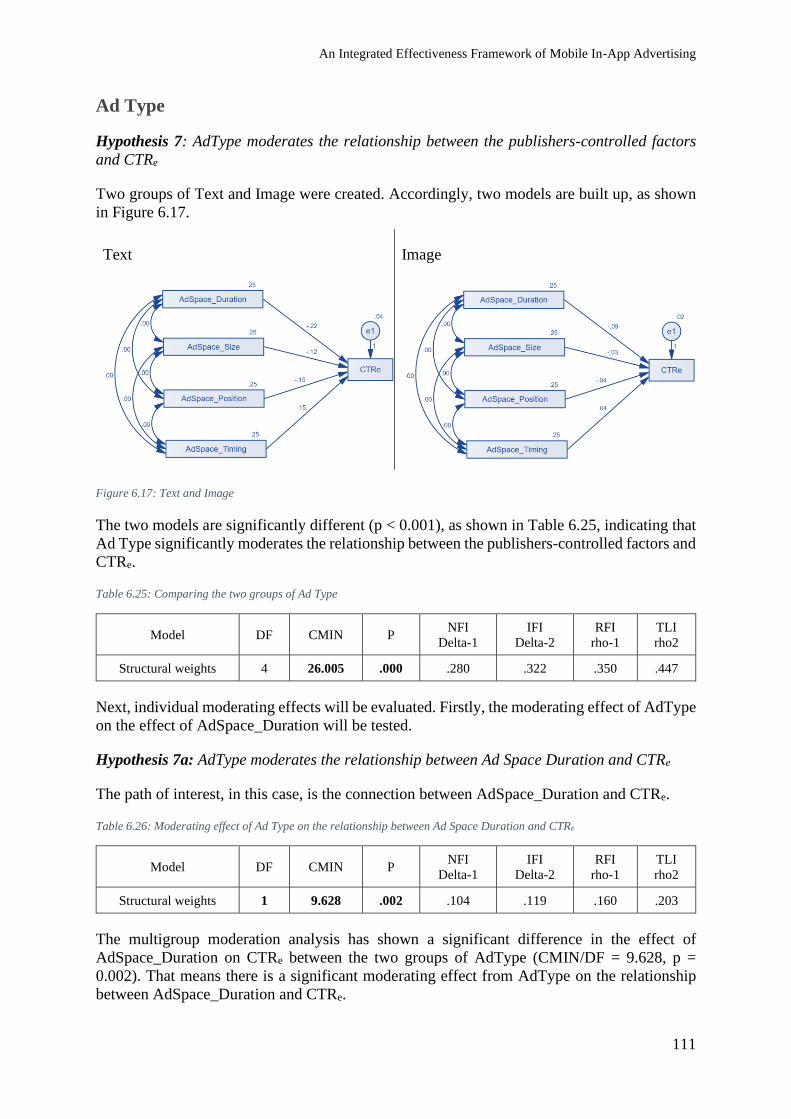
An Integrated Effectiveness Framework of Mobile In-App Advertising
111
Ad Type
Hypothesis 7: AdType moderates the relationship between the publishers-controlled factors
and CTRe
Two groups of Text and Image were created. Accordingly, two models are built up, as shown
in Figure 6.17.
Text
Image
Figure 6.17: Text and Image
The two models are significantly different (p < 0.001), as shown in Table 6.25, indicating that
Ad Type significantly moderates the relationship between the publishers-controlled factors and
CTRe.
Table 6.25: Comparing the two groups of Ad Type
Model DF CMIN P NFI
Delta-1
IFI
Delta-2
RFI
rho-1
TLI
rho2
Structural weights 4 26.005 .000 .280 .322 .350 .447
Next, individual moderating effects will be evaluated. Firstly, the moderating effect of AdType
on the effect of AdSpace_Duration will be tested.
Hypothesis 7a: AdType moderates the relationship between Ad Space Duration and CTRe
The path of interest, in this case, is the connection between AdSpace_Duration and CTRe.
Table 6.26: Moderating effect of Ad Type on the relationship between Ad Space Duration and CTRe
Model DF CMIN P NFI
Delta-1
IFI
Delta-2
RFI
rho-1
TLI
rho2
Structural weights 1 9.628 .002 .104 .119 .160 .203
The multigroup moderation analysis has shown a significant difference in the effect of
AdSpace_Duration on CTRe between the two groups of AdType (CMIN/DF = 9.628, p =
0.002). That means there is a significant moderating effect from AdType on the relationship
between AdSpace_Duration and CTRe.
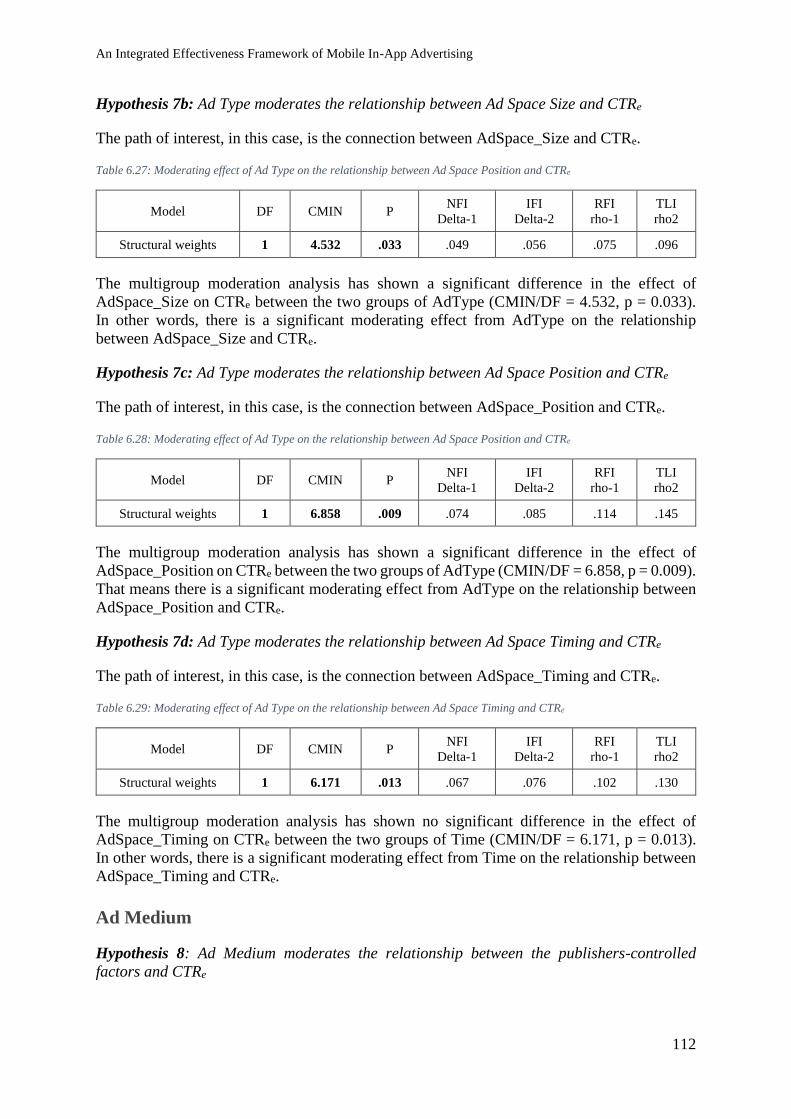
An Integrated Effectiveness Framework of Mobile In-App Advertising
112
Hypothesis 7b: Ad Type moderates the relationship between Ad Space Size and CTRe
The path of interest, in this case, is the connection between AdSpace_Size and CTRe.
Table 6.27: Moderating effect of Ad Type on the relationship between Ad Space Position and CTRe
Model DF CMIN P NFI
Delta-1
IFI
Delta-2
RFI
rho-1
TLI
rho2
Structural weights 1 4.532 .033 .049 .056 .075 .096
The multigroup moderation analysis has shown a significant difference in the effect of
AdSpace_Size on CTRe between the two groups of AdType (CMIN/DF = 4.532, p = 0.033).
In other words, there is a significant moderating effect from AdType on the relationship
between AdSpace_Size and CTRe.
Hypothesis 7c: Ad Type moderates the relationship between Ad Space Position and CTRe
The path of interest, in this case, is the connection between AdSpace_Position and CTRe.
Table 6.28: Moderating effect of Ad Type on the relationship between Ad Space Position and CTRe
Model DF CMIN P NFI
Delta-1
IFI
Delta-2
RFI
rho-1
TLI
rho2
Structural weights 1 6.858 .009 .074 .085 .114 .145
The multigroup moderation analysis has shown a significant difference in the effect of
AdSpace_Position on CTRe between the two groups of AdType (CMIN/DF = 6.858, p = 0.009).
That means there is a significant moderating effect from AdType on the relationship between
AdSpace_Position and CTRe.
Hypothesis 7d: Ad Type moderates the relationship between Ad Space Timing and CTRe
The path of interest, in this case, is the connection between AdSpace_Timing and CTRe.
Table 6.29: Moderating effect of Ad Type on the relationship between Ad Space Timing and CTRe
Model DF CMIN P NFI
Delta-1
IFI
Delta-2
RFI
rho-1
TLI
rho2
Structural weights 1 6.171 .013 .067 .076 .102 .130
The multigroup moderation analysis has shown no significant difference in the effect of
AdSpace_Timing on CTRe between the two groups of Time (CMIN/DF = 6.171, p = 0.013).
In other words, there is a significant moderating effect from Time on the relationship between
AdSpace_Timing and CTRe.
Ad Medium
Hypothesis 8: Ad Medium moderates the relationship between the publishers-controlled
factors and CTRe
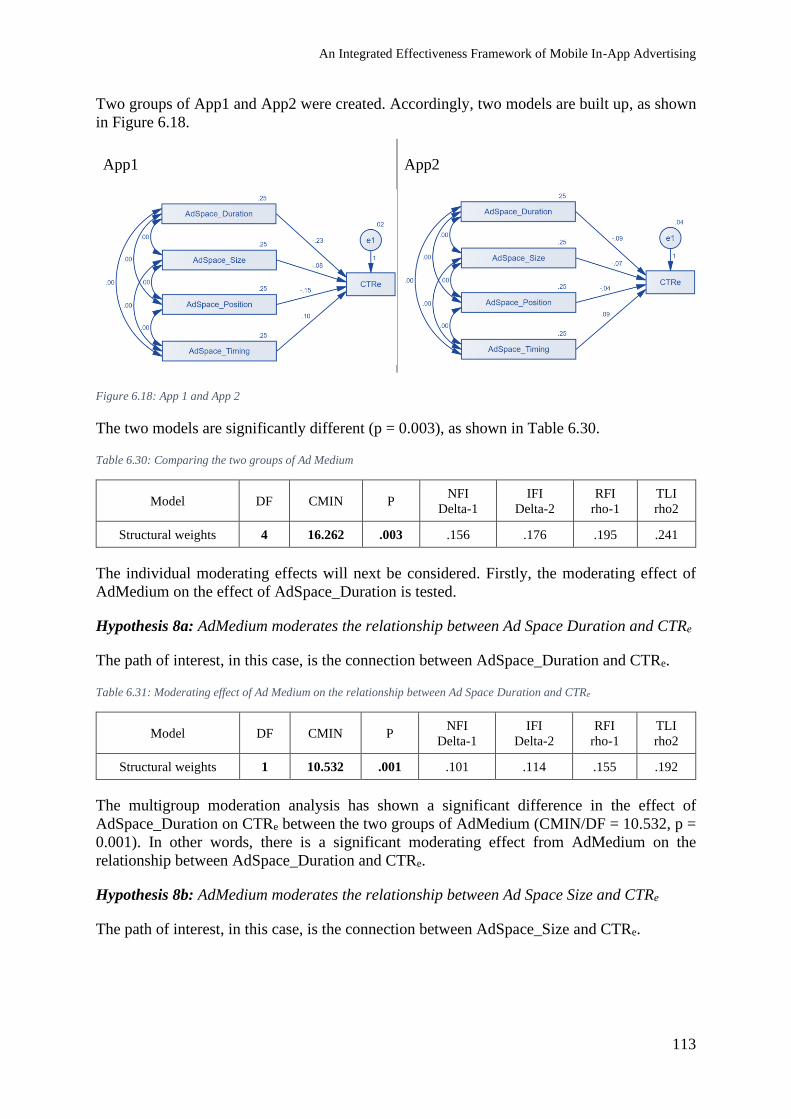
An Integrated Effectiveness Framework of Mobile In-App Advertising
113
Two groups of App1 and App2 were created. Accordingly, two models are built up, as shown
in Figure 6.18.
App1
App2
Figure 6.18: App 1 and App 2
The two models are significantly different (p = 0.003), as shown in Table 6.30.
Table 6.30: Comparing the two groups of Ad Medium
Model DF CMIN P NFI
Delta-1
IFI
Delta-2
RFI
rho-1
TLI
rho2
Structural weights 4 16.262 .003 .156 .176 .195 .241
The individual moderating effects will next be considered. Firstly, the moderating effect of
AdMedium on the effect of AdSpace_Duration is tested.
Hypothesis 8a: AdMedium moderates the relationship between Ad Space Duration and CTRe
The path of interest, in this case, is the connection between AdSpace_Duration and CTRe.
Table 6.31: Moderating effect of Ad Medium on the relationship between Ad Space Duration and CTRe
Model DF CMIN P NFI
Delta-1
IFI
Delta-2
RFI
rho-1
TLI
rho2
Structural weights 1 10.532 .001 .101 .114 .155 .192
The multigroup moderation analysis has shown a significant difference in the effect of
AdSpace_Duration on CTRe between the two groups of AdMedium (CMIN/DF = 10.532, p =
0.001). In other words, there is a significant moderating effect from AdMedium on the
relationship between AdSpace_Duration and CTRe.
Hypothesis 8b: AdMedium moderates the relationship between Ad Space Size and CTRe
The path of interest, in this case, is the connection between AdSpace_Size and CTRe.
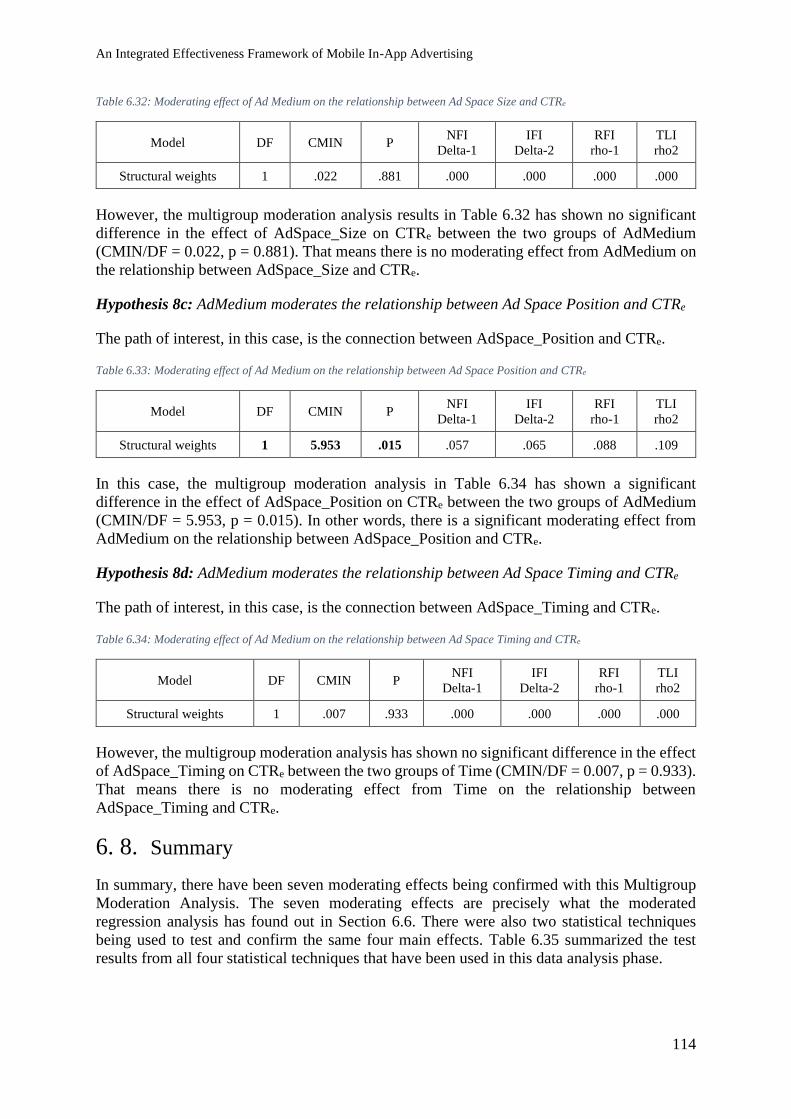
An Integrated Effectiveness Framework of Mobile In-App Advertising
114
Table 6.32: Moderating effect of Ad Medium on the relationship between Ad Space Size and CTRe
Model DF CMIN P NFI
Delta-1
IFI
Delta-2
RFI
rho-1
TLI
rho2
Structural weights 1 .022 .881 .000 .000 .000 .000
However, the multigroup moderation analysis results in Table 6.32 has shown no significant
difference in the effect of AdSpace_Size on CTRe between the two groups of AdMedium
(CMIN/DF = 0.022, p = 0.881). That means there is no moderating effect from AdMedium on
the relationship between AdSpace_Size and CTRe.
Hypothesis 8c: AdMedium moderates the relationship between Ad Space Position and CTRe
The path of interest, in this case, is the connection between AdSpace_Position and CTRe.
Table 6.33: Moderating effect of Ad Medium on the relationship between Ad Space Position and CTRe
Model DF CMIN P NFI
Delta-1
IFI
Delta-2
RFI
rho-1
TLI
rho2
Structural weights 1 5.953 .015 .057 .065 .088 .109
In this case, the multigroup moderation analysis in Table 6.34 has shown a significant
difference in the effect of AdSpace_Position on CTRe between the two groups of AdMedium
(CMIN/DF = 5.953, p = 0.015). In other words, there is a significant moderating effect from
AdMedium on the relationship between AdSpace_Position and CTRe.
Hypothesis 8d: AdMedium moderates the relationship between Ad Space Timing and CTRe
The path of interest, in this case, is the connection between AdSpace_Timing and CTRe.
Table 6.34: Moderating effect of Ad Medium on the relationship between Ad Space Timing and CTRe
Model DF CMIN P NFI
Delta-1
IFI
Delta-2
RFI
rho-1
TLI
rho2
Structural weights 1 .007 .933 .000 .000 .000 .000
However, the multigroup moderation analysis has shown no significant difference in the effect
of AdSpace_Timing on CTRe between the two groups of Time (CMIN/DF = 0.007, p = 0.933).
That means there is no moderating effect from Time on the relationship between
AdSpace_Timing and CTRe.
6. 8. Summary
In summary, there have been seven moderating effects being confirmed with this Multigroup
Moderation Analysis. The seven moderating effects are precisely what the moderated
regression analysis has found out in Section 6.6. There were also two statistical techniques
being used to test and confirm the same four main effects. Table 6.35 summarized the test
results from all four statistical techniques that have been used in this data analysis phase.
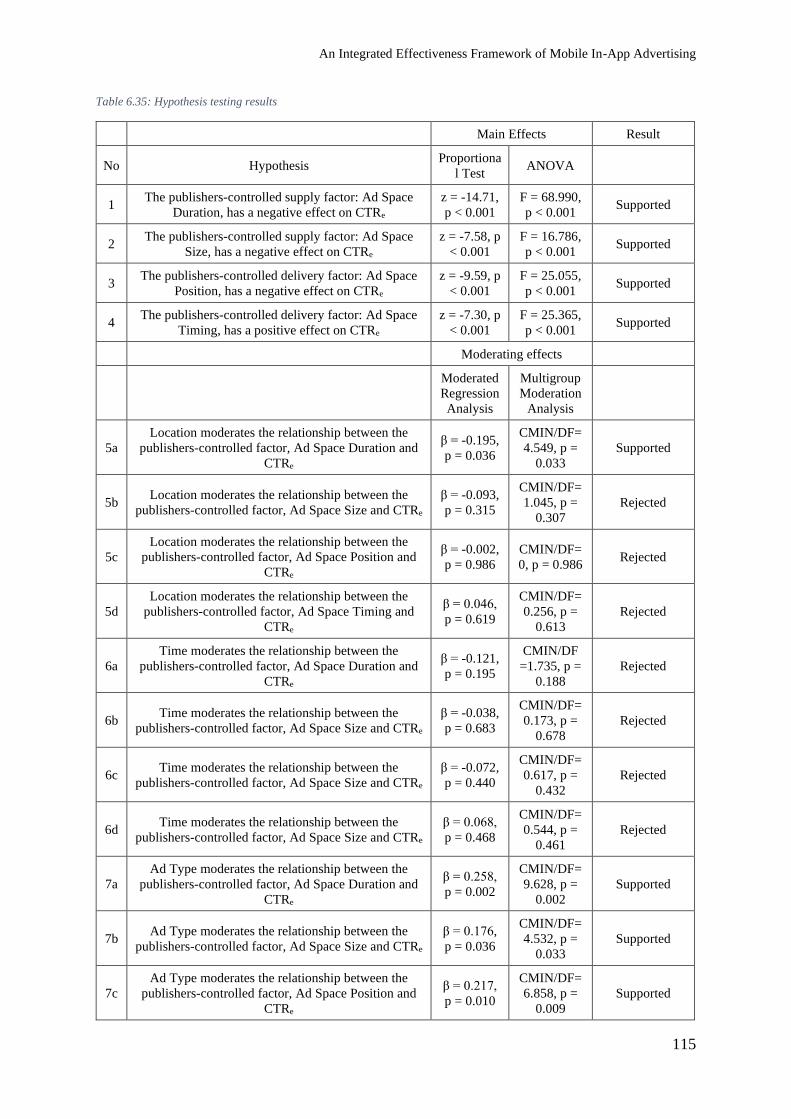
An Integrated Effectiveness Framework of Mobile In-App Advertising
115
Table 6.35: Hypothesis testing results
Main Effects Result
No Hypothesis Proportiona
l Test ANOVA
1 The publishers-controlled supply factor: Ad Space
Duration, has a negative effect on CTRe
z = -14.71,
p < 0.001
F = 68.990,
p < 0.001 Supported
2 The publishers-controlled supply factor: Ad Space
Size, has a negative effect on CTRe
z = -7.58, p
< 0.001
F = 16.786,
p < 0.001 Supported
3 The publishers-controlled delivery factor: Ad Space
Position, has a negative effect on CTRe
z = -9.59, p
< 0.001
F = 25.055,
p < 0.001 Supported
4 The publishers-controlled delivery factor: Ad Space
Timing, has a positive effect on CTRe
z = -7.30, p
< 0.001
F = 25.365,
p < 0.001 Supported
Moderating effects
Moderated
Regression
Analysis
Multigroup
Moderation
Analysis
5a
Location moderates the relationship between the
publishers-controlled factor, Ad Space Duration and
CTRe
β = -0.195,
p = 0.036
CMIN/DF=
4.549, p =
0.033
Supported
5b Location moderates the relationship between the
publishers-controlled factor, Ad Space Size and CTRe
β = -0.093,
p = 0.315
CMIN/DF=
1.045, p =
0.307
Rejected
5c
Location moderates the relationship between the
publishers-controlled factor, Ad Space Position and
CTRe
β = -0.002,
p = 0.986
CMIN/DF=
0, p = 0.986 Rejected
5d
Location moderates the relationship between the
publishers-controlled factor, Ad Space Timing and
CTRe
β = 0.046,
p = 0.619
CMIN/DF=
0.256, p =
0.613
Rejected
6a
Time moderates the relationship between the
publishers-controlled factor, Ad Space Duration and
CTRe
β = -0.121,
p = 0.195
CMIN/DF
=1.735, p =
0.188
Rejected
6b Time moderates the relationship between the
publishers-controlled factor, Ad Space Size and CTRe
β = -0.038,
p = 0.683
CMIN/DF=
0.173, p =
0.678
Rejected
6c Time moderates the relationship between the
publishers-controlled factor, Ad Space Size and CTRe
β = -0.072,
p = 0.440
CMIN/DF=
0.617, p =
0.432
Rejected
6d Time moderates the relationship between the
publishers-controlled factor, Ad Space Size and CTRe
β = 0.068,
p = 0.468
CMIN/DF=
0.544, p =
0.461
Rejected
7a
Ad Type moderates the relationship between the
publishers-controlled factor, Ad Space Duration and
CTRe
β = 0.258,
p = 0.002
CMIN/DF=
9.628, p =
0.002
Supported
7b Ad Type moderates the relationship between the
publishers-controlled factor, Ad Space Size and CTRe
β = 0.176,
p = 0.036
CMIN/DF=
4.532, p =
0.033
Supported
7c
Ad Type moderates the relationship between the
publishers-controlled factor, Ad Space Position and
CTRe
β = 0.217,
p = 0.010
CMIN/DF=
6.858, p =
0.009
Supported
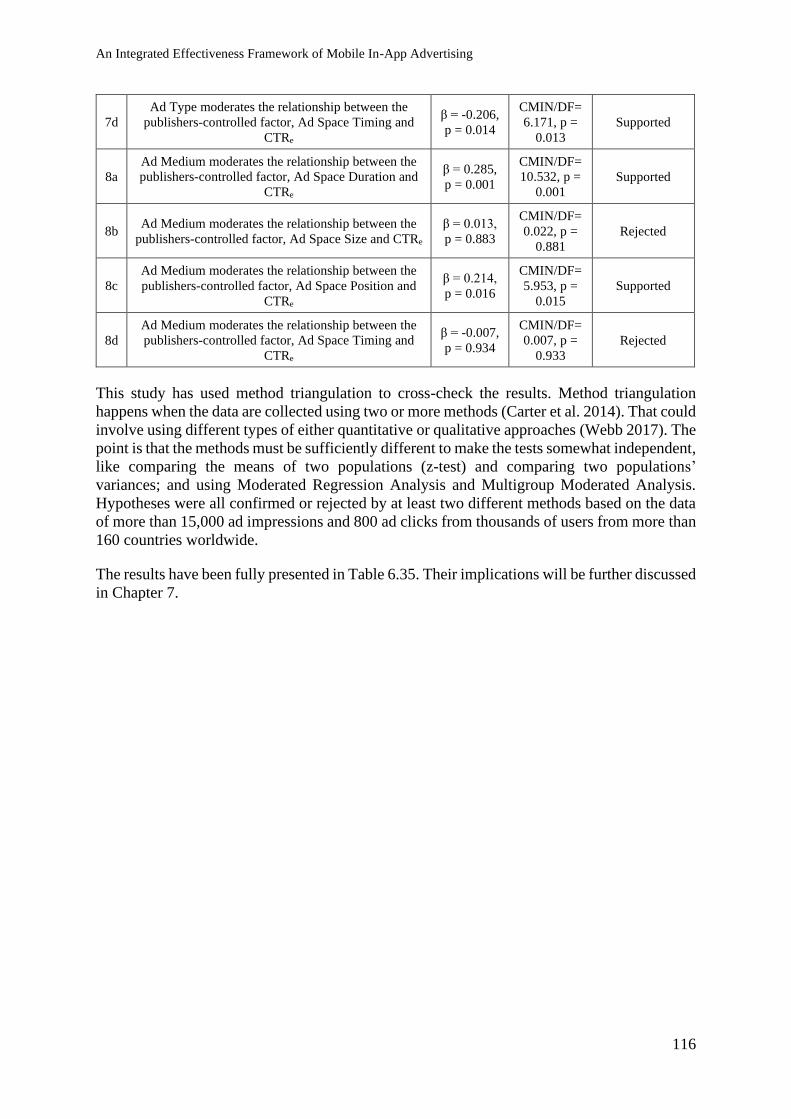
An Integrated Effectiveness Framework of Mobile In-App Advertising
116
7d
Ad Type moderates the relationship between the
publishers-controlled factor, Ad Space Timing and
CTRe
β = -0.206,
p = 0.014
CMIN/DF=
6.171, p =
0.013
Supported
8a
Ad Medium moderates the relationship between the
publishers-controlled factor, Ad Space Duration and
CTRe
β = 0.285,
p = 0.001
CMIN/DF=
10.532, p =
0.001
Supported
8b Ad Medium moderates the relationship between the
publishers-controlled factor, Ad Space Size and CTRe
β = 0.013,
p = 0.883
CMIN/DF=
0.022, p =
0.881
Rejected
8c
Ad Medium moderates the relationship between the
publishers-controlled factor, Ad Space Position and
CTRe
β = 0.214,
p = 0.016
CMIN/DF=
5.953, p =
0.015
Supported
8d
Ad Medium moderates the relationship between the
publishers-controlled factor, Ad Space Timing and
CTRe
β = -0.007,
p = 0.934
CMIN/DF=
0.007, p =
0.933
Rejected
This study has used method triangulation to cross-check the results. Method triangulation
happens when the data are collected using two or more methods (Carter et al. 2014). That could
involve using different types of either quantitative or qualitative approaches (Webb 2017). The
point is that the methods must be sufficiently different to make the tests somewhat independent,
like comparing the means of two populations (z-test) and comparing two populations’
variances; and using Moderated Regression Analysis and Multigroup Moderated Analysis.
Hypotheses were all confirmed or rejected by at least two different methods based on the data
of more than 15,000 ad impressions and 800 ad clicks from thousands of users from more than
160 countries worldwide.
The results have been fully presented in Table 6.35. Their implications will be further discussed
in Chapter 7.
An Integrated Effectiveness Framework of Mobile In-App Advertising
117
Chapter 7. DISCUSSION AND CONCLUSIONS
This chapter presents the main results and the key findings of this study. It then discusses
through those findings how the study contributes theoretically, practically and empirically.
This chapter also discusses the limitations and suggest some recommendations for future
researchers to pursue similar or related research. A summary of the study is presented at the
end to one last time revisit the research gaps, research questions and the research objectives
and how they are addressed, answered and achieved in this study.
The following items are accordingly discussed:
• Key Findings (Section 7.1)
• Contributions (Section 7.2)
• Limitations and Future Research (Section 7.3)
• Conclusions (Section 7.4)
7. 1. Key Findings
Publishers-controlled factors
Previous research on mobile in-app advertising only focused on the demand side of an ad
serving process (Brakenhoff & Spruit 2017; Grewal et al. 2016; Rodgers & Thorson 2000).
Limited research was actually on the supply side, including the app publisher (Choi et al. 2017;
Korula, Mirrokni & Nazerzadeh 2016; Yuan et al. 2014). There is a need to identify the factors
controlled by publishers and their direct effects on the effectiveness of mobile in-app
advertising. This study has attempted to address that issue and found out that the publisher is
actually a key participant in the ad serving process and can enhance mobile in-app advertising
effectiveness. In this study, all hypotheses 1, 2, 3 and 4 are supported when analysing the
collected data. The confirmation of those hypotheses has proved the importance of the
publisher role. At the 95% confidence level, publishers-controlled factors: ad space duration,
ad space size, ad space position and ad space timing all significantly impact the efficacy of
mobile in-app ads.
Ad Space Duration
Referring to the IAB’s guidelines, ads have two key characteristics: duration and size
(Interactive Advertising Bureau 2017b). Publishers own the right to decide how long they want
the advertisements to last on the apps, regardless of how long they are built by the advertisers
(Maillé & Tuffin 2018). They may set their ad space duration by entering a refreshing time.
Only advertisements with the required elements will be provided and displayed, even if they
are not from the specified publisher. However, for a long, while there were measurement
standards for web and banner advertisements, mobile in-app advertisements have different
measurement standards to work with. On TV or other types of advertising, advertisers also
define uniform standards of what constitutes a “view” of an ad. On smartphones, the findings
are inconclusive. The latest mobile advertisement literature lacks a description of a view (Sun
et al. 2017). Bringing advertisements on an app is distinct from conventional media, in that the
ads must be put alongside other content. In comparison, TV and radio advertisements appear
An Integrated Effectiveness Framework of Mobile In-App Advertising
118
instead of content (Sun et al. 2017). Even on handheld devices, screen time is considerably
shorter on average. Conversations on desktops take on average three times as long as those on
smartphones, and bounce rates are slightly lower (Paulson 2017).
Some previous studies have concluded that longer ads are more effective than shorter ones.
One example is a study by Kong et al. (2019). The study showed that as exposure time
increased, so did the TV recognition and recall. Khattab and Mahrous (2016) found that longer
ads had higher click-through rates. When banner ads are difficult to process, there is a linear
increase in respondent attitudes to the target ads and the brand followed by a gradual
reassessment (Wang, Shih & Peracchio 2013). Those studies' findings of the effects of ad
length on the efficacy of online ads are contradictory to those by Cheung and To (2017) and
Goldstein, McAfee and Suri (2015). These contradictory findings are due to the lack of
standardisation when measuring the duration of ads and ad spaces. In most instances,
conventional monetization has ignored time as an optimisation method until recently (Sun, et
al, 2017).
This study has addressed the current issue of ad space duration in mobile apps and found that
the shorter ads are much more effective than the longer ones taking into account their duration.
This result can be explained by the fact that the first few seconds of advertisements appear to
be long enough for consumers to get attention and take action if they want to. After that short
period of time, the advertisements will never have that level of attention and effectiveness
anymore (Hill et al. 2013). This finding seems to be consistent with many previous studies,
which have shown that users are only looking for the first few pages of a catalogue and the first
few search engine results (Burke et al. 2005; Hoque & Lohse 1999). The finding in mobile in-
app advertising reinforced that understanding, while still showed their significance to be
applied in practice. In mobile in-app advertising, this finding could help publishers optimize
their ad space inventory further with ad space duration. Is that necessary to design an ad with
90 seconds of duration when an ad of 30 seconds could deliver the same result? Can two 30
seconds of ads double up the number of clicks? Time is usually not considered a resource to be
optimized in the past (Sun et al. 2017). However, with this finding, the importance of this factor
was acknowledged. This temporal dimension needs to be optimized further, starting from
mobile advertisements.
Ad Space Size
Similar to the ad space duration, publishers can set the size of their ad spaces (Interactive
Advertising Bureau 2017b). Ad space is selected with a predefined ad size set, and only those
ads that meet the requirement are chosen.
Conventional wisdom has long been maintained that those big banner ads can garner more
viewers, as shown by the number of clicks on banner ads (Marx 1996; North & Ficorilli 2017).
Also, the effectiveness of more mass ads in helping promote the brand impacts the viewer’s
perception of the brand’s quality. More massive advertising indicates a higher degree of
promotional expense and effort than the brand’s prestige and popularity (Huang & Yang 2012).
When banner ads carry viewers to other pages, this increases user impressions and site
expectations; this leads to increased visitor response, i.e. clicks (Rejón-Guardia & Martínez-
López 2014). Kyung, Thomas and Krishna (2017) concluded that larger advertisements are
more likely to catch customer interest and are more likely to sell. Wang, Shih and Peracchio
(2013) observed beneficial results from five banner sizes, but there was no significant
difference between the two larger sizes.
An Integrated Effectiveness Framework of Mobile In-App Advertising
119
However, the mobile app ad size can differ from that of an online ad. That is possible because
the consumer has limited cognitive capacity. Prior research has shown that customers’
capacities are constrained by their ability (Craik 2002; Miller 1956). In the mobile context,
there is a problem with the small size of the screen. The screen size of mobile devices may be
as small as the Apple Watch, but smartphone screens typically measure around one-fourth that
of a personal computer (Kim & Han 2014). The challenge is worth considering. However,
metrics are not available to calculate size itself (Schick 2013). Herrewijn and Poels (2018)
claimed that the effect of ad size, while significant, is neglectable because it has not been taken
into account until recently.
This study has addressed the current issue of ad space size in mobile apps and found that
smaller ads performed much better than larger ones, taking into account their size. It can be
explained in the same way as the duration of ad spaces. The result implies that the first few
pixels of the content are large enough to attract the user to take action. If any, the rest of the
display could be considered redundant or not as effective as its first part. More content also
means a higher amount of cognitive consumption, which is limited. If any action required too
much cognitive effect, people tend to ignore it (Lee & Faber 2007). Nonetheless, over time,
the size has not generally been considered as a tool to be optimized in ads (Schick 2013). Is
this a full-screen view, or just half of it? This finding is the answer to that long-overdue
question. Measuring the efficacy of an ad must take into account its spatial dimensions. In
practice, this result could allow advertisers to refine further their ad space inventory to make
use of mobile devices' small screen size. By limiting each advertisement’s size, they could save
the screen estate for other features and functions, or even for more ads (Kohavi & Longbotham
2017). Furthermore, considering ads as physical objects that could be measured through spatial
and temporal dimensions, this study has shown the importance of ad space duration and ad
space size, allowing us to maximize the ad space inventory even further.
Ad Space Position
In addition to selling ad space, the publisher also monitors the distribution of ad impressions.
When an advertiser and a publisher have chosen the advertisements, the publisher would have
total control over what ads to display and how to show them. The publishing company can
choose how the advertisements are shown and where they are placed. The Interactive
Advertising Bureau suggests ad locations to be at the top and on the sides of the page
(Interactive Advertising Bureau 2017b). They suggest allowing ad timing to occur before,
during or after the primary content experience (Interactive Advertising Bureau 2017b). There
are many studies on positioning and scheduling ads on a website, pioneering by Adler, Gibbons
and Matias (2002), Nakamura and Abe (2005) and Kumar, Jacob and Sriskandarajah (2006).
This position effect has received intense research in the past but with contradicting results
(Narayanan & Kalyanam 2015).
Several studies have even shown that prominent placement in advertising (e.g. full ads, central
advertisements) can help create brand awareness and dramatically influence brands'
perceptions. (Jeong & Biocca 2012; Lee & Faber 2007; Schneider, Systems & Cornwell 2005).
In their report, Agarwal, Hosanagar and Smith (2011) assessed the effect on sales and income
of sponsored search ad placement. The authors measure the impact of ad placement on click-
through and conversion. They claimed that the click-through rate decreases with the rating, and
the top spot is not the position of sales or profit-maximizing. However, in handheld devices,
the computer screen is much more interactive, while in personal computers, the screen is static.
Although the response is unknown, some publishers use banner ads without finding out how
An Integrated Effectiveness Framework of Mobile In-App Advertising
120
successful they are (Oak 2008). Questions about the optimal positioning of mobile ads remain
unanswered until recently (Grewal et al. 2016).
This study has addressed the current issue of ad space position in mobile ads and found that
the advertisements shown on the top of the screen performed much better than those shown in
the middle of the screen. This result can be explained by the fact that the top position is always
perceived as the most desirable eyespot (Josephson 2004; Sundar & Kalyanaraman 2004). It is
typically the location that the eyes of the consumer are directly connected to. The central
location may be convenient for users to touch because it is closer to the users’ pointing finger.
However, the click behaviour is caused by the brains of the recipient, who first interpreted the
inputs from the eyes (Djamasbi, Hall-Phillips & Yang 2013). That could explain why the top
position is more effective. The finding cleared out a range of misunderstandings about the
efficacy of middle ads and helped publishers design their ad spaces to be more successful.
Usually, in the past, when designing their ad spaces, publishers do not pay much attention to
this feature (Oak 2008). This finding will help them rethink the importance of this factor,
especially on their mobile apps. Ad Space Position is confirmed to have a significant impact
on the effectiveness of mobile in-app advertising.
Ad Space Timing
Ads may also be scheduled before or after the main session (Chatterjee, Hoffman & Novak
2003; Kumar, Dawande & Mookerjee 2007; Sun et al. 2017). However, Goldstein, McAfee
and Suri (2015) claimed that there is no advice given to advertisers on when to advertise. Online
media have sought one way or another to be innovative in scheduling the show of their ads
(Yuan et al. 2012). In online search advertising, Hoque and Lohse (1999) found that consumers
are more likely to use ads close to the start of an online directory than to use paper directories.
Furthermore, compared to TV networks, mobile app publishers have better visibility into the
traffic on their websites (Roels & Fridgeirsdottir 2009). King (2017) recently called publishers
to take back control of the inventory and to remind them that timing is just as important as
audience targeting.
This study has addressed the current issue of ad space timing in mobile apps and found that the
ads shown at the end of the main activity are significantly more effective than those shown at
the beginning. This result can be explained by the fact that the user tends to focus only on the
main activity (Paulson 2017). Any ads appearing at that time would be considered a nuisance,
and would usually be ignored. On the other hand, when the user has successfully completed
the main activity, they may put the emphasis aside and perform additional tasks, such as seeing
advertisements (Kim & Han 2014). Therefore, the ads showing at that time are more
appropriate and more effective. Previous studies, unfortunately, did not really consider this
feature (King 2017). With this confirmation, publishers are now in a better position to schedule
the display of their advertisements in order to gain better user interest. No other participants,
except the publisher, can control this display feature and directly affect the efficacy of the
advertisements shown in their mobile apps.
An Integrated Effectiveness Framework
Despite the seeming utility of previous effectiveness frameworks (e.g. MAEF and IAM), they
basically included only factors related to consumers, advertisers, ad networks and built around
the goals of advertisers (Brakenhoff & Spruit 2017; Grewal et al. 2016; Rodgers & Thorson
2000). However, there are also other participants involved with advertising and have their own
An Integrated Effectiveness Framework of Mobile In-App Advertising
121
goal (Busch 2016; Maillé & Tuffin 2018; Rejón-Guardia & Martínez-López 2014). There is a
necessity to find out a common goal of all participants and construct an integrated effectiveness
framework for mobile in-app advertising. This study has addressed that issue by proposing the
components of factors and evaluating their effects.
The integrated effectiveness framework that this study proposed is built around all participants'
common goal and includes factor components that previously identified in other effective
frameworks: the context component controlled by ad networks, the consumer component -
controlled by consumers and the ad elements controlled by advertisers. Two new components
of factors that have been introduced are the ad space designing and ad space displaying ones.
The common outcome metric is the CTRe, which measures the short and long term goals for
all participants.
This study started by evaluating the direct effects of factors controlled by advertisers,
consumers and ad networks on the effectiveness of mobile in-app advertising and then
evaluated the moderating effects on the relationships between the factors controlled by
publishers with the effectiveness of mobile in-app advertising.
Location
Firstly, in the MAEF, ten contextual factors are being listed out, including Location, Time,
Weather, Events, Economic Conditions, Devices, Delivery Mechanism Availability, Owned or
3rd party, Another Screen presence. About Location, Goh, Chu and Wu (2015) further
categorized it as area, city, and country. Goh, Chu and Wu (2015) looked at regional location
functions, the pre/postpaid mobile service program, and last-digit promotional success goals
initiatives. Luo et al. (2014) found out ads that advertise to people in a specific geo-location
are more successful than those that do not. Location data remains a powerful tool for advertisers
and other companies, with nearly nine out of ten advertisers claiming that location-based
advertising resulted in higher sales, contributing to revenue development (84 per cent) (Dusane
2019). Today, data-driven marketer tools and strategies allow us better to understand creative
messaging and its effect on sales. Simultaneously, modern distribution networks deliver
personalised, individualised information through a user’s media consumption habits. The
position is a primary sales marketing strategy data point. Location data improves effectiveness
and profitability for organisations (Thiga et al. 2016).
Unlike previous studies about Location, this study found a significant difference in click-
through rates between the developed countries (East Asia, North America, Europe, Australia
and New Zealand) and the developing countries (South America, Africa and the Middle East
and Southern Asia). People living in developing countries seem to be clicking more on mobile
apps than those living in developed countries. That could be due to the fact that developing
countries typically have higher Gross Domestic Product (GDP) per capita growth rates and
higher consumption rates than developed countries (fe Bureau 2013). That can be explained in
another way that, due to higher consumer demands, including advertisement consumption, the
economies of their countries are growing at higher rates. There could be some relationship
between the GDP growth rate and the click-through rate. Previous reports showed the
difference in click-through rates between countries worldwide (Chaffey 2019; SmartInsights
2010), but have not found and statistically verified that the significant difference between the
two regions of developed and developing countries. The result is essential because it lets
companies determine where to spend their mobile advertising money geographically to get a
better return on their investment.
An Integrated Effectiveness Framework of Mobile In-App Advertising
122
Time
Similarly, in previous research, Time has been considered to affect online advertisement
effectiveness. For example, Li (2014) found that the vast majority of Twitter messages were
written from 10 AM to midnight, with a peak of around 9 PM. Twitter users are found to have
a higher tendency towards weekend use than weekday use (Li 2014). Similarly, Baker, Fang
and Luo (2014) found that advertising efficacy varies depending on daytime. Different times
of day can lead to different outcomes, as shown in a study by Luo et al. (2014). The time of
day and the day of the week also have significant consequences. It was found that the best days
to send emails are during the business week, Tuesday, Wednesday, and Thursday, particularly
for the K-12 market and the Higher Ed market (MDR Education 2018). In the K-12 market,
emails were read most frequently on Thursdays. In the Higher Ed market, emails were read
most frequently on Wednesdays. Likewise, Wednesday and Saturday are the most popular days
for Indian Internet users to check email, and Monday and Thursday are not far behind (Octane
Marketing 2015). On Tuesday, they see the highest mix of participants with the highest rate of
open email rates. In video advertisements, early morning viewers are usually more receptive
and accepting of a brand message while evening viewers are more receptive and accepting of
advertising. According to a national survey, ads viewed during the early morning hours are
11% more likely to lead to a purchase or favourable response than in the evening (Chaffey
2020). That is the quickest buying intention. Late night/early morning (9:00 p.m. – 2:59 a.m.)
is the next time to buy at an average of 5 per cent higher than other times of the day (Li & Lo
2015).
Unlike previous studies about Time, this study has focused on mobile apps and found similar
results that mobile ads are more effective during the weekends than on weekdays. Weekends
are usually considered the time for people to relax (Do & Gatica - Perez 2012). During this
time, they will do more entertainment and shopping activities. Traditionally, people go to
shopping malls and movie theatres at weekends (Li 2014). In the online world, people tend to
make more transactions over the Internet on weekends than on weekdays (Laudon & Traver
2018). That might explain the result of this study. This result allows companies to targets their
ads on the right day of the week to have a higher click-through rate. Some related research has
found the difference in the click-through rates per day of email marketing (Octane Marketing
2015). However, they have not emphasized that the discrepancy in display advertising, and
more specifically in mobile in-app advertising.
Ad Type
Ads may be in other media such as text, image, and rich media (Dens, De Pelsmacker &
Puttemans 2011). Those creative qualities are defined as interactive/static in the MAEF
(Grewal et al. 2016). The type of creativity shown in the ad can influence how it is intended
for customer interaction (Brakenhoff & Spruit 2017). Lim, Tan and Jnr Nwonwu (2013)
reported that mobile users are more likely than others to recall static picture ads and often be
confused with broad banner ads that contain much text-based content. A static display ad is an
ad that is fixed in stone on the web page or app. A static banner ad consists of a lone image
with a slogan. The findings can be explained by the fact that static advertisements are more
successful because they cater to past visitors who recognise a brand immediately. In
comparison, animated advertisements often do not have a company logo at all and reduce the
chance to be recalled and clicked (Lim, Tan & Jnr Nwonwu 2013).
According to Edizel, Mantrach and Bai (2017), some advertisers have started producing
animated banners that introduce a product over some time. Due to its use, the creation of
An Integrated Effectiveness Framework of Mobile In-App Advertising
123
moving images, television is considered one of the most disruptive media types. When banners
use animation, they also deal with the theme of television advertising, thereby gaining more
interest and clicks, leading them to cost more (Wegert 2002). Side-by-side analyses of
ACNielsen commercials for different companies indicate that animation can draw more clicks
(Lohtia, Donthu & Hershberger 2003). Cheung, Hong and Thong (2017)demonstrated that
animation increases reaction time and online banner ads catch a user’s attention with regular
stimulation.
In contrast to previous studies in web advertising, this study found that text ads perform better
than multimedia ones. That can be explained by the fact that only banner ads are used in their
study. Multimedia ads can work better in the interstitial/full-screen format. Having a video on
the already multimedia content page may not be a good idea. This result is notable because it
varies from the results in the other field of online advertising, like web advertising (Lin & Chen
2009). In web/personal computer advertising, image ads are found to be more effective than
text ads because they seem to stand out from text-only websites (Lin & Chen 2009). However,
for mobile apps, people need to write short texts to illustrate what their advertisements are all
about so that mobile users can be encouraged to click on them. Either way, ad type is confirmed
to be a factor that could significantly impact advertising effectiveness.
Ad Medium
Grewal et al. (2016) identified six ad elements: ad medium, medium type, push/pull,
interactive/static, promotional elements. The ad medium is the means by which the ad is being
transmitted. Each medium must be either a web page or a mobile application. An ad may be
interpreted differently in the context of a web page or a computer programme (Grewal et al.
2016). Ad Medium refers to the design/aesthetics of the software or website upon which
advertisements are put, regulated, and served by the advertisers (Brakenhoff & Spruit 2017).
The ad medium may consist of either operating systems (e.g. iOS and Android) or platforms
(e.g. web browsers) on which the software is running. It can be expected that ads shown on
various mobile platforms such as Facebook, Twitter, YouTube, and Yahoo will produce
different click-through rates. Because different users have different reasons for the use of the
internet, they can respond differently to advertising on the web (San José-Cabezudo, Gutiérrez-
Cillán & Gutiérrez-Arranz 2008). A study conducted by Zorn et al. (2012) found that different
websites’ traffic is disparate. On one social networking platform, myspace.com, consumers
favoured animated advertisements while on the other site, ebuddys.com, consumers prefered
static ads. Animated commercials were more effective at interacting with surfers than static
advertising. Regardless, myspace.no dominated the surfing video market, and English static
advertising was most effective for second place (Zorn et al. 2012). That demonstrated an
interaction between ad type and ad medium.
This study extended those previous studies to compare the effectiveness between apps and
found that ads showing in different apps could produce significantly different click-through
rates. Specifically, the mobile ads being shown on an app with a menu screen and an activity
screen had higher click-through rates than those on the app with only an activity screen. That
can be explained by the fact that advertising alongside the main functions of apps can be viewed
as distracting content and overlooked by consumers who should instead be more focused on
the function buttons (Lim, Tan & Jnr Nwonwu 2013). This finding is important because it lets
companies select higher-performance applications to run their advertising campaigns as the
advertising effectiveness is actually different from one app to another.
An Integrated Effectiveness Framework of Mobile In-App Advertising
124
Moderating Effects
The confirmation of the factors controlled by advertisers, consumers and ad networks led the
researcher to study their moderating effects on the relationships between the publishers-
controlled and the click-through rate. More broadly, it led to the construction of a newly
integrated effectiveness framework of mobile in-app advertising. Mobile in-app advertising
has its own characteristics and requires its own effectiveness framework (Luo et al. 2014).
Unfortunately, there are actually not many effectiveness frameworks for mobile in-app
advertising in the current literature, and no effectiveness frameworks include the factors
controlled by publishers (Choi et al. 2017; Rodgers, Ouyang & Thorson 2017; Yuan et al.
2014). In this study, at the confidence level of 95%, hypothesis 7 is fully supported, the
hypotheses 5 and 8 are partly supported. At a glance, three factors controlled by advertisers,
consumers and ad networks significantly moderate the main effects resulting in seven
significant moderating effects on the click-through rate.
The two factors, Location and Ad Space Duration were found to interact significantly. People
in different regions of the world seem to have different behaviour towards advertising
(SmartInsights 2010). Still, it is fascinating to see that people in developed and developing
countries perceive the way advertisements are brought up in shorter and longer forms. People
in developed countries seem to like shorter advertisements much more than those in developing
countries. This finding is very significant because it helps publishers design their ads according
to the region of the ad spaces. The ad network could also benefit from this finding because ad
networks are the party who has access to the location information (Thiga et al. 2016). This
finding implies that to enhance the effectiveness of mobile in-app advertising further,
publishers should not work alone, but together with other participants. The moderating effect
from Location to Ad Space Duration prove the necessity of collaboration between the
publishers and all other participants.
The factor Ad Type was found to moderate the effect of Ad Space Duration significantly. That
means text and image ads have different impacts, but it also depends on how long those ads for
each type. That finding can actually be explained when considering that a message might need
a longer time in the video format than in a text format (Chaffey 2020; Mahadevan 2019). In
fact, this study has confirmed that shorter ads in text format have the highest effectiveness,
taking into account their display time. The finding helps publishers and advertisers select the
optimal combination of those two factors to enhance effectiveness further. Duration is usually
not considered a factor to be optimized in the past (Sun et al. 2017). The combination of Ad
Space Duration with other factors like Ad Type has not been even well-studied before (Grewal
et al. 2016). Again, this finding emphasizes the importance of Ad Space Duration and its impact
on mobile in-app advertising’s effectiveness either directly or indirectly.
Ad Type also significantly moderates the effect from another factor according to the analysis.
That is the Ad Space Size factor. This finding implies that the difference between text and
image ads when their sizes change is significantly different. In specifics, the text ads in the
smaller size were found to be the most effective, taking into account their total area of the
display. That can be explained by the fact that multimedia ads usually required bigger sizes
than text ones (Cheung, Hong & Thong 2017; Mahadevan 2019). This finding is significant
for publishers and advertisers and encourages them to come together and select the right size
of an ad for each ad type. If a temporal dimension measures the duration, then the size is
measured by two spatial dimensions (Goh, Chu & Wu 2015; Trope & Liberman 2003, 2010).
Unfortunately, the previous methods have not considered them in their measurement (Schick
An Integrated Effectiveness Framework of Mobile In-App Advertising
125
2013). Without such a metric, ad space size’s impact could not be detected, not to mention their
moderating effects like the one between ad type and ad space size.
The factor Ad Type was also found to moderate the effect from Ad Space Position significantly.
This study found out that the impact of ad spaces’ position on the click-through rate is
significantly different between text and multimedia ads. This finding showed an interaction
between a factor controlled by advertisers and another factor controlled by publishers. In
specifics, with the collected data of this study, it is clearly shown that the top position should
be dedicated to text ads. That position seems to be the closest position for users to read, while
a lower position could be used for watching videos or viewing images (Djamasbi, Hall-Phillips
& Yang 2013; Lapa 2007). This study also gives a comparison among three other possible
combinations of these two factors. Publishers could select the optimal combination of those to
enhance the effectiveness of their ad space inventory even further.
It has been found that Ad Type significantly moderates the impact of Ad Space Timing. This
study found that the effect of ad space timing on the click-through rate between text and
multimedia advertising is significantly different as well. In specifics, the initial timing should
be devoted to text ads. That timing seems to be the closest time for users to read while watching
videos or viewing images that might be used later (Nitza & Ruti 2015; Perez 2017). This study
also offered a comparison of these two variables with three other possible combinations.
Publishers could choose the best combination of these to further improve the efficacy of their
inventory of ad space.
Ad Space Duration and Ad Medium are the next two factors that have a strong relationship.
The analysis has shown that the difference in the impacts of shorter ads on different apps is
significantly different from the difference in the impacts of the longer ones. In other words,
shorter ads performed much better when the ad medium is changed compared to longer ones.
That can be explained considering that different apps have different designs (Atkinson,
Driesener & Corkindale 2014; North & Ficorilli 2017). Some designs work best with shorter
ads, while others do not. The finding has significance in helping publishers combine the
duration of their ad spaces with the app to optimize their ad spaces' click-through rates. This
finding also showed a significant moderating effect from a contextual factor on a publishers-
controlled factor’s effect.
Lastly, Ad Space Position and Ad Medium are the two factors that also have a strong
relationship. The results have shown that the difference in the impact of ad space position
among apps is significantly different. The top ads are found to be more effective than the
middle ones. However, those differences are significantly different in one app than another.
That can be explained as in the case of the interaction between ad space duration and ad
medium above that each app has its unique design, and that design could moderate how the
position of ads impacting the click-through rate (Atkinson, Driesener & Corkindale 2014;
North & Ficorilli 2017). Combining which apps with which position could bring more
significant benefits for publishers and advertisers.
Previous effectiveness frameworks (e.g. MAEF and IAM) basically included only factors
related to consumers, advertisers, ad networks and built around the goals of advertisers – the
demand side of an ad serving process (Brakenhoff & Spruit 2017; Grewal et al. 2016; Rodgers
& Thorson 2000). On the unexplored supply side, the publishers still have their own control of
supplying ad spaces (Brakenhoff & Spruit 2017; Hao, Guo & Easley 2017) and delivering ad
impressions on those ad spaces (Choi et al. 2017; Ha 2008). The integrated effectiveness
An Integrated Effectiveness Framework of Mobile In-App Advertising
126
framework that this study constructed extended previous effectiveness frameworks in that
respect.
The integrated effectiveness framework proposed by this study is designed around the common
goal of all participants and includes factor components previously established in other effective
frameworks (Boerman, Kruikemeier & Zuiderveen Borgesius 2017; Grewal et al. 2016;
Rodgers & Thorson 2000). Two new factors components added are ad space designing and ad
space displaying ones. The framework responds to the question as to what framework the goals
of the publisher and other participants could integrate. The common outcome metric calculates
the short- and long-term goals for all participants. The framework includes four participants:
consumer, advertiser, ad network and publisher. The confirmation of the conceptual model has
proven the interaction among the factors controlled by all participants involving in a mobile
in-app ad serving process, which have not been identified and evaluated before.
7. 2. Contributions
As the key research questions and suggested directions summarised above revealed, publishers
play an integral role in the ad serving process, impacting the click-through rate individually
and interactively. This argument was proven with this study. Several main factors determine
these relationships, including ad space duration, ad space size, ad space location and ad space
timing. Accordingly, this study proposed an integrated effectiveness framework building
around a common goal of all participants. One metric has also been developed to measure that
common goal, facilitating the framework’s evaluation process. The integrated effectiveness
framework is the backbone for this study to develop its hypotheses, which have been tested
successfully with the collected data from thousands of mobile users worldwide. The
contribution of this study is, therefore, threefold: theoretical, practical and empirical.
Theoretically, the research contributes to mobile in-app advertising literature by modelling
publishers' role and the impact of their design and display factors on the click-through rate of
mobile in-app advertising. Models are how humans perceive reality. Physicists tend to find a
universal formula of the universe one way or another. Biologists tend to find a typical pattern
of all walks of life. Social scientists want to find typical behaviour among humans. Models are,
therefore, the ultimate goal of our works in science. A theoretical contribution is the
introduction of new constructs and relationships in a model (MacInnis 2011). This study has
done this part of extending previous models of mobile advertising effectiveness models (e.g.
Grewal et al. (2016) and Brakenhoff and Spruit (2017)) to include more constructs and
relationships, helping us conceptualizing our understanding about how participants could
individually and interactively impact the effectiveness of mobile in-app advertising. In
specifics, this study has introduced two new conceptual constructs: ad space designing and ad
space displaying ones. It also introduced new conceptual relationships between these two new
constructs with the existing theoretical constructs of ad elements, context and consumer. These
new constructs and relationships are all drawn up into an integrated effectiveness framework,
based on which the conceptual model of this study was created.
While successful factors are currently raised more frequently in mobile research, there is no
focus on mobile ads as a subject of their own (Hao, Guo & Easley 2017). Instead, they research
mobile ads using a theoretical framework for various platforms, such as the Internet or
television (Choi et al. 2020; Okazaki & Barwise 2011). Researchers believe that mobile ads’
ad characteristics are similar to those for other media (Rosenkrans & Myers 2012).
Consequently, literature was saturated with contradictory research attempting to apply
An Integrated Effectiveness Framework of Mobile In-App Advertising
127
established theories to mobile advertising and very little research attempting to understand
mobile advertising from the base (Korula, Mirrokni & Nazerzadeh 2016). That poses a
problem, as researchers also attempt to clarify associations based on previously established
theoretical viewpoints (Bryman & Bell 2011). In the context of advertising platforms, Persaud
and Azhar (2012) explained that continuous innovation in mobile technologies allows for new
advertising methods that are not found on more traditional mediums like television and the
web. So if we repeatedly apply findings from other media to the mobile platform without caring
about its uniqueness, we will repeatedly find different results as seen in the literature. Not
because the study itself was faulty, but because there were no proper theoretical foundations
and structure to support these correlations and account for these discrepancies (Persaud &
Azhar 2012). This study’s integrated effectiveness framework is for mobile in-app advertising
and considers all the mobile characteristics. Subsequently, the study has drawn up a conceptual
model to be tested and laid out a theoretical foundation for future studies on mobile in-app
advertising effectiveness.
Practically, based on the data analysis results, this study then suggests new advertising
strategies associated with publishers to enhance mobile in-app advertising further. By which,
newly integrated advertising strategies were recommended to be applied in practice. They
could increase mobile in-app advertising revenue significantly higher by balancing the benefits
of all participants involved. Until recently, there are only three targeting options available using
either ad elements, consumer information or context data (Boerman, Kruikemeier &
Zuiderveen Borgesius 2017). This study proposed a new targeting method relating to designing
and displaying ad spaces. The study proposed four values and seven combinations of their
variants to optimize and further improve the advertising effectiveness in specifics. Many
authors have called for publishers to take back control of their ad spaces. Until recently,
publishers usually outsource their ad spaces to ad networks to optimize their inventory (Effendi
& Ali 2017). That is nothing wrong, except that many features left that the ad networks cannot
do on their behalf. Those are the duration, the size, the position and the timing of their ad
spaces. An integrated advertising campaign, therefore, must include the publishers whose
important role was shown in this study.
Furthermore, for publishers, who have more than one app published, applying the new ad space
designing and displaying strategies could bring multiple benefits. For agents, who publish the
apps on the publishers’ behalf, this strategy can bring even more value. Some big agents of
mobile apps are WillowTree, Hyperlink InfoSystem, Rightpoint, Blue Label Labs, Cubix
(Appsee 2018). Such agents could find the strategies proposed by this study useful when
running mobile in-app advertising campaigns and further increase revenue. Today, many “big”
publishers could have just a few apps, but each one attracted many users. With such a large
installed base, applying the new strategies could bring back immediate benefits. Some big
publishers are Tencent, NetEase, Activision Blizzard, Bandai Namco, Netmarble, Sony,
Supercell, mixi, Playrix and Line (Briskman 2019). This study has found that one variant could
increase the click-through rate by up to 30% with the same variable. If that is the combination
of two variables, the increase could reach up to 50% in some cases. In the advertising business,
those are really a significant increase (Kotler, Kartajaya & Setiawan 2016). Not only the
publishers, but other participants could also find these strategies benefitable for them.
Currently, most ad networks allow publishers to select the duration and size. However, their
options are very limited. For example, Admob only allows ad spaces longer than 30 seconds
and not smaller than 16-kilo pixels (Olennikova 2019). They could provide more options. Ad
networks can also integrate new strategies associated with these factors to increase the
matching and the relevance of theỉr ads. A higher click-through rate then benefits the
An Integrated Effectiveness Framework of Mobile In-App Advertising
128
advertisers as their ads are better consumed, and the customers find the ads more relevant for
their own usage.
This study also developed a new empirical method, whereas multiple factors controlled by
multiple participants could be tested concurrently. Previous studies have always struggled to
test individual factors sequentially (Kohavi & Longbotham 2017). That will consume much
time, and could leave out high-level interaction effects. In fact, at Google, the technique they
use is the overlapping measurement (Kohavi et al. 2009b). The disadvantage of that approach
is that it does not provide a full factorial analysis of the collected data. On the other hand, this
study proposed a new way of measuring the click-through rate on at least 16 ad spaces
concurrently. It started by designing all those ad spaces in one app, then scheduling to display
them randomly. The use of randomization mechanism helps all ad spaces chances to be equally
displayed. Firebase employed some multiway testing technique, which allows users to select a
specific combination of factors (Khawas & Shah 2018). However, such a combination is tested
over a limited period of time, before another test can be run. Therefore, the users will find that
sequential testing challenging to keep track and narrow down the chance for them to find out
what combination of two or more factors could yield the highest click-through rate (Rojas,
Meireles & Dias-Neto 2016). Instead, by using a new method, the data collected is in a multi-
dimensional panel format, which could help us test one, two, and multiway effects much more
efficiently while minimizing the confounding effects at the same time.
This study also proposed a new formula for click-through rate. The conventional formula of
click-through rate was found to be not suitable to measure the impacts of time and size-related
factors (Truong 2016). By considering the total exposure of impressions, not just by the count,
time, and size-related factors can now be tested more correctly. It helps eliminate current
misunderstandings and explain previous contradicting results (Baltas 2003; Cho 2003; Huang
& Yang 2012). Many authors have complained about the lack of measurement methods that
could correctly measure advertising effectiveness (Schick 2013). Some pinpoint clearly that
previous studies have not successfully defined a view – half of a screen or a full screen. When
working with spatial and temporal factors, this study has experienced many measurement
insufficiencies. Accordingly, a new metric - a new formula of click-through rate, which takes
into measurement the duration and the size of ad spaces, has been constructed. This new metric
has helped this study and could help future research when dealing with spatial and temporal
factors. Without considering their duration and size, there is no significant difference between
them, as shown in Section 6.3. That explained why previous studies showed contradicting
results regarding these two variables (Burke et al. 2005; Cho 2003; Danaher & Mullarkey 2003;
Huang & Yang 2012; Lohtia, Donthu & Hershberger 2003; Sun et al. 2017).
The idea behind this new formula of click-through rate is worth mentioning. It started by
considering an ad space or a view as a physical object. For a long, an online/electronic entity
seems to be not defined as a physical object which should be measured by both spatial and
temporal dimensions. However, as human senses observe those entities, they are perceived by
our brains, which have limited capacities. A longer video consumes more cognitive resources
than a shorter one. A larger image requires more neural processing than a smaller one (Angell
et al. 2016). An online entity, therefore, should be specified and defined by duration, width and
height. The same image displayed with a double-sized should be considered a different image,
as it is perceived differently by the users. The idea of taking the duration and the size of ad
spaces into consideration also hints at a new direction for ad networks to charge their inventory.
Until now, the bidding price for smaller ad space is not different from that of a larger one
(Constantin et al. 2018). Similarly, a longer video is charged the same as a shorter one. All of
An Integrated Effectiveness Framework of Mobile In-App Advertising
129
them are simply considered as an impression. That conventional pricing scheme could work on
web advertising, where the personal computer screen usually is large (Marx 1996). However,
on the small screen size of mobile devices, that pricing scheme could yield incorrect results. It
also does not encourage advertisers and publishers to make use of their limited screen estate.
Google recently started employing a new mechanism to make use of ad space duration, or
refresh rate as they called it (Constantin et al. 2018). The trend should continue so that
publishers could have more options to optimize their ad spaces to improve the advertising
effectiveness first for themselves and then later for all other participants.
The present study is quantitative, and a range of traditional and relatively new and more
advanced statistical approaches was implemented to unravel the research problem. Ultimately,
the main contribution to methodology and empirical measurement came from implementing
Moderated Regression Analysis and Multi0group Moderation Analysis techniques. In the
moderated regression analysis, the study created additional paths within a single
model representing interaction effects. With these interaction effects, it can assess group
differences between specific effects. On the other hand, this study examined differences in how
variables are related between groups in multigroup moderation analysis. The latter was found
superior to the former in testing the relationships between variables by accounting for errors of
the measurement indicators used for the construct operationalisation, whereas the conventional
techniques could not. Besides, the technique allowed statistical estimates that incorporate both
latent and manifest variables to be examined simultaneously, whereas the regression-based
techniques usually handled only estimates of the observed variables. That is different from
most previous work in the field that relied extensively on techniques that could not account for
measurement errors. The technique separately estimated the moderating effects for each group
and identified the significance of statistical differences between the groups. Furthermore, all
measurement errors were accounted for in all moderation tests. The problems of
underestimating or overestimating the moderating values and the model are distorted, are less
likely compared with the conventional ones.
Therefore, when conducting these analyses between groups, Multigroup Moderation Analysis
is generally preferred. However, Moderated Regression Analysis can do one thing Multigroup
Moderation Analysis cannot. In Moderated Regression Analysis, one can include continuous
moderating variables. One cannot do this in Multigroup Moderation Analysis as Multigroup
Moderation Analysis requires categorical groupings (Matthews 2017). One can even combine
the two approaches when the moderating variable is continuous and have a Multigroup
Moderation Analysis with continuous moderation for specific variables of interest. Considering
the conceptual model from the two perspectives of a regression equation and a path diagram
has led this study to apply both techniques. This practice could apply to other research with a
similar set of categorical moderating variables. The use of more than one statistics technique
is called method triangulation (Carter et al. 2014). Its purpose is to cross-check and improve
the credibility of the findings (Webb 2017). The use of both Moderated Regression Analysis
and Multigroup Moderation Analysis to test the moderating effects set out an example for
future research and could be considered another empirical contribution of this study.
7. 3. Limitations
This study, however, has several limitations that need to be mentioned. Firstly, in its theoretical
conceptualisation, the proposed framework has included only a limited set of variables,
although other potentially influential variables can also be included. In specifics, this study
found four factors being controlled by publishers. Among them, two factors are related to the
An Integrated Effectiveness Framework of Mobile In-App Advertising
130
ad space designing process, and the other two are related to the ad space displaying one. Future
research needs to explore deeply these two processes in order to find out more factors
controlled by publishers. When designing the ad spaces, the publishers could specify the
characteristics of those ad spaces. They could specify the duration and the size of them as
studied in this research. They could also specify the shape of the ad space, for example. This
study has not examined the difference between banner, rectangle and leader board ads. The
leader board ads are the one that runs along with the mobile screen’s height, while the rectangle
ads are usually placed in the middle of the screen with the width and the height is roughly equal
(Santora 2020). The shape of the ad space could be a factor that can impact the advertisement
effectiveness.
Publishers also control the displaying of ad spaces. They could place them on the top or in the
middle of the screen. They could also schedule to display them before and after the main
activity as in this study. The publishers could also have different scheduling schemes other than
those. For example, instead of placing ads statically, the publishers could choose to place them
alongside the content in scroll or grid views. This type of ad is called a native ad. Native ads
have the advantage of less disruptive than other ad formats and give users a more enjoyable
flow of content (Sweetser et al. 2016). Today, Facebook, Twitter and many other companies
have started adopting this ad format (Manic 2015). Future research could focus on this new
value of the ad space position factor and assess its effectiveness.
Besides the two-way interactions which have been tested, the factorial design could help detect
even higher interactions among factors, making the practical contribution of this study more
extensive and profound. Some other areas that could be explored include the interactions
among publishers-controlled factors or the interactions among contextual factors themselves. Future research could evaluate the combined effects of these factors, which include multiway
moderating effects.
Even though the research has shown the main effects of ad space duration, ad space size, ad
space position and ad space timing, it has not found the optimal value for each. Practitioners
can continue the test on each factor with more variants in order to determine the optimal value.
For example, the duration of ad space could have a variant ranging from 0 up to 120 seconds.
However, this study has only measured the click-through rates of the durations of 30 and 90
seconds. Even it showed that the 30-second ads have a higher click-through rate than the 90-
second one, it is possibly not the highest among this duration range. To find the optimal value
in this range, practitioners need to set the duration to different values, then measure the
resulting click-through rates, and finally compare those numbers to find the optimal value. That
could be a very time-consuming process and can be done by publishers who have a large user
base. Finding the optimal value of each factor if achieved, however, could help to increase the
effectiveness of advertising even higher. That applies to the case of ad space size, ad space
position and ad space timing as well.
Not only finding the optimal value for each factor individually, but future research could also
increase the effectiveness even higher if they could find the optimal combination of them as
well. For example, ad spaces designed with the optimal duration and optimal size could
increase the individual click-through rates even higher. Similarly, other factors can also be
combined. That could lead to a dramatic improvement in terms of engagement and revenue.
This study responded to the call of many scholars in the field to explore the interaction of
factors in mobile in-app advertising (e.g. Grewal et al. (2016), Jiang, Liang and Tsai (2019)).
The study itself calls for even more research into this promising area. This study has confirmed
An Integrated Effectiveness Framework of Mobile In-App Advertising
131
that there are indeed interactions among factors controlled by different participants, but the
search for them is just at its beginning.
7. 4. Conclusions
In recent years, mobile in-app advertising has become one of the most common business
advertising platforms. Annual spending on this new advertisement form keeps rising year after
year. Despite its practical success, mobile in-app advertising’s background theory is still in its
infancy. Subsequently, educational resources related to in-app advertising are scarce. Therefore
further research on this new subject is required, both conceptually and empirically. The topic
of improving advertisement efficacy in mobile apps continues and is more urgent than ever. In
many respects, the challenge is that mobile in-app advertising is mostly different from other
online advertising types with their smaller screen sizes and shorter screen times. Even today,
there are ongoing challenges in assessing and maximising the efficacy of advertising. This kind
of advertising often witnesses the emergence of new actors, the ad network, and the app
publisher, leading to new theoretical constructs and more nuanced conceptual relationships.
Besides, due to the inherent technical and organisational complexity of developing a realistic
field experiment with mobile ads, it required close cooperation with practitioners and
technicians who could provide greater access to relevant data, such as system traffic. No time
in the past has combined advertising with technology as in the present, and no other advertising
where technology plays such a significant role as in mobile in-app advertising. As a vibrant
new discipline, mobile in-app advertising involves various research fields, including
marketing, communications, data mining and analytics, statistics, economics, and even
psychology, to predict and understand consumer behaviours. Mobile in-app advertising is a
new and challenging topic from both theoretical and empirical perspectives.
Previous research looked at the efficacy of interactive ads depending on the variables regulated
by the advertiser, the user, or the ad network. Although the factors listed in mobile research are
discussed more frequently, there is no in-depth analysis of mobile advertising as a subject of
its own. Instead, they research mobile ads through a theoretical framework that is specific to
another medium. It has been believed that such ad features are the same for various forms of
advertisements. It was subsequently found the literature saturated with contradictory research
trying to apply current theories to mobile advertising and very little research trying to
understand mobile advertising at its heart. That generates problems when the researcher goes
back to their previously known theoretical views. In the sense of advertising networks,
groundbreaking mobile technologies allow for creating new advertising strategies that are not
widely seen on conventional mediums like television and the Internet. Despite the apparent
usefulness of the previous effectiveness frameworks, it only involves factors related to
advertisers, and consumers - the demand side of an ad serving process. On the supply side, the
publishers also have their own influence over the supply of ad spaces and how many ads appear
on their websites. Data reveals that a significant percentage of the mobile in-app advertising
budget is directly charged to the publisher. Furthermore, the publishers have their own agendas,
profit maximisation being one of them, which can often clash with advertisers. However, few
studies have been completed on app publishers’ vital role, and there are not many optimisation
options available for them. Research on mobile in-app advertising needs to overcome the
inherent technical and organisational challenge of implementing a reasonable field experiment
with mobile ads and the need for close cooperation with practitioners/publishers who can
provide greater access to relevant data, such as traffic acquired through apps.
An Integrated Effectiveness Framework of Mobile In-App Advertising
132
Considering mobile in-app ads as a topic of its own, this study went deep into examining this
new platform, finding new knowledge about its participants, roles, goals, outcome metrics and
factors with the intention of creating an integrated effectiveness framework for mobile in-app
advertising. The emphasis is on publishers, who received the least attention in the current
literature. The first research objective of this study is to identify the publishers-controlled
factors and evaluate their impacts on the effectiveness of mobile in-app advertising. Four
publishers-controlled factors were successfully found in this study and used to evaluate their
effects. The empirical evidence has shown that all the four publishers-controlled factors: Ad
Space Duration, Ad Space Size, Ad Space Position and Ad Space Timing all have strong
impacts on the effectiveness of mobile in-app advertising. That finding has confirmed the
important role of publishers, closing our gap of understanding about through which factors this
participant can impact the effectiveness of mobile in-app advertising.
The second research objective of this study has also be achieved in this study. To construct an
integrated effectiveness framework for mobile in-app advertising, academic literature about
online advertising, programmatic advertising and mobile advertising was first reviewed,
focusing on their processes and factors. The factors were grouped by participants. Next,
scholarly literature correlating the goals of in-app ads and the outcome metrics to evaluate the
common outcome goal was checked. After a critical analysis of previous effectiveness
frameworks, this study successfully constructed a new integrated framework for mobile in-app
advertising effectiveness. To evaluate the moderating effects of contextual factors on the
publishers-controlled effect, an experiment using a factorial 24 design was then performed.
Using both a z-test and an analysis of variance, the study tested the main effects of publishers-
controlled factors on the data analysis process. Besides the four publishers-controlled factors,
four other factors controlled by advertisers, consumers, and ad networks were also included in
the experiments to test their moderating effects on the relationships between the publishers-
controlled factors and mobile in-app advertising effectiveness. Both Structured Equation
Modelling-based Multigroup Moderation Analysis and regression-based Moderated
Regression Analysis techniques were used to assess the discrepancies between the groups. Each
technique has its benefits and drawbacks. Multiple statistics techniques are regarded as
methodological triangulation. The experiment aims to compare each others’ results and ensure
that the most accurate results are obtained. The conceptual model has been successfully
validated with data from thousands of ad impressions, more than 800 ad clicks from thousands
of smartphone users in more than 160 countries worldwide, overcoming the challenge that
previous researchers had when dealing with mobile traffic data.
The study has found that publishers play a crucial role in mobile in-app advertising and directly
enhance its effectiveness. This study also found that advertisers, consumers and ad networks
moderated the relationships between publishers and mobile in-app advertising. Theoretically,
the study has constructed a new integrated effectiveness framework that includes new concepts
and relationships. It extends our knowledge about the publisher's role in enhancing mobile in-
app advertising’s effectiveness directly and indirectly. Empirically, this research established a
new approach for creating multiple ad spaces in a single application and simultaneously testing
multiple ad space-related factors. This research also initiated the development of a new metric
to measure in-app mobile advertisement effectiveness, taking into account the mobile ads’
duration and size. Practically, this study proposed new integrated techniques for mobile in-app
advertising campaigns to further improve its efficacy. By doing so, the study would support
rising mobile in-app advertising revenue significantly higher by balancing the benefits of all
participants involved.
An Integrated Effectiveness Framework of Mobile In-App Advertising
133
Nowadays, a buzzword of “Adtech” has been emerging in this field, to illustrate the new trend
of combining technology and advertising. Together with Fintech, Proptech, Biotech, Adtech
will become a significant branch of Industry 4.0, which will change our society and the life of
each of us for the better for many years to come. Adtech will become even more sophisticated
and will be able to target consumers, based on behavioural, location, demographic and
contextual data on an individual basis in real-time. As funding keeps pouring into the Adtech
industry, it looks like the future will come sooner than expected. The annoyance of irrelevant
interfering ads on smartphones will soon be a problem of the past. That is good news for
everyone: consumers, advertisers and of course app publishers. Adtech brings good changes to
our society. That is also the purpose of this study. Not only highly applicable to the mobile in-
app advertising area, but this study could also extend to other types of advertising where the
role of publishers has not been well studied. This study sheds light on online marketing where
interactive outcome metrics play a more critical role than ever before. The results could be
immediately applied to the programmatic advertising on emerging platforms of web, smart
TVs, smartwatches and voice assistants. In that sense, the study could lay out a ground for
future research in other emerging advertising types when the technology keeps evolving
rapidly.
An Integrated Effectiveness Framework of Mobile In-App Advertising
134
REFERENCES AdDuplex 2012, 'Country CTR Stats: Spaniards like to tap', AdDuplex. Adler, M, Gibbons, PB & Matias, Y 2002, 'Scheduling space‐sharing for internet advertising', Journal of Scheduling, vol. 5, no. 2, pp. 103-119. Agarwal, A, Hosanagar, K & Smith, MD 2011, 'Location, Location, Location: An Analysis of Profitability of Position in Online Advertising Markets', Journal of marketing research, vol. 48, no. 6, pp. 1057-1073. Aghakhani, H, Qiu, P, Main, K & Wan, F 2019, 'When the Bigger Is Not the Better: Backlash Effects of Before-And-After Advertising', ACR North American Advances, vol. 47, no. 1. Aguinis, H & Vandenberg, RJ 2014, 'An ounce of prevention is worth a pound of cure: Improving research quality before data collection', Annual Review of Organizational Psychology and Organizational Behavior, vol. 1, no. 1, pp. 569-595. Aguirre, E, Mahr, D, Grewal, D, de Ruyter, K & Wetzels, M 2015, 'Unraveling the personalization paradox: The effect of information collection and trust-building strategies on online advertisement effectiveness', Journal of Retailing, vol. 91, no. 1, pp. 34-49. Aguirre, M, Mahr, D, de Ruyter, K, Wetzels, M & Grewal, D 2012, 'The Impact Of Vulnerability During Covert Personalization–A Regulatory Model Approach', in Proceedings of the 41st EMAC Conference, EMAC, Liston-ISCTE, 23-26 May 2012, pp. 1-4, <http://www.emac2012.org/>. Aimonetti, J 2012, 'Apple increases developer iAd revenue to 70 percent', CNET. Aitchison, J 1982, 'The statistical analysis of compositional data', Journal of the Royal Statistical Society: Series B (Methodological), vol. 44, no. 2, pp. 139-160. Aksakallı, V 2012, 'Optimizing direct response in Internet display advertising', Electronic Commerce Research and Applications, vol. 11, no. 3, pp. 229-240. Al-Busaidi, ZQ 2008, 'Qualitative Research and its Uses in Health Care', Sultan Qaboos University Medical Journal, vol. 8, no. 1, pp. 11-19. Alavi, M & Carlson, P 1992, 'A review of MIS research and disciplinary development', Journal of management information systems, vol. 8, no. 4, pp. 45-62. Albertson, D & Johnston, MP 2020, 'Modelling users’ perceptions of video information seeking, learning through added value and use of curated digital collections', Journal of Information Science, vol. 1, no. 1. Altman, DG & Bland, JM 2003, 'Interaction revisited: the difference between two estimates', Bmj, vol. 326, no. 7382, p. 219. Anderson, DR, Sweeney, DJ, Williams, TA, Camm, JD & Cochran, JJ 2016, Statistics for business & economics, Nelson Education. Andrews, M 2017, 'Increasing the Effectiveness of Mobile Advertising by Using Contextual Information', GfK Marketing Intelligence Review, vol. 9, no. 2, p. 37.
An Integrated Effectiveness Framework of Mobile In-App Advertising
135
Angel, S & Walfish, M 2013, 'Verifiable auctions for online ad exchanges', in Proceedings of the ACM SIGCOMM Computer Communication Review, ACM, pp. 195-206. Angell, R, Gorton, M, Sauer, J, Bottomley, P & White, J 2016, 'Don't Distract Me When I'm Media Multitasking: Toward a Theory for Raising Advertising Recall and Recognition', Journal of Advertising, vol. 45, no. 2, pp. 1-13. Ansari, A & Mela, CF 2003, 'E-Customization', Journal of marketing research, vol. 40, no. 2, pp. 131-145. Appsee 2018, 'Top App Development Agencies 2018–2019', Product Coalition. Ashari Nasution, R, Arnita, D & Fatimah Azzahra, D 2021, 'Digital Readiness and Acceptance of Mobile Advertising', Australasian Marketing Journal, vol. 29, no. 1, pp. 95-103. Atkinson, G, Driesener, C & Corkindale, D 2014, 'Search Engine Advertisement Design Effects on Click-Through Rates', Journal of Interactive Advertising, vol. 14, no. 1. Awang, Z 2012, A handbook on SEM for academicians and practitioners: the step by step practical guides for the beginners., Structural equation modeling, MPWS Rich Resources. Azimi, J, Zhang, R, Zhou, Y, Navalpakkam, V, Mao, J & Fern, X 2012, 'The impact of visual appearance on user response in online display advertising', in Proceedings of the 21st International Conference on World Wide Web, ACM, pp. 457-458. Babaioff, M, Hartline, JD & Kleinberg, RD 2009, 'Selling ad campaigns: online algorithms with cancellations', in Proceedings of the 10th ACM conference on Electronic commerce, ACM, pp. 61-70. Bagozzi, RP 1977, 'Structural equation models in experimental research', Journal of marketing research, vol. 14, no. 2, pp. 209-226. Baker, BJ, Fang, Z & Luo, X 2014, 'Hour-by-hour sales impact of mobile advertising', Available in SSRN. Bakshy, E, Eckles, D, Yan, R & Rosenn, I 2012, 'Social influence in social advertising: evidence from field experiments', in Proceedings of the 13th ACM Conference on Electronic Commerce, ACM, Valencia, Spain, pp. 146-161. Balakrishnan, R & Bhatt, RP 2015, 'Real-time bid optimization for group-buying ads', ACM Transactions on Intelligent Systems and Technology (TIST), vol. 5, no. 4, p. 62. Ballard, B 2007, Designing the mobile user experience, John Wiley & Sons. Balseiro, SR & Candogan, O 2017, 'Optimal contracts for intermediaries in online advertising', Operations Research, vol. 65, no. 4, pp. 878-896. Balseiro, SR, Feldman, J, Mirrokni, V & Muthukrishnan, S 2014, 'Yield optimization of display advertising with ad exchange', Management Science, vol. 60, no. 12, pp. 2886-2907. Baltas, G 2003, 'Determinants of internet advertising effectiveness: an empirical study', International Journal of Market Research, vol. 45, no. 4, pp. 1-9.
An Integrated Effectiveness Framework of Mobile In-App Advertising
136
Bamoriya, H & Singh, R 2011, 'Attitude towards advertising and information seeking behavior–a structural equation modeling approach', European Journal of Business and Management, vol. 3, no. 3. Barnes, SJ 2002, 'Wireless digital advertising: nature and implications', International Journal of Advertising, vol. 21, no. 3, pp. 399-420. Barry, TE 1987, 'The Development of the Hierarchy of Effects: An Historical Perspective', Current Issues and Research in Advertising, vol. 10, no. 1, pp. 251-295. Barwise, P & Strong, C 2002, 'Permission-based mobile advertising', Journal of Interactive Marketing, vol. 16, no. 1, pp. 14-24. Baxton, A 2018, 'Long-term vs short-term marketing campaigns', ADMA. Belk, RW 1975, 'Situational variables and consumer behavior', Journal of consumer research, vol. 2, no. 3, pp. 157-164. Bergen, M 2014, 'Twitter beats revenue expectations again but user engagement slows', Advertising Age. Berger, J & Milkman, KL 2012, 'What makes online content viral?', Journal of marketing research, vol. 49, no. 2, pp. 192-205. Bhalgat, A, Feldman, J & Mirrokni, V 2012, 'Online allocation of display ads with smooth delivery', in Proceedings of the 18th ACM SIGKDD international conference on Knowledge discovery and data mining, ACM, pp. 1213-1221. Bharadwaj, V, Chen, P, Ma, W, Nagarajan, C, Tomlin, J, Vassilvitskii, S, Vee, E & Yang, J 2012, 'Shale: an efficient algorithm for allocation of guaranteed display advertising', in Proceedings of the 18th ACM SIGKDD international conference on Knowledge discovery and data mining. Bhat, S, Bevans, M & Sengupta, S 2002, 'Measuring users' Web activity to evaluate and enhance advertising effectiveness', Journal of Advertising, vol. 31, no. 3, pp. 97-106. Bhave, K, Jain, V & Roy, S 2013, 'Understanding the orientation of gen Y toward mobile applications and in-app advertising in India', International Journal of Mobile Marketing, vol. 8, no. 1. Bidmon, S & Röttl, J 2018, 'Advertising Effects of In-Game-Advertising vs. In-App-Advertising', in Advances in Advertising Research IX, Springer, pp. 73-86. Billore, A & Sadh, A 2015, 'Mobile advertising: A review of the literature', The Marketing Review, vol. 15, no. 2, pp. 161-183. Blask, T-B 2018, 'Analyzing paid search campaigns using keyword-level data and Bayesian statistics', thesis, Leuphana Universität Lüneburg. Bleier, A & Eisenbeiss, M 2015a, 'The importance of trust for personalized online advertising', Journal of Retailing, vol. 91, no. 3, pp. 390-409. Bleier, A & Eisenbeiss, M 2015b, 'Personalized Online Advertising Effectiveness: The Interplay of What, When, and Where', Marketing Science, vol. 34, no. 5, pp. 669-688.
An Integrated Effectiveness Framework of Mobile In-App Advertising
137
Blumberg, B, Cooper, DR & Schindler, PS 2008, Business research methods, McGraw-Hill Higher Education London. Boerman, SC, Kruikemeier, S & Zuiderveen Borgesius, FJ 2017, 'Online Behavioral Advertising: A Literature Review and Research Agenda', Journal of Advertising, vol. 46, no. 3, pp. 363-376. Bolin, JH 2014, 'Review of Introduction to mediation, moderation, and conditional process analysis: a regression-based approach', Journal of Educational Measurement, vol. 51, no. 3, pp. 335–337. Börgers, T, Cox, I, Pesendorfer, M & Petricek, V 2013, 'Equilibrium bids in sponsored search auctions: Theory and evidence', American economic Journal: microeconomics, vol. 5, no. 4, pp. 163-187. Borsboom, D 2006, 'When does measurement invariance matter?', Medical care, vol. 44, no. 11, pp. S176-S181. Boutilier, CE, Nemhauser, GL, Parkes, DC, Sandholm, T, Shields Jr, RL & Walsh, WE 2013, Automated channel abstraction for advertising auctions, Patent No. 8,515,814, US. Box, GE, Hunter, JS & Hunter, WG 2005, Statistics for experimenters, Wiley Series in Probability and Statistics, Wiley Hoboken, NJ. Brakenhoff, L & Spruit, M 2017, 'Consumer Engagement Characteristics in Mobile Advertising', in Proceedings of the 9th International Joint Conference on Knowledge Discovery, Knowledge Engineering and Knowledge Management, pp. 206-2014. Breitsohl, H 2019, 'Beyond ANOVA: An introduction to structural equation models for experimental designs', Organizational Research Methods, vol. 22, no. 3, pp. 649-677. Briggs, R & Hollis, N 1997, 'Advertising on the Web: Is there response before click-through?', Journal of Advertising Research, vol. 37, no. 2, pp. 33-45. Briskman, J 2019, 'Top Mobile App Publishers Worldwide for Q2 2019 by Downloads', SensorTower. Broder, A, Fontoura, M, Josifovski, V & Riedel, L 2007, 'A semantic approach to contextual advertising', in Proceedings of the 30th annual international ACM SIGIR conference on Research and development in information retrieval, ACM, pp. 559-566. Broder, AZ 2008, 'Computational advertising and recommender systems', in Proceedings of the 2008 ACM conference on Recommender systems, ACM, pp. 1-2. Broussard, G 2000, 'How advertising frequency can work to build online advertising effectiveness', International Journal of Market Research, vol. 42, no. 4, pp. 439-457. Bruner II, GC & Kumar, A 2005, 'Explaining consumer acceptance of handheld Internet devices', Journal of Business Research, vol. 58, no. 5, pp. 553-558. Bryman, A & Bell, E 2011, 'Ethics in business research', Business Research Methods, vol. 7, no. 5, pp. 23-56. Brynjolfsson, E, Dick, AA & Smith, MD 2010, 'A nearly perfect market?', QME, vol. 8, no. 1, pp. 1-33.
An Integrated Effectiveness Framework of Mobile In-App Advertising
138
Bucklin, RE & Hoban, PR 2017, 'Marketing models for internet advertising', in Handbook of marketing decision models, Springer, pp. 431-462. Bukhari, S, Hamid, S, Ravana, SD & Ijab, MT 2018, 'Modelling the Information-Seeking Behaviour of International Students in Their Use of Social Media in Malaysia', Information Research: An International Electronic Journal, vol. 23, no. 4, p. 4. Burke, M, Hornof, A, Nilsen, E & Gorman, N 2005, 'High-cost banner blindness: Ads increase perceived workload, hinder visual search, and are forgotten', ACM Transactions on Computer-Human Interaction (TOCHI), vol. 12, no. 4, pp. 423-445. Burns, A & Bush, R 2005, Marketing Research: online research applications, Prentice Hall. Burns, KS & Lutz, RJ 2006, 'THE FUNCTION OF FORMAT: Consumer Responses to Six On-line Advertising Formats', Journal of Advertising, vol. 35, no. 1, pp. 53-63. Busch, O 2016, Programmatic Advertising: The Successful Transformation to Automated, Data-Driven Marketing in Real-Time, The Successful Transformation to Automated, Data-Driven Marketing in Real-Time, Springer International Publishing, Cham. Čaić, M, Mahr, D, Aguirre, E, de Ruyter, K & Wetzels, M 2015, '“Too Close for Comfort”: The Negative Effects of Location-Based Advertising', Advances in advertising research, vol. 5, no. 1, pp. 103-111. Calder, BJ, Malthouse, EC & Schaedel, U 2009, 'An experimental study of the relationship between online engagement and advertising effectiveness', Journal of Interactive Marketing, vol. 23, no. 4, pp. 321-331. Carson, D, Gilmore, A, Perry, C & Gronhaug, K 2001, Qualitative marketing research, Sage. Carter, N, Bryant-Lukosius, D, DiCenso, A, Blythe, J & Neville, AJ 2014, 'The use of triangulation in qualitative research', Oncology Nursing Forum, vol. 41, no. 5. Cavallo, R, Mcafee, RP & Vassilvitskii, S 2015, 'Display advertising auctions with arbitrage', ACM Transactions on Economics and Computation, vol. 3, no. 3, p. 15. Cavana, RY, Delahaye, BL & Sekaran, U 2001, Applied business research: Qualitative and quantitative methods, John Wiley & Sons Inc. Celis, LE, Lewis, G, Mobius, M & Nazerzadeh, H 2011, 'Buy-it-now or Take-a-chance: A New Pricing Mechanism for Online Advertising', IDEAS. Chaffey, D 2019, 'Mobile marketing statistics compilation', SmartInsights. Chaffey, D 2020, 'Video marketing statistics to know for 2020', Smart Insights. Chakraborty, T, Even-Dar, E, Guha, S, Mansour, Y & Muthukrishnan, S 2010, 'Selective call out and real time bidding', in Proceedings of the International Workshop on Internet and Network Economics, Springer, pp. 145-157. Champoux, JE & Peters, WS 1987, 'Form, effect size and power in moderated regression analysis', Journal of Occupational Psychology, vol. 60, no. 3, pp. 243-255.
An Integrated Effectiveness Framework of Mobile In-App Advertising
139
Chandrasekaran, D, Srinivasan, R & Sihi, D 2018, 'Effects of offline ad content on online brand search: Insights from super bowl advertising', Journal of the Academy of Marketing Science, vol. 46, no. 3, pp. 403-430. Chatterjee, P, Hoffman, D & Novak, T 2003, 'Modeling the Clickstream: Implications for Web-Based Advertising Efforts', Marketing Science, vol. 22, no. 4, pp. 520-541. Chellappa, RK & Sin, RG 2005, 'Personalization versus privacy: An empirical examination of the online consumer’s dilemma', Information technology and management, vol. 6, no. 2-3, pp. 181-202. Chen, J & Stallaert, J 2014, 'An economic analysis of online advertising using behavioral targeting', MIS quarterly, vol. 38, no. 2, pp. 429-449. Chen, P-T & Hsieh, H-P 2011, 'Personalized mobile advertising: Its key attributes, trends, and social impact', Technological Forecasting & Social Change, vol. 79, no. 3, pp. 543-557. Chen, Y-J 2017, 'Optimal dynamic auctions for display advertising', Operations Research, vol. 65, no. 4, pp. 897-913. Chen, Y, Berkhin, P, Anderson, B & Devanur, NR 2011, 'Real-time bidding algorithms for performance-based display ad allocation', in Proceedings of the 17th ACM SIGKDD international conference on Knowledge discovery and data mining, ACM, pp. 1307-1315. Cheng, H, Zwol, Rv, Azimi, J, Manavoglu, E, Zhang, R, Zhou, Y & Navalpakkam, V 2012, 'Multimedia features for click prediction of new ads in display advertising', in Proceedings of the 18th ACM SIGKDD international conference on Knowledge discovery and data mining, ACM, pp. 777-785. Cheng, HK, Li, S & Liu, Y 2015, 'Optimal software free trial strategy: Limited version, time‐locked, or hybrid?', Production and Operations Management, vol. 24, no. 3, pp. 504-517. Cheung, MFY & To, WM 2017, 'The influence of the propensity to trust on mobile users' attitudes toward in-app advertisements: An extension of the theory of planned behavior', Computers in Human Behavior, vol. 76, no. 1, pp. 102-111. Cheung, MY, Hong, W & Thong, JY 2017, 'Effects of animation on attentional resources of online consumers', Journal of the Association for Information Systems, vol. 18, no. 8, pp. 605-632. Chin, WW, Peterson, RA & Brown, SP 2008, 'Structural equation modeling in marketing: Some practical reminders', Journal of marketing theory and practice, vol. 16, no. 4, pp. 287-298. Cho, C-H 2003, 'The Effectiveness of Banner Advertisements: Involvement and Click-through', Journalism & Mass Communication Quarterly, vol. 80, no. 3, pp. 623-645. Choi, H, Mela, C, Balseiro, S & Leary, A 2017, 'Online Display Advertising Markets: A Literature Review and Future Directions', Available at SSRN 3070706. Choi, H, Mela, CF, Balseiro, SR & Leary, A 2020, 'Online display advertising markets: A literature review and future directions', Information systems research, vol. 31, no. 2. Chouliaraki, L & Fairclough, N 1999, Discourse in late modernity: Rethinking critical discourse analysis, Edinburgh University Press.
An Integrated Effectiveness Framework of Mobile In-App Advertising
140
Chuklin, A, Markov, I & Rijke, Md 2015, 'Click models for web search', Synthesis lectures on information concepts, retrieval, and services, vol. 7, no. 3. Churchill, GA & Iacobucci, D 2006, Marketing research: methodological foundations, Dryden Press, New York. Clement, J 2019, 'Cumulative number of apps downloaded from the Apple App Store from July 2008 to June 2017 (in billions)', Statista. Cochran, WG 1977, Sampling techniques, 3rd ed. edn, Wiley, New York. Cohen, P, West, SG & Aiken, LS 2014, Applied multiple regression/correlation analysis for the behavioral sciences, Psychology Press. Collins, LM, Dziak, JJ, Kugler, KC & Trail, JB 2014, 'Factorial experiments: efficient tools for evaluation of intervention components', American journal of preventive medicine, vol. 47, no. 4, pp. 498-504. Conner, M & Armitage, CJ 1998, 'Extending the theory of planned behavior: A review and avenues for further research', Journal of applied social psychology, vol. 28, no. 15, pp. 1429-1464. Constantin, F, Harris, C, Ieong, S, Mehta, A & Tan, X 2018, 'Optimizing Ad Refresh In Mobile App Advertising', in Proceedings of the 2018 World Wide Web Conference, pp. 1399-1408. Coolidge, FL 2020, Statistics: A gentle introduction, SAGE Publications Incorporated. Coopers, D & Schindler, P 2006, Business Research Methods, Mac Grow–Hill, New Delhi, India. Coustan, D & Strickland, J 2016, 'How Smartphones Work', HowStuff Works. Cowton, CJ 1998, 'The use of secondary data in business ethics research', Journal of Business Ethics, vol. 17, no. 4, pp. 423-434. Cox, DR & Reid, N 2000, The theory of the design of experiments, Chapman and Hall/CRC. Craik, FI 2002, 'Levels of processing: Past, present... and future?', Memory, vol. 10, no. 5-6, pp. 305-318. Dalessandro, B, Hook, R, Perlich, C & Provost, F 2015, 'Evaluating and optimizing online advertising: Forget the click, but there are good proxies', Big data, vol. 3, no. 2, pp. 90-102. Danaher, PJ & Mullarkey, GW 2003, 'Factors Affecting Online Advertising Recall: A Study of Students', Journal of Advertising Research, vol. 43, no. 3, pp. 252-267. Davidavičienė, V 2012, 'Effectiveness factors of Online advertising', in Proceedings of the 7th International Scientific Conference in “Business and Management", pp. 822-830. Davis, FD 1985, 'A technology acceptance model for empirically testing new end-user information systems: Theory and results', thesis, Massachusetts Institute of Technology.
An Integrated Effectiveness Framework of Mobile In-App Advertising
141
De Pelsmacker, P 2020, 'The internet and the world wide web', in A Reader in Marketing Communications, Routledge, pp. 199-214. De Pelsmacker, P, Geuens, M & Anckaert, P 2002, 'Media context and advertising effectiveness: The role of context appreciation and context/ad similarity', Journal of Advertising, vol. 31, no. 2, pp. 49-61. De Vreede, G-J 1995, 'Facilitating Organizational Change: The participative application of dynamic modelling', in Policy and Management, The Delft University of Technology, School of Systems Engineering. Delafrooz, N & Zanjankhah, ZS 2015, 'Investigation of psychological factors affecting consumers' intention of accepting mobile advertising', QScience Connect, vol. 2015, no. 1. Dens, N, De Pelsmacker, P & Puttemans, B 2011, Text or Pictures? Effectiveness of Verbal Information and Visual Cues in Advertisements for New Brands versus Extensions, Gabler, Wiesbaden. Denzin, NK 2017, 'Strategies of multiple triangulation', in The Research Act, Routledge, pp. 297-313. Dhawan, S 2010, Research methodology for business and management studies, Swastik Publications. Dickson, G & DeSanctis, G 1990, 'The management of information systems: Research status and themes', in Research Issues in Information Systems: An Agenda for the 1990s, pp. 45-81. Dixon, E, Enos, E & Brodmerkle, S 2011, A/B testing of a webpage, Patent No. 797,500,0B2, US. Djamasbi, S, Hall-Phillips, A & Yang, R 2013, 'SERPs and Ads on Mobile Devices: An Eye Tracking Study for Generation Y', in Proceedings of the International Conference on Universal Access in Human-Computer Interaction, Springer, pp. 259-268, <https://doi.org/10.1007/978-3-642-39191-0_29>. Do, TMT & Gatica - Perez, D 2012, 'Contextual Conditional Models for Smartphone-based Human Mobility Prediction', in Proceedings of the 2012 ACM conference on ubiquitous computing, pp. 163-172. Donnini, G 2013, 'How Marketers Can Optimize For Clicks Based On Time Of Day', MarketingLand. Doorn, J & Hoekstra, J 2013, 'Customization of online advertising: The role of intrusiveness', A Journal of Research in Marketing, vol. 24, no. 4, pp. 339-351. Drèze, X & Hussherr, FX 2003, 'Internet advertising: Is anybody watching?', Journal of Interactive Marketing, vol. 17, no. 4, pp. 8-23. Ducoffe, RH 1996, 'Advertising value and advertising on the Web', Journal of Advertising Research, vol. 36, no. 5, p. 21. Dusane, A 2019, '83% Increase in Customers Due to Location-Based Advertising, According to Factual's 2019 Report', Martech Advisors.
An Integrated Effectiveness Framework of Mobile In-App Advertising
142
Easton, VJ & McColl, JH 2002, Statistics glossary, Steps. Edelman, B, Ostrovsky, M & Schwarz, M 2007, 'Internet advertising and the generalized second-price auction: Selling billions of dollars worth of keywords', American economic review, vol. 97, no. 1, pp. 242-259. Edizel, B, Mantrach, A & Bai, X 2017, 'Deep Character-Level Click-Through Rate Prediction for Sponsored Search', in Proceedings of the 40th International ACM SIGIR Conference on Research and Development, pp. 305-314, <https://dl.acm.org/citation.cfm?doid=3077136.3080811>. Effendi, MJ & Ali, SA 2017, 'Click Through Rate Prediction for Contextual Advertisement Using Linear Regression', arXiv preprint arXiv:1701.08744. Eichenbaum, H 2017, 'On the integration of space, time, and memory', Neuron, vol. 95, no. 5, pp. 1007-1018. eMarketer 2015, 'Social Network Ad Spending to Hit $23.68 Billion Worldwide in 2015', eMarketer. eMarketer 2020, 'US Mobile Ad Spending, In-App vs. Mobile Web, 2016-2020', eMarketer. Evans, DS 2009, 'The Online Advertising Industry: Economics, Evolution, and Privacy', Journal of Economic Perspectives, vol. 23, no. 3, pp. 37-60. fe Bureau 2013, 'World Bank lowers GDP growth forecast to 4.7%', Financial Express. Feige, U, Immorlica, N, Mirrokni, V & Nazerzadeh, H 2008, 'A combinatorial allocation mechanism with penalties for banner advertising', in Proceedings of the 17th international conference on the World Wide Web, ACM, pp. 169-178. Feldman, J, Korula, N, Mirrokni, V, Muthukrishnan, S & Pál, M 2009, 'Online ad assignment with free disposal', in Proceedings of the International workshop on internet and network economics, Springer, pp. 374-385. Fishbein, M & Ajzen, I 1975, Intention and Behavior: An introduction to theory and research, Addison-Wesley, Reading, MA. Fisher, L 2018, 'US Programmatic Ad Spending Forecast Update', eMarketer. Fisher, L 2019, 'US Programmatic Ad Spending Forecast 2019', eMarketer. Fisher, RA 1950, Statistical methods for research workers, 11th edn, Oliver & Boyd, Edinburgh. Flores, W, Chen, J-CV & Ross, WH 2014, 'The effect of variations in banner ad, type of product, website context, and language of advertising on Internet users’ attitudes', Computers in Human Behavior, vol. 31, no. 1, pp. 37-47. Fowler Jr, FJ 2013, Survey research methods, Sage publications. Frey, RM, Xu, R, Ammendola, C, Moling, O, Giglio, G & Ilic, A 2017, 'Mobile recommendations based on interest prediction from consumer's installed apps–insights from a large-scale field study', Information Systems, vol. 71, no. 1, pp. 152-163.
An Integrated Effectiveness Framework of Mobile In-App Advertising
143
Fruergaard, BØ, Hansen, TJ & Hansen, LK 2013, 'Dimensionality reduction for click-through rate prediction: Dense versus sparse representation', arXiv preprint arXiv:1311.6976. Galliers, RD 1991, 'Strategic information systems planning: myths, reality and guidelines for successful implementation', European Journal of Information Systems, vol. 1, no. 1, pp. 55-64. Garg, D & Narahari, Y 2009, 'An optimal mechanism for sponsored search auctions on the web and comparison with other mechanisms', IEEE Transactions on Automation Science and Engineering, vol. 6, no. 4, pp. 641-657. Ghauri, PN & Grønhaug, K 2005, Research methods in business studies: A practical guide, Pearson Education. Ghose, A, Goldfarb, A & Han, SP 2013, 'How Is the Mobile Internet Different? Search Costs and Local Activities', Information systems research, vol. 24, no. 3, pp. 613-631. Ghose, A & Todri, V 2015, 'Towards a digital attribution model: Measuring the impact of display advertising on online consumer behavior', Available at SSRN 2672090. Ghosh, A, McAfee, P, Papineni, K & Vassilvitskii, S 2009a, 'Bidding for representative allocations for display advertising', in Proceedings of the International workshop on internet and network economics, Springer, pp. 208-219. Ghosh, A, Rubinstein, BI, Vassilvitskii, S & Zinkevich, M 2009b, 'Adaptive bidding for display advertising', in Proceedings of the 18th international conference on World wide web, ACM, pp. 251-260. Giddens, A 1986, The constitution of society: Outline of the theory of structuration, Univ of California Press. Gidofalvi, G 2008, 'Spatio-Temporal Data Mining for Location-Based Services', thesis, Aalborg University. Goh, K-Y, Chu, J & Wu, J 2015, 'Mobile Advertising: An Empirical Study of Temporal and Spatial Differences in Search Behavior and Advertising Response', Journal of Interactive Marketing, vol. 30, no. 1, pp. 34-45. Goldfarb, A & Tucker, C 2011, 'Online display advertising: Targeting and obtrusiveness', Marketing Science, vol. 30, no. 3, pp. 389-404. Goldstein, DG, McAfee, RP & Suri, S 2011, 'The effects of exposure time on memory of display advertisements', in Proceedings of the 12th ACM conference on Electronic commerce - EC '11, ACM, San Jose, California, USA, pp. 49-58. Goldstein, DG, McAfee, RP & Suri, S 2015, 'Improving the Effectiveness of Time-Based Display Advertising', ACM Transactions on Economics and Computation (TEAC), vol. 3, no. 2, pp. 1-20. Gomes, R & Mirrokni, V 2014, 'Optimal revenue-sharing double auctions with applications to ad exchanges', in Proceedings of the 23rd international conference on World wide web, ACM, pp. 19-28. Gomila, R & Clark, CS 2020, 'Missing data in experiments: Challenges and solutions', in Psychological Methods.
An Integrated Effectiveness Framework of Mobile In-App Advertising
144
Google 2019, 'Clickthrough rate (CTR): Definition', https://support.google.com. Gowreesunkar, GV & Dixit, SK 2017, 'Consumer information-seeking behaviour', in The Routledge handbook of consumer behaviour in hospitality and tourism, Routledge, pp. 55-68. Graham, R 2010, 'A brief history of digital ad buying and selling', Clickz. Gravetter, FJ, Wallnau, LB, Forzano, L-AB & Witnauer, JE 2020, Essentials of statistics for the behavioral sciences, Cengage Learning. Grewal, D, Bart, Y, Spann, M & Zubcsek, PP 2016, 'Mobile advertising: a framework and research agenda', Journal of Interactive Advertising, vol. 34, no. 1, pp. 3-14. Guba, EG & Lincoln, YS 1994, 'Competing paradigms in qualitative research', Handbook of qualitative research, vol. 2, no. 163-194, p. 105. Gugliotta, G 2007, 'How Radio Changed Everything', Discover Magazine, vol. 6, p. 2007. Gupta, R, Khirbat, G & Singh, S 2014, 'A Novel Method to Calculate Click Through Rate for Sponsored Search', arXiv preprint arXiv:1403.5771. GuruFocus 2017, 'Alphabet Will Dominate Digital Ad Space, but Facebook Can Also Grow', GuruFocus. Guttman, A 2020, 'Online advertising revenue in the U.S. from 2000 to 2019', Statistica. Ha, L 2008, 'Online Advertising Research in Advertising Journals: A Review', Journal of Current Issues & Research in Advertising (CTC Press), vol. 30, no. 1, pp. 31-48. Hagen, P, Robertson, T & Sadler, K 2006, 'Accessing Data: methods for understanding mobile technology use', Australasian Journal of Information Systems, vol. 13, no. 2. Haghirian, P & Inoue, A 2007, 'An advanced model of consumer attitudes toward advertising on the mobile internet', International Journal of Mobile Communications, vol. 5, no. 1, pp. 48-67. Hague, PN, Hague, N & Morgan, C-A 2013, Market research in practice: how to get greater insight from your market, 2nd ed. edn, Kogan Page, London. Hair, JF, Black, WC, Babin, BJ, Anderson, RE & Tatham, RL 2006, Multivariate data analysis (Vol. 6), Pearson Prentice Hall, Upper Saddle River, NJ. Hancock, GR & Mueller, RO 2013, Structural equation modeling: A second course, IAP Information Age Publishing. Hao, L, Guo, H & Easley, RF 2017, 'A Mobile Platform's In-App Advertising Contract Under Agency Pricing for App Sales', Production and Operations Management, vol. 26, no. 2, pp. 189-202. Härdle, WK & Simar, L 2015, 'Canonical correlation analysis', in Applied multivariate statistical analysis, Springer, pp. 443-454.
An Integrated Effectiveness Framework of Mobile In-App Advertising
145
Harshman, C, Siroker, D & Koomen, P 2013, A/B testing : the most powerful way to turn clicks into customers, Wiley, Hoboken, New Jersey. Hayes, AF 2017, Introduction to mediation, moderation, and conditional process analysis: A regression-based approach, Guilford Publications. Hayes, AF 2018, 'Partial, conditional, and moderated moderated mediation: Quantification, inference, and interpretation', Communication Monographs, vol. 85, no. 1, pp. 4-40. Hedges, A, Ford-Hutchinson, S & Stewart-Hunter, M 1997, Testing to Destruction: A Critical Look at the Uses of Research in Advertising, Institute of Practitioners in Advertising. Henseler, J 2007, 'A new and simple approach to multi-group analysis in partial least squares path modeling', in Proceedings of the 5th International Symposium on PLS and Related Methods, PLS, Norway, pp. 104-107. Herrewijn, L & Poels, K 2018, 'The effectiveness of in-game advertising : examining the influence of ad format.', in Advances in advertising research. Hewson, C, Vogel, CM & Laurent, D 2016, Internet research methods, Second Edition edn, SAGE Publications Ltd, London. Highhouse, S 2009, 'Designing experiments that generalize', Organizational Research Methods, vol. 12, no. 3, pp. 554-566. Hill, SJ, Lo, J, Vavreck, L & Zaller, J 2013, 'How quickly we forget: The duration of persuasion effects from mass communication', Political Communication, vol. 30, no. 4, pp. 521-547. Hirose, M, Mineo, K & Tabe, K 2017, 'The Influence of Personal Data Usage on Mobile Apps', in Advances in advertising research, Springer, pp. 101-113. Hirschheim, R 1985, 'Information systems epistemology: An historical perspective', Research methods in information systems, vol. 9, pp. 13-35. Hoffman, DL & Novak, TP 2000, 'Advertising pricing models for the world wide web', Internet publishing and beyond: The economics of digital information and intellectual property, vol. 5, p. 2. Hojjat, A, Turner, J, Cetintas, S & Yang, J 2017, 'A unified framework for the scheduling of guaranteed targeted display advertising under reach and frequency requirements', Operations Research, vol. 65, no. 2, pp. 289-313. Holland, CW & Cravens, DW 1973, 'Fractional factorial experimental designs in marketing research', Journal of marketing research, vol. 10, no. 3, pp. 270-276. Holliman, G & Rowley, J 2014, 'Business to business digital content marketing: marketers’ perceptions of best practice', Journal of research in interactive marketing, vol. 8, no. 4, pp. 269-293. Hollis, N 2005, 'Ten years of learning how online advertising builds brands', Journal of Advertising Research, vol. 45, no. 2, pp. 255-268.
An Integrated Effectiveness Framework of Mobile In-App Advertising
146
Hoque, AY & Lohse, GL 1999, 'An Information Search Cost Perspective for Designing Interfaces for Electronic Commerce', Journal of marketing research, vol. 36, no. 3, pp. 387-394. Hox, JJ & Boeije, HR 2005, 'Data collection, primary versus secondary', Encyclopedia of Social Measurement, vol. 1. Hsiao, C 2014, Analysis of panel data, Cambridge University Press. Huang, J-H & Yang, T-K 2012, 'The effectiveness of in-game advertising: the impacts of ad type and game/ad relevance', International journal of electronic business management, vol. 10, no. 1, p. 61. Huizingh, EK & Hoekstra, JC 2003, 'Why do consumers like websites?', Journal of Targeting, Measurement and Analysis for Marketing, vol. 11, no. 4, pp. 350-361. Hunt, SD 1991, 'Positivism and paradigm dominance in consumer research: toward critical pluralism and rapprochement', Journal of consumer research, vol. 18, no. 1, pp. 32-44. Huurdeman, HC & Kamps, J 2020, 'Designing multistage search systems to support the information seeking process', in Understanding and Improving Information Search, Springer, pp. 113-137. Hyde, KF 2000, 'Recognising deductive processes in qualitative research', Qualitative Market Research: An International Journal, vol. 3, no. 2, pp. 82-90. Ilisin, A 2020, 'How Much Traffic Do You Need To Make $100/Day with Adsense?', Alpha Investors. Interactive Advertising Bureau 2010-2020, Internet Advertising Revenue Report, Interactive Advertising Bureau, <https://www.iab.com/insights/iab-internet-advertising-revenue-report-conducted-by-pricewaterhousecoopers-pwc-2/>. Interactive Advertising Bureau 2014, Interactive Audience Measurement and Advertising Campaign Reporting and Audit Guidelines, Interactive Advertising Bureau, <https://www.iab.com/wp-content/uploads/2015/06/Ad-Impression-Measurment-Guideline-US.pdf>. Interactive Advertising Bureau 2015, Display and mobile advertising creative format guidelines, Interactive Advertising Bureau, <https://archive.iab.com/www.iab.net/media/file/IAB_Display_Mobile_Creative_Guidelines_HTML5_20153.pdf>. Interactive Advertising Bureau 2016, Internet Advertising Revenue Report, Interactive Advertising Bureau, <https://www.iab.com/insights/iab-internet-advertising-revenue-report-conducted-by-pricewaterhousecoopers-pwc-2/>. Interactive Advertising Bureau 2017a, European Programmatic Market Sizing, Interactive Advertising Bureau, <https://iabeurope.eu/research-thought-leadership/iab-europe-report-european-programmatic-market-sizing-2017/>. Interactive Advertising Bureau 2017b, New Standard Ad Unit Portfolio, Interactive Advertising Bureau, <https://www.iab.com/wp-content/uploads/2017/08/IABNewAdPortfolio_FINAL_2017.pdf>.
An Integrated Effectiveness Framework of Mobile In-App Advertising
147
Interactive Advertising Bureau 2018, Internet Advertising Revenue Report, Interactive Advertising Bureau, <https://www.iab.com/wp-content/uploads/2019/05/Full-Year-2018-IAB-Internet-Advertising-Revenue-Report.pdf>. Interactive Advertising Bureau 2019, Internet Advertising Revenue Report, Interactive Advertising Bureau, <www.iab.com>. Jabareen, Y 2009, 'Building a conceptual framework: philosophy, definitions, and procedure', International journal of qualitative methods, vol. 8, no. 4, pp. 49-62. Jaccard, J 1998, Interaction effects in factorial analysis of variance, Sage Publications, Thousand Oaks. Jaccard, J 2000, Statistics for the behavioral sciences, Brooks, Pacific Grove (CA). Jaccard, J & Turrisi, R 2003, Interaction effects in multiple regression, Sage. Jafarzadeh, H, Aurum, A, D'Ambra, J & Ghapanchi, A 2015, 'A systematic review on search engine advertising', Pacific Asia Journal of the Association for Information Systems, vol. 7, no. 3. Jankowicz, A 2000, Business research projects, London: Thomson Learning, Thomson Learning. Jansen, BJ & Schuster, S 2011, 'Bidding on the buying funnel for sponsored search and keyword advertising', Journal of Electronic Commerce Research, vol. 12, no. 1, p. 1. Jansen, BJ & Spink, A 2007, 'Sponsored search: is money a motivator for providing relevant results?', Computer, vol. 40, no. 8, pp. 52-57. Jansen, J 2011, Understanding sponsored search: Core elements of keyword advertising, Cambridge University Press. Jason, S 2010, 'Decoding the Mobile Ad Space', Adweek. Jefferson, S & Tanton, S 2015, Valuable content marketing: how to make quality content your key to success, Kogan page publishers. Jeong, EJ & Biocca, FA 2012, 'Are there optimal levels of arousal to memory? Effects of arousal, centrality, and familiarity on brand memory in video games', Computers in Human Behavior, vol. 28, no. 2, pp. 285-291. Jiang, J, Liang, T-P & Tsai, JC-A 2019, 'Knowledge Profile in PAJAIS: A Review of Literature and Future Research Directions', Pacific Asia Journal of the Association for Information Systems, vol. 11, no. 1. Joe, R 2021, 'Google's Q4 Ad Rev Soars As Advertisers Return', AdExchanger. Johnson, G & Lewis, R 2015, 'Cost per incremental action: Efficient pricing of advertising', Available on SSRN 2668315. Josephson, S 2004, 'Eye-tracking methodology and the Internet', in Handbook of Visual Communication, Routledge, pp. 85-102.
An Integrated Effectiveness Framework of Mobile In-App Advertising
148
Kaplan, B & Duchon, D 1988, 'Combining qualitative and quantitative methods in information systems research: a case study', MIS quarterly, vol. 1988, pp. 571-586. Karimova, GZ 2012, 'Toward a Bakhtinian typology of ambient advertising', Journal of Marketing Communications, vol. 20, no. 4, pp. 251-269. Karp, S 2008, 'Google AdWords: A brief history of online advertising innovation', Publishing 2.0. Katz, E, Blumler, JG & Gurevitch, M 1973, 'Uses and gratifications research', The public opinion quarterly, vol. 37, no. 4, pp. 509-523. Keller, KL 2016, 'Unlocking the power of integrated marketing communications: How integrated is your IMC program?', Journal of Advertising, vol. 45, no. 3, pp. 286-301. Kenny, D & Marshall, J 2001, 'Contextual marketing: The real business of the internet', Harvard Business Review, vol. 78, no. 6, pp. 119-125. Kent, RJ 1993, 'Competitive versus noncompetitive clutter in television advertising', Journal of Advertising Research, vol. 33, no. 2, pp. 40-47. Kent, RJ 1995, 'Competitive clutter in network television advertising: current levels and advertiser responses', Journal of Advertising Research, vol. 35, no. 1, pp. 49-49. Keppel, G 1991, Design and analysis: A researcher's handbook, Prentice-Hall, Inc. Khattab, L & Mahrous, AA 2016, 'Revisiting online banner advertising recall: An experimental study of the factors affecting banner recall in an Arab context', Journal of Arab & Muslim Media Research, vol. 9, no. 2, pp. 237-249. Khawas, C & Shah, P 2018, 'Application of Firebase in Android App Development-A Study', International Journal of Computer Applications, vol. 975, p. 8887. Khurshed, A, Tong, Y & Wang, M 2015, 'Split-share structure reform and the underpricing of Chinese initial public offerings', The European Journal of Finance, vol. 24, no. 16, pp. 1-25. Kim, KY & Lee, BG 2015, 'Marketing insights for mobile advertising and consumer segmentation in the cloud era: A Q–R hybrid methodology and practices', Technological Forecasting and Social Change, vol. 91, pp. 78-92. Kim, YJ & Han, J 2014, 'Why smartphone advertising attracts customers: A model of Web advertising, flow, and personalization', Computers in Human Behavior, vol. 33, pp. 256-269. King, V 2017, 'Publishers, It’s Time to Take Back Control of Your Inventory.', Medium. Kline, RB 2015, Principles and practice of structural equation modeling, Guilford publications. Kock, N 2014, 'Advanced mediating effects tests, multi-group analyses, and measurement model assessments in PLS-based SEM', International Journal of e-Collaboration (IJeC), vol. 10, no. 1, pp. 1-13. Kohavi, R, Crook, T, Longbotham, R, Frasca, B, Henne, R, Ferres, JL & Melamed, T 2009a, 'Online experimentation at Microsoft', Data Mining Case Studies, vol. 11, p. 39.
An Integrated Effectiveness Framework of Mobile In-App Advertising
149
Kohavi, R & Longbotham, R 2017, 'Online controlled experiments and a/b testing', Encyclopedia of machine learning and data mining, vol. 7, no. 8, pp. 922-929. Kohavi, R, Longbotham, R, Sommerfield, D & Henne, R 2009b, 'Controlled experiments on the web: survey and practical guide', Data mining and knowledge discovery, vol. 18, no. 1, pp. 140-181. Kolb, DA 2016, The Kolb learning style inventory 4.0: Guide to theory, psychometrics, research, and applications, Experience Based Learning Systems. Kong, S, Huang, Z, Scott, N, Zhang, Za & Shen, Z 2019, 'Web advertisement effectiveness evaluation: Attention and memory', Journal of Vacation Marketing, vol. 25, no. 1, pp. 130-146. Korgaonkar, P, Petrescu, M & Karson, E 2015, 'Hispanic-Americans, Mobile Advertising and Mobile Services', Journal of Promotion Management, vol. 21, no. 1, pp. 107-125. Korula, N, Mirrokni, V & Nazerzadeh, H 2016, 'Optimizing display advertising markets: Challenges and directions', IEEE Internet Computing, vol. 20, no. 1, pp. 28-35. Kotler, P, Kartajaya, H & Setiawan, I 2016, Marketing 4.0: Moving from traditional to digital, John Wiley & Sons. Kumar, S 2016, Optimization issues in web and mobile advertising: past and future trends, Springer, Cham. Kumar, S, Dawande, M & Mookerjee, V 2007, 'Optimal Scheduling and Placement of Internet Banner Advertisements', IEEE Transactions on Knowledge and Data Engineering, vol. 19, no. 11, pp. 1571-1584. Kumar, S, Jacob, VS & Sriskandarajah, C 2006, 'Scheduling advertisements on a web page to maximize revenue', European journal of operational research, vol. 173, no. 3, pp. 1067-1089. Kumar, V & Gupta, S 2016, 'Conceptualizing the evolution and future of advertising', Journal of Advertising, vol. 45, no. 3, pp. 302-317. Kurtz, OT, Wirtz, BW & Langer, PF 2021, 'An Empirical Analysis of Location-Based Mobile Advertising—Determinants, Success Factors, and Moderating Effects', Journal of Interactive Marketing, vol. 54, pp. 69-85. Kyung, EJ, Thomas, M & Krishna, A 2017, 'When bigger is better (and when it is not): Implicit bias in numeric judgments', Journal of consumer research, vol. 44, no. 1, pp. 62-79. Lahaie, S, Parkes, DC & Pennock, DM 2008, 'An Expressive Auction Design for Online Display Advertising', in Proceedings of the 23rd AAAI Conference on Artificial Intelligence, pp. 108-113. Lahaie, S, Pennock, DM, Saberi, A & Vohra, RV 2007, 'Sponsored search auctions', Algorithmic game theory, vol. 1, pp. 699-716. Landau, S & Everitt, BS 2003, A handbook of statistical analyses using SPSS, Chapman and Hall/CRC.
An Integrated Effectiveness Framework of Mobile In-App Advertising
150
Lang, K, Delgado, J, Jiang, D, Ghosh, B, Das, S, Gajewar, A, Jagadish, S, Seshan, A, Botev, C & Bindeberger-Ortega, M 2011, 'Efficient online ad serving in a display advertising exchange', in Proceedings of the fourth ACM international conference on Web search and data mining, ACM, pp. 307-316. Lapa, C 2007, 'Using eye tracking to understand banner blindness and improve website design', thesis, Rochester Institute of Technology. Laszlo, J 2009, 'The new unwired world: an IAB status report on mobile advertising', Journal of Advertising Research, vol. 49, no. 1, pp. 27-43. Laudon, KC & Traver, CG 2018, E-Commerce 2017: Business, Technology, Society, Pearson. Lavidge, R & Steiner, G 1961, 'A Model for Predictive Measurements of Advertising Effectiveness', Journal of Marketing, vol. 25, no. 6, p. 59. Lavrakas, PJ 2008, Encyclopedia of survey research methods, Sage Publications. Lavrakas, PJ 2010, An evaluation of methods used to assess the effectiveness of advertising on the internet, Interactive Advertising Bureau. Le, TD & Nguyen, B-TH 2014, 'Attitudes toward mobile advertising: A study of mobile web display and mobile app display advertising', Asian Academy of Management Journal, vol. 19, no. 2, pp. 87-103. Lee, K-C, Jalali, A & Dasdan, A 2013, 'Real time bid optimization with smooth budget delivery in online advertising', in Proceedings of the Seventh International Workshop on Data Mining for Online Advertising, ACM, pp. 1-9. Lee, M & Faber, RJ 2007, 'Effects of product placement in online games on brand memory: A perspective of the limited-capacity model of attention', Journal of Advertising, vol. 36, no. 4, pp. 75-90. Lemon, KN & Verhoef, PC 2016, 'Understanding customer experience throughout the customer journey', Journal of Marketing, vol. 80, no. 6, pp. 69-96. Levin, DM 2008, The opening of vision: Nihilism and the postmodern situation, Routledge. Li, H & Bukovac, JL 1999, 'Cognitive Impact of Banner Ad Characteristics: An Experimental Study', Journalism & Mass Communication Quarterly, vol. 76, no. 2, pp. 341-353. Li, H & Leckenby, JD 2004, 'Internet advertising formats and effectiveness', Center for Interactive Advertising, vol. 14, no. 1, pp. 1-31. Li, H & Lo, H-Y 2015, 'Do you recognize its brand? The effectiveness of online in-stream video advertisements', Journal of Advertising, vol. 44, no. 3, pp. 208-218. Li, X, Zhao, X & Iyer, L 2018, 'Investigating of In-app Advertising Features' Impact on Effective Clicks for Different Advertising Formats', in Proceedings of the International Conference on Information Systems - Bridging the Internet of People, Data, and Things. Li, Y-W, Yang, S-M & Liang, T-P 2015, 'Website interactivity and promotional framing on consumer attitudes toward online advertising: Functional versus symbolic brands', Pacific Asia Journal of the Association for Information Systems, vol. 7, no. 2.
An Integrated Effectiveness Framework of Mobile In-App Advertising
151
Li, Y 2014, 'Spatial and temporal patterns of geo-tagged tweets', thesis, Purdue University. Lim, TY, Tan, TL & Jnr Nwonwu, GE 2013, 'Mobile In-App Advertising for Tourism: A Case Study', in Proceedings of the HCI International 2013, Las Vegas, NV, USA, July 21-26, 2013, Springer Berlin Heidelberg, Berlin, Heidelberg, pp. 695-699, <https://doi.org/10.1007/978-3-642-39473-7_138>. Lin, AC 1998, 'Bridging positivist and interpretivist approaches to qualitative methods', Policy studies journal, vol. 26, no. 1, pp. 162-180. Lin, TTC, Paragas, F, Goh, D & Bautista, JR 2015, 'Developing location-based mobile advertising in Singapore: A socio-technical perspective', Technological Forecasting & Social Change, vol. 103, no. C, pp. 334-349. Lin, Y-L & Chen, Y-W 2009, 'Effects of ad types, positions, animation lengths, and exposure times on the click-through rate of animated online advertisings', Computers & Industrial Engineering, vol. 57, no. 2, pp. 580-591. Lin, Y & Lin, K 2006, 'Effects of ad sizes, positions, types, and user's gender on the click-through rate of web advertisements', in Proceedings of the twenty-third AAAI Conference on Artificial IntelligenceThe 7th Asia-Pacific conference on Computer-Human Interaction, Taipei, Taiwan, 11-14 October, 2006, <https://link.springer.com/book/10.1007/978-3-540-70585-7>. Little, RJ & Rubin, DB 2019, Statistical analysis with missing data, John Wiley & Sons. Locke, EA 2007, 'The Case for Inductive Theory Building†', Journal of Management, vol. 33, no. 6, pp. 867-890. Locke, LF, Spirduso, WW & Silverman, SJ 2014, Proposals that work, Sage. Lohtia, R, Donthu, N & Hershberger, EK 2003, 'The Impact of Content and Design Elements on Banner Advertising Click-through Rates', Journal of Advertising Research, vol. 43, no. 4, pp. 410-418. Luo, X, Andrews, M, Fang, Z & Phang, CW 2014, 'Mobile Targeting', Management Science, vol. 60, no. 7, pp. 1738-1756. Ma, Q 2016, 'Modeling users for online advertising', thesis, Rutgers University, New Brunswick. MacInnis, DJ 2011, 'A framework for conceptual contributions in marketing', Journal of Marketing, vol. 75, no. 4, pp. 136-154. Mackenzie, S, Lutz, R & Belch, G 1986, 'The Role of Attitude Toward the Ad as a Mediator of Advertising Effectiveness: A Test of Competing Explanations', Journal of marketing research, vol. 23, no. 2, p. 130. Mahadevan, S 2019, 'Amazon eyes digital advertising, to sell video ads on apps to take on Google, Facebook', The News Minute. Maillé, P & Tuffin, B 2018, 'Auctions for online ad space among advertisers sensitive to both views and clicks', Electronic Commerce Research, vol. 18, no. 3, pp. 485-506.
An Integrated Effectiveness Framework of Mobile In-App Advertising
152
Mangani, A 2004, 'Online advertising: Pay-per-view versus pay-per-click', Journal of Revenue and Pricing Management, vol. 2, no. 4, pp. 295-302. Manic, M 2015, The Rise of Native Advertising, 1,2065-2194, University of Brasov. Mansour, Y, Muthukrishnan, S & Nisan, N 2012, 'Doubleclick ad exchange auction', arXiv preprint arXiv:1204.0535. Martin, W, Sarro, F, Jia, Y, Zhang, Y & Harman, M 2016, 'A survey of app store analysis for software engineering', IEEE transactions on software engineering, vol. 43, no. 9, pp. 817-847. Marx, W 1996, 'How to make Web ads more effective', Advertising Age's Business Marketing, vol. 81, no. 10, p. M1. Maseeh, HI, Ashraf, HA & Rehman, M 2020, 'Examining the Impact of Digital Mobile Advertising on Purchase Intention', Review of Integrative Business and Economics Research, vol. 9, no. 1, pp. 84-95. Mason, RL, Gunst, RF & Hess, JL 2003, Statistical design and analysis of experiments: with applications to engineering and science, John Wiley & Sons. Matheson, M 2011, 'Implementing a Mobile Strategy as an Independent Publisher', Folio: The Magazine for Magazine Management, vol. 40, no. 4, pp. 19-20. Matthews, L 2017, 'Applying multigroup analysis in PLS-SEM: A step-by-step process', in Partial least squares path modeling, Springer, pp. 219-243. Maxwell, JA 2005, 'Conceptual framework: What do you think is going on', Qualitative research design: An interactive approach, vol. 41, pp. 33-63. Maxwell, S, Delaney, H & Kelley, K 2017, Designing experiments and analyzing data: A model comparison perspective, Routledge. McAfee, RP 2011, 'The design of advertising exchanges', Review of Industrial Organization, vol. 39, no. 3, pp. 169-185. McAfee, RP & Vassilvitskii, S 2012, 'An overview of practical exchange design', Current Science, vol. 2012, pp. 1056-1063. McDonald, A & Cranor, LF 2010, 'Beliefs and behaviors: Internet users' understanding of behavioral advertising', Available at SSRN 1989092. McMahan, HB, Holt, G, Sculley, D, Young, M, Ebner, D, Grady, J, Nie, L, Phillips, T, Davydov, E & Golovin, D 2013, 'Ad click prediction: a view from the trenches', in Proceedings of the 19th ACM SIGKDD international conference on Knowledge discovery and data mining, ACM, pp. 1222-1230. MDR Education 2018, Digital Marketing Trends in the Education Market, MDR, <https://mdreducation.com/reports/digital-marketing-trends-in-the-education-market/>. Menon, AK, Chitrapura, K-P, Garg, S, Agarwal, D & Kota, N 2011, 'Response prediction using collaborative filtering with hierarchies and side information', in Proceedings of the 17th ACM SIGKDD international conference on Knowledge discovery and data mining, ACM, pp. 141-149.

An Integrated Effectiveness Framework of Mobile In-App Advertising
153
Meyer, KE, Ding, Y, Li, J & Zhang, H 2018, 'Overcoming distrust: How state-owned enterprises adapt their foreign entries to institutional pressures abroad', in State-Owned Multinationals, Springer, pp. 211-251. Miller, GA 1956, 'The magical number seven, plus or minus two: Some limits on our capacity for processing information', Psychological review, vol. 63, no. 2, p. 81. Miller, S 2006, 'How to experiment your way to increased web sales using split testing and Taguchi optimization', ConversionLab. Mitti, Z 2018, 'Google AdWords Benchmarks for YOUR Industry', GrowthPoint. Mokbel, MF & Levandoski, JJ 2009, 'Toward context and preference-aware location-based services', in Proceedings of the eighth ACM international workshop on data engineering for wireless and mobile access, ACM, pp. 25-32. Molitor, D, Reichhart, P & Spann, M 2012, 'Location-based advertising: measuring the impact of context-specific factors on consumers’ choice behavior', Available at SSRN 2116359. Momoh, M & Folorunso, RO 2013, 'Effect of demographic variables on information seeking behaviour of company advertising strategies in north-eastern Nigeria', IOSR Journal of Business and Management, vol. 9, no. 3, pp. 46-51. Montgomery, A, Hosanagar, K & Clay, K 2004, 'Designing a Better Shopbot', Management Science, vol. 50, no. 2, pp. 189-206. Montgomery, DC 2017, Design and analysis of experiments, John Wiley & sons. Moon, Y & Kwon, C 2011, 'Online advertisement service pricing and an option contract', Electronic Commerce Research and Applications, vol. 10, no. 1, pp. 38-48. Moorman, M 2003, Context considered: The relationship between media environments and advertising effects, Universiteit van Amsterdam. Morgan, G & Smircich, L 1980, 'The case for qualitative research', Academy of management review, vol. 5, no. 4, pp. 491-500. Mostagir, M 2010, 'Optimal delivery in display advertising', in Proceedings of the 2010 48th Annual Allerton Conference on Communication, Control, and Computing (Allerton), IEEE, pp. 577-583. Muthukrishnan, S 2009, 'Ad Exchanges: Research Issues', in International Workshop on Internet and Network Economics, Springer Berlin Heidelberg, Berlin, Heidelberg, pp. 1-12. Nairn, Aea 2018, UK advertising in a digital age, Select Committee on Communications. House of Lords, <https://publications.parliament.uk/pa/ld201719/ldselect/ldcomuni/116/116.pdf>. Najafi-Asadolahi, S & Fridgeirsdottir, K 2014, 'Cost-per-click pricing for display advertising', Manufacturing & Service Operations Management, vol. 16, no. 4, pp. 482-497. Nakamura, A & Abe, N 2005, 'Improvements to the linear programming based scheduling of web advertisements', Electronic Commerce Research, vol. 5, no. 1, pp. 75-98.
An Integrated Effectiveness Framework of Mobile In-App Advertising
154
Narayanan, S & Kalyanam, K 2015, 'Position effects in search advertising and their moderators: A regression discontinuity approach', Marketing Science, vol. 34, no. 3, pp. 388-407. Nasco, SA & Bruner, GC 2008, 'Comparing consumer responses to advertising and non‐advertising mobile communications', Psychology & Marketing, vol. 25, no. 8, pp. 821-837. Navarro, D 2015, Learning Statistics with R: A Tutorial for Psychology Students and Other Beginners (R package version 0.5), University of Adelaide. Newbold, P, Carlson, WL & Thorne, B 2013, Statistics for business and economics, Pearson Boston, MA. Newman, DA 2014, 'Missing data: Five practical guidelines', Organizational Research Methods, vol. 17, no. 4, pp. 372-411. Newman, N, Fletcher, R, Levy, DA & Nielsen, RK 2016, 'Digital news report 2016', Reuters Institute for the Study of Journalism. Niculescu, MF & Wu, DJ 2014, 'Economics of free under perpetual licensing: Implications for the software industry', Information systems research, vol. 25, no. 1, pp. 173-199. Nielsen, J 2005, 'Putting A/B testing in its place', NNGroup. Nihel, Z 2013, 'The effectiveness of internet advertising through memorization and click on a banner', International Journal of Marketing Studies, vol. 5, no. 2, p. 93. Nittala, R 2011, 'Registering for incentivized mobile advertising: Discriminant analysis of mobile users', International Journal of Mobile Marketing, vol. 6, no. 1, pp. 42-53. Nitza, G & Ruti, G 2015, 'Evolving Consumption Patterns of Various Information Media via Handheld Mobile Devices', Issues in Informing Science and Information Technology, vol. 12, pp. 083-093. Norris, CE & Colman, AM 1993, 'Context effects on memory for television advertisements', Social Behavior and Personality: an international journal, vol. 21, no. 4, pp. 279-296. North, M & Ficorilli, M 2017, 'Click me: an examination of the impact size, color, and design has on banner advertisements generating clicks', Journal of Financial Services Marketing, vol. 22, no. 3, pp. 99-108. Nwafor, CU, Ogundeji, AA & van der Westhuizen, C 2020, 'Marketing Information Needs and Seeking Behaviour of Smallholder Livestock Farmers in the Eastern Cape Province, South Africa', Journal of Agricultural Extension, vol. 24, no. 3, pp. 98-114. O'Reilly, L 2015, 'The cost of ad blocking: PageFair and Adobe 2015 Ad Blocking Report', BusinessInsider. Oak, P 2008, 'The importance of ad placement', eConsultancy. Octane Marketing 2015, 'Annual State of Email Marketing in India', Octane Marketing. Okazaki, S 2012, 'Lessons Learned for Teaching Mobile Advertising', in Advertising Theory, p. 373.
An Integrated Effectiveness Framework of Mobile In-App Advertising
155
Okazaki, S & Barwise, P 2011, 'Has the time finally come for the medium of the future?: Research on mobile advertising', Journal of Advertising Research, vol. 51, no. 1 50th Anniversary Supplement, pp. 59-71. Olennikova, J 2019, 'What is Google AdSense and How to Make Money With It?', Semrush. Orlikowski, WJ & Baroudi, JJ 1991, 'Studying information technology in organizations: Research approaches and assumptions', Information systems research, vol. 2, no. 1, pp. 1-28. Pansuwong, W 2009, 'Entrepreneurial strategic orientation and export performance of Thai small and medium-sized enterprises', thesis, The Swinburne University of Technology, Faculty of Business and Enterprise. Park, T, Shenoy, R & Salvendy, G 2008, 'Effective advertising on mobile phones: a literature review and presentation of results from 53 case studies', Behaviour & Information Technology, vol. 27, no. 5, pp. 355-373. Parsons, D 2009, Mobile Portal Technologies and Business Models. Patsioura, F, Vlachopoulou, M & Manthou, V 2009, 'A new advertising effectiveness model for corporate advertising websites', Benchmarking: An International Journal, vol. 16, no. 3, pp. 372-386. Patzer, GL 1991, 'Multiple dimensions of performance for 30-second and 15-second commercials. (includes appendices)', Journal of Advertising Research, vol. 31, no. 4, p. 18. Paulson, K 2017, 'Understanding Mobile Users: Characteristics, Habits & Behavior on Mobile Web', Instant Shift. Pavlou, PA & Stewart, DW 2000, 'Measuring the Effects and Effectiveness of Interactive Advertising: A Research Agenda', Journal of Interactive Advertising, vol. 1, no. 1, pp. 61-77. Pearson, K 1904, On the theory of contingency and its relation to association and normal correlation; On the general theory of skew correlation and non-linear regression, Cambridge University Press. Perez, S 2017, 'Consumers now spend 5 hours per day on mobile devices', Techcrunch. Perkel, J 2016, 'Democratic databases: science on GitHub', Nature News, vol. 538, no. 7623, p. 127. Perlich, C, Dalessandro, B, Hook, R, Stitelman, O, Raeder, T & Provost, F 2012, 'Bid optimizing and inventory scoring in targeted online advertising', in Proceedings of the 18th ACM SIGKDD international conference on Knowledge discovery and data mining, ACM, pp. 804-812. Persaud, A & Azhar, I 2012, 'Innovative mobile marketing via smartphones: are consumers ready?', Marketing Intelligence & Planning, vol. 30, no. 4, pp. 418-443. Pervan, GP 1994, 'The measurement of GSS effectiveness: A meta-analysis of the literature and recommendations for future GSS research', in Proceedings of the Twenty-Seventh Annual Hawaii International Conference on System Sciences, pp. 562-571.
An Integrated Effectiveness Framework of Mobile In-App Advertising
156
Petsas, T, Papadogiannakis, A, Polychronakis, M, Markatos, EP & Karagiannis, T 2013, 'Rise of the planet of the apps: a systematic study of the mobile app ecosystem', in Proceedings of the 2013 conference on Internet measurement conference, ACM, Barcelona, Spain, pp. 277-290. Pierre, J 2017, 'Qualitative Marketing Research ', An International Journal of Qualitative Market Research, vol. 20, pp. 390-392. Pieters, FGM & Raaij, WF 1992, Reclamewerking, Stenfert Kroese. Ployhart, RE & Oswald, FL 2004, 'Applications of mean and covariance structure analysis: Integrating correlational and experimental approaches', Organizational Research Methods, vol. 7, no. 1, pp. 27-65. Popper, K 2014, Conjectures and refutations: The growth of scientific knowledge, Routledge. Prerna, B 2015, 'Can ‘Mobile Platform’ and ‘Permission Marketing’ dance a tango to the consumers' tune? Modeling adoption of ‘SMS based Permission Advertising’', Acta Universitatis Danubius: Communicatio, vol. 9, no. 2, pp. 67-95. Prew, N & Lin, M-H 2019, The benefits and challenges of conducting field experiments in consumer research, SAGE Research Methods. Cases, SAGE Publications Ltd, London. Prochkova, I, Singh, V & Nurminen, JK 2012, 'Energy Cost of Advertisements in Mobile Games on the Android Platform', in Proceedings of the 2012 Sixth International Conference on Next Generation Mobile Applications, Services and Technologies, IEEE, pp. 147-152. Pulizzi, J 2012, 'The rise of storytelling as the new marketing', Publishing research quarterly, vol. 28, no. 2, pp. 116-123. Punyatoya, P 2011, 'How Effective are Internet Banner Advertisements in India?', Journal of Marketing & Communication, vol. 7, no. 1. Qian, F, Wang, Z, Gao, Y, Huang, J, Gerber, A, Mao, Z, Sen, S & Spatscheck, O 2012, 'Periodic transfers in mobile applications: network-wide origin, impact, and optimization', in Proceedings of the 21st international conference on World Wide Web, ACM, pp. 51-60. Quarto-vonTivadar, J 2006, 'AB Testing: Too Little, Too Soon', Future Now. Quinton, S 2013, 'The digital era requires new knowledge to develop relevant CRM strategy: a cry for adopting social media research methods to elicit this new knowledge', Journal of Strategic Marketing, vol. 21, no. 5, pp. 402-412. Radovanovic, A & Heavlin, WD 2012, 'Risk-aware revenue maximization in display advertising', in Proceedings of the 21st international conference on World Wide Web, ACM, pp. 91-100. Rafieian, O & Yoganarasimhan, H 2021, 'Targeting and privacy in mobile advertising', Marketing Science, vol. 40, no. 2, pp. 193-218. Rastogi, V, Shao, R, Chen, Y, Pan, X, Zou, S & Riley, R 2016, 'Are these Ads Safe: Detecting Hidden Attacks through the Mobile App-Web Interfaces', in Proceedings of the Network and Distributed System Security Symposium, San Diego, California, 21-24 February 2016, <http://doi.org/10.14722/ndss.2016.23234>.
An Integrated Effectiveness Framework of Mobile In-App Advertising
157
Ratcliff, C 2015, 'The current state of programmatic: latest stats and infographic round-up', Econsultancy. Rejón-Guardia, F & Martínez-López, FJ 2014, 'An integrated review of the efficacy of Internet advertising: Concrete approaches to the banner ad format and the context of social networks', in Handbook of strategic e-business management, Springer, pp. 523-564. Rejón-Guardia, F & Martínez-López, FJ 2017, 'A Review of Internet and Social Network Advertising Formats 1', in Digital Advertising: Theory and Research, p. 362. Remenyi, D & Williams, B 1996, 'The nature of research: qualitative or quantitative, narrative or paradigmatic?', Information Systems Journal, vol. 6, no. 2, pp. 131-146. Rettie, R, Grandcolas, U & McNeil, C 2004, 'Post-impressions: internet advertising without click-through', thesis, Kingston University Research Repository. Richards, JI & Curran, CM 2002, 'Oracles on "advertising": searching for a definition', Journal of Advertising, vol. 31, no. 2, p. 63. Richardson, M, Dominowska, E & Ragno, R 2007, 'Predicting clicks: estimating the click-through rate for new ads', in Proceedings of the 16th international conference on World Wide Web, ACM, pp. 521-530. Robinson, H, Wysocka, A & Hand, C 2007, 'Internet advertising effectiveness: The effect of design on click-through rates for banner ads', International Journal of Advertising, vol. 26, no. 4, pp. 527-541. Rodgers, S, Ouyang, S & Thorson, E 2017, 'Revisiting the Interactive Advertising Model (IAM) after 15 Years: An Analysis of Impact and Implications', in Digital Advertising, Routledge, pp. 3-18. Rodgers, S & Sheldon, K 2002, 'An improved way to characterize Internet users', Journal of Advertising Research, vol. 42, no. 5, pp. 85-94. Rodgers, S & Thorson, E 2000, 'The Interactive Advertising Model: How Users Perceive and Process Online Ads', Journal of Interactive Advertising, vol. 1, no. 1, pp. 41-60. Rodgers, S & Thorson, E 2012, Advertising theory, Routledge. Roehm, HA & Haugtvedt, CP 1999, 'Understanding interactivity of cyberspace advertising', in Advertising and the world wide web, pp. 27-39. Roels, G & Fridgeirsdottir, K 2009, 'Dynamic revenue management for online display advertising', Journal of Revenue and Pricing Management, vol. 8, no. 5, pp. 452-466. Rojas, IKV, Meireles, S & Dias-Neto, AC 2016, 'Cloud-based mobile app testing framework: architecture, implementation and execution', in Proceedings of the 1st Brazilian Symposium on Systematic and Automated Software Testing, ACM, p. 10. Rollins, BL, King, K, Zinkhan, G & Petri, M 2010, 'Behavioral intentions and information-seeking behavior: A comparison of nonbranded versus branded direct-to-consumer prescription advertisements', Drug information journal: DIJ/Drug Information Association, vol. 44, no. 6, pp. 673-683.
An Integrated Effectiveness Framework of Mobile In-App Advertising
158
Rosales, R, Cheng, H & Manavoglu, E 2012, 'Post-click conversion modeling and analysis for non-guaranteed delivery display advertising', in Proceedings of the fifth ACM international conference on Web search and data mining, ACM, pp. 293-302. Rosenkrans, G 2007, 'Online advertising metrics', in Handbook of research on electronic surveys and measurements, IGI Global, pp. 136-143. Rosenkrans, G 2009, 'The Creativeness and Effectiveness of Online Interactive Rich Media Advertising', Journal of Interactive Advertising, vol. 9, no. 2, pp. 18-31. Rosenkrans, G & Myers, K 2012, 'Mobile advertising effectiveness', International Journal of Mobile Marketing, vol. 7, no. 3. Roy, RK 2001, Design of experiments using the Taguchi approach: 16 steps to product and process improvement, John Wiley & Sons. Rubin, DB 1976, 'Inference and missing data', Biometrika, vol. 63, no. 3, pp. 581-592. Rust, RT 2016, 'Comment: Is Advertising a Zombie?', Journal of Advertising, vol. 45, no. 3, pp. 346-347. Rutherford, A 2011, ANOVA and ANCOVA: a GLM approach, John Wiley & Sons. Sahni, N 2015, 'Effect of temporal spacing between advertising exposures: Evidence from online field experiments', QME, vol. 13, no. 3, pp. 203-247. Salomatin, K, Liu, T-Y & Yang, Y 2012, 'A unified optimization framework for auction and guaranteed delivery in online advertising', in Proceedings of the 21st ACM international conference on Information and knowledge management, ACM, pp. 2005-2009. Salsburg, D 2001, The lady tasting tea: How statistics revolutionized science in the twentieth century, Macmillan. San José-Cabezudo, R, Gutiérrez-Cillán, J & Gutiérrez-Arranz, AM 2008, 'The moderating role of user motivation in Internet access and individuals' responses to a Website', Internet Research, vol. 18, no. 4, pp. 393-404. Sanakulov, N & Karjaluoto, H 2015, 'Consumer adoption of mobile technologies: a literature review', International Journal of Mobile Communications, vol. 13, no. 3, pp. 244-275. Sandberg, R & Rollins, M 2013, The Business of Android Apps Development Making and Marketing Apps that Succeed on Google Play, Amazon App Store and More, 2nd ed. edn, Apress, Berkeley, CA. Santora, J 2020, 'Ten Highest Performing Adsense Banner Sizes and Formats', Influencer Marketing Hub. Satorra, A & Bentler, PM 2001, 'A scaled difference chi-square test statistic for moment structure analysis', Psychometrika, vol. 66, no. 4, pp. 507-514. Saunders, MNK 2015, Research Methods for Business Students, 7th edn, Pearson Education Limited, Harlow, United Kingdom. Sayedi, A 2018, 'Real-time bidding in online display advertising', Marketing Science, vol. 37, no. 4, pp. 553-568.
An Integrated Effectiveness Framework of Mobile In-App Advertising
159
Schain, M & Mansour, Y 2012, 'Ad exchange–proposal for a new trading agent competition game', in Agent-Mediated Electronic Commerce. Designing Trading Strategies and Mechanisms for Electronic Markets, Springer, pp. 133-145. Schick, S 2013, 'The in-app advertising metrics that will matter', FierceDeveloper. Schneider, L-P, Systems, B & Cornwell, TB 2005, 'Cashing in on crashes via brand placement in computer games: The effects of experience and flow on memory', International Journal of Advertising, vol. 24, no. 3, pp. 321-343. Scholten, M 1996, 'Lost and found: the information-processing model of advertising effectiveness', Journal of Business Research, vol. 37, no. 2, pp. 97-104. Schonberg, E, Cofino, T, Hoch, R, Podlaseck, M & Spraragen, SL 2000, 'Measuring success', Communications of the ACM, vol. 43, no. 8, pp. 53-53. Schultz, D 2016, 'The future of advertising or whatever we're going to call it', Journal of Advertising, vol. 45, no. 3, pp. 276-285. Shavitt, S, Lowrey, P & Haefner, J 1998, 'Public attitudes toward advertising: More favorable than you might think', Journal of Advertising Research, vol. 38, no. 4, pp. 7-22. Shelly, R & Esther, T 2017, Digital Advertising: Theory and Research, Taylor and Francis. Shiau, W-L, Sarstedt, M & Hair, JF 2019, 'Internet research using partial least squares structural equation modeling (PLS-SEM)', Internet Research, vol. 29, no. 3. Shu, SB & Peck, J 2011, 'Psychological ownership and affective reaction: Emotional attachment process variables and the endowment effect', Journal of Consumer Psychology, vol. 21, no. 4, pp. 439-452. Singh, SN, Dalal, N & Spears, N 2005, 'Understanding web home page perception', European Journal of Information Systems, vol. 14, no. 3, pp. 288-302. Sinkovics, RR, Pezderka, N & Haghirian, P 2012, 'Determinants of consumer perceptions toward mobile advertising—a comparison between Japan and Austria', Journal of Interactive Marketing, vol. 26, no. 1, pp. 21-32. Siroker, D & Koomen, P 2013, A/B testing: The most powerful way to turn clicks into customers, John Wiley & Sons. Siroker, D, Koomen, P, Kim, E & Siroker, E 2014, Systems and methods for website optimization, Patent No. 8,839,093, US. SmartInsights 2010, 'DoubleClick for Advertisers, a cross section of regions', SmartInsights. Soo Jiuan, T & Chia, L 2016, 'Are we measuring the same attitude? Understanding media effects on attitude towards advertising', Marketing Theory, vol. 7, no. 4, pp. 353-377. Spence, C 2014, 'Multisensory advertising & design', in Advertising and Design, pp. 15-28. Spiller, SA, Fitzsimons, GJ, Lynch Jr, JG & McClelland, GH 2013, 'Spotlights, floodlights, and the magic number zero: Simple effects tests in moderated regression', Journal of marketing research, vol. 50, no. 2, pp. 277-288.
An Integrated Effectiveness Framework of Mobile In-App Advertising
160
Statista 2018, 'Worldwide mobile in-app advertising revenues in 2015, 2016 and 2020 (in billion U.S. dollars)', Statista. Stavrogiannis, LC, Gerding, EH & Polukarov, M 2014, 'Auction mechanisms for demand-side intermediaries in online advertising exchanges', in Proceedings of the 2014 international conference on Autonomous agents and multi-agent systems, International Foundation for Autonomous Agents and Multiagent Systems, pp. 1037-1044. Steel, E 2011, 'Using credit cards to target web ads', Wall Street Journal. Stone-Gross, B, Stevens, R, Zarras, A, Kemmerer, R, Kruegel, C & Vigna, G 2011, 'Understanding fraudulent activities in online ad exchanges', in Proceedings of the 2011 ACM SIGCOMM conference on Internet measurement conference, ACM, pp. 279-294. Straub, D, Boudreau, M-C & Gefen, D 2004, 'Validation guidelines for IS positivist research', Communications of the Association for Information systems, vol. 13, no. 1, p. 24. Student 1908, 'The probable error of a mean', Biometrika, vol. 6, no. 1, pp. 1-25. Su, K-W, Huang, P-H, Chen, P-H & Li, Y-T 2016, 'The impact of formats and interactive modes on the effectiveness of mobile advertisements', Journal of Ambient Intelligence and Humanized Computing, vol. 7, no. 6, pp. 817-827. Sun, Z, Dawande, M, Janakiraman, G & Mookerjee, V 2017, 'Not Just a Fad: Optimal Sequencing in Mobile In-App Advertising', Information systems research, vol. 28, no. 3. Sundar, SS & Kalyanaraman, S 2004, 'AROUSAL, MEMORY, AND IMPRESSION-FORMATION EFFECTS OF ANIMATION SPEED IN WEB ADVERTISING', Journal of Advertising, vol. 33, no. 1, pp. 7-17. Sweetser, KD, Ahn, SJ, Golan, GJ & Hochman, A 2016, 'Native advertising as a new public relations tactic', American behavioral scientist, vol. 60, no. 12, pp. 1442-1457. Tam, KY & Ho, SY 2006, 'Understanding the impact of web personalization on user information processing and decision outcomes', MIS quarterly, vol. 30, no. 4, pp. 865-890. Tang, S, Yuan, J & Mookerjee, V 2020, 'Optimizing ad allocation in mobile advertising', in Proceedings of the Twenty-First International Symposium on Theory, Algorithmic Foundations, and Protocol Design for Mobile Networks and Mobile Computing, pp. 181-190. Templeton, B 2008, 'Reaction to the DEC Spam of 1978', http://www.templetons.com/brad/spamreact.html. Thiga, M, Siror, J, Githeko, J & Njagi, K 2016, 'A Use Intention Model for Location-Based Mobile Advertising', African journal of information systems, vol. 8, no. 1, p. 2. Thorson, E & Schumann, DW 1999, Advertising and the World Wide Web, Psychology Press, Mahwah, N.J. Ting, H & de Run, EC 2015, 'Attitude towards advertising: A young generation cohort’s perspective', Asian Journal of Business Research ISSN, vol. 5, no. 1, p. 2015.
An Integrated Effectiveness Framework of Mobile In-App Advertising
161
Ting, H, de Run, EC & Thurasamy, R 2015, 'Young adults’ attitude towards advertising: A multi-group analysis by ethnicity', Revista Brasileira de Gestão de Negócios-RBGN, vol. 17, no. 54, pp. 769-787. Top Growth Marketing 2012, 'The Facebook Ads Benchmark Report', Top Growth Marketting. Trivedi, JP 2015, 'Mobile Advertising Effectiveness on Gen Ys Attitude and Purchase Intentions', International Journal of Marketing and Business Communication, vol. 4, no. 2, p. 2. Trope, Y & Liberman, N 2003, 'Temporal construal', Psychological review, vol. 110, no. 3, p. 403. Trope, Y & Liberman, N 2010, 'Construal-level theory of psychological distance', Psychological review, vol. 117, no. 2, p. 440. Truong, VN 2016, 'Optimizing mobile advertising using ad refresh interval', in Proceedings of the International Conference on Electronics, Information, and Communications (ICEIC), IEEE, Vietnam, pp. 1-4. Tucker, CE 2014, 'Social networks, personalized advertising, and privacy controls', Journal of marketing research, vol. 51, no. 5, pp. 546-562. Turner, J 2012, 'The planning of guaranteed targeted display advertising', Operations Research, vol. 60, no. 1, pp. 18-33. Ullah, I, Kanhere, SS & Boreli, R 2020, 'Privacy-preserving targeted mobile advertising: A Blockchain-based framework for mobile ads', arXiv preprint arXiv:2008.10479. Vallina-Rodriguez, N, Shah, J, Finamore, A, Grunenberger, Y, Papagiannaki, K, Haddadi, H & Crowcroft, J 2012, 'Breaking for commercials: characterizing mobile advertising', in Proceedings of the 2012 Internet Measurement Conference, ACM, pp. 343-356. Van Belle, G 2011, Statistical rules of thumb, John Wiley & Sons. Van Reijmersdal, E, Neijens, P & Smit, E 2005, 'Readers' reactions to mixtures of advertising and editorial content in magazines', Journal of Current Issues & Research in Advertising, vol. 27, no. 2, pp. 39-53. van Ryzin, GJ & Talluri, KT 2005, 'An introduction to revenue management', in Emerging Theory, Methods, and Applications, Informs, pp. 142-194. Varian, HR 2007, 'Position auctions', international Journal of industrial Organization, vol. 25, no. 6, pp. 1163-1178. Varnali, K & Toker, A 2010, 'Mobile marketing research: The-state-of-the-art', International journal of information management, vol. 30, no. 2, pp. 144-151. Vega, T 2011, 'AOL, Yahoo and Microsoft Reportedly in Ad Deal', New York Times. Walsham, G 1995, 'The emergence of interpretivism in IS research', Information systems research, vol. 6, no. 4, pp. 376-394.
An Integrated Effectiveness Framework of Mobile In-App Advertising
162
Wang, J & Wang, X 2019, Structural equation modeling: Applications using Mplus, John Wiley & Sons. Wang, J, Zhang, W & Yuan, S 2016, 'Display advertising with real-time bidding (RTB) and behavioural targeting', arXiv preprint arXiv:1610.03013. Wang, K-Y, Shih, E & Peracchio, LA 2013, 'How banner ads can be effective: Investigating the influences of exposure duration and banner ad complexity', International Journal of Advertising, vol. 32, no. 1, pp. 121-141. Wayner, P 2008, 'Cloud versus cloud: A guided tour of Amazon, Google, AppNexus, and GoGrid', InfoWorld, vol. 21. Webb, EJ 2017, 'Unconventionality, triangulation, and inference', in Sociological Methods, Routledge, pp. 449-456. Wegert, T 2002, 'Pop-up Ads, Part 1: Good? Bad? Ugly', Clickz, p. 2004. Weingarten, E & Berger, J 2017, 'Fired up for the future: How time shapes sharing', Journal of consumer research, vol. 44, no. 2, pp. 432-447. Weissman Adam, J & Elbaz Gilad, I 2015, Meaning-based advertising and document relevance determination, Patent No. 6,816,857, US. Weller, B & Calcott, L 2012, The Definitive Guide to Google AdWords Create Versatile and Powerful Marketing and Advertising Campaigns, Apress, Berkeley, CA. Wilson, T 2006, 'Information-seeking behaviour and the digital information world', Indexer, vol. 25, no. 1. Wolfinbarger, M & Gilly, MC 2003, 'eTailQ: dimensionalizing, measuring and predicting etail quality', Journal of Retailing, vol. 79, no. 3, pp. 183-198. Yacko, S 2012, 'Minimum sample size: How many users are enough?', Vuurr. Yadav, MS 2010, 'The decline of conceptual articles and implications for knowledge development', Journal of Marketing, vol. 74, no. 1, pp. 1-19. Yan, J, Liu, N, Wang, G, Zhang, W, Jiang, Y & Chen, Z 2009, 'How much can behavioral targeting help online advertising?', in Proceedings of the 18th international conference on World wide web, ACM, pp. 261-270. Yang, B, Kim, Y & Yoo, C 2013, 'The integrated mobile advertising model: The effects of technology- and emotion-based evaluations', Journal of Business Research, vol. 66, no. 9, pp. 1345-1352. Yang, Y, Yang, YC, Jansen, BJ & Lalmas, M 2017, 'Computational Advertising: A Paradigm Shift for Advertising and Marketing?', IEEE Intelligent Systems, vol. 32, no. 3, pp. 3-6. Yuan, K-H & Chan, W 2016, 'Measurement invariance via multigroup SEM: Issues and solutions with chi-square-difference tests', Psychological Methods, vol. 21, no. 3, p. 405. Yuan, S, Abidin, AZ, Sloan, M & Wang, J 2012, 'Internet advertising: An interplay among advertisers, online publishers, ad exchanges and web users', arXiv preprint arXiv:1206.1754.
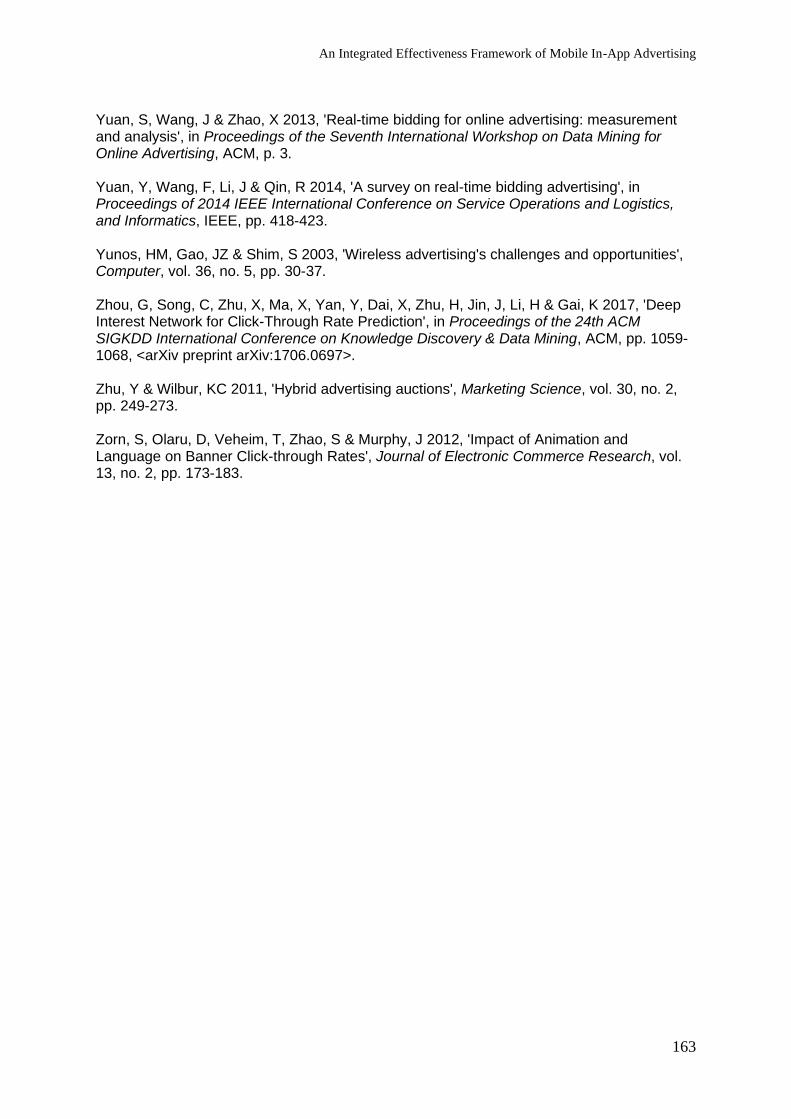
An Integrated Effectiveness Framework of Mobile In-App Advertising
163
Yuan, S, Wang, J & Zhao, X 2013, 'Real-time bidding for online advertising: measurement and analysis', in Proceedings of the Seventh International Workshop on Data Mining for Online Advertising, ACM, p. 3. Yuan, Y, Wang, F, Li, J & Qin, R 2014, 'A survey on real-time bidding advertising', in Proceedings of 2014 IEEE International Conference on Service Operations and Logistics, and Informatics, IEEE, pp. 418-423. Yunos, HM, Gao, JZ & Shim, S 2003, 'Wireless advertising's challenges and opportunities', Computer, vol. 36, no. 5, pp. 30-37. Zhou, G, Song, C, Zhu, X, Ma, X, Yan, Y, Dai, X, Zhu, H, Jin, J, Li, H & Gai, K 2017, 'Deep Interest Network for Click-Through Rate Prediction', in Proceedings of the 24th ACM SIGKDD International Conference on Knowledge Discovery & Data Mining, ACM, pp. 1059-1068, <arXiv preprint arXiv:1706.0697>. Zhu, Y & Wilbur, KC 2011, 'Hybrid advertising auctions', Marketing Science, vol. 30, no. 2, pp. 249-273. Zorn, S, Olaru, D, Veheim, T, Zhao, S & Murphy, J 2012, 'Impact of Animation and Language on Banner Click-through Rates', Journal of Electronic Commerce Research, vol. 13, no. 2, pp. 173-183.
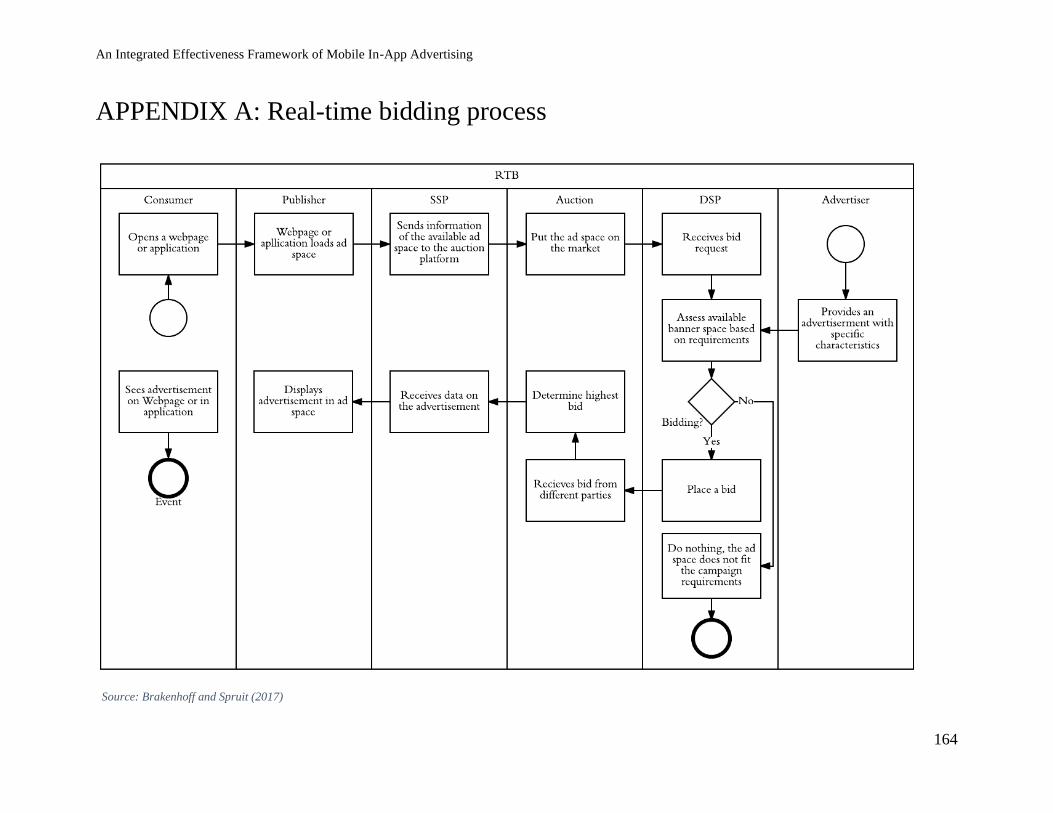
An Integrated Effectiveness Framework of Mobile In-App Advertising
164
APPENDIX A: Real-time bidding process
Source: Brakenhoff and Spruit (2017)
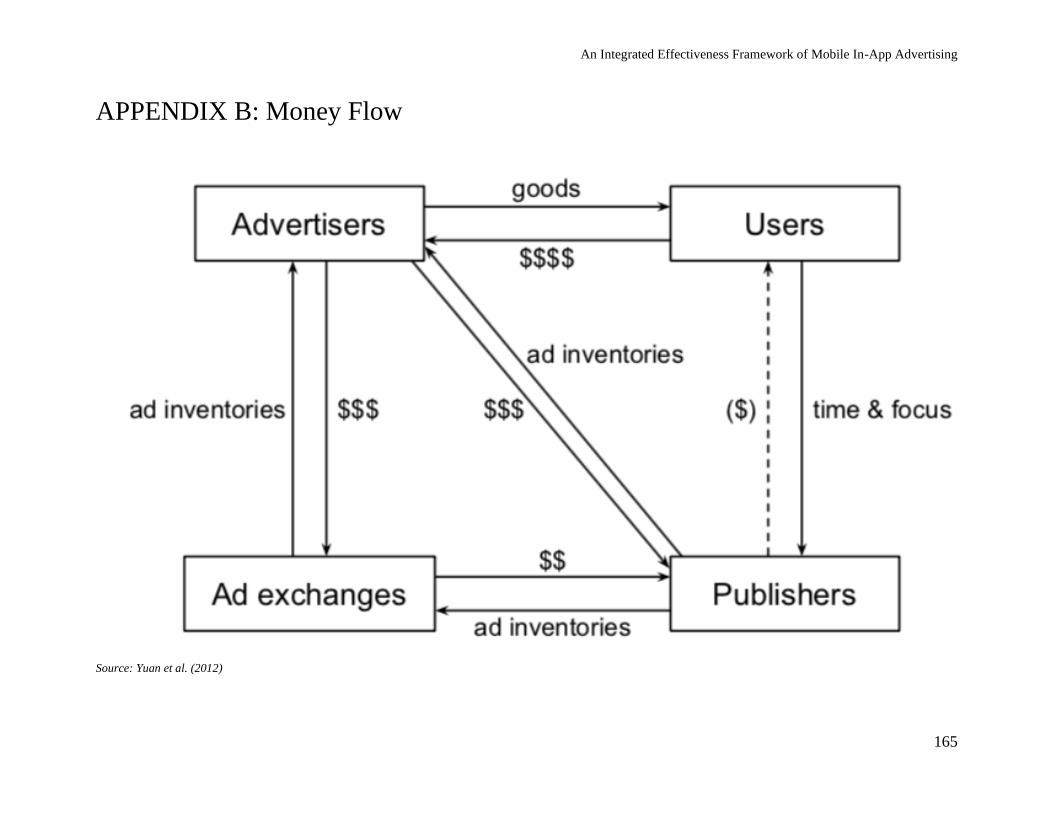
An Integrated Effectiveness Framework of Mobile In-App Advertising
165
APPENDIX B: Money Flow
Source: Yuan et al. (2012)
An Integrated Effectiveness Framework of Mobile In-App Advertising
166
APPENDIX C: Interactive Advertising Model
Source Rogers & Thorson, 2000
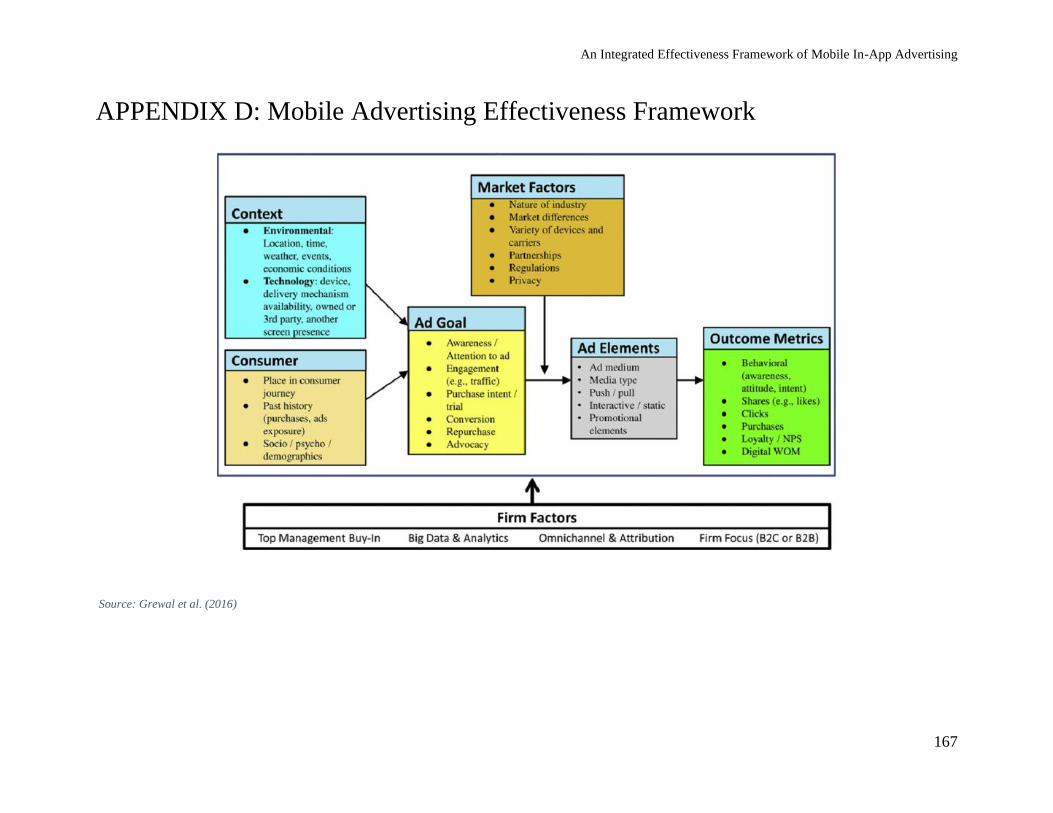
An Integrated Effectiveness Framework of Mobile In-App Advertising
167
APPENDIX D: Mobile Advertising Effectiveness Framework
Source: Grewal et al. (2016)
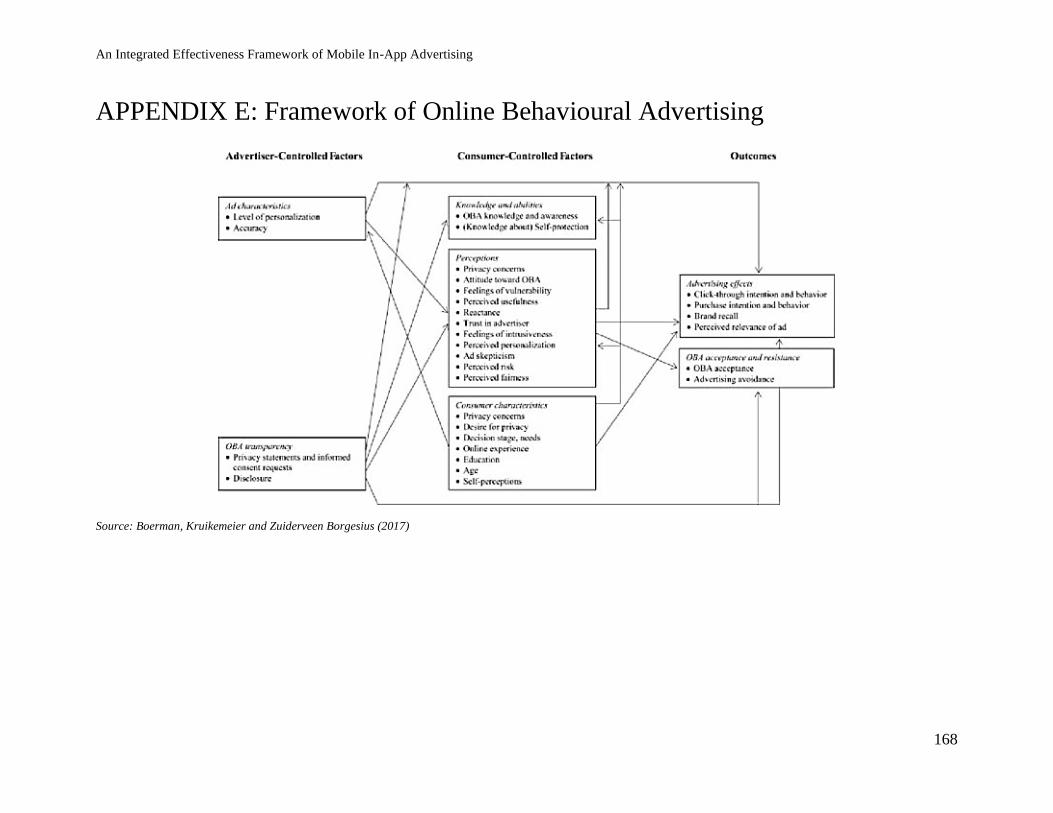
An Integrated Effectiveness Framework of Mobile In-App Advertising
168
APPENDIX E: Framework of Online Behavioural Advertising
Source: Boerman, Kruikemeier and Zuiderveen Borgesius (2017)
An Integrated Effectiveness Framework of Mobile In-App Advertising
169
APPENDIX F: App Setup
Appendix F1: Participants are using different kinds of mobile devices –
Captured from Google Developer Console
Appendix F2: Participants are from different regions of the world – Captured
from Google Developer Console
An Integrated Effectiveness Framework of Mobile In-App Advertising
170
Appendix F3: Participants demographics captured from Google Analytics

An Integrated Effectiveness Framework of Mobile In-App Advertising
171
APPENDIX G: Ad Space Setup
Appendix G1: Ad space duration can be set as 30 or 90 seconds – Captured
from Google Admob
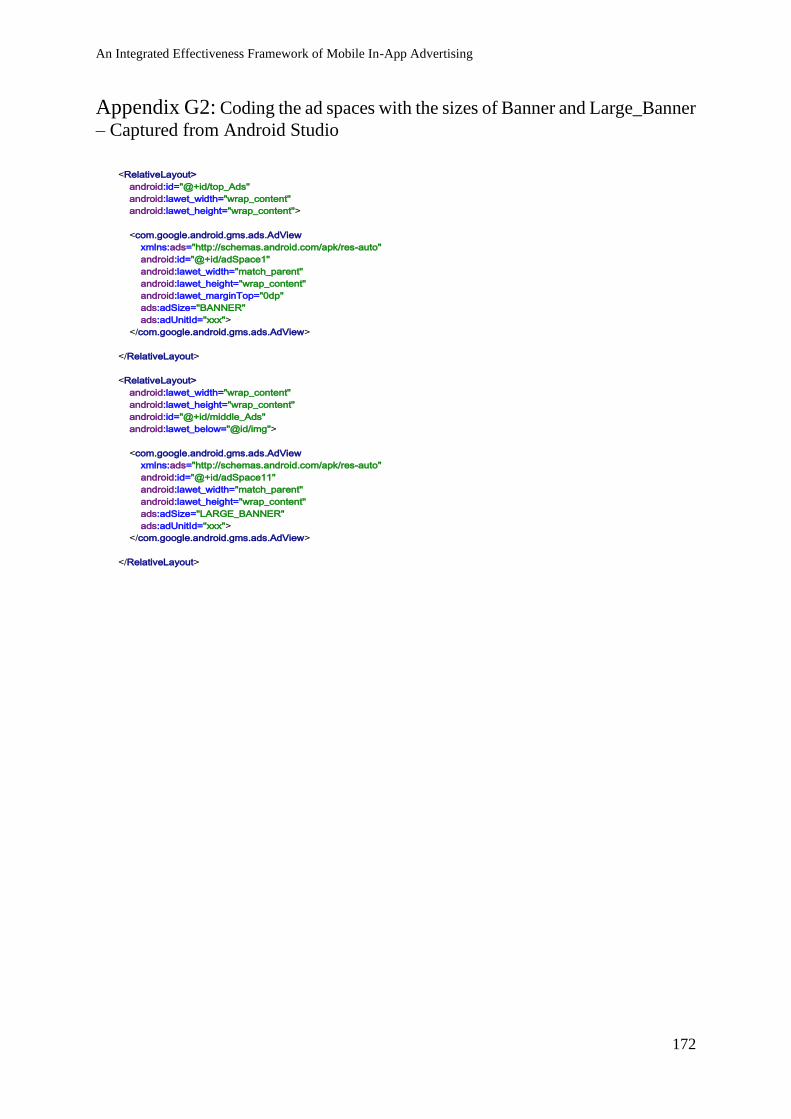
An Integrated Effectiveness Framework of Mobile In-App Advertising
172
Appendix G2: Coding the ad spaces with the sizes of Banner and Large_Banner
– Captured from Android Studio
<RelativeLayout> android:id="@+id/top_Ads" android:lawet_width="wrap_content" android:lawet_height="wrap_content"> <com.google.android.gms.ads.AdView xmlns:ads="http://schemas.android.com/apk/res-auto" android:id="@+id/adSpace1" android:lawet_width="match_parent" android:lawet_height="wrap_content" android:lawet_marginTop="0dp" ads:adSize="BANNER" ads:adUnitId="xxx"> </com.google.android.gms.ads.AdView> </RelativeLayout> <RelativeLayout> android:lawet_width="wrap_content" android:lawet_height="wrap_content" android:id="@+id/middle_Ads" android:lawet_below="@id/img"> <com.google.android.gms.ads.AdView xmlns:ads="http://schemas.android.com/apk/res-auto" android:id="@+id/adSpace11" android:lawet_width="match_parent" android:lawet_height="wrap_content" ads:adSize="LARGE_BANNER" ads:adUnitId="xxx"> </com.google.android.gms.ads.AdView> </RelativeLayout>
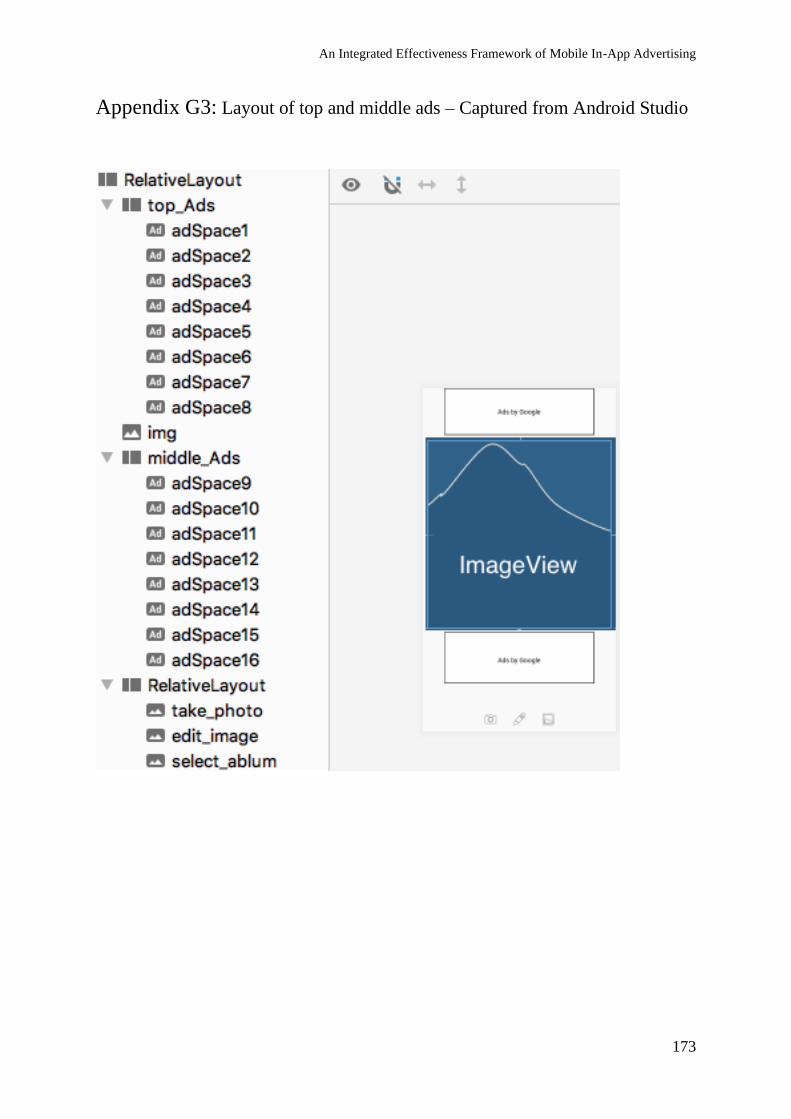
An Integrated Effectiveness Framework of Mobile In-App Advertising
173
Appendix G3: Layout of top and middle ads – Captured from Android Studio
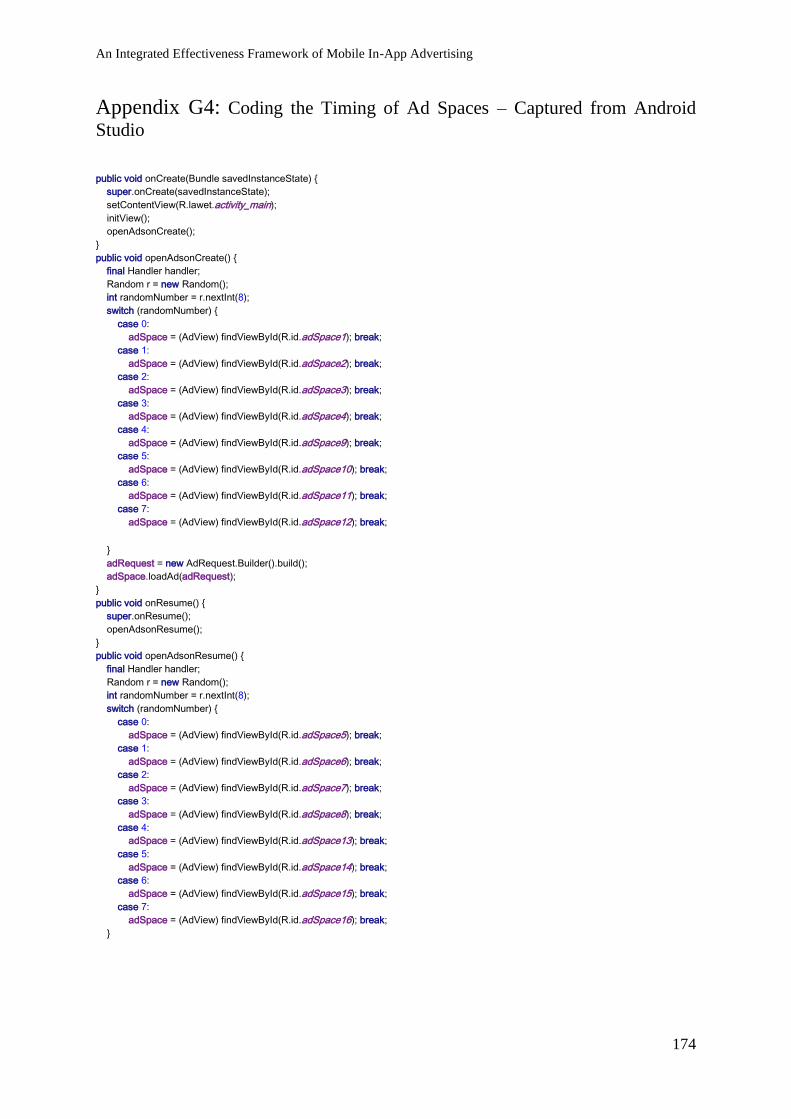
An Integrated Effectiveness Framework of Mobile In-App Advertising
174
Appendix G4: Coding the Timing of Ad Spaces – Captured from Android
Studio
public void onCreate(Bundle savedInstanceState) { super.onCreate(savedInstanceState); setContentView(R.lawet.activity_main); initView(); openAdsonCreate(); } public void openAdsonCreate() { final Handler handler; Random r = new Random(); int randomNumber = r.nextInt(8); switch (randomNumber) { case 0: adSpace = (AdView) findViewById(R.id.adSpace1); break; case 1: adSpace = (AdView) findViewById(R.id.adSpace2); break; case 2: adSpace = (AdView) findViewById(R.id.adSpace3); break; case 3: adSpace = (AdView) findViewById(R.id.adSpace4); break; case 4: adSpace = (AdView) findViewById(R.id.adSpace9); break; case 5: adSpace = (AdView) findViewById(R.id.adSpace10); break; case 6: adSpace = (AdView) findViewById(R.id.adSpace11); break; case 7: adSpace = (AdView) findViewById(R.id.adSpace12); break;
} adRequest = new AdRequest.Builder().build(); adSpace.loadAd(adRequest); } public void onResume() { super.onResume(); openAdsonResume(); } public void openAdsonResume() { final Handler handler; Random r = new Random(); int randomNumber = r.nextInt(8); switch (randomNumber) { case 0: adSpace = (AdView) findViewById(R.id.adSpace5); break; case 1: adSpace = (AdView) findViewById(R.id.adSpace6); break; case 2: adSpace = (AdView) findViewById(R.id.adSpace7); break; case 3: adSpace = (AdView) findViewById(R.id.adSpace8); break; case 4: adSpace = (AdView) findViewById(R.id.adSpace13); break; case 5: adSpace = (AdView) findViewById(R.id.adSpace14); break; case 6: adSpace = (AdView) findViewById(R.id.adSpace15); break; case 7: adSpace = (AdView) findViewById(R.id.adSpace16); break; }
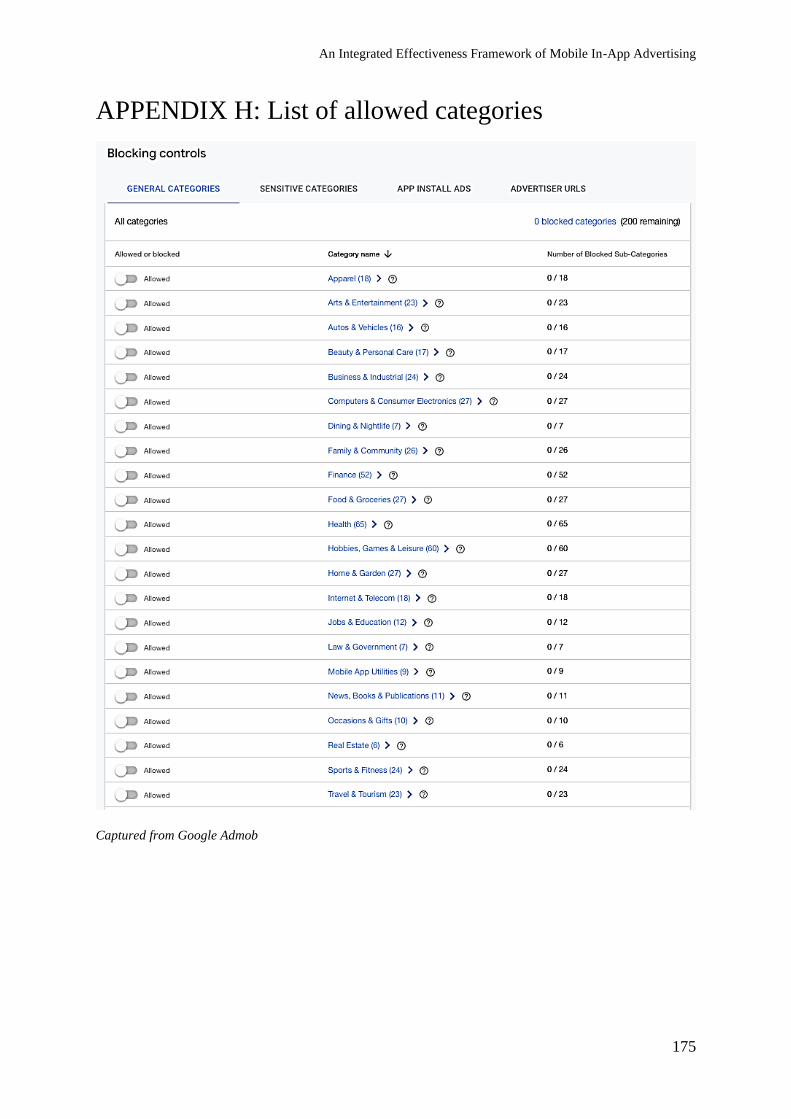
An Integrated Effectiveness Framework of Mobile In-App Advertising
175
APPENDIX H: List of allowed categories
Captured from Google Admob
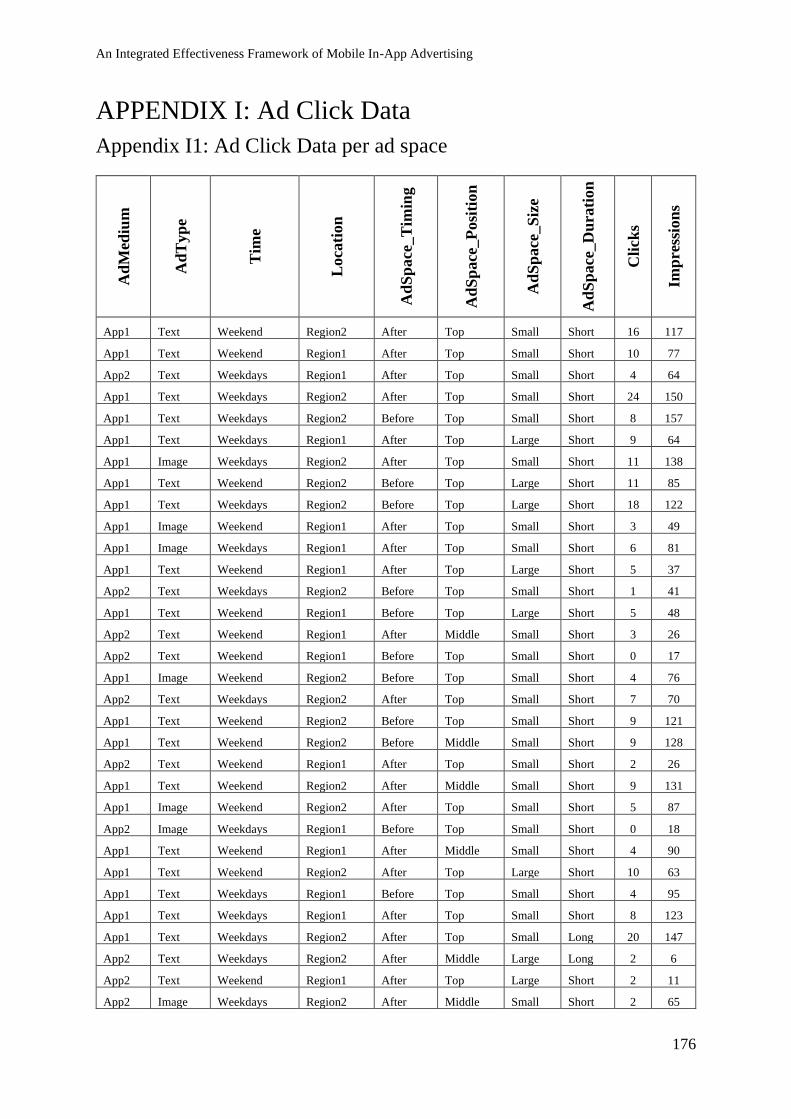
An Integrated Effectiveness Framework of Mobile In-App Advertising
176
APPENDIX I: Ad Click Data
Appendix I1: Ad Click Data per ad space
Ad
Med
ium
Ad
Typ
e
Tim
e
Loca
tion
Ad
Sp
ace
_T
imin
g
Ad
Sp
ace
_P
osi
tion
Ad
Sp
ace
_S
ize
Ad
Sp
ace
_D
ura
tion
Cli
cks
Imp
ress
ion
s
App1 Text Weekend Region2 After Top Small Short 16 117
App1 Text Weekend Region1 After Top Small Short 10 77
App2 Text Weekdays Region1 After Top Small Short 4 64
App1 Text Weekdays Region2 After Top Small Short 24 150
App1 Text Weekdays Region2 Before Top Small Short 8 157
App1 Text Weekdays Region1 After Top Large Short 9 64
App1 Image Weekdays Region2 After Top Small Short 11 138
App1 Text Weekend Region2 Before Top Large Short 11 85
App1 Text Weekdays Region2 Before Top Large Short 18 122
App1 Image Weekend Region1 After Top Small Short 3 49
App1 Image Weekdays Region1 After Top Small Short 6 81
App1 Text Weekend Region1 After Top Large Short 5 37
App2 Text Weekdays Region2 Before Top Small Short 1 41
App1 Text Weekend Region1 Before Top Large Short 5 48
App2 Text Weekend Region1 After Middle Small Short 3 26
App2 Text Weekend Region1 Before Top Small Short 0 17
App1 Image Weekend Region2 Before Top Small Short 4 76
App2 Text Weekdays Region2 After Top Small Short 7 70
App1 Text Weekend Region2 Before Top Small Short 9 121
App1 Text Weekend Region2 Before Middle Small Short 9 128
App2 Text Weekend Region1 After Top Small Short 2 26
App1 Text Weekend Region2 After Middle Small Short 9 131
App1 Image Weekend Region2 After Top Small Short 5 87
App2 Image Weekdays Region1 Before Top Small Short 0 18
App1 Text Weekend Region1 After Middle Small Short 4 90
App1 Text Weekend Region2 After Top Large Short 10 63
App1 Text Weekdays Region1 Before Top Small Short 4 95
App1 Text Weekdays Region1 After Top Small Short 8 123
App1 Text Weekdays Region2 After Top Small Long 20 147
App2 Text Weekdays Region2 After Middle Large Long 2 6
App2 Text Weekend Region1 After Top Large Short 2 11
App2 Image Weekdays Region2 After Middle Small Short 2 65
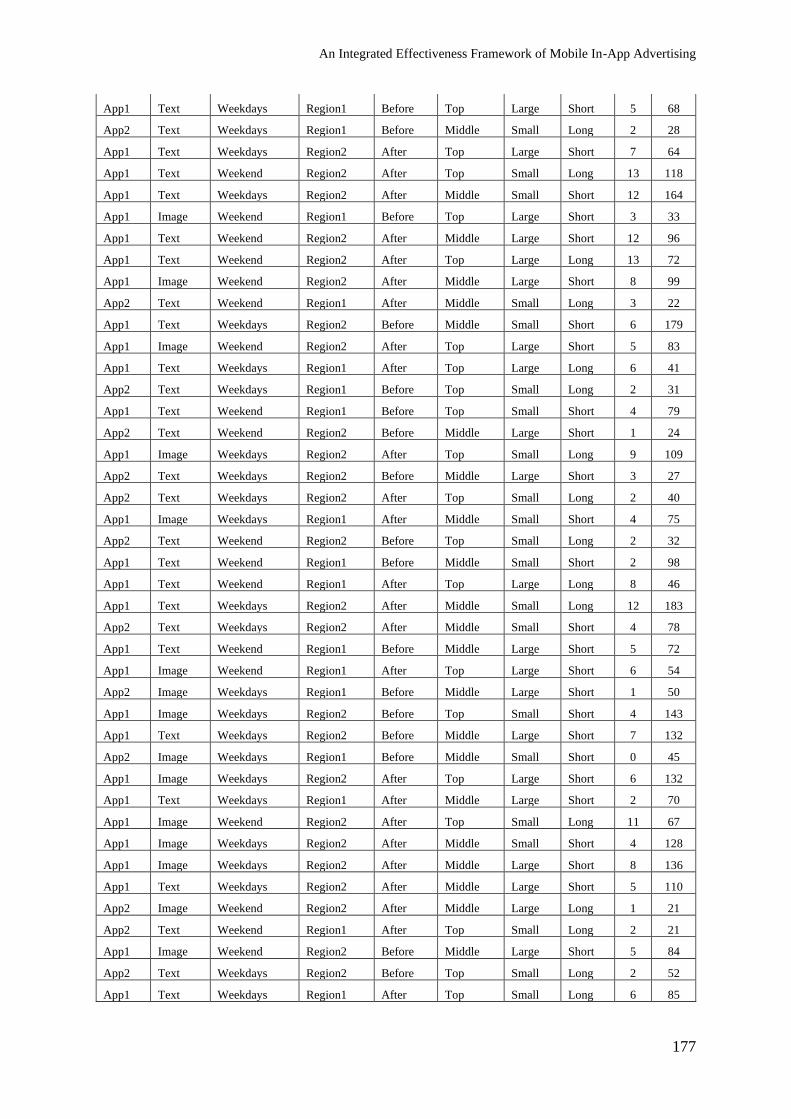
An Integrated Effectiveness Framework of Mobile In-App Advertising
177
App1 Text Weekdays Region1 Before Top Large Short 5 68
App2 Text Weekdays Region1 Before Middle Small Long 2 28
App1 Text Weekdays Region2 After Top Large Short 7 64
App1 Text Weekend Region2 After Top Small Long 13 118
App1 Text Weekdays Region2 After Middle Small Short 12 164
App1 Image Weekend Region1 Before Top Large Short 3 33
App1 Text Weekend Region2 After Middle Large Short 12 96
App1 Text Weekend Region2 After Top Large Long 13 72
App1 Image Weekend Region2 After Middle Large Short 8 99
App2 Text Weekend Region1 After Middle Small Long 3 22
App1 Text Weekdays Region2 Before Middle Small Short 6 179
App1 Image Weekend Region2 After Top Large Short 5 83
App1 Text Weekdays Region1 After Top Large Long 6 41
App2 Text Weekdays Region1 Before Top Small Long 2 31
App1 Text Weekend Region1 Before Top Small Short 4 79
App2 Text Weekend Region2 Before Middle Large Short 1 24
App1 Image Weekdays Region2 After Top Small Long 9 109
App2 Text Weekdays Region2 Before Middle Large Short 3 27
App2 Text Weekdays Region2 After Top Small Long 2 40
App1 Image Weekdays Region1 After Middle Small Short 4 75
App2 Text Weekend Region2 Before Top Small Long 2 32
App1 Text Weekend Region1 Before Middle Small Short 2 98
App1 Text Weekend Region1 After Top Large Long 8 46
App1 Text Weekdays Region2 After Middle Small Long 12 183
App2 Text Weekdays Region2 After Middle Small Short 4 78
App1 Text Weekend Region1 Before Middle Large Short 5 72
App1 Image Weekend Region1 After Top Large Short 6 54
App2 Image Weekdays Region1 Before Middle Large Short 1 50
App1 Image Weekdays Region2 Before Top Small Short 4 143
App1 Text Weekdays Region2 Before Middle Large Short 7 132
App2 Image Weekdays Region1 Before Middle Small Short 0 45
App1 Image Weekdays Region2 After Top Large Short 6 132
App1 Text Weekdays Region1 After Middle Large Short 2 70
App1 Image Weekend Region2 After Top Small Long 11 67
App1 Image Weekdays Region2 After Middle Small Short 4 128
App1 Image Weekdays Region2 After Middle Large Short 8 136
App1 Text Weekdays Region2 After Middle Large Short 5 110
App2 Image Weekend Region2 After Middle Large Long 1 21
App2 Text Weekend Region1 After Top Small Long 2 21
App1 Image Weekend Region2 Before Middle Large Short 5 84
App2 Text Weekdays Region2 Before Top Small Long 2 52
App1 Text Weekdays Region1 After Top Small Long 6 85
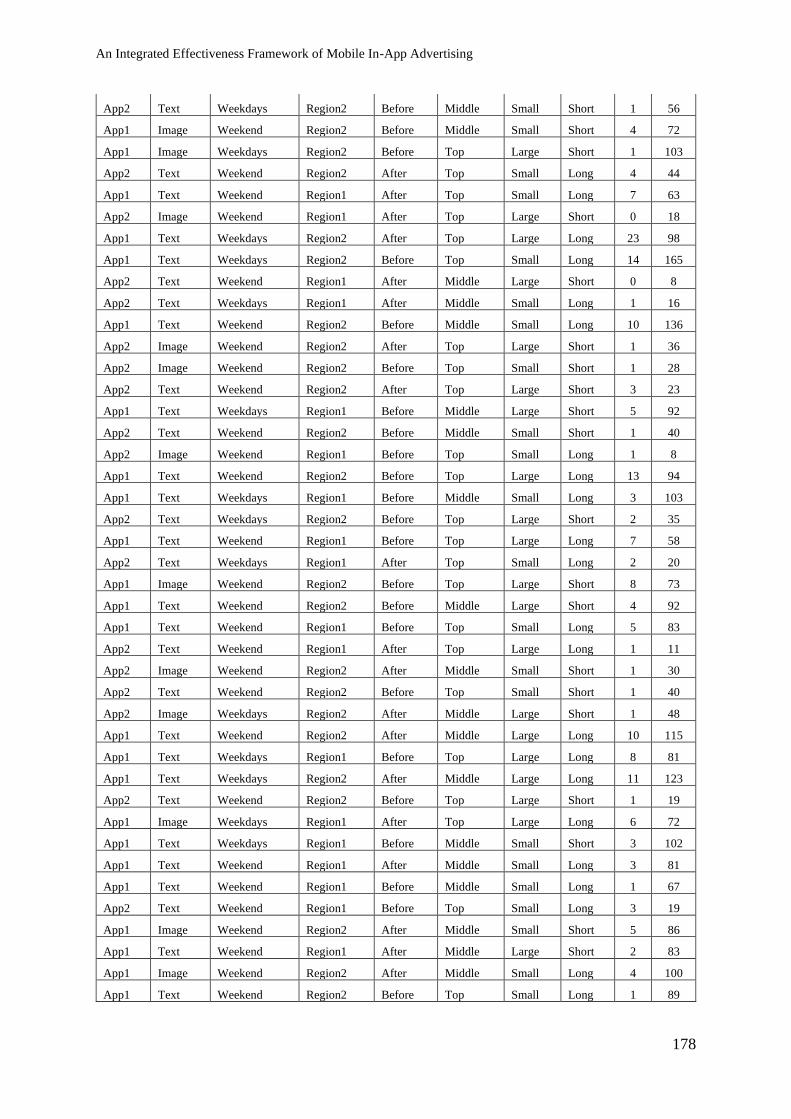
An Integrated Effectiveness Framework of Mobile In-App Advertising
178
App2 Text Weekdays Region2 Before Middle Small Short 1 56
App1 Image Weekend Region2 Before Middle Small Short 4 72
App1 Image Weekdays Region2 Before Top Large Short 1 103
App2 Text Weekend Region2 After Top Small Long 4 44
App1 Text Weekend Region1 After Top Small Long 7 63
App2 Image Weekend Region1 After Top Large Short 0 18
App1 Text Weekdays Region2 After Top Large Long 23 98
App1 Text Weekdays Region2 Before Top Small Long 14 165
App2 Text Weekend Region1 After Middle Large Short 0 8
App2 Text Weekdays Region1 After Middle Small Long 1 16
App1 Text Weekend Region2 Before Middle Small Long 10 136
App2 Image Weekend Region2 After Top Large Short 1 36
App2 Image Weekend Region2 Before Top Small Short 1 28
App2 Text Weekend Region2 After Top Large Short 3 23
App1 Text Weekdays Region1 Before Middle Large Short 5 92
App2 Text Weekend Region2 Before Middle Small Short 1 40
App2 Image Weekend Region1 Before Top Small Long 1 8
App1 Text Weekend Region2 Before Top Large Long 13 94
App1 Text Weekdays Region1 Before Middle Small Long 3 103
App2 Text Weekdays Region2 Before Top Large Short 2 35
App1 Text Weekend Region1 Before Top Large Long 7 58
App2 Text Weekdays Region1 After Top Small Long 2 20
App1 Image Weekend Region2 Before Top Large Short 8 73
App1 Text Weekend Region2 Before Middle Large Short 4 92
App1 Text Weekend Region1 Before Top Small Long 5 83
App2 Text Weekend Region1 After Top Large Long 1 11
App2 Image Weekend Region2 After Middle Small Short 1 30
App2 Text Weekend Region2 Before Top Small Short 1 40
App2 Image Weekdays Region2 After Middle Large Short 1 48
App1 Text Weekend Region2 After Middle Large Long 10 115
App1 Text Weekdays Region1 Before Top Large Long 8 81
App1 Text Weekdays Region2 After Middle Large Long 11 123
App2 Text Weekend Region2 Before Top Large Short 1 19
App1 Image Weekdays Region1 After Top Large Long 6 72
App1 Text Weekdays Region1 Before Middle Small Short 3 102
App1 Text Weekend Region1 After Middle Small Long 3 81
App1 Text Weekend Region1 Before Middle Small Long 1 67
App2 Text Weekend Region1 Before Top Small Long 3 19
App1 Image Weekend Region2 After Middle Small Short 5 86
App1 Text Weekend Region1 After Middle Large Short 2 83
App1 Image Weekend Region2 After Middle Small Long 4 100
App1 Text Weekend Region2 Before Top Small Long 1 89
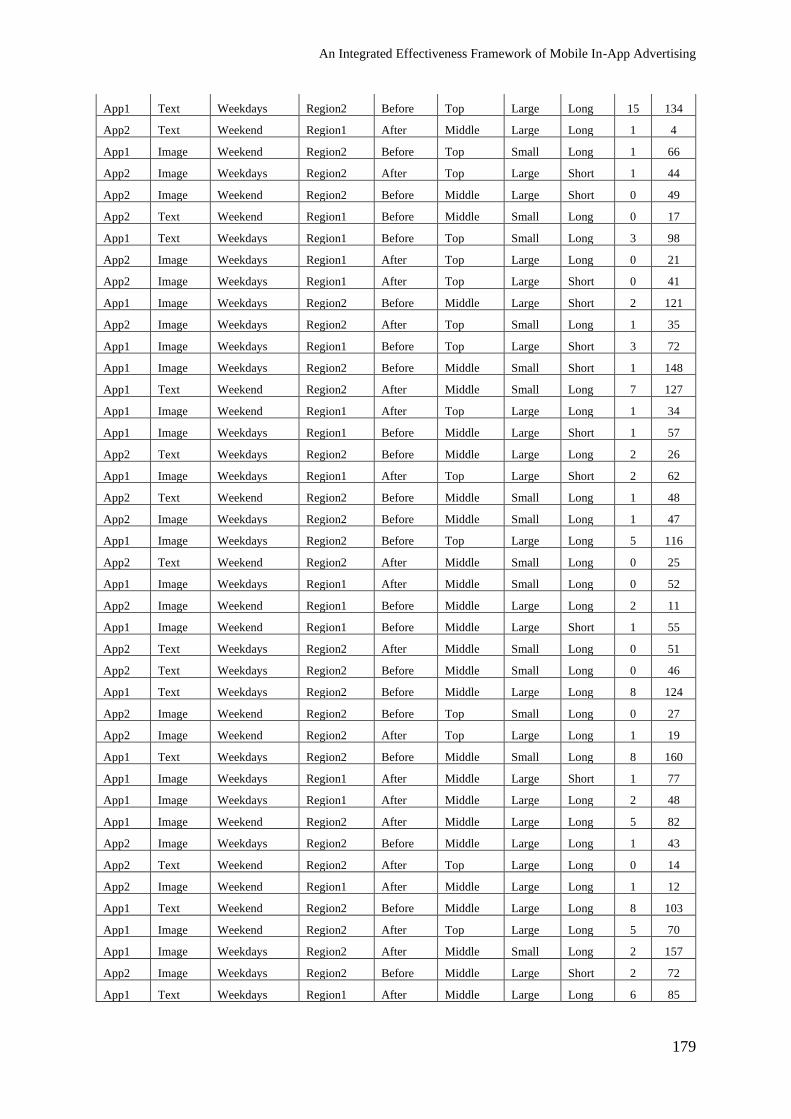
An Integrated Effectiveness Framework of Mobile In-App Advertising
179
App1 Text Weekdays Region2 Before Top Large Long 15 134
App2 Text Weekend Region1 After Middle Large Long 1 4
App1 Image Weekend Region2 Before Top Small Long 1 66
App2 Image Weekdays Region2 After Top Large Short 1 44
App2 Image Weekend Region2 Before Middle Large Short 0 49
App2 Text Weekend Region1 Before Middle Small Long 0 17
App1 Text Weekdays Region1 Before Top Small Long 3 98
App2 Image Weekdays Region1 After Top Large Long 0 21
App2 Image Weekdays Region1 After Top Large Short 0 41
App1 Image Weekdays Region2 Before Middle Large Short 2 121
App2 Image Weekdays Region2 After Top Small Long 1 35
App1 Image Weekdays Region1 Before Top Large Short 3 72
App1 Image Weekdays Region2 Before Middle Small Short 1 148
App1 Text Weekend Region2 After Middle Small Long 7 127
App1 Image Weekend Region1 After Top Large Long 1 34
App1 Image Weekdays Region1 Before Middle Large Short 1 57
App2 Text Weekdays Region2 Before Middle Large Long 2 26
App1 Image Weekdays Region1 After Top Large Short 2 62
App2 Text Weekend Region2 Before Middle Small Long 1 48
App2 Image Weekdays Region2 Before Middle Small Long 1 47
App1 Image Weekdays Region2 Before Top Large Long 5 116
App2 Text Weekend Region2 After Middle Small Long 0 25
App1 Image Weekdays Region1 After Middle Small Long 0 52
App2 Image Weekend Region1 Before Middle Large Long 2 11
App1 Image Weekend Region1 Before Middle Large Short 1 55
App2 Text Weekdays Region2 After Middle Small Long 0 51
App2 Text Weekdays Region2 Before Middle Small Long 0 46
App1 Text Weekdays Region2 Before Middle Large Long 8 124
App2 Image Weekend Region2 Before Top Small Long 0 27
App2 Image Weekend Region2 After Top Large Long 1 19
App1 Text Weekdays Region2 Before Middle Small Long 8 160
App1 Image Weekdays Region1 After Middle Large Short 1 77
App1 Image Weekdays Region1 After Middle Large Long 2 48
App1 Image Weekend Region2 After Middle Large Long 5 82
App2 Image Weekdays Region2 Before Middle Large Long 1 43
App2 Text Weekend Region2 After Top Large Long 0 14
App2 Image Weekend Region1 After Middle Large Long 1 12
App1 Text Weekend Region2 Before Middle Large Long 8 103
App1 Image Weekend Region2 After Top Large Long 5 70
App1 Image Weekdays Region2 After Middle Small Long 2 157
App2 Image Weekdays Region2 Before Middle Large Short 2 72
App1 Text Weekdays Region1 After Middle Large Long 6 85
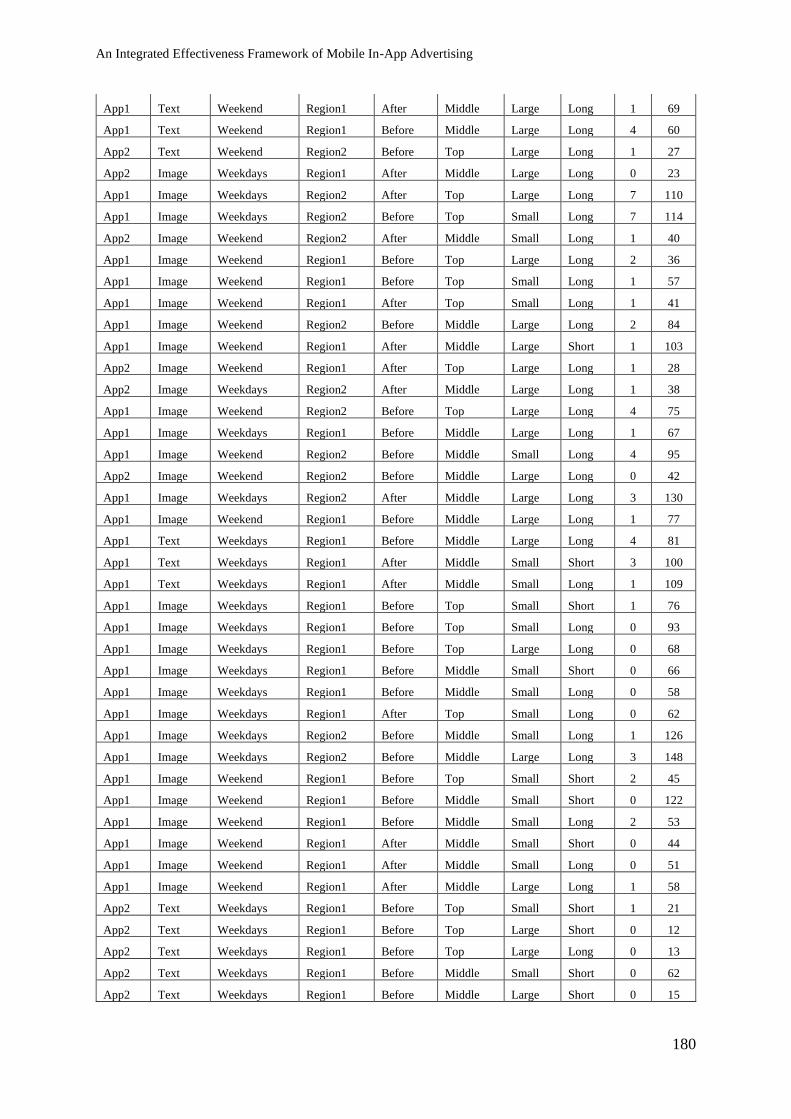
An Integrated Effectiveness Framework of Mobile In-App Advertising
180
App1 Text Weekend Region1 After Middle Large Long 1 69
App1 Text Weekend Region1 Before Middle Large Long 4 60
App2 Text Weekend Region2 Before Top Large Long 1 27
App2 Image Weekdays Region1 After Middle Large Long 0 23
App1 Image Weekdays Region2 After Top Large Long 7 110
App1 Image Weekdays Region2 Before Top Small Long 7 114
App2 Image Weekend Region2 After Middle Small Long 1 40
App1 Image Weekend Region1 Before Top Large Long 2 36
App1 Image Weekend Region1 Before Top Small Long 1 57
App1 Image Weekend Region1 After Top Small Long 1 41
App1 Image Weekend Region2 Before Middle Large Long 2 84
App1 Image Weekend Region1 After Middle Large Short 1 103
App2 Image Weekend Region1 After Top Large Long 1 28
App2 Image Weekdays Region2 After Middle Large Long 1 38
App1 Image Weekend Region2 Before Top Large Long 4 75
App1 Image Weekdays Region1 Before Middle Large Long 1 67
App1 Image Weekend Region2 Before Middle Small Long 4 95
App2 Image Weekend Region2 Before Middle Large Long 0 42
App1 Image Weekdays Region2 After Middle Large Long 3 130
App1 Image Weekend Region1 Before Middle Large Long 1 77
App1 Text Weekdays Region1 Before Middle Large Long 4 81
App1 Text Weekdays Region1 After Middle Small Short 3 100
App1 Text Weekdays Region1 After Middle Small Long 1 109
App1 Image Weekdays Region1 Before Top Small Short 1 76
App1 Image Weekdays Region1 Before Top Small Long 0 93
App1 Image Weekdays Region1 Before Top Large Long 0 68
App1 Image Weekdays Region1 Before Middle Small Short 0 66
App1 Image Weekdays Region1 Before Middle Small Long 0 58
App1 Image Weekdays Region1 After Top Small Long 0 62
App1 Image Weekdays Region2 Before Middle Small Long 1 126
App1 Image Weekdays Region2 Before Middle Large Long 3 148
App1 Image Weekend Region1 Before Top Small Short 2 45
App1 Image Weekend Region1 Before Middle Small Short 0 122
App1 Image Weekend Region1 Before Middle Small Long 2 53
App1 Image Weekend Region1 After Middle Small Short 0 44
App1 Image Weekend Region1 After Middle Small Long 0 51
App1 Image Weekend Region1 After Middle Large Long 1 58
App2 Text Weekdays Region1 Before Top Small Short 1 21
App2 Text Weekdays Region1 Before Top Large Short 0 12
App2 Text Weekdays Region1 Before Top Large Long 0 13
App2 Text Weekdays Region1 Before Middle Small Short 0 62
App2 Text Weekdays Region1 Before Middle Large Short 0 15
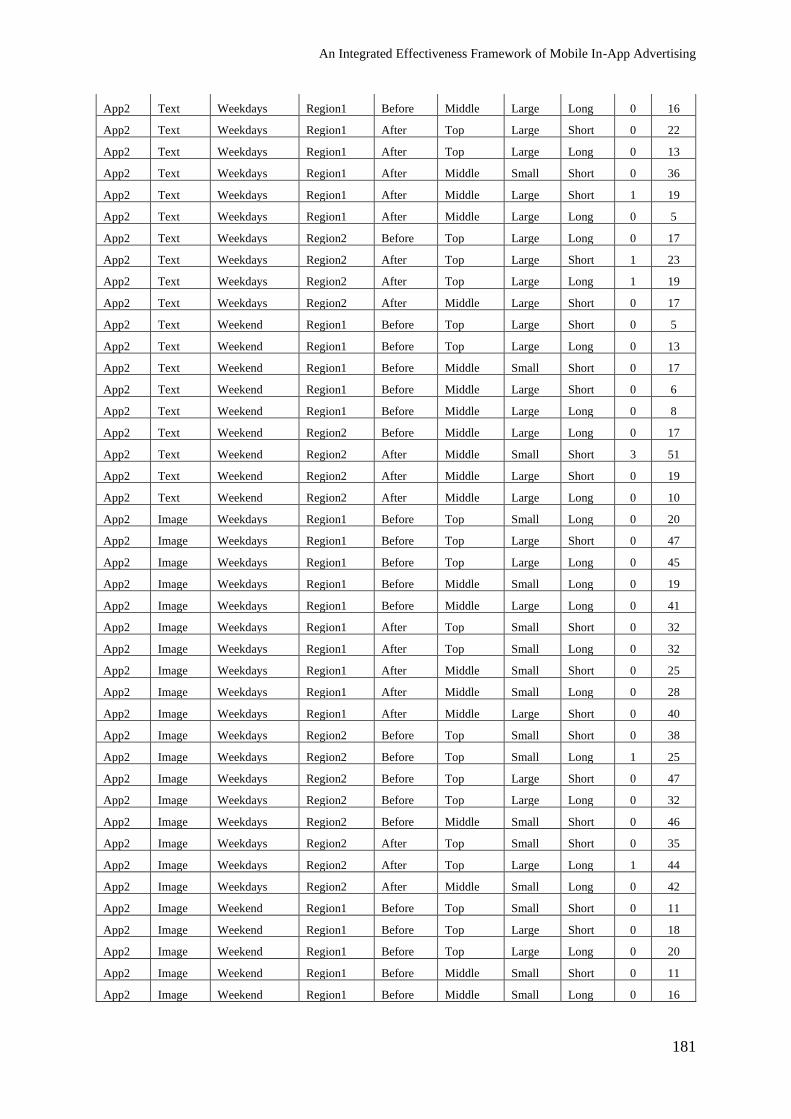
An Integrated Effectiveness Framework of Mobile In-App Advertising
181
App2 Text Weekdays Region1 Before Middle Large Long 0 16
App2 Text Weekdays Region1 After Top Large Short 0 22
App2 Text Weekdays Region1 After Top Large Long 0 13
App2 Text Weekdays Region1 After Middle Small Short 0 36
App2 Text Weekdays Region1 After Middle Large Short 1 19
App2 Text Weekdays Region1 After Middle Large Long 0 5
App2 Text Weekdays Region2 Before Top Large Long 0 17
App2 Text Weekdays Region2 After Top Large Short 1 23
App2 Text Weekdays Region2 After Top Large Long 1 19
App2 Text Weekdays Region2 After Middle Large Short 0 17
App2 Text Weekend Region1 Before Top Large Short 0 5
App2 Text Weekend Region1 Before Top Large Long 0 13
App2 Text Weekend Region1 Before Middle Small Short 0 17
App2 Text Weekend Region1 Before Middle Large Short 0 6
App2 Text Weekend Region1 Before Middle Large Long 0 8
App2 Text Weekend Region2 Before Middle Large Long 0 17
App2 Text Weekend Region2 After Middle Small Short 3 51
App2 Text Weekend Region2 After Middle Large Short 0 19
App2 Text Weekend Region2 After Middle Large Long 0 10
App2 Image Weekdays Region1 Before Top Small Long 0 20
App2 Image Weekdays Region1 Before Top Large Short 0 47
App2 Image Weekdays Region1 Before Top Large Long 0 45
App2 Image Weekdays Region1 Before Middle Small Long 0 19
App2 Image Weekdays Region1 Before Middle Large Long 0 41
App2 Image Weekdays Region1 After Top Small Short 0 32
App2 Image Weekdays Region1 After Top Small Long 0 32
App2 Image Weekdays Region1 After Middle Small Short 0 25
App2 Image Weekdays Region1 After Middle Small Long 0 28
App2 Image Weekdays Region1 After Middle Large Short 0 40
App2 Image Weekdays Region2 Before Top Small Short 0 38
App2 Image Weekdays Region2 Before Top Small Long 1 25
App2 Image Weekdays Region2 Before Top Large Short 0 47
App2 Image Weekdays Region2 Before Top Large Long 0 32
App2 Image Weekdays Region2 Before Middle Small Short 0 46
App2 Image Weekdays Region2 After Top Small Short 0 35
App2 Image Weekdays Region2 After Top Large Long 1 44
App2 Image Weekdays Region2 After Middle Small Long 0 42
App2 Image Weekend Region1 Before Top Small Short 0 11
App2 Image Weekend Region1 Before Top Large Short 0 18
App2 Image Weekend Region1 Before Top Large Long 0 20
App2 Image Weekend Region1 Before Middle Small Short 0 11
App2 Image Weekend Region1 Before Middle Small Long 0 16
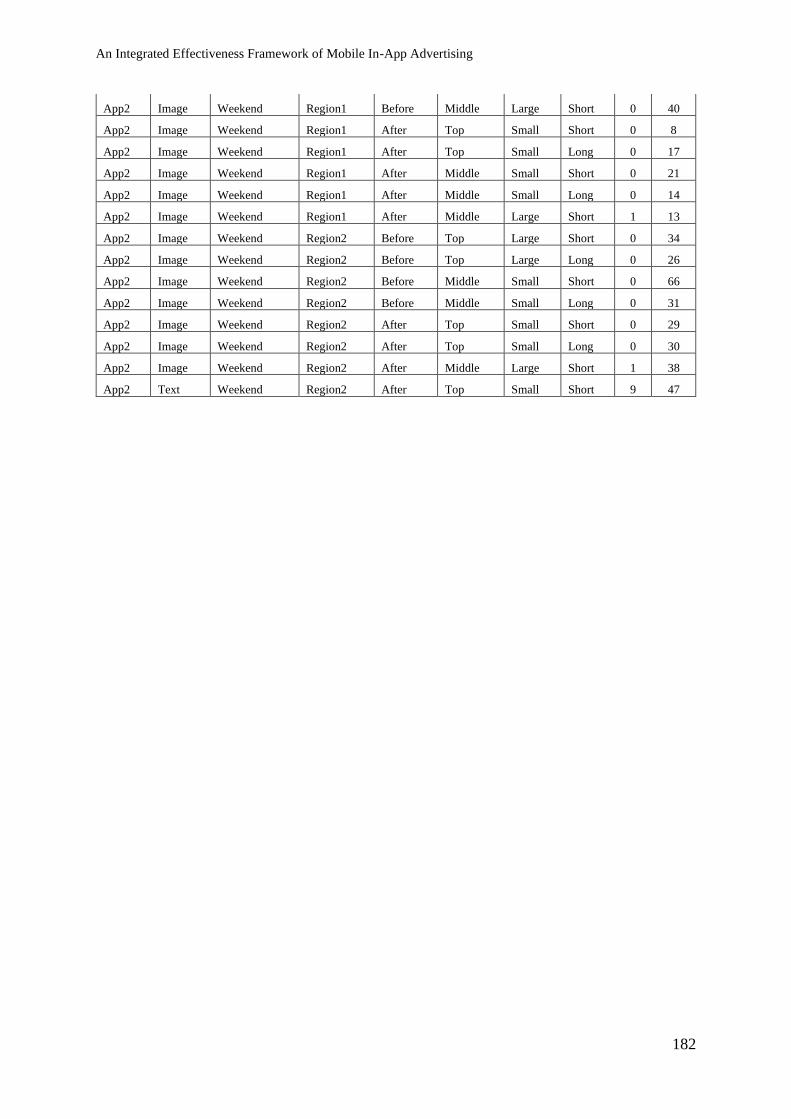
An Integrated Effectiveness Framework of Mobile In-App Advertising
182
App2 Image Weekend Region1 Before Middle Large Short 0 40
App2 Image Weekend Region1 After Top Small Short 0 8
App2 Image Weekend Region1 After Top Small Long 0 17
App2 Image Weekend Region1 After Middle Small Short 0 21
App2 Image Weekend Region1 After Middle Small Long 0 14
App2 Image Weekend Region1 After Middle Large Short 1 13
App2 Image Weekend Region2 Before Top Large Short 0 34
App2 Image Weekend Region2 Before Top Large Long 0 26
App2 Image Weekend Region2 Before Middle Small Short 0 66
App2 Image Weekend Region2 Before Middle Small Long 0 31
App2 Image Weekend Region2 After Top Small Short 0 29
App2 Image Weekend Region2 After Top Small Long 0 30
App2 Image Weekend Region2 After Middle Large Short 1 38
App2 Text Weekend Region2 After Top Small Short 9 47
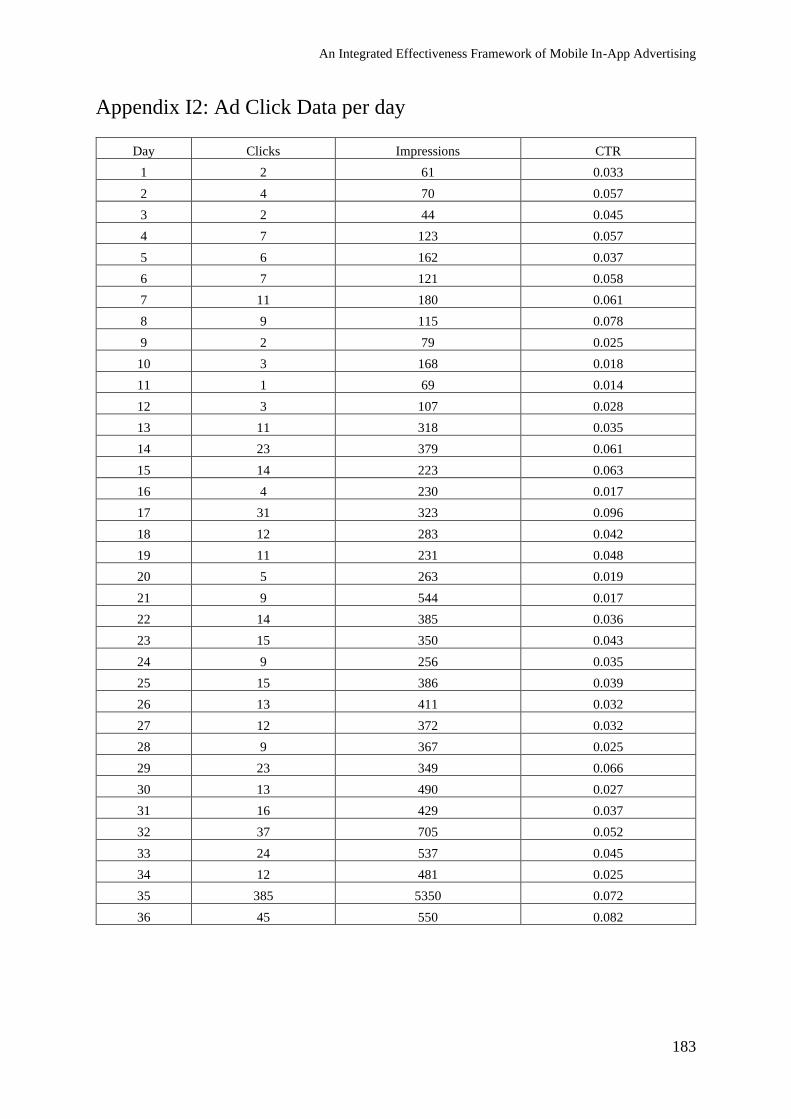
An Integrated Effectiveness Framework of Mobile In-App Advertising
183
Appendix I2: Ad Click Data per day
Day Clicks Impressions CTR
1 2 61 0.033
2 4 70 0.057
3 2 44 0.045
4 7 123 0.057
5 6 162 0.037
6 7 121 0.058
7 11 180 0.061
8 9 115 0.078
9 2 79 0.025
10 3 168 0.018
11 1 69 0.014
12 3 107 0.028
13 11 318 0.035
14 23 379 0.061
15 14 223 0.063
16 4 230 0.017
17 31 323 0.096
18 12 283 0.042
19 11 231 0.048
20 5 263 0.019
21 9 544 0.017
22 14 385 0.036
23 15 350 0.043
24 9 256 0.035
25 15 386 0.039
26 13 411 0.032
27 12 372 0.032
28 9 367 0.025
29 23 349 0.066
30 13 490 0.027
31 16 429 0.037
32 37 705 0.052
33 24 537 0.045
34 12 481 0.025
35 385 5350 0.072
36 45 550 0.082
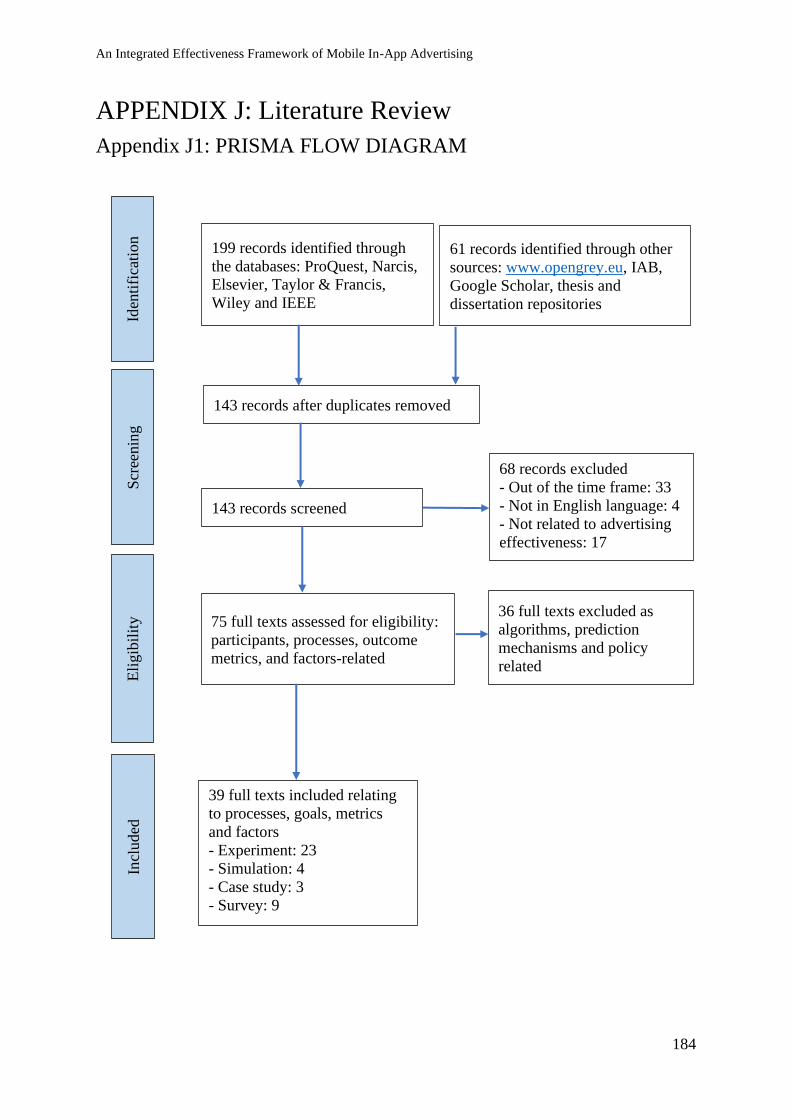
An Integrated Effectiveness Framework of Mobile In-App Advertising
184
APPENDIX J: Literature Review
Appendix J1: PRISMA FLOW DIAGRAM
199 records identified through
the databases: ProQuest, Narcis,
Elsevier, Taylor & Francis,
Wiley and IEEE
61 records identified through other
sources: www.opengrey.eu, IAB,
Google Scholar, thesis and
dissertation repositories
143 records after duplicates removed
143 records screened
75 full texts assessed for eligibility:
participants, processes, outcome
metrics, and factors-related
39 full texts included relating
to processes, goals, metrics
and factors
- Experiment: 23
- Simulation: 4
- Case study: 3
- Survey: 9
Iden
tifi
cati
on
S
cree
nin
g
Eli
gib
ilit
y
Incl
uded
68 records excluded
- Out of the time frame: 33
- Not in English language: 4
- Not related to advertising
effectiveness: 17
36 full texts excluded as
algorithms, prediction
mechanisms and policy
related
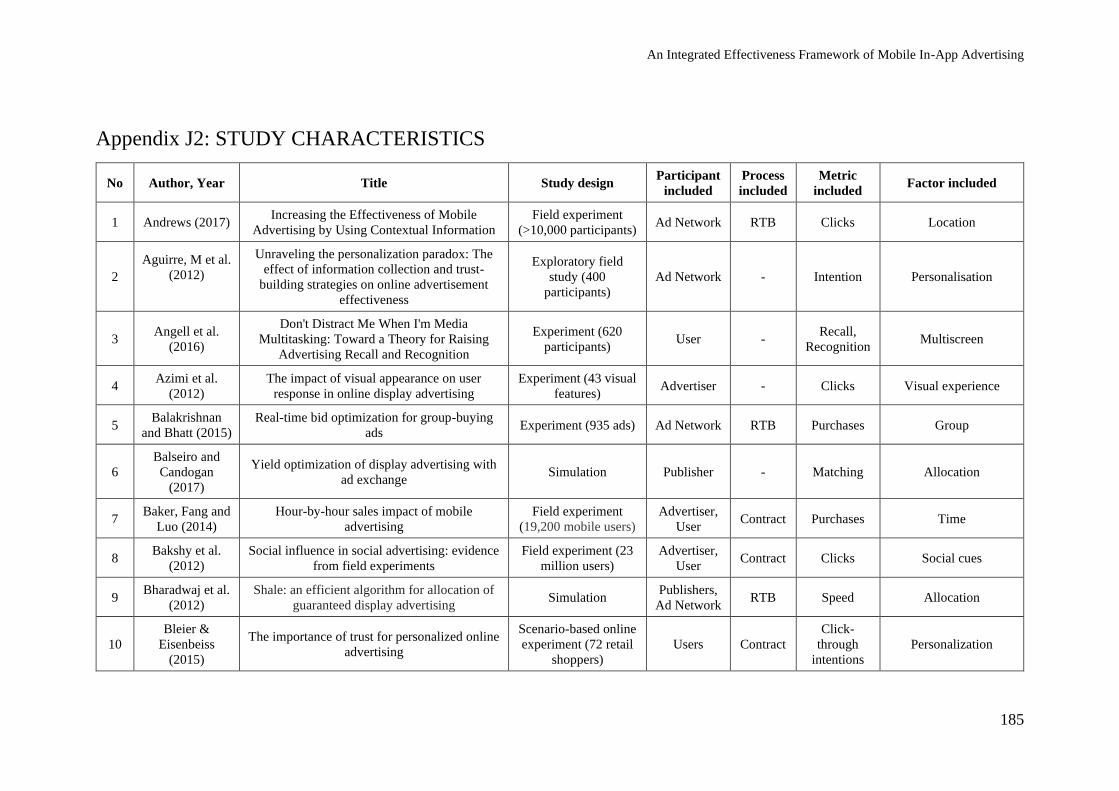
An Integrated Effectiveness Framework of Mobile In-App Advertising
185
Appendix J2: STUDY CHARACTERISTICS
No Author, Year Title Study design Participant
included
Process
included
Metric
included Factor included
1 Andrews (2017) Increasing the Effectiveness of Mobile
Advertising by Using Contextual Information
Field experiment
(>10,000 participants) Ad Network RTB Clicks Location
2
Aguirre, M et al.
(2012)
Unraveling the personalization paradox: The
effect of information collection and trust-
building strategies on online advertisement
effectiveness
Exploratory field
study (400
participants)
Ad Network - Intention Personalisation
3 Angell et al.
(2016)
Don't Distract Me When I'm Media
Multitasking: Toward a Theory for Raising
Advertising Recall and Recognition
Experiment (620
participants) User -
Recall,
Recognition Multiscreen
4 Azimi et al.
(2012)
The impact of visual appearance on user
response in online display advertising
Experiment (43 visual
features) Advertiser - Clicks Visual experience
5 Balakrishnan
and Bhatt (2015)
Real-time bid optimization for group-buying
ads Experiment (935 ads) Ad Network RTB Purchases Group
6
Balseiro and
Candogan
(2017)
Yield optimization of display advertising with
ad exchange Simulation Publisher - Matching Allocation
7 Baker, Fang and
Luo (2014)
Hour-by-hour sales impact of mobile
advertising
Field experiment
(19,200 mobile users)
Advertiser,
User Contract Purchases Time
8 Bakshy et al.
(2012)
Social influence in social advertising: evidence
from field experiments
Field experiment (23
million users)
Advertiser,
User Contract Clicks Social cues
9 Bharadwaj et al.
(2012)
Shale: an efficient algorithm for allocation of
guaranteed display advertising Simulation
Publishers,
Ad Network RTB Speed Allocation
10
Bleier &
Eisenbeiss
(2015)
The importance of trust for personalized online
advertising
Scenario-based online
experiment (72 retail
shoppers)
Users Contract
Click-
through
intentions
Personalization
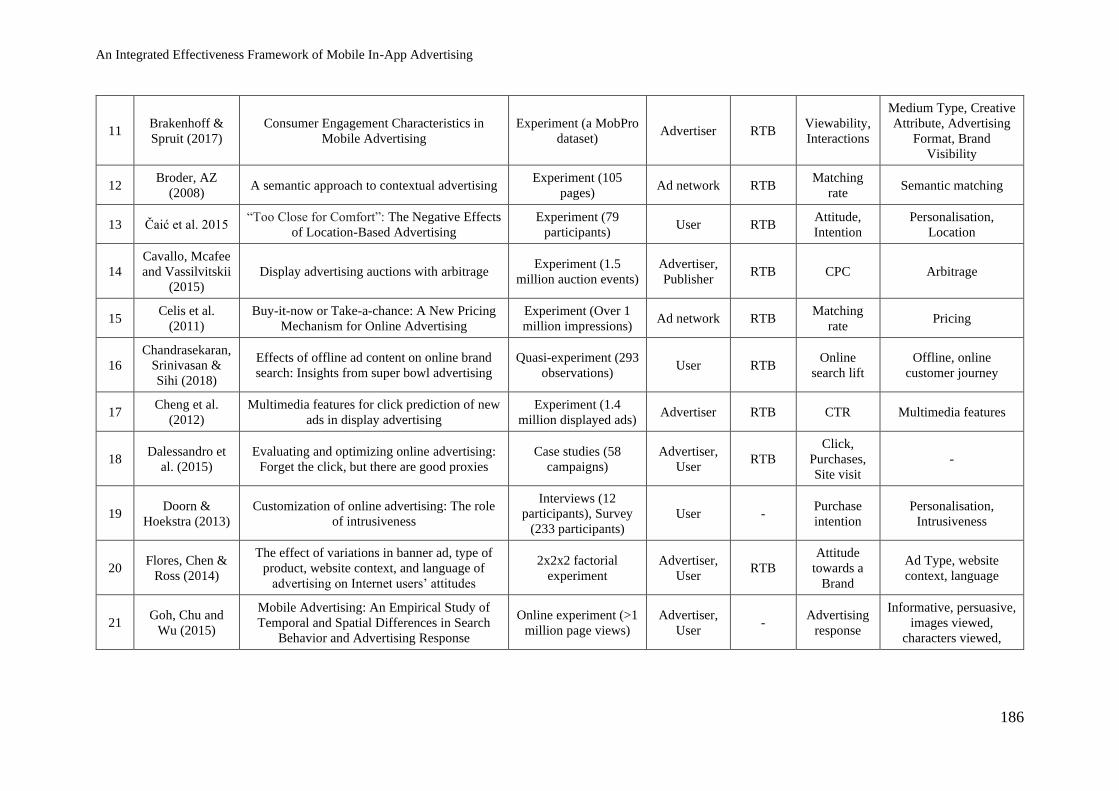
An Integrated Effectiveness Framework of Mobile In-App Advertising
186
11 Brakenhoff &
Spruit (2017)
Consumer Engagement Characteristics in
Mobile Advertising
Experiment (a MobPro
dataset) Advertiser RTB
Viewability,
Interactions
Medium Type, Creative
Attribute, Advertising
Format, Brand
Visibility
12 Broder, AZ
(2008) A semantic approach to contextual advertising
Experiment (105
pages) Ad network RTB
Matching
rate Semantic matching
13 Čaić et al. 2015 “Too Close for Comfort”: The Negative Effects
of Location-Based Advertising
Experiment (79
participants) User RTB
Attitude,
Intention
Personalisation,
Location
14
Cavallo, Mcafee
and Vassilvitskii
(2015)
Display advertising auctions with arbitrage Experiment (1.5
million auction events)
Advertiser,
Publisher RTB CPC Arbitrage
15 Celis et al.
(2011)
Buy-it-now or Take-a-chance: A New Pricing
Mechanism for Online Advertising
Experiment (Over 1
million impressions) Ad network RTB
Matching
rate Pricing
16
Chandrasekaran,
Srinivasan &
Sihi (2018)
Effects of offline ad content on online brand
search: Insights from super bowl advertising
Quasi-experiment (293
observations) User RTB
Online
search lift
Offline, online
customer journey
17 Cheng et al.
(2012)
Multimedia features for click prediction of new
ads in display advertising
Experiment (1.4
million displayed ads) Advertiser RTB CTR Multimedia features
18 Dalessandro et
al. (2015)
Evaluating and optimizing online advertising:
Forget the click, but there are good proxies
Case studies (58
campaigns)
Advertiser,
User RTB
Click,
Purchases,
Site visit
-
19 Doorn &
Hoekstra (2013)
Customization of online advertising: The role
of intrusiveness
Interviews (12
participants), Survey
(233 participants)
User - Purchase
intention
Personalisation,
Intrusiveness
20 Flores, Chen &
Ross (2014)
The effect of variations in banner ad, type of
product, website context, and language of
advertising on Internet users’ attitudes
2x2x2 factorial
experiment
Advertiser,
User RTB
Attitude
towards a
Brand
Ad Type, website
context, language
21 Goh, Chu and
Wu (2015)
Mobile Advertising: An Empirical Study of
Temporal and Spatial Differences in Search
Behavior and Advertising Response
Online experiment (>1
million page views)
Advertiser,
User -
Advertising
response
Informative, persuasive,
images viewed,
characters viewed,
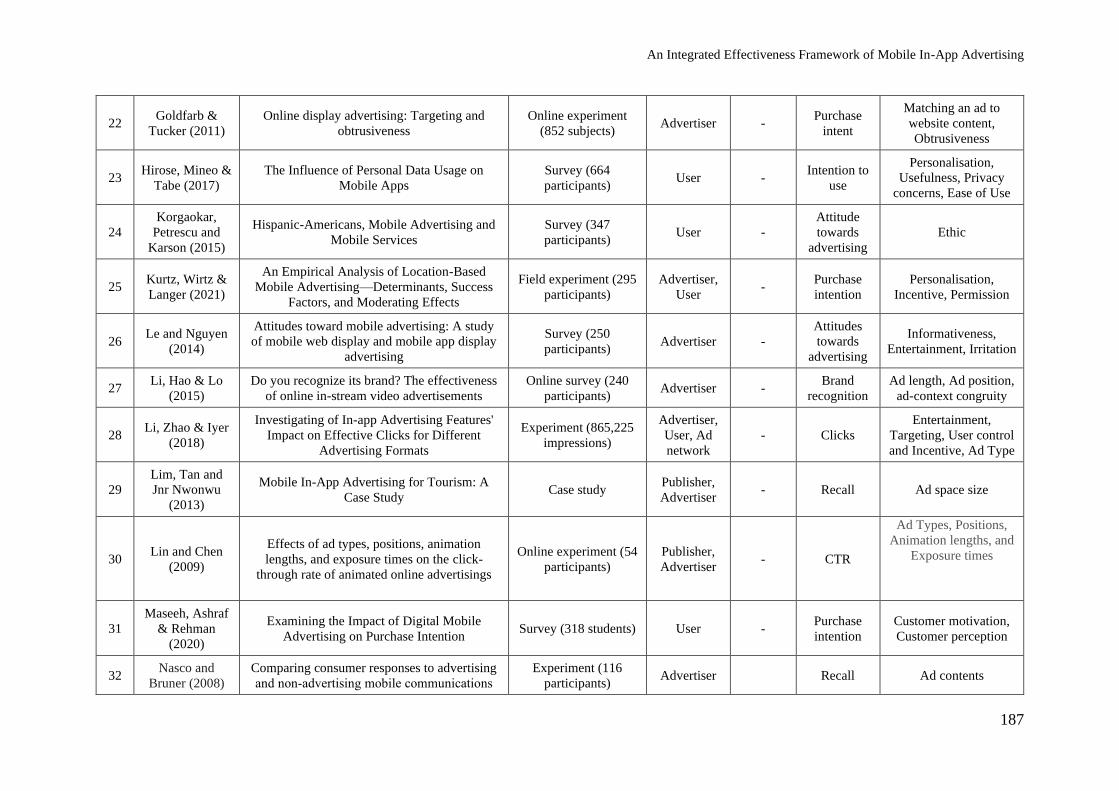
An Integrated Effectiveness Framework of Mobile In-App Advertising
187
22 Goldfarb &
Tucker (2011)
Online display advertising: Targeting and
obtrusiveness
Online experiment
(852 subjects) Advertiser -
Purchase
intent
Matching an ad to
website content,
Obtrusiveness
23 Hirose, Mineo &
Tabe (2017)
The Influence of Personal Data Usage on
Mobile Apps
Survey (664
participants) User -
Intention to
use
Personalisation,
Usefulness, Privacy
concerns, Ease of Use
24
Korgaokar,
Petrescu and
Karson (2015)
Hispanic-Americans, Mobile Advertising and
Mobile Services
Survey (347
participants) User -
Attitude
towards
advertising
Ethic
25 Kurtz, Wirtz &
Langer (2021)
An Empirical Analysis of Location-Based
Mobile Advertising—Determinants, Success
Factors, and Moderating Effects
Field experiment (295
participants)
Advertiser,
User -
Purchase
intention
Personalisation,
Incentive, Permission
26 Le and Nguyen
(2014)
Attitudes toward mobile advertising: A study
of mobile web display and mobile app display
advertising
Survey (250
participants) Advertiser -
Attitudes
towards
advertising
Informativeness,
Entertainment, Irritation
27 Li, Hao & Lo
(2015)
Do you recognize its brand? The effectiveness
of online in-stream video advertisements
Online survey (240
participants) Advertiser -
Brand
recognition
Ad length, Ad position,
ad-context congruity
28 Li, Zhao & Iyer
(2018)
Investigating of In-app Advertising Features'
Impact on Effective Clicks for Different
Advertising Formats
Experiment (865,225
impressions)
Advertiser,
User, Ad
network
- Clicks
Entertainment,
Targeting, User control
and Incentive, Ad Type
29
Lim, Tan and
Jnr Nwonwu
(2013)
Mobile In-App Advertising for Tourism: A
Case Study Case study
Publisher,
Advertiser - Recall Ad space size
30 Lin and Chen
(2009)
Effects of ad types, positions, animation
lengths, and exposure times on the click-
through rate of animated online advertisings
Online experiment (54
participants)
Publisher,
Advertiser - CTR
Ad Types, Positions,
Animation lengths, and
Exposure times
31
Maseeh, Ashraf
& Rehman
(2020)
Examining the Impact of Digital Mobile
Advertising on Purchase Intention Survey (318 students) User -
Purchase
intention
Customer motivation,
Customer perception
32 Nasco and
Bruner (2008)
Comparing consumer responses to advertising
and non‐advertising mobile communications
Experiment (116
participants) Advertiser Recall Ad contents
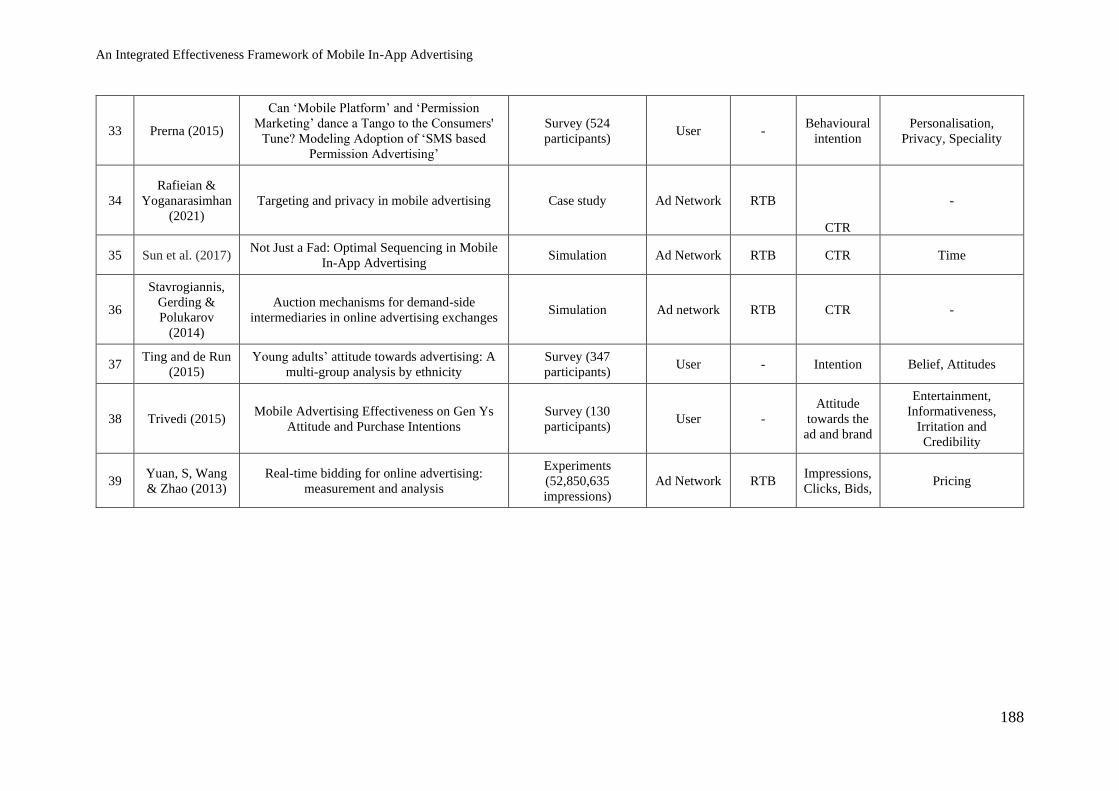
An Integrated Effectiveness Framework of Mobile In-App Advertising
188
33 Prerna (2015)
Can ‘Mobile Platform’ and ‘Permission
Marketing’ dance a Tango to the Consumers'
Tune? Modeling Adoption of ‘SMS based
Permission Advertising’
Survey (524
participants) User -
Behavioural
intention
Personalisation,
Privacy, Speciality
34
Rafieian &
Yoganarasimhan
(2021)
Targeting and privacy in mobile advertising Case study Ad Network RTB
CTR
-
35 Sun et al. (2017) Not Just a Fad: Optimal Sequencing in Mobile
In-App Advertising Simulation Ad Network RTB CTR Time
36
Stavrogiannis,
Gerding &
Polukarov
(2014)
Auction mechanisms for demand-side
intermediaries in online advertising exchanges Simulation Ad network RTB CTR -
37 Ting and de Run
(2015)
Young adults’ attitude towards advertising: A
multi-group analysis by ethnicity
Survey (347
participants) User - Intention Belief, Attitudes
38 Trivedi (2015) Mobile Advertising Effectiveness on Gen Ys
Attitude and Purchase Intentions
Survey (130
participants) User -
Attitude
towards the
ad and brand
Entertainment,
Informativeness,
Irritation and
Credibility
39 Yuan, S, Wang
& Zhao (2013)
Real-time bidding for online advertising:
measurement and analysis
Experiments
(52,850,635
impressions)
Ad Network RTB Impressions,
Clicks, Bids, Pricing
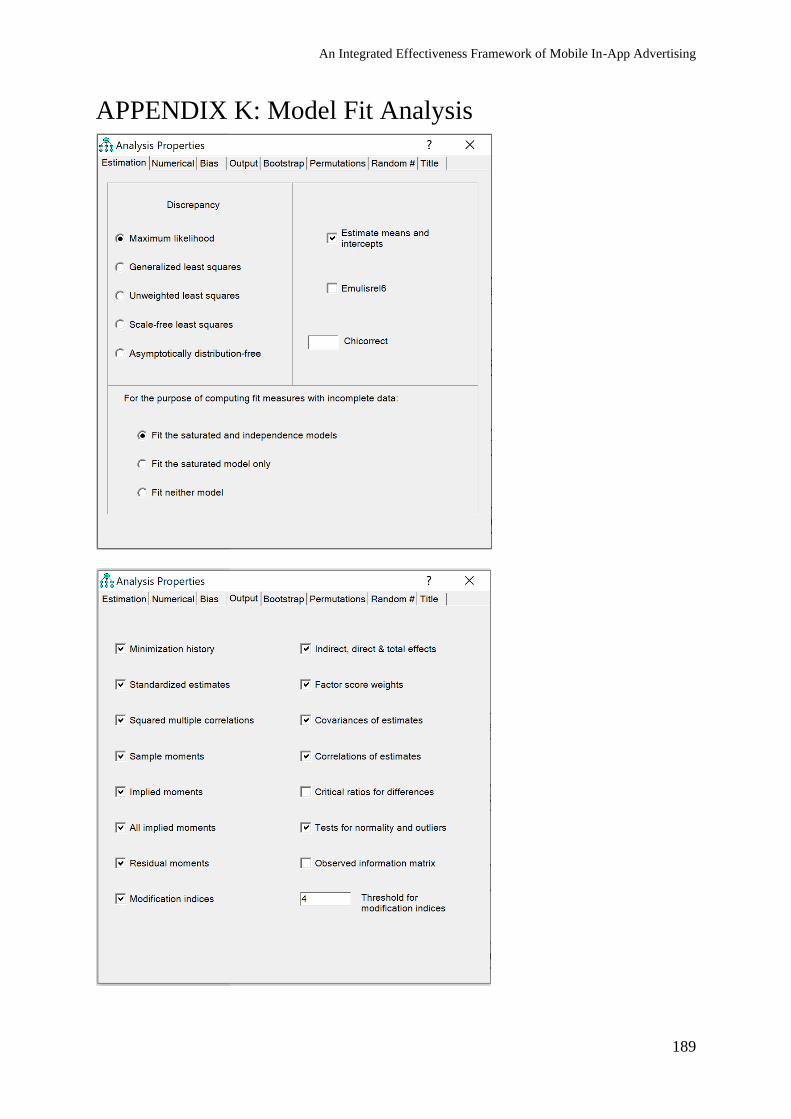
An Integrated Effectiveness Framework of Mobile In-App Advertising
189
APPENDIX K: Model Fit Analysis
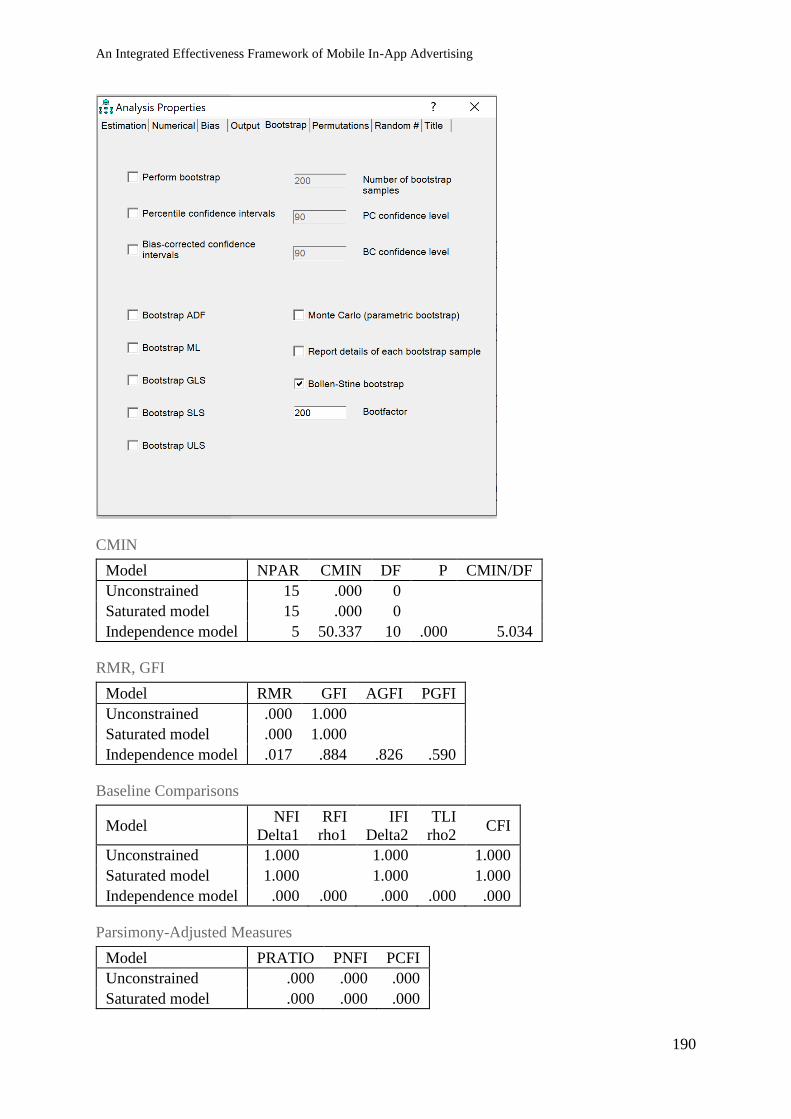
An Integrated Effectiveness Framework of Mobile In-App Advertising
190
CMIN
Model NPAR CMIN DF P CMIN/DF
Unconstrained 15 .000 0
Saturated model 15 .000 0
Independence model 5 50.337 10 .000 5.034
RMR, GFI
Model RMR GFI AGFI PGFI
Unconstrained .000 1.000
Saturated model .000 1.000
Independence model .017 .884 .826 .590
Baseline Comparisons
Model NFI
Delta1
RFI
rho1
IFI
Delta2
TLI
rho2 CFI
Unconstrained 1.000 1.000 1.000
Saturated model 1.000 1.000 1.000
Independence model .000 .000 .000 .000 .000
Parsimony-Adjusted Measures
Model PRATIO PNFI PCFI
Unconstrained .000 .000 .000
Saturated model .000 .000 .000
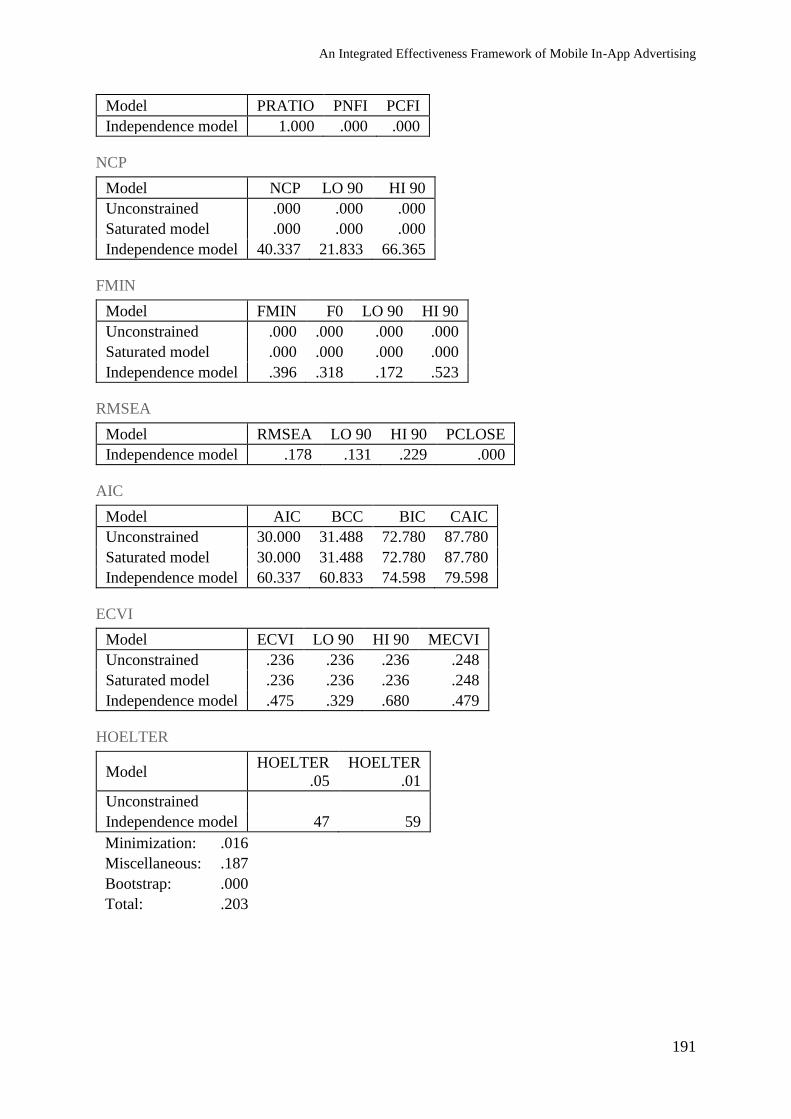
An Integrated Effectiveness Framework of Mobile In-App Advertising
191
Model PRATIO PNFI PCFI
Independence model 1.000 .000 .000
NCP
Model NCP LO 90 HI 90
Unconstrained .000 .000 .000
Saturated model .000 .000 .000
Independence model 40.337 21.833 66.365
FMIN
Model FMIN F0 LO 90 HI 90
Unconstrained .000 .000 .000 .000
Saturated model .000 .000 .000 .000
Independence model .396 .318 .172 .523
RMSEA
Model RMSEA LO 90 HI 90 PCLOSE
Independence model .178 .131 .229 .000
AIC
Model AIC BCC BIC CAIC
Unconstrained 30.000 31.488 72.780 87.780
Saturated model 30.000 31.488 72.780 87.780
Independence model 60.337 60.833 74.598 79.598
ECVI
Model ECVI LO 90 HI 90 MECVI
Unconstrained .236 .236 .236 .248
Saturated model .236 .236 .236 .248
Independence model .475 .329 .680 .479
HOELTER
Model HOELTER
.05
HOELTER
.01
Unconstrained
Independence model 47 59
Minimization: .016
Miscellaneous: .187
Bootstrap: .000
Total: .203

An Integrated Effectiveness Framework of Mobile In-App Advertising
192
APPENDIX L: Participant Information Sheet
Participant Information Sheet
Title An Integrated Effectiveness Framework of Mobile
In-App Advertising
Chief Investigator/Senior Supervisor Professor Mathews Nkhoma
Associate Investigator(s)/Associate
Supervisor(s) Dr Wanniwat Pansuwong
Principal Research Student(s) Mr Vinh Truong
What does my participation involve? 1 Introduction
You are invited to take part in this research project, which is called An Integrated Effectiveness Framework of Mobile In-App Advertising. This Participant Information Sheet/Consent Form tells you about the research project. It explains the processes involved in taking part. Knowing what is involved will help you decide if you want to take part in the research. Please read this information carefully. Ask questions about anything that you do not understand or want to know more about. Before deciding whether or not to take part, you might want to talk about it with a relative or friend. Participation in this research is voluntary. If you do not wish to take part, you do not have to. 2 What is the purpose of this research? In recent years, advertising in mobile apps has become one of the most popular advertising channels for businesses. The annual spending for this emerging type of advertising keeps increasing year after year. Despite its popularity in practice, the background theory of mobile in-app advertising is, however, still in its infancy. Educational materials related to mobile in-app advertising are scarce. More research on this new topic is therefore needed, both from conceptual and empirical perspectives. The question of how to further enhance the effectiveness of advertising in mobile apps still persists and is more urgent than ever before. This research explores the role of publishers in mobile in-app advertising and proposes new advertising strategies associated with publishers to enhance their effectiveness further. This research aims to identify publishers-controlled factors and evaluate their impacts on the effectiveness of mobile in-app advertising. The proposed research will contribute to mobile in-app advertising literature by exploring the role of publishers and their supply and delivery factors on the ad click performance of mobile

An Integrated Effectiveness Framework of Mobile In-App Advertising
193
in-app advertising. By which, new advertising strategies could be recommended to be applied in practice and could help to increase the mobile in-app advertising revenue significantly higher by balancing the benefits of all parties involved in an ad serving process. 3 What does participation in this research involve? The participants in this project only need to use our apps as usual. They could use our apps to capture photos and edit them. Ads will then be displayed randomly on their apps. If they are interested in any ad, they could click on them. That is all the participants have to do. The following screen capture shows that the participants could use the functions of the camera, photo editing and gallery in our apps when the ads are randomly shown on the screen.
Camera Photo Editing Ads
4 Other relevant information about the research project
Based on our calculation, we need to have at least 1,300 times the ads are displayed. That is
equivalent to 26 active users. 5 Do I have to take part in this research project? Participation in any research project is voluntary. If you do not wish to take part, you do not have to. You will be provided with a link to our Participant Information Statement (https://sites.google.com/view/pis-ief) to study our project. You will also be given another link to your privacy policy (https://sites.google.com/view/mobileapp-privacypolicy) to learn about what data we collect from you and how we manage them. Based on this information, you could decide to take part in our project or not. Your decision whether to take part or not to take part, or to take part and then withdraw, will not affect your relationship with the

An Integrated Effectiveness Framework of Mobile In-App Advertising
194
researchers or with RMIT University. Accepting the in-app consent is an indication of your consent to participate in the study.
Consent Accepted (YES) Declined (NO)
If you decide to take part and later change your mind, you are free to withdraw from the project at any stage. You can opt-out of our study at any time by selecting the “NoAds” option. 6 What are the possible benefits of taking part? There will be no clear benefit to you from your participation in this research. However, you may appreciate contributing to knowledge. 7 What are the risks and disadvantages of taking part? If you agree to participate in this research, the number of ads displayed to you and the number of times you clicked on those displayed ads will be recorded. Apart from those, no personal information will be collected in this research. 8 What if I withdraw from this research project? If you do consent to participate, you may withdraw at any time. On the app, there is a button called “NoAds”. When you click on that button, a dialogue will be displayed, asking if you still want to be part of the research or not. By selecting No, you will then be opted out of the research project. You will then see no advertisements on your app while you still enjoy all other functionalities that the app provides as shown in the following figures.
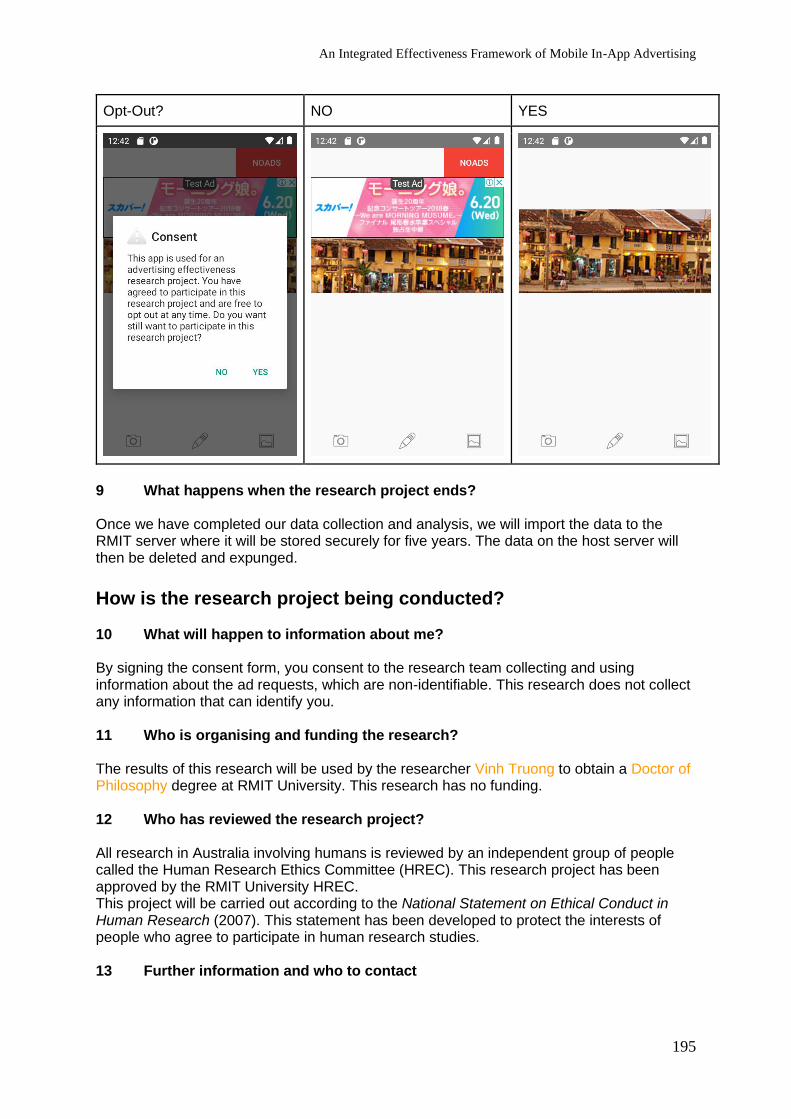
An Integrated Effectiveness Framework of Mobile In-App Advertising
195
Opt-Out? NO YES
9 What happens when the research project ends? Once we have completed our data collection and analysis, we will import the data to the RMIT server where it will be stored securely for five years. The data on the host server will then be deleted and expunged.
How is the research project being conducted? 10 What will happen to information about me? By signing the consent form, you consent to the research team collecting and using information about the ad requests, which are non-identifiable. This research does not collect any information that can identify you. 11 Who is organising and funding the research? The results of this research will be used by the researcher Vinh Truong to obtain a Doctor of Philosophy degree at RMIT University. This research has no funding. 12 Who has reviewed the research project? All research in Australia involving humans is reviewed by an independent group of people called the Human Research Ethics Committee (HREC). This research project has been approved by the RMIT University HREC. This project will be carried out according to the National Statement on Ethical Conduct in Human Research (2007). This statement has been developed to protect the interests of people who agree to participate in human research studies. 13 Further information and who to contact
An Integrated Effectiveness Framework of Mobile In-App Advertising
196
If you want any further information concerning this project, you can contact the researcher or any of the following people: Research contact person
Name Mathews Nkhoma
Position Chief investigator / Senior supervisor
14 Complaints Should you have any concerns or questions about this research project, which you do not wish to discuss with the researchers listed in this document, then you may contact:
Reviewing HREC name RMIT University
HREC Secretary Vivienne Moyle
Telephone 03 9925 5037
Email [email protected]
Mailing address Manager, Research Governance and Ethics RMIT University GPO Box 2476 MELBOURNE VIC 3001
An Integrated Effectiveness Framework of Mobile In-App Advertising
197
APPENDIX M: Research Data Management Plan
RMIT Research Data Management Plan – Student
This plan has five sections. You may also find the Guidelines for RMIT Research Data
Management Plan a useful document for advice on how to fill in each section.
Section 1: WHAT IS YOUR PROJECT?
Research Project Title/Name: An Integrated Effectiveness Framework of Mobile In-
App Advertising
Project Number or Unique Identifier (if applicable):
Date of Plan: 01-Jan-2019
Last Updated: 01-Jan-2020
Senior Supervisor: Prof. Mathews Nkhoma
Higher Degree by Research Candidate/Student: Vinh Truong
Ethics approval number (if applicable): BCHEAN22845
Section 2: WHAT DATA ARE YOU COLLECTING OR USING?
1. What data will you be collecting or using and in what form?
Digital data: We collect the numbers of ad requests, which are coming from our published mobile apps. For example, PDFs, spreadsheets, word documents, drawings, video, audio or photographic recordings and
documentation,
Non-digital data: None For example, models, notebooks, specimens
2. Are there any IP issues with the data you will use or collect? NO
If there are, record details here. For example, is there an ownership or collaborative agreement? Are you using other
people’s images, designs, software etc.? Do you need copyright clearance or permission to use a patent, images, video,
sound recordings, or design?
Section 3: WHERE WILL YOU STORE THE DATA DURING THE PROJECT?
1. During your research project, where will you store the Digital and Non-Digital data?
☐ RMIT network drive. Location: __________________________________________
☒ RMIT approved cloud application. Details: As recommended by RMIT, we use CloudStor+ to store

An Integrated Effectiveness Framework of Mobile In-App Advertising
198
our collected data. We log on to CloudStor+ using an RMIT account.
☐ RMIT Large Storage Space – if you have more than 20 GB Ask ITS for access Details:
_________________
☐ Building: _____________ , Level:______ , Room ________________ ,
Cabinet/box__________________
2. If any data is not stored at RMIT, where is it stored and why? N/A
If applicable, please insert the answer here.
Section 4: WHO WILL HAVE ACCESS TO THE DATA?
1. Record the names and roles of anyone who will access the data during the project. Press Tab to add rows to the table
Name Role: e.g. Chief Investigator/ Senior Supervisor,
Research Assistant, Technician.
Mathews Nkhoma Chief Investigator
Wanniwat Pansuwong Co-Investigator
Vinh Truong Student Investigator
2. How is the data protected? The data is in Excel format. We protect each Excel file with a password.
For example, passwords, encryption, locked filing cabinets, check-out procedures etc.
Section 5: WHAT WILL HAPPEN TO YOUR DATA AFTER THE PROJECT?
1. I will keep the data for at least the minimum legal retention period from the date of thesis
submission/ publication:
☒5 years (most research)
☐6 years (commercial contract research)
☐15 years (clinical trials)
☐Permanently (gene therapy or research that has community or heritage value)
☐ I will store the data and any copies appropriately or leave them with my supervisor or school. A copy of your data must be on RMIT approved infrastructure for at least the minimum legal retention period.
2. At the end of the project, the data will be:
☐ Banked for use in future research. (If so, you may need to talk to your school or supervisor)
☒ Deleted or destroyed if required by ethics approval, contract or other requirements.
☐ The data or the metadata will be available for use by other researchers at the end of the
project. The Library provides assistance in making data and metadata available.
An Integrated Effectiveness Framework of Mobile In-App Advertising
199
APPENDIX N: Ethics Approval Letter